distribution and organic pollutant - TDX (Tesis Doctorals en ...
Upload
khangminh22Category
view
0download
0
Tesis doctoral!
Universitat Politècnica de Catalunya ! BarcelonaTech (UPC)
Consejo Superior de Investigaciones Científicas (CSIC)
Coral Reef Ecosystem Services Economic Valuation Experiences From The South Pacific
Nicolas Pascal
2013
Tesis presentada para obtener el título de Doctor por la Universitat Politècnica de Catalunya
El director de la tesis:
Dr. Francesc Maynou
Centre Mediterrani d'Investigacions Marines i Ambientals (CMIMA)
Consejo Superior de Investigaciones Científicas
El co-director de la tesis:
Dr. Eric Clua
Ministère de l’Agriculture, de l’Alimentation, de la Forêt et des Pêches
51, Rue de Vaugirard, 75015 Paris, FRANCE

Coral Reef Ecosystem Services Economic Valuation. Phd dissertation, Nicolas Pascal, 2013 Page ii / 351!

Coral Reef Ecosystem Services Economic Valuation. Phd dissertation, Nicolas Pascal, 2013 Page iii / 351!
Acta de calificación de tesis doctoral
Curso académico: Nombre y apellidos: Nicolas Pascal
DNI / NIE / Pasaporte: X957310P / 12AI00641
Programa de doctorado: CIENCIAS DEL MAR
Unidad estructural responsable del programa
Resolución del Tribunal
Reunido el Tribunal designado a tal efecto, el doctorando / la doctoranda expone el tema de la su tesis doctoral
titulada: “Coral Reef Ecosystem Services Economic Valuation. Experiences From The South Pacific”.
Acabada la lectura y después de dar respuesta a las cuestiones formuladas por los miembros titulares del tribunal,
éste otorga la calificación:
APTA/O NO APTA/O
Presidente/a (Nombre, apellidos y firma)
Secretario/a (Nombre, apellidos y firma)
Vocal (Nombre, apellidos y firma) ______________________, _______ de __________________ de _______________
El resultado del escrutinio de los votos emitidos por los miembros titulares del tribunal, efectuado por la Escuela de
Doctorado, a instancia de la Comisión de Doctorado de la UPC, otorga la MENCIÓN CUM LAUDE:
SÍ NO
Presidente/a de la Comisión de Doctorado (Nombre, apellidos y firma)
Secretaria de la Comisión de Doctorado (Nombre, apellidos y firma) Barcelona a _______ de ____________________ de __________

Coral Reef Ecosystem Services Economic Valuation. Phd dissertation, Nicolas Pascal, 2013 Page iv / 351!
!"#$%&
!"#$%&''''''''''''''''''''''''''''''''''''''''''''''''''''''''''''''''''''''''''''''''''''''''''''''''''''''''''''''''''''''''''''''''''''''''''''''''''''''''''''''''''''''''''''''&!(!
)!*+&,-&+./)$*&'''''''''''''''''''''''''''''''''''''''''''''''''''''''''''''''''''''''''''''''''''''''''''''''''''''''''''''''''''''''''''''''''''''''''''''''''''''''''''&!%!
)!*+&,-&-!012$*&'''''''''''''''''''''''''''''''''''''''''''''''''''''''''''''''''''''''''''''''''''''''''''''''''''''''''''''''''''''''''''''''''''''''''''''''''''''''''&%!!
)!*+&,-&3.4*&'''''''''''''''''''''''''''''''''''''''''''''''''''''''''''''''''''''''''''''''''''''''''''''''''''''''''''''''''''''''''''''''''''''''''''''''''''''''''''''&%!!!
2$3$25!$3$"+*&'''''''''''''''''''''''''''''''''''''''''''''''''''''''''''''''''''''''''''''''''''''''''''''''''''''''''''''''''''''''''''''''''''''''''''''''''''''&%!!!!
)!*+&,-&.52,"63*&''''''''''''''''''''''''''''''''''''''''''''''''''''''''''''''''''''''''''''''''''''''''''''''''''''''''''''''''''''''''''''''''''''''''''''''''&%(!!!
./*+2.5+&''''''''''''''''''''''''''''''''''''''''''''''''''''''''''''''''''''''''''''''''''''''''''''''''''''''''''''''''''''''''''''''''''''''''''''''''''''''''''''''''''&%!%!
.'! 0$"$2.)&!"+2,#15+!,"&'''''''''''''''''''''''''''''''''''''''''''''''''''''''''''''''''''''''''''''''''''''''''''''''''''''''''''''''''''''''''''''''''&7!
.'7! $5,",3!5&(.)1.+!,"&,-&5,2.)&2$$-&$5,*6*+$3*&!"&+8$&4.5!-!5&'''''''''''''''''''''''''''''''''''''''''''''''''''''''''''''''''&7!
"#$#$! %"&'()!(*)(&+",-)-(.!#######################################################################################################################################################!$!
"#$#/! (01+1%-0!2",3")-1+!14!(01.5.)(%!.(&2-0(.!#############################################################################################################!/!
"#$#6! 01&",!&((4.!"+7!.13)8!9"0-4-0!013+)&-(.!###############################################################################################################!$/!
.'9! ."&,($2(!$:&,-&+8$&58.))$"0$*&,-&52$*(&'''''''''''''''''''''''''''''''''''''''''''''''''''''''''''''''''''''''''''''''''''''''''''''''''&7;!
"#/#$! )&"+.%-)!"!01&&(0)!.-:+",!";13)!(01.5.)(%!.(&2-0(.!#######################################################################################!$<!
"#/#/! )"'(!-+!"0013+)!9"0-4-0!.9(0-4-0-)-(.!########################################################################################################################!$=!
"#/#6! -+0&(".(!)8(!-+4,3(+0(!1+!91,-05!###############################################################################################################################!/>!
.'<! ,/=$5+!($*&."#&*+215+12$&,-&+8$&+8$*!*&''''''''''''''''''''''''''''''''''''''''''''''''''''''''''''''''''''''''''''''''''''''''''''''''''''&9<!
"#6#$! 1;?(0)-2(.!#############################################################################################################################################################################!/6!
"#6#/! .)&30)3&(!#############################################################################################################################################################################!/@!
/'! $(.)1.+!,"&$5,",3!>1$&#$*&*$2(!5$*&2$"#1*&4.2&)$*&$5,*6*+$3$*&5,2.))!$"*&
#$&",1($))$&5.)$#,"!$&''''''''''''''''''''''''''''''''''''''''''''''''''''''''''''''''''''''''''''''''''''''''''''''''''''''''''''''''''''''''''''''''''''''&9?!
/'7! !"+2,#15+!,"&''''''''''''''''''''''''''''''''''''''''''''''''''''''''''''''''''''''''''''''''''''''''''''''''''''''''''''''''''''''''''''''''''''''''''''''''''''&9?!
/'9! ,/=$5+!-&''''''''''''''''''''''''''''''''''''''''''''''''''''''''''''''''''''''''''''''''''''''''''''''''''''''''''''''''''''''''''''''''''''''''''''''''''''''''''''''&9@!
/'<! 5,"+$%+$&*,5!,A$5,),0!>1$&#$&).&",1($))$A5.)$#,"!$&'''''''''''''''''''''''''''''''''''''''''''''''''''''''''''''''''''''''''&9@!
;#6#$! :(1:&"98-(!###########################################################################################################################################################################!/=!
;#6#/! 8";-)").!################################################################################################################################################################################!6$!
;#6#6! %"+:&12(!#############################################################################################################################################################################!6/!
;#6#@! 8(&;-(&.!################################################################################################################################################################################!6/!

Coral Reef Ecosystem Services Economic Valuation. Phd dissertation, Nicolas Pascal, 2013 Page v / 351!
;#6#<! ",:3(&"-(.!############################################################################################################################################################################!66!
;#6#A! ,(!2-2"+)!###############################################################################################################################################################################!66!
;#6#B! -+.0&-9)-1+!3+(.01!###########################################################################################################################################################!6@!
;#6#C! 9193,")-1+!()!.10-D)D!#####################################################################################################################################################!6@!
;#6#=! (21,3)-1+!91,-)-E3(!#########################################################################################################################################################!6B!
;#6#$>! (01+1%-(!############################################################################################################################################################################!6B!
;#6#$$! ,F(01+1%-(!7(!.3;.-.)"+0(!'"+"'!G!##########################################################################################################################!6C!
/'B! 3$+8,#$&'''''''''''''''''''''''''''''''''''''''''''''''''''''''''''''''''''''''''''''''''''''''''''''''''''''''''''''''''''''''''''''''''''''''''''''''''''''''''''''&B7!
;#@#$! "99&108(!:(+(&",(!###########################################################################################################################################################!@$!
;#@#/! 2",(3&!(01+1%-E3(!)1)",(H!2",(3&!"?13)((!()!2",(3&!4-+"+0-(&(G!#############################################################!@6!
;#@#6! 081-*!%()8171,1:-E3(.!##################################################################################################################################################!@@!
;#@#@! 01+.1,-7")-1+.!7(.!&(.3,)").!#####################################################################################################################################!@B!
/';! .442,58$&3$+8,#,),0!>1$&#$+.!))$$&''''''''''''''''''''''''''''''''''''''''''''''''''''''''''''''''''''''''''''''''''''''''''''''''''''''''&BC!
;#<#$! 9(08(!I(.!$H/H6!()!@J!########################################################################################################################################################!@=!
;#<#/! )13&-.%(!I(.!<H!A!()!BJ!####################################################################################################################################################!BB!
;#<#6! &(08(&08(!()!(730")-1+!I(.!CJ!###################################################################################################################################!=@!
;#<#@! 9&1)(0)-1+!01)-(&(!I(.!=J!#############################################################################################################################################!=A!
;#<#<! ;-1K9&1.9(0)-1+!I(.!$>J!##############################################################################################################################################!$>/!
;#<#A! 9-(:(!7(!01/!I(.!$$J!#####################################################################################################################################################!$$/!
;#<#B! "3)&(.!.(&2-0(.!(2",3(.!##############################################################################################################################################!$$<!
/'D! 2$*1)+.+*&''''''''''''''''''''''''''''''''''''''''''''''''''''''''''''''''''''''''''''''''''''''''''''''''''''''''''''''''''''''''''''''''''''''''''''''''''''''''&77?!
;#A#$! 01+.1,-7(.!#########################################################################################################################################################################!$$B!
;#A#/! 9(08(!I(.!$!"!(.!@J!#########################################################################################################################################################!$/$!
;#A#6! )13&-.%(!I(.!<!L!(.!BJ!##################################################################################################################################################!$6<!
;#A#@! &(08(&08(!()!(730")-1+!I(.!CJ!################################################################################################################################!$@<!
;#A#<! 9&1)(0)-1+!01)-(&(!I(.!=J!##########################################################################################################################################!$@<!
;#A#A! ;-1K9&1.9(0)-1+!I(.!$>J!##############################################################################################################################################!$@B!
;#A#B! 9-(:(!7(!01/!!I(.!$$J!######################################################################################################################################################!$@=!
5'! $5,",3!5&(.)1.+!,"&,-&/$"$-!+*&,-&5,2.)&2$$-&3.2!"$&2$*$2($E&",2+8&$-.+$E&
(."1.+1&'''''''''''''''''''''''''''''''''''''''''''''''''''''''''''''''''''''''''''''''''''''''''''''''''''''''''''''''''''''''''''''''''''''''''''''''''''''''''''''''''''&7;9!
5'7! !"+2,#15+!,"&''''''''''''''''''''''''''''''''''''''''''''''''''''''''''''''''''''''''''''''''''''''''''''''''''''''''''''''''''''''''''''''''''''''''''''''''''&7;9!
0#$#$! 01%%3+-)5K;".(7!%9"!-+!9"0-4-0!01+)(*)!###########################################################################################################!$</!
0#$#/! .13)8!9"0-4-0!01%%3+-)5K;".(7!%"&-+(!9&1)(0)(7!"&(".!#############################################################################!$</!
0#$#6! 4&1%!)8(1&5!)1!&(",-)5G!M8")!71!M(!'+1M!&(",,5!";13)!%9".!;(+(4-).!41&!9(19,(N!#####################!$<6!

Coral Reef Ecosystem Services Economic Valuation. Phd dissertation, Nicolas Pascal, 2013 Page vi / 351!
0#$#@! %9".!"+7!)8(!"47!-+!)8(!9"0-4-0!#############################################################################################################################!$<A!
0#$#<! 1;?(0)-2(.!##########################################################################################################################################################################!$<A!
5'9! 3$+8,#&''''''''''''''''''''''''''''''''''''''''''''''''''''''''''''''''''''''''''''''''''''''''''''''''''''''''''''''''''''''''''''''''''''''''''''''''''''''''''''&7;?!
0#/#$! :(+(&",!"99&1"08!##########################################################################################################################################################!$<B!
0#/#/! .(,(0)-1+!14!%9"!.-)(.!#################################################################################################################################################!$<B!
0#/#6! 2",-7")-1+!14!01+)&1,!.-)(.!#######################################################################################################################################!$AA!
0#/#@! .(,(0)(7!(.!-%9"0)(7!;5!%9"!###################################################################################################################################!$B>!
0#/#<! .9")-",!9(&-%()(&!14!"+",5.-.!###################################################################################################################################!$B>!
0#/#A! 2",3")-1+!%()817.!########################################################################################################################################################!$B/!
0#/#B! %9"!-%9"0).!1+!4-.8(&5!9&1730)-2-)5!I1&!.9-,,12(&!(44(0)J!#######################################################################!$B@!
0#/#C! (01+1%-0!2",3")-1+!14!-%9"0).!1+!.3;.-.)(+0(!4-.8(&5!I(.!$J!###################################################################!$BB!
0#/#=! (01+1%-0!2",3")-1+!14!-%9"0).!1+!01%%(&0-",!4-.8(&5!I(.!/J!###################################################################!$C>!
0#/#$>! 7()"-,.!14!%()817!01%%1+!)1!;1)8!4-.8(&-(.!#################################################################################################!$C/!
0#/#$$! %9"!-%9"0).!1+!)13&-.%!2-.-)!%1)-2")-1+.!#######################################################################################################!$C6!
0#/#$/! (01+1%-0!2",3")-1+!14!-%9"0).!1+!)13&-.%!I(.!6J!########################################################################################!$C@!
0#/#$6! (01+1%-0!2",3")-1+!14!-%9"0).!1+!01".)",!9&1)(0)-1+!I(.!@J!################################################################!$CA!
0#/#$@! (01+1%-0!2",3")-1+!14!)8(!-%9"0).!1+!;-17-2(&.-)5!I(.!<J!#######################################################################!/>/!
0#/#$<! (01+1%-0!2",3")-1+!14!-%9"0).!1+!.10-",!0"9-)",!I(.!AJ!############################################################################!/>@!
0#/#$A! -%9"0).!14!%9"!1+!)8(!2-,,":(!(01+1%5!###########################################################################################################!/><!
0#/#$B! 01.).!14!%9".!###############################################################################################################################################################!/>A!
0#/#$C! 4-+"+0-",!"+",5.-.!#######################################################################################################################################################!/>B!
5'<! 2$*1)+*&'''''''''''''''''''''''''''''''''''''''''''''''''''''''''''''''''''''''''''''''''''''''''''''''''''''''''''''''''''''''''''''''''''''''''''''''''''''''''''''&979!
0#6#$! 01+.1,-7")(7!&(.3,).!###################################################################################################################################################!/$/!
0#6#/! 4-.8(&5!.(0)1&!I(.$!"+7!(./J!###################################################################################################################################!/$@!
0#6#6! )13&-.%!.(0)1&!I(.6J!####################################################################################################################################################!/$A!
0#6#@! 2-,,":(!:&1..!71%(.)-0!-+01%(!################################################################################################################################!/$B!
0#6#<! -%9"0).!14!%9"!1+!4-.8(&5!9&1730)-2-)5!I.9-,,12(&J!#####################################################################################!/$C!
0#6#A! (01+1%-0!-%9"0).!14!%9"!1+!4-.8(&-(.!I(.!$!"+7!(.!/J!##################################################################################!//$!
0#6#B! %9"!-%9"0).!1+!)13&-.%!2-.-)!%1)-2")-1+.!#########################################################################################################!///!
0#6#C! (01+1%-0!-%9"0).!14!%9"!1+!)13&-.%!I(.!6J!######################################################################################################!//6!
0#6#=! (01+1%-0!-%9"0).!14!%9"!1+!01".)",!9&1)(0)-1+!(01.5.)(%!.(&2-0(!I(.!@J!########################################!//@!
0#6#$>! (01+1%-0!-%9"0).!14!%9"!1+!;(E3(.)!2",3(!I(.!<J!#######################################################################################!//A!
0#6#$$! (01+1%-0!-%9"0).!14!%9"!1+!)8(!.10-",H!83%"+!"+7!985.-0",!0"9-)",!I(.!AJ!####################################!//C!
0#6#$/! 01.).!14!%9".!###############################################################################################################################################################!//=!
0#6#$6! (*K91.)!4-+"+0-",!"+",5.-.G!9O,H!;P0!&")-1!"+7!&1-!#####################################################################################!/6$!

Coral Reef Ecosystem Services Economic Valuation. Phd dissertation, Nicolas Pascal, 2013 Page vii / 351!
0#6#$@! .0(+"&-1.!#########################################################################################################################################################################!/66!
0#6#$<! 9&1?(0)(7!4-+"+0-",!"+",5.-.!##################################################################################################################################!/6@!
0#6#$A! .(+.-)-2-)5!"+",5.-.!####################################################################################################################################################!/6<!
5'B! 5,"5)1*!,"*&''''''''''''''''''''''''''''''''''''''''''''''''''''''''''''''''''''''''''''''''''''''''''''''''''''''''''''''''''''''''''''''''''''''''''''''''''''&9<?!
0#@#$! -+2(.)%(+)!7(.0&-9)-1+!###############################################################################################################################################!/6B!
0#@#/! -+2(.)%(+)!"99&"-.",!###################################################################################################################################################!/6C!
#'! 0$"$2.)&#!*51**!,"&''''''''''''''''''''''''''''''''''''''''''''''''''''''''''''''''''''''''''''''''''''''''''''''''''''''''''''''''''''''''''''''''''&9B9!
#'7! 2$*1)+*&!"+$242$+.+!,"&''''''''''''''''''''''''''''''''''''''''''''''''''''''''''''''''''''''''''''''''''''''''''''''''''''''''''''''''''''''''''''''&9B<!
7#$#$! &(,")-2(!-%91&)"+0(!"+7!M(-:8)!14!(.!-+!)8(!(01+1%-(.!14!.13)8!9"0-4-0!-.,"+7.!##########################!/@6!
7#$#/! )8(!2",3(!14!(.!4&1%!.13)8!9"0-4-0!01&",!&((4.H!01%9"&(7!)1!1)8(&!01&",!&(:-1+.!#######################!/@<!
7#$#6! ;(+(4-).!14!%9"H!01%9"&(7!)1!1)8(&!01&",!&(:-1+.!######################################################################################!/@A!
#'9! +2."*3!+&.&5,22$5+&*!0".)&./,1+&$5,*6*+$3&*$2(!5$*&''''''''''''''''''''''''''''''''''''''''''''''''''''''''''''''''''''''''&9B@!
7#/#$! 1;.(&2(7!2",3(.!2(&.3.!19)-1+H!19)-%3%!"+7!;(.)!3.(!2",3(.!###################################################################!/@C!
7#/#/! .8"71M!9&-0(.!#################################################################################################################################################################!/<@!
7#/#6! .9")-",!7-.)&-;3)-1+!14!(01.5.)(%!9&10(..(.!"+7!.(&2-0(.!##########################################################################!/<<!
7#/#@! 9&1730)-1+!43+0)-1+!####################################################################################################################################################!/A>!
7#/#<! -+.3&"+0(!"+7!&(.-,-(+0(!&1,(!+1)!&(4,(0)(7!###################################################################################################!/A@!
7#/#A! %3,)-9,-(&.!#######################################################################################################################################################################!/A<!
7#/#B! ;(+(4-)!)&"+.4(&!############################################################################################################################################################!/AA!
7#/#C! 9&1?(0)-1+.!14!(01.5.)(%!.(&2-0(.!2",3")-1+!###################################################################################################!/AC!
7#/#=! 7")"!01,,(0)-1+!%()817.!41&!E3"+)-)")-2(!2",3")-1+.!-+!)8(!.13)8!9"0-4-0!01+)(*)!###################!/B$!
7#/#$>! 9&-1&-)5!)1!%"'(!Q2-.-;,(R!",,!)8(!(01.5.)(%!.(&2-0(.!################################################################################!/B/!
7#/#$$! .(+.-)-2-)5!"+",5.-.!####################################################################################################################################################!/B/!
#'<! 4,)!56&!"-)1$"5$&''''''''''''''''''''''''''''''''''''''''''''''''''''''''''''''''''''''''''''''''''''''''''''''''''''''''''''''''''''''''''''''''''''''''''''&9?B!
7#6#$! 4-+"+0-",!-+7-0")1&.!#####################################################################################################################################################!/B@!
7#6#/! 1;.(&2(7!-+4,3(+0(!1+!91,-05!%"'(&.!###################################################################################################################!/B<!
7#6#6! (.2!"+7!01%9(+.")-1+.!###############################################################################################################################################!/C$!
$'! 5,"5)1*!,"*&''''''''''''''''''''''''''''''''''''''''''''''''''''''''''''''''''''''''''''''''''''''''''''''''''''''''''''''''''''''''''''''''''''''''''''''''''&9@B!
-'! .""$%&'''''''''''''''''''''''''''''''''''''''''''''''''''''''''''''''''''''''''''''''''''''''''''''''''''''''''''''''''''''''''''''''''''''''''''''''''''''''''''''''''&9@@!
-'7! .44$"#!%&7F&4.5!-!5&5,"+$%+&'''''''''''''''''''''''''''''''''''''''''''''''''''''''''''''''''''''''''''''''''''''''''''''''''''''''''''''''''''''''&9@@!
-'9! .""$%$&9F&5.2+$&#$*&2G5!-*&5,2.))!$"*&#$&",1($))$A5.)G#,"!$&''''''''''''''''''''''''''''''''''''''''''''''''''''''''&9CH!
-'<! .""$%$&<F&#!*+2!/1+!,"&*4.+!.)$&#$&).&(.)$12&#$*&*$&#$*&2G5!-*&5,2.))!$"*&#$&",1($))$A
5.)G#,"!$&''''''''''''''''''''''''''''''''''''''''''''''''''''''''''''''''''''''''''''''''''''''''''''''''''''''''''''''''''''''''''''''''''''''''''''''''''''''''''''''''''''&9C7!

Coral Reef Ecosystem Services Economic Valuation. Phd dissertation, Nicolas Pascal, 2013 Page viii / 351!
-'B! .44$"#!%&BF&#$*52!4+!,"&,-&*$)$5+$#&*+1#!$*&-2,3&5/.&3$+.A.".)6*!*&'''''''''''''''''''''''''''''''''''''''''&9C@!
-';! .44$"#!%&;F&*+.+!*+!5*&2$*1)+*&,-&34.&$--$5+*&,"&541$*&."#&,+8$2&/!,),0!5.)&!"#!5$*&''''''''''&<H7!
4#<#$! 2"&-")-1+!9"&)-)-1+-+:!################################################################################################################################################!6>$!
4#<#/! 4-.8!";3+7"+0(!7")"!#####################################################################################################################################################!6>$!
4#<#6! 4-.8!;-1%"..!7")"!############################################################################################################################################################!6>/!
4#<#@! 01+0,3.-1+!########################################################################################################################################################################!6>6!
-'D! .44$"#!%&DF&4.2+!.)&2#.&'''''''''''''''''''''''''''''''''''''''''''''''''''''''''''''''''''''''''''''''''''''''''''''''''''''''''''''''''''''''''''''&<HB!
4#A#$! 4-.8!;-1%"..!7")"!############################################################################################################################################################!6>@!
4#A#/! ;-1%"..!7")"!(*9,"-+(7!;5!6!.3;.().!14!(*9,"+")1&5!2"&-";,(.G!###############################################################!6>A!
4#A#6! ;-1%"..!7")"!(*9,"-+(7!;5!/!.3;.().!14!(*9,"+")1&5!2"&-";,(.G!###############################################################!6>B!
0'! 2$-$2$"5$*&''''''''''''''''''''''''''''''''''''''''''''''''''''''''''''''''''''''''''''''''''''''''''''''''''''''''''''''''''''''''''''''''''''''''''''''''''''&<HC!
&

Coral Reef Ecosystem Services Economic Valuation. Phd dissertation, Nicolas Pascal, 2013 Page ix / 351!
'()*&+,&*-./$)&Tableau B-1: Estimations démographiques par typologie de résidence et par provinces ................................................... 36!Tableau B-2: Multiplicateurs estimés pour la Nouvelle Calédonie. Détails par secteur d’activité .................................... 46!Tableau B-3: Méthodologie employée pour la monétarisation des SE d’usages extractifs ................................................. 50!Tableau B-4: Évaluation du service de la pêche récifo-lagonaire ...................................................................................... 51!Tableau B-5: Principaux métiers de pêche récifo-lagonaire en Nouvelle-Calédonie ......................................................... 52!Tableau B-6: Facteurs de correction maximum appliqués aux volumes de pêche déclarés ............................................... 55!Tableau B-7: Dépenses monétaires annuelles par ménage CFP, 2008. .............................................................................. 56!Tableau B-8: Circuits de commercialisation des produits de la mer. .................................................................................. 57!Tableau B-9: Estimations des Valeurs Ajoutées par acteur de la pêche commerciale. Détails par provinces. .................. 58!Tableau B-10: Estimation des principaux engins de pêche utilisés ..................................................................................... 61!Tableau B-11: Présentation des estimations utilisées pour la pêche vivrière (kg/capita/an) .............................................. 63!Tableau B-12: Principales familles de poissons ciblées par la pêche vivrière .................................................................... 64!Tableau B-13: Valeur ajoutée par typologie de pêche vivrière (sans le coût du temps humain). ....................................... 65!Tableau B-14: Valeur des importations reliées aux embarcations sur la Nouvelle-Calédonie ........................................... 70!Tableau B-15: Méthodes de monétarisation des SE des usages directs non-extractifs ....................................................... 78!Tableau B-16: Taux d’occupation moyens estimés des gites et hôtels par provinces ......................................................... 91!Tableau B-17: Méthode pour l’évaluation du service de protection du littoral .................................................................. 98!Tableau B-18: Caractéristiques physiques du littoral et degré de protection (extrait de Burke et al. (2008)). ................ 100!Tableau B-19: Méthode de monétarisation du service de bio-prospection ....................................................................... 108!Tableau B-20: Valeurs des paramètres utilisées pour le service de bio-prospection ........................................................ 111!Tableau B-21: Principaux paramètres utilisés pour le service de séquestration du carbone ........................................... 113!Tableau B-22: Prix du marché EU—ETS , 2004-2009. Prix au 30/12/11: 6,70!/t ......................................................... 114!Tableau B-23: Valeur financière totale des services écosystémiques des récifs coralliens de Nouvelle-Calédonie. ........ 118!Tableau B-24: La pêche récifo-lagonaire en Nouvelle-Calédonie. (Tonnes, Millions F Cfp) .......................................... 121!Tableau B-25: Captures de la pêche récifo-lagonaire commerciale professionnelle et non-professionnelle (2008). ...... 124!Tableau B-26: Chiffre d’affaires et valeur ajoutée de la pêche commerciale en Nouvelle-Calédonie ............................. 125!Tableau B-27: Distribution (%) des captures non-commerciales entre pêche vivrière et loisir. ...................................... 127!Tableau B-28: Volumes et valeur ajoutée des captures de la pêche vivrière en Nouvelle-Calédonie ............................... 127!Tableau B-29: Attributs des embarcations immatriculées en 2008 en Nouvelle-Calédonie ............................................. 128!Tableau B-30: Dépenses moyennes d’une embarcation de pêche loisir ............................................................................ 128!Tableau B-31: Caractéristiques de la flotte de pêche de loisir et des dépenses associées ................................................ 128!Tableau B-32: Valeur ajoutée des dépenses de la pêche de loisir en Nouvelle-Calédonie. .............................................. 129!Tableau B-33: Volumes et valeur ajoutée des captures et dépenses de la filière nautisme de plaisance liée à la pêche. 129!Tableau B-34: Contenus des estomacs des principales espèces pélagiques de Nouvelle-Calédonie ................................ 131!Tableau B-35: Pêche hauturière et contribution des récifs néo-calédoniens .................................................................... 131!Tableau B-36: Aspects sociaux de la pêche récifo-lagonaire Nouvelle-Calédonie (différentes métriques). ..................... 134!Tableau B-37: Valeur ajoutée du tourisme lié aux récifs coralliens en Nouvelle-Calédonie. ........................................... 135!Tableau B-38: Principaux attributs influençant le choix des sites de plongées et le niveau de satisfaction. .................... 138!Tableau B-39: Valeurs ajoutées des activités de plongée, de tourisme nautique et de nautisme de plaisance. ................ 140!Tableau B-40: Usagers du tourisme nautique en Nouvelle-Calédonie (2008- Différentes sources). ................................ 140!Tableau B-41: Immatriculations d’embarcations de plaisance en Nouvelle-Calédonie (2008) ........................................ 141!Tableau B-42: Caractéristiques de la flotte de plaisance sans activité de pêche de loisir. ............................................... 141!Tableau B-43: Valeur ajoutée du nautisme de plaisance (non liée à la pêche). ................................................................ 141!Tableau B-44: Distributions des arrivées de touristes par catégorie d’usages des récifs (valeurs maximales) ............... 142!Tableau B-45: Nombre de touristes par catégorie d’usages des récifs ............................................................................. 142!Tableau B-46: Valeurs ajoutées des dépenses du tourisme non-résident attribuable aux récifs coralliens. ..................... 143!Tableau B-47: Paramètres des dépenses associées des usagers résident .......................................................................... 143!

Coral Reef Ecosystem Services Economic Valuation. Phd dissertation, Nicolas Pascal, 2013 Page x / 351!
Tableau B-48: Valeurs ajoutées des dépenses associées du tourisme résident attribuable aux récifs coralliens. ............ 143!Tableau B-49: Valeur du service de recherche et éducation lié aux récifs coralliens de Nouvelle-Calédonie ................. 145!Tableau B-50: Facteurs de contribution du récif dans la protection du littoral contre la houle. ..................................... 146!Tableau B-51: Service écosystémique de protection contre la houle en Nouvelle-Calédonie ........................................... 147!Tableau B-52: Valeur d’option du service de bio-prospection. ......................................................................................... 148!Tableau B-53: Valeur du service de séquestration de carbone par les écosystèmes associés. ......................................... 150! Table C-1: Status of science knowledge about MPA effects. Adapted from Mumby and Steneck (2008a) ...................... 155!Table C-2: Socio-ecological context of the villages (descriptions in the text) ................................................................... 159!Table C-3: Description of the main fishery management rules (modern and traditional) ................................................ 160!Table C-4: MSA analysis for MPA sites (Emua, Piliura) and control sites (Nekapa, Saama). ......................................... 167!Table C-5: Fishing effort index based on selected criteria ................................................................................................ 167!Table C-7: Description of the 5 main selected ES and MPA impacts involved in the study (Details in the text) .............. 170!Table C-8: Damages influencing flood characteristics (Messner et al., 2007) ................................................................. 192!Table C-9 : The calculation of the CPI (Coastal Protection Index) based on characteristics of the coastline ................. 193!Table C-10 : Typology of flood damages with examples (Messner et al., 2007) ............................................................... 196!Table C-11: Parameters used in projections ..................................................................................................................... 207!Table C-12: MPA economic valuation of impacts. Consolidated results. Year 2009 , Annual figures. Added values ...... 212!Table C-13: Estimated yields for the reef fisheries during the year 2009. ........................................................................ 215!Table C-14: Estimated added values for the tourism sector (ES3). Annual figures for 2009. ........................................... 216!Table C-15: Consolidated results of village monetary and non-monetary needs .............................................................. 217!Table C-16: Estimates of MPA impacts on fishery yields in volume (kg) and added value (!). ........................................ 221!Table C-17: Contributing factor of MPA in tourism activities .......................................................................................... 222!Table C-18: Estimates of MPA impacts on tourism added value (ES 3) ........................................................................... 223!Table C-19: The calculation of the CPI (Coastal Protection Index) based on characteristics of the coastline ................ 225!Table C-20: Coastal protection index and weight of coral reef. ........................................................................................ 225!Table C-21: Main factors used in the avoided damage valuation ..................................................................................... 226!Table C-22: Parameters used in valuation of the coastal protection ecosystem service and MPA contribution .............. 226!Table C-23: Variables used for the transfer benefit approach .......................................................................................... 227!Table C-24: Estimates of bequest values (annual figures) and MPA contribution ............................................................ 227!Table C-25: Total annual costs for each MPA (description in the text) ............................................................................ 229!Table C-26: Details of MPA costs ...................................................................................................................................... 230!Table C-27: MPA Profit & Loss statement for 2009 .......................................................................................................... 232!Table C-28: MPA Net Present Values from cost-benefit analysis. .................................................................................... 232!Table C-29: RoI and B/C ratios for each MPA. Based on historic values starting from MPA creation to 2009. ............. 233!Table C-30: Projected values at 25 years for fishery and tourism sector. ........................................................................ 234!Table C-31: Present values of benefits and costs of MPA (25y , discount rate=10%) ...................................................... 234!Table D-1: Summary of South Pacific CRESVs. ................................................................................................................ 244!Table D-2: Comparison of values (US$) for ecosystem services from coral reefs in the South Pacific and other regions ............................................................................................................................................................................................ 246!Table D-3: Main attributes in destination choice for scuba diving industry ..................................................................... 252!Table D-4: Scale of Ecosystem Services ............................................................................................................................ 258!Table D-5: Tentative dependency links between ecosystem services and ecological attributes. ....................................... 261!Table D-6: Tourism and Fisheries Economic Multipliers (From François et al. (2012)). ................................................ 265!Table D-7: Choice of Discount Rate and Time Horizon in the Reviewed Literature ........................................................ 271!Table F-1: Description of case studies analysed in the review (François et al., 2012). .................................................... 300!
&

Coral Reef Ecosystem Services Economic Valuation. Phd dissertation, Nicolas Pascal, 2013 Page xi / 351!
'()*&+,&,(012$)&&Figure A-1: Classification of ecosystem services. .................................................................................................................. 4!Figure A-2: Coral reef ecosystem services classification through Total Economic Valuation (details in the text). ............. 5!Figure A-3: Methods of economic valuation .......................................................................................................................... 8!Figure A-4: Ecosystem processes and services from coral reefs ......................................................................................... 16!Figure B-1: Surfaces récifales de grands complexes Néo-Calédonien ................................................................................ 31!Figure B-2: Distribution de la population par communes (Isee 2004) ................................................................................ 35!Figure B-3: Classification des services générés par les écosystèmes coralliens. ................................................................ 41!Figure B-4: Etapes d’analyse pour les services écosystémiques sélectionnés .................................................................... 45!Figure B-5: Description du secteur pêche en Nouvelle-Calédonie ..................................................................................... 49!Figure B-6: Organisation de la commercialisation des produits récifo-lagonaires (hors import/export). ......................... 53!Figure B-8: Facteurs de distinction entre pêche vivrière et pêche de loisir ........................................................................ 60!Figure B-9: Monétarisation du service tourisme ................................................................................................................. 79!Figure B-10: Arrivée de touristes dans les pays du Pacifique (2006). (ISEE, 2008a) ........................................................ 80!Figure B-11: Distribution par typologie de tourisme (2008). Adapté de Isee (2008) ......................................................... 80!Figure B-12: Arrivées des visiteurs 1980-2008 - Source ISEE et PAF ............................................................................... 81!Figure B-13: Dépenses locales des touristes (Adapté de ISEE (2008)) ............................................................................... 86!Figure B-14: Distribution des dépenses touristiques par résidence d’origine. (Isee, 2008b) ............................................. 89!Figure B-15: Evolution du taux d’occupation hôtelière de la Province Sud ....................................................................... 91!Figure B-16: Rôle des récifs comme absorbeurs d’énergie de la houle. ............................................................................. 96!Figure B-17: Effets des mangroves sur la hauteur des vagues ............................................................................................ 97!Figure B-18: Ingrédients actifs provenant d’organismes marins. ..................................................................................... 102!Figure B-19: Composés marins par phyla (Extrait de (Hunt and Vincent, 2006) ............................................................. 103!Figure B-20: Distribution et nombre de composés marins connus dans les eaux côtières. .............................................. 106!Figure B-21: Distribution de la valeur financière des services d’usages directs (ES1 à ES8) des récifs coralliens de Nouvelle-Calédonie (estimations maximales) .................................................................................................................... 119!Figure B-22: Distribution de la valeurs financière totale des services écosystémiques des récifs coralliens de Nouvelle-Calédonie (estimations maximales). ................................................................................................................................... 119!Figure B-23: Distribution de la valeur financière du service de pêche récifo-lagonaire. ................................................ 121!Figure B-24: Description des processus écosystémiques et services associés à la pêche. ................................................ 122!Figure B-25: Performances métabolique pour 3 types de substrats. (Done et al. 1996) .................................................. 123!Figure B-26: Processus écosystémiques du récif impliqués dans la pêche hauturière et profonde. ................................. 130!Figure B-27: Processus écosystémiques du récif impliqués dans l’aquaculture de crevette ............................................ 132!Figure B-29: Distribution de la valeur financière du service du tourisme attribuable aux récifs coralliens. .................. 136!Figure B-30: Processus écosystémiques impliqués dans les services du tourisme ............................................................ 137!Figure B-31: Analyse d’images publicitaires .................................................................................................................... 139!Figure B-32: Aspects sociaux du tourisme lié aux récifs coralliens en Nouvelle-Calédonie (différentes métriques). ...... 144!Figure B-33: Estimation des hauteurs maximales de vagues en Nouvelle-Calédonie (source : Météo-France) .............. 146!Figure C-1: Expected ecological processes of MPAs and main socio-economic impacts. Adapted from Pascal (2005) 154!Figure C-2: Village locations, MPA and control sites. ...................................................................................................... 158!Figure C-3: Mean Hard Bottom Composition by Protection Status, Site and Zone (NPMPA stands for Non-permanent Marine protected area and CCA for crustose coralline algae). Extracted from (Bonito et al., 2012) .............................. 163!Figure C-4: Mean Biomass of Target Fishes by Site, Protection Status and Zone. .......................................................... 164!Figure C-5: Mean (a) CPUE, (b) BPUE, and (c) biomass of individual Epinephelus spp. ± SE. ..................................... 165!Figure C-6: Storm surges occurring on higher mean sea levels. ...................................................................................... 186!Figure C-7 : (Above) Reef as wave energy absorber (Extracted from Kench et Brander (2009)) .................................... 187!Figure C-8: Streamlines of mean surface wind (extracted from SOPAC, 2006) ............................................................... 194!Figure C-9: Count of extreme climatic events in Fiji and Vanuatu since 1940. ................................................................ 195!

Coral Reef Ecosystem Services Economic Valuation. Phd dissertation, Nicolas Pascal, 2013 Page xii / 351!
Figure C-10: Historical Hurricane Tracks for Efate, Vanuatu – 70 years of historic data .............................................. 195!Figure C-11: MPA economic benefit distribution .............................................................................................................. 212!Figure C-12: Benefits of MPA on ES per villages. Based on 2009 estimated values. ....................................................... 213!Figure C-13: Stakeholder economic benefit distribution. Based on average benefits for 2009. ....................................... 213!Figure C-14: 2009 annual MPA impacts in proportion to village annual GDI. ............................................................... 214!Figure C-15: Mean CPUEs for gillnets (n=76hours) and speargun fishing (n=170h) at different locations. ................. 218!Figure C-16: Size distribution of the catches from different locations. ............................................................................. 219!Figure C-17: Average weight of catches for different families. ......................................................................................... 219!Figure C-18: Partition of variation in RDA (explications in the text) ............................................................................... 220!Figure C-19: Advertising Image Analysis based on 21 media support and 151 images. .................................................. 222!Figure C-20: MPA operational cost distribution (2009) ................................................................................................... 231!Figure C-21: MPA cost benefit analysis and Return on Investment, ................................................................................. 233!Figure C-22: MPA Cost Benefit analysis and Return on Investment, ................................................................................ 235!Figure C-23: sensitivity analysis to main uncertainties on impact estimates .................................................................... 236!Figure C-24: sensitivity analysis to discount rate (t= 10%, 7% and 5%) ......................................................................... 236!Figure C-25: MPA economic benefit distribution .............................................................................................................. 238!Figure C-26: MPA Return on Investment after 5 years of activity .................................................................................... 239!Figure D-1: Attributes associated with reef-related tourism ............................................................................................. 253!Figure D-2: spatial perimeter of ecosystem services (extracted from Balmford et al. (2008)) ......................................... 256!Figure D-3: Ecological links between the three ecosystems . Source: Moberg and Folke (1999) .................................... 259!Figure D-4: Comparison between ecological and economic indices of biodiversity. ....................................................... 265!Figure F-1: South Pacific map ........................................................................................................................................... 289!Figure F-2: Répartition des grands complexes récifaux autour de la Nouvelle-Calédonie .............................................. 290!
'()*&+,&3-4)& Carte F.3-1: Distribution spatiale des valeurs ajoutées des principaux services écosystémiques .................................... 291!Carte F.3-2: Distribution spatiale de la valeur ajoutée du service de la pêche et du tourisme ........................................ 292!Carte F.3-3: Distribution spatiale de la valeur ajoutée du service consolidé de la pêche récifo-lagonaire ..................... 293!Carte F.3-4: Distribution spatiale de la valeur ajoutée du service de la pêche commerciale récifo-lagonaire ............... 294!Carte F.3-5: Distribution spatiale de la valeur ajoutée du service de la pêche récifo-lagonnaire de loisir ..................... 295!Carte F.3-6: Distribution spatiale de la valeur ajoutée du service de la pêche récifo-lagonnaire vivrière ..................... 295!Carte F.3-7: Distribution spatiale de la valeur ajoutée du service du tourisme ............................................................... 296!Carte F.3-8: Distribution spatiale de la valeur économique du service de protection côtière (Mfcfp) ............................ 297!
&

Coral Reef Ecosystem Services Economic Valuation. Phd dissertation, Nicolas Pascal, 2013 Page xiii / 351!
5$3$26($3$"*)&
Comme pour la majorité des projets, la finalisation de cette thèse, commencée en 2006, est le résultat
d’une combinaison de circonstances favorables, de l’appui opportun de plusieurs personnes et d’une dose
personnelle de persistance et de passion. Pour les circonstances, il n’y a pas d’autres options que de
remercier la vie et ses changements continus qui font que l’on est parfois au bon endroit au bon moment et
avec les yeux ouverts. Pour les personnes, j’aimerais pouvoir remercier toutes les personnes qui ont
accompagné et appuyé ce travail. Je commencerai par mon directeur de thèse, Francesc Maynou qui m’a
confirmé son soutien inconditionnel depuis le début malgré une durée de rédaction de la thèse un peu
longue, un sujet qui a évolué en s’éloignant de ses champs de recherche et mon parcours académique et
professionnel atypique. Je le remercie aussi pour ses nombreuses relectures, ses conseils méthodologiques et
ses discussions sur le monde de la recherche. Je remercie Jocelyne Ferrarris pour avoir porté sa confiance
sur moi sur la base de la conviction dans mes projets quand mon curriculum scientifique était bien peu
rempli. Cela a débouché sur une première mission dans le Pacifique à Tikehau et sur la création d’une amitié
qui perdure aujourd’hui. Je remercie Eric Clua pour m’inviter à participer au développement de cette
initiative de l’économie de l’environnement pour les récifs coralliens dans le Pacifique. Cela s’est concrétisé
sous la forme de plusieurs actions (ateliers économiques, étude Vanuatu, article scientifique,…) et avec le
développement d’une amitié qui s’est découverte sur et sous l’eau à travers d’une passion commune pour
l’apnée (sans parler des ciguatoxines partagées). Eric, qui m’a épaulé sur divers articles scientifiques liés à
ce sujet de thèse, a aussi accepté d’être co-directeur de cette thèse. Je tiens à remercier Serge Planes pour
son amitié, son soutien et ses discussions à Perpignan et Mooréa sur de nombreux thèmes en référence ou
non à la recherche. Je veux diriger ma reconnaissance à Bernard Salvat et René Galzin pour leur insistance
lors de nos rencontres pour que je termine ma thèse.
Je voudrais donner un remerciement spécial à Yann Laurans et Olivier François pour la rédaction
conjointe de deux articles ainsi qu’à Gilbert David, Thomas Binet, Luke Brander, Dominique Rojat et
Andrew Seidl qui ont participé à ces articles et contribué a certains des contenus de cette thèse.
De même, je pense important de reconnaitre l’importance de toutes les discussions maintenues avec de
nombreuses personnes sur les approches économiques et qui ont produit les idées et réflexions développées
dans ce travail. La liste est longue et non exhaustive: Annie Aubanel, Tamatoa Bambridge, Luke Brander,
Mahé Charles, Aude Chenet, Thierry Clément, Christian Chaboud, François Féral, Catherine Gabrié, Hugh
Govan, Nathalie Hilmi, Jean-Brice Herrenschmidt, Arthur Katossky, Paula Holland, Marc Léopold, Jean-
Baptiste Marre, Linwood Pendleton, Philippe Méral, Jan Steffen, Touasi Tiwok, Caroline Vieux, Clive
Wilkinson

Coral Reef Ecosystem Services Economic Valuation. Phd dissertation, Nicolas Pascal, 2013 Page xiv / 351!
Plus qu’un remerciement, j’envoie de la reconnaissance à ma compagne, Alejandra, qui a bien voulu
s’adapter à tous les changements provoqués par ce travail ainsi qu’à la vie en communauté! isolée (avec tout
ce que cela implique) pendant le temps du projet Vanuatu. Mes trois filles, Inès, Laïa et Ona ont grandi
(sans s’en rendre compte) avec cette thèse.
Remerciements pour l’étude de Nouvelle Calédonie:
Cette étude est le résultat de financements majoritairement assurés par l’Initiative Française pour les
récifs coralliens (IFRECOR) sous le programme Thème d’Intérêt Transversal « socio-économie » des récifs
et complétés (i) par la direction de l’environnement de la Province Sud et, (ii) le programme CRISP sous la
composante 3A.
L’étude n’aurait pu avoir de tels résultats sans l’appui de nombreuses personnes et institutions. L’étude
ayant couvert de nombreux secteurs différents la liste des personnes rencontrées lors de l’étude est longue et
je m’attacherai à rendre ces remerciements les plus exhaustifs possible.
Je remercie les représentants des commanditaires Messieurs Pierre!Yves Vion, Lionel Garde, François
Devinck et Eric Clua pour la confiance témoignée dès la formalisation de la prestation.
Je tiens à remercier tout particulièrement l’équipe de L’ISEE de Nouvelle!Calédonie qui m’a facilité
amplement l’accès à leurs données et a entrepris des analyses spécifiques pour cette étude. Je remercie ainsi
l’appui de Mesdames Elise Desmazures, Christiane Jone, Cecile Menard, Anne Rosaire et Christel
Valentini.
Les Services des Pêches des Provinces ont fourni des données précieuses pour la mise en œuvre de cette
étude. Je tiens à remercier tout particulièrement Madame et Messieurs Bernard FAO de la Province Sud et
Nathalie BAILLON et Nathaniel Cornuet de la Province Nord.
Les réunions du comité technique local de l’IFRECOR ont permis d’orienter efficacement les efforts de
l’étude et de valider les résultats intermédiaires. Les points de vue et commentaires exprimés par les
différents membres ont été enrichissants.
Je veux remercier Madame Naig Cozannet de L’Agence Française pour le Développement pour son
invitation dans une conférence grand public organisée en Novembre sur le capital naturel de la Nouvelle!Calédonie afin de présenter les résultats de l’étude.
Monsieur Pascal Sébastien Dumas de l’Université de Nouvelle!Calédonie a facilité la sélection d’une
équipe d’enquêteurs pour les enquêtes de la zone côtière Ouest et je l’en remercie.

Coral Reef Ecosystem Services Economic Valuation. Phd dissertation, Nicolas Pascal, 2013 Page xv / 351!
Je tiens aussi à remercier les institutions suivantes: Bureau du Tourisme des Provinces Nord et Sud,
Service du développement économique DEFE de la Province Sud, Gouvernement de Nouvelle!Calédonie,
Chambre de Commerce et d’Industrie, Direction des Technologies et des Services de l'Information, Service
de la Mer et de la Protection du Lagon de la direction de l’environnement de la Province Sud, L’Université
de Nouvelle!Calédonie, l’Ifremer, l’unité de recherche Coréus de l’IRD, le secrétariat général de la
Communauté du Pacifique (CPS), L’Agence Française pour le Développement et L’ADECAL.
Derrière ces institutions se trouvent des personnes que je remercie personnellement: Valérie Allain,
Michel Allenbach, Jean!Claude Angué, Benoît Beliaeff, Régis Etaix Bonnin, Damien Buisson, Lauretta
Burke, Olivier Chardin, Pablo Chavance, Emmanuel Coutures, Gilbert David, Cécile Debitus, Pascal
Dumas, Pascal Sébastien Dumas, Lionel Gardes, Fréderic Guillard, Nicolas Guillemot, Jean Brice
Herrenschmidt, Matthieu Juncker, Mecki Kronen, Anne Le Leizour, Julie Laronde, Hugues Lemonnier,
Morgan Mangeas, Marita Manley, Claude Payri, Dominique Pelletier, Laurent Wantiez, Antoine Wickel, et
tous les pêcheurs et operateurs touristiques rencontrés.
Je tiens à exprimer ma reconnaissance et ma sympathie au programme CRISP, à Aude Chenet, Claire
Dupré et à Marie!Charlotte Jumel de l’Ifrecor pour m’avoir facilité les conditions de travail lors de mes
séjours sur Nouméa.
La cartographie a été réalisée par Sylvain Broucke et Antoine Wickel du GIE océanide.
Je souhaite exprimer une reconnaissance spéciale à Monsieur Marc Léopold et Madame Jocelyne
Ferrarris pour m’avoir communiqué l’existence de ce dossier.
Remerciements pour l’étude de Vanuatu:
Cette étude est le résultat de financements assurés par le programme CRISP (Coral Reef InitiativeS for
the Pacific) avec l’appui technique de l’Agence Française de développement (AFD) en la personne de
Dominique Rojat.
L’étude n’aurait pu avoir de tels résultats sans l’appui de nombreuses personnes et institutions.
Je remercie les représentants des commanditaires Messieurs Eric Clua et Dominique Rojat pour la
confiance témoignée dès la formalisation de la prestation.
Je remercie aussi les département des pêches et de l’environnement du gouvernement du Vanuatu pour
leur appui institutionnel et technique lors de la phase de montage de l’étude et lors des premieres restitutions
de résultats. Je remercie également le réseau NgunaPele MPA et l’ONG FSPV (Foundation for the Peoples

Coral Reef Ecosystem Services Economic Valuation. Phd dissertation, Nicolas Pascal, 2013 Page xvi / 351!
of the South Pacific –Vanuatu) pour leur accueil, leur coopération et la mise à disposition d’un logement sur
un des sites d’études (Unakap).
Je tiens à remercier tout particulièrement tous les membres des équipes qui sont intervenus dans les
collectes (souvent longues) de données sur sites. Ainsi je remercie toute l’équipe des pêcheurs pour leur
temps et coopération (Ronnett, Morris, Piter, Thomas, Jonas, Moises, Gilles, Obeit, Eddy), l’équipe en
charge de l’évaluation écologique (Eric Clua) qui s’est déplacée depuis Nouméa et enfin, l’équipe des
acteurs touristiques (Kenneth, Leipakoa, David, Morri). Un remerciement s’adresse aussi aux personnes
impliquées dans l’analyse statistique des données de pêche (François Gillet).
Je remercie aussi le bureau des Statistiques du Vanuatu pour leur appui sur les enquêtes au ménage et
pour partager certaines de leurs données. Je tiens à remercier le service culturel de l’Ambassade de France
pour son appui institutionnel et légal. De même, les echanges avec le Vanuatu Kulturel Senta (VKS) à
travers de Marcelin Abong ont permis d’affiner certains aspects de l’étude.
Un remerciement se dirige aussi aux villageois d’Unakap qui ont bien voulu m’accueillir avec ma famille
et nous permettre de les accompagner chez eux.
&

Coral Reef Ecosystem Services Economic Valuation. Phd dissertation, Nicolas Pascal, 2013 Page xvii / 351!
'()*&+,&-62+"73)&89:& "#$%&!'()(*+,-(&.!/%&0!8;9& "1(&2(!34%&5%$#(!6(!'7)(*+,,(-(&.!8!8&& "6)(4.$#$&1!8-%1(!"&%*9#$#!8<5& "1(&2(!:%.$+&%*(!6(!*%!;(2<(42<(!:8=!& /(=+4(>%=.(4?!@+&.4+*>$-,%2.!:>=& /(&(=$.A@+#.!4%.$+!:?@& /B#$&(##!CD,(&6$.B4(!EB4)(9!=8& @<$==4(!6F%==%$4(#!!=8A& @+&#(&.(-(&.!G!H%9(4!=8@&2$4+2*& @<()%##B#>"B>I+B$#!4(,+4.!=:8& @+#.>/(&(=$.!"&%*9#$#!=:B& @+--B&$.9!/%#(6!J%&%1(-(&.!==!& @<%-K4(!6(!@+--(42(#!(.!6F8&6B#.4$(#!=!& @+&#+--%.$+&#!$&.(4-(6$%$4(#!=<B!& @+--+&>L(%*.<!+=!.<(!:+4.<(4&!J%4$%&%!8#*%&6#!=CB& @+**(2.$)$.7#!6FMB.4(>J(4!=CD& @4+L&>+=>N<+4&!!=A@& E(247.%4$%.!O7&74%*!6(!*%!2+--B&%B.7!6B!H%2$=$PB(!=AE?& @%.2<>H(4>Q&$.>+=>C==+4.!=5?@F& @+4%*!;((=!C2+#9#.(-!E(4)$2(#!R%*B%.$+&!=5!@A& @+4%*!;((=!8&$.$%.$)(E!=+4!.<(!H%2$=$2!9?<F&& '$4(2.$+&!6(!*F(&)$4+&&(-(&.!95<& '$4(2.$+&!6(#!;(##+B42(#!:%.B4(**(#!?!8& C&)$4+&-(&.%*!8-,%2.!"##(##-(&.!?@& C2+#9#.(-!E(4)$2(#!?EG?D@& CB4+,(%&!Q&$+&!C-$##$+&#!N4%6$&1!E9#.(-!;,64& 34%&2!6B!H%2$=$PB(!ST,=U!;?H@& 3$&%*!C2+#9#.(-!!;;?B& 3+&6#!34%&5%$#!,+B4!*FC&)$4+&(-(&.!J+&6$%*!;@AF& 3+B&6%.$+&!=+4!.<(!H(+,*(#!+=!.<(!E+B.<!H%2$=$2!R%&B%.B!H9!& O4+##!'+-(#.$2!8&2+-(!H9A& O4+##!'+-(#.$2!H4+6B2.!I!?@& V+B#(<+*6!8&2+-(!%&6!CD,(&#(!EB4)(9!!;??=C5& 8&$.$%.$)(!34%&5%$#(!,+B4!*(#!;72$=#!@+4%**$(&#!!;5?B?5& 8&#.$.B.!34%&5%$#!6(!;(2<(42<(!,+B4!*FCD,*+$.%.$+&!6(!*%!J(4!!A:?@& 8&.(41+)(4&(-(&.%*!H*%.(=+4-!+=!/$+6$)(4#$.9!%&6!C2+#9#.(-!E(4)$2(#!!A==& 8H@@!>!8&.(41+)(4&-(&.%*!H%&(*!+&!@*$-%.(!@<%&1(!!59& 8&#.$.B.!6(!;(2<(42<(!,+B4!*(!'7)(*+,,(-(&.!!55& 8&.(4&%*!;%.(!+=!;(.B4&!!@??& 8&#.$.B.!6(!*%!E.%.$#.$PB(!(.!6(#!W.B6(#!W2+&+-$PB(!!E=<& 8&.(4&%.$+&%*!Q&$+&!=+4!@+&#(4)%.$+&!+=!:%.B4(!'BB8& I+2%**9!J%4$&(!J%&%1(6!"4(%!B?8& J$**(&$B-!C2+#9#.(-!"##(##-(&.!B??9D'& J$&$#.X4(!6(!*FC2+*+1$(?!6B!'7)(*+,,(-(&.!6B4%K*(?!6(#!N4%&#,+4.#!(.!6B!I+1(-(&.!

Coral Reef Ecosystem Services Economic Valuation. Phd dissertation, Nicolas Pascal, 2013 Page xviii / 351!
BB8& J%4$&(!J%&%1(6!"4(%!BCB& J$&$#.X4(!6FMB.4(>J(4!BA8& J%4$&(!H4+.(2.(6!"4(%!B@J& J%D$-B-!EB#.%$&%K*(!Y$(*6!<HC& :+&!O+)(4&-(&.%*!M41%&$#%.$+&!<AF& :(.!H4(#(&.!R%*B(!C=9?& M41%&$#%.$+&!=+4!C2+&+-$2!@+>+,(4%.$+&!%&6!'()(*+,-(&.!A8;& H+*$2(>%BD>=4+&.$X4(#!A?@& H%9-(&.!=+4!C2+#9#.(-!E(4)$2(!A!:& H4+6B$.!8&.(4$(B4!/4B.!A!=D)& H%2$=$2!8#*%&6!@+B&.4$(#!%&6!N(44$.+4$(#!A!'& H4+)$&2(!6(#!8*(#!ABD& H%*-(!J%#PB(!NBK%!A<& H4+)$&2(!:+46!A<E?& H4+14%--(!6(#!:%.$+&#!Q&$(#!,+B4!*F(&)$4+&&(-(&.!AAA& HB42<%#$&1!H+L(4!H%4$.9!A5C=;!@I& H%2$=$2!@+%#.%*!3$#<(4$(#!"##(##-(&.!A@& H4+)$&2(!EB6!598& ;(6B&6%&29!"&%*9#$#!5+!&& ;(.B4&!+&!8&)(#.-(&.!@BBDA& E(4)$2(!6(!*%!J%4$&(!J%42<%&6(!(.!6(#!H(2<(#!J%4$.$-(#!@CA8=& H%2$=$2!8#*%&6#!",,*$(6!O(+E2$(&2(!@+--$##$+&!D??:& N<(!C2+&+-$2#!+=!C2+#9#.(-#!%&6!/$+6$)(4#$.9!D?K& N4%6$.$+&%*!C2+*+1$2%*!Z&+L*(61(!D?F& N+.%*!C2+&+-$2!R%*B(!DCB& N(44$.+$4(!6FMB.4(>J(4!DA!&& N+B4$#-!H(&(.4%.$+&!8&6(D!E<=& Q&$)(4#$.7!:+B)(**(>@%*76+&$(!EF=& Q&6(4L%.(4!R$#B%*!@(&#B#!F8& R%*(B4!"[+B.7(!FK@& R%&B%.B!ZB*.B4%*!E(&.%!FEF& R%.B!!LDA& \$**$&1&(##!N+!H%9!M??& ]+&(!C2+&+-$PB(!CD2*B#$)(!
!

Coral Reef Ecosystem Services Economic Valuation. Phd dissertation, Nicolas Pascal, 2013 Page xix / 352!
8.)*2-6*&
Economic approaches through ecosystem services (ES) valuation are increasingly recommended by
several multilateral agencies and conservation organisations to face main market externalities affecting
biodiversity in general and coral reef ecosystems. Nonetheless, the ES approach is recent and still has to
prove its effectiveness for policymaking and design of market based instruments. In this dissertation, we
will analyse the experience of two economic valuations of coral reef ecosystems in the Pacific focusing on
two aspects. The first is to evaluate if current methods of Coral Reef Ecosystem Services Valuation
(CRESV) permits to transmit a correct signal about ES and the second is to assess the impacts of results on
policy-making and market externalities.
The first study is the economic valuation of the coral reef ecosystems of New Caledonia. Financed by
French Ministries of Environment and Oversea Territories, the main objective was to make visible the value
of this ecosystem in the economy of the territory. The second one is a cost-benefit analysis of Marine
Protected Areas. Required by the French Development Bank, the aim was to realize an ex-post valuation of
the impacts of marine biodiversity conservation on the economic development of the implicated villages and
other stakeholders. More precisely, MPA impacts on the ES were quantified, total costs linked to each MPA
were calculated and the B/C (Cost-Benefit) ratio and RoI (Return-on-Investment) were computed.
More than 10 ecosystem services have been analysed with methods mainly based on financial values
through producer surplus and avoided damage costs. Applied methods are classic ones with some
improvements and originality such as the use of protein content equivalent for subsistence fishery, the larval
stomach content to quantify links between reef ecosystem and pelagic fisheries, the application of the
Advertising Image Analysis to tune the role of CR in the tourism motivation, the setup of experimental
fishery to determine precise improvements in fishery productivity and the adaptation of a bio-physical
model for coastal protection ES.
Results in New Caledonia have permitted to make visible a contribution comprised between 195 and 330
M".y-1 highlighting the importance of the coastal protection, the non-commercial fishery and the underwater
tourism.
In Vanuatu, results revealed that the MPA cash benefits for the villages represented an important part of
their total cash and non-cash incomes (varies from 4% to 21%). For donors and local policymakers, we
demonstrated that, after at least 6 years of MPA implementation, all RoI except one were above 0, implying
that financial benefits exceeded costs. Based on a 25-year project life, the mean expected B/C ratio was also
well above 1 (4.1). We estimate the mean aggregate economic value of MPA impacts to be approximately
US$ 44,000 per year per km2. Tourism ES were the largest estimated effect for all MPAs, despite stark

Coral Reef Ecosystem Services Economic Valuation. Phd dissertation, Nicolas Pascal, 2013 Page xx / 351!
differences in tourism development across sites. Impacts on tourism were followed by impacts on fish
productivity.
CRESV in the South Pacific context are complex exercises, which face a series of specific challenges to
transmit a “right” signal about their importance. Enabling a comparison between the observed values and
the "best use" value to reflect the sustainability of use, identifying the spatial distribution of ecosystem
processes and services to relate customer and service provider and linking ecosystem indicators to levels of
services, especially for indirect services through production functions, have been identified as the most
critical. Some solutions have been proposed and discussed. Specific recommendations on the realization of
the exercise have been also identified.
CRESVs have demonstrated both promising results and important limitations. Based on an impact
assessment through different media, workshops and events, the results of the 2 reports have mostly been
used for “informative” purposes by public organisations and support in an ex-ante decision has been scarce.
Different reasons are advanced to explain this lower than expected impact such as the lack of precise
definition of the decision making question and the absence of a clear strategy of communication to different
audiences.
Ecosystem services are increasingly entering into general discussions on coral reef management and are
likely to continue to expand their reach. The next step to improve the application of information produced
by CRESVs is to directly inform public decisions, play a role in designing instruments such as PES, and be
utilised in local development planning. Our analysis suggests that CRESVs are not totally ready to play such
a role. A balance between science for knowledge and science for policy must be found to build the
credibility of ecosystem service approaches.
In parallel, the financial approach of ESV can bring concrete information about potential returns for
private sources of financing for conservation. In the case of the impact investment funds or the Socially
Responsible Investment (SRI) funds(Van den Bossche et al., 2010), where capital is invested with the
explicit expectation of financial, social and environmental returns, the B/C ratios and the RoIs are common
indicators. These funds may be attracted by the MPA’s financial ratios as the business case for Vanuatu was
convincingly made.
Many requirements for viable and effective investment of this type are still necessary and this work is a
very first step in this new field.

Coral Reef Ecosystem Services Economic Valuation. Phd dissertation, Nicolas Pascal, 2013 Page 1 / 351!
8N H$"$2-/&("*2+#16*(+"&
8NO ?6+"+3(6&P-/1-*(+"&+,&6+2-/&2$$,&$6+)7)*$3)&("&*Q$&A-6(,(6&
8NONO B-2R$*&?%*$2"-/(*($)&
From an economic point of view, the main local threats to coral reef ecosystems - overfishing,
contamination and habitat destruction - may be explained by 2 market failures: (i) The “tragedy of the
commons” (Hardin, 1968; Sathirathai and Barbier., 2001) explaining why there is usually little private
interest in the sustainable use of public or common resources because the cost of such action will be borne
by individuals, but benefits will be enjoyed by the public at large and/or by the next generations.
Overfishing in open access fishery illustrates this concept. The underlying mechanism is that "any fish that I
do not take today will be potentially caught by my neighbour today or tomorrow". In this sense, coral reef
fisheries are highly sensible because overfishing levels are quickly reached (Dalzell and Adams, 1997). The
second market failure (ii) is the lack of marketplace for many coral reef ecosystem services, making
unrecognized values for the benefits received from their use and at the same time no reflection of the
impacts of altering the ecosystem processes. This refers to the concept of externality when the action of an
agent, through its positive or negative impact on biodiversity, changes the amount or quality of ecosystem
services to another agent, thus affecting his well-being without that variation giving rise to an exchange in a
market (MEA, 2003). As an illustration, the main local negative externalities concern the effects of
overfishing, the pollution from watersheds or uncompensated reef damage by tourists. When producers in a
market economy make decisions about what and how much to produce, they normally take into account the
price of what they expect for their product, and the cost of items for which they will have to pay: labour, raw
materials, energy, machinery, and so on. These are the private costs. In many production operations,
however, there are other types of costs that, while representing a true cost to society, do not show up in the
producer’s profit and loss. If externality costs were actually absorbed by the producer, either the good would
become more expensive to consumers, or less of it could be produced. These are external costs for the
producer, but these costs are borne by the society. On the other side, positive externalities may come from
the implementation of coastal management regulations that ensure in the long term the "biomass" sought by
commercial fishery and by underwater tourism or will maintain the coastal protection ecosystem service. If
the production is to be socially and ecologically efficient, then it must take both private and social costs and
benefits into account. This process is called “internalize externalities” (Azqueta and Sotelsek, 2007).
In general, market mechanism works best when property rights are well defined (Ostrom et al., 1999;
Ram-Bidesi et al., 2011). Property rights refer to a bundle of entitlements defining the owner’s rights,
privileges, and limitations for use of the resources. An owner of a resource with a well-defined property
right, such as a private property has a powerful incentive to use that resource in its most profitable venture,

Coral Reef Ecosystem Services Economic Valuation. Phd dissertation, Nicolas Pascal, 2013 Page 2 / 351!
because a decline in the value of that resource presents a personal loss. The concept of establishment of a
property right regime refers to situation where such rights do not exist, or are poorly defined – particularly
enabling trade – to achieve an efficient allocation of resources.
8NONS ?6+"+3(6&P-/1-*(+"&+,&$6+)7)*$3&)$2P(6$)&
!"#"$"# %&'()*+,(-./0.123.
In response to these market failures, economic valuation of coral reefs ecosystem services1 is viewed as a
promising approach at different levels.
Ecosystems services valuations can be undertaken to address one or several objectives from among the
following (Laurans et al., 2013a): (i) “decisive” valuations are intended to allow an ex-ante choice or ex-
post appraisal over a given set of options by weighing the ecologic and economic consequences of those
options; it is a way to incorporate the present and future values of negative and positive externalities with a
common metric and provide ‘correct’ signals (Campbell and Brown, 2003; Whitten and Bennett, 2004). (ii)
“technical” valuations are designed to “fine tune” economic instrument internalizing “externalities”. For
example, it may provide the price baseline for negotiation in the setup of a payment for ecosystem services,
user fee or environmental taxes (Chevassus-au-Louis et al., 2009; Engel et al., 2008; Meignien and
Lemaître-Curri, 2010; PNUE, 2004); and, (iii) “informative” valuations are intended to raise awareness
among decision-makers and the public regarding the condition of environment. Based on the general
recognition that “money talks”, their role is to strengthen the support to environment and resource
management actions. At the same time, they can be part of a monitoring routine to inform management with
economic indicators (“we manage better what we can measure”) (Beukering et al., 2007a; David et al.,
2007; Pascal et al., 2008).
Within this classification, Total Economic Valuation2 (TEV) of coral reef ecosystem services enters in the
third category of “informative” objectives. Usually covering more than 15 services (Moberg and Folke,
1999), coral reef TEV has been recognized as a useful way to compare and synthesize very different
services (e.g. subsistence fishery can be compared with coastal protection). Decision-makers easily grasp
that “you can’t manage what you don’t measure” (Seidl et al., 2011). Managing a portfolio of ecosystem
services – those that are well reflected in markets as well as those that are not – is the central message from
TEV estimates. TEV also provides guidance about the main stakeholders who benefit from the ecosystem
processes. This is valuable information for decision makers to identify the socio-economic group affected by
a particular policy.
^!H*(%#(!4(=(4!.+!.<(!2<%,.(4!!"_^_`_`!=+4!6(=$&$.$+&_!!
`!'(=$&(6!$&!2<%,.(4!!"_^_`_a!

Coral Reef Ecosystem Services Economic Valuation. Phd dissertation, Nicolas Pascal, 2013 Page 3 / 351!
In turn, Cost-Benefit Analysis (CBA) of a project or a policy belongs both to the previous first and third
category of valuation exercises. They improve decision-making comparing different scenarios, make
appraisal of investments and inform about implicit or explicit costs and benefits for host communities,
nations and donor agencies. CBA is a consolidated policy assessment tool that quantifies in monetary terms
the value of all consequences of a policy to all members of society. The CBA of a project or policy
generally leads to an aggregate value or net social benefits. Although in practice not all benefits and costs
are or should be quantifiable, CBA provides a useful tool to help social decision-making and to make it
more rational. For example, CBA of Marine Protected Areas, an essential component of the policy for the
preservation of coral reef (Mumby and Steneck, 2008) , is expected to both convince policy makers and
identify the losers and winners amongst the main stakeholders (Mangos and Rojat, 2008).
This role is however nuanced by different authors who have highlighted that several principles
underlying CBA, such as the Pareto-optimality, the Kaldor-Hicks compensation principle and the
anthropocentric framing are questions of debate (Boardman et al., 1996; François et al., 2012; Gowdy, 2007;
OECD, 2006). The reliability of the CBA exercise is also hampered by methodological limitations in the
evaluation of marginal changes of the ES, the choice of discount rate, and scarcity of sensitivity analysis.
The main source of uncertainty is generally a lack of knowledge on the dynamics of spatial processes and
ecosystem functioning. Linking impacts of management measures to levels of ecosystem services is fraught
with difficulties, especially for direct and indirect services such as fishery or coastal protection.
!"#"$"$ 1)/-4-*(5.-(6,+)(-./0.7/689.6((0.
The most common definition of ecosystem services are "services that human populations derive, directly
or indirectly from ecosystem functions” (Costanza et al., 1997) or more simply as "services that people
obtain from ecosystems" (Boyd and Banzhaf, 2007) (MEA, 2003). Ecosystem is defined by the Millennium
Ecosystem Assessment as “a dynamic complex of plant, animal, and micro-organism communities, and the
non-living environment interacting as a functional unit” (MEA, 2003).
Several classifications of ecosystem services generated by coral reefs have been proposed (Balmford et
al., 2008; Beukering et al., 2007a; Cesar et al., 2003b; MEA, 2003; Moberg and Folke, 1999). The two most
common classifications used in Coral Reef Valuation of Ecosystem Services (CRESV) are those of the
Millennium Ecosystem Assessment and that of the Total Economic Value.

Coral Reef Ecosystem Services Economic Valuation. Phd dissertation, Nicolas Pascal, 2013 Page 4 / 351!
Figure A-1: Classification of ecosystem services.
On the left: the Millennium Ecosystem Assessment (MEA 2005) on the right: the Total Economic Value framework (adapted from Balmford et al (2008) and Spash (2000))
The Millennium Ecosystem Assessment (MEA) defines four main classes of ecosystem services. These
are the provisioning, regulating, supporting and cultural services. These services manifest in a variety of
forms, from concrete harvestable goods such as fish or shells to more abstract regulating services such as
water treatment, wave protection for flood control and maintenance of biodiversity.
Even if the previous categorization has been adopted by both the Convention on Biological Diversity and
the MA, it was chosen to apply the TEV classification to our case studies. As pointed out by some
economists since its publication, the MEA seems not to fit adequately for the purpose of economic
evaluation (Balmford et al., 2008). By mixing processes (means) and benefits (ends) it is particularly prone
to double counting. Following Balmford et al (2008) and Harborne et al. (2006), it is important to make a
clear distinction between ecosystem processes and ecosystem services. Processes are biophysical functions,
while services are the end services that directly affect the human welfare. Two types of ecological processes
are considered: ‘core’ ecosystem processes, the basic ecosystem functions (e.g., nutrient cycling,
bioquimical processes) supporting the processes that provide benefits to humankind; and ‘beneficial’
ecosystem processes, the specific ecosystem processes that directly underpin services for humankind (e.g.
waste assimilation, biomass production). The ecosystem services are the end products of these beneficial
ecosystem processes (e.g., fishing). Figure A-2 describes the classification of the different coral reef
ecosystem services to be used throughout this document.
28
relates to the MEA framework. This is, naturally, work in progress: the MEA is still very recent, and much more work will still build from it.
Figure 7 Classification of ecosystem services followed in the Millennium Ecosystem Assessment (MEA 2005).
3.3 The need to avoid double counting
Ecosystem services have been defined in the literature in a diversity of ways (see Fisher et al. in press-a for a review), including the “conditions and processes through which natural ecosystems, and the species that make them up, sustain and fulfil human life” (Daily 1997), “the benefits human populations derive, directly or indirectly, from ecosystem functions (Costanza et al. 1997), and “the benefits people obtain from ecosystems” (MEA 2005). These definitions reveal a mix between ecological functions (e.g. pollination, water regulation) which are the means for the production of benefits, and the ends (benefits) resulting from these processes (e.g., food from crops, drinking water) (Wallace 2007).
The MEA classification of ecosystem services has proved highly useful as an educational and policy tool. However, as many economists have pointed out since its publication, it is not fit for the purpose of economic evaluation (Boyd & Banzhaf 2007; Wallace 2007; Fisher et al. in press-a). By mixing processes (means) and benefits (ends) it is particularly prone to double counting. For example, the regulating service ‘water purification’ provides added value to the benefits that this process underpins, including drinking water, food (through purification of water used in crop irrigation and in rivers producing freshwater fisheries) and cultural benefits (e.g., aesthetic, spiritual and tourism benefits from a clean river). Valuing separately ‘water purification’ and ‘drinking water’, ‘food’, and ‘cultural
!"#$%&'(")"*+(&,$%-.&
/0.&,$%-.&
1+2.(#&-0.&
'3#2$(45.&-0.&& 6")7.3#2$(45.&-0.&
8)9+2.(#&-0.&:;4")&5$%-.&$)9&;"#.)4$%&
-0.&
6")7-0.&5$%-.&
'3+0#.)(.& <.=-.0#&5$%-.&
6")7.(")"*+(&5$%-.0&&>"2$%?&%.3+("@2$;A+(&

Coral Reef Ecosystem Services Economic Valuation. Phd dissertation, Nicolas Pascal, 2013 Page 5 / 351!
Figure A-2: Coral reef ecosystem services classification through Total Economic Valuation (details in the text).
Use values include ecosystem services from direct uses with and without extraction, indirect uses and
potential uses (Groot et al., 2002). Direct uses refer to activities where the individual enjoy directly from the
resource whether by extracting it (e.g. fisheries) or by taking a non-extractive satisfaction (e.g. underwater
tourism). They can be market-type if the service goes through a market that sets the price (e.g. fish or a
tourism service) or non-market (e.g. subsistence fishing or unorganized snorkelling activities). Other direct
uses include aquaculture and pearling industry that incorporate ecosystem processes as inputs such as water,
nutrients, etc.(Moberg and Folke, 1999). Indirect uses include ecosystem services that exist without the
intervention of man (Defra, 2008). For example, reefs can provide physical protection against waves and
can contribute to wastewater treatment (UNEP-WCMC, 2006). The option values refer to future use (direct
or indirect) of coral reef ecosystems, which can be assimilated also to potential values (e.g. not all known
marine fish stocks need to be exploited today (even sustainably). One possibility is that some stocks may be
exploited immediately and some left untouched as options for the future. (Turner et al., 2003).
The non-use values, also called passive use values, correspond to all the economic values that are not
related to the use of the ecosystem (Krutilla, 1967). They often include multiple values for the composite
nature of the motivations of the individuals (Manoka, 2003). In this work, it was chosen to include in this
category only the existence value and bequest value. All the other ones (such as the intrinsic value of nature,
the moral value, etc.) have been categorized as non-economic or lexicographic values (Spash, 2000). The
existence value is the value given to the mere existence of coral reefs independently from its use (Rudd,
2009). Bequest value is associated with the preservation of coral reefs for future generations (Nijkampa et
al., 2008). Lexicographic values refer to values for which “all or nothing” decisions take place. They go
Total Economic Value Coral reef ecosystem services
Use values Non-use values
Direct use with extraction
Direct use without extraction Indirect use Option or potential
use
• Subsistence fishery • Recreational fishery • Reef commercial fishery • High-sea fishery • Aquaculture
• Underwater tourism • Nautical tourism • Education and research
• Coastal protection • Water treatment • Ciguatera protection • Landscape formation
• Bio-prospection • Maximum Sustainable Yield • Tourism carrying capacity • Others
Existence and bequest value (Self and altruist ) • Cognitive • Cultural
Non-economic value
• Intrinsic value • Moral value

Coral Reef Ecosystem Services Economic Valuation. Phd dissertation, Nicolas Pascal, 2013 Page 6 / 351!
beyond consequentialist (utilitarian) and deontological (rights-based) values (David et al., 2007; Spash,
2007) and ignore the compensation choices underlying the Hicksian economic theory. Therefore they cannot
be valued in a monetary way.
Recent works about CRESV ((Daily et al., 2009; Goldman and Tallis, 2009; Laurans et al., 2013a)
coincided that it is important to concentrate mainly valuation efforts on the three following ES:
(i) Food production: coral reef associated fisheries provide an important source of food and basis
for livelihoods
(ii) Recreation tourism: coastal recreation and tourism activities generate significant economic
value depending on the quality and availability of specific marine ecosystem attributes.
(iii) Coastal protection: Corals and other marine ecosystems (mangroves, seagrass) can buffer
coastlines from storm-induced erosion and inundation. They also can help to regulate natural
processes of erosion and sedimentation that are critical to maintaining beaches.
!"#"$": ;<(.;/*89.1)/=/5+).389>(.?;13@..
The TEV is defined as the sum of consumer surplus and producer surplus of all the services of direct,
indirect use and non-use. The model of the TEV is explained in many books (Abaza, 2004; Beukering et al.,
2007a; Defra, 2008; Pagiola, 2004a) and we will present the underlying theory.
The neoclassical theories of “value” introduce the concepts of producer and consumer surplus at the
micro economic level (Azqueta and Sotelsek, 2007; Diaz-Balteiro and Romero, 2008; Dimand, 2007). The
"producer surplus" is here calculated in the same way as the added value used in national accountancy
systems3 (Defra, 2008; Farber et al., 2002). It can be estimated as the sum of profits and Ricardian rents
going to factors of production (e.g. value of a productive marine zone). Some authors call it also the
financial value when estimations concentrate on the cash flows with multiplier effects that are linked to the
use values of the ecosystem good or service (Beukering et al., 2006). The "consumer surplus", defined as the
difference between the maximum price a consumer is willing to pay and the actual price they do pay is
more complex to obtain and requires either the existence of a demand curve obtained from data (historical
prices and quantities sold in the market) or the application of revealed-preference analysis (e.g. travel costs)
or stated-preference survey (e.g. choice experiment) (TEEB, 2010). For recreative use, for example,
consumer surplus is the value of an activity beyond what must be paid to enjoy it. There are two prominent
types of consumer surplus estimated using slightly different definitions of the demand function: Marshallian
consumer surplus based on an ordinary demand function, and Hicksian consumer surplus based on either a
compensated demand function or elicited directly using hypothetical market techniques. The difference
b!! "66(6! R%*B(! $#! 6(=$&(6! %#! .<(! 6$==(4(&2(! K(.L((&! .<(! #%*(! ,4$2(! %&6! .<(! $&.(4-(6$%.(! 2+#.#! +=! %! ,4+6B2.! SL<$2<!2+&#$#.!+=!.<(!.+.%*!1++6#!%&6!#(4)$2(#!2+&#B-(6!%#!$&,B.#!$&!,4+6B2.$+&U_!

Coral Reef Ecosystem Services Economic Valuation. Phd dissertation, Nicolas Pascal, 2013 Page 7 / 351!
between these measures is due to the income effect. Since outdoor recreation expenditures are a relatively
small percentage of total expenditures (income), differences between the two measures are expected to be
negligible.
!"#"$"A 389>8*+/=.5(*</B-.
As described by various authors (Farber et al., 2002; Groot et al., 2010; Pagiola, 2004a; Remoundou et
al., 2009) three main methods can be identified for valuing absolute or marginal values of ecosystem
services (Figure A-3).
The method of production inputs is based on evaluation of physical volumes generated by the ecosystem
(biomass, tourism attributes...) and considered as an input in the production of services. This is particularly
well adapted to determine the direct and indirect values but has rarely been applied in CRESV. Cesar
(1996), Cesar et al. (2003) and Beukering (2006 and 2007) have used this method, estimating the “effect on
production” through the difference in producers’ output (fishermen, tourism businesses) from a change in
the ecosystem. The technique can be used to calculate marginal changes in production or absolute values of
production. When data are based on market data added values we refer to it as producer surplus or financial
analysis. When direct market data is not available, another approach is to measure production inputs through
(i) the replacement cost method which estimates the costs of replacing ecosystem services with human-made
services (e.g. artificial reef to provide costal protection) or, (ii) the cost of avoided damages method that
estimates damages avoided due to ecosystem services (e.g. costs of avoided flood due to wave energy
absorption by coral reefs).
The revealed preference method is based on observation of individual behaviours, since they are
supposed to translate the preferences and thus the value people place on the environment. The most common
methods are the travel costs, the hedonic pricing and the averting behaviour. In the first one, the travel costs
to access a site are assumed to indicate the value people place on this resource. The second method
estimates the influence of ES and environment characteristics on price of marketed goods such as real estate
or touristic services. The third one begins with the assumption that people make choices in order to
maximize their level of well being when faced with increased health risks. Averting behaviour requires
expenditures that would not be made if not faced with the environmental health risk (e.g. the purchase of
bottled water when faced with the risk of contaminated drinking water).
The stated preference method uses surveys with users to get statements about their practices and
preferences. The techniques place the consumer in a hypothetical market context but realistic, and asked him
to make choices between alternatives with different characteristics. It is then possible to deduce the value
people place on a specific ecosystem service. This value is called willingness to pay (WTP). It is interpreted
as the change in consumer surplus of the individual resulting from the change in the quality of services

Coral Reef Ecosystem Services Economic Valuation. Phd dissertation, Nicolas Pascal, 2013 Page 8 / 351!
provided by an ecosystem. It is therefore a method for valuing both use and non-use values. Conjoint
analysis (or method of choice experiments and experimental choices or choice modelling) and contingent
valuation methods are the two most commonly used stated preferences in environmental economics.
All methods are complementary to each other with their own biases (Balmford et al. 2002; Beukering et
al. 2007).
Figure A-3: Methods of economic valuation
(adapted from several sources (Beukering et al., 2007a; Defra, 2008; EFEC et al., 2006)
!"#"$"C D+-*/64./0.)/689.6((0.123.+=.*<(.E8)+0+)..
Born in the 70’s with the pioneer works of Marsh and Leopold (Pesche et al., 2011), the notion of SE has
only gained significant recognition by several scientific disciplines in the early 1990s. Put forward by
biologists and ecologists and renowned work of ecological economics, the notion of SE was nevertheless
still a concept of specialists, not well known outside the circles interested in environmental issues.
Since the 1990s, the valuation of Coral Reef Ecosystems Services has gained considerable interest. Many
international institutions now recommend the approach (CBD, OCDE, UNEP) as well as French national
ones (Strategie Nationale pour la Biodiversité, Grenelle de l'environnement). The creation in late 2010 of
the IPBES (Intergovernmental Platform of Biodiversity and Ecosystem Services) similar to the IPCC
(Intergovernmental Panel on Climate Change) is a confirmation of the expectative on this approach.
More specifically four monographs and meta-analyses have been produced on the coral reef ecosystems
(Ahmed et al., 2005; Brander et al., 2007; Cesar and Chong, 2006; Conservation International, 2008). The
Ecosystem services valuation
Input production method Behaviour methods
Producer surplus (financial analysis)
Replacement cost
Damage cost avoided
Revelead preferences Stated preferences
Contingent valuation
Choice experiment
Hedonic value
Travel cost
Averting behaviour cost Deliberative monetary valuation
Data envelopment analysis
Damage schedule
Citizen jury
Scenarios workshop

Coral Reef Ecosystem Services Economic Valuation. Phd dissertation, Nicolas Pascal, 2013 Page 9 / 351!
number of economic valuation studies on coral reefs has increased rapidly to exceed one hundred by the
mid-2000s (Brander et al., 2007). These numerous studies have, however, mainly concentrated on the
United States (Hawaii and Florida), Southeast Asia (Philippines, Indonesia, Thailand, etc.) and the
Caribbean (Jamaica, Saint Lucia, Trinidad and Tobago, Martinique, etc.) (Laurans et al., 2011), while few
valuations (6 including those of this work) were carried out in South Pacific independent countries (Pascal
and De Maziere, 2008).
!"#"$"F G/9(./0.7G123.
Most of the past studies in the Pacific fall in the third category of “informative” ESVs, few of them in
“decisive” and, to our knowledge none in the “technical” category. This situation reflects that agencies in
PICTs have tended to focus on command and control policy measures, awareness-raising, and education
strategies to control and manage natural resource use and environmental protection (Ram-Bidesi et al.,
2011). In the Pacific, CRESVs have targeted a varied list of stakeholders:
a. Development banks, for which CRESVs intend to highlight “how conservation has helped the local
or regional economy and the people who depend on the managed ecosystems” (e.g. the AFD cost-benefit
analysis of community based marine managed areas in Fiji). The development partners, such as ADB and
World Bank, regularly use CBA of their projects as standard tool to make more informed choices (Mangos
and Rojat, 2008).
b. Environmental agencies and conservation NGOs that would need to demonstrate “why do we need
conservation here?” when pristine and uniqueness arguments of ecosystems are considered insufficient (e.g.
the valuation of coral reef services to raise awareness of the role of these ecosystems in human well-being
(Beukering et al., 2006); or valuation of the costs of wild versus cultured live corals to inform public policy
- (Lal and Kinch, 2005)
c. Government planners to whom it is then suggested to incorporate "green" welfare accounting in
their monitoring and planning activities, so as to change the compass, as is suggested by TEEB (TEEB,
2010) (e.g. in New Caledonia, the application of the natural capital world bank approach (Brelaud et al.,
2009)).
d. Environmental government agencies that may find it useful to assess and communicate the
ecosystem services that their actions protect or improve. For instance, the local environmental department
used the results of the TEV in New Caledonia (one of the case study of this thesis) to influence public
budget allocation (at least try to do so). Moreover, agencies are increasingly being asked to demonstrate the
public benefits of their environmental regulations, programs, and expenditures.

Coral Reef Ecosystem Services Economic Valuation. Phd dissertation, Nicolas Pascal, 2013 Page 10 / 351!
e. Local stakeholders such as customary chiefs or MPA managers that could use the results to
highlight benefits for the local users and members of the community. For example, the Fiji MPA valuation
(O’Garra, 2009 ) helped put forward benefits and equity distribution that, perhaps, were not perceived by the
inhabitants. It may have been used also as a tool in the community for argumenting trade-offs between the
short and medium term.
!"#"$"H I9/&89.,89>(-./0.7G123.
The results of compilation exercises of CRESV confirm that there is no single worldwide value for the
economic value of one km# of coral reefs. Therefore the valuation of coral reefs has conferred values (in
international US$, 2000 prices) between US$ 15,000 km-2.y-1 and more than US$ 1,200,000.km-2.y-1 (Cesar
and Chong, 2006; Dixon, 1993; Ruitenbeek and Cartier, 1999; Seenprachawong, 2003 {White, 2000 #40).
Updating and citing a recent analysis of CRESV compilations in which the author participated (Laurans et
al., 2013a): the main components of these TEVs are (annual values): (1) tourism and recreational activities,
ranging from around US$1,000 per km# in the Philippines (Beukering et al., 2003; Samonte-Tan et al.,
2007), to several tens of thousands of US$ per km# in Jamaica (Cesar and Chong, 2006) and up to around
US$1,000,000 per km# in the Caribbean islands (Burke et al., 2008; Cesar et al., 2003a; Harrison, 2007;
Ruitenbeek and Cartier, 1999); (2) indirect use values such as shoreline protection, from several tens of US$
per km# in Indonesia (Cesar, 1996) to more than US$ 100,000 per km# in the Caribbean (Beukering et al.,
2006; Burke et al., 2008; Ruitenbeek and Cartier, 1999); and (3) extractive activities such as fisheries, up to
US$ 8,000 per km# in Sulawesi (Hargreaves-Allen, 2004), with maximum values around US$90,000 per
km# in Hawaii (Friedlander and Cesar, 2004).
Specifically in the South Pacific, the figures vary widely. In current US$, the Australia’s Great Barrier
Reef ecosystem services were estimated at US$ 3.7 billion per year (Access Economics Pty, 2007; Carr and
Mendelsohn, 2003) for an equivalent value4 of US$ 75,000.km-2.y-1, the ES of coral reefs of American
Samoa were estimated at US$ 17,000 km-2.y-1 (Spurgeon, 2004), the ES of the reefs of Commonwealth of
the Northern Mariana Islands were estimated at US$ 1,700,000 km-2.y-1 (Beukering et al., 2006), Guam’s
reefs ES were estimated at US$ 1,100,000 km-2.y-1 (Beukering et al., 2007b) and coral reef ecosystems
services of the main Hawai’ian Islands (Hawai’i, Maui, Oahu, Kauai, and Molokai) have been found to
amount to US$ 320,000 km-2.y-1 (Cesar et al., 2003a).
This variation in values is highly dependent on the socio-economic and ecological context in which
assessments are performed, in addition to methodological heterogeneity between studies (Brander et al.,
2007; Laurans et al., 2013a). According to these authors and considering geomorphological similar reefs,
a!!"**!(PB$)%*(&.!)%*B(#!+&!%!#PB%4(!0$*+-(.(4!K%#$#!L(4(!K%#(6!+&!2+&)(4#$+&!=4+-!6$==(4(&.!#+B42(#!+=!2+4%*!4((=!%4(%#!(#.$-%.(#!SE,%*6$&1?!J_?!;%)$*$+B#?!@_?!O4((&?!C_?!`cc^_!\+4*6!".*%#!+=!@+4%*!;((=#_!Q:CH>\@J@_!'%.(!HBK*$#<(6d!e%&B%49!`cc^_!8E/:d!c>f`c>`b`ff>c_?!!

Coral Reef Ecosystem Services Economic Valuation. Phd dissertation, Nicolas Pascal, 2013 Page 11 / 351!
values generally increase with four factors: (1) the economic development of the coastal zone, as an
indicator of both opportunity cost and regional economic effects, (2) the concentration of population, as the
multiplier to which per capita estimates are extrapolated, (3) per capita national Gross Domestic Product, as
a proxy for the budget constraint or ‘ability to pay’ and (4) the rate of highly valued activities, such as
tourism as opposed to agriculture and small-scale fisheries. As an illustration, the value of shoreline
protection of coral reefs in American Samoa increases from US$ 2,000 per km in reefs adjacent to sparsely
populated areas where agriculture is the main activity, to US$ 50,000 per km for reefs adjacent to areas of
high densities of population, and US$ 1 million per km for reefs in areas where tourism is the main activity.
.
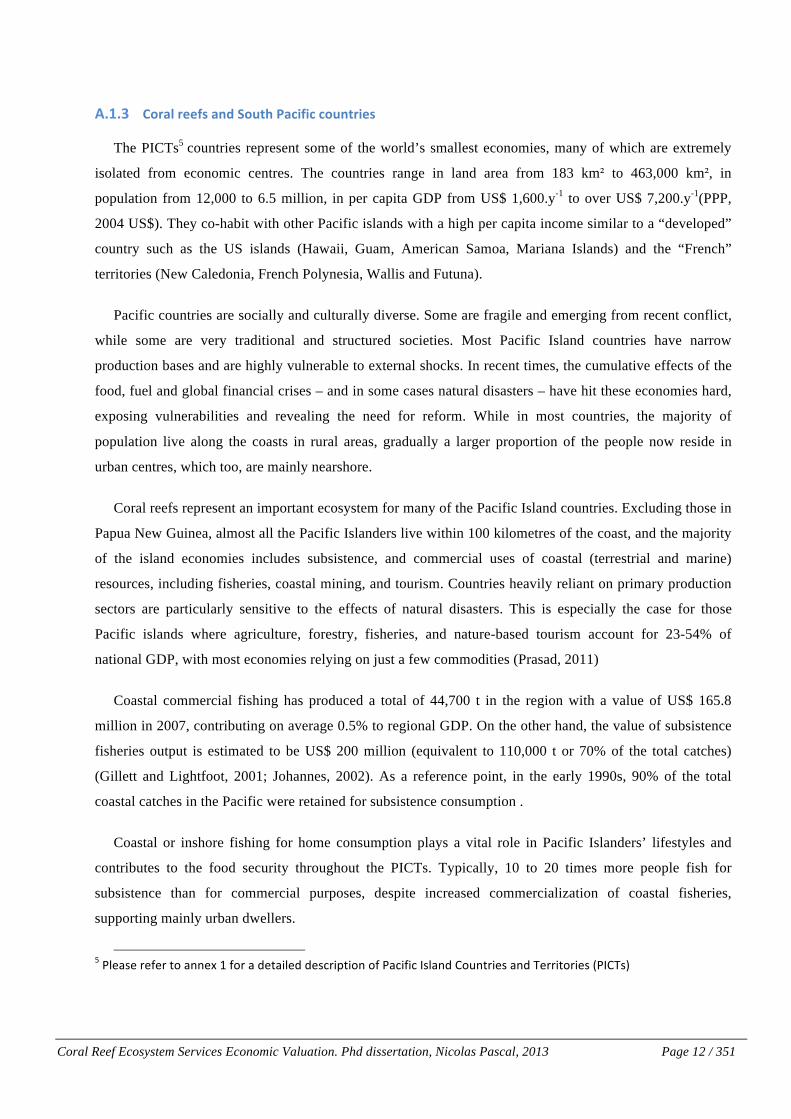
Coral Reef Ecosystem Services Economic Valuation. Phd dissertation, Nicolas Pascal, 2013 Page 12 / 351!
8NONT =+2-/&2$$,)&-"#&@+1*Q&A-6(,(6&6+1"*2($)&
The PICTs5 countries represent some of the world’s smallest economies, many of which are extremely
isolated from economic centres. The countries range in land area from 183 km# to 463,000 km#, in
population from 12,000 to 6.5 million, in per capita GDP from US$ 1,600.y-1 to over US$ 7,200.y-1(PPP,
2004 US$). They co-habit with other Pacific islands with a high per capita income similar to a “developed”
country such as the US islands (Hawaii, Guam, American Samoa, Mariana Islands) and the “French”
territories (New Caledonia, French Polynesia, Wallis and Futuna).
Pacific countries are socially and culturally diverse. Some are fragile and emerging from recent conflict,
while some are very traditional and structured societies. Most Pacific Island countries have narrow
production bases and are highly vulnerable to external shocks. In recent times, the cumulative effects of the
food, fuel and global financial crises – and in some cases natural disasters – have hit these economies hard,
exposing vulnerabilities and revealing the need for reform. While in most countries, the majority of
population live along the coasts in rural areas, gradually a larger proportion of the people now reside in
urban centres, which too, are mainly nearshore.
Coral reefs represent an important ecosystem for many of the Pacific Island countries. Excluding those in
Papua New Guinea, almost all the Pacific Islanders live within 100 kilometres of the coast, and the majority
of the island economies includes subsistence, and commercial uses of coastal (terrestrial and marine)
resources, including fisheries, coastal mining, and tourism. Countries heavily reliant on primary production
sectors are particularly sensitive to the effects of natural disasters. This is especially the case for those
Pacific islands where agriculture, forestry, fisheries, and nature-based tourism account for 23-54% of
national GDP, with most economies relying on just a few commodities (Prasad, 2011)
Coastal commercial fishing has produced a total of 44,700 t in the region with a value of US$ 165.8
million in 2007, contributing on average 0.5% to regional GDP. On the other hand, the value of subsistence
fisheries output is estimated to be US$ 200 million (equivalent to 110,000 t or 70% of the total catches)
(Gillett and Lightfoot, 2001; Johannes, 2002). As a reference point, in the early 1990s, 90% of the total
coastal catches in the Pacific were retained for subsistence consumption .
Coastal or inshore fishing for home consumption plays a vital role in Pacific Islanders’ lifestyles and
contributes to the food security throughout the PICTs. Typically, 10 to 20 times more people fish for
subsistence than for commercial purposes, despite increased commercialization of coastal fisheries,
supporting mainly urban dwellers.
f!H*(%#(!4(=(4!.+!%&&(D!^!=+4!%!6(.%$*(6!6(#24$,.$+&!+=!H%2$=$2!8#*%&6!@+B&.4$(#!%&6!N(44$.+4$(#!SH8@N#U!
!

Coral Reef Ecosystem Services Economic Valuation. Phd dissertation, Nicolas Pascal, 2013 Page 13 / 351!
Marine resources are one of the vital sources of dietary protein with the average annual per capita
consumption of 50 kg reef fish being significantly higher than the global average. Subsistence fishery still
provides the great majority of dietary animal protein in the region, with fish providing 50-90% of animal
protein intake in rural areas and 40-80% in urban centres (Kronen, 2007).
The total regional tourist expenditure in 2004 was US$ 1,500 M, of which 32% was for local wages and
38% for materials and supplies from within the local economies (Milne, 2005). There are currently 12
Pacific Island member countries and the SPTO (South Pacific Tourism Organization) member countries
have adopted a trading name as South-Pacific Travel. 3 countries (French Polynesia, Fiji and New
Caledonia) represent 75% of the total tourism expenditures. The potential for generating downstream
benefits from coastal tourism related activities is high, considering the various types of activities that are
being promoted, ranging from snorkelling, scuba diving, sports fishing, and surfing, to selling locally-made
produce, handicrafts, food and beverages. Ecotourism is seen in many countries to provide an alternative
source of income to extractive activities (McElroy, 2003).
Insular economies are particularly fragile, due to their relatively high dependence on natural resources,
the risk of natural calamity, demographic pressure, poverty rates and low human capital capacity (Leisher et
al., 2007; Pollnac, 2007).
There is another link associated with coral reef for religion, folklore, painting, cultural and spiritual
traditions. Human communities living by and off the sea often attach special importance to marine
ecosystems that have played a founding or significant role in the economic or cultural definition of the
community. This identification may be associated with a strong economic interest in the extraction of the
site but as economic significance decreases the community may attach increased symbolic values to the
preservation of the site. This role is distinct from the economic importance of revitalised and
commercialised cultural heritage, which is included below under the heading tourism service.
As explained before and despite the importance of coral reefs in the South Pacific countries, they remain
threatened by various negative drivers: overfishing, coastal development, sedimentation and pollution from
agriculture and logging, recreational overuse, climate change and acidification of the oceans (Baker et al.,
2008; Bryant et al., 2011; Mumby and Steneck, 2008; Wilkinson, 2008).
The most recent global monitoring study suggests that the world has effectively lost 19% of the original
area of coral reefs and that 35 % of the world’s reefs are under threat of loss within 10 to 40 years
(Wilkinson, 2008). A more recent study suggests that, in many regions of the world, 50 to 70 % of reefs are
likely or very likely to cease providing basic ecosystem services (Bryant et al., 2011). The same study
shows, however, that coral reefs in the South Pacific appear healthier (on average) than in other regions such
as the Indian Ocean and Caribbean.

Coral Reef Ecosystem Services Economic Valuation. Phd dissertation, Nicolas Pascal, 2013 Page 14 / 351!
Today most territories are facing challenges such as increased fish demand from human population
growth (expected to increase by 50% by 2030) , the rapid introduction of a market economy with its
associated rural exodus and loss of traditional customs, a small island context with limited economic options
and potential climate change effects on their coral reef ecosystems. These challenges are reinforced by the
lack of adequate governmental and quasi-governmental institutional structures to facilitate broader scale
management of increasingly scarce resources.

Coral Reef Ecosystem Services Economic Valuation. Phd dissertation, Nicolas Pascal, 2013 Page 15 / 351!
8NS 8"&+P$2P($U&+,&*Q$&6Q-//$"0$)&+,&=5?@F&
The recent growing demand of CRESV in the Pacific brings new challenges both in improving the
robustness of results through progress in methodology and in increasing their policy relevancy. This thesis
therefore concentrates on topics that are still in exploration and not consolidated. These challenges are
reviewed briefly as follows:
8NSNO D2-")3(*&-&6+22$6*&)(0"-/&-.+1*&$6+)7)*$3&)$2P(6$)&
!"$"#"# 1)/9/J+)89.9+=K-.
Very few studies have addressed the exact links between ecosystem processes6 and ecosystems services
as described by Balmford (Balmford et al., 2008) and little emphasis has been placed on the functional
ecology of coral reefs (Beaumont et al., 2007; Done et al., 1996; Duarte, 2000; Holmlund and Hammer,
1999).
A paper produced by a group of 14 scientists has intended to evidence links between marine biodiversity
and ocean ecosystem services (Worm et al., 2006). Based on local experiments, long-term regional time
series, and global fisheries data they showed that restoration of biodiversity increased productivity fourfold
and decreased variability by 21%, on average. It proved also that there was no evidence for redundancy at
high levels of diversity; the improvement of services was continuous on a log-linear scale.
Nonetheless, this study is still a pioneer one. Many scientific knowledge gaps exist for coral reef
ecosystems to establish robust links between processes and services and worse to quantify it for
monetization. For example, one of the most commonly cited relationships is the link between coral reef
ecological attributes and commercial fish biomass productivity. This link has only been proven in the last 10
years (Harborne et al., 2006; Jones and al, 2004; Mumby and Steneck, 2008). Science has begun to focus on
this kind of relationship very recently and many uncertainties are evidenced. Two meta-analysis concluded
that for half or more of herbivorous reef species, including species of commercial genera Scaridae and
Acanthuridae, a significant decline in their abundance is proven after a long bleaching event (Mumby and
Steneck 2008) but without specifying clearly if decline was due to a loss in the coverage of live coral reef,
changes in communities characteristics or modifications of physical refugees for fish (Holmlund and
Hammer, 1999). Another illustration is the exact role of coral reefs in the coastal protection ecosystem
services. Coastal protection against waves is a complex process implicating many factors such as
geomorphologic patterns of the coast, the presence of other ecosystems such as mangroves, etc and the coral
g!H4+2(##(#!%4(!,<9#$2%*?!2<(-$2%*!+4!K$+*+1$2%*!%&6!2+&.4$KB.(!.+!.<(!-%$&.(&%&2(!+=!.<(!(2+#9#.(-?!L<$*(!#(4)$2(#!%4(!.<(!(&6!1++6#!%&6!#(4)$2(#!.<%.!6$4(2.*9!%==(2.!.<(!<B-%&!L(*=%4(_!8&!.<$#!2*%##$=$2%.$+&?!2+4(!(2+#9#.(-!,4+2(##(#!%&6!K(&(=$2$%*!(2+#9#.(-!,4+2(##(#!%4(!$6(&.$=$(6_!!!
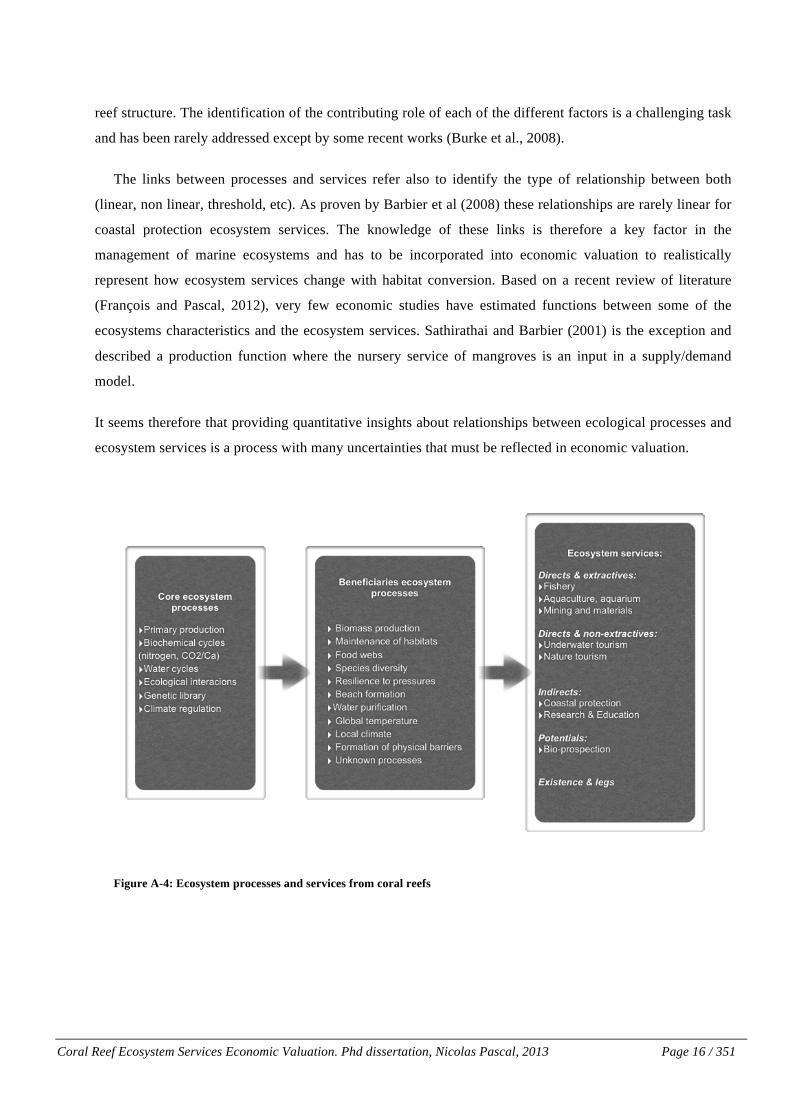
Coral Reef Ecosystem Services Economic Valuation. Phd dissertation, Nicolas Pascal, 2013 Page 16 / 351!
reef structure. The identification of the contributing role of each of the different factors is a challenging task
and has been rarely addressed except by some recent works (Burke et al., 2008).
The links between processes and services refer also to identify the type of relationship between both
(linear, non linear, threshold, etc). As proven by Barbier et al (2008) these relationships are rarely linear for
coastal protection ecosystem services. The knowledge of these links is therefore a key factor in the
management of marine ecosystems and has to be incorporated into economic valuation to realistically
represent how ecosystem services change with habitat conversion. Based on a recent review of literature
(François and Pascal, 2012), very few economic studies have estimated functions between some of the
ecosystems characteristics and the ecosystem services. Sathirathai and Barbier (2001) is the exception and
described a production function where the nursery service of mangroves is an input in a supply/demand
model.
It seems therefore that providing quantitative insights about relationships between ecological processes and
ecosystem services is a process with many uncertainties that must be reflected in economic valuation.
Figure A-4: Ecosystem processes and services from coral reefs
Coral Reef Ecosystem Services Economic Valuation. Phd dissertation, Nicolas Pascal, 2013 Page 17 / 351!
!"$"#"$ E/*(=*+89.8=B.->-*8+=8&9(.9(,(9-.
A question that is legitimate to ask is the sustainability of uses and the meaning of the calculated values.
The estimation of a single monetary value to characterize an ecosystem service must then be
"contextualized" with information about environmental sustainability and the potential of ecosystem service
evaluated.
The report of the Centre d’Analyse Stratégique from the French Prime Minister office (Chevassus-au-
Louis et al., 2009) on economic valuation refers to the "maximum plausible use" that it may be possible to
determine qualitatively (e.g. based on expert opinions) or quantitatively from production functions for
certain ecosystem services.
As recommended by the economic taskforce of the IFRECOR (the French Initiative for Coral Reef), the
potential values should be calculated for the following services: fishing, underwater tourism, coastal
protection and wastewater treatment (direct and indirect values). The maximum plausible values may be
categorized as option values of current uses.
Reef fish populations are very sensitive to fishing effort and overfishing is rapidly reached in these
ecosystems. Nonetheless, CRESVs rarely take into account the ecological sustainability of the fishery, when
calculating an ecosystem service based on fisheries. Defining the value based on the total fish population is
inadequate since this would be equivalent to a capital value and not sustainable revenue. In order to
calculate the potential fishery ES or to project future ES flows it is necessary to define a maximum annual
productivity.
In a similar way, the Sheraton paradox (Mirault, 2006) describes how the valuation of coral reef
ecosystem services linked to tourism will provide big numbers depending mainly on the tourism capacity.
Results are independent of future effects on the ecosystem through sewage, overcrowding of sites, etc. This
involves defining the limits of ecological and sociological changes that could cause some degradation but
that will be allowed on site (Stankey et al., 1985).
Additional methodological questions include how potential values should be calculated when trade-off
between ecosystem services exist. Fish harvest is of concern, particularly when tourism is a potential non-
consumptive use of the fish stock. Defining the trade-offs of a yield that values the diversity of fish species
for tourism relative to selective fishing for consumption is a further challenge.
!"$"#": 2L8*+89.B+-*6+&>*+/=.
Many challenges remain in defining the spatial dimension of the valuation of the ecosystem services. The
first question addresses the choice of what is being assessed: the place of the ecosystem processes, the place
where the human activity takes place, or the place where benefits will be transformed into money. Other

Coral Reef Ecosystem Services Economic Valuation. Phd dissertation, Nicolas Pascal, 2013 Page 18 / 351!
challenges concern important knowledge gaps in the marine ecological processes (e.g. larval dispersion and
trophic migrations) and their spatial distribution (Kendall and Picquelle, 2003; Leis, 2002; Sale et al., 2005).
The practical identification of the study perimeter for each service being valued is not necessarily
straightforward and can impact substantially the outcome of the analysis (Mumby and Steneck, 2008). It
seems to be also a key variable for policy-makers when evaluating policy choices usually influenced by the
identification of the spatial extension of beneficiaries or losers.
Considering the complexity of these processes (variability and importance) and the technical challenge to
identify the flows of dispersion of some services, especially marine species, this aspect of CRESV appears
to be one the main challenge to take into account.
!"$"#"A M5L8)*-./0.N86+=(.E6/*()*(B.!6(8-./=.1)/-4-*(5.2(6,+)(-.
The findings of many authors have shown that the very extensive scientific and technical literature
produced on MPAs during the last 10 years has concentrated mainly on biological impacts inside the closed
area (Caddy, 2000; Cote et al., 2001; Gell and Roberts., 2003; Roberts and Hawkins, 2000). The effects
inside the MPA on fishery biomass, density and diversity are now well demonstrated in many sites (Caddy,
2000) (Caddy, 2000; Halpern and Warner, 2002; Murray et al., 1999; Roberts, 1995; Roberts et al., 2001).
Even if uncertainties on MPA size and species remain, it can be considered that the management of a zone
reducing the fishing effort will create a build-up of biomass and diversity of exploited species inside the
closed area after a period of 5 years (Gell and Roberts., 2003). These effects have had remarkably consistent
effects throughout the world (Halpern and Warner, 2002).
Nonetheless, outside effects on fishery yields through spillover of biomass or larval dispersion from
MPA are expected but only confirmed by few studies so far (Castilla and Bustamente, 1989; McClanaham
and Graham, 2005; Roberts et al., 2001; Russ and Alcala, 1996). In a similar way, MPA are usually
presented as a powerful attractor for tourism but evidences remain scarce (Andersson, 2007; Asafu-Adjaye
and Tapsuwan, 2008; Beukering et al., 2003; Depondt and Green, 2006). The relationship between
underwater tourism and the impacts of MPA on some ecological attributes is also not well known
(Andersson, 2007). Scientific knowledge gaps, technical difficulties to separate MPA effects on fishery and
tourism from other context variables, expensive costs of studies, late participation of social sciences in MPA
science and effects too weak to be proven have been proposed as reasons for this lack of studies of MPA
benefits on people (Sale et al., 2005), Ferrarris, pers. comm.). Some recent studies have intended to
overcome some of the difficulties to identify individually sectorial benefits of MPA (e.g.. fishery, tourism,
social capital) by measuring directly the impacts on household welfare (Guzman, 2004; Hoagland et al.,
1995; Leisher et al., 2007).

Coral Reef Ecosystem Services Economic Valuation. Phd dissertation, Nicolas Pascal, 2013 Page 19 / 351!
!"$"#"C O8*8.)/99()*+/=.5(*</B-.0/6.P>8=*+*8*+,(.,89>8*+/=-./0.1)/-4-*(5.2(6,+)(-.
Data collection involves several techniques: interviews and questionnaires, focus group, experimental
fishery, fishing logbooks and monitoring. As revealed by several authors (Pickering et al., 2003), impacts of
coral reef management such as MPA are usually very low and can be very localized spatially. Their
identification requires then accurate data and the limits of the common method of perception surveys with
local population (fishermen, tourists, managers, business owner, etc.) to quantify precisely MPA impacts
have been raised by several studies (Hubert, 2007; Ram-Bidesi et al., 2011; Seidl et al., 2011).
8NSNS D-R$&("&-66+1"*&A-6(,(6&)4$6(,(6(*($)&
Important ecosystem services generated by coral reef ecosystems in the Pacific (such as the subsistence
fishing, the coastal protection service, the cultural and recreational uses) have to be addressed with
methodological challenges due to the socio-ecological context.
!"$"$"# 2>&-+-*(=)(.0+-<+=J.
One of the first methodological difficulties encountered in valuation studies in the Pacific is the estimate
of non-commercial fisheries, which includes two very different types: subsistence and recreational fishing.
For each, the appropriate methodological approaches are substantially different and require the clear
identification of their respective volumes and fishing efforts.
Estimation and valuation of fish stocks, catch and fishing effort has to overcome many obstacles: (i) how
to robustly estimate volumes of non-commercial catches, which are sometimes as important as commercial
reef fisheries (and greater in some countries), but not monitored by officials (Gillett, 2009); (ii) how to
reflect the key aspects of subsistence fishing activity in the South Pacific, which includes: the protein
dependence for some vulnerable socio-demographic groups (the “Engel law” defining the food demand
elasticity with incomes), the non-substitutability of the activity due to its low level of initial investment and
training (Hickey, 2008), the maintenance of a stable source of income independent of market uncertainty
(Turner et al., 2007) and its importance as a factor of social cohesion (Bensa and Freyss, 1994; Boyer,
1997).
@+--B&$.9!2+&.(D.!
The contexts of community and traditional economy pose a challenge to the neo-classical approach of
individual maximization of welfare. Although no published studies exist to our knowledge, it is possible that
customary tenure arrangements in the Pacific significantly skew the influence of community in individual
choice (constrains or enables), clan, family, village, resource allocation decisions (Cinner et al., 2007). This
could question the appropriate scale of economic valuation analysis from the individual or individual
household level to some broader scale (group of families, clan, villages, etc.)

Coral Reef Ecosystem Services Economic Valuation. Phd dissertation, Nicolas Pascal, 2013 Page 20 / 351!
Many of the natural resources in PICTs are communally owned, often with boundaries, which are not
clearly defined or formally recorded, creating unique challenges in the use and management of natural
resources in a modern world.
In many Pacific islands and mainly in Melanesia (Fiji, New Caledonia, Papua-New Guinea, Solomon
and Vanuatu), the cash economy is still under-developed. Therefore, the value that local communities
attribute to money, and its function in life, differs widely from common economic assumptions. Island
societies assign value to things that lack exchange equivalents, or relative prices, and which therefore cannot
be included in TEV. Three can be mentioned here (Laurans et al., 2013a):
• The degree of familiarity of islanders with the reef, which is measured by the density of place names
per km# and the number of fishes named locally. These two metrics are a proxy for both the non-use value
of the reef and its use value (Pacific islanders name only what they use).
• The role of the reef in the identity of the village community. The highest values are attached in the
place where the canoe of the founding ancestor of the island population first landed.
• The role of the reef in the social and political positioning of the community towards other island
communities. The highest values are found among reef fishing clans as in New Caledonia (Leblic, 1999)
and among communities where the alliance relationships are built on sharing of fishery products, including
turtles, as in Tanna island, Vanuatu (Bonnemaison, 1986).
To our knowledge, only one study has addressed the non-use value of coral reefs for local populations in
PICTs. The study was conducted in Fiji with several communities to identify the bequest value attached to
the reef (O’Garra, 2009). O’Garra’s results highlight that local communities were willing to contribute 3
hours of their time per week towards conservation mainly for future generations (bequest value). In this
study several challenging issues were raised such as time allocation conflict between communal and
personal obligations, gender influence in decision-making and common property resource management by
villagers. All the other works addressing non-use values through contingent valuation or choice experiment
have been estimated for high-income groups from Australia or developed Pacific islands (Ahmed et al.,
2007; Beukering et al., 2006; Cesar et al., 2003a; Whitten and Bennett, 2004).
8NSNT !"62$-)$&*Q$&(",/1$"6$&+"&4+/(67&&
There is an increasing anxiety that the international community is not making sufficient effort to halt the
loss of biodiversity. Currently, new ways are sought to increase the financial basis for biodiversity
protection. At the 10th Conference of the Parties (COP) to the Convention on Biological Diversity (CBD) in
Nagoya in 2010, it was decided to invite the Parties “... to submit information concerning innovative
financial mechanisms that have potential to generate new and additional financial resources as well as

Coral Reef Ecosystem Services Economic Valuation. Phd dissertation, Nicolas Pascal, 2013 Page 21 / 351!
possible problems that could undermine achievement of the Convention’s three objectives”. At the same
time, the people who are affected and those who provide resources are increasingly asking for evidence that
interventions improve ecosystem services and human well-being.
As claimed by some authors (Miteva et al., 2012; Sutherland, 2005) credible evaluations of common
conservation instruments are rare. Protected Areas (PA) are the most commonly used tool for biodiversity
conservation in developing countries and calls for rigorous empirical evaluation of PA have been called for
repeatedly (Carpenter et al., 2009; Pattanayak, 2009; Sutherland, 2005; Vincent, 2010).
In the discussion, we will present the communication strategy (workshops, meetings, policy briefs,
scientific articles) conducted in New Caledonia and Vanuatu. Most of the implicated stakeholders were
informed of the results of the studies during the year following the studies. In New Caledonia, it was
possible to meet stakeholders one year after they received the information. The objective will be to
understand some of the decision-making processes and the incorporation of the results from each study in
these processes.
We will complement the discussion with the results from other studies. In particular, two studies have
analyzed the influence of past coastal economic valuations on policy, management, or investment decisions
(Kushner et al., 2012; Slootweg and Beukering, 2008). Based on analogous protocols (semi-direct
interviews with conservation and valuation experts), they described concrete experiences highlighting the
influence of economic valuations.
However, even if the gap in time may not be sufficient to evaluate truly the effectiveness of these studies
in the decision making process, all the authors recognized that the influence seems lower than expected and
rather uneven (Kushner et al., 2012; Lal, 2001; Seidl et al., 2011; Slootweg and Beukering, 2008).
From different discussions held in platforms of exchange with experts on ecosystem services7, it seems
Ecosystem Services are falling short of expectations in terms of policy effectiveness. Different authors have
identified a similar implementation gap (Farley et al., 2007; Fisher et al., 2009; Kushner et al., 2012;
Laurans et al., 2011; Laurans et al., 2013b). The main issues raised are:
(i) Were they oversold from the beginning? Are there realistic expectations for the role they might play
in conservation management and finance? Or has not enough development time passed?
h !! <..,dAALLL_(2+#9#.(-2+--+&#_+41! %&6! C2+#9#.(-! E(4)$2(#! =+4! H+)(4.9! "**()$%.$+&! H4+14%--(! SCEH"U!LLL_(#,%_%2_B0!!

Coral Reef Ecosystem Services Economic Valuation. Phd dissertation, Nicolas Pascal, 2013 Page 22 / 351!
(ii) Is getting the methodology right one-success key factor to increase the influence of studies? This is
one of the priorities for scientists looking for the improvement and standardisation of methods as well as
increasing the level of accuracy
(iii) Is there a failure in the design of the studies (answer the management and policy questions) or in the
way results are communicated?
It seems important to discuss these issues in light of the results of our 2 studies and propose some
corrective actions.
On the other hand, although command and control approaches to coastal resource management, such as
MPA declarations, ban of harvest, and control of output and inputs, have been the norm, their effectiveness
depends on compliance, and enforcement is necessary (Govan, 2009). Difficulties in determining
appropriate penalties for non-compliance with regulations, and the costs of implementing effective
monitoring and enforcement often limit the ability to achieve their policy and management objectives (Ram-
Bidesi et al., 2011). It seems therefore important to consider if CRESV results can be used to support other
strategy than only command and control approaches.
The setup of market-based instruments (e.g. Payments for Ecosystem Services or the design of
compensation schemes) is identified as a potential one for economic valuation (Laurans et al., 2011;
Meignien and Lemaître-Curri, 2010; OECD, 2010; TEEB, 2010).
&
Coral Reef Ecosystem Services Economic Valuation. Phd dissertation, Nicolas Pascal, 2013 Page 23 / 351!
8NT C.V$6*(P$)&-"#&)*216*12$&+,&*Q$&*Q$)()&
8NTNO C.V$6*(P$)&
The objective of the thesis is to contribute to improving the scientific basis permitting to address most of
the previous challenges through the analysis of two empiric case studies on coral reefs in the Pacific.
The first one concerns the economic valuation of coral reef ecosystems of New Caledonia. The CRESV
was commissioned in 2008 by the French initiative for coral reefs (IFRECOR) driven by demand from
central and local governments. The objectives of the study were to: (i) estimate the value of coral reef ES in
order to convince decision-makers to take into account the ecosystems in land and resource planning; and
(ii) identify the key beneficiaries of these ES. The valuation has been conducted through different methods
(production approach, market price, damage costs, transport costs and specific models) to determine the
annual producer surplus of more than 18 ES (covering all kinds of fisheries and aquaculture, several tourism
sectors, coastal protection, bio-prospecting and education).
The second one is the CBA of community managed MPA in Vanuatu. The AFD (Agence Française de
Développement, the French Development Bank) was interested in assessing the impacts of community
managed MPAs on local economic growth, poverty reduction and on world biodiversity as a public good.
An ex-post appraisal of investment in MPAs through a Benefit/Cost ratio and Return on Investment (RoI)
has been conducted in 5 selected villages in Vanuatu during a 2-year on site residency (a period long enough
to incorporate ecological seasonality in the results and improve understanding of community way of life).
The main impacts of MPAs on the value of selected ES (fisheries, tourism, social capital, coastal protection
services and bequest value) have been assessed. As far as possible the value of selected ecosystem services
was compared to villages without MPAs (control sites). A focus is made on the effects of the marine
reserves on fishery yields through a control-impact protocol of experimental fisheries and multivariate
statistical analysis to separate MPA role from context.
The analysis of the case studies will focus (i) on the methodological difficulties in the exercise of
valuation of the ecosystem services, (ii) on the improvements that have been tested, and (iii) enhance
communication between researchers and policy makers, so that economic valuation research results can aid
local policy decision-making.
Even after 10 years of practices, the exercises of CRESV still bring challenges both in improving the
robustness of results through methodological progress (Balmford et al., 2008) and in increasing their policy
relevance (TEEB, 2010). This thesis therefore concentrates on topics that are still in exploration and not
consolidated and represents a contribution in this direction.

Coral Reef Ecosystem Services Economic Valuation. Phd dissertation, Nicolas Pascal, 2013 Page 24 / 351!
From the experiences of our 2 case studies, we intent to identify what results and learnings can be drawn
out for other CRESV studies, for the environmental economy science and for coral reef management in
general8.
To our knowledge, it is also the first attempt to value the benefits of small MPAs managed by
communities. Given the impressive recent growth of the number of these MPAs in the region and other parts
of the world (Govan, 2009), the methodological choices and results of the study should open the way for
future valuation works.
Our analysis discusses the use of applying CRESVs for decision-making in the context of Small Islands
Developing States (SIDS), particularly in the South Pacific. How can these CRESVs prove useful for
decision-making in such contexts where, as mentioned above, better management practices are urgently
needed?
8NTNS @*216*12$&
To complete the previous objectives, the thesis was divided in 3 chapters. The first two ones present the
method and results of the two case studies. We will follow a top down approach following the geographic
scale of the study. Therefore we start with the New Caledonia work that covers valuation of a whole
territory for a very general purpose before going downwards to the Vanuatu exercise that valuates a very
precise area (village level) and a specific policy (MPA). The third chapter is a general discussion about the
results and conclusions.
More precisely, the chapter 2 describes the socio-ecological context of New Caledonia related to coral
reef, details the method and data collection employed to quantify, value and map each of the selected ES.
Results are then presented and main conclusions are highlighted.
The chapter 3 is dedicated to the CBA of MPA in Vanuatu. An introduction about the context of
community based MPA in the Pacific and the main socio-ecological characteristics of the studied villages is
made. All methods used in the identification and quantification of the MPA impacts on ES and those used in
their valuation are then detailed. Results and the financial analysis are presented. A specific part highlights
the results about the observed impacts of MPAs on fishery productivity.
The Chapter 4 is a general discussion of the results presented in the previous chapters. Going beyond the
specificities of each of the case studies, results are analysed conjointly within the framework of the
i!8.!$#!$-,+4.%&.!.+!0((,!$&!-$&6!.<%.!K+.<!#.B6$(#!L(4(!+4$1$&%.(6!-%$&*9!.+!4(#,+&6!.+!.<(!6(-%&6#!+=!`!.9,(#!+=!,+*$29!-%0(4#d!6()(*+,-(&.!K%&0!%&6!*+2%*!(&)$4+&-(&.%*!%1(&2$(#_!N<(!$-,4+)(-(&.!+=!#2$(&.$=$2!0&+L*(61(!L%#!%!K9>#$6(!4(#B*.!+=!.<(#(!#.B6$(#_!N<(4(=+4(!.<(!2<+$2(#!+=!#$.(#!%#!L(**!%#!.<(!6(#$1&!+=!-(.<+6#!L(4(!64$)(&!K9!6(-%&6>#$6(!*+1$2!6$==(4(&.!=4+-!#2$(&.$=$2!+&(#!S#B,,*9>#$6(U_!

Coral Reef Ecosystem Services Economic Valuation. Phd dissertation, Nicolas Pascal, 2013 Page 25 / 351!
challenges identified before. Three aspects are treated: (i) the interpretation of the results in the context of
the South Pacific is completed with a comparison with other coral regions in the world to identify common
traits, (ii) the methodological issues encountered in the exercises of CRESV and the way to take into
account some of the Pacific specificities are discussed and, (iii) the observed influence of the 2 case studies
on policy making are compared with other studies to understand the lower than expected impacts.
Some of the discussions points are based on comparison with results from two publications in which the
author participated. The first one (Laurans et al., 2013a) is a scientific paper about CRESV in the Pacific
and an analysis of recent experiences. The second one (François et al., 2012) is a technical report on a
literature review of 15 studies on CBA of coral reefs and mangroves management.
A reference list and relevant annexes are also provided at the end.

Coral Reef Ecosystem Services Economic Valuation. Phd dissertation, Nicolas Pascal, 2013 Page 26 / 351!
&

Coral Reef Ecosystem Services Economic Valuation. Phd dissertation, Nicolas Pascal, 2013 Page 27 / 351!
:N ?P-/1-*(+"& W6+"+3(X1$& #$)& )$2P(6$)& 2$"#1)& 4-2& /$)& W6+)7)*Y3$)&6+2-//($")&#$&<+1P$//$&=-/W#+"($&
:NO !"*2+#16*(+"&
Le travail présent s’inscrit dans le cadre du plan d'actions national IFRECOR (Initiative Française pour
les Récifs CORalliens), financée par le ministère de l'Ecologie, du Développement durable, des Transports
et du Logement (MEEDTL) et le ministère de l’Outre-Mer (MOM). Plus particulièrement, le Thème
d'Intérêt Transversal (TIT) « Socio-économie » du plan d’actions nait à partir de la nécessité d’approfondir
la compréhension du contexte et des enjeux sociaux et économiques des écosystèmes coralliens et
écosystèmes associés (mangroves et herbiers).
Reprenant les termes de l’IFRECOR: « le TIT vise principalement à : (i) obtenir une première
estimation de la valeur socio-économique des écosystèmes coralliens par nature de biens et services rendus
(pêche, tourisme, industrie) pour chacune des huit collectivités d’outre-mer ; (ii) diffuser les résultats
obtenus auprès des décideurs locaux et nationaux afin d’augmenter de façon significative la prise en compte
des récifs dans les processus d’élaboration des politiques d’aménagement du territoire (mise en place d’aires
marines protégées, définition de plans de gestion, de restauration, de monétarisation des écosystèmes
coralliens, amélioration de la connaissance et de la diffusion des savoirs) ainsi que proposer des options
d’aménagement et de monétarisation des écosystèmes coralliens. »
Le développement d’une méthodologie générique et son application à la Martinique, à la Nouvelle-
Calédonie et à Mayotte constitue le premier temps du TIT. Avec les ajustements idoines, son emploi dans
les 6 autres collectivités d’outre-mer constituera le second temps du TIT (Wallis et Futuna, Réunion, îles
Éparses, Guadeloupe/St Barthélemy/St Martin, Clipperton, Polynésie française). ». Ce travail s’inscrit ainsi
dans le cadre de développement de politique de gestion de l’environnement cherchant la durabilité des
usages. Une des approches pour appuyer cette démarche vise à mettre une valeur sur les services rendus par
l’environnement jusqu’alors considérés comme un service gratuit, illimité, et public (Théorie de
l’externalité (Farber et al., 2002). Selon plusieurs courants de pensée, cette monétarisation doit permettre
une meilleure prise de conscience par son approche quantitative monétaire (théoriquement plus parlante
qu’un simple argumentaire qualitatif) (TEEB, 2010) . Elle facilite aussi l’identification claire des bénéfices
et des dommages ainsi que leur distribution au sein des acteurs. Cette connaissance acquise contribue à une
meilleure gestion par la mise en place de compensations, paiements pour services écosystémiques ou taxes
environnementales (Meignien and Lemaître-Curri, 2010).

Coral Reef Ecosystem Services Economic Valuation. Phd dissertation, Nicolas Pascal, 2013 Page 28 / 351!
L’approche IFRECOR TIT « socio-économie des récifs » se veut donc être la base de ces processus en
monétarisant les services générés par les écosystèmes coralliens et leur distribution au sein des différents
acteurs.
:NS C.V$6*(,&&
L’objectif principal du travail est d’effectuer une évaluation économique des services générés par les
récifs coralliens et écosystèmes associés de Nouvelle-Calédonie. Douze services sont sélectionnés: la pêche
commerciale (ES1) la pêche vivrière (ES2), la pêche de loisir (ES3), les autres type de pêche (ES4), le
tourisme sous-marin (ES5), le tourisme nautique (ES6), la plaisance (ES7), la recherche et éducation (ES8),
la protection côtière (ES9), la bio-prospection (ES10), la séquestration du carbone (ES11) et les services de
non-usage (ES12). Cette étude s’est effectuée en deux temps : le premier temps correspond à l’évaluation de
la valeur financière des services générés par les écosystèmes (Valeur ajoutée et multiplicateur). Il s’agit de
monétariser les flux dans l’économie Calédonienne des onze premiers services décrits antérieurement. Dans
un deuxième temps, une autre évaluation (Pascal and Marre, 2012) se centre sur les surplus consommateurs
(consentements à payer) des principaux usagers ainsi que sur l’estimation de la valeur d’existence des récifs
pour les non-usagers. Les deux approches permettent de compléter la Valeur Economique Totale (VET) des
services rendus par les récifs coralliens de Nouvelle-Calédonie. La distribution de la valeur économique
totale entre les différents acteurs est identifiée afin de faciliter l’interprétation des résultats et la mise en
place de politiques publiques. Avec le même objectif, une analyse SIG (Système d’Information
Géographique) informe sur la distribution spatiale de la valeur des différents services.
:NT =+"*$%*$&)+6(+GW6+/+0(X1$&#$&/-&<+1P$//$G=-/W#+"($&
La Nouvelle-Calédonie représente un contexte socio-écologique et économique très spécifique. Elle
dispose de complexes récifaux importants (plus de 4.500km# de récifs et 20.000km# environ de zones
lagonaires) avec une densité de population réduite (245.000 habitants). Les relations homme-récif et les
usages qui en sont faits sont contrastés entre les différentes cultures présentes. De même, une économie
basée sur les services et le nickel générant un fort pouvoir d’achat à une partie de la population coexiste
avec une économie non-marchande basée sur l’agriculture et la pêche vivrière. Une description en
profondeur du contexte socio-écologique est donnée dans les parties suivantes. En particulier
l’environnement géographique, écologique, humain, politique et économique de la Nouvelle-Calédonie est
décrit sous la perspective de leurs relations avec les récifs coralliens et la présente évaluation.

Coral Reef Ecosystem Services Economic Valuation. Phd dissertation, Nicolas Pascal, 2013 Page 29 / 351!
:NTNO HW+02-4Q($&
La Nouvelle-Calédonie est la quatrième île du Pacifique Sud par sa superficie (18.575km#). Située à
environ 1.500 km de la côte australienne, elle comprend : (i) la Grande Terre ; (ii) les îles Loyauté (Maré,
Lifou, Tiga, Beautemps-Beaupré et Ouvéa), (iii) l'île des Pins, (iv) l'archipel des Belep, (v) Huon et
Surprise, (vi) l'île Walpole, (vii) les îles de l'Astrolabe, (viii) les îles Matthew Fearn ou Hunter et, (ix) les
îlots proches du littoral.
Sa longueur s’étend sur 500 km pour une largeur moyenne de 50 km. Elle est entourée d’un espace
lagonaire qui s’étend sur près de 800 km Nord-Sud.
Il est possible d’y distinguer 4 grands sous-ensembles (Andréfouët and Torres-Pulliza, 2004; Gabrié et
al., 2005; Virly and Garrigue, 2008) :
Le Lagon Sud, qui s’étend de l’île des Pins jusqu’à Bourail sur la côte Ouest. Cette zone se caractérise
par un lagon qui devient de plus en plus large vers le Sud (de 1 mille à Bourail à 30 milles à l’extrémité sud)
et profond (moins de 10 m à Bourail, plus de 80 m dans le Sud). Ce lagon couvre environ 5000 km#. Il est
délimité par un récif barrière bien formé, des passes relativement nombreuses et des îlots coralliens et récifs
intra-lagonaires dont le nombre va croissant vers le sud.
Le Lagon Ouest qui s’étend de Bourail jusqu’au Nord de Koumac. Ce lagon est assez étroit (moins de 10
milles) et peu profond (moins de 15 m). Le récif barrière est souvent large et adossé à des zones
sédimentaires peu profondes. Les îlots coralliens sont peu nombreux et de petite taille. La limite vers le
Nord n’est pas marquée, le passage étant progressif vers le Lagon Nord.
Le Lagon Nord s’étend des environs de Koumac jusqu’au « Grand Passage » vers le Nord et jusqu’à l’île
de Balabio vers l’est. Sa profondeur va en augmentant vers le Nord pour atteindre plus de 60 m. Les fonds
meubles dominent, avec des apports terrigènes importants provenant du Diahot. Il y a très peu de récifs
intra-lagonaires. Les îles (Belep) et îlots ne sont pas de nature corallienne ; leur taille est supérieure aux îlots
des autres lagons. La barrière récifale est pratiquement continue, les passes étant peu nombreuses. La
largeur du récif barrière est beaucoup plus grande à l’est qu’à l’ouest et aboutit à un immense récif réticulé
au nord de Balabio, zone qui constitue une des zones les moins accessibles de Nouvelle Calédonie.
Le Lagon Est s’étend de Balabio jusqu’à la passe de la Sarcelle au sud de la Grande Terre. Ce lagon se
caractérise par un récif barrière irrégulier, parfois immergé, et même par endroit par l’existence de deux
récifs barrière consécutifs. Les fonds sont en général importants (plus de 30 m) et de relief plus tourmenté
que dans les autres lagons. Les apports terrigènes y sont importants. Les passes sont nombreuses mais
souvent mal définies. Les îlots sont de nature corallienne et de dimension comparable à ceux du Lagon Sud.

Coral Reef Ecosystem Services Economic Valuation. Phd dissertation, Nicolas Pascal, 2013 Page 30 / 351!
Au nord de la Grande Terre, au delà du « Grand Passage » existe des récifs à structure d’atoll: les
Surprises et Huon. Ces pseudo-atolls sont peu profonds et entourés d’un récif barrière bien défini. Chacun
de ces récifs comporte des petits îlots.
Les îles Loyauté se scindent en 2 groupes : les îles surélevées (Lifou, Maré et Tiga) et les atolls ou
pseudo-atolls (Ouvéa, Beautemps-Beaupré, récifs de la Gazelle et de l’Astrolabe). Les îles surélevées sont
de grands plateaux calcaires d’origine corallienne, entourés par un récif frangeant en général très étroit à
l’exception de quelques petites baies. Il n’existe aucun récif barrière autour de ces îles. Les atolls sont de
taille et nature diverse : Ouvéa est un atoll basculé d’assez grande taille (900 km#) entouré d’un récif
barrière et d’une ceinture d’îlots, les Pléiades, sur deux tiers de son périmètre, le dernier tiers étant constitué
par l’île principale de nature corallienne. Les autres atolls sont de taille nettement plus réduite, seul
Beautemps-Beaupré étant bien fermé et possédant un îlot.
D’autres formations récifales existent au sud et à l’est des Loyauté, en particulier le récif Durand, les
récifs frangeants des îles Walpole, Mathew et Hunter, ces deux derniers faisant partie de l’arc des Nouvelles
Hébrides et étant donc d’une nature géologique différente.
Les Chesterfields sont un chapelet d’îlots bordant un immense plateau d’origine corallienne qui se scinde
en deux grandes zones: Chesterfield et Bellona. Ce plateau est bordé sur une grande partie de sa façade
ouest par un récif barrière, alors qu’à l’est ce récif barrière n’est continu que pour le sud de Bellona. Les
plateaux des Chesterfields et Bellona sont parsemés de pinacles d’origine corallienne de taille parfois très
importante, puisque certains font plus de 60 m de hauteur, cependant aucun ne dépasse la surface.
L’ensemble de ces récifs sont à mi-distance entre la Grande Terre et l’Australie et de ce fait sont peu
fréquentés. »
L'espace maritime de la Nouvelle-Calédonie est évalué à environ 1.450.000 km# (ZEE).

Coral Reef Ecosystem Services Economic Valuation. Phd dissertation, Nicolas Pascal, 2013 Page 31 / 351!
:NTNS I-.(*-*)&
Q":"$"# GR)+0-.)/6899+(=-..
Suivant la classification proposée par Andréfouët et Torres-Pulliza (2004), les complexes récifaux
comprennent les structures suivantes : Atolls océaniques (atoll), Atolls océaniques surélevés (raised atoll),
Bancs (bank), Récifs barrières (barrier reef), Récifs frangeants (fringing reef), Complexes de massifs
coralliens (patch reef) et Complexes récifaux d’îles.
Chacune de ces structures de complexes récifaux comprend ensuite différentes unités
géomorphologiques comme, par exemple, les lagons, couronne et massifs coralliens pour les atolls
océaniques. Avec ce niveau de détails, Andréfouët et Torres-Pulliza (2004) distinguent les superficies
appartenant aux complexes récifaux mais non considérées comme récifs. C’est le cas des superficies
lagonaires ou des terrasses lagonaires (Entrecasteaux, Ouvéa et Beautemps principalement) dont le substrat
est majoritairement constitué de fonds meubles.
En appliquant cette distinction la superficie récifale est d’environ 4.570 km# (voir annexe 2). Les lagons
pour leur part couvrent une superficie de 23.400 km# avec une différence marquée entre les 2 côtes
Est/Ouest. La barrière récifale présente un linéaire d’environ 1.600 km, la classant comme la 1ère plus
longue barrière continue et la 2ème plus grande barrière au monde. On observe à certains endroits un double
ou triple récif barrière.
Figure B-1: Surfaces récifales de grands complexes Néo-Calédonien
Extrait de Andréfouët and Torres-Pulliza (2004)

Coral Reef Ecosystem Services Economic Valuation. Phd dissertation, Nicolas Pascal, 2013 Page 32 / 351!
La distribution par superficie des différents complexes récifaux montre la présence d’un récif barrière
très développé et omniprésent sur la Nouvelle-Calédonie. La superficie des récifs frangeants est
relativement faible et ne concerne qu’une faible part du Territoire.
Ces deux caractéristiques ont une influence majeure sur les typologies de pêche et de tourisme car elles
conditionnent l’usage du récif. Par exemple, un récif frangeant peu développé implique qu’une grande partie
des usages se fasse à travers d’une embarcation pour accéder aux récifs barrières plus éloignés. La pêche à
pied, les randonnées sous-marines en apnée et d’autres activités touristiques depuis le bord du littoral sont
relativement peu développées en Nouvelle-Calédonie et se concentrent dans certaines zones de récif
frangeant.
Santé des récifs :
Selon Virly et al (2008), les derniers suivis sur la couverture corallienne moyenne sur l’ensemble des
stations de suivi (GORC) montrent des résultats relativement stables depuis le début des suivis (1997).
L’état de santé des sites échantillonnés est globalement satisfaisant puisque 35% des stations sont en bonne
santé et 30% ont un état de santé satisfaisant.
Une décroissance significative de la couverture corallienne a été observée sur certains sites depuis 1997.
Ces mortalités sont le résultat du développement ponctuel de populations d’Acanthaster observé sur ces sites
depuis 1997 dont les conséquences ont été observées en 2000 et 2001. Sur les autres sites la couverture
corallienne reste stable ou montre des signes de reconstitution après les mortalités observées en 1998. (Virly
and Garrigue, 2008)
:NTNT B-"02+P$&
La mangrove est omniprésente en Nouvelle-Calédonie avec plus de 25 000 hectares ce qui représente 1%
de la superficie globale de l’île (Roussel et al., 2009; Virly 2008). Elle est particulièrement développée sur
la côte ouest (88% des mangroves). 16 espèces de palétuviers et trois hybrides peuplent les mangroves de
Nouvelle-Calédonie
:NTNZ I$2.($2)&
Les herbiers de phanérogames marines (plantes à fleurs) occupent une part importante des fonds de lagon
de la Nouvelle-Calédonie, notamment le long de la côte ouest et à un moindre degré le long de la côte est.
Selon la cartographie des herbiers peu profonds (0-5 m) réalisée par Andréfouët et ses collaborateurs, les
herbiers denses à diffus (clairement visibles sur l’imagerie Landsat) occuperaient 40.000 ha sur les zones
sédimentaires. Une estimation des zones d’herbiers très diffus porterait ces surfaces à 93.635 ha. (Hily et al.,
2010). 12 espèces de phanérogames ont été identifiées.

Coral Reef Ecosystem Services Economic Valuation. Phd dissertation, Nicolas Pascal, 2013 Page 33 / 351!
:NTN[ 8/01$2-($)&
Actuellement, 332 espèces d'algues appartenant à 46 familles sont signalées en Nouvelle-Calédonie. Les
algueraies du lagon sont généralement situées dans des fonds plus profonds que les herbiers, entre une
quinzaine de mètres et moins de 25 mètres.
:NTN\ '$&P(P-"*&
La biodiversité marine en Nouvelle-Calédonie est estimée à environ 15.000 espèces. Plus de 320 espèces
de coraux ont été inventoriées avec les scléractiniaires hermatypiques (constructeurs de récifs) bien
représentés. Près de 2.000 espèces de poissons sont recensées en Nouvelle Calédonie, dont plus de 1.600 se
rencontrent dans la tranche de profondeur 0-100m. Une trentaine d’espèces sont ciblées au niveau
alimentaire. Le tableau ci-dessus présente un inventaire quantifié de cette biodiversité en termes de nombre
d’espèces.
L’environnement marin se caractérise également par la présence de nombreuses espèces emblématiques:
tortues marines (4 espèces présentes), baleines à bosse (Megaptera novaeanglieae) et petits rorquals,
dugongs, dauphins (5 espèces), oiseaux marins, requins (39 espèces) dont le requin marteau halicorne
(Sphyrna lewini) le grand requin blanc (Carcharodon carcharias) et le requin baleine (Rhincodon typus),
napoléons (Cheilinus undulatus), tricots rayés, nautiles, etc. Plusieurs de ces espèces sont inscrites sur la
liste rouge de l’UICN.

Coral Reef Ecosystem Services Economic Valuation. Phd dissertation, Nicolas Pascal, 2013 Page 34 / 351!
:NTN] !")62(4*(+"&E"$)6+&
Le lagon de la Nouvelle-Calédonie est inscrit à la liste du Patrimoine mondial de l’Unesco depuis juillet
2008. Près de 15.000 km² se repartissent sur six sites néo-calédoniens dont le Grand Lagon Sud et la zone
côtière Ouest, la zone côtière Nord et Est et le Grand Lagon Nord, les Atolls d’Ouvéa et de Beautemps-
Beaupré et les Atolls d´Entrecasteaux.
Pour obtenir le label du Patrimoine mondial de l’Unesco, les sites proposés ont répondu à trois critères:
• Critère (vii) : Phénomènes naturels remarquables ou beauté naturelle exceptionnelle
• Critère (ix) : Processus biologiques et écologiques en cours
• Critère (x): Diversité biologique et espèces menacées
Le bien en série comprend six groupes marins qui sont aussi protégés par des zones tampons marines et
terrestres ne faisant pas partie du bien inscrit.
Plusieurs enjeux sociaux, environnementaux et économiques sont nés de cette inscription. Le
développement d’une gestion participative incluant une grande partie des acteurs (co-gestion), le
renforcement des budgets publics de gestion de l’environnement et l’augmentation du tourisme en sont des
illustrations.
:NTN^ A+41/-*(+"&$*&)+6(W*W&&
La Nouvelle-Calédonie fait partie de l'ensemble mélanésien qui se compose de la Papouasie-Nouvelle-
Guinée, des îles Salomon, Fidji et Vanuatu.
La Nouvelle-Calédonie compte 245.600 habitants au dernier recensement de 2009. L'âge moyen de la
population est de 27 ans et près de la moitié de la population à moins de 25 ans. La population a une
tendance au vieillissement et Broustet (2008) estime qu’un cinquième de la population sera âgé de plus de
60 ans en 2030 (le double d’aujourd’hui). La croissance démographique est cependant élevée avec un
rythme annuel de 1,9% et une moyenne de + 4 000 habitants par an depuis 1996. (Isee, 2004 ). Selon les
projections démographiques, il est prévu qu’en 2030 la Nouvelle-Calédonie comptera plus de 312.000
habitants. (Broustet, 2008).
La Nouvelle Calédonie compte 36 communes et plus de 340 tribus. Certaines estimations évaluent
environ qu’un tiers de la population réside en tribu (Isee, 2004 ). La distribution spatiale des communes,
fruit des différents mouvements historiques, montre que 90% d’entre elles sont situées le long des côtes.
Pour les tribus nous pouvons estimer que 60% des tribus se situent en bord de mer.
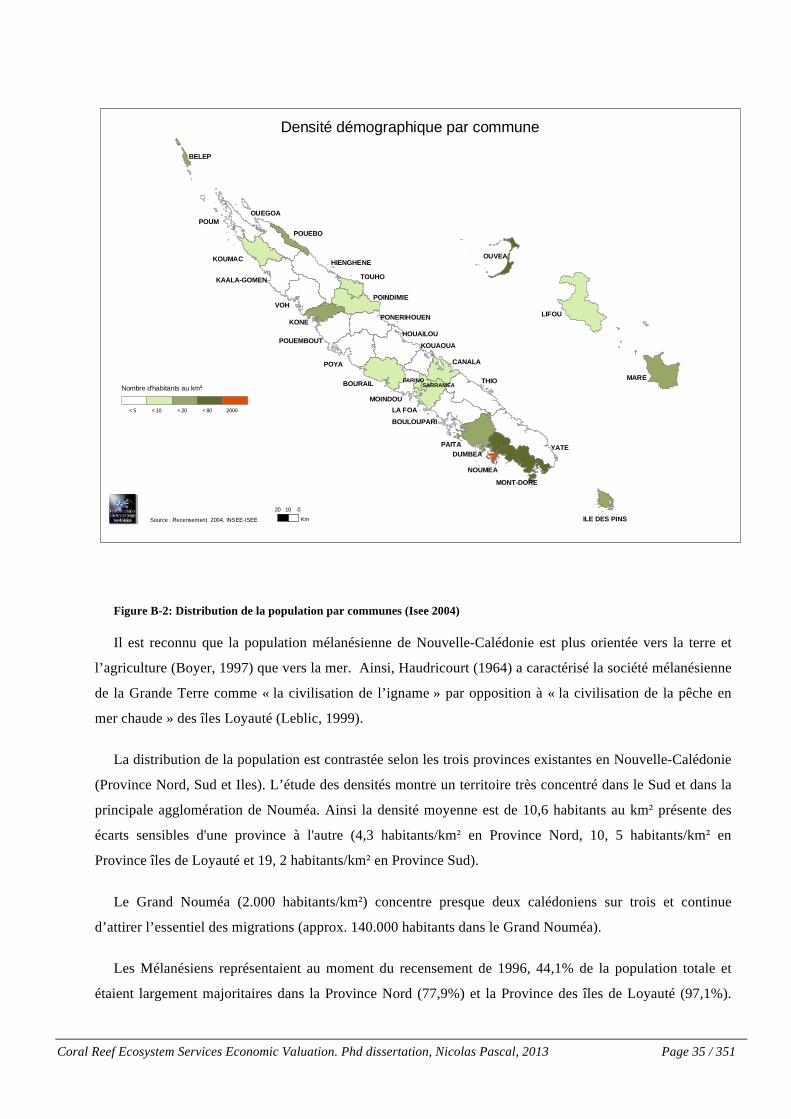
Coral Reef Ecosystem Services Economic Valuation. Phd dissertation, Nicolas Pascal, 2013 Page 35 / 351!
Figure B-2: Distribution de la population par communes (Isee 2004)
Il est reconnu que la population mélanésienne de Nouvelle-Calédonie est plus orientée vers la terre et
l’agriculture (Boyer, 1997) que vers la mer. Ainsi, Haudricourt (1964) a caractérisé la société mélanésienne
de la Grande Terre comme « la civilisation de l’igname » par opposition à « la civilisation de la pêche en
mer chaude » des îles Loyauté (Leblic, 1999).
La distribution de la population est contrastée selon les trois provinces existantes en Nouvelle-Calédonie
(Province Nord, Sud et Iles). L’étude des densités montre un territoire très concentré dans le Sud et dans la
principale agglomération de Nouméa. Ainsi la densité moyenne est de 10,6 habitants au km# présente des
écarts sensibles d'une province à l'autre (4,3 habitants/km# en Province Nord, 10, 5 habitants/km# en
Province îles de Loyauté et 19, 2 habitants/km# en Province Sud).
Le Grand Nouméa (2.000 habitants/km#) concentre presque deux calédoniens sur trois et continue
d’attirer l’essentiel des migrations (approx. 140.000 habitants dans le Grand Nouméa).
Les Mélanésiens représentaient au moment du recensement de 1996, 44,1% de la population totale et
étaient largement majoritaires dans la Province Nord (77,9%) et la Province des îles de Loyauté (97,1%).
YATE
THIO
LIFOUVOH
POYA
PAITA
MAREBOURAIL
HOUAILOU
HIENGHENE
OUEGOAPOUM
KONE
LA FOA
POINDIMIE
BOULOUPARI
KOUMAC
CANALA
POUEMBOUT
KAALA-GOMEN
PONERIHOUEN
TOUHO
KOUAOUA
MOINDOU
DUMBEA
POUEBO
OUVEA
ILE DES PINS
SARRAMEA
BELEP
FARINO
NOUMEA
MONT-DORE
20 010
Km
Nombre d'habitants au km!
< 5 < 10 < 20 < 80 2000
Densité démographique par commune
Source : Recensement 2004, INSEE-ISEE
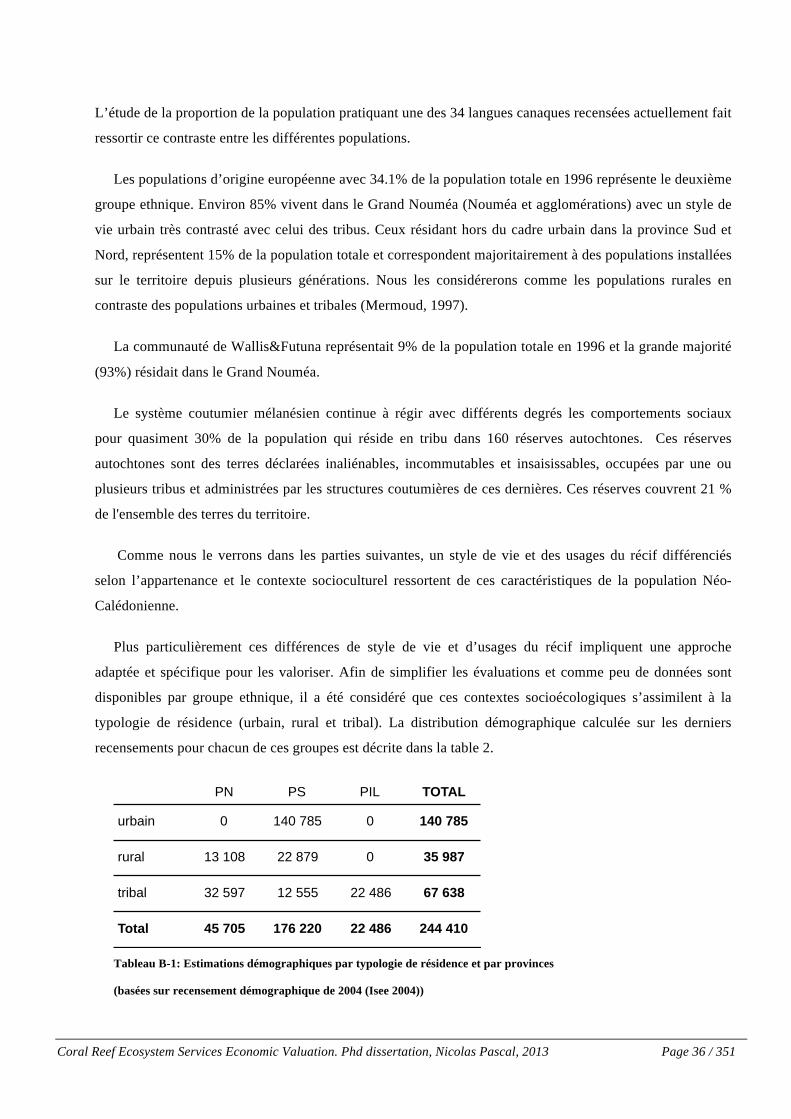
Coral Reef Ecosystem Services Economic Valuation. Phd dissertation, Nicolas Pascal, 2013 Page 36 / 351!
L’étude de la proportion de la population pratiquant une des 34 langues canaques recensées actuellement fait
ressortir ce contraste entre les différentes populations.
Les populations d’origine européenne avec 34.1% de la population totale en 1996 représente le deuxième
groupe ethnique. Environ 85% vivent dans le Grand Nouméa (Nouméa et agglomérations) avec un style de
vie urbain très contrasté avec celui des tribus. Ceux résidant hors du cadre urbain dans la province Sud et
Nord, représentent 15% de la population totale et correspondent majoritairement à des populations installées
sur le territoire depuis plusieurs générations. Nous les considérerons comme les populations rurales en
contraste des populations urbaines et tribales (Mermoud, 1997).
La communauté de Wallis&Futuna représentait 9% de la population totale en 1996 et la grande majorité
(93%) résidait dans le Grand Nouméa.
Le système coutumier mélanésien continue à régir avec différents degrés les comportements sociaux
pour quasiment 30% de la population qui réside en tribu dans 160 réserves autochtones. Ces réserves
autochtones sont des terres déclarées inaliénables, incommutables et insaisissables, occupées par une ou
plusieurs tribus et administrées par les structures coutumières de ces dernières. Ces réserves couvrent 21 %
de l'ensemble des terres du territoire.
Comme nous le verrons dans les parties suivantes, un style de vie et des usages du récif différenciés
selon l’appartenance et le contexte socioculturel ressortent de ces caractéristiques de la population Néo-
Calédonienne.
Plus particulièrement ces différences de style de vie et d’usages du récif impliquent une approche
adaptée et spécifique pour les valoriser. Afin de simplifier les évaluations et comme peu de données sont
disponibles par groupe ethnique, il a été considéré que ces contextes socioécologiques s’assimilent à la
typologie de résidence (urbain, rural et tribal). La distribution démographique calculée sur les derniers
recensements pour chacun de ces groupes est décrite dans la table 2.
Tableau B-1: Estimations démographiques par typologie de résidence et par provinces
(basées sur recensement démographique de 2004 (Isee 2004))
PN PS PIL TOTAL
urbain 0 140 785 0 140 785
rural 13 108 22 879 0 35 987
tribal 32 597 12 555 22 486 67 638
Total 45 705 176 220 22 486 244 410

Coral Reef Ecosystem Services Economic Valuation. Phd dissertation, Nicolas Pascal, 2013 Page 37 / 351!
:NTN_ ?P+/1*(+"&4+/(*(X1$&
Du statut de TOM décidé en 1946, la Nouvelle-Calédonie est passé, avec des périodes de calme et de
tensions politiques à celui de collectivité territoriale à statut particulier dotée d'une large autonomie. Il est
prévu entre 2014 et 2018, une consultation sur l'accession à la pleine souveraineté.
:NTNO` ?6+"+3($&
La croissance a été soutenue entre 1998 et 2007 (3,7% en rythme annuel moyen). Le niveau de vie en
Nouvelle-Calédonie est aujourd’hui comparable à celui de la grande majorité des régions françaises et le
PIB par habitant est proche de celui de Singapour et supérieur à celui de la Nouvelle-Zélande.
La structure économique de Nouvelle-Calédonie est particulière. Elle est une société de services (70% du
PIB en 2008 dont 30% provient des administrations publiques) mais avec un poids relatif du nickel (3eme
réserve mondiale) important (15% du PIB en 2008). La forte croissance des recettes fiscales a réduit la
dépendance des finances publiques vis-à-vis des transferts métropolitains et permis de financer
l’accroissement des dépenses publiques, sans hausse de l’endettement public (Isee, 2008c).
Le poids relatif de la pêche ainsi que celui du tourisme (environ 3% de la valeur ajoutée) est faible dans
l’économie de la Nouvelle-Calédonie.
Les inégalités spatiales et ethniques sont cependant très marquées. En 2004, le PIB par habitant dans la
province des îles Loyauté était inférieur de moitié à celui de la province Nord et ce dernier lui-même était
inférieur d’un tiers à celui de la province Sud (Isee, 2008c). Ces inégalités se retrouvent aussi à travers
l’Indicateur de Développement Humain (IDH) dont les différences entre provinces s’expliquent
essentiellement par des écarts de nature économique. (L’IDH est un indice calculé à partir de 3 indicateurs:
l’espérance de vie à la naissance, le niveau d’instruction et le PIB par habitant).
De même, le coefficient de Gini, indicateur de la distribution de l’ensemble des revenus, ressort à 0,50,
c’est-à-dire plus proche de ceux prévalant dans les pays en développement que de ceux constatés dans les
pays développés. Conséquence des inégalités de revenu, la pauvreté (relative) touche près d’un Calédonien
sur quatre (Isee, 2009a).
Ces constats peuvent être nuancés car ils ne prennent pas en compte les revenus non monétaires générés
par une économie de subsistance. Ces revenus, comme nous le verrons dans le chapitre III, peuvent

Coral Reef Ecosystem Services Economic Valuation. Phd dissertation, Nicolas Pascal, 2013 Page 38 / 351!
représenter une part substantielle des ressources des ménages calédoniens les plus pauvres sous la forme de
produits agricoles et issus de la pêche principalement (Isee, 1992).
:NTNOO 'aW6+"+3($&#$&)1.)()*-"6$&R-"-R&b&&
Bensa et Freyss (1994) ont réalisé une excellente description de l’évolution de l´économie de subsistance
kanak, et nous nous contenterons de reprendre certaines idées et les compléter avec d’autres travaux et
observations personnelles.
Selon ces auteurs, avant la transition vers l’économie de marché, chaque foyer assurait sa subsistance sur
des terres cédées au terme d'un accord de gré à gré avec ses propriétaires originels ou simplement transmises
de père en fils. Aucun travail au bénéfice d'autrui n'était rémunéré; seules prévalaient en la matière des
obligations associées aux relations interindividuelles de parenté et aux rapports politiques statutaires entre
les unités domestiques.
Les produits de l'agriculture étaient consommés par le foyer, donnés à des parents ou des alliés qui
retourneront à terme ce geste très quotidien ; ou bien encore échangés contre des produits similaires en
qualité et en quantité, à l'occasion des grandes cérémonies (naissance, mariage, deuil) qui ponctuent la vie
sociale.
Ces échanges cérémoniels frappaient par leur ampleur, leur minutie et leur inutilité économique: des
volumes relativement importants de tubercules, d'étoffes et de billets de banque changent de main, chaque
lot offert ou reçu donnant lieu à de solennels discours et à de stricts comptages sans que les partenaires
présents se retrouvent plus riches après qu'avant la transaction, ni même en possession d'un bien qui leur
aurait fait précédemment défaut.
En dehors de ces cérémonies d'échange, toujours pratiquées et dont la spécificité est clairement attestée
par les langues kanak, des transactions appelées jèna et aujourd'hui disparues permettaient aux
communautés du bord de mer d'avoir accès aux produits de l'intérieur de l'île et réciproquement. Des taux
d'équivalence entre les produits de la pêche et ceux de l'agriculture étaient fixés mais des formes de
marchandage, de paiement différé et de dettes sont aussi avérées par le vocabulaire et les observations de
quelques voyageurs. En assimilant le jèna à un « marché », les Kanak insistaient sur son caractère utilitaire
et le rapprochent du commerce européen
Dans les 25 dernières années et spécialement durant cette décennie, d'importantes transformations
économiques sont intervenues dans la société kanak de Nouvelle-Calédonie : l'argent est beaucoup plus
présent, le salariat s'est étendu, les modes de consommation ont évolué. Plusieurs études montrent que les

Coral Reef Ecosystem Services Economic Valuation. Phd dissertation, Nicolas Pascal, 2013 Page 39 / 351!
économies de subsistance sont peu résilientes au développement urbain et à l’introduction de l’économie de
marché {Cinner, 2007 #589}. L’emploi salarié a augmenté de 36% entre 1998 et 2006. Entre 1969 et 2006,
le poids de l’alimentation dans le total de la consommation des ménages a régressé sensiblement, passant de
34 à 21%, ce qui est traditionnellement observé lorsque le revenu du ménage augmente (Isee, 2009a).
Deux pôles de la société calédonienne peuvent être identifiés: celui de l'économie kanak domestique et
celui de l'économie mercantile occidentale de Nouméa. Entre ces deux extrêmes, la catégorie constituée par
la population des Kanak urbanisés occupe un niveau intermédiaire. Coexiste tant bien que mal avec
l'économie vivrière kanake d'autosubsistance une économie marchande assez particulière dont la
reproduction repose sur une aide permanente de la métropole. De plus, l'industrie minière, le commerce de
produits importés, le marché agricole local restreint et l'important secteur tertiaire sont des activités
entièrement maîtrisées par les non mélanésiens.
La société kanak n'est plus fondée que sur la seule économie domestique. Mais sa dynamique n'est pas
pour autant assimilable à celle d'une économie de marché.
Selon Bensa et Freyss (2004) cette situation intermédiaire s’explique pour 2 raisons : (i) d'une part, faute
de rentabilité suffisante, l'activité agricole et la pêche, fondements de l'économie domestique, ne peuvent
offrir une base solide à la mutation vers une économie marchande ; le processus de développement ne peut
se déployer qu'en dehors de cette société rurale et même en rupture avec elle ; (ii) d'autre part, le système
dominant n’est pas optimal pour enclencher une diversification vers différentes filières d’activités. En effet,
la dépendance du système calédonien aux transferts de la métropole (même si son poids relatif diminue)
entraine peu d'effort productif.
Le travail salarié, temporaire ou permanent, comme ouvrier ou employé, la commercialisation plus ou
moins sporadique ou difficile du poisson, du café ou des fruits et les subventions de tout ordre font entrer
dans les foyers des gains en espèces qui donnent accès aux biens de consommations européens. Cependant
ces derniers, comme la monnaie, peuvent être réinsérés en tant qu'objets précieux dans le circuit des
transactions non commerciales internes aux communautés kanak. Ainsi, systèmes marchand et non
marchand se côtoient sans être vraiment altérés l'un par l'autre.L'argent est perçu comme un moyen
d'acquérir des biens de consommation mais non comme la base d'une accumulation productive. Le fait que
l'argent puisse servir, comme capital, à faire de l'argent demeure (encore) inconnu.
L'enquête de consommation des ménages 1991 (Isee, 1992) nous apprend que les ressources non
monétaires pour les ménages des tribus atteignaient le tiers du revenu monétaire. L'importance de ce facteur
est encore plus visible dans le domaine alimentaire: 55 % des besoins étaient couverts par l'autoproduction.
Les premières estimations de l’étude des revenus non-monétaires de 2008 entreprise par l’Isee montrent une

Coral Reef Ecosystem Services Economic Valuation. Phd dissertation, Nicolas Pascal, 2013 Page 40 / 351!
diminution de l’importance de ces revenus (24% au lieu de 33% 17 ans avant) mais il s’agit de données
préliminaires non définitives.

Coral Reef Ecosystem Services Economic Valuation. Phd dissertation, Nicolas Pascal, 2013 Page 41 / 351!
:NZ BW*Q+#$&
:NZNO 8442+6Q$&0W"W2-/$&
L’évaluation économique des services écosystémiques entreprise en Nouvelle-Calédonie se base sur la
classification des services décrite dans la figure suivante.
Figure B-3: Classification des services générés par les écosystèmes coralliens.
Adapté de Beukering (2007), Pascal et al (2010), César (2003) et Moberg (1999)
R%*(B4#!6(#!#(4)$2(#!6jB#%1(!d!!
Les services d’usage comprennent les valeurs provenant des usages directs avec et sans extraction, les
valeurs d’usages indirects et les valeurs d’options et de legs. Les usages directs concernent les activités où
l’individu peut jouir directement de la ressource soit en la consommant (par exemple : pêche) soit en tirant
une satisfaction de la ressource en soi (par exemple: valeur récréative d’une zone côtière). Ils peuvent ainsi
être de type marchand si l’usage passe par un marché qui définit son prix (par exemple le poisson ou une
prestation touristique) ou non-marchand (par exemple : la pêche vivrière). Les usages indirects comprennent
les services des écosystèmes qui existent sans l’intervention de l’Homme. Par exemple, les récifs peuvent
fournir une protection physique contre la houle ou les mangroves peuvent contribuer au traitement des eaux
usées. !
Les valeurs d’options découlent de l’usage potentiel d’un service écosystémique, si le besoin devait s’en
faire sentir. Comme décrit par Bolt (Bolt et al., 2005): « le concept est très populaire dans le monde de la
finance, où l’on prend des options pour acheter le droit de vente d’un produit boursier, à un prix déterminé,
Total Economic Value Coral reef ecosystems services
Use services Non-use services
Direct service with extraction
Direct service without extraction Indirect services Other services
• Subsistence fishery • Recreational fishery • Reef commercial fishery • High-sea fishery • Aquaculture and PCC
• Underwater tourism • Nautical tourism • Pleasance tourism • Non-resident nature tourism • Resident nature tourism • Education and research
• Coastal protection • Water treatment • Ciguatera protection • Landscape formation
Option or potential uses: • Bio-prospection • MSY • Tourism expansion
Existence value (Self and altruist ) • Cognitive • Cultural
Bequest services: (Self and altruist)
Non-economic value
• Intrinsic value • Moral value

Coral Reef Ecosystem Services Economic Valuation. Phd dissertation, Nicolas Pascal, 2013 Page 42 / 351!
et à une date ultérieure préalablement fixée. La valeur des options tient au fait que l'information actuelle
n'est pas parfaite. Le temps nous dira si conserver l'actif est profitable ». Par exemple, le volume maximum
durable de captures de pêche représente un potentiel de l’écosystème qui pourra être exploité dans le futur.
C’est le cas aussi de la bio-prospection qui cherche des substances chimiques présentes dans les récifs qui
peuvent être exploitées commercialement par l’industrie pharmaceutique.
La valeur de legs ou d’héritage est celle qui permet l’utilisation des écosystèmes par les générations
futures. Les valeurs de legs peuvent devenir particulièrement importantes dans les populations locales qui
exploitent actuellement un écosystème lorsqu’elles voudraient que le mode de vie qui l’accompagne soit
transmis à leurs héritiers et aux générations futures.
R%*(B4!6(#!#(4)$2(#!6(!&+&>B#%1(!!
Les valeurs de non-usage ont été introduites par John Krutilla en 1967 (Krutilla, 1967). Elles constituent
aujourd’hui un domaine important de la recherche en matière d’économie de l’environnement. Ces valeurs
correspondent à des usages passifs qui sont la manifestation du consentement à payer des gens pour
l’existence d’une ressource, indépendamment de la possibilité pour eux de l’utiliser dans l’immédiat ou dans
l’avenir. L’interaction doit donc être non-consommatrice, indirecte et hors-site. Elles comprennent la valeur
d’altruisme non paternalistique (les générations futures connaitront l’existence d’un écosystème) et la
valeur d’existence (connaissance aujourd’hui que l’écosystème existe) (Flores, 2002; Manoka, 2003).
Il est important de reconnaitre qu’aujourd’hui il n’existe pas de consensus clair entre les économistes sur
la définition et l’évaluation économique des valeurs de non-usages (Rudd, 2009).
R%*(B4!&+&>72+&+-$PB(!+B!*(D$2+14%,<$PB(#!
D’autres valeurs comme la valeur morale ou encore la valeur intrinsèque d’un écosystème ne sont pas
considérées comme des valeurs économiques (Flores, 2002; Spash, 2000). Ces valeurs lexicographiques
ignorent les choix de compensations et sont plus de l’ordre « tout ou rien » (Spash 2000) sortant ainsi du
cadre classique des valeurs économiques reposant sur la substituabilité des biens. En effet, outre l’aspect
non-éthique de mettre un prix sur des valeurs morales ou intrinsèques, l’approche économique Hicksienne
utilisée actuellement ne considère pas ces valeurs comme économiques. Les individus n’acceptent pas
d’arbitrages entre ces valeurs ou ne sont pas indifférents aux substituts de ces valeurs. Il n’existe donc pas
de compensation ou de mesures équivalentes qui reflètent ces valeurs. Développées par des économistes
comme Hicks et Kaldor dans les années 1930s et 1940s, l’approche Hicksienne propose des critères clairs
pour la prise de décision dans pratiquement tous les cas où l’action de la politique publique entraîne des
bénéfices pour certains, et impose des coûts à d’autres (Dimand, 2007). Le « critère de compensation »
établit qu’une action est justifiée si ceux qui en profitent peuvent potentiellement apporter une compensation

Coral Reef Ecosystem Services Economic Valuation. Phd dissertation, Nicolas Pascal, 2013 Page 43 / 351!
à ceux qui en sont lésés, tout en produisant une amélioration par rapport à la situation initiale. Et c’est le cas
même si la compensation n’a pas effectivement lieu. Ces mécanismes ne peuvent s’appliquer aux valeurs
lexicographiques.
:NZNS F-/$12&W6+"+3(X1$&*+*-/$c&P-/$12&-V+1*W$&$*&P-/$12&,("-"6(Y2$b&
R%*(B4!72+&+-$PB(!.+.%*(!
La valeur économique totale se définit comme la somme des surplus consommateurs et surplus
producteurs de tous les services d’usage directs et de non-usages décrits antérieurement. Le modèle de la
Valeur économique totale est expliqué dans de nombreux ouvrages (Pagiola, 2004b; TEEB, 2010) et nous
nous contenterons de résumer les principaux concepts ainsi que de souligner ses différences avec la valeur
financière.
La valeur économique est souvent assimilée à son prix de marché. Cependant le marché nous révèle
seulement le montant minimum qu’une personne est prête à payer pour acheter le bien. Dans une
transaction, l’acheteur compare le montant qu’il serait prêt à payer avec le prix de marché et ne procède à
l’achat que si ce prix est inferieur à son consentement à payer (CAP). Beaucoup d’acheteurs sont en réalité
parfois prêts à payer pour un bien ou un service plus que son prix de marché. Cela signifie que la valeur
monétaire du bien dépasse son prix de marché. La différence entre le CAP et le prix de marché est appelée
le surplus consommateur.
Le surplus producteur est plus classiquement assimilé au bénéfice économique de l’activité productrice et
prend la forme de valeur ajoutée.
R%*(B4!%[+B.7(!+B!#B4,*B#!,4+6B2.(B4!
La valeur ajoutée (VA) permet de mesurer la valeur créée par un agent économique. Elle mesure l'écart
entre la somme des valeurs des entrants d'un processus de production (les consommations intermédiaires) et
la somme des valeurs des produits ou des services qu'il vend. Elle permet de mesurer la contribution exacte
d’une unité de production à la création de richesses.
Les agents économiques qui créent de la valeur sont les entreprises, les organisations, ou encore le
secteur public. On calcule la valeur ajoutée en utilisant deux chiffres : (i) Le chiffre d'affaires de l'entreprise
: les quantités produites et vendues multipliées par le prix de vente ; (ii) Les consommations intermédiaires :
tous les achats faits par l'entreprise pour réaliser sa production, sa consommation en biens et services
(matières premières, fournitures...). La valeur ajoutée est la différence entre le chiffre d'affaires et les
consommations intermédiaires. Dans le cas de production qui n'est pas vendue (les services non marchands

Coral Reef Ecosystem Services Economic Valuation. Phd dissertation, Nicolas Pascal, 2013 Page 44 / 351!
ou services publics), la valeur finale de la production est estimée comme égale aux salaires. La somme des
valeurs ajoutées d'un pays constitue son produit intérieur brut (PIB). Cette valeur ajoutée sert à rémunérer
les différent acteurs qui concourent au fonctionnement des agents économiques : les salariés, les apporteurs
de capitaux (versement de dividendes aux actionnaires ou d'intérêts aux créanciers), les administrations
(impôts sur les bénéfices, taxes, cotisations sociales, l'entreprise elle-même (valeur ajoutée non distribuée:
réserves, investissements).
R%*(B4!=$&%&2$X4(!
Les valeurs financières se concentrent seulement sur les valeurs qui génèrent un flux financier réel,
potentiel, évité ou de remplacement. Il s’agit donc de la valeur ajoutée des activités reliées aux services
d’usages directs et indirects et représente l’impact direct sur l’économie locale. Ces activités génèrent aussi
des impacts sur d’autres activités à travers des flux vers des entreprises tiers qui à leur tour génèrent des VA.
Ce sont les impacts indirects. De même, les salaires, dividendes, impôts et investissements générés par les
activités précédentes ont un impact sur l’économie locale. Ce sont les impacts induits. La somme des
impacts indirects et induits est définie comme l’effet multiplicateur de la valeur ajoutée calculée pour
l’activité.
:NZNT =Q+(%&3W*Q+#+/+0(X1$)&
E(4)$2(#!#7*(2.$+&&7#!
Une sélection des services d’usages a été réalisée sur des critères d’importance relative et de
disponibilités des données. Cette sélection a permis de distinguer 8 services générés par les écosystèmes
coralliens qui sont évalués dans cette étude (Voir Figure B-3). Ces services sont la pêche commerciale (ES1)
la pêche vivrière (ES2), la pêche de loisir (ES3), les autres type de pêche (ES4), le tourisme sous-marin
(ES5), le tourisme nautique (ES6), la plaisance (ES7), la recherche et éducation (ES8), la protection côtière
(ES9), la bio-prospection (ES10) et la séquestration du carbone (ES11).
J7.<+6(#!-$#(#!(&!kB)4(!
Pour l’évaluation monétaire de chacun de ces 11 services identifiés, 3 étapes d’analyse sont réalisées
(figure suivante).
La première étape correspond à l’identification des processus basiques et bénéficiaires définis par
Balmford (2008). Ces processus sont ceux impliqués de manière exclusive ou contributive dans la
production du service à évaluer.

Coral Reef Ecosystem Services Economic Valuation. Phd dissertation, Nicolas Pascal, 2013 Page 45 / 351!
Figure B-4: Etapes d’analyse pour les services écosystémiques sélectionnés
De manière plus précise, les méthodes par intrants de production qui sont utilisées sont : la méthode des
prix de marché (par exemple: prix moyen au consommateur final des espèces commerciales pêchées) ; la
Méthode des prix équivalents protéines (pour monétariser les captures de la pêche vivrière) ; la méthode des
coûts de remplacement (par exemple: remplacer les services d’assainissement des eaux des mangroves par
une station de traitement) et la méthode des dommages évités (par exemple: coûts de destruction ou
dégradation évités sur le foncier par la protection du récif contre l’érosion côtière).
Pour la majorité de ces méthodes, les résultats calculés sont les valeurs ajoutées (VA). Un multiplicateur
(quand son calcul est possible) est appliqué pour refléter les impacts indirects et induits de chacun des
services sur l’économie locale. Les résultats font l’objet d’analyse de sensibilité aux différentes estimations
effectuées. Chaque résultat présente ainsi une valeur minimum et maximum pour refléter ces incertitudes.
@%*2B*!6(#!-B*.$,*$2%.(B4#!d!!
La méthodologie pour prendre en compte les impacts des valeurs ajoutées sur l’économie d’un pays varie
suivant le degré de précision recherché. En général ces impacts indirects et induits sont calculés à travers de
modèles entrée/sorties (E/S) style IMPLAN (Pagiola 2004). Ces modèles sont lourds à développer et
n’existent pas à l’échelle de la Nouvelle-Calédonie. Une autre méthode a été choisie pour refléter ces
impacts à travers l’usage des multiplicateurs. Ces multiplicateurs s’appliquent aux calculs de VA et
permettent de prendre en compte les impacts indirects et induits. Ils proviennent de la base de données de
l’ITSEE et sont calculés à partir des comptes du territoire et des déclarations fiscales et financières des
entreprises. Les calculs se font au niveau des secteurs d’activités (voir Table 1). Il a été pris en compte les
possibilités de double comptage en corrigeant les multiplicateurs affectés. Un exemple illustrera cette
correction: le secteur pêche professionnelle a un effet multiplicateur de 1,7 selon les estimations de L’ISEE.
Ce multiplicateur inclut, par définition, des impacts indirects sur le circuit de distribution post-captures qui
!"#$%&'()*+(,$#,-$./%'0*+(,-$.,0%+/$..1.,"/+2+3'41$.,'&02'41".,50%+-1/*+(,-$,6'+&)..$7,/8/2$,6'+/9'&'41$7:;,
<1)(*=/)*+(,-$.,.$%>'/$.,50+'-.,-$.,6'+&)..$.,/)0#1%"$.7,)?%)/*>'#",-$.,.'#$.,-$,02+(3"$7,-$3%",-@)6.+%0*+(,-$,2@"($%3'$,-$,2),9+12$7:;,
A)2+%'.)*+(,"/+(+&'41$,5BC)(;,,

Coral Reef Ecosystem Services Economic Valuation. Phd dissertation, Nicolas Pascal, 2013 Page 46 / 351!
ont déjà été pris en compte dans nos calculs de VA du secteur d’activité. Le multiplicateur de la pêche
commerciale a donc été corrigé à 1,3 pour quitter le poids de la distribution. Une correction similaire s’est
appliquée sur le tourisme nautique de plaisance. La pêche vivrière n’a pas d’effets multiplicateurs mais un
facteur de pondération qui sera expliqué ensuite. Dans le même ordre d’idée, les dépenses des résidents en
activités de loisir ou en hôtellerie attribuables à l’existence des récifs nécessitent un éclaircissement. En
effet elles sont parfois considérées comme étant seulement une redistribution et non une création de la
richesse existante. Elles sont compensées par une diminution des autres dépenses dans d’autres activités. En
tant que telles, ces dépenses sont généralement exclues des modèles entrées/sorties. Il est clair, cependant,
que les dépenses des résidents maintiennent des emplois dans des industries spécifiques qui n'auraient peut
être pas de substitut autrement. Dans cette étude les dépenses sont incorporées dans la création de richesse à
l’échelle du territoire.
Tableau B-2: Multiplicateurs estimés pour la Nouvelle Calédonie. Détails par secteur d’activité
'$#.4$KB.$+&!#,%.$%*(!6(!*%!)%*(B4!=$&%&2$X4(!!
Les différents supports cartographiques représentent la distribution des valeurs ajoutées des services
entre les différentes communes de Nouvelle-Calédonie. Plusieurs choix de distribution spatiale sont
disponibles et ont été étudiés. En suivant la méthodologie proposée par Balmford et al (2008) nous avons
analysé les différentes options suivantes : (i) la distribution spatiale par habitats (le récif barrière pour
certains métiers de pêche), (ii) la distribution par fonctions écosystémiques (zones de fraies des espèces
commerciales ou emblématiques), (iii) la distribution par zone de réalisation de l’usage (lieu de pêche ou
d’immersion de plongée sous-marine), (iv) la distribution par lieu de consommation de la valeur ajoutée
(siège social de l’opérateur touristique).
Les nombreuses incertitudes existant sur les processus écosystémiques et sur le rôle précis du récif dans
la génération du service ont rendu difficile de spatialiser les résultats sur la base de critères écologiques
(habitat ou fonctions de l’écosystème, paragraphes i et ii). Ainsi seulement pour la pêche, les processus
bénéficiaires impliquent différents habitats couvrant les zones de reproduction, les zones de dispersion
Effets multiplicateurs des valeurs ajoutées
Pêche commerciale (corrigé) 1,3
Secteur de la distribution de la pêche 1,4
Pêche de loisir (idem pêche commerciale) 1,3
Pêche vivriere (facteur de pondération) 1,4
Tourisme (hotellerie-restauration) 1,6
Tourisme (activités nautique) 1,7
Secteur de l'industrie nautique de plaisance (corrigé) 1,4
Coral Reef Ecosystem Services Economic Valuation. Phd dissertation, Nicolas Pascal, 2013 Page 47 / 351!
larvaire, les espaces d’installations de juvéniles et ceux de migrations ontogéniques. Monétariser une zone
de fraie rarement identifiée et pouvant fluctuer d’une année sur l’autre est un exercice qui nous a semblé peu
robuste au vu des connaissances actuelles et à l’échelle géographique de l’étude (7.500 km# de récif).
Le choix entre les autres options s’est basé sur les données disponibles pour les services les plus
importants. La spatialisation s’est faite par zone de réalisation du service (paragraphe iii).
:NZNZ =+")+/(#-*(+")&#$)&2W)1/*-*)&
La consolidation des résultats a pour objectif de couvrir tous les services évalués dans les chapitres
précédents en sommant les différents résultats. Les valeurs minimum et maximum obtenues sont ainsi
consolidées et reflètent toutes les incertitudes et approximations faites sur les paramètres de la
monétarisation.
C44(B4#!6(!2+&#+*$6%.$+&!
Une attention spéciale doit être prêtée pour éviter les doubles comptages au moment de la consolidation
des résultats (Beukering et al., 2007a). Ces doubles comptages concernent le fait de monétariser le même
service sous différentes catégories en produisant une surévaluation des résultats. Ce double-comptage peut
provenir soit de l’utilisation simultanée de différentes méthodes (intrants de production et coûts de transport
par exemple) soit du manque de limites claires dans la définition des services. Tout au long de notre
approche cette difficulté a été prise en compte. Par exemple, la monétarisation du tourisme résident et non-
résident distingue clairement les catégories de dépenses afin d’éviter les doubles comptages avec le service
du tourisme sous-marin ou nautique. De même, la distinction entre filière de plaisance liée et non liée à la
pêche de loisir évite ce genre de répétitions. L’approche bottom-up que nous avons choisie en monétarisant
chacun des services séparément et en réalisant des segmentations fines entre usages permet alors ce type de
consolidation directe (Defra, 2008; Pagiola, 2004a). Cette erreur n’est néanmoins pas totalement éliminée
par l’introduction des multiplicateurs. En effet le degré de précision des multiplicateurs est au niveau de la
filière (filière pêche par exemple) et très rarement au niveau du secteur d’activité. Il est donc probable que
certains multiplicateurs prennent en compte les mêmes effets indirects sur certains secteurs annexes. Il est
difficile de quantifier et corriger cette erreur sans avoir un modèle entrées/sorties mais nous pensons qu’elle
influe peu sur les conclusions de l’étude.
De même, le service de protection contre la houle, un des principaux services écosystémiques est difficile
à consolider. Comme nous le verrons, ce service qui ne fait l’objet d’aucune monétarisation par un marché
ne représente pas non plus une création directe de richesse pour les populations locales. C’est une valeur de
support indirect comme l’indique sa classification comme service d’usage indirect. Nous l’avons distingué
des autres résultats car il est difficile de considérer cette valeur comme un service annuel. En effet une
détérioration totale des structures physiques (vivantes ou mortes) des récifs n’est pas un processus probable
Coral Reef Ecosystem Services Economic Valuation. Phd dissertation, Nicolas Pascal, 2013 Page 48 / 351!
à une échelle temporelle annuelle et il est ainsi difficile d’estimer sa valeur annuelle sans mettre en place des
scénarios complexes accompagnés de calculs d’actualisation financière.
R%*(B4#!,%4!B&$.7!6(!#B4=%2(!
Afin de réaliser des comparaisons avec d’autres études, les résultats ont été reportés à une unité de
surface de récif corallien ("/km#). La superficie totale du complexe récifal (7.250 km# environ) a été
corrigée des superficies lagonaires d’atolls et de terraces (Entrecasteaux, Ouvéa et Beautemps). En effet, la
superficie totale des lagons de la Grande terre (23.000 km# environ) n’est pas considérée comme complexe
récifal et incorporer les lagons des atolls et des bancs revient à apporter un biais.
Au regard des superficies importantes des lagons, le choix de les prendre en compte ou non n’est pas
neutre dans les évaluations par unité de surface. Les processus écosystémiques générés dans les lagons sont
importants pour certains des services évalués et sont incorporés dans les résultats. En particulier pour la
pêche le lagon joue le rôle de nursery (herbiers) et de zones d’échanges trophiques. Ce rôle est cependant
moindre pour le tourisme, la bio-prospection, la protection contre la houle et pour la recherche. De plus, à
notre connaissance, la contribution des lagons n’a jamais été identifiée séparément des autres écosystèmes et
sa quantification est difficile. Notre choix est donc de ne pas les inclure dans les calculs par unité de surface.
A notre connaissance, les autres travaux réalisés sur les récifs coralliens n’ont pas soulevé cette distinction.
Nous suggérons comme explication que les superficies lagonaires et récifales évaluées dans ces études
n’étaient pas aussi disproportionnées. La superficie récifale considérée est alors de 4.572 km# (Andréfouët
and Torres-Pulliza, 2004). La superficie des mangroves, 351 km#, a été ajoutée à cette superficie (Virly
2008).
@+&)(4#$+&!(&!CB4+#!
Les résultats ont été convertis en euros et en PPP (Purchasing Power Parity). Le PPP provient de la base
de données de l’OCDE et Banque mondiale et permet de comparer les pouvoirs d’achat entre différents pays
(Schreyer and Koechlin, 2002). Le PPP pour la France et l’Outre Mer est de 99. Le détail des calculs n’est
pas disponible pour différencier métropole et Outre-mer. Il a donc été considéré que le PPP donnait des
résultats similaires à la conversion avec le taux de change fixe.

Coral Reef Ecosystem Services Economic Valuation. Phd dissertation, Nicolas Pascal, 2013 Page 49 / 351!
:N[ 8442+6Q$&3W*Q+#+/+0(X1$&#W*-(//W$&
Dans la partie suivante, nous présentons en détail la méthodologie proposée pour chacun des services.
:N[NO Ad6Q$&e?@&OcScT&$*&Zf&
L’évaluation économique porte sur les activités identifiées pour la Nouvelle-Calédonie et décrite dans la
figure suivante. Les activités de pêche sont décrites de manière extensive dans différents travaux
scientifiques (Labrosse et al., 2000; Leopold, 2000; Letourneur et al., 1998; Virly, 2002), dans le schéma
directeur de la filière pêche (2004) et d’autres rapports techniques des services de la pêche des différentes
provinces. L’objectif du présent chapitre est de présenter uniquement les aspects nécessaires à leur
quantification et évaluation. Le tableau ci-après synthétise les processus biophysiques quantifiés ainsi que
les méthodes employées pour les calculs de VA pour chacune des activités de pêche identifiées.
Figure B-5: Description du secteur pêche en Nouvelle-Calédonie
Pêche et industries annexes
Pêche
récifo-lagonaire Pêche profonde Pêche hauturière
Commerciale Non-commerciale
Pêche loisir
Pêche vivrière
Professionnelle
Non-professionnelle
Aquaculture Industrie aquariophile

Coral Reef Ecosystem Services Economic Valuation. Phd dissertation, Nicolas Pascal, 2013 Page 50 / 351!
Services Méthode
d’évaluation
Quantification
du service
Chiffre
d’affaires
Consommat
ions
intermédiaires
(CI)
Multiplic
ateur
appliqué
Pêche
commerciale
côtière
(professionnelle
et non-
professionnelle)
ES1
Surplus
producteur
Business
Expenditure
Survey (BES)
avec pêcheurs
professionnels et
non-
professionnels
Volumes de
captures (kg)
d’espèces côtières.
Prix au
consommateu
r final
CI de la
pêche
commerciale et
du circuit de
distribution
Filière
Pêche et
distribution
Pêche non-
commerciale
vivrière (pêche à
pied, embarquée)
ES2
Surplus
producteur
Volumes de
consommation (kg)
d’espèces côtières
d’origine non-
monétaire.
Prix
équivalent
protéine de
remplacement
CI de
l’effort de
pêche
Facteur de
pondération
Pêche non-
commerciale de
loisir (captures)
ES3
Surplus
producteur
Volumes de
captures (kg)
d’espèces côtières
Facteur
d’élasticité de la
demande
Prix au
consommateu
r final
CI de la
pêche
commerciale et
du circuit de
distribution
Filière Pêche
et
distribution
Pêche non-
commerciale de
loisir (filière
nautique)
ES3
Surplus
producteur
BES
Fréquentation
(nombre de sorties)
Immatriculatio
n de nouvelles
embarcations
Dépenses
par sortie et
par
embarcation
Prix
moyens
d’achats des
embarcations
CI des
différentes
industries
impliquées
(fabricants
locaux,
brokers,
détaillants)
Filière
industrie
nautique

Coral Reef Ecosystem Services Economic Valuation. Phd dissertation, Nicolas Pascal, 2013 Page 51 / 351!
Services Méthode
d’évaluation
Quantification
du service
Chiffre
d’affaires
Consommat
ions
intermédiaires
(CI)
Multi
plicateur
appliqué
Industrie
aquariophile
ES4
Surplus
producteur
BES
Volume de
captures Prix FOB
CI de
l’industrie
Aquaculture
ES4
Coûts de
remplacement
des intrants
Volumes de
production phyto-
planctonique,
oxygène et
meiofaune des
eaux récifo-
lagonnaire.
Prix des
intrants
Tableau B-3: Méthodologie employée pour la monétarisation des SE d’usages extractifs

Coral Reef Ecosystem Services Economic Valuation. Phd dissertation, Nicolas Pascal, 2013 Page 52 / 351!
Q"C"#"# S8.LT)<(.6R)+0/U98J/=8+6(.?12.#.V.:@.W....
'7=$&$.$+&!!
Elle est réalisée à l’intérieur du lagon, barrière incluse. La profondeur est de 0 à 100 m et elle
touche les récifs frangeants, les mangroves, les herbiers, les lagons, les pentes des récifs barrières,
les atolls et complexe récifaux d’îles. Pour cette étude, nous distinguons la pêche commerciale, la
pêche vivrière et la pêche de loisir car leur technique d’évaluation diffère sensiblement. La pêche
commerciale correspond à toutes les captures vendues qu’elles soient déclarées (professionnelles)
ou non. Pour la pêche vivrière et la pêche de loisir les captures sont autoconsommées, données ou
échangées. L’approche générale de l’évaluation est résumée dans la figure suivante pour les
différents usages de pêche récifo-lagonaire identifié. Il s’agit de pêches multi-espèces et multi-
engins souvent informelles. La collecte des données de pêche ainsi que leur quantification s’en
retrouve complexifiée. Certaines études ont essayé de quantifier les pêcheries commerciales et
vivrières (Gillett and Lightfoot, 2001) mais sont arrivées à des résultats très hétérogènes et avec des
écarts importants dans les évaluations suivant les méthodes utilisées. En effet, plusieurs facteurs se
combinent pour augmenter l’incertitude sur les données de pêche récifo-lagonaire. Les pêcheries
sont souvent de petites tailles avec généralement une structure d’entreprise individuelle familiale
(pas de comptabilité fiable, mixte entre budget familial et entreprise,…). Il n’existe pas d’obligation
claire de déclarations et le traitement des données statistiques de pêcheries ciblant plus de 60
espèces est difficile. Une grande diversité des activités et des moyens employés rend ainsi peu
fiables les extrapolations réalisées. De même, des méthodes diverses entre les différents services
statistiques et des pêches compliquent les estimations.
Tableau B-4: Évaluation du service de la pêche récifo-lagonaire

Coral Reef Ecosystem Services Economic Valuation. Phd dissertation, Nicolas Pascal, 2013 Page 53 / 351!
Q"C"#"$ O(-)6+L*+/=..
La pêche commerciale professionnelle se caractérise par une flotte déclarée de 243 navires armés
pour la pêche récifo-lagonaire mais comprend aussi, très minoritairement (de manière officielle) des
pêcheurs à pied. La flottille est majoritairement composée de bateaux d’une longueur comprise entre
4 et 7 mètres avec une jauge inferieure à 5 tx. Cependant une grande partie de l’effort de pêche
échappe aux déclarations pour différentes raisons (réglementation, circuits informels de vente).
Nous distinguons ainsi les pêches commerciales professionnelles (ou déclarées) de celles non-
professionnelles.
Les principaux engins de pêche sont la ligne (30% des captures en valeur), les filets maillants
(senne ou filet droit, 30%), la chasse sous-marine (25%), les nasses (8%) et la collecte à pied (7%)
(Virly, 2001). Toutes les captures récifo-lagonaires sont distribuées sur le marché local sauf les
trocas (Trochus niloticus) et les bêches de mer (Holothuroidea sp.) qui sont en majeure partie
exportées. La pêche commerciale couvre une grande diversité d’espèces avec des métiers de pêche
(combinaison d’engins et d’espèces cibles) très variés. Les espèces de poissons les plus capturées
sont les Lethrinidae, Acanthuridae, Mugilidae, Scaridae et Serranidae. La pêche à pied est
majoritairement pratiquée par les femmes des tribus.
Cibles Techniques employées
Poissons récifo-lagonaire Ligne, filets, fusils, épervier
Crabes de palétuvier Nasse, main
Poulpe Pêche à pied (barre)
Langouste Plonge
Trocas (Trochus sp.) Pêche à pied, plonge
Bêche-de-mer Plonge, pied
Bénitiers (Tridacna sp.), autres bivalves Plonge
Tableau B-5: Principaux métiers de pêche récifo-lagonaire en Nouvelle-Calédonie

Coral Reef Ecosystem Services Economic Valuation. Phd dissertation, Nicolas Pascal, 2013 Page 54 / 351!
La commercialisation se réalise soit à travers la vente directe aux consommateurs soit à travers
les intermédiaires suivants : colporteurs, poissonniers du marché de Nouméa, poissonniers de
brousse, restaurants, groupements, GMS et grossistes (Marty et al., 2005). La vente directe
comprend les ventes réalisées lors des marchés et foires des communes, des ventes lors des fêtes des
tribus ou des communes, des ventes sur les bords de route et des ventes au porte à porte ou sur
commande (figure suivante).
La coquille de trocas (Trochus niloticus) est destinée à la vente et à l’exportation vers l’Asie et
l’Europe pour la fabrique de boutons nacrés. (La bête est destinée à la consommation ou à la vente
sur le marché local). Sur dix ans, les ventes de trocas à l’extérieur du territoire ont progressé de près
d’un tiers en volume, mais seulement de 11,1% en valeur. Les exportations de trocas sont divisées
entre le Viet Nam, l’Italie, Madagascar et la Chine.
Les bêches de mer (Holothuroidea sp.) sont séchées par les pêcheurs ou les colporteurs. Les ventes
d’holothuries « grises » ont presque doublé en volume et ont été multipliées par 4,5 en valeur dans
les dernières années en raison d’un prix de vente élevé. La quasi-totalité des exportations
calédoniennes d’holothuries est absorbée par deux marchés : Hong Kong (pour plus de 80%, en
volume et en valeur) et l’Australie.
Figure B-6: Organisation de la commercialisation des produits récifo-lagonaires (hors import/export).

Coral Reef Ecosystem Services Economic Valuation. Phd dissertation, Nicolas Pascal, 2013 Page 55 / 351!
Extrait de Marty et al. (2005)
Q"C"#": ET)<(.6R)+0/U98J/=8+6(.)/55(6)+89(.?12.#@.
l)%*B%.$+&!=$&%&2$X4(!!
Les estimations de la Valeur Ajoutée (VA) de la pêche récifo-lagonaire commerciale
professionnelle et non professionnelle se basent sur la méthode de calculs suivante :
VApc= CApc - !e CI e – !d CI d * m
CApc= !ie Qie * pie
Qie < MSYie
pie = !dped
CIe = !bCIb
m = m1 + m2
Avec
Qie : Quantités commercialisées corrigées par zone de pêche (i=commune) et par famille (e=poissons, crabes, langoustes, holothuries, trocas).
MSYie : Capture maximum durable par commune (i) et par famille (seulement poissons)
pe : Prix moyens au consommateur final par famille (e).
ped : Prix moyens au consommateur final par circuits de distribution (d=marché, colporteur, vente directe, GMS) et par famille (e).
CIe : Consommations intermédiaires par métier de pêche associé à une famille (e)
CIb : Consommations intermédiaires par métiers de pêche (b)
CId : Consommations intermédiaires par circuits de distribution (d)
m : multiplicateur filière pêche (m1) et circuits de distribution (m2)
'(#24$,.$+&!
!"#"$"%""$ &'()*+,+-(*+.)/0'/1234+-2//
Les données pour la pêche commerciale professionnelle récifo-lagonaire proviennent des
statistiques officielles de pêche de différentes sources : (i) services de la pêche des 3 provinces
(poissons et invertébrés) et (ii) service des douanes (export bêches de mer et trocas). La principale

Coral Reef Ecosystem Services Economic Valuation. Phd dissertation, Nicolas Pascal, 2013 Page 56 / 351!
source des données provient des cahiers de production complétés par les pêcheurs pour pouvoir
renouveler leur licence de pêche. Des vérifications sont diligentées auprès des pêcheurs (demande
factures, vérifications comptabilité). Sur une flotte de 240 navires en 2007, 50% des navires
représentant 60% approximativement de la production (comm. pers. Services de la pêche de PS et
PN) remplissent ces cahiers. La fiabilité de ces données est par contre plus difficile à estimer. La
table suivante présente les facteurs qui ont été appliqués aux volumes déclarés. Deux types de
corrections ont été effectués pour couvrir les principaux biais : (i) les données ne couvrent pas 100%
de la flotte. Le facteur nº1 est une extrapolation des volumes déclarés par une partie de la flotte sur
la totalité de la flotte (ii) les volumes déclarés ne correspondent pas aux volumes réellement
commercialisés et une correction a été estimée (facteur nº2). Ces facteurs correctifs proviennent
d’études qui ont analysé les circuits de commercialisation (Marty et al., 2005) ou réalisé des
échantillonnages directs de captures (Casabonnet, 2007; Letourneur et al., 2000; Virly, 2001).
Diverses opinions d’experts ont complété cette approche (Services des pêches de la Province Nord
et Sud).
Plus précisément, la pêche au crabe de palétuvier (Scylla serrata) ne demandant pas de licence
de pêche, les volumes déclarés représentent seulement une partie des pécheurs et des volumes
vendus. Des études in-situ sont donc nécessaires pour compléter les statistiques officielles. Les
études de Rocklin (2006) sur des communes de la PN et de Virly dans la PS (2001) montrent que les
volumes commercialisés peuvent représenter suivant les villages entre 2 à 10 fois les volumes
déclarés.
Tableau B-6: Facteurs de correction maximum appliqués aux volumes de pêche déclarés
Validation des résultats
Ces captures sont recoupées avec les données provenant de l’étude 2008 de consommation des
ménages (Isee, 2009a). Les résultats de cette étude ont été convertis en équivalent kg frais en se
basant sur les prix moyens 2008 des produits consommés. Selon cette étude, le résultat total de
Province Nord (PN)
Zone Cotière Ouest (ZCO)
Province des Iles (PIL)
Facteur 1: extrapolation 1,8 1,6 1,5
Facteur 2: correction
Poissons 2,0 1,8 1,1
Crabes 10,0 1,7
Crustacés autres 2,0 1,5
Mollusques 3,0 2,0
Facteurs appliqués sur les declarations de pêche

Coral Reef Ecosystem Services Economic Valuation. Phd dissertation, Nicolas Pascal, 2013 Page 57 / 351!
volume de produits de la mer achetés et issus de la zone récifo-lagonaire néo-calédonienne est de
approximativement 1.250 t.
Tableau B-7: Dépenses monétaires annuelles par ménage CFP, 2008.
(1 Euro=119,33 CFP, taux de change fixe). Source: ISEE (2009).
Estimation des prix
Les prix utilisés pour les calculs de chiffre d’affaires des pêcheries proviennent des statistiques
officielles de pêche et permettent une estimation de prix moyen annuel par familles (poissons,
crabes, langoustes, holothuries et trochas). Ce prix varie suivant le circuit de distribution (vente
directe au marché de Nouméa, à un colporteur, à une GMS). Les prix aux consommateurs des
poissons et invertébrés proviennent d’échantillonnages réalisés sur les marchés par la SMMPM et
actualisés lors de la présente étude par des visites sur les principaux points de distribution. L’étude
de prix couvre les produits vendus sur le territoire ainsi que les volumes exportés.
Calculs des valeurs ajoutées (VA)
La méthode proposée permet de refléter l’importance économique de cette pêche dans les
comptes économiques calédoniens. Elle ne prend pas en compte seulement les bénéfices générés par
les pêcheurs mais aussi ceux générés lors de la distribution. Le circuit de distribution du pêcheur au
consommateur final employant parfois plusieurs niveaux (colporteurs, poissonniers, GMS par
exemple), il est important de refléter ces différences de prix et de coûts dans les calculs de VA.
F Cfp (2008) % total
Poisson du lagon 6 238 15%
Bivalve 3 423 8%
Crabe 2 926 7%
Origine recifo-lagonnaire 12 588 31%
Poisson du large 8 118 20%
Crevette 8 783 22%
Conserve 5 266 13%
Surgelé 6 079 15%
Origine non recifo-lagonnaire 28 247 69%
TOTAL 40 835 100%

Coral Reef Ecosystem Services Economic Valuation. Phd dissertation, Nicolas Pascal, 2013 Page 58 / 351!
Les consommations intermédiaires (CI) des distributeurs correspondent aux coûts associés à leur
fonctionnement et frais d’exploitation (véhicules, matériel, entretien, assurance et carburant pour
le(s) véhicule(s), frais professionnels, consommables, stockage le cas échéant). Ces structures sont
le plus souvent des sociétés familiales avec des entreprises unipersonnelles (un entrepreneur, 1
véhicule) ou plus importantes (1 ou 2 salariés). La distribution de la flotte par jauge brute
(SMMPM, 2008) confirme ce constat. En effet, pratiquement 80% de la flotte est inferieure à 5 tjb.
Le circuit de commercialisation a été quantifié entre les différents principaux acteurs (pêcheurs,
poissonniers, colporteurs, consommateurs, GMS) (voir Figure B-6). Cette quantification par famille
et par provinces s’est basée sur les travaux de Marty (2005) et sur le schéma directeur de la pêche
(2007). Le tableau suivant résume les différentes estimations réalisées.
Tableau B-8: Circuits de commercialisation des produits de la mer.
Détails par provinces (PS= Province Sud, PN= Province Nord, PIL= Provinces de Iles).
Ces distributions ont été appliquées aux volumes commercialisés antérieurement calculés.
Il est estimé que 90% environ de la production commerciale de poissons est écoulée sur Nouméa
aux consommateurs finaux à travers le marché et les ventes aux GMS. Le reste représente des
ventes directes lors des marchés, fêtes et foires ou vente sur le bord des routes, au porte à porte ou
sur commande. Les circuits plus spécifiques du crabe et de la langouste sont aussi reflétés.
Les calculs des consommations intermédiaires pour les différents secteurs identifiés proviennent
(i) d’entretiens réalisés avec les acteurs, (ii) rapports des banques de développement et d’autres
PoissonZCO PN PIL
Vente ex-pecheur
Marché (Consommateur) 61%
Marché (Poissonier) 28% 49%
Colporteur 0% 43%
Direct magasin/restaurant 6% 9% 83%
GMS (Grande-Moyenne surfaces) 5% 0% 17%
Vente ex-colporteur (PN)
Marché 76%
GMS (Grande-Moyenne surfaces) 14%
Clients directs 10%
Vente ex-poissoniers
Consommateurs finaux 91%
GMS (Grande-Moyenne surfaces) 9%
Vente consommateurs finaux
GMS (Grande-Moyenne surfaces) 13%
Marché 76%
Vente directe 10%
ZCO PN total PS PN iles pins PIL PS PN
5% 25% 7% 25% 9%
5% 34% 5% 25% 18%
30% 47% 30% 40% 73% 20%
32% 19% 40% 53% 80%
27% 75% 75%
14% 2%
14% 3%
10%
26%
21%
53% 1%
LangousteCrabe Cephalopodes

Coral Reef Ecosystem Services Economic Valuation. Phd dissertation, Nicolas Pascal, 2013 Page 59 / 351!
institutions financières (Gillett and Lightfoot, 2001) (iii) études de la SMMPM, des services de la
pêche et autres agents (JDConsultant, 2005; Marty et al., 2005). Il est important de rappeler que les
estimations de coûts intermédiaires pour les pêcheries récifo-lagonaire et les différents distributeurs
sont approximatives et présentent une forte variabilité entre les différents acteurs. Le caractère
informel des activités, le manque de comptabilité, la diversité des engins utilisés expliquent ces
incertitudes qui se reflètent dans les écarts entre résultats minimum et maximum. De plus, le fait
que le système à la part (présent en Polynésie et en métropole) n’existe pas en Nouvelle-Calédonie
implique que les comptes de dépenses par campagne ne sont pas utilisés. Plusieurs typologies de
bateaux ont été identifiées sur la base de leurs caractéristiques principales (longueur, puissance
moteur, construction). Les principaux comptes de dépenses identifiés sont: le carburant, les
fournitures, la glace, les vivres, les appâts, les frais de l’armement (entretien, assurance, salaires),
les impôts et frais financiers.
Le tableau suivant résume les valeurs ajoutées utilisées dans les calculs.
Tableau B-9: Estimations des Valeurs Ajoutées par acteur de la pêche commerciale. Détails par provinces.
PS PN PIL
Pêcheur embarqué 49% 70% 73%Pêcheur à pied 90% 90% 90%Pêcheur Beche de mer 76% 81%
Colporteur
Poissonier colporteur 73%Poissonier pêcheur 71%GMS 55%Revendeur Beche de mer
68%
80%
Valeur Ajoutée (en % du Chiffre d'affaires)
Circuit de commercialisation
Pêcheurs

Coral Reef Ecosystem Services Economic Valuation. Phd dissertation, Nicolas Pascal, 2013 Page 60 / 351!
Q"C"#"A ET)<(.=/=U)/55(6)+89(.6R)+0/U98J/=8+6(W.LT)<(.,+,6+X6(.?12$@.
l)%*B%.$+&!=$&%&2$X4(!!
Les estimations de la Valeur Ajoutée (VA) de la pêche récifo-lagonaire vivrière suivent la
méthode de calcul suivante :
VApv= CApv – !b CI b * f
CApv= !ie Qie * Pre * p
Avec
Qie : Quantités vivrières consommées par zone de résidence (i=urbain, rural, tribal) et par famille
(e=poissons, invertébrés).
CIb : Consommations intermédiaires par métiers de pêche (b)
f : facteur de pondération correctif de dépendance à la ressource.
Pre : Equivalent protéine des captures par famille (e)
p = Prix de la protéine de remplacement (f Cfp/g)

Coral Reef Ecosystem Services Economic Valuation. Phd dissertation, Nicolas Pascal, 2013 Page 61 / 351!
'(#24$,.$+&!!
La pêche non-commerciale correspond aux volumes capturés mais non commercialisés dans les
espaces récifo-lagonaire. Il s’agit d’autoconsommation, de dons ou d’échanges non monétaires.
Deux types de pêches peuvent être distingués: la pêche vivrière ou de subsistance et la pêche de
loisir. Chacun a une approche d’évaluation sensiblement différente et il est nécessaire de bien
identifier les volumes et efforts de pêche propres de chacun. Il est important de rappeler le poids de
cette pêche dans les sociétés océaniennes où la pêche vivrière est estimée représenter jusqu'à 80%
de la pression totale de pêche (Labrosse et al., 2000). Certains pays mélanésiens (Vanuatu, PNG,
Salomon) ont des populations rurales très dépendantes de la ressource terrestre et marine et
fonctionnent sous un mode d’économie de subsistance (Gillett and Lightfoot, 2001).
Comme nous l’avons décrit dans le chapitre 0 la population mélanésienne de Nouvelle-
Calédonie présente des spécificités propres à son développement et est en transition entre une
économie de subsistance et une économie marchande. Les contours entre pêche de subsistance et
pêche loisir deviennent alors diffus. Mis à part les deux extrêmes entre une pêche à but alimentaire
comme source importante nutritive et une pêche 100% de loisir (quasi-non dépendantes des
captures), il existe différents niveaux intermédiaires rendant la distinction entre les 2 types de pêche
souvent difficiles. L’étude de Virly (2002) a montré un continuum entre ces 2 types de pêche plutôt
que des classes aux limites bien distinctes. Les gradients se caractérisent par les variables décrites
dans la figure ci-après.
Figure B-8: Facteurs de distinction entre pêche vivrière et pêche de loisir
(Adapté de Virly (2002))
Un effort de recherche a été effectué pour identifier et catégoriser ces groupes afin de pouvoir les
quantifier.
Plus de la moitié des pêcheurs enquêtés (n=942) lors de l´étude de Virly (2002) pêchent à 2 ou 3
personnes, majoritairement à la demi-journée (46%). Une grande majorité (70%) utilise un bateau
(dont 90% ont un bateau à moteur) du fait de la configuration du récif. Les principales embarcations
Faible source de nourriture ________________ Forte source de nourriture
Européen, Polynésien ____________________ Mélanésien
Urbain ________________ ________________ Province Ile et Nord tribal, rural
Bateau Large, moteur ____________________ Frangeant. A pied, engin de proximité

Coral Reef Ecosystem Services Economic Valuation. Phd dissertation, Nicolas Pascal, 2013 Page 62 / 351!
sont de 4 à 7 m de longueur et 80% des pêcheurs utilisent un bateau sur remorque. En effet, les
rampes d’accès à la mer sont très utilisées en Nouvelle Calédonie sur la côte Ouest évitant ainsi des
frais de port et marina aux propriétaires.
Les métiers les plus utilisés sont les lignes, les fusils et les filets. D’autres engins comme la
canne, les nasses, les éperviers, la collecte à la main et la sagaïe sont observés. Les pêcheurs sont
peu spécialisés puisque quasiment 9 pêcheurs sur 10 utilisent au moins 2 engins. Le tableau ci-après
présente une estimation des principaux engins suivant les zones de résidence. Les estimations se
sont basées sur différentes sources (Friedman et al., 2006; Guillemot et al., 2009; Leopold, 2000;
Letourneur et al., 2000; Virly, 2002) et sont approximatives.
Tableau B-10: Estimation des principaux engins de pêche utilisés
Par zone de résidence et en % des réponse (adapté de Virly (2002))
Les principales espèces ciblées sont les bec de cane (Lethrinidae sp.), les perroquets (Scaridae
sp.), les saumonées et loches (Serranidae sp.), les picots gris et rayés (Siganidae sp.), et les dawas
(Acanthuridae sp.). Bien que le bec de cane soit l’espèce unanimement la plus citée, l’importance
des autres espèces cibles varie en fonction de la communauté d’appartenance ou de la zone. En
effet, les mulets (Chanos chanos) par exemple représentent une espèce plus prisée pour les
Mélanésiens (8% de l’ensemble des espèces) que pour les autres communautés d’appartenance (5%
en moyenne) (Guillemot et al., 2009; Virly, 2002). Certaines espèces de poissons sont considérées
comme « coutumières » et sont ciblées principalement lors de pêches collectives par les clans
pêcheurs (par exemple Chanos chanos pour l’ile des Pins et Naso unicornis pour Goro) (Leblic,
1999). Des espèces semblent plus caractéristiques de certaines zones : les crabes en Province Nord,
les bénitiers en Province des Iles. (Rocklin, 2006; Virly, 2002). La chasse sous-marine est pratiquée
sur la pente interne et externe du récif barrière ainsi que sur les bancs récifaux éloignés. La pêche à
pied se pratique sur différentes zones du littoral selon les types de pêche. Les platiers sont les zones
les plus pêchées où tous les types de pêcheurs se rencontrent. Les zones de mangroves sont surtout
fréquentées par les pêcheuses aux crabes. Les femmes kanakes jouent un rôle clé dans cette activité.
Urbain Rural Tribal
Lignes 32% 40% 20%
Fusils 26% 35% 15%
Filets 11% 8% 40%
Cannes 20% 2% 10%
Eperviers 5% 3% 8%
Nasses 3% 4% 6%
Autres 3% 8% 1%

Coral Reef Ecosystem Services Economic Valuation. Phd dissertation, Nicolas Pascal, 2013 Page 63 / 351!
mB%&.$=$2%.$+&!6B!#(4)$2(!6(!*%!,n2<(!)$)4$X4(!
Les estimations des captures de la pêche non-commerciale se réalisent de manière indirecte en se
basant sur des études de consommation des ménages. Cette méthode est recommandée par plusieurs
auteurs (Gillett and Lightfoot, 2001; Labrosse et al., 2000; Leopold, 2000) .
L’approche permet de déduire les volumes capturés de produits de la mer récifo-lagonaire
provenant d’autoconsommation ou de dons. En effet, pour la pêche non-commerciale aucune
donnée de captures n’est évidemment reportée. De plus, les suivis directs de ces pêches ne
produisent des résultats fiables qu’à une petite échelle ou nécessitent des études lourdes en
ressources impossibles à mettre en œuvre à l’échelle de la Nouvelle-Calédonie. Au travers d’études
de consommation des ménages bien échantillonnée et bien conduites ces difficultés sont
surmontées. Si l’étude permet de distinguer la part de produits frais de la mer achetés et non-
achetés, cela donne une estimation indirecte des captures de la pêche non-commerciale. En effet, ces
produits non-achetés sont en grande partie des produits issus du lagon à travers la pêche vivrière et
de loisir. Certaines corrections sont nécessaires pour déduire les volumes capturés.
Les études disponibles pour la consommation des ménages sont celles du Budget Consommation
des Ménages de l’ISEE 1991 et 2008 (Isee, 1992, 2009a). Nous avons complété l’approche basée
sur la consommation des ménages en analysant les résultats d’autres études qui ont estimé à plus
petite échelle et avec d’autres méthodes les pêcheries non-commerciales. Sept études ont été prises
en compte. Il s’agit des travaux de Procfish réalisés sur 5 villages (2006), ceux de Léopold sur
Ouvéa (2000), de Labrosse et al. (2000) sur la Province Nord, de Guillemot et al. (2009) sur la zone
de Koné, de Rocklin (2006) sur la zone de Voh et Kone, de Jollit (Jollit et al., 2010) sur le Grand
Lagon sud et Jumel (2008) sur le Grand Nouméa .
Les enquêtes de budgets de consommations des ménages permettent de calculer la
consommation annuelle totale de produits de la mer et distinguent la consommation d’origine
monétaire de celle non-monétaire (autoconsommation, don ou échange de produits frais de la mer).
L’étude de 1991 a touché 1.332 ménages (2 enquêtes à 6 mois d’intervalle) Celle de 2008, 3.709
ménages avec un questionnaire auto rempli pendant 14 jours. Labrosse et al (2006) se sont basés
sur la consommation de poissons frais de la Province Nord pour estimer la production vivrière. Des
enquêtes ont été réalisées en 1997-1998 sur 646 ménages pour compléter ces données et estimer la
quantité et l’origine des poissons frais consommés lors des 3 derniers repas. Les études socio-
économiques Procfish ont été conduites en 1993, 2003 et 2005. Il s’agit d’un programme entrepris
par la CPS depuis l’année 2000 sur 17 pays du pacifique sud. 5 sites ont été échantillonnés en
Nouvelle-Calédonie et 148 ménages ont été enquêtés pour estimer plusieurs aspects de leur
consommation de produits de la mer, de leur activité de pêche et de dépendance économique à la

Coral Reef Ecosystem Services Economic Valuation. Phd dissertation, Nicolas Pascal, 2013 Page 64 / 351!
pêche. Les résultats sont basés sur un questionnaire dirigé aux pécheurs et basés sur une activité et
rendement moyen annuel. Un questionnaire aux ménages a permis d’estimer la consommation de
poissons frais et conserves des ménages (7 jours précédents). Jollit (2009) a réalisé 530 enquêtes sur
les points de débarquements avec les pécheurs non-professionnels de la zone urbaine et périurbaine
du Grand Lagon Sud. Un travail d’harmonisation a été réalisé pour rendre les résultats comparables
entre eux pour l’année 2008 (Tableau suivant)
Tableau B-11: Présentation des estimations utilisées pour la pêche vivrière (kg/capita/an)
Les différentes sources utilisées ont été harmonisées pour l’estimation de la pêche non-commerciale par provinces et style de vie (PN= Province Nord, Ps= Province Sud, PIL= Province des Iles).
Les estimations de consommation ont été réalisées sur la segmentation des ménages entre style
de vie urbain, périurbain, rural et tribal. Cette segmentation permet alors de refléter des différences
marquées de consommation et d’usages entre les différents groupes comme décrit précédemment.
Les études d’estimation d’efforts de pêche et de captures très focalisées géographiquement
permettent de corriger les estimations provenant des études plus générales et à l’échelle du territoire
de consommation des ménages.
bcm 91 bcm 2008 Labrosse, 2006 Jollit, 2009 Guillemot, 2009 Leopold, 2002 Rocklin, 2006
conso. non monetaire pduits mer locaux (incl. aquaculture)
conso. non monetaire pduits mer (sans
aquaculture)
Captures vivriere poissons lagon
Captures vivriere invertebres
Consommation poissons lagon
Captures vivriere poissons lagon
Captures vivriere poissons lagon
Consommation poisson lagon Consommation crabes
PNrural 9,3 21,6 28 15,9
tribal 31,2 41,3 14 8,7 28 25,0 11
PS
rural 9,3 21,6 28
tribal 31,2 41,3 18,5 23,4
urbain 5,3 14,1 7,7
PIL 0,0
tribal 31,2 41,3 16 10,2 44
Procfish, 2008

Coral Reef Ecosystem Services Economic Valuation. Phd dissertation, Nicolas Pascal, 2013 Page 65 / 351!
C)%*B%.$+&!=$&%&2$X4(!6(!*%!,n2<(!)$)4$X4(!
La méthode choisie a été de calculer l’équivalent protéine des captures des pêches vivrière pour les
espèces de poissons et invertébrés les plus représentatives. La base de données développée par
Ramseyer (2000) a été utilisée pour convertir ces kg de captures en poids protéine.
La distribution des captures des principales espèces ciblées par la pêche vivrière est estimée à
partir des travaux décrits précédemment et résumée dans le tableau ci-après. Les résultats précédents
permettent de définir plus précisément l’équivalent protéine des captures vivrières.
Tableau B-12: Principales familles de poissons ciblées par la pêche vivrière
L’équivalent protéine est alors converti en poids d’une denrée alimentaire de base accessible,
très répandue sur le territoire et dont le prix est connu. La sardine en conserve (huile) a été choisie.
Le prix 2008 provient de la base de données ISEE et donne un résultat de 300 FCFP pour 100 g de
protéine (équivalent à 2,5" pour 100g de protéine). Le prix moyen 2008 du kg est de 833 FCFP pour
un contenu de protéine de 227 g/kg.
Le manque de précision sur la population totale de pêcheurs informels ainsi que sur les engins
utilisés rendent l’estimation difficile des VA de la pêche vivrière. En se basant sur la littérature
existante (Gillett and Lightfoot, 2001; Kronen, 2003; Kronen, 2007) et sur les entretiens réalisés
avec un échantillon de pêcheurs, nous estimons les coûts associés à ces activités de pêche. Les
caractéristiques utilisées sont : (i) les principaux engins utilisés pour les poissons sont la ligne à
main, le fusil et filet. Pour la pêche à pied (crabe) ce sont les nasses; (ii) 60% des pêcheurs utilisent
un bateau à moteur (propre ou prêté) ; (iii) 10% des pêcheurs utilisent un bateau non motorisé
(propre ou prêté). La réalité sous-jacente derrière ces chiffres est cependant assez complexe.
Comme précédemment expliqué il s’agit de pêcheries informelles, avec des engins peu couteux qui
ont une durée de vie de plusieurs années, des embarcations qui sont propres ou appartiennent à un
membre de la famille et avec des efforts et des rendements de pêche très variables. Des arbitrages
% captures (kg)
Lethrinidae 25%
Acanthuridae 15%
Mugilidae 15%
Scaridae 10%
Serranidae 10%
Siganidae 10%
Autres 15%

Coral Reef Ecosystem Services Economic Valuation. Phd dissertation, Nicolas Pascal, 2013 Page 66 / 351!
ont été réalisés afin de quantifier ces coûts. L’analyse des résultats généraux montre qu’ils sont peu
sensibles à ces incertitudes. A titre d’illustration, la pêche vivrière inclut la collecte à la main de
coquillages, la pêche au poulpe sur platier avec barre à mine, les pêches du bord lors des grandes
marées, la pêche en pirogue ou embarquée motorisée, la pêche au filet, à l’épervier, à la ligne de
jour ou de nuit avec torche, avec fusil, … une trentaine de différents métiers sont ainsi répertoriés.
Afin de clarifier l’approche de évaluation, 3 catégories ont été définies : la pêche à pied, la pêche
non-motorisée et la pêche motorisée.
Les niveaux de VA appliqués à ces catégories est résumé dans le tableau suivant :
Tableau B-13: Valeur ajoutée par typologie de pêche vivrière (sans le coût du temps humain).
Facteur de pondération :
Un des problèmes classiques de l’approche économique est qu’elle considère substituables les
satisfactions retirées des activités de pêche vivrière. Les satisfactions peuvent s’exprimer en termes
de valeurs ajoutées ou de protéines. Ceci pose problème pour la pêche vivrière car nous ne reflétons
pas plusieurs aspects de la pêche vivrière : (i) il s’agit d’une activité difficilement substituable
(faible investissement initial, peu de formation nécessaire) (Mermoud, 1997); (ii) elle constitue une
source de revenus et d’aliments pour les femmes qui restent en tribu. Le degré de dépendance à cette
source de revenus dépend suivant les ménages ; (iii) le maintien de la présence des femmes en tribu
est un facteur de cohésion sociale (Tennant, 1998) ; (iv) la pêche représente une source alimentaire
stable face à des incertitudes futures (Bensa and Freyss, 1994); (v) les pêches collectives à caractère
coutumier et les captures de pêche qui y sont associées sont des évènements importants pour
certaines tribus (Boyer, 1997).
Un calcul basé sur les ressources monétaires des ménages en milieu tribal (ISEE, 2008) et sur les
résultats précédents montre que les captures peuvent représenter entre 5 et 11% du revenu monétaire
total des ménages. Cela est conforme à la loi d’Engel qui stipule que la part du revenu allouée aux
dépenses alimentaires est d’autant plus faible que le revenu est élevé.
Nous avons montré que les invertébrés collectés par les femmes représentent une part
importante des captures totales et sont un apport l’alimentaire plus ou moins forts pour les familles
des tribus. Comme décrit par Tennat, 1998, cet apport alimentaire (parfois monétaire) des femmes
kanakes peut leur éviter de devoir sortir du foyer pour générer un revenu sous forme de salaires. Ce
maintien de la femme au sein de la cellule familiale est clé car les femmes sont les principales
VA (% du CA)
Pêche à pied 95%
Pêche embarquée non motorisée 89%
Pêche embarquée motorisée 71%

Coral Reef Ecosystem Services Economic Valuation. Phd dissertation, Nicolas Pascal, 2013 Page 67 / 351!
responsables de transmettre aux enfants les traditions, la culture, le langage et le respect pour les
anciens (Bensa and Freyss, 1994; Tennant, 1998). C’est donc un facteur de cohésion sociale.
Il est proposé de majorer l’importance de la pêche vivrière en appliquant une pondération de 1,3
sur les résultats. Cette pondération, arbitraire est similaire aux effets multiplicateurs de la pêche
commerciale (1,3).
Q"C"#"C ET)<(.=/=U)/55(6)+89(.6R)+0/U98J/=8+6(W.ET)<(.B(.9/+-+6.?12:@.
l)%*B%.$+&!=$&%&2$X4(!!
Les estimations de la valeur ajoutée (VA) de la pêche récifo-lagonaire de loisir se basent sur la
somme : (i) de la VA des captures (calculées de manière similaire à la pêche commerciale) avec (ii)
la VA de la filière nautisme de plaisance (achat et dépenses annuelles des embarcations).
Les estimations de la Valeur Ajoutée (VA) de la pêche récifo-lagonaire de loisir suivent la
méthode de calcul suivante :
VApl= (CApl – !b CI b * m) + (!a VAa * m3)
CApl= !ie Qie * T * pie
CIe = !bCIb
VAa = !dVAda
VAda = CAda – Cida
Avec
Qie : Quantités capturées par zone de résidence (i=urbain, rural ou tribal) et par famille
(e=poissons ou invertébrés).
T : Facteur d’élasticité de remplacement des captures par des achats

Coral Reef Ecosystem Services Economic Valuation. Phd dissertation, Nicolas Pascal, 2013 Page 68 / 351!
CIb : Consommations intermédiaires par métiers de pêche (b)
m : multiplicateur filière pêche (m1) et circuits de distribution (m2)
m3 : multiplicateur filière nautisme de plaisance
Pie : Prix moyens issus des calculs de la pêche commerciale
VA da : Valeur ajoutée de la filière nautisme de plaisance par typologie d’embarcations (a) et par
catégories de dépenses (d=achat embarcation ou dépenses annuelles)
mB%&.$=$2%.$+&!6B!#(4)$2(!6(!*%!,n2<(!6(!*+$#$4!
L’évaluation de la pêche de loisir se base sur 2 aspects: la valeur ajoutée des captures de pêches
et la valeur ajoutée générée par la filière du nautisme de plaisance reliée à la pêche de loisir. En
effet, l’estimation de la pêche de loisir implique l’évaluation de la notion de loisir additionnelle à
celle des captures. La pêche de loisir se différencie des autres pêches commerciales ou vivrières
dans la mesure où la satisfaction du pêcheur ne se base pas uniquement sur un volume de captures
ou sur un bénéfice financier mais sur un bien-être généré par une activité de loisir. Uncles (1997) le
démontre de manière pertinente en présentant des résultats dans l’état de Victoria (Australie) où le
coût de revient moyen de poisson pêché avoisine les 120 US$.kg-1 (Uncles, 1997) contre un prix
d’achat de 5 US$.kg-1 en moyenne.
L’absence d’équivalent monétaire sur le marché pour ce service rend son estimation directe
impossible. Une estimation de la valeur attachée au plaisir de pêcher peut se déterminer à travers
des techniques de préférences révélées qui demande au pêcheur un consentement à payer pour
certains attributs de son activité (équivalent au surplus consommateur). Sans passer par ces
techniques plus demandeuses en moyens humains et financiers (enquêtes aux usagers), une méthode
par l’estimation des dépenses sur les travaux existants et sur la base d’entretiens professionnels
permet d’avoir une estimation du surplus producteur de cette filière.
l)%*B%.$+&!-+&7.%$4(!6(#!2%,.B4(#!!!
L’estimation des volumes de captures de pêche récréative récifo-lagonaire se base sur plusieurs
études réalisées avec les pêcheurs récréatifs : Jollit (2009), Virly (1999 et 2002), Jumel (2008) et
You (2004). Une description plus précise du profil de cette pêche a été réalisée dans la partie pêche
vivrière. En résumé, la pêche de loisir en Nouvelle-Calédonie est en majorité une pêche embarquée,
concentrée sur les milieux urbains et périurbains. Elle dispose de moyens importants en termes de
flotte et d’engins. Plus de 6.000 embarcations sont recensées comme actives entre le Grand lagon
Sud et la zone Voh Kone Prony de la Province Nord (Jollit et al., 2010) sur un recensement total de

Coral Reef Ecosystem Services Economic Valuation. Phd dissertation, Nicolas Pascal, 2013 Page 69 / 351!
21.200 navires de plaisance immatriculés dans les 20 dernières années (SMMPM, 2008). La plupart
des pêcheurs pratiquent une à deux techniques de pêche et les principaux engins utilisés sont la
pêche à la traine (et palangrotte) et la chasse sous-marine. Les lieux de pêche et les techniques
utilisées montrent que les pêcheurs récréatifs ciblent les ressources récifo-lagonaire en priorité
(pente externe du récif barrière et lagon).
Les captures de la pêche récifo-lagonaire de loisir sont monétarisées avec les même prix au
consommateur final que pour la pêche commerciale. Ce choix implique cependant que la totalité des
captures de loisir soit substituée par des achats de poissons similaires sur les différents points de
vente du territoire. Bien entendu, il n’est pas possible de considérer une substituabilité totale des
captures de la pêche de loisir vers la pêche commerciale. Un facteur d’élasticité de la demande de
70% est estimé pour les pêcheurs du grand Nouméa qui dispose d’un marché régulier de poissons du
lagon. Ceci signifie que 30% des captures de la pêche récréative disparaitraient si ces pécheurs
devaient acheter leurs captures. Ce facteur est estimé à partir de réunions avec différents experts
rencontrés ainsi qu’avec des entretiens réalisés auprès des pêcheurs récréatifs. Les VA appliquées
sont les mêmes que celles de la pêche commerciale.
l)%*B%.$+&!=$&%&2$X4(!6(!*%!=$*$X4(!&%B.$PB(!6(!,*%$#%&2(!4(*$7(!G!*%!,n2<(!6(!*+$#$4!
L’industrie nautique de plaisance est à l’origine d’un « ensemble d’activités cohérentes articulées
au sein d’un système productif » qui répond au principe de la notion de filière, définie par les
économistes. La filière peut se diviser entre (i) le secteur d’activité de l’achat de l’embarcation et du
moteur et (ii) celui des dépenses liées aux embarcations.
Les calculs du secteur d’activité achat embarcation/moteur se basent sur la détermination d’un
prix moyen d’achat par type de navires (tonnage et puissance). Ceux de la filière dépenses liées aux
embarcations reposent sur les dépenses annuelles fixes et les dépenses par sorties. La Valeur ajoutée
des deux filières est ensuite calculée.
!"#"$"#""$ 52-*2'3/06(-*+4+*7/02/86(-9(*/062:;(3-(*+.)//
Une segmentation sur les embarcations par jauge brute a été faite afin de pallier la forte disparité
de la flottille et des usagers. Le recensement de la flottille de plaisance avec activité de pêche
identifie plus de 6000 bateaux actifs (au moins 1 sortie par an) (Jollit et al., 2010). Les sorties de
charter de pêche ont été calculées dans les usages touristiques (la majorité se focalisant sur la pêche
hauturière avec du catch and release).

Coral Reef Ecosystem Services Economic Valuation. Phd dissertation, Nicolas Pascal, 2013 Page 70 / 351!
D’un côté, les calculs se sont basés sur les données d’activité des études de Jollit (2010), Virly
(2002), SMMPM (2009) et du service des douanes pour l´estimation du nombre de bateaux actifs en
2008, les importations et nombre de sorties annuelles. D’un autre côté, les études de la filière de
Nguyen-Khoa (1993), de You (2004) et l’étude IFREMER-pêche de loisir (IFREMER, 2009) ont
permis de renseigner les calculs de valeurs ajoutées.
L’étude lancée en 2007 par le Ministère de l’agriculture et de la pêche relative à la pêche de
loisir (récréative et sportive) en mer en Métropole et dans les DOM a été adaptée au contexte
Calédonien sur la base du Purchasing Power Parity (PPP) (Heston et al., 2009) et sur la base des
prix des frais portuaires, marinas, des assurances.
L’estimation de l’activité économique des achats d’embarcations se base sur le nombre de
nouvelles immatriculations d’embarcations pour l’année 2008 (source SMMPM) estimées pour
l’usage de la pêche. Les activités liées à l’importation et à la distribution des embarcations sont
prises en compte. Un total de 730 nouvelles immatriculations est recensé en 2008. Ce chiffre reste
assez similaire aux autres années et est donc représentatif pour l’estimation même si nous savons
que cette industrie est souvent soumise aux cycles du marché.
La proportion de cette nouvelle flotte qui se dédie à l’activité pêche a été estimée à 70% pour les
embarcations de jauge inferieure à 2 tjb et 40% pour celles supérieurs à 2 tjb (au total 616 nouvelles
embarcations sélectionnées). Ces estimations sont basées sur l’étude de Jumel (2008) montrant un
usage de pêche (n= 516 enquêtes) d’au moins 50% de la flotte. Cette estimation tient compte de la
faible proportion des voiliers dans la flottille totale (<5%) (Exclus des activités de pêche même si la
pêche à la traine est possible) et des caractéristiques générales de la flotte de pêche (longueur
moyenne entre 4 et 5 m).
La quasi-totalité de ces nouvelles immatriculations correspond à des importations car l’industrie
nautique calédonienne est peu développée (SMMPM, 2007). Les calculs de CA et de VA se sont
basés sur les statistiques de la SMMPM et les calculs de l’ISEE. Ces données ont été comparées aux
chiffres officiels du service des douanes sur les importations d’embarcations de moins de 20 Tjb,
moteurs et équipement de pêche (voir tableau suivant). A des fins de comparaison avec les valeurs
précédentes, il faut rajouter à ces valeurs d’importations les coûts et bénéfices locaux réalisés par les
importateurs et distributeurs. Ces coûts et bénéfices doivent être équivalents à la VA estimée avec
les autres coûts non inclus dans le calcul de la VA (ressources humaines et frais financiers).
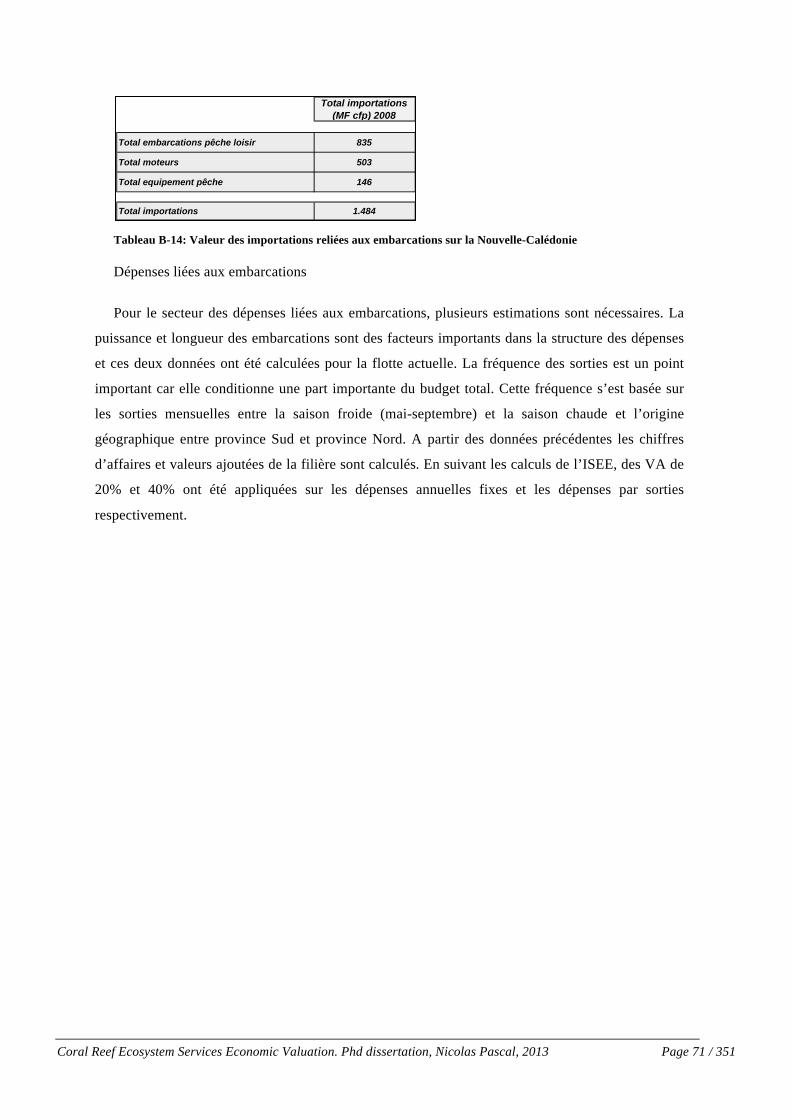
Coral Reef Ecosystem Services Economic Valuation. Phd dissertation, Nicolas Pascal, 2013 Page 71 / 351!
Tableau B-14: Valeur des importations reliées aux embarcations sur la Nouvelle-Calédonie
Dépenses liées aux embarcations
Pour le secteur des dépenses liées aux embarcations, plusieurs estimations sont nécessaires. La
puissance et longueur des embarcations sont des facteurs importants dans la structure des dépenses
et ces deux données ont été calculées pour la flotte actuelle. La fréquence des sorties est un point
important car elle conditionne une part importante du budget total. Cette fréquence s’est basée sur
les sorties mensuelles entre la saison froide (mai-septembre) et la saison chaude et l’origine
géographique entre province Sud et province Nord. A partir des données précédentes les chiffres
d’affaires et valeurs ajoutées de la filière sont calculés. En suivant les calculs de l’ISEE, des VA de
20% et 40% ont été appliquées sur les dépenses annuelles fixes et les dépenses par sorties
respectivement.
Total importations (MF cfp) 2008
Total embarcations pêche loisir 835
Total moteurs 503
Total equipement pêche 146
Total importations 1.484

Coral Reef Ecosystem Services Economic Valuation. Phd dissertation, Nicolas Pascal, 2013 Page 72 / 351!
Q"C"#"F ET)<(.<8>*>6+X6(.(*.L6/0/=B(.?12A@.
l)%*B%.$+&!=$&%&2$X4(!
Les estimations et de la valeur ajoutée (VA) de la pêche hauturière se basent sur la méthode de
calcul suivante :
VAh= CAh –CI h * m
CAh= !e Qe * fe * pe
Avec
Qe : Captures de poissons pélagiques par espèces (e)
fe : facteur de contribution écosystémique des récifs coralliens par espèces (e)
pe : prix moyen aux consommateurs par espèces (e)
CAh : Chiffre d’affaire pêche pélagique et profonde
Vah : Valeur ajoutée pêche pélagique et profonde
'(#24$,.$+&!
Pêche profonde
Cette pêche artisanale est réalisée à l’extérieur du lagon dans les profondeurs comprises entre
100 et 500 m. Elle se pratique à partir de navires polyvalents de 9 à 12 m, d’une jauge brute
moyenne de 20 tjb. Elle englobe : (i) la pêche profonde sur les pentes récifales externes au moyen
d’engins divers comme la palangre de fond, le moulinet et le casier, (ii) la petite pêche pélagique
dans les eaux territoriales (pêche à la canne avec leurre en nacre, pêche à la traîne notamment autour
des Dispositifs de Concentration de Poissons). Les sorties sont en moyenne limitées à la semaine. Il
n’existe à l’heure actuelle aucune pêche profonde industrielle.
Pêche hauturière
Elle correspond à la pêche palangrière des thonidés et espèces associées à partir de palangriers
opérant essentiellement à l’intérieur de la zone économique (Virly, 1996). On recense 27 bateaux
thoniers palangriers opérant sur la Nouvelle-Calédonie. Il s’agit donc d’une flotte assez réduite.

Coral Reef Ecosystem Services Economic Valuation. Phd dissertation, Nicolas Pascal, 2013 Page 73 / 351!
(SMMPM, 2009). Il s’agit de navires qui réalisent des campagnes de 10 jours en moyenne dont la
durée est contrainte par la taille des navires (moins de 24 mètres pour la plupart).
Ces 2 types de pêche permettent la capture de poissons commercialisés en grande partie en frais sur
le marché local (70% des captures).
mB%&.$=$2%.$+&!(.!7)%*B%.$+&!6B!#(4)$2(!6(!*%!,n2<(!<%B.B4$X4(!
Les données de captures et les données financières de cette pêche sont estimées à partir des
cahiers de pêche fournis par les armateurs. (SMMPM, 2007). En contrepartie des licences de pêche
accordées pour leurs navires, les armateurs fournissent régulièrement pour chaque campagne une
fiche de pêche standardisée. En 2008 les volumes de pêche hauturière sont de 2.384 t dont 705 t sont
exportées. Le chiffre d’affaire est de 258 Millions de Fcfp (2,4 M" approximativement). Les
données disponibles proviennent de l’observatoire de la pêche hauturière et de la SMMPM (pêche
palangrière) (SMMPM, 2007). Suivant des entretiens avec les experts, la fiabilité des données est
reconnue comme convenable et permet donc leur utilisation sans facteur correctif. La valeur ajoutée
de la pêche correspond à celle de la flotte de pêche et à celle du réseau de distribution. Le
multiplicateur de la pêche commerciale a été appliqué. Actuellement la flotte de pêche hauturière ne
présente pas des résultats d’exploitation très attractifs du fait du poids relatif important de la main
d’œuvre pour des volumes de captures limités (communication personnelle SMMPM).
Nous avons choisi d’estimer la contribution du récif à cette pêche pélagique à travers les
contenus des estomacs des espèces hauturières. Ceci nous permet d’estimer les échanges trophiques
entre récif et haute mer sans distinguer s’il s’agit de migration des espèces à l’intérieur du lagon ou
une exportation de biomasse vers l’extérieur. Aucune donnée n’étant disponible pour la pêche
profonde, son étude a été laissée de côté.
Les données utilisées proviennent du Secrétariat General de la Communauté du Pacifique et du
programme Oceanic Fisheries Programme / Ecosystem Monitoring and Analysis. Basé sur plus de
700 échantillons sur 4 ans, ce programme dispose des contenus stomacaux des principales espèces
pélagiques (Allain et al., 2012) .

Coral Reef Ecosystem Services Economic Valuation. Phd dissertation, Nicolas Pascal, 2013 Page 74 / 351!
Q"C"#"H !P>8)>9*>6(.(*.8P>86+/L<+9+(.?12A@.
'(#24$,.$+&!
La principale espèce développée est la crevette Penaeus stylirostris (2036 t en 2008). Plusieurs
autres types d’élevage existent comme les huitres (80 t), les écrevisses (10 t) et les bénitiers. Nous
nous sommes intéressés principalement à la filière crevette qui représente plus de 95% du total de la
production. La filière aquaculture constitue, depuis 1995, la seconde activité exportatrice de
Nouvelle-Calédonie (1.295 t exportées en 2008 pour une valeur de 12,6 Millions de Euros) derrière
le nickel (800 Millions d’Euros) (ISEE, 2008). La surface totale de production des 18 fermes
aquacoles en 2008 s’établit à 699 ha. La topographie requise pour permettre l’implantation de
fermes est de larges zones planes d’arrière-mangrove qui existent essentiellement sur le littoral des
plaines côtières ouest. La filière comprend des provendiers, des écloseries pour la production de
post-larves, des fermes de grossissement et deux ateliers de conditionnement.
mB%&.$=$2%.$+&!#(4)$2(!6j%PB%2B*.B4(!
La méthode d’évaluation s’est basée sur une approche par les coûts de remplacement du service
écosystémique d’enrichissement des eaux. Dans un premier temps, il a été recherché de quantifier la
contribution des récifs sous la forme des apports identifiés (phytoplancton, oxygène, macroalgae).
Un consensus semble exister autour des apports du lagon sur la qualité gustative des crevettes
calédoniennes. Cependant aucune étude n’a été menée pour isoler cet effet et aucun référent
scientifique n’a été rencontré dans la littérature publiée. Cela impliquerait aussi identifier l’effet
différentiel de la qualité sur les prix commerciaux ou sur les quantités vendues. Ces estimations
sortent du cadre de cette étude.
Des entretiens avec différents dirigeants et des réunions d’experts ont servi pour estimer les
différents paramètres. L’aliment, qui représente près de 40% des charges d’un élevage, est
déterminant dans la vitesse de croissance des animaux, leurs poids moyens et donc le prix auquel ils
sont vendus à l’atelier de conditionnement. L’évaluation se base sur des données officielles des
industries (GFA , DAVAR). L’industrie repose sur 4 espèces principales et les données de CA et de
VA ont été estimées sur la base de ces statistiques.
C)%*B%.$+&!=$&%&2$X4(!
La méthode repose sur l’évaluation du coût de remplacement des apports des eaux du lagon en
nitrogène et phosphate comme source alimentaire.

Coral Reef Ecosystem Services Economic Valuation. Phd dissertation, Nicolas Pascal, 2013 Page 75 / 351!
CRaq= !e Cae * fe
Avec
CRaq : Coûts de remplacement du service aquaculture
fe : facteur d’augmentation en aliments ajoutés par type d’exploitation (e)
Cae: Coûts en aliments moyens par type d’exploitation (e)

Coral Reef Ecosystem Services Economic Valuation. Phd dissertation, Nicolas Pascal, 2013 Page 76 / 351!
Q"C"#"Y !-L()*-.-/)+8>Z.B(.98.LT)<(.
Les emplois directs créés par la pêche commerciale ainsi que le nombre de ménages impliqués
dans des activités de pêche sont présentés. Les résultats sont basés sur les différentes études citées
précédemment. Il faut signaler l’hétérogénéité des données pour la pêche vivrière notamment où des
différences importantes peuvent exister entre des tribus (même voisines) ou entre des communes
rurales. Certaines caractéristiques additionnelles ont été prises en compte comme la présence du
village en bord de mer et la taille moyenne des ménages suivant les lieux de résidence. Les valeurs
minimum et maximum reflètent les incertitudes dans les estimations.
Les emplois directs de la pêche commerciale concernent ceux crées par l’activité ainsi que ceux
générés par le circuit de commercialisation. Les données d’emplois crées par les impacts indirects
ne sont pas disponibles. Les données reflètent donc une sous-estimation des emplois créés par
l’activité de pêche. En dehors des chiffres il faut rappeler les points suivants :
(i) la pratique de la pêche à pied est pratiquée majoritairement par les femmes des tribus. Cette
pratique représente un complément de revenu qui est difficilement substituable par d’autres
activités. Comme nous l’avons décrit précédemment, ce complément de revenu peut contribuer à
maintenir la présence des femmes dans les tribus renforçant la cohésion sociale de la communauté
car les femmes sont les principales responsables de transmettre aux enfants les traditions, la culture,
le langage et le respect pour les anciens (Bensa and Freyss, 1994; Tennant, 1998).
(ii) les invertébrés collectés par les femmes peuvent représenter un apport alimentaire plus ou
moins importants pour les familles des tribus.
(iii) un calcul basé sur les ressources monétaires des ménages en milieu tribal (bcm 2008, isee) et
sur les résultats précédents montre que les captures peuvent représenter entre 5 et 11% du revenu
total des ménages.
(iv) les captures et la pratique de certaines pêches sont importantes aussi pour des célébrations
culturelles traditionnelles.
Q"C"#"[ O+-*6+&>*+/=.-L8*+89(.
Pour la pêche commerciale, la distribution spatiale s’est basée sur les statistiques officielles des
services de la pêche à l’échelle des communes d’appartenance des pêcheurs. Il a été estimé que les
données pouvaient s'assimiler aux zones de captures de pêche. En effet, la majorité des pêcheurs
réalisent leur pêche dans un périmètre proche de leur commune soit parce que les zones proches

Coral Reef Ecosystem Services Economic Valuation. Phd dissertation, Nicolas Pascal, 2013 Page 77 / 351!
sont suffisamment productives, soit parce que la capacité des embarcations n’est pas suffisante. Des
corrections sont faites pour ceux réalisant des pêches plus éloignées (Belep, Grand Lagon Sud).
La pêche vivrière s’est basée sur les recensements de population distinguant les populations
urbaines, rurales et tribales. En s’appuyant sur nos estimations de proportions de pêcheurs vivriers
les valeurs par habitants sont projetées. Seules les tribus de bord de mer sont prises en compte. Les
résultats ont été trouvés cohérents avec les études existantes sur des sites précis (Guillemot et al.,
2009; Rocklin, 2006)
La spatialisation de la pêche de loisir a été plus simple car elle se concentre principalement sur
les communes urbaines et rurales disposant de marinas et de rampes d’accès.

Coral Reef Ecosystem Services Economic Valuation. Phd dissertation, Nicolas Pascal, 2013 Page 78 / 351!
:N[NS D+12()3$&e?@&[c&\&$*&]f&
Pour les usages directs non-extractifs, les méthodes diffèrent selon les services : les calculs des
surplus producteur via la valeur ajoutée sont appliqués pour les services avec un prix de marché
(plongée, tourisme, excursions, dépenses associées) via les méthodes de Business Expenditure
Survey (BES) et des interviews avec des acteurs clés. Pour les services non marchands ou ne
donnant pas lieu à une transaction monétaire de la part des usagers récréatifs, la méthode des coûts
de transport est testée pour évaluer leurs surplus consommateurs.
Le Tableau B-15 présente les méthodes d’évaluation des services d’usages directs non extractifs.
Q"C"$"# NR*</B(.
La méthode suivie est dans un premier temps de monétariser les usages directs reliés aux récifs :
(i) tourisme sous-marin (encadré), (ii) tourisme nautique (bateaux taxis, location d’embarcations,
observation de baleines, etc.) et (iii) nautisme de plaisance.
Dans un deuxième temps, l’évaluation des dépenses indirectes (logement, transport,
alimentation, autres) reliées aux activités précédentes ainsi qu’aux activités non encadrées sera
effectuée. Les usagers non-résidents et usagers résidents seront distingués afin de refléter la
complexité des comportements.

Coral Reef Ecosystem Services Economic Valuation. Phd dissertation, Nicolas Pascal, 2013 Page 79 / 351!
Services Méthode
d’évaluation
Quantific
ation du
service
Chiffre
d’affaires
Consomm
ations
intermédiaire
s (CI)
Multiplic
ateur
appliqué
Tourisme sous-
marin (plongée
sous-marine,
randonnées
palmées encadrées)
ES5
Surplus producteur
Business
Expenditure Survey
(BES) avec les
principaux opérateurs
Fréquenta
tion
Prix des
prestations
CI de
l’activité
Filière
tourisme
Activités
nautiques (bateaux
taxi, sorties mer et
ilots, charter,
locations, kayaks)
ES6
Surplus producteur
BES avec les
principaux opérateurs
Fréquenta
tion
Prix des
prestations
CI de
l’activité
Filière
tourisme
Dépenses
associées du
tourisme non-
résident et usagers
résidents (liées aux
activités
précédentes et aux
activités non-
encadrées)
ES5 et ES6
Surplus producteur
BES et enquêtes
usagers
Analyse d’images
publicitaires
Analyse de
positionnement de
l’offre touristique
(analyse de contenu)
Quantifica
tion des
touristes et
résidents par
degré
d’usages
Dépenses
locales
(hébergement,
restauration,
transport local) +
transport
international
CI des
différentes
catégories de
dépenses
Filière
tourisme et
hôtellerie
Plaisance
nautique
ES7
Surplus producteur
BES
Fréquenta
tion (nombre
de sorties)
Immatricu
lations
annuelles de
nouvelles
embarcations
Dépenses par
sortie et par
embarcation
Prix moyens
d’achats des
embarcations
CI des
différents
secteurs
d’activités
Filière
industrie
nautique
Tableau B-15: Méthodes de monétarisation des SE des usages directs non-extractifs

Coral Reef Ecosystem Services Economic Valuation. Phd dissertation, Nicolas Pascal, 2013 Page 80 / 351!
Figure B-9: Monétarisation du service tourisme
Q"C"$"$ O(-)6+L*+/=.B>.-()*(>6.*/>6+-5(.
Les recettes totales générées localement en Nouvelle-Calédonie par l’activité des touristes non
résidents sont estimées à 18,2 milliards de F Cfp (152 millions d’Euros) (ISEE, 2008a) et
représentent 2,3% du Produit Intérieur Brut de la Nouvelle-Calédonie. Ce poids économique rend
critique de déterminer de la meilleure manière possible la part réellement attribuable aux récifs
coralliens.
"&%*9#(!6(!2+&.(&B!(.!,+#$.$+&&(-(&.!.+B4$#.$PB(!
Il est utile de resituer la Nouvelle-Calédonie dans son contexte de destination touristique
mondiale. La Nouvelle-Calédonie appartient à deux familles touristiques distinctes : celle des «
Archipels paradisiaques » (destinations insulaires exotiques), et celle des «Grandes Terres» (îles
continents). La famille des Archipels Paradisiaques est caractérisée par un ensemble d’« îles de rêve
» balnéaires. Tandis que celle des «Grandes Terres» est caractérisée par la découverte, l’aventure,
les paysages littoraux et intérieurs, l’expérience unique, l’espace, la nature sauvage (KPMG, 2005).

Coral Reef Ecosystem Services Economic Valuation. Phd dissertation, Nicolas Pascal, 2013 Page 81 / 351!
Figure B-10: Arrivée de touristes dans les pays du Pacifique (2006). (ISEE, 2008a)
En moyenne, 100.000 touristes arrivent sur la Nouvelle-Calédonie par voie aérienne et 180.000
par croisière. La Nouvelle-Calédonie est ainsi loin de représenter une destination touristique de
poids dans le panorama de la région (voir Figure B-10). Les croisiéristes ont une structure de
dépenses et des motivations très différentes du reste des touristes et nous les analyserons ensuite.
Pour les touristes non croisiéristes, la France et le Japon représente plus de 50% de la résidence
d’origine des visiteurs suivi de l’Australie et la Nouvelle-Zélande. La figure suivante présente les
principales motivations de séjour des visiteurs. Les différents motifs de séjours sont (i) pour
vacances: la motivation du séjour est la découverte de la Nouvelle-Calédonie; (ii) pour raison
affinitaire: la motivation du séjour est la visite à des parents ou amis ; (iii) pour motif professionnel:
les séjours sont liés à l’activité professionnelle, missions , réunions, séminaires, etc. ; (iv) pour
autres motifs: ils regroupent la santé, le sport, les stages, les études, les formations, etc. (Isee,
2008b)
Figure B-11: Distribution par typologie de tourisme (2008). Adapté de Isee (2008)
Le risque de baser l’estimation sur des données provenant d’une période non représentative du
secteur doit être examinée. La théorie de cycle de vie du tourisme (Butler, 1980) explique ce risque.
Distribution des touristes par typologie (2007)
Vacances56%
Affinitaire25%
Affaires&autres19%

Coral Reef Ecosystem Services Economic Valuation. Phd dissertation, Nicolas Pascal, 2013 Page 82 / 351!
Figure B-12: Arrivées des visiteurs 1980-2008 - Source ISEE et PAF
Le nombre de visiteurs en Nouvelle-Calédonie peut être utilisé comme indicateur du cycle de vie
du produit. Sur une période de pratiquement 30 ans et hormis les années 1985-1989 (non propices
au tourisme suite à des évènements politiques internes), on remarque une relative stabilité des
visiteurs (entre 80.000 et 100.000 /an). Même en considérant qu’une grande partie de ces visiteurs
provient du tourisme affinitaire, cela montre (i) que le tourisme n’est pas dans une phase de
développement ou de déclin et (ii) que la dépendance au contexte international est faible. La
monétarisation du tourisme sur la base des dernières années est donc représentative des valeurs
historiques de ce secteur d’activité.
Q"C"$": !)*+,+*R-.B(.9/+-+6-.-/>-U586+=(-.(*.(Z)>6-+/=-.?12.C@.
Il s’agit d’évaluer ici la valeur associée aux activités récréatives sous-marines et ludiques à
caractère commercial: l’usager paye une prestation pour la réalisation de cette activité. Le principe
est de quantifier et de monétariser tous les secteurs d’activités touristiques qui utilisent un ou
plusieurs des services écosystémiques. La quantification des usages se traduit en terme de nombre
de visiteurs ou de plongées tandis que la monétarisation se base à la fois sur le calcul des surplus
producteurs des activités payantes liées aux récifs et sur une méthode des coûts de transport pour les
activités non-payantes. La méthodologie est la suivante pour ce type d’usage : on calcule les valeurs
ajoutées des clubs de plongées sous-marines et autres centres d’activités nautiques.
La valeur ajoutée du tourisme sous-marin se calcule à partir de la formule suivante :
VA = fréquentation touristes * prix prestation – coûts intermédiaires de la prestation
N+B4$#-(!#+B#>-%4$&!SCE!fU!
Pour la plongée sous-marine, le nombre de clients a été recensé ainsi que le nombre
d’immersions. Les coûts des prestations de plongée sont généralement assez homogènes ainsi que
Evolution des arrivées de visiteurs en Nouvelle Caledonie 1980-2008
0
20.000
40.000
60.000
80.000
100.000
120.000
1980
1981
1982
1983
1984
1985
1986
1987
1988
1989
1990
1991
1992
1993
1994
1995
1996
1997
1998
1999
2000
2001
2002
2003
2004
2005
2006
2007
2008
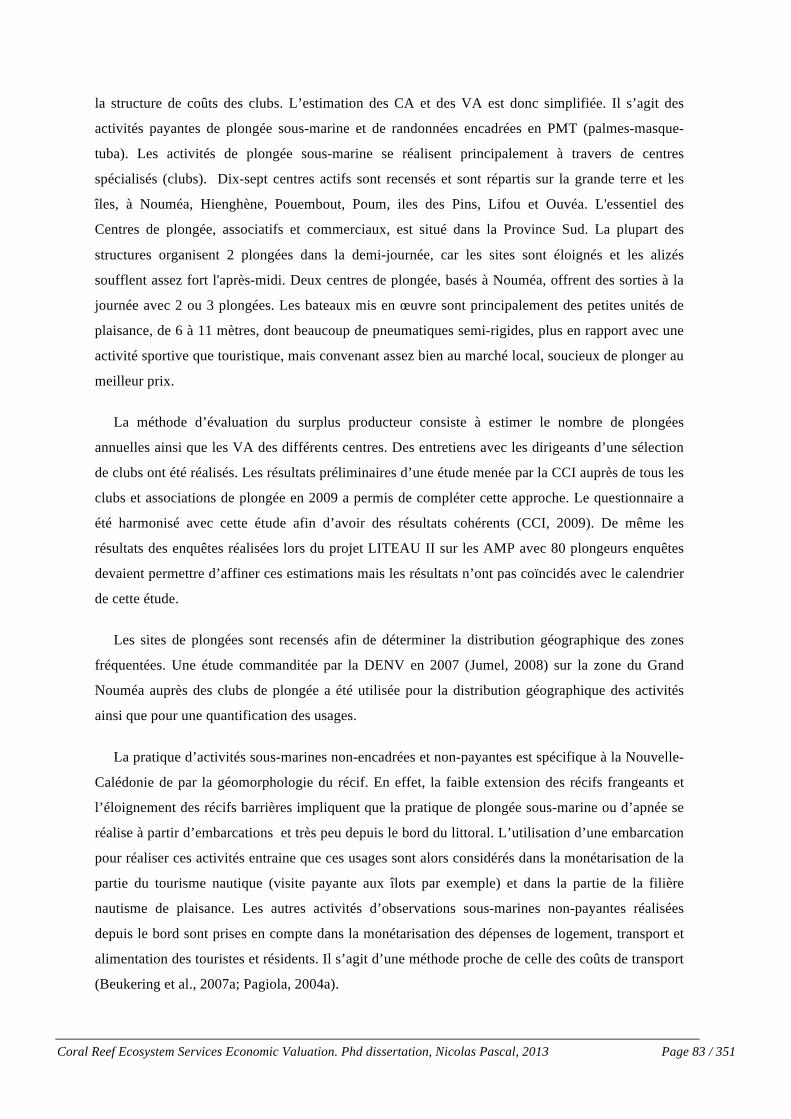
Coral Reef Ecosystem Services Economic Valuation. Phd dissertation, Nicolas Pascal, 2013 Page 83 / 351!
la structure de coûts des clubs. L’estimation des CA et des VA est donc simplifiée. Il s’agit des
activités payantes de plongée sous-marine et de randonnées encadrées en PMT (palmes-masque-
tuba). Les activités de plongée sous-marine se réalisent principalement à travers de centres
spécialisés (clubs). Dix-sept centres actifs sont recensés et sont répartis sur la grande terre et les
îles, à Nouméa, Hienghène, Pouembout, Poum, iles des Pins, Lifou et Ouvéa. L'essentiel des
Centres de plongée, associatifs et commerciaux, est situé dans la Province Sud. La plupart des
structures organisent 2 plongées dans la demi-journée, car les sites sont éloignés et les alizés
soufflent assez fort l'après-midi. Deux centres de plongée, basés à Nouméa, offrent des sorties à la
journée avec 2 ou 3 plongées. Les bateaux mis en œuvre sont principalement des petites unités de
plaisance, de 6 à 11 mètres, dont beaucoup de pneumatiques semi-rigides, plus en rapport avec une
activité sportive que touristique, mais convenant assez bien au marché local, soucieux de plonger au
meilleur prix.
La méthode d’évaluation du surplus producteur consiste à estimer le nombre de plongées
annuelles ainsi que les VA des différents centres. Des entretiens avec les dirigeants d’une sélection
de clubs ont été réalisés. Les résultats préliminaires d’une étude menée par la CCI auprès de tous les
clubs et associations de plongée en 2009 a permis de compléter cette approche. Le questionnaire a
été harmonisé avec cette étude afin d’avoir des résultats cohérents (CCI, 2009). De même les
résultats des enquêtes réalisées lors du projet LITEAU II sur les AMP avec 80 plongeurs enquêtes
devaient permettre d’affiner ces estimations mais les résultats n’ont pas coïncidés avec le calendrier
de cette étude.
Les sites de plongées sont recensés afin de déterminer la distribution géographique des zones
fréquentées. Une étude commanditée par la DENV en 2007 (Jumel, 2008) sur la zone du Grand
Nouméa auprès des clubs de plongée a été utilisée pour la distribution géographique des activités
ainsi que pour une quantification des usages.
La pratique d’activités sous-marines non-encadrées et non-payantes est spécifique à la Nouvelle-
Calédonie de par la géomorphologie du récif. En effet, la faible extension des récifs frangeants et
l’éloignement des récifs barrières impliquent que la pratique de plongée sous-marine ou d’apnée se
réalise à partir d’embarcations et très peu depuis le bord du littoral. L’utilisation d’une embarcation
pour réaliser ces activités entraine que ces usages sont alors considérés dans la monétarisation de la
partie du tourisme nautique (visite payante aux îlots par exemple) et dans la partie de la filière
nautisme de plaisance. Les autres activités d’observations sous-marines non-payantes réalisées
depuis le bord sont prises en compte dans la monétarisation des dépenses de logement, transport et
alimentation des touristes et résidents. Il s’agit d’une méthode proche de celle des coûts de transport
(Beukering et al., 2007a; Pagiola, 2004a).

Coral Reef Ecosystem Services Economic Valuation. Phd dissertation, Nicolas Pascal, 2013 Page 84 / 351!
N+B4$#-(!&%B.$PB(!SCE!gU!
Le tourisme nautique comprend les autres activités marines payantes liées aux récifs coralliens.
Les usages suivants sont répertoriés: (i) bateaux taxis, (ii) observation baleines, (iii) sorties ilots
(day charters), (iv) randonnée sous-marine (v) locations bateaux, (vi) charter de pêche et (vii)
location de bateaux à la journée ou semaine. La connaissance des motivations des usagers ainsi que
leurs pratiques s’est basée sur des entretiens réalisés auprès des prestataires à défaut d’une étude
plus complète avec les usagers. Ils permettent d’identifier l’intensité de l’usage des récifs dans leurs
activités. Une soixantaine d’entreprises sont recensées sur le territoire selon l’ISEE (2008) et la
SMMPM (2009). Ces entretiens ont montré que la plupart des usagers (sauf charter de pêche et
observation baleine) pratiquent de façon plus ou moins intensive de la randonnée sous-marine sur
les sites visités. La vision des paysages du lagon, l’usage des plages des ilots ainsi que la randonnée
terrestre sont les autres activités répertoriées. L’observation de cétacés est une activité à part et se
réalise pendant la saison de migration des espèces.
Il peut être considéré que ce tourisme utilise les mêmes processus écosystémiques des récifs
coralliens que le tourisme sous-marin et que la pêche (pour les pêches charter non-hauturières). Les
usages qui n’impliquent pas d’immersion, de vision sous-marine, d’observations d’animaux marins
ou de pêche ont été éliminés. Ainsi la location d’engins motorisés ou de matériel de sport de glisse,
de voile sportive, ne sont pas considérés comme reliés au récif corallien.
Les données proviennent de l´étude CCI (2009) et des calculs réalisés par l’ISEE. Les calculs de
CA se basent sur des prix moyens par type de prestations. Le même niveau de valeur ajoutée est
appliqué à l’ensemble du secteur, considéré comme homogène suivant l’ISEE.
La valeur ajoutée du tourisme nautique se calcule à partir de la formule suivante :
VA (par type d’activité) = fréquentation touristes * prix prestation – coûts intermédiaires de la
prestation
:%B.$#-(!6(!,*%$#%&2(!SCE!hU!
Il s’agit des activités marines liées à l’utilisation d’un navire de plaisance. L’expression «navire
de plaisance » regroupe tous les navires à usage privé n’entrant pas dans la définition des « navires à
passagers » et pratiquant à titre gratuit une navigation sportive ou touristique (SMMPM, 2009). Le
surplus producteur suit la formule suivante :

Coral Reef Ecosystem Services Economic Valuation. Phd dissertation, Nicolas Pascal, 2013 Page 85 / 351!
VAa = !dVAda * mt
VAda = CAda – Cida
Avec
VA a : Valeur ajoutée de la filière nautisme de plaisance
VA da : Valeur ajoutée de la filière nautisme de plaisance par typologie d’embarcations (a) et par
catégories de dépenses (d=achat embarcation ou dépenses par sorties annualisée)
mt : multiplicateur de la filière tourisme
La méthodologie de monétarisation est similaire à celle utilisée dans les calculs de la pêche de
loisir et portant sur les dépenses de la filière nautisme de plaisance. Elle se divise entre le secteur
d’activité de l’achat de l’embarcation et celui des dépenses liées aux embarcations. L’activité de
navigation de plaisance est très développée sur la Nouvelle-Calédonie avec un nombre de bateaux
immatriculés dépassant les 9.000 unités (1 pour 25 habitants) dont 65% approximativement dans le
Grand Lagon Sud (Jollit et al., 2010; Jumel, 2008). La grande majorité des navires de plaisance ont
une longueur inférieure à 5 m et la plupart des bateaux de plaisance sont des bateaux à moteur. (Les
voiliers représentent moins de 10% de la flotte). Les deux catégories de navires les plus
représentées en Nouvelle-Calédonie sont la cinquième et la sixième catégorie, ce qui correspond à
des navires ne s’éloignant pas de plus de 2 ou 5 milles d’un abri. Cependant, la puissance moyenne
des moteurs (voiliers exclus) peut s’estimer entre 100 et 150 chevaux. Les principales activités des
plaisanciers ont été identifiées et ont permis de les catégoriser entre (i) pêche (ii) baignade (iii)
ballade et (iv) plongée en apnée afin de ne considérer que les usages reliés spécifiquement aux
processus écosystémiques des récifs.
Selon Jumel (2008) les principaux usages de la plaisance sont la pêche (50% des embarcations le
considèrent comme le principal usage), la baignade et la plongée en apnée. Il semble donc réaliste
de considérer la plaisance comme fortement lié à l’écosystème corallien et aux processus
écosystémiques associés au service du tourisme.
Une étude de la DRN de la PS réalisée en 2004 (You, 2004) auprès de 185 plaisanciers du Grand
lagon sud a permis de compléter ces estimations.
La méthodologie de monétarisation est similaire à celle utilisée dans les calculs de la pêche de
loisir et portant sur les dépenses de la filière nautisme de plaisance. Elle se divise entre le secteur
d’activité de l’achat de l’embarcation et celui des dépenses liées aux embarcations.

Coral Reef Ecosystem Services Economic Valuation. Phd dissertation, Nicolas Pascal, 2013 Page 86 / 351!
Les détails de calcul sont les mêmes que pour la pêche de loisir.
Q"C"$"A ORL(=-(-.8--/)+R(-.B(-.>-8J(6-.B(-.6R)+0-.?12.C.(*.F@.
Comme décrit antérieurement, les recettes totales générées localement en Nouvelle-Calédonie
par les dépenses des touristes non-résidents sont estimées à plus de 150 millions d’Euros (ISEE,
2008a). Elles ont un poids potentiellement important dans cette évaluation et il parait critique de
déterminer la part réellement attribuable aux récifs coralliens.
La formule est la suivante :
VAtnr = CAtnr – !d CI d * mt
CAtnr= !ie Qie * pe * fie
Pe = !dped
Avec :
VAtnr : Valeur ajoutée du tourisme non-résident lié aux récifs.
Qie : nombre de touristes par motifs de visite (i=catégorie 1,2,3) et nationalité (e)
fie : facteur de contribution des récifs par catégorie (i) et nationalité (e)
ped : dépenses moyennes par nationalité (e) et par type de dépenses (d)
CId : consommations intermédiaires par types de dépenses (d)
mt : multiplicateur de la filière tourisme
Sur la base de leurs profils de dépenses, trois catégories d’usagers sont identifiées : les touristes
non-résidents, les résidents et les croisiéristes.
'7,(&#(#!%##+2$7(#!6(#!B#%1(4#!&+&>47#$6(&.#!
Les dépenses évaluées comprennent : (i) le transport international et les (ii) dépenses locales. Les
dépenses liées aux usages directs décrits antérieurement (plongée sous-marine, nautisme, plaisance)
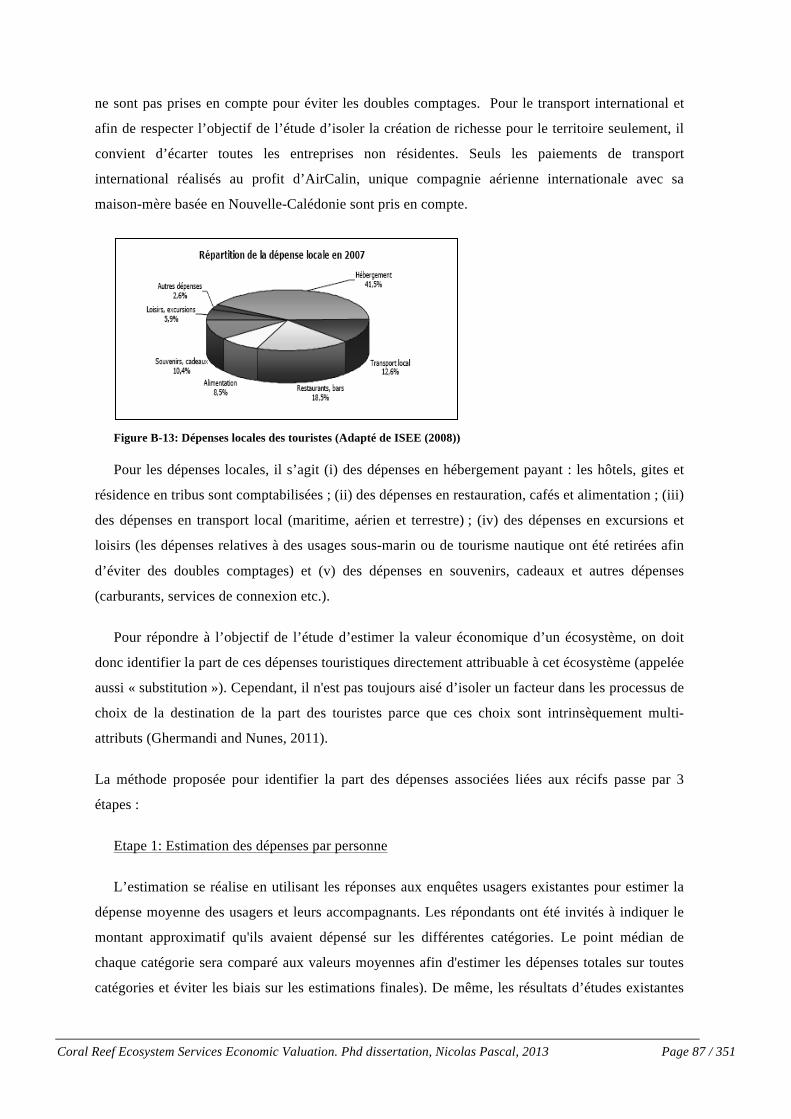
Coral Reef Ecosystem Services Economic Valuation. Phd dissertation, Nicolas Pascal, 2013 Page 87 / 351!
ne sont pas prises en compte pour éviter les doubles comptages. Pour le transport international et
afin de respecter l’objectif de l’étude d’isoler la création de richesse pour le territoire seulement, il
convient d’écarter toutes les entreprises non résidentes. Seuls les paiements de transport
international réalisés au profit d’AirCalin, unique compagnie aérienne internationale avec sa
maison-mère basée en Nouvelle-Calédonie sont pris en compte.
Figure B-13: Dépenses locales des touristes (Adapté de ISEE (2008))
Pour les dépenses locales, il s’agit (i) des dépenses en hébergement payant : les hôtels, gites et
résidence en tribus sont comptabilisées ; (ii) des dépenses en restauration, cafés et alimentation ; (iii)
des dépenses en transport local (maritime, aérien et terrestre) ; (iv) des dépenses en excursions et
loisirs (les dépenses relatives à des usages sous-marin ou de tourisme nautique ont été retirées afin
d’éviter des doubles comptages) et (v) des dépenses en souvenirs, cadeaux et autres dépenses
(carburants, services de connexion etc.).
Pour répondre à l’objectif de l’étude d’estimer la valeur économique d’un écosystème, on doit
donc identifier la part de ces dépenses touristiques directement attribuable à cet écosystème (appelée
aussi « substitution »). Cependant, il n'est pas toujours aisé d’isoler un facteur dans les processus de
choix de la destination de la part des touristes parce que ces choix sont intrinsèquement multi-
attributs (Ghermandi and Nunes, 2011).
La méthode proposée pour identifier la part des dépenses associées liées aux récifs passe par 3
étapes :
Etape 1: Estimation des dépenses par personne
L’estimation se réalise en utilisant les réponses aux enquêtes usagers existantes pour estimer la
dépense moyenne des usagers et leurs accompagnants. Les répondants ont été invités à indiquer le
montant approximatif qu'ils avaient dépensé sur les différentes catégories. Le point médian de
chaque catégorie sera comparé aux valeurs moyennes afin d'estimer les dépenses totales sur toutes
catégories et éviter les biais sur les estimations finales). De même, les résultats d’études existantes
Coral Reef Ecosystem Services Economic Valuation. Phd dissertation, Nicolas Pascal, 2013 Page 88 / 351!
sur la base d’enquêtes au départ à l’aéroport sont utilisés. Les protocoles et les échantillonnages ont
été vérifiés afin d’assurer la robustesses des données utilisées.
Étape 2: Estimation des dépenses par personne attribuables aux récifs-Analyse d’images
publicitaires
Cela est fait en appliquant les techniques d’analyse d’images publicitaires et des entretiens avec
experts et usagers. La méthode d’analyse d’images publicitaires est décrite par (Hajkowicz and
Okotai, 2005). Elle se base sur les supports publicitaires touristiques existants de la collectivité
(imprimés et online principalement) qui ont pu être connus par les touristes avant leur venue. La
théorie sous-jacente est que les messages publicitaires relèvent d'une stratégie de communication. Ils
sont conçus en fonction d'une cible précise et ont pour objectif de susciter chez le destinataire le
désir d'acquérir le service promu. Dans notre cas ils sont utilisés comme proxy du choix réalisés par
les touristes dans leur destination. Ces supports touristiques publicitaires sont analysés
quantitativement afin de déterminer la proportion d’images et de mots-clés relatifs à certains
attributs. Les attributs sélectionnés sont :
• Images reliées à la culture et aux gens
• Images reliées aux écosystèmes et paysages terrestres
• Images reliées aux plages
• Images reliées aux loisirs sous-marins, aux récifs et à la biodiversité marine
• Images reliées à d’autres formes de loisir
Plus de 2000 images ont été classifiées pour déterminer l’importance des récifs dans les supports
publicitaires analysés. Ces supports sont les brochures et sites internet disponibles aux touristes
avant et après leur arrivée et proviennent des différents offices de tourisme.
Etape nº3: Estimation des dépenses touristiques annuelles imputables aux récifs
En se basant sur les données de fréquentation de visiteurs annuels et sur les résultats précédents,
une matrice de facteurs de contribution des récifs sur les dépenses des touristes est alors générée. La
variable « reef_contribution » est crée pour segmenter les visiteurs usagers. Elle prend une valeur
comprise entre 0 et 1 suivant la proportion de temps dédié aux activités dans le temps total du
séjour, la motivation principale du voyage et l’importance de ces activités dans le choix de la
destination. L’objectif est de produire des extrapolations le plus fiables possible. La première
catégorisation concerne les motivations de séjour.

Coral Reef Ecosystem Services Economic Valuation. Phd dissertation, Nicolas Pascal, 2013 Page 89 / 351!
Les différents motifs de séjours sont (i) pour agrément: la motivation du séjour est la découverte
de la collectivité, les vacances (ii) pour raison affinitaire: la motivation du séjour est la visite à des
parents ou amis ; (iii) pour motif professionnel: les séjours sont liés à l’activité professionnelle,
missions, réunions, séminaires, etc. et, (iv) pour autres motifs: ils regroupent la santé, le sport, les
stages, les études, les formations, etc. Chacune des catégories a des comportements de dépenses
bien différenciés.
La deuxième catégorisation correspond chacune à un profil d’usages et de dépenses lié aux
récifs.
Catégorie 1: elle correspond aux visiteurs (toutes motivations confondues) qui ne seraient pas
venu dans la collectivité si les récifs n’existaient pas ou ne soient pas dans son état actuel (la
variable reef_contribution est égale à 1). Il peut s’agir de voyages spécialisés de plongée, de chasse
ou photographie sous-marine par exemple. Les dépenses totales associées de leur déplacement (y
compris accompagnant) sont comptées à 100%.
Catégorie 2: Il s’agit des visiteurs qui sont venus dans la collectivité pour plusieurs raisons mais
réalisent un des usages suivants: (i) plongée sous marine, (ii) randonnée sous-marine (inclus
excursions nautiques), (iii) pêche loisir et au gros, (iv) sorties mer et (v) location de bateaux. Il est
important de distinguer entre les visiteurs de tourisme affinitaire (en provenance de France
principalement) et le tourisme d’agrément car leurs structures de dépenses locales et comportements
sont relativement différenciées. La matrice des variables de reef_contribution provenant des
enquêtes et complétée par l’analyse d’images publicitaires est appliquée sur les dépenses totales des
touristes. Une segmentation par nationalité est réalisée afin d’affiner les estimations. Pour les
visiteurs de métropole qui viennent visiter leur famille ou amis la méthode par l’analyse d’images
publicitaires n’est pas valable. Le visiteur regarde peu les supports publicitaires touristiques et ses
activités localement sont plus proches de celle d’un résident. Sur ce constat, nous nous baserons
principalement sur les résultats des enquêtes pour déterminer la proportion de leur budget dédié aux
activités liées à l’existence des récifs.
Catégorie 3 : Les dépenses des visiteurs qui ne pratiquent aucune des activités reliées aux récifs
décrites précédemment sont exclues de cette monétarisation. Pour les usagers de plages, il est
important de signaler que le rôle des récifs comme contribution au maintien des plages et comme
créateur de paysage par son rôle de protection contre l’érosion côtière est considérée à travers le
service de protection côtière.

Coral Reef Ecosystem Services Economic Valuation. Phd dissertation, Nicolas Pascal, 2013 Page 90 / 351!
!"#"<"=""$ >(82'31/(?.'*721/
Une étude sur la structure des dépenses des touristes réalisée en 2007 permet de définir et mieux
quantifier les différentes catégories (Isee, 2008b). Cette étude, dirigée par l’ISEE tout au long de
l’année 2007, a couvert un échantillon représentatif et important de touristes (4.700 touristes
environ) au départ de l’aéroport international de La Tontouta (exit survey). Les dépenses analysées
prennent en compte la majorité des dépenses effectuées sur le territoire de Nouvelle Calédonie par
les visiteurs non-résidents. Les dépenses disponibles et sélectionnées sont de deux types :
(i) les dépenses en transport international des compagnies résidentes. Il s’agit de la
principale recette du tourisme (100 millions d’euros en 2007). Cependant, comme nous
l’avons précisé précédemment, seules les recettes et valeurs ajoutées qui proviennent de
la compagnie AirCalin ont été considérées. En moyenne sur 2007, 42% des recettes du
transport international sont réalisées par la compagnie locale (ISEE, 2008a).
(ii) les dépenses locales. Il s’agit des dépenses en hébergement payant : les hôtels, gites et
résidence en tribus sont comptabilisées ; des dépenses en restauration, cafés et
alimentation ; des dépenses en transport local (maritime, aérien et terrestre) ; des
dépenses en excursions et loisirs: toutes les dépenses relatives à des usages sous-marin
ou de tourisme nautique ont été retirées afin d’éviter des doubles comptages et des
dépenses en souvenirs, cadeaux et autres dépenses (carburants, services de connexion
etc.).
Les calculs de VA sont basés (i) sur la base de donnée statistique de l’ISEE, (ii) sur les données
de l’enquête ISEE 2007 relatives aux dépenses des touristes (décrite précédemment) et, (iii) sur les
enquêtes hôtelières 2008 réalisées par la Province Sud dans les principaux hôtels et une sélection de
gites de la zone sud. La dernière étude permet une estimation des taux d’occupations et fournit des
informations sur l’origine des touristes.
Figure B-14: Distribution des dépenses touristiques par résidence d’origine. (Isee, 2008b)

Coral Reef Ecosystem Services Economic Valuation. Phd dissertation, Nicolas Pascal, 2013 Page 91 / 351!
'7,(&#(#!%##+2$7(#!6(#!24+$#$74$#.(#!
Les dépenses des croisiéristes qui visitent la Nouvelle-Calédonie ont été analysées. Il s’agit de
séjours très courts en Nouvelle-Calédonie (moins de 24 heures par escale) pendant lesquels les
croisiéristes consomment des produits et services touristiques (excursions, souvenirs, transport
local….). Une partie de ces dépenses est déjà comptabilisée dans les dépenses du tourisme sous-
marin ou tourisme nautique. Une estimation de la proportion de croisiéristes utilisant ces services
est réalisée et permet d’attribuer la part des dépenses moyennes par croisiéristes attribuable aux
récifs coralliens. Cette estimation s’est basée sur l’étude ISEE de la consommation des croisiéristes
(2008) et sur des entretiens avec les acteurs clés du tourisme.
'7,(&#(#!%##+2$7(#!6(#!B#%1(4#!47#$6(&.#!
Au même titre que pour les touristes non-résidents, les résidents de la collectivité qui réalisent un
des usages liés aux récifs et qui ont des dépenses de logement, restauration et transport ont été pris
en compte. La part attribuable aux récifs et aux usages qui en sont faits est alors déterminée.
L’objectif principal est de connaitre l’usage précis des récifs réalisés par ces résidents et les
dépenses qui y sont associées. Les dépenses des usagers résidents qui sont prises en compte sont :
(i) Transport: terrestre, maritime ou aérien, (ii) logement: hôtels, gites ou location (iii) alimentation.
La méthode proposée pour identifier la part des dépenses associées liées aux récifs passe par 3
étapes :
Etape 1: Estimation des dépenses faites par les résidents
Les études de fréquentation hôtelière de la Province Sud (qui représente une proportion
importante des destinations locales) organisées par l’ISEE permettent de quantifier le nombre
annuel d’usagers. Ces études disposent des fréquentations mensuelles d’un échantillon représentatif
des hôtels et gites par nationalité (ISEE, 2008). Des entretiens professionnels avec un échantillon de
gites et d’hôtels de la Province Nord ont permis de mieux connaitre les usages du récif réalisés par
les clients ainsi que la typologie de la clientèle (étrangère/résidente). Une sélection des hôtels et
gites avec accès à moins de 15 km à la mer a été réalisée pour la Province Nord et Province Sud afin
de retenir les hébergements avec influence des activités liées aux récifs. Pour la Province des Iles,
ont été pris en compte tous les établissements. De même, les gites ou hôtels situés en bord de mer
mais sans possibilité de réaliser les activités décrites antérieurement du fait de difficultés d’accès ont
été éliminés. Le GIE tourisme a été consulté sur la même base afin de connaitre plus précisément

Coral Reef Ecosystem Services Economic Valuation. Phd dissertation, Nicolas Pascal, 2013 Page 92 / 351!
les caractéristiques des touristes. Les taux d’occupation proviennent de l’enquête de fréquentation
hôtelière de la province Sud. Pour les autre provinces, les entretiens avec un échantillonnage
d’hôtels et de gites ainsi qu’avec des acteurs clés (GIE tourisme) ont permis d’avoir une
approximation de la valeur moyenne.
Plusieurs estimations ont dû être réalisées:
(i) Les estimations du taux d’occupation des structures de logement touristique attribuable aux
résidents. En se basant sur les résultats des enquêtes décrites ci-après et en les croisant avec les
données sur le tourisme international, il a été possible de calculer cette proportion par type de
structure (gite, catégorie hôtels) et par destination touristique
(ii) Les chiffres d’affaires et les valeurs ajoutées sont calculés sur la base des prix moyens des
nuitées et sur les calculs de l’ISEE pour les valeurs ajoutées de la filière tourisme.
Tableau B-16: Taux d’occupation moyens estimés des gites et hôtels par provinces
Sur la base d’une analyse récente effectuée sur les principales zones du territoire, il est estimé
que les résidents ont effectué plus de 256.000 nuitées dans les gites et hôtel de Nouvelle-Calédonie
(ISEE, 2009b).
Figure B-15: Evolution du taux d’occupation hôtelière de la Province Sud
(source : ISEE, 2008)
Une capacité de 2.700 U.H. (unités d’habitations ou équivalent lits) est estimée en 2008. La
Province Sud représente 80% de cette capacité principalement sur Nouméa avec la zone côtière
PN PS PIL
Gites 52% 56% 56%
Hotels 1,2* 37% 37% 51%
Hotels 3* + 48% 51% 51%
% occupation moyen

Coral Reef Ecosystem Services Economic Valuation. Phd dissertation, Nicolas Pascal, 2013 Page 93 / 351!
ouest et la zone du Grand Lagons Sud à part égale sur le reste. La Province Nord et la Province des
Iles représentent 13% et 7% de la capacité totale respectivement. 220 unités d’habitations
correspondent à des gites qui se distribuent sur les trois provinces.
Étape 2: Estimation des dépenses par personne attribuables aux récifs
Cela est fait en utilisant les résultats des enquêtes aux usagers (décrites ci-après). Les enquêtés
ont été invité à répondre à des questions spécifiques sur leur choix de la destination , l’importance
des récifs dans le choix de la destination et le montant approximatif qu'ils ont dépensé sur les
différentes catégories.
Question nº1 (ouverte) : « Quelle a été votre principale raison de venir sur ce site? »
Question nº2 (fermée) : « Si vous n'aviez pas été en mesure de plonger/visiter les récifs
coralliens ou autres, auriez vous effectuer ce déplacement sur ….? »
Question nº3 (fermée) : « la plongée/autres activités ont-ils été importants dans votre choix de
venir sur ….?
Ces questions permettent de renseigner la variable reef_contribution et de segmenter les visiteurs
usagers. Elle prend la valeur 1 si la réponse est non à la question nº2. Sinon elle prend une valeur
comprise entre 0 et 1 suivant : la proportion de temps dédié aux activités dans le temps total du
séjour, la motivation principale du déplacement et l’importance de ces activités dans le choix de la
destination.
Etape nº3: Estimation des dépenses annuelles imputables aux récifs
En se basant sur les données de fréquentation de visiteurs annuels et sur les résultats précédents,
des catégories d’usagers sont réalisées sur leurs profils d’usages et de dépenses liés aux récifs.
Catégorie 1: elle correspond aux visiteurs qui ne seraient pas venu sur le site si les récifs
n’existaient pas ou ne soient pas dans son état actuel (la variable reef_contribution est égale à 1). Il
peut s’agir de déplacements spécialisés de plongée, de chasse ou photographie sous-marine par
exemple. Les dépenses totales associées de leur déplacement (y compris accompagnant) sont
comptées à 100%.
Catégorie 2: Il s’agit des visiteurs qui sont venus sur le site pour plusieurs raisons mais réalisent
un des usages sous-marins déjà identifié.
Catégorie 3 : Les dépenses des visiteurs qui ne pratiquent aucune des activités reliées aux récifs
décrites précédemment sont exclues de cette monétarisation.

Coral Reef Ecosystem Services Economic Valuation. Phd dissertation, Nicolas Pascal, 2013 Page 94 / 351!
!"#"<"=""$ @)A'B*21/('C/'1(D231//
Afin de monétariser ces usages, des enquêtes ont été menées auprès des usagers résidents. La
zone Côtière Ouest a été choisie comme représentative d’une destination locale assez commune,
proche du centre urbain et avec des activités liées aux récifs avec différents degrés. De plus, sa
récente inscription au patrimoine UNESCO a généré des expectatives de croissance touristique. Ces
enquêtes menées par 4 enquêteurs de l’UNC et 2 enquêteurs recrutés ont permis d’interroger plus de
210 résidents-usagers des récifs pendant plusieurs mois (juillet à septembre). 195 questionnaires
sont considérés comme valides. Le questionnaire a été modifié sur la base d’un questionnaire
développé par le programme ANR LITEAU (PAMPA). Les enquêtes en face-à-face ont été
effectuées sur les principaux lieux de fréquentation (plages, rampe d’accès,…) pendant les WE et
jours fériés. L’objectif principal est de connaitre l’usage précis des récifs réalisés par ces résidents et
les dépenses qui y sont associées. Les dépenses des usagers résidents qui sont prises en compte
sont : (i) Transport: terrestre, maritime ou aérien, (ii) logement: hôtels, gites ou location (iii)
alimentation. Les profils obtenus sont représentatifs de la population Néo-calédonienne en terme de
proportion homme/femme et âge (ISEE, 2009). Les distributions par catégories socio-
professionnelles et niveaux de salaires sont peu représentatives de la population générale et reflètent
une typologie d’usagers bien définie. En estimant le potentiel annuel de fréquentation des sites
enquêtés, l’échantillonnage représente 2% de la population des usagers. Etant donné une certaine
homogénéité des comportements (CV faible), cet échantillonnage est assez robuste pour utiliser les
conclusions. L’enquête ayant ciblé les usagers des récifs, il n’est pas possible d’en déduire la part de
la population utilisant les récifs.
Q"C"$"C !-L()*-.-/)+8>Z.
Basées sur les statistiques officielles de l’ISEE, les estimations d’emplois liés aux usages
touristiques des récifs ont distingués les emplois provenant des usages sous-marins et ceux liés aux
dépenses associées. Les mêmes ratios de contribution des récifs ont été appliqués sur le nombre
d’emplois total de la filière (4.442 emplois en 2008).
L’estimation du nombre d’usagers est plus approximative et repose sur les estimations du
nombre de ménages ayant passé une nuitée en gîte (avec une activité liée aux récifs) et ceux ayant
pratiqué un des usages directs identifiés.
Q"C"$"F O+-*6+&>*+/=.-L8*+89(.B(-.6R->9*8*-..
Les usages directs du tourisme (plongée, tourisme nautique,…) sont distribués par lieu d’usage.
Ainsi les principaux sites de plongées, les ilots les plus visités par les touristes et les sites de

Coral Reef Ecosystem Services Economic Valuation. Phd dissertation, Nicolas Pascal, 2013 Page 95 / 351!
plaisance ont été identifiés à partir de différentes études (Jollit et al., 2010; Jumel, 2008; You, 2004)
et rattachés à leur commune correspondante.
La spatialisation des valeurs du tourisme non-résident et résident s’est principalement appuyée
sur l’emplacement des hôtels et gites touristiques. Pour la province Sud des taux d’occupation par
typologie d’hôtels et par communes sont disponibles. Pour la province Nord et celle des Iles la
distribution s’est appuyée sur le recensement des capacités d’hébergements. Les taux d’occupation
spécifiques à chaque commune n’ont pu être calculés et l’évaluation s’est faite à partir de taux
moyen d’occupation.
:N[NT 5$6Q$26Q$&$*&?#16-*(+"&e?@&^f&
'(#24$,.$+&!
Les récifs coralliens constituent une source d’informations et de connaissances qui génèrent
aussi des activités économiques. Ces activités se traduisent en termes de recherche et éducation.
mB%&.$=$2%.$+&!6B!#(4)$2(!d!
La recherche est réalisée par des organismes publics ou semi-publics et une sélection des
programmes de recherche liés aux écosystèmes coralliens (biologie et écologie descriptive,
géologie, halieutique, conservation,…) est effectuée. Les budgets de ces programmes ont été
évalués à partir d’entretiens avec les acteurs (IRD, Ifremer, FFEM, AFD, CRISP) et avec le
gouvernement (recherche et technologie). Même si la majorité des fonds est d’origine publique et
pour autant constitue une redistribution de la richesse et non une création au terme strict
économique, nous pouvons considérer que ces fonds proviennent en majorité de transfert extérieur
au territoire et peuvent être assimilés à une création locale de richesse. Pour l’éducation, il n’a pas
été possible d’évaluer précisément toutes les actions entreprises par des organismes publics ou
privés sur ou autour de la thématique des récifs coralliens. Dans le cas des pouvoirs publics en
charge des récifs (service environnementaux et service des pêches) les dépenses d’éducation et de
recherche ne sont généralement pas différenciées dans les budgets totaux de gestion des récifs. Les
budgets de gestion des récifs, comme les budgets des services d’environnement des provinces, ne
constituent pas une création de valeur liée à l’existence des récifs mais plutôt une redistribution de
richesse dirigée à conserver les bénéfices écosystémiques. Ils ont été exclus de cette monétarisation.
Les dépenses prises en compte sont celles reliées à la recherche sur les récifs coralliens et à leurs
usages (frais de fonctionnement, budget des programmes, salaires). La source de financement ne
doit pas être en provenance d’une administration publique locale utilisant ses financements locaux.
En effet, dans le cas des recherches financées par le pays sur des fonds propres (recettes fiscales) il
ne s’agit pas de création de richesse mais de redistribution. L'évaluation des bénéfices économiques

Coral Reef Ecosystem Services Economic Valuation. Phd dissertation, Nicolas Pascal, 2013 Page 96 / 351!
associés à l'information générée par la recherche n'a jamais été réalisée. Quand une application de la
recherche au secteur réel est identifiable il semble cependant qu’il est possible de la rattacher à un
des usages déjà évalués (pêche, bio-prospection, aquaculture,…).

Coral Reef Ecosystem Services Economic Valuation. Phd dissertation, Nicolas Pascal, 2013 Page 97 / 351!
:N[NZ A2+*$6*(+"&6g*(Y2$&e?@&_f&
Q"C"A"# O(-)6+L*+/=.
Les récifs coralliens et les mangroves créent « inévitablement » une protection contre la houle en
formant des barrières le long de la ligne de cote. De même, les zones lagonaires protégées par les
récifs barrière sont généralement des zones calmes qui favorisent les multiples usages décrits
antérieurement. Plusieurs études (Brander et al., 2004; Kench and Brander, 2009; Lugo-Fernandez
et al., 1998) montrent que les récifs agissent de manière similaire à des brises-vagues immergés ou à
des littoraux de peu de profondeur. Ils imposent des contraintes fortes sur la houle de l’océan
entrainant des transformations sur les caractéristiques des vagues et sur une atténuation rapide de
l’énergie des vagues. Les vagues formées par le vent ont une grande partie de leur énergie dans la
zone de surface. Le récif frangeant ainsi que la crête récifale absorbent une grande partie de cette
force, parfois jusqu'à 90% à basse et haute marée (Lugo-Fernandez et al., 1998). La Figure B-16
présente différents résultats pour les récifs des Antilles. Il existe une variabilité forte suivant le type
de récif, la profondeur et le régime des vagues (Kench and Brander, 2009). De plus, le rôle des
récifs coralliens et des mangroves dans la protection du littoral est difficile à isoler face à d’autres
variables. En effet une combinaison de facteurs rentre en jeu dans ce processus. Les principaux sont:
(i) la bathymétrie (ii) la géomorphologie (iii) la topographie et (iv) la couverture végétale (Burke et
al., 2008). Peu d’études permettent d’isoler le rôle contributif du récif dans la combinaison de
facteurs (Barbier et al., 2008).
.
Figure B-16: Rôle des récifs comme
absorbeurs d’énergie de la houle.
(Extrait de Kench et Brander (2009)).
Au même titre, une analyse réalisée par Barbier et al. (2008) révèle que la relation entre
superficie des récifs et ce processus d’absorption est non linéaire. Ceci entraine une complexité
additionnelle dans l’évaluation de ce service écosystémique. A titre d’illustration de la non-linéarité
des effets, la même analyse sur les effet des mangroves sur la hauteur des vagues montre que des
vagues de 1,1 m en bord de mer et en bord de forêt de mangroves sont réduites à 0,91 m si la forêt a

Coral Reef Ecosystem Services Economic Valuation. Phd dissertation, Nicolas Pascal, 2013 Page 98 / 351!
une extension de 100 m. La vague continue à baisser, bien qu'à un rythme moindre, pour chaque
100 m supplémentaire de mangroves à l’intérieur des terres. Pour une forêt s'étendant de 1000 m
dans les terres, les vagues seraient réduites à un négligeable 0,12 m (Figure B-17).
Figure B-17: Effets des mangroves sur la hauteur
des vagues
(extrait de Barbier et al. (2008)
Rôle contre des vagues tsunamis
Certaines études ont suggéré le rôle des récifs et des mangroves face aux vagues tsunami. Ainsi
des travaux montrent que, historiquement, les tsunamis n’ont pu traversé la Grande Barriere de
Corail qu’à travers les passes. (Knott, 1997). De même, pour les mangroves, la densité d’arbres
semble expliquer certains des effets réducteurs face au tsunami. Les effets des récifs face aux
vagues de tsunami sont cependant différents de ceux face aux vagues et à la houle. Une vague
tsunami est beaucoup plus grande et son énergie se distribue sur toute la colonne d’eau. Ses effets
sont amplifiés sur les côtes à profondeur graduelles. Plusieurs études cherchant des corrélations
entre couverture de mangrove et réduction du risque (UNEP-WCMC, 2006) n’ont pu montrer de
résultats clairs. Dans beaucoup de cas, les endroits où la mangrove a servi de réducteur étaient hors
du chemin principal de la vague ou étaient proches de zones profondes qui atténuent fortement
l’effet du tsunami. Ce qui ressort de ces études est que l’extension du récif ou de la mangrove n’est
pas le facteur principal influençant les dommages sur la cote. La bathymétrie côtière et le profil
géomorphologique de la côte sont probablement des facteurs explicatifs clés (Burke, 2004).
Formation des plages
D’autres processus autres que la protection côtière existent, comme le rôle des récifs comme
fournisseurs de sable pour les plages et les îles. C’est un processus qui est facilement observable.
Les apports de sédiment sous la forme d’organismes calcifiés ou coraux morts sont générés
principalement par le système récifal. Les plages existent dans un équilibre dynamique (entre les
forces érosives des tempêtes et des vagues, le pouvoir restaurateur des courants et des marées et les
apports depuis les coraux et les animaux à squelette calcaire). Au-delà des modifications

Coral Reef Ecosystem Services Economic Valuation. Phd dissertation, Nicolas Pascal, 2013 Page 99 / 351!
géomorphologiques régulières qu’elles subissent au gré du cycle des tempêtes et des saisons, des
tendances évolutives sont présentes (stabilité, érosion, accrétion). Ainsi, la connaissance de la
tendance géomorphologique présente est déterminante et dépend souvent de nombreux paramètres
locaux naturels ou anthropiques qui échappent aux moyens de cette évaluation. Ainsi, même si le
processus de protection des plages est démontré, il n’existe pas, à notre connaissance, d’études à une
échelle suffisante permettant de quantifier annuellement le rôle précis des récifs.
Afin de simplifier l’approche, nous nous sommes concentrés sur le processus de protection
contre la houle et les vagues.
Q"C"A"$ N/=R*86+-8*+/=..
La monétarisation financière passe par une évaluation des dommages évités sur le littoral par le
rôle des récifs comme protection contre la houle. La formule est la suivante :
CDEpl = !ie hSli * fi * pie
h Sli < max. h
Avec :
Service Méthode
d’évaluation Quantification du service Monétarisation
Protection du
littoral
Dommages
évités
Portion du littoral en zone
potentielle de risque (probabilité)
Contribution des récifs, herbiers
et mangroves à la protection du
littoral
Superficie urbanisée et
construite
Valeurs foncières
protégées
Tableau B-17: Méthode pour l’évaluation du service de protection du littoral

Coral Reef Ecosystem Services Economic Valuation. Phd dissertation, Nicolas Pascal, 2013 Page 100 / 351!
CDEpl :coûts des dommages évités par la protection du littoral
hSli : superficie du littoral à risque sous la hauteur maximal de la houle par zone (i)
Max h : hauteur maximale des vagues des 20 dernières années
Fi : facteur de contribution du récif dans la protection du littoral contre la houle par zone (i)
P ie : prix du foncier estimé par zone (i) et par qualification urbanistique (e: urbain, rural, tribal).
Q"C"A": \>8=*+0+)8*+/=.B>.-(6,+)(.
De manière simplifiée et adaptant la méthodologie développée par Burke et al. (2008), le modèle
général passe par : (i) identifier les zones du littoral potentiellement à risque face au régime de
vagues de l’océan ; (ii) déterminer la contribution des récifs coralliens dans la protection des
différentes zones vulnérables et, (iii) quantifier les impacts potentiels et les monétariser par une
méthode des dommages évités.
De manière plus détaillée les étapes suivantes sont menées :
Etape nº1 : Identifier les zones du littoral potentiellement à risque sur la base de la hauteur
maximale et de la direction principale des vagues.
Etape nº2: Contribution des récifs coralliens dans la protection côtière.
Un groupe de travail de l’Institute of Marine Affairs (IMA) a développé un modèle de facteurs
de protection côtière qui permet de catégoriser le niveau de protection côtière du littoral (Burke et
al., 2008) suivant différents facteurs de protection. La stabilité du littoral est définie comme un
indice de protection du littoral qui intègre dix caractéristiques physiques afin d'estimer la résistance
à l’érosion de chaque segment de côte. Les caractéristiques physiques inclues dans l'indice de
protection du littoral sont :
• géomorphologie côtière (une falaise de calcaire, plage, etc.);
• géologie côtière (ignées, métamorphiques, etc.),
• exposition de la côte (protégé par un promontoire, digue, ou enrochement ou exposés),
• énergie des vagues (en général la hauteur maximale des vagues),
• fréquence des tempêtes,
• caractéristiques des récifs coralliens (type de récifs, surface et distance à la côte),
• végétation côtière (mangroves, zones humides, etc.),
• élévation et pente des côtes (m),
• présence d'activités d'érosion d’origine anthropique, telles que les extractions de sable.

Coral Reef Ecosystem Services Economic Valuation. Phd dissertation, Nicolas Pascal, 2013 Page 101 / 351!
Tableau B-18: Caractéristiques physiques du littoral et degré de protection (extrait de Burke et al. (2008)).
Ces caractéristiques physiques sont converties en une valeur comprise entre 0 et 4 (voir tableau ci-
dessus) et la moyenne est calculée pour produire une valeur d'index unique pour chaque rivage qui
est la protection relative totale côtière (PRTC). Burke et al. (2008) calculent alors la contribution
relative des récifs dans le PRTC. Cette méthode utilisée par Burke et al. dans leur évaluation de la
contribution des récifs à Tobago et Sta Lucia a été modifiée pour répondre au contexte Calédonien
(extension très supérieure du récif barrière et frangeant) et pour l’adapter aux données disponibles.
Etape 3 : Monétarisation
Sur les zones vulnérables, les impacts potentiels sont monétarisés à partir d’une approche
d’analyse géographique des dommages potentiels sur le construit. Les zones construites urbaines,
rurales et tribales sont différenciées. L’analyse s’est concentrée sur l’estimation du nombre de
foyers présents dans la zone vulnérable (moins de 5 m d’altitude et à moins de 1 km de la ligne de
côte). Ce nombre s’est basé sur (i) l’identification des communes, quartiers et tribus affectés (ii) le
recensement des populations (Isee, 2004 ) et (iii) le nombre moyen de personnes par foyer. Les
impacts directs sont ensuite monétarisés en évaluant les dommages évités sur le résidentiel construit
au prix du marché immobilier. A partir d’une étude de prix immobiliers basée sur plusieurs sources
et différentes bases de données (IEOM, 2008), les prix moyens du m2 construit résidentiel ont pu

Coral Reef Ecosystem Services Economic Valuation. Phd dissertation, Nicolas Pascal, 2013 Page 102 / 351!
être déterminés sur la zone du grand Nouméa. Des estimations plus sommaires ont été réalisées à
partir d’entretiens avec des professionnels et des prix de transactions disponibles sur internet (15
jours, 10 zones échantillonnées). Une superficie moyenne par résidence et par zone est estimée sur
la base d’estimations d’experts. Les impacts sur les installations touristiques ont été identifiés et
quantifiés par catégorie et nombre de chambres. Cependant il n’a pas été possible de les monétariser
faute de données cohérentes sur les bénéfices par chambres.
Q"C"A"A O+-*6+&>*+/=.-L8*+89(.
La monétarisation du service de protection contre la houle s’est basée sur une analyse de la
distribution géographique des zones à risques et des dommages potentiels. La distribution spatiale
de la valeur par commune reflète la densité et typologie d’habitats présents dans la zone de risque
évaluée.
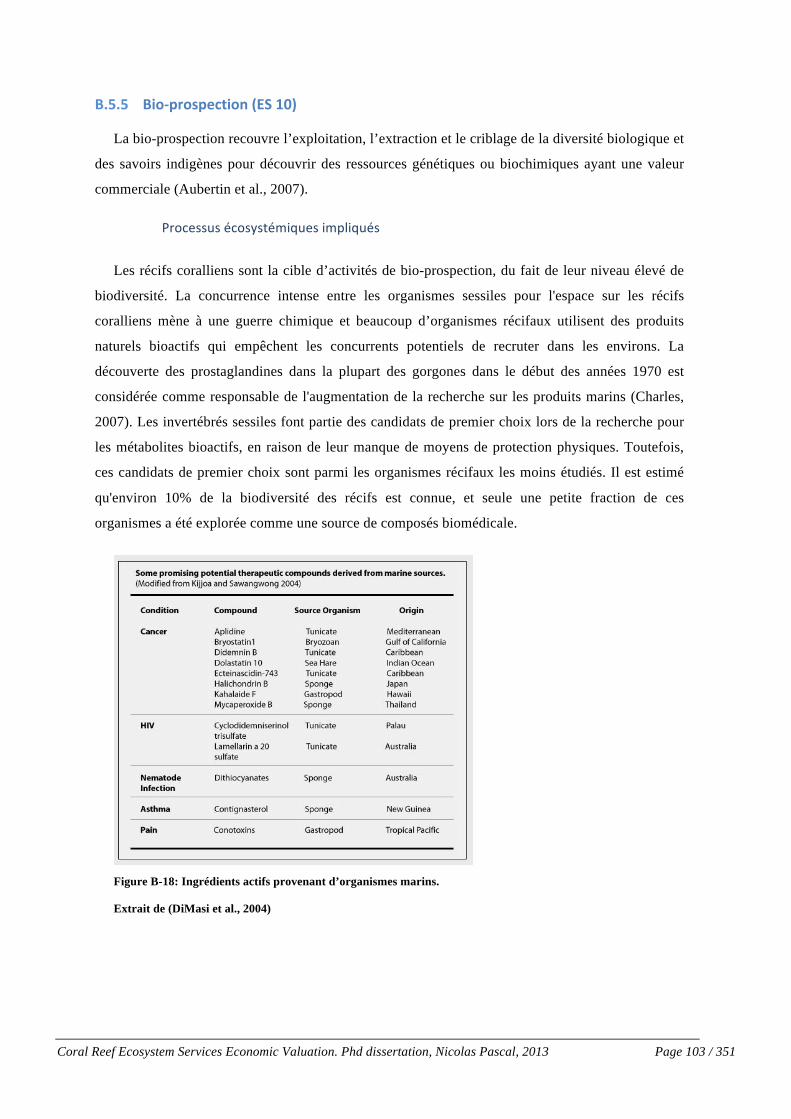
Coral Reef Ecosystem Services Economic Valuation. Phd dissertation, Nicolas Pascal, 2013 Page 103 / 351!
:N[N[ :(+G42+)4$6*(+"&e?@&O`f&
La bio-prospection recouvre l’exploitation, l’extraction et le criblage de la diversité biologique et
des savoirs indigènes pour découvrir des ressources génétiques ou biochimiques ayant une valeur
commerciale (Aubertin et al., 2007).
H4+2(##B#!72+#9#.7-$PB(#!$-,*$PB7#!
Les récifs coralliens sont la cible d’activités de bio-prospection, du fait de leur niveau élevé de
biodiversité. La concurrence intense entre les organismes sessiles pour l'espace sur les récifs
coralliens mène à une guerre chimique et beaucoup d’organismes récifaux utilisent des produits
naturels bioactifs qui empêchent les concurrents potentiels de recruter dans les environs. La
découverte des prostaglandines dans la plupart des gorgones dans le début des années 1970 est
considérée comme responsable de l'augmentation de la recherche sur les produits marins (Charles,
2007). Les invertébrés sessiles font partie des candidats de premier choix lors de la recherche pour
les métabolites bioactifs, en raison de leur manque de moyens de protection physiques. Toutefois,
ces candidats de premier choix sont parmi les organismes récifaux les moins étudiés. Il est estimé
qu'environ 10% de la biodiversité des récifs est connue, et seule une petite fraction de ces
organismes a été explorée comme une source de composés biomédicale.
Figure B-18: Ingrédients actifs provenant d’organismes marins.
Extrait de (DiMasi et al., 2004)

Coral Reef Ecosystem Services Economic Valuation. Phd dissertation, Nicolas Pascal, 2013 Page 104 / 351!
Au début des années 2000, plus de 30 médicaments dérivés d'espèces marines sont en examens
préclinique par des organisations de recherche privées et publiques, et par l'Institut national du
cancer (Mestel, 1999). À ce jour, la majorité des nouveaux composés ont été des métabolites
secondaires de corps mou, invertébrés sessiles, comme Porifera sp. (éponges), cnidaires (méduses,
coraux, anémones de mer) et Urochordata sp. (ascidies). La figure suivante présente les principaux
phyla marins utilisés. Les coraux sont aussi utilisés pour les greffes osseuses (Spurgeon, 2004).
Figure B-19: Composés marins par phyla (Extrait de (Hunt and Vincent, 2006)
"2.(B4#!$-,*$PB7#!
Le contrat entre un acteur privé et un Etat ou une communauté locale est la solution proposée par
la Convention sur la Diversité Biologique (CDB) pour encadrer juridiquement la bio-prospection et
assurer la conservation de la biodiversité. Les populations insulaires sont à la recherche de
mécanismes leur permettant de protéger leurs droits de propriété, et par lesquels elles peuvent en
tirer profit d'une manière durable. La Convention sur la diversité biologique définit le cadre légal
pour que les pays en développement soient protégés. Il y a une quinzaine d’années, la recherche
d’une molécule concernait seulement les laboratoires publics (instituts de recherche, faculté, etc.) et
les industriels exploitant les découvertes de recherche fondamentale. Aujourd’hui, les firmes ont
tendance à externaliser les coûts et activités de bio-prospection en les confiant à des intermédiaires
qui leur livrent des chimiotheques. Ainsi interviennent des firmes de courtage, des institutions du
secteur public (institut de recherche), des ONGs, des ethnobotanistes, etc.). C’est donc ce
fournisseur qui se charge de la négociation avec les parties intéressées. Plusieurs auteurs signalent
que l’apparition de cet intermédiaire coïncide avec le développement de la bio-piraterie (Aubertin et
al., 2007).
Article Bob Hunt and Amanda C. J. Vincent
Scale and Sustainability of MarineBioprospecting for Pharmaceuticals
Collecting marine organisms for the discovery and de-velopment of pharmaceuticals has been perceived vari-ously as sustaining and threatening conservation. Ourinitial expectations that marine bioprospecting might poseconservation challenges were largely not confirmed.Thousands of marine species have been collected forinitial assessment, but usually only in very small amounts.Very few compounds are sufficiently promising to provokere-collections, where volumes can be much larger. This iswhere conservation concerns may arise, particularly if theorganism is rare, has a restricted distribution, or istargeted in one narrow area. However, industry generallyseeks to avoid dependency on small populations, foreconomic as well as ecological reasons. Alternativesupply strategies to wild capture include synthesis andculture. Mandatory collection protocols and environmentalimpact (stock) assessments are useful routes for man-agement to achieve sustainable use where extraction isdesirable. In general, the scanty information availablesuggests that marine bioprospecting for pharmaceuticalsmay have minimal impacts on the environment, particu-larly compared with those created by other pressures.
INTRODUCTION
The use of wild plants and animals as medicinals has a longhistory (1, 2). In traditional Chinese medicine, for example,dried seahorses (Hippocampus spp.) have been prescribed forrespiratory problems and sexual dysfunction for at least 600years (3). In allopathic (Western) medicine, bioactive com-pounds are isolated from organisms and used to produce a widerange of pharmaceuticals (4–6). Indeed, most anticancer andantibacterial drugs approved by the US Food and DrugAdministration over the last 20 years are either based on, orderived from, natural products (7, 8).
Marine species have become of increasing interest tobioprospectors for Western medicinals. Over 14 000 newchemical entities have been identified from marine sources (9),and at least 300 patents have been issued on marine naturalproducts (10). The earliest known example of such explorationwas the 1950s discovery of spongothymidine and spongouridinefrom the sponge, Tethya crypta, which led to the development ofantiviral, anticancer, and anti-HIV drugs (4). Today, a newgeneration of marine-derived pharmaceuticals are set to enter themarket. Examples include a chronic pain treatment, Prialt(ziconitide)—which is based on a peptide isolated from the coneshell, Conus magnus (11)—and the anticancer drug Yondelis(ecteinascidin 743), from the ascidianEcteinascidia turbinata (12).
Bioprospecting for pharmaceuticals has been representedtypically as an environmentally benign form of resourcedevelopment that would simultaneously increase our under-standing of biodiversity (13) and help fund its conservation,especially in developing countries (14–16). It has been arguedthat developing nations with high marine biodiversity couldbenefit financially from granting access for bioprospecting andindirectly by building industry capacity through joint ventures.However, bioprospecting continues to generate considerable
debate. Critics dispute the idea that the commodification ofnature will contribute to conservation (17), or that naturalproducts have a future in the discovery of new drugs (18). Arelated controversy revolves around the allocation of benefitsbetween the traditional owners of the resource and the ownersof the intellectual property from drug discovery (19, 20).
The potential environmental impacts of marine bioprospect-ing are poorly understood. It would be ironic if the process ofbioprospecting, expected to facilitate conservation of biodiver-sity, actually reduced it. In terrestrial systems bioprospectingcollections have caused the decline of wild plant populations(21), such as the Pilocarpus spp., which are officially listed asthreatened in Brazil because of overexploitation of the leaves toproduce the drug pilocarpine (22). Although less is knownabout the marine environment, conservation concerns havebeen raised (23–25). Here we draw on our backgrounds inmarine conservation in reviewing current knowledge about thescale and potential consequences of marine bioprospecting forpharmaceuticals, as well as its management options. We use theterm ‘‘bioprospecting’’ broadly to refer to the collection ofmarine organisms for the discovery, development, and possiblecommercial supply of pharmaceuticals.
BACKGROUND
Many thousands of marine species have been collected in thehope of discovering novel bioactive compounds and fordeveloping pharmaceutical drugs (13, 26–29). Initial collectionsare typically broad and speculative to maximize the possibilityof discovering bioactive compounds (30). They tend, however,to focus on organisms containing chemicals, known assecondary metabolites, that primarily serve ecological functionsin competition for space and in protection from predation,fouling, and ultraviolet light (31). To date, the majority of novelcompounds have been secondary metabolites from soft-bodied,sessile invertebrates, such as Porifera (sponges); Cnidaria(jellyfish, corals, sea anemones); and Urochordata (ascidians).(Fig. 1). This pattern may, however, partly reflect the relativeease with which these taxa can be collected by hand on scubafrom popular (i.e., biodiverse, shallow, and warm) collectionhabitats such as coral reefs (D. Newman, Natural Products
Figure 1. Marine compounds grouped by phyla (84).
Ambio Vol. 35, No. 2, March 2006 57! Royal Swedish Academy of Sciences 2006http://www.ambio.kva.se

Coral Reef Ecosystem Services Economic Valuation. Phd dissertation, Nicolas Pascal, 2013 Page 105 / 351!
@+&.(D.(!6(!*j$&6B#.4$(!,<%4-%2(B.$PB(!
Dominé par les « bigpharmas », le secteur pharmaceutique est toujours à la recherche de
nouvelles molécules. L’objectif des bigpharmas est de cibler sur de nouveaux blockbusters
(médicaments dont le CA est supérieur à un milliard d’euros par an). Poursuivant cet objectif, 14
laboratoires (Pfizer, Glaxo, Sanofi-Aventis, Novartis,…) investissent entre 1 et 5 milliards de
dollars en 2002 en recherche et développement. Même si les bigpharmas subissent la concurrence
des génériques et la pression des Etats qui veulent réduire leur facture de santé, les
médicaments représentent un enjeu important de plus de 550 milliards de dollars de recettes. Les
sources des nouvelles substances développées par l’industrie sont diverses : dérivés biologiques,
substances naturelles, hemisynthèse, synthèse d’une molécule naturelle et molécule synthétique sans
origine naturelle. Entre 1981 et 2006, plus de 60% de ces nouvelles substances avaient une origine
naturelle. Ces dernières années, nombre d'infections bactériennes sont devenues de plus en plus
résistantes aux antibiotiques existants. Les scientifiques se tournent vers les océans à la recherche de
nouveaux traitements pour ces maladies et d'autres. Les laboratoires se concentrent aussi sur les
domaines les plus lucratifs (cancers, cardiovasculaires, troubles liés au vieillissement) pour lesquels
les extraits marins sont prometteurs.
'7)(*+,,(-(&.!6jB&!-76$2%-(&.!
Le développement d’un médicament passe par plusieurs étapes DiMasi réalise une description
précise des différentes étapes (DiMasi et al., 2004). En moyenne, il faut plus d'une décennie et
plusieurs centaines de millions de dollars pour mettre un nouveau médicament sur le marché. Les
valeurs maximum montrent que la recherche peut durer jusqu'à 15-20 ans et coûter jusqu'à 800
millions de dollars. Aussi, pour chaque nouveau traitement qui est homologué des milliers d'autres
sont abandonnés, soit parce qu'ils ont été jugés cliniquement inefficaces ou dangereux à des doses
thérapeutiques efficaces, soit parce que leur potentiel commercial n’est pas (ou plus) suffisant. Pour
les médicaments développés à partir de produits naturels, les premières étapes se composent
généralement de plusieurs années de recherche préclinique.
3+4-(#!6(!K$+>,4+#,(2.$+&!
Diverses techniques sont possibles par les acteurs: (i) l’exploitation par le prélèvement direct
dans le milieu (ii) production aquacole des organismes recherchés (iii) culture cellulaire (iv)
synthèse chimique en laboratoire (v) ingénierie génétique. Les techniques (i) et (ii) correspondent à

Coral Reef Ecosystem Services Economic Valuation. Phd dissertation, Nicolas Pascal, 2013 Page 106 / 351!
des techniques peu complexes et sont très peu utilisées pour des raisons de quantité de collecte
insuffisante, des coûts de collecte ou d’élevage trop élevés et des processus biologiques complexes
non contrôlés. Les autres solutions sont donc favorisées par l’industrie. En particulier et en l’état des
connaissances actuelles, la synthèse (et semi-synthèse) des molécules représente la technique la plus
utilisée. La sélection des molécules repose sur le criblage à haut-débit. Le criblage (screening)
consiste à réaliser un tamisage de très nombreuses substances par des tests discriminants et
prédictifs. La probabilité du heureux hasard a été augmentée grâce aux progrès technologiques. Le
criblage à haut débit permet aujourd’hui de tester un million d’échantillons par an sur 5 ou 6 cibles
différentes. Des bibliothèques de milliers de produits sont ainsi constituées et les activités de bio-
prospection enrichissent les chimiotheques. De grandes campagnes ont été relancées dans les années
90 (Fabre sur du moyen débit, National cancer institute) pour poursuivre cet objectif.
Les quantités prélevées dans le cadre de la bio-prospection pour le criblage sont dérisoires
(quelques kilos au maximum). Un seul spécimen ou échantillon par espèce peut parfois suffire car
ce sont avant tout les qualités génétiques et moléculaires des individus, des populations ou des
espèces qui sont prisées par les chercheurs. La vente d’échantillons en grand nombre pour le
criblage à haut débit est souvent présentée comme une source de financement potentiel pour les
laboratoires des pays du sud. Avec le criblage à haut-débit, la bio-prospection change d’image el les
substances naturelles prennent la forme de micro-organismes ou de produits de nano-
biotechnologies.
"2.$)$.7#!6(!K$+>,4+#,(2.$+&!
Il est difficile d’estimer directement le potentiel d’un récif en termes d’extraits collectés.
L’analyse des quelques rapports existants (Beurier et al., 2009; Hunt and Vincent, 2006; Newman
and Cragg, 2004)nous révèle les situations suivantes. La société pharmaceutique espagnole
PharmaMar dispose d'une bibliothèque d'environ 39.000 échantillons de macro-organismes marins,
dont environ 6.000 ont été recueillis en collaboration avec le New Zealand National Institute of
Water and Atmospheric Research. PharmaMar a identifié environ 150 composés anticancéreux à
partir de sa bibliothèque (dont 14 sont en essais précliniques et 4 en essais cliniques). L’US National
Cancer Institute (NCI) a traité 18.000 extraits marins entre 1975 et 1982 et, après une suspension de
son programme de produits naturels, a collecté de nouveau plus de 10 000 échantillons d'invertébrés
marins et d'algues. Ce total
comprend 4.000 à 6.000 échantillons provenant de la Grande Barrière de corail en
collaboration avec l'Institut australien des sciences marines (AIMS) de 1986 à 1992, et plus
récemment sur 4.000 échantillons à Palau avec la Coral Reef Research Foundation. En Australie,
l'AIMS a recueilli 6.000 autres échantillons avec Amrad Corp Ltd, et une collaboration entre
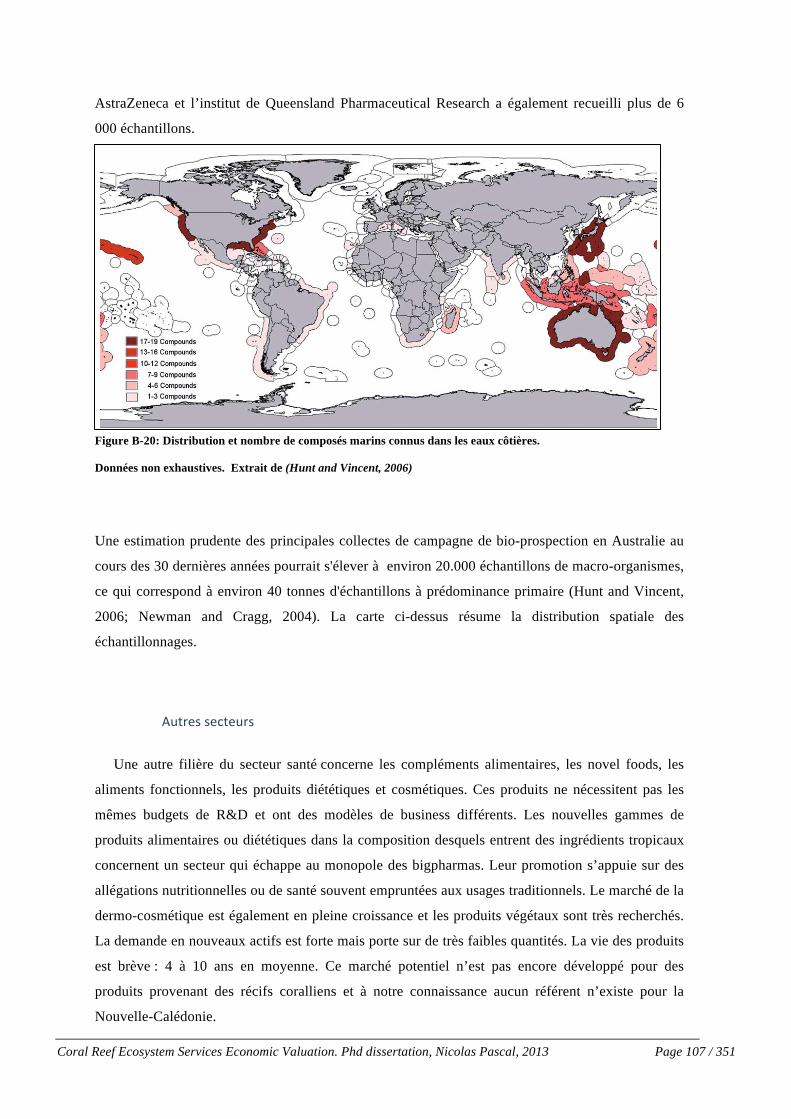
Coral Reef Ecosystem Services Economic Valuation. Phd dissertation, Nicolas Pascal, 2013 Page 107 / 351!
AstraZeneca et l’institut de Queensland Pharmaceutical Research a également recueilli plus de 6
000 échantillons.
Figure B-20: Distribution et nombre de composés marins connus dans les eaux côtières.
Données non exhaustives. Extrait de (Hunt and Vincent, 2006)
Une estimation prudente des principales collectes de campagne de bio-prospection en Australie au
cours des 30 dernières années pourrait s'élever à environ 20.000 échantillons de macro-organismes,
ce qui correspond à environ 40 tonnes d'échantillons à prédominance primaire (Hunt and Vincent,
2006; Newman and Cragg, 2004). La carte ci-dessus résume la distribution spatiale des
échantillonnages.
"B.4(#!#(2.(B4#!
Une autre filière du secteur santé concerne les compléments alimentaires, les novel foods, les
aliments fonctionnels, les produits diététiques et cosmétiques. Ces produits ne nécessitent pas les
mêmes budgets de R&D et ont des modèles de business différents. Les nouvelles gammes de
produits alimentaires ou diététiques dans la composition desquels entrent des ingrédients tropicaux
concernent un secteur qui échappe au monopole des bigpharmas. Leur promotion s’appuie sur des
allégations nutritionnelles ou de santé souvent empruntées aux usages traditionnels. Le marché de la
dermo-cosmétique est également en pleine croissance et les produits végétaux sont très recherchés.
La demande en nouveaux actifs est forte mais porte sur de très faibles quantités. La vie des produits
est brève : 4 à 10 ans en moyenne. Ce marché potentiel n’est pas encore développé pour des
produits provenant des récifs coralliens et à notre connaissance aucun référent n’existe pour la
Nouvelle-Calédonie.
Bioprospecting collections generally occur in two stages.Primary or initial collections remove small samples from each ofa large number of species, then seek to identify a hit, or possiblya lead. Sample sizes (per species) in primary collections appearto have declined significantly over the last 30 years because ofadvances in technology (e.g., miniaturization; 29, 32) andnatural products chemistry (1, 32). As one example, from 1974to 1981 the Roche Research Institute of Marine Pharmacologyin Sydney, Australia, required 10 kg (wet weight) samples toscreen, isolate, and determine a chemical structure (13, 29). Incontrast, some researchers in 2004 claimed to need only 100 g(13) with screening possible on amounts as small as 20–40 g orsingle specimens (P. Cronin, Principal Policy Officer, Queens-land Department of Primary Industries, Australia in litt., 20November 2003), although other collectors cite 0.5 to 1 kgsamples as being common (38, 39). If a hit or lead is identified,then secondary collection may ensue.
Samples in secondary collection (re-collections) can be muchlarger than in primary collections because i) the very lownatural concentrations of some compounds dictates theexploitation of large-scale wild harvests for bulk supply duringdevelopment (40), and ii) the structural complexity of bioactivecompounds can make industrial-scale synthesis difficult andpotentially uneconomic (39). The size of secondary collectionvaries with the concentration of a compound in the organism(usually 10!4 to 10!6, but can be as low as 10!9); type and scopeof tests; dosage required (to maximize efficacy and minimizetoxicity); solubility of the compound (J. Hooper, AdjunctProfessor, Natural Products Discovery, Griffith University,Australia in litt., 10 December 2003); availability of alternativesupply; and permit restrictions. In one secondary collection, in1988, 13 metric tons of the bryozoan Bugula neritina fromsouthern California yielded only 18 g of the anticancercompound bryostatin 1 for use in preclinical and clinical trials(38). At present, such large re-collections are argued to be‘‘technologically less likely’’ (13, p. 111), with much smalleramounts sometimes sufficing; for example, a 1.5 kg re-collectionof a sponge yielded over 100 mg of target compound, sufficientfor preclinical trials (13).
EXTENT OF BIOPROSPECTING
It is very difficult to gauge accurately the global extent ofmarine bioprospecting. Because protection of intellectualproperty is key in the pharmaceutical industry, most collectiondata are protected by confidentiality agreements betweenbioprospectors and the source country. Attempts by the authorsto acquire even coarse collection data [such as yearly collectiontotals by phylum for each national exclusive economic zone(EEZ)] from various research groups and pharmaceuticalcompanies have so far been largely unsuccessful. The UnitedNations Convention on the Law of the Sea recognizes nationalsovereignty over resources in the water and under the seabed inthe EEZ, an area extending 200 nautical miles from thecoastline. Our search of the marine pharmacology literaturerevealed only that marine collections were focused in countrieswith corals, reefs, and/or with active natural products researchprograms (41; Fig. 3).
We know that collection programs can be extensive. TheSpanish pharmaceutical company PharmaMar has a ‘‘library’’of approximately 39 000 samples of marine macroorganisms(28), about 6 000 of which were collected in collaboration withthe New Zealand National Institute of Water and AtmosphericResearch and the University of Canterbury, New Zealand (30).The US National Cancer Institute (NCI) processed 18 000marine extracts between 1975 and 1982 (26) and, after a 4-ysuspension of its natural products program, collected a further10 000 samples of marine invertebrates and algae (27). This totalincludes 4 000–6 000 samples from the Great Barrier Reef inconjunction with the Australian Institute of Marine Science(AIMS) from 1986 to 1992, and more recently about 4 000samples in Palau with the Coral Reef Research Foundation (27,42). In Australia, AIMS has collected another 6 000 sampleswith Amrad Corp. Ltd., and an AstraZeneca/QueenslandPharmaceutical Research Institute collaboration has alsocollected another 6 000 samples (29, 42). This list is certainlynot exhaustive, as many other significant collectors operatefrom North America, Europe, and Asia.
Figure 3. Distribution and number of known novel marine compounds in coastal waters. The origin [recorded as national exclusive economiczone (EEZ)] and number of novel marine compounds sampled from the published literature (American Chemical Society database) are usedas surrogates for location and relative intensity of bioprospecting activity. The data used are not exhaustive.
Ambio Vol. 35, No. 2, March 2006 59! Royal Swedish Academy of Sciences 2006http://www.ambio.kva.se
Coral Reef Ecosystem Services Economic Valuation. Phd dissertation, Nicolas Pascal, 2013 Page 108 / 351!
J+&7.%4$#%.$+&!=$&%&2$X4(!
Il s’agit de monétariser une activité qui n’est pas présente sur la Nouvelle-Calédonie. Nous nous
attacherons à déterminer le potentiel économique (chiffre d’affaires et valeur ajoutée) que peuvent
représenter des contrats de bio-prospection entre un acteur privé et les institutions publiques. Notre
exercice de monétarisation se centre sur des contrats potentiels de bio-prospection de screening
(échantillonnages) plus rentables et plus probables que des contrats d’exploitation.
Les programmes de bio-prospection ont des résultats par nature aléatoire et leur projection
économique doit incorporer les incertitudes. Le moyen le plus évident de refléter les incertitudes est
de se baser sur des transactions réelles entre les acteurs et utiliser les prix des transactions. En effet,
selon la théorie économique néo-libérale, les prix de transaction doivent refléter toutes les
informations disponibles sur le marché. Cependant la réalité des contrats de bio-prospection est très
différente pour plusieurs aspects :
(i) d’un côté, les pouvoirs publics et communautés locales manquent d’information quant aux
finalités et retombées potentielles de la recherche. Les contrats sont aussi souvent conclus dans des
environnements légaux inexistants (Beurier et al., 2009). Ceci favorise les comportements
opportunistes où les acteurs tirent bénéfices de leur information (aléa moral). Les coûts de
transaction sont alors élevés (Aubertin et al., 2007).
(ii) De même, certains contrats s’accompagnent aussi de transactions non-marchandes (transfert
technologie, formations,…) qui sont plus difficiles à monétariser.
(iii) D’autre part, il existe peu d’informations fiables sur ces transactions. Les transactions entre
fournisseurs locaux et les acheteurs sont discrètes. Les clauses de confidentialité apportent une
grande opacité entourant les sources d’approvisionnement, les quantités utilisées ou les prix
pratiqués.
(iv) La représentativité des rares contrats rendus publics est aussi questionnable (une des parties
pouvant chercher une notoriété à partir d’un contrat exceptionnel ou encore vouloir dénoncer une
biopiraterie) (Beurier et al., 2009).
En conclusion les transactions réelles, quand disponibles, sont peu fiables pour estimer le
potentiel d’un contrat générique de bio-prospection. Un modèle sous forme de fonction de
production a été développé.

Coral Reef Ecosystem Services Economic Valuation. Phd dissertation, Nicolas Pascal, 2013 Page 109 / 351!
Service Méthode
d’évaluation
Quantification du
service Monétarisation
Bio-
prospection
Fonction de
production sur le
revenu potentiel des
contrats de bio-
prospection
Nombre d’échantillons
maximums prélevés
Taux de succès de
découverte (hit
success)
Estimations des revenus et
bénéfices potentiels des
médicaments pour l’industrie
Estimations des prix des
échantillons
Estimations des paiements de
royalties et de droits
d’échantillonnage
Tableau B-19: Méthode de monétarisation du service de bio-prospection
'7)(*+,,(-(&.!6B!-+6X*(!d!!
L’objectif est d’estimer les revenus potentiels que la Nouvelle-Calédonie et les acteurs locaux
pourraient retirer des contrats de bio-prospection de criblage à haut-débit. Les accords de rétribution
économique inclus dans ces contrats peuvent prendre trois formes de paiement qui se combinent
généralement entre elles:
• le paiement de royalties (sur les ventes du médicament pendant sa durée de vie
commerciale)
• le paiement de droits par échantillons prélevés (au moment de la collecte).
• la mise en place de bénéfices non-marchands (formation, transfert de technologies,…)
Chacune de ces formes a sa propre complexité légale et les modes de calculs peuvent devenir
compliqués. Pour le modèle de monétarisation, nous choisirons une forme simplifiée de calcul sur
les deux premières formes de paiements. Le modèle proposé repose (i) sur une estimation des
revenus et bénéfices potentiels des médicaments pour l’industrie pour déduire ensuite les potentiels
prix des échantillons et, (ii) sur des estimations des paiements de royalties et de droits
d’échantillonnage. Le modèle intègre (i) les projections de revenus et bénéfices par médicament, (ii)
les coûts de bio-prospection locales, (iii) les coûts institutionnels associés au contrat de bio-
prospection et, (iv) les taux de succès de découverte (hit success) d’une substance commercialement

Coral Reef Ecosystem Services Economic Valuation. Phd dissertation, Nicolas Pascal, 2013 Page 110 / 351!
intéressante. Il simule le développement d’un programme hypothétique de bio-prospection en se
basant sur les protocoles de différents instituts (Inbio, National Cancer Insitute).
Il se base sur le développement d’une méthodologie spécifique adaptée au contexte marin de
Nouvelle Calédonie. Plusieurs auteurs ont proposé des modèles avec différentes approches pour
évaluer les revenus de l’industrie pharmaceutique par médicament. (DiMasi et al., 2003; Grabowski
et al., 2002; Hunt and Vincent, 2006; Ruitenbeek and Cartier, 1999; Simpson and Sedjo, 1996).
(Pour une description des différents modèles ainsi que leur évolution, les travaux de Ruitenbeek et
Cartier (1999) sont une référence). La majorité des études ne traitent pas directement de l’activité de
bio-prospection et, mise à part Ruitenbeek et Cartier (1999) aucune recherche, à notre connaissance,
ne concerne les récifs coralliens ou même le milieu marin.
J7.<+6(!
La valeur ajoutée des contrats potentiels de bio-prospection prend la forme suivante :
VAl = CA * ry + f * Nt – I
CA = !t CAt*(1+r)^-t * p
avec :
CA : Valeur actualisée annuelle du chiffre d’affaire d’un médicament par échantillon (Nt)
p : Taux de succès de découverte (hit success) par échantillon prélevé.
Nt : nombre d’échantillons maximums prélevés pendant une période de t années
CAt : Chiffre d’affaire moyen par année (t) d’un médicament pendant sa durée de vie
commerciale.
r: Taux d’actualisation de l’industrie pharmaceutique
C#.$-%.$+&!6(#!,%4%-X.4(#!!
Les paramètres sont estimés à partir des sources suivantes: (i) avis d’experts consultés ; (ii)
Rapports et articles scientifiques (Aubertin et al., 2007; DiMasi et al., 2004; Haygood and
Davidson, 1997; Hunt and Vincent, 2006; McLaughlin, 2003; Newman and Cragg, 2004;

Coral Reef Ecosystem Services Economic Valuation. Phd dissertation, Nicolas Pascal, 2013 Page 111 / 351!
Ruitenbeek and Cartier, 1999; Simpson and Sedjo, 1996) et (iii) bilans financiers des entreprises
impliquées.
Les paramètres ont été estimé de la manière suivante :
- Le taux de succès de découverte (hit success) est une probabilité de développer
commercialement un médicament depuis un échantillon. Différents travaux montrent qu’elle se
situe entre 1/80.000 et 1/30.000 (Newman and Cragg, 2004; Ruitenbeek and Cartier, 1999).
- L’estimation du nombre d’échantillons maximums prélevés pendant une période de t années se
base sur les différentes techniques de collecte (scuba, techniques submersibles,…). Le potentiel
de collecte évolue entre 3.000 et 5.000 échantillons par an (Newman and Cragg, 2004;
Ruitenbeek and Cartier, 1999).
- Le coût moyen par échantillon se base sur des campagnes réalisées sur les Caraïbes et sur les
avis d’experts du Pacifique sud. Il couvre les frais directs de collecte, de transport et de stockage.
Le modèle privilégie les collectes à travers de plongeurs contre l’usage de submersibles
beaucoup plus couteuses. Le coût moyen se situe entre 75 " et 500 " par échantillon collecté.
- Différents travaux ont permis d’estimer les chiffres d’affaires annuels moyens par médicament
entre 250 et 380 Millions et la valeur du bénéfice net moyen entre 48 et 72 Millions d’euros par
an dans les années 2000.
- L’estimation des droits et royalties standards est plus complexe du fait de l’opacité des contrats
rendus publics et de l’hétérogénéité des différents accords. Un choix a été fait sur la base de
différentes sources. Les droits à payer par échantillons (valeurs fixes) sont fixés entre 100" et
250" par échantillon et les royalties (variables suivant le succès commercial) entre 2% et 4% des
ventes du médicament.
- Les royalties ont été calculées sur des valeurs actualisées de chiffre d’affaires sur la durée de vie
commerciale du médicament en reflétant sa probabilité de succès suivant le nombre
d’échantillons réalisés.
- Il a été considéré que l’activité de collecte d’échantillons corresponde à une création de richesse
pour une entreprise ou un institut local. Sur son chiffre d’affaire, un taux moyen de VA
industriel a été appliqué.
Il s’agit en général de valeurs moyennes appliquées aux différents paramètres ne reflétant pas
l’hétérogénéité entre les familles de médicaments et entre les médicaments mêmes (cas des
« blockbuster » finançant les autres médicaments).

Coral Reef Ecosystem Services Economic Valuation. Phd dissertation, Nicolas Pascal, 2013 Page 112 / 351!
Tableau B-20: Valeurs des paramètres utilisées pour le service de bio-prospection
Une projection des flux financiers sur 15 ans incorporant le cycle de vie du produit est réalisée.
Ce flux a ensuite été actualisé avec un taux d’actualisation (r=5%) recommandé comme coût de
capital pour les analyses industrielles (Centre d’Analyse Stratégique, 2009). Les coûts
institutionnels représentent le coût local nécessaire pour assurer le suivi et contrôle des compromis
générés par les contrats. Il s’agit de prévisions de dépenses pour les besoins des institutions qui sont
fondées sur des discussions avec les représentants des provinces, après une évaluation des capacités
locales administratives. En se basant sur les échelles de salaire actuel, les frais généraux et les
exigences de formation, les coûts annuels institutionnels sont estimés. Ils représentent les dépenses
générées par la gestion des contrats de bio-prospection.
Des analyses de sensibilité du modèle seront testées afin d’identifier les paramètres les plus
critiques.
min max
Probabilité de succés (hit success) 0,0013% 0,0033%
Nombres d'echantillons collectés pendant l'année t 3 000 5 000
Chiffres d'affaires annuel par médicament (!) 400 000 000 580 000 000
Benefice net annuel par medicament (!) 76 000 000 110 200 000
Cout R&D total (!) 380 000 000 527 000 000
Durée R&D (années) 8 8
Durée de vie commerciale (années) 20 20
Taux d'actualisation 5% 5%
Valeur actualisée des ventes sur la durée de vie (!) 5 003 931 756 7 255 701 046
Valeur actualisée des benefices sur la durée de vie (!) 950 747 034 1 378 583 199
Coûs de collecte par echantillons (!) 75 250
Droits à payer par echantillons (!) 100 250
Coûts institutionnels (!) 33 000 49 500
Royalties (% du Chiffre d'affaires) 2% 4%

Coral Reef Ecosystem Services Economic Valuation. Phd dissertation, Nicolas Pascal, 2013 Page 113 / 351!
:N[N\ A(Y0$&#$&=CS&e?@&OOf&
'(#24$,.$+&!!
Les écosystèmes côtiers éliminent le CO2 de l'atmosphère via la photosynthèse, en retournent
une partie à l'atmosphère via la respiration et l'oxydation et stockent le carbone restant dans deux
stocks: la biomasse vivante (qui comprend à la fois la végétation aérienne et souterraine) et le
carbone organique du sol (Knowlton, 2000). Le taux de séquestration du carbone quantifie la
quantité annuelle de carbone qui est ajoutée à la biomasse et aux bassins de carbone du sous-sol.
Pour des écosystèmes intacts, la végétation mature maintient une biomasse vivante constante et
pratiquement toute la séquestration finit enterrée dans le stock de carbone du sous-sol. Ce taux est
supposé être constant dans le temps (Duarte and Middleburg, 2005; Jennerjahn and Ittekkot, 2002;
Suzuki and Kawahata, 2004).
Bien que les récifs jouent un rôle important dans le budget de carbone, contribuant entre un 7 et
15 pour cent de la production mondiale de carbonate de calcium, ils ne semblent pas contribuer à la
séquestration du carbone. Les carbonates sédimentaires, dont les coraux, les algues coralliennes et
les coquilles d'autres organismes marins, sont le plus grand réservoir de carbone sur Terre, et c’est
pourquoi les fluctuations du budget de carbonate de calcium mondial influent sur la concentration
atmosphérique de dioxyde de carbone. Toutefois, la chimie du système est telle que, bien que les
océans eux-mêmes sont un «puits» de carbone (c'est à dire qu'ils absorbent le dioxyde de carbone),
les récifs, par le processus de calcification, sont des «sources» ou des producteurs nets de dioxyde
de carbone à une échelle très réduite au niveau mondial (Suzuki and Kawahata, 2004). Des modèles
et des données de terrain limitées indiquent que les récifs coralliens semblent être des très petites
sources nettes d’émissions de dioxyde de carbone à l'atmosphère sur des échelles décennales (moins
de 0,1 milliards de tonnes de carbone par année, comparativement à environ 6 milliards de tonnes de
carbone par an provenant de la combustion de combustibles fossiles). Cela est dû à la libération de
dioxyde de carbone lors de la calcification, ce qui implique la précipitation du carbonate de calcium,
du bicarbonate et du calcium dans l'eau salée. En outre, alors que les récifs coralliens absorbent de
grandes quantités de dioxyde de carbone (par unité de surface) au cours de la photosynthèse, elles
rejettent généralement des montants presque équivalents par la respiration, entraînant peu de
stockage net.
Deux écosystèmes sont alors analysés: les mangroves et les herbiers. Selon des publications
récentes (Murray et al., 2010; Sifleet et al., 2011), les taux minimum et maximum de séquestration
de carbone peuvent être estimés sur la base de compilations de nombreuses études. Ainsi, pour les
mangroves , des variations entre 0,12 et 13,97 t .CO2eq. ha-1 y-1 sont calculées. Le carbone du sol
représente cependant le principal stock de carbone (de 1040 à 1800 tCO2 eq ha-1) pour les

Coral Reef Ecosystem Services Economic Valuation. Phd dissertation, Nicolas Pascal, 2013 Page 114 / 351!
mangroves. La quantité de ce stock reléguable dans l’atmosphère est estimée à partir de la
profondeur des impacts potentiels que peuvent subir les mangroves (20% de leur profondeur). Le
tableau suivant présente les résultats pour ces écosystèmes côtiers.
En Nouvelle-Calédonie, la mangrove représente plus de 25 800 Ha (Virly 2008). Elle est
particulièrement développée sur la côte ouest (88% des mangroves).
Les herbiers de phanérogames marines occupent une part importante des fonds de lagon de la
Nouvelle-Calédonie, notamment le long de la côte ouest et à un moindre degré le long de la côte est.
Selon la cartographie des herbiers peu profonds (0-5 m) réalisée par Andréfouët et ses
collaborateurs, les herbiers denses à diffus (clairement visibles sur l’imagerie Landsat) occuperaient
40.000 ha sur les zones sédimentaires. Une estimation des zones d’herbiers très diffus porterait ces
surfaces à 93.635 ha. (Hily et al., 2010).
Tableau B-21: Principaux paramètres utilisés pour le service de séquestration du carbone
(Duarte and Middleburg, 2005; Jennerjahn and Ittekkot, 2002; Murray et al., 2010; Sifleet et al., 2011)
J+&7.%4$#%.$+&!
Pour le calcul de ce service, nous nous baserons sur les 2 processus: la séquestration sous forme
de biomasse vivante et celle effectuée dans les bassins de carbone du sous-sol. Le résultat sera la
quantité annuelle de CO2 eq qui sera évitée d’être rejetée dans l’atmosphère en maintenant les
écosystèmes dans leur superficie actuelle.
En s’appuyant sur la méthodologie développée par différents auteurs (Murray et al., 2010; Sifleet et
al., 2011), les différents paramètres estimés sont :
a. Taux d’absorption annuel du carbone par l’écosystème dans son état actuel
b. Les stocks de carbone dans la biomasse et le sous-sol a 1 m de profondeur maximale comme
quantité reléguable dans l’atmosphère (appelés encore réduction d’émission)
c. La quantité d’émissions potentielles de gaz à effet de serre et changement climatique
provenant de la destruction des écosystèmes
!"#$%&'('$)*+,- .'/ .,0 !12"$34%1)5,/3)6$)376)
8",/4'41)%$6,%9",:6$)5,/3)6;,4.73#<=%$
>,/9%7?$3 !"### #$%! %&$'( %)"** &%*
+$%:'$%3 +#### ,'$+ "#$!! # #
@4,/93)3,613 # &$" -$( %)'#! &*#
!"#$% &'(((
4)ABC$2D)EFGD)<,FG 4)ABC$2D))<,FG

Coral Reef Ecosystem Services Economic Valuation. Phd dissertation, Nicolas Pascal, 2013 Page 115 / 351!
La valeur monétaire est le produit de la quantité annuelle de t CO2 eq par une projection des prix
par unité de réduction d’émission (" t-1 CO2eq).
SCe = !e ((Te + Qe)* Prixt (tCo2eq)))
Avec :
SCe : Valeur annuelle de séquestration de t CO2 eq par écosystème (e)
Te : Taux d’absorption annuel du carbone par écosystème (e)
Qe,t: quantité annuelles d’émissions potentielles de gaz à effet de serre et changement climatique
provenant de la destruction des écosystèmes (e)
Prixt (tCo2eq) : prix par unité de réduction d’émission
L’estimation du prix par unité de réduction d’émission s’est basée sur l’analyse historique des
transactions des EUA (European Union Allowances) sur la place de marché européenne ECX
(European Climate Exchange). Ces transactions sous la forme d’EU ETS (European Union
Emissions Trading System) ou de Kyoto–CER (Certified Emissions Reduction) ont représenté en
2010 plus de 80% des transactions sur les marchés mondiaux du carbone (12 000Mt Co2 eq. depuis
2006). Le reste a correspondu à des opérations volontaires de vente de crédits carbone sur d’autres
places de marchés ou directement entre fournisseurs et acheteurs (www.carbon-investments.co.uk).
Un prix moyen pour 2009 de 15"/t avec une évolution a été estimée sur la base des résultats d’une
enquête conduite par Point Carbon auprès de 1300 acteurs intervenants sur les marchés du carbone
(Point Carbon, 2010).
Tableau B-22: Prix du marché EU—ETS , 2004-2009. Prix au 30/12/11: 6,70!/t
Source: Point Carbon
3
Carbon 2010
All rights reserved © 2010 Point Carbon
Figure 2.1: Prices in the EU ETS, 2004-present Front year contracts for phase 1 and phase 2
0
8
16
24
32
1/12/04 18/11/05 09/11/06 02/11/07 24/10/08 19/10/09
!/ t
onne
EUA phase 1 EUA phase 2
Source: Point Carbon
Figure 2.2: Monthly EUA volumesOTC and exchanges, 2004-present
500
600
400
500
Exchanges OTC
200
300
CO
2e
0
100
Mt
0
Dec 04 Dec 05 Dec 06 Dec 07 Dec 08 Dec 09
Source: Point Carbon

Coral Reef Ecosystem Services Economic Valuation. Phd dissertation, Nicolas Pascal, 2013 Page 116 / 351!
Il est important de remarquer qu’il n’existe pas d’historique sur des transactions de crédits
carbone portant sur des écosystèmes de mangroves et d’herbiers (Murray et al., 2010). Le concept
de « blue carbon » est dans une phase préliminaire de conception et des adaptations pour les
mangroves sont en cours d’implémentation en 2012. En particulier l’assimilation des mangroves à
des écosystèmes forestiers leur permettent de rentrer dans le programme REDD+ (Reducing
Emissions from Deforestation and Forest Degradation in Developing Countries) mené par les
Nations Unies.
Les valeurs obtenues par l’exercice de monétarisation sont alors des valeurs d’option car elles ne
correspondent pas à une réalité de marché en 2009. De même, la volatilité des prix des transactions
ainsi que les écarts importants dans les taux de séquestration de carbone crée des résultats
contradictoires sur ce service (séquestration ou émission dans certains cas). Le service ne portant
pas sur les écosystèmes coralliens, nous nous contenterons de communiquer les valeurs estimées du
service de séquestration rendu par les mangroves et les herbiers sans les inclure dans les résultats
consolidés.
:N[N] 81*2$)&)$2P(6$)&WP-/1W)&&
Q"C"H"# 74)9(.B(-.=>*6+(=*-.
Selon Moberg et al (1999) le cycle des éléments nutrients favorise la productivité, y compris la
productivité de la pêche, en mettant à disposition les nutrients nécessaires à tous les niveaux de la
chaîne alimentaire. Pour les eaux côtières, les systèmes benthiques sont une source importante de
nutriments pour les eaux sus-jacentes et il est estimé qu’ils peuvent fournir jusqu'à 100% des
éléments nutritifs de la productivité totale utilisée dans la colonne d'eau (Sundbäck et al., 2003). Ce
«couplage benthique-pélagique» joue un rôle majeur dans la détermination de la production et la
structure biologique des systèmes pélagiques. Les nutrients régénérés stimulent la production
bactérienne pélagique et le phytoplancton, qui stimule la production du zooplancton et cela perpétue
la chaîne alimentaire influençant finalement la pêche et autres services. Il s’agit donc d’un processus
écosystémique lié à des services que nous avons analysés antérieurement (pêche et tourisme).
Q"C"H"$ NRB+)85(=*-.(*.-8,/+6-.*68B+*+/==(9-..
Cette partie traite des services de connaissances sur les médicaments et savoirs traditionnels
générés par l’existence des récifs. Il s’agit ainsi de l’utilisation d’organismes marins pour la
pharmacopée traditionnelle et du support aux savoirs traditionnels. Les plantes d’usage traditionnel
relevant des pharmacopées traditionnelles représentent une forme de phytomedicament qui échappe
au circuit officiel. Les plantes médicinales contribuent à répondre aux besoins de santé des
populations locales. Plus de 1.000 espèces sont utilisées comme plantes médicinales en chine et
n’entrent pas dans les statistiques officielles. On assiste aussi à un retour à l’automédication par les

Coral Reef Ecosystem Services Economic Valuation. Phd dissertation, Nicolas Pascal, 2013 Page 117 / 351!
plantes dans les pays développés (médecine alternative). La majorité des ressources utilisées sont
cependant d’origine européenne. Certains écrits datant du Moyen Age montrent que les habitants du
littoral ont récolté des algues à des fins médicinales, ainsi que pour l'alimentation et autres
utilisations. Certains chercheurs pensent cependant que le stock d’informations ethnobotaniques
n’est pas renouvelable et que l’essentiel des savoirs locaux utiles a déjà été adapté et transposé dans
la médecine occidentale (Aubertin et al. 2007). Les savoirs locaux continuent cependant d’intéresser
la recherche. Les partisans de la méthode ethnopharmacologique soulignent que cette méthode
augmente les chances de découvrir des substances actives.
La reconnaissance et la rémunération des médicaments et savoirs traditionnels font l’objet
d’amples débats (reconnaissance des droits, souveraineté, détenteurs du savoir, définition du
« Traditional Ecological Knowledge (TEK), etc.). En 1984 a été promulgué l’Aboriginal and Torres
Strait Islander Heritage Protection Act qui protège les sites et objets sacrés d’Australie. Selon les
termes de ce jugement qui reconnait aux premiers arrivants leur occupation des terres de longue date
et leur accorde des titre de propriété, la terre est indissociable des autres aspects de la culture (idées,
styles de dessin, rituels et espèces animales et végétales). L’élaboration de systèmes adaptés à la
promotion et à la valorisation des savoirs détenus par les communautés autochtones ou locales est
un exercice technocratique lourd.
La valorisation de ce service écosystémique apparaît comme un exercice difficile. Une partie est
considérée sous d’autres services déjà valorisés (bio-prospection) tandis que d’autres aspects ne
disposent d’aucun référent de transaction ou de quantification. A notre connaissance, aucun modèle
ou valorisation de ce service de connaissance a été développé.

Coral Reef Ecosystem Services Economic Valuation. Phd dissertation, Nicolas Pascal, 2013 Page 118 / 351!
:N\ 5W)1/*-*)&
:N\NO =+")+/(#W)&
Les résultats consolidés des différents services (valeurs en euros, 2009) sont résumés dans le
tableau et les graphes suivants.
La valeur financière consolidée pour tous les services est estimée entre 194 et 328 millions
d’euros par an. Le service le plus important en terme économique à l’échelle du territoire est celui
de la protection du littoral contre la houle puisqu’il représente les 2/3 de la valeur totale. Il est suivi
par la pêche (20% de la valeur totale) et le tourisme (10%).
Nous observons le poids important de la protection contre la houle (ES 9) comme principal
service écosystémique généré par les écosystèmes coralliens. L’écart important entre les valeurs
minimum et maximum reflète les incertitudes sans remettre en cause son importance comme
premier service écosystémique. Ce service passif qui ne fait l’objet d’aucune transaction par un
marché ne représente pas cependant une création directe de richesse pour la collectivité de
Nouvelle-Calédonie. C’est une valeur de support indirect comme l’indique sa classification comme
service d’usage indirect.
Si nous nous centrons sur les flux financiers réels comptabilisables dans les calculs du PIB de la
Nouvelle-Calédonie (services d’usages directs), les processus et services écosystémiques des récifs
créent une richesse sur le territoire qui varie entre 78 et 104 M" par an. La pêche occupe la première
place (70% env.), suivie du tourisme (28%) et la recherche et éducation. Le poids de la pêche de
loisir (ES2) et vivrière (ES3) est important (27% et 22% respectivement). Pour les services d’usages
directs, le principal service est celui de la pêche non-commerciale (ES 2 et 3) alors que la pêche
commerciale (déclarée et non déclarée) (ES 1) représente moins du tiers de la valeur de la pêche
totale. Ceci reflète le contexte socio-culturel des activités de pêche récifo-lagonaire qui échappe à
toute forme de suivis et monétarisation officielle. Le faible poids du tourisme est notable et met en
évidence l’état de développement de cette filière sur le territoire considérée comme peu prioritaire
jusqu'à aujourd’hui du fait du modèle économique de la Nouvelle-Calédonie.
L’exercice de monétarisation de la bio-prospection présente un résultat avec une forte variabilité
(écart important entre les valeurs minimum et maximum). En effet, la prise en compte de la
probabilité de succès réduit fortement les avantages pour le pays en termes de royalties sur les
ventes du futur médicament. L’autre service d’usage indirect de support aux budgets de recherche et
éducation est important mais son poids n’est pas dominant dans le total des services. Il est notable

Coral Reef Ecosystem Services Economic Valuation. Phd dissertation, Nicolas Pascal, 2013 Page 119 / 351!
qu’il ait une valeur similaire à celle des dépenses en hébergement, transport et alimentation des
résidents usagers des récifs.
Tableau B-23: Valeur financière totale des services écosystémiques des récifs coralliens de Nouvelle-Calédonie.
Pêche commerciale (ES1)
Pêche vivrière (ES2)
Pêche de loisir (ES3)
Autres pêches (ES4)
Sous-total du service de la pêche
Plongée sous-marine (ES5)
Tourisme nautique (ES6)
Nautisme de plaisance (hors pêche loisir) (ES7)
Tourisme non-résident (ES 5 et 6)
Tourisme résident (ES 5 et 6)
Sous-total du service du tourisme
Recherche et éducation (ES 8)
Valeur totale des services d'usages directs
Protection du littoral (ES 9)
Bio-prospection (ES 10)
Valeur totale des services d'usages indirects et d'options
Valeur financiére totale des services ecosystémiques
min max min max
14,4 20,3 2 928 4 119
16,4 22,7 3 321 4 607
19,6 27,1 3 981 5 506
1,4 2,0 290 411
51,8 72,1 10 519 14 644
1,3 1,8 270 365
1,6 2,2 323 437
5,4 5,6 1 104 1 140
11,9 14,2 2 418 2 881
3,5 4,6 716 932
23,8 28,3 4 831 5 755
2,8 3,5 578 706
78,4 103,9 15 928 21 105
115,0 219,4 23 369 44 575
0,6 4,4 120 887
115,6 223,8 23 488 45 462
194 328 39 416 66 568
VA (M !) VA (!.km-2.an-1)

Coral Reef Ecosystem Services Economic Valuation. Phd dissertation, Nicolas Pascal, 2013 Page 120 / 351!
Figure B-21: Distribution de la valeur financière des services d’usages directs (ES1 à ES8) des récifs coralliens
de Nouvelle-Calédonie (estimations maximales)
Figure B-22: Distribution de la valeurs financière totale des services écosystémiques des récifs coralliens de
Nouvelle-Calédonie (estimations maximales).
De manière générale, les résultats reproduisent certaines des spécificités de la Nouvelle–
Calédonie qui est de présenter des aspects de pays « développés » (poids du tertiaire, PIB/habitant)
avec ceux de pays en développement (activités primaires minières, économie non-marchande).
!"#$%&#'((%)#*+,%&-./01&234&
!"#$%&5*5)*6)%&-./21&224&
!"#$%&7%&,'*8*)&-./91&2:4&
;<=)%8&>"#$%8&-./?1&24&
!,'@AB%&8'<8C(+)*@%&-./D1&24&
E+<F8(%&>,+*8+@#%&&!"#$"%&'()*+%
G4&
E+<F8(%&7%&>,+*8+@#%&-$')8&>"#$%&,'*8*)1&-./G1&
D4&
H'<)*8(%&@'@C)B8*7%@=&-./&D&%=&:1&0?4&
H'<)*8(%&)B8*7%@=&-./&D&%=&:1&?4&
I%#$%)#$%&%=&B7<#+F'@&-./&J1&94&
!"#$%&"'("')*'+,&-"'./!0'*'/!12'334'
!"#$%&"'(5'675#%89"'"6'"(5&*:7;'./!<'='/!>2'
?4'
@"&-"#&-"'"6'A(5&*:7;'./!>2'04'
B#76"&:7;'(5')%C7#*)'./!?2'DE4'
F%7G+#78+"&:7;'./!'0H2'04'

Coral Reef Ecosystem Services Economic Valuation. Phd dissertation, Nicolas Pascal, 2013 Page 121 / 351!
Le résultat sur la valeur des captures de la pêche illustre cette observation. Nous avons d’un côté
des captures de pêche de loisir estimées à un coût de revient de pratiquement 1.200 Fcfp par kg de
poissons pêché contre une valeur d’environ 100 Fcfp par kg de pêche de subsistance.
De même la coexistence de diverses cultures a entrainé la nécessité de valoriser les services des
écosystèmes de différentes manières pour refléter les différents types de valeur (marchande,
échange, sacré, culturelle, etc.). Nous nous sommes attachés à représenter seulement certains de ces
aspects. L’utilisation d’un facteur de pondération sur la pêche vivrière pour refléter la non-
substituabilité de l’activité pour une partie de la population ainsi que son importance pour le
maintien des femmes en tribu en est un exemple.
'$#.4$KB.$+&!#,%.$%*(!
La carte F.3-1 (en annexe nº3) présente la distribution spatiale de la valeur ajoutée totale estimée
des services écosystémiques. Le poids de la protection contre la houle dans le total apparait
clairement par la concentration des valeurs maximales autour des centres urbains. Nous pouvons
remarquer que, mis à part 2 communes, les récifs produisent un minimum de 1,7 M d’euros de
valeur ajoutée annuelle pour chacune d’elles.
La distribution des valeurs ajoutées pour les services d’usages directs de la pêche et du tourisme
est présentée dans la carte F.3-2 (en annexe nº3). L’importance de la zone urbaine de Nouméa est
mise en évidence pour son rôle dans la pêche de loisir et comme destination des usages touristiques.
Les communes à forte population tribale comme Lifou montrent le poids que peut avoir la pêche
vivrière et des activités touristiques de petites échelles (gites). Les cartes de la pêche et du tourisme
soulèvent un résultat intéressant à l’échelle de la Nouvelle-Calédonie. Si le tourisme et la pêche de
loisir se concentrent spatialement sur peu de communes, le service de la pêche vivrière (et celui du
tourisme à petite échelle même si il n’est pas représenté) se distribue d’une manière plus équilibrée
sur l’ensemble du territoire.

Coral Reef Ecosystem Services Economic Valuation. Phd dissertation, Nicolas Pascal, 2013 Page 122 / 351!
:N\NS Ad6Q$&e?@&O&h&?@&Zf&
Q"F"$"# 389(>6.5/=R*8+6(.)/=-/9+BR(.B>.-(6,+)(.B(.98.LT)<(.6R)+0/U98J/==8+6(..
Les résultats consolidés de la pêche commerciale, pêche vivrière et pêche loisir sont présentés
dans le tableau et figure suivants. La valeur ajoutée totale pour 2008 varie entre 50 et 70 millions
d’euros.
Tableau B-24: La pêche récifo-lagonaire en Nouvelle-Calédonie. (Tonnes, Millions F Cfp)
Figure B-23: Distribution de la valeur financière du service de pêche récifo-lagonaire.
Le principal service est celui de la pêche non-commerciale alors que la pêche commerciale
(déclarée et non déclarée) représente moins du tiers du total de la valeur de la pêche totale. Ceci
reflète le contexte socio-culturel des activités de pêche récifo-lagonaire qui échappe à toute forme
min max
Poissons 4 009 6 061
Invertébrés 1 819 2 423
Pêche commerciale 1 687 2 148
Pêche vivrière 2 318 3 358
Pêche de loisir (total) 1 823 2 979
Total pêche 5 828 8 485
Pêche recifo-lagonnaire
Volume (t)
min max
3 863 5 566
2 147 2 795
1 720 2 420
1 951 2 707
2 338 3 234
6 010 8 361
Pêche recifo-lagonnaire
VA (M F cfp)
!"#$%&#'((%)#*+,%&-./01&234&
!"#$%&5*5)*6)%&-./21&704&
!"#$%&8%&,'*9*)&-./71&734&
:;<)%9&="#$%9&-./>1&74&

Coral Reef Ecosystem Services Economic Valuation. Phd dissertation, Nicolas Pascal, 2013 Page 123 / 351!
de suivis et valorisation officielle. Nos résultats permettent de compléter les calculs officiels de la
pêche qui ne prennent pas en compte la pêche de loisir et la pêche vivrière. En effet, les valeurs
ajoutées de ces deux activités ne sont généralement pas comptabilisées (pêche vivrière) ou bien sont
classifiées sous d’autres chapitres (la pêche de loisir n’est pas comptabilisée comme de la pêche).
La valorisation obtenue, sans l’effet multiplicateur, permet de corriger le poids de la pêche dans
les statistiques officielles du PIB et nous obtenons une valeur trois fois supérieure à la valeur
officielle. L’écart entre les valeurs minimum et maximum reflète principalement les incertitudes sur
les estimations de volumes capturés.
Q"F"$"$ E6/)(-->-.R)/-4-*R5+P>(-.+5L9+P>R-.B8=-.98.LT)<(.6R)+0/U98J/==8+6(.
Plusieurs processus sont identifiés dans la production du service de la pêche récifo-lagonaire
(Figure suivante). Nous distinguerons principalement le processus de production de biomasse et
celui de maintien de la complexité des habitats.
Figure B-24: Description des processus écosystémiques et services associés à la pêche.

Coral Reef Ecosystem Services Economic Valuation. Phd dissertation, Nicolas Pascal, 2013 Page 124 / 351!
H4+6B2.$+&!6(!K$+-%##(!7*()7(!(&!-$*$(B!,%B)4(!!
La description de ce processus se base sur les travaux de Done et al. (1996) et Pollnac (2007).
Un écosystème corallien en bonne santé est une communauté d’organismes marins diversifiée et
hautement productive dans un milieu environnant pauvre en nutrients. La productivité ici se réfère
au volume de fixation de carbone qui prend place dans ces écosystèmes. Des mesures de cette
productivité ont montré que les récifs coralliens sont parmi les écosystèmes marins les plus
productifs. De plus, cette productivité est obtenue en l’absence relative de nutrients dissous (N et P)
dans les eaux oligotrophiques environnantes (Done et al., 1996).
Figure B-25: Performances métabolique pour 3 types de substrats. (Done et al. 1996)
Le « secret » de ce succès repose sur un recyclage très important des niveaux de nitrogène dans le
système symbiotique entre les algues et les polypes coralliens. Il faut cependant remarquer que cette
productivité en nutrients bénéficie très peu aux zones adjacentes du fait des faibles échanges nets
entre les deux (Pollnac, 2007).
J%$&.$(&!6(!*%!2+-,*(D$.7!6(#!<%K$.%.#!!
La science ne s’est intéressée que depuis très peu de temps sur les liens entre la couverture en
corail vivant et les populations de poissons (Worm et al. 2006; Mumby and Steneck 2008). Deux
méta-analyses ont conclu que pour la moitié ou plus des espèces récifales herbivores, inclues les
espèces commerciales des genres scaridae et acanthuridae, un déclin significatif dans leur
abondance est vérifié après un événement long de blanchissement (Mumby and Steneck,
2008)(Wilson and al 2006; Mumby and Steneck 2008). Ce type de pression sur la couverture en
corail vivant a une influence sur l’abondance et la diversité des poissons et invertébrés qui ont qui
dépendent directement des coraux pour leur phase d’installation larvaire ou pour leur alimentation.
Ainsi de nombreux changements dans les communautés de poissons sont observés entre espèces
spécialistes (en alimentation et habitats) vers des espèces généralistes après des changements dans la
couverture de corail vivant (Wilson and al 2006). Certaines études ont montré que plus de 60% des
espèces de poissons déclinent dans les 3 ans qui suivent une réduction de plus de 10% dans la
couverture de corail vivant (Jones and al 2004). La perte de complexité dans l’habitat peut
augmenter l’efficacité des prédateurs et influence la densité des poissons de petites tailles (Hixon
and Beets 1993). Elle agit aussi sur la diversité des espèces d’invertébrés (Idjadi and Edmunds

Coral Reef Ecosystem Services Economic Valuation. Phd dissertation, Nicolas Pascal, 2013 Page 125 / 351!
2006). Même les recrutements de poissons qui ne dépendent pas de la couverture en corail vivant
déclinent en abondance dans les zones dégradées. Pour les espèces des récifs de l’Indopacifique,
60% des premiers stades de développement sont associés avec un écosystème corallien vivant
(Jones and al 2004).
Il y a un mix assez unique dans les 1.600 espèces récifo-lagonaire estimées en Nouvelle-
Calédonie (dans la tranche 0 à 100m). En effet espèces récifales et espèces associées aux fonds
meubles se mélangent. Près de la moitié se rencontrent exclusivement sur les récifs, mais un nombre
important circulent entre les récifs et les autres formations lagonaires. Ainsi près du tiers des
espèces côtières, fréquentant mangroves, baies et estuaires, se retrouvent dans les récifs ou leurs
abords à un moment ou un autre de leur cycle de vie. Il en est de même des espèces que l’on trouve
sur les fonds de lagon, qui se nourrissent fréquemment à proximité des récifs, même si elles ne les
fréquentent pas directement (Nagelkerken et al., 2000).
Pour l’évaluation, toutes les espèces capturées par les pêcheries récifo-lagonaire ont été inclues.
A la fois les espèces généralistes et spécialisées ainsi que tous les groupes trophiques bénéficient au
moins d’un des processus écologiques identifiés générés par les récifs coralliens.
Q"F"$": 389(>6.5/=R*8+6(.B>.-(6,+)(.B(.98.LT)<(.6R)+0/U98J/==8+6(.)/55(6)+89(.
Les résultats de la quantification des captures pour la pêche commerciale sont présentés dans le
tableau suivant en reflétant les estimations maximum et minimum:
Tableau B-25: Captures de la pêche récifo-lagonaire commerciale professionnelle et non-professionnelle (2008).
Le tableau ci-après présente les chiffres d’affaires et les valeurs ajoutées de la pêche
commerciale pour l’année 2008. Les chiffres d’affaires sont monétarisés aux prix finaux aux
consommateurs. La valeur ajoutée du secteur d’activité pêche commerciale inclut les valeurs
ajoutées de l’activité pêche et celles du circuit de distribution. Le multiplicateur présenté dans le
chapitre précédent est appliqué sur ces valeurs ajoutées. La valeur ajoutée totale varie entre 14 et 20
Millions d’euros par an.
t 2008
Poissons Langouste Crabes Bdm Troca TOTAL
Minimum 1.033 17 182 259 196 1.687Maximum 1.314 25 339 270 200 2.148

Coral Reef Ecosystem Services Economic Valuation. Phd dissertation, Nicolas Pascal, 2013 Page 126 / 351!
Tableau B-26: Chiffre d’affaires et valeur ajoutée de la pêche commerciale en Nouvelle-Calédonie
(Millions F cfp, 1 euro=119 F cfp)
Q"F"$"A 389(>6.5/=R*8+6(.B>.-(6,+)(.B(.98.LT)<(.6R)+0/U98J/==8+6(.,+,6+X6(.
Afin de segmenter les usages par style de vie, nous nous sommes attachés à caractériser le plus
précisément possibles la pêche vivrière. En se basant sur les résultats de plusieurs études déjà citées,
sur les opinions d’experts et sur des observations personnelles, nous obtenons les caractéristiques
suivantes :
Population tribale :
• Les ménages disposent d’un revenu mensuel moyen de 196.400 Fcfp (ISEE 2008)
• Il existe très peu de consommation monétaire de produits frais locaux.
• 90 à 95% de la consommation provient soit de la pêche vivrière soit d’achat de conserve.
• La collecte et la consommation d’invertébrés sont importantes (crabes, poulpes,
bénitiers,…)
• Les tribus sont moins équipées en moyens de pêche (puissance, engins,…) mais ont un
effort de pêche plus important et une productivité meilleure.
• Une différence persiste entre les tribus avec droits d’accès à la mer et les tribus sans
(clans de pêche).
• Une hétérogénéité forte entre les tribus dans leurs modes de pêche et de consommation
est marquée sans que des facteurs explicatifs soient identifiés.
• La pêche collective sur certaines espèces pour des activités coutumières ou
cérémonielles est présente pour certaines tribus.
Sur cette base, les captures non commercialisées des communautés tribales ont été considérées à 80% comme pêche vivrière dans la province Nord, à 100% dans la province des Iles et à 70% dans la province Sud.
Population rurale:
Les traits de la consommation des populations rurales sont les moins connus de tous.
• Les ménages disposent d’un revenu mensuel moyen de 323.600 Fcfp (isee 2008)
min max min max min max
Poissons 1 033 1 314 787 1 180 748 1 122
Invertébrés 654 834 754 998 972 1 298
Total 1 687 2 148 1 540 2 178 1 720 2 420
Volume (t) CA (M F cfp) VA (MF cfp)
Total pêche commerciale
Coral Reef Ecosystem Services Economic Valuation. Phd dissertation, Nicolas Pascal, 2013 Page 127 / 351!
• Leur consommation monétaire alimentaire est proche de celle des tribus et implique une
consommation monétaire de produits frais locaux très réduite à faveur de conserves de
poissons.
• Les pêcheurs non professionnels ruraux disposent généralement de moyens de pêche
importants (1 bateaux/43 habitants) et de budget de pêche proportionnels.
• L’effort de pêche est limité principalement aux WE et jours fériés. Ceci reflète une
dominance de l’activité de pêche loisir.
• Des pêcheurs ruraux plus réguliers et plus dépendants de la capture sont présents.
• La proportion de pêche considérée comme vivrière dans la population rurale a été
estimée entre 30% et 40%.
Population urbaine et périurbaine:
• Les ménages disposent d’un revenu mensuel moyen de 485.600 Fcfp (isee 2008).
• La flotte d’embarcations a une très forte densité (1 bateaux/36hab), une taille moyenne
importante et une puissance moyenne élevée (>80CV).
• Les embarcations disposent d’un niveau d’équipement élevé et ont des budgets annuels
importants conformes aux pouvoirs d’achat de cette catégorie.
• Les activités de pêche sont sporadiques avec 2 à 3 sorties par mois les WE et jours
fériés. Elles sont très conditionnées par les conditions météorologiques.
• La consommation vivrière d’invertébrés est quasi-inexistante par les populations
urbaines d’origine européenne.
• La pêche sur les platiers des communes urbaines (poulpe principalement) est effectuée
par les femmes des tribus vivant en milieu urbain et donc est considérée comme vivrière.
La proportion de pêche loisir pour la population urbaine a été estimée à 90%
En résumé, les caractéristiques de consommation par style de vie nous permettent de segmenter les captures entre vivrier et loisir de la manière suivante :

Coral Reef Ecosystem Services Economic Valuation. Phd dissertation, Nicolas Pascal, 2013 Page 128 / 351!
Tableau B-27: Distribution (%) des captures non-commerciales entre pêche vivrière et loisir.
Distribution par provinces et par style de vie.
L’estimation des volumes de captures est présentée dans le tableau suivant. Les calculs donnent
une consommation vivrière assimilable aux captures vivrières comprises entre 2.300 et 3.400 t/an.
Les valeurs ajoutées estimées de la pêche vivrière à partir des équivalents protéines varient entre 16
et 23 Millions d’euros. L’application du facteur de pondération aux valeurs ajoutées pour refléter
certains aspects clés de la pêche vivrière expliquent pourquoi les VA sont supérieures aux CA sans
pondération.
Tableau B-28: Volumes et valeur ajoutée des captures de la pêche vivrière en Nouvelle-Calédonie
(Millions F cfp, 1 euro=119 Fcfp)
Q"F"$"C 389(>6.5/=R*8+6(.B>.-(6,+)(.B(.98.LT)<(.6R)+0/U98J/==8+6(.B(.9/+-+6.
Les résultats des étapes intermédiaires pour la monétarisation du secteur d’activité des
embarcations de pêche de loisir sont présentés dans les tableaux suivants. Les attributs des
embarcations immatriculées en 2008 sont décrits ainsi que les estimations de VA pour cette même
année (5 millions d’euros approx.). Un autre tableau résume la structure des dépenses moyennes par
embarcation en distinguant les frais par sorties et les dépenses annuelles. Finalement, les
caractéristiques de la flotte de pêche de loisir et des dépenses associées sont décrites avec les
estimations du nombre de sorties annuelles (Tableau B-31).
vivrier loisir
Province Nord
rural 40% 60%
tribal 80% 20%
Province Sud
rural 30% 70%
rural 30% 70%
tribal 70% 30%
urbain 10% 90%
Province des Iles
tribal 100%
% des captures totales
min max
Poissons 1 582 2 276
Invertébrés 736 1 082
Total 2 318 3 358
Pêche vivriere
Volume (t)
min max
1 235 1 770
716 937
1 951 2 707
Pêche vivriere
VA avec pondération (M F cfp)
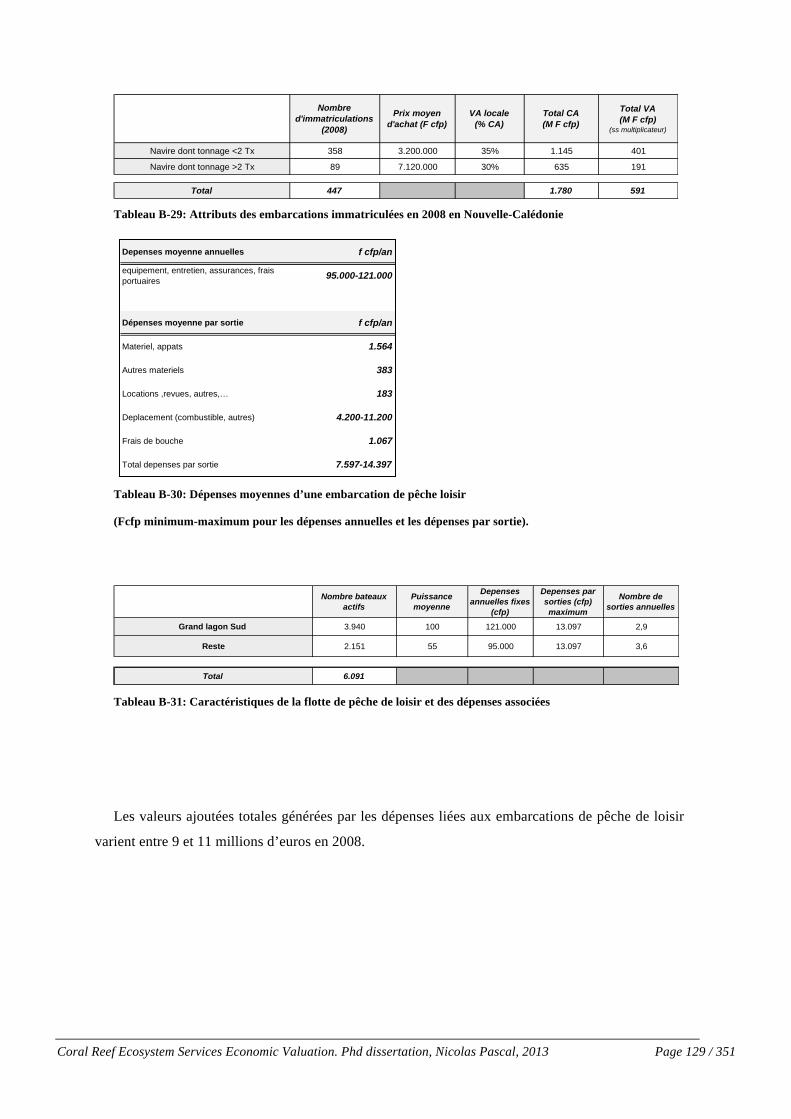
Coral Reef Ecosystem Services Economic Valuation. Phd dissertation, Nicolas Pascal, 2013 Page 129 / 351!
Tableau B-29: Attributs des embarcations immatriculées en 2008 en Nouvelle-Calédonie
Tableau B-30: Dépenses moyennes d’une embarcation de pêche loisir
(Fcfp minimum-maximum pour les dépenses annuelles et les dépenses par sortie).
Tableau B-31: Caractéristiques de la flotte de pêche de loisir et des dépenses associées
Les valeurs ajoutées totales générées par les dépenses liées aux embarcations de pêche de loisir
varient entre 9 et 11 millions d’euros en 2008.
Nombre d'immatriculations
(2008)
Prix moyen d'achat (F cfp)
VA locale (% CA)
Total CA (M F cfp)
Total VA (M F cfp)
(ss multiplicateur)
Navire dont tonnage <2 Tx 358 3.200.000 35% 1.145 401
Navire dont tonnage >2 Tx 89 7.120.000 30% 635 191
Total 447 1.780 591
Depenses moyenne annuelles f cfp/an
equipement, entretien, assurances, frais portuaires 95.000-121.000
Dépenses moyenne par sortie f cfp/an
Materiel, appats 1.564
Autres materiels 383
Locations ,revues, autres,! 183
Deplacement (combustible, autres) 4.200-11.200
Frais de bouche 1.067
Total depenses par sortie 7.597-14.397
Nombre bateaux actifs
Puissance moyenne
Depenses annuelles fixes
(cfp)
Depenses par sorties (cfp) maximum
Nombre de sorties annuelles
Grand lagon Sud 3.940 100 121.000 13.097 2,9
Reste 2.151 55 95.000 13.097 3,6
Total 6.091

Coral Reef Ecosystem Services Economic Valuation. Phd dissertation, Nicolas Pascal, 2013 Page 130 / 351!
Tableau B-32: Valeur ajoutée des dépenses de la pêche de loisir en Nouvelle-Calédonie.
Le total de la valeur ajoutée pour la filière nautique de plaisance reliée à la pêche loisir est
compris entre 19 et 27 millions d’euros environ. Il englobe les valeurs des captures et celles des
dépenses des embarcations.
Tableau B-33: Volumes et valeur ajoutée des captures et dépenses de la filière nautisme de plaisance liée à la
pêche.
Depenses des sorties de pêche de loisir
Dépenses en achat d'embarcations et moteur
Total
min max
331 331
753 910
1 084 1 241
VA (M FCFP)
min max
Captures 1 823 2 979
Dépenses totales des embarcations
Total 1 823 2 979
Volume (t)
Pêche loisir
min max
1 255 1 993
1 084 1 241
2 338 3 234
VA (M FCFP)
Pêche loisir

Coral Reef Ecosystem Services Economic Valuation. Phd dissertation, Nicolas Pascal, 2013 Page 131 / 351!
Q"F"$"F 389(>6.5/=R*8+6(.B>.-(6,+)(.B(.98.LT)<(.<8>*>6+X6(..
H4+2(##B#!72+#9#.7-$PB(#!$-,*$PB7#!
Différents processus écosystémiques d’échange interviennent entre le récif, le lagon et
l’extérieur. Les principaux sont: (i) les migrations des espèces hauturières à l’intérieur de l’espace
récifo-lagonaire et (ii) l’exportation de biomasse larvaire du récif vers l’extérieur.
Figure B-26: Processus écosystémiques du récif impliqués dans la pêche hauturière et profonde.
;7#B*.%.#!-+&7.%$4(#!!
Sur la base des contenus stomacaux des principales espèces pélagiques et provenant du
programme Oceanic Fisheries Programme / Ecosystem Monitoring and Analysis, basé sur plus de
700 échantillons sur 4 ans (Allain et al., 2012), nous pouvons estimer la part des proies du récif dans
l’alimentation de ces espèces.

Coral Reef Ecosystem Services Economic Valuation. Phd dissertation, Nicolas Pascal, 2013 Page 132 / 351!
Tableau B-34: Contenus des estomacs des principales espèces pélagiques de Nouvelle-Calédonie
(adapté d’Allain (2012))
En se concentrant sur les thons jaunes (Thunnus albacares) et blancs (Thunnus alalunga) pour
lesquels les espèces récifo-lagonaires représentent plus de 5% du poids total des proies, nous
obtenons les résultats de VA décrits dans le tableau suivant. La valeur ajoutée totale varie entre "
220k et 28 k environ.
Tableau B-35: Pêche hauturière et contribution des récifs néo-calédoniens
Thons blancs (Thunnus alalunga) 10% 62%
Thons jaunes (Thunnus albacares) 8% 52%
Thons obèses (Thunnus obesus) 1% 56%
Marlins (Tretapturus sp.) 0,1% 45%
% du poids total des proies dans les estomacs échantillonés
Principales espèces pélagiques Espèces recifo-lagonaire Espèces non-identifées
min max
20% 25%
13% 16%
1% 2%
0,1% 0,1%
% du poids total des proies dans les estomacs échantillonés
Total espèces recifo-lagonaire
Thons blancs (Thunnus alalunga) 1 324
Thons jaunes (Thunnus albacares) 393
Total peche hauturiere1 717
Captures (t)
111
33
144
VA filiere totale (M F cfp)
min max
22 28
4 5
27 34
VA attribuable au récif (M F cfp)

Coral Reef Ecosystem Services Economic Valuation. Phd dissertation, Nicolas Pascal, 2013 Page 133 / 351!
Q"F"$"H 389(>6.5/=R*8+6(.B>.-(6,+)(.B(.9]8P>8)>9*>6(..
H4+2(##B#!72+#9#.7-$PB(#!$-,*$PB7#!
Les processus écosystémiques identifiés entre les exploitations et le lagon sont principalement la
contribution des récifs à (i) la production phytoplanctonique et de meiofaune et, (ii) à la production
d’oxygène.
Figure B-27: Processus écosystémiques du récif impliqués dans l’aquaculture de crevette
Les bassins de crevettes de Nouvelle-Calédonie sont des milieux enrichis dans la mesure où il est
essentiel que la production phytoplanctonique y soit stimulée eu égard au contrôle de la production
d'oxygène dans le bassin. Le phytoplancton est un producteur d'oxygène important pour des
crevettes très demandeuses en oxygène (en particulier l'espèce cultivée en Nouvelle-Calédonie)
(Beliaeff, comm. Perso.). Dans la phase initiale de l'élevage, l'eau d'entrée du lagon ensemence
naturellement les bassins en phytoplancton mais également en meiofaune, dont on pense qu'elle
constitue une part non négligeable, qualitativement et quantitativement, de l'alimentation naturelle
des crevettes dans le bassin hormis les granulés (HSIEH et al., 2010; Lemonnier and Faninoz,

Coral Reef Ecosystem Services Economic Valuation. Phd dissertation, Nicolas Pascal, 2013 Page 134 / 351!
2006). Ensuite, l'entrée d'eau dans les bassins permet de compenser la vidange nécessaire pour le
contrôle de la production de phytoplancton.
Les apports de nitrogène dans les exploitations semi-intensives se divisent entre 63% depuis les
eaux entrantes et 36% depuis les aliments. Pour le phosphore le ratio est de 51% et 47%
respectivement (HSIEH et al., 2010). Ces ratios dépendent de nombreux facteurs comme le nombre
d’individus au m2, la taille de l’exploitation, les techniques aquacoles et les niveaux d’échanges
d’eau. Des modèles de budgets in-out existent sur les exploitations semi-extensives mais ne sont pas
disponibles pour la Nouvelle-Calédonie. La richesse des eaux du lagon en nitrogène et phosphate est
cependant démontrée (Martin et al., 1998). Ainsi, même si leur rôle comme enrichisseur d’eau dans
l’alimentation des fermes de crevettes ne fait pas un consensus parmi les experts de Nouvelle-
Calédonie, il a été estimé que l’apport du lagon pouvait varier entre 10% et 40% des besoins totaux
en alimentation. Ce ratio dont les valeurs sont relativement dispersées reflètent les incertitudes et sur
le processus. L’aliment, qui représente près de 40% des charges d’un élevage, est déterminant dans
la vitesse de croissance des animaux, leurs poids moyens et donc le prix auquel ils sont vendus à
l’atelier de conditionnement.
Sur la base des paramètres précédents, la valeur ajoutée des services écosystémiques générés par
les récifs coralliens est estimée varier entre 130 et 195 Millions de F cfp (entre 1 et 1,6 Millions
d’euros) pour 2008.

Coral Reef Ecosystem Services Economic Valuation. Phd dissertation, Nicolas Pascal, 2013 Page 135 / 351!
Q"F"$"Y !-L()*-.-/)+8>Z.
Les emplois directs ainsi que le nombre de ménages pratiquant une forme de pêche non-
commerciale sont décrits dans les tableaux suivants. Nous remarquons l’importance de la pêche
vivrière dans la population totale de la Nouvelle-Calédonie (30% des ménages environ).
Tableau B-36: Aspects sociaux de la pêche récifo-lagonaire Nouvelle-Calédonie (différentes métriques).
Q"F"$"[ O+-*6+&>*+/=.-L8*+89(.
La distribution par communes des valeurs ajoutées des services de la pêche est présentée dans
l’annexe nº3 (cartes F.3-3 à F.3-7).
&
min max Total NC % total NC
Pêche commerciale (pêche et distribution) 560 684 57.411 1,1%
Pêche non commerciale filière nautisme de plaisance 240 310 57.411 0,5%
Total emplois directs 800 994 57.411 1,6%
min max Total NC % total NC
Pêche vivriere 13.670 25.388 67.040 29%
Pêche de loisir 5.178 7.005 67.040 9%
Total utilisateurs (ménages) 18.848 32.393 67.040 38%
Ménages utilisateurs
Emplois directs

Coral Reef Ecosystem Services Economic Valuation. Phd dissertation, Nicolas Pascal, 2013 Page 136 / 351!
:N\NT D+12()3$&e?@&[&h&?@&]f&
Q"F":"# 389(>6.5/=R*8+6(.B>.-(6,+)(.B>.*/>6+-5(.?6R->9*8*-.)/=-/9+BR-@.
Les résultats consolidés de la monétarisation du service du tourisme sont présentés dans le
tableau suivant. Les différents usages directs sont consolidés avec les dépenses des touristes et des
résidents qui sont associées à ces usages et attribuables aux récifs.
Tableau B-37: Valeur ajoutée du tourisme lié aux récifs coralliens en Nouvelle-Calédonie.
Plongée sous-marine
Tourisme nautique
Nautisme de plaisance (sans la pêche de loisir)
Dépenses associées du tourisme non-résident
Dépenses associées des résidents
Total du service du tourisme
min max
158 214
190 257
649 670
1 421 1 693
421 548
2 838 3 381
Total tourisme
VA (M F cfp)

Coral Reef Ecosystem Services Economic Valuation. Phd dissertation, Nicolas Pascal, 2013 Page 137 / 351!
Figure B-28: Distribution de la valeur financière du service du tourisme attribuable aux récifs coralliens.
Le faible poids du tourisme est notable et met en évidence l’état de développement de cette
filière sur le territoire. Considérée comme peu prioritaire jusqu'à aujourd’hui du fait du modèle
économique de la Nouvelle-Calédonie, son rôle tente d’être renforcé dans les années à venir.
L’inscription au patrimoine UNESCO, le développement et l’implantation du plan directeur du
tourisme avec un positionnement plus clair semblent confirmer ce constat. Les valeurs obtenues sur
les Caraïbes ou d’autres états du Pacifique (Hawaï et les Iles Mariannes) montrent le potentiel de
cette filière. Les valeurs des activités directement liées au récif sont très inferieures à celles
rencontrées sur d’autres récifs beaucoup moins grands et moins diversifiés que celui de la Nouvelle-
Calédonie.
Plus que pour les autres services, le poids du contexte international et de celui des politiques
économiques locales est très influent dans les résultats. Ainsi la faible valeur rencontrée dans les
usages touristiques du récif ne s’explique pas par une faible quantité de processus écosystémiques
mais par des raisons politico-économiques.
Q"F":"$ E6/)(-->-.R)/-4-*R5+P>(-.+5L9+P>R-..
Les processus écosystémiques du récif corallien sont ceux qui agissent sur l’attractivité d’un site
pour les différents types de tourisme.
!"#$%&'()#*)+,-./$'(01234(56(
7#*./),'($-*89*'(01254(:6(
;-*8),'(<'(="-/)-$>'(0?#.)(=@>?'("#/)/.4(012A4(
BC6(
D&='$)')(-))#>/&')(<*(E#*./),'($#$+.&)/<'$E(012(3('E(54(
3C6(
D&='$)')(-))#>/&')(<')(.&)/<'$E)(012(3('E(54(F56(

Coral Reef Ecosystem Services Economic Valuation. Phd dissertation, Nicolas Pascal, 2013 Page 138 / 351!
Figure B-29: Processus écosystémiques impliqués dans les services du tourisme
Les processus permettant la présence d’espèces emblématiques sont divers. Entre autres, nous
pouvons citer la disponibilité de certaines conditions de l’habitat pour la reproduction ou comme
refuge, la présence d’aliments ou de certaines espèces. Les principales espèces emblématiques des
eaux récifo-lagonaire de Nouvelle-Calédonie sont les napoléons (Cheilinus undulatus), les requins,
les cétacés, les tortues, les dugongs, etc. Pour les cétacés, une grande partie des espèces sont
présentes toute l’année dans le lagon ou réalisent de courtes migrations de reproduction, trophiques
ou ontogéniques proche du récif barrière. Les baleines à bosse trouvent ainsi une zone de
reproduction dans le Grand Lagon Sud pendant certains mois de l’année ou une zone refuge dans les
lagons pour les juvéniles loin des principaux requins du large. La tortue verte (Chelonia mydas)
réalise des migrations longues mais ses lieux de reproduction et d’alimentation sont liés aux récifs
coralliens. Les Dugongs fréquentent aussi les baies peu profondes de la côte Ouest et son habitat est
lié aux herbiers.
Différents auteurs se sont attachés à identifier les attributs d’attractivité sur les préférences des
touristes usagers des récifs (Ahmed et al., 2007; Brander et al., 2007; Park et al., 2000; Parsons and
Thur, 2007). Ces attributs sont nombreux et variés. Le choix entre les préférences ainsi que le poids
de chacun des attributs dans la satisfaction des usagers est très contextuel et variable suivant les

Coral Reef Ecosystem Services Economic Valuation. Phd dissertation, Nicolas Pascal, 2013 Page 139 / 351!
études. A titre d’illustration, nous citerons les principaux attributs environnementaux identifiés lors
des entretiens avec les professionnels: (i) la présence, le nombre et la taille d’espèces
emblématiques, (ii) la couverture en corail vivant, (iii) la transparence de l’eau, (iv) la diversité des
espèces. A ces attributs se rajoutent d’autres attributs non-environnementaux comme (i) la
fréquentation (et non-congestion) des sites (ii) les infrastructures existantes, (iii) la taille des
palanquées (pour la plongée) et (iv) le prix des prestations.
Attributs environnementaux Attributs non environnementaux:
Présence d’espèces emblématiques Facilité d’accès
Diversité des espèces (micro et macro) Épaves
Santé des écosystèmes Congestion des sites
Tombants et grottes Niveau technique et sécurité
Transparence de l’eau Activités annexes et contexte
Tableau B-38: Principaux attributs influençant le choix des sites de plongées et le niveau de satisfaction.
Certaines études (Arin and Kramer, 2002; Wielgus et al., 2002) se centrant sur l’identification
des motivations et satisfaction des usagers montrent la difficulté de situer l’importance des attributs
environnementaux les uns par rapport aux autres. Brander et al (2007) montre dans sa metanalyse
sur plus de 166 études sur les récifs coralliens que la valeur des services liés au tourisme est parfois
peu corrélée à un état de biodiversité. Ceci montre le peu de sensibilité du tourisme en milieu récifal
à l’état de santé des écosystèmes.

Coral Reef Ecosystem Services Economic Valuation. Phd dissertation, Nicolas Pascal, 2013 Page 140 / 351!
Q"F":": GR->9*8*-.B(.9]!=894-(.B]+58J(-.L>&9+)+*8+6(-.
Les supports touristiques publicitaires sélectionnés ont été analysés quantitativement afin de
déterminer la proportion d’images et de mots-clés relatifs aux attributs choisis. 2100 images ont peu
être classifiées pour déterminer l’importance des récifs dans les supports publicitaires analysés. Ces
supports sont les brochures disponibles aux touristes avant et après leur arrivée sur le territoire et
proviennent des différents offices de tourisme. La figure suivante présente les résultats de cette
analyse. Le faible poids des récifs coralliens dans les attributs touristiques communiqués aux
touristes est notable.
A partir de ces résultats, il est estimé que les récifs représentent entre 0 et 20% dans le choix de
destination des touristes non résidents selon leur motif de visite et leur nationalité.
Figure B-30: Analyse d’images publicitaires
Q"F":"A 389(>6.5/=R*8+6(.B>.-(6,+)(.B>.*/>6+-5(.-/>-U586+=^.=8>*+P>(.(*.B(.L98+-8=)(.
Le tableau suivant résume les résultats pour les trois activités récréatives principales des récifs
(hors pêche de loisir) : la plongée sous-marine, le tourisme nautique et la plaisance. Ces activités
peuvent être considérées comme directement liées à certains processus écosystémiques du récif.
Comme nous l’avons expliqué avant, la totalité de leur valeur ajoutée est considérée comme
attribuable aux processus écosystémiques des récifs coralliens. La VA totale est estimée varier entre
8 et 10 Millions d’euros pour 2008. La plongée et les activités de tourisme nautique représente
chacune 20% du total environ tandis que le nautisme de plaisance pèse quasiment 60%.
15%
16%
21%
24%
24%
0% 5% 10% 15% 20% 25%
Récifs coralliens et loisirssous-marins
Plages
Ecosystemes et paysagesterrestres
Culture et gens
Activités de loisir autres
Analyse d'images publicitaires (n=2100 images)

Coral Reef Ecosystem Services Economic Valuation. Phd dissertation, Nicolas Pascal, 2013 Page 141 / 351!
Tableau B-39: Valeurs ajoutées des activités de plongée, de tourisme nautique et de nautisme de plaisance.
Pour la plongée sous-marine, 20.000 clients environ ont été recensés équivalent à 2.800 sorties
sur le lagon et 39.000 immersions. Il a été estimé que plus de 125.000 usagers ont utilisé en 2008
un des services du tourisme nautique décrit. Les services de bateaux taxis du Grand Nouméa ont
transporté à eux seuls plus de 80.000 personnes sur les ilots proches : îlots maitre, Canards, Amédée
et passe de Boulari (Jumel, 2008). Le tableau suivant résume les fréquentations des principales
activités de tourisme nautique.
Tableau B-40: Usagers du tourisme nautique en Nouvelle-Calédonie (2008- Différentes sources).
Secteur d’activité de la plaisance
Les 2 tableaux suivants montrent les résultats intermédiaires pour l’estimation du secteur de la
plaisance. D’un côté les activités d’acquisitions d’embarcations et de moteurs basées sur le nombre
de nouvelles immatriculations est recensé à 290 embarcations environ pour 2008 (Tableau suivant).
Pour les dépenses des embarcations actives sur la collectivité, la structure de dépenses a été estimée
pour les principaux items dans la partie correspondante à la pêche. Le Tableau B-42 décrit les
caractéristiques de la flotte de plaisance sur la base des estimations du nombre de sorties annuelles
et des dépenses annuelles fixes et par sorties.
Plongée sous-marine
Tourisme nautique
Nautisme plaisance (sans pêche)
Total
min max
158 214
190 257
649 670
997 1 141
VA (M F cfp)
min max
Location de bateaux (Charter) 28.727 32.277
Sorties en mer (Peche sportive, baleines,!) 5.880 6.533
Bateau Taxi 75.432 88.744
Total usagers 110.039 127.554
Nombre d'usagers

Coral Reef Ecosystem Services Economic Valuation. Phd dissertation, Nicolas Pascal, 2013 Page 142 / 351!
Tableau B-41: Immatriculations d’embarcations de plaisance en Nouvelle-Calédonie (2008)
Tableau B-42: Caractéristiques de la flotte de plaisance sans activité de pêche de loisir.
Les valeurs ajoutées du secteur d’activité du nautisme de plaisance sont présentées dans le
tableau suivant. Elles comprennent les dépenses liées à l’achat des embarcations et les dépenses
annuelles d’utilisation de l’embarcation. Les valeurs ajoutées sont calculées sur la même base que
pour la pêche de loisir.
Tableau B-43: Valeur ajoutée du nautisme de plaisance (non liée à la pêche).
Q"F":"C 389(>6.5/=R*8+6(.B(-.BRL(=-(-.8--/)+R(-.B(-.=/=U6R-+B(=*-.
La matrice de la variable « reef_contribution » est présentée dans le tableau suivant les
catégories de visiteurs définies préalablement.
Nombre d'immatriculations
(2008)
Prix moyen d'achat (F cfp)
VA locale (% CA)
Navire dont tonnage <2 Tx 153 2.560.000 35%
Navire dont tonnage >2 Tx 134 6.408.000 30%
Total 287
Nombre bateaux actifs
Puissance moyenne
Depenses annuelles fixes
(cfp)
Depenses par sorties (cfp) maximum
Nombre de sorties annuelles
Grand lagon Sud 2.060 100 98.010 4.950 4,0
Reste 849 55 76.000 2.640 4,0
Total 2.909
Dépenses en achat d'embarcations et de moteurs
Depenses des sorties de plaisance
Total nautisme de plaisance (sans pêche de loisir)
min max
552 552
96 118
649 670
VA (M FCFP)

Coral Reef Ecosystem Services Economic Valuation. Phd dissertation, Nicolas Pascal, 2013 Page 143 / 351!
Tableau B-44: Distributions des arrivées de touristes par catégorie d’usages des récifs (valeurs maximales)
Le tableau ci-après présente l’estimation maximum du nombre de touristes de chacune des
catégories.
Tableau B-45: Nombre de touristes par catégorie d’usages des récifs
La table suivante résume les résultats obtenus. Les valeur ajoutées générées par les dépenses
associées par les usagers non résidents et attribuables aux récifs coralliens sont présentées. Elles
consolident les dépenses locales (logement, restauration et transport local) et en transport
international (compagnie locale) des touristes non-résidents ainsi que les dépenses des croisiéristes.
Elles varient entre 12 et 14 Millions d’euros pour 2008.
Etant donné l’importance des recettes totales du tourisme, les résultats sont sensibles aux
estimations faites sur les distributions par catégories d’usagers et sur les facteurs de contribution.
Ces données sont délicates à estimer. En particulier, la distribution entre les catégories est difficile à
connaitre et les enquêtes disponibles permettent d’en avoir seulement une approximation. L’effort
d’analyse effectué pour affiner les résultats par nationalité et selon le motif de séjours (vacance,
affinitaire, affaire, autres) (itsee, 2007) a permis de réduire le niveau d’incertitude.
Distribution du nombre de touristes
Pays d'origine France Japon Australie NZ Pacifique AutresCategorie 1 (% total arrivées) 2% 1% 1% 1% 1% 1%Categorie 2 (% total arrivées) 45% 50% 40% 50% 50% 40%Categorie 3 (% total arrivées) 53% 49% 59% 49% 49% 59%
Categorie 1 % contribution recif aux depenses 100% 100% 100% 100% 100% 100%Categorie 2 % contribution recif aux depenses 30% 25% 20% 20% 20% 20%
Categorie 1: % visiteurs dont 90% de leurs activités sont sous-marines Categorie 2: % visiteurs dont au moins 30% de leurs activités sont sous-marines Categorie 3: visiteurs specifiques sans activités sous-marines
Nombre de touristes par pays d'origine France Japon Australie NZ Pacifique Autres Total
Categorie 1 582 268 164 95 131 84 1.323
Categorie 2 13.096 13.378 6.546 4.734 6.550 3.360 47.664

Coral Reef Ecosystem Services Economic Valuation. Phd dissertation, Nicolas Pascal, 2013 Page 144 / 351!
Tableau B-46: Valeurs ajoutées des dépenses du tourisme non-résident attribuable aux récifs coralliens.
Q"F":"F 389(>6.5/=R*8+6(.B(-.BRL(=-(-.8--/)+R(-.B(-.6R-+B(=*-.
Tableau B-47: Paramètres des dépenses associées des usagers résident
Selon les résultats des enquêtes aux usagers effectuées, entre 10% et 30% des dépenses sont
attribuables aux récifs. Il a été estimé qu’environ 125 000 résidents ont utilisé une des structures
hôtelières en 2008. Le tableau suivant résume les résultats obtenus. Les valeurs ajoutées générées
par les dépenses associées des résidents et attribuables aux récifs coralliens sont présentées. Elles
consolident les dépenses en logement et les dépenses en restauration et transport local. Les résultats
varient entre 3 et 5 Millions d’euros.
Tableau B-48: Valeurs ajoutées des dépenses associées du tourisme résident attribuable aux récifs coralliens.
Dépenses locales
Dépenses en transport international
Dépenses des croisieristes
Total dépenses associées du tourisme non-résident
min max
861 1 053
430 475
129 165
1 421 1 693
VA (M FCFP)
Nombre d'unités d'habitation
% occupation moyenne
Gite 221 55-60%
Hotel 2 472 35-55%
Total 2 693
% attribuable aux recifs
20-30%
10-20%
Dépenses en hébergement
Dépenses en transport et alimentation
Total dépenses associées des résidents
Total tourisme résident
min max
256 347
164 201
421 548
VA (M F cfp)Total tourisme résident

Coral Reef Ecosystem Services Economic Valuation. Phd dissertation, Nicolas Pascal, 2013 Page 145 / 351!
Q"F":"H !-L()*-.-/)+8>Z.B>.-(6,+)(.B>.*/>6+-5("..
Les estimations d’emplois et du nombre d’usagers sont résumées dans le tableau ci-après.
L’importance des récifs pour la population Néo-Calédonienne se reflète dans la forte proportion de
ménages usagers des récifs (6 ménages sur 10).
Figure B-31: Aspects sociaux du tourisme lié aux récifs coralliens en Nouvelle-Calédonie (différentes
métriques).
min max Total NC % total NC
Usages directs (plongée, tourisme nautique, plaisance) 220 320 57.411 0,5%
Usages indirects (hebergement, alimentation,transport) 888 1.333 57.411 1,9%
Total emplois directs 1.108 1.653 57.411 2,4%
min max Total NC % total NC
Total usagers des récifs coralliens (ménages) 38.330 45.158 67.040 62%
Emplois directs
Ménages utilisateurs

Coral Reef Ecosystem Services Economic Valuation. Phd dissertation, Nicolas Pascal, 2013 Page 146 / 351!
Q"F":"Y O+-*6+&>*+/=.-L8*+89(..
La distribution par communes des valeurs ajoutées des services du tourisme est présentée dans
l’annexe nº3 (carte F.3-8).&
:N\NZ 5$6Q$26Q$&$*&W#16-*(+"&e?@&^f&
La valeur estimée est présentée dans la table suivante. La valeur ajoutée correspond à
l’évaluation des différents budgets des programmes de recherche hormis les salaires non-locaux et
les frais de fonctionnement des institutions.
Tableau B-49: Valeur du service de recherche et éducation lié aux récifs coralliens de Nouvelle-Calédonie
:N\N[ A2+*$6*(+"&6g*(Y2$&e?@&_f&
Les résultats intermédiaires des différentes étapes du calcul sont présentés à continuation. Les
zones potentiellement à risque face au risque de la houle sont identifiées et la contribution des récifs
coralliens dans la protection côtière est calculée sur la base des données existantes.
Les zones du littoral potentiellement à risque ont été identifiées. Pour la Nouvelle-Calédonie, les
modèles météorologiques définissent la hauteur de 3 à 5,5 m comme la hauteur maximale des
vagues suivant les zones (source Météo France). Il a été considéré que les zones vulnérables aux
impacts des vagues et de la houle correspondent à toutes les zones qui ont moins de 5 m d'altitude
par rapport au niveau de référence de la mer et jusqu’à 1 km à l’intérieur des terres. L’analyse SIG
permet alors de quantifier et cartographier ces zones. Une surface correspondant à 657 km# (3% du
territoire) est identifiée comme zone vulnérable.
Total (M Fcp)
Service recherche et education
min max
339 415
Service recherche et education VA (M F cfp)

Coral Reef Ecosystem Services Economic Valuation. Phd dissertation, Nicolas Pascal, 2013 Page 147 / 351!
Figure B-32: Estimation des hauteurs maximales de vagues en Nouvelle-Calédonie (source : Météo-France)
La méthode utilisée par Burke et al. dans leur évaluation de la contribution des récifs à Tobago et
Sta Lucia a été modifiée pour répondre au contexte Calédonien (extension très supérieure du récif
barrière et frangeant) et pour l’adapter aux données disponibles. L’analyse des bases de données
existantes sur la Nouvelle-Calédonie ainsi que la constitution de réunions de travail avec différents
organismes de recherche (IRD, UNC) ont permis le calcul des facteurs de protection seulement sur
des zones très petites et sur 5 des facteurs du calcul du protection relative totale côtière (PRTC) dans
le meilleur des cas. L’IMA considère qu’au minimum 5 des facteurs doivent être renseignés afin
d’assurer une robustesse dans les résultats (Burke, comm. pers.). Les différents degrés de valeurs
contributives estimés selon le nombre de facteurs de protection identifiés avec un niveau minimum
moyen (niveau 2) sont exposés dans le tableau suivant.
Tableau B-50: Facteurs de contribution du récif dans la protection du littoral contre la houle.
Les résultats intermédiaires et finaux sont présentés dans le tableau suivant. La valeur des
dommages évités est calculée sur la base du nombre de logements résidentiels potentiellement
Valeur contributive du récif
0%
1%-4%
5%-10%
pour zones avec au moins 3 facteurs de protection
pour zones avec 1 ou 2 facteurs de protection
Types de littoral
pour zones vulnérables sans récif

Coral Reef Ecosystem Services Economic Valuation. Phd dissertation, Nicolas Pascal, 2013 Page 148 / 351!
affectés et sur les prix moyens du résidentiel construit. Les valeurs du service varient entre 115 et
220 millions d’euros.
Tableau B-51: Service écosystémique de protection contre la houle en Nouvelle-Calédonie
Q"F"C"# O+-*6+&>*+/=.-L8*+89(..
La distribution par communes des valeurs ajoutées des services de protection côtière est
présentée dans l’annexe nº3 (carte F.3-9).&
:N\N\ :(+G42+)4$6*(+"&e?@&O`f&
Les résultats estimant le potentiel économique (valeur ajoutée) que peuvent représenter des
contrats de bio-prospection entre un acteur privé et les institutions publiques sont présentés dans le
tableau suivant. Notre exercice de monétarisation se centre sur des contrats potentiels de bio-
prospection de screening (échantillonnages). La valeur potentielle des bénéfices nets reçus par les
institutions publiques et les organismes de collecte d’échantillons forment le total annuel
potentiellement perçu par le pays. Les résultats du modèle sont extrêmement sensibles à deux
paramètres clés : la probabilité de succès et la valeur du CA net par médicament. Les résultats basés
sur des moyennes de ces 2 paramètres montrent une valeur de bénéfices annuels comprise entre
" 600 K et " 4M. Il s’agit d’une valeur d’option qui reflète les bénéfices potentiels que peut
représenter un contrat de bio-prospection.
min max
Population urbaine 5 967 172 937 8 647 17 294
Population rurale 1 228 21 741 1 739 3 044
Population tribale 4 017 41 776 3 342 5 849
Total 11 212 236 454 13 728 26 186
Contribution des récifs (M Fcfp)Nombre de logements
affectésValeur des dommages
évités (M Fcfp)

Coral Reef Ecosystem Services Economic Valuation. Phd dissertation, Nicolas Pascal, 2013 Page 149 / 351!
Tableau B-52: Valeur d’option du service de bio-prospection.
L’exercice de valorisation de la bio-prospection présente un résultat beaucoup moins attractif
qu’attendu et avec une forte variabilité (écart important entre les valeurs minimum et maximum). En
effet la prise en compte de la probabilité de succès réduit fortement les avantages pour le pays en
termes de royalties sur les ventes du futur médicament.
min max
Benefice net total par echantillon valeur présente 11 884 45 953
Benefice net par echantillon valeur actualisée annuelle moyenne 594 2 298
Chiffre d'affaires total par echantillon valeur présente 62 549 241 857
Chiffre d'affaires par echantillon valeur actualisée annuelle moyenne 3 127 12 093
Total annuel sous forme de royalties 187 647 2 418 567Total annuel sous forme de droits d'echantillons 267 000 1 200 500
Total annuel VA entreprises collectrice d'echantillons 135 000 750 000
Total annuel perçu par le pays 589 647 4 369 067
!

Coral Reef Ecosystem Services Economic Valuation. Phd dissertation, Nicolas Pascal, 2013 Page 150 / 351!
:N\N] A(Y0$&#$&=CS&&e?@&OOf&
Bien que les récifs jouent un rôle important dans le budget de carbone, contribuant entre un 7 et
15 % de la production mondiale de carbonate de calcium, ils ne semblent pas contribuer à la
séquestration du carbone.
Les carbonates sédimentaires, dont les coraux, les algues coralliennes et les coquilles d'autres
organismes marins, sont le plus grand réservoir de carbone sur Terre, et c’est pourquoi les
fluctuations du budget de carbonate de calcium mondial influent sur la concentration atmosphérique
de dioxyde de carbone.
Toutefois, la chimie du système est telle que, bien que les océans eux-mêmes sont un «puits» de
carbone (c'est à dire qu'ils absorbent le dioxyde de carbone), les récifs, par le processus de
calcification, sont des «sources» ou des producteurs nets de dioxyde de carbone à une échelle très
réduite au niveau mondial (Suzuki and Kawahata, 2004). En effet, en raison de leur taux élevé de
calcification, les récifs coralliens jouent un rôle majeur dans le cycle de calcium mondial, malgré
leur étendue en surface limitée, fixant la moitié environ de tout le calcium dans la mer en carbonate
de calcium. Leur rôle dans le cycle de carbone de la planète et les autres cycles géochimiques est
actuellement en cours d´étude.
Des modèles et des données de terrain limitées indiquent que les récifs coralliens semblent être des
très petites sources nettes de dioxyde de carbone (moins de 0,1 milliards de tonnes de carbone par
année, comparativement à environ 6 milliards de tonnes de carbone par an provenant de la
combustion de combustibles fossiles) à l'atmosphère sur des échelles décennales. Cela est dû à la
libération de dioxyde de carbone lors de la calcification, ce qui implique la précipitation du
carbonate de calcium, du bicarbonate et du calcium dans l'eau salée. En outre, alors que les récifs
coralliens absorbent de grandes quantités de dioxyde de carbone (par unité de surface) au cours de la
photosynthèse, elles rejettent généralement des montants presque équivalents par la respiration,
entraînant peu de stockage net.
Pour les mangroves et herbiers, l’application des variables explicitées dans le chapitre méthode
produit les résultats ci-après décrits. Cependant, les écosystèmes associés n’ayant pas été l’objet
principal de l’étude et les ressources de l’étude ne permettant pas d’approfondir plus précisément
ces résultats, les valeurs de ce service ne sont pas inclues dans les résultats consolidés de l’étude.

Coral Reef Ecosystem Services Economic Valuation. Phd dissertation, Nicolas Pascal, 2013 Page 151 / 351!
Tableau B-53: Valeur du service de séquestration de carbone par les écosystèmes associés.
(Valeurs non inclues dans les résultats consolidés)
&
!"#$%&'('$)*+,- .'/ .,0 !12"$34%1)5,/3)6$)376)
8",/4'41)%$6,%9",:6$)5,/3)6;,4.73#<=%$
.'/ .,0
>,/9%7?$3 !"### #$%! %&$'( %)"** &%* &)### &+')!"# %%)',#)### !')%##)###
+$%:'$%3 +#### -'$+ "#$!! # # -&(,)### !)##*)*## -"),##)### &#)%##)###
@4,/93)3,613 # &$" ,$( %)'#! &*# # # # #
!"#$% &'((( &)*&()((( '+),(()(((
4)ABC$2D)EFGD)<,FG 4)ABC$2D))<,FG H,6$"%)5$)3$2"$34%,4'7/)5")(,%:7/$)*IJ,/-K74,6)4)ABC$2D)EFGD)

Coral Reef Ecosystem Services Economic Valuation. Phd dissertation, Nicolas Pascal, 2013 Page 152 / 351!
&

Coral Reef Ecosystem Services Economic Valuation. Phd dissertation, Nicolas Pascal, 2013 Page 153 / 351!
=N ?6+"+3(6& P-/1-*(+"& +,& .$"$,(*)& +,& 6+2-/& 2$$,& 3-2("$& 2$)$2P$c&<+2*Q&?,-*$c&F-"1-*1&
=NO !"*2+#16*(+"&&
=NONO =+331"(*7G.-)$#&BA8&("&A-6(,(6&6+"*$%*&
Near shore fisheries remain critically important to virtually all islands of the Pacific countries in
promoting easily accessible household food and a diversification of protein sources and livelihoods
(2007; Gillett, 2009; Kronen, 2007; Sprep, 2007).
Today most Pacific territories are facing challenges such as (i) increased fish demand from
human population growth (projected to increase by 50% by 2030 with projected food requirements
well in excess of what coastal areas are currently likely to produce without significant
improvements in management and productivity) (Bell et al., 2009) (ii) the rapid introduction of
market economy with its associated rural migration, loss of traditional customs and urban poverty
(Cinner and Aswani, 2007), (iii) a small island context with limited economic options (Beukering et
al., 2007a) and, (iv) potential climate change effects on their coral reef ecosystems services (Baker
et al., 2008; Knowlton, 2000). These challenges are reinforced by the fact that national budgets are
usually small and face considerable demands to meet human development priorities such as health,
education and food production.
As a result, local populations and local governments would greatly benefit from improved
understanding of the means to manage marine resources sustainably with inexpensive and strong
performing tools. For some actors, Community Based Management (CBM) approach is now
proposed as the main basis for securing the well-being of both reefs and communities of most of the
Pacific Islands (Johannes, 2002; Johannes and Hickey, 2004; Tawake and Aalbersberg, 2002;
UNEP, 2004)
=NONS @+1*Q&A-6(,(6&6+331"(*7G.-)$#&3-2("$&42+*$6*$#&-2$-)&&
Community-based Marine Protected Areas (MPAs) have experienced an impressive
development during the last decade (Aalbersberg et al., 2005). They usually form a part of a larger
management scheme named Marine Managed Area (MMA) and more than 550 documented MMAs
now exist in the South Pacific (Govan, 2009). An MMA is defined as an area of nearshore waters
and coastal resources that is largely or wholly managed at a local level by the coastal communities,
land-owning groups, partner organizations, and/or collaborative government representatives who
reside or are based in the immediate area (Govan, 2009). Community-based management (CBM)
starts from the basic premise that people have the innate capacity to understand and act on their own

Coral Reef Ecosystem Services Economic Valuation. Phd dissertation, Nicolas Pascal, 2013 Page 154 / 351!
problems (Ruddle, 1994). Essentially, CBM builds on what the community thinks and allows each
community to develop a management strategy that meets its particular needs and conditions. Its
approach is people centred and driven by consensus. The core of CBM is community organization,
where empowerment is a primary concern. The management is carried out primarily by the
community through the relevant user groups and also involves appropriately the locally and
nationally institutional and private stakeholders.
Management rules such as fishing closure, temporary bans, size restriction, gear controls can be
very diverse and some of them are still based on Traditional Ecological Knowledge (TEK)
(Johannes, 1998, 2002). In recognition of these characteristics a regional term has been adopted
since 2000, Locally Managed Marine Area or LMMA.
The detractors of protected areas critique their establishment and management for three reasons
(Ruddle and Hickey, 2007; Wilkie et al., 2006a). First, they argue that only initiatives related to
poverty alleviation will lead to successful biodiversity conservation because only these initiatives
address the root cause of environmental destruction (Leisher et al., 2007; UNEP, 2004). Second,
protected areas take away the property and rights of local people and can be an unjust drag on their
present and future welfare (Dixon, 1993). Third, even if protected areas do generate economic
value, the distribution of these benefits is so skewed against poor rural people that the role of such
areas in local development is negligible and they neither justly compensate for lost property and
rights nor contribute to poverty alleviation (Garaway and Esteban, 2002; WFC, 2008) .
Following the descriptions realized by several authors (Govan, 2009; Johannes and Hickey,
2004; UNEP, 2004), the MMAs (with MPAs) of the Pacific present therefore some specificity that
apparently solves the three previous identified issues of protected areas. First, the theory of MPAs
tells that they should produce benefits for fishery as well as other benefits from a potentially long
list including tourism, access to information, enhancing property rights and so on (Angulo-Valdes
and Hatcher, 2010; Gell and Roberts., 2003; Roberts and Hawkins, 2000). These benefits should be
an incentive for permanency of the MPA inside the MMAs. Second, their management through
village committees respecting customary rights and land tenure should improve the chances of
acceptance by local communities. (Johannes, 1984). Third, due to the size and remoteness of these
small MPAs the distribution of benefits on fishery and tourism are more likely to be directed to
local community stakeholders (Tacconi and Bennett, 1997)
=NONT ;2+3&*Q$+27&*+&2$-/(*7b&UQ-*&#+&U$&R"+U&2$-//7&-.+1*&BA8)&.$"$,(*)&,+2&4$+4/$i&
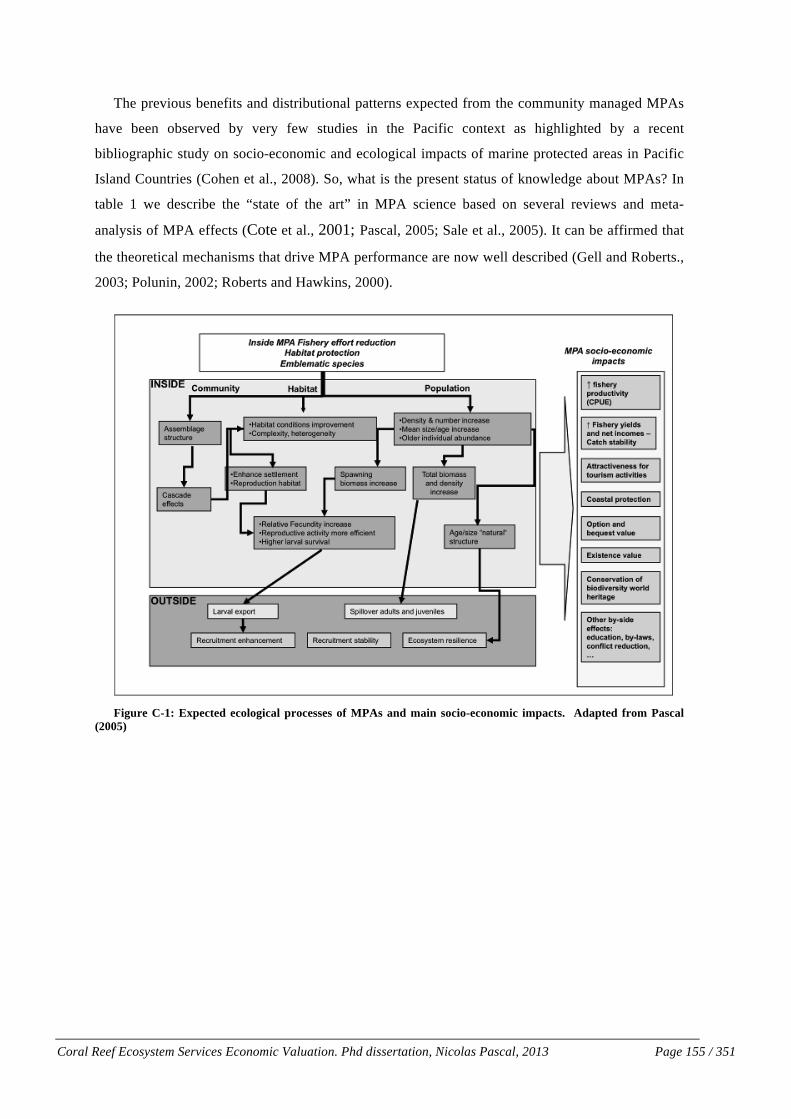
Coral Reef Ecosystem Services Economic Valuation. Phd dissertation, Nicolas Pascal, 2013 Page 155 / 351!
The previous benefits and distributional patterns expected from the community managed MPAs
have been observed by very few studies in the Pacific context as highlighted by a recent
bibliographic study on socio-economic and ecological impacts of marine protected areas in Pacific
Island Countries (Cohen et al., 2008). So, what is the present status of knowledge about MPAs? In
table 1 we describe the “state of the art” in MPA science based on several reviews and meta-
analysis of MPA effects (Cote et al., 2001; Pascal, 2005; Sale et al., 2005). It can be affirmed that
the theoretical mechanisms that drive MPA performance are now well described (Gell and Roberts.,
2003; Polunin, 2002; Roberts and Hawkins, 2000).
Figure C-1: Expected ecological processes of MPAs and main socio-economic impacts. Adapted from Pascal
(2005)

Coral Reef Ecosystem Services Economic Valuation. Phd dissertation, Nicolas Pascal, 2013 Page 156 / 351!
Although, a good deal has been written about what MPAs could or should do, few empirical
studies demonstrate what they actually do for people (Mumby and Steneck, 2008).
Table C-1: Status of science knowledge about MPA effects. Adapted from Mumby and Steneck (2008a)
The findings of these authors have shown that the very extensive scientific and technical
literature produced on MPAs during the last 10 years has concentrated mainly on biological impacts
inside the closed area. The effects inside MPA on fishery biomass, density and diversity are now
well demonstrated in many sites. Even if uncertainties on MPA size and species remain, it can be
considered that the management of a zone reducing the fishing effort will create a build-up of
biomass and diversity of exploited species inside the closed area after a period of 5 years (Gell and
Roberts., 2003). These effects have had remarkably consistent effects throughout the world
(Halpern, 2003; Halpern and Warner, 2002). Nonetheless, outside effects on fishery yields through
spillover of biomass or larval dispersion from MPA are expected but only confirmed by few studies
so far (Castilla and Bustamente, 1989; McClanahan et al., 2009; Roberts et al., 2001; Russ and
Alcala, 1996). In a similar way, MPA are usually presented as a powerful attractor for tourism but
evidences remain scarce (Andersson, 2007; Asafu-Adjaye and Tapsuwan, 2008; Beukering et al.,
2003; Depondt and Green, 2006; Harrison, 2007). The relationship between underwater tourism and
the impacts of MPA on some ecological attributes is also not well known (Andersson, 2007).
Scientific knowledge gaps, technical difficulties to separate MPA effects on fishery and tourism
MPA ecological effects: Status of science
Inside MPA effects:
Biomass and density increase for fishery target fish and invertebrates Widely demonstrated - high variability
Increase of average age/size Widely demonstrated - high variability
Increase of reproductive capacity Confirmed by few studies so far
Change in assemblage structure Confirmed by few studies so far
Trophic cascade effects on algae and invertebrates Confirmed by few studies so far
Biodiversity indices Mixed results (positive, negative, no impacts)
Outside MPA effects:
Biomass gradient from the border (spillover) Confirmed by few studies so far
Larval export Expected but not demonstrated
Recruitment stability Expected but not demonstrated
Ecosystem resilience Confirmed by few studies so far
MPA socio-economic effects: Status of science
Use values Change in average CPUE Confirmed by few studies so far
Total catches and net incomes Confirmed by few studies so far
Catch stability Expected but not demonstrated
Underwater tourism attractiveness Confirmed by few studies so far
Improvement of coastal protection ecosystem service Expected but not demonstrated
Education and awareness Confirmed by few studies so far
Non-use values Change in existence value Expected but not demonstrated
Coral Reef Ecosystem Services Economic Valuation. Phd dissertation, Nicolas Pascal, 2013 Page 157 / 351!
from other context variables, expensive costs of studies, late participation of social sciences in MPA
science and effects too weak to be proven have been proposed as reasons for this lack of studies of
MPA benefits on people ((Sale et al., 2005)Ferrarris, pers. Comm..). Some recent studies have
intended to overcome some of the difficulties to identify individually sectorial benefits of MPA
(e.g.. fishery, tourism, social capital) by measuring directly the impacts on household welfare.
(Guzman, 2004; Hoagland et al., 1995; Leisher et al., 2007).
=NONZ BA8)&-"#&*Q$&8;9&("&*Q$&A-6(,(6&&
The AFD aim is to reduce poverty and inequalities, promote sustainable economic growth, and
protect “Global Public Goods” of benefit to all humanity. The activities cover 8 sectors
(environmental protection, forests and forestry, forest industries, fishing, agriculture, water and
sanitation, tourism, urban development and management). Projects for protected areas are realized
with the main objective to preserve local or national biodiversity and contribute to economic growth
and poverty reduction.
In the Pacific region, the AFD has used several intervention instruments for the coral reef
ecosystems protected areas (direct support via a project approach, programs, trust funds, capacity
building or alternative livelihood promotion) to both large MPAs and small MMAs (with MPAs).
Thirty-nine MPAs or MMAs with marine reserves in 10 pacific countries and territories have been
supported since 2005 (Oréade-Brèche, 2008).
=NON[ C.V$6*(P$)&
The financial investment in small MPAs from the AFD perspective must then be analysed from a
double bottom line perspective: (i) impacts on economic growth and poverty reduction and, (ii)
impacts on world biodiversity.
Another important criteria of AFD investments is the continuity of the investment. As described
before, the existence of local benefits and their distribution patterns are often identified as a success
key factor for continuity and projects should be marketable not only to donors but also to
stakeholders and government (UNEP, 2004).
To respond to the previous requirements of AFD investment appraisal and to increase the
ownership of the project by local stakeholders, a cost benefit analysis per stakeholders has been
conducted in selected case studies of community-based MPAs.
The research was designed to focus on observed and, as far as possible, proven impacts of the
investment and results have come from an extensive one-year and in situ field studies.

Coral Reef Ecosystem Services Economic Valuation. Phd dissertation, Nicolas Pascal, 2013 Page 158 / 351!
=NS B$*Q+#&
=NSNO H$"$2-/&-442+-6Q&&
The study has proceeded through the following steps: (i) identification of the MPA impacts on
ES through a control-impact protocol, and (ii) a cost-benefit analysis (CBA) per MPA and per
stakeholder (village, national and international). CBA has been realized on observed historic values
(ex-post) and on projections. CBA results are then used to: (i) compare the benefits of MPA with
the calculated annual village GDP to give an idea of their relative importance for villages and, (ii)
realize a financial analysis of MPA cash flows to present the Cost-Benefit ratio (B/C ratio) and the
Return on Investment (RoI) for development banks.
=NSNS @$/$6*(+"&+,&BA8&)(*$)&
7"$"$"# 76+*(6+8.
A dozen villages recommended by local stakeholders or identified by the project PROCFISH
were visited in Efate, Vanuatu. The identified sites were visited and the communities contacted to
explain and gain approval and support for the project’s activities in their areas. The initial appraisals
were carried out in each community over a 2-3 days period.
5 villages with MPA and 2 villages without MPA were selected in the North Efate zone (Figure
C-2). Each of the MPA sites respond to the three following criteria: (i) fringing coral reefs as
dominant ecosystem, (ii) MPA managed and adequately enforced by communities for at least five
years with the reserve covering at least 10% of the fishing ground area. These criteria correspond to
the minimum prudential time and fraction of fishing ground for effects of MPAs to build-up and to
be visible on fishery yields (Gell and Roberts., 2003) and, (iii) fulfil at least 3 of the 6 success key
factors identified for community-based MPA (Pollnac and Crawford., 2000). The success key
factors met by the selected sites are: (a) population size and the village area are relatively small, (b)
a visible level of community participation in decision making and (c) continuing presence from the
implementing agency. These factors tend to make community consensus building easier and make
community compliance with rules of the MPA easier in smaller geographic areas. Periodic outsider
visits to MPA sites help reinforce their value among the community and may help stimulate
continued implementation activities. As explained further, the other three success key factors:
perception of a crisis in fish abundance, successful alternative income projects and inputs from the
municipal government were not present in the selected sites.

Coral Reef Ecosystem Services Economic Valuation. Phd dissertation, Nicolas Pascal, 2013 Page 159 / 351!
7"$"$"$ 2/)+/U()/9/J+)89.8=B.+=-*+*>*+/=89.)/=*(Z*.
Populations are comprised between 40 and 220 residents with a mean household size of 5
persons (generally an extended family). Most of the villages have a young age structure with an
important part of the population (40% approximate) aged less than 15 years and only 5% aged over
60 years. Results are similar to the last demographic census (Vanuatu National Statistics Office,
2009). Most of the houses in the villages are permanent houses with a galvanized iron or similar
roof and cement floor. No village has access to electricity service. All the households received
income on their own account through subsistence production (e.g. food, firewood, house building
materials) and the majority was engaged in the sale of agricultural products, fish and handicrafts.
The Household Incomes and Expenses Survey (Vanuatu National Statistics Office 2008a) estimated
the average income of rural households in Vanuatu to be around 500 " per household per month.
This revenue is equivalent to international $US 1.300 when applying PPP and Geary–Khamis dollar
conversion (Heston et al., 2009). Approximately 40% of this income comes from subsistence
production. The surveys conducted in some of the villages based on the same protocol as the HIES
confirmed similar results with some variations (please refer to the description made in “Control site
validation”)
Figure C-2: Village locations, MPA and control sites.
When analysing selected descriptors (Table C-1), some differences among the villages are
notable in the fishing effort index and access to modern goods (the number of private electric
generators per household is selected as indicator). Following Cinner and Aswani (2007), this
Nguna Is.
Emua Saama
Piliura
Unakap
Worasifiu
Efate Is.
Nekapa
Laonamoa
Pele Is.
MPA village
Control village
Coral reef
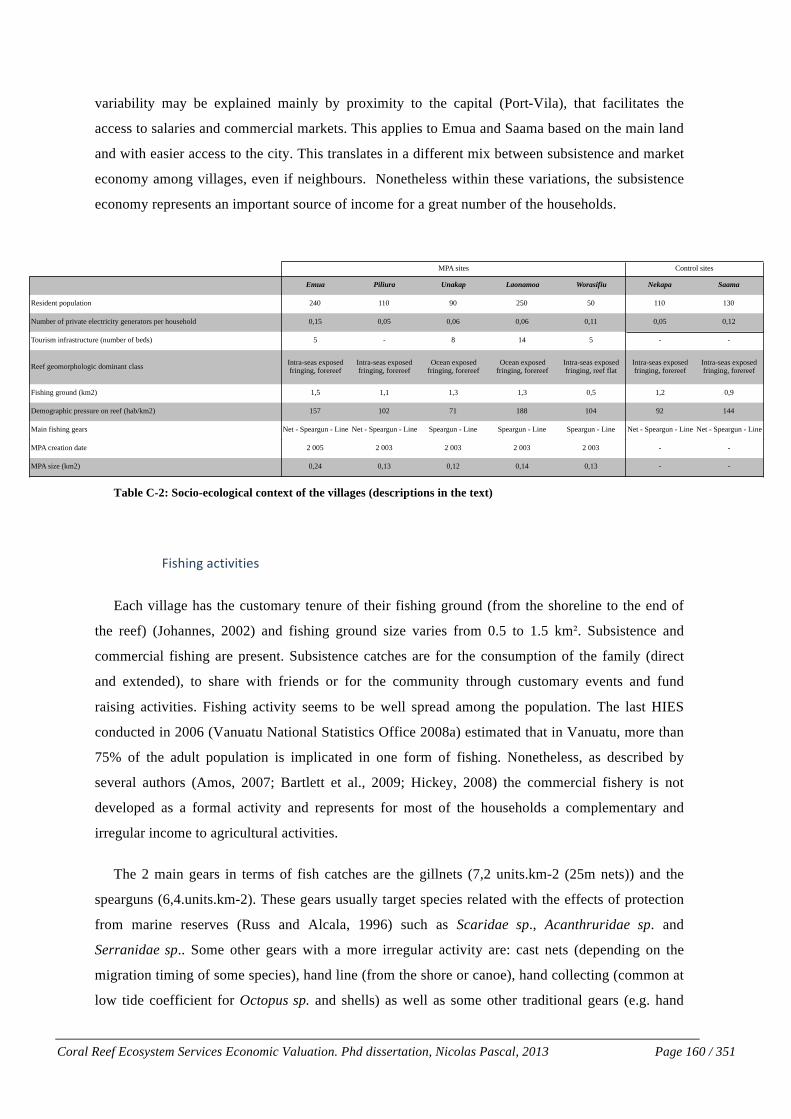
Coral Reef Ecosystem Services Economic Valuation. Phd dissertation, Nicolas Pascal, 2013 Page 160 / 351!
variability may be explained mainly by proximity to the capital (Port-Vila), that facilitates the
access to salaries and commercial markets. This applies to Emua and Saama based on the main land
and with easier access to the city. This translates in a different mix between subsistence and market
economy among villages, even if neighbours. Nonetheless within these variations, the subsistence
economy represents an important source of income for a great number of the households.
Table C-2: Socio-ecological context of the villages (descriptions in the text)
3$#<$&1!%2.$)$.$(#!
Each village has the customary tenure of their fishing ground (from the shoreline to the end of
the reef) (Johannes, 2002) and fishing ground size varies from 0.5 to 1.5 km#. Subsistence and
commercial fishing are present. Subsistence catches are for the consumption of the family (direct
and extended), to share with friends or for the community through customary events and fund
raising activities. Fishing activity seems to be well spread among the population. The last HIES
conducted in 2006 (Vanuatu National Statistics Office 2008a) estimated that in Vanuatu, more than
75% of the adult population is implicated in one form of fishing. Nonetheless, as described by
several authors (Amos, 2007; Bartlett et al., 2009; Hickey, 2008) the commercial fishery is not
developed as a formal activity and represents for most of the households a complementary and
irregular income to agricultural activities.
The 2 main gears in terms of fish catches are the gillnets (7,2 units.km-2 (25m nets)) and the
spearguns (6,4.units.km-2). These gears usually target species related with the effects of protection
from marine reserves (Russ and Alcala, 1996) such as Scaridae sp., Acanthruridae sp. and
Serranidae sp.. Some other gears with a more irregular activity are: cast nets (depending on the
migration timing of some species), hand line (from the shore or canoe), hand collecting (common at
low tide coefficient for Octopus sp. and shells) as well as some other traditional gears (e.g. hand
Emua Piliura Unakap Laonamoa Worasifiu Nekapa Saama
Control sitesMPA sites
Resident population 240 110 90 250 50 110 130
Number of private electricity generators per household 0,15 0,05 0,06 0,06 0,11 0,05 0,12
Tourism infrastructure (number of beds) 5 - 8 14 5 - -
Reef geomorphologic dominant class Intra-seas exposed fringing, forereef
Intra-seas exposed fringing, forereef
Ocean exposed fringing, forereef
Ocean exposed fringing, forereef
Intra-seas exposed fringing, reef flat
Intra-seas exposed fringing, forereef
Intra-seas exposed fringing, forereef
Fishing ground (km2) 1,5 1,1 1,3 1,3 0,5 1,2 0,9
Demographic pressure on reef (hab/km2) 157 102 71 188 104 92 144
Main fishing gears Net - Speargun - Line Net - Speargun - Line Speargun - Line Speargun - Line Speargun - Line Net - Speargun - Line Net - Speargun - Line
MPA creation date 2!005 2!003 2!003 2!003 2!003 - -
MPA size (km2) 0,24 0,13 0,12 0,14 0,13 - -

Coral Reef Ecosystem Services Economic Valuation. Phd dissertation, Nicolas Pascal, 2013 Page 161 / 351!
spear). Few fishing activities are conducted by women (hand collecting and handline from the shore
principally). The gillnets are used principally in the form of drive-in nets. A fishing trip is composed
by 4 to 8 fishermen and up to 100 m length of nets. The nets are fixed in some kind of corridors
formed by fringing reefs at a depth between 3 to 10 m. Fishermen drive the fish into the nets by
creating some sort of commotion. They can repeat several times this action without moving the nets
or nets can be setup in a new location. Depending on water conditions and fish catches, a fishing trip
can last from 1 to 5 hours. Nets are monofilament gillnets with 3-inch diagonal mesh. Spearfishing
in the village fishing ground is realized from the shore or from a non-motorized boat. Depth is
comprised between 2 to 15 m and coral reefs habitats are the main target. Fishing trips are usually
made alone. Night spear fishing is common with diving lamps when targeting Scaridae sp. and
especially bumphead parrotfish (Bolbometopon muricatum). Invertebrates (mainly Trochus sp.) are
collected during the opening of the Trochus ban with snorkel gears from the shore.
JH"!%&6!+.<(4!=$#<(49!-%&%1(-(&.!4B*(#!6(#24$,.$+&!
Every MMA is associated to a unique village. The MPA included in the MMA size varies from
0.1 to 0.2 km#, which is similar to most of the small MPAs in the Pacific (Govan, 2009) and
represent an average 15% of the reef fishing ground. Even if difficult to track precisely the precise
origin of the MPAs, each village councils proposed them with different degree of assistance from
external agencies. They are all managed by the village through a MPA or environment committee
formed by members of the village. Some of the MPAs are non-permanent closures where periodic
harvest events can occur for village subsistence or celebration. Many activities around MPA have
been observed during our presence in 2009 and 2010 (e.g. regular meetings, participation in
workshops and trainings, collection of crown-of-thorn (Acanthaster planci), rubbish cleaning,
organization of environment awareness campaign, monitoring, maintenance of buoys).
Table C-3: Description of the main fishery management rules (modern and traditional)
Four villages (Piliura, Unakap, Laonamoa, Worasifiu) belong to a MPA network. This implies
that all the funding, assistance and workshop invitations are received through the network and
redistributed among the active MPAs by the network committee. Nonetheless, each village of the
network has also its own committee and managed with independence its marine zone. One village,
Coral Reef Ecosystem Services Economic Valuation. Phd dissertation, Nicolas Pascal, 2013 Page 162 / 351!
Emua receives directly the assistance from a local NGO and does not form part of any network. The
level and quality of enforcement, which are critical factors to evaluate effects of MPA (Pollnac and
Crawford., 2000) have been assessed through interviews with village and fishery department
representatives. As anecdotal evidence, during the 10 months that our program lived with the
villages, we were able to confirm that members of the communities in all villages actively managed
enforcement of the MPAs. Discussions with key person revealed that only one trespass had been
reported in the last 2 years. The village council through the person of the paramount chief has
applied a fine in local goods and money to the poachers. Visible buoys delimit the selected MPAs.
Differences in governance will be reflected through the costs and social capital impacts.
Other fishery management rules are in place. A classification has been adapted from Johannes
and Hickey (2004) who have realized a study of fishery management in more than 20 villages in
Vanuatu. The trochus (Trochus sp.) bans are in place in most of the villages in North Efate since the
last 90s. These bans are usually opened every 3 to 4 years for a controlled harvest (in minimum size
and volume) by villagers. A fishery act limits the size of specimens harvested. The giant clam
(Tridacna sp.) follows the same pattern. Many villages have developed the concept of clams and
trochus “garden” gathering together collected specimens and enhancing the spawning success. All
the villages have put a ban or tabu on their harvest of turtles and their eggs. The Vanuatu Fishery
Department (VFD) regulates some catches with a previous authorization. The public awareness
about the turtle regulation is surprisingly high (Johannes and Hickey, 2004) and the presence of
voluntary “turtle monitors” trained from a local NGO is common in every village. In 2008, a five-
year ban on the harvest and sale of beche-de-mer has been setup to let the stocks recover. In
addition to those specific rules, there is an additional ‘rule’ related to controlling the access
permitted for non-locals. This rule originated at the local level among communities to control access
to their natural resources has since been incorporated into national legislation. Article 74 of the
Constitution states that ‘The rules of custom shall form the basis of ownership and use of land in the
Republic of Vanuatu’. The implication of this Article for individuals or companies who do not have
primary access rights (i.e. they are not members of a clan or community) is that the resource
custodian must be consulted and his permission sought prior to access being granted. This implies
the existence and official recognition of fishing rights for the villages. These rights apply from the
shore up to the end of the reef.
N+B4$#-!%2.$)$.$(#!
Small-scale rural tourism activities take place in every village. The tourism activities include (i)
day tours, (ii) snorkel tours, (iii) scuba diving, (iii) guesthouses, (v) scientific tourism, and (vi) the
other activities associated with the previous activities such as restoration and selling of handicrafts.

Coral Reef Ecosystem Services Economic Valuation. Phd dissertation, Nicolas Pascal, 2013 Page 163 / 351!
The day-tour activities correspond to visits coming from Vila to spend a whole day in the village.
Tour operators from the capital organize them and a fee is paid to village for each visit. The snorkel
tours are realized in the MPA and a fee is charged to visitors to get inside the MPA with a guide. All
the scuba diving clubs (3) are based in or near the Port-Vila city. The mean capacity for each club
varies from 12 to 40 dives per day. The most frequented scuba diving sites are close to the capital
(time to access less than 1 hour by boat).
Guesthouses are small structures corresponding to the niche of adventure and nature travel. The
standards are adventure lodge standards (bush toilets, no electricity, etc.). They usually have a
capacity comprised between 2 to 6 beds. They are developed without external financing (except
occasional aid) and can survive even with low occupancy rate as they do not borrow funds from
banks and keep their costs very low. Some of them have no established product: description, price
list, brochure, etc… Owners have little training in business and management. Marketing initiatives
realized by the government for the development of rural tourism are reduced. All the guesthouses
studied belong to a local family or to the community. No foreign or domestic investment was
identified. The land tenure system (custom land unregistered) creates an investment disincentive due
to the insecurity of land tenure. Statistics about occupancy rates are scarce. Some statistics from
1998 (Vanuatu Tourism Office) indicate that average occupancy rate for rural tourism varies from
3% to 18%. This occupancy rate is very far from usual breakeven point of 40% for rural tourism in
other countries (King Sturge, 2001) and reflects the low level of initial investment and operational
costs. The majority is managed privately but some are owned and managed by the community.
Scientific tourism represents the visits from researchers, NGOs members or other professionals.
It takes usually the form of payment for sporadic visits in food and accommodation. Some of the
visits imply long-term residence in a village.
The main attractions of Vanuatu rural tourism (VTO pers. Comm..) consist of : (i) nature
(volcanoes, sites of natural beauty such as volcanoes, cascades, forests, beaches, coral reef and sites
with specific attributes: turtle spawning places, fish biodiversity, emblematic species presence…)
(ii) culture: the different lifestyles and languages constitute one important asset for tourism (iii)
adventure: bushwalking, treks, discovery of custom sites, dancing grounds, volcanoes, scuba diving,
etc. These attractions are the reason why travellers choose the rural tourism, since the
accommodation and catering standard are generally well below the international standard. Efate is
the most visited island in Vanuatu and has a mountainous centre, some good beaches and is
surrounded by several small islands. Efate does not have the original custom and culture found in
the outer islands but it has the advantage of its international airport and relatively good transport
infrastructure. A study revealed that international and domestic (non-affinity tourism) visitors
coming to the North Efate zone were around 8 000 in 2007. This number is expected to increase

Coral Reef Ecosystem Services Economic Valuation. Phd dissertation, Nicolas Pascal, 2013 Page 164 / 351!
after the improvement of the main road and access to all the villages in the study zone. This huge
public work through the Millennium Challenge Account was completed in mid 2010 and effects
were therefore not visible in our research.
C2+*+1$2%*!<%K$.%.#!
Data extracted from the Millennium Coral Reef Mapping Project show that the dominant reef
geomorphologic type is the ocean and the intra-seas exposed fringing reef (classes 222 and 230
respectively) (Andréfouët et al., 2005)
7"$"$": NE!.()/9/J+)89.+5L8)*-..
We present the results of a benthic monitoring campaign, a target fish population’s census and an
herbivore algal assay comparing sites with and without MPA conducted in the to should give us
some ideas of the ecological impacts of small size MPAs (Bonito et al., 2012). In the same way, an
assessment of catch per unit effort (as a proxy for fish abundance), fish biomass per unit effort and
percentage of potentially reproductive fish was compared to adjacent fished areas (Clements et al.,
2012). Both studies have shown clear evidence of the ecological impacts of MPAs on habitats and
fish populations inside the boundaries of the MPA.
The main results found are:
Impacts on habitats:
MPAs have 4-8 times the amount of hard coral cover than fished sites with hard coral covering 20-
40% of the benthos in MPAs compared to 4-14% at fished sites. Also, MPAs had little to no macro-
algae, while macro-algae dominated fished and taboo areas covering up to 87% of the hard bottom
in some locations
Figure C-3: Mean Hard Bottom Composition by Protection Status, Site and Zone (NPMPA stands for Non-
permanent Marine protected area and CCA for crustose coralline algae). Extracted from (Bonito et al., 2012)
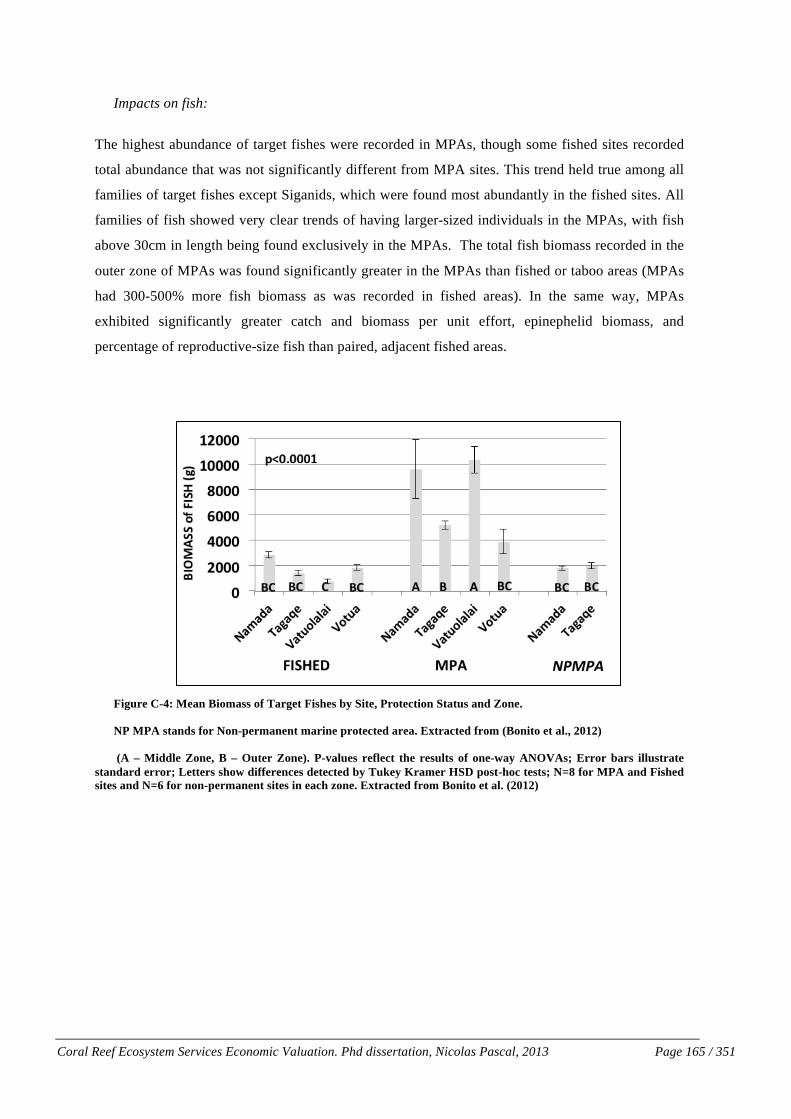
Coral Reef Ecosystem Services Economic Valuation. Phd dissertation, Nicolas Pascal, 2013 Page 165 / 351!
Impacts on fish:
The highest abundance of target fishes were recorded in MPAs, though some fished sites recorded
total abundance that was not significantly different from MPA sites. This trend held true among all
families of target fishes except Siganids, which were found most abundantly in the fished sites. All
families of fish showed very clear trends of having larger-sized individuals in the MPAs, with fish
above 30cm in length being found exclusively in the MPAs. The total fish biomass recorded in the
outer zone of MPAs was found significantly greater in the MPAs than fished or taboo areas (MPAs
had 300-500% more fish biomass as was recorded in fished areas). In the same way, MPAs
exhibited significantly greater catch and biomass per unit effort, epinephelid biomass, and
percentage of reproductive-size fish than paired, adjacent fished areas.
Figure C-4: Mean Biomass of Target Fishes by Site, Protection Status and Zone.
NP MPA stands for Non-permanent marine protected area. Extracted from (Bonito et al., 2012)
(A – Middle Zone, B – Outer Zone). P-values reflect the results of one-way ANOVAs; Error bars illustrate standard error; Letters show differences detected by Tukey Kramer HSD post-hoc tests; N=8 for MPA and Fished sites and N=6 for non-permanent sites in each zone. Extracted from Bonito et al. (2012)

Coral Reef Ecosystem Services Economic Valuation. Phd dissertation, Nicolas Pascal, 2013 Page 166 / 351!
Figure C-5: Mean (a) CPUE, (b) BPUE, and (c) biomass of individual Epinephelus spp. ± SE.
Asterisks indicate significant differences for pair-wise Wilcoxon rank-sum tests (*p < 0.05, **p < 0.01). Numbers below the bars indicate number of sampling days (a & b) and number of fish sampled (c); CPUE: catch per unit effort; BPUE: biomass per unit effort. Extracted from Clements et al. (2012)
Impacts on herbivore fish:
Herbivore assays conducted in 2010 and 2011 clearly show that herbivore on the five common
species of brown algae used in the assays was significantly greater in the MPAs than in the fished
areas with more than 80 of the algae being consumed at some MPA sites while little to no algae
were consumed at the fished sites
Impacts on invertebrates
Results indicate that there are two species that clearly dominate the harvest: Tripneustes gratilla
(common name: cake urchin) is the most harvested species (35% of households consider this to be
their most frequently harvested product from the iqoliqoli) and the second-most is Lethrinus harak
Clements et al: Evaluating small Fijian MPAs
highest diversity was recorded from Namatakula’sMPA and Namada’s fished area (Fig. 2). Catch diver-sity was not correlated with sample size (r2 = 0.0097,p = 0.82). At all sites except Namatakula, the fishedarea had higher catch diversity than the MPA. AnMDS ordination plot of the diversity at each samplinglocation illustrates that the Komave former MPA andfished area had similar diversity to each other (lowestcatch diversity), while the fished areas in Votua andNamatakula and the Namada MPA (intermediatecatch diversity) were also similar to each other(Fig. 3). Epinephelids comprised most of the catch atsites exhibiting low catch diversity.
Significant differences in CPUE between the MPAand fished area were observed at Votua (z = !2.586,p < 0.01) and Namada (z = !2.123, p = 0.03), withgreater mean CPUE found in the MPAs (Fig. 4a).While the MPA at Namatakula also had a greatermean CPUE than the fished area, this difference wasnot significant (z = !1.789, p = 0.07). In contrast, thefished area in Komave had a greater mean CPUEthan the former MPA, though this difference was alsonot significant (z = 1.795, p = 0.07).
Significant differences in BPUE between the MPAand fished areas were observed at all sites, withgreater BPUE in the MPA at Namada (z = !2.552, p =0.01), Namatakula (z = !2.087, p = 0.04), and Votua(z = !2.489, p = 0.01) (Fig. 4b). However, at Komave,the BPUE was greater in the fished area than in theMPA (z = 1.984, p < 0.05) (Fig. 4b). When compared tothe Komave sites, the 3 maintained MPAs had meanBPUEs ranging from 1.7 to 3.2 times greater thanKomave’s fished area and 2.7 to 5.1 times greaterthan Komave’s opened MPA.
Individual epinephelid mean biomass was signifi-cantly greater in all 3 MPAs and the former MPA thanin the adjacent fished areas of Namada (z = !12.699,p < 0.0001), Namatakula (z = !4.338, p < 0.0001), Vo-tua (z = !3.470, p < 0.001), Komave (z = 2.533, p = 0.01)(Fig. 4c). Epinephelids had 89.8, 44.3, 33.1, and11.3% greater individual mean biomass in the MPAthan in the fished area at Namada, Namatakula, Vo-tua, and Komave respectively.
A review of the literature yielded values of the sizeat sexual maturity (SSM) for 33 of the 55 species, orapproximately 60.0% of all species caught. Thistranslated to 97.5% of all individual fish caught in
5
Fig. 3. Multi-dimensional scaling plot of the Shannon-Weiner diversity index value of each catch based on familylevel analyses from each location sampled. Sites are repre-sented by shapes — Komave (n), Namada (y), Namatakula(h), Votua (s) — and areas by colors (dark gray = MPA; light
gray = fished area). MPA: marine protected area
Fig. 4. Mean (a) CPUE, (b) BPUE, and (c) biomass of individ-ual Epinephelus spp. ±1 SE. Asterisks indicate significantdifferences for pair-wise Wilcoxon rank-sum tests (*p < 0.05,**p < 0.01). Numbers below the bars indicate number ofsampling days (a & b) and number of fish sampled (c); CPUE:
catch per unit effort; BPUE: biomass per unit effort

Coral Reef Ecosystem Services Economic Valuation. Phd dissertation, Nicolas Pascal, 2013 Page 167 / 351!
(Blackspot emperor). Between 2004 and 2005 there was over an eight-fold increase in T. gratilla
abundance in the open harvest area10 of the Navakavu iqoliqoli (Navakavu LMMA Site Report,
2005). Urchin abundance has been linked to increased macro-algae cover (Dumas et al., 2007).
=NSNT F-/(#-*(+"&+,&6+"*2+/&)(*$)&
The control-impact approach is proposed by several authors (Balmford et al., 2008; Underwood,
1994) as a way to solve the difficulty of separating and identifying MPA effects from site or context
effects.
Two villages acting as control sites have been chosen to be compared with the selected MPA
villages. Ideally they had to be similar with the MPA sites on ecological attributes, fishing effort,
tourism and socio-economic context to make possible comparison among the sites and identify the
MPA effects. Specific methods have been employed to validate the degree of similarity.
7"$":"# 1)/9/J+)89.8**6+&>*(-.
For ecological attributes, a first categorization of the marine habitats has been made following
the geomorphologic classification proposed by the Millennium Coral Reef Mapping Project
(Andréfouët et al., 2005). More precise attributes of habitats were collected with the Medium Scale
Approach (Clua, 2006), which is designed for commercial fishery ecological assessment. It is based
on a semi-quantitative description of 20 quadrats of 25 m2 (500 m2 in total) for assessing habitat–
fish assemblage of certain stocks of commercial reef fish. Sixteen substrate components, totalling
100% coverage, were recorded if present. Each component was quickly estimated using a semi-
quantitative scale (SQS): 0 (0%), 1 (1–10%), 2 (11– 30%), 3 (31–50%), 4 (51–75%) and 5 (76–
100%). Transects were surveyed by an experienced diver and 3 transects were made in each village
(MPA border and 500 m) covering 1.500m2 (!0,1% of fishing ground). Due to time constraints, the
MSA transects were conducted only in Emua, Piliura (MPA sites) and in Saama and Nekapa
(control sites). Exact locations are given in Figure C-2.
As described in the next table, the variances on the substrate components with high influence on
commercial fish presence (red colour) are relatively small. The latter confirms the ecological
similarity among the MPA and control sites in the aim to compare their fishing productivity (Clua.
Pers. Comm.) .
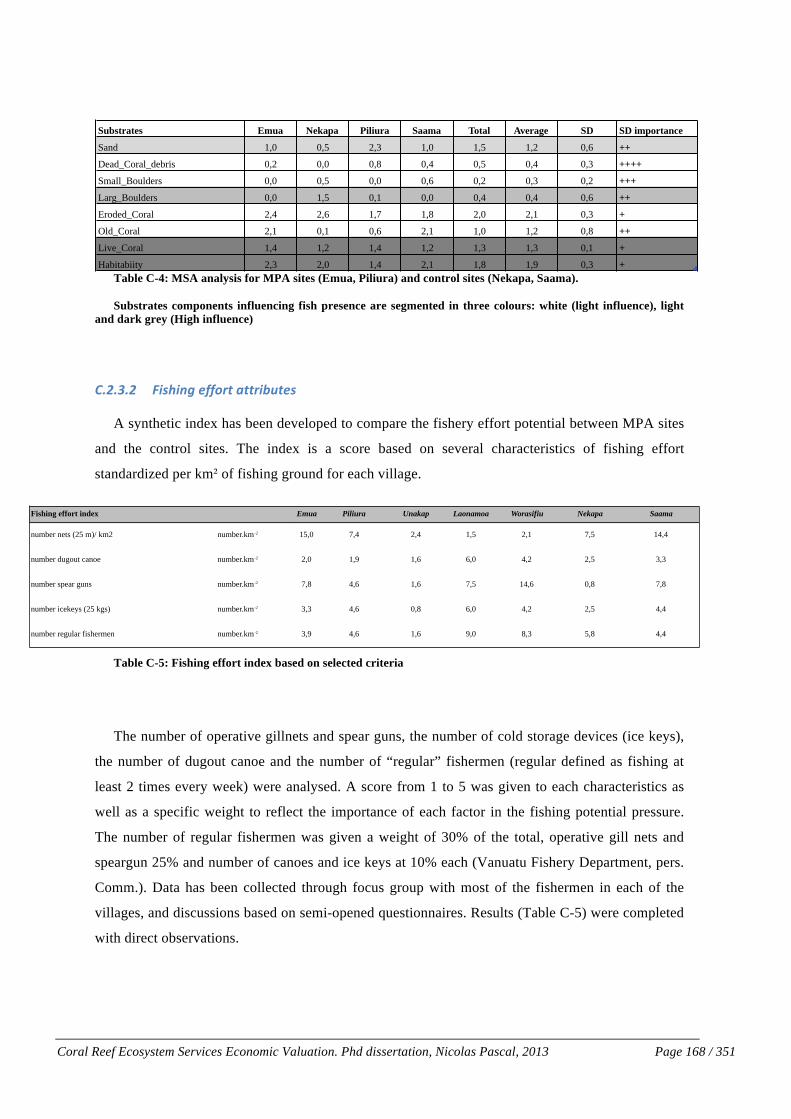
Coral Reef Ecosystem Services Economic Valuation. Phd dissertation, Nicolas Pascal, 2013 Page 168 / 351!
Table C-4: MSA analysis for MPA sites (Emua, Piliura) and control sites (Nekapa, Saama).
Substrates components influencing fish presence are segmented in three colours: white (light influence), light and dark grey (High influence)
7"$":"$ _+-<+=J.(00/6*.8**6+&>*(-.
A synthetic index has been developed to compare the fishery effort potential between MPA sites
and the control sites. The index is a score based on several characteristics of fishing effort
standardized per km# of fishing ground for each village.
Table C-5: Fishing effort index based on selected criteria
The number of operative gillnets and spear guns, the number of cold storage devices (ice keys),
the number of dugout canoe and the number of “regular” fishermen (regular defined as fishing at
least 2 times every week) were analysed. A score from 1 to 5 was given to each characteristics as
well as a specific weight to reflect the importance of each factor in the fishing potential pressure.
The number of regular fishermen was given a weight of 30% of the total, operative gill nets and
speargun 25% and number of canoes and ice keys at 10% each (Vanuatu Fishery Department, pers.
Comm.). Data has been collected through focus group with most of the fishermen in each of the
villages, and discussions based on semi-opened questionnaires. Results (Table C-5) were completed
with direct observations.
Fishing effort index Emua Piliura Unakap Laonamoa Worasifiu Nekapa Saama
number nets (25 m)/ km2 number.km-2 15,0 7,4 2,4 1,5 2,1 7,5 14,4
number dugout canoe number.km-2 2,0 1,9 1,6 6,0 4,2 2,5 3,3
number spear guns number.km-2 7,8 4,6 1,6 7,5 14,6 0,8 7,8
number icekeys (25 kgs) number.km-2 3,3 4,6 0,8 6,0 4,2 2,5 4,4
number regular fishermen number.km-2 3,9 4,6 1,6 9,0 8,3 5,8 4,4
Substrates Emua Nekapa Piliura Saama Total Average SD SD importance
Sand 1,0 0,5 2,3 1,0 1,5 1,2 0,6 ++
Dead_Coral_debris 0,2 0,0 0,8 0,4 0,5 0,4 0,3 ++++
Small_Boulders 0,0 0,5 0,0 0,6 0,2 0,3 0,2 +++
Larg_Boulders 0,0 1,5 0,1 0,0 0,4 0,4 0,6 ++
Eroded_Coral 2,4 2,6 1,7 1,8 2,0 2,1 0,3 +
Old_Coral 2,1 0,1 0,6 2,1 1,0 1,2 0,8 ++
Live_Coral 1,4 1,2 1,4 1,2 1,3 1,3 0,1 +
Habitabiity 2,3 2,0 1,4 2,1 1,8 1,9 0,3 +

Coral Reef Ecosystem Services Economic Valuation. Phd dissertation, Nicolas Pascal, 2013 Page 169 / 351!
7"$":": 2/)+/U()/=/5+).8**6+&>*(-.
As described in Table C-2, the control sites present similarities in terms of demographics, areas
and some indicators of consumer goods. A more detailed comparison has been made through
household expense surveys. As the results of the HIES (Household Income and Expense Survey)
undertaken by the statistics office of Vanuatu in 2006 were only available at a provincial level, a
specific survey was conducted in two of the villages during 3 weeks. The survey was similar to the
HIES but with a focus on expenses only to determine monetary and non-monetary needs of the
households. The objective was to have some comparative base with the HIES 2006 consolidated
results.
A sample of households (n=12) was selected in Nekapa and Unakap (25% approx. of the total
households). The survey is based on a logbook of daily expenses filled by the households during 3
weeks. The logbook was in the Bislama language. A visit every 2 days during the first week was
made to each household to ensure a good comprehension of the logbook. The households were
selected through random walking. A more detailed description of the method used is given in the
HIES 2006 final report (Vanuatu National Statistics Office 2008b). Extrapolations of results give us
the value of monetary and non-monetary expenses of the village.
In the same way as for MPA sites, control sites have had to fulfil some common factors with the
success key factors identified for community-based MPA (Pollnac and Crawford, 2000). The
common factors met by the selected control sites are: (i) population size and village area relatively
small, (ii) visible level of community participation in decision-making. As for MPA sites, the other
success key factors: perception of a crisis in fish abundance, successful alternative income projects,
inputs from the municipal government were not observed in the selected sites.
For tourism, MPA villages and non-MPA villages are contrasted. The control sites have none or
little tourism activities related to marine ecosystems. Saama has developed a different market niche
with the cultural tourism whereas Nekapa has only accidental tourism visits. Nonetheless all villages
are in a geographical perimeter with similar tourism context characteristics. External variables such
as transport, distance from airport and accessibility are similar. Other factors such as business skill
levels and facilities (e.g. access to water and electricity) are also very similar (pers. observation.).

Coral Reef Ecosystem Services Economic Valuation. Phd dissertation, Nicolas Pascal, 2013 Page 170 / 351!
7"$":"A %*<(6.)/=-+B(68*+/=-.8&/>*.)/=*6/9.-+*(-.
The control sites have been chosen also with the minimum potential spillover effects from other
neighbouring MPAs. They are upstream from MPA sites diminishing potential for export of larvae
or biomass from MPAs (main current is NW).
Control sites were chosen initially as sites only without MPAs but they resulted to be also sites
without any management rules on finfish and with very few rules on invertebrates. It is therefore
reasonable to consider that these sites act not only as control site for MPA evaluation but also for
MMA comparison.
A special attention has been given to understand the reasons why the control sites do not have
MPA. Even if difficult to fully repertoriate all the factors, historic land dispute and chief or family
clans’ conflicts were observed as the main reasons. This situation does not seem to have an
influence in the validity of the sites to act as control sites for comparison purposes.
Pascal, 2010 –Cost-Benefit analysis of Community-based marine protected areas, Vanuatu – Research report Page: 32/105
weeks. The logbook was in the Bislama language. A visit every 2 days during the first week was made
to each household to ensure a good comprehension of the logbook. The households were selected
through random walking. A more detailed description of the method used is given in the HIES 2006
final report (Vanuatu National Statistics Office 2008). Extrapolations of results give us the value of
monetary and non-monetary expenses of the village.
In the same way as for MPA sites, control sites have had to fulfill some common factors with the
success key factors identified for community-based MPA (Pollnac and Crawford, 2000). The common
factors met by the selected control sites are: (i) population size and village area relatively small, (ii)
visible level of community participation in decision-making. As for MPA sites, the other success key
factors: perception of a crisis in fish abundance, successful alternative income projects, inputs from
the municipal government were not observed in the selected sites.
For tourism, MPA villages and non-MPA villages are contrasted. The control sites have none or little
tourism activities related to marine ecosystems. Saama has developed a different market niche with the
cultural tourism whereas Nekapa has only accidental tourism visits. Nonetheless all villages are in a
geographical perimeter with similar tourism context characteristics. External variables such as
transport, distance from airport and accessibility are similar. Other factors such as business skill levels
and facilities (e.g. access to water and electricity) are also very similar (pers. observation.).
!"#$%&'&(&)*+,%-*$.&/01%2,%,&,+34%5,&6.%,738198*2&82&9-%&9%09:&&&
!"#$%&'()*+,$%-"+()*&-.(/"&'()"%(0&*+"$*&
The control sites have been chosen also with the minimum potential spillover effects from other
neighboring MPAs. They are upstream from MPA sites diminishing potential for export of larvae or
biomass from MPAs (main current is NW).
Control sites were chosen initially as sites only without MPAs but they resulted to be also sites
without any management rules on finfish and with very few rules on invertebrates (Table 3). It is
therefore reasonable to consider that these sites act not only as control site for MPA evaluation but
also for MMA comparison.
A special attention has been given to understand the reasons why the control sites do not have MPA.
Even if difficult to fully repertoriate all the factors, historic land dispute and chief or family clans’
Table C-6: Household Expenses surveys (description in the text)

Coral Reef Ecosystem Services Economic Valuation. Phd dissertation, Nicolas Pascal, 2013 Page 171 / 351!
=NSNZ @$/$6*$#&?@&(34-6*$#&.7&BA8&&
Six primary ES categories were chosen for analysis (Angulo-Valdes and Hatcher, 2010): (i)
subsistence proteins (ES1) and commercial reef fishing (ES2) (ii) tourism (scuba diving,
recreational boating, snorkelling tours, charters, etc.) and associated activities (accommodation,
food, etc.) (ES3), (iii) wave protection services (ES4), (iv) non-local non-use values of the
ecosystems (ES5) and (v) social capital effects, defined as the ability to attract external assistance
(ES6).
The underlying ecological processes implicated in the production of these impacts are identified
in many works (Gell and Roberts., 2003; Halpern, 2003; Polunin, 2002; Roberts and Hawkins,
2000) and presented in Figure C-1. The next table presents in detail the selection of the economic
impacts that will be valued. A distinction is made between ecological and governance processes
(Leisher et al., 2007; Mangos and Rojat, 2008). Some of the ecological processes take place inside
the MPA zone such as effects on biodiversity indicators, on the live coral reef coverage or on the
presence of emblematic species. Others are outside the MPA: the spill over of fish and invertebrates
biomass, the export of larvae or the reproduction enhancement.
Table C-7: Description of the 6 main selected ES and MPA impacts involved in the study (Details in the text)
=NSN[ @4-*(-/&4$2(3$*$2&+,&-"-/7)()&
The definition of the spatial perimeter of MPA impacts must take in account (i) the spillover and
larval dispersal effects of MPA, (ii) the area where the uses take place such as the fishing grounds or
the diving sites and, (iii) the residence of the stakeholders such as fishermen or tourism businesses.
The task of identifying the fishing grounds is made easy in Vanuatu due to the customary tenure
of every fishing grounds which belongs to the communities (Hickey, 2008). Only fishers belonging
to the same community or authorized fishermen can have access to the fishing ground. This
situation limits the spatial scope of uses and users. Nonetheless the spatial distribution of the MPA
ecological processes such as spill over or larval export is more complex. The spatial distributions of
the spillover effect have been estimated upon present knowledge about species home range and
Ecosystem service Valuation method MPA contributing factor Spatial perimeter
Subsistence and commercial fishing ES 1 and ES 2 Producer surplus MPA impact on fishing productivity Spillover and larval
dispersion zone
Tourism and associated expenses ES 3 Producer surplus MPA role on tourist visit motivation MPA
Coastal protection ES 4 Avoided damage costs MPA impact on habitat protection MPA coastline
Bequest value ES 5 Transfer benefit MPA impact on ecosystem health MPA
Social capital ES 6 Direct expenditures Proportion of grants linked to theMPA MPA

Coral Reef Ecosystem Services Economic Valuation. Phd dissertation, Nicolas Pascal, 2013 Page 172 / 351!
migration patterns. Many of the commercially valuable fish species harvested within the sites
(Scaridae sp., Acanthuridae sp., etc.) have small home ranges (e.g., on the scale of hectares to
kilometres) (Kramer and Chapman, 1997). Following the conclusions of different authors (Halpern,
2003; Jennings et al., 2001; McClanaham and Graham, 2005; Russ and Alcala, 1998) and given the
small size of the studied MPAs (less than 50 ha), it was assumed that the potential spill over area
would cover maximum 1 km on either side of the MPA when habitat was continuous. This spatial
effect applies for the main local commercial reef fish species (Scaridae sp., Acanthuridae sp. and
Siganidae sp.). For invertebrates a spill over area of 500 m was assumed for trochus (Trochus sp.)
(Tawake and Aalbersberg, 2002). Therefore, considering the size of the fishing grounds of the
villages, it is found that most of the potential spillover effects from MPA benefit mainly the village
with the MPA.
When considering larval export, more uncertainties and knowledge gaps exist. Many authors
(García Charton et al., 2000; Hilborn et al., 2002; Planes et al., 2000) have shown the
unpredictability and variability of recruitment patterns. They identify hydrology and current
patterns, the inter- and intra-species differences in larvae behaviours, the habitat features and the
distribution of adults as main influencing factors in larval export. Many, if not all, of these factors
are unknown or impossible to collect in the study sites with the available resources. To fix a spatial
range of larval export would be totally unfunded and the larval export effect from MPA has not
been studied.
Regarding effects on pelagic and deep-sea fisheries it was chosen not to include them in the
valuation. MPA has very little effect on the benthic species of the continental shelf and offshore
pelagic species. The only demonstrated effects would be the trophic exchange through export of reef
fish species larvae from MPA. These reef fish species larvae form part of the diet of some non-
coastal fish species. However, studies analysing stomach contents show that the contribution is
relatively low (between 5-10% of the total diet) (Allain et al., 2012)
For tourism impacts, it was determined that additionally to activities taking place in the selected
villages, all tourism activities and facilities within a 15 minutes walk perimeter from the MPA
should be surveyed for potential MPA benefits.
Coral Reef Ecosystem Services Economic Valuation. Phd dissertation, Nicolas Pascal, 2013 Page 173 / 351!
=NSN\ F-/1-*(+"&3$*Q+#)&
7"$"F"# \>8=*+0+)8*+/=.8=B.,89>8*+/=.
The valuation of the impacts is based on a two-step bio-economic approach. The first step
covers the quantification of the MPA benefits (e.g. volume of extracted biomass). The second step
is the economic valuation per se to calculate the monetary value of the impacts. The valuation is
focused on the financial value of the impacts.
7"$"F"$ _+=8=)+89.,89>(..
The financial value is formed by the added value (or producer surplus) and a multiplier effect of
this added value and is recommended for its similarity with GDP calculations (Beukering et al.,
2006). The added value can be defined as the value of benefits and salaries created by an economic
agent (people, companies, organizations and public institutions) and are obtained by deduction of
the intermediate goods (all goods and services purchased) from the gross output (quantity produced
and sold). The multiplier is the sum of the indirect and induced impacts of the activity (Pagiola,
2004b)
7"$"F": O8*8.)/99()*+/=.8LL6/8)<(-.0/6.P>8=*+*8*+,(.,89>8*+/=-.
Data collection has implied several techniques: interviews and questionnaires, focus group,
experimental fishery, fishing logbooks and monitoring. As revealed by several authors (Caddy,
2000; Pickering et al., 2003), MPA impacts on fishery are usually small and their identification
require precise data. Preference was given to collect data through field observations and
experiments instead of surveys when the objective was to get quantitative data (e.g. fishery). Several
studies have shown the limitations of interviews with villagers or fishermen in the Pacific context to
quantify precisely fishing efforts, catches or visitors (Aswani and Hamilton, 2004; Hubert, 2009). In
the villages, the fishing activities are informal, highly variable in effort and run without any
accountancy by an important number of households. Respondents do not have the data in memory
or enough motivation to answer in a reliable way (Johannes and Hickey, 2004; Kuster et al., 2006).
Additionally, some cultural differences exist between the Western approach educated to quantify
things as precisely as possible and the Melanesian approach where precise quantification is only
secondary (Bensa and Freyss, 1994). As far as possible and as described later, methods not based on
interviews were used to collect quantitative data about fishing effort, catches or number of tourist
visitors.

Coral Reef Ecosystem Services Economic Valuation. Phd dissertation, Nicolas Pascal, 2013 Page 174 / 351!
7"$"F"A 389>8*+/=.5(*</B-.8B8L*(B.*/.->&-+-*(=)(.8=B.)>-*/5864.()/=/54.
The present analysis has taken into account that individuals living in the community may make
different resource allocation decisions from those they may make when acting in their own interests.
The basic statements of neo-classical economy based on Pareto efficiency do not apply integrally in
this context and must be adapted (Cinner et al., 2007; Flores, 2002; The World Bank, 2000). The
life in community implies the existence of many links between people and a constant inter-
connection with the other households. Many services and goods are given without direct and rapid
compensation among families or with the community. For example, it is usual that a day of the
week is dedicated to some work decided by the village council and that will benefit the community
or a family without any kind of retribution (except from receiving in the future the same kind of
assistance from the community or from using the community goods). In the same way, un-
reattributed help and exchange of services are very common (Johannes, 2002). Another feature are
customary obligations to kin and reciprocity of exchange in material possessions or cash, whereby
the measure of a person is not by how much they own, but rather by how much they can give (Bensa
and Freyss, 1994). These aspects are reflected in the choice of consolidating results at the village
level instead of individual end-users level such as fishermen or tourism business-owners. For the
same reasons, it was not possible to realize a Lorenz curve analysis on the distribution of benefits.

Coral Reef Ecosystem Services Economic Valuation. Phd dissertation, Nicolas Pascal, 2013 Page 175 / 351!
=NSN] BA8&(34-6*)&+"&,()Q$27&42+#16*(P(*7&e+2&)4(//+P$2&$,,$6*f&&
7"$"H"# 1ZL(6+5(=*89.0+-<(64.8=B.9/J&//K-..
The Catch Per Unit of Effort (CPUE) (e.g. kg of fish captured per hour of a standard fishing
effort) has been chosen as indicator of fish productivity. CPUEs have been collected and
differentiated by gears in order to cope with the complexity of multi-métier and multi-species
fishery. CPUEs for gillnets and spear fishing are collected in MPA and control sites. Experimental
fishing is used for gillnet métiers and fishing logbooks for spear fishing.
Experimental fishing is useful in MPA’s evaluation to test expected gradients of abundance in
time and space e.g. (Rakitin and Kramer., 1996) ideally using a BACI (Before-after, Control-
impact) design (Underwood, 1994). The experimental fishing consists of a program of standardized
fishing effort repeated in selected locations at selected moments. The fishing experiment consist of a
1 hour fishing time with a group of 4 experimented fishermen maximum, 2 monofilament nets of 25
m each with a diagonal mesh of $ inch and 1,8 m height. This gear corresponds to the most
common and accessible fishing gillnet in North Efate. The 1 hour-time duration starts when the nets
are first setup in the water. Nets can change place 2 or 3 times during this experiment. As
recommended by several studies (Sánchez Lizaso and Goñi, 2000), a preference has been given to
make more replicates in time than in different places due to the high variability of catches over time.
2 locations in each site were chosen. In MPA village, the first one is close to the MPA border and
the other is !500m away from it (Figure C-2). Site selection came from discussion with fishermen.
56 experiments (45 hours) were realized from June to November during the dry season
corresponding to 14 replicas per site. A total of 276 kg of fish have been scaled and weighted. As
far as possible experiments were intended to be made in MPA and control sites on the same day or
in the same tide cycle. Different moon and tide cycles have been tested after discussions with
fishermen. The presence of the same experimented fishermen has been pursued to reduce the human
skill effect. Data are collected at a species level for selected families. Weight per species is
measured with a spring balance and specimens are counted by length class (2 cm FL (Fork Length)).
For spear gun, the situation is different. The know-how and personal skills of the fisherman are
very important in the output of the fishery. As it was not possible to have the same level of fishing
effort in MPA and control site, the results of the repeated experiments would not have been
comparable. The logbook method is then employed to monitor the fishing catches and efforts
(Hubert, 2009). It consists of logbooks filled by fishermen containing the details of their fishing trip.
Data about duration, place and catches are collected. The place corresponds to a simplified zoning
of the fishing ground to identify distance from MPA. The time (in hours) starts from the first dive.
Transport time was not taken into account. The catches are described through local names, number

Coral Reef Ecosystem Services Economic Valuation. Phd dissertation, Nicolas Pascal, 2013 Page 176 / 351!
of fish per group size (FL 2 cm class) and total weight per species. When species detail was not
possible catches were grouped by family level. Implicated fishermen are the most active fishermen
of the village with recognized experience in spearfishing. From 2 to 4 fishermen in each village
have participated in this program. Individual meetings were held with every fisherman to explain
the logbooks followed by a weekly visit to motivate participants and collect the data. As far as
possible, data reliability was checked with personal observations. Logbooks have been filled
irregularly during 4 months (July to October). Data from 96 hours of spearfishing were collected, 80
hours were considered as valid for an average of 20 hours per village.
The data collected from the logbooks and fishing experiments have made possible the
calculations of mean CPUEs in kg.h-1 of gillnet and kg.h-1 of spear-gun for every place. CPUEs
have been calculated at a species or family level when recognition was not possible.
7"$"H"$ 2(9()*(B.0+-<.085+9+(-^.0>=)*+/=89.8=B.5/&+9+*4.)8*(J/6+(-.
The selected families for the study are Acanthuridae, Haemulidae, Labridae, Lethrinidae,
Serranidae, Siganidae and Scaridae, considered as the main commercial families (Amos, 2007). To
facilitate the analysis, 2 groups were realized. The first one is the trophic group with four categories
(herbivorous, omnivorous, planktivorous, and carnivorous). The other group is the mobility one
with four mobility categories based on mobility patterns and home–range sizes: M1, migratory
species or highly mobile species with schooling behaviour; M2, demersal species with wide
horizontal displacements (e.g. Scaridae sp. and Acanthuridae sp.); M3, demersal, relatively
sedentary species that live in close association with the habitat substratum, such as Serranidae sp. ;
and M4, site-attached species with very small home ranges showing a territorial behaviour. This
mobility classification is an adaptation of the categories originally distinguished by several authors
(Cote et al., 2001; Eristhee and Oxenford, 2001; Guenette and Pitcher, 1999; Harmelin, 1987;
Rowley, 1994; Russ and Alcala, 1996; Smith and Wilen, 2003).
7"$"H": 7/=*(Z*.B8*8..
One of the main difficulties of MPA evaluation is to identify what effects are due to the
existence of the MPA or due to the socio-ecological context. In other terms, many factors from the
environment can explain difference in CPUEs when comparing MPA to control sites. Different
habitat characteristics, distinctive fish populations and unequal fishing effort are some of the factors
to take in account when comparing fishing productivity (Labrosse et al., 2000). As described
Coral Reef Ecosystem Services Economic Valuation. Phd dissertation, Nicolas Pascal, 2013 Page 177 / 351!
previously in the “control site validation” part, data have been collected about ecological habitat
characteristics through MSA transects and a fishing effort index have been developed.
Additionally, fish populations were surveyed with underwater visual census (UVC). The
stationary point method was chosen (Labrosse et al., 2002) where the observer counts fish from a
determined point while slowly turning in a circle. The variable distance counting method was used
to maximize sampling coverage. Maximum area surveyed was depending on water visibility. Length
(FL) data at a species level were collected for the selected families. Census surveys (n=48) were
made during 6 months (June to November). UVC occur before fishing experiments to avoid human
interferences. UVC locations were closed to the fishery experiments. An additional survey inside
MPA was realized in the MPA villages. To eliminate the observer bias, the same observer realized
the UVC campaign. Species richness (i.e. the number of species) and abundance (number of fish)
are estimated. The density (the number of fish per m2) is calculated with the following formula:
D= " ni / # r2
where ni: number of fish seen
r: radius for observation.
7"$"H"A 2*8*+-*+)89.8=894-+-.
To explore the distribution of CPUEs per species and its relationship with the existence of the
MPA and environmental variables we performed a direct gradient analysis (redundancy analysis:
RDA and partial RDA) on data using the ordination program CANOCO for Windows version 4.0.
The RDA introduces a series of explanatory (marine reserve existence and environmental) variables
and resembles the model of multivariate multiple regression, allowing us to determine what linear
combinations of these variables determine the gradients. As described in Legendre et al (Legendre
and Anderson, 1999) RDA has normally been used in ecology for ordination.
The data matrix included three groups of explanatory variables of which two correspond to
environmental variables. The first ones cover the “reserve” variables including MMA existence
(binary) and distance from MMA bordure (semi-quantitative). The second one include
“temporality” ones covering the moon cycle (qualitative), the tide (qualitative) and the third one
describe the habitat variables. The habitat is formed by three variables (all quantitative) coming
from the MSA transects. These habitat variables covered (i) the depth, (ii) coral reef description
(branched corals, other corals, debris and encrusting corals) and (iii) substrate category (Sand, Dead
Coral debris, Small Boulders, Large Boulders, Erodes Coral, Old Coral, Live Coral, Soft Coral,

Coral Reef Ecosystem Services Economic Valuation. Phd dissertation, Nicolas Pascal, 2013 Page 178 / 351!
Sponges, Macro Algae. Please refer to Table C-4 for results of MSA transects in the selected sites
and to Clua et al. (Clua et al., 2006) for MSA transect methodology description.
We pooled data from all taxa into fish groups to facilitate the large-scale analysis. 5 fish families
were grouped: Acanthuridae (Ac), Labridae (La), Lethrinidae (Le), Scaridae (Sc) and Siganidae
(Si).
The same analysis was applied to abundances by size class instead of CPUEs to determine their
relationships with the three groups of explanatory variables.
=NSN^ ?6+"+3(6&P-/1-*(+"&+,&(34-6*)&+"&)1.)()*$"6$&,()Q$27&e?@&Of&
7"$"Y"# O(0+=+*+/=.
The subsistence fishery corresponds to the non-commercial fishery where all catches are auto
consumed, given or exchanged but no monetary transaction takes place. This definition applies also
to the recreational fishery but it was non-existent in the studied sites. The fishery ceremonies for
specific events or celebrations form part of the subsistence fishery. Even if monetary transaction
may occur, fish sold in the village during fund raising activities have been included in this category
due to their low price of fish (less than 10% of the normal commercial price).
7"$"Y"$ _/65>98.
The financial values of the impacts of MPAs on subsistence fishery are calculated through (i)
quantification of the effects of MPAs in terms of catches (kg.y-1) and, (ii) its economic valuation.
The quantification is based on determining the CPUEs, the fishing effort and the effect of MPA on
CPUES.
The effects on the catches due to MPA (Aie) per fishing métier (i= gillnet or spearfishing) and
per fish and invertebrate family (e) are deduced from the following formula:
Aie = ("ie fi * cpuei * mi)
With:
fi : Fishing effort per fishing métier in hours of activity
cpuei: catch per unit of effort per fishing métier (i)
mi: CPUE differential (%) attributable to MPA per fishing métier (i)

Coral Reef Ecosystem Services Economic Valuation. Phd dissertation, Nicolas Pascal, 2013 Page 179 / 351!
The valuation of the MPA impacts on added value (VA f mpa) is based on :
VA f mpa= ((Aie*s * Pre *p) - %i CIi) * b
With:
s: proportion of catches for subsistence fishery.
Pre : Protein equivalent content per family
p = Price of basic replacement protein (euro/g)
CIi : Intermediary costs per fishing métiers (i)
b: Weight factor to correct resource dependency
7"$"Y": O8*8.)/99()*+/=.5(*</B-.
Several methods are applied in the collection of fishery effort data (i) logbooks auto-filled by
fishermen to determine fishing effort (ii) regular interviews with fishermen (selected individuals or
with group every week) to complete the previous data and, (iii) regular monitoring of fish
commercialization (with transporters).
The methods applied to determine effects of MPAs on CPUEs have been described before.
7"$"Y"A _+-<+=J.(00/6*.
Fishing effort (fi) per métier was estimated through weekly semi-structured questionnaires with a
sample of the most active fishermen during 6 months (June to November) and completed by direct
observations. The sample comes from the most active fishermen and was updated regularly to
reflect the variability of the subsistence fishing (Hickey, 2008). The surveys used only short
memory to improve the reliability of answers and had a very reduced number of questions. The
number, the approximate duration of their fishing trips during the last 6 days (no fishing on Sunday)
for gillnet and spear fishing and the destination of their catches (sold or consumed) were asked.
Data from the logbooks (described before) have completed the estimates for spear fishing. Effort for
gillnet was estimated as the number of hours (h) during which nets are setup (50 m long nets). The
number of hours (h) of permanency in the water per spear gun was used as a measure of the effort.

Coral Reef Ecosystem Services Economic Valuation. Phd dissertation, Nicolas Pascal, 2013 Page 180 / 351!
An additional regular monitoring of commercialized fish landings has been set up during 2
months with transport professionals carrying fish to be sold or given in the capital to check the
validity of the observed data.
7"$"Y"C !==>89.)8*)<(-.(-*+58*(-.
The estimates of annual catches are the product of the fishing effort per métier (e.g. number of
hours p.a. of net fishing) by the average CPUEs (e.g. average fish catch in kg.h-1 with net). Catches
for reef fish are estimated for every village during the study-sampling period. Variability of CPUEs
estimated through their variance has been taken into account in presenting minimum and maximum
values of annual catches.
Additionally the fishing catches during the temporary opening of the MPA for some special
event have been taken into account in the valuation when it was possible to be present.
7"$"Y"F E6/*(+=.)/=,(6-+/=.
The monetary valuation for subsistence fishing catches was realized in two steps. First the
protein equivalent of catches for the most representative species of fish was estimated. The database
developed by Ramseyer (Ramseyer, 2000) was used to convert the catch of fish in protein weight.
The weight of the catch of the principal families is converted into protein weight (Pre), which is then
transformed into the equivalent weight of a basic food. Canned tuna (in oil) was chosen as a very
common and affordable product. The Vanuatu Statistics Office uses its market price as a reference
in regular macroeconomic indicators. The price was relatively stable during the observed period and
converted in Euros/g of protein (p).
7"$"Y"H !BB(B.,89>(..
The intermediary costs (CIi) associated with the 2 main fishing métiers are estimated through
interviews with fishermen. The methods described by several authors (Gillett and Lightfoot, 2001;
Kronen, 2003; Kronen, 2007) have been used to take into account all cost categories for the coastal
fishery métiers (motorized or not).
7"$"Y"Y 7/66()*+=J.08)*/6.0/6.->&-+-*(=)(.0+-<(64..
One of the problems of the economic approach is that it considers substitutable all the benefits
withdrawn from subsistence fishing activities. In this case it was chosen to measure the benefit in
protein weight leaving aside many aspects of the subsistence fishing. For example the following
benefits are not reflected in the valuation: (i) the fishing activity needs low requirement of
investment and training (Sprep, 2007), (ii) it can be a factor of social cohesion in villages because it
contributes to maintain the women in the villages instead of seeking a cash income outside (Bensa
and Freyss, 1994), (iii) for some household the part of the protein obtained from fishing in the total

Coral Reef Ecosystem Services Economic Valuation. Phd dissertation, Nicolas Pascal, 2013 Page 181 / 351!
diet is non-replaceable (Pollnac et al., 2000), (iv) fishing is a stable food source against future
uncertainties and a way to spread alimentary risks (Johannes, 2002). To reflect these benefits of the
subsistence fishery, a weight-correcting factor (b) of 1.3 is applied on the results of added value
(Seidl et al., 2011)
=NSN_ ?6+"+3(6&P-/1-*(+"&+,&(34-6*)&+"&6+33$26(-/&,()Q$27&e?@&Sf&
7"$"["# O(0+=+*+/=.
Commercial catches include all captures of fish and invertebrates sold for food or for shells.
Food can be sold as fresh or prepared.
7"$"["$ _/65>98.
The same method than subsistence fishery was applied to calculate the financial value of the
impacts of MPAs on commercial fishery. First a quantification of the MPA effects on annual
catches was estimated and then economic valuation was applied on this result.
For the valuation, the formula is:
VA fc mpa= ((Aie*(1-s) * pm) - "i CIi)
With:
Pm : average market price for commercial catches
CIi : Intermediary goods per fishing métiers and other related businesses (i)
Aie: Fishery catch volume differential due to MPA (same as for subsistence fishery)
s: proportion of catches for subsistence fishery .
7"$"[": _+-<+=J.(00/6*.
The data collection methods are the same ones as for subsistence fishery. No difference exists
between both fisheries in the target species or in the métiers except for trochus fishery (Trochus sp.),
which are collected to be sold for their shells in the capital.
As described before, all the studied villages have setup a temporary ban on trochus. The ban can
cover all the fishing ground or be limited to the MPA area. Most of these bans were created as a
response to the severe depletion of trochus stocks in the late 90’s (Johannes, 2002). In theory, it

Coral Reef Ecosystem Services Economic Valuation. Phd dissertation, Nicolas Pascal, 2013 Page 182 / 351!
was planned to open the bans every 3-4 years and a limited quota of trochus catch would have been
given to each household. As both MPA and control village have a ban on trochus it was not possible
to compare them and determine the effect of the ban. Following expert opinions, we make the
following assumptions that catches of Trochus have been possible only if the ban was present. This
comes from the historical experience of stock overfishing when no ban (as well as size control) is
present. No opening of ban or trochus collection occurred during our presence. Therefore catches of
trochus have been assessed through interviews with fishermen relying on their memory.
Consultations with the fishery department experts have been held to complete and validate the data.
Data was transformed on an annual base. The contributing factor of trochus ban on trochus catches
is assumed to be 100% (mie).
7"$"["A E6+)(.
Finfish are sold as fresh fish or used in food preparation as the main prepared dish or as a
complement. Commercialized fresh or prepared fish are valued on their market price. This allows
covering all the added value generated by reef fishery sector. The price of reef finfish is species
independent and does not seem to fluctuate according to criteria of supply or demand. The price for
Trochus has been collected with intermediaries.
When used as a complement in prepared food, the commercial value is based on the final
consumer price converted with the estimated weight of fish in the preparation.
7"$"["C !BB(B.,89>(.
The commercial circuit for fresh fish is short. The fishermen have 2 options: sell directly to
consumers (in the village or in the city) or to an intermediary who will sell in the city. Sales in the
city can be made informally in some neighbourhood or through the market place. No direct sales of
reef fish have been observed with consumers such as restaurants or fish retailers.
In the studied villages, all the intermediaries belong to the same village as fishermen. The
distribution of the fishery benefits per actor is then limited to the village level.
Intermediary costs per fishing métiers are the same ones as for the subsistence fishing. The costs
related to commercialization such as ice, transport, market place and labour costs were collected.

Coral Reef Ecosystem Services Economic Valuation. Phd dissertation, Nicolas Pascal, 2013 Page 183 / 351!
=NSNO` 9$*-(/)&+,&3$*Q+#&6+33+"&*+&.+*Q&,()Q$2($)&
7"$"#`"# !==>89.(Z*68L/98*+/=-..
The data collection took place mainly during the cold and dry period of the year in Vanuatu,
from June to November. The extrapolation of observed results to an annual base has needed some
corrections. The hot and wet season lasts from November to April and is characterized by higher
temperatures. The period has an impact on the fishing effort as fishermen can stay longer in the
water or more fishing trips can be made. As described by Amos (2007), fishing activity is often
correlated to the agriculture calendar and the wet season corresponds to a weaker crop activity.
These 2 potential sources of bias are taken into account in the extrapolations through the application
of a factor of 1.3 on the catches from spear gun and 1.2 for gillnets. Factors were deduced from a
previous study (Mees and Anderson, 1999) which surveyed a full year of fishing effort for the same
gears.
7"$"#`"$ N8Z+5>5.->-*8+=8&9(.4+(9B.)/66()*/6.
The obtained catches were aggregated and reported to the fishing grounds area (in t.y-1.km-2) and
compared to a reference of Maximum Sustainable Yield (MSY) value for reef fisheries. The value
of 5 t. y-1.km-2 of reef is proposed as an indicator of sustainability for coral reef fisheries (Mumby
and Steneck, 2008) (Armada et al., 2009; Jennings and Polunin, 1995; Munro, 1984; Newton et al.,
2007). In case of village with yields over-passing the MSY, only the yields under this level were
taken into account. The underlying idea is to limit the valuation of MPA effects to sustainable
activities only.

Coral Reef Ecosystem Services Economic Valuation. Phd dissertation, Nicolas Pascal, 2013 Page 184 / 351!
=NSNOO BA8&(34-6*)&+"&*+12()3&P()(*&3+*(P-*(+")&&
For each of the following tourism activities, the role of MPA in the visit motivation of tourists
has to be assessed (Wielgus et al., 2002). The tourism activities include (i) day tours, (ii) snorkel
tours, (iii) scuba diving, (iv) guesthouses, and (v) scientific tourism. The option of comparing MPA
sites with control sites was rejected as only one of the control village’s had of a day-tour activity.
Comparisons were not robust enough to detect the role of MPA in tourism motivations. Direct
assessment through different techniques in the MPA sites was chosen.
For the guest houses and the other associated activities not all the expenses should be attributed
to the MPA. During their stay in the village, most of the tourists can realize several activities such as
trekking, participation in cultural ceremonies, relax on the beach, etc. As described before, several
niches of rural tourism exist (e.g. cultural, nature, adventure, leisure, etc.) and the degree in which
MPA will serve as an attraction will vary between them. The share of the activities related to marine
ecosystem must then be identified. Two methods are used: (i) semi-directed interviews with
business owners to define a distribution of activities undertaken by the tourists and, (ii) a tourism
Advertising Images Analysis (AIA) to estimate the weight that marine related activities has had in
their choice of destination. The AIA is a method based on the fact that tourists take their decision to
come to a specific site influenced by previous information received through advertising (Andersson,
2007). The AIA was realized through a counting of the number of images suggesting different
activities or ecosystems. The activities categories were: culture and people, terrestrial landscapes or
activities, beaches, other leisure activities and underwater landscapes or activities. Then the relative
weight of each category is calculated. The relative number of images containing underwater
landscapes or activities was used as a proxy of the role of MPA in the tourist destination choice. It
takes mainly the form of pictures of healthy colourful reef, emblematic species or activities related
to marine environment. Advertising media printed or web pages available to international and
domestic tourists were collected. In total 21 media were analysed and 151 images categorized.
The results from interviews and the AIA are used to calculate the contributing factor (ci) of the
MPA for guesthouse and other tourism associated activities. Average, minimum and maximum
estimates have been assessed. For these expenses associated to marine activities, it was defined that
MPA contributing factor (ci) would be defined as a proportion of the expenses. The ci reflects the
relative importance of the MPA as a decisive factor in the motivations of tourists to visit the
villages. It reflects also the impacts of the MPA on some ecological attributes important for their
tourism attractiveness. More precisely these attributes concern the beauty of the sea landscapes and
the diversity and abundance of fish. Both are potentially influenced by the MPA (see the
corresponding chapter about MPA ecological impacts C.2.2.3). The comparison of MPAs with no

Coral Reef Ecosystem Services Economic Valuation. Phd dissertation, Nicolas Pascal, 2013 Page 185 / 351!
MPA sites, as demonstrated with the described studies, provided evidence of the important role of
MPAs for these 2 tourism attractive factors.
For scuba diving clubs, semi-structured interviews (n=3) were conducted with business owners
to understand the motivations in their choices of diving in the MPA sites. 2 main groups of
attributes were tested: (i) infrastructure attributes such as accessibility or transport costs and, (ii)
ecological attributes such as the presence of emblematic species, the coral reef health or the
tameness of fish. The respondents made a ranking of attributes. When ecological attributes
dominated, a contributing factor of 100% was applied to the added value of dives realized in the
MPA. Otherwise the factor was reduced to 50%.
For all MPA entrance fees, the contributing factor is obviously equal to 100%. The same apply
to scientific tourism when field of research is related to the MPA.
=NSNOS ?6+"+3(6&P-/1-*(+"&+,&(34-6*)&+"&*+12()3&e?@&Tf&
7"$"#$"# O(0+=+*+/=.
The tourism activities include (i) day tours, (ii) snorkel tours, (iii) scuba diving, (iv) guesthouses,
(v) scientific tourism, and (vi) the other activities associated with the previous activities such as
restoration and handicrafts. A description of these activities has been given previously.
7"$"#$"$ N(*</B.
The approach is relatively straightforward. The added values of each of the activities taking
place in the villages are assessed following classical methods (Beukering et al., 2007a; Cesar et al.,
2003a). Then, estimates of the role of the MPA in tourism visit motivations are applied to each
added value (see previous part). The total MPA impact on tourism is then the sum of the added
values obtained.
Additionally, the distribution of the added values among the different actors is determined upon
the residence of the business owners (village or national level). For villages, the added values come
from MPA entrance fees, day-visit fees, direct expenses in village, local guesthouse and scientific
tourism. At a national level, the added value of day visit and scuba diving activities are accounted.
A multiplier effect of the tourism sector is applied on the added value results. It was chosen to
apply it only on the added values at national level as very few village tourism businesses have
employees or subcontractors. Based on the existing literature (Jin et al., 2003; Pascal, 2010), a
multiplier of 1.3 is chosen as the best estimate.

Coral Reef Ecosystem Services Economic Valuation. Phd dissertation, Nicolas Pascal, 2013 Page 186 / 351!
7"$"#$": _/65>98.
The value of the MPA impacts on tourism (Vtmpa) follows the formula above:
Vtmpa= (!i VAi * ci ) * m
With :
VAi: added value from the different tourism activities (i= day tours; snorkel tours; scuba diving;
guest houses; scientific tourism; other activities)
ci: contributing factor of the MPA (%) for the different tourism activities (i)
mt: multiplier of tourism sector
7"$"#$"A O8*8.)/99()*+/=.
Data were collected through interviews (n=45) with almost all the tourism professionals
implicated in the study zone. Interviews with guesthouses were conducted on a monthly basis
during 6 months (June to November) for added value details and occupancy rates estimates. When
possible, access to visitor guest books and private accountant books completed the data set for better
estimates of quantitative figures. Interviews with other professionals have covered all the diving
clubs and most of the tour operators. For all business categories, information about business
activity, revenues, cost structure and visitor profiles were collected. Main activities of visitors
during their visits were observed.
7"$"#$"C !==>89.L6/'()*+/=-.
The observations took place during the cold (or dry) season in Vanuatu, from June to November.
This period has an impact on tourist flows as the high touristic season takes place during the dry
season . For annual projections, a correction factor of 0.9 was applied to the average monthly
number of visitors. This factor is based on interviews with professionals and results from tourist exit
survey .

Coral Reef Ecosystem Services Economic Valuation. Phd dissertation, Nicolas Pascal, 2013 Page 187 / 351!
=NSNOT ?6+"+3(6&P-/1-*(+"&+,&(34-6*)&+"&6+-)*-/&42+*$6*(+"&e?@&Zf&
7"$"#:"# 1)/-4-*(5.L6/)(--(-.
The coral reefs and mangroves are natural barriers to coastal protection. They limit the
phenomenon of coastal erosion by absorbing 70-90% of the energy waves (Kench and Brander,
2009) and lessen the damage in case of severe weather events (hurricanes, tropical storms, ...)
(UNEP-WCMC, 2006).
Storm systems such as tropical cyclones and mid-latitude storms and their associated cold fronts
are the main cause of storm surges. Storm surges can interact with other ocean processes such as
tides and waves to further increase coastal sea levels and flooding. A storm surge will have
maximum impact if it coincides with high tide. Breaking waves at the coast can also produce an
increase in coastal sea levels, known as wave setup. Storm surges occurring on higher mean sea
levels will enable inundation and damaging waves to penetrate further inland. This would increase
flooding, erosion and damage to built infrastructure and natural ecosystems.
The shape of the sea floor and the proximity to bays, headlands and islands also affect the storm
surge height. Wide and gently sloping continental shelves amplify the storm surge, and bays and
channels can funnel and increase the storm surge height.
Figure C-6: Storm surges occurring on higher mean sea levels.
They will enable inundation and damaging waves to penetrate further inland increasing flooding, erosion and damage to built infrastructure and natural ecosystems (extracted from (CSIRO and Australian Bureau of Meteorology, 2007)
The climate change effect of rising mean sea levels will be felt most profoundly during extreme
storm conditions.
Coral reefs and mangroves create "inevitably" protection against waves forming barriers along
the costal line. Similarly, lagoon areas protected by barrier reefs are generally quiet areas that
promote the multiple uses described previously. Several studies (Brander et al., 2004; Kench and

Coral Reef Ecosystem Services Economic Valuation. Phd dissertation, Nicolas Pascal, 2013 Page 188 / 351!
Brander, 2009; Lugo-Fernandez et al., 1998) show that the reefs act similarly to waves breakers or
shallow coast. They impose strong constraints on the swell of the ocean resulting in transformations
on wave characteristics and a rapid attenuation of wave energy. The waves formed by the wind have
a large part of their energy in the surface. The fringing reef and the reef crest can absorb a large part
of this force, sometimes up to 90% at low tide (Lugo-Fernandez et al., 1998). The following figures
show different results for the reefs of the Caribbean. There is a high variability depending on the
type of reef, the depth and the waves (Kench and Brander, 2009). In addition, the role of coral reefs
and mangroves in coastal protection is difficult to isolate from other variables. In fact, a
combination of factors comes into the process. The main ones are: (i) bathymetry (ii)
geomorphology (iii) topography and (iv) the biological cover (Burke, 2004). Few studies have
focused on isolating the contributory role of the reef in this combination of factors (Barbier et al.,
2008).
Figure C-7 : (Above) Reef as wave energy absorber (Extracted from Kench et Brander (2009))
(below) Effects of mangroves on wave height (extracted from Barbier et al. (2008)
In the same way, an analysis by Barbier et al. (2008) found that the relationship between reef
area and this absorption process is nonlinear. This adds an additional complexity in the evaluation of
this ecosystem service. To illustrate the non-linearity effects, the same analysis on the effect of

Coral Reef Ecosystem Services Economic Valuation. Phd dissertation, Nicolas Pascal, 2013 Page 189 / 351!
mangroves on the wave height shows that waves of 1.1 m in the sea are reduced to 0.91 m along the
mangrove forest if the forest has an extension of 100 m. The wave continues to decline, albeit at a
slower rate, for each additional 100 m of mangroves inland. For a forest extending 1000 m inland,
the waves would be reduced to a negligible 0.12 m).
Seagrasses, composed of four major families of plants (Zosteraceae, Posidoniaceae, and
Cymodoceaceae, Hydrocharitacea), play a major role in coastal areas they colonize, forming
extensive meadows, more or less diversified and expanded. Their presence is an important factor in
the stability of sedimentary substrates they colonize. The leaves of these plants slow currents by
increasing the viscosity of water and they decrease the energy dissipated by the waves (up to - 40%
of erosive energy when seagrasses are dense (Barbier et al., 2011). They also contribute to increase
the sedimentation rates (Pearson, 2001). The roots and rhizomes fix the material in which they
grow. As such, seagrass effectively contributes to the protection against mechanical waves and limit
coastal erosion.
A study by Das and Vincent (Das and Vincent, 2009) assesses the storm protection role of
mangroves, based on data on human casualties, damages to houses and livestock losses suffered in
the Kendrapada district in Orissa state during the super cyclone of October 1999. The analysis
incorporates meteorological, geo-physical and socio-economic factors to separate out the impact of
mangrove vegetation on cyclone damage. The results indicate that the mangroves significantly
reduced human death and seemed more effective in saving lives (both human as well as animals)
than in reducing damage to static property (Vishwanathan et al., 2004). Factors like land elevation,
immovable asset holdings, etc, too, had decisive effects on human casualties in the storm surge
affected areas. Further analysis by Das (2009) on the storm protection role of mangroves revealed
that if the mangrove cover had remained at the level that it had been in the 1950s, the area would
not have suffered any fully collapsed houses at all. The study suggests that mangrove forests
provided protection benefits to houses to the extent of USD 23 233 per km width of forests.
Barbier (Barbier, 2007) through a count data model9 based on EM-DAT (2005) data showed that
a change in mangrove area had a significant influence on the incidence of coastal natural disasters in
Thailand, and with the predicted sign. Results indicate that a decline in mangrove area increases the
expected number of disasters. The analysis for Thailand over 1979–96 shows also that loss of
mangrove area in Thailand increases the expected number of economically damaging natural
o!8&! (2+&+-$2#?! 2+B&.! 6%.%!-+6(*#! <%)(! K((&! B#(6! .+! (D,*%$&! %! )%4$(.9! +=! ,<(&+-(&+&?! #B2<! %#! (D,*%$&$&1!#B22(##=B*! ,%.(&.#! 6(4$)(6! =4+-! =$4-! ;p'! (D,(&6$.B4(#?! %22$6(&.! 4%.(#?! 6$#(%#(! $&2$6(&2(?! 24$-(! 4%.(#! %&6!4(24(%.$+&%*! )$#$.#! S#((! S/%4K$(4?! `cchKU! =+4! -+4(! 6(.%$*#U_! @+B&.! 6%.%! -+6(*#! 2+B*6! K(! B#(6! .+! (#.$-%.(!L<(.<(4!.<(!,4(#(&2(!+=!%&!(2+#9#.(-!%==(2.#!.<(!(D,(2.(6!$&2$6(&2(!+=!(2+&+-$2%**9!6%-%1$&1!#.+4-!()(&.#_!

Coral Reef Ecosystem Services Economic Valuation. Phd dissertation, Nicolas Pascal, 2013 Page 190 / 351!
disasters affecting coastal provinces. It suggests that the marginal effect of a one-km2 loss of
mangrove area increased expected storm damages of about US$585 000 per km2.
As a reference, average annual direct loss caused by tropical cyclones in 15 South Pacific
countries was calculated to vary from US$ 2 to 80 million (2009 prices) with 60% of damages
coming from loss on buildings, 30% on cash crops and 10% on infrastructure (PCRAFI, 2011a).
;+*(!%1%$&#.!.#B&%-$!L%)(#!
Some studies have suggested the role of reefs and mangroves against tsunami waves (Das and
Vincent, 2009; UNEP-WCMC, 2006). Thus, studies show that, historically, tsunamis waves have
been through the Great Barrier Reef only through the channels (Knott, 1997). Similarly, for the
mangrove, tree density seems to explain some of the effects reducing tsunami threats. The effects of
coral reefs against the tsunami waves, however, are different from those facing wind-originated
waves. A tsunami wave is much larger and its energy is distributed throughout the water column.
Evidence from the 12 Indian Ocean countries affected by the tsunami disaster, including Thailand,
suggests that those coastal areas that had dense and healthy mangrove forests suffered fewer losses
and less damage to property than those areas in which mangroves had been degraded or converted to
other land uses10.
Nonetheless, other studies seeking correlations between mangrove cover and tsunami risk
reduction (Done et al., 1996; Pérez-Maqueo et al., 2007; SOPAC, 2008) have not been able to show
clear results. In many cases, where the mangroves were supposed to have reduce the tsunami wave,
they were off the main path of the wave or were close to deep zones that already greatly reduce the
effect of the tsunami. What emerges from these studies is that the extension of the reef or mangrove
may be not the main factor influencing the reduction of damage on the coast. Coastal bathymetry
and geomorphic profile of the coast are probably other key explanatory factors (Burke, 2004).
Tsunami effects are amplified on the coasts with gradual depth.
^c!\$.<!.<(!+)(4L<(*-$&1!()$6(&2(!+=!.<(!#.+4-!,4+.(2.$+&!#(4)$2(!,4+)$6(6!K9! $&.%2.!%&6!<(%*.<9!-%&14+)(!#9#.(-#?! #$&2(! .<(! .#B&%-$! 6$#%#.(4! $&24(%#(6! (-,<%#$#! <%#! K((&! ,*%2(6! +&! 4(,*%&.$&1! 6(14%6(6! %&6!6(=+4(#.(6!-%&14+)(!%4(%#! $&!"#$%!%#!%!-(%&#! .+!K+*#.(4$&1!2+%#.%*!,4+.(2.$+&_!3+4!(D%-,*(?! .<(! 8&6+&(#$%&!J$&$#.(4! =+4! 3+4(#.49! <%#! %&&+B&2(6! ,*%&#! .+! 4(=+4(#.! gcc! ccc! <(2.%4(#! +=! 6(,*(.(6! -%&14+)(! =+4(#.!.<4+B1<+B.! .<(! &%.$+&! +)(4! .<(! &(D.! f! 9(%4#_! N<(! 1+)(4&-(&.#! +=! E4$! I%&0%! %&6! N<%$*%&6! <%)(! %*#+! #.%.(6!,BK*$2*9! $&.(&.$+&#! .+! 4(<%K$*$.%.(! %&6! 4(,*%&.!-%&>! 14+)(! %4(%#! SQ:CH?! `ccfq!V%4%0B&%4%0! %&6!"0#+4&0+%(?!`ccfU_!

Coral Reef Ecosystem Services Economic Valuation. Phd dissertation, Nicolas Pascal, 2013 Page 191 / 351!
7"$"#:"$ N(*</B.
The first step of the avoided damage method11 is to quantify the coastal protection ecosystem
service in terms of land protected. The second one is to value this ecosystem service provided by
ecosystems in terms of avoided damage and the third one is to apply the coral reef and associated
ecosystems contributing factor. Similar methodology to value this coral reef ecosystem service has
been tested by Burke (Burke et al., 2008) and by the author (Pascal, 2010) to Caribbean and New
Caledonian reef respectively.
One of the main challenges is that coastal protection against waves is a complex process
implicating many factors such as geomorphologic patterns of the coast, the presence of other
ecosystems, etc. The identification of the contributing role of each of the different factors is a
challenging task and is out of the scope of this study.
The general model is:
^^!$.! %##(##(#! .<(! 6%-%1(! 2+#.#! %)+$6(6! K9! .<(! ,4(#(&2(! +=! .<(! (2+#9#.(-#_! N<$#! $#! %! #,(2$%*! 2%.(1+49! +=!r)%*B$&1j! .<(! (&)$4+&-(&.! %#! r$&,B.jq! $.! %##B-(#! .<%.! .<(! )%*B(! +=! %&! %##(.! .<%.! 9$(*6#! %! K(&(=$.! $&! .(4-#! +=!4(6B2$&1!.<(!,4+K%K$*$.9!%&6!#()(4$.9!+=!#+-(!(2+&+-$2!6%-%1(!$#!-(%#B4(6!K9!.<(!4(6B2.$+&!$&!.<(!(D,(2.(6!6%-%1(!S/%4K$(4?!`cchKU_!
A. Identify coastal areas potentially at risk against the regime of coastal flooding events.
B. Determine the contribution of coral reefs, mangroves and seagrass in the costal
protection of the vulnerable areas.
C. Quantify and value the potential damage repair costs with a method of damage avoided
costs:
C.1. Characterization of the assets exposed to risk (3 categories of land use)
C.2. Valuation of the total repair costs of direct and indirect tangible damages based on
approximate values per land use category (object oriented data) and as a function of
inundation depth (relative depth-damage function)
C.3. Estimation of the probability of flood event per impact catagory.

Coral Reef Ecosystem Services Economic Valuation. Phd dissertation, Nicolas Pascal, 2013 Page 192 / 351!
86(&.$=9!2+%#.%*!%4(%#!,+.(&.$%**9!%.!=*++6!4$#0!%1%$&#.!.<(!4(1$-(!+=!+2(%&!L%)(#!!
Coastal flooding can occur during severe weather conditions. They are related to "storm surge"
(elevation in sea level in low pressure situations (hurricanes)) and the onslaught of cyclone swells
(DEAL, 2012).
Directive 2007/60/EC on the assessment and management of flood risks, more commonly known
as Directive "Floods" is the first European directive in the field of risk prevention. It is transposed
into French law with Article 212 of the Law of 12 July 2010 on the National Commitment to the
Environment (known as Grenelle II). Decree No. 2011-227 of 2 March 2011 on the assessment and
management of flood risks complements these provisions.
Estimates will be realized on the coastal land zone comprised between an altitude of 0 and 5 m
upper the high tide sea level (a storm surge will have maximum impact if it coincides with high
tide). This level comes from the historic maximum height of non-tsunami waves during the last 25
years in the tropical regions (source: NOAA, Meteo France and Vanuatu Meteorological Office).
A projection of this height will be made with GIS topographic data to project potential impacts
of flood events. Several sources of data are used:
• SOPAC Vanuatu maps of infrastructure and buildings
• Government of Vanuatu 1:50,000 cartographic maps for coral reefs, mangroves, bathymetry,
topography
• Vanuatu National Statement on Vulnerability and Adaptation, Rarua J. Nelson, Mawa
Patricia, Nari, Russell & Smith M. Atchinson, 1998.
• Aerial photography: PlanetObserver (satellite images), Institut national de l'information
géographique et forestière, Centre national d'études spatiales (CNES), Astrium
• SHOM maps (Service hydrographique et océanographique de la marine). Marine maps from
1:8 000 to 1:8 725 000) with bathymetry.
The areas vulnerable to the flood impacts of waves and swell are all areas that have less
elevation than the maximum height relative to the sea level at low tide and up to 0.5 km inland
(Kench and Brander, 2009)(Das and Vincent, 2009).
The area and depth of inundation are the most important information to be sampled in flood risk
evaluation (Torterotot, 1993). Inundation depth is generally the most important or at least most
frequently used inundation parameter in damage evaluation. Based on the assumption that

Coral Reef Ecosystem Services Economic Valuation. Phd dissertation, Nicolas Pascal, 2013 Page 193 / 351!
inundation depth has the strongest influence on damage magnitude, nearly all damage functions are
solely depth-damage functions (see chapter C.3.).
Nevertheless it should be noticed that analyses of empirical damage data showed that the
variability of damages can only be explained to a rather small extent by the depth of flooding
experienced (Messner et al., 2007). The duration, time of occurrence, velocity or the toxicological
load of flooding water could have also a significant influence on damage. Other flood characteristics
than depth are not recorded, so that it is difficult to quantify their influence.
Due to the macro-scale of the study and the knowledge gaps, only depth and area will be taken in
account.
Table C-8: Damages influencing flood characteristics (Messner et al., 2007)
@+&.4$KB.$&1!=%2.+4!+=!2+4%*!4((=#!$&!2+%#.%*!,4+.(2.$+&_!
Different working groups from the Institute of Marine Affairs (IMA) and the University of New
Caledonia (UNC) have developed models of factors that categorize the level of coastal protection
(Burke et al., 2008) according to various contexts.
Coastal stability is defined as an index of coastal protection that incorporates ten physical
characteristics. The index estimates the erosion resistance of each segment of coastline. Physical
characteristics included in the index of coastal protection are: coastal geomorphology (a limestone
cliff, beach, etc.) and coastal geology (igneous, metamorphic, etc..); exposure of the coast (protected
by a breakwater or riprap or exposed); characteristics of coral reefs (reef type, area and distance to
the coast); slope of the platform (m); inner slope and crest width (m); mean depth between the reef
and the coast; presence of activities causing erosion, such as sand extraction and coastal vegetation
(mangroves, wetlands, etc..).
These physical characteristics are converted to a value between 1 and 5 and the average is
calculated to produce a unique index value for each shore: the Coastal Protection Index (CPI). The
relative contribution of reefs in the CPI is then calculated.
!"##$%&'()*+,-(.')$(/&0(+12/()$345) )6,7'+1.')8,9:#6;<6=<>??@<A?A@>?)
=?3B?CB?5B!/,,DBD1E1F(BFG&D(/&7(%B$3B5B0>B>BH@@4D,.) 5C)?>)>??I)JC)
)!"#$%&'(')& *"+",%&-./$0%.1-.,&-.0.2"3-4.&15"6"13%6-73-17&&
!"#"$%&'(")*+%,%*&-,'.&'*.) /-0-1%"*-)K+(1) $('(+E&7(%)LM&.M)(/(E(7'%)1')+&%N)L&//)2()1OO(.'(D)$(H'M) P1%)H(+M1H%)'M()%'+,7F(%')&7O/G(7.(),7)'M()1E,G7'),O)D1E1F()$G+1'&,7) QH(.&1/)&7O/G(7.(),7)D1E1F(%)',)2G&/D&7F)O12+&.)
R(/,.&'S) #7/S)M&FM)0(/,.&'&(%)L&//)/(1D)',)&7.+(1%(D)D1E1F(%T)'M(+(O,+()E1&7/S)+(/(017')&7)O/1%M)O/,,D)1+(1%),+)1+(1%)7(1+)D&N()2+(1.M(%)
U&%()+1'() V7O/G(7.(),7)D1E1F()+(DG.&7F)(OO(.'%),O)L1+7&7F%)17D)(01.G1'&,7)=&E(),O),..G++(7.() ;%H(.&1//S)&EH,+'17')O,+)1F+&.G/'G+1/)H+,DG.'%)6,7'1E&71'&,7%)) 6,7'1E&71'&,7%)17D)/,1D%)E1S)&7.+(1%()D1E1F(%)%&F7&O&.17'/S)Q1/'<WO+(%ML1'(+) Q1/'L1'(+)E1S)&7.+(1%()D1E1F(%T)+(/(017')&7).,1%'1/)1+(1%))=M() E,%') %&EH/() 2G') 7(0(+'M(/(%%) &EH,+'17') &7O,+E1'&,7) &%) O&+%') ,O) 1//) 'M() %,-%) (2) '"#"$%&'("4) V7).,E2&71'&,7)L&'M)/17D)G%()D1'1X)&')+(0(1/%)LM&.M)(/(E(7'%)1')+&%N)L,G/D)2()1OO(.'(D)&7).1%(),O)1).(+'1&7)O/,,D)(0(7'4)V7)0(+S)21%&.)1HH+,1.M(%)D1E1F(%),+)(/(E(7'%)1')+&%N)1+()%&EH/S)(%'&E1'(D)2S)E(17%),O)'M()%M1+(),O)'M()','1/)1+(1),O)1).&'S),+)EG7&.&H1/&'S)1OO(.'(D)2S)&7G7D1'&,7)Y(4F4)Z(M7(7)>???T);2(7M[M)(') 1/4) 533I\4) #'M(+%) %&EH/S) '1N() 'M() O/,,DH/1&7) 1+(1) 17D) 'M(7) (%'&E1'() 'M() 10(+1F() O/,,D) D(H'M) 2S)E(17%),O)(EH&+&.1/)D1'1),7)O/,,D)D(H'M%)YP1//)(')1/4)>??JT)$;!UK)>??5T)%(()1HH+,1.M)E1.+,)>\4))!"#"$%&'(") $-3&+) &%) F(7(+1//S) 'M() E,%') &EH,+'17') ,+) 1') /(1%') E,%') O+(]G(7'/S) G%(D) &7G7D1'&,7)H1+1E('(+) &7) D1E1F() (01/G1'&,74) Z1%(D) ,7) 'M() 1%%GEH'&,7) 'M1') &7G7D1'&,7) D(H'M) M1%) 'M() %'+,7F(%')&7O/G(7.(),7)D1E1F()E1F7&'GD(X)7(1+/S)1//)D1E1F()OG7.'&,7%)1+()%,/(/S)D(H'M<D1E1F()OG7.'&,7%)Y%(().M1H'(+)J4@4@\4)8(0(+'M(/(%%)&')%M,G/D)2()7,'&.(D)'M1')171/S%(%),O)(EH&+&.1/)D1E1F()D1'1)%M,L(D)'M1')'M() 01+&12&/&'S) ,O) D1E1F(%) .17) ,7/S) 2() (^H/1&7(D) ',) 1) +1'M(+) %E1//) (^'(7') 2S) 'M() D(H'M) ,O) O/,,D&7F)(^H(+&(7.(D)Y%(()_(+`)(')1/4)>??@\4)ZG'),O'(7),'M(+)O/,,D).M1+1.'(+&%'&.%)'M17)D(H'M)1+()7,')+(.,+D(DX)%,)'M1')&')&%)D&OO&.G/')',)]G17'&OS)'M(&+)&7O/G(7.(4))=M()$#,%&'("),O)O/,,D&7F)&%)&EH,+'17')O,+)&7%'17.()LM(7).1/.G/1'&7F)H+,DG.'&,7)/,%%(%)2G').,G/D)1/%,)&7O/G(7.() D&+(.') D1E1F(%4) aQK6;) Y533CX) H) C<C\) 1+FG() 'M1') DG+1'&,7) bE1S) 2() 'M() E,%') %&F7&O&.17')O1.',+)&7)'M()D(%'+G.'&,7),O)2G&/D&7F)O12+&.4c)*(77&7F<U,L%(//)(')1/4)Y>??J\)1%%GE()&7.+(1%(D)D1E1F(%)O+,E)/,7F(+)DG+1'&,7),O)O/,,D&7F)(4F4)O,+)E,+'1+X)D+1&7%X)'&E2(+%X)H/1%'(+L,+N)17D)'&/(%4)=M(S)'M(+(O,+()D&%'&7FG&%M) 2('L((7) %M,+') Yd) 5>) M,G+%\) 17D) /,7F) DG+1'&,7) ,O) O/,,D&7F) Ye) 5>) M,G+%\) &7) 'M() D1E1F()OG7.'&,7%),O)'M(&+)E17G1/)O,+)D1E1F()(01/G1'&,7)&7)'M()af)Y%(()O&FG+()J4C\4)
)8-,06%&'(9& :;"+<$%& /64+& 35%&=>& /46&*%<35?*"+",%?*06"3-4.&*"3"& /46& @%7-2%.3-"$& A64<%63-%7&
BC%1346&D%".E&
Q,G+.(9)*(77&7F<U,L%(//)(')1/4)>??J))=M()1-0(*'&4),O) &7G7D1'&,7).17)1/%,)M10()1)%&F7&O&.17') &7O/G(7.(),7)D1E1F(%X)(%H(.&1//S).,7%&D(+&7F)O/1%M)O/,,D)1+(1%),+)1+(1%)./,%()',)H,'(7'&1/)D&N()2+(1.M(%4)8(0(+'M(/(%%)0(/,.&'S)M1%)GH)',)7,L)+1+(/S)
!
"!!!!
#!!!!
$!!!!
%!!!!
&!!!!
'!!!!
(!)$!
!)!!
!)!&
!)"!
!)#!
!)$!
!)'!
!)*!
")#!
")&!
")+!
#)"!
#)%!
#),!
$)!!
!"#$%&'()
!*(*+"&',) -"#
./012
3"#./012

Coral Reef Ecosystem Services Economic Valuation. Phd dissertation, Nicolas Pascal, 2013 Page 194 / 351!
This method will be adapted to the context of each geomorphological sites and available data.
The UNC considers that at least five factors must be filled in (Allenbach pers. Comm.) to ensure
robustness in the results. In cases where local data are not available, it will be chosen to simplify the
model to assess the contribution of reefs.
Table C-9 : The calculation of the CPI (Coastal Protection Index) based on characteristics of the coastline
(developed by Allenbach and Pascal).
E"<"$%"<""$ F(+)/-8+:(*2/-.)*2C*//
The Streamlines of Mean Surface Wind (Figure below) shows how the region is dominated by
easterly trade winds. In the Southern Hemisphere the Trades blow to the northwest and in the
Northern Hemisphere they blow to the southwest. The streamlines converge, or crowd together,
along the SPCZ. The Southeast Asian Monsoon also influences much of the Melanesian subregion.
(Siméoni and Lebot, 2012)
The strength and timing varies considerably, but at Manus Island (PNG), for example, the NW
monsoon season (winds from the northwest) runs from November to March, while the SE monsoon
brings wind (also known as the Southeast Trade Winds) from May to October. Unlike many
monsoon-dominated areas, the rainfall is distributed evenly throughout the year (in normal years).
(SOPAC, 2006)
!"#$%&'#()* +'#()* ,"-./0 1(2 3()"! " # $ %
4"(0(#56(7(*$ &'()*+,-'./
012+'3+
.'(),4,/516/78,4697:
.';/,
097:.';/, </516/78, =/9(-/,
8(9&'97%":5(&/#" >.'8/(8/5+?9*+ </61@A.'8/(8/5+?9* B.8131(19C+.//3,D'E+A.'8/(8/5+?9*+'.+
('9,8F'+A.'8/(81'7
;""<%0(#56(7(*$=%9#"9%9)-%-.&'9)>"%'(%'6"%>(9&'G'7817H'H,+?9..1/.+
IJKLMN+(C',/+8'+8-/+('9,8+
IO%)6N
G'7817H'H,+?9..1/.+
IJ!LMN+P+A98(-+.//3P+
(C',/+8'+8-/+('9,8+
IO%)6N
Q.17:17:+.//3+IE158-+
J%LL+6N
G'.9C+3'.6981'7+
51,('7817H'H,F'+.//3
?))"#%&7(5"=%>#"&'%2.-'6%R/.*+39;'.9?C/+
('75181'7,+I:/78C/+,C'A/P+
C9.:/+(./,8+E158-N
Q9;'.9?C/+('75181'7,+
I,C'A/P+C9.:/+(./,8+
E158-N
Q9;'.9?C/+('75181'7,+
I98+C/9,8+'7/+
('6A'7/78S+,C'A/P+
(./,8+E158-N
&/5H(/5+39;'.9?C/+
('75181'7,+I,8.'7:+
,C'A/P+./5H(/5+(./,8+
E158-N
F'7/
@79'<(#0%&7(5" T@%LM $U!@TM %U%@$U!M LU"@%U%M O+LU"M
,"9)%-"5'6%ABC%D0%<#(0%'6"%>(9&'7.)"E% J+#L6 J+%L+6 J+!6 O+!6 O+!6
F'6"#%">(&$&'"0&697:.';/,P+,/9:.9,,+J+
V!M+('9,8C17/
697:.';/,P+,/9:.9,,+J+
!LM+('9,8C17/
697:.';/,P+,/9:.9,,+J+
$!M+('9,8C17/
697:.';/,P+,/9:.9,,+
O$!M+('9,8C17/P+,975+
/28.9(81'7+9./9,+
F'7/

Coral Reef Ecosystem Services Economic Valuation. Phd dissertation, Nicolas Pascal, 2013 Page 195 / 351!
Figure C-8: Streamlines of mean surface wind (extracted from SOPAC, 2006)
Vanuatu is located south of the equator in an area known for the frequent occurrence of tropical
cyclones with damaging winds, rains and storm surge between the months of October and May. In
the South Pacific region from the equator to New Zealand in latitude and from Indonesia to east of
Hawaii in longitude, almost 1,000 tropical cyclones with hurricane-force winds spawned in the last
60 years, with an average of about 16 tropical storms per year (PCRAFI, 2011b).
If we quote the last report about natural hazards in the Pacific (PCRAFI, 2011b), Vanuatu was
affected by devastating cyclones multiple times in the last few decades.
“Since 1990, Vanuatu has been subject to at least 20 damaging tropical cyclones. The most
significant cyclones in recent years were Uma in 1987 and Ivy in 2004, each affecting nearly 50,000
people and causing destruction that amounted to losses in the tens to hundreds of million USD.
Figure below shows the levels of wind speed due to tropical cyclones that have about a 40% chance
to be exceeded at least once in the next 50 years (100-year mean return period). These wind speeds,
if they were to occur, are capable of generating severe damage to buildings, infrastructure and crops
with consequent large economic losses. A number of destructive tropical cyclones have passed near
Vanuatu sin the last 25 years. Three in particular have come close enough to Port Vila to be
recorded as very low pressures. TC Prema, on 29 March 1993, TC Paula (Category 3), on 2 March
2001 and TC Ivy (Category 4) on 26 February 2004 have all caused considerable damage.”
Quoting other report, we can figure out the importance of cyclone damages in Vanuatu:
“Disaster impact assessments in Vanuatu principally focus on the impacts of cyclones, and related
flooding and landslides. The most comprehensive impact assessment in Vanuatu was conducted for
Cyclone Ivy, which struck the country in February 2004. The total cost of Cyclone Ivy was
estimated at VT 427.6 million. Cyclone Ivy affected 50,000 people, and caused one fatality. In the

Coral Reef Ecosystem Services Economic Valuation. Phd dissertation, Nicolas Pascal, 2013 Page 196 / 351!
affected communities 90 per cent of the water sources and water supply systems, 70 per cent of
roads, 60 per cent of health infrastructure, 112 schools, and over 80 per cent of food crops were
damaged” (McKenzie et al., 2005).
The number of extreme events since 1940 per category is presented in the following tables for
Fiji and Vanuatu.
&Figure C-9: Count of extreme climatic events in Fiji and Vanuatu since 1940.
Source: National Oceanic and Atmospheric Administration (NOAA) Coastal Services Centre , Historical Hurricane Tracks.!
Figure C-10: Historical Hurricane Tracks for Efate, Vanuatu – 70 years of historic data
(source: NOAA Coastal Services Centre , Historical Hurricane Tracks.)! !
Category Count
Category 5 (H5) 0
Category 4 (H4) 2
Category 3 (H3) 9
Category 2 (H2) 4
Category 1 (H1) 9
Trop./Sub. Storm (TS/SS) 7
Trop./Sub. Depression (TD/SD) 0
Extratropical (ET) 0
Unknown (N/A)
Vanuatu
Historical Hurricane TracksNational Oceanic and Atmospheric Administration
http://www.csc.noaa.gov/hurricanes
Summary of Search:Location: Éfaté, island, VanuatuBuffer: 120380 Meters (65 Nautical Miles)Search Refined By:Timeframe
Summary of Storms
Category CountCategory 5 (H5) 0Category 4 (H4) 2Category 3 (H3) 9Category 2 (H2) 4Category 1 (H1) 9Trop./Sub. Storm (TS/SS) 7Trop./Sub. Depression (TD/SD) 0Extratropical (ET) 0Unknown (N/A) 16
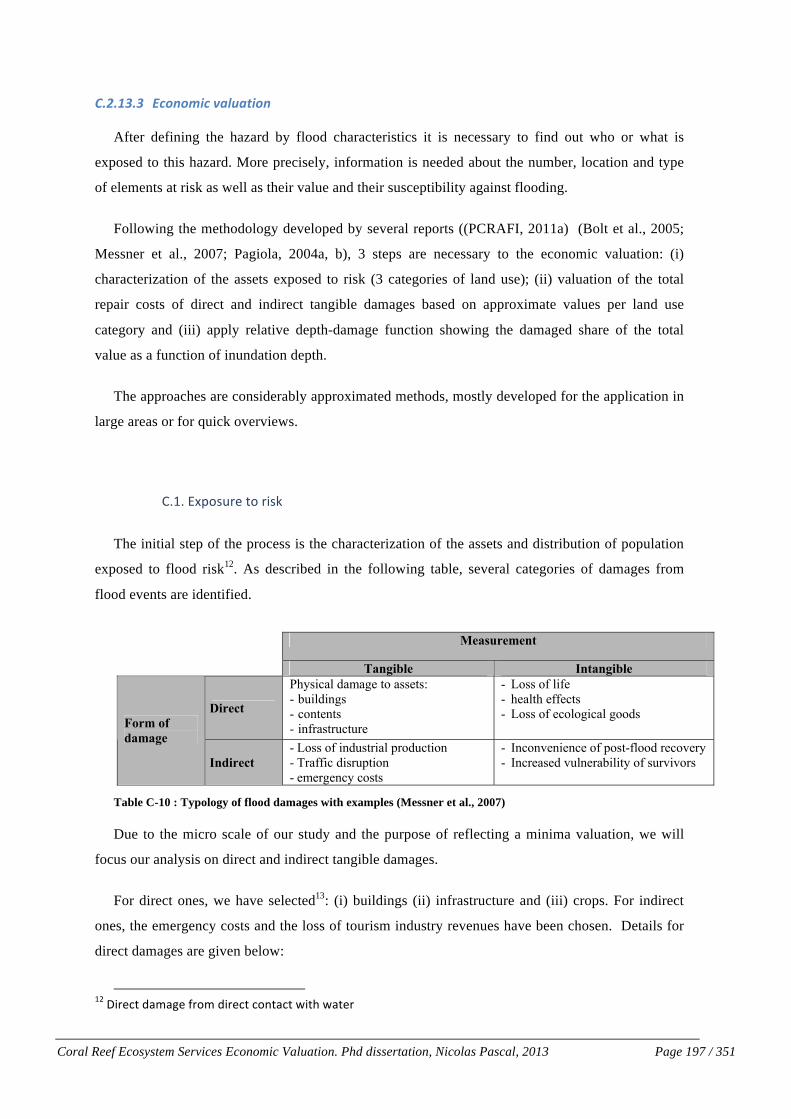
Coral Reef Ecosystem Services Economic Valuation. Phd dissertation, Nicolas Pascal, 2013 Page 197 / 351!
7"$"#:": 1)/=/5+).,89>8*+/=.
After defining the hazard by flood characteristics it is necessary to find out who or what is
exposed to this hazard. More precisely, information is needed about the number, location and type
of elements at risk as well as their value and their susceptibility against flooding.
Following the methodology developed by several reports ((PCRAFI, 2011a) (Bolt et al., 2005;
Messner et al., 2007; Pagiola, 2004a, b), 3 steps are necessary to the economic valuation: (i)
characterization of the assets exposed to risk (3 categories of land use); (ii) valuation of the total
repair costs of direct and indirect tangible damages based on approximate values per land use
category and (iii) apply relative depth-damage function showing the damaged share of the total
value as a function of inundation depth.
The approaches are considerably approximated methods, mostly developed for the application in
large areas or for quick overviews.
@_^_!CD,+#B4(!.+!4$#0!
The initial step of the process is the characterization of the assets and distribution of population
exposed to flood risk12. As described in the following table, several categories of damages from
flood events are identified.
Table C-10 : Typology of flood damages with examples (Messner et al., 2007)
Due to the micro scale of our study and the purpose of reflecting a minima valuation, we will
focus our analysis on direct and indirect tangible damages.
For direct ones, we have selected13: (i) buildings (ii) infrastructure and (iii) crops. For indirect
ones, the emergency costs and the loss of tourism industry revenues have been chosen. Details for
direct damages are given below:
^`!'$4(2.!6%-%1(!=4+-!6$4(2.!2+&.%2.!L$.<!L%.(4!
!"##$%&'()*+,-(.')$(/&0(+12/()$345) ) )6,7'+1.')8,9:#6;<6=<>??@<A?A@>?)
=?3B?CB?5B!/,,DBD1E1F(BFG&D(/&7(%B$3B5B0>B>BH@@4D,.) 5C)?>)>??I)5?)
2(/,7F&7F%J) ,7) HG2/&.) &7K+1%'+G.'G+(J) .G/'G+1/) L(+&'1F(J) (.,/,F&.1/) %M%'(E%J) &7DG%'+&1/) H+,DG.'&,7) 17D)'L().,EH('&'&0()%'+(7F'L),K)'L()1KK(.'(D)(.,7,EM4)N/'L,GFL)'L()'(+E&7,/,FM)D&KK(+%),..1%&,71//MJ)K/,,D)D1E1F(%)1+()E,%'/M).1'(F,+&%(D)K&+%'/M)&7)D&+(.')17D)&7D&+(.')D1E1F(%)17D)%(.,7D/M)&7)'17F&2/()17D)&7'17F&2/()D1E1F(%)OPE&'L)Q)R1+D)533ST)*1+U(+)(')1/4)53SIT)*(77&7F<V,W%(//)(')1/4)>??XT)Y(%%7(+)Q)Y(M(+)>??AZ4)))!! !"#$%&'"(!"#$%&) !*+*,$-9) D&+(.') K/,,D) D1E1F() .,0(+%) 1//) 01+&('&(%) ,K) L1+E) WL&.L) +(/1'() ',) 'L()
&EE(D&1'() HLM%&.1/) .,7'1.') ,K) K/,,D) W1'(+) ',) LGE17%J) H+,H(+'M) 17D) 'L() (70&+,7E(7'4) =L&%)&7./GD(%J)K,+)([1EH/(J)D1E1F()',)2G&/D&7F%J)(.,7,E&.)1%%('%J)/,%%),K)%'17D&7F).+,H%)17D)/&0(%',.U)&7)1F+&.G/'G+(J)/,%%),K)LGE17)/&K(J)&EE(D&1'()L(1/'L)&EH1.'%J)17D)/,%%),K)(.,/,F&.1/)F,,D%4)$&+(.')D1E1F(%)1+()G%G1//M)E(1%G+(D)1%)D1E1F()',)%',.U)01/G(%4)) )\7D&+(.') K/,,D)D1E1F(%)1+()D1E1F(%).1G%(D)2M)D&%+GH'&,7),K)HLM%&.1/)17D)(.,7,E&.) /&7U1F(%),K)'L()(.,7,EMJ)17D)'L()(['+1).,%'%),K)(E(+F(7.M)17D),'L(+)1.'&,7%)'1U(7)',)H+(0(7')K/,,D)D1E1F()17D),'L(+)/,%%(%4)=L&%)&7./GD(%J)K,+)([1EH/(J)'L()/,%%),K)H+,DG.'&,7),K).,EH17&(%)1KK(.'(D)2M)'L()K/,,D&7FJ)&7DG.(D)H+,DG.'&,7)/,%%(%),K)'L(&+)%GHH/&(+%)17D).G%',E(+%J)'L().,%'%),K)'+1KK&.)D&%+GH'&,7),+)'L().,%'%),K)(E(+F(7.M)%(+0&.(%4)\7D&+(.')D1E1F(%)1+(),K'(7)E(1%G+(D)1%)/,%%),K)K/,W)01/G(%4)
!! &*(,"./$'"(&*(,"./$)!*+*,$-9)D1E1F(%J)WL&.L).17)2()(1%&/M)%H(.&K&(D)&7)E,7('1+M)'(+E%J)%G.L)1%)D1E1F(%),7)1%%('%J)/,%%),K)H+,DG.'&,7)('.4)1+().1//(D)'17F&2/()D1E1F(%4)61%G1/'&(%J)L(1/'L)(KK(.'%),+)D1E1F(%) ',)(.,/,F&.1/)F,,D%)17D) ',)1//)U&7D),K)F,,D%)17D)%(+0&.(%)WL&.L)1+()7,') '+1D(D) &7)1)E1+U(') 1+() K1+) E,+() D&KK&.G/') ',) 1%%(%%) &7) E,7('1+M) '(+E%4) =L(M) 1+() 'L(+(K,+() &7D&.1'(D) 1%)]&7'17F&2/(%^4X)
)=12/()>45).,E2&7(%)'L()'W,)D&KK(+(7'&1'&,7).+&'(+&1)17D)F&0(%)%,E()([1EH/(%)K,+)(1.L).1'(F,+M4))!"#$%&'()*&& !+,-$-.+&-/&/$--0&0"1".%2&3456&%7"1,$%2&
0$*-1#$+$(&))
2*(,"./$) 3(&*(,"./$)
4"#$%&)
*LM%&.1/)D1E1F()',)1%%('%9)<!2G&/D&7F%)<!.,7'(7'%)<!&7K+1%'+G.'G+()
<!",%%),K)/&K()<! L(1/'L)(KK(.'%)<!",%%),K)(.,/,F&.1/)F,,D%)
56#+)67)!*+*,$)
3(!"#$%&)<!",%%),K)&7DG%'+&1/)H+,DG.'&,7)<!=+1KK&.)D&%+GH'&,7)<!(E(+F(7.M).,%'%)
<! \7.,70(7&(7.(),K)H,%'<K/,,D)+(.,0(+M)<! \7.+(1%(D)0G/7(+12&/&'M),K)%G+0&0,+%)
ND1H'(D)K+,E9)*(77&7F<V,W%(//)(')1/4)>??XT)PE&'L)Q)R1+D)533S)))!G+'L(+E,+(J)PE&'L)Q)R1+D)O533SZ)D&%'&7FG&%L)2('W((7)H+&E1+M)D1E1F(%J)WL&.L)+(%G/')K+,E)'L()(0(7')&'%(/KJ) 17D) %(.,7D1+M) D1E1F(%J) WL&.L) 1+() 1') /(1%') ,7() .1G%1/) %'(H) +(E,0(D) K+,E) 'L() K/,,D4) !,+)([1EH/(J) 'L() /,%%),K)H+,DG.'&,7),K)1) K&+E)WL&.L) &%) K/,,D(D)17D) 'L(+(K,+() &%)G712/() ',).1++M),7)W&'L)'L(&+)H+,DG.'&,7)W,G/D)+(K(+)',)1%)H+&E1+M)&7D&+(.')/,%%4)=L()&7DG.(D)/,%%(%),K)H+,DG.'&,7),K).G%',E(+%),+)%GHH/&(+%)&7<)17D),G'%&D()'L()1KK(.'(D)1+(1)DG()',)21.UW1+D)17D)K,+W1+D)/&7U1F(%)W,G/D)2()&7D&.1'(D)1%)%(.,7D1+M)&7D&+(.')D1E1F(%4)@))
))))))))))))))))))))))))))))))))))))))))))))))))))))))X)8(0(+'L(/(%%J)'L(+()([&%'%)1)+17F(),K)E('L,D%))2M)WL&.L)%G.L)]&7'17F&2/(%^).17)2()(01/G1'(D)&7)E,7('1+M)'(+E%)O%(()(4F4).L1H'(+%)C)Q)IZ4)@)=L&%)'(+E&7,/,FM)D&KK(+%)K+,E)'L1')G%(D)&7)(.,7,E&.%4)_(+(J)'L()H+&E1+M)&7D&+(.')D1E1F(%)W,G/D)2()+(K(++(D)',)1%)]D&+(.').,%'^)WL&/(),7/M)%(.,7D1+M)&7D&+(.')D1E1F(%)W,G/D)2().1//(D)17)]&7D&+(.').,%'^4)8,'()'L1')(4F4)&7)'L()`P)!;YN)+(H,+'%)OWWW4K(E14F,0aL1bG%aZ)/,%%),K)&7DG%'+&1/)H+,DG.'&,7)&%)L17D/(D)1%)1)D&+(.')/,%%T)&7)'L(),KK&.&1/)$G'.L):,0(+7E(7')+(H,+'%)'L&%)1HH+,1.L)&%)1/%,)1HH/&(D4))

Coral Reef Ecosystem Services Economic Valuation. Phd dissertation, Nicolas Pascal, 2013 Page 198 / 351!
(i) The building exposure will include residential, commercial, public, and industrial buildings.
A database with building quantification, replacement cost and simplified structural characteristics
that affect the vulnerability to natural perils will be created in the zone at risk. It will be assembled
at a varying level of resolution and accuracy. Two aspects determine the level of detail of land use
data: the spatial resolution of the data and the level of differentiation of different land use types.
Especially regarding urban areas, the spatial resolution of land use information varies considerably.
Detailed data contains information about single properties or buildings. This kind of data is called
object-oriented data and damage valuation methods based on this data can be called property-by-
property approach (Penning-Rowsell et al. 2003). In other data sources properties or buildings are
aggregated to areas of more or less homogeneous land use. This type of data is called aggregated
land use data. Both land use data are often available from secondary sources. Two different kinds of
data can be mentioned here: address-point data, where each property is represented by a point in a
map, and cadastral maps, which also give information on ground floor area of properties (see
chapter A for a list of GIS sources used). Data field verification, if planned, will be located in areas
that have more variety of building types and usage with more costly structures.
(ii) The infrastructure exposure will be assembled using similar techniques as those used for
buildings, comprises a detailed and extensive inventory of major assets, such as airports, ports,
power plants, dams, major roads, and bridges.
(iii) The spatial distribution of major commercial crops will be derived from medium resolution
satellite imagery (see chapter A for a list of GIS sources used). To the extent possible, results will be
validated by ground “truthing”. Additional validation will be performed using agricultural census
data and feedback from local experts.
A GIS-based population database (when available) is analysed in order to geographically
identify the population most at risk in each site. This database, which will be compiled from data
sets of many sources, such as the bureaus of statistics from the countries’ government and other
databases (the World Bank), provides population counts within the main administrative boundary.
@_`!;(,%$4$&1!2+#.#!
The costs reflect the construction costs needed to repair or replace the damaged assets. The
repair cost values for different buildings and infrastructure will be collected from a variety of
^b!'$4(2.! .%&1$K*(! 6%-%1(! 2%&! $&2*B6(! -+4(! 2%.(1+4$(#! S$&)(&.+4$(#?! 2%4#?! (.2_U_! V+L()(4?! #+-(! 6%-%1(!2%.(1+4$(#! s! (#,(2$%**9! KB$*6$&1#! s! B#B%**9! 6+-$&%.(! .<(! .+.%*! %-+B&.! +=! 6%-%1(_! N<(4(=+4(?! $.! 2%&! K(!4(%#+&%K*(!.+!$&2*B6(!+&*9!.<(!-+#.!$-,+4.%&.!6%-%1(!2%.(1+4$(#!.+!4(6B2(!.<(!(==+4.!+=!.<(!#.B69_!

Coral Reef Ecosystem Services Economic Valuation. Phd dissertation, Nicolas Pascal, 2013 Page 199 / 351!
sources, including construction cost management firm, governmental reports, interviews with local
experts, and historical disaster reports. The potential damages on the constructed areas will be
measured with average construction costs to replace damages assets. Average surface per house will
be estimated from official and real estate sources. Three types of structures considered are single-
story timber, masonry/concrete, and traditional-style buildings. For infrastructures, the construction
costs can be either derived from official statistics, special publications or directly from the
responsible offices.
The chosen approach through repair costs permits to consider homogenous cost category
independent of the site and real estate price fluctuations. When compared to the approach of
calculating the costs of losses in assets values, it avoids the issues associated with estimates of
assets appraisals. Additionally, using assets values is an overestimation of damage from a broader
economic perspective, because it does not include depreciation and assume a replacement with a
new asset. Depreciated values should be applied in order to reflect the value of a good at the time
when a flood damages it.
For cash crops, the damages will be derived from loss in gross profit from crop production. Data
will come from local governments and/or official annual rental costs of croplands. What is lost is
the real economic value of the crops minus the variable costs avoided because the crop has been
destroyed e.g. harvesting, drying the crop. No permanent reduction in the value of agricultural
output will be considered.
All of the assets in the exposure database of buildings, infrastructure assets, and crops will be
categorized in groups of similar vulnerability to tropical cyclones.
For population impacts, potential available results from models developed to estimate the
number of casualties caused by each type of event will be incorporated. For example, in the South
Pacific, the tropical cyclone casualty model predicts the number of casualties as a function of the
total economic losses, which are used as a proxy for the number of damaged buildings.
When data is available, indirect tangible damage (e.g. loss of tourism revenues, emergency costs,
traffic disruption, etc.) will be estimated.
The emergency costs that local governments may sustain, include debris removal, setting up
shelters for those made homeless, or supplying medicine and food (Messner et al., 2007; PCRAFI,
2011a). The emergency losses will be estimated as a fraction of the direct losses. Research on
historical tropical cyclones and earthquakes has revealed that an “average” estimate of the
emergency losses, as a percentage of the direct losses suffered by residential dwellings, commercial

Coral Reef Ecosystem Services Economic Valuation. Phd dissertation, Nicolas Pascal, 2013 Page 200 / 351!
establishments, public buildings, schools, and hospitals, is about 23% for tropical cyclones and
flood (Bolt et al., 2005; Pagiola, 2004a; PCRAFI, 2011a).
@_!b!'%-%1(!=B&2.$+&#!
The vulnerability of different types of buildings, infrastructure assets, and crops will be derived
from damage functions. A damage function between storm intensity and expected level of losses
(vulnerability) in a typical building will be developed. Damage functions are needed to provide
information on the susceptibility of elements at risk against inundation characteristics. They show
either the damaged share (referred to as relative damage functions) or the absolute monetary amount
of damages per property or square metre (referred to as absolute damage functions) of a certain
group of elements at risk as a function of the magnitude of certain inundation characteristics. In the
current state-of-the-art the main inundation parameter considered in these damage functions is
inundation depth (depth-damage functions). Others, like velocity, duration and time of occurrence
are rarely taken into account(Messner et al., 2007). The function will provide the loss that is
expected when an asset is subject to different levels of storm intensity and will be usually expressed
as a percentage of the replacement cost of the asset.
The valuation of the present study has relied on the following estimates. For houses from the
villages an estimate of 35% damage was used in Vanuatu. This situation represents an average
impact of floods on houses with traditional materials and on more modern houses with concrete
walls. For resorts 20% damage on buildings was employed for flood impacts.
Costs are calculated on the average costs of a cement and traditional house for a household of 5
persons. An average cost of $US 15 000 and $19 000 has been applied to cement house in Vanuatu
and $US 6 000 for traditional house built with local materials (pers. observ.).
@_a_!H4+K%K$*$.9!+=!.<(!<%t%46!()(&.!
The last step is to calculate the probability of the hazard event (storm, cyclones). Tropical
cyclone activity and intensity is variable on the intraseasonal, interannual, interdecadal and multi-
decadal timescales. Variations in the number of tropical cyclones from year-to-year are strongly
correlated with local sea surface temperature before and near the start of the cyclone season (CSIRO
and Australian Bureau of Meteorology, 2007). Tropical cyclone numbers are also correlated with
indices of ENSO, indicating a remote effect on tropical cyclone numbers through the Walker
Circulation (CSIRO and Australian Bureau of Meteorology, 2007).

Coral Reef Ecosystem Services Economic Valuation. Phd dissertation, Nicolas Pascal, 2013 Page 201 / 351!
There is also substantial evidence from theory and model experiments that the large-scale
environment in which tropical cyclones form and evolve is changing as a result of greenhouse
warming. Projected changes in tropical cyclones are subject to the sources of uncertainty inherent in
climate change projections. These include errors in the modelled tropical cyclone climatology and
regional patterns and magnitude of change for various fields and climate patterns such as ENSO
(PWA and SAIC, 2009).
Consequently there is large uncertainty in the tropical cyclone frequency projected by climate
models. IPCC (2001) concluded, “There is some evidence that regional frequencies of tropical
cyclones may change. There is also evidence that the peak intensity may increase by 5% to 10% and
precipitation rates may increase by 20% to 30%. There is a need for much more work in this area to
provide more robust results.”
The probability of events will therefore be calculated from existing models for the study region.
A review of models that range from global climate models to higher resolution regional models will
be done.
The spatial and temporal occurrence and severity of past events is often used as a guide to
predict potential tropical cyclones and earthquakes that may affect the study zone in the future. The
simulated events are not necessarily identical to those that occurred in the past but are statistically
consistent. For example, in the south Pacific, the catalogue of simulated events, which spans the
entire Pacific basin, contains more than 400,000 tropical cyclones, grouped in 10,000 potential
realizations of what may happen in the next year. Mathematical models are then used to estimate
the intensity of the simulated events in the affected region. These effects are wind speed,
precipitation, and coastal surge for tropical cyclones, and ground shaking for earthquakes. If the
earthquakes produce a tsunami, wave height and velocity is estimated as well. The models are based
on empirical data and on the underlying physics of the phenomena (CSIRO and Australian Bureau
of Meteorology, 2007).
When no models are available, the tracks of historical tropical cyclones will be analysed. The
catalogue of historical storms is assembled starting from the dataset of the International Best Tracks
Archive for Climate Stewardship project, the NOAA Historical Hurricane Tracks, the Joint
Typhoon Warning Centre (JTWC), the Australia Bureau of Meteorology (BoM), the France Météo
and other country Meteorological Service.
The spatial and temporal occurrence and severity of past events will be used as a guide to
determine potential tropical cyclones and earthquakes that may affect the study zone in the future.
The probability on the occurrence of climatic events, will be applied to annualize the calculations

Coral Reef Ecosystem Services Economic Valuation. Phd dissertation, Nicolas Pascal, 2013 Page 202 / 351!
and reflect the potentiality of avoided damages. A probability annual event of 44% was deduced
from historic storm events analysis (70 years for both countries).
7"$"#:"A M5L8)*-./0.NE!./=.12.A.
The determination of the contribution of the MPA on the production of the ES5 must take into
account that the ES is more dependent on physical factors rather than biological ones (M.
Allenbach, Pers. Comm.). MPAs strengthened mainly the biological factors with little evidence of
influence on the physical factors driving the production of the ES (Boersma and Parrish, 1999;
Halpern, 2003). Nonetheless, recent works have suggested the importance of MPAs (i) as a way to
enhance coral reef live coverage and resilience through an adequate level of herbivory pressures and
(ii) as a source of coral larvae’s for neighbouring zones. In Vanuatu the configuration of fringing
reef and relative habitat continuity have strengthened these processes. For example, a recent study in
the coral coast of Fiji with a similar fringing reef (Bonito et al., 2012) have shown that MPAs have
4-8 times the amount of hard coral cover than fished sites with hard coral covering 20-40% of the
benthos in MPAs compared to 4-14% at fished sites. In the same way, they proved that MPAs had
little to no macro-algae, while macro-algae dominated fished and tabu areas covering up to 87% of
the hard bottom in some locations. In our sites the contrast between MPA and non-MPA zone is not
so critical in terms of hard coral covering (pers. obs.) and the results of the MSA surveys confirm
this hypothesis. The difference in fishing effort (Fiji has a high fishing pressure) may be one of the
explicative factor.
Without any more precise literature references, a contributing factor comprised between 10%
and 30% of the value of the ES5 was applied.

Coral Reef Ecosystem Services Economic Valuation. Phd dissertation, Nicolas Pascal, 2013 Page 203 / 351!
=NSNOZ ?6+"+3(6&P-/1-*(+"&+,&*Q$&(34-6*)&+"&.(+#(P$2)(*7&e?@&[f&
The method to value impacts on biodiversity is not straightforward. If the quantification of the
effects of MPA on biodiversity is quite consolidated with the use of adequate biological indicators
(e.g. biomass, diversity index increase) (Cote et al., 2001; Gell and Roberts., 2003; Halpern, 2003),
the economic valuation of this effect is complex (Balmford et al., 2008; Jin et al., 2003; Pagiola,
2004b). With the methods described in the previous chapters, the contributive role of biodiversity in
fishery and tourism ecosystem services as well as in coastal protection has been partially taken into
account. Evaluating again the value of these ecosystem processes would generate double counting
(Abaza, 2004). We must now turn the analysis to different values. We can distinguish (i) the option
value (ii) the bequest value and, (iii) the existence value of coral reef ecosystems. As described by
several authors (Beukering et al., 2007a; Pagiola, 2004b; Pendleton, 1995), the option value can be
defined as the value now of potential future direct (fish, tourism) and indirect uses (coastal
protection) of the biodiversity. Bequest value represents the value attached to preserving an
ecosystem for use by future generations, independent of one’s own use of the ecosystem. The
existence value corresponds to the value people give to biodiversity independently of any present,
future or altruistic use. Existence can be categorized as a non-use value in the TEV approach (Groot
et al., 2002).
The most common methods employed to figure out these values of biodiversity through stated
preferences approaches require very extended and complex questionnaires to determine a
willingness to pay (WTP). These methods have been discarded due to their costs and the resources
needed as well as their lack of solid background in the context of subsistence economy (David, G,
pers. Comm.).
When primary or secondary data from the studied sites are not available or possible, the transfer
benefit is a recommended method (Wilson and Hoehn, 2006). It has to be employed with precaution
(Wiley, 2003) and is not recommended for the existence values (Rudd, 2009; Spash, 2007). Only
one study on bequest values about coral reef in Fiji was selected (O’Garra, 2007, 2009). It presents
some similarities with the socio-ecological context of Vanuatu: customary management of marine
tenure, small villages, small fringing reef and mix between non-market and market economy. The
economic values were obtained from villagers through willingness to contribute (in hours/week)
towards conservation of their marine zone to maintain some of the ecosystem services (option and
bequest value). A transfer benefit protocol has been setup to adapt adequately the results to this
study and correcting factors were applied on the data. The protocol was based on a comparison of
the main socio-economic characteristics between the 2 countries. The average size of the household,
the proportion of households owning a television, the main source of income have been compared
with data from the studies villages. The monetary monthly income and the Human Development

Coral Reef Ecosystem Services Economic Valuation. Phd dissertation, Nicolas Pascal, 2013 Page 204 / 351!
Index have been compared with data for rural zone and whole country respectively (source: UNEP).
Corrective factors of Purchasing Power Parity (PPP) from the World Bank and the Geary–Khamis
dollar conversion (Heston et al., 2009) have been applied. The PPP for Vanuatu and Fiji are 0,96
and 36,1 respectively and the Geary–Khamis dollar for Vanuatu and Fiji are: 13 and 13,5
respectively. Other data were obtained through official statistics and the Household Income and
Expenses Survey (HIES) conducted in both countries. The HIES is described in a different chapter.
The bequest value for the marine ecosystem is first expressed in hour.year-1 per adult and
converted in money with the mean average wage rate. This value represents the time (converted in
money) that people are ready to give to ensure a future use (fishing and tourism mainly) of the
ecosystem for themselves or not for themselves (option and bequest value respectively).
With the present knowledge, is not possible to apply a precise quantitative impact of MPA on
this value. For example, how to apply a 20% increase in fish diversity to an option value expressed
in euros.y-1per household? Therefore, a MPA contribution factor varying from 20% to 50% has been
proposed on the same base as for coastal protection. This contribution has relied on existing
evidence of MPA support to biodiversity and some ecosystem processes (Mosquera et al., 2000;
Palumbi, 2001; Sale et al., 2005). This means that without MPA 20% to 50% of the bequest value
would be lost.

Coral Reef Ecosystem Services Economic Valuation. Phd dissertation, Nicolas Pascal, 2013 Page 205 / 351!
=NSNO[ ?6+"+3(6&P-/1-*(+"&+,&(34-6*)&+"&)+6(-/&6-4(*-/&e?@&\f&
7"$"#C"# O(0+=+*+/=.
According to Putnam (Putnam, 2006) the social capital can be separated in two. On one side, the
bonding capital represents the cohesion of the group, the solidarity, and the trust in the community.
It forms one of the bases of the common pool resource management, which is enhanced in
community-based management (Ostrom et al., 1999). One form of this capital is the political
empowerment of groups that may not have been represented before MPA establishment (Wilkie et
al., 2006b).
On the other side the bridging capital is formed by the capacity of the community to be
represented in external events. It refers to the value assigned to social networks between socially
heterogeneous groups (Putnam, idem). One example of the bridging capital is the belonging to
networks (e.g. MPAs, monitoring). Another one is the ability to attract external assistance through
grants or assistance.
For facility of understanding, the social capital in this study has included also the human capital
which refers to the knowledge and capabilities of individuals that contribute to the process of
production (Deardorff, 1982; Heckman and Klenow, 1998). The trainings and education received
through MPA workshops are assumed to have an impact on the capabilities of individuals.
Impacts on physical capital are present too. Some physical assets of MPA such as a boat can be
used for other uses (transport) and to simplify analysis have been mixed with this category of social
capital.
7"$"#C"$ O8*8.)/99()*+/=.8=B.5(*</B.
Data was collected from the census of all grants and assistances received in villages with MPA
and the control sites. The objectives of these funds can be very diverse. The processes and people
implicated in this process of fundraising as well as the capacities and abilities needed for it have
been assessed through interviews with village stakeholders. The objective is to determine if the
MPA village has a different capacity of fundraising than non-MPA villages. This will be valued in
terms of social capital impacts in the process following the method described by Matous et al.
(Matous and Ozawa, 2010).
All the activities of meetings, trainings and workshops related to MPAs and MMAs (distinction
was not possible) have been identified. They are considered as investments in human capital. An
economic estimation of their cost was assessed since the creation of the MPA to reflect all the
potential trainings received. To our knowledge and as mentioned by Woehr (1994), very few

Coral Reef Ecosystem Services Economic Valuation. Phd dissertation, Nicolas Pascal, 2013 Page 206 / 351!
references exist to quantify the efficiency of these trainings on other processes of production and
none on these topics are for rural audiences. Based on discussions with trainers visiting villages, it is
proposed that 30% of the costs are transformed annually in human capital and effects disappear
rapidly during the next 2 years. Costs are then used as a proxy value of their impact as a
replacement cost (Heckman and Klenow, 1998).
For physical capital impact, the assets of MPA were identified and valued. When these assets
produce some monetary flows, the added value of these flows was determined. In case of no
monetary flows but effective use by people, the proportion between dedicated use to MPA and other
uses is determined. This proportion is applied to the replacement cost of the asset based on the
purchasing price minus amortizing.
=NSNO\ !34-6*)&+,&BA8&+"&*Q$&P(//-0$&$6+"+37&
7"$"#F"# O(0+=+*+/=.
The objective is to determine the relative importance of the MPA (through its local economic
impacts) for each village. It was chosen to use the annual incomes generated in the village as an
indicator. Monetary and non-monetary incomes are included and have been called village Gross
Domestic Income (GDI). The GDI will be used as a base to evaluate the weight of the economic
cash flows generated by MPAs at a village level.
7"$"#F"$ N(*</B.
The incomes are determined at the household level. As described by the HIES protocol (Vanuatu
National Statistics Office 2008b), the household is defined as a group of people who usually live
together and have a common arrangement for food, such as using a common kitchen or a common
food budget. Household incomes are defined by: (i) income from employment (both paid and self-
employment); (ii) property income; (iii) income from the production of household goods and
services for own consumption; and (iv) current transfers received.
Household consumption expenditure is the value of consumer goods and services acquired, used
or paid for by a household through direct monetary purchases, own-account production, barter or as
income in-kind for the satisfaction of the needs and wants of its members.
Results from the surveys conducted in Nekapa and Unakap (see description of the method in
control site validation) have permitted to adapt the HIES provincial results to the village level. As
observed by HIES 2006, the irregularity of incomes and cash generating activities makes difficult
any quantification of incomes on a short term study. Following the HIES conclusions, it is then
assumed that (i) incomes should equalize expenses at the annual scale and, (ii) an average 33% of
incomes are generated locally.

Coral Reef Ecosystem Services Economic Valuation. Phd dissertation, Nicolas Pascal, 2013 Page 207 / 351!
=NSNO] =+)*)&+,&BA8)&&
7"$"#H"# O(0+=+*+/=.
Different kind of costs of MPA are distinguished: direct, indirect and opportunity costs
(Sanchirico, 2000). The first ones cover the costs of establishment, administration, employment,
monitoring and enforcement. The second ones refer to some possible compensation payments to
people adversely affected by MPA (e.g. alternative employment packages or infrastructure costs of
increasing tourism). The third ones consider all the losses of potential earnings such as loss in the
fishery revenues, longer displacement time for fishermen or loss from the time spent in the MPA
management. For the direct costs, 2 categories were analysed. The first one corresponds to the setup
phase, which covered activities that served in the implementation of the MPA. The activities
included some preliminary studies, organization of MPA management, capacity building,
formulation of the management plan and the physical setup of the MPA (house, buoys, signboards,
launching events, etc.). Costs covered the expenses for assets and materials, for coordination time,
training, meetings and incentives. A second category corresponds to the operational costs, which
covered the period after the formulation of the management plan and physical implementation of the
MPA. The activities include mainly enforcement, realization of awareness campaigns,
environmental education activities, resource monitoring and management, livelihood project
enhancement and regular meetings. Materials, human resource, activities and meetings form the
main costs. We have considered that the costs of training and the costs of awareness campaigns
respond to a similar objective of “capacity building”. Even if differences between MPA and MMA
have been described before, the specific direct costs for each one was not possible to be identified in
the field.
7"$"#H"$ N(*</B.
Data was collected through interviews with managers of MPAs and the various stakeholders.
The value of the time spent in the planning, follow-up and monitoring activities was estimated
based on (i) direct salaries received and, (ii) the minimum national daily wage when no salary is
received. The establishment costs were amortized on a 10 years period, corresponding to a classic
accountancy rule for establishment costs (replacement of materials and assets, reformulation of
management plan, etc.). Trainings received by village members (e.g. monitoring techniques or
environment awareness) are valued with the individual average daily cost of a regular training
workshop. The origins of funds among villages, national actors or international stakeholders were
identified. Government institutions or other agencies financed from the national budget were
considered as national (even if maybe a part of their resource comes from external source).
International refers to NGOs, institutions and initiatives financed from external donors or agencies.
A management administrative fee of 30% was applied to all international funding received locally to
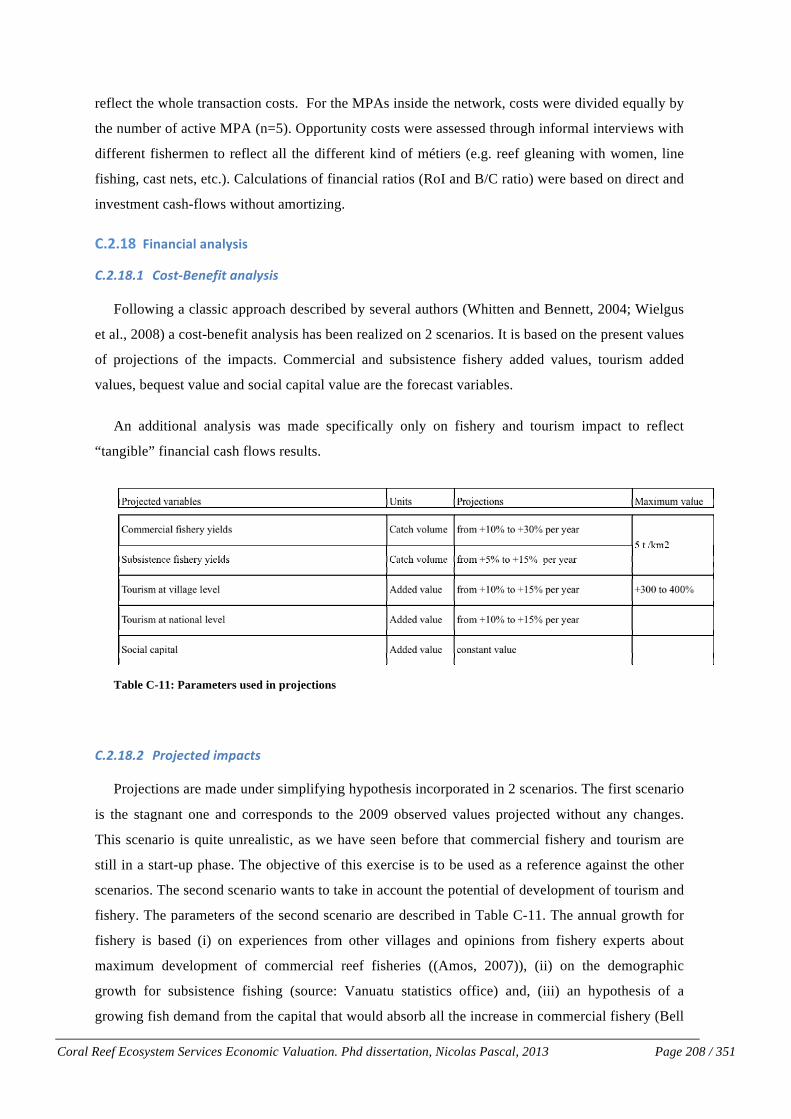
Coral Reef Ecosystem Services Economic Valuation. Phd dissertation, Nicolas Pascal, 2013 Page 208 / 351!
reflect the whole transaction costs. For the MPAs inside the network, costs were divided equally by
the number of active MPA (n=5). Opportunity costs were assessed through informal interviews with
different fishermen to reflect all the different kind of métiers (e.g. reef gleaning with women, line
fishing, cast nets, etc.). Calculations of financial ratios (RoI and B/C ratio) were based on direct and
investment cash-flows without amortizing.
=NSNO^ ;("-"6(-/&-"-/7)()&&
7"$"#Y"# 7/-*UQ(=(0+*.8=894-+-.
Following a classic approach described by several authors (Whitten and Bennett, 2004; Wielgus
et al., 2008) a cost-benefit analysis has been realized on 2 scenarios. It is based on the present values
of projections of the impacts. Commercial and subsistence fishery added values, tourism added
values, bequest value and social capital value are the forecast variables.
An additional analysis was made specifically only on fishery and tourism impact to reflect
“tangible” financial cash flows results.
Table C-11: Parameters used in projections
7"$"#Y"$ E6/'()*(B.+5L8)*-.
Projections are made under simplifying hypothesis incorporated in 2 scenarios. The first scenario
is the stagnant one and corresponds to the 2009 observed values projected without any changes.
This scenario is quite unrealistic, as we have seen before that commercial fishery and tourism are
still in a start-up phase. The objective of this exercise is to be used as a reference against the other
scenarios. The second scenario wants to take in account the potential of development of tourism and
fishery. The parameters of the second scenario are described in Table C-11. The annual growth for
fishery is based (i) on experiences from other villages and opinions from fishery experts about
maximum development of commercial reef fisheries ((Amos, 2007)), (ii) on the demographic
growth for subsistence fishing (source: Vanuatu statistics office) and, (iii) an hypothesis of a
growing fish demand from the capital that would absorb all the increase in commercial fishery (Bell
Pascal, 2010 –Cost-Benefit analysis of Community-based marine protected areas, Vanuatu – Research report Page: 57/105
!"#$#%"$&'$#$&()")''
*+),-./#/0",'$#$&()")'
Following a classic approach described by several authors (Whitten and Bennett, 2004; Wielgus et al.,
2008) a cost-benefit analysis has been realized on 2 scenarios. It is based on the present values of
projections of the impacts. Commercial and subsistence fishery added values, tourism added values,
bequest value and social capital value are the forecast variables.
An additional analysis was made specifically only on fishery and tourism impact to reflect “real”
financial cash flows results.
12+3/%,/4'"56$%,)'
Projections are made under simplifying hypothesis incorporated in 2 scenarios. The first scenario is
the stagnant one and corresponds to the 2009 observed values projected without any changes. This
scenario is quite unrealistic, as we have seen before that commercial fishery and tourism are still in a
startup phase. The objective of this exercise is to be used as a reference against the other scenarios.
The second scenario wants to take in account the potential of development of tourism and fishery. The
parameters of the second scenario are described in Table 8. The annual growth for fishery is based (i)
on experiences from other villages and opinions from fishery experts about maximum development of
commercial reef fisheries ((Amos, 2007)), (ii) on the demographic growth for subsistence fishing
(source: Vanuatu statistics office) and, (iii) an hypothesis of a growing fish demand from the capital
that would absorb all the increase in commercial fishery (Bell et al., 2009). No projections on price
were made. The maximum projected values were compared to the chosen and previously described
MSY level for each village. We use this concept as an indicator of sustainability of the fishery to
determine the maximum effects of MPA in case of increasing fishing effort.
For tourism, the projections are based on the cycle theory of business (Burns and W. C. Mitchell,
1946; Morgan, 1991). Most of the Vanuatu tourism sector is today in a start-up phase with a very low
level of visitors (80 000 international visitors per year). Domestic and international tourism
!"#$%&'(&)"*"+%,%*-&.-%/&01&2*34%5,031-&

Coral Reef Ecosystem Services Economic Valuation. Phd dissertation, Nicolas Pascal, 2013 Page 209 / 351!
et al., 2009) . No projections on price were made. The maximum projected values were compared to
the chosen and previously described MSY level for each village. We use this concept as an indicator
of sustainability of the fishery to determine the maximum effects of MPA in case of increasing
fishing effort.
For tourism, the projections are based on the cycle theory of business (Burns and W. C. Mitchell,
1946; Morgan, 1991). Most of the Vanuatu tourism sector is today in a start-up phase with a very
low level of visitors (80 000 international visitors per year). Domestic and international tourism
projections are based (i) on interviews with experts, (ii) a tourism sector survey which revealed that
total visitors coming to the North Efate zone were around 8 000 in 2007 (Trip consultants, 2008)
and, (iii) other tourism references in the region (source: national tourism office from Fiji and
Solomon Islands). Projections on guesthouse capacities and occupancy level were made. It was
considered that motivations and type of tourism were not modified from present situation.
Distinction is made between village and domestic added values.
Social capital and bequest values are assumed to remain stable on an annual base. The costs were
projected on the average operational costs of the last 5 years and a 10-year recurrent cost was
planned to replace assets. As no published data has been found, it is hypothesized that the estimated
MPA effects on fishery productivity and tourism motivation visit will remain the same, independent
of the level of fishing and tourism.
It is important to emphasize that the objective of this approach is to provide potential values for
MPAs projections. The results reflect many approximations and do not take in account many
external factors on reef productivity (such as climate change) or on tourism (e.g. macro economic
context).
7"$"#Y": !"#$%&$'"#$($'W.
The projections necessary to the cost-benefit analysis covered a period of 25 years after the
creation of the MPA. This range is most often proposed in similar studies to reflect the ecological
responses of ecosystems to scenarios tested (Balmford et al., 2008). The period starts from the first
payment of establishment costs.
7"$"#Y"A E6/0+*.a.9/--.$``[..
A simplified profit and Loss (P&L) analysis was done for every village for 2009. The figures are
based on the observed data and takes in account all the benefits and costs. Setup costs are amortized
on a 10-year basis. The objective was to give an easy reading of the costs and benefits.

Coral Reef Ecosystem Services Economic Valuation. Phd dissertation, Nicolas Pascal, 2013 Page 210 / 351!
7"$"#Y"C _+=8=)+89.+=B+)8*/6-..
The Net Present Value (NPV) of a project or policy is an indicator reflecting a positive value when
discounted benefits exceed discounted costs. It is the main indicator recommended for CBA
exercise (Pearce et al., 2006) as it permits objectively to make accept-reject choices, rank
independent projects and choose between mutually exclusive projects. A positive NPV means that
benefits outweigh costs and the investment should be considered. A negative NPV means that the
costs outweigh the benefits. An NPV of 0 means the benefits are equal to the costs. It is an absolute
measurement of a program’s net benefit or cost.
NPV= " Pn *(1+d)-n - " In *(1+d)-n
Where:
Pn = positive cash flow of ES1 to ES5 during period n
d= discount rate
n= period of time (years)
In = cost of investment
Other capital budgeting indicators are proposed to make an appraisal of the investment in the MPA.
Several manuals described precisely the approach (Campbell and Brown, 2003; HM Treasury,
1991). The principal objective is to give funding agencies tools to rank different prospective and
independent projects (e.g. compare the investment in natural capital with investment in physical
capital). Based on historic values and projections, the Benefit/Cost (B/C) ratio and the Return on
Investment (ROI) are calculated as financial ratios.
The B/C ratio and the ROI are calculated through the values of net cash flows divided by the cost of
the investment; the results are expressed as a ratio and all values are calculated in present values.
The B/C ratio is calculated on the flows of average values (between minimum and maximum) of
impacts on all ES and costs. For example, a B/C ratio of 2.5 means policymakers can expect "2.5 in
benefits for every "1 in costs. A B/C ratio greater than 1 means the benefits outweigh the costs and
the investment should be considered. If the ratio is less than 1, the costs outweigh the benefits. If the
B/C ratio is equal to 1, the benefits equal the costs.
The ROI is similar to B/C ratio, but compares the net benefit (total discounted benefits minus total
discounted costs) to costs. The ROI indicates how much of the investment policymakers can expect
to receive as a benefit. If the ROI is positive, the benefits exceed the costs and the investment should

Coral Reef Ecosystem Services Economic Valuation. Phd dissertation, Nicolas Pascal, 2013 Page 211 / 351!
be considered. A negative ROI means that the costs outweigh the benefits. An ROI of 0 means the
benefits equal the costs. The RoI is based on the cash flows of impacts on ES1, ES2 and ES3 to
reflect “tangible” financial cash flows.
The B/C ratio and the ROI are relative measurement of the investment’s benefits and costs. The B/C
ratio is commonly used to demonstrate an investment’s “worth it” by showing the relationship
between total benefits and total costs. The ROI is frequently used in financial settings and reports
the gain from the investment14.
B/C= " Pn *(1+d)-n / " In *(1+d)-n
Where:
Pn = positive cash flow of ES1 to ES5 during period n
d= discount rate
n= period of time (years)
In = cost of investment
ROI= " Pn *(1+d)-n / " In *(1+d)-n
Where :
Pn = positive cash flow of ES1, ES2 and ES3 during period n
d= discount rate
n= period of time (years)
In = cost of investment
Analyses were conducted using real or constant values, i.e., by measuring benefits and costs in
units of stable purchasing power (2009). All local currencies results were converted in Euro with the
average 2009 rate of change (1 VUV= 0,0083 EUR).
^a!/(2%B#(!(%2<!-(.4$2!2%*2B*%.(#!K(&(=$.#!%&6!2+#.#!6$==(4(&.*9?!$.!$#!,+##$K*(!=+4!%&!$&)(#.-(&.!.+!<%)(!%!<$1<(4!/@;!%&6!;M8?!KB.!%!*+L(4!:HR!.<%&!%&+.<(4!$&)(#.-(&.!

Coral Reef Ecosystem Services Economic Valuation. Phd dissertation, Nicolas Pascal, 2013 Page 212 / 351!
In the use of B/C ratio and following recommandations from Pearce et al (2006), it was
identified when classification of a project benefits as a cost rather than a benefit, and vice versa was
possible. Except for some specific costs such as trainings, salaries of external advisers and physical
investment (e.g. boat), the swap between benefits and costs was not possible. For the previous costs,
results have shown to be low sensitive if they were treated as negative benefits.
7"$"#Y"F _+=8=)+89.8=894-+-./=.<+-*/6+).)8-<U09/b-.
In order to reflect the real cash flows of cost and benefits observed, the 3 financial indicators have
been estimated since the setup of the MPA up to 2009.
In average this period has covered 5 years. As no observations of MPA benefits were available
before 2009, it was assumed that they had started 2 years after the setup of the MPA and increased
gradually every year up to 2009 level (25%-50%-75% of total MPA benefits). The cash flow of
costs has come from the data collected.
7"$"#Y"H O+-)/>=*.68*(.
In order to compute present values, it is necessary to discount future benefits and costs. This
discounting reflects the time value of money. As described by several studies (Balmford et al.,
2008; Beukering et al., 2007a; Cesar and Chong, 2006; Cousens et al., 2002; OECD, 2006;
Panayotou, 2003) no consensus exists on the discount rate to be applied. An alternative choice has
been to apply a discount rate of 10% coupled with a sensibility analysis on 3% and 7% discount rate
(Holland, P. pers. Comm.)
7"$"#Y"Y 2(=-+*+,+*4.8=894-+-.
A clear identification of the main uncertainties is compulsory to ensure a reliable use of this
analysis. Evaluation methods of uncertainty on assumptions (min-max, best estimate) were used to
reflect the variability to results (Mullan and Kontoleon, 2008). Major assumptions were changed
sequentially and present values were recomputed to determine how sensitive outcomes are to
uncertainties. The assumptions tested are (i) the minimum and maximum range of estimations of the
effect of MPA on fishing yields, (ii) the range of estimations of the MPA contribution on tourism,
(iii) the projected growth of the 2 sectors during the next 25 y, and (iv) a discount rate of 5, 7% and
10%.
&

Coral Reef Ecosystem Services Economic Valuation. Phd dissertation, Nicolas Pascal, 2013 Page 213 / 351!
=NT 5$)1/*)&
=NTNO =+")+/(#-*$#&2$)1/*)&
Table C-12: MPA economic valuation of impacts. Consolidated results. Year 2009 , Annual figures. Added
values (!)
The mean economic impacts of MPA per village have been estimated at 8.900 ".y-1 (minimum:
6,000 " and maximum: 13,400 ") in 2009. The effects of MPA on tourism added values have
represented the major part (56%) followed by effects on fishery added value (26%) and other
impacts (19%).
Figure C-11: MPA economic benefit distribution
Based on average benefits for 2009.
Results vary among village reflecting a different socio-ecological context on fishing effort and
tourism activities. Impacts are proportional to the level of fishing pressure and tourism business
development stage found in each village.
Euros Emua Piliura Unakap Laonamoa Worasifiu Mean
MPA impacts on subsistence fishery (ES1) !.y-1 2"250 1"146 671 1"768 866 1!340
MPA impacts on commercial fishery (ES2) !.y-1 541 544 540 2"081 986 938
MPA impacts on tourism (ES3) !.y-1 3"457 10"097 3"228 4"107 3"803 4!938
MPA impacts on coastal protection ecosystem service (ES4) !.y-1 136 816 816 1"088 272 626
MPA impacts on bequest value (ES 5) !.y-1 1"064 488 399 1"131 200 656
MPA impacts on social capital (ES6) !.y-1 633 291 291 291 291 359
TOTAL MPA impacts !.y-1 8!081 13!382 5!945 10!465 6!416 8!858
!"#$%&'()*+$,-$.+/0123$456$
!"#$%&'()*+$,-$*,71%+&$3$856$
9*/01$!"#$%&'()*+3$:;6$
!"#$%&'(')*&$+%(%,-$.*/-0*+12'($+3/%.$'($34%035%$+%(%,-/$'($3..%.$4361%/$70')$8$!"#/9$:;;<$
!%3($+%(%,-$=$>?>@;A?BCD$

Coral Reef Ecosystem Services Economic Valuation. Phd dissertation, Nicolas Pascal, 2013 Page 214 / 351!
Figure C-12: Benefits of MPA on ES per villages. Based on 2009 estimated values.
The villages are the main beneficiary (65%) of the MPA impacts with a mean value of 6,200 "
p.a.. Except one village (Piliura) where day tourism activities produce important benefits for
national stakeholders, the distribution village/domestic level has been relatively homogenous.
Figure C-13: Stakeholder economic benefit distribution. Based on average benefits for 2009.
!"# $!"# %!"# &!"# '!"# (!"# )!"# *!"# +!"# ,!"# $!!"#
!"#$%%
&'('#)$%
*+$,$-%
.$/+$"/$%
0/)$1'2#%
3'145)6%7/""5)7'$(%
3'145)6%1#81'195+75%
:/#)'1"%;'(($<5%
=/7'$(%7$-'9$(%;'(($<5%
!"##$%&'#&(&#')*+'
,$-./$#'#&(&#'0*+'
!"#$%&'(')*&$+%(%,-$.*/-0*+12'($+3$/-45%6'7.%0/$+4/%.$'($48%049%$+%(%,-/$'($4..%.$8471%/$:0')$;$!"#/<$=>>?$
!%4($+%(%,-$@$ABAC>DB3EF$

Coral Reef Ecosystem Services Economic Valuation. Phd dissertation, Nicolas Pascal, 2013 Page 215 / 351!
In terms of “real” financial cash flow and proteins, the benefits at village level from fishery and
tourism represented a mean value of 3,200 " p.a. for each MPA (next table). Average effects on
tourism and fishery added value for villages have been similar.
The importance of these local benefits on the village varies from 4% to 21% of their GDI. The
average impact (without Worasifiu) is 7% (std=4) meaning that the MPA has produced benefits
representing approximately 7% of the total 2009 cash and non-cash incomes generated in the
village.
Figure C-14: 2009 annual MPA impacts in proportion to village annual GDI.
=NTNS ;()Q$27&)$6*+2&e?@O&-"#&?@Sf&
The estimations of the reef fishing yields for the year 2009 are presented in the next table. Total
reef fish catches per village are estimated between 1 to 5.2 t.y-1.km-2 of fishing ground.
In average, 30% of the fish catches are sold and the rest is used for own consumption in the
village. Values differ from every village and reflect the level of fishing effort synthetic index. The
non-monetary consumption of fresh fish corresponds to an average 17 kg.y-1 per capita. The
distribution between net and speargun gears is variable among villages and depends on the
ecological context (for example, some villages can not use gill nets due to their reef
geomorphology).
The resulting added value for subsistence and commercial fishery is 2.7 ".kg-1 and 3.04 ".kg-1
respectively. Intermediary costs for commercial fishery represent an average of 16% of the market
price.
Even if activity with other gears is not continuous or very intensive, they are well spread out
among households. Reef gleaning, cast nets, line, shell collection have been observed with a certain
regularity.
Emua Piliura Unakap Laonamoa Worasifiu Mean
Total monetary impacts of MPA at village level (fishery and tourism) euros 3!174 1!855 2!601 4!198 4!291 3!224
Total protein impacts of MPA at village level euros 2!250 1!146 671 1!768 866 1!340
% impacts of MPA on village GDI % 3% 7% 12% 5% 21% 7%

Coral Reef Ecosystem Services Economic Valuation. Phd dissertation, Nicolas Pascal, 2013 Page 216 / 351!
Table C-13: Estimated yields for the reef fisheries during the year 2009.
Totals are truncated at 102
Unit Emua Piliura Unakap Laonamoa Worasifiu Nekapa (control) Saama (control) Average
Total yields kg.y-1 4!300 2!500 1!100 5!400 2!500 3!500 2!600 3!100
min kg.y-1 3!450 1!990 900 4!290 1!990 2!780 2!110 2!501
max kg.y-1 5!180 2!980 1!350 6!430 2!990 4!170 3!160 3!751
Fishing net % total catches 41% 43% 27% 18% 61% 43% 33%
Speargun % total catches 59% 57% 73% 100% 82% 39% 57% 67%
% commercial sales % total catches 21% 36% 13% 40% 48% 26% 23% 30%
Equivalent catch per area t.y-1.km-2 2,8 2,3 0,9 4,0 5,2 3,5 3,7 3,2
Equivalent fresh fish consumption kg.y-1 per capita 14 16 11 15 26 23 16 17
Total fishery added value: subsistence (ES 1) euros 9!400 4!300 2!700 8!800 3!500 7!000 5!400 5!871
Total fishery added value: commercial (ES 2) euros 2!700 2!700 800 7!200 3!800 2!800 1!800 3!114
Total fishery added value (subsistence and commercial) euros 12!100 7!100 3!400 16!000 7!400 9!800 7!200 9!000

Coral Reef Ecosystem Services Economic Valuation. Phd dissertation, Nicolas Pascal, 2013 Page 217 / 351!
=NTNT D+12()3&)$6*+2&e?@Tf&
The estimates of the tourism activities are presented in the table below. In 2009 the mean annual
occupancy rate for Guesthouses was 8% with a maximum value of 15% in one guesthouse. Day
tours activities are not present in every village. Mean annual number of day tour visitors is around
100 tourists with a maximum value of 480 in one village.
The distribution of the activities is different among villages. Some villages have a consolidated
activity of day tours without guesthouse business whereas for others, the tourism is based only on
guesthouse visits. Scuba diving activities have occurred only in one village and with a very reduced
activity. The scientific tourism has brought a significant number of visits (residing scientist, visits
from NGOs, etc.) and has represented as much as 60% of the total visits to guesthouses for one
village.
Results of interviews show that visits to guesthouses are relatively short ones: in average 1 night
per every week of total visit to Vanuatu for international visitor and 2 nights for domestic visitors.
These short stays reveal that this kind of tourism is highly dependant on the transport connectivity
with main tourism destinations. Repeat visitors seem important for domestic and are very low for
foreign visitors. As described before all but one of the guesthouses are privately owned and
revenues go to the owners without any distribution to the community. The day tours activities are
different because benefits are shared between an operator in the capital (80% of the added value)
and a village representative that redistributes to some families in charge of restoration and the
community.
The estimated added value of activities represent more than 80% for local guest houses where
intermediary costs are mainly the amortizing costs of construction, advertising and maintenance. For
day tours the average added value is 55%, including benefits made at village and national level
through the tour operators. Day tour main costs include transport and advertising. Added value of
scientific tourism is similar to guest house as main expenses are realized in the form of
accommodation and food. The intermediary costs of diving clubs are estimated to represent 50% of
the revenues.
Table C-14: Estimated added values for the tourism sector (ES3). Annual figures for 2009.
Year 2009 added value (!) Emua Piliura Unakap Laonamoa Worasifiu Nekapa (control)
Saama (control) Average
Daytour visitors with marine activities Euros 1!565 12!518 782 1!565 782 730 782 2"675Guest house Euros 2!952 787 2!132 4!100 2"493Occupancy rate % 11% 2% 3% 15% 8%Visits to MPA Euros 1!920 240 240 400 700Scientific MPA tourism Euros 880 120 1!080 240 120 488Diving visits Euros 980 1!568 1"274Total Euros 5"397 14"558 3"870 5"745 5"402 730 782 5"212

Coral Reef Ecosystem Services Economic Valuation. Phd dissertation, Nicolas Pascal, 2013 Page 218 / 351!
=NTNZ F(//-0$&H2+))&9+3$)*(6&!"6+3$&&
The mean annual expenses per village are estimated at 154 000 " and the mean GDI per village
(i.e. the part of the incomes generated in the village) is 49 000 ".y-1. The previous results mean that
villages are able to produce approximately 30% of their needs locally.
The added value of fishery and tourism represent an average of 19% and 8% respectively of the
village GDI (extreme values are omitted). Added value of tourism is considered only at village
level.
The subsistence fishery represent in average 10% of the non-cash needs of a village.
Table C-15: Consolidated results of village monetary and non-monetary needs
(* Extreme values have been omitted)
&
Emua Piliura Unakap Laonamoa Worasifiu Mean
Total annual expenses euros 275!811 98!380 80!493 270!084 45!392 154!032
Total annual monetary expenses euros 189!117 58!645 47!982 161!000 31!775 97!704
Estimated GDI for the village euros 96!534 25!579 20!928 81!025 20!427 48!899
Fishery contribution to village GDI % 13% 28% 16% 20% 36% * 19%
Tourism contribution to village GDI % 4% 14% 11% 4% 23% * 8%
Subsistence fishery contribution to village non monetary incomes % 11% 11% 8% 8% 26% * 10%

Coral Reef Ecosystem Services Economic Valuation. Phd dissertation, Nicolas Pascal, 2013 Page 219 / 351!
=NTN[ !34-6*)&+,&BA8&+"&,()Q$27&42+#16*(P(*7&e)4(//+P$2f&
7":"C"# M5L8)*-./=.7Ec1-.
For gillnets, the mean CPUEs for village with and without MPA is 7.2 kg.h-1 (std=2.8) and 2.8
kg.h-1 (std=1.8) respectively. The mean CPUE for all the villages is equivalent to 5.2 kg.h-1
(std=2.5).
For speargun, the villages with MPA fish on average 3.18 kg.h-1 (std=0.8) and villages without
MPA: 2.1 kg.h-1 (std=0.6). The mean CPUE is 2.9 kg.h-1 (std=0.7) for all the villages.
The next figures describe more precisely the average CPUES observed at different locations with
and without MPA and at a variable distance from the MPA border.
Figure C-15: Mean CPUEs for gillnets (n=76hours) and speargun fishing (n=170h) at different locations.
!"
#"
$"
%"
&"
'!"
'#"
()*+",-."/012*13" ()*+"4!!")",-." -565*1+",-."/012*13" -65*1+"4!!")",-." 738+9+" :++)+"
!"#$%&'()*%+,
%-%./01%
!"#"!
!"#$!
!%#"!
!%#$!
!&#"!
!&#$!
!'#"!
!'#$!
!(#"!
!(#$!
!$#"!
)*+,! -./.+0,! 12,3,4! 5,62,*6,! 760,8.9+! :;3,4,!<=62>06/?! @,,*,!<=62>06/?!
!"#$%&'()*%+,-./(01
2%

Coral Reef Ecosystem Services Economic Valuation. Phd dissertation, Nicolas Pascal, 2013 Page 220 / 351!
Figure C-16: Size distribution of the catches from different locations.
Results are expressed in number of individuals caught per hour of standard effort of gillnet for Scaridae sp.
Figure C-17: Average weight of catches for different families.
Results are expressed in kg per hour of gillnet standard effort.
!"!!#
!"$!#
%"!!#
%"$!#
&"!!#
&"$!#
'"!!#
'"$!#
("!!#
)*+,#-./#0123+24# )*+,#$!!#*#-./# .565+2,#-./#0123+24# .565+2,#$!!*#-./# 748,9,# :,,*,#
!"#
$%&'()'*+,*-*,"
./0'1%
&'2(
"&'''
;%$# %$<%=# %><&&# &'<&?# &@<'!# '%<'(# '$<'># A(!#
!!"
!#"
!#"
!$"
!$"
!%"
!%"
&'()"*+,"-./0(/1" &'()"2!!"'"*+," +343(/)"*+,"-./0(/1" +343(/)"2!!'"*+," 516)7)" 8))')"
!"#$%&#'(#)&*+',-&.*/01''
89)/30)1"
83:);30)1"
,9);<(/30)1"

Coral Reef Ecosystem Services Economic Valuation. Phd dissertation, Nicolas Pascal, 2013 Page 221 / 351!
Figure C-18: Partition of variation in RDA (explications in the text)
Results based on CPUEs of grouped species by family (Acanthuridae, Labridae, Lethrinidae, Scaridae and Siganidae). Fraction [a] corresponds to the variation explained by the ‘reserve’ variables (i.e. existence of the MPA and distance from the bordure of the MPA) alone, after accounting for the variation explained by the ‘temporality’ (i.e. moon and tide) and ‘habitat’ variables (depth, coral reef type and substrate). Explained variation is expressed by adjusted R2 and is tested by random permutations. The ‘reserve’ variables explain 16.2% of the variance of the species matrix, which is significant (**). Fraction [b] corresponds to the variation explained by the ‘temporality’ variables alone : 15,7% (*). Fraction [c] corresponds to the variation explained by the ‘habitat’ variables alone: 3,7% (n.s.). Other fractions represent the variation shared by 2 or 3 subsets of explanatory variables and are not testable. All variables explain 35.7% of the variation (***).
Results from the multivariate analysis and ordination are presented in Figure C-18. The ‘reserve’
variables (i.e. existence of the MPA and distance from the bordure of the MPA) have the most
significant impact on net CPUEs for whole species with 16,2% of the variance explained with a
significant level (**). The rest of the variation is explained by the ‘temporality’ variables (15,7%
(*), the ‘habitat’ variables (3,7% (n.s.)). All variables explain 35.7% of the variation (***). From
that gradient ordination, it was concluded that variance is therefore partly explained by ‘reserve’
variables (existence and distance to MPA).
The same analysis applied to abundance by size class has shown that variability is mainly
explained by habitat properties.
From the previous results, we concluded that MPA sites present a fish productivity higher than
non-MPA locations. Increase in catch productivity is situated between 15% and 33% (kg.h-1) for
gillnet and 6% to 22% (kg.h-1) for speargun métiers. These results represent the impact on CPUEs
that can be attributed to the existence of the reserve.

Coral Reef Ecosystem Services Economic Valuation. Phd dissertation, Nicolas Pascal, 2013 Page 222 / 351!
=NTN\ ?6+"+3(6&(34-6*)&+,&BA8&+"&,()Q$2($)&e?@&O&-"#&?@&Sf&
The results of the MPA impacts on fishery yields are presented in the next table. The impacts of
MPA on the CPUEs for the different metiers represent an average benefit of between 500 and 870
kg.y-1 for each MPA village. Sporadic ceremonials catch inside MPA have represented an average
of 96 kg.y-1 for each village.
In monetary value the average impact on fishery is estimated at 2 300 ".y-1 (std=1 050). Mean
benefits for subsistence and commercial fishery is 1 300 ".y-1 and 940 ".y-1 respectively.
Average maximum and minimum values reveal a difference in the order of 1 000 " (41% of the
mean) and reflect the uncertainties on fish yields and the MPA impact estimates.
Table C-16: Estimates of MPA impacts on fishery yields in volume (kg) and added value (!).
As all the species are sold with the same price, the effects of MPA on specific commercial
species are not revealed by the valuation. In the same way, the effects of MPA on the mean size of
catches were not reflected either. The size has some influence in prices (normally bigger fish
represent a bonus in price) but differences observed in the market price were hardly discernible and
very variable. On the opposite, in the case of reef fish that are considered ciguatoxic, price is usually
lower (or null) for big individuals. The effects of MPAs on catch variability are reflected in the
annual benefits of the MPA villages and in the projections of the fishery (Cost Benefit chapter).
As explained, no catch of trochus fishery has occurred during our stay in the villages. The results
of the surveys and expert interviews show that for some MPA villages no trochus collection was
done in the last 3 years and stocks are still depleted or with a too low density for exploitation.
Experts are very pessimistic about recovery for future exploitation. For other MPA villages (2 of
them), fishermen have reported trochus collection and commercialization. Volumes were dependant
on the size of the village in terms of fishing ground area and number of households. For the two
villages, the average volume of trochus collection has been estimated to be 510 kg of shells every 3
years. Transformed to an annual basis with 2009 price this represents an average added value of 600
" per annum per village. As described before, all the benefits have stayed in the villages through
fishermen or intermediaries.
Emua Piliura Unakap Laonamoa Worasifiu Mean
min kg.y-1 710 430 204 743 392 496
max kg.y-1 1!288 766 342 1!279 678 871MPA contribution in finfish catches volumes
MPA contribution to trochas fishery " . y-1 -- -- 473 1!014 338 608
min ! 1"981 1"212 1"020 3"083 1"441 1!747
max ! 3"600 2"168 1"402 4"613 2"262 2!809
Best estimate 2"800 1"700 1"200 3"800 1"900 2!280
Mean MPA contribution to fishery added value
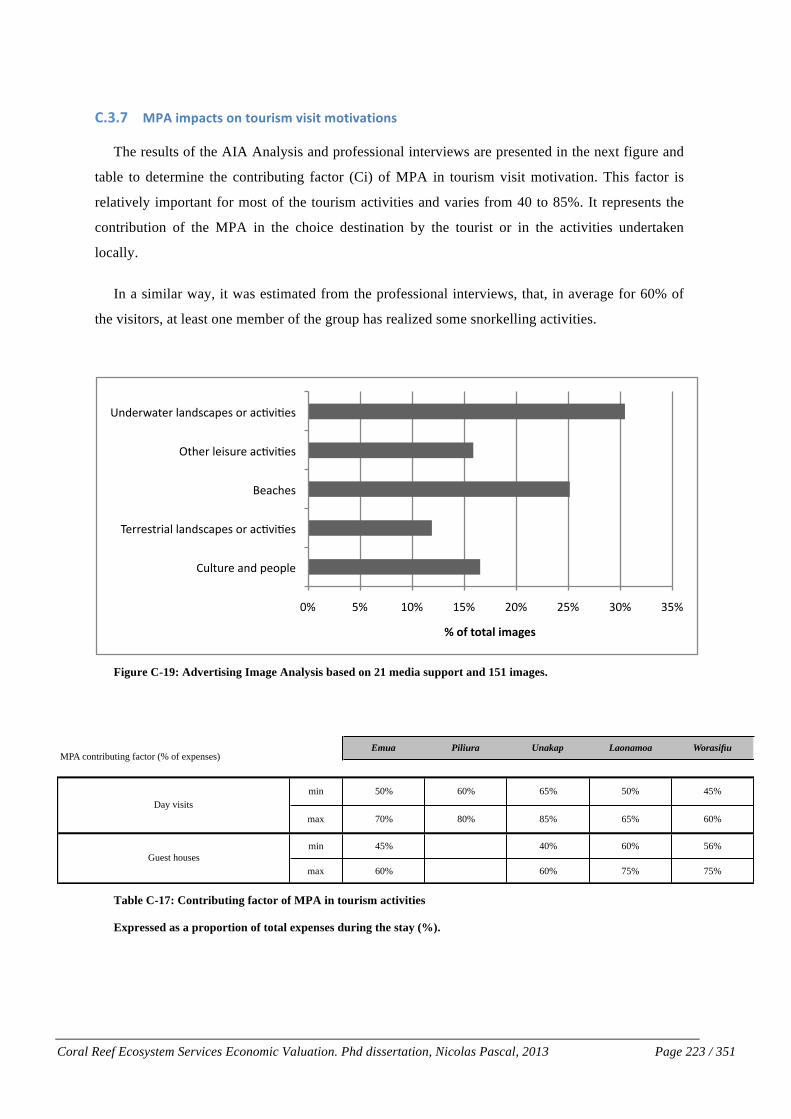
Coral Reef Ecosystem Services Economic Valuation. Phd dissertation, Nicolas Pascal, 2013 Page 223 / 351!
=NTN] BA8&(34-6*)&+"&*+12()3&P()(*&3+*(P-*(+")&
The results of the AIA Analysis and professional interviews are presented in the next figure and
table to determine the contributing factor (Ci) of MPA in tourism visit motivation. This factor is
relatively important for most of the tourism activities and varies from 40 to 85%. It represents the
contribution of the MPA in the choice destination by the tourist or in the activities undertaken
locally.
In a similar way, it was estimated from the professional interviews, that, in average for 60% of
the visitors, at least one member of the group has realized some snorkelling activities.
Figure C-19: Advertising Image Analysis based on 21 media support and 151 images.
Table C-17: Contributing factor of MPA in tourism activities
Expressed as a proportion of total expenses during the stay (%).
!"# $"# %!"# %$"# &!"# &$"# '!"# '$"#
()*+),-#./0#1-21*-#
3-,,-4+,5.*#*./046.1-4#2,#.67857-4#
9-.6:-4#
;+:-,#*-54),-#.67857-4#
</0-,=.+-,#*./046.1-4#2,#.67857-4#
!"#$"%#%&'"()&*+,""
Emua Piliura Unakap Laonamoa Worasifiu
min 50% 60% 65% 50% 45%
max 70% 80% 85% 65% 60%
min 45% 40% 60% 56%
max 60% 60% 75% 75%
MPA contributing factor (% of expenses)
Day visits
Guest houses

Coral Reef Ecosystem Services Economic Valuation. Phd dissertation, Nicolas Pascal, 2013 Page 224 / 351!
=NTN^ ?6+"+3(6&(34-6*)&+,&BA8&+"&*+12()3&e?@&Tf&
The mean valuation of MPA impact on tourism visits represents an average added value of 4 900
" .y-1 (std= 2 900) generated by each MPA. These benefits are mainly generated by day tour and
guesthouse activities that received the main benefits from MPA.
MPA benefits are distributed among stakeholders at village and domestic level. Villages with
guesthouses tend to keep all benefits in the village (private or community owned) whereas villages
with day tour activities have a great part of the added value is for domestic stakeholders (operators,
intermediaries).
Table C-18: Estimates of MPA impacts on tourism added value (ES 3)
Year 2009 MMA estimated impacts (!) Emua Piliura Unakap Laonamoa Worasifiu Mean
Daytour activities ! . y-1 939 9"861 638 1"140 548 2!625
Guest house ! . y-1 1"550 394 1"439 2"691 1!215
Visits to MPA ! . y-1 120 240 400 152
Scientific MPA tourism ! . y-1 968 236 1"476 328 164 634
Diving visits ! . y-1 600 960 312
Total ! . y-1 3"457 10"097 3"228 4"107 3"803 4!938
Minimum impact valuation on tourism ! . y-1 3"079 7"675 3"019 3"590 3"222 4!117
Maximum impact valuation on tourism ! . y-1 3"835 12"519 3"436 4"625 4"383 5!760
Village level ! . y-1 2"633 1"311 2"062 2"118 3"305 2!286
Other national stakeholders ! . y-1 824 8"786 1"166 1"990 498 2!653

Coral Reef Ecosystem Services Economic Valuation. Phd dissertation, Nicolas Pascal, 2013 Page 225 / 351!
=NTN_ ?6+"+3(6&(34-6*)&+,&BA8&+"&6+-)*-/&42+*$6*(+"&$6+)7)*$3&)$2P(6$&e?@&Zf&
As presented in the method chapter, the valuation was done in 3 steps:
A. Identify coastal areas potentially at risk against the regime of coastal flooding events.
B. Determine the contribution of coral reefs, mangroves and seagrass in the costal protection of
the vulnerable areas.
C. Quantify and value the potential damage repair costs through the method of avoided costs:
C.1. Characterization of the assets exposed to risk (3 categories of land use)
C.2. Valuation of the total repair costs of direct and indirect tangible damages based on
approximate values per land use category (object oriented data) and as a function of
inundation depth (relative depth-damage function)
7":"["# 7/8-*89.86(8-.L/*(=*+8994.8*.6+-K.
The analysis of the different sources described in the method (oceanographic for major wind
direction and extreme climatic event, topographic and geomorphologic) has permitted to delimitate
the perimeter under risk of coastal flooding. Most of the villages present a similar pattern of people
from villages living relatively high above the sea level. Due to the topography of the islands
(volcanic with mountains), the villages are placed in the hills or quite far from the sea. Nonetheless,
even if the majority of houses are protected naturally from coastal flooding, we identified some
houses places in zones at risk in both countries.
Between 20 and 25 houses have been censed as potentially in risk. Regarding crops, the coconut
plantation in the Undine bay (Vanuatu) was not identified as a potential flooding zone.
Even if some parts of the coastal road are in the flooding zone and maybe potentially damaged, it
was decided not to take them in account due to lack of robust data on damage function and costs.
7":"["$ 7/=*6+&>*+/=. /0. )/689. 6((0-^. 58=J6/,(-. 8=B. -(8J68--. +=. *<(. )/-*89. L6/*()*+/=. /0. *<(.,>9=(68&9(.86(8-".
The contribution of the coral reef in the coastal protection index of the areas previously
described have been estimated. Based on several mapping sources of coastal geomorphology, and
bathymetry the level of protection provided by different factors were categorized through GIS
analysis (see method, the sum-up table is recorded hereafter).

Coral Reef Ecosystem Services Economic Valuation. Phd dissertation, Nicolas Pascal, 2013 Page 226 / 351!
Table C-19: The calculation of the CPI (Coastal Protection Index) based on characteristics of the coastline
(Developed by Allenbach and Pascal).
We can comment that most of the sites have a relatively high coastal protection index (mean CPI>3)
due mainly to be placed in semi-closed bay with natural barriers to winds and extreme climatic
events. The presence of fringing reef on a relatively large band of the coast (>100 m in some of the
villages) coupled with a relatively inner slope and shallow depth are the other main contributing
factors. The weight of the fringing reef in the CPI vary from 30 to 40% with an average of 37%. For
Emua the other ecosystems present are seagrass and mangroves (on a reduced width lesser than 15
m).
Table C-20: Coastal protection index and weight of coral reef.
A. Characterisation of damages and economic valuation (C1 and C2 in the methodology)
The results of the economic valuation are based on the determination of the exposure to risk
factor of buildings and infrastructures, the estimates of repairing costs from damage functions and
the probability of the hazard. Main factors are sum-up in the same table.
!"#$%&'#()* +'#()* ,"-./0 1(2 3()"! " # $ %
4"(0(#56(7(*$ &'()*+,-'./
012+'3+
.'(),4,/516/78,4697:
.';/,
097:.';/, </516/78, =/9(-/,
8(9&'97%":5(&/#" >.'8/(8/5+?9*+ </61@A.'8/(8/5+?9* B.8131(19C+.//3,D'E+A.'8/(8/5+?9*+'.+
('9,8F'+A.'8/(81'7
;""<%0(#56(7(*$=%9#"9%9)-%-.&'9)>"%'(%'6"%>(9&'G'7817H'H,+?9..1/.+
IJKLMN+(C',/+8'+8-/+('9,8+
IO%)6N
G'7817H'H,+?9..1/.+
IJ!LMN+P+A98(-+.//3P+
(C',/+8'+8-/+('9,8+
IO%)6N
Q.17:17:+.//3+IE158-+
J%LL+6N
G'.9C+3'.6981'7+
51,('7817H'H,F'+.//3
?))"#%&7(5"=%>#"&'%2.-'6%R/.*+39;'.9?C/+
('75181'7,+I:/78C/+,C'A/P+
C9.:/+(./,8+E158-N
Q9;'.9?C/+('75181'7,+
I,C'A/P+C9.:/+(./,8+
E158-N
Q9;'.9?C/+('75181'7,+
I98+C/9,8+'7/+
('6A'7/78S+,C'A/P+
(./,8+E158-N
&/5H(/5+39;'.9?C/+
('75181'7,+I,8.'7:+
,C'A/P+./5H(/5+(./,8+
E158-N
F'7/
@79'<(#0%&7(5" T@%LM $U!@TM %U%@$U!M LU"@%U%M O+LU"M
,"9)%-"5'6%ABC%D0%<#(0%'6"%>(9&'7.)"E% J+#L6 J+%L+6 J+!6 O+!6 O+!6
F'6"#%">(&$&'"0&697:.';/,P+,/9:.9,,+J+
V!M+('9,8C17/
697:.';/,P+,/9:.9,,+J+
!LM+('9,8C17/
697:.';/,P+,/9:.9,,+J+
$!M+('9,8C17/
697:.';/,P+,/9:.9,,+
O$!M+('9,8C17/P+,975+
/28.9(81'7+9./9,+
F'7/
Piliura Unakap Laonamoa Worasifiu !"#$
Geomorphology 2 4 4 4 4
Coastal exposure 4 1 3 3 3
Reef morphology, area and distance to the coast 3 5 5 5 3
Inner slope, crest width 3 3 3 3 4
Platform slope 3 4 3 3 2
Mean depth (<1 km from the coastline) 3 5 5 3 3
Other ecosystems 1 1 1 1 2
Coastal protection index 2,71 3,29 3,43 3,14 3,00
%&'$()*&+)",-.($/0&+-1+(2&++.&&1+)/+(2&+0-3($'+,.-(&0()-/+)/4&5
678 9:8 968 9;8 9:8
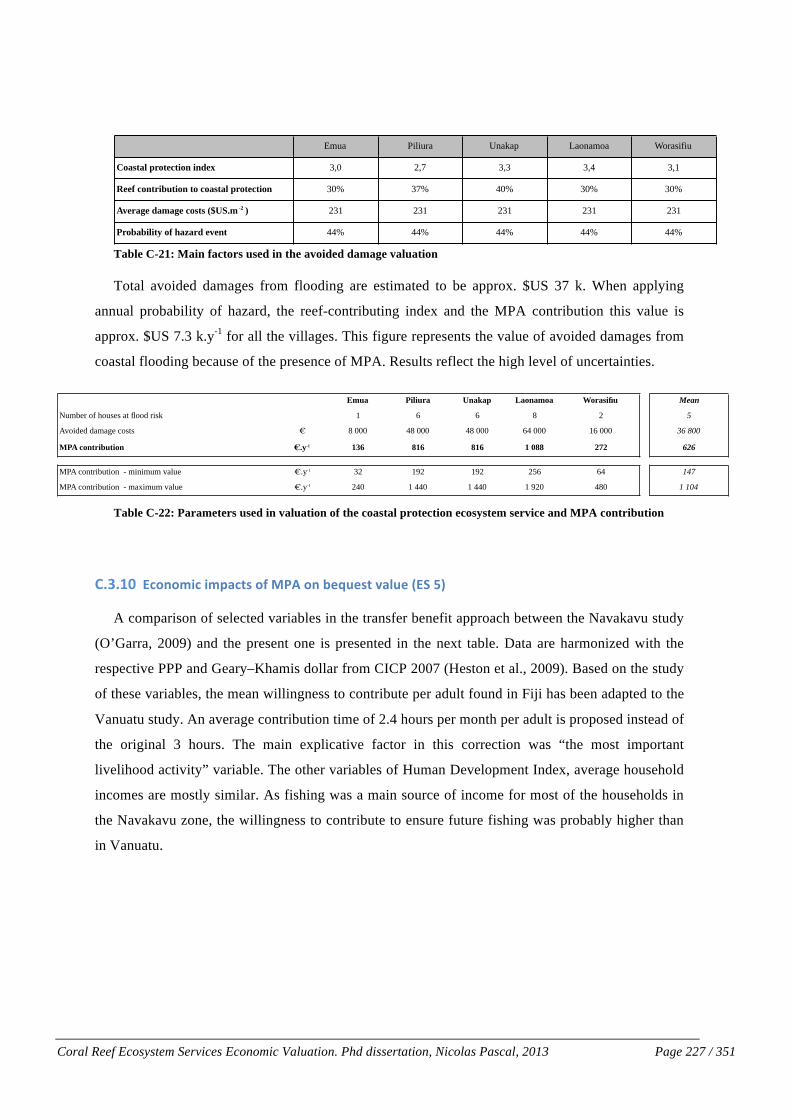
Coral Reef Ecosystem Services Economic Valuation. Phd dissertation, Nicolas Pascal, 2013 Page 227 / 351!
Table C-21: Main factors used in the avoided damage valuation
Total avoided damages from flooding are estimated to be approx. $US 37 k. When applying
annual probability of hazard, the reef-contributing index and the MPA contribution this value is
approx. $US 7.3 k.y-1 for all the villages. This figure represents the value of avoided damages from
coastal flooding because of the presence of MPA. Results reflect the high level of uncertainties.
Table C-22: Parameters used in valuation of the coastal protection ecosystem service and MPA contribution
=NTNO` ?6+"+3(6&(34-6*)&+,&BA8&+"&.$X1$)*&P-/1$&e?@&[f&
A comparison of selected variables in the transfer benefit approach between the Navakavu study
(O’Garra, 2009) and the present one is presented in the next table. Data are harmonized with the
respective PPP and Geary–Khamis dollar from CICP 2007 (Heston et al., 2009). Based on the study
of these variables, the mean willingness to contribute per adult found in Fiji has been adapted to the
Vanuatu study. An average contribution time of 2.4 hours per month per adult is proposed instead of
the original 3 hours. The main explicative factor in this correction was “the most important
livelihood activity” variable. The other variables of Human Development Index, average household
incomes are mostly similar. As fishing was a main source of income for most of the households in
the Navakavu zone, the willingness to contribute to ensure future fishing was probably higher than
in Vanuatu.
Emua Piliura Unakap Laonamoa Worasifiu
Coastal protection index 3,0 2,7 3,3 3,4 3,1
Reef contribution to coastal protection 30% 37% 40% 30% 30%
Average damage costs ($US.m-2 ) 231 231 231 231 231
Probability of hazard event 44% 44% 44% 44% 44%
Emua Piliura Unakap Laonamoa Worasifiu Mean
Number of houses at flood risk 1 6 6 8 2 5
Avoided damage costs ! 8"000 48"000 48"000 64"000 16"000 36!800
MPA contribution !.y-1 136 816 816 1"088 272 626
MPA contribution - minimum value !.y-1 32 192 192 256 64 147
MPA contribution - maximum value !.y-1 240 1"440 1"440 1"920 480 1!104

Coral Reef Ecosystem Services Economic Valuation. Phd dissertation, Nicolas Pascal, 2013 Page 228 / 351!
Table C-23: Variables used for the transfer benefit approach
Based on Willingness to contribute in time per adult to maintain ecosystem services of coral reef for future generations.
Table C-24: Estimates of bequest values (annual figures) and MPA contribution
The mean result for the MPA impact on the annual bequest value is estimated to be: 650 ".y-1
per MPA. Benefits for each village depend directly on each village population.
Unit Fidji-Navakavu Study Source of data
Mean household size Person 4,8 4,9 HIES, Fiji (2008-2009) - Vanuatu (2006)
Average wage rate Euro.h-1 0,87-1,68 0,8-1,4 HIES, Fiji (2008-2009) - Vanuatu (2006)
Proportion of households owning a television % 69,0 37,0
Most important livelihood activity (% of revenue) % Fishing Growing crops
Monthly household cash income (PPP usd 2007) PPP usd 928,6 1!103,9 (National Statistics office, PPP 2007: CICP)
Human Development Index HDI 0,669 0,693 (UNDP , 2007)
Mean Willingness to contribute per adult h.month-1 3,0 2,4
Emua Piliura Unakap Laonamoa Worasifiu Mean
Total bequest value (Willingness to contribute per village) !.y-1 3"041 1"394 1"140 3"231 570 1!875
MPA contribution to bequest value !.y-1 1"064 488 399 1"131 200 656
MPA contribution to bequest value - minimum value !.y-1 608 279 228 646 114 375
MPA contribution to bequest value - maximum value !.y-1 1"521 697 570 1"616 285 938

Coral Reef Ecosystem Services Economic Valuation. Phd dissertation, Nicolas Pascal, 2013 Page 229 / 351!
=NTNOO ?6+"+3(6&(34-6*)&+,&BA8&+"&*Q$&)+6(-/c&Q13-"&-"#&4Q7)(6-/&6-4(*-/&e?@&\f&
Both MPAs and non-MPAs villages have received funds for assets purchased such as solar
panels or water pumps. It was not possible to identify clearly through the interviews the role of the
MPA in this fundraising activity. Therefore potential benefits in bridging social capital have not
been valued.
For each village, sums comprised between 1 200 " and 2 400 " have been invested every year in
trainings and workshops linked with MPA activities. The part of the skills and knowledge acquired
during this trainings that may be useful for other sectors have been assessed in approximately 300 "
to 630 ".y-1 depending on the villages. This represents the valuation of annual impacts of MPA in
human capital.
For physical impact, boats have been identified as the main MPA assets and both MPAs in the
network disposed of a boat in 2009. In average, it has been estimated that 10% of its available time
was dedicated to activities related to the MPA (e.g. monitoring, COTs collection, transport for
meeting). The rest of the time was whether inactive or used for transport of goods or people from
the village to closed places. The estimated added value of these other activities is close to zero
meaning that incomes have compensated the running costs of the boat (i.e. inputs, maintenance and
taxes).

Coral Reef Ecosystem Services Economic Valuation. Phd dissertation, Nicolas Pascal, 2013 Page 230 / 351!
=NTNOS =+)*)&+,&BA8)&
The total costs for Emua MPA were 6 182 " p.a. and 7 100 " p.a. for the MPA network (1 400 "
p.a. for each of the 5 MPA inside the network). These values include amortizing setup costs on a 10-
year basis (next table). For international comparison purposes, the average cost is equivalent to 14
100 ".y-1.km-2 of protected area or 2 100 ".y-1.km-2 of managed area.
Costs during all the setup phase were estimated at 25 500 " (5 100 " per MPA) for the network
whereas Emua MPA spent 19 000 ". The weight of external assistance human resource costs is
relevant (from 40% to 50% of the total) and reflects the role of NGOs or other agencies in the initial
phase. The network has permitted to distribute the cost among different MPAs. The other costs are
common to every MPA and cover equipments and meetings. Both the network and Emua MPA
have received a boat.
Annual operational costs for 2009 is 900 " for each MPA in the network. Emua MPA has a
running cost of 4 300 " p.a. Costs of human resource from external agencies or from staff from the
village have represented the main item. Activities have covered the setup of the MPA management
plan, the secretary tasks of meetings, budgets, proposals, etc. and the organization of awareness or
monitoring campaigns. The transaction costs of the funding agency (through their estimated
administrative cost of funding) represent the second one. The time dedicated to the boat for MPA
activities has been estimated to be very low (10%) but other activities (e.g. transport) have allowed
covering the annual running costs.
Table C-25: Total annual costs for each MPA (description in the text)
The capacity building costs have represented more than 25% of the observed costs in 2009 and
have been directed to the village people in the form of (i) trainings on resource management,
monitoring or environment and, (ii) campaign organized in the village to increase awareness about
the environment. Costs of meetings and follow up visits were one important item due to the
remoteness of the villages. Surprisingly, monitoring of resource and maintenance of MPA
equipment have had a very low weight in annual budget and reflect that very few activities of this
kind have been realized.
Unit Emua Piliura Unakap Laonamoa Worasifiu Average
Total costs w/amortizing setup costs Euros.y-1 6!182 1!424 1!424 1!424 1!424 2!376
Total Costs per km2 of MPA Euros.y-1 .km-2 25!756 11!304 11!869 10!277 11!304 14!102
Total Costs per km2 of MPA Euros.y-1 .km-2 4!040 1!319 1!130 1!071 2!967 2!106
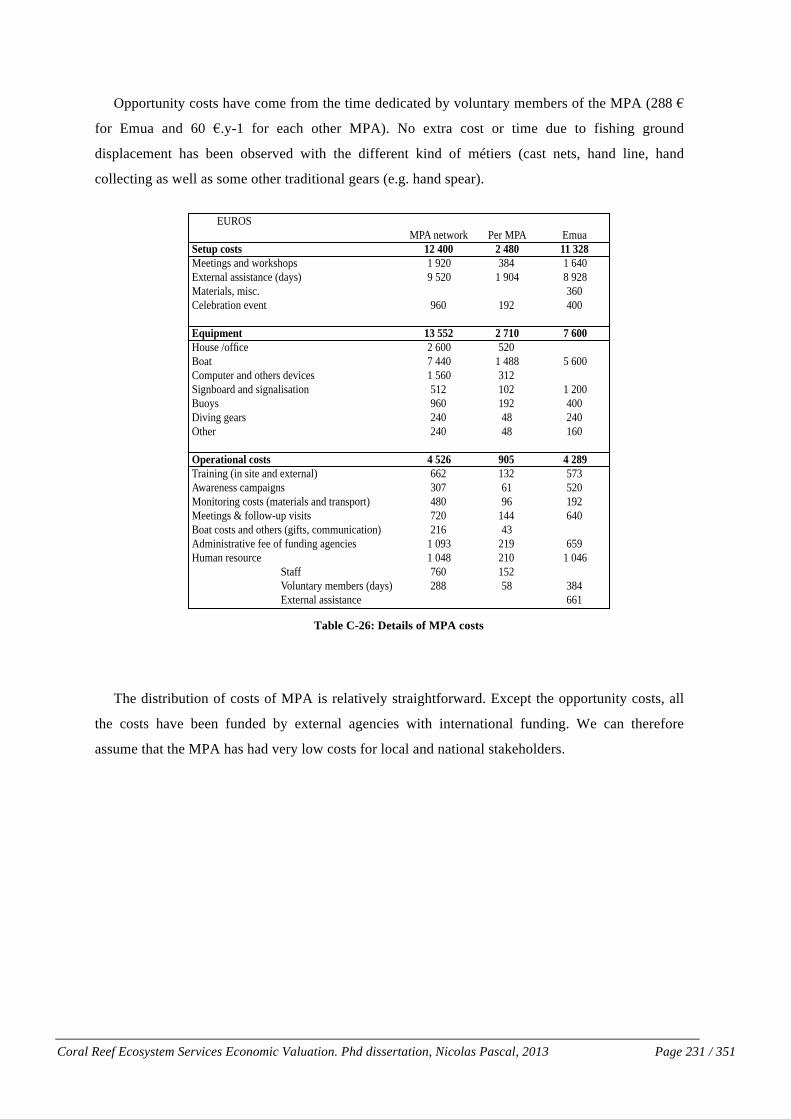
Coral Reef Ecosystem Services Economic Valuation. Phd dissertation, Nicolas Pascal, 2013 Page 231 / 351!
Opportunity costs have come from the time dedicated by voluntary members of the MPA (288 "
for Emua and 60 ".y-1 for each other MPA). No extra cost or time due to fishing ground
displacement has been observed with the different kind of métiers (cast nets, hand line, hand
collecting as well as some other traditional gears (e.g. hand spear).
Table C-26: Details of MPA costs
The distribution of costs of MPA is relatively straightforward. Except the opportunity costs, all
the costs have been funded by external agencies with international funding. We can therefore
assume that the MPA has had very low costs for local and national stakeholders.
EUROSMPA network Per MPA Emua
Setup costs 12!400 2!480 11!328Meetings and workshops 1!920 384 1!640External assistance (days) 9!520 1!904 8!928Materials, misc. 360Celebration event 960 192 400
Equipment 13!552 2!710 7!600House /office 2!600 520Boat 7!440 1!488 5!600Computer and others devices 1!560 312Signboard and signalisation 512 102 1!200Buoys 960 192 400Diving gears 240 48 240Other 240 48 160
Operational costs 4!526 905 4!289Training (in site and external) 662 132 573Awareness campaigns 307 61 520Monitoring costs (materials and transport) 480 96 192Meetings & follow-up visits 720 144 640Boat costs and others (gifts, communication) 216 43Administrative fee of funding agencies 1!093 219 659Human resource 1!048 210 1!046
Staff 760 152Voluntary members (days) 288 58 384External assistance 661
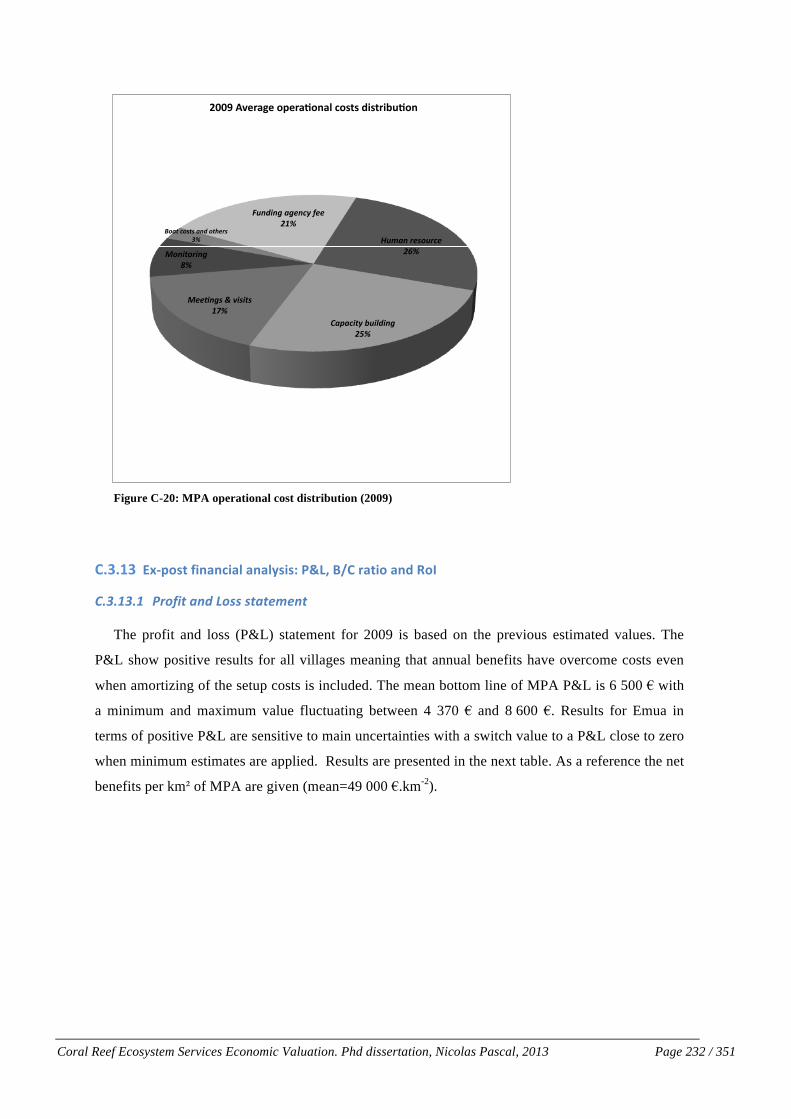
Coral Reef Ecosystem Services Economic Valuation. Phd dissertation, Nicolas Pascal, 2013 Page 232 / 351!
Figure C-20: MPA operational cost distribution (2009)
=NTNOT ?%G4+)*&,("-"6(-/&-"-/7)()b&Aj'c&:>=&2-*(+&-"#&5+!&
7":"#:"# E6/0+*.8=B.S/--.-*8*(5(=*.
The profit and loss (P&L) statement for 2009 is based on the previous estimated values. The
P&L show positive results for all villages meaning that annual benefits have overcome costs even
when amortizing of the setup costs is included. The mean bottom line of MPA P&L is 6 500 " with
a minimum and maximum value fluctuating between 4 370 " and 8 600 ". Results for Emua in
terms of positive P&L are sensitive to main uncertainties with a switch value to a P&L close to zero
when minimum estimates are applied. Results are presented in the next table. As a reference the net
benefits per km# of MPA are given (mean=49 000 ".km-2).
!"#$%&'()*"'+(&,-.&
/$0$+123&4"1561%7&,8.&
9((:%7)&;&<1)12)&=>.&
9*%12*'1%7&&?.&
@*$2&+*)2)&$%6&*2A(')&B.&
C"%61%7&$7(%+3&D((&,=.&
!""#$%&'()*'$+,'()-+.)/$0+121$3412(456-+.$

Coral Reef Ecosystem Services Economic Valuation. Phd dissertation, Nicolas Pascal, 2013 Page 233 / 351!
Table C-27: MPA Profit & Loss statement for 2009
7":"#:"$ D+-*/6+).Q(=(0+*d7/-*.68*+/-.8=B.G(*>6=./=.M=,(-*5(=*.?G/M@.
When analysing the cash flows since the creation of MPA up to 2009, the mean NPV is positive
(approximately 7 000 "). This means that after 5 years after the initial investment, benefits are
greater than the costs. Nonetheless NPV has been negative for one village reflecting (i) that more
time is necessary to compensate for the costs of MPA and/or (ii) the investment was too high.
Table C-28: MPA Net Present Values from cost-benefit analysis.
Based on estimated cash flows, 5 years after creation with a 10% discount rate, * negative values have been omitted.
The mean Return on Investment after 5 years of activity is 0.4 (std=0.9) meaning that 1 euro
invested has produced almost 0.5 euro in “tangible” net benefits through added value in fishery and
tourism sector. As the ROI is positive, the benefits have exceeded the costs and the investment
should be considered. A negative ROI would have meant that the costs have outweighed the
benefits. An ROI of 0 means the benefits have equaled the costs.
The B/C ratio is higher than the RoI ratio and reflects the benefits created by other MPA impacts
and the formula used. Following B/C ratio rule, the ratio of 1.8 means that policymakers can expect
"1.8 in benefits for every "1 in costs. A ratio greater than 1 means the benefits outweigh the costs
and the investment should be considered.
Emua Piliura Unakap Laonamoa Worasifiu Mean
Profit & loss 2009
Minimum MPA impacts !.y-1 6"333 9"648 4"750 7"866 5"132 6!746
Maximum MPA impacts !.y-1 9"828 17"115 7"140 13"064 7"701 10!969
Cost of MPA (w/amortizing) !.y-1 -6"182 -1"424 -1"424 -1"424 -1"424 -2!376
MPA net benefit 1!899 11!957 4!521 9!041 4!992 6!482
MPA net minimum benefits !.y-1 152 8"224 3"326 6"442 3"707 4!370
MPA net maximum benefits !.y-1 3"647 15"691 5"715 11"640 6"276 8!594
Total net benefits per km2 of MPA !.y-1 .km-2 7"913 94"899 37"671 65"229 39"618 49"066
Emua Piliura Unakap Laonamoa Worasifiu MeanPresent values (n=5, t=10%)
MPA impacts on fishery added value PV, euros 4!352 2!409 1!589 5!262 2!596 3!242
MPA impacts on tourism added value PV, euros 5!571 14!393 4!784 6!087 5!636 7!294
Other MPA impacts PV, euros 2!671 2!666 2!560 3!873 2!202 2!795
Costs of MPA PV, euros -23!553 -6!301 -6!301 -6!301 -6!301 -9!751
MPA net present value PV, euros -11!002 13!040 2!508 8!569 4!072 * 7!047

Coral Reef Ecosystem Services Economic Valuation. Phd dissertation, Nicolas Pascal, 2013 Page 234 / 351!
As for NPV, the ratios have identifed a negative signal of investment for only one village
(negative ROI and B/C ratio less than 1).
Table C-29: RoI and B/C ratios for each MPA. Based on historic values starting from MPA creation to 2009.
For the stakeholder distribution, as observed before, almost all the MPA costs are assumed by
external agencies. This involves that all the benefits generated in the village are net benefits for
them (average= 6 200 ".y-1).
Figure C-21: MPA cost benefit analysis and Return on Investment,
Based on historic values, discount rate t=10%, benefits for all ES are in dark grey, costs (negative values) are in light grey.
=NTNOZ @6$"-2(+)&
The results of the 25-year projections on fishery and tourism added value are presented in the
following table. The MSY for each village based on its reef area vary from 2.4 to 7.7 t.y-1 with a
mean value around 5.7 t.y-1 for an added value of 17 000 ".y-1. Tourism at national and village level
has been projected to represent an average maximum added value of 47 000 ".y-1 with a maximum
value of 71 000 ".y-1.
Emua Piliura Unakap Laonamoa Worasifiu MeanPresent values (n=5, t=10%)
MPA net present value PV, euros -11!002 13!040 2!508 8!569 4!072 7!047
B/C ratio 0,5 3,1 1,4 2,4 1,7 1,8
Return on Investment (RoI) -0,6 1,7 0,0 0,8 0,3 0,4
!"#$%%%$
!"%$%%%$
!&#$%%%$
!&%$%%%$
!#$%%%$
%$
#$%%%$
&%$%%%$
&#$%%%$
"%$%%%$
!"#$%&%'()*+,&-%%
./0/#1$&%'()*2&3%%
45$6$7&%'()*,%%
8$(5$"($&%'()*,&9%%
:(1$;/<#&%'()*,&=%%
.1>;>5
?%@$0#>
;%(A%B
>5><
?;%$5C
%D(;?;%%E!#
1(;F%

Coral Reef Ecosystem Services Economic Valuation. Phd dissertation, Nicolas Pascal, 2013 Page 235 / 351!
Table C-30: Projected values at 25 years for fishery and tourism sector.
=NTNO[ A2+V$6*$#&,("-"6(-/&-"-/7)()&
The results of the cost benefit analysis on projected values are presented in the next table. The
present values (PV) are consolidated at village and national level.
Table C-31: Present values of benefits and costs of MPA (25y , discount rate=10%)
The analysis through the NPV presents positive returns for every MPA meaning that benefits
flows have overcome costs in all the cases. In average the NPV at 25 years for each MPA is
approximately 61 100 ". The main benefits are generated by impacts of MPA on tourism and fishery
added value. In these projections the tourism benefits represent almost 3 times the fishery ones. In
the projected timeline, the fishery benefits reach quickly their maximum value as the MSY is close
to the present level whereas the tourism development is in a start-up phase and has a larger
potential. Tourism sector presents heterogeneous results reflecting the different mix of tourism
services.
As shown in the previous table, the benefits are relatively homogeneous for each village in
terms of potential values for fishery and tourism but differences in MPA costs are present. This
explains the differences in financial ratios.
In terms of B/C ratios, the MPAs have produced in average a 5.4 ratio with a minimum of 1.9
and a maximum of 7.8. The ratio means that 1" invested by the funding agency is expected to return
5.4" in benefits for all stakeholders.
Emua Piliura Unakap Laonamoa Worasifiu Mean
Fishery maximum yield kg 7!650 5!400 6!300 6!650 2!400 5!680
Fishery maximum added value euros 22!343 15!772 18!400 19!423 7!010 16!590
Tourism maximum added value (village level) euros 12!245 7!483 6!411 12!499 15!951 10!918
Tourism maximum added value (consolidated) euros 22!333 23!655 13!535 21!963 20!683 20!434
Emua Piliura Unakap Laonamoa Worasifiu Mean
Present values (n=25, t=10%)
MPA impacts on fishery added value PV, euros 21!078 12!137 12!257 23!572 9!638 15!736
MPA impacts on tourism added value PV, euros 37!100 59!256 32!473 42!374 31!016 40!444
Other MPA impacts PV, euros 15!305 10!689 8!930 14!156 7!504 11!317
Costs of MPA PV, euros -39!661 -10!503 -10!503 -10!503 -10!503 -16!334
TOTAL MPA net benefits PV, euros 33!639 86!477 53!615 84!513 47!258 61!100
B/C ratio 1,9 7,8 5,1 7,6 4,6 5,4
Return on Investment (RoI) 0,5 5,8 3,3 5,3 2,9 3,5

Coral Reef Ecosystem Services Economic Valuation. Phd dissertation, Nicolas Pascal, 2013 Page 236 / 351!
In terms of RoI, mean return is around 3.5 (std=2.1) meaning that 1" invested by the funding
agency is expected to return 3.5" in “tangible” added value (fishery and tourism sector). About 2.5"
will be directed to village stakeholders whereas national ones will receive the rest.
When inclued in calculations, the other benefits from MPAs (on bequest value, social capital and
coastal protection) have improved the ratios but have not changed the overall conclusions (no switch
from negative to positive ratio for example).
Figure C-22: MPA Cost Benefit analysis and Return on Investment,
Based on projected values at 25 years , discount rate t=10% , benefits of all ES are in dark grey, costs (negative values) are in light grey.
=NTNO\ @$")(*(P(*7&-"-/7)()&
Results of sensitivity tests have been applied to MPA P&L for 2009. Results with main
uncertainties are presented in the next figure. No uncertainties on a unique benefit have been enough
to switch positive results from P&L statement to a negative one. Nonetheless the combination of all
minimum estimates is a switching value for one of the village (see P&L chapter).
!"#$###$
!%#$###$
#$
%#$###$
"#$###$
&#$###$
'#$###$
(##$###$
!"#$%&%'()*+&,%%
-./.#0$&%'()*,&1%%
23$4$5&%'()*6&7%%
8$(3$"($&%'()*,&7%%
9(0$:.;#&%'()*7&<%%
-0=:=3
>%?$/#=
:%(@%A
=3=;
>:%$3B
%C(:>:%D!
#0(:E%

Coral Reef Ecosystem Services Economic Valuation. Phd dissertation, Nicolas Pascal, 2013 Page 237 / 351!
Figure C-23: sensitivity analysis to main uncertainties on impact estimates
Sensitivity analysis conducted on discount rate are presented in the next figure. The results of the
study show a low sensitivity to different levels of discount rate on 25 years projections. The mean
B/C ratio has increased from 4.4 to 6.1 when the minimum discount rate level is applied (5%).
Figure C-24: sensitivity analysis to discount rate (t= 10%, 7% and 5%)
!" #$!!!" %$!!!" &$!!!" '$!!!" ($!!!" )$!!!" *$!!!" +$!!!" ,$!!!" #!$!!!"
-./0123""
4562./7"
89012/"
!"#$%&&'$()*$
+,-./01/23$4-453./.$26$74/-$8-9,:24/-0,.$(7/-;74<$1458,.$=6:$%&&'$!"#*$
7:;.767" 7.<.767"
!"
#"
$"
%"
&"
'"
("
)"
*"
#!+" )+" '+"
!"#$%&'(
)$*+%,),-
.$/&01,
)$$(-
$2345$
67)8(1-.$%&.,$

Coral Reef Ecosystem Services Economic Valuation. Phd dissertation, Nicolas Pascal, 2013 Page 238 / 351!
=NZ =+"6/1)(+")&&
Investing in community-based MPA for the development bank: is it worth it? An investment
appraisal has been made in 5 MPAs to respond to this question through a bottom line analysis on
their impacts on economic growth and poverty reduction for local stakeholders. The objective of
the investment appraisal is to give some criteria to support the decision-making process and
facilitate comparison among projects.
=NZNO !"P$)*3$"*&#$)62(4*(+"&
The average investment per community-based MPA is 2 400 ".y-1 (including amortizing of setup
costs). Investments for each of the five MPAs have represented values ranging from 5 000 " to
19 000 " for the initial investment phase (setup and assets) and 900 " to 4 000 " for the annual
operational costs. The investment has presented some original aspects: (i) the investment has been
relatively low per receptor (village or community) and, (ii) investment was mainly focused on
building capacity in the villages (70% of the operational costs) which will be the primarily
responsible of the management of the MPA.
To be taken as a reference, the average annual cost observed has been 14 000 ".km-2 of protected
area (including amortizing of setup costs).
More than 95% of the origin of the costs has come from external agencies. Observed opportunity
costs have been weak (estimated to be less than 400".y-1) and have mainly consisted of voluntary
time dedicated to MPA management.

Coral Reef Ecosystem Services Economic Valuation. Phd dissertation, Nicolas Pascal, 2013 Page 239 / 351!
=NZNS !"P$)*3$"*&-442-()-/&
Regarding the impacts on economic growth and reduction of poverty, the following results have
been found:
Result #1 MPAs managed by communities have made an average gross profit of around 8 900 ".
y-1 (std=3 000). They concentrated mainly on rural tourism and fishery (56% and 26% of the total
respectively), which represent both important sources of local cash incomes (30% of the total cash
sources) and proteins for the villages. Less visible in the economic valuation, MPAs have had also
positive impacts on the social capital, the ecosystem service of protection against waves and the option
value attached to the ecosystem.
Figure C-25: MPA economic benefit distribution
!"#$%&'()*+$,-$.+/0123$456$
!"#$%&'()*+$,-$*,71%+&$3$856$
9*/01$!"#$%&'()*+3$:;6$
!"#$%&'(')*&$+%(%,-$.*/-0*+12'($+3/%.$'($34%035%$+%(%,-/$'($3..%.$4361%/$70')$8$!"#/9$:;;<$
!%3($+%(%,-$=$>?>@;A?BCD$

Coral Reef Ecosystem Services Economic Valuation. Phd dissertation, Nicolas Pascal, 2013 Page 240 / 351!
Result #2 Mean observed Return on Investment (RoI) is 0.4 after 5 years (std=0.9) with a
potential of 3.5 (std=2.1) after 25 years. Not all the investments in MPAs have been recuperated after
the first 5 years and for some of them the B/C ratio stays close to 1 after 25 years of projections when
main uncertainties on estimations are applied. Some precautions must therefore be taken in the MPA
investment decision process.
Figure C-26: MPA Return on Investment after 5 years of activity
Based on historic values, discount rate t=10%, benefits for all ES are in dark grey, costs (negative values) are in light grey.
Result #3 If financial indicators drive the investment decision in MPA, the development stage of
the village fishery and tourism sectors must be taken into account. When other success key factors for
MPA (e.g. ecological adequate context and effectiveness of enforcement) are met, the development
stage of both sectors has a direct influence on the level of B/C ratio and RoI and therefore on the
optimal amount to be invested. Villages with low fishing effort and no tourism potential have given
low RoI.
!"#$%%%$
!"%$%%%$
!&#$%%%$
!&%$%%%$
!#$%%%$
%$
#$%%%$
&%$%%%$
&#$%%%$
"%$%%%$
!"#$%&%'()*+,&-%%
./0/#1$&%'()*2&3%%
45$6$7&%'()*,%%
8$(5$"($&%'()*,&9%%
:(1$;/<#&%'()*,&=%%
.1>;>5
?%@$0#>
;%(A%B
>5><
?;%$5C
%D(;?;%%E!#
1(;F%

Coral Reef Ecosystem Services Economic Valuation. Phd dissertation, Nicolas Pascal, 2013 Page 241 / 351!
Result #4 Observed benefits on fishery sector from these small MPAs were revealed through an
increase in productivity for the principal gears (estimated to vary from 4% to 33% increase in the
catch per unit of effort). Both subsistence and commercial fishery were benefited. Other observed
effects include: (i) catches more stable every fishing trip and, (ii) higher maximum fish size for
villages with MPA. The MPA effects generally follow a gradient from the MPA border up to 500m
before disappearing for the main species. For periodic MPA, the impact of opening temporarily the
closed area seems to be low on the resource (less than 100kg.y-1) but important for the villages as
catches are visible and shared within the community. Few effects have been observed on invertebrates.
More generally, all these impacts on CPUES can be hard to perceive by local people, as increases are
subtle for informal and artisanal fisheries. Fishery impacts have represented an average of 25% of the
total benefits of the 5 MPAs.
Result #5 Benefits on tourism are present for the niche of rural tourism (through guest house and
day tours family own-businesses). The importance of MPA in the choice of the site from visitors was
estimated to vary between 40% and 75%. In a similar way, it was observed that, in average, for 60%
of the visitors, at least one member of the group has realized some snorkelling activities. Nonetheless,
the exact role of specific biodiversity indicators impacted by MPA (such as emblematic species, live
coral reef coverage, etc.) compared to other attributes (i.e. transport, infrastructures, facilities) were
not possible to be assessed due to the lack of control sites. The tourism benefits have represented more
than 55% of the total benefits of the 5 MPAs.
Result #6 Other impacts include benefits on social and human capital, the option value and the
ecosystem service of protection against waves. The first benefits have been observed through the
estimated impacts of the learning from trainings and workshops. The benefits on the option value have
been valued in terms of willingness to work through transfer benefit. This corresponds to the amount
that people are ready to give to maintain in the future the potential of some ecosystem services such as
fishing or tourism. The last benefit is the contribution of MPA in maintaining the ecosystem service of
protection against wave produced by coral reefs. These three values have been estimated to represent
20% of the total benefits of the 5 MPAs.
Result #7 In average 70% of the benefits flows have been directed to the villages. The other 30%
went to the national stakeholders (mainly through tourism activities). Main beneficiaries inside the
villages are fishermen and tourism business owners. It was not possible to determine any revenue
distribution indicators (e.g. Gini coefficient) because of the complex mix between subsistence,

Coral Reef Ecosystem Services Economic Valuation. Phd dissertation, Nicolas Pascal, 2013 Page 242 / 351!
customary and market economy. Nonetheless, fishery sector seems to have a wider distributional
impact than tourism where benefits are concentrated in a few households.
Result #8 The opportunity costs at local level have been found to be very low and no local
stakeholders have been identified as really worse off as regards to before the setup of the MPA. If we
take in account that most, if not all, of the direct MPA costs are assumed by external agencies, the
cost-benefit ratio is likely to be positive at a village level even when benefits are low (i.e. commercial
fishery or tourism sector in a start-up phase). The need of compensation for conservation seems
therefore not necessary.
Result #9 Observed benefits have represented an average of 7% of the total village Gross
Domestic Income (GDI). Impacts have been assessed at a village level to take into account some
characteristics of customary, community and subsistence economic specificities.
No observations have been found to demonstrate that MPAs have influence on the level of
maximum sustainable yield for fishery or for the maximum carrying capacity for tourism. Therefore
the hypothesis that MPA can ensure sustainable benefits (from fishery and tourism) at
intergenerational scale remains uncertain.

Coral Reef Ecosystem Services Economic Valuation. Phd dissertation, Nicolas Pascal, 2013 Page 243 / 351!
9N H$"$2-/&#()61))(+"&
The recent growing expectations from CRESV in the Pacific brings new challenges both in
improving the robustness of results through methodological progress and in increasing their policy
relevance. This thesis therefore concentrates on topics that are still in exploration and not
consolidated and represents a contribution in this direction. From the experiences of our 2 case
studies, we intent to identify what results and learnings can be drawn out for other CRESV studies,
for the environmental economy science and for coral reef management in general.
Three parts have been identified:
- In the first part, the results of the 2 studies have been compared to other studies in the coral reef
Pacific and in the rest of the world. The objective was to identify context-specific characteristics
that may explain the differences or similarities found. In the same way, some common features to all
CRESV will be identified.
- In the second part, we focused discussions about the tools used by CRESV and the signal they
transmit through their results. A selection of several points of discussions was made to keep this part
as dynamic as possible. They cover (i) the aspects of observed against optimum level of ES
valuation, (ii) the challenges of the spatial distribution of ecosystem services and processes, (iii) the
production functions to value variations and scenarios (iv) the shadow prices and other values not
reflected in our studies (non use), (v) the benefit transfer and, (vi) the projections of ES through
scenarios.
- In the third part, we will direct discussion on the relevancy of CRESV to decision makers
through the experiences of diffusion of the studies in New Caledonia and Vanuatu to different
audiences.
&
Coral Reef Ecosystem Services Economic Valuation. Phd dissertation, Nicolas Pascal, 2013 Page 244 / 351!
9NO 5$)1/*)&("*$242$*-*(+"&&
The contexts and results from a selection of total economic values studies in the South Pacific
are briefly summarized in the form of an abstract and a table recapitulating their main quantitative
results. The outputs are then discussed regarding the relative importance of the various ES across
South Pacific contexts, and compared with valuations of coral reef ecosystem services for other
parts of the world. These results are extracted or adapted from a scientific publication in which the
author participated (Laurans et al., 2013a). Another scientific report in which the author participated
has conducted a literature review about 15 studies on CBA of coral reefs and mangroves
management. The selection does not pretend to be exhaustive, but to have selected the majority of
the CBAs on mangroves and coral reefs, and therefore to be representative of the methodological
and topical extent of the literature. Most of the studies were not published in peer-reviewed journals,
but as reports by/for specific institutions. Of the 15 selected studies, 9 deal with coral reef
ecosystems and 6 with mangrove forests. Details about the selected studies are given in annex F.2.
9NONO 5$/-*(P$&(34+2*-"6$&-"#&U$(0Q*&+,&?@&("&*Q$&$6+"+3($)&+,&@+1*Q&A-6(,(6&()/-"#)&
The analysis confirms that three main ES (e.g. tourism, coastal protection and coral reef fisheries
in their different forms) explain over 80% of the total estimated value (see Table 4-2). They
represent the key ecosystem services generated by these reefs in the Pacific, regardless of social and
ecological contexts.
At the country scale, tourism and fisheries producer surplus represent values equivalent to 5% of
the GDP of the islands on average (SD +/- 4). At the local scale for Vanuatu and Fiji, these two ES
provide at least 25% of the monetary and non-monetary annual village incomes. In both cases,
natural processes have produced added value to the economy in a non-negligible way. This
highlights the high dependence of those economies to natural resources.
Surprisingly, value-added estimates in reef fisheries are nearly homogeneous across case studies,
and unrelated to the types of fishing activities and of reef geomorphology. This result is related to
the relatively low productivity of coral ecosystems and to a maximum fishing yield, which is rapidly
met or exceeded, which will be commented further on.
Conversely, tourism ES appear quite variable in terms of values derived by countries or villages
from marine related tourism. In all cases, the figures presented in this table relate specifically to
tourism that depends on reefs with fairly similar attributes in terms of tourism business.
Subsequently, the socio-cultural and developmental context of the tourism industry appears to
provide a much better explanation of variation in values than the ecological attributes of the reef.

Coral Reef Ecosystem Services Economic Valuation. Phd dissertation, Nicolas Pascal, 2013 Page 245 / 351!
In int. Dollar Per hectare New Caledonia Vanuatu Fiji Marianne Is. Hawaii
Subsistence fishing 46 147 336
Commercial fishery 45 88 257 106 18
Recreational fishery 55 Non-existent Negligible 72
Underwater and nautical tourism 20 Negligible Non-existent 1 595 939
Associated tourism 42 179 2 13 045 1 889
Coastal protection 394 38 350 2 782
Research and education 8 273
Bequest value - 207 26 20
Amenity values 282
Total 609 658 972 17 873 3 148
Table D-1: Summary of South Pacific CRESVs.
All values are expressed in US$ per hectare of coral cover per year at 2007 price levels. For commercial fishing, figures correspond to fishery industry added value based on market prices (production approach). For subsistence fishing, the method used is the production approach in all studies except Vanuatu and New Caledonia For recreation/tourism, results correspond to producer surplus from several methodologies (travel costs, production approach). For coastal protection, values are the results of avoided damages and replacement costs valuation methods (table extracted from Laurans et al. (in review)).
N<(!N+.%*!C2+&+-$2!R%*B(!SNCRU!+=!%!3$[$%&!I+2%**9>J%&%1(6!J%4$&(!"4(%!SMjO%44%?!`c^`U!
The aim of this study was to estimate the total economic value (TEV) of the coastal ecosystems within the
Navakavu Locally Managed Marine Area (LMMA). In addition, the study aimed to estimate the economic
value of the LMMA management intervention, in order to assess the economic impact of establishing a
protected area. Demand for this research came from the network of LMMA and several local stakeholders.
Using several valuation methodologies – a contingent valuation questionnaire, a catch survey and benefits
transfer from secondary data – this study has produced estimates of the economic value of key services
provided by the marine ecosystems within the Navakavu LMMA (i.e., fisheries, coastal protection, bequest
value and education).
N+.%*!(2+&+-$2!)%*B(!+=!V%L%$$%&!2+4%*!4((=#!S@(#%4!%&6!)%&!/(B0(4$&1?!`ccaU!
The economic valuation of the coral reefs of Hawaii study was commissioned by the US National Oceanic
and Atmospheric Administration (NOAA), Coastal Ocean Programme. The three objectives of the study were:
(i) to estimate the total economic value of Hawaii’s coral reefs, (ii) to assess the economic costs of coral reef
degradation; (iii) to compare the costs of benefits of selected management options to protect Hawaiian coral
reefs. The services valued (and valuation methods employed) are: support to commercial fisheries (net factor
income), tourism (net factor income), marine recreation (contingent valuation), amenity values (rough hedonic
pricing) and non-use values (value transfer).
Coral Reef Ecosystem Services Economic Valuation. Phd dissertation, Nicolas Pascal, 2013 Page 246 / 351!
N+.%*! (2+&+-$2! )%*B(! +=! .<(! 2+4%*! 4((=#! +=! E%$,%&! $&! .<(! @+--+&>L(%*.<! +=! .<(! :+4.<(4&!
J%4$%&%!8#*%&6#!S)%&!/(B0(4$&1!(.!%*_?!`ccgU!
This study was commissioned by the US National Oceanographic and Atmospheric Administration
(NOAA) with the main objective to carry out an economic valuation of the six main services provided by
selected coral reef areas on Saipan. The services valued (and the valuation methods employed) are: fishing
(total revenue), recreational uses (value transfer), tourism uses (net factor income), shoreline protection
(avoided damage costs), amenity values (value transfer), and information and education (gross expenditure).
In addition to the estimation of TEV of Saipan’s coral reefs in general, two extensions of the study aim to
demonstrate the practical use of economic valuation for: i) representing the spatial variation of ecosystem
service values across reef locations using a Geographic Information System (GIS) in order to aid the
prioritization of different management options at various locations; ii) designing financing measures that take
into account the value of coral reefs to the CNMI.
9NONS DQ$&P-/1$&+,&?@&,2+3&@+1*Q&A-6(,(6&6+2-/&2$$,)c&6+34-2$#&*+&+*Q$2&6+2-/&2$0(+")&
This chapter is quoted from a recent scientific article in which the author participated (Laurans et
al., 2013a).
“In order to make a direct comparison between the values for coral reef ecosystem services in the
South Pacific (summarised above) and those from other parts of the world, we review the
international CRESV literature and calculate mean annual values per hectare. This ratio is of course
a very simplistic one, and it does not account for all contextual differences between the reefs and
uses being compared. This comparison, however, allows us to then comment on the reasons why
values vary across coral reefs, and to formulate observations and hypotheses. Values have been
standardised to US$ and 2007 price levels using purchasing power parity exchange rates and GDP
deflators from the World Bank World Development Indicators (indicated as “international $” in the
tables below; see World Bank, 2010).
Our review encompasses three key ecosystem services, namely i) fisheries, ii)
recreation/tourism, and iii) coastal protection. The results are presented in Table D-2. This analysis
supports the hypothesis that ecosystem service values from coral reefs in the South Pacific are
significantly lower than in other regions. Recreation and tourism values per hectare of coral cover
are found to be an order of magnitude lower in the South Pacific than in South East Asia and the
Caribbean. This may be explained by relatively low rates of tourism in comparison to these regions.
It is noted that per hectare values for Australia are even lower but this is due to the very large area
of coral cover of the Great Barrier Reef (total recreation and tourism values for Australian reefs are
still high). The value of South Pacific reefs in supporting commercial fisheries is also relatively low,
particularly in comparison to South East Asia. This might reflect differences in types of fisheries
across regions – with South Pacific fisheries being of smaller scale and less commercial oriented.
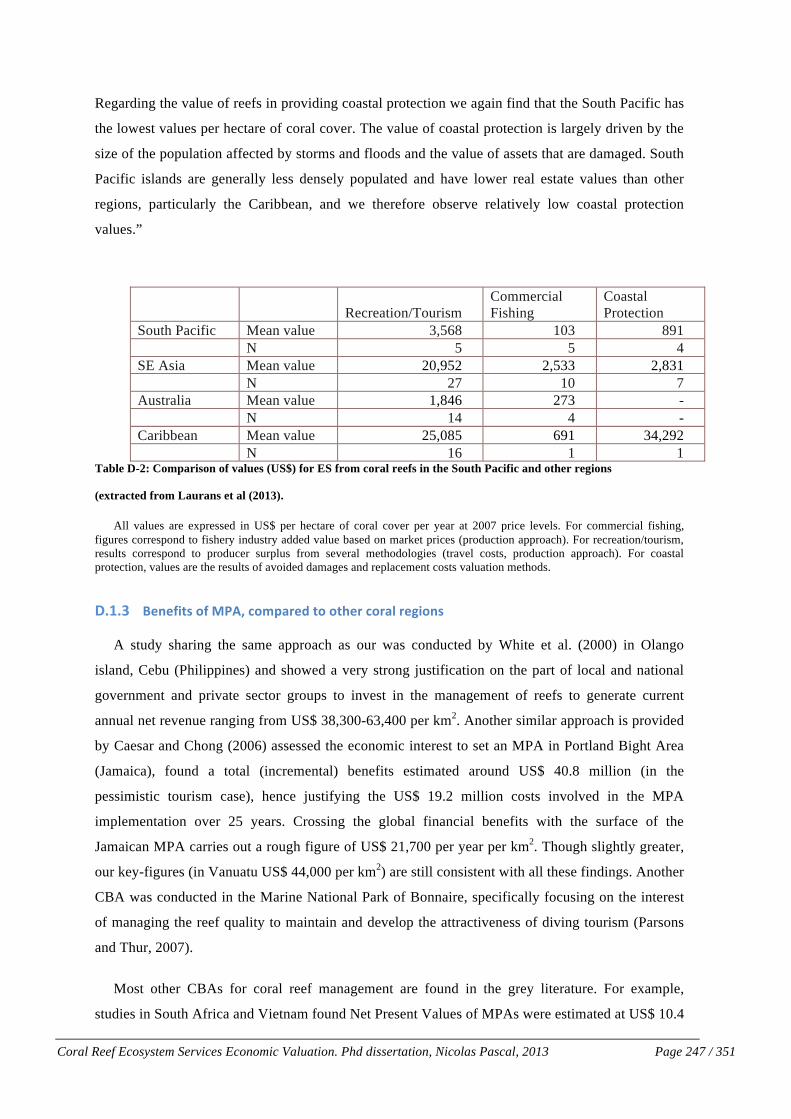
Coral Reef Ecosystem Services Economic Valuation. Phd dissertation, Nicolas Pascal, 2013 Page 247 / 351!
Regarding the value of reefs in providing coastal protection we again find that the South Pacific has
the lowest values per hectare of coral cover. The value of coastal protection is largely driven by the
size of the population affected by storms and floods and the value of assets that are damaged. South
Pacific islands are generally less densely populated and have lower real estate values than other
regions, particularly the Caribbean, and we therefore observe relatively low coastal protection
values.”
Recreation/Tourism Commercial Fishing
Coastal Protection
South Pacific Mean value 3,568 103 891 N 5 5 4 SE Asia Mean value 20,952 2,533 2,831 N 27 10 7 Australia Mean value 1,846 273 - N 14 4 - Caribbean Mean value 25,085 691 34,292 N 16 1 1
Table D-2: Comparison of values (US$) for ES from coral reefs in the South Pacific and other regions
(extracted from Laurans et al (2013).
All values are expressed in US$ per hectare of coral cover per year at 2007 price levels. For commercial fishing, figures correspond to fishery industry added value based on market prices (production approach). For recreation/tourism, results correspond to producer surplus from several methodologies (travel costs, production approach). For coastal protection, values are the results of avoided damages and replacement costs valuation methods.
9NONT :$"$,(*)&+,&BA8c&6+34-2$#&*+&+*Q$2&6+2-/&2$0(+")&
A study sharing the same approach as our was conducted by White et al. (2000) in Olango
island, Cebu (Philippines) and showed a very strong justification on the part of local and national
government and private sector groups to invest in the management of reefs to generate current
annual net revenue ranging from US$ 38,300-63,400 per km2. Another similar approach is provided
by Caesar and Chong (2006) assessed the economic interest to set an MPA in Portland Bight Area
(Jamaica), found a total (incremental) benefits estimated around US$ 40.8 million (in the
pessimistic tourism case), hence justifying the US$ 19.2 million costs involved in the MPA
implementation over 25 years. Crossing the global financial benefits with the surface of the
Jamaican MPA carries out a rough figure of US$ 21,700 per year per km2. Though slightly greater,
our key-figures (in Vanuatu US$ 44,000 per km2) are still consistent with all these findings. Another
CBA was conducted in the Marine National Park of Bonnaire, specifically focusing on the interest
of managing the reef quality to maintain and develop the attractiveness of diving tourism (Parsons
and Thur, 2007).
Most other CBAs for coral reef management are found in the grey literature. For example,
studies in South Africa and Vietnam found Net Present Values of MPAs were estimated at US$ 10.4

Coral Reef Ecosystem Services Economic Valuation. Phd dissertation, Nicolas Pascal, 2013 Page 248 / 351!
million (Turpie et al. 2006) and US$ 18.9 million (Nam et al. 2005), respectively. However, these
results at a global scale are difficult to link with our single MPA figures. Other CBA reports
significantly differ from our objectives as they focus on analysing other management options. For
example, Fahrudin (2003) looked at the economic effect of reducing coral threats (cyanide and coral
collection) in Indonesia, while Beukering and Caesar (2002) analysed the management options of
six MPAs in Hawaii, and Clarke et al. (2010) assessed the cost and benefits of a zoning extension of
a marine park in Australia.
Another interesting feature of our approach is the unique manner of calculating costs for MPA
establishment and management. Our study indicated that these costs per km2 were around 7 times
greater than the meta-analytical average cost estimates of Balmford et al. (2004) at US$ 2,698 per
km2 per year and at least four times their estimates if comparing only annual direct operational costs
(US$ 9,800 in Vanuatu). These same authors estimated that total running costs per unit area were
greater for MPAs in developed countries, and that the strongest cost correlation was with MPA size;
per unit area, bigger MPAs cost substantially less to run. When compared to a recent study
conducted in St Martin (Pascal, 2012), the present study shows contradictory results regarding these
two points as the status of being an MPA in a developed country (i.e. Saint-Martin) seems to
overtake (by 22% per km2) the cost advantage of scale in developing countries (i.e. Vanuatu). From
a donor point of view an important difference exists as almost all the Vanuatu MPA costs are
assumed by external agencies whereas local public funding covers almost 70% of Saint Martin
costs.

Coral Reef Ecosystem Services Economic Valuation. Phd dissertation, Nicolas Pascal, 2013 Page 249 / 351!
9NS D2-")3(*&-&6+22$6*&)(0"-/&-.+1*&$6+)7)*$3&)$2P(6$)&&
9NSNO C.)$2P$#&P-/1$)&P$2)1)&+4*(+"c&+4*(313&-"#&.$)*&1)$&P-/1$)&
The two studies have focused their valuation on observed values instead of potential or
maximum values calculated from model or other experiences. This choice was made to reflect as
best as possible the reality of the direct and indirect use of the Coral Reef ecosystems. The objective
was to enable comparison of results with GDP figures for a given year. In the same way, it was
intended to highlight “real” cash flow in the territory economy generated or linked to the existence
of these ecosystems. The calculated values are designed to be “a minima” values (Chevassus-au-
Louis et al., 2009), without any projection in time, and accordingly do not reflect anything about
optimality or the actual performance of the current uses. Moreover, these values are not exhaustive,
and only a "snapshot point" in time.
Two main limitations have been identified about this approach. On one hand, realizing a
“snapshot” valuation of ES produced during a given year does not give any indication of the
ecological sustainability of the use. As explained in the next paragraph, this is critical information
for a renewable resource such as fish and invertebrates. Effectively, a valuation can highlight an
important value for fishery during the study year but if no indicators of sustainability are given,
there is no guarantee this value can be maintained. The same argument applies to tourism where a
valuation of a high concentration of tourism business can boost the TEV without taking into account
the impacts this same industry generates on the ecosystems. The Sheraton paradox (Mirault, 2006)
describes how, for some economic valuation studies, the value of tourism services depends mainly
on hotel room capacity (essentially the multiplier for per tourist day expenditure estimates)
independent of the cumulative effect of increasing tourism pressure on the ecosystem through waste
management, water use, infrastructure investments, congestion effects, etc. An optimum value to be
used as a benchmark to ensure valuation reflects sustainable use is recommended. The
determination of optimum use is made by systematically answering the criteria of the principle, i.e.,
the only one use or group of associated uses that is (are) ecologically sustainable, legally
permissible, financially feasible and maximally productive (Goodwin, 2007).
On the other hand, the same “year snapshot” valuation of ES reflects the level of current use of
the ecosystem and not the potential or optional one. This applies specifically to fishery and tourism
where, as explained before, the socio-economic context will be more determinant in the valuation
than the ecological characteristics of the site (e.g. a coral reef with similar habitat and fish density
attributes will have a higher value if several international resorts are closed to it). A best use value
must be identified to reflect this potentiality taking into account ecological, social, economic and

Coral Reef Ecosystem Services Economic Valuation. Phd dissertation, Nicolas Pascal, 2013 Page 250 / 351!
business contexts. As explained in the next chapter, appraisal techniques of land assets with
Business Enterprise Valuation Technique bring interesting ideas for tourism developments. The
approach is similar to what has been done in the New Caledonia study with the calculations of the
bio-prospection potential fees. A business valuation of molecule development from collection to
marketing has been developed to determine a potential basis for fee to be paid during prospection.
Another approach is proposed by the CAS report (Chevassus-au-Louis et al., 2009) which refers
to the "maximum plausible" that it might be possible to determine qualitatively (based on expert
opinions, etc.) or quantitatively (functions production) for some services.
Also, all activities related to previously listed use values (direct and indirect) could potentially
have a component of option value. For example, not all known marine resources need to be
exploited today (even in a sustainable way). One possibility is that some stocks may be exploited
immediately and some left untouched as options for the future. These two types of values are likely
to be monetized differently in the subsequent economic valuation.
As an example of option values for indirect use, coastal protection processes have no use value if
nobody is using the coastal zone, for example in a region with no inhabitants. Nonetheless, we may
want to attach value to those processes (and the ecosystems generating them) as providing options
for future use. Option values also apply to non-consumptive uses: we may want to set aside areas as
valuable for future tourism, even if currently they are not used as such.
The estimation of a single monetary value to characterize an ecosystem service must therefore be
"contextualized" with information about environmental sustainability and potential of ecosystem
service evaluated. Fishery and tourism are discussed in the next paragraphs.
O"$"#"# _+-<(64.()/-4-*(5.-(6,+)(-W./&-(6,(B.,(6->-.L/*(=*+89.,89>(-.
For fishing, the concept of renewable resource leads to refer to a maximum sustainable catch
level. The theory is that this level corresponds to catches and fishing practices that would be
considered stable over time because they would not affect the rate of natural renewal of the resource
(Armada et al., 2009, Dalzell and Adams, 1997). In the calculations of maximum plausible usage,
the various environmental variables as input parameters of the production function (health of
ecosystems, trophic relationships, fishing effort, etc.) will be placed at an optimal level.
To do so, some of the CRESVs have proposed to reintroduce the use of the “Maximum
Sustainable Yield” (MSY) coupled with expert opinions. The MSY is described in many fishery
management works (Dalzell and Adams, 1997; Labrosse et al., 2000) and theoretically corresponds
Coral Reef Ecosystem Services Economic Valuation. Phd dissertation, Nicolas Pascal, 2013 Page 251 / 351!
to the catch that would be considered stable over several generations, since it would not affect the
rate of natural renewal of the resource. Nonetheless, some caveats should be mentioned, when
applying this approach for ES valuation:
(i) Reef fisheries science shows that the calculations of MSY for these multi-species fisheries
are highly uncertain and highly variable depending on ecological context (Munro, 1984). There is
no consensus among experts on indicators to assess whether the quantities extracted by reef and
lagoon fisheries can be considered sustainable or not . As a reference, the indicative levels of
sustainable exploitation of fisheries and reefs in the Pacific vary from 3 to 20 t.km-2.y-1 (Dalzell and
Adams, 1997; Jennings and Polunin, 1995; Kuster et al., 2005; Labrosse et al., 2000; Munro, 1984;
Newton et al., 2007);
(ii) As it is the case in general for ES, the level of sustainable activity for one ES may not be
compatible with the sustainable level of another ES (Dixon, 1993; Groot et al., 2010). For example,
conflicts have been observed between fishery catch of specific species and the scuba diving
industry, dependant on their clients’ encounter rate with these species (Rudd and Tupper, 2002).
This approach was applied to the New Caledonia study. The few studies addressing this issue on
the New Caledonia reef seem to consider that, except for some very specific fishing areas and
species for export, the New Caledonia reef is not overexploited (Dalzell and Adams, 1997;
Guillemot et al., 2009; Labrosse et al., 2000). These studies are based on catches indices (CPUE,
average size of catches) by analysing their evolution in time or in comparison to other fisheries in
the Pacific. On this basis the levels of exploitation of fisheries were compared with the theoretical
thresholds. The spatial resolution of the results at the commune level is very rough and this
comparison plays only a very indicative role to identify cases of overexploitation. On the scale of
the 26 municipalities studied and estimates of areas of fishing grounds and reefs, no fishery has
been considered in a state of overexploitation. The monetary valuation of the fishery ecosystem
service can therefore be completed with an indicator regarding its ecological sustainability. We
recall that this validation require a more detailed analysis at a smaller scale and specific to some
species (e.g. sea cucumbers).
In the case of under-utilization, a potential or best use analysis should be performed. This is
similar to the option value. Based on the differences between the current levels of exploitation and
potential levels, and comparing this difference with future consumption of seafood a best use fishery
value can be obtained. This study should take into account population projections, the evolution of
fresh and imported fish consumption, fishery bio economic models and spatial features. This kind of
work is generally beyond the scope of many studies limited in resource and time. This is why the
option value of the fishery is generally not reflected in the results.

Coral Reef Ecosystem Services Economic Valuation. Phd dissertation, Nicolas Pascal, 2013 Page 252 / 351!
Many bio economic fishery models have been developed (Holland, 2000; Lleonart et al., 2000;
Pauly et al., 2000; Pelletier and Mahevas, 2005; Sanchirico and Wilen, 1998) to give more precise
and robust results about sustainable levels and “command and control” measures. Depending on the
model used (spatial or not, multispecies or not, etc.), they permit to assess some of the expected
effects from fishery management such as: spawning stock biomass increase, spillover, larval export,
fecundity improvement with age and size differential price (Pelletier and Mahevas, 2005).
Nonetheless most of the coral reefs models are very data demanding with many (if nor most) of the
data estimated and very few are operationalized by end-users such as government fishery
departments or fishery regional agencies (pers. observ.) Therefore they usually require to be
calibrated specifically to answer this response of multispecies maximum levels of yields. The latter
may explain why so few economic studies have used this kind of model to assess optimal values of
extractive fishery.
O"$"#"$ ;/>6+-5.()/-4-*(5.-(6,+)(-W./&-(6,(B.,(6->-.->-*8+=8&9(.8=B.L/*(=*+89.,89>(-.
M,.$-B-!B#(!
For tourism, the concepts of carrying capacity, maximum load capacity and limits of acceptable
change (LAC) are the most commonly used to reflect ecological sustainability (McElroy, 2003;
Spurgeon, 2004; Stoeckl et al., 2010). Like any ecosystem, coral reefs have capacities of
regeneration from minor impacts from natural and human origin. But the cumulative effect of
thousands of these minor impacts can create damage often not reversible when threshold levels are
reached. The concept of carrying capacity is the number of visitors an ecosystem can tolerate
without suffering irreparable degradation (Wielgus et al., 2002). The concept of acceptable limits of
change sets standards for minimum acceptable conditions (which may differ from the desired
conditions). This involves defining the limits of ecological and sociological changes that could
cause some degradation but that will be allowed on site. The focus is placed more on the desired
conditions of the site than on the amount of usage that the site can tolerate (Stankey et al., 1985).
Other tools such as Mc Elroy’s tourism penetration index (TPI) and Butler’s tourist destination
product life cycle are useful in analysing how sustainable the current level of tourism is (Butler,
1980; McElroy, 2003). These tools take into consideration factors such as the number of days the
average visitor stays and the amount of environmental resources used by guests. The TPI is
designed for destinations as an indicator that they may be going over carrying capacity.
For diving activity, the literature gives us quite different carrying capacities. For Hasler et al
(Hasler and Ott, 2008), a total of 500 dives per site per year is sufficient to cause substantial damage

Coral Reef Ecosystem Services Economic Valuation. Phd dissertation, Nicolas Pascal, 2013 Page 253 / 351!
to the sites. Dixon et al (1993) suggests a much larger number from 4 000 to 6 000 dives per site per
year to cause prolonged damage to the environment. In practice, many sites are not frequented the
same way and only complete data communication by the clubs would identify problem sites.
Other research works, where users were asked in order to see how "the quality of their visit"
could be impacted by overcrowding, bring different results of levels (Barker and Roberts, 2004; Fau
et al., 2008; Park et al., 2000).
H+.(&.$%*!.+B4$#-!)%*B(#!
Several methodologies to determine the potential value of an ecosystem for tourism are possible.
Even if none of the study produced figures about potential tourism values, all the proposed
methodologies rely on the method used through the 2 case studies. It is the competitiveness analysis
of the destination based on the Advertising Image analysis and professional interviews. As shown in
New Caledonia, the destination competitiveness is based on both comparative advantage and
competitive advantage. Whilst the competitiveness of individual firms is an important element of
the reef tourism industry, it is the destination competitiveness of the country that is of principle
interest. Models of destination choice generally combine measures of the destination’s attributes
(“pull” measures) with the tourists travel motivation (“push” factors) to cover all the subjective
factors intervening in the decision process. Several authors have attempted to identify the “pull”
attributes that may attract tourists to reef destinations (Asafu-Adjaye and Tapsuwan, 2008; Brander
et al., 2007; Park et al., 2000). These attributes are numerous and maybe complex to separate (see
next figure and table). They include both characteristics of the ecosystem and of the surrounding
man-made environment. These studies also highlight that the importance of each of these attributes
in the choice of the destination and the satisfaction from the visit varies greatly upon the context.
Substitution in recreation demand is an important element when determining the potential impacts
of resource changes and it seems important to collect information on the availability of substitute
sites, substitute site prices, and the substitution relationship across sites and among activities.
Ecosystem characteristics Non-ecosystem characteristics Presence of emblematic species Accessibility Species diversity (micro and macro) Wrecks Ecosystem health Congestion of the sites Underwater landscape and caves Security and technical difficulty of diving Water transparency Context and other activities attached to site Table D-3: Main attributes in destination choice for scuba diving industry
It is not always possible to isolate a manageable number of factors in the process by which a
tourist chooses a destination, because most destinations have many attributes. Parry and McElroy

Coral Reef Ecosystem Services Economic Valuation. Phd dissertation, Nicolas Pascal, 2013 Page 254 / 351!
(Parry and McElroy, 2009) and Tourism and Transport Consult (Tourism and Transport Consult,
2005) identify about 30 factors that are relevant to a tourist’s choice of destination and satisfaction
from the stay. Such factors (described in the next figure) include accessibility, price, existing
infrastructures, security, cultural atmosphere, hospitality, proposed activities, etc. Considering the
number and variety of factors, some of which are difficult to quantify, it is generally difficult to
assess the expenses from tourism that are directly attributable to an ecosystem.
Figure D-1: Attributes associated with reef-related tourism
Another approach for potential values is the use of appraisal techniques for submerged lands
valuation and corresponding lease rates. They employ the highest and best use analysis. The
Business enterprise valuation Technique (BevT) is necessary for the determination of the financial
feasibility of the development, as well as the determination of its maximal productivity. It is also
used in conjunction with the cost approach and the sales comparison approach. The BevT is not a
business valuation15 and is realised at a site or national scale based usually on official tourism
development plan.
^f!N<(!,B4,+#(!+=!%!KB#$&(##!)%*B%.$+&!$#!.+!)%*B(!.<(!#<%4(#!+=!%!2+-,%&9!+4!%!KB#$&(##!.<%.!-%9!%*#+!$&2*B6(!$&)(#.-(&.! %##(.#! %&6! *$%K$*$.$(#! +.<(4! .<%&! .<(! #BK[(2.! ,4+,(4.9! %&6! $.#! %2.B%*! +4! <9,+.<(.$2%*! 6()(*+,-(&.!%&6!#,(2$=$2%**9!4(*%.(6!,4+=$.!2(&.4(#!
Coral Reef Ecosystem Services Economic Valuation. Phd dissertation, Nicolas Pascal, 2013 Page 255 / 351!
9NSNS @Q-#+U&42(6$)&
As proposed through the methodological choices exposed in our 2 case studies, CRESV with
financial values (a minima value) may be enough to reflect the balance of impacts of policies in
CBA exercises. Nonetheless, other approaches have been proposed to improve these first estimates.
The impact of most extractive and non-extractive activities create externalities that are not taken
into account in the market price of the goods produced. They also generally include subsistence
practices, for which output there isn’t a price at all. These issues can be dealt with by estimating the
true social cost, or shadow price16, of the activities. They therefore include additional costs and
benefits such as the subsistence value of the good or the environmental externalities of the
production process.
Although shadow prices can always be criticized, an effort should be made at estimating them.
Several authors (Hoagland et al., 1995; Kuosmanen and Kortelainen, 2007; Whitten and Bennett,
2004) provide a review of methods to estimate shadow values. In the New Caledonia study for
example, we use a weight correcting factor of 1.3 to reflect benefits specific to subsistence fisheries
&especially the non-substitutability of the goods for subsistence fishermen and as a factor of social
cohesion& that are not taken into account by the market price of fish, due to the absence of a formal
market specific to these products. The methodology through which the value is derived is not the
most precise and reliable one (it is based on estimates of the economic multiplier of commercial
fisheries) but the approach is potentially interesting and should be considered when it is too
complex to estimate directly a shadow price. Few of the reviewed studies on coral reefs and
mangroves (François et al., 2012) have attempted the exercise, in a very partial and rough way.
Padilla and Janssen (Padilla and Janssen, 1996) estimate the shadow price of mangrove wood
products as the price of the market alternative plus the transport costs (to and from market) minus
the gathering costs. This is a back of the envelope estimate that may be biased as it assumes a
specific behaviour of local dwellers, and ignores potential externalities from the gathering process,
points that are not discussed. Padilla and Janssen (1996) assume that the opportunity costs of time
spent foraging is negligible at subsistence levels and use directly the inland price of the closest
substitute. Cesar and Chong (Cesar and Chong, 2006) make very simplistic assumptions on the true
cost of wood collection, simply doubling the market price. Cesar et al. (1996) assumes that the
opportunity cost of labour for fishermen is the wage of a local rural worker, based on the limited
employment alternatives in the area. Shadow price may be difficult to estimate locally in the field in
practice.
^g!N<(!#<%6+L!,4$2(!4(,4(#(&.#!.<(!#+2$%*!+,,+4.B&$.9!2+#.!+=!.<(!1++6!$=!.4%6(6?!+4!.<(!+,,+4.B&$.9!2+#.!+=!B#(4!K(&(=$.#!=+4(1+&(!$=!&+.!.4%6(6_!

Coral Reef Ecosystem Services Economic Valuation. Phd dissertation, Nicolas Pascal, 2013 Page 256 / 351!
In evaluating the benefits from tourism, both studies have focused entirely on the producer
surplus. An important effort was directed to determine as precise as possible the part of the producer
surplus depending of coral reefs. Common business interviews and tourism surveys were used as
well as more innovative techniques such as Advertising Image Analysis. Several segmentations of
tourists upon their use and dependency on the existence of coral reef were necessary to fine tune
theses estimates. The decision to focus on precision about producer surplus was not neutral and has
implicated a choice on the estimates of the consumer surplus from coral reef users. This choice was
driven mostly by the available resource of the study. Several authors (Ahmed et al., 2005;
Beukering et al., 2007b; Cesar, 1996; Cesar et al., 2003a) have implemented a travel cost method
and/or contingent valuation and/or choice experiment valuation to measure the willingness to pay of
tourists. The implementation of these methods is not straightforward and a review of the common
limits of these approaches are described in different works (Alpizar et al., 2001; Jin et al., 2006;
Parsons and Thur, 2007; Rudd, 2009; Siikamäki, 2011; Wielgus et al., 2002).
For non-commercial use such as beach swimming or snorkelling without cash transaction, the
question then has arisen of how to evaluate this service, and under what name if no consumer
surplus was calculated? Taking into account that for many of these users, their satisfaction is not
dependent of the health and the presence of coral reefs, decision was made to account for this
service in the coastal protection ecosystem services..
The specific method to use to develop the correcting factor is critical, however, and should be
theoretically sound and its assumptions clearly identified.
9NSNT @4-*(-/&#()*2(.1*(+"&+,&$6+)7)*$3&42+6$))$)&-"#&)$2P(6$)&
The practical identification of the study perimeter for each service being valued has not
been straightforward. It has been guided for use values by identifying: (i) the area affected by the
spillover of the ecosystem processes and services, (ii) the area where the uses take place (e.g.
fishing grounds, diving sites, etc.), (iii) the residence of the stakeholders such as fishermen, tourism
and extractive businesses, and (iv) the final destination of the services extracted from the ecosystem
(domestic/export).
In the New Caledonia study, the spatial distribution of ES was intentionally limited to the
area where the uses take place. The lack of precise data and the many knowledge gaps in identifying
patterns of dispersal of marine species have motivated this choice. For Vanuatu a similar process
happened and ES were valued where the uses take place. In the same way, it was decided that larval
dispersal would not be taken into account as a benefit from the marine reserve due to the complexity
of these processes.

Coral Reef Ecosystem Services Economic Valuation. Phd dissertation, Nicolas Pascal, 2013 Page 257 / 351!
From another point of view, the spatial perimeter of the study has rarely been discussed
systematically and specifically in the reviewed analyses (François et al., 2012). Most studies define
and delimit the ecosystem being studied, and some explicitly limit their analysis to the local
communities and areas directly interacting with the ecosystem (“local” economy), but these limits
generally do not coincide with the area affected by the ecosystem processes, or the economic
jurisdiction.
A more detailed description of the spatial perimeter is provided in the following figure based on the
classification by Balmford et al. (2008). The spatial extent of fluxes from Coral Reef ecosystem
processes and services has been divided into five categories:
Figure D-2: spatial perimeter of ecosystem services (extracted from Balmford et al. (2008))
The definition of the spatial perimeter depends on the type of project and services being valued.
In the case of the restoration or management of a coral reef or mangrove, the study should ideally
encompass all the individuals and regions affected by goods and services produced by the
ecosystem. A classification of reef ecosystem services according to the scale at which they affect the
economy can be proposed (next table): the local scale includes the local coastal communities living
in or in the immediate vicinity of the ecosystem; regional services impact either the regional or
Local services: The place of production of the service is also the place of
consumption/use (e.g. subsistence shellfish collecting);
Omnidirectional services: The use of the service takes place in a buffer zone
surrounding the place of production (e.g. export of biomass from a reserve)
Directional services: The use of the service takes place in a buffer zone that is
in a specific direction from the place of production (e.g. coastal protection against
storms)
Long distance services: Users of the services are located far from the place of
production, and the services flow in specific directions (e.g. larvae production
from a reproduction site)
Global services: The service can be used anywhere, independently from where
it is produced (e.g. reduction in greenhouse gases from carbon sequestration)

Coral Reef Ecosystem Services Economic Valuation. Phd dissertation, Nicolas Pascal, 2013 Page 258 / 351!
national economy around the ecosystem; global services impact the world economy, either through
exports or the provision of global public goods.
Changing the spatial aggregation in particular changes the number of people who hold a value
for the service considered (Smith, 1993). The values attached to local ecosystems vary with distance
from the ecosystem. It seems reasonable to assume that value decreases with distance for users.
Bateman et al. (2006) confirm this decrease through a review of the literature and propose to use a
spatially sensitive valuation function that explicitly incorporates distance decay relationships into
defining the limits of the economic jurisdiction.
Several authors coincide that spatialization of ES is a key variable for the implementation of the
majority of economic instruments (Balmford et al., 2008; TEEB, 2010). Indeed, identification of
areas where the processes required to generating ecosystem services is basic to relate customer and
service provider. For example, the larval dispersal and migration areas of key species for fishing or
as dive attractions are often different from the fishing grounds and dive sites. Similarly, the place
where the added value of fishing and tourism is generated may be different to where the benefit is
accounted (residence tax, pre-paid package tourism, etc.).
Considering the complexity of these processes (variability and importance) and the technical
challenge to identify the flows of dispersion of some services, especially marine species, it seems
that experts will need to use proxies and make simplifying assumptions.
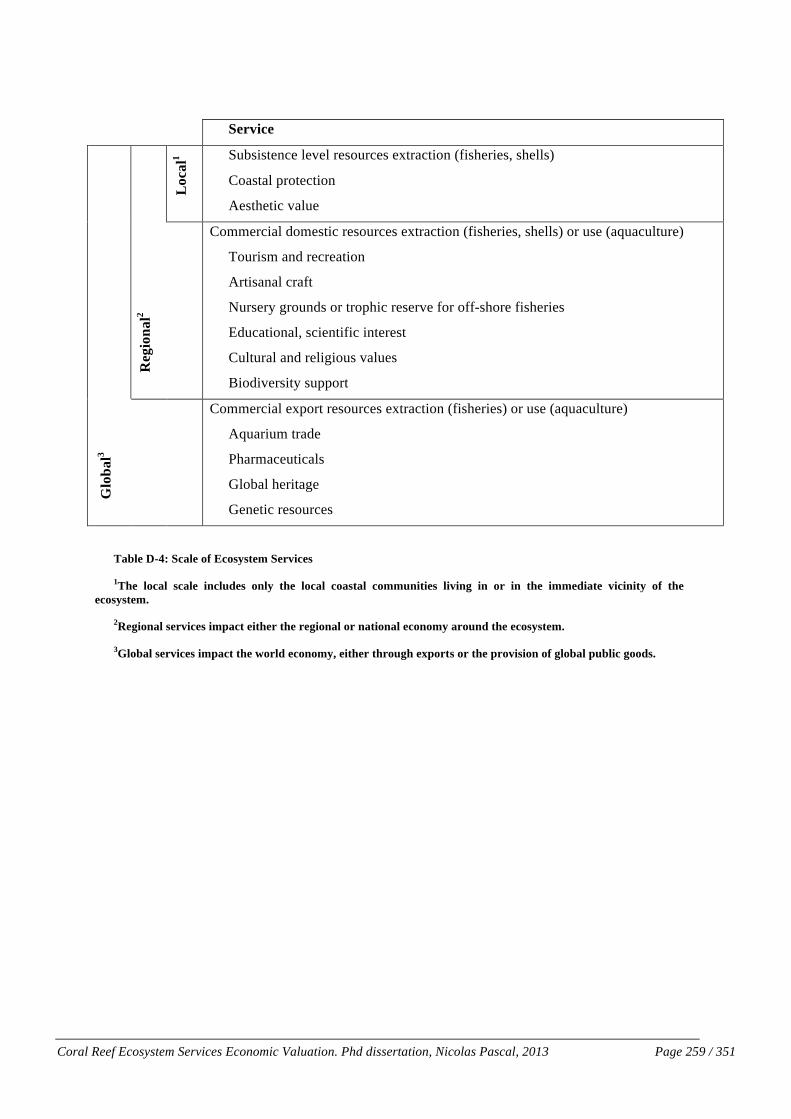
Coral Reef Ecosystem Services Economic Valuation. Phd dissertation, Nicolas Pascal, 2013 Page 259 / 351!
Service
Glo
bal3
Reg
iona
l2
Loc
al1 Subsistence level resources extraction (fisheries, shells)
Coastal protection
Aesthetic value
Commercial domestic resources extraction (fisheries, shells) or use (aquaculture)
Tourism and recreation
Artisanal craft
Nursery grounds or trophic reserve for off-shore fisheries
Educational, scientific interest
Cultural and religious values
Biodiversity support
Commercial export resources extraction (fisheries) or use (aquaculture)
Aquarium trade
Pharmaceuticals
Global heritage
Genetic resources
Table D-4: Scale of Ecosystem Services
1The local scale includes only the local coastal communities living in or in the immediate vicinity of the ecosystem.
2Regional services impact either the regional or national economy around the ecosystem.
3Global services impact the world economy, either through exports or the provision of global public goods.

Coral Reef Ecosystem Services Economic Valuation. Phd dissertation, Nicolas Pascal, 2013 Page 260 / 351!
E,%.$%*!6$#.4$KB.$+&!K9!(2+#9#.(-#!!
A clear limit of our 2 valuations is that they do not reflect the interconnectivity with other
ecosystems such as mangroves and seagrass beds. As described in the figure below these
connections are present for many of the ecosystem services of the coral reefs. A classic example is
the role of mangroves as nursery or as a nutrient and sediment cleaner to maintain clean the coastal
waters. In our two valuations, mainly in the New Caledonian one, the mangroves were present in
many coasts of the islands but their role was not differentiated from coral reef ecosystems.
Therefore the valuation of the ecosystem service of commercial fish biomass production included
some of the processes from the other ecosystems of mangroves and seagrass. In the same way,
identifying the part due to mangrove and coral reef in the fish biomass production or coastal
protection ecosystem services has proven to be a difficult exercise (see discussion about production
function in the next chapter). The authors that have intended to make this ecosystem functional
differentiation for valuation (Ruitenbeek, 1994; Sathirathai and Barbier., 2001) have used from
simplistic approach with linear links to complex production functions linking many attributes of the
ecosystems.
Figure D-3: Ecological links between the three ecosystems . Source: Moberg and Folke (1999)
&
F. Moberg, C. Folke / Ecological Economics 29 (1999) 215–233218
Fig. 1. Interactions in the tropical seascape, showing the connections between mangroves, sea-grass beds and coral reefs.
3.2. Mining of reefs
Among the obviously destructive coral reef usesare the exploitation of hard corals for buildingmaterials and for the production of lime, mortarand cement (Dulvy et al., 1995). In the Maldives,coral blocks, rubble and sands serve as the mainconstruction materials with approximately 20 000m3 corals mined every year (Cesar, 1996). Lime isalso used as a pH regulator in agriculture (Cesar1996), and in some regions coral debris is also
corals were imported to the United States in1991.
The use of the natural resources describedabove could perhaps be sustainable, but there is atendency for their overexploitation, especiallywhen world market prices rise (e.g. Cesar, 1996;Birkeland, 1997b). Further, the dynamic complex-ity of coral reef ecosystems implies that it isextremely difficult to estimate sustainable harvestrates of reef organisms (Sorokin, 1993; Hodgson,1997).

Coral Reef Ecosystem Services Economic Valuation. Phd dissertation, Nicolas Pascal, 2013 Page 261 / 351!
9NSNZ A2+#16*(+"&,1"6*(+"&&
As shown in the Vanuatu case study, the conceptual framework of CBA is based on the monetary
valuation of changes in marginal benefits and costs of ecosystem management. This approach is
essential because, at any time the relevant question is: what is the difference between benefits and
costs of implementation, or not, of a set of specific policies ? Quantifying costs and marginal
benefits requires to confront at least two well-defined situations. Each scenario reflects a particular
set of biotic and abiotic conditions, including aspects such as coverage of habitat, population
distribution, human activities and conservation actions in place. Evaluation of these marginal
changes is quite complex because the function of an ecosystem may be subject to changes in its
nonlinear process (e.g. a "reversal" suddenly a steady state to another) (Barbier et al., 2008). Stir in
the marginal valuation of ecosystem services thus requires an understanding of the factors and
pressures on the systems under study, and how the system changes or can change its current state to
a different state under the action of a particular policy (Ruitenbeek and Cartier, 1999).
Obtaining maps of the production of a particular service (or beneficiary of a process) requires a
good understanding of the factors underlying production. These factors include a combination of
abiotic factors (e.g., type of substrates, oceanography, topography) and biotic (e.g. the type of
ecosystem, species diversity), and factors that are determined by the human actions (e.g. habitat
modification). If these relationships are understood, it should be possible to generate a mathematical
model that can reasonably predict the production of underlying factors. Such a model is, in
economic terms, a production function.
When we refer to the links described between ecosystem processes and services of our 2 case
studies, the functional form of the relationship between the physical characteristics of the reef and
ecosystem services is not well known (Beukering et al., 2007b; Crepin, 2003; Harborne et al.,
2006). Linking ecosystem processes to levels of ecosystem services is therefore fraught with
difficulty. Ecosystem production functions similar to other production functions in agricultural and
resource economics seem to be a promising avenue to better account for these interactions. The
production function must be expressed in physical units appropriate for measuring the provision of
the service (e.g., tons of storage carbone.km-2, m3 of water. km-2.an-1, the number of visitors.km#,
etc.). Once defined this production function, it is possible, by changing some key variables, to
compare different scenarios. The comparative spatial approach is crucial in this comparison,
A first step in the determination of production function is a qualitative classification of the
strength of the links between activity and ecological processes (or ecological attributes) of the
ecosystem and then between ecological processes and services. With this in mind, a simplified
qualitative classification of the strength of the links between activity and ecological attributes of the

Coral Reef Ecosystem Services Economic Valuation. Phd dissertation, Nicolas Pascal, 2013 Page 262 / 351!
ecosystem and then between these processes and services was used in the Vanuatu study. This
classification follows and extends Ruitenbeek (Ruitenbeek, 1994))17. In the table, “Strong” is used
to qualify interactions that are proportional or near proportional, while “Weak” is used for
interactions that are much less proportional. In addition, we identify some of the interactions as
delayed, which means here that consequences take about at least 5 years to manifest themselves.
The stock quantity is defined as coral coverage (and therefore would include dead coral). The stock
quality, on the over hand, includes indicators of the health of the coral, and quality of the water and
marine environment. The indicators of ecosystem quality and their empirical feasibility should be
identified and discussed with an ecologist specializing on the ecosystem under study.
Ecosystem services
Coral coverage (stock quantity)
Health of coral, quality of water, ecosystem physical
environment, biodiversity index (stock quality)
Strength Delay (>5years) Strength Delay
(>5 years)
Fisheries Medium Strong Delayed Underwater tourism Medium Delayed Strong Education Weak Delayed Strong Delayed Aquaculture Weak Delayed Medium Delayed Coastal protection Strong Weak Delayed Aesthetic value (sea view) Weak Weak Genetic resources Strong Delayed Strong Delayed Global heritage Strong Strong Delayed Option value Strong Strong Delayed
Table D-5: Tentative dependency links between ecosystem services and ecological attributes.
The table should be read as “what is the dependency for fishery from coral reef quantity and quality”. Explanations in the text. Table modified from (François et al., 2012).
In the absence of a known or empirically estimated relationship, a link between the productivity
of the ecosystem (for a given service) to the coverage of the undisturbed ecosystem has been
proposed (François et al., 2012). Based partially on Ruitenbeek equation (1994), this formula has
the advantage to approximate simply the relationship between the productivity of an ecosystem and
its physical characteristics, and to reduce it to a few testable parameters. Discussion about
advantages and limitations is described in François et al. (2012).
^h!I$..*(!4(#(%42<!%,,(%4#!.+!<%)(!K((&!6+&(!+&!.<(#(!$##B(#_!;B$.(&K((0!S^ooaU!$#!.<(!+&*9!4(=(4(&2(!,4+,+#$&1!%&!%2.B%*!2*%##$=$2%.$+&_!

Coral Reef Ecosystem Services Economic Valuation. Phd dissertation, Nicolas Pascal, 2013 Page 263 / 351!
!"#$! ! !"#$! ! !"#$%&'$!!!!"#$%&'$!
!! !"#$%&'!!!!"#$%&'!
!
With:
PROD: Productivity
COVERAGE: the area of undisturbed ecosystem (stock quantity)
QUALITY: Health of coral, quality of water, ecosystem physical environment, biodiversity index
(stock quality)
' and (: strength and delay parameters for the stock quantity
) : strength parameters of the relationship between productivity and coverage
*: strength parameters of the relationship between productivity and quality
µ and +: strength and delay parameters for the stock quality
In practice on coral reef ecosystems of the Pacific, very few study have intended to model
production function to study the value of fisheries (Cesar, 1996; Gunawardena and Rowan, 2005;
Sathirathai and Barbier., 2001). From our review (François et al., 2012), we can conclude that the
approaches used by Cesar and Gunawardena are very simplistic when compared to other production
functions in agricultural of industrial economics. They assume a linear relationship in their study
between the yield of fisheries and coral/mangrove area instead of logarithmic relationship evidenced
by different authors. Sathirathai and Barbier (2001) value the link between mangroves and fishery
by applying a model originally developed by Ellis and Fisher (1987) and updated by Freeman
(1991). Roughly, the Ellis-Fisher-Freeman model is based on a static optimization framework using
the Cobb-Douglas form to represent production of an offshore fishery in which the mangrove area is
included as one of the input factors. This approach is more justified economically and provides a
basis for the estimation of welfare effects from changes in the mangrove coverage. It has been
criticized, however, due to its reduced form, which lacks micro-foundations and understanding of
the ecological functioning of the ecosystem. In the case of fisheries and marine reserves, many bio
economic models have been developed that can serve as a reference for future CBA analysis
(Sanchirico and Wilen, 1998, 1999; Holland, 2000; Lleonart et al., 2000; Pauly etal., 2000; Pelletier
and Mahevas, 2005; Schnier, 2005).
Coral Reef Ecosystem Services Economic Valuation. Phd dissertation, Nicolas Pascal, 2013 Page 264 / 351!
For the coastal protection ecosystem service, the model developed by Burke et al (2004) and
adapted in the New Caledonia study represents an interesting base to model this important
ecosystem service. The combination of all the attributes implicated in the processes of wave energy
absorption allows to better reflecting the complexity of the service. Based on this model,
simulations of scenarios influencing some of the attributes should be tested. The calibration of the 9
attributes is nonetheless an aspect that should be improved to respond to the low-data context of the
region. In the same way, the model developed by Barbier et al. (2009) reflects non-linear links
between the coastal protection and the width of a mangrove forest.
As Daily et al. (Daily et al., 2009) point out, much more work is needed, especially on
integrating multiple services at local and regional scales. One should be careful about the results
from such modelling due to the non-linearity of ecosystems’ responses and the existence of
thresholds.
&
Coral Reef Ecosystem Services Economic Valuation. Phd dissertation, Nicolas Pascal, 2013 Page 265 / 351!
9NSN[ !")12-"6$&-"#&2$)(/($"6$&2+/$&"+*&2$,/$6*$#&
The resilience theory from the perspective of environmental economics focuses primarily on the
concept of insurance value. It introduces the concepts of resilience thresholds change (shifts), the
adaptive cycles and risk analyses (Isbell et al., 2011; Yachi and Loreau, 1999). The United Nations
made it the theme of International Biodiversity Day, May 22, 2005, under the slogan "Biodiversity
is life insurance for our changing world." Similarly, the famous Stern Review (Stern, 2006) on
climate change, said:
"The insurance value of biodiversity can be compared to financial markets. Like the stock
market, a diverse portfolio of species can serve as a regulatory element for fluctuations in the
environment or the market that cause the decline of some resources. The stabilizing effect of a
biodiverse portfolio is likely to be especially important as environmental change accelerates with
climate change and other impacts of human activities. "
In this sense, the value of biodiversity can be interpreted as an insurance premium that agents
would agree to pay to reduce the possible consequences of the realization of potential risks
(Baumgärtner, 2007). Loreau et al. (2003) have shown that insurance function at a spatial scale.
There now appears to be consensus on some fundamental mechanisms of the insurance value of
biodiversity on ecosystem services. The study by Worm et al (2006), previously described in the
introduction, shows the role of marine biodiversity on ecosystem productivity in a fluctuating
environment. It highlights two processes (i) a reduction of the temporal variance of productivity
(buffer), and (ii) an increase in average productivity (effect of performance improvement). These
two effects are comparable to the effects of insurance because they both contribute to maintain or
improve the functioning of the ecosystem in the context of environmental fluctuations.
The implications of this notion, however, have hardly been explored so far in economic
valuation of ES. A notable exception is in the field of agricultural economy where financial
assurances against over-or underproduction of ecosystem services allow hedging income. These
financial products can be considered as substitutes for natural insurance provided by biodiversity.
Yacchi and Laureau (1999) stressed the importance of clearly identifying the mechanisms
underlying this role of insurance (the role of keystone species, richness and diversity spécfique,
functional diversity, degree of redundancy and complementarity, etc.). Complementary approaches
between ecological and economic indicators are beginning to emerge and to better assess this
service (Figure below) (Baumgärtner, 2007).

Coral Reef Ecosystem Services Economic Valuation. Phd dissertation, Nicolas Pascal, 2013 Page 266 / 351!
Figure D-4: Comparison between ecological and economic indices of biodiversity.
Extracted from (Baumgärtner, 2007)
9NSN\ B1/*(4/($2)&
Due to the lack of data or modelling capacity limitations it is generally impossible to take into
account directly the potential secondary effects of the services, and simplifying assumptions have
been employed in our 2 case studies. While the estimation of a general equilibrium (input/output)
model is generally not feasible, it seems sensible to assume some variability in local/regional prices
as the ecosystem changes and to take into account indirect impacts on the economy. Provided
enough information is available, a small local economy may be more easily modelled. In response
to the complexity of the modelling and data limitations, it was chosen to use multipliers in the 2
valuations. Some of the studies reviewed (François et al., 2012) take into account the indirect effects
of tourism on the economy through multipliers applied to the estimated producer surplus. The value
of the multiplier varies depending on the studied country’s context and economic sector. Cesar
(Cesar, 1996) uses a value of 2, Cesar et al. (2002) a value of 1.25 and we use a value of 1.3 for
small scale coastal fishery. In all three studies, these values are not estimated directly but transferred
from other sources: Jin et al. (Jin et al., 2003) estimate the multiplier effects of a marine ecosystem’s
resources on the coastal economy; Lindberg and Enriquez (Lindberg and Enriquez., 1993) provide
estimates of the multiplier of tourism in the case of Belize; and we use estimates of the multipliers
for fisheries and tourism for New Caledonia provided by the country’s official statistics office. The
values from these studies are summarized in the table below.
Multipliers are likely to have a significant impact in the result, and the uncertainty around their
values should be discussed.
Study location Tourism Fisheries Jin et al. (2003) New England (U.S.) -- 1.4–1.5 Lindberg and Enriquez (1993) Belize 2–3 -- Pascal (2010) – this study New Caledonia 1.6–1.7 1.3–1.4 Table D-6: Tourism and Fisheries Economic Multipliers (From François et al. (2012)).
&
Information about species . . .
. . . abundances p . . . number n . . . features f
• species richness
ecological indices
• Shannon-Wiener• Simpson• Berger-Parker
economic indices
• Weitzman• Solow et al.• Weikard• Nehring-Puppe
!
""
""
""
""# !
$$
$$
$$
$$% !
Figure 3: Biodiversity indices di!er by the information on species and ecosystem
composition they use.
Up to now, there do not exist any encompassing diversity indices based on all
ecological information considered here – species richness n, abundances a, and fea-
tures f . A logical next step at this point could be to construct a general diversity
index based on species richness, abundances and features, which contains the ex-
isting indices as special cases. However, one should not jump to this conclusion too
quickly. It is important to note that the ecological and economic diversity indices
have come out of very di!erent modes of thinking. They have been developed for
di!erent purposes and are based on fundamentally di!erent value systems. There-
fore, they may not even be compatible. This point is addressed in detail in the
following.
4.3 Diversity of What? – The Relevance of Abundances
and Features
From an economic point of view, relative abundances are usually considered irrele-
vant for the measurement of diversity. The reason is that in economics the diversity
issue is usually framed as a choice problem. Diversity is then a property of the
choice set, i.e. the set of feasible alternatives to choose from. Individuals facing a
23

Coral Reef Ecosystem Services Economic Valuation. Phd dissertation, Nicolas Pascal, 2013 Page 267 / 351!
9NSN] :$"$,(*&*2-"),$2&&
Benefit transfer18 is a practical way to evaluate management and policy impacts when primary
research is not possible or justified (Rosenberger and Loomis, 2001) because of budget constraints,
time limitations, or impacts that are expected to be low or insignificant. When primary research is
not possible or plausible, then benefit transfer, as a “second-best” strategy, becomes important to
evaluate management and policy impacts. The “worst-best” strategy in economic evaluation is to
not account for recreation values, thus implying recreation has zero value in an evaluation or
assessment model.
Benefit transfer assumes that there is an underlying value or function that links the values of a
resource or an activity to the characteristics of markets and sites across space and over time
(Rosenberger and Stanley, 2006). Benefit transfer is not limited to economic values or functions19,
and encompasses other scientific (especially ecological here) and social data (Spash and Vatn,
2006). As demonstrated for the Vanuatu study with the benefit transfer of bequest values from a
Fijian context (O'Garra, 2012), this type of transfer can become important in the case of ecosystem
valuation.
However, the transfer of benefits has generally been conducted very roughly in most of the
studies reviewed (François et al., 2012). Many of them use values taken from other studies either
directly or adapted using qualitative arguments. Although most of the primary studies are chosen for
their close location to the study site, there is generally no specific discussion of the similarities or
differences between the origin and destination studies, especially the ecosystems, and it is not clear
that the ecosystem type (type of reefs or mangrove forests) is the same or that they are of similar
maturity/quality. Tri et al. (1998) is the only study to have used an ecological functional form and
calibrated it to fit the destination ecosystem (although it is done at the country level).
^i!N<(! )%*B(! +4! K(&(=$.! .4%&#=(4!-(.<+6! 2+&#$#.#! $&! B#$&1! $&=+4-%.$+&! +&! .<(! )%*B(! +=! %&! (2+#9#.(-! #(4)$2(!S%)(4%1(!+4!-%41$&%*U?!(2+&+-$2!,%4%-(.(4!S(_1_!+,,+4.B&$.9!2+#.!+=!.$-(U?!+4!(2+&+-$2!=B&2.$+&!2%,.B4(6!%.!+&(!,*%2(!%&6!.$-(!.+!-%0(!$&=(4(&2(#!%K+B.!.<(!#%-(!#(4)$2(!%.!%&+.<(4!,*%2(!%&6!.$-(_!
^o!N<(4(! %4(! .L+! K4+%6! %,,4+%2<(#! .+! K(&(=$.! .4%&#=(4d! S^U! )%*B(! .4%&#=(4! %&6! S`U! =B&2.$+&! .4%&#=(4_! R%*B(!.4%&#=(4#! (&2+-,%##! .<(! .4%&#=(4! +=! %! #$&1*(! K(&(=$.! (#.$-%.(! =4+-! %! #.B69! #$.(?! +4! %! -(%#B4(! +=! 2(&.4%*!.(&6(&29!=+4!#()(4%*!K(&(=$.!(#.$-%.(#!=4+-!%!#.B69!#$.(!+4!#$.(#!S#B2<!%#!%&!%)(4%1(!)%*B(U_!3B&2.$+&!.4%&#=(4#!(&2+-,%##! .<(! .4%&#=(4! +=! %! ,4+6B2.$+&! =B&2.$+&! =4+-! %! #.B69! #$.(?! +4! %! -(.%! 4(14(##$+&! %&%*9#$#! =B&2.$+&!6(4$)(6!=4+-!#()(4%*!#.B69!#$.(#_!3B&2.$+&!.4%&#=(4#!.<(&!%6%,.!.<(!=B&2.$+&!.+!=$.!.<(!#,(2$=$2#!+=!.<(!,+*$29!#$.(!#B2<! %#! #+2$+(2+&+-$2! 2<%4%2.(4$#.$2#?! (D.(&.! +=! -%40(.! %&6! (&)$4+&-(&.%*! $-,%2.?! %&6! +.<(4! -(%#B4%K*(!2<%4%2.(4$#.$2#!.<%.!#9#.(-%.$2%**9!6$==(4!K(.L((&!.<(!#.B69!#$.(S#U!%&6!.<(!,+*$29!#$.(!;+#(&K(41(4?!;_E_?!I++-$#?!e_/_?! `cc^_! /(&(=$.! .4%&#=(4! +=! +B.6++4! 4(24(%.$+&! B#(! )%*B(#d! "! .(2<&$2%*! 6+2B-(&.! #B,,+4.$&1! .<(! 3+4(#.!E(4)$2(! E.4%.(1$2! H*%&! S`ccc! 4()$#$+&U_! O(&_! N(2<_! ;(,_! ;J;E>ON;>h`_! 3+4.! @+**$&#?! @Md! Q_E_! '(,%4.-(&.! +=!"14$2B*.B4(?!3+4(#.!E(4)$2(?!;+209!J+B&.%$&!;(#(%42<!E.%.$+&_!fo!,,__!
Coral Reef Ecosystem Services Economic Valuation. Phd dissertation, Nicolas Pascal, 2013 Page 268 / 351!
The use of benefit transfer for ecosystem direct use services (fisheries, underwater tourism, etc.)
and indirect (coastal protection, etc.) seems to require precise comparison at the ecological level
whereas for non-use values the data comparison is merely on socio-demographic variables. The
collection of the ecological data to estimate the ecosystem productivity or mechanical function
seems more difficult to obtain but relatively easily transferable. The economic data needed to value
the amount of goods being extracted or the infrastructure protected is generally relatively easily
available but context specific. In this regard, consistency, breadth and depth of coral reef economic
valuation information from the Pacific are improving, but remain in the early stages. The transfer of
information from one site to another can be particularly complex in the Pacific due to highly
variable governances, property rights systems, and cultural norms and the emergent nature of many
of the economies of the region. The great number (400–600) of Marine Managed Areas (MMAs) in
the region have not yet been classified by any potentially useful strata (e.g., fishing activity, tourism
activity, proximity to formal market or population centre, size, size of resident human population,
age of MMA, evidence of active management, customary tenure) in order to better guide the
transfer of values or appropriate categories for meta-analysis. Locating good natural experiments
(comparable with and without MMA scenarios) is quite complicated and generally open to criticism
no matter what focal dimensions are identified for common comparison.
Several necessary conditions should be met to perform effective and efficient benefit transfers.
Several authors have identified these conditions ((Brander et al., 2007; Morrison and Bennett, 2004;
Rosenberger and Loomis, 2001) (Wilson and Hoehn, 2006)) focusing mainly on the policy context,
the availability and quality of transfer data (the garbage-in, garbage-out factor), the robustness of
statistical interferences from an adequate number of individual studies and the research methods
used. Some of the previous studies have tested the convergent validity and reliability of different
benefit transfer methods and the general indication is that in some cases, benefit transfer can
produce tailored values very similar to the true values but, in other cases the disparity between the
true value and the tailored value was quite large (in excess of 800% difference).
'%.%>2+&#B-$&1!#.B6$(#!
In general, high quality analyses require high quality data. Policy relevant studies of coral reefs
and their management require consistent ecological and economic data at the appropriate spatial
scale, measuring the most important indicators of influence and importance, over an ecologically,
economically and politically appropriate time frame. A persistent concern worldwide is the quality
and quantity of relevant ecological and economic data, particularly in developing countries. A lack
of adequate expertise and capacity to undertake economic valuation studies in developing countries
is another challenge facing decision-makers and analysts in those countries. Scientifically rigorous

Coral Reef Ecosystem Services Economic Valuation. Phd dissertation, Nicolas Pascal, 2013 Page 269 / 351!
studies are typically time consuming and expensive. Ex-post studies, for example, are dependent on
relevant data over a time series long enough to be able to say with some level of confidence whether
or not there has been a difference in the focal variables. Baseline data, essential for such analyses,
are sorely lacking in most developing countries. Time and money are commonly the most
constraining factors for decision-makers, particularly in developing countries. The Pacific is no
exception on any of these dimensions.
A lack of local data, expertise, time and money, and research that is not policy-relevant, timely,
and/or properly communicated, lead policy-makers to make poorly informed decisions or to seek
out substitute information for guidance. Potentially useful information can be gleaned from the grey
and peer reviewed literature ‘off the shelf’, or more systematic approaches such as meta-analysis
and benefits transfer can help to inform such decisions. The more similar the published case history
is to the problem at hand, the more likely the information available is useful to making better
decisions. As economic valuation approaches, measures, metrics, and indicators become
standardized across studies, the more easily they can be transferred or analysed collectively and the
more likely they are to be useful in making individual decisions.
9NSN^ A2+V$6*(+")&+,&$6+)7)*$3&)$2P(6$)&P-/1-*(+"&
The illustration of the projections of ecosystem services from the Vanuatu NPV of ecosystem
services has raised several topics. The first one is the time horizon of projections. A healthy
ecosystem will provide services and goods indefinitely. The benefits of a restoration project may
only be reaped after several years. Therefore benefits and costs will likely not be experienced at the
same time. The present value, using discounting, has permitted to compare costs and benefits over
time. We address these questions in turn.
O"$"Y"# E6/'()*.</6+e/=.
The project horizon has an important impact on the NPV of the project, because it limits the time
window during which benefits and costs are considered. The time horizon of a project depends on
its characteristics and on the useful lifetime of the investment or of the system under study. In the
case of coral reefs and mangroves, it will clearly depend on the type of management activities and
characteristics of the ecosystem. As in the Vanuatu study, most of the studies reviewed consider a
time horizon of 20-25 years (see table below). This value is often not justified explicitly, but seems
to constitute a consensus on representing enough time for changes in a coral reef or mangrove to
fully realize.

Coral Reef Ecosystem Services Economic Valuation. Phd dissertation, Nicolas Pascal, 2013 Page 270 / 351!
The choice of the time horizon to consider should be discussed directly in reference to the
ecological literature or with an ecologist specializing on the ecosystem under study. It is not clear a
priori why the analysis should not use an infinite time horizon, considering that the ecosystem
continues to deliver services and benefits. If a finite time horizon is to be chosen for more political
reasons, the study should discuss what horizon value to use (Boardman et al., 2011).
O"$"Y"$ O+-)/>=*.68*(.
The table below, adapted from François et al. (2012) presents a summary of the social discount
rates applied in the literature reviewed. It appears from this summary, as well as from additional
studies (Balmford et al., 2008; Beukering et al., 2007; OECD, 2006), that there is not a consensus
on which discount rate to apply to projects related to ecosystems. It is also difficult to discuss the
values found in the literature as they may not necessarily be nominal discount rates and the value
chosen for inflation is not provided20. All of the studies reviewed find their results to be robust to
the various discount rates they choose to apply.
There are three values of discounting that a project might try applying, the marginal rate of
return on investment (MRRI), the social marginal rate of time preference (SMRTP -- extra amount
of future consumption required as compensation by society for giving up one unit of current
consumption), and the economy-wide market rate of interest (MRI). These three rates would equal
in a perfect market, but will be different in the real economy. Although the reasoning behind the
choice of the specific discount rate used in each study is rarely discussed, it seems that the authors
have been oscillating between these three values.
The value of each of these discount rates will depend on the country in which they are being
estimated. The use of the MRRI has been criticized for being too high, as sector rates of return may
be pushed upward by market distortions and risk premiums. Using this rate would reflect the fact
that resources used for the project being valued crowd out more investment than consumption. This
may not be the case if the project is being financed through taxes and not loans. Such crowding out
is also unlikely if the resources in the economy are not being fully employed.
The SMRTP on the other hand is often considered too low, and would make the government
engage in long-term investments that provide low returns at the expense of higher-return private
projects. More problematic, however, is the fact that individuals differ strongly in their preferences
and it is not clear how these individual rates should be aggregated into a social discount rate. There
`c!8&=*%.$+&!2%&!<%)(!%!*%41(!$-,%2.!+&!.<(!)%*B(!+=!.<(!6$#2+B&.!4%.(_!"!&+-$&%*!6$#2+B&.!4%.(!+=!hu!L$**!+&*9!4(,4(#(&.!%!4(%*!6$#2+B&.!4%.(!+=!`_iiu!L$.<!%&!$&=*%.$+&!4%.(!+=!au_!\$.<+B.!.4(%.$&1!$&=*%.$+&!%&6!6$#2+B&.$&1!#(,%4%.(*9?!.<(!6$#2B##$+&!+=!6$#2+B&.!4%.(!)%*B(#!K(%4#!*$..*(!-(%&$&1_!

Coral Reef Ecosystem Services Economic Valuation. Phd dissertation, Nicolas Pascal, 2013 Page 271 / 351!
is also evidence in the economic literature that individuals are not always consistent and rational
(Frederick et al., 2002), questioning the reliability of such discount rate estimates.
Like the MRRI, the MRI may be biased upward due to market failures. This rate would not be
appropriate if the projects were funded by taxes, and the government may not be able to borrow at
an unchanging real interest rate.
It is not clear what the value of each of these three values might be on average in a specific
country. Several studies have used the opportunity cost of capital recommended by the World Bank
(e.g. 10% for Indonesia), as it may not be possible to use the before tax return on corporate bonds in
(small) developing countries. Based on the reviewed literature, it seems that the SMRTP is much
lower than the opportunity cost of capital, however, in the range of 2 to 6%.
Some economists have also advised using the discount rate recommended by oversight agencies
of the country’s study, to facilitate the comparison of the results to other projects in the country.
In the case of long-term ecosystem management projects, it has also been argued that the
discount rate should be lowered to take into account future generations, or as in the case of the
climate change literature, that a time-declining discount rate be used. It is not clear that this
approach is appropriate or necessary, however, and it may be better to carefully incorporate all
important environmental effects and values into the analysis (Barton, 1994).
The choice of an exact discount rate is ultimately political. Based on the Pacific experience,
however, it seems reasonable to use a main value centred on the opportunity cost of capital or the
rate recommend by the country’s government if any (8-12%), and to evaluate the sensibility of the
study around this value between the SMRTP (2-4%) and a higher private short-term MRRI (15%).
Other approaches presented in the Vanuatu study have appeared to be useful. The graphical
variation of the NPV on the discount rate through the sensitivity analysis, and calculating the
internal rate of return (value of the discount rate for which the NPV is zero) have provided a
different perspectives on the discount rate discussion.
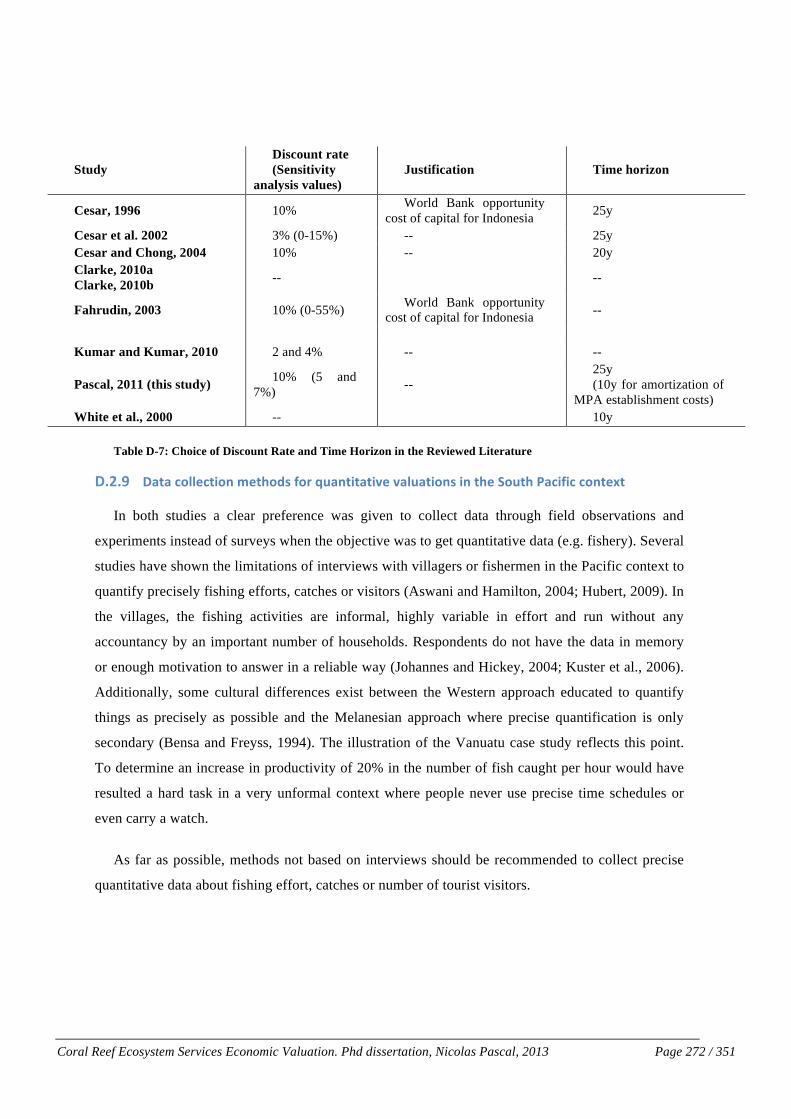
Coral Reef Ecosystem Services Economic Valuation. Phd dissertation, Nicolas Pascal, 2013 Page 272 / 351!
Study Discount rate (Sensitivity
analysis values) Justification Time horizon
Cesar, 1996 10% World Bank opportunity cost of capital for Indonesia 25y
Cesar et al. 2002 3% (0-15%) -- 25y Cesar and Chong, 2004 10% -- 20y Clarke, 2010a Clarke, 2010b -- --
Fahrudin, 2003 10% (0-55%) World Bank opportunity cost of capital for Indonesia --
Kumar and Kumar, 2010 2 and 4% -- --
Pascal, 2011 (this study) 10% (5 and 7%) --
25y (10y for amortization of
MPA establishment costs) White et al., 2000 -- 10y
Table D-7: Choice of Discount Rate and Time Horizon in the Reviewed Literature
9NSN_ 9-*-&6+//$6*(+"&3$*Q+#)&,+2&X1-"*(*-*(P$&P-/1-*(+")&("&*Q$&@+1*Q&A-6(,(6&6+"*$%*&
In both studies a clear preference was given to collect data through field observations and
experiments instead of surveys when the objective was to get quantitative data (e.g. fishery). Several
studies have shown the limitations of interviews with villagers or fishermen in the Pacific context to
quantify precisely fishing efforts, catches or visitors (Aswani and Hamilton, 2004; Hubert, 2009). In
the villages, the fishing activities are informal, highly variable in effort and run without any
accountancy by an important number of households. Respondents do not have the data in memory
or enough motivation to answer in a reliable way (Johannes and Hickey, 2004; Kuster et al., 2006).
Additionally, some cultural differences exist between the Western approach educated to quantify
things as precisely as possible and the Melanesian approach where precise quantification is only
secondary (Bensa and Freyss, 1994). The illustration of the Vanuatu case study reflects this point.
To determine an increase in productivity of 20% in the number of fish caught per hour would have
resulted a hard task in a very unformal context where people never use precise time schedules or
even carry a watch.
As far as possible, methods not based on interviews should be recommended to collect precise
quantitative data about fishing effort, catches or number of tourist visitors.
&

Coral Reef Ecosystem Services Economic Valuation. Phd dissertation, Nicolas Pascal, 2013 Page 273 / 351!
9NSNO` A2(+2(*7&*+&3-R$&kP()(./$l&-//&*Q$&$6+)7)*$3&)$2P(6$)&
The valuation of the bio-prospection ES is an illustration of the valuation of a potential service.
As no market value exist in New Caledonia, neither other techniques such as consumer surplus were
available, a business model has been developed. The computational complexity, the estimates of
many variables and the lack of transparency in many existing financial transactions were
challenging in the valuation exercise. The output is to have generated results that give an indication
of the potential of the services even with an important difference between minimum and maximum
value.
The same applies to other ecosystem services. For example, for pelagic fisheries, the proportion of
reef species in the diet of pelagic represents a proxy of the contribution of the reef. However, it is
doubtful that the diet coming from reef fish would not have been substituted by other species from
other ecosystems. For coastal protection, it is important to emphasize too the exploratory nature of
the approach. We evaluate large-scale damage potential by simplifying a lot of variables
(infrastructure, urban planning, residential building typology, ...). In addition other key attributes in
the precise role of the reef such as the attributes of distance between the reef and the coast line, the
height of the water column above the reef (with tidal coefficients), the amplitude and continuity of
the strip reef are not taken into account. In our model it was considered that all the reefs of New
Caledonia act in a uniform and homogeneous way as an absorber of wave energy. This hypothesis,
justified by the extension of the barrier reef and fringing reef, is an oversimplification of reality.
9NSNOO @$")(*(P(*7&-"-/7)()&
The sensitivity analysis is a very important part of the analysis, and results have little legitimacy in
its absence. Uncertainties are inherent in all aspects of the valuation process and non-intensive
sensitivity analysis techniques should be used to identify those inputs that generate the most
sensitivity. In the Vanuatu study, we conduct a sensitivity analysis of four major parameter
assumptions, including the discount rate, by changing them sequentially and looking at the impact
on the results. For each assumption we use a minimum and maximum value around the chosen best
estimate. In the New Caledonia study we consider the same approach of minimum and maximum
values but no sensitivity analysis was made. Other techniques include to calculate the standard
deviations for the parameter estimates and calculates variations in the NPV from reducing the future
number of tourists and the fishing yields (Fahrudin, 2003), Cesar and Chong (2004) use two
scenarios to capture the uncertainty surrounding many of the relationships between coral bleaching
and coral mortality and ecosystem services and the recovery rate of reef areas after widespread
mortality. The first, optimistic scenario assumes that damage to the reef is not too bad and recovery
is relatively quick, while the second, negative scenario assumes that damage is great and there is
very slow or no recovery, with the result that long-term impacts are severe. Sathirathai and Barbier

Coral Reef Ecosystem Services Economic Valuation. Phd dissertation, Nicolas Pascal, 2013 Page 274 / 351!
(2001) only test for sensitivity in the demand elasticity in fish and shellfish markets, computing the
NPV for a range of demand elasticity. Ruitenbeek (1994) focuses his analysis on ecological
uncertainties in mangroves using scenarios. He studies the same management options (from clear
cutting to protection) for different assumptions on the strength in the links between human
activities, ecosystem physical characteristics and ecosystem services. Cesar (1996) also considers
two scenarios, labelled high and low, that consider systematically positive or negative values of the
parameters around the chosen best estimates. He justifies qualitatively the lack of sensitivity
analysis by the fact that large margins exist between the estimated benefits to individuals and the
costs to society. He explains that “even considerably higher benefits would not alter the broad
picture” and that the base case assumptions are conservative.
The method we employed with minimum-maximum value has two major limitations. First, it does
not take into account the probability of the minimum and maximum values to happen, which may be
low as they require the joint occurrence of a large number of independent low-probability events. It
also does not provide information about the variance or volatility of the distribution of the realized
net benefits. In particular, in the presence of two similar policies in terms of outcome this method
will not be able to inform the decision, while knowledge of the variance would allow choosing the
policy with the smaller variance. Following the conclusions from different authors (Cousens et al.,
2002; Smith, 2002), the Monte Carlo analysis does not have these limitations and should be
preferred. Cares about the choice of the probability distribution function and parameters are
necessary. Nonetheless this method implicates the existence of a production function for the ES,
which, as described before, is far from being frequent in coral reef ecosystems.
&

Coral Reef Ecosystem Services Economic Valuation. Phd dissertation, Nicolas Pascal, 2013 Page 275 / 351!
9NT A+/(67&(",/1$"6$&
As described in the introduction, the two case studies can potentially address one or several
policy related objectives from among the following (Laurans et al., 2013): (i) “decisive” valuations
to allow an ex-ante choice or ex-post appraisal over a given set of options by weighing the ecologic
and economic consequences of those options; it is a way to incorporate the present and future values
of negative and positive externalities with a common metric and provide ‘correct’ signals (Campbell
and Brown, 2003; Whitten and Bennett, 2004); (ii) “technical” valuations to “fine tune” economic
instrument internalizing “externalities”. For example, it may provide the price baseline for
negotiation in the setup of a payment for ecosystem services, user fee or environmental taxes
(Chevassus-au-Louis et al., 2009; Engel et al., 2008; Meignien and Lemaître-Curri, 2010; PNUE,
2004); and, (iii) “informative” valuations to raise awareness among decision-makers and the public
regarding the condition of environment. Based on the general recognition that “money talks”, their
role is to strengthen the support to environment and resource management actions. At the same
time, they can be part of a monitoring routine to inform management with economic indicators (“we
manage better what we can measure”) (Beukering et al., 2007a; David et al., 2007; Pascal et al.,
2008).
9NTNO ;("-"6(-/&("#(6-*+2)&
In Vanuatu, the positive NPV and ratios of B/C greater than 1 for all the studied MPAs
demonstrates that investment in marine reserves, in addition to conserving coral reefs, is an effective
means to encourage local economic development in nature-dependent communities. This finding
may provide information to decision-makers about investment in marine reserves as a conservation
and development tool for local populations.
The NPV reports the total difference between benefits and costs in monetary terms. It reflects
therefore an absolute measurement of the MPA investment net benefit or cost, whereas B/C ratio
and ROI are relative measurement of the investment’s benefits and costs. The B/C ratio and ROI are
used here to demonstrate if the investment in MPA is “worth it” by showing the ratios between
benefits and costs.
To our knowledge, the juxtaposition of measures of local financial returns (RoI) and of broader
economic measures of project net benefits (NPV, B/C ratio) to bridge the gap between incentives for
local stewardship on one hand and total economic value on the other, has been very little used in the
environmental economics scientific literature. By comparing it with the B/C ratio, the indicator RoI
provides less complete information, leaving aside benefits not presents in markets (ES 4 to 6).

Coral Reef Ecosystem Services Economic Valuation. Phd dissertation, Nicolas Pascal, 2013 Page 276 / 351!
The RoI was intended to highlight the cash flows for the local economy in additional fisheries
and tourism, which represent both concrete sources of local cash incomes and implicit income
through harvested foodstuffs.
In a similar way, the RoI may be a suitable indicator for the usual ex-post valuations of
investments from multilateral agencies such as development banks (Mangos and Rojat 2008). It
indicates that the development stage of the village fishery and tourism sectors must be added as one
of the variables in the MPA investment decision process (Tisdell 1993, Hoagland et al. 1995). The
RoI has shown too that not all the investments in MPAs have been recuperated after the 6-8 first
years of MPA implementation and some precautions must therefore be taken in the optimal amount
to be invested.
Focusing on flows of observable impacts may complement the B/C ratio with results easier to
understand. Financial decision-makers (e.g. public finance, private equity sector), accustomed to the
financial tools (Arrow et al., 1996) may feel more comfortable to base their budget allocation trade-
offs on these type of results. As highlighted by several authors (de Wit et al., 2012; Naidoo et al.,
2008) it is important to prove that public investments in natural assets provide yield with adequate
returns, as do investment in other infrastructure and services such as housing and education.
9NTNS C.)$2P$#&(",/1$"6$&+"&4+/(67&3-R$2)&
We will now discuss the incorporation of the results from each study in decision-making
processes in New Caledonia and Vanuatu. For New Caledonia, several meetings were held with
managers and decision-makers from different institutions of New Caledonia (Environment,
Fisheries, Tourism, Economy, conservation NGOs and mining industries). Meetings were held
between the 3 and 18 months following the finalization of the study. Concretely a first meeting was
organized to present specifically the outputs of the study (La Foa, June 2009, Comité local Ifrecor),
a second one was part of a workshop on mining impacts (atelier de restitution, « effets résiduels et
mesures compensatoires », 26-27 April 2010, Province Sud et Valeinco) and the third one was part
of a general South Pacific conference about coral reef economics (‘Investing in coral reefs: Is it
worth it?,’ 22-26 November 2010, CRISP-SPC, IUCN, SPREP) during a special session with
decision makers from New Caledonia.
All participants were asked about concrete uses they have made with the study results or think
they will make in the near future. The main applications that have been identified are the following:
(i) Use the results to refine the value of fines or offsets imposed for the ex-ante or ex-post
destruction of reef and mangrove at small scales (e.g. individual real estate or warf
projects). Several stakeholders identified this role.

Coral Reef Ecosystem Services Economic Valuation. Phd dissertation, Nicolas Pascal, 2013 Page 277 / 351!
(ii) Justify and convince budget guidelines. This corresponds precisely to one experience
reported by a provincial environment agency when negotiating annual budget dedicated
to environmental protection of coral.
(iii) Complete the Environmental Impact Assessments (EIA) mandatory for all major
activities with impacts on the coast. These EIA allows to quantify the surface and type of
impact, but do not define any method for ES quantification or valuation. Some of the
environmental agencies plan to incorporate the identification and categorisation of ES
described in the study in a revision of the legal framework about offset compensation.
(iv) Provide a basis of cost-effectiveness of different management policies by comparing the
gains, losses and expected costs of each of these policies. There is however a potential
use that has not been realized.
(v) The results were incorporated in a report (Brelaud et al., 2009) about natural capital
requested by the AFD (Agence Française de Développement) and the IAS (Institut
Agronomique néo-Calédonien). The objective was to analyse the sustainability of
development through the incorporation of the value of ecosystems services in national
accounting systems (similar to the Wealth Accounting and Valuation of Ecosystem
Services proposed by the World Bank). Focus was put on non-renewable resource
affected by mining activities and only the fishery ES was included in the study. Other ES
were not accounted because our results were not available or methodology not
compatible with their approach.
For Vanuatu, restitution of results were held with (i) stakeholders from the villages (chiefs,
church representatives, fishermen and members from the committees of women, elders, youth,
tourism and environment), (ii) national stakeholders from fishery, environment and cultural
agencies and (iii) the French development bank (AFD) and a bilateral agency, FFEM (Fonds
Français pour l’Environnement Mondial).
The meetings were held individually or in groups during the 6 months after publication of the
technical reports and presentation of results.
(i) The main application for the stakeholders from the villages was to dispose of concrete
arguments to take into account the importance of natural resources to generate cash
flows for their community. It was used also as additional arguments to establish or
maintain a protected area. However, in most of the communities, these arguments have
been observed to be “forgotten” when they have to face pressures from commercial
fishermen or real estate developers.

Coral Reef Ecosystem Services Economic Valuation. Phd dissertation, Nicolas Pascal, 2013 Page 278 / 351!
(ii) Very few concrete impacts have been observed from institutional national decision-
makers. The importance of the results was acknowledged but few concrete actions were
expected to derive from the study. Results were more considered as “inform and
convince” about the relevancy of the establishment of networks of MPAs co-managed
by communities at a large scale. Even if a consolidated study has still to be made at a
regional scale, results from the study have permitted the comparison at a local scale of
the costs and benefits between the classic top-down approach and the bottom-up
approach. This has resulted in an increased interest from government and non-
government stakeholders in the development of community based management. Yet,
Pacific states’ budgets are often too modest to fully support such projects, and the
involvement of private donors – foundations or international NGOs – is generally
indispensable for developing networks of MPAs.
(iii) The third category of stakeholders (development banks and multilateral agencies) were
mainly interested in the social analysis of distribution of benefits. The general results
confirmed their knowledge about investment in natural capital and reinforce their
position to justify budget allocations. From their point of view, the identification of
benefits with or without real cash flows should be the starting point for the
implementation of economic instruments internalizing them. In this case, the study has
played a double role: (1) to attract support from international donors, who are sensitive
to environmental and economic values and (2) to guarantee a form of accountability of
their actions towards their board and contributors.
To our knowledge, very few studies have highlighted concrete applications of economic
valuation in decision-making process.
A recent one was conducted in the Caribbean (Kushner et al., 2012) to get a picture of the
influence of past coastal valuations and to identify the key “enabling conditions” for valuations to
influence policy, management, or investment decisions. It is based on semi-structured interviews
with more than thirty marine conservation and valuation experts (in countries where coastal
valuations had been conducted). They found the following concrete cases of influence (quote): “ (i)
Belize saw both policy making and fruitful NGO advocacy as a result of valuation, including a
damage assessment, a campaign against offshore oil drilling, a ban on bottom trawling, the full
protection of parrot- fish, and the protection of grouper spawning sites. (ii) The Bonaire Marine
Park adopted, and later increased, user fees—making it one of the few self- financed marine parks in
the Caribbean. (iii) The Man of War Shoal Marine Park in St. Maarten was established as the
country’s first national park. (iv) The Florida Keys National Marine Sanctuary recovered millions
for reef restoration after ship groundings—just one of several U.S. examples”.

Coral Reef Ecosystem Services Economic Valuation. Phd dissertation, Nicolas Pascal, 2013 Page 279 / 351!
Another study is the “Valuation of Ecosystem Services and Strategic Environmental Assessment.
Lessons from Influential Cases “ from Slooteg at al. (Slootweg and Beukering, 2008). Based on a
selection of 10 examples from compensation of oil spill to cost-benefit analysis of project
development through Payment for ecosystem services, the impacts on policy making were assessed
for each of them. The choice in the selection of the case study is not discussed and surely has
generated a bias towards successful studies. The impacts observed have been:
(i) Affect the design of the intervention project such that costs and benefits are traded off in
a rational manner through identification of relevant ecosystem services and stakeholders
(ii) Change the language of decision-makers who, instead of declaring conservation-worthy
“no-go” areas, emphasises on the value of the ecosystem services for society showing
that biodiversity conservation makes economic sense. In other case study, it contributed
to the recognised need for a precautionary approach and a strict environmental
management plan.
(iii) To define the reference values of economic instruments. In cases where money was the
key issue, economic valuation was a central tool. Examples are the penalties in the
Exxon Valdez case, compensation payments in the Costa Rica PES case, and
management fees in the Antilles case.
Another concrete application of ESV was observed through personal experience in Honduras. The
author conducted a study to evaluate the potential of financing for a natural park in Honduras
(Pascal et al., 2013). This study was based on an economic valuation of ES in the perimeter of the
Park with a clear identification of beneficiaries (Pascal et al., 2012). Three ES (sediment trap
(mangroves), carbon sequestration (mangroves) and tourism) were identified with a potential to
generate incomes through the setup of a PES instrument or other “beneficiary payer” scheme. Based
on these reports, first meetings between potential sellers and buyers are organised.
Nonetheless, all the authors of the 2 studies described before report in their conclusions that
there is a general feeling that the great potential of impact of such studies is not used to the full
benefit. (“few valuations have actually had a positive influence on conservation and management-
oriented policy, legislation, or investment in the region” (Kushner et al., 2012)).
In the same way, we showed above that the 2 presented CRESVs have mostly targeted an
“informative” role rather than a specific decisive influence or a technical role. In the case of
informing decision-making in general, influence is not easily measured, both because the processes
are multi-criteria, and because environmental decision-making as a whole is a diffuse process, from
inter-governmental negotiations to individuals’ behaviour. Moreover, there may be a time gap
between the economic assessment and the management decision. For example a CRESV study may
Coral Reef Ecosystem Services Economic Valuation. Phd dissertation, Nicolas Pascal, 2013 Page 280 / 351!
influence public policy only several years after its publication. In that perspective, the effectiveness
of CRESVs to convince decision-makers has been somehow uneven. According to the conclusions
of a recent meeting in the Pacific attended by more than a dozen economists (Seidl & Pascal, 2011)
and recent experiences in Honduras and Colombia (Pascal et al., 2012), there is a perception that the
influence of CRESV results in regional, national and local policy decisions and in practical
implementation of measures is still low.
In the next part we will address some of these issues to help the understanding of this apparent
lower-than-expected impact.
O":"$"# S/b(6.+5L8)*-.*<8=.(ZL()*(B.
Too often economic valuation is touted as the answer when we don’t really know what the
question is. Economics helps us mostly to understand how to manage people, not the environment.
Economic research helps us to understand the influence of different states of the environment on
people. Economic valuation of coral reef management is driven out of an assessment of the stocks
and flows of ecosystem services derived from coral reef.
In part due to the differing motivations of the valuation studies and the tools employed, research
results are not always policy relevant. There is an observed tendency for the economic valuation
hammer to be wielded to fix all manner of development challenges. There seems to exist a
consensus to fully recognize the power of economic valuation information. However, many
economists caution that economic values are only part of the information set needed to inform
decision-making and that some decisions do not depend on economic information or economic
policy instruments. For example, in persuading local communities, other approaches appear to be
more effective than estimating TEV. Territorial management and customary governance
strengthening are often cited as more convincing (Govan, 2009). In the same way, it seems
important to consider what level of aggregation is appropriate. It may not always be possible or
expedient to monetize all costs and benefits and it may not be desirable to aggregate all measures
into a single value (Schaffer, 2010; Sen 1995). This view is generally referred to as multiple account
benefit cost analysis. In this view, the goal of CBA is to focus and inform, not to resolve, public
policy debates. CBA then serves as an accounting framework rather than a decision-making
criterion (Morgenstern, 1997).
This approach should also not be divorced from the social approach (Gadrey 2005; Azqueta
Sotelsek and 2007, Boyd 2007; Diaz-Balteiro and Romero 2008; Faber 2008) at the risk of
presenting only a dimension of reality. Approaches show that environmental economic value is only
one way to define and measure value in a cultural and social context (Ostrom et al. 1999). So
although both studies have attempted to take into account the importance of the resource for food

Coral Reef Ecosystem Services Economic Valuation. Phd dissertation, Nicolas Pascal, 2013 Page 281 / 351!
security or as a factor of social cohesion, the results are only part of the value that people place on
services rendered by reefs.
A major concern among planners and decision makers is the time and costs involved in
environmental assessment; similarly so for valuation studies. Fully-fledged valuation studies are
thought to be time consuming, as large amounts of data need to be collected (Seidl et al., 2011). The
practise of environmental assessment has shown that it can be done at any required level of detail,
varying from a “back-of-an envelope” assessment to a comprehensive Stern-like evaluation (Stern,
2006). Nonetheless, the divide between the worlds of environmental economy and environmental
assessment has been highlighted by several authors (Slootweg and Beukering, 2008). Economists
often are not aware of the environmental assessment instrument and the opportunities provided by
this tool to embed their methods and knowledge in a planning context and decision-making process.
In an environment with a pressing need for policy relevant information, there is a particular
premium on appropriately crafted applied science, potentially at a cost or loss to more pure
(‘bench’) scientific inquiry. In the policy context, more (costly) information is better only insofar as
it may help decision in favour of one decision over another and the differences due to the decision
are more valuable than the cost of providing the information. This is an essential difference between
science to inform policy and science to advance knowledge. Too often researchers are concerned
with finding ‘the truth’ when such precision is neither necessary nor useful. In many policy
contexts, the cost in time and budget that it takes to go from broad accuracy to robust precision is
too high. This has been termed the ’80-20’ problem or solution, depending on one’s perspective.
The rule of thumb states that takes 20% of the time and budget to get an 80% accurate solution and
the remaining 80% of the budget and time to get to the 100% solution.
There is a perceived need to be able to communicate research results to at least three audiences:
academics, policy-makers with opinion-formers, and the public, including the business community,
in this environment. Each audience requires a message and a media support specific. For instance,
specialized report on communication strategy conclude that messages about the value of
biodiversity to the general public should not be based on economic terms but more on affective
links (Futerra sustainibility communication, 2010). The underlying reason seems to be that people
will protect nature because they want to, not because they have to. Different messages are designed
for policy makers or opinion formers. Similarly, the Stern Review case teaches us that the one who
conveys the message also makes a difference in the impact of the study.
&

Coral Reef Ecosystem Services Economic Valuation. Phd dissertation, Nicolas Pascal, 2013 Page 282 / 351!
9NTNT ?@F&-"#&6+34$")-*(+")&&&
Cautions must be given when communicating results of CRESV performed at a large scale (e.g.
territory, island level). The results are not directly transferable to studies on a small scale. Some
values represent very heterogeneous uses and their mean values calculated may be very different
from reality. The illustration of subsistence fisheries is relevant where catches may differ greatly
even between two neighbouring tribes (Guillemot et al., 2009; Rocklin, 2006).
Even keeping this caution in mind, compensation has been identified by many of the decision-
makers interviewed as one of the most direct application of the CRESV of New Caledonia. It is
therefore important to describe the process underlying a compensation scheme and identify when
CRESV can be incorporated. Adapted from a recent work in which the author has participated
(François and Pascal, 2012) comparing the U.S. and French Frameworks and Practices for Ex-ante
and Ex-post valuation of Impacts and Compensation on Coral Reef ecosystems, the conclusions
about insertion of economic valuation in offset are the followings:
(i) While some legislation restrict the use of economic valuation methods outright, most
regulations do not restrict their use. Yet wherever feasible, resource trustees attempt to
use a service-to-service (or resource-to-resource) scaling approach. In the U.S., while
the regulations direct the trustees to examine value-to-value scaling methods, they are
rarely used in practice. Indeed, value-to-cost, which is specified as the least preferred
approach in the Oil Pollution Act regulations, is more commonly employed than the
value-to-value method.
(ii) Economic valuation methods are sophisticated and can be used to generate reasonably
accurate case-specific estimates of damages. They have drawbacks, however, that limit
their use in the practice of compensation. They generally require extensive data, which
may simply not be available, especially for small impacts. They are time consuming,
expensive, and most trustee agencies have few staff members spending time on damage
assessment and recovery, and several have no personnel who regularly dedicate time to
these activities. In addition, most of the agency personnel devoted to damage programs
are natural or physical scientists, with few economists. Overall, the use of economic
valuation methods therefore tends to lengthen the time between the impact and the
implementation of compensatory measures, which tends to reduce the amount of
compensations awarded, and make it less likely that temporal losses of ecosystem
services and the costs of the assessment itself will be covered. Expensive methods will
only be worth it on major impacts, but are out of the question on the majority of small
and medium impacts. In the same way, the Compensation for the loss of direct non-
market, indirect and non-use ecosystem services from an oil spill is the result of a

Coral Reef Ecosystem Services Economic Valuation. Phd dissertation, Nicolas Pascal, 2013 Page 283 / 351!
decision-making process involving numerous agents with different and sometimes
opposite objectives. In many cases already there are no claims for compensation of strict
ecological damages because of the anticipation that the expected costs of the procedure
outweigh the expected benefits. Considering that the complexity of most economic
valuation methods, variability in their implementation, and the many assumptions they
rely on make them particularly prone to this type of haggling, they are not seen as
desirable (Hay and Treyer, 2006). Therefore, although more damages may be claimed
by using economic valuation methods, they come with a trade-off in terms of time and
cost, and in practice trustees favour the rapidity of the implementation of the restoration
and less drain on their resources. They give preference to valuation methods that are
faster, less costly and less information intensive, even though they may be less precise.
The cooperative nature of the damage assessment in the U.S. also works against the use
of complex and time-consuming methods. U.S. trustees prefer to use less contentious
and more straightforward methods.

Coral Reef Ecosystem Services Economic Valuation. Phd dissertation, Nicolas Pascal, 2013 Page 284 / 351!

Coral Reef Ecosystem Services Economic Valuation. Phd dissertation, Nicolas Pascal, 2013 Page 285 / 351!
?N =+"6/1)(+")&
Pacific Coral reef ecosystem face increasing challenges from market externalities and their
management is not yet adequate to ensure their conservation. In the South Pacific, as in other parts
of the world, coral reef ecosystem services valuation is seen by many as an essential instrument to
be developed.
For the South Pacific, our two valuations have demonstrated that three types of ecosystem
services constitute the major share of valuated economic benefits: tourism, coastal protection and
fisheries. Compared to other coral reef regions, monetary values for the South Pacific are generally
lower. Lower values of ecosystem services in the South Pacific can be explained by a number of
contextual factors: the remote situation leads to lower rates of tourism; relatively low population
density and low per capita income result in lower values of coastal protection, since the same
physical protection affects fewer people and less valuable property; the relatively low productivity
of fisheries and low population densities, results in lower fishery production.
CRESV in the South Pacific context are complex exercises, which face a series of specific
challenges to transmit a “right” signal about their services. The first identified point is to compare
the observed values with their "best use" value to reflect the sustainability of use. Indicators of MSY
for fishery and "sustainability indicators" for tourism have been presented while recognizing the
importance of their limitations. Similarly, the values should reflect also the potential or maximum
sustainable value for the services in the local context because, as described in the Pacific, the
development of fisheries and tourism is generally in its early stages.
The spatial distribution of services is basic to relate customer and service provider but still suffer
many knowledge gaps. The spatial identification of ecosystem processes involved in producing the
service is complicated by the large-scale dispersal affecting commonly the marine environment.
Very few studies have addressed this issue because it involves the development of important
scientific knowledge in the field of functional ecology.
Linking ecosystem indicators to levels of services is fraught with difficulty, especially for
indirect services. Ecosystem production functions similar to other production functions in
agricultural and resource economics seem to be a promising avenue to better account for these
interactions. One should be careful about the results from such modelling, however, due to the non-
linearity of ecosystems’ responses and the existence of thresholds. A qualitative classification of the
strength of the links between activity and physical characteristics of the ecosystem and then between
physical characteristics and services, is proposed.

Coral Reef Ecosystem Services Economic Valuation. Phd dissertation, Nicolas Pascal, 2013 Page 286 / 351!
CRESV has reflected so far only a small part of nature because markets can capture only a subset of
the values involved and are best at handling well-demarcated and discrete assets. Biodiversity is,
however, a system good that is not very conducive to piecemeal strategies. What is desired is not
fragmented pockets of particular ecosystem services, but the overall viability of complex systems.
The notion of insurance value for biodiversity resiliency through more stable catches for example
needs to be introduced. Ensuring that the notion of substitutability characterizing trades in offsets
does not adversely impact on ecosystem function and environmental qualities is also vital.
Specific recommendations on the realization of the exercise have been also identified. Thus we
can mention the following advices: distribute the efforts in the study beginning with valuing the
most tangible services such as calculating surplus producers and a minima values; cover as many
services to make them visible, even at the cost of losing accuracy in the assessments; include
sensitivity analyses to complement the results of the analysis and transmit their robustness; promote
direct methods of observation when it comes to collect accurate quantitative data; define the spatial
perimeter of ecosystem processes and uses of coral reefs; and use carefully the transfer benefit
approach due to the well-known cultural specificity of the South Pacific Communities.
CRESVs have demonstrated both promising results and important limitations. Based on an
impact assessment through different workshops and events, the results of the 2 reports have mostly
been used for “informative” purposes by public organisations. One concrete case has been related to
considering an ex-ante decision, where a CRESV was used to try and obtain a specific budget
allotment in New Caledonia. No other direct impact of the 2 CRESV on local choices has been
recorded so far. The impacts of other studies around the world seem to be as low as in our study.
Some explanations have been proposed to explain such a low impact. The lack of clarity of
decision-makers’ objectives prior to the study, the dilemma “science to inform policy and science to
advance knowledge” creating results often complicated and including a high uncertainty, the lack of
standardization of assessment protocols, and the cost of the concerned studies have been cited.
In addition, the lack of clear strategy for communicating the results of the studies focusing at
least three audiences: academics, policy-makers with opinion-formers, and the public, including the
business community, must be mentioned. Each audience requires a message with a different level of
quantitative results and a media support specific.
Another limit is linked to the potential unadapted use of CREVs results. Considering the ES
valuation as a valuation of the Nature or looking at using the calculated values as direct financial
amounts of compensatory measures are the most usual traps.
Coral Reef Ecosystem Services Economic Valuation. Phd dissertation, Nicolas Pascal, 2013 Page 287 / 351!
This strengthening and replication of coral reef CRESVs leads also to inevitable comparisons of
values, which, even if flawed for many possible reasons, should preferably be done and discussed,
rather than avoided and left tacit.
ES are increasingly becoming central into general discussions on coral reef management and are
likely to continue to expand their reach. From a conservation point of view, this is positive, in that it
will help advocate a better management of coral reefs ecosystems. The TEEB report (TEEB, 2010)
conclude that significant progress have been made in economic valuation over the last twenty years,
and the economic invisibility of ecosystems and biodiversity has no doubt been reduced over these
years, although a lot more needs to be done.
The next step to improve the application of information produced by CRESVs is to better inform
public and investment decisions, play a role in designing policy instruments such as PES with
beneficiaries, and be utilized in legal proceedings, negotiations, choices and local development
planning. Our analysis suggests that CRESVs are not totally ready to play such a role. A balance
between research effort for knowledge and science for policy is needed to build the credibility of
ecosystem service approaches. We see the following research focus: (i) combine direct biophysical
measurements of ecosystem processes with economic valuation to estimate the monetary value of
ES at the scale of decisions; (ii) develop non-monetary methods for reflecting human health and
security, and cultural services, and incorporating these in easy-to-use, easy-to-understand, but
rigorous tools for valuing ecosystem services; and, (iii) develop methods for identifying who
benefits from ecosystem services, and where and when they receive these benefits.
On the other side, using ES as performance measures for government, multilateral agencies and
private investments will result in improved project prioritization and increased attractiveness. This
has the opportunity to multiply the funding from conservation investments (Goldman and Tallis,
2009). The financial approach of ESV can bring concrete information about potential returns for
private sources of financing for conservation (Parker et al., ed. 2012). In the case of the impact
investment funds (Achleitner et al., 2011; Littlefield, 2011) or the Socially Responsible Investment
(SRI) funds (Van den Bossche et al., 2010), where capital is invested with the explicit expectation
of financial, social and environmental returns, the B/C ratio and the RoI are common indicators
(Littlefield, 2011). These funds may be attracted by the MPA’s financial ratios as the business case
for Vanuatu was convincingly made. Many requirements for viable and effective investment of this
type are still necessary (conservation market institutions, quantifying benefits, business models,
accounting and auditing standards) (Miteva et al., 2012) and this work is a very first step in this
promising and critical field of conservation finance.

Coral Reef Ecosystem Services Economic Valuation. Phd dissertation, Nicolas Pascal, 2013 Page 288 / 351!
&

Coral Reef Ecosystem Services Economic Valuation. Phd dissertation, Nicolas Pascal, 2013 Page 289 / 351!
;N 8""$%&&
;NO 844$"#(%&Ob&A-6(,(6&6+"*$%*&
The Pacific community is formed by 26 members. They include the 22 Pacific islands countries
(American Samoa, Cook Islands, Federated States of Micronesia, Fiji, French Polynesia, Guam,
Kiribati, Marshall Islands, Nauru, New Caledonia, Niue, Northern Mariana Islands, Palau, Papua
New Guinea, Pitcairn Islands, Samoa, Solomon Islands, Tokelau, Tonga, Tuvalu, Vanuatu, and
Wallis and Futuna) plus the Hawaiian Islands (United States of America), Australia and New
Zealand. They are scattered over one third of the globe (thirty million km# mostly ocean) and their
total population (excluding Australia and New Zealand) is about 8 million; half of which reside in
Papua New Guinea (Bell et al., 2009) . The Pacific Islands comprise 20,000 to 30,000 islands lying
south of the tropic of Cancer. They are traditionally grouped into the three divisions of Melanesia
(New Guinea, New Caledonia, Vanuatu, Fiji, and the Solomon Islands), Micronesia (Northern
Marianas, Guam, Palau, Marshall Islands, Kiribati, Nauru, and the Federated States of Micronesia,
and Polynesia (the Hawaiian Islands, Samoa, American Samoa, Tonga, Tuvalu, Cook Islands,
Wallis and Futuna, Tokelau, Niue and French Polynesia).
Extracted from the Collins atlas of the world (William Collins Sons & Co Ltd, 1995), the
region's islands are classified into two groups, high islands and low islands. Volcanoes form high
islands, which generally can support more people and have a more fertile soil. Low islands are reefs
or atolls, and are relatively small and infertile. Melanesia, the most populous of the three regions,
contains mainly high islands, while an important part of Micronesia and Polynesia are low islands.
In addition, there are many other islands located within the boundaries of the Pacific Ocean that are
not considered part of the Pacific community (Secretariat of the Pacific Community, 2007). These
islands include the Galápagos Islands of Ecuador; the Aleutian Islands in Alaska, United States; the
Russian islands of Sakhalin and Kuril Islands; Taiwan and other islands of the Republic of China;
the Philippines; islands in the South China Sea, which includes the disputed South China Sea
Islands; most of the islands of Indonesia; and the island nation of Japan, which includes the Ryukyu
Islands and the Japanese Archipelago.

Coral Reef Ecosystem Services Economic Valuation. Phd dissertation, Nicolas Pascal, 2013 Page 290 / 351!
Figure F-1: South Pacific map
&

Coral Reef Ecosystem Services Economic Valuation. Phd dissertation, Nicolas Pascal, 2013 Page 291 / 351!
;NS 8""$%$&Sb&=-2*$&#$)&2W6(,)&6+2-//($")&#$&<+1P$//$G=-/W#+"($&
Figure F-2: Répartition des grands complexes récifaux autour de la Nouvelle-Calédonie
(Andréfouët and Torres-Pulliza, 2004)
NC
2/26

Coral Reef Ecosystem Services Economic Valuation. Phd dissertation, Nicolas Pascal, 2013 Page 292 / 351!
;NT 8""$%$& Tb& 9()*2(.1*(+"& )4-*(-/$& #$& /-& P-/$12& #$)& @?& #$)& 2W6(,)& 6+2-//($")& #$&<+1P$//$G6-/W#+"($&
Carte F.3-1: Distribution spatiale des valeurs ajoutées des principaux services écosystémiques

Coral Reef Ecosystem Services Economic Valuation. Phd dissertation, Nicolas Pascal, 2013 Page 293 / 351!
Carte F.3-2: Distribution spatiale de la valeur ajoutée du service de la pêche et du tourisme
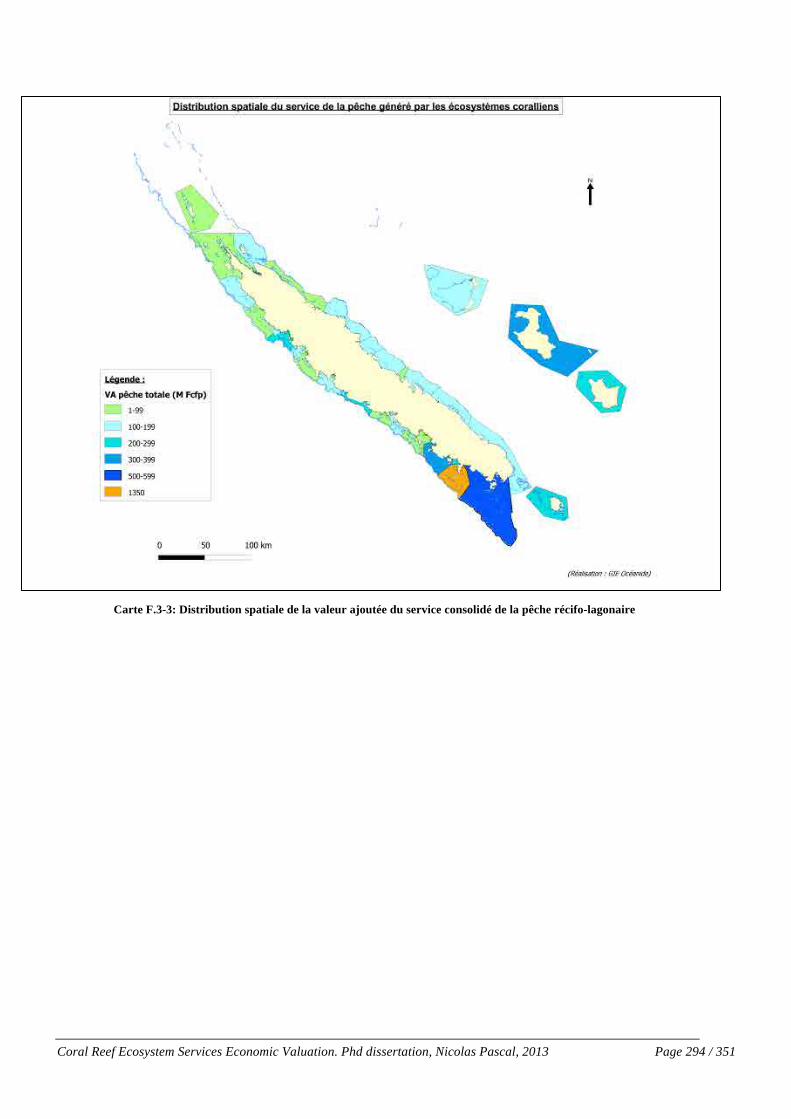
Coral Reef Ecosystem Services Economic Valuation. Phd dissertation, Nicolas Pascal, 2013 Page 294 / 351!
Carte F.3-3: Distribution spatiale de la valeur ajoutée du service consolidé de la pêche récifo-lagonaire

Coral Reef Ecosystem Services Economic Valuation. Phd dissertation, Nicolas Pascal, 2013 Page 295 / 351!
Carte F.3-4: Distribution spatiale de la valeur ajoutée du service de la pêche commerciale récifo-lagonaire

Coral Reef Ecosystem Services Economic Valuation. Phd dissertation, Nicolas Pascal, 2013 Page 296 / 351!
Carte F.3-5: Distribution spatiale de la valeur ajoutée du service de la pêche récifo-lagonnaire de loisir
Carte F.3-6: Distribution spatiale de la valeur ajoutée du service de la pêche récifo-lagonnaire vivrière

Coral Reef Ecosystem Services Economic Valuation. Phd dissertation, Nicolas Pascal, 2013 Page 297 / 351!
Carte F.3-7: Distribution spatiale de la valeur ajoutée du service du tourisme

Coral Reef Ecosystem Services Economic Valuation. Phd dissertation, Nicolas Pascal, 2013 Page 298 / 351!
Carte F.3-8: Distribution spatiale de la valeur économique du service de protection côtière

Coral Reef Ecosystem Services Economic Valuation. Phd dissertation, Nicolas Pascal, 2013 Page 299 / 351!
;NZ 844$"#(%&Zb&9$)62(4*(+"&+,&@$/$6*$#&@*1#($)&,2+3&=:8&3$*-G-"-/7)()&
Study Country Ecosystem Summary
Cesar, 1996 Indonesia Coral reef )ST! UVWXY! Z[\]^XTU! _T`Ta^VKb\UV! c`X! UVcdTS\eXT[!
c`ceYU^U!\a! a^]T!fcg\[! VS[TcVU! V\! b\[ce! [TTaUG!Z\^U\`!
a^US^`hH! TiZe\U^]T! a^US^`hH! b\[ce! f^`^`hH!
UTX^fT`VcV^\`PZ\eeWV^\`H! c`X! \]T[a^US^`h#! (cbS! \a!
VST! VS[TcVU! ^U!TUV^fcVTX!UTZc[cVTeY! a\[!SYZ\VSTV^bce!
U^VTU!\a!\`T!UjWc[T!d^e\fTV[T#!
Cesar et al.,
2002
U.S. (Hawaii) Coral reef )ST!UVWXY!c`ceYUTU!VS[TT!bcUT!UVWX^TU!^`!8ckc^^G!!
$#!8c`cWfc!;cYG!)ST!bcUT! UVWXY!\a! V\W[^UV!\]T[WUT!
b\`XWbVU! VST!0;"!\a! VST!8c`cWfc!;cY!(XWbcV^\`ce!
9[\h[cf!
/#! '^ST^! c`X! 'cFc`cZce^G! )ST! bcUT! UVWXY! a\bWUTU! \`!
VST! 0;"! \a! [TXWb^`h! TibTUU^]T! `WV[^T`VU! c`X! cehcT!
_e\\fU!^`!+\[VS!'^ST^#!
6#!'\`c!b\cUVG!)ST!bcUT!UVWXY!a\bWUTU!\`!VST!0;"!\a!
\]T[a^US^`h!ITUZTb^ceeY!a\[!VST!cjWc[^Wf!V[cXTJ#!
"`! ^`VTh[cVTX! f\XTe! XT]Te\ZTX! W`XT[! VS^U! Z[\gTbV!
a\[fU!VST!_cU^U!\a! VST!c`ceYU^U#!)ST!XY`cf^b!f\XTe!
I.0&((%! l.^fZeT! 0\[ce! &TTa! (b\e\h^bce! (b\`\f^b!
%\XTeJ!e^`dU!Tb\e\hY!c`X!Tb\`\fY#!!
Cesar and
Chong, 2004
Jamaica,
Indonesia
Coral reef )ST!ZcZT[!^`beWXTU!VS[TT!bcUT!UVWX^TU!\a!b\UVK_T`Ta^V!
c`ceYU^UG! "! Z[\VTbVTX! c[Tc! ^`! ?cfc^bcH! b\[ce!f^`^`h!
^`!-`X\`TU^cH!c`X!_eTcbS^`h!^`!VST!-`X^c`!1bTc`#!
Clarke, 2010a
Clarke, 2010b
Australia Coral reef )ST!UVWX^TU! ^XT`V^aYH!c`X! a\[!U\fT!UT[]^bTU![\WhSeY!
jWc`V^aY! c`X! ]ceWTH! Tb\`\f^b! ^fZcbVU! a[\f!
Z[\Z\UTX!bSc`hTU!V\!VST!m\`^`h!Zec`!a\[!Vk\!fc[^`T!
Zc[dU#!
)ST!UVWX^TU!c[T!]T[Y![\WhS#!)ST[T!^U!`\!X^Ub\W`V^`hH!
`\![Tce!UbT`c[^\U!c`X!`\!UT`U^V^]^VY!c`ceYU^U#!%\UV!\a!
VST!X^UbWUU^\`!^U!jWce^VcV^]T#!!
Fahrudin,
2003.
Indonesia Coral reef )ST! UVWXY! e\\dU! cV! VST! ^fZcbV! \a! bYc`^XT! a^US^`hH!
b\[ce! Sc[]TUV! c`X! V\W[^Uf! \`! b\[ce! [TTa! b\]T[H! c`X!
TUV^fcVTU!XcfchTU!_cUTX!\`!VS^U#!1`eY!aTk!XcfchTU!
c[T!VST[Ta\[T!^`beWXTX!^`!VST!c`ceYU^U#!
)ST!0;"!^U! a^[UV!b\`XWbVTX!a\[!VS[TT!U^VTUH!c`X!VST`!
TiV[cZ\ecVTX!V\!VST!T`V^[T!-`X\`TU^c`!b\[ce
Coral Reef Ecosystem Services Economic Valuation. Phd dissertation, Nicolas Pascal, 2013 Page 300 / 351!
a[\f! e^`Tc[! [TecV^\`US^ZU! TUV^fcVTX! _Y! 1[X^`c[Y!
,TcUV!.jWc[T![Th[TUU^\`U!_TVkTT`!\_UT[]TX!cbV^]^VY!
eT]TeU! c`X!b\[ce! b\]T[chT! ^fZcbV!\`! VST! VS[TT! U^VTU!
a\[! c! h^]T`! YTc[#! -V! ^U! VST[Ta\[T! `\V! beTc[! S\k! VST!
[TUWeV^`h!b\Taa^b^T`VU!c[T!`\V!_^cUTX!b\`U^XT[^`h!VScV!
VSTUT!Z[\bTUUTU!c[T!W`e^dTeY!V\!_T!^`XTZT`XT`V!a[\f!
TcbS! \VST[! c`X! a[\f! b\`a\W`X^`h! ]c[^c_eTU! Ie^dT!
TXWbcV^\`H!TiZT[^T`bTH!^`b\fT!eT]TeH!hTc[!VYZTH!TVb#J#!!
)ST!UbT`c[^\U!cUUWfT!VScV!VST!e\bce!a^UST[fT`!cXcZV!
V\!VST!e\kT[![TTa!b\]T[!c`X![TXWbT!VST^[!cbV^]^VY!In!
^fZcbV!b\`UVc`VJ!c`X!VScV!VST[T!^U!`\!US^aV!\a!ec_\W[!
_TVkTT`!cbV^]^V^TU#!
Gunawardena
and Rowan, 2005
Sri Lanka Mangrove )ST! UVWXY! W`XT[VcdTU! c`! TiVT`XTX! b\UVK_T`Ta^V!
c`ceYU^U! \a! c! f\XT[cVTeY! ec[hT! US[^fZ! cjWcbWeVW[T!
Z[\gTbV!Z[\Z\UTX!a\[!c![TecV^]TeY!Z[^UV^`T!fc`h[\]T!
Tb\UYUVTf! ^`! VST! U\WVS! \a! .[^! ,c`dc#! )ST! c`ceYU^U!
a\bWUTU!\`!VST!b\UVU!c`X!_T`Ta^VU!\a!VST!Z[\gTbVH!VST!
`Wf_T[! \a! ^`X^]^XWceU! caaTbVTXH! c`X! VST! X^aaT[T`V!
U\b^ce!h[\WZU!V\!kS^bS!VST!b\UVU!c`X!_T`Ta^VU!\a!VST!
Z[\gTbV!cbb[WT#!)ST!UVWXY!cVVTfZVU!V\!XTVT[f^`T!VST!
V\Vce!Tb\`\f^b!]ceWT!\a!VST!fc`h[\]T!UYUVTf#!
"! Ub\Z^`h! c`ceYU^U!kcU! a^[UV! W`XT[VcdT`! V\! ^XT`V^aY!
VST! dTY! T`]^[\`fT`Vce! c`X! U\b^\Tb\`\f^b! ^fZcbVU!
e^dTeY! V\! c[^UT! a[\f! VST! Z[\Z\UTX! US[^fZ! bWeVW[T!
Z[\gTbV!
Kumar and
Kumar, 2010
India Coral reef )ST! ZcZT[! cVVTfZVU! V\! ]ceWT! VST! _T`Ta^VU! a[\f! VST!
b\[ce![TTaU!^`!VST!:Wea!\a!'cbSbSS#!)ST!UVWXY!c^fU!V\!
jW^bdeY! fTcUW[T! VST! Tb\`\f^b! ]ceWTU! \a! ]c[^\WU!
h\\XU!c`X!UT[]^bTU!\a!b\[ce![TTaU!WU^`h!XcVc!VScV!c[T!
ce[TcXY! c]c^ec_eT! a[\f! X^aaT[T`V! chT`b^TU! c`X!
^`UV^VWV^\`UH! c`X! VST[Ta\[T! a\bWUTU! Z[^fc[^eY! \`!
_T`Ta^V!V[c`UaT[#!.\fT!a^TeXK_cUTX!cUUTUUfT`VU!kT[T!
b\`XWbVTX!V\!]ce^XcVT!VST!XcVc#!
Padilla and
Janssen, 1996
Philippines Mangrove )ST! ZcZT[! b\fZc[TU! VST! b\UVU! c`X! _T`Ta^VU! \a!
fc`h[\]T! Z[TUT[]cV^\`! k^VS! VS\UT! hT`T[cVTX! _Y!
ceVT[`cV^]T! WUTUH! UWbS! cU! cjWcbWeVW[T! c`X! a\[TUV[Y#!
)ST! Z[\XWbVU! c`X! UT[]^bTU! a[\f! VST!fc`h[\]T! c[T!
jWc`V^a^TX!c`X!]ceWTX!a\[!TcbS!fc`chTfT`V!\ZV^\`#!
Pascal, 2011. Vanuatu
(Pacific Island)
Coral reef )ST! UVWXY! e\\dU! cV! VST!`TV! _T`Ta^VU! a[\f! a^]T! Ufcee!
fc[^`T!fc`chTX!c[TcU!VScV!^`beWXT!c!Z[\VTbVTX!c[Tc!
cU! \`T! \a! VST^[!fc`chTfT`V! [WeTU#! )STUT! c[TcU! c[T!
Z[TUT`VTX! cU! \`T! \a! VST! fc^`! a^UST[Y! c`X! b\cUVce!
fc`chTfT`V! V\\e! cXcZVTX! V\! VST! b\`VTiV! \a! fc`Y!
9cb^a^b! b\W`V[^TU#! )ST! UVWXY! b\`U^XT[U! X^[TbVH!
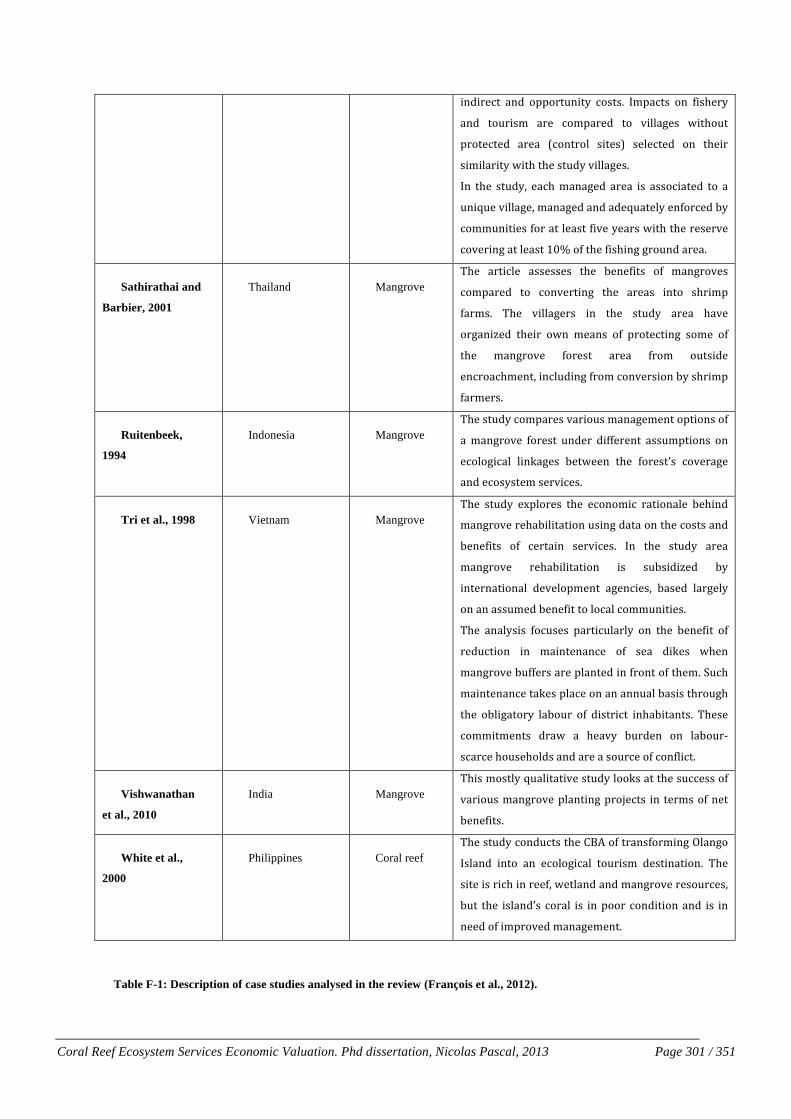
Coral Reef Ecosystem Services Economic Valuation. Phd dissertation, Nicolas Pascal, 2013 Page 301 / 351!
^`X^[TbV! c`X! \ZZ\[VW`^VY! b\UVU#! -fZcbVU! \`! a^UST[Y!
c`X! V\W[^Uf! c[T! b\fZc[TX! V\! ]^eechTU! k^VS\WV!
Z[\VTbVTX! c[Tc! Ib\`V[\e! U^VTUJ! UTeTbVTX! \`! VST^[!
U^f^ec[^VY!k^VS!VST!UVWXY!]^eechTU#!
-`! VST! UVWXYH! TcbS!fc`chTX! c[Tc! ^U! cUU\b^cVTX! V\! c!
W`^jWT!]^eechTH!fc`chTX!c`X!cXTjWcVTeY!T`a\[bTX!_Y!
b\ffW`^V^TU!a\[!cV!eTcUV!a^]T!YTc[U!k^VS!VST![TUT[]T!
b\]T[^`h!cV!eTcUV!$>n!\a!VST!a^US^`h!h[\W`X!c[Tc#!!
Sathirathai and
Barbier, 2001
Thailand Mangrove )ST! c[V^beT! cUUTUUTU! VST! _T`Ta^VU! \a! fc`h[\]TU!
b\fZc[TX! V\! b\`]T[V^`h! VST! c[TcU! ^`V\! US[^fZ!
ac[fU#! )ST! ]^eechT[U! ^`! VST! UVWXY! c[Tc! Sc]T!
\[hc`^mTX! VST^[! \k`! fTc`U! \a! Z[\VTbV^`h! U\fT! \a!
VST! fc`h[\]T! a\[TUV! c[Tc! a[\f! \WVU^XT!
T`b[\cbSfT`VH!^`beWX^`h!a[\f!b\`]T[U^\`!_Y!US[^fZ!
ac[fT[U#!
Ruitenbeek,
1994
Indonesia Mangrove )ST!UVWXY!b\fZc[TU!]c[^\WU!fc`chTfT`V!\ZV^\`U!\a!
c!fc`h[\]T! a\[TUV! W`XT[! X^aaT[T`V! cUUWfZV^\`U! \`!
Tb\e\h^bce! e^`dchTU! _TVkTT`! VST! a\[TUVFU! b\]T[chT!
c`X!Tb\UYUVTf!UT[]^bTU#!
Tri et al., 1998 Vietnam Mangrove )ST! UVWXY! TiZe\[TU! VST! Tb\`\f^b! [cV^\`ceT! _TS^`X!
fc`h[\]T![TSc_^e^VcV^\`!WU^`h!XcVc!\`!VST!b\UVU!c`X!
_T`Ta^VU! \a! bT[Vc^`! UT[]^bTU#! -`! VST! UVWXY! c[Tc!
fc`h[\]T! [TSc_^e^VcV^\`! ^U! UW_U^X^mTX! _Y!
^`VT[`cV^\`ce! XT]Te\ZfT`V! chT`b^TUH! _cUTX! ec[hTeY!
\`!c`!cUUWfTX!_T`Ta^V!V\!e\bce!b\ffW`^V^TU#!
)ST! c`ceYU^U! a\bWUTU! Zc[V^bWec[eY! \`! VST! _T`Ta^V! \a!
[TXWbV^\`! ^`! fc^`VT`c`bT! \a! UTc! X^dTU! kST`!
fc`h[\]T!_WaaT[U!c[T!Zec`VTX!^`!a[\`V!\a!VSTf#!.WbS!
fc^`VT`c`bT!VcdTU!ZecbT!\`!c`!c``Wce!_cU^U!VS[\WhS!
VST! \_e^hcV\[Y! ec_\W[! \a! X^UV[^bV! ^`Sc_^Vc`VU#! )STUT!
b\ff^VfT`VU! X[ck! c! STc]Y! _W[XT`! \`! ec_\W[K
Ubc[bT!S\WUTS\eXU!c`X!c[T!c!U\W[bT!\a!b\`ae^bV#!
Vishwanathan
et al., 2010
India Mangrove )S^U!f\UVeY!jWce^VcV^]T!UVWXY!e\\dU!cV!VST!UWbbTUU!\a!
]c[^\WU!fc`h[\]T!Zec`V^`h!Z[\gTbVU! ^`! VT[fU!\a!`TV!
_T`Ta^VU#!
White et al.,
2000
Philippines Coral reef )ST!UVWXY!b\`XWbVU!VST!0;"!\a!V[c`Ua\[f^`h!1ec`h\!
-Uec`X! ^`V\! c`! Tb\e\h^bce! V\W[^Uf! XTUV^`cV^\`#! )ST!
U^VT!^U![^bS!^`![TTaH!kTVec`X!c`X!fc`h[\]T![TU\W[bTUH!
_WV! VST! ^Uec`XFU! b\[ce! ^U! ^`!Z\\[! b\`X^V^\`!c`X! ^U! ^`!
`TTX!\a!^fZ[\]TX!fc`chTfT`V#!
!
Table F-1: Description of case studies analysed in the review (François et al., 2012).

Coral Reef Ecosystem Services Economic Valuation. Phd dissertation, Nicolas Pascal, 2013 Page 302 / 351!
;N[ 844$"#(%& [b& @*-*()*(6)& 2$)1/*)& +,&BA8& $,,$6*)& +"& =AE?)& -"#& +*Q$2& .(+/+0(6-/&("#(6$)&
;N[NO F-2(-*(+"&4-2*(*(+"("0&
Partition of the variation of the fish abundance or biomass data, using a series of RDAs and
partial RDAs, with 3 sets of explanatory variables:
• ‘reserve’ MMA (binary), distMMA (semi-quantitative) • ‘temporality’ Moon (qualitative), Tide (qualitative) • ‘habitat’ TOPO, HABI, Sand (all quantitative)
;N[NS ;()Q&-.1"#-"6$&#-*-&
Raw abundance of 5 fish families, split by size class (25 response variables):
• Ac1 Ac2 Ac3 Ac4 Ac5 Ac6 • La2 La3 La4 La7 • Le4 Le5 Le6 Le7 • Sc3 Sc4 Sc5 Sc6 Sc7 Sc8 • Si2 Si3 Si4 Si5 Si6
Partition of variation in RDA Call: varpart(Y = abo2, X = reserve, temporality, habitat) Explanatory tables: X1: reserve X2: temporality X3: habitat No. of explanatory tables: 3 Total variation (SS): 286.51 Variance: 6.2285 No. of observations: 47 Partition table: Df R.square Adj.R.square Testable [a+d+f+g] = X1 2 0.15737 0.11906 TRUE [b+d+e+g] = X2 8 0.20385 0.03624 TRUE [c+e+f+g] = X3 3 0.22907 0.17528 TRUE [a+b+d+e+f+g] = X1+X2 10 0.32351 0.13559 TRUE [a+c+d+e+f+g] = X1+X3 5 0.30425 0.21940 TRUE [b+c+d+e+f+g] = X2+X3 11 0.40910 0.22339 TRUE [a+b+c+d+e+f+g] = All 13 0.46560 0.25508 TRUE Individual fractions [a] = X1 | X2+X3 2 0.03169 TRUE [b] = X2 | X1+X3 8 0.03568 TRUE [c] = X3 | X1+X2 3 0.11949 TRUE [d] 0 0.01243 FALSE [e] 0 -0.01915 FALSE [f] 0 0.06767 FALSE [g] 0 0.00728 FALSE [h] = Residuals 0.74492 FALSE Controlling 1 table X [a+d] = X1 | X3 2 0.04412 TRUE [a+f] = X1 | X2 2 0.09936 TRUE [b+d] = X2 | X3 8 0.04811 TRUE [b+e] = X2 | X1 8 0.01653 TRUE [c+e] = X3 | X1 3 0.10034 TRUE [c+f] = X3 | X2 3 0.18715 TRUE

Coral Reef Ecosystem Services Economic Valuation. Phd dissertation, Nicolas Pascal, 2013 Page 303 / 351!
Fraction [a] corresponds to the variation explained by the ‘reserve’ variables (i.e. MMA +
distMMA) alone, after accounting for the variation explained by the ‘temporality’ and ‘habitat’
variables. Explained variation is expressed by adjusted R2 and is tested by random permutations.
The ‘reserve’ variables explain 3.2% of the variance of the species matrix, which is significant (*).
Fraction [b] corresponds to the variation explained by the ‘temporality’ variables alone : 3.6% (n.s.).
Fraction [c] corresponds to the variation explained by the ‘habitat’ variables alone : 11.9% (**).
Other fractions represent the variation shared by 2 or 3 subsets of explanatory variables and are not
testable. All variables explain 25.5% of the variation (***).
;N[NT ;()Q&.(+3-))&#-*-&
Total biomass (‘Total_Weight’) of 5 fish families: Acanthuridae (Ac), Labridae (La), Lethrinidae
(Le), Scaridae (Sc) and Siganidae (Si). Partition of variation in RDA Call: varpart(Y = bio2, X = reserve, temporality, habitat) Explanatory tables: X1: reserve X2: temporality X3: habitat No. of explanatory tables: 3 Total variation (SS): 267.36 Variance: 5.8122 No. of observations: 47 Partition table: Df R.square Adj.R.square Testable [a+d+f+g] = X1 2 0.21882 0.18331 TRUE [b+d+e+g] = X2 8 0.27726 0.12511 TRUE [c+e+f+g] = X3 3 0.10996 0.04787 TRUE [a+b+d+e+f+g] = X1+X2 10 0.46769 0.31983 TRUE [a+c+d+e+f+g] = X1+X3 5 0.28665 0.19965 TRUE [b+c+d+e+f+g] = X2+X3 11 0.38731 0.19475 TRUE

Coral Reef Ecosystem Services Economic Valuation. Phd dissertation, Nicolas Pascal, 2013 Page 304 / 351!
[a+b+c+d+e+f+g] = All 13 0.53839 0.35654 TRUE Individual fractions [a] = X1 | X2+X3 2 0.16179 TRUE [b] = X2 | X1+X3 8 0.15689 TRUE [c] = X3 | X1+X2 3 0.03671 TRUE [d] 0 -0.01001 FALSE [e] 0 -0.02037 FALSE [f] 0 0.03292 FALSE [g] 0 -0.00140 FALSE [h] = Residuals 0.64346 FALSE Controlling 1 table X [a+d] = X1 | X3 2 0.15178 TRUE [a+f] = X1 | X2 2 0.19472 TRUE [b+d] = X2 | X3 8 0.14688 TRUE [b+e] = X2 | X1 8 0.13651 TRUE [c+e] = X3 | X1 3 0.01634 TRUE [c+f] = X3 | X2 3 0.06964 TRUE
Fraction [a]: 16.2% (**)
Fraction [b]: 15.7% (*)
Fraction [c]: 3.7% (n.s.)
All variables: 35.7% (**)
;N[NZ =+"6/1)(+"&
Total biomass is mainly explained by ‘reserve’ variables, whereas abundance by size class is
mainly explained by habitat properties.
&

Coral Reef Ecosystem Services Economic Valuation. Phd dissertation, Nicolas Pascal, 2013 Page 305 / 351!
;N\ 844$"#(%&\b&A-2*(-/&598&
;N\NO ;()Q&.(+3-))&#-*-&
In a first step, I run a forward selection of the ‘habitat’ variables (except ‘temporality’ variables).
For Total biomass (‘Total_Weight’) as response dataset, I got the best model according to adjusted
R2 with Sand + Smal_Bould + Live_Coral.
Then, I performed a partial RDA with MMA + distMMA as explanatory variables and Sand +
Smal_Bould + Live_Coral as covariables. The ‘reserve’ variables explain 17.4% and the ‘habitat’
covariables 23.4% of the variation (R2). The model is significant (adj-R2 = 15.5%, P = 0.001***): > anova(res, step=10000) Permutation test for rda under reduced model Model: rda(formula = bio2 ~ MMA + distMMA + Condition(Sand + Smal_Bould + Live_Coral), data = hab2) Df Var F N.Perm Pr(>F) Model 2 1.0119 6.0283 9999 0.0017 ** Residual 41 3.4410 --- Signif. codes: 0 ‘***’ 0.001 ‘**’ 0.01 ‘*’ 0.05 ‘.’ 0.1 ‘ ’ 1
The triplot below shows that after accounting for the selected habitat variables, the binary MMA
variable is well expressed along axis 1 and the presence of MMA influences positively the biomass
of Scaridae (but negatively the biomass of Acanthuridae), whereas the biomass of Siganidae
increases with distMMA. Colour letters are sites (4 locations), red arrows are response variables and
blue arrows or centroids are explanatory variables.

Coral Reef Ecosystem Services Economic Valuation. Phd dissertation, Nicolas Pascal, 2013 Page 306 / 351!
> summary(res) Call: rda(formula = bio2 ~ MMA + distMMA + Condition(Sand + Smal_Bould + Live_Coral), data = hab2) Partitioning of variance: Inertia Proportion Total 5.812 1.0000 Conditioned 1.359 0.2339 Constrained 1.012 0.1741 Unconstrained 3.441 0.5920 Eigenvalues, and their contribution to the variance after removing the contribution of conditiniong variables Importance of components: RDA1 RDA2 PC1 PC2 PC3 PC4 PC5 Eigenvalue 0.9216 0.09032 2.7379 0.39002 0.19177 0.06961 0.05169 Proportion Explained 0.2070 0.02028 0.6149 0.08759 0.04307 0.01563 0.01161 Cumulative Proportion 0.2070 0.22724 0.8421 0.92969 0.97276 0.98839 1.00000
Only axis 1 is significant (R2 = 20.7%): > anova(res, by="axis", step=1000) Model: rda(formula = bio2 ~ MMA + distMMA + Condition(Sand + Smal_Bould + Live_Coral), data = hab2) Df Var F N.Perm Pr(>F) RDA1 1 0.9216 10.9804 999 0.001 *** RDA2 1 0.0903 1.0762 999 0.304 Residual 41 3.4410 ---
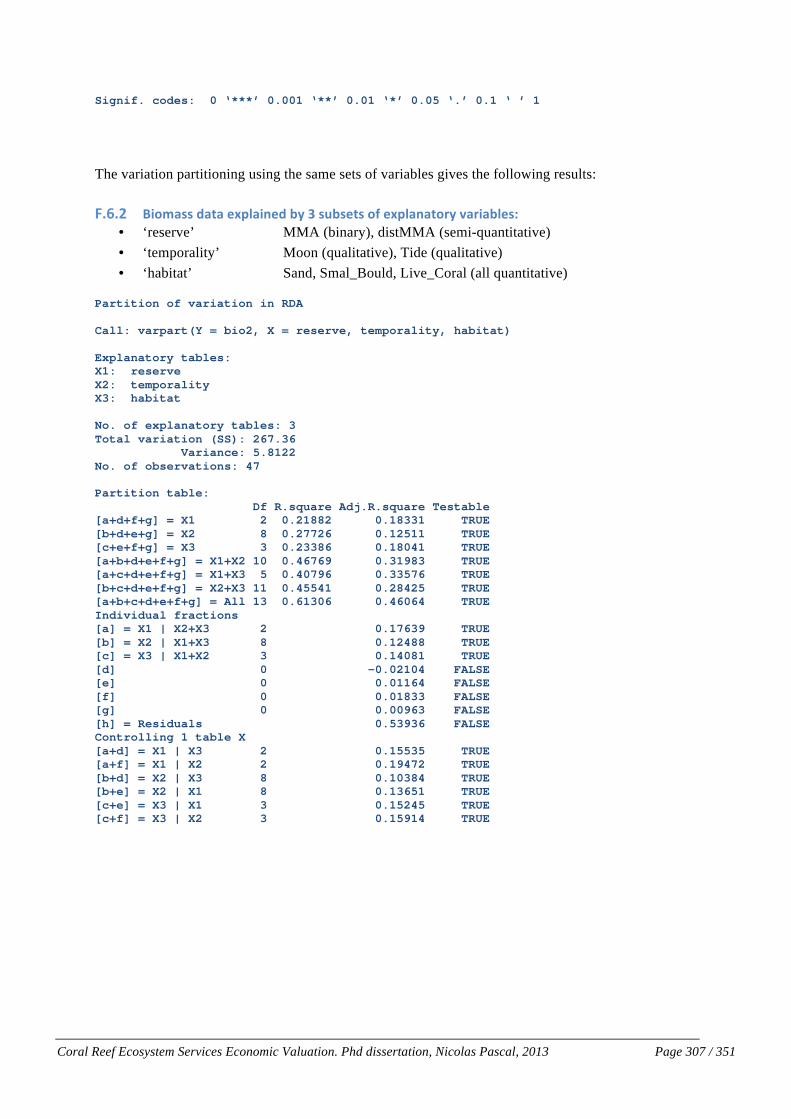
Coral Reef Ecosystem Services Economic Valuation. Phd dissertation, Nicolas Pascal, 2013 Page 307 / 351!
Signif. codes: 0 ‘***’ 0.001 ‘**’ 0.01 ‘*’ 0.05 ‘.’ 0.1 ‘ ’ 1
The variation partitioning using the same sets of variables gives the following results:
;N\NS :(+3-))&#-*-&$%4/-("$#&.7&T&)1.)$*)&+,&$%4/-"-*+27&P-2(-./$)b&• ‘reserve’ MMA (binary), distMMA (semi-quantitative) • ‘temporality’ Moon (qualitative), Tide (qualitative) • ‘habitat’ Sand, Smal_Bould, Live_Coral (all quantitative)
Partition of variation in RDA Call: varpart(Y = bio2, X = reserve, temporality, habitat) Explanatory tables: X1: reserve X2: temporality X3: habitat No. of explanatory tables: 3 Total variation (SS): 267.36 Variance: 5.8122 No. of observations: 47 Partition table: Df R.square Adj.R.square Testable [a+d+f+g] = X1 2 0.21882 0.18331 TRUE [b+d+e+g] = X2 8 0.27726 0.12511 TRUE [c+e+f+g] = X3 3 0.23386 0.18041 TRUE [a+b+d+e+f+g] = X1+X2 10 0.46769 0.31983 TRUE [a+c+d+e+f+g] = X1+X3 5 0.40796 0.33576 TRUE [b+c+d+e+f+g] = X2+X3 11 0.45541 0.28425 TRUE [a+b+c+d+e+f+g] = All 13 0.61306 0.46064 TRUE Individual fractions [a] = X1 | X2+X3 2 0.17639 TRUE [b] = X2 | X1+X3 8 0.12488 TRUE [c] = X3 | X1+X2 3 0.14081 TRUE [d] 0 -0.02104 FALSE [e] 0 0.01164 FALSE [f] 0 0.01833 FALSE [g] 0 0.00963 FALSE [h] = Residuals 0.53936 FALSE Controlling 1 table X [a+d] = X1 | X3 2 0.15535 TRUE [a+f] = X1 | X2 2 0.19472 TRUE [b+d] = X2 | X3 8 0.10384 TRUE [b+e] = X2 | X1 8 0.13651 TRUE [c+e] = X3 | X1 3 0.15245 TRUE [c+f] = X3 | X2 3 0.15914 TRUE

Coral Reef Ecosystem Services Economic Valuation. Phd dissertation, Nicolas Pascal, 2013 Page 308 / 351!
• Fraction [a] ‘reserve’ alone: adjR2 = 17.6% (P = 0.001***) • Fraction [b] ‘temporality’ alone: adjR2 = 12.5% (P = 0.026*) • Fraction [c] ‘habitat’ alone: adjR2 = 14.1% (P = 0.006**) • Fraction [a+d] ‘reserve’ without ‘habitat’: adjR2 = 15.5% (P = 0.001***) • All variables: adjR2 = 46.1% (P = 0.001***)
Strange result due to negative share variation in fraction [d]!
;N\NT :(+3-))&#-*-&$%4/-("$#&.7&S&)1.)$*)&+,&$%4/-"-*+27&P-2(-./$)b&• ‘reserve’ MMA (binary), distMMA (semi-quantitative) • ‘habitat’ Sand, Smal_Bould, Live_Coral (all quantitative)
Partition of variation in RDA Call: varpart(Y = bio2, X = reserve, habitat) Explanatory tables: X1: reserve X2: habitat No. of explanatory tables: 2 Total variation (SS): 267.36 Variance: 5.8122 No. of observations: 47 Partition table: Df R.squared Adj.R.squared Testable [a+b] = X1 2 0.21882 0.18331 TRUE [b+c] = X2 3 0.23386 0.18041 TRUE [a+b+c] = X1+X2 5 0.40796 0.33576 TRUE Individual fractions [a] = X1|X2 2 0.15535 TRUE [b] 0 0.02796 FALSE [c] = X2|X1 3 0.15245 TRUE [d] = Residuals 0.66424 FALSE

Coral Reef Ecosystem Services Economic Valuation. Phd dissertation, Nicolas Pascal, 2013 Page 309 / 351!
• Fraction [a] ‘reserve’ alone: adjR2 = 15.5% (P = 0.001***) • Fraction [c] ‘habitat’ alone: adjR2 = 15.2% (P = 0.005**) • All variables: adjR2 = 33.6% (P = 0.001***)
&

Coral Reef Ecosystem Services Economic Valuation. Phd dissertation, Nicolas Pascal, 2013 Page 310 / 351!
HN 5$,$2$"6$)&
Aalbersberg, B., Tawake, A., Parras., T., 2005. Village by village: recovering Fiji’s coastal fisheries. In World Resources 2005: the wealth of the poor: managing ecosystems to fight poverty. World Resources Institute, Washington D.C. 144-152.
Abaza, H., 2004. Environmental Impact Assessment and Strategic Environmental Assessment: Towards an Integrated Approach. United Nations Environment Programme- 86 pp.
Access Economics Pty, 2007. Measuring the economic & financial value of the Great Barrier Reef Marine Park, 2005-06. Great Barrier Reef Marine Park Authority - Research publication (Great Barrier Reef Marine Park Authority : Online) ; 88 pp.
Achleitner, A.-K., Heinecke, A., Noble, A., Schoning, M., Spiess-Knafl, W., 2011. Unlocking the Mystery: An Introduction to Social Investment. Innovations: Technology, Governance, Globalization 6, 145-154.
Ahmed, M., Chong, C.K., Cesar, H., 2005. Economic Valuation and Policy Priorities for Sustainable Management of Coral Reefs, in: Second Edition. International Consultative Workshop for Economic Valuation and Policy Priorities for Sustainable Management of Coral Reefs - WorldFish Center’s Headquarters, P., Malaysia, 8-10 December 2001. WorldFish Center Conference Proceedings 70 pp. (Ed.).
Ahmed, M., Umali, G.M., Chong, C.K., Rull, M.F., Garcia, M.C., 2007. Valuing recreational and conservation benefits of coral reefs--The case of Bolinao, Philippines. Ocean & Coastal Management 50 (1-2): 103-114.
Allain, V., Fernandez, E., Hoyle, S., Caillot, S., Jurado-Molina, J., Andrefouet, S., Nicol, S.J., 2012. Interaction between Coastal and Oceanic Ecosystems of the Western and Central Pacific Ocean through Predator-Prey Relationship Studies. Public Library of Science 7 e36701.
Alpizar, F., Carlsson, F., MartinssonA, P., 2001. Using Choice Experiments for Non-Market Valuation. Working Papers in Economics no. 52 June 2001 Department of Economics Göteborg University JEL classification: H41, D61, Q20.
Amos, M.J., 2007. Vanuatu fishery resource profiles. Apia, Samoa : SPREP, 2007 viii, 195 p. ; (IWP-Pacific Technical report, ISSN 1818-5614 ; no.49).
Andersson, J.E.C., 2007. The recreational cost of coral bleaching - A stated and revealed preference study of international tourists. Ecological Economics 62 (3-4): 704-713.
Andréfouët, S., Hochberg, E.J., Chevillon, C., Muller-Karger, F.E., Brock, J.C., Hu, C., 2005. Multi-Scale Remote Sensing of Coral Reefs. Remote Sensing and Digital Image Processing. 7: 297-315.
Andréfouët, S., Torres-Pulliza, D., 2004. Atlas des récifs coralliens de Nouvelle-Calédonie. IFRECOR Nouvelle-Calédonie, IRD, Nouméa, 26 pp. + 22 planches.
Angulo-Valdes, J.A., Hatcher, B.G., 2010. A new typology of benefits derived from marine protected areas. Marine Policy 34: 635–644.
Arin, T., Kramer, R.A., 2002. Divers' willingness to pay to visit marine sanctuaries: an exploratory study. Ocean & Coastal Management 45 (2-3): 171-179.

Coral Reef Ecosystem Services Economic Valuation. Phd dissertation, Nicolas Pascal, 2013 Page 311 / 351!
Armada, N., White, A.T., Christie, P., 2009. Managing Fisheries Resources in Danajon Bank, Bohol, Philippines: An Ecosystem-Based Approach. Coastal Management, 37: 308–330.
Arrow, K.J., Cropper, M.L., Eads, G.C., Hahn, R.W., Lave, L.B., Noll, R.G., Portney, P.R., Russell, M., Schmalensee, R.L., Smith, V.K., Stavin, 1996. Is there a role for benefit-cost analysis in environmental, health, and safety regulation? . Science 272: 221–222.
Asafu-Adjaye, J., Tapsuwan, S., 2008. A contingent valuation study of scuba diving benefits: Case study in Mu Ko Similan Marine National Park, Thailand. Tourism Management 2008;29:1122–1130. doi: 10.1016/j.tourman.2008.02.005.
Aswani, S., Hamilton, R.J., 2004. Integrating indigenous ecological knowledge and customary sea tenure with marine and social science for conservation of bumphead parrotfish (Bolbometopon muricatum) in the Roviana Lagoon, Solomon Islands. Environmental Conservation 31, 69-83.
Aubertin, C., Pinton, F., Boisvert, V., 2007. Les marchés de la biodiversité. IRD Editions, 248pp
Azqueta, D., Sotelsek, D., 2007. Valuing nature: From environmental impacts to natural capital. Ecological Economics Volume 63 1: 22-30.
Baker, A.C., Glynn, P.W., Riegl, B., 2008. Climate change and coral reef bleaching: An ecological assessment of long-term impacts, recovery trends and future outlook. Estuarine, Coastal and Shelf Science 80: 435–471 h.
Balmford, A., Rodrigues, A., Walpole, M., ten Brink, P., Kettunen, M., Braat, L., de Groot, R., 2008. Review on the economics of biodiversity loss: scoping the science. Report produced for the European Commision under contract ENV/070307/2007/486089/ETU/B2 - 60 pp.
Barbier, E.B., 2007. Valuing Ecosystem Services as Productive Inputs. Economic Policy, 49: 178–229.
Barbier, E.B., Hacker, S.D., Kennedy, C., Koch, E.W., Stier, A.C., Silliman, B.R., 2011. The value of estuarine and coastal ecosystem services. Ecological Monographs, 81(2), 2011, pp. 169–193.
Barbier, E.B., Koch, E.W., Silliman, B.R., Hacker, S.D., Wolanski, E., Primavera, J., Granek, E.F., Polasky, S., Aswani, S., Cramer, L.A., Stoms, D.M., Kennedy, C.J., Bael, D., Kappel, C.V., Perillo, G.M.E., Reed, D.J., 2008. Coastal Ecosystem–Based Management with Nonlinear Ecological Functions and Values. Science, 319: 89-98
Barker, N.H.L., Roberts, C.M., 2004. Scuba diver behaviour and the management of diving impacts on coral reefs. Biological Conservation 120: 481-489.
Bartlett, C., K.Pakoa, C.Manua, 2009. Marine reserve phenomenon in the Pacific islands. Marine Policy. Volume 33: 673–678.
Baumgärtner, S., 2007. The Insurance Value of Biodiversity in the Provision of Ecosystem Services Natural Resource Modeling, Vol. 20, No. 1: 87-127.
Beaumont, N.J., Austen, M.C., Atkins, J.P., Burdon, D., Degraer, S., Dentinho, T.P., Derous, S., Holm, P., Horton, T., van Ierland, E., Marboe, A.H., Starkey, D.J., Townsend, M., Zarzycki, T., 2007. Identification, definition and quantification of goods and services provided by marine biodiversity: Implications for the ecosystem approach. Marine Pollution Bulletin 54, 253-265.
Bell, J.D., Kronen, M., Vunisea, A., Nash, W.J., Keeble, G., Demmke, A., Pontifex, S., Andréfouët, S., 2009. Planning the use of fish for food security in the Pacific. Marine Policy, 33: 64-73 33.

Coral Reef Ecosystem Services Economic Valuation. Phd dissertation, Nicolas Pascal, 2013 Page 312 / 351!
Bensa, A., Freyss, J., 1994. La société kanak est-elle soluble dans l’argent ? . Terrain, n° 23: 11-26.
Beukering, P.v., Brander, L., Tompkins, E., McKenzie, E., 2007a. Valuing the Environment in Small Islands, in: Joint Nature Conservation Committee, P.P.J.U.T.r., 128 pages. June 2007 (Ed.), Available at http://www.jncc.gov.uk/page-4065.
Beukering, P.v., Cesar, H.S.J., Janssen, M.A., 2003. Economic valuation of the Leuser National Park on Sumatra, Indonesia, . Ecological Economics 44: 43-62.
Beukering, P.v., Haider, J.H., Longland, W., Cesar, M., Sablan, H.J.S., Shjegstad, J., Beardmore, S., Liu, B.Y., Garces, G.O., 2007b. The economic value of Guam’s coral reefs. University of Guam Marine Laboratory. Technical Report (116): 100pp.
Beukering, P.v., Haider, W., Wolfs, E., Liu, Y., Leeuw, K.v.d., Longland, M., Sablan, J., Beardmore, B., Prima, S.d., Massey, E., Cesar, H., Hausfather, Z., 2006. The Economic Value of the Coral Reefs of Saipan, Commonwealth of the Northern Mariana Islands. Department of Interior, NOAA - Technical report, 99 pp.
Beurier, J.-P., Zakovska, K., Guilloux, B., 2009. Le droit de la biodiversité marine aux îles fidji, salomon et vanuatu. Synthèse du rapport final - composante 2C - projet 2C1 Substances Actives Marines - CRISP . Available online: http://www.crisponline.net.
Boersma, P.D., Parrish, J.K., 1999. Limiting abuse: marine protected areas, a limited solution. Ecological Economics 31, 287-304.
Bolt, K., Ruta, G., Sarraf, M., 2005. Estimating the cost of environmental degradation: A Training Manual. The World Bank: environment department papers.
Bonito, V., Simpson, R., Waqairagata, F., 2012. Evaluating the performance of LMMAs in the districts of Korolevu-i-Wai, Dawasamu, and Nakorotubu. Technical report, NOAA grant: na09nos4630017, 96 pp.
Bonnemaison, J., 1986. La dernière île. Paris, Arléa/Orstom, 408 p.
Boyd, J., Banzhaf, S., 2007. What are ecosystem services? The need for standardized environmental accounting units,. Ecological Economics 63, Coastal Disasters Special Section: 616-626.
Boyer, P., 1997. La mer, espace, perception et imaginaire dans le Pacifique sud. C.O.R.A.I.L & L'Harmattan - Actes du neuvieme colloque CORAIL -ISBN : 2-7384-6014-3 • 1997 • 434 pages.
Brander, L.M., Beukering, P.V., Cesar, H.S.J., 2007. The recreational value of coral reefs: A meta-analysis. Ecological Economics 63, 209-218.
Brander, R.W., Kench, P.S., Hart, D., 2004. Spatial and temporal variations in wave characteristics across a reef platform, Warraber Island, Torres Strait, Australia. Marine Geology 207: 169– 184.
Brelaud, C., Couharde, C., Geronimi, V., d’Hotel, E.M., Radja, K., Schembri, P., Taranco, A., 2009. Capital naturel et développement durable en Nouvelle-Calédonie. Etude 1. Mesures de la « richesse totale » et soutenabilité du développement de la Nouvelle-Calédonie. Agence Française de Développement - Série Documents de travail / Working Papers Series - Document de travail n° 82 - Juin 2009.
Broustet, D., 2008. Projections de population pour la Nouvelle-Calédonie à l’horizon 2030. ISEE Nouvelle-Calédonie, Rapport technique 6 pp.

Coral Reef Ecosystem Services Economic Valuation. Phd dissertation, Nicolas Pascal, 2013 Page 313 / 351!
Bryant, D., Burke, L., Mcmanus, J., Spalding, M., 2011. Reefs at risk: A Map-Based Indicator of Threats to the World’s Coral Reefs. World Resources Institute (WRI), International Center for Living Aquatic Resources Management (ICLARM), World Conservation Monitoring Centre (WCMC), United Nations Environment Programme (UNEP).
Burke, L., 2004. Reef at risk in the Caribean: Economic Valuation Methodology. Working Paper. Washington, DC: World Resources Institute. Available online at http://www.wri.org/ coastal-capital.
Burke, L., Suzie Greenhalgh, Prager, D., Cooper, E., 2008. Coastal Capital – Economic Valuation of Coral Reefs in Tobago and St. Lucia. Working Paper. Washington, DC: World Resources Institute. Available online at http://www.wri.org/ coastal-capital.
Burns, A.F., W. C. Mitchell, 1946. Measuring business cycles, New York, National Bureau of Economic Research.
Butler, R.W., 1980. The concept of a tourist area cycle of evolution: implications for management of resources. Canadian geographer, 24:.5-12
Caddy, J.F., 2000. A fisheries management perspective on marine protected areas in the Mediterranean. Environmental Conservation 27 (2): 98–103.
Campbell, H.F., Brown, R.P.C., 2003. Investment Appraisal: Principles. Cambridge University Press, 185 pp. section 18-35.
Carpenter, S.R., Mooney, H.A., Agard, J., Capistrano, D., DeFries, R.S., Díaz, S., Dietz, T., Duraiappah, A.K., Oteng-Yeboah, A., Pereira, H.M., Perrings, C., Reid, W.V., Sarukhan, J., Scholes, R.J., Whyte, A., 2009. Science for managing ecosystem services: Beyond the Millennium Ecosystem Assessment. Proceedings of the National Academy of Sciences 106 (5) 1305-1312.
Carr, L., Mendelsohn, R., 2003. Valuing Coral Reefs: A Travel Cost Analysis of the Great Barrier Reef. Ambio 32: 78-89.
Casabonnet, H., 2007. La pêche au tazard Scomberomorus commerson aux îles Bélep (Nouvelle-Calédonie). Rapport Master professionnel - Génie des Anthroposystèmes Littoraux.
Castilla, J.C., Bustamente, R.H., 1989. Human exclusion from rocky intertidal of Las Cruces, central Chile: Effects on Durvillaea antartica (Phaeophyta, Durvilleales). Marine Ecology Progress Series 50: 203-214.
CCI, 2009. Le transport maritime touristique: audit de filière. Rapport technique CCI Nouvelle-Caléonie - Plan stratégique de développement 2006-2009, 45 pp.
Centre d’Analyse Stratégique, 2009. Approche économique de la biodiversité et des services liés aux écosystèmes. Rapports et Documents n°18, Groupe de travail présidé par Bernard Chevassus-au-Louis, La Documentation Française. 89 pp.
Cesar, H., 1996. Economic analysis of indonesian coral reefs. Environment Department, The World Bank Group, Washington, DC, 103 pp.
Cesar, H., Beukering, P.v., 2002. Economic Valuation of the Coral Reefs of Hawaii. Pacific Science 58: 231-42. .
Cesar, H., Beukering, P.v., Pintz, S., Dierking, J., 2003a. Economic valuation of the coral reefs of Hawaii. National Oceanic and Atmospheric Administration, Coastal Ocean Program. 91 pp.

Coral Reef Ecosystem Services Economic Valuation. Phd dissertation, Nicolas Pascal, 2013 Page 314 / 351!
Cesar, H., Burke, L., Pet-Soede, L., 2003b. The Economics of Worldwide Coral Reef Degradation. Cesar Environmental Economics Consulting (CEEC), Arnhem, and WWF-Netherlands, Zeist, The Netherlands. 23 pp.
Cesar, H., Chong, C.K., 2006. Economic Valuation and Socioeconomics of Coral Reefs: Methodological Issues and Three Case Studies. WorldFish Center - Economic Valuation and Policy Priorities for Sustainable Management of Coral Reefs. Technical report - 250 pp.
Charles, M., 2007. Functions and socio-economic importance of coral reefs and lagoons and implications for sustainable management case study of moorea, french polynesia. MSc Thesis (Major) Environmental Sciences.
Chevassus-au-Louis, B., Salles, J.-M., Bielsa, S., Richard, D., Martin, G., Pujol, J.-L., 2009. Approche économique de la biodiversité et des services liés aux écosystèmes, Contribution à la décision publique. Rapport du groupe de travail Centre d’analyse stratégique, Premier Ministre. 34 pp. http://www.strategie.gouv.fr.
Cinner, J., Sutton, S., Bond., T., 2007. Socio-economic thresholds that affect use of customary fisheries management tools. Conservation Biology 21 (6): 1603-1611.
Cinner, J.E., Aswani, S., 2007. Integrating customary management into marine conservation. Biological Conservation 140: 201-216.
Clua, E., Legendre P, Vigliola L, Magron F, Kulbicki M, Sarramegna S, Labrosse P, Galzin R, 2006. Medium scale approach (MSA) for improved assessment of coral reef fish habitat. Journal of Experimental Marine Biology and Ecology, 333: 219-228.
Cohen, P., Valemei, A.D., Govan., H., 2008. Annotated Bibliography on Socio-economic and Ecological Impacts of Marine Protected Areas in Pacific Island Countries. WorldFish Bibliography No. 1870. The WorldFish Center, Penang, Malaysia. 36 pp.
Conservation International, 2008. Economic Values of Coral Reefs, Mangroves, and Seagrasses: A Global Compilation. Center for Applied Biodiversity Science. Conservation International , Arlington, VA, USA. 65 pp.
Costanza, R., d'Arge, R., de Groot, R., Farber, S., Grasso, M., Hannon, B., Limburg, K., Naeem, S., O'Neill, R.V., Paruelo, J., Raskin, R.G., Sutton, P., van den Belt, M., 1997. The value of the world's ecosystem services and natural capital. Nature 387 (6630): 253-258
Cote, I.M., Mosqueira, I., Reynolds, J.D., 2001. Effects of marine reserve characteristics on the protection of fish populations: a meta-analysis., Journal of Fish Biology 59(A): 178-189.
Cousens, R., Tom, S., Ben, W., Suzy, W., 2002. Generic Scenarios: A Strategic Futures paper. Strategy Unit Cabinet office UK. Working paper, 76 pp..
Crepin, A.-S., 2003. Threshold Effects in Coral Reef Fisheries. Beijer International Institute of Ecological Economics - FEEM Working Paper No. 107.2003 - 43 pp.
CSIRO, Australian Bureau of Meteorology, 2007. Climate Change in Australia – CSIRO and Bureau of Meteorology - Technical Report 2007. Chapter 5: Regional climate change projections. Chapter 5.9.1 Severe weather: Tropical cyclones.
Daily, G.C., Polasky, S., Goldstein, J., Kareiva, P.M., Mooney, H.A., Pejchar, L., Ricketts, T.H., Salzman, J., Shallenberger, R., 2009. Ecosystem services in decision making: time to deliver. Frontiers in Ecology and the Environment 7, 21-28.

Coral Reef Ecosystem Services Economic Valuation. Phd dissertation, Nicolas Pascal, 2013 Page 315 / 351!
Dalzell, P., Adams, T.J.H., 1997. Sustainability and management of reef fisheries in the Pacific Islands. 8th International Coral Reef Symposium, Panama City, Panama, 24-29 June 1996.
Das, S., Vincent, J.R., 2009. Mangroves protected villages and reduced death toll during Indian super cyclone. Proceedings of the National Academy of Sciences vol. 106, no. 18.
David, G., Herrenschmidt, J.B., Mirault, E., 2007. Valeur sociale et economique des recifs coralliens du pacifique insulaire. Rapport technique - CRISP Projet 1A4 - 40 pp
de Wit, M., van Zyl, H., Crookes, D., Blignaut, J., Jayiya, T., Goiset, V., Mahumani, B., 2012. Including the economic value of well-functioning urban ecosystems in financial decisions: Evidence from a process in Cape Town. Ecosystem Services 2, 38-44.
DEAL, 2012. Évaluation Préliminaire des Risques d'Inondation, district de Guadeloupe. Mise en œuvre de la phase 1 de la Directive « Inondations » – Janvier 2012. Direction de l'Environnement de l'Aménagement et du Logement - Rapport technique, 104 pp..
Deardorff, A., 1982. The General Validity of the Heckscher-Ohlin Theorem. American Economic Review, September 1982, 72(4): 683—694.
Defra, 2008. An introductory guide to valuing ecosystem services. Department for Environment, Food and Rural Affairs Ref: PB12852 - 68 pp. Website: http://www.defra.gov.uk.
Depondt, F., Green, E., 2006. Diving user fees and the financial sustainability of marine protected areas: Opportunities and impediments. Ocean & Coastal Management 49 (3-4): 188-199.
Diaz-Balteiro, L., Romero, C., 2008. Valuation of environmental goods: A shadow value perspective. Ecological Economics Volume 64, 517-520.
Dimand, R.W., 2007. Keynes, IS-LM, and the Marshallian Tradition. . History of Political Economy (Duke University Press) 39 (1): 81–95. .
DiMasi, J.A., Grabowski, H.G., Vernon, J., 2004. R&D Costs and Returns by Therapeutic Category. Drug Information Journal, Vol. 38: 211–223, 2004 • 0092-8615/2004.
DiMasi, J.A., Hansen, R.W., Grabowski, H.G., 2003. The price of innovation: new estimates of drug development costs. Journal of Health Economics 22: 151–185.
Dixon, J.A., 1993. Economic benefits of marine protected areas. Oceanus (Fall): 35-40.
Done, T.J., Ogden, J.C., Wiebe, W.J., Rosen, B.R., 1996. Biodiversity and ecosystem function of Coral Reef. Book: Functional roles of biodiversity: a global perspective
Duarte, C.M., 2000. Marine biodiversity and ecosystem services: an elusive link. Journal of Experimental Marine Biology and Ecology (250):117-131.
Duarte, C.M., Middleburg, J.J., 2005. Major role of marine vegetation on the oceanic carbon cycle. Biogeosciences 2: 1–8.
Dumas, P., Kulbicki, S., Chifflet, S., Fichez, R., Ferraris, J., 2007. Environmental factors influencing the urchin spatial distributions on disturbed coral reefs (New Caledonia, South Pacific). [Online] Journal of Experimental Marine Biology and Ecology, (344), 88-100.
EFEC, Ece Ozdemiroglu, Robert Tinch, Helen Johns, Allan Provins, Jane C Powell, Clare Twigger-Ross, 2006. Valuing Our Natural Environment - Final Report NR0103, in: DEFRA (Ed.). Department for Environment, Food and Rural Affairs, London.

Coral Reef Ecosystem Services Economic Valuation. Phd dissertation, Nicolas Pascal, 2013 Page 316 / 351!
Engel, S., Pagiola, S., Wunder, S., 2008. Designing payments for environmental services in theory and practice: An overview of the issues. Ecological Economics, 65 (2008): 663–674.
Eristhee, N., Oxenford, H.A., 2001. Home range size and use of space by Bermuda chub Kyphosus sectatrix (L.) in two marine reserves in the Soufrie`re Marine Management Area, St Lucia, West Indies. Journal of Fish Biology (2001) 59 (Supplement A), 129–151.
Fahrudin, A., 2003. “Extended cost benefit analysis of present and future use of Indonesian coral reefs: An Empirical Approach to Sustainable Management of Tropical Marine Resources.” Dissertation, Christiand-Albrechts University, Kiel, 225pp.
Farber, S.C., Costanza, R., Wilson, M.A., 2002. Economic and ecological concepts for valuing ecosystem services, . Ecological Economics Volume 41: 375-392.
Farley, J., Baker, D., Batker, D., Koliba, C., Matteson, R., Mills, R., Pittman, J., 2007. Opening the policy window for ecological economics: Katrina as a focusing event. Ecological Economics 63, 344-354.
Fau, U.M., Watkinson, A., Cote, I.M., 2008. Managing dive tourism for the sustainable use of coral reefs: validating diver perceptions of attractive site features.
Fisher, B., Kulindwa, K., Mwanyoka, I., Turner, R.K., Burgess, N.D., 2009. Common pool resource management and PES: Lessons and constraints for water PES in Tanzania. Ecological Economics (2009), Volume 69, Issue 6: 1253–1261.
Flores, N.E., 2002. Non-paternalistic altruism and welfare economics. Journal of Public Economics 83: 293-304.
François, O., Pascal, N., 2012. Compensation of Impacts on Coral Reef Ecosystems. Comparative Study of the U.S. and French Frameworks and Practices for Ex-ante and Ex-post valuation of Impacts and Compensation on Coral Reef ecosystems. Technical report - T 04IF2012 - IFRECOR : Initiative Française pour les Récifs Coralliens - Plan d'action 2011-2015. TIT économie - 40 p.
François, O., Pascal, N., Méral, P., 2012. Cost-Benefit Analysis of Coral Reefs and Mangroves: A Review of the Literature. Technical report - T 03IF2012 - IFRECOR : Initiative Française pour les Récifs Coralliens - Plan d'action 2011-2015. TIT économie - 43 pp. .
Friedlander, A., Cesar, H., 2004. Fisheries benefits of Marine Managed Areas in Hawaii, Economic valuation of the coral reefs of Hawaii. National Oceanic and Atmospheric Administration, Coastal Ocean Program. 91 pp.
Friedman, K., Kronen, M., Magron, F., Sauni, S., Vigliola, L., 2006. PROCFish/C “Socio-Economic Survey” - Preliminary draft report - August 2006. Rapport technique - Secretariat of the Pacific Community- 24 pp. .
Futerra sustainibility communication, 2010. Branding biodiversity: The new nature message. IUCN Technical Report - 24 pp. http://www.futerra.co.uk/downloads/Branding_Biodiversity.pdf.
Gabrié, C., A. Cros, Chevillon, C., Downer, A., 2005. Analyse écorégionale marine de Nouvelle Calédonie – Atelier d’identification des aires de conservation prioritaires. CRISP (Coral Reef Initiatives for the Pacific) - Technical report - 64 pp. .
Garaway, C., Esteban, N., 2002. The impact of marine protected areas on poorer communities living in and around them: institutional opportunities and constraints: Appendix 1 – methodology for case study fieldwork. December 2002. DFID NRSP PROJECT R7976.
Coral Reef Ecosystem Services Economic Valuation. Phd dissertation, Nicolas Pascal, 2013 Page 317 / 351!
García Charton, J.A., Williams, I.D., Pérez Ruzafa, A., Milazzo, M., Chemello, R., Marcos, C., Kitsos, M.-S., Koukouras, A. & Riggio, S, 2000. Evaluating the ecological effects of Mediterranean marine protected areas: habitat, scale and the natural variability of ecosystems. . Environmental Conservation, 27: 159–178.
Gell, F.R., Roberts., C.M., 2003. The Fishery Effects of Marine Reserves and Fishery Closures. WWF-US, 1250 24th Street, NW, Washington, DC 20037, USA.
Ghermandi, A., Nunes, P.A.L.D., 2011. A Global Map of Costal Recreation Values: Results from a Spatially Explicit Based Meta-Analysis. FEEM Working Paper No. 39.2011. Available at SSRN: http://ssrn.com/abstract=1865793.
Gillett, R., 2009. Fisheries in the economies of the Pacific island countries and territories. Mandaluyong City, Philippines: Asian Development Bank., 521 pp.
Gillett, R., Lightfoot, C., 2001. The Contribution of Fisheries to the Economies of Pacific Island Countries. Asian Development Bank, Forum Fisheries Agency, the World Bank. 94 pp.
Goldman, R.L., Tallis, H., 2009. A Critical Analysis of Ecosystem Services as a Tool in Conservation Projects. Annals of the New York Academy of Sciences 1162, 63-78.
Goodwin, W.H., 2007. The market valuation of submerged lands. Canadian Appraiser Volume 51 Book 2: 39-44.
Govan, H., 2009. Status and potential of locally-managed marine areas in the South Pacific: meeting nature conservation and sustainable livelihood targets through wide-spread implementation of LMMAs. SPREP/WWF/WorldFish-Reefbase/CRISP. 95pp + 5 annexes.
Grabowski, H., Vernon, J., DiMasi, J.A., 2002. Returns on Research and Development for 1990s New Drug Introductions. Pharmacoeconomics 2002; 20 Suppl. 3: 11-29.
Groot, R.d., Kumar, P., Ploeg, S.v.d., Sukhdev, P., 2010. Estimates of Monetary Values of Ecosystem Services. The Economics of Ecosystems and Biodiversity (TEEB) - The Ecological and Economic Foundations (TEEB D0-Chapter 5, Appendix C: The economics of valuing ecosystem services and biodiversity).
Groot, R.S.D., Wilson, M.A., Boumans, R.M.J., 2002. A typology for the classification, description and valuation of ecosystem functions, goods and services. Ecological Economics Volume 41: 393-408.
Guenette, S., Pitcher, T.J., 1999. An age-structured model showing the benefits of marine reserves in controlling overexploitation. . Fisheries Research 39: 295-303.
Guillemot, N., Léopold, M., Cuif, M., Chabanet, P., 2009. Characterization and management of informal fisheries confronted with socio-economic changes in New Caledonia (South Pacific). Fisheries Research 98 (2009) 51–61.
Gunawardena, M., Rowan, J.S., 2005. “Economic Valuation of a Mangrove Ecosystem Threatened by Shrimp Aquaculture in Sri Lanka.” Environmental Management 36 (4): 535–550.
Guzman, A.B.d., 2004. A Fishery in Transition: Impact of a Community Marine Reserve on a Coastal Fishery in Northern Mindanao, Philippines EEPSEA Research Report 2004-RR6.
Hajkowicz, S., Okotai, P., 2005. An Economic Valuation of Watershed Management in Rarotonga, the Cook Islands. . CSIRO Sustainable Ecosystems, Brisbane, Australia - 62 pp.

Coral Reef Ecosystem Services Economic Valuation. Phd dissertation, Nicolas Pascal, 2013 Page 318 / 351!
Halpern, B.S., 2003. The impact of marine reserves: do reserves work and does reserve size matter? ecological Applications, 13(1) Supplement, 2003, pp. S117 S137.
Halpern, B.S., Warner, R.R., 2002. Marine reserves have rapid and lasting effects. Ecology Letters 5, 361-366.
Harborne, A.R., Mumby, P.J., Micheli, F., Perry, C.T., Dahlgren, C.P., Holmes, K.E., Brumbaugh, D.R., 2006. The functional value of caribbean coral reef, seagrass and mangrove habitats to ecosystem processes. Advances in Marine Biology (50): 57-189.
Hardin, 1968. The Tragedy of the Commons. Science 162, 1243-1248.
Hargreaves-Allen, V., 2004. Estimating the Total Economic Value of Coral Reefs for Residents of Sampela, a Bajau Community in Wakatobi Marine National, Sulawesi: A Case Study. MSc Thesis, Facility of Life Sciences, Imperial College of Science, Technology and Medicine, London. .
Harmelin, J.G., 1987. Structure et variabilité de l’ichtyofaune d’une zone rocheuse protegeé en Mediterranée (Parc National de Port-Cros, France). . P.S.Z.N.I.: Mar. Ecol., 8: 263-284. doi:10.1111/j.1439-0485.1987.tb00188.x.
Harrison, D., 2007. cocoa, conservation and tourism Grande Riviere, Trinidad. Annals of Tourism Research, Vol. 34, No. 4, 919–942.
Hasler, H., Ott, J.r.A., 2008. Diving down the reefs? Intensive diving tourism threatens the reefs of the northern Red Sea. Marine Pollution Bulletin 56, 1788-1794.
Haygood, M., Davidson, S., 1997. Small-subunit rRNA genes and in situ hybridization with oligonucleotides specific for the bacterial symbionts in the larvae of the bryozoan Bugula neritina and proposal of "Candidatus Endobugula sertula." Appl. Environ. Microbiol. 63:4612-4616. .
Heckman, J., Klenow, P.J., 1998. Human Capital Policy. In Michael Boskin (ed.) Policies to Promote Capital Formation. Stanford, CA: Hoover Institution, 1998.
Heston, A., Summers, R., Aten, B., 2009. Penn World Table Version 6.3, Center for International Comparisons of Production, Income and Prices University of Pennsylvania, August 2009.
Hickey, F.R., 2008. Nearshore fisheries and human development in Vanuatu and other parts of Melanesia. SPC Traditional Marine Resource Management and Knowledge Information Bulletin #24 – December 2008.
Hilborn, R., Ward, T.J., Barrett, N.S., Craik, W., 2002. Measuring the effects of marine reserves on fisheries: The dilemnas of experimental programs. mpa news October 2002 Vol 4 nº4.
Hily, C., Duchêne, J., Bouchon, C., Bouchon-Navaro, Y., Gigou, A., Payri, C., Védie, F., 2010. Les herbiers de phanérogames marines de l'outre-mer français. Hily C., Gabrié C., Duncombe M. . coord. IFRECOR, Conservatoire du littoral, 140 pp.
HM Treasury, 1991. The Green Book: Economic Appraisal in Central Government. HMSO, Technical guides - 92 pp.
Hoagland, P., Kaoru Y., Broadus J.M., 1995. A methodological review of net benefit evaluation for marine reserves. Environmental Economics Series 027. The World Bank, 1995. 78 pp.
Holland, D.S., 2000. A bioeconomic model of marine sanctuaries on Georges Bank. Can. J. Fish. Aquat. Sci./J. Can. Sci. Halieut. Aquat. 57(6): 1307-1319

Coral Reef Ecosystem Services Economic Valuation. Phd dissertation, Nicolas Pascal, 2013 Page 319 / 351!
Holmlund, C.M., Hammer, M., 1999. Ecosystem services generated by fish populations. Ecological Economics 29, 253-268.
HSIEH, W., HungJen, L., KweeSiong, T., Chitsan, L., KuoShuh, F., PeiJie, M., 2010. Estimating nutrient budgets in a coastal lagoon. Chinese Sci Bull February (2010) Vol.55 No.6.
Hubert, A., 2007. Utilisation de la perception des pêcheurs dans la gestion participative des ressources: Etude de cas à Navukavu (Fidji) - Rapport final. CRISP Composante 2A - Projet 2A2 : Amélioration de la connaissance et des modalités de gestion des écosystèmes coralliens. 68 pp.
Hubert, A., 2009. Utilisation de la perception des pêcheurs dans la gestion participative des ressources: etude de cas à navakavu (fidji). Rapport technique - Coral reef initiatives for the Pacific - COMPOSANTE 2A - PROJET 2A2 - 51 pp
Hunt, B., Vincent, A.C.J., 2006. Scale and Sustainability of Marine Bioprospecting for Pharmaceuticals. Ambio Vol. 35, No. 2: 45-68.
IEOM, 2008. L’habitat et le développement urbain dans le Grand Nouméa : Constat & Enjeux. Les notes de l'Institut d'Emission d'Outre-Mer. 8 pp. http://www.ieom.fr/publication_notes.asp.
IFREMER, 2009. Etude relative à la pêche de loisir (récréative et sportive) en mer en Métropole et dans les DOM. Synthèse finale, Avril 2009 - 28 pp.
Isbell, F., Calcagno, V., Hector, A., Connolly, J., Harpole, W.S., Reich, P.B., Scherer-Lorenzen, M., Schmid, B., Tilman, D., van Ruijven, J., Weigelt, A., Wilsey, B.J., Zavaleta, E.S., Loreau, M., 2011. High plant diversity is needed to maintain ecosystem services. Nature 477: 199–202.
Isee, 1992. ISEE - Budget Consommation des Ménages - Résultats 1991 - 112 pp.
Isee, 2004 Recensement de la population de la nouvelle-caledonie au 31 aout 2004. Rapport technique, 2004 - 44 pp.
ISEE, 2008a. Comptes du tourisme 2005-2006. ND N°106, ISEE Édition : Juin 2008.
Isee, 2008b. Dépenses des touristes non résidents en 2007 ISEE Nouvelle-Calédonie, Rapport technique , 34 pp, 111 pp.
Isee, 2008c. Les comptes économiques de la Nouvelle-Calédonie 2004. ND N°107, ISEE Édition : Juillet 2008.
Isee, 2009a. ISEE - Budget Consommation des Ménages - Résultats 2008.
ISEE, 2009b. Statistiques touristiques rapides année 2008. Rapport technique - bilan touristique 2008 81 pp.
JDConsultant, 2005. Etude de la structure de compte d'exploitation des bateaux pratiquant la peche artisanale. Rapport technique - Province Sud : 45 pp.
Jennerjahn, T.C., Ittekkot, V., 2002. Relevance of mangroves for the production and deposition of organic matter along tropical continental margins.”. Naturwissen-schaften 89: 23–30.
Jennings, S., Kaiser, M.J., Reynolds, J.D., 2001. Marine fisheries ecology. . Blackwell Scientific Ltd,Oxford. 417 pp.
Jennings, S., Polunin, N.V.C., 1995. Comparative size and composition of yield from six Fijian reef fisheries. Journal of Fish Biology 46, 28-46.

Coral Reef Ecosystem Services Economic Valuation. Phd dissertation, Nicolas Pascal, 2013 Page 320 / 351!
Jin, D., Hoagland, P., Morin Dalton, T., 2003. Linking economic and ecological models for a marine ecosystem. Ecological Economics 46: 367-379.
Jin, J., Wang, Z., Ran, S., 2006. Comparison of contingent valuation and choice experiment in solid waste management programs in Macao. Ecological Economics 57: 430-446.
Johannes, R.E., 1984. Marine conservation in relation to traditional life-styles of tropical artisanal fishermen. The Environmentalist 4, Supplement 7: 30-48.
Johannes, R.E., 1998. The case for data-less marine resource management: examples from tropical nearshore finfisheries. Trends in Ecology & Evolution -6: 243-265.
Johannes, R.E., 2002. The Renaissance of Community-Based Marine Resource Management in Oceania. Annual Review of Ecology and Systematics 33: 317-329.
Johannes, R.E., Hickey, F.R., 2004. Evolution of village-based marine resource management in Vanuatu. Coastal region and small island papers 15, UNESCO, Paris, 48 pp.
Jollit, I., Léopold, M., Guillemot, N., David, G., Chabanet, P., Lebigre, J., Ferraris, J., 2010. Geographical aspects of informal reef fishery systems in New Caledonia. Mar. Poll. Bul. 2010, 61 (7-12): 585-597.
Jones, G.P., al, 2004. Coral decline threatens fish biodiversity in marine reserves. . Proc. Natl. Acad. Sci. U. S. A. 101, 8251–8253
Jumel, M.-C., 2008. L’utilisation du lagon du Grand Nouméa par les plaisanciers. Mémoire de Master Professionnel « Génie des Anthroposystèmes Littoraux » de l’Université de La Rochelle.
Kench, P.S., Brander, R.W., 2009. Wave Processes on Coral Reef Flats: Implications for Reef Geomorphology Using Australian Case Studies. Journal of Coastal Research 22: 209-221.
Kendall, A.J., Picquelle, S., 2003. Marine protected areas and the early life history of fishes AFSC processed report 2003-10 Alaska fishery science center - US department of commerce 81 pp.
Knowlton, N., 2000. The future of coral reefs. National Academy of Sciences colloquium vol. 98 no. 10 5419-5425.
KPMG, 2005. Plan de développement touristique concerté de Nouvelle-Calédonie. Rapport technique: 135 pp.
Kramer, L., Chapman, M., 1997. Implications of fish home range size and relocation for marine reserve function. Environmental biology of fishes, 55: 65-79.
Kronen, 2003. The socioeconomics of reef fisheries in the South Pacific. SPC SPC Women in Fisheries Information Bulletin # 12 – May 2003.
Kronen, M., 2007. Monetary and non-monetary values of small-scale fisheries in Pacific Island countries. SPC Women in Fisheries Information Bulletin #16 – March 2007.
Krutilla, J.V., 1967. Conservation reconsidered. American Economic Review 57, 777–786.
Kuosmanen, T., Kortelainen, M., 2007. Valuing environmental factors in cost-benefit analysis using data envelopment analysis. Ecological economics 62: 56-67.
Kushner, B., Waite, R., Jungwiwattanaporn, M., Burke, L., 2012. Influence of Past Coastal Economic Valuations in the Caribbean: Summary of Enabling Conditions and Lessons Learned.

Coral Reef Ecosystem Services Economic Valuation. Phd dissertation, Nicolas Pascal, 2013 Page 321 / 351!
Working Paper. Washington, DC: World Resources Institute. Available online at http://www.wri.org/ coastal-capital.
Kuster, C., V. C, V., L. P, Z., 2006. Validation of the accuracy of household reporting of subsistence fishing catch and effort: a Fijian case study. Fisheries Management and Ecology 13, 177-184.
Kuster, C., Vuki, V.C., Zann, L.P., 2005. Long-term trends in subsistence fishing patterns and coral reef fisheries yield from a remote Fijian island. Fish Res. 76, 221-228.
Labrosse, P., Kulbicki, M., Ferraris, J., 2002. Underwater visual fish census sur veys: Proper use and implementation by Pierre Labrosse , Michel Kulbicki and Jocelyne Ferraris. (REAT: Reef resources assessment tools) Secretariat of the Pacific Community cataloguing-in-publication data.
Labrosse, P., Letourneur, Y., Kulbicki, M., Paddon, J.R., 2000. Fish stock assessment of the northern New Caledonian lagoons: 3 – Fishing pressure, potential yields and impact on management options. Aquat. Living Resour. 13 (2) (2000) 91,98.
Lal, P., 2001. Coral Reef Use and Management – The Need, Role, and Prospects of Economic Valuation in the Pacific. Second Edition. International Consultative Workshop for Economic Valuation and Policy Priorities for Sustainable Management of Coral Reefs - WorldFish Center’s Headquarters, Penang, Malaysia, 8-10 December 2001. WorldFish Center Conference Proceedings 70 pp.
Lal, P., Kinch, J., 2005. Financial Assessment of the Marine Trade of Corals in the Solomon Islands. . Apia, Samoa, SPREP and Foundation of the Peoples of the Pacific - International. Technical report, 28 pp.
Laurans, Y., Leménager, T., Aoubid, S.h.r., 2011. Les paiements pour services environnementaux. De la théorie à la mise en œuvre, quelles perspectives dans les pays en développement ? Rapport Technique - collection À Savoir nº07 - Agence Française de Développement (AFD).
Laurans, Y., Pascal, N., Binet, T., Brander, L., Clua, E., David, G., Rojat, D., Seidl, A., 2013a. Economic valuation of ecosystem services from coral reefs in the South Pacific: taking stock of recent experience. Journal of Environmental Management 116 (2013) 135-144.
Laurans, Y., Rankovic, A., Bille, R., Pirard, R., Mermet, L., 2013b. Use of ecosystem services economic valuation for decision making: Questioning a literature blindspot. Journal of Environmental Management 119, 208-219.
Leblic, I., 1999. Pêcheurs kanak et politiques de développement de la pêche en Nouvelle-Calédonie. Les petites activités de pêche dans le Pacifique Sud Gilles Blanchet - Éditions de l'IRD, Paris - 209 pp.
Legendre, P., Anderson, M.J., 1999. Distance-based redundancy analysis: testing multispecies responses in multifactorial ecological experiments. Ecological Monographs, 69(1): 1–24.
Leis, J.M., 2002. Pacific coral-reef fishes: the implications of behaviour and ecology of larvae for biodiversity and conservation, and a reassessment of the open population paradigm. Environmental Biology Of Fishes 65, 199-208.
Leisher, C., Beukering, P.v., Scherl, L.M., 2007. Nature’s Investment Bank: how marine protected areas contribute to poverty reduction Report The Nature Conservancy - Technical report, 123 pp. , Available on: http://www.nature.org/initiatives/protectedareas/howwework/art23185.html.

Coral Reef Ecosystem Services Economic Valuation. Phd dissertation, Nicolas Pascal, 2013 Page 322 / 351!
Lemonnier, H., Faninoz, S., 2006. Effect of water exchange on effluent and sediment characteristics and on partial nitrogen budget in semi-intensive shrimp ponds in New Caledonia. Aquaculture Research, 37, 938-948.
Leopold, M., 2000. Evaluation de la production halieutique par la consommation en milieu insulaire - l’exemple d’Ouvéa dans le Pacifique sud -. Mémoire de fin d’études Diplôme d’Agronomie Approfondie Spécialisation Halieutique.
Letourneur, Y., Kulbicki, M., Labrosse, P., 1998. Spatial structure of commercial reef fish communities along a terrestrial runoff gradient in the northern lagoon of New Caledonia. Environmental Biology of Fishes 51: 141-153.
Letourneur, Y., Kulbicki, M., Labrosse, P., 2000. Fish stock assessment of the northern New Caledonian lagoons:. Aquat. Living Resour. 13 (2) 65,76.
Lindberg, K., Enriquez., J., 1993. An Analysis of Ecotourism’s Economic Contribution to Conservation and Development in Belize: A report,” World Wildlife Fund, 85 pp. .
Littlefield, E., 2011. Impact Investing: Roots & Branches. Innovations: Technology, Governance, Globalization 6, 19-25.
Lleonart, j., Maynou, F., Recasens, L., Franquesa, R., 2000. A bioeconomic model for Mediterranean fisheries: the hake off Catalonia as a case study. Scientia marina 67, 337-351.
Lugo-Fernandez, A., Roberts, H.H., W. J. Wiseman, J., 1998. Tide Effects on Wave Attenuation and Wave Set-up on a Caribbean Coral Reef. Estuarine, Coastal and Shelf Science (1998), 47, 385–393.
Mangos, A., Rojat, D., 2008. « Les impacts socioéconomiques des Aires Marines Protégées et leur évaluation ». Compte rendu d'atelier - Rapport technique Agence Française de Développement- 92 pp.
Manoka, B., 2003. Existence Value: A Re-Appraisal and Cross-Cultural Comparison. EEPSEA Research Report Economy and Environment Program for Southeast Asia (EEPSEA) - 48 pp.
Martin, J.-L.M., Veran, Y., Guelorget, O., Pham, D., 1998. Shrimp rearing: stocking density, growth, impact on sediment, waste output and their relationships studied through the nitrogen budget in rearing ponds. Aquaculture 164: 135–149.
Marty, C., Kronen, M., Magron, F., 2005. Analyse de l’etat actuel de la commercialisation des produits de la peche lagonaire au niveau du territoire Zoneco - Rapport technique, 64 pp. .
Matous, P., Ozawa, K., 2010. Measuring Social Capital in a Philippine Slum. Field Methods 22: 133-153.
McClanaham, T., Graham, N., 2005. Recovery trajectories of coral fish assemblages within Kenyan marine protected areas. . Marine Ecology Progress Series 294:241-248.
McClanahan, T., Castilla, J., White, A., Defeo, O., 2009. Healing small-scale fisheries by facilitating complex socio-ecological systems. Reviews in Fish Biology and Fisheries 19: 33-48.
McElroy, J.L., 2003. Tourism Development in Small Islands across the World. Geografiska Annaler. Series B, Human Geography Vol. 85, No. 4, Special Issue: Nature-Society Interactions on Islands: 231-242

Coral Reef Ecosystem Services Economic Valuation. Phd dissertation, Nicolas Pascal, 2013 Page 323 / 351!
McKenzie, E., Prasad, B., Kaloumaira, A., 2005. Economic impact of natural disasters on development in the pacific Volume 1: Research Report. University of the South Pacific (USP) and the South Pacific Applied Geoscience Commission (SOPAC) - Report 92 pp.
McLaughlin, R.J., 2003. Foreign Access to Shared Marine Genetic Materials: Management Options for a Quasi-Fugacious Resource. Ocean Development & International Law 34, 297 - 348.
MEA, 2003. Ecosystems and Human Well-being. Millenium Ecosystem Assessment - Synthesis. Island Press, Washington, DC. 47 pp.
Mees, C.C., Anderson, J.D., 1999. The Performance of Customary Marine Tenure in the Management of Community Fishery Resources in Melanesia. Final Technical Report.
Meignien, P., Lemaître-Curri, E., 2010. Conservation et utilisation durable de la biodiversité et des services écosystémiques : analyse des outils économiques. « RéférenceS » du Service de l’Économie, de l’Évaluation et de l’Intégration du Développement Durable (SEEIDD) du Commissariat Général au Développement Durable (CGDD) Rapport de la commission des comptes et de l’économie de l’environnement - 78 pp.
Mermoud, J.C., 1997. La mer et les caldoches. La mer, espace, perception et imaginaire dans le Pacifique sud - C.O.R.A.I.L & L'Harmattan - Actes du neuvieme colloque CORAIL -ISBN : 2-7384-6014-3 • 1997 • 434 pp.
Messner, F., Penning-Rowsell, E., Green, C., Meyer, V., Tunstall, S., Veen, A.v.d., 2007. Evaluating flood damages: guidance and recommendations on principles and methods. FLOODsite Project Deliverable D9.1; Integrated Flood Risk Analysis and Management Methodologies - 156 pp.
Milne, S., 2005. The economic impact of tourism in SPTO member countries. South Pacific Tourism Organisation - technical report: 89 pp.
Mirault, E., 2006. Les fonctions et enjeux socio-économiques des écosystèmes récifaux : une approche géographique des valeurs de l’environnement appliquée à l’île de la Réunion. Thèse de doctorat : Géographie : Paris 10 : 2007., 713 pp.
Miteva, D.A., Pattanayak, S.K., Ferraro, P.J., 2012. Evaluation of biodiversity policy instruments: what works and what doesn'tt? Oxford Review of Economic Policy 28, 69-92.
Moberg, F., Folke, C., 1999. Ecological goods and services of coral reef ecosystems. Ecological Economics Volume 29, Issue 2, Pp. 215-233.
Morgan, M.S., 1991. The History of Econometric Ideas, Cambridge University Press.
Morrison, M., Bennett, J., 2004. Valuing New South Wales rivers for use in benefit transfer. The Australian Journal of Agricultural and Resource Economics , 48: 591–611.
Mosquera, I., Côté, I.M., Jennings, S., Reynolds, J.D., 2000. Conservation benefits of marine reserves for fish populations. Animal Conservation 4: 321-332. .
Mullan, K., Kontoleon, A., 2008. Benefits and costs of forest biodiversity: economic theory and case study evidence. University of Cambridge. Dept. of Land Economy, 2008. June 2008- 82 pp.
Mumby, P.J., Steneck, R.S., 2008. Coral reef management and conservation in light of rapidly evolving ecological paradigms. Review- Trends in Ecology and Evolution Vol.23 No.10: 35-48.
Munro, J.L., 1984. Yields from coral reef fisheries. . Fishbyte 2 (3), 13–15.

Coral Reef Ecosystem Services Economic Valuation. Phd dissertation, Nicolas Pascal, 2013 Page 324 / 351!
Murray, B.C., W. Aaron Jenkins, Samantha Sifleet, Pendleton, L., Baldera, A., 2010. Payments for blue carbon: potential for protecting threatened coastal habitats. Policy brief: Nicholas Institute for Environmental Policy Solutions, Duke University - 12 pp.
Murray, S.N., R.F. Ambrose, J.A. Bohnsack, L.W. Botsford, M.H. Carr, G.E. Davis, P.K. Dayton, D. Gotshall, D.R. Gunderson, M.A. Hixon, J. Lubchenco, M. Mangel, A. MacCall, D.A. McArdle, J.C. Ogden, J. Roughgarden, R.M. Starr, M.J. Tegner, Yoklavich, M.M., 1999. No-take Reserve Networks: Sustaining Fishery Populations and Marine Ecosystems. . Fisheries 24(11):11-25.
Nagelkerken, I., van der Velde, G., Gorissen, M., Meijer, G., van‘t Hof, T., den Hartog, C., 2000. Importance of mangroves, seagrass beds and the shallow coral reef as a nursery for important coral reef fishes, using a visual census technique. Estuarine, Coastal and Shelf Science 51: 31-44
Naidoo, R., Balmford, A., Costanza, R., Fisher, B., Green, R.E., Lehner, B., Malcolm, T.R., Ricketts, T.H., 2008. Global mapping of ecosystem services and conservation priorities. Proceedings of the National Academy of Sciences 100 (22), October 28, 12765-12770.
Newman, D., Cragg, G., 2004. Advanced preclinical and clinical trials of natural products and related compounds from marine sources. . Current Medicinal Chemistry 11:1693-1713. .
Newton, K., Cote, I.M., Graham M. Pilling, Jennings, S., Dulvy, N.K., 2007. Current and Future Sustainability of Island Coral Reef Fisheries. Report - Current Biology 17, 655–658.
Nguyen-Khoa, S., 1993. Impact de la plaisance dans le Grand Nouméa sur l'economie de la Nouvelle-Caledonie. Service de la Mer, Province Sud. 78 pp.
Nijkampa, P., Vindigni, G., Nunes, P.A.L.D., 2008. Economic valuation of biodiversity: A comparative study. Ecological Economics 67: 217 – 231.
O'Garra, T., 2012. Economic valuation of a traditional fishing ground on the coral coast in Fiji. Ocean & Coastal Management 56, 44-55.
O’Garra, T., 2007. Estimating the total economic value (tev) of the navakavu lmma. Final report CRISP, Component 2A - Project 2A2, may 2007 - 95 pp.
O’Garra, T., 2009. Bequest values for marine resources: how important for indigenous communities in less-developed economies? Environmental and Resource Economics 44, 179-202.
OECD, 2006. Cost-Benefit Analysis and the Environment: Recent Developments. Environmental policy tools and evaluation, OECD 2006 . Working paper, 258 pp.
OECD, 2010. Paying for biodiversity - Enhancing the Cost-Effectiveness of Payments for Ecosystem Services (PES) Oxford Dictionary of Economics (2003), Oxford University Press.
Oréade-Brèche, 2008. Evaluation a mi-parcours du programme CRISP (initiative régionale pour la protection et la gestion durable des récifs coralliens dans le pacifique - Coral Reef InitiativeS in the Pacific) Mid-term review Rapport d'évaluation, 265 pp. Agence francaise de Developpement - Fonds Francais pour l'environnement Mondial
Ostrom, E., Burger, J., Field, C.B., Norgaard, R.B., Policansky, D., 1999. Revisiting the Commons: Local Lessons, Global Challenges. Science 284, 278-282.
Padilla, J.E., Janssen, R., 1996. “Extended benefit-cost analsyis of management alternatives: Pagbilao mangrove forest.” Journal of Philippine Development 23 (2): 339–363.

Coral Reef Ecosystem Services Economic Valuation. Phd dissertation, Nicolas Pascal, 2013 Page 325 / 351!
Pagiola, S., 2004a. Assessing the economic value of ecosystem conservation. The World bank - Technical report: 75 pp.
Pagiola, S., 2004b. How much is an ecosystem worth? The International Bank for Reconstruction and Development/The World Bank, Washington, June 2004. Technical report, 45 pp.
Palumbi, R.S., 2001. The ecology of Marine Protected areas. Marine Community Ecology, M. Bertness, S. Gaines, and M. Hay, Eds. Sinauer Press.
Panayotou, T., 2003. Basic Concepts and Common Valuation Errors in Cost-Benefit Analysis. Singapore: Economy and environment program for Southeast Asia (EEPSEA) 34 pp. .
Park, T.A., Bowker, J.M., Leeworthy, V.R., 2000. Valuing Snorkeling Visits to the Florida Keys With Stated and Revealed Preference Models. Journal of Environmental Management Volume 65: 301–312.
Parker, C., Cranford, M., Oakes, N., Leggett, M., ed. 2012. The Little Biodiversity Finance Book. Global Canopy Programme; Oxford. 142 pp.
Parry, C.E., McElroy, J.L., 2009. The supply determinants of small island tourist economies. Annals of Tourism Research Vol. 2 - No 1. 13-22.
Parsons, G.R., Thur, S.M., 2007. Valuing changes in the quality of coral reef ecosystems: a stated preference study of scuba diving in the Bonaire National Marine Park. working paper no. 2007-18 http://lerner.udel.edu/economics/workingpaper.htm.
Pascal, N., 2005. Networks design of fishery protected areas incorporating dispersal patterns and evaluation of effectiveness as a fishery management tool through bioeconomic modelization. Case study of the future marine reserve of El Garraf. NW Mediterranean. Mémoire de DEA Marine Sciences, Universidad Politecnica de Catalunya, Universidad de Barcelona, CMIMA. 125 pp.
Pascal, N., 2010. Ecosystèmes coralliens de Nouvelle-Calédonie, valeur économique des services écosystémiques Partie I: Valeur financière. IFRECOR (Initiative Française pour les Récifs Coralliens) Nouvelle-Calédonie, Nouméa, Avril 2010, 155 pp. + 12 planches.
Pascal, N., 2012. Analyse des bénéfices économiques de la Réserve Naturelle de Saint Martin. Rapport technique - IFRECOR (Initiative Française pour les Récifs Coralliens) Guadeloupe (MEEDTL-MOM) APNSP/MOM 2010, Novembre 2011, 139 pp. .
Pascal, N., De Maziere, J., 2008. Analysis of economic studies on coral reefs ecosystems in the South Pacific Region. A methodological approach. CRISP/3B/3B3 - Workshop proceedings, Fiji, May 2008 - 6 pp.
Pascal, N., Laurent, J.-M., Burgos, E., 2012. Evaluación económica de los servicios ecosistémicos del Parque Nacional Blanca Jeannette Kawas Fernández, Honduras. Technical Report - UNEP, United Nations Environmental Program, Regional office for Latin America and the Caribbean, 95 pp.
Pascal, N., Laurent, J.-M., Burgos, E., 2013. Instrumentos financieros para la financiacion del Parque Nacional Blanca Jeannette Kawas Fernández, Honduras. Technical Report - UNEP, United Nations Environmental Program, Regional office for Latin America and the Caribbean, 45 pp.
Pascal, N., Marre, J.-B., 2012. Ecosystèmes coralliens de Nouvelle-Calédonie, valeur économique des services écosystémiques Partie II: Valeurs de non-usage. IFRECOR Nouvelle-Calédonie, Nouméa, Septembre 2012, 105 pp.

Coral Reef Ecosystem Services Economic Valuation. Phd dissertation, Nicolas Pascal, 2013 Page 326 / 351!
Pascal, N., Mercier, J.-R., Conner, N., 2008. Economics of Marine Managed Areas of the South Pacific. Workshop proceedings. CRISP/3B/3B3 - Workshop proceedings, Fiji, May 2008 - 16 pp.
Pattanayak, S.K., 2009. Rough guide to impact evaluation of environmental and development programs. Working Paper 2187, eSocialSciences, available at http://ideas.repec.org/p/ess/wpaper/ id2187.html.
Pauly, D., Christensen, V., Walters, C., 2000. Ecopath, Ecosim, and Ecospace as tools for evaluating ecosystem impact of fisheries. ICES Journal of Marine Science 57: 15-26.
PCRAFI, 2011a. Pacific Catastrophe Risk Assessment and Financing Initiative, country risk profile: Fiji. World Bank, Asian Development Bank and SPC/SOPAC. Technical report - Risk assessment methodology: 18 pp.
PCRAFI, 2011b. Pacific Catastrophe Risk Assessment and Financing Initiative, country risk profile: Fiji. World Bank, Asian Development Bank and SPC/SOPAC. Technical report -
Pearce, D., Atkinson, G., Mourato, S., 2006. Cost-Benefit Analysis and the Environment: recent developments. ORGANISATION FOR ECONOMIC CO-OPERATION AND DEVELOPMENT, ISBN 92-64-01004-1 – © OECD 2006- Technical report, 315 pages. http://www.sourceoecd.org/environment/9264010041.
Pearson, T.H., 2001. Functional Group Ecology in soft-sediment marine benthos: The role of bioturbation. Oceanography and Marine Biology: an annual review 39, 233-267.
Pelletier, D., Mahevas, S., 2005. Spatially explicit fisheries simulation models for policy evaluation. Fish and Fisheries 2005, 6, 307-349.
Pendleton, L.H., 1995. Valuing coral reef protection. Ocean & Coastal Management 26, no. 2: 119-131.
Pérez-Maqueo, O., A. Intralawana, Martíneza, M.L., 2007. Coastal disasters from the perspective of ecological economics. Ecological Economics 63: 273 – 284.
Pesche, D., Méral, P., Hrabanski, M., Bonnin, M., 2011. Services écosystémiques et Paiements pour services environnementaux : les deux faces d'une même logique ? Document de travail n° 2011-01, SERENA, programme SYSTERRA, ANR-08-STRA-13. 18 pp.
Pickering, H., A. Himes, Badalamenti, F., D’Anna, G., James, C., Kienzle, M., Mardle, S., Pipitone, C., Whitmarsh, D., Smith, I.P., Jensen, A.C., 2003. Fisheries Exclusion Zones: Value and its sensitivity to data uncertainty. Pickering, H. (Ed.) 2003. The Value of Exclusion Zones as a Fisheries Management Tool: A strategic evaluation and the development of an analytical framework for Europe. CEMARE Report, University of Portsmouth, UK.
Planes, S., Galzin, R., Rubies, A.G., Goñi, R., Harmelin, J.-G., Diréach, L.L., Lenfant, P., Quetglas, A., 2000. Effects of marine protected areas on recruitment processes with special reference to Mediterranean littoral ecosystems. Environmental Conservation 27 (2): 126–143
PNUE, 2004. Le rôle des instruments économiques dans le contexte de la biodiversité liée aux engagements multilatéraux sur l’environnement. Document de travail, nº123-serie GT intruments économiques, 56 pp.
Point Carbon, 2010. ”Carbon 2010 - Return of the sovereign,” Tvinnereim, E. and Røine, K. (eds.). 48 pp..

Coral Reef Ecosystem Services Economic Valuation. Phd dissertation, Nicolas Pascal, 2013 Page 327 / 351!
Pollnac, R., 2007. Theme section on the “Aspects of interactions between humans and coral reefs”. Coral Reefs 26: 913-921.
Pollnac, R.B., Crawford., B.R., 2000. Discovering factors that influence the success of community-based marine protected areas in the Visayas, Philippines. . Coastal Management Report # 2229. PCAMRD Book Series No. 33. Coastal Resources Center, University of Rhode Island, Narragansett, RI, USA, and Philippine Council for Aquatic and Marine Research and Development, Los Banos, Laguna, Philippines.
Pollnac, R.B., McManus, J.W., del Rosario, A.E., Banzon, A.A., Vergara, S.G., Gorospe, M.L.G., 2000. Unexpected relationships between coral reef health and socio-economic pressures in the Philippines: reefbase/RAMP applied. Marine and Freshwater Research 51, 529-533.
Polunin, N.V.C., 2002. Marine protected areas, fish and fisheries. In: Handbook of Fish and Fisheries. Volume 2: Fisheries (eds. P.J.B. Hart and J.D. Reynolds). Blackwell Science, Oxford. pp 293-318
Prasad, B.C., 2011. Economic Growth in Pacific Island Countries: Addressing the Critical Issues. Paper presented at the conference on ‘ Resilience in the Pacific: Addressing the Critical Challenges,, February, 2011, Victoria University Wellington, New Zealand.
Putnam, R.D., 2006. E Pluribus Unim: Diversity and Community in the Twenty-First Century. Scandinavian Political Studies Volume 30, Issue 2: 137–174.
PWA, SAIC, 2009. Greenhouse Gas Mitigation Typology Issues Philip Williams & Associates and Science Applications International Corporation for California Climate Action Registry PWA REF. 1957.
Rakitin, A., Kramer., D.L., 1996. Effect of a marine reserve on the distribution of coral reef fishes in Barbados. Marine Ecology-Progress Series 131:97–113.
Ram-Bidesi, V., Lal, P., Conner, N., 2011. Economics of Coastal Zone Management in the Pacific. An IUCN Report to SPREP, CRISP Programme, Suva,Fiji. 113 p.
Ramseyer, L.J., 2000. Predicting whole-fish nitrogen content from fish wet weight using regression analysis,. N. Am. J. Aquac. 64: 195–204.
Remoundou, K., Koundouri, P., Kontogianni, A., Nunes, P.A.L.D., Skourtos, M., 2009. Valuation of natural marine ecosystems: an economic perspective. Environmental Science & Policy 12 (7): 1040-1059.
Roberts, C.M., 1995. Rapid Build-up of Fish Biomass in a Caribbean Marine Reserve. Conservation Biology 9, 815-826.
Roberts, C.M., Bohnsack, J.A., Gell, F., Hawkins, J.P., Goodridge, R., 2001. Effects of marine reserves on adjacent fisheries. Science 294, 1920-1923.
Roberts, C.M., Hawkins, J.P., 2000. Fully-protected marine reserves: a guide. WWF Endangered Seas Campaign, 1250 24th Street, NW, Washington, DC 20037, USA and Environment Department, University of York, York, YO10 5DD, UK.
Rocklin, D., 2006. La pêche au crabe de palétuvier à Voh (Nouvelle-Calédonie) : Typologie de la pêcherie et proposition d’indicateurs. Mémoire de fin d’études Diplôme d’Agronomie Approfondie Spécialisation Halieutique.

Coral Reef Ecosystem Services Economic Valuation. Phd dissertation, Nicolas Pascal, 2013 Page 328 / 351!
Rosenberger, R.S., Loomis, J.B., 2001. Benefit transfer of outdoor recreation use values: A technical document supporting the Forest Service Strategic Plan (2000 revision). Gen. Tech. Rep. RMRS-GTR-72. Fort Collins, CO: U.S. Department of Agriculture, Forest Service, Rocky Mountain Research Station. 59 pp.
Roussel, E., Duncombe, M., Gabrié, C., 2009. Les Mangroves De L’outre-Mer Français Écosystèmes Associés Aux Récifs Coralliens. coord. IFRECOR, Conservatoire du littoral, 145 pp.
Rowley, R.J., 1994. Case studies and reviews. Marine reserves in fisheries management. Aquatic Conservation. Marine and Freshwater ecosystems, 4: 233-254.
Rudd, M.A., 2009. Non-market Economic Valuation and "The Economists Fallacy". Journal of MultiDisciplinary Evaluation, Volume 6, Number 11 1556-1568.
Rudd, M.A., Tupper, M.H., 2002. The impact of Nassau grouper size and abundance on scuba diver site selection and MPA economics. Coastal Management 30: 133 - 151.
Ruddle, K., 1994. A guide to the literature on traditional community-based fishery management in the Asia-Pacific tropics. Fisheries Circular No. 869. Rome: FAO.
Ruddle, K., Hickey, F.R., 2007. Accounting for the mismanagement of tropical nearshore fisheries. Environment, Development and Sustainability. Volume 10, Issue 5: 565-589.
Ruitenbeek, H.J., 1994. Modelling economy-ecology linkages in mangroves: Economic evidence for promoting conservation in Bintuni Bay, Indonesia. Ecological Economics 10: 233-247.
Ruitenbeek, J., Cartier, C., 1999. Issues in applied coral reef biodiversity valuation: results for Montego Bay, Jamaica. World Bank Research Committee Project RPO# 682-22 “Marine System Valuation: An Application to Coral Reef Systems in the Developing Tropics”. Final Report March 1999, 78 pp.
Russ, G.R., Alcala, A.C., 1996. Marine reserves: rates and patterns of recovery and decline of large predatory fish. Ecological Applications, 6(3): 947–961.
Russ, G.R., Alcala, A.C., 1998. Natural fishing experiments in marine reserves 1983 - 1993: roles of life history and fishing intensity in family responses. Coral Reefs 17: 399-412.
Sale, F.P., Cowen, R.K., Danilowicz B.S., Jones, P.J.S., Kritzer J.P., Lindeman K.C., Planes S., Polunin, N.V.C., Russ, G.R., 2005. Critical science gaps impede use of no-take fishery reserve. Trends in Ecology and Evolution, 20: 74-80.
Samonte-Tan, G.P.B., White, A.T., Tercero, M.A., Diviva, J., Tabara, E., Caballes, C., 2007. Economic Valuation of Coastal and Marine Resources: Bohol Marine Triangle, Philippines. Coastal Management, 35:319–338.
Sánchez Lizaso, J.L., Goñi, R., 2000. Density dependence in marine protected populations: a review. Environmental Conservation 27(2): 144–158.
Sanchirico, j.N., 2000. Marine Protected Areas as fishery policy: a discussion of potential costs and benefits. Resources for the Future, Discussion Papers- IS - dp-00-23-rev. http://ideas.repec.org/p/rff/dpaper/dp-00-23-rev.html 13.
Sanchirico, J.N., Wilen, J.E., 1998. A Bioeconomic Model of Marine Reserve Creation. Journal of Environmental Economics and Management 42, 265-276.

Coral Reef Ecosystem Services Economic Valuation. Phd dissertation, Nicolas Pascal, 2013 Page 329 / 351!
Sathirathai, S., Barbier., E.B., 2001. Valuing mangrove conservation in Southern Thailand. Contemporary Economic Policy 19 (2): 109–122.
Schreyer, P., Koechlin, F., 2002. Purchasing power parities – measurement and uses Organisation for Economic Coperation and Development, Statistics brief - March 2002, nº3 - 18pp.
Secretariat of the Pacific Community, 2007. Meeting house of the Pacific : the story of SPC 1947-2007 - La maison commune du Pacifique : l'histoire de la CPS de 1947 à 2007. SPC, Nouméa, New Caledonia : 179, [12] p. : ill. (some col.), maps (some col.) ; 24 x 27 cm. .
Seenprachawong, U., 2003. An Economic Analysis of Coral Reefs in the Andaman Sea of Thailand. International Journal of Global Environmental Issues Volume 3 (1): 86-92
Seidl, A., Pascal, N., Clua, E., 2011. Economics of Coral reef management in the South Pacific. Workshop proceedings : "Investing in Coral Reef: is it worth it?", Nouméa, November 2011. CRISP/3B/3B3 - Workshop report, 35 pp http://www.crisp-online.com.
Sifleet, S., Pendleton, L., Murray, B.C., 2011. State of the science on coastal blue carbon: a summary for policy makers. Nicholas Institute for Environmental Policy Solutions Report NI R 11-06 (2011) - 12 pp.
Siikamäki, J., 2011. Contributions of the US state park system to nature recreation. Proceedings of the National Academy of Sciences 2011 ; published ahead of print August 9, 2011, doi:10.1073/pnas.1108688108.
Siméoni, P., Lebot, V., 2012. Spatial Representation of Land Use and Population Density: Integrated Layers of Data Contribute to Environmental Planning in Vanuatu. Human Ecology, 40 : 541-555.
Simpson, R.D., Sedjo, R.A., 1996. Investments in Biodiversity Prospecting and Incentives for Conservation. Discussion Paper 96-14 Resources for the Future.
Slootweg, R., Beukering, P.v., 2008. Valuation of Ecosystem Services and Strategic Environmental Assessment. Lessons from Influential Cases. Netherlands Commission for Environmental Assessment - Technical report - 33 pp.
Smith, E.P., 2002. BACI design. Encyclopedia of Environmetrics Volume 1, pp 141–148.
Smith, M.D., Wilen, J.E., 2003. Economic impacts of marine reserves: the importance of spatial behavior. Journal of Environmental Economics and Management 46: 183-194.
SMMPM, 2007. Pêches professionnelles maritimes et aquaculture marine de 2000 à 2005. Service de la Marine Marchande et des Pêches Maritimes, Janvier 2007. 12 pp.
SOPAC, 2006. Pacific Country Report Sea Level & Climate: Their Present State, Vanuatu. SOPAC (Pacific Islands Applied GeoScience Commission) technical report, 28 pp.
SOPAC, 2008. Kiribati technical summary report of economic analysis of aggregate mining on tarawa. EU EDF 8 – SOPAC (Pacific Islands Applied GeoScience Commission) Project Report 71b - 52 pp.
Spalding, M., Ravilious, C., Green, E., 2001. World Atlas of Coral Reefs. UNEP-WCMC. Date Published: January 2001. ISBN: 0-520-23255-0.
Spash, C.L., 2000. Ecosystems, contingent valuation and ethics: the case of wetland recreation. Ecological Economics 34: 195-201.

Coral Reef Ecosystem Services Economic Valuation. Phd dissertation, Nicolas Pascal, 2013 Page 330 / 351!
Spash, C.L., 2007. Deliberative monetary valuation (DMV): Issues in combining economic and political processes to value environmental change. Ecological Economics 63, 690.
Sprep, 2007. Socioeconomic study of the Crab Bay villages of Central Malekula, Vanuatu, Volume 1: Overview, in: Unit, V.E. (Ed.), Vanuatu Environment Unit Vanuatu Environment Unit SPREP, 2007. iv, 20 p. ; 29 cm. - (IWP-Pacific Technical report, ISSN 1818-5614 ; no.46).
Spurgeon, J., 2004. Economic Valuation of Coral Reefs and Adjacent Habitats in American Samoa. Final Report 2004, Jacobs: UK - MRAG Americas, Inc., USA - 113 pp.
Stankey, G.H., Cole, D.N., Lucas, R.C., Petersen, M.E., Frissell, S.S., 1985. The Limits of Acceptable Change (LAC) System for Wilderness Planning. United States Department of Agriculture Forest Service Intermountain Forest and Range Experiment Station Ogden, UT 84401 - General Technical Report INT-176 - 40 pp.
Stern, N., 2006. "Summary of Conclusions" . Executive summary. Stern Review Report on the Economics of Climate Change (pre-publication edition). HM Treasury. Retrieved 28 April 2011.
Stoeckl, N., Birtles, A., Valentine, P., Farr, M., Curnock, M., Mangott, A., Sobtzick, S., 2010. Understanding the social and economic values of key marine species in the Great Barrier Reef. Marine and Tropical Sciences Research Facility (MTSRF) Project 4.8.6(a) Final Report, June 2010. James Cook University, Townsville (76 pp.).
Sundbäck, K., Miles, A., Hulth, S., Pihl, L., P., E., Selander, E., Svenson, A., 2003. Importance of benthic nutrient regeneration for the initiation of macroalgal blooms in shallow bays. . Mar. Ecol. Prog. Ser. 246: 115-126.
Sutherland, W.J., 2005. How Can We Make Conservation More Effective. Oryx, 39, 1.
Suzuki, A., Kawahata, H., 2004. Reef water CO2 system and carbon production of coral reefs: Topographic control of system-level performance. In: Global Environmental Change in the Ocean and on land" Shiomi, M. and Kawahata, H. ed.) Terra-Pub, Tokyo, 229-248.
Tacconi, L., Bennett, J., 1997. Protected area assessment and establishment in Vanuatu: a socioeconomic apporach. ACIAR monograph nº38 - 180pp.
Tawake, A., Aalbersberg, W.G.L., 2002. Community-based refugia management in Fiji. Institute of Applied Science, Faculty of Science and Technology, University of the South Pacific, Suva, Fiji. 12 pp.
TEEB, 2010. The Economics of Ecosystems and Biodiversity: Mainstreaming the Economics of Nature: A synthesis of the approach, conclusions and recommendations of TEEB. http://www.teebweb.org/teeb-study-and-reports/main-reports/synthesis-report/.
Tennant, S., 1998. Kanak women and their participation in social, economic and political development in New Caledonia. Pacific Women's Resource Bureau, Secretariat of the Pacific Community - 28 pp.
The World Bank, 2000. Voices from the village: a comparative study of coastal resource management in the Pacific Islands - Final Report. Pacific Islands Discussion Paper, Series No. 9. East Asia and the Pacific Region, Papua New Guinea and Pacific Island Country Management Unit World Bank, Washington DC, USA. 85 pp.
Torterotot, J.P., 1993. Le coût des dommages dus aux inondations : Estimation et analyse des incertitudes. Mémoire présenté pour l'obtention du titre de Docteur de l'Ecole Nationale des Ponts et Chaussées (06/10/1993), Pierre-Alain Roche (Dir.).

Coral Reef Ecosystem Services Economic Valuation. Phd dissertation, Nicolas Pascal, 2013 Page 331 / 351!
Tourism and Transport Consult, 2005. St. Maarten Tourism Master Plan – TourMap. Final Report & Action Plan, 283 pp.
Trip consultants, 2008. Millennium Challenge Account - Vanuatu tourism survey baseline study. Final report, 45 pp.
Turner, R., Cakacaka, A., Graham, N., Polunin, N., Pratchett, M., Stead, S., Wilson, S., 2007. Declining reliance on marine resources in remote South Pacific societies: ecological versus socio-economic drivers. Coral Reefs 26, 997.
Turner, R.K., Paavola, J., Cooper, P., Farber, S., Jessamy, V., Georgiou, S., 2003. Valuing nature: lessons learned and future research directions, . Ecological Economics Volume 46, Pages 493-510.
Uncles, K., 1997. Economic Impact of Recreational Fishing in Victoria. Department of Natural Resources and Environment, Melbourne, 53 pp. .
Underwood, A.J., 1994. On beyond BACI: sampling designs that might reliably detect environmental disturbances. Ecological Applications, 4: 3-15
UNEP, 2004. People and reefs: successes and challenges in the management of coral reef marine protected areas. United Nations Environment Programme-Regional Seas Programme, Nairobi, Kenya. 103 pp.
UNEP-WCMC, 2006. In the front line: shoreline protection and other ecosystem services from mangroves and coral reefs. . UNEP-WCMC, Cambridge, UK. 33 pp.
Van den Bossche, F., Rogge, N., Devooght, K., Van Puyenbroeck, T., 2010. Robust corporate social responsibility investment screening. Ecological Economics 69, 1159-1169.
Vanuatu National Statistics Office 2008a. Main report on Household Income and Expenditure Survey (HIES). Vanuatu National Statistics Office, technical report, 96 pp.
Vanuatu National Statistics Office 2008b. Main report on Household Income and Expenditure Survey (HIES), 2006, Household Income and Expenditure Survey. Vanuatu National Statistics Office.
Vanuatu National Statistics Office, 2009. National Census of Population and Housing. Technical report, 113 pp.
Vincent, J.R., 2010. Microeconomic analysis of innovative environmental programs in developing countries. Review of Environmental Economics and Policy, 4(2), 221–33.
Virly, S., 2001. Perceptions de l’état de la ressource,dumilieu et desmesures de gestion par les pêcheurs professionnels de Nouvelle-Calédonie :Domaines côtier et lagonaire. Rapport technique, Zoneco. 77 pp.
Virly, S., 2002. Analyse de l’enquête sur la pêche vivrière et plaisancière dans les lagons de Nouvelle-Calédonie. Zoneco, Rapport final - 56 pp.
Virly , S., 2008. Atlas des mangroves de Nouvelle-Caledonie. Rapport Zoneco 2006 - 208 pp.
Virly , S., Garrigue, C., 2008. Suivi de l’état de santé des récifs coralliens Réseau d’observation des récifs coralliens (RORC), : Rapport final 2008 - 65 pp.
Vishwanathan, P.K., Pathak, K.D., Mehta, I., 2004. Socio-Economic and Ecological Benefits of Mangrove Plantation A Study of Community Based Mangrove Restoration Activities in Gujarat.

Coral Reef Ecosystem Services Economic Valuation. Phd dissertation, Nicolas Pascal, 2013 Page 332 / 352!
Gujarat Ecology Commission (GEC) Gandhinagar - Gujarat Institute of Development Research Ahmedabad - Technical report, 164 pp.
WFC, 2008. Lessons Learned and best practices in the management of coral reefs. The WorldFish Center - Working Papers, Vol. 37642 - 8 pp.
White, A.T., Vogt, H.P., Arin, T., 2000. Philippine coral reefs under threat: the economic losses caused by reef destruction. Marine Pollution Bulletin Vol. 40, No. 7: 598-605.
Whitten, S.M., Bennett, J., 2004. A bio-economic model of wetland protection on private lands. Australian Government Department of Environment and Heritage Private and Social Values of Wetlands Research Report No. 8 (Canberra, The University of New South Wales). 89 pp.
Wielgus, J., Chadwick-Furman, N., Dubinsky, Z., Shechter, M., Zeitouni, N., 2002. Dose-response modeling of recreationally important coral-reef attributes: a review and potential application to the economic valuation of damage. Coral Reefs 21, 253.
Wielgus, J., Sala, E., Gerber, L.R., 2008. Assessing the ecological and economic benefits of a no-take marine reserve. Ecological Economics 67, 32-40.
Wiley, P.C., 2003. Valuing our National Marine Sanctuaries. National Oceanic and Atmospheric Administration - Office of Management and Budget - Special Projects -124 pp.
Wilkie, D.S., Morelli, G.A., Demmer, J., Starkey, M., Telfer, P., Steil, M., 2006a. Parks and People: Assessing the Human Welfare Effects of Establishing Protected Areas for Biodiversity Conservation. Conservation Biology Volume 20, No. 1, 247–249.
Wilkie, D.S., Morelli, G.A., Demmer, J., Starkey, M., Telfer, P., Steil, M., 2006b. Parks and People: Assessing the Human Welfare Effects of Establishing Protected Areas for Biodiversity Conservation. Conservation Biology 20, No. 1, 247–249.
Wilkinson, C., 2008. Status of Coral Reefs of the World. Global Coral Reef Monitoring Network and Australian Institute of Marine Science, Reef and Rain Forest Research Center, Townsville, Australia, 296 pp.
William Collins Sons & Co Ltd, 1995. Collins Atlas of the World (revised 1995 ed.), London W6 8JB: HarperCollins.
Wilson, M.A., Hoehn, J.P., 2006. Valuing environmental goods and services using benefit transfer: The state-of-the art and science. Ecological Economics 60: 335-343.
Woehr, D.J., 1994. Rater training for performance appraisal: a quantitative review. Journal of Occupational and Organizational Psychology vol. 67, 3: 189-205.
Worm, B., Barbier, E.B., Beaumont, N., Duffy, J.E., Folke, C., Halpern, B.S., Jackson, J.B.C., Lotze, H.K., Micheli, F., Palumbi, S.R., Sala, E., Selkoe, K.A., Stachowicz, J.J., Watson, R., 2006. Impacts of Biodiversity Loss on Ocean Ecosystem Services. Science 314, 787-790.
Yachi, S., Loreau, M., 1999. Biodiversity and ecosystem productivity in a fluctuating environment: The insurance hypothesis. Proceedings of the National Academy of Sciences of the United States of America, 96: 1463–1468.
You, H., 2004. Étude de l’activité plaisancière dans le lagon du Grand Nouméa – Nouvelle-Calédonie. Mémoire présenté en vue de l’obtention du DESS « Expertise et Gestion des Littoraux » - Service de l’environnement marin de la Direction des Ressources Naturelles. 48 pp.
Copyright © 2022 FDOKUMEN