
dbo1de1.pdf - TDX (Tesis Doctorals en Xarxa)
186
ADVERTIMENT. Lʼaccés als continguts dʼaquesta tesi queda condicionat a lʼacceptació de les condicions dʼús establertes per la següent llicència Creative Commons: http://cat.creativecommons.org/?page_id=184 ADVERTENCIA. El acceso a los contenidos de esta tesis queda condicionado a la aceptación de las condiciones de uso establecidas por la siguiente licencia Creative Commons: http://es.creativecommons.org/blog/licencias/ WARNING. The access to the contents of this doctoral thesis it is limited to the acceptance of the use conditions set by the following Creative Commons license: https://creativecommons.org/licenses/?lang=en
-
Upload
khangminh22 -
Category
Documents
-
view
2 -
download
0
Transcript of dbo1de1.pdf - TDX (Tesis Doctorals en Xarxa)
ADVERTIMENT. Lʼaccés als continguts dʼaquesta tesi queda condicionat a lʼacceptació de les condicions dʼúsestablertes per la següent llicència Creative Commons: http://cat.creativecommons.org/?page_id=184
ADVERTENCIA. El acceso a los contenidos de esta tesis queda condicionado a la aceptación de las condiciones de usoestablecidas por la siguiente licencia Creative Commons: http://es.creativecommons.org/blog/licencias/
WARNING. The access to the contents of this doctoral thesis it is limited to the acceptance of the use conditions setby the following Creative Commons license: https://creativecommons.org/licenses/?lang=en

1
Understanding the impact of Management Control Systems over capabilities and organizational performance, under the influence
of perceived environmental uncertainty
Doctoral Thesis
International Doctoral Programme in Entrepreneurship and Management Department of Business
by
Daniel Ballesteros Orozco
under supervision of
Dr. Joan-Lluís Capelleras
Dr. Yancy Vaillant November 2016

2
.

3
UNDERSTANDING THE IMPACT OF MANAGEMENT CONTROL SYSTEMS OVER CAPABILITIES AND ORGANIZATIONAL PERFORMANCE, UNDER THE INFLUENCE OF PERCEIVED ENVIRONMENTAL UNCERTAINTY.
Submitted to the Department of Business in partial fulfillment of the requirements for the degree of Doctor of Philosophy – Ph D. by the Universitat Autònoma de Barcelona.
Daniel Ballesteros Orozco Author
Dr. Joan-Lluís Capelleras Dr. yancy Vaillant
Supervisors
Barcelona, November 2016

4

5
Dedicated to my family

6

7
Table of contents
Tableofcontents............................................................................................................................................................................................................7Listoffigures................................................................................................................................................................................................................10Listoftables..................................................................................................................................................................................................................11Acknowledgements....................................................................................................................................................................................................13Abstract...........................................................................................................................................................................................................................15Resumen.........................................................................................................................................................................................................................17Chapter1:Introductionofthedissertation....................................................................................................................................................191.1.Problemstatement:Researchtopicanditslocationintheacademicfield................................................................................191.2.Objectiveofthedissertationandresearchquestions...........................................................................................................................201.3.Theoreticalbackground....................................................................................................................................................................................221.3.1Strategicmanagement.........................................................................................................................................................................221.3.2TheoryofResource-BasedView(RBV)........................................................................................................................................231.3.3ManagementControlSystems(MCS)............................................................................................................................................241.3.4Performance.............................................................................................................................................................................................261.3.5Contingencytheoryoforganizations............................................................................................................................................26
1.4.Theoreticalmodel................................................................................................................................................................................................271.4Dissertationapproach.........................................................................................................................................................................................281.5.Anticipatedcontributions.................................................................................................................................................................................311.6.StructureoftheDoctoralThesis....................................................................................................................................................................32
ChapterII:ExaminingtheimpactofManagementControlSystemsuseonthedevelopmentoffirmcapabilities.........332.1Abstract:....................................................................................................................................................................................................................332.2Introduction.............................................................................................................................................................................................................342.3Theoreticalframework:RBV,OrganizationalCapabilities-MCS...................................................................................................362.4Theoreticalmodelandresearchhypotheses.............................................................................................................................................402.4.1Theoreticalmodel..................................................................................................................................................................................402.4.2Hypotheses...............................................................................................................................................................................................41
2.5Methodology............................................................................................................................................................................................................432.5.1Stages,datacollection,variablemeasurement,anddescriptivestatistics...................................................................432.5.2Constructvalidityandreliability....................................................................................................................................................472.5.5Analysismodels......................................................................................................................................................................................48
2.6Researchfindings..................................................................................................................................................................................................492.6.1ResultsoftheANOVAanalyses:.......................................................................................................................................................492.6.2Resultsofthemultipleregressionanalyses:.............................................................................................................................502.6.3MRLsub-groupanalyses(Size&Industry)................................................................................................................................53

8
2.6.4Resultssummary...................................................................................................................................................................................552.7Conclusionsanddiscussion...............................................................................................................................................................................562.8Limitationsandsuggestionsforfurtherresearch..................................................................................................................................60
ChapterIII:ImpactofManagementControlSystemsusesonperformance:DirectorIndirectEffect?..............................633.1Abstract:....................................................................................................................................................................................................................633.2Introduction.............................................................................................................................................................................................................643.3TheoreticalFramework:RBV,OrganizationalCapabilities,MCS,Performance.......................................................................663.4Theoreticalmodelandresearchhypotheses.............................................................................................................................................773.4.1Theoreticalmodel..................................................................................................................................................................................773.4.2Hypotheses...............................................................................................................................................................................................78
3.5Methodology............................................................................................................................................................................................................843.5.1Stages,datacollection,descriptivestatisticsandvariablemeasurement....................................................................843.5.2Secondorderconstructs:Diagnostic&InteractiveUses......................................................................................................883.5.3ConstructValidityandReliability...................................................................................................................................................903.5.4AnalysisModels......................................................................................................................................................................................91
3.6Researchfindings..................................................................................................................................................................................................963.6.1ResultsoftheStructuralModel.......................................................................................................................................................96
3.7Conclusions,discussionandmanagerialimplications........................................................................................................................1003.8.Limitationsandsuggestionsforfurtherresearch...............................................................................................................................105
ChapterIV:ManagementControlSystems,CapabilitiesandPerformance:TheinfluenceoftheEnvironmental
Uncertainty.................................................................................................................................................................................................................1074.1Abstract...................................................................................................................................................................................................................1074.2Introductionandresearchobjective...........................................................................................................................................................1084.3Theoreticalframework:RBV,OrganizationalCapabilities,MCS,Performance,EnvironmentalUncertainty...........1114.4.Theoreticalmodelandresearchhypotheses..........................................................................................................................................1194.4.1Theoreticalmodel...............................................................................................................................................................................1194.4.2Hypotheses............................................................................................................................................................................................120
4.5Methodology..........................................................................................................................................................................................................1214.5.1Datacollection,descriptivestatisticsandvariablemeasurement................................................................................1214.5.2Constructvalidityandreliability.................................................................................................................................................1254.5.3AnalysisModels...................................................................................................................................................................................1274.5.4Second-orderconstructs:Diagnostic&Interactiveuses...................................................................................................1274.5.5Structuralequationmodeling(SEM).........................................................................................................................................128
4.6Researchfindings................................................................................................................................................................................................1304.6.1ResultsofStructuralModel............................................................................................................................................................130
4.7Conclusions,discussionandmanagerialimplications........................................................................................................................133

9
4.7.1Conclusionsanddiscussions..........................................................................................................................................................1334.7.2Managerialimplications..................................................................................................................................................................135
4.8Limitationsandfurtherresearch.................................................................................................................................................................137ChapterV:Conclusions.........................................................................................................................................................................................1395.1.Summaryanddiscussionofthemainresultsandcontributions...................................................................................................1395.2.Theoreticalimplications.................................................................................................................................................................................1475.3.Practicalimplications......................................................................................................................................................................................148
6.ChapterVI:Appendix........................................................................................................................................................................................151AppendixA:DatainthedirectorySCIANMéxico2012................................................................................................................151AppendixB.Surveyinstrument...............................................................................................................................................................152AppendixC.Nonresponsebiasanalysis..............................................................................................................................................154AppendixD.Descriptivestats,correlations.Part1:MCSuses,LO,EO(ch.II).....................................................................155AppendixD.Descriptivestats,correlations:Part2:MCSuses,LO,EO,Performance(ch.III).....................................155AppendixD.Descriptivestats,correlations:Part3:Diagnostic,interactive,LO,EO,Performance,PEU(ch.IV).156AppendixE.Reliability.Part1:AverageInter.itemTotalCorrelation....................................................................................157AppendixE.Reliability.Part2:Testofnormality...........................................................................................................................157AppendixF.Convergent-discriminantvalidity.Part1:CorrelationMCSuses,capabilities,performance,PEU..158AppendixF.Convergent-discriminantvalidity.Part2:EFA:MCSuses–LO&EO(ch.II).............................................160AppendixF.Convergent-discriminantvalidity.Part3:EFA:MCSuses–LO&EO–Performance(ch.III)...........161AppendixF.Convergent-discriminantvalidity.Part4:EFA:MCSuses–LO&EO-Performance–PEU(ch.IV).162AppendixG.ChapterII:Anovaresults..................................................................................................................................................163AppendixH.ChapterII:MultipleLinearRegressionsresults.Part1:Fullsample,size&industry...........................163AppendixH.ChapterII:MultipleLinearRegressionsresults.Part2:subgroupsize.....................................................164AppendixH.ChapterII:MultipleLinearRegressionsresults.Part2:subgroupIndustry.............................................165AppendixI.ChapterII:Hypothesesresultsofthesub-group(Size&Industry)analyses............................................166AppendixJ.ChapterIII:EFAforDiagnosticandInteractiveuses(2ndordersfactoranalysis).................................166AppendixK.ChapterIII:Measurementinvariancetest(Directeffect-IndirectEfect).................................................167AppendixL.ChapterIII:Structuralmodelresults-overallsampleandmulti-groupsizeanalysis.........................168AppendixM.ChapterIV:PEUFactoranalysis..................................................................................................................................169AppendixN.ChapterIV:Secondorderconstructs:Diagnostic&Interactiveuses..........................................................170AppendixO.ChapterIV:Measurementmodel.................................................................................................................................172
7.ChapterVII:References....................................................................................................................................................................................173

10
List of figures
Figure 1.1: Strategic Process ..................................................................................................................................................... 23Figure 1.2: Complete project theoretical model ....................................................................................................................... 27Figure 2.1: Theoretical model and hypothesis: H1 (a & b) to H4 (a &b) ................................................................................. 41Figure 2.2: Descriptive Statistics .............................................................................................................................................. 46Figure 3.1: Uses of Management Control Systems .................................................................................................................. 73Figure 3.2: Theoretical model ................................................................................................................................................... 78Figure 3.3 Structural model results H1 to H8 (Overall sample) .............................................................................................. 97Figure 4.1: Theoretical model ................................................................................................................................................. 120Figure 4.2: Hypothesis H1 to H4 (Diagnostic / Interactive MCS uses - Capabilities through PEU2 mediating effect) ....... 120Figure 4.3: Hypotheses H5 and H6 (Capabilities - Performance through PEU1 mediating effect) ...................................... 121Figure 4.4: Hypothesis H1 to H4 results; (Diagnostic / Interactive uses of MCS - Capabilities through PEU2) .................. 131Figure 4.5: Hypotheses H5, H6 results; (Capabilities - Performance through PEU1) ........................................................... 131

11
List of tables
Table1.1:Dissertationapproach.........................................................................................................................................................................30Table2.1:Variablemeasurement........................................................................................................................................................................45Table2.2:ANOVAanalysesbetweenMCSuses,LO&EOversusSizeandIndustry......................................................................50Table2.3:MultipleLinearRegressionsresults..............................................................................................................................................50Table2.4:Summaryofhypothesesandresults.............................................................................................................................................52Table2.5:LO-Sizesub-groupanalyses............................................................................................................................................................53Table2.6:EO-Sizesub-groupanalyses...........................................................................................................................................................54Table2.7:LO-Industrysub-groupanalyses..................................................................................................................................................54Table2.8:EO-Industrysub-groupanalyses..................................................................................................................................................54Table3.1:VariableMeasurement........................................................................................................................................................................86Table3.2:Analysisofmultidimensionalityinthesecond-orderfactors............................................................................................90Table3.3:Internalconsistencyandconvergentvalidity...........................................................................................................................93Table3.4Discriminantvalidity............................................................................................................................................................................94Table3.5Measurementinvariancetest...........................................................................................................................................................95Table3.6:Resultsofthestructuralequationmodels.................................................................................................................................96Table3.7:ResultsofHypotheses.........................................................................................................................................................................98Table3.8:Hypothesesresults:MCS–Performance(direct&indirecteffect).................................................................................99Table3.9:MCSuses(Dignostic/Interactive)-LO&EO-Performanceanalysis(direct&indirecteffect)......................100Table4.1:Variablemeasurement.....................................................................................................................................................................123Table4.2:Internalconsistencyandconvergentvalidity........................................................................................................................126Table4.3:Internalconsistencyandconvergentvalidity(factorloadings)....................................................................................129Table4.4:Discriminantvalidity........................................................................................................................................................................130Table4.5:Resultsofthestructuralequationmodels..............................................................................................................................132Table4.6:Hypothesessummaryresults:H1toH6(PEU).....................................................................................................................133Table5.1:Summaryofthecontributionsthroughhypotheses...........................................................................................................146

12

13
Acknowledgements
A phrase that has struck me throughout my life is this: "You get further if you are in good company" and although this has
been a long journey, I was always in very good company.
There are many people among those companions with whom I am very grateful. I would like to begin by expressing my
heartfelt recognition to my supervisors, Dr. Joan-Lluis Capelleras and Dr. Yancy Vaillant, for their dedication and expertise
to carry out this work. I deeply appreciate all the help offered by the Department of Business Economics, above all special
thanks to my advisor on quantitative analysis for useful suggestions and comments in the design of the theoretical model and
carry out the relevant analysis, Dr. Josep Rialp. Thanks to Dr. Victor Gutierrez in his unconditional support, detonating the
relevant questions of my work and give me guidance in conducting this study.
Thanks to the survey reviewers for their helpful comments and suggestions and also we thank the encuestafacil.com for their
assistance in collecting the survey data used in this thesis.
My Ph.D thesis has benefited from the great generosity of my institution Tecnológico de Monterrey that gave me the
opportunity to study at all stages of my career.
I want to express my deepest acknowledgements to my three coworkers and friends, Juan Manuel Duran, Alfonso Pompa and
Edgar Coronado for the support they gave me during these years, not only their unconditional help, but also moral support
and guidance at all stages of this study.
Finally, I am forever thankful to my family, especially to my wife, Astrid, who have supported me all the time and understood
the choices that I made, to my children Daniel, Mathias, and Caty for all time I stole from them while studying my Ph.D. and
to my father, who although he could not accompany me on this adventure, he was with me all the time, guiding me and
motivating me to move on.
This thesis is dedicated to them.

14

15
Abstract
Management Control Systems (MCS) literature states that firms believe that MCS help them to deliver value (Ittner et al.,
2003) by facilitating strategy implementation and enhancing organizational performance (Franco-Santos, et. al., 2012). The
overall research results are valuable but ambiguous, inconclusive, and often contradictory. In general, prior research suggests
that capabilities are shaped by MCS (Henri, 2006a; Koufteros et al. 2014). However, there are important questions that remains
unclear, e.g. A manager using a MCS understand the reason for using it? or how does MCS enable a company to get the
desired results? Will using a MCS in different ways have an impact on its results?. Little is known about how the MCS use
can impact on organizational capabilities that trigger performance. Furthermore, does the environment influence this
relationship? are these results applicable in a context of uncertainty? (Khandwalla, 1977; Chenhall, 2003).
Based on empirical data collected from 644 planning directors of companies of various sizes and sectors, the main purpose of
this doctoral thesis is to examine how MCS uses can act as an antecedent to organizational capabilities and lead to superior
performance, while recognizing that the context of every control takes place under conditions of uncertainty, and different
perceptions of this can have different effects (Otley 2016). A topic which has been little studied.
In order to contribute to the literature that investigates performance determinants, we use four lines of study as a framework
for this thesis: The Resource-Based View (RBV) theory (Barney 1991; Teece et al. 1997), MCS literature (Simons 1995;
Vandenbosch 1999), performance literature (Ittner & Larcker 2003; Jaworski & Kohli, 1996) and contingence theory of
organizations (Burns & Stalker 1961; Lawrence & Lorsch 1967; Otley, 1980, 2012, 2016). Especially, RBV & MCS literature
can offer useful theoretical frameworks and only on few occasions have been integrated within the contingence theory.
MCS practices have been widely studied and demonstrate how an effective use of them affects organizational performance
(Simons, 1995; Henri, 2006a; Bisbe & Malagueño 2012; Koufteros et al. 2014). Nevertheless, there is little evidence to show
the effects they can have on organizational capabilities. The results show that when an entrepreneurial orientation (EO) has
been installed as an organizational capability, it implies a competitive advantage that contributes to better results (Covin &
Slevin 1991; Lumpkin & Dess 1996; Ripollés & Blesa 2005). In the other hand, learning orientation capability (LO) gives a
company an advantage that others do not possess and can thereby lead to better results (Slater & Narver 1995). However, little
has been documented about the relationship between MCS – capabilities – performance, and thus this work seeks to contribute
to this line of knowledge. Finally, to see how the relationships raised above, behave depending on the context, the model was
extended to include the uncertainty variable, thus offering a contextualized view of how MCS can be used in diferent ways in
order to obtain different results, enabling a better understanding of the context importance for research in this field.
Our findings suggest a positive and significative relationships between MCS uses and capabilities. Contrary to previous
studies (Henri 2006a), but in line with Koufteros et al. (2014), our results show a direct, positive and significant relationship
between MCS diagnostic use and both of the constructs studied, capabilities and performance. In addition, EO has a significant
effect on performance on companies of any size, but this is not the case of LO. This thesis concludes by discussing theoretical
and practical implications derived from the findings. Limitations and future research directions are also offered in each essay.

16

17
Resumen
La literatura de los sistemas de control administrativo muestra que en general las empresas creen que los sistemas de control
administrativo ayudan a entregar valor (Ittner et al., 2003), facilitando la implementación de la estrategia y mejoras en el
desempeño organizacional (Franco-Santos, et. al., 2012). Los resultados globales en este ramo son valiosos pero ambiguos,
no concluyentes y a menudo contradictorios. Investigaciones anteriores sugieren que las capacidades organizacionales en gran
parte están determinadas por los MCS (Henri, 2006a; Koufteros et al. 2014). Sin embargo, aun existen preguntas importantes
que no quedan claras: Cuando un administrador está usando un MCS, ¿entiende las razones para usarlo? ó ¿cómo lo va a
utilizar para generar el resultado deseado?. Usarlos de una manera u otra, ¿tendrá un impacto diferente en los resultados?.
Poco se sabe acerca de cómo los MCS impactan las capacidades y el rendimiento. Por otra parte, ¿existe una influencia del
entorno en estas relaciones?, ¿son aplicables los resultados ante incertidumbre? (Khandwalla, 1977; Chenhall, 2003).
Con base en datos empíricos recogidos de 644 directores de planeación, el objetivo principal de esta tesis doctoral es examinar
cómo los diversos usos de los MCS pueden actuar como un antecedente de las capacidades organizacionales y dar lugar a un
rendimiento superior, al tiempo que reconoce que el contexto de cada control se lleva a cabo en condiciones de incertidumbre
(Otley 2016). Un tema que ha sido poco estudiado. En el desarrollo de esta tesis, utilizamos cuatro líneas de estudio como
marco de referencia: La teoría de los recursos y capacidades (Resorurce-based view, RBV) (Barney, 1991; Teece et al 1997),
la literatura de sistemas de control administrativo (MCS) (Simons 1995; Vandenbosch 1999), literatura de desempeño (Ittner
& Larcker 2003; Jaworski & Kohli, 1996) y la teoría de la contingencia en las organizaciones (Burns & Stalker 1961;
Lawrence & Lorsch 1967; Otley, 1980, 2012, 2016). Especialmente RBV y la literatura de MCS, son considerados como
marcos teóricos útiles, pero hasta ahora no se han integrado con la teoría de la contingencia.
El estudio de los MCS demuestran la importancia de su uso sobre el desempeño organizacional (Simons, 1995; Henri, 2006a;
Koufteros et al. 2014), pero es poca la evidencia que muestre los efectos que pueden tener en las capacidades organizacionales.
Los resultados muestran que cuando la orientación emprendedora (EO) se instala como una capacidad organizacional,
representa una ventaja competitiva que permite obtener mejores resultados (Covin y Slevin 1991; Lumpkin y Dess 1996;
Ripollés y Blesa 2005). Por otro lado, la orientación al aprendizaje (LO), ofrece a las empresas una ventaja que otros no tienen
y con ello tambien obtener mejores resultados organizacionales (Slater y Narver 1995). Sin embargo, poco se ha documentado
acerca de la relación entre los MCS, las capacidades y el desempeño. Finalmente, para observar cómo se comportan las
relaciones anteriores en función del contexto, el modelo incluyó a la incertidumbre, ofreciendo así una visión contextualizada
sobre cómo los MCS se pueden utilizar en formas diferentes, con el fin de obtener resultados diferentes.
Nuestros resultados sugieren una relacion positiva y significativa entre los usos de los MCS y las capacidades. Contrario a
estudios anteriores (Henri 2006a), y en línea con Koufteros et al. (2014), nuestros resultados muestran una relación directa,
positiva y significativa entre el uso diagnóstico de los MCS y las capacidades y el desempeño. Además, la orientación
emprendedora (EO) tiene un efecto significativo y positivo en el desempeño, pero no es el caso para la orientación al
aprendizaje (LO), que no tiene ningún efecto directo. Esta tesis concluye con un análisis de las implicaciones teóricas y
prácticas derivadas de los hallazgos. Las limitaciones y futuras líneas de investigación también se ofrecen en cada ensayo.

18

19
Chapter 1: Introduction of the dissertation
1.1. Problem statement: Research topic and its location in the academic field
This study is based on the research literature in strategic management (Mintzberg 1973, 1978, 1994; Mintzberg & Waters
1985; Porter 1980), strategic capabilities (Barney, 1991; Day, 1994; Wernerfelt, 1984) and management control systems
(Simons 1990; 1995; Vandenbosch 1999, Henri 2006a, 2006b) that have been developed in an accounting-based framework
(Otley, Broadbent, & Berry, 1995). This type of framework shows how strategic management and especially strategic process
are supported by control and information systems, and helps us to identify and analytically describe how the way such systems
are used can impact on capabilities and better results (Grant, 1991; 1996). Furthermore, this thesis seeks to identify the impact
of some contingence variables (Burns & Stalker, 1961; Lawrence & Lorsch, 1967) that could affect these relationships. Since
in numerous studies it is the contingency variables that are primarily responsible for the results, we decided to make our
analysis based on the interactions previously raised.
Although the topic of Management Control Systems (MCS) is approximately 30 years old, in the last 15 years its development
has been exponential, due mainly to three issues which have had a considerable impact on performance control practice:
1) The development of new technologies with the advent of powerful computers and high-speed software which has
allowed access and dissemination of more and better data.
2) Fast changes due to increased competition for clients, developing and using technology in a globalized world with
greater complexity, uncertainty and risk, with the need to renew and change structures.
3) Increasing corporate control in multinational organizations and a global trend toward accountability and value creation,
in different perspectives, brought about by the development of concepts such as financial and nonfinancial indicators,
tangible and intangible benefits, and competitive differentiators.
These issues have detonated the need for a paradigm shift in the design and use of MCS from a focus on business planning to
a wider focus on business strategy and strategic control processes. They have highlighted the importance of optimizing
business practices and securing the results. But to do this, the task requires having a better understanding of MCS role and
how they can better meet managerial needs.
It is widely believed that MCS are tools that can help to identify weaknesses, clarify strategies and objectives defined to
deliver value, by facilitating strategy implementation and by enhancing organizational performance in today’s competitive
environment (Ittner et al. 2003; Widener 2007). Nevertheless, in general, studies on the relationship between MCS -
Capabilities – Performance, have yielded ambiguous, inconclusive, or sometimes contradictory results. Specifically, we have
identified three gaps in the literature that deserve investigation, and on that basis will develop the chapters of this thesis.
The first gap shows that MCS research has focused on its relation to design, purpose, types, and factors influencing its
adoption and use, but without dealing with MCS impact on organizational capabilities. As we can see in the literature review,
except for the work done by Henri (2006a) and Koufteros et al. (2014), little is known about how MCS use can impact

20
organizational capabilities, or what variables affect these relationships. There are very few studies linking the various uses of
the MCS and their impact on the strategic capabilities of firms. Furthermore, there were no specific studies that tested
entrepreneurial orientation empirically.
The second gap is related to organizational performance, related to criticism that a more comprehensive approach to forms of
MCS and its impact on performance should be studied (Otley 1980; Fisher 1995; Milgrom & Roberts 1995). As explained
by Otley (2014, 2016) among others, although organizations believe that MCS can help them in the task to deliver value,
some researchers, such as Henri (2006a), claim that the specific relationship between MCS and performance is ambiguous
and that there is insufficient evidence to suggest a direct relationship between MCS and organizational performance. In the
opposite direction, Koufteros et al. (2014) argue that there is a gap in the literature on how specific uses of MCE affect
performance (p. 315); they emphasize the importance for a business to explore this effect in order to direct resources and
maximize returns. There is, however, very little broad-based empirical research examining the role that MCS can play in
shaping organizational performance. In this line, Pavlov and Bourne (2011) added that since MCS relationship to performance
has not been clearly analyzed, little is known about the mechanisms that link this relationship between MCS impact and
performance, directly or indirectly through the organizational capabilities that trigger performance in different kind of firms.
Thus, this suggests an unresolved area for study.
The third gap is a response to Otley’s and Soin’s (2014) calls for researchers to “develop better ways of describing likely
sources of uncertainty and their possible impacts,” in particular related to the use of MCS. The research found that the way
the results are dependent on the degree of certainty a firm holds about its current and future business operations (Chenhall &
Morris 1986; Mia 1993). Still the environmental context has been one of the issues that have not been developed in the
literature. Management Control studies need to recognize that all control takes place under conditions of uncertainty: this is
true today and always was (Otley & Kim 2014). Thus, given that the effect of some environmental factors is unclear, this gap
concerns to what extent a perceived environmental uncertainty will influence (PEU) (Govindarajan, 1984; Hoque, 2004)
decision makers, and mediate the relationships previously studied between MCS uses, capabilities (EO & LO), and
performance.
In general, our study contributes knowledge to the research frontier with respect to these relationships. It is important to
understand and identify uses and ongoing management processes associated with MCS administrative practices that can
enable and enhance strategic firm capabilities and thus, the emergence of new strategies and performance.
1.2. Objective of the dissertation and research questions
The general objective of this doctoral thesis is to identify and analytically describe the role played by the MCS in the
development of strategic capabilities impacting on performance from RBV perspective and MCS literature. Taking into
consideration the importance of context and that there are no studies that have evaluated whether these relationships are

21
maintained under different contexts or circumstances, the initial model is complemented with the PEU variable, to analyze it
under the influence of uncertainty as perceived by decision makers.
To accomplish this, it is first necessary to analyze in the strategic management process literature 1, how MCS are part of the
research environment and their relationship to performance. After that, we view in MCS literature how this concept was
defined and operationalized, the reasons or purposes sought by managers using MCS, as well as the dimensions of information
used and the type of use applied. This allows us to develop relationships proposed in this thesis, including MCS - Capabilities
– Performance. The relationships between MCS uses – capabilities and MCS uses – performance, have been addressed in the
literature, but as shown in this work, the operationalization of the various uses (e.g., monitoring, attention focusing, strategic
decision-making and legitimization) or purposes (e.g., diagnostic or interactive) and the relation to the capabilities and
performance have yielded ambiguous, inconclusive or sometimes contradictory results. Besides that, there are no studies that
have evaluated whether these relationships are maintained under different contexts or circumstances, such as uncertainty.
Typically, control practices seem to function as if uncertainty does not exist, and thus, a common misconception is that
previous studies of control systems tend to implicitly assume conditions of certainty (Otley 2012).
Once the principal features of this thesis have been described, the main objectives in each chapter of this investigation are
presented below. Furthermore, we have specific objectives to be met throughout this research. This doctoral work consists of
three essays which make up the main body of this thesis.
In this first paper entitled “Examining the impact of Management Control Systems use on the development of firm
capabilities”, the general objective is to examine: the impact of MCS uses on the development of firm capabilities; and the
specific objective is: How MCS uses determine capabilities (LO and EO). As a check of strength, this work also seeks to
investigate the role-played by the firm characteristics (size, age, and industry) in MCS uses – Capabilities relationship.
In the second paper, called “Impact of Management Control Systems uses on performance: Direct or Indirect effect?”,
the overall objective is to answer the following questions: To what extent does MCS use affect performance? Is this effect
direct or indirect through capabilities? In other words, is there a mediating effect of organizational capabilities (LO and EO)
among the MCS uses and performance? Also to strengthen the results obtained and to analyze the effect of the size of the
organizations concerned, also relevant in previous studies, we attempt to answer the following question: Does the size of the
company matter in this relationship? In other words, is the effect the same in a business of any size?
Finally, the third paper called “Management Control Systems, Capabilities and Performance: The influence of the
Environmental Uncertainty”, goes a step further and looks at the impact of external organizational context. From a
contingency perspective (Burns & Stalker, 1961; Lawrence & Lorsch, 1967), the general objective is to identify the impact
of the environmental context that may discourage or enhance the relationships studied. Specifically, the objective is to examine
the extent to which decision makers perceive the influence of environmental uncertainty (PEU) (Govindarajan, 1984; Hoque,
2004), and if this influence mediate the relationships between MCS uses, capabilities (EO & LO), and organizational
performance. Literature suggests that somehow the contradictory results that have been found could be attributed to the context 1 Especially in the step of evaluation and control, where MCS take shape and activities & performance results are monitored: (Figure 2.1 Strategic Process)

22
in which the research was conducted (Otley 2012). Hence, by the inclusion of the variable PEU into the model, we seek to
learn if two variables, e.g., MCS uses (independent variable) and PEU (potentially mediating variable), influence capabilities
(the dependent variable). Thus the specific objectives are:
- To what extent does PEU play a mediating role between MCS and capabilities? (MCS - PEU - Capabilities)
- To what extent does PEU play a mediating role between capabilities and performance? (Capabilities - PEU - Performance)
This last study illustrates the importance of the context variables in order to understand the relationships between MCS uses,
capabilites and performance.
As you can see, we have several objectives in the form of research questions that stem from the general objectives. Then, a
synthesis of the research questions, the theoretical framework, the research methodology as well as key findings of each
chapter are presented in table 1.1: Dissertation approach.
1.3. Theoretical background
Next we present a brief explanation of the theories used in this thesis to understand the role played by the MCS uses in relation
to organizational capabilities and performance, and finally we analyze how the context of organizations can influence the
relations created.
1.3.1 Strategic management
Strategic management is the conceptual framework for making decisions that are considered strategic in an enterprise.
Strategic management is “The major intended and emergent initiatives…… taken by general managers on behalf of
owners……involving utilization of resources …. To enhance the performance…..of firms……in their external environments”
(Nag, Hambrick, & Chen, 2007). There is general agreement that strategic management is concerned with the strategic
processes that can generate a competitive advantage to allow better performance. This process commonly consists of four
phases (formulation-implementation-outcomes-evaluation and control). The last phase is that which has been the least
developed. Management Control Systems (MCS) are the models and systems that could support the integration of all the
strategic process in this fourth stage. MCS comprise the process by which managers ensure that resources are obtained and
used effectively and efficiently in the accomplishment of the organization’s objectives (Anthony, 1965)2. Therefore, the
information provided from this system is relevant in all phases of the strategic process (Figure 1.1). In general, MCS or also
called PMS´s help translate strategy into objectives and measures that can be clearly communicated, thus facilitating the
closure of the gap between the strategic vision of the firm and the management of its operating activities (Bisbe & Malagueño
2012). Strategy as a research program has two broad approaches: content and process. Both types are important for this
research. Content research studies present and evaluate strategic options that companies follow, arguing two principal causes.
2 The term “management control systems, MCS” was brought into general use by Professor Robert Anthony of Harvard University in his seminal book published in 1965.

23
Figure 1.1: Strategic Process The first is external (i.e. factors where the industry structure
determines the rules of competitive play (Porter, 1980). The
second is internal (i.e. factors where strategy and
competitive advantage depends on the firm resources and
capabilities (Barney, 1991; Teece, Pisano, & Shuen, 1997;
Wernerfelt, 1984)), that allow the company to build
competitive advantage and achieve better results than the competition. In this line, MCS are used to implement the strategy
within the organization (Gates, 2001) by providing the information necessary to challenge the content and validity of the
strategy (Ittner et al. 2003) and set the conditions for the creation or development of the strategic capabilities in organizations
through the routines they stimulate (Franco-Santos et al. 2012). From the point of view of process research, investigators
have focused mainly on two lines: deliberate and emergent. The deliberate line refers to strategy as an analytical approach
that is developed in a planned and rational way (Ansoff, R. L. Hayes, & Declerck, 1976)). The emergent line refers to the
strategy that arises from the collective organization through patterns of behavior which are not intentional but rather involve
a social process, an interaction of the organization with its environment, not in the strategist’s mind (Mintzberg, 1987;
Mintzberg & Lampel, 1999). Both deliberate and emergent lines are related to MCS: an interactive MCS use is eminently
social; while a diagnostic MCS use is completely rational.
Content (internal and external) and process (deliberate and emergent) strategy researchers are still separated by structural
holes, and some authors argue for the need to integrate both branches (Cuervo, 1996; Mellahi & Sminia, 2009). Greater
knowledge from research can help us understand how MCS use can assure the two areas (content & process) of the entire
strategic process.
1.3.2 Theory of Resource-Based View (RBV)
The principal theoretical framework of this research is the Resource-Based View (RBV) theory, also called the theory of
resources and capabilities, and its relationship to the study of management control systems. The RBV of the firm was
originally developed in the field of strategic management with the aim of explaining the reasons why firms obtain different
results (Barney, 1991; Wernerfelt, 1984) and how firms achieve sustainable competitive advantages. These reasons are based
on the fact that some firms are able to control and use different tangible and intangible assets or resources (Lengnick-Hall &
Wolff, 1999) which enable them to have some capabilities that provide sustainable competitive advantage and earn superior
returns (Grant, 1996). Capabilities are a link between resources and their deployment, because they are organizational
processes and routines to integrate, reconfigure, gain and release resources, to match and even create market change
(Eisenhardt & Jeffrey, 2000; Grant, 1996). MCS research has used an explicit or implicit RBV approach (Barney, 1991;
Teece et al., 1997; Wernerfelt, 1984) and together with Simons’ levers of control framework (Simons 1995) shows that MCS
influence the strategic capabilities in firms through the routines they stimulate (Franco-Santos et al. 2012).
Market orientation, learning orientation, entrepreneurship, and innovation are the capabilities most studied in the literature.
Source: Self-devised
3. Performance
1. Formulation
2. Implementation
Management Control Systems
Strategy Process

24
In this study we will focus on the capabilities of learning orientation and entrepreneurial orientation for various reasons.
Elements of entrepreneurship and innovativeness studied in previous MCS works are included to some extent by the construct
known as entrepreneurial orientation (Lumpkin, et. al,. 2009). MCS use is ssociated with superior performance in firms which
have an entrepreneurial orientation (Chenhall & Morris, 1995).
Learning Orientation (LO) capability is considered an important facilitator of competitive advantage (Baker & Sinkula, 1999).
The use of MCS supports a holistic look at all the strategic process, resulting in organizational learning (Slater & Narver,
1995; Speckbacher et. al., 2003).
Entrepreneurial orientation capability (EO) is a permanent attitude of a company (Covin & Slevin, 1991) that is proactively
seeking new business opportunities (Zahra & Garvis, 2000). This capability favors the generation of competitive advantage
and better results (Ripollés & Blesa, 2005). Empirical evidence has found a positive direct relationship between EO and results
(Wiklund, 1999; Wiklund et. al., 2007; Zahra, 1991; Zahra & Covin, 1995) for companies of all sizes: small, medium and
large (Rauch, et. al., 2009; Wiklund & Shepherd, 2003; 2005).
The literature supports the theory that organizational learning (Widener, 2007) and entrepreneurial orientation (Ripollés &
Blesa, 2005) are two capabilities positively associated with performance, while other capabilities are not clearly affected this
way.
1.3.3 Management Control Systems (MCS)
Management control systems (MCS) are formalized procedures and systems that use information to maintain or alter patterns
in an organizational activity (Simons, 1987). MCS is comprised of multiple control systems that work together (Widener,
2007); providing the information necessary to challenge the content and validity of the strategy (Ittner et al., 2003). MCS have
evolved from a purely financial approach to more comprehensive business characteristics (Kaplan & Norton, 1992), from
business planning to a wider focus on business strategy (Berry et. al., 2009). It is widely accepted that a firm’s MCS is
designed to support its strategy (Widener, 2004), but MCS should be tailored explicitly to support such strategies (Langfield
Smith, 1997) in order to achieve superior performance (Dent, 1990). MCS does not automatically improve performance;
rather, performance is intimately related to how systems are designed, developed and used. It should be noted, though, that
MCS use can be more significant than formal design. The use made of information and controls is a cornerstone of MCS
(Ferreira, 2002). Therefore, to study MCS, it is important to start with the different uses that are given to those who apply
them (Langfield Smith, 1997). Our study proposes a combination of two classifications of MCS use that have been used
separately in previous studies, and this combination creates a new model that allows us to observe the phenomenon of study
in a more holistic manner. These classifications are the theoretical proposition about levers of control (LOC) (Simons, 1995)
and the Vandenbosch executive support systems classification proposal (Vandenbosch, 1999).
Levers of control (LOC) (Simons, 1995)
Simons (1995) argues that MCS are used with different purposes in four different ways: beliefs (commitment towards goals
and inspiration, values, vision, direction, core values), boundary (administrative controls hierarchically based, guidelines for
behavior, behavioral constraints), diagnostic use (control over organizational goal, monitoring), and interactive use (the ability
25
to search opportunities, solve problems or forward- looking and make decisions with management involvement).
In this study we focused on diagnostic and interactive uses because MCS are related with them (Simons, 1990, 1995).
Specifically, Diagnostic MCS use refers to monitoring of organizational performance against important dimensions, to
“justify, monitor and reward” goals, used to compare actual performance against pre-set targets to identify exceptions and
deviations from plans (Mundy, 2010; Navarro & Guerras Martín, 2001). Diagnostic use constrains innovation / opportunities
and weakens capabilities (Simons 1995) in the firm, because the proposed routines send a negative signal (Henri, 2006a;
2006b). On the other hand, interactive MCS use is forward-looking and characterized by active and frequent dialogue among
top managers and employees (Naranjo-Gil & Hartmann 2007a). This stimulates dialogue, participation, and involvement, and
thus detonates new strategies (Simons 1995). This type of use supports the emergence of new bottom–up strategies (Henri
2006a; Mellahi & Sminia 2009) and the development of strategic capabilities by fostering innovative practices, developing
entrepreneurship (Ahn, 2001; Bisbe & Otley, 2004; Cruz, et. al, 2011; Henri, 2006a; Marginson, 2002) and facilitating
organizational learning by providing information intelligence, generation, dissemination, and responsiveness (Kohli &
Jaworski 1990),
The main difference between diagnostic and interactive use is that the former focuses on actual results evaluation, the latter
on the formulation and use of predictions.
Executive support systems classification (ESS) (Vandenbosch, 1999)
The second classification used in this study is based on the proposal made by Betty Vandenbosch (1999), which identifies a
typology with four categories for management information systems use: 1) Score keeping (monitoring); 2) Legitimizing
decisions; 3) Focusing organizational attention and learning; and 4) Problem solving (Vandenbosch, 1999).
- Score keeping (monitoring) is characterized by comparisons in time periods, responding to the question: How am I doing?
(Simon et. al., 1954). MCS are used to provide feedback regarding expectations.
- Legitimizing decisions (Legitimization): This refers principally to justify and validate past actions or a decision that has
been made, increasing and ensuring the legitimacy of future actions. The information use of the entire firm in a MCS, gives
them the authority and credibility to provide legitimacy of activities (Vandenbosch, 1999).
- Focusing organizational attention (Attention focusing) contributes to the emergence of new strategies within the
organizations (Mintzberg, 1978; Simons, 1990; 1995) by responding to the questions: What problems must we focus on?
What opportunities are there? (Simon et al., 1954).
- Problem solving (Strategic decision making) refers to a non-routine activity of senior management strategic decision-making,
which is based on data analysis processes. Simon et al. (1954) stressed the importance of information to improve these
processes and several studies found that information is the key to success.
On one hand, monitoring and legitimization MCS uses proposed by Vandenbosch (1999) are similar to diagnostic use
proposed by Simons (1990, 1995). However, strategic decision-making and attention focusing (Vandenbosch, 1999) are
similar to interactive use (Simons, 1995). Based on the previous statements, this proposal seeks to analyze the existence of a

26
second-order construct that allows us to observe how the different indicators can interact in a single measurement, to create a
more specific observation of how they can interact together and produce different results. Since most of literature in this area
was done using case studies and less frequently empirical analysis, there is a lack of coherence, creation and accumulation of
knowledge on this subject.
Over all, this framework shows that MCS uses, through the routines they stimulate, influence or inhibit strategic capabilities
in organizations (Franco-Santos et al. 2012).
1.3.4 Performance
Performance in the entire strategic process refers principally to the various consequences in the organization, commonly called
value creation. According to RBV, performance is a function of a firm’s ability to exploit its capabilities (Barney, 1991; Grant,
1991) to establish a competitive advantage that is required to sustain both current and future performance (Grant, 1996). The
consequences of capabilities could be organized in four categories: organizational performance, customer consequences,
innovation consequences, and employee consequences (Kohli & Jaworski 1990; Kohli & Jaworski 1993; Jaworski & Kohli
1996; Kirca et al. 2005). A long debate has focused on identifying the variables that make up the performance of a firm
(Rumelt et al., 1991) and there have been explicit requests to include outcomes in some other shape or form because the
tendency to think in terms of financial parameters limits their perspective (Mellahi & Sminia 2009). MCS encompass multiple
measures (Kaplan & Norton 1996) and are not limited to only the financial aspect (Henri & Journeault, 2010). In this line,
MCS is an important firm resource that facilitates decision making and evaluation and control processes impacting
performance (Ittner & Larcker 2003; Chenhall 2005; Kaplan & Norton 1996).
Performance has been analyzed from two perspectives: reported performance (financial, stock market & non-financial
performance) and perceived performance (perceived financial and non-financial performance, etc.). Both reported and
perceived performance apparently achieved inconsistent results, positive or negative or mixed. Given this, research along
these lines is still considered important.
1.3.5 Contingency theory of organizations
The concept of uncertainty refers to the difference between the amount of information required to perform a task and the
amount of information already possessed by an organization, a gap between the information known and desired (Galbraith,
1973). Contingency theory (Burns & Stalker, 1961; Lawrence & Lorsch, 1967) predicts that the relationship between an
organization’s characteristics (such as its MCS, orientations or capabilities) and organizational performance depends upon
specific contingencies or situations (Hayes, 1977; Otley, 1980). We find that numerous contingencies can influence the impact
of these MCS. Contextual factors as environmental uncertainty might play an important role in the impact of MCS and
capabilities. Since the inconsistencies found in the literature could be explained by looking at the context in which the studies
were conducted, the contingency approach is highly recommended (Lind & Kraus, 2010). Some of the most studied variables
in contingency works are: strategic orientation (e.g., Ittner et al., 2003), environmental uncertainty perception PEU (e.g.,
Govindaraján, 1984, Hoque, 2004), comprehensive/diversity MCS (Hall 2008; Chenhall, 2005), access to human capital
employees (Chandler and Hanks,1994) or human capital background (Naranjo-Gil & Hartmann 2007a, 2007b).

27
1.4. Theoretical model
This structured research, as mentioned above, is divided into three main parts according to the objectives: In the first essay,
we explicitly examine the relationships among four MCS uses (monitoring, legitimization, attention focusing, and strategic
Ddecision-making) (Vandenbosch, 1999) and two organizational capabilities (Entrepreneurial & Learning Orientations). The
relationships proposed are based on the theoretical framework, where the major premise is that monitoring and legitimization
uses negatively influence capabilities because they are acting in a diagnostic mode (Simons 1991, 1995; Henri 2006a). It
should be mentioned, however, that Koufteros et al. (2014) have recently found that diagnostic use has a positive impact on
the development of organizational capabilities.3 Likewise, it is expected that attention focusing and strategic decision-making
uses are positively related to capabilities because they are acting in an interactive manner (Simons 1991, 1995).
Figure 1.2: Complete project theoretical model
It is important to note that in this first approach, as control variables, we also compare the differences of how a firm uses the
diverse MCS by industry and firm size. In a second essay, this work expands Vandenbosch (1999) and Simons (1995)
classifications of MCS uses and both are related in to a 2nd order constructs to examine the extent to which MCS uses impact
a firm’s capabilities and performance directly or indirectly through capabilities. In other words, is there is a mediating effect
of organizational capabilities (LO and EO) among the various MCS uses and performance? At this stage, the role played by
the firm size will not only be a control variable, it will be an integral part of the study because we seek to know whether the
effect obtained is the same in businesses of different sizes. Finally, in the third essay of this research, the set of constructs
3 Koufteros et al. (2014) found that there is sufficient evidence to suggest that MCS uses (diagnostic and interactive) leads to improved capabilities, which then impact performance.
Monitoring: How are we doing?
Legitimization: How do we justify our decisions or actions?
Strategic decision-making:
How can we best use it as a facilitating technique?
Attention focusing: What problems should
we look into?
Learning Orientation
Capabilities
Entrepreneurial Orientation
3. Contingence factors
1. Capabilities1. MCS 2. Performance
Interactive use
(enable to search opportunities,
solve problems and make decisions)
Diagnostic use
(control over organizational
goals)
Management Control Systems (MCS)Lever of control Type of use
PEU (1)
Performance1) return on investment 2) level of benefits 3) increase in sales 4) customer satisfaction 5) employee satisfaction6) overall results
2º orderConstructsusing SEM
PEU (2)
Source: Self-devised
Contingence Factors : Uncertainty perception PEU Mediating effect of PEU between MCS-Capabilities & Capabilities-Performance
Control variablesFirm sizeIndustry
System amplitudeFirm age
(Paper 2)
(Paper 3)
(Paper 1)
(Paper 1)
(Paper 2, 3)
(Paper 3)
(Paper 3)
Simons (1991,1995) Vandenbosch (1999)
(Lumpkin et al. 2009)
Hult (1988)
Govindaraján (1984)
(Kohli & Jaworski 1993; Gómez-Villanueva 2008)
28
(MCS – Capabilities - Performance) and their proposed relationships (MCS - Capabilities & Capabilities - Performance) will
be tested by relating them to perceived uncertaintiy, in order to discover if both relationships are mediated by the inclusion of
the variable PEU (MCS-PEU-Capabilities and Capabilities-PEU-Performance) in a complete form of the model presented
below.
Thus, by linking MCS, capabilities, and performance in a context of uncertainty, this dissertation attempts to shed light on
some issues that are still unexplained, as well as to strengthen the existing literature. Therefore, it is very important to provide
a holistic view of the effect of the MCS and capabilities on a company’s performance. Figure 1.2 presented above, shows the
conceptual model of this work and also represents the major relationships that we seek to demonstrate in each essay.
1.4 Dissertation approach
After reviewing the principal theories of of this research: Resource Based View, Organizational Capabilities, Contingence,
Theory of Organizations, Management Control Systems and Performance literature, this structured investigation is based on
the above objectives and research questions. The literature reports the need for quantitative research that provides insights
into different MCS uses and their interrelations with other constructs (Ahrens & Chapman, 2007; Henri, 2006a; Henri &
Journeault, 2010) and this study responds to that need.
This work was designed as a quantitative study, based on data collected from primary sources in the form of structured surveys
from a list of business managers of firms in the manufacturing, trade, banking, and service sector in Mexico. The objective
population consisted of 4750 companies belonging to the DENUE 2012 database of the Instituto Nacional de Estadística y
Geografía (INEGI). Participanting firms were selected according to the primary and secondary SIC codes related to the
manufacture, trade, banking, and services (Appendix A shows the data fields in the directory SCIAN México 2012). We use
the firm classification of the Official Journal of the Mexican Federation published on June 2009 to categorize firms by size,
so that the number of workers in the firm determines the size of the company. Thus, 1-50 workers composed a small firm,
51–250 a medium-sized firm, and >250 employees is categorized as a large company. Information was collected over the
course of eight weeks using online and offline surveys. There were a total of 644 units (13.56% of the sample). 323 completed
surveys (50.2%) were collected through online participation and 321 (49.8%) were performed offline, with a response rate of
13.56%. Analyses were performed using SPSS (V.21.0) software and structural the equation modeling software program
SPSS-AMOS (V.21.0) to estimate structural equation modelling. In a first stage, we conducted several procedures and tests
to establish database and construct validity and reliability4; The scales used in this study were founded on the review of the
most relevant literature ensuring the content validity of the measurement instrument (See table 1.1: Dissertation approach and
appendix B. Survey instrument).
Each paper includes various methods of analysis as detailed below:
For the 1st paper (chapter II in this thesis) we use multiple linear regressions and analysis of variance (ANOVA) to give
4 Survey content and face validity and pre-test in three steps, convergence and discriminant validity tests, exploratory and confirmatory factor analyses, assessment of interraterTOTAL reliability and normality test) (appendixes C, D, E, F)

29
robustness to the model and to verify whether the relationships are maintained in companies of different sizes and industries.
We conducted a multiple regression analysis dividing the sample into subgroups by size and industry.
In the second paper (chapter III) we use Structural Equation Modelling (SEM) with multi-group analyses. It was found to be
appropriate to distinguish between companies of different sizes, so the structural equation model was used in multi-group
form by splitting the sample to assess the influence of the size factor and take into consideration one of the dominant focal
points for analyzing the multi-group data using SEM, the measurement invariance (Hair et al. 2006). This procedure is
neccesary because we must ensure that our instrument does not vary with different groups of answers in order to compare the
groups (Steenkamp & Baumgartner 1998); in other words, we needed to assure the measurement invariance of the
measurement instrument (Hair et al. 2006). We chose to use the Structural Equation Modelling approach (SEM), for several
reasons: First of all, SEM analyses are appropriate when the theory sets out to explain the role of variables that intervene in
the studied relationship (Luft & Shields, 2003). Secondly, this approach assumed contextual factors such as noise within the
models and did not consider how the results might be modified by these contextual factors (Chenhall, 2005), unless the theory
and model explicitly support it. SEM methodology allows researchers to be able to incorporate the influence of various factors
under the theory that supports it and provides an evaluation of the entire model at a macro-level perspective (Kline, 1998) as
a whole, rather than simply its parts. Finally, structural equation models eliminate measurement error bias, but require large
samples (Bisbe et al. 2006), feature that perfectly fulfills our database. Also, in this second paper, structural Equation
Modelling (SEM) was used for the development and testing of the 2nd order constructs related to the combination of the two
classifications: the theoretical proposition of levers of control (LOC) (Simons 1995) and the proposal of the four MCS uses
called “executive support systems classification” (Vandenbosch 1999).
In the third paper (Chapter IV) we use Structural Equation Modelling (SEM) to test the hypotheses about the relationships
between MCS uses-PEU-Capabilities & Capabilities-PEU-Performance, and how these relationships are impacted by the PEU
variable inclusion in the model in two different positions.
Control variables used in the doctoral dissertation are: System amplitude, firm size (10-50 small; 51-250 medium; > 250
Large), firm age and industry. Some variables were asked with a flipped scale (reverse-scored, †EO4 †EO13 †EO14)†, to
ensure the absence of bias in responding. Thus Table 1.1 Dissertation approach, shows a summary of all the above.

30
Table 1.1: Dissertation approach
Tabl
e 1.1
Dis
serta
tion
appr
oach
Essa
y (c
hapt
er)
One
(Ch.
II)
Two
(Ch.
III
)Th
ree (
Ch. I
V)
Rese
arch
que
stio
n
Wha
t is t
he im
pact
of M
CS u
ses o
n th
e de
velo
pmen
t of
firm
cap
abili
ties?
Sp
ecifi
c ob
ject
ive
is: H
ow d
oes M
CS u
ses d
eter
min
e ca
pabi
litie
s (LO
& E
O).
As a
robu
stnes
s che
ck, w
e in
vesti
gate
the r
ole-
play
ed b
y th
e fir
m c
hara
cter
istic
s (siz
e, ag
e, an
d in
dustr
y) in
M
CS u
ses –
Capa
bilit
ies r
elat
ions
hip
To w
hat e
xten
t has
MCS
use
s had
an
effe
ct co
ntrib
utin
g to
pe
rfor
man
ce?
It is
dire
ct o
r ind
irect
thro
ugh
capa
bilit
ies?
-Is
ther
e a
med
iatin
g ef
fect
of o
rgan
izati
onal
cap
abili
ties
(LO
& E
O) a
mon
g th
e va
rious
MCS
use
s and
per
form
ance
?
-To
stre
ngth
en th
e ob
tain
ed re
sults
and
to a
naly
ze th
e ef
fect
of
the
size:
Is th
e ef
fect
the
sam
e in
bus
ines
s of a
ny si
ze?
To w
hat e
xten
t doe
s per
ceiv
ed
envi
ronm
enta
l unc
erta
inty
(PEU
) for
de
cisio
n m
aker
s, in
fluen
ce th
e re
latio
nshi
ps b
etw
een
the
MCS
use
s, ca
pabi
litie
s (EO
& L
O) a
nd p
erfo
rman
ce.
-PEU
pla
ys a
med
iato
r rol
e be
twee
n M
CS
and
Cap
abili
ties?
-P
EU p
lays
a m
edia
tor r
ole
betw
een
Capa
bilit
ies a
nd P
erfo
rman
ce?
Theo
retic
al F
ram
ewor
kRe
sour
ce B
ased
Vie
wO
rgan
izat
iona
l cap
abili
ties
Man
agem
ent c
ontro
l sys
tem
s Lite
ratu
re
Reso
urce
Bas
ed V
iew
Org
aniz
atio
nal c
apab
ilitie
sM
anag
emen
t con
trol s
yste
ms
Perf
orm
ance
Lite
ratu
re
Reso
urce
Bas
ed V
iew
Org
aniz
atio
nal c
apab
ilitie
sM
anag
emen
t con
trol s
yste
ms
Perf
orm
ance
Lite
ratu
reCo
ntin
genc
e th
eory
of o
rgan
izat
ions
Rese
arch
Des
ign
Quan
titat
ive s
tudy
Surv
ey fr
om 6
44 M
exica
n fir
ms
(pop
ulat
ion
4750
; res
pons
e rat
e =1
3.56
%)
Cont
rol v
aria
bles
: Sy
stem
am
plitu
de,
firm
size
(10-
50 sm
all;
51-2
50 m
ediu
m; >
25
0 La
rge)
, firm
age
and
indu
stry
Som
e va
riabl
es w
ere
aske
d fli
pped
Ana
lyse
s per
form
ed: C
onstr
uct v
alid
ity/re
liabi
lity;
Ana
lysis
of v
aria
nce
(AN
OV
A); M
ultip
le L
inea
r Reg
ress
ions
; St
ruct
ural
Equ
atio
n M
odel
ling
(SEM
): M
ulti-
grou
p an
alys
es (s
ize)
; Mea
sure
men
t inv
arian
ce
MC
S: 2
7-ite
m (H
enri
, 200
6) in
four
dim
ensio
ns:
mon
itori
ng; f
ocus
ing
atte
ntio
n; st
rate
gic
deci
sion-
mak
ing;
legi
timiz
ing
Le
arni
ng O
rien
tatio
n: 4
-item
(Hul
t, 19
98)
Entr
epre
neur
ial O
rien
tatio
n: 1
4-ite
m
(Lum
pkin
et a
l. ,2
009)
MCS
: 27-
item
in tw
o 2n
dor
der c
onstr
ucts:
D
iagn
ostic
& in
tera
ctiv
e us
es
(Sim
ons,
1995
; Van
denb
osch
1999
)Le
arni
ng O
rient
atio
n: 4
-item
En
trepr
eneu
rial O
rient
ation
: 14-
item
Pe
rfor
man
ce:6
-item
(Jaw
orsk
i& K
ohli,
199
3,19
96) a
dapt
ed
(Góm
ez-V
illan
ueva
, 200
8)
MCS
: 27-
item
in tw
o 2n
dor
der c
onstr
ucts:
D
iagn
ostic
& in
tera
ctiv
e us
es
Lear
ning
Orie
ntat
ion:
4-it
em
Entre
pren
euria
l Orie
ntati
on: 1
4-ite
m
Perf
orm
ance
: 6-it
em
Perc
eive
d en
viro
nmen
tal u
ncer
tain
ty
(PEU
): 8
-item
Gov
inda
raja
n(1
984)
Key
find
ings
-La
rge
firm
s use
MCS
as m
onito
ring
mor
e th
an sm
all
-Sm
alle
r com
pani
es p
rese
nts g
reat
er le
arni
ng
orie
ntat
ion
than
larg
e fir
ms
-M
anuf
actu
ring,
and
serv
ices
firm
s, ha
ve h
ighe
r en
trepr
eneu
rial o
rient
ation
that
trad
e an
d ba
nkin
g
-Th
e fo
ur M
CS u
ses h
ave
a po
sitiv
e an
d sig
nific
ant
impa
ct o
n bo
th c
apab
ilitie
s (LO
& E
O)
-Th
e va
riabl
e of
gre
atest
impa
ct in
LO
is le
gitim
izin
g us
e an
d th
at o
f the
leas
t im
pact
is m
onito
ring
use
-Th
e va
riabl
e of
gre
atest
impa
ct in
EO
is fo
cusin
g at
tent
ion
and
that
of l
east
is str
ateg
ic d
ecisi
on-m
akin
g-
Mon
itorin
g an
d le
gitim
izin
g us
es (D
iagn
ostic
) do
not
nece
ssar
ily in
hibi
t cap
abili
ties i
n th
e or
gani
zatio
n
-In
firm
sof a
ll siz
es,d
iagn
ostic
MCS
use
show
s a p
ositi
ve a
nd
signi
ficat
ive
rela
tions
hip
with
LO
& E
O c
apab
ilitie
s,bu
t in
the
oppo
site
(+) d
irect
ion
than
we
expe
cted
(-).
-In
tera
ctiv
e M
CS u
se sh
ows p
ositi
ve a
nd si
gnifi
cativ
e re
latio
nshi
p w
ith c
apab
ilitie
s in
the
full,
mid
dle
and
larg
e sa
mpl
e,no
t in
smal
l bus
ines
ses.
-M
CS h
as a
dire
ct e
ffec
t on
orga
niza
tiona
l per
form
ance
, on
ly if
it w
as u
sed
diag
nosti
cally
, in
any
size
com
pany
-EO
cap
abili
ty h
as a
med
iatin
g ef
fect;
Tot
al o
n In
tera
ctive
use-
perf
orm
ance
(exc
ept f
or sm
all c
ompa
nies
)and
par
tial i
n D
iagn
ostic
use
-Per
form
ance
-LO
cap
abili
ty h
as n
o m
edia
ting
effe
ct o
n th
e re
latio
nshi
p be
twee
n M
CS u
ses &
Per
form
ance
-PE
U v
aria
ble,
bet
wee
n M
CS a
nd
capa
bilit
ies (
PEU
2),
does
not
hav
e a
med
iatin
g ef
fect
as w
e or
igin
ally
pr
opos
ed.
-PE
U v
aria
ble,
betw
een
capa
bilit
ies a
nd
perf
orm
ance
(PEU
1),
show
a
signi
ficat
ive
and
posit
ive
resu
lt, b
ut
diff
eren
t eff
ect i
s obs
erve
d.-
PEU
in L
O-p
erfo
rman
ce re
latio
nshi
p sh
ows a
tota
l med
iatin
g ef
fect
-
PEU
in E
O-P
erfo
rman
ce re
latio
nshi
p sh
ows a
par
tially
med
iatin
g ef
fect
Sour
ce: S
elf-
devi
sed

31
1.5. Anticipated contributions
By achieving the specific objectives and reaching the overall purpose of the doctoral thesis, the anticipated contribution of the
present study is threefold:
This study contributes to the research boundary by building insights about the MCS-capabilities-performance relationships,
to shed understanding the role of MCS and how it can act as an antecedent of organizational capabilities and performance.
Thus, MCS use can be seen as a source of competitive advantage by its contribution to the development of strategic capabilities
and results in the organization. In the literature there is a paucity of studies that explore the results of MCS influence (Bisbe
& Otley, 2004; Chenhall, 2003). Moreover, as Henri (2006a) suggests, a more detailed understanding of the MCS role as an
antecedent to the development of organizational capabilities is needed. This study may help to resolve some of the ambiguous
findings from literature. There are very few empirical and comprehensive studies to address these questions and there is no
study like this for Mexican companies.
Our work makes contributions with respect to the initial proposal of Henri (2006a), linking two proposals that have been
tested separately. The first is the executive support systems (ESS) classification of Vandenbosch (1999), and the second is
Simons (1995) proposal for the Levers of Control (LOC). This research makes an empirical application of the levers of control
(Simons, 1990) and Vandenbosch (1999) models together in firms of different sizes (small, medium and large firms). Such
studies have not been performed in SMEs nor compared to large firms. In fact, we have not yet found such an investigation
related to MCS in sectors other than manufacturing.
The results obtained in this work highlight how to improve management practices related to MCS uses. Our contribution will
be relevant to design and deployment processes of MCS and for identifying some practices related to the development of
strategic capabilities impacting organizational performance.
Certainly, we believe that the results derived from this doctoral thesis can be useful in furthering our understanding in this
field and they will enrich the current research stream of MCS and Performance. Moreover, our results are based on a large
sample of different firm sizes, including four sectors -manufacturing, trade, banking and services- and covering a wide range
of variables, as suggested by Hall and Wahab (2007).
Table 1.1 Dissertation approach, provides a brief of the findings in each chapter of this thesis.

32
1.6. Structure of the Doctoral Thesis
Consistent with the objectives of the dissertation, we structured our report by developing three empirical chapters (essays). In
each empirical essay we delineate a theoretical framework by doing a literature review and we also present a theoretical model
and hypotheses; then we develop a research design, followed by the results findings, conclusions, discussion and managerial
implications. Each chapter has a summary of the limitations and possible future research directions identified in the final
section.
Hence, chapter II contains an essay related to the first question: What is the impact of Management Control Systems use on
the development of firm capabilities? Here the key concepts and theoretical frameworks of the thesis are reviewed. The
primary focus of this chapter is to provide empirical evidence of the relationship between the four different MCS
(Vandenbosch, 1999) uses and organizational capabilities (LO & EO). This paper was presented in several conferences as
CLADEA (The Latin American Council of Management Schools) 2013 XLVIII Annual Assembly in Río de Janeiro, Brasil
in October, 2013 obtaining the recognition as the Best Paper of the conference in the Strategy, Corporate Governance and
Sustainable Development stream; the XIX Congreso Internacional de Contaduría, Administración e Informática de ANFECA
en la Universidad Autónoma de México, UNAM in October 2013, in México City, and achieved very good reviews. The work
was also was presented in the AIMS (Association Internationale de Management Stratégique) XXIII Conférence in Rennes
France in May 2014.
In chapter III, the second essay provides evidence for the next objective in this thesis: Do MCS uses have a direct or indirect
effect on performance through capabilities? The purpose was to analyze whether this effect is the same for any size company.
This second paper was accepted for presentation at the 8th Iberoamerican Academy of Management conference in December
2013, in Sao Paolo Brasil, and again at the 7th Annual New Zealand Management Accounting Conference (NZMAC) in
September, 2014, in New Zealand.
Chapter IV, the third essay incorporates the preceding results into a contingency framework; we remake the model in a
different context, seeking to examine the extent to which the influence of the environment, specifically, the perceived
environmental uncertainty (PEU) for decision makers, mediates the relationships between the various MCS uses,
organizational capabilities (EO & LO) and organizational performance. An initial draft of this paper was accepted for
presentation in the European Institute for Advanced Studies in Management (EIASM) in the 8th conference on performance
measurement and management control in Nice, France in October 2015.
Finally, this doctoral dissertation concludes by presenting in a chapter V the summary with the study’s results and
contributions, as well as theoretical and practical implications. In the Chapter VI, there is the appendix, and in the chapter
VII, the references.

33
Chapter II: Examining the impact of Management Control Systems use on the development of firm capabilities
2.1 Abstract:
Changes in individual expectations, social and economic environment and technological capacity have transformed
management control practices over the last 40 years. Organizations, under great pressure to deliver value, believe that
Management Control Systems (MCS) can help them in this task (Ittner & Larcker 2001; Ittner et al. 2003). The use of MCS
is frequently seen as facilitating strategy to enhance organizational performance. Research in MCS has been done regarding
the design criteria, purposes, types, and other factors that influence the adoption and use, but less is known about MCS impact
on the organizational capabilities that trigger performance. Resource-based theory (RBT) (Barney et al. 2011) and
management control literature (Simons 1995; Vandenbosch 1999) provide the context needed to explain the role of MCS and
its relation to organizational capabilities.
The research question in this work is: How does MCS use impact the generation of capabilities in a firm? This work also
seeks to investigate how MCS uses determine capabilities of Entrepreneurial Orientation (EO) and Learning orientation (LO)
and the role-played by firm characteristics (size, age, and industry) in this relationship. The hypothesized relationship was
supported by evidence from a study of 644 firms in Mexico, and provides results supported by the theory. Some possible
causes are discussed. The main findings show that the type of use (Monitoring, Legitimizing, Attention Focusing or Strategic
Decision-Making) is directly related to the strategic capabilities of Entrepreneurial Orientation and Learning Orientation in
firms independently of size, to a greater or lesser extent, depending on the industry in which they reside, but in all cases with
a positive and significative relation.
Keywords: Management Control Systems (MCS), Performance Measurement Systems (PMS), Strategic Management and
Capabilities.
34
2.2 Introduction Strategic Management, as a set of functions and processes 5; is the conceptual framework for decisions that are considered
strategic in a firm (Rialp 2003). It covers all matters that are of primary interest to the general direction (Rumelt et al. 1991).
There is general acceptance that strategic management is concerned with the strategic processes, whose fundamental purpose
is to generate a competitive advantage, typically based on the creation, use, and exploitation of resources and capabilities
(Wernerfelt 1984; Barney 1991; Teece et al. 1997) that will allow better performance.
The strategic process is usually represented by three main stages (Rumelt et al. 1991; Ittner & Larcker 2001; Ittner et al. 2003;
Hitt et al. 2011; Hutzschenreuter & Kleindienst 2006). First, the “formulation” phase is when the analysis of internal and
external business environment and the strategic intent (mission, vision, purpose) is performed. The “implementation” phase
is when plans and activities are realized, and the “performance” phase is when the implementation results are identified and
evaluated. Besides these, there is an activity common to all phases, usually not specified, but that plays an important evaluation
and control role, when activities and results are monitored, so that actual performance can be compared to desired
performance. If the desired performance is not achieved, managers can take corrective actions (Rumelt et al. 1991; Hitt et al.
2011). It is during this activity that Management Control Systems (MCS) are responsible for creating and reviewing the
models and systems to support the strategic process. MCS are defined by Anthony as the process by which managers ensure
that resources are obtained and used effectively and efficiently in the accomplishment of the organization’s objectives
(Anthony 1965). The information provided from these systems is relevant in all strategic process phases (Widener 2007): in
the formulation stage for exploring and evaluating alternatives (Naranjo-Gil & Hartmann 2007); in the implementation stage
to support financial analysis, to monitor results and information; and in the final performance and feedback stage, to provide
information on the drivers of success and causes of failures (Mintzberg 1994; Simons 1995). This is why MCS have moved
from a purely financial focus to include more comprehensive business characteristics (Kaplan & Norton 1992), from a focus
on business planning to a wider focus on business strategy (Berry et al. 2009) trying to cover the complete strategic process.
Over the last two decades, the development of the MCS in firms has been exponential due to the increase of various factors:
I) Fast changes in the world due to increased competition in a globalized world with a strong sense of uncertainty and
associated risks, with companies still needing to show excellent performance. II) New technologies with the advent of
powerful computers and high-speed software that has allowed access and dissemination of more and better data and III)
Increasing corporate control in multinational organizations and a global trend toward accountability and value creation. These
issues, among others, have triggered the need for a paradigm shift in the design and use of MCS and also require a better
understanding of the role of MCS and how to meet managerial needs. Nevertheless, little has been studied. It is widely believed
that MCS can help to identify weaknesses, clarify objectives and strategies and greatly help improve management processes
(Ittner & Larcker 2001) and the success of firms (Widener 2007) in today’s competitive environment.
Our approach agrees that MCS should be more than mechanical tools to support strategy implementation, and in fact can
become powerful tools to stimulate and manage the emergence of strategies. Based on the model proposed by Simons (1995)
and Vandenbosch (1999), this research focuses on the relationship of four MCS uses (Monitoring, Legitimizing, Attention
5 Generally, the term strategic management is used to refer to the entire scope of strategic decision-making activities performed within an organization (Hitt et al. 2011)

35
Focusing, Strategic Decision-Making) and firm organizational capabilities (Entrepreneurial and Learning Orientations). Both
types of capabilities are related to superior performance of firms (Ripollés & Blesa 2005). The literature shows that Learning
Orientation (LO) capability seems to be an effective facilitator of competitive advantage (Hult 1998; Baker & Sinkula 1999)
and in the same manner, Entrepreneurial Orientation (EO) favors the generation of competitive advantage and better results
(Lumpkin et al. 2009). Some studies have analyzed these relationships and suggest that capabilities are shaped by MCS, but
how? The results have been inconclusive or in some cases, contradictory. For example we can see relationships between MCS
and capabilities that are positive (Simons 1990; Simons 1991; Simons 1995; Cruz et al. 2011) or negative (Bisbe & Otley
2004); MCS relationships with organizational learning (Ahn 2001; Johnston et al. 2002; Godener & Söderquist 2004; Chenhall
2005); MCS as a learning machine (Abernethy & Brownell 1999); MCS as a performance capability (Hall 2008), MCS as a
decision-making patterns (Wiersma 2009; Grafton et al. 2010), MCS as strategic capability (Marginson 2002). We can also
find mixed results depending on how the MCS are used. For example, Henri (2006a), previous studies and the seminal work
of Simons (1995) found results positively related with capabilities when MCS are used interactively or negatively when used
for diagnostics. Although, Koufteros et al. (2014) argue that Henri´s (2006a) univariate statistics reveal a positive relation
between diagnostic controls and learning. In this line, the work of Koufteros et al. (2014) hypothesizes that diagnostic use can
positively impact the development of organizational capabilities. But it is important to note a discrepancy between these two
studies: the way to measure diagnostic use in both cases is quite different. Finally, Henri (2006a) measures diagnostic use
based only on indicators of use as a monitoring tool. Widener (2007) and Koufteros et al. (2014) claim that Henri (2006a)
found a negative relation between diagnostic and organizational learning because he used a narrow definition of diagnostic
use; instead, these authors measure diagnostic MCS use with three sets of indicators. In addition to the use of 1) monitoring,
they also include 2) legitimization, an issue raised by Vandenbosch (1999) before, and without further arguments, his proposal
also includes 3) focusing attention on MCS use as diagnostic use. Worth mentioning that attention focusing proposal by
Vandenbosch (1999) resembles a more interactive use because it involves a dialogue between people; the main feature of
interactive use as interpreted by Simons (1995) and Henri (2006a).
Continuing with the studies results, we can also find research on this interaction of both uses (diagnostic and interactive) as a
capability in itself (Mundy 2010). Despite all these studies, there is still a need to better understand the impact of the various
MCS uses on organizational capabilities that trigger performance, in different kind of firms, e.g., SME’s or services.
As we can see in our literature review, except for the work done by Henri (2006a) and Koufteros et al. (2014) there are no
studies linking the various uses of the MCS and their impact on firm strategic capabilities. Even more, we found no studies
that specifically tested entrepreneurial orientation empirically. Koufteros et al. (2014) focus on three organizational
capabilities (strategic management capability, operational capability and external stakeholder relations capability), but we
should point out that the literature does not provides solid arguments for the development of these three organizational
capabilities, nor does it identify the scales previously used for the measurement. Hence, to resolve some of the ambiguous
findings, the literature suggest that a more detailed understanding of the MCS role as a determinant of organizational
capabilities is needed.
Based on the studies insights and the fact that the impact of MCS on some capabilities remains unclear, this work argues that
the different uses of MCS (Monitoring, Legitimization, Attention Focusing, and Strategic Decision-Making) could encourage

36
the utilization and development of strategic firm capabilities such as organizational learning and entrepreneurship.
Specifically, the research question in this work is: What is the impact of MCS use in generating capabilities in the firm?. Our
study will also investigate how MCS uses determine capabilities of EO and LO in the firm, and the role-played by the firm
characteristics (size, age, and industry) in this relationship.
We hope that this paper will make several contributions. First of all, this study explores how the MCS uses impacts on the
way firms achieve strategic capabilities and contribute to the research boundary by building in-sights into these relationships.
In this sense, we seek to improve understanding of how the various uses of the MCS can be a source of competitive advantage
by their contribution to the creation and development of the organization's strategic capabilities. Prior research on MCS use
and capabilities has yielded valuable, but ambiguous, inconclusive or sometimes contradictory results. A major contribution
of this study is to perform an empirical application of the Executive Support Systems classification (ESS) (Vandenbosch
1999) and the levers of control (LOC) model (Simons 1990), in a large sample of different sectors (Manufacturing, Services,
Trade and Banking). Previous applications have been applied to samples of 100-300 and focused only on manufacturing firms
(Bisbe & Otley 2004; Henri 2006a; Henri 2006b; Theriou et al. 2009; Cruz et al. 2011). Such studies were not performed in
SMEs or new firms, nor was there a comparison with large firms. This is especially important because information of SMEs
can allow us to design models, tools and processes according to their reality. There are very few empirical and comprehensive
studies to address these questions and there is no study like this for Mexican companies. Moreover, this study goes beyond
the initial proposal of Henri (2006a), including other MCS uses, not only monitoring (as a diagnostic MCS use) or attention-
focusing (as interactive MCS use), as well as other capabilities like Entrepreneurial Orientation. Finally, this research
combines arguments from international business literature, management accounting research and management control systems
in order to improve hypothesis development and discussion of the results. Finally, survey data from 644 Mexican firms from
different sectors were analyzed with ANOVAs and multiple linear regression models to provide empirical evidence.
After this introduction, the remainder of this paper is organized as follows. Section 2.3 defines the theoretical framework
behind this research, composed mainly of the resources-based theory (RBT) (Barney et al. 2011), the levels of control (LOC)
framework developed by Simons (1995) and the Executive Support Systems classification (ESS) (Vandenbosch 1999) of the
type of MCS uses. Section 2.4 presents the theoretical model and hypotheses of the research. Section 2.5 shows the research
methods, sampling procedures, data collection and measurement of variables. Section 2.6 shows the results of the study using
factor analysis, ANOVA and multiple regressions. Section 2.7 reports our conclusions, and and finally section 2.8 the
limitations and suggests avenues for future research.
2.3 Theoretical framework: RBV, Organizational Capabilities - MCS
Resource-Based Theory (RBT)
This work draws on the principles of Resource Based View (RBV) and the Dynamic Capabilities (DC) literature (Wernerfelt
1984; Barney 1991; Day 1994; Teece et al. 1997). The RBV of firms was originally developed in the field of strategic
management with the aim of explaining the reasons why firms obtain different results (Wernerfelt 1984; Barney 1991) and
how firms achieve sustainable competitive advantages. RBV rests on the principle that competitiveness is a function of the
strength, exploitation, and leveraging of specific internal resources and capabilities controlled by a firm (Lengnick-Hall &

37
Wolff 1999) and conceptualizes firms as a group of resources heterogeneously distributed, whose resource differences persist
over time (Barney 2001). In other words, resources are tied semi-permanently to the company and the sources of sustainable
competitive advantage are specific and idiosyncratic resources (rare, valuable, imperfectly imitable and non-replaceable or
substitutable) that cannot be easily duplicated (Wernerfelt 1984; Barney 1991). Although in words of Porter, competitive
advantage6 depends on firms’ ability to position and differentiate themselves in their industry (Porter 1980), some studies
provided evidence to suggest that firm-level resources and capabilities, not industry characteristics, are the primary
determinants of firms’ performance (Hoskisson et al. 1999). It is worth mentioning that resources do not generate rents per
se, but rather are a function of the way in which they are used (Penrose 1995). Capabilities are a link between resources and
their deployment, because they are organizational processes and routines to integrate, reconfigure, gain, and release resources,
to match and even create market change (Grant 1996; Eisenhardt & Jeffrey 2000). According to RBV principles, firms must
pay special attention to identifying, developing, protecting and using those resources and capabilities that assure the
achievement of a sustainable competitive advantage (Santos et al. 2005).
The most recognized and researched organizational strategic capabilities are: entrepreneurship, innovativeness, market
orientation, and organizational learning (Covin & Slevin 1991; Lumpkin & Dess 1996; Ripollés & Blesa 2005; Henri 2006a;
Henri 2010). In this study we will focus on the capabilities of entrepreneurial and learning orientation for various reasons.
Although the beneficial effect of market orientation on results has been extensively studied (Narver & Slater 1990), other
studies have questioned this effect, suggesting several limitations to a market orientation.7 Therefore, learning processes may
be critical in creating competitive advantages in the firm (Baker & Sinkula 1999). On the other hand, the studied characteristics
of innovativeness and the classical elements of entrepreneurship, among others, are included to some extent in the construct
known as entrepreneurial orientation. Business literature supports that learning (Widener 2007) and entrepreneurial
orientations (Ripollés & Blesa 2005) are positively associated with performance.
Learning Orientation (LO)
LO is considered an important facilitator of competitive advantage by improving a firm’s information processing activities at
a faster rate than rivals do (Baker & Sinkula 1999), but is necessary to have frequently updated information (Simons 1987).
LO was defined as the development of ideas, knowledge and relations among past actions and future actions (Fiol & Lyles
1985). Some studies report that high performing firms rely on the information provided by frequently updated formal control
systems to drive organizational learning (Simons 1987), and argue that MCS have a significant positive impact on staff
perceptions about learn capability (Yuan et al. 2008). The use of MCS supports a holistic view at all the strategic processes,
resulting in organizational learning (Slater & Narver 1995; Speckbacher et al. 2003) through the operationalization of the four
6 Day (1994) distinguishes two related sources of advantage: assets (e.g., scale economies, locations, distribution system or brand value) and capabilities (complex set of knowledge and abilities accumulated throughout time) that allow the firm to coordinate and make use of its assets. 7 Hamel and Prahalad (1991) suggest that market oriented firms may suffer from the "tyranny of the served market”, ignoring or missing markets and competitors (Hamel & Prahalad 1991). Many times, market oriented firms may fail to identify and capitalize on the latent needs of customers, due to their excessive focus on expressed needs (Slater & Narver 1995). The same studies suggest that organizations should aim to become learning oriented if they look to achieve a sustainable competitive advantage, because market orientation can be copied but the learning environment cannot.

38
steps of the organizational learning process8 (Slater & Narver 1995).
Entrepreneurial Orientation (EO)
EO captures specifically the entrepreneurial aspects of the firm’s strategies (Covin & Slevin 1989; Lumpkin & Dess 1996;
Covin & Lumpkin 2011). EO is defined as the set of processes, practices and decision-making activities undertaken to
successfully manage the entry of a new company into the market (Lumpkin & Dess 1996). It is a permanent attitude of the
company (Covin & Slevin 1991) that is proactively seeking new business opportunities (Zahra & Garvis 2000). From the
standpoint of the RBV, the entrepreneurial orientation can be identified as a high-level organizational routine, durable, and
difficult to imitate or transfer (Gómez-Villanueva et al. 2010). Literature on entrepreneurship emphasizes the importance of
EO as a determinant of business performance (Ripollés & Blesa 2005). Entrepreneurial orientation can be seen as the
intangible ability of the company's strategic position, difficult to replicate, and related to superior results (Wiklund & Shepherd
2005). There is a growing interest in literature to identify and define the determinants of organizational capabilities (such as
EO and LO). MCS play an important role here because, as discussed above, they have a direct impact on the perceptions
related to learning and they can support strategic decision making in the company related to the market, opportunities, and
results.
MCS use: The levers of control framework
Management control was defined by Anthony (1965) as the process by which managers ensure that resources are obtained
and used effectively and efficiently in the accomplishment of the organization’s objectives. MCS seek to influence human
activity within the company; they are formal or informal procedures and systems that can be identified by common
management practicest in a business that use information to maintain or alter patterns in an organizational activity (Mintzberg
& Waters 1985). MCS are comprised of multiple control systems that work together (Widener 2007); for example,
Performance Measurement Systems (PMS) are one important aspect of MCS and represent the process and the set of metrics
used to quantify both the efficiency and effectiveness of actions (Neely et al. 1994) by providing the information necessary
to challenge the content and validity of the strategy (Ittner et al. 2003). Some MCS are formal such as planning, budgeting or
reporting systems, monitoring procedures, project management systems, human resource systems, cost accounting systems or
support decision making systems like SAP platforms or informal as weekly meetings, daily checks, emails, etc. (Simons
1991). There is general agreement that MCS does not automatically improve performance, rather, performance is totally
related to how systems are designed, developed and used. Langfield Smith (1997) argues that the best way to approach the
study of administrative controls is by looking at the different uses by those who apply them (Langfield Smith 1997).
This study combines two MCS classification of uses and relates both to identify the expected relationships: The theoretical
proposition of Simons (1995) about levers of control (LOC) and Vandenbosch’s (1999) executive support systems
classification (ESS).
Simons (1995) proposed a framework that has been used extensively. The central point of the Levers of Control framework
8 Learning process: Information acquisition (How am I doing), information dissemination (communication), shared interpretation (what does it mean) and organizational memory (How I Do it) (Slater & Narver 1995).
39
(LOC) is that control of business strategy is achieved by balancing the forces of four different levers of control: beliefs control
and values, boundary control, diagnostic control and interactive control. The power of these four levers, it is argued, does not
lie in how each is used individually, but rather in how they work together and complement each other, and how they achieve
balance (Kruis et al 2015).
Beliefs and values are systems to secure commitment towards goals and to inspire employees in their search for opportunities
and solutions. Belief systems are an explicit set of organizational definitions or procedures, that can be used by top
management (Marginson 2002) to formally communicate the organization’s basic values, purpose vision and direction
(Simons 1995). Belief systems are: communication channels, formal mission statements, credos, statements of purpose, email,
meetings, (un)written codes of conduct, strategic planning systems, and formal rules and procedures.
The boundary lever of control is an explicit set of organizational definitions and parameters; administrative controls which
are hierarchically based (Marginson 2002), expressed in negative or minimum terms (Simons 1995). Any system that sets out
minimum standards or guidelines for behavior can be used by managers as a boundary lever of control (Pun & White 2005;
Mundy 2010). For example, boundary processes aim to prevent employees from wasting the organization’s resources.
The Diagnostic MCS use (control over organizational goals), refers to the use of MCS, including PMS (performance
measurement systems) or KPIs (key performance indicators), to monitor organizational performance against important
dimensions of a given strategy, with a broad range of metrics in key areas (Marginson 2002) used to compare actual
performance against pre-set targets (Simons 1995) and to identify exceptions and deviations from plans (Navarro & Guerras
Martín 2001; Mundy 2010).
Interactive MCS use consists of formal two-way processes of communication between managers and subordinates, where
employee participation is encouraged in a formal process of debate (enable employees to search for opportunities, solve
problems, and make decisions). In this use, managers involve employees in the objective design to find relationships within
and performance measurement, as a form to share information (Simons 1995; Henri 2006a; Mellahi & Sminia 2009; Mundy
2010). An example of this practice is creation process of a Balanced Scorecard (Kaplan & Norton 1992).
Simons (1995) suggests that the four levers create tension: two of the levers, the beliefs and interactive control system, create
positive energy; while the remaining two levers, boundary systems and diagnostic control, create negative energy.
It should be mentioned that the notion of balance, a fundamental idea, has been criticized in the LOC framework because of
its ambiguity. It is argued that the various controls must be balanced in order to manage competing tensions, such as the
achievement of predictable objectives on the one hand, and innovation on the other (Kruis et al. 2015); but the model does
not specify how to achieve this or even where to observe. However, this framework shows that MCS uses influence or inhibits
strategic capabilities in organizations through the routines they stimulate (Franco-Santos et al. 2012). In this study we focused
on these last two uses (diagnostic and interactive) because MCS are present and related with them (Simons 1990).
The second classification of MCS use was proposed in an empirical analysis between MCS and organizational competitiveness
(Vandenbosch 1999). Described below are four major categories of management information systems use: 1. Score keeping;

40
2. Problem solving; 3. Focusing organizational attention and learning; and 4. Legitimizing decisions.
Score Keeping (Monitoring): Score keeping refers to standardized processes that evolve over long periods of time within an
organization. Monitoring use responds to the question: How am I doing? (Simon et al. 1954). Here MCS are used to provide
feedback regarding expectations: a feedback system where goals are previously defined, outcomes are measured and compared
with the goals, thus providing feedback that enables the necessary corrections. Monitoring is characterized by consistency
between time periods so that comparisons are easy to make (Vandenbosch 1999). This type of use is similar to diagnostic
control (Simons 1990).
Problem solving (Strategic decision making): Problem solving concerns a non-routine issue that requires top managers’
commitment and requires information to support the analytical processes of strategic decision-making. Fast decision makers
use more information and develop more alternatives than slow decision makers (Eisenhardt 1989). This type of use is similar
to an interactive control (Simons 1990).
Focusing organizational attention (Attention focusing): The organizational learning associated with an attention-focusing
MCS use contributes to the emergence of new strategies within the organizations (Mintzberg 1978; Simons 1990; Simons
1995) by responding to the question: What problems must we focus on? (Simon et al. 1954). The above question implies an
active and regular dialogue between senior managers and their subordinates (Widener 2007). Thus, because this type of use
is forward-looking, it is similar to interactive control system (Simons 1990).
Legitimizing decisions (Legitimization): Refers to justifying a decision that has been made and is a major reason for the use
of a decision support system (Vandenbosch 1999). MCS can be used to justify and validate past actions and increase and
ensure the legitimacy of future actions. MCS use information of the entire firm, which gives them the authority and credibility
to provide legitimacy of activities. Thus, this type of information use is similar to diagnostic control (Simons 1990).
2.4 Theoretical model and research hypotheses
2.4.1 Theoretical model
Figure 2.1 presents the conceptual model and also represents the major relationships that we seek to demonstrate. In this
structured investigation we explicitly examine the relationships among the four MCS uses (Monitoring, Legitimization,
Attention Focusing, Strategic Decision-Making) and two organizational capabilities (Entrepreneurial & Learning
Orientations).
Based on the theoretical framework, a major premise behind the development of this model is that monitoring and
legitimization uses influence capabilities negatively because they are acting in a diagnostic mode. Likewise, it is expected
that attention focusing and strategic decision-making uses can help to improve capabilities positively because they are acting
in an interactive manner.

41
Figure 2.1: Theoretical model and hypothesis: H1 (a & b) to H4 (a &b)
2.4.2 Hypotheses
Monitoring & Legitimizing uses (Diagnostic use):
In a LOC approach (Simons 1995), monitoring and legitimizing uses (Vandenbosch 1999) are related to diagnostic MCS use,
to “justify, monitor and reward” the achievement of pre-established goals. Simons (1995) argues that when MCS is for
diagnostics, it is seeking primarily to achieve objectives and thus can constrain innovation and the search for opportunities;
therefore a negative input signal is sent because it is based on a negative sense of deviations search. In the same line, Henri
(2006a) argues that these systems represent a negative force because typically this use focuses on review, finding “errors” and
seeing what was not achieved, when productivity and efficiency have fallen (Theriou et al. 2009), implying that innovation
needs to be curbed (Miller and Friesen 1982). Also Widener (2007) asserts that diagnostic MCS work as negative force which
influences behavior, to constrain the space that employees have to explore, and anly to ensure compliance with organizational
objectives, in negative form. Tt is noteworthy that in recent studies (Koufteros et al. 2014) has identified a positive relationship
between the diagnostic use of MCS and organizational capabilities, but as explained above, have included attention focusing
on diagnostic use makes us doubt its foundation.
Monitoring use: In the original conceptualization, MCS are considered part of the strategy-implementation process. This
traditional feedback role of MCS to support the implementation of strategy is related to monitoring or diagnostic use (Simons
1995) and comprises the review of critical performance variables to monitor and coordinate the implementation of intended
strategies in a routine process. These MCS are usually tied to a division and specialized work, and control values like stability,
Source: Self-devised
Monitoring
Legitimization
Strategic decision-making
Attention focusing
Lever of control Type of use Management Control Systems (MCS)
Interactive use!
Diagnostic use !
Control variables System amplitude
Firm size Firm age Industry Gender
b. Entrepreneurial Orientation (EO)
Capabilities!
a. Learning Orientation (LO)
H1a,b (-)!
H4a,b (+)!
H2a,b (-)!
H3a,b (+)!

42
enforced roles and bureaucracy (Hofstede 1978). Previous studies indicate that monitoring or diagnostic use of MCS is not
related to innovation activities present in the entrepreneurial orientation, which requires a considerable amount of risk, a high
degree of flexibility and broad communication processes within organizations. Instead, monitoring use is associated with
highly structured channels of communication and limited organizational performance (Chenhall et al. 1995). Because of its
routine nature or single-loop learning (Argyris & Schön 1978), there is evidence that people tend to react to control measures
by developing suspicion and resistance (Henri 2006a), critical factors in the learning orientation. The above arguments about
monitoring MCS use generate the following hypothesis:
H1a: Monitoring use of MCS exerts a negative influence on LO
H1b: Monitoring use of MCS exerts a negative influence on EO
Legitimizing use: MCS can be used to justify past actions or decisions that have been previously made under conditions of
uncertainty (Henri, 2006b). In this sense, legitimizing MCS use is a political tool not only to establish authority but also to
maintain credibility (Dermer 1990). This use is associated with a control dominant type (Henri 2006b), centralization of power
and sometimes a strong prevalence of only financial indicators, as a weapon of power (Markus & Pfeffer 1983). Centralizing
power, as a feature of controlling companies, is not related to the characteristics of the capabilities studied. Based on the
previous arguments about legitimization, the following hypotheses occur:
H2a: Legitimizing use of MCS exerts a negative influence on LO
H2b: Legitimizing use of MCS exerts a negative influence on EO
Attention focusing and strategic decision-making uses (Interactive use):
In a LOC approach (Simon et al. 1954), interactive MCS use is associated with the signals sent throughout the firm to focus
organizational attention, stimulate dialogue, and support the emergence of new strategies. Interactive uses emphasize boss-
employee interaction and reflect a leadership style (Naranjo-Gil & Hartmann 2007). Thus, in terms of information processing,
three basic components result: intelligence generation, intelligence dissemination, and responsiveness (Kohli & Jaworski
1990). This use has a positive impact on capabilities because it promotes participation and involvement of employees, essential
elements in both studied capabilities.
Attention focusing use: This type of use send signals to the organization about strategic issues (Simons 1995). It is a high-
level learning (double-loop) (Argyris & Schön 1978) that contributes to the emergence of new strategies within the
organizations (Simons 1995). This type of MCS use fosters organizational dialogue, debate, discussion, and information
exchange to encourage organizational learning (Mintzberg 1978; Simons 1990; Simons 1995). This use is more compatible
with factors like innovation, creativity, flexibility, responsiveness, change and adaptability (Henri 2006b), all of which are
related to learning and entrepreneurial orientations. Attention-focusing use requires a liberal management style that values the
principles of empowerment, entrepreneurship, and self-control (de Haas & Kleingeld 1999). Therefore, the following
hypotheses are proposed:
H3a: Attention focusing use of MCS exerts a positive influence on LO

43
H3b: Attention focusing use of MCS exerts a positive influence on EO
Strategic decision-making use: In this type of use, MCS are facilitators (Hickson 1986) by providing information support
systems when faced with a problem or the need to make a decision. Top managers involved in a new venture or an
entrepreneurial action should be associated with more frequent strategic decision-making and changes, thus needing a
considerable amount of information from the MCS to support their decision-making processes. Fast decision makers use more
information and develop more alternatives than slow decision makers (Eisenhardt 1989). However, information systems can
limit learning by showing only what is evident from the data (Vandenbosch 1999): if the information is too focused, strategies
may be too narrow-minded; if too broad or too flexible, strategies will be vague (Argyris & Schön 1978). Nevertheless, in all
cases, this leads to developmental attitudes expected for the studied capabilities. Hence the following hypothesis is
consequently suggested:
H4a: Strategic decision-making use of MCS exerts a positive influence on LO
H4b: Strategic decision-making use of MCS exerts a positive influence on EO
2.5 Methodology
This study responds specifically to calls in the literature for quantitative research that provides insights into different uses of
MCS and their interrelations with other constructs (Ahrens & Chapman 2007).
2.5.1 Stages, data collection, variable measurement, and descriptive statistics
Data- Sources:
Data were collected from primary sources in the form of structured surveys. We collected data from business managers from
a list of firms in the manufacturing, trade, banking and service sectors in Mexico City. The target population consisted of
4750 Mexican firms in México DF, listed in the DENUE 2012 database (INEGI 9) with primary and secondary SIC codes
related to manufacturing, trade, banking and services 10. The classification used to categorize firms by size was published in
June 2009 in the Official Journal of the Mexican Federation. This publication states that the firm size is determined according
to the number of workers: 1-50 Small, 51–250 Medium size, and 250 > Large firms.
Collection of information
To collect information over the course of eight weeks, we used two systems, online and offline systems; online was
administered by a professional service called encuestafacil.com; offline was administered by a professional market research
company. 323 (50.2%) completed surveys were collected through online participation and 321 (49.8%) were performed
offline, giving a total of 644 units (13.56% of the sample). The response rate was calculated as a percentage of the number of
usable completed surveys out of the number of sent (13.56%).
The invitation to participate consisted of an initial personalized email letter. In order to increase the response rate (Dillman
2000), we send two follow-up reminder emails and a final reminder to non-respondents, as susggested by Dillman. We
9 Instituto Nacional de Estadística y Geografía (INEGI) 10 Appendix A, shows the data fields in the directory SCIAN México 2012.

44
invested two months collecting information in a personalized way to ensure the quality; data was also captured in the same
online system. In all cases, as an incentive to respond, we promise to provide the participants with an executive summary of
the results. Because of this incentive, we have 350 new emails waiting for the results.
Survey
To test our hypotheses, we collected data through a questionnaire-based survey (appendix B). The survey was designed
following the steps suggested by the literature (Dillman 2000; Archer 2003): 1) Select in the literature of strategy and
management control systems the constructs that measure the variables and draw up a first draft of the questionnaire. 2) This
draft is then contrasted with interviews of members of the target population. 3) Make adaptations based on the comments
received. 4) Choose an attractive format, good quality WEB page, and printout form.
Non-response bias
To check for potential non-response bias, online and offline respondents, used as proxies for non-response, were compared
across five measures. Using a comparison of the means, no significant differences (p < 0.01) were found between the firm
age, size, system amplitude used, and respondent formal education or management experience of online respondent firms and
offline firms (non-respondent), suggesting the absence of any obvious non-response bias in this sample 11.
Common method variance
The Harman´s one-factor test, was employed to ensure the absence of the potential undesirable effects of common method
variance (CMV) (Podsakoff et al. 2003), caused by single-source bias. This test has yielded 7 factors with eigenvalues greater
than one, with the first factor explaining only 19.04% of the variance, indicating that no single factor was dominant. In general,
this test indicated the absence of common method effects in our data, suggesting that CMV due to single-source biases was
not an issue in our study (See Appendix C. Non response bias & common method variance (CMV) analysis). Past studies
(Bisbe & Otley, 2004; Bisbe & Malagueño 2009, 2015) show that charge percentages in a single load factor below 22% are
typically accepted.
Variable measurement
The variables in the model are explained below and were measured using previously validated scales. All questions were
asked using a five-point Likert scale. The scales are shown in the appendix B. Survey instrument.
MCS uses are measured using an adapted version of Vandenbosch (1999). With four dimensions: Monitoring; Focusing
Attention; Legitimizing decisions and Solving problems, but adapted by (Henri 2006b) leaving aside the dimension of solving
problems, an adding a dimension to measure the Strategic Decision-Making with seven elements given by (Brockmann &
Simmonds 1997). Henri (2006a) chooses those items because they are the most generic (refer to strategic decision making in
general) while the others refer to specific strategic decisions (venturing, new regulations, etc.). Anchors for the MCS uses
scale were ``1= we never used, 2= used rarely, 3 = sometimes used, 4 = often used, 5 = always used”. A factor score is
calculated for each of the four uses based on all the items. A higher factor score indicates a more intense MCS use.
11 See appendix C: Non response bias analysis.

45
Table 2.1: Variable measurement
System amplitude was measured using a comprehensive MCS forced-choice instrument, developed by Hall (2008).
Respondents were asked to indicate, which of the following two options represents more your management control system. 1
corresponds to a comprehensive and 0 corresponds to a partial MCS use.
Capabilities: Two different validated scales are used to measure capabilities. Learning Orientation is measured using an
adapted version of the four-item scale proposed by (Hult 1998). This scale is intended to measure a learning orientated
company, thus it is more general than the 13 items scale of (Sinkula et al. 1997). This section asks the respondents the extent
to which each item describes their organization. A factor score is calculated with the four items. A higher factor score indicates
a more Learning-Oriented firm. Entrepreneurial Orientation: To measure EO, the scale proposed by Lumpkin et al. (2009)
was used, which is a mixture between the 9 items and the three dimensions scale (proactiveness, innovation and risk aversion)
originally developed by (Covin & Slevin 1989), on which he added two more dimensions (autonomy with four items and
competitive aggressiveness with one more item), staying with five dimensions: innovativeness, risk taking, proactiveness,
autonomy and competitive aggressiveness (Lumpkin et al. 2009). A factor score is calculated with the fourteen items. A higher
factor score indicates a more Entrepreneurial-Oriented firm.
Although Lumpkin and Dess proposed the inclusion of autonomy as a dimension of EO in 1996, few EO studies have
investigated autonomy as an element of EO, perhaps because autonomy is not one of the “original” dimensions of EO
identified by (Miller 1983) and developed by Covin and Slevin (1989)—innovativeness, proactiveness, and risk taking—.
However, autonomy is important because this enables both opportunity-seeking and advantage-seeking behaviors (Ireland et
al. 2003). The definition included for competitive aggressiveness was “the intensity of a firm’s efforts to outperform rivals
and is characterized by a strong offensive posture or aggressive responses to the actions of competitors” (Lumpkin & Dess
1996) and the item used is: “My business "does not" make a special effort to win a business competition”, †EO14. (Lumpkin
& Dess 2001). Descriptive statistics of the constructs and correlation matrix are presented in appendix D. Descriptive stats,
correlations. Part 1: MCS uses, LO, EO (ch.II)
Construct Source Dependent & independent variables Measurements
MCS uses 27-item scale adapted by
Henri (2006a) from Vandenbosch (1999)
IndependentFour dimensions: monitoring; focusing
attention; strategic decision-making; legitimizing
A factor score is calculated for each of the four uses based on their respective items.
A higher score indicates a more intense MCS use.
Learning Orientation 4-item scale proposed by Hult (1998).
DependentOne dimension scale (LO)
A factor score is calculated with the four items. A higher factor score indicates a more Learning-
Oriented firm.
Entrepreneurial Orientation
14-item scale by Lumpkin et al. (2009)
DependentFive dimension Scale (EO)
innovativeness, risk taking, proactiveness, autonomy, and competitive aggressiveness
A factor score is calculated with the fourteen items. A higher factor score indicates a more
Entrepreneurial-Oriented firm.
Control variablesSystem amplitude, firm size (10-50 small; 51-250 medium; > 250 Large), firm age, industry and genderIndustry was recoded to four categories (manufacturing, trade, services & banking); Firm size in binary mode; Some variables were asked in a flipped form (reversed-score)

46
Control variables
This study is controlled by the following variables: Amplitude of the system, firm size (10-50 small; 51-250 medium size; >
250 Large firm), firm age, industry to which it belongs and gender. The Industry variable was recoded to include four
categories, to provide a higher level of identification. Size is measured converted as a binary variable. Questions about certain
variables were asked with a flipped scale (reverse-scored), (†EO4 †EO13 †EO14)†. († Items with a superscript (†) are reverse-
scored.)
Descriptive statistics
With 644 usable questionnaires received we obtained a response rate of 13.56%. This is similar to the 12–25% range reported
in recent studies 22.5% (Hall 2008); 24% (Henri 2006a); 42% (Naranjo-Gil & Hartmann 2007); 12% (McKelvie & Davidsson
2009); 15.6% (Wiklund & Shepherd 2003). Some authors forecasted a 20% response rate from surveys.
The final sample is comprised of 644 firms of which 296 (46%) are large-sized with an average of 4,257 employees and a
mean of 44 years age; 191 firms (29.7%) are medium sized with an average of 158 employees and a mean of 24 years age;
and 157 (24.4%) are small with an average of 32 employees and a mean of 11 years age. 49% of companies say they use or
have a system that captures the key performance areas of their business units, providing a comprehensive overview of them;
While 51.2% of companies say their systems cover some, but not all the key performance areas of the business units, offering
only a partial view of the business.
Figure 2.2: Descriptive Statistics
The group is composed
of 79 CEOs or General
Managers (12.3%), 109
Functional or divisional
directors (16.9%), 111
Department Directors
(17.2%) and 345 managers (53.6%). 57 (8.9%) of them have completed high school, 393 (61%) have bachelor's degrees, 189
(29.3%) have a master's degree, and 5 (0.8%) have a doctoral degree.
The respondent’s formal education in management is an average of 3.25 years; experience in management has a mean of 7.87
years and experience within their sector is an average of 9 years. The sample is distributed in four sectors. 105 manufacturing
firms (16.3%), 51 trading firms (7.9%), 407 service firms (63.2%), and 81 related to banking (12.6%).
Exploratory factor analysis (EFA) with items related to each construct.
EFA across all items of different constructs (MCS Uses 27 items and Capabilities 18 items) was performed with several
objectives: to ensure convergence and discriminant validity of the scales and to generate scores in each construct that will be
Firm Industry Category# %
Manufacturing 105 16.3Trade 51 7.9Services 407 63.2Banking 81 12.6Total 644 100.0Source: Self-devised
0
100
200
300
400
Manufacturing Trade Services Banking
47
used in subsequent analyses. With this procedure we avoid multicollinearity problems present in the scale items (see appendix
F. Convergent-discriminant validity, Part 2: EFA: MCS uses – LO & EO). Once completed, the following tests (ANOVA &
MLR) are performed with the new scores produced by these factors in each construct.
Since there was an underlying factor to the items in each construct and their variances were similar, the internal consistency
of the items included in the scale was assessed using Cronbach-alpha as a reliability coefficient. All the resulting alphas, above
the 0.70 recommended level of acceptability (Nunnally et al. 1967) indicated a high internal consistency of the summed scales.
MCS uses exploratory factor analyses (EFA) results, which indicated that the 27 items loaded on four factors, namely FAC_L
(Legitimizing), FAC_M (Monitoring), FAC_F (Focusing attention) and FAC_D (Strategic Decision-Making), were exactly
the same theoretical factors that defined and represented by the scales used, and which explained the 65.26% of common
variance. Capabilities EFA results with the 18 items, loaded on two factors, namely FA_EO (Entrepreneurial orientation) and
FA_LO (Learning Orientation), explained the 69.227% of common variance 12.
2.5.2 Construct validity and reliability
Several procedures and tests were conducted to establish the validity of constructs and reliability: Content & face validity,
pre-test of the survey in three steps, tests of convergence and discriminant validity, assessment of interraterTOTAL reliability
and test of normality. Based on the tests, all constructs reflect strong validity and reliability.
Construct validity
Content and face validity: Here we focus on whether the operationalization (survey) is a good reflection of the constructs.
We used content and face validity approaches to demonstrate that the measures reflect what we want to measure.
• To establish content validity, existing scales used in current literature have been employed.
• To provide face validity, we pre-tested the survey in 3 steps for clarity, complexity, ambiguity and face validity 13.
• Minor adjustments were made in terms of wording and presentation, according to recommendations given.
Convergent and discriminant validity: To ensure convergent and discriminant validity we conducted two empirical tests:
1) A correlation matrix of all items related to MCS uses and capabilities, and 2) An exploratory factor analysis (EFA) across
all questions (MCS uses and capabilities):
1) Both correlation matrix, MCS uses (Monitoring, focusing attention, strategic decision making, Legitimization) and
capabilities (LO & EO), show positive and significant correlation coefficients at the 0.01 level. Knowing that convergent
correlations should always be higher than the discriminant ones, we can assume from the pattern of correlations that the
different items are converging on the same point,14 which in turn shows the discriminant ones15. I would conclude from this
that the correlation matrix provides evidence for both convergent and discriminant validity (see appendix F, Convergent- 12 See appendix D. Descriptive stats, correlations. Part 1: MCS uses, LO, EO (ch.II) and appendix F, Convergent-discriminant validity, Part 2: EFA: MCS uses – LO & EO (ch II). 13 1) Five academic business professors in planning/financial/accounting were asked to revise and complete the survey to provide comments on its form and content; 2) Five top managers (planning/financial/accounting officers) were interviewed and asked to complete the survey; 3) The survey was completed by a group of MBA students. 14 The convergent correlations are associated with higher coefficients within the same construct among others. 15 Measures that should not be related are in reality not related or have lower coefficients.

48
discriminant validity: Part 1 Correlation matrix MCS uses, capabilities)
2) The exploratory factor analysis (EFA) across all questions (MCS uses and capabilities) shows that every construct exhibits
acceptable results. In the case of MCS uses, EFA shows that items related to the same construct, measure the same, and
confirm that the information present in the 27 items can be summarized in four factors (precisely the theoretically proposed
uses for MCS). That explains much of the information contained in the original variables, showing their discriminating power.
In capabilities, the information resident in 18 items together, can be summarized in two factors, Learning and Entrepreneurial
Orientations (exactly the theoretically proposed capabilities).
Bartlett's test (X2=11,860 -MCS use- and X2=9,884 –capabilities-) and a KMO (0.956 and 0.961 respectively), provides a
suitable check for this factorial analysis (see appendix F. Convergent-discriminant validity. Part 2: EFA: MCS uses – LO &
EO). Additionally, a statistical analysis of the reliability of these factors through Cronbach's Alpha was made; in both cases
the results show values above 0.95, confirming previous results16. Furthermore, this analysis demonstrates that in turn, using
the information provided by these new factors, by orthogonal origin, we will not have problems of multicollinearity when
performing correlations.
Reliability
Internal consistency reliability was tested using the same instrument administered to a group of people to estimate reliability.
This refers to how well the items that reflect the same construct yield similar results. Here we are looking at how consistent
the results are for different items for the same construct within the measure. There are a wide variety of internal consistency
measures that can be used. In this analysis focusing on the various uses of MCS, we use the “Average InteritemTOTAL
Correlation”. The Average InteritemTOTAL Correlation approach uses all the items on our instrument that are designed to
measure the same construct. We first compute the correlation between each pair of items. The average interitem correlation
is the average or mean of all these correlations in each construct, but also we compute an average score for the items in each
use (Mavg, Favg, Davg, Lavg) and use it as a variable in the correlation analysis. Then we calculate an average of this
correlation and the results in each use show an average of 0.806, significant at the 99% level and ranging from 0.766 to 0.853
in this sample, remaining at a very acceptable level for this analysis (see appendix E: Reliability. Part 1: Average
Inter.itemTotal Correlation). Also two tests were performed (Kolmogorov-Smirnov; Shapiro–Wilk) to verify the hypothesis
of normality necessary for the result of some reliable analysis, for example ANOVA. These tests supported the normality of
all constructs (See appendix E: Reliability. Part 2: Normality test).
2.5.5 Analysis models
The methodologies selected for this study are twofold: 1) Analysis of variance (ANOVA) with the control variables as factors
and the results of factor analyzes (EFA) as dependent variables to provide empirical evidence and 2) Multiple linear
regressions with the full sample and dividing it into sub-groups by size and industry to test the robustness of the model.
Statistical analysis was performed using SPSS (V.21) software.
16 Nunnally et al. (1967) recommended 0.70 level of acceptability.

49
1) ANOVA: Analysis of variance about to check the means of the quantitative variables (MCS uses and capabilities),
with respect to the categories in the qualitative variables (Size and Industry).
Dependent variables: MCS Uses (Monitoring; Focusing Attention; Strategic Decision-Making; Legitimizing);
Learning Orientation (LO); Entrepreneurial Orientation (EO).
Fixed Factors: Size (Small; Medium; Large) and Industry (Manufacturing, Trade, Services, Banking).
2) MULTIPLE REGRESSION analysis was developed in two models that are explained forthcoming.
Model A: tests the relationship between Capabilities (LO & EO) and the control variables (System amplitude, firm
size, firm age, Industry sector and gender), as control and splitting variables, to provide a complementary testing of
the hypotheses.
Model B: Tests the relationship between Capabilities (LO and EO) and the different MCS uses (Monitoring M,
Legitimization L, Attention focusing F and Strategic Decision-Making D) and introduces all the control variables
(System amplitude, firm size, firm age, Industry sector and gender). This model seeks to support hypotheses 1 a, b;
2 a, b; 3 a, b and 4 a, b, where the coefficients and significance from linear regressions will be used to provide
evidence and impact on two sets of hypotheses (a, b).
Also, to add robustness to the model and test whether the relationships are maintained in the same manner in companies of
different sizes and industries, we conducted a multiple regression analysis dividing the sample into subgroups by size and
industry.
2.6 Research findings
2.6.1 Results of the ANOVA analyses:
Table 2.2 presents the summary of the ANOVA analyses. Based on a comparison of the means obtained from the different
MCS uses in companies of different sizes and different sectors, the results show that of the four different types of use
(Monitoring, legitimizing, Focusing attention and Strategic Decision-Making), three of them do not show a significant
difference in companies of different sizes (p<0.001). The exception is observed in “monitoring use”, in which we can identify
two groups of companies: small companies that have a mean of monitoring well below the average for the entire group of
companies (-0.257) and another group of medium-sized (0.052) and large (0.103) companies (no statistical differences
between medium & large size).
In the same analysis of company-size regarding capabilities, the results show that in learning orientation we can identify two
groups: a group of small and a group of large firms (as mid-sized companies, statistically could be part of both groups); with
small firms having a higher and positive mean (0.141) than large firms (-0.088), suggesting that smaller companies present
greater learning orientation (p<0.10). With respect to industry type observed, in the entrepreneurial orientation analysis, we
can identify the major differences between the banks with a negative average (-0.246) and the manufacturing industry (0.200).
This suggests that manufacturing, followed by services firms, have higher entrepreneurial orientation than trade and banking
(p<0.05) (see appendix G. Chapter II: Anova results).

50
Table 2.2: ANOVA analyses between MCS uses, LO & EO versus Size and Industry
2.6.2 Results of the multiple regression analyses:
Table 2.3: Multiple Linear Regressions results
Table 2.3 presents the results for each capability (LO & EO) with two models comprising the control variables and the set of
independent or predictor variables (MCS uses). All hypotheses were tested using multiple linear regression analyses . The
base model (Model A) included only the effects of the control variables. The model B includes the control variables and the
Table 2.6: : ANOVA analyses between MCS uses, LO & EO versus Size and Industry
Source: Own devised
MCS$uses CapabilitiesMonitoring Learning$Orientation Entrepreneurial$ Orientation
Differing Mean$(S.D.) Groups Differing Mean$(S.D.) Groups Differing Mean$(S.D.) Groups
Size%%% %%F:7.126%***
.0.257%(1.155) Small
Size%F:2.757%*
0.141%(0.964) Small%&%Medium
Industry%F:3.398%**
.0.246%(0.982)%%%%% %
.0.133%(1.083)Banking%%%%% %%%% %%%% %%%% %%%&%Trade%
0.052%(0.941)%%%%%0.103%(0.925)
Medium%&%Large
0.02%(0.996)%%%%.0.088%(1.016)
Medium%&%Large
0.014%(0.994)%%0.200%(0.959)
Services%&%Manufacturing
Note:%N=644%in%all%cases Note%1:%*%Significant%@%90%;%**%%Significant%@%95%;%%***%Significant%@%99% Note%2:%All others constructs are%not significative
Note%3:%Mean%(S.D.)
Source: Self-devised
Learning Orientation Entrepreneurial OrientationModel A Model B Model A Model B
VariablesControl
variablesControl & Independent
variables Control variablesControl & Independent
variables ControlsSystem amplitude 0.636*** 0.287*** 0.627*** 0.326***Small firm 0.206** 0.204** 0.176* 0.183*Large firm -0.192** -.110 0.042 .655Firm age 0.001 .000 .002 .133
Ind 1: Manufacturing 0.211 .086 0.463*** 0.368***Ind 2: Trade -0.005 -.058 .098 0.567Ind 3: Services 0.124 .055 0.312*** 0.264**
Gender -.060 -0.046 .003 0.967
Mgmt. Control Use MCS use MCS use
Legitimizing 0.310*** Focusing att. 0.234***Focusing att. 0.274*** Legitimizing 0.223***
Strat. Dec. 0.185*** Monitoring 0.168***Monitoring 0.151*** Strat. Dec. 0.156***
F-value 10.105*** 23.507*** 10.649*** 17.662***R2 0.113 0.309 0.118 0.251
N=644; Note 1: Unstandardized Coefficients are reportedNote 2: Industry reference: BankingNote 3: Size reference: Medium* Sig. at 90% level ** Sig. at 95% level *** Sig. at 99% level

51
four MCS uses. The variance inflation factor (VIF) and TOLER scores were examined for all variables to quantify the severity
of multicollinearity and all were within acceptable ranges (Ryan 1997); Results are reported in table 2.3 (see appendix H.
Chapter II: Multiple Linear Regressions results (Full sample, size & industry complete details).
Learning orientation & hypotheses:
Model A
The base model A included only the effects of the control variables; It explained a significant portion of variance (R2 = 0.113,
F = 10.105, p < .001). Significant variables are system amplitude (0.636; p<.001), being a small (0.206; p<0.05) and large
firm (-0.192; p<0.05) instead of a medium-sized firm.
Model B
To assess the direct relationships of each capability, the MCS uses set variables were introduced in Model B. The results
explained a significant portion of variance in learning orientation, compared to Model 1, suggesting that the overall model is
significant (R2 = 0.309, F = 23.507, p < .001). Significant variables are system amplitude (0.287; p<.001), and being a small
firm (0.204; p<0.05) instead of being a medium-sized firm. All the MCS uses are significant and positive and with these
results the hypotheses (a) are verified.
Hypotheses (set a) vs. LO:
H1a predicted that a monitoring use would be negatively related to learning orientation in firms. Our analyses suggest that
MCS used as monitoring is positively and significantly related to the learning orientation capability, contrary to the expected
direction (i.e., positive instead of the expected negative direction) (β= 0.151, p < .001). H1a therefore is not supported.
H2a predicted that a legitimizing use would be negatively related to learning orientation in firms. Our analyses suggest that
MCS use as legitimizing is positively and significantly related to the learning orientation capability, contrary to the expected
direction (β = 0.310, p < .001). H2a therefore is not supported.
H3a predicted that attention focusing use would be positively related to learning orientation in firms. Our analyses suggest
that MCS use as attention focusing is positively and significantly related to the learning orientation capability (β = 0.274, p <
.001). H3a therefore is supported.
H4a predicted that a strategic decision-making use would be positively related to learning orientation in firms. Our analyses
suggest that MCS used as strategic decision-making is positively and significantly related to the learning orientation capability
(β = 0.185, p < .001). H4a therefore is supported.
Entrepreneurial orientation and hypotheses:
Model A
In the EO capability, the base model A included only the effects of the control variables and explained a significant portion
of variance (R2 = 0.118, F = 10.649, p < .001). Significant variables are system amplitude (0.627; p<001), with a small firm
(0.176; p<0.1) instead of a medium-size firm and if the firm belongs to the manufacturing industry (0.463, p < .001) or service
(0.312, p<.001) and not banking; this shows a direct relationship with the entrepreneurial orientation. To be a trade firm is

52
not significant in this analysis.
Model B
Model B assess the direct relationships with EO and the MCS uses and control variables. Model B explained a significant
portion of variance in the entrepreneurial orientation, suggesting that the overall model is significant (R2 = 0.251, F = 17.662,
p < .001). Significant variables are system amplitude (0.326; p<.001), with a small firm (0.183; p<0.10) instead of a medium-
size firm, and if the firm belongs to the manufacturing industry (0.368, p < .001) or services (0.264, p<.005) and not banking,
it shows a direct relationship with the entrepreneurial orientation. Again, to be a trade firm is not significant in these analyses.
All the MCS uses are significant and positive, and with these results the hypotheses (b) are verified.
Hypotheses (set b) vs. EO:
H1b predicted that a monitoring use would be negatively related to entrepreneurial orientation in firms. Our analyses show
that, contrary to the expected direction (i.e., positive instead of the expected negative direction), MCS used as monitoring is
positively and significantly related to the entrepreneurial orientation capability, ( β= 0.168, p < .001). H1b therefore is not
supported.
H2b proposed that a legitimizing use would be negatively related to entrepreneurial orientation in firms. Our analyses suggest
that MCS used as legitimizing is positively and significantly related to the entrepreneurial orientation capability, contrary to
the expected direction (β = 0.223, p < .001). H2b therefore is not supported.
H3b predicted that a focusing attention use would be positively related to entrepreneurial orientation in firms. Our analyses
suggest that MCS use as focusing attention is positively and significantly related to the entrepreneurial orientation capability
(β = 0.234, p < .001). H3b therefore is supported.
H4b predicted that a strategic decision-making use would be positively related to entrepreneurial orientation in firms. Our
analyses suggest that MCS use as strategic decision-making is positively and significantly related to the entrepreneurial
orientation capability (β = 0.156, p < .001). H4b therefore is supported. (Appendix H. Chapter II: Multiple Linear Regressions
results (part 1 Full sample).
Table 2.4: Summary of hypotheses and results
In general, the results (table 2.4) show that both
Learning Orientation (LO) and Entrepreneurial
Orientation (EO) in an organization relate more to
the use of MCS to legitimize ideas or approaches,
to something we know or we need to do or learn,
and as systems that help in the focusing attention
on opportunities or problems in organizations.
Using the MCS for monitoring or strategic
decisions making, with a positive and significant
Table 2.8: Summary of hypotheses & results
Source: Own devised
Hypotheses ResultsH1a (LO vs. monitoring (-)) Not supportedH2a (LO vs. legitimizing (-)) Not supportedH3a (LO vs focusing attention (+)) SupportedH4a (LO vs Strategic decision-making (+)) SupportedH1b (EO vs. monitoring (-)) Not supportedH2b (EO vs. legitimizing (-)) Not supportedH3b (EO vs focusing attention (+)) SupportedH4b (EO vs Strategic decision-making (+)) Supported

53
relevance, have less impact on the relationship with both capabilities, but are positive and significative.
2.6.3 MRL sub-group analyses (Size & Industry)
To test whether these relationships hold in the same way previously shown, in different company sizes and industry, the
multiple regression analysis was repeated but now dividing the sample into subgroups by size and industry. The overall results
are shown below (tables 2.5, 2.6, 2.7 & 2.8) and detailed analysis is shown in appendix H. Chapter II: Multiple Linear
Regressions results (Part 2 size and industry)
MLR results sub-groups (Size)
LO and EO - Size sub-group analyses (table 2.5 and 2.6) holds that legitimizing and attention focusing were the MCS uses
more related with both capabilities (LO and EO), with the only exception that for EO in large companies the two most
important MCS uses are legitimizing and strategic decision making. The complete sample tells us that in the case of LO, MCS
use as Legitimization has a greater impact on LO capability, followed by attention focusing, strategic decision-making and
finally monitoring. This order is maintained for small firms; midsize businesses show that only two uses are significant,
legitimizing and attention focusing, and in the case of large firms, the order changes to attention focusing being the most
explanatory variable, followed by legitimizing, monitoring and finally strategic decision-making.
Table 2.5: LO - Size sub-group analyses
EO capability – Size sub-group analyses (table 2.6) show that the order for the entire sample remains in small and medium
firms, while in large companies this order changes to legitimizing, strategic decision making, focusing attention, and
monitoring.
Source: Own devised
Legitimizing 0.310*** Focusing att. 0.291*** Legitimizing 0.400*** Legitimizing 0.297***Focusing att. 0.274*** Legitimizing 0.274*** Focusing att. 0.238*** Focusing att. 0.280***
Strat. Dec. 0.185*** Monitoring 0.252*** Strat. Dec. Strat. Dec. 0.266***Monitoring 0.151*** Strat. Dec. 0.225*** Monitoring Monitoring 0.129**
Note: * Sig. at 90% level; ** Sig. at 95% level; *** Sig. at 99% level
BIG Medium SMALLAll sampleCoefficients Coefficients CoefficientsCoefficients
Model 2 Model 2 Model 2Model 2
Learning Orientation LO

54
Table 2.6: EO - Size sub-group analyses
MLR results sub-groups (Industry)
In the case of LO - Industry sub-group analyses (table 2.7), the results show that legitimizing and attention focusing are the
most related variables in all the industries. The order for the entire sample is maintained only in services companies: in
manufacturing companies the order changes, with the most important attention focusing, followed by monitoring, legitimizing
and strategic decision-making. In trade firms only legitimizing and monitoring uses are statistically significant. For banking
firms, the most important variable was legitimizing, followed by strategic decision-making and attention focusing while
monitoring use was not statistically significant.
Table 2.7: LO - Industry sub-group analyses
EO capability - Industry sub-group analyses (table 2.8) show that the order for the entire sample remains in services
companies; In Manufacturing firms, only MCS uses as Focusing attention and Monitoring are statistically significant. For
trade companies, only Legitimizing and Focusing attention uses are significant and for banking companies the order changes
to strategic decision-making, legitimizing and focusing attention, while monitoring use is not significant.
Table 2.8: EO - Industry sub-group analyses
Source: Own devised
Entrepreneurial+Orientation+LO
Focusing att. 0.234*** Legitimizing 0.219*** Focusing att. 0.340*** Focusing att. 0.327***Legitimizing 0.223*** Strat. Dec. 0.212*** Legitimizing 0.329*** Legitimizing 0.178***Monitoring 0.168*** Focusing att. 0.154*** Monitoring 0.238*** Monitoring 0.151***Strat. Dec. 0.156*** Monitoring 0.115** Strat. Dec. 0.203*** Strat. Dec.
Note: * Sig. at 90% level; ** Sig. at 95% level; *** Sig. at 99% level
All sample
Model 2 Model 2 Model 2 Model 2
Entrepreneurial Orientation EOBIG Medium SMALL
Coefficients Coefficients Coefficients Coefficients
Source: Own devised
Legitimizing 0.310*** Focusing att. 0.386*** Legitimizing 0.465*** Legitimizing 0.299*** Legitimizing 0.355***Focusing att. 0.274*** Monitoring 0.307*** Monitoring 0.290** Focusing att. 0.282*** Strat. Dec. 0.284***
Strat. Dec. 0.185*** Legitimizing 0.286*** Focusing att. Strat. Dec. 0.157*** Focusing att. 0.274***Monitoring 0.151*** Strat. Dec. 0.229*** Strat. Dec. Monitoring 0.110** Monitoring
Note: * Sig. at 90% level; ** Sig. at 95% level; *** Sig. at 99% level
MANUFACTURING TRADE SERVICES BANKINGCoefficients
Model 2Coefficients
Model 2Model 2CoefficientsCoefficients
Model 2Model 2CoefficientsAll sample
Learning Orientation LO
Source: Own devised
Legitimizing 0.223*** Focusing att. 0.268*** Legitimizing 0.326*** Legitimizing 0.236*** Strat. Dec. 0.400***Focusing att. 0.234*** Monitoring 0.255*** Focusing att. 0.256** Focusing att. 0.257*** Legitimizing 0.377***Monitoring 0.168*** Strat. Dec. Strat. Dec. Monitoring 0.205*** Focusing att. 0.248**Strat. Dec. 0.156*** Legitimizing Monitoring Strat. Dec. 0.153*** Monitoring
Note: * Sig. at 90% level; ** Sig. at 95% level; *** Sig. at 99% level
Coefficients Coefficients Coefficients Coefficients CoefficientsModel 2 Model 2 Model 2 Model 2 Model 2
Entrepreneurial Orientation EOMANUFACTURING TRADE SERVICES BANKINGAll sample

55
2.6.4 Results summary
MCS uses – Size and Industry
In general, the various uses of MCS are not different in companies of various sizes, except use as monitoring that shows
significant differences between companies of different sizes and especially was much greater among small and large
businesses. Based on the idea that the larger the company, the greater need for control, it has been shown that medium-large
companies have more resources and formal systems with which they can carry out such controls. In the full sample we found
no significant differences for size and the various uses of MCS in different sectors.
Learning Orientation (LO) - Size
Similarly, to the previous ANOVA results, the coefficients in the multiple linear regressions suggest that small firms have a
greater propensity to learn (p<0.10) than large companies and even more, the negative coefficient in large companies suggests
an inverse relationship between the size and learning orientation. The organizational learning of a process proposed by Slater
and Narver (1995) show that some factors in this inverse relationship may be related to the inherent size complexity including:
not having have an attitude of search and learning, difficulties in obtaining relevant information being away from their clients,
the lack of a common understanding and the complexity of disseminating information for being a large organization.
Entrepreneurial Orientation (EO) - Industry
As the ANOVA results, the coefficients in multiple regression analysis (positive and significant) suggest that manufacturing,
followed by services firms, have higher entrepreneurial orientation than trade and banking (p<0.05).
MCS uses
The global study results indicate that different MCS uses have substantively different effects on Learning and Entrepreneurial
orientations. Impacts (coefficients magnitude) of the different MCS uses vary, depending on the size of the company, and
with greater or lesser extent, depending on the industry in which they reside, but in all cases the relation is positive and
significant.
For LO: The MCS use with more impact on LO is legitimizing, followed by attention focusing, strategic decision-making and
finally monitoring. For EO: The MCS use with more impact on EO is attention focusing, followed by legitimizing, Monitoring
and lastly strategic decision-making. Both capabilities (LO and EO) are more related with the uses of legitimizing and focusing
attention, but monitoring and strategic decision-making uses are positive and significant too.
In the complete sample, on the one hand, hypotheses H1 and H2, in both capabilities, are not supported. Although, in line
with Koufteros et al. (2014), monitoring and legitimizing (diagnostic) MCS uses are positively and significantly related to the
learning and entrepreneurial orientations, but contrary to the expected negative direction, argued by Henri (2006a). On the
other hand, MCS uses of attention focusing and strategic decision making (interactive) support hypotheses H3 and H4 (a and
b).
The analyses of hypotheses (a and b) by sub-groups (size and industry) show different results:
H1 a and b (monitoring) is not supported, although the relationship is positive and significant in all cases, except for LO-
56
medium-size firms and LO-banking, EO-trade & EO-banking firms, where it is not statistically significant.
H2 a and b (legitimizing) is not supported, although the relationship is positive and significant in all cases with exception of
EO-manufacturing industry, where it is not statistically significant.
H3 a and b (focusing attention) receives complete support for firms of all sizes and all industries with exception of LO-trade
industry where it is not statistically significant.
H4 a and b (strategic decision making) receives partial support fulfilling the assumption, except for LO-medium and EO-
small-sized firms, LO-trade firms, EO-manufacturing and EO-trade firms where the strategic decision making variable is not
statistically significant. For complete analyses see appendix I. Chapter II: Hypotheses results of the sub-group, size and
industry analyses.
Globally, significant and positive relationship is observed for small firms in both capabilities, which can be understood as a
higher propensity of small firms to develop both learning and entrepreneurial orientations. Specifically, in the case of
entrepreneurial orientation (table 2.3), we can see that belonging to manufacturing or service industry, also relates in a positive
and significant manner with EO.
2.7 Conclusions and discussion
In general, the literature in management control systems (MCS) uses an explicitly or implicitly RBV approach (Wernerfelt
1984; Barney 1991; Teece et al. 1997), and together with Simons’ levers of control framework (Simons, 1995) and Executive
support systems classification (ESS) (Vandenbosch, 1999), shows that MCS influence the strategic capabilities in
organizations through the routines they stimulate. Based on the RBV we can identify the MCS as available resources in an
organization, which generate a competitive advantage in terms of the use made for them (Lengnick-Hall & Wolff 1999).
Therefore, understanding how these resources can be used in a better way, such as generating a source of sustainable
competitive advantage, MCS can become a specific resource that cannot be duplicated easily. MCS (resources) do not generate
profits per se, but can help by the way they are used (Penrose 1995). Although MCS can be employed for different uses, there
is a lack of prior empirical research on these uses.
The general findings of this work are aligned with Simons’ (1990) arguments in terms of going beyond the contribution of
MCS as a tool for monitoring and evaluation, suggesting them more as a catalyst for the complete strategic process, which
supports and encourages the creation and execution of strategies across the organization.
The results suggest globally that MCS use as monitoring shows significant differences between small and medium-large
companies, while large companies make more monitoring use of their MCS. The other three uses (legitimizing, focusing
attention and strategic decision making) of MCS are not significantly different in the various sizes of companies analyzed.
Our results suggest that small firms have a greater propensity to learn (p<0.10) than large companies and even more, the
resulting negative coefficient in large companies suggests an inverse relationship between size and orientation to learning.
The results also suggest that manufacturing, followed by services firms, have higher entrepreneurial orientation than trade and
banking (p<0.05) firms.

57
The results also show that the four uses analyzed, Monitoring, Legitimizing, Attention focusing and Strategic Decision-
Making of MCS, contribute positively to capabilities. Thus, this supports both previous findings (Koufteros et al. 2014), that
MCS interactive use enhances the development of organizational capabilities, but also raises the possibility of questioning the
position that diagnostic use inhibits strategic capabilities of the organization (Simons 1995; Henri 2006a). Our findings also
highlight a positive impact of diagnostic use (monitoring and legitimizing) on capabilities, contrary to the expected direction
identified in previous studies.
Contrary to the current literature, but in line with our results, in a recent study, Koufteros et al (2014) argued that there is
sufficient evidence to suggest that the diagnostic use of MCS leads to improved capabilities, which then impact performance.
Like our research, they discovered that when analyzing interactive use and diagnostic use, the latter seems to be the the most
constructive explanatory variable for capabilities. Note that in both works, although they are analyzed with different methods
and measurement scales, the positive results of diagnostic use are consistent and seem to cast doubt on the results obtained by
previous works (Henri 2006a), although we do not agree with how the construct was measured; this point is explained below.
In our case, based on Simons (1995) and Vandenbosch (1999), diagnostic use was measured directly with two applications
(monitoring and legitimizing), 16 while Koufteros et al (2014) measured diagnostic with three uses (monitoring, legitimizing
and "focusing attention"). Specifically, and given that this is clearly established in the literature (Vandenbosh 1999), we do
not agree that attention focusing should be considered a diagnostic use.17 Finally, the positive outcome in both studies is
consistent because in our case, attention focusing also positively impacts capabilities either individually or grouped as a second
order construct such as that by Koufteros et al (2014).
Although potential diagnostic MCS use is recognized by Simons (1995), the literature has generally maintained that diagnostic
controls limit the capacity of a firm to innovate (Henri 2006a). In the literature we can identify some positions for and against
this negative or positive relationship. Grafton et al. (2010) argues that diagnostic use of MCS facilitates exploitation of existing
capabilities and in the same line Vandenbosch (1999) argued that the discussion triggered by the diagnostic use leads to
corrective action as a way of learning, but Henri (2006a) argues that corrective actions are not sufficient to sustain such
capabilities. This would mean that, in theory, even if diagnostic use works against the deployment of capabilities (Henri
2006a), it may contribute to performance through organizational capabilities by monitoring goal achievement, restricting risk
taking, providing boundaries for innovation, and closely monitoring variations in effectiveness, which is necessary to produce
a better performance. Diagnostic use of MCS could help to increase the positive effects of an interactive use on capabilities
by providing the necessary information to perform the interactive use (Widener 2007). In the same line, we suggest that the
diagnostic MCS use is important for capabilities development in firms seeking an entrepreneurial orientation (EO) and to
learn as a process (LO). Therefore, further research should be developed to provide a better understanding of these
relationships.
The preceding research and theoretical arguments are provided to tentatively explain these expected and unexpected results.
Our results are not consistent with those of Henri (2006), which fully supported the negative relationship of diagnostic use
17 Appendix N in this thesis, analyze with EFA and CFA why the four types of use (Vandenbosch 1999) charge with respect to two factors, namely diagnostic and interactive as proposed by the literature.
58
and capabilities in the Canadian context. This difference can be explained in part by the concentration of his studies on
diagnostic and interactive use of MCS while the current study integrates four kinds of uses, not only monitoring as a diagnostic
MCS use and focusing attention as interactive MCS use.
Furthermore, the context for our research could be a possible explanation for our results. Mexico is a newly developed country
and has the characteristics of an emergent economy. This has implications, for example: competition is at an early stage, and
companies use traditional MCS in a diagnostic manner (which is not necessarily undesirable). However, they are in a learning
process in which their reality requires meeting the first challenge of knowing how to use MCS in an interactive manner. In
this line, Ittner et al. (2003) find that firms operating in new economy industries, in which strategies are unproven and therefore
more uncertain, are more likely to rely on formal measures, like diagnostic measures.
Monitoring and capabilities: Research findings show that the primary reason for having a MCS was monitoring/controlling
(30%) (Marr 2005). MCS as monitoring is a necessary condition, but not sufficient to generate a capability. As Chenhall
(2003) stated, diagnostic MCS use should be sufficient to assist in taking and implementing decisions in an interactive manner.
This conceptualization is directly linked to the notion of "what is not measured is not controlled" (Kaplan & Norton 1992;
Berry et al. 2009). Monitoring is a necessary condition for providing information to challenge the context, the content and
validity of the strategy followed by firms (Ittner et al. 2003). Translating that strategy into deliverables (outcomes) and
measures helps managers to measure and ensure business (Hall 2008), necessary conditions for learning and to carry out a
process conducive of change or improvement (Mintzberg 1973). Two of the four steps proposed by Slater & Narver (1995)
in the process of organizational learning are related to the monitoring use of MCS: i) Information Acquisition –Collection-
(How am I doing?) and iiii) Organizational memory –Storage- (How do I do it?). Previous research shows that the MCS
monitoring use helps ensure that performance information is distributed fairly among participants, which enables learning and
problem solving (Mahama 2006). The argument is that high performing firms rely on the information provided by frequently
updated formal control systems to drive organizational learning (Simons 1987), and it was found that updated MCS has a
significant positive impact on staff perceptions about learning capability (Yuan et al. 2008). The use of updated MCS supports
a holistic look at all the strategic process, resulting in organizational learning (Slater & Narver 1995; Speckbacher et al. 2003).
In summary, monitoring uses provides updated MCS, necessary elements to conduct a constructive dialogue on the evaluation
of a situation or to evaluate performance vs. expectations.
Legitimizing and capabilities: Executives in organizations often use MCS to confirm or deny their own prior beliefs or to
check against their primary expectations (Vandenbosch 1999). The legitimizing use of a MCS can operationalize the second
and third steps of the organizational learning process,18 as proposed by Slater & Narver (1995). Both steps are related with
communication, the purpose of the legitimizing MCS use. Disseminating information, according to Mintzberg's (1973) is
related to learning, and can be either directing attention or legitimizing previous decisions and thus increasing knowledge.
Managers use information systems not only to justify decisions, but also to legitimize prior ideas ensuring their interpretation
because they believe that doing so will encourage the competitiveness of organizations (entrepreneurial characteristics)
18 Learning process: Information acquisition (How am I doing), information dissemination (communication), shared interpretation (what does it mean) and organizational memory (How I Do it) (Slater & Narver 1995).

59
(Vandenbosch 1999). This suggests that to make things happen, the leaders in an organization must devote considerable effort
to justify and legitimize their proposals and actions. Feldman and March (1981) argue that legitimacy may be a relevant
attribute of effective decisions in some organizations because, if actions will only be taken if they have been legitimized,
organizations become dependent on information that can provide such legitimacy (Feldman and March 1981). From this point
of view, the ability to learn or perform depends heavily on this stage of legitimization. For example, with the legitimizing use
of MCS, Headquarters employ MCS in order to monitor local performance results, influence and guide local decision-making
(Dossi 2008), or influence entrepreneurial attitude for initiation and implementation of strategic decisions (Fama and Jensen
1983; Prahalad and Doz 1987) or simply to legitimize different organizational actions (Vandenbosch 1999).
Focusing attention and capabilities: Seeking opportunities by stimulating participation and dialogue, proposed in attention
focusing MCS use, is presented in the Entrepreneurial Orientation perspective as a permanent attitude and a process to
proactively seek and exploit new business opportunities (Covin & Slevin 1991; Zahra & Garvis 2000). This will favor the
generation of competitive advantage and better results in relation to competitors (Ripollés & Blesa 2005). Attention focusing
MCS use can facilitate and guide organizational learning (Simons 1991; Ahn 2001) and foster innovative practices (Marginson
2002; Bisbe & Otley 2004; Henri 2006a; Cruz et al. 2011). The attention focusing use of a MCS is also related with steps 2
and 3 in the organizational learning process proposed by Slater and Narver (1995). By fostering organizational dialogue,
stimulating creativity, and focusing organizational attention, Attention Focusing MCS use will thus impact the development
of both capabilities.
Strategic Decision-Making and capabilities: This influencing role of the MCS is widely accepted in International Business
literature, according to which MCS are data management tools influencing the cognitive orientation of managers in decision-
making (Prahalad & Doz 1987). These tools have the potential to be not only answering and learning machines, but also
ammunition and rationalization for learning and decision-making (Burchell et al. 1980). According to Mintzberg (1973)
identifying problems and opportunities are ways to direct attention and making decisions. Therefore, strategic decision-
making MCS use positively impacts the development of capabilities.
System amplitude
The control variable “System amplitude” is significant in all analyses and highly correlated with the various uses of MCS. In
recent years, organizations have sought to develop more comprehensive MCS to provide managers and employees with
relevant information for the complete strategic process by which managers are provided the necessary information to track
their initiatives (Ittner et al. 2003). More comprehensive MCS provide an understanding of the linkages between business
operations and strategy (Chenhall 2005). Previous studies indicate that today most complete MCS includes a more diverse set
of monitoring and performance measures that are linked to the entire strategic process and can be used in different ways, to
follow, to motivate, to challenge, or to drive (Neely et al. 1995; Malina & Selto 2001; Chenhall 2005). Norton and Kaplan
(1996) argue that the more comprehensive system used, the greater the contribution to managerial performance by clarifying
managers’ role expectations (diagnostic use), and by providing feedback to enhance managers intrinsic task motivation
(interactive use). A practical example can be observed in the widespread deployment in different kinds of firms of “the

60
Balanced Scorecard” (Kaplan & Norton 1996) and the “Performance pyramid” (Lynch & Cross 1991). Thus, we can conclude
that a broad set of measures that cover different parts of an organization’s operation is an important aspect of more
comprehensive MCS.
Our results show that, to a greater or lesser extent, the different uses that can be given to MCS are related to learning and
entrepreneurial orientations in business. MCS used diagnostically creates the necessary conditions to subsequently generate
interactive use; i.e., by encouraging the necessary elements in order to explore and evaluate alternatives and thus to have a
constructive dialogue. This may be another reason that both uses (diagnostic & interactive) have a positive and significant
relationship with capabilities. Managers who use these systems must be aware and be wary of designing and using such
systems, as the results show a possible complementarity and balance necessary between different uses without limiting their
use. If a MCS is used only diagnostically, this will not generate maximum potential, because although relevant information is
generated, there will not necessarily be improvement. Similarly, MCS used only to focus attention or make strategic decisions
supported by financial analysis or results without continuous data feeding from monitoring will not add much value to the
dialogues generated. The elements provided from these systems are relevant in all strategic process phases (Widener 2007)
and if being used in a complementary manner, MCS can provide information about the drivers of success and causes of
failures.
2.8 Limitations and suggestions for further research
Limitations
Our study has potential limitations that must be considered when making generalizations. Tests on the instrument used to
measure the different variables show high reliability and propose a valid measure from a psychometrical point of view, but
studies that attempt to make a measurement as the one proposed here, could refine and validate the instrument, thus ensuring
reliability.
Although the corresponding tests were performed to ensure reliability, the results should be analyzed taking into account that
they were obtained by a survey, which entails several implications. The survey method to collect data creates potential for
bias due to common response. In this line, we are aware that the results of this study could show a bias by a form of common
method variance (CMV) called Single Source Bias (SSB) (Campbell & Fiske 1959), and although Harman’s one-factor test
indicated the absence of common method effects in our survey data (See Appendix C. Non response bias & common method
variance (CMV) analysis). There are arguments to think that this test is necessary but insufficient (Podsakoff et al. 2003). So,
this is a limitation in our study and also an area of opportunity for future research using multi-method strategies for data
collection, in order to enhance the validity and reliability of the construct measures. Future studies in this area should also use
more refined measurement instruments to address these concerns and, where feasible use multi-source measures.
The surveys also provide results according to manager perceptions, which is our particular interest (Van der Stede et al. 2005).
Although the tests do not show signs of bias or noise, surveys habitually contain noise and should be interpreted taking this

61
into account.
Some possible limitations regarding the database are that the scope was limited to Mexican organizations; thus generalizations
can only be made cautiously. Finally, the study focused on business managers or directors; thus further research is required
to assess whether different MCS uses have the same results at other managerial levels.
Suggestions for further research
The study points to several avenues for future research. Previous studies suggest negative results in the relationship between
the various uses of MCS and organizational capabilities. In other words, MCS uses as a diagnostic tool can inhibit capabilities.
Since the results obtained in this study show positive and significant relationships between uses monitoring and legitimization
and organizational capabilities of EO and LO, we consider it important to keep an open discussion, and take these results with
caution, as they may be being modified by any variable outside our field of study. Linked to this, future lines of research could
offer empirical evidence using the proposed model, but under other environmental conditions.
This study analyzes the classification of MCS under the Vandenbosch proposal (1999), so new models that include other
classifications trying to prove the above relationships, would bring knowledge to the line of study that seeks to find the impact
of MCS on organizational capabilities and performance.
This study focused on evaluating the impact of MCS uses in two capabilities (Learning and Entrepreneurial Orientation), but
other strategic orientations also may be impacted by the various uses of MCS, so this is a line of research that can be developed.
The use of qualitative research methodologies can provide different conclusions to those presented in this study and it would
be particularly useful to find further explanations and new insights into the relationships tested. In the same line, other
methodologies, such as the structural equation model, can support studies like this because of the latent variables.
An additional avenue for future research is to examine the specific characteristics or attributes of the measures used, i.e., the
number of measures, kind of measures, financial and nonfinancial and the impact with the MCS uses and capabilities
relationship. However, it is important to note that recent research indicates that simply adding more performance measures
does not necessarily improve the impact of MCS on performance (Cheng et al. 2007).
The results of this study show that MCS uses are positively related with capabilities development. This essay does not
investigate if these relationships affect firm performance, and therefore, an important avenue for future research is to
investigate the relationship between the different MCS uses and performance, mediating this relationship through the company
capabilities.
Moreover, future research could investigate whether contextual factors influence the relations reported in this study. Factors
like perception of uncertainty, measurement diversity, or human capital factors (e.g., access to human capital employee or
human capital background), have been used in similar studies and have reported an impact on the usability of the systems and
their final results on performance.
Finally, future research could track firms over time, giving the work a longitudinal character.

62

63
Chapter III: Impact of Management Control Systems uses on performance: Direct or Indirect Effect?
3.1 Abstract:
Organizations believe that Management Control Systems (MCS) can help them in the task to deliver value. There is, however,
very little broad-based empirical research examining the role that MCS can play in shaping organizational performance. This
study, based on a resource-based perspective (Barney 1991; Barney et al. 2011; Wernerfelt 1984; Day 1994; Teece et al.
1997) and management control literature (Simons 1995; Vandenbosch 1999), aims to examine how the various uses of MCS
can act as an antecedent to organizational capabilities leading to superior performance. MCS research has been done with
respect to design, purpose, types, or adoption factors with ambiguous findings; but less is known about MCS impact on
performance, directly or indirectly through the organizational capabilities that trigger performance in different kind of firms.
Looking to examine the relationship between MCS use, capabilities and performance, a theoretical model is developed and
tested with empirical data gathered from a survey. Using structural equation modelling this research attempts to answer these
questions: First, what is the impact of MCS use in generating capabilities of Entrepreneurial Orientation (EO) and Learning
Orientation (LO) in firms? Second, what are the implications of these capabilities in organizational performance? And finally,
how do diverse uses of MCS impact on performance?, directly or indirectly?
Data collected from 644 Mexican companies of various sizes and sectors provide valuable results. The main findings show
that in line with previous studies, in general both Diagnostic and Interactive MCS uses, show a positive impact on the
organizational capabilities (LO and EO) studied, independently of what industry or size. Only Diagnostic use generates a
significant, positive and direct impact on organizational performance; interactive use does not. Entrepreneurial Orientation
(EO) has a direct impact on organizational performance and therefore also has a mediating effect on the indirect impact of
both uses of MCS on performance; learning orientation (LO) has no effect directly on performance.
Keywords: Management control systems use; Capabilities; Learning orientation; Entrepreneurial orientation; performance.
64
3.2 Introduction Much of empirical research in management literature has been focused on the mechanisms and processes that facilitate
strategic processes. As a part of this strategic process19, administrators perform a set of activities supported by some tools,
with which they ensure the execution of work plans, so that actual results can be compared to the desired performance and
thus permit corrective actions. It is in this activity where Management Control Systems (MCS) are responsible for creating
the models and systems to support the strategic process. A number of researchers (Hopwood 1987; Dent 1990; Argyris 1990;
Hedberg & Jönsson 1978) have provided strong theoretical support for the idea that MCS may have an active role in shaping
this task, arguing that the MCS use is recommended for facilitating strategy implementation and enhancing organizational
performance (Davis & Albright 2004). However, there is little broad-based empirical research examining how management
control systems (MCS) are used in different organizations in order to develop capabilities that enable them to perform better
(Shields 1997; C.-L. Lee & Yang 2011).
MCS are defined as the process by which managers ensure that resources are obtained and used effectively and efficiently in
the accomplishment of the organization’s objectives (Anthony 1965). MCS provide relevant strategic information on the
drivers of success and causes of failures (Mintzberg 1994; Simons 1995). Over the last two decades, the development of MCS
has been exponential and many organizations are investing heavily in his development and maintenance (Neely et al. 2008).
This has triggered the need for a better understanding of the role of MCS and how to meet managerial needs. The findings of
this research may help management better understand what types of MCS use should be encouraged to increase the level of
strategic orientations and thus impact firm performance (Hult 2004).
This research responds to criticism that more comprehensive types of MCS should be studied (Otley 1980; Fisher 1995;
Milgrom & Roberts 1995), and follows the lines of approach that see MCS as more than mechanistic tools. This research
investigates a combination of four MCS uses: Monitoring, Legitimizing, Attention Focusing, Strategic Decision-Making
(Vandenbosch, 1999), grouped in two latent constructs called Diagnostic and Interactive uses (Simons, 1990, 1995, 2000),
which until now it have not been proven systematically, with the exception of proposals in research by Koufteros et al. (2014)
and Henri (2006a). In these two cases, the researchers use only part of the Vandenbosch (1999) proposal and complement
their work with other studies. Thus, we seek to find how these uses may be associated with two firm organizational capabilities,
learning and entrepreneurial orientations (LO and EO) (Ripollés & Blesa 2005), resulting in better performance in companies
of various sizes.
From the resource-based perspective (Barney 1991), MCS (resources) do not generate utilities per se, but rather are a function
of the way they are used (Penrose 1995). That is, the different uses that are given to the MCS can be a source of organizational
capabilities development. Based on a review of relevant literature and theoretical conceptualizations, we will argue that among
the key antecedents to performance are the constructs of learning orientation (LO) and entrepreneurial orientation (EO). While
it is generally agreed that capabilities contributes to business performance, relatively little is known about the drivers of EO
and LO and how those drivers operate via capabilities to collectively influence performance (Hult 2004). Even assuming that
MCS can be employed for different uses, there is a lack of prior empirical research examining such use. Some studies suggest
19 Mainly consisting of three phases (Formulation, implementation, performance) (Hitt et al. 2011; Rumelt et al. 1991)

65
that capabilities are shaped by MCS, but how? Research on MCS use and capabilities have yielded valuable, but ambiguous,
inconclusive or sometimes contradictory results (Chenhall 2003; Ittner et al. 2003). We can see positive (Simons 1990; Simons
1991; Simons 1995; Cruz et al. 2011) or negative (Bisbe & Otley 2004) relationships between MCS and innovation or learning
(Ahn 2001; Chenhall 2005; Godener & Söderquist 2004), or mixed relationships, depending on how the MCS are used;
positively related (used interactively) or negatively (used as diagnostic) with capabilities (Henri 2006a; Henri 2006b). With
the possible exception of research conducted by Henri (2006a, 2006 b), there are no studies linking the various MCS uses and
its impact on firm strategic capabilities (Berry et al. 2009). Despite these studies, there is still a need to better understand the
impact of the various MCS uses on organizational capabilities.
Based on insights from performance literature and the fact that the impact of MCS on capabilities remains unclear, this work
argues that the different MCS uses (Simons 1995; Vandenbosch 1999) could encourage the development of strategic firm
capabilities, thus impacting performance. It is noteworthy that a rich body of literature has examined the link between MCS
and performance, finding ambiguous results (Luft & Shields 2003). Three are the research questions in this work: First of all,
how do the diverse MCS uses impact on performance? Second, to what extent do MCS uses contribute to organizational
performance, through an indirect effect on organizational capabilities? And finally, does MCS have a direct effect on
performance?
In the attempt to test the link between MCS use - strategic capabilities - performance, this study builds upon the model
presented by Henri (2006a) which connected two MCS uses extracted from Simons (1995) (diagnostic and interactive use)
with four capability items (entrepreneurship, innovativeness, market orientation, and organizational learning). However,
unlike the previous studies, in the current research we use the complete Vandenbosch (1999) categorization of MCS usage,
relating it to Simons (1995) diagnostic and interactive uses, thus to generate our hypotheses. We also expand Henri’s (2006a)
work using an more encompassing EO and LO concepts (Yuan et al. 2008), which hold five items in the case of the former
(Lumpkin et al. 2009) and a four-item scale in the case of the latter (Hult 1998). Finally, another contribution of this work
can be seen in the way of measuring performance. Unlike Henri´s (2006a) work, where he uses only three indicators: volume
sales, return on investment and profits, our work uses a more holistic view of the organizational performance level with a six-
indicator proposal to measure perceived organizational performance. We consider financial, operational, customer satisfaction
and employee satisfaction aspects, besides an integrative question, in the twelve past months against the expectations or goals
at the beginning of the year. This form was used in studies of different authors (Kohli & Jaworski 1993; Narver & Slater
1990) and was included in a meta-analysis research (Kirca et al. 2005). With this richer model, a more complete analysis of
the MCS Use–Strategic Capabilities-Performance linkage will be carried out which may help to solve some of the inconsistent
results. In addition, our study uses structural equation modeling (SEM) to test the proposed relationships. SEM provides an
evaluation of the entire model as a whole, rather than simply its parts, focusing the analysis at a macro-level perspective (Kline
1998).
To improve understanding of how various MCS uses can be a source of competitive advantage by the development of
organizational capabilities in different firm sizes, we realize this empirical application in a large sample of different sectors
(manufacturing, services, trade, and banking). Previous studies have been done on samples of 100-300, and focused only on
manufacturing firms (Bisbe and Otley 2004; Cruz et al. 2011; Henri 2006a; Henri 2006b). Moreover, such studies were not

66
performed in SMEs and have not been compared with large firms.
The remainder of this paper is organized as follows: Section 3.3 defines the theoretical framework behind this research. The
following section 3.4 develops the theoretical model used to study the relationship between MCS uses, organizational
capabilities and performance, besides developing a set of hypotheses. Section 3.5 shows the research methods, sampling
procedures, data collection, measurement of variables, test validity, and reliability analysis. The results of the data analysis
using structural equation modeling are discussed in Section 3.6. Then, Section 3.7 ends by summarizing the findings,
conclusions and discussing the managerial implications. Finally, Section 3.8 evaluates some of the limitations of the study
and introduces some directions for future research.
3.3 Theoretical Framework: RBV, Organizational Capabilities, MCS, Performance.
The Resource-Based View and Organizational Capabilities
This study is based on the principles of Resource Based View (RBV) and Dynamic Capabilities (DC) (Barney 1991; Day
1994; Teece et al. 1997; Wernerfelt 1984), as an attempt to explain why some firms are able to have and use different tangible
and intangible assets which enable them to have some capabilities that provide sustainable competitive advantage and earn
superior returns (Wernerfelt 1984; Grant 1996; Barney 1991; Eisenhardt & Jeffrey 2000; Day 1994; Teece et al. 1997).
Resource-based view theory claims that firms with resources with specific characteristics have the potential of achieving
superior performance (Barney 1991; Barney 2001; Wernerfelt 1984). RBV rests on the principle that competitiveness is a
function of the strength, exploitation, and leveraging of the specific internal resources and capabilities controlled by a firm
(Lengnick-Hall & Wolff 1999). This theory conceptualizes firms as a group of resources heterogeneously distributed, whose
differences will persist over time (Barney 2001). That is, resources are tied semi-permanently to a company and specific and
idiosyncratic resources (rare, valuable, imperfectly imitable and non-replaceable or substitutable) are sources of sustainable
competitive advantage that cannot be easily duplicated (Wernerfelt 1984; Barney 1991). A company’s resources must not
only fulfill the above characteristics to facilitate superior performance, but must be appropriately organized in order to take
advantage of these resources (Wiklund & Shepherd 2003).
Resources are assets that can be divided into two major categories (Miller & Shamsie 1996): Property-based (tangibles) and
knowledge-based resources (intangibles). Property-based refers primarily to tangible input resources as access to financial
capital or access to production equipment, constituting the basic factors of production. Knowledge-based resources may be
particularly important and play an essential role in the firm’s ability to be entrepreneurial (Galunic & Eisenhardt 1994), and
improve performance (McGrath et al. 1996). As RBV proposes, knowledge is difficult to imitate, and mainly refers to two
types of resources: first, capabilities that can be seen in successful firms’ practices; and second to the capabilities related to
the human capital (founder/executives/employee’s) (Wiklund & Shepherd 2003). These are the ways in which firms combine
and transform the tangible input resources in value (McEvily & Chakravarthy 2002; Hoskisson et al. 1999).
Although in words of Porter (1980), competitive advantage depends on firms’ ability to position and differentiate themselves
in their industry, some studies have provided evidence to suggest that firm-level resources and capabilities, not industry

67
characteristics, are the primary determinants of firms’ performance (Hoskisson et al. 1999). RBV literature, establishes that a
competitive advantage20 is required to sustain both current and future performance (Grant 1996), but this is a function of
firm’s ability to exploit its existing capabilities and the development of new ones (Barney 1991; Grant 1991). Capabilities are
a link between resources and their deployment because they are organizational processes and routines to integrate, reconfigure,
gain and release resources (Grant 1996; Eisenhardt & Jeffrey 2000). In this vein, organizational capabilities are present in the
firm practices and knowledge of individuals, and are reflected in the different uses that managers give to their MCS (Bisbe &
Otley 2004; Grafton et al. 2010; Henri 2006a; Marginson 2002; Mundy 2010; Tuomela 2005). In this study we focus on the
capabilities of entrepreneurial and learning orientation because they are between the most recognized and researched
organizational strategic capabilities (entrepreneurship, innovativeness, market orientation and organizational learning) (Covin
& Slevin 1991; Lumpkin & Dess 1996; Ripollés & Blesa 2005; Henri 2006a; Henri 2010). Moreover, business literature
supports that learning (Widener 2007) and entrepreneurial orientations (Ripollés & Blesa 2005) are positively associated with
performance (Yuan et al. 2008).
Learning Orientation (LO)
The changing environments of business organizations are becoming highly competitive, involving high demands for
information and knowledge (Senge 1990). This has promoted the creation of knowledge-based organizations that learn and
use intellectual capital as a source of sustainable competitive advantage enabling them to obtain better yields (Garvin 1993;
Senge 1990). LO was defined in various forms: as the development of ideas, knowledge and relations among past actions and
future actions (Fiol & Lyles 1985); as creating structures and strategies that facilitate the learning of all members of the
organization (Chenhall 2005); as a phenomenon directly related to new product success (Slater & Narver 1995); and more
strictly, as a process that results in new behaviors (Argyris & Schön 1978).
LO refers to the activities undertaken by the organization in the creation and dissemination of knowledge, to achieve superior
results and develop competitive advantages (Sinkula et al. 1997). According to Baker and Sinkula (2002) orientation to
learning can be viewed as the degree to which the company questions their beliefs and practices to proactively seek new
knowledge to maximize the performance of the organization. Comprehensive review of the LO concept are found in the
literature (Argyris & Schön 1978; Fiol & Lyles 1985).
Theoretical research on learning contends that LO involves systems to acquire, interpret, diffuse and store information and
results (Huber 1991; Roth & Senge 1996). Information acquisition entails obtaining information and knowledge to provide
potentially useful ideas and opportunities that are relevant for the formulation of innovative strategies (Hambrick 1982);
Information interpretation refers to the process whereby information is given meaning (Daft & Weick 1984). The very process
of clarifying purpose can result in seemingly accidental discovery of effective strategies which then provide focus (Kogut
1991); Information distribution is concerned with sharing information, linking individuals who need information with those
who possess it (Huber 1991). Such distribution is central to enabling organizations to conduct their business (Tushman &
Nadler 1978) and organizational memory provides a repository of information that is often extensive and precise (Chenhall
20 Day (1994) propose two related sources of advantage: assets (e.g., scale economies, locations, distribution system or brand value) and capabilities (complex set of knowledge and abilities accumulated throughout time) that allow a firm to coordinate and make use of its assets (Day 1994).

68
2005), whereby information and knowledge are stored for the future (Huber 1991).
LO is considered to be an important facilitator of competitive advantage by way of improving a firm’s information processing
activities at a faster rate than rivals do (Baker & Sinkula 1999), giving a linkage among learning orientation, and performance
in the firm (Calantone et al. 2002). But to do so, requires frequently updated information (Simons 1987). MCS have been
identified as an important tool to acquire, interpret, diffuse, and store information and results (Huber 1991; Levitt & March
1988). Some studies report that high performance firms rely on the information provided by frequently updated formal control
systems to drive organizational learning (Simons 1987) and argue that MCS has a significant positive impact on staff
perceptions of learning capability (Yuan et al. 2008).
Empirical evidence has shown that there is a direct positive relationship between LO and performance (Aragón-Correa et al.
2007; Sinkula et al. 1997; Calantone et al. 2002; Tippins & Sohi 2003). Although admittedly, there are also studies where this
relationship showed little or no significance (Farrell & Oczkowski 2002; Llonch Andreu et al. 2007). Sinkula et al. (1997)
developed a 13 item scale to measure LO (Sinkula et al. 1997). This scale has been adapted by Hult (1998) into a four-item
scale intended to offer a more general measure of learning orientation applicable to the overall company (Hult 1998).
Entrepreneurial orientation (EO)
Like LO, Entrepreneurial Orientation (EO) has been defined from several points of view: as a permanent attitude of the
company (Covin & Slevin 1991) that is proactively seeking new business opportunities (Zahra & Garvis 2000); as the set of
processes, practices and decision-making activities undertaken to successfully manage the entry of a new company to market
(Slater & Narver 1995; Slater & Narver 1994); as the intangible ability of the company's strategic position hardly replicable
and related to superior results (Wiklund & Shepherd 2005). The EO concept (Covin & Slevin 1991; Lumpkin & Dess 1996)
is an extension of the entrepreneurship concept that has been moved from the individual level to the organizational level (C.
Lee et al. 2001). It is suggested that entrepreneurial values enhance the creation of new businesses within the existing business
and the renewal or revival of ongoing businesses that have become stagnant or require transformation (Slater & Narver 1994;
Slater & Narver 1995). The concept of EO specifically captures entrepreneurial aspects (processes, methods, and styles)
(Miller 1983) of a firm’s strategies (Covin & Slevin 1989; Lumpkin & Dess 1996; Covin & Lumpkin 2011). Entrepreneurial
orientation is also identified as a critical organizational process that contributes to firm survival and performance (Hitt et al.
2001; Miller 1983).
From the standpoint of the RBV, EO can be identified as a high-level organizational routine, durable and difficult to imitate
or transfer (Gómez-Villanueva, Llonch Andreu, & Rialp Criado, 2010), and a positive association between EO and
performance has been suggested by several studies (Wiklund 1999; Covin & Slevin 1991; C. Lee et al. 2001; Lumpkin &
Dess 1996; Ripollés & Blesa 2005). MCS use is related to the superior performance of companies who have an EO, unlike
those who have more conservative strategies. Furthermore, performance was associated with entrepreneurial firms where the
MCS is used extensively (Chenhall & Morris 1995). Barney (1991, 2001). The way that a firm uses its information systems,
when combined with firm resources, can enhance the positive relationship between resources and firm performance (Barney
1991; Barney 2001). In this line, knowledge-based resources as the MCS use, when are directed to discover and exploitation
of opportunities, are positively related to firm performance, and EO enhances this relationship (Wiklund & Shepherd 2003).
69
Empirical evidence has found a positive direct relationship between EO and results (Wiklund 1999; Zahra 1991; Zahra &
Covin 1995; Wiklund et al. 2007), for companies of all sizes, small, medium, and large (Wiklund & Shepherd 2003; Wiklund
& Shepherd 2005; Rauch et al. 2009).
Entrepreneurship can be viewed as a set of organizational characteristics and can be measured by looking at managerial
behavior as the firm engages in the entrepreneurial process. Entrepreneurial firms are those in which top managers have
entrepreneurial management styles, as evidenced by the firm’s strategic and operative decisions and philosophies (Covin &
Slevin 1986). One of the first measures of EO was done by Covin and Slevin (1989), who developed a three-dimension scale
(proactiveness, innovation and risk aversion). This scale was later built upon by Lumpkin et al. (2009) who added two more
dimensions (autonomy and competitive aggressiveness), an addition which gave it a more complete character. This latter scale
has become the accepted measure for EO within the related literature.
Current literature reflects interest in identifying and defining the determinants of organizational capabilities (such as EO and
LO). MCS play an important role here because, as discussed above, they have a direct impact on the ways and perceptions
related to learning and they can support strategic-decision making in the company related to the market, opportunities and
results. Simons (1995, 2000) argues that top managers use interactive control systems ‘‘to stimulate experimentation’’ and
‘‘to stimulate opportunity-seeking and encourage the emergence of new initiatives’’.
Overview of Management Control Systems (MCS)
Management Control Systems have been conceptualized in various ways. The classic view is outlined in Anthony’s (1965)
study, in which he divided the control concept between strategic planning, management control, and operational control. He
defined management control (p. 17) as “the process by which managers assure that resources are obtained and used effectively
and efficiently in the accomplishment of the organization’s objectives” (Anthony 1965). A more comprehensive notion of the
MCS role may include the entire strategic process, that is, strategic formulation (Mintzberg 1978) and strategic
implementation and evaluation (Merchant & Otley 2007). In this line a modern MCS definition would be “the evolving
formal and informal mechanisms, processes, systems, and networks used by organizations for conveying the key objectives
and goals elicited by management, for assisting the strategic process and ongoing management through analysis, planning,
measurement, control, rewarding, and broadly managing performance, and for supporting and facilitating organizational
learning and change” (Ferreira & Otley 2009) 21.
The term MCS, refers to the set of procedures and processes that managers and other organizational participants use in order
to help ensure the achievement of their goals and the goals of their organizations (Otley et al. 1995) and it encompasses formal
control systems as well as informal personal and social controls (Otley 1980; Ouchi 1977). Formal MCS consist of
purposefully designed, information-based sets of explicit structures, routines, procedures and processes (Maciarello & Kirby
1994), which help managers ensure that strategies and plans are carried out (Simons 1995; Merchant 1998).
According to Otley (1999) Management control systems framework can be viewed as a five-step process: 1) Identification of
the key organizational objectives and processes/methods to assess the level of achievement. 2) Process of formulating and
21 A number of MCS definitions have been proposed in more recent years, for a review and discussion see (Malmi & Brown 2008).

70
implementing strategies, plans, performance measurement and evaluation. 3) Setting performance targets. 4) The rewards
systems (achieving or failing). 5) Information flows required for monitoring of performance and to support learning (Otley
1999).
MCS are composed of multiple control systems that work together (Widener 2007) and complement each other (Otley 1994).
The purpose of the MCS is to support the processes of decision-making, planning, monitoring and evaluation by providing
valuable and relevant information at the right time (Kaplan & Norton 1992). MCS seek to influence human activity within
the company; they are formal or informal procedures and systems that can be identified by common business management
practices that use information to maintain or alter patterns in an organizational activity (Mintzberg & Waters 1985). Some
MCS are formal, such as planning, budgeting or reporting systems, monitoring procedures, project management systems,
human resource systems, cost accounting systems, or support decision making systems like SAP platforms22. Some MCS are
informal like weekly meetings, daily checks, emails, etc. (Simons 1991).
It is widely accepted that a firm’s MCS is designed to support its strategy (Widener 2004), but they should be explicity tailored
to do so (Langfield Smith 1997). Only then can they lead to competitive advantage and superior performance of a business
(Dent 1990). In the literature we can observe a general understanding that MCS does not automatically improve the
performance of enterprises; instead, performance is related to how systems are designed, developed, and used. Evidence
suggests MCS use can be more significant than its formal design. The use made of information and controls is a cornerstone
of the MCS (Ferreira 2002). Thus, the best way to approach the study of MCS is by looking at how they are used (Langfield
Smith 1997).
While management accounting literature is replete with studies that investigate MCS, only some of them focus on detailed
controls such as the MCS uses (Ittner & Larcker 1998b). Furthermore, the concept of “use” has not been well-developed in
the literature (Ferreira 2002)23. In this line, this study proposes a combination of two classifications that have been used
separately in previous studies: These classifications will both be related to generate the hypotheses proposed: The theoretical
proposition about levers of control (LOC) (Simons 1995) and the proposal of executive support systems (ESS) classification
(Vandenbosch 1999).
Levers of control (LOC) (Simons 1995)
Simons (1995) hypothesized that senior managers may use different aspects of the control system to focus on four key
constructs of MCS uses that are critical to the successful implementation of strategy: beliefs (core values), boundary
(behavioral constraints), diagnostics (monitoring), and interactive uses (forward- looking, management involvement). A brief
explanation of each is presented.
Beliefs and values are systems to secure commitment to goals and to inspire employees in their search for opportunities and
solutions (Marginson 2002). These systems are “the explicit set of organizational definitions that senior managers use for
22 For example, Performance Measurement Systems (PMS), one important aspect of MCS, represent the formal process and the set of metrics used to quantify both the efficiency and effectiveness of actions (Neely et al. 1994) by providing the information necessary to challenge the content and validity of the strategy (Ittner et al. 2003). 23 Except for the work of Hopwood’s (1972) who speaks about a ‘rigid’ and ‘flexible’ use categories (Hopwood 1972), Simons (1995) Levers of Control framework and Vandenbosch (1999) executive support systems classification,; we cannot find other studies focused on MCS use.
71
formal communication and systematic reinformcement, providing basic values, purpose, vision and direction for the
organization” (Simons, 1995, p. 34). Belief systems are: communication channels, formal mission statements, credos,
statements of purpose, email, meetings, (un)written codes of conduct, strategic planning systems and formal rules and
procedures.
The boundary lever of control “delineates the acceptable domain of strategic activity for participants” (Simons, 1995, p. 39).
It is an explicit set of organizational definitions and parameters: administrative controls hierarchically based (Marginson
2002), expressed in negative or minimum terms (Simons 1995). The boundary system communicates the actions that
employees should avoid (Widener 2007). Any system that sets out minimum standards or guidelines for behavior can be used
by managers as a boundary lever of control (Pun & White 2005; Mundy 2010). For example, boundary processes aim to
prevent employees from wasting the organization’s resources. It is hoped that these restrictions will somehow provide
employees the freedom to innovate and achieve, but within certain predefined areas (Widener 2007).
Diagnostic systems use (control over organizational goals (Simons 1995)) refers to the use of MCS, including PMS
(performance measurement systems) or KPIs (key performance indicators), to monitor organizational performance against
important dimensions of a given strategy. These systems are intended to motivate employees to perform and align their
behavior with organizational objectives (Widener 2007). Such systems include a broad range of metrics in key areas
(Marginson 2002) for comparing actual performance against pre-set targets, thus identifying exceptions and deviations from
plans (Navarro & Guerras Martín 2001; Mundy 2010). Diagnostic controls consist of data transmitted through formal reports
and rely heavily on specialists to prepare and interpret information (Widener 2007). In its purest form, a diagnostic system
acts as a constraint on employee behavior (Simons 2000).
Interactive MCS use is intended to be forward-looking and is characterized by active and frequent dialogue among top
managers and employees. This use implies formal two-way processes of communication where employee participation is
encouraged in a formal process of debate, as a way of sharing information (Simons 1995; Henri 2006a; Mellahi & Sminia
2009; Mundy 2010). The aim is to enable employees to search for opportunities, solve problems, make decisions (Widener
2007), and to influence and guide the learning process (Simons 1990). As Simons (1991) shows, interactive use of MCS
provides a vehicle for top management to reveal their values and preferences to organization members (Simons 1991). An
example of this practice is the creation process of a Balanced Scorecard (Kaplan & Norton 1992).
Diagnostic use focuses on the evaluation of actual results, while Interactive use focuses on the formulation and use of
predictions.
Beliefs & core values and interactive control systems are described as creating positive inspirational forces. Boundary systems
(which control risks) and diagnostic control systems (which control critical performance variables) create behavior constraints
(Simons 1995; Widener 2007; Langfield Smith 1997; Henri 2006a; Henri 2006b). Simons posits that in LOC framework, the
four control systems working together are necessary to provide an effective control environment (Simons 2000).
Two of the main criticisms of the LOC model is that, on one hand, this framework is strongly focused on the top level of
management and that it does not cope well with the range of informal controls that exist in organizations, particularly in small
ones, and furthermore, the concept of balance is quite ambiguous (Ferreira 2002).

72
LOC framework shows that MCS uses influence or inhibit strategic capabilities in organizations through the routines they
stimulate (Franco-Santos et al. 2012). In this study we focused on these last two uses (diagnostic and interactive uses) because
MCS are present and related with them (Simons 1990). We argue that, depending on the type of use, diagnostic control
systems (used on a basis to monitor and reward achievement of specified goals through the review of critical performance
variables or key success factors) or interactive control systems (used to expand opportunity-seeking and learning), show
different results for the MCS-Performance relationship.
Simons (1995, 2000) suggests a positive association between the interactive use of MCS and performance at both individual
and organisational levels (Simons 1995; Simons 2000). However, innovation management literature tends to minimize or
ignore the potential role of MCS diagnostic use as a factor that may influence successful product innovation (Dougherty &
Hardy 1996; Verona 1999). This literature even suggests that a widespread use of formal diagnostic MCS use is in fact
incompatible with innovation. MCS are seen as deterrents for creativity (Abernethy & Stoelwinder 1991; Amabile 1998;
Ouchi 1977). This suggests that the use of formal MCS by top managers is not relevant for successful innovation performance.
At the same time, formal use of an MCS remains a priority and a forum for the generation and implementation of creative
ideas. In fact, the most innovative companies are intensive users of formal MCS and intensive use of MCS can lead to
increased innovation capacity (Simons 1990; Simons 1995). Still, some studies have found formal MCS to coexist with
product innovation (Khandwalla 1977; Miller & Friesen 1982). In other words, although the formal use of a MCS is expected
to block excessive innovation or creativity, it can also help ideas to be transferred effectively to generate product innovation
and thereby impact organizational performance (Dent 1990; Chenhall & Morris 1995; Kaplan & Norton 1996). Moreover,
when multiple uses of control systems are combined in the context of a “Control package” (Otley 1980; Otley 1999),
companies are expected to encourage innovation, a critical aspect of LO and EO, and performance.
Executive support systems classification (Vandenbosch 1999)
The second classification used in this study is based on a proposal made by Betty Vandenbosch (1999), an empirical
comparative analysis of MCS and organizational competitiveness, which identifies a typology with four categories for the use
of management information systems. A brief explanation of each category is presented.
Score Keeping (Monitoring) is a composite activity of standardized processes for obtaining and processing management
information. Such processes evolve over long periods of time and seek to keep up to date information relevant to the business
(e.g., fulfillment of goals or the degree of progress in an initiative). Monitoring is characterized by consistency between time
periods so that comparisons are easy to make. Score keeping or monitoring activity responds to the question: How am I doing?
(Simon et al., 1954). Here MCS are used to provide feedback regarding expectations. That is MCS becomes a feedback
system that measures the outputs of a process and, by comparison with previously predefined goals, can provide feedback to
identify corrective actions to ensure reaching targets (Vandenbosch 1999). This proposed use for MCS is somewhat similar
to Simons’ (1995) proposal of diagnostic controls. In both cases, what is sought is mainly to ensure that a business obtains
the information necessary for accessing whether or not objectives have been achieved.
Problem solving (Strategic decision making) refers to a non-routine activity of senior management where data analysis
processes are performed for strategic decision-making. Simon et al. (1954) stressed the importance of information to improve
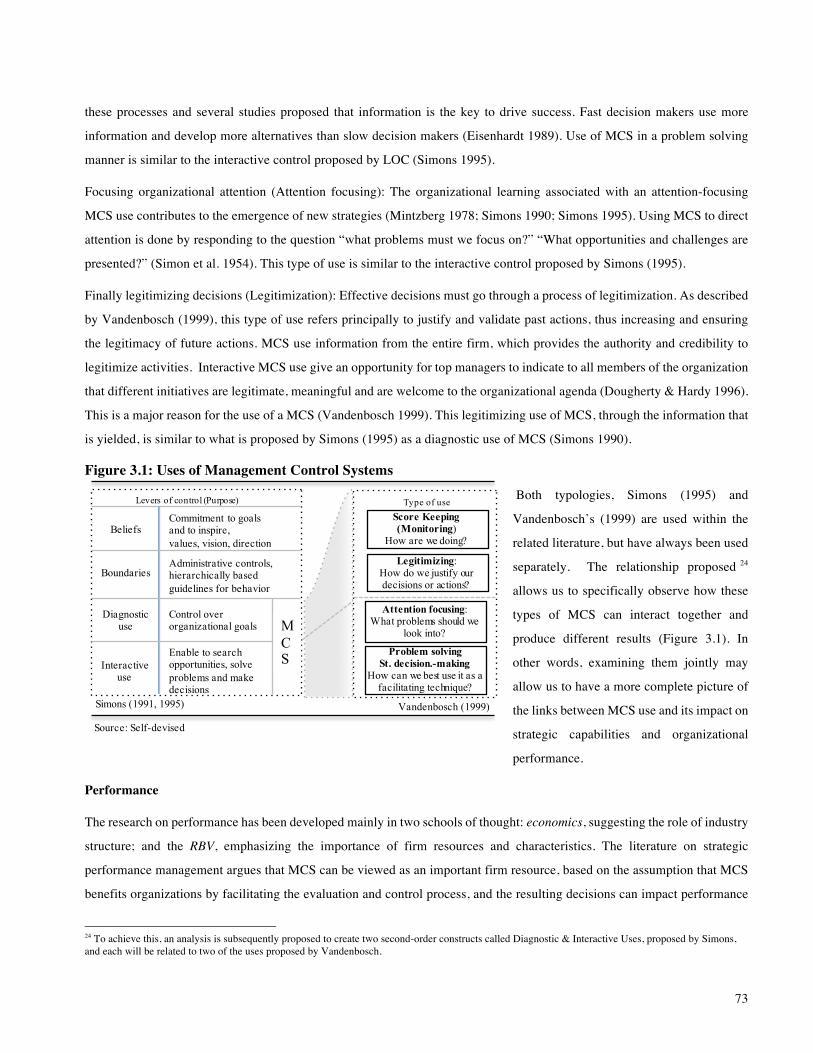
73
these processes and several studies proposed that information is the key to drive success. Fast decision makers use more
information and develop more alternatives than slow decision makers (Eisenhardt 1989). Use of MCS in a problem solving
manner is similar to the interactive control proposed by LOC (Simons 1995).
Focusing organizational attention (Attention focusing): The organizational learning associated with an attention-focusing
MCS use contributes to the emergence of new strategies (Mintzberg 1978; Simons 1990; Simons 1995). Using MCS to direct
attention is done by responding to the question “what problems must we focus on?” “What opportunities and challenges are
presented?” (Simon et al. 1954). This type of use is similar to the interactive control proposed by Simons (1995).
Finally legitimizing decisions (Legitimization): Effective decisions must go through a process of legitimization. As described
by Vandenbosch (1999), this type of use refers principally to justify and validate past actions, thus increasing and ensuring
the legitimacy of future actions. MCS use information from the entire firm, which provides the authority and credibility to
legitimize activities. Interactive MCS use give an opportunity for top managers to indicate to all members of the organization
that different initiatives are legitimate, meaningful and are welcome to the organizational agenda (Dougherty & Hardy 1996).
This is a major reason for the use of a MCS (Vandenbosch 1999). This legitimizing use of MCS, through the information that
is yielded, is similar to what is proposed by Simons (1995) as a diagnostic use of MCS (Simons 1990).
Figure 3.1: Uses of Management Control Systems Both typologies, Simons (1995) and
Vandenbosch’s (1999) are used within the
related literature, but have always been used
separately. The relationship proposed 24
allows us to specifically observe how these
types of MCS can interact together and
produce different results (Figure 3.1). In
other words, examining them jointly may
allow us to have a more complete picture of
the links between MCS use and its impact on
strategic capabilities and organizational
performance.
Performance
The research on performance has been developed mainly in two schools of thought: economics, suggesting the role of industry
structure; and the RBV, emphasizing the importance of firm resources and characteristics. The literature on strategic
performance management argues that MCS can be viewed as an important firm resource, based on the assumption that MCS
benefits organizations by facilitating the evaluation and control process, and the resulting decisions can impact performance
24 To achieve this, an analysis is subsequently proposed to create two second-order constructs called Diagnostic & Interactive Uses, proposed by Simons, and each will be related to two of the uses proposed by Vandenbosch.
Simons (1991, 1995)
Interactive use
Diagnostic use
Levers of control (Purpose)
Beliefs
Boundaries
Commitment to goalsand to inspire,values, vision, direction
Administrative controls, hierarchically based guidelines for behavior
Control over organizational goals
Enable to search opportunities, solve problems and make decisions
MCS
Score Keeping (Monitoring)
How are we doing?
Legitimizing: How do we justify our decisions or actions?
Problem solving St. decision.-making
How can we best use it as a facilitating technique?
Attention focusing: What problems should we
look into?
Type of use
Vandenbosch (1999)
Source: Self-devised

74
(Ittner & Larcker 2003; Chenhall 2005; Kaplan & Norton 1996).
In order to manage critical success factors and achieve desired performance in today’s complex businesses, MCS encompasses
multiple measures (Kaplan & Norton 1996). Therefore, the concept of performance is not limited to only the financial aspect
but also integrates aspects such as customer satisfaction, productivity, quality, and innovation (Henri & Journeault 2010).
Franco-Santos et al. (2012) classify the consequences/results into three categories 25 : people’s behavior, organizational
capabilities, and performance. Unlike Franco-Santos et al. (2012), Henri (2006a) sees these capabilities as a cause of
performance and not as a result. Along this line, our work considers capabilities to be key drivers of organizational
performance and views capabilities as a trigger of performance.
The concept of performance mainly refers to the various consequences in an organization. Seeing performance as a
consequence has some advantages, allowing attention to focus on causes, considering results of different types, such as market
response, quantifiable benefit, profitability, growth achieved, rent-seeking business, or what is also commonly called value
creation. Some studies use innovation to measure organizational effectiveness or performance (Miller & Friesen 1982), while
others define performance using 10 or 12 dimensions, recognizing that there are many possible performance dimensions
critical to measuring the a firm’s success (Govindarajan 1988; Govindarajan & Fisher 1990). A long debate has focused on
identifying the variables that make up the performance of a firm (Rumelt et al. 1994), and after 20 years, researchers are still
debating how to operationalize constructs such as performance (Boyd & Reuning-Elliot 1998). In recent studies, there have
been explicit requests to include outcomes in some other shape or form, because the connotation of performance with financial
parameters is too limiting (Mellahi & Sminia 2009).
Two perspectives have been taken when approaching the study of firm performance: reported performance and perceived
performance (Franco-Santos et al. 2012). Reported performance26 is based on information internally or externally reported,
and can be financial or non-financial. Perceived performance27 is based on responses from research participants’ perceptions
of firm performance. Firm performance can be measured both objectively and subjectively, and is indeed a complex issue
(Sandberg & Hofer 1987). Performance research has been dominated by self-assessment processes, commonly used in
research on private firms (Narver & Slater 1990), where individuals provide an evaluation of performance across a range of
important processes (Chenhall 2003) or organizational goals (Govindarajan 1984). Evidence suggests that a subordinate’s
self-assessment correlates with their objective counterparts (superior’s) and objective assessments (Chenhall 2003; Dess &
Robinson 1984). Although objective reported measures are desirable, a researcher should consider a perceptual measure when
there is no available objective data or when he or she may not have the option of removing the variable performance of its
study (Dess & Robinson 1984).
However, MCS impact on performance is unclear on both reported and perceived performance; the results are inconclusive
25 Franco-Santos et al (2012) made the following classifications: consequences/results-- people’s behavior: actions or reactions of employees as motivation, participation; organizational capabilities--specific processes or competences that enable the organization to perform and gain competitive advantages; and performance--financial and non-financial results at all levels of the organization. 26 Reported performance: financial: accounting performance, stock market performance, market performance, financial annual reports, and non-financial performance: customer satisfaction, etc. (Franco-Santos et al. 2012). 27 Perceived performance: financial and non-financial performance; performance improvement; strategic goals achievement; positioning; and strategic performance outcomes in terms of delivery, flexibility, low cost, quality and customer performance (Franco-Santos et al. 2012.
75
and inconsistent. The literature shows some studies finding a positive MCS effect (Crabtree & DeBusk 2008; Cruz et al. 2011;
Ittner & Larcker 1998a; Ittner & Larcker 2003; Ittner et al. 2003; Banker & Potter 2000; Hyvönen 2007; Chenhall 2005;
Chenhall & Langfield-Smith 1998; Grafton et al. 2010; Henri 2006a; Hoque 2004; Hoque & James 2000). In fact, a second
set of studies finds mixed results (Griffith & Neely 2009; Ittner & Larcker 1997; Kihn 2007; Braam & Nijssen 2004), Bisbe
& Malagueño (2012) find evidence supporting a positive association between SPMS and performance that is mediated by the
comprehensiveness of the strategic decision arrays; And finally a third set of studies finds no relationship – or a very weak
relationship with performance (HassabElnaby et al. 2005; Ittner et al. 2003; Said et al. 2003; Perera et al. 1997). The
perceptions of the impact of MCS on firm performance is highly dependent on the way MCS are designed, developed and
used (e.g., (Griffith & Neely 2009; Ittner & Larcker 1997; Henri 2006a; Henri 2006b; Godener & Söderquist 2004; Johnston
et al. 2002; Malina & Selto 2001)). Because of these contradictions, research on MCS effect on performance is still considered
important.
MCS, capabilities, and performance relationships
Firms build and use a MCS in order to provide administrators with critical information regarding the firm's resources and
capabilities (Simons 2000), which in turn will positively affect performance (Kaplan & Norton 2002). The three constructs,
MCS, capabilities, and performance, have been widely studied individually. The hypotheses proposed in the theoretical model
of this paper are based on the relationships that these constructs may have as a whole. Some theoretical arguments supporting
these relationships are explained in the following section.
MCS and capabilities
In general, as to the connection between MCS and capabilities, literature using an RBV approach (Barney 1991), Simons’
LOC (Simons 1995) and of lesser degree, the ESS of Vandenbosch (1999), show that MCS does influence (creating or
enhancing) strategic capabilities (Henri 2006a; Henri 2006b; Bisbe & Otley 2004; Cruz et al. 2011; Marginson 2002; Johnston
et al. 2002; Godener & Söderquist 2004; Mundy 2010; Grafton et al. 2010; Chenhall 2005; Ahn 2001).
Studies show that combined MCS use for feedback and feed-forward, affects the exploitation of existing capabilities, or the
search for and identification of new capabilities (Grafton et al. 2010). In fact, this suggests that the ability to use MCS
constitutes a unique capability in its own right (Mundy 2010). While others found a negative relationships between MCS and
some capabilities (Bisbe & Otley 2004), e.g., Widener (2007) find that interactive MCS use does not facilitate organizational
learning. Studies have shown that different MCS uses generate different capabilities. An interactive MCS use can foster
innovative practices (Marginson 2002; Bisbe & Otley 2004; Henri 2006a; Cruz et al. 2011), facilitate organizational learning
(Ahn 2001; Johnston et al. 2002; Godener & Söderquist 2004; Henri 2006a) and develop entrepreneurship, and market
orientation (Henri 2006a). Some studies indicate that a diagnostic use of MCS seems to weaken all capabilities (Henri 2006a;
Henri 2006b). However, in the same line, Widener (2007) concludes that both interactive and diagnostic MCS uses, generate
a positive effect on firm performance (Widener 2007), although there is a cost for such control. The above arguments show
inconsistent results in the literature. In other words, there are arguments for, against, or with mixed results, depending on the
context where they have been analyzed.

76
Capabilities and performance
The second group of relationships is between capabilities and performance. Following the RBV of the firm, unique resources
and capabilities lead to a sustained competitive advantage, which in turn contributes to performance differences among firms.
It is argued that firms with greater capabilities are able to develop a competitive advantage, achieving corporate renewal and
higher levels of performance (Danneels 2002; Hurley & Hult 1998). In this sense LO and EO constitute two capabilities that
are valuable, hard to duplicate, and non-substitutable. Previous empirical studies provide evidence showing that both
capabilities contribute positively to performance (C. Lee et al. 2001; Hult & Ketchen 2001; Naman & Slevin 1993; Narver &
Slater 1990; Spanos & Lioukas 2001). On one hand, literature maintains that LO is critical to maintaining competitive
advantage and is associated with improved performance (Levitt & March 1988; Slater & Narver 1995). Tippins and Sohi
(2003) find that improved firm performance results in the presence of LO capability (Tippins & Sohi 2003). Secondly,
literature on entrepreneurship supports that EO concept captures specifically the entrepreneurial aspects (processes, methods,
and styles) (Miller 1983) of a firm’s strategies (Covin & Slevin 1989; Lumpkin & Dess 1996; Covin & Lumpkin 2011).
Overall, company strategies are related to obtaining better results than the competition and to achieve this, and one of the
ways used by companies is by finding and implementing new profitable business opportunities. EO is defined as a permanent
attitude of the company (Covin & Slevin 1991) that is proactively seeking new business opportunities (Zahra & Garvis 2000)
through a set of processes, practices, and decision-making activities undertaken to successfully manage the entry of a new
company to market (Lumpkin & Dess 1996). EO does not only include entry into new markets; it would seem that
entrepreneurial values enhance the creation of new businesses within the existing business, and the renewal or revival of
ongoing businesses that have become stagnant or require transformation (Slater & Narver 1994; Slater & Narver 1995). The
search of opportunities from various MCS uses is present in the EO perspective as an attitude and the processes involved can
exploit opportunities. Empirical studies propose that MCS are associated with the superior performance of companies who
have an EO, unlike those who have more conservative strategies. Furthermore, this performance was associated with
entrepreneurial firms where MCS is used extensively (Chenhall & Morris 1995). But despite all the arguments in favor of this
relationship (Capabilities-Performance), there are still inconsistencies in the literature about the impact produced by some
capabilities (innovation and entrepreneurship) in performance; thus these theoretical concepts remain unclear and require
further research (Franco-Santos et al. 2012).
MCS and capabilities and performance:
Regarding the relationship between MCS, capabilities, and performance as a whole, the impact of capabilities on performance
has also been studied adopting a RBV approach. Studies suggest that MCS indirectly influence organizational performance
by impact on the strategic capabilities that are essential to reach competitive advantages (Covin & Slevin 1991; Lumpkin &
Dess 1996; Ripollés & Blesa 2005; Henri 2006a; Henri & Journeault 2010). There is empirical evidence that supports the
existence of this indirect relationship, e.g., studies investigating the association between market competition capability and
performance. These studies have found that the use of accounting information, mediates this relationship (Widener 2006).
Furthermore, management accounting literature has a number of studies suggesting a positive relationship between MCS and
economic performance (Ittner & Larcker 1997; Ittner et al. 2003; Luft & Shields 2003; Widener 2006). These studies argue

77
that appropriate accounting information provided by MCS supports effective resource management and contributes to
economic performance (Baines & Langfield Smith 2003; Widener 2007). Kofteros et al. (2014) argued that there is sufficient
evidence to suggest that the use of MCS leads to improved capabilities, which then impact performance. His results show that
both MCS uses, disgnostic and interactive, impact performance positively and, furthermore, diagnostic use appears to be the
most constructive explanatory variable for capabilities, and thus performance.
However, despite the fact that prior research has examined the relationship between MCS and performance supporting a
positive relationship, we can also find arguments against this, proposals that insist MCS be aligned with capabilities in order
to be effective and consistent with performance (Franco-Santos et al. 2012). Also, there are some empirical studies (Abernethy
& Brownell 1999; Bisbe & Otley 2004) that did not find evidence supporting a direct relationship between MCS and
performance. Some researchers have argued that looking for a direct link between MCS and performance might be misleading
due to the internal and external factors that play a role in economic performance evaluation (C.-L. Lee & Yang 2011).
Following RBV arguments, MCS are not necessarily strategic resources that allow a company to maintain a sustainable
competitive advantage because, besides the resources that can be purchased or transferred between companies, these do not
necessarily generate sustainable rents (Barney, 1991). Therefore, the use of MCS may not directly contribute to performance.
Some others attributed several interrelated factors contributing to performance, arguing it is difficult to attribute a direct causal
relationship MCS - performance (Henri 2010).
Not only are there relatively few empirical studies in both the capabilities-performance and MCS literatures that address this
relationship, but also the limited prior research appears to provide contradictory findings. Therefore, theoretical support and
prior empirical evidence in the literature are inconclusive and insufficient (Bisbe & Otley 2004) to justify or not MCS use -
performance direct relationship. Consequently, to obtain more knowledge about these relationships, this paper makes
hypotheses supporting a direct relationship between the use of MCS and performance; moreover, the impact between MCS
and performance will be examined indirectly through capabilities.
3.4 Theoretical model and research hypotheses
3.4.1 Theoretical model In this work, we adopt classifications of MCS use according to Simons (1995) and Vandenbosch (1999), both to examine the
extent to which MCS use can impact a firm’s capabilities and performance. In other words, organizational performance is
modeled as a result of strategic capabilities and these in turn as a result of the various MCS uses. Our expectations and
hypotheses are developed in this section.
Figure 3.2 presents the conceptual model of this study and also represents the major relationships that we seek to demonstrate,
among the two MCS uses (Diagnostic & Interactive), two organizational capabilities (Entrepreneurial and Learning
Orientations) and Performance.

78
Figure 3.2: Theoretical model
Based on the theoretical framework, there are three major premises behind the development of this model:
1) The two MCS uses impact capabilities in various ways. In other words, the different MCS uses have been linked to
capabilities of LO and EO (Hypotheses 1 to 4): On one hand, monitoring and legitimization MCS uses (Vandenbosch
1999), acting as a a 2nd order construct called “Diagnostic MCS use” negatively influences capabilities because they
are acting in a Diagnostic mode (Simons 1995)28. On the other hand, it is expected that focusing attention and
strategic decision-making uses (Vandenbosch 1999), acting as a 2nd order construct called “Interactive MCS use,”
are positively related with capabilities because they are acting in an interactive way (Simons 1995).
2) Likewise, it is expected that LO and EO Capabilities have a positive impact on organizational performance
(Hypotheses 5-6).
3) MCS impact performance directly (Hypotheses 7-8) and indirectly through capabilities (through LO, if H1+H5 and
H3+ H5 are met; and through EO if H2+H6 and H4+H6 are met)
3.4.2 Hypotheses
Relationships between MCS and Capabilities:
MCS Diagnostic use: Monitoring and Legitimizing uses
Diagnostic MCS use, comprised of monitoring and legitimizing uses in a LOC approach (Simons 1995), is employed to
“justify, monitor and reward” the achievement of pre-established objectives and goals, providing motivation and direction.
The diagnostic systems are formalized routines intended to guide behavior, and as such, facilitate organizational learning 28 It is noteworthy that despite the results obtained in the previous chapter, the two applications that are related to the MCS diagnostic use (monitoring and legitimizing) individuallyshow a positive impact on capabilities, in the same line of Koufteros et al’s. (2014) research. In this paper we have decided to continue a hypothesis in a negative sense on capabilities for three reasons: 1) The proposed theoretical arguments (Simons 1995; Henri 2006ª; Theriou et al. 2009; among others) have more support than the Koufteros et al. (2014) results; 2) The approach in the previous chapter employed the four uses individually proposed by Vandenbosh (1999), unlike what is proposed in this chapter, where the four uses are integrated into two second-order constructs called diagnostic and interactive, and 3) in this chapter with a very different and more robust methodology (SEM), where we expect to keep the same positive trend, thus our positive results will have more definite findings.
Control VariablesSystem amplitude, Firm size, Firm age,
Industry
Source: Self-devised
Diagnostic MCS use
InteractiveMCS use
LO
EOPerformance
H8 (+)
H7 (+)
Capabilities
Management Control Systems types of use

79
(Simons 1990). It is generally believed that the contribution of diagnostic MCS use was in deviations searches or finding
“errors”, in other words, seeing why we have not become what we intended (Theriou et al. 2009). This is based on a negative
way of thinking that typically arises when productivity and efficiency have fallen and innovation needs to be curbed; this use
sends a negative signal (Henri 2006a) which could limit the search for opportunities and innovation. However, diagnostic
MCS use comprises the review of critical variables to monitor and coordinate the implementation of intended strategies. And
in the same vein, there are arguments (Mintzberg, 1973; Eisenhardt, 1989; Vandenbosch, 1999; Slater & Narver, 1995;
Grafton et al. 2010; Koufteros et al. 2014) suggesting that MCS diagnostic use can have a positive influence on the
development of capabilities, laying the foundation for carrying out a conversation to enable better decisions, such as
communicating the same information and allowing it to be understood in the same way. Even, Koufteros et al. (2014),
studying 386 Italian firms and using longitudinal panel data over a ten-year period, found that there is sufficient evidence to
suggest that MCS uses (diagnostic and interactive) leads to improved capabilities, which then impact performance.
Furthermore, these results show that, on the one hand, the most constructive explanatory variable for capabilities was
diagnostic use. On the other hand, when both MCS uses are used simultaneously and with different intensity, the results differ,
ie, high levels of both types of usage generate high levels of capabilities. Conversely, lower levels of organizational
capabilities occur with a high level of diagnostic use and low interactive use. But, as mentioned above, analyzing their
approaches, we have found reasons to question the way MCS diagnostic use has been measured, with such shortcomings and
omissions.
With MCS use as a monitoring tool, findings show that the primary reason (30 %) for having MCS was monitoring/controlling
(Marr 2005). The use of MCS as monitoring represents the more traditional role that has been documented, supporting and
reviewing critical performance variables to monitor-coordinate the implementation of intended strategies in a routine process
(Simons 1995). By consistency between time periods, comparisons and standardized reports are easy to make in a routine
way. Monitoring use was usually tied to specialized work and control values like stability, enforced roles, and bureaucracy
(Hofstede 1978), and is also associated with highly structured channels of communication and limited organizational
performance (Chenhall et al. 1995).
Previous studies indicate that monitoring use of MCS is not related to a considerable amount of risk, flexibility, broad
communication processes or innovation activities present in the entrepreneurial orientation. Also, because of its routine nature
or single-loop learning (Argyris & Schön 1978), there is evidence that people tend to react to control measures by developing
suspicion and resistance (Henri 2006a), critical factors in learning orientation. This would mean that diagnostic use, measured
as monitoring MCS use, works against the deployment of capabilities (Henri 2006a).
Although there are arguments relating monitoring and capabilities negatively, this statement is not conclusive. We can also
find mixed and positive relationships or dependency of some other variables. i.e., studies found that if the manager perceives
that assessment based on a limited controlled budget style, he or she is more likely to experience work-related stress (Hopwood
1972). Otley’s (1978) research found that the use of a budget-constrained style did not lead to high levels of job-related
tension; in fact, this style was associated with higher performance (Otley 1978), a result opposite to that of Hopwood. Brownell
(1982), who argue that a budget constrained leadership style is most effective under conditions of high participation,

80
supporting a contingency framework between MCS use and performance linking environmental uncertainty. Miller and
Friesen (1982), in a moderate position, argue that the relationship between monitoring and innovation depends on the firm’s
strategy (Miller & Friesen 1982). In other words, monitoring was positively correlated with innovation for conservative firms,
allowing administrators to become aware of potential areas of opportunity; and negatively correlated with innovation for
entrepreneurial firms seeking continuous product/market development by monitoring innovation in excess (Simons 1990).
On the other hand, and in a positive sense, Vandenbosch (1999) contended that the discussion triggered by diagnostic use
leads to corrective action as a way of learning, and similar to Grafton et al. (2010), argues that diagnostic use of MCS facilitates
exploitation of existing capabilities. The use of MCS as a monitoring tool also represents an instrument of communication
between managers and subordinates to share information about environmental issues (Henri & Journeault 2010). Hence,
monitoring MCS use can operationalize the first, second, and fourth steps of the organizational learning process29 (Slater &
Narver 1995). Moreover, other MCS uses need this important monitoring role because they require information to support the
analytical process. In fact, it has been observed that those who make more rapid decisions, use more information and generate
more alternatives than slow decision makers (Eisenhardt 1989). This would mean that monitoring goal achievement,
restricting risk taking, providing boundaries for innovation, and closely monitoring variations in effectiveness would produce
a better performance. In other words, monitoring use may contribute to performance through organizational capabilities.
Legitimizing MCS use is also called decision ratification (Simons 1990) or decision-influencing (Dossi 2008). In the negative
sense, legitimizing MCS use is a political tool not only to maintain credibility but also to establish authority (Dermer 1990).
Markus and Pfeffer (1983) provide evidence that this use is related to the acquisition or exercise of power by setting direction,
altering performance, and thus conferring legitimacy (Markus & Pfeffer 1983). Legitimizing MCS use is associated to a
control dominant type (Henri 2006b), centralization of power, and sometimes a strong prevalence of only financial indicators
(Kaplan & Norton 1992, 1996, 2001, 2002). The feature of controlling companies is not related to the characteristics of the
capabilities of LO and EO, and has a negative effect on the studied relationships.
In the positive sense, MCS is used as legitimization tool to justify past actions or decisions (Burchell et al. 1980) made under
conditions of uncertainty (Henri, 2006b). This use is beneficial to executives because the information provided confirms or
denies their own previously held beliefs or expectations (Vandenbosch 1999). This influencing MCS role is widely accepted
in international business literature, according to which, MCS are data management tools influencing the cognitive orientation
of managers in decision-making (Prahalad & Doz 1987). MCS use information of the entire firm, which gives them the
authority and credibility to provide legitimacy of activities. Legitimizing is a major reason for the use of a decision support
system because there is a strong relationship between legitimizing decisions and enabling competitiveness (Vandenbosch
1999); i.e., corporate headquarters employ MCS to influence and guide local decision-making (Fama & Jensen 1983) and to
influence initiation and implementation of strategic decisions (Entrepreneurial orientation) (Prahalad & Doz 1987). Managers
not only use information to justify their decisions, they believe that doing so enables their organization's competitiveness
(Vandenbosch 1999). These findings seem to indicate that the energy that managers expend on justifying and legitimizing, in
order to make things happen, is directly related with characteristics of entrepreneurship (Zahra & Garvis 2000; Covin & Slevin
29 Learning process: Information acquisition (How am I doing?), information dissemination (communication), shared interpretation (What does it mean?) and organizational memory (How do I Do it?) (Slater & Narver 1995).

81
1991). Legitimacy may be a relevant attribute of making things happen, because if actions will only be taken if they have been
legitimized, organizations become dependent on such information (Feldman & March 1981). In addition, by legitimizing prior
ideas, managers ensure their interpretation; therefore, we can interpret that MCS use the of legitimizing operationalizes the
second and third steps of the organizational learning process (Slater & Narver 1995), impacting the development of this
capacity. As we can see in the previous arguments, there is a lack of consensus in the literature about legitimization, so the
research cannot clarify whether its impact is clearly positive or negative.
The above arguments about monitoring and legitimizing open more than one possibility for the construct of diagnostic use.
In our approach, the two uses monitoring and legitimizing are acting diagnostically and thus impact capabilities negatively.
In other words, we know that Henri (2006a) found a negative relationship, but also know that Koufteros et al. (2014) have
found a positive relationship between the diagnostic use and organizational capabilities. Tto corroborate our previous results
(Chapter 2) and uUsing a more robust methodology than SEM, we decided to propose a negative relationship between
diagnostic use and capabilities, in line with a previous studies (Henri 2006a), leading to hypothesis 1 and 2:
H1: Diagnostic use of MCS exerts a negative influence on LO
H2: Diagnostic use of MCS exerts a negative influence on EO
Interactive use: Attention focusing & Strategic decision-making uses
Interactive MCS use, comprised of attention focusing and strategic decision-making uses, in a LOC approach (Simon et al.
1954), facilitates and guides organization learning (Simons 1991; Simons 1995; Ahn 2001) and fosters innovative practices
(Marginson 2002; Bisbe & Otley 2004; Henri 2006a; Cruz et al. 2011). Studies report empirical support of the relationship
between interactive controls and organizational learning (Abernethy & Brownell 1999) demonstrating that high performing
firms rely on the information provided by frequently updated MCS to drive organizational learning (Simons 1987). This has
a significant positive impact on staff perceptions about learning capability (Yuan et al. 2008). This use provides, in terms of
information processing, three basic components: intelligence generation, intelligence dissemination, and responsiveness
(Kohli & Jaworski 1990). Interactive MCS use is associated with the signals sent throughout the firm to focus organizational
attention, stimulate dialogue (Simons 1995), support the decision-making process and the emergence of new strategies
(Mintzberg 1978). This emphasizes boss-employee interaction and reflects a leadership style (Naranjo-Gil & Hartmann
2007a). Interactive MCS use, composed of attention focusing and strategic decision making MCS uses, has a positive impact
on capabilities because it promotes participation and involvement of employees, essential elements in both capabilities
studied.
When the MCS focus is on attention, action and improvement (Interactive) rather than on reporting and control
(diagnostic), these systems become effective mechanisms for facilitating organizational learning that supports growth and
development at all levels (Johnston et al. 2002; Godener & Söderquist 2004; Ahn 2001; Chenhall 2005). MCS used to focus
attention fosters organizational dialogue, debate, discussion and information exchange, as a high-level learning double-loop
(Argyris & Schön 1978), to encourage organizational learning (Mintzberg 1978; Simons 1990; Simons 1995) in general. This
type of use send signals to the organization about strategic issues (Simons 1995) and the seeking of opportunities, proposed
in the EO perspective as an attitude and a process to exploit business opportunities. Attention-focusing MCS use requires a
82
liberal management style that values the principles of empowerment, entrepreneurship, and self-control (De Haas & Kleingeld
1999).
Strategic decision-making MCS use works as a facilitator (Hickson 1986) by providing information support systems to make
decisions. Top managers involved in a new venture or an entrepreneurial action should be associated with more frequent
strategic decision-making and more changes. Thus, they need a considerable amount of information from the MCS to support
their decision-making processes. Eisenhardt (1989) says that fast decision makers use more information and develop more
alternatives than slow decision makers (Eisenhardt 1989).
Hence the following hypotheses are suggested:
H3: Interactive use of MCS exerts a positive influence on LO
H4: Interactive use of MCS exerts a positive influence on EO
Relationships between Capabilities (LO & EO) and Performance
It is argued that firms with greater capabilities (valuable, hard to duplicate, etc.) are able to develop a competitive advantage
(Widener 2007), achieving higher levels of performance (Danneels 2002; Hurley & Hult 1998). Some studies provide
evidence showing that both, LO & EO, contribute positively to performance (C. Lee et al. 2001; Hult & Ketchen 2001; Naman
& Slevin 1993; Narver & Slater 1990; Spanos & Lioukas 2001).
LO – Performance: The literature argues that organizational learning is critical to maintaining competitive advantage and is
associated with improved performance (Levitt & March 1988; Slater & Narver 1995), and some authors believe that learning
is the only way to compete in the long-term (Hult 1998; Slater & Narver 1995; Widener 2007). Tippins and Sohi (2003) have
investigated information technologies competencies and found that firm performance results are better in the presence of
organizational learning capability (Tippins & Sohi 2003).
EO – Performance: From the standpoint of the RBV, entrepreneurial orientation can be identified as a high-level
organizational routine, durable and difficult to imitate or transfer (Gómez-Villanueva et al. 2010), an intangible ability of the
company's strategic position, difficult to replicate and related to superior results. Studies suggest that EO enhances the
relationship of MCS and performance, when used to discover and exploit opportunities (Wiklund & Shepherd 2003).
Literature on entrepreneurship emphasizes the importance of EO as a determinant of business performance (Ripollés & Blesa
2005) and empirical studies have proposed that MCS are associated with the superior performance of companies who have
an entrepreneurial orientation, unlike those with more conservative strategies, and furthermore, performance was associated
with entrepreneurial firms where MCS is used extensively (Chenhall & Morris 1995).
In summary, and from the standpoint of innovation, good performance or superior customer value, is achieved through LO
and EO; i.e., incremental innovations caused by the knowledge obtained in LO and radical innovation as a result of the EO
that favors the development of new designs and technology applications (Atuahene-Gima 1996; Atuahene-Gima & Ko 2001;
Li et al. 2009; Wiklund & Shepherd 2003). Hence, the following hypotheses are consequently suggested:
H5: There is a positive relationship between learning orientation capability and performance
H6: There is a positive relationship between entrepreneurial orientation capability and performance

83
Relationships between MCS & Performance
Based on the facts of prior research, there is evidence of a link between MCS and different levels of performance, such as
manufacturing performance, quality performance, and customer performance (CHOW et al. 1991; Selto et al. 1995; Sim &
Killough 1998). Using a fit notion within the context of the organization, some works have examined the relationship between
MCS and performance and have found a significant and positive relationship (Govindarajan 1988; Govindarajan & Fisher
1990). Also, the research line of MCS design and performance has supported this positive relationship (Baines & Langfield
Smith 2003; Davila 2000; Scott & Tiessen 1999). It is noteworthy that although Koufteros et al. (2014) argue that there is a
gap in the literature on how the specific uses of MCS use affect performance (p. 315), and refer to their business importance
of exploring this effect, mainly to alloting resources and maximizing returns, their study does not make a hypothesis in regards
to a direct relationship between MCS and performance, as we do.
Continuing with the review of the literature, in the middle we can see studies with empirical evidence supporting the MCS-
performance relationship. For example, Abernethy & Brownell (1997), who examined the role of accounting and non-
accounting controls, found that personal control forms (similar to those of interactive use) have a more positive effect on
performance than the accounting forms (comparable to those of diagnostic use); in other words, behavior controls, in which
the involvement of managers is necessary, are significantly more effective than accounting controls, thus showing that
interactive controls have a positive relationship, whereas diagnostic controls could have a negative or no relationship at all.
Finally, there are studies that cast doubt over the existence of the relationship between MCS and performance at the
organizational level (Bisbe & Otley 2004). Others such as Henri (2006a) who provides a theoretical explanation does not
propose hypotheses about this relationship, arguing that from the RBV view, MCS can not be a source of competitive
advantage for two reasons: firstly, it does not generate sustainable incomes directly and readily so that they can be transferred;
therefore, the MCS may not directly contribute to performance (Henri 2006a). On the other hand, he also argues that the
accounting and systems literature emphasizes that “how this system is used” impacts the organizations performance.
Overall, both -accounting and MCS extant literature research- provide inconsistent findings regarding the relationship
between MCS and performance and have pointed to the different styles of use (Simons 1987; Simons 1990; Simons 1995;
Simons 2000) or the different roles (Chapman 1997; Chapman 1998) as explanations for these apparently inconsistent studies.
On emphasizing the relevance of attributes related to use, Simons levers of control framework provides insights that help
understand the apparent inconsistencies mentioned.
Because we find mixed results in the existing literature regarding the direct relationship between MCS and performance, it is
evident the need for further studies to distinguish the potential of the various roles that an MCS can play. Since neither the
theoretical development nor previous evidence gives us strong arguments for or against a potential direct effect, our conceptual
framework contemplates the possibility that the use of both diagnostic and interactive MCS might directly influence
performance. However, according to prior studies that hold the existence of a relationship via capabilities (Koufteros et al.
2014), this direct effect is expected to be relatively small, and a large proportion of the potential relationship between MCS
use and performance is expected to come indirectly through capabilities rather than through a direct effect. Therefore, specific
84
hypotheses supporting a direct relationship between MCS use and performance have been formulated.
H7: There is a positive relationship between MCS diagnostic use and organizational performance
H8: There is a positive relationship between MCS Interactive use and organizational performance
MCS – Indirect Performance Effect
While hypotheses H7 and H8 predict a direct effect of MCS uses on performance, an indirect effect may also occur through
the mediated effect of LO & EO capabilities. In other words, we propose that EO and LO have a mediating effect on the MCS-
Performance relationship, which will also be analyzed in this study, and should be reflected upon completion of the hypotheses
described above.
To prove the above assertion will require a series of steps: First, the effect that exists in a model that includes only three
constructs should be assessed: the diagnostic use, the interactive use and performance, in the hope that present relationships
are significant. Second, the LO & EO constructs will be included in a stepwise model, and the results and their implications
will be observed individually. Finally, the relationships will be discussed in the full model which includes the five constructs:
diagnostic use, Interactive use, LO, EO and performance. This analysis will be first done for the whole sample; subsequently,
a second analysis will be done for a company size sub-groups in an effort to reinforce the results and to study the differences
between companies.
This indirect effect on performance of the uses of Interactive and Diagnostic MCS, acting through EO & LO capabilities could
be proposed according to the following explanation: The mediating effect of LO & EO capabilities can show a full, partial or
null relationship between the observed uses of MCS (Interactive and diagnostic) and performance. In other words, besides
the direct impact, there should be a part of the relationship between the MCS uses (Interactive and Diagnostic) and
performance, explained by an indirect effect of the LO & EO capabilities which in return impacts performance.
This can be formally expressed as:
a) If H1 and H5 are met, there will be a mediating effect of LO between the use of Diagnostic MCS and Performance.
b) If H3 and H5 are met, there will be a mediating effect of LO between the use of Interactive MCS and Performance.
c) If H2 and H6 are met, there will be a mediating effect of EO between the use of Diagnostic MCS and Performance.
d) If H4 and H6 are met, there will be a mediating effect of EO between the use of Interactive MCS and Performance
3.5 Methodology
3.5.1 Stages, data collection, descriptive statistics and variable measurement
Data- Information Sources & Collection
Data were collected from primary sources in the form of structured surveys from business managers in the fields of
manufacturing, trade, banking and services of 4750 Mexican firms in Mexico City, listed in the Mexican DENUE 2012 INEGI
database. We collected information over the course of eight weeks using online systems (323 surveys received, 50.2%) and
offline systemes (face-to-face) (321 surveys received, 49.8%), giving a total of 644 received questionnaires (response rate of
13.56% of the sample). The invitation to participate consisted in an initial personalized email letter. In order to increase the

85
response rate, we sent two follow-up reminding emails, and a final reminder to non-respondents (Dillman 2000).
Questionnaire
The hypotheses were tested with data collected through a questionnaire survey (Appendix B shows the questionnaire items),
which was designed following the steps suggested by the literature (Archer 2003; Dillman 2000):
1) Select in the literature of strategy and management control systems the constructs that measure the variables and prepare
a first draft of the questionnaire; 2) This draft is contrasted with the interviews done to members of the target population; 3)
Make adaptations based on the comments received; 4) Choose an attractive format, good quality WEB and printout form.
Non-response bias
To check for potential non-response bias, offline respondents were used as proxies for non-response across five measures.
Using a comparison of the means, no significant differences (p < 0.01) were found between the firm’s age, size, system
amplitude used, respondents’ formal education and management experience of online and offline respondent firms (non-
respondent), suggesting the absence of any obvious non-response bias in this sample (Appendix C shows the Non-Response
bias analysis).
Common method variance
The Harman´s one-factor test, was employed to ensure the absence of the potential undesirable effects of common method
variance (CMV) (Podsakoff et al. 2003), caused by single-source bias. This test has yielded 7 factors with eigenvalues greater
than one, with the first factor explaining only 19.04% of the variance, indicating that no single factor was dominant. In general,
this test indicated the absence of common method effects in our data, suggesting that CMV due to single-source biases was
not an issue in our study (See Appendix C. Non response bias & common method variance (CMV) analysis). Past studies
(Bisbe & Otley, 2004; Bisbe & Malagueño 2009, 2015) show that charge percentages in a single load factor below 22% are
typically accepted.
Descriptive statistics
We received 644 questionnaires and obtained a response rate of 13.56%. This range is similar to the 12–25% range reported
in recent studies, such as 22.5% (Hall 2008); 24% (Henri 2006a); 42% (Naranjo-Gil & Hartmann 2007a); 12% (McKelvie &
Davidsson 2009); 15.6% (Wiklund & Shepherd 2003). The distribution of the response sample is as follows: 296 (46%) are
large companies with an average of 4,257 employees and 44 years of age; 191 (29.7%) medium-sized firms with an average
of 158 employees and 24 years of age; and 157 (24.4%) are small businesses with an average of 32 employees and 11 years
of age. The respondents’ positions are 79 CEOs (12.3%); 109 division directors (16.9%); 111 department directors (17.2%);
and 345 managers (53.6%). Firms are distributed in four sectors: 407 in services (63.2%); 105 in manufacturing (16.3%); 81
in banking (12.6%); and 51 in trading (7.9%).
Variable measurement
Lastly, the validation variables used to test robustness of the model are measured as follows. Variables (table 3.1) were
measured using previously validated scales. All questions were asked using a five-point Likert scale. The scales are shown in
Appendix B. Survey instrument.
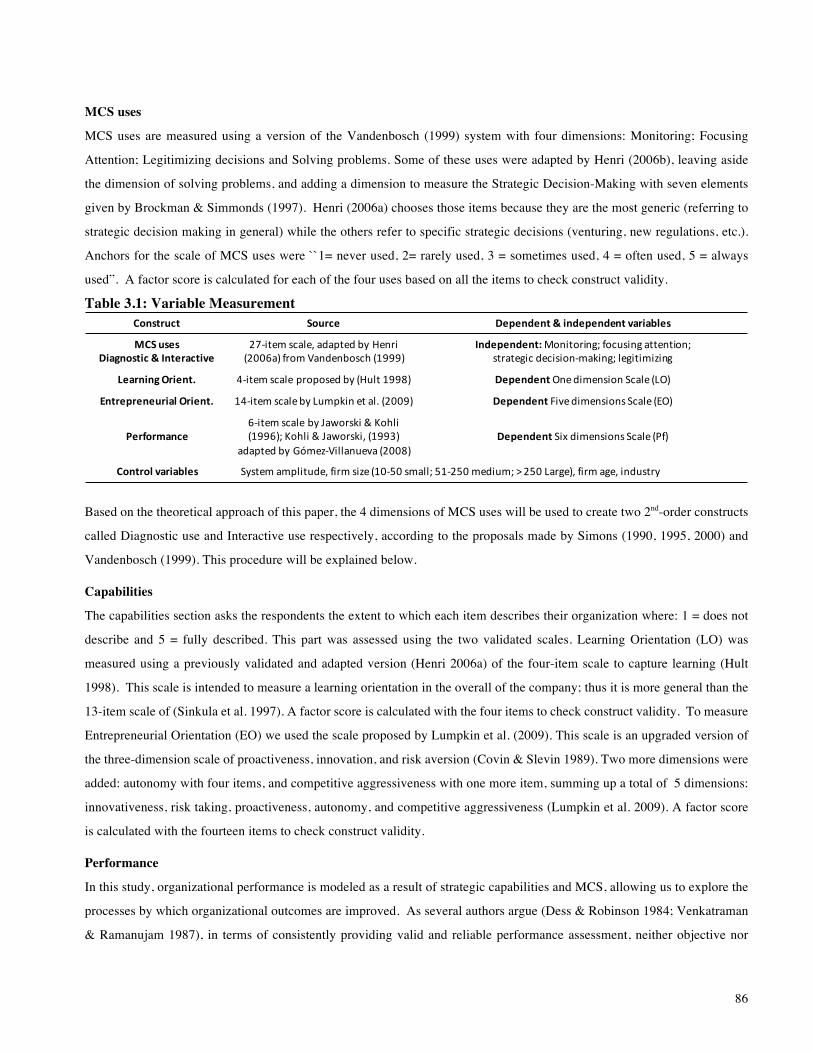
86
MCS uses
MCS uses are measured using a version of the Vandenbosch (1999) system with four dimensions: Monitoring; Focusing
Attention; Legitimizing decisions and Solving problems. Some of these uses were adapted by Henri (2006b), leaving aside
the dimension of solving problems, and adding a dimension to measure the Strategic Decision-Making with seven elements
given by Brockman & Simmonds (1997). Henri (2006a) chooses those items because they are the most generic (referring to
strategic decision making in general) while the others refer to specific strategic decisions (venturing, new regulations, etc.).
Anchors for the scale of MCS uses were ``1= never used, 2= rarely used, 3 = sometimes used, 4 = often used, 5 = always
used”. A factor score is calculated for each of the four uses based on all the items to check construct validity.
Table 3.1: Variable Measurement
Based on the theoretical approach of this paper, the 4 dimensions of MCS uses will be used to create two 2nd-order constructs
called Diagnostic use and Interactive use respectively, according to the proposals made by Simons (1990, 1995, 2000) and
Vandenbosch (1999). This procedure will be explained below.
Capabilities
The capabilities section asks the respondents the extent to which each item describes their organization where: 1 = does not
describe and 5 = fully described. This part was assessed using the two validated scales. Learning Orientation (LO) was
measured using a previously validated and adapted version (Henri 2006a) of the four-item scale to capture learning (Hult
1998). This scale is intended to measure a learning orientation in the overall of the company; thus it is more general than the
13-item scale of (Sinkula et al. 1997). A factor score is calculated with the four items to check construct validity. To measure
Entrepreneurial Orientation (EO) we used the scale proposed by Lumpkin et al. (2009). This scale is an upgraded version of
the three-dimension scale of proactiveness, innovation, and risk aversion (Covin & Slevin 1989). Two more dimensions were
added: autonomy with four items, and competitive aggressiveness with one more item, summing up a total of 5 dimensions:
innovativeness, risk taking, proactiveness, autonomy, and competitive aggressiveness (Lumpkin et al. 2009). A factor score
is calculated with the fourteen items to check construct validity.
Performance
In this study, organizational performance is modeled as a result of strategic capabilities and MCS, allowing us to explore the
processes by which organizational outcomes are improved. As several authors argue (Dess & Robinson 1984; Venkatraman
& Ramanujam 1987), in terms of consistently providing valid and reliable performance assessment, neither objective nor
Construct Source+ Dependent+&+independent+variables
MCS+uses+Diagnostic+&+Interactive
27#item(scale,(adapted(by(Henri((2006a)(from(Vandenbosch((1999)(
Independent:+Monitoring;(focusing(attention;(((((((((((((strategic(decision#making;(legitimizing(
Learning+Orient. 4#item(scale(proposed(by((Hult 1998) Dependent+One(dimension(Scale((LO)
Entrepreneurial+Orient. 14#item(scale(by(Lumpkin(et(al.((2009) Dependent+Five(dimensions(Scale((EO)
Performance6#item(scale(by(Jaworski &(Kohli(1996);(Kohli &(Jaworski,((1993)(
adapted(by(Gómez#Villanueva((2008)Dependent+Six(dimensions(Scale((Pf)
Control+variables System(amplitude,(firm(size((10#50(small;(51#250(medium;(>(250(Large),(firm(age,(industry

87
subjective measures are superior. Following upon prior studies (Swieringa & Moncur 1972; Milani 1975; Hayes 1977; Kenis
1979; Merchant 1981), this study chooses to use self-ratings of performance measures since we have small businesses in the
sample. It has been shown that it is quite common for owners/entrepreneurs to refuse to provide objective measures of
performance to researchers. Therefore, it is better to ask for perceived performance (Sapienza et al. 1988).
The instrument used is a self- rated measure of performance, commonly used in management accounting research. It measures
performance on six dimensions: return on investment (ROI), profit, sales growth, customer satisfaction, employee satisfaction,
and overall performance (Kohli & Jaworski 1993; Jaworski & Kohli 1996; Kirca et al. 2005) adapted by Gómez-Villanueva
(2008). The respondents were asked to indicate their organization’s performance over the past 12 months against the
expectations or goals set at the beginning of the year, using a scale of 1 to 5, (where 1=Very poor performance, 2= Low
performance, 3=Goals were reached, 4=Above goals, and 5=Outstanding performance above targets). Descriptive statistics
of the constructs and correlation matrix are presented in Appendix D. Descriptive stats, correlations: Part 2: MCS uses, LO,
EO, Performance (ch.III).
Control variables
There is little evidence of the effect of control variables on the relationship of the MCS - Business capabilities and Results.
Several studies used different factors related to the company, such as the industry effect of whether they belonged to the
manufacturing or service sectors (Avlonitis & Gounaris 1997; Gray & Hooley 2002), or the size of firms (Narver & Slater
1990; Pelham 2000; C. Lee et al. 2001; Santos et al. 2002). Kirca et al. (2005) meta-analysis mainly emphasizes the size of
the company, the dynamism of the environment, and the generic strategy of the organization (Kirca et al. 2005) as the more
widely used control variables.
Size has been measured in several ways including profits, sales volume, assets, and employees. The use of financial measures
can make comparisons between organizations difficult as different accounting treatments can be found across firms (Chenhall
2003). Most MCS studies have defined and measured size relating it to the number of employees. Contingency theories of
organizations (Burns & Stalker 1961; Lawrence & Lorsch 1967) suggest that size may affect the way organizations design
and use management systems (Wiklund & Shepherd 2003). As firm size increased, this enabled firms to improve efficiency,
providing with the resources to expand into global operations, sometimes in the way of mergers, take-overs, licensing, or
other collaborative arrangements, and internally with opportunities for specialization and work division. However, all this
comes at a cost of accounting and control processes that tend to become more specialized and sophisticated; also, the need for
the flow of effective communication becomes more apparent. Merchant (1981) claims that organizational growth poses
increased communication and control problems (Merchant 1981). As a consequence, managers of large firms need to handle
a greater deal of information and measurement issues (Kaplan & Atkinson 1998), and with this, the implementation of controls
such as rules, documentation, roles, functions, and extended hierarchical structures (Child & Mansfield 1972). Khandwalla
(1977) and Merchant (1981) found that large firms were more diversified and divisionalized, employed more formal
communication, and made greater use of sophisticated controls (Khandwalla 1977; Merchant 1981). On the other hand, small
enterprises frequently do not elaborate performance evaluation techniques, as the strategy setters are close to the action (Hoque
& James 2000). In line with the above arguments, Bruns and Waterhouse (1975) identified two forms of control associated

88
with size: administrative with large firms and personal with small firms (Bruns & Waterhouse 1975).
The role of MCS in smaller or medium-sized entities has received little attention in the MCS literature (Reid & J. A. Smith
2000), and few MCS studies have explicitly considered size as a contextual variable (Merchant 1981; Kaplan & Atkinson
1998). Almost all studies have examined relatively large organizations, usually justifying this by arguing that large firms tend
to have incorporated formal MCS´s and are more likely to benefit from the use of MCS than are smaller firms (OConnor et
al. 2011). Narver & Slater (1990) hypothesize a positive relation between a business’s relative size advantage and its
profitability (Narver & Slater 1990).
Finally, in the literature there is no evidence of empirical studies that analyze the potential industry impact on the different
applications that are given to the MCS. In our study, industry effects were captured by dummy variables for the firm’s main
line of business (Manufacturing, Trade, Services and Banking).
Our study is controlled by the following variables: firm size, industry to which it belongs, understanding of the system used,
and firm age (years of foundation). Since the size of a firm has been shown to affect the way in which control systems are
utilized (Bruns & Waterhouse 1975; Merchant 1981), in our study, the classification used to categorize firms size is
determined according to the number of workers, as is done in previous research (C. Lee et al. 2001; Santos et al. 2002) and
converted into a binary variable. Additionally, the sample for this study was split based on the size to create three subsamples
of firms: Small (10-50), medium-sized (51–250), and large firms (250 >) as was published on the Official Journal of the
Mexican Federation (2009). The industry variable was recoded to four categories to give it a higher level of identification.
Comprehensive/Amplitude MCS was measured by an adapted version of the “Comprehensive MCS forced-choice instrument”
(Hall 2008), in which the respondents are invited to indicate with an “X”, which of the following two options represent more
the Management Control Systems in their company: Comprehensive or Partial (See Appendix B: Survey instrument). Some
variables had a flipped scale (reverse-scored), (†EO4 †EO13 †EO14)†.
3.5.2 Second order constructs: Diagnostic & Interactive Uses
It is important to note that our predictions linking the four MCS uses (monitoring, legitimizing, attention focusing and strategic
decision-making) proposed by Vandenbosch (1999) with capabilities and performance are not capabilities causal in isolation;
instead they are predicted to be elements that collectively contribute to the development of latent and intangible constructs
(Joreskog & Sorbom 1993). These constructs are named Diagnostic use and Interactive use respectively. A construct is a
conceptual term used to describe a phenomenon of theoretical interest (Edwards & Bagozzi 2000; Bisbe et al. 2007).
Since conceptual specification of constructs is the process by which imprecise notions are made more specific and precise, it
involves considering at least two issues: i) to define the exact meaning of a construct and ii) determining the nature and
direction of the relationships between a construct and its indicators (Bisbe et al. 2007). We argue, according to the arguments
offered by Simons (1990, 1995, 2000) and Vandenbosch (1999), that the four uses (latent exogenous variables: Monitoring,
Legitimization, Attention Focusing, and Strategic Decision-Making) proposed by Vandenbosch (1999) can be grouped in two
second-order-constructs named Diagnostic and Interactive uses (Latent variables endogenous) (Simons, 1990, 1995, 2000).
While other indicators can be related, the presence of these four is due to their deep roots in past research and use (Henri

89
2006a; Vandenbosch 1999). Koufteros et al. (2014) propose a different arrangement of these applications where monitoring,
legitimizing and atttention focusing charge on the second order diagnostic construct. Nevertheless, the seminal literature
proposed by Simons (1990, 1995) and Vandenbosch (1999) does not support this whole approach. However, it is noteworthy
that the 2nd order construct proposed here still has not been proven systematically in the literature, yet. Specifically, the scale
for Diagnostic use is a second order factor measured by two first order factors: Monitoring (4 reflective indicators) and
Legitimizing (9 reflective indicators). In other words, “Monitoring and Legitimizing” uses are positive first-order indicators
or latent exogenous variables of the higher-order factor of “Diagnostic use”. In the same way, the scale for Interactive use is
a second order factor measured by two first-order factors or latent variables, Attention focusing (5 reflective indicators) and
Strategic Decision-making (7 reflective indicators). Theses uses are positive first-order indicators or latent endogenous
variables of the higher-order factor of “Interactive use”.
The first step is to perform an exploratory factor analysis (EFA) for each of the two constructs: the diagnostic, which includes
items related to monitoring and legitimizing; and the Interactive, which includes items related to attention focusing and
strategic decision making. The EFA results across all ítems of the four MCS uses (Monitoring, Legitimizing & Attention
focusing-Strategic Decisión- making) show two factors in general (diagnostic and interactive) and two factors in each EFA
(Monitoring and Legitimizing in Diagnostic, and Attention focusing-Strategic Decisión- making in Interactive), indicated that
the different scales were one-dimensional and that every construct showed acceptable results. We examined the KMO (0.935
for diagnostic & 0.910 for interactive) and the Cronbach Alpha reliability coefficient showing values above 0.90 (Nunnally
et al. 1967). Results of 0.930 for diagnostic & 0.908 for interactive confirm our expectations (see Appendix J. Chapter III:
EFA for Diagnostic and Interactive uses (Second order factor analysis), and Appendix N: Chapter IV Second Order
constructs).
The second step is to confirm the existence of multidimensionality through a confirmatory factor analysis using structural
equations. In order to confirm this, in the 2nd order constructs for Diagnostic & interactive uses, a rival model strategy was
developed (Anderson and Gerbing, 1988; Hair et al., 2006). Therefore, we compared the second order models in which various
dimensions measured the multidimensional construct under consideration with a first order model in which all items weighed
on a single factor (Steenkamp and Van Trijp, 1991). The results showed that the second-order model had a much better fit
than the first-order model. These results led us to conclude that the variables “Diagnostic use” & “Interactive use” showed a
multidimensional nature. The next table (3.2) shows the results of the analysis of the second-order model for Diagnostic and
Interactive uses. The loadings of the measurement ítems of the first-order factors (Monitoring-legitimizing & Attention
focusing-Strategic Decision-making) on the second-order factors, named diagnostic & Interactive uses respectively, were all
significant (p<0.001). Furthermore, the goodness of fit índices exceed the requirements. The second-order CFA was estimated
by summarizing in single factors the indicators of the Diagnostic (Monitoring-legitimizing) and Interactive (Attention
focusing-Strategic Decision-making) uses through the analysis of structural equations (Using SPSS AMOS 21.0 for
Windows).
The Goodness-of-fit index (GFI) measures how much the actual input matrix is predicted by the estimated model. Usually,
values above 0.80 indicate reasonable model fit (Browne et al. 1993). The GFIs of our second-order models were 0 .931 &
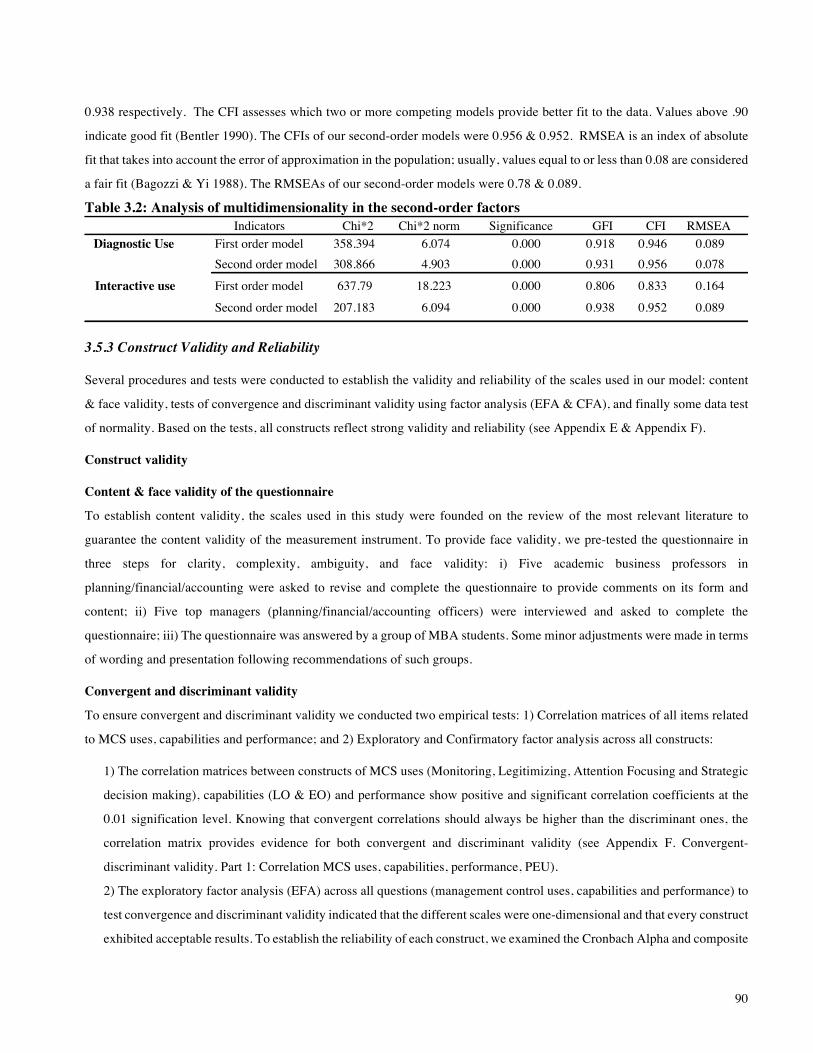
90
0.938 respectively. The CFI assesses which two or more competing models provide better fit to the data. Values above .90
indicate good fit (Bentler 1990). The CFIs of our second-order models were 0.956 & 0.952. RMSEA is an index of absolute
fit that takes into account the error of approximation in the population; usually, values equal to or less than 0.08 are considered
a fair fit (Bagozzi & Yi 1988). The RMSEAs of our second-order models were 0.78 & 0.089.
Table 3.2: Analysis of multidimensionality in the second-order factors
3.5.3 Construct Validity and Reliability
Several procedures and tests were conducted to establish the validity and reliability of the scales used in our model: content
& face validity, tests of convergence and discriminant validity using factor analysis (EFA & CFA), and finally some data test
of normality. Based on the tests, all constructs reflect strong validity and reliability (see Appendix E & Appendix F).
Construct validity
Content & face validity of the questionnaire
To establish content validity, the scales used in this study were founded on the review of the most relevant literature to
guarantee the content validity of the measurement instrument. To provide face validity, we pre-tested the questionnaire in
three steps for clarity, complexity, ambiguity, and face validity: i) Five academic business professors in
planning/financial/accounting were asked to revise and complete the questionnaire to provide comments on its form and
content; ii) Five top managers (planning/financial/accounting officers) were interviewed and asked to complete the
questionnaire; iii) The questionnaire was answered by a group of MBA students. Some minor adjustments were made in terms
of wording and presentation following recommendations of such groups.
Convergent and discriminant validity
To ensure convergent and discriminant validity we conducted two empirical tests: 1) Correlation matrices of all items related
to MCS uses, capabilities and performance; and 2) Exploratory and Confirmatory factor analysis across all constructs:
1) The correlation matrices between constructs of MCS uses (Monitoring, Legitimizing, Attention Focusing and Strategic
decision making), capabilities (LO & EO) and performance show positive and significant correlation coefficients at the
0.01 signification level. Knowing that convergent correlations should always be higher than the discriminant ones, the
correlation matrix provides evidence for both convergent and discriminant validity (see Appendix F. Convergent-
discriminant validity. Part 1: Correlation MCS uses, capabilities, performance, PEU).
2) The exploratory factor analysis (EFA) across all questions (management control uses, capabilities and performance) to
test convergence and discriminant validity indicated that the different scales were one-dimensional and that every construct
exhibited acceptable results. To establish the reliability of each construct, we examined the Cronbach Alpha and composite
Indicators Chi*2 Chi*2 norm Significance GFI CFI RMSEADiagnostic Use First order model 358.394 6.074 0.000 0.918 0.946 0.089
Second order model 308.866 4.903 0.000 0.931 0.956 0.078
Interactive use First order model 637.79 18.223 0.000 0.806 0.833 0.164
Second order model 207.183 6.094 0.000 0.938 0.952 0.089
Source: own devised
Table&2:&Analysis&of&multidimensionality&in&the&2nd&order&factor

91
reliability. The constructs must exceed the recommended cut-off point of 0.70 to reflect an acceptable level (Fornell &
Larcker 1981; Nunnally et al. 1967). Cronbach's Alpha reliability coefficient results show values of above 0.873 for the
overall sample and above 0.808 for the multi-group analysis, confirming previous results (Nunnally et al. 1967) (see Table
3.3 and Appendix F. Convergent-discriminant validity. Part 3: EFA: MCS uses – LO & EO – Performance (Ch.III)).
To verify convergent validity, we use the confirmatory factor analysis (CFA). We have performed first-order CFA for seven
constructs (e.g., MCS uses –Monitoring, Legitimizing, Attention Focusing and Strategic decision making-, capabilities -LO
& EO- and performance). The variance extracted must exceed the recommended cut-off point of 0.50 (Hair et al. 2006) to
adequately reflect convergent validity (Fornell and Larcker, 1981). In addition, these three elements were examined for the
CFA: a) the significance of the factor loading and the R2 for each item, b) the overall acceptability of the measurement model
using chi-square statistics, and c) three fit indices 30: GFI, CFI and RMSEA. These indices are among the most frequently
reported. The results for the second-order constructs (diag. / inter.) are (i) GFI (0.931/0.938); CFI (0.956/0.952); RMSEA
(0.078/0.089). Table 3.2 shows the CFA results for each construct.
Reliability
Internal consistency reliability means how well the items, that reflect the same construct, yield similar results. i.e., we are
looking at how consistent the results are, for different items for the same construct within the measure. There is a wide variety
of internal consistency measures that can be used. We use the “Average Interitem Total Correlation” and focus on the various
uses of MCS. This approach uses all of the items in our instrument that are designed to measure the same construct. We first
compute the correlation between each pair of items. The average interitem correlation is the average or mean of all these
correlations in each construct, and we also compute an average score for the items in each use (Mavg, Favg, Davg, Lavg) and
use it as a variable in the correlation analysis. Then, we calculate an average of this correlation. The results in each use show
an average of 0.806 significance at 99% level, ranging from 0.766 to 0.853 in this sample, remaining at a very acceptable
level for this analysis (see Appendix E Reliability. Part 1: Average Inter.itemTotal Correlation).
Normality
Finally, to verify the hypothesis of normality, necessary for the result of reliable analysis, two tests were performed
(Kolmogorov-Smirnov; Shapiro–Wilk), supporting the normality of all constructs (see Appendix E . Reliability. Part 2: Test
of normality).
3.5.4 Analysis Models
Structural equation modeling (SEM)
This study specifically responds to calls (Ahrens & Chapman 2007; Henri 2006a; Henri & Journeault 2010) for quantitative
research that provides insights into different uses of MCS and their interrelations with other constructs. Studies that have
examined the relationship between MCS and performance have mainly done it in two ways: by introducing variables, such as 30 GFI: Goodness of fit index, (Joreskog & Sorbom 1984)), GFI value is less than or equal to 1, a value of 1 indicates a perfect fit; CFI: comparative-fit index, (Bentler 1990; Hu & Bentler 1995), fall in the range from 0 to 1, values close to 1 indicate a very good fit. RMSEA:root mean square error of approximation, (Browne et al. 1993), practical experience show that a value of the RMSEA of about .05 or less would indicate a close fit of the model in relation to the degrees of freedom. The threshold values recommended are (i) GFI > 0.90 , (ii) CFI > 0.9 , and (iii) RMSEA < 0.08.
92
environmental uncertainty or technology to mediate this relationship and by building structural models that help explain how
some constructs affect the outcomes (Chenhall 2005). This study uses Structural Equation Modeling (SEM)31 to test the
relationship between the MCS uses – Organizational Capabilities – Performance. In addition to testing individual path
coefficients, SEM will provide us with an evaluation of the entire model; thus, the anaylsis focuses on a macro-level
perspective (Kline 1998) rather than on its parts. SEM assumes multivariate normality, which is usually identified through
univariate analysis (Kline 1998). A review of the data shows that all measures were within tolerable limits of skewness and
kurtosis, and no outliers were identified.
Also, we find that it is appropriate to make distincitions regarding firm size. The procedure followed proposes dividing the
sample of companies into three groups according to the number of employees: small (10-50), medium-sized (51–250), and
large firms (250 >). In order to be able to analyze the model proposed, a multi-group structural equation model is used, taking
into consideration one of the dominant focal points for analyzing the multi-group data, the measurement invariance (Hair et
al. 2006). We conduct the tests for the global sample (644 firms) as well as for each sub-group (157 small, 191 medium, 296
large firms) . Statistical analysis was performed using SPSS (V.21.0) software, and a structural equation modeling software
program SPSS-AMOS (V.21.0) was used to estimate the structural equation model depicted in Figure 3.2. As suggested by
Kline (1998), a SEM model is analyzed and interpreted in two stages (Kline 1998): The first stage estimates the measurement
model while the second estimates the structural model. The estimation method used was that of maximum likelihood (Blentler
& Chou 1987). The data analysis follows two steps. First, structural equation modeling (SEM) is used to test the model.
Second, still using SEM, multi-group analyses are conducted to assess the influence of the size factor on the model. As
aforementioned, by splitting the sample, three sub-samples are created and compared.
Measurement model
The first step is to perform a CFA for all the constructs in the model employing the SEM technique, with the aim of assessing
the measurement reliability and validity. The first analysis showed that to be better adjusted (some items show inadequate R2,
<0.7, or variance extracted <0.50) it was necessary to refine the scales. In other words, the model had to be respecified.
According to Joreskog and Soroborn (1993) and following their recommendations, respecifications were necessary for the
following constructs: Three items from Attention Focusing (F1, F6 and F7), and one item from Strategic decision making
(D1). In regards to capabilities, it was necessary to eliminate one item from Learning Orientation (L03). Finally, regarding
performance, two items were deleted (P4_SC and P5_SW). From a total of 51 items, 7 were eliminated. After those re-
specifications, all constructs exceeded the recommended cut-off point for the Cronbach Alpha, composite reliability and
variance extracted, exhibited acceptable model fit, reflected adequate R2, all factor loadings were statistically significant (p<
0.01) and complied with the recommendation regarding at least three indicators to be used per latent construct (Landis et al.
2000). Results of the final confirmatory factor analysis for the entire sample and for the sub group analysis are reported in
Table 3.3. All comparisons between the variances extracted and the squared correlations support the discriminant validity of 31 Structural modeling approach are appropriate when the theory sets out to explain the role of variables that intervene in the studied relationship (Luft & Shields 2003). SEM, have been employed in order to build latent variables from multi-item questionnaires and thereby to identify, simultaneously, statistical significance with multiple dependent variables (S. W. Anderson & Young 1999; Shields et al. 2000). This approach assumed contextual factors as noise within the models and does not consider how the results might be modified by these contextual factors (Chenhall 2005). Also this methodology allows researchers to be able to incorporate the influence of various factors under the theory that support it unfolds.

93
the constructs. These results suggest that our re-specified measurement model provides a good fit to the data on the basis of a
number of fit statistics.
Table 3.3: Internal consistency and convergent validity
Reliability of the constructs, also presented in Table 3.3, demonstrates their high-internal consistency. In all cases, Cronbach’s
Alpha (α) exceeded the recommendation of 0.70 (Nunnally et al. 1967), also Kaiser-Meyer-Olkin measure (KMO) and
Variable Indicator
*"
Factor"
Loadin
g" α CR AVE
*"
Factor"
Loadin
g" α CR AVE
*"
Factor"
Loadin
g α CR AVE
*"
Factor"
Loadin
g" α CR AVE
Monitoring M1 0.829 0.87 0.88 0.64 0.845 0.89 0.90 0.68 0.810 0.853 0.857 0.601 0.827 0.87 0.87 0.63
M2 0.866 0.897 0.849 0.848
M3 0.884 0.876 0.880 0.890
M4 0.832 0.870 0.806 0.818
Legitimizing L1 0.769 0.93 0.93 0.61 0.823 0.94 0.94 0.62 0.724 0.912 0.913 0.539 0.761 0.94 0.94 0.64
L2 0.760 0.753 0.753 0.768
L3 0.786 0.782 0.722 0.820
L4 0.811 0.808 0.731 0.852
L5 0.809 0.840 0.733 0.829
L6 0.816 0.824 0.839 0.802
L7 0.791 0.764 0.798 0.807
L8 0.856 0.838 0.835 0.881
L9 0.851 0.885 0.760 0.874
Att.5Focus F2 0.777 0.88 0.85 0.59 0.819 0.88 0.85 0.59 0.720 0.866 0.829 0.551 0.787 0.90 0.86 0.61
F3 0.742 0.771 0.660 0.773
F4 0.796 0.754 0.811 0.816
F5 0.822 0.810 0.817 0.836
St.5Mgmnt.5Dec. D2 0.812 0.91 0.90 0.60 0.812 0.91 0.89 0.58 0.812 0.906 0.898 0.595 0.812 0.91 0.91 0.62
D3 0.842 0.842 0.842 0.842
D4 0.804 0.804 0.804 0.804
D5 0.821 0.821 0.821 0.821
D6 0.782 0.782 0.782 0.782
D7 0.799 0.799 0.799 0.799
Diagnostic52º5order Monitoring 0.684 0.930 0.76 0.62 0.675 0.93 0.71 0.55 0.671 0.913 0.743 0.595 0.790 0.939 0.81 0.68
Legitimizing 0.882 0.801 0.860 0.863
Interactive52º5order Focusing 0.896 0.927 0.82 0.69 0.930 0.922 0.83 0.71 0.779 0.916 0.779 0.638 0.857 0.937 0.85 0.74
Desicion 0.759 0.743 0.818 0.859
LO LO1 0.862 0.83 0.81 0.58 0.880 0.81 0.84 0.64 0.871 0.818 0.838 0.638 0.848 0.84 0.82 0.60
LO2 0.850 0.860 0.884 0.825
LO4 0.797 0.769 0.759 0.829
EO EO1 0.880 0.97 0.96 0.65 0.886 0.97 0.96 0.66 0.901 0.967 0.968 0.682 0.865 0.97 0.97 0.68
EO2 0.845 0.847 0.862 0.833
EO3 0.870 0.873 0.882 0.861
EO4r 0.779 0.771 0.783 0.781
EO5 0.846 0.832 0.852 0.850
EO6 0.832 0.846 0.840 0.821
EO7 0.846 0.815 0.864 0.848
EO8 0.854 0.849 0.860 0.855
EO9 0.815 0.812 0.766 0.851
EO10 0.833 0.852 0.818 0.835
EO11 0.847 0.848 0.822 0.866
EO12 0.838 0.832 0.807 0.866
EO13r 0.814 0.774 0.842 0.814
EO14r 0.797 0.750 0.845 0.785
Performance P1_S 0.818 0.88 0.87 0.62 0.822 0.86 0.86 0.62 0.800 0.891 0.888 0.665 0.826 0.87 0.87 0.64
P2_Bº 0.830 0.829 0.810 0.844
P3_R 0.834 0.803 0.868 0.831
P6_G 0.813 0.796 0.860 0.786
Goodness5of5fit5indices5(Measurement5models): *=p<0.01
Overall"sample:""χ2"(888"DF)"="2363.362V""χ2/DF=2.661V"Significance=0V""GFI=0.848V""CFI=0.931V""RMSEA=0.051.
Small"Firms:""χ2"(888"DF)"="1452.182V""χ2/DF=1.635V"Significance=0V""GFI=0.709V""CFI=0.9V""RMSEA=0.064.
Medium"firms:""χ2"(888"DF)"="1506.778V""χ2/DF=1.697V"Significance=0V""GFI=0.743V""CFI=0.901V""RMSEA=0.061.
Large"firms:""χ2"(888"DF)"="1744.444V""χ2/DF=1.964V"Significance=0V""GFI=0.79V""CFI=0.917V""RMSEA=0.057.
Overall"sample"measurement"model"(Multigroup"Unconstrained):""χ2"(2664"DF)"="4704.539V""χ2/DF=1.766V""Significance=0V""GFI=0.755V""CFI=0.907V""RMSEA=0.035.
Source:"Own"devised
Overall5Sample Small5size Medium5size Large5size

94
Bartlett´s test of sphericity meet desired levels. The Composite reliability (CR) also complied fully with the recommendations
of at least 0.60 (Bagozzi & Yi 1988) and represented the shared variance among a set of observed variables measuring an
underlying construct (Fornell & Larcker 1981). The Average Variance Extracted (AVE) calculated for each construct was
used to assess the convergent validity of constructs within the SEM model. The results indicate that all AVEs are above the
conventional guideline of 0.50 for adequate convergent validity (Fornell & Larcker 1981). Convergent validity is also verified
by analysing the factor loadings and their significance. On one hand, the coefficient of all the standardized loadings were
higher than 0.50 and the average of the item-to-factor loadings were higher than 0.70 (Hair et al. 2006). On the other hand
all factor loadings were significant (p<.001) by the t test scores obtained. In conclusion, the seven scales used demonstrated
high levels of reliability. Finally, as we can see, the goodness of fit indices meet the recommended levels. GFI >.80; CFI>
0.90 and RMSEA < 0.08, for both analysis conducted, one for the entire sample and one for the multi group.
The discriminant validity of the constructs in the measurement model was assessed by calculating the average variance
extracted (AVE) and compared with the squared correlations between constructs. This provides a test of the extent to which
a construct shares more variance with its measures than it shares with other constructs (Fornell & Larcker 1981). Table 3.4
shows that the shared variance between pairs of constructs (squared correlations), was always less than the corresponding
AVE in the diagonal (Fornell & Larcker 1981). All AVE measures are greater than the respective squared correlations attesting
to satisfactory discriminant validity. This is true for both the full sample and for the subgroup analysis. Moreover, and
confirming the discriminant validity of this model, it is argued that existing discriminant validity is acceptable if the
correlations between the variables in the confirmatory model are not much higher than 0.8 (Bagozzi 1994), situation which is
perfectly fulfilled in our study.
Table 3.4 Discriminant validity
Based on the conclusions reached with the above criteria, we
believe that the scales used and the proposed model has
sufficient evidence of reliability and convergent and
discriminant validity. Therefore, the measurement model of
this study is considered reliable and we can continue, first
assuring the measurement invariance of the instrument and
then with the second step related to the structural model.
Measurement invariance
With the above procedures, we can assure the validity and
reliability of the scales we used; however, since our study is
based on the multi-group analysis, that is not enough to
ensure robust conclusions. Now we must make sure that the
instrument we use does not vary with different groups of
answers so that those can be compared. (Steenkamp & Baumgartner 1998). Therefore, we must assure the measurement
Diagnostic Interactive LO EO Performance
Diagnostic 0.623Interactive 0.500 0.689
LO 0.373 0.359 0.584EO 0.251 0.259 0.241 0.652
Performance 0.228 0.190 0.126 0.165 0.624
Diagnostic 0.549Interactive 0.456 0.708
LO 0.394 0.326 0.643EO 0.297 0.283 0.317 0.663
Performance 0.167 0.110 0.106 0.173 0.616
Diagnostic 0.595Interactive 0.513 0.638
LO 0.318 0.231 0.638EO 0.274 0.289 0.224 0.682
Performance 0.287 0.285 0.211 0.170 0.665
Diagnostic 0.684Interactive 0.465 0.736
LO 0.440 0.473 0.600EO 0.229 0.250 0.215 0.680
Performance 0.230 0.187 0.110 0.158 0.636
Note: Diagonal = AVE, below the diagonal, the shared variance (squared correlations) is represented.
Source: Own devised
Overall Sample
Small size firms
Medium size firms
Table 4: Discriminant validity
Large size firms

95
invariance of the measurement instrument (Hair et al. 2006). This is essential to obtain robust conclusions (Horn 1991).
Then, we will carry out three steps to analyze the invariance of our measuring instrument (Byrne 2013; Byrne 2004); These
steps correspond to the three invariance levels the study must meet.
STEP 1: This step evaluates the loose cross-validation or single group solution. This involves making estimates for the CFA
model for each of the three groups separately. A good fit is required in the three groups. The CFA fit results were good for
the three groups. Table 3.5 shows a summary of these estimates, in the line of single group, individual solutions.
STEP 2: In step 2, the groups factor structure is analysed, looking to be the same in the different groups than in the complete
sample. This step is known as equal form factor or structure or configurational invariance. Unlike the previous step where the
groups were analyzed separately, in this case, a multi-group study is done (i.e., simultaneously for all groups). We verified
that the chi-squared and the degrees of freedom (DF) in this new model were the sum of the previous ones that were estimated
separately (see Table 3.5 in the line of measurement invariance: Equal Form), χ2, & DF still remain significant; in addition,
the rest of the indicators showed that it was reasonable to assume the same factorial structure in the samples (GFI=0.755;
CFI=0.907; RMSEA=0.035).
STEP 3: The third step verifies the invariance of the factorial loadings (called equal factor loadings or metric invariance).
This step relates to verifying that it can be assumed that in the samples of the various groups, the factor loadings linking each
factor with its indicators is the same; in other words, the concepts have been measured similarly in all cases. This verification
is done by comparing the chi-square in steps 2 and 3, (see Table 3.5 in the line measurement invariance "equal form" and
"equal factor loadings"), verifying that the fit of the new model is not significantly worse (p= 0.24).
Table 3.5 Measurement invariance test
The difference of the chi-squared is 106.11, but it is not significant, so we can assume that the fit of the new model is not
significantly worse. Thus, we can conclude that imposing restrictions of the equality of factorial loadings does not deteriorate
the fit significantly. In other words, we can affirm the factorial invariance of the measurement instrument.
MCS – Performance indirect effect
While hypotheses H7 and H8 predict a direct effect of MCS uses on performance, an indirect effect may also occur through
the mediating effect of LO & EO capabilities. i.e., we propose that EO and LO have a mediating effect on the MCS-
Performance relationship and that it should reflect upon completion of the hypotheses described below.
To prove the above assertion, we followed a series of steps: 1) A model that included only three constructs –diagnostic use,
Model χ2 DF ∆ χ2 ∆ DF p GFI CFI RMSEASingle Group, Individual solutionSmall firms (n=157) 1452.182 888 0.709 0.900 0.064Medium-sized firms (n=191) 1506.778 888 0.743 0.901 0.061Large firms (n=296) 1744.444 888 0.790 0.917 0.057Measurement invariance (n=644)Equal form (Multi-group) 4704.5 2664 0.755 0.907 0.035Equal factor loadings 4811 2738 106.11 74 0.236 0.750 0.906 0.034* (p<0.01)Source: Own devised

96
interactive use, and performance- was assessed, hoping that the relationships were significantly present. 2) In a stepwise
model, LO & EO were included; and the results and their implications were observed individually. Finally, a full model that
included the five constructs was assessed: diagnostic, interactive, LO, EO, and performance. This analysis was performed for
the whole sample and for the size of the sub-groups; this last with the aim of analyzing the differences between companies.
Thus, the indirect effect of the uses of the Interactive and Diagnostic MCS acting through the EO and LO capabilities over
performance is formally expressed as:
a) If H1 and H5 are met, there will be a mediating effect of LO between the use of Diagnostic MCS and Performance.
b) If H3 and H5 are met, there will be a mediating effect of LO between the use of Interactive MCS and Performance.
c) If H2 and H6 are met, there will be a mediating effect of EO between the use of Diagnostic MCS and Performance.
d) If H4 and H6 are met, there will be a mediating effect of EO between the use of Interactive MCS and Performance.
3.6 Research findings
3.6.1 Results of the Structural Model
Table 3.6 presents the main results in terms of path coefficients, significance, goodness-of-fit indices and hypotheses results
of two models of structural equations (Model 1: Overall Sample and Model 2: Multi-group Analysis).
Table 3.6: Results of the structural equation models
Path coeff. Hyp. Path coeff.
H1 Diagnostic use ! LO (-) 0.659 *** ✗ 1.443 ***
H2 Diagnostic use ! EO (-) 0.532 *** ✗ 1.084 ***
H3 Interactive use ! LO (+) 0.401 *** ✓ -0.003
H4 Interactive use ! EO (+) 0.429 *** ✓ 0.008
H5 LO ! Performance (+) 0.047 ✗ -0.066
H6 EO ! Performance (+) 0.163 *** ✓ 0.161 *
H7 Diagnostic use ! Performance (+) 0.409 *** ✓ 0.623 *
H8 Interactive use ! Performance (+) 0.055 ✗ -0.002
Goodness-of-fit indices of the modelChi-square 3031.772
DF 890χ2/DF 3.406
GFI 0.827CFI 0.9
RMSEA 0.061# cases 644
Note 1: *significant at the 0.1 level; ** Significant at the 0.05 level; *** Significant at the 0.01 level.Note 2: Hyp. = Hypothesis conclusion: "✓ Supported" or "✗ not supported"Source: Own devised
157
Small
2744
A: Overall B:Multigroup analysis by firm sizePath descript. & expected sign Overall sample
2.0010.734
5491.5
0.8750.04
Table 6: Results of the structural equation models
Hyp. Path coeff.
✗ 1.037 ***
✗ 0.752 ***
✗ 0.239 **
✗ 0.478 ***
✗ 0.164 **
✓ 0.105 *
✓ 0.414 **
✗ 0.143
Note 1: *significant at the 0.1 level; ** Significant at the 0.05 level; *** Significant at the 0.01 level.157
Small
2744
B:Multigroup analysis by firm size
2.0010.734
Medium
5491.5
0.8750.04191
Table 6: Results of the structural equation models
Hyp. Path coeff.
✗ 0.391 ***
✗ 0.29 ***
✓ 0.593 ***
✓ 0.521 ***
✓ -0.001
✓ 0.174 ***
✓ 0.448 ***
✗ 0.02
296
2744
B:Multigroup analysis by firm size
2.0010.734
Medium Large
5491.5
0.8750.04191
Table 6: Results of the structural equation models
Hyp.
✗
✗
✓
✓
✗
✓
✓
✗
296
2744
B:Multigroup analysis by firm size
2.0010.734
Large
5491.5
0.8750.04
Table 6: Results of the structural equation models

97
Model A tests the specific hypothesis of the overall study, between the two uses of the MCS (Diagnostic and Interactive), the
organizational capabilities, and performance in the whole sample. Model B presents the results of the analyses of three sub-
groups, performed to validate the robustness of the theoretical model, using firm size as a splitting variable and using multi-
group analyses. Both models meet the recommended threshold of limit values (Kline, 1998).
A. Overall sample. Figure 3.3 shows the main results of the relationship between the uses of MCS - capabilities - performance
for the overall sample. In the line of Koufteros et al. (2014) results 32 , the use of diagnostic MCS shows a significant
relationship with the LO and EO capabilities but in the opposite direction (+). Those results fail to support hypotheses H1 and
H2 because this impact is contrary to our predictions and to the results of prior studies that have found negative links between
the diagnostic use of MCS and capabilities (Henri 2006a). We can observe positive and significant path coefficients between
(i) the diagnostic use of MCS (0.659, p<0.001) and LO, and the same positive relationship with EO (0.532, p<0.001). On the
other hand and consistent with previous predictions and results of studies that have found links between the use of interactive
MCS and Capabilities (Henri 2006a; Koufteros et al. 2014), our results in the whole sample show a positive and significant
relationship between interactive MCS use and organizational capabilities in both cases, with LO (0.401, p<0.001) and with
EO (0.429, p<0.001). Therefore, H3 and H4 are fully supported.
Figure 3.3 Structural model results H1 to H8 (Overall sample) Regarding the capabilities – performance
relationship in the whole sample, only EO
showed a positive and significant coefficient
(0.163, p<0.001) in this relationship. Thus,
H5 (LO – performance) was not supported,
but H6 (EO – performance) was fully
supported.
In relation to the MCS direct effect on
performance, the use of diagnostic MCS
reflected a positive and significant
relationship in the overall model (0.409
p<0.001); therefore, H7 was fully supported.
However, it was not the case for the use of
interactive MCS in which such use does not reflect a significant relationship between MCS and performance. Therefore, H8
was not supported. For a complete summary of the results of the hypotheses see Table 3.7.
As we explained above, there should be a part of the relationship between MCS uses (interactive and diagnostic) and
performance which was explained in part by an indirect effect, whereby interactive / diagnostic uses of MCS increase LO
and EO capabilities which in turn increases performance. i.e., There is a mediating effect of capabilities (LO and EO) in the
32 Koufteros et al. (2014) results found a significant and positive relationship between the use of diagnostic MCS and organizational capabilities.
Diagnostic MCS use
InteractiveMCS use
LO
EOPerformance
H8: 0.055
H7: 0.409***
Source: Self-devised *** Non significant relationshipsSignificant

98
relationship between the MCS uses and performance. In the context of the whole sample, the results show that EO capability
plays a mediating effect on the relationship between both uses and performance (diagnostic use-EO, 0.532, p<0.001;
interactive use–EO, 0.429, p<0.001; and EO-Performance; 0.163, p<0.001). Nevertheless, it is not the case for LO, which
does not have a mediating effect between the uses of MCS and performance. See table 3.9 for a complete summary of the
indirect effect of MCS on Performance.
B: Multi-group analysis by firm size
In regards to the relationships between the uses of MCS and capabilities, the use of diagnostic MCS show a positive and
significant relationship with LO and EO capabilities in all cases of the multigroup analysis (small, medium, and large firms),
but in the unexpected opposite direction (+). Thus, those results fail to support hypotheses H1 and H2. For the relationship
of the use of MCS with capabilities (LO and EO), the subgroup analysis remains in the same positive and significant impact
as the whole sample, with the exception of small businesses, where the use of interactive MCS shows no significant relevance
in these relationships. Hence, H3 and H4 are partially supported.
In regards to capabilities and performance, the relationship EO-performance is present in all firms, positively and significantly
(small 0.161 p<0.1, medium 0.105 p<0.1, 0.237; large 0.174 p<0.001). The LO-Performance case is positive and significant
only in medium-sized businesses (0.164, p<0.05), but that is not the case for small and large firms since no significant
relationship was found. In summary, LO shows almost no impact; thus, H5 is partially supported, while the EO capability is
positive and significantly related to organizational performance in all firm sizes, thus, supporting H6.
In relation to the direct effect of the uses of MCS –Performance (H7 & H8), the use of diagnostic MCS reflects a positive and
significant direct relationship with performance in the analysis of each sub-group (0.623, p<0.1 in small; 0.414, p<0.01 in
medium & 0.448, p<0.001 in large size firms); hence, H7 is fully supported. However, this is not the case for the use of
interactive MCS, which does not reflect a significant relationship with performance for the analyses of all sub-groups;
therefore, H8 is not supported. (For a complete overview, see Appendix L. Chapter III: Structural model results -overall
sample and multi-group size analysis). Table 3.7 show a summary of the result hypotheses.
Table 3.7: Results of Hypotheses
In regards to the indirect effect of the uses of MCS –Performance
Overall sample Small size Medium size Large size
H1: Diagnostic use ! LO (-) ✗ Not supported ✗ Not supported ✗ Not supported ✗ Not supported
H2: Diagnostic use ! EO (-) ✗ Not supported ✗ Not supported ✗ Not supported ✗ Not supported
H3: Interactive use ! LO (+) ✓ Supported ✗ Not supported ✓ Supported ✓ Supported
H4: Interactive use ! EO (+) ✓ Supported ✗ Not supported ✓ Supported ✓ Supported
H5: LO ! Performance ✗ Not supported ✗ Not supported ✓ Supported ✗ Not supported
H6: EO ! Performance ✓ Supported ✓ Supported ✓ Supported ✓ Supported
H7: Diagnostic use ! Performance ✓ Supported ✓ Supported ✓ Supported ✓ Supported
H8: Interactive use! Performance ✗ Not supported ✗ Not supported ✗ Not supported ✗ Not supported
Source: own devised
Table 7: Hypotheses results

99
As previously stated, hypotheses H7 and H8 predict a direct effect of the uses of MCS on performance, but an indirect effect
may also occur through the mediating effect of the LO and EO capabilities; i.e., EO and LO may have a mediating effect on
the MCS-Performance relationship. Since these analyses are based on the multi-group analysis, the results presented below
were also executed assuring the stability of the measurement model for each observed group (measurement invariance, see
Appendix K. Chapter III: Measurement invariance test (Direct effect - Indirect Efect)). To prove this, we took 4 steps and the
results were as follows:
1) The relationship between the uses of MCS and Performance was observed in isolation, both for the entire sample and for
the analysis of the sub-groups by company size (see Tables 3.8 and 3.9). In the whole sample, we can see that both the
diagnostic use as interactive use has a significant positive influence on organizational performance. In the case of the
diagnostic use, this positive and significant relationship is maintained in all firm sizes; nonetheless, in the case of the
interactive, the relationship is not significant in small businesses. In the second and third steps, each of the two organizational
capabilities (EO and LO) were introduced into the model to examine whether the relationships identified in the previous step
still held true.
Table 3.8: Hypotheses results: MCS – Performance (direct & indirect effect)
2) By introducing EO, we could observe that with the diagnostic use it maintained its positive and significant influence directly
on performance; moreover, this use had an indirect effect on performance through EO which also had an influence on
performance and kept these results for businesses of any size. The results in the interactive use were different and showed that
when EO was introduced, the direct effect of the interactive use on performance was completely lost; however, EO had an
indirect impact on performance. Likewise, both relationships were present in companies of any size.
3) By introducing LO, we could observe that for diagnostic use, although the magnitude of its coefficient decreaseed, it
remained a directly positive and significant influence on performance. Moreover, an indirect relationship was generated
between the diagnostic use and performance through LO, which in turn affected the performance in companies of any size.
Again, it was not the case of the interactive use, in which by introducing LO, the direct relationship of this use with
performance was maintained in the complete sample but completely lost in the analyses by sub-groups. In addition, no kind
Overall sample Small size Medium size Large sizeDirect effect
H7: Diagnostic use ! Performance � Supported � Supported � Supported � SupportedH8: Interactive use! Performance �Not supported �Not supported �Not supported �Not supported
Indirect effectH1 + H5 Mediating effect of LO between
Diagnostic use ! Performance �Not supported �Not supported � Supported �Not supported
H2 + H6 Mediating effect of EO between Diagnostic use ! Performance
� Supported(partial)
� Supported(partial)
� Supported(partial)
� Supported(partial)
H3 + H5 Mediating effect of LO between Interactive use! Performance �Not supported �Not supported � Supported �Not supported
H4 + H6 Mediating effect of EO between Interactive use! Performance
� Supported(total)
✓ Supported(total)
� Supported(total)
� Supported(total)

100
of indirect relationship through LO of firms was generated.
Finally, in the fourth step, by introducing both constructs (EO and LO) in the full model, we observed that the diagnostic use
continued having a direct, positive and significant influence towards organizational performance. On the other hand, its
counterpart, the interactive use, completely lost this direct effect, and this was also true for any size of firms. EO mediates the
relationship between the two uses and performance in different ways: i) In the relationship between the diagnostic use of
MCS and performance, EO was a partially mediating variable; and ii) EO completely mediates the relationship between the
interactive use and performance in large and medium-sized firms. I.e., In the first case the direct impact remained but
decreased and occured in parallel to the diagnostic impact on performance indirectly by Eo and this in turn in performance.
While in the second case, the direct impact of the interactive use on performance disappeared and the possibility of having an
influence on performance was only indirect through EO. Generally, LO did not work as a mediating variable in the relationship
between the uses of MCS and organizational performance, except for the medium-sized companies. LO had no significant
direct impact on performance. Table 3.8 shows the MCS – Performance (direct & indirect effect) hypotheses results. For a
complete step by step Direct and Indirect effect summary of the MCS-Performance relationship, see Table 3.9.
Table 3.9: MCS uses (Dignostic/Interactive) - LO & EO - Performance analysis (direct & indirect effect)
3.7 Conclusions, discussion and managerial implications
Companies today compete in a complex world that reinvents itself faster and pays a high price for innovation and business
models based on knowledge. This context drives the need to better understand the role of different systems and how they can
better meet managerial needs (Widener 2004). Company managers need to identify what the best practices are, on the one
1:#Diagnostic#/#Interactive#2#Performance Estimate P Estimate P Estimate P Estimate PDiagnostic.//>.Performance 0.485 *** 0.517 *** 0.554 *** 0.464 ***Interactive.//>.Performance 0.188 *** 0.088 ... 0.353 ** 0.129 **2:#Diagnostic#/#Interactive#2#EO#2#PerformanceDiagnostic.//>.EO 0.493 *** 0.457 ** 0.652 ** 0.285 **Interactive.//>.EO 0.409 *** 0.257 ** 0.519 *** 0.528 ***EO.//>.Performance 0.176 *** 0.243 *** 0.139 ** 0.178 ***Diagnostic.//>.Performance 0.425 *** 0.467 ** 0.514 ** 0.428 ***Interactive.//>.Performance 0.064 ... /0.051 ... 0.193 ... 0.028 ...3:#Diagnostic#/#Interactive#2#LO#2#PerformanceDiagnostic.//>.LO 0.679 *** 0.661 *** 1.456 *** 0.429 ***Interactive.//>.LO 0.358 *** 0.435 *** /0.152 ... 0.513 ***LO.//>.Performance 0.119 ** 0.150 ... 0.250 *** 0.053 ...Diagnostic.//>.Performance 0.427 *** 0.430 ** 0.302 ** 0.492 ***Interactive.//>.Performance 0.100 ** 0.006 ... 0.333 ** 0.054 ...4:#Diagnostic#/#Interactive#2#EO#&#LO#2#PerformanceDiagnostic.//>.LO 0.659 *** 1.443 *** 1.037 *** 0.391 ***Interactive.//>.LO 0.401 *** /0.003 ... 0.239 ** 0.593 ***Diagnostic.//>.EO 0.532 *** 1.084 *** 0.752 *** 0.290 **Interactive.//>.EO 0.429 *** 0.008 ... 0.478 *** 0.521 ***LO.//>.Performance 0.047 ... /0.066 ... 0.164 ** /0.001 ...EO.//>.Performance 0.163 *** 0.161 ** 0.105 ** 0.174 ***Diagnostic.//>.Performance 0.409 *** 0.623 ** 0.414 ** 0.448 ***Interactive.//>.Performance 0.055 ... /0.002 ... 0.143 ... 0.020 ...
p<0.001:.***F.p<0.05:.**F.P>0.05:.___
Overall Small Medium LargeTable#9:#MCS#uses#(Diagnostic/Interactive)#2#EO#&#LO#2#Performance#(Direct#effect#2#Indirect#Effect)

101
hand, allowing them to make better use of their MCS; and on the other hand, to enable them to develop competitive
advantages, being both future drivers of improved performance (Widener 2007). The purpose of this paper, from a resource-
based perspective, is to investigate the role played by the different uses of MCS as an antecedent to organizational capabilities
as well as to assess their significance. It also pursues to identify whether the uses of MCS and capabilities are drivers of
organizational performance.
It has been found in the literature that the MCS can be a catalyst for all stages of the strategic process of a company (Mintzberg
1978; Mintzberg & Waters 1985), by providing the necessary information to challenge the content and validity of the strategy
(Ittner et al. 2003). Research indicates that MCS are not only important for strategy implementation, but also for strategy
formation (Simons 1990). The general findings of this work related to the direct and indirect impact of MCS over perfomance
are aligned with Simons’ (1990) arguments in terms of raising the contribution of MCS to more than just a tool for monitoring
and evaluating, but to also offer them as a catalyst for the complete strategic process; a process which supports and encourages
the creation and execution of strategies across the organization. Although there is a common understanding that the systems
do not have a direct impact on performance, performance is a function of the way these systems are designed and used. Our
results challenge the previous statement and show that MCS are resources in an organization, which generate a competitive
advantage in terms of how they are used. (Lengnick-Hall & Wolff 1999). Therefore, understanding how these resources can
be better used as specific, hard-to-duplicate resources generates a sustainable source of competitive advantage because from
that point of view, they directly or indirectly have an impact on performance.
The MCS studied in this work show a different impact on capabilities; a summary of the results for the whole sample and the
multigroup analysis are shown below. The diagnostic use of MCS had a direct impact on performance, and it also had an
indirect effect through the entrepreneurial orientation in business.
Diagnostic use – LO and EO
The main findings showed that the use of the diagnostic MCS generated a significant, positive, and direct and indirect impact
on organizational performance. In all cases (the overall sample and the multigroup analysis) the use of the diagnostic MCS
showed a significant relationship with LO & EO capabilities but in the unexpected opposite direction (+). This is contrary to
our predictions and results of prior studies that had not found links between MCS and Capabilities (Henri 2006a). Although
those results fail to support hypotheses H1 and H2, they are in the same line of studies that found a positive and significant
relationship between MCS and capabilities (Koufteros et al. 2014). This important finding is discussed below.
The above results lead to the possibility of questioning the previous literature that assumed that the use of diagnostic MCS
inhibited the development of organizational capabilities, and thus, have a possibly negative impact on firm performance
(Simons 1995; Henri 20016a; among others). The positive sign and significance found in the use of the diagnostic MCS - LO
& EO capabilities relationship- highlights the positive impact that the use of the diagnostic MCS has on capabilities. This
leads to have several explanations: There are arguments (Mintzberg, 1973; Eisenhardt, 1989; Slater & Narver, 1995;
Vandenbosch, 1999; Grafton et al. 2010, Koufteros et al. 2014) suggesting that the diagnostic use has a positive influence on
the development of capabilties, laying the foundation for carrying out a conversation to enable better decisions, i.e., to have
102
the same information and understand it in the same way. The diagnostic use operationalizes the first and the second steps in
the learning process33 (Slater & Narver 1995). Also, the diagnostic systems legitimizing the use of MCS are formalized
routines (Simons 2000) intended to guide behavior, to communicate, and to formalize decisions that may already have been
taken. Somehow, Simons (1995) also contends that diagnostic controls to legitimize are used to communicate agendas and
translate strategy through the identification of critical success factors. In the same line, organizational learning originates in
historical experiences, which are then encoded in routines that guide behavior (Levitt & March 1988). Putting together these
ideas, legitimizing MCS use, serves as a lever that facilitates organizational learning, and then, we can assume why we obtain
a strong and positive relationship. LO is related to learning from past events, learning from our previous results (Levitt &
March 1988), that can only be achieved by making a solid diagnostic use of MCS. Finally, Koufteros et al. (2014) argue that
Henri (2006a) found a negative relationship between diagnostic controls and organizational learning because he used a narrow
definition of the diagnostic use, only for monitoring uses. On the other hand, EO as a concept is related to an organizational
level where systems are widely used. They could be influenced by how a company uses its information systems when
combined with strategic resources, such as knowledge-based resources directed to discover and exploit opportunities which
can boost competitiveness and entrepreneurship (Barney 1991, Chenhall & Morris, 1995)
In addition, since an essential characteristic of entrepreneurship is to make things happen, leaders devoted considerable effort
to justify and legitimize their proposals and actions. Legitimacy may be relevant because if actions will only be taken if they
have been legitimized, organizations become dependent on information that can provide legitimacy (Feldman & March 1981),
and thus, the diagnostic use of MCS plays an important role. Managers use MCS to legitimize prior ideas assuring the right
interpretation (Vandenbosch 1999) because they believe that by doing so, it leads to organizations’ competitiveness. Evidence
of this argument is shown in a Dossi (2008) study, arguing that with a legitimized use of MCS use, headquarters employ MCS
to monitor local performance results, influence, legitimize, and guide local decision-making (Dossi 2008), influencing the
entrepreneurial attitude for initiation and implementation of strategic decisions (Fama & Jensen 1983; Prahalad & Doz 1987).
Finally, the positive sign of the results in the diagnostic use of MCS may also be due to the interrelationship that exists in the
two uses of MCS which has been documented by some academics (Mundy, 2010). These results allow us to suppose that the
assumption that a control system has a negative impact when used in such a way could be engrossed if we think that it had an
individual use. Apparently, somehow the systems work at the same time and support each other (Simons 1995). Widener
(2007) study finds that when firms emphasize one use of MCS, they also emphasize each of the other three control systems,
involving the same direction. The evidence suggests that the inter-dependencies are complementary. The interactive use of
MCS influences the diagnostic use of MCS since the latter provides the necessary structure that enables the interactive control
system to be effective (Chenhall & Morris 1995). This interrelationship between the uses of diagnostic and interactive MCS
is summarized by Simons (2000) when he says, “the information and learning generated by interactive systems can be
embedded in the strategies and goals that are monitored by diagnostic control systems” (Simons 2000), arguing that different
uses do not occur in isolation. Hence, controls are interrelated and complementary, not substitutes. Managers should consider
33 Learning process: Information acquisition (How am I doing), information dissemination (communication), shared interpretation (what does it mean) and organizational memory (How I Do it) (Slater & Narver 1995).

103
both when designing and using their control system to increase its effectiveness, and thus, translate it into performance.
Interactive use – LO & EO
Consistent with previous results, the interactive use of MCS, such as expected, has an impact on the development of both
capabilities (LO & EO) by fostering organizational dialogue, stimulating creativity, and focusing organizational attention. It
showed a positive and significant relationship with the development of organizational capabilities in the overall sample.
Subgroup analysis kept the same relationships in medium-sized and large companies; however, in the case of small businesses,
the interactive use of MCS showed no significant relevance. Our results are in the same line of prior studies that found links
between the uses of interactive MCS and Capabilities (Henri 2006a; Koufteros et al. 2014). Hence, those results support
hypotheses H3 and H4.
LO - Perfomance
Learning orientation has been identified in previous studies as a trigger for better performance (Levitt & March 1988; Slater
& Narver 1995; Tippins & Sohi 2003). However, in general in our study, Learning Orientation (LO) has no effect on
performance, thus failing to support H5. It has been argued in previous studies that through intensive and deliberately specific
use of MCS, managers sent signals to the firm. These signals were used as information to search for understanding, to set the
agenda and action plans, and to look for new initiatives in an entrepreneurial way (Simons 1991), thereby guiding
organizational learning. Our results did not support these arguments, and therefore, we believe that further research is needed.
EO - Performance
In line with previous results (Chenhall & Morris 1995), our results showed that Entrepreneurial Orientation (EO) had a direct
impact on organizational performance; thus, it supports H6. Even more, in our results we could see that this impact is positive
in companies of different sizes (small, medium and large); and therefore, it also has a mediating effect on the indirect impact
of both uses of MCS on performance. Recent studies suggest that there is a contingent relationship between EO and the firm’s
internal characteristics (Wiklund & Shepherd 2003). Some scholars argue that the relationship between EO and performance
is likely to be more complex than a simple main-effect-only (Lumpkin & Dess 1996); therefore, it would be important to
consider the modifying effects of the firm’s internal characteristics, such as human resources or technology. In addition there
are systematic differences in MCS among firms that compete in different ways and with different orientations (Miller &
Friesen 1982; Govindarajan & Gupta 1985).
MCS & Performance
Direct effect. The use of diagnostic MCS reflects a positive and significant direct relationship between MCS and performance,
in the overall model giving full support to H7. This is not the case for the interactive where such use does not reflect a
significant direct relationship between MCS and performance in the entire model. As a consequence, our results failed to
support hypotheses H8. In previous research, there was evidence specifically arguing that the emphasis on the use of
interactive control was associated to enhanced performance, for firms engaged in exploratory innovation but not in
exploitation (Bedford 2015). This could be the main explanation for the absence of a direct impact of interactive MCS on
organizational performance. Still, other studies have argued an indirect impact of interactive controls on performance, which

104
can be observed by increasing the effectiveness of other processes, such as an intervening effect (Henri 2006a; Widener 2007;
Bedford 2015).
Indirect effect. As stated above, there should be some relationship between the uses of MCS and performance, which was
partly explained by an indirect effect; while the interactive / diagnostic uses of MCS increase the LO & EO capabilities, which
in turn increase performance, i.e., there is a mediating effect of organizational capabilities (LO & EO) among the various uses
of MCS and organizational performance.
EO. In general, the entrepreneurial orientation capability (EO) plays a mediating effect on the relationship between both
diagnostic and interactive uses of MCS and performance in both the full sample and the analysis by subgroups, except for
small companies in relation to the interactive use. In the EO case, the impact on perceived performance is positive in the
overall sample and in firms of different sizes, showing itself as one of the main drivers of the new economy. Literature on
entrepreneurship emphasizes the importance of EO as a determinant of business performance (Ripolles & Blesa, 2005). Some
studies suggest that there is a contingent relationship between EO and the firm’s internal characteristics. Wiklund & Shepherd
(2003) and other scholars argue that the relationship between EO and performance is likely more complex than a simple main-
effect-only (Lumpkin & Dess 1996); therefore, it would be important to consider the modifying effects of the firm’s internal
characteristics, such as access to human resources or external factors (uncertainty or technology).
LO. The learning orientation had no mediating effect on the various uses of MCS and organizational performance, except
for medium-sized firms, where there was a mediating effect on the relationships between the diagnostic and interactive uses
of MCS and performance. Previous research had found an indirect relationship between the different capabilities and a
company’s performance (Widener 2006) through variables that mediated that relationship. For small businesses, this
relationship has been widely investigated. As for this study, the impact of OL in small companies was not significant, bringing
to light one of the most studied aspects in small businesses, their focus on the short -term survival.
The Sub-group analysis showed that the uses of diagnostic MCS had a significant and positive impact on capabilities (EO
& LO) in any size of firms. Although the impact was positive and significant, it came out in an unexpected opposite direction.
The interactive use of MCS also showed that significant and positive capabilities have an impact on medium-sized and large
firms; however, this is not so for small firms, where this result was not significant. Our conclusions show that the diagnostic
use of MCS infuences performance directly, positively and significantly in any size of company. The use of interactive MCS
does not have an impact on organizational performance in a direct way in any of the studied subgroups.
Thus, this study provides empirical evidence of the relationships among the MCS in the LOC (Simons 1995) & ESS (executive
support systems classification) (Vandenbosch 1999) frameworks and contributes to the body of work that investigates the
relationships among MCS and other constructs (Kaplan & Norton 1992; Henri 2006a; Widener 2006). In addition, the study
adds to our knowledge of the MCS/Capabilities/Performance relationships and provides some empirical evidence useful to
understand the apparent conflict that has emerged from studies examining this link. We hope that this study will provide an
impetus for researchers to address these issues and begin to systematically explore the role played by MCS in the development
of capabilities and performance of the firm.

105
Managerial implications
How do managers actually use MCS to assist in the achievement of organizational goals? What formal processes and practices
are emphasized at the top management levels where responsibility rests for the results? These are two questions we must
continuously ask in the business world. These questions are required by definition, remembering that Anthony (1965) defined
management control systems in terms of assuring that organizational objectives are achieved. Relevant implications can be
seen in the results of our study. On the one hand, managers should be aware that the MCS might have different uses. On the
other hand, managers need to identify what the best uses of MCS are in order to develop organizational capabilities which
will be the drivers of improved performance. Both points will allow them to identify what kind of practice needs to be achieved
to meet their goals, and specifically, how people will respond to these systems and to the different factors that affect their
responses.
Recent empirical studies have suggested that the effectiveness of MCS depends not only on their design but also on the way
superiors use them (Otley 1978; Govindarajan 1984). The results of this work show that the development of organizational
capabilities, such as LO & EO, require different practices and uses of the various control systems, beyond -as its name implies-
control, allowing them to have better organizational results. A business that increases its competitive position will improve
its performance (Narver & Slater 1990).
Our results highlight that the two uses of MCS, diagnostic and interactive, are relevant in different ways: There are several
applications that MCS can be given, but these applications or uses work together to impact the development of capabilities
and performance of a company. The use of a diagnostic way directly impacts the performance, and it will indirectly provide
the information needed to act. In addition, the use of the MCS in an interactive way will have an indirect impact through the
capabilities they develop.
A diagnostic use implies taking time to legitimize an idea or an action, which is very important in a culture where things
happen as long as we explain. Thus, legitimizing appears to allows us to have better acceptance, focus, and finally, action
(Feldman & March 1981; Fama & Jensen 1983; Prahalad & Doz 1987). The interactive use implies to be continually
answering the question: What problems do we have to focus on? (Simon et al. 1954)This implies to be seeking opportunities
to stimulate the participation and dialogue between manager and employees, and to finally cause the dissemination of
information and assuring its right interpretation (Slater & Narver 1995). Used as processes, both generate the necessary
capabilities to act. Finally, understanding the consequences of the uses of MCS is an important topic for organizations on
account of the high investment these systems require.
3.8. Limitations and suggestions for further research
Limitations In the same way that all empirical studies have, this study presents potential limitations that should be taken into account
when making generalizations, and thus, the findings need to be interpreted in light of these limitations.
Although the corresponding tests were performed to ensure reliability and we used a valid measure of the uses of MCS,

106
capabilities and performance (satisfactory psychometric properties), future research could refine and further validate the
instrument. We must see the results in good conscience that these were obtained through a survey, and using the survey
method to collect data creates the potential for bias due to common response. In this case, the results should be analyzed
taking into account that they were obtained by a survey, which entails several implications. The survey method to collect data
creates potential for bias due to common response. In this line, we are aware that the results of this study could show a bias
by a form of common method variance (CMV) called Single Source Bias (SSB) (Campbell & Fiske 1959), and although
Harman’s one-factor test indicated the absence of common method effects in our survey data (See Appendix C. Non response
bias & common method variance (CMV) analysis). There are arguments to think that this test is necessary but insufficient
(Podsakoff et al. 2003). So, this is a limitation in our study and also an area of opportunity for future research using multi-
method strategies for data collection, in order to enhance the validity and reliability of the construct measures. Future studies
in this area should also use more refined measurement instruments to address these concerns and, where feasible use multi-
source measures.
This study does not examine a specific type of MCS. Generalizations about the different types of MCS should be handled
with care. We only examine two uses of MCS -diagnostic and interactive control- and leave the rest of LOC framework
components for future research. In terms of capabilities, this study focuses on learning and entrepreneurial capabilities that
have been studied and shown to have a strong relationship with performance in organizations. Therefore, making global
generalizations about organizational capabilities must be done carefully. Performance is measured using a subjective
instrument. Even if there were evidence in favor of consistent results between objective and subjective measurement, the
results should be interpreted with caution considering the potential for bias.
Finally, the study focused on business managers or directors; therefore, further research is required to assess whether different
uses of MCS have the same results at other managerial levels.
Suggestions for further research The results of this study provide guidance and point at several avenues for future research.
Previous research indicates that the relationship between the various uses of MCS and the development of capabilities in the
firm has positive or negative coefficients, depending on usage and on the context in which the investigation is conducted.
Similarly, our research obtained significant relationships but always in a positive sense in regards to capabilities; hence, future
research could retest the meaning of these relationships in other contexts and with other companies, as the results shown so
far cannot be conclusive.
Empirical evidence (Kirca et al. 2005) has proposed that contextual factors are very welcome, as there are few empirical
applications developed. Variables as the uncertainty perception and human capital factors should be emphasized because of
its impact on the usability of the systems. Also, since the size of a firm has been shown to affect the way in which control
systems are utilized (Bruns & Waterhouse 1975; Merchant 1981), size must also be a control variable in studies like this one.
Finally, this study focused only on two capabilities (Learning & Entrepreneurial Orientation); other strategic capabilities may
have a relationship with MCS & performance and could be taken into account.
107
Chapter IV: Management Control Systems, Capabilities and Performance: The influence of the Environmental Uncertainty
4.1 Abstract
From a contingency framework, this paper looks to contribute to a stream of literature that investigates determinants and
consequences of performance. Specifically, this study examines the extent to which the perceived environment uncertainty
(PEU) for decision makers, impacts in the relationships between the various uses of management control systems (MCS) to
develop organizational capabilities –entrepreneurial orientation and learning orientation (EO and LO)- and performance.
To test these hypotheses, a theoretical model was developed and tested, using structural equation modeling, applied to
questionnaire data that surveyed 644 companies in various sectors. Specifically, it tried to examine the mediating effect of
PEU in both relationships between i) the uses of MCS and capabilities, and ii) capabilities and performance.
As we hypothesized, the results revealed the existence of a positive and significant mediating effect of the PEU in the
relationship between the LO and EO capabilities and performance; however, a different effect was observed in each capability.
PEU has a total mediating effect in the LO-performance relationship and a partial mediating effect in the EO-Performance
relationship; In the other hand, the mediating effect of PEU in the relationship betweeh the uses of MCS and capabilities was
null.
The perceived uncertainty is described in relation to the uses of MCS, capabilities and performance. Their implications for
the behavior of an organization’s administrator are discussed.
Keywords: Management control systems uses; Capabilities; Learning orientation; Entrepreneurial orientation; performance;
Uncertainty, Environment,
108
4.2 Introduction and research objective
This study works on the resource based view (RBV) and strategic capabilities literature (Barney 1991; Day 1994; Teece et al.
1997). It pursues to explain why some firms are able to have and use different tangible and intangible assets which enable
them to have some capabilities that provide sustainable competitive advantages and earn superior returns (Wernerfelt 1984;
Grant 1996; Barney 1991; Day 1994; Teece et al. 1997; Eisenhardt & Jeffrey 2000).
The use of management control systems (MCS) is frequently recommended for strategy implementation and for enhancing
organizational performance (Davis & Albright 2004). These systems comprise the use of financial and non-financial
performance measures linked to the organization’s business strategy, e.g., the balanced scorecards (BSC) (Kaplan & Norton
2000) and multi-criteria key performance indicators (KPI) (Cheng et al. 2007; Hall 2008). The MCS concept has been
extensively studied and developed for nearly two decades, but we still have very little knowledge about the implications for
its development, use and results. Proponents of MCS studies often promote the idea that MCS facilitate the implementation
of the organization’s business strategy, and by doing so improve organization’s overall performance (Franco-Santos et al.
2012). Even more, prior research has suggested that organizational capabilities that trigger performance are shaped by MCS
(Henri 2006a; Koufteros et al. 2014). Our previous results showed that the diagnostic and interactive uses of MCS, will have
a different impact on organizational practices and results, both directly and indirectly. Also, it is important to take into account
the size of the organizations, as we saw earlier, the size variable modifies these relationships.
Prior studies have explained what the definition of MCS implies they should do, but have failed to explain how they do it,
and if there are other variables that have an impact on these results. The key-missing premise in previous studies is if the use
of MCS can be universally appropriate and if the studied relationships between the uses of MCS uses – Capabilities -
Performance have had the same results in in different contexts.
This essay, focusing on environmental uncertainty, is a response to Otley’s and Soin (2014) calls for researchers to ‘develop
better ways to describe likely sources of uncertainty and their possible impacts’, in particular how it relates to the use of MCS.
The constructs management control systems, capabilities and performance have been widely studied individually;
nevertheless, considering the potential influence of other factors on this relationships, the perceived environmental uncertainty
contingence factor is examined here. Based on the contingency theory, the potential impact of the inclusion of the perceived
environmental uncertainty (PEU)34 variable in the relationships between the uses of MCS- Capabilities - Performance are the
base for the hypotheses proposed in the theoretical model of this paper.
Recent studies have shown a number of internal or external factors that modify the relationship between MCS and the firm
performance (Speklé & Kruis 2014). Contingency variables, acting as mediating factors, have been linked to internal factors
to analize the relationship between MCS and performance (Franco-Santos et al. 2012), such as people’s behaviors in
communication (Burney & Widener 2007), cooperation (Mahama 2006), coordination (Dossi 2008; Cruz et al. 2011),
participation (Butler et al. 1997; Kolehmainen 2010) , motivation (Malina & Selto 2001; Godener & Söderquist 2004), role
understanding (Hall 2008), job satisfaction (Lau & Sholihin 2005), and leadership (Bititci et al. 2006). On the other hand, also
34 PEU: Scale used to reflect the changes in the external environment as perceived by managers (Govindarajan 1984).

109
internal and external variables, have been associated with the company as a whole, for instance, strategic orientation (Perera
et al. 1997; Chenhall & Langfield-Smith 1998; Ittner et al. 2003; Stede et al. 2006), a mediating role of strategic decision
arrays was examined a simple mediation model to test in the relationship between SPMS and organisational performance
(Bisbe & Malagueño 2012), organizational structure and competition (C.-L. Lee & Yang 2011), perceived environmental
change (Kihn 2007), environmental uncertainty (Hoque 2004), organizational culture - management style (Bititci et al. 2006)
and quality of information systems (Hyvönen 2007). Some results show that not all of the contingencies studied influence
the relationship between the use of MCS and performance, for example, Hoque and James (2000) found that market position,
product life cycle or organizational size were not contingent in this relationship (Hoque & James 2000). All these studies
have shown factors that modify the relationship between MCS and firm performance, but since Anthony (1965) addressed the
structural attributes of planning and control systems and suggested possible design modifications contingent upon the context
of their use, few studies have taken into account the implications of the context and its influence on the use of management
control systems.
In the theoretical contingent approach, the term contingency means that something is true only under specified conditions
(Chenhall 2003). This approach is recommended in our research, because it shows how a specific contingency may affect the
impact of MCS uses. Also, as proposed by Otley (2016), a survey method needs to be tailored to take into account the context
of specific organizations as we did in our study. We suspect that many of the inconsistencies found in the literature could be
explained by looking at the context in which the studies took place.
The contingency theory of organizations (Burns & Stalker 1961; A. D. Chandler 1962; Lawrence & Lorsch 1967), predicts
that the relationship between an organization’s characteristics, such as its MCS uses or capabilities, and organizational
performance depends on specific contingencies or situations (Hayes 1977; Otley 1980). Empirical studies adopting this
contingency perspective provide evidence of different contingent aspects of the firms and have suggested that the effectiveness
of MCS and its ability to generate organizational capabilities to impact organizational performance depends on several factors
including its design, technological sophistication, or the type of use that managers give to these systems and the information
they generate (Hopwood 1972; Otley 1978). Thus, numerous contingencies can influence the impact of MCS, e.g., strategy
(Gosselin 2005), strategic orientation (Ittner et al. 2003), environmental context (Bhimani 2003), environmental uncertainty
perception PEU (Govindarajan 1984; Hoque 2004), corporate context as size, product diversity and extent of decentralization
(Merchant 1981), performance assessment (Hayes 1977), technology (Daft & MacIntosh 1978), size (Chenhall 2003),
comprehensive/diversity MCS (Chenhall 2005; Hall 2008), access to human capital (G. N. Chandler & Hanks 1994), human
capital background (McEvily & Chakravarthy 2002; Naranjo-Gil & Hartmann 2007b), organizational culture (Hoque & James
2000; Henri 2010; Henri & Journeault 2010), employee participation and involvement (Johnston et al. 2002) and user
characteristics such as education or work experience (Franco-Santos et al. 2012). All of them are important contextual factors
which influence the role of MCS.
In another branch, strategy literature (Miles & Snow 1978) suggests that improved business performance requires that the
strategy of a specific firm should be fully aligned with at least three important points: organizational structure, information
systems, and management style. In the previous statement, it is important to note two focal points that have been highlighted

110
by some researchers (Miles & Snow 1978; Dent 1990; Govindarajan & Shank 1992). First of all is that the strategy
implementation phase does not occur in isolation. There are context situations in which firm actions depend on the lack of
information, situation which may impact differently on companies and may play a major role in the firm performance (Hoque
2004). The second point is that many companies operate in different environments and have different priorities and initiatives.
Although firms compete in the same context and face the same set of potential uncertainties35, the strategy of the firm strongly
influences which uncertainties are critical for the achievement of the chosen objectives. Therefore, their systems and
management styles are also different. Research has found that the way to act it is dependent on the degree of certainty a firm
holds about its current and future business operations (Chenhall & Morris 1986; Mia 1993). Both points lead us to argue that
the level of uncertainty perceived by decision makers in the company is a key point. Hence, this research should consider it.
Although some researchers in accounting literature suggest that the environmental uncertainty is positively associated with
the design and use of MCS (Otley 1980; Chapman 1997; Hoque 2004), studies on the MCS role (Govindarajan & Gupta 1985;
Simons 1987, 1990, 1995; Ittner & Larcker 1997; Henri 2006a, 2006b; Henri & Journeault 2010) have not commonly
addressed the possible intervening role of environmental uncertainty perceived by those who make use of these systems.
Then, it seems necessary to develop new, different approaches to deal with situations of uncertainty (Otley 2016).
Finally, the complex and changing environmental context, calls for fluidity and flexibility in the management practice (Dent
1987). An accelerated dissemination of technology, globalization, and country deregulation among other factors (Hamel &
Prahalad 1994; Cooper 1995; Richard A D'Aveni & Gunther 1995), produce a difference in the information held by firms,
creating a gap between the known and the desired information (Galbraith 1973). These are reasons found in the business
environment literature to suggest that the perception of uncertainty should be considered in research (Hoque 2004). As Otley
& Kim (2014) said, examining different aspects of the MCS in the modern world, whilst paying more explicit attention to the
ubiquitous nature of uncertainty, it is a focal point of current research (Otley & Kim 2014) . Therefore, given that the effect
of some environmental factors in the proposed relationships is unclear, studies providing a better understanding of PEU effects
and how these effects occur would be beneficial for further progress in this research line.
As a consequence, the question that arises is if the contingency, represented by the perception of uncertainty in the
environment, has some impact on the relationships of MCS uses-capabilities-performance. In other words, is there any
relationship with the perceived environmental uncertainty for decision makers and the effectiveness of the MCS uses so as to
develop capabilities that impact performance?
Using a contingency-theoretical perspective, the conceptual roots of this work lie in the idea that the relationships of the uses
of MCS – Capabilities and Capabilities – Performance depend significantly on the perceived environmental uncertainty.
Specifically, this paper investigates the extent to which PEU may play a significant role in the relationships raised. The three
sets of constructs (uses of MCS, capabilities and performance) will now be tested, trying to see if these proposed relationships
are mediated by the inclusion of the variable PEU in a model presented later.
35 Potential uncertainties as changes in government regulation, intensity of competition, advance of new technologies, nature of customers and suppliers, product life cycles, and diversity in product lines.

111
Chenhall (2003) argues that in general, it may be useful to follow three stages in contingency based studies. First, the adoption
and use of MCS should be established; in our case it was defined since the lifting of data, making sure that companies used
some form of MCS. Second, it was necessary to examine how they were used. Here our model proposed asking the respondents
about the extent to which four MCS were used in their firms and then linked the models of Simons and Vandenbosch in second
order constructs with capabilities and organizational performance. Finally, in the third place, linking the above variables and
verifying contingent factors (PEU) that could modify these relationships (Chenhall 2003). In our case, using the theory of
contingency, we had to include organizational performance as the dependent variable to identify the theory that showed how
the combination of MCS uses, capabilities and context, allowed leaders to make better decisions to impact performance.
The remainder of the paper is organized as follows: Review of the relevant literature in section 4.3 where the theoretical
framework of this work is developed. Section 4.4 describes the theoretical model and develops the research hypotheses;
followed by 4.5, which is the research method applied and data validity. Section 4.6 presents the research findings. A
discussion of the results, conclusions and managerial implications are developed in section 4.7. Finally, section 4.8 describes
the limitations and further research.
4.3 Theoretical framework: RBV, Organizational Capabilities, MCS, Performance, Environmental
Uncertainty
RBV & Organizational capabilities
From the perspective of the theory of resources and capabilities, firm capabilities refer to the consequences associated with
specific processes, activities, or competences that enable the organization to perform and gain competitive advantages (e.g.,
strategic alignment, entrepreneurial orientation, organizational learning, etc.). While it is generally agreed that capabilities
contribute to business performance, relatively little is known about the capabilities drivers and how those drivers operate via
capabilities to collectively influence performance (Hult 2004). Moreover, little is known about how the use of MCS as a
driver of capabilities operates under varying conditions in the firm’s external environment.
In this study we focus on the capabilities of entrepreneurial and learning orientation because they are among the most
recognized and researched organizational strategic capabilities (entrepreneurship, innovativeness, market orientation and
organizational learning) (Covin & Slevin 1991; Lumpkin & Dess 1996; Ripollés & Blesa 2005; Henri 2006a). Also, the
business literature supports that the learning (Widener 2007) and entrepreneurial orientations (Ripollés & Blesa 2005) are
positively associated with performance (Yuan et al. 2008).
The learning orientation (LO) capability refers to the activities undertaken by the organization to create and disseminate
knowledge, to achieve superior results, and to develop competitive advantages (Sinkula et al. 1997). LO has been defined as
the development of ideas, knowledge, and relations among past and future actions (Fiol & Lyles 1985). LO facilitates
competitive advantages by improving a firm’s information processing activities at a faster rate than rivals do (Baker & Sinkula
1999), strategic activity in times of change and uncertainty. However, to do so requires frequently updated information

112
(Simons 1987). Hence, MCS have been identified as an important tool to acquire, interpret, diffuse, and store information
and results (Huber 1991; Levitt & March 1988). Empirical evidence has shown that there is a direct positive relationship
between LO and performance (Sinkula et al. 1997; Calantone et al. 2002; Tippins & Sohi 2003; Aragón-Correa et al. 2007).
In contrast, there are also studies in which this relationship showed little or no significance, depending on the context in which
the study is developed. (Farrell & Oczkowski 2002; Llonch Andreu et al. 2007).
Among the different definitions given for the entrepreneurship concept, we present the following: a permanent attitude (Covin
& Slevin 1991) that is proactively seeking new business opportunities (Zahra & Garvis 2000); and the intangible ability of
the company's strategic position which is hard to replicate and is related to superior results (Wiklund & Shepherd 2005).
Hence, the entrepreneurial orientation (EO) concept (Covin & Slevin 1991; Lumpkin & Dess 1996) is an extension of the
entrepreneurship concept, which is moved from the individual level to an organizational level (C. Lee et al. 2001); A critical
organizational process that contributes to the firm’s survival and performance (Miller 1983; Zahra 1991; Zahra & Covin 1995;
Wiklund 1999; Hitt et al. 2001; Wiklund et al. 2007) for companies of all sizes (Wiklund & Shepherd 2003; Wiklund &
Shepherd 2005; Rauch et al. 2009). From the standpoint of the RBV, EO can be identified as a high-level organizational
routine, durable, and difficult to imitate or transfer (Covin & Slevin 1991; Lumpkin & Dess 1996; Wiklund 1999; C. Lee et
al. 2001; Ripollés & Blesa 2005).
Management control systems (MCS)
In the classic view of Anthony’s (1965) study, MCS have been conceptualized as “the process by which managers assure that
resources are obtained and used effectively and efficiently in the accomplishment of the organization’s objectives” (Anthony
1965). A more comprehensive notion of the MCS role may include the support of the entire strategic process (Mintzberg
1978; Merchant & Otley 2007). Otley refers to the MCS as the set of procedures and processes that managers and other
organizational participants use in order to help ensure the achievement of their goals and the goals of their organizations
(Otley et al. 1995). A modern MCS definition is “the evolving formal and informal mechanisms, processes, systems, and
networks used by organizations for conveying the key objectives and goals elicited by management, for assisting the strategic
process, and ongoing management through analysis, planning, measurement, control, rewarding, and for supporting and
facilitating organizational learning and change” (Ferreira & Otley 2009).
This is what the definitions have proposed, but we want to highlight two issues that are not clear in these proposals. First,
MCS have been regarded as static and unchanging, rather than dynamic; and second the need to recognize that all control
takes place under conditions of uncertainty (Otley & Kim 2014). The first point is related to the fact that MCS should be
considered beyond a static and mechanistic system, which should develop and adapt along with the context (Otley 2016). The
second point is concerned with something that management control literature in general has not made explicit: the
environments in which organizations operate are subject to some uncertainty. and it is important to note that as there are
different perspectives used to study MCS, the literature lacks an agreed-upon definition and deployment (Otley & Kim 2014).
Specifically, this second point will be addressed as the main subject of this study.
Management Control literature argues a general understanding that MCS do not automatically improve the firm performance,

113
rather, performance is completely related to how systems are designed, developed, and used. Evidence suggests that the “use”
can be more significant than the formal “design” of the MCS (Ferreira 2002). Thus, the best way to approach the study of
MCS is by looking at the how they are used. (Langfield Smith 1997).
Regarding the use of the systems, while the management accounting literature has studies that investigate MCS, the concept
of ‘use’ has not been well-developed in the literature (Ferreira 2002). Except for the work of Simons (1995) LOC and
Vandenbosch (1999) ESS, we could not find other studies focusing on the uses of MCS or their categories. In this line, as
tested above, this study uses a combination of these two classifications that have been studied separately and relates both to
generate the hypotheses proposed, explained in greater detail below.
Most research on MCS has used a resource-based view approach (Barney 2001) and the levers of control (LOC) framework:
beliefs, boundaries, diagnostic and interactive uses of MCS (Simmons 1995)36, but most frequently using only the last two
uses (diagnostic & interactive) because that is where the MCS take shape. The LOC framework asserts that strategic
uncertainty drives the choice and use of MCS (Widener 2007), which in turn, impacts the organization through organizational
learning and triggers the conversation that causes the search for entrepreneurial opportunities (Simons 2000). The second
MCS classification used in this study is an empirical analysis between MCS and organizational competitiveness, called
“Executive support systems classification (ESS)” (Vandenbosch 1999) 37. This identifies a typology with the four categories
used in management information systems: score keeping (Monitoring); decision legitimization (Legitimizing); focusing
organizational attention (Attention focusing); and problem solving (Strategic decision making).
The literature main results show that MCS are effective mechanisms for facilitating organizational learning and supports
entrepreneurial initiatives to growth and develop at all levels, but specially when the use of MCS is focused on action and
improvement rather than on reporting and controlling (Johnston et al. 2002; Godener & Söderquist 2004; Ahn 2001; Chenhall
2005); These arguments imply that they are more useful when used interactively and less when used diagnostically. Some
studies show that the interactive use of MCS fosters organizational capabilities. However, previous studies also show that the
diagnostic use of MCS weakens some of these capabilities (Henri 2006a). Our results highlight the opposite, and in line with
the studies by Koufteros et al. (2014), our results show that the uses of MCS can positively influence the firm strategic
capabilities. Specially, we confirm that the diagnostic use of MCS is positively related to LO & EO capabilities.
Based on the insights from the above studies, it can be argued that MCS can encourage the utilization and development of
strategic firm capabilities but the impact of different uses of the MCS remains unclear and necessitating further research.
Performance
Performance mainly refers to the various consequences in the organization (e.g., customer satisfaction, productivity, quality,
36 Levers of control (LOC) (Simons, 1995): Beliefs (commitment towards goals and to inspire, values, vision, direction, core values), boundary (administrative controls hierarchically based, guidelines for behavior, behavioral constraints), diagnostic use (control over organizational goal, monitoring), and interactive use (enable to search opportunities, solve problems or forward- looking and make decisions with management involvement). 37 “Executive support systems classification (ESS)” (Vandenbosch 1999): i) Score keeping (monitoring) refers to the question, how am I doing?. ii) Legitimizing decisions (Legitimization): Refers principally to justify and validate past actions or decisions that has been made to ensure the legitimacy of future actions; Focusing organizational attention (Attention focusing) respond to the question, what problems must we focus on? and Problem solving (Strategic decision making) is a non-routine activity of senior management strategic decision-making based in data analysis processes.

114
innovation, among others (Henri & Journeault 2010). In our study performance comprises the different effects that the uses
of MCS and capabilities can have on financial and non-financial results at all levels of the organization. Research on
performance has been developed mainly in two schools of thought: Economics, suggesting a role of industry structure and the
RBV, exalting the importance of the resources and firm characteristics in the firm results. In this last line, MCS can be viewed
as an important firm resource, based on the assumption that MCS benefits organizations to facilitate the evaluation and control
process and the decision making impacting on performance (Ittner & Larcker 2003; Chenhall 2005; Kaplan & Norton 1996).
The literature recognizes several ways or dimensions that are critical in measuring the success or performance of a firm
(Govindarajan 1988; Govindarajan & Fisher 1990); however, the connotation that performance has with financial parameters
is frequently large and too limiting (Mellahi & Sminia 2009). Two perspectives have been taken when approaching the study
of firm performance: reported performance and perceived performance. Reported performance was based on information
internally or externally reported, financial and non-financial. Perceived performance was based on responses from research
participants perceptions, also including: financial & non-financial (Franco-Santos et al. 2012). In general performance
research has been dominated by the last (Narver & Slater 1990): self assessment processes where individuals provide an
evaluation of their performance (Chenhall 2003) or organizational goals (Govindarajan 1984). Heneman (1974) reported a
very high correlation in self-ratings between superiors and subordinates, specially in situations in which the subordinate was
guaranteed anonymity and assured that the data collection was for scientific research and not his personal evaluation
(Heneman 1974).
Research has found that the impact of MCS on performance is unclear on both, reported and perceived performance. Studies
results are inconsistent, with positive effect (Chenhall & Langfield-Smith 1998; Ittner & Larcker 1998a; Ittner & Larcker
2003; Ittner et al. 2003; Banker & Potter 2000; Hoque & James 2000; Hoque 2004; Chenhall 2005; Henri 2006a; Hyvönen
2007; Crabtree & DeBusk 2008; Grafton et al. 2010; Cruz et al. 2011), mixed positive and negative results (Ittner & Larcker
1997; Braam & Nijssen 2004; Kihn 2007; Griffith & Neely 2009), and studies with no or weak relationship between MCS
systems and performance (Perera et al. 1997; Ittner et al. 2003; Said et al. 2003; HassabElnaby et al. 2005). In this light, still
more studies are considered important. In our work, performance was assessed from the perspective of perceived performance
based on responses from research participant’s perceptions. Heneman’s conditions were met fully in our study.
Environmental Uncertainty: The influence of the environment
We begin by clarifying the central concept in this study. Perceived environmental uncertaitnty (PEU) is a scale used to reflect
the changes in the external environment as perceived by managers (Govindarajan 1984). According to Galbraith's definition,
the concept of uncertainty is about the difference between the amount of information required to perform a task and the amount
of information already possessed by the organization, a gap between the information known and desired (Galbraith 1973). It
is important to note that in early contingency research, the focus was mainly on the effects of uncertainty within the internal
organizational structure (Burns et al. 1961; Galbraith 1973). The inclusion of an external environment is a powerful contextual
variable that is at the foundation of contingency-based research (Chenhall 2003).
A well accepted concept of environment uncertainty was proposed by Govindarajan (1984), in which, the focus is on a

115
business unit level and only in a portion of the total environment that is related on how to get and achieve organizational goals.
Here, the basic effect of uncertainty is to limit the ability of the organization to plan or make decisions about activities in
advance of their execution, and specifically due to the inability to predict the actions of four groups directly related and who
make the business environment: i) customers, ii) suppliers of materials, labor and capital, iii) both competitors for markets
and resources and iv) regulatory groups. Gonvindarajan (1984) sees environment as a source of information and argues that
it is the decision-makers perceptions of this information which leads them to make changes in organizational processes,
structures and strategies. Thus, environmental uncertainty refers to a firm’s ability or inability to predict accurately the effects
of various aspects of its environment such as customers, suppliers, deregulation and globalization, technological processes,
competitors, government regulations/policies, economic environment and industrial relations (Govindarajan 1984). It is
important to distinguish uncertainty from risk. Risk is concerned with situations in which probabilities can be attached to
particular occurring events, whereas uncertainty is defined by situations in which probabilities cannot be attached because the
elements of the environment may not be predictable (Chenhall 2003).
As stated by Otley (2016), there are several reasons to choose uncertainty among all variables used in studies of the
contingency theory. First of all, it has produced some of the strongest results in early studies. Secondly, with the emergence
of a global economy and increased competition, uncertainty has increased in recent years and affects all businesses; in any
situation there is a degree of uncertainty. Finally, it is an issue of measurement. Perceived environmental uncertainty can
easily be incorporated into interviews or questionnaires to individual managers. Although it is a very subjective measure, the
most relevant aspect of uncertainty is the uncertainty perceived by individuals that will most directly affect their behavior.
Research in uncertainty usually measured PEU based on the Govindarajan (1984) instrument, where respondents are asked to
assess the predictability or unpredictability of eight environmental factors (Govindarajan 1984). Finally, this study uses
Govindarajan (1984) concept, because it fits perfectly in our approach; this is data pertaining to a global business and were
identified through an inquiry to functional areas related to the planning and strategy areas.
Relationships between constructs:
MCS (Diagnostic & Interactive uses)-PEU-Capabilities
Management control systems are about the process of steering organizations through the environments in which they operate
to achieve both short and long-term goals. These goals will differ from organization to organization for two main reasons:
their stakeholders are different, and each one has a different context (Otley & Kim 2014). Although it is easy to say, with
some exceptions, the environmental context is one of the issues that has not been developed in the literature. Therefore,
management control studies need to recognize that all control takes place under conditions of uncertainty: it does now, and it
has always been this way (Otley & Kim 2014).
MCS are used not only to assure that outcomes are in accordance with plans (diagnostic), but also to motivate the organization
(interactive) to be fully informed concerning the current and expected state of strategic uncertainties (Simons 1990). In
general, accounting literature supports that the environmental uncertainty is positively associated with the design and use of
116
management control systems (Otley 1980; Chapman 1997, 1998; Hoque 2004). Results suggest that managers, who perceive
greater influence of environmental uncertainty in the performance of their businesses, give greater importance to the MCS
used to deal with the situation. Furthermore, Mia (1993) suggests that MCS may help managers to better understand uncertain
situations (Mia 1993). Scholars suggest that managerial choice may be severely influenced by the effect of the external
business environment (Greenley & Oktemgil 1997), arguing that uncertainty influences the relationships among firm culture,
strategy and performance (Miller 1987; Kohli & Jaworski 1993; Slater & Narver 1994; Slater & Narver 1995). This implies
that impact of how MCS are used in the strategic planning-performance relationship will be stronger because it provides the
information needed to align organization’s strategy and structure to its environment. When organizations are facing high
uncertainty in changing and complicated environments, also known as turbulent environments, more information is needed
(Hutzschenreuter & Kleindienst 2006) and they will utilize their MCS to a higher degree (Tushman & Nadler 1978). MCS
allow managers to deploy control information systems as a tool to manage uncertainty (Sakka et al. 2013). When goals are
clearly defined and communicated using an MCS in diagnostic form, they help to absorb uncertainty, and then they can direct
attention toward the desired outcomes in an interactive use of MCS (Bedford 2015). In summary, when a firm faces a situation
of uncertainty and the ability to identify future situations decreses, there is a need to make better decisions, for which more
information is needed. Information is provided by the MCS in different ways. The diagnostic use provides information on the
fulfillment of goals, progress and reporting. On the other hand, the interactive use enables the search for opportunities,
facilitating information flow, improving decision making and stimulating a dialogue that produces action and leads to
organizational learning (Janke et al. 2014). Hence, the various MCS uses are the channel to provide important information for
strategy deployment of the whole process under different levels of uncertainty. The above reasoning suggests that both MCS
uses, diagnostic and interactive, allow you to address the information requirements arising from observed external uncertainty,
and thereby produce the desired effects on capabilities (Pondeville et al. 2013; Janke et al. 2014).
In their original proposal, Simons (1995) argues that the higher the uncertainty, the more monitoring/diagnostic uses are
necessary to reduce the information gap and to manage this strategic uncertainty (Galbraith 1973; Simons 1995; Simons 2000).
Some studies show that when MCS are used or at least analyzed separately, the results are inconclusive and the perceived
level of uncertainty is not directly related with a type of system used. Here are some examples. It has been found that diagnostic
controls, such as financial budgets for performance evaluation, tend to be used to a lesser extent when uncertainty levels are
relatively high (Govindarajan 1984; Hayes 1977). Instead, they tend to use an interactive non-financial MCS use (broad scope)
to a greater extent in order to cope with external environmental uncertainty more effectively (Chenhall & Morris 1986
;Ezzamel 1990). Simons (1987, 1995) also argues that some firms operating in uncertain environments require the ongoing
attention of managers and employ highly interactive control processes to enhance managers’ abilities to anticipate and manage
future uncertainties. Scott and Tiessen (1999) also propose that companies facing uncertainty should emphasize employee
participation, encouraging teamwork to have more and better answers, ie, an interactive use of MCS. Even more, Govindarajan
(1984) argues that the greater the environmental uncertainty, the greater the need for superiors to rely on subjective rather
than formula-based approaches in evaluating performance. I.e., in highly uncertain situations, measuring firm performance
requires management’s greater reliance on non-financial measures used in interactive controls (e.g., market share, customer
117
satisfaction, efficiency and quality) (Govindarajan & Shank 1992). This means that the results are inclined towards that
increased uncertainty related more with the interactive use; thus, PEU should be associated with the development of the
interactive use of MCS. Nevertheless, this is not conclusive because Hoque (2004) found an insignificant effect of the
environmental uncertainty on performance acting through use of non-financial performance measures (Interactive MCS uses),
casting doubt on previous results that support a strong effect. On the other hand, studies show that formal diagnostic controls
may be especially relevant in uncertainty circumstances because they support “systematic rather than chaotic reaction to
change” (Abernethy and Brownell, 1999). Also, Sakka et al. (2013) findings show that MCS used in a formal traditional
diagnostic way enhanced performance when uncertainty was present. Thus, PEU should be associated with the development
of formal diagnostic MCS.
Diagnostic and interactive use of MCS fulfill different roles and a balanced use might vary depending on the level of
uncertainty (Henri 2006a). Research grounded in contingency theory finds that companies use “sophisticated management
control systems” when facing environmental uncertainty (Mia 1993; Khandwalla 1977; Chenhall 2003). Even more,
researchers suggest the need for a combination of traditional formal controls, such as diagnostic controls, but they should be
more flexible controls and take place within a situation that involves intense verbal communication between groups in
conditions of environmental uncertainty (Merchant 1990; Chapman 1998; Chenhall 2003). Khandwalla (1977) argues that
organizations facing pressure will initially tighten control so as to threaten short-term survival and then adopt more organic
controls. In line with the most sophisticated systems that promote both uses, Chenhall (2003) argued that in an uncertain
situation, where there is a need for more information, the diagnostic MCS use should be sufficient to assist in taking and
implementing decisions in an interactive manner. From the above results we can see that a balance between diagnostic and
interactive MCS uses facilitate the creation of unique organizational capabilities. As Simons (1995, 2000) said, top managers
use diagnostic controls to know and learn; and interactive control, to experiment and stimulate opportunity-seeking (Simons
1995; Simons 2000). Environmental uncertainty requires the company to act in two directions: first understand the situation,
and second to be able to respond more rapidly to unforeseen changes in order to survive (Lawrence and Lorsch, 1967; Covin
and Slevin, 1989). Learning orientation is responsible for the first, and entrepreneurial orientation can enhance this response
(DeSarbo et al. 2005).
The use of MCS is associated with the superior performance of companies that have an entrepreneurial orientation (EO),
unlike those that have more conservative strategies. Furthermore, performance has been associated with entrepreneurial firms
where the MCS is extensively used (Chenhall & Morris 1995). In the same line, knowledge-based resources as the use of
MCS, when they are directed to discover and exploit opportunities (interactively), are positively related to firm performance,
and an entrepreneurial orientation (EO) enhances this relationship (Wiklund & Shepherd 2003). There is growing interest in
literature in identifying and defining the determinants of organizational capabilities. MCS and uncertainty play an important
role here. On the one hand, our previous results support that the diagnostic and interactive uses of MCS have a direct impact
on the ways and perceptions related to learning and entrepreneurial behaviors that can support, in different ways, the search
for opportunities and results. On the other hand, it can be argued that the relationships studied could change and be modified
when facing a perception of uncertainty.

118
From the above results we can conclude that both diagnostic and interactive uses of MCS are related to the development of
organizational capabilities; however, in the presence of uncertainty a balanced use of diagnostic and interactive MCS
facilitates the creation of unique organizational capabilities. Totally in line with Mundy’s (2010) assertion that balanced use
of MCS is essential to effectively generate and support organizational capabilities and performance. This allows us to assume
that the perception of uncertainty affects the level of impact of both uses of MCS in other variables; therefore, capabilities
and performance will be affected by this perception. Despite this, it is not totally clear yet how the perception of environmental
uncertainty (PEU) affects the development of capabilities and performance.
Capabilities-PEU-Performance
The changing environments of business organizations are leading them to become highly competitive, promoting the creation
of knowledge-based organizations that learn and use intellectual capital as a source of sustainable entrepreneurial competitive
advantage, thus enabling them to obtain better yields (Garvin 1993; Senge 1990). In this study we focus on two capabilities
that have shown to be directly related to performance, learning orientation (LO) and entrepreneurial orientation (EO), and we
seek if PEU has a mediating effect in this relationship. Lumpkin and Dess (1996) argue that the relationship between
capabilities and performance is likely more complex than a simple main-effect-only. It could be modified by differences in
the context, and scholars can benefit from considering the mediating effects of the environment in the firm’s characteristics.
Recent investigations suggest that the environment modifies the relationship between organizational capabilities and
performance (Zahra & Garvis 2000; Lumpkin & Dess 2001; Wiklund & Shepherd 2005). Environmental uncertainty, in which
the source of uncertainty is the external environment, implies that unpredictable environmental variables can influence firm
performance (Miller, 1993). Also, Wiklund and Shepherd (2005) defend the idea that the diverse dimensions of the
environment will also influence different factors of performance growth, as can do capabilities. Frequently, two dimensions
called dynamism and hostility are used to investigate this influence; both dimensions are related to uncertainty, but they do
not have the same impact on all capabilities. Environmental dynamism was defined as the rate of unexpected change or change
that is hard to predict in a given environment (Bisbe & Malagueño 2012). For example, the most common argument is that
the influence of capabilities, such as EO, on performance becomes more intense when the firm acts in a dynamic and hostile
environment, i.e., when an environment of uncertainty is perceived. In this type of environment, firms that behave more
proactively and aggressively will achieve better performance (Lumpkin & Dess 2001). In the same line, studies suggest that
entrepreneurial orientation constitutes a good alternative for SMEs when they face hostile and uncertain environments (Covin
& Slevin 1989; Miller & Friesen 1982; Miller 1983). Also, according to the life cycle models of the sectors (Porter 1980), a
dynamic environment where not everything is known, suggests a good space with an entrepreneurial attitude where radical
innovations proposed are developed. On the other hand, there are studies suggesting that uncertainty does not have the same
impact on all capabilities. Smith et al. (2001) argue that firm performance will tend to be greater when the firm moves in
stable, simple, and benign environments; an environment that assumes that learning orientation moves in a continuous and
that there is space to reflect on lessons learned (K. G. Smith et al. 2001). Following the same argument, in stable sectors where
it is easier to predict the actions of competitors, technological movements and consumption patterns, a learning orientation
(LO) should thrive to develop, but instead, an entrepreneurial orientation is less likely to succeed (Moreno & Casillas 2008).
119
This implies that a business will use its particular internal strengths or capabilities, depending on the circumstances and its
assessment of the situation in the external uncertain environment (DeSarbo et al. 2005). There is a relationship between both
capabilities studied, uncertainty and performance, but the impact may vary. We can generalize that both relationships (EO-
performance & LO-performance) can be modified in the presence of uncertainty.
In summary, following the research on the contingency theory outlined in the previous section and the above rationale, we
expect that both studied relationships: i) Capabilities–Performance and ii) MCS–Capabilities, will be modified by the
mediating variable called perceived environmental uncertainty (PEU). The mediating function of the perceived uncertainty
variable represents the generative mechanism through which the focal independent variable is able to influence the dependent
variable of interest (Baron & Kenny 1986). Mediating model are used where the nature or strength of a relationship between
a variable and an outcome criterion will depend on the influence of particular aspects of context (Brownell 1982; Brownell
1983; Brownell 1985; Davila 2000). This interaction approach include studies that examine how organizational context
mediate the relationship between variables, in this case: i) Capabilities–Performance and ii) the uses of MCS–Capabilities
(Brownell 1983; Brownell 1985; Govindarajan & Gupta 1985).
4.4. Theoretical model and research hypotheses
4.4.1 Theoretical model
This work adopts Simons (1995) and Vandenbosch (1999) classifications of MCS uses and both are related to examine the
extent to which MCS uses impact the firm´s capabilities and performance. Secondly, the set of constructs and their proposed
relationships (MCS-Capabilities & Capabilities-Performance) will then be tested relating them to PEU, trying to see if these
relationships are mediated by the inclusion of the variable PEU in the model presented below (figure 4.1).
Based on the results obtained in the previous chapters, about the impact of MCS uses on LO & EO capabilities and how the
diverse MCS uses impact on performance, directly or indirectly through capabilities, the main question in this work,
represented in Figure 4.1, seeks to identify if PEU mediates these relationships. Using a contingency-theoretic perspective,
the conceptual roots of this work lie in the idea that: MCS-Capabilities-Performance relationships will be modified by the
mediating variable called perceived environmental uncertainty (PEU). Specifically, this work investigates the extent to which
PEU may play a significant mediating role in the relationships between: 1) Capabilities-PEU(1)-performance and 2) MCS-
PEU(2)-Capabilities. In Figure 4.1, PEU (1) represents the inclusion of the PEU variable between Capabilities and
Performance, while PEU (2) represents the inclusion of the PEU variable between MCS and Capabilities.

120
Figure 4.1: Theoretical model
4.4.2 Hypotheses
Summing up the suggestions, we propose the following general hypothesis. This chapter takes the relationships proposed and
results in the last chapter of this thesis, as the basis of comprehensive analysis in this chapter. Here, we analyze, how the
inclusion of the variable PEU modifies the previously studied relationships. In other words, considering the importance of the
PEU mediating effect in our model, we intend to provide an approximate significance test for the mediating effect of perceived
uncertainty over the MCS – Capabilities – Performance relationships in two steps: MCS–PEU2–Capabilities (Figure 4.2) and
Capabilities–PEU1–Performance (Figure 4.3). Thus the hypotheses related to the environmental uncertainty are developed.
Figure 4.2: Hypothesis H1 to H4 (Diagnostic / Interactive MCS uses - Capabilities through PEU2 mediating effect)
Hypotheses for the direct effect of
Diagnostic/Interactive MCS uses –
Capabilities relationship through the
mediating effect of PEU2 (Figure 4.3) (H1 to
H4) are:
Monitoring:"How"are"we"doing?
Legitimization:"How"do"we"justify"our"decisions"or"actions?
Strategic/decision2making:"
How"can"we"best"use"it"as"a"facilitating" technique?
Attention/focusing:"What"problems"should"we"
look"into?
a:"Learning"Orientation
Capabilities
b:"Entrepreneurial"Orientation
Management/Control/Systems/(MCS)
Contingence/ factors
CapabilitiesMCS Performance
Interactive"use
(enable" to"search"
opportunities,"solve"problems"and"make"decisions)
Diagnostic"use"
(control"over"organizational"goals)"
Type"of"use"""""""""""""""""""""""""""""""Lever"of"control"
Perceived"Uncertainty"(1)
Performance1)"return"on"investment"2)"level"of"benefits"3)"increase"in"sales"4)"customer"satisfaction"5)"employee"satisfaction6)"overall"results
2º/orderConstructsusing/SEM
Perceived"Uncertainty"(2)
Source: Self-devised
Contingence/Factors/:/Uncertainty/perception/ PEU/Mediating/effect//of/PEU/between/MCS2Capabilities/ &/Capabilities2Performance
Diagnostic MCS use
InteractiveMCS use
LO
EO
PerformancePEU (2)
Source: Self-devised
Ra
Rb
Rd
Rc
PEU2 mediatingeffect between:
H1: Diag. use – LO if Ra & Rd are met
H2: Inter. use – LOif Rb & Rd are met
H3: Diag. use – EO if Ra & Rc are met
H4: Inter. Use – EO if Rb & Rc are met
Previous relationships

121
H1) There will be a PEU2 mediating effect between the diagnostic use of MCS – LO Capability, if Ra and Rd are met 38.
H2) There will be a PEU2 mediating effect between the interactive use of MCS – LO Capability, if Rb and Rd are met 38.
H3) There will be a PEU2 mediating effect between the diagnostic use of MCS --EO Capability, if Ra and Rc are met 38.
H4) There will be a PEU2 mediating effect between the interactive use of MCS – EO Capability, if Rb and Rc are met 38.
Hypotheses for the direct effect of Capabilities - Performance relationship through the mediating effect of PEU2
(Figure 4.3) (H5 and H6 ) are:
H5) There will be a PEU1 mediating effect between LO Capability – Performance, if Re and Rg are met 39.
H6) There will be a PEU1 mediating effect between EO Capability – Performance, if Rf and Rg are met 39.
Figure 4.3: Hypotheses H5 and H6 (Capabilities - Performance through PEU1 mediating effect)
It is noteworthy that the mediating effect
can be total, partial or null, depending on
changes that occur in the proposed
relationships before entering the PEU
variable.
4.5 Methodology
4.5.1 Data collection, descriptive statistics and variable measurement
Data- Sources and information collection
Data were collected from primary sources in the form of structured surveys from business managers in the manufacturing,
trade, banking and service sectors, in 4750 Mexican firms in México City, listed in the Mexican DENUE 2012 INEGI
database. We collected information over the course of eight weeks, using online systems (323 surveys received, 50.2%) and
offline (face-to-face) (321 surveys received, 49.8%), giving a total of 644 received questionnaires (response rate 13.56% of
the sample). The invitation to participate consisted of an initial personalized email letter. In order to increase the response
rate, we sent two follow-up reminding emails, and a final reminder to non-respondents (Dillman 2000).
38 Ra, Rb, Rc, Rd: Relationship a,b,c,d 39 Re, Rf, Rg: Relationship e,f,g
Diagnostic MCS use
InteractiveMCS use
LO
EO
PerformancePEU (1)
Re
Rf
Rg
Source: Self-devised
PEU1 mediatingeffect between:
H5: LO Cap. – Performanceif Re & Rg are met
H6: EO Cap. – Performance if Rf & Rg are met
Previous relationships

122
Questionnaire
Hypotheses were tested with data collected through a questionnaire survey (Appendix B shows the questionnaire items),
which was designed following the steps suggested by the literature (Archer 2003; Dillman 2000):
1) Select in the literature of strategy and management control systems, the constructs that measure the variables and
draw up a first draft of the questionnaire. 2) This draft is contrasted with interviews of members of the target population.
3) Make adaptations based on the comments received. 4) Choose an attractive format, good quality WEB, and printout
form.
Non-response bias
To check for potential non-response bias, offline respondents were used as proxies for non-response across five measures.
Using a comparison of the means, no significant differences (p < 0.01) were found between the firms age, size, system
amplitude used, respondents’ formal education and management experience of online and offline respondents’ firms (non-
respondent), suggesting the absence of any obvious non-response bias in this sample (Appendix C shows the Non-Response
bias analysis).
Common method variance
The Harman´s one-factor test, was employed to ensure the absence of the potential undesirable effects of common method
variance (CMV) (Podsakoff et al. 2003), caused by single-source bias. This test has yielded 7 factors with eigenvalues greater
than one, with the first factor explaining only 19.04% of the variance, indicating that no single factor was dominant. This test
indicated the absence of common method effects in our data, suggesting that CMV due to single-source biases was not an
issue in our study (See Appendix C). Past studies (Bisbe & Otley, 2004; Bisbe & Malagueño 2009, 2015) show that charge
percentages in a single load factor below 22% are typically accepted.
Descriptive statistics
We received 644 usable questionnaires, making it a response rate of 13.56%. This range is similar to the 12–25% range
reported in recent studies, 22.5% (Hall 2008); 24% (Henri 2006a); 42% (Naranjo-Gil & Hartmann 2007a); 12% (McKelvie
& Davidsson 2009); 15.6% (Wiklund & Shepherd 2003). The response sample is distributed as follows: 296 (46%) are large
firms with an average of 4,257 employees, on average 44 years of age, 191 (29.7%) medium-sized firms with an average of
158 employees and 24 years of age, and finally 157 (24.4%) small firms with an average of 32 employees and 11 years of
age. The respondents’ positions are 79 CEOs (12.3%), 109 directors of divisio (16.9%), 111 directors of department (17.2%)
and 345 managers (53.6%). Firms are distributed in four sectors: 407 services (63.2%), 105 manufacturing (16.3%), 81
banking (12.6%) and 51 trading (7.9%). (Descriptive statistics of the constructs used and correlations matrix are in Appendix
D Part 3).
Variable measurement
The variables used to test robustness of the model were measured as follows. All variables were measured using previously
validated scales (Table 4.1). All questions were asked using a five-point Likert scale. The scales are shown in Appendix B.
Survey instrument.

123
MCS uses
The MCS uses were measured using a version of Bety Vandenbosch (1999) system with four dimensions: Monitoring;
Focusing Attention; Legitimizing Decisions and Solving problems. Henri (2006a) adapted this Vandenbosch version changing
the dimension of solving problems, an adding a dimension to measure the Strategic Decision-Making with seven elements
given by Brockman & Simmonds (1997). The anchors for the uses of MCS scale were ``1= never used, 2= rarely used, 3 =
sometimes used, 4 = often used, 5 = always used”. A factor score was calculated for each of the four uses based on all the
items to check construct validity. Based on the theoretical approach of this paper, as was done in the previous chapter, the
four dimensions scales of the MCS uses were used to create two second-order constructs called Diagnostic and Interactive
uses respectively in accordance to the proposals made by Simons (Simons 1990; Simons 1995; Simons 2000) and
Vandenbosch (1999). A summary of this procedure will be explained in section 4.5.4: Second-order constructs.
Table 4.1: Variable measurement
Capabilities
The Capabilities section asks the respondents the extent to which each item describes their organization where: 1 = does not
describe and 5 = fully described. LO & EO Capabilities were assessed using the two different validated scales.
Learning Orientation (LO). Sinkula et al. (1997) developed a first 13-item scale to measure LO, then it was adapted by Hult
(1998) into a four-item scale. Our work uses this last scale which offers a more general measure of learning orientation
applicable to the whole company (Hurley & Hult 1998), since we found it fit for this study. A factor score is calculated with
the four items to check construct validity.
Entrepreneurial Orientation (EO). We used the scale proposed by Lumpkin et al. (2009). This scale is an upgraded version
of the three-dimension scale of proactiveness, innovation and risk aversion (Covin & Slevin 1989), to which two more
dimensions were added: autonomy with four items, and competitive aggressiveness with one more item, giving a total of 5
dimensions.: innovativeness, risk taking, proactiveness, autonomy and competitive aggressiveness (Lumpkin et al. 2009)
giving a more complete character to the concept. This latter scale has become the accepted measure for EO within the related
Construct Source Dependent & independent variables
MCS uses 27-item scale adapted by Henri (2006a) from Vandenbosch (1999)
Independent: Diagnostic use: Monitoring; legitimizing
Interactive use: focusing att.; strat. decision-making; Learning Orient. 4-item scale proposed by Hult (1998) Dependent & Independent (LO)
Entrepreneurial Orient. 14-item scale by Lumpkin et al. (2009) Dependent & Independent (EO)
Performance6-item scale by Jaworski & Kohli, (1996); Kohli & Jaworski, (1993)
adapted by Gómez-Villanueva, (2008)Dependent (Pf)
Perceived environmental
uncertainty (PEU)
8-item scale by Govindarajan (1984) Independent (PEU)
Control variables Firm size (10-50 small; 51-250 medium; > 250 Large)

124
literature (Lumpkin et al. 2009). A factor score is calculated with the fourteen items to check construct validity.
Performance
In our model, organizational performance is modeled as a result of strategic capabilities and MCS uses, which allows us to
explore the processes by which organizational outcomes are improved. As several authors argue (Dess & Robinson 1984;
Venkatraman & Ramanujam 1987), in terms of consistently providing valid and reliable performance assessment, neither
objective nor subjective measures are superior. Following upon prior studies by accounting researchers (Swieringa & Moncur
1972; Milani 1975; Hayes 1977; Kenis 1979; Merchant 1981), this study chose to use self-ratings of performance measures
for performance differences among firms, since we have small businesses in the sample and it has been shown that is quite
common for owners/entrepreneurs to refuse to provide objective and actual measures of organizational performance to
researchers. Therefore, it is better to ask for the perceived performance (Sapienza et al. 1988). Furthermore, it was decided to
undertake self-ratings along a multiplicity of dimensions rather than on any single dimension. The instrument used includes
measuring performance on six dimensions of functional and overall performance: return on investment (ROI), profit, sales
growth, customer satisfaction, employee satisfaction and overall performance (Kohli & Jaworski 1993; Jaworski & Kohli
1996; Kirca et al. 2005) adapted by (Gómez-Villanueva 2008). These are self- rated measures of performance, frequently used
to measure organizational performance in management accounting research. The respondents were asked to indicate the
performance of their organization over the past 12 months against the expectations or goals set at the beginning of the year,
on a scale of 1 to 5, (where 1=Very poor performance, 2= Low performance, 3=Goals were reached, 4=Above goals and
5=Outstanding performance, above targets). A higher score indicated better performance. Descriptive statistics of the
constructs and correlation matrix are presented in Appendix D. Descriptive stats, correlations: Part 3: Diagnostic, interactive,
LO, EO, Performance, PEU (Ch.IV).
Perceived Environmental Uncertainty (PEU).
According to Tymon et al. (1998), the measure should represent top managers’ perceptions of the level of uncertainty
regarding the external environment. This research focuses on decision-makers’ perceptions of the uncertainty related to four
groups, 1) customers; 2) suppliers of materials, labor and capital; 3) both competitors for markets and resources and 4)
regulatory groups. PEU was assessed using eight items: manufacturing technology, competitor’s actions, market demand,
product attributes/design, raw material availability, raw material price, government regulation, and labor union actions. These
items were used from the early, widely used instrument developed by Govindarajan (1984). Respondents were asked to
indicate on a 5-point Likert-type scale, the extent that each of the following factors was predictable or unpredictable in the
context of their main business, where: 1= highly unpredictable and 5= highly predictable. The descriptive statistics (means
and standard deviations) of responses on PEU factor is presented in Appendix D. (Descriptive stats, correlations: Part 3:
Diagnostic, interactive, LO, EO, Performance, PEU (ch.IV)). Also, Appendix M. Chapter IV: PEU Factor analysis, provides
a correlation matrix between the eight environmental items with a significant correlation between the variables coefficients,
suggesting that they are related and may constitute one factor. Additionally, it also presents the factor loadings derived from
an EFA. It extracted one factor explaining 67.79% of the variance. The KMO & Cronbach coefficient alpha (Cronbach 1951)
was computed to measure internal reliability of the instrument. The KMO of 0.805 and Cronbach Alpha of 0.779 for the scale
125
suggested that the scale was internally reliable (Nunnally et al. 1967).
Control variables
Kirca et al. (2005) meta-analysis mainly emphasizes the size of the company, the dynamism of the environment, and the
generic strategy of the organization (Kirca et al. 2005) as the control variables more often used. Most MCS studies have
defined and measured size relating it to the number of employees. Contingency theories of organizations (Burns & Stalker
1961; Lawrence & Lorsch 1967) suggest that size may affect the way organizations design and use management systems
(Wiklund & Shepherd 2003). Khandwalla (1977). Moreover, Merchant (1981) found that large firms were more diversified
and divisionalized, employed more formal communications, and made greater use of sophisticated controls (Khandwalla 1977;
Merchant 1981). Few MCS studies have explicitly considered size as a contextual variable. Almost all studies have examined
relatively large organizations, usually justifying this by arguing that large firms tend to have incorporated formal MCS and
are more likely to benefit from the use of MCS than are smaller firms (OConnor et al. 2011). Thus, considering the influence
of common factors in MCS, such as firm size (Chenhall 2003; Hoque 2004; Hoque & James 2000), size is used as a control
variable. Since the size of a firm has been shown to affect the way in which control systems are utilized (Bruns & Waterhouse
1975; Merchant 1981), in our study, the classification used to categorize firms size is determined according to the number of
workers, as is done in other previous research studies (C. Lee et al. 2001; Santos et al. 2002) and converted into a binary
variable. Finally, some variables in the questionnaire were asked with a flipped scale (reverse-scored), (†EO4 †EO13
†EO14)†, to ensure the absence of bias in responses.
4.5.2 Construct validity and reliability
Several procedures and tests were conducted to establish the validity and reliability of the scales employed in our model:
content and face validity, tests of convergence and discriminant validity using exploratory and confirmatory factor analyses
(EFA & CFA), and finally some data test of normality. Based on the tests, all constructs reflect strong validity and reliability
(see Appendix F. Convergent-discriminant validity. Part 4: EFA: MCS uses – LO & EO - Performance – PEU (Ch.IV).
Content and face validity of questionnaire
The scales used in this study were founded on the review of the most relevant literature, guaranteeing the content validity of
the measurement instrument. We pre-tested the questionnaire in three steps for clarity, complexity, and ambiguity to provide
face validity: i) Five academic business professors in planning/financial/accounting were asked to revise and complete the
questionnaire to provide comments on its form and content; ii) Five top managers (planning/financial/accounting officers)
were interviewed and asked to complete the questionnaire; iii) The questionnaire was completed by a group of MBA students.
Minor adjustments were made in terms of wording and presentation according to recommendations given.
Convergent and discriminant validity
To provide convergent and discriminant validity, we ran several analyses:
1) The correlation matrices of MCS uses, capabilities, performance and PEU show positive and significant correlation
coefficients at the 0.01 signification level (see Appendix F. Convergent-discriminant validity. Part 1: Correlation MCS uses,

126
capabilities, performance, PEU). Knowing that convergent correlations should always be higher than the discriminant ones,
the correlation matrix provided a first evidence for both convergent and discriminant validity.
2) The exploratory factor analysis (EFA) across all constructs (e.g., four MCS uses in two second-order factors, two
capabilities, performance and PEU) to test convergence and discriminant validity indicated that the different scales were one-
dimensional, and every construct exhibited acceptable results.
Table 4.2: Internal consistency and convergent validity To establish the reliability of the test, we examined the
Cronbach Alpha, KMO and composite reliability of each
construct 40. Our results showed individually Cronbach's
Alpha values above 0.87, confirming the reliability
(Nunnally et al. 1967). Also Kaiser-Meyer-Olkin
Measure showed a value of 0.957 and Bartlett´s test of
sphericity met the desired levels. Composite reliability
(CR) represented the shared variance among a set of
observed variables measuring an underlying construct
(Fornell & Larcker 1981). Our results fully complied
with the recommendations of at least 0.60 (Bagozzi & Yi
1988). Thus, reliability of the constructs demonstrated
high-internal consistency of the constructs41.
3) To verify convergent validity, we made a confirmatory factor analysis (CFA) for all constructs (MCS uses –Diagnostic &
Interactive-, capabilities -LO & EO- performance - PEU). The variance extracted had to exceed the recommended cut-off
point of 0.50 (Hair et al. 2006) to reflect adequate convergent validity (Fornell & Larcker 1981), and besides three elements
were examined for the CFA, the significance of the factor loading, the R2 for each item and the overall acceptability of the
measurement model using chi-square statistics and three fit indices (GFI, CFI and RMSEA)42. This indices are among the
most frequently reported. The recommended threshold values are as follows: (i) GFI > 0.90 (Joreskog & Sorbom 1984), (ii)
CFI > 0.9 (Hu & Bentler 1995), and (iii) RMSEA < 0.08 (Browne et al. 1993). Our results are: GFI 0.904; CFI 0.924; RMSEA
0.046. Table 4.2 shows the results of the CFA (α, CR & AVE) for each construct, fit indices.
Reliability
Reliability internal consistency means how well the items that reflect the same construct yield similar results. There is a wide
variety of internal consistency measures that can be used. We used the “Average InteritemTOTAL Correlation” and focus on
the two uses of MCS. These approaches use all of the items in our instrument, designed to measure the same construct. We 40 Constructs must exceed the recommended Cronbach's Alpha reliability coefficient cut-off point of 0.70 (Fornell & Larcker 1981; Nunnally et al. 1967). 41 See appendix F. Convergent-discriminant validity. Part 4: EFA: MCS uses – LO & EO - Performance – PEU (ch.IV) and table 4.2. 42 GFI, Goodness of fit index, (Joreskog & Sorbom 1984) value is less than or equal to 1, a value of 1 indicates a perfect fit; CFI, comparative-fit index, (Bentler 1990), fall in the range from 0 to 1, values close to 1 indicate a very good fit; RMSEA, root mean square error of approximation, (Browne et al. 1993), practical experience show that a value of the RMSEA of about .05 or less would indicate a close fit of the model in relation to the degrees of freedom
Table 2: Internal consistency and convergent validity Table 2: Internal consistency and convergent validity Table 2: Internal consistency and convergent validity Table 2: Internal consistency and convergent validity Variable Indicator
Monitoringα
0.87CR AVE0.88 0.64
Legitimizing 0.93 0.93 0.61Att. Focus 0.88 0.85 0.59
St. Mgmnt. Dec. 0.91 0.90 0.60Diagnostic 2º order Monitoring
LegitimizingInteractive 2º order Focusing
DesicionLO 0.83
0.93
0.93
0.83 0.62
0.77 0.62
0.82 0.70
EO 0.97 0.97 0.68PEU 0.78 0.95 0.69
Performance 0.88 0.88 0.64Goodness of fit indices (Measurement model):
Source: Own devised
χ2 ( DF) = 2980.307; χ2/DF=2.375; NFI= 0; Significance=0; GFI=0.904; CFI=0.924; RMSEA=0.046
Goodness of fit indices (Measurement model):χ2 ( DF) = 2980.307; χ2/DF=2.375; NFI= 0; Significance=0; GFI=0.904; CFI=0.924; RMSEA=0.046
Goodness of fit indices (Measurement model):χ2 ( DF) = 2980.307; χ2/DF=2.375; NFI= 0; Significance=0; GFI=0.904; CFI=0.924; RMSEA=0.046χ2 ( DF) = 2980.307; χ2/DF=2.375; NFI= 0; Significance=0; GFI=0.904; CFI=0.924; RMSEA=0.046

127
first computed the correlation between each pair of items. The average interitem correlation was the average or mean of all
these correlations in each construct, and we also computed an average score for the items in each use and used it as a variable
in the correlation analysis. Then, we calculated an average of this correlation and the results in each use showed an average
of 0.806 significant at a level of 99%, ranging from 0.766 to 0.853 in this sample, remaining at a very acceptable level for this
analysis (see Appendix E Reliability. Part 1: Average Inter.itemTotal Correlation).
Normality
Similar to Westphal, to verify the hypothesis of normality necessary for the result of some reliable analysis (Westphal 1999)
two tests were performed (Kolmogorov-Smirnov; Shapiro–Wilk). The analysis, performed by separating the sample into six
factors, supported the normality of all constructs and provided support for the robustness of the findings (see Appendix E .
Reliability. Part 2: Test of normality).
4.5.3 Analysis Models
Following is a review of the set of analysis to be performed. The first step was the development and testing of the second-
order constructs related to the four MCS uses. With the results of the previous analysis and using the full model proposed, the
second step was to use structural equation modeling (SEM) to test the relation between the MCS use – PEU –Capabilities –
PEU – Performance. Next we will develop and prove the second-order constructs.
4.5.4 Second-order constructs: Diagnostic & Interactive uses
As we said above, this essay uses the second-order constructs 43, proposed and analyzed in the previous chapter. Second-order
constructs named Diagnostic & Interactive uses, treated as latent and intangible second- order constructs (Joreskog & Sorbom
1993) are proposed as the combination of two classifications: The theoretical proposition of levers of control (LOC) (Simons
1995) and the proposal of executive support systems classification (ESS) (Vandenbosch 1999). Following is the summary of
the main results (See Appendix N, for a complete description of the analyses performed). We argue, according to the
arguments offered by Simons (1990, 1995, 2000) and Vandenbosch (1999), that the four uses (Vandenbosch 1999) can be
grouped in two second-order constructs proposed by Simons (1995). On the one hand, the diagnostic use scale is a second-
order factor measured by two first-order factors: monitoring and legitimizing. On the other hand, the interactive use scale is a
second-order factor measured by two first-order factors: attention focusing and strategic decision-making. After performing
an exploratory factor analysis (EFA) for each of the two constructs, results indicated one-dimensional scales and exhibited
acceptable results. To confirming the existence of multidimensionality in our second-order constructs we did a confirmatory
factor analysis (CFA) using structural equations analysis and SPSS AMOS 21.0, with a rival model strategy (Anderson and
Gerbing, 1988; Steenkamp and Van Trijp, 1991; Hair et al., 2006). Results showed that the second-order model had a much
better fit than the first-order model. Thus, we could conclude that the variables “diagnostic use” & “interactive use” showed
a multidimensional nature, that the second-order models were significant and that we would use it in our complete model to
43 Second order constructs: Diagnostic & Interactive uses : According to the arguments of Simons (1990, 1995, 2000) and Vandenbosch (1999), that the four uses (Monitoring, Legitimization, Attention Focusing, and Strategic Decision-Making) (Vandenbosch 1999), can be grouped in two second order constructs named diagnostic and interactive uses proposed by Simons (1995). See appendix N, for a complete descrption of the analyses performed.

128
estimate the proposed hypotheses.
4.5.5 Structural equation modeling (SEM)
This study uses Structural Equation Modeling (SEM) to test the hypotheses about the relationships between MCS uses – PEU
– Capabilities & Capabilities – PEU – Performance and how these relationships are impacted by PEU in two steps. This work
responds specifically to calls for quantitative research that provides insights into different uses of MCS and their interrelations
with other constructs (Ahrens & Chapman 2007; Henri 2006a; Henri & Journeault 2010).
We use SEM to test individual path coefficients in the relationships proposed. Additionally SEM will provide us with an
evaluation of the entire model; thus, we focus the analysis on a macro-level perspective (Kline 1998) rather than on its parts.
This allows to draw learning from the theoretical model as a whole. SEM models have been employed in order to build latent
variables from multi-item questionnaires, and thereby to simultaneously identify statistical significance with multiple
dependent variables (S. W. Anderson & Young 1999; Shields et al. 2000). Finally, the SEM approach is appropriate when
the theory sets out to explain the role of variables that intervene in the studied relationships (Luft & Shields 2003). SEM
allows us to incorporate the influence of various factors under the theory supporting that it unfolds and to assume contextual
factors (such as noise) within the model, and not to consider how the results might be modificated by these contextual factors
(Chenhall 2005), unless you make explicit in theory foundation -as is our case- to analyze the contextual effect of PEU.
Importantly, SEM assumes multivariate normality, which can usually be identified through univariate analysis (Kline 1998).
A review of the data shows that all measures were within tolerable limits of skewness and kurtosis, and no outliers were
identified. We conducted the statistical analysis for the 644 firms present in the sample, using SPSS (V.21.0) software, and
the structural equation modeling software program SPSS-AMOS (V.21.0) was used to estimate the structural equation models
depicted in Figures 4.2 and 4.3.
SEM model is analyzed and interpreted in two stages (Kline 1998; Byrne 2013; J. C. Anderson & Gerbing 2004): The first
stage estimates the measurement model while the second estimates the structural model. Both stages were assessed using the
maximum likelihood estimation method (Blentler & Chou 1987). In our study, we followed these steps: first, we estimated
the general measurement model; then, in order to be able to analyze the hypotheses in the proposed model, the structural
model analysis was conducted with three models. Findings were documented in each one.
Model 1) Analysis of the relationships between MCS - Capabilities – Performance (no PEU)
Model 2) Analysis including the PEU variable in position "2", between MCS and capabilities (H1 to H4)
Model 3) Analysis including the PEU variable in position "1", between capabilities and performance (H5-H6).
Measurement model
With the aim of assessing the measurement reliability and validity, the first step was to perform a CFA for all the constructs
in the model, employing SEM technique. In other words, it is important to assure that all constructs exhibit acceptable model
fit, the factor loadings reflect adequate R2 (higher than 0.50), all factor loadings are statistically significant (p< 0.01) and
variance extracted (above 0.50) for adequate convergent validity. Also, it is important to exceed the recommended cut-off
point above 0.70 for the Cronbach Alpha and composite reliability at least 0.60 and to comply with the recommendation

129
regarding the use of at least three indicators per latent construct (Landis et al. 2000), and Goodness of fit indices should also
meet the recommended levels: GFI >0.9; CFI> 0.9 and RMSEA < 0.08. The first analysis showed some items with inadequate
R2 (<0.7) or variance extracted (AVE<0.50). To have a better adjustment it was necessary to carry out a process of refinement
of the scales, i.e., the model needed to be respecificied by eliminating items that did not comply with these recommendations
(Joreskog & Sorbom 1993). Respecifications were necessary for 7 of the 59 total items in the following constructs: Attention
Focusing (F1, F6 and F7), Strategic decision making (D1); Learning Orientation (L03); and Performance, (P4_SC & P5_SW).
After those re-specifications, all constructs exceeded the recommended indicators.
Table 4.3: Internal consistency and convergent validity (factor loadings) Convergent validity is verified by analyzing the
factor loadings and their significance (Table 4.3).
Coefficients scores of all factor loadings were
significant (p<.001) and all the standardized
loadings were higher than 0.50 (Steenkamp and
Geyskens 2006), supporting the convergent
validity of the indicators (Anderson and Gerbing,
1988). In the measurement model, constructs
discriminant validity was assessed by calculating
the average variance extracted (AVE) and the
squared correlations between constructs were
compared (see Table 4.4). The shared variance
between pairs of constructs (squared
correlations), was always less than the
corresponding AVE in the diagonal (Fornell &
Larcker 1981); this provided a test of the extent to
which a construct shared more variance with its
measures than it shared with other constructs
(Fornell & Larcker 1981).
Table 4: Internal consistency and convergent validity Table 4: Internal consistency and convergent validity Table 4: Internal consistency and convergent validity Table 4: Internal consistency and convergent validity
Variable IndicatorFactor
Loading * α CR AVE
Diagnostic 2º order MonitoringLegitimizing
Interactive 2º order FocusingDesicion
LO LO1LO2
0.7230.8460.8520.8150.8620.850
0.930
0.927
0.83
0.77 0.62
0.82 0.70
0.83 0.62
LO4EO EO1
EO2EO3EO4rEO5EO6EO7EO8EO9EO10EO11EO12EO13rEO14r
PEU PU1PU2PU3PU4PU5PU6PU7PU8
Performance P1_SP2_BºP3_R
0.7970.8800.8450.8700.7790.8460.8320.8460.8540.8150.8330.8470.8380.8140.7970.6770.5540.5710.6800.7250.6920.5680.5450.8180.8300.834
0.97
0.78
0.88
0.97 0.68
0.95 0.69
0.88 0.64
P6_G
Goodness of fit indices (Measurement models):
Source: Own devised
Overall sample: χ2 ( DF) = 2980.307; χ2/DF=2.375; NFI= 0; Significance=0; GFI=0.904; CFI=0.924; RMSEA=0.046.
0.813
Goodness of fit indices (Measurement models):Overall sample: χ2 ( DF) = 2980.307; χ2/DF=2.375; NFI= 0; Significance=0; GFI=0.904; CFI=0.924; RMSEA=0.046.
Goodness of fit indices (Measurement models):Overall sample: χ2 ( DF) = 2980.307; χ2/DF=2.375; NFI= 0; Significance=0; GFI=0.904; CFI=0.924; RMSEA=0.046.
*=p<0.01Overall sample: χ2 ( DF) = 2980.307; χ2/DF=2.375; NFI= 0; Significance=0; GFI=0.904; CFI=0.924; RMSEA=0.046.

130
Table 4.4: Discriminant validity The CFA results showed that all
comparisons between the variances
extracted and the squared correlations
supported the discriminant validity of
the constructs. They also suggested that
our re-specified measurement model
provided a good fit to the data on the
basis of a number of fit statistics. All scales used demonstrated high levels of reliability; all constructs and indicators reflected
adequate R2; all factor loadings were statistically significant (p< 0.01), met the recommended cut-off point for the Cronbach
Alpha, composite reliability and variance extracted, exhibited acceptable model fit, and complied with the recommendation
regarding the use of at least three indicators per latent construct (Landis et al. 2000). Therefore, the measurement model was
considered reliable and we could continue with the second step related to the structural model (see Appendix O. Chapter IV:
Measurement model).
4.6 Research findings
4.6.1 Results of Structural Model
Structural Model
With the above procedures, we could assure the validity and reliability of the used scales to get robust conclusions. Once the
measurement model had been analyzed, the complete model was estimated again, but in a structural mode. Remembering
that the question we seek to answer is if perceived environmental uncertainty (PEU) mediates the uses of MCS – capabilities
– performance relationships, Figures 4.2 and 4.3 (Models 2 & 3). The results obtained are presented for each of the three
models: Model 1 tested the initial model without PEU. Model 2, tested the initial model including PEU in position 2, (H1 to
H4), between MCS – Capabilities; while model 3 tested the inclusion of PEU in position 1 (H5 & H6), between Capabilities
and Performance. All models respected the recommended threshold (Kline 1998) previously mentioned. Table 4.5 presents
the results of the structural equation models in terms of path coefficients, significance, goodness-of-fit indices, and results of
hypotheses.
Model 1 represents the results obtained in the previous chapter about the relationships between the uses of MCS - capabilities
-- performance without PEU.
Model 2 introduces the PEU variable in position 2, (Model 2, Figure 4.4), between MCS and capabilities, proposing a
mediating PEU effect on the relationship between the diagnostic / interactive uses of MCS and capabilities (LO and EO),
according to the following hypothesis:
Table 5: Discriminant validity Diagnostic Interactive LO EO PEU Performance
Diagnostic 0.619 Interactive 0.500 0.695
LO 0.373 0.359 0.619 EO 0.251 0.259 0.241 0.676
PEU 0.147 0.167 0.049 0.063 0.693Performance 0.228 0.190 0.126 0.165 0.102 0.640
Note: Diagonal = AVE, below the diagonal, the shared variance (squared correlations) is represented.
Source: Own devised

131
Figure 4.4: Hypothesis H1 to H4 results; (Diagnostic / Interactive uses of MCS - Capabilities through PEU2)
Remembering that, there will be a PEU2
mediating effect between:
H1) Diag. use - LO Cap. if Ra and Rd are met:
(Diagnostic -> PEU(2)) + (PEU(2) -> LO)
H2) Inter. use - LO Cap. if Rb and Rd are met:
(Interactive -> PEU(2)) + (PEU(2) -> LO)
H3) Diag. use - EO Cap. if Ra and Rc are met:
(Diagnostic -> PEU(2)) + (PEU(2) -> EO)
H4) Inter. use - EO Cap. if Rb and Rc are met: (Interactive -> PEU(2)) + (PEU(2) -> EO)
Although the relationship between the diagnostic and interactive uses of MCS with PEU (2) is positive and significant (Ra
and Rb), the results showed that PEU in position 2 did not present significant coefficients in the PEU (2) – Capabilities
relationship (Rc and Rd); hence, PEU (2) did not have a mediating effect between the uses of MCS and capabilities as
originally proposed. In addition, previously proposed direct relations between the diagnostic / interactive uses of MCS and
capabilities were not modified either in magnitude or in sign and continued to be significant.
Model 3 introduced the PEU variable in the model (in position 1, Figure 4.5), between capabilities & performance, proposing
a mediating PEU effect on the relationship between LO – EO Capabilities - Performance, according to the following
hypothesis: There will be a PEU1 mediating effect between:
H5) LO Cap.–Performance if Re and Rg are met: (LO -> PEU(1)) + (PEU(1) -> Performance)
H6) EO Cap.–Performance if Rf amd Rg are met: (EO -> PEU(1)) + (PEU(1) -> Performance)
Figure 4.5: Hypotheses H5, H6 results; (Capabilities - Performance through PEU1)
Knowing that model 1 showed us that
the EO–Performance relationship was
positive and significant, and that LO–
Performance relationship was not
significant, Model 3 results showed
that, as initially proposed, PEU (1)
between the capabilities and
performance had a significant and
positive relationship; however, a
different effect was observed in each
capability.
Source: Self-devised
Diagnostic MCS use
InteractiveMCS use
LO
EO
PEU (2) Performance
Ra:$0.196
Rb:$0.195 Rc:$0.083
Rd:$0.052
*** Non significant relationshipsSignificant
Diagnostic MCS use
InteractiveMCS use
LO
EO
PEU (1) Performance
Re:$.098
Rf:$.097
Rg:$.225
Source: Self-devised *** Non significant relationshipsSignificant

132
Table 4.5: Results of the structural equation models
PEU (1) in LO–performance relationship had a total mediating effect, in other words, without PEU, LO – Performance direct
Path coeff. ResultPath coeff. Result
0.667 *** 0.661 ***
0.526 *** 0.531 ***
0.418 *** 0.404 ***
0.416 *** 0.429 ***
0.036 0.34 0.049 0.304
0.157 *** 0.152 ***
0.412 *** 0.378 ***
0.077 0.135 0.018 0.718
0.196 *** �
0.195 *** �
0.083 0.322 �
-0.052 0.505 �
0.098 0.003 �
0.097 *** �
0.225 *** �
Diagnostic/Interactive MCS uses-> Capabilities through PEU2
(Diagnostic -> PEU(2)) + (PEU(2) -> LO) � + � �
(Interactive -> PEU(2)) + (PEU(2) -> LO) � + � �
(Diagnostic -> PEU(2)) + (PEU(2) -> EO) � + � �
(Interactive -> PEU(2)) + (PEU(2) -> EO) � + � �
(LO -> PEU(1)) + (PEU(1) -> Performance) � + � �
(EO -> PEU(1)) + (PEU(1) -> Performance) � + � �
3031.772890
3.4060.8270.9000.061
644
0.047 0.32
0.163 ***
0.409 ***
0.055 0.277
Hyp. Res.
2.3750.9040.9240.046
Table 6: Results of the structural equation models
Overall sample PEU in (2) PEU in (1)Including PEU
2980.31255
644
Without PEU
Path coeff.
Model 1 Model 2 Model 3
0.659 ***
0.532 ***
0.401 ***
0.429 ***
Path description & expected sign
Diagnostic -> LO (-)
Diagnostic -> EO (-)
Interactive -> LO (+)
Interactive -> EO (+)
LO -> Performance (+)
EO -> Performance (+)
Diagnostic -> Performance (+)
Interactive -> Performance (+)
Ra: Diagnostic -> PEU(2)
Rb: Interactive -> PEU(2)
Rc: PEU(2) -> EO
Rd: PEU(2) -> LO
Re: LO -> PEU(1)
Rf: EO -> PEU(1)
Rg: PEU(1) -> Performance
Diagnostic/Interactive MCS uses-> Capabilities through PEU2
H1 If Ra & Rd: PEU(2) effect on Diagnostic -> LO
H2 If Rb & Rd: PEU(2) effect on Interactive -> LO
H3 If Ra & Rc: PEU(2) effect on Diagnostic -> EO
H4 If Rb & Rc: PEU(2) effect on Interactive -> EO
Capabilities->Performance through PEU1
H5 If Re & Rg: PEU(1) effect on LO -> Performance
H6 If Rf & Rg: PEU(1) effect on EO -> Performance
Goodness-of-fit indices of the modelChi-square
DFχ2/DF
GFICFI
RMSEA# cases
Hyp.
Table 6: Results of the structural equation models
Note 1: *significant at the 0.1 level; ** Significant at the 0.05 level; *** Significant at the 0.01 level.Note 2: Hyp. = Hypothesis conclusion: "� Supported" or "� not supported"Source: Own devised
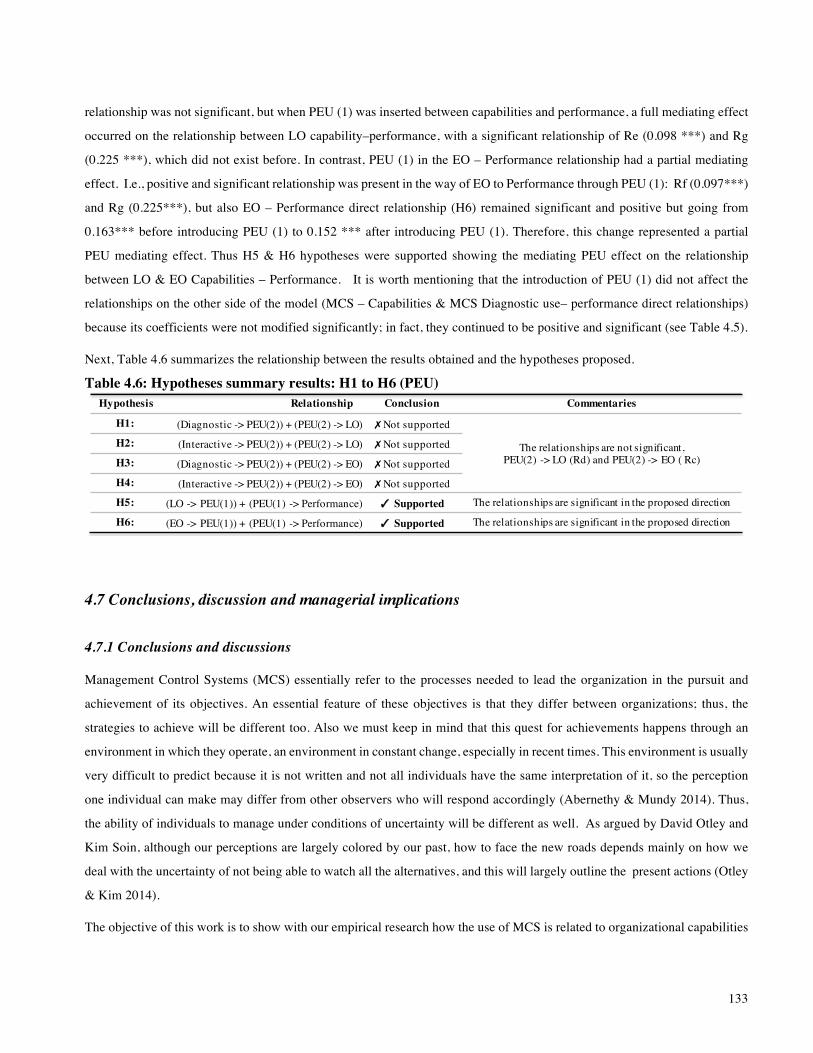
133
relationship was not significant, but when PEU (1) was inserted between capabilities and performance, a full mediating effect
occurred on the relationship between LO capability–performance, with a significant relationship of Re (0.098 ***) and Rg
(0.225 ***), which did not exist before. In contrast, PEU (1) in the EO – Performance relationship had a partial mediating
effect. I.e., positive and significant relationship was present in the way of EO to Performance through PEU (1): Rf (0.097***)
and Rg (0.225***), but also EO – Performance direct relationship (H6) remained significant and positive but going from
0.163*** before introducing PEU (1) to 0.152 *** after introducing PEU (1). Therefore, this change represented a partial
PEU mediating effect. Thus H5 & H6 hypotheses were supported showing the mediating PEU effect on the relationship
between LO & EO Capabilities – Performance. It is worth mentioning that the introduction of PEU (1) did not affect the
relationships on the other side of the model (MCS – Capabilities & MCS Diagnostic use– performance direct relationships)
because its coefficients were not modified significantly; in fact, they continued to be positive and significant (see Table 4.5).
Next, Table 4.6 summarizes the relationship between the results obtained and the hypotheses proposed.
Table 4.6: Hypotheses summary results: H1 to H6 (PEU)
4.7 Conclusions, discussion and managerial implications
4.7.1 Conclusions and discussions
Management Control Systems (MCS) essentially refer to the processes needed to lead the organization in the pursuit and
achievement of its objectives. An essential feature of these objectives is that they differ between organizations; thus, the
strategies to achieve will be different too. Also we must keep in mind that this quest for achievements happens through an
environment in which they operate, an environment in constant change, especially in recent times. This environment is usually
very difficult to predict because it is not written and not all individuals have the same interpretation of it, so the perception
one individual can make may differ from other observers who will respond accordingly (Abernethy & Mundy 2014). Thus,
the ability of individuals to manage under conditions of uncertainty will be different as well. As argued by David Otley and
Kim Soin, although our perceptions are largely colored by our past, how to face the new roads depends mainly on how we
deal with the uncertainty of not being able to watch all the alternatives, and this will largely outline the present actions (Otley
& Kim 2014).
The objective of this work is to show with our empirical research how the use of MCS is related to organizational capabilities
Hypothesis Relationship Conclusion Commentaries
H1: (Diagnostic -> PEU(2)) + (PEU(2) -> LO) ✗ Not supported
The relationships are not significant, PEU(2) -> LO (Rd) and PEU(2) -> EO ( Rc)
H2: (Interactive -> PEU(2)) + (PEU(2) -> LO) ✗ Not supportedH3: (Diagnostic -> PEU(2)) + (PEU(2) -> EO) ✗ Not supportedH4: (Interactive -> PEU(2)) + (PEU(2) -> EO) ✗ Not supportedH5: (LO -> PEU(1)) + (PEU(1) -> Performance) ✓ Supported The relationships are significant in the proposed direction
H6: (EO -> PEU(1)) + (PEU(1) -> Performance) ✓ Supported The relationships are significant in the proposed direction
Source: Own devised

134
to impact performance; specifically, when decision-makers face uncertainty. From a contingency framework, we seek to
contribute to the stream of literature that investigates determinants and consequences of performance. In this line, it is argued
that the two uses of MCS -diagnostic and interactive- are related to organizational capabilities in the company. This paper
also proposes that organizational performance is related to the different ways in which companies develop and use their
organizational capabilities and that MCS have different results. However, the focal point in this study, as mentioned earlier,
is related to the contingent approach, which means that something is true only under specified conditions (Chenhall 2003). In
other words, we seek to identify the extent to which the decision-makers’ perceived environment uncertainty (PEU) has a
mediating effect, modifying or altering the relationships between, on the one hand, the MCS uses and organizational
capabilities of EO & LO, and on the other hand, between organizational capabilities and performance. To test the hypotheses,
a theoretical model was developed and tested with structural equation modeling applied to questionnaire survey data from
644 companies in various sectors.
As mentioned above, the contingency approach involves examining whether the relationships that were raised earlier are kept
under uncertainty conditions (Chenhall, 2003). Next, we will explain the results of how the perception of uncertainty has a
mediating effect between the different constructs and their implications for managers’ behavior.
Our results show that PEU in position 2 has a null mediating effect on the relationship MCS uses-Capabilities (LO & EO).
However, PEU in position 1 shows that in the LO-performance relationship there is a total mediating effect, but PEU in EO-
Performance relationship has a partial mediating effect. A brief explanation of these claims follows.
PEU in position 2, (Model 2) between MCS and Capabilities
We begin analyzing the obtained results by including the variable PEU in position 2. The proposal implies that for the
existence of a mediating effect of PEU in this relationship, we must observe that there are significant relationships between
the uses of MCS -PEU and PEU-Capabilities. The results show that introducing the PEU variable in the model in PEU (2)
position, it does not have a mediating effect as originally proposed. Hence, the mediating effect of PEU in the MCS uses -
Capabilities relationship (LO & EO) is null. Although the relationship between MCS uses, diagnostic (Ra) and interactive
(Rb), with PEU (2) is positive and significant: The results of the relationships PEU (2)–LO & EO (Rd & RC) do not present
significant coefficients. Hence, PEU (2) does not have a mediating effect between MCS and capabilities. This result is contrary
to previous studies that provide evidence that, for example, nonfinancial or subjective measures in an interactive MCS use
can mitigate the effects of uncertainty. The main argument is about that measures produced by an interactive MCS which is
informative because they provide incremental information over and above what is provided by financial measures in a
diagnostic manner (Abernethy & Mundy 2014). A reason that we envision for this is that the relationship between the MCS
uses and capabilities is an internal issue, which would be little affected by the perception of uncertainty. In other words, the
diagnostic use of MCS seeks to verify whether we are near or far from the targets set and check the possible causes of why
we are where we are. This represents the basic approach of the diagnostic use which provides the minimum necessary to
initiate a dialogue between managers and subordinates; a dialogue through which they can identify possible actions to achieve
the development of the organizational capacity or goal, as the interactive use proposes. Since the interactive use starts as a
question that seeks to identify actions to move towards the goals and not necessarily something that happened to us, it could

135
not be very affected by the environment. The literature (Otley 2016) presents a possible explanation for these results. It was
based on a possible confusion between uncertainty and hostility concepts. Although hostility may produce a degree of
uncertainty, the study results indicate that the two functions have opposite impacts on the use of MCS. Hostility is associated
with a greater reliance on accounting controls, such as budgets, while uncertainty is associated with a more flexible control
style, open and externally focused. However, this continues as an open question, as Chenhall (2007) has pointed out. It is
important to know how the tension between the uncertainty and hostility factors should be managed in MCS, as they can often
occur simultaneously. In conclusion and following this line of argument, PEU could modify and show itself more as a
consequence than a precedent of the capabilities.
PEU in position 1, (Model 3) between Capabilities and Performance
Having included the PEU variable in position 1 of the model -between capabilities and performance- revealed the existence
of a positive and significant PEU mediating effect between capabilities (LO & EO) and performance, but a different effect
was observed between each one of the capabilities.
On the one hand, the relationship of PEU between LO – Performance revealed a total mediating effect. It was total because
before introducing PEU, LO had no effect on performance, but by including PEU in the relationship a significant effect was
shown, suggesting that PEU had a total mediating effect in the LO-performance relationship. This means that in the presence
of uncertainty, learning orientation can positively affect performance.On the other hand, by having included PEU in the
relationship between EO – performance showed a partial mediating effect, because although the direct relationship remained
significant as it was already before introducing PEU, we could observe a lower coefficient in this relationship, which means
that EO not only maintained a direct effect on performance, but also an indirect effect through PEU which in turn impacts
performance. Our results are totally in line with studies suggesting that there is a contingent relationship between EO and
internal/external characteristics of the firm (Wiklund & Shepherd 2003). Also, unlike studies where just the relationship
between the two main variables is reviewed, our results demonstrate that the relationship between EO and performance is
likely more complex than a simple main-effect only (Lumpkin & Dess 1996). These results show that it would be important
to consider the mediating effects of different characteristics external to the firm (Miller & Friesen 1982; Govindarajan &
Gupta 1985).
In summary, the results highlight that it is very important to be aware of how the different MCS uses produce different results
in the development of capabilities, and especially that the relationship MCS uses - capabilities is not impacted by uncertainty.
Nevertheless, PEU plays an important and different role in the organizational performance produced by the organizational
capabilities in situations of uncertainty, providing insights into the way capabilities are used to deal with an evolving
environment.
4.7.2 Managerial implications
Control systems were developed to enable organization management (Simons 1995), even under conditions of uncertainty
(Otley 2014). Today the level of uncertainty has increased and the diverse management control approaches, specifically the
design and use of sophisticated management control systems, have become a focal point and an indispensable source to deal

136
with the speed of change and the growing uncertainty in the business environment. Companies face uncertainty in several
aspects, which may be known or unknown in the context of its core business, such as likes, actions, and reactions of their
customers and suppliers, new technology and deregulation processes, global competition, volatile economic environment
amending prices, availability of raw materials, sectorial actions, and regulatory government policies. As firms struggle to
maintain their earnings, human behavior becomes increasingly important, especially the human resources directing people,
making better choices consciously in the everyday activity, and using the information provided by the MCS -diagnostic,
interactive, or both- are indisputable sources to build or maintain competitive advantages.
Many of the studies on management control systems are carried out under the assumption (almost always implicitly) that the
future can be predicted with a high degree of certainty, which makes the validity and transfer of results be questioned. As
stated by Otley (2016), in his literature review of MCS – Contingency theory from 1980 to 2014, “ all research on these topics
has to take a ‘contingency’ approach as it becomes recognized that universal solutions to problems in organizational control
generally do not exist”. Or as Saulpic and Zarlowski (2014) argued, we need to recognize that in this field “research does not
often lead to establishing what does or does not work in a specific organizational context.” (p.215).
In our study, where uncertainty is explicitly recognized and has been treated as a contingent variable which may modify the
form of well-understood relationships between variables, it is somehow like a content variable (Otley 2014) and managed in
a specific situation (perceived uncertainty). Therefore, it is important to recognize that in a real-world situation, where there
are many types of uncertainty producing totally unexpected situations with unforeseen consequences, this perception may
vary and results may differ from those discussed here. In other words, there is no universal solution. More over, Otley (2016)
argues that the contingency theory was initially developed from the idea that there is no universal solution to the problems of
control; however, if there were such a universal solution, by the moment it were applied, the world would have moved. Thus,
the idea of contingency should be much more dynamic than before, using process-based models and staying tuned in to the
mechanisms of change and implementation of modified forms of management and control. Otley (2012) also said that in an
uncertain environment, processes become more important than outcomes and results, because the latter are significantly
influenced by unknown and unpredictable external effects.
Following the line of argumentation on the importance of human resources, Hansen & Wernerfelt (1989) find that twice as
much of the variance in firm performance is due to factors related to human behavior than is due to economic factors (Hansen
& Wernerfelt 1989). One of the most important internal factors determining the performance of business organizations is the
human behavior that originates within them (Widener 2014). Hence, the importance that managers understand how, when and
why to use MCS to develop advantages that give them better results than those their competitiors get.
In the preceding paragraphs, we discussed how MCS and its enabling role in the creation of organizational capabilities are a
framework to obtain better results, without leaving aside that companies are trying to cope with changes in the environment
(Ezzamel 1990). Designing, implementing and using an administrative control system takes time and has a cost. The
effectiveness and efficiency of managers’ actions and decisions are related to both, time and cost. Therefore, since managers
make decisions, produce actions, and keep up with changes, it is essential to understand the variability of situations and the
137
level of uncertainty faced. This gives rise to the need for new approaches to deal with situations with better tools for monitoring
and action (Abernethy & Mundy 2014).
To practice, our findings hold the greatest relevance for controllers and other executives responsible for the design and
implementation of MCS in firms. Our findings can help management to better understand what uses of MCS should be
encouraged with a view to increase the level of strategic orientations among firms. Finally it is top managers, after all, who
decide which systems to use interactively and which to use diagnostically (Simons 1990), based on their sense of purpose for
the organization and their personal assessment of uncertainties.
At the theory level, the primary relevance of this study lies in its examination, from a contingency perspective, of the
interactions of three constructs that had been studied separately: uses of MCS, Capabilities and Performance. Our results add
to a growing body of literature that investigates how the role of the MCS differs (Abernethy & Brownell 1999; Bisbe & Otley
2004; Henri 2006a) and supports previous findings regarding the relationship of the MCS and organizational capabilities. We
can see that both uses can be developed; for example, Marginson’s (2002) finding that firms may use some parts of their MCS
interactively while using other parts diagnostically (Marginson 2002) and both uses are related to better performance.
Our paper contributes to the literature in several ways. The first contribution is relatively straightforward. If MCS are used,
one should be aware of their several uses and of the different ways they can be used at the same time, which we believe to be
the most common case. Subsequently, understanding the three questions of when, how and why it is important to use MCS in
one way or the other or simultaneously, is even more important since their use is is directly related to the generation of
organizational capabilities that enable the firm to have an effective performance. We not only provide results underlying these
relationships, but our study also provides guidelines for future research in this area.
Second, while many studies have proven the existence of these relationships, so far no study has shown how these relationships
behave in the presence of uncertainty, responding to the call for the need for new and different approaches in the field of
management control systems studies, including situations that could help cope with the level of uncertainty (Otley 2016).
Finally, in particular, our analysis provides formal empirical research and statistical knowledge in the field and shows how
MCS can be used to maximize the development of organizational capabilities impacting performance, and how in presence
of external factors such as uncertainty, these relationships can change; thus giving contingency theorists the necessary
ingredient to move forward.
4.8 Limitations and further research
Limitations
Our first limitation is about the instrument. The instrument used is reliable (satisfactory psychometric properties), and we
chose a valid previously used measures for each construct in this paper (MCS uses, Capabilities, Performance & PEU). With
all this, future research trying to repeat this study should make sure to carry out a process of refinement and improvement of
the instrument.

138
We must see the results in good conscience that these were obtained through a survey, and using the survey method to collect
data creates the potential for bias due to common response. In this line, we are aware that the results of this study could show
a bias by a form of common method variance (CMV) called Single Source Bias (SSB) (Campbell & Fiske 1959), and although
Harman’s one-factor test indicated the absence of common method effects in our survey data (See Appendix C. Non response
bias & common method variance (CMV) analysis). There are arguments to think that this test is necessary but insufficient
(Podsakoff et al. 2003). So, this is a limitation in our study and also an area of opportunity for future research using multi-
method strategies for data collection, in order to enhance the validity and reliability of the construct measures. Future studies
in this area should also use more refined measurement instruments to address these concerns and, where feasible use multi-
source measures.
Another limitation of our study is that we only focus on learning and entrepreneurial orientations, but other capabilities could
be included.
Also, our study focuses only on one of many possible environment variables that impact the proposed relationships. It would
be welcome to try the same model, but relating it to other contingency variables that could modify these relationships.
Finally, in our work PEU is related to variables that directly affect both internal operations, such as raw materials, technology
used, price, quality; and external or market variables, such as competition, regulations, government actions and / or trade
unions, etc. but in a single construct. The uncertainty variable has sometimes been measured separately, highlighting issues
such as competition and dynamism (King & Clarkson 2015).
Suggestions for further research
An important part of the research agenda is to understand how different MCS uses can be combined to suit the particular
circumstances of the organization (Fisher 1995) . There are few contingency works published dealing with issues related to
MCS as balanced scorecards, target costing, life cycle costing, non-financial performance indicators, including capabilities of
the organization. Therefore, it is necessary to broaden the base of studies linking the contingency framework and MCS.
In regards to how we measure uncertainty, we see an area of opportunity in how we measured PEU because it could be split
in two, internal and external. Thus, studies that can break the moderating effect of uncertainty in these two groups would
provide us a more accurate understanding of the effect.
There is an opportunity area related to environmental variables as mediating variables with other relationships, different from
those proposed here. Therefore, studies with different relations would be beneficial to increase the knowledge base.
Finally, it is still necessary to generate and accumulate knowledge through studies that replicate previous research but that
improve the validity and reliability of results. This seeks to create a solid basis to further develop models that can be
generalized (Lindsay 1995). Studies have not developed enough ‘critical mass’ to confirm findings.

139
Chapter V: Conclusions
5.1. Summary and discussion of the main results and contributions
This thesis looks to contribute to a stream of literature that investigates determinants and consequences of performance. In
this line, this thesis delves into the fourth step of the strategic process, where MCS take shape and seek to track the objectives
of the process itself, allowing us to improve our understanding of some relationships in the field of Management Control
Systems. Moreover, it has important implications for the literature and managerial practice. We hope that the fruit of this task
provides new features to this line of research, and also reinforces the findings of previous investigations. It should be noted
that although this study has several limitations, it also provides several possibilities for future research.
In this chapter we offer the final remarks of the study through a summary of the dissertation main findings and contributions.
We also provide a brief discussion in terms of the general purpose and specific objectives of the doctoral thesis. Next, we
conclude the thesis emphasizing some theoretical implications which can be used to grow and further develop the current
theoretical framework on MCS – capabilities – performance. We also discuss and recommend some practical implications for
managers.
Our initial review of the literature revealed several shortcomings in the field of research of uses of MCS and their relationships
with organizational capabilities and organizational performance. However, it also opened a space to identify the contextual
variables that had not been developed yet. Throughout this thesis, we have realized that most investigations in this area have
been conducted in advanced economies where development, acceptance and use of management control systems are a reality.
No studies were identified as the one proposed here to have been done in countries with developing economies such as
Mexico’s. In addition, to our knowledge, there are no studies with empirical evidence on the determinants of performance
based on uses of MCS and context-characterized by the perceived uncertainty. Considering the gaps in the literature, the
general purpose of the present doctoral thesis was to identify and describe analytically the role played by the uses of the MCS
in the development of strategic capabilities and their impact on performance, under the influence of uncertainty perceived by
decision makers.
Departing from the general purpose of the doctoral thesis, we derived three objectives which were developed in each of the
chapters as three interdependent essays, each one with its own research questions, methodology of analysis and empirical
results:
1. Our first objective in this thesis was to analyze what the impact of the use of MCS was in generating capabilities in
the firm; how the uses of MCS determined capabilities (LO & EO) and what role the firm characteristics (size and
industry) played in the MCS – Capabilities relationship.
Thus, as a result of the first empirical essay, our findings recommend that the four MCS uses (monitoring, legitimizing,
attention focusing & strategic decision-making) have a positive and significant impact on both capabilities (LO & EO). It
should be mentioned that unlike previous studies (Henri, 2006a) the monitoring and legitimizing uses of MCS (Diagnostic
use) do not necessarily inhibit capabilities in the organization; in contrast, our results imply a positive relationship and the

140
most significant of all the applications studied. Thus, this research complements and reinforces existing studies, and suggests
that this initial approach to expect a negative outcome could be wrong, ie, on one hand, in the literature we can observe that
the diagnostic use of MCS represented by the monitoring and legitimizing uses of MCS could help to increase the positive
effects of an Interactive use on capabilities by providing the necessary information to perform the interactive use. Also, the
monitoring use of MCS is a necessary condition to learn (Slater & Narver 1995), to improve, and to challenge the context
(Mintzberg 1973), but it is not sufficient. Moreover, the legitimizing use of MCS is related to people’s communication, to
detonate “information dissemination” and to have a “shared interpretation”, all important parts of the organizational learning
process (Slater & Narver 1995). Another possible explanation for this counterintuitive result may be in the context in which
our research was conducted. México is a newly developed country and has the characteristics of an emergent economy, such
as competition at an early stage, a paternalistic culture, and companies that mostly use traditional MCS in a diagnostic manner,
among others. The challenge is to know how to use MCS as interactive tools.
Regarding the research question about how the uses of MCS determine capabilities, the coefficient indicates that the variables
impact differently and that the scale gives us an interesting reading. Hence, LO is more related with the legitimizing use and
less with the monitoring MCS use, while EO is more related to focusing attention and less to the use of MCS for strategic
decision-making.
Related to the question about the role-played by the firm’s characteristics (size and industry) in the MCS – Capabilities
relationship, our results highlight that except for the monitoring use of MCS more widely used by large than by small fimrs,
in general the other uses of MCS (legitimizing, attention focusing and strategic decision-making) are not different in
companies of various sizes. Also, our results show that smaller companies present greater learning orientation than large firms
and that manufacturing and services firms have higher entrepreneurial orientation than those in the trade and banking fields.
2. Secondly, recognizing the important role of performance in the business context, and consistent with the growing
interest in investigating performance drivers, our second objective was to know if the uses of MCS had a direct or an
indirect effect on performance through capabilities; i.e., to what extent there was a mediating effect of organizational
capabilities (LO & EO) in the relationship among the uses of MCS and performance and if it was the same effect in
business of any size.
In the second empirical essay, our study contributes by offering evidence of the relationship MCS – Capabilities -
Performance, and specifically of the role played by capabilities as a determinant of performance while providing empirical
evidence of the direct relationship between MCS and performance. Also, reinforcing our findings and seeking the universality
of results, our second quantitative essay contributes further, by offering evidence to check if previous results are maintained
in the same direction in companies of various sizes.
Unlike what was done in the first paper where we used as the main methodology multiple linear regressions and ANOVA, in
this second paper we decided to use a different methodology that allowed us, on the one hand, to corroborate the results
previously obtained in a more complex model; and on the other hand, the inclusion of the performance variable. Thus,
methodologically, our second study seeks to analyze the impact of MCS on performance in two ways: i) analyze the

141
relationship and direct impact between MCS and performance and ii) analyze the relationship and existing indirect impact
between MCS and performance through organizational capabilities. Both analyses were performed for different samples,
because we needed to know if the overall results were maintained when analyzed by splitting the sample by company size.
The theory implies using a model that calls for a different analysis since we needed to first analyze the impact of non-
observable latent variables grouped into two constructs called diagnostic and interactive. These could only be measured by
other directly observable variables, i.e. the four uses originally proposed (monitoring, legitimizing, attention focusing and
strategig decision making). Secondly, it required to generate a model that could measure the impacts all together, something
like the simultaneous equation models used in the study of economics and path analysis road used in psychology to follow a
chain of impacts. In other words, it sought to simultaneously integrate a series of equations of different multiple regression
and the interdependent, where the variables are dependent and independent within the same model. This was exactly what
proposed the analysis of structural equations used.
Thus, in this essay and using structural equations modeling, we could conclude that:
MCS -> Capabilities
MCS uses have an impact over capabilities, in all firm sizes. Again, the diagnostic use of the MCS case showed a positive
and significant relationship with LO & EO capabilities, but in an unexpected opposite (+) direction. Once again and using a
different metology, our results suggested that based on prior research, this initial approach expected to have a negative
outcome could be wrong. As we argued above, there are arguments (Mintzberg, 1973; Eisenhardt, 1989; Vandenbosch, 1999;
Slater & Narver, 1995; Grafton et al. 2010) suggesting that the diagnostic use -this time represented in a second-order
construct- comprised by the monitoring and legitimization uses, can have a positive influence on the development of
capabilities. This laid the foundation for carrying out a conversation to enable better decisions, such as having the same
information and understanding it in the same way because the diagnostic use of MCS operationalizes some steps in the learning
process: i) information dissemination and ii) shared interpretation (Slater & Narver 1995). The diagnostic use of MCS can
impact both capabilities because LO is related to learning from past events (Levitt & March, 1988), which can only be
achieved by making a solid use of the diagnostic MCS; and EO as a concept is related to an organizational level where systems
are widely used in combination with strategic resources, such as knowledge-based resources. If they are directed to discover
and exploit opportunities, they can boost competitiveness and entrepreneurship (Barney, 1991; Chenhall & Morris, 1995).
More over, as stated by Feldman and March (1981), an essential characteristic of entrepreneurship is that in order to make
things happen, it is implied that leaders devote considerable effort to justify and legitimize their proposals and actions.
Managers use MCS to legitimize prior ideas ensuring their interpretation because they believe that by doing so it leads to
reach competitiveness in their organizations (Vandenbosch 1999). All this is achieved by using diagnostic MCS. Apparently,
somehow the systems work at the same time (diagnostic and interactive) and support each other in a holistic way. Although
it has not been explained in this way in previous research, if the MCS is used for diagnostic purposes and in isolation, the
impact could only be negative for the signal it sends which is to just focus on finding deviations or errors. It is noteworthy
that this case was not proven in this thesis but could be in future research. On the other hand, and corroborating and consistent
with prior results, the interactive use of MCS shows a positive and significant relationship with capabilities in the full sample.

142
It also showed it in the medium-sized and large firms, but not in small ones. This was expected since by definition small firms
have few resources and are scarce of time and resources to address something related to learning Small firms are more
concerned about their survival or growth plan. Some authors argued that SMEs tend to have poor processes, such as strategic
planning, and do not fully understand what their critical success factors are (Garengo et al., 2005). Perhaps it is because the
cost of development and implementation of these systems are still beyond the reach of most small and medium firms.
However, apart from the cost, there are barriers, such as the lack of quantity, quality and human-resource capacity in the
SME´s. (Hudson, 1999; Garengo et al., 2005). Hudson et al. (2001) argues that the degree of formality in the use of “complex”
models, such as the use of information systems and learning from them, is much lower in small than in medium and large
enterprises.Additionally, improvements are usually incremental with a preference to adjust processes and systems in response
to specific identified needs and to learning-by-doing approaches, not as a formal process needed in a Learning Orientation.
MCS -> Capabilities -> Performance: Direct / Indirect effect over performance through Capabilities.
In regards to the question if MCS uses have a direct or indirect effect on performance through capabilities, it can also be
understood as to what extent there is a mediating effect of organizational capabilities (LO & EO) among the MCS uses and
performance relationship.
Direct effect. Firstly, we can see that MCS have a direct effect on organizational performance only if they were used
diagnostically, in any company size. Secondly, it is not the case for the interactive use, since our results show that using the
MCS interactively has no direct effect on organizational performance.
Indirect effect. Regarding the indirect effect, first we recapitulate the role of a mediating variable- Mediating variables are
those that help explain how and why two constructs are related; more formally, a mediating variable is one that mediates the
causal sequence that relates an independent variable (input) with a dependent variable (outcome). There is an overview of
what we mean when referring to the mediating and moderating effects, then a brief explanation of why we decided to use the
mediating effect in our analysis. Both mediating and moderating variables are third variables, ie. They are intervening
variables affecting the relationship between two variables. In the case of mediating, two variables -the independent variable
and potentially mediating variable-, have an influence on the dependent variable; whereas in moderation, a third variable
affects the relationship between the other two variables. Thus: "While moderating variables specify when certain effects will
take place, mediators say how and why these effects occur" (Baron and Kenny, 1986). Thus, the analysis of mediators
identifies or discriminates whether it is a complete or partial mediation. A complete mediation takes place when the direct
path between the independent variable and the dependent variable equals zero. The independent variable does not influence
the dependent variable. Instead, the partial mediation takes place when, still having reduced the direct path between the
independent and dependent variables in its absolute size, they are different from zero.
Taking the above into account, the results for the mediating effect of capabilities are discussed ahead.
EO. In summary, the entrepreneurial orientation (EO) capabilty has a mediating effect in the use of MCS -> performance
relationship. It was positive in the overall sample and in firms of different sizes, showing it as one of the main drivers of the
new economy. Literature on entrepreneurship emphasizes the importance of EO as a determinant of business performance
143
(Ripolles & Blesa, 2005), but is different in each capability. In other words, on the one hand, we had a total mediator EO
effect on the interactive use of MCS -> performance relationship (except for small companies.) Thus, the relationship between
the interactive use of MCS and performance indirectly exists only through the EO capability: On the other hand, we had a
partial mediating EO effect in the use of the diagnostic MCS - > Performance because there is a direct relationship between
the diagnostic use of MCS -> Performance and also an indirect effect in the Diagnostic use of MCS -> Performance
relationship through EO capability.
LO. The above results are not the case for the learning orientation (LO) capability which -except for midsize companies- has
no mediating effect between the diagnostic and interactive uses of MCS and organizational performance. This counterintuitive
and positive result in medium-sized enterprises should be subject for further research because previous studies have found an
indirect relationship between the different capabilities and performance of a company (Widener 2006). For small businesses,
this relationship has been widely investigated, while in this study, the impact of OL in small companies was not significant.
This brought to light some of the most studied aspects in small businesses for their focus on short -term survival.
Importantly, as our empirical results suggest, the direct impact of the diagnostic use of MCS over performance is partially
modified in the presence of an entrepreneurial orientation. This means that apart from MCS having a direct impact on
performance, they would also have an indirect impact through EO, ie you can maximize the impact of a system if used
diagnostically when it also has guidance to seize opportunities and to do something with them, which makes it an
entrepreneurial orientation. In the case of LO, it is shown that the MCS used interactively have no direct impact on
performance.
Other studies have suggested that there is a contingent relationship between capabilities (LO & EO) and internal/external
characteristics of the firm context (Wiklund & Shepherd, 2003) and that the relationship between capabilities and performance
is likely more complex than a simple main-effect-only (Lumpkin & Dess, 1996). Therefore, it would be important to consider
the effects of internal or external characteristics to the firm, such as the access to human resources or environment factors as
uncertainty or technology development. Based on the above, our third empirical chapter unfolds below.
3. Finally, aware that all the controls are performed within a context that may vary between different situations, the
third objective sought to examine the extent to which the influence of the environment, specifically the perceived
environmental uncertainty (PEU) for decision makers, mediated the relationships between the various MCS uses,
organizational capabilities (EO & LO) and organizational performance.
It is worth mentioning that MCS, capabilities, and performance constructs have been widely studied individually, but few
studies have examined the relationship of these constructs analyzing them as a whole, and have not typically addressed the
possible intervening role of the perceived environmental uncertainty by those who make use of these systems. Thus,
considering the increasingly environmental uncertainty over the last few years, our research contributes by offering an analysis
which highlights the importance of analyzing the previously raised relationships between MCS, capabilities and performance
but now including them within a context of uncertainty perceived by decision makers. Recent studies show that a great number

144
of internal or external factors can mediate the relationship between control systems and firm performance (Franco-Santos et
al., 2012; Speklé & Kruis 2014), but no study has taken into account the implications of uncerttainty and its influence on the
use of control systems. Furthermore, most research in the field of MCS assumes that the future can be predicted with a high
degree of certainty, and thus, also assumes (consciously or unconsciously) that the context in which they happen is not affected
by external variables to the study. This issue in one of the biggest criticisms of the studies detonating also that the results may
not be valid in different circumstances.
In the third essay of this thesis, the context was explicitly recognized as a contingent variable (perceived uncertainty) that may
mediate the relationship between the MCS constructs, capabilitie, and performance. Morevoer, using a structural equation
analysis (SEM), allowed us to observe the model as a whole and reach a holistic conclusion.
It is important to mention that in the development of this last essay, we validated the results of impact proposed in the initial
hypotheses were met, namely that the initial hypothesis on existing relationships between the diagnostic /interactive uses of
MCS => Capabilities => Performance in the model was met, without the PEU variable. In this respect the results of hypotheses
H1 - H8 were the same as those of Chapter III. In addtioin, it was necessary to recalculate them to be certain that by introducing
a new variable initial relationships were valid (Figure 4.5: Hypothesis results H1-H8 MCS uses - Capabilities – Performance).
Hence, our research results addressing the last objective of the present doctoral thesis, about the mediating effect of PEU
showed that, on the one hand, the PEU variable between the diagnostic and interactive uses of MCS and capabilities (PEU 2)
did not have a mediating effect as originally proposed (Figure 4.8). Perhaps, this was because the relationship between the
MCS uses and capabilities is an internal issue, which would be little affected by the perception of uncertainty in the
environment. Tipically, the diagnostic uses of MCS seek to verify whether we are near or far from the targets set. Therefore,
to check the possible causes it was neccesary a minimum of information to initiate a dialogue between managers and
subordinates to find opitions (interactive use of MCS). With the previous two that depended on domestic issues without
necessarily turning to see the environment, it could start a process to generate targeted actions. Here impact of external
situations as PEU would have no effect, and the impact of external situations in the company could be minimized. PEU could
be more of a consequence than a precedent of the capabilities. These results could be the initial part of another more detailed
research study.
Concerning the inclusion of PEU between capabilities and performance (PEU 1), this doctoral thesis reveals that PEU showed
a significant and positive effect as a mediating variable, but a different effect was observed in each capability (Figure 4.9):
the PEU in LO-performance relationship showed a total mediating effect. This is, although originally LO had no effect on
performance, when the PEU variable is introduced in the model, a significant effect is shown, suggesting that PEU had a total
mediating effect in the LO-performance relationship. I.e., in the presence of uncertainty, learning orientation can positively
affect performance. On the other hand, the PEU in the EO-performance relationship showed a partial mediating effect. It was
partial because the relationship between EO->performance remained significant as it already was before introducing PEU.
However, with the introduction it had a lower magnitude, which meant that the effect was twofold: EO maintained a direct
effect on performance but also an indirect effect through PEU which in turn had an impact on performance. The interpretation

145
could be that in the presence of uncertainty, entrepreneurial orientation develops in a different way impacting performance.
Our results support what others have argued as a contingent relationship between EO and internal/external characteristics of
the firm (Wiklund & Shepherd 2003). It also supports that the relationship between EO and performance is likely more
complex than a simple main-effect-only (Lumpkin & Dess 1996).
In summary, the results of our third paper, first highlight the importance of understanding how the various uses of MCS relate
differently to capabilities and especially that this relationship is not related to uncertainty. Secondly, this study underlines a
robust relationship between capabilities – PEU – performance; i.e., perception of uncertainty plays an important and different
role in the capabilities - performance relationship, providing insights into the way that capabilities are used to deal with an
evolving environment.
To sum up, Table 5.1 reinforces the main contributions of this dissertation through the hypotheses tested in our study. With
the above results, we can state that our study contributes to the literature, and presents some implications for theory and
practice.

146
Table 5.1: Summary of the contributions through hypotheses
Tabl
e 5.1
Sum
mar
y of
the
cont
ribut
ions
thro
ugh
hypo
thes
es
Essa
y (c
hapt
er)
Hyp
othe
ses
Resu
lt
Essa
y 1
(cha
pter
II)
H1a
: Mon
itorin
g us
e of
MCS
exe
rts a
neg
ativ
e in
fluen
ce o
n LO
H1b
: Mon
itorin
g us
e of
MCS
exe
rts a
neg
ativ
e in
fluen
ce o
n EO
N
ot su
ppor
ted
Not
supp
orte
d
H2a
: Leg
itim
izin
g us
e of
MCS
exe
rts a
neg
ativ
e in
fluen
ce o
n LO
H2b
: Leg
itim
izin
g us
e of
MCS
exe
rts a
neg
ativ
e in
fluen
ce o
n EO
Supp
orte
dSu
ppor
ted
H3a
: Atte
ntio
n fo
cusin
g us
e of
MCS
exe
rts a
pos
itive
influ
ence
on
LOH
3b: A
ttent
ion
focu
sing
use
of M
CS e
xerts
a p
ositi
ve in
fluen
ce o
n EO
Not
supp
orte
dN
ot su
ppor
ted
H4a
: Stra
tegi
c de
cisio
n-m
akin
g us
e of
MCS
exe
rts a
pos
itive
influ
ence
on
LOH
4b: S
trate
gic
deci
sion-
mak
ing
use
of M
CS e
xerts
a p
ositi
ve in
fluen
ce o
n EO
Supp
orte
dSu
ppor
ted
Essa
y 2
(cha
pter
III)
H1:
Dia
gnos
tic u
se o
f MCS
exe
rts a
neg
ativ
e in
fluen
ce o
n LO
H
2: D
iagn
ostic
use
of M
CS e
xerts
a n
egat
ive
influ
ence
on
EO
H3:
Inte
ract
ive
use
of M
CS e
xerts
a p
ositi
ve in
fluen
ce o
n LO
H4:
Inte
ract
ive
use
of M
CS e
xerts
a p
ositi
ve in
fluen
ce o
n EO
H5:
The
re is
a p
ositi
ve re
latio
nshi
p be
twee
n Le
arni
ng O
rient
atio
n ca
pabi
lity
and
perfo
rman
ce
H6:
The
re is
a p
ositi
ve re
latio
nshi
p be
twee
n En
trepr
eneu
rial O
rient
ation
cap
abili
ty a
nd p
erfo
rman
ce
Full
sam
ple
Not
supp
orte
dN
ot su
ppor
ted
Supp
orte
dSu
ppor
ted
Not
supp
orte
dSu
ppor
ted
Smal
l fir
ms
Not
supp
orte
dN
ot su
ppor
ted
Not
supp
orte
dN
ot su
ppor
ted
Not
supp
orte
dSu
ppor
ted
Med
ium
firm
sN
ot su
ppor
ted
Not
supp
orte
dSu
ppor
ted
Supp
orte
dSu
ppor
ted
Supp
orte
d
Larg
e fir
ms
Not
supp
orte
dN
ot su
ppor
ted
Supp
orte
dSu
ppor
ted
Not
supp
orte
dSu
ppor
ted
Dir
ect e
ffec
t of L
O &
EO
in D
iagn
ostic
& In
tera
ctiv
e us
es ->
Per
form
ance
H7:
The
re is
a p
ositi
ve re
latio
nshi
p be
twee
n M
CS d
iagn
ostic
use
and
org
aniz
ation
al p
erfo
rman
ce
H8:
The
re is
a p
ositi
ve re
latio
nshi
p be
twee
n M
CS In
tera
ctive
use
and
orga
niza
tiona
l per
form
ance
Su
ppor
ted
Not
supp
orte
dSu
ppor
ted
Not
supp
orte
dSu
ppor
ted
Not
supp
orte
dSu
ppor
ted
Not
supp
orte
d
Indi
rect
eff
ect o
f LO
& E
O in
Dia
gnos
tic &
Inte
ract
ive
uses
-> P
erfo
rman
ceLO
a) H
1 +
H5:
Med
iato
r effe
ct of
LO
betw
een
Dia
gnos
tic u
se ->
Per
form
ance
b)
H3
+ H
5: M
edia
tor e
ffec
t of L
O be
twee
n In
terac
tive
use
-> P
erfo
rman
ce
EO c
) H2
+ H
6: M
edia
tor e
ffect
of E
O b
etwee
n D
iagn
ostic
use
-> P
erfo
rman
ce
d) H
4 +
H6:
Med
iato
r eff
ect o
f EO
betw
een
Inter
activ
e us
e ->
Per
form
ance
Not
supp
orte
dN
ot su
ppor
ted
Parti
al su
ppor
ted
Supp
orte
d
Not
supp
orte
dN
ot su
ppor
ted
Parti
al
supp
orte
dSu
ppor
ted
Supp
orte
dSu
ppor
ted
Parti
al
supp
orte
dSu
ppor
ted
Not
supp
orte
dN
ot su
ppor
ted
Parti
al
supp
orte
dSu
ppor
ted
Essa
y 3
(cha
pter
IV)
PEU
in p
ositi
on 2
: PEU
med
iato
r eff
ect b
etw
een
MCS
use
s and
cap
abili
ties (
H1
to H
4)
H1:
(Dia
gnos
tic->
PEU
(2))
+ (P
EU(2
) ->
LO)
H2:
(Int
erac
tive
-> P
EU(2
)) +
(PEU
(2) -
> LO
)H
3: (D
iagn
ostic
-> P
EU(2
)) +
(PEU
(2) -
> EO
)H
4: (I
nter
activ
e ->
PEU
(2))
+ (P
EU(2
) ->
EO)
Not
supp
orte
dN
ot su
ppor
ted
Not
supp
orte
dN
ot su
ppor
ted
PEU
in p
ositi
on 1
: PE
U m
edia
tor e
ffec
t bet
wee
n ca
pabi
litie
s and
per
form
ance
(H5,
H6
) H
5: (L
O ->
PEU
(1))
+ (P
EU(1
) ->
Perfo
rman
ce)
H6:
(EO
-> P
EU(1
)) +
(PEU
(1) -
> Pe
rform
ance
)Su
ppor
ted
Supp
orte
d
Sour
ce: O
wn
devi
sed

147
5.2. Theoretical implications
For academics, this study adds to the stream of research that explains the performance antecedents. There is general agreement
that management control systems (resources) do not generate rents per se, but are rather a function of the way in which they
are used (Penrose 1995). Assuming that MCS can be employed for different uses, the results of our empirical research affirm
the existence of a direct relationship of MCS to organizational performance, when they are used diagnostically in firms of any
size. On the other hand, results confirm that the interactive use has no direct relationship to performance, but indirectly through
capabilities.
Although some studies have argued that firms may sometimes use parts of their MCS interactively while using other parts
diagnostically, both uses are related to better performance (Marginson 2002; Koufteros et al. 2014). Our result of a positive
and significant effect of the diagnostic use of MCS over capabilities is somehow against Simons (1995) and Henri´s (2006a)
results, who proposed a diagnostic use of MCS, and a restrictive environment for both learning and implementing
entrepreneurial initiatives. That was the basis of our initial approach. Our results contrast the above, and propose a new
outlook to this paradigm, in which the diagnostic use of MCS diagnostic does not necessarily inhibit strategic capabilities in
the organization. In contrast, this diagnostic use provides the necessary information to challenge the context (Mintzberg 1973)
and guidance to implement actions related to organizational capabilities that in turn impact performance. Furthermore, the
diagnostic use of MCS is a necessary condition to the organizational learning process (Slater & Narver 1995) because this
process relies on the “information dissemination” and “shared interpretation”. In summary, the firm’s ability to use MCS for
diagnosis constitutes an essential driver to face the development of organizational capabilities and performance.
Another counterintuitive result that deserves more attention from the theoretical point of view is that small companies present
greater learning orientation than large firms. This is because in general literature argues that small businesses have specific
characteristics (lack of quantity, quality and human resource capacity Hudson, 1999; Garengo et al., 2005) that do not allow
them to develop activities and / or processes that are identifiable in large firms. They have attributed this to their main focus
on short-term survival. It is noteworthy that this result means that small businesses are more prone to learn than large ones.This
is not related to the use of MCS since it had been previously identified that small firms used these systems less. The above
has a theoretical implication that we propose to be taken into account for future research.
From the theoretical point of view of the typology of administrative control systems, this study provides empirical evidence
of the relations among the uses of MCS in the LOC (Simons 1995) and ESS (executive support systems classification)
(Vandenbosch 1999) frameworks by offering, methodologically speaking, a second-order construct that meets the standards
required to use in future research. In addition, it contributes to the body of work that investigates relations among MCS (Henri,
2006a; Widener, 2006; Kaplan & Norton, 1992, 1996; Koufteros et al. 2014).
While some studies have proven the existence of the MCS – Capabilities - Performance relationships (Henri 2006a; Koufteros
et al. 2014), so far no study has shown how these relationships behave in the presence of uncertainty, responding to proposals
to develop new approaches in the MCS field of research, including situations that could cope with the level of uncertainty
(Otley 2016). Studies results show us that not all contingencies studied in prior studies influence the relationships proposed;

148
therefore, our work provides a better understanding of the PEU effects as a mediating variable in the uses of MCS–
Capabilities–Performance relationships, as well as how these effects occur in firms of different sizes, providing knowledge
that would be beneficial for further progress in this research line. Moreover, we contribute to research in a dimension still
under-exploited, e.g., the effect of uncertainty on the uses of MCS – Capabilities – Performance relationship. Hence, the
theoretical contributions of this essay extend the research on MCS uses with an emphasis on environmental uncertainty.
Finally, in the strategy field, our work provides some insights. As we argue above, strategy research has two broad approaches:
content and process. In strategy content lie the external factors, such as industry structure determining competition (Porter,
1980), and internal factors such as strategy depending on the firm’s resources and capabilities (Barney, 1991; Teece, Pisano,
& Shuen, 1997; Wernerfelt, 1984). Thus, MCS uses can be seen as inimitable resources used to implement the strategy by
providing the necessary information to challenge the content (Ittner, Larcker, & Randall, 2003) and setting the conditions for
the development of capabilities through the routines they stimulate (Franco-Santos, Lucianetti, & Bourne, 2012).
On the other hand, strategy process research has two lines, deliberate 44 and emergent45. Both of them are related to MCS. An
interactive MCS use is eminently social, while the diagnostic use of MCS is completely rational. Content (internal and
external) and process (deliberate and emergent) researchers are still separated by structural gaps, and some authors argue for
the need to integrate both branches (Cuervo, 1996; Mellahi & Sminia, 2009). Research and understanding how MCS uses can
secure the two areas of the entire process can be benefical for the strategy research line, and our investigation is in this line.
In summary, from the theoretical point of view, our analysis provides a formal empirical research and statistical knowledge
in the field of the uses of MCS. Our results highlight the importance of being aware of how the different MCS uses relate
differently to capabilities and performance. It also refers that the MCS use - capabilities relationship is not impacted by
uncertainty, but environmental perceived uncertainty plays an important and different role in the organizational capabilities-
performance relationship, providing insights into the way capabilities are used to deal with an evolving environment. Finally,
it should be emphasized that much of the impact of uncertainty on the use of MCS remains not fully understand.
5.3. Practical implications
Apart from the theoretical implications, our results also point to several implications for managers as well. Given the important
role of the uses of MCS and the positive and significant but different impact on both capabilities and performance, managers
who use these systems must be aware and wary of designing and using such systems. The results show a possible
complementarity and balance, necessary for the different uses and not just for focusing on some of them. If the MCS are only
used diagnostically, they do not generate their maximum potential because despite generating relevant information, the
necessary actions do not necessarily occur. Similarly, if the MCS are used only interactively in order to focus attention or to
make decisions without updated diagnostic information, the dialogues that are raised in this application will not add much
value. Our work shows that the elements provided from these systems are relevant in all the phases of a strategic process
44 Deliberate: Strategy as analytical approach in a deliberate form is planned and rational (Ansoff, R. L. Hayes, & Declerck, 1976) 45 Emergent: Arise from the collective organization, are not intentional, a social process, (Mintzberg, 1987; Mintzberg & Lampel, 1999)

149
(Widener 2007). In addition, it they are used in a complementary manner, MCS can provide information about the drivers of
success and causes of failures.
Given that, a business increasing its competitive position will improve its performance (Narver & Slater 1990); hence,
managers seeking to develop capabilities that produce them better results should benefit from knowing which of the various
uses they should give to their MCS. Empirical studies have suggested that the effectiveness of MCS depends more on the way
superiors use them (Otley 1978; Govindarajan 1984). Our results highlight that the two uses of MCS -diagnostic and
interactive- are relevant in different forms as explained above.
Finally, it is important for business managers to know how to use their MCS since this will develop a superior capacity to
gain competitive advantages. On account of the high investment involved in the formalization of MCS, understanding their
consequences should be an important issue for organizations. Following the arguments of Hansen & Wernerfelt (1989) about
the importance of human resources in today’s business environment to determine performance, it is essential that managers
understand how, when and why to use MCS to develop advantages that allow them to perform better in a world of competition
(Widener 2014). It is just as important that they know how to do it in a turbulent environment, with a high degree of uncertainty
and learn to deal with it, balancing and managing short-term actions efficiently, while being alert and adapting to the changing
environment. As stated by March (1991), firms must be ambidextrous.
Our findings are relevant to the controlling function in a company because it is quite so often responsible for the design and
implementation of MCS. Our findings can help them to better understand what types of MCS use they should prioritize to
generate the expected results. This position must not only take into account the level of uncertainty perceived by the user of
the systems, but also the strategy decided by the company. They should consider what the firm’s strategic orientation is in
order to promote it since it is also a perceivable influence in the presence of uncertainty.
Management is not easy under conditions of uncertainty; both research and practice have tended to avoid their existence or at
least have paid little attention to it (Otley 2012). Given that uncertainty and decision making are always present, in addition
to accepting their existence, it is important to act accordingly and to better understand how management control systems work
when facing uncertainty.

150

151
6. Chapter VI: Appendix
Appendix A: Data in the directory SCIAN México 2012.
Identification of the economic unit Location • Name of the economic unit • Economic name • Stratum of employed persons * • Class code and description of activity * • Type of economic unit
* Determined by the INEGI
• Mailing address or geographic • Type and name of the road • Outside number • Building, floor or level • Internal number • Name and type of human settlement • Industrial corridor, mall or public market • Number of local • Zip code • Location within the national geostatistical
• Federal entity • Municipality • Locality • Basic geostatistical Area • Block • Phone number • E-mail • Website • Approximate Location • Latitude • Length
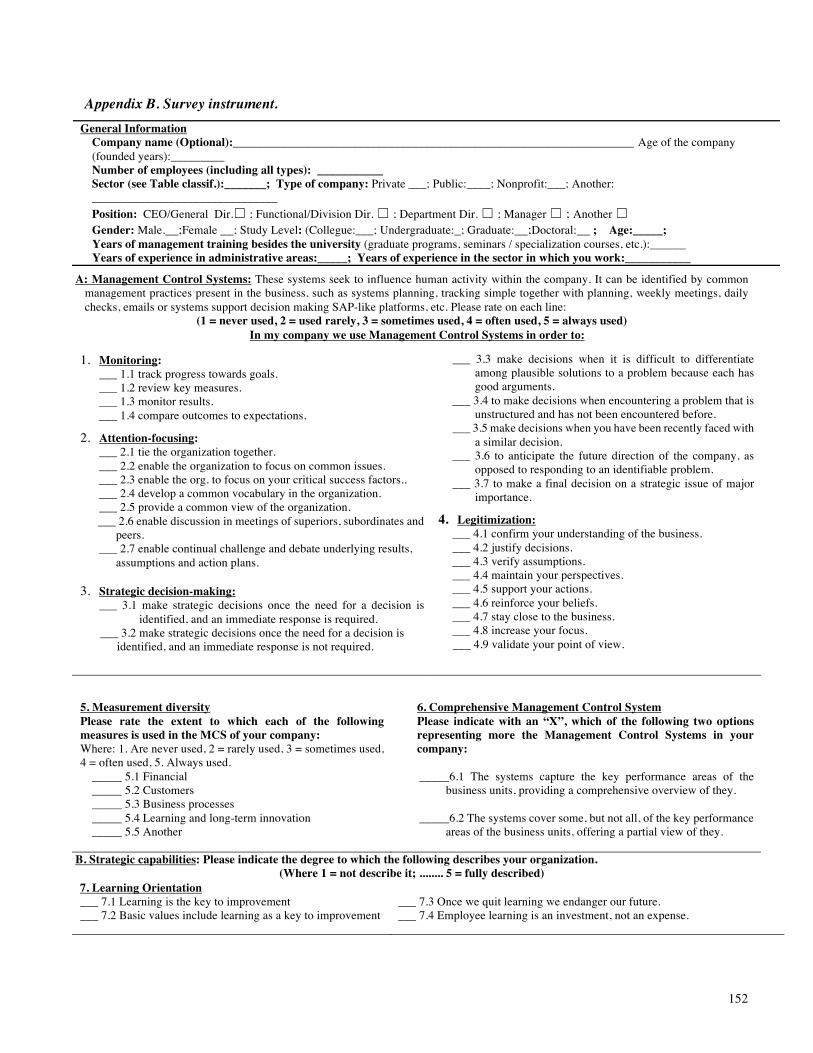
152
Appendix B. Survey instrument. General Information
Company name (Optional):___________________________________________________________________ Age of the company (founded years):_________ Number of employees (including all types): ___________ Sector (see Table classif.):_______; Type of company: Private ___; Public:____; Nonprofit:___; Another: _______________________________ Position: CEO/General Dir.☐ ; Functional/Division Dir. ☐ ; Department Dir. ☐ ; Manager ☐ ; Another ☐ Gender: Male.__;Female __; Study Level: (Collegue:___; Undergraduate:_; Graduate:__;Doctoral:__ ; Age:_____;
Years of management training besides the university (graduate programs, seminars / specialization courses, etc.):______ Years of experience in administrative areas:_____; Years of experience in the sector in which you work:___________
A: Management Control Systems: These systems seek to influence human activity within the company. It can be identified by common management practices present in the business, such as systems planning, tracking simple together with planning, weekly meetings, daily checks, emails or systems support decision making SAP-like platforms, etc. Please rate on each line:
(1 = never used, 2 = used rarely, 3 = sometimes used, 4 = often used, 5 = always used) In my company we use Management Control Systems in order to:
1. Monitoring: ___ 1.1 track progress towards goals. ___ 1.2 review key measures. ___ 1.3 monitor results. ___ 1.4 compare outcomes to expectations.
2. Attention-focusing: ___ 2.1 tie the organization together. ___ 2.2 enable the organization to focus on common issues. ___ 2.3 enable the org. to focus on your critical success factors.. ___ 2.4 develop a common vocabulary in the organization. ___ 2.5 provide a common view of the organization. ___ 2.6 enable discussion in meetings of superiors, subordinates and
peers. ___ 2.7 enable continual challenge and debate underlying results,
assumptions and action plans.
3. Strategic decision-making: ___ 3.1 make strategic decisions once the need for a decision is
identified, and an immediate response is required. ___ 3.2 make strategic decisions once the need for a decision is
identified, and an immediate response is not required.
___ 3.3 make decisions when it is difficult to differentiate among plausible solutions to a problem because each has good arguments.
___ 3.4 to make decisions when encountering a problem that is unstructured and has not been encountered before.
___ 3.5 make decisions when you have been recently faced with a similar decision.
___ 3.6 to anticipate the future direction of the company, as opposed to responding to an identifiable problem.
___ 3.7 to make a final decision on a strategic issue of major importance.
4. Legitimization: ___ 4.1 confirm your understanding of the business. ___ 4.2 justify decisions. ___ 4.3 verify assumptions. ___ 4.4 maintain your perspectives. ___ 4.5 support your actions. ___ 4.6 reinforce your beliefs. ___ 4.7 stay close to the business. ___ 4.8 increase your focus. ___ 4.9 validate your point of view.
5. Measurement diversity Please rate the extent to which each of the following measures is used in the MCS of your company: Where: 1. Are never used, 2 = rarely used, 3 = sometimes used, 4 = often used, 5. Always used.
_____ 5.1 Financial _____ 5.2 Customers _____ 5.3 Business processes _____ 5.4 Learning and long-term innovation _____ 5.5 Another
6. Comprehensive Management Control System Please indicate with an “X”, which of the following two options representing more the Management Control Systems in your company: _____6.1 The systems capture the key performance areas of the
business units, providing a comprehensive overview of they. _____6.2 The systems cover some, but not all, of the key performance
areas of the business units, offering a partial view of they.
B. Strategic capabilities: Please indicate the degree to which the following describes your organization. (Where 1 = not describe it; ........ 5 = fully described)
7. Learning Orientation ___ 7.1 Learning is the key to improvement ___ 7.2 Basic values include learning as a key to improvement
___ 7.3 Once we quit learning we endanger our future. ___ 7.4 Employee learning is an investment, not an expense.

153
Please indicate on each line of 1 to 5, the extent (Where: 1 = does not describe……………..
8. Entrepreneurial Orientation ___ 8.1 In general, we have a strong emphasis on research and
development of new products or services, rather than on the marketing of products that the market already knows.
___ 8.2 During the past 5 years, we have sold many new products or services.
___ 8.3 In recent years, changes in product lines or services that we offer have been steady and significant.
___ 8.4 Our company, rather than having pioneered actions in the market, typically responds to actions which competitors have begun.–
___ 8.5 Often we are the first to introduce new products or services, new management techniques or operating technologies.
___ 8.6 Our company typically takes strong measures to "overcome" competitors, rather than taking a more "live and let live" posture.
___ 8.7 In general, in the company tend to take high-risk projects with high probability profit rates, instead of low-risk projects with normal benefits.
to which it describes your organization. ………….. 5 = fully described) ___ 8.8 In general, we believe in great changes, bold and quick to achieve the
objectives of the company, rather than small changes, shy and slow.
___ 8.9 When confronted with decision-making situations involving uncertainty, usually adopt an aggressive stance to exploit opportunities rather than seeking positions prudent decisions avoid costly.
___ 8.10 The company is supporting the efforts of individuals and / or teams that operate autonomously, more than require senior management to guide its work.
___ 8.11 In our company we believe that the best results occur when individuals / teams decide for themselves the opportunities to follow, rather than when they are driven by senior managers in the pursuit of these opportunities.
___ 8.12 In search of opportunity, people / teams make decisions on their own without referring constantly to his supervisor, more than expected to get approval before taking such decisions.
___ 8.13 The CEO and his management team play the most important role in the identification and selection of opportunities rather than the ideas and initiatives of employees. –
___ 8.14 In my business "not" make a special effort to win a business competition. –
C: Organizational performance and control variables 9. Organizational performance: Please rate the performance of your organization in the past 12 months against the expectations or goals at the beginning of the year on a scale of 1 to 5 (where 1 = Very poor performance, 2 = Low performance, 3 = goals were reached 4 = above goals, 5 = outstanding performance above targets)
_____ 9.1 In relation to its objectives, the level of increase in sales last year was _____ 9.2 In relation to its objectives, the level of benefits in the past year was: _____ 9.3 In relation to its objectives, level of return on investment (ROI) in the last year was: _____ 9.4 In relation to its objectives, the degree of customer satisfaction in the last year was: _____ 9.5 In relation to its objectives, the employee satisfaction at work in the last year was: _____ 9.6 The overall results in your business in the last year were:
10. Perceived environmental uncertainty (PEU) Please indicate the extent that each of the following factors is predictable or unpredictable in the context of your main business. (where: 1= highly unpredictable...5= highly predictable) _____ 10.1 Manufacturing technology _____ 10.2 Competitors’ actions _____ 10.3 Market demand _____ 10.4 Product attributes/design _____ 10.5 Raw material availability _____ 10.6 Raw material price _____ 10.7 Government regulation _____ 10.8 Labor union actions
11. Access to resources:
Please rate from 1 to 5, "access" to the following resources compared
to other companies in your sector:
(Where 1 = Less access to other companies, 5 = Improved access) _____11.1 Staff with a positive commitment towards the development
of the company. _____ 11.2 Highly productive Staff _____11.3 Staff trained to provide excellent customer service _____11.4 Personal likes to contribute ideas for new products / services
_____11.5 Staff trained to market their products and / or services
Thank you for participating in this study!. If you are interested in receiving a summary of the results of this study (in March 2013), please write an emai or personal contact data . Name:________________________________________________________ email:________________________________________ Phone number:______________________
For more information please contact Daniel Ballesteros in [email protected] or phone (52) 55 91 77 82 81. This study was carried out jointly by the Instituto Tecnológico y de Estudios Superiores de Monterrey (Mexico) and the Universidad Autónoma de Barcelona (Spain).
Classification of business sectors
1 manufacturing industries 5 Financial services and insurance 9 Educational services 13 Other services except government activities
2 Wholesale business 6 Professional, scientific and technical services 10 Health care and social assistance 14 Governmental activities
3 Retail business 7 Corporate 11 Recreational, cultural and sporting and other recreational services
4 Mass media information 8 Services business support and waste management and remediation services
12 Temporary accommodation and food and beverage preparation

154
Appendix C. Non response bias & common method variance (CMV) analysis
N Mean Std. Dev. F Sig.online 323 30.55 29.55 0.005 0.942offline 321 30.39 27.24Total 644 30.47 28.40online 323 1979 4809 0.03 0.862offline 321 2043 4494Total 644 2011 4651online 323 3.16 2.60 0.779 0.378offline 321 3.34 2.72Total 644 3.25 2.66online 323 7.99 6.59 0.194 0.66offline 321 7.76 6.52Total 644 7.87 6.55online 323 0.52 0.500 2.25 0.134offline 321 0.46 0.499Total 644 0.49 0.500
Note: N=644 in all casesNote: ** Significant @ 95% level; *** Significant @ 99% level
Firm age
# employees
Repondent Formal Management
Education
Respondent Management Experience
System amplitude used
Non-response bias analisys
variablesDescriptives Anova
Total% of
VarianceCumulative
% Total% of
Variance Cumulative %
1 4.381 19.0484 19.048 4.381 19.048 19.048
2 3.123 13.578 32.6273 2.346 10.198 42.8254 2.149 9.345 52.1705 2.078 9.034 61.2046 1.716 7.460 68.6647 1.083 4.710 73.3748 .752 3.268 76.6429 .627 2.726 79.368
10 .565 2.456 81.82411 .532 2.311 84.13512 .447 1.945 86.08013 .386 1.678 87.75814 .366 1.589 89.34715 .356 1.549 90.89616 .334 1.452 92.34917 .301 1.307 93.65618 .283 1.229 94.88519 .272 1.184 96.06920 .260 1.130 97.19921 .248 1.077 98.27622 .205 0.893 99.16923 .192 .835 100.000
Common Method Variance (CMV): Total Variance ExplainedComponent
Initial Eigenvalues Extraction Sums of Squared
Extraction Method: Principal Component Analysis.
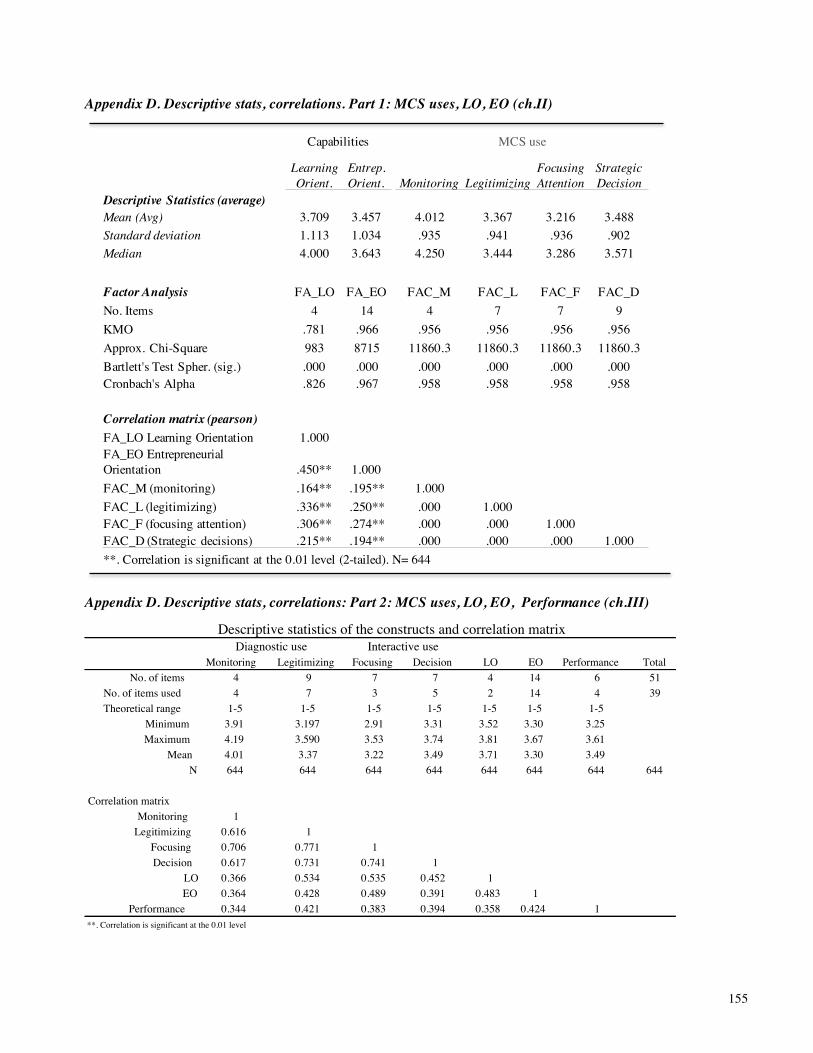
155
Appendix D. Descriptive stats, correlations. Part 1: MCS uses, LO, EO (ch.II)
Appendix D. Descriptive stats, correlations: Part 2: MCS uses, LO, EO, Performance (ch.III)
Table 2.3: Constructs descriptive statistics and correlations
Source: Own devised
Capabilities MCS use
Learning Orient.
Entrep. Orient. Monitoring Legitimizing
Focusing Attention
Strategic Decision
Descriptive Statistics (average)Mean (Avg) 3.709 3.457 4.012 3.367 3.216 3.488Standard deviation 1.113 1.034 .935 .941 .936 .902Median 4.000 3.643 4.250 3.444 3.286 3.571
Factor Analysis FA_LO FA_EO FAC_M FAC_L FAC_F FAC_DNo. Items 4 14 4 7 7 9KMO .781 .966 .956 .956 .956 .956Approx. Chi-Square 983 8715 11860.3 11860.3 11860.3 11860.3Bartlett's Test Spher. (sig.) .000 .000 .000 .000 .000 .000Cronbach's Alpha .826 .967 .958 .958 .958 .958
Correlation matrix (pearson)FA_LO Learning Orientation 1.000FA_EO Entrepreneurial Orientation .450** 1.000FAC_M (monitoring) .164** .195** 1.000FAC_L (legitimizing) .336** .250** .000 1.000FAC_F (focusing attention) .306** .274** .000 .000 1.000FAC_D (Strategic decisions) .215** .194** .000 .000 .000 1.000**. Correlation is significant at the 0.01 level (2-tailed). N= 644
Monitoring Legitimizing Focusing Decision LO EO Performance TotalNo. of items 4 9 7 7 4 14 6 51
No. of items used 4 7 3 5 2 14 4 39Theoretical range 1-5 1-5 1-5 1-5 1-5 1-5 1-5
Minimum 3.91 3.197 2.91 3.31 3.52 3.30 3.25Maximum 4.19 3.590 3.53 3.74 3.81 3.67 3.61
Mean 4.01 3.37 3.22 3.49 3.71 3.30 3.49N 644 644 644 644 644 644 644 644
Correlation matrixMonitoring 1
Legitimizing 0.616 1Focusing 0.706 0.771 1Decision 0.617 0.731 0.741 1
LO 0.366 0.534 0.535 0.452 1EO 0.364 0.428 0.489 0.391 0.483 1
Performance 0.344 0.421 0.383 0.394 0.358 0.424 1**. Correlation is significant at the 0.01 level
Descriptive statistics of the constructs and correlation matrixDiagnostic use Interactive use

156
Appendix D. Descriptive stats, correlations: Part 3: Diagnostic, interactive, LO, EO, Performance, PEU (ch.IV)
Monitoring Legitimizing Focusing Decision LO EO Performance PEU TotalNo. of items 4 9 7 7 4 14 6 8 59
No. of items used 4 9 4 6 3 14 4 8 52Theoretical range 1-5 1-5 1-5 1-5 1-5 1-5 1-5 1-5
Minimum 3.91 3.197 2.91 3.31 3.52 3.30 3.25 3.15Maximum 4.19 3.590 3.53 3.74 3.81 3.67 3.61 3.56
Mean 4.01 3.37 3.22 3.49 3.71 3.30 3.49 3.40N 644 644 644 644 644 644 644 644 644
Correlation matrixDiagnostic 1.000Interactive 0.500 1.000
LO 0.373 0.359 1.000EO 0.251 0.259 0.241 1.000
PEU 0.147 0.167 0.049 0.063 1.000Performance 0.228 0.190 0.126 0.165 0.102 1.000
**. Correlation is significant at the 0.01 level
Descriptive statistics of the constructs and correlation matrixDiagnostic use Interactive use

157
Appendix E . Reliability. Part 1: Average Inter.itemTotal Correlation
Appendix E . Reliability. Part 2: Test of normality
Figure 2.4: Test of normality
Source: Own devised
Table 2.5: Test of normality
Source: Own devised
FactorsKolmogorov-Smirnova Shapiro-WilkStatistic df Sig. Statistic df Sig.
FAC_L .049 644 .001 .978 644 .000FAC_D .036 644 .046 .992 644 .001FAC_F .036 644 .049 .995 644 .039FAC_M .075 644 .000 .961 644 .000FA_LO .125 644 .000 .915 644 .000FA_EO .092 644 .000 .958 644 .000
a. Lilliefors Significance Correction
Table 2.4: Average Inter.itemTotal Correlation
Source: Own devised
Average Min MaxMonitoring 0.853 0.829 0.875
Focusing attention 0.766 0.737 0.817Strategic Decision making 0.800 0.743 0.835Legitimizing 0.805 0.763 0.854Note: N = 644 in all cases 0.806Note 1: All correlations are significant at the 99% level

158
Appendix F. Convergent-discriminant validity. Part 1: Correlation MCS uses, capabilities, performance, PEU.
M1 M2 M3 M4 F1 F2 F3 F4 F5 F6 F7 D1 D2 D3 D4 D5 D6 D7 L1 L2 L3 L4 L5 L6 L7 L8 L9
M1 1 .639** .627** .572** .322** .407** .413** .385** .386** .238** .273** .417** .367** .398** .303** .282** .340** .336** .402** .335** .319** .264** .430** .314** .303** .395** .386**
M2 .639** 1 .706** .602** .354** .398** .434** .393** .406** .262** .312** .426** .412** .375** .330** .325** .391** .373** .414** .349** .373** .319** .413** .380** .333** .455** .427**
M3 .627** .706** 1 .673** .332** .425** .478** .420** .447** .294** .331** .443** .418** .407** .382** .387** .411** .416** .427** .354** .360** .319** .403** .402** .383** .477** .417**
M4 .572** .602** .673** 1 .348** .380** .474** .448** .449** .334** .359** .429** .462** .422** .389** .407** .430** .445** .385** .382** .411** .323** .395** .368** .417** .447** .420**
F1 .322** .354** .332** .348** 1 .653** .456** .514** .559** .433** .439** .387** .450** .420** .394** .392** .397** .423** .474** .389** .450** .438** .436** .469** .500** .488** .484**
F2 .407** .398** .425** .380** .653** 1 .591** .502** .558** .407** .449** .409** .419** .422** .423** .391** .401** .451** .488** .384** .428** .415** .440** .416** .461** .480** .466**
F3 .413** .434** .478** .474** .456** .591** 1 .569** .537** .400** .431** .449** .412** .433** .432** .423** .448** .492** .513** .460** .445** .461** .427** .381** .429** .492** .466**
F4 .385** .393** .420** .448** .514** .502** .569** 1 .733** .472** .450** .357** .372** .380** .335** .384** .396** .378** .497** .382** .404** .404** .366** .421** .474** .503** .461**
F5 .386** .406** .447** .449** .559** .558** .537** .733** 1 .496** .490** .422** .446** .444** .403** .422** .471** .484** .513** .418** .439** .442** .433** .451** .488** .528** .481**
F6 .238** .262** .294** .334** .433** .407** .400** .472** .496** 1 .744** .387** .427** .399** .439** .452** .449** .428** .347** .364** .400** .412** .322** .412** .402** .419** .402**
F7 .273** .312** .331** .359** .439** .449** .431** .450** .490** .744** 1 .440** .426** .431** .416** .448** .470** .436** .391** .398** .417** .424** .376** .414** .405** .484** .423**
D1 .417** .426** .443** .429** .387** .409** .449** .357** .422** .387** .440** 1 .649** .536** .473** .496** .478** .542** .482** .449** .446** .402** .441** .372** .396** .481** .478**
D2 .367** .412** .418** .462** .450** .419** .412** .372** .446** .427** .426** .649** 1 .652** .545** .579** .552** .569** .436** .435** .487** .419** .456** .457** .440** .488** .487**
D3 .398** .375** .407** .422** .420** .422** .433** .380** .444** .399** .431** .536** .652** 1 .686** .640** .588** .590** .434** .477** .474** .425** .459** .424** .408** .498** .456**
D4 .303** .330** .382** .389** .394** .423** .432** .335** .403** .439** .416** .473** .545** .686** 1 .677** .544** .562** .398** .399** .451** .415** .404** .445** .456** .489** .451**
D5 .282** .325** .387** .407** .392** .391** .423** .384** .422** .452** .448** .496** .579** .640** .677** 1 .599** .591** .416** .450** .483** .457** .451** .434** .443** .477** .464**
D6 .340** .391** .411** .430** .397** .401** .448** .396** .471** .449** .470** .478** .552** .588** .544** .599** 1 .626** .421** .427** .478** .454** .401** .425** .422** .493** .441**
D7 .336** .373** .416** .445** .423** .451** .492** .378** .484** .428** .436** .542** .569** .590** .562** .591** .626** 1 .478** .473** .486** .470** .474** .455** .478** .503** .484**
L1 .402** .414** .427** .385** .474** .488** .513** .497** .513** .347** .391** .482** .436** .434** .398** .416** .421** .478** 1 .575** .568** .582** .561** .542** .530** .621** .619**
L2 .335** .349** .354** .382** .389** .384** .460** .382** .418** .364** .398** .449** .435** .477** .399** .450** .427** .473** .575** 1 .655** .553** .546** .550** .507** .553** .601**
L3 .319** .373** .360** .411** .450** .428** .445** .404** .439** .400** .417** .446** .487** .474** .451** .483** .478** .486** .568** .655** 1 .667** .601** .561** .499** .575** .589**
L4 .264** .319** .319** .323** .438** .415** .461** .404** .442** .412** .424** .402** .419** .425** .415** .457** .454** .470** .582** .553** .667** 1 .642** .627** .556** .624** .625**
L5 .430** .413** .403** .395** .436** .440** .427** .366** .433** .322** .376** .441** .456** .459** .404** .451** .401** .474** .561** .546** .601** .642** 1 .637** .547** .652** .671**
L6 .314** .380** .402** .368** .469** .416** .381** .421** .451** .412** .414** .372** .457** .424** .445** .434** .425** .455** .542** .550** .561** .627** .637** 1 .687** .665** .640**
L7 .303** .333** .383** .417** .500** .461** .429** .474** .488** .402** .405** .396** .440** .408** .456** .443** .422** .478** .530** .507** .499** .556** .547** .687** 1 .745** .653**
L8 .395** .455** .477** .447** .488** .480** .492** .503** .528** .419** .484** .481** .488** .498** .489** .477** .493** .503** .621** .553** .575** .624** .652** .665** .745** 1 .744**
L9 .386** .427** .417** .420** .484** .466** .466** .461** .481** .402** .423** .478** .487** .456** .451** .464** .441** .484** .619** .601** .589** .625** .671** .640** .653** .744** 1
Correlations MCS uses (Monitoring, focusing attention, strategic decision making, Legitimization)
**. Correlation is significant at the 0.01 level (2-tailed).
LO1 LO2 LO3 LO4 EO1 EO2 EO3 EO4r EO5 EO6 EO7 EO8 EO9 EO10 EO11 EO12 EO13r EO14rLO1 1 .704** .512** .552** .345** .275** .330** .247** .302** .306** .354** .362** .382** .356** .355** .366** .282** .277**
LO2 .704** 1 .459** .568** .370** .309** .349** .249** .305** .327** .365** .370** .351** .389** .369** .359** .320** .321**
LO3 .512** .459** 1 .478** .297** .237** .290** .207** .247** .310** .294** .290** .292** .270** .286** .304** .213** .207**
LO4 .552** .568** .478** 1 .311** .250** .285** .227** .264** .276** .274** .301** .315** .328** .335** .308** .277** .270**
EO1 .345** .370** .297** .311** 1 .764** .762** .672** .730** .686** .711** .731** .684** .695** .715** .705** .740** .689**
EO2 .275** .309** .237** .250** .764** 1 .818** .647** .729** .674** .683** .687** .638** .637** .639** .656** .645** .662**
EO3 .330** .349** .290** .285** .762** .818** 1 .622** .731** .722** .719** .708** .677** .674** .686** .687** .681** .680**
EO4r .247** .249** .207** .227** .672** .647** .622** 1 .690** .630** .598** .607** .579** .577** .577** .599** .655** .700**
EO5 .302** .305** .247** .264** .730** .729** .731** .690** 1 .723** .686** .695** .650** .664** .655** .641** .645** .653**
EO6 .306** .327** .310** .276** .686** .674** .722** .630** .723** 1 .713** .693** .637** .659** .674** .668** .609** .643**
EO7 .354** .365** .294** .274** .711** .683** .719** .598** .686** .713** 1 .770** .732** .678** .678** .704** .618** .603**
EO8 .362** .370** .290** .301** .731** .687** .708** .607** .695** .693** .770** 1 .766** .696** .700** .674** .630** .627**
EO9 .382** .351** .292** .315** .684** .638** .677** .579** .650** .637** .732** .766** 1 .674** .671** .674** .596** .562**
EO10 .356** .389** .270** .328** .695** .637** .674** .577** .664** .659** .678** .696** .674** 1 .799** .725** .657** .605**
EO11 .355** .369** .286** .335** .715** .639** .686** .577** .655** .674** .678** .700** .671** .799** 1 .815** .683** .611**
EO12 .366** .359** .304** .308** .705** .656** .687** .599** .641** .668** .704** .674** .674** .725** .815** 1 .655** .597**
EO13r .282** .320** .213** .277** .740** .645** .681** .655** .645** .609** .618** .630** .596** .657** .683** .655** 1 .720**
EO14r .277** .321** .207** .270** .689** .662** .680** .700** .653** .643** .603** .627** .562** .605** .611** .597** .720** 1
Correlations Capabilities (Learning Orientation and Entrepreneurial Orientation)
**. Correlation is significant at the 0.01 level (2-tailed).
Correlations performance & Perceived environmental uncertaintyP1_S P2_Bº P3_R P4_SC P5_SW P6_G PU1 PU2 PU3 PU4 PU5 PU6 PU7 PU8
Correlations performance & Perceived environmental uncertainty
P1_SP2_BºP3_RP4_SCP5_SWP6_GPU1PU2PU3PU4PU5PU6PU7PU8
1.000 .660 .647 .400 .464 .644 .150 .172 .187 .159 .107 .090 .164 .134.660 1.000 .697 .462 .482 .576 .131 .164 .144 .174 .145 .127 .166 .177.647 .697 1.000 .469 .477 .606 .154 .103 .158 .156 .141 .161 .180 .120.400 .462 .469 1.000 .547 .491 .112 .149 .118 .155 .134 .132 .155 .114.464 .482 .477 .547 1.000 .500 .163 .143 .134 .170 .107 .138 .182 .159.644 .576 .606 .491 .500 1.000 .205 .153 .157 .175 .120 .169 .173 .134.150 .131 .154 .112 .163 .205 1.000 .286 .276 .380 .455 .369 .255 .310.172 .164 .103 .149 .143 .153 .286 1.000 .401 .260 .266 .229 .274 .180.187 .144 .158 .118 .134 .157 .276 .401 1.000 .432 .232 .266 .205 .133.159 .174 .156 .155 .170 .175 .380 .260 .432 1.000 .416 .366 .240 .258.107 .145 .141 .134 .107 .120 .455 .266 .232 .416 1.000 .563 .267 .307.090 .127 .161 .132 .138 .169 .369 .229 .266 .366 .563 1.000 .320 .256.164 .166 .180 .155 .182 .173 .255 .274 .205 .240 .267 .320 1.000 .397.134 .177 .120 .114 .159 .134 .310 .180 .133 .258 .307 .256 .397 1.000

159
M1
M2
M3
M4
L1L2
L3L4
L5L6
L7L8
L9F1
F2F3
F4F5
F6F7
D1
D2
D3
D4
D5
D6
D7
LO1
LO2
LO3
LO4
EO1
EO2
EO3
EO4r
EO5
EO6
EO7
EO8
EO9
EO10
EO11
EO12
EO13rEO14rP1_S
P2_Bº
P3_R
P4_SC
P5_SW
P6_G
PU1
PU2
PU3
PU4
PU5
PU6
PU7
PU8
M1
1.000
.639
.627
.572
.402
.335
.319
.264
.430
.314
.303
.395
.386
.322
.407
.413
.385
.386
.238
.273
.417
.367
.398
.303
.282
.340
.336
.250
.253
.159
.277
.254
.249
.254
.220
.255
.253
.228
.300
.252
.249
.244
.252
.183
.262
.258
.241
.199
.217
.211
.211
.143
.093
.215
.198
.138
.093
.141
.136
M2
.639
1.000
.706
.602
.414
.349
.373
.319
.413
.380
.333
.455
.427
.354
.398
.434
.393
.406
.262
.312
.426
.412
.375
.330
.325
.391
.373
.252
.222
.141
.233
.238
.221
.265
.206
.271
.277
.224
.273
.236
.253
.239
.264
.173
.225
.244
.220
.202
.193
.179
.224
.144
.169
.187
.185
.132
.095
.130
.135
M3
.627
.706
1.000
.673
.427
.354
.360
.319
.403
.402
.383
.477
.417
.332
.425
.478
.420
.447
.294
.331
.443
.418
.407
.382
.387
.411
.416
.255
.253
.149
.247
.235
.235
.257
.175
.269
.280
.240
.279
.249
.276
.237
.232
.149
.234
.245
.223
.215
.198
.214
.252
.153
.147
.178
.199
.133
.116
.137
.162
M4
.572
.602
.673
1.000
.385
.382
.411
.323
.395
.368
.417
.447
.420
.348
.380
.474
.448
.449
.334
.359
.429
.462
.422
.389
.407
.430
.445
.242
.279
.200
.230
.255
.251
.264
.208
.239
.257
.210
.269
.228
.219
.224
.217
.157
.238
.204
.183
.199
.193
.221
.221
.097
.116
.180
.204
.085
.076
.113
.124
L1.402
.414
.427
.385
1.000
.575
.568
.582
.561
.542
.530
.621
.619
.474
.488
.513
.497
.513
.347
.391
.482
.436
.434
.398
.416
.421
.478
.334
.361
.191
.289
.297
.242
.286
.231
.254
.315
.292
.326
.331
.324
.321
.312
.235
.299
.296
.242
.226
.239
.250
.279
.169
.145
.206
.183
.120
.082
.119
.117
L2.335
.349
.354
.382
.575
1.000
.655
.553
.546
.550
.507
.553
.601
.389
.384
.460
.382
.418
.364
.398
.449
.435
.477
.399
.450
.427
.473
.302
.319
.224
.255
.230
.200
.238
.190
.205
.277
.251
.267
.234
.283
.274
.298
.165
.173
.256
.240
.199
.253
.240
.244
.175
.181
.161
.145
.129
.011
.088
.148
L3.319
.373
.360
.411
.568
.655
1.000
.667
.601
.561
.499
.575
.589
.450
.428
.445
.404
.439
.400
.417
.446
.487
.474
.451
.483
.478
.486
.338
.382
.255
.308
.235
.221
.261
.170
.213
.266
.287
.275
.268
.325
.298
.319
.194
.196
.255
.261
.230
.223
.278
.271
.176
.185
.228
.136
.124
.020
.114
.094
L4.264
.319
.319
.323
.582
.553
.667
1.000
.642
.627
.556
.624
.625
.438
.415
.461
.404
.442
.412
.424
.402
.419
.425
.415
.457
.454
.470
.314
.366
.225
.312
.249
.242
.311
.234
.257
.319
.294
.313
.288
.328
.337
.318
.196
.268
.251
.285
.258
.260
.267
.297
.125
.165
.167
.179
.132
.083
.171
.138
L5.430
.413
.403
.395
.561
.546
.601
.642
1.000
.637
.547
.652
.671
.436
.440
.427
.366
.433
.322
.376
.441
.456
.459
.404
.451
.401
.474
.374
.392
.259
.323
.293
.266
.314
.252
.291
.325
.286
.326
.329
.318
.359
.342
.220
.290
.269
.322
.232
.262
.256
.324
.155
.167
.192
.178
.168
.079
.174
.206
L6.314
.380
.402
.368
.542
.550
.561
.627
.637
1.000
.687
.665
.640
.469
.416
.381
.421
.451
.412
.414
.372
.457
.424
.445
.434
.425
.455
.270
.352
.240
.306
.224
.232
.254
.184
.229
.269
.233
.249
.247
.257
.277
.265
.165
.206
.262
.258
.225
.270
.253
.296
.170
.185
.181
.183
.121
.118
.192
.186
L7.303
.333
.383
.417
.530
.507
.499
.556
.547
.687
1.000
.745
.653
.500
.461
.429
.474
.488
.402
.405
.396
.440
.408
.456
.443
.422
.478
.336
.348
.261
.351
.275
.261
.324
.189
.246
.287
.255
.280
.296
.319
.335
.322
.226
.242
.185
.209
.212
.281
.285
.277
.125
.113
.172
.130
.084
.103
.170
.148
L8.395
.455
.477
.447
.621
.553
.575
.624
.652
.665
.745
1.000
.744
.488
.480
.492
.503
.528
.419
.484
.481
.488
.498
.489
.477
.493
.503
.375
.371
.276
.371
.306
.274
.340
.210
.276
.320
.301
.320
.333
.357
.347
.350
.257
.278
.268
.260
.253
.283
.304
.314
.122
.166
.155
.162
.118
.080
.189
.163
L9.386
.427
.417
.420
.619
.601
.589
.625
.671
.640
.653
.744
1.000
.484
.466
.466
.461
.481
.402
.423
.478
.487
.456
.451
.464
.441
.484
.370
.383
.276
.315
.245
.223
.285
.211
.246
.285
.255
.279
.290
.291
.316
.322
.203
.220
.243
.253
.212
.249
.259
.293
.186
.189
.168
.183
.128
.114
.179
.179
F1.322
.354
.332
.348
.474
.389
.450
.438
.436
.469
.500
.488
.484
1.000
.653
.456
.514
.559
.433
.439
.387
.450
.420
.394
.392
.397
.423
.371
.399
.239
.392
.305
.235
.274
.178
.220
.262
.280
.306
.307
.312
.305
.321
.214
.233
.202
.259
.207
.247
.350
.236
.195
.179
.150
.132
.134
.099
.162
.144
F2.407
.398
.425
.380
.488
.384
.428
.415
.440
.416
.461
.480
.466
.653
1.000
.591
.502
.558
.407
.449
.409
.419
.422
.423
.391
.401
.451
.316
.321
.275
.347
.298
.246
.316
.233
.281
.301
.298
.334
.320
.310
.294
.324
.212
.273
.193
.237
.200
.207
.274
.194
.193
.125
.132
.130
.151
.093
.139
.153
F3.413
.434
.478
.474
.513
.460
.445
.461
.427
.381
.429
.492
.466
.456
.591
1.000
.569
.537
.400
.431
.449
.412
.433
.432
.423
.448
.492
.308
.348
.279
.341
.309
.265
.322
.269
.284
.371
.333
.351
.329
.342
.328
.351
.191
.287
.252
.237
.228
.238
.255
.280
.147
.141
.154
.186
.138
.081
.094
.145
F4.385
.393
.420
.448
.497
.382
.404
.404
.366
.421
.474
.503
.461
.514
.502
.569
1.000
.733
.472
.450
.357
.372
.380
.335
.384
.396
.378
.295
.338
.198
.280
.261
.240
.288
.192
.230
.265
.301
.299
.259
.298
.259
.276
.187
.228
.198
.165
.200
.263
.217
.215
.171
.189
.157
.185
.173
.145
.122
.156
F5.386
.406
.447
.449
.513
.418
.439
.442
.433
.451
.488
.528
.481
.559
.558
.537
.733
1.000
.496
.490
.422
.446
.444
.403
.422
.471
.484
.358
.371
.271
.362
.295
.275
.337
.215
.285
.314
.352
.334
.302
.304
.286
.312
.220
.284
.208
.209
.250
.272
.302
.256
.183
.159
.137
.175
.185
.120
.191
.157
F6.238
.262
.294
.334
.347
.364
.400
.412
.322
.412
.402
.419
.402
.433
.407
.400
.472
.496
1.000
.744
.387
.427
.399
.439
.452
.449
.428
.237
.260
.230
.290
.230
.194
.246
.178
.203
.263
.282
.284
.275
.293
.268
.306
.168
.185
.155
.148
.160
.233
.276
.197
.133
.102
.146
.173
.070
.090
.126
.106
F7.273
.312
.331
.359
.391
.398
.417
.424
.376
.414
.405
.484
.423
.439
.449
.431
.450
.490
.744
1.000
.440
.426
.431
.416
.448
.470
.436
.269
.304
.226
.311
.263
.256
.308
.210
.247
.294
.327
.312
.338
.320
.302
.323
.197
.241
.209
.172
.194
.215
.256
.243
.187
.085
.123
.172
.086
.086
.159
.135
D1
.417
.426
.443
.429
.482
.449
.446
.402
.441
.372
.396
.481
.478
.387
.409
.449
.357
.422
.387
.440
1.000
.649
.536
.473
.496
.478
.542
.347
.348
.233
.309
.264
.211
.271
.191
.196
.267
.265
.284
.300
.260
.273
.272
.136
.220
.247
.239
.220
.211
.262
.297
.211
.140
.147
.184
.163
.100
.118
.097
D2
.367
.412
.418
.462
.436
.435
.487
.419
.456
.457
.440
.488
.487
.450
.419
.412
.372
.446
.427
.426
.649
1.000
.652
.545
.579
.552
.569
.294
.331
.244
.279
.229
.232
.270
.194
.224
.242
.248
.282
.296
.248
.238
.257
.158
.197
.240
.226
.234
.273
.284
.314
.188
.139
.138
.194
.210
.146
.169
.149
D3
.398
.375
.407
.422
.434
.477
.474
.425
.459
.424
.408
.498
.456
.420
.422
.433
.380
.444
.399
.431
.536
.652
1.000
.686
.640
.588
.590
.320
.316
.233
.315
.225
.254
.289
.198
.251
.256
.303
.318
.326
.292
.266
.280
.174
.223
.265
.229
.254
.285
.283
.288
.194
.135
.145
.180
.168
.066
.145
.166
D4
.303
.330
.382
.389
.398
.399
.451
.415
.404
.445
.456
.489
.451
.394
.423
.432
.335
.403
.439
.416
.473
.545
.686
1.000
.677
.544
.562
.260
.267
.223
.250
.193
.204
.237
.174
.207
.250
.250
.263
.292
.259
.243
.268
.112
.184
.203
.219
.226
.240
.241
.271
.142
.123
.163
.141
.110
.049
.141
.169
D5
.282
.325
.387
.407
.416
.450
.483
.457
.451
.434
.443
.477
.464
.392
.391
.423
.384
.422
.452
.448
.496
.579
.640
.677
1.000
.599
.591
.233
.280
.167
.212
.193
.232
.268
.171
.204
.266
.261
.240
.255
.257
.245
.271
.137
.215
.182
.192
.210
.261
.218
.269
.161
.117
.155
.198
.189
.088
.145
.205
D6
.340
.391
.411
.430
.421
.427
.478
.454
.401
.425
.422
.493
.441
.397
.401
.448
.396
.471
.449
.470
.478
.552
.588
.544
.599
1.000
.626
.277
.297
.278
.319
.267
.280
.311
.226
.267
.295
.319
.313
.296
.293
.254
.294
.184
.254
.180
.201
.219
.273
.313
.289
.160
.111
.123
.133
.162
.120
.166
.150
D7
.336
.373
.416
.445
.478
.473
.486
.470
.474
.455
.478
.503
.484
.423
.451
.492
.378
.484
.428
.436
.542
.569
.590
.562
.591
.626
1.000
.299
.318
.251
.294
.284
.268
.319
.239
.263
.308
.309
.328
.307
.319
.304
.295
.196
.248
.225
.236
.218
.258
.254
.315
.202
.162
.151
.222
.209
.122
.156
.177
LO1
.250
.252
.255
.242
.334
.302
.338
.314
.374
.270
.336
.375
.370
.371
.316
.308
.295
.358
.237
.269
.347
.294
.320
.260
.233
.277
.299
1.000
.704
.512
.552
.345
.275
.330
.247
.302
.306
.354
.362
.382
.356
.355
.366
.282
.277
.242
.228
.189
.292
.344
.267
.119
.075
.161
.095
.063
.053
.114
.087
LO2
.253
.222
.253
.279
.361
.319
.382
.366
.392
.352
.348
.371
.383
.399
.321
.348
.338
.371
.260
.304
.348
.331
.316
.267
.280
.297
.318
.704
1.000
.459
.568
.370
.309
.349
.249
.305
.327
.365
.370
.351
.389
.369
.359
.320
.321
.201
.262
.221
.321
.333
.283
.181
.069
.145
.120
.092
.098
.109
.057
LO3
.159
.141
.149
.200
.191
.224
.255
.225
.259
.240
.261
.276
.276
.239
.275
.279
.198
.271
.230
.226
.233
.244
.233
.223
.167
.278
.251
.512
.459
1.000
.478
.297
.237
.290
.207
.247
.310
.294
.290
.292
.270
.286
.304
.213
.207
.135
.136
.146
.297
.274
.180
.123
.048
.152
.112
.089
.127
.143
.093
LO4
.277
.233
.247
.230
.289
.255
.308
.312
.323
.306
.351
.371
.315
.392
.347
.341
.280
.362
.290
.311
.309
.279
.315
.250
.212
.319
.294
.552
.568
.478
1.000
.311
.250
.285
.227
.264
.276
.274
.301
.315
.328
.335
.308
.277
.270
.197
.237
.179
.274
.356
.243
.182
.064
.147
.127
.081
.085
.120
.076
EO1
.254
.238
.235
.255
.297
.230
.235
.249
.293
.224
.275
.306
.245
.305
.298
.309
.261
.295
.230
.263
.264
.229
.225
.193
.193
.267
.284
.345
.370
.297
.311
1.000
.764
.762
.672
.730
.686
.711
.731
.684
.695
.715
.705
.740
.689
.254
.264
.231
.312
.287
.343
.153
.073
.112
.169
.102
.093
.131
.097
EO2
.249
.221
.235
.251
.242
.200
.221
.242
.266
.232
.261
.274
.223
.235
.246
.265
.240
.275
.194
.256
.211
.232
.254
.204
.232
.280
.268
.275
.309
.237
.250
.764
1.000
.818
.647
.729
.674
.683
.687
.638
.637
.639
.656
.645
.662
.251
.227
.235
.330
.281
.339
.202
.049
.072
.174
.094
.036
.105
.140
EO3
.254
.265
.257
.264
.286
.238
.261
.311
.314
.254
.324
.340
.285
.274
.316
.322
.288
.337
.246
.308
.271
.270
.289
.237
.268
.311
.319
.330
.349
.290
.285
.762
.818
1.000
.622
.731
.722
.719
.708
.677
.674
.686
.687
.681
.680
.266
.247
.264
.325
.300
.355
.192
.054
.092
.177
.102
.062
.123
.148
EO4r
.220
.206
.175
.208
.231
.190
.170
.234
.252
.184
.189
.210
.211
.178
.233
.269
.192
.215
.178
.210
.191
.194
.198
.174
.171
.226
.239
.247
.249
.207
.227
.672
.647
.622
1.000
.690
.630
.598
.607
.579
.577
.577
.599
.655
.700
.221
.183
.233
.241
.190
.281
.157
.012
.084
.160
.133
.085
.099
.096
EO5
.255
.271
.269
.239
.254
.205
.213
.257
.291
.229
.246
.276
.246
.220
.281
.284
.230
.285
.203
.247
.196
.224
.251
.207
.204
.267
.263
.302
.305
.247
.264
.730
.729
.731
.690
1.000
.723
.686
.695
.650
.664
.655
.641
.645
.653
.276
.240
.242
.293
.259
.362
.176
.075
.100
.183
.158
.095
.123
.121
EO6
.253
.277
.280
.257
.315
.277
.266
.319
.325
.269
.287
.320
.285
.262
.301
.371
.265
.314
.263
.294
.267
.242
.256
.250
.266
.295
.308
.306
.327
.310
.276
.686
.674
.722
.630
.723
1.000
.713
.693
.637
.659
.674
.668
.609
.643
.311
.270
.287
.330
.296
.356
.184
.081
.122
.174
.150
.099
.124
.136
EO7
.228
.224
.240
.210
.292
.251
.287
.294
.286
.233
.255
.301
.255
.280
.298
.333
.301
.352
.282
.327
.265
.248
.303
.250
.261
.319
.309
.354
.365
.294
.274
.711
.683
.719
.598
.686
.713
1.000
.770
.732
.678
.678
.704
.618
.603
.257
.263
.284
.304
.282
.340
.151
.084
.124
.153
.129
.084
.137
.108
EO8
.300
.273
.279
.269
.326
.267
.275
.313
.326
.249
.280
.320
.279
.306
.334
.351
.299
.334
.284
.312
.284
.282
.318
.263
.240
.313
.328
.362
.370
.290
.301
.731
.687
.708
.607
.695
.693
.770
1.000
.766
.696
.700
.674
.630
.627
.267
.249
.234
.305
.287
.349
.174
.076
.099
.122
.108
.056
.117
.123
EO9
.252
.236
.249
.228
.331
.234
.268
.288
.329
.247
.296
.333
.290
.307
.320
.329
.259
.302
.275
.338
.300
.296
.326
.292
.255
.296
.307
.382
.351
.292
.315
.684
.638
.677
.579
.650
.637
.732
.766
1.000
.674
.671
.674
.596
.562
.247
.266
.255
.297
.276
.344
.163
.102
.112
.136
.090
.079
.120
.108
EO10
.249
.253
.276
.219
.324
.283
.325
.328
.318
.257
.319
.357
.291
.312
.310
.342
.298
.304
.293
.320
.260
.248
.292
.259
.257
.293
.319
.356
.389
.270
.328
.695
.637
.674
.577
.664
.659
.678
.696
.674
1.000
.799
.725
.657
.605
.248
.291
.258
.350
.330
.350
.198
.119
.120
.196
.131
.122
.131
.145
EO11
.244
.239
.237
.224
.321
.274
.298
.337
.359
.277
.335
.347
.316
.305
.294
.328
.259
.286
.268
.302
.273
.238
.266
.243
.245
.254
.304
.355
.369
.286
.335
.715
.639
.686
.577
.655
.674
.678
.700
.671
.799
1.000
.815
.683
.611
.300
.319
.307
.355
.353
.407
.170
.070
.107
.182
.089
.077
.142
.131
EO12
.252
.264
.232
.217
.312
.298
.319
.318
.342
.265
.322
.350
.322
.321
.324
.351
.276
.312
.306
.323
.272
.257
.280
.268
.271
.294
.295
.366
.359
.304
.308
.705
.656
.687
.599
.641
.668
.704
.674
.674
.725
.815
1.000
.655
.597
.224
.254
.267
.340
.324
.319
.171
.081
.110
.116
.109
.057
.140
.104
EO13r
.183
.173
.149
.157
.235
.165
.194
.196
.220
.165
.226
.257
.203
.214
.212
.191
.187
.220
.168
.197
.136
.158
.174
.112
.137
.184
.196
.282
.320
.213
.277
.740
.645
.681
.655
.645
.609
.618
.630
.596
.657
.683
.655
1.000
.720
.192
.174
.191
.266
.239
.278
.143
.009
.087
.131
.082
.066
.145
.104
EO14r
.262
.225
.234
.238
.299
.173
.196
.268
.290
.206
.242
.278
.220
.233
.273
.287
.228
.284
.185
.241
.220
.197
.223
.184
.215
.254
.248
.277
.321
.207
.270
.689
.662
.680
.700
.653
.643
.603
.627
.562
.605
.611
.597
.720
1.000
.220
.184
.195
.254
.239
.314
.194
.010
.077
.144
.121
.075
.142
.166
P1_S
.258
.244
.245
.204
.296
.256
.255
.251
.269
.262
.185
.268
.243
.202
.193
.252
.198
.208
.155
.209
.247
.240
.265
.203
.182
.180
.225
.242
.201
.135
.197
.254
.251
.266
.221
.276
.311
.257
.267
.247
.248
.300
.224
.192
.220
1.000
.660
.647
.400
.464
.644
.150
.172
.187
.159
.107
.090
.164
.134
P2_Bº
.241
.220
.223
.183
.242
.240
.261
.285
.322
.258
.209
.260
.253
.259
.237
.237
.165
.209
.148
.172
.239
.226
.229
.219
.192
.201
.236
.228
.262
.136
.237
.264
.227
.247
.183
.240
.270
.263
.249
.266
.291
.319
.254
.174
.184
.660
1.000
.697
.462
.482
.576
.131
.164
.144
.174
.145
.127
.166
.177
P3_R
.199
.202
.215
.199
.226
.199
.230
.258
.232
.225
.212
.253
.212
.207
.200
.228
.200
.250
.160
.194
.220
.234
.254
.226
.210
.219
.218
.189
.221
.146
.179
.231
.235
.264
.233
.242
.287
.284
.234
.255
.258
.307
.267
.191
.195
.647
.697
1.000
.469
.477
.606
.154
.103
.158
.156
.141
.161
.180
.120
P4_SC
.217
.193
.198
.193
.239
.253
.223
.260
.262
.270
.281
.283
.249
.247
.207
.238
.263
.272
.233
.215
.211
.273
.285
.240
.261
.273
.258
.292
.321
.297
.274
.312
.330
.325
.241
.293
.330
.304
.305
.297
.350
.355
.340
.266
.254
.400
.462
.469
1.000
.547
.491
.112
.149
.118
.155
.134
.132
.155
.114
P5_SW
.211
.179
.214
.221
.250
.240
.278
.267
.256
.253
.285
.304
.259
.350
.274
.255
.217
.302
.276
.256
.262
.284
.283
.241
.218
.313
.254
.344
.333
.274
.356
.287
.281
.300
.190
.259
.296
.282
.287
.276
.330
.353
.324
.239
.239
.464
.482
.477
.547
1.000
.500
.163
.143
.134
.170
.107
.138
.182
.159
P6_G
.211
.224
.252
.221
.279
.244
.271
.297
.324
.296
.277
.314
.293
.236
.194
.280
.215
.256
.197
.243
.297
.314
.288
.271
.269
.289
.315
.267
.283
.180
.243
.343
.339
.355
.281
.362
.356
.340
.349
.344
.350
.407
.319
.278
.314
.644
.576
.606
.491
.500
1.000
.205
.153
.157
.175
.120
.169
.173
.134
PU1
.143
.144
.153
.097
.169
.175
.176
.125
.155
.170
.125
.122
.186
.195
.193
.147
.171
.183
.133
.187
.211
.188
.194
.142
.161
.160
.202
.119
.181
.123
.182
.153
.202
.192
.157
.176
.184
.151
.174
.163
.198
.170
.171
.143
.194
.150
.131
.154
.112
.163
.205
1.000
.286
.276
.380
.455
.369
.255
.310
PU2
.093
.169
.147
.116
.145
.181
.185
.165
.167
.185
.113
.166
.189
.179
.125
.141
.189
.159
.102
.085
.140
.139
.135
.123
.117
.111
.162
.075
.069
.048
.064
.073
.049
.054
.012
.075
.081
.084
.076
.102
.119
.070
.081
.009
.010
.172
.164
.103
.149
.143
.153
.286
1.000
.401
.260
.266
.229
.274
.180
PU3
.215
.187
.178
.180
.206
.161
.228
.167
.192
.181
.172
.155
.168
.150
.132
.154
.157
.137
.146
.123
.147
.138
.145
.163
.155
.123
.151
.161
.145
.152
.147
.112
.072
.092
.084
.100
.122
.124
.099
.112
.120
.107
.110
.087
.077
.187
.144
.158
.118
.134
.157
.276
.401
1.000
.432
.232
.266
.205
.133
PU4
.198
.185
.199
.204
.183
.145
.136
.179
.178
.183
.130
.162
.183
.132
.130
.186
.185
.175
.173
.172
.184
.194
.180
.141
.198
.133
.222
.095
.120
.112
.127
.169
.174
.177
.160
.183
.174
.153
.122
.136
.196
.182
.116
.131
.144
.159
.174
.156
.155
.170
.175
.380
.260
.432
1.000
.416
.366
.240
.258
PU5
.138
.132
.133
.085
.120
.129
.124
.132
.168
.121
.084
.118
.128
.134
.151
.138
.173
.185
.070
.086
.163
.210
.168
.110
.189
.162
.209
.063
.092
.089
.081
.102
.094
.102
.133
.158
.150
.129
.108
.090
.131
.089
.109
.082
.121
.107
.145
.141
.134
.107
.120
.455
.266
.232
.416
1.000
.563
.267
.307
PU6
.093
.095
.116
.076
.082
.011
.020
.083
.079
.118
.103
.080
.114
.099
.093
.081
.145
.120
.090
.086
.100
.146
.066
.049
.088
.120
.122
.053
.098
.127
.085
.093
.036
.062
.085
.095
.099
.084
.056
.079
.122
.077
.057
.066
.075
.090
.127
.161
.132
.138
.169
.369
.229
.266
.366
.563
1.000
.320
.256
PU7
.141
.130
.137
.113
.119
.088
.114
.171
.174
.192
.170
.189
.179
.162
.139
.094
.122
.191
.126
.159
.118
.169
.145
.141
.145
.166
.156
.114
.109
.143
.120
.131
.105
.123
.099
.123
.124
.137
.117
.120
.131
.142
.140
.145
.142
.164
.166
.180
.155
.182
.173
.255
.274
.205
.240
.267
.320
1.000
.397
PU8
.136
.135
.162
.124
.117
.148
.094
.138
.206
.186
.148
.163
.179
.144
.153
.145
.156
.157
.106
.135
.097
.149
.166
.169
.205
.150
.177
.087
.057
.093
.076
.097
.140
.148
.096
.121
.136
.108
.123
.108
.145
.131
.104
.104
.166
.134
.177
.120
.114
.159
.134
.310
.180
.133
.258
.307
.256
.397
1.000
Inte
r-Ite
m C
orre
latio
n M
atri
x
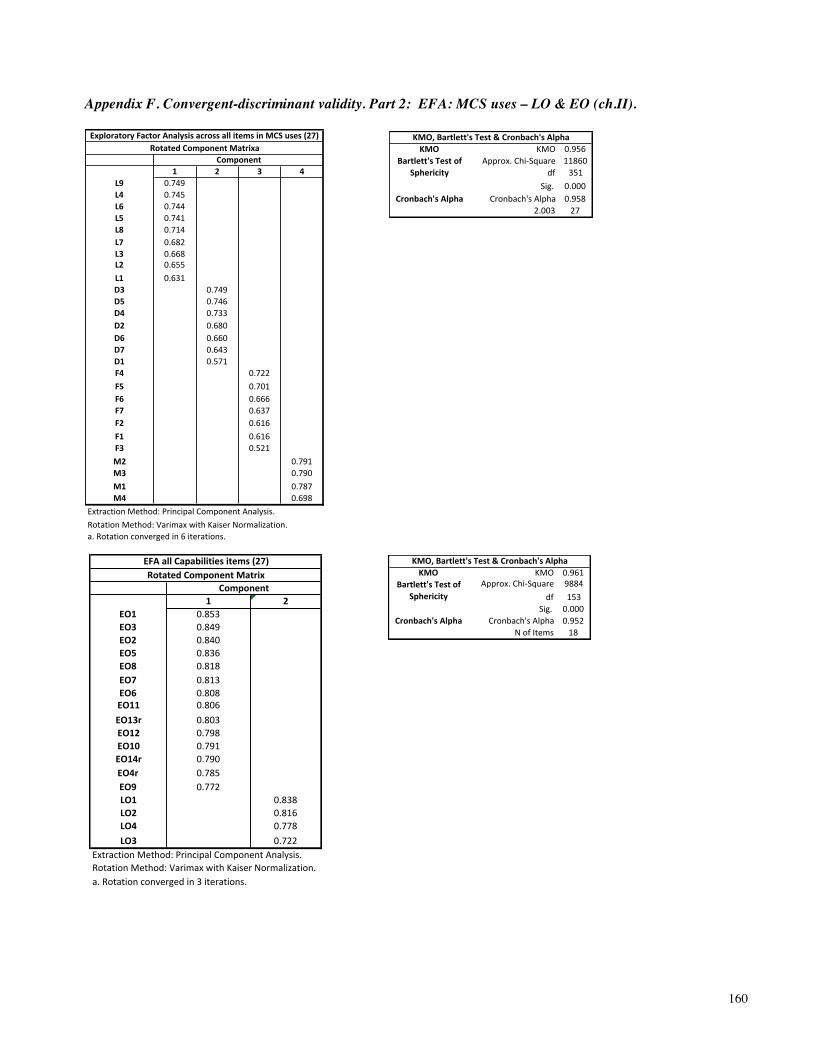
160
Appendix F. Convergent-discriminant validity. Part 2: EFA: MCS uses – LO & EO (ch.II).
EO1EO3EO2EO5EO8EO7EO6EO11EO13rEO12EO10EO14rEO4rEO9LO1LO2LO4LO3
Extraction*Method:*Principal*Component*Analysis.*Rotation*Method:*Varimax*with*Kaiser*Normalization.a.*Rotation*converged*in*3*iterations.
EFA1all1Capabilities1items1(27)Rotated1Component1Matrix
Component2
0.8030.7980.791
10.8530.8490.8400.8360.8180.8130.8080.806
0.7900.7850.772
0.8380.8160.7780.722
KMO KMO 0.961Approx..Chi2Square 9884
df 153Sig.. 0.000
Cronbach's.Alpha Cronbach's.Alpha 0.952N.of.Items 18
KMO,.Bartlett's.Test.&.Cronbach's.Alpha
Bartlett's.Test.of.Sphericity
KMO KMO 0.956Approx..Chi2Square 11860
df 351Sig.. 0.000
Cronbach's.Alpha Cronbach's.Alpha 0.9582.003 27
KMO,.Bartlett's.Test.&.Cronbach's.Alpha
Bartlett's.Test.of.Sphericity1 2 3 4
L9 0.749L4 0.745L6 0.744L5 0.741L8 0.714L7 0.682L3 0.668L2 0.655L1 0.631D3 0.749D5 0.746D4 0.733D2 0.680D6 0.660D7 0.643D1 0.571F4 0.722F5 0.701F6 0.666F7 0.637F2 0.616F1 0.616F3 0.521M2 0.791M3 0.790M1 0.787M4 0.698
Extraction5Method:5Principal5Component5Analysis.555Rotation5Method:5Varimax5with5Kaiser5Normalization.a.5Rotation5converged5in565iterations.
Rotated4Component4MatrixaComponent
Exploratory4Factor4Analysis4across4all4items4in4MCS4uses4(27)

161
Appendix F. Convergent-discriminant validity. Part 3: EFA: MCS uses – LO & EO – Performance (ch.III).

162
Appendix F. Convergent-discriminant validity. Part 4: EFA: MCS uses – LO & EO - Performance – PEU (ch.IV).
1 2 3 4 5 6 7 8EO1 .851EO3 .834EO2 .828EO5 .825
EO13r .815EO8 .808EO7 .804EO11 .793EO6 .788EO12 .787EO14r .782EO4r .779EO10 .778EO9 .764L9 .748L6 .742L4 .730L5 .719L8 .716L7 .683L3 .658L2 .649L1 .627D5 .732D3 .728D4 .713D2 .667D6 .645D7 .626D1 .561
P3_R .814P2_Bº .804P1_S .790P6_G .725
P5_SW .623P4_SC .589
F4 .679F6 .648F5 .640F7 .599F1 .550F2 .547F3 .454M3 .760M2 .758M1 .757M4 .680LO1 .761LO2 .720LO4 .702LO3 .692PU3 .764PU8 .710PU7 .649PU6 .641PU5 .632PU2 .632PU1 .490PU4 .585
Extraction Method: Principal Component Analysis. Rotation Method: Varimax with Kaiser Normalization.
a. Rotation converged in 7 iterations.
Exploratory Factor AnalysisRotated Component Matrixa
Component KMO$and$Bartlett's$TestKaiser'Meyer'Olkin.Measure.of.Sampling. Adequacy. .957
Bartlett's Test.of.Sphericity
Approx.. CHI2 26279.7df 1711
Sig. 0.000Cronbach's.Alpha
Coefficient .961Items 59

163
Appendix G. Chapter II: Anova results
Appendix H. Chapter II: Multiple Linear Regressions results. Part 1: Full sample, size & industry
Small Medium Large Manuf. Trade Services BankingMean%(S.D.)
Mean%(S.D.)
Mean%(S.D.) F: Sig.: Groups:
Mean%%%%%%%%%%%%%%%%%(S.D.)
Mean%(S.D.)
Mean%(S.D.)
Mean%(S.D.) F: Sig.: Groups:
Monitoring 60.257;(1.155)
0.052;(0.941)
0.103;(0.925)
7.126***
0.001 Small%…..%%%%%Medium%&%Large
0.004%%%%%%%%%%(0.932)
0.191%(0.983)
F0.053%(1.02)
0.142%(0.98)
1.556 0.199
Focusing%Attention 0.032%(0.998)
F0.012%(1.031)
F0.009%(0.984)
0.105 0.900 0.052%%%%%%%%%%%%(1.018)
F0.142%(1.049)
0.018%(0.993)
F0.07%(0.989)
0.616 0.605
Strat.%Dec.Fmaking 0.019%(1.063)
F0.048%(1.001)
0.021%(0.967)
0.317 0.728 0.097%%%%%%%%%%%%(0.952)
0.099%(0.986)
F0.017%(1.019)
F0.102%(0.977)
0.811 0.488
Legitimizing F0.004%(1.151)
0.094%(0.885)
F0.058%(0.982)
0.811 0.488 0.105%%%%%%%%%(0.876)
F0.01%(1.064)
F0.005%(1.042)
F0.103%(0.894)
0.678 0.566
Learning%Orient. 0.141;(0.964)
0.02;(0.996)
60.088;(1.016)
2.757*
0.064
Small%&%Medium...%Medium%&%Large
0.086%%%%%%%%%(0.973)
F0.061%(1.03)
0.008%(1.034)
F0.111%(0.831)
0.667 0.573
Entrepreneurial%O. F0.004%(0.959)
F0.08%(1.042)
0.054%(0.993) 1.041 0.354
0.200;(0.959)
60.133;(1.083)
0.014;(0.994)
60.246;(0.982)
3.398**
0.018 Bank%&%TradeFServ.%…%TradeFServ.%&%Manuf.
Note:%N%=%644%in%all%cases
Note%1:%Significant%at: 90% 95% 99%%level
Note%2:%All%others%constructs%are%not%significative
Note%3:%Mean%(S.D.)
Size Industry
MCS;Uses
Capa
bilities
ANOVA;;MCS;Uses;&;LO;&;EO;by;Size;&;industry
Model&A& Model&A&
VariablesControl&variables
Control&variables
ControlsSystem'amplitude 0.636*** 0.627***Firm'Small' 0.206** 0.176*Firm'Large 00.192** 0.042Firm'Age 0.001 .002''Ind'1:'Manufacturing 0.211 0.463***''Ind'2:'Trade >0.005 .098''Ind'3:'Services 0.124 0.312***Gender >.060 .003
Mgmt.6Control6UseLegitimizing 0.310*** Focusing'att. 0.234***Focusing'att. 0.274*** Legitimizing 0.223***Strat.'Dec. 0.185*** Monitoring 0.168***Monitoring 0.151*** Strat.'Dec. 0.156***
F0value 10.105*** 10.649***R2 0.113 0.118
N=644;'Industry'reference:'BankingNote'1:'Unstandardized'Coefficients'are'reported*'Sig.'at'90%'level **'Sig.'at'95%'level ***''Sig.'at'99%'level
0.309 0.251
>0.046 0.967
MCS6use MCS6use
23.507*** 17.662***
0.204** 0.183*
>.058 0.567.055 0.264**
>.110 .655.000 .133.086 0.368***
Control&&&Independent&&variables&
Control&&&Independent&&variables&
0.287*** 0.326***
Multiple6Linear6Regressions6resultsLearning6Orientation Entrepreneurial6Orientation
Model&B Model&B

164
Appendix H. Chapter II: Multiple Linear Regressions results. Part 2: subgroup size
Model&1 Model&2 Model&1 Model&2 Model&1 Model&2 Model&1 Model&2Monitoring 0.252*** 0.129** 0.151***Legitimizing 0.274*** 0.400*** 0.297*** 0.310***Focusing&att. 0.291*** 0.238*** 0.280*** 0.274***Strat.&Dec. 0.225*** 0.266*** 0.185***
System3amplitude 0.689*** 0.247** 0.665*** 0.431*** 0.484*** 0.636*** 0.287***Firm3Small3 0.206** 0.204**Firm3Large B0.192**R"square 0.114 0.347 0.112 0.280 0.058 0.293 0.113 0.309
F 37.677 30.830 23.810 24.274 9.578 15.754 10.105 23.507F"Sig. .000 0.000 .000 0.000 .002 0.000 0.000 0.000
Model&1 Model&2 Model&1 Model&2 Model&1 Model&2 Model&1 Model&2Monitoring 0.115** 0.238*** 0.151*** 0.168***Legitimizing 0.219*** 0.329*** 0.178*** 0.223***Focusing&att. 0.154*** 0.340*** 0.327*** 0.234***Strat.&Dec. 0.212*** 0.203*** 0.156***
System3amplitude 0.626*** 0.341*** 0.584*** 0.632*** 0.380*** 0.627*** 0.326***Firm3Small3 0.176* 0.183*Firm_age 0.004**
&&Ind&1:&Manufacturing&&Ind&3:&Services
R"square 0.116 0.220 0.079 0.245 0.100 0.288 .118 .251F 19.217 16.322 16.169 15.093 17.302 15.368 10.649 17.662
F"Sig. .000 .000 .000 .000 .000 .000 .000 .000
N=
Note11:1Model111(Control1variables);11Model121(Factors1MCS1uses1&1Control1variables)Note12:1*1Sig.1at190%1level;1**1Sig.1at195%1level;1***11Sig.1at199%1level
Learning&Orientation&LOBIG Medium SMALL
Coefficients Coefficients Coefficients
BIG Medium SMALLEntrepreneurial&Orientation&LO
Coefficients Coefficients Coefficients
296 191 157
All&sampleCoefficients
All&sampleCoefficients
644
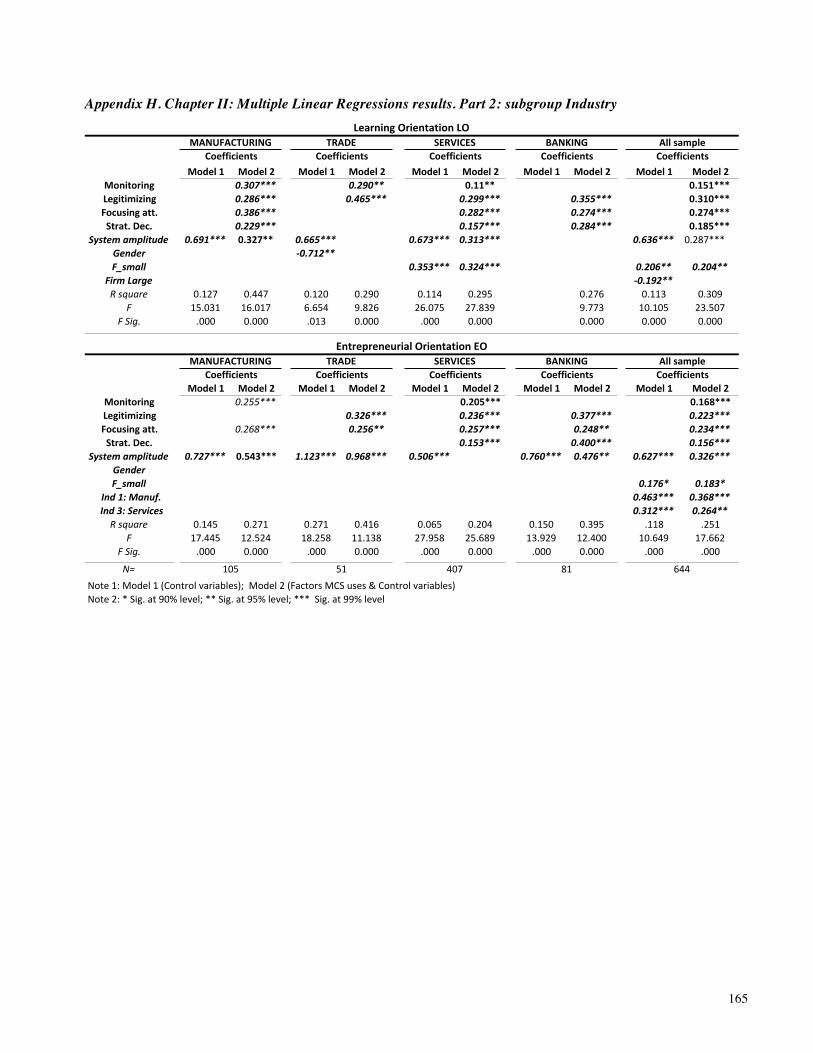
165
Appendix H. Chapter II: Multiple Linear Regressions results. Part 2: subgroup Industry
Model&1 Model&2 Model&1 Model&2 Model&1 Model&2 Model&1 Model&2 Model&1 Model&2Monitoring 0.307*** 0.290** 0.11** 0.151***Legitimizing 0.286*** 0.465*** 0.299*** 0.355*** 0.310***Focusing&att. 0.386*** 0.282*** 0.274*** 0.274***Strat.&Dec. 0.229*** 0.157*** 0.284*** 0.185***
System3amplitude 0.691*** 0.327** 0.665*** 0.673*** 0.313*** 0.636*** 0.287***Gender =0.712**F_small 0.353*** 0.324*** 0.206** 0.204**
Firm3Large =0.192**R"square 0.127 0.447 0.120 0.290 0.114 0.295 0.276 0.113 0.309
F 15.031 16.017 6.654 9.826 26.075 27.839 9.773 10.105 23.507F"Sig. .000 0.000 .013 0.000 .000 0.000 0.000 0.000 0.000
Model&1 Model&2 Model&1 Model&2 Model&1 Model&2 Model&1 Model&2 Model&1 Model&2Monitoring 0.255*** 0.205*** 0.168***Legitimizing 0.326*** 0.236*** 0.377*** 0.223***Focusing&att. 0.268*** 0.256** 0.257*** 0.248** 0.234***Strat.&Dec. 0.153*** 0.400*** 0.156***
System3amplitude 0.727*** 0.543*** 1.123*** 0.968*** 0.506*** 0.760*** 0.476** 0.627*** 0.326***GenderF_small 0.176* 0.183*
33Ind31:3Manuf. 0.463*** 0.368***33Ind33:3Services 0.312*** 0.264**
R"square 0.145 0.271 0.271 0.416 0.065 0.204 0.150 0.395 .118 .251F 17.445 12.524 18.258 11.138 27.958 25.689 13.929 12.400 10.649 17.662
F"Sig. .000 0.000 .000 0.000 .000 0.000 .000 0.000 .000 .000
N=Note11:1Model111(Control1variables);11Model121(Factors1MCS1uses1&1Control1variables)Note12:1*1Sig.1at190%1level;1**1Sig.1at195%1level;1***11Sig.1at199%1level
105 51 407 81
All&sampleCoefficients
All&sampleCoefficients
Entrepreneurial&Orientation&EO
644
MANUFACTURING TRADE SERVICES BANKINGCoefficients Coefficients Coefficients Coefficients
MANUFACTURING TRADE SERVICES BANKINGCoefficients Coefficients Coefficients Coefficients
Learning&Orientation&LO

166
Appendix I. Chapter II: Hypotheses results of the sub-group (Size & Industry) analyses
Appendix J. Chapter III: EFA for Diagnostic and Interactive uses (2nd orders factor analysis)
Hyp. Coeff. Hyp. Coeff. Hyp. Coeff. Hyp. Coeff. Hyp. Coeff. Hyp. Coeff. Hyp. Coeff. Hyp. Coeff.H1a+Monitoring ✗ 0.151*** ✗ 0.252*** ✗ 0.129** ✗ 0.307*** ✗ 0.290** ✗ 0.11**H2a+Legitimizing ✗ 0.310*** ✗ 0.274*** ✗ 0.400*** ✗ 0.297*** ✗ 0.286*** ✗ 0.465*** ✗ 0.299*** ✗ 0.355***H3a+Focusing+att. ✓ 0.274*** ✓ 0.291*** ✓ 0.238*** ✓ 0.280*** ✓ 0.386*** ✓ 0.282*** ✓ 0.274***H4a+Strat.+Dec.+Mak. ✓ 0.185*** ✓ 0.225*** ✓ 0.266*** ✓ 0.229*** ✓ 0.157*** ✓ 0.284***
R"square 0.309 0.347 0.280 0.293 0.447 0.290 0.295 0.276F 23.507 30.830 24.274 15.754 16.017 9.826 27.839 9.773
F"Sig. 0.000 0.000 0.000 0.000 0.000 0.000 0.000 0.000
Hyp. Coeff. Hyp. Coeff. Hyp. Coeff. Hyp. Coeff. Hyp. Coeff. Hyp. Coeff. Hyp. Coeff. Hyp. Coeff.H1b+Monitoring ✗ 0.168*** ✗ 0.115** ✗ 0.238*** ✗ 0.151*** ✗ 0.255*** ✗ 0.205***H2b+Legitimizing ✗ 0.223*** ✗ 0.219*** ✗ 0.329*** ✗ 0.178*** ✗ 0.326*** ✗ 0.236*** ✗ 0.377***H3b+Focusing+att. ✓ 0.234*** ✓ 0.154*** ✓ 0.340*** ✓ 0.327*** ✓ 0.268*** ✓ 0.256** ✓ 0.257*** ✓ 0.248**H4b+Strat.+Dec.+Mak. ✓ 0.156*** ✓ 0.212*** ✓ 0.203*** ✓ 0.153*** ✓ 0.400***
R"square .251 0.220 0.245 0.288 0.271 0.416 0.204 0.395F 17.662 16.322 15.093 15.368 12.524 11.138 25.689 12.400
F"Sig. .000 .000 .000 .000 0.000 0.000 0.000 0.000
N=
Note:1*1Sig.1at190%1level;1**1Sig.1at195%1level;1***11Sig.1at199%1levelAre"not"significant
644 296 191 157 105 51 407 81
HYPOTHESES+BY+INDUSTRYHYPOTHESES+BY+SIZE
Hypotheses+b:+Entrepreneurial+Orientation+LOAll+sample BIG Medium SMALL MANUFACTURING TRADE SERVICES BANKING
Hypotheses+b:+Entrepreneurial+Orientation+EO
All+sample BIG Medium SMALL MANUFACTURING TRADE SERVICES BANKINGHypotheses+a:+Learning+Orientation+LO Hypotheses+a:+Learning+Orientation+LO
.9350.00.93067.6
2
Component 1 2L4 0.821L9 0.803L8 0.794L6 0.792L7 0.762L3 0.759L5 0.756L2 0.728L1 0.705M3 0.846M2 0.831M1 0.813M4 0.777Extraction Method: Principal Component Analysis. Rotation Method: Varimax with Kaiser Normalization.a. Rotation converged in 3 iterations.Source: own devised
Rotated Component Matrix
EFA Diagnostic use: Monitoring & LegitimizingKaiser-Meyer-Olkin Measure
Sig.Cronbach's Alpha
% variance (cumulative %)Factors
.9100.00.908
67.7782
Component 1 2D3 .820D5 .808D4 .805D2 .742D6 .723D7 .720F4 .855F5 .817F3 .731F2 .718Extraction Method: Principal Component Analysis. Rotation Method: Varimax with Kaiser Normalization.a. Rotation converged in 3 iterations.Source: own devised
Factors
Rotated Component Matrix
EFA Interactive use: Att. Focusing & St. Dec. MakingKaiser-Meyer-Olkin Measure
Sig.Cronbach's Alpha
% variance (cumulative %)

167
Appendix K. Chapter III: Measurement invariance test (Direct effect - Indirect Efect)
Model χ2 DF ∆+χ2 ∆+DF p GFI CFI RMSEASingle+Group,+Individual+solutionSmall+Firms+(n=157) 563.1 317 0.788 0.913 0.071Medium+size+firms+(n=191) 595.6 317 0.815 0.911 0.068Large+size+firms+(n=296) 658.6 317 0.858 0.939 0.060Measurement+invariance+(n=644)Equal+form+(MultiQgroup) 1817.7 951 0.827 0.925 0.038Equal+factor+loadings 1880 995 61.83 44 0.272 0.822 0.924 0.037*+(p<0.01)
Model χ2 DF ∆+χ2 ∆+DF p GFI CFI RMSEASingle+Group,+Individual+solutionSmall+Firms+(n=157) 1309.7 769 0.914 0.910 0.067Medium+size+firms+(n=191) 1358.1 769 0.908 0.900 0.063Large+size+firms+(n=296) 1576.4 769 0.914 0.918 0.060Measurement+invariance+(n=644)Equal+form+(MultiQgroup) 4245.3 2307.00 0.760 0.907 0.036Equal+factor+loadings 4338.4 2377.00 93.15 70 0.154 0.755 0.906 0.036*+(p<0.01)
Model χ2 DF ∆+χ2 ∆+DF p GFI CFI RMSEASingle+Group,+Individual+solutionSmall+Firms+(n=157) 637.2 395 0.887 0.922 0.063Medium+size+firms+(n=191) 701.6 395 0.896 0.911 0.064Large+size+firms+(n=296) 780.3 395 0.891 0.937 0.057Measurement+invariance+(n=644)Equal+form+(MultiQgroup) 2119.5 1185.00 0.821 0.926 0.035Equal+factor+loadings 2195.7 1233.00 76.21 48 0.342 0.816 0.924 0.035*+(p<0.01)
Model χ2 DF ∆+χ2 ∆+DF p GFI CFI RMSEASingle+Group,+Individual+solutionSmall+Firms+(n=157) 1452.2 888 0.895 0.904 0.064Medium+size+firms+(n=191) 1506.8 888 0.903 0.901 0.061Large+size+firms+(n=296) 1744.4 888 0.910 0.917 0.057Measurement+invariance+(n=644)Equal+form+(MultiQgroup) 4704.5 2664.00 0.880 0.907 0.035Equal+factor+loadings 4810.6 2738.00 106.11 74 0.236 0.890 0.906 0.034*+(p<0.01)
MCS$uses$(Diagnostic/Interactive)$6$Performance:$Measurement$invariance$test$(Direct$effect$6$Indirect$Effect)
MCS$uses$(Diagnostic/Interactive)$6$EO$6$Performance:$Measurement$invariance$test$(Direct$effect$6$Indirect$Effect)
MCS$uses$(Diagnostic/Interactive)$6$EO$&$LO$6$Performance:$Measurement$invariance$test$(Direct$effect$6$Indirect$Effect)
MCS$uses$(Diagnostic/Interactive)$6$LO$6$Performance:$Measurement$invariance$test$(Direct$effect$6$Indirect$Effect)

168
Appendix L. Chapter III: Structural model results -overall sample and multi-group size analysis
Source: Self-devised
Small Size
Diagnostic MCS use
InteractiveMCS use
LO
EOPerformance
H8: -0.002
H7: 0.623*
Large Size
Diagnostic MCS use
InteractiveMCS use
LO
EOPerformance
H8: 0.02
H7: 0.448***
Overall sample
Diagnostic MCS use
InteractiveMCS use
LO
EOPerformance
H8: 0.055
H7: 0.409***
Medium Size
Diagnostic MCS use
InteractiveMCS use
LO
EOPerformance
H8: 0.143
H7: 0.414**
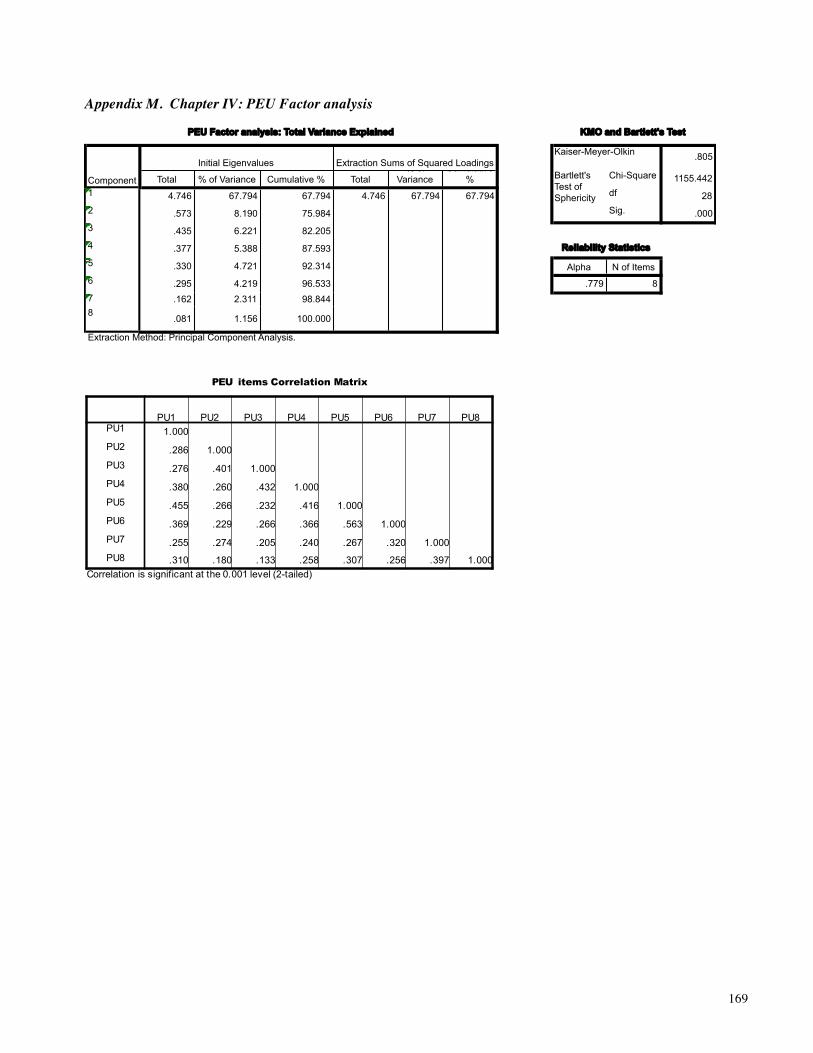
169
Appendix M. Chapter IV: PEU Factor analysis
.805
Total % of Variance Cumulative % Total% of
VarianceCumulative
% Chi-Square 1155.4421 4.746 67.794 67.794 4.746 67.794 67.794 df 282 .573 8.190 75.984 Sig. .0003 .435 6.221 82.2054 .377 5.388 87.5935 .330 4.721 92.314
Cronbach's Alpha N of Items
6 .295 4.219 96.533 .779 87 .162 2.311 98.8448 .081 1.156 100.000
Extraction Method: Principal Component Analysis.
KMO and Bartlett's Test
Kaiser-Meyer-Olkin
Bartlett's Test of Sphericity
Reliability Statistics
PEU Factor analysis: Total Variance Explained
Component
Initial Eigenvalues Extraction Sums of Squared Loadings
PEU items Correlation Matrix
PU1 PU2 PU3 PU4 PU5 PU6 PU7 PU8PU1 1.000PU2 .286 1.000PU3 .276 .401 1.000PU4 .380 .260 .432 1.000PU5 .455 .266 .232 .416 1.000PU6 .369 .229 .266 .366 .563 1.000PU7 .255 .274 .205 .240 .267 .320 1.000PU8 .310 .180 .133 .258 .307 .256 .397 1.000
Correlation is significant at;the 0.001;level (2?tailed)

170
Appendix N. Chapter IV: Second order constructs: Diagnostic & Interactive uses
Results to linking the two levers of control (diagnostic and interactive) proposed by Simons (1995) and the four MCS uses
(Monitoring, Legitimizing decisions, Attention Focusing and Strategic Decision-Making) proposed by Vandenbosch (1999).
The results will be treated as latent and intangible 2nd order constructs (Joreskog & Sorbom 1993).
Management Control Systems uses
We propose, according to the arguments offered by Simons (1990, 1995, 2000), that the four uses (Monitoring, Legitimization,
Attention Focusing, and Strategic Decision-Making) proposed by Vandenbosch (1999), can be grouped in two second order
constructs named Diagnostic and Interactive uses proposed by Simons (1995). Hence, Diagnostic use scale is a 2nd order
factor measured by two first order factors: Monitoring and legitimizing who influence negatively on capabilities, because they
are acting in a Diagnostic mode (Simons 1995). In the same way, Interactive use scale is a 2nd order factor measured by two
first order factors: Attention focusing and Strategic Decision-making are acting in an interactive form (Simons 1995) 46. (See
appendix J. Chapter III: EFA for Diagnostic and Interactive uses (2nd orders factor analysis).
1st step: Results of the exploratory factor analysis (EFA) for each of the two constructs (Diagnostic and interactive), and across
the all items of the four MCS uses (Monitoring, Legitimizing & Attention focusing and Strategic Decision-making), show
two factors in each EFA, indicated that the different scales were one-dimensional and every construct exhibits acceptable
results (KMO, 0.935 for diagnostic & 0.910 for interactive). Cronbach Alpha reliability coefficient showing acceptable values
(0.930 for diagnostic and 0.908 for interactive), above 0.90 (Nunnally et al. 1967).
2nd step: Confirming the existence of multidimensionality in our 2nd order constructs, is done through a confirmatory factor
analysis (CFA) using SEM in SPSS AMOS 21.0, with a rival model strategy (Anderson and Gerbing, 1988; Hair et al., 2006).
This analizes consist of comparing a 2nd order model in which various dimensions measured the multidimensional construct,
46 Koufteros et al. (2014) propose a different arrangement in these applications where Monitoring, legitimizing and focusing attention in the diagnostic charge second order construct. But the seminal literature proposed by Simons (1990, 1995) and Vandenbosch (1999), does not support this whole approach.
Simons (1991, 1995)
Interactive use
Diagnostic use
Levers of control (Purpose)
Beliefs
Boundaries
Commitment towards goals and to inspire,values, vision, direction
Administrative controls hierarchically based, guidelines for behavior
Control over organizational goals
Enable to search opportunities, solve problems and make decisions
MCS
Score Keeping (Monitoring)
How am I doing?
Legitimizing: How do we justify our decisions or actions?
Problem solving St. decision.-making
How can we best use it as a facilitating technique?
Attention focusing: What problems should we
look into?
Type of use
Vandenbosch (1999)
Source: Self-devised

171
with a 1st order model in which all items weighed on a single factor (Steenkamp and Van Trijp, 1991).
Second order constructs (Diagnostic & Interactive MCS uses)
The loadings of the measurement items were all significant (p<0.001). The indicators, goodness of fit indices exceeds the
requirements. Goodness-of-fit index (GFI) our second-order models was 0.931 Diagnostic and 0.938 interactive. CFI in our
second-order models was 0.956 for diagnostic and 0.952 for interactive respectively (see table below). RMSEA was 0.78 in
diagnostic and 0.089 in interactive constructs.
Analysis of multidimensionality en the 2nd order factors
Results showed that the 2nd-order model had a much better fit than the 1st-order model, thus we can conclude that the variables
“Diagnostic use” & “Interactive use” showed a multidimensional nature. The 2nd order models are significant.
vs. 2nd order models 1st order models
Source: Own devised
Figure 6: Second order constructs Diagnostic & Interactive MCS uses
Diagnostic
Interactive
Monitoring
Legitimizing
Attention focusing
Strategic Decision-making
Table 3: Analysis of multidimensionality in the 2nd order factor model Chi^2 Chi^2 norm Significance GFI CFI RMSEA
Diagnostic use 1st order 358.394 6.074 0.000 0.918 0.946 0.0892nd order 308.866 4.903 0.000 0.931 0.956 0.078
Interactive use 1st order 637.790 18.223 0.000 0.806 0.833 0.1642nd order 207.183 6.094 0.000 0.938 0.952 0.089
Source: own devised

172
Appendix O. Chapter IV: Measurement model
Measurement*model*(Without* PEU)
Source: Own devised
Measurement*model*(With*PEU)
Source: Own devised

173
7. Chapter VII: References Abernethy, M.A. & Brownell, P., 1997. Management control
systems in research and development organizations: the role of accounting, behavior and personnel controls. Accounting, Organizations and Society, 22(3), pp. 233–248.
Abernethy, M.A. & Brownell, P., 1999. The role of budgets in organizations facing strategic change: an exploratory study. Accounting, Organizations and Society, 24(3), pp. 189–204.
Abernethy, M.A. & Mundy, J., 2014. Uncertainty as a Determinant of Performance Measurement and Compensation Systems: A Review of the Literature. In D. Otley & K. Soin, eds. Management Control and Uncertainty. London: Palgrave Macmillan, Basingstoke, UK. pp. 114–133.
Abernethy, M.A. & Stoelwinder, J.U., 1991. Budget use, task uncertainty, system goal orientation and subunit performance: A test of the “fit” hypothesis in not-for-profit hospitals. Accounting, Organizations and Society, 16(2), pp. 105–120.
Ahn, H., 2001. Applying the balanced scorecard concept: an experience report. Long Range Planning, 34(4), pp. 441–461.
Ahrens, T. & Chapman, C.S., 2007. Management accounting as practice. Accounting, Organizations and Society, 32(1), pp. 1–27.
Amabile, T., 1998. How to Kill Creativity - HBR. Harvard Business Review, 1, September–October.
Anderson, J.C. & Gerbing, D.W., 2004. Structural equation modeling in practice: A review and recommended two-step approach. Psychological Bulletin, 103(3), pp. 411–423.
Anderson, S.W. & Young, S.M., 1999. The impact of contextual and process factors on the evaluation of activity-based costing systems. Accounting, Organizations and Society, 24(7), pp. 525–559.
Ansoff, I. H. 1991. Critique of Henry Mintzberg's ‘The design school: Reconsidering the basic premises of strategic management’. Strategic Management Journal, 12(6): pp. 449–461.
Ansoff, I. H., Hayes, R. L., & Declerck, R. P. 1976. From strategic planning to strategic management. London: John Wiley & Sons Inc.
Anthony, R.N., 1965. Planning and Control Systems: A Framework for analysis, Cambridge, MA: Graduate School of Business Administration, Harvard University.
Aragón-Correa, J.A., García-Morales, V.J. & Cordón-Pozo, E., 2007. Leadership and organizational learning's role on innovation and performance: Lessons from Spain. Industrial Marketing Management, 36(3), pp. 349–359.
Archer, T.M., 2003. Web-Based Surveys. Journal of Extension, 41(4), pp. 1–5.
Argyris, C., 1990. The dilemma of implementing controls: The case of managerial accounting. Accounting, Organizations and Society, 15(6), pp. 503–511.
Argyris, C. & Schön, D.A., 1978. Organizational learning: A theory of action perspective 1st ed., Reading, Massachusets: Addison Wesley.
Atuahene-Gima, K., 1996. Market orientation and innovation. Journal of Business Research, 35(2), pp. 93–103.
Atuahene-Gima, K. & Ko, A., 2001. An Empirical Investigation of the Effect of Market Orientation and Entrepreneurship Orientation Alignment on Product Innovation. Organization Science, 12(1) pp. 54-74.
Avlonitis, G.J. & Gounaris, S.P., 1997. Marketing orientation and company performance: industrial vs. consumer goods companies. Industrial Marketing Management, 26(5), pp. 385–402.
Bagozzi, R.P., 1994. “Structural equation model in marketing research. Basic principles,” in Bagozzi, R.P. (Ed.), Principles of Marketing Research, Oxford: Blackwell Publishers.
Bagozzi, R.P. & Yi, Y., 1988. On the evaluation of structural equation models. Journal of the Academy of Marketing Science, 16(1), pp. 74–94.
Baines, A. & Langfield Smith, K., 2003. Antecedents to management accounting change: a structural equation approach. Accounting, Organizations and Society, 28(7-8), pp. 675–698.
Baker, W.E. & Sinkula, J.M., 1999. The Synergistic Effect of Market Orientation and Learning Orientation on Organizational Performance. Academy of Marketing Science, 27(4), pp. 411–427.
Banker, R. & Potter, G., 2000. An empirical investigation of an incentive plan that includes nonfinancial performance measures. Accounting Review. 75 (1), pp. 65-92
Barney, J., 1991. Firm Resources and sustained Competitive Advantage. Journal of Management, 17(1), pp. 99–120.
Barney, J., 2007. Is the resource-based“ view” a useful perspective for strategic management research? Yes. Academy of Management Review, pp. 41–56.

174
Barney, J., 2001. Resource-based theories of competitive advantage: A ten-year retrospective on the resource-based view. Journal of Management, 27, pp. 643–650.
Barney, J.B., Ketchen, D.J. & Wright, M., 2011. The Future of Resource-Based Theory: Revitalization or Decline? Journal of Management, 37(5), pp. 1299–1315.
Baron, R.M. & Kenny, D.A., 1986. The moderator–mediator variable distinction in social psychological research: Conceptual, strategic, and statistical considerations. Journal of personality and social psychology, 51(6), pp. 1173-1182.
Bedford, D.S., 2015. Management control systems across different modes of innovation: Implications for firm performance. Management Accounting Research, 28, pp. 12-30.
Bentler, P., 1990. Comparative Fit Indices in Structural Models. Psychological Bulletin, 107(2), pp. 238–246.
Berry, A.J., Coad, A.F. & Harris, E.P., 2009. Emerging themes in management control: A review of recent literature. The British Accounting Review, 41(1), pp. 2–20.
Bhimani, A., 2003. A study of the emergence of management accounting system ethos and its influence on perceived system success. Accounting, Organizations and Society, (28), pp. 523–548.
Bisbe, J. & Otley, D., 2004. The effects of the interactive use of management control systems on product innovation. Accounting, Organizations and Society, 29(8), pp. 709–737.
Bisbe , J., Coenders Gallart, G., Saris, W. & Batista-Foguet, J. (2006). Correcting measurement error bias in interaction models with small samples. Metodoloski Zvezki: Advances in Methodology and Statistics, 3 (2), pp. 267-287.
Bisbe , J., Batista-Foguet, J. & Chenhall , R. (2007). Defining management accounting constructs: A methodological note on the risks of conceptual misspecification. Accounting, Organizations and Society, 32 (7-8), pp. 789-820.
Bisbe , J. & Malagueño de Santana, R. (2009). The choice of interactive control systems under different innovation management modes. European Accounting Review, 18 (2), pp. 371-405.
Bisbe, J., & Malagueño, R. (2012). Using strategic performance measurement systems for strategy formulation: Does it work in dynamic environments?. Management Accounting Research, 23(4), 296-311.
Bisbe , J. & Malagueño de Santana, R. (2015). How control systems influence product innovation processes: The role of entrepreneurial orientation. Accounting and Business Research, 45 (3), pp. 356-386.
Bititci, U.S. et al., 2006. Dynamics of performance measurement and organisational culture. Dynamics of performance measurement, 26(12), pp. 1325–1350.
Blentler, P.M. & Chou, C.P., 1987. Practical Issues in Structural Modeling. Sociological Methods Research, 16(1), pp. 78–117.
Boyd, B.K. & Reuning-Elliot, E., 1998. A measurement model of strategic planning. Strategic Management Journal, 19(2), pp. 181–192.
Braam, G.J.M. & Nijssen, E.J., 2004. Performance effects of using the Balanced Scorecard: a note on the Dutch experience. Long Range Planning, 37(4), pp. 335–349.
Brockmann, E.N. & Simmonds, P.G., 1997. Strategic decision making: The influence of CEO experience and use of tacit knowledge. Journal of Managerial Issues, IX(4), pp. 454–467.
Browne, M.W., Cudeck, R. & R, 1993. Alternative ways of assessing model fit. In Kenneth A. Bollen & J. Scott Long (Eds.), Testing structural equation models, Newburry Park, CA: Sage Publications.
Brownell, P., 1985. Budgetary Systems and the Control of Functionally Differentiated Organizational Activities. Journal of accounting research, 23(2), pp. 502–512.
Brownell, P., 1983. Leadership style, budgetary participation and managerial behavior. Accounting, Organizations and Society, 8(4), pp. 307–321.
Brownell, P., 1982. The role of accounting data in performance evaluation, budgetary participation, and organizational effectiveness. Journal of accounting research, pp. 12–27.
Bruns, W.J. & Waterhouse, J.H., 1975. Budgetary control and organization structure. Journal of accounting research, 13(2), pp. 177–203.
Burchell, S., Clubb, C., Hopwood, A., Hughes, J. and Nahapiet, J., 1980. The roles of accounting in organizations and society. Accounting, Organizations and Society, 5(1), pp. 5-27.
Burney, L. & Widener, S.K., 2007. Strategic Performance Measurement Systems, Job-Relevant Information, and Managerial Behavioral Responses—Role Stress and Performance. Behavioral Research in Accounting, 19(1), 43–69.
175
Burns, T. & Stalker, G.M., 1961. The Management of Innovation 1st ed., London, UK: Lavistock.
Butler, A., Letza, S.R. & Neale, B., 1997. Linking the balanced scorecard to strategy. Long Range Planning, 30(2), pp. 242–153.
Byrne, B.M., 2013. Structural Equation Modeling With AMOS, Routledge.
Byrne, B.M., 2004. Testing for Multigroup Invariance Using AMOS Graphics: A Road Less Traveled. Structural Equation Modeling: A Multidisciplinary Journal, 11(2), pp. 272–300.
Calantone, R.J., Cavusgil, S.T. & Zhao, Y., 2002. Learning orientation, firm innovation capability, and firm performance. Industrial Marketing Management, 31(6), pp. 515–524.
Campbell, D. T., & Fiske, D. (1959). Convergent and discriminant validation by the multitrait-multimethod matrix. Psychological Bulletin, 56(2), 81-105.
Chandler, A.D., 1962. Strategy and structure, Cambridge, MA: MIT Press.
Chandler, G.N. & Hanks, S.H., 1994. Market attractiveness, resource-based capabilities, venture strategies, and venture performance. Journal of Business Venturing, 9(4), pp. 331–349.
Chapman, C.S., 1997. Reflections on a contingent view of accounting*. Accounting, Organizations and Society, 22(2), pp. 189–205.
Chapman, C.S., 1998. Accountants in organisational networks. Accounting, Organizations and Society, 23(8), pp. 737–766.
Cheng, M.M., Luckett, P.F. & Mahama, H., 2007. Effect of perceived conflict among multiple performance goals and goal difficulty on task performance. Accounting & Finance, 47(2), pp. 221–242.
Chenhall, R., 2003. Management control systems design within its organizational context: findings from contingency-based research and directions for the future. Accounting, Organizations and Society, 28, pp. 127–168.
Chenhall, R., 2005. Integrative strategic performance measurement systems, strategic alignment of manufacturing, learning and strategic outcomes: an exploratory study. Accounting, Organizations and Society, 30(5), pp. 395–422.
Chenhall, R., 2007. Theorizing contingencies in management control systemsresearch. In: Chapman, C.S., Hopwood, A.G., Shields, M.D. (Eds.), Handbook of Management Accounting Research. Elsevier, pp. 163–205.
Chenhall, R. & Langfield-Smith, K., 1998. The relationship between strategic priorities, management techniques and management accounting: an empirical investigation using a systems approach. Accounting, Organizations and Society, 23(3), pp. 243–264.
Chenhall, R. & Morris, D., 1995. Organic decision and communication processes and management accounting systems in entrepreneurial and conservative business organizations. International Journal of Management Science, 23(5), pp. 485–497.
Chenhall, R. & Morris, D., 1986. The Impact of Structure, Environment, and Interdependence on the Perceived Usefulness of Management Accounting Systems on JSTOR. The Accounting Review, 61(1), pp. 16–35.
Child, J. & Mansfield, R., 1972. Technology, Size, and Organization Structure. Sociology, 6(3), pp. 369–393.
CHOW, C.W., Shields, D.M. & Chan, Y.K., 1991. The effects of management controls and national culture on manufacturing performance: An experimental investigation. Accounting, Organizations and Society, 16(3), pp. 209–226.
Cooper, R., 1995. When Lean Enterprises Collide: Competing Through Confrontation. Harvard Business School Press, Boston MA.
Covin, J. & Slevin, D.P., 1986. The development and testing of an organizational-level entrepreneurship scale, in Frontiers of entrepreneurship research: Proceedings of the UIC Symposium on Marketing and Entrepreneurship, Wellesley, MA: Center for entrepreneurial studies, Babson College.
Covin, J.G. & Lumpkin, G.T., 2011. Entrepreneurial Orientation theory and research: reflections on a needed construct. Entrepreneurship Theory and Practice, 35(5), pp. 855–872.
Covin, J.G. & Slevin, D.P., 1991. A Conceptual Model of Entrepreneurship as Firm Behavior. Entrepreneurship Theory and Practice, 16(1), pp. 7–25.
Covin, J.G. & Slevin, D.P., 1989. Strategic management of small firms in hostile and benign environments. Strategic Management Journal, 10(1), pp. 75–87.
Crabtree, A.D. & DeBusk, G.K., 2008. The effects of adopting the Balanced Scorecard on shareholder returns. Advances in Accounting, 24(1), pp. 8–15.
Cronbach, J.L., 1951. Cofficient alpha and the internal structure of tests. Psichometrika, 16(3), pp. 297-334.
Cruz, I., Scapens, R.W. & Major, M., 2011. The localization of a global management control system. Accounting, Organizations and Society, 36(7), pp. 412–427.

176
Cuervo, Á. 1996. Introducción a la administración de empresas. Dirección de empresas de los noventa : homenaje al profesor Marcial-Jesús López Moreno, 1995, ISBN 84-470-0509-7, págs. 51-70: 51–70. Madrid, España: 2a Ed. Editorial Civitas.
Daft, R.L. & MacIntosh, N.B., 1978. A New Approach to the Design and Use of Management Information. California Management Review, 21(1), pp. 82–92.
Daft, R.L. & Weick, K.E., 1984. Toward a Model of Organizations as Interpretation Systems. Academy of Management Review, 9(2), pp. 284–295.
Danneels, E., 2002. The dynamics of product innovation and firm competences. Strategic Management Journal, 23(12), pp. 1095–1121.
Davila, T., 2000. An empirical study on the drivers of management control systems' design in new product development. Accounting, Organizations and Society, 25, pp. 383–409.
Davis, S. & Albright, T., 2004. An investigation of the effect of Balanced Scorecard implementation on financial performance. Management Accounting Research, 15(2), pp. 135–153.
Day, G.S., 1994. The capabilities of market-driven organizations. Journal of Marketing, 58(4), pp. 37–52.
De Haas, M. & Kleingeld, A., 1999. Multilevel design of performance measurement systems: enhancing strategic dialogue throughout the organization. Management Accounting Research, 10(3), pp. 233–261.
Dent, J.F., 1990. Strategy, organization and control: some possibilities for accounting research*. Accounting, Organizations and Society, 15(1/2), pp. 3–25.
Dent, J.F., 1987. Tensions in the design of formal control systems: a field study in a computer company. In W. J. Bruns & R. S. Kaplan (Eds.), Accounting and management: Field study perspectives. Boston, MA: Harvard Business School Press.
Dermer, J., 1990. The strategic agenda: Accounting for issues and support. Accounting, Organizations and Society, 15(1-2), pp. 67–76.
DeSarbo, W.S., Anthony Di Benedetto, C., Song, M. and Sinha, I., 2005. Revisiting the Miles and Snow strategic framework: uncovering interrelationships between strategic types, capabilities, environmental uncertainty, and firm performance. Strategic Management Journal, 26(1), pp. 47-74.
Dess, G.G. & Robinson, R.B., 1984. Measuring organizational performance in the absence of objective measures: the case of the privately-held firm and conglomerate business
unit. Strategic Management Journal. 5(3), pp. 265-273
Dillman, D., 2000. Mail and Internet Surveys: The Tailored design method, New York: John Wiley and Sons, Inc.
Dossi, A., 2008. The decision-influencing use of performance measurement systems in relationships between headquarters and subsidiaries. Management Accounting Research, 19, pp. 126–148.
Dougherty, D. & Hardy, C., 1996. Sustained Product Innovation in Large, Mature Organizations: Overcoming Innovation-to-Organization Problems. The Academy of Management Journal, 39(5), pp. 1120–1153.
Edwards, J. R., & Bagozzi, R. P. (2000). On the nature and direction of relationships between constructs and measures. Psychological Methods, 5, 155–174.
Eisenhardt, K.M., 1989. Building Theories From Case Study Research. The Academy of Management Review, 14(4), pp. 532-550.
Eisenhardt, K.M. & Jeffrey, M., 2000. Dynamic Capabilities: What are they? Strategic Management Journal, 21, pp. 1105–1121.
Ezzamel, M., 1990. The impact of environmental uncertainty, managerial autonomy and size on budget characteristics. Management Accounting Research, 1(3), pp. 181-197.
Fama, E.F. & Jensen, M.C., 1983. Separation of ownership and control. Journal of law and economics, 26(2), pp. 301–325.
Farrell, M.A. & Oczkowski, E., 2002. Are Market Orientation and Learning Orientation Necessary For Superior Organizational Performance? Working Paper, School of Management, Charles Sturt University, pp. 1–40.
Feldman, M.S. & March, J.G., 1981. Information in Organizations as Signal and Symbol. Administrative Science Quarterly, 26(2), pp. 171–186.
Ferreira, A., 2002. Management accounting and control systems design and use: an exploratory study in Portugal. PhD Thesis. Department of Accounting and Finance Lancaster University.
Ferreira, A. & Otley, D., 2009. The design and use of performance management systems: An extended framework for analysis. Management Accounting Research, 20(4), pp. 263–282.
Fiol, C.M. & Lyles, M.A., 1985. Organizational Learning. The Academy of Management Review, 10(4), pp. 803–813.
Fisher, J., 1995. Contingency-based research on management control systems: categorization by level of complexity. Journal of Accounting Literature, 14, pp. 24–53.

177
Fornell, C. & Larcker, D.F., 1981. Evaluating structural equation models with unobservable variables and measurement error. Journal of Marketing Research (JMR), 18(1) pp. 39-50.
Franco-Santos, M., Lucianetti, L. & Bourne, M., 2012. Contemporary performance measurement systems: A review of their consequences and a framework for research. Management Accounting Research, pp. 1–41.
Galbraith, J.R., 1973. Designing Complex Organizations, Boston, MA.: Addison-Wesley Longman Publishing Co. Inc.
Galunic, D.C. & Eisenhardt, K.M., 1994. Renewing the strategy-structure-performance paradigm, JAI Press LTD: Research in organizational behavior.
Garengo, P., Biazzo, S., & Bititci, U. S. 2005. Performance measurement systems in SMEs: A review for a research agenda. International Journal of Management Reviews, 7(1), pp. 25–47.
Garvin, D.A., 1993. Building a Learning Organization. Harvard Business Review, 71(4), pp. 78–91.
Gates, S. 2001. Aligning strategic performance measures and results: 41. Presented at the Balanced Scorecard Interest Group November 14, 2001, Washington, DC: Conference Board.
Godener, A. & Söderquist, K.E., 2004. Use and impact of performance measurement results in R&D and NPD: an exploratory study. R&D Management, 34(2), pp. 191–219.
Gosselin, M., 2005. An empirical study of performance measurement in manufacturing firms. International Journal of Productivity and Performance Management, 54(5/6), pp. 419–437.
Govindarajan, V., 1988. A contingency approach to strategy implementation at the business-unit level: integrating administrative mechanisms with strategy. Academy of Management Journal, 31(4), pp. 828–853.
Govindarajan, V., 1984. Appropriateness of accounting data in performance evaluation: An empirical examination of environmental uncertainty as an intervening variable. Accounting, Organizations and Society, 9(2), pp. 125–135.
Govindarajan, V. & Fisher, J., 1990. Strategy, control systems, and resource sharing: effects on business-unit performance. Academy of Management Journal, 33(2), pp. 259–285.
Govindarajan, V. & Gupta, A.K., 1985. Linking control systems to business unit strategy: impact on performance*. Accounting, Organizations and Society, 10(1), pp. 51–66.
Govindarajan, V. & Shank, J.K., 1992. Strategic cost management: tailoring controls to strategies. Journal of Cost Management, 6(3), pp. 14–25.
Gómez-Villanueva, J.E., 2008. Orientación al mercado, capacidades empresariales y resultados en las PYMES de nueva creación. Universidad Autónoma de Barcelona.
Gómez-Villanueva, J.E., Llonch Andreu, J. & Rialp Criado, J., 2010. Orientación estratégica, innovación y resultados en PYMES de nueva creación: el rol del marketing. Cuadernos de Gestión, 10 (No. especial), pp. 85–110.
Grafton, J., Lillis, A.M. & Widener, S.K., 2010. The role of performance measurement and evaluation in building organizational capabilities and performance. Accounting, Organizations and Society, 35(7), pp. 689–706.
Grant, R.M., 1991. The Resource-Based Theory of Competitive Advantage: Implications for Strategy Formulation. California Management Review, 33(3), pp. 114–135.
Grant, R.M., 1996. Toward a Knowledge-based theory of the firm. Strategic Management Journal, 17(Special Issue), pp. 109–122.
Gray, B.J. & Hooley, G.J., 2002. Market orientation and service firm performance. European Journal of Marketing, 36(9/10), pp. 980–989.
Greenley, G.E. & Oktemgil, M., 1997. An Investigation of Modulator Effects on Alignment Skill. Journal of Business Research, 39(2), pp. 93–105.
Griffith, R. & Neely, A., 2009. Performance pay and managerial experience in multitask teams: evidence from within a firm. Journal of Labor Economics, 27(1), pp. 49–82.
Hair, F.J. et al., 2006. Multivariate Data Analysis 6 ed., New Jersey.: Prentice-Hall International.
Hall, G., & Wahab, K. A. 2007. Influences on the survival and failure of small firms in Malaysia. International Journal of Business and Globalisation, 1(2), pp. 88-106.
Hall, M., 2008. The effect of comprehensive performance measurement systems on role clarity, psychological empowerment and managerial performance. Accounting, Organizations and Society, 33(2-3), pp. 141–163.
Hambrick, D.C., 1982. Environmental scanning and organizational strategy. Strategic Management Journal, 3(2), pp. 159–174.
Hamel, G. & Prahalad, C., 1991. Corporate imagination and expeditionary marketing. Harvard Business Review, 69(4), pp. 81–92.

178
Hamel, G. & Prahalad, C., 1994. Competing For The Future, Harvard Business School Press, Boston MA.
Hansen, G.S. & Wernerfelt, B., 1989. Determinants of firm performance: The relative importance of economic and organizational factors. Strategic Management Journal. 10(5), pp. 399-411.
HassabElnaby, H.R., Said, A.A. & Wier, B., 2005. The Retention of Nonfinancial Performance Measures in Compensation Contracts. Journal of Management Accounting Research, 17 (1), pp.23–42.
Hayes, D.C., 1977. The contingency theory of managerial accounting. Accounting Review, pp.22–39.
Hedberg, B. & Jönsson, S., 1978. Designing semi-confusing information systems for organizations in changing environments. Accounting, Organizations and Society, 3(1), pp. 47–64.
Heneman, H.G., 1974. Comparisons of self- and superior ratings of managerial performance. Journal of applied psychology, 59(5), pp. 638–642.
Henri, J.-F., 2006a. Management control systems and strategy: A resource-based perspective. Accounting, Organizations and Society, 31(6), pp. 529–558.
Henri, J.-F., 2006b. Organizational culture and performance measurement systems. Accounting, Organizations and Society, 31(1), pp. 77–103.
Henri, J.-F., 2010. The periodic review of performance indicators: An empirical investigation of the dynamism of performance measurement systems. European Accounting Review, 19(1), pp. 73–96.
Henri, J.-F. & Journeault, M., 2010. Eco-control: The influence of management control systems on environmental and economic performance. Accounting, Organizations and Society, 35(1), pp. 63–80.
Hickson, D.J., 1986. Top decisions: Strategig decision-making in organizations, Oxford & San Francisco: Basil Blackwell / Jossey Bass.
Hitt, M.A. et al., 2001. Strategic entrepreneurship: entrepreneurial strategies for wealth creation. Strategic Management Journal, 22(6-7), pp. 479–491.
Hitt, M.A., Ireland, R.D. & Hoskisson, R.E., 2011. Strategic Management: Competitiveness and Globalization (Concepts and Cases) 9 ed., Mason, OH: Prentice Hall.
Hofstede, G., 1978. The Poverty of Management Control Philosophy. Academy of Management Review, 3(3), pp. 450–461.
Hopwood, A.G., 1972. An empirical study of the role of accounting data in performance evaluation. Supplement of Journal of Accounting Research, pp. 156–182.
Hopwood, A.G., 1987. The archeology of accounting systems. Accounting, Organizations and Society, 12(3), pp. 207–234.
Hoque, Z., 2004. A contingency model of the association between strategy, environmental uncertainty and performance measurement: impact on organizational performance. International Business Review, 13(4), pp. 485–502.
Hoque, Z. & James, W., 2000. Linking balanced scorecard measures to size and market factors: impact on organizational performance. Journal of Management Accounting Research, 12, pp. 1–17.
Horn, J.L., 1991. “Comments on issues in factorial invariance,” in Collins, L.M. and Horn, J.L. (Eds), Best methods for the analysis of change, Washington, DC: American Psychological Association.
Hoskisson, R.E. et al., 1999. Theory and research in strategic management: Swings of a pendulum. Journal of Management, 25(3), pp. 417–456.
Hu, L.-T. & Bentler, P.M., 1995. Evaluating model fit. In R. H. Doyle (Ed.), Structural equation modeling, Thousand Oaks, CA: Sage.
Huber, G.P., 1991. Organizational learning: The contributing processes and the literatures. Organization Science, 2(1), pp. 88–115.
Hudson, M. 1999. Performance measurement for planning and control in SME. (K. Mertins, O. Krause, & B. Schallock, Eds.), 219–225. Berlin, Germany: Global production management: IFIP WG5.7 International Conference on Advances in Production Management Systems.
Hudson, M., Smart, A. and Bourne, M. 2001. Theory and practice in SME performance measurement systems. International Journal of Operations & Production Management, 21, pp. 1096–1115.
Hult, T., 2004. Innovativeness: Its antecedents and impact on business performance. Industrial Marketing Management, 33(5), pp. 429–438.
Hult, T., 1998. Managing the international strategic sourcing process as a market-driven organizational learning system. Decision Sciences, 29(1), pp. 193–216.
Hult, T. & Ketchen, D.J., 2001. Does market orientation matter?: A test of the relationship between positional advantage and performance. Strategic Management Journal, 22(9), pp. 899.

179
Hurley, R.F. & Hult, T., 1998. Innovation, Market Orientation, and Organizational Learning: An Integration and Empirical Examination. Journal of Marketing, 62(3), pp. 42.
Hutzschenreuter, T. & Kleindienst, I., 2006. Strategy-Process Research: What Have We Learned and What Is Still to Be Explored. Journal of Management, 32(5), pp. 673–720.
Hyvönen, J., 2007. Strategy, performance measurement techniques and information technology of the firm and their links to organizational performance. Management Accounting Research, 18(3), pp. 343–366.
Ireland, R.D., Hitt, M.A. & Sirmon, D.G., 2003. A model of strategic entrepreneurship: The construct and its dimensions. Journal of Management, 29(6), pp. 963–989.
Ittner, C.D. & Larcker, D.F., 1998a. Are Nonfinancial Measures Leading Indicators of Financial Performance? An Analysis of Customer Satisfaction. Journal of accounting research, 36, pp. 1–35.
Ittner, C.D. & Larcker, D.F., 2001. Assessing empirical research in managerial accounting: a value-based management perspective. Journal of accounting and economics, 32(1-3), pp. 349–410.
Ittner, C.D. & Larcker, D.F., 2003. Coming Up Short on Nonfinancial Performance Measurement. Harvard Business Review, November, pp. 1–9.
Ittner, C.D. & Larcker, D.F., 1998b. Innovations in performance measurement: Trends and research implications. Journal of Management Accounting Research, fall, pp. 205–238.
Ittner, C.D. & Larcker, D.F., 1997. Quality strategy, strategic control systems, and organizational performance. Accounting, Organizations and Society, 22(3-4), pp. 293–314.
Ittner, C.D., Larcker, D.F. & Randall, T., 2003. Performance implications of strategic performance measurement in financial services firms. Accounting, Organizations and Society, 28(7-8), pp. 715–741.
Janke, R., Mahlendorf, M.D. and Weber, J., 2014. An exploratory study of the reciprocal relationship between interactive use of management control systems and perception of negative external crisis effects. Management Accounting Research, 25(4), pp. 251-270.
Jaworski, B.J. & Kohli, A.K., 1996. Market orientation: Review, refinement, and roadmap. Journal of Market-Focused Management, 1(2), pp. 119–135.
Johnston, R., Brignall, S. & Fitzgerald, L., 2002. Good enough performance measurement: a trade-off between activity and action. The Journal of the Operational Research
Society, 53(3 Part Special Issue: Performance Management), pp. 256–262.
Joreskog, K.G. & Sorbom, D., 1984. LISREL VI user's guide, Mooresville, IN: Scientific Software International.
Joreskog, K.G. & Sorbom, D., 1993. New Features in LISREL 8, Chicago: Scientific Software International.
Kaplan, R. & Atkinson, A.A., 1998. Advanced management accounting 3rd ed., Upper Saddle River, N.J.: Prentice hall.
Kaplan, R. & Norton, D., 1992. The Balanced ScoreCard- Measures that drive performance. Harvard Business Review, January-February, pp. 1–28.
Kaplan, R. & Norton, D., 1996. Using the balanced scorecard as a strategic management system. Harvard Business Review, January-february, pp. 73–85.
Kaplan, R. & Norton, D., 2000. Focus on your organization Strategy - with the balanced scorecard 3er edition. Harvard Business Review (1) pp. 61–72.
Kaplan, R. & Norton, D., 2001. The strategy-focused organization. Strategy and Leadership, 29(3), pp.41-42.
Kaplan, R. & Norton, D., 2002. The strategy-focused organization: How balanced scorecard companies thrive in the new business environment, Harvard Business Press.
Kenis, I., 1979. Effects of Budgetary Goal Characteristics on Managerial Attitudes and Performance. The Accounting Review, 54(4), pp. 707–721.
Khandwalla, P.N., 1977. The design of organizations, Harcourt Brace Jovanovich.
Kihn, L.-A., 2007. Financial Consequences in Foreign Subsidiary Manager Performance Evaluations. European Accounting Review, 16(3), pp. 531–554.
King, R. & Clarkson, P., 2015. Management control system design, ownership, and performance in professional service organisations. Accounting, Organizations and Society, 45(C), pp. 24–39.
Kirca, A.H., Jayachandran, S. & Bearden, W.O., 2005. Market orientation: a meta-analytic review and assessment of its antecedents and impact on performance. Journal of Marketing, 69(April), pp. 24–41.
Kline, R.B., 1998. Principles and Practices of Structural Equation Modeling, New York: Guilford Press.
Kogut, B., 1991. Joint Ventures and the Option to Expand and Acquire. Management Science, 37(1), pp. 19–33.

180
Kohli, A.K. & Jaworski, B.J., 1993. Market orientation: antecedents and consequences. The Journal of Marketing, 57(3), pp. 53–70.
Kohli, A.K. & Jaworski, B.J., 1990. Market Orientation: The Construct, Research Propositions, and Managerial Implications. Joumal of Marketing, 54(april), pp. 1–18.
Kolehmainen, K., 2010. Dynamic Strategic Performance Measurement Systems: Balancing Empowerment and Alignment. Long Range Planning, 43(4), pp. 527–554.
Koufteros, X., Verghese, A.J. and Lucianetti, L., 2014. The effect of performance measurement systems on firm performance: A cross-sectional and a longitudinal study. Journal of Operations Management, 32(6), pp. 313-336.
Kruis, A.M., Speklé, R.F. and Widener, S.K., 2015. The Levers of Control Framework: An exploratory analysis of balance. Management Accounting Research,http://dx.doi.org/10.1016/j.mar.2015.12.002, article in press
Landis, R.S., Beal, D.J. & Tesluk, P.E., 2000. A Comparison of Approaches to Forming Composite Measures in Structural Equation Models. Organizational Research Methods, 3(2), pp. 186–207.
Langfield Smith, K., 1997. Management Control Systems and Strategy: a critical review. Accounting, Organizations and Society, 22(2), pp. 207–232.
Lau, C.M. & Sholihin, M., 2005. Financial and nonfinancial performance measures: How do they affect job satisfaction? The British Accounting Review, 37(4), pp. 389–413.
Lawrence, P.R. & Lorsch, J.W., 1967. Organization and environment, Boston, MA: Harvard Business School, Division of Research.
Lee, C., Lee, K. & Pennings, J.M., 2001. Internal capabilities, external networks, and performance: a study on technology-based ventures. Strategic Management Journal, 22(6-7), pp. 615–640.
Lee, C.-L. & Yang, H.-J., 2011. Organization structure, competition and performance measurement systems and their joint effects on performance. Management Accounting Research, 22(2), pp. 84–104.
Lengnick-Hall, C.A. & Wolff, J.A., 1999. Similarities and contradictions in the core logic of three strategy research streams. Strategic Management Journal, 20(12), pp. 1109–1132.
Levitt, B. & March, J.G., 1988. Organizational Learning. Annual Review of Sociology, 14(1), pp. 319–338.
Li, Y.-H., Huang, J.-W. & Tsai, M.-T., 2009. Entrepreneurial orientation and firm performance: The role of knowledge creation process. Industrial Marketing Management, 38(4), pp. 440–449.
Lind, J., & Kraus, K. 2010. The Impact of the Corporate Balanced Scorecard on Corporate Control. Management Accounting Research, 21(1): 265–277.
Lindsay, R.M., 1995. Reconsidering the status of tests of significance: An alternative criterion of adequacy. Accounting, Organizations and Society, 20(1), pp. 35–53.
Llonch Andreu, J., López Belbeze, M.ª.P. & Eusebio, R., 2007. Orientación al aprendizaje, Orientación al mercado, Resultados y el efecto moderador de la procedencia funcional del Director General. Cuadernos de Economía y Dirección de la Empresa, 10(33), pp. 63–94.
Luft, J. & Shields, M.D., 2003. Mapping management accounting: graphics and guidelines for theory-consistent empirical research. Accounting, Organizations and Society, 28(2-3), pp. 169–249.
Lumpkin, G. & Dess, G.G., 1996. Clarifying the entrepreneurial orientation construct and linking it to performance. Academy of Management Review, 21(1), pp. 135–172.
Lumpkin, G.T. & Dess, G.G., 2001. Linking two dimensions of entrepreneurial orientation to firm performance. Journal of Business Venturing, 16(5), pp. 429–451.
Lumpkin, G.T., Cogliser, C.C. & Schneider, D.R., 2009. Understanding and Measuring Autonomy: An Entrepreneurial Orientation Perspective. Entrerpreneur Theory And Practice, January, pp. 47–69.
Lynch, R. & Cross, K., 1991. Measure Up! Yardsticks for Continuous Improvement, Cambridge MA: Blackwell Publishers.
Maciarello, J.A. & Kirby, C.J., 1994. Management Control Systems by Joseph A. Maciariello - New, Rare & Used Books Online at Alibris for Libraries 2nd ed., Englewood Cliffs: Prentice Hall: Englewood Cliffs: Prentice Hall.
Mahama, H., 2006. Management control systems, cooperation and performance in strategic supply relationships: A survey in the mines. Management Accounting Research, 17(3), pp. 315–339.
Malina, M.A. & Selto, F.H., 2001. Communicating and Controlling Strategy: An Empirical Study of the Effectiveness of the Balanced Scorecard. Journal of Management Accounting Research, 13(1), pp. 47–90.
Malmi, T. & Brown, D.A., 2008. Management control systems as a package—Opportunities, challenges and research directions. Management Accounting Research, 19(4), pp. 287–300.

181
March, J.G., 1991. Exploration and exploitation in organizational learning. Organization Science 2, 71–87.
Marginson, D.E.W., 2002. Management control systems and their effects on strategy formation at middle-management levels: evidence from a U.K. organization. Strategic Management Journal, 23(11), pp. 1019–1031.
Markus, M.L. & Pfeffer, J., 1983. Power and the design and implementation of accounting and control systems. Accounting, Organizations and Society, 8(2-3), pp. 205–218.
Marr, B., 2005. Business performance measurement: an overview of the current state of use in the USA. Measuring Business Excellence, 9(3), pp. 1–5.
McEvily, S.K. & Chakravarthy, B., 2002. The persistence of knowledge-based advantage: an empirical test for product performance and technological knowledge. Strategic Management Journal, 23(4), pp. 285–305.
McGrath, R.G. et al., 1996. Innovation, Competitive Advantage and Rent: A Model and Test. Management Science, 42(3), pp. 389–403.
McKelvie, A. & Davidsson, P., 2009. From Resource Base to Dynamic Capabilities: an Investigation of New Firms. British Journal of Management, 20, pp. S63–S80.
Mellahi, K. & Sminia, H., 2009. Guest Editors’ Introduction: The frontiers of strategic management research. International Journal of Management Reviews, 11(1), pp. 1–7.
Merchant, K.A., 1981. The design of the corporate budgeting system: influences on managerial behavior and performance. The Accounting Review, 4, pp. 813–829.
Merchant, K.A., 1990. The effects of financial controls on data manipulation and management myopia. Accounting, Organizations and Society. 15 (4, Oct), pp. 619–638.
Merchant, K.A., 1998. Modern management control systems, Upper Saddle River, N.J.: Prentice Hall.
Merchant, K.A. & Otley, D., 2007. A Review of the Literature on Control and Accountability. In C. Chapman, A. Hop- wood, & M. Shield (Eds.) In Handbooks of management accounting research, Elsevier Press, (2) pp. 785–802.
Mia, L., 1993. The Role Of Mas Information In Organisations: An Empirical Study. The British Accounting Review, 25(3), pp. 269–285.
Milani, K., 1975. The Relationship of Participation in Budget-Setting to Industrial Supervisor Performance and Attitudes: A Field Study. The Accounting Review, 50(2), pp. 274–284.
Miles, R.E. & Snow, C.C., 1978. Organizational strategy, structure, and process, New York, NY: McGraw-Hill - Stanford University Press.
Milgrom, P. & Roberts, J., 1995. Complementarities and fit strategy, structure, and organizational change in manufacturing. Journal of accounting and economics, 19(2-3), pp. 179–208.
Miller, D., 1983. The correlates of entrepreneurship in three types of firms. Management Science, 29(7), pp. 770-791.
Miller, D., 1987. The structural and environmental correlates of business strategy. Strategic Management Journal, 8(1), pp. 55–76.
Miller, D.,1993. Industry and country effects on managers’ perceptions of environmental uncertainties. Journal of International Business Studies 24 (4), pp. 693–714.
Miller, D. & Friesen, P.H., 1982. Innovation in conservative and entrepreneurial firms: Two models of strategic momentum. Strategic Management Journal, 3(1), pp. 1-25.
Miller, D. & Shamsie, J., 1996. The resource-based view of the firm in two environments: the hollywood film studios from 1936 to 1965. Academy of Management Journal, 39(3), pp. 519–543.
Mintzberg, H., 1973. The nature of managerial work 1st ed., New York: HarperCollins Publishers.
Mintzberg, H., 1978. Patterns in Strategy Formation. Management Science, 24(9), pp. 934–948.
Mintzberg, H. 1987. The strategy concept 1. California Management Review, Fall (1), pp. 11–24.
Mintzberg, H., 1994. The fall and rise of strategic planning. Harvard Business Review, 72 (Jan-Feb), pp. 107–114.
Mintzberg, H., & Lampel, J. 1999. Reflecting on the strategy process. Sloan management review, (Spring), pp. 21–30.
Mintzberg, H. & Waters, J.A., 1985. Of strategies, deliberate and emergent. Strategic Management Journal, 6(3), pp. 257–272.
Moreno, A.M. & Casillas, J.C., 2008. Entrepreneurial orientation and growth of SMEs: A causal model. Entrepreneurship Theory and Practice, 32(3), pp. 507–528.
Mundy, J., 2010. Creating dynamic tensions through a balanced use of management control systems. Accounting, Organizations and Society, 35(5), pp. 499–523.
Nag, R., Hambrick, D. C., & Chen, M.-J. 2007. What is strategic management, really? Inductive derivation of a
182
consensus definition of the field. Strategic Management Journal, 28(9): 935–955.
Naman, J.L. & Slevin, D.P., 1993. Entrepreneurship and the concept of fit: A model and empirical tests. Strategic Management Journal, 14(2), pp. 137–153.
Naranjo-Gil, D. & Hartmann, F., 2007a. How CEOs use management information systems for strategy implementation in hospitals. Health Policy, 81(1), pp. 29–41.
Naranjo-Gil, D. & Hartmann, F., 2007b. Management accounting systems, top management team heterogeneity and strategic change. Accounting, Organizations and Society, 32(7), pp. 735–756.
Narver, J.C. & Slater, S.F., 1990. The Effect of a Market Orientation on Business Profitability. Journal of Marketing, 54(4), pp. 20–35.
Navarro, A.M. & Guerras Martín, L.A., 2001. El proceso de toma de decisiones estratégicas en las principales revistas internacionales (1994-2000). In XI Congreso nacional de ACEDE, Universidad de Zaragoza. Zaragoza, España, pp. 1–25.
Neely, A., Gregory, M. & Platts, K., 1995. Performance measurement system design: A literature review and research agenda. International Journal of Operations & Production Management, 15(4), pp. 80–116.
Neely, A., Mills, A. & Platts, J., 1994. Realizing strategy through measurement. International Journal of Operations & Production Management, 14(3), pp. 140–152.
Neely, A., Yaghi, B. & Youell, N., 2008. Enterprise performance management: The global state of the art. Oracle and Cranfield School of Management, 9, pp. 3-4.
Nunnally, J.C., Bernstein, I.H. & Berge, J., 1967. Psychometric theory 2nd ed., NY: McGraw-Hill.
OConnor, N.G., Vera-Muñoz, S.C. & Chan, F., 2011. Competitive forces and the importance of management control systems in emerging-economy firms: The moderating effect of international market orientation. Accounting, Organizations and Society, 36(4), pp. 246–266.
Otley, D., 1978. Budget Use and Managerial Performance. Journal of accounting research, 16(1), pp. 122–149.
Otley, D., 1980. The contingency theory of management accounting: Achievement and prognosis. Accounting, Organizations and Society, 5(4), pp. 413–428.
Otley, D., 1994. Management control in contemporary organizations: towards a wider framework. Management Accounting Research, (5), pp. 289–299.
Otley, D., 1999. Performance management: a framework for management control systems research. Management Accounting Research, 10(4), pp. 363–382.
Otley, D., 2012. Performance management under conditions of uncertainty: some valedictory reflections. Pacific Accounting Review, 24(3), pp. 247-261.
Otley, D., 2014. Management Control under Uncertainty: Thinking about Uncertainty. In D. Otley & K. Soin, eds. Management Control and Uncertainty. London: Palgrave Macmillan Basingstoke UK, pp. 83–96.
Otley, D., 2016. The contingency theory of management accounting and control: 1980–2014. Management Accounting Research. 31, pp. 45-62.
Otley, D. & Soin K., 2014. Management Control and Uncertainty: Thinking about uncertainty 1st ed. D. Otley & S. Kim, eds., Boston MA: Palgrave Macmillan, Boston MA.
Otley, D., Broadbent, J. & Berry, A., 1995. Research in Management Control: An Overview of its Development. British Journal of Management, 6(supplement 1), pp. S31–S44.
Ouchi, W.G., 1977. The relationship between organizational structure and organizational control. Administrative Science Quarterly, (22), pp. 95–113.
Pavlov, A. and Bourne, M., 2011. Explaining the effects of performance measurement on performance: An organizational routines perspective. International Journal of Operations & Production Management, 31(1), pp.101-122.
Pelham, A.M., 2000. Market orientation and other potential influences on performance in small and medium-sized manufacturing firms. Journal of Small Business Management, 38(1), pp. 48–67.
Penrose, E.T., 1995. The Theory of the Growth of the Firm 2nd ed., New York: oxford University Press.
Perera, S., Harrison, G. & Poole, M., 1997. Customer-focused manufacturing strategy and the use of operations-based non-financial performance measures: A research note. Accounting, Organizations and Society, 22(6), pp. 557–572.
Podsakoff, P.M., MacKenzie, S.B., Jeong-Yeon Lee, and Podsakoff, N.P., 2003. Common Method Biases in Behavioral Research: A Critical Review of the Literature and Recommended Remedies. Journal of

183
Applied Psychology , 88 (5), 879-903
Pondeville, S., Swaen, V. and De Rongé, Y., 2013. Environmental management control systems: The role of contextual and strategic factors. Management Accounting Research, 24(4), pp. 317-332.
Porter, M.E., 1980. Competitive Strategy: Techniques for Analyzing Industries and Competitors, New York, NY: The free press.
Prahalad, C.K. & Doz, Y.L., 1987. The multinational mission, New York: Free Press.
Pun, K.F. & White, A.S., 2005. A performance measurement paradigm for integrating strategy formulation: A review of systems and frameworks. International Journal of Management Reviews, 7(1), pp. 49–71.
Rauch, A. Johan Wiklund, G. T. Lumpkin, and Michael Frese, 2009. Entrepreneurial Orientation and Business Performance: An Assessment of Past Research and Suggestions for the Future. Entrepreneurship Theory and Practice, 33(3), pp. 761–787.
Reid, G.C. & Smith, J.A., 2000. The impact of contingencies on management accounting system development. Management Accounting Research, 11(4), pp. 427–450.
Rialp, A., 2003. Fundamentos teóricos de la organización de empresas, Materiales de clases.
Richard A D'Aveni & Gunther, R.E., 1995. Hypercompetitive rivalries: competing in highly dynamic environments, Harvard Business School Press, Boston MA.
Ripollés, M. & Blesa, A., 2005. Relación entre la orientación al mercado y la orientación emprendedora: su influencia en el rendimiento de la empresa. Revista europea de dirección y economía de la empresa, 14(3), pp. 165–180.
Roth, G.L. & Senge, P.M., 1996. From theory to practice: research territory, processes and structure at an organizational learning centre. Journal of Organizational Change Management, 9(1), pp. 92–106.
Rumelt, R.P., Schendel, D. & Teece, D.J., 1994. Fundamental Issues in Strategy: A research agenda, 9, p.47, Harvard Business Press.
Rumelt, R.P., Schendel, D. & Teece, D.J., 1991. Strategic Management and Economics. Strategic Management Journal, 12 Winter (Special issue: Fundamental research issues in Strategy and Economics), pp. 5–29.
Ryan, T.P., 1997. Modern Regression Methods 1st ed., New York: John Wiley and Sons, Inc.
Said, A.A., HassabElnaby, H.R. & Wier, B., 2003. An Empirical Investigation of the Performance Consequences of Nonfinancial Measures. Journal of Management Accounting Research, 15(1), pp. 193–223.
Sakka, O., Barki, H. and Côte, L., 2013. Interactive and diagnostic uses of management control systems in IS projects: Antecedents and their impact on performance. Information & Management, 50(6), pp. 265-274.
Sandberg, W.R. & Hofer, C.W., 1987. Improving new venture performance: The role of strategy, industry structure, and the entrepreneur. Journal of Business Venturing, 2(1), pp. 5–28.
Santos, M.L. et al., 2002. El aprendizaje organizativo y la orientación al mercado como recursos empresariales: interacciones y efectos sobre la competitividad. Revista española de investigación de marketing ESIC, 6(1), pp. 7–33.
Santos, M.L., Pérez, M.J.S. & González, L.I.A., 2005. Effects of market orientation on business strategic behaviour. Journal of Strategic Marketing, 13(1), pp. 17–42.
Sapienza, J.H., Smith, K.G. & Gannon, M.J., 1988. Using subjective evaluation of organizational performance in small business research. American Journal of Small Business, 12(3), pp. 45–53.
Saulpic, O., Zarlowski, P., 2014. Management control research and the management of uncertainty: rethinking knowledge in management. In D. Otley & K. Soin, eds. Management Control and Uncertainty. London: Palgrave Macmillan Basingstoke UK, pp. 207–223 (Chapter 14).
Scott, T.W. & Tiessen, P., 1999. Performance measurement and managerial teams. Accounting, Organizations and Society, 24(3), pp. 263–285.
Selto, F.H., Renner, C.J. & Young, S.M., 1995. Assessing the organizational fit of a just-in-time manufacturing system: Testing selection, interaction and systems models of contingency theory. Accounting, Organizations and Society, 20(7-8), pp. 665–684.
Senge, P.M., 1990. The Fifth Discipline London, UK, London, UK: Random House LLC.
Shields, M.D., 1997. Research in management accounting by North Americans in the 1990s. Journal of Management Accounting Research, (9), pp. 3–61.
Shields, M.D., Deng, F.J. & Kato, Y., 2000. The design and effects of control systems: tests of direct- and indirect-effects models. Accounting, Organizations and Society, 25(2), pp. 185–202.

184
Sim, K.L. & Killough, L.N., 1998. The Performance Effects of Complementarities Between Manufacturing Practices and Management Accounting Systems. Journal of Management Accounting Research. 10(1), pp.325-336.
Simon, H., Guetzkow, H. & Kometsky, G., 1954. Centralization vs. Decentralization in in Organizing the Controller's Department, Controllership Foundation, New York, NY: Controllership foundation, Inc.
Simons, R., 1987. Accounting control systems and business strategy: An empirical analysis. Accounting, Organizations and Society, 12(4), pp. 357–374.
Simons, R., 1990. The role of management control systems in creating competitive advantage: New perspectives. Accounting, Organizations and Society, 15(1/2), pp. 127–143.
Simons, R., 1991. Strategic orientation and top management attention to control systems. Strategic Management Journal, 12(1), pp. 49–62.
Simons, R., 1995. Levers of control: how managers use innovative control systems to drive strategic renewal, Harvard Business Press.
Simons, R., 2000. Performance Measurement and Control Systems for Implementing Strategy 1st ed., Upper Saddle River, NJ: Prentice Hall.
Sinkula, J.M., 1994. Market Information Processing and Organizational Learning. The Journal of Marketing, 58(1), pp. 35–45.
Sinkula, J.M., Baker, W.E. & Noordewier, T., 1997. A Framework for Market-Based Organizational Learning: Linking Values, Knowledge, and Behavior. Journal of the Academy of Marketing Science, 25(4), pp. 305–318.
Slater, S.F. & Narver, J.C., 1994. Does Competitive Environment Moderate the Market Orientation- Performance Relationship? Journal of Marketing, 58(1), pp. 46–55.
Slater, S.F. & Narver, J.C., 1995. Market orientation and the learning organization. Journal of Marketing, 59(3), pp. 63–74.
Smith, K.G., Baum, J.R. & Locke, E.A., 2001. A multidimensional model of venture growth. Academy of Management Journal, 44(2), pp. 292–303.
Spanos, Y.E. & Lioukas, S., 2001. An examination into the causal logic of rent generation: contrasting Porter's competitive strategy framework and the resource-based perspective. Strategic Management Journal, 22(10), pp. 907–934.
Speckbacher, G., Bischof, J. & Pfeiffer, T., 2003. A descriptive analysis on the implementation of Balanced Scorecards in German-speaking countries. Management Accounting Research, 14(4), pp. 361–388.
Speklé, R. & Kruis, A.-M., 2014. Management Control Research: A Review of Current Developments. In D. Otley & K. Soin, eds. Management Control and Uncertainty. London: Palgrave Macmillan Basingstoke UK, pp. 30–46.
Stede, W.A.V.D., Chow, C.W. & Lin, T.W., 2006. Strategy, Choice of Performance Measures, and Performance. Behavioral Research in Accounting, 18(1), pp. 185–205.
Steenkamp, J.B.E.M. & Baumgartner, H., 1998. Assessing Measurement Invariance in Cross-National Consumer Research. Journal of Consumer Research, 25(1), pp. 78–107.
Swieringa, R.J. & Moncur, R.H., 1972. The Relationship between Managers' Budget-Oriented Behavior and Selected Attitude, Position, Size, and Performance Measure. Journal of accounting research, pp. 194–209.
Teece, D.J., Pisano, G. & Shuen, A., 1997. Dynamic Capabilities and Strategic Management. Strategic Management Journal, 18(7), pp. 509–533.
Theriou, N., Maditinos, D. & Šević, Z., 2009. Management Control Systems and Strategy: A Resource based Perspective. Evidence from Greece. In 7th International Conference on Accounting and Finance in Transition (ICAFT), Greenwich University.
Tippins, M.J. & Sohi, R.S., 2003. IT competency and firm performance: is organizational learning a missing link? Strategic Management Journal, 24(8), pp. 745–761.
Tuomela, T.S., 2005. The interplay of different levers of control: A case study of introducing a new performance measurement system. Management Accounting Research, 16(3), pp.293-320.
Tushman, M.L. & Nadler, D.A., 1978. Information Processing as an Integrating Concept in Organizational Design. Academy of Management Review, 3(3), pp. 613–624.
Tymon Jr, W.G., Stout, D.E., Shaw, K. N. , 1998.Critical analysis and recommendations regarding the role of perceived environmental uncertainty in behavioural accounting research. Behavioral Research in Accounting 10, 23–46.
Vandenbosch, B., 1999. An empirical analysis of the association between the use of executive support systems and perceived organizational competitiveness. Accounting, Organizations and Society, 24(1), pp. 77–92.

185
Van der Stede, W.A., Young, S.M. and Chen, C.X., 2005. Assessing the quality of evidence in empirical management accounting research: The case of survey studies. Accounting, organizations and society, 30(7), pp. 655-684.
Venkatraman, N.U. & Ramanujam, V., 1987. Measurement of business economic performance: an examination of method convergence. Journal of Management, 13(1), pp. 109–122.
Verona, G., 1999. A resource-based view of product development. Academy of Management Review, 24(1), pp. 132–142.
Wernerfelt, B., 1984. A Resource-Based View of the Firm. Strategic Management Journal, 5(2), pp. 171–180.
Westphal, J.D., 1999. Collaboration in the boardroom: behavioral and performance consequences of ceo-board social ties. Academy of Management Journal, 42(1), pp. 7–24.
Widener, S.K., 2004. An empirical investigation of the relation between the use of strategic human capital and the design of the management control system. Accounting, Organizations and Society, 29(3), pp. 377–399.
Widener, S.K., 2006. Associations between strategic resource importance and performance measure use: The impact on firm performance. Management Accounting Research, 17(4), pp. 433–457.
Widener, S.K., 2007. An empirical analysis of the levers of control framework. Accounting, Organizations and Society, 32(7-8), pp. 757–788.
Widener, S.K., 2014. Researching the Human Side of Management Control: Using Survey-Based Methods. I In D. Otley & K. Soin, eds. Management Control and Uncertainty. London: Palgrave Macmillan Basingstoke UK, pp. 69–82.
Wiersma, E., 2009. For which purposes do managers use Balanced Scorecards?: An empirical study. Management Accounting Research. 20(4), pp.239-251.
Wiklund, J., 1999. The Sustainability of the Entrepreneurial Orientation Performance Relationship - Research and Read Books, Journals, Articles at Questia Online Library. Entrepreneurship Theory and Practice.
Wiklund, J. & Shepherd, D., 2005. Entrepreneurial orientation and small business performance: a configurational approach. Journal of Business Venturing, 20(1), pp. 71–91.
Wiklund, J. & Shepherd, D., 2003. Knowledge-based resources, entrepreneurial orientation, and the performance of small and medium-sized businesses. Strategic Management Journal, 24(13), pp. 1307–1314.
Wiklund, J., Patzelt, H. & Shepherd, D.A., 2007. Building an integrative model of small business growth. Small Business Economics, 32 (4), pp. 351–374.
Yuan, X.W., Wang, J.R. & Yi, J.B., 2008. Performance Measurement System and Staff Perceptions of Learning: Empirical Evidence from China. In 2008 IEEE International Conference on Industrial Engineering and Engineering Management (IEEM), 8-11 December. Singapore: IEEE, pp. 877–881.
Zahra, S.A., 1991. Predictors and financial outcomes of corporate entrepreneurship: An exploratory study. Journal of Business Venturing, 6(4), pp. 259–285.
Zahra, S.A. & Covin, J.G., 1995. Contextual influences on the corporate entrepreneurship-performance relationship: A longitudinal analysis. Journal of Business Venturing, 10(1), pp. 43–58.
Zahra, S.A. & Garvis, D.M., 2000. International corporate entrepreneurship and firm performance: The moderating effect of international environmental hostility. Journal of Business Venturing, 15(5-6), pp. 469–492.