Carmen Herranz Ors - TDX (Tesis Doctorals en Xarxa)
202
Towards improving lymphangioleiomyomatosis care: a study of biomarkers and therapies Carmen Herranz Ors TESI DOCTORAL UPF / 2019 Thesis supervisor Dr. Miguel Àngel Pujana RESISTANCE, SUSCEPTIBILITY AND TUMOR PROGRESSION GROUP PROGRAM AGAINST CANCER THERAPEUTIC RESISTANCE (PROCURE) INSTITUT D'INVESTIGACIÓ BIOMÈDICA DE BELLVITGE (IDIBELL)
-
Upload
khangminh22 -
Category
Documents
-
view
1 -
download
0
Transcript of Carmen Herranz Ors - TDX (Tesis Doctorals en Xarxa)

Towards improving lymphangioleiomyomatosis care: a study of
biomarkers and therapies
Carmen Herranz Ors
TESI DOCTORAL UPF / 2019
Thesis supervisor
Dr. Miguel Àngel Pujana
RESISTANCE, SUSCEPTIBILITY AND TUMOR PROGRESSION
GROUP
PROGRAM AGAINST CANCER THERAPEUTIC RESISTANCE
(PROCURE)
INSTITUT D'INVESTIGACIÓ BIOMÈDICA DE BELLVITGE
(IDIBELL)


I
AGRADECIMIENTOS
Primerodetodo,quierodar lasgraciasaMiguelÀngel,porconfiardesdeelprimerdíaenmí.Hassidounapersonamuycercanayrealmentehashechotodo lo posible para que mi paso por tu grupo haya sido perfecto a nivelpersonal y profesional. He podido disfrutar demuchas experiencias que noestánalalcancedetodoelmundograciasati.
Quiero darle las gracias a una de las personas más importantes en estedoctorado,Paqui.Realmente,estoscasi5añoshabríansidoMUYdiferentessitu no hubieras estado aquí. No solo me has ayudado en todo lo que haspodido,sinoquehemosformadountándemquevaasermuydifícilvolverarepetir.Mehassalvadolavidaconlosratonesyconmuchasotrascosas.Voyaechardemenosaunacompañeracomotúallídondevaya.
Tambiénquieroagradeceralrestodelaspersonasconlasquehecompartidogrupo.Gorka,menosmalquecompartílosprimerosañoscontigo.Creoqueeldoctoradoha idobienporqueempecé conbuenpie.Meensañastemuchascosasysetehaechadodemenosmuchoporaquí.Anabel,graciasporsertanatentaconmigoysiempreintentardarmelosmejoresconsejos.Nadia,nohaypersonamásmáquinaquetú.Graciasporvenirconunasonrisatodoslosdías,pasara loquepasara,yporsiempreestardispuestaaecharunamanoen loquehicierafalta,entodoslosaspectos.Sandra,esperoquetevayamuybienenlanuevaetapaquevasacomenzar.
AmischicasAELAM,graciasporconfiarenmí.Lasreunionesanualesmehancargado las pilas para seguir investigando, a ver si de una vez por todasencontramos una cura para esta enfermedad “interesante”. Siempre osllevaréenmicorazón.
A todoelLRT1,GRACIASporhacerestosañostaaan fáciles.Puedoasegurarquenohahabidoniunapersonaconlaquemehayacruzadoduranteestos5añosquenohayaaportadosugranitodearenaaestatesis.Soyconscientedequeestacomplicidadno lavoyaencontrarenningúnotrositioalquevaya.Deaquímellevonosolocompañeros,sinoamigos.
Atodalagentequeyaabandonóelbarco.Beto,Marcel,Nick,Natalia,Luis,Ahmedalfinalhemosterminadopasandomuchosmomentosjuntos;esperoseguir sabiendo que todo os va muy bien y que allá donde estéis seguíshaciendo lo que osmotiva, porque valéismucho.Mariona, la personamaslianta del mundo, como me convenciste para seguirte a tantos sitios jajanunca dejes que se te vaya esa sonrisa de la cara. Iratxe, eres una de laspersonas más capaces que conozco. Que esta nueva aventura que vas a

II
comenzar en breves te aporte todo lo que buscas, porque quien la sigue laconsigue,ydesdeluegonohaypersonamásperseverantequetú.Nocambiesesecarácterfuertequetienes,porqueesloquetehaceúnica.Jana,bebesita,dondeestarásahoramismo?Madremíasimehellegadoareírcontigo.Hasdadotaaantojuegoaestelaboratorioyahoraquetehasidosenotamuchotu ausencia. Gracias por de alguna manera incluirme en esa vida tuya tanalocadaquellevas.
A la gente con la quemás tiempohe compartido elmaravillosomundodellaboratorio.María,comosenoshacomplicadolavidasindarnoscuentajajaunapenanopoderseguirmástiempohaciéndonoscompañíalaunaalaotra.No dejes de luchar con ese carácter que tienes, y muchas gracias porescucharme estos dos últimos años y por llamarme a merendar estos dosúltimosmeses.Roser,quechicamás intensa!Perocuantamarcahasdejadodurante estos años. Los últimosmeses nos hemos compadecido la una a laotra, y se nos da bastante bien ser un poco dramáticas jaja Gracias porescuchar todasmis preocupaciones y no te desanimes, que de verdad quevalesparaesto.Sònia,eresunadelaspersonasconmáspersonalidadymássinceraqueconozco.Perolomásimportante,notehasperdidoniunafiesta,aunque vivieras a unos cuantos kilómetros jajaMartí, eres tan trabajadorcomofestero.Hasnacidoparalasdoscosas,porquetodoloquehehabladocontigo de la tesis ha sido de gran ayuda y porque salir contigo son risasaseguradas.Tambiénereselúltimoquesevadel labyelúltimoquesevaadormirjajaQuedaelúltimoempujón¡porellocrack!Álvaro,laverdadesqueestos años no hubieran sido lo mismo sin tu presencia. Me has ayudadomuchoyhasdadovidillaalasaladebecarios.
A losnuevosfichajes,Kiko,Adrián,Gemma,Laura,Núria, Iván,ytambiénaSilviayXin.Disfrutarmuchodeestaetapa,aunquesedeprimeramanoqueyaloestáishaciendo.Graciasporaportarmecadaunounpoquitodevuestrasabiduríaypormostrarostalycomosoisconmigo.
Yal restodeLRT1.Samu,Katia,Rana,Eli,María, Fran,Elena,Sandra,Mar,Agnès,Alba,Mónica,Gaby,Rafa, Laura,Nataliay a todos los jefes,graciasporque siempre habéis tenido buenas palabras conmigo y sin vosotrostampocohubierasidoposiblehacerestecamino.
Menciónaparte tienenesaspersonasquehanpasadoa formarpartede lafamiliaqueunoelige.Nerea,deverdadquenoséquéhubierasidodemisitúno hubieras aparecido por este laboratorio. Me has cuidado como unahermana y has estado a mi lado cuando más lo necesitaba. He disfrutadomuchísimocontodoloquehemoshechojuntasyhecrecidocomopersonaatu lado. Júlia, eresunade las personasmásbondadosasque conozco yhas

III
aportado ese optimismo quemuchas veces he necesitado enmi vida. Eresunaamiga fiel y séquesiempreque lonecesitevasaestarami lado.En lamayoría de buenos momentos que me voy a llevar de este doctoradoaparecéis vosotras y espero que juntas sigamos creando nuevos recuerdos.Francis, aunque a que a ti no te veía todos los días, has sido una de laspersonasquemásagradezcohaberconocidoduranteestosaños.Valesparatodo, tienes un carácter arrollador y esmuy difícil no querer ser tu amigo.Gracias por cuidarme tanto y darme de comer durante este tiempo.Diego,peseaqueeresmástranquilo,alfinaldejashuellaentodaslaspersonasqueteconocen.¡¡Chicos,nosquedaunviajependiente!!
AmisZorris,graciasporinteresarossiempreporloquehago.Aunqueavecesnoentendíaisloqueosdecía,memirabaisconadmiraciónymehacíaissentirespecial.Siempre,paseloquepase,yestemosdondeestemos,vaisaestarenmicorazón.
Neus,AlexyRoser.Estoyorgullosadequesigáisformandopartedemividadespuésdetantosaños.Neus,graciasporsertanatentayescucharcontantapacienciatodoslosproblemasquetecuento.Alex,graciasporsertanbuenaypordarmeunainyeccióndeenergíasiemprequenosvemos.Roser,pesealadistancia,graciasportenermesiemprepresente.
A los dos grandes pilares demi vida. Papas, todo este párrafo tendría queestarescritoconmayúsculas,einclusoasínoquedaríaretratadotodoloquesignificáisparamí.Soismismayoresfansyalavezmismayorescríticos,perosé que todo lo queme decís es pormi bien. Os debo taaaaanto en tantosaspectos,quenecesitaría3vidasmásparapoderdevolvéroslotodoenformade cariño. Sé queme vais a seguir allá donde vaya y que nuncame vais asoltar lamano. Al resto demi familia, gracias por darme ánimo e intentarcomprenderlavidaqueheelegido.
Y, por último, a ti, Fran. ¿Quién nos iba a decir hace 4 años que hacer undoctoradoibaaserunaexperienciatandifícil?Peromíranos,aquíestamos,ycreoque lohemossuperadoconnota.Graciasporaguantartodas lasturrasquetehedadoygraciaspor interesarteporcadadetalledemitrabajo.Noshemosembarcadoenunaaventuraquenovaa ser fácil.Novamosa tenerunavidanormal,pero¿desdecuándonosotrosdossomosnormales?Vamosavivirmilexperienciasqueotraspersonasnisiquierapuedenimaginar,perolomás importante, todas estas cosas las vamos a pasar juntos. Somos unosafortunados,porteneralladoaunapersonaquetevaacomprender,quetevaaanimarcuandoestésdecaído,yalaquetambiénvasatenerqueanimarcuando pase por malos momentos. Eres mi persona complementaria, mimejoramigoylapersonaalaquemásquiero.


ABSTRACT

Abstract
VII
Lymphangioleiomyomatosis(LAM) isararemetastasizinganddestructivedisorderof the lung.Thedisease is causedbycells carryingmutations inthe sclerosis complex1 and2 (TSC1/2) genes,but the tissueoforiginofdiseased cells remains unknown. The standard of care for LAM is theinhibition of themechanistic target of rapamycin (mTOR)with sirolimus(rapamycin). However, this therapy has variable tolerability, and somepatientsshowprogressivedeclineoflungfunctiondespitetreatment.LAMdiagnosisandmonitoringcanbechallengingduetotheheterogeneityofsymptoms and the insufficiency of non-invasive tests. In this thesis, weaimed to provide evidence for improving LAM care through theidentification of useful biomarkers and the exploration of noveltherapeutic approaches. In parallel, we also studied disease origin andanalyzed circulatingdiseased cells.At the level of biomarkers, themajorhistamine-derivedmetabolitemethylimidazoleaceticacid(MIAA)hasbeenfoundtobemoreabundant inLAMplasmathaninsamplesfromcontrolindividuals.MIAA values were independent of the established canonicalLAM biomarker, the vascular endothelial growth factor D (VEGF-D), andmay improve disease diagnosis and monitoring using novel predictivemodels. MIAA was the result of altered metabolism of monoamines.CombinedstudiesofLAMlungtissuesandcellmodelsshowedenhancedmonoamine metabolism and histamine-mediated signaling. LAMtumorigenesis inimmunodeficientandimmunocompetentmousemodelswas reduced using drugs (as single agents or combinedwith rapamycin)targetinghistaminereceptor1 (HRH1)andmonoamineoxidases (MAO-Aand MAO-B). In parallel with these targeted analyses, high-throughputdrug screening was performed to identify novel therapeutic strategies.Thisscreeningidentifiedpromisingapproachesthatarecomplementarytothose targeting monoamine metabolism/signaling. The results of thisthesis may help improve the diagnostic process, clinical monitoring andtherapeuticmanagementofLAMpatients.


RESUMEN


Resumen
XI
Linfangioleiomiomatosis(LAM)esuntrastornopulmonarraro,destructivoy metastásico. Esta enfermedad está causada por células que tienenmutacionesenlosgenesTSC1/2(tuberoussclerosiscomplex1and2)cuyoorigen sigue siendo desconocido. El tratamiento de LAM consiste en lainhibición de mTOR (mechanistic target of rapamycin) con sirolimus(rapamicina). Sin embargo, esta terapia presenta una tolerabilidadvariable y algunos pacientesmuestran una disminución progresiva de lacapacidadpulmonarpeseaestarentratamiento.EldiagnósticodeLAMysu monitorización puede ser un desafío ya que los síntomas son muyheterogéneosyapenasexistenpruebasdiagnósticasnoinvasivas.Enestatesis, nuestro objetivo era mejorar la atención de LAM a través de laidentificación de biomarcadores y la exploración de nuevos enfoquesterapéuticos. Paralelamente, también estudiamos el origen de laenfermedad. En cuanto a los biomarcadores, el principal metabolitoderivadode lahistamina,MIAA(methylimidazoleaceticacid),estabamáspresente en el plasmadepacientes de LAMqueenmuestras de gruposcontrol. Los valores de MIAA eran complementarios a las medidas delbiomarcadorcanónicodeLAM,VEGF-D(vascularendotelialgrowthfactorD), y podríanmejorar el diagnóstico ymonitorización de la enfermedadusando nuevos modelos predictivos. Este metabolito es el resultado deuna alteración en el metabolismo de las monoaminas. Estudioscombinados de tejidos pulmonares y modelos celulares mostraron unaumentoenelmetabolismodelasmonoaminasyenlavíadeseñalizaciónde lahistamina.Compuestos (solosoencombinacióncon la rapamicina)cuyas dianas eran el receptor 1 de la histamina (HRH1) o lasmonoaminoxidasas (MAO-A y MAO-B) redujeron la tumorogénesis demodelos LAM de ratón inmunodeficientes e inmunocompetentes. Enparaleloaestosanálisisdirigidos,serealizóuncribadodefármacosagranescala para identificar nuevas dianas terapéuticas. En este cribado seidentificaronnuevosenfoquescomplementariosalosrelacionadosconelmetabolismo y señalización de las monoaminas. Los resultados de estatesis podrían ayudar a mejorar el diagnóstico, la monitorización y eltratamientodelaspacientesdeLAM.


XIII
TABLEOFCONTENTS
AGRADECIMIENTOS______________________________________I
ABSTRACT_____________________________________________III
RESUM________________________________________________IX
TABLEOFCONTENTS____________________________________XII
LISTOFFIGURES_______________________________________XXI
LISTOFTABLES_______________________________________XXV
ABBREVIATIONS_____________________________________XXVII
INTRODUCTION_________________________________________1
1. INTRODUCTIONTOLYMPHANGIOLEIOMYOMATOSIS_______ 3
1.1 DiscoveryandgeneticbasisofLAM_____________________ 3
1.2 ClinicalfeaturesofLAM ______________________________ 4
1.3 GeneticandmolecularalterationsinLAMcells____________ 5
1.4 LAMcellphenotype _________________________________ 7
1.5 CellularheterogeneityinLAMlunglesions _______________ 9
1.6 LAMasametastaticdisease___________________________ 9
Lymphaticrecruitment_________________________________________11
Matrixmetalloproteinases______________________________________11
Theroleofestrogen___________________________________________11
1.7 OriginofLAMcells _________________________________ 12
TheuterusasasiteofLAMcellorigin _____________________________13
AngiomyolipomasasasiteofLAMcellorigin _______________________13
TheneuralcrestasasiteofLAMcellorigin_________________________13

XIV
BreasttissueasasiteofLAMcellorigin____________________________14
2. DIAGNOSISOFLAM ________________________________ 16
2.1 Pulmonaryfunctiontests ____________________________ 16
2.2 High-resolutioncomputedtomography_________________ 16
2.3 VEGF-DasALAMplasmabiomarker ___________________ 17
2.4 Transbronchialorsurgicallungbiopsy__________________ 18
3. TREATMENTOFTHEDISEASE_________________________ 19
3.1 Beforesirolimus:hormonE-basedapproaches____________ 19
Oophorectomy _______________________________________________19
Tamoxifen___________________________________________________20
Gonadotropin-releasinghormoneagonists_________________________20
Progesterone_________________________________________________20
3.2 Abreakthroughwithsirolimus________________________ 21
InitialstudiesassessingsirolimusinTSCandLAM____________________21
TheMILEStrial________________________________________________21
FurtherstudiesafterMILES _____________________________________22
3.3 Aftersirolimus:novelclinicaltrials_____________________ 24
Estrogeninhibitor:Letrozole ____________________________________24
MMPinhibitor:Doxycycline_____________________________________25
Autophagyinhibitors:Hydroxychloroquineandresveratrol____________25
Cyclooxygenase-2inhibitor:Celecoxib_____________________________26
OBJECTIVES____________________________________________27
MATERIALSANDMETHODS_______________________________31
1. HUMANSAMPLES__________________________________ 33

XV
1.1 Liquidchromatography–massspectrometryassay ________ 33
1.2 Enzyme-Linkedimmunosorbentassay__________________ 34
2. CELLCULTURE_____________________________________ 35
2.1 Celllinesandcultureconditions_______________________ 35
2.2 Mycoplasmatest___________________________________ 35
2.3 Cellcounting______________________________________ 35
2.4 Cellfreezingandcryopreservation_____________________ 36
2.5 Transfectionandinfectionofcells _____________________ 36
Descriptionofplasmids_________________________________________36
ObtainingplasmidDNAfrombacterialcultures______________________37
Lentiviralproductionusingpolyethyleniminetransfection_____________37
Lentiviralinfections____________________________________________38
3. CELL-BASEDASSAYS ________________________________ 38
3.1 High-throughputdrugscreening_______________________ 38
3.2 Othertreatments __________________________________ 39
3.3 Cellviabilityassay__________________________________ 39
3.4 Colonyformationassay______________________________ 39
3.5 Migrationassay____________________________________ 39
3.6 Invasionassay_____________________________________ 40
3.7 ALDHactivityassay_________________________________ 40
3.8 MAOactivityassay _________________________________ 41
3.9 FADdetectionassay ________________________________ 41
3.10 Mitotracker_______________________________________ 41

XVI
3.11 Mitochondrialrespirationassay_______________________ 42
3.12 Mitosox__________________________________________ 42
3.13 H2O2detectionassay________________________________ 42
4. INVIVOMODELS___________________________________ 42
4.1 Animalcorefacilitiesandconditions ___________________ 42
4.2 Patient-derivedxenograftmousemodel________________ 43
4.3 Tumorgenerationbycellinjection_____________________ 43
ELT3-V3invivomodel__________________________________________43
105K-EVinvivomodel__________________________________________43
4.4 Transgenicmousemodel ____________________________ 44
Genotyping __________________________________________________44
ValidationofTsc2recombination_________________________________46
5. MOLECULARANALYSIS______________________________ 47
5.1 Geneexpression ___________________________________ 47
RNAextractionfromcells_______________________________________47
RNAextractionoftissues _______________________________________47
ObtainingcDNAfromRNA ______________________________________47
Real-timequantitativePCR(RT-PCR) ______________________________48
5.2 Proteindetection __________________________________ 49
Westernblot(WB) ____________________________________________49
Hematoxylin-eosin(HE)staining__________________________________51
Immunohistochemistry(IHC) ____________________________________52
Doubleimmunohistofluorescence(IHF)____________________________53
6. INSILICO:ENRICHMENTANALYSESANDGENEEXPRESSION_ 55
7. STATISTICALANALYSES______________________________ 56

XVII
RESULTS______________________________________________57
1. EVALUATIONOFNOVELLAMANIMALMODELS __________ 59
1.1 Study of conditional Tsc2-deletion in the mammary
epithelium____________________________________________59
ValidationofTsc2recombination_________________________________61
Phenotypicanalyses___________________________________________62
1.2 Evaluation of engraftment of LAM lung tissue in
immunodeficientmice_____________________________________ 65
2. STUDYOFLAMPLASMABIOMARKERS__________________ 66
2.1 Selection of plasma biomarker candidates using breast cancer
metastaticprofiles________________________________________ 66
2.2 Secretedproteinsasnovellamplasmabiomarkers________ 67
Proteomicanalysisformeasuringlevelsofsecretedproteinsinplasma __67
ANGPTL4asanovelLAMplasmabiomarkercomplementarytoVEGF-D__68
Additionalbiomarkercandidates_________________________________70
2.3 Metabolitesasnovelplasmabiomarkers________________ 70
Predictionandanalysisoftargetmetabolites _______________________70
MIAAisanovelLAMplasmabiomarkerindependentofVEGF-D________72
3. STUDY OFMOLECULAR AND CELLULAR FEATURES LINKED TO
THEIDENTIFIEDMETABOLITEBIOMARKERS _________________ 75
3.1 High levels of ALDH andMAO expression and activity in LAM
cellmodelsandtissue _____________________________________ 75
3.2 High levelsofmitochondrialandROSactivity in lamtissueand
thecellmodel____________________________________________ 78

XVIII
3.3 High levels of histamine metabolism and HRH1 expression in
LAMtissuesandthecellmodel______________________________ 81
4. NOVELTHERAPEUTICSTRATEGIES_____________________ 85
4.1 Therapeutic studies based on enhanced monoamine
metabolismandsignaling___________________________________ 85
EffectofAldh-MaosandmTORinhibitorsinLAMcelllinesinvitro_______85
EffectofAldh-MaosandmTORinhibitorsinanimmunodeficientinvivoLAM
model_______________________________________________________90
4.2 Therapeutictargetsbasedonhistamine-mediatedsignaling 97
EffectofHrh1andmTORinhibitorsinLAMcelllinesinvitro ___________97
4.3 Effect of Maos-Hrh1 and mTOR inhibitors in an
immunocompetentinvivoLAMmodel________________________ 99
4.4 Drug screening for additional therapeutics strategies in
monotherapyorincombinationwithmTORinhibition __________ 104
Selection of 35 drugs based on single-agent effects and TSC2 expression
correlations_________________________________________________105
Selectionoftendrugcombinationswitheverolimus_________________106
Identificationofthemostsynergisticcombinations _________________109
DISCUSSION__________________________________________111
1. ASSESSMENTOFNOVELLAMMOUSEMODELS__________ 113
2. IDENTIFICATION OF LAM PLASMA BIOMARKERS
COMPLEMENTARYTOVEGF-D___________________________ 115
Selected proteins and metabolites overexpressed in the plasma of LAM
patients____________________________________________________115
Molecularandcellularfeaturesassociatedwithnovelbiomarkers______117
3. DISCOVERYOFNOVELTHERAPEUTICSTRATEGIES _______ 119

XIX
Novel therapeutic strategies in vitro and in vivo based on the identified
biomarkers _________________________________________________120
Molecularandcellularchangesunderlyingbeneficialtherapeuticresponses
___________________________________________________________122
High-throughput drug screening to uncover additional therapeutic
approaches _________________________________________________124
REFERENCES__________________________________________131
ANNEXES_____________________________________________163

XXI
LISTOFFIGURES
Figure1:SchematicrepresentationofthemTORC1signalingpathway_________6
Figure2:MarkersofLAMcells_________________________________________8
Figure3:MultistepmodelofmetastaticLAMdisease______________________10
Figure4:CandidatesforsiteoftissueoriginofLAMcells___________________12
Figure5:Lungmetastasismediatorsandbreastcancerstemnessbiomarkers __15
Figure6:SerumlevelsofVEGF-Dinpatientswithdifferentdiseases__________18
Figure7:ChangeinFEV1duringphasesoftheMILEStrial.__________________22
Figure8:AgarosegelsofPCRsforgenotypingtransgenicmice ______________45
Figure9:GenerationofTsc2floxandTsc2nullalleles ________________________46
Figure 10: Crossing strategy for obtaining the Tsc2flox/flox/BLGCRE/wt and
Tsc2flox/flox/BLGwt/wttransgenicmice____________________________________60
Figure11:Experimentalgroupsanalyzedinthisstudy_____________________61
Figure 12: Representative PCR showing the Tsc2null and Tsc2 non-recombinant
alleles ___________________________________________________________62
Figure13:Histologicalstudyoftargettissue.____________________________63
Figure 14: Expression of α-Sma and pS6 in target tissues from the three
experimentalmousegroups__________________________________________64
Figure15:IdentificationofnovelLAMplasmabiomarkers__________________66
Figure 16: Plasma levels of four secreted proteins measured by LC-MS/MS in
plasmasamplesfromhealthypremenopausalwomenandLAMpatients______68
Figure17:PlasmaANGPTL4levelsmeasuredbyELISAintheindicatedsettings_69
Figure18:ExpressionofANGPTL4inLAMtissues_________________________70
Figure 19: Significantly enriched metabolic pathways among the 30 enzymes
identifiedinthepreviousanalysis _____________________________________71
Figure 20: Plasma levels of six metabolites measured by LC-MS/MS in plasma
samplesfromhealthypremenopausalwomenandLAMpatients_____________72
Figure 21: Plasma MIAA levels measured by LC-MS/MS in a novel setting of
samplescorrelation_________________________________________________73

XXII
Figure 22: Plasma levels of three other metabolic products measured by LC-
MS/MSinanovelsettingofsamples___________________________________74
Figure 23: Receiver operating characteristic (ROC) curves and the corresponding
AUC_____________________________________________________________74
Figure 24: Representation of enzymatic reactions that give rise to the identified
metabolites_______________________________________________________75
Figure25:ExpressionofMAOsandcolocalizationwithα-SMAinLAMlunglesions
_________________________________________________________________76
Figure26:ExpressionofAldhsandMaosinLAMcellmodels________________77
Figure27:MeasurementofAldhandMaoactivity________________________78
Figure28:MitochondrialactivityandrespirationinaLAMcellmodel_________79
Figure29:ROSactivityinaLAMcellmodel. _____________________________80
Figure30:RepresentativeimagesofROS-relatedmarkersidentifiedbyIHCinLAM
lunglesions_______________________________________________________81
Figure31:HRH1expressionassociationsinbreastcancer __________________82
Figure 32: Hrh1/HRH1 expression in a LAM cellmodel and in human LAM lung
lesions___________________________________________________________83
Figure33:HistaminesignalinginLAMcellline___________________________84
Figure34:InvitrocellviabilityassaysusingALDHandMAOinhibitorsaloneandin
combinationwith20nMofeverolimusinELT3celllines____________________86
Figure35:InvitrocellviabilityassaysusingALDHandMAOinhibitorsaloneandin
combinationwith20nMofeverolimusinMEFcelllines____________________87
Figure 36: Colony-forming assays using GA11 and everolimus alone, and in
combination ______________________________________________________88
Figure37:Invitrowound-healingassaysusingGA11andeverolimusalone,andin
combinationinELT3cells____________________________________________89
Figure 38: Therapeutic study in ELT3 in vivo LAMmodel usingGA11, clorgyline,
rasagilineandeverolimus____________________________________________91
Figure39:Pilotinvivoexperimentusingarangeofconcentrationsofrapamycin91
Figure 40: Therapeutic study in ELT3 in vivo LAMmodel using rapamycin alone
andincombinationwithclorgyline,andwithrasagiline____________________92

XXIII
Figure41: Keymarkersofproteinexpression in tumors fromTsc2-deficientELT3
cells_____________________________________________________________93
Figure 42: Gene expression changes and functional differences between ELT3
rapamycin-treatedandcontroltumors _________________________________94
Figure43:MitophagymarkersexpressionintumorsfromTsc2-deficientELT3cells
_________________________________________________________________95
Figure 44: Histamine-related marker expression in tumors from Tsc2-deficient
ELT3cells_________________________________________________________96
Figure45: Invitrocellviabilityassaysusing loratadinealoneand incombination
with20nMofrapamycin____________________________________________98
Figure46:Expressionoftherapeutictargetsinthe105Kcellmodel___________99
Figure 47: Therapeutic study in the 105K in vivo LAM model using clorgyline,
rasagiline,loratadineandrapamycin__________________________________101
Figure48:Tumorigenesisstudyin105KinvivoLAMmodelwithMao-Adepletion
________________________________________________________________101
Figure49:KeymarkerproteinexpressionintumorsfromTsc2-deficient105Kcells
treatedwithmonotherapiesandcontrols______________________________102
Figure50:KeymarkersexpressionintumorsfromTsc2-deficient105Kcellstreated
withcombinationsandrapamycinalone_______________________________103
Figure 51: High-throughput drug screening strategy for selecting the ten most
synergisticcombinationswitheverolimus.______________________________104
Figure52:Classificationofdose-responsecurves ________________________105
Figure 53: Example of one combination of everolimus and a novel compound
representedbytwotypesof10x10matrix______________________________107
Figure 54: In vitro cell viability assays using PKC-412 alone and in combination
with20nMeverolimus_____________________________________________110


XXV
LISTOFTABLES
Table1:Mediausedforcellculture. ___________________________________35
Table2:SequencesofMaoashRNAs. __________________________________36
Table3:Primersforgenotypingtransgenicmice._________________________44
Table4:PrimersforvalidationofTsc2recombination._____________________46
Table5:PrimersusedinRT-PCRassays. ________________________________48
Table6:Primersofhousekeepinggenesforeachspecies. __________________49
Table7:Antibodiesusedforeachapplicationandtheirdilutions. ____________53
Table8:ThemostsynergisticcombinationswitheverolimusselectedinTsc2-
deficientMEFcells.________________________________________________108


XXVII
ABBREVIATIONS
°C Centigradedegreesµg Microgramµl Microliterµm MicrometerµM Micromolar4E-BP1 4E-bindingprotein14-HPAA 4-hydroxyphenylaceticacidAAALAC Association for assessment and accreditation of
laboratoryanimalcareAIC AkaikeinformationcriterionAKR1C1 Aldo-KetoReductaseFamily1MemberC1ALDH AldehydedehydrogenaseAML AngiomyolipomaAMPK AMP-dependentproteinkinaseANGPTL4 Angiopoietin-Like4APS AmmoniumpersulfateAUC AreaunderthecurveBHD Birt-Hogg-DubéBLG Betalactoglobulinpromoterbp BasepairBSA BovineSerumAlbumincDNA ComplementaryDNAc-Fgr Tyrosine-proteinkinaseFgrCI Combinationindexc-Kit Mast/stemcellgrowthfactorreceptorKitCMC CarboxymethylcelluloseCNS CentralnervoussystemCOLA COX-2inhibitioninLAMandTSCtrialCOS CenterofOmicSciencesCOX-2 Cyclooxygenase-2CRC CurveresponseclassCt ThresholdcycleDAPI 4',6-diamidino-2-phenylindoleDBSum DeltaBlissSummary

XXVIII
ddNTP 2'3'dideoxynucleotidDEAB DiethylaminobenzaldehydedH2O DistilledwaterDLCO DiffusioncapacityforcarbonmonoxideDMSO DimethylsulfoxideDNA DeoxyribonucleicacidDOMA 3,4-dihydroxymandelicacidDPX Distyrene,plasticiserandxyleneECM ExtracellularmatrixEDTA EthylenediaminetraaceticacideIF4E Eukaryoticinitiationfactor-likeproteinELISA Enzyme-linkedimmunosorbentassayER EstrogenreceptorETC ElectrontransportchainFAD FlavinadeninedinucleotideFBS FetalbovineserumFDA FoodanddrugadministrationFEV1 ForcedexpirationvolumeinthefirstsecondFlt3 Receptor-typetyrosine-proteinkinaseFLT3FSCN1 Fascin1FVC Forcedvitalcapacityg Gramg GaugeGEO GeneexpressionomnibusGnRH Gonadotropin-releasinghormoneGO GeneontologyGSEA GeneSetEnrichmentAnalysisGTP Guanosinetriphosphateh HourH2O2 HydrogenperoxideHBSS Hank’sbufferedsaltsolutionHCl ChloridricacidHE Haematoxylin-eosynHIF1α Hypoxia-induciblefactor1alphaHMB-45/GP100 MelanocyteproteinPMEL
HR Histaminereceptor

XXIX
HRCT High-resolutioncomputedtomographyHRF High-resolutionfiberHRP HorseradichperoxidaseHVA HomovanillicacidID1 InhibitorofDNAbinding1IDIBELL Institutd'InvestigaciónBiomèdicadeBellvitgeIgG ImmunoglobulinGIHC ImmunohistochemistryIHF ImmunohistofluorescenceIL2 Interleukin2IRB InstitutdeRecercabiomèdicaITGB3/CD61 Integrinbeta3Kb KilobaseKDa KilodaltonKOH PotassiumhydroxideL LitreLAM LymphangioleiomyomatosisLC-MS/MS Liquidchromatography–massspectrometryassayLEC LymphaticendothelialcellLMFS Lungmetastasis-freesurvivalLOH LossofheterozigosityLRF Low-resolutionfiberM MolarMAO MonoamineoxidaseMART-1 Melanoma-associatedantigenrecognizedbyTcellsMCP-1 Monocytechemoattractantprotein-1MEF MouseembrionicfibroblastMeSH MedicalSubjectHeadingsmg Milligrammg MilligramMIAA MethylimidazoleaceticacidMILES Multicenter international LAM efficacy of sirolimus
trialmin MinuteMIPE NCATSMechanismInterrogationPlatEml Milliliter
XXX
mm MillimetermM Millimolarmm3 CubicmillimeterMMP MatrixmetalloproteinasemTOR MechanistictargetofrapamycinmTORC1 Mechanistictargetofrapamycincomplex1mTORC2 Mechanistictargetofrapamycincomplex2NaCl SodiumchlorideNCATS NationalcenterforadvancingtranslationalsciencesNCC NeuralcrestcellNES Normalizedenrichmentscorenm NanometernM NanomolarNPC NCGCPharmaceuticalCollectionNRP1 Neuropilin-1NSC NeuralstemcellOCR OxygenconsumptionratesON Over-nightPAA PhenylaceticacidPBS Phosphate-bufferedsalinePBS-T Phosphate-bufferedsalinetweenPCA PerchloricacidPCC Pearson’scorrelationcoefficientPCR PolymerasechainreactionPD-1 Programmedcelldeath-1PD-L1 Programmedcelldeath-ligand1PDX Patient-derivedxenograftPEI PolyethyleniminePFA Paraformaldehyde
PFT PulmunaryfunctiontestPGE2 ProstaglandinE2PgR ProgesteronereceptorPKC ProteinkinaseCPLCH PulmonaryLangerhanscellhistiocytosisPRLR Prolactinreceptorpsi Poundpersquareinch

XXXI
PTGS2 Prostaglandin-EndoperoxideSynthase2PVDF PolyvinylidenefluorideRAPTOR RegulatoryaasociatedpartnerofmTORRESULT ResveratrolandsirolimusinLAMTrialRHEB RashomologenrichedinbrainRNA RibonucleicacidRNAseq RibonucleicacidsequencingROC ReceiveroperatingcharacteristicROS Reactiveoxygenspeciesrpm RevolutionsperminuteRT RoomtemperatureRT-PCR RealtimequantitativepolymerasechainreactionS6K1 S6kinasebeta-1SAIL SirolimusandautophagyinhibitioninLAMtrialSCF StemcellfactorSDS SodiumdodecylsulfateSDS-PAGE Sodiumdodecylsulfate–polyacrylamidegelSIR StandardizedincidenceratioS-LAM SporadicLymphangioleiomyomatosisSLC18A1/VMAT Solutecarrierfamily18member1SOX9 Sex-determiningregionY-box9SPF SpecificpathogenfreeSrc Tyrosine-proteinkinaseSrcSREBP Sterolregulatortelement-bindingproteinSTAT3 Signaltransducerandactivatoroftranscription3Syk Tyrosine-proteinkinaseSYKTBS Tris-bufferedsalineTBS-T Tris-bufferedsalinetweenTEMED TetramethylethylenediamineTGFβ TumorgrowthfactorbetaTOS TORsignalingTRIAL TrialofanaromataseinhibitorinLAMTris Tris(hydroxymethyl)aminomethaneTSC TuberoussclerosiscomplexTSC-LAM Lymphangioleiomyomatosis associated with tuberous
sclerosiscomplex
XXXII
V VoltVDAC1 Voltage-dependentanion-selectivechannelprotein1VEGF VascularendothelialgrowthfactorVEGFR VascularendothelialgrowthfactorreceptorVMA 3-methoxy-4-hydroxymandelicacidWB WesternblotWT WildtypeXTT 2,3-Bis-(2-Methoxy-4-Nitro-5-Sulfophenyl)-2H-
Tetrazolium-5-Carboxanilideα-SMA AlphasmoothmuscleactinΔ Delta

INTRODUCTION


Introduction
3
1. INTRODUCTIONTOLYMPHANGIOLEIOMYOMATOSIS
Lymphangioleiomyomatosis(LAM)isararelungdisordercharacterizedbycystic lung destruction that affects primarily women of childbearing age(Blei, 2011; Hammes and Krymskaya, 2013; McCormack, 2008). It ischaracterized by the infiltration of abnormal smooth muscle-like cells,called LAM cells, in the lung (Darling et al., 2010). This process destroysthepulmonary connective tissueand formscysts.The symptoms includeprogressivedyspnea,pneumothoraxand chylothorax, and somepatientsmay require lung transplantation to avoid chronic respiratory failure.Another frequent manifestation is the appearance of angiomyolipomas(AMLs), which are fat and smooth muscle-rich benign kidney tumors(McCormack,2008).
1.1 DISCOVERYANDGENETICBASISOFLAM
In 1966, Carnog and Enterline described the first collection of LAMpatients.Theypostulatedthattheyallpresentedatypicalcellsinthelung,whichweresmoothmuscle-like, lackedthe featuresofamalignancyandpossibly shared a common genetic origin. They also noted that cystsformedbyLAMcellsnotonlyappearedsporadically inadultwomen,butalso frequently in women with tuberous sclerosis complex (TSC). Theyconfirmed that the corresponding pulmonary lesions were histologicallysimilar to those identified in sporadic LAM(S-LAM)patients (CornogandEnterline,1966).
TSC is an autosomal dominant genetic disease characterized byhamartomatousproliferationsthataffect, inparticular, thebrain,kidney,skin,heart,andlung(Randle,2017).ItiscausedbygermlinemutationsinthetumorsuppressorgenesTSC1andTSC2(Carbonaraetal.,1994;Greenetal.,1994).WhenaTSC1/2mutationisinheritedorsomaticallyacquiredearlyinorganismdevelopment,asecondhitaffectingtheremainingwild-type allele leads to disease emergence; that is, disease developmentfollows the “two-hit” model for canonical tumor suppressors (Knudson,2001).
A common genetic basis of TSC and S-LAM was first indicated by theidentification of TSC2 genetic alterations (based on “loss ofheterozygosity”,LOH)inAMLsfrompatientswithS-LAM(Smolareketal.,1998). Building on the LOH evidence, different types of genemutations(pointmutationsorsmalldeletions)werealso identified inAMLsfromS-

Introduction
4
LAM cases (Carsillo et al., 2000). Subsequently, analyses of geneticmarkers ledtotheimportantdiscoveryofsimilarLOHinAMLandmicro-dissected lung LAM tissue from the same patients,which confirmed thecommongeneticoriginof the two lesions (Carsilloetal.,2000;Yuetal.,2001).
All the findingsdescribedaboveestablished the currentdiseaseetiologymodelinwhichLAMcanoccursporadicallyorbeassociatedwithTSC(TSC-LAM). The incidence of S-LAM is estimated to be 1 in 400,000 adultwomeninEurope,andTSC-LAMoccursin30-40%ofthewomenaffectedbyTSC(Johnsonetal.,2010).
1.2 CLINICALFEATURESOFLAMThemainclinicalfeaturesincludeprogressivedyspnea(70%ofcases)andrecurrent pneumothorax (50% of cases) (Ryu et al., 2006). Pulmonaryfunction tests show airflow obstruction and/or decreased lung diffusioncapacityin66%ofcases;thesealterationsmayleadtochronicrespiratoryfailure (Johnson et al., 2010). The most frequent extra-pulmonarymanifestation is the presence of AMLs; these lesions occur inapproximately40%and90%ofpatientswithS-andTSC-LAM,respectively(McCormack,2008).Hemoptysis(32%),lymphangioleiomyoma(29%),andpleural effusions (12%), and less commonly, chylothorax and chylousascitesarealsodetected(Johnsonetal.,2010;Ryuetal.,2006).
TheclinicalcourseofLAMisvariable:somepatientshavestabledisease,or progress very slowly for several years,while others suffer from rapidprogressivediseaseandcanbeaffectedbyrespiratoryfailureshortlyafterdisease onset, even with treatment (see section 3.3) (Johnson et al.,2010). Symptoms may worsen during pregnancy or with otherconditions/treatmentsthat increaseestrogen levels (Brunellietal.,1996;Yano, 2002), because this influences LAM cell proliferation (see section1.6).
BOX1:GenepcsofLAMdisease
LAMiscausedbyloss-of-functionmutationsinTSC1andTSC2.InpatientswithTSC-LAM,amutationinTSC1orTSC2ispresentinthegermline,andasecondmutation in theotheralleleof the same locusoccurs inasomatic tissue,resultinginLOHforthenormalallele(Carbonaraetal.,1994;Greenetal.,1994).In patients with S-LAM, only TSC2 mutations have been reported, and bothmutationsoccurinsomatictissues(Carsilloetal.,2000).

Introduction
5
1.3 GENETICANDMOLECULARALTERATIONSINLAMCELLS
As mentioned above, LAM and TSC are caused by loss-of-functionmutations in TSC1 (on chromosome 9q34) and TSC2 (on chromosome16p13).InS-LAM,onlymutationsinTSC2havebeendescribed(Crooksetal.,2004).
The products of TSC1 and TSC2 are hamartin and tuberin, respectively.TheseproteinsformaheterodimerthatactsasanegativeregulatorofRashomologenrichedinbrain(RHEB),whichinturnactivatesthemechanistictargetofrapamycin(mTOR)(SaxtonandSabatini,2017).Thus,mutationsin TSC1 and TSC2 genes lead to overactivation of mTOR complex 1(mTORC1) (McCormack, 2008) (Figure 1). A second mTOR complex(mTORC2) is regulated by insulin/PI3K signaling. mTORC1 also controlsmTROC2 through a negative feedback loop with the PI3K signalingpathway(SaxtonandSabatini,2017).

Introduction
6
Figure 1: Schematic representation of themTORC1 signaling pathway. In LAMandTSC,theTSC1/2complexisinactivated,leadingtoconstitutionalactivationofmTORC1, inhibition of autophagy, increase of protein synthesis, and metabolicreprogramming.
The regulatory associated protein of mTOR (RAPTOR) is an mTORC1bindingpartnerwhichfacilitatessubstraterecruitmentthroughbindingtothe TOR signaling (TOS) motif found on several canonical mTORC1substrates(Nojimaetal.,2003).mTORC1actsasamasterregulatorofcellbiology,controllingproteintranslation,nutrientimport,stress-responsivetranscription, ribosome biogenesis and autophagy (Saxton and Sabatini,2017). Rapamycin, also known as sirolimus, is a naturally occurringcompounddiscoveredinbacteriafromtheislandofRapaNuithatinhibitsmTORC1 function by binding to the peptidyl-prolyl-isomerase FKBP12(Sabatini et al., 1994). By contrast, mTORC2 is relatively insensitive torapamycin(SaxtonandSabatini,2017).
Innormalcells,activationofmTORC1requiresgrowthfactorsandaminoacids (SaxtonandSabatini,2017).Undernormalconditions,healthycellsmaintain homeostasis by regulating the uptake of enough glucose andamino acid nutrients to sustain ATP production. In states of nutrient orenergy depletion, healthy cells activate AMP-dependent protein kinase(AMPK), which induces autophagy through TSC1/2 activation andinhibitionofmTORC1signaling(Chantranupongetal.,2015).However, inLAM cells, sincemTROC1 is constitutively activated, autophagy is largelyinhibited(Parkhitkoetal.,2011).
The activation of mTORC1 leads to phosphorylation and activation ofribosomalproteinS6kinasebeta-1(S6K1).Thisresultsintheactivationoftranslationalmechanisms,cellgrowthandcellproliferation(Kwiatkowski,2003). Active mTORC1 kinase phosphorylates eukaryotic translationinitiation factor 4E-binding protein 1 (4E-BP1), which inhibits itsinteraction with eukaryotic initiation factor-like protein (elF4E), causingtheactivationoftranslationandcellcycling(Kristof,2010).
When mTORC1 is overactivated, transcriptional reprogramming occurs,which affects energy metabolism (DeNicola and Cantley, 2015). TSC2-deficient cells strongly express hypoxia-inducible factor 1 alpha (HIF1α)under normoxic conditions. This protein stimulates glycolytic enzymes(Marín-Hernández et al., 2009) that lead to the activation of aerobicglycolysis (Warburg effect) (Liberti and Locasale, 2016). This source ofenergyseemsineffectiveduetothelowlevelofATPproduction.However,

Introduction
7
manyglycolytic intermediates subsequentlygeneratemolecules requiredfor cell division and organelle formation. HIF1α also gives rise to anincrease in vascular endothelial growth factor (VEGF) expression(Simiantonaki et al., 2008). The expression of the sterol regulatoryelement-binding protein (SREBP) is also affected by mTROC1overactivation.Thisproteinisresponsiblefortheincreaseoftheoxidativearm of the pentose phosphate pathway and de novo lipid biosynthesis(Düvel et al., 2010). In addition, the signal transducer and activator oftranscription 3 (STAT3) is also enhanced, which regulates pro-survivalgenes(Goncharovaetal.,2009).
ReactiveoxygenproductionandmitochondriainLAMMitochondrial activity also raises the level of reactive oxygen species(ROS) in LAM cells (Finlay et al., 2005). As mentioned above, TSC2-deficient cells have low autophagic flux, which reduces the degradationcapacityofdysfunctionalmitochondriathatproduceevenmoreROSthanthe normal ones (Sena and Chandel, 2012; Tal et al., 2009). Consistentwith these observations, LAM cells also produce a large quantity ofantioxidants, in particular glutathione, which protects them from ROSdamage and highlights a potential therapeutic vulnerability (Lam et al.,2017a;J.Lietal.,2016).AdditionalevidenceofsusceptibilitytohighROScomesfromthestudiesoftheRIP1/RIP3/MLKLpathway,whichstimulatesglutaminolysisandsustainstheviabilityofTSC2-deficientcellsexposedtooxidativeandmitochondrialstress(Filipczaketal.,2016).
1.4 LAMCELLPHENOTYPE
LAM cells in lung nodules are morphologically heterogeneous with aphenotyperangingfromsmaller,spindle-shaped,smoothmuscle-likecellstobiggerepithelioid-likecells (Ferransetal.,2000).Thesmaller, spindle-
BOX2:SignalingofLAMcells
Mutations in TSC1 and TSC2 result in the overactivation of mTORC1. Theupregulationofthiscomplexproduces:• Inhibitionofautophagy(Parkhitkoetal.,2011)• Increase in protein synthesis (Kristof, 2010), which helps continuous cell
proliferation• Activationofaerobicglycolysis(DeNicolaandCantley,2015)• Upregulationofangiogenesis(Simiantonakietal.,2008)
Introduction
8
shaped cells are generally located centrally in lung nodule lesions,whiletheepithelioid-likecellsoccurmainlyattheperipheryoftheseareas.
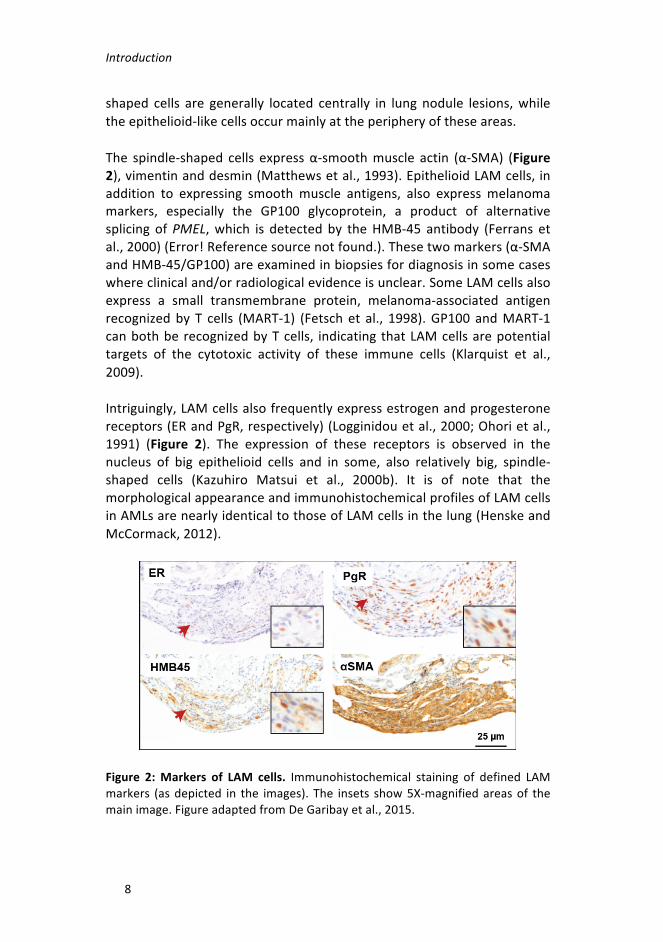
The spindle-shaped cells expressα-smoothmuscle actin (α-SMA) (Figure2),vimentinanddesmin(Matthewsetal.,1993).EpithelioidLAMcells,inaddition to expressing smooth muscle antigens, also express melanomamarkers, especially the GP100 glycoprotein, a product of alternativesplicing ofPMEL,which is detectedby theHMB-45 antibody (Ferrans etal.,2000)(Error!Referencesourcenotfound.).Thesetwomarkers(α-SMAandHMB-45/GP100)areexaminedinbiopsiesfordiagnosisinsomecaseswhereclinicaland/orradiologicalevidenceisunclear.SomeLAMcellsalsoexpress a small transmembrane protein, melanoma-associated antigenrecognizedby T cells (MART-1) (Fetsch et al., 1998).GP100 andMART-1canbothberecognizedbyTcells, indicatingthatLAMcellsarepotentialtargets of the cytotoxic activity of these immune cells (Klarquist et al.,2009).
Intriguingly,LAMcellsalsofrequentlyexpressestrogenandprogesteronereceptors(ERandPgR,respectively)(Logginidouetal.,2000;Ohorietal.,1991) (Figure 2). The expression of these receptors is observed in thenucleus of big epithelioid cells and in some, also relatively big, spindle-shaped cells (Kazuhiro Matsui et al., 2000b). It is of note that themorphologicalappearanceandimmunohistochemicalprofilesofLAMcellsinAMLsarenearlyidenticaltothoseofLAMcellsinthelung(HenskeandMcCormack,2012).
Figure 2:Markers of LAM cells. Immunohistochemical staining of defined LAMmarkers (asdepicted in the images). The insets show5X-magnifiedareasof themainimage.FigureadaptedfromDeGaribayetal.,2015.

Introduction
9
1.5 CELLULARHETEROGENEITYINLAMLUNGLESIONS
Inthelung,LAMnodularstructuresarecomposedofdifferenttypeofcellsotherthanthespindle-shapedandepithelioid-likeLAMcells.HyperplastictypeIIpneumocyteslinethesurfaceofLAMlesions(Matsuietal.,2000).These cells have cytoplasmatic projections that connect with theinterstitial connective tissue. Lymphatic endothelial cells (LECs) areinfiltrated and surround LAM cells (Kumasaka et al., 2004). In parallel,severallymphaticchannelsinfiltrateLAMnodules.Cellsfromtheimmunesystems, such as mast cells (Valencia et al., 2006) or T cells (Liu et al.,2018;Maiseletal.,2018),arealsopresentintheselesions.
1.6 LAMASAMETASTATICDISEASE
ThetissueororganoforiginofLAMcellsremainsunclear.Asmentionedabove, thediscoveryof identicalLOHpatternsofTSC2 inLAMcells frompathologicallesionsofthelungandkidneyinwomenwithS-LAMsuggestsacommongeneticorigin(Carsilloetal.,2000;Yuetal.,2001).Inaddition,there are reports of cases of recurrent LAM after complete lungtransplantation, inwhich the relapsed lesionsdidnotoriginate from thedonortissue(Bittmannetal.,2003;Karbowniczeketal.,2003).
Accordingtotheaboveobservations,LAMcellsarethoughttobeabletomigratefromtheir tissueororganoforigintothe lungthroughdifferentbodyfluids.Indeed,proposedLAMcellpopulations(classifiedonthebasisof TSC2 LOH) have been identified in the blood, the lymphatic system,urineandthechylous fluidofpatients (Crooksetal.,2004).However, todate,singleLAMcellshavenotbeenidentifiedandcharacterized.
BOX3:LAMcelllines
Todate, ithasnotbeenpossible to isolateandcultureLAMcells,butseveralcellmodelsareusedtostudythisdisease:• Mouse embryo fibroblasts derived from Tsc2/Tp53 knockout mice (MEF
Tsc2-/-)(Zhangetal.,2003)• Proliferative smooth cells isolated from Eker rat uterine leiomyomas that
wereTsc2-null(ELT3-V3)(Walkeretal.,2003)• TSC2-nullhumanangiomyolipomacells(621-101)(Yuetal.,2004)• Tsc2-null mouse kidney cystadenoma cells with an empty vector (105K-EV)
(Parkhitkoetal.,2014)Allthesecelllineshavetheircorrespondingcontrolcounterparts.

Introduction
10
The above findings depict LAM as a “benign metastatic” (probably aninaccuratedefinition)diseaseofunknownorigin; in this theory,acquiredsomaticmutationsofTSC2inaspecificcelltype(seesection1.7)originateLAM cells that can then migrate to lungs and kidney and produceobservablelesions(HenskeandMcCormack,2012).However,thefactthatLAMcellsproducetissuedestruction,progressiverespiratory failureand,in some cases, a need for complete lung transplantation, make it moreappropriate to define the pathology as a “low-grade, destructive,metastasizing”disease(McCormacketal.,2012).
Hence, once themetastatic natureof LAMdiseasehasbeenassumed, amodelofdisseminationofLAMcellswasdescribedinvolvingseveralpro-metastaticfactors(seeFigure3foranillustrationofthemodel).
Figure3:MultistepmodelofmetastaticLAMdisease. LAMcellscreateclustersand secrete VEGF-D and recruit LECs. They then producemetalloproteinases todegrade the extracellular matrix. LAM cell clusters enter the lymphatic systemsurrounded by LECs. Estrogen enhances the survival of LAM cell clusters.
Introduction
11
Circulating LAM cells arrive at different organs through a variety of circulatorysystems.
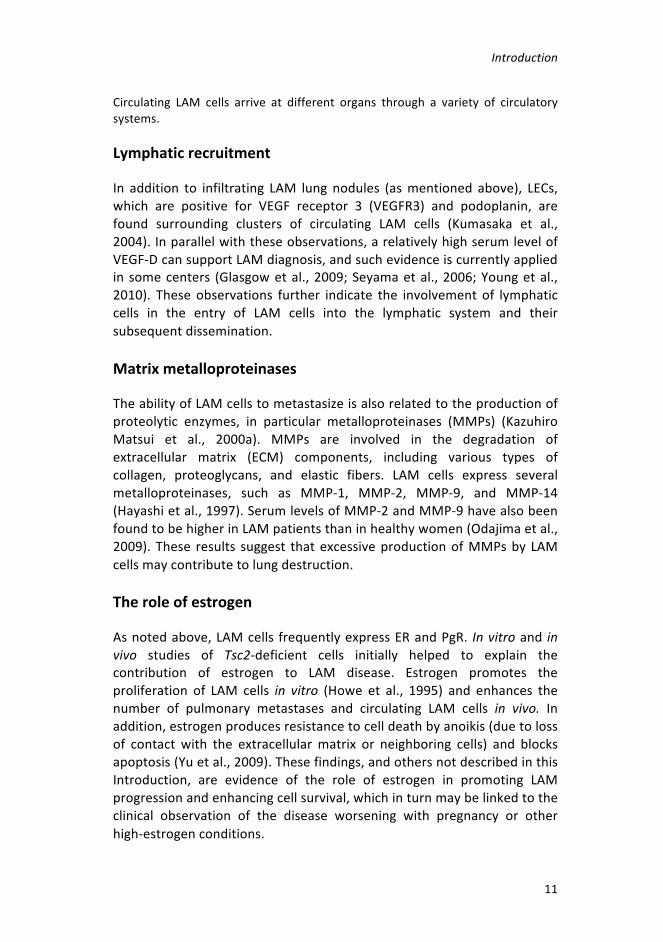
Lymphaticrecruitment
In addition to infiltrating LAM lung nodules (asmentioned above), LECs,which are positive for VEGF receptor 3 (VEGFR3) and podoplanin, arefound surrounding clusters of circulating LAM cells (Kumasaka et al.,2004).Inparallelwiththeseobservations,arelativelyhighserumlevelofVEGF-DcansupportLAMdiagnosis,andsuchevidenceiscurrentlyappliedin somecenters (Glasgowetal.,2009;Seyamaetal.,2006;Youngetal.,2010). These observations further indicate the involvement of lymphaticcells in the entry of LAM cells into the lymphatic system and theirsubsequentdissemination.
Matrixmetalloproteinases
TheabilityofLAMcellstometastasizeisalsorelatedtotheproductionofproteolytic enzymes, in particular metalloproteinases (MMPs) (KazuhiroMatsui et al., 2000a). MMPs are involved in the degradation ofextracellular matrix (ECM) components, including various types ofcollagen, proteoglycans, and elastic fibers. LAM cells express severalmetalloproteinases, such as MMP-1, MMP-2, MMP-9, and MMP-14(Hayashietal.,1997).SerumlevelsofMMP-2andMMP-9havealsobeenfoundtobehigherinLAMpatientsthaninhealthywomen(Odajimaetal.,2009). These results suggest thatexcessiveproductionofMMPsby LAMcellsmaycontributetolungdestruction.
Theroleofestrogen
Asnotedabove,LAMcells frequentlyexpressERandPgR. Invitroand invivo studies of Tsc2-deficient cells initially helped to explain thecontribution of estrogen to LAM disease. Estrogen promotes theproliferation of LAM cells in vitro (Howe et al., 1995) and enhances thenumber of pulmonary metastases and circulating LAM cells in vivo. Inaddition,estrogenproducesresistancetocelldeathbyanoikis(duetolossof contact with the extracellularmatrix or neighboring cells) and blocksapoptosis(Yuetal.,2009).Thesefindings,andothersnotdescribedinthisIntroduction, are evidence of the role of estrogen in promoting LAMprogressionandenhancingcellsurvival,whichinturnmaybelinkedtotheclinical observation of the disease worsening with pregnancy or otherhigh-estrogenconditions.

Introduction
12
1.7 ORIGINOFLAMCELLS
There are several hypotheses about the origin of LAM cells, the initialcandidates being AMLs (although not all cases show these lesions(McCormack,2008))uterus,andneuralcrest(Carsilloetal.,2000;Delaneyet al., 2014; Prizant et al., 2013). Our group has also suggested breasttissueasbeinga locationoforigin (DeGaribayetal.,2015;Nuñezetal.,2016) (Figure4).WherevertheLAMcellsoriginate, itmaybenotedthatacquisition of mutations in TSC1 or TSC2, followed by overactivation ofmTORC1,confermetastaticpotentialwithlungtropismonthesecells.
Figure 4: Candidates for site of tissue origin of LAM cells. Angiomyolipomas,uterus,neuralcrestandbreastare thetissuesproposedas thesitesoforiginofLAMcells.

Introduction
13
TheuterusasasiteofLAMcellorigin
LungLAMlesionsanduterine leiomyomas(benigntumorsofmyometrialcells of the uterus) share many features, including similar-appearingsmoothmusclecells,expressionofERandPgR,andsensitivitytoestrogen(Prizantetal.,2013).
Totestthehypothesisofauterineorigin,theTsc2genewasconditionallydeleted from uterine cells of mice using ER-inducible Cre expression(Prizantetal.,2013).Inthisstudy,almost100%ofmicewithTsc2knock-out developed uterine leiomyomas. Most notably, Tsc2-deficientmyometrialtumorswerefoundinlungsfrom75%ofmicethatlivedtoatleast31weeksofage. Inaddition,estrogenappeared tobe required formyometrial mTORC1/S6 signaling and proliferation. While this mousemodelrecapitulatedsomefeaturesofLAMbiology,ER-mediateddeletionof Tsc2 does not rule out the possible existence of other sites of originbesidestheuterus.
AngiomyolipomasasasiteofLAMcellorigin
Several investigators have proposed thatAMLsmaybe a source of LAMcells(Carsilloetal.,2000;Yuetal.,2001).ThesharedTSC2LOHfoundinAMLsandlunglesions,inadditiontoconfirmingacommongeneticoriginof those cells, also suggests that pulmonary LAM may result from themigrationof smoothmusclecells fromrenalAMLs to the lung (Yuetal.,2001).However,thishypothesishasbeenrejectedsincenotallTSC-orS-LAMpatientshaveradiologicallydetectableAMLs;theselesionsappearinonly approximately 40% of S-LAM and 90% of TSC-LAM patients(McCormack,2008).
TheneuralcrestasasiteofLAMcellorigin
LAMcells in lung lesionsandAMLsexpressneuralcrest lineagemarkers,predominantly those associated with the smooth muscle cells andimmature melanocyte lineages (Ferrans et al., 2000; Matthews et al.,1993). These cells are highly migratory and have an extensive multi-lineagepotential,whichcouldbeevidenceofanoriginofLAM(Delaneyetal.,2014;Julianetal.,2017).
It is suggested that TSC hamaratomas originate in neuronal ormesenchymalcells.Whileembryonicneuralstemcells(NSCs)appeartobe

Introduction
14
thecelloforiginofcentralnervoussystem(CNS)manifestations(neuronalnetworkdysfunction and seizure activity), themesenchymalneural crestcells(NCCs)havebeenpostulatedtogiverisetoothertypesof lesionsinTSC and in LAM (Delaney et al., 2014). Moreover, the moment duringdevelopment when TSC1 or TSC2 mutations would occur in cells couldaffecttheseverityofthediseases.ForTSCpatients,second-hitmutationsduring early stages of embryogenesis would lead to a severe TSCphenotype, resulting in CNS manifestations. However, second-hitmutationsintheemergingneuralcrestpopulationwouldleadtonon-CNSsymptoms, potentially including LAM. First-hit mutations at this timewouldresultinS-LAM,andtheneuralcrestlineagewouldbevulnerabletosecond-hit mutations. First-hit and/or second-hit mutations acquiredwithinadultNCCswouldleadtoLAMandsomeTSC-associatedlesions.
BreasttissueasasiteofLAMcellorigin
Inbreastcancer,lowlevelsofhamartinandtuberinhavebeenassociatedwithpoorprognosis(Jiangetal.,2005)anddepletionoftuberinpromotesmetastasis (Nasr et al., 2013). Breast cancer patients with low levels ofexpression of TSC1 and TSC2, and therefore abnormal activation ofmTORC1, are more likely to develop lung metastasis than other breastcancerpatients(Jiangetal.,2005).Moreover,theexpressionofthesetwogenesiscorrelatedwiththeexpressionofasetofgenesdescribedaslungmetastasismediators(DeGaribayetal.,2015;Minnetal.,2005).
LAMcellsexpresslungmetastasismediatorssuchasfascin1(FSCN1)andinhibitorofDNAbinding1(ID1);inaddition,breastcancerstemorluminalprogenitor cell biomarkers, such as aldehyde dehydrogenase 1 (ALDH1),integrin-ß3(ITGB3/CD61),andthesex-determiningregionY-box9(SOX9)(DeGaribay et al., 2015) (Figure 5These results describe a stem cell-likephenotype of LAM cells and propose another disease origin linked to ahormonal-responsiveorgan.Thus,ourgroupsuggestedthatLAMcellsmayalso originate in a specific ER-positive luminal progenitor cell population(Nuñezetal.,2016).

Introduction
15
Figure 5: Lung metastasis mediators and breast cancer stemness biomarkers.Immunohistochemical staining of LAM cells. Figure adapted fromDeGaribay etal.,2015.
Whatare the similaritiesbetweenbreast cancerandLAM?What couldtheirimplicationsbe?
1. HormonalinfluenceandER/PgRexpression2. mTORC1activationinmetastaticcellsandmetastases3. Lungtropismbreastcancersubtype(withmTORactivation)4. Commonstemcellmarkers
The above similarities indicate the possible existence of a common cellorigin; nonetheless, they depict common biology influencing bothmetastaticprocesses.Multipletissueororganoriginscancoexistasthereare several cancer types whose metastatic behavior is mediated bymTROC1overactivation(Hsiehetal.,2012).Lungmetastaticbreastcanceris generally ER/PgR-negative (Gerratana et al., 2015), which calls thecommon origin hypothesis into question. However, while it has beenproposed that this cancer subtype is derived froma specific ER-negativeluminalprogenitorpopulation,there isalsoevidencefortheexistenceofan ER-positive luminal progenitor subpopulation in normal breast tissue(Fuetal.,2014).Thispopulationmight thereforealsocontribute toLAMwhen somatic inactivation of TSC2 occurs. With regard to this, thehormonal cycles of breast cell division provide a window for acquiringgenetic errors. Nevertheless, the order and type of acquired mutationsprobablydeterminethefinalconsequenceofmalignantorbenignlesions(KentandGreen,2017;Southetal.,2012),andasdescribedabove,LAMcellsappeartoharboronlydriveralterationsinTSC2.

Introduction
16
Given theaboveobservations, it is reasonable tohypothesize that theremay be certain comorbidities and/or shared risks common to bothdiseases.Toaddressthis,ourgroupstudiedtheincidenceofbreastcancerin LAM cohorts compared with that in the general population, usingstandardized incidence ratios (SIRs). First, cohorts from Japan, SpainandUnited Kingdomwere analyzed (Nuñez et al., 2016), and then the studywasreplicatedincohortsfromBrazilandPoland(Nuñezetal.,2019).Inallcohorts,theSIRswere>1,whichindicatesasignificant increaseinbreastcancerincidenceintheLAMpopulations.
2. DIAGNOSISOFLAM
The variability of the clinical features among LAM patients makesdiagnosis of the disease challenging in some cases. Accepting thatdiagnosis should be accomplished using the least invasive methodpossible, twomajorguidelineshavebeendeveloped (Guptaetal., 2017;Johnsonetal.,2010).
2.1 PULMONARYFUNCTIONTESTS
Pulmonary function tests (PFTs), including forced vital capacity (FVC),forcedexpirationvolumeinthefirstsecond(FEV1),anddiffusingcapacityof lung forcarbonmonoxide (DLCO),arecarriedout inyoung-to-middle-aged women who present dyspnea and/or pneumothorax/chylothorax(Gupta et al., 2017). Most patients with LAM show substantial airflowobstruction (FEV1/FVC ratio < 70%) and impaired gas exchange (DLCO <80%) (Johnson et al., 2010). In contrast, some patients may beasymptomaticandhavenormalPFTs,especiallyearlyon inthecourseoftheirdisease.
2.2 HIGH-RESOLUTIONCOMPUTEDTOMOGRAPHY
Ahigh-resolutioncomputedtomography(HRCT)scanofthethorax istherecommended imagingtechniquefor thediagnosisofdiffuse, infiltrative,lung diseases like LAM with the presence of multiple, bilateral, round,well-defined, relatively uniform, thin-walled cysts (Johnson et al., 2010).Other manifestations, such as chylous pleural effusions andpneumothorax,canalsobeseenbyHRCT.

Introduction
17
ThepresenceoflungcystsinanHRCTscanwithnootherevidenceisnotdefinitive for an LAM diagnosis. However, if there is a history ofpneumothorax or chylothorax, and if pulmonary function tests showairflowobstructionand/orimpaireddiffusioncapacity,thereisnoneedtoperforma lungbiopsyor other tests (Gupta et al., 2017). In addition, inwomen with TSC, the identification of lung cysts strongly suggests thepresenceofLAM(Johnsonetal.,2006).
All patients with, or suspected of suffering from, LAM should have anabdominal computed tomography scan to identify potential AMLs orrelatedlesions,suchaslymphangioleiomyomas(Johnsonetal.,2010).
2.3 VEGF-DASALAMPLASMABIOMARKER
PlasmaVEGF-D levels aremeasured as part of the diagnostic process ofLAM in some countries (Gupta et al., 2017), although not yet in Spain.PlasmaVEGF-Dlevelsgreaterthan800pg/mLinwomenwithtypicalcysticchangesinanHRCTscanarespecificforaLAMdiagnosis.SuchlevelscandistinguishLAMpatients fromhealthypeopleand fromthosewithothercystic lung diseases, including Langerhans cell histiocytosis (PLCH),emphysema, Sjögren syndrome, and Birt-Hogg-Dubé (BHD) syndrome(Figure6A).Moreover,anevenhigherthresholdof900pg/mL isenoughtodiscriminatebetweenwomenwithTSC-LAMandwomenwithonlyTSC(Youngetal.,2010)(Figure6B).
However,anegativeVEGF-Dresult (i.e.,belowthe800pg/mLthreshold)does not exclude a LAM diagnosis. For patients whose VEGF-D test isunavailable or uninformative, other clinical or pathological evidence isneeded.

Introduction
18
Figure6:SerumlevelsofVEGF-Dinpatientswithdifferentdiseases.A)VEGF-DlevelsofsubjectswithdefiniteS-LAMincomparisonwithwomenwithothercysticlungdiseasesandhealthyvolunteers.B)VEGF-DlevelsofwomenwithTSC-LAMincomparisonwithwomenwithTSConly.FigureadaptedfromYoungetal.,2010.
Other studies have described a relationship between VEGF-D levels andthe severity of the disease. Levels of plasma VEGF-D were negativelycorrelatedwithDLCOmeasurements, indicating that this biomarkermaybe more abundant in the plasma of patients with a high degree ofpulmonary involvement (Seyama et al., 2006). In addition, LAMpatientswith lymphatic involvement,asdefinedby thepresenceofadenopathiesorlymphangioleiomyomas,generallyhavehigherlevelsofplasmaVEGF-Dthanotherpatients(Glasgowetal.,2009).
2.4 TRANSBRONCHIALORSURGICALLUNGBIOPSY
WhenHRCTrevealsthatapatienthasparenchymalcystscharacteristicofLAM,butnoadditionalconfirmatoryfeatures,atransbronchiallungbiopsyisconsideredappropriatebeforeproceedingwithasurgicalbiopsy(Guptaetal.,2017).Theadvantageofatransbronchiallungbiopsyisthatitoffers

Introduction
19
alessinvasivemethodofhistopathologicallyconfirmingLAM.Whentherearenomoreoptions,avideo-assistedthoracoscopylungbiopsyisneededto confirm the diagnosis of LAM (Johnson et al., 2010). It is the mostinvasiveofthediagnostictechniquesinusebutisnecessaryinsomecases.
Inlungbiopsies,immunohistochemistryforα-SMA,desminandHMB-45isperformedtoobtainadiagnosis(Johnsonetal.,2006).Inrarecases,HMB-45stainingisabsent,butcharacteristiclesionsarepresent(Johnsonetal.,2010); this observation also shows that disease heterogeneity hampersclinicalmanagement. Inabouthalfof thecases,ERand/orPgRpositivitycanalsobedetectedinLAMlunglesions(KazuhiroMatsuietal.,2000b).
3. TREATMENTOFTHEDISEASE
3.1 BEFORESIROLIMUS:HORMONE-BASEDAPPROACHES
There is much evidence that hormones, particularly estrogen andprogesterone, play an important role in the pathogenesis of LAM(Logginidou et al., 2000; Ohori et al., 1991). Several studies assessingdisease treatment with hormone-based therapies have been publishedovertheyears.
Although there are many reports in which the use of oophorectomy,tamoxifen, gonadotropin-releasing hormone agonists or progesterone(Baldi et al., 2011;Banneret al., 1981;Clemmet al., 1987;Harari et al.,2008; Johnson and Tattersfield, 1999; Taveira-DaSilva et al., 2004) areassessed, none of them has yielded robust and definitive resultssupportingtheirclinicalefficacy.Moreover, thereportedeffectsofsomeof these hormonal therapies are inconsistent within and acrosscohorts/studies.Nevertheless, formany years, hormone-based therapiesweretheonlyexistingtreatmentchoiceforLAM.
Oophorectomy
Anoophorectomyisasurgicalproceduredirectedatremovingoneorbothovaries.InasmallseriesofthreeLAMpatients,justoneofthemshowedasignificant improvement in lung function (measured by FVC) after thissurgery(Banneretal.,1981).

Introduction
20
Tamoxifen
TamoxifenisadrugusedtotreatER-positivebreastcancerthatfunctionsby blocking the signaling effects of estrogen (Ferlay et al., 2010). Itwasfirst used to treat LAMpatients in 1982 (Tomasian et al., 1982). SeveralseriesofLAMpatientssubsequentlyreceivedthistreatment(Clemmetal.,1987; Svendsen et al., 1984; Taylor et al., 1990). One report indicatedclinicalimprovementwithtamoxifeninoneoftheirpatients(Clemmetal.,1987), whereas the others were either inconclusive or described aworseningclinicalstate.
Gonadotropin-releasinghormoneagonists
Gonadotropin-releasinghormone(GnRH)agonistsarecompoundsusedtoreduce gonadotropin, luteinizing hormone and follicle-stimulatinghormonelevelsinhormone-sensitivecancerssuchasthoseoftheprostateand breast (Kittai, 2018; Robertson and Blamey, 2003). Several case-reportsstudyingtheeffectsofthesedrugshavebeenpublished,butsomeof their results have proved contradictory. In an initial study, 11 LAMpatientstreatedwithtriptorelinshowednoimprovementinlungfunctionparameters (Harari et al., 2008), but in a subsequent study in whichgoserelin was used to treat nine LAM patients, FEV1 and FVC valuesimproved in all of them (Baldi et al., 2011). The difference between thetwodrugsisthattriptorelinismorepotent,withastructuremoresimilarto that of native hormones and with a longer half-life than goserelin,althoughtheydonotproduceanydifferencesinthecytoreductiveefficacyandqualityoflifeofpatientswithprostatecancer(Bahl,2019).
Progesterone
In a retrospective study of 43 LAM patients, those treated withprogesterone showed a smaller decline in DCLO as those receiving nohormone treatment, although the differences were only significant inpremenopausal patients (Johnson and Tattersfield, 1999). Conversely, inanother retrospective study of 275 LAM patients, the rate of decline inDLCO was higher in those treated with progesterone than in patientsreceiving no hormone treatment; in addition, there were no significantdifferencesinFEV1inthisstudy(Taveira-DaSilvaetal.,2004).
Introduction
21
3.2 ABREAKTHROUGHWITHSIROLIMUS
AbnormalmTORC1activationunderliesthedevelopmentandprogressionofS-andTSC-LAM.Sirolimus(rapamycin)isanallostericinhibitorofmTORkinasethat isthecurrentstandardofLAMtreatment.ThisapproachwasoriginallypromptedbythefundamentaldataproducedbytheMulticenterInternational LAM Efficacy of Sirolimus (MILES) trial (McCormack et al.,2011).
InitialstudiesassessingsirolimusinTSCandLAM
Twoinitialopen-label,uncontrolledtrialsweredesignedandcompletedtodetermine the effect of sirolimus on AMLs and lung function in LAMpatients.Inonetrial,patientswithTSCorLAMweretreatedwithsirolimusfor 12months (Bissler et al., 2008). This therapy reduced the volumeofAMLs by 53.2%, statistically significantly improved FVC, and showed atrendtowardsanimprovementinFEV1.Inasimilartrial,patientswithTSCandLAMweretreatedwithsirolimusfor24months(Daviesetal.,2008).In this study, the treatment reduced AML volumes of all patients by anaverageof26.1%,butnosignificant improvements in lungfunctionwereobserved.
TheMILEStrial
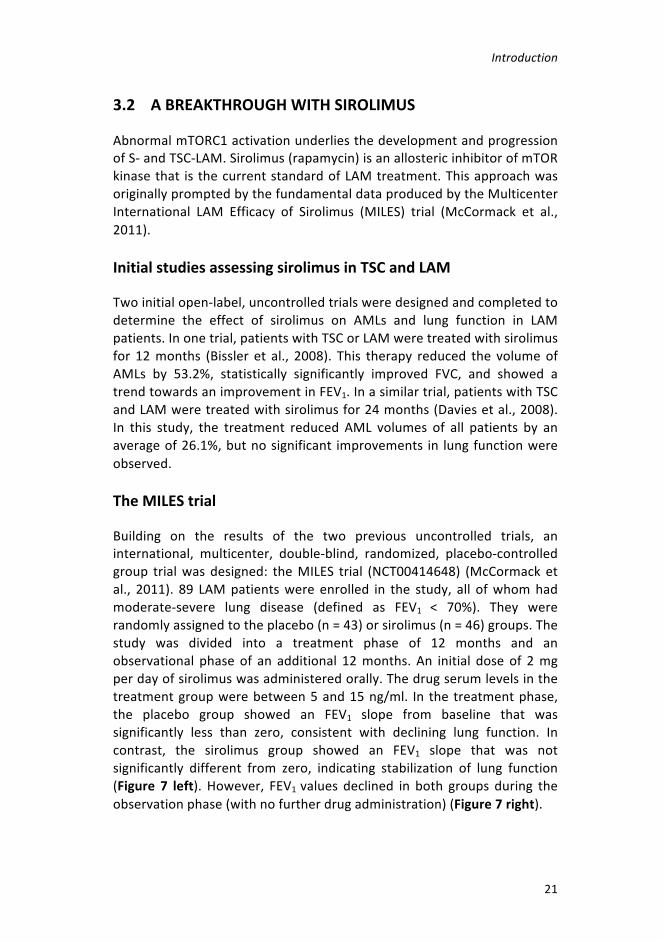
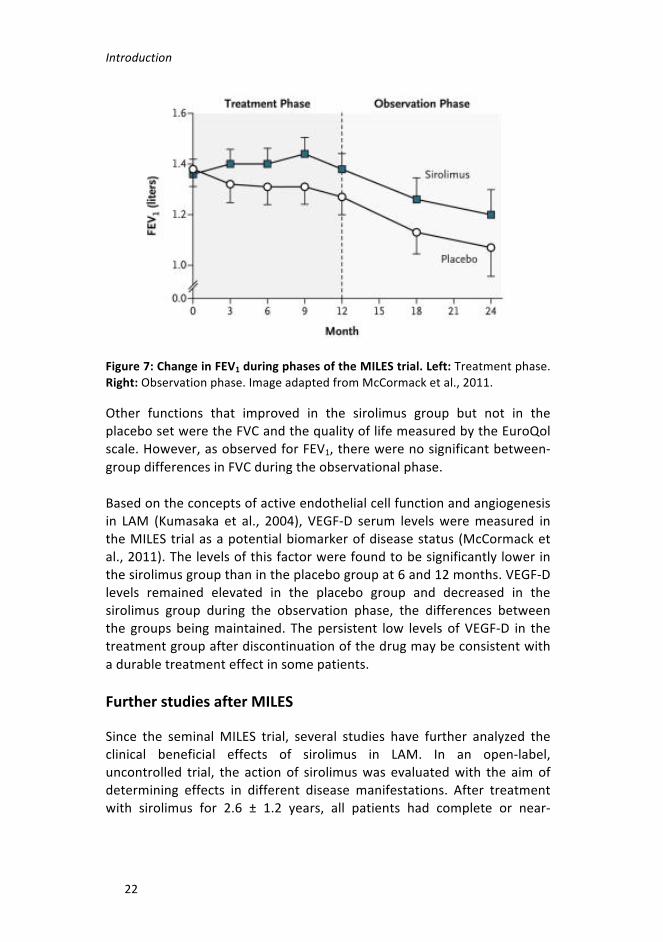
Building on the results of the two previous uncontrolled trials, aninternational, multicenter, double-blind, randomized, placebo-controlledgroup trialwasdesigned: theMILES trial (NCT00414648) (McCormacketal., 2011). 89 LAMpatientswere enrolled in the study, all ofwhomhadmoderate-severe lung disease (defined as FEV1 < 70%). They wererandomlyassignedtotheplacebo(n=43)orsirolimus(n=46)groups.Thestudy was divided into a treatment phase of 12 months and anobservational phase of an additional 12months. An initial dose of 2mgperdayofsirolimuswasadministeredorally.Thedrugserumlevelsinthetreatmentgroupwerebetween5and15ng/ml. In the treatmentphase,the placebo group showed an FEV1 slope from baseline that wassignificantly less than zero, consistent with declining lung function. Incontrast, the sirolimus group showed an FEV1 slope that was notsignificantly different from zero, indicating stabilization of lung function(Figure 7 left). However, FEV1 values declined in both groups during theobservationphase(withnofurtherdrugadministration)(Figure7right).
Introduction
22
Figure7:ChangeinFEV1duringphasesoftheMILEStrial.Left:Treatmentphase.Right:Observationphase.ImageadaptedfromMcCormacketal.,2011.
Other functions that improved in the sirolimus group but not in theplacebosetweretheFVCandthequalityoflifemeasuredbytheEuroQolscale.However,asobservedforFEV1,therewerenosignificantbetween-groupdifferencesinFVCduringtheobservationalphase.
Basedontheconceptsofactiveendothelialcellfunctionandangiogenesisin LAM (Kumasaka et al., 2004), VEGF-D serum levelsweremeasured intheMILEStrialasapotentialbiomarkerofdiseasestatus(McCormacketal.,2011).Thelevelsofthisfactorwerefoundtobesignificantlylowerinthesirolimusgroupthanintheplacebogroupat6and12months.VEGF-Dlevels remained elevated in the placebo group and decreased in thesirolimus group during the observation phase, the differences betweenthe groupsbeingmaintained. Thepersistent low levelsofVEGF-D in thetreatmentgroupafterdiscontinuationofthedrugmaybeconsistentwithadurabletreatmenteffectinsomepatients.
FurtherstudiesafterMILES
Since the seminalMILES trial, several studies have further analyzed theclinical beneficial effects of sirolimus in LAM. In an open-label,uncontrolled trial, the actionof sirolimuswas evaluatedwith the aimofdetermining effects in different disease manifestations. After treatmentwith sirolimus for 2.6 ± 1.2 years, all patients had complete or near-

Introduction
23
complete resolution of their chylous fluids and lymphangioleiomyomas(Taveira-DaSilvaetal.,2011).
Todate,norandomizedstudyhasbeenspecificallydesignedtoassesstheusefulness of VEGF-D as a prognostic or predictive biomarker, althoughtheMILEStrialdatahavebeenanalyzedtoaddressthismatter(Youngetal., 2013). The results showed that baseline plasma VEGF-D levels areassociated with LAM severity, whereby VEGF-D concentrations werehigherinpatientswhoneededsupplementaloxygenthaninthosewhodidnotneed it. Inthesirolimusgroup, improvement inFEV1wasseen inthe65% patients whose VEGF-D levels decreased after 12 months oftreatment. These findings suggest that plasma VEGF-D concentrationscould inform the risk–benefit analysis of sirolimus treatment in patientswithLAM.
Theeffectof sirolimusoncirculatingLAMcellswasalsoassessed (Caietal.,2014).Inthisstudy,theauthorswereabletoisolatecirculatingbloodcell populationswithTSC2LOH from100%of LAMpatients and inurinesamplesfrom75%ofthembeforetreatment.Overameandurationof2.2± 0.4 years of sirolimus therapy, LAM cell detection rates decreasedsignificantly,to25%ofpatientswhenbloodsampleswereconsideredandto 8% of them when their urine samples were analyzed. However, theisolated cell populations were defined as “LAM” based solely on LOHevidence, which means that they may comprise heterogeneous sets ofunknownproportionsofnormalanddiseasecells.
SevenyearsafterthepublicationoftheMILEStrialresults,andsirolimus-based therapy having been proved to reduce serum VEGF-D and tostabilize lung function in LAM patients, the long-term effects of thetherapywereunknown.Taveira-DaSilvaetal.evaluatedLAMpatientswhoreceived sirolimus for a period of 4.5 ± 1.6 years (Taveira-DaSilva et al.,2018). They described that sirolimus produced a persistent reduction inVEGF-Dlevelsandastabilizationoflungfunction.However,noassociationbetween the reduction of VEGF-D and improved lung function wasobserved, contradicting the findings of the two aforementioned reports(Seyama et al., 2006; Young et al., 2013). They also found that thereduction in VEGF-D was greater in LAM patients with lymphaticinvolvement, which may limit the utility of this biomarker to specificconditions.

Introduction
24
3.3 AFTERSIROLIMUS:NOVELCLINICALTRIALS
Rapamycin induces a cytostatic, rather than a cytotoxic, effect in TSC2-deficient cells. When the medication is discontinued, lung functiondeclines (McCormack et al., 2011) and the volume of AMLs tends toincrease (Bissler et al., 2008). For those reasons, continuous treatmentwithrapamycinisnecessary,andnoveltherapeuticstrategiesthatinducecytotoxic effects to promote LAM cell death are needed as a definitivediseasetreatment.
Someproposednewtherapies involvecompoundsother than rapamycinthattargetothervulnerabilitiesofLAMcells(Changetal.,2014;Luetal.,2017).However,asrapamycindoes improve lungfunctionandqualityoflife of LAM patients, other approaches consist of a combination of themTORC1 inhibitorwith other compounds that, together,may be able tokillthediseasecells(El-Chemalyetal.,2017).Rapamyciniswelltoleratedin general, but adverse events, such as mucositis, diarrhea and nausea,havebeenassociatedwiththeuseofthecurrentlyrecommendeddosesinsome LAM patients (McCormack et al., 2011). Thus, another potentiallyeffective strategy might involve using lower doses of rapamycin incombinationwithothercompounds,whichactsynergisticallytoeliminateLAMcells.
Estrogeninhibitor:Letrozole
Inpostmenopausalwomen,estrogensaremainlyderivedfromtheactionofthearomataseenzyme,whichconvertsadrenalandrogenstoestrogen(Dowsettetal.,1995).Estrogenbiosynthesiscanthereforebesuppressedbyinhibitingthearomataseenzyme.
Letrozole isanon-steroidalaromatase inhibitorand itsefficacyhasbeentestedinthetrialofanaromataseinhibitorinlymphangioleiomyomatosis(TRAIL, NCT01353209) (Lu et al., 2017). The study did not have thestatistical power necessary to assess the impact of letrozole in FEV1 inpostmenopausal patients with LAM. However, exploratory post hoc-matchedpairstudiesprovidedtentativeevidencesuggestingthat furtherstudiesofletrozoleinLAMwereworthwhile.

Introduction
25
MMPinhibitor:Doxycycline
Asmentioned above, TSC2-deficient cells overexpress someMMPs, andMMP-2andMMP-9arepresentathigher levels in theserumofpatientswithLAMthaninnormalsubjects(Odajimaetal.,2009).Doxycyclineisatetracycline antibiotic that inhibits the activity and production ofMMPs(Palomino-Moralesetal.,2016).
Anopen-labeluncontrolledtrialdemonstratedthat, inpatientswithmildLAM,treatmentwithdoxycyclinefor12monthsreducesMMP-9levels inurine and slows the rate of FEV1 decline (Pimenta et al., 2013). As aconsequence of this report, a randomized, double-blind, placebo-controlled trial of doxycycline in lymphangioleiomyomatosis(NCT00989742)was performed (Chang et al., 2014). After 24months oftreatment,thedoxycyclinegroupshowedareductionofMMP-9levels inurine.However, therewerenodifferencesbetween thedoxycyclineandtheplacebogroupsintherateofFEV1declineorqualityoflife.
Autophagyinhibitors:Hydroxychloroquineandresveratrol
It is known in TSC2-deficient cells that autophagy is almost completelyinhibitedandthattheautophagysubstratep62/SQSXM1accumulatesandisessentialfortumorformation(Parkhitkoetal.,2011).Nevertheless,thetreatment of these cells with the mTROC1 inhibitor sirolimus increasesautophagy, providing a pro-survival stimulus to cells. The authors thenshowed that combination of sirolimus with an autophagy inhibitor,hydroxychloroquine, results in greater cell death in vitro and a smallertumor size in vivo compared with sirolimus alone. Hydroxychloroquineblocks lysosome–autophagosome fusion and lysosomal proteindegradation(Yangetal.,2013).
Basedonthesepreclinicaldata,theSirolimusandAutophagyInhibitioninLAM(SAIL,NCT01687179)trialwascarriedouttoevaluatethesafetyandtolerability of the combination of sirolimus and hydroxychloroquine (El-Chemalyetal., 2017). The study showed improved lung function in LAMpatients24weeksafterthestartofthetreatment.However,by48weeks,onlythosepatientsreceivingthehighestdoseofhydroxychloroquine(400mg/day) had stable levels of FEV1 and FVC. This clinical trial yieldedadditionalevidenceof serumbiomarkers.VEGFR3 levelswereassociatedwithFEV1changesduringtreatmentwiththecombinationofsirolimusandhydroxychloroquine(Lamattinaetal.,2018).

Introduction
26
Resveratrolisanotherautophagyinhibitor,whichinhibitsautophagyinanmTOR-dependent manner (Armour et al., 2009). As withhydroxychloroquine, resveratrol in combination with rapamycin canreduce autophagy and promote apoptosis in Tsc2-deficient cells in vitro(Alayev et al., 2014). In a subsequent study by the same group, thecombinationofrapamycinandresveratrolreducedtumorsizeinvivomorethan did rapamycin alone (Alayev et al., 2015). Consequently, a clinicaltrial, called the Resveratrol and Sirolimus in LymphangioleiomyomatosisTrial(RESULT,NCT03253913),isbeingconductedtoassessthesafetyandadverse effects of combined resveratrol and sirolimus in patients withLAM, and to determine the changes in lung function and quality of life.Theresultsofthisclinicaltrialarenotyetavailable.
Cyclooxygenase-2inhibitor:Celecoxib
Cyclooxigenase-2 (COX-2), a rate-limiting enzyme catalyzing theconversion of arachidonate to prostaglandins, was strongly expressed inTsc2-deficientcells invitroand,consequently,prostaglandinbiosynthesiswasalsoenhancedinthesecells(Lietal.,2014).Moreover,thetreatmentwithcelecoxib(aCOX-2-specificinhibitor)waseffectiveinreducingtumorsize in twomousemodels (Li et al., 2014; H. Li et al., 2016). They alsodemonstrated that COX-2was abundant in LAM lesions, and that serumlevels of the prostaglandin E2 (PGE2) were elevated in LAM patientscomparedwithhealthycontrols(Lietal.,2014).Thus,aPilotClinicalTrialof COX-2 Inhibition in LAM and TSC (COLA, NCT02484664) is beingconductedtotestthesafetyandtolerabilityofcelecoxib inpatientswithLAM who are not taking everolimus or rapamycin, and to provide analternativeapproachforthelong-termtreatmentofpatientswithmild-to-moderate LAM. The results of this clinical trial are not yet available.
BOX4:TreatmentofLAM
Formanyyears,hormone-basedtherapieshavebeenusedtotreatLAMpatients,but none of these treatments has yielded robust or definitive evidence of theirclinicalefficacy(McCormacketal.,2016).TheMILES trial demonstrated that sirolimus, amTORC1 inhibitor, improves lungfunctions and reduces the size of AMLs (McCormack et al., 2011). This is thestandard of care for the disease. However, as sirolimus does not kill LAM cells,differentapproachesareneeded.Inhibitors of several factors have been tested, alone or in combination withsirolimus, in recent years. Someexamples are autophagy (Alayevet al., 2014; El-Chemalyetal.,2017)andMMPproduction(Changetal.,2014)inhibitors.

OBJECTIVES


Objectives
29
LAM is caused by the proliferation of stem cell-like cells with lungmetastaticpotentialwhoseoriginiscurrentlyunknown.TheidentificationoftheoriginmayhelptoisolatecirculatingLAMcells,andtheirmolecularcharacterization would be extremely valuable for further understandingdisease development, lung tropism and neoplastic progression. Diseasediagnosis is challenging because of the variability of clinical symptoms.Thereare somecases inwhichnon-invasive techniques suchasHRCTorthe measurement of VEGF-D in plasma are not definitive for diagnosis.Therefore,complementarybiomarkersmayhelpconsolidatenon-invasivedifferential diagnostic protocols, which can also be used for monitoringdisease.Rapamycin, the standardof care for LAM, significantly stabilizespulmonaryfunctionanddecreasesAMLsizeinmostcases.However,thistreatmentdoesnotfullyeradicateLAMcellsandasubstantialproportionofpatientstreatedwiththiscompoundshowacontinueddecline in lungfunction.Consequently,itisnecessarytodiscovernoveltherapiesthat,assingle agents or in combination with a reduced dose of rapamycin, canimprovediseasecare.Toachievethesegoals,specificobjectivesweresetforthreeparallelprojects:
AssessmentoftheleveloftumorigenesisandmetastaticpotentialtothelungofTsc2-deficientmammaryepithelialcells
- To generate a mouse model with conditional Tsc2 deletion inbreasttissue
- To characterize the consequences of Tsc2 deletion in mammaryepithelialcellsfortumorigeniccapacityandlungmetastasis
IdentificationofLAMplasmabiomarkersthatarecomplementarytoVEGF-D
- To predict and analyze selected proteins in the plasma of LAMpatientsrelativetothoseofcontrolgroups
- TopredictandanalyzeselectedmetabolitesintheplasmaofLAMpatientsrelativetothoseofcontrolgroups
- To study the molecular and cellular alterations associated withnovelplasmabiomarkers

Objectives
30
Discoveryofnoveltherapeuticstrategies
- Toexploit knowledgeacquired fromthe identifiedbiomarkers totestnoveltherapeuticstrategiesinvitroandinvivo
- To characterize the molecular and cellular changes underlyingbeneficialtherapeuticresponses
- To perform high-throughput drug screening to reveal additionaltherapeuticapproachesforthisdisease

MATERIALSANDMETHODS


Materialsandmethods
33
1. HUMANSAMPLESLAM patients were recruited, and lung tissue samples collected by theparticipatingcentersandwiththesupportoftheSpanishLAMAssociation(AELAM).ThestudywasapprovedbytheEthicsCommitteesoftheInstitutd’Investigació Biomèdica de Bellvitge (IDIBELL) (Hospitalet de Llobregat,Spain) and the Instituto de Investigación Sanitaria La Princesa (Alcalá deHenares,Spain).
Controlsampleswereobtainedfromasetofhealthywomenwithasimilarage distribution to that of the LAM patients. LAM patient and controlplasma samples were processed in similar ways. Blood was collected inEDTA-treatedtubesandthesetubeswerecentrifugedfor10minat900g.The resulting supernatant was collected using Pasteur pipettes anddepositedin2-mlEppendorftubes,whichwerecentrifugedfor30minat12,000g.Afterthat,theplasmawasapportionedinto150-μlaliquotsandstoredina–80°Cfreezer.Itisimportanttoavoidfreeze-thawcycles.
Emphysema-related plasma samples were obtained from patientsattendingtheInterstitialLungDiseaseUnit,ServiceofPneumologyoftheHospitaldeBellvitge(HospitaletdeLlobregat,Spain).Plasmasamplesforpatientswith LAM-relatedpulmonarydiseaseswere collectedby the ILDCentre of Excellence in St. Antonius Hospital Biobank (Nieuwegein, TheNetherlands).ThestudywasapprovedbytheSt.AntoniusHospitalEthicsCommitteewithreferenceR05-08A.
All the above patients provided theirwritten informed consent for theirsamplestobeused.
1.1 LIQUID CHROMATOGRAPHY–MASS SPECTROMETRYASSAY
Results of liquid chromatography–mass spectrometry assays (LC-MS/MS)were analyzed by the Centre of Omic Sciences (COS) at the UniversitatRovira i Virgili, Spain, set up as part of the Campus de ExcelenciaInternacionalCatalunyaSud.
Plasmasamples(50μleach)weremixedwith300μlcoldmethanol:water,vortexed and cold-centrifuged. Cell pellets were scraped, collected andfrozen. The pellets were resuspended in cold methanol:water andmetabolite lysates, purified with three rounds of liquid nitrogenimmersionandsonication,followedby1honicebeforecentrifugation.To

Materialsandmethods
34
assaythecellcultures,100μlofmediawerelyophilizedandresuspendedin cold methanol:water. The extracts were analyzed by an ultra-high-performance LC system coupled to a 6490 triple-quadruple massspectrometer(QqQ,AgilentTechnologies)withanelectrosprayionsource(LC-ESI-QqQ)workinginpositivemode.
2μlofplasmaextractand1μlofcellandmediaextractwereinjectedintothe LC system.AnACQUITYUPLCHSS T3 column (1.8 μm, 2.1×150mm,Waters), a gradient mobile phase consisting of water with 0.1% formicacid(phaseA)andacetonitrilewith0.1%formicacid(phaseB)wereusedforchromatographicseparation.Theflowofthemethodwas0.3ml/min.The mass spectrometer parameters were: drying and sheath gastemperaturesof120and400°C,respectively;sourceandsheathgasflowsof 19 and 12 L/min, respectively; nebulizer flow 20 psi; capillary voltage2100 V; nozzle voltage 500 V; and iFunnel HRF and LRF 150 and 60 V,respectively.
1.2 ENZYME-LINKEDIMMUNOSORBENTASSAYEnzyme-linkedimmunosorbentassay(ELISA)forhigh-sensitivitydetectionof the human angiopoietin-like 4 (ANGPTL4) (DY3485 DuoSet ELISA kit,R&D systems) was performed in human plasma according to themanufacturer’s instructions.ANGPTL4captureantibodywasplaced inallwells of a 96-well plate and incubated overnight (ON) at roomtemperature (RT). The next day, wells werewashed, and standards andsamples were diluted using the reagent diluent and then loaded induplicateintothe96-wellplate.Afterwashingawayunboundsubstances,the detection antibody was added into the wells. Following a wash toremoveanyunboundreagent,streptavidin-HRPwasaddedtoamplifythesignal.Then,thesubstratesolutionwasaddedtothewellsandthecolordeveloped in proportion to the amount of ANGPLT4 present in thesamples. Color development was stopped with Stop Solution and theintensity of the color was measured as the absorbance at 450 nm byspectrophotometry (VICTOR Multilabel plate reader, PerkinElmer).ExpressionofANGPLT4wascalculatedbyextrapolationfromthestandardcurve.
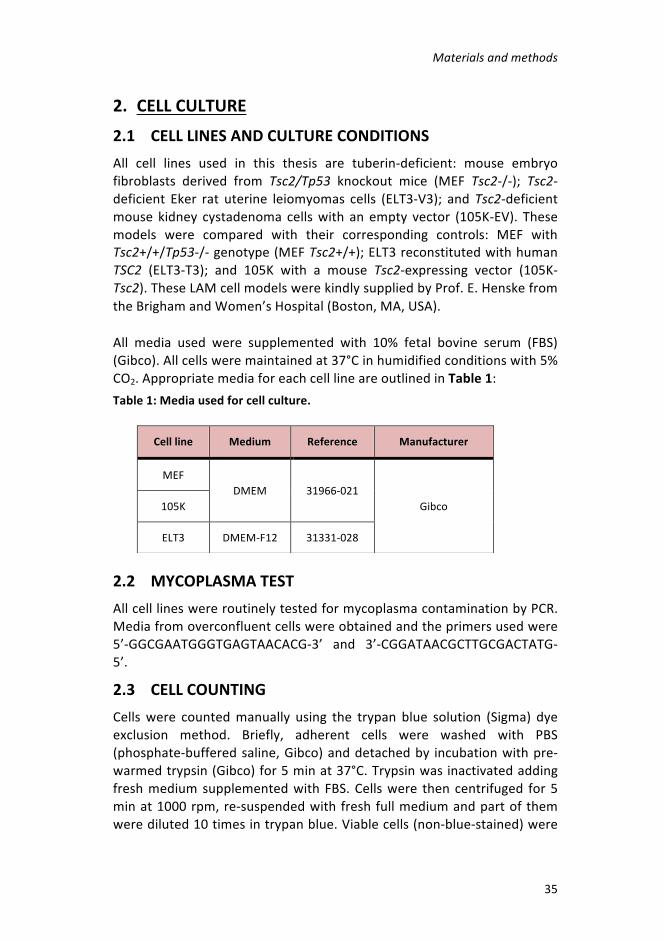
Materialsandmethods
35
2. CELLCULTURE2.1 CELLLINESANDCULTURECONDITIONSAll cell lines used in this thesis are tuberin-deficient: mouse embryofibroblasts derived from Tsc2/Tp53 knockout mice (MEF Tsc2-/-); Tsc2-deficient Eker rat uterine leiomyomas cells (ELT3-V3); andTsc2-deficientmouse kidney cystadenoma cellswith an empty vector (105K-EV). Thesemodels were compared with their corresponding controls: MEF withTsc2+/+/Tp53-/-genotype(MEFTsc2+/+);ELT3reconstitutedwithhumanTSC2 (ELT3-T3); and 105K with a mouse Tsc2-expressing vector (105K-Tsc2).TheseLAMcellmodelswerekindlysuppliedbyProf.E.HenskefromtheBrighamandWomen’sHospital(Boston,MA,USA).
All media used were supplemented with 10% fetal bovine serum (FBS)(Gibco).Allcellsweremaintainedat37°Cinhumidifiedconditionswith5%CO2.AppropriatemediaforeachcelllineareoutlinedinTable1:Table1:Mediausedforcellculture.
2.2 MYCOPLASMATESTAllcelllineswereroutinelytestedformycoplasmacontaminationbyPCR.Mediafromoverconfluentcellswereobtainedandtheprimersusedwere5’-GGCGAATGGGTGAGTAACACG-3’ and 3’-CGGATAACGCTTGCGACTATG-5’.
2.3 CELLCOUNTINGCellswere countedmanually using the trypan blue solution (Sigma) dyeexclusion method. Briefly, adherent cells were washed with PBS(phosphate-bufferedsaline,Gibco)anddetachedby incubationwithpre-warmedtrypsin(Gibco)for5minat37°C.TrypsinwasinactivatedaddingfreshmediumsupplementedwithFBS.Cellswere then centrifuged for5minat1000rpm,re-suspendedwithfreshfullmediumandpartof themwerediluted10timesintrypanblue.Viablecells(non-blue-stained)were
Cellline Medium Reference Manufacturer
MEFDMEM 31966-021
Gibco105K
ELT3 DMEM-F12 31331-028

Materialsandmethods
36
counted using a Neubauer chamber and eight squares/condition wereanalyzed. Cell concentration was calculated according to the followingformula:
𝐶𝑜𝑛𝑐𝑒𝑛𝑡𝑟𝑎𝑡𝑖𝑜𝑛 𝑐𝑒𝑙𝑙𝑠/𝑚𝑙= 𝑀𝑒𝑎𝑛𝑣𝑖𝑎𝑏𝑙𝑒𝑐𝑒𝑙𝑙𝑠𝑝𝑒𝑟𝑞𝑢𝑎𝑑𝑟𝑎𝑛𝑡𝑥𝑑𝑖𝑙𝑢𝑡𝑖𝑜𝑛𝑓𝑎𝑐𝑡𝑜𝑟(0.1𝑥10=)
2.4 CELLFREEZINGANDCRYOPRESERVATIONAftertrypsinizationandcentrifugation,cellswerere-suspendedinfreezingmediumcontaining90%FBSand10%DMSO(Sigma)inaone-thirddilutionofaP100plate.Cellsuspensionwasdistributedincryotubesat1ml/tubeand placed in a container filled with 2-propanol for freezing at –80°Cminimum for 24hours. Then, cryotubeswere stored in a liquidnitrogentankorina–80°Cfreezer.
Tothawcells,cryotubeswereplacedindryicefromthenitrogentankandmoved to the cell culture room,where the cellswerewarmedmanuallyanddiluted inpre-warmedmedium.Theywere centrifugedat1000 rpmfor 5min and the pellet was resuspended in fresh full medium. Finally,they were plated onto a P100 plate to ensure high confluence and tooptimizerecovery.
2.5 TRANSFECTIONANDINFECTIONOFCELLS
Descriptionofplasmids
MISSION short hairpin RNA (shRNA) bacterial glycerol stocks werepurchased from Sigma-Aldrich. These were constructed within thelentivirus plasmid vector, pLKO.1-puro, followed by transformation inEscherichia coli. The vectors contained bacterial (ampicillin) andmammalian(puromycin)antibioticresistancegenestoenableselectionofinserts in either bacterial or mammalian cell lines. The sequences ofshRNAsareoutlinedinTable2andareagainstthemouseMaoagene.ApLKO.1-puroemptyvectorwasusedasthecontrol.Table2:SequencesofMaoashRNAs.
TRCNumber Region Sequence
TRCN0000076750 CDS CCGGCCACACCTTCTTAGAGAGGAACTCGAGTTCCTCTCTAAGAAGGTGTGGTTTTTG

Materialsandmethods
37
TRCNumber Region Sequence
TRCN0000352172 CDS CCGGCCAGAACAGAATCTTACGCTTCTCGAGAAGCGTAAGATTCTGTTCTGGTTTTTG
TRCN0000327502 CDS CCGGCGGATATTCTCAGTCACCAATCTCGAGATTGGTGACTGAGAATATCCGTTTTTG
TRCN0000327503 3’UTR CCGGGCTCAGTTTAATTTCAGTCTTCTCGAGAAGACTGAAATTAAACTGAGCTTTTTG
TRCN0000327588 CDS CCGGCCAACCCAGAACAGAATCTTACTCGAGTAAGATTCTGTTCTGGGTTGGTTTTTG
ObtainingplasmidDNAfrombacterialcultures
BacterialculturesmaybeamplifiedfromtheglycerolstockstopurifytheshRNAplasmidDNA.To thisend,bacteriawere streaked in LB-ampicillindishesandincubatedONat37°C.Thenextday,oneclonewasinoculatedin20mlofLB-ampicillinandincubatedONat37°Cwithagitationof200-250rpm.
LargeamountsofhighlypureplasmidDNAwereextractedfromthe20mlof saturated bacterial culture using PureLink™ HiPure Plasmid FilterMidiprep Kit (Invitrogen), following the manufacturer’s protocol. Theconcentration of the DNA obtained was measured with a NanoDropTM1000spectrophotometer(ThermoScientific).
Lentiviralproductionusingpolyethyleniminetransfection
LentivirusesweregeneratedfromtheHEK293FTcellline.Fortransfection,cellswereseededat60-80%confluenceonaP100plateandtransfectedwiththelentiviralplasmids.
The next day, the followingmixture was prepared in order to transfecteachplasmid:2.3µgofplasmidDNA,1.5µgpPAX2vector,1.5µgpMD2-G,60µlpolyethylenimine(PEI)(Polysciences)andmediumwithoutFBStoa final volumeof1ml. Themixturewas incubated for30minatRTandwasthenaddeddrop-wisetotheplateswhileshakingtheplategentlytoensureitshomogenousdistribution.
Materialsandmethods
38
Onthefollowingday,themediumwasreplacedby10%FBSmediumandincubated ON at 37°C. The day after, supernatants containing lentiviruswerecollectedandfilteredthrougha0.45-μmPESfilter.Thesupernatantsobtainedwerestoredat–80°Cuntiluse.
Lentiviralinfections
The105K-EVcelllinewasusedinthisstep.Cellswereseededtoreach70-80% confluence by the time of infection on 6-well plates. The next day,they were infected with 1ml of the supernatants and incubated ON at37°C.Thefollowingmorning,mediumwasreplacedbyfreshmediumwith2-5µg/mlofpuromycin inorder to selecteffectively infectedcells.Non-infected cellswere always cultured in parallel and treated identically, ascontrols for antibiotic efficiency. Cells were cultured with mediumcontainingpuromycinuntilthenon-infectedcellswerealldead.
3. CELL-BASEDASSAYS3.1 HIGH-THROUGHPUTDRUGSCREENINGIncollaborationwithDr.M.FerrerfromtheNationalCenterforAdvancingTranslational Sciences (NCATS), two drug libraries (NCATS MechanismInterrogation PlatE (MIPE) and NCGC Pharmaceutical Collection (NPC))containingmorethan5000compounds(includingmanydrugsapprovedorinclinicaldevelopmentinthefieldofoncology)werescreenedintheMEFTsc2-deficient cell line and its control counterpart. All processes wereautomated.
Cells were plated at a density of 300 cells/well in 384-well plates andincubatedovernight at 5%CO2 and 37°C. 16 h later, compound librarieswerethenpin-transferredtoproduce10finalconcentrations.Plateswereincubated foranadditional48handATP levelswereanalyzedusingCellTiter Glo as a readout for cell proliferation. All compounds from thelibrariesweretestedinduplicate.
First, the single effects of these compounds were tested, and havingselected some of them, they were combined with everolimus. Tencombinationswereselectedtobevalidatedbyspecificassayswithdose-responsecurvesin96-wellplates.

Materialsandmethods
39
3.2 OTHERTREATMENTSClorgyline was purchased from Sigma-Aldrich, R406 from MedchemExpress,andeverolimus,rapamycin,loratadineandrasagilinefromSelleckChemicals. GA11 was synthesized in the Department of Pharmacy,UniversityofPisa, Italy, followinganestablishedprocedure(Chengetal.,2016).
For cell viability assays, cells were treated with serial dilutions of thesecompounds, alone or in combination with everolimus/rapamycin, whicharebothmTROC1inhibitorsandwhichwehaveusedinterchangeably.Fortheothercell-basedassays, thesameconcentrationswereusedforeachcompound: everolimus/rapamycin 20 nM, clorgyline 1 µM, rasagiline 1µM,GA11100nM,loratadine100nM,andR4061µM.
3.3 CELLVIABILITYASSAYCellswereplatedonto96-well plates at adensityof 500-1250 cells/well(MEF 500 and ELT3 1250 cells/well) in triplicate. After 24 h, cells weretreated for 72 h. Cell viability was evaluated with 2,3-bis-(2-methoxy-4-nitro-5-sulfophenyl)-2H-tetrazolium-5-carboxanilide (XTT, Sigma-Aldrich).After 2 h of incubation, the absorbance was measured byspectrophotometry at a wavelength of 450 nm. Cell viabilities wereevaluated as relative values compared with untreated controls. Forcombinations of treatments, the combination index (CI) was calculatedusingtheCompusyntool(Chou,2006).
3.4 COLONYFORMATIONASSAYCellsweredissociatedintoasingle-cellsuspensionandthenseededonto6-well plates at a density of 50-100 cells/ml (MEF 50 and ELT3 100cells/ml). Two days after seeding, the medium was replaced by freshmedium containing the different treatments, and thereafter every threedays. Cells were cultured for up to two weeks. At the end of theexperiment, cellswere fixedwith coldmethanol, thenwashedwith PBSandstainedwith0.1%crystalviolet(1mg/ml).Threewellswereusedforeachconditionandcolonieswerecountedmanually.
3.5 MIGRATIONASSAYFormigrationassays,two-chambersiliconeinsertswitha500µmcell-freegapinthemiddle(Ibidi)wereplacedin24-wellplates.Cellswereplatedineachchamberatafinalvolumeof70µl,and500µlofadditionalmedium
Materialsandmethods
40
was added, surrounding the insert. Cells were grown to a confluentmonolayerON.Thenextday,theinsertswereremovedtocreatethegapandthemediumwasreplacedwithfreshmediumcontainingthedifferenttreatmentsandwithoutFBS.
For each condition, three measurements were taken for each of threeinserts. Images were collected every 4 h using an inverted DMi1microscope (Leica Microsystems). Migration was measured as thepercentage of the closed area using Image J software. This assay wasperformedwith20,000cells/chamber.
3.6 INVASIONASSAYForinvasionassays,Transwells(Sarstedt)for24-wellplateswithan8-μmpolycarbonatemembranewere used. The bottomof the Transwellswascoveredwith100µlofMatrigel®1hbeforeseedingthecells.Cellswereplaced over theMatrigel® layer in a final volume of 200 µl of completemediumwithoutFBS.Moreover,500µlof10%FBScompletemediumwasadded to thebottomcompartment toactas chemoattractant.Allmediacontainedthedifferenttreatments.Theplatewasincubatedfor24-48hat37°Cinhumidconditionswith5%CO2.
The membrane was then wiped with a cotton swab to remove non-invasivecellsfromtheupperpartofthechamberandfixedfor5minwithcold methanol. It was then washed with PBS and removed from theTranswell using a blade. Finally, the membrane was mounted usingVectashieldwithDAPIonaslide.Foreachcondition,twoTranswellswereusedandninemeasurementsweretakenpermembraneusingaDM6000fluorescence microscope (Leica Microsystems). The invasive cells weremanually counted using Image J software and represented as the totalnumber of invasive cells/field for each condition. This assay wasperformedwith50,000cells/Transwell.
3.7 ALDHACTIVITYASSAYALDHactivitywasdeterminedusingtheALDEFLUOR™assaykit(StemCellTechnologies)accordingtoanoptimizedmanufacturer’sprotocol.Briefly,4x105 cellswerediluted in 400µl ofALDHFbuffer. 5µl of the activatedALDEFLUORreagentwerethenaddedtothecells,andhalfofthismixturewas immediately transferred to a diethylaminobenzaldehyde (DEAB)“control”tubewith5µlofDEABreagent.Bothtubeswere incubatedfor30minat37°C.Cellswerecentrifuged for5minat1000rpmto remove

Materialsandmethods
41
thesupernatantandresuspendedin200µlofALDHFbuffer.ALDHactivitywas measured with a Gallios flow cytometer (Beckman Coulter).Experiments were performed in duplicate for each condition and ALDHactivitywasevaluatedasvaluesrelativetothoseofDEABcontrols.
3.8 MAOACTIVITYASSAYTheactivityofMao-AandMao-BwasmeasuredinMEFTsc2-deficientcellline and its control counterpart in collaborationwithDr. A.Ugun Klusekfrom Nottingham Trent University, UK. Briefly, cells were treated withDMSO, clorgyline 1 µM, deprenyl 1 µM (similar to rasagiline), and thecombinationof the twoMao inhibitors. Thus,we related the amount ofspecificactivitytoeachMaoisoform,andcomparedthetotalMaoactivityoftheTsc2-deficientcelllinewiththatofthecontrolline.Theactivitywasmeasured as the level of radioactivity exhibited by the products of thereactioninrelationtothetotalmassofthoseproducts.
3.9 FADDETECTIONASSAYThe intracellular production of FAD was measured using the FADColorimetric Assay Kit (BioVision) following themanufacturer’s protocol.Briefly, 2x10⁶ cells were diluted in 400 µl of assay buffer. Cells werecentrifuged for 3 min at 13,000 g and the supernatant was retained.Samples were deproteinized using cold perchloric acid (PCA) at a finalconcentration of 1 M and centrifuged again. The supernatant wasneutralizedwith cold potassiumhydroxide (KOH) and centrifuged for 15minat4°C.SamplesandstandardswereincubatedwithFADenzymemix,OxiRed Probe and assay buffer for 15–60 min at 37°C in triplicate andmeasuredbythecolorimetricmethod(λ=570nm).
3.10 MITOTRACKERThe MitoTracker™ Red CMXRos (Invitrogen) was used to labelmitochondria within live cells by using the mitochondrial membranepotential.Cellsseededin6-wellplateswereincubatedwith500nMoftheMitoTrackerdyedilutedinPBSfor30minat37°C.Cellswerethenwashedwith PBS, trypsinized, and fixed with 2% PFA. MitoTracker staining wasmeasured by flow cytometry. Experiments were performed in duplicateforeachcondition.

Materialsandmethods
42
3.11 MITOCHONDRIALRESPIRATIONASSAYHigh-resolution Oxygraph-2K (Oroboros Instruments) was used tomeasuretheoxygenconsumptionincells.Inbrief,aconcentrationof106cells/mldilutedincompletemediumwasplacedintheclosedspirometerchamber to measure oxygen consumption. Oxygen flux was recordedcontinuously using DatLab software 4.3 (Oroboros Instruments). Theresultingdataweredirectlyproportionaltooxygenconsumption.
3.12 MITOSOXThe MitoSOX™ Red (Invitrogen) was used to quantify mitochondrialsuperoxideproduction.Cellsseededin6-wellplateswereincubatedwith5µMoftheMitoSOXdyediluted inHank’sBufferedSaltSolution(HBSS)for10minat37°C.CellswerethenwashedwithPBS,trypsinized,andfixedwith2%paraformaldehyde(PFA).MitoSOXstainingwasmeasuredbyflowcytometry.Experimentswereperformedinduplicateforeachcondition.
3.13 H2O2DETECTIONASSAYThe production of hydrogen peroxide (H2O2) was measured with afluorescent hydrogen peroxide assay kit (Sigma) following themanufacturer’sprotocol.Briefly,differentconcentrationsofcells(0-1x10⁵)were diluted in 50 µl of assay buffer and seeded in a 96-well plate. Astandard curve of H2O2 ranging from 0 to 10 µM was prepared. Thestandardsandthesampleswereincubatedwithredperoxidasesubstrate,horseradishperoxidaseandassaybuffer toa finalvolumeof100µl.Theplate was incubated for 30 min at RT protected from light. Finally, thefluorescenceintensity(λex=540/λem=590nm)wasmeasured.
4. INVIVOMODELS4.1 ANIMALCOREFACILITIESANDCONDITIONSAnimal studies inwhich patient-derived sampleswere implanted, or celllines injected, were performed at the IDIBELL Animal Core Facility(AAALAC unit 1155). In this case, animals were maintained in SpecificPathogen Free (SPF) and sterile conditions. These experiments wereperformedfollowingtheEuropeandirectivesonethicaluseofrodentsforanimalresearch(approval#8409).

Materialsandmethods
43
TransgenicmicewerekeptintheUBAnimalCoreFacility(UEAdeBellvitgeB-9900046) andmouse colonieswere generated following the Europeandirectivesonethicaluseofrodentsforanimalresearch(approval#9774).
4.2 PATIENT-DERIVEDXENOGRAFTMOUSEMODELInorder toobtainapatient-derivedxenograft (PDX)mousemodel, smallfreshpiecesoflungfrombiopsiesofLAMpatientswereimplantedintothemammary fat pad and/or subcutaneously into the flank of femaleNOD-scid mice and perpetuated throughout several passages. In most cases,miceweresacrificedwhenthetumorsreachedavolumeof1000mm3.
4.3 TUMORGENERATIONBYCELLINJECTION
ELT3-V3invivomodel
Six-week-old female NOD-scidmice were purchased from Charles River,and subcutaneously injected bilaterally into the flank and shoulderwithELT3-V3cells(2×10⁶cellsperinjection/site/mouse).Whentumorsreacheda volume of 150-200mm3 they were randomly assigned to control andtreatment groups. The drugs were administered on 5 days/week asfollows: vehicle control (0.2% carboxymethylcellulose (CMC) and 0.25%Tween-80;intraperitoneal),everolimusorrapamycin(1or0.25mg/kg/dayin CMC; intraperitoneal), GA11 (20 mg/kg/day in CMC; intraperitoneal),clorgyline (10 mg/kg/day in PBS; intraperitoneal), and rasagiline (1mg/kg/dayinPBS,intraperitoneal).
105K-EVinvivomodel
Six-week-old female C57BL/6J mice were purchased from Charles River,and inoculated with 105K cells (2.5×10⁶ cells). When tumors attained avolumeof50-100mm3(monotherapy)or150-200mm3(rapamycinanditscombinations) they were randomly assigned to control and treatmentgroups.Thedrugswereadministeredasdetailedaboveaddingloratadine(25mg/kg/dayinCMC;intraperitoneal).
ForshRNAassays,after testing theeffect inMaoa silencingproducedbyall the constructs listed in section 3.5.1, the following were used:TRCN0000327502 and TRCN0000327503. The 105K cells (2.5×10⁶ cells)were injected subcutaneously and tumor growthwasmeasuredweekly,starting2weeksafterinjection.
Materialsandmethods
44
4.4 TRANSGENICMOUSEMODELC57BL/6JmicewithloxPsitesflankingexons2,3and4ofTsc2(Tsc2flox/flox)andmiceexpressingCrerecombinaseunderthecontroloftheovinebetalactoglobulin promoter (BLGCre+) were crossed to obtain offspring withexons 2, 3 and 4 deleted in the Cre-expressing tissues. A first crossprogeny(F1)washeterozygousfortheTsc2floxedallele,andanimalsforthis F1 were then crossed with parental Tsc2flox/flox mice to obtain Crerecombinase carrier animals homozygous for the Tsc2 floxed allele. Forthispurpose,micewereperiodicallygenotyped.
Genotyping
Pupswereweanedat3weeksofage,sexedandidentifiedwitheartags.DNA for genotyping the pups was extracted from tail pieces that wereimmersed in digestion solution (10-10-0.15 TEN; 0.8% SDS; 0.4 mg/mlproteinaseK)andincubatedat56°Cfor3h.Then,onevolumeeachof10-10-0.65 TEN and of phenol chloroform isoamyl alcohol were added andcentrifugedat 12,000 rpm for 10min. Theaqueousphasewas kept andmixedwithtwovolumesofabsoluteethanoland10%ofsodiumacetate3M.ThiswasleftONat–20°CtoallowtheDNAtoprecipitate.Thenextday,the sampleswere centrifuged,washedwith ethanol and resuspended indH2O.
GenotypingPCRswerethenperformedusingtheprimerslistedinTable3.ForCretransgene,onepairofprimersspannedtheCrerecombinaseandanother pair the endogenous control Interleukin 2 (Il2). For the Tsc2transgene, one pair of primers guaranteed that two different fragmentswereobtainedwhenwildtype(WT)orTsc2floxedalleleswereamplified.
Table3:Primersforgenotypingtransgenicmice.
Gene Primer Sequence Primertype Amplification
Cre
oIMR1084
GCGGTCTGGCAGTAAAAACTATC
Transgeneforward Cre
oIMR1085
GTGAAACAGCATTGCTGTCACTT
Transgenereverse Cre
oIMR7338
CTAGGCCACAGAATTGAAAGATCT
Internalcontrolforward Il2

Materialsandmethods
45
Gene Primer Sequence Primertype Amplification
oIMR7339
GTAGGTGGAAATTCTAGCATCATCC
Internalcontrolreverse Il2
Tsc2
25229 ACAATGGGAGGCACATTACC
Transgeneforward Tsc2
25230 AAGCAGCAGGTCTGCAGTG
Transgenereverse Tsc2
Sampleswerethenrunona2%agarosegelstainedwiththecyaninedyeSYBRSafe™(LifeTechnologies) forvisualizingtheDNAfragments.A1KbPlusDNAladder(Invitrogen)wasusedasamolecularweightmarkerandnegative (water) and positive controls were also included in order toconfirm the quality of the PCR. An example of these PCRs is shown inFigure8.
Figure8:AgarosegelsofPCRs for genotyping transgenicmice.A)Cre: a singleband(300bp),correspondingto Il2amplification,canbeobservedforWTmice.An extra band (100 bp), corresponding to Cre amplification, represented Crecarrier(Cre+)mice.B)Tsc2:asingleband(200bp)correspondedtoWT(Tsc2+/+)mice,anothersingleband(250bp)tohomozygousTsc2 floxed(Tsc2flox/flox)mice,andthedouble-bandpatterntoheterozygousTsc2floxed(Tsc2flox/+)mice.

Materialsandmethods
46
ValidationofTsc2recombination
Whentheanimalsreachedtheend-pointoftheexperiment,Tsc2deletionwasevaluatedbytargetedPCRassays.DNAwasextractedfrommammaryglandand liver tissueusing thesameprotocolas that for tail tissueDNAextraction(explainedinthegenotypingsection).PrimersP3F,P4FandP3R(listedinTable4)weredesignedtodetecttheTsc2nullalleleaswellasthenon-recombinantallele(Figure9).Table4:PrimersforvalidationofTsc2recombination.
Gene Primer Sequence Target
Tsc2
P3F AAGATTCCGGCTTGAAGGAG Exon1
P4F CACTAGTCTAGCCTGACTCT Exon4
P3R GAGGACAAGCCAACATCCAT Exon5
Figure 9: Generation of Tsc2flox and Tsc2null alleles. Gene-targeting construct.Exons are indicated by boxes labeled with exon numbers and LoxP sites aremarkedbyorange triangles.PCRprimersP3F,P4FandP3Rare shownbygreenarrows.TheblueexonsarethosedeletedafterCre-mediatedrecombination.

Materialsandmethods
47
5. MOLECULARANALYSIS5.1 GENEEXPRESSION
RNAextractionfromcells
After trypsinization and centrifugation, the pelletwaswashedwith PBS,recentrifuged, and immediately stored at –80°C until the RNA wasextracted. Total RNA was isolated from the resulting cell pellet usingTRIzol™ reagent (Life Technologies) according to the manufacturer’sinstructions.
TheRNAobtainedwasquantified inaNanoDropspectrophotometerandthequalityoftheRNAwasvalidatedbyloading500ngontoa2%agarosegel.
To avoid gDNA contamination, an additional DNAse treatment wasperformed using a DNASE I amplification grade kit (Thermo FisherScientific),followingthemanufacturer’sinstructions.
RNAextractionoftissues
Frozen tissue samples were disrupted using a TissueLyser II (Qiagen).Approximately25mgoftissueweremixedwith1mlofTRIzolreagentandwith stainless-steel beads in 1.5-ml Eppendorf tubes. The TissueLyser IIsimultaneously homogenized multiple biological samples by high-speedshaking (20 shakes/s for 5 min). The same manufacturer’s protocol asbeforewasfollowedfromthisstep.
ObtainingcDNAfromRNA
First-strandcDNAwassynthesizedusingtheHighCapacitycDNAReverseTranscription Kit (Thermo Fisher Scientific) following themanufacturer’sprotocol.Briefly,amixtureofelementswaspreparedforeachsample:1µlRNaseinhibitor,3µlRTbuffer,3µlrandomprimers,1.2µlddNTPs,1µlreversetranscriptase,and0.8µlsterilewater.10µlofthismixturewerethenaddedtosamplesandthereversetranscriptionreactioncarriedoutunderthefollowingconditions:10minat25°C,2hat37°Cand5minat85°C.ThecDNAobtainedwasstoredat–20°Cuntiluse.

Materialsandmethods
48
Real-timequantitativePCR(RT-PCR)
Gene expression values were measured using SYBR Green dye (AppliedBiosystems). 1µl of cDNAwas loaded intoeachwell of a 384-well platemixedwith5µlofPowerUp™SYBR™GreenMasterMix (ThermoFisherScientific),0.25µloftheprimersofinterest(listedinTable5)anddH2Otoafinalvolumeof10µl.Table5:PrimersusedinRT-PCRassays.
Gene Forward Reverse Species
Aldh1a3 CACAGGCTCCATTTGGTGG CAGCTTTTGAGGAAGAAGCC Mouse
Aldh1a3 ACCGGCTCCACAGAGGTT AGTGTGACCCGCTTCAGGT Rat
Aldh2 GACGCCGTCAGCAGGAAAA CGCCAATCGGTACAACAGC Mouse
Aldh2 CAGCTACACCCGCCAGAGC GCGGTAGGGCCGAATCCAGG Rat
Aldh3a1 GATGCCCATTGTGTGTGTTCG CCACCGCTTGATGTCTCTGC Mouse
Aldh3a1 CAAATCGTGGAGAAGCTCAAG CCATAATCACGGGACTGCTT Rat
Aldh3b1 CCTTCTCCAAGAGAAGCCAGG GGAGAACTTGCCGTGGTACC Mouse
Aldh3b1 GGTGGGCCTCAGGAAACT CCATGACGATCTTGCCTACAT Rat
Aldh3b2 GCTTTGCTGTGATGTTGGGGAGG TCGCAGTTGTCATCCACATAGC Mouse
Aldh3b2 TTGTATGCCTTCTCCAACAATG AGGTAGAGGAAGCCGTCGTT Rat
Bnipl TGGCCTCAATGCTGTCATC GCTCCAAAGTTCCCACCATA Rat
Catalase AGCGACCAGATGAAGCAGTG
TCCGCTCTCTGTCAAAGTGTG
Mouse
Hrh1 CAAGATGTGTGAGGGGAACAG CTACCGACAGGCTGACAATGT Mouse
Maoa GCCCAGTATCACAGGCCAC CGGGCTTCCAGAACCAAGA Mouse
Maoa TTCAGCGTCTTCCAATGGGAGCT TGCTCCTCACACCAGTTCTTCTC Rat
Maob CCAGAATCATCTCAACAACCAA TCACTTGACCAGATCCACCA Mouse
Maob GCATCTTGACCCAGTATGGAA TGCCTGCAAAGAAAATCTTG Rat
Prlr CGCTTCTCTGTGGAGGTGA GGAGGCTGATGCTGAGGACA Mouse

Materialsandmethods
49
Gene Forward Reverse Species
Prlr GTAGATGGAGCCAGGAGAGTTC GGTGGAAAGATGCAGGTCATCAT Rat
Slc18a1 TGGCAGTAGGTATCAGCTTGC ATTGGGGCCAATAAGACCA Rat
Vdac CCCACATACGCCGATCTTGG GTGGTTTCCGTGTTGGCAGA Mouse
The plate was read with a LightCycler®480 Instrument II (Roche) andresultswereanalyzedusingLightCycler®480Software1.5(Roche).
Thedifferencesbetweengeneswerecomputedusing theΔ-ΔCtmethod.Thenumberofcyclesrequiredtodetectthefluorescentsignal(Ct)ofeachgenewas normalizedwith respect to the Ct of the housekeeping genes(Table 6). Finally, RNA expressionwas calculated using the value of ΔCtobtainedinaccordancewiththeequation:
𝑅𝑁𝐴𝑒𝑥𝑝𝑟𝑒𝑠𝑠𝑖𝑜𝑛:2D∆FG = 2D(FGHIJIKDFGLMNOIPIIQRJHHIJI)
Table6:Primersofhousekeepinggenesforeachspecies.
Housekeeping Forward Reverse Species
Actb GGGGGTTGAGGTGTTGAG GTCTCAAGTCAGTGTACAGGCC Mouse
Actb AGAGGGAAATCGTGCGTGAC GTGCTAGGAGCCAGGGCAGTA Rat
5.2 PROTEINDETECTION
Westernblot(WB)
Preparationofproteinlysatesfromcellculture
CellsculturedusuallyonP100plateswerelysedusinglysisbuffer(80mMTris-HCl, 2% SDS, pH 6.8). After washing cells with PBS, the plate wasplacedonicetoavoidproteindegradation,thelysisbufferwasadded,andcellswerescrapedusingacellscraper(Sarstedt).Thelysatewassonicatedoniceandwasstoredat–20°C.
Materialsandmethods
50
Preparationofproteinlysatesfromtissues
Pieces of fresh or frozen tissues weremechanically disrupted in a glasshomogenizerusingRIPAbuffer(PBS,1%NP40,0.1%SDS,5mg/mlsodiumdeoxycholate)supplementedwithproteaseinhibitorcocktail(cOmplete™,Roche Molecular Biochemicals) and phosphatase inhibitor cocktail(PhosSTOP™,RocheMolecularBiochemicals).Thisprocesswasperformedon ice. The lysate was transferred into a 1.5-ml Eppendorf tube andincubatedonicefor30min.Itwasthencentrifugedat14,000rpmfor15minat4°C,thesupernatantwascollectedandwasstoredat–20°C.
Quantificationofproteinextracts
ProteinconcentrationwasmeasuredusingtheThermoScientificPierce™BCA Protein Assay. A standard curve of protein concentration, rangingfrom 0 to 2 mg/ml, was prepared using bovine serum albumin (BSA).Samplesofinterestwerepredilutedto1:5inPBS.
First,200μlofBCAWorkingReagent(50:1,ReagentsA:B)wereplacedin96-well plates. Then, 25 µl of the known concentrations of BSA orprediluted samples were added and mixed carefully in order not toproduce bubbles. Every measurement was done in triplicate. The platewas incubated at 37°C for 30 min, protected from light, and thenabsorbancewasmeasuredat560nmby spectrophotometry. Finally, theproteinconcentrationofthesampleswascalculatedbyextrapolationfromtheBSAstandardcurveandapplyinga1:5dilutionfactor.
Once quantified, each lysate was mixed with loading buffer (Laemmlibuffer:300mMTris-HClpH6.8,8%SDS,0.008%bromophenolblue,40%glycerol,10%2-mercaptothanol)atafinalconcentrationof1:4andboiledfor 5 min at 95°C in order to reduce and denature the samples. Thesewerethenstoredat–20°Cuntiluse.
ProteinanalysisbyWB
Tomeasureproteinexpression, lysateswere resolved in sodiumdodecylsulfate–polyacrylamide gel (SDS-PAGE) electrophoresis gels. These gelscomprisedtwoparts:astackingandaresolvingfraction.Thestackingpartwasalwayspreparedat4%acrylamideconcentrationanditspurposewastogatherproteins. Intheresolvingpart, theconcentrationofacrylamiderangedfrom8to15%,dependingonthemolecularweightoftheproteinsofinterest.Thisportionservedtoseparatetheseproteinsbysize.
Materialsandmethods
51
Gelswerepreparedusing1.5-mm-wideglassplates(Bio-Rad)and10-wellcombs,withamixtureofH2O,acrylamide-bisacrylamide,Tris-HCl(1.5mMandpH8.8forstacking;0.5mMandpH6.8forresolving)with0.4%SDS,APSandTEMED.Usually,50µgofproteinwereloadedintothewellsandamolecular weight marker (pre-stained Page RulerTM, Thermo Scientific)wasused.
Thegelwasplacedintotherunningbuffer(25mMTris,192mMglycine,0.1%SDS)andtheproteinswereseparatedataconstantvoltageof120Vfor approximately 90 min at RT. The proteins were then transferred topolyvinylidene fluoride (PVDF) membranes (Roche MolecularBiochemicals) that had been previously activated in methanol. Theacrylamidegel togetherwiththePVDFmembrane,Whatmanpapersandsponges, forming a “sandwich”,wereplaced into the transfer buffer (25mM Tris, 192 mM glycine, 20% methanol), and the proteins weretransferredat90Vfor100minat4°C.
Themembranewasblockedtopreventnon-specificbindingoftheprimaryantibodywith5%skimmedmilk(Nestle®)inTBS-T(Tris50mM,NaCl150mMand0.1%Tween20) for1hatRTwithagitation.Afterblocking, themembrane was cut and incubated with appropriate dilutions of theprimaryantibodieslistedinTable7inTBS-T1%skimmedmilkONat4°C.
Thenextday,afterwashing inTBS-Tthrice for10min,membraneswereincubated with the HRP-linked secondary antibodies anti-rabbit or anti-mouseIgG-HRP(SantaCruz)diluted1:2000inTBS-T1%skimmedmilkfor1houratRT.Finally,afterwashinginTBS-Tthricefor10min,blotsweredevelopedusingtheNovex™ECLChemiluminescentSubstrateReagentKit(Invitrogen) inChemiDoc™ ImagingSystem(Bio-Rad)andquantifiedwithImageLabsoftware(Bio-Rad).
Hematoxylin-eosin(HE)staining
In order to visualize the morphology of the tissues, paraffin-embeddedblocks were cut into 3-5-µm-thick sections using a microtome (ThermoFisherScientific)anddepositedonpoly-L-lysinepretreatedslides.Sectionsweredeparaffinizedbysubjectingthemtoabatteryoffourxylene(10mineach), threeabsoluteethanol, three96%ethanol,one70%ethanol, andone 50% ethanol (5 min each) submersions. Finally, sections wererehydratedbysubmergingthemindH2O.

Materialsandmethods
52
Slides were submerged for 10min in hematoxylin 0.1% (Merck) in 96%ethanolandrinsedintapwatertoeliminatetheexcessliquid.Afterwards,theyweresubmerged in1%HCluntil thetissuecolorshiftedtored,andtheninanaqueousammoniasolution(200mlofdH2Owith1mlof30%ammonia) until the color reverted to turned blue. Sections werecounterstained in eosin (2.5 g eosin in 1 L 50% ethanol) for 10 min,dehydratedandmountedusingDPX(Merck).TheywerevisualizedusingaNikonEclipse80imicroscopeandimageswerecapturedwithaNikonDS-Ri1digitalcamerausingNIS-ElementsBR3.2(64-bit)software.
Immunohistochemistry(IHC)
Toidentifyproteinsinthecellsofatissuesection,afterdeparaffinizationand rehydration, slideswere submerged in sodium citrate solution (0.38mg/ml)atpH6.0,or incommercialEDTAsolution(DAKO)atpH9.0,andheated for 15min in a pressure cooker, or for 25min in a microwave,respectively. This process served to retrieve antigens masked duringroutine fixation.Sampleswerecooledwithin thesolutions for20-30minandwashedwithdH2Ofor5min.
Endogenousperoxidaseactivitywasblockedby incubationwith6%H2O2for15min.SlideswerewashedwithdH2Ofor5minandcellmembraneswerepermeabilizedbyimmersioninPBS-T(PBSwith0.1%Tween20)for10min.
The next step involved blocking the sections in order to reduce non-specificbindingwithgoatserumdiluted1:10inPBSfor1hatRT,followedby incubation ON at 4°C with primary antibodies (Table 7) diluted inblocking solution. All incubations were performed in a humid chamberprotectedfromthelight.
The next day, slides were washed thrice with PBS-T for 10 min, thenincubatedwithsecondaryanti-mouseoranti-rabbitEnvision+-System-HRP(Dako)antibodiesfor1hatRT.Afterthat,sampleswerewashedagainanddevelopedusingachromogenicsubstrateDAB+kit(EnVision™Kit,Dako),for 1 to 10 min, depending on the antibody, until a brown precipitateappeared.Thereactionwasstoppedbyrinsingtheslideswithtapwater.Finally, sections were counterstained with hematoxylin, dehydrated,mountedandanalyzedasHE-stainedslides.
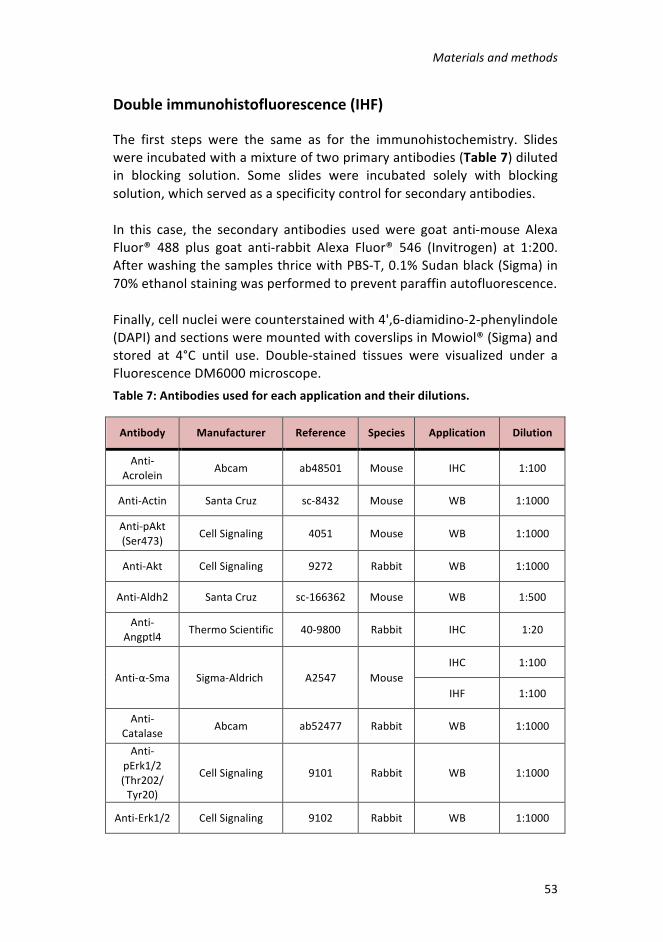
Materialsandmethods
53
Doubleimmunohistofluorescence(IHF)
The first steps were the same as for the immunohistochemistry. Slideswereincubatedwithamixtureoftwoprimaryantibodies(Table7)dilutedin blocking solution. Some slides were incubated solely with blockingsolution,whichservedasaspecificitycontrolforsecondaryantibodies.
In this case, the secondary antibodies usedwere goat anti-mouse AlexaFluor® 488 plus goat anti-rabbit Alexa Fluor® 546 (Invitrogen) at 1:200.AfterwashingthesamplesthricewithPBS-T,0.1%Sudanblack(Sigma)in70%ethanolstainingwasperformedtopreventparaffinautofluorescence.
Finally,cellnucleiwerecounterstainedwith4',6-diamidino-2-phenylindole(DAPI)andsectionsweremountedwithcoverslipsinMowiol®(Sigma)andstored at 4°C until use. Double-stained tissues were visualized under aFluorescenceDM6000microscope.Table7:Antibodiesusedforeachapplicationandtheirdilutions.
Antibody Manufacturer Reference Species Application Dilution
Anti-Acrolein Abcam ab48501 Mouse IHC 1:100
Anti-Actin SantaCruz sc-8432 Mouse WB 1:1000
Anti-pAkt(Ser473) CellSignaling 4051 Mouse WB 1:1000
Anti-Akt CellSignaling 9272 Rabbit WB 1:1000
Anti-Aldh2 SantaCruz sc-166362 Mouse WB 1:500
Anti-Angptl4 ThermoScientific 40-9800 Rabbit IHC 1:20
Anti-α-Sma Sigma-Aldrich A2547 MouseIHC 1:100
IHF 1:100
Anti-Catalase Abcam ab52477 Rabbit WB 1:1000
Anti-pErk1/2(Thr202/Tyr20)
CellSignaling 9101 Rabbit WB 1:1000
Anti-Erk1/2 CellSignaling 9102 Rabbit WB 1:1000

Materialsandmethods
54
Antibody Manufacturer Reference Species Application Dilution
Anti-Hif1α NovusBiologicals NB100-105SS Mouse
WB 1:500
IHC 1:50
Anti-Hrh1 ThermoScientific PA5-27817 RabbitWB 1:1000
IHC 1:500
Anti-Lc3 MBLInternational PM036 Rabbit WB 1:1000
Anti-MaoA Abcam ab126751 Rabbit
WB 1:1000
IHC 1:100
IHF 1:100
Anti-MaoB ThermoScientific HPA002328 Rabbit
WB 1:250
IHC 1:100
IHF 1:100
Anti-p62 CellSignaling 5114 Rabbit WB 1:1000
Anti-Parkin Sigma-Aldrich P6248 Mouse WB 1:500
Anti-Pink1 Abcam ab23707 Rabbit WB 1:500
Anti-Prlr SantaCruz sc-30225 Rabbit IHC 1:100
Anti-pS6RibosomalProtein(Ser235/236)
CellSignaling 2211 Rabbit
WB 1:1000
IHC 1:250
Anti-S6RibosomalProtein
SantaCruz sc-74459 Mouse WB 1:500
Anti-pSrc(Tyr416) CellSignaling 2101 Rabbit WB 1:1000
Anti-pSrc(Tyr530) CellSignaling 2105 Rabbit WB 1:1000
Anti-Src CellSignaling 2108 Rabbit WB 1:1000
Anti-Tsc2 SantaCruz sc-893 Rabbit WB 1:250

Materialsandmethods
55
Antibody Manufacturer Reference Species Application Dilution
Anti-Tubulin Abcam ab44928 Mouse WB 1:1000
Anti-Vdac Abcam ab15895 Rabbit WB 1:1000
Anti-Vimentin SantaCruz sc-6260 Mouse IHC 1:200
Anti-Vinculin Sigma-Aldrich V9131 Mouse WB 1:1000
Anti-Vmat1/Slc18a1
SantaCruz sc-166391 mouse IHC 1:100
6. INSILICO:ENRICHMENTANALYSESANDGENEEXPRESSION
Metastatic breast cancer data were taken from the correspondingpublication (Finlay et al., 2005) and Gene Expression Omnibus (GEO)reference GSE5327. The TSC2 expression correlations were computedusing probe 215735_s_at and Pearson’s correlation coefficients (PCCs).Official gene names and Entrez IDs were cross-referenced to UniProtsecreted and enzymatic protein identifiers (human only and manuallycurated).Associatedreactantmetabolitesfromagenome-scalemetabolicnetwork model (Recon 2.2 (Swainston et al., 2016)) were mapped toenzymes,resultinginatotalof47metabolites,whichwereevaluatedforover-represented pathways using theMetaboAnalyst tool (Chong et al.,2018), assuming standard parameter values. Cancer Genome Atlasnormalized breast cancer RNAseq data were obtained from cBioPortal,andtheGeneSetEnrichmentAnalysis(GSEA)method(Subramanianetal.,2005)wasapplied,adoptingstandardparametervalues.
ELT3-V3 tumor xenographs were sequenced at the IRB’s facility inBarcelona. For transcriptomicanalyses, theRNASeq readswere trimmedof adaptors,masked for low-complexity and low-quality sequences, andsubsequently quantified for transcript expression using Kallisto v0.43.1(Bray et al., 2016) and rat genome build rn6. Gene-level counts wereobtained using tximport, rn6 and Ensembl v94 annotations. DifferentialexpressionanalyseswereperformedusingDESeq2v2.13.Geneontology(GO)termenrichmentwasanalyzedusingclusterProfiler(Yuetal.,2012)andGOnet(Pomaznoyetal.,2018).
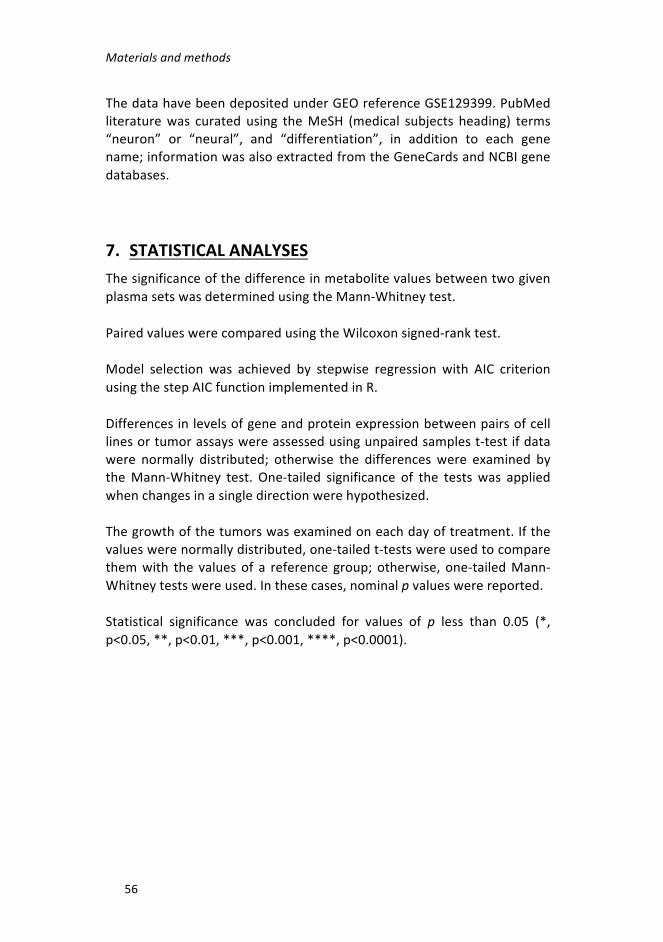
Materialsandmethods
56
ThedatahavebeendepositedunderGEOreferenceGSE129399.PubMedliteraturewas curated using theMeSH (medical subjects heading) terms“neuron” or “neural”, and “differentiation”, in addition to each genename;informationwasalsoextractedfromtheGeneCardsandNCBIgenedatabases.
7. STATISTICALANALYSESThesignificanceofthedifferenceinmetabolitevaluesbetweentwogivenplasmasetswasdeterminedusingtheMann-Whitneytest.
PairedvalueswerecomparedusingtheWilcoxonsigned-ranktest.
Model selection was achieved by stepwise regression with AIC criterionusingthestepAICfunctionimplementedinR.
Differencesinlevelsofgeneandproteinexpressionbetweenpairsofcelllinesortumorassayswereassessedusingunpairedsamplest-testifdatawere normally distributed; otherwise the differences were examined bytheMann-Whitney test. One-tailed significance of the testswas appliedwhenchangesinasingledirectionwerehypothesized.
Thegrowthofthetumorswasexaminedoneachdayoftreatment.Ifthevalueswerenormallydistributed,one-tailedt-testswereusedtocomparethemwith the valuesof a reference group;otherwise, one-tailedMann-Whitneytestswereused.Inthesecases,nominalpvalueswerereported.
Statistical significance was concluded for values of p less than 0.05 (*,p<0.05,**,p<0.01,***,p<0.001,****,p<0.0001).

RESULTS


Results
59
1. EVALUATIONOFNOVELLAMANIMALMODELS
Contribution: I carried out the following tasks: design of the strategy togenerate the transgenic mice model and to study their evolution;managementofthemousecolony,thegenotypingprocess,thesacrificeofmiceandthevalidationofTsc2recombination;phenotypicandmolecularanalyses of tissue samples; participation in the implantation of patient-derivedsamples.
1.1 STUDY OF CONDITIONAL Tsc2-DELETION IN THEMAMMARYEPITHELIUM
GiventheunknownoriginofLAMcellsandthesimilaritiesofthediseasetolung-metastatic breast cancer, we aimed to test the phenotypicconsequences of conditional deletion of Tsc2 in the normal mousemammaryepithelium.
For this study, C57BL/6J mice with loxP sites flanking exons 2-4 of Tsc2(generated by Dr. M. Gambello’s group (Hernandez et al., 2007)) werepurchased from Jackson Laboratories. When these mice are bred withothersthatexpresstheCretransgene,theresultingoffspringhaveexons2-4 deleted in their Cre-expressing tissue. So, these Tsc2flox/flox mice were crossedwithmiceexpressingCreunderthecontroloftheovineBLGgene,codingforbeta-lactoglobulin,togenerateheterozygousBLGcre/wt/Tsc2flox/wtmice. The lactoglobulin promoter has been shown only to direct Creexpression to the secretory epithelial cell compartment of themammarygland (Selbert et al., 1998). Importantly, conditional deletionofBrca1 bythesameapproachproducedbreasttumorsthatrecapitulatedthehumantumor subtype that preferentially metastasizes to lung (Molyneux et al.,2010).HeterozygousmicewerethencrossedwithparentalTsc2flox/floxmicetoobtainTsc2flox/flox/BLGcre/wtorTsc2flox/flox/BLGwt/wtfemalemice.AnoutlineofthestrategyisshowninFigure10.

Results
60
Figure 10: Crossing strategy for obtaining the Tsc2flox/flox/BLGCRE/wt andTsc2flox/flox/BLGwt/wttransgenicmicetobeanalyzedinthisstudy.
TheexpressionoftheBLGpromoterisknowntobehighduringgestation,birth and lactation (Selbert et al., 1998). Thus, to ensure maximalrecombination within the mammary gland, the desired females werepairedtoexperiencetwocyclesofpregnancyandlactationtoactivatetheexpression ofCre and develop the conditional deletion of the Tsc2 gene(hereafter,theCre+inducedgroup).FemalelittermatesthatdidnotharbortheCretransgenebutdidexperiencetwocyclesofpregnancyandlactation(Cre- induced group)wereused as controls ofTsc2deletionwithoutCre.ThosethatdidexpressCrebutwerenotpaired(Cre+non-inducedgroup)wereusedascontrolsofCreexpressionwithoutBLGactivation(Figure11).

Results
61
Figure 11: Experimental groups analyzed in this study. Three groups weregenerated:Cre+induced,Cre-inducedandCre+non-inducedgroups.WeexpectedtoobtainTsc2deficientallelesintheCre+inducedgroupaftertwocyclesofpregnancyandlactation.
ValidationofTsc2recombination
Exons2-4ofTsc2weredeletedinthebreasttissueofCre+ inducedmice,butnotinlivertissue(Figure12A).However,inCre+non-inducedmice,theTsc2-null allele was also identified, suggesting that some leakage of Creexpression occurs (Figure 12A). In turn, the detection of the non-recombinant floxed allele in breast tissue from the Cre+ inducedmousegroup(Figure12B)probablyreflectstheexistenceofnon-epithelialstromalcells (e.g., adipocytes, fibroblasts, and immune cells) that were notresponsive to lactation/pregnancyand/or someepithelial cells that failedtoundergo recombination. Inaddition, thenon-recombinant floxedallelewaspresent in the liver tissueofallmiceand in thebreast tissueofCre-inducedandCre+non-inducedmice,asexpected(Figure12B).

Results
62
Figure 12: Representative PCR showing the Tsc2null and Tsc2 non-recombinantalleles. A)Validation of presence ofTsc2null allele. The yellow arrow depicts thePCRproductoftheprimersP3FandP3R(1090bp).B)Validationofthepresenceof Tsc2 non-recombinant allele. The blue arrow depicts the PCR product of theprimersP4FandP3R(1367bp).TherearethreerepresentativemicefromtheCre+inducedandCre+non-inducedgroups,andtwofromtheCre- inducedgroup. B:Breast;L:liver.
Phenotypicanalyses
Cre+ induced and Cre+ non-induced groups included 25 animals and theCre- inducedgroupcontained18animals.Miceweremonitoredforupto48 weeks after lactation or 60 weeks of age in the case of Cre+ non-induced controls. There were no differences between the groups in theweightorsurvivalofthemice.
To assess whether deletion of Tsc2 bestowed tumorigenic capacity onmammary epithelial cells and/or metastatic potential on lung epithelialcells,wefirstanalyzedthehistologyofthebreastandlungtissueofmice

Results
63
from the three experimental groups.Wedid not observe any changes inthemorphologyofthebreasttissue,andthelungsshowednoanomalouscellularmassesinanycase(Figure13).
Figure13:Histologicalstudyoftargettissue.RepresentativeimagesofHE-stainedtissuesectionsoflung(toppanels)andbreast(bottompanels)tissueofmicefromthe three experimental groups. No differences between groups were observed.Scalebarsareshown.
IfsomemammaryepithelialcellswithTsc2deletionacquiretheexpectedmetastatic capacities and phenotype of LAM cells, wemay expect to beabletodetectpositivityfordefinedmarkers,includingα-SmaandphosphoSer235/236 ribosomal S6 protein (pS6). Therefore, we examined theexpression of these proteins by IHC, but no substantial differences orabnormalitieswereobservedacrosstheexperimentalgroups.Asexpected,α-Smapositivitywasobservedinthesmoothmuscle-likecellssurroundingthe bronchioles and in the luminal and basal cell layers of acini (Figure14A). Inparallel,pS6positivitywasobserved inthe luminalandbasalcelllayersofsomebronchiolesandinsomeacini(Figure14B).
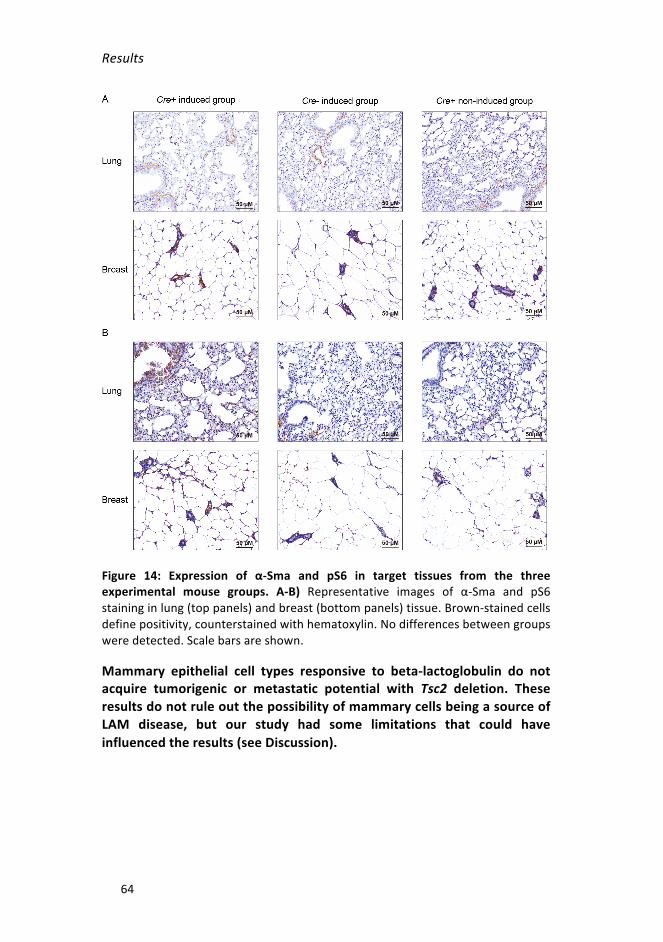
Results
64
Figure 14: Expression of α-Sma and pS6 in target tissues from the threeexperimental mouse groups. A-B) Representative images of α-Sma and pS6staininginlung(toppanels)andbreast(bottompanels)tissue.Brown-stainedcellsdefinepositivity,counterstainedwithhematoxylin.Nodifferencesbetweengroupsweredetected.Scalebarsareshown.
Mammary epithelial cell types responsive to beta-lactoglobulin do notacquire tumorigenic or metastatic potential with Tsc2 deletion. TheseresultsdonotruleoutthepossibilityofmammarycellsbeingasourceofLAM disease, but our study had some limitations that could haveinfluencedtheresults(seeDiscussion).

Results
65
1.2 EVALUATION OF ENGRAFTMENT OF LAM LUNG TISSUEINIMMUNODEFICIENTMICE
SmallfreshpiecesoflungbiopsiesfromfiveLAMpatientswereimplantedinto themammary fat pad of immunodeficientmice to testwhether thebreast tissue environment enables LAM lung cells to grow. In addition,piecesfromthesamepatientsweresubcutaneouslyimplantedintomouseflanks. In two out of the five cases, mice developed PDX tumors in thebreast. However, after histological analyses (data not shown), weconfirmedthatthesetwocaseswere lymphocyticneoplasmswithhumanorigin.Human tumorsengrafted in immunodeficientmiceare susceptibletotheformationofB-andT-cellPDXtumors(Bondarenkoetal.,2015).
Human LAM lung tissueswere not able to engraft in themammary fatpad of immunocompetent mice. Nevertheless, no case has beendescribedinwhichapieceoflungfromaLAMpatientbiopsywasabletogrowinimmunodeficientmice.

Results
66
2. STUDYOFLAMPLASMABIOMARKERS
Contribution:Icontributedtothefollowing:bioinformaticanalysesofgeneexpressionprofiles;selectionofsecretedproteinsandenzymecandidates;acquisitionandpreparationofplasmasamples;compilationandanalysisofclinicaldata;statisticalanalysis;measurementofspecificproteinsusingtheappropriateassays.
2.1 SELECTIONOFPLASMABIOMARKERCANDIDATESUSINGBREASTCANCERMETASTATICPROFILES
AbnormallyenhancedmTORC1activity andexpressionof lungmetastasismediatorsaremolecularfeaturessharedbylung-metastaticbreastcancerand LAM (De Garibay et al., 2015;Mateo et al., 2017).Moreover, a lowlevelofTSC2expressioninbreasttumorsisassociatedwithlungmetastaticpotential(DeGaribayetal.,2015;Jiangetal.,2005;Minnetal.,2005;Nasretal.,2013).Toexaminethehypothesisthatthetranscriptionalprogramsof thebreastcancercells thatmetastasize to lungcanrevealmechanisticsimilaritiestothoseofLAMcells,weanalyzedthegeneexpressionprofilesof this breast cancer type to identify genes with a significant negativecorrelation with TSC2 (PCC < 0 and one-tailed p < 0.05). A list of 1,538genes was obtained, and we only selected those coding for secretedproteins(n=27,Annex1)orenzymes(n=30,Annex2)thatcouldindicatespecificbiomarkersinplasma(Figure15).
Figure15:IdentificationofnovelLAMplasmabiomarkers.Strategyforidentifyingplasma biomarkers based on the analysis of lung-metastatic breast cancer geneexpressiondata.
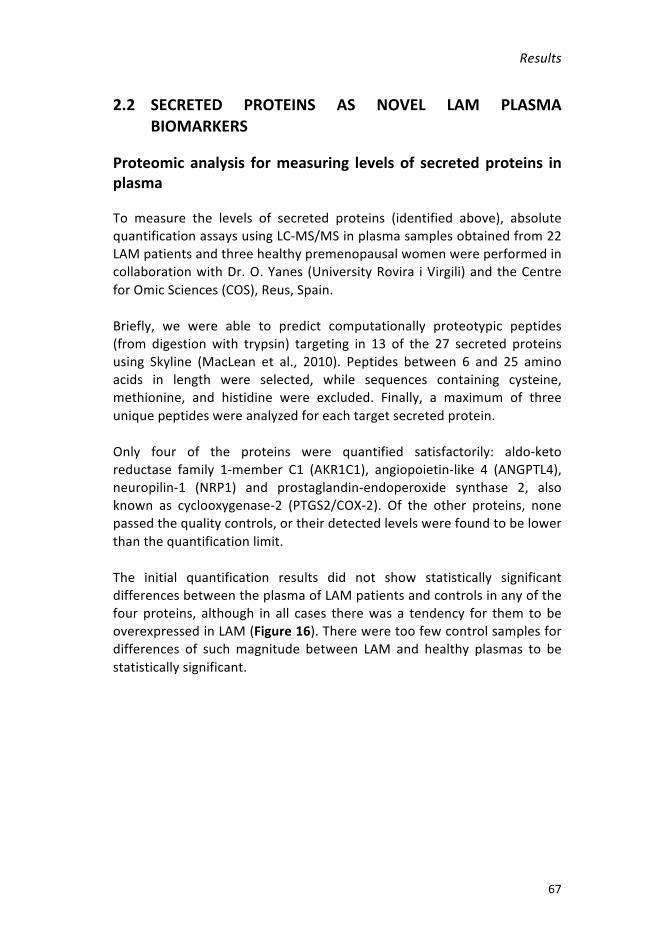
Results
67
2.2 SECRETED PROTEINS AS NOVEL LAM PLASMABIOMARKERS
Proteomic analysis formeasuring levelsof secretedproteins inplasma
To measure the levels of secreted proteins (identified above), absolutequantificationassaysusingLC-MS/MSinplasmasamplesobtainedfrom22LAMpatientsandthreehealthypremenopausalwomenwereperformedincollaborationwithDr.O.Yanes (UniversityRovira iVirgili)andtheCentreforOmicSciences(COS),Reus,Spain.
Briefly, we were able to predict computationally proteotypic peptides(from digestion with trypsin) targeting in 13 of the 27 secreted proteinsusing Skyline (MacLean et al., 2010). Peptides between 6 and 25 aminoacids in length were selected, while sequences containing cysteine,methionine, and histidine were excluded. Finally, a maximum of threeuniquepeptideswereanalyzedforeachtargetsecretedprotein.
Only four of the proteins were quantified satisfactorily: aldo-ketoreductase family 1-member C1 (AKR1C1), angiopoietin-like 4 (ANGPTL4),neuropilin-1 (NRP1) and prostaglandin-endoperoxide synthase 2, alsoknown as cyclooxygenase-2 (PTGS2/COX-2). Of the other proteins, nonepassedthequalitycontrols,ortheirdetectedlevelswerefoundtobelowerthanthequantificationlimit.
The initial quantification results did not show statistically significantdifferencesbetweentheplasmaofLAMpatientsandcontrolsinanyofthefour proteins, although in all cases therewas a tendency for them to beoverexpressedinLAM(Figure16).Thereweretoofewcontrolsamplesfordifferences of suchmagnitude between LAM and healthy plasmas to bestatisticallysignificant.

Results
68
Figure 16: Plasma levels of four secreted proteins measured by LC-MS/MS inplasmasamples fromhealthypremenopausalwomen(n=3)andLAMpatients(n=22).A)AKR1C1,p=0.166,B)ANGPTL4,p=0.467,C)NRP1,p=0.332,andD)PTGS2/COX-2,p=0.418.Mann-Whitneytest.
ANGPTL4asanovel LAMplasmabiomarker complementary toVEGF-D
SinceANGPTL4isalungmetastasismediatorinbreastcancer(Minnetal.,2005) that protects circulating cancer cells against anoikis (Padua et al.,2008),weaimed tovalidate theobservedoverabundance inLAMplasmausingELISA-basedassays.Westudiedtheprevious25LAMsamplesandanadditionalsetof42samples,12healthycontrols,aswellassamplesfromwomen with related pulmonary diseases: 10 individuals diagnosed withLangerhans cell histiocytosis, 10 with Sjögren syndrome, seven withemphysema, and three with lupus erythematosus Thus, ANGPTL4 wasfound to be more abundant in plasma from LAM patients than fromhealthy individuals (Figure 17A-B). Intriguingly, however, the combinedsamplesfrompatientswithallotherpulmonarydiseaseshowedagreaterabundanceofANGPTL4thandidtheLAMcases(Figure17A-B).
Through our collaboration with Prof. S. R. Johnson (National Centre forLymphangioleiomyomatosis, Nottingham University Hospitals NHS Trust,

Results
69
UK)wewereabletodeterminetheVEGF-DlevelsinLAMsamplesusingaQuantikineVEGF-DELISADVED00kit(R&DSystems).Notably,thelevelsofANGPTL4 were not positively correlated with those of VEGF-D in LAMplasma(Figure17C).
Figure17:PlasmaANGPTL4levelsmeasuredbyELISAintheindicatedsettings.A)ANGPTL4 levels in healthy controls, LAM patients and LAM-related pulmonarydiseases.B)Three-groupanalysisofhealthy controls, LAMpatients andgroupedpulmonary diseases. (A, B. One-sidedMann-Whitney test. Asterisks indicate thelevelofsignificantdifferences:*,p<0.05;**,p<0.01;***,p<0.001;and****,p< 0.0001. Bars indicate means and standard deviations). C) Lack of correlationbetweenANGPTL4andVEGF-Dlevels(Spearmancorrelation.n.s.,notsignificant).
Next,wesoughttoassesswhetherANGPTL4ispresentinLAMlunglesions,by testing its expression by IHC.We detected strong positivity in lesionsfromfiveofthesevenpatientsanalyzed(Figure18).

Results
70
Figure 18: Expression of ANGPTL4 in LAM tissues. Representative images ofimmunohistochemical positivity of ANGPTL4 in LAM lung lesions (two patients)and a kidney tumor as a positive control. Brown-stained cells define positivity,counterstainedwith hematoxylin. The arrow indicatesmagnified fields shown intheinsets,wherespindle-likecellsarepositive.Scalebarsareshown.
ANGPTL4 is a secreted protein expressed by LAM cells that may becomplementary toVEGF-Dmeasurements and that can act as a plasmabiomarkerfordifferentiatingbetweenLAMpatientsandhealthycontrols,but not related pulmonary diseases. The precise function of ANGPTL4overabundanceinLAMremainstobedetermined.
Additionalbiomarkercandidates
Thethreeadditionalbiomarkersfromtargetedproteinmeasuresinplasmasamples include: AK1C1, an aldo-keto reductase involved in themetabolism of progesterone (Barski et al., 2008); NRP1, a neuropilininvolved in cell migration and VEGF-mediated signaling (Herzog et al.,2011); and PTGS2/COX-2, a cyclooxygenase involved in the synthesis ofprostaglandins (Cianchi et al., 2005). These candidates may be linked toLAM cell functions and, importantly, PTSG2/COX-2 has been shown tomediateLAMprogressionandmetastasis(Lietal.,2016).Aclinicaltrial isunderway to investigate the safety and tolerability of celecoxib, a COX-2specific inhibitor, in LAM patients (NCT02484664). Collectively, ourpreliminarydataforadditionalLAM-secretedproteinbiomarkersappeartobe consistent with current knowledge, but also have the potential toprovidefurtherinsightsintothebiologyofdisease.
2.3 METABOLITESASNOVELPLASMABIOMARKERS
Predictionandanalysisoftargetmetabolites
Following the strategy depicted above (Figure 15), we identified 30enzymeswhose gene expressionprofileswere negatively correlatedwith

Results
71
those of TSC2 in lung-metastatic breast cancer. Enrichment analysisidentifiedseveralmetabolicpathwaysassociatedwiththisgeneset(Figure19), some of which, for example, the mitochondrial β-oxidation andpentosephosphatepathways,hadpreviouslybeenlinkedtoLAM(Düveletal.,2010;Lietal.,2016;YeciesandManning,2011;Yuetal.,2009).Afterconsidering the overrepresented pathways and their reactions, sevenmetaboliteswerechosenformeasuringbyLC-MS/MSinthesameplasmasamplesasusedfortheprotein-biomarkeranalyses.
Figure 19: Significantly enriched metabolic pathways among the 30 enzymesidentified in the previous analysis. The magnitude of enrichment and false-discoveryrateadjustedprobabilitiesareshown.
Oneofthemetabolites(3,4-dihydroxyphenylaceticacid(DOPAC))couldnotbequantifiedbecause its levelswerebelow thedetection threshold. Thesixothermetabolitesmeasuredwere:3,4-dihydroxymandelicacid(DOMA),4-hydroxyphenylacetic acid (4-HPAA), homovanillic acid (HVA),methylimidazoleacetic acid (MIAA), phenylacetic acid (PAA) and 3-methoxy-4-hydroxymandelicacid(VMA).

Results
72
In an initial test, four of themetabolites (4-HPA, HVA,MIAA, and VMA)showed a trend towards overabundance in LAM samples (n = 22)comparedwithhealthycontrols(n=3)(Figure20).
Figure 20: Plasma levels of six metabolites measured by LC-MS/MS in plasmasamplesfromhealthypremenopausalwomen(n=3)andLAMpatients(n=22).A)DOMA,p=0.143B)4-HPAA,p=0.249C)HVA,p=0.152D)MIAA,p=0.054E)PAA,p=0.422andF)VMA,p=0.073.Mann-Whitneytest.
MIAAisanovelLAMplasmabiomarkerindependentofVEGF-D
Followingonfromthetestresults,additionalcohortsof30LAMpatients,12 healthy controls, and 30 related pulmonary disease patients wereexaminedforthespecificmetabolites. Inthisstudy,sincethemetabolitescould not be quantified by ELISA, they were measured by LC-MS/MSassays,which identified a significantly greater abundance ofMIAA in theLAMplasma group than in the other groups (Figure 21A-B). Importantly,the levels of MIAA were not correlated with those of VEGF-D in LAMplasma (Figure 21C). However,MIAAwas found to bemore abundant insamples from patients who were not receiving rapamycin treatment(includingthoseusingprogesteroneandbronchodilators)relativetoothercases(Figure21D).

Results
73
Figure 21: Plasma MIAA levels measured by LC-MS/MS in a novel setting ofsamples.A)MIAAlevelsinhealthycontrols,LAMpatientsandvariousLAM-relatedpulmonary diseases plasmas. B) Three-group analysis of healthy controls, LAMpatients and combined pulmonary diseases. Bars indicate means and standarddeviations. C) Lack of correlation between MIAA and VEGF-D levels (Spearmancorrelation). D)Higher plasmaMIAA levels in LAM patients with no therapy orothertherapiesrelativetorapamycin-treatedpatients.(A,B,D.One-sidedMann-Whitney test. Asterisks indicate levels of statistical significance of groupdifferences:*,p<0.05;**,p<0.01;***,p<0.001;****,p<0.0001).
The three additional metabolites tested in the validation assays (4-HPA,HVA and VMA) also showed significant differences among the samplegroups, although to a lesser extent than those observed with MIAA. Allthreewere found to bemore abundant in LAM than in healthy plasmas,and HVA was also more abundant in LAM than in related pulmonarydiseasesplasmas(Figure22).
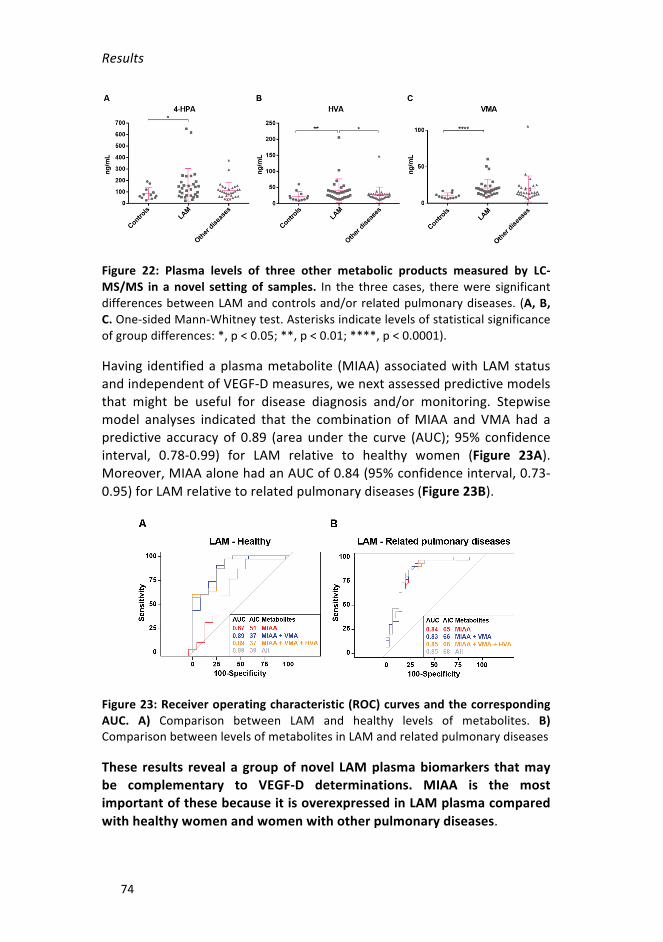
Results
74
Figure 22: Plasma levels of three other metabolic products measured by LC-MS/MS in anovel settingof samples. In the three cases, therewere significantdifferencesbetweenLAMandcontrolsand/orrelatedpulmonarydiseases. (A,B,C.One-sidedMann-Whitneytest.Asterisksindicatelevelsofstatisticalsignificanceofgroupdifferences:*,p<0.05;**,p<0.01;****,p<0.0001).
Having identifiedaplasmametabolite (MIAA)associatedwithLAMstatusandindependentofVEGF-Dmeasures,wenextassessedpredictivemodelsthat might be useful for disease diagnosis and/or monitoring. Stepwisemodel analyses indicated that the combination ofMIAA and VMA had apredictive accuracyof 0.89 (areaunder the curve (AUC); 95% confidenceinterval, 0.78-0.99) for LAM relative to healthy women (Figure 23A).Moreover,MIAAalonehadanAUCof0.84(95%confidenceinterval,0.73-0.95)forLAMrelativetorelatedpulmonarydiseases(Figure23B).
Figure23:Receiveroperatingcharacteristic(ROC)curvesandthecorrespondingAUC. A) Comparison between LAM and healthy levels of metabolites. B)ComparisonbetweenlevelsofmetabolitesinLAMandrelatedpulmonarydiseases
These results revealagroupofnovel LAMplasmabiomarkers thatmaybe complementary to VEGF-D determinations. MIAA is the mostimportantofthesebecauseitisoverexpressedinLAMplasmacomparedwithhealthywomenandwomenwithotherpulmonarydiseases.

Results
75
3. STUDY OF MOLECULAR AND CELLULAR FEATURESLINKEDTOTHEIDENTIFIEDMETABOLITEBIOMARKERS
Contribution:Iperformedthefollowingtasks:proteinandgeneexpressionanalyses in cell models and tissues; all cell-based assays except thatmeasuringMAOactivity;statisticalanalyses.
3.1 HIGH LEVELS OF ALDH AND MAO EXPRESSION ANDACTIVITYINLAMCELLMODELSANDTISSUE
The identified metabolites may have originated from LAM lung lesionsand/orthesurroundingaffectedtissue,butallofthemwerederivedfromthe catabolism of monoamines mediated by monoamine oxidases A/B(MAO-A/B) and aldehyde dehydrogenases (ALDHs) in the mitochondria(Bortolatoetal.,2008)(Figure24).
Figure24:Representationofenzymaticreactionsthatgiverisetotheidentifiedmetabolites.Theenzymesandmetabolitesarelistedintheinset.
Toassessthesourceofthemetabolites,wefirstanalyzedtheexpressionofkey genes and proteins in LAM tissue and cell models. In a previousinvestigation, we showed frequent ALDH1 positivity in LAM lung lesions(DeGaribayetal.,2015).PositivityofMAO-AandMAO-BwasdetectedbyIHC assays in all lung lesions of seven LAM patients (Figure 25A, toppanels). In normal lung tissue from healthy individuals, MAOs wereexpressed in the alveolar endothelium and the luminal layer of thebronchioles(Figure25A,bottompanels).Subsequently,costainingwiththe

Results
76
LAMmarkerα-SMAbydouble-IHFrevealedcolocalizationwithbothMAO-AandMAO-B in lung lesions,withMAO-Bbeingconfined topathologicalareas(Figure25B).
Figure 25: Expression of MAOs and colocalization with α-SMA in LAM lunglesions.A)RepresentativeimagesofimmunohistochemicalpositivityofMAO-A/BinLAMlunglesions(toppanels)andhealthylung(bottompanels).Brown-stainedcellsdefinepositivity,counterstainedwithhematoxylin.Scalebarsareshown.B)RepresentativeimagesofimmunofluorescencedetectionofMAO-A/Bandα-SMAinLAMlunglesions,costainedwithDAPI(merged).
Next, we studied the expression of Aldh and Mao isoforms in LAM cellmodelsandtheircorrespondingcontrolcounterparts(Walkeretal.,2003;Zhanget al., 2003). Relativelyhigher levels ofmostAldh isoformsandofMaoaandMaobweredetectedbyRT-PCRinTsc2-deficientcomparedwithTsc2-wild-typeMEFs (Figure 26A). For ELT3, onlyMaob was found to beoverexpressed in Tsc2-deficient cells relative to cells reconstituted withhumanTSC2(Figure26B).
ProteinexpressiondetectedbyWBassaysconfirmedtheincreaseofMaoisoforms in the MEF LAM model (Figure 26C). Intriguingly, the levels ofthese enzymeswere not affected by exposure to the rapalog everolimus(Figure26C).Unfortunately,wewerenotable tomeasuretheexpression

Results
77
of these proteins in the rat cell model because the antibodies did notrecognizethecorrespondingspeciesgeneproducts.
Figure26:ExpressionofAldhsandMaos inLAMcellmodels.A)Graphshowinggene expression differences (log-fold changes) of defined genes (X-axis) inTsc2-deficientrelativetowild-typeMEFs.B)Graphshowingdifferencesinlevelsofgeneexpression in Tsc2-deficient relative to TSC2-reconstituted ELT3 cells. (A, B.Multiple t-testswithHolm-Sidakcorrection.Asterisks indicate levelsof statisticalsignificanceofgroupdifferences:*,p<0.05;**,p<0.01;****,p<0.0001.Thebars indicatemeans and standard deviations. Dotted horizontal lines indicate 2-fold(top)and0.5-fold(bottom)changes).C)WBofkeyproteinsdetectedinTsc2-deficientandwild-typeMEFsinDMSO-exposedconditionsortreatedwith20nMofeverolimusfor16h.Loadingcontrols(tubulinandactin)areshown.
AsTsc2-deficientMEFsshowedthebiggestdifferenceatthe levelofAldhandMaoexpressioncomparedwiththeircontrolcounterparts,wedecidedto measure the activity of the enzymes in this cell line. A slight, butconsistentemergenceofALDH-positivecellsasmeasuredbyALDEFLUOR-basedassayswasnotedinLAM-likecells:meanTsc2wild-typepercentage=0.02±0.03;meanTsc2-deficientpercentage=0.31±0.19(Figure27A).
WeidentifiedsignificantlyhigherMaobasalactivityinTsc2-deficientMEFsthan in their control counterparts (Figure 27B). Cells exposed to 1 μMclorgyline(Mao-Ainhibitor)for48hshowedareductioninthisactivitytozero;separately,exposureto1μMdeprenyl(Mao-Binhibitor)forthesameperiod reduced activity by approximately 35%. These effects wereconsistentwith the basal protein expression levels ofMao-A andMao-B,suggesting that both isoforms are relativelymore active inTsc2-deficientcells.Furthermore,consistentwithMaoactivitiesbeingdependentonthe

Results
78
flavin adenine dinucleotide (FAD), the total levels of this cofactor werefoundtobesignificantlyhigherinTsc2-deficientMEFs(Figure27C).
Figure 27: Measurement of Aldh and Mao activity. A) Representative flowcytometryresults(n=2)showingcellpercentagesforALDEFLUOR-positivecells.B)QuantifiedMaobasalactivity(Y-axis)inMEFcellcultureconditionsasdepictedontheX-axisandintheinset.CPM:countsperminute.C)QuantifiedFADinMEFcellcultures as depicted in the inset. (B, C. Two-tailed unpaired samples t-test.Asterisksindicatestatisticallysignificantdifferences:*,p<0.05;***,p<0.001).
The expression and functionofAldh andMao appear to be stronger inLAMcells. Suchoveractivationmayaccount for theenhanceddetectionofmonoamine-derivedmetabolitesintheplasmaofLAMpatients.
3.2 HIGHLEVELSOFMITOCHONDRIALANDROSACTIVITYINLAMTISSUEANDTHECELLMODEL
Considering that Aldh and Mao enzymes mediate the catabolism ofmonoamines in the mitochondria, we sought to examine mitochondrialactivity in the MEF cell lines. First, we assessed whether the observeddifferences between Tsc2-deficient and wild-type MEFs could be due toalteredmitochondrial contentby analyzing the voltage-dependent anion-selectivechannelprotein1(Vdac1),whichisthemostabundantproteinin

Results
79
themitochondrialoutermembrane.Nodifferenceswereobservedingeneorproteinexpressionbetweenthetwocelllines(Figure28A).
Subsequently,mitochondrialactivitywasevaluatedbymeasuringorganellemembranepotential.TheTsc2-deficientcellsshowedahigherpotential,asdeterminedbyMitoTrackerred-basedassays(Figure28B).TheseLAM-likecellsalsoexhibitedhighervaluesofbasal respiration,asdeterminedbyahigh-resolutionoxygraph(Figure28C).
Figure28:MitochondrialactivityandrespirationinaLAMcellmodel.A)Proteinand RNA expression of Vdac1/Vdac1 in MEF cell lines. B) Representative flowcytometryresults(n=3)showingtheintensity(X-axis)ofMitoTrackerred-positivecells.C)Basalcellrespiration(asmeasuredbyoxygenconsumption,Y-axis;n=5).Two-tailed unpaired samples t-test. Asterisks indicate statistically significantdifferences:***,p<0.001.
Greater activity of Aldh andMao has been linked to high levels of ROS(Ugun-Kluseketal.,2019)and,specifically,theseenzymesproduceH2O2byoxidation of monoamines. For this reason, we measured general ROSspecies with MitoSOX red dye using flow cytometry. The Tsc2-deficientMEFs showedhigher positivity and intensity of ROS signal than thewild-typecounterpart(Figure29A).H2O2productionwasthenquantifiedwithafluorescent H2O2 assay kit. This showed that the LAM-like cells showedsignificantly higher levels of H2O2 than did those of the wild-typecounterpart(Figure29B).
H2O2decomposesintowaterandoxygenbytheactionofvariousenzymes,of which catalase is particularly important. We set out to quantify theexpression of this enzyme in MEF cell lines and found relatively higherlevelsofgeneandproteinexpressioninTsc2-deficientMEFs(Figure29C).Asobservedforthekeyenzymesdepictedabove,catalaseexpressionwasnotaffectedbyeverolimusexposure(Figure29C).
Arecentpublicationhasdescribedthehigh levelofexpressionofthekeyhypoxiafactorHIF1αandmitochondrialdysfunctionincandidateLAMcells
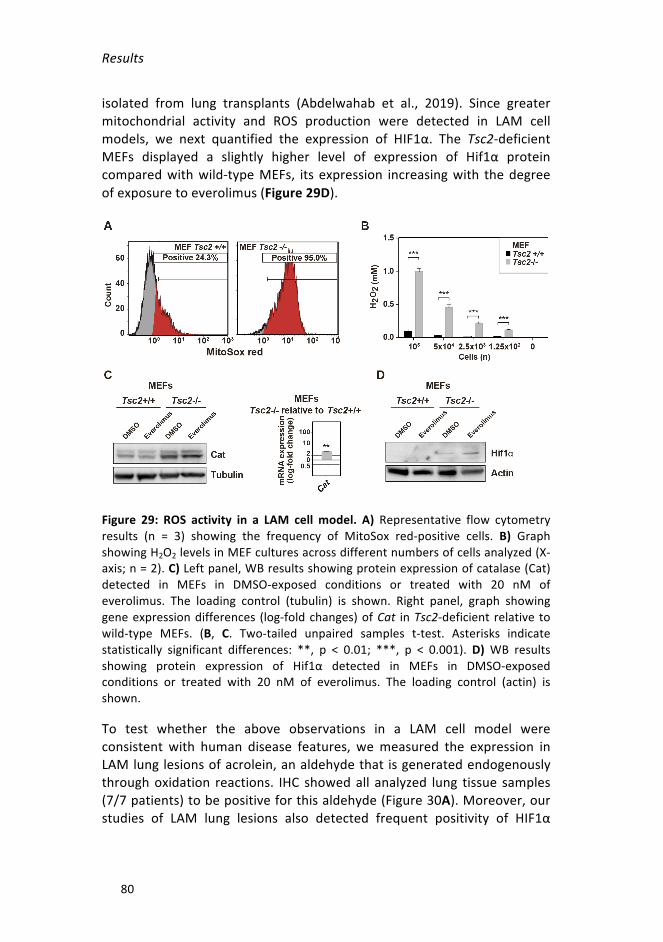
Results
80
isolated from lung transplants (Abdelwahab et al., 2019). Since greatermitochondrial activity and ROS production were detected in LAM cellmodels, we next quantified the expression of HIF1α. The Tsc2-deficientMEFs displayed a slightly higher level of expression of Hif1α proteincomparedwithwild-typeMEFs, its expression increasingwith thedegreeofexposuretoeverolimus(Figure29D).
Figure 29: ROS activity in a LAM cell model. A) Representative flow cytometryresults (n = 3) showing the frequency of MitoSox red-positive cells. B) GraphshowingH2O2levelsinMEFculturesacrossdifferentnumbersofcellsanalyzed(X-axis;n=2).C)Leftpanel,WBresultsshowingproteinexpressionofcatalase(Cat)detected in MEFs in DMSO-exposed conditions or treated with 20 nM ofeverolimus. The loading control (tubulin) is shown. Right panel, graph showinggeneexpressiondifferences (log-foldchanges)ofCat inTsc2-deficient relative towild-type MEFs. (B, C. Two-tailed unpaired samples t-test. Asterisks indicatestatistically significant differences: **, p < 0.01; ***, p < 0.001). D)WB resultsshowing protein expression of Hif1α detected in MEFs in DMSO-exposedconditions or treated with 20 nM of everolimus. The loading control (actin) isshown.
To test whether the above observations in a LAM cell model wereconsistent with human disease features, wemeasured the expression inLAMlunglesionsofacrolein,analdehydethat isgeneratedendogenouslythroughoxidation reactions. IHC showedall analyzed lung tissue samples(7/7patients)tobepositiveforthisaldehyde(Figure30A).Moreover,ourstudies of LAM lung lesions also detected frequent positivity of HIF1α

Results
81
(Figure 30B) and their mesenchymal target, vimentin (Figure 30C; 5/7positivecasesforthesetwomarkers).
Figure 30: Representative images of ROS-related markers identified by IHC inLAM lung lesions (two patients). A) Acrolein B) HIF1α, and C) vimentin (VIM).Brown-stainedcellsdefinepositivity,counterstainedwithhematoxylin.Scalebarsareshown.
Collectively,ourfindingsdemonstratefunctionallinksbetweenenhancedALDHandMAOactivity,ROSproductionandLAMbiology.
3.3 HIGH LEVELS OF HISTAMINE METABOLISM AND HRH1EXPRESSIONINLAMTISSUESANDTHECELLMODEL
MIAAisthemajormetaboliteofhistamineanditcanbeexcretedinurineand detected in other body fluids (Khandelwal et al., 1982). PreviousmetabolicanalysesidentifiedlowerhistaminelevelsinTsc2-deficientthanwild-typeMEFs(Düveletal.,2010).Thehistaminesignalingismediatedbyhistamine receptors (HRs), which are a class of G protein-coupledreceptors, of which HRH1 and HRH2 are the most widely expressed inhumantissuesandorgans(Brancoetal.,2018).
Studying breast cancer cell expression may lead us to a betterunderstandingofLAMcellbiology,soweanalyzedtheexpressionofgenescoding for HRs in the original lung-metastatic breast cancer dataset (thesameas insection2.1oftheresults).Coxregressionanalyses identifiedasignificantassociationofrelativelyhighlevelofHRH1expressionwithlungmetastasis in breast cancer (Figure 31A). In addition, analyzing a larger,

Results
82
canonicalbreastcancerdataset(CancerGenomeAtlasNetwork,2012),theHRH1andTSC2expressionprofileswerefoundtobenegativelycorrelated(PCC=-0.15,p=2x10⁻⁶,Figure31B).Thus,HRH1expressionwasfoundtobepositivelycorrelatedwiththecanonicallung-metastasissignature(Minnetal.,2005)andthemTORpathwaygeneset(Figure31C).
Figure31:HRH1expressionassociations inbreast cancer.A)Kaplan-Meier lungmetastasis-freesurvival(LMFS)curvesbasedoncategorizationofHRH1expressioninbreasttumors.ThemultivariateCoxproportional-hazardsregressionresultsareshown: HR, hazard ratio; CI, confidence interval. B-C) Results from the GSEAmethodshowingpositiveexpressioncorrelations(basedonPCCs)betweenHRH1and indicated key gene sets. The GSEA normalized enrichment score (NES) andassociatedprobabilitiesareindicated.
Having established the aforementioned links between HRH1, lungmetastasis andmTOR,weperformed targeted studies in cellmodels andlung tissue. Hrh1 was overexpressed in Tsc2-deficient MEFs relative towild-type MEFs, but the expression of its product did not differsubstantiallybetweenthecelllines(Figure32A).However,thelunglesionsofall sevenLAMpatientsanalyzedwereclearlypositive forHRH1(Figure32B).

Results
83
Figure32:Hrh1/HRH1expression ina LAMcellmodeland inhumanLAM lunglesions.A)Leftpanel,WBresultsshowingproteinexpressionofHrh1inMEFcelllines.Rightpanel,graphshowinggeneexpressiondifferences(log-foldchanges)ofHrh1 inTsc2-deficientrelativetowild-typeMEFs.Two-tailedunpairedsamplest-test. Asterisks indicate statistically significant differences: ****, p < 0.0001. B)RepresentativeimagesofHRH1positivitydetectedbyIHCinLAMlunglesions(twopatients).Brown-stainedcellsdefinepositivity, counterstainedwithhematoxylin.Scalebarsareshown.
Having demonstrated that MEFs cell lines express Hrh1, we wereinterested to know the response of these cells to an alteration inhistamine-mediatedsignaling.First,weculturedMEFs inmediumwithouthistidine,whichisanessentialaminoacidthat isnotsynthesizeddenovoinhumansandistheprecursorofhistamine(StifelandHerman,1971).Themediumwithouthistidinebutwith10%FBS revealedan inhibitoryeffectsolely inTsc2-deficientcells (Figure33A).Wethendecidedto reducetheamountofFBSbecauseitisknowntocontainenoughhistaminetoactivateHrh1(Kawazoeetal.,2004).TherewasastrongerinhibitoryeffectinTsc2-deficientMEFswhen cellswere culturedwithout histidine andwith only0.5%FBS(Figure33B).
HRH1 is a G protein-coupled receptor that can mediate downstreamsignaling through tyrosine-protein kinase Src (Luttrell and Luttrell, 2004).Activation of mTORC1 in LAM cells and tissues has been linked toaccumulationofactiveSrc(Tyryshkinetal.,2014a).Therefore,westudiedthe activation of this signaling pathway by measuring phospho-Tyr 416(pTyr416)Src.Whencellswereexposedto100μMofhistaminefor30min
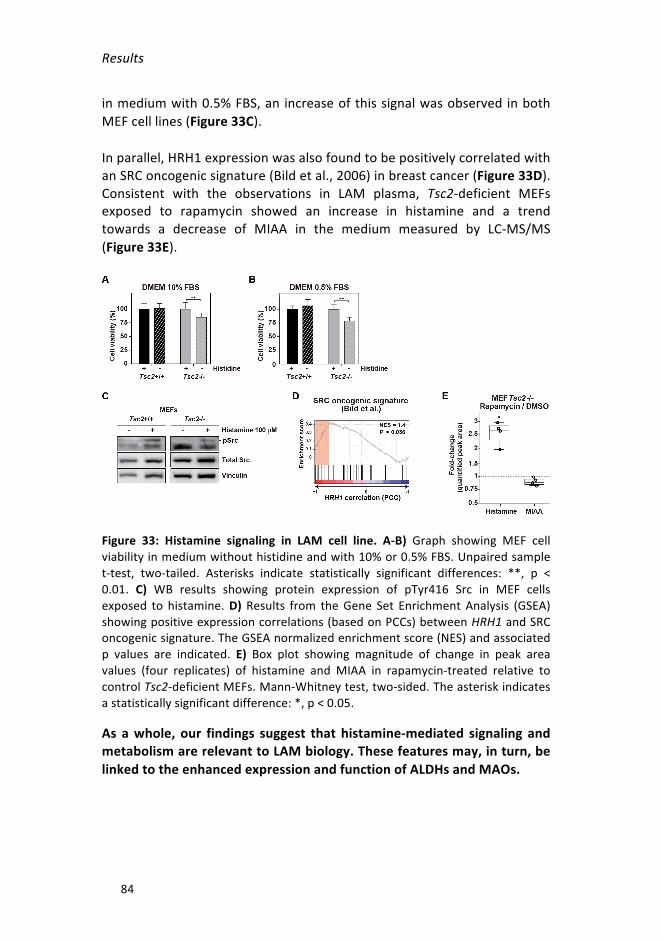
Results
84
inmediumwith0.5%FBS,an increaseofthissignalwasobservedinbothMEFcelllines(Figure33C).
Inparallel,HRH1expressionwasalsofoundtobepositivelycorrelatedwithanSRConcogenicsignature(Bildetal.,2006)inbreastcancer(Figure33D).Consistent with the observations in LAM plasma, Tsc2-deficient MEFsexposed to rapamycin showed an increase in histamine and a trendtowards a decrease of MIAA in the medium measured by LC-MS/MS(Figure33E).
Figure 33: Histamine signaling in LAM cell line. A-B) Graph showing MEF cellviabilityinmediumwithouthistidineandwith10%or0.5%FBS.Unpairedsamplet-test, two-tailed. Asterisks indicate statistically significant differences: **, p <0.01. C) WB results showing protein expression of pTyr416 Src in MEF cellsexposed to histamine.D)Results from theGene Set EnrichmentAnalysis (GSEA)showingpositiveexpressioncorrelations(basedonPCCs)betweenHRH1andSRConcogenicsignature.TheGSEAnormalizedenrichmentscore(NES)andassociatedp values are indicated. E) Box plot showing magnitude of change in peak areavalues (four replicates) of histamine andMIAA in rapamycin-treated relative tocontrolTsc2-deficientMEFs.Mann-Whitneytest,two-sided.Theasteriskindicatesastatisticallysignificantdifference:*,p<0.05.
As awhole, our findings suggest that histamine-mediated signaling andmetabolismarerelevanttoLAMbiology.Thesefeaturesmay,inturn,belinkedtotheenhancedexpressionandfunctionofALDHsandMAOs.
Results
85
4. NOVELTHERAPEUTICSTRATEGIES
Contribution: Iperformedthe following tasks: IHCandHEstaining (initialevaluation of the corresponding antibodies was done by me and ourgroup’sresearchtechnician);cell-basedassaysandtheirstatisticalanalysis;preparation of cells for in vivo experiments; mouse management andstudies; evaluation of data from in vivo experiments and statisticalanalyses; measurement of gene and protein expression, and statisticalanalyses;high-throughputdrugscreeningattheNCATS;andinterpretationandselectionofdrugsforfurtheranalysis.
4.1 THERAPEUTIC STUDIES BASED ON ENHANCEDMONOAMINEMETABOLISMANDSIGNALING
Basedonthehighlevelsofexpressionandactivityofenzymesparticipatinginmonoaminecatabolism,theconsequencesofpharmacologicalinhibitionof the corresponding proteins were assessed in vitro and in vivo. Theselected drugs for these assays were: a small-molecule ALDH inhibitor(GA11); clorgyline, aMAO-A inhibitor; and rasagiline, aMAO-B inhibitor.We selected these compounds because they are approved for thetreatment of other human diseases or have yielded promising preclinicaldata in other neoplastic conditions: clorgyline is an antidepressant drug,andrasagilineisusedtotreatsymptomsinearlyParkinson'sdisease;GA11isanexperimentalcompoundthatefficientlyinhibitsmesenchymalgliomastem cells (Cheng et al., 2016). Critically, rapamycin or rapalogs (e.g.,everolimus)donot fully eradicate LAMcells inpatients, but substantiallyimprove lung function and quality of life; therefore, we were alsointerested in testing the combination of ALDH or MAO inhibitors witheverolimus/rapamycintodeterminewhetherLAMcarecanbeimproved.
Effect of Aldh-Maos and mTOR inhibitors in LAM cell lines invitro
Cell viability assays were carried out as an initial assessment of thepotentialbenefitoftheaforementioneddrugs.Theseexperimentsinvolvedmeasuringmetabolicactivitytoquantifythefrequencyofviablecellsaftera particular exposure to the drug. We used the three previously citedinhibitors as single agents and in combination with everolimus, andevaluatedtheireffectsinTsc2-deficientELT3andMEFcelllinesandintheircontrolcounterparts.

Results
86
First,we administered serial dilutions of the compounds alone, includingeverolimus, and in various combinations, to the cell cultures for 72 h. Awide rangeof everolimus concentrations produced similar effects on cellviabilityandsoafixedconcentration(20nM)ofthedrugwasusedinmostsubsequent experiments. This concentration of the rapalog is thatcommonlyadoptedinLAMresearch(Alayevetal.,2015).
Invitrocellviabilityassaysdidnotindicategreatersensitivitytoanyofthethreecompounds(i.e.,clorgyline,GA11,andrasagiline)assingleagentsinTsc2-deficient ELT3 cells compared with their control counterpart cells(depictedbyblacklinesinthegraphsofFigure34A-B-C).
Figure34:InvitrocellviabilityassaysusingALDHandMAOinhibitorsaloneandin combinationwith20nMofeverolimus inELT3 cell lines.A)Graphs showinginhibitory effects ofGA11 alone (black line) and in combinationwith everolimus(greenline).Combinationswithasynergisticeffect(CI<1)areindicatedinpink.B)Graphs showing inhibitory effects of clorgyline alone (black line) and incombinationwith everolimus (blue line).C)Graphs showing inhibitory effects ofrasagilinealone(blackline)andincombinationwitheverolimus(redline).(A,B,C.The effect of 20 nM of everolimus is indicated by a dotted grey line for everycondition).
SynergiesweremeasuredbytheChouandTalalaycriterion(Chou,2006),which is a method based upon discreet concentration responses andreports reflecting the overall combination response of the two agents.Significant synergistic effects were particularly evident when GA11 and

Results
87
everolimuswere combined inTsc2-deficient ELT3 cells (CIs < 1, p < 0.05,Figure34A).Thesynergisticinteractionsareindicatedwhenthegreenlines(corresponding to GA11 plus 20 nM everolimus) are observed under thedottedgreyline(correspondingto20nMeverolimusalone) inthegraphsofcell viability.CombinationsofclorgylineandrasagilinewitheverolimusdidnotshowanysynergyinELT3cells(i.e.,theblueandredlinesdidnotappearbeneaththedottedgreylines;Figure34).
InMEFcelllines,GA11,theinhibitoryeffectsofclorgylineandrasagilineassingle agents did not differ between Tsc2-deficient and wild-type MEFs(blacklines). Inaddition,wefoundnosignificantsynergisticeffects inanyofthethreecombinationswitheverolimus(coloredlines)(Figure35).
Figure35:InvitrocellviabilityassaysusingALDHandMAOinhibitorsaloneandin combinationwith 20nMof everolimus inMEF cell lines.A)Graphs showinginhibitory effects ofGA11 alone (black line) and in combinationwith everolimus(green line).B)Graphs showing inhibitory effects of clorgyline alone (black line)and in combination with everolimus (blue line). C) Graphs showing inhibitoryeffects of rasagiline alone (black line) and in combination with everolimus (redline).(A,B,C.Theeffectofeverolimus20nMisindicatedbyadottedgreylineforallconditions).
Basedontheaboveresults,subsequentinvitroexperimentsusedonlyoneconcentrationof theALDHandMAO inhibitors:GA11100nM, clorgyline1µM,andrasagiline1µM.

Results
88
Afternoting that the combinationofGA11andeverolimus synergisticallyaffected the viability of ELT3 cells, additional cell-based assays wereperformed to corroborate this relationship. The combination of 20 nMeverolimuswith100nMofGA11affected thecolony-formingcapacityofTsc2-deficientELT3cells(Figure36A)andTsc2-deficientMEFscells(Figure36B) in a synergistic manner, giving rise to fewer colonies than wheneverolimus or GA11 alone were used. This effect was similar in TSC2-reconstitutedELT3cellsandwild-typeMEFscells(Figure36).
Figure 36: Colony-forming assays using GA11 and everolimus alone, and incombination.A)GraphsshowingthecolonyformationcapacityofELT3cellswhentreatedasindicatedintheinset.B)Graphsshowingthecolony-formationcapacityofMEFcellswhentreatedasindicatedintheinset.(A,B.Unpairedsamplest-test,two-tailed. Asterisks indicate statistically significant differences: *, p < 0.05 and***,p<0.001).
Colony-forming assays were also performed using 1 µM clorgyline andrasagilinealone,andincombinationwith20nMofeverolimusinbothcellmodels.Undersuchcircumstances,thecombinationsdidnotshowgreaterreductions of colony-forming capacity compared with the compoundsalone(datanotshown).
LAM is a diseasewhose cells are spread by the blood and the lymphaticsystemandaresupposedtometastasizetothelung(Crooksetal.,2004).Forthisreason,assayswerealsoperformedtoevaluatecellmigrationandinvasion capacities when exposed to the above drugs. Wound-healingassays were used to measure non-directional migration and Transwell-based assays were used to analyze directional invasion. In theseexperiments,we used only the ELT3 cells because, at thatmoment, thatwas theonly cell line known tobeuseful for in vivo tumorigenic studies.TheresultsshowedthatELT3cellsmigrateslowerwhenexposedtoGA11alone or combinedwith everolimus, relative to everolimus alone (Figure37).Thiseffectwassomewhatgreater inTsc2-deficientELT3cells than intheir control counterpart cells. In this case, the effect on the migration

Results
89
capacity seemed to be due to GA11 alone more than the combination,becausetherewasnosignificantdifferencebetweentheplainanddottedgreen lines (GA11100nMandGA11andeverolimus, respectively; Figure37).
Figure37: Invitrowound-healingassaysusingGA11andeverolimusalone,andincombinationinELT3cells.GraphsshowingthemigrationcapacityofELT3cells,treated as indicated in the inset.Measurementswere taken every 4 h for 12 h.GreenasterisksrepresentasignificantdifferencebetweenGA11aloneandDMSOoreverolimus20nM.Underlinedgreenasterisksrepresentasignificantdifferencebetweeneverolimus+GA11andDMSO/everolimus20nM.Multiple t-testswithHolm-Sidakcorrection.Levelsofstatisticalsignificanceare:*,p<0.05;**,p<0.01.
Again,wedid not see a reduction in themigration capacity of ELT3 cellswhen we treated them with clorgyline and rasagiline alone, or incombination with everolimus. In this case, cells under all conditionsmigrated at the same speed (data not shown). Finally, ELT3 cells treatedwithALDHorMAO inhibitors did not have a lower capacity for invasion.Everolimus reduced the number of cells invading the membrane of theTranswell,butneitherGA11,clorgylinenorrasagilineproduceddifferencesfromtheDMSO-treatedcells(datanotshown).
Collectively, our results suggest that GA11 alone could affect theproliferation of LAM cells in vitro, especially of Tsc2-deficient ELT3 cells.This effect is increased when GA11 is combined with a rapalog likeeverolimus, acting synergistically in some instances.However, the impacton migration and invasion remains unclear. In contrast, clorgyline andrasagilinedonot impairtheproliferation,migration,or invasionofanyofthe LAM cell models. Despite this observation, the effect of thesecompounds might be dependent on tissue microenvironment-tumorinteractions, sinceROSalso influence cancerprogression through cellularinterplay(Gorrinietal.,2013).

Results
90
EffectofAldh-MaosandmTORinhibitorsinanimmunodeficientinvivoLAMmodel
Given the in vitro results, we next assessed the effect of Aldh andMaoinhibitors in vivo by measuring the growth rate of tumor xenograftsoriginatingfromthesubcutaneousengraftmentofTsc2-deficientELT3cellsinfemaleNOD-scidmice.Initially,basedontheliteraturedescribingsimilarorhigherdrugdoses,1mg/kg/dayofeverolimuswasusedintheseassays(Alayevetal.,2015;Valvezanetal.,2017).Fortheothercompounds, thedoses used were: GA11 20 mg/kg/day, clorgyline 10 mg/kg/day, andrasagiline1mg/kg/day.Inthesestudies,4-5mice/conditionwithtumorsinboth sides (n = 8-10 tumors) were evaluated. The results showed nosignificant benefit from GA11, clorgyline or rasagiline as single agents(Figure 38A); however, the combination of clorgyline or rasagiline witheverolimus produced a stronger inhibitory effect than everolimus alone(Figure38B).
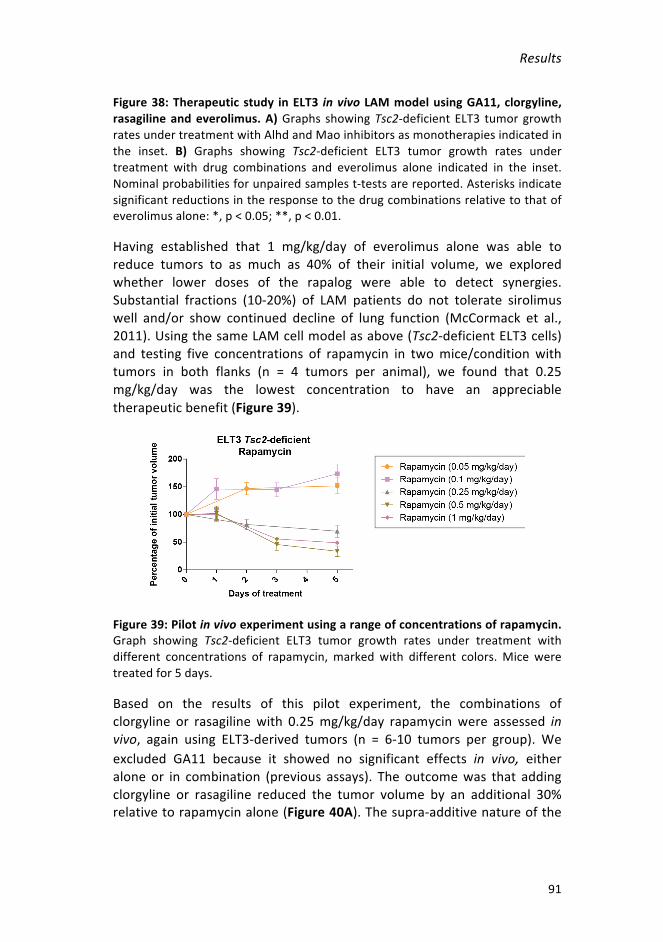
Results
91
Figure38:Therapeuticstudy inELT3 invivo LAMmodelusingGA11,clorgyline,rasagilineandeverolimus.A)Graphs showingTsc2-deficientELT3 tumorgrowthratesundertreatmentwithAlhdandMaoinhibitorsasmonotherapiesindicatedinthe inset. B) Graphs showing Tsc2-deficient ELT3 tumor growth rates undertreatment with drug combinations and everolimus alone indicated in the inset.Nominalprobabilitiesforunpairedsamplest-testsarereported.Asterisksindicatesignificantreductionsintheresponsetothedrugcombinationsrelativetothatofeverolimusalone:*,p<0.05;**,p<0.01.
Having established that 1 mg/kg/day of everolimus alone was able toreduce tumors to as much as 40% of their initial volume, we exploredwhether lower doses of the rapalog were able to detect synergies.Substantial fractions (10-20%) of LAM patients do not tolerate sirolimuswell and/or show continued decline of lung function (McCormack et al.,2011).UsingthesameLAMcellmodelasabove(Tsc2-deficientELT3cells)and testing five concentrations of rapamycin in twomice/conditionwithtumors in both flanks (n = 4 tumors per animal), we found that 0.25mg/kg/day was the lowest concentration to have an appreciabletherapeuticbenefit(Figure39).
Figure39:Pilotinvivoexperimentusingarangeofconcentrationsofrapamycin.Graph showing Tsc2-deficient ELT3 tumor growth rates under treatment withdifferent concentrations of rapamycin, marked with different colors.Mice weretreatedfor5days.
Based on the results of this pilot experiment, the combinations ofclorgyline or rasagilinewith 0.25mg/kg/day rapamycinwere assessed invivo, again using ELT3-derived tumors (n = 6-10 tumors per group). Weexcluded GA11 because it showed no significant effects in vivo, eitheralone or in combination (previous assays). The outcomewas that addingclorgyline or rasagiline reduced the tumor volume by an additional 30%relativetorapamycinalone(Figure40A).Thesupra-additivenatureofthe

Results
92
combinationswascorroboratedwith respect to tumorweight,whichwasreducedbyupto65%relativetothecontrolgroup(Figure40B).
Figure40:Therapeutic study inELT3 invivo LAMmodelusing rapamycinaloneandincombinationwithclorgyline,andwithrasagiline.A)GraphsshowingTsc2-deficient ELT3 tumor growth ratesunder treatmentwithdrug combinations andeverolimusaloneindicatedintheinset.Nominalprobabilitiesofunpairedsamplest-tests are reported.Asterisks indicate a significant reduction in response to thedrugcombinationsrelativetothatofeverolimusalone:*,p<0.05;**,p<0.01;****, p < 0.0001. B) Tsc2-deficient ELT3 tumor volume changes at the end oftherapeuticassays.
We subsequently examined markers that could explain the strongerinhibitoryeffectofthedrugcombinationsrelativetorapamycinalone.Asexpected, all rapamycin treatments reduced the levels of pS6 and totalribosomalS6protein,while increasingAktandErksignaling (Figure41A).Reductions in pS6 levels were even greater with the combinations,particularly when employing clorgyline (Figure 41B). A lower level ofautophagywasalsosuggestedbya lowerLc3-II/controlsignalratio inthedrug combinations (Figure 41B), but these settings did not show anygreater reduction of the autophagy substrate p62 relative to rapamycinalone(Figure41A).

Results
93
Figure41:KeymarkersofproteinexpressionintumorsfromTsc2-deficientELT3cells.A)WBresults forkeymarkersanalyzed in tworepresentative tumors fromeachtreatmentgroup.B)Topandmiddlepanels,WBresultsforpS6,totalS6,Lc3-I/II and vinculin loading control in 4-5 tumors treatedwith rapamycin, alone orcombinedwithaMaoinhibitor.Bottompanel, levelsofLc3-IIandpS6relativetocontrols. One-sided Mann-Whitney test probabilities are reported. Asterisksindicatestatisticallysignificantdifferences:*,p<0.05.
To understand the mechanistic basis of the enhanced inhibition oftumorigenesis promoted by mTOR-Mao drug combinations in greaterdepth, the transcriptomes of two tumor xenografts fromeach treatmentgroup were analyzed. As expected, the comparison between rapamycin-treated and control tumors showed differences in immune-relatedprocesses, accompanied by the repression of metabolic- andmitochondrial-relatedpathways(Figure42A).GenesetsregulatedbyTSC2-mTORsignaling (Düveletal.,2010)also showedchanges in theexpecteddirection(Figure42B).
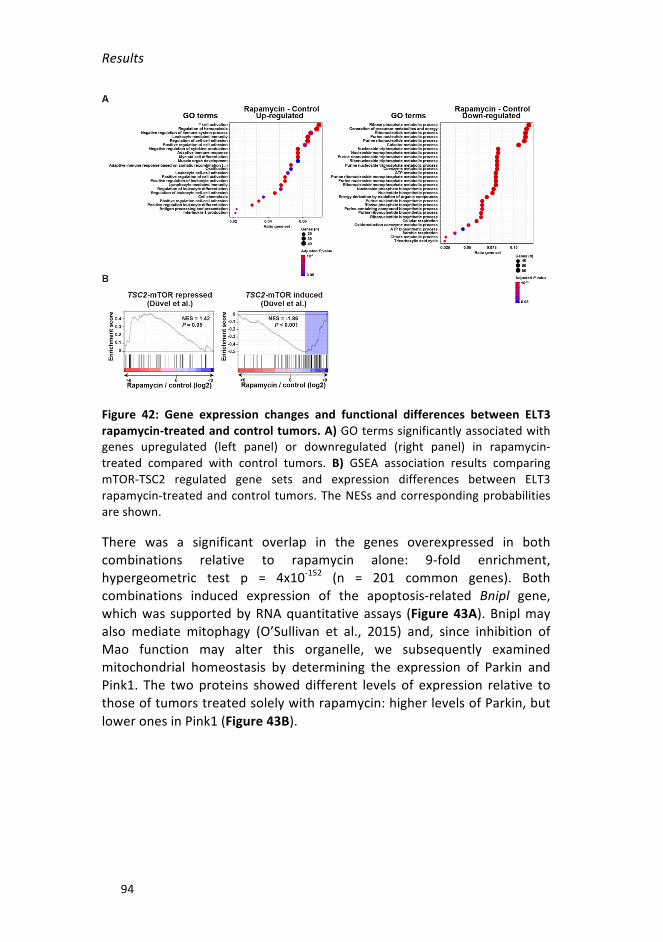
Results
94
Figure 42: Gene expression changes and functional differences between ELT3rapamycin-treatedandcontroltumors.A)GOtermssignificantlyassociatedwithgenes upregulated (left panel) or downregulated (right panel) in rapamycin-treated compared with control tumors. B) GSEA association results comparingmTOR-TSC2 regulated gene sets and expression differences between ELT3rapamycin-treatedandcontrol tumors.TheNESsandcorrespondingprobabilitiesareshown.
There was a significant overlap in the genes overexpressed in bothcombinations relative to rapamycin alone: 9-fold enrichment,hypergeometric test p = 4x10-152 (n = 201 common genes). Bothcombinations induced expression of the apoptosis-related Bnipl gene,whichwas supportedbyRNAquantitativeassays (Figure43A).Bniplmayalso mediate mitophagy (O’Sullivan et al., 2015) and, since inhibition ofMao function may alter this organelle, we subsequently examinedmitochondrial homeostasis by determining the expression of Parkin andPink1. The twoproteins showeddifferent levels of expression relative tothoseoftumorstreatedsolelywithrapamycin:higherlevelsofParkin,butloweronesinPink1(Figure43B).

Results
95
Figure 43: Mitophagy markers expression in tumors from Tsc2-deficient ELT3cells. A) Quantification of Bnipl gene expression in tumors of each treatmentgroup(n=4-5/group).B)Topandmiddlepanels,WBresultsforParkinandPink1,and loading control tubulin in 4-5 tumors treated with rapamycin alone orcombinedwithaMaoinhibitor.Bottompanel,resultsofsignalquantifications.(A,B. One-sided Mann-Whitney test probabilities are reported. Asterisks indicatestatisticallysignificantdifferences:*,p<0.5;**,p<0.01).
Notably, the genes commonly overexpressed in the combinations alsoincluded Hrh1 and Slc18a1/Vmat1, which is a vesicular transporter formonoamines with a relatively low affinity for histamine (Merickel andEdwards, 1995). These overexpressions in the combinations relative torapamycin alone were confirmed at the gene (Slc18a1; Figure 44A) andprotein(Hrh1;Figure44B)levels.OverexpressionofHrh1isconsistentwithits induction incellsexposed tohistamine (Dasetal.,2007)andwith thefactthatMaoactivityisinhibitedintheseassays.Moreover,aswithHRH1,alltheLAMlunglesionstestedrobustlyexpressedtheproteinencodedbySLC18A1/VMAT1(Figure44C).
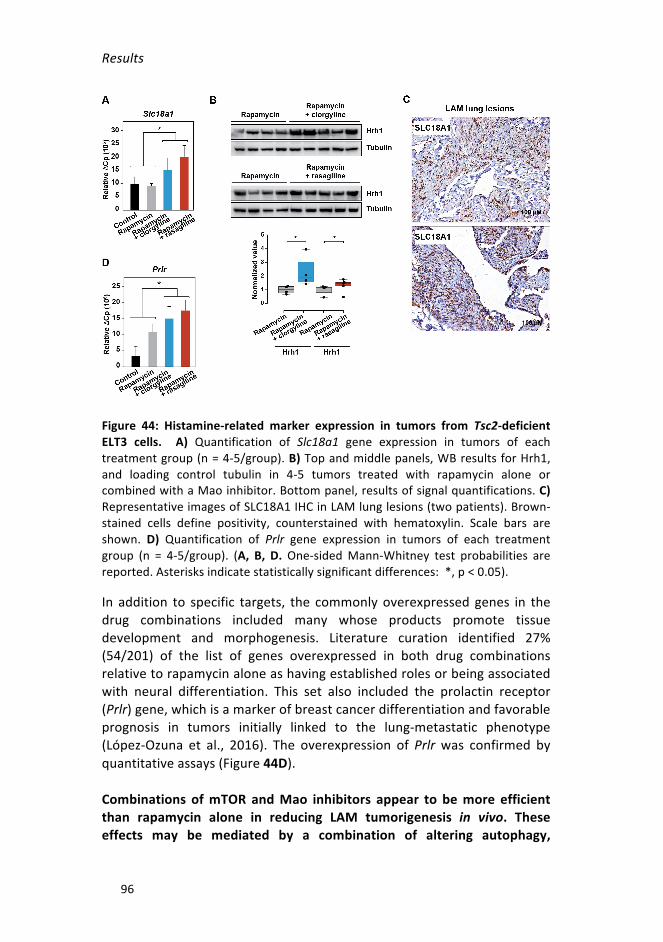
Results
96
Figure 44: Histamine-related marker expression in tumors from Tsc2-deficientELT3 cells. A) Quantification of Slc18a1 gene expression in tumors of eachtreatmentgroup(n=4-5/group).B)Topandmiddlepanels,WBresultsforHrh1,and loading control tubulin in 4-5 tumors treated with rapamycin alone orcombinedwithaMaoinhibitor.Bottompanel,resultsofsignalquantifications.C)RepresentativeimagesofSLC18A1IHCinLAMlunglesions(twopatients).Brown-stained cells define positivity, counterstained with hematoxylin. Scale bars areshown. D) Quantification of Prlr gene expression in tumors of each treatmentgroup (n = 4-5/group). (A, B, D.One-sidedMann-Whitney test probabilities arereported.Asterisksindicatestatisticallysignificantdifferences:*,p<0.05).
In addition to specific targets, the commonlyoverexpressed genes in thedrug combinations included many whose products promote tissuedevelopment and morphogenesis. Literature curation identified 27%(54/201) of the list of genes overexpressed in both drug combinationsrelativetorapamycinaloneashavingestablishedrolesorbeingassociatedwith neural differentiation. This set also included the prolactin receptor(Prlr)gene,whichisamarkerofbreastcancerdifferentiationandfavorableprognosis in tumors initially linked to the lung-metastatic phenotype(López-Ozuna et al., 2016). The overexpression of Prlr was confirmed byquantitativeassays(Figure44D).
Combinations ofmTOR andMao inhibitors appear to bemore efficientthan rapamycin alone in reducing LAM tumorigenesis in vivo. Theseeffects may be mediated by a combination of altering autophagy,

Results
97
mitochondria homeostasis, monoamine metabolism, and tumor cellphenotype.
4.2 THERAPEUTIC TARGETS BASED ON HISTAMINE-MEDIATEDSIGNALING
The function of immune modulators has recently been shown to be animportant factor in LAM biology (Liu et al., 2018; Maisel et al., 2018).Histamine is a pro-inflammatory factor whose signaling through definedreceptorscaninfluenceinnateandadaptiveimmuneresponses(Brancoetal., 2018), and our study provides evidence for histamine-mediatedsignaling in LAM. For these two reasons, the potential benefit fromtargeting HRH1 was evaluated. In particular, loratadine is a second-generation antihistamine that targets HRH1 and is widely used to treatallergiesandrelatedconditions(Virakuletal.,2016).
EffectofHrh1andmTORinhibitorsinLAMcelllinesinvitro
Inassaysofcellviabilityusingafixedconcentrationofrapamycin(20nM),Tsc2-deficientMEFsexperiencedalargersynergisticinhibitoryeffectwhencombinedwithloratadine(CI<1)thanwild-typeMEFs.Wedidnotfindanydifferences between LAM-like cells and their control counterparts in theELT3cellmodel,whetherloratadinewasusedaloneorincombinationwithrapamycin(Figure45).

Results
98
Figure45:Invitrocellviabilityassaysusingloratadinealoneandincombinationwith 20 nM of rapamycin.Graphs showing inhibitory effect of loratadine alone(black line) or in combination with rapamycin (yellow line) in two LAM-like cellmodelsandtheircontrolcounterparts.Combinationswithasynergisticeffect(CI<1) are indicated in pink. The effect of 20 nM rapamycin is marked in everyconditionwithadottedgreyline.
Wealsomeasuredtheabilityofsinglecellstoformcoloniesuponexposureto loratadine. In this case, there were no significant differences in thenumberof coloniesbetween cells treatedwith loratadine and rapamycinassingleagents,orforthecombinationassaysbetweenanycelllines(datanotshown).
Together,thesefindingsindicatethatthecombinationofloratadinewithrapamycinmay impair proliferation of LAM-likeMEF cells, inwhichwealso detected enhanced histaminemetabolism. However, another LAMcellmodeldidnotshowsimilarresults.
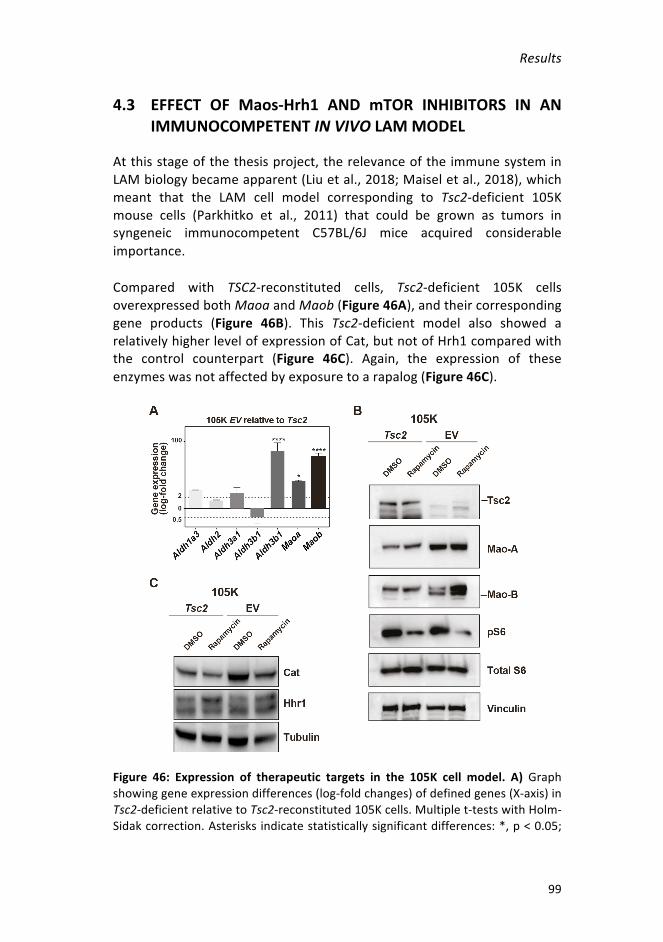
Results
99
4.3 EFFECT OF Maos-Hrh1 AND mTOR INHIBITORS IN ANIMMUNOCOMPETENTINVIVOLAMMODEL
Atthisstageofthethesisproject,therelevanceoftheimmunesysteminLAMbiologybecameapparent(Liuetal.,2018;Maiseletal.,2018),whichmeant that the LAM cell model corresponding to Tsc2-deficient 105Kmouse cells (Parkhitko et al., 2011) that could be grown as tumors insyngeneic immunocompetent C57BL/6J mice acquired considerableimportance.
Compared with TSC2-reconstituted cells, Tsc2-deficient 105K cellsoverexpressedbothMaoaandMaob(Figure46A),andtheircorrespondinggene products (Figure 46B). This Tsc2-deficient model also showed arelativelyhigherlevelofexpressionofCat,butnotofHrh1comparedwiththe control counterpart (Figure 46C). Again, the expression of theseenzymeswasnotaffectedbyexposuretoarapalog(Figure46C).
Figure 46: Expression of therapeutic targets in the 105K cell model. A)Graphshowinggeneexpressiondifferences(log-foldchanges)ofdefinedgenes(X-axis)inTsc2-deficientrelativetoTsc2-reconstituted105Kcells.Multiplet-testswithHolm-Sidakcorrection.Asterisksindicatestatisticallysignificantdifferences:*,p<0.05;

Results
100
****, p < 0.0001. The bars indicate means and standard deviations. Dottedhorizontallinesindicate2-fold(top)and0.5-fold(bottom)changes.B-C)WBofkeyproteins detected in Tsc2-deficient and Tsc2-reconstituted 105K cells in DMSO-exposed conditions or treatedwith 20 nM rapamycin for 16 h. Loading controls(tubulinandvinculin)areshown.
Next, the inhibitors identified above were used as single agents (4-5mice/condition; n = 7-9 tumors per group) or in combination with 0.25mg/kg/dayrapamycin(5-6mice/condition;n=10-12tumorspergroup)toassesstheeffectson105Ktumorigenesis.UnliketheassaysinELT3tumorsand immunodeficient mice, in vivo treatment of Tsc2-deficient 105Ktumors revealed significant inhibitory effects inmonotherapy: clorgyline,loratadine,andrasagilineshowedsignificantreductionsrelativetocontrol-treatedtumors,strongereffectsbeingobservedwhenthe first twodrugswereused(Figure47A).Intriguingly,histologicalexaminationofthetumorsat theconclusionof thetherapeuticassays indicatedgreater immunecellinfiltration in the loratadine-treated cases than in controls and in othertherapeuticsettings(Figure47B).
Inadditiontothemonotherapies,combinationsofclorgylineorloratadinewith 0.25 mg/kg/day of rapamycin showed further reductions of tumorvolumerelativetorapamycinalone(Figure47C).
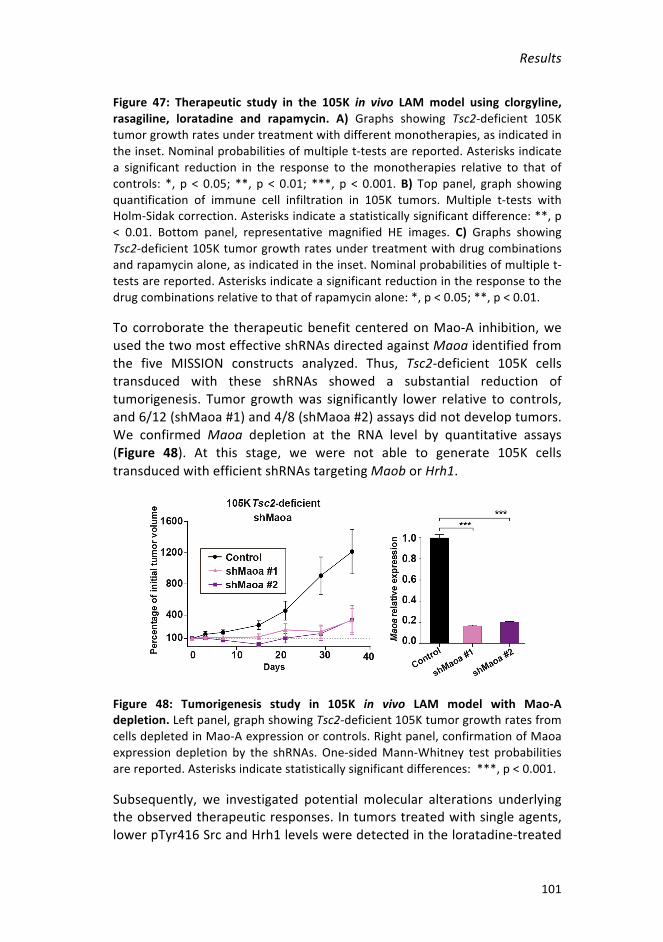
Results
101
Figure 47: Therapeutic study in the 105K in vivo LAMmodel using clorgyline,rasagiline, loratadine and rapamycin. A) Graphs showing Tsc2-deficient 105Ktumorgrowthratesundertreatmentwithdifferentmonotherapies,asindicatedintheinset.Nominalprobabilitiesofmultiplet-testsarereported.Asterisksindicatea significant reduction in the response to themonotherapies relative to that ofcontrols: *, p < 0.05; **, p < 0.01; ***, p < 0.001.B)Top panel, graph showingquantification of immune cell infiltration in 105K tumors. Multiple t-tests withHolm-Sidakcorrection.Asterisksindicateastatisticallysignificantdifference:**,p< 0.01. Bottom panel, representative magnified HE images. C) Graphs showingTsc2-deficient105Ktumorgrowthratesundertreatmentwithdrugcombinationsandrapamycinalone,asindicatedintheinset.Nominalprobabilitiesofmultiplet-testsarereported.Asterisksindicateasignificantreductionintheresponsetothedrugcombinationsrelativetothatofrapamycinalone:*,p<0.05;**,p<0.01.
Tocorroborate the therapeuticbenefit centeredonMao-A inhibition,weusedthetwomosteffectiveshRNAsdirectedagainstMaoaidentifiedfromthe five MISSION constructs analyzed. Thus, Tsc2-deficient 105K cellstransduced with these shRNAs showed a substantial reduction oftumorigenesis. Tumor growthwas significantly lower relative to controls,and6/12(shMaoa#1)and4/8(shMaoa#2)assaysdidnotdeveloptumors.We confirmedMaoa depletion at the RNA level by quantitative assays(Figure 48). At this stage, we were not able to generate 105K cellstransducedwithefficientshRNAstargetingMaoborHrh1.
Figure 48: Tumorigenesis study in 105K in vivo LAM model with Mao-Adepletion.Leftpanel,graphshowingTsc2-deficient105KtumorgrowthratesfromcellsdepletedinMao-Aexpressionorcontrols.Rightpanel,confirmationofMaoaexpression depletion by the shRNAs.One-sidedMann-Whitney test probabilitiesarereported.Asterisksindicatestatisticallysignificantdifferences:***,p<0.001.
Subsequently, we investigated potential molecular alterations underlyingtheobservedtherapeuticresponses.Intumorstreatedwithsingleagents,lowerpTyr416SrcandHrh1levelsweredetectedintheloratadine-treated

Results
102
tumors (Figure 49A). This setting and the clorgyline-treated tumors alsoshoweda trendtowardshigher levelsof theSrc inhibitorysignalpTyr530(Figure 49A). In addition, all three monotherapies tested showed lowerLc3-II/controlratiosthanincontrols(Figure49B).
Figure 49: Key marker protein expression in tumors from Tsc2-deficient 105Kcells treated withmonotherapies and controls. A) Top andmiddle panels,WBresults formarkers of histaminemetabolismand loading control vinculin in fourtumors treatedwithmonotherapiesandcontrols.Bottompanel, resultsof signalquantifications. B) Top andmiddle panels,WB results for an autophagymarkerand loading control tubulin in four tumors treated with monotherapies, andcontrols. Bottom panel, results of Lc3-II signal quantifications. (A, B. One-sidedMann-Whitney test probabilities are reported. Asterisks indicate statisticallysignificantdifferences:*,p<0.05).
All rapamycin combinations appeared to alter histamine-mediatedsignaling, as indicated by the higher Hrh1 levels relative to that withrapamycin alone (Figure 50A). The combination of rapamycin and

Results
103
loratadine also reduced the total levels of S6 (Figure 50A). We alsoexamined Prlr expression and detected significantly higher levels in thedrug combinations compared with those with rapamycin alone (Figure50B).AnotableoverexpressionofPrlr inthe loratadine-combinedtumorswasconfirmedbyimmunohistochemicalassays(Figure50C).
Figure 50: Key markers expression in tumors from Tsc2-deficient 105K cellstreatedwithcombinationsandrapamycinalone.A)Topandmiddlepanels,WBresults formarkersofHrh1andS6 totaland loadingcontrolvinculin in4 tumorstreatedwith combinations and rapamycin alone. Bottom panel, results of signalquantifications. B) Quantification of Prlr gene expression in tumors of eachtreatmentgroup(n=4tumors)(A,B.One-sidedMann-Whitneytestprobabilitiesarereported.Asterisksindicatestatisticallysignificantdifferences:*,p<0.05,**,p<0.01and***,p<0.001).C)RepresentativeimagesofPrlrIHCintwotumors.Brown-stainedcellsdefinepositivity,counterstainedwithhematoxylin.Scalebarsareshown.
Together, the data obtained from an immunocompetent LAM modelconfirm the validity of combiningmTOR andMao inhibitors, aswell as
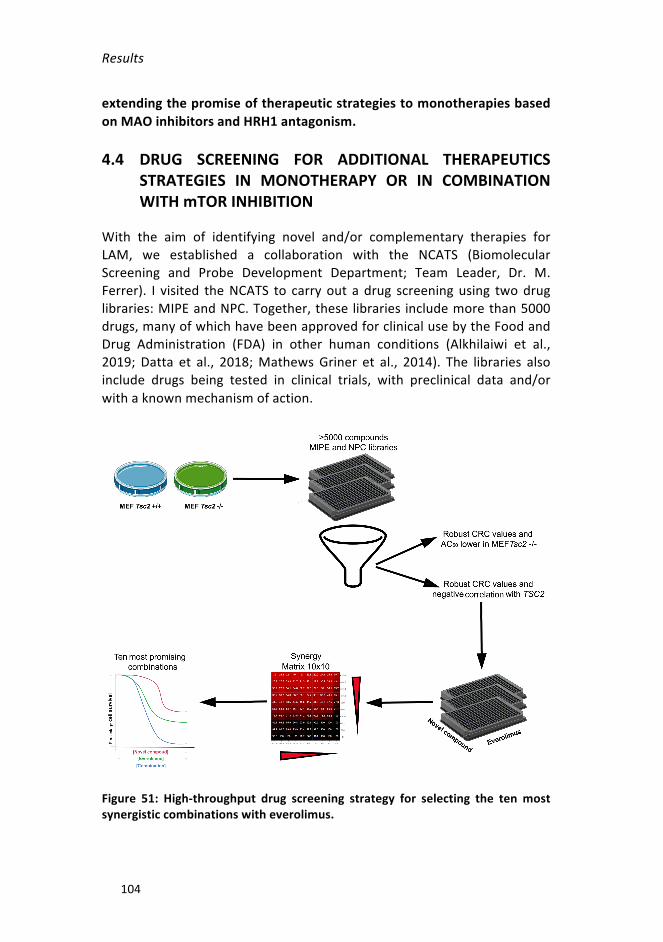
Results
104
extendingthepromiseoftherapeuticstrategiestomonotherapiesbasedonMAOinhibitorsandHRH1antagonism.
4.4 DRUG SCREENING FOR ADDITIONAL THERAPEUTICSSTRATEGIES IN MONOTHERAPY OR IN COMBINATIONWITHmTORINHIBITION
With the aim of identifying novel and/or complementary therapies forLAM, we established a collaboration with the NCATS (BiomolecularScreening and Probe Development Department; Team Leader, Dr. M.Ferrer). I visited theNCATS to carryout a drug screeningusing twodruglibraries:MIPEandNPC.Together,theselibraries includemorethan5000drugs,manyofwhichhavebeenapprovedforclinicalusebytheFoodandDrug Administration (FDA) in other human conditions (Alkhilaiwi et al.,2019; Datta et al., 2018;MathewsGriner et al., 2014). The libraries alsoinclude drugs being tested in clinical trials, with preclinical data and/orwithaknownmechanismofaction.
Figure 51: High-throughput drug screening strategy for selecting the tenmostsynergisticcombinationswitheverolimus.

Results
105
Tsc2-deficient and wild-typeMEF cell lines were used for the screening.First,wetestedtheindividualeffectsofeachofthe5000compoundsinanautomatedway.Then,fortheeverolimus-combinationassays,weselecteddrugsthat:showedgoodfitstothedose-responsedatadistributioninthesingleagentassays;showeda largerdecrease inviability inTsc2-deficientcells than the control cell line; and/or whose target gene expressioncorrelated negatively with the expression of TSC2 across breast tumors.The combination assays were performed in 10x10 matrices that canindicate synergistic, additive or antagonistic effects. Finally, the tenmostsynergisticcombinationswereselectedforfurtherstudy(Figure51).
Selection of 35 drugs based on single-agent effects and TSC2expressioncorrelations
As a first step, compounds were selected based on the curve responseclass (CRC) algorithm (Inglese et al., 2006), which classifies datadistributions by the quality of curve fit (r2) and the magnitude of theresponse (efficacy) (Figure 52). Fifteen of the 5000 compounds testedshowed robust dose response curves, as determined by CRC values (-1a,-1b, -2a, -2b), and Tsc2-decifient cells presented lower AC50 values (theconcentration producing the half-maximal response along a sigmoidalcurve)thancontrolcells(Annex3).Tothisset,weincluded20drugswhosetargets were found to be negatively correlated with TSC2 expression(Annex 4); the hypothesis guiding this selection was that genes whoseexpression was negatively correlated with that of TSC2 across lung-metastaticbreasttumorsindicateproductsthatareoverexpressedinthosetumorsand,therefore,putativetargetsforimpairingmetastaticpotential.
Figure 52: Classification of dose-response curves. The curves were categorizedwithrespecttotheCRCvalues,asindicatedintheinset.

Results
106
Selectionoftendrugcombinationswitheverolimus
The 35 selecteddrugswere tested for their effectswhen combinedwitheverolimus. Ten concentrations of each individual drug and tenconcentrations of the combinations were evaluated in each case. Theresults were represented in two different 10x10matrices. The first typedepictscellviability,wherein thecolor redrepresents lowerviability.Thenumbers in the table are the percentage cell viabilities for the particulardosecombinations.AsobservedintheexampledepictedinFigure53A,thecombination of everolimus with a given compound reduced viabilitysignificantlymoreinTsc2-deficientthaninwild-typeMEFs.
In the second typeofmatrix, thenatureandpotentialmechanismof thedrug interactions is represented by the Blissmetric, which assumes thateach agent’s activity is independent of the action of the second agent(Berenbaum,1981;MathewsGrineretal.,2014).Anegativenumberinthematrix (in red)meansthat there isasynergisticeffect,apositivenumber(inblue)indicatesanantagonisticeffect,andavalueof0(inwhite)showsthat the combination is additive. In the example presented (Figure 53B),thecombinationeffect issynergisticatseveralconcentrations inLAM-likecells,butadditiveorevenantagonisticinthecontrolcells.

Results
107
Figure 53: Example of one combination of everolimus and a novel compoundrepresented by two types of 10x10 matrix. A) 10x10 matrix representing celldeathasdeterminedbyCellTiterGlo.B)10x10matrixrepresentingcombinationinteractions with Bliss indices. (A, B. The X-axis displays ten concentrations ofeverolimus; theY-axisdisplays tenconcentrationsofanovel compoundselectedfromthehigh-throughputdrugscreening).
To select the tenmost synergistic combinations, theDeltaBlissSummary(DBSum)wasused,which isdefinedasthesumofalldeviationsfromtheBliss model (Mott et al., 2015). The threshold for considering that twocompoundsact synergistically in thismodel is typicallydefinedas -3.Thegamma indexwas also taken into account; this parameterminimizes thedifference between the observed combination effect and Gaddums non-interactionmodel(whichissimilarinnaturetotheBlissmodel,exceptthatthecombinationtermofthemodelresponseisthemaximumofthesingleagentfractionalresponses)(MathewsGrineretal.,2014).Accordingtothis

Results
108
latter criterion, synergistic, additive, and antagonistic combinations arethosewitha gammascoreof<0.96,0.96–1.04, and>1.04, respectively.Nine combinations with everolimus fulfilled the selection criteria: theypresentedaDBSumindexlessthan-3andagammascorelessthan0.95inTsc2-deficientMEFs.Inwild-typecells,theDBSumandgammascoreswerebothhigherthaninLAM-likecells(Table8).Weaddedatenthcompound,fingolimodhydrochloride,becauseitalmostfulfilledthecriteria(Table8).
Table 8: The most synergistic combinations with everolimus selected in Tsc2-deficientMEFcells.
COMPOUNDNAME MECHANISM Gamma
LAMDBSumLAM
GammaWT
DBSumWT
Monensinsodiumsalt Polyetherantibiotic 0.7463 -16.9970 1.0002 -1.8469
Sepantroniumbromide Survivininhibitor 0.5917 -13.0601 0.9651 -3.9003
CUDC-907 PI3Kinhibitor 0.6747 -12.0860 0.9125 -3.8911
CP-868596(Crenolanib) PDGFRbetainhibitor 0.8477 -8.6359 0.9874 -1.1869
Auranofin Thioredoxinreductaseinhibitors 0.8855 -7.4338 1.0331 -1.2989
Cetylpyridiniumbromide Null 0.7842 -9.6920 0.9209 -3.7262
PKC412(Midostaurin) PKC/flt3inhibitor 0.8091 -8.5714 0.9889 -2.7943
Fingolimodhydrochloride
Sphingosinekinase1(SphK1)inhibitors 0.9641 -2.5887 1.0404 -0.3577
Dinaciclib(SCH727965) CDK1/2/5/9inhibitor 0.8267 -6.3440 0.9655 -4.6475
Dovitinib FGFRinhibitor 0.7840 -11.2662 0.9137 -9.7704

Results
109
Identificationofthemostsynergisticcombinations
Tovalidatethefindingsofthehigh-throughputassays,theselecteddrugsand their everolimus-based combinations were assessedmanually in thehost laboratory using regular viability assays. Serial dilutions of theselecteddrugscombinedwithafixedconcentrationofeverolimus(20nM)wereanalyzed.
Severalsynergistic (CI<1)combinationswereobserved in thereplicationassays, but the most promising was the combination of PKC-412 witheverolimus. Most doses of this combination were synergistic in Tsc2-deficientMEFs,whileonlythreeconditionspresentedCIs<1inwild-typeMEFs (Figure54).We repeated the cell viability assayusingPKC-412andeverolimus inELT3 cells. In this case,mostof thePKC-412doses showedsignificant synergistic effects when combined with everolimus, but thesameinteractionswereobservedinthecontrolcounterpart(Figure54).
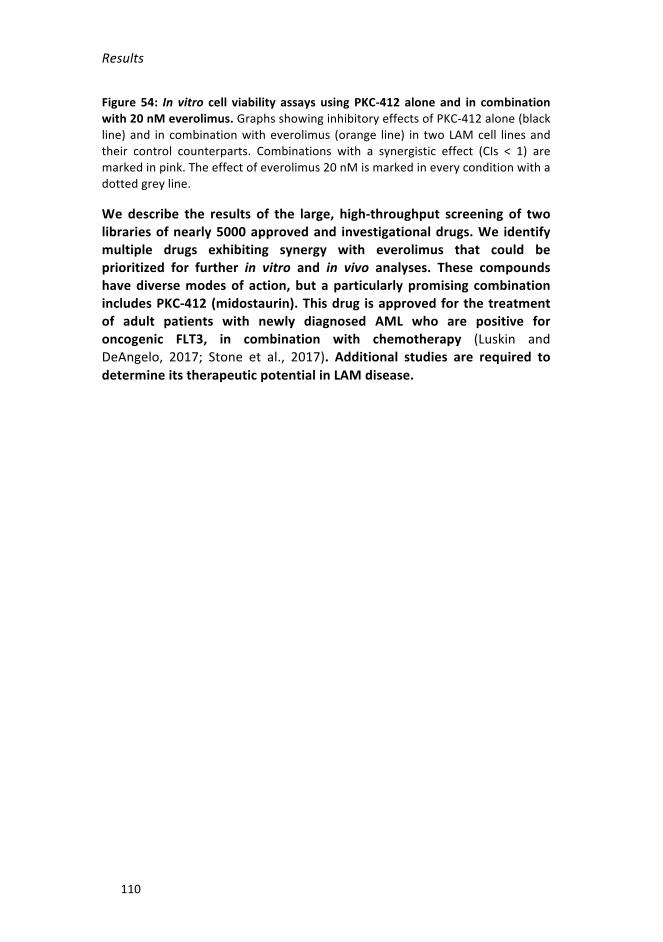
Results
110
Figure 54: In vitro cell viability assays using PKC-412 alone and in combinationwith20nMeverolimus.GraphsshowinginhibitoryeffectsofPKC-412alone(blackline)and in combinationwitheverolimus (orange line) in twoLAMcell linesandtheir control counterparts. Combinations with a synergistic effect (CIs < 1) aremarkedinpink.Theeffectofeverolimus20nMismarkedineveryconditionwithadottedgreyline.
We describe the results of the large, high-throughput screening of twolibrariesofnearly5000approvedand investigationaldrugs.We identifymultiple drugs exhibiting synergy with everolimus that could beprioritized for further in vitro and in vivo analyses. These compoundshavediversemodesof action, but aparticularlypromising combinationincludesPKC-412(midostaurin).Thisdrug isapprovedforthetreatmentof adult patients with newly diagnosed AML who are positive foroncogenic FLT3, in combination with chemotherapy (Luskin andDeAngelo, 2017; Stone et al., 2017). Additional studies are required todetermineitstherapeuticpotentialinLAMdisease.

DISCUSSION


Discussion
113
1. ASSESSMENTOFNOVELLAMMOUSEMODELS
LAM is a rare lung disease defined as a low-grade, destructive andmetastasizingneoplasm(McCormacketal.,2012). Insporadiccases—thecategory inwhichmostpatients fall—somatic inactivationofTSC2 leadsto abnormal activation of mTOR in an unknown cell type, which isexpectedtobetheoriginofLAMpathogenesis (HenskeandMcCormack,2012). Thus, each S-LAMpatient is thought tobeaffectedbyone clonalLAM cell expansion due to accidental, somatic inactivation of bothTSC2alleles in a phenotypically susceptible cell type (Grzegorek et al., 2013).This hypothesis is compatiblewith the fact that tissueoriginsmaydifferamongpatients. Subsequently,thesecellsmaycirculateinthegivenbody,colonize and metastasize to the lung, leading to the tissue destructioncharacteristicofLAM.
LAM lesions are frequently phenotypically heterogeneous, appearing insmooth muscle-like cells and epithelioid-like cells (Ferrans et al., 2000),and including various other cell types (Kumasaka et al., 2004; Liu et al.,2018;KazuhiroMatsuietal.,2000a;Valenciaetal.,2006). Inmostcases,diseasedcellsarepositiveforthemarkersα-SMAandHMB-45(Ferransetal., 2000), and for ER and/or PgR (Logginidou et al., 2000; Ohori et al.,1991).However,patientsareheterogeneouseveninthecaseofcanonicalmarkers.
Basedoncellmorphologyandbiomarkers,themainsitesoforiginofLAMcells have been postulated to be the uterus, AMLs or the neural crestlineage(Carsilloetal.,2000;Delaneyetal.,2014;Prizantetal.,2013). Inparallel, our group has suggested an alternative origin in a specificmammary luminal progenitor cell population (Nuñez et al., 2016). Thishypothesis is based on key observations: the shared hormonal influenceondiseasebiology;thesharedassociationwithlossofTSC2andenhancedmTORC1;thesharedexpressionofspecificstemcell-likemarkers;andthesharedexpressionof lungmetastasismediators (DeGaribayetal., 2015;Mateoetal.,2017).Otherstudieshaveshownthatlung-metastaticbreastcancer cells commonly show loss of expressionof theTSC1 and/orTSC2products, and therefore abnormal activation of mTORC1 (Jiang et al.,2005;Mateoetal.,2017;Nasretal.,2013).
Inthisthesis, to investigatethehypothesisthatLAMcanoriginate inthebreasttissue,westudiedamousemodelwithspecificdeletionofTsc2 inproliferatingepithelialcellsofthemammarygland.Wehypothesizedthat

Discussion
114
someofthesecellswouldmigratetothe lungtogeneratesimilar lesionsto those of LAM. However, themodel did not show any obvious tissuelesioneitherinthebreastorinthelung.
The mammary epithelium is formed of two main cell lineages: thebasal/myoepithelial cells with contractile capacity, and the luminal cellswith milk-producing function (Fu et al., 2014). The luminal cells can befurtherdividedintotwogrosssublineages:ER-positiveandER-negative.IthasbeenshownthattheBLG-Cretransgene ismostactive inthe luminalER-negativepopulationatalldevelopmentalstages,althoughasweeksgoby,there isan increase inthefrequencyofbasaland luminalER-positivecells that express Cre (Molyneux et al., 2010). In addition, althoughpregnancy and lactation were described as being essential for theexpressionoftheBLGpromoter(Selbertetal.,1998),therehasalsobeenCre-mediated recombination in virgin femalemice. Thismaybe becauseCre can be expressed outside the designed cell type, a phenomenonknownasleakage,whichhasbeendescribedinothermodels(Maoetal.,2006;Zhongetal.,2015).
LAMcellsexpressER,sotheBLGmaynotbethemostsuitablepromoterfor testing our hypothesis because it ismostly expressed in luminal ER-negative cells, and thereforedeletionofTsc2wouldmainlyoccur in thiscellsubtype.AlthoughBLGcanalsobesomewhatactiveinothercelltypesduring lactation (Molyneux et al., 2010), to completely rule out thepossibility that we did not target the correct cell population, we wouldneedtouseastrongerpromoterinER-positiveluminalprogenitorcells.
Nevertheless,thefactthatwedidnotobserveanyanomalouscellgrowthinthebreasttissueoffemalemicewithconditionalTsc2deletionremainsintriguing.Deletionof thisgene (confirmedbyPCRassays)wasexpectedto produce overactivation of mTOR and, thus, cell overgrowth andproliferation similar to that observed in TSC lesions in other tissues.Although the expected lesions would not be invasive, overgrowth wasclearly expected. The lack of these anomalies might be because targetcells died with abnormal mTOR activation. This limitation could also belinked to the possibility that target cells require larger amounts ofcirculating estrogens for survival. For example, tumor xenograftsoriginating from the canonical ER-positive MCF7 breast cancer cell linerequire mouse supplementation with estradiol (Dall et al., 2015;Dobrolecki et al., 2016). Further studies using different approaches forconditional Tsc2 deletion and supplemented exposure to hormones are
Discussion
115
warranted to establish whether breast tissue can be a site of origin ofLAM.
2. IDENTIFICATION OF LAM PLASMA BIOMARKERSCOMPLEMENTARYTOVEGF-D
The diagnosis of LAM is still clinically challenging. There is no standardprocedure because of the variability in the symptoms among patients.There are several non-invasive techniques that, when combined, allowclinicians tomake a proper diagnosis, such as those based on PFTs andHRCT,andVEGF-Dmeasurementinplasma(Guptaetal.,2017;Johnsonetal.,2010).However,whenpatientspresentonlyonetypicalindicatorandexhibit no additional confirmatory features, or if a VEGF-D test is non-informative,alungbiopsyisstillneededtoconfirmthediagnosis(Johnsonet al., 2010). For these reasons, novel biomarkers are required to avoidinvasivemethodsfordiagnosing,andeventuallymonitoring,thisdisease.Working on the assumption that LAM cells could have similartranscriptionalprograms to thoseofbreast cancer cells thatmetastasizeto the lung, here we used gene expression data to predict novel LAMplasmabiomarkers.
SelectedproteinsandmetabolitesoverexpressedintheplasmaofLAMpatients
Current analytical technologies enable high-throughput analysis andquantitationofbiomarkersfromrelativelysmallsamples(Mirnezamietal.,2012; Nicholson et al., 2012). For this reason, we performed absolutequantification assays to measure secreted proteins and metabolites inplasma fromLAMpatients.We foundANGPTL4 tobemore abundant inLAMplasmathaninhealthywomen,andthatitisexpressedincellsfromlunglesions.ANGPTL4isasecretedglycosylatedadipokinethatbelongstoa family of angiopoietin-like proteins (Tan et al., 2012). This protein iscleaved into an N-terminal coiled-coil fragment (n-ANGPTL4) and a C-terminalfibrinogen-likedomain(c-ANGPTL4),bothofwhicharesecreted.Our results suggest that itwouldbea goodbiomarkerof LAMdiagnosisthatiscomplementarytoVEGF-Dmeasurements.
High levelsofexpressionofthisproteinhavebeenfound invarioussolidtumors, such as breast cancer, colorectal cancer, hepatocarcinoma,

Discussion
116
prostate cancer, and renal cell carcinoma (La Paglia et al., 2017). ThehypoxicconditionsinthetumormicroenvironmentleadtoanincreaseofHIF1α that, in turn, induces the overexpression of COX-2 (Kaidi et al.,2006). Prostaglandins synthesized by COX-2 stimulate the production ofANGPTL4 and its secretion (Kim et al., 2011). c-ANGPTL4 is involved inanoikis resistance since it interactswith beta-integrins andmaintains anelevatedROSrate,inducingaredox-basedsurvivalmechanism(Zhuetal.,2011). Moreover, ANGPTL4 is associated with metastatic processes. Inbreast cancer, this protein is described as a lung metastasis mediator(Minn et al., 2005) and transforming growth factor beta (TGFβ) makesbreast cancer cells metastasize to the lung through the induction ofANGPTL4 (Padua et al., 2008). ANGPTL4 is upregulated in cancer cellswhen they extravasate and colonize the lungs, because it increases thepermeabilityofcapillariesbybreakingvasculartight junctions(Tanetal.,2012). In LAM, diseased cells express HIF1α even under normoxicconditions (Düveletal.,2010)due tomTORC1overactivation.Given thisobservation, we hypothesized that ANGPTL4 helps LAM cells reach thelungdue to its role in anoikis resistance andmetastasis,which accountsfor its presence in patient plasma. This hypothesis will be tested in thenearfuture.
COX-2wasothersecretedproteinanalyzed inthisproject.Asmentionedabove,itisinvolvedintheexpressionofANGPTL4,andthePGE2producedby COX-2 is also elevated in LAM patients plasma (Li et al., 2014). Inaddition, it has been demonstrated that COX-2 is expressed by Tsc2-deficient cell lines (Li et al., 2014; H. Li et al., 2016). A clinical trial isunderway to assess the action of celecoxib (a COX-2 inhibitor) in LAMpatients (NCT02484664).However,COX-2 itselforPGE2could serveasabiomarkerofthedisease.COX-2hasbeenshowntoplayacrucialrole incarcinogenesis by promoting growth, survival, andmetastasis of tumourcells(Greenhoughetal.,2009).Incoloncancercells,histaminestimulatesthe expression of COX-2, which mediates the production of PGE2 andincreases cell proliferation and VEGF production (Cianchi et al., 2005).OverexpressionofCOX-2increasesmigrationandinvasioncapacities,andpromotes stemcellmarkersexpression inbreast cancer cells (Majumderetal.,2016).
In addition to protein biomarkers, this project has also identifiedmetabolitesthatareoverabundantinLAMplasmarelativetocontrols.Allof them are products of the catabolism of monoamines, indicating thatthis process is also a hallmark of LAM pathology. The most promisingmetabolite is MIAA, because it shows significant differences from the

Discussion
117
patterns observed in healthywomenand in theplasmaof patientswithLAM-related pulmonary diseases. MIAA can be detected in urine andsaliva (Martens-Lobenhoffer andNeumann, 1999; Sugimoto et al., 2010;Wishartetal.,2018),whichcouldfurtherfacilitatetheapplicationofnon-invasive clinical protocols for LAM. It occurs at raised levels in otherdiseases, such as mastocytosis (Doormaal et al., 2012) and pancreaticcancer (Sugimotoet al., 2010). It is of particular note that the results ofthisstudyindicatethatMIAAmeasuresareindependentofVEGF-Dvalues,which provides an opportunity to generate robust predictive models.Nevertheless, prospective clinical studies are warranted to corroborateourobservationsbeforeanyof thesenovelbiomarkersare implementedinaclinicalsetting.Inparticular,itwillbenecessarytoassessMIAAlevelsrelative to a range of symptoms, the status of disease progression, andbeforeandaftertreatmentwithsirolimus.
Molecular and cellular features associated with novelbiomarkers
ThecontinuousproliferationofLAMcellsasaresultoftheoveractivationofmTORC1requiresmajoradjustments incellmetabolism(DeNicolaandCantley, 2015). Catecholamines are metabolized through the enzymaticactivities of ALDHs and MAOs, and the result of these reactions is theproductionofMIAAandtheothermetabolitesfoundinplasmafromLAMpatients. Our results indicate that these enzymes are overexpressed inLAMmodels and tissues, and that their activity is high inTsc2-null cells.Wethereforehypothesize that theoveractivationofALDHsandMAOs isthereasonwhy4-HPA,HVA,MIAAandVMAisrelativelymoreabundantinLAMplasma.
Cancer stem cells are characterized by the relative overexpression andactivity of certain ALDH isoforms (Toledo-Guzmán et al., 2019), ametabolic trait associated with the metastatic potential of variousneoplasms,includingbreastcancer(Ginestieretal.,2007).ArecentstudyshowedthatcirculatinghumanLAMcellswithLOHofTSC2haverelativelyhigh ALDH activity (Pacheco-Rodríguez et al., 2019). MAOA isoverexpressed in the transition from breast cancer bone metastaticdormancy to relapse (Lu et al., 2011) and promotes prostate cancermetastasis(Wuetal.,2017).MAOBexpressionisalsoaprognosticfactorin breast cancer (Jin Cha et al., 2018) and gliomas, where it is alsopositively correlated with HIF1α (Sharpe and Baskin, 2016). Our currentobservations inLAM-relatedcellmodels,tissueandplasmaaretherefore

Discussion
118
consistent with a pivotal role for ALDHs and MAOs in neoplasticprogressionand, importantly,mayextend theconceptofLAMasa stemcell-likedisease(DeGaribayetal.,2015;HenskeandMcCormack,2012).
Mitochondria play a critical role in cell metabolism. Some processesproduced in themitochondriagenerateROSasmetabolicproducts.Highlevels of ROS are a hallmark of many cancer types (Hanahan andWeinberg, 2011), contributing to their development and progression byengagingsurvivalandstemcell-likesignals(Gorrinietal.,2013).Themainsource of ROS in the mitochondria is electron leak from the electrontransportchain(ETC),butROSproductionalsotakesplaceoutsidetheETCon the mitochondrial outer membrane because of the oxidation ofmonoaminesbyALDHsandMAOs (Hauptmannetal.,1996;Ugun-Kluseketal.,2019).ThisiscompatiblewithourresultsinLAM-relatedcellmodelswheretherewasoveractivationofAldhsandMaosandahighproductionof ROS, particularly due to H2O2 production. These effects are alsoconsistentwiththeresultsofthestudiespublishedbyFinlayetal.,2005.and Lam et al., 2017b, which showed elevated ROS generation bymitochondriainLAMcells.
It has beenproposed that LAMcells experiencemetabolic reprogramingtowards dependence from aerobic glycolysis at the expense ofmitochondrial oxidative phosphorylation (Liberti and Locasale, 2016).SomestudieshaveshownthatcertainLAMcellmodelshave lowoxygenconsumptionrates(OCRs)(Abdelwahabetal.,2019;Julianetal.,2017).Inapparent contradiction,we have demonstrated that Tsc2-deficientMEFsshow relatively higher oxygen consumption under basal conditions. Thisdiscrepancymaybe due to the different cellmodels used in the studiesand/orbecausenon-mitochondrialrespirationrepresentsasignificantpartof the total respiration in our model. Non-mitochondrial respiration isassignedtoenzymes, includingmonoaminoxidases,thatconsumeoxygeninotherprocessesorreactions(Chackoetal.,2014).Wecoulddeterminethe extent of non-mitochondrial oxygen-consuming processes in ourmodelat the terminationofanexperimentby theresidual respiration inthe presence of electron transport inhibitors such as antimycin A androtenone.ThesecompoundswouldinhibitmitochondrialrespiratoryETC,and we could attribute the remaining oxygen consumption to non-mitochondrialoxidasespresentinthecell.
Histamine ismetabolized by ALDHs andMAOs to generateMIAA. It is amoleculederived from thedecarboxylationof the aminoacid L-histidine(Branco et al., 2018). Histamine is mainly produced bymast cells when

Discussion
119
theyareactivated,oftenaspartofanallergic immuneresponse(Gallietal., 2005). However, it is now known to be able to participate in otherpathological processes. Histamine metabolism is altered in a range ofhuman neoplasms, including melanoma and breast cancer, and mayregulatecancerprogression(Medinaetal.,2006;Reynoldsetal.,1998).Inpatientswithductalbreast cancer,histamine levelsarehigher inplasmaand in neoplastic and adjacent normal tissues than in healthy controls(Sieja et al., 2005). In addition, normal breast cells express histaminereceptors (Lemos et al., 1995) and histamine plays a role in mammarygland growth formation and differentiation during pregnancy andlactation(Wagneretal.,2003).Eveninmelanoma,histamineplaysaroleinprotectingtumorfromtheimmunesystem(Martinetal.,2014).HRH1is also expressed in breast cancer with stem cell-like features andregulatesitsprogression(Fernández-Nogueiraetal.,2018).Inourmodel,itremainsunknownwhetherhistamineisproducedbyLAMcellsormastcells,orifitissynthesizedelsewhere.FutureexperimentsusinglabelledL-histidinemayservetodeterminewhetherLAMcellsareabletosynthesizehistamine, and/or if mast cells are the main factor responsible for thatproduction.Coculturecellstudieswouldalsobeworthwhiletodeterminewhether histamine signaling is mediated by paracrine and/or autocrinepathways. In melanoma, histamine acts in both an autocrine and aparacrine manner; the one endogenously produced by melanoma cellsmodulates their proliferation in early stages and theother, producedbymastcells,regulatesthegrowthofmetastaticmelanomacells(Falusetal.,2001;Molnar et al., 2001).However, the autocrinehistamine stimulatescellgrowthinmammarycarcinomacelllines(Criccoetal.,1994).
3. DISCOVERYOFNOVELTHERAPEUTICSTRATEGIES
In recent years, several approaches to the treatment of LAM diseaseinvolving or not involving sirolimus have been tested. Having evidencethat mTOR inhibition is cytostatic but not cytotoxic, and that chronictreatmentisneededbecausethediseasereappearswhentherapamycinisdiscontinued(McCormacketal.,2011),meansthatthereisacriticalneedtodevelopadditionaltherapiesthatcouldprovideacompletecureforthedisease. Some of these novel therapies take advantage of metabolicvulnerabilities of LAM cells. The hyperactivation of mTORC1 enhancesbioenergetic and biosynthetic processes that, in turn, provoke a criticalburdenonbufferingROS(Filomenietal.,2015;Poillet-Perezetal.,2015).
Discussion
120
Inkeepingwiththisidea,theinhibitionofthesynthesisoftheantioxidantglutathione, exposure to ROS inducers, or RIP1 inhibition have beenreported topromotecelldeath inTsc2-deficientcellmodels (Filipczaketal.,2016;Lametal.,2017a;J.Lietal.,2016;Medvetzetal.,2015).ThesecompoundsfurtherincreaseROSlevels,andthistriggerscelldeathduetotheir hypersensitivity to oxidative stress. In addition, after inhibition ofmTOR with rapamycin, autophagy is increased as a cancer cell survivalmechanism,andthisactionconstitutesthebasisofcombinationtherapiesusingresveratrolorchloroquine,autophagyinhibitors(Alayevetal.,2015;El-Chemalyetal.,2017;Parkhitkoetal.,2011).Basedonthesestudies,theclinical trials SAIL (NCT01687179, already completed) and RESULT(NCT03253913, on-going) were designed to demonstrate thatsimultaneouslyblockingmTORandautophagyisbetterat improvinglungfunctioninpatientsthantargetingmTORactivityalone.
Novel therapeutic strategies in vitro and in vivo based on theidentifiedbiomarkers
Our study expands on these observations by highlighting additionalmechanistic traits that should be considered when treating LAM. Giventhe evidence obtained about altered monoamine and histaminemetabolism, we tested inhibitors of ALDHs and MAOs and an HRH1antagonist in cell models in vitro and in vivo. Our study provides noveltherapeuticstrategiesthatmaybecomplementaryto,orcombinedwith,thestandardofcareforthedisease.Orphandrugs,whicharecompoundsintended to treat diseases that affect only a small proportion of thepopulation,arenotusuallydevelopedbythepharmaceutical industryforseveralreasons(Ahmedetal.,2019).ForrarediseaseslikeLAM,off-labeluseof some compounds, bywhich apharmaceutical drug is used for anunapprovedindicationorinanunapprovedagegroup,dosage,orrouteofadministration (Hurko, 2013), is common. Hence, the novel schemes forthe treatmentof rarediseasesarebasedondrugsapproved for treatingotherhumanconditions.
TheALDHinhibitor,GA11,affectedtheproliferationofLAMcells invitro,but had no effect in the immunodeficientmicemodel in vivo. However,the MAO inhibitors, clorgyline and rasagiline, in combination withrapamycin, only influenced LAM cell survival in vivo. Key differencesbetweeninvitroandinvivoassayshavebeendescribedinvariouscancer-relatedsettings(Milleretal.,2017). SinceenhancedactivityofALDHsandMAOs may result in high levels of ROS production, the tumor micro-

Discussion
121
environmentislikelytoplayanimportantroleindeterminingtherapeuticresponses, as described for most cancer types (Gorrini et al., 2013).Additionally, LAM lung lesions can appear very heterogeneous at thecellularlevelanddiseasecellsaresensitivetotumormicroenvironmentalfactors (Pacheco-Rodriguez andMoss, 2010). In any case, a novel ALDHinhibitor has been developed for the treatment of melanoma cancer(Pérez-Aleaetal.,2017)thatcouldbetestedintheLAMcontext.
Theeffectsofloratadine,anantagonistofHRH1,togetherwithclorgylineand rasagiline, were assessed in an immunocompetentmousemodel invivo.Monotherapiesshowedastrongerinhibitoryeffectontumorgrowthrelative to controls. Clorgyline and rasagiline are approved compounds,but they are known to have some serious side effects (Youdim et al.,2006), whereas loratadine is generally very safe (Sidhu and Akhondi,2019).
The specific effect of clorgylinewas confirmedwith two shRNAs againstMaoa. However, the available shRNAs targetingMaob andHrh1 did notlead to a reduction in the expression of these genes and the specificeffectsofrasagilineand loratadinecouldnotbevalidated.OthershRNAstargetingthesetwogenesmustbefoundtotestthem.
Inthesameimmunocompetentmodel,thecombinationsofclorgylineandloratadinewith rapamycin gave rise to an additional reduction of tumorvolume comparedwith that achievedwith rapamycin alone. Although acombinationwithrasagilinemightalsobeeffective,ourstudiesproducedconflicting results between the immunodeficient and immunocompetentsettings. This discrepancymay be due to the different LAM cell modelsemployedand/ortheinfluenceoftheimmunesystem.
An unsolved aspect is the relation between LAM cells and the immunesystem.LAMcellnodulesarefoundinchylouspleuralfluidsurroundedbyVEGFR3-positivelymphaticendothelialcells(Kumasakaetal.,2004).Tcellsinfiltrating AMLs or lung lesions strongly express the programmed celldeath-1(PD-1)receptor.ThisupregulationismotivatedbytheexpressionofthePD-ligand1(PD-L1)byLAMcellsitself(Maiseletal.,2018)ortumor-infiltratingimmunosuppressiveimmunecells(Liuetal.,2018).Thebindingof PD-L1 to its receptor PD-1 delivers a signal that inhibits the adaptivearmofthe immunesystem.Recently,severalstudieshavedemonstratedtheefficacyof theblockadeofPD-1 in reactivating the immune systemsagainst LAM cells (Liu et al., 2018; Maisel et al., 2018). Mast cells areanother type of immune cell present in LAM lung nodules (Pacheco-

Discussion
122
Rodriguez andMoss, 2010; Valencia et al., 2006), and are an importantsourceofhistamine.Here,ithasbeenshownthatLAMcellshavealteredhistamine-mediated signaling, and we hypothesized that inhibiting theirhistaminereceptorsmayprotectthesecellsfromcontinuousstimulation.Thus, several immune modulators play an important role in LAMprogression and in the response of the disease to different therapeuticstrategies.
Molecular and cellular changes underlying beneficialtherapeuticresponses
Inthe invivoassaywiththeimmunodeficientmodel,therapamycindrugcombinationsdisplayaslightlylowerleveloftheLc3-IIautophagicmarkercompared with rapamycin alone. This may indicate that the latterupregulates autophagosome formation, while this accumulation isreverted inthecombinations. Inaddition, thecombinationsproducedanincrease in mitophagy with respect to the levels of Parkin and Pink1(canonicalmarkers) (Chourasiaetal.,2015a),andBnipl (Chourasiaetal.,2015b; O’Sullivan et al., 2015). When mitochondria are chemicallytargeted, these organelles accumulate functional defects andmitophagycan remove the damaged mitochondria, acting as a pro-survivalmechanism.Thus,aftertreatmentwithMAOinhibitors,therapy-resistantcellsmightbeexpectedtodisplayhighermitophagylevels(Vara-Perezetal., 2019). Another possible mechanism of cell survival activated aftertreatmentwithdrugcombinationsistheoverexpressionofthePrlrgene,which is a marker of breast cancer differentiation (López-Ozuna et al.,2016). Prolactin increases the proliferation of Tsc2-deficient cells,promotingthephosphorylationofStat3andErk,andLAMlesionsexpressprolactin receptors (Alkharusi et al., 2016; Terasaki et al., 2010).Therefore, the upregulation of Prlr may help LAM cells survive. Finally,histamine-related markers were also moderately overexpressed in thedrug combinations, suggesting that the activation of the histaminesignalingpathwayisrelevanttoresistancetocelldeath.
The resultsof the invivo assay in the immunocompetentmodel indicatethat the therapeutic benefit ofmonotherapies based onMAO inhibitorsand HRH1 antagonismmay be due to alteration of autophagy and SRC-mediated signaling; the lattermay bemore relevant with regard to theeffects of loratadine. Tyryshkin et al., 2014, demonstrated that thereductionof autophagypromotes theaccumulationof active Src in LAMcells, which reduces cell-cell adhesion and increases the metastatic

Discussion
123
potential.Thisobservationisthebasisofanon-goingphaseIIclinicaltrialtesting a Src inhibitor, saracatinib (NCT02737202). In our setting,loratadinereducedthelevelsofbothLc3-IIandpTyr416Src(activeform)relativetocontrols,whichseemstocontradicttheresultsofTyryshkinetal., 2014. However, low levels of Lc3-II only indicate a reduction in theproduction of autophagosomes, which does not mean that there is areduction in the degree of autophagy (Klionsky et al., 2016). The use ofautophagy markers such as Lc3-II should have been complemented byassaystoestimateoverallautophagicfluxandtoenabletheresultstobeinterpretedcorrectly.Nonetheless, the reductionofpTyr416Srcand theincrease of pTyr530 Src suggest an alteration of SRC-mediated signalingdueto loratadinetreatment,andthiscouldhelpreducetheproliferationof Tsc2-deficeint cells. In addition, loratadine-treated tumors alsopresented a higher level of immune cell infiltration. Further studies areneeded to determine which type of immune cells is recruited to thesetumors. Finally, in the immunocompetentmousemodel, tumors treatedwith combinations also presented an increase of Hrh1 and Prlr, inaccordance with the results obtained in the immunodeficient model.Thesecomponentsmaybeimportantforthesurvivaloftherapy-resistantcells.
Here,Tsc2-deficientMEFsexposedtorapamycinpresentedhigh levelsofhistamine in culture medium. Additionally, cyproheptadine, a serotoninantagonist andHRH1blocker,was reported to induceapoptosis throughthe inhibitionof thePI3K/mTORsignalingaxis inmyelomaandurothelialcarcinomacells (Hsiehetal.,2016;Lietal.,2013).These twoeventsareevidence of an interaction between the histamine and mTOR signalingpathways and, in parallel, support the combination of rapamycin withloratadine.
Together, the observed benefit of the depicted monotherapies andrapamycin-drugcombinationsintheinvivoassaysindicatethatalterationof autophagy, in addition tomitochondrial homeostasis andmonoamineand histamine metabolism, are important underlying factors in LAMpathogenesis.Asalimitation,thenoveltherapeuticoptionsdonotappeartoeliminate LAMcells completelybutmay insteadalter someprocessesandthetumorcellphenotype.Nonetheless, thecorrespondingapproveddrugs are promising alternatives for patients who do not toleraterapamycin,orwhosuffercontinuouslungfunctiondecaywiththisdrug.

Discussion
124
High-throughput drug screening to uncover additionaltherapeuticapproaches
High-throughput screening for compounds that affect cell viability hasbeenusedtodiscovernoveltreatmentsforvariousdiseases(Shinnetal.,2019).Combinationsofdrugsthatactsynergisticallyaregiventopatientstoachievemaximalclinicalbenefit,becauselowdosesofeachdrugcanbeadministered, which reduces off-target toxicities. The search for novelsynergistic drug pairs requires the use of a systematic, large-scalescreening platform. Here, we collaborated with the NCATS to performhigh-throughputdrugscreening for thetreatmentofLAM.Regardingthepossibilityofutilizingapproveddrugsforotherhumandiseases,wetestedtheMIPEandNPClibraries,incombinationwitheverolimus.Afterfilteringthe results by our own criteria, the most synergistic combination waseverolimusplusthecompoundPKC-412.
PKC-412isaninhibitorofseveralkinases,includingproteinkinaseC(PKC)isoforms (α, β, and γ), tyrosine-protein kinase SYK (Syk), mast/stem cellgrowth factor receptor Kit (c-Kit), tyrosine-protein kinase Fgr (c-Fgr),receptor-type tyrosine-protein kinase FLT3 (Flt3), Src, VEGFR1, andVEGFR2 (Andrejauskas-Buchdunger and Regenass, 1992; Fabbro et al.,1999;Ozakietal.,2000;Tenzeretal.,2001).
In LAM, there is an overexpression and overactivation of Syk in Tsc2-deficient cells and in lung nodules (Cui et al., 2017). Treatment ofTsc2-deficient cells in vitro, and an immunodeficient mouse xenograft tumormodel in vivo with R406 or R788 (Sky inhibitors) had antiproliferativeeffects.Thesamestudyshowedthatothercellsinthemicroenvironmentwere responsible for the VEGF-D production. LAM cells, via the Skysignaling pathwaymay express themonocyte chemoattractant protein-1(MCP-1) in a STAT3-dependent manner to recruit peripheral bloodmononuclear cells that produceVEGF-D (Cui et al., 2017). Src is anotherpotential target of PKC-412. As mentioned above, active Src promotesLAM pathogenesis and its inhibition with saracatinib (Src inhibitor)reduces the metastatic potential of the disease cells (Tyryshkin et al.,2014b).Inaddition,HRH1canalsomediatedownstreamsignalingthroughPKC (Luttrell and Luttrell, 2004), and mast cells express c-Kit, whichpromotesthedevelopmentofthesecellswhenboundtotheligand,stemcellfactor(SCF)(Iemuraetal.,1994).

Discussion
125
Taken together, these findings suggest a clinical application forPKC-412,aloneor incombinationwithrapamycin, inLAMdisease.Thiscompoundmayhaveapolypharmacologicalmechanismofactionbywhichitinhibitsdifferent kinases that are overactivated in LAM cells. However, furtherstudies are needed to identify the specific targets of PKC-412 in thisdiseasecontextandtoexaminetheireffectinvivoinimmunodeficientandimmunocompetentLAMmousemodels.


CONCLUSIONS


Conclusions
129
1. Mammaryepithelialcelltypesresponsivetobeta-lactoglobulindonot acquire tumorigenic or metastatic potential with Tsc2deletion.TheseresultsdonotruleoutthepossibilityofmammarycellsbeingasourceofLAMdisease.
2. LAMcellsexpressANGPTL4,asecretedproteinthatactsasplasmabiomarker for differentiating between LAM patients and healthycontrols, but not with related pulmonary diseases. TheirmeasurementsarecomplementarytothoseofVEGF-D.
3. MIAA, themajor histamine-derivedmetabolite, is overexpressedin LAMplasma comparedwith healthywomen andwomenwithother pulmonary diseases and their measurements arecomplementarytothoseofVEGF-D.
4. Aldh andMao are overexpressed in LAM cell models, and theiroveractivation may account for the enhanced detection ofmonoamine-derivedmetabolitesintheplasmaofLAMpatients.
5. There are functional links between enhanced ALDH and MAOactivity,ROSproductionandLAMbiology.
6. Histamine-mediated signaling and metabolism are relevant toLAM biology. These features are linked to the enhancedexpressionandfunctionofALDHsandMAOs.
7. ThemTORandMaoinhibitorcombinationsaremoreefficientthanrapamycinaloneinreducingtumorigenesisinanimmunodeficientLAMmodel invivo.Theseeffectsaremediatedbyacombinationof altering autophagy, mitochondria homeostasis, monoaminemetabolism,andtumorcellphenotype.
8. ThedataobtainedfromanimmunocompetentLAMmodelinvivoconfirm the validity of combining mTOR and Mao inhibitors, aswell as the combinationwith aHrh1 antagonist. In addition, thepromise of therapeutic strategies is extended to monotherapiesbasedontheseinhibitors.
9. A high-throughput drug screening identifies a promisingcombination of PKC-412 with everolimus, which exhibits asynergisticeffect inLAMcellsandcouldbeprioritizedforfurtherinvitroandinvivoanalyses.


REFERENCES


References
133
A
Abdelwahab, E.M.M., Pal, S., Kvell, K., Sarosi, V., Bai, P., Rue, R.,Krymskaya, V., McPhail, D., Porter, A., Pongracz, J.E., 2019.Mitochondrial dysfunction is a key determinant of the rare diseaselymphangioleiomyomatosisandprovidesanoveltherapeutictarget.Oncogene38,3093–3101.
Adam S. Kittai, M.J.B.J.N.G.M., 2018. Gonadotropin-Releasing HormoneAntagonistsinProstateCancer.
Ahmed,M.A.,Okour,M., Brundage, R., Kartha, R. V, 2019.Orphan drugdevelopment: the increasing role of clinical pharmacology. J.Pharmacokinet.Pharmacodyn.
Alayev,A.,Salamon,R.S.,Sun,Y.,Schwartz,N.S.,Li,C.,Yu,J.J.,Holz,M.K.,2015. Effects of combining rapamycin and resveratrol on apoptosisand growth of tsc2-deficient xenograft tumors. Am. J. Respir. CellMol.Biol.53,637–646.
Alayev, A., Sun, Y., Snyder, R.B., Berger, S.M., Yu, J.J., Holz,M.K., 2014.Resveratrol prevents rapamycin-induced upregulation of autophagyand selectively induces apoptosis in TSC2-deficient cells. Cell Cycle13,371–382.
Alkharusi,A., Lesma, E.,Ancona, S., Chiaramonte, E.,Nyström, T.,Gorio,A., Norstedt, G., 2016. Role of prolactin receptors inlymphangioleiomyomatosis.PLoSOne11.
Alkhilaiwi, F., Paul, S., Zhou,D., Zhang, X.,Wang, F., Palechor-Ceron,N.,Wilson, K.,Guha,R., Ferrer,M.,Grant,N., Thomas,C., Schlegel, R.,Yuan,H.,2019.High-throughputscreeningidentifiescandidatedrugsfor the treatment of recurrent respiratory papillomatosis.PapillomavirusRes.8,100181.
Andrejauskas-Buchdunger,E.,Regenass,U.,1992.Differentialinhibitionofthe epidermal growth factor-, platelet-derived growth factor-, andprotein kinase C-mediated signal transduction pathways by thestaurosporinederivativeCGP41251.CancerRes.52,5353–8.
Armour, S.M., Baur, J.A., Hsieh, S.N., Land-Bracha, A., Thomas, S.M.,

References
134
Sinclair,D.A.,2009.InhibitionofmammalianS6kinasebyresveratrolsuppressesautophagy.Aging(Albany.NY).1,515–28.
B
Bahl,A.,2019.ARandomisedControlledTrial toDetermine theEffectofTriptorelin on Reduction of Prostate Volume Pre-RadiotherapyCompared with Standard Therapy (Goserelin) OPEN ACCESS ARandomisedControlledTrialto,RemedyPublicationsLLC.,|ClinicsinOncology.
Baldi, B.G., Medeiros Junior, P., Pimenta, S.P., Lopes, R.I., Kairalla, R.A.,Carvalho, C.R.R., 2011. Evolution of pulmonary function aftertreatment with goserelin in patients withlymphangioleiomyomatosis.J.Bras.Pneumol.37,375–9.
Banner,A.S.,Carrington,C.B.,Emory,W.B.,Kittle,F.,Leonard,G.,Ringus,J., Taylor, P., Addington,W.W., 1981. Efficacy of Oophorectomy inLymphangioleiomyomatosis and Benign Metastasizing Leiomyoma.N.Engl.J.Med.305,204–209.
Barski,O.A.,Tipparaju,S.M.,Bhatnagar,A.,2008.Thealdo-ketoreductasesuperfamilyanditsroleindrugmetabolismanddetoxification.DrugMetab.Rev.
Berenbaum, M.C., 1981. Criteria for analyzing interactions betweenbiologicallyactiveagents.Adv.CancerRes.35,269–335.
Bild,A.H.,Yao,G.,Chang,J.T.,Wang,Q.,Potti,A.,Chasse,D.,Joshi,M.-B.,Harpole, D., Lancaster, J.M., Berchuck, A., Olson, J.A., Marks, J.R.,Dressman, H.K., West, M., Nevins, J.R., 2006. Oncogenic pathwaysignaturesinhumancancersasaguidetotargetedtherapies.Nature439,353–357.
Bissler,J.J.,McCormack,F.X.,Young,L.R.,Elwing,J.M.,Chuck,G.,Leonard,J.M., Schmithorst, V.J., Laor, T., Brody, A.S., Bean, J., Salisbury, S.,Franz,D.N.,2008.Sirolimusforangiomyolipomaintuberoussclerosiscomplexorlymphangioleiomyomatosis.N.Engl.J.Med.358,140–51.
Bittmann, I., Rolf, B., Amann, G., Löhrs, U., 2003. Recurrence oflymphangioleiomyomatosis after single lung transplantation: New

References
135
insightsintopathogenesis.Hum.Pathol.34,95–98.
Blei,F.,2011.Lymphangiomatosis:ClinicalOverview.Lymphat.Res.Biol.9,185–190.
Bondarenko,G.,Ugolkov,A.,Rohan,S.,Kulesza,P.,Dubrovskyi,O.,Gursel,D.,Mathews,J.,O’Halloran,T.V,Wei,J.J.,Mazar,A.P.,2015.Patient-Derived Tumor Xenografts Are Susceptible to Formation of HumanLymphocyticTumors.Neoplasia17,735–741.
Bortolato,M.,Chen,K.,Shih,J.C.,2008.Monoamineoxidaseinactivation:Frompathophysiologytotherapeutics.Adv.DrugDeliv.Rev.
Branco,A.C.C.C.,Yoshikawa,F.S.Y.,Pietrobon,A.J.,Sato,M.N.,2018.RoleofHistamineinModulatingtheImmuneResponseandInflammation.MediatorsInflamm.2018,9524075.
Bray, N.L., Pimentel, H., Melsted, P., Pachter, L., 2016. Erratum: Near-optimal probabilistic RNA-seq quantification. Nat. Biotechnol. 34,888–888.
Brunelli, A., Catalini, G., Fianchini, A., 1996. Pregnancy exacerbatingunsuspected mediastinal lymphangioleiomyomatosis andchylothorax.Int.J.Gynaecol.Obstet.52,289–90.
C
Cai, X., Pacheco-Rodriguez,G.,Haughey,M., Samsel, L., Xu, S.,Wu,H.P.,McCoy, J.P., Stylianou, M., Darling, T.N., Moss, J., 2014. Sirolimusdecreases circulating lymphangioleiomyomatosis cells in patientswithlymphangioleiomyomatosis.Chest145,108–112.
CancerGenomeAtlasNetwork,T.C.G.A.,2012.Comprehensivemolecularportraitsofhumanbreasttumours.Nature490,61–70.
Carbonara,C.,Longa,L.,Grosso,E.,Borrone,C.,Garré,M.G.,Brisigotti,M.,Migone,N.,1994.9q34lossofheterozygosityinatuberoussclerosisastrocytoma suggests a growth suppressor-like activity also for theTSC1gene.Hum.Mol.Genet.3,1829–1832.
Carsillo, T., Astrinidis, A., Henske, E.P., 2000.Mutations in the tuberous

References
136
sclerosis complex gene TSC2 are a cause of sporadic pulmonarylymphangioleiomyomatosis.Pnas97,6085–6090.
Chacko,B.K.,Kramer,P.A.,Ravi, S.,Benavides,G.A.,Mitchell, T.,Dranka,B.P.,Ferrick,D.,Singal,A.K.,Ballinger,S.W.,Bailey,S.M.,Hardy,R.W.,Zhang,J.,Zhi,D.,Darley-Usmar,V.M.,2014.TheBioenergeticHealthIndex: a new concept in mitochondrial translational research. Clin.Sci.(Lond).
Chang, W.Y.C., Cane, J.L., Kumaran, M., Lewis, S., Tattersfield, A.E.,Johnson,S.R.,2014.A2-yearrandomisedplacebo-controlledtrialofdoxycyclinefor lymphangioleiomyomatosis.Eur.Respir.J.43,1114–23.
Chantranupong, L.,Wolfson, R.L., Sabatini, D.M., 2015. Nutrient-SensingMechanismsacrossEvolution.Cell161,67–83.
Cheng,P.,Wang, J.,Waghmare, I.,Sartini,S.,Coviello,V.,Zhang,Z.,Kim,S.H., Mohyeldin, A., Pavlyukov, M.S., Minata, M., Valentim, C.L.L.,Chhipa, R.R., Bhat, K.P.L., Dasgupta, B., La Motta, C., Kango-Singh,M.,Nakano,I.,2016.FOXD1-ALDH1A3signalingisadeterminantforthe self-renewal and tumorigenicity of mesenchymal glioma stemcells.CancerRes.76,7219–7230.
Chong,J.,Soufan,O.,Li,C.,Caraus,I.,Li,S.,Bourque,G.,Wishart,D.S.,Xia,J., 2018. MetaboAnalyst 4.0: towards more transparent andintegrative metabolomics analysis. Nucleic Acids Res. 46, W486–W494.
Chou, T.-C., 2006. Theoretical Basis, Experimental Design, andComputerized Simulation of Synergism and Antagonism in DrugCombinationStudies.Pharmacol.Rev.58,621–681.
Chourasia, A.H., Boland, M.L., Macleod, K.F., 2015a. Mitophagy andcancer.CancerMetab.3,4.
Chourasia, A.H., Tracy, K., Frankenberger, C., Boland,M.L., Sharifi,M.N.,Drake, L.E., Sachleben, J.R., Asara, J.M., Locasale, J.W., Karczmar,G.S.,Macleod,K.F.,2015b.MitophagydefectsarisingfromBNip3losspromotemammarytumorprogressiontometastasis.EMBORep.16,1145–63.

References
137
Cianchi, F., Cortesini, C., Schiavone, N., Perna, F., Magnelli, L., Fanti, E.,Bani,D.,Messerini,L.,Fabbroni,V.,Perigli,G.,Capaccioli,S.,Masini,E., 2005. The role of cyclooxygenase-2 in mediating the effects ofhistamineoncellproliferationandvascularendothelialgrowthfactorproductionincolorectalcancer.Clin.CancerRes.11,6807–15.
Clemm, C., Jehn, U., Wolf-Hornung, B., Siemon, G., Walter, G., 1987.Lymphangiomyomatosis: A report of three cases treated withtamoxifen.Klin.Wochenschr.65,391–393.
COLA: A Pilot Clinical Trial of COX-2 Inhibition in LAM and TSC -ClinicalTrials.gov [WWW Document], n.d. URLhttps://clinicaltrials.gov/ct2/show/study/NCT02484664 (accessed6.18.19).
Cornog, J.L.,Enterline,H.T.,1966.Lymphangiomyoma,abenign lesionofchyliferous lymphatics synonymous with lymphangiopericytoma.Cancer19,1909–1930.
Cricco, G.P., Davio, C.A., Martin, G., Engel, N., Fitzsimons, C.P., Bergoc,R.M.,Rivera,E.S.,1994.Histamineasanautocrinegrowth factor inexperimentalmammarycarcinomas.AgentsActions43,17–20.
Crooks,D.M.,Pacheco-Rodriguez,G.,DeCastro,R.M.,McCoy,J.P.,Wang,J.-a., Kumaki, F., Darling, T., Moss, J., 2004. Molecular and geneticanalysis of disseminated neoplastic cells inlymphangioleiomyomatosis.Proc.Natl.Acad.Sci.101,17462–17467.
Cui,Y., Steagall,W.K., Lamattina,A.M.,Pacheco-Rodriguez,G.,Stylianou,M.,Kidambi,P.,Stump,B.,Golzarri,F.,Rosas,I.O.,Priolo,C.,Henske,E.P.,Moss, J., El-Chemaly, S., 2017.AberrantSYKkinase signaling isessentialfortumorigenesisinducedbyTSC2inactivation.CancerRes.77,1492–1502.
D
Dall, G., Vieusseux, J., Unsworth, A., Anderson, R., Britt, K., 2015. LowDose,LowCostEstradiolPelletsCanSupportMCF-7TumourGrowthinNudeMicewithoutBladderSymptoms.J.Cancer6,1331–6.
Darling, T.N., Pacheco-Rodriguez, G., Gorio, A., Lesma, E., Walker, C.,

References
138
Moss, J., 2010. Lymphangioleiomyomatosis and TSC2-/- cells.Lymphat.Res.Biol.8,59–69.
Das,A.K.,Yoshimura,S.,Mishima,R.,Fujimoto,K.,Mizuguchi,H.,Dev,S.,Wakayama, Y., Kitamura, Y., Horio, S., Takeda, N., Fukui, H., 2007.Stimulation of histamine H1 receptor up-regulates histamine H1receptor itself through activation of receptor gene transcription. J.Pharmacol.Sci.103,374–82.
Datta, A., Kim, H., McGee, L., Johnson, A.E., Talwar, S., Marugan, J.,Southall,N.,Hu, X., Lal,M.,Mondal,D., Ferrer,M., Abdel-Mageed,A.B.,2018.High-Throughputscreening identifiedselective inhibitorsof exosome biogenesis and secretion: A drug repurposing strategyforadvancedcancer.Sci.Rep.8.
Davies, D.M., Johnson, S.R., Tattersfield, A.E., Kingswood, J.C., Cox, J.A.,McCartney, D.L., Doyle, T., Elmslie, F., Saggar, A., de Vries, P.J.,Sampson, J.R., 2008. Sirolimus Therapy in Tuberous Sclerosis orSporadicLymphangioleiomyomatosis.N.Engl.J.Med.358,200–203.
De Garibay, G.R., Herranz, C., Llorente, A., Boni, J., Serra-Musach, J.,Mateo,F.,Aguilar,H.,Gómez-Baldó,L.,Petit,A.,Vidal,A.,Climent,F.,Hernández-Losa, J., Cordero, Á., González-Suárez, E., Sánchez-Mut,J.V., Esteller, M., Llatjós, R., Varela, M., López, J.I., García, N.,Extremera,A.I.,Gumà,A.,Ortega,R.,Plà,M.J.,Fernández,A.,Pernas,S., Falo, C., Morilla, I., Campos, M., Gil, M., Román, A., Molina-Molina, M., Ussetti, P., Laporta, R., Valenzuela, C., Ancochea, J.,Xaubet, A., Casanova, Á., Pujana, M.A., 2015.Lymphangioleiomyomatosis biomarkers linked to lung metastaticpotentialandcellstemness.PLoSOne10,1–18.
Delaney,S.P.,Julian,L.M.,Stanford,W.L.,2014.TheneuralcrestlineageasadriverofdiseaseheterogeneityinTuberousSclerosisComplexandLymphangioleiomyomatosis.Front.cellDev.Biol.2,69.
DeNicola,G.M.,Cantley,L.C.,2015.Cancer’sFuelChoice:NewFlavorsforaPickyEater.Mol.Cell60,514–23.
Dobrolecki, L.E., Airhart, S.D., Alferez, D.G., Aparicio, S., Behbod, F.,Bentires-Alj,M.,Brisken,C.,Bult,C.J.,Cai,S.,Clarke,R.B.,Dowst,H.,Ellis,M.J.,Gonzalez-Suarez,E.,Iggo,R.D.,Kabos,P.,Li,S.,Lindeman,

References
139
G.J.,Marangoni,E.,McCoy,A.,Meric-Bernstam,F.,Piwnica-Worms,H., Poupon,M.-F., Reis-Filho, J., Sartorius, C.A., Scabia, V., Sflomos,G., Tu, Y., Vaillant, F., Visvader, J.E.,Welm, A.,Wicha,M.S., Lewis,M.T., 2016. Patient-derived xenograft (PDX) models in basic andtranslationalbreastcancerresearch.CancerMetastasisRev.35,547–573.
Doormaal, J.J., Veer, E., Voorst Vader, P.C., Kluin, P.M., Mulder, A.B.,Heide, S., Arends, S., Kluin-Nelemans, J.C., Oude Elberink, J.N.G.,Monchy, J.G.R., 2012. Tryptase and histamine metabolites asdiagnostic indicatorsof indolentsystemicmastocytosiswithoutskinlesions.Allergy67,683–690.
Dowsett,M., Jones, A., Johnston, S.R., Jacobs, S., Trunet, P., Smith, I.E.,1995.Invivomeasurementofaromataseinhibitionbyletrozole(CGS20267) inpostmenopausalpatientswithbreast cancer.Clin.CancerRes.1,1511–5.
Düvel, K., Yecies, J.L., Menon, S., Raman, P., Lipovsky, A.I., Souza, A.L.,Triantafellow,E.,Ma,Q.,Gorski,R.,Cleaver,S.,VanderHeiden,M.G.,MacKeigan,J.P.,Finan,P.M.,Clish,C.B.,Murphy,L.O.,Manning,B.D.,2010. Activation of a metabolic gene regulatory networkdownstreamofmTORcomplex1.Mol.Cell39,171–83.
E
El-Chemaly,S.,Taveira-Dasilva,A.,Goldberg,H.J.,Peters,E.,Haughey,M.,Bienfang, D., Jones, A.M., Julien-Williams, P., Cui, Y., Villalba, J.A.,Bagwe, S., Maurer, R., Rosas, I.O., Moss, J., Henske, E.P., 2017.Sirolimus and Autophagy Inhibition in Lymphangioleiomyomatosis:ResultsofaPhaseIClinicalTrial.Chest151,1302–1310.
F
Fabbro,D.,Buchdunger,E.,Wood,J.,Mestan,J.,Hofmann,F.,Ferrari,S.,Mett,H.,O’Reilly, T.,Meyer, T., 1999. Inhibitorsofprotein kinases:CGP41251,aproteinkinaseinhibitorwithpotentialasananticanceragent.Pharmacol.Ther.82,293–301.
Falus,A.,Hegyesi,H.,Lázár-Molnár,E.,Pós,Z.,László,V.,Darvas,Z.,2001.Paracrine and autocrine interactions in melanoma: histamine is a
References
140
relevantplayerinlocalregulation.TrendsImmunol.22,648–52.
Ferlay,J.,Shin,H.-R.,Bray,F.,Forman,D.,Mathers,C.,Parkin,D.M.,2010.Estimatesofworldwideburdenofcancerin2008:GLOBOCAN2008.Int.J.Cancer127,2893–2917.
Fernández-Nogueira, P., Noguera-Castells, A., Fuster, G., Recalde-Percaz,L., Moragas, N., López-Plana, A., Enreig, E., Jauregui, P., Carbó, N.,Almendro,V.,Gascón,P.,Bragado,P.,Mancino,M.,2018.Histaminereceptor 1 inhibition enhances antitumor therapeutic responsesthrough extracellular signal-regulated kinase (ERK) activation inbreastcancer.CancerLett.424,70–83.
Ferrans, V., Yu, Z.-X., Nelson, W., Valencia, J., Tatsuguchi, A., Avila, N.,Riemenschneider, W., Matsui, K., Travis, W., Moss, J., 2000.Lymphangioleiomyomatosis (LAM): a review of clinical andmorphologicalfeatures.J.NipponMed.Sch.67,311–329.
Fetsch,P.A.,Fetsch,J.F.,Marincola,F.M.,Travis,W.,Batts,K.P.,Abati,A.,1998.ComparisonofmelanomaantigenrecognizedbyTcells(MART-1)toHMB-45:additionalevidencetosupportacommonlineageforangiomyolipoma, lymphangiomyomatosis, and clear cell sugartumor.Mod.Pathol.11,699–703.
Filipczak,P.T.,Thomas,C.,Chen,W.,Salzman,A.,McDonald, J.D.,Lin,Y.,Belinsky, S.A., 2016. TSC2 Deficiency Unmasks a Novel NecrosisPathway That Is Suppressed by the RIP1/RIP3/MLKL SignalingCascade.CancerRes.76,7130–7139.
Filomeni,G.,DeZio,D.,Cecconi,F.,2015.Oxidativestressandautophagy:the clash between damage andmetabolic needs. Cell DeathDiffer.22,377–388.
Finlay, G.A., Thannickal, V.J., Fanburg, B.L., Kwiatkowski, D.J., 2005.Platelet-Derived Growth Factor–Induced p42/44 Mitogen-ActivatedProtein Kinase Activation and Cellular Growth Is Mediated byReactive Oxygen Species in the Absence of TSC2 /Tuberin. CancerRes.65,10881–10890.
Fu, N., Lindeman, G.J., Visvader, J.E., 2014. The Mammary Stem CellHierarchy,1sted,CurrentTopics inDevelopmentalBiology.Elsevier
References
141
Inc.
G
Galli, S.J., Nakae, S., Tsai, M., 2005. Mast cells in the development ofadaptiveimmuneresponses.Nat.Immunol.6,135–142.
Gerratana, L., Fanotto, V., Bonotto, M., Bolzonello, S., Minisini, A.M.,Fasola, G., Puglisi, F., 2015. Pattern of metastasis and outcome inpatientswithbreastcancer.Clin.Exp.Metastasis32,125–133.
Ginestier, C., Hur, M.H., Charafe-Jauffret, E., Monville, F., Dutcher, J.,Brown,M., Jacquemier, J., Viens, P., Kleer, C.G., Liu, S., Schott, A.,Hayes, D., Birnbaum, D.,Wicha,M.S., Dontu, G., 2007. ALDH1 is amarkerofnormalandmalignanthumanmammarystemcellsandapredictorofpoorclinicaloutcome.CellStemCell1,555–67.
Glasgow,C.G.,Avila,N.A.,Lin,J.-P.,Stylianou,M.P.,Moss,J.,2009.Serumvascular endothelial growth factor-D levels in patients withlymphangioleiomyomatosis reflect lymphatic involvement. Chest135,1293–1300.
Goncharova, E.A., Goncharov, D.A., Damera, G., Tliba, O., Amrani, Y.,Panettieri, R.A., Krymskaya, V.P., Krymskaya, V.P., 2009. Signaltransducerandactivatorof transcription3 is required forabnormalproliferation and survival of TSC2-deficient cells: relevance topulmonarylymphangioleiomyomatosis.Mol.Pharmacol.76,766–77.
Gorrini,C.,Harris,I.S.,Mak,T.W.,2013.Modulationofoxidativestressasananticancerstrategy.Nat.Rev.DrugDiscov.12,931–947.
Green, A.J., Smith, M., Yates, J.R., 1994. Loss of heterozygosity onchromosome 16p13.3 in hamartomas from tuberous sclerosispatients.Nat.Genet.6,193–6.
Greenhough,A.,Smartt,H.J.M.,Moore,A.E.,Roberts,H.R.,Williams,A.C.,Paraskeva,C.,Kaidi,A.,2009.TheCOX-2/PGE2pathway:Keyrolesinthe hallmarks of cancer and adaptation to the tumourmicroenvironment.Carcinogenesis.
Grzegorek, I., Drozdz, K., Podhorska-Okolow, M., Szuba, A., Dziegiel, P.,

References
142
2013. LAM cells biology and lymphangioleiomyomatosis. FoliaHistochem.Cytobiol.51,1–10.
Gupta,N.,Finlay,G.A.,Kotloff,R.M.,Strange,C.,Wilson,K.C.,Young,L.R.,Taveira-DaSilva,A.M., Johnson,S.R.,Cottin,V.,Sahn,S.A.,Ryu, J.H.,Seyama, K., Inoue, Y., Downey, G.P., Han, M.K., Colby, T. V,Wikenheiser-Brokamp, K.A., Meyer, C.A., Smith, K., Moss, J.,McCormack, F.X., ATS Assembly on Clinical Problems, 2017.Lymphangioleiomyomatosis Diagnosis and Management: High-Resolution Chest Computed Tomography, Transbronchial LungBiopsy, and Pleural Disease Management. An Official AmericanThoracic Society/Japanese Respiratory Society Clinical PracticeGuideline.Am.J.Respir.Crit.CareMed.196,1337–1348.
H
Hammes, S.R., Krymskaya, V.P., 2013. Targeted Approaches towardUnderstanding and Treating Pulmonary Lymphangioleiomyomatosis(LAM).Horm.Cancer4,70–77.
Hanahan, D., Weinberg, R.A., 2011. Hallmarks of cancer: the nextgeneration.Cell144,646–74.
Harari,S.,Cassandro,R.,Chiodini,I.,Taveira-DaSilva,A.M.,Moss,J.,Moss,J.,2008.EffectofaGonadotrophin-ReleasingHormoneAnalogueonLungFunctioninLymphangioleiomyomatosis.Chest133,448–454.
Hauptmann,N.,Grimsby,J.,Shih,J.C.,Cadenas,E.,1996.TheMetabolismofTyraminebyMonoamineOxidaseA/BCausesOxidativeDamagetoMitochondrialDNA.Arch.Biochem.Biophys.335,295–304.
Hayashi,T., Fleming,M.V,Stetler-Stevenson,W.G., Liotta, L.A.,Moss, J.,Ferrans, V.J., Travis, W.D., 1997. Immunohistochemical study ofmatrixmetalloproteinases(MMPs)andtheirtissueinhibitors(TIMPs)in pulmonary lymphangioleiomyomatosis (LAM). Hum. Pathol. 28,1071–8.
Henske, E.P., McCormack, F.X., 2012. Lymphangioleiomyomatosis — awolfinsheep’sclothing.J.Clin.Invest.122,3807.
Hernandez,O.,Way,S.,McKenna,J.,Gambello,M.J.,2007.Generationof

References
143
aConditionalDisruptionoftheTsc2Gene.genesis45,101–106.
Herzog, B., Pellet-Many, C., Britton, G., Hartzoulakis, B., Zachary, I.C.,2011. VEGF binding to NRP1 is essential for VEGF stimulation ofendothelial cell migration, complex formation between NRP1 andVEGFR2,andsignalingviaFAKTyr407phosphorylation.Mol.Biol.Cell22,2766–2776.
Howe, S.R., Gottardis, M.M., Everitt, J.I., Walker, C., 1995. Estrogenstimulation and tamoxifen inhibition of leiomyoma cell growth invitroandinvivo.Endocrinology136,4996–5003.
Hsieh, A.C., Liu, Y., Edlind,M.P., Ingolia, N.T., Janes,M.R., Sher, A., Shi,E.Y., Stumpf,C.R., Christensen,C.,Bonham,M.J.,Wang, S., Ren,P.,Martin,M., Jessen,K., Feldman,M.E.,Weissman, J.S., Shokat,K.M.,Rommel,C.,Ruggero,D.,2012.ThetranslationallandscapeofmTORsignallingsteerscancerinitiationandmetastasis.Nature485,55–61.
Hsieh,H.-Y., Shen,C.-H., Lin,R.-I., Feng,Y.-M.,Huang, S.-Y.,Wang,Y.-H.,Wu, S.-F., Hsu, C.-D., Chan,M.W.Y., 2016. Cyproheptadine exhibitsantitumoractivityinurothelialcarcinomacellsbytargetingGSK3βtosuppressmTORandβ-catenin signalingpathways.CancerLett.370,56–65.
Hurko, O., 2013. Drug Development for Rare Mitochondrial Disorders.Neurotherapeutics.
I
Iemura, A., Tsai, M., Ando, A., Wershil, B.K., Galli, S.J., 1994. The c-kitligand, stem cell factor, promotesmast cell survival by suppressingapoptosis.Am.J.Pathol.144,321–8.
Inglese, J., Auld,D.S., Jadhav,A., Johnson,R.L., Simeonov,A., Yasgar,A.,Zheng, W., Austin, C.P., 2006. Quantitative high-throughputscreening: a titration-based approach that efficiently identifiesbiologicalactivitiesinlargechemicallibraries.Proc.Natl.Acad.Sci.U.S.A.103,11473–8.

References
144
J
Jiang,W.G.,Sampson,J.,Martin,T.A.,Lee-Jones,L.,Watkins,G.,Douglas-Jones,A.,Mokbel,K.,Mansel,R.E.,2005.Tuberinandhamartinareaberrantlyexpressedandlinkedtoclinicaloutcomeinhumanbreastcancer:TheroleofpromotermethylationofTSCgenes.Eur.J.Cancer41,1628–1636.
JinCha,Y.,Hee Jung,W., SeungKoo, J., 2018. Site-specificexpressionofamineoxidasesinbreastcancermetastases.TumorBiol.1–10.
Johnson, S.R., Cordier, J.F., Lazor, R., Cottin, V., Costabel, U., Harari, S.,Reynaud-Gaubert,M.,Boehler,A.,Brauner,M.,Popper,H.,Bonetti,F., Kingswood, C., Albera, C., Bissler, J., Bouros, D., Corris, P.,Donnelly, S.,Durand,C., Egan, J.,Grutters, J.C.,Hodgson,U.,Hollis,G., Korzeniewska-Kosela,M., Kus, J., Lacronique, J., Lammers, J.W.,McCormack, F., Mendes, A.C., Moss, J., Naalsund, A., Pohl, W.,Radzikowska,E.,Robalo-Cordeiro,C.,Rouvière,O.,Ryu,J.,Schiavina,M.,Tattersfield,A.E.,Travis,W.,Tukiainen,P.,Urban,T.,Valeyre,D.,Verleden, G.M., 2010. European Respiratory Society guidelines forthe diagnosis andmanagement of lymphangioleiomyomatosis. Eur.Respir.J.35,14–26.
Johnson, S.R., Tattersfield, A.E., 1999. Decline in Lung Function inLymphangioleiomyomatosis: Relation to Menopause andProgesterone Treatment. Am. J. Respir. Crit. Care Med. 160, 628–633.
Johnson, S.R., Taveira-DaSilva, A.M., Moss, J., 2006.Lymphangioleiomyomatosis.Clin.ChestMed.37,389–403.
Julian, L.M., Delaney, S.P., Wang, Y., Goldberg, A.A., Doré, C., Yockell-Lelièvre, J., Tam, R.Y., Giannikou, K.,McMurray, F., Shoichet,M.S.,Harper,M.E.,Henske,E.P.,Kwiatkowski,D.J.,Darling,T.N.,Moss, J.,Kristof, A.S., Stanford, W.L., 2017. Human pluripotent stem cell–derived TSC2-haploinsufficient smooth muscle cells recapitulatefeaturesoflymphangioleiomyomatosis.CancerRes.77,5491–5502.
K
Kaidi, A., Qualtrough, D., Williams, A.C., Paraskeva, C., 2006. Direct

References
145
Transcriptional Up-regulation of Cyclooxygenase-2 by Hypoxia-InducibleFactor(HIF)-1PromotesColorectalTumorCellSurvivalandEnhancesHIF-1 Transcriptional Activity duringHypoxia. Cancer Res.66,6683–6691.
Karbowniczek,M.,Astrinidis,A.,Balsara,B.R.,Testa,J.R.,Lium,J.H.,Colby,T. V., McCormack, F.X., Henske, E.P., 2003. RecurrentLymphangiomyomatosis after Transplantation. Am. J. Respir. Crit.CareMed.167,976–982.
Kawazoe,Y.,Tanaka,S.,Uesugi,M.,2004.ChemicalGeneticIdentificationof the Histamine H1 Receptor as a Stimulator of Insulin-InducedAdipogenesis.Chem.Biol.11,907–913.
Kent, D.G., Green, A.R., 2017. Order Matters: The Order of SomaticMutations Influences Cancer Evolution. Cold Spring Harb. Perspect.Med.7.
Khandelwal, J.K., Hough$, L.B., Pazhenchevskyg, B., Morrishow, A.M.,Green1, J.P., 1982. Presence and Measurement ofMethylimidazoleaceticAcidsinBrainandBodyFluids*Onepathwayinvolves ring N-methylation by histamine methyltransferase (EC2.1.1.8) (2) to form N’-MH’, THE JOURNAL OF BIOLOGICALCHEMISTRYPrzntedinU.S.A.
Kim,S.-H.,Park,Y.-Y.,Kim,S.-W.,Lee,J.-S.,Wang,D.,DuBois,R.N.,2011.ANGPTL4 induction by prostaglandin E2 under hypoxic conditionspromotescolorectalcancerprogression.CancerRes.71,7010–20.
Klarquist,J.,Barfuss,A.,Kandala,S.,Reust,M.J.,Braun,R.K.,Hu,J.,Dilling,D.F.,McKee,M.D.,Boissy,R.E.,Love,R.B.,Nishimura,M.I.,LePoole,I.C., 2009. Melanoma-associated antigen expression inlymphangioleiomyomatosis renders tumor cells susceptible tocytotoxicTcells.Am.J.Pathol.175,2463–72.
Klionsky, D.J., Abdelmohsen, K., Abe, A., Abedin, M.J., Abeliovich, H.,Arozena,A.A.,Adachi,H.,…,Zong,W.X.,Zorzano,A.,Zughaier,S.M.,2016. Guidelines for the use and interpretation of assays formonitoringautophagy(3rdedition).Autophagy.
Knudson,A.G.,2001.TwoGeneticHits(Moreorless)toCancer.Nat.Rev.

References
146
Cancer1,637–641.
Kristof, A.S., 2010. mTOR signaling in lymphangioleiomyomatosis.Lymphat.Res.Biol.8,33–42.
Kumasaka, T., Seyama, K., Mitani, K., Sato, T., Souma, S., Kondo, T.,Hayashi, S., Minami, M., Uekusa, T., Fukuchi, Y., Suda, K., 2004.Lymphangiogenesis in lymphangioleiomyomatosis: its implication inthe progression of lymphangioleiomyomatosis. Am. J. Surg. Pathol.28,1007–16.
Kwiatkowski, D.J., 2003. Rhebbing up mTOR New Insights on TSC1 andTSC2,andthePathogenesisofTuberousSclerosis.CancerBiol.Ther.2,471–476.
L
La Paglia, L., Listì, A., Caruso, S., Amodeo, V., Passiglia, F., Bazan, V.,Fanale, D., 2017. Potential Role of ANGPTL4 in the Cross TalkbetweenMetabolism and Cancer through PPAR Signaling Pathway.PPARRes.2017,8187235.
Lam, H.C., Baglini, C. V, Lope, A.L., Parkhitko, A.A., Liu, H.-J., Alesi, N.,Malinowska,I.A.,Ebrahimi-Fakhari,D.,Saffari,A.,Yu,J.J.,Pereira,A.,Khabibullin, D., Ogorek, B., Nijmeh, J., Kavanagh, T., Handen, A.,Chan, S.Y.,Asara, J.M.,Oldham,W.M.,Diaz-Meco,M.T.,Moscat, J.,Sahin,M., Priolo, C., Henske, E.P., 2017a. p62/SQSTM1 Cooperateswith Hyperactive mTORC1 to Regulate Glutathione Production,Maintain Mitochondrial Integrity, and Promote Tumorigenesis.CancerRes.77,3255–3267.
Lam,H.C.,Liu,H.-J.,Baglini,C.V,Filippakis,H.,Alesi,N.,Nijmeh,J.,Du,H.,Lope, A.L., Cottrill, K.A., Handen, A., Asara, J.M., Kwiatkowski, D.J.,Ben-Sahra, I., Oldham, W.M., Chan, S.Y., Henske, E.P., 2017b.Rapamycin-induced miR-21 promotes mitochondrial homeostasisand adaptation in mTORC1 activated cells. Oncotarget 8, 64714–64727.
Lamattina, A.M., Taveira-Dasilva, A., Goldberg, H.J., Bagwe, S., Cui, Y.,Rosas, I.O.,Moss, J., Henske, E.P., El-Chemaly, S., 2018. CirculatingBiomarkers From the Phase 1 Trial of Sirolimus and Autophagy

References
147
Inhibition for PatientsWith Lymphangioleiomyomatosis. Chest 154,1070–1082.
Lemos,B.,Davio,C.,Gass,H.,Gonzalez,P.,Cricco,G.,Martin,G.,Bergoc,R.,Rivera,E.,1995.Histaminereceptors inhumanmammarygland,differentbenignlesionsandmammarycarcinomas.Inflamm.Res.44Suppl1,S68-9.
Li,C.,Lee,P.-S.,Sun,Y.,Gu,X.,Zhang,E.,Guo,Y.,Wu,C.-L.,Auricchio,N.,Priolo,C., Li, J.,Csibi,A.,Parkhitko,A.,Morrison,T.,Planaguma,A.,Kazani, S., Israel, E., Xu, K.-F., Henske, E.P., Blenis, J., Levy, B.D.,Kwiatkowski, D., Yu, J.J., 2014. Estradiol andmTORC2 cooperate toenhance prostaglandin biosynthesis and tumorigenesis in TSC2-deficientLAMcells.J.Exp.Med.211,15–28.
Li,H.,Jin,F.,Jiang,K.,Ji,S.,Wang,L.,Ni,Z.,Chen,X.,Hu,Z.,Zhang,H.,Liu,Y.,Qin,Y.,Zha,X.,2016.mTORC1-mediateddownregulationofCOX2restrains tumor growth caused by TSC2 deficiency. Oncotarget 7,28435–28447.
Li, J., Cao, B., Zhou, S., Zhu, J., Zhang, Z., Hou, T., Mao, X., 2013.Cyproheptadine-inducedmyeloma cell apoptosis is associated withinhibitionofthePI3K/AKTsignaling.Eur.J.Haematol.91,514–521.
Li,J.,Shin,S.,Sun,Y.,Yoon,S.O.,Li,C.,Zhang,E.,Yu,J.,Zhang,J.,Blenis,J.,2016.MTORC1-driventumorcellsarehighlysensitivetotherapeutictargeting by antagonists of oxidative stress. Cancer Res. 76, 4816–4827.
Liberti, M. V., Locasale, J.W., 2016. The Warburg Effect: How Does itBenefitCancerCells?TrendsBiochem.Sci.41,211–218.
Liu, H.-J., Lizotte, P.H., Du, H., Speranza, M.C., Lam, H.C., Vaughan, S.,Alesi,N.,Wong,K.-K.,Freeman,G.J.,Sharpe,A.H.,Henske,E.P.,2018.TSC2-deficient tumors have evidence of T cell exhaustion andrespond toanti–PD-1/anti–CTLA-4 immunotherapy. JCI Insight3,1–19.
Logginidou,H.,Ao,X.,Russo,I.,Henske,E.P.,2000.Frequentestrogenandprogesterone receptor immunoreactivity in renal angiomyolipomasfromwomenwithpulmonarylymphangioleiomyomatosis.Chest117,
References
148
25–30.
López-Ozuna,V.M.,Hachim, I.Y.,Hachim,M.Y.,Lebrun, J.-J.,Ali,S.,2016.Prolactin Pro-Differentiation Pathway in Triple Negative BreastCancer: Impact on Prognosis and Potential Therapy. Sci. Rep. 6,30934.
Lu, C., Lee, H.-S., Pappas, G.P., Dilling, D.F., Burger, C.D., Shifren, A.,Veeraraghavan, S., Chapman, J.T., Parambil, J., Ruoss, S.J., Young,L.R.,Hammes,S.R.,Kopras,E.J.,Roads,T.,Krischer,J.P.,McCormack,F.X., 2017. A Phase II Clinical Trial of an Aromatase Inhibitor forPostmenopausalWomenwithLymphangioleiomyomatosis.Ann.Am.Thorac.Soc.14,919–928.
Lu,Xin,Mu,E.,Wei,Y.,Riethdorf,S.,Yang,Q.,Yuan,M.,Yan, J.,Hua,Y.,Tiede,B.J.,Lu,Xuemin,Haffty,B.G.,Pantel,K.,Massagué,J.,Kang,Y.,2011. VCAM-1 promotes osteolytic expansion of indolent bonemicrometastasis of breast cancer by engaging α4β1-positiveosteoclastprogenitors.CancerCell20,701–14.
Luskin,M.R.,DeAngelo,D.J.,2017.Midostaurin/PKC412forthetreatmentofnewlydiagnosedFLT3mutation-positiveacutemyeloid leukemia.ExpertRev.Hematol.10,1033–1045.
Luttrell, D.K., Luttrell, L.M., 2004. Not so strange bedfellows: G-protein-coupledreceptorsandSrcfamilykinases.Oncogene23,7969–7978.
M
MacLean, B., Tomazela, D.M., Shulman, N., Chambers, M., Finney, G.L.,Frewen, B., Kern, R., Tabb, D.L., Liebler, D.C.,MacCoss,M.J., 2010.Skyline:anopensourcedocumenteditor forcreatingandanalyzingtargetedproteomicsexperiments.Bioinformatics26,966–968.
Maisel,K.,Merrilees,M.J.,Atochina-Vasserman,E.N.,Lian,L.,Obraztsova,K.,Rue,R.,2018.ImmuneCheckpointLigandPD-L1IsUpregulatedinPulmonary Lymphangioleiomyomatosis (LAM). Am. J. Respir. CellMol.Biol.59,723–732.
Majumder, M., Xin, X., Liu, L., Tutunea-Fatan, E., Rodriguez-Torres, M.,Vincent,K.,Postovit,L.-M.,Hess,D.,Lala,P.K.,2016.COX-2Induces

References
149
BreastCancerStemCellsviaEP4/PI3K/AKT/NOTCH/WNTAxis. StemCells34,2290–2305.
Mao, J., Ligon,K.L.,Rakhlin,E.Y.,Thayer,S.P.,Bronson,R.T.,Rowitch,D.,Mcmahon, A.P., 2006. A Novel Somatic Mouse Model to SurveyTumorigenicPotentialAppliedtotheHedgehogPathway.CancerRes66,10171–10179.
Marín-Hernández,A.,Gallardo-Pérez,J.C.,Ralph,S.J.,Rodríguez-Enríquez,S., Moreno-Sánchez, R., 2009. HIF-1alpha modulates energymetabolism in cancer cells by inducing over-expression of specificglycolyticisoforms.MiniRev.Med.Chem.9,1084–101.
Martens-Lobenhoffer, J., Neumann, H.J., 1999. Determination of 1-methylhistamineand1-methylimidazoleaceticacidinhumanurineasa tool for the diagnosis ofmastocytosis. J. Chromatogr. B. Biomed.Sci.Appl.721,135–40.
Martin, R.K., Saleem, S.J., Folgosa, L., Zellner, H.B., Damle, S.R., Nguyen,G.-K.T., Ryan, J.J., Bear,H.D., Irani,A.-M., Conrad,D.H., 2014.Mastcell histamine promotes the immunoregulatory activity ofmyeloid-derivedsuppressorcells.J.Leukoc.Biol.96,151–159.
Mateo, F., Arenas, E.J., Aguilar, H., Serra-Musach, J., De Garibay, G.R.,Boni,J.,Maicas,M.,Du,S.,Iorio,F.,Herranz-Ors,C.,Islam,A.,Prado,X., Llorente,A.,Petit,A.,Vidal,A.,Català, I., Soler,T.,Venturas,G.,Rojo-Sebastian, A., Serra, H., Cuadras, D., Blanco, I., Lozano, J.,Canals, F., Sieuwerts, A.M., De Weerd, V., Look, M.P., Puertas, S.,García,N.,Perkins,A.S.,Bonifaci,N.,Skowron,M.,Gómez-Baldó,L.,Hernández,V.,Martínez-Aranda,A.,Martínez-Iniesta,M.,Serrat,X.,Cerón, J.,Brunet, J.,Barretina,M.P.,Gil,M.,Falo,C.,Fernández,A.,Morilla,I.,Pernas,S.,Plà,M.J.,Andreu,X.,Seguí,M.A.,Ballester,R.,Castellà,E.,Nellist,M.,Morales,S.,Valls,J.,Velasco,A.,Matias-Guiu,X., Figueras,A., Sánchez-Mut, J.V., Sánchez-Céspedes,M.,Cordero,A., Gómez-Miragaya, J., Palomero, L., Gómez, A., Gajewski, T.F.,Cohen, E.E.W., Jesiotr,M., Bodnar, L.,Quintela-Fandino,M., López-Bigas, N., Valdés-Mas, R., Puente, X.S., Viñals, F., Casanovas, O.,Graupera,M.,Hernández-Losa,J.,RamónyCajal,S.,García-Alonso,L.,Saez-Rodriguez,J.,Esteller,M.,Sierra,A.,Martín-Martín,N.,Matheu,A., Carracedo, A., González-Suárez, E., Nanjundan, M., Cortés, J.,Lázaro, C., Odero, M.D., Martens, J.W.M., Moreno-Bueno, G.,Barcellos-Hoff,M.H.,Villanueva,A.,Gomis,R.R.,Pujana,M.A.,2017.

References
150
Stem cell-like transcriptional reprogramming mediates metastaticresistancetomTORinhibition.Oncogene36,2737–2749.
MathewsGriner,L.A.,Guha,R.,Shinn,P.,Young,R.M.,Keller,J.M.,Liu,D.,Goldlust, I.S., Yasgar, A., McKnight, C., Boxer, M.B., Duveau, D.Y.,Jiang, J.-K.,Michael, S.,Mierzwa, T., Huang,W.,Walsh,M.J.,Mott,B.T.,Patel,P.,Leister,W.,Maloney,D.J.,Leclair,C.A.,Rai,G.,Jadhav,A., Peyser, B.D.,Austin, C.P.,Martin, S.E., Simeonov,A., Ferrer,M.,Staudt, L.M., Thomas, C.J., 2014. High-throughput combinatorialscreening identifies drugs that cooperate with ibrutinib to killactivated B-cell-like diffuse large B-cell lymphoma cells. Proc. Natl.Acad.Sci.U.S.A.111,2349–54.
Matsui,Kazuhiro,Takeda,K.,Yu,Z.-X.,Travis,W.D.,Moss,J.,Ferrans,V.J.,2000a. Role for Activation of Matrix Metalloproteinases in thePathogenesisofPulmonaryLymphangioleiomyomatosis,ArchPatholLabMed.
Matsui, Kazuhiro, Takeda, K., Yu, Z., Valencia, J., Travis, W.D., Moss, J.,Ferrans, V.J., 2000b. Downregulation of Estrogen and ProgesteroneReceptors in the Abnormal Smooth Muscle Cells in PulmonaryLymphangioleiomyomatosis Following Therapy. Am. J. Respir. Crit.CareMed.161,1002–1009.
Matsui,K,W,K.R.,Hilbert,S.L.,Yu,Z.X.,Takeda,K.,Travis,W.D.,Moss,J.,Ferrans,V.J.,2000.HyperplasiaoftypeIIpneumocytesinpulmonarylymphangioleiomyomatosis.ArchPatholLabMed124,1642–1648.
Matthews,T.J.,Hornall,D.,Sheppard,M.N.,1993.Comparisonoftheuseofantibodiestoalphasmoothmuscleactinanddesmininpulmonarylymphangioleiomyomatosis.J.Clin.Pathol.46,479–80.
McCormack, F.X., 2008. Lymphangioleiomyomatosis: A clinical update.Chest133,507–516.
McCormack, F.X., Gupta, N., Finlay, G.R., Young, L.R., Taveira-Da Silva,A.M., Glasgow, C.G., Steagall, W.K., Johnson, S.R., Sahn, S.A., Ryu,J.H., Strange, C., Seyama, K., Sullivan, E.J., Kotloff, R.M., Downey,G.P.,Chapman, J.T.,Han,M.K.,D’Armiento, J.M., Inoue,Y.,Henske,E.P., Bissler, J.J., Colby, T. V., Kinder, B.W., Wikenheiser-Brokamp,K.A., Brown, K.K., Cordier, J.F., Meyer, C., Cottin, V., Brozek, J.L.,

References
151
Smith, K., Wilson, K.C., Moss, J., 2016. Official American thoracicsociety/Japanese respiratory society clinical practice guidelines:Lymphangioleiomyomatosis diagnosis and management. Am. J.Respir.Crit.CareMed.194,748–761.
McCormack,F.X., Inoue,Y.,Moss, J., Singer, L.G., Strange,C.,Nakata,K.,Barker, A.F., Chapman, J.T., Brantly,M.L., Stocks, J.M., Brown, K.K.,Lynch, J.P., Goldberg, H.J., Young, L.R., Kinder, B.W., Downey, G.P.,Sullivan, E.J., Colby, T. V, McKay, R.T., Cohen, M.M., Korbee, L.,Taveira-DaSilva, A.M., Lee, H.-S., Krische, J.P., Trapnell, B.C.,Institutes, for the N., Group, of H.R.L.D.C. and the M.T., 2011.Efficacy and safety of sirolimus in lymphangioleiomyomatosis. N.Engl.J.Med.364,1595–1606.
McCormack, F.X., Travis,W.D., Colby, T. V.,Henske, E.P.,Moss, J., 2012.Lymphangioleiomyomatosis - Calling it what it is: A low-grade,destructive,metastasizing neoplasm. Am. J. Respir. Crit. CareMed.186,1210–1212.
Medina,V.,Cricco,G.,Nuñez,M.,Martín,G.,Mohamad,N.,Correa-Fiz,F.,Sanchez-Jiménez, F., Bergoc, R., Rivera, E.S., 2006. Histamine-mediated signaling processes in human malignant mammary cells.CancerBiol.Ther.5,1462–1471.
Medvetz,D.,Sun,Y.,Li,C.,Khabibullin,D.,Balan,M.,Parkhitko,A.,Priolo,C.,Asara,J.,Pal,S.,Yu,J.,Henske,E.P.,2015.High-throughputdrugscreen identifies chelerythrine as a selective inducer of death in aTSC2-nullsetting.Mol.CancerRes.13,50.
Merickel, A., Edwards, R.H., 1995. Transport of histamine by vesicularmonoaminetransporter-2.Neuropharmacology34,1543–1547.
Miller,T.E.,Liau,B.B.,Wallace,L.C.,Morton,A.R.,Xie,Q.,Dixit,D.,Factor,D.C., Kim, L.J.Y., Morrow, J.J., Wu, Q., Mack, S.C., Hubert, C.G.,Gillespie, S.M., Flavahan, W.A., Hoffmann, T., Thummalapalli, R.,Hemann, M.T., Paddison, P.J., Horbinski, C.M., Zuber, J., Scacheri,P.C., Bernstein, B.E., Tesar, P.J., Rich, J.N., 2017. Transcriptionelongation factors represent in vivo cancer dependencies inglioblastoma.Nature547,355–359.
Minn,A.J.,Gupta,G.P.,Siegel,P.M.,Bos,P.D.,Shu,W.,Giri,D.D.,Viale,A.,

References
152
Olshen, A.B., Gerald,W.L.,Massagué, J., 2005.Genes thatmediatebreastcancermetastasistolung.Nature436,518–524.
Mirnezami, R., Kinross, J.M., Vorkas, P.A., Goldin, R., Holmes, E.,Nicholson, J., Darzi, A., 2012. Implementation of MolecularPhenotyping Approaches in the Personalized Surgical PatientJourney.Ann.Surg.255,881–889.
Molnar,E.L.,Cricco,G.,Martin,G.,Darvas,Z.,Hegyesi,H.,Fitzsimons,C.,Bergoc, R., Falus, A., Rivera, E., 2001. Histamine as a potentialautocrineregulatorofmelanoma.Inflamm.Res.50Suppl2,S102-3.
Molyneux, G., Geyer, F.C., Magnay, F.-A., McCarthy, A., Kendrick, H.,Natrajan,R.,Mackay,A.,Grigoriadis,A.,Tutt,A.,Ashworth,A.,Reis-Filho, J.S., Smalley, M.J., 2010. BRCA1 basal-like breast cancersoriginatefromluminalepithelialprogenitorsandnotfrombasalstemcells.CellStemCell7,403–17.
Mott,B.T.,Eastman,R.T.,Guha,R.,Sherlach,K.S.,Siriwardana,A.,Shinn,P.,McKnight,C.,Michael,S.,Lacerda-Queiroz,N.,Patel,P.R.,Khine,P., Sun, H., Kasbekar, M., Aghdam, N., Fontaine, S.D., Liu, D.,Mierzwa, T.,Mathews-Griner, L.A., Ferrer,M.,Renslo,A.R., Inglese,J., Yuan, J., Roepe, P.D., Su, X.-Z., Thomas, C.J., 2015. High-throughput matrix screening identifies synergistic and antagonisticantimalarialdrugcombinations.Sci.Rep.5,13891.
N
Nasr, Z., Robert, F., Porco, J.A., Muller, W.J., Pelletier, J., 2013. eIF4Fsuppression in breast cancer affects maintenance and progression.Oncogene32,861–71.
Nicholson, J.K., Holmes, E., Kinross, J.M., Darzi, A.W., Takats, Z., Lindon,J.C., 2012. Metabolic phenotyping in clinical and surgicalenvironments.Nature491,384–392.
Nojima, H., Tokunaga, C., Eguchi, S., Oshiro, N., Hidayat, S., Yoshino, K.,Hara,K.,Tanaka,N.,Avruch,J.,Yonezawa,K.,2003.TheMammalianTarget of Rapamycin (mTOR) Partner, Raptor, Binds the mTORSubstrates p70 S6 Kinase and 4E-BP1 through Their TOR Signaling(TOS)Motif.J.Biol.Chem.278,15461–15464.
References
153
Nuñez, O., Baldi, B.G., Radzikowska, E., Carvalho, C.R.R., Herranz, C.,Sobiecka, M., Torre, O., Harari, S., Vergeer, M.A.M.H., Kolbe, J.,Pollán,M.,Pujana,M.A.,2019.Riskofbreastcancerinpatientswithlymphangioleiomyomatosis.CancerEpidemiol.61,154–156.
Nuñez,O.,Román,A.,Johnson,S.R.,Inoue,Y.,Hirose,M.,Casanova,Á.,deGaribay, G.R., Herranz, C., Bueno-Moreno, G., Boni, J., Mateo, F.,Petit, A., Climent, F., Soler, T., Vidal, A., Sánchez-Mut, J.V., Esteller,M.,López,J.I.,García,N.,Gumà,A.,Ortega,R.,Plà,M.J.,Campos,M.,Ansótegui,E.,Molina-Molina,M.,Valenzuela,C.,Ussetti,P.,Laporta,R.,Ancochea,J.,Xaubet,A.,Pollán,M.,Pujana,M.A.,2016.Studyofbreast cancer incidence in patients of lymphangioleiomyomatosis.BreastCancerRes.Treat.156,195–201.
O
O’Sullivan, T.E., Johnson, L.R., Kang, H.H., Sun, J.C., 2015. BNIP3- andBNIP3L-Mediated Mitophagy Promotes the Generation of NaturalKillerCellMemory.Immunity43,331–42.
Odajima,N.,Betsuyaku,T.,Nasuhara,Y.,Inoue,H.,Seyama,K.,Nishimura,M., 2009. Matrix metalloproteinases in blood from patients withLAM.Respir.Med.103,124–9.
Ohori, N.P., Yousem, S.A., Sonmez-Alpan, E., Colby, T. V, 1991. Estrogenand progesterone receptors in lymphangioleiomyomatosis,epithelioid hemangioendothelioma, and sclerosing hemangioma ofthelung.Am.J.Clin.Pathol.96,529–35.
Ozaki, H., Seo, M.S., Ozaki, K., Yamada, H., Yamada, E., Okamoto, N.,Hofmann, F., Wood, J.M., Campochiaro, P.A., 2000. Blockade ofvascularendothelialcellgrowthfactorreceptorsignalingissufficienttocompletelypreventretinalneovascularization.Am.J.Pathol.156,697–707.
P
Pacheco-Rodriguez, G., Moss, J., 2010. The role of chemokines inmigration of metastatic-like lymphangioleiomyomatosis cells. Crit.Rev.Immunol.30,387–94.
References
154
Pacheco-Rodríguez,G.,Steagall,W.K.,Samsel,L.,Dagur,P.K.,McCoy,J.P.,Tunc, I., Pirooznia, M., Wang, J.-A., Darling, T.N., Moss, J., 2019.Circulating Lymphangioleiomyomatosis Tumor Cells With Loss ofHeterozygosity in the TSC2 Gene Show Increased AldehydeDehydrogenaseActivity.Chest156,298–307.
Padua, D., Zhang, X.H.F.,Wang, Q., Nadal, C., Gerald,W.L., Gomis, R.R.,Massagué,J.,2008.TGFβPrimesBreastTumorsforLungMetastasisSeedingthroughAngiopoietin-like4.Cell133,66–77.
Palomino-Morales, R., Torres, C., Perales, S., Linares, A., Alejandre,M.J.,2016.Inhibitionofextracellularmatrixproductionandremodelingbydoxycyclineinsmoothmusclecells.J.Pharmacol.Sci.132,218–223.
Parkhitko, A., Myachina, F., Morrison, T.A., Hindi, K.M., Auricchio, N.,Karbowniczek, M., Wu, J.J., Finkel, T., Kwiatkowski, D.J., Yu, J.J.,Henske, E.P., 2011. Tumorigenesis in tuberous sclerosis complex isautophagy and p62/sequestosome 1 (SQSTM1)-dependent. Proc.Natl.Acad.Sci.108,12455–12460.
Parkhitko,A.A., Priolo, C., Coloff, J.L., Yun, J.,Wu, J.J.,Mizumura, K., Xu,W.,Malinowska, I.A.,Yu, J.,Kwiatkowski,D.J.,Locasale, J.W.,Asara,J.M., Choi, A.M.K., Finkel, T., Henske, E.P., 2014. Autophagy-dependent metabolic reprogramming sensitizes tsc2-deficient cellstotheantimetabolite6-aminonicotinamide.Mol.CancerRes.12,48–57.
Pérez-Alea,M.,McGrail, K., Sánchez-Redondo, S., Ferrer, B., Fournet,G.,Cortés, J., Muñoz, E., Hernandez-Losa, J., Tenbaum, S., Martin, G.,Costello,R.,Ceylan,I.,Garcia-Patos,V.,Recio,J.A.,2017.ALDH1A3isepigenetically regulated duringmelanocyte transformation and is atargetformelanomatreatment.Oncogene36,5695–5708.
Pimenta,S.P.,Baldi,B.G.,Kairalla,R.A.,Carvalho,C.R.R.,2013.Doxycyclineuse in patients with lymphangioleiomyomatosis: biomarkers andpulmonaryfunctionresponse.J.Bras.Pneumol.39,5–15.
Poillet-Perez, L., Despouy, G., Delage-Mourroux, R., Boyer-Guittaut, M.,2015. Interplay between ROS and autophagy in cancer cells, fromtumorinitiationtocancertherapy.RedoxBiol.4,184–192.

References
155
Pomaznoy,M.,Ha,B.,Peters,B.,2018.GOnet:atoolforinteractiveGeneOntologyanalysis.BMCBioinformatics19,470.
Prizant,H.,Sen,A.,Light,A.,Cho,S.-N.,DeMayo,F.J.,Lydon,J.P.,Hammes,S.R.,2013.Uterine-SpecificLossofTsc2LeadstoMyometrialTumorsinBoththeUterusandLungs.Mol.Endocrinol.27,1403–1414.
R
Randle, S.C., 2017. Tuberous Sclerosis Complex: A Review. Pediatr. Ann.46,e166–e171.
Reynolds, J.L., Akhter, J.A., Magarey, C.J., Schwartz, P., Adams, W.J.,Morris,D.L.,1998.Histamineinhumanbreastcancer.Br.J.Surg.85,538–541.
Robertson,J.F.R.,Blamey,R.W.,2003.Theuseofgonadotrophin-releasinghormone(GnRH)agonistsinearlyandadvancedbreastcancerinpre-andperimenopausalwomen.Eur.J.Cancer39,861–9.
Ryu,J.H.,Moss,J.,Beck,G.J.,Lee,J.-C.,Brown,K.K.,Chapman,J.T.,Finlay,G.A., Olson, E.J., Ruoss, S.J., Maurer, J.R., Raffin, T.A., Peavy, H.H.,McCarthy, K., Taveira-Dasilva, A., McCormack, F.X., Avila, N.A.,Decastro,R.M.,Jacobs,S.S.,Stylianou,M.,Fanburg,B.L.,NHLBILAMRegistry Group, for the N.L.R., 2006. The NHLBIlymphangioleiomyomatosisregistry:characteristicsof230patientsatenrollment.Am.J.Respir.Crit.CareMed.173,105–11.
S
Sabatini,D.M., Erdjument-Bromage,H., Lui,M., Tempst, P., Snyder, S.H.,1994. RAFT1: a mammalian protein that binds to FKBP12 in arapamycin-dependentfashionandishomologoustoyeastTORs.Cell78,35–43.
Saxton,R.A.,Sabatini,D.M.,2017.mTORSignalinginGrowth,Metabolism,andDisease.Cell168,960–976.
Selbert,S.,Bentley,D.J.,Melton,D.W.,Rannie,D.,Lourenço,P.,Watson,C.J., Clarke,A.R., 1998. EfficientBLG-Cremediatedgenedeletion inthemammarygland.TransgenicRes.7,387–396.

References
156
Sena, L.A., Chandel, N.S., 2012. Physiological roles of mitochondrialreactiveoxygenspecies.Mol.Cell48,158–67.
Seyama, K., Kumasaka, T., Souma, S., Sato, T., Kurihara, M., Mitani, K.,Tominaga,S.,Fukuchi,Y.,2006.VascularEndothelialGrowthFactor-DIsIncreasedinSerumofPatientswithLymphangioleiomyomatosis.Lymphat.Res.Biol.4.
Sharpe,M.A., Baskin,D.S., 2016.MonoamineoxidaseB levels are highlyexpressed inhumangliomasandarecorrelatedwiththeexpressionofHiF-1αandwith transcription factorsSp1andSp3.Oncotarget7,3379–93.
Shinn,P.,Chen,L.,Ferrer,M., Itkin,Z.,Klumpp-Thomas,C.,McKnight,C.,Michael,S.,Mierzwa,T.,Thomas,C.,Wilson,K.,Guha,R.,2019.High-throughput screening for drug combinations. Methods Mol. Biol.1939,11–35.
Sidhu,G.,Akhondi,H.,2019.Loratadine,StatPearls.
Sieja,K.,Stanosz,S.,vonMach-Szczypiński,J.,Olewniczak,S.,Stanosz,M.,2005.Concentrationofhistamineinserumandtissuesoftheprimaryductalbreastcancersinwomen.Breast14,236–41.
Simiantonaki,N.,Jayasinghe,C.,Michel-Schmidt,R.,Peters,K.,Hermanns,M.I., Kirkpatrick, C.J., 2008. Hypoxia-induced epithelial VEGF-C/VEGFR-3 upregulation in carcinoma cell lines. Int. J. Oncol. 32,585–92.
Smolarek,T.A.,Wessner, L.L.,McCormack,F.X.,Mylet, J.C.,Menon,A.G.,Henske, E.P., 1998. Evidence that lymphangiomyomatosis is causedby TSC2 mutations: chromosome 16p13 loss of heterozygosity inangiomyolipomas and lymph nodes from women withlymphangiomyomatosis.Am.J.Hum.Genet.62,810–5.
South,A.P.,Cho,R.J.,Aster,J.C.,2012.Thedouble-edgedswordofNotchsignalingincancer.Semin.CellDev.Biol.23,458–64.
Stifel,F.B.,Herman,R.H.,1971.Histidinemetabolism.Am.J.Clin.Nutr.24,207–217.
References
157
Stone, R.M., Mandrekar, S.J., Sanford, B.L., Laumann, K., Geyer, S.,Bloomfield,C.D.,Thiede,C.,Prior,T.W.,Dohner,K.,Marcucci,G.,Lo-Coco,F.,Klisovic,R.B.,Wei,A.,Sierra,J.,Sanz,M.A.,Brandwein,J.M.,De Witte, T., Niederwieser, D., Appelbaum, F.R., Medeiros, B.C.,Tallman, M.S., Krauter, J., Schlenk, R.F., Ganser, A., Serve, H.,Ehninger,G.,Amadori,S.,Larson,R.A.,Dohner,H.,2017.Midostaurinplus chemotherapy for acute myeloid leukemia with a FLT3Mutation.N.Engl.J.Med.377,454–464.
Subramanian, A., Tamayo, P., Mootha, V.K., Mukherjee, S., Ebert, B.L.,2005. Gene set enrichment analysis : A knowledge-based approachforinterpretinggenome-wideexpressionprofiles.ProcNatlAcadSciUSA102,15545–15550.
Sugimoto, M., Wong, D.T., Hirayama, A., Soga, T., Tomita, M., 2010.Capillary electrophoresis mass spectrometry-based salivametabolomics identified oral, breast and pancreatic cancer-specificprofiles.Metabolomics6,78–95.
Svendsen,T.L.,Viskum,K.,Hansborg,N.,Thorpe,S.M.,Nielsen,N.C.,1984.Pulmonary lymphangioleiomyomatosis: a case of progesteronereceptor positive lymphangioleiomyomatosis treated withmedroxyprogesterone, oophorectomy and tamoxifen. Br. J. Dis.Chest78,264–71.
Swainston,N.,Smallbone,K.,Hefzi,H.,Dobson,P.D.,Brewer,J.,Hanscho,M., Zielinski, D.C., Ang, K.S., Gardiner, N.J., Gutierrez, J.M.,Kyriakopoulos, S., Lakshmanan, M., Li, S., Liu, J.K., Martínez, V.S.,Orellana,C.A.,Quek,L.-E.,Thomas,A.,Zanghellini,J.,Borth,N.,Lee,D.-Y., Nielsen, L.K., Kell, D.B., Lewis, N.E.,Mendes, P., 2016. Recon2.2: from reconstruction to model of human metabolism.Metabolomics12,109.
T
Tal,M.C., Sasai,M., Lee, H.K., Yordy, B., Shadel, G.S., Iwasaki, A., 2009.Absenceofautophagy results in reactiveoxygenspecies-dependentamplification of RLR signaling. Proc. Natl. Acad. Sci. U. S. A. 106,2770–5.
Tan,M.J., Teo, Z., Sng,M.K., Zhu, P., Tan,N.S., 2012. Emerging Roles of
References
158
Angiopoietin-like4inHumanCancer.Mol.CancerRes.10,677–688.
Taveira-DaSilva, A.M., Hathaway, O., Stylianou, M., Moss, J., 2011.Changes in Lung Function and Chylous Effusions in Patients WithLymphangioleiomyomatosis Treated With Sirolimus. Ann. Intern.Med.154,797.
Taveira-DaSilva,A.M.,Jones,A.M.,Julien-Williams,P.,Stylianou,M.,Moss,J.,2018.Long-TermEffectofSirolimusonSerumVascularEndothelialGrowthFactorDLevelsinPatientsWithLymphangioleiomyomatosis.Chest153,124–132.
Taveira-DaSilva,A.M.,Stylianou,M.P.,Hedin,C.J.,Hathaway,O.,Moss,J.,2004. Decline in Lung Function in Patients WithLymphangioleiomyomatosis TreatedWithorWithout Progesterone.Chest126,1867–1874.
Taylor, J.R., Ryu, J., Colby, T. V., Raffin, T.A., 1990.Lymphangioleiomyomatosis.N.Engl.J.Med.323,1254–1260.
Tenzer,A.,Zingg,D.,Rocha,S.,Hemmings,B.,Fabbro,D.,Glanzmann,C.,Schubiger, P.A., Bodis, S., Pruschy, M., 2001. Thephosphatidylinositide 3’-kinase/Akt survival pathway is a target forthe anticancer and radiosensitizing agent PKC412, an inhibitor ofproteinkinaseC.CancerRes.61,8203–10.
Terasaki, Y., Yahiro, K., Pacheco-Rodriguez, G., Steagall, W.K., Stylianou,M.P.,Evans,J.F.,Walker,A.M.,Moss,J.,2010.EffectsofprolactinonTSC2-null Eker rat cells and in pulmonarylymphangioleiomyomatosis.Am.J.Respir.Crit.CareMed.182,531–539.
Toledo-Guzmán, M.E., Hernández, M.I., Gómez-Gallegos, A.A., Ortiz-Sánchez,E.,2019.ALDHasaStemCellMarkerinSolidTumors.Curr.StemCellRes.Ther.14,375–388.
Tomasian, A., Greenberg, M.S., Rumerman, H., 1982. Tamoxifen forlymphangioleiomyomatosis.N.Engl.J.Med.306,745–6.
Tyryshkin, A., Bhattacharya, A., Eissa, N.T., 2014a. SRC kinase is a noveltherapeutic target in lymphangioleiomyomatosis. Cancer Res. 74,
References
159
1996–2005.
Tyryshkin,A.,Bhattacharya,A.,TonyEissa,N.,2014b.SrcKinaseisaNovelTherapeutic Target in Lymphangio-leiomyomatosis. Cancer Res. 74,1996–2005.
U
Ugun-Klusek,A.,Theodosi,T.S.,Fitzgerald,J.C.,Burté,F.,Ufer,C.,Boocock,D.J., Yu-Wai-Man, P., Bedford, L., Billett, E.E., 2019. Monoamineoxidase-A promotes protective autophagy in human SH-SY5Yneuroblastoma cells through Bcl-2 phosphorylation. Redox Biol. 20,167.
V
Valencia, J.C., Pacheco-Rodriguez,G., Carmona,A.K., Xavier, J., Bruneval,P.,Riemenschneider,W.K.,Ikeda,Y.,Yu,Z.-X.,Ferrans,V.J.,Moss,J.,2006. Tissue-Specific Renin–Angiotensin System in PulmonaryLymphangioleiomyomatosis.Am.J.Respir.CellMol.Biol.35,40.
Valvezan, A.J., Turner,M., Belaid, A., Lam, H.C.,Miller, S.K.,McNamara,M.C., Baglini, C., Housden, B.E., Perrimon, N., Kwiatkowski, D.J.,Asara, J.M., Henske, E.P., Manning, B.D., 2017. mTORC1 CouplesNucleotideSynthesistoNucleotideDemandResultinginaTargetableMetabolicVulnerability.CancerCell32,624-638.e5.
Vara-Perez,M.,Felipe-Abrio,B.,Agostinis,P.,2019.MitophagyinCancer:ATaleofAdaptation.Cells8.
Virakul, S., Phetsuksiri, T., van Holten-Neelen, C., Schrijver, B., vanSteensel,L.,Dalm,V.A.S.H.,Paridaens,D.,vandenBosch,W.A.,vanHagen, P.M., Dik, W.A., 2016. Histamine induces NF-κB controlledcytokinesecretionbyorbitalfibroblastsviahistaminereceptortype-1.Exp.EyeRes.147,85–93.
W
Wagner,W.,Ichikawa,A.,Tanaka,S.,Panula,P.,Fogel,W.A.,2003.Mousemammary epithelial histamine system. J. Physiol. Pharmacol. 54,211–23.

References
160
Walker,C.L.,Hunter,D.,Everitt,J.I.,2003.UterineLeiomyomaintheEkerRat: A Unique Model for Important Diseases of Women. GenesChromosom.Cancer38,349–356.
Wishart, D.S., Feunang, Y.D., Marcu, A., Guo, A.C., Liang, K., Vázquez-Fresno,R.,Sajed,T., Johnson,D.,Li,C.,Karu,N.,Sayeeda,Z.,Lo,E.,Assempour,N.,Berjanskii,M.,Singhal,S.,Arndt,D.,Liang,Y.,Badran,H.,Grant,J.,Serra-Cayuela,A.,Liu,Y.,Mandal,R.,Neveu,V.,Pon,A.,Knox,C.,Wilson,M.,Manach,C.,Scalbert,A.,2018.HMDB4.0: thehumanmetabolomedatabasefor2018.NucleicAcidsRes.46,D608–D617.
Wu, J.B., Yin, L., Shi, C., Li, Q., Duan, P., Huang, J.-M., Liu, C.,Wang, F.,Lewis,M.,Wang,Y., Lin,T.-P.,Pan,C.-C.,Posadas,E.M.,Zhau,H.E.,Chung,L.W.K.,2017.MAOA-DependentActivationofShh-IL6-RANKLSignalingNetworkPromotesProstateCancerMetastasisbyEngagingTumor-StromalCellInteractions.CancerCell31,368–382.
Y
Yang, Y., Hu, L., Zheng, H.,Mao, C., Hu,W., Xiong, K.,Wang, F., Liu, C.,2013.Applicationandinterpretationofcurrentautophagyinhibitorsandactivators.ActaPharmacol.Sin.34,625.
Yano,S.,2002.Exacerbationofpulmonary lymphangioleiomyomatosisbyexogenousoestrogenusedforinfertilitytreatment.Thorax57,1085–6.
Yecies, J.L., Manning, B.D., 2011. Transcriptional control of cellularmetabolismbymTORsignaling.CancerRes.71,2815–20.
Youdim, M.B.H., Edmondson, D., Tipton, K.F., 2006. The therapeuticpotential of monoamine oxidase inhibitors. Nat. Rev. Neurosci. 7,295–309.
Young,L.,Lee,H.-S.,Inoue,Y.,Moss,J.,Singer,L.G.,Strange,C.,Nakata,K.,Barker, A.F., Chapman, J.T., Brantly,M.L., Stocks, J.M., Brown, K.K.,Lynch,J.P.,Goldberg,H.J.,Downey,G.P.,Swigris,J.J.,Taveira-DaSilva,A.M., Krischer, J.P., Trapnell, B.C., McCormack, F.X., MILES TrialGroup,P.F.X.,2013.SerumVEGF-Daconcentrationasabiomarkeroflymphangioleiomyomatosis severity and treatment response: a
References
161
prospective analysis of the Multicenter InternationalLymphangioleiomyomatosis Efficacy of Sirolimus (MILES) trial.Lancet.Respir.Med.1,445–52.
Young,L.R.,VanDyke,R.,Gulleman,P.M.,Inoue,Y.,Brown,K.K.,Schmidt,L.S.,Linehan,W.M.,Hajjar,F.,Kinder,B.W.,Trapnell,B.C.,Bissler,J.J.,Franz, D.N., McCormack, F.X., 2010. Serum vascular endothelialgrowth factor-D prospectively distinguisheslymphangioleiomyomatosis from other diseases. Chest 138, 674–681.
Yu,G.,Wang,L.-G.,Han,Y.,He,Q.-Y.,2012.clusterProfiler:anRpackagefor comparing biological themes among gene clusters. OMICS 16,284–7.
Yu, J., Astrinidis, A., Henske, E.P., 2001. Chromosome 16 Loss ofHeterozygosity in Tuberous Sclerosis and SporadicLymphangiomyomatosis. Am. J. Respir. Crit. CareMed. 164, 1537–1540.
Yu, J., Astrinidis, A., Howard, S., Henske, E.P., 2004. Estradiol andtamoxifen stimulate LAM-associated angiomyolipoma cell growthandactivatebothgenomicandnongenomicsignalingpathways.Am.J.Physiol.Cell.Mol.Physiol.286,L694–L700.
Yu, J.J., Robb, V.A., Morrison, T.A., Ariazi, E.A., Karbowniczek, M.,Astrinidis, A., Wang, C., Hernandez-Cuebas, L., Seeholzer, L.F.,Nicolas,E.,Hensley,H.,Jordan,V.C.,Walker,C.L.,Henske,E.P.,2009.Estrogenpromotesthesurvivalandpulmonarymetastasisoftuberin-nullcells.Proc.Natl.Acad.Sci.U.S.A.106,2635–40.
Z
Zhang,H.,Cicchetti,G.,Onda,H.,Koon,H.B.,Asrican,K.,Bajraszewski,N.,Vazquez, F., Carpenter, C.L., Kwiatkowski, D.J., 2003. Loss ofTsc1/Tsc2 activates mTOR and disrupts PI3K-Akt signaling throughdownregulationofPDGFR.J.Clin.Invest.112,1223–1233.
Zhong,Z.A.,Sun,W.,Chen,H.,Zhang,H.,Lay,Y.-A.E.,Lane,N.E.,Yao,W.,2015. Optimizing tamoxifen-inducible Cre/loxp system to reducetamoxifen effect on bone turnover in long bones of young mice.

References
162
Bone81,614–619.
Zhu,P.,Tan,M.J.,Huang,R.-L.,Tan,C.K.,Chong,H.C.,Pal,M.,Lam,C.R.I.,Boukamp,P.,Pan, J.Y.,Tan,S.H.,Kersten,S.,Li,H.Y.,Ding, J.L.,Tan,N.S., 2011. Angiopoietin-like 4 Protein Elevates the ProsurvivalIntracellular O2−:H2O2 Ratio and Confers Anoikis Resistance toTumors.CancerCell19,401–415.

ANNEXES

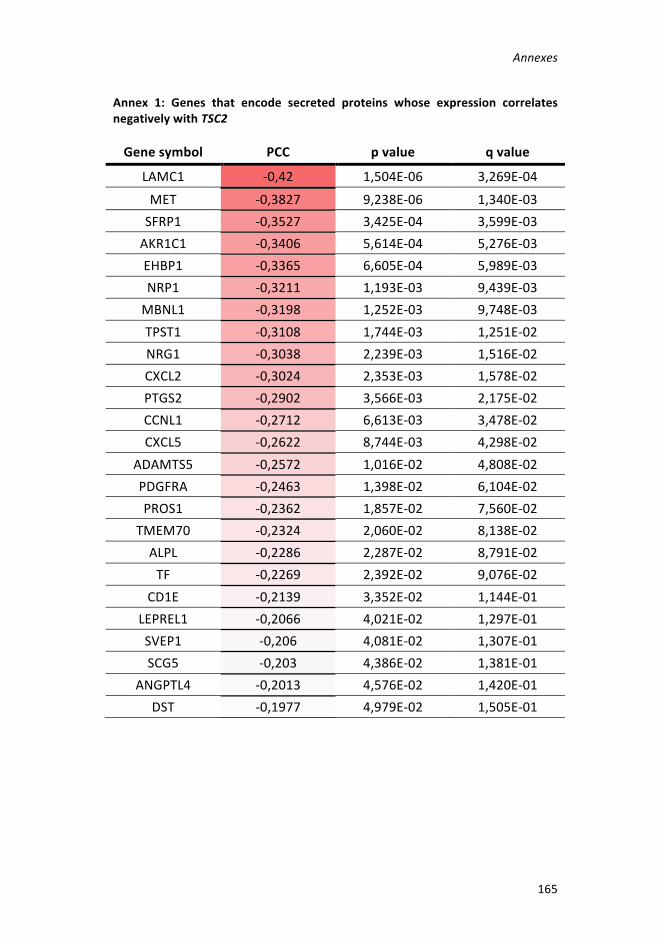
Annexes
165
Annex 1: Genes that encode secreted proteins whose expression correlatesnegativelywithTSC2
Genesymbol PCC pvalue qvalue
LAMC1 -0,42 1,504E-06 3,269E-04MET -0,3827 9,238E-06 1,340E-03SFRP1 -0,3527 3,425E-04 3,599E-03AKR1C1 -0,3406 5,614E-04 5,276E-03EHBP1 -0,3365 6,605E-04 5,989E-03NRP1 -0,3211 1,193E-03 9,439E-03MBNL1 -0,3198 1,252E-03 9,748E-03TPST1 -0,3108 1,744E-03 1,251E-02NRG1 -0,3038 2,239E-03 1,516E-02CXCL2 -0,3024 2,353E-03 1,578E-02PTGS2 -0,2902 3,566E-03 2,175E-02CCNL1 -0,2712 6,613E-03 3,478E-02CXCL5 -0,2622 8,744E-03 4,298E-02
ADAMTS5 -0,2572 1,016E-02 4,808E-02PDGFRA -0,2463 1,398E-02 6,104E-02PROS1 -0,2362 1,857E-02 7,560E-02
TMEM70 -0,2324 2,060E-02 8,138E-02ALPL -0,2286 2,287E-02 8,791E-02TF -0,2269 2,392E-02 9,076E-02
CD1E -0,2139 3,352E-02 1,144E-01LEPREL1 -0,2066 4,021E-02 1,297E-01SVEP1 -0,206 4,081E-02 1,307E-01SCG5 -0,203 4,386E-02 1,381E-01
ANGPTL4 -0,2013 4,576E-02 1,420E-01DST -0,1977 4,979E-02 1,505E-01

Annexes
166
Annex 2: Genes that encode enzymeswhose expression correlates negativelywithTSC2
Genesymbol PCC pvalue qvalue
PLA2G4A -0,5206 3,314E-03 2,883E-02MET -0,3827 9,238E-06 1,340E-03PGCP -0,3549 3,130E-04 3,355E-03PLD1 -0,3521 3,522E-04 3,673E-03
AKR1C1 -0,3406 5,614E-04 5,276E-03AKR1C2 -0,3316 8,003E-04 6,914E-03TPST1 -0,3108 1,744E-03 1,251E-02ATP10B -0,3062 2,053E-03 1,421E-02ADCY3 -0,3033 2,273E-03 1,534E-02AKR1C3 -0,2978 2,757E-03 1,796E-02RANBP2 -0,293 3,245E-03 2,029E-02DDX3X -0,2903 3,554E-03 2,170E-02PTGS2 -0,2902 3,566E-03 2,175E-02PTGIS -0,2869 3,990E-03 2,364E-02CCNL1 -0,2712 6,613E-03 3,478E-02
ADAMTS5 -0,2572 1,016E-02 4,808E-02DIMT1L -0,2501 1,254E-02 5,629E-02NTRK3 -0,2466 1,388E-02 6,070E-02PDGFRA -0,2463 1,398E-02 6,104E-02GLT25D2 -0,2451 1,449E-02 6,275E-02TGFBR2 -0,2434 1,520E-02 6,497E-02CA3 -0,2402 1,661E-02 6,953E-02
PAPOLA -0,2365 1,844E-02 7,523E-02CYLD -0,2338 1,984E-02 7,922E-02NMT2 -0,2259 2,457E-02 9,248E-02C1R -0,2231 2,643E-02 9,754E-02
LEPREL1 -0,2066 4,021E-02 1,297E-01ALDH1A3 -0,2061 4,070E-02 1,306E-01PKD2 -0,2052 4,161E-02 1,327E-01UBE2I -0,2017 4,531E-02 1,410E-01

Annexes
167
Annex3:CompoundswithrobustdoseresponsecurvesandlowerAC50inTsc2-deficientcells.
Compoundname CRCLAM
AC50(uM)LAM
CRCWT
AC50(uM)WT
Benzethoniumchloride -1,1 1,3336 -1,2 5,95693Berberine -1,1 0,6619 -1,2 5,25764Rotenone -1,1 0,0299 -1,2 0,03759
Cetylpyridiniumbromide -1,1 0,4732 -1,1 1,05931GentianViolet -1,1 0,9441 -2,1 1,67889Azoxystrobin -1,2 0,5448 -1,2 1,36854
Monensinsodiumsalt -1,1 0,1620 -2,2 1,14706Prasugrelhydrochloride -1,1 2,9566 -1,2 3,31734Sepantroniumbromide -1,1 0,2349 -2,1 11,77038
SNS-032 -1,1 1,8655 -1,2 7,42661PHA-793887 -2,1 16,6261 -2,2 20,93103
Adriamycinhydrochloride-DNAcomplex -1,1 0,9441 -1,2 2,11360
Benzylhexadecyldimethylammoniumchloride -1,2 0,1496 -1,2 0,21136
Dinaciclib -1,1 0,0662 -1,2 0,07427Crenolanib -2,1 10,4904 -2,1 13,20659PF-04691502 -1,1 0,0833 -1,1 0,18655

Annexes
168
Annex 4: Compounds with whose targets correlated negatively with TSC2expression.
Compoundname CRCLAM
CRCWT Target PCC pvalue
Chlorhexidine -2b -2b MMP1 -0,4392 0,0003Auranofin -2a -1a TXRND1 -0,4189 0,0005Fingolimod
hydrochloride -2a -1a SPHK1 -0,3183 0,013
Idronoxil -1a -1a SPHK1 -0,3183 0,013PF-543 -2a -1a SPHK1 -0,3183 0,013G?-6983 -2a -3 PRKCA -0,2992 0,0213PKC412 -1b -1b PRKCA -0,2992 0,0213
Ro-31-8425 -1a -1a PRKCA -0,2992 0,0213Sotrastaurin -2b -2b PRKCA -0,2992 0,0213
Ingenolmebutate -2b -3 PRKCA -0,2992 0,0213Endoxifen -2a -1a PRKCA -0,2992 0,0213AP-768 -2b -2,4 PTGS2 -0,2902 0,0217
GSK-2126458 -1a -1a PIK3CA -0,2411 0,0683PF-04691502 -1a -1a PIK3CA -0,2411 0,0683CUDC-907 -1a -1a PIK3CA -0,2411 0,0683
Ruboxistaurinmesilate -2a -2a PRKCB -0,196 0,1547PD-173074 -1a -1a FGFR1 -0,0733 0,6615Dovitinib -1a -1a FGFR1 -0,0733 0,6615Ponatinib -1a -1a FGFR1 -0,0733 0,6615LY-2874455 -1b -1a FGFR1 -0,0733 0,6615