Elliptic Integrals: the Landen Transformation and Carlson Duplication
Upload
independentCategory
view
0download
0
Inverse Symmetry in Complete Genomes andWhole-Genome Inverse DuplicationSing-Guan Kong1, Wen-Lang Fan2, Hong-Da Chen2, Zi-Ting Hsu1, Nengji Zhou3,4, Bo Zheng1,
Hoong-Chien Lee1,2,3,4*
1 Graduate Institute of Systems Biology and Bioinformatics, National Central University, Chungli, Taiwan, Republic of China, 2 Department of Physics, National Central
University, Chungli, Taiwan, Republic of China, 3 Institute of Modern Physics, Zhejiang University, Hangzhou, Zhejiang, China, 4 National Center for Theoretical Science,
Shinchu, Taiwan, Republic of China
Abstract
The cause of symmetry is usually subtle, and its study often leads to a deeper understanding of the bearer of the symmetry.To gain insight into the dynamics driving the growth and evolution of genomes, we conducted a comprehensive study oftextual symmetries in 786 complete chromosomes. We focused on symmetry based on our belief that, in spite of theirextreme diversity, genomes must share common dynamical principles and mechanisms that drive their growth andevolution, and that the most robust footprints of such dynamics are symmetry related. We found that while complementand reverse symmetries are essentially absent in genomic sequences, inverse–complement plus reverse–symmetry isprevalent in complex patterns in most chromosomes, a vast majority of which have near maximum global inversesymmetry. We also discovered relations that can quantitatively account for the long observed but unexplainedphenomenon of k-mer skews in genomes. Our results suggest segmental and whole-genome inverse duplications areimportant mechanisms in genome growth and evolution, probably because they are efficient means by which the genomecan exploit its double-stranded structure to enrich its code-inventory.
Citation: Kong S-G, Fan W-L, Chen H-D, Hsu Z-T, Zhou N, et al. (2009) Inverse Symmetry in Complete Genomes and Whole-Genome Inverse Duplication. PLoSONE 4(11): e7553. doi:10.1371/journal.pone.0007553
Editor: Ramy K. Aziz, Cairo University, Egypt
Received March 20, 2009; Accepted July 22, 2009; Published November 9, 2009
Copyright: � 2009 Kong et al. This is an open-access article distributed under the terms of the Creative Commons Attribution License, which permitsunrestricted use, distribution, and reproduction in any medium, provided the original author and source are credited.
Funding: This work is supported in part by grant nos. 96-2112-M-008-025 and 97-2112-M-008-013, National Science Council, ROC (http://web1.nsc.gov.tw/), andthe Cathy General Hospital-National Central University (http://www.ncu.edu.tw/e_web/index.php) Grant 96-CGH-NCU-A1. The funders had no role in studydesign, data collection and analysis, decision to publish, or preparation of the manuscript.
Competing Interests: The authors have declared that no competing interests exist.
* E-mail: [email protected]
Introduction
Symmetry has been considered as an aspect of beauty in
mathematics [1], physics [2], chemistry [3], evolution [4], human
appearance [5], and psychology [6]. The cause of symmetry is
usually subtle, and the pursue of it often leads to a deep
understanding of the possessor of the symmetry. Chargaff’s parity
rule, stating that in a DNA sequence contents of A and T, and of C
and G, are separately identical [7], was a crucial clue to Watson
and Crick’s discovery of the double helical structure of DNA [8].
Chargaff’s second parity rule (CPR2) states that at a lower level of
accuracy the first rule also extends to a single strand of DNA
[9–12]. This monomeric base-complement symmetry has two
possible generalizations to k-letter words, or k-mers: complement
and reverse-complement, or inverse, symmetries. It has been
suggested that CPR2 is a special case of inverse symmetry, not
complement symmetry [13–16]. If we represent the four types of
bases by black and white arrows that can point up or down–black,
A/T; white, C/G; up, A/G; down, C/T–and place a k-mer in
front of a pair of right-angled mirrors, then the laterally reflected
image is the reverse (conjugate) of the k-mer, the image reflected
through the mirror below, its complement, and the doubly-
reflected image through both mirrors, its inverse. For example, the
reverse, complement, and inverse conjugates of the 5-mer
AAGTC are CTGAA, TTCAG, and GACTT, respectively. In
our notion, a genome with a perfect symmetry is one where for
every word in the genome, there is symmetry-conjugate of that
word somewhere else in the genome. For a proper discussion of
symmetry a quantitative description of the phenomenon, including
its complete absence, is needed.
In a search for insights into the dynamics that drive the growth
and evolution of genomes, we conducted a comprehensive study of
the three symmetries in 786 complete chromosomes (all the
complete genomes available in public databases when the study
was initiated). We focused on symmetry because, in spite of the
extreme diversity of genomes, we expect the same dynamical
principles and mechanisms to drive genome growth, and expect
footprints of the symmetry generating part of the dynamics to be
the most robust. For this study we define a new symmetry index,
xr, where r~r, c, and i stand for reverse, complement and
inverse, respectively, that allows us to quantify accurately the three
symmetries in any sequence long enough–about 5 kb–to make
word counting in the sequence statistically meaningful. Each
symmetry index has a value ranging from zero (perfect symmetry)
to approximately unity (absence of symmetry). The value of our
index is intuitively understood. For instance, in the case of inverse
symmetry, an index value of 0.05 for 5-mers implies that the
average difference in the frequencies of all inverse-conjugate pairs
of 5-mers is one-twentieth that of all pairs of 5-mers. Using the
indexes we verified that all three symmetries are absent as
PLoS ONE | www.plosone.org 1 November 2009 | Volume 4 | Issue 11 | e7553
expected in sufficiently long random sequences, and we found
that: reverse and complement symmetries are absent, globally and
locally, in the 786 complete chromosomes studied; in sharp
contrast, a high level of global inverse symmetry (GIS) is
ubiquitous in almost all complete chromosomes; the grand average
of the GIS index in all complete chromosomes is 0:073+0:066;
while broadly similar in their global behavior, chromosomes
exhibit a wide variety of patterns in local inverse symmetry (LIS);
coding and non-coding regions have essentially the same global
and local symmetry properties. We infer from these results that
inverse segmental duplication, in several forms, is an important
mechanism in the growth and evolution of genomes. As a by-
product we also gained a quantitative understanding of reverse,
complement, and inverse skews in genomes, in monomers and
k-mers.
Methods
Ethics StatementN/A.
Partition of k-mers into m-setsBy a genomic sequence we mean a single-stranded sequence.
We call a k-nucleotide word a k-mer and denote the set of all
t:4k types of k-mers by S. Given a sequence, we count the
frequency of occurrence (or frequency) fu of each k-mer type u in
S using an overlapping sliding window of width k and slide one
[17]. The sum of the frequencies isP
u[S fu~L{kz1,
approximated by L, and the mean frequency is �ff ~L=t. Let the
fractional A/T- and C/G-content of a sequence be denoted by
p and q~1{p, respectively. Whereas the p : q ratio varies widely
from genome to genome, the well-verified CPR2 [9,11,12,18]
states that in any long stretch of a single strand of genomic
sequence the A:T and C:G ratios are both invariably close to 1.
This property suggests a binary partition of S into subsets (m-sets)
Sm, m~0 to k, where each of the tm~k
m
� �2k types of k-mers in
Sm contain m and only m A/T’s (note thatP
m tm~t) [19]. For
example, in the case of k~2, S0 is the set CC, CG, GC, GG; S1 is
the set CA, CT, GA, GT, AC, AG, TC, TG; and S2 is the set AA
AT, TA, TT.
Definition of Symmetry IndexesGiven k§2, let Pr be the set of distinct r-conjugate (but non-
self-conjugate) pairs of k-mers types, where r~r, c, and i denote
reverse, complement, and inverse symmetry, respectively. For
example, for k~2, Pr~ AT,TAð Þ, AC,CAð Þ, AG,GAð Þ,fTC,CTð Þ, TG,GTð Þ, CG,GCð Þg; Pc~ AA,TTð Þ, AT,TAð Þ,fAC,TGð Þ, AG,TCð Þ, CC,GGð Þ, CA,GTð Þ, CT,GAð Þ, CG,GCð Þg;Pi ~ AA,TTð Þ, AC,GTð Þ, AG,CTð Þ, TC,GAð Þ, TG,CAð Þ,fCC,GGð Þg. The r-symmetry index, xr, is defined as:
x2r~
1
2Nr
X(u,u{)[Pr
fu{fu{
smu
� �2
, r~r, c,or i, ð1Þ
where u{ is the r-conjugation of u, smuis the standard deviation of
the m-set to which both u and u{ belong, and Nr is the number of
r-conjugate pairs in Pr. For example, for k~2, Pr~6, Pc~8,
and Pr~6. We make two remarks concerning Eq. (1). First,
k-mers from different m{sets are treated separately. Second, the
difference (fu{fu{ ) is measured relative toffiffiffi2p
smu, the average
fluctuation of frequencies of k-mers within the m-set to which u and
u{ belong. Because the standard deviation in frequencies of all
k-mers (for given k, but regardless of m-sets) depends sensitively on
base composition and is not an accurate measure of the fluctuation
in frequencies, the two features mentioned above are crucial for
disentangling symmetry from the effects of base composition. By
design xr is expected to be close to unity in the absence of
r-symmetry. A xr significantly less than unity indicates the
presence of r-symmetry and xr~0 implies exact r-symmetry. We
have verified that xr&1 for all three symmetries in random
sequences.
Comparing xr with an L1-Distance IndexIn [15] an index defined in terms of an L1-distance,
S1~1{P
u[S fu{fu{j j� �� P
u[S fuzfu{� �
, was used to measure
symmetries in DNA sequences: the closer S1 approaches unity the
better the symmetry. The weakness of an algorithm based on S1 is
that it is of the order of unity in all cases. Moreover, unlike x it is
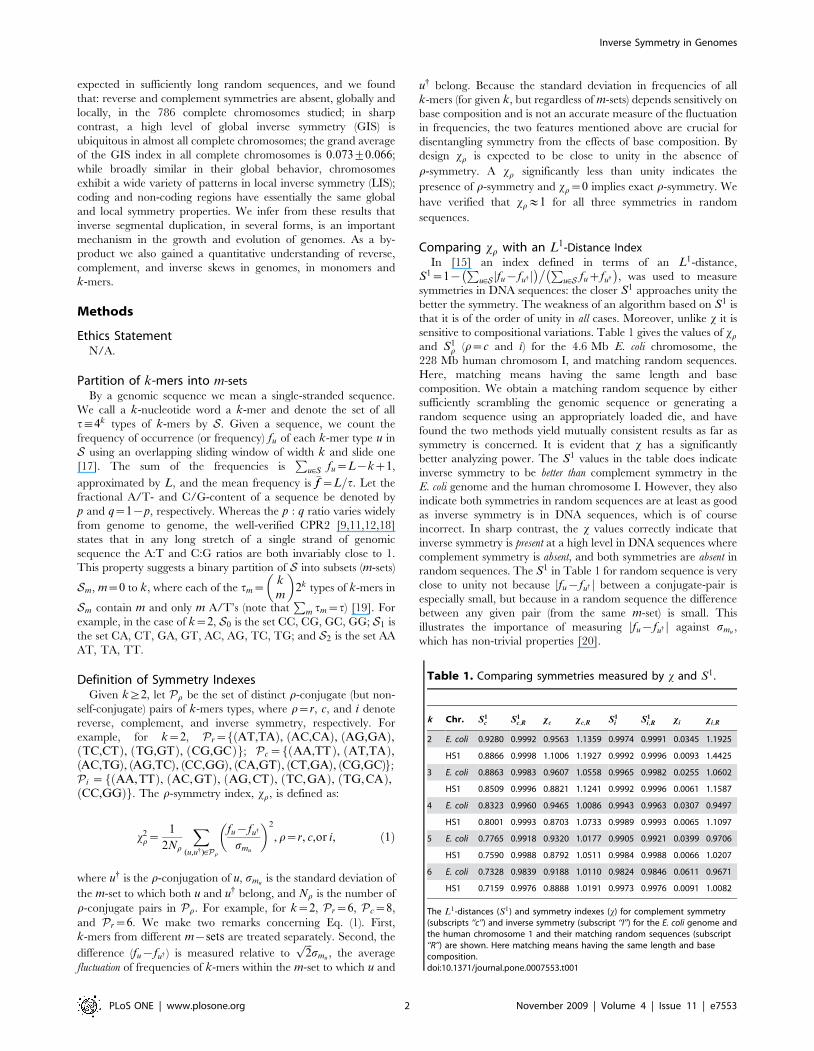
sensitive to compositional variations. Table 1 gives the values of xr
and S1r (r~c and i) for the 4.6 Mb E. coli chromosome, the
228 Mb human chromosom I, and matching random sequences.
Here, matching means having the same length and base
composition. We obtain a matching random sequence by either
sufficiently scrambling the genomic sequence or generating a
random sequence using an appropriately loaded die, and have
found the two methods yield mutually consistent results as far as
symmetry is concerned. It is evident that x has a significantly
better analyzing power. The S1 values in the table does indicate
inverse symmetry to be better than complement symmetry in the
E. coli genome and the human chromosome I. However, they also
indicate both symmetries in random sequences are at least as good
as inverse symmetry is in DNA sequences, which is of course
incorrect. In sharp contrast, the x values correctly indicate that
inverse symmetry is present at a high level in DNA sequences where
complement symmetry is absent, and both symmetries are absent in
random sequences. The S1 in Table 1 for random sequence is very
close to unity not because fu{fu{j j between a conjugate-pair is
especially small, but because in a random sequence the difference
between any given pair (from the same m-set) is small. This
illustrates the importance of measuring fu{fu{j j against smu,
which has non-trivial properties [20].
Table 1. Comparing symmetries measured by x and S1.
k Chr. S1c S1
c,R xc xc,R S1i S1
i,R xi xi,R
2 E. coli 0.9280 0.9992 0.9563 1.1359 0.9974 0.9991 0.0345 1.1925
HS1 0.8866 0.9998 1.1006 1.1927 0.9992 0.9996 0.0093 1.4425
3 E. coli 0.8863 0.9983 0.9607 1.0558 0.9965 0.9982 0.0255 1.0602
HS1 0.8509 0.9996 0.8821 1.1241 0.9992 0.9996 0.0061 1.1587
4 E. coli 0.8323 0.9960 0.9465 1.0086 0.9943 0.9963 0.0307 0.9497
HS1 0.8001 0.9993 0.8703 1.0733 0.9989 0.9993 0.0065 1.1097
5 E. coli 0.7765 0.9918 0.9320 1.0177 0.9905 0.9921 0.0399 0.9706
HS1 0.7590 0.9988 0.8792 1.0511 0.9984 0.9988 0.0066 1.0207
6 E. coli 0.7328 0.9839 0.9188 1.0110 0.9824 0.9846 0.0611 0.9671
HS1 0.7159 0.9976 0.8888 1.0191 0.9973 0.9976 0.0091 1.0082
The L1-distances (S1) and symmetry indexes (x) for complement symmetry(subscripts ‘‘c’’) and inverse symmetry (subscript ‘‘I’’) for the E. coli genome andthe human chromosome 1 and their matching random sequences (subscript‘‘R’’) are shown. Here matching means having the same length and basecomposition.doi:10.1371/journal.pone.0007553.t001
Inverse Symmetry in Genomes
PLoS ONE | www.plosone.org 2 November 2009 | Volume 4 | Issue 11 | e7553
A Mean-Field Estimate of xrWe derive a relation between xr and vr, the fraction of
r-conjugate k-mers that are paired. For simplicity we do not
explicitly mention m-sets and write sm as �ss, but it is understood
that a pair of k-mers always implies a pair in which both k-mers
belong to the same m-set. Let SDf T~ffiffiffi2p
�ss be the average
frequency difference of an unrelated pair (of k-mers). This
means a typical pair of k-mers have respective frequencies
f{~�ff {SDf T=2 and fz~�ff zSDf T=2, so that on average the
fraction of unrelated k-mers that are ‘‘paired-up’’ is
2f{�
�ff ~2v0~ �ff {SDf T=2� ��
�ff ~1{ffiffiffi2p
�ss.
2�ff : ð2Þ
Similarly, if SDf Tr is the average frequency difference in a
r-conjugate pair, then the fraction of k-mers paired with their
respective r-conjugate partners is
2vr~ �ff {SDf Tr
.2
� �.�ff ~1{SDf Tr
.2�ff : ð3Þ
It follows from the definition of xr (Eq. (1)) that a mean-field
approximation of its value is
SxrT~SDf T. ffiffiffi
2p
�ss~ 1{2vr
� ��1{2v0ð Þ: ð4Þ
Note that SxrT~1 when vr~v0 and SxrT~0 when vr~0:5. It
is important to realize that the value of v0 alone does not
determine the level of symmetry. For long random sequences, �ssscales as L1=2 so that �ss
�2�ff*0 and v0 0:5. Yet none of three
symmetries are present in random sequences, nor are they
expected (see Table 1). Finally, the fraction of r-conjugate-paired
k-mers above background level is
2dvr~2 vr{v0
� �~ 1{2v0ð Þ 1{SxrT
� �: ð5Þ
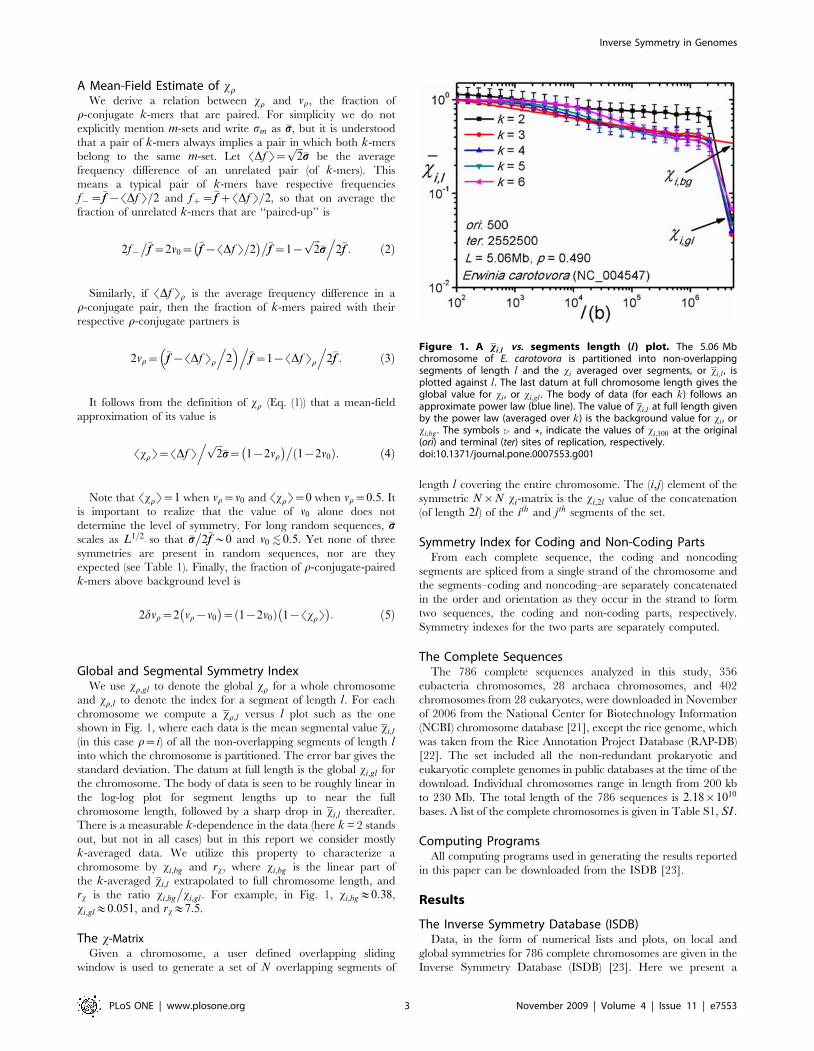
Global and Segmental Symmetry IndexWe use xr,gl to denote the global xr for a whole chromosome
and xr,l to denote the index for a segment of length l. For each
chromosome we compute a xr,l versus l plot such as the one
shown in Fig. 1, where each data is the mean segmental value xi,l
(in this case r~i) of all the non-overlapping segments of length linto which the chromosome is partitioned. The error bar gives the
standard deviation. The datum at full length is the global xi,gl for
the chromosome. The body of data is seen to be roughly linear in
the log-log plot for segment lengths up to near the full
chromosome length, followed by a sharp drop in xi,l thereafter.
There is a measurable k-dependence in the data (here k = 2 stands
out, but not in all cases) but in this report we consider mostly
k-averaged data. We utilize this property to characterize a
chromosome by xi,bg and rx, where xi,bg is the linear part of
the k-averaged xi,l extrapolated to full chromosome length, and
rx is the ratio xi,bg
�xi,gl . For example, in Fig. 1, xi,bg&0:38,
xi,gl&0:051, and rx&7:5.
The x-MatrixGiven a chromosome, a user defined overlapping sliding
window is used to generate a set of N overlapping segments of
length l covering the entire chromosome. The (i,j) element of the
symmetric N|N xi-matrix is the xi,2l value of the concatenation
(of length 2l) of the ith and jth segments of the set.
Symmetry Index for Coding and Non-Coding PartsFrom each complete sequence, the coding and noncoding
segments are spliced from a single strand of the chromosome and
the segments–coding and noncoding–are separately concatenated
in the order and orientation as they occur in the strand to form
two sequences, the coding and non-coding parts, respectively.
Symmetry indexes for the two parts are separately computed.
The Complete SequencesThe 786 complete sequences analyzed in this study, 356
eubacteria chromosomes, 28 archaea chromosomes, and 402
chromosomes from 28 eukaryotes, were downloaded in November
of 2006 from the National Center for Biotechnology Information
(NCBI) chromosome database [21], except the rice genome, which
was taken from the Rice Annotation Project Database (RAP-DB)
[22]. The set included all the non-redundant prokaryotic and
eukaryotic complete genomes in public databases at the time of the
download. Individual chromosomes range in length from 200 kb
to 230 Mb. The total length of the 786 sequences is 2:18|1010
bases. A list of the complete chromosomes is given in Table S1, SI .
Computing ProgramsAll computing programs used in generating the results reported
in this paper can be downloaded from the ISDB [23].
Results
The Inverse Symmetry Database (ISDB)Data, in the form of numerical lists and plots, on local and
global symmetries for 786 complete chromosomes are given in the
Inverse Symmetry Database (ISDB) [23]. Here we present a
Figure 1. A xi,l vs. segments length (l) plot. The 5.06 Mbchromosome of E. carotovora is partitioned into non-overlappingsegments of length l and the xi averaged over segments, or xi,l , isplotted against l. The last datum at full chromosome length gives theglobal value for xi , or xi,gl . The body of data (for each k) follows anapproximate power law (blue line). The value of xi,l at full length givenby the power law (averaged over k) is the background value for xi , orxi,bg . The symbols 4 and ?, indicate the values of xi,100 at the original(ori) and terminal (ter) sites of replication, respectively.doi:10.1371/journal.pone.0007553.g001
Inverse Symmetry in Genomes
PLoS ONE | www.plosone.org 3 November 2009 | Volume 4 | Issue 11 | e7553
summary; results for individual chromosomes are given for
illustrative purposes. Some Tables and Figures mentioned but
not shown in the text are given in Supporting Information (SI ).
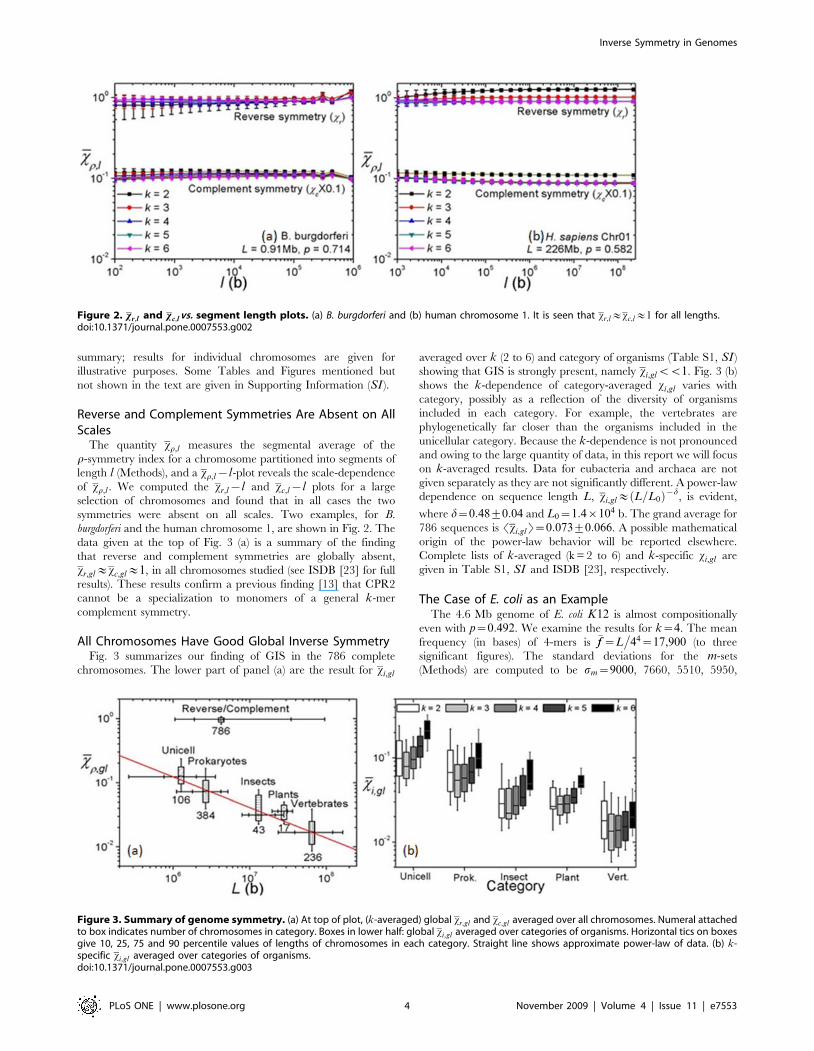
Reverse and Complement Symmetries Are Absent on AllScales
The quantity xr,l measures the segmental average of the
r-symmetry index for a chromosome partitioned into segments of
length l (Methods), and a xr,l{l-plot reveals the scale-dependence
of xr,l . We computed the xr,l{l and xc,l{l plots for a large
selection of chromosomes and found that in all cases the two
symmetries were absent on all scales. Two examples, for B.
burgdorferi and the human chromosome 1, are shown in Fig. 2. The
data given at the top of Fig. 3 (a) is a summary of the finding
that reverse and complement symmetries are globally absent,
xr,gl&xc,gl&1, in all chromosomes studied (see ISDB [23] for full
results). These results confirm a previous finding [13] that CPR2
cannot be a specialization to monomers of a general k-mer
complement symmetry.
All Chromosomes Have Good Global Inverse SymmetryFig. 3 summarizes our finding of GIS in the 786 complete
chromosomes. The lower part of panel (a) are the result for xi,gl
averaged over k (2 to 6) and category of organisms (Table S1, SI )
showing that GIS is strongly present, namely xi,glvv1. Fig. 3 (b)
shows the k-dependence of category-averaged xi,gl varies with
category, possibly as a reflection of the diversity of organisms
included in each category. For example, the vertebrates are
phylogenetically far closer than the organisms included in the
unicellular category. Because the k-dependence is not pronounced
and owing to the large quantity of data, in this report we will focus
on k-averaged results. Data for eubacteria and archaea are not
given separately as they are not significantly different. A power-law
dependence on sequence length L, xi,gl& L=L0ð Þ{d, is evident,
where d~0:48+0:04 and L0~1:4|104 b. The grand average for
786 sequences is Sxi,glT~0:073+0:066. A possible mathematical
origin of the power-law behavior will be reported elsewhere.
Complete lists of k-averaged (k = 2 to 6) and k-specific xi,gl are
given in Table S1, SI and ISDB [23], respectively.
The Case of E. coli as an ExampleThe 4.6 Mb genome of E. coli K12 is almost compositionally
even with p~0:492. We examine the results for k~4. The mean
frequency (in bases) of 4-mers is �ff ~L�
44~17,900 (to three
significant figures). The standard deviations for the m-sets
(Methods) are computed to be sm~9000, 7660, 5510, 5950,
Figure 2. xr,l and xc,l vs. segment length plots. (a) B. burgdorferi and (b) human chromosome 1. It is seen that xr,l&xc,l&1 for all lengths.doi:10.1371/journal.pone.0007553.g002
Figure 3. Summary of genome symmetry. (a) At top of plot, (k-averaged) global xr,gl and xc,gl averaged over all chromosomes. Numeral attachedto box indicates number of chromosomes in category. Boxes in lower half: global xi,gl averaged over categories of organisms. Horizontal tics on boxesgive 10, 25, 75 and 90 percentile values of lengths of chromosomes in each category. Straight line shows approximate power-law of data. (b) k-specific xi,gl averaged over categories of organisms.doi:10.1371/journal.pone.0007553.g003
Inverse Symmetry in Genomes
PLoS ONE | www.plosone.org 4 November 2009 | Volume 4 | Issue 11 | e7553
6050 for m~0 to 4, respectively. The weighted mean standard
deviation is �ss~P
m smLm
�L~6410, hence the average difference
between the frequencies of a typical pair of 4-mers (among the
32640 pairs) is Df ~ffiffiffi2p
�ss~9060. There are 120, 128, and 120
reverse-, complement-, and inverse-conjugate pairs of 4-mers.
The global symmetry indexes for the genome are computed to
be xr~0:977, xc~0:946, and xi~0:031. The average fre-
quency differences for a typical pair of reverse, complement, and
inverse-conjugate pairs of 4-mers are Dfr~8910, Dfc~8620, and
Dfi~280, respectively. We remark that xi is well approximated by
a mean-field estimation of SxiT~Dfi
��ss~0:031 (Methods). This
implies, for instance, that if the frequency of the 4-mer AAGC is
18000, then the frequencies of its reverse-conjugate (CGAA),
complement-conjugate (TTCG) and inverse-conjugate (GCTT)
would fall within the ranges 9000–27000, 9400–26400, and
17700–18300, respectively, with *0:95% confidence. Note that a
single inverse-conjugate pair having a frequency difference of the
order of Dfr is sufficient to cause Dfi to increase from 280 to 860
and raise xi from 0.031 to 0.095.
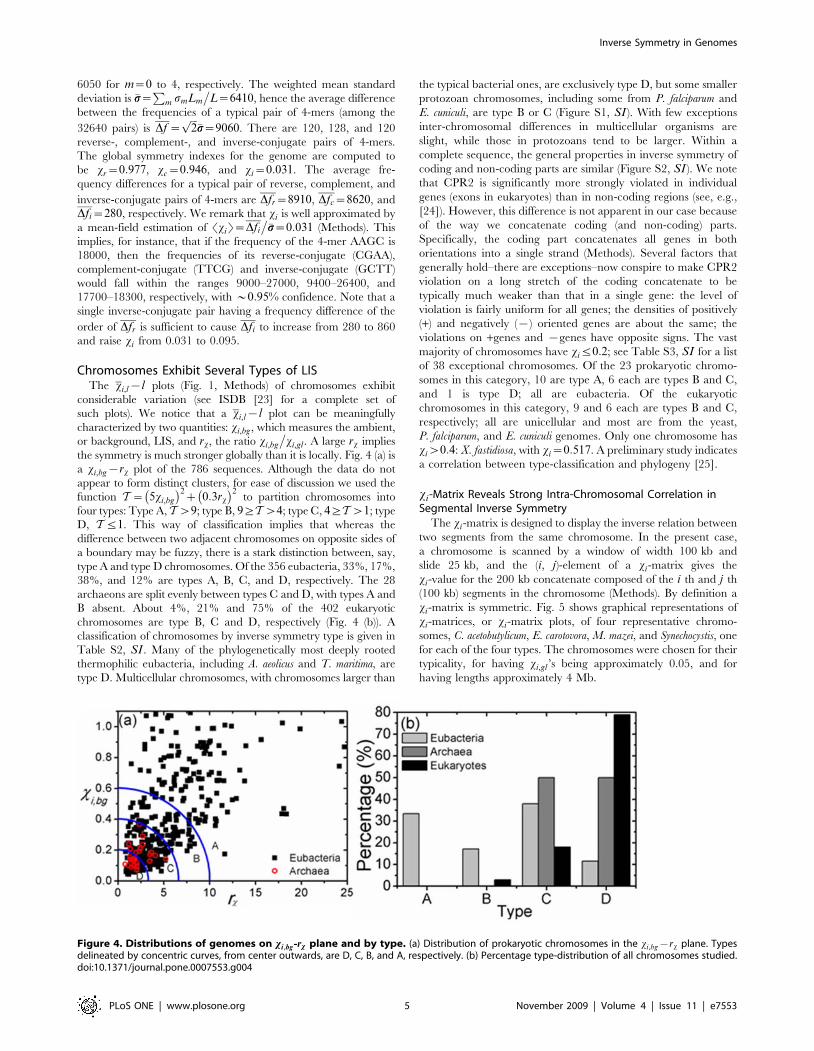
Chromosomes Exhibit Several Types of LISThe xi,l{l plots (Fig. 1, Methods) of chromosomes exhibit
considerable variation (see ISDB [23] for a complete set of
such plots). We notice that a xi,l{l plot can be meaningfully
characterized by two quantities: xi,bg, which measures the ambient,
or background, LIS, and rx, the ratio xi,bg
�xi,gl . A large rx implies
the symmetry is much stronger globally than it is locally. Fig. 4 (a) is
a xi,bg{rx plot of the 786 sequences. Although the data do not
appear to form distinct clusters, for ease of discussion we used the
function T~ 5xi,bg
� �2z 0:3rx
� �2to partition chromosomes into
four types: Type A, Tw9; type B, 9§Tw4; type C, 4§Tw1; type
D, Tƒ1. This way of classification implies that whereas the
difference between two adjacent chromosomes on opposite sides of
a boundary may be fuzzy, there is a stark distinction between, say,
type A and type D chromosomes. Of the 356 eubacteria, 33%, 17%,
38%, and 12% are types A, B, C, and D, respectively. The 28
archaeons are split evenly between types C and D, with types A and
B absent. About 4%, 21% and 75% of the 402 eukaryotic
chromosomes are type B, C and D, respectively (Fig. 4 (b)). A
classification of chromosomes by inverse symmetry type is given in
Table S2, SI . Many of the phylogenetically most deeply rooted
thermophilic eubacteria, including A. aeolicus and T. maritima, are
type D. Multicellular chromosomes, with chromosomes larger than
the typical bacterial ones, are exclusively type D, but some smaller
protozoan chromosomes, including some from P. falciparum and
E. cuniculi, are type B or C (Figure S1, SI ). With few exceptions
inter-chromosomal differences in multicellular organisms are
slight, while those in protozoans tend to be larger. Within a
complete sequence, the general properties in inverse symmetry of
coding and non-coding parts are similar (Figure S2, SI ). We note
that CPR2 is significantly more strongly violated in individual
genes (exons in eukaryotes) than in non-coding regions (see, e.g.,
[24]). However, this difference is not apparent in our case because
of the way we concatenate coding (and non-coding) parts.
Specifically, the coding part concatenates all genes in both
orientations into a single strand (Methods). Several factors that
generally hold–there are exceptions–now conspire to make CPR2
violation on a long stretch of the coding concatenate to be
typically much weaker than that in a single gene: the level of
violation is fairly uniform for all genes; the densities of positively
(+) and negatively ({) oriented genes are about the same; the
violations on +genes and {genes have opposite signs. The vast
majority of chromosomes have xiƒ0:2; see Table S3, SI for a list
of 38 exceptional chromosomes. Of the 23 prokaryotic chromo-
somes in this category, 10 are type A, 6 each are types B and C,
and 1 is type D; all are eubacteria. Of the eukaryotic
chromosomes in this category, 9 and 6 each are types B and C,
respectively; all are unicellular and most are from the yeast,
P. falciparum, and E. cuniculi genomes. Only one chromosome has
xiw0:4: X. fastidiosa, with xi~0:517. A preliminary study indicates
a correlation between type-classification and phylogeny [25].
xi-Matrix Reveals Strong Intra-Chromosomal Correlation inSegmental Inverse Symmetry
The xi-matrix is designed to display the inverse relation between
two segments from the same chromosome. In the present case,
a chromosome is scanned by a window of width 100 kb and
slide 25 kb, and the (i, j)-element of a xi-matrix gives the
xi-value for the 200 kb concatenate composed of the i th and j th
(100 kb) segments in the chromosome (Methods). By definition a
xi-matrix is symmetric. Fig. 5 shows graphical representations of
xi-matrices, or xi-matrix plots, of four representative chromo-
somes, C. acetobutylicum, E. carotovora, M. mazei, and Synechocystis, one
for each of the four types. The chromosomes were chosen for their
typicality, for having xi,gl ’s being approximately 0.05, and for
having lengths approximately 4 Mb.
Figure 4. Distributions of genomes on xi,bg-rx plane and by type. (a) Distribution of prokaryotic chromosomes in the xi,bg{rx plane. Typesdelineated by concentric curves, from center outwards, are D, C, B, and A, respectively. (b) Percentage type-distribution of all chromosomes studied.doi:10.1371/journal.pone.0007553.g004
Inverse Symmetry in Genomes
PLoS ONE | www.plosone.org 5 November 2009 | Volume 4 | Issue 11 | e7553
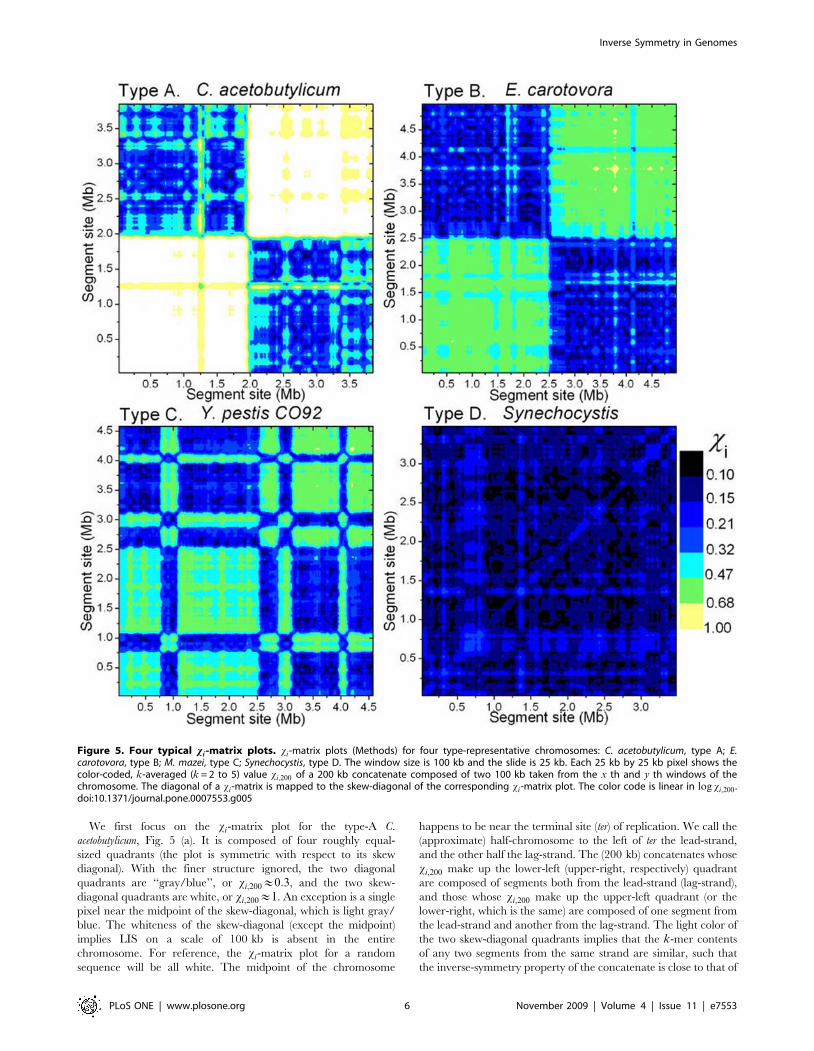
We first focus on the xi-matrix plot for the type-A C.
acetobutylicum, Fig. 5 (a). It is composed of four roughly equal-
sized quadrants (the plot is symmetric with respect to its skew
diagonal). With the finer structure ignored, the two diagonal
quadrants are ‘‘gray/blue’’, or xi,200&0:3, and the two skew-
diagonal quadrants are white, or xi,200&1. An exception is a single
pixel near the midpoint of the skew-diagonal, which is light gray/
blue. The whiteness of the skew-diagonal (except the midpoint)
implies LIS on a scale of 100 kb is absent in the entire
chromosome. For reference, the xi-matrix plot for a random
sequence will be all white. The midpoint of the chromosome
happens to be near the terminal site (ter) of replication. We call the
(approximate) half-chromosome to the left of ter the lead-strand,
and the other half the lag-strand. The (200 kb) concatenates whose
xi,200 make up the lower-left (upper-right, respectively) quadrant
are composed of segments both from the lead-strand (lag-strand),
and those whose xi,200 make up the upper-left quadrant (or the
lower-right, which is the same) are composed of one segment from
the lead-strand and another from the lag-strand. The light color of
the two skew-diagonal quadrants implies that the k-mer contents
of any two segments from the same strand are similar, such that
the inverse-symmetry property of the concatenate is close to that of
Figure 5. Four typical xi-matrix plots. xi-matrix plots (Methods) for four type-representative chromosomes: C. acetobutylicum, type A; E.carotovora, type B; M. mazei, type C; Synechocystis, type D. The window size is 100 kb and the slide is 25 kb. Each 25 kb by 25 kb pixel shows thecolor-coded, k-averaged (k = 2 to 5) value xi,200 of a 200 kb concatenate composed of two 100 kb taken from the x th and y th windows of thechromosome. The diagonal of a xi-matrix is mapped to the skew-diagonal of the corresponding xi-matrix plot. The color code is linear in log xi,200 .doi:10.1371/journal.pone.0007553.g005
Inverse Symmetry in Genomes
PLoS ONE | www.plosone.org 6 November 2009 | Volume 4 | Issue 11 | e7553
either of the component segments, which in this case have similar
low levels of symmetry. In contrast, and this is the most interesting
part of the plot, the dark color of the two diagonal quadrants
suggests that any two segments taken from different strands–one
each from the lead and lag strands–have a significant ‘‘inverse
relation’’, meaning that, as far as k-mer content is concerned, the
two segments are relatively close to being mutual inverse
conjugates. This being the case, the nature of the non-whiteness
of the single pixel near the middle of the skew-diagonal is also
understood: it indicates a (200 kb) concatenate that straddles the
ter site, so that one of its component segments is (mostly) from the
lead-strand, and the other from the lag-strand. We can now
interpret the entire pattern of the type-A xi-matrix plot as follows:
the chromosome is bisected by the ter site into two almost equal
strands (in some cases the bisection occurs at the origin site (ori)
and in some cases the partition is not so nearly equal), each of
which is without inverse symmetry, but k-mer-wise the two are
nearly mutual inverse conjugates. However, it cannot be said that
the two strands are simply mutual mirror inverse copies. For if that
were the case, then the two diagonal quadrants would be mostly
white save for a black, narrow diagonal ridge several pixels wide.
In the type-A xi-matrix plot shown in Fig. 5, which is that of C.
acetobutylicum, the neat four-quadrant appearance reflects the fact
that the ori site is close to the origin of the genome. In some type-A
chromosomes neither the ori nor the ter site is close to the origin,
and this causes their xi-matrix plots to look superficially more
complicated (see below).
The xi-matrix plot for the type-B chromosome is similar to a
type-A plot, except that all four quadrants are a shade darker than
their counterparts in the type-A plot, caused by the chromosome
having a higher (and nearly) homogeneous ambient inverse
symmetry with xi,200&0:5. The type-D plot is qualitatively
different from the two just discussed. It does not have a quadrant
structure and therefore exhibits no hint of bisection of the
chromosome. Rather, not counting finer structures, it shows xi,200
to be 0.2 or less everywhere, implying that the inverse relation
between any two segments is strong. The type-C chromosome has
a structure intermediate between types B and D. The example
shown in Fig. 5 is broadly composed of two sections: a type-B-like
section from 0 to 2.7 Mb and a type-D-like section from 2.7 to
4 Mb. In this context, the 0.9 to 3.8 Mb segment of the type-D
Synechocystis appears to be a ‘‘super-type D’’ embedded within the
chromosome. Fig. 5 (a–c) show that some segments within a
chromosome, some as long as 1 Mb, have LIS significantly distinct
from that of the rest of the chromosome. Such segments suggest
alien origins, possibly the result of lateral gene transfers [26].
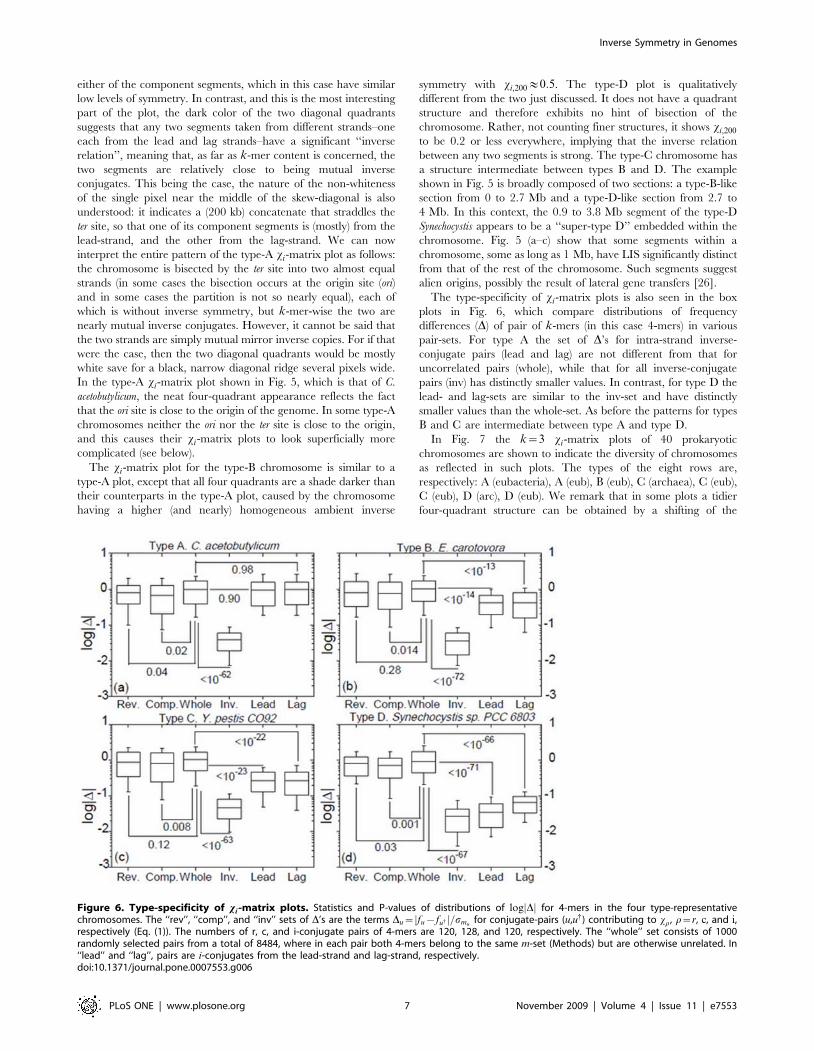
The type-specificity of xi-matrix plots is also seen in the box
plots in Fig. 6, which compare distributions of frequency
differences (D) of pair of k-mers (in this case 4-mers) in various
pair-sets. For type A the set of D’s for intra-strand inverse-
conjugate pairs (lead and lag) are not different from that for
uncorrelated pairs (whole), while that for all inverse-conjugate
pairs (inv) has distinctly smaller values. In contrast, for type D the
lead- and lag-sets are similar to the inv-set and have distinctly
smaller values than the whole-set. As before the patterns for types
B and C are intermediate between type A and type D.
In Fig. 7 the k~3 xi-matrix plots of 40 prokaryotic
chromosomes are shown to indicate the diversity of chromosomes
as reflected in such plots. The types of the eight rows are,
respectively: A (eubacteria), A (eub), B (eub), C (archaea), C (eub),
C (eub), D (arc), D (eub). We remark that in some plots a tidier
four-quadrant structure can be obtained by a shifting of the
Figure 6. Type-specificity of xi-matrix plots. Statistics and P-values of distributions of log Dj j for 4-mers in the four type-representativechromosomes. The ‘‘rev’’, ‘‘comp’’, and ‘‘inv’’ sets of D’s are the terms Du~ fu{fu{j j=smu
for conjugate-pairs (u,u{) contributing to xr, r~r, c, and i,respectively (Eq. (1)). The numbers of r, c, and i-conjugate pairs of 4-mers are 120, 128, and 120, respectively. The ‘‘whole’’ set consists of 1000randomly selected pairs from a total of 8484, where in each pair both 4-mers belong to the same m-set (Methods) but are otherwise unrelated. In‘‘lead’’ and ‘‘lag’’, pairs are i-conjugates from the lead-strand and lag-strand, respectively.doi:10.1371/journal.pone.0007553.g006
Inverse Symmetry in Genomes
PLoS ONE | www.plosone.org 7 November 2009 | Volume 4 | Issue 11 | e7553
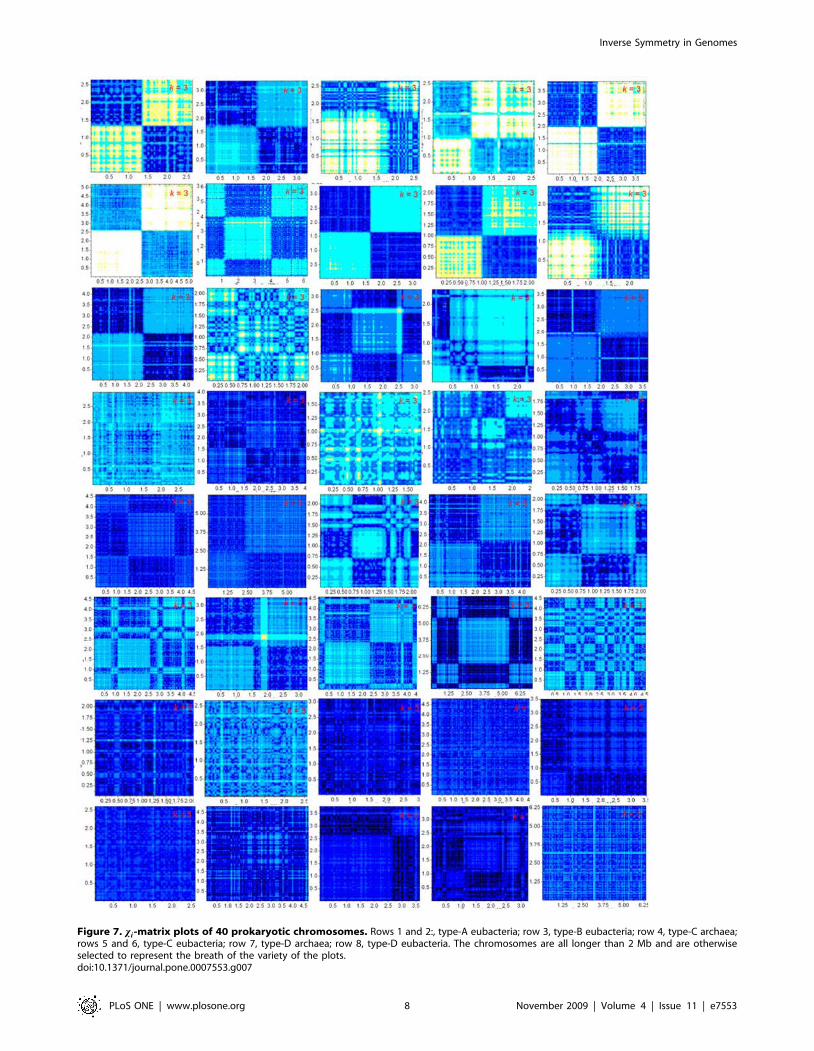
Figure 7. xi-matrix plots of 40 prokaryotic chromosomes. Rows 1 and 2:, type-A eubacteria; row 3, type-B eubacteria; row 4, type-C archaea;rows 5 and 6, type-C eubacteria; row 7, type-D archaea; row 8, type-D eubacteria. The chromosomes are all longer than 2 Mb and are otherwiseselected to represent the breath of the variety of the plots.doi:10.1371/journal.pone.0007553.g007
Inverse Symmetry in Genomes
PLoS ONE | www.plosone.org 8 November 2009 | Volume 4 | Issue 11 | e7553
coordinates of the origin. The general trend of type-dependence of
the plots is such that, going from A to D, the largest structure
decreases in size, and the lightest color gets darker, or equivalently,
the ambient level of inverse symmetry rises. All plots are rich in
fine structure and invite a deeper level of analysis than presented
here. The k-specific xi-matrix plots of all 384 prokaryotic
chromosomes are given in ISDB [23]. xi-matrix plots of eukaryotic
chromosomes, which generally take longer to compute, will be
added to the database at a later date.
Four-Quadrant Structure of xi-Matrix Plot Is DirectlyRelated to Discontinuity in xi,l -l Plot
Some characteristics of chromosomes that cause each to have a
distinct xi-matrix plot are evident in their xi,l{l plot. The (a)
panels in Fig. 8 illustrate the four type-distinct xi,l{l-plots. These
plots have two prominent features: (i) From l§2 kb onward,
except the data near full length, xi,l and l have an approximate
power-law relation, with the power-law exponent increasing from
type A (in which case it is almost zero) to type D; (ii) xi,l tends
to show a discontinuity when l is near full length, with the
discontinuity increasing from type D (not apparent) to type A. The
magnitude of the continuity is given by rx (Methods), with rx~1indicating no discontinuity. For a type-A chromosome, the large
value of rx (*20) is directly related to four-quadrant structure of
its xi-matrix plot (Fig. 5 (a)). For l less than half the full sequence
length L, xi,l gives the (averaged) values of xi for segments that are
entirely either in the lead-strand or in the lag-strand of the
chromosome. Since in these halves inverse symmetry is essentially
absent, xi,l*1. That xi,l decreases from about 1 at l L=2 to
about 0.05 at l~L implies the k-mers in the lead- and lag-strands
have a strong inverse-conjugate relation.
We now analyze in detail the plots in Fig. 8 (a) near l equals to
full length L where the discontinuity of data occurs. Let u be a
typical k-mer (say, AACGC, in the case of k~5) in an m-set (for
the present example it is the m~2 set), and u{ (GCGTT) be its
inverse-conjugate. Consider the two halves of the chromosome,
the lead-strand and the lag-strand, and let fu and fu{ (f ’u and f ’u{ ,resp.) be the frequencies of u and u{ from the lead-strand (lag-
strand). Then the data near l*L=2 in panels (a) of Fig. 8 imply
that on average (Methods)
fu{fu{j j& f ’u{f ’u{j j&xi,bg
ffiffiffi2p
smu, ð6Þ
whereffiffiffi2p
smuis the average fluctuation of the frequencies of all k-
mers in the m-set (the subscript u in mu indicates the m-set to
which the pair u and u{ belongs). The value of xi,bg ranges from
*1 for type A, implying that LIS is absent in both the lead- and
lag-strands of the chromosome, to being in the range of 0.2 to 0.5
for types B and C, implying LIS is moderate, to *0:05 for type D,
implying LIS being strongly present in both halves. The data at
the end points giving the discontinuity may be written as
fu{fu{~{ f ’u{f ’u{ð ÞzO xi,glsmu
� �: ð7Þ
The last term is expressed as a remainder because, regardless of
type, the global xi,gl is typically small, of the order of 0.05.
Significantly, the negative sign attached to the right-hand-side
characterizes a ‘‘mutual inverse relation’’ between the lead- and
lag-strands. To summarize, a strong LIS is absent in type A but
present in type D everywhere, and the strong GIS in type A is an
expression of a lead-lag mutual inverse relation while in type D it
may be an extension of LIS.
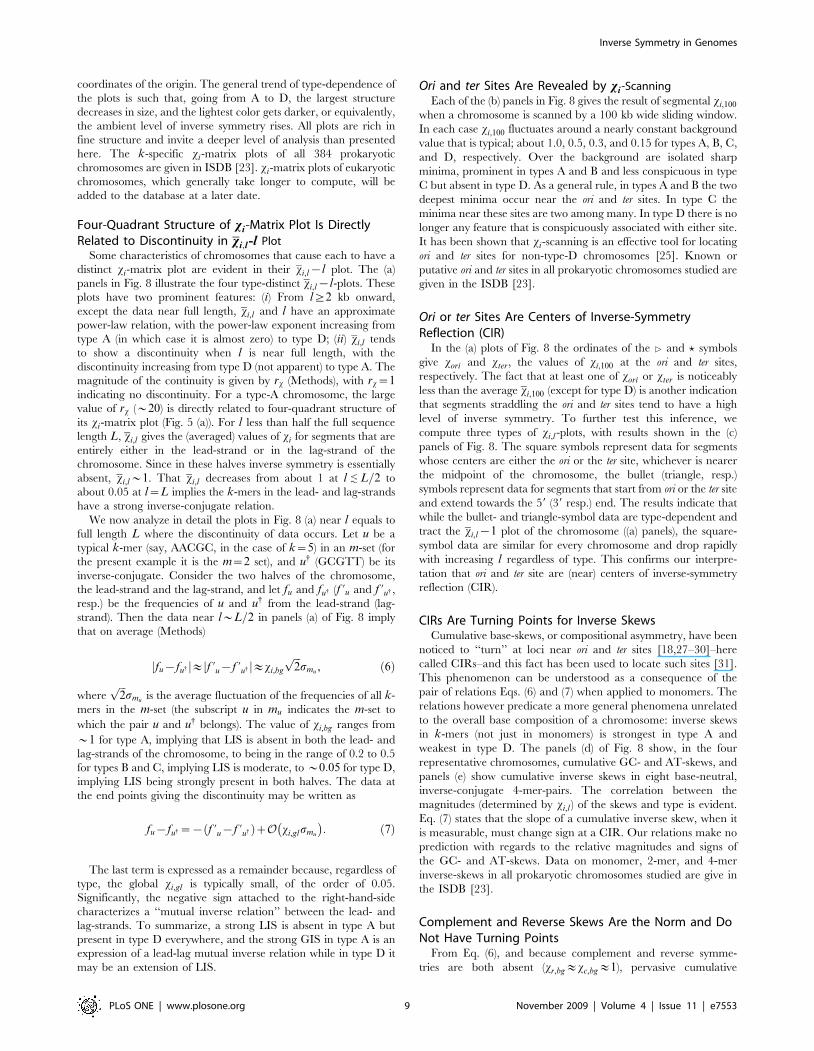
Ori and ter Sites Are Revealed by xi -ScanningEach of the (b) panels in Fig. 8 gives the result of segmental xi,100
when a chromosome is scanned by a 100 kb wide sliding window.
In each case xi,100 fluctuates around a nearly constant background
value that is typical; about 1.0, 0.5, 0.3, and 0.15 for types A, B, C,
and D, respectively. Over the background are isolated sharp
minima, prominent in types A and B and less conspicuous in type
C but absent in type D. As a general rule, in types A and B the two
deepest minima occur near the ori and ter sites. In type C the
minima near these sites are two among many. In type D there is no
longer any feature that is conspicuously associated with either site.
It has been shown that xi-scanning is an effective tool for locating
ori and ter sites for non-type-D chromosomes [25]. Known or
putative ori and ter sites in all prokaryotic chromosomes studied are
given in the ISDB [23].
Ori or ter Sites Are Centers of Inverse-SymmetryReflection (CIR)
In the (a) plots of Fig. 8 the ordinates of the 4 and ? symbols
give xori and xter, the values of xi,100 at the ori and ter sites,
respectively. The fact that at least one of xori or xter is noticeably
less than the average xi,100 (except for type D) is another indication
that segments straddling the ori and ter sites tend to have a high
level of inverse symmetry. To further test this inference, we
compute three types of xi,l-plots, with results shown in the (c)
panels of Fig. 8. The square symbols represent data for segments
whose centers are either the ori or the ter site, whichever is nearer
the midpoint of the chromosome, the bullet (triangle, resp.)
symbols represent data for segments that start from ori or the ter site
and extend towards the 59 (39 resp.) end. The results indicate that
while the bullet- and triangle-symbol data are type-dependent and
tract the xi,l{1 plot of the chromosome ((a) panels), the square-
symbol data are similar for every chromosome and drop rapidly
with increasing l regardless of type. This confirms our interpre-
tation that ori and ter site are (near) centers of inverse-symmetry
reflection (CIR).
CIRs Are Turning Points for Inverse SkewsCumulative base-skews, or compositional asymmetry, have been
noticed to ‘‘turn’’ at loci near ori and ter sites [18,27–30]–here
called CIRs–and this fact has been used to locate such sites [31].
This phenomenon can be understood as a consequence of the
pair of relations Eqs. (6) and (7) when applied to monomers. The
relations however predicate a more general phenomena unrelated
to the overall base composition of a chromosome: inverse skews
in k-mers (not just in monomers) is strongest in type A and
weakest in type D. The panels (d) of Fig. 8 show, in the four
representative chromosomes, cumulative GC- and AT-skews, and
panels (e) show cumulative inverse skews in eight base-neutral,
inverse-conjugate 4-mer-pairs. The correlation between the
magnitudes (determined by xi,l ) of the skews and type is evident.
Eq. (7) states that the slope of a cumulative inverse skew, when it
is measurable, must change sign at a CIR. Our relations make no
prediction with regards to the relative magnitudes and signs of
the GC- and AT-skews. Data on monomer, 2-mer, and 4-mer
inverse-skews in all prokaryotic chromosomes studied are give in
the ISDB [23].
Complement and Reverse Skews Are the Norm and DoNot Have Turning Points
From Eq. (6), and because complement and reverse symme-
tries are both absent (xr,bg&xc,bg&1), pervasive cumulative
Inverse Symmetry in Genomes
PLoS ONE | www.plosone.org 9 November 2009 | Volume 4 | Issue 11 | e7553
complement and reverse skews in k-mers without turning points are
expected in all chromosomes. We have verified this to be true in
general. As examples, panels (f) in Fig. 8 show cumulative reverse
skews in eight base-neutral, complement-conjugate 4-mer-pairs in
the four representative chromosomes (see Figure S3, SI for more
examples).
Figure 8. Some xi,l characteristics and cumulative k-mer-skews in the four types. The four column of panels are, left to right, for C.acetobutylicum, type A, E. carotovora, type B, M. mazei, type C, and Synechocystis, type D. In each column: (a) Mean segmental xi,l vs. segment length l;see also caption of Fig. 1 (Methods). (b) Fixed segment-length xi,100 along a chromosome; data obtained by a sliding window of size 100 kb and slide5 kb. (c) xi,l{l: (%) l measured with ter (or ori, whichever is near mid-chromosome) as center; (N) l measured from ter towards 59 end; (D) l measuredfrom ter towards 39 end. Chromosome is treated as being circular. (d) Cumulative GC- and AT-skews. (e) Cumulative inverse skews in eight base-neutral, inverse-conjugate pairs of 4-mers; e.g., ACTG denotes the ACTG-CAGT pair. (f) Cumulative complement skews in eight base-neutral,complement-conjugate pairs of 4-mers; e.g., ACTG denotes the ACTG-TGAC pair.doi:10.1371/journal.pone.0007553.g008
Inverse Symmetry in Genomes
PLoS ONE | www.plosone.org 10 November 2009 | Volume 4 | Issue 11 | e7553
Discussion
A Quantitative Description of the Three Prototypes ofCumulative k-mer-Skews
The relation between base-skew [18,27–33] and complement/
inverse symmetry has been noted previously [13–16,34]. Rocha
et al. [35] made a comprehensive review of the pro and con of
eight hypotheses, including the most often evoked cytosine
deamination, genome rearrangements, recombination signals,
put forward to explain compositional skews. They concluded that
whereas all the (eight) hypotheses have the potential to explain
part of available data, none is entirely satisfactory, and that the
simplest explanation is that the bias is multifactorial.
Our study shows that cumulative skews in k-mers, including
monomer, have three prototypes: up-and-up (row (f), Fig. 8; Figure
S3, SI ), up-and-down (or down-and-up) (rows (d) and (e), type-A
and -B columns, Fig. 8), and flat (rows (d) and (e), type-D column,
Fig. 8). The classification is dictated by Eqs. (6) and (7) and the
values of xr,bg and xr,gl : up-and-up if xr,bg&xr,gl&1; up-and-down
if xr,gl%xr,bg 1; flat if xr,gl&xr,bg%1. Thus, the cumulative skew
between an inverse-conjugate pair of k-mers (including monomers)
will be up-and-down in type-A or -B chromosomes (mildly so for
type-C), flat in type-D chromosomes, and never up-and-up in any
chromosome. In contrast, the cumulative skew between a reverse-
conjugate or complement-conjugate pair of k-mers, or any pair of
k-mers that are not inverse-conjugate (unless the pair are related by
a hidden, not yet discovered symmetry), will be up-and-up in any
chromosome. In other words, up-and-up manifests no symmetry,
up-and-down manifests strong global symmetry but weak or no
local symmetry, and flat manifests strong local (and consequentially
global) symmetry. To sum: cumulative skew of the up-and-up type is
the norm, to be expected between a randomly selected pair, and the
other two types are special, occurring only between inverse-
conjugate pairs.
In the up-and-up and up-and-down types, the approximate
constant of the slope of the cumulative skew is a reflection of the
typical approximate uniformity of k-mer-content on a scale greater
than 25 kb in most chromosomes [36,37]. Eq. (6) shows the key to
the magnitude of the slope is sm. It has been pointed out that sm
has an approximate k- and m-dependent universal (for all
genomes) value:ffiffiffi2p
sm&ffiffiffi2p
�ss&0:20L 3:2ð Þ{k(to within a factor
of two) [19] (Strictly, �ss&max 0:14L 3:2ð Þ{k�
, 2kL{1=2), so the
maximum k for which the first expression applies is 10 and 14 for
2 Mb and 200 Mb chromosomes, respectively). This means that,
typically, the full values (when xr,bg~1) for skews are about
6:3|104 b per Mb for monomers, 2:0|104 b per Mb for 2-mers,
and about 1:9|103 b per Mb for 4-mers. These estimates,
together with the computed xr,bg and xr,gl , give a reasonable
quantitative account of the k-mer-skews we observe, including
data shown in Fig. 8 (d–e) and in Figure S3, SI . An in-depth
quantitative study of this subject will be reported elsewhere.
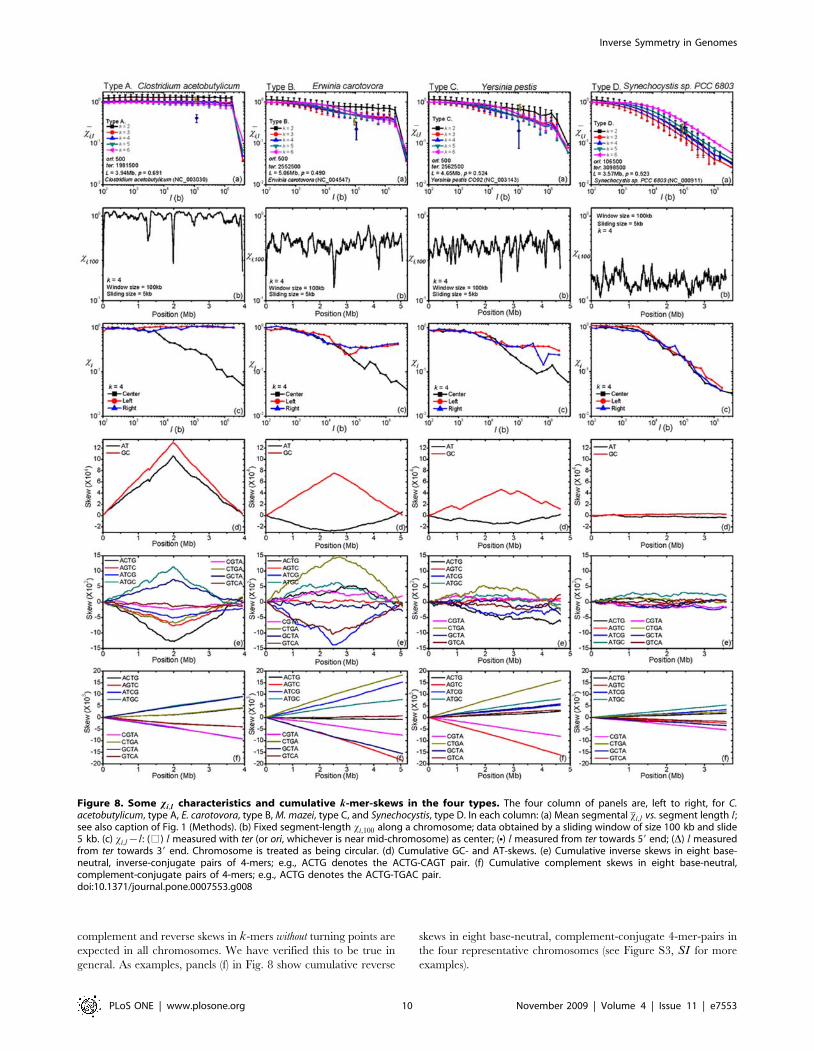
Inverse Duplication Generates Inverse SymmetrySegmental duplication is known to be a driving force in
chromosome growth and evolution [38–43], and inverse segmen-
tal duplication (ISD), or segmental duplication from one strand of
the DNA to the other strand (Fig. 9), is also known to have
occurred in chromosome evolution [44–46]. ‘‘Countless inversions
and inverted transporsitions,’’ which are types of ISD events, were
invoked to explain patterns of violation of CPR2 in 3-mers
[47,48]. Instead of being mass produced by ISD, inverse-conjugate
pairs may also be generated in a deliberate base-by-base process in
the form of stem-loop extrusions (SLEs) from duplex DNA [12], to
be discussed at length in a later section. We know of no
mechanism analogous to ISD that can stochastically generate
either reverse or complement symmetry on a large scale, and this
may explain why these two symmetries are not prominent in
chromosomes.
Figure 9. A schematic inverse segmental duplication event. In an inverse segmental duplication, a segment is copied, inverted, and reinsertedinto the host sequence. In such an event, because the inverse conjugates of all k-mers appearing in the copied segment is added to the sequence viathe inverse duplicate, such a duplication event enhances global inverse symmetry (GIS).doi:10.1371/journal.pone.0007553.g009
Inverse Symmetry in Genomes
PLoS ONE | www.plosone.org 11 November 2009 | Volume 4 | Issue 11 | e7553
The fraction of a sequence that causes it to manifest inverse-
inverse symmetry is estimated in mean-field approximation
to be 2dvinv& 1{2v0ð Þ 1{SxiTð Þ (Eq. (5), Methods), where
1{2v0ð Þ~�ss� ffiffiffi
2p
�ff is the fraction of unrelated k-mers that are
paired-up and SxiT is the mean-field approximation of xi.
For sequences with strong inverse symmetry (xi&0:05),
2dvinv& 1{2v0ð Þ 1{SxiTð Þ. Using the universal value for �ss given
above and noting that �ff ~L�
4k we have 2dvinv&0:10 1:26ð Þk (for
kƒ10), which for k~2 to 6 yield
2dvinv~0:25+0:15: ð8Þ
This suggests that inverse-symmetry generating mechanisms
played a major role in chromosome composition.
Codon Usage and Inverse SymmetryWe analyze possible effects of codon usage on inverse symmetry.
The 3-mer and codon frequencies from a DNA sequence differ in
two aspects. First, codons are counted in the natural orientations of
the genes, while 3-mers are counted along the gene concatenate in
one direction (Methods). For example, the codon Trp, or UGG,
encoded in a negatively oriented gene (or in a gene in the negative
strand) adds one count to the frequency of codon Trp, but one
count to that of the 3-mer CCT, not AGG. Second, codons are
read only from protein-coding genes and are frame defined, while
3-mers are read over the entire sequence–non-coding as well as
coding parts–using a sliding window of slide one. Therefore, the
summed frequency of the codons (Lcodon) is one-third the summed
length of protein-coding genes, and that of 3-mers (L3mer) is the
length of the DNA sequence (minus 2). In prokaryotes, where the
coding region is typically about 88% of the chromosome, the ratio
Lcodon=L3mer 1=3, so the likelihood that codon usage could
determine the inverse symmetry of the entire chromosome is
already small. In increasingly advanced eukaryotes the ratio
becomes progressively much less than 1/3–in human it is about
0.01, and the likelihood decreases accordingly. Table 2 uses the
coding region (gene concatenate) in the four type-representative
chromosomes to illustrates the difference between inverse
symmetries in codons and 3-mers. Over the entire gene
concatenate 3-mers have excellent symmetry even as codons have
no or very poor symmetry. This can be the manifest of ‘‘genic
inverse symmetry’’, meaning that the two sets of positively and
negatively oriented genes are broadly homologous. Genic inverse
symmetry ensures k-mer inverse symmetry in the coding region,
independent of codon usage. The ‘‘lead’’ and ‘‘lag’’ results in
Table 2 show that, just as for k-mers, genic inverse symmetry may
also be global (type A), or local (type D), or shades in between.
Even good genic inverse symmetry is insufficient to explain the k-
mer inverse symmetry we observe, because the latter is of the
entire chromosome, which includes both coding and non-coding
regions. Therefore, genic inverse symmetry cannot be the cause
genomic inverse symmetry. Rather, it is a consequence of
whatever that causes genomes to have inverse symmetry.
Type A Suggests Chromosome-Size Inverse Duplicationand the prox Hypothesis
To simplify discussion we define the following: a prox duplication
is one such that the site of insertion of the duplicated segment is
proximal (relative to chromosome-scale) to the site of duplication;
a dist duplication, necessarily trans-CIR, is one such that the site of
insertion is distal to the site of the duplication (Fig. 10). A prox-ISD
tends to enhance LIS–near the location of the ISD event–as well as
GIS, whereas a dist-ISD can enhance only GIS. The most
parsimonious explanation for the fact that a type-A chromosome
has strong GIS while both of its two approximately equal sized
halves–the lead and lag strands–are without inverse symmetry is
that it is the result of a whole-genome/chromosome ISD (WGID)
on a chromosome that had no inverse symmetry before the event.
Following a WGID event, an originally symmetry-free chromo-
some will have perfect GIS, with xi,bg~1 but xi,gl~0, which
defines an extreme type-A chromosome. The xi-matrix plot of a
chromosome immediately after an WGID event will not look
exactly like Fig. 5 (a), however. Its skew-diagonal quadrants will be
mostly white, just like in Fig. 5 (a). The two dark diagonal
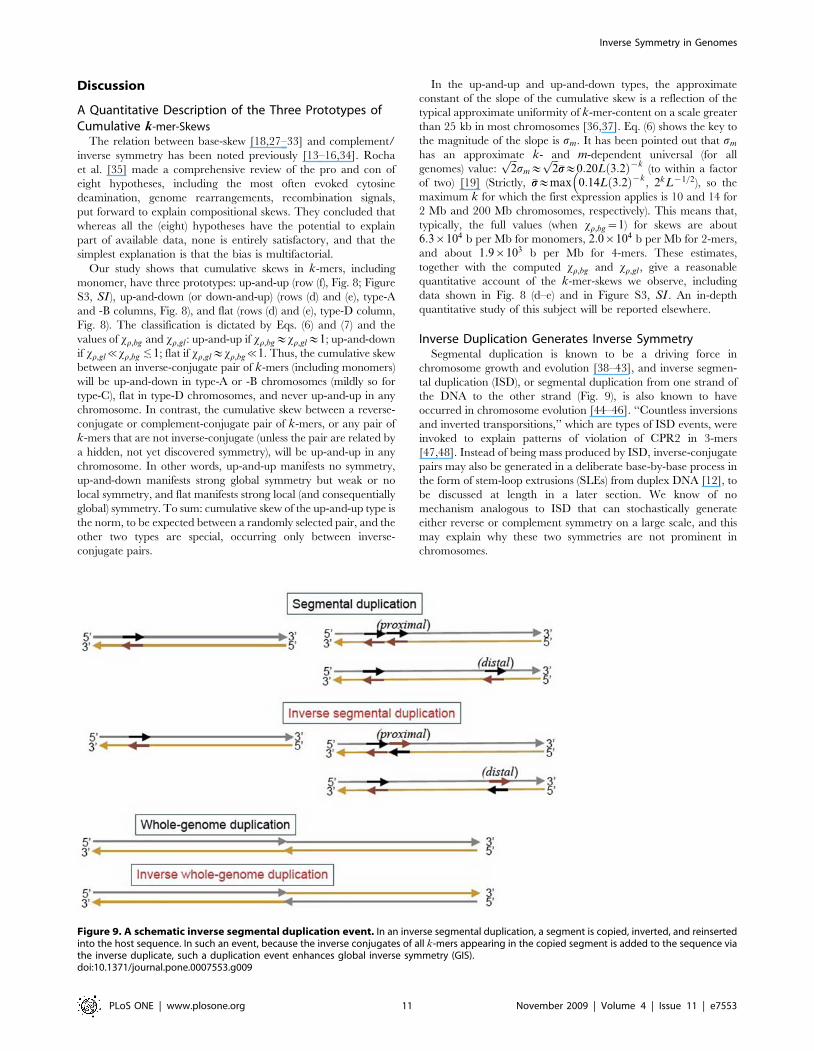
Table 2. Inverse symmetry indexes for codons and 3-mers.
Type Genes Lc Mbð Þ Lc=L ori ter xcod=x3mer Wð Þ xcod=x3mer Ldð Þ xcod=x3mer Lgð Þ
A 3882 3.42 0.87 500 1981500 1.112/0.032 1.112/1.043 1.112/1.040
B 4501 4.35 0.89 500 2552500 0.657/0.055 0.650/0.412 0.665/0.438
C 4205 3.90 0.84 500 2562500 0.735/0.055 0.734/0.306 0.737/0.307
D 3462 3.13 0.88 106500 3098500 1.019/0.028 0.813/0.037 1.021/0.074
Inverse symmetry indexes computed from counting codons in genes (xcod ) and from counting 3-mers in gene-concatenates (x3mer) for four type-representativechromosomes. The four typical bacterial genomes are: A, C. acetobutylicum; B, E. carotovora; C, Y. pestis: and D, Synechocystis. Given a segment - Whole, Lead or Lag - thenumber of codons is counted in all gene-embedding sequences in the segment, and the number of 3-mers is counted in the gene-concatenate formed by stitchingtogether all gene-embedding sequences (Methods). In the last three columns listing xcod=x3mer , ‘‘W’’ means gene-embedding sequences are spliced from the entirechromosome, ‘‘Ld’’, from the ori to ter strand, and ‘‘Lg’’, from the ter to ori strand. Codons do not exhibit inverse symmetry ((xcod*1)) in all cases. 3-mers exhibit stronginverse symmetry ((xcod%1)) in ‘‘W’’ always, and in ‘‘Ld’’ and ‘‘Lg’’ according to type.doi:10.1371/journal.pone.0007553.t002
Figure 10. Modes of segmental duplication. Proximal and distalmodes of segmental duplications (top) and direct and inverse whole-genome duplications (bottom).doi:10.1371/journal.pone.0007553.g010
Inverse Symmetry in Genomes
PLoS ONE | www.plosone.org 12 November 2009 | Volume 4 | Issue 11 | e7553
quadrants seen in panel (a) will be replaced by quadrants of a
much lighter shade (but not white, owing to the fact that the word-
content of a chromosome has a fair degree of homogeneity), with a
black, narrow diagonal strip running through it. The actual type-A
patterns seen in Figs. 4 and 5 could be the consequence of (i) very
few of either prox-ISD or dist-DSDs (direct segmental duplications)
but (ii) many prox-DSDs occurring after the WGID. If we assume
that a WGID is the major event giving rise to the pattern of inverse
symmetry in type-A chromosomes, then (i) and (ii) above may be
viewed as constraints that need to be satisfied. Since it is known
that DSD is a major driving force in genome growth [38–43],
satisfaction of constraint (ii) and the second half of constraint (i)
follows if we hypothesize that as a general rule SDs are mostly prox.
We call this the ‘‘ prox hypothesis’’. (This hypothesis is consistent
with an unrelated requirement, put forward for understanding the
general existence of long-range correlation in genomes, that at
least a significant portion of DSDs are made in tandem [20].) The
prox hypothesis drastically simplifies the narrative for a type-A
chromosome: a chromosome suffers a WGID, after which very few
prox-ISD occurred. If a WGID event did occur then we should find
homologs between the two arms of the chromosome. Our
preliminary study using sequence alignment indicates that the
pattern of homologs is consistent with the hypothesis that a WGID
occurred in a type-A chromosome (C. acetobutylicum) and not in a
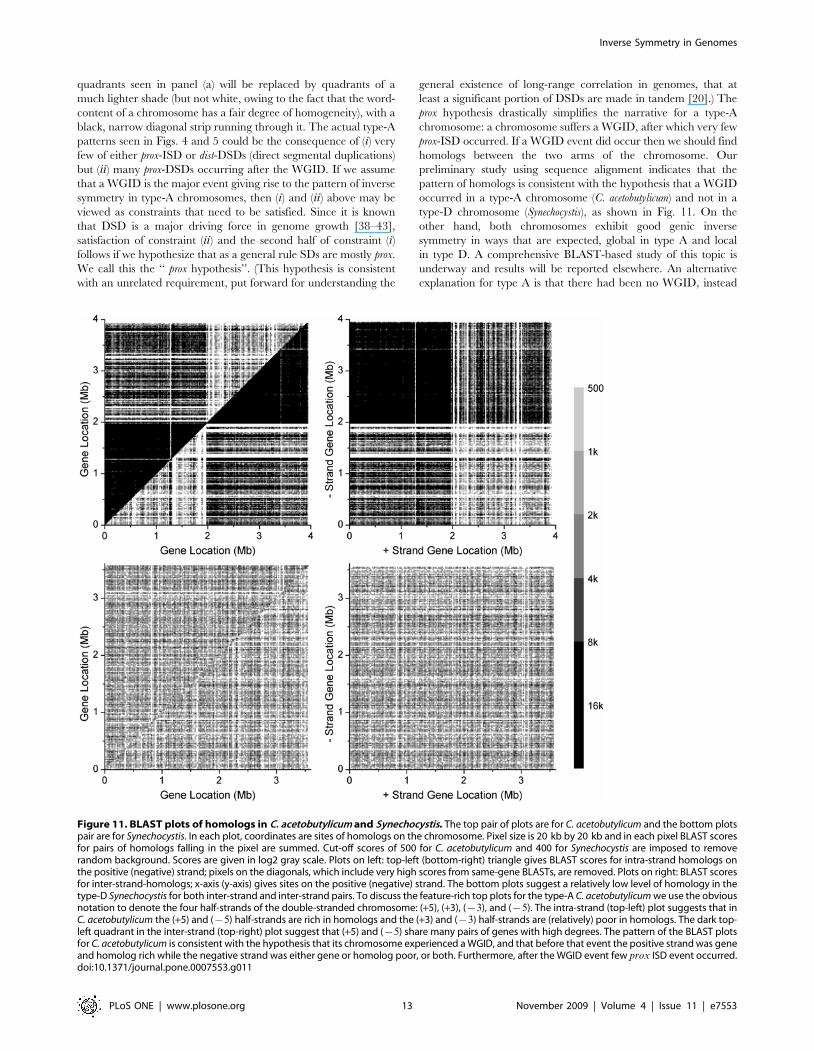
type-D chromosome (Synechocystis), as shown in Fig. 11. On the
other hand, both chromosomes exhibit good genic inverse
symmetry in ways that are expected, global in type A and local
in type D. A comprehensive BLAST-based study of this topic is
underway and results will be reported elsewhere. An alternative
explanation for type A is that there had been no WGID, instead
Figure 11. BLAST plots of homologs in C. acetobutylicum and Synechocystis. The top pair of plots are for C. acetobutylicum and the bottom plotspair are for Synechocystis. In each plot, coordinates are sites of homologs on the chromosome. Pixel size is 20 kb by 20 kb and in each pixel BLAST scoresfor pairs of homologs falling in the pixel are summed. Cut-off scores of 500 for C. acetobutylicum and 400 for Synechocystis are imposed to removerandom background. Scores are given in log2 gray scale. Plots on left: top-left (bottom-right) triangle gives BLAST scores for intra-strand homologs onthe positive (negative) strand; pixels on the diagonals, which include very high scores from same-gene BLASTs, are removed. Plots on right: BLAST scoresfor inter-strand-homologs; x-axis (y-axis) gives sites on the positive (negative) strand. The bottom plots suggest a relatively low level of homology in thetype-D Synechocystis for both inter-strand and inter-strand pairs. To discuss the feature-rich top plots for the type-A C. acetobutylicum we use the obviousnotation to denote the four half-strands of the double-stranded chromosome: (+5), (+3), ({3), and ({5). The intra-strand (top-left) plot suggests that inC. acetobutylicum the (+5) and ({5) half-strands are rich in homologs and the (+3) and ({3) half-strands are (relatively) poor in homologs. The dark top-left quadrant in the inter-strand (top-right) plot suggest that (+5) and ({5) share many pairs of genes with high degrees. The pattern of the BLAST plotsfor C. acetobutylicum is consistent with the hypothesis that its chromosome experienced a WGID, and that before that event the positive strand was geneand homolog rich while the negative strand was either gene or homolog poor, or both. Furthermore, after the WGID event few prox ISD event occurred.doi:10.1371/journal.pone.0007553.g011
Inverse Symmetry in Genomes
PLoS ONE | www.plosone.org 13 November 2009 | Volume 4 | Issue 11 | e7553
the high degree of inverse symmetry was the result of many dist-
ISDs, such that the cumulative length of inversely copied segments
was close to (dvinv*) 13% of the full chromosome length (Eq. (8)).
For this explanation to work constraint (i) is still needed. This
alternative explanation seems highly unnatural since it implies
there were simultaneously many dist-ISDs and very few prox-ISDs.
Whole-genome duplication (WGD) was first proposed by Ohno
as an important mechanism for genome evolution [49]. Recently it
has been firmly established that such events did occur in yeast [50–
52], ray-finned fishes [53], and freshwater puffer fish [54]. The
possibility of WGID was previously discussed in connection with
base-skews in B. burgdorferi [16,34].
Type D Suggests Many prox-ISD EventsIn a type-D chromosome, the existence of inverse symmetry on
all scales (greater than 5 kb) including local genic inverse
symmetry (Fig. 11) and the homogeneity of xi across the entire
chromosome (type-D patterns in in Figs. 4, 5, and 6) can best be
explained as the result of many small, and mostly prox, ISD events;
necessarily prox because otherwise LIS on a small scale would not
be generated. This explanation is consistent with the prox
hypothesis. Our results suggest that the upper bound of the
distance between copying and insertion sites in a prox-ISD should
be considerably less than 100 kb. In spite of the absence of distinct
CIRs in type-D chromosomes (type D in Fig. 8 (b,c)), we may not
rule out the possibility that early WGIDs did occur in such
chromosomes, because much of the trace of an early WGID,
assuming that it had occurred, would have been obliterated by the
large number of small ISDs that came afterwards.
Possible Role of SLE in Local Inverse SymmetryExtrusion of a stem-loop (SLE) from duplex DNA [12] can
enhance local inverse symmetry in general and CPR2 in
particular. If such structures are of adaptive significance, then in
a scenario of ‘‘Nature (writing) with parity primarily at the
oligonucleotide level’’, organisms which had single base mutations
that strengthened the stem would have been selected over
organisms that had not [24]. Inverse-conjugate pairs formed in
such a process are necessarily extremely proximal to each other,
with a separation not exceeding tens of base pairs. SLE cannot be
the sole cause of inverse symmetry because unlike prox-ISD it does
not generate local genic inverse symmetry, which is prevalent in
type-D chromosomes (Table 2 and Fig. 11). Furthermore, SLE
promotes inverse symmetry at the expense of violating Chargaff’s
(first) parity rule [7] (CPR1), a key to DNA replication and
biological inheritance. The CPR1-violating effect of SLE may be
lessened if it is considered as a mechanism that generates, as
opposed to a structural form that manifests, inverse symmetry. In
this case SLE exists as a extruding structure only during its
formative phase (which cannot be too short a time if it is to be
formed one nucleotide at a time [12]), but subsequently becomes a
part of the (non-extruding) stem-loop structure [55] via DNA
replication (making two copies that are slightly different). Then
only a small number of structural SLEs need to exist in the
chromosome at any given time, causing only a miniscule violation
of CPR1. Current sequencing techniques based on the shotgun
method cannot distinguish SLS from SLE. The number of SLSs in
excess of expected background with minimum stem length of
12 bp and loop length ranging from 5 to 100 nt was measured to
be *0:004 per base in 40 prokaryotes [55]. If we assume all SLSs
with loop lengths less than 50 nt–about half the total [55]–are
generated by the SLE mechanism then we estimate the SLE
contribution to 2dvinv to be about 0:002|12~0:024, about one-
tenth of the full value of 2dvinv (Eq. (8)).
A Unified Interpretation for All TypesIf we view types B and C as intermediates between A and D,
then a unified interpretation of the behavior of xi for all types
emerges: Every chromosome, with the possible exception of type-
Ds, experienced a WGID. The chromosomes differ mainly in the
amount of prox-ISDs each had, in increasing amount from type A
to D, with type A hardly any, and type D close to the saturation
amount, involving a fraction of 2dvinv*0:25 of the chromosome.
In all cases a large number (unconstrained as far as inverse
symmetry is concerned) of prox-DSD events may have happened,
while dist events, either ISDs or DSDs, occurred rarely. A fraction
of highly proximal inverse-conjugate pairs, possibly contributing to
up to one-tenth of the local inverse symmetry in type D
chromosomes, and possibly a larger fraction in the background
component in the inverse symmetry in the other types, may have
been generated by SLE instead of ISD. The DSD and ISD (and
SLE) events that occurred were mostly neutral, because the coding
and non-coding parts in a chromosome do not differ significantly
in their patterns of inverse symmetry (Figure S2, SI ). On the other
hand, because segments involved in ISD (as well as DSD) events
sometimes contained genes, ISD enhanced genic inverse symmetry
just as it did k-mer inverse symmetry, so the unified interpretation
explains the results seen in Table 2 and in Fig. 11. Many
alternative interpretations are possible for our data, but none will
be as unifying, simple, and parsimonious as the one proposed here.
We believe that by refining and expanding the analysis reported
here, a great deal more about how genomes grew and evolved can
be learned.
Our study suggests that the ISD events, if they did occur, were
causatively related to DNA replication. First, we found it
consistent to identify the sites of insertion of WGID events in
type-A, B and C chromosomes (the CIRs) with ori or ter sites.
Second, genomes known to have multiple ori sites tend to be
archaeons and eukaryotes [56,57], not eubacteria, and we found
archaeons and eukaryotes tended to be type D and never type A,
while eubacteria tended to be the opposite. On the other hand,
some type-D chromosomes are from eubacteria, and half of
archaea are not type D. It could be that not all ISD events are
associated with replication, or that some eubacteria also have
multiple ori sites while some archeaons do not, or both. We offer
no explanation why replication may cause ISD, except to point out
that during replication the chromosome is spliced at the ori site,
and this offers opportunities for the chromosome to misconnect on
rare occasions, possibly resulting in an ISD event. In any case, the
genome seemed to have developed machineries for ISD and used
it frequently, probably because ISDs allow it to efficiently exploit
its double-stranded structure to enrich its code-inventory.
Supporting Information
Table S1 List of chromosomes by taxonomy and global k-
averaged symmetry index of reverse, complement and inverse
symmetries.
Found at: doi:10.1371/journal.pone.0007553.s001 (1.46 MB
DOC)
Table S2 Classification of chromosomes by inverse symmetry
type and xi,bg and rx values.
Found at: doi:10.1371/journal.pone.0007553.s002 (0.83 MB
DOC)
Table S3 List of 38 exceptional chromosomes and their xi
values.
Found at: doi:10.1371/journal.pone.0007553.s003 (0.09 MB
DOC)
Inverse Symmetry in Genomes
PLoS ONE | www.plosone.org 14 November 2009 | Volume 4 | Issue 11 | e7553
Figure S1 xi,l-l plots for six eukaryotes (number of chromosomes
in parentheses). (a) Yeast (16), (b) Worm (6), (c) Fly (6), (d) Human
(24), (e) P. falciparum(14), (f) E. cuniculi (11). In each case the result
for all chromosomes are overlayed. Results for other k-mers are
similar.
Found at: doi:10.1371/journal.pone.0007553.s004 (1.26 MB TIF)
Figure S2 xi,l-l plots for the coding and non-coding parts of (a)
the type-A eubacterial B. burgdorferi (5% of chromosome is non-
coding), (b) the type-D archaeon M. acetivorans (29%), (c) the type-C
chromosome 14 of the protozoan P. falciparum (41%), and (d) the
type-D chromosome 1 of human (49%).
Found at: doi:10.1371/journal.pone.0007553.s005 (0.92 MB TIF)
Figure S3 Cumulative skews of 12 base-neutral reverse- and
complement-conjugate paris of 4-mers in four types of chromo-
somes. Reverse (a) and complement (b) skews in type-A C.
acetobutylicum; reverse (c) and complement (d) skews in type-B E.
carotovora; reverse (e) and complement (f) skews in type-C M. mazei;
reverse (g) and complement (h) skews in type-D Synechocystis.
Found at: doi:10.1371/journal.pone.0007553.s006 (1.29 MB TIF)
Author Contributions
Conceived and designed the experiments: HCL. Performed the experi-
ments: SGK WLF HDC ZTH NZ. Analyzed the data: SGK WLF HDC
ZTH NZ BZ HCL. Wrote the paper: HCL.
References
1. Dixon L, Ginsparg P, Harvey J (1988) Beauty and the beast: Superconformalsymmetry in a monster module. Comm Math Phys 119: 221–241.
2. Zee A (1999) Fearful Symmetry: The Search for Beauty in Modern Physics.Princeton: Princeton University Press. 336 p.
3. Mueller A (2003) The beauty of symmetry. Science 300: 749–750.
4. Enquist M, Arak A (1994) Symmetry, beauty and evolution. Nature 372:169–172.
5. Grammer K, Thornhill R (1994) Human (Homo sapiens) facial attractiveness andsexual selection: the role of symmetry and averageness. J Comp Psychol 108:
233–242.6. Rhodes G (2006) The evolutionary psychology of facial beauty. Annu Rev
Physiol 57: 199–226.
7. Chargaff E (1951) Structure and function of nucleic acids as cell constituents.Fed Proc 10: 654–659.
8. Watson JD, Crick FH (1953) Molecular structure of nucleic acids; a structure fordeoxyribose nucleic acid. Nature 171: 737–738.
9. Rudner R, Karkas JD, Chargaff E (1968) Separation of B. subtilis DNA into
complementary strands, iii. direct analysis. Proc Natl Acad Sci USA 60:921–922.
10. Rudner R, Karkas JD, Chargaff E (1969) Fractals related to long DNAsequences and complete genomes. Proc Natl Acad Sci USA 63: 152–159.
11. Prabhu VV (1993) Symmetry observations in long nucleotide sequences. NucleicAcids Res 21: 2797–2800.
12. Bell SJ, Forsdyke DR (1999) Accounting units in DNA. J Theor Biol 197: 51–61.
13. Qi D, Cuticchia AJ (2001) Compositional symmetries in complete genomes.Bioinformatics 17: 557–559.
14. Forsdyke DR (2002) Symmetry observations in long nucleotide sequences: acommentary on the discovery note of qi and cuticchia. Bioinformatics 18:
215–217.
15. Baisnee PF, Hampson S, Baldi P (2002) Why are complementary DNA strandssymmetric? Bioinformatics 18: 1021–1033.
16. Jose MV, Govezensky T, Bobadilla JR (2005) Statistical properties of DNAsequences revisited: the role of inverse bilateral symmetry in bacterial
chromosomes. Physica A 351: 477–498.17. Hao BL, Lee HC, Zhang SY (2000) Fractals related to long DNA sequences and
complete genomes. Chaos, Solitons and Fractals 11: 825–836.
18. Mrazek J, Karlin S (1998) Strand compositional asymmetry in bacterial andlarge viral genomes. Proc Natl Acad Sci USA 95: 3720–3725.
19. Chen HD, Chang CH, Hsieh LC, Lee HC (2005) Divergence and shannoninformation in genomes. Phys Rev Lett 94: 178103.
20. Chang CH, Hsieh LC, Chen TY, Chen HD, Luo L, et al. (2005) Shannon
information in complete genomes. JBCB 3: 587–608.21. National center for biotechnology information genome database. Available:
http://www.ncbi.nlm.nih.gov/.22. Rice annotation project database. Available: http://rapdb.lab.nig.ac.jp/.
23. Inverse symmetry database. Available: http://sybbi115.sybbi.ncu.edu.tw/ rolf/.24. Forsdyke DR, Bell SJ (2004) Purine-loading, stem-loops, and Chargaff’s second
parity rule. Appl Bioinformatics 3: 3–8.
25. Hsu ZT (2008) Inverse symmetry and original and terminal sites in prokaryoticgenomes. Master’s thesis, National Central University, Zhongli, Taiwan.
26. Ochman H, Lawrence JG, Groisman EA (2000) Lateral gene transfer and thenature of bacterial innovation. Proc Natl Acad Sci USA 405: 209–304.
27. Lobry JR (1996) Asymmetric substitution patterns in the two DNA strands of
bacteria. Mol Biol Evol 13: 660–665.28. Blattner FR, GP 3rd, Bloch CA, Nicole TP, Valerie B, et al. (1997) The
complete genome sequence of Escherichia coli k-12. Science 277: 1453–1474.29. Freeman JM, Plasterer T, Smith TF, Mohr SC (1998) Patterns of genome
organization in bacteria. Science 279: 1827a–.
30. Salzberg SL, Salzberg AJ, Kerlavage AR, Tomb JF (1998) Skewed oligomersand origins of replication. Gene 217: 57–67.
31. Picardeau M, Lobry JR, Hinnebusch BJ (2000) Analyzing DNA strand
compositional asymmetry to identify candidate replication origins of Borrelia
burgdorferi linear and circular plasmids. Genome Res 10: 1594–1604.
32. Rocha EPC (2002) Is there a role for replication fork asymmetry in the
distribution of genes in bacterial genomes? Trends Microbiol 10(9): 393–395.
33. Rocha EPC (2004) The replication-related organization of bacterial genomes.Microbiology 150: 1609–1627.
34. Sanchez J, Jose MV (2002) Analysis of bilateral inverse symmetry in whole
bacterial chromosomes. Biochem Biophys Res Commun 99: 126–134.
35. Rocha EPC, Touchon M, Feil EJ (2006) Similar compositional biases are causedby very different mutational effects. Genome Res 16: 1537–1547.
36. Chen TY, Hsieh LC, Lee HC (2005) Shannon information and self-similarity in
complete chromosomes. Comp Phys Comm 169: 218–221.
37. Zhou F, Olman V, Xu Y (2008) Barcodes for genomes and applications. BMCBioinformatics 9: 546.
38. Lynch M (2002) Gene duplication and evolution. Science 297: 945–947.
39. Bailey JA, Z G, Clark RA, Reinert K, Samonte RV, et al. (2002) Recent
segmental duplications in the human genome. Science 297: 1003–1007.
40. Hsieh LC, Luo L, Ji F, Lee HC (2003) Minimal model for genome evolution and
growth. Phys Rev Lett 90: 018101.
41. Zhang J (2003) Evolution by gene duplication: an update. Trends Eco Evolut 18:
292–298.
42. Zhang L, Lu HH, Chung WY, Yang J, Li WH (2005) Patterns of segmental
duplication in the human genome. Mol Biol Evol 22: 135–141.
43. Messer PW, Arndt PF, Lassig M (2005) Solvable sequence evolution models andgenomic correlations. Phys Rev Lett 94: 138103.
44. Nussinov R (1982) Some indications for inverse DNA duplication. J Theor Biol
95: 783–791.
45. Biebricher CK, Luce R (1992) In vitro recombination and terminal elongation ofRNA by Q beta replicase. EMBO J 11: 5129–5135.
46. Volz A, Wende H, Laun K, Ziegler A (2001) Genesis of the ILT/LIR/MIR
clusters within the human leukocyte receptor complex. Immunol Rev 181:39–51.
47. Albrecht-Buehler G (2006) Asymptotically increasing compliance of genomes
with Chargaff’s second parity rules through inversions and inverted transposi-
tions. Proc Natl Acad Sci USA 103: 17828–17833.
48. Albrecht-Buehler A (2007) Inversions and inverted transpositions as the basis for
an almost universal ‘‘format’’ of genome sequences. Genomics 90: 297–305.
49. Ohno S (1970) Evolution by Gene Duplication. London: George Allen andUnwin. 160 p.
50. Wolfe KH, Shields DC (1997) Molecular evidence for an ancient duplication of
the entire yeast genome. Nature 387: 708–713.
51. Kellis M, Birren BW, Lander ES (2004) Proof and evolutionary analysis ofancient genome duplication in the yeast Saccharomyces cerevisiae. Nature 428:
617–624.
52. Wapinski I, Pfeffer A, Friedman N, Regev A (2007) Natural history andevolutionary principles of gene duplication in fungi. Nature 449: 54–61.
53. Christoffels A, Koh EG, Chia JM, Brenner S, Aparicio S, et al. (2004) Fugu
genome analysis provides evidence for a whole-genome duplication early duringthe evolution of ray-finned fishes. Mol Biol Evol 21: 1146–1151.
54. Jaillon O, Aury JM, Brunet F, Petit JL, Nicole ST, et al. (2004) Genome
duplication in the teleost fish Tetraodon nigroviridis reveals the early vertebrate
proto-karyotype. Nature 431: 946–957.
55. Petrillo M, Silvestro G, Nocera PPD, Boccia A, Paolella G (2006) Stem-loop
structures in prokaryotic genomes. BMC Genomics 7: 170.
56. Gilbert DM (2001) Making sense of eukaryotic DNA replication origins. Science294: 96–100.
57. Kelman LM, Kelman Z (2004) Multiple origins of replication in archaea. Trends
Microbiol 12: 399–401.
Inverse Symmetry in Genomes
PLoS ONE | www.plosone.org 15 November 2009 | Volume 4 | Issue 11 | e7553
Copyright © 2022 FDOKUMEN