Integrated functional visualization of eukaryotic genomes
10
BioMed Central Page 1 of 10 (page number not for citation purposes) BMC Bioinformatics Open Access Software Integrated functional visualization of eukaryotic genomes Rohit Ghai*, Hannes Lindemann and Trinad Chakraborty Address: Institute of Medical Microbiology, Faculty of Medicine, Justus-Liebig University, Frankfurter Strasse 107, 35392 – Giessen, Germany Email: Rohit Ghai* - [email protected]; Hannes Lindemann - [email protected]; Trinad Chakraborty - [email protected] * Corresponding author Abstract Background: Increasing amounts of data from large scale whole genome analysis efforts demands convenient tools for manipulation, visualization and investigation. Whole genome plots offer an intuitive window to the analysis. We describe two applications that enable users to easily plot and explore whole genome data from their own or other researchers' experiments. Results: STRIPE and GFFtool (General Feature Format Tool) are softwares designed to support integration, visualization and exploration of whole genome data from eukaryotic genomes. STRIPE, in addition to providing a highly customizable and interactive data plot, provides access to numerous well-selected databases with updated information on all genes of a genome. GFFtool provides a user-friendly solution to integrating experimental data with the genomic information available in public databases. They also obviate the need for users to maintain large annotation resources, as they link to well-known resources using standard gene and protein identifiers. Conclusion: The programs provide the user with broad genomic overviews of data distribution, fast access to data of interest, and the ability to navigate speedily from one resource to another, and gain a better understanding of result of whole genome analysis experiments. Background The continuously growing availability of genomic infor- mation exercises pressure on the systems used to capture it and on users concerned with its interpretation. Analysis of large scale genomic data is a demanding task, requiring extensive input from diverse sources of biological signifi- cance, statistical methodologies and data exchange stand- ards. To answer interesting biological questions, biologists need accessible interfaces that enable conven- ient visualization of information, searching multiple data- bases and flexible maneuvering within the data. When confronted with the lists of significantly differentially expressed genes from the microarray experiments per- formed, it is important to get a feel for the genome-wide distribution of the data and to be able to quickly navigate between diverse sources of information. Visualization on a genomic scale is also helpful in identifying and repre- senting clusters of genes that are co-regulated and map close to each other in the genome. There are several exam- ples of regions in the genome where genes implicated in the same biological processes are clustered together on the genome, e.g the cytokine-receptor cluster on mouse chro- mosome 16 [1], and a group of cytokine related genes associated with IL-4 on mouse chromosome 11 [2]. Chro- matin remodeling events control transcription of closely mapped genes, and chromosomal clustering may point to regions where such events are actively induced. Published: 18 July 2006 BMC Bioinformatics 2006, 7:348 doi:10.1186/1471-2105-7-348 Received: 16 January 2006 Accepted: 18 July 2006 This article is available from: http://www.biomedcentral.com/1471-2105/7/348 © 2006 Ghai et al; licensee BioMed Central Ltd. This is an Open Access article distributed under the terms of the Creative Commons Attribution License (http://creativecommons.org/licenses/by/2.0 ), which permits unrestricted use, distribution, and reproduction in any medium, provided the original work is properly cited.
-
Upload
independent -
Category
Documents
-
view
4 -
download
0
Transcript of Integrated functional visualization of eukaryotic genomes

BioMed CentralBMC Bioinformatics
ss
Open AcceSoftwareIntegrated functional visualization of eukaryotic genomesRohit Ghai*, Hannes Lindemann and Trinad ChakrabortyAddress: Institute of Medical Microbiology, Faculty of Medicine, Justus-Liebig University, Frankfurter Strasse 107, 35392 – Giessen, Germany
Email: Rohit Ghai* - [email protected]; Hannes Lindemann - [email protected]; Trinad Chakraborty - [email protected]
* Corresponding author
AbstractBackground: Increasing amounts of data from large scale whole genome analysis efforts demandsconvenient tools for manipulation, visualization and investigation. Whole genome plots offer anintuitive window to the analysis. We describe two applications that enable users to easily plot andexplore whole genome data from their own or other researchers' experiments.
Results: STRIPE and GFFtool (General Feature Format Tool) are softwares designed to supportintegration, visualization and exploration of whole genome data from eukaryotic genomes. STRIPE,in addition to providing a highly customizable and interactive data plot, provides access tonumerous well-selected databases with updated information on all genes of a genome. GFFtoolprovides a user-friendly solution to integrating experimental data with the genomic informationavailable in public databases. They also obviate the need for users to maintain large annotationresources, as they link to well-known resources using standard gene and protein identifiers.
Conclusion: The programs provide the user with broad genomic overviews of data distribution,fast access to data of interest, and the ability to navigate speedily from one resource to another,and gain a better understanding of result of whole genome analysis experiments.
BackgroundThe continuously growing availability of genomic infor-mation exercises pressure on the systems used to captureit and on users concerned with its interpretation. Analysisof large scale genomic data is a demanding task, requiringextensive input from diverse sources of biological signifi-cance, statistical methodologies and data exchange stand-ards. To answer interesting biological questions,biologists need accessible interfaces that enable conven-ient visualization of information, searching multiple data-bases and flexible maneuvering within the data. Whenconfronted with the lists of significantly differentiallyexpressed genes from the microarray experiments per-formed, it is important to get a feel for the genome-wide
distribution of the data and to be able to quickly navigatebetween diverse sources of information. Visualization ona genomic scale is also helpful in identifying and repre-senting clusters of genes that are co-regulated and mapclose to each other in the genome. There are several exam-ples of regions in the genome where genes implicated inthe same biological processes are clustered together on thegenome, e.g the cytokine-receptor cluster on mouse chro-mosome 16 [1], and a group of cytokine related genesassociated with IL-4 on mouse chromosome 11 [2]. Chro-matin remodeling events control transcription of closelymapped genes, and chromosomal clustering may point toregions where such events are actively induced.
Published: 18 July 2006
BMC Bioinformatics 2006, 7:348 doi:10.1186/1471-2105-7-348
Received: 16 January 2006Accepted: 18 July 2006
This article is available from: http://www.biomedcentral.com/1471-2105/7/348
© 2006 Ghai et al; licensee BioMed Central Ltd.This is an Open Access article distributed under the terms of the Creative Commons Attribution License (http://creativecommons.org/licenses/by/2.0), which permits unrestricted use, distribution, and reproduction in any medium, provided the original work is properly cited.
Page 1 of 10(page number not for citation purposes)

BMC Bioinformatics 2006, 7:348 http://www.biomedcentral.com/1471-2105/7/348
Since existing visualization solutions were not sufficientfor our needs, we designed and implemented two pro-grams, STRIPE and GFFtool for integrating, visualizingand exploring whole genome data. We feel that the solu-tions developed here will interest a broad range of scien-tists in different laboratory settings working with largescale genomic data sets from microarray, proteomic oreven computational methods. We have made both toolsfreely available to academic users on our website. Cur-rently, the human, mouse and rat genomes are available
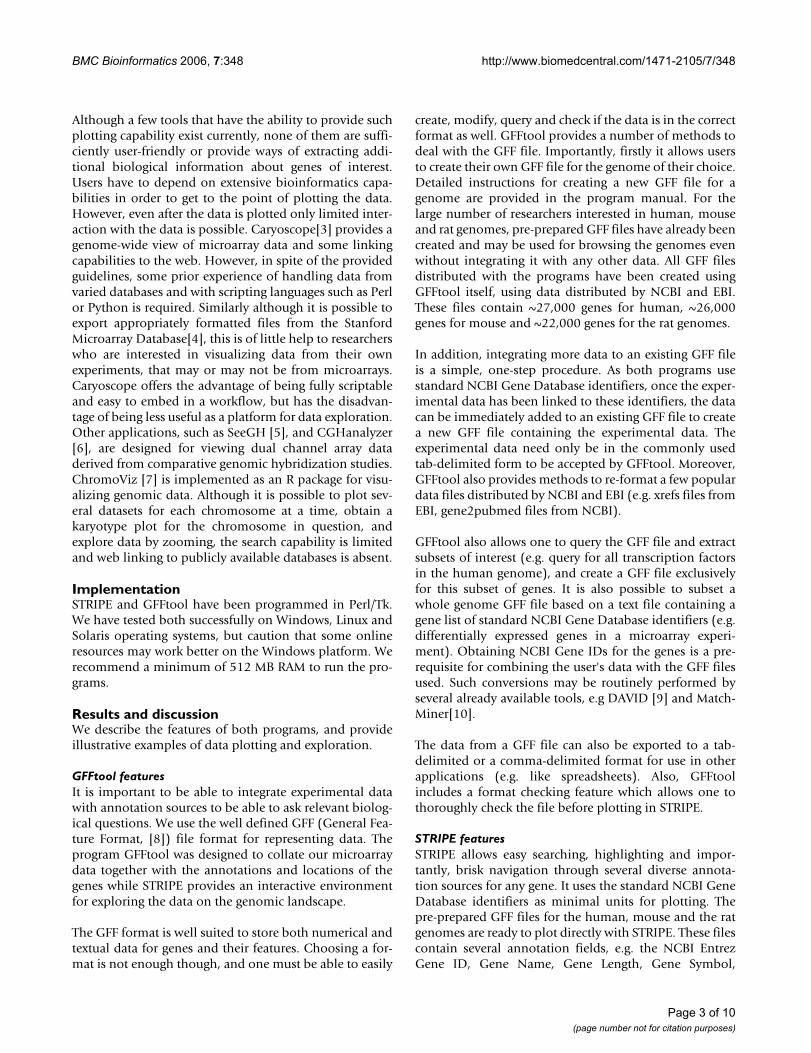
for immediate use. Figure 1 shows a plot of the entirehuman genome in STRIPE. The chromosome numbersand designations are indicated at the top of each chromo-some. The gene lengths of all genes are plotted. Longergenes are thicker than shorter genes as the length of thegenes here is scaled along both the vertical and the hori-zontal axes. The blue rectangle is a selection rectangle. It ispossible to zoom in to a selected region by simply select-ing a portion of the plot.
The figure shows all the genes in the human genome and their length plotted with STRIPEFigure 1The figure shows all the genes in the human genome and their length plotted with STRIPE. Similar plots can be created imme-diately for the mouse and the rat genome by selecting a pre-prepared file. The blue colored box represents a selected region of interest. The data plotted in the figure is the gene lengths of all genes in the human genome. Longer genes appear thicker than shorter genes, as the lengths are scaled to size both along the vertical chromosome and the horizontal axis.
Page 2 of 10(page number not for citation purposes)
BMC Bioinformatics 2006, 7:348 http://www.biomedcentral.com/1471-2105/7/348
Although a few tools that have the ability to provide suchplotting capability exist currently, none of them are suffi-ciently user-friendly or provide ways of extracting addi-tional biological information about genes of interest.Users have to depend on extensive bioinformatics capa-bilities in order to get to the point of plotting the data.However, even after the data is plotted only limited inter-action with the data is possible. Caryoscope[3] provides agenome-wide view of microarray data and some linkingcapabilities to the web. However, in spite of the providedguidelines, some prior experience of handling data fromvaried databases and with scripting languages such as Perlor Python is required. Similarly although it is possible toexport appropriately formatted files from the StanfordMicroarray Database[4], this is of little help to researcherswho are interested in visualizing data from their ownexperiments, that may or may not be from microarrays.Caryoscope offers the advantage of being fully scriptableand easy to embed in a workflow, but has the disadvan-tage of being less useful as a platform for data exploration.Other applications, such as SeeGH [5], and CGHanalyzer[6], are designed for viewing dual channel array dataderived from comparative genomic hybridization studies.ChromoViz [7] is implemented as an R package for visu-alizing genomic data. Although it is possible to plot sev-eral datasets for each chromosome at a time, obtain akaryotype plot for the chromosome in question, andexplore data by zooming, the search capability is limitedand web linking to publicly available databases is absent.
ImplementationSTRIPE and GFFtool have been programmed in Perl/Tk.We have tested both successfully on Windows, Linux andSolaris operating systems, but caution that some onlineresources may work better on the Windows platform. Werecommend a minimum of 512 MB RAM to run the pro-grams.
Results and discussionWe describe the features of both programs, and provideillustrative examples of data plotting and exploration.
GFFtool featuresIt is important to be able to integrate experimental datawith annotation sources to be able to ask relevant biolog-ical questions. We use the well defined GFF (General Fea-ture Format, [8]) file format for representing data. Theprogram GFFtool was designed to collate our microarraydata together with the annotations and locations of thegenes while STRIPE provides an interactive environmentfor exploring the data on the genomic landscape.
The GFF format is well suited to store both numerical andtextual data for genes and their features. Choosing a for-mat is not enough though, and one must be able to easily
create, modify, query and check if the data is in the correctformat as well. GFFtool provides a number of methods todeal with the GFF file. Importantly, firstly it allows usersto create their own GFF file for the genome of their choice.Detailed instructions for creating a new GFF file for agenome are provided in the program manual. For thelarge number of researchers interested in human, mouseand rat genomes, pre-prepared GFF files have already beencreated and may be used for browsing the genomes evenwithout integrating it with any other data. All GFF filesdistributed with the programs have been created usingGFFtool itself, using data distributed by NCBI and EBI.These files contain ~27,000 genes for human, ~26,000genes for mouse and ~22,000 genes for the rat genomes.
In addition, integrating more data to an existing GFF fileis a simple, one-step procedure. As both programs usestandard NCBI Gene Database identifiers, once the exper-imental data has been linked to these identifiers, the datacan be immediately added to an existing GFF file to createa new GFF file containing the experimental data. Theexperimental data need only be in the commonly usedtab-delimited form to be accepted by GFFtool. Moreover,GFFtool also provides methods to re-format a few populardata files distributed by NCBI and EBI (e.g. xrefs files fromEBI, gene2pubmed files from NCBI).
GFFtool also allows one to query the GFF file and extractsubsets of interest (e.g. query for all transcription factorsin the human genome), and create a GFF file exclusivelyfor this subset of genes. It is also possible to subset awhole genome GFF file based on a text file containing agene list of standard NCBI Gene Database identifiers (e.g.differentially expressed genes in a microarray experi-ment). Obtaining NCBI Gene IDs for the genes is a pre-requisite for combining the user's data with the GFF filesused. Such conversions may be routinely performed byseveral already available tools, e.g DAVID [9] and Match-Miner[10].
The data from a GFF file can also be exported to a tab-delimited or a comma-delimited format for use in otherapplications (e.g. like spreadsheets). Also, GFFtoolincludes a format checking feature which allows one tothoroughly check the file before plotting in STRIPE.
STRIPE featuresSTRIPE allows easy searching, highlighting and impor-tantly, brisk navigation through several diverse annota-tion sources for any gene. It uses the standard NCBI GeneDatabase identifiers as minimal units for plotting. Thepre-prepared GFF files for the human, mouse and the ratgenomes are ready to plot directly with STRIPE. These filescontain several annotation fields, e.g. the NCBI EntrezGene ID, Gene Name, Gene Length, Gene Symbol,
Page 3 of 10(page number not for citation purposes)

BMC Bioinformatics 2006, 7:348 http://www.biomedcentral.com/1471-2105/7/348
Cytogenetic location, GenBank accession, and SwissprotID for all genes that have been mapped to a definite chro-mosomal location. These fields are used to link the appli-cation to a variety of different publicly availabledatabases. Additional annotation fields may also beadded to a GFF file using GFFtool.
STRIPE offers up-to forty different methods for plottingand coloring the data. It is possible to plot raw, zero-cen-tered, mean-centered, log-transformed, and mean log-transformed data. One can plot a histogram plot and thenoverlay on it several line plots. Each plot can be colored inthree different ways: using any user-defined color, adefined COLOR column in the GFF file, or a separate tagfile that allows different groups of genes (e.g. genesbelonging to the same biological process category asdefined by Gene Ontology, or genes in the same pathway)to be appropriately labeled and colored. Upregulated anddownregulated genes may also be colored differently atany time. In the absence of any user data, one can createand navigate a plot based only on the locations of thegenes. This plot can also be colored as described above. Itis useful when the user is mainly interested in knowingthe location of the genes and exploring the genome.
It is possible to choose a data column from the GFF file,values from which are displayed whenever one places themouse cursor on any gene as a tool tip. In addition, thecytogenetic band and the value in the plotted data set arealways displayed. Pressing and dragging the right sidemouse button over a group of genes activates the zoomingand lassoing feature. The selected area is zoomed inimmediately for a closer examination. Figure 2 shows thisin detail for a part of the plot. It is easy to see the bar-chartlike plots in this view. The various options available forplotting are also shown in the plot pull-down menu. Thismenu is used when one desires to also scale the genelength along the chromosome. STRIPE provides two waysof creating each plot. One is to plot a data value associatedwith a gene as a horizontal rectangle on a vertical chromo-some, where the horizontal axis of the rectangle corre-sponds to the data value and the vertical axis to the lengthof the gene. This is shown in the zoomed in view in Figure2 where the gene lengths are scaled along the chromo-some. The menu shown in the plot is used when onedesires to have an idea of the actual gene lengths as well.The other method is to use a line perpendicular to the ver-tical chromosome. The Plot Uniform menu is used whenone needs to ignore the gene length. In this case, this lineis drawn at the exact midpoint of the gene and the genelength is disregarded. We have noticed that excluding thegene length during visualization provides a more reliableview of potential clusters of genes as the width of eachgene is constant. An illustrative comparison is shown inthe two insets in Figure 2. In the left inset the gene lengths
have been plotted and in the right inset a single line isdrawn at the center of each gene. A large number of spuri-ous clusters can thus be visually filtered. It must be notedthat this method does not override any statistical methodused to identify clusters, but rather, acts as an aid to visu-alizing and exploring potential clusters. We suggest thatany statistical tests for overrepresentation on the data beperformed prior to its incorporation into STRIPE.
Intuitive PERL-based regular expression searches may becarried out in the displayed tool tip column (e.g. search-ing the GENE_NAME column for genes matching the text"transcription factor") and the search results can be high-lighted immediately on the plot. Highlighting can bedone in many different ways (encircling the gene by anoval, circle or a rectangle, or changing its color). Thecolors of highlighting search results can be customizedbefore each search is performed. This provides the userwith the ease of locating the genes of interest. Also, as anynumber of searches may be performed on a plot, differentsubsets of genes may be highlighted simultaneously onthe plot. Figure 3 shows an example of the search func-tionality in STRIPE. In this example, a simple search forthe word "toll" highlights all the gene names in thehuman genome that contain the word "toll". The toll-likereceptors are pathogen recognition receptors and impor-tant components of innate immune defense. The match-ing genes are colored red on the plot and encircled by anoval for immediate identification. The lasso window isalso shown with details of the all the search resultsobtained with the pattern. The inset also shows the resultsof how two different search results may be highlighted inthe plot. The blue rectangles are a search result for theword "interleukin" and the red ovals are the search resultsfor the word "interferon". These search results can besaved to a text file. Plots may be saved as postscript filesthat can be read easily using standard graphics programs.
It is easy to reset the plot to its original state, and thenselect another area for zooming in. The lasso window pro-vides detailed information on genes each time a search isperformed or the plot is zoomed in. "Panning" on thecanvas is done by pressing and dragging the left mousebutton.
An important feature of STRIPE is the linking of the exper-imental data to a variety of biological databases. Using thedatabase identifiers specified in the GFF file, STRIPE linksto databases providing information on the gene, nucle-otide and protein sequence information, single nucle-otide polymorphisms, homologous genes across species,available PubMed literature, pathway information, geneexpression data in public databases, genotype reports,chromosome maps, gene ontology categories, alternatesplicing data, protein domains information, neighboring
Page 4 of 10(page number not for citation purposes)

BMC Bioinformatics 2006, 7:348 http://www.biomedcentral.com/1471-2105/7/348
gene network associations, and genetic association data-bases. A customized link to a website using a data columnfrom the GFF file can be defined. Figure 4 shows a closeup view of the toll-like receptor 3 gene in the humangenome. The gene is colored red and encircled by an oval.The mouse over feature provides a small box that indicatesthe gene name, the cytogenetic location, and the data
value at that point. A double click on any gene brings upa small gene page window which shows further annota-tion details on the gene, in this case, toll-like receptor 3.The NCBI GeneID, official gene name, official gene sym-bol, cytogenetic location, Genbank accession number andthe Swissprot identifier, is shown in the upper part of thiswindow. The lower part of the gene page provides access
A zoomed in view of a few chromosomes is shown hereFigure 2A zoomed in view of a few chromosomes is shown here. The plot menu shows the different choices for plotting a bar-chart in STRIPE. The two insets show a comparison between plotting data with (left inset) and without gene lengths (right inset) respectively, scaled along the chromosome. It is possible to plot the genes on the chromosomes in two ways, one in which the gene length is accurately scaled along the chromosome (giving the appearance of thick lines, which may be misunderstood for clusters of genes), and another in which the gene lengths are ignored and a line is drawn at the exact center of the gene. The latter gives a better view and helps avoid the misunderstanding that there are clusters. This is helpful in visual identification of possible gene clusters.
Page 5 of 10(page number not for citation purposes)

BMC Bioinformatics 2006, 7:348 http://www.biomedcentral.com/1471-2105/7/348
to over 50 resources on this gene. All resources have beenclassified for easier access. It is also possible to provide anidentifier in the GFF file and use it to create a customizeddeep link to any user-defined resource.
STRIPE provides access to a large number of differentresources for each gene. Basic information, e.g. name,gene symbol, cytogenetic location etc, is provided rightaway. Deep links to several NCBI databases are provided,e.g. PubMed, GenBank, OMIM, Gene Expression Omni-
bus (GEO), HomoloGene. Three choices for genomebrowsers are provided, the NCBI Map Viewer, UCSCGenome Browser, and the Ensembl Genome Browser, sothat users interested in a different display can easily switchto any of these and access additional information availa-ble there. All of the important databases for proteindomains, PFAM, Interpro and SMART are available. GeneOntology searches are available from the GO database.Transcripts with known alternative splice variants can belooked up the in Alternative Splicing Database. Pathway
Search functionality in STRIPEFigure 3Search functionality in STRIPE. It is possible to perform a free-text or a regular expression based search on the entire genome and identify genes of interest. It is also possible to perform as many searches on a plot and mark up different search results in different colors and shapes. Shown in the figure are search results for the keyword "toll" in the human genome. Shown in the inset is how two different searches may be highlighted in the same plot (blue rectangle: keyword interleukin, red oval: keyword interferon).
Page 6 of 10(page number not for citation purposes)

BMC Bioinformatics 2006, 7:348 http://www.biomedcentral.com/1471-2105/7/348
information can queried from KEGG and BioCarta, whileliterature connections can be explored using PubGene.
In order to illustrate the utility of these programs we useddata derived from a microarray-based genome-wide anal-ysis of palindrome formation or GAPF [11]. The methoddescribed is a novel technique to detect the prevalence ofpalindrome-containing regions in cancer cells and toidentify those regions harboring structural chromosomeaberrations. The GAPF method was compared to conven-tional array comparative genome hybridization (CGH) inits ability to identify palindromes. The study concludedthat DNA palindromes were frequent in human cancer
and also provided evidence of possible clustering of palin-dromic sequences at specific chromosomal loci. In addi-tion, GAPF was demonstrated to be more sensitive thanarray CGH in detecting DNA palindromes. Two datasetsfrom the original publication, Colo_CGH andColo_GAPF have been plotted together in line plots inSTRIPE and are depicted in Figure 5. It is clearly seen thatthere is clustering of some of the data which is not imme-diately evident from tabular data as given in the supple-mentary section of the publication. The two insets showzoomed in regions of the plot. The left inset shows thechromosomal region at 1q21 where clustering of genescan be seen. The right inset shows a close up of the "MYC"
A zoomed in view of a search result for the keyword "toll" is shown hereFigure 4A zoomed in view of a search result for the keyword "toll" is shown here. Search results are shown encircled by a oval, and are colored in red. Both the color of the matching results, and how the result is encircled (oval, circle or rectangle) can be custom-ized before searching, allowing several searches to be performed on the same plot. Also shown is the gene page window which provides well-organized access to the several information resources for each gene.
Page 7 of 10(page number not for citation purposes)

BMC Bioinformatics 2006, 7:348 http://www.biomedcentral.com/1471-2105/7/348
gene at locus 8q24 encircled in the two line plots (both ofwhich are also highlighted in the original publication).Once such a plot is created, it is publication-ready, fullyinteractive, zoomable and searchable and provides a start-ing point for navigation through several databases foreach gene. This demonstrates how, in addition to provid-ing tables, one may also easily provide overall visualiza-tion of the genomic distribution of the data.
To provide another example of the program's capability toplot actual microarray data, we have taken data from arecent gene expression profiling study on cancerous renalcell carcinoma [12] and plotted it with STRIPE (see Figure6). The data was retrieved from the Stanford MicroarrayDatabase and added to the human genome GFF file usingGFFtool. A single experiment is shown here (SHEB155exp001) and the log2 ratios have been plotted centeredaround zero. Upregulated genes are colored red and areplotted on the right sides of each chromosome while thedownregulated genes are colored blue and are plotted onthe left sides. It is also useful to plot identified differen-tially expressed genes separately purely as a means forreducing complexity and exploring hypotheses. The insetin the figure shows the cancer survival signature gene setidentified by the authors plotted separately. As the plot islinked to the various resources for each gene, it provides
an excellent gateway to explore each gene individually.The GFF files containing both the experiment and the can-cer survival gene signature data are available with the pro-grams.
ConclusionSTRIPE and GFFtool are programs that make wholegenome plotting easy for users, provide organized accessto information resources, reducing time for manual navi-gation, and allow using a single plot as a gateway forexploration. Both STRIPE and GFFtool are still underdevelopment. Detailed documentation for both programsis available from the project home page.
Availability and requirements• Project Name: STRIPE and GFFtool
• Project Home Page: http://www.uniklinikum-giessen.de/genome
• Operating system(s): Windows, Linux, Solaris
• Programming Language: Perl/Tk
• Other requirements: none
Plotting experimental data from study on a genome-wide analysis of palindrome prevalence using STRIPEFigure 5Plotting experimental data from study on a genome-wide analysis of palindrome prevalence using STRIPE. Two sets of data deriving from GAPF- and CGH-based arrays are plotted as line plots, one over the other. GAPF and CGH-based profiles of two selected regions (1q21 and 8q24) are shown in the figure. The Colo-CGH dataset is shown in green lines and with the genes as red, while the Colo-GAPF dataset is plotted with blue lines and blue spots as genes. The numerical values of the data are scaled along the horizontal axis.
Page 8 of 10(page number not for citation purposes)

BMC Bioinformatics 2006, 7:348 http://www.biomedcentral.com/1471-2105/7/348
• License: Free for academic use
• Any restrictions on use by non-academics: Contactcorresponding author for a license
AbbreviationsGFF: General Feature Format
NCBI: National Centre for Biotechnology Information
EBI: European Bioinformatics Institute
PFAM: Protein Families Database
KEGG: Kyoto Encyclopedia of Genes and Genomes
GAPF: Genome wide analysis of palindrome formation
Authors' contributionsRG conceived the program, wrote and tested it, preparedthe manuals and the website. HL assisted in coding andtesting both programs. TC oversaw the entire develop-ment process. RG and TC prepared the manuscript. Allauthors read and approved of the final manuscript.
AcknowledgementsThe work described herein was made possible by grants from the Deutsche Forschungsgemeinshaft through the Graduate College of Biochemistry of Nucleoprotein Complexes (GK370) at Justus Liebig University, Giessen,
Plotting experimental data from a gene expression profiling study on renal cell carcinoma plotted with STRIPEFigure 6Plotting experimental data from a gene expression profiling study on renal cell carcinoma plotted with STRIPE. Upregulated genes are colored red and down regulated genes shown in blue. The inset depicts a genome-based representation of the genes identified as predictors for survival in conventional renal cell carcinoma. The numerical values of the data are scaled along the horizontal axis.
Page 9 of 10(page number not for citation purposes)

BMC Bioinformatics 2006, 7:348 http://www.biomedcentral.com/1471-2105/7/348
Publish with BioMed Central and every scientist can read your work free of charge
"BioMed Central will be the most significant development for disseminating the results of biomedical research in our lifetime."
Sir Paul Nurse, Cancer Research UK
Your research papers will be:
available free of charge to the entire biomedical community
peer reviewed and published immediately upon acceptance
cited in PubMed and archived on PubMed Central
yours — you keep the copyright
Submit your manuscript here:http://www.biomedcentral.com/info/publishing_adv.asp
BioMedcentral
Germany and the German National Genome Network (NGFN-2) to T.C. This work forms part of the doctoral thesis of R.G. H. L. is carrying out his civilian community service at the Justus-Liebig University. The authors would like to thank Dr. Uday Kishore for helpful comments on the manu-script.
References1. Hardy MP, Sanij EP, Hertzog PJ, Owczarek CM: Characterization
and transcriptional analysis of the mouse Chromosome 16cytokine receptor gene cluster. Mamm Genome 2003,14(2):105-18.
2. Wenderfer SE, Slack JP, McCluskey TS, Monaco JJ: Identification of40 genes on a 1-Mb contig around the IL-4 cytokine familygene cluster on mouse chromosome 11. Genomics 2000,63:354-373.
3. Awad IA, Rees CA, Hernandez-Boussard T, Ball CA, Sherlock G:Caryoscope: an Open Source Java application for viewingmicroarray data in a genomic context. BMC Bioinformatics 2004,5:151.
4. Sherlock G, Hernandez-Boussard T, Kasarskis A, Binkley G, MateseJC, Dwight SS, et al.: The Stanford Microarray Database. NucleicAcids Res 2001, 29:152-155.
5. Chi B, DeLeeuw RJ, Coe BP, MacAulay C, Lam WL: SeeGH – a soft-ware tool for visualization of whole genome array compara-tive genomic hybridization data. BMC Bioinformatics 2004, 5:13.
6. Greshock J, Naylor TL, Margolin A, Diskin S, Cleaver SH, Futreal PA,et al.: 1-Mb resolution array-based comparative genomichybridization using a BAC clone set optimized for cancergene analysis. Genome Res 2004, 14:179-187.
7. Kim J, Chung HJ, Park CH, Park WY, Kim JH: ChromoViz: multi-modal visualization of gene expression data onto chromo-somes using scalable vector graphics. Bioinformatics 2004,20:1191-1192.
8. GFF Format Specification [http://www.sanger.ac.uk/Software/formats/GFF/GFF_Spec.shtml]
9. Dennis G Jr, Sherman BT, Hosack DA, Yang J, Gao W, Lane HC, Lem-picki RA: DAVID: Database for Annotation, Visualization,and Integrated Discovery. Genome Biol 2003, 4:3.
10. Bussey KJ, Kane D, Sunshine M, Narasimhan S, Nishizuka S, ReinholdWC, Zeeberg B, Ajay W, Weinstein JN: MatchMiner: a tool forbatch navigation among gene and gene product identifiers.Genome Biol 2003, 4:R27.
11. Tanaka H, Bergstrom DA, Yao MC, Tapscott SJ: Widespread andnonrandom distribution of DNA palindromes in cancer cellsprovides a structural platform for subsequent gene amplifi-cation. Nat Genet 2005, 37(3):320-327.
12. Zhao H, Ljungberg B, Grankvist K, Rasmuson T, Tibshirani R, BrooksJD: Gene Expression Profiling Predicts Survival in Conven-tional Renal Cell Carcinoma. PLoS Med 2006, 3(1):e13.
Page 10 of 10(page number not for citation purposes)