Duplication in biological databases: definitions, impacts and ...
277
School of Computing and Information Systems The University of Melbourne DUPLICATION IN BIOLOGICAL DATABASES: DEFINITIONS, IMPACTS AND METHODS Qingyu Chen ORCID ID: 0000-0002-6036-1516 Supervisors: Prof. Justin Zobel Prof. Karin Verspoor Submitted in total fulfilment of the requirements of the degree of Doctor of Philosophy Produced on archival quality paper August 2017
-
Upload
khangminh22 -
Category
Documents
-
view
2 -
download
0
Transcript of Duplication in biological databases: definitions, impacts and ...
School of Computing and Information SystemsThe University of Melbourne
DUPL ICAT ION IN B IOLOGICAL
DATABASES : DEF IN IT IONS ,
IMPACTS AND METHODS
Qingyu Chen
ORCID ID: 0000-0002-6036-1516
Supervisors:Prof. Justin Zobel Prof. Karin Verspoor
Submitted in total fulfilment of the requirementsof the degree of Doctor of Philosophy
Produced on archival quality paper
August 2017

ABSTRACT
Duplication is a pressing issue in biological databases. This thesis concerns duplication,in terms of its definitions (what records are duplicates), impacts (why duplicates aresignificant) and solutions (how to address duplication).The volume of biological databases is growing at an unprecedented rate, populated
by complex records drawn from heterogeneous sources; the huge data volume and thediverse types cause concern for the underlying data quality. A specific challenge is dupli-cation, that is, the presence of redundant or inconsistent records. While existing studiesconcern duplicates, the definitions of duplicates are not clear; the foundational under-standing of what records are considered as duplicates by database stakeholders is lacking.The impacts of duplication are not clear either; existing studies have different or eveninconsistent views on the impacts. The unclear definitions and impacts of duplicationin biological databases further limit the development of the related duplicate detectionmethods.In this work, we refine the definitions of duplication in biological databases through a
retrospective analysis of merged groups in primary nucleotide databases – the duplicatesidentified by record submitters and database staff (or biocurators) – to understand whattypes of duplicates matter to database stakeholders. This reveals two primary representa-tions of duplication under the context of biological databases: entity duplicates, multiplerecords belonging to the same entities, which particularly impact record submission andcuration, and near duplicates (or redundant records), records sharing high similarities,particularly impact database search. The analysis also reveals different types of dupli-cate records, showing that database stakeholders are concerned with diverse types ofduplicates in reality, whereas previous studies mainly consider records with very highsimilarities as duplicates.Following this foundational analysis, we investigate both primary representations. For
entity duplicate, we establish three large-scale benchmarks of labelled duplicates from
iii
different perspectives (submitter-based, expert curation and automatic curation), assessthe effectiveness of an existing method, and develop a new supervised learning methodthat detects duplicates more precisely than previous approaches. For near duplicates, weassess the effectiveness and the efficiency of the best known clustering-based methods interms of database search results diversity (whether retrieved results are independentlyinformative) and completeness (whether retrieved results miss potentially importantrecords after de-duplication), and propose suggestions and solutions for more effectivebiological database search.
iv
DECLARATION
This is to certify that:
1. The thesis comprises only my original work towards the degree of Doctor of Phi-losophy except where indicated in the Preface;
2. Due acknowledgement has been made in the text to all other material used;
3. The thesis is fewer than 100,000 words in length, exclusive of tables, maps, bibli-ographies and appendices.
Qingyu Chen
v

PREFACE
This thesis has been written at the School of Computing and Information Systems, TheUniversity of Melbourne. Each chapter is based on manuscripts published or acceptedfor publication. I declare that I am the primary author and have contributed to morethan 50% of each of these papers.
Chapter 3 to Chapter 9 collectively contain seven relevant publications completed duringmy PhD candidature:
• Chen, Q., Zobel, J., and Verspoor, K. “Duplicates, redundancies and inconsis-tencies in the primary nucleotide databases: a descriptive study”. Published inDatabase: The Journal of Biological Databases and Curation, baw163, 2017.
• Chen, Q., Zobel, J., and Verspoor, K. “Benchmarks for measurement of duplicatedetection methods in nucleotide databases”. Published in Database: The Journalof Biological Databases and Curation, baw164, 2017.
• Chen, Q., Zobel, J., and Verspoor, K. “Evaluation of a machine learning dupli-cate detection method for bioinformatics databases”. Published in Proceedings ofthe ACM Ninth International Workshop on Data and Text Mining in BiomedicalInformatics, pp. 4–12, 2015.
• Chen, Q., Zobel, J., Zhang., and Verspoor, K. “Supervised learning for detectionof duplicates in genomic sequence databases”. Published in PLOS ONE, 11(8),2016.
• Chen, Q., Wan, Y., Lei, Y., Zobel, J., and Verspoor, K. “Evaluation of CD-HITfor constructing non-redundant databases”. Published in Proceedings of the IEEEInternational conference on Bioinformatics and Biomedicine (BIBM), pp. 703–706,2016.
vii
• Chen, Q., Wan, Y., Zhang, X., Lei, Y., Zobel, J., and Verspoor, K. “Comparativeanalysis of sequence clustering methods for de-duplication of biological databases”.To appear in ACM Journal of Data and Information Quality.
• Chen, Q., Wan, Y., Zhang, X., Zobel, J., and Verspoor, K. “Sequence clusteringmethods and completeness of biological database search”. Published in Proceedingsof the Bioinformatics and Artificial Intelligence Workshop, pp. 1–7, 2017.
viii
ACKNOWLEDGMENTS
First and most importantly, I would like to offer my gratitude to my supervisors, ProfJustin Zobel and Prof Karin Verspoor. Without them, it would have been impossiblefor me to complete the thesis. I have known Justin since I undertook the honours degreeat RMIT University; I still remember the situation where he provided decent commentsfor my minor thesis. Now, after three years, his advice still holds for my PhD thesis. Hisintelligence and diligence have been motivating me to be a good researcher in the future.Karin, likewise, has provided dedicated support throughout my PhD candidature. Herdomain expertise, great passion and persistence have been inspiring me. I really enjoytalking with her, regardless of the topics.I also want to thank co-authors of the work published during the candidature: A/Prof
Xiuzhen Zhang, who is always my teacher, mentor and friend; Yu Wan, who is one ofthe most helpful collaborators that I have found during the candidature and Yang Lei,who has helped thoroughly on the topic of clustering. They are rewarding collaboratorsand I sincerely appreciate their help.I wish to further thank the International Society for Biocuration, the official biocu-
ration community. The members in the community have brought me to the area ofbiocuration; many of the members also have provided solid comments on impacts ofduplication in biological databases. In particular, I want to express my appreciation toDr Alex Bateman for his reviews, feedback and suggestions; I will always rememberhis comments on my first research papers. I also want to thank Dr Zhiyong Lu for hisconsistent encouragement.Many individuals have helped me in different ways during the journey. I sincerely
appreciate Prof Rui Zhang for being my committee chair, Prof Tim Baldwin, ProfJames Bailey, Prof Rao Kotagiri, Prof Chris Leckie, Dr Tim Miller, Dr Toby Murray,Jeremy Nicholson, Prof Andrew Turpin, Dr Robert McQuillan, Dr Halil Ali, Dr MatthiasPetri, Dr Caspar Ryan, A/Prof George Fernandez, Cecily Walker, Prof Lin Padgham,
ix
Dr Dhirendra Singh, Prof Timos Sellis, Dr Shane Culpepper, A/Prof Falk Scholer, DrCharles Thevathayan, A/Prof James Harland and A/Prof Isaac Balbin for being mylecturers, mentors or colleagues, Dr Jan Schroeder, Dr Jianzhong Qi and Prof AlistairMoffat for research advice, Rhonda Smithies and Julie Ireland for their administrativesupport, Dr Yingjiang Zhou and Dr Jiancong Tong for being my research mentors, andWenjun Zhu and Benyang Zhu for their long friendship.
I would like to extend my thanks to officemates, fellow students and friends: Miji,Mohammad, Reda, Yitong, Moe, Fei, Yuan, Zeyi, Moha, Pinpin, Afshin, Nitika, Oliver,Wenxi, Elaheh, Ekaterina, Aili, Doris, Yude, Wei, Diego, Ziad, Xiaolu, Anh, Kai, Jin-meng, and Chao. There are many others that I am indebted to but cannot thank dueto limited space. A final huge thank you goes to my parents, Xi Chen and Jun Qing,for their unconditional love and encouragement.
Thank you all,Qingyu
x
In memory of my grandfather 庆绪昌 (1937–2008)

CONTENTS
1 introduction 11.1 Thesis problem statement, aim and scope . . . . . . . . . . . . . . . . . . 51.2 Contributions . . . . . . . . . . . . . . . . . . . . . . . . . . . . . . . . . 61.3 Structure of the thesis . . . . . . . . . . . . . . . . . . . . . . . . . . . . 7
2 background 112.1 Fundamental database concepts . . . . . . . . . . . . . . . . . . . . . . . 112.2 Biological sequence databases: an overview . . . . . . . . . . . . . . . . . 12
2.2.1 Genetic background . . . . . . . . . . . . . . . . . . . . . . . . . . 132.2.2 The development of biological sequence databases . . . . . . . . . 15
2.3 GenBank: a representative nucleotide database . . . . . . . . . . . . . . 182.4 UniProtKB: a representative protein database . . . . . . . . . . . . . . . 21
2.4.1 Record submission . . . . . . . . . . . . . . . . . . . . . . . . . . 232.4.2 Automatic curation . . . . . . . . . . . . . . . . . . . . . . . . . . 242.4.3 Expert curation . . . . . . . . . . . . . . . . . . . . . . . . . . . . 25
2.4.3.1 Sequence curation . . . . . . . . . . . . . . . . . . . . . 272.4.3.2 Sequence analysis . . . . . . . . . . . . . . . . . . . . . . 292.4.3.3 Literature curation . . . . . . . . . . . . . . . . . . . . . 302.4.3.4 Family-based curation . . . . . . . . . . . . . . . . . . . 302.4.3.5 Evidence attribution . . . . . . . . . . . . . . . . . . . . 312.4.3.6 Quality assurance, integration and update . . . . . . . . 31
2.5 Other biological databases . . . . . . . . . . . . . . . . . . . . . . . . . . 312.6 Data quality in databases . . . . . . . . . . . . . . . . . . . . . . . . . . 31
2.6.1 Conceptions of data quality . . . . . . . . . . . . . . . . . . . . . 332.6.2 What is data quality? . . . . . . . . . . . . . . . . . . . . . . . . 352.6.3 Data quality issues . . . . . . . . . . . . . . . . . . . . . . . . . . 38
2.7 Duplication: definitions and impacts . . . . . . . . . . . . . . . . . . . . . 412.7.1 Duplication in general . . . . . . . . . . . . . . . . . . . . . . . . 41
xiii
xiv contents
2.7.1.1 Exact duplicates . . . . . . . . . . . . . . . . . . . . . . 412.7.1.2 Entity duplicates . . . . . . . . . . . . . . . . . . . . . . 422.7.1.3 Near duplicates . . . . . . . . . . . . . . . . . . . . . . . 42
2.7.2 Duplication in biological databases . . . . . . . . . . . . . . . . . 502.7.2.1 Duplicates based on a simple similarity threshold (re-
dundant) . . . . . . . . . . . . . . . . . . . . . . . . . . 532.7.2.2 Duplicates based on expert curation . . . . . . . . . . . 53
2.8 Duplicate records: methods . . . . . . . . . . . . . . . . . . . . . . . . . 572.8.1 General duplicate detection paradigm . . . . . . . . . . . . . . . . 572.8.2 Data pre-processing . . . . . . . . . . . . . . . . . . . . . . . . . . 572.8.3 Comparison . . . . . . . . . . . . . . . . . . . . . . . . . . . . . . 582.8.4 Decision . . . . . . . . . . . . . . . . . . . . . . . . . . . . . . . . 582.8.5 Evaluation . . . . . . . . . . . . . . . . . . . . . . . . . . . . . . . 582.8.6 Compare at the attribute level . . . . . . . . . . . . . . . . . . . . 592.8.7 Compare at the record level . . . . . . . . . . . . . . . . . . . . . 60
2.9 Biological sequence record deduplication . . . . . . . . . . . . . . . . . . 632.9.1 BARDD: a supervised-learning based duplicate detection method 632.9.2 CD-HIT: a distance-based duplicate detection method . . . . . . . 66
3 paper 1 733.1 Abstract of the paper . . . . . . . . . . . . . . . . . . . . . . . . . . . . . 733.2 Summary and reflection . . . . . . . . . . . . . . . . . . . . . . . . . . . 74
4 paper 2 954.1 Abstract of the paper . . . . . . . . . . . . . . . . . . . . . . . . . . . . . 954.2 Summary and reflection . . . . . . . . . . . . . . . . . . . . . . . . . . . 96
5 paper 3 1175.1 Abstract of the paper . . . . . . . . . . . . . . . . . . . . . . . . . . . . . 1175.2 Summary and reflection . . . . . . . . . . . . . . . . . . . . . . . . . . . 118
6 paper 4 1296.1 Abstract of the paper . . . . . . . . . . . . . . . . . . . . . . . . . . . . . 1296.2 Summary and reflection . . . . . . . . . . . . . . . . . . . . . . . . . . . 130
7 paper 5 153
contents xv
7.1 Abstract of the paper . . . . . . . . . . . . . . . . . . . . . . . . . . . . . 1537.2 Summary and reflection . . . . . . . . . . . . . . . . . . . . . . . . . . . 154
8 paper 6 1618.1 Abstract of the paper . . . . . . . . . . . . . . . . . . . . . . . . . . . . . 1618.2 Summary and reflection . . . . . . . . . . . . . . . . . . . . . . . . . . . 162
9 paper 7 1939.1 Abstract of the paper . . . . . . . . . . . . . . . . . . . . . . . . . . . . . 1939.2 Summary and reflection . . . . . . . . . . . . . . . . . . . . . . . . . . . 194
10 conclusion 20310.1 Future work . . . . . . . . . . . . . . . . . . . . . . . . . . . . . . . . . . 204
Appendix 207
a appendix 209a.1 Sample record in FASTA format . . . . . . . . . . . . . . . . . . . . . . . 209a.2 Sample record in GBFF format . . . . . . . . . . . . . . . . . . . . . . . 209

L I ST OF F IGURES
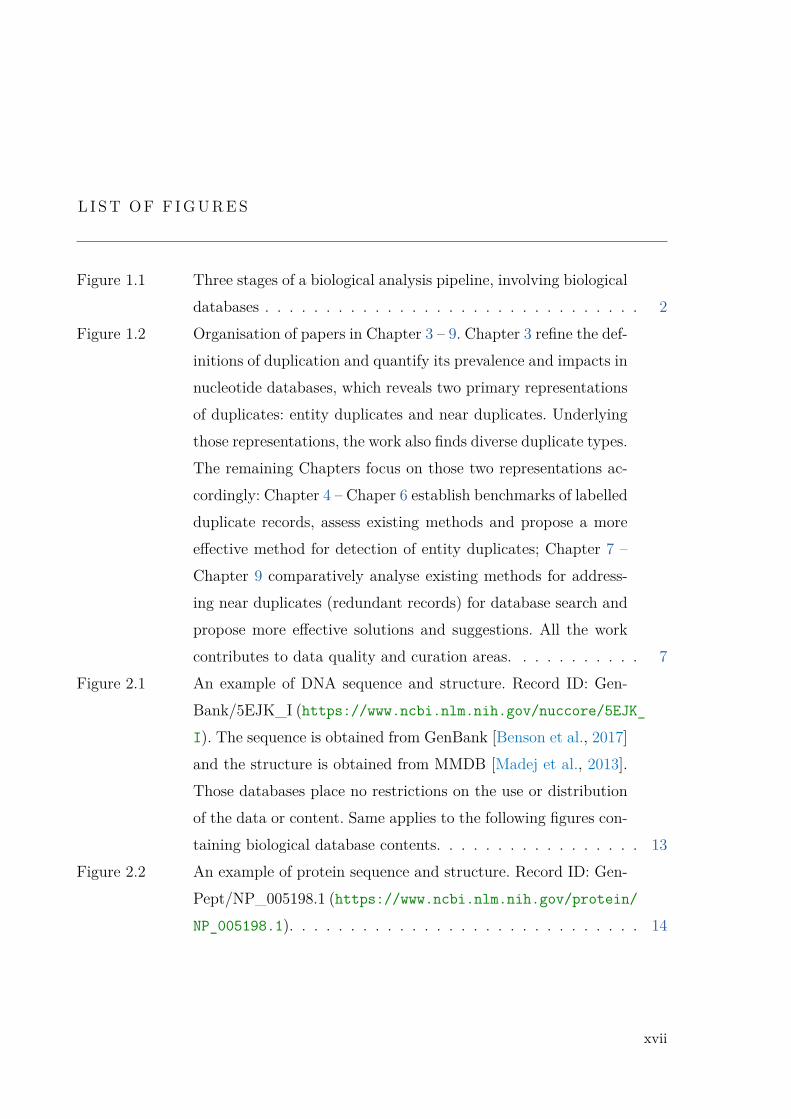
Figure 1.1 Three stages of a biological analysis pipeline, involving biologicaldatabases . . . . . . . . . . . . . . . . . . . . . . . . . . . . . . . 2
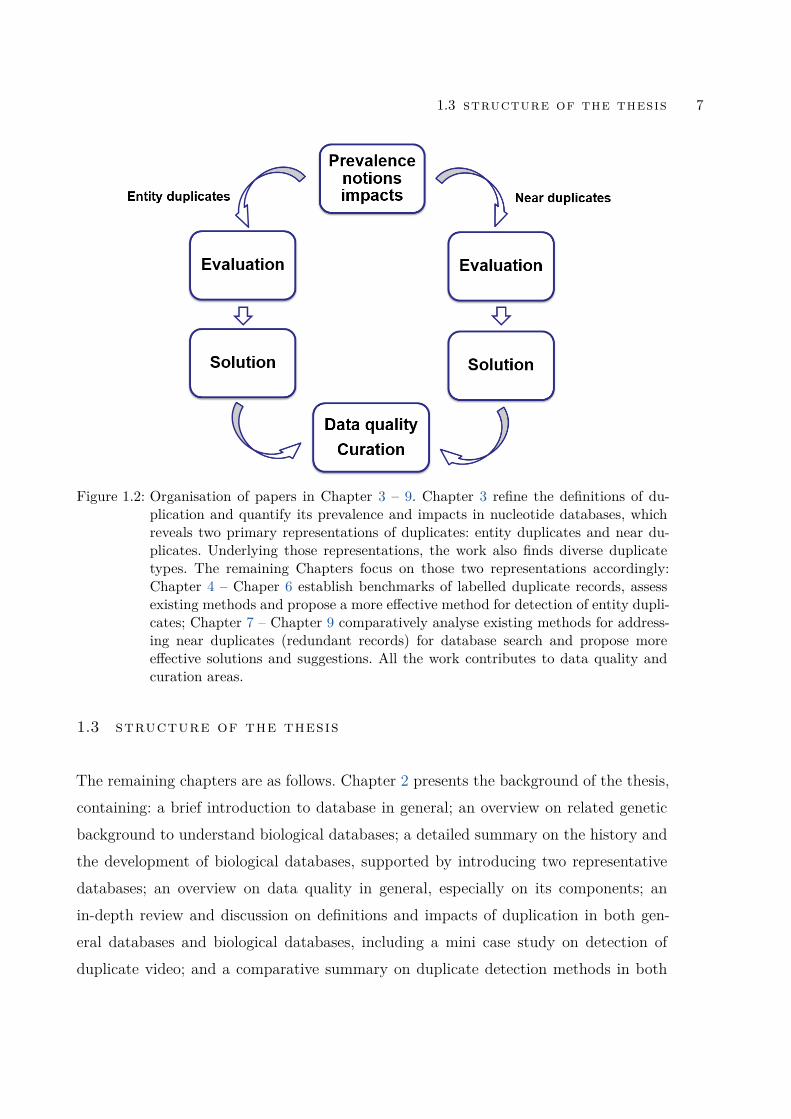
Figure 1.2 Organisation of papers in Chapter 3 – 9. Chapter 3 refine the def-initions of duplication and quantify its prevalence and impacts innucleotide databases, which reveals two primary representationsof duplicates: entity duplicates and near duplicates. Underlyingthose representations, the work also finds diverse duplicate types.The remaining Chapters focus on those two representations ac-cordingly: Chapter 4 – Chaper 6 establish benchmarks of labelledduplicate records, assess existing methods and propose a moreeffective method for detection of entity duplicates; Chapter 7 –Chapter 9 comparatively analyse existing methods for address-ing near duplicates (redundant records) for database search andpropose more effective solutions and suggestions. All the workcontributes to data quality and curation areas. . . . . . . . . . . 7
Figure 2.1 An example of DNA sequence and structure. Record ID: Gen-Bank/5EJK_I (https://www.ncbi.nlm.nih.gov/nuccore/5EJK_
I). The sequence is obtained from GenBank [Benson et al., 2017]and the structure is obtained from MMDB [Madej et al., 2013].Those databases place no restrictions on the use or distributionof the data or content. Same applies to the following figures con-taining biological database contents. . . . . . . . . . . . . . . . . 13
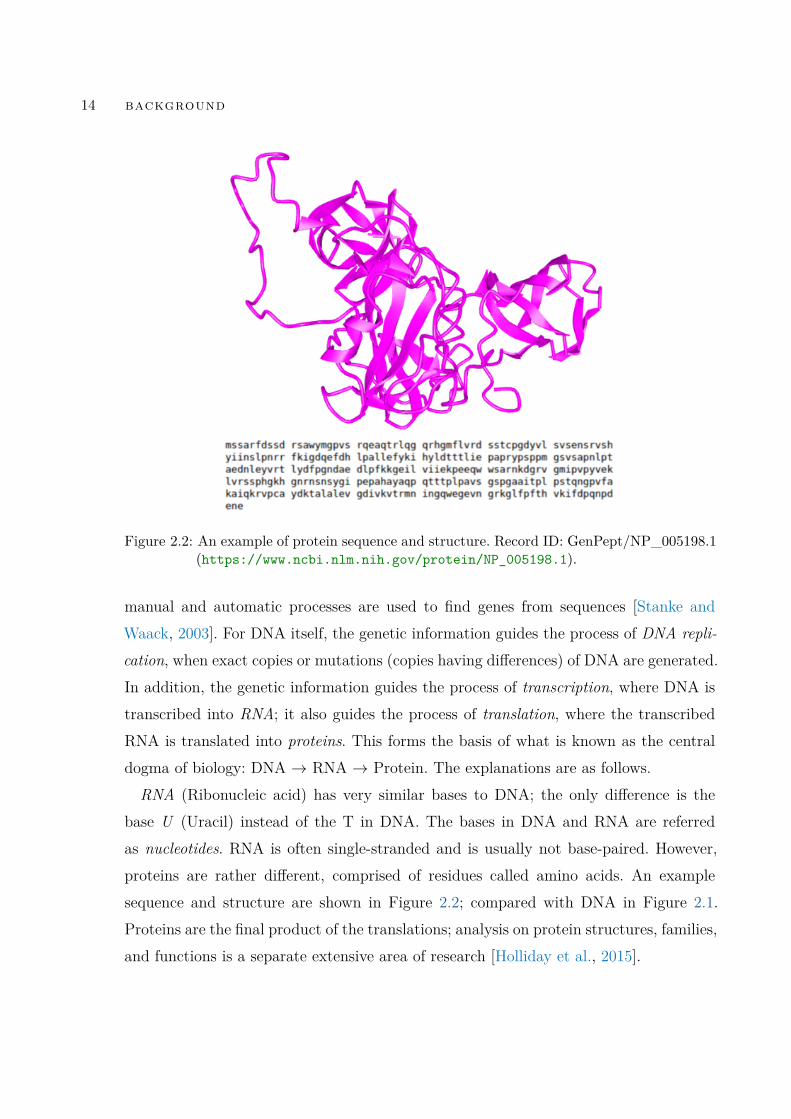
Figure 2.2 An example of protein sequence and structure. Record ID: Gen-Pept/NP_005198.1 (https://www.ncbi.nlm.nih.gov/protein/
NP_005198.1). . . . . . . . . . . . . . . . . . . . . . . . . . . . . 14
xvii
xviii List of Figures
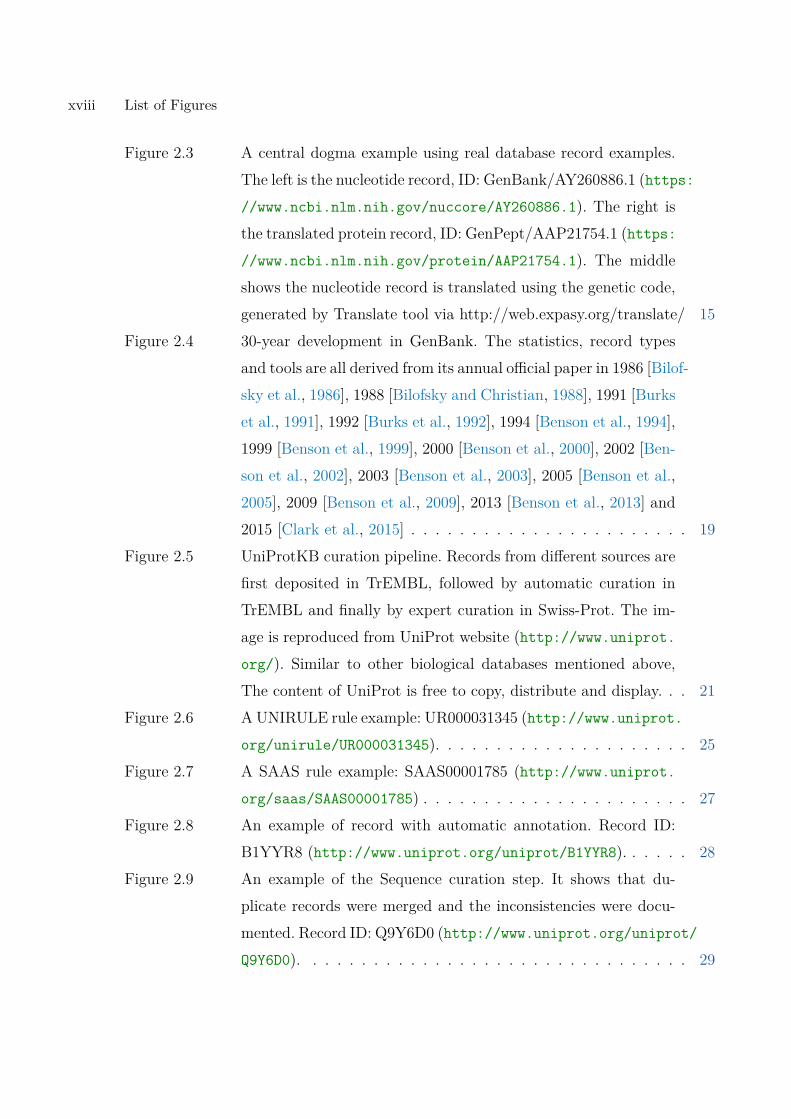
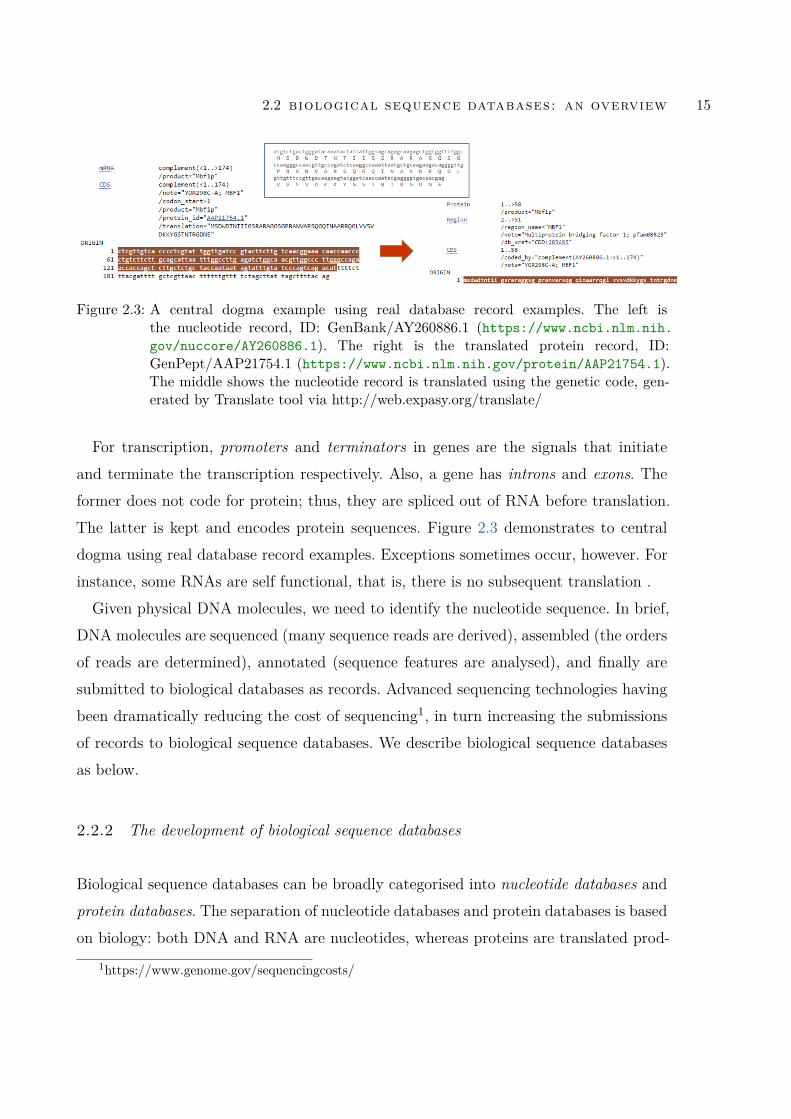
Figure 2.3 A central dogma example using real database record examples.The left is the nucleotide record, ID: GenBank/AY260886.1 (https:
//www.ncbi.nlm.nih.gov/nuccore/AY260886.1). The right isthe translated protein record, ID: GenPept/AAP21754.1 (https:
//www.ncbi.nlm.nih.gov/protein/AAP21754.1). The middleshows the nucleotide record is translated using the genetic code,generated by Translate tool via http://web.expasy.org/translate/ 15
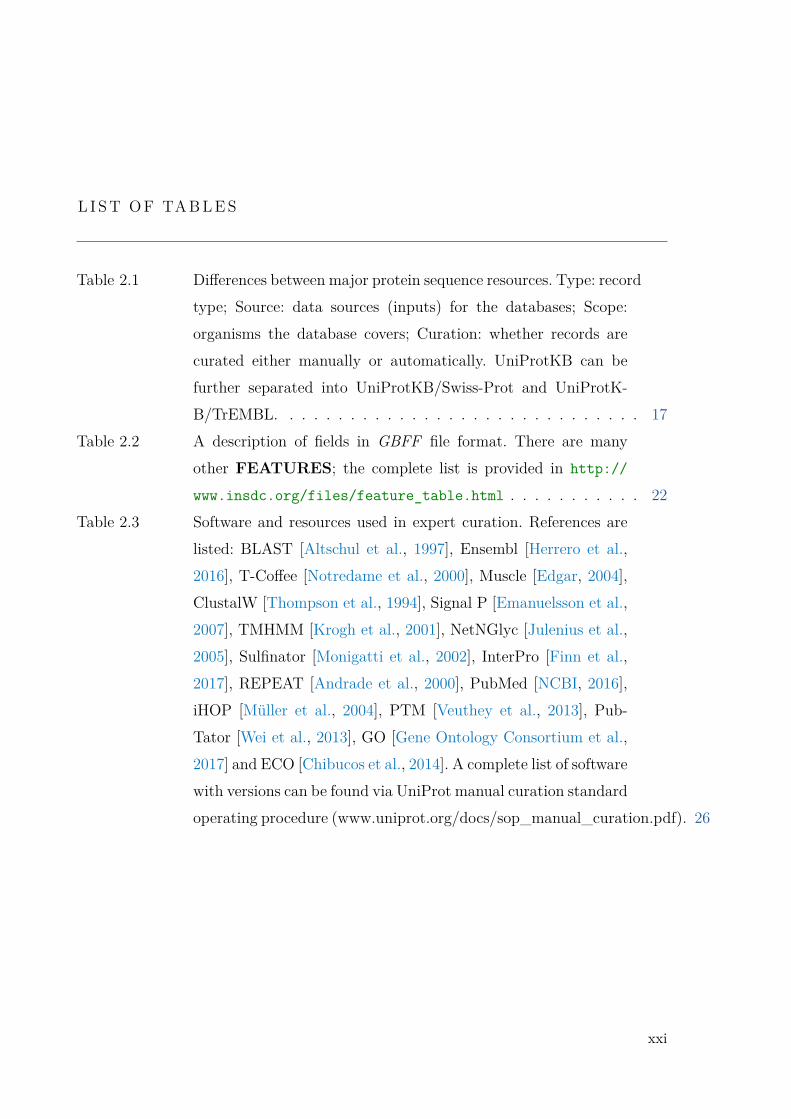
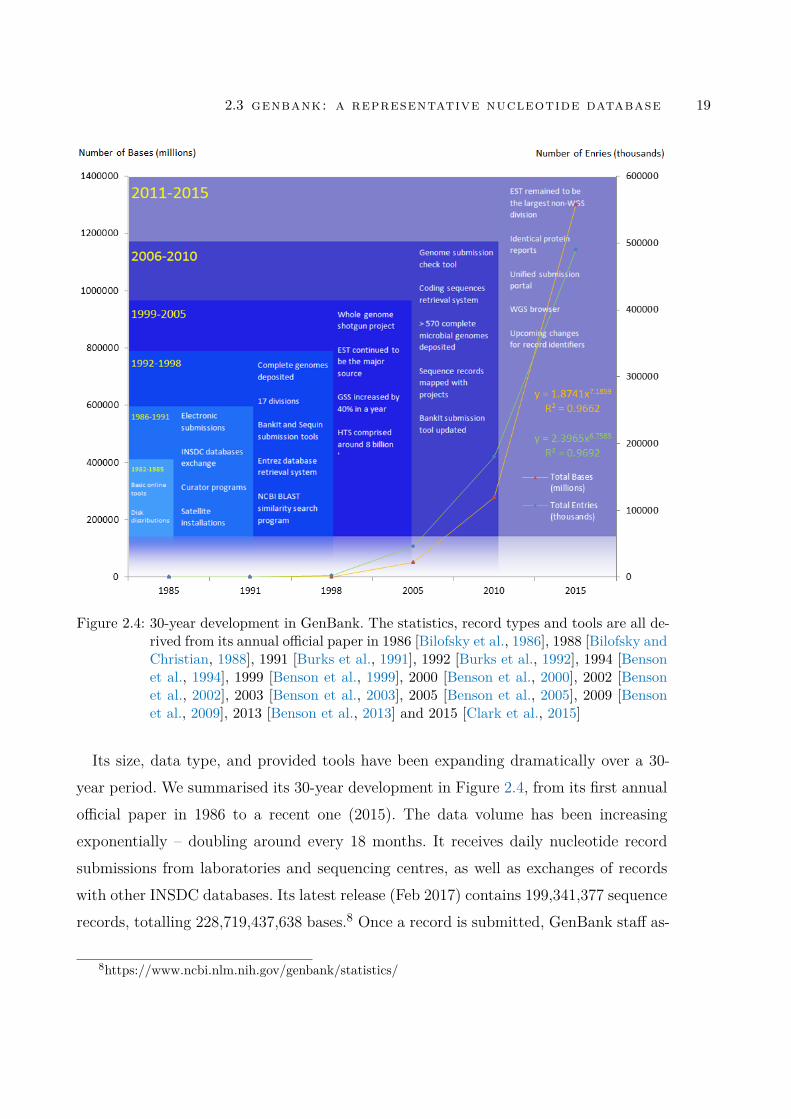
Figure 2.4 30-year development in GenBank. The statistics, record typesand tools are all derived from its annual official paper in 1986 [Bilof-sky et al., 1986], 1988 [Bilofsky and Christian, 1988], 1991 [Burkset al., 1991], 1992 [Burks et al., 1992], 1994 [Benson et al., 1994],1999 [Benson et al., 1999], 2000 [Benson et al., 2000], 2002 [Ben-son et al., 2002], 2003 [Benson et al., 2003], 2005 [Benson et al.,2005], 2009 [Benson et al., 2009], 2013 [Benson et al., 2013] and2015 [Clark et al., 2015] . . . . . . . . . . . . . . . . . . . . . . . 19
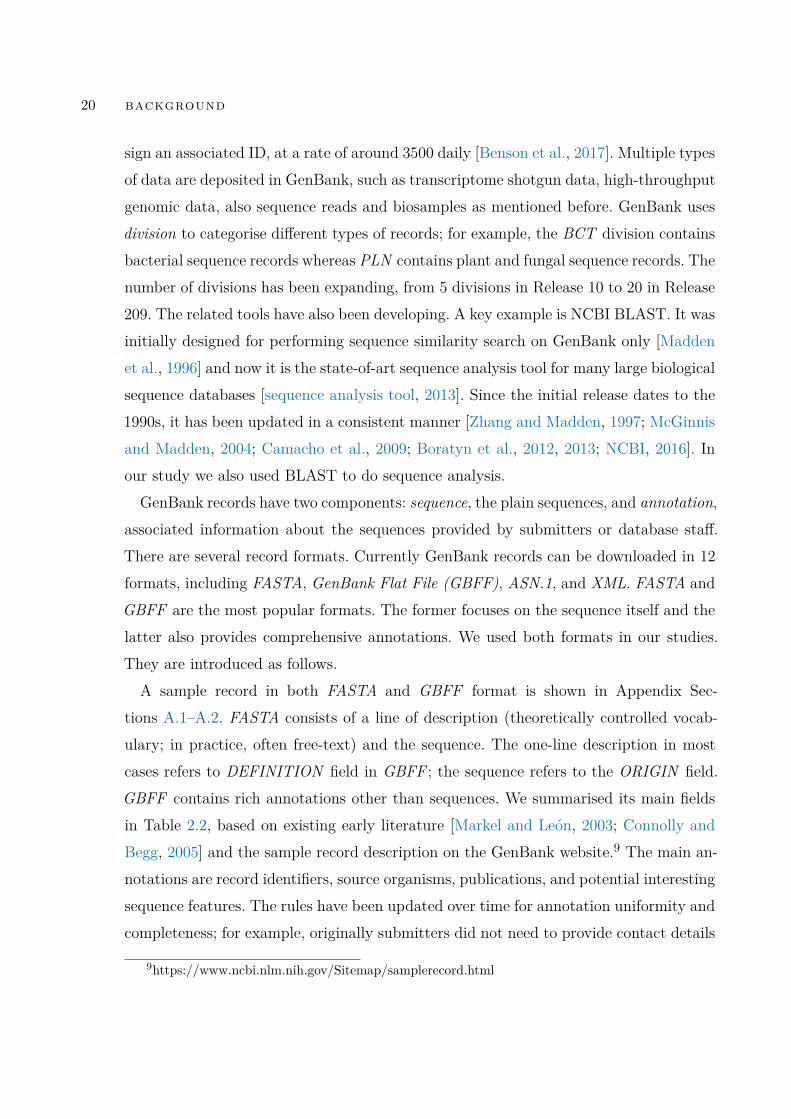
Figure 2.5 UniProtKB curation pipeline. Records from different sources arefirst deposited in TrEMBL, followed by automatic curation inTrEMBL and finally by expert curation in Swiss-Prot. The im-age is reproduced from UniProt website (http://www.uniprot.
org/). Similar to other biological databases mentioned above,The content of UniProt is free to copy, distribute and display. . . 21
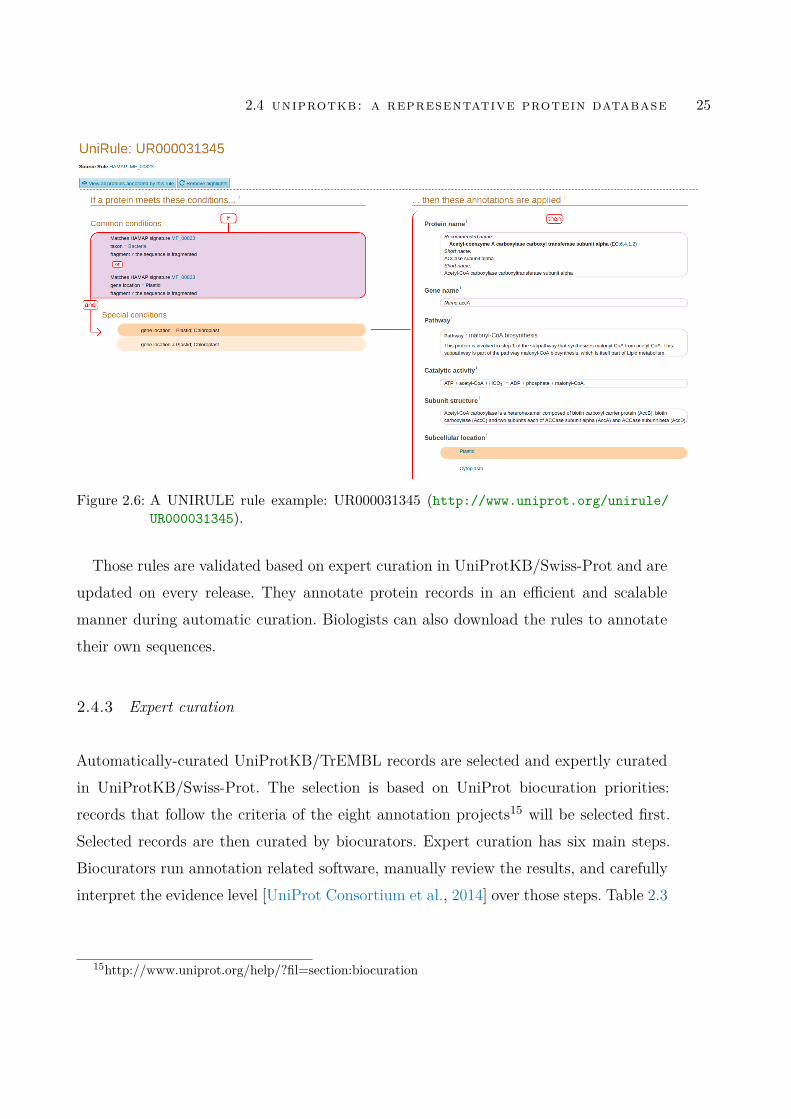
Figure 2.6 A UNIRULE rule example: UR000031345 (http://www.uniprot.
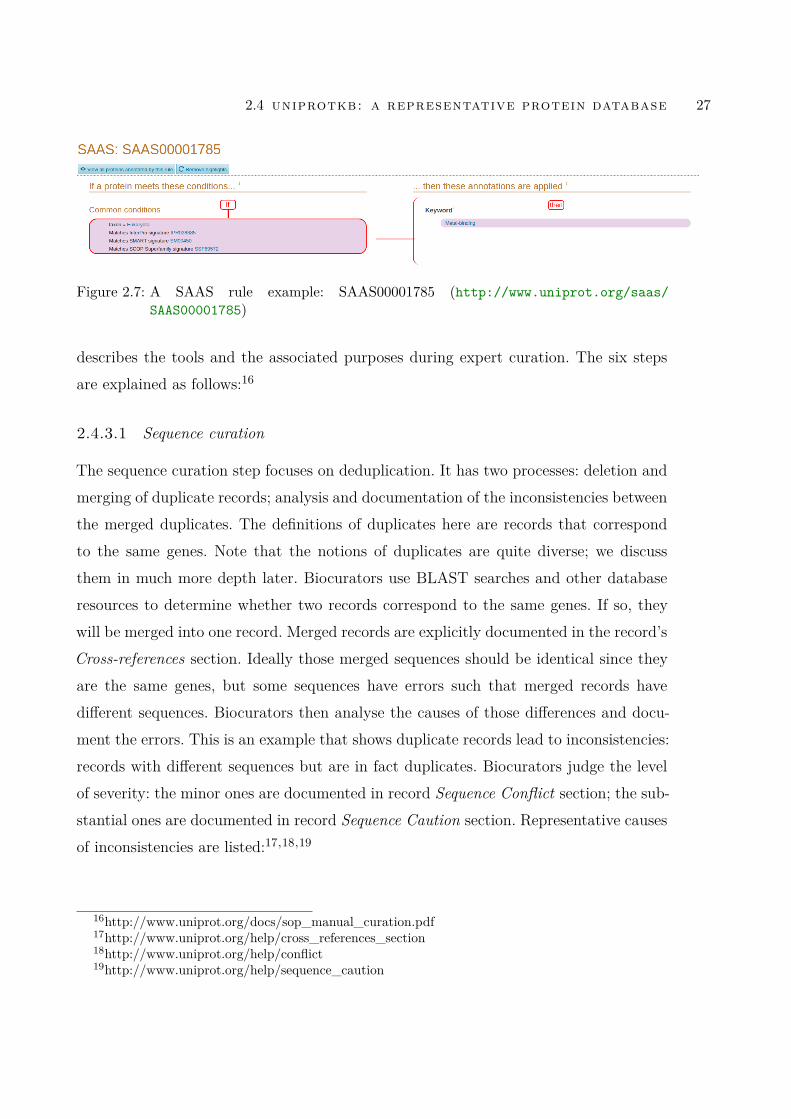
org/unirule/UR000031345). . . . . . . . . . . . . . . . . . . . . 25Figure 2.7 A SAAS rule example: SAAS00001785 (http://www.uniprot.
org/saas/SAAS00001785) . . . . . . . . . . . . . . . . . . . . . . 27Figure 2.8 An example of record with automatic annotation. Record ID:
B1YYR8 (http://www.uniprot.org/uniprot/B1YYR8). . . . . . 28Figure 2.9 An example of the Sequence curation step. It shows that du-
plicate records were merged and the inconsistencies were docu-mented. Record ID: Q9Y6D0 (http://www.uniprot.org/uniprot/
Q9Y6D0). . . . . . . . . . . . . . . . . . . . . . . . . . . . . . . . 29

List of Figures xix
Figure 2.10 Literature curation example. Record ID: UniProtKB/Swiss-Prot/Q24145(http://www.uniprot.org/uniprot/Q24145). . . . . . . . . . . 29
Figure 2.11 Evidence Attribution example. Evidence code ID: ECO_0000269(http://purl.obolibrary.org/obo/ECO_0000269). . . . . . . . 30
Figure 2.12 BARDD method paradigm . . . . . . . . . . . . . . . . . . . . . 63Figure 2.13 CD-HIT method paradigm . . . . . . . . . . . . . . . . . . . . . 66Figure 2.14 Database search pipeline using sequence clustering methods . . . 66

L I ST OF TABLES
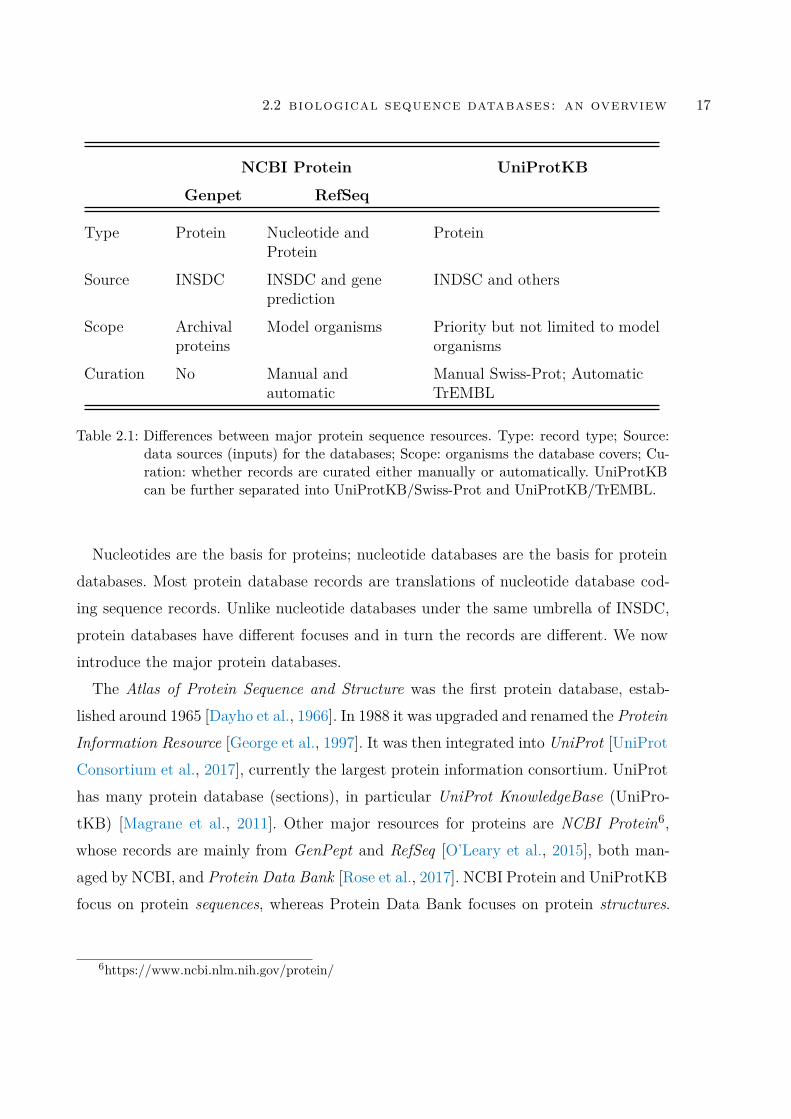
Table 2.1 Differences between major protein sequence resources. Type: recordtype; Source: data sources (inputs) for the databases; Scope:organisms the database covers; Curation: whether records arecurated either manually or automatically. UniProtKB can befurther separated into UniProtKB/Swiss-Prot and UniProtK-B/TrEMBL. . . . . . . . . . . . . . . . . . . . . . . . . . . . . . 17
Table 2.2 A description of fields in GBFF file format. There are manyother FEATURES; the complete list is provided in http://
www.insdc.org/files/feature_table.html . . . . . . . . . . . 22Table 2.3 Software and resources used in expert curation. References are
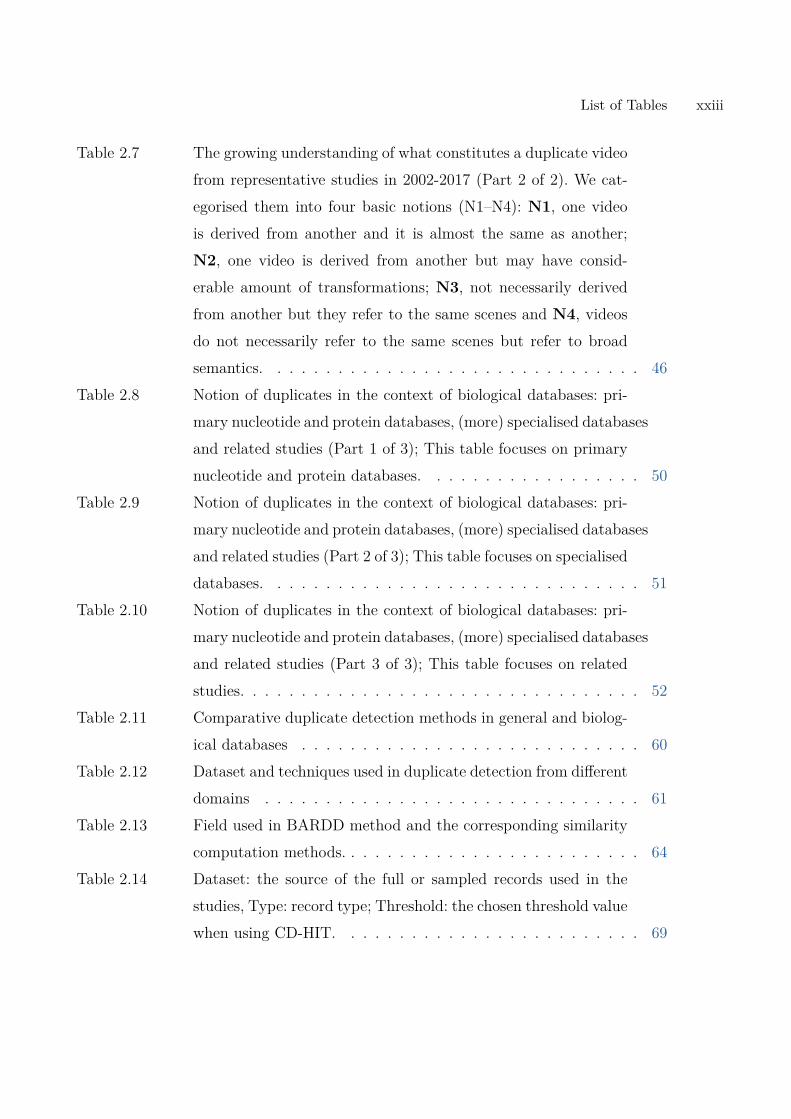
listed: BLAST [Altschul et al., 1997], Ensembl [Herrero et al.,2016], T-Coffee [Notredame et al., 2000], Muscle [Edgar, 2004],ClustalW [Thompson et al., 1994], Signal P [Emanuelsson et al.,2007], TMHMM [Krogh et al., 2001], NetNGlyc [Julenius et al.,2005], Sulfinator [Monigatti et al., 2002], InterPro [Finn et al.,2017], REPEAT [Andrade et al., 2000], PubMed [NCBI, 2016],iHOP [Müller et al., 2004], PTM [Veuthey et al., 2013], Pub-Tator [Wei et al., 2013], GO [Gene Ontology Consortium et al.,2017] and ECO [Chibucos et al., 2014]. A complete list of softwarewith versions can be found via UniProt manual curation standardoperating procedure (www.uniprot.org/docs/sop_manual_curation.pdf). 26
xxi
xxii List of Tables
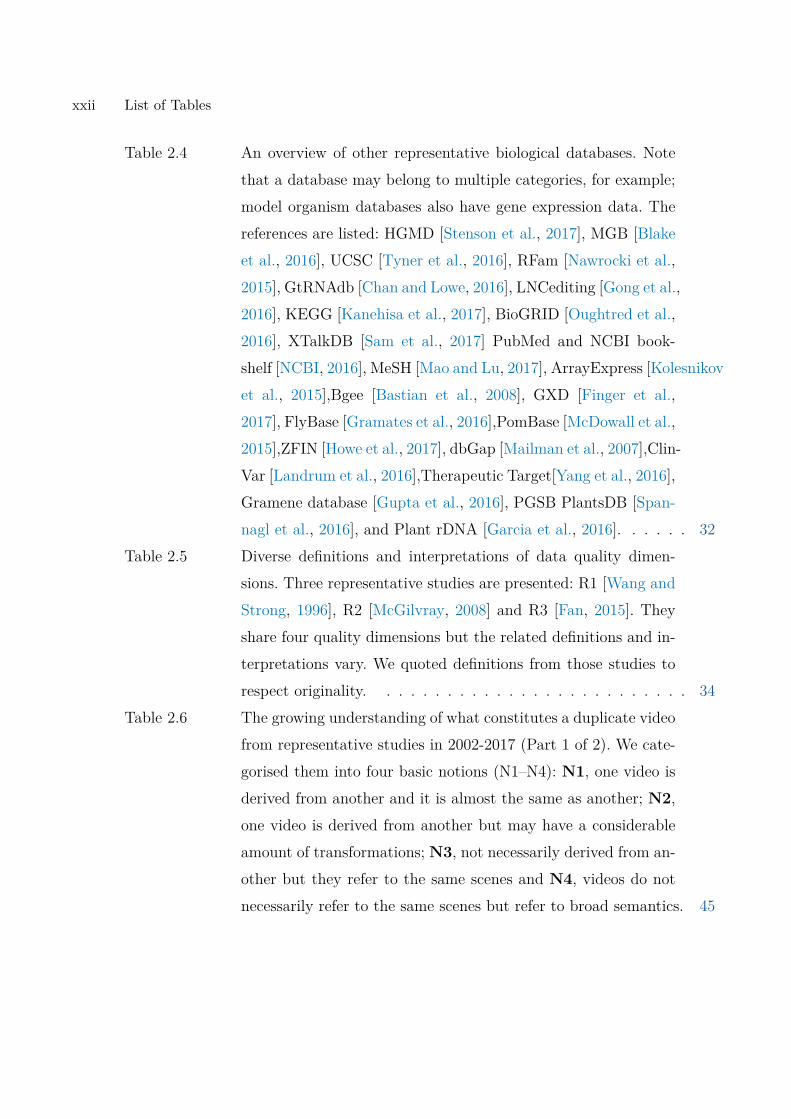
Table 2.4 An overview of other representative biological databases. Notethat a database may belong to multiple categories, for example;model organism databases also have gene expression data. Thereferences are listed: HGMD [Stenson et al., 2017], MGB [Blakeet al., 2016], UCSC [Tyner et al., 2016], RFam [Nawrocki et al.,2015], GtRNAdb [Chan and Lowe, 2016], LNCediting [Gong et al.,2016], KEGG [Kanehisa et al., 2017], BioGRID [Oughtred et al.,2016], XTalkDB [Sam et al., 2017] PubMed and NCBI book-shelf [NCBI, 2016], MeSH [Mao and Lu, 2017], ArrayExpress [Kolesnikovet al., 2015],Bgee [Bastian et al., 2008], GXD [Finger et al.,2017], FlyBase [Gramates et al., 2016],PomBase [McDowall et al.,2015],ZFIN [Howe et al., 2017], dbGap [Mailman et al., 2007],Clin-Var [Landrum et al., 2016],Therapeutic Target[Yang et al., 2016],Gramene database [Gupta et al., 2016], PGSB PlantsDB [Span-nagl et al., 2016], and Plant rDNA [Garcia et al., 2016]. . . . . . 32
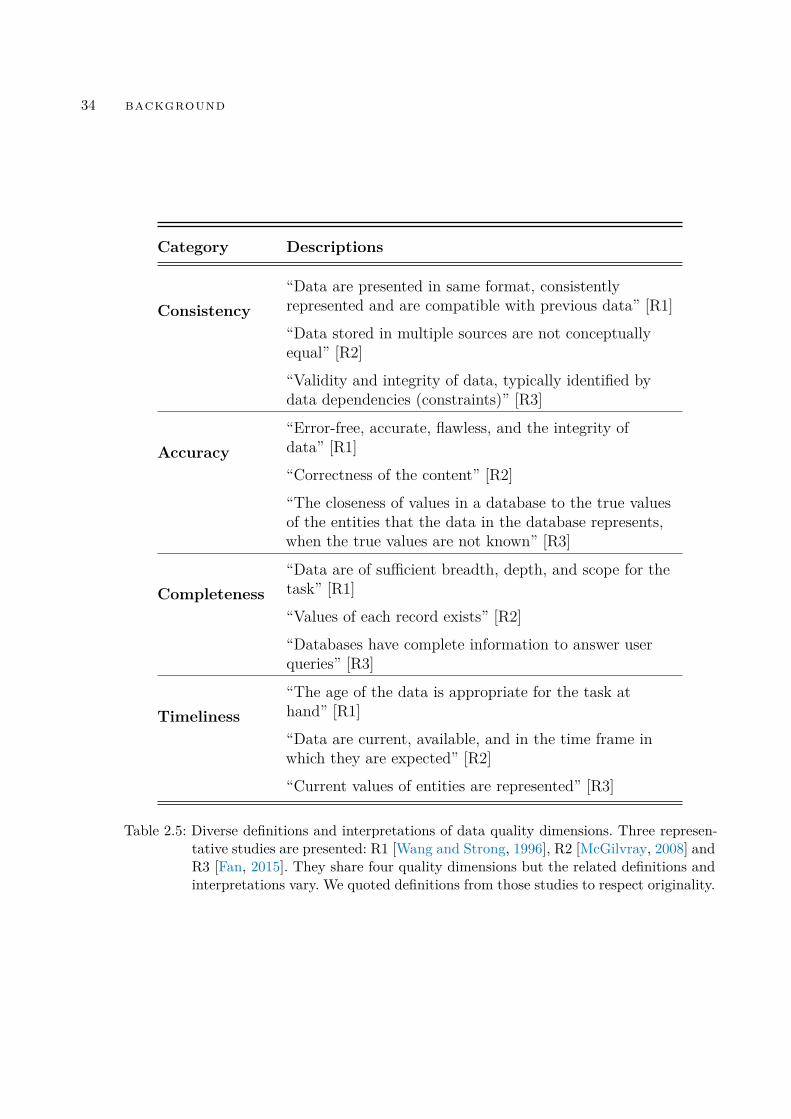
Table 2.5 Diverse definitions and interpretations of data quality dimen-sions. Three representative studies are presented: R1 [Wang andStrong, 1996], R2 [McGilvray, 2008] and R3 [Fan, 2015]. Theyshare four quality dimensions but the related definitions and in-terpretations vary. We quoted definitions from those studies torespect originality. . . . . . . . . . . . . . . . . . . . . . . . . . 34
Table 2.6 The growing understanding of what constitutes a duplicate videofrom representative studies in 2002-2017 (Part 1 of 2). We cate-gorised them into four basic notions (N1–N4): N1, one video isderived from another and it is almost the same as another; N2,one video is derived from another but may have a considerableamount of transformations; N3, not necessarily derived from an-other but they refer to the same scenes and N4, videos do notnecessarily refer to the same scenes but refer to broad semantics. 45
List of Tables xxiii
Table 2.7 The growing understanding of what constitutes a duplicate videofrom representative studies in 2002-2017 (Part 2 of 2). We cat-egorised them into four basic notions (N1–N4): N1, one videois derived from another and it is almost the same as another;N2, one video is derived from another but may have consid-erable amount of transformations; N3, not necessarily derivedfrom another but they refer to the same scenes and N4, videosdo not necessarily refer to the same scenes but refer to broadsemantics. . . . . . . . . . . . . . . . . . . . . . . . . . . . . . . 46
Table 2.8 Notion of duplicates in the context of biological databases: pri-mary nucleotide and protein databases, (more) specialised databasesand related studies (Part 1 of 3); This table focuses on primarynucleotide and protein databases. . . . . . . . . . . . . . . . . . 50
Table 2.9 Notion of duplicates in the context of biological databases: pri-mary nucleotide and protein databases, (more) specialised databasesand related studies (Part 2 of 3); This table focuses on specialiseddatabases. . . . . . . . . . . . . . . . . . . . . . . . . . . . . . . 51
Table 2.10 Notion of duplicates in the context of biological databases: pri-mary nucleotide and protein databases, (more) specialised databasesand related studies (Part 3 of 3); This table focuses on relatedstudies. . . . . . . . . . . . . . . . . . . . . . . . . . . . . . . . . 52
Table 2.11 Comparative duplicate detection methods in general and biolog-ical databases . . . . . . . . . . . . . . . . . . . . . . . . . . . . 60
Table 2.12 Dataset and techniques used in duplicate detection from differentdomains . . . . . . . . . . . . . . . . . . . . . . . . . . . . . . . 61
Table 2.13 Field used in BARDD method and the corresponding similaritycomputation methods. . . . . . . . . . . . . . . . . . . . . . . . . 64
Table 2.14 Dataset: the source of the full or sampled records used in thestudies, Type: record type; Threshold: the chosen threshold valuewhen using CD-HIT. . . . . . . . . . . . . . . . . . . . . . . . . 69

1INTRODUCTION
The data quality of biological databases plays a vital role in ensuring the correctnessof results of biological studies using the data. This thesis is concerned with one of theprimary data quality issues – duplication, in terms of its definitions (what records areduplicates), impacts (why duplication matters) and solutions (how to address duplica-tion).The major biological databases represent an extraordinary collective volume of work.
Diligently built up over decades and comprised of many millions of contributions fromthe biomedical research community, biological databases provide worldwide-access toa massive number of records (also known as entries) from individuals [Baxevanis andBateman, 2015].In the particular area of genome research, starting from individual laboratories and se-
quencing centres, genomes are sequenced, assembled, annotated, and ultimately submit-ted to primary nucleotide databases such as GenBank [Benson et al., 2017], ENA [Toribioet al., 2017], and DDBJ [Mashima et al., 2015] (collectively known as INSDC) [Cochraneet al., 2015]. Translations of those nucleotide records, protein sequence records, are de-posited into central protein databases such as UniProtKnowledgeBase (UniProtKB) [UniProtConsortium et al., 2017] and the Protein Data Bank [Rose et al., 2017]. Sequence recordsare further accumulated into more specialised databases: RFam [Nawrocki et al., 2014]and PFam [Finn et al., 2016] for RNA and protein families respectively, DictyBase [Basuet al., 2012] and PomBase [McDowall et al., 2014] for model organisms, and ArrayEx-press [Kolesnikov et al., 2014] and GEO [Barrett et al., 2012] for gene expressions.Those databases in turn benefit individual studies, many of which use these publicly
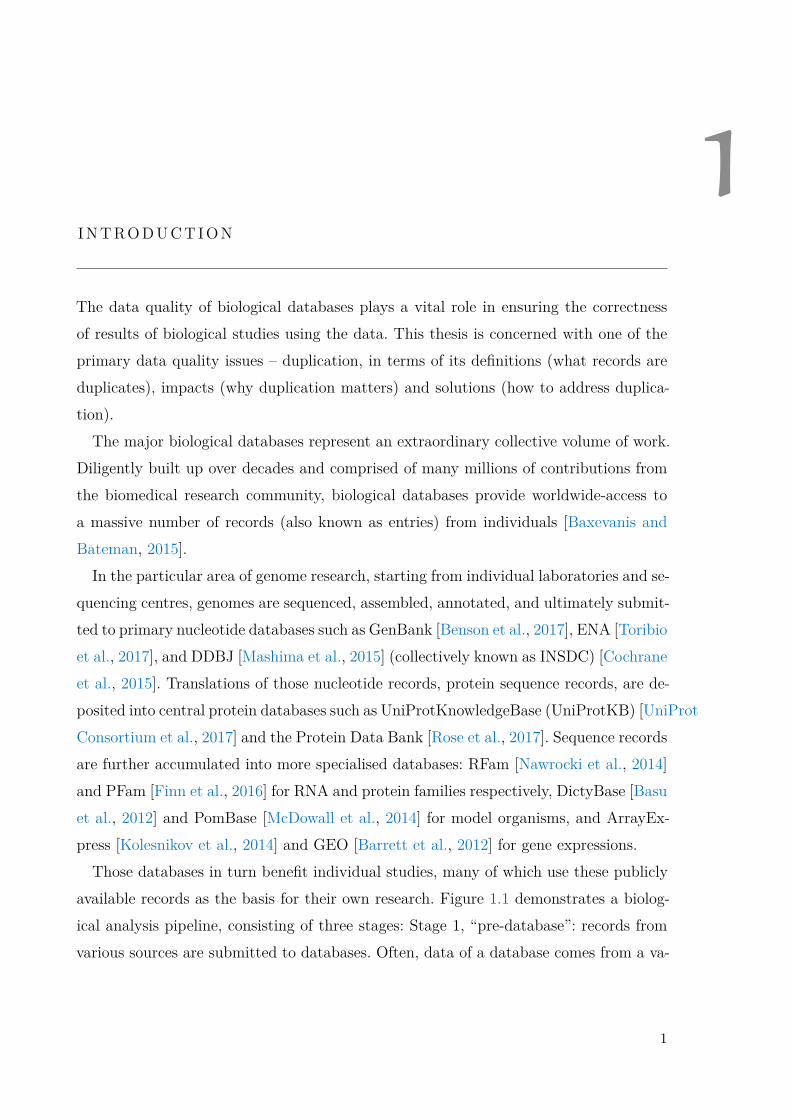
available records as the basis for their own research. Figure 1.1 demonstrates a biolog-ical analysis pipeline, consisting of three stages: Stage 1, “pre-database”: records fromvarious sources are submitted to databases. Often, data of a database comes from a va-
1
2 introduction
Figure 1.1: Three stages of a biological analysis pipeline, involving biological databases
riety of sources. (We explain sources for UniProtKB in Section 2.4, Chapter 2). Stage 2,“within database”: database curation, search, and visualisation. In biological databases,database curation, namely biocuration, plays vital roles. It captures the latest biologicalknowledge, addresses quality issues and normalises the data. (We explain the curationprocess for UniProtKB in Section 2.4, Chapter 2). Stage 3, “post-database”: recorddownload, analysis and inference. Records are downloaded and analysed for differentpurposes; the findings of these studies may in turn contribute to new sources.Given the scale of these databases, the quality of the underlying data has been a long-
term concern. As early in 1996, a range of data quality issues were observed; the concernswere raised that those issues may impact biological study results [Bork and Bairoch,1996]. Quality issues are ongoing with ever-increasing data volumes. The following arerepresentative quality issues [Fan, 2015]:
• Duplication, where records refer to the same entities or share high similarities; forexample, Rosikiewicz et al. filtered duplicate microarray chips from GEO and Ar-rayExpress for integration into the Bgee database [Bastian et al., 2008], amountingto about 14% of the data [Rosikiewicz et al., 2013].
introduction 3
• Inconsistency, where records have contradictory information; for example, Bouad-jenek et al. found about 29 nucleotide records of a 100-record dataset had in-consistencies between the record sequences and literatures associated with thoserecords [Bouadjenek et al., 2017].
• Inaccuracy, where records have wrong information; for example, Schnoes et al.found surprisingly high levels of mis-annotation ranging from 5% to 63% [Schnoeset al., 2009].
• Incompleteness, where records have missing information; for example, Nellore etal. found 18.6% of over 1000 RNA sequence samples have incomplete annota-tions [Nellore et al., 2016] .
• Untimeliness, where records have outdated information; for example, Huntley etal. pointed out that gene ontology for microRNAs was outdated [Huntley et al.,2016].
As a particular example, in 2016 UniProt removed 46.9 million records correspondingto duplicate proteomes [Bursteinas et al., 2016], which was considered as a significantchange by the community [Finn et al., 2016].A pragmatic definition for duplication is that “a pair of records A and B are dupli-
cates if the presence of A means that B is not required, that is, B is redundant in thecontext of a specific task or is superseded by A.” (Chapter 3). In general domains, theprimary representations of duplicates are entity duplicates, where records refer to thesame entities [Christen, 2012a], and near duplicates (or redundant records), where recordsshare high similarities [Xiao et al., 2011]. Both representations of duplication matter; forexample, entity duplicates lead to inconsistencies if those records are rather distinct [El-magarmid et al., 2007] and near duplicates bring a high level of redundancy [Liu et al.,2013]. In practice, databases often contain mixed types of duplicates [Thompson et al.,1995; Turtle and Croft, 1989; Conrad et al., 2003; Cherubini et al., 2009; Hao et al.,2017]. The definitions of duplicates, more importantly, should be ultimately judged bydatabase stakeholders – they are consumers using databases regularly – it is critical tounderstand what types of duplicates matter to them [Cherubini et al., 2009].
4 introduction
In the context of biological databases, the definitions of duplication are not clear; whatduplicate records matter to database stakeholders has not been explored in depth. Exist-ing databases or studies consider a few duplicate types; for example, UniProtKB/Swiss-Prot (a database section of UniProtKB) merges records belonging to the same genes intoone record and documents the inconsistencies, if any and the CD-HIT method considersrecords sharing 90% similarity as redundant by default. We review diverse definitionsof duplicates in biological databases in detail in Section 2.7.2, Chapter 2. However, itis still not clear what records are considered as duplicates by database stakeholders;there is no large-scale study on analysing the prevalence and definitions of duplicates inbiological databases.Unclear definitions of duplication also make the impacts of duplicates unclear –
whether duplication has impacts – or, if so, whether the impacts are positive or negative.Related studies in the literature mentioned the impacts of duplicates, but they are incon-sistent and are not deeply supported by concrete examples. For instance, Müller et al.regard duplication as being of value and de-duplication should not be applied [Mülleret al., 2003], Koh et al. state that duplication has negative impacts but should notbe removed [Koh et al., 2004], and Chellamuthu and Punithavalli claim that duplica-tion has negative impacts and should be removed [Chellamuthu and Punithavalli, 2009].However, those examples are sufficient to demonstrate that it is not clear what impactduplication has. The above views are inconsistent and are not supported by extensiveexamples.Furthermore, unclear definitions and impacts of duplication directly limit the devel-
opment of the associated methods: duplicate detection techniques. Without knowingwhat kind of duplicates matter to database consumers, it is impossible to work outwhether the current methods are sufficient; without knowing whether duplicates matter,it is impossible to know whether developing duplicate detection is necessary. Indeed, asa well-known duplicate detection survey stressed, lack of benchmarks of labelled dupli-cates is a bottleneck for both assessment of the robustness of existing duplicate detectionmethods and development of innovative duplicate detection methods [Elmagarmid et al.,2007].
1.1 thesis problem statement, aim and scope 5
1.1 thesis problem statement, aim and scope
This thesis investigates duplication in biological databases, in terms of its definitions,impacts and solutions. It aims to solve three main questions:
1. What records are considered as duplicates by database stakeholders?
2. What are the impacts of duplication?
3. Whether existing methods are sufficient to detect duplicates, or if not, how topropose better solutions?
In other words, we aim to quantify what kind of duplicates are prevalent; investi-gate whether they impact database consumers, in particular biocurators (database staffcurating records) and end users (database users who submit and download records);assess the effectiveness and the efficiency of existing duplicate detection methods in thisdomain; and develop more effective duplicate detection methods.We specify three main constraints of the investigation. First, the investigation of
duplication is limited in biological sequence databases; that is, sequences are essentialcomponents of the database records. The term “biological databases” and “biologicalsequence databases” are often used interchangeably [Baxevanis and Bateman, 2015] andwe do so as well in the thesis. There are some biological databases that do not containbiological sequences, such as PUBMED (https://www.ncbi.nlm.nih.gov/pubmed/), abiomedical literature database. More precisely, we focus on primary nucleotide and pro-tein sequence databases: INSDC nucleotide databases (introduced in Section 2.3, Chap-ter 2) and UniProt protein databases(introduced in Section 2.4, Chapter 2). There arefurther biological sequence databases, many of which use INSDC and UniProt databasesas data sources; they are more specialised and are outside the scope of the thesis.In addition, duplication is constrained at record-level, that is, duplication must occur
between a pair of records or entries. The term “duplication” is also used to describebiological processes, such as gene duplication [Ohno et al., 1968], which is not our focus.Duplicate records are considered in more general biological tasks such as biocuration
and biological database search. In other words, we focus on duplicate records that are in
6 introduction
Stage 1 and 2 of Figure 1.1. In terms of biological databases, biocuration and databasesearch are popular use-cases [Li et al., 2015; Howe et al., 2008]. Studies in Stage 3 mayconsider more specialised types of duplicates. For example, we have a biological casestudy on the impacts of duplication in Paper 1 presented in Chapter 3.
1.2 contributions
We have made the following contributions:
• We refine the definitions of duplicates by quantifying prevalence, types and im-pacts of duplication through a retrospective analysis of merged records in INSDCdatabases, in 67,888 merged groups with 111,823 duplicate pairs across 21 popularorganisms. This is the first study of that scale. The results demonstrate that dis-tinct types of duplicate records are present; they not only introduce redundancies,but also lead to inconsistencies.
• We establish three benchmarks of duplicate records in INSDC from three differ-ent principles: records merged directly in INSDC (111,826 pairs); labelled dur-ing UniProtKB/Swiss-Prot expert curation (2,465,891 pairs); and labelled duringUniProtKB/TrEMBL automatic curation (473,555,072 pairs). The benchmarksform the basis of assessment and development of duplicate detection methods; thebenchmarks also facilitate database curation.
• We assess the performance of existing methods and propose better methods forboth entity duplicates and near duplicates. For entity duplicates, we measure theeffectiveness of an existing entity duplicate detection method on a large collectionof duplicates and propose a new method using supervised learning techniquesthat detect duplicates more precisely. For near duplicates, we assess effectivenessand efficiency under the task of biological database search and propose a simplesolution that reduces redundancies in the search results while also reducing therisk of missing of important results after de-duplication.
1.3 structure of the thesis 7
Figure 1.2: Organisation of papers in Chapter 3 – 9. Chapter 3 refine the definitions of du-plication and quantify its prevalence and impacts in nucleotide databases, whichreveals two primary representations of duplicates: entity duplicates and near du-plicates. Underlying those representations, the work also finds diverse duplicatetypes. The remaining Chapters focus on those two representations accordingly:Chapter 4 – Chaper 6 establish benchmarks of labelled duplicate records, assessexisting methods and propose a more effective method for detection of entity dupli-cates; Chapter 7 – Chapter 9 comparatively analyse existing methods for address-ing near duplicates (redundant records) for database search and propose moreeffective solutions and suggestions. All the work contributes to data quality andcuration areas.
1.3 structure of the thesis
The remaining chapters are as follows. Chapter 2 presents the background of the thesis,containing: a brief introduction to database in general; an overview on related geneticbackground to understand biological databases; a detailed summary on the history andthe development of biological databases, supported by introducing two representativedatabases; an overview on data quality in general, especially on its components; anin-depth review and discussion on definitions and impacts of duplication in both gen-eral databases and biological databases, including a mini case study on detection ofduplicate video; and a comparative summary on duplicate detection methods in both
8 introduction
general databases and biological databases, as well as a detailed description on tworepresentative duplicate detection methods under the domain of biological databases.Chapter 3 to Chapter 9 collectively contain seven publications completed during my
PhD candidature that are directly relevant to the thesis. Each chapter contains ansummary on the paper and a reflection to the underlying research; moreover, it presentsthe published version of that paper. The organisation of those papers is demonstratedin Figure 1.2; a summary is as follows.
• Paper 1 in Chapter 3 [Chen et al., 2017c] investigates the scale, types and impactsof duplicate records in primary nucleotide databases through a retrospective anal-ysis of 111,823 duplicate record pairs merged by database staff and record submit-ters. To our knowledge, this is the first study of that scale.
• Paper 2 in Chapter 4 [Chen et al., 2017b] establishes three large-scale benchmarksfrom different perspectives (submitter-based, automatic curation based and expertcuration based). They can be used as bases for evaluation and development ofmethods that detect entity duplicates.
• Paper 3 in Chapter 5 [Chen et al., 2015] evaluates an existing duplicate detec-tion method that addresses entity duplicate records; it finds that the method hasserious shortcomings such that cannot detect entity duplicates precisely.
• Paper 4 in Chapter 6 [Chen et al., 2016b] proposes a new supervised duplicatedetection method that detect entity duplicates in a much more precise manner.
• Paper 5 in Chapter 7 [Chen et al., 2016a] assesses an existing duplicate detectionmethod that addresses near duplicates, under the context of biological databasesearch results diversity (whether retrieved database search results are indepen-dently informative).
• Paper 6 in Chapter 8 [Chen et al., to appear] extends the assessment in Paper 5in much more depth. It comparatively analysed both effectiveness and efficiencyof two best-known methods that address near duplicates.
1.3 structure of the thesis 9
• Paper 7 in Chapter 9 [Chen et al., 2017a] further measures the effectiveness ofmethods addressing near duplicates under the context of search results complete-ness (whether important retrieved database search results are missed after de-duplication); moreover, it proposes a simple solution that facilitate more effectiveand efficient database search.
The final chapter Chapter 10 summarises the contributions and outlines future direc-tions.

2BACKGROUND
OutlineThis chapter provides background to the thesis, including:
• An introduction to databases in general;
• An overview of biological databases, in terms of their history, development andrepresentatives;
• A summary of data quality, in general and in biological databases;
• A review of concepts and impacts of duplication, in general and in biologicaldatabases;
• A comparative analysis of duplicate detection methods, in general and in biologicaldatabases.
2.1 fundamental database concepts
The term database is ued to refer to a collection of data, whose information can be char-acterised as: structured, organised as a collection of records where each individual recordcontains a set of attributes that are logically connected, defined in schema; searchable,queried, and retrieved using specified languages, such as SQL; updated and released ina regular manner; and cross-referenced, often linked with other sources [Connolly andBegg, 2005; Garcia-Molina, 2008].Databases also refer to the underlying database management systems (DBMS) [Coro-
nel and Morris, 2016]. DBMS have developed from file systems, where data is stored in(independent) files such that storage and search are often done manually or via limited
11
12 background
tools [Stein, 2013]. The early databases (around 60 years ago) were very similar to basicfile systems, called flat file databases. They organise data into one or more files, essen-tially like spreadsheets today. However, such basic file systems have tedious developmenttimes, long searching time, and a lack of security [Garcia-Molina, 2008]. They cannotscale to large data volumes, nor to complex data types. Those limitations have urgedthe development of advanced DBMS, which support users to create new databases andspecify their schemas, store massive amounts of data, search and retrieve data in anefficient manner, recover from failures or misuses, and control access to data [Connollyand Begg, 2005].Databases involves two stakeholders [Coronel and Morris, 2016]: the first stakeholder
is Database staff : a group of people who coordinate the internal database process. Thespecific roles of database staff depend on domain. In general they include system admin-istrators and database designers; in specific contexts such as biological databases, whichwe will introduce later, biocurators are the key database staff [Burge et al., 2012]. Thesecond stakeholder is Database end users: they use the functions provided by databases,such as submission of new records and search target records and many other kinds ofuse.
2.2 biological sequence databases: an overview
In this section, we provide genetic background, demonstrate the development of biolog-ical sequence databases, and further explain representative databases in detail.Biological databases have the above characteristics of databases, but the underlying
data is from the biological domain. Biological data has diverse types, yielding diversetypes of biological databases. Below we introduce different biological data types via anoverview of biological concepts and then describe primary biological databases accordingto those data types.
2.2 biological sequence databases: an overview 13
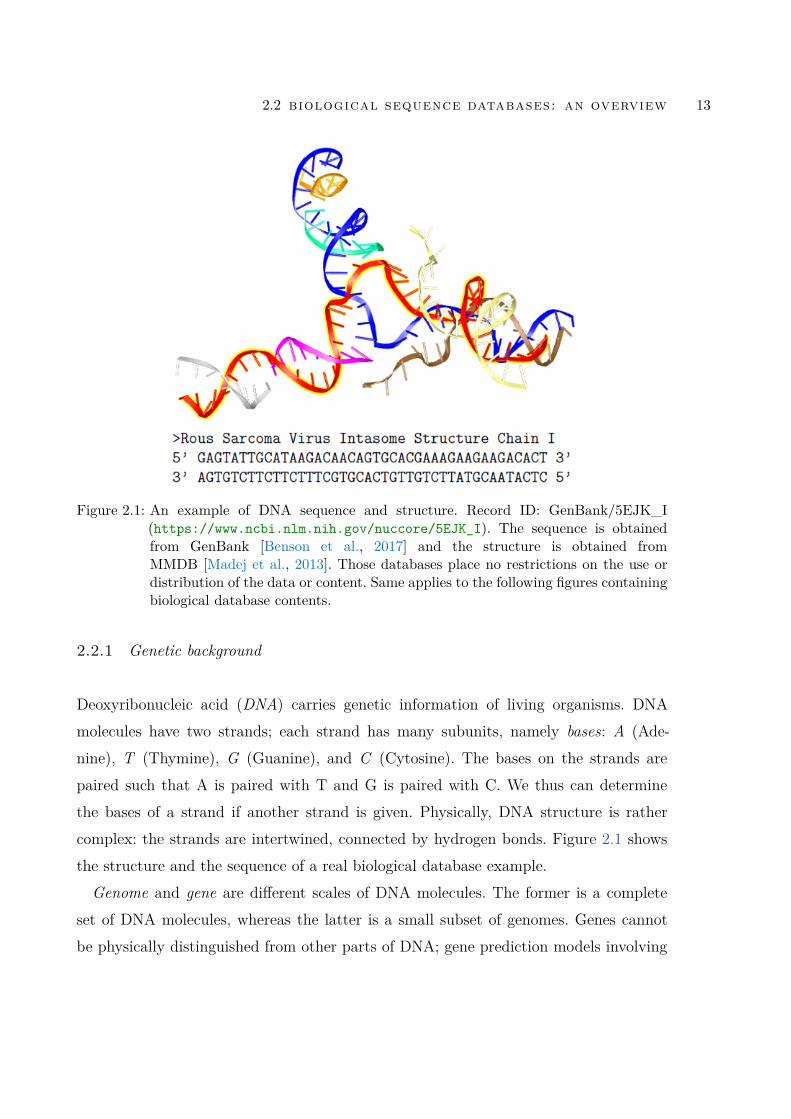
Figure 2.1: An example of DNA sequence and structure. Record ID: GenBank/5EJK_I(https://www.ncbi.nlm.nih.gov/nuccore/5EJK_I). The sequence is obtainedfrom GenBank [Benson et al., 2017] and the structure is obtained fromMMDB [Madej et al., 2013]. Those databases place no restrictions on the use ordistribution of the data or content. Same applies to the following figures containingbiological database contents.
2.2.1 Genetic background
Deoxyribonucleic acid (DNA) carries genetic information of living organisms. DNAmolecules have two strands; each strand has many subunits, namely bases: A (Ade-nine), T (Thymine), G (Guanine), and C (Cytosine). The bases on the strands arepaired such that A is paired with T and G is paired with C. We thus can determinethe bases of a strand if another strand is given. Physically, DNA structure is rathercomplex: the strands are intertwined, connected by hydrogen bonds. Figure 2.1 showsthe structure and the sequence of a real biological database example.Genome and gene are different scales of DNA molecules. The former is a complete
set of DNA molecules, whereas the latter is a small subset of genomes. Genes cannotbe physically distinguished from other parts of DNA; gene prediction models involving
14 background
Figure 2.2: An example of protein sequence and structure. Record ID: GenPept/NP_005198.1(https://www.ncbi.nlm.nih.gov/protein/NP_005198.1).
manual and automatic processes are used to find genes from sequences [Stanke andWaack, 2003]. For DNA itself, the genetic information guides the process of DNA repli-cation, when exact copies or mutations (copies having differences) of DNA are generated.In addition, the genetic information guides the process of transcription, where DNA istranscribed into RNA; it also guides the process of translation, where the transcribedRNA is translated into proteins. This forms the basis of what is known as the centraldogma of biology: DNA → RNA → Protein. The explanations are as follows.RNA (Ribonucleic acid) has very similar bases to DNA; the only difference is the
base U (Uracil) instead of the T in DNA. The bases in DNA and RNA are referredas nucleotides. RNA is often single-stranded and is usually not base-paired. However,proteins are rather different, comprised of residues called amino acids. An examplesequence and structure are shown in Figure 2.2; compared with DNA in Figure 2.1.Proteins are the final product of the translations; analysis on protein structures, families,and functions is a separate extensive area of research [Holliday et al., 2015].
2.2 biological sequence databases: an overview 15
Figure 2.3: A central dogma example using real database record examples. The left isthe nucleotide record, ID: GenBank/AY260886.1 (https://www.ncbi.nlm.nih.gov/nuccore/AY260886.1). The right is the translated protein record, ID:GenPept/AAP21754.1 (https://www.ncbi.nlm.nih.gov/protein/AAP21754.1).The middle shows the nucleotide record is translated using the genetic code, gen-erated by Translate tool via http://web.expasy.org/translate/
For transcription, promoters and terminators in genes are the signals that initiateand terminate the transcription respectively. Also, a gene has introns and exons. Theformer does not code for protein; thus, they are spliced out of RNA before translation.The latter is kept and encodes protein sequences. Figure 2.3 demonstrates to centraldogma using real database record examples. Exceptions sometimes occur, however. Forinstance, some RNAs are self functional, that is, there is no subsequent translation .Given physical DNA molecules, we need to identify the nucleotide sequence. In brief,
DNA molecules are sequenced (many sequence reads are derived), assembled (the ordersof reads are determined), annotated (sequence features are analysed), and finally aresubmitted to biological databases as records. Advanced sequencing technologies havingbeen dramatically reducing the cost of sequencing1, in turn increasing the submissionsof records to biological sequence databases. We describe biological sequence databasesas below.
2.2.2 The development of biological sequence databases
Biological sequence databases can be broadly categorised into nucleotide databases andprotein databases. The separation of nucleotide databases and protein databases is basedon biology: both DNA and RNA are nucleotides, whereas proteins are translated prod-
1https://www.genome.gov/sequencingcosts/
16 background
ucts. The separation is also historical: the first databases were built separately over 30years ago. The EMBL Nucleotide Sequence Data Library, now referred as the EMBLNucleotide Archive (ENA), was the first nucleotide database (more accurately, DNAsequence database at that time), initiated in 1982 [Hamm and Stübert, 1982]. Anothernucleotide database GenBank started around 1986 [Bilofsky et al., 1986], followed bythe DNA Data Bank of Japan (DDBJ) in 1987. In 1988, the leaders of those databasesformed a collaboration International Nucleotide Sequence Databases (INSD) [Tatenoet al., 1998] that is now named as the International Nucleotide Sequence Database Col-laboration (INSDC) [Cochrane et al., 2016]. INSDC databases exchange data on a dailybasis: records are submitted to any of those databases and are exchanged daily. There-fore, while INSDC databases represent nucleotide records in different formats (for in-stance, record FJ770791.1 has three different representations in GenBank2, in ENA3
and in DDBJ4), the contents are the same. Through such long-term global collabora-tions, INSDC databases contain all the nucleotide sequences that are publicly available.5
INSDC databases are primary nucleotide sequence resources nowadays. In 1992, INSDCestablished five policies to emphasise their mission. The core is that records in INSDCdatabases can be accessed in a free, unrestricted, and permanent manner [Brunak et al.,2002]. Those databases play a vital role in biological studies; related studies must ex-plicitly cite accession numbers of the records for reproducibility. The databases arestill developing incrementally. Originally, INSDC databases exchange mainly nucleotidesequence records, that is, sequences with associated annotations. Recently they havestarted exchanging other types of nucleotide sequences: next generation sequencingreads, for example in the Sequence Read Archive [Kodama et al., 2012], whole-genomedata, for example in the Trace Archive [Cochrane et al., 2008], biological samples, forexample in the Biosamples [Federhen et al., 2014], and biological data from the sameorganisation or consortium, for example in the BioProject [Federhen et al., 2014]. By con-vention, the term GenBank/EMBL/DDBJ refers to the traditional nucleotide sequencerecords. We focus on this type of records.
2https://www.ncbi.nlm.nih.gov/nuccore/FJ7707913http://www.ebi.ac.uk/ena/data/view/FJ7707914http://getentry.ddbj.nig.ac.jp/getentry/na/Z11562/?filetype=html5https://www.ncbi.nlm.nih.gov/genbank/
2.2 biological sequence databases: an overview 17
NCBI Protein UniProtKB
Genpet RefSeq
Type Protein Nucleotide andProtein
Protein
Source INSDC INSDC and geneprediction
INDSC and others
Scope Archivalproteins
Model organisms Priority but not limited to modelorganisms
Curation No Manual andautomatic
Manual Swiss-Prot; AutomaticTrEMBL
Table 2.1: Differences between major protein sequence resources. Type: record type; Source:data sources (inputs) for the databases; Scope: organisms the database covers; Cu-ration: whether records are curated either manually or automatically. UniProtKBcan be further separated into UniProtKB/Swiss-Prot and UniProtKB/TrEMBL.
Nucleotides are the basis for proteins; nucleotide databases are the basis for proteindatabases. Most protein database records are translations of nucleotide database cod-ing sequence records. Unlike nucleotide databases under the same umbrella of INSDC,protein databases have different focuses and in turn the records are different. We nowintroduce the major protein databases.The Atlas of Protein Sequence and Structure was the first protein database, estab-
lished around 1965 [Dayho et al., 1966]. In 1988 it was upgraded and renamed the ProteinInformation Resource [George et al., 1997]. It was then integrated into UniProt [UniProtConsortium et al., 2017], currently the largest protein information consortium. UniProthas many protein database (sections), in particular UniProt KnowledgeBase (UniPro-tKB) [Magrane et al., 2011]. Other major resources for proteins are NCBI Protein6,whose records are mainly from GenPept and RefSeq [O’Leary et al., 2015], both man-aged by NCBI, and Protein Data Bank [Rose et al., 2017]. NCBI Protein and UniProtKBfocus on protein sequences, whereas Protein Data Bank focuses on protein structures.
6https://www.ncbi.nlm.nih.gov/protein/
18 background
The scope of this thesis is biological sequence records, not the structures. So we focuson the first two protein resources.NCBI Protein accumulates protein records from two major databases, GenPept and
RefSeq. UniProtKB consists of two databases (or sections),UniProtKB/Swiss-Prot [Boutetet al., 2016] and UniProtKB/TrEMBL.7 For simplicity we will use the term Swiss-Protand TrEMBL from now. Table 2.1 compares those four databases; they have differencesdespite all having protein records. The record type is different: GenPet and UniProtKBcontain purely protein records, whereas RefSeq has nucleotide records as well. The datasource is different: GenPept protein records are completely derived from INSDC (morespecifically GenBank). In contrast, while most protein records from RefSeq and UniPro-tKB are also sourced from INSDC, they also have other data sources: RefSeq has itsown gene prediction model; UniProtKB also contains protein records from direct proteinsequencing and others, which is detailed in Section 2.4. The construction and curationis also different: GenPept simply contains all the translations of coding sequences fromGenBank – as long as a GenBank nucleotide sequence has coding regions – it will havea corresponding protein record in GenPept, therefore it does not have curation. RefSequses a mixture of manual and automatic curation, whereas Swiss-Prot uses dedicatedmanual curation and TrEMBL uses purely automatic curation. We detail curation inSwiss-Prot and TrEMBL in Section 2.4.We next introduce GenBank and UniProt and representative nucleotide and protein
databases. They are arguably the most significant databases and we have used themextensively in our study.
2.3 genbank: a representative nucleotide database
GenBank is arguably the biological sequence database that most biologists or bioin-formaticians are familiar with [Baxevanis and Bateman, 2015]. It contains all of thepublicly available nucleotide records and provides comprehensive tools for downloading,searching, and analysing the records. It is known as “the experimenter’s museum”, asone of the earliest sequence databases [Strasser, 2011] and as an archival resource.
7http://www.ebi.ac.uk/trembl/
2.3 genbank: a representative nucleotide database 19
Figure 2.4: 30-year development in GenBank. The statistics, record types and tools are all de-rived from its annual official paper in 1986 [Bilofsky et al., 1986], 1988 [Bilofsky andChristian, 1988], 1991 [Burks et al., 1991], 1992 [Burks et al., 1992], 1994 [Bensonet al., 1994], 1999 [Benson et al., 1999], 2000 [Benson et al., 2000], 2002 [Bensonet al., 2002], 2003 [Benson et al., 2003], 2005 [Benson et al., 2005], 2009 [Bensonet al., 2009], 2013 [Benson et al., 2013] and 2015 [Clark et al., 2015]
Its size, data type, and provided tools have been expanding dramatically over a 30-year period. We summarised its 30-year development in Figure 2.4, from its first annualofficial paper in 1986 to a recent one (2015). The data volume has been increasingexponentially – doubling around every 18 months. It receives daily nucleotide recordsubmissions from laboratories and sequencing centres, as well as exchanges of recordswith other INSDC databases. Its latest release (Feb 2017) contains 199,341,377 sequencerecords, totalling 228,719,437,638 bases.8 Once a record is submitted, GenBank staff as-
8https://www.ncbi.nlm.nih.gov/genbank/statistics/
20 background
sign an associated ID, at a rate of around 3500 daily [Benson et al., 2017]. Multiple typesof data are deposited in GenBank, such as transcriptome shotgun data, high-throughputgenomic data, also sequence reads and biosamples as mentioned before. GenBank usesdivision to categorise different types of records; for example, the BCT division containsbacterial sequence records whereas PLN contains plant and fungal sequence records. Thenumber of divisions has been expanding, from 5 divisions in Release 10 to 20 in Release209. The related tools have also been developing. A key example is NCBI BLAST. It wasinitially designed for performing sequence similarity search on GenBank only [Maddenet al., 1996] and now it is the state-of-art sequence analysis tool for many large biologicalsequence databases [sequence analysis tool, 2013]. Since the initial release dates to the1990s, it has been updated in a consistent manner [Zhang and Madden, 1997; McGinnisand Madden, 2004; Camacho et al., 2009; Boratyn et al., 2012, 2013; NCBI, 2016]. Inour study we also used BLAST to do sequence analysis.GenBank records have two components: sequence, the plain sequences, and annotation,
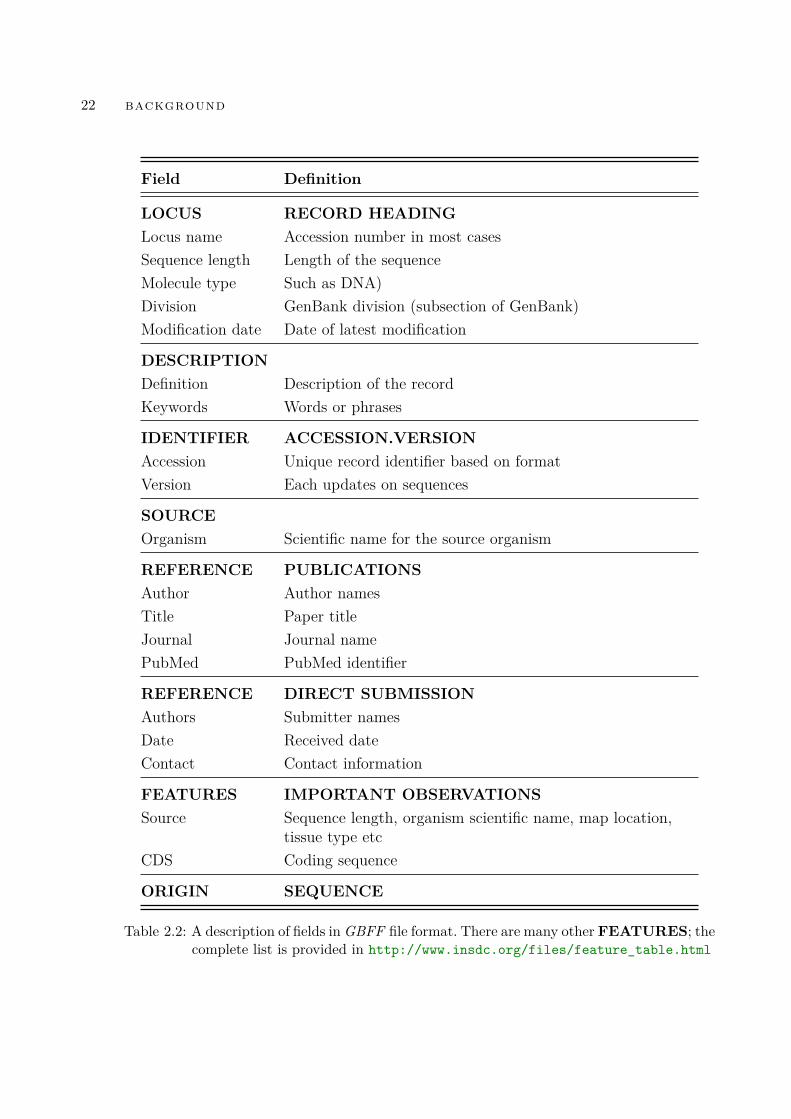
associated information about the sequences provided by submitters or database staff.There are several record formats. Currently GenBank records can be downloaded in 12formats, including FASTA, GenBank Flat File (GBFF), ASN.1, and XML. FASTA andGBFF are the most popular formats. The former focuses on the sequence itself and thelatter also provides comprehensive annotations. We used both formats in our studies.They are introduced as follows.
A sample record in both FASTA and GBFF format is shown in Appendix Sec-tions A.1–A.2. FASTA consists of a line of description (theoretically controlled vocab-ulary; in practice, often free-text) and the sequence. The one-line description in mostcases refers to DEFINITION field in GBFF ; the sequence refers to the ORIGIN field.GBFF contains rich annotations other than sequences. We summarised its main fieldsin Table 2.2, based on existing early literature [Markel and León, 2003; Connolly andBegg, 2005] and the sample record description on the GenBank website.9 The main an-notations are record identifiers, source organisms, publications, and potential interestingsequence features. The rules have been updated over time for annotation uniformity andcompleteness; for example, originally submitters did not need to provide contact details
9https://www.ncbi.nlm.nih.gov/Sitemap/samplerecord.html
2.4 uniprotkb: a representative protein database 21
Figure 2.5: UniProtKB curation pipeline. Records from different sources are first depositedin TrEMBL, followed by automatic curation in TrEMBL and finally by expertcuration in Swiss-Prot. The image is reproduced from UniProt website (http://www.uniprot.org/). Similar to other biological databases mentioned above, Thecontent of UniProt is free to copy, distribute and display.
and affiliations, but now it is compulsory. The table provides main sequence featuressuch as CDS and RNA-related annotations. The complete feature tables are summarisedin INSDC documentation.10
If a sequence is annotated as CDS, it is used as a source record for protein databases,such as UniProtKB.
2.4 uniprotkb: a representative protein database
The UniProt consortium manages three primary protein databases: UniProtKB [Ma-grane et al., 2011], UniParc [Leinonen et al., 2004], and UniRef [Suzek et al., 2014]. Thethree databases have different purposes: UniProtKB provides the state-of-art annota-tions and dedicated curation of protein records; UniParc archives all publicly available
10http://www.insdc.org/documents/feature_table.html
22 background
Field Definition
LOCUS RECORD HEADINGLocus name Accession number in most casesSequence length Length of the sequenceMolecule type Such as DNA)Division GenBank division (subsection of GenBank)Modification date Date of latest modification
DESCRIPTIONDefinition Description of the recordKeywords Words or phrases
IDENTIFIER ACCESSION.VERSIONAccession Unique record identifier based on formatVersion Each updates on sequences
SOURCEOrganism Scientific name for the source organism
REFERENCE PUBLICATIONSAuthor Author namesTitle Paper titleJournal Journal namePubMed PubMed identifier
REFERENCE DIRECT SUBMISSIONAuthors Submitter namesDate Received dateContact Contact information
FEATURES IMPORTANT OBSERVATIONSSource Sequence length, organism scientific name, map location,
tissue type etcCDS Coding sequence
ORIGIN SEQUENCE
Table 2.2: A description of fields in GBFF file format. There are many other FEATURES; thecomplete list is provided in http://www.insdc.org/files/feature_table.html
2.4 uniprotkb: a representative protein database 23
proteins; UniRef is designed for efficient BLAST database searches. Our studies mainlyused UniProtKB.UniProtKB has two sections: UniProtKB/Swiss-Prot [Boutet et al., 2016] and UniPro-
tKB/TrEMBL.11 The main distinction between them is that TrEMBL annotates proteinrecords completely automatically: computational software annotates the records withoutmanual review, which is called automatic curation. In contrast, UniProtKB/Swiss-Prothas a substantial amount of manual effort, such as manual review of sequence proper-ties, literature references, and protein families. The manual processes are collectivelyreferred to as expert curation [Poux et al., 2016] and manual curation [Magrane et al.,2011] interchangeably.
Figure 2.5 demonstrates the curation process in UniProtKB. It consists of Recordsubmission (records from various data sources), Automatic curation and Expert curationin UniProtKB/TrEMBL and in UniProtKB/Swiss-Prot respectively. The descriptionsare as follows.
2.4.1 Record submission
In contrast to records that are directly submitted to INSDC, UniProtKB records aresubmitted indirectly in most cases. The records are collected with three main ap-proaches [Magrane et al., 2011]:
• CDS in INSDC records. If an INSDC nucleotide record has annotated codingregions, it will be considered a source record. More than 95% of UniProtKB recordsare from this approach12;
• CDS from gene prediction models. Coding regions of nucleotide records are anno-tated by gene prediction models in other databases such as Ensembl [Aken et al.,2016], RefSeq [O’Leary et al., 2015], and CCDS [Farrell et al., 2014];
• Protein records from direct protein sequencing. Protein sequences derived fromdirect protein sequencing are directly submitted to UniProtKB/Swiss-Prot;
11http://www.uniprot.org/uniprot/?query=*&fil=reviewed%3Ano12http://www.uniprot.org/help/sequence_origin
24 background
• Protein records from other protein databases. Protein sequences from PDB [Roseet al., 2017] and PRF [Eswar et al., 2008] that do not have a corresponding entryin UniProtKB will also be considered as source records.
2.4.2 Automatic curation
Source records are curated automatically in UniProtKB/TrEMBL first; then they areselected and curated further in UniProtKB/Swiss-Prot. A major task in UniProtK-B/TrEMBL automatic curation, shown in Figure 2.5, is to generate automatic annota-tion rules. The rules have the syntax: if a condition holds, then annotate the terms inthe field of the related record, where condition are the facts of the protein records, suchas the organisms and gene names. field are like subsections that we mentioned in GBFFformat. Protein records also have those fields like protein names and functions. Termsare standardised terms and controlled vocabularies; for example, submitters may usedifferent terms to describe the protein names and the related rules standardise namesfor consistency.Two systems are used to generate annotation rules: the main system UniRules13 and
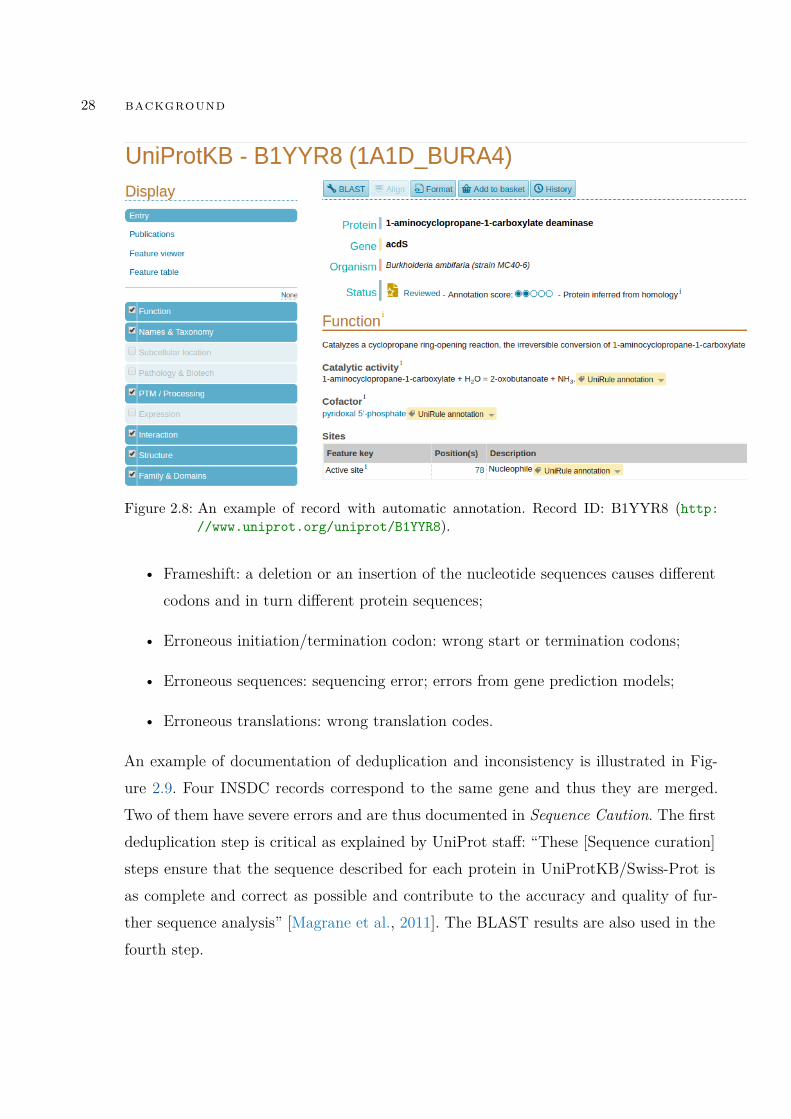
the complementary system Statistical Automatic Annotation Systems (SAAS)14. Fig-ures 2.6 and 2.7 show rule examples. A main distinction between the two systems isthe rule generation method: the rules in the former are manually created by biocu-rators, whereas in the latter they are automatically created using Decision Tree C4.5algorithm [Quinlan, 2014]. Both systems also use external resources about the proteinrecords as inputs, such as InterPro, which provides protein family classifications [Finnet al., 2017]. UniRules also incorporates rules from other rule-based annotation systems:PIR Rules [Natale et al., 2004; Nikolskaya et al., 2006], RuleBase [Fleischmann et al.,1999], and HAMAP [Pedruzzi et al., 2015]. Once a protein record is annotated usingthose rules, the particular field will be labelled accordingly. Figure 2.8 shows an exampleof what functions of a record are annotated using UniRules.
13http://www.uniprot.org/unirule/?query=&sort=score14http://www.uniprot.org/saas/?query=&sort=score
2.4 uniprotkb: a representative protein database 25
Figure 2.6: A UNIRULE rule example: UR000031345 (http://www.uniprot.org/unirule/UR000031345).
Those rules are validated based on expert curation in UniProtKB/Swiss-Prot and areupdated on every release. They annotate protein records in an efficient and scalablemanner during automatic curation. Biologists can also download the rules to annotatetheir own sequences.
2.4.3 Expert curation
Automatically-curated UniProtKB/TrEMBL records are selected and expertly curatedin UniProtKB/Swiss-Prot. The selection is based on UniProt biocuration priorities:records that follow the criteria of the eight annotation projects15 will be selected first.Selected records are then curated by biocurators. Expert curation has six main steps.Biocurators run annotation related software, manually review the results, and carefullyinterpret the evidence level [UniProt Consortium et al., 2014] over those steps. Table 2.3
15http://www.uniprot.org/help/?fil=section:biocuration
26 background
Curation steps Software Roles
1.Sequence curation
(a)Identify homologs BLAST Sequence alignmentEnsembl Phylogenetic resources
(b)Document inconsistenciesT-Coffee
Causes of inconsistenciesMuscleClustalW
2.Sequence analysis
(a)Predict topology Signal P Signal peptides predictionTMHMM Transmembrance domain
(b)Post-translations NetNGlyc N-glycosylation sitesSulfinator Tyrosine sulfation sites
(c)Identify domains InterPro Retrievals of motif matchesREPEAT Identification of repeats
3.Literature curation
(a)Identify relevant literature PubMed Literature databasesiHOP
(b)Text mining PTM Information extraction; Map keywordsPubTator
(c)Assign GOs GO Gene ontology terms
4.Family curation Same as 1(a)
5.Evidence attribution ECO Evidence code ontology
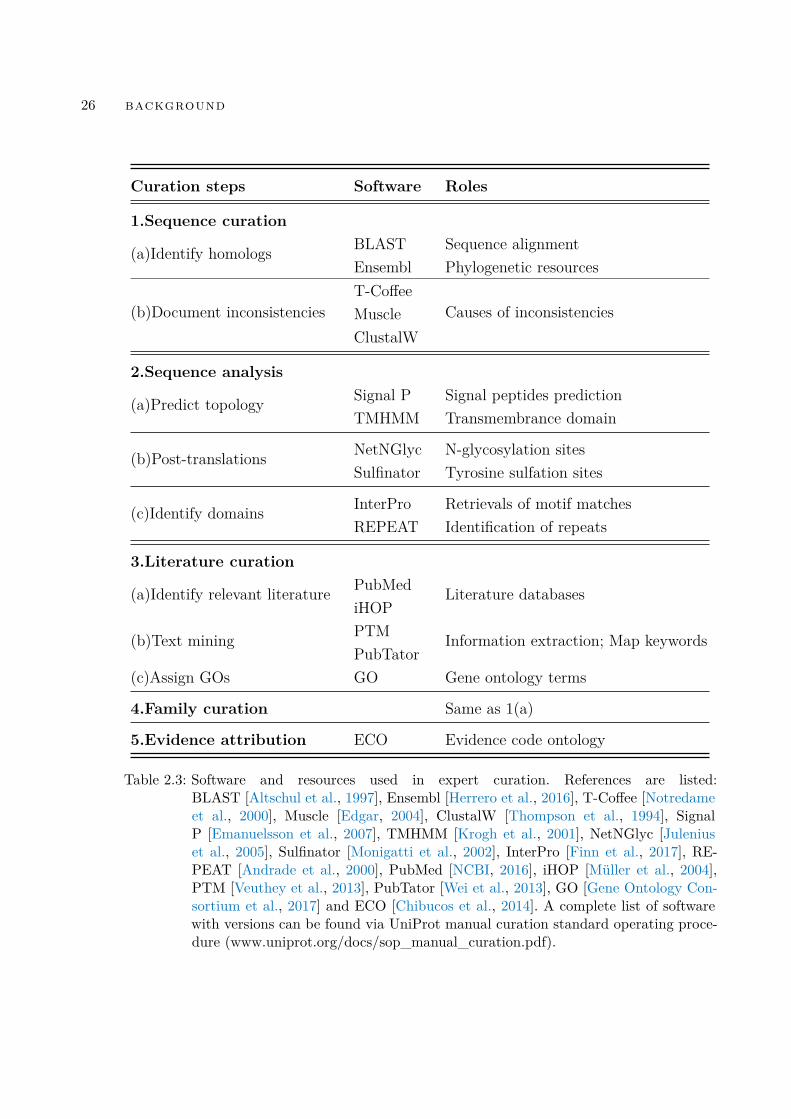
Table 2.3: Software and resources used in expert curation. References are listed:BLAST [Altschul et al., 1997], Ensembl [Herrero et al., 2016], T-Coffee [Notredameet al., 2000], Muscle [Edgar, 2004], ClustalW [Thompson et al., 1994], SignalP [Emanuelsson et al., 2007], TMHMM [Krogh et al., 2001], NetNGlyc [Juleniuset al., 2005], Sulfinator [Monigatti et al., 2002], InterPro [Finn et al., 2017], RE-PEAT [Andrade et al., 2000], PubMed [NCBI, 2016], iHOP [Müller et al., 2004],PTM [Veuthey et al., 2013], PubTator [Wei et al., 2013], GO [Gene Ontology Con-sortium et al., 2017] and ECO [Chibucos et al., 2014]. A complete list of softwarewith versions can be found via UniProt manual curation standard operating proce-dure (www.uniprot.org/docs/sop_manual_curation.pdf).
2.4 uniprotkb: a representative protein database 27
Figure 2.7: A SAAS rule example: SAAS00001785 (http://www.uniprot.org/saas/SAAS00001785)
describes the tools and the associated purposes during expert curation. The six stepsare explained as follows:16
2.4.3.1 Sequence curation
The sequence curation step focuses on deduplication. It has two processes: deletion andmerging of duplicate records; analysis and documentation of the inconsistencies betweenthe merged duplicates. The definitions of duplicates here are records that correspondto the same genes. Note that the notions of duplicates are quite diverse; we discussthem in much more depth later. Biocurators use BLAST searches and other databaseresources to determine whether two records correspond to the same genes. If so, theywill be merged into one record. Merged records are explicitly documented in the record’sCross-references section. Ideally those merged sequences should be identical since theyare the same genes, but some sequences have errors such that merged records havedifferent sequences. Biocurators then analyse the causes of those differences and docu-ment the errors. This is an example that shows duplicate records lead to inconsistencies:records with different sequences but are in fact duplicates. Biocurators judge the levelof severity: the minor ones are documented in record Sequence Conflict section; the sub-stantial ones are documented in record Sequence Caution section. Representative causesof inconsistencies are listed:17,18,19
16http://www.uniprot.org/docs/sop_manual_curation.pdf17http://www.uniprot.org/help/cross_references_section18http://www.uniprot.org/help/conflict19http://www.uniprot.org/help/sequence_caution
28 background
Figure 2.8: An example of record with automatic annotation. Record ID: B1YYR8 (http://www.uniprot.org/uniprot/B1YYR8).
• Frameshift: a deletion or an insertion of the nucleotide sequences causes differentcodons and in turn different protein sequences;
• Erroneous initiation/termination codon: wrong start or termination codons;
• Erroneous sequences: sequencing error; errors from gene prediction models;
• Erroneous translations: wrong translation codes.
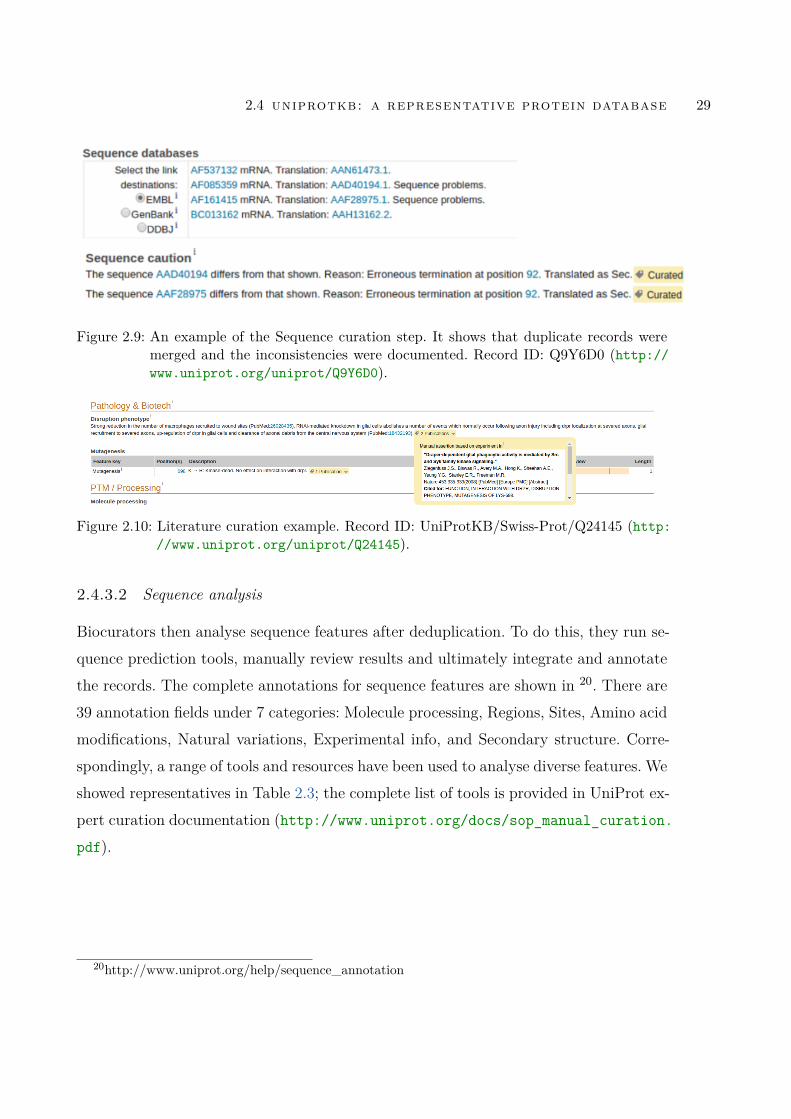
An example of documentation of deduplication and inconsistency is illustrated in Fig-ure 2.9. Four INSDC records correspond to the same gene and thus they are merged.Two of them have severe errors and are thus documented in Sequence Caution. The firstdeduplication step is critical as explained by UniProt staff: “These [Sequence curation]steps ensure that the sequence described for each protein in UniProtKB/Swiss-Prot isas complete and correct as possible and contribute to the accuracy and quality of fur-ther sequence analysis” [Magrane et al., 2011]. The BLAST results are also used in thefourth step.
2.4 uniprotkb: a representative protein database 29
Figure 2.9: An example of the Sequence curation step. It shows that duplicate records weremerged and the inconsistencies were documented. Record ID: Q9Y6D0 (http://www.uniprot.org/uniprot/Q9Y6D0).
Figure 2.10: Literature curation example. Record ID: UniProtKB/Swiss-Prot/Q24145 (http://www.uniprot.org/uniprot/Q24145).
2.4.3.2 Sequence analysis
Biocurators then analyse sequence features after deduplication. To do this, they run se-quence prediction tools, manually review results and ultimately integrate and annotatethe records. The complete annotations for sequence features are shown in 20. There are39 annotation fields under 7 categories: Molecule processing, Regions, Sites, Amino acidmodifications, Natural variations, Experimental info, and Secondary structure. Corre-spondingly, a range of tools and resources have been used to analyse diverse features. Weshowed representatives in Table 2.3; the complete list of tools is provided in UniProt ex-pert curation documentation (http://www.uniprot.org/docs/sop_manual_curation.
pdf).
20http://www.uniprot.org/help/sequence_annotation
30 background
Figure 2.11: Evidence Attribution example. Evidence code ID: ECO_0000269 (http://purl.obolibrary.org/obo/ECO_0000269).
2.4.3.3 Literature curation
The above two steps focus on sequences. Scientific literature, such as journal articles, alsoprovide information about the sequences. Many teams may have analysed the same se-quences from different perspectives, publishing the findings in the literature. Accumulat-ing and curating the relevant information from the literature provides richer annotationsand represents the community knowledge. This step often contains two processes: re-trieval of relevant literatures for a record and application of text mining tools to analysetext data, such as recognition of important entities [Choi et al., 2016] and identificationof critical relationships [Peng et al., 2016]. Likewise, biocurators check and integrate theresults and in the end annotate the records. The annotations are made using controlledvocabularies. 21; the annotations are explicitly labelled as “Manual assertion based onexperiment in LITERATURE”. Figure 2.10 shows an example.
2.4.3.4 Family-based curation
Family-based curation transitions from single-record level to family-level: finding re-lationships amongst records. Biocurators use BLAST searches and phylogenetic re-sources to identify putative homologs and make standardised annotations across dif-ferent sources.
21http://www.uniprot.org/docs/keywlist
2.5 other biological databases 31
2.4.3.5 Evidence attribution
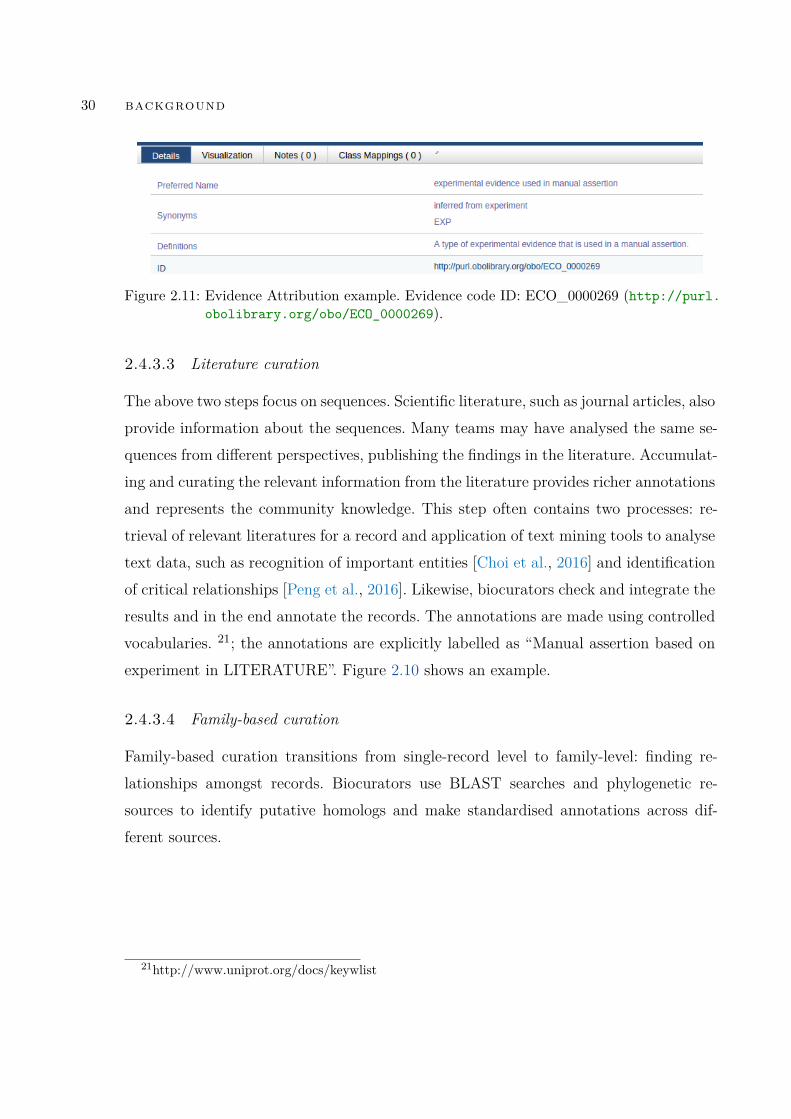
The Evidence Attribution step characterises the curations made from the previous steps.Curations are made manually or automatically from different types of sources, such assequence similarity, animal model results and clinical study results. This step uses theEvidence Codes Ontology to describe evidence: the source of curation information, andassertion method, whether the decision is made manually or automatically [Chibucoset al., 2014] using structural and standardised terms. Figure 2.11 shows an exampleevidence code and its use in a literature curation example (Figure 2.10).
2.4.3.6 Quality assurance, integration and update
The curation is complete up to now. This step finally checks everything and integratesto the existing UniProtKB/Swiss-Prot. The new records will be available in the newrelease.
2.5 other biological databases
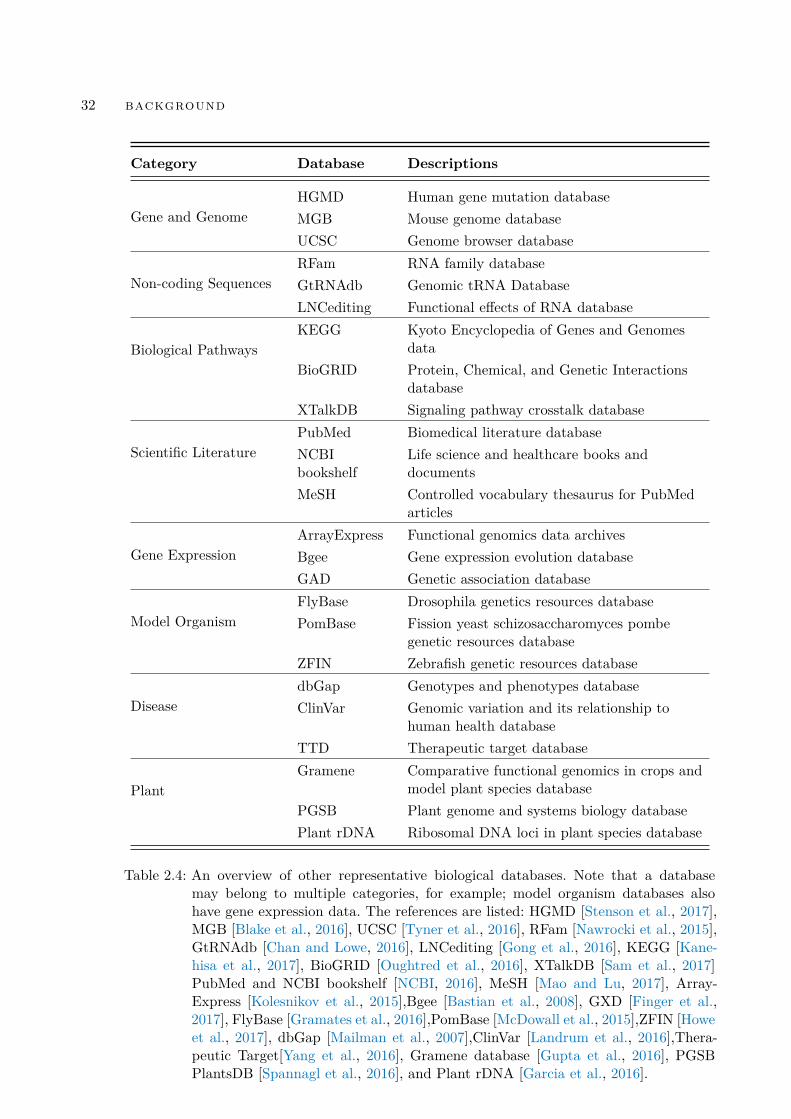
We have described GenBank and UniProtKB as representative biological databases thatare also core databases in our work. There are many more biological databases in thecommunity; for example, the NAR collection has more than a thousand databases.22
We list a broad range of other popular biological databases in Table 2.4, as examples tocomplement the detailed description above.
2.6 data quality in databases
In this section, we review conceptions of data quality and key data quality issues.
22http://www.oxfordjournals.org/nar/database/c/
32 background
Category Database Descriptions
Gene and GenomeHGMD Human gene mutation databaseMGB Mouse genome databaseUCSC Genome browser database
Non-coding SequencesRFam RNA family databaseGtRNAdb Genomic tRNA DatabaseLNCediting Functional effects of RNA database
Biological PathwaysKEGG Kyoto Encyclopedia of Genes and Genomes
dataBioGRID Protein, Chemical, and Genetic Interactions
databaseXTalkDB Signaling pathway crosstalk database
Scientific LiteraturePubMed Biomedical literature databaseNCBIbookshelf
Life science and healthcare books anddocuments
MeSH Controlled vocabulary thesaurus for PubMedarticles
Gene ExpressionArrayExpress Functional genomics data archivesBgee Gene expression evolution databaseGAD Genetic association database
Model OrganismFlyBase Drosophila genetics resources databasePomBase Fission yeast schizosaccharomyces pombe
genetic resources databaseZFIN Zebrafish genetic resources database
DiseasedbGap Genotypes and phenotypes databaseClinVar Genomic variation and its relationship to
human health databaseTTD Therapeutic target database
PlantGramene Comparative functional genomics in crops and
model plant species databasePGSB Plant genome and systems biology databasePlant rDNA Ribosomal DNA loci in plant species database
Table 2.4: An overview of other representative biological databases. Note that a databasemay belong to multiple categories, for example; model organism databases alsohave gene expression data. The references are listed: HGMD [Stenson et al., 2017],MGB [Blake et al., 2016], UCSC [Tyner et al., 2016], RFam [Nawrocki et al., 2015],GtRNAdb [Chan and Lowe, 2016], LNCediting [Gong et al., 2016], KEGG [Kane-hisa et al., 2017], BioGRID [Oughtred et al., 2016], XTalkDB [Sam et al., 2017]PubMed and NCBI bookshelf [NCBI, 2016], MeSH [Mao and Lu, 2017], Array-Express [Kolesnikov et al., 2015],Bgee [Bastian et al., 2008], GXD [Finger et al.,2017], FlyBase [Gramates et al., 2016],PomBase [McDowall et al., 2015],ZFIN [Howeet al., 2017], dbGap [Mailman et al., 2007],ClinVar [Landrum et al., 2016],Thera-peutic Target[Yang et al., 2016], Gramene database [Gupta et al., 2016], PGSBPlantsDB [Spannagl et al., 2016], and Plant rDNA [Garcia et al., 2016].
2.6 data quality in databases 33
2.6.1 Conceptions of data quality
Data quality can be considered purely in terms of accuracy: data does not containerrors [Rekatsinas et al., 2015]. In fact, even today accuracy is used as the only metricto judge the data quality in some studies or individuals. The view that data qualityis accuracy has a historical basis. Once, data had limited volume, fixed types and wasderived manually.Some pioneers were aware of the diverse notions of data and in turn reconsidered
the definition of data quality, from about the 1970s. Hoare found that data is not justlike program input [Hoare, 1975]. He used “data reliability” to describe data quality andstated that the problem of achieving data reliability was more challenging than achievingprogram reliability. Brodie then explicitly used and defined data quality [Brodie, 1980].Studies since the 1980s have demonstrated that data quality does not merely refer
to accuracy from different perspectives, including but not limited to: exploring otherquality issues with concrete examples [Imieliński and Lipski Jr, 1984]; demonstratingmultiple quality issues in specific domains such as product management [Wang, 1998]and criminal record systems [Laudon, 1986]; highlighting dramatic different character-istics of data [Fox et al., 1994]. The consistent findings from diverse studies lead tothe view that data quality is multifaceted. Studies have also raised the view that dataquality is more than accuracy:
“For example, error rates in the 10-50% range have been cited for a varietyof applications [2-4]. But astounding as these error rates are, they understatethe true extent of the data-quality problem because they concern only the ac-curacy dimension of data quality. These figures do not reflect inconsistenciesin supposedly identical data items in overlapping databases, incompleteness(data omitted for whole segments of the relevant population), or data thatis out-of-date.” [Huh et al., 1990]
34 background
Category Descriptions
Consistency“Data are presented in same format, consistentlyrepresented and are compatible with previous data” [R1]
“Data stored in multiple sources are not conceptuallyequal” [R2]
“Validity and integrity of data, typically identified bydata dependencies (constraints)” [R3]
Accuracy“Error-free, accurate, flawless, and the integrity ofdata” [R1]
“Correctness of the content” [R2]
“The closeness of values in a database to the true valuesof the entities that the data in the database represents,when the true values are not known” [R3]
Completeness“Data are of sufficient breadth, depth, and scope for thetask” [R1]
“Values of each record exists” [R2]
“Databases have complete information to answer userqueries” [R3]
Timeliness“The age of the data is appropriate for the task athand” [R1]
“Data are current, available, and in the time frame inwhich they are expected” [R2]
“Current values of entities are represented” [R3]
Table 2.5: Diverse definitions and interpretations of data quality dimensions. Three represen-tative studies are presented: R1 [Wang and Strong, 1996], R2 [McGilvray, 2008] andR3 [Fan, 2015]. They share four quality dimensions but the related definitions andinterpretations vary. We quoted definitions from those studies to respect originality.
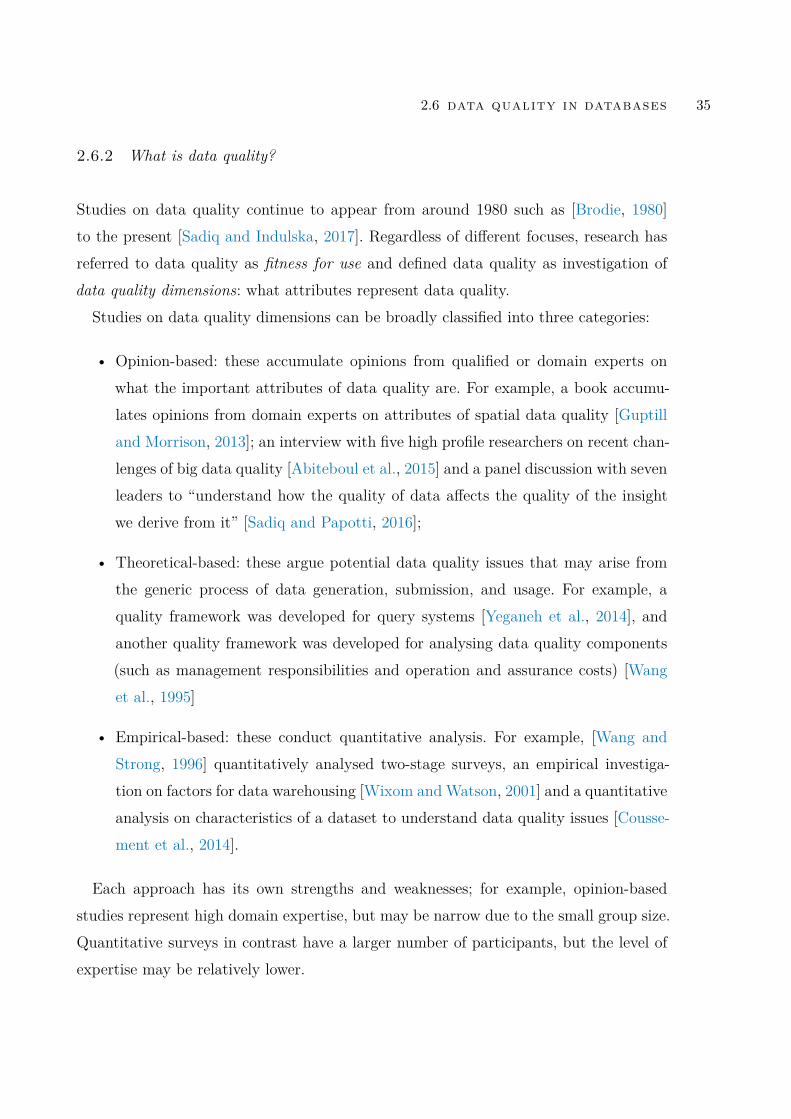
2.6 data quality in databases 35
2.6.2 What is data quality?
Studies on data quality continue to appear from around 1980 such as [Brodie, 1980]to the present [Sadiq and Indulska, 2017]. Regardless of different focuses, research hasreferred to data quality as fitness for use and defined data quality as investigation ofdata quality dimensions: what attributes represent data quality.
Studies on data quality dimensions can be broadly classified into three categories:
• Opinion-based: these accumulate opinions from qualified or domain experts onwhat the important attributes of data quality are. For example, a book accumu-lates opinions from domain experts on attributes of spatial data quality [Guptilland Morrison, 2013]; an interview with five high profile researchers on recent chan-lenges of big data quality [Abiteboul et al., 2015] and a panel discussion with sevenleaders to “understand how the quality of data affects the quality of the insightwe derive from it” [Sadiq and Papotti, 2016];
• Theoretical-based: these argue potential data quality issues that may arise fromthe generic process of data generation, submission, and usage. For example, aquality framework was developed for query systems [Yeganeh et al., 2014], andanother quality framework was developed for analysing data quality components(such as management responsibilities and operation and assurance costs) [Wanget al., 1995]
• Empirical-based: these conduct quantitative analysis. For example, [Wang andStrong, 1996] quantitatively analysed two-stage surveys, an empirical investiga-tion on factors for data warehousing [Wixom and Watson, 2001] and a quantitativeanalysis on characteristics of a dataset to understand data quality issues [Cousse-ment et al., 2014].
Each approach has its own strengths and weaknesses; for example, opinion-basedstudies represent high domain expertise, but may be narrow due to the small group size.Quantitative surveys in contrast have a larger number of participants, but the level ofexpertise may be relatively lower.
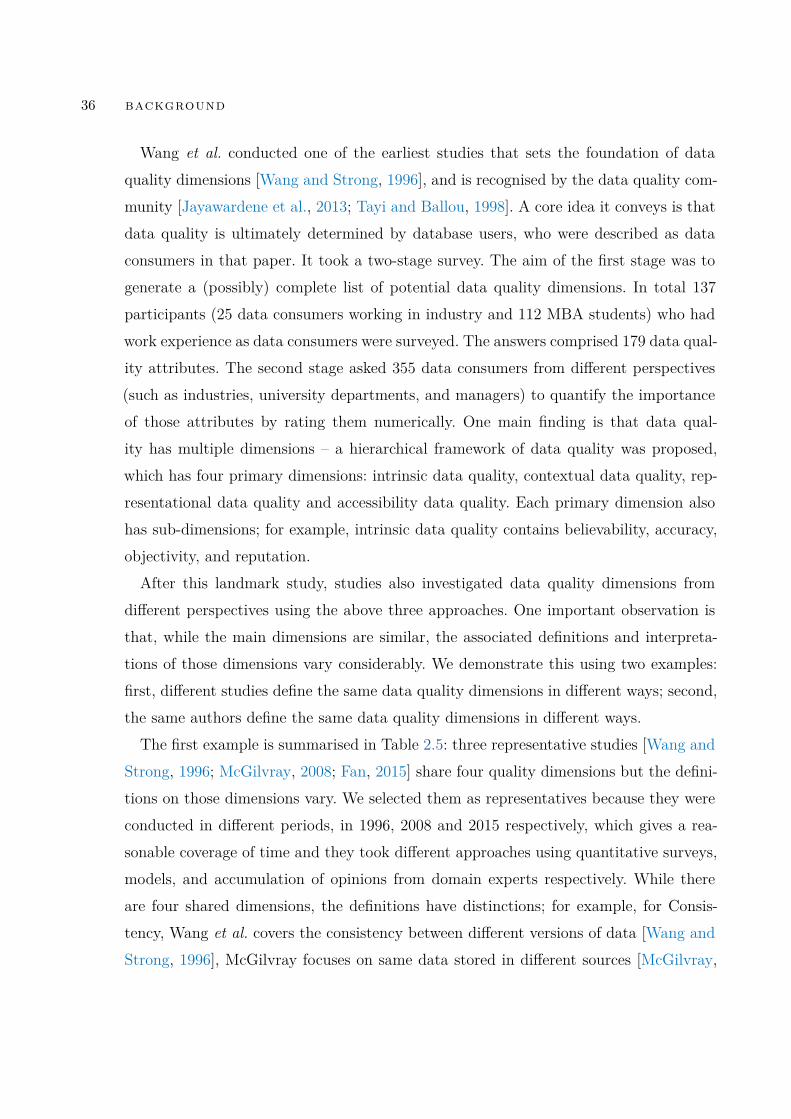
36 background
Wang et al. conducted one of the earliest studies that sets the foundation of dataquality dimensions [Wang and Strong, 1996], and is recognised by the data quality com-munity [Jayawardene et al., 2013; Tayi and Ballou, 1998]. A core idea it conveys is thatdata quality is ultimately determined by database users, who were described as dataconsumers in that paper. It took a two-stage survey. The aim of the first stage was togenerate a (possibly) complete list of potential data quality dimensions. In total 137participants (25 data consumers working in industry and 112 MBA students) who hadwork experience as data consumers were surveyed. The answers comprised 179 data qual-ity attributes. The second stage asked 355 data consumers from different perspectives(such as industries, university departments, and managers) to quantify the importanceof those attributes by rating them numerically. One main finding is that data qual-ity has multiple dimensions – a hierarchical framework of data quality was proposed,which has four primary dimensions: intrinsic data quality, contextual data quality, rep-resentational data quality and accessibility data quality. Each primary dimension alsohas sub-dimensions; for example, intrinsic data quality contains believability, accuracy,objectivity, and reputation.After this landmark study, studies also investigated data quality dimensions from
different perspectives using the above three approaches. One important observation isthat, while the main dimensions are similar, the associated definitions and interpreta-tions of those dimensions vary considerably. We demonstrate this using two examples:first, different studies define the same data quality dimensions in different ways; second,the same authors define the same data quality dimensions in different ways.The first example is summarised in Table 2.5: three representative studies [Wang and
Strong, 1996; McGilvray, 2008; Fan, 2015] share four quality dimensions but the defini-tions on those dimensions vary. We selected them as representatives because they wereconducted in different periods, in 1996, 2008 and 2015 respectively, which gives a rea-sonable coverage of time and they took different approaches using quantitative surveys,models, and accumulation of opinions from domain experts respectively. While thereare four shared dimensions, the definitions have distinctions; for example, for Consis-tency, Wang et al. covers the consistency between different versions of data [Wang andStrong, 1996], McGilvray focuses on same data stored in different sources [McGilvray,
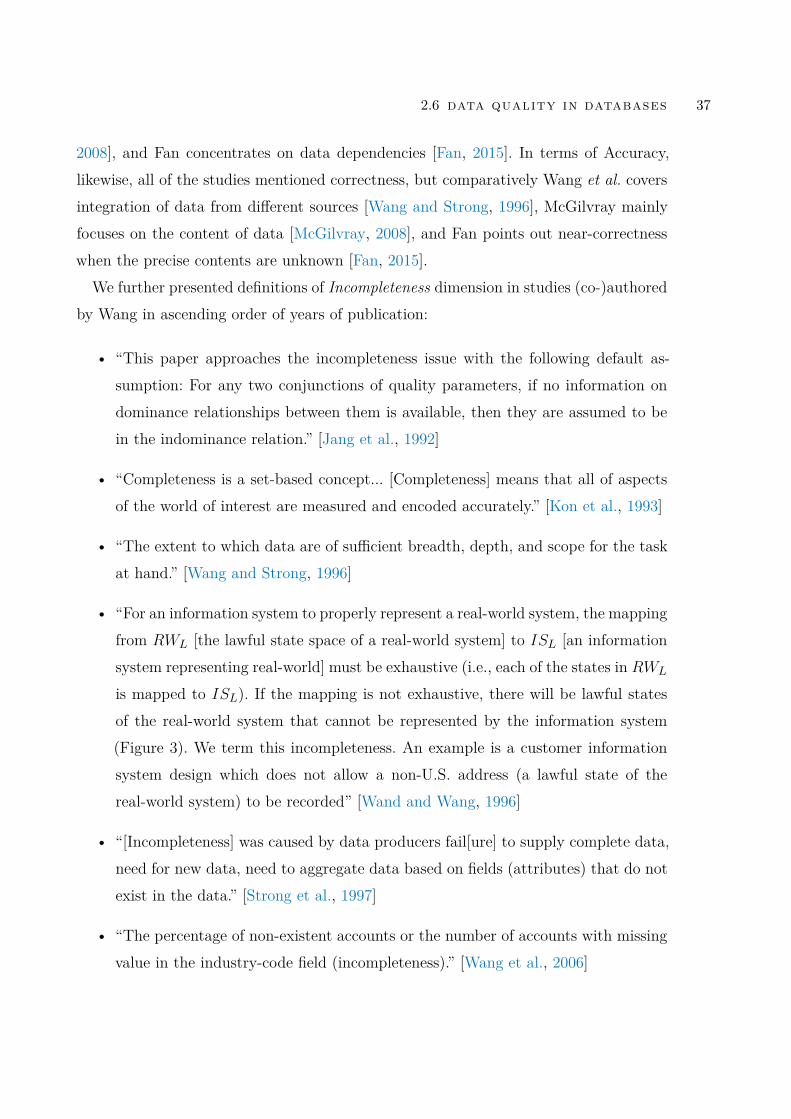
2.6 data quality in databases 37
2008], and Fan concentrates on data dependencies [Fan, 2015]. In terms of Accuracy,likewise, all of the studies mentioned correctness, but comparatively Wang et al. coversintegration of data from different sources [Wang and Strong, 1996], McGilvray mainlyfocuses on the content of data [McGilvray, 2008], and Fan points out near-correctnesswhen the precise contents are unknown [Fan, 2015].
We further presented definitions of Incompleteness dimension in studies (co-)authoredby Wang in ascending order of years of publication:
• “This paper approaches the incompleteness issue with the following default as-sumption: For any two conjunctions of quality parameters, if no information ondominance relationships between them is available, then they are assumed to bein the indominance relation.” [Jang et al., 1992]
• “Completeness is a set-based concept... [Completeness] means that all of aspectsof the world of interest are measured and encoded accurately.” [Kon et al., 1993]
• “The extent to which data are of sufficient breadth, depth, and scope for the taskat hand.” [Wang and Strong, 1996]
• “For an information system to properly represent a real-world system, the mappingfrom RWL [the lawful state space of a real-world system] to ISL [an informationsystem representing real-world] must be exhaustive (i.e., each of the states in RWL
is mapped to ISL). If the mapping is not exhaustive, there will be lawful statesof the real-world system that cannot be represented by the information system(Figure 3). We term this incompleteness. An example is a customer informationsystem design which does not allow a non-U.S. address (a lawful state of thereal-world system) to be recorded” [Wand and Wang, 1996]
• “[Incompleteness] was caused by data producers fail[ure] to supply complete data,need for new data, need to aggregate data based on fields (attributes) that do notexist in the data.” [Strong et al., 1997]
• “The percentage of non-existent accounts or the number of accounts with missingvalue in the industry-code field (incompleteness).” [Wang et al., 2006]
38 background
• “[Incompleteness refers to] IC [the Intelligence Community] organizations usuallycannot collect all necessary information because of the obstacles created by theadversaries. Also, it is often difficult to validate the collected information.” [Zhuand Wang, 2009]
The above seven studies all address incompleteness, but the associated definitions vary.Importantly, we do not regard this variation as inconsistency or discrepancy. Rather, weregard it as diversity: definitions of data quality dimensions are context-dependent; di-verse definitions on the same dimensions are from different domains, tasks, stakeholdersand so on. The opinion of diversity coincides with data quality related reviews [Jayawar-dene et al., 2013; Batini and Scannapieco, 2016].
2.6.3 Data quality issues
Data quality issues can arise from diverse causes and they have different effects. In thissection, we describe concrete data quality issue examples and their impacts.A major issue caused by duplication is that multiple records referring to the same
individuals are deposited in databases. Often those records are not exactly the same –such as missing fields and different spelling – making duplication difficult to detect. Werefer to this type of duplicate as Entity Duplicates. The causes of entity duplicates aremixed, such as applications for the same individuals being submitted twice, or detailsupdated but old records not archived or deleted. More serious causes are identity fraudand theft [Lai et al., 2012]. There are other cases for entity duplicates [Christen, 2012a;Jagadish et al., 2014], and there are more kinds of duplicates.
Inconsistency often occurs for data in different versions or different time frames; forexample, Jürges compared unemployment records deposited in two years (current andprevious). He observed that 13% of unemployment spells were not reported and another7% were misreported [Jürges, 2007]. Another example is that George et al. found thatinconsistencies for climate changes monitored in different systems in the same period(2003-2007). The overall differences are 12.2% and specific differences range from 7.3%to 25.8% [Ohring et al., 2007].
2.6 data quality in databases 39
Incompleteness is often related to missing records. As an example, Miller et al. sur-veyed prenatal records at birth centres for three months. The results shows that recordswere never obtained for 20% of patients and it took a median of 1.4 hours to retrieve amissing record [Miller Jr et al., 2005]. Another example is that Botsis found that closeto 50% of patent reports on ICD-9-CM diagnoses for pancreatic cancer were missing(1479 out of 3068) [Botsis et al., 2010].
As mentioned, accuracy can be interpreted in different ways. Considering it simplyas errors in records, it already has considerable impacts. Redman found that reportederror rates range from 0.5% to 30% [Redman, 1998]. Goldman et al. examined theaccuracy on 1,059 medical records collected from 48 hospitals in California and reportedthat about 25% of them may be inaccurate: 13.7% over-reported and 11.9% under-reported [Goldman et al., 2011].In addition to the immediate impacts from data quality issues, repairing those issues
can have propagated consequences. Marsh conducted a survey and quantified variousimpacts; we quote a few of them containing supporting statistics from the survey [Marsh,2005]:
• 88% of all data integration projects either fail completely or significantlyover-run their budgets.
• 75% of organisations have identified costs stemming from dirty data.
• 33% of organisations have delayed or cancelled new IT systems becauseof poor data.
• $611bn per year is lost in the US in poorly targeted mailings and staffoverheads alone.
• Less than 50% of companies claim to be very confident in the qualityof their data.
• Only 15% of companies are very confident in the quality of externaldata supplied to them.
• Customer data typically degenerates at 2% per month or 25% annually.
40 background
Other studies on the cost of data quality also have similar findings [Haug et al., 2013,2011].
For biological databases, the main quality issues summarised above apply; they arealso ongoing. We list a few representatives chronologically:
• In 1995, researchers found mixed quality issues in the GenBank Arabidopsisthaliana dataset: inconsistencies in reading frames and splice sites, missing startor stop codons, erroneous intron records, and duplicate records [Korning et al.,1996];
• In 1999, researchers found inconsistencies and errors in Mycoplasma genitaliumgenome annotations [Brenner, 1999];
• In 2003, researchers observed and summarised quality issues in genomic databases:sequences in records having errors or missing bases, transformation errors – errorsin protein sequences due to errors in corresponding DNA sequences, gene predic-tion errors, and wrong annotations due to outdated records [Müller et al., 2003];
• In 2007, researchers found that most biodiversity databases suffered from incom-pleteness – lacking records that describe rich geographic patterns or lacking recordsthat cover geographic and environmental variations [Hortal et al., 2007];
• In 2009, researchers examined the molecular function for 37 enzyme families in fourprotein databases. They found a prevalence of misannotations in three databasesranges from 5% to 63% overall, even over 80% in specific enzyme families [Schnoeset al., 2009];
• In 2015, database staff observed a high prevalence of duplicate proteome records inUniProt/TrEMBL. For example, 5.97 million records corresponded to only 1,692strains of Mycobacterium tuberculosis. They ultimately removed 46.9 million du-plicate records [Bursteinas et al., 2016].
2.7 duplication: definitions and impacts 41
2.7 duplication: definitions and impacts
In this section, we review different notions and impacts of duplication, in general andin biological databases.
2.7.1 Duplication in general
The focus of this thesis is duplication in biological databases. We review duplicationin general domains first. The term duplicates is the general terminology used to de-scribe duplication [Elmagarmid et al., 2007], but other terms are used in the litera-ture: copies [Wang et al., 2016], redundancies [Šupak Smolčić and Bilić-Zulle, 2013] andnear-duplicates [Yang et al., 2017]. In turn, the associated action duplicate detection,identification of duplicate records [Elmagarmid et al., 2007], have also been described indifferent terms: entity resolution [Brizan and Tansel, 2015], record linkage [Koudas et al.,2006], object identification [Tejada et al., 2002], redundancy removal [Jeon et al., 2013],and near duplicate detection [Zhang et al., 2016]. Some studies also used those termsinterchangeably [Landau, 1969; Walenstein et al., 2007; Wu et al., 2007]. We summarisethree primary notions of duplicates from the general literatures: exact duplicates, entityduplicates and near duplicates, supported by a mini case study on detecting duplicatevideos as a specific case.
2.7.1.1 Exact duplicates
The definition of exact duplicates is arguably the most stringent: records are consideredas duplicates only if they are exactly identical. Babb designed a relational databasethat detects repeated records, which he considered as “remove redundant data” [Babb,1979]. Bitton and DeWitt [Bitton and DeWitt, 1983] also designed an evaluation systemto assess the performance to detect exact duplicates, which they consider as “identicalrecords”. Chen et al. also addressed data integration by removing repeated data copies,which they considered as “repeated data delection”; they used ”redundancy” if recordsare not exactly identical [Chen et al., 2014].
42 background
2.7.1.2 Entity duplicates
Entity duplicates refer to records belonging to the same entities. Comparing with exactduplicates, this definition of duplicates has been used extensively in the literature. Thefocus is the entity or object, regardless of whether they are identical. Batini and Scan-napieco [Batini and Scannapieco, 2016] noted “duplication occurs when a real-worldentity is stored twice or more in a data source.” Christen [Christen, 2012a] distinguisheddeduplication from record linkage: they both identify records which belong to the sameentities, but the former stands for the same database whereas the latter refers to multi-ple databases: “Record linkage is the process of matching records from several databasesthat refer to the same entities. When applied on a single database, this process is knownas deduplication”. Elmagarmid et al. [Elmagarmid et al., 2007] also mentioned that “Of-ten, in the real world, entities have two or more representations in databases. Duplicaterecords do not share a common key and/or they contain errors that make duplicatematching a difficult task”. There are many other studies using this definition [Law-Toet al., 2006; Getoor and Machanavajjhala, 2012; Bhattacharya and Getoor, 2007; Chris-ten, 2012b; Wang et al., 2012].
2.7.1.3 Near duplicates
Near duplicates refer to records that share some similarities. Comparing with entityduplicates, the focus is not at the entity or object level. This definition has also beenused broadly. Xiao et al. [Xiao et al., 2011] defined the concept in a quantitative man-ner: “A quantitative way to define two objects as near duplicates is to use a similarityfunction. The similarity function measures degree of similarity between two objects andwill return a value in [0, 1]”. They have used the similarity range from 0.80 to 0.95 in thestudy. Under this type of duplicates, studies use the same definition, but use differentmethods to compute the similarity, such as Jaccard [Theobald et al., 2008] and editdistance [Mitzenmacher et al., 2014].In practical databases (or datasets), the term duplication or duplicates contains a
combination of the above types, or specific duplicates that are considered by studies.One of the earliest studies, undertaken by Yan and Molina [Yan and Garcia-Molina,
2.7 duplication: definitions and impacts 43
1995], considered two broad types of duplicate documents: (1) Intentional duplicates:documents may have substantially different contents, but the users or creators considerthem as duplicates, including five subcategories: Replication, such as when the samemessages have been posted into multiple newsgroups at multiple times, Indirections, suchas when a document is actually just a reference to another, even with different contents,Versions, same documents having different versions, Multiple Formats, same documentsin different formats, and Nesting, a document is nested within another document. (2)Extensional duplicates: whether the documents have the exact same textual content.Thus we can see that type (1) focuses on entity level, whereas type (2) focuses onsimilarity level. Conrad et al. further did a classic study to investigate the notion ofduplicates in two web document collections: ALLNEWS (45 million documents) andALLNEWSPLUS (55 million documents) [Thompson et al., 1995; Turtle and Croft,1989]. They ran 25 real queries (entered by users) to the two collections respectivelyand examined the retrieved documents to identify duplicates. Five types of duplicatedocuments were identified [Conrad et al., 2003]:
1. Exact duplicates (same title not required);
2. Excerpt: one document takes the first section; for example, the first fewhundred words from another (longer) article;
3. Elaboration: one document adds one or more paragraphs to another(shorter) article;
4. Insertions: one document is the same, but adds one or more sentencesor phrases to the paragraphs of another article;
5. Focus: one document is a rewrite, using visibly different vocabulary,descriptions or content than that of the other article, but about anidentical or very similar topic.
It shows that the real collection contains a mixed type of duplicates: excerpt is anexample of entity duplicates; in contrast, elaboration or insertions may not be entityduplicates since the added paragraphs or sentences may vary the meaning or semanticsof the original documents, so they may not refer to the same documents, but they can
44 background
be captured as near duplicates since the similarity between them is still high. It alsoshows that databases or studies may consider specific types of duplicates different to theabove types. Focus, in this case, is arguably hard to be classified as entity duplicates ornear duplicates: it only refers to the same topics, not the same documents; the contentand even vocabularies are different so the similarity is also low.The notions of duplicate documents have been further studied extensively by Bern-
stein and Zobel [Bernstein and Zobel, 2004, 2005; Zobel and Bernstein, 2006]. Theyasked a group of participants to assess document pairs and assign them into one of thecategories: not equivalent, where documents are sufficient to distinguish with respect toqueries, nearly equivalent, the differences between the documents are minor; condition-ally equivalent, the documents may be both returned by some queries but not by otherqueries, and completely equivalent, the documents only have trivial differences and can-not be distinguished with respect to any queries. They additionally quantified duplicatesfrom collections consisting of over a million documents in total and found over 17% andclose to 25% of documents are in fact duplicates in two collections respectively. Thoseduplicates dramatically degrade search effectiveness and user satisfaction: removing du-plicates increases mean average precision by 16% [Bernstein and Zobel, 2005]. Critically,the authors further pointed out the underlying problem regarding duplication: “Worse,the concept of ’duplicate’ not only proved difficult to define, but on reflection was not log-ically defensible” [Zobel and Bernstein, 2006]. Different work concerned different kindsof duplicates; yet, there was no fundamental analysis on what a duplicate was and whatspecific tasks or contexts matter to users in reality.The above issues are not restricted to documents, but indeed are prevalent in many
domains. We further present duplication in a mini case study on detecting duplicatevideos.
Duplicate video detection: a mini case study Detection of duplicate video has beenextensively studied for over a decade [Zobel and Hoad, 2006]. The related literature alsostresses the diversity of duplication. We summarised the definition of duplicate videosderived from represented studies over 15 years in Table 2.6 and Table 2.7 collectively.We also labelled the focuses of the definitions: whether it focuses on exactly identical,entity-level or similarity-level. Related duplicate video examples are also provided in
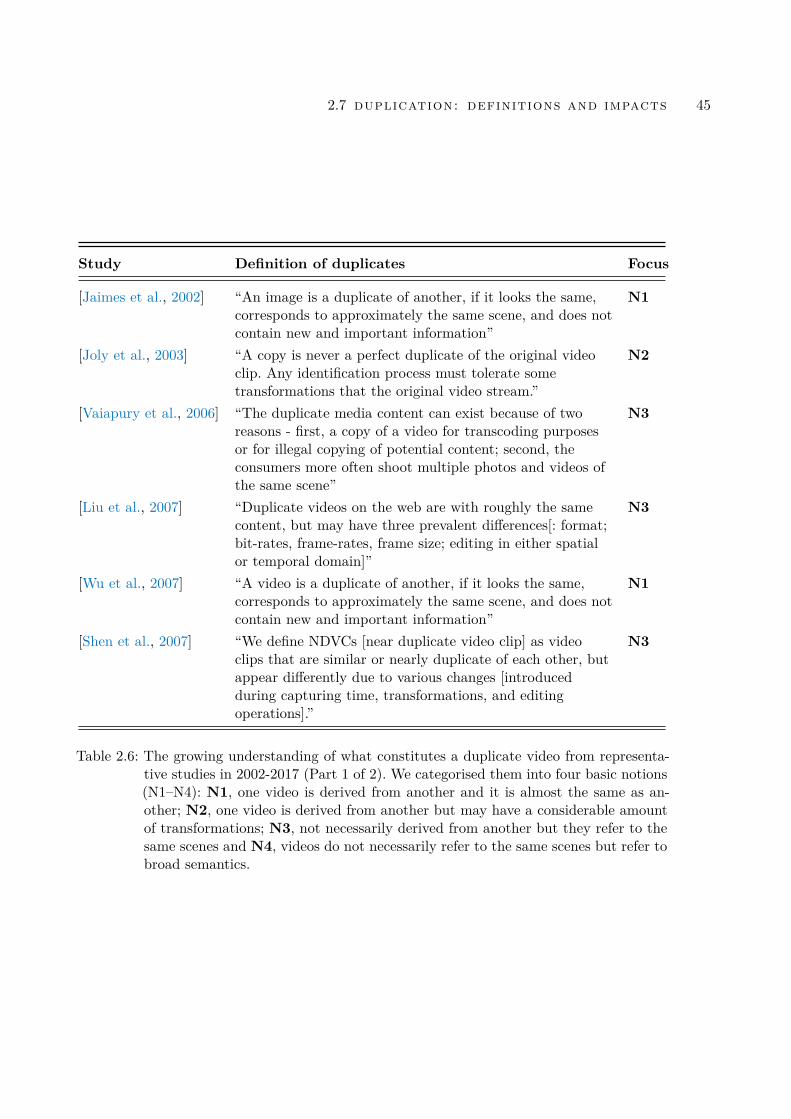
2.7 duplication: definitions and impacts 45
Study Definition of duplicates Focus
[Jaimes et al., 2002] “An image is a duplicate of another, if it looks the same,corresponds to approximately the same scene, and does notcontain new and important information”
N1
[Joly et al., 2003] “A copy is never a perfect duplicate of the original videoclip. Any identification process must tolerate sometransformations that the original video stream.”
N2
[Vaiapury et al., 2006] “The duplicate media content can exist because of tworeasons - first, a copy of a video for transcoding purposesor for illegal copying of potential content; second, theconsumers more often shoot multiple photos and videos ofthe same scene”
N3
[Liu et al., 2007] “Duplicate videos on the web are with roughly the samecontent, but may have three prevalent differences[: format;bit-rates, frame-rates, frame size; editing in either spatialor temporal domain]”
N3
[Wu et al., 2007] “A video is a duplicate of another, if it looks the same,corresponds to approximately the same scene, and does notcontain new and important information”
N1
[Shen et al., 2007] “We define NDVCs [near duplicate video clip] as videoclips that are similar or nearly duplicate of each other, butappear differently due to various changes [introducedduring capturing time, transformations, and editingoperations].”
N3
Table 2.6: The growing understanding of what constitutes a duplicate video from representa-tive studies in 2002-2017 (Part 1 of 2). We categorised them into four basic notions(N1–N4): N1, one video is derived from another and it is almost the same as an-other; N2, one video is derived from another but may have a considerable amountof transformations; N3, not necessarily derived from another but they refer to thesame scenes and N4, videos do not necessarily refer to the same scenes but refer tobroad semantics.
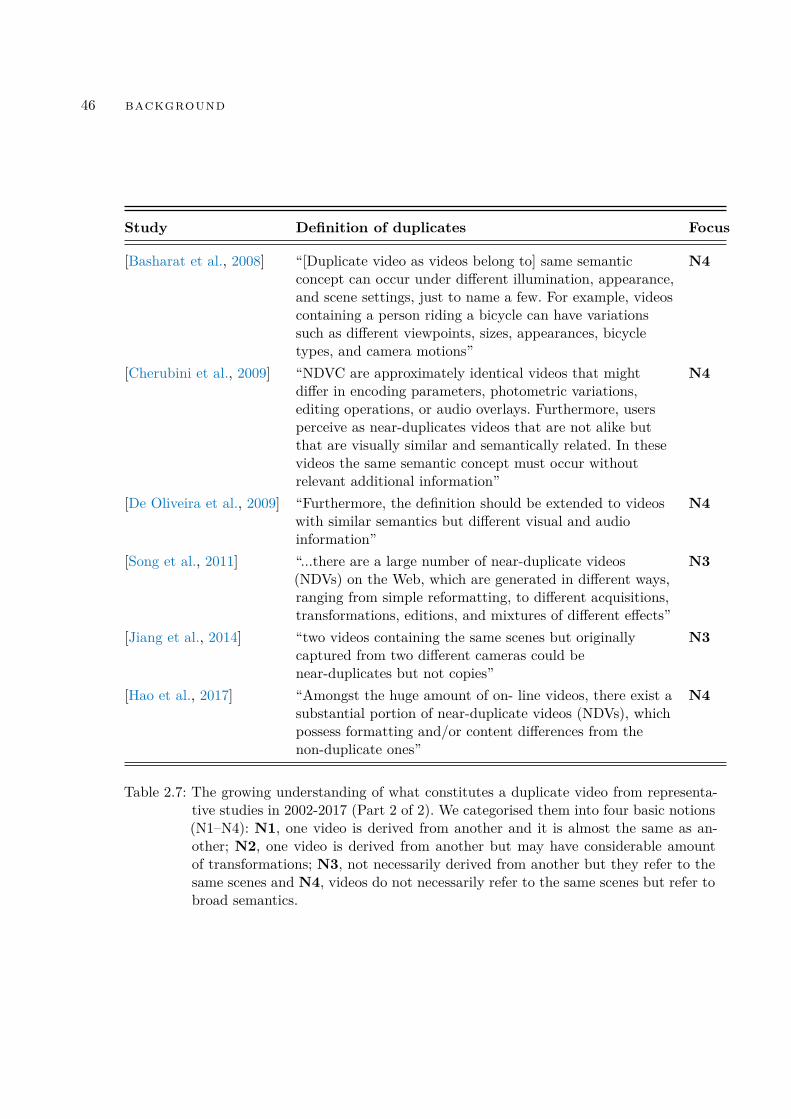
46 background
Study Definition of duplicates Focus
[Basharat et al., 2008] “[Duplicate video as videos belong to] same semanticconcept can occur under different illumination, appearance,and scene settings, just to name a few. For example, videoscontaining a person riding a bicycle can have variationssuch as different viewpoints, sizes, appearances, bicycletypes, and camera motions”
N4
[Cherubini et al., 2009] “NDVC are approximately identical videos that mightdiffer in encoding parameters, photometric variations,editing operations, or audio overlays. Furthermore, usersperceive as near-duplicates videos that are not alike butthat are visually similar and semantically related. In thesevideos the same semantic concept must occur withoutrelevant additional information”
N4
[De Oliveira et al., 2009] “Furthermore, the definition should be extended to videoswith similar semantics but different visual and audioinformation”
N4
[Song et al., 2011] “...there are a large number of near-duplicate videos(NDVs) on the Web, which are generated in different ways,ranging from simple reformatting, to different acquisitions,transformations, editions, and mixtures of different effects”
N3
[Jiang et al., 2014] “two videos containing the same scenes but originallycaptured from two different cameras could benear-duplicates but not copies”
N3
[Hao et al., 2017] “Amongst the huge amount of on- line videos, there exist asubstantial portion of near-duplicate videos (NDVs), whichpossess formatting and/or content differences from thenon-duplicate ones”
N4
Table 2.7: The growing understanding of what constitutes a duplicate video from representa-tive studies in 2002-2017 (Part 2 of 2). We categorised them into four basic notions(N1–N4): N1, one video is derived from another and it is almost the same as an-other; N2, one video is derived from another but may have considerable amountof transformations; N3, not necessarily derived from another but they refer to thesame scenes and N4, videos do not necessarily refer to the same scenes but refer tobroad semantics.
2.7 duplication: definitions and impacts 47
different studies (for instance, Figure 1 of [Liu et al., 2013, 2011; Law-To et al., 2006;Song et al., 2011] and Figure 1–3 in [Jiang et al., 2014]).The definitions of Table 2.6 clearly show that the understanding or definition of
duplicate is diverse: almost no studies used exactly the same definition. The early studiesexplicitly specify that one video must be derived from another [Jaimes et al., 2002;Joly et al., 2003]. This constraint was loosened later, where duplicate videos can bedifferent videos about the same contents or scenes made by different consumers [Liuet al., 2007]. In 2007 some studies have started to focus on similarity regardless ofwhether they refer to the same contents or scenes [Shen et al., 2007]. A further importanttransition is in 2008: Mauro et al. investigated which videos database users consideras duplicates [Cherubini et al., 2009]. They prepared seven video pairs (videos withimages in different qualities, added or removed scenes, different lengths, audio and imageoverlays, audio in different qualities, similar images and different audio, and similar audioand different images respectively) and surveyed thousands of individuals. The resultsshow that the videos considered to be duplicates by database users are broader thanthe existing definitions; for instance, most users consider a video pair (one contains asoda can and another contains a beer can and the scenes and audios are different) asduplicates. This is different from the previous definition in terms of entity-level: thescenes are distinct; and is also different in terms of similarity-level: similarities betweenscenes and audio are low. This motivates further studies focusing on multiple types ofduplicate videos, rather than a single definition; the recent studies consider duplicateson both entity and similarity level and the ‘entity’ and ‘similarity’ include the semanticlevel [Wang et al., 2016; Hao et al., 2017]. Also more studies explored characteristicsof duplicate videos from the user perspective [De Oliveira et al., 2009; Rodrigues et al.,2010].
While there is no universal definition, the above different definitions are not incon-sistent. Rather, it demonstrates the diversity of duplication. It is context-dependent:different use-cases consider different types of duplicates and conversely different dupli-cate types impact different use-cases. A recent survey in this domain summarises fourmain use-cases and the associated notions and impacts of duplication [Liu et al., 2013]:
48 background
• Copyright protection: where videos are copied, edited, redistributed without au-thorisation [Sterling, 1998]. Here the notion of duplication focuses on videos referto exactly the same videos, that is, one video is copied, edited or transformed fromanother video [Ngo et al., 2006; Ginsburg, 1990].
• Video monitoring: where a company monitors the frequency and time spot of a TVcommercial such that it follows the contract specification [Smeaton et al., 2006].Here the notion of duplication focuses on video contents, that is, videos share sim-ilar content, but it is not necessarily the case that one comes from another [Huanget al., 2010b].
• Video retrieval: where users search videos. Here the notion of duplication focuseson retrieved videos which are not independently informative – such as videos aboutthe same topics – since users often want to see diverse videos retrieved [Cherubiniet al., 2009]
• Video thread tracking: where different media report the same events in differentways. Here the notion of duplication focuses on the event, that is, videos on sameevents. Identification of such duplicates can aggregate views from different mediaor even from different countries to make people understand the event better [Zhaoet al., 2007].
The diverse definitions of duplication demonstrate two common characteristics of du-plicates: redundant, such as highly similar videos and inconsistent, such as one videotransformed from another. The impacts of duplication are accordingly redundanciesand inconsistencies. The similar videos bring redundancy, and particularly impact videosearching where there are repetitive search results or search results that are not indepen-dently informative [Song et al., 2013]. Videos edited or transformed from other videos,from another perspective, bring inconsistent contents and figures to users [Ngo et al.,2006]. Related literature in broader domains also stresses that duplicate records bringredundancies and inconsistencies; we list a few. For redundancies: Bernstein and Zobelfound that duplicate documents in TREC (Text REtrieval Conference) in 2004 con-tains over 16% redundancy overall; in one specific collection, the redundancy is over
2.7 duplication: definitions and impacts 49
25% [Bernstein and Zobel, 2005], Wu et al. measured retrieved videos from 24 queriesand found that 27% are redundant [Wu et al., 2007], Valderrama-Zurián et al. measuredpublications in Scopus and found the level of redundancies in subcollections range from0.08% to 27.1% [Valderrama-Zurián et al., 2015]. For inconsistencies, Bennett high-lighted the errors in a study of blood pressure measurement due to multiple samplesthat are in fact from the same patient [Bennett, 1994], Mahbod et al. found duplicaterecords in a benchmark dataset, making accuracies of supervised learning methods over-estimated, such that the accuracy of random forest classifier dropped over 10% afterremoving the duplicate records [Tavallaee et al., 2009]. To some extent, redundanciesand inconsistencies can lead to inaccuracies [Batini and Scannapieco, 2016; Christen,2012a]. Redundancies could also result to inconsistencies; for example, highly redun-dant retrieved videos may bias the video that users indeed want to find out [Wu et al.,2007].
From the above, we can summarise the following key points regarding duplication ingeneral:
• Understandings and definitions on duplicate records are diverse; there is no uni-versal definition. This was also emphasised in surveys [Liu et al., 2013];
• Regardless of various definitions, the understanding of duplication is dependenton database stakeholders [De Oliveira et al., 2009; Rodrigues et al., 2010]. Thisconcurs with the findings of studies on data quality mentioned earlier [Wang andStrong, 1996]. Studies on understanding characteristics can be quantitative analy-sis [Yan and Garcia-Molina, 1995; Rodrigues et al., 2010] or via surveys [Cherubiniet al., 2009; Oliveira et al., 2010];
• Two primary characteristics of duplication are redundancy and inconsistency, sothese are the primary impacts.
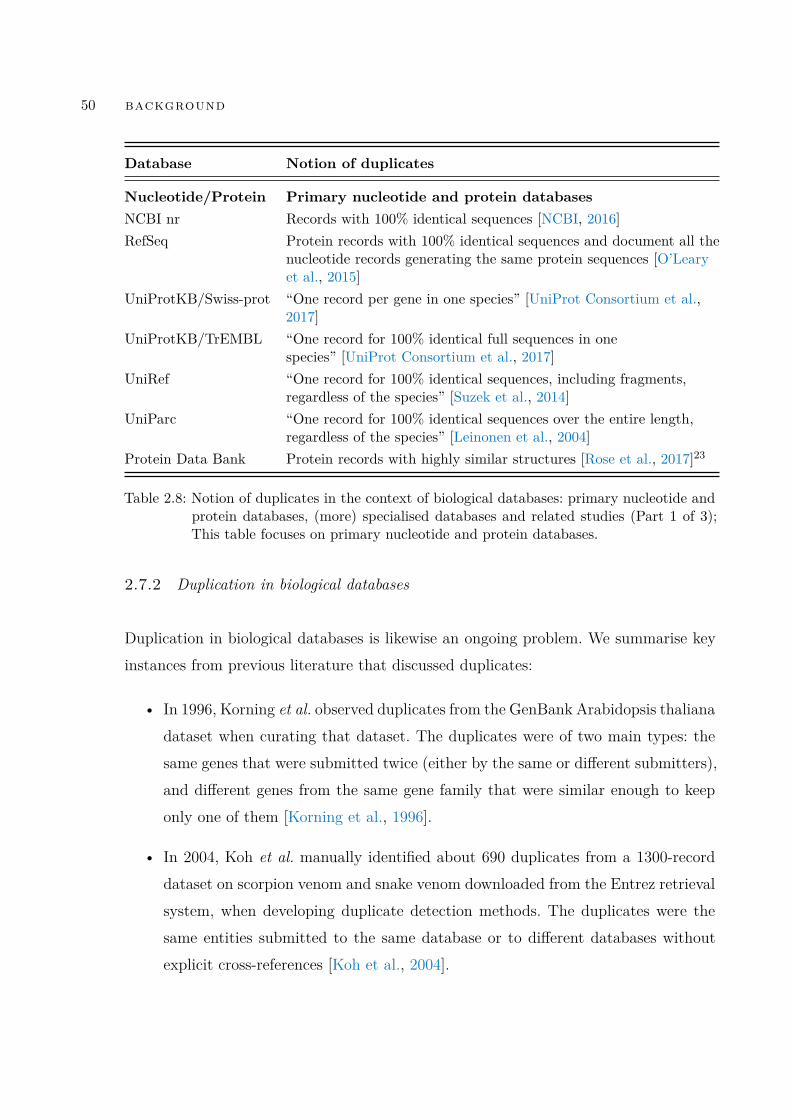
50 background
Database Notion of duplicates
Nucleotide/Protein Primary nucleotide and protein databasesNCBI nr Records with 100% identical sequences [NCBI, 2016]RefSeq Protein records with 100% identical sequences and document all the
nucleotide records generating the same protein sequences [O’Learyet al., 2015]
UniProtKB/Swiss-prot “One record per gene in one species” [UniProt Consortium et al.,2017]
UniProtKB/TrEMBL “One record for 100% identical full sequences in onespecies” [UniProt Consortium et al., 2017]
UniRef “One record for 100% identical sequences, including fragments,regardless of the species” [Suzek et al., 2014]
UniParc “One record for 100% identical sequences over the entire length,regardless of the species” [Leinonen et al., 2004]
Protein Data Bank Protein records with highly similar structures [Rose et al., 2017]23
Table 2.8: Notion of duplicates in the context of biological databases: primary nucleotide andprotein databases, (more) specialised databases and related studies (Part 1 of 3);This table focuses on primary nucleotide and protein databases.
2.7.2 Duplication in biological databases
Duplication in biological databases is likewise an ongoing problem. We summarise keyinstances from previous literature that discussed duplicates:
• In 1996, Korning et al. observed duplicates from the GenBank Arabidopsis thalianadataset when curating that dataset. The duplicates were of two main types: thesame genes that were submitted twice (either by the same or different submitters),and different genes from the same gene family that were similar enough to keeponly one of them [Korning et al., 1996].
• In 2004, Koh et al. manually identified about 690 duplicates from a 1300-recorddataset on scorpion venom and snake venom downloaded from the Entrez retrievalsystem, when developing duplicate detection methods. The duplicates were thesame entities submitted to the same database or to different databases withoutexplicit cross-references [Koh et al., 2004].
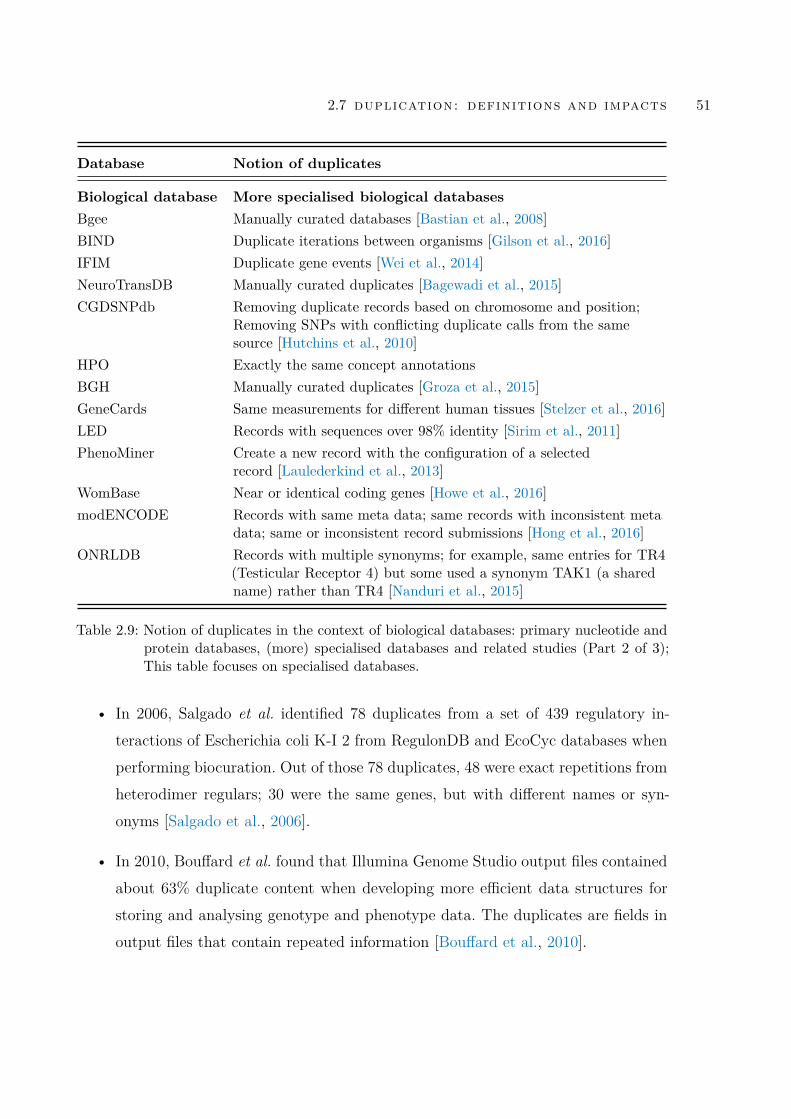
2.7 duplication: definitions and impacts 51
Database Notion of duplicates
Biological database More specialised biological databasesBgee Manually curated databases [Bastian et al., 2008]BIND Duplicate iterations between organisms [Gilson et al., 2016]IFIM Duplicate gene events [Wei et al., 2014]NeuroTransDB Manually curated duplicates [Bagewadi et al., 2015]CGDSNPdb Removing duplicate records based on chromosome and position;
Removing SNPs with conflicting duplicate calls from the samesource [Hutchins et al., 2010]
HPO Exactly the same concept annotationsBGH Manually curated duplicates [Groza et al., 2015]GeneCards Same measurements for different human tissues [Stelzer et al., 2016]LED Records with sequences over 98% identity [Sirim et al., 2011]PhenoMiner Create a new record with the configuration of a selected
record [Laulederkind et al., 2013]WomBase Near or identical coding genes [Howe et al., 2016]modENCODE Records with same meta data; same records with inconsistent meta
data; same or inconsistent record submissions [Hong et al., 2016]ONRLDB Records with multiple synonyms; for example, same entries for TR4
(Testicular Receptor 4) but some used a synonym TAK1 (a sharedname) rather than TR4 [Nanduri et al., 2015]
Table 2.9: Notion of duplicates in the context of biological databases: primary nucleotide andprotein databases, (more) specialised databases and related studies (Part 2 of 3);This table focuses on specialised databases.
• In 2006, Salgado et al. identified 78 duplicates from a set of 439 regulatory in-teractions of Escherichia coli K-I 2 from RegulonDB and EcoCyc databases whenperforming biocuration. Out of those 78 duplicates, 48 were exact repetitions fromheterodimer regulars; 30 were the same genes, but with different names or syn-onyms [Salgado et al., 2006].
• In 2010, Bouffard et al. found that Illumina Genome Studio output files containedabout 63% duplicate content when developing more efficient data structures forstoring and analysing genotype and phenotype data. The duplicates are fields inoutput files that contain repeated information [Bouffard et al., 2010].
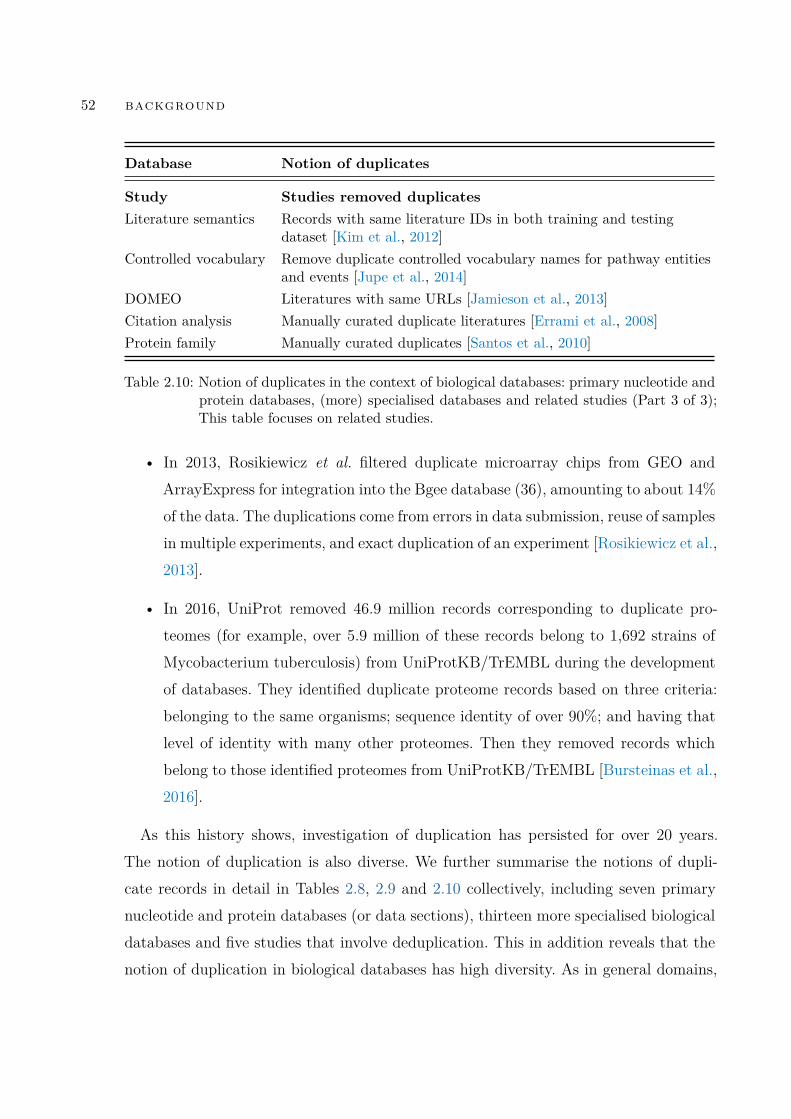
52 background
Database Notion of duplicates
Study Studies removed duplicatesLiterature semantics Records with same literature IDs in both training and testing
dataset [Kim et al., 2012]Controlled vocabulary Remove duplicate controlled vocabulary names for pathway entities
and events [Jupe et al., 2014]DOMEO Literatures with same URLs [Jamieson et al., 2013]Citation analysis Manually curated duplicate literatures [Errami et al., 2008]Protein family Manually curated duplicates [Santos et al., 2010]
Table 2.10: Notion of duplicates in the context of biological databases: primary nucleotide andprotein databases, (more) specialised databases and related studies (Part 3 of 3);This table focuses on related studies.
• In 2013, Rosikiewicz et al. filtered duplicate microarray chips from GEO andArrayExpress for integration into the Bgee database (36), amounting to about 14%of the data. The duplications come from errors in data submission, reuse of samplesin multiple experiments, and exact duplication of an experiment [Rosikiewicz et al.,2013].
• In 2016, UniProt removed 46.9 million records corresponding to duplicate pro-teomes (for example, over 5.9 million of these records belong to 1,692 strains ofMycobacterium tuberculosis) from UniProtKB/TrEMBL during the developmentof databases. They identified duplicate proteome records based on three criteria:belonging to the same organisms; sequence identity of over 90%; and having thatlevel of identity with many other proteomes. Then they removed records whichbelong to those identified proteomes from UniProtKB/TrEMBL [Bursteinas et al.,2016].
As this history shows, investigation of duplication has persisted for over 20 years.The notion of duplication is also diverse. We further summarise the notions of dupli-cate records in detail in Tables 2.8, 2.9 and 2.10 collectively, including seven primarynucleotide and protein databases (or data sections), thirteen more specialised biologicaldatabases and five studies that involve deduplication. This in addition reveals that thenotion of duplication in biological databases has high diversity. As in general domains,
2.7 duplication: definitions and impacts 53
the concept can be generalised into two broad types: duplicates based on sequence sim-ilarity threshold and duplicates based on expert or manual curation. Those two typesare similar compared to near duplicates and entity duplicates in general domains re-spectively, but also have distinctions in the context of biological databases. We describethem in detail as below.
2.7.2.1 Duplicates based on a simple similarity threshold (redundant)
Some previous work used a single sequence similarity threshold to find duplicates [Cameronet al., 2007; Grillo et al., 1996; Holm and Sander, 1998; Li et al., 2002a; Sikic and Carugo,2010]. Such duplicates are described as redundant records in the context of biologicaldatabases [Cameron et al., 2007; Grillo et al., 1996; Holm and Sander, 1998; Li andGodzik, 2006; Sikic and Carugo, 2010]. Those duplicates have a dominant characteris-tic: a pair of records are redundant if their sequence identity, that is, similarity betweenthe record sequences, is over a user-defined threshold; sequence identity is often theonly criteria as the threshold. For instance, one study located all records with over 90%mutual sequence identity [Holm and Sander, 1998]. Same threshold also applies in theCD-HIT method for sequence clustering, where by default it assumes that such dupli-cates share 90% sequence identity [Li and Godzik, 2006]. The sequence-based approachalso forms the basis of the non-redundant database used for BLAST.24
Additionally, compared to near duplicates in general domains, the used threshold islower. For instance, studies in other domain used 80%-95% as the threshold [Xiao et al.,2011], whereas major biological databases often use lower threshold values: UniRef used50% and 90% [Suzek et al., 2014]; Uniclust used 30%, 50% and 90% [Mirdita et al., 2016].For biological studies, protein structure prediction related studies used 75% [Cole et al.,2008]. We summarise the choice in detail later when describing the CD-HIT method.
2.7.2.2 Duplicates based on expert curation
A simple threshold may find near duplicates, but cannot address more complex duplicatetypes, for example, where records with high similarity are not duplicates but records
24ftp://ftp.ncbi.nlm.nih.gov/blast/db/
54 background
with low similarity are in fact duplicates. Duplicate types such as entity duplicatescannot be fully addressed just using a simple threshold. Compared with techniques ingeneral domains, such duplicates in biological databases often require dedicated manualor expert curation. Previous work on duplicate detection has acknowledged that expertcuration is the best strategy for determining duplicates, due to the experience and thepossibility of checking external resources that experts bring [Christen and Goiser, 2007;Martins, 2011; Joffe et al., 2013]. Methods using human-generated labels aim to detectduplicates precisely, either to build models to mimic expert curation behaviour [Martins,2011], or to use expert curated datasets to quantify method performance [Rudniy et al.,2014]. Indeed, manual curation can find more diverse types of duplicates, as shown inthe manual curation cases in Table 2.8. For instance, biocurators found 21 duplicates ina 178-record dataset: 11 of them are different genes coding for the same 60-amino-acidhomeodomains, whereas the other 10 are the same genes expressed in different aliquotsor alternate constructs [Santos et al., 2010]. In another study biocurators also need tofind complex duplicates with uncertain start-stop coordinates but correspond to thesame pathway entities and events [Jupe et al., 2014].The previous studies do not present an understanding of characteristics of duplicates
and what cases matter to database stakeholders – arguably the most important compo-nent before addressing duplication. As shown above, such studies have been undertakenin general domains [Cherubini et al., 2009; De Oliveira et al., 2009; Rodrigues et al.,2010; Liu et al., 2013; Yan and Garcia-Molina, 1995; Conrad et al., 2003]. Those studiesanalysed duplicates that have been merged or surveyed database stakeholders on whatcases they consider as duplicates. The results highlight prevalence of duplicate records,detail characteristics of different types of duplicates, and are an argument for addressingthe instances where duplication has significant impacts to database stakeholders. In thebiological database domain, the prevalence, characteristics, and impacts of duplicationare still not clear. A simple threshold can find redundant records, but redundant recordsare only one type of duplication; methods using expert curation can find more diversetypes than using a simple threshold, but are still not able to capture the diversity ofduplication in biological databases. We show a few such studies as follows.
2.7 duplication: definitions and impacts 55
Korning et al. identified two types of duplicates: the same gene submitted multipletimes (near-identical sequences), and different genes belonging to the same family. Inthe latter case, the authors argue that, since such genes are highly related, one of themis sufficient to represent the others. However, this assumption that only one version isrequired is task-dependent; as noted in the introduction, for other tasks the existenceof multiple versions is significant. To the best of our knowledge, this is the first pub-lished work that identified different kinds of duplicates in biological databases, but theimpact, prevalence and characteristics of the types of duplicates they identify is notdiscussed [Korning et al., 1996].Koh et al. separated the fields of each gene record, such as species and sequences,
and measured the similarities among these fields. They then applied association rulemining to pairs of duplicates using the values of these fields as features [Koh et al.,2004]. In this way, they characterised duplicates in terms of specific attributes andtheir combination. The classes of duplicates considered were broader than Korning etal.’s, but are primarily records containing the same sequence, specifically: (1) the samesequence submitted to different databases; (2) the same sequence submitted to thesame database multiple times; (3) the same sequence with different annotations; and(4) partial records. This means that the (near-)identity of the sequence dominates themined rules. Indeed, the top ten rules generated from Koh et al.’s analysis share thefeature that the sequences have exact (100%) sequence identity. This classification isalso used in other work [Chellamuthu and Punithavalli, 2009; Rudniy et al., 2010; Songand Rudniy, 2010], which therefore has the same limitation. This work again does notconsider the prevalence and characteristics of the various duplicate types. While Koh hasa more detailed classification in her thesis [Koh, 2007], the problem of characterisationof duplicates remains.Those limitations directly cause incomplete or even contradictory understandings of
whether duplication has broad consequences. There has been relatively little investiga-tion of the impact of duplication, but there are some observations in the literature:
• “The problem of duplicates is also existent in genome data, but duplicates areless interfering than in other application domains. Duplicates are often acceptedand used for validation of data correctness. In conclusion, existing data cleansing
56 background
techniques do not and cannot consider the intricacies and semantics of genomedata, or they address the wrong problem, namely duplicate elimination.” [Mülleret al., 2003]. In other words, the authors are arguing that duplication is of valueand deduplication should not be applied.
• “Biological data duplicates provide hints of the redundancy in biological datasets...but rigorous elimination of data may result in loss of critical information.” [Kohet al., 2004]. In other words, the authors are arguing that duplicates have a negativeimpact, but should not be removed.
• “The bioinformatics data is characterized by enormous diversity matched by highredundancy, across both individual and multiple databases. Enabling interoperabil-ity of the data from different sources requires resolution of data disparity and trans-formation in the common form (data integration), and the removal of redundantdata, errors, and discrepancies (data cleaning).” [Chellamuthu and Punithavalli,2009]. In other words, the authors are arguing that duplicates have a negativeimpact and should be removed.
Therefore, the impacts of duplicates are not clear either. The above views are incon-sistent, and are not supported by examples. Moreover, they are not recent, and maynot represent the current environment. Understanding of the prevalence, characteristicsand impacts of duplication is the fundamental problem to investigate. Without knowingthem, it is not clear whether current duplicate detection methods are sufficient either.We can now summarise the following key points with regard to duplication detection
methods in biological databases:
• As for duplication in the general domain, duplication in biological databases hasdiverse definitions;
• There is no previous large-scale analysis on what are considered to be duplicatesfrom the perspective of biological database stakeholders. Without this, the impactsof duplication on biological database stakeholders remain unclear; it is also anobstacle to the development of duplicate detection methods.
2.8 duplicate records: methods 57
2.8 duplicate records: methods
In this section, we introduce duplicate detection methods, in general and in biologicaldatabases.
2.8.1 General duplicate detection paradigm
Detection of duplicate records in a database requires comparisons of pairs of records.Many different duplicate detection methods exist, but share the following general paradigm [Her-zog et al., 2007]:
• Data pre-processing: make records “comparable”.
• Comparison: compare pairs of records.
• Decision: decide whether each pair is duplicate or not.
• Evaluation: measure the performance and decide whether to go back to the Com-parison step.
2.8.2 Data pre-processing
Data pre-processing aims to make records ready to compare in the next step. It ofteninvolves data transformation: recall that a database record has many attributes; recordsfrom different databases may have different attributes. So in some cases attributes needto be transformed such that attributes in a pair of records can be comparable [Bleiholderand Naumann, 2009]; data normalisation: this converts attribute values to a consistentscale and representation, such as scaling [Evans, 2006] and data imputation [Larose,2014], such as ways to replace a feature missing value. If the attribute type is textual,it could also involves text processing [Manning et al., 1999], such as case folding.
58 background
2.8.3 Comparison
Comparison is the core of duplicate detection methods. It aims to solve three ques-tions: what pair(s) to compare? what attributes to compare? and how to compare thoseattributes? An intuitive way to detect duplicate records in a database would be to com-pare all the pairs of records. However, a 2000-record database would yield over a millionpairs to compare. To improve the efficiency, several methods are designed to remove (fil-ter) pairs that are unlikely to be duplicates (Question 1); they may also compare onlyimportant attributes rather than all of the attributes (Question 2). Also, attributeshave different types and in turn the methods to compare attributes vary. Conversely,comparing a subset of all pairs or only selected features may decrease the effective-ness. Duplicate detection surveys accordingly classify duplicate detection methods intoaccuracy-based and efficiency-based [Naumann and Herschel, 2010; Herzog et al., 2007;Christen, 2012a; Elmagarmid et al., 2007; Fan and Geerts, 2012].
2.8.4 Decision
Decision aims to interpret the results of Comparison and determine whether the recordpair is duplicate or not. Often it is binary classification, that is, duplicate or not. In somecases it is multi-class classification for two possible cases: methods classify records intomultiple types, as in [Conrad et al., 2003] mentioned above; a record pair is classified asduplicate, distinct or indeterminate, where indeterminate requires manual review [Joffeet al., 2013]
2.8.5 Evaluation
Evaluation aims to assess the performance of duplicate detection methods. The perfor-mance has two perspectives: efficiency, the time to run a duplicate detection method overa certain database; effectiveness, the accuracy of the method. Effectiveness comparespairs identified by methods with manually classified pairs (or the pairs are inspected
2.8 duplicate records: methods 59
by domain experts), where the latter is called global truth. The comparison outcomeconsists of four basic cases: TP: a pair is classified as duplicate by the method and it isindeed duplicate (recognised by human), TF: a pair is classified as distinct and indeedit is not, FP: a pair is classified as duplicate but it is not and FN: a pair is classified asdistinct but in fact is duplicate. Those four basic instances form the metrics to evaluatethe performance of duplicate detection methods, such as precision and recall. Now wedetail Comparison in terms of attribute level and record level.
2.8.6 Compare at the attribute level
We consider Question 3 of Comparison, “How to compare attributes?”. Attributes havedifferent types and in turn the methods to compare attributes vary. For instance, if anattribute value is an integer or an identifier, it would only need a direct comparison.Complex cases are often textual or string based, where they may have typographicalerrors and different orders of words. There are three primary types of methods [Elma-garmid et al., 2007; Naumann and Herschel, 2010], explained as follows.Character-based methods compare the strings character by character. A popular
method is to measure the edit distance between two strings: the number of edits totransform one string to another; the edits include insertion (add a character to thestring), deletion (remove a character) and replacement (substitute a character). Basicversion of this method is named as the Levenshtein distance [Levenshtein, 1966] and ex-tended versions include Needleman-Wunsch [Needleman and Wunsch, 1970] (also referto global alignment) and Smith-Waterman [Smith and Waterman, 1981] (also refer tolocal alignment), which assign different weights to the edits and only focus on similarsubstrings respectively. Note that BLAST used in biological database search is an ex-ample of a local alignment method. Another common method is called N-grams [Brownet al., 1992] (also called q-grams [Ukkonen, 1992]), where a string is represented as alist of short character substrings of length N, e.g., “string” of length 2 is “st”, “tr”, “ri”,“in” and “ng”.25 Comparing two strings effectively compares the common substrings.
25Notice that some N-gram methods also pad special characters at the beginning and the end of thestring.
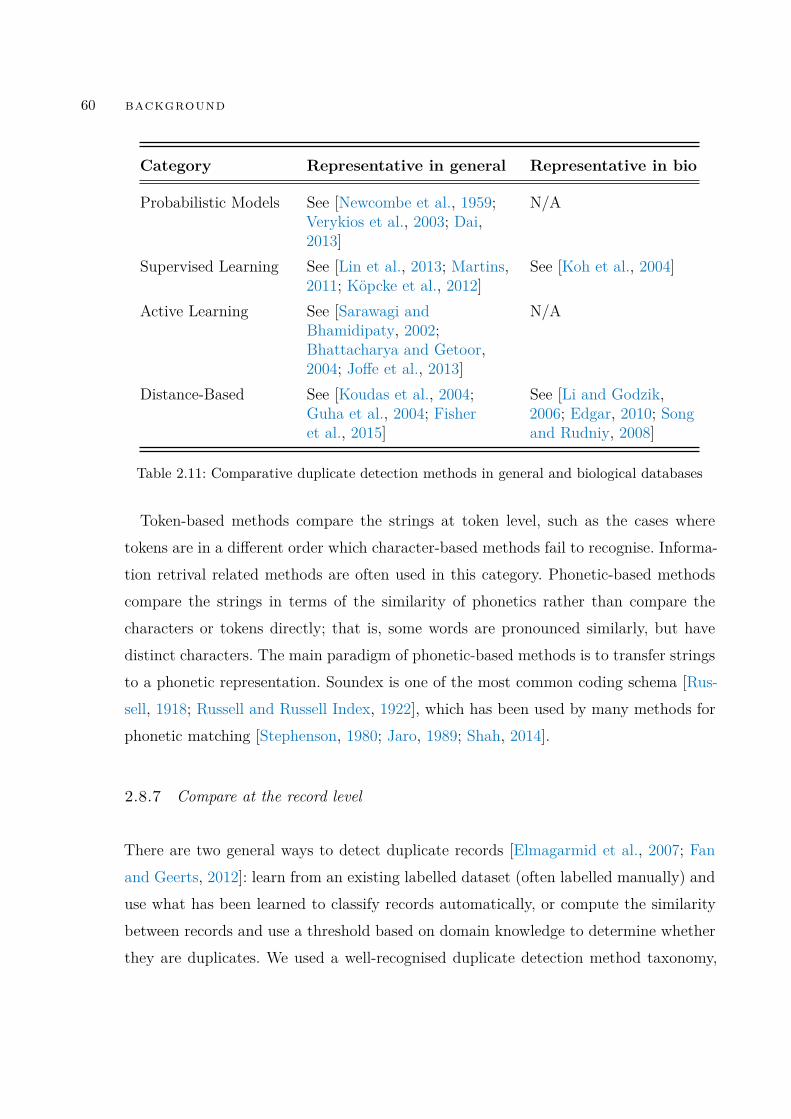
60 background
Category Representative in general Representative in bio
Probabilistic Models See [Newcombe et al., 1959;Verykios et al., 2003; Dai,2013]
N/A
Supervised Learning See [Lin et al., 2013; Martins,2011; Köpcke et al., 2012]
See [Koh et al., 2004]
Active Learning See [Sarawagi andBhamidipaty, 2002;Bhattacharya and Getoor,2004; Joffe et al., 2013]
N/A
Distance-Based See [Koudas et al., 2004;Guha et al., 2004; Fisheret al., 2015]
See [Li and Godzik,2006; Edgar, 2010; Songand Rudniy, 2008]
Table 2.11: Comparative duplicate detection methods in general and biological databases
Token-based methods compare the strings at token level, such as the cases wheretokens are in a different order which character-based methods fail to recognise. Informa-tion retrival related methods are often used in this category. Phonetic-based methodscompare the strings in terms of the similarity of phonetics rather than compare thecharacters or tokens directly; that is, some words are pronounced similarly, but havedistinct characters. The main paradigm of phonetic-based methods is to transfer stringsto a phonetic representation. Soundex is one of the most common coding schema [Rus-sell, 1918; Russell and Russell Index, 1922], which has been used by many methods forphonetic matching [Stephenson, 1980; Jaro, 1989; Shah, 2014].
2.8.7 Compare at the record level
There are two general ways to detect duplicate records [Elmagarmid et al., 2007; Fanand Geerts, 2012]: learn from an existing labelled dataset (often labelled manually) anduse what has been learned to classify records automatically, or compute the similaritybetween records and use a threshold based on domain knowledge to determine whetherthey are duplicates. We used a well-recognised duplicate detection method taxonomy,
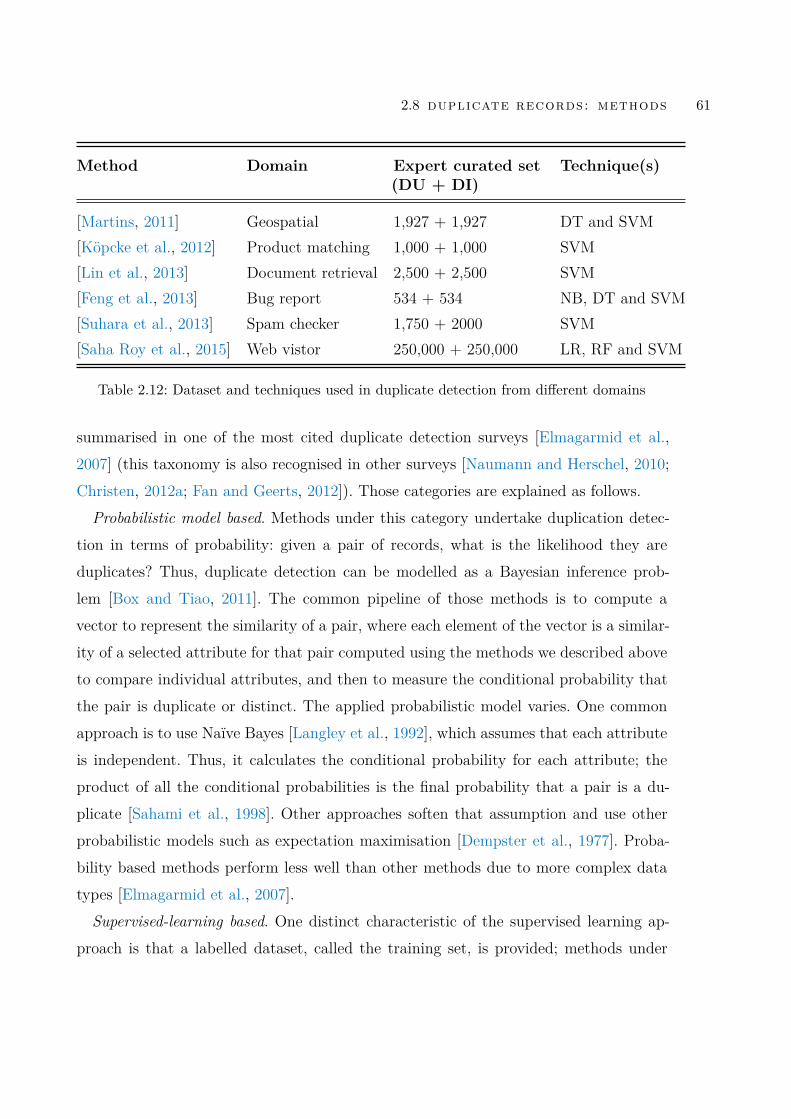
2.8 duplicate records: methods 61
Method Domain Expert curated set(DU + DI)
Technique(s)
[Martins, 2011] Geospatial 1,927 + 1,927 DT and SVM[Köpcke et al., 2012] Product matching 1,000 + 1,000 SVM[Lin et al., 2013] Document retrieval 2,500 + 2,500 SVM[Feng et al., 2013] Bug report 534 + 534 NB, DT and SVM[Suhara et al., 2013] Spam checker 1,750 + 2000 SVM[Saha Roy et al., 2015] Web vistor 250,000 + 250,000 LR, RF and SVM
Table 2.12: Dataset and techniques used in duplicate detection from different domains
summarised in one of the most cited duplicate detection surveys [Elmagarmid et al.,2007] (this taxonomy is also recognised in other surveys [Naumann and Herschel, 2010;Christen, 2012a; Fan and Geerts, 2012]). Those categories are explained as follows.Probabilistic model based. Methods under this category undertake duplication detec-
tion in terms of probability: given a pair of records, what is the likelihood they areduplicates? Thus, duplicate detection can be modelled as a Bayesian inference prob-lem [Box and Tiao, 2011]. The common pipeline of those methods is to compute avector to represent the similarity of a pair, where each element of the vector is a similar-ity of a selected attribute for that pair computed using the methods we described aboveto compare individual attributes, and then to measure the conditional probability thatthe pair is duplicate or distinct. The applied probabilistic model varies. One commonapproach is to use Naïve Bayes [Langley et al., 1992], which assumes that each attributeis independent. Thus, it calculates the conditional probability for each attribute; theproduct of all the conditional probabilities is the final probability that a pair is a du-plicate [Sahami et al., 1998]. Other approaches soften that assumption and use otherprobabilistic models such as expectation maximisation [Dempster et al., 1977]. Proba-bility based methods perform less well than other methods due to more complex datatypes [Elmagarmid et al., 2007].Supervised-learning based. One distinct characteristic of the supervised learning ap-
proach is that a labelled dataset, called the training set, is provided; methods under
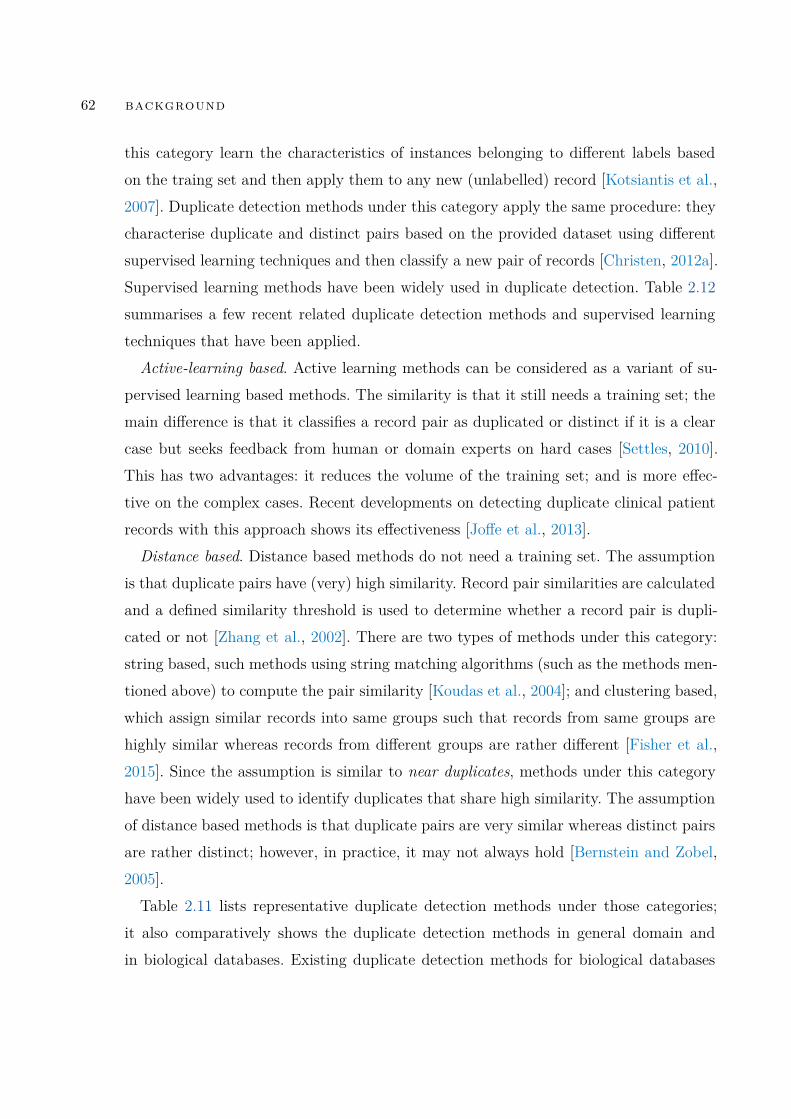
62 background
this category learn the characteristics of instances belonging to different labels basedon the traing set and then apply them to any new (unlabelled) record [Kotsiantis et al.,2007]. Duplicate detection methods under this category apply the same procedure: theycharacterise duplicate and distinct pairs based on the provided dataset using differentsupervised learning techniques and then classify a new pair of records [Christen, 2012a].Supervised learning methods have been widely used in duplicate detection. Table 2.12summarises a few recent related duplicate detection methods and supervised learningtechniques that have been applied.Active-learning based. Active learning methods can be considered as a variant of su-
pervised learning based methods. The similarity is that it still needs a training set; themain difference is that it classifies a record pair as duplicated or distinct if it is a clearcase but seeks feedback from human or domain experts on hard cases [Settles, 2010].This has two advantages: it reduces the volume of the training set; and is more effec-tive on the complex cases. Recent developments on detecting duplicate clinical patientrecords with this approach shows its effectiveness [Joffe et al., 2013].Distance based. Distance based methods do not need a training set. The assumption
is that duplicate pairs have (very) high similarity. Record pair similarities are calculatedand a defined similarity threshold is used to determine whether a record pair is dupli-cated or not [Zhang et al., 2002]. There are two types of methods under this category:string based, such methods using string matching algorithms (such as the methods men-tioned above) to compute the pair similarity [Koudas et al., 2004]; and clustering based,which assign similar records into same groups such that records from same groups arehighly similar whereas records from different groups are rather different [Fisher et al.,2015]. Since the assumption is similar to near duplicates, methods under this categoryhave been widely used to identify duplicates that share high similarity. The assumptionof distance based methods is that duplicate pairs are very similar whereas distinct pairsare rather distinct; however, in practice, it may not always hold [Bernstein and Zobel,2005].
Table 2.11 lists representative duplicate detection methods under those categories;it also comparatively shows the duplicate detection methods in general domain andin biological databases. Existing duplicate detection methods for biological databases
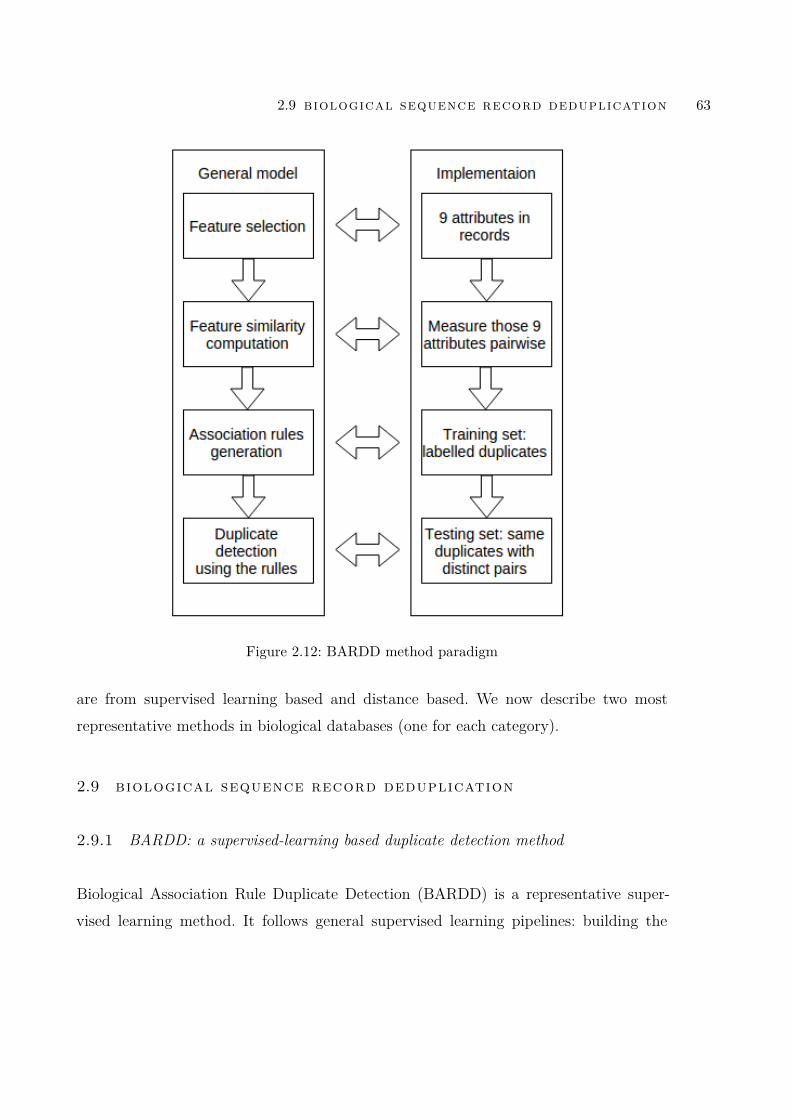
2.9 biological sequence record deduplication 63
Figure 2.12: BARDD method paradigm
are from supervised learning based and distance based. We now describe two mostrepresentative methods in biological databases (one for each category).
2.9 biological sequence record deduplication
2.9.1 BARDD: a supervised-learning based duplicate detection method
Biological Association Rule Duplicate Detection (BARDD) is a representative super-vised learning method. It follows general supervised learning pipelines: building the
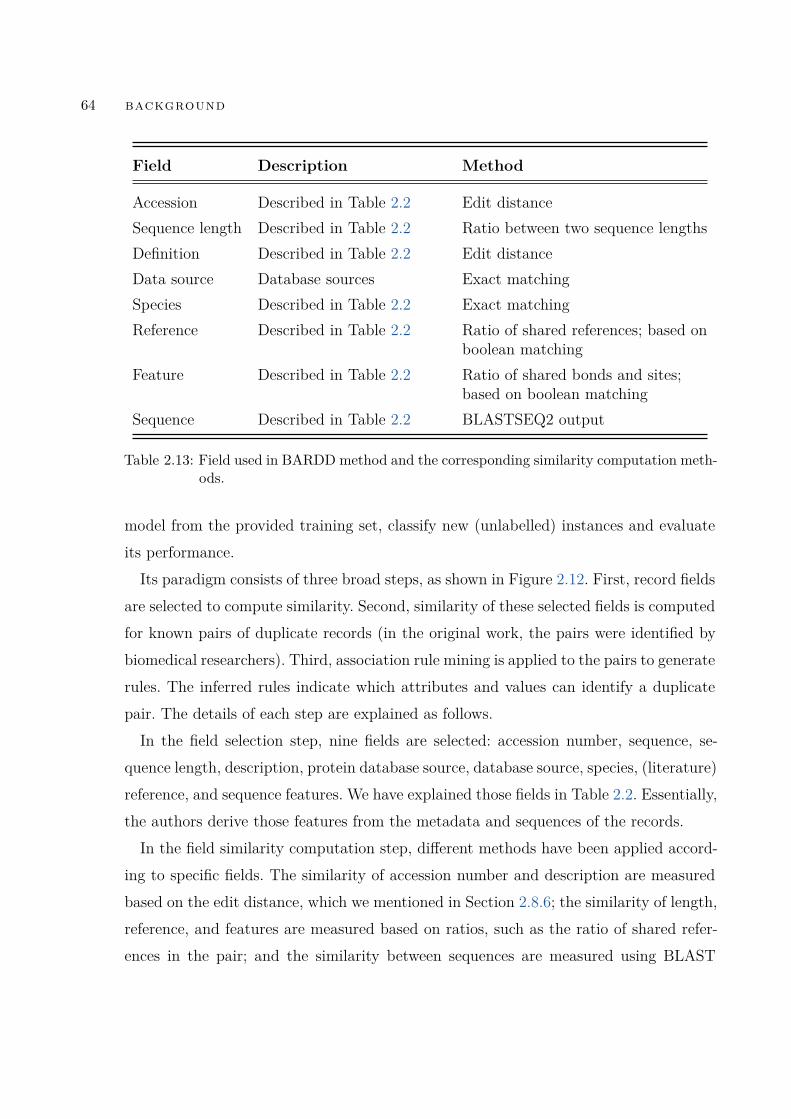
64 background
Field Description Method
Accession Described in Table 2.2 Edit distanceSequence length Described in Table 2.2 Ratio between two sequence lengthsDefinition Described in Table 2.2 Edit distanceData source Database sources Exact matchingSpecies Described in Table 2.2 Exact matchingReference Described in Table 2.2 Ratio of shared references; based on
boolean matchingFeature Described in Table 2.2 Ratio of shared bonds and sites;
based on boolean matchingSequence Described in Table 2.2 BLASTSEQ2 output
Table 2.13: Field used in BARDD method and the corresponding similarity computation meth-ods.
model from the provided training set, classify new (unlabelled) instances and evaluateits performance.Its paradigm consists of three broad steps, as shown in Figure 2.12. First, record fields
are selected to compute similarity. Second, similarity of these selected fields is computedfor known pairs of duplicate records (in the original work, the pairs were identified bybiomedical researchers). Third, association rule mining is applied to the pairs to generaterules. The inferred rules indicate which attributes and values can identify a duplicatepair. The details of each step are explained as follows.In the field selection step, nine fields are selected: accession number, sequence, se-
quence length, description, protein database source, database source, species, (literature)reference, and sequence features. We have explained those fields in Table 2.2. Essentially,the authors derive those features from the metadata and sequences of the records.In the field similarity computation step, different methods have been applied accord-
ing to specific fields. The similarity of accession number and description are measuredbased on the edit distance, which we mentioned in Section 2.8.6; the similarity of length,reference, and features are measured based on ratios, such as the ratio of shared refer-ences in the pair; and the similarity between sequences are measured using BLAST
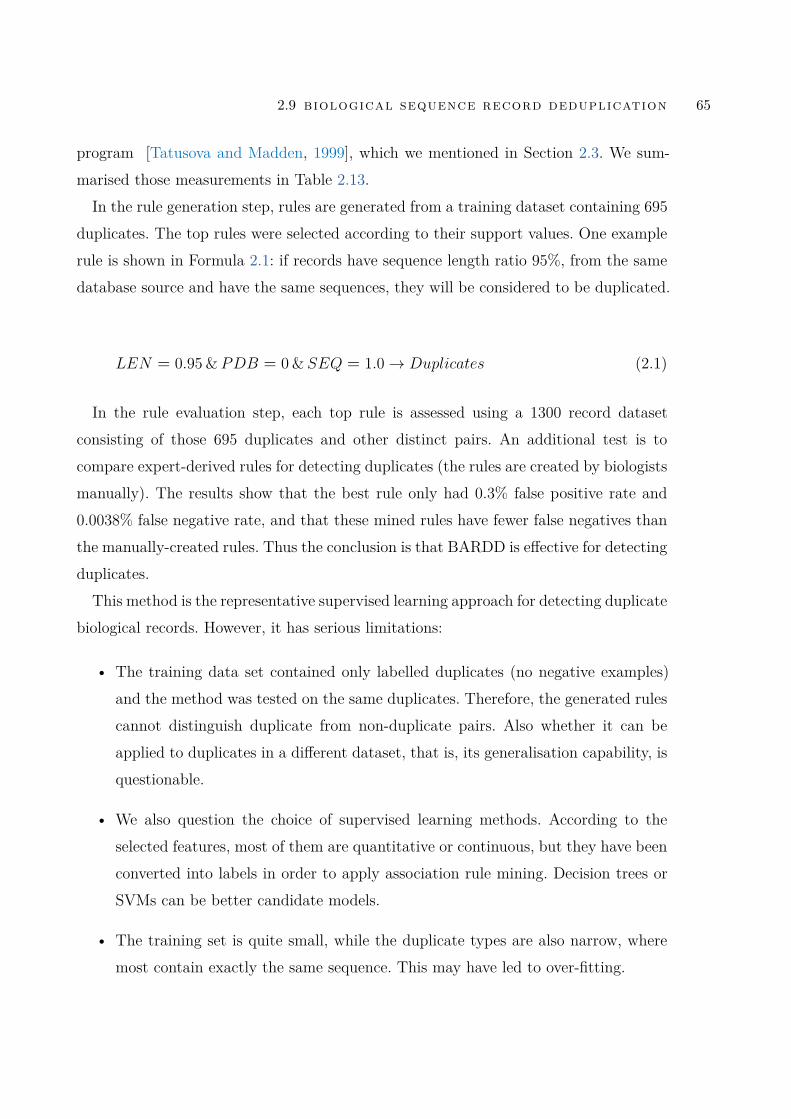
2.9 biological sequence record deduplication 65
program [Tatusova and Madden, 1999], which we mentioned in Section 2.3. We sum-marised those measurements in Table 2.13.In the rule generation step, rules are generated from a training dataset containing 695
duplicates. The top rules were selected according to their support values. One examplerule is shown in Formula 2.1: if records have sequence length ratio 95%, from the samedatabase source and have the same sequences, they will be considered to be duplicated.
LEN = 0.95 & PDB = 0 & SEQ = 1.0 → Duplicates (2.1)
In the rule evaluation step, each top rule is assessed using a 1300 record datasetconsisting of those 695 duplicates and other distinct pairs. An additional test is tocompare expert-derived rules for detecting duplicates (the rules are created by biologistsmanually). The results show that the best rule only had 0.3% false positive rate and0.0038% false negative rate, and that these mined rules have fewer false negatives thanthe manually-created rules. Thus the conclusion is that BARDD is effective for detectingduplicates.This method is the representative supervised learning approach for detecting duplicate
biological records. However, it has serious limitations:
• The training data set contained only labelled duplicates (no negative examples)and the method was tested on the same duplicates. Therefore, the generated rulescannot distinguish duplicate from non-duplicate pairs. Also whether it can beapplied to duplicates in a different dataset, that is, its generalisation capability, isquestionable.
• We also question the choice of supervised learning methods. According to theselected features, most of them are quantitative or continuous, but they have beenconverted into labels in order to apply association rule mining. Decision trees orSVMs can be better candidate models.
• The training set is quite small, while the duplicate types are also narrow, wheremost contain exactly the same sequence. This may have led to over-fitting.
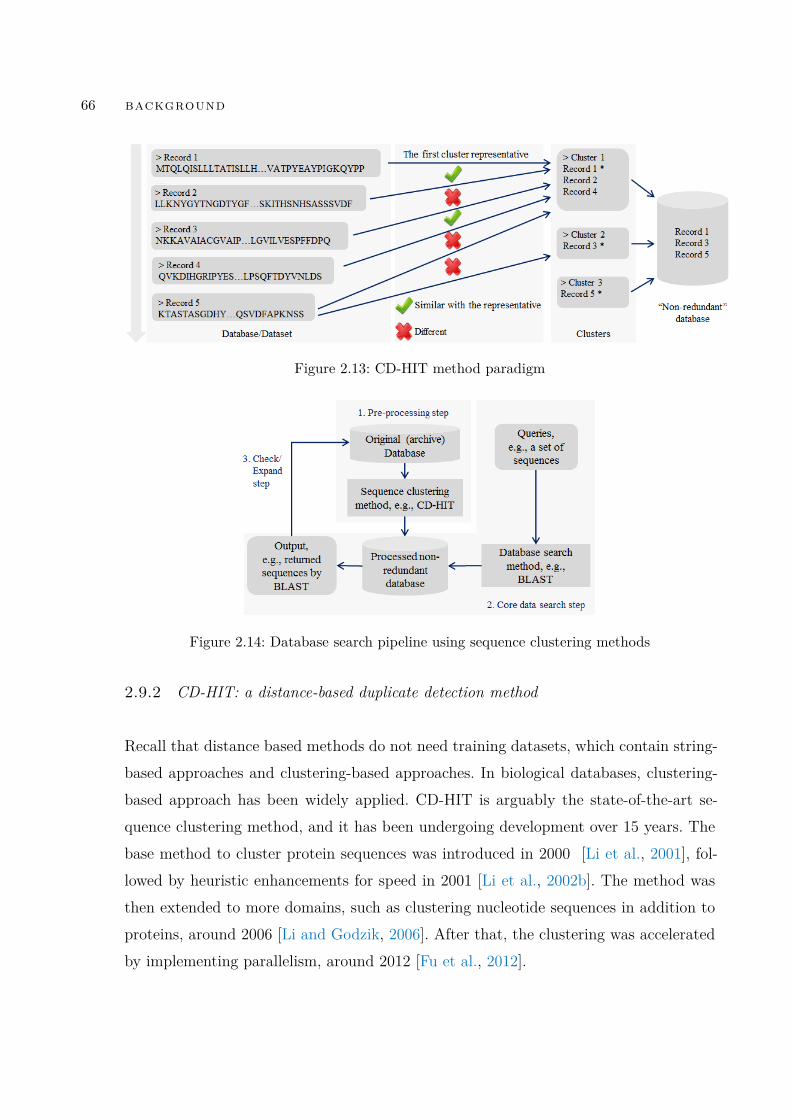
66 background
Figure 2.13: CD-HIT method paradigm
Figure 2.14: Database search pipeline using sequence clustering methods
2.9.2 CD-HIT: a distance-based duplicate detection method
Recall that distance based methods do not need training datasets, which contain string-based approaches and clustering-based approaches. In biological databases, clustering-based approach has been widely applied. CD-HIT is arguably the state-of-the-art se-quence clustering method, and it has been undergoing development over 15 years. Thebase method to cluster protein sequences was introduced in 2000 [Li et al., 2001], fol-lowed by heuristic enhancements for speed in 2001 [Li et al., 2002b]. The method wasthen extended to more domains, such as clustering nucleotide sequences in addition toproteins, around 2006 [Li and Godzik, 2006]. After that, the clustering was acceleratedby implementing parallelism, around 2012 [Fu et al., 2012].
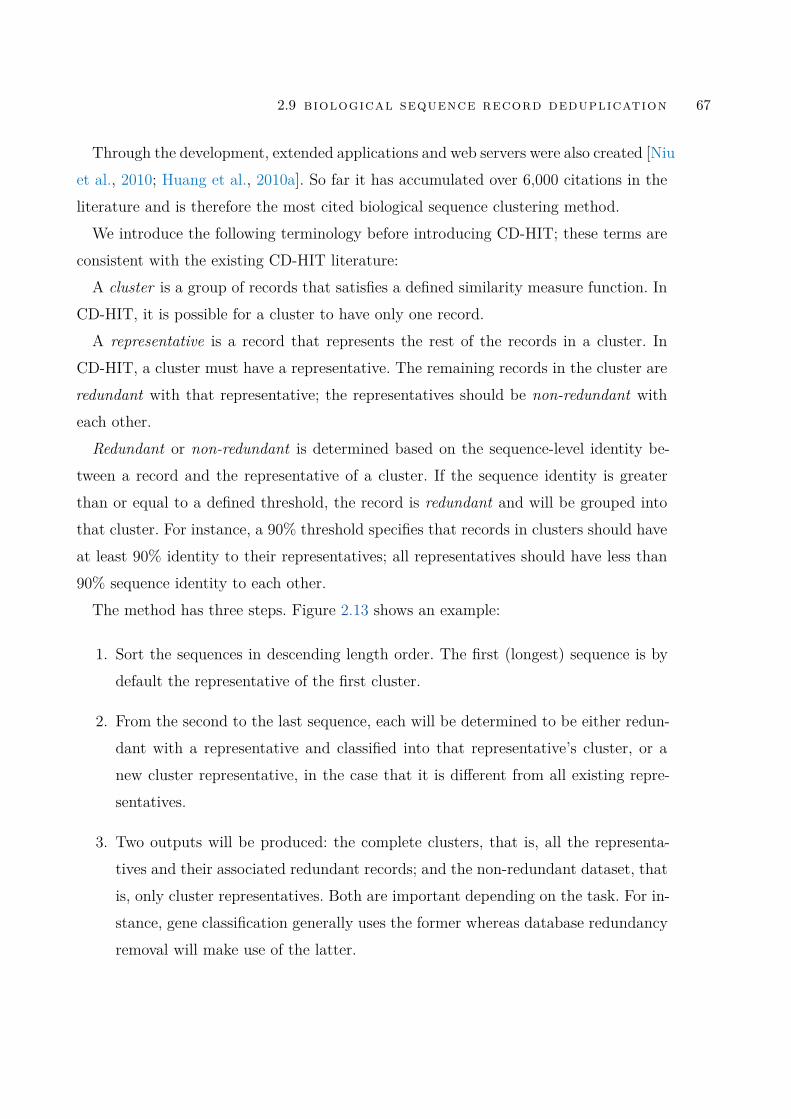
2.9 biological sequence record deduplication 67
Through the development, extended applications and web servers were also created [Niuet al., 2010; Huang et al., 2010a]. So far it has accumulated over 6,000 citations in theliterature and is therefore the most cited biological sequence clustering method.We introduce the following terminology before introducing CD-HIT; these terms are
consistent with the existing CD-HIT literature:A cluster is a group of records that satisfies a defined similarity measure function. In
CD-HIT, it is possible for a cluster to have only one record.A representative is a record that represents the rest of the records in a cluster. In
CD-HIT, a cluster must have a representative. The remaining records in the cluster areredundant with that representative; the representatives should be non-redundant witheach other.Redundant or non-redundant is determined based on the sequence-level identity be-
tween a record and the representative of a cluster. If the sequence identity is greaterthan or equal to a defined threshold, the record is redundant and will be grouped intothat cluster. For instance, a 90% threshold specifies that records in clusters should haveat least 90% identity to their representatives; all representatives should have less than90% sequence identity to each other.The method has three steps. Figure 2.13 shows an example:
1. Sort the sequences in descending length order. The first (longest) sequence is bydefault the representative of the first cluster.
2. From the second to the last sequence, each will be determined to be either redun-dant with a representative and classified into that representative’s cluster, or anew cluster representative, in the case that it is different from all existing repre-sentatives.
3. Two outputs will be produced: the complete clusters, that is, all the representa-tives and their associated redundant records; and the non-redundant dataset, thatis, only cluster representatives. Both are important depending on the task. For in-stance, gene classification generally uses the former whereas database redundancyremoval will make use of the latter.
68 background
CD-HIT is used in many biological tasks. There are generally two kinds of input dataand applications: sequencing reads, where the objective is to remove duplicate reads;and a set of data records, where the objective is to remove redundant records or toproduce a classification such as a protein family classification.The use cases underlying each category can differ in many ways. Using the second
category as an example, the dataset might vary. For instance, it might consist of recordsfrom multiple organisms for homology search, or from just one organism for dedicatedbiocuration.Because of the broad application of the method, it requires comprehensive clustering
evaluation to ensure that it is robust and generally applicable in the different cases.However, existing studies have emphasised evaluation of use cases of CD-HIT such asremoval of duplicate reads [Zorita et al., 2015] and classification of operational taxonomyunits [Kopylova et al., 2016]. Little work has validated the method in terms of thearguably more common use case of non-redundant database construction. In this context,the accuracy or quality of the clustering refers to assessing the remaining redundancyratio of generated non-redundant databases: if the remaining redundancy ratio is low,it will imply high accuracy or high clustering quality. The redundancy ratio of CD-HITwas evaluated as described in the supplementary file of Fu et al. [Fu et al., 2012]. Thatevaluation had three primary steps:
1. Use CD-HIT to generate a non-redundant database at a specified identity thresh-old from a provided database;
2. Perform BLAST all-by-all searches over the sequences in the generated non-redundantdatabase;
3. Identify sequences in the generated database with identity values still at or abovethe identity threshold, and therefore redundant, based on BLAST alignments.The redundancy ratio is calculated by number of incorrectly included redundantsequences over the total number of representative sequences;
The redundancy ratio was originally evaluated on the first 50,000 representative se-quences out of the non-redundant database generated from Swiss-Prot at a threshold of
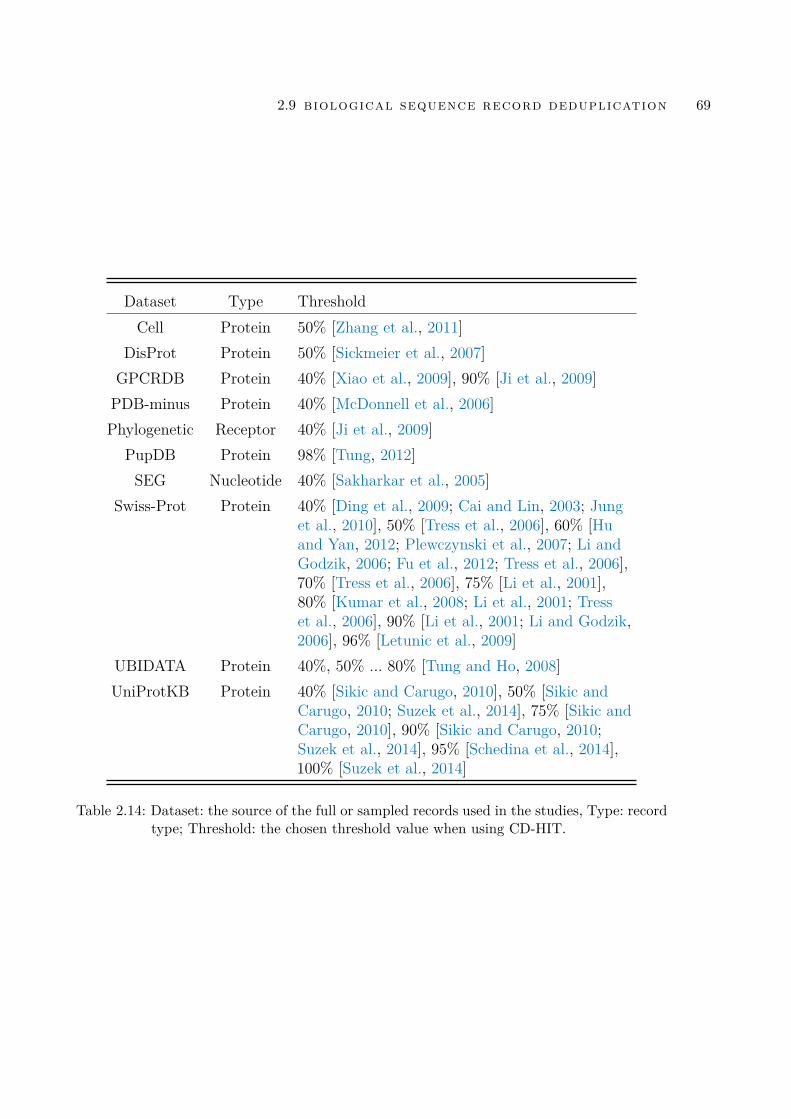
2.9 biological sequence record deduplication 69
Dataset Type ThresholdCell Protein 50% [Zhang et al., 2011]
DisProt Protein 50% [Sickmeier et al., 2007]GPCRDB Protein 40% [Xiao et al., 2009], 90% [Ji et al., 2009]PDB-minus Protein 40% [McDonnell et al., 2006]Phylogenetic Receptor 40% [Ji et al., 2009]
PupDB Protein 98% [Tung, 2012]SEG Nucleotide 40% [Sakharkar et al., 2005]
Swiss-Prot Protein 40% [Ding et al., 2009; Cai and Lin, 2003; Junget al., 2010], 50% [Tress et al., 2006], 60% [Huand Yan, 2012; Plewczynski et al., 2007; Li andGodzik, 2006; Fu et al., 2012; Tress et al., 2006],70% [Tress et al., 2006], 75% [Li et al., 2001],80% [Kumar et al., 2008; Li et al., 2001; Tresset al., 2006], 90% [Li et al., 2001; Li and Godzik,2006], 96% [Letunic et al., 2009]
UBIDATA Protein 40%, 50% ... 80% [Tung and Ho, 2008]UniProtKB Protein 40% [Sikic and Carugo, 2010], 50% [Sikic and
Carugo, 2010; Suzek et al., 2014], 75% [Sikic andCarugo, 2010], 90% [Sikic and Carugo, 2010;Suzek et al., 2014], 95% [Schedina et al., 2014],100% [Suzek et al., 2014]
Table 2.14: Dataset: the source of the full or sampled records used in the studies, Type: recordtype; Threshold: the chosen threshold value when using CD-HIT.
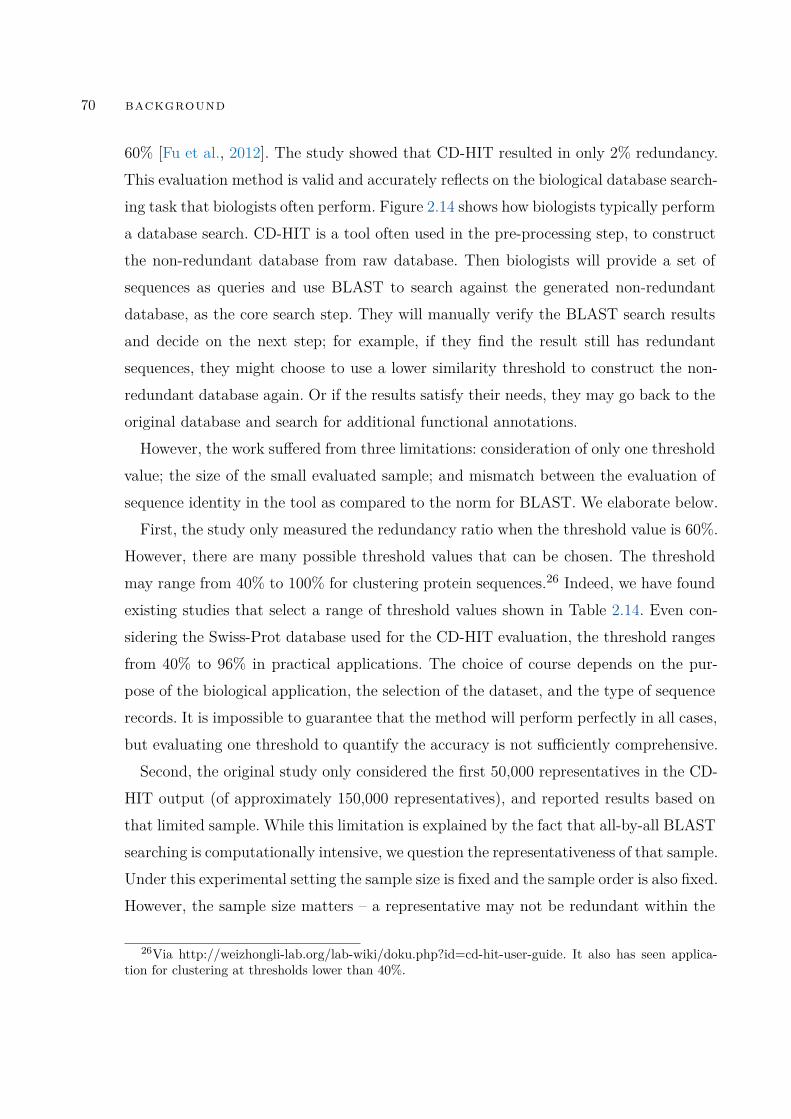
70 background
60% [Fu et al., 2012]. The study showed that CD-HIT resulted in only 2% redundancy.This evaluation method is valid and accurately reflects on the biological database search-ing task that biologists often perform. Figure 2.14 shows how biologists typically performa database search. CD-HIT is a tool often used in the pre-processing step, to constructthe non-redundant database from raw database. Then biologists will provide a set ofsequences as queries and use BLAST to search against the generated non-redundantdatabase, as the core search step. They will manually verify the BLAST search resultsand decide on the next step; for example, if they find the result still has redundantsequences, they might choose to use a lower similarity threshold to construct the non-redundant database again. Or if the results satisfy their needs, they may go back to theoriginal database and search for additional functional annotations.However, the work suffered from three limitations: consideration of only one threshold
value; the size of the small evaluated sample; and mismatch between the evaluation ofsequence identity in the tool as compared to the norm for BLAST. We elaborate below.First, the study only measured the redundancy ratio when the threshold value is 60%.
However, there are many possible threshold values that can be chosen. The thresholdmay range from 40% to 100% for clustering protein sequences.26 Indeed, we have foundexisting studies that select a range of threshold values shown in Table 2.14. Even con-sidering the Swiss-Prot database used for the CD-HIT evaluation, the threshold rangesfrom 40% to 96% in practical applications. The choice of course depends on the pur-pose of the biological application, the selection of the dataset, and the type of sequencerecords. It is impossible to guarantee that the method will perform perfectly in all cases,but evaluating one threshold to quantify the accuracy is not sufficiently comprehensive.Second, the original study only considered the first 50,000 representatives in the CD-
HIT output (of approximately 150,000 representatives), and reported results based onthat limited sample. While this limitation is explained by the fact that all-by-all BLASTsearching is computationally intensive, we question the representativeness of that sample.Under this experimental setting the sample size is fixed and the sample order is also fixed.However, the sample size matters – a representative may not be redundant within the
26Via http://weizhongli-lab.org/lab-wiki/doku.php?id=cd-hit-user-guide. It also has seen applica-tion for clustering at thresholds lower than 40%.
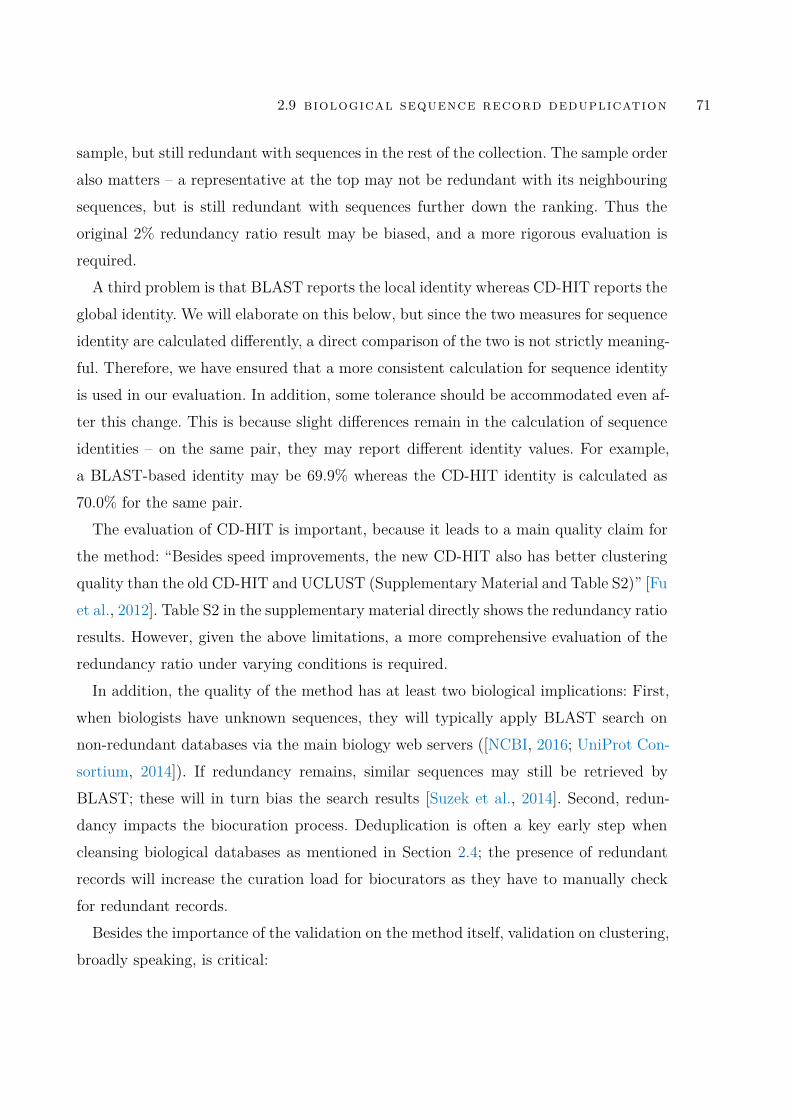
2.9 biological sequence record deduplication 71
sample, but still redundant with sequences in the rest of the collection. The sample orderalso matters – a representative at the top may not be redundant with its neighbouringsequences, but is still redundant with sequences further down the ranking. Thus theoriginal 2% redundancy ratio result may be biased, and a more rigorous evaluation isrequired.A third problem is that BLAST reports the local identity whereas CD-HIT reports the
global identity. We will elaborate on this below, but since the two measures for sequenceidentity are calculated differently, a direct comparison of the two is not strictly meaning-ful. Therefore, we have ensured that a more consistent calculation for sequence identityis used in our evaluation. In addition, some tolerance should be accommodated even af-ter this change. This is because slight differences remain in the calculation of sequenceidentities – on the same pair, they may report different identity values. For example,a BLAST-based identity may be 69.9% whereas the CD-HIT identity is calculated as70.0% for the same pair.
The evaluation of CD-HIT is important, because it leads to a main quality claim forthe method: “Besides speed improvements, the new CD-HIT also has better clusteringquality than the old CD-HIT and UCLUST (Supplementary Material and Table S2)” [Fuet al., 2012]. Table S2 in the supplementary material directly shows the redundancy ratioresults. However, given the above limitations, a more comprehensive evaluation of theredundancy ratio under varying conditions is required.In addition, the quality of the method has at least two biological implications: First,
when biologists have unknown sequences, they will typically apply BLAST search onnon-redundant databases via the main biology web servers ([NCBI, 2016; UniProt Con-sortium, 2014]). If redundancy remains, similar sequences may still be retrieved byBLAST; these will in turn bias the search results [Suzek et al., 2014]. Second, redun-dancy impacts the biocuration process. Deduplication is often a key early step whencleansing biological databases as mentioned in Section 2.4; the presence of redundantrecords will increase the curation load for biocurators as they have to manually checkfor redundant records.Besides the importance of the validation on the method itself, validation on clustering,
broadly speaking, is critical:
72 background
The validation of clustering structures is the most difficult and frustratingpart of cluster analysis. Without a strong effort in this direction, clusteranalysis will remain a black art accessible only to those true believers whohave experience and great courage. [Jain and Dubes, 1988]
Therefore, we believe validations of distance-based duplicate detection methods areinadequate.We can now summarise the following key points with regard to duplication detection
methods in biological databases:
• Supervised learning techniques have been extensively applied in duplicate detec-tion in general domain, but duplicate detection methods in biological databaseslack both breadth and depth.
• While distance-based methods have been widely used in duplicate detection in bi-ological databases, especially clustering methods, the validation of such methodshave significant shortcomings; without deeper validation, their impact on biologi-cal database stakeholders is not clear.

3PAPER 1
OutlineIn this chapter we summarise the results and reflect on the research process based onthe following manuscript:
• Title: Duplicates, redundancies and inconsistencies in the primary nucleotidedatabases: a descriptive study.
• Authors: Qingyu Chen, Justin Zobel, and Karin Verspoor
• Publication venue: Database: The Journal of Biological Databases and Curation
• Publication year: 2017
3.1 abstract of the paper
GenBank, the EMBL European Nucleotide Archive and the DNA DataBank of Japan,known collectively as the International Nucleotide Sequence Database Collaboration orINSDC, are the three most significant nucleotide sequence databases. Their records arederived from laboratory work undertaken by different individuals, by different teams,with a range of technologies and assumptions and over a period of decades. As a con-sequence, they contain a great many duplicates, redundancies and inconsistencies, butneither the prevalence nor the characteristics of various types of duplicates have beenrigorously assessed. Existing duplicate detection methods in bioinformatics only addressspecific duplicate types, with inconsistent assumptions; and the impact of duplicates inbioinformatics databases has not been carefully assessed, making it difficult to judgethe value of such methods. Our goal is to assess the scale, kinds and impact of dupli-
73
74 paper 1
cates in bioinformatics databases, through a retrospective analysis of merged groups inINSDC databases. Our outcomes are threefold: (1) We analyse a benchmark datasetconsisting of duplicates manually identified in INSDC – a dataset of 67,888 mergedgroups with 111,823 duplicate pairs across 21 organisms from INSDC databases – interms of the prevalence, types and impacts of duplicates. (2) We categorize duplicatesat both sequence and annotation level, with supporting quantitative statistics, showingthat different organisms have different prevalence of distinct kinds of duplicate. (3) Weshow that the presence of duplicates has practical impact via a simple case study onduplicates, in terms of GC content and melting temperature. We demonstrate that du-plicates not only introduce redundancy, but can lead to inconsistent results for certaintasks. Our findings lead to a better understanding of the problem of duplication inbiological databases.
3.2 summary and reflection
The core of the paper is to investigate the scale, characteristics and impacts of duplicaterecords in biological databases. The investigation contributes to the fundamental under-standing of duplication: what is duplication and how does it impact database users,namely database staff (more on database curators) and database users. As mentionedin Section 2.2.2 in Chapter 2, nucleotide databases are the basis for other biologicalsequence databases; INSDC are the primary and authoritative nucleotide sequence re-sources. On one hand, they have been used directly: end users submit records and searchpotential interesting results. On the other hand, they have also been source records forgeneral protein databases such as UniProtKB as explained in Section 2.4 in Chapter 2.Thus, the quality of the deposited records in those databases may have a direct impacton end users; also those records may have propagated impacts on other databases.Recall that data quality has multiple dimensions (details are in Section 2.6.1, Chap-
ter 2). We have reviewed definitions of duplication in general domains in Section 2.7 witha case study on development of conceptions of duplication in duplicate video detection,showing that the definition of duplication is diverse. We further reviewed 25 definitionsof duplication in biological databases shown in Tables 2.8–2.10 (some of them are also
3.2 summary and reflection 75
in the Background section of this paper): it is consistent with the findings on generaldomains that duplication is diverse, but there has been a lack of substantial investiga-tion on what database users regard as duplication. Without this it is not clear whetherexisting definitions of duplication from either biological databases or methods are cap-tured properly; it is not clear either what kinds of duplicates impact database users andwhether the existing methods can effectively detect such kinds of duplicates.
We constructed a dataset (one of the three benchmarks which we introduce in thenext chapter), consisting of 111,823 duplicate pairs across 21 organisms that have beenmerged in INSDC databases. Those records may be reported by submitters as theyspot duplicates, may be directly merged by database curators, and may be reportedby sequencing projects; the details on different procedures to merge are in the Dataand methods section of this paper. We further analyse its prevalence (what proportionof records is duplicated), characteristics (what are the detailed duplicate types) andimpacts (how those duplicates matter to users). The main results are presented:
• Different organisms have different prevalence of distinct kinds of duplicate (thesupporting statistics are shown in Table 2 of the paper). The amount of curationeffort impact the prevalance of duplicates;
• We categorised duplicate records into eight categories based on the sequences andmetadata (as explained in Table 2.2 in Chapter 2); the supporting statistics areshown in Table 2. The results show that existing definitions of duplication inbiological database are not adequate; for example, records with distinct sequencescan be duplicates, whereas existing literature mainly focuses on near or identicalsequences.
• We did a simple case study on GC content and melting temperature, a commonbiological study that measures the proportion of base G and C and the temperatureat which half of the sequence form double strands respectively. GC content andmelting temperatures are correlated, where the former is used to determine thelatter. We compared GC content and melting temperature under the conditionsthat duplicate records have and have not been merged correspondingly. The results
76 paper 1
demonstrate that duplicate records could give inconsistent results as shown inFigures 1–4, Tables 3 and 4 in the paper.
I1 completed the experiments and the paper draft in my first year of PhD candidature.However, this paper was not published until my third year was almost complete. Out ofmany, two representative obstacles or criticisms are: first, it has been argued that themerged record collection are not duplicates because they are not what are considered asduplicates by some individuals or some databases; and second, it has been argued thatINSDC are mainly for archival purposes so duplication is fine. I have then realised thatthe statement that duplication has diverse definitions seems trivial, but in fact it is notwidely understood. As a result, this paper:
• Has a dedicated section (Section 2) to summarise different definitions of duplica-tion and stresses that the different definitions do not necessarily mean inconsis-tencies.
• Details the reasons that the records have been merged, in Section 3, based ondatabase documentations and communications between database staff, and ex-plains why those merged records can be considered as duplicates.
• Assembles the concerns of duplication from various studies to demonstrate thenecessity of analysing impacts of duplication and argues that databases need tohandle duplication – such as labelling duplicates to resolve users’ confusion – evenif they are for archival purposes.
Over time, my understanding of the topic has increased. Initially, I mainly consid-ered entity duplicates (recall that records belong to the same entities) as the majorrepresentation of duplication, whereas near duplicates or redundant records also impactdatabase users significantly. This has lead to the investigation on redundant recordssummarised in Paper 5–7 (Chapter 7–9 respectively).The findings in these two papers, from another perspective, also show that the im-
portance of data quality and curation related studies have been ignored. As described
1The term “I” is used for the personal reflection.

3.2 summary and reflection 77
in Section 2.6.1, data quality often is considered as accuracy solely – if there is no errorin the data, it will not be important. This motivates the development of further studieson understanding the importance of data quality.
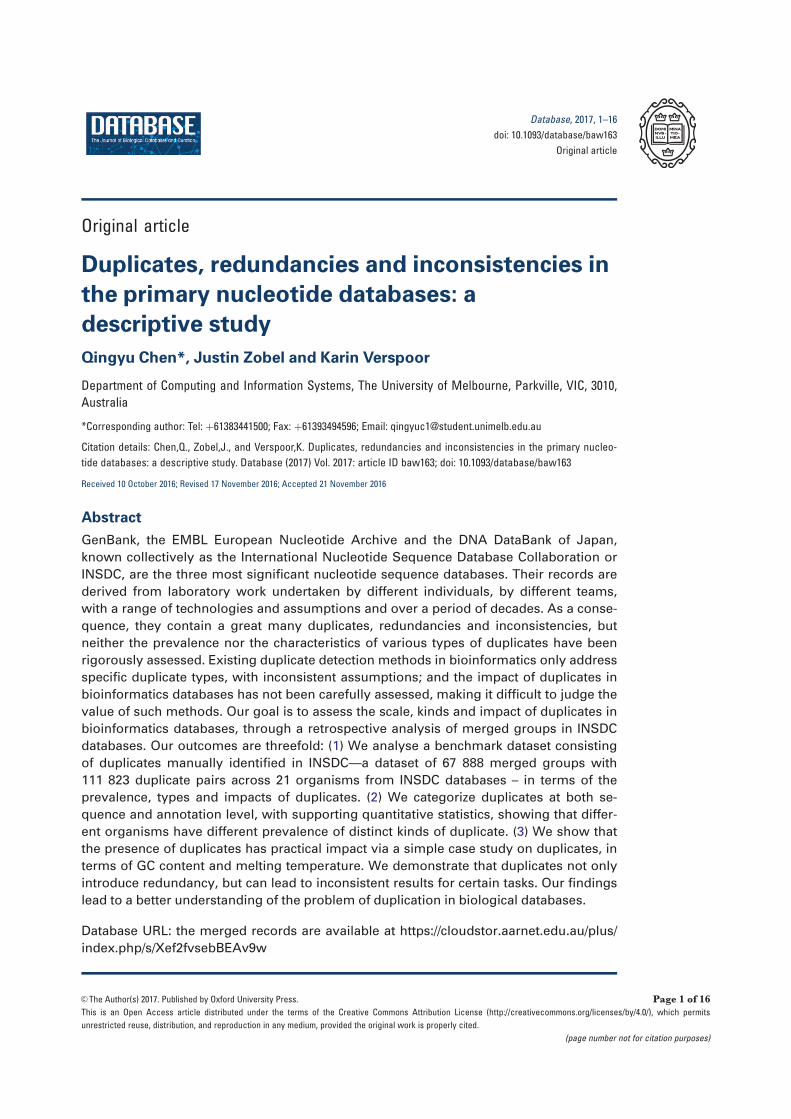
Original article
Duplicates, redundancies and inconsistencies in
the primary nucleotide databases: a
descriptive study
Qingyu Chen*, Justin Zobel and Karin Verspoor
Department of Computing and Information Systems, The University of Melbourne, Parkville, VIC, 3010,
Australia
*Corresponding author: Tel: þ61383441500; Fax: þ61393494596; Email: [email protected]
Citation details: Chen,Q., Zobel,J., and Verspoor,K. Duplicates, redundancies and inconsistencies in the primary nucleo-
tide databases: a descriptive study. Database (2017) Vol. 2017: article ID baw163; doi: 10.1093/database/baw163
Received 10 October 2016; Revised 17 November 2016; Accepted 21 November 2016
Abstract
GenBank, the EMBL European Nucleotide Archive and the DNA DataBank of Japan,
known collectively as the International Nucleotide Sequence Database Collaboration or
INSDC, are the three most significant nucleotide sequence databases. Their records are
derived from laboratory work undertaken by different individuals, by different teams,
with a range of technologies and assumptions and over a period of decades. As a conse-
quence, they contain a great many duplicates, redundancies and inconsistencies, but
neither the prevalence nor the characteristics of various types of duplicates have been
rigorously assessed. Existing duplicate detection methods in bioinformatics only address
specific duplicate types, with inconsistent assumptions; and the impact of duplicates in
bioinformatics databases has not been carefully assessed, making it difficult to judge the
value of such methods. Our goal is to assess the scale, kinds and impact of duplicates in
bioinformatics databases, through a retrospective analysis of merged groups in INSDC
databases. Our outcomes are threefold: (1) We analyse a benchmark dataset consisting
of duplicates manually identified in INSDC—a dataset of 67 888 merged groups with
111 823 duplicate pairs across 21 organisms from INSDC databases – in terms of the
prevalence, types and impacts of duplicates. (2) We categorize duplicates at both se-
quence and annotation level, with supporting quantitative statistics, showing that differ-
ent organisms have different prevalence of distinct kinds of duplicate. (3) We show that
the presence of duplicates has practical impact via a simple case study on duplicates, in
terms of GC content and melting temperature. We demonstrate that duplicates not only
introduce redundancy, but can lead to inconsistent results for certain tasks. Our findings
lead to a better understanding of the problem of duplication in biological databases.
Database URL: the merged records are available at https://cloudstor.aarnet.edu.au/plus/
index.php/s/Xef2fvsebBEAv9w
VC The Author(s) 2017. Published by Oxford University Press. Page 1 of 16
This is an Open Access article distributed under the terms of the Creative Commons Attribution License (http://creativecommons.org/licenses/by/4.0/), which permits
unrestricted reuse, distribution, and reproduction in any medium, provided the original work is properly cited.
(page number not for citation purposes)
Database, 2017, 1–16
doi: 10.1093/database/baw163
Original article
Introduction
Many kinds of database contain multiple instances of re-
cords. These instances may be identical, or may be similar
but with inconsistencies; in traditional database contexts,
this means that the same entity may be described in con-
flicting ways. In this paper, as elsewhere in the literature,
we refer to such repetitions—whether redundant or incon-
sistent—as duplicates. The presence of any of these kinds
of duplicate has the potential to confound analysis that ag-
gregates or reasons from the data. Thus, it is valuable to
understand the extent and kind of duplication, and to have
methods for managing it.
We regard two records as duplicates if, in the context of a
particular task, the presence of one means that the other is
not required. Duplicates are an ongoing data quality problem
reported in diverse domains, including business (1), health
care (2) and molecular biology (3). The five most severe data
quality issues in general domains have been identified as re-
dundancy, inconsistency, inaccuracy, incompleteness and un-
timeliness (4). We must consider whether these issues also
occur in nucleotide sequence databases.
GenBank, the EMBL European Nucleotide Archive
(ENA) and the DNA DataBank of Japan (DDBJ), the three
most significant nucleotide sequence databases, together
form the International Nucleotide Sequence Database
Collaboration (INSDC) (5). The problem of duplication in
the bioinformatics domain is in some respects more acute
than in general databases, as the underlying entities being
modelled are imperfectly defined, and scientific under-
standing of them is changing over time. As early as 1996,
data quality problems in sequence databases were
observed, and concerns were raised that these errors may
affect the interpretation (6). However, data quality prob-
lems persist, and current strategies for cleansing do not
scale (7). Technological advances have led to rapid gener-
ation of genomic data. Data is exchanged between reposi-
tories that have different standards for inclusion.
Ontologies are changing over time, as are data generation
and validation methodologies. Data from different individ-
ual organisms, with genomic variations, may be conflated,
while some data that is apparently duplicated—such as
identical sequences from different individuals, or even dif-
ferent species—may in fact not be redundant at all. The
same gene may be stored multiple times with flanking re-
gions of different length, or, more perniciously, with differ-
ent annotations. In the absence of a thorough study of the
prevalence and kind of such issues, it is not known what
impact they might have in practical biological
investigations.
A range of duplicate detection methods for biological
databases have been proposed (8–18). However, this
existing work has defined duplicates in inconsistent ways,
usually in the context of a specific method for duplicate
detection. For example, some define duplicates solely on
the basis of gene sequence identity, while others also con-
sider metadata. These studies addressed only some of the
kinds of duplication, and neither the prevalence nor the
characteristics of different kinds of duplicate were
measured.
A further, fundamental issue is that duplication (redun-
dancy or inconsistency) cannot be defined purely in terms
of the content of a database. A pair of records might only
be regarded as duplicates in the context of a particular ap-
plication. For example, two records that report the coding
sequence for a protein may be redundant for tasks that
concern RNA expression, but not redundant for tasks that
seek to identify their (different) locations in the genome.
Methods that seek to de-duplicate databases based on spe-
cific assumptions about how the data is to be used will
have unquantified, potentially deleterious, impact on other
uses of the same data.
Thus definitions of duplicates, redundancy and incon-
sistency depend on context. In standard databases, a du-
plicate occurs when a unique entity is represented
multiple times. In bioinformatics databases, duplicates
have different representations, and the definition of ‘en-
tity’ may be unclear. Also, duplicates arise in a variety of
ways. The same data can be submitted by different
research groups to a database multiple times, or to differ-
ent databases without cross-reference. An updated ver-
sion of a record can be entered while the old version
still remains. Or there may be records representing the
same entity, but with different sequences or different
annotations.
Duplication can affect use of INSDC databases in a var-
iety of ways. A simple example is that redundancy (such as
records with near-identical sequences and consistent anno-
tations) creates inefficiency, both in automatic processes
such as search, and in manual assessment of the results of
search.
More significantly, sequences or annotations that are
inconsistent can affect analyses such as quantification of
the correlation between coding and non-coding sequences
(19), or finding of repeat sequence markers (20).
Inconsistencies in functional annotations (21) have the po-
tential to be confusing; despite this, an assessment of 37
North American branchiobdellidans records concluded
that nearly half are inconsistent with the latest taxonomy
(22). Function assignments may rely on the assumption
that similar sequences have similar function (23), but re-
peated sequences may bias the output sequences from the
database searches (24).
Page 2 of 16 Database, Vol. 2017, Article ID baw163
Why care about duplicates?
Research in other disciplines has emphasized the import-
ance of studying duplicates. Here we assemble comments
on the impacts of duplicates in biological databases,
derived from public or published material and curator
interviews:
1. Duplicates lead to redundancies: ‘Automated analyses
contain a significant amount of redundant data and
therefore violate the principles of normalization. . . In a
typical Illumina Genomestudio results file 63% of the
output file is composed of unnecessarily redundant
data’ (25). ‘High redundancy led to an increase in the
size of UniProtKB (TrEMBL), and thus to the amount
of data to be processed internally and by our users, but
also to repetitive results in BLAST searches . . . 46.9
million (redundant) entries were removed (in 2015)’
(http://www.uniprot.org/help/proteome_redundancy.)
We explain the TrEMBL redundancy issue in detail
below.
2. Duplicates lead to inconsistencies: ‘Duplicated samples
might provide a false sense of confidence in a result,
which is in fact only supported by one experimental
data point’ (26), ‘two genes are present in the dupli-
cated syntenic regions, but not listed as duplicates (true
duplicates but are not labelled). This might be due to
local sequence rearrangements that can influence the re-
sults of global synteny analysis’ (25).
3. Duplicates waste curation effort and impair data qual-
ity: ‘for UniProtKB/SwissProt, as everything is checked
manually, duplication has impacts in terms of curation
time. For UniProtKB/TrEMBL, as it (duplication) is not
manually curated, it will impact quality of the dataset’.
(Quoted from Sylvain Poux, leader of manual curation
and quality control in SwissProt.)
4. Duplicates have propagated impacts even after being
detected or removed: ‘Highlighting and resolving miss-
ing, duplicate or inconsistent fields . . . �20% of (these)
errors require additional rebuild time and effort from
both developer and biologist’ (27), ‘The removal of
bacterial redundancy in UniProtKB (and normal flux in
protein) would have meant that nearly all (>90%) of
Pfam (a highly curated protein family database using
UniProtKB data) seed alignments would have needed
manual verification (and potential modification)
. . .This imposes a significant manual biocuration bur-
den’ (28).
The presence of duplicates is not always problematic,
however. For instance, the purpose of the INSDC data-
bases is mainly to archive nucleotide records. Arguably,
duplicates are not a significant concern from an archival
perspective; indeed the presence of a duplicate may indi-
cate that a result has been reproduced and should be
viewed as confident. That is, duplicates can be evidence for
correctness. Recognition of such duplicates supports re-
cord linkage and helps researchers to verify their sequenc-
ing and annotation processes. However, there is an implicit
assumption that those duplicates have been labelled accur-
ately. Without labelling, those duplicates may confuse
users, whether or not the records represent the same
entities.
To summarize, the question of duplication is context-
dependent, and its significance varies in these contexts: dif-
ferent biological databases, different biocuration processes
and different biological tasks. However, it is clear that we
should still be concerned about duplicates in INSDC. Over
95% of UniProtKB data are from INSDC and parts of
UniProtKB are heavily curated; hence duplicates in INSDC
would delay the curation time and waste curation effort in
this case. Furthermore, its archival nature does not limit
the potential uses of the data; other uses may be impacted
by duplicates. Thus, it remains important to understand
the nature of duplication in INSDC.
In this paper, we analyse the scale, kind and impacts of
duplicates in nucleotide databases, to seek better under-
standing of the problem of duplication. We focus on
INSDC records that have been reported as duplicates by
manual processes and then merged. As advised to us by
database staff, submitters spot duplicates and are the
major means of quality checking in these databases;
sequencing projects may also merge records once the gen-
ome construction is complete; other curated databases
using INSDC records such as RefSeq may also merge re-
cords. Revision histories of records track the merges of du-
plicates. Based on an investigation of the revision history,
we collected and analysed 67 888 merged groups contain-
ing 111 823 duplicate pairs, across 21 major organisms.
This is one of three benchmarks of duplicates that we have
constructed (53). While it is the smallest and most nar-
rowly defined of the three benchmarks, it allows us to in-
vestigate the nature of duplication in INSDC as it arises
during generation and submission of biological sequences,
and facilitates understanding the value of later curation.
Our analysis demonstrates that various duplicate types
are present, and that their prevalence varies between organ-
isms. We also consider how different duplicate types may
impact biological studies. We provide a case study, an as-
sessment of sequence GC content and of melting point, to
demonstrate the potential impact of various kinds of dupli-
cates. We show that the presence of duplicates can alter the
results, and thus demonstrate the need for accurate recogni-
tion and management of duplicates in genomic databases.
Database, Vol. 2017, Article ID baw163 Page 3 of 16
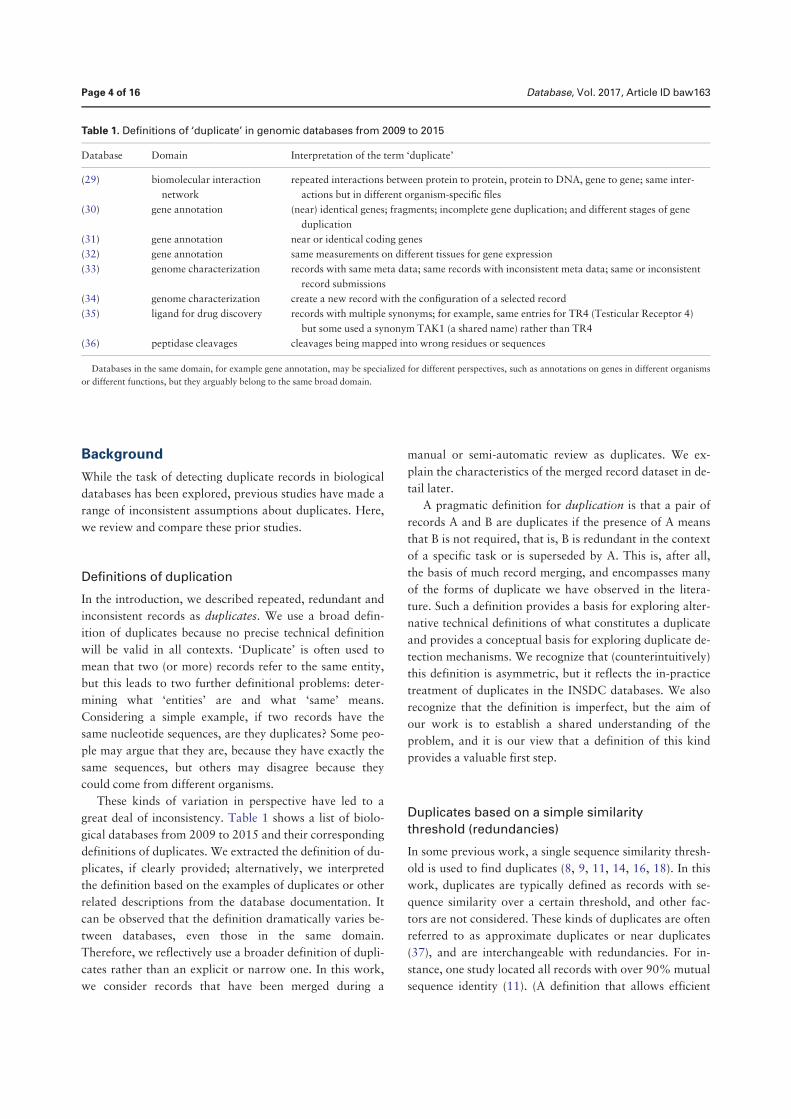
Background
While the task of detecting duplicate records in biological
databases has been explored, previous studies have made a
range of inconsistent assumptions about duplicates. Here,
we review and compare these prior studies.
Definitions of duplication
In the introduction, we described repeated, redundant and
inconsistent records as duplicates. We use a broad defin-
ition of duplicates because no precise technical definition
will be valid in all contexts. ‘Duplicate’ is often used to
mean that two (or more) records refer to the same entity,
but this leads to two further definitional problems: deter-
mining what ‘entities’ are and what ‘same’ means.
Considering a simple example, if two records have the
same nucleotide sequences, are they duplicates? Some peo-
ple may argue that they are, because they have exactly the
same sequences, but others may disagree because they
could come from different organisms.
These kinds of variation in perspective have led to a
great deal of inconsistency. Table 1 shows a list of biolo-
gical databases from 2009 to 2015 and their corresponding
definitions of duplicates. We extracted the definition of du-
plicates, if clearly provided; alternatively, we interpreted
the definition based on the examples of duplicates or other
related descriptions from the database documentation. It
can be observed that the definition dramatically varies be-
tween databases, even those in the same domain.
Therefore, we reflectively use a broader definition of dupli-
cates rather than an explicit or narrow one. In this work,
we consider records that have been merged during a
manual or semi-automatic review as duplicates. We ex-
plain the characteristics of the merged record dataset in de-
tail later.
A pragmatic definition for duplication is that a pair of
records A and B are duplicates if the presence of A means
that B is not required, that is, B is redundant in the context
of a specific task or is superseded by A. This is, after all,
the basis of much record merging, and encompasses many
of the forms of duplicate we have observed in the litera-
ture. Such a definition provides a basis for exploring alter-
native technical definitions of what constitutes a duplicate
and provides a conceptual basis for exploring duplicate de-
tection mechanisms. We recognize that (counterintuitively)
this definition is asymmetric, but it reflects the in-practice
treatment of duplicates in the INSDC databases. We also
recognize that the definition is imperfect, but the aim of
our work is to establish a shared understanding of the
problem, and it is our view that a definition of this kind
provides a valuable first step.
Duplicates based on a simple similarity
threshold (redundancies)
In some previous work, a single sequence similarity thresh-
old is used to find duplicates (8, 9, 11, 14, 16, 18). In this
work, duplicates are typically defined as records with se-
quence similarity over a certain threshold, and other fac-
tors are not considered. These kinds of duplicates are often
referred to as approximate duplicates or near duplicates
(37), and are interchangeable with redundancies. For in-
stance, one study located all records with over 90% mutual
sequence identity (11). (A definition that allows efficient
Table 1. Definitions of ‘duplicate’ in genomic databases from 2009 to 2015
Database Domain Interpretation of the term ‘duplicate’
(29) biomolecular interaction
network
repeated interactions between protein to protein, protein to DNA, gene to gene; same inter-
actions but in different organism-specific files
(30) gene annotation (near) identical genes; fragments; incomplete gene duplication; and different stages of gene
duplication
(31) gene annotation near or identical coding genes
(32) gene annotation same measurements on different tissues for gene expression
(33) genome characterization records with same meta data; same records with inconsistent meta data; same or inconsistent
record submissions
(34) genome characterization create a new record with the configuration of a selected record
(35) ligand for drug discovery records with multiple synonyms; for example, same entries for TR4 (Testicular Receptor 4)
but some used a synonym TAK1 (a shared name) rather than TR4
(36) peptidase cleavages cleavages being mapped into wrong residues or sequences
Databases in the same domain, for example gene annotation, may be specialized for different perspectives, such as annotations on genes in different organisms
or different functions, but they arguably belong to the same broad domain.
Page 4 of 16 Database, Vol. 2017, Article ID baw163
implementation, but is clearly poor from the point of view
of the meaning of the data; an argument that 90% similar
sequences are duplicated, but that 89% similar sequences
are not, does not reflect biological reality.) A sequence
identity threshold also applies in the CD-HIT method for
sequence clustering, where it is assumed that duplicates
have over 90% sequence identity (38). The sequence-based
approach also forms the basis of the non-redundant data-
base used for BLAST (39).
Methods based on the assumption that duplication is
equivalent to high sequence similarity usually share two
characteristics. First, efficiency is the highest priority; the
goal is to handle large datasets. While some of these meth-
ods also consider sensitivity (40), efficiency is still the
major concern. Second, in order to achieve efficiency,
many methods apply heuristics to eliminate unnecessary
pairwise comparisons. For example, CD-HIT estimates the
sequence identity by word (short substring) counting and
only applies sequence alignment if the pair is expected to
have high identity.
However, duplication is not simply redundancy.
Records with similar sequences are not necessarily dupli-
cates and vice versa. As we will show later, some of the du-
plicates we study are records with close to exactly identical
sequences, but other types also exist. Thus, use of a simple
similarity threshold may mistakenly merge distinct records
with similar sequences (false positives) and likewise
may fail to merge duplicates with different sequences
(false negatives). Both are problematic in specific studies
(41, 42).
Duplicates based on expert labelling
A simple threshold can find only one kind of duplicate,
while others are ignored. Previous work on duplicate de-
tection has acknowledged that expert curation is the best
strategy for determining duplicates, due to the rich experi-
ence, human intuition and the possibility of checking exter-
nal resources that experts bring (43–45). Methods using
human-generated labels aim to detect duplicates precisely,
either to build models to mimic expert curation behaviour
(44), or to use expert curated datasets to quantify method
performance (46).They can find more diverse types than
using a simple threshold, but are still not able to capture
the diversity of duplication in biological databases. The
prevalence and characteristics of each duplicate type are
still not clear. This lack of identified scope introduces re-
strictions that, as we will demonstrate, impair duplicate
detection.
Korning et al. (13) identified two types of duplicates:
the same gene submitted multiple times (near-identical se-
quences), and different genes belonging to the same family.
In the latter case, the authors argue that, since such genes
are highly related, one of them is sufficient to represent the
others. However, this assumption that only one version is
required is task-dependent; as noted in the introduction,
for other tasks the existence of multiple versions is signifi-
cant. To the best of our knowledge, this is the first pub-
lished work that identified different kinds of duplicates in
bioinformatics databases, but the impact, prevalence and
characteristics of the types of duplicates they identify is not
discussed.
Koh et al. (12) separated the fields of each gene record,
such as species and sequences, and measured the similar-
ities among these fields. They then applied association rule
mining to pairs of duplicates using the values of these fields
as features. In this way, they characterized duplicates in
terms of specific attributes and their combination. The
classes of duplicates considered were broader than Korning
et al.’s, but are primarily records containing the same se-
quence, specifically: (1) the same sequence submitted to
different databases; (2) the same sequence submitted to the
same database multiple times; (3) the same sequence with
different annotations; and (4) partial records. This means
that the (near-)identity of the sequence dominates the
mined rules. Indeed, the top ten rules generated from Koh
et al.’s analysis share the feature that the sequences have
exact (100%) sequence identity.
This classification is also used in other work (10, 15,
17), which therefore has the same limitation. This work
again does not consider the prevalence and characteristics
of the various duplicate types. While Koh has a more de-
tailed classification in her thesis (47), the problem of char-
acterization of duplicates remains.
In this previous work, the potential impact on bioinfor-
matics analysis caused by duplicates in gene databases is
not quantified. Many refer to the work of Muller et al. (7)
on data quality, but Muller et al. do not encourage the
study of duplicates; indeed, they claim that duplicates do
not interfere with interpretation, and even suggest that du-
plicates may in fact have a positive impact, by ‘providing
evidence of correctness’. However, the paper does not pro-
vide definitions or examples of duplicates, nor does it pro-
vide case studies to justify these claims.
Duplication persists due to its complexity
De-duplication is a key early step in curated databases.
Amongst biological databases, UniProt databases are well-
known to have high quality data and detailed curation
processes (48). Uniprot use four de-duplication processes
depending on the requirements of using specific databases:
‘one record for 100% identical full-length sequences in one
species’; ‘one record per gene in one species’; ‘one record
Database, Vol. 2017, Article ID baw163 Page 5 of 16
for 100% identical sequences over the entire length, re-
gardless of the species’; and ‘one record for 100% identical
sequences, including fragments, regardless of the species’,
for UniProtKB/TrEMBL, UniProtKB/SwissProt, UniParc
and UniRef100, respectively (http://www.uniprot.org/help/
redundancy). We note the emphasis on sequence identity in
these requirements.
Each database has its specific design and purpose, so
the assumptions made about duplication differ. One com-
munity may consider a given pair to be a duplicate whereas
other communities may not. The definition of duplication
varies between biologists, database staff and computer
scientists. In different curated biological databases, de-
duplication is handled in different ways. It is far more com-
plex than a simple similarity threshold; we want to analyse
duplicates that are labelled based on human judgements ra-
ther than using a single threshold. Therefore, we created
three benchmarks of nucleotide duplicates from different
perspectives (53). In this work, we focus on analysing one
of these benchmarks, containing records directly merged in
INSDC. Merging of records is a way to address data dupli-
cation. Examination of merged records facilitates under-
standing of what constitutes duplication.
Recently, in TrEMBL, UniProt staff observed that it
had a high prevalence of redundancy. A typical example is
that 1692 strains of Mycobacterium tuberculosis have
been represented in 5.97 million entries, because strains of
this same species have been sequenced and submitted mul-
tiple times. UniProt staff have expressed concern that such
high redundancy will lead to repetitive results in BLAST
searches. Hence, they used a mix of manual and automatic
approaches to de-duplicate bacterial proteome records,
and removed 46.9 million entries in April 2015 (http://
www.uniprot.org/help/proteome_redundancy). A ‘dupli-
cate’ proteome is selected by identifying: (a) two proteomes
under the same taxonomic species group, (b) having over
90% identity and (c) selecting the proteome of the pair
with the highest number of similar proteomes for removal;
specifically, all protein records in TrEMBL belonging to
the proteome will be removed (http://insideuniprot.blog
spot.com.au/2015/05/uniprot-knowledgebase-just-got-
smaller.html). If proteome A and B satisfy criteria (a) and
(b), and proteome A has 5 other proteomes with over 90%
identity, whereas proteome B only has one, A will be
removed rather than B. This notion of a duplicate differs
from those above, emphasizing the context dependency of
the definition of a ‘duplicate’. This de-duplication strategy
is incomplete as it removes only one kind of duplicate, and
is limited in application to full proteome sequences; the ac-
curacy and sensitivity of the strategy is unknown.
Nevertheless, removing one duplicate type already signifi-
cantly reduces the size of TrEMBL. This not only benefits
database search, but also affects studies or other databases
using TrEMBL records.
This de-duplication is considered to be one of the two
significant changes in UniProtKB database in 2015 (the
other change being the establishment of a comprehensive
reference proteome set) (28). It clearly illustrates that du-
plication in biological databases is not a fully solved prob-
lem and that de-duplication is necessary.
Overall, we can see that foundational work on the
problem of duplication in biological sequence databases
has not previously been undertaken. There is no prior thor-
ough analysis of the presence, kind and impact of dupli-
cates in these databases.
Data and methods
Exploration of duplication and its impacts requires data.
We have collected and analysed duplicates from INSDC
databases to create a benchmark set, as we now discuss.
Collection of duplicates
Some of the duplicates in INSDC databases have been
found and then merged into one representative record. We
call this record the exemplar, that is, the current record re-
tained as a proxy for a set of records. Staff working at
EMBL ENA advised us (by personal communication) that
a merge may be initiated by original record submitter,
database staff or occasionally in other ways. We further
explain the characteristics of the merged dataset below,
but note that records are merged for different reasons,
showing that diverse causes can lead to duplication. The
merged records are documented in the revision history. For
instance, GenBank record AC011662.1 is the complete se-
quence of both BACR01G10 and BACR05I08 clones for
chromosome 2 in Drosophila melanogaster. Its revision
history (http://www.ncbi.nlm.nih.gov/nuccore/6017069?re
port¼girevhist) shows that it has replaced two records
AC007180.20 and AC006941.18, because they are
‘SEQUENCING IN PROGRESS’ records with 57 and 21
unordered pieces for BACR01G10 and BACR05I08
clones, respectively. As explained in the supplementary ma
terials, the groups of records can readily be fetched using
NCBI tools.
For our analysis, we collected 67 888 groups (during
15–27 July 2015), which contained 111 823 duplicates (a
given group can contain more than one record merge)
across the 21 popular organisms used in molecular re-
search listed in the NCBI Taxonomy web page (http://
www.ncbi.nlm.nih.gov/Taxonomy/taxonomyhome.html/).
The data collection is summarized in Supplementary Table
S1, and, the details of the collection procedure underlying
Page 6 of 16 Database, Vol. 2017, Article ID baw163
the data are elaborated in the Supplementary file Details of
the record collection procedure. As an example, the
Xenopus laevis organism has 35 544 directly related re-
cords. Of these, 1,690 have merged accession IDs; 1620
merged groups for 1660 duplicate pairs can be identified in
the revision history.
Characteristics of the duplicate collection
As explained in ‘Background’ section, we use a broad def-
inition of duplicates. This data collection reflects the broad
definition, and in our view is representative of an aspect of
duplication: these are records that are regarded as similar
or related enough to merit removal, that is, are redundant.
The records were merged for different reasons, including:
• Changes to data submission policies. Before 2003, the se-
quence submission length limit was 350 kb. After releas-
ing the limit, the shorter sequence submissions were
merged into a single comprehensive sequence record.
• Updates of sequencing projects. Research groups may
deposit current draft records; later records will merge the
earlier ones. Also, records having overlapping clones are
merged when the construction of a genome is close to
complete (49).
• Merges from other data sources. For example, RefSeq
uses INSDC records as a main source for genome assem-
bly (50). The assembly is made according to different or-
ganism models and updated periodically and the records
may be merged or split during each update (51). The pre-
dicted transcript records we discuss later are from
RefSeq (still searchable via INSDC but with RefSeq
label).
• Merges by record submitters or database staff occur
when they notice multiple submissions of the same
record.
While the records were merged due to different reasons,
they can all be considered duplicates. The various reasons
for merging records represent the diversity. If those records
above had not been merged, they would cause data redun-
dancy and inconsistency.
These merged records are illustrations of the problem of
duplicates rather than current instances to be cleaned.
Once the records are merged, they are no longer active or
directly available to database users. However, the obsolete
records are still of value. For example, even though over
45 million duplicate records were removed from UniProt,
the key database staff who were involved in this activity
are still interested in investigating their characteristics.
(Ramona Britto and Benoit Bely, the key staff who
removed over 45 million duplicate records from
UniProtKB.)They would like to understand the similarity
of duplicates for more rapid and accurate duplicate identi-
fication in future, and to understand their impacts, such as
how their removal affects database search.
From the perspective of a submitter, those records
removed from UniProtKB may not be duplicates, since
they may represent different entities, have different annota-
tions, and serve different applications. However, from a
database perspective, they challenge database storage,
searches and curation (48). ‘Most of the growth in se-
quences is due to the increased submission of complete
genomes to the nucleotide sequence databases’ (48). This
also indicates that records in one data source may not be
considered as duplicates, but do impact other data sources.
To the best of our knowledge, our collection is the larg-
est set of duplicate records merged in INSDC considered to
date. Note that we have collected even larger datasets
based on other strategies, including expert and automatic
curation (52). We focus on this collection here, to analyse
how submitters understand duplicates as one perspective.
This duplicate dataset is based on duplicates identified by
those closest to the data itself, the original data submitters,
and is therefore of high quality.
We acknowledge that the data set is by its nature in-
complete; the number of duplicates that we have collected
is likely to be a vast undercounting of the exact or real
prevalence of duplicates in the INSDC databases. There
are various reasons for this that we detail here.
First, as mentioned above, both database staff and sub-
mitters can request merges. However, for submitters, re-
cords can only be modified or updated if they are the
record owner. Other parties who want to update records
that they did not themselves submit must get permission
from at least one original submitter (http://www.ncbi.nlm.
nih.gov/books/NBK53704/). In EMBL ENA, it is suggested
to contact the original submitter first, but there is an add-
itional process for reporting errors to the database staff
(http://www.ebi.ac.uk/ena/submit/sequence-submis
sion#how_to_update). Due to the effort required for these
procedures, the probability that there are duplicates that
have not been merged or labelled is very high.
Additionally, as the documentation shows, submitter-
based updates or correction are the main quality control
mechanisms in these databases. Hence, the full collections
of duplicates listed in Supplementary Table S1 presented in
this work are limited to those identified by (some) submit-
ters. Our other duplicate benchmarks, derived from map-
ping INSDC to Swiss-Prot and TrEMBL, contain many
more duplicates (53). This implies that many more poten-
tial duplicates remain in INSDC.
The impact of curation on marking of duplicates can be
observed in some organisms. The total number of records
in Bos taurus is about 14% and 1.9% of the number of
Database, Vol. 2017, Article ID baw163 Page 7 of 16
records in Mus musculus and Homo sapiens, respectively,
yet Bos taurus has a disproportionately high number of du-
plicates in the benchmark: >20 000 duplicate pairs, which
is close (in absolute terms) to the number of duplicates
identified in the other two species. Another example is
Schizosaccharomyces pombe, which only has around 4000
records but a relatively large number (545) of duplicate
pairs have been found.
An organism may have many more duplicates if its
lower taxonomies are considered. The records counted in
the table are directly associated to the listed organism; we
did not include records belonging to taxonomy below the
species level in this study. An example of the impact of this
is record AE005174.2, which replaced 500 records in 2004
(http://www.ncbi.nlm.nih.gov/nuccore/56384585). This
record belongs to Escherichia coli O157:H7 strain
EDL933, which is not directly associated to Escherichia
coli and therefore not counted here. The collection statis-
tics also demonstrate that 13 organisms contain at least
some merged records for which the original records have
different submitters. This is particularly evident in
Caenorhabditis elegans and Schizosaccharomyces pombe
(where 92.4 and 81.8%, respectively, of duplicate records
are from different submitters). A possible explanation is
that there are requests by different members from the same
consortium. While in most cases the same submitters (or
consortiums) can merge the records, the merges cumula-
tively involve many submitters or different consortiums.
This benchmark is the only resource currently available
for duplicates directly merged in INSDC. Staff have also
advised that there is currently no automatic process for col-
lecting such duplicates.
Categorization of duplicates
Observing the duplicates in the collection, we find that
some of them share the same sequences, whereas others
have sequences with varied lengths. Some have been anno-
tated by submitters with notes such as ‘WORKING
DRAFT’. We therefore categorized records at both se-
quence level and annotation level. For sequence level, we
identified five categories: Exact sequences, Similar se-
quences, Exact fragments, Similar fragments and Low-
identity sequences. For annotation level, we identified
three categories: Working draft, Sequencing-in-progress
and Predicted. We do not restrict a duplicate instance to be
in only one category.
This categorization represents diverse types of dupli-
cates in nucleotide databases, and each distinct kind has
different characteristics. As discussed previously, there is
no existing categorization of duplicates with supporting
measures or quantities in prior work. Hence, we adopt this
categorization and quantify the prevalence and characteris-
tics of each kind, as a starting point for understanding the
nature of duplicates in INSDC databases more deeply.
The detailed criteria and description of each category
are as follows. For sequence level, we measured local se-
quence identity using BLAST (9). This measures whether
two sequences share similar subsequences. We also calcu-
lated the local alignment proportion (the number of identi-
cal bases in BLAST divided by the length of the longer
sequence of the pair) to estimate the possible coverage of
the pair globally without performing a complete (expen-
sive) global alignment. Details, including formulas, are
provided in the supplementary materials Details of measur-
ing submitter similarity and Details of measuring sequence
similarities.
Category 1, sequence level
Exact sequences. This category consists of records that
share exact sequences. We require that the local identity
and local alignment proportion must both be 100%. While
this cannot guarantee that the two sequences are exactly
identical without a full global alignment, having both local
identity and alignment coverage of 100% strongly implies
that two records have the same sequences.
Category 2, sequence level
Similar sequences. This category consists of records that
have near-identical sequences, where the local identity and
local alignment proportion are <100% but no< 90%.
Category 3, sequence level
Exact fragments. This category consists of records that
have identical subsequences, where the local identity is
100% and the alignment proportion is< 90%, implying
that the duplicate is identical to a fragment of its
replacement.
Category 4, sequence level
Similar fragments. By correspondence with the relationship
between Categories 1 and 2, this category relaxes the con-
straints of Category 3. It has the same criteria of alignment
proportion as Category 3, but reduces the requirement for
local identity to no< 90%.
Category 5, sequence level
Low-identity sequences. This category corresponds to du-
plicate pairs that exhibit weak or no sequence similarity.
This category has three tests: first, the local sequence iden-
tity is< 90%; second, BLAST output is ‘NO HIT’, that is,
no significant similarity has been found; third, the expected
value of the BLAST score is> 0.001, that is, the found
match is not significant enough.
Page 8 of 16 Database, Vol. 2017, Article ID baw163
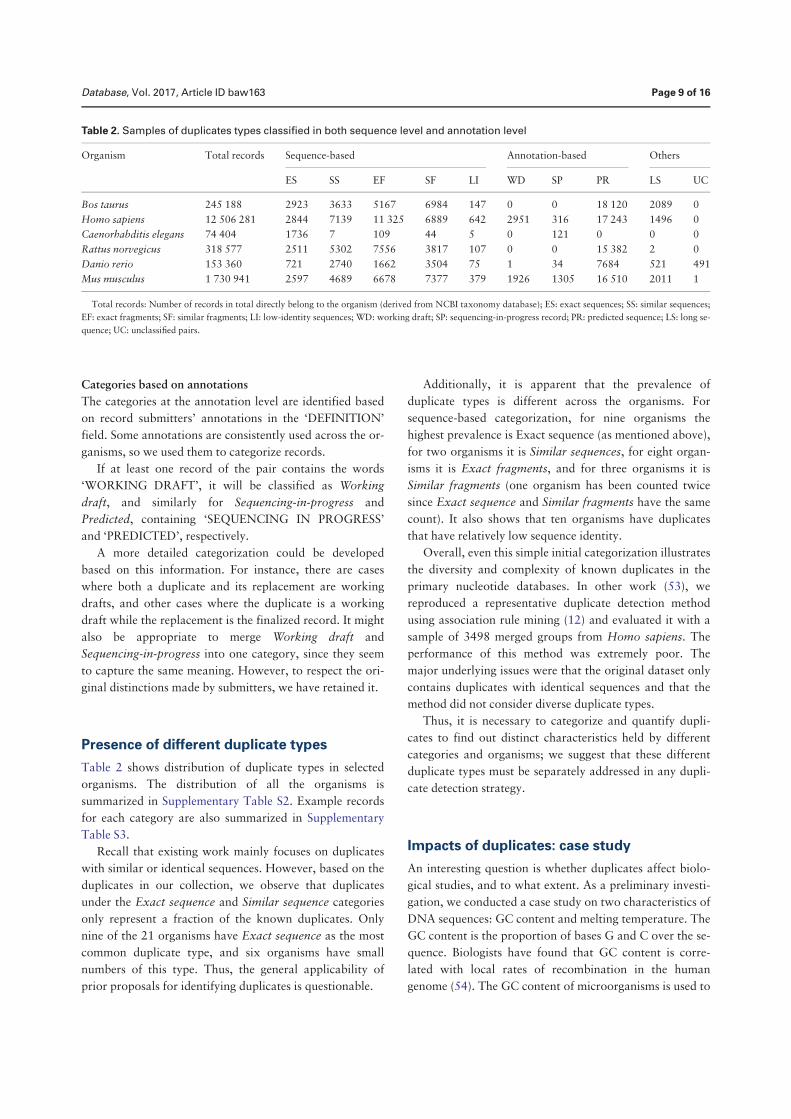
Categories based on annotations
The categories at the annotation level are identified based
on record submitters’ annotations in the ‘DEFINITION’
field. Some annotations are consistently used across the or-
ganisms, so we used them to categorize records.
If at least one record of the pair contains the words
‘WORKING DRAFT’, it will be classified as Working
draft, and similarly for Sequencing-in-progress and
Predicted, containing ‘SEQUENCING IN PROGRESS’
and ‘PREDICTED’, respectively.
A more detailed categorization could be developed
based on this information. For instance, there are cases
where both a duplicate and its replacement are working
drafts, and other cases where the duplicate is a working
draft while the replacement is the finalized record. It might
also be appropriate to merge Working draft and
Sequencing-in-progress into one category, since they seem
to capture the same meaning. However, to respect the ori-
ginal distinctions made by submitters, we have retained it.
Presence of different duplicate types
Table 2 shows distribution of duplicate types in selected
organisms. The distribution of all the organisms is
summarized in Supplementary Table S2. Example records
for each category are also summarized in Supplementary
Table S3.
Recall that existing work mainly focuses on duplicates
with similar or identical sequences. However, based on the
duplicates in our collection, we observe that duplicates
under the Exact sequence and Similar sequence categories
only represent a fraction of the known duplicates. Only
nine of the 21 organisms have Exact sequence as the most
common duplicate type, and six organisms have small
numbers of this type. Thus, the general applicability of
prior proposals for identifying duplicates is questionable.
Additionally, it is apparent that the prevalence of
duplicate types is different across the organisms. For
sequence-based categorization, for nine organisms the
highest prevalence is Exact sequence (as mentioned above),
for two organisms it is Similar sequences, for eight organ-
isms it is Exact fragments, and for three organisms it is
Similar fragments (one organism has been counted twice
since Exact sequence and Similar fragments have the same
count). It also shows that ten organisms have duplicates
that have relatively low sequence identity.
Overall, even this simple initial categorization illustrates
the diversity and complexity of known duplicates in the
primary nucleotide databases. In other work (53), we
reproduced a representative duplicate detection method
using association rule mining (12) and evaluated it with a
sample of 3498 merged groups from Homo sapiens. The
performance of this method was extremely poor. The
major underlying issues were that the original dataset only
contains duplicates with identical sequences and that the
method did not consider diverse duplicate types.
Thus, it is necessary to categorize and quantify dupli-
cates to find out distinct characteristics held by different
categories and organisms; we suggest that these different
duplicate types must be separately addressed in any dupli-
cate detection strategy.
Impacts of duplicates: case study
An interesting question is whether duplicates affect biolo-
gical studies, and to what extent. As a preliminary investi-
gation, we conducted a case study on two characteristics of
DNA sequences: GC content and melting temperature. The
GC content is the proportion of bases G and C over the se-
quence. Biologists have found that GC content is corre-
lated with local rates of recombination in the human
genome (54). The GC content of microorganisms is used to
Table 2. Samples of duplicates types classified in both sequence level and annotation level
Organism Total records Sequence-based Annotation-based Others
ES SS EF SF LI WD SP PR LS UC
Bos taurus 245 188 2923 3633 5167 6984 147 0 0 18 120 2089 0
Homo sapiens 12 506 281 2844 7139 11 325 6889 642 2951 316 17 243 1496 0
Caenorhabditis elegans 74 404 1736 7 109 44 5 0 121 0 0 0
Rattus norvegicus 318 577 2511 5302 7556 3817 107 0 0 15 382 2 0
Danio rerio 153 360 721 2740 1662 3504 75 1 34 7684 521 491
Mus musculus 1 730 941 2597 4689 6678 7377 379 1926 1305 16 510 2011 1
Total records: Number of records in total directly belong to the organism (derived from NCBI taxonomy database); ES: exact sequences; SS: similar sequences;
EF: exact fragments; SF: similar fragments; LI: low-identity sequences; WD: working draft; SP: sequencing-in-progress record; PR: predicted sequence; LS: long se-
quence; UC: unclassified pairs.
Database, Vol. 2017, Article ID baw163 Page 9 of 16
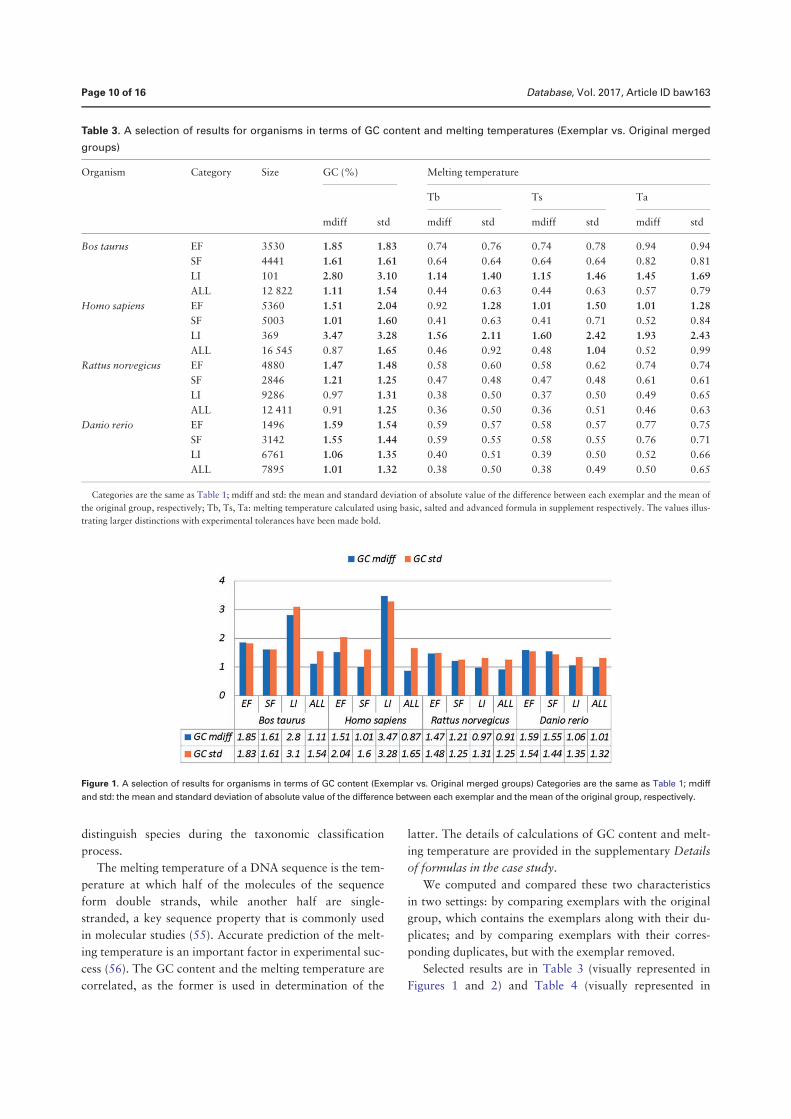
distinguish species during the taxonomic classification
process.
The melting temperature of a DNA sequence is the tem-
perature at which half of the molecules of the sequence
form double strands, while another half are single-
stranded, a key sequence property that is commonly used
in molecular studies (55). Accurate prediction of the melt-
ing temperature is an important factor in experimental suc-
cess (56). The GC content and the melting temperature are
correlated, as the former is used in determination of the
latter. The details of calculations of GC content and melt-
ing temperature are provided in the supplementary Details
of formulas in the case study.
We computed and compared these two characteristics
in two settings: by comparing exemplars with the original
group, which contains the exemplars along with their du-
plicates; and by comparing exemplars with their corres-
ponding duplicates, but with the exemplar removed.
Selected results are in Table 3 (visually represented in
Figures 1 and 2) and Table 4 (visually represented in
Figure 1. A selection of results for organisms in terms of GC content (Exemplar vs. Original merged groups) Categories are the same as Table 1; mdiff
and std: the mean and standard deviation of absolute value of the difference between each exemplar and the mean of the original group, respectively.
Table 3. A selection of results for organisms in terms of GC content and melting temperatures (Exemplar vs. Original merged
groups)
Organism Category Size GC (%) Melting temperature
Tb Ts Ta
mdiff std mdiff std mdiff std mdiff std
Bos taurus EF 3530 1.85 1.83 0.74 0.76 0.74 0.78 0.94 0.94
SF 4441 1.61 1.61 0.64 0.64 0.64 0.64 0.82 0.81
LI 101 2.80 3.10 1.14 1.40 1.15 1.46 1.45 1.69
ALL 12 822 1.11 1.54 0.44 0.63 0.44 0.63 0.57 0.79
Homo sapiens EF 5360 1.51 2.04 0.92 1.28 1.01 1.50 1.01 1.28
SF 5003 1.01 1.60 0.41 0.63 0.41 0.71 0.52 0.84
LI 369 3.47 3.28 1.56 2.11 1.60 2.42 1.93 2.43
ALL 16 545 0.87 1.65 0.46 0.92 0.48 1.04 0.52 0.99
Rattus norvegicus EF 4880 1.47 1.48 0.58 0.60 0.58 0.62 0.74 0.74
SF 2846 1.21 1.25 0.47 0.48 0.47 0.48 0.61 0.61
LI 9286 0.97 1.31 0.38 0.50 0.37 0.50 0.49 0.65
ALL 12 411 0.91 1.25 0.36 0.50 0.36 0.51 0.46 0.63
Danio rerio EF 1496 1.59 1.54 0.59 0.57 0.58 0.57 0.77 0.75
SF 3142 1.55 1.44 0.59 0.55 0.58 0.55 0.76 0.71
LI 6761 1.06 1.35 0.40 0.51 0.39 0.50 0.52 0.66
ALL 7895 1.01 1.32 0.38 0.50 0.38 0.49 0.50 0.65
Categories are the same as Table 1; mdiff and std: the mean and standard deviation of absolute value of the difference between each exemplar and the mean of
the original group, respectively; Tb, Ts, Ta: melting temperature calculated using basic, salted and advanced formula in supplement respectively. The values illus-
trating larger distinctions with experimental tolerances have been made bold.
Page 10 of 16 Database, Vol. 2017, Article ID baw163
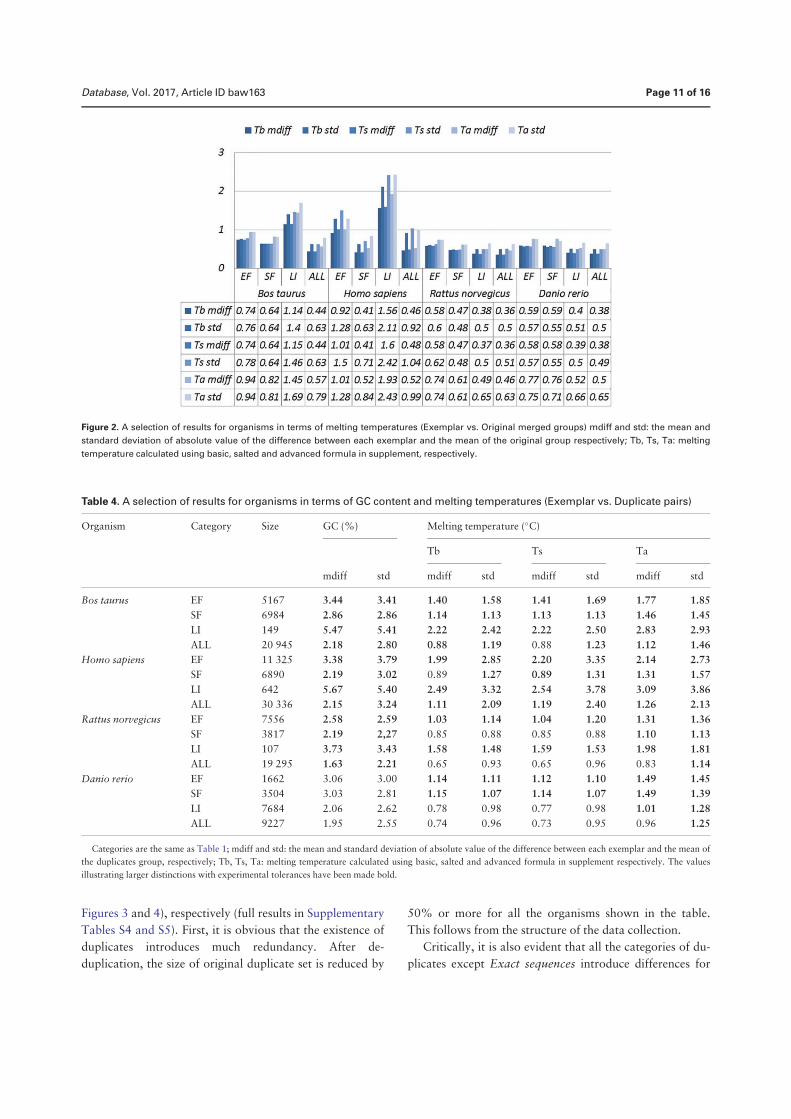
Figures 3 and 4), respectively (full results in Supplementary
Tables S4 and S5). First, it is obvious that the existence of
duplicates introduces much redundancy. After de-
duplication, the size of original duplicate set is reduced by
50% or more for all the organisms shown in the table.
This follows from the structure of the data collection.
Critically, it is also evident that all the categories of du-
plicates except Exact sequences introduce differences for
Figure 2. A selection of results for organisms in terms of melting temperatures (Exemplar vs. Original merged groups) mdiff and std: the mean and
standard deviation of absolute value of the difference between each exemplar and the mean of the original group respectively; Tb, Ts, Ta: melting
temperature calculated using basic, salted and advanced formula in supplement, respectively.
Table 4. A selection of results for organisms in terms of GC content and melting temperatures (Exemplar vs. Duplicate pairs)
Organism Category Size GC (%) Melting temperature (�C)
Tb Ts Ta
mdiff std mdiff std mdiff std mdiff std
Bos taurus EF 5167 3.44 3.41 1.40 1.58 1.41 1.69 1.77 1.85
SF 6984 2.86 2.86 1.14 1.13 1.13 1.13 1.46 1.45
LI 149 5.47 5.41 2.22 2.42 2.22 2.50 2.83 2.93
ALL 20 945 2.18 2.80 0.88 1.19 0.88 1.23 1.12 1.46
Homo sapiens EF 11 325 3.38 3.79 1.99 2.85 2.20 3.35 2.14 2.73
SF 6890 2.19 3.02 0.89 1.27 0.89 1.31 1.31 1.57
LI 642 5.67 5.40 2.49 3.32 2.54 3.78 3.09 3.86
ALL 30 336 2.15 3.24 1.11 2.09 1.19 2.40 1.26 2.13
Rattus norvegicus EF 7556 2.58 2.59 1.03 1.14 1.04 1.20 1.31 1.36
SF 3817 2.19 2,27 0.85 0.88 0.85 0.88 1.10 1.13
LI 107 3.73 3.43 1.58 1.48 1.59 1.53 1.98 1.81
ALL 19 295 1.63 2.21 0.65 0.93 0.65 0.96 0.83 1.14
Danio rerio EF 1662 3.06 3.00 1.14 1.11 1.12 1.10 1.49 1.45
SF 3504 3.03 2.81 1.15 1.07 1.14 1.07 1.49 1.39
LI 7684 2.06 2.62 0.78 0.98 0.77 0.98 1.01 1.28
ALL 9227 1.95 2.55 0.74 0.96 0.73 0.95 0.96 1.25
Categories are the same as Table 1; mdiff and std: the mean and standard deviation of absolute value of the difference between each exemplar and the mean of
the duplicates group, respectively; Tb, Ts, Ta: melting temperature calculated using basic, salted and advanced formula in supplement respectively. The values
illustrating larger distinctions with experimental tolerances have been made bold.
Database, Vol. 2017, Article ID baw163 Page 11 of 16
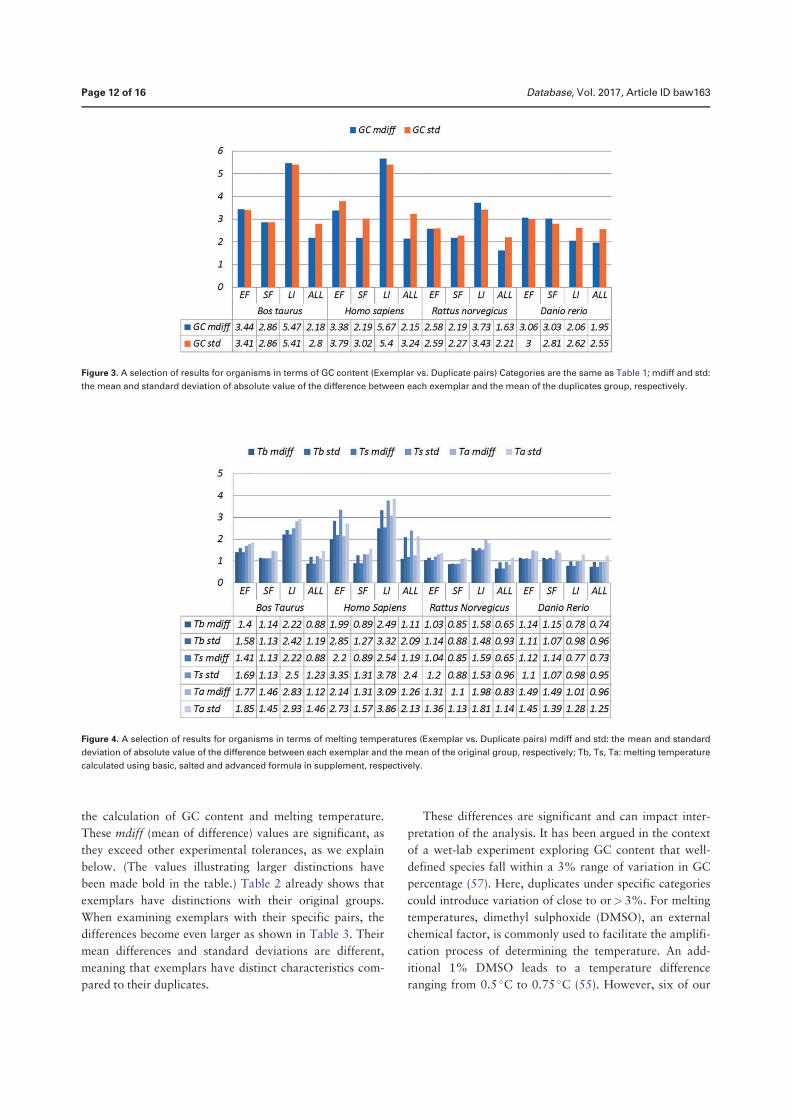
the calculation of GC content and melting temperature.
These mdiff (mean of difference) values are significant, as
they exceed other experimental tolerances, as we explain
below. (The values illustrating larger distinctions have
been made bold in the table.) Table 2 already shows that
exemplars have distinctions with their original groups.
When examining exemplars with their specific pairs, the
differences become even larger as shown in Table 3. Their
mean differences and standard deviations are different,
meaning that exemplars have distinct characteristics com-
pared to their duplicates.
These differences are significant and can impact inter-
pretation of the analysis. It has been argued in the context
of a wet-lab experiment exploring GC content that well-
defined species fall within a 3% range of variation in GC
percentage (57). Here, duplicates under specific categories
could introduce variation of close to or> 3%. For melting
temperatures, dimethyl sulphoxide (DMSO), an external
chemical factor, is commonly used to facilitate the amplifi-
cation process of determining the temperature. An add-
itional 1% DMSO leads to a temperature difference
ranging from 0.5 �C to 0.75 �C (55). However, six of our
Figure 3. A selection of results for organisms in terms of GC content (Exemplar vs. Duplicate pairs) Categories are the same as Table 1; mdiff and std:
the mean and standard deviation of absolute value of the difference between each exemplar and the mean of the duplicates group, respectively.
Figure 4. A selection of results for organisms in terms of melting temperatures (Exemplar vs. Duplicate pairs) mdiff and std: the mean and standard
deviation of absolute value of the difference between each exemplar and the mean of the original group, respectively; Tb, Ts, Ta: melting temperature
calculated using basic, salted and advanced formula in supplement, respectively.
Page 12 of 16 Database, Vol. 2017, Article ID baw163
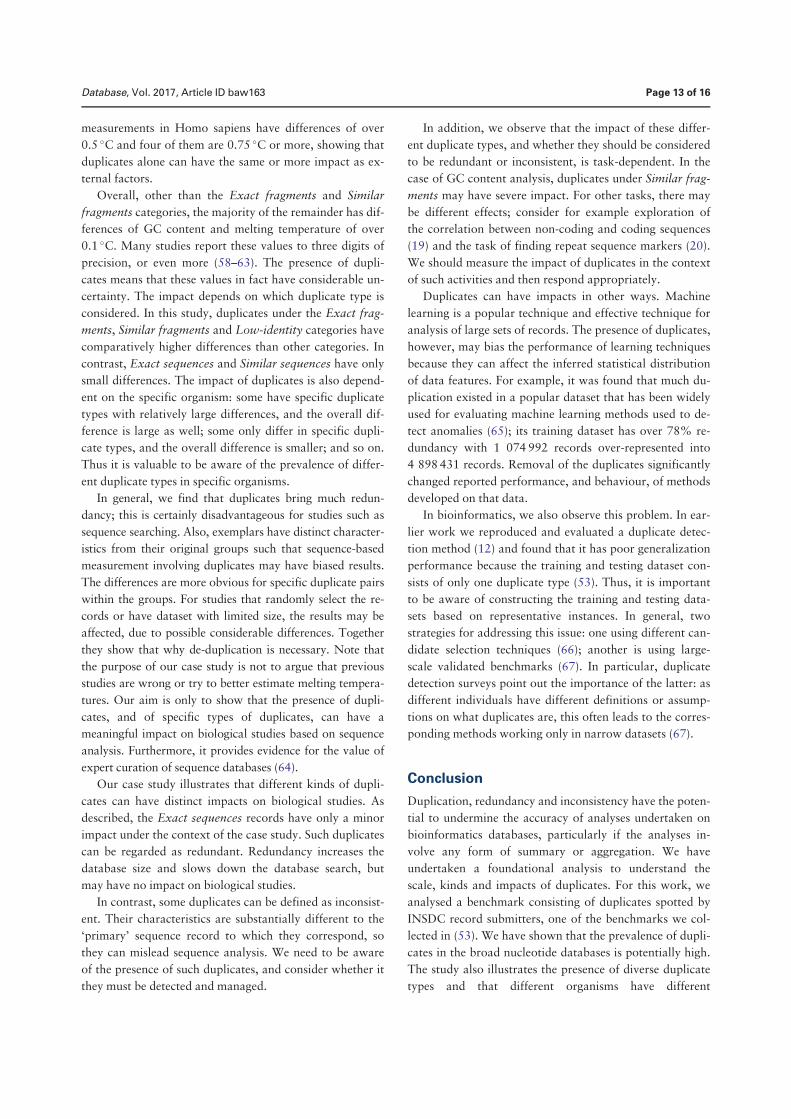
measurements in Homo sapiens have differences of over
0.5 �C and four of them are 0.75 �C or more, showing that
duplicates alone can have the same or more impact as ex-
ternal factors.
Overall, other than the Exact fragments and Similar
fragments categories, the majority of the remainder has dif-
ferences of GC content and melting temperature of over
0.1 �C. Many studies report these values to three digits of
precision, or even more (58–63). The presence of dupli-
cates means that these values in fact have considerable un-
certainty. The impact depends on which duplicate type is
considered. In this study, duplicates under the Exact frag-
ments, Similar fragments and Low-identity categories have
comparatively higher differences than other categories. In
contrast, Exact sequences and Similar sequences have only
small differences. The impact of duplicates is also depend-
ent on the specific organism: some have specific duplicate
types with relatively large differences, and the overall dif-
ference is large as well; some only differ in specific dupli-
cate types, and the overall difference is smaller; and so on.
Thus it is valuable to be aware of the prevalence of differ-
ent duplicate types in specific organisms.
In general, we find that duplicates bring much redun-
dancy; this is certainly disadvantageous for studies such as
sequence searching. Also, exemplars have distinct character-
istics from their original groups such that sequence-based
measurement involving duplicates may have biased results.
The differences are more obvious for specific duplicate pairs
within the groups. For studies that randomly select the re-
cords or have dataset with limited size, the results may be
affected, due to possible considerable differences. Together
they show that why de-duplication is necessary. Note that
the purpose of our case study is not to argue that previous
studies are wrong or try to better estimate melting tempera-
tures. Our aim is only to show that the presence of dupli-
cates, and of specific types of duplicates, can have a
meaningful impact on biological studies based on sequence
analysis. Furthermore, it provides evidence for the value of
expert curation of sequence databases (64).
Our case study illustrates that different kinds of dupli-
cates can have distinct impacts on biological studies. As
described, the Exact sequences records have only a minor
impact under the context of the case study. Such duplicates
can be regarded as redundant. Redundancy increases the
database size and slows down the database search, but
may have no impact on biological studies.
In contrast, some duplicates can be defined as inconsist-
ent. Their characteristics are substantially different to the
‘primary’ sequence record to which they correspond, so
they can mislead sequence analysis. We need to be aware
of the presence of such duplicates, and consider whether it
they must be detected and managed.
In addition, we observe that the impact of these differ-
ent duplicate types, and whether they should be considered
to be redundant or inconsistent, is task-dependent. In the
case of GC content analysis, duplicates under Similar frag-
ments may have severe impact. For other tasks, there may
be different effects; consider for example exploration of
the correlation between non-coding and coding sequences
(19) and the task of finding repeat sequence markers (20).
We should measure the impact of duplicates in the context
of such activities and then respond appropriately.
Duplicates can have impacts in other ways. Machine
learning is a popular technique and effective technique for
analysis of large sets of records. The presence of duplicates,
however, may bias the performance of learning techniques
because they can affect the inferred statistical distribution
of data features. For example, it was found that much du-
plication existed in a popular dataset that has been widely
used for evaluating machine learning methods used to de-
tect anomalies (65); its training dataset has over 78% re-
dundancy with 1 074 992 records over-represented into
4 898 431 records. Removal of the duplicates significantly
changed reported performance, and behaviour, of methods
developed on that data.
In bioinformatics, we also observe this problem. In ear-
lier work we reproduced and evaluated a duplicate detec-
tion method (12) and found that it has poor generalization
performance because the training and testing dataset con-
sists of only one duplicate type (53). Thus, it is important
to be aware of constructing the training and testing data-
sets based on representative instances. In general, two
strategies for addressing this issue: one using different can-
didate selection techniques (66); another is using large-
scale validated benchmarks (67). In particular, duplicate
detection surveys point out the importance of the latter: as
different individuals have different definitions or assump-
tions on what duplicates are, this often leads to the corres-
ponding methods working only in narrow datasets (67).
Conclusion
Duplication, redundancy and inconsistency have the poten-
tial to undermine the accuracy of analyses undertaken on
bioinformatics databases, particularly if the analyses in-
volve any form of summary or aggregation. We have
undertaken a foundational analysis to understand the
scale, kinds and impacts of duplicates. For this work, we
analysed a benchmark consisting of duplicates spotted by
INSDC record submitters, one of the benchmarks we col-
lected in (53). We have shown that the prevalence of dupli-
cates in the broad nucleotide databases is potentially high.
The study also illustrates the presence of diverse duplicate
types and that different organisms have different
Database, Vol. 2017, Article ID baw163 Page 13 of 16
prevalence of duplicates, making the situation even more
complex. Our investigation suggests that different or even
simplified definitions of duplicates, such as those in previ-
ous studies, may not be valuable in practice.
The quantitative measurement of these duplicate re-
cords showed that they can vary substantially from
other records, and that different kinds of duplicates have
distinct features that imply that they require different
approaches for detection. As a preliminary case study, we
considered the impact of these duplicates on measurements
that depend on quantitative information in sequence data-
bases (GC content and melting temperature analysis),
which demonstrated that the presence of duplicates intro-
duces error.
Our analysis illustrates that some duplicates only intro-
duce redundancy, whereas other types lead to inconsist-
ency. The impact of duplicates is also task-dependent; it is
a fallacy to suppose that a database can be fully de-
duplicated, as one task’s duplicate can be valuable infor-
mation in another context.
The work we have presented based on the merge-based
benchmark as a source of duplication, may not be fully
representative of duplicates overall. Nevertheless, the col-
lected data and the conclusions derived from them are reli-
able. Although records were merged due to different
reasons, these reasons reflect the diversity and complexity
of duplication. It is far from clear how the overall preva-
lence of duplication might be more comprehensively as-
sessed. This would require a discovery method, which
would inherently be biased by the assumptions of the
method. We therefore present this work as a contribution
to understanding what assumptions might be valid.
Supplementary data
Supplementary data are available at Database Online.
AcknowledgmentsWe are grateful to Judice LY Koh and Alex Rudniy for explaining
their duplicate detection methods. We also appreciate the database
staff who have supported our work with domain expertise: Nicole
Silvester and Clara Amid from EMBL ENA (advised on merged re-
cords in INSDC databases); Wayne Matten from NCBI (advised
how to use BLAST to achieve good alignment results); and Elisabeth
Gasteiger from UniProt (explained how UniProt staff removed re-
dundant entries in UniProt TrEMBL).
Funding
Qingyu Chen’s work is supported by an International Research
Scholarship from The University of Melbourne. The project receives
funding from the Australian Research Council through a Discovery
Project grant, DP150101550.
Conflict of interest. None declared.
References
1. Watson,H.J. and Wixom,B.H. (2007) The current state of busi-
ness intelligence. Computer, 40, 96–99.
2. Bennett,S. (1994) Blood pressure measurement error: its effect
on cross-sectional and trend analyses. J. Clin. Epidemiol., 47,
293–301.
3. Tintle,N.L., Gordon,D., McMahon,F.J., and Finch,S.J. (2007)
Using duplicate genotyped data in genetic analyses: testing asso-
ciation and estimating error rates. Stat. Appl. Genet. Mol. Biol.,
6, Article 4.
4. Fan,W. (2012), Web-Age Information Management. Springer,
Berlin, pp. 1–16.
5. Nakamura,Y., Cochrane,G., and Karsch-Mizrachi,I. (2013) The
international nucleotide sequence database collaboration.
Nucleic Acids Res., 41, D21–D24.
6. Bork,P. and Bairoch,A. (1996) Go hunting in sequence databases
but watch out for the traps. Trends Genet., 12, 425–427.
7. Muller,H., Naumann,F., and Freytag,J. (2003) Data quality in
genome databases. Eighth International Conference on
Information Quality (IQ 2003). MIT Press, Cambridge, MA.
8. Cameron,M., Bernstein,Y., and Williams,H.E. (2007) Clustered
sequence representation for fast homology search. J. Comput.
Biol., 14, 594–614.
9. Grillo,G., Attimonelli,M., Liuni,S., and Pesole,G. (1996)
CLEANUP: a fast computer program for removing redundancies
from nucleotide sequence databases. Comput. Appl. Biosci., 12,
1–8.
10. Chellamuthu,S. and Punithavalli,D.M. (2009) Detecting redun-
dancy in biological databases? An efficient approach. Global J.
Comput. Sci. Technol., 9, 11.
11. Holm,L. and Sander,C. (1998) Removing near-neighbour redun-
dancy from large protein sequence collections. Bioinformatics,
14, 423–429.
12. Koh,J.L., Lee,M., Khan,L.M., et al. (2004) Duplicate detection
in biological data using association rule mining. Locus, 501,
S22388.
13. Korning,P.G., Hebsgaard,S.M., Rouze,P., and Brunak,S. (1996)
Cleaning the GenBank Arabidopsis thaliana data set. Nucleic
Acids Res., 24, 316–320.
14. Li,W., Jaroszewski,L., and Godzik,A. (2002) Sequence cluster-
ing strategies improve remote homology recognitions while
reducing search times. Protein Eng., 15, 643–649.
15. Rudniy,A., Song,M., and Geller,J. (2010) Detecting duplicate
biological entities using shortest path edit distance. Int. J. Data
Mining Bioinformatics, 4, 395–410.
16. Sikic,K. and Carugo,O. (2010) Protein sequence redundancy re-
duction: comparison of various method. Bioinformation, 5, 234.
17. Song,M. and Rudniy,A. (2010) Detecting duplicate biological
entities using Markov random field-based edit distance. Knowl.
Information Syst., 25, 371–387.
18. Suzek,B.E., HuanG,H., McGarvey,P. et al. (2007) UniRef: com-
prehensive and non-redundant UniProt reference clusters.
Bioinformatics, 23, 1282–1288.
19. Buldyrev,S.V., Goldberger,A.L., Havlin,S. et al. (1995) Long-
range correlation properties of coding and noncoding DNA se-
quences: GenBank analysis. Phys. Rev. E, 51, 5084.
Page 14 of 16 Database, Vol. 2017, Article ID baw163
20. Lewers,K.S., Styan,S.M.N., Hokanson,S.C., and Bassil,N.V.
(2005) Strawberry GenBank-derived and genomic simple se-
quence repeat (SSR) markers and their utility with strawberry,
blackberry, and red and black raspberry. J. Am. Soc. Horticult.
Sci., 130, 102–115.
21. Brenner,S.E. (1999) Errors in genome annotation. Trends
Genet., 15, 132–133.
22. Williams,B.W., Gelder,S.R., Proctor,H.C., and Coltman,D.W.
(2013) Molecular phylogeny of North American
Branchiobdellida (Annelida: Clitellata). Mol. Phylogenet. Evol.,
66, 30–42.
23. Devos,D. and Valencia,A. (2001) Intrinsic errors in genome an-
notation. Trends Genet., 17, 429–431.
24. Altschul,S.F., Boguski,M.S., Gish,W. et al. (1994) Issues in
searching molecular sequence databases. Nat. Genet., 6,
119–129.
25. Droc,G., Lariviere,D., Guignon,V. et al. (2013) The banana gen-
ome hub. Database, 2013, bat035.
26. Bastian,F., Parmentier,G., Roux,J. et al. (2008), Data
Integration in the Life Sciences. Springer, Berlin, pp. 124–131.
27. Lyne,M., Smith,R.N., Lyne,R. et al. (2013) metabolicMine: an
integrated genomics, genetics and proteomics data warehouse
for common metabolic disease research. Database, 2013,
bat060.
28. Finn,R.D., Coggill,P., Eberhardt,R.Y. et al. (2015) The Pfam
protein families database: towards a more sustainable future.
Nucleic Acids Res., 44:D279–D285.
29. Isserlin,R., El-Badrawi,R.A., and Bader,G.D. (2011) The biomo-
lecular interaction network database in PSI-MI 2.5. Database,
2011, baq037.
30. Wilming,L.G., Boychenko,V., and Harrow,J.L. (2015)
Comprehensive comparative homeobox gene annotation in
human and mouse. Database, 2015, bav091.
31. Williams,G., Davis,P., Rogers,A. et al. (2011) Methods and
strategies for gene structure curation in WormBase. Database,
2011, baq039.
32. Safran,M., Dalah,I., Alexander,J. et al. (2010) GeneCards
Version 3: the human gene integrator. Database, 2010, baq020.
33. Washington,N.L., Stinson,E., Perry,M.D. et al. (2011)
The modENCODE Data Coordination Center: lessons in har-
vesting comprehensive experimental details. Database, 2011,
bar023.
34. Laulederkind,S.J., Liu,W., Smith,J.R. et al. (2013) PhenoMiner:
quantitative phenotype curation at the rat genome database.
Database, 2013, bat015.
35. Nanduri,R., Bhutani,I., Somavarapu,A.K. et al. (2015)
ONRLDB—manually curated database of experimentally vali-
dated ligands for orphan nuclear receptors: insights into new
drug discovery. Database, 2015, bav112.
36. Rawlings,N.D. (2009) A large and accurate collection of peptidase
cleavages in the MEROPS database. Database, 2009, bap015.
37. Lin,Y.S., Liao,T.Y., and Lee,S.J. (2013) Detecting near-
duplicate documents using sentence-level features and supervised
learning. Expert Syst. Appl., 40, 1467–1476.
38. Fu,L., Niu,B., Zhu,Z. et al. (2012) CD-HIT: accelerated for clus-
tering the next-generation sequencing data. Bioinformatics, 28,
3150–3152.
39. Benson,D.A., Cavanaugh,M., Clark,K. et al. (2012) GenBank.
Nucleic Acids Res., 41: D36–D42.
40. Zorita,E.V., Cusc�o,P., and Filion,G. (2015) Starcode: sequence
clustering based on all-pairs search. Bioinformatics, btv053.
41. Verykios,V.S., Moustakides,G.V., and Elfeky,M.G. (2003) A
Bayesian decision model for cost optimal record matching.
VLDB J., 12, 28–40.
42. McCoy,A.B., Wright,A., Kahn,M.G. et al. (2013) Matching
identifiers in electronic health records: implications for duplicate
records and patient safety. BMJ Qual. Saf., 22, 219–224.
43. Christen,P. and Goiser,K. (2007) Quality Measures in Data
Mining. Springer, Berlin, pp. 127–151.
44. Martins,B. (2011) GeoSpatial Semantics. Springer, Berlin, pp.
34–51.
45. Joffe,E., Byrne,M.J., Reeder,P. et al. (2013) AMIA Annual
Symposium Proceedings. American Medical Informatics
Association, Vol. 2013, pp. 721–730.
46. Rudniy,A., Song,M., and Geller,J. (2014) Mapping biological
entities using the longest approximately common prefix method.
BMC Bioinformatics, 15, 187.
47. Koh,J.L. (2007), Correlation-Based Methods for Biological Data
Cleaning, PhD thesis, National university of Singapore.
48. UniProt Consortium. and others. (2014) UniProt: a hub for pro-
tein information. Nucleic Acids Res., 43:D204–D212.
49. Celniker,S.E., Wheeler,D.A., Kronmiller,B. et al. (2002)
Finishing a whole-genome shotgun: release 3 of the Drosophila
melanogaster euchromatic genome sequence. Genome Biol., 3,
1.
50. O’Leary,N.A., Wright,M.W., Brister,J.R. et al. (2015) Reference
sequence (RefSeq) database at NCBI: current status, taxonomic
expansion, and functional annotation. Nucleic Acids Res.,
44:D733–D745.
51. Kitts,P.A., Church,D.M., Thibaud-Nissen,F. et al. (2016)
Assembly: a resource for assembled genomes at NCBI. Nucleic
Acids Res., 44, D73–D80.
52. Chen,Q., Jobel,J., and Verspoor,K. (2016) Benchmarks for
Measurement of Duplicate Detection Methods in Nucleotide
Databases. Database, doi: http://dx.doi.org/10.1101/085324.
53. Chen,Q., Zobel,J., and Verspoor,K. (2015) Evaluation of a
Machine Learning Duplicate Detection Method for
Bioinformatics Databases. ACM Ninth International Workshop
on Data and Text Mining in Biomedical Informatics in conjunc-
tion with CIKM, October 19–23, 2015, Melbourne, VIC,
Australia. ACM Press, New York.
54. Fullerton,S.M., Carvalho,A.B., and Clark,A.G. (2001) Local
rates of recombination are positively correlated with GC content
in the human genome. Mol Biol. Evol., 18, 1139–1142.
55. Ahsen,N.V., Wittwer,C.T., and Schutz,E. (2001)
Oligonucleotide melting temperatures under PCR conditions:
nearest-neighbor corrections for Mg2þ, deoxynucleotide triphos-
phate, and dimethyl sulfoxide concentrations with comparison
to alternative empirical formulas. Clin. Chem., 47, 1956–1961.
56. Muyzer,G., Waal,E.C.D., and Uitterlinden,A.G. (1993) Profiling
of complex microbial populations by denaturing gradient gel
electrophoresis analysis of polymerase chain reaction-amplified
genes coding for 16S rRNA. Appl. Environ. Microbiol., 59,
695–700.
Database, Vol. 2017, Article ID baw163 Page 15 of 16
57. Gonzalez,J.M. and Saiz-Jimenez,C. (2002) A fluorimetric
method for the estimation of Gþ C mol\% content in micro-
organisms by thermal denaturation temperature. Environ.
Microbiol., 4, 770–773.
58. Benjamini,Y. and Speed,T.P. (2012) Summarizing and correcting
the GC content bias in high-throughput sequencing. Nucleic
Acids Res., 40, e72.
59. Goddard,N.L., Bonnet,G., Krichevsky,O., and Libchaber,A.
(2000) Sequence dependent rigidity of single stranded DNA.
Phys. Rev. Lett., 85, 2400.
60. Lassalle,F., Perian,S., Bataillon,T. et al. (2015) GC-content evo-
lution in bacterial genomes: the biased gene conversion hypoth-
esis expands. PLoS Genet., 11, e1004941.
61. Mashhood,C.M.A., Sharfuddin,C., and Ali,S. (2015) Analysis of
simple and imperfect microsatellites in Ebolavirus species and
other genomes of Filoviridae family. Gene Cell Tissue, 2, e26204
62. Meggers,E., Holland,P.L., Tolman,W.B. et al. (2000) A novel
copper-mediated DNA base pair. J. Am. Chem. Soc., 122,
10714–10715.
63. Veleba,A., Bure�s,P., Adamec,L. et al. (2014) Genome size and
genomic GC content evolution in the miniature genome-sized
family Lentibulariaceae. New Phytol., 203, 22–28.
64. Poux,S., Magrane,M., Arighi,C.N., UniProt Consortium.
et al. (2014) Expert curation in UniProtKB: a case study on
dealing with conflicting and erroneous data. Database, 2014,
bau016.
65. Tavallaee,M., Bagheri,E., Lu,W., and Ghorbani,A.A.
(2009) Proceedings of the Second IEEE Symposium on
Computational Intelligence for Security and Defence
Applications 2009.
66. Bilenko,M. and Mooney,R.J. (2003) Proceedings of the KDD-
2003 Workshop on Data Cleaning, Record Linkage, and Object
Consolidation, Washington, DC, pp. 7–12.
67. Elmagarmid,A.K., Ipeirotis,P.G., and Verykios,V.S. (2007)
Duplicate record detection: a survey. IEEE Trans. Knowl. Data
Eng., 19, 1–16.
Page 16 of 16 Database, Vol. 2017, Article ID baw163

4PAPER 2
OutlineIn this chapter we summarise the results and reflect on the research process based onthe following manuscript:
• Title: Benchmarks for measurement of duplicate detection methods in nucleotidedatabases.
• Authors: Qingyu Chen, Justin Zobel, and Karin Verspoor
• Publication venue: Database: The Journal of Biological Databases and Curation
• Publication year: 2017
4.1 abstract of the paper
Duplication of information in databases is a major data quality challenge. The presenceof duplicates, implying either redundancy or inconsistency, can have a range of impactson the quality of analyses that use the data. To provide a sound basis for research onthis issue in databases of nucleotide sequences, we have developed new, large-scale vali-dated collections of duplicates, which can be used to test the effectiveness of duplicatedetection methods. Previous collections were either designed primarily to test efficiency,or contained only a limited number of duplicates of limited kinds. To date, duplicatedetection methods have been evaluated on separate, inconsistent benchmarks, leading toresults that cannot be compared and, due to limitations of the benchmarks, of question-able generality. In this study, we present three nucleotide sequence database benchmarks,based on information drawn from a range of resources, including information derived
95
96 paper 2
from mapping to two data sections within the UniProt Knowledgebase (UniProtKB),UniProtKB/Swiss-Prot and UniProtKB/TrEMBL. Each benchmark has distinct char-acteristics. We quantify these characteristics and argue for their complementary valuein evaluation. The benchmarks collectively contain a vast number of validated biologicalduplicates; the largest has nearly half a billion duplicate pairs (although this is proba-bly only a tiny fraction of the total that is present). They are also the first benchmarkstargeting the primary nucleotide databases. The records include the 21 most heavilystudied organisms in molecular biology research. Our quantitative analysis shows thatduplicates in the different benchmarks, and in different organisms, have different char-acteristics. It is thus unreliable to evaluate duplicate detection methods against anysingle benchmark. For example, the benchmark derived from UniProtKB/Swiss-Protmappings identifies more diverse types of duplicates, showing the importance of expertcuration, but is limited to coding sequences. Overall, these benchmarks form a resourcethat we believe will be of great value for development and evaluation of the duplicatedetection or record linkage methods that are required to help maintain these essentialresources.
4.2 summary and reflection
As explained in Chapter 3, this paper is paired with the previous one, Paper 1. Theformer paper investigates the prevalence, notions and impacts of duplication; the currentpaper serves two main purposes: it provides three benchmark datasets at a large scaleand characterises duplicates in each of the benchmarks and illustrates use cases to showhow to use those benchmarks.In the previous paper we focus on the direct impact of duplication for INSDC users. As
aforementioned, INSDC databases are also the primary sources for protein databases(explained in Section 2.4, Chapter 2); this paper concentrates on the propagated im-pacts of duplication for databases using INSDC as sources. In the context of proteindatabases, nucleotide records that correspond to the same proteins are considered asduplicates (recall biological central dogma introduced in Section 2.2.1, Chapter 2). Wethus further collected INSDC records that have been merged or cross-referenced at
4.2 summary and reflection 97
UniProtKB. As mentioned in Section 2.4, UniProtKB uses two kinds of curation: expertcuration in UniProtKB/Swiss-Prot and automatic curation in UniProtKB. The dupli-cate records are detected, merged, and documented accordingly; one example is shownin Figure 2.9, Chapter 2. We therefore construct two additional collections consisting oflabelled duplicate records via expert curation and automatic curation correspondingly.The detailed process is summarised in Methods section of this paper. The benchmarkscontain three collections for 21 organisms: (1) submitter-based, 111,826 record pairsthat have been merged directly in INSDC (the collection analysed in the previous pa-per); (2) expert curation-based, 2,465,891 record pairs identified via UniProtKB/Swiss-Prot curation; and (3) automatic curation-based, 473,555,072 record pairs identified viaUniProt/TrEMBL curation.We further investigated the characteristics of duplicates in each collection. The re-
sults reveal three primary notions of duplicates: similar or identical records; fragments;and somewhat different records that belong to the same entities. These results alsodemonstrate that more diverse types of duplicate records are found by expert curation.This agrees with the dedicated expert curation process in UniProtKB/Swiss-Prot, asdescribed in Section 2.4, Chapter 2.The constructed benchmark has two main useful cases. First, it has much greater
volume and more complex types of duplicates than the previous dataset used in dupli-cate detection methods, as mentioned in Section 2.12, Chapter 2. This can better assessperformance of the current duplicate detection methods, such as robustness and gener-alisation. This can also motivate the development of better duplicate detection methods.Second, it can facilitate better database curation and cross-references. When the recordsare merged, as mentioned before, UniProt curators have made explicit annotations todocument the reasons and inconsistencies. Therefore, those annotations can be used toidentify problematic sequence records submitted to INSDC. We detailed two examplesin the Results and discussion section of the paper.In contrast to the paper presented in Chapter 3, this paper covers the construction of
three benchmarks across multiple databases. I need to understand the curation processin each of the databases and how the merged records are documented; it involves com-munications with several database staff to ensure that those records are duplicates and
98 paper 2
the associated collection procedure is correct. Those iterations improve my understand-ing of those databases and how to do effective research communication, and ultimatelyfacilitate my understanding of my research topic.Another reflection is from one of the reviewers’ comments. That reviewer asks why
a benchmark of duplicate records is valuable and other related comments on use casesof the benchmark. The published version has a dedicated section summarising exist-ing duplicate detection methods and stresses the importance of large-scale benchmarks(Background section), and describes how to use the benchmark and use cases to demon-strate the benefits of the benchmarks (Results and discussion section).The work could be further improved. The most important change would be to provide
more information about the labelled duplicates to users: the records were labelled asduplicates, but I have not detailed any other further information, such as why differentsequence records are duplicates and what are the differences between them. For example,UniProtKB/Swiss-Prot labels duplicates, merges them into one entry, and documentsthe differences between those records, as explained in Section 2.5, Chapter 2. This iswhat my benchmark lacks: I should clearly document that those records are labelled asduplicates based on what principles and whether there are differences between records;for example, frame-shift errors and reading frame errors.
Original article
Benchmarks for measurement of duplicate
detection methods in nucleotide databases
Qingyu Chen, Justin Zobel and Karin Verspoor*
Department of Computing and Information Systems, The University of Melbourne, Parkville, VIC 3010,
Australia
*Corresponding author: Tel: þ61 3-8344-4902; Email: [email protected]
Citation details: Chen,Q., Zobel,J., and Verspoor,K. (2016) Benchmarks for measurement of duplicate detection methods in
nucleotide databases. Database, Vol. 2016: article ID baw164; doi:10.1093/database/baw164
Received 10 October 2016; Revised 17 November 2016; Accepted 21 November 2016
Abstract
Duplication of information in databases is a major data quality challenge. The presence
of duplicates, implying either redundancy or inconsistency, can have a range of impacts
on the quality of analyses that use the data. To provide a sound basis for research on this
issue in databases of nucleotide sequences, we have developed new, large-scale vali-
dated collections of duplicates, which can be used to test the effectiveness of duplicate
detection methods. Previous collections were either designed primarily to test efficiency,
or contained only a limited number of duplicates of limited kinds. To date, duplicate de-
tection methods have been evaluated on separate, inconsistent benchmarks, leading to
results that cannot be compared and, due to limitations of the benchmarks, of question-
able generality. In this study, we present three nucleotide sequence database bench-
marks, based on information drawn from a range of resources, including information
derived from mapping to two data sections within the UniProt Knowledgebase
(UniProtKB), UniProtKB/Swiss-Prot and UniProtKB/TrEMBL. Each benchmark has distinct
characteristics. We quantify these characteristics and argue for their complementary
value in evaluation. The benchmarks collectively contain a vast number of validated bio-
logical duplicates; the largest has nearly half a billion duplicate pairs (although this is
probably only a tiny fraction of the total that is present). They are also the first bench-
marks targeting the primary nucleotide databases. The records include the 21 most heav-
ily studied organisms in molecular biology research. Our quantitative analysis shows
that duplicates in the different benchmarks, and in different organisms, have different
characteristics. It is thus unreliable to evaluate duplicate detection methods against any
single benchmark. For example, the benchmark derived from UniProtKB/Swiss-Prot
mappings identifies more diverse types of duplicates, showing the importance of expert
curation, but is limited to coding sequences. Overall, these benchmarks form a resource
that we believe will be of great value for development and evaluation of the duplicate
VC The Author(s) 2017. Published by Oxford University Press. Page 1 of 17
This is an Open Access article distributed under the terms of the Creative Commons Attribution License (http://creativecommons.org/licenses/by/4.0/), which permits
unrestricted reuse, distribution, and reproduction in any medium, provided the original work is properly cited.
(page number not for citation purposes)
Database, 2017, 1–17
doi: 10.1093/database/baw164
Original article
detection or record linkage methods that are required to help maintain these essential
resources.
Database URL: https://bitbucket.org/biodbqual/benchmarks
Introduction
Sequencing technologies are producing massive volumes of
data. GenBank, one of the primary nucleotide databases,
increased in size by over 40% in 2014 alone (1). However,
researchers have been concerned about the underlying data
quality in biological sequence databases since the 1990s
(2). A particular problem of concern is duplicates, when a
database contains multiple instances representing the same
entity. Duplicates introduce redundancies, such as repeti-
tive results in database search (3), and may even represent
inconsistencies, such as contradictory functional annota-
tions on multiple records that concern the same entity (4).
Recent studies have noted duplicates as one of five central
data quality problems (5), and it has been observed that de-
tection and removal of duplicates is a key early step in bio-
informatics database curation (6).
Existing work has addressed duplicate detection in bio-
logical sequence databases in different ways. This work
falls into two broad categories: efficiency-focused methods
that are based on assumptions such as duplicates have
identical or near-identical sequences, where the aim is to
detect similar sequences in a scalable manner; and quality-
focused methods that examine record fields other than the
sequence, where the aim is accurate duplicate detection.
However, the value of these existing approaches is unclear,
due to the lack of broad-based, validated benchmarks; as
some of this previous work illustrates, there is a tendency
for investigators of new methods to use custom-built col-
lections that emphasize the kind of characteristic their
method is designed to detect.
Thus, different methods have been evaluated using sep-
arate, inconsistent benchmarks (or test collections).
The efficiency-focused methods used large benchmarks.
However, the records in these benchmarks are not necessar-
ily duplicates, due to use of mechanical assumptions about
what a duplicate is. The quality-focused methods have used
collections of expert-labelled duplicates. However, as a result
of the manual effort involved, these collections are small and
contain only limited kinds of duplicates from limited data
sources. To date, no published benchmarks have included
duplicates that are explicitly marked as such in the primary
nucleotide databases, GenBank, the EMBL European
Nucleotide Archive, and the DNA DataBank of Japan. (We
refer to these collectively as INSDC: the International
Nucleotide Sequence Database Collaboration (7).)
In this study, we address these issues by accomplishing
the following:
• We introduce three benchmarks containing INSDC du-
plicates that were collected based on three different prin-
ciples: records merged directly in INSDC (111 ,826
pairs); INSDC records labelled as references during
UniProtKB/Swiss-Prot expert curation (2 465 891 pairs);
and INSDC records labelled as references in UniProtKB/
TrEMBL automatic curation (473 555 072 pairs);
• We quantitatively measure similarities between dupli-
cates, showing that our benchmarks have duplicates with
dramatically different characteristics, and are comple-
mentary to each other. Given these differences, we argue
that it is insufficient to evaluate against only one bench-
mark; and
• We demonstrate the value of expert curation, in its iden-
tification of a much more diverse set of duplicate types.
It may seem that, with so many duplicates in our bench-
marks, there is little need for new duplicate detection meth-
ods. However, the limitations of the mechanisms that led to
discovery of these duplicates, and the fact that the preva-
lences are so very different between different species and re-
sources, strongly suggest that these are a tiny fraction of the
total that is likely to be present. While a half billion dupli-
cates may seem like a vast number, they only involve
710 254 records, while the databases contain 189 264 014
records (http://www.ddbj.nig.ac.jp/breakdown_stats/dbgro
wth-e.html#ddbjvalue) altogether to date. Also, as sug-
gested by the effort expended in expert curation, there is a
great need for effective duplicate detection methods.
Background
In the context of general databases, the problems of quality
control and duplicate detection have a long history of re-
search. However, this work has only limited relevance for
bioinformatics databases, because, for example, it has
tended to focus on tasks such as ensuring that each real-
world entity is only represented once, and the attributes of
entities (such as ‘home address’) are externally verifiable.
In this section we review prior work on duplicate detection
in bioinformatics databases. We show that researchers
have approached duplicate detection with different as-
sumptions. We then review the more general duplicate
Page 2 of 17 Database, Vol. 2017, Article ID baw164
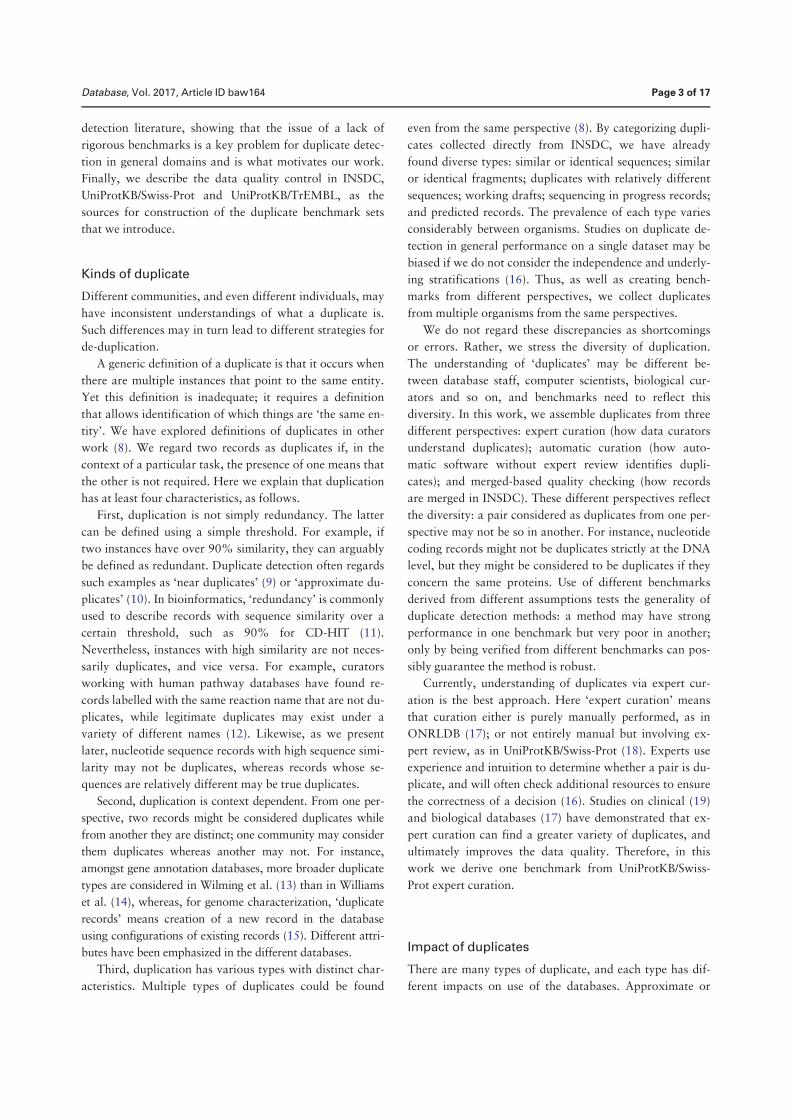
detection literature, showing that the issue of a lack of
rigorous benchmarks is a key problem for duplicate detec-
tion in general domains and is what motivates our work.
Finally, we describe the data quality control in INSDC,
UniProtKB/Swiss-Prot and UniProtKB/TrEMBL, as the
sources for construction of the duplicate benchmark sets
that we introduce.
Kinds of duplicate
Different communities, and even different individuals, may
have inconsistent understandings of what a duplicate is.
Such differences may in turn lead to different strategies for
de-duplication.
A generic definition of a duplicate is that it occurs when
there are multiple instances that point to the same entity.
Yet this definition is inadequate; it requires a definition
that allows identification of which things are ‘the same en-
tity’. We have explored definitions of duplicates in other
work (8). We regard two records as duplicates if, in the
context of a particular task, the presence of one means that
the other is not required. Here we explain that duplication
has at least four characteristics, as follows.
First, duplication is not simply redundancy. The latter
can be defined using a simple threshold. For example, if
two instances have over 90% similarity, they can arguably
be defined as redundant. Duplicate detection often regards
such examples as ‘near duplicates’ (9) or ‘approximate du-
plicates’ (10). In bioinformatics, ‘redundancy’ is commonly
used to describe records with sequence similarity over a
certain threshold, such as 90% for CD-HIT (11).
Nevertheless, instances with high similarity are not neces-
sarily duplicates, and vice versa. For example, curators
working with human pathway databases have found re-
cords labelled with the same reaction name that are not du-
plicates, while legitimate duplicates may exist under a
variety of different names (12). Likewise, as we present
later, nucleotide sequence records with high sequence simi-
larity may not be duplicates, whereas records whose se-
quences are relatively different may be true duplicates.
Second, duplication is context dependent. From one per-
spective, two records might be considered duplicates while
from another they are distinct; one community may consider
them duplicates whereas another may not. For instance,
amongst gene annotation databases, more broader duplicate
types are considered in Wilming et al. (13) than in Williams
et al. (14), whereas, for genome characterization, ‘duplicate
records’ means creation of a new record in the database
using configurations of existing records (15). Different attri-
butes have been emphasized in the different databases.
Third, duplication has various types with distinct char-
acteristics. Multiple types of duplicates could be found
even from the same perspective (8). By categorizing dupli-
cates collected directly from INSDC, we have already
found diverse types: similar or identical sequences; similar
or identical fragments; duplicates with relatively different
sequences; working drafts; sequencing in progress records;
and predicted records. The prevalence of each type varies
considerably between organisms. Studies on duplicate de-
tection in general performance on a single dataset may be
biased if we do not consider the independence and underly-
ing stratifications (16). Thus, as well as creating bench-
marks from different perspectives, we collect duplicates
from multiple organisms from the same perspectives.
We do not regard these discrepancies as shortcomings
or errors. Rather, we stress the diversity of duplication.
The understanding of ‘duplicates’ may be different be-
tween database staff, computer scientists, biological cur-
ators and so on, and benchmarks need to reflect this
diversity. In this work, we assemble duplicates from three
different perspectives: expert curation (how data curators
understand duplicates); automatic curation (how auto-
matic software without expert review identifies dupli-
cates); and merged-based quality checking (how records
are merged in INSDC). These different perspectives reflect
the diversity: a pair considered as duplicates from one per-
spective may not be so in another. For instance, nucleotide
coding records might not be duplicates strictly at the DNA
level, but they might be considered to be duplicates if they
concern the same proteins. Use of different benchmarks
derived from different assumptions tests the generality of
duplicate detection methods: a method may have strong
performance in one benchmark but very poor in another;
only by being verified from different benchmarks can pos-
sibly guarantee the method is robust.
Currently, understanding of duplicates via expert cur-
ation is the best approach. Here ‘expert curation’ means
that curation either is purely manually performed, as in
ONRLDB (17); or not entirely manual but involving ex-
pert review, as in UniProtKB/Swiss-Prot (18). Experts use
experience and intuition to determine whether a pair is du-
plicate, and will often check additional resources to ensure
the correctness of a decision (16). Studies on clinical (19)
and biological databases (17) have demonstrated that ex-
pert curation can find a greater variety of duplicates, and
ultimately improves the data quality. Therefore, in this
work we derive one benchmark from UniProtKB/Swiss-
Prot expert curation.
Impact of duplicates
There are many types of duplicate, and each type has dif-
ferent impacts on use of the databases. Approximate or
Database, Vol. 2017, Article ID baw164 Page 3 of 17
near duplicates introduce redundancies, whereas other
types may lead to inconsistencies.
Approximate or near duplicates in biological databases is
not a new problem. We found related literature in 1994 (3),
2006 (20) and as recently as 2015 (http://www.uniprot.org/
help/proteome_redundancy). A recent significant issue was
proteome redundancy in UniProtKB/TrEMBL (2015).
UniProt staff observed that many records were over-
represented, such as 5.97 million entries for just 1692 strains
of Mycobacterium tuberculosis. This redundancy impacts se-
quence similarity searches, proteomics identification and
motif searches. In total, 46.9 million entries were removed.
Additionally, recall that duplicates are not just redun-
dancies. Use of a simple similarity threshold will result in
many false positives (distinct records with high similarity)
and false negatives (duplicates with low similarity). Studies
show that both cases matter: in clinical databases, merging
of records from distinct patients by mistake may lead to
withholding of a treatment if one patient is allergic but the
other is not (21); failure to merge duplicate records for the
same patient could lead to a fatal drug administration error
(22). Likewise, in biological databases, merging of records
with distinct functional annotations might result in incor-
rect function identification; failing to merge duplicate re-
cords with different functional annotations might lead to
incorrect function prediction. One study retrieved corres-
ponding records from two biological databases, Gene
Expression Omnibus and ArrayExpress, but surprisingly
found the number of records to be significantly different:
the former has 72 whereas only 36 in latter. Some of the re-
cords were identical, but in some cases records were in one
but not the other (23). Indeed, duplication commonly
interacts with inconsistency (5).
Further, we cannot ignore the propagated impacts of
duplicates. The above duplication issue in UniProtKB/
TrEMBL not only impacts UniProtKB/TrEMBL itself, but
also significantly impacts databases or studies using
UniProtKB/TrEMBL data. For instance, release of Pfam, a
curated protein family database, was delayed for close to 2
years; the duplication issue in UniProtKB/TrEMBL was the
major reason (24). Even removal of duplicates in
UniProtKB/TrEMBL caused problems: ‘the removal of bac-
terial duplication in UniProtKB (and normal flux in pro-
tein) would have meant that nearly all (>90%) of Pfam
seed alignments would have needed manual verification
(and potential modification) . . . This imposes a significant
manual biocuration burden’ (24).
Finally, duplicate detection across multiple sources pro-
vides valuable record linkages (25–27). Combination of in-
formation from multiple sources could link literature
databases, containing papers mentioning the record; gene
databases; and protein databases.
Duplicate detection methods
Most duplicate detection methods use pairwise compari-
son, where each record is compared against others in pairs
using a similarity metric. The similarity score is typically
computed by comparing the specific fields in the two re-
cords. The two classes of methods that we previously intro-
duced, efficiency-focused and quality-focused, detect
duplicates in different ways; we now summarize those
approaches.
Efficiency-focused methods
Efficiency-focused methods have two common features.
One is that they typically rest on simple assumptions, such
as that duplicates are records with identical or near-
identical sequences. These are near or approximate dupli-
cates as above. The other is an application of heuristics to
filter out pairs to compare, in order to reduce the running
time. Thus, a common pattern of such methods is to assume
that duplicates have sequence similarity greater than a cer-
tain threshold. In one of the earliest methods, nrdb90, it is
assumed that duplicates have sequence similarities over
90%, with k-mer matching used to rapidly estimate similar-
ity (28). In CD-HIT, 90% similarity is assumed, with
short-substring matching as the heuristic (11); in starcode,
a more recent method, it is assumed that duplicates have se-
quences with a Levenshtein distance of no> 3, and pairs of
sequences with greater estimated distance are ignored (29).
Using these assumptions and associated heuristics, the
methods are designed to speed up the running time, which
is typically the main focus of evaluation (11,28). While
some such methods consider accuracy, efficiency is still the
major concern (29). The collections are often whole data-
bases, such as the NCBI non-redundant database (Listed at
https://blast.ncbi.nlm.nih.gov/Blast.cgi?PAGE_
TYPE¼BlastSearch) for nucleotide databases and Protein
Data Bank (http://www.rcsb.org/pdb/home/home.do) for
protein databases. These collections are certainly large, but
are not validated, that is, records are not known to be du-
plicates via quality-control or curation processes. The
methods based on simple assumptions can reduce redun-
dancies, but recall that duplication is not limited to redun-
dancy: records with similar sequences may not be
duplicates and vice versa. For instance, records INSDC
AL592206.2 and INSDC AC069109.2 have only 68%
local identity (measured in Section 3.2 advised by NCBI
BLAST staff), but they have overlapped clones and were
merged as part of the finishing strategy of the human gen-
ome. Therefore, records measured solely based on a simi-
larity threshold are not validated and do not provide a
basis for measuring the accuracy of a duplicate detection
method, that is, the false positive or false negative rate.
Page 4 of 17 Database, Vol. 2017, Article ID baw164
Quality-focused methods
In contrast to efficiency-focused methods, quality-focused
methods tend to have two main differences: use of a
greater number of fields; and evaluation on validated data-
sets. An early method of this kind compared the similarity
of both metadata (such as description, literature and biolo-
gical function annotations) and sequence, and then used
association rule mining (30) to discover detection rules.
More recent proposals focus on measuring metadata using
approximate string matching: Markov random models
(31), shortest-path edit distance (32) or longest approxi-
mately common prefix matching (33), the former two for
general bioinformatics databases and the latter specifically
for biomedical databases. The first method used a 1300-re-
cord dataset of protein records labelled by domain experts,
whereas the others used a 1900-record dataset of protein
records labelled in UniProt Proteomes, of protein sets from
fully sequenced genomes in UniProt.
The collections used in this work are validated, but
have significant limitations. First, both of the collections
have <2000 records, and only cover limited types of dupli-
cates (46). We classified duplicates specifically on one of
the benchmarks (merge-based) and it demonstrates that
different organisms have dramatically distinct kinds of du-
plicate: in Caenorhabditis elegans, the majority duplicate
type is identical sequences, whereas in Danio rerio the ma-
jority duplicate type is of similar fragments. From our case
study of GC content and melting temperature, those differ-
ent types introduce different impacts: duplicates under the
exact sequence category only have 0.02% mean difference
of GC content compared with normal pairs in Homo sapi-
ens, whereas another type of duplicates that have relatively
low sequence identity introduced a mean difference of
5.67%. A method could easily work well in a limited data-
set of this kind but not be applicable for broader datasets
with multiple types of duplicates. Second, they only cover
a limited number of organisms; the first collection had two
and the latter had five. Authors of prior studies, such as
Rudniy et al. (33), acknowledged that differences of dupli-
cates (different organisms have different kinds of duplicate;
different duplicate types have different characteristics) are
the main problem impacting the method performance.
In some respects, the use of small datasets to assess
quality-based methods is understandable. It is difficult to
find explicitly labelled duplicates. Typically, for nucleotide
databases, sources of labelled duplicates are limited. In
addition, these methods focus on the quality and so are un-
likely to use strategies for pruning the search space, mean-
ing that they are compute intensive. These methods also
generally consider many more fields and many more pairs
than the efficiency-focused methods. A dataset with 5000
records yields over 12 million pairs; even a small data set
requires a large processing time under these conditions.
Hence, there is no large-scale validated benchmark, and
no verified collections of duplicate nucleotide records in
INSDC. However, INSDC contains primary nucleotide
data sources that are essential for protein databases. For
instance, 95% of records in UniProt are from INSDC
(http://www.uniprot.org/help/sequence_origin). A further
underlying problem is that fundamental understanding of
duplication is missing. The scale, characteristics and im-
pacts of duplicates in biological databases remain unclear.
Benchmarks in duplicate detection
Lack of large-scale validated benchmarks is a problem in
duplicate detection in general domains. Researchers sur-
veying duplicate detection methods have stated that the
most challenging obstacle is lack of ‘standardized, large-
scale benchmarking data sets’ (34). It is not easy to identify
whether new methods surpass existing ones without reli-
able benchmarks. Moreover, some methods are based on
machine learning, which require reliable training data. In
general domains, many supervised or semi-supervised du-
plicate detection methods exist, such as decision trees (35)
and active learning (36).
The severity of this issue is illustrated by the only super-
vised machine-learning method for bioinformatics of
which we are aware, which was noted above (30). The
method was developed on a collection of 1300 records. In
prior work, we reproduced the method and evaluated
against a larger dataset with different types of duplicates.
The results were extremely poor compared with the ori-
ginal outcomes, which we attribute to the insufficiency of
the data used in the original work (37).
We aim to create large-scale validated benchmarks of
duplicates. By assembling understanding of duplicates
from different perspectives, it becomes possible to test dif-
ferent methods in the same platform, as well as test the ro-
bustness of methods in different contexts.
Quality control in bioinformatics databases
To construct a collection of explicitly labelled duplicates,
an essential step is to understand the quality control pro-
cess in bioinformatics databases, including how duplicates
are found and merged. Here we describe how INSDC and
UniProt perform quality control in general and indicate
how these mechanisms can help in construction of large
validated collections of duplicates.
Database, Vol. 2017, Article ID baw164 Page 5 of 17
Quality control in INSDC
Merging of records addresses duplication in INSDC. The
merge may occur due to various reasons, including cases
where different submitters adding records for the same bio-
logical entities, or changes of database policies. We have
discussed various reasons for merging elsewhere (8).
Different merge reasons reflect the fact that duplication
may arise from diverse causes. Figure 1 shows an example.
Record INSDC AC034192.5 is merged with Record
INSDC AC087090.1 in Apr 2002. (We used recommended
accession.version format to describe record. Since the
paper covers three data sources, we also added data source
name.) In contrast, the different versions of Record INSDC
AC034192 (version 2 in April 2000 and version 3 in May
2000) are just normal updates on the same record.
Therefore we only collect the former.
Staff confirmed that this is the only resource for merged
records in INSDC. Currently there is no completely auto-
matic way to collect such duplicates from the revision his-
tory. Elsewhere we have explained the procedure that we
developed to collect these duplicates, why we believe that
many duplicates are still present in INSDC, and why the
collection is representative (8).
Quality control in UniProt
UniProt Knowledgebase (UniProtKB) is a protein database
that is a main focus of the UniProt Consortium. It has two
sections: UniProtKB/Swiss-Prot and UniProtKB/TrEMBL.
UniProtKB/Swiss-Prot is expert curated and reviewed, with
software support, whereas UniProtKB/TrEMBL is curated
automatically without review. Here, we list the steps of
curation in UniProtKB/Swiss-Prot (http://www.uniprot.
org/help/), as previously explained elsewhere (38):
1. Sequence curation: identify and merge records from
same genes and same organisms; identify and document
sequence discrepancies such as natural variations and
frameshifts; explore homologs to check existing anno-
tations and propagate other information;
2. Sequence analysis: predict sequence features using se-
quence analysis programs, then experts check the
results;
3. Literature curation: identify relevant papers, read the
full text and extract the related context, assign gene
ontology terms accordingly;
4. Family curation: analyse putative homology relation-
ships; perform steps 1–3 for identified instances;
5. Evidence attribution: link all expert curated data to the
original source;
6. Quality assurance and integration: final check of fin-
ished entries and integration into UniProtKB/Swiss-
Prot.
UniProtKB/Swiss-Prot curation is sophisticated and sen-
sitive, and involves substantial expert effort, so the data
quality can be assumed to be high. UniProtKB/TrEMBL
complements UniProtKB/Swiss-Prot using purely auto-
matic curation. The automatic curation in UniProtKB/
TrEMBL mainly comes from two sources: (1) the Unified
Rule (UniRule) system, which derives curator-tested rules
from UniProtKB/Swiss-Prot manually annotated entries.
For instance, the derived rules have been used to determine
family membership of uncharacterized protein sequences
(39); and (2) Statistical Automatic Annotation System
(SAAS), which generates automatic rules for functional an-
notations. For instance, it applies C4.5 decision tree algo-
rithm to UniProtKB/Swiss-Prot entries to generate
automatic functional annotation rules (38). The whole pro-
cess is automatic and does not have expert review.
Therefore, it avoids expert curation with the trade-off of
lower quality assurance. Overall both collections represent
the state of the art in biological data curation.
Recall that nucleotide records in INSDC are primary
sources for other databases. From a biological perspective,
protein coding nucleotide sequences are translated into
protein sequences (40). Both UniProtKB/Swiss-Prot and
UniProtKB/TrEMBL generate cross-references from the
coding sequence records in INSDC to their translated pro-
tein records. This provides a mapping between INSDC and
curated protein databases. We can use the mapping be-
tween INSDC and UniProtKB/Swiss-Prot and the mapping
between INSDC and UniProtKB/TrEMBL, respectively, to
construct two collections of nucleotide duplicate records.
We detail the methods and underlying ideas below.
Figure 1. A screenshot of the revision history for record INSDC AC034192.5 (http://www.ncbi.nlm.gov/nuccore/AC034192.5?report¼girevhist). Note
the differences between normal updates (changes on a record itself) and merged records (duplicates). For instance, the record was updated from ver-
sion 3 to 4, which is a normal update. A different record INSDC AC087090.1 is merged in during Apr 2002. This is a case of duplication confirmed by
ENA staff. We only collected duplicates, not normal updates.
Page 6 of 17 Database, Vol. 2017, Article ID baw164
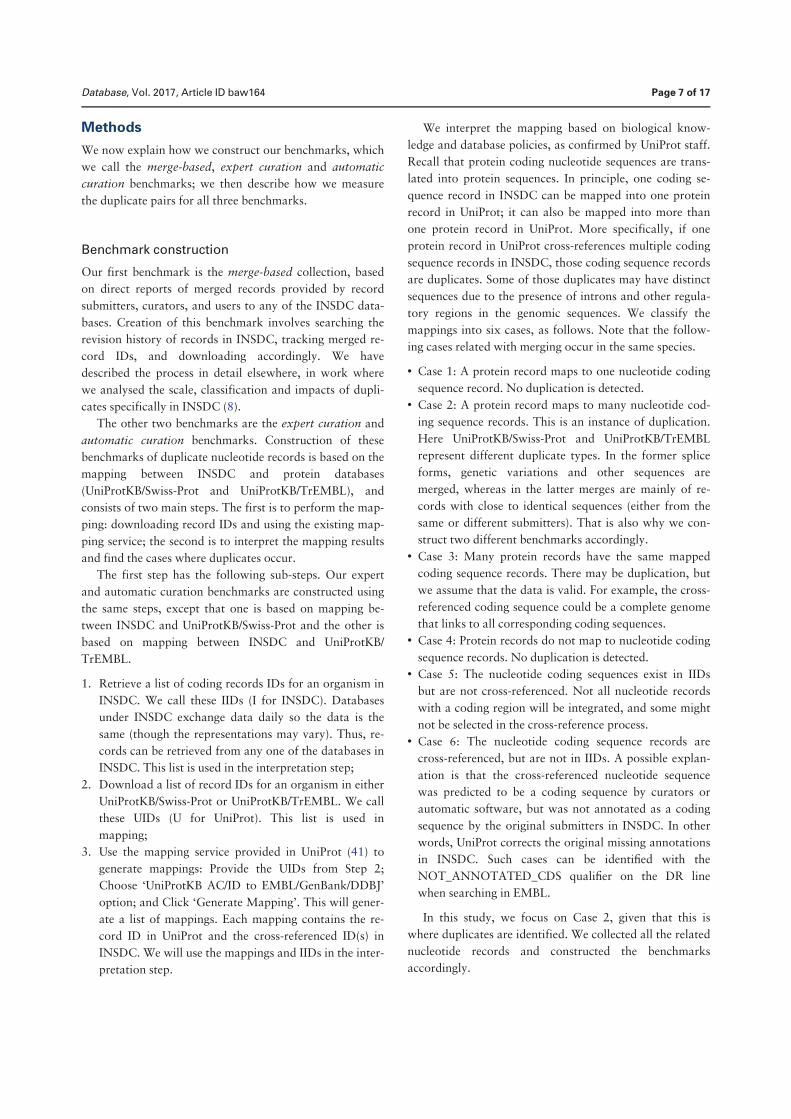
Methods
We now explain how we construct our benchmarks, which
we call the merge-based, expert curation and automatic
curation benchmarks; we then describe how we measure
the duplicate pairs for all three benchmarks.
Benchmark construction
Our first benchmark is the merge-based collection, based
on direct reports of merged records provided by record
submitters, curators, and users to any of the INSDC data-
bases. Creation of this benchmark involves searching the
revision history of records in INSDC, tracking merged re-
cord IDs, and downloading accordingly. We have
described the process in detail elsewhere, in work where
we analysed the scale, classification and impacts of dupli-
cates specifically in INSDC (8).
The other two benchmarks are the expert curation and
automatic curation benchmarks. Construction of these
benchmarks of duplicate nucleotide records is based on the
mapping between INSDC and protein databases
(UniProtKB/Swiss-Prot and UniProtKB/TrEMBL), and
consists of two main steps. The first is to perform the map-
ping: downloading record IDs and using the existing map-
ping service; the second is to interpret the mapping results
and find the cases where duplicates occur.
The first step has the following sub-steps. Our expert
and automatic curation benchmarks are constructed using
the same steps, except that one is based on mapping be-
tween INSDC and UniProtKB/Swiss-Prot and the other is
based on mapping between INSDC and UniProtKB/
TrEMBL.
1. Retrieve a list of coding records IDs for an organism in
INSDC. We call these IIDs (I for INSDC). Databases
under INSDC exchange data daily so the data is the
same (though the representations may vary). Thus, re-
cords can be retrieved from any one of the databases in
INSDC. This list is used in the interpretation step;
2. Download a list of record IDs for an organism in either
UniProtKB/Swiss-Prot or UniProtKB/TrEMBL. We call
these UIDs (U for UniProt). This list is used in
mapping;
3. Use the mapping service provided in UniProt (41) to
generate mappings: Provide the UIDs from Step 2;
Choose ‘UniProtKB AC/ID to EMBL/GenBank/DDBJ’
option; and Click ‘Generate Mapping’. This will gener-
ate a list of mappings. Each mapping contains the re-
cord ID in UniProt and the cross-referenced ID(s) in
INSDC. We will use the mappings and IIDs in the inter-
pretation step.
We interpret the mapping based on biological know-
ledge and database policies, as confirmed by UniProt staff.
Recall that protein coding nucleotide sequences are trans-
lated into protein sequences. In principle, one coding se-
quence record in INSDC can be mapped into one protein
record in UniProt; it can also be mapped into more than
one protein record in UniProt. More specifically, if one
protein record in UniProt cross-references multiple coding
sequence records in INSDC, those coding sequence records
are duplicates. Some of those duplicates may have distinct
sequences due to the presence of introns and other regula-
tory regions in the genomic sequences. We classify the
mappings into six cases, as follows. Note that the follow-
ing cases related with merging occur in the same species.
• Case 1: A protein record maps to one nucleotide coding
sequence record. No duplication is detected.
• Case 2: A protein record maps to many nucleotide cod-
ing sequence records. This is an instance of duplication.
Here UniProtKB/Swiss-Prot and UniProtKB/TrEMBL
represent different duplicate types. In the former splice
forms, genetic variations and other sequences are
merged, whereas in the latter merges are mainly of re-
cords with close to identical sequences (either from the
same or different submitters). That is also why we con-
struct two different benchmarks accordingly.
• Case 3: Many protein records have the same mapped
coding sequence records. There may be duplication, but
we assume that the data is valid. For example, the cross-
referenced coding sequence could be a complete genome
that links to all corresponding coding sequences.
• Case 4: Protein records do not map to nucleotide coding
sequence records. No duplication is detected.
• Case 5: The nucleotide coding sequences exist in IIDs
but are not cross-referenced. Not all nucleotide records
with a coding region will be integrated, and some might
not be selected in the cross-reference process.
• Case 6: The nucleotide coding sequence records are
cross-referenced, but are not in IIDs. A possible explan-
ation is that the cross-referenced nucleotide sequence
was predicted to be a coding sequence by curators or
automatic software, but was not annotated as a coding
sequence by the original submitters in INSDC. In other
words, UniProt corrects the original missing annotations
in INSDC. Such cases can be identified with the
NOT_ANNOTATED_CDS qualifier on the DR line
when searching in EMBL.
In this study, we focus on Case 2, given that this is
where duplicates are identified. We collected all the related
nucleotide records and constructed the benchmarks
accordingly.
Database, Vol. 2017, Article ID baw164 Page 7 of 17
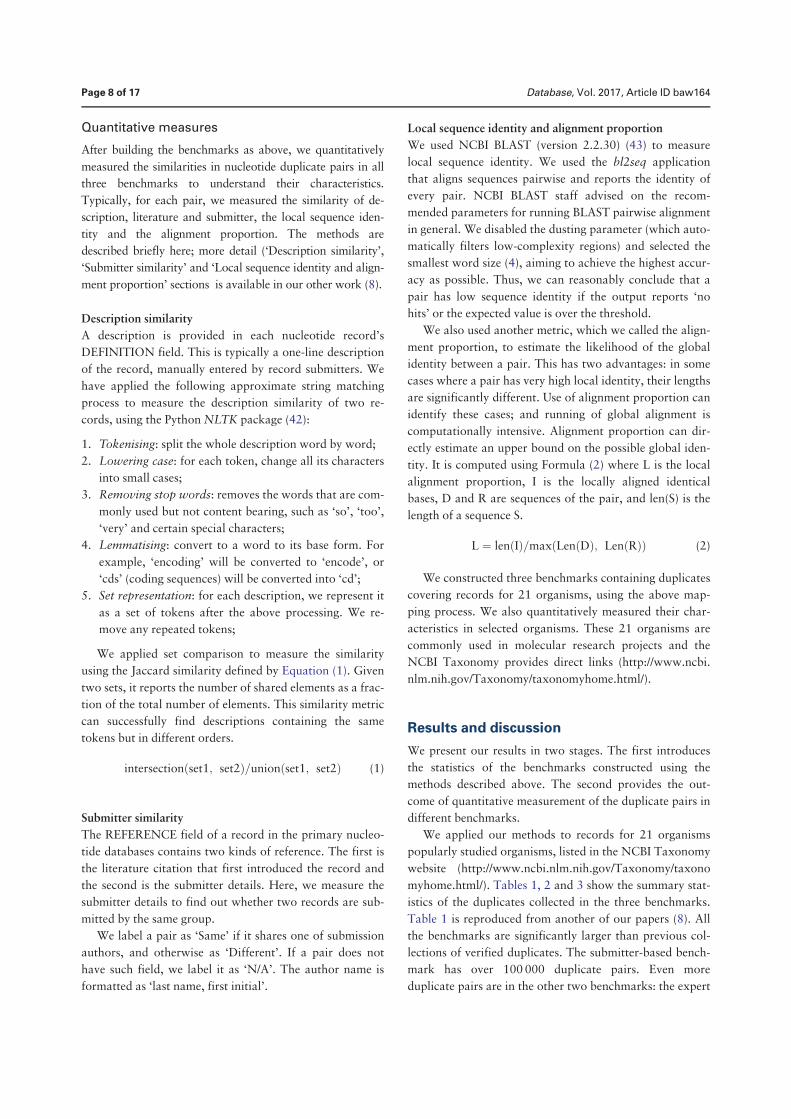
Quantitative measures
After building the benchmarks as above, we quantitatively
measured the similarities in nucleotide duplicate pairs in all
three benchmarks to understand their characteristics.
Typically, for each pair, we measured the similarity of de-
scription, literature and submitter, the local sequence iden-
tity and the alignment proportion. The methods are
described briefly here; more detail (‘Description similarity’,
‘Submitter similarity’ and ‘Local sequence identity and align-
ment proportion’ sections is available in our other work (8).
Description similarity
A description is provided in each nucleotide record’s
DEFINITION field. This is typically a one-line description
of the record, manually entered by record submitters. We
have applied the following approximate string matching
process to measure the description similarity of two re-
cords, using the Python NLTK package (42):
1. Tokenising: split the whole description word by word;
2. Lowering case: for each token, change all its characters
into small cases;
3. Removing stop words: removes the words that are com-
monly used but not content bearing, such as ‘so’, ‘too’,
‘very’ and certain special characters;
4. Lemmatising: convert to a word to its base form. For
example, ‘encoding’ will be converted to ‘encode’, or
‘cds’ (coding sequences) will be converted into ‘cd’;
5. Set representation: for each description, we represent it
as a set of tokens after the above processing. We re-
move any repeated tokens;
We applied set comparison to measure the similarity
using the Jaccard similarity defined by Equation (1). Given
two sets, it reports the number of shared elements as a frac-
tion of the total number of elements. This similarity metric
can successfully find descriptions containing the same
tokens but in different orders.
intersectionðset1; set2Þ=unionðset1; set2Þ (1)
Submitter similarity
The REFERENCE field of a record in the primary nucleo-
tide databases contains two kinds of reference. The first is
the literature citation that first introduced the record and
the second is the submitter details. Here, we measure the
submitter details to find out whether two records are sub-
mitted by the same group.
We label a pair as ‘Same’ if it shares one of submission
authors, and otherwise as ‘Different’. If a pair does not
have such field, we label it as ‘N/A’. The author name is
formatted as ‘last name, first initial’.
Local sequence identity and alignment proportion
We used NCBI BLAST (version 2.2.30) (43) to measure
local sequence identity. We used the bl2seq application
that aligns sequences pairwise and reports the identity of
every pair. NCBI BLAST staff advised on the recom-
mended parameters for running BLAST pairwise alignment
in general. We disabled the dusting parameter (which auto-
matically filters low-complexity regions) and selected the
smallest word size (4), aiming to achieve the highest accur-
acy as possible. Thus, we can reasonably conclude that a
pair has low sequence identity if the output reports ‘no
hits’ or the expected value is over the threshold.
We also used another metric, which we called the align-
ment proportion, to estimate the likelihood of the global
identity between a pair. This has two advantages: in some
cases where a pair has very high local identity, their lengths
are significantly different. Use of alignment proportion can
identify these cases; and running of global alignment is
computationally intensive. Alignment proportion can dir-
ectly estimate an upper bound on the possible global iden-
tity. It is computed using Formula (2) where L is the local
alignment proportion, I is the locally aligned identical
bases, D and R are sequences of the pair, and len(S) is the
length of a sequence S.
L ¼ lenðIÞ=maxðLenðDÞ; LenðRÞÞ (2)
We constructed three benchmarks containing duplicates
covering records for 21 organisms, using the above map-
ping process. We also quantitatively measured their char-
acteristics in selected organisms. These 21 organisms are
commonly used in molecular research projects and the
NCBI Taxonomy provides direct links (http://www.ncbi.
nlm.nih.gov/Taxonomy/taxonomyhome.html/).
Results and discussion
We present our results in two stages. The first introduces
the statistics of the benchmarks constructed using the
methods described above. The second provides the out-
come of quantitative measurement of the duplicate pairs in
different benchmarks.
We applied our methods to records for 21 organisms
popularly studied organisms, listed in the NCBI Taxonomy
website (http://www.ncbi.nlm.nih.gov/Taxonomy/taxono
myhome.html/). Tables 1, 2 and 3 show the summary stat-
istics of the duplicates collected in the three benchmarks.
Table 1 is reproduced from another of our papers (8). All
the benchmarks are significantly larger than previous col-
lections of verified duplicates. The submitter-based bench-
mark has over 100 000 duplicate pairs. Even more
duplicate pairs are in the other two benchmarks: the expert
Page 8 of 17 Database, Vol. 2017, Article ID baw164
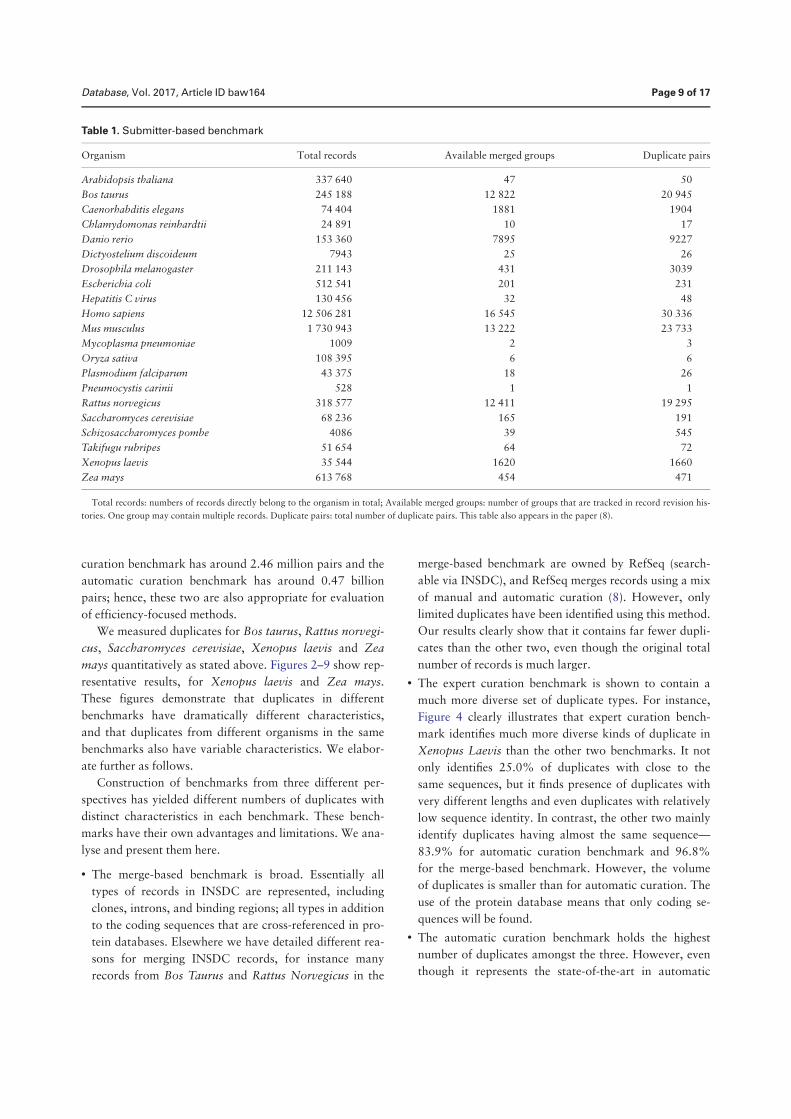
curation benchmark has around 2.46 million pairs and the
automatic curation benchmark has around 0.47 billion
pairs; hence, these two are also appropriate for evaluation
of efficiency-focused methods.
We measured duplicates for Bos taurus, Rattus norvegi-
cus, Saccharomyces cerevisiae, Xenopus laevis and Zea
mays quantitatively as stated above. Figures 2–9 show rep-
resentative results, for Xenopus laevis and Zea mays.
These figures demonstrate that duplicates in different
benchmarks have dramatically different characteristics,
and that duplicates from different organisms in the same
benchmarks also have variable characteristics. We elabor-
ate further as follows.
Construction of benchmarks from three different per-
spectives has yielded different numbers of duplicates with
distinct characteristics in each benchmark. These bench-
marks have their own advantages and limitations. We ana-
lyse and present them here.
• The merge-based benchmark is broad. Essentially all
types of records in INSDC are represented, including
clones, introns, and binding regions; all types in addition
to the coding sequences that are cross-referenced in pro-
tein databases. Elsewhere we have detailed different rea-
sons for merging INSDC records, for instance many
records from Bos Taurus and Rattus Norvegicus in the
merge-based benchmark are owned by RefSeq (search-
able via INSDC), and RefSeq merges records using a mix
of manual and automatic curation (8). However, only
limited duplicates have been identified using this method.
Our results clearly show that it contains far fewer dupli-
cates than the other two, even though the original total
number of records is much larger.
• The expert curation benchmark is shown to contain a
much more diverse set of duplicate types. For instance,
Figure 4 clearly illustrates that expert curation bench-
mark identifies much more diverse kinds of duplicate in
Xenopus Laevis than the other two benchmarks. It not
only identifies 25.0% of duplicates with close to the
same sequences, but it finds presence of duplicates with
very different lengths and even duplicates with relatively
low sequence identity. In contrast, the other two mainly
identify duplicates having almost the same sequence—
83.9% for automatic curation benchmark and 96.8%
for the merge-based benchmark. However, the volume
of duplicates is smaller than for automatic curation. The
use of the protein database means that only coding se-
quences will be found.
• The automatic curation benchmark holds the highest
number of duplicates amongst the three. However, even
though it represents the state-of-the-art in automatic
Table 1. Submitter-based benchmark
Organism Total records Available merged groups Duplicate pairs
Arabidopsis thaliana 337 640 47 50
Bos taurus 245 188 12 822 20 945
Caenorhabditis elegans 74 404 1881 1904
Chlamydomonas reinhardtii 24 891 10 17
Danio rerio 153 360 7895 9227
Dictyostelium discoideum 7943 25 26
Drosophila melanogaster 211 143 431 3039
Escherichia coli 512 541 201 231
Hepatitis C virus 130 456 32 48
Homo sapiens 12 506 281 16 545 30 336
Mus musculus 1 730 943 13 222 23 733
Mycoplasma pneumoniae 1009 2 3
Oryza sativa 108 395 6 6
Plasmodium falciparum 43 375 18 26
Pneumocystis carinii 528 1 1
Rattus norvegicus 318 577 12 411 19 295
Saccharomyces cerevisiae 68 236 165 191
Schizosaccharomyces pombe 4086 39 545
Takifugu rubripes 51 654 64 72
Xenopus laevis 35 544 1620 1660
Zea mays 613 768 454 471
Total records: numbers of records directly belong to the organism in total; Available merged groups: number of groups that are tracked in record revision his-
tories. One group may contain multiple records. Duplicate pairs: total number of duplicate pairs. This table also appears in the paper (8).
Database, Vol. 2017, Article ID baw164 Page 9 of 17
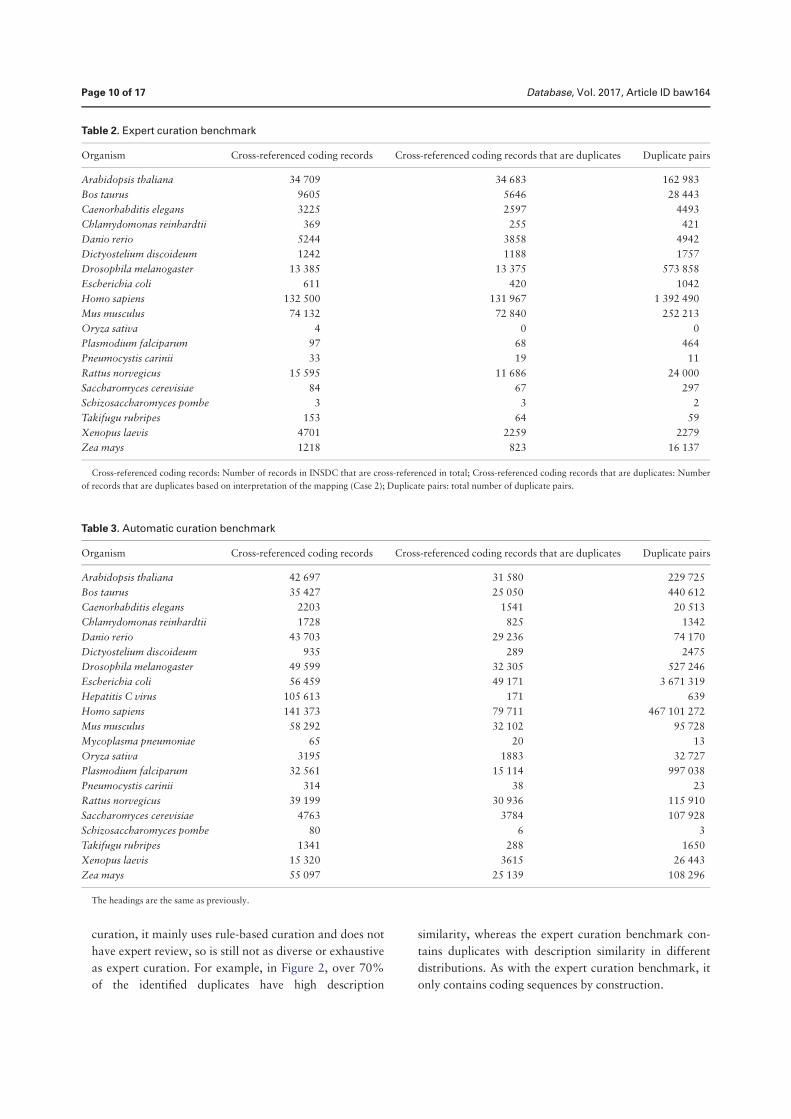
curation, it mainly uses rule-based curation and does not
have expert review, so is still not as diverse or exhaustive
as expert curation. For example, in Figure 2, over 70%
of the identified duplicates have high description
similarity, whereas the expert curation benchmark con-
tains duplicates with description similarity in different
distributions. As with the expert curation benchmark, it
only contains coding sequences by construction.
Table 2. Expert curation benchmark
Organism Cross-referenced coding records Cross-referenced coding records that are duplicates Duplicate pairs
Arabidopsis thaliana 34 709 34 683 162 983
Bos taurus 9605 5646 28 443
Caenorhabditis elegans 3225 2597 4493
Chlamydomonas reinhardtii 369 255 421
Danio rerio 5244 3858 4942
Dictyostelium discoideum 1242 1188 1757
Drosophila melanogaster 13 385 13 375 573 858
Escherichia coli 611 420 1042
Homo sapiens 132 500 131 967 1 392 490
Mus musculus 74 132 72 840 252 213
Oryza sativa 4 0 0
Plasmodium falciparum 97 68 464
Pneumocystis carinii 33 19 11
Rattus norvegicus 15 595 11 686 24 000
Saccharomyces cerevisiae 84 67 297
Schizosaccharomyces pombe 3 3 2
Takifugu rubripes 153 64 59
Xenopus laevis 4701 2259 2279
Zea mays 1218 823 16 137
Cross-referenced coding records: Number of records in INSDC that are cross-referenced in total; Cross-referenced coding records that are duplicates: Number
of records that are duplicates based on interpretation of the mapping (Case 2); Duplicate pairs: total number of duplicate pairs.
Table 3. Automatic curation benchmark
Organism Cross-referenced coding records Cross-referenced coding records that are duplicates Duplicate pairs
Arabidopsis thaliana 42 697 31 580 229 725
Bos taurus 35 427 25 050 440 612
Caenorhabditis elegans 2203 1541 20 513
Chlamydomonas reinhardtii 1728 825 1342
Danio rerio 43 703 29 236 74 170
Dictyostelium discoideum 935 289 2475
Drosophila melanogaster 49 599 32 305 527 246
Escherichia coli 56 459 49 171 3 671 319
Hepatitis C virus 105 613 171 639
Homo sapiens 141 373 79 711 467 101 272
Mus musculus 58 292 32 102 95 728
Mycoplasma pneumoniae 65 20 13
Oryza sativa 3195 1883 32 727
Plasmodium falciparum 32 561 15 114 997 038
Pneumocystis carinii 314 38 23
Rattus norvegicus 39 199 30 936 115 910
Saccharomyces cerevisiae 4763 3784 107 928
Schizosaccharomyces pombe 80 6 3
Takifugu rubripes 1341 288 1650
Xenopus laevis 15 320 3615 26 443
Zea mays 55 097 25 139 108 296
The headings are the same as previously.
Page 10 of 17 Database, Vol. 2017, Article ID baw164
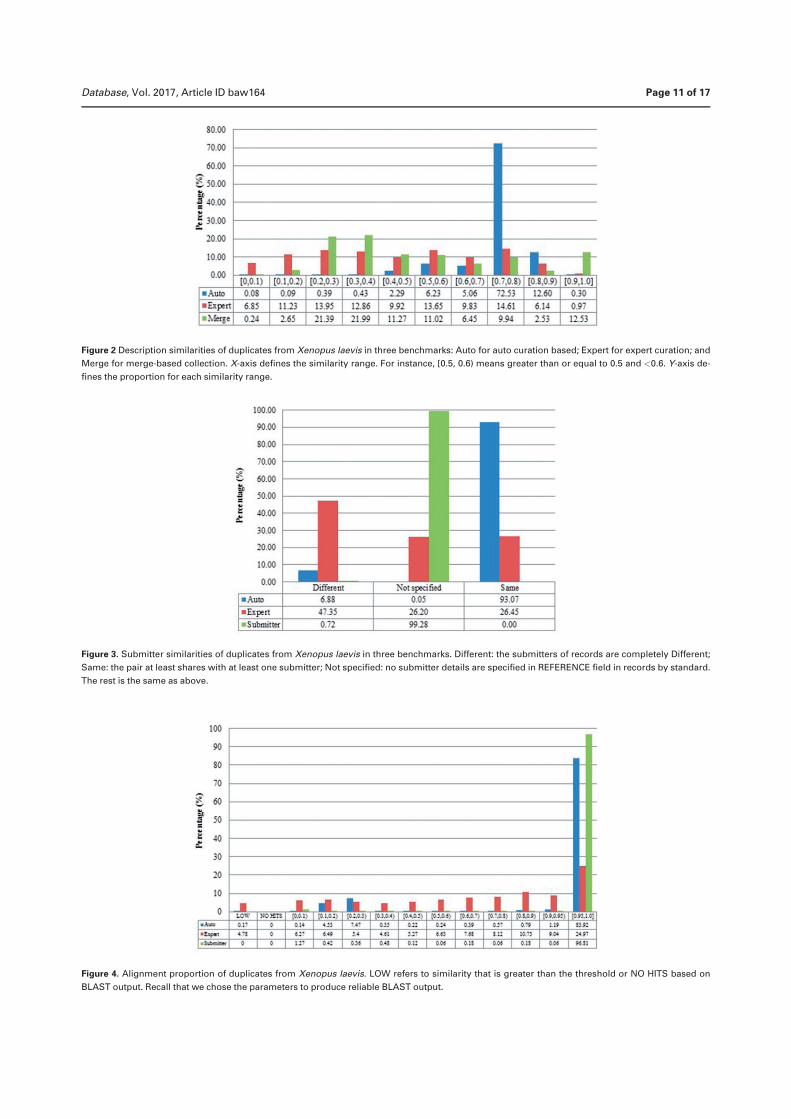
Figure 2 Description similarities of duplicates from Xenopus laevis in three benchmarks: Auto for auto curation based; Expert for expert curation; and
Merge for merge-based collection. X-axis defines the similarity range. For instance, [0.5, 0.6) means greater than or equal to 0.5 and <0.6. Y-axis de-
fines the proportion for each similarity range.
Figure 3. Submitter similarities of duplicates from Xenopus laevis in three benchmarks. Different: the submitters of records are completely Different;
Same: the pair at least shares with at least one submitter; Not specified: no submitter details are specified in REFERENCE field in records by standard.
The rest is the same as above.
Figure 4. Alignment proportion of duplicates from Xenopus laevis. LOW refers to similarity that is greater than the threshold or NO HITS based on
BLAST output. Recall that we chose the parameters to produce reliable BLAST output.
Database, Vol. 2017, Article ID baw164 Page 11 of 17
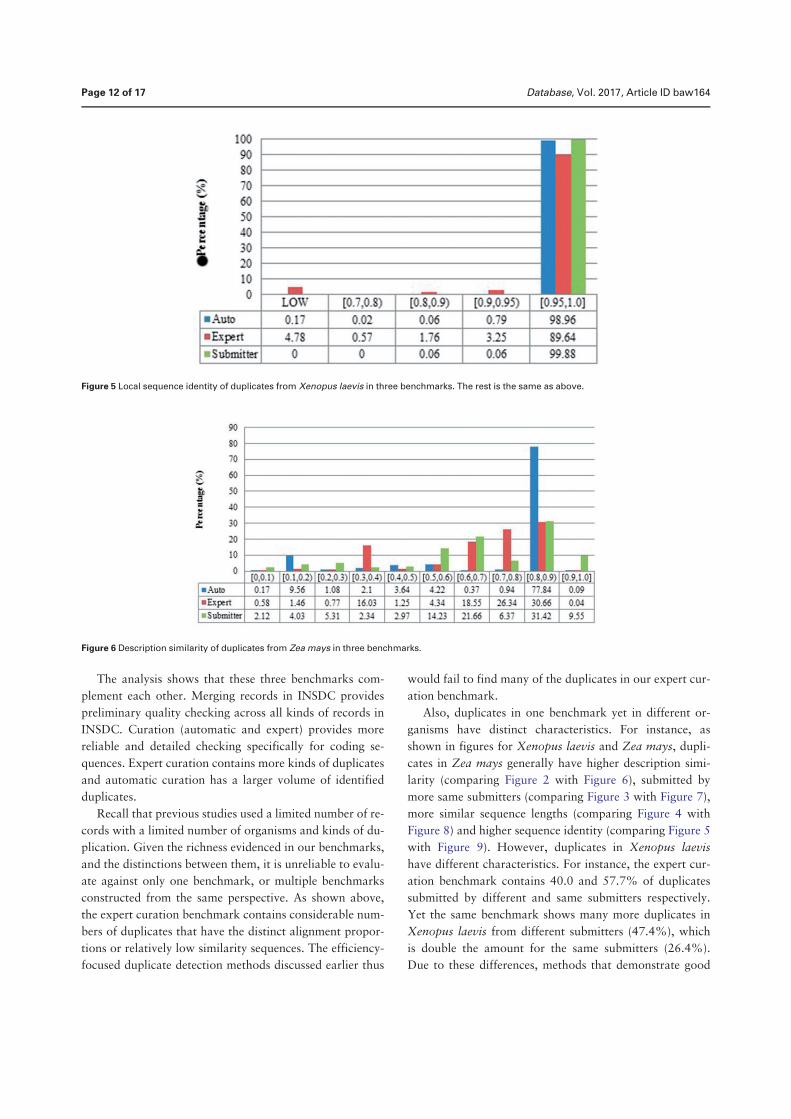
The analysis shows that these three benchmarks com-
plement each other. Merging records in INSDC provides
preliminary quality checking across all kinds of records in
INSDC. Curation (automatic and expert) provides more
reliable and detailed checking specifically for coding se-
quences. Expert curation contains more kinds of duplicates
and automatic curation has a larger volume of identified
duplicates.
Recall that previous studies used a limited number of re-
cords with a limited number of organisms and kinds of du-
plication. Given the richness evidenced in our benchmarks,
and the distinctions between them, it is unreliable to evalu-
ate against only one benchmark, or multiple benchmarks
constructed from the same perspective. As shown above,
the expert curation benchmark contains considerable num-
bers of duplicates that have the distinct alignment propor-
tions or relatively low similarity sequences. The efficiency-
focused duplicate detection methods discussed earlier thus
would fail to find many of the duplicates in our expert cur-
ation benchmark.
Also, duplicates in one benchmark yet in different or-
ganisms have distinct characteristics. For instance, as
shown in figures for Xenopus laevis and Zea mays, dupli-
cates in Zea mays generally have higher description simi-
larity (comparing Figure 2 with Figure 6), submitted by
more same submitters (comparing Figure 3 with Figure 7),
more similar sequence lengths (comparing Figure 4 with
Figure 8) and higher sequence identity (comparing Figure 5
with Figure 9). However, duplicates in Xenopus laevis
have different characteristics. For instance, the expert cur-
ation benchmark contains 40.0 and 57.7% of duplicates
submitted by different and same submitters respectively.
Yet the same benchmark shows many more duplicates in
Xenopus laevis from different submitters (47.4%), which
is double the amount for the same submitters (26.4%).
Due to these differences, methods that demonstrate good
Figure 5 Local sequence identity of duplicates from Xenopus laevis in three benchmarks. The rest is the same as above.
Figure 6 Description similarity of duplicates from Zea mays in three benchmarks.
Page 12 of 17 Database, Vol. 2017, Article ID baw164
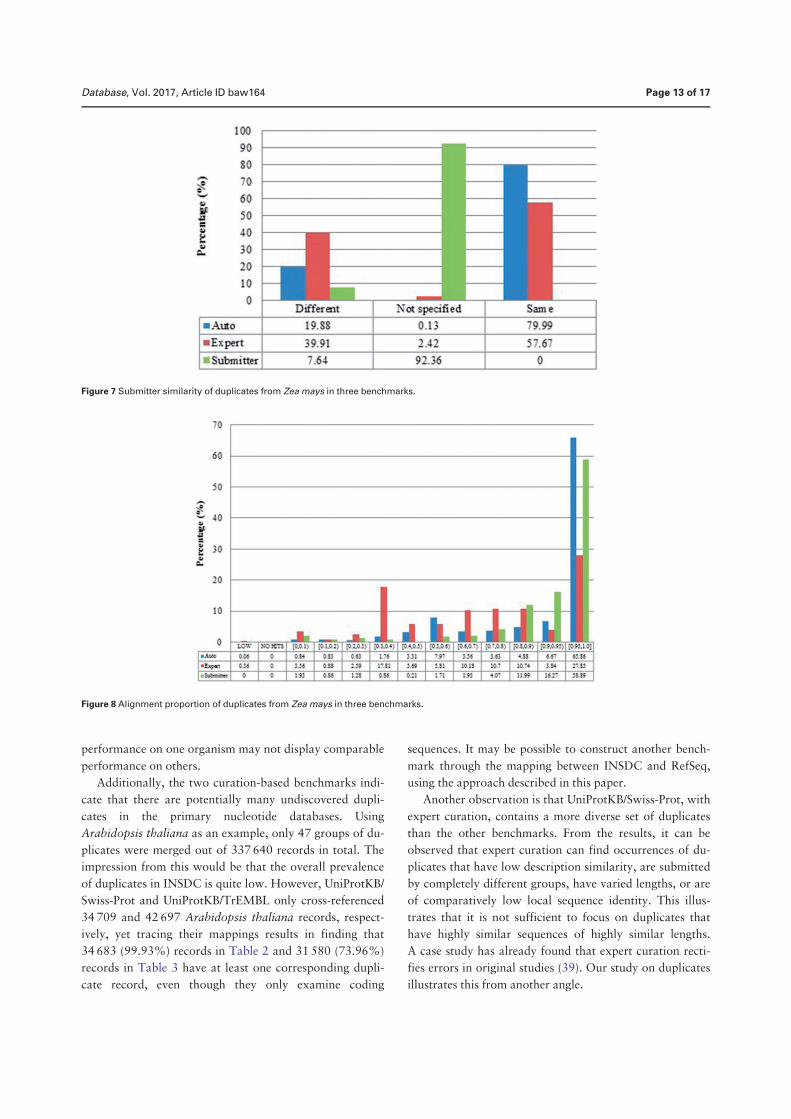
performance on one organism may not display comparable
performance on others.
Additionally, the two curation-based benchmarks indi-
cate that there are potentially many undiscovered dupli-
cates in the primary nucleotide databases. Using
Arabidopsis thaliana as an example, only 47 groups of du-
plicates were merged out of 337 640 records in total. The
impression from this would be that the overall prevalence
of duplicates in INSDC is quite low. However, UniProtKB/
Swiss-Prot and UniProtKB/TrEMBL only cross-referenced
34 709 and 42 697 Arabidopsis thaliana records, respect-
ively, yet tracing their mappings results in finding that
34 683 (99.93%) records in Table 2 and 31 580 (73.96%)
records in Table 3 have at least one corresponding dupli-
cate record, even though they only examine coding
sequences. It may be possible to construct another bench-
mark through the mapping between INSDC and RefSeq,
using the approach described in this paper.
Another observation is that UniProtKB/Swiss-Prot, with
expert curation, contains a more diverse set of duplicates
than the other benchmarks. From the results, it can be
observed that expert curation can find occurrences of du-
plicates that have low description similarity, are submitted
by completely different groups, have varied lengths, or are
of comparatively low local sequence identity. This illus-
trates that it is not sufficient to focus on duplicates that
have highly similar sequences of highly similar lengths.
A case study has already found that expert curation recti-
fies errors in original studies (39). Our study on duplicates
illustrates this from another angle.
Figure 7 Submitter similarity of duplicates from Zea mays in three benchmarks.
Figure 8 Alignment proportion of duplicates from Zea mays in three benchmarks.
Database, Vol. 2017, Article ID baw164 Page 13 of 17
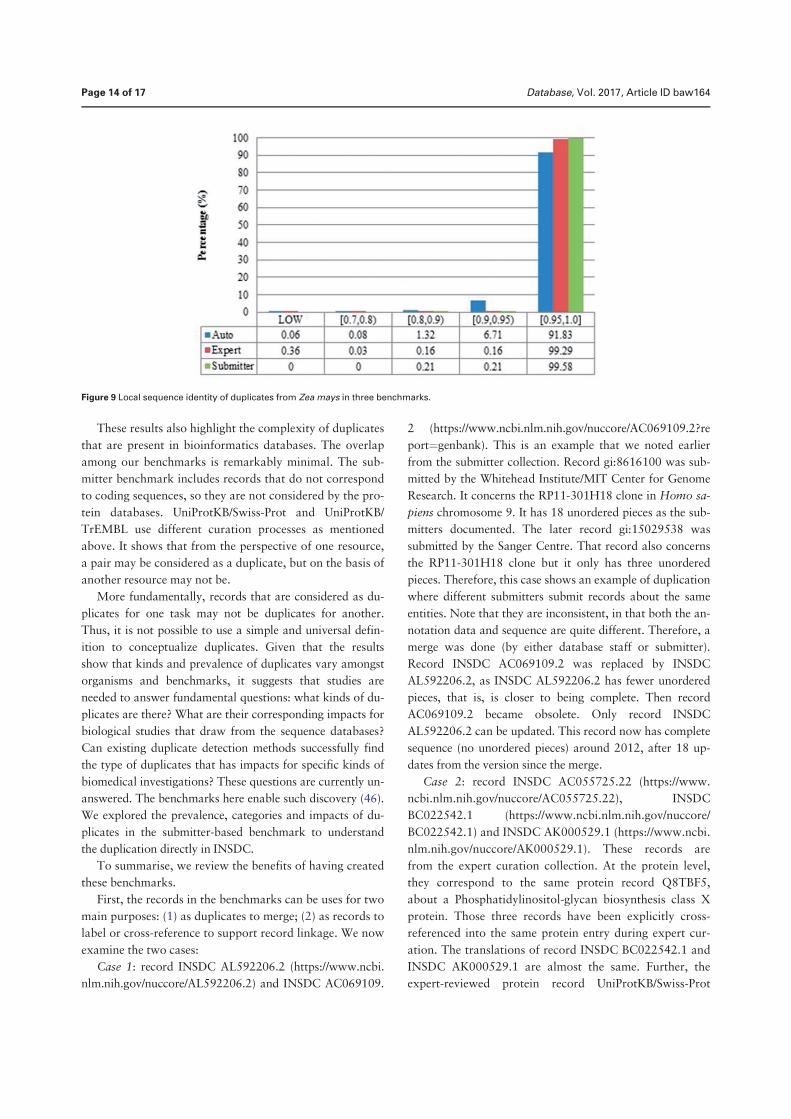
These results also highlight the complexity of duplicates
that are present in bioinformatics databases. The overlap
among our benchmarks is remarkably minimal. The sub-
mitter benchmark includes records that do not correspond
to coding sequences, so they are not considered by the pro-
tein databases. UniProtKB/Swiss-Prot and UniProtKB/
TrEMBL use different curation processes as mentioned
above. It shows that from the perspective of one resource,
a pair may be considered as a duplicate, but on the basis of
another resource may not be.
More fundamentally, records that are considered as du-
plicates for one task may not be duplicates for another.
Thus, it is not possible to use a simple and universal defin-
ition to conceptualize duplicates. Given that the results
show that kinds and prevalence of duplicates vary amongst
organisms and benchmarks, it suggests that studies are
needed to answer fundamental questions: what kinds of du-
plicates are there? What are their corresponding impacts for
biological studies that draw from the sequence databases?
Can existing duplicate detection methods successfully find
the type of duplicates that has impacts for specific kinds of
biomedical investigations? These questions are currently un-
answered. The benchmarks here enable such discovery (46).
We explored the prevalence, categories and impacts of du-
plicates in the submitter-based benchmark to understand
the duplication directly in INSDC.
To summarise, we review the benefits of having created
these benchmarks.
First, the records in the benchmarks can be uses for two
main purposes: (1) as duplicates to merge; (2) as records to
label or cross-reference to support record linkage. We now
examine the two cases:
Case 1: record INSDC AL592206.2 (https://www.ncbi.
nlm.nih.gov/nuccore/AL592206.2) and INSDC AC069109.
2 (https://www.ncbi.nlm.nih.gov/nuccore/AC069109.2?re
port¼genbank). This is an example that we noted earlier
from the submitter collection. Record gi:8616100 was sub-
mitted by the Whitehead Institute/MIT Center for Genome
Research. It concerns the RP11-301H18 clone in Homo sa-
piens chromosome 9. It has 18 unordered pieces as the sub-
mitters documented. The later record gi:15029538 was
submitted by the Sanger Centre. That record also concerns
the RP11-301H18 clone but it only has three unordered
pieces. Therefore, this case shows an example of duplication
where different submitters submit records about the same
entities. Note that they are inconsistent, in that both the an-
notation data and sequence are quite different. Therefore, a
merge was done (by either database staff or submitter).
Record INSDC AC069109.2 was replaced by INSDC
AL592206.2, as INSDC AL592206.2 has fewer unordered
pieces, that is, is closer to being complete. Then record
AC069109.2 became obsolete. Only record INSDC
AL592206.2 can be updated. This record now has complete
sequence (no unordered pieces) around 2012, after 18 up-
dates from the version since the merge.
Case 2: record INSDC AC055725.22 (https://www.
ncbi.nlm.nih.gov/nuccore/AC055725.22), INSDC
BC022542.1 (https://www.ncbi.nlm.nih.gov/nuccore/
BC022542.1) and INSDC AK000529.1 (https://www.ncbi.
nlm.nih.gov/nuccore/AK000529.1). These records are
from the expert curation collection. At the protein level,
they correspond to the same protein record Q8TBF5,
about a Phosphatidylinositol-glycan biosynthesis class X
protein. Those three records have been explicitly cross-
referenced into the same protein entry during expert cur-
ation. The translations of record INSDC BC022542.1 and
INSDC AK000529.1 are almost the same. Further, the
expert-reviewed protein record UniProtKB/Swiss-Prot
Figure 9 Local sequence identity of duplicates from Zea mays in three benchmarks.
Page 14 of 17 Database, Vol. 2017, Article ID baw164
Q8TBF5 is documented as follows (http://www.uniprot.
org/uniprot/Q8TBF5):
• AC055725 [INSDC AC055725.22] Genomic DNA. No
translation available;
• BC022542 [INSDC BC022542.1] mRNA. Translation:
AAH22542.1. Sequence problems;
• AK000529 [INSDC AK000529.1] mRNA. Translation:
BAA91233.1. Sequence problems.
Those annotations were made via curation to mark
problematic sequences submitted to INSDC. The ‘no trans-
lation available’ annotation indicates that the original sub-
mitted INSDC records did not specify the coding sequence
(CDS) regions, but the UniProt curators have identified the
CDS. ‘Sequence problems’ refers to ‘discrepancies due to
an erroneous gene model prediction, erroneous ORF as-
signment, miscellaneous discrepancy, etc.’ (http://www.uni
prot.org/help/cross_references_section) resolved by the cur-
ator. Therefore, without expert curation, it is indeed diffi-
cult to access the correct information and is difficult to
know they refer to the same protein. As mentioned earlier,
an important impact of duplicate detection is record link-
age. Cross-referencing across multiple databases is cer-
tainly useful, regardless of whether the linked records are
regarded as duplicates.
Second, considering the three benchmarks as a whole,
they cover diverse duplicate types. The detailed types are
summarized elsewhere (8), but broadly three types are evi-
dent: (1) similar records, if not identical; (2) fragments; (3)
somewhat different records belonging to the same entities.
Existing studies have already shown all of them have spe-
cific impacts on biomedical tasks. Type (1) may affect
database searches (44); type (2) may affect meta-analyses
(45); while type (3) may confuse novice database users.
Third, those benchmarks are constructed based on differ-
ent principles. The large volume of the dataset, and diversity
in type of duplicate, can provide a basis for evaluation of
both efficiency and accuracy. Benchmarks are always a
problem for duplicate detection methods: a method can de-
tect duplicates in one dataset successfully, but may get poor
performance on another. This is because the methods have
different definitions of duplicate, or those datasets have dif-
ferent types or distributions. This is why the duplicate detec-
tion survey identified the creation of benchmarks as a
pressing task (34). Multiple benchmarks enable testing of
the robustness and generalization of the proposed methods.
We used six organisms from the expert curated benchmark
as the dataset and developed a supervised learning duplicate
detection method (46). We tested the generality of the
trained model as an example: whether a model trained from
duplicate records in one organism maintains the perform-
ance in another organism. This is effectively showing how
users can use the benchmarks as test cases, perhaps organ-
ized by organisms or by type.
Conclusion
In this study, we established three large-scale validated
benchmarks of duplicates in bioinformatics databases, spe-
cifically focusing on identifying duplicates from primary nu-
cleotide databases (INSDC). The benchmarks are available
for use at https://bitbucket.org/biodbqual/benchmarks.
These benchmark data sets can be used to support develop-
ment and evaluation of duplicate detection methods. The
three benchmarks contain the largest number of duplicates
validated by submitters, database staff, expert curation or
automatic curation presented to date, with nearly half a bil-
lion record pairs in the largest of our collections.
We explained how we constructed the benchmarks and
their underlying principles. We also measured the charac-
teristics of duplicates collected in these benchmarks quanti-
tatively, and found substantial variation among them. This
demonstrates that it is unreliable to evaluate methods with
only one benchmark. We find that expert curation in
UniProtKB/Swiss-Prot can identify much more diverse
kinds of duplicates and emphasize that we appreciate the
effort of expert curation due to its finer-grained assessment
of duplication.
In future work, we plan to explore the possibility of
mapping other curated databases to INSDC to construct
more duplicate collections. We will assess these duplicates
in more depth to establish a detailed taxonomy of dupli-
cates and collaborate with biologists to measure the pos-
sible impacts of different types of duplicates in practical
biomedical applications. However, this work already pro-
vides new insights into the characteristics of duplicates in
INSDC, and has created a resource that can be used for the
development of duplicate detection methods. With, in all
likelihood, vast numbers of undiscovered duplicates, such
methods will be essential to maintenance of these critical
databases.
Funding
Qingyu Chen’s work is supported by an International
Research Scholarship from The University of Melbourne.
The project receives funding from the Australian Research
Council through a Discovery Project grant, DP150101550.
Conflict of interest. None declared.
AcknowledgementsWe greatly appreciate the assistance of Elisabeth Gasteiger from
UniProtKB/Swiss-Prot, who advised on and confirmed the mapping
Database, Vol. 2017, Article ID baw164 Page 15 of 17
process in this work with domain expertise. We also thank Nicole
Silvester and Clara Amid from the EMBL European Nucleotide
Archive, who advised on the procedures regarding merged records
in INSDC. Finally we are grateful to Wayne Mattern from NCBI,
who advised how to use BLAST properly by setting reliable param-
eter values.
References
1. Benson,D.A., Clark,K., Karsch-Mizrachi,I. et al. (2015)
GenBank. Nucleic Acids Res., 43, D30.
2. Bork,P. and Bairoch,A. (1996) Go hunting in sequence databases
but watch out for the traps. Trends Genet., 12, 425–427.
3. Altschul,S.F., Boguski,M.S., Gish,W., et al. (1994) Issues in
searching molecular sequence databases. Nat. Genet., 6,
119–129.
4. Brenner,S.E. (1999) Errors in genome annotation. Trends
Genet., 15, 132–133.
5. Fan,W. (2012) Web-Age Information Management. Springer,
Berlin, pp. 1–16.
6. UniProt Consortium. (2014) Activities at the universal protein
resource (UniProt). Nucleic Acids Res., 42, D191–D198.
7. Nakamura,Y., Cochrane,G., and Karsch-Mizrachi,I. (2013) The
international nucleotide sequence database collaboration.
Nucleic Acids Res., 41, D21–D24.
8. Chen,Q., Justin,Z., and Verspoor,K. (2016) Duplicates, redundan-
cies, and inconsistencies in the primary nucleotide databases: a de-
scriptive study. Database, doi: http://dx.doi.org/10.1101/085019.
9. Lin,Y.S., Liao,T.Y., and Lee,S.J. (2013) Detecting near-
duplicate documents using sentence-level features and supervised
learning. Expert Syst. Appl., 40, 1467–1476.
10. Liu,X. and Xu,L. (2013), Proceedings of the International
Conference on Information Engineering and Applications (IEA)
2012. Springer, Heidelberg, pp. 325–332.
11. Fu,L., Niu,B., Zhu,Z. et al. (2012) CD-HIT: accelerated for clus-
tering the next-generation sequencing data. Bioinformatics, 28,
3150–3152.
12. Jupe,S., Jassal,B., Williams,M., and Wu,G. (2014) A controlled vo-
cabulary for pathway entities and events. Database, 2014, bau060.
13. Wilming,L.G., Boychenko,V., and Harrow,J.L. (2015)
Comprehensive comparative homeobox gene annotation in
human and mouse. Database, 2015, bav091.
14. Williams,G., Davis,P., Rogers,A. et al. (2011) Methods and
strategies for gene structure curation in WormBase. Database,
2011, baq039.
15. Safran,M., Dalah,I., Alexander,J. et al. (2010) GeneCards
Version 3: the human gene integrator. Database, 2010, baq020.
16. Christen,P. and Goiser,K. (2007) Quality Measures in Data
Mining. Springer, Berlin, pp. 127–151.
17. Nanduri,R., Bhutani,I., Somavarapu,A.K. et al. (2015)
ONRLDB—manually curated database of experimentally vali-
dated ligands for orphan nuclear receptors: insights into new
drug discovery. Database, 2015, bav112.
18. UniProt Consortium. (2014) UniProt: a hub for protein informa-
tion. Nucleic Acids Res., 43:D204–D212.
19. Joffe,E., Byrne,M.J., Reeder,P. et al. (2013), AMIA Annual
Symposium Proceedings. American Medical Informatics
Association, Washington, DC, Vol. 2013, pp. 721.
20. Li,W. and Godzik,A. (2006) Cd-hit: a fast program for clustering
and comparing large sets of protein or nucleotide sequences.
Bioinformatics, 22, 1658–1659.
21. Verykios,V.S., Moustakides,G.V., and Elfeky,M.G. (2003) A
Bayesian decision model for cost optimal record matching.
VLDB J., 12, 28–40.
22. McCoy,A.B., Wright,A., Kahn,M.G. et al. (2013) Matching
identifiers in electronic health records: implications for duplicate
records and patient safety. BMJ Qual. Saf., 22, 219–224.
23. Bagewadi,S., Adhikari,S., Dhrangadhariya,A. et al. (2015)
NeuroTransDB: highly curated and structured transcriptomic
metadata for neurodegenerative diseases. Database, 2015,
bav099.
24. Finn,R.D., Coggill,P., Eberhardt,R.Y. et al. (2015) The Pfam
protein families database: towards a more sustainable future.
Nucleic Acids Res., 44:D279–D285.
25. Herzog,T.N., Scheuren,F.J., and Winkler,W.E. (2007) Data
Quality and Record Linkage Techniques. Springer, Berlin.
26. Christen,P. (2012) A survey of indexing techniques for scalable
record linkage and deduplication. IEEE Trans. Knowl. Data
Eng., 24, 1537–1555.
27. Joffe,E., Byrne,M.J., Reeder,P. et al. (2014) A benchmark com-
parison of deterministic and probabilistic methods for defining
manual review datasets in duplicate records reconciliation.
J. Am. Med. Informat. Assoc., 21, 97–104.
28. Holm,L. and Sander,C. (1998) Removing near-neighbour redun-
dancy from large protein sequence collections. Bioinformatics,
14, 423–429.
29. Zorita,E.V., Cusc�o,P., and Filion,G. (2015) Starcode: sequence
clustering based on all-pairs search. Bioinformatics, 31,
1913–1919.
30. Koh,J.L., M.L., Lee,M., Khan,A.M., Tan,P.T., and Brusic,V.
(2004) Duplicate detection in biological data using association
rule mining. Locus, 501, S22388.
31. Cross,G.R. and Jain,A.K. (1983) Markov random field texture
models. IEEE Trans. Pattern Anal. Mach. Intell., 5, 25–39.
32. Rudniy,A., Song,M., and Geller,J. (2010) Detecting duplicate
biological entities using shortest path edit distance. Int. J. Data
Mining Bioinformatics, 4, 395–410.
33. Rudniy,A., Song,M., and Geller,J. (2014) Mapping biological
entities using the longest approximately common prefix method.
BMC Bioinformatics, 15, 187.
34. Elmagarmid,A.K., Ipeirotis,P.G., and Verykios,V.S. (2007)
Duplicate record detection: a survey. IEEE Trans. Knowl. Data
Eng., 19, 1–16.
35. Martins,B. (2011), GeoSpatial Semantics. Springer, Berlin, pp.
34–51.
36. Bilenko,M. and Mooney,R.J. (2003) Proceedings of the ninth
ACM SIGKDD international conference on Knowledge discov-
ery and data mining. ACM, New York, pp. 39–48.
37. Chen,Q., Zobel,J., and Verspoor,K. (2015) Evaluation of a
Machine Learning Duplicate Detection Method for
Bioinformatics Databases. ACM Ninth International
Workshop on Data and Text Mining in Biomedical Informatics
in conjunction with CIKM, Washington, DC. ACM Press, New
York.
Page 16 of 17 Database, Vol. 2017, Article ID baw164

38. Magrane,M. and UniProt Consortium. (2011) UniProt
Knowledgebase: a hub of integrated protein data. Database,
2011, bar009.
39. Poux,S., Magrane,M., Arighi,C.N. et al. (2014) Expert curation
in UniProtKB: a case study on dealing with conflicting and erro-
neous data. Database, 2014, bau016.
40. Crick,F. (1970) Central dogma of molecular biology. Nature,
227, 561–563.
41. Huang,H., McGarvey,P.B., Suzek,B.E. et al. (2011) A compre-
hensive protein-centric ID mapping service for molecular data in-
tegration. Bioinformatics, 27, 1190–1191.
42. Bird,S., Klein,E., and Loper,E. (2009) Natural
Language Processing with Python. O’Reilly Media, Inc.,
Sebastopol, CA.
43. Camacho,C., Coulouris,G., Avagyan,V. et al. (2009) BLASTþ:
architecture and applications. BMC Bioinformatics, 10, 421.
44. Suzek,B.E., Wang,Y., Huang,H. et al. (2014) UniRef clusters: a
comprehensive and scalable alternative for improving sequence
similarity searches. Bioinformatics, 31, 926–932.
45. Rosikiewicz,M., Comte,A., Niknejad,A. et al. (2013)
Uncovering hidden duplicated content in public transcriptomics
data. Database, 2013, bat010.
46. Chen,Q., Zobel,J., Zhang,X., and Verspoor,K. (2016)
Supervised learning for detection of duplicates in genomic se-
quence databases. PLoS One, 11, e0159644.
Database, Vol. 2017, Article ID baw164 Page 17 of 17

5PAPER 3
OutlineIn this chapter we summarise the results and reflect on the research process based onthe following manuscript:
• Title: Evaluation of a Machine Learning Duplicate Detection Method for Bioin-formatics Databases.
• Authors: Qingyu Chen, Justin Zobel, and Karin Verspoor.
• Publication venue: ACM 9th International Workshop on Data and Text MiningBiomedical Informatics.
• Publication year: 2015
5.1 abstract of the paper
The impact of duplicate or inconsistent records in databases can be severe, and forgeneral databases has led to the development of a range of techniques for identificationof such records. In bioinformatics, duplication arises when two or more database recordsrepresent the same biological entity, a problem that has been known for over 20 years.However, only a limited number of techniques for detecting bioinformatic duplicates haveemerged. Special techniques for handling large data sets (a common 5000-record dataset has over 10 million pairs to compare) and imbalanced data (where the prevalenceof duplicate pairs is minute as compared to non-duplicate pairs). Biological domaininterpretation (records with very similar sequences are not necessarily duplicates) isalso important to adapt general methods to this context.
117
118 paper 3
In particular, machine learning techniques are widely used for finding duplicate recordsin general databases, but only a few have been proposed for bioinformatics. We haveevaluated one such method against a collection of submitter- labelled duplicates in nu-cleotide databases. The results reveal that the best rule in the original study can onlydetect 0.2% of the duplicates, and overall results for all the rules are extremely poor.Our study highlights the need for techniques to solve this pressing problem.
5.2 summary and reflection
The paired papers (Chapter 3 and 4) investigate the fundamental prevalence, charac-teristics, and impacts of duplication and provide large-scale benchmarks for duplicaterecords identified from different perspectives. These results lead to the assessment ofcurrent duplicate detection methods: given those duplicate records, how effective arethe current methods. This work assessed one representative duplicate detection method;it was the only supervised learning method for the biological databases context. Theimportance of supervised learning techniques for detection of duplicates is explainedin Section 2.11, Chapter 2. In particular, supervised learning techniques aim to detectduplicate records precisely. We have demonstrated that records with high similaritiesmay not be duplicates and verse versa: those cases arguably take most of the time forbiocurators to assess manually; the appendix of this paper also shows two real cases. Ourbenchmarks are especially useful for assessing the performance of those precision-basedmethods: regardless of whether the benchmark was constructed from submitter based,expert curation based or automatic curation based, those duplicate records all need tobe labelled, cross-referenced or merged in a precise manner. Therefore, the benchmarkswere used to assess the performance of this method.
The method is explained in details in Section 2.12, Chapter 2. Briefly recall that itselects features from sequence records, computes feature similarities and applies asso-ciation rule mining to find potentially interesting rules. We used 3,498 merged groupsfrom Homo sapiens, submitter-based benchmark as the sample collection. It consists of7,105 duplicate pairs; those pairs were categorised into 4 broad categories and 8 sub-categories. As mentioned before, the training set used in that method contains only
5.2 summary and reflection 119
695 duplicate pairs and most of them have the same sequences. Therefore, the samplecollection that we used is much larger and contains more diverse types of duplicaterecords. We carefully reproduced the method and got confirmation from the originalauthors. The evaluation results show that the method has serious shortcomings whendetecting records in a much larger volume with more complex duplicate types; it canonly detect 0.2% of duplicates in this collection. Figure 2 in the paper shows detailedprecision, recall, false positive, and false negative results.The evaluation directly leads to the necessity of developing better supervised learning
methods. We summarised the suggestions accordingly: more robust feature comparisonmethods; the training set should contain instances from two or more classes; stratifica-tions may be used for different categories of duplicates; and better feature representa-tions and more supervised learning methods should be investigated.The paper reflects that I was at the early stage of a PhD candidature. The termi-
nologies are not all that appropriate; “bioinformatics databases” should be used as“biological databases” or “biological sequence databases” instead, as explained in Chap-ter 3. This work, however, demonstrates that the existing duplicate detection has seriousshortcomings mainly because the notions of duplicates considered in that work are nar-row and cannot fully capture the diverse notions of duplication in biological databases inreality – it reveals that the foundational analysis on notions and impacts of duplicationis lacking – in turn it motivates the related work that I described in Paper 1 (Chapter 3)and 2 (Chapter 4).
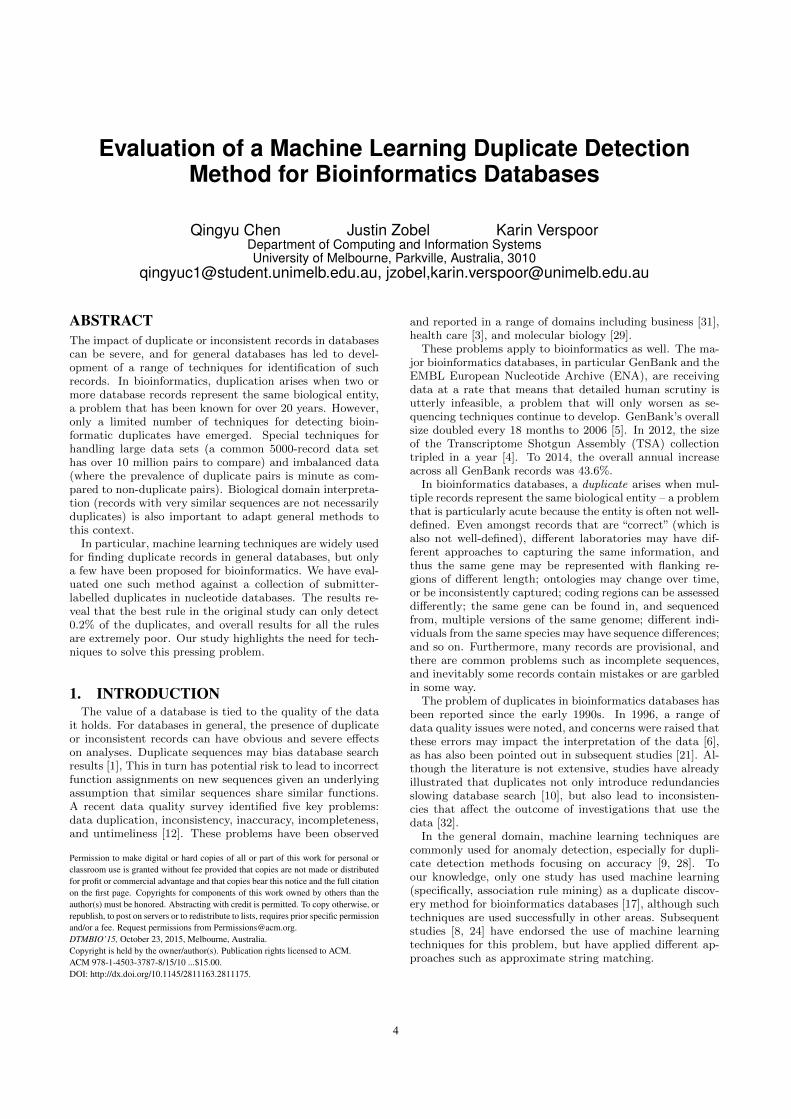
Evaluation of a Machine Learning Duplicate DetectionMethod for Bioinformatics Databases
Qingyu Chen Justin Zobel Karin VerspoorDepartment of Computing and Information SystemsUniversity of Melbourne, Parkville, Australia, 3010
[email protected], jzobel,[email protected]
ABSTRACTThe impact of duplicate or inconsistent records in databasescan be severe, and for general databases has led to devel-opment of a range of techniques for identification of suchrecords. In bioinformatics, duplication arises when two ormore database records represent the same biological entity,a problem that has been known for over 20 years. However,only a limited number of techniques for detecting bioin-formatic duplicates have emerged. Special techniques forhandling large data sets (a common 5000-record data sethas over 10 million pairs to compare) and imbalanced data(where the prevalence of duplicate pairs is minute as com-pared to non-duplicate pairs). Biological domain interpreta-tion (records with very similar sequences are not necessarilyduplicates) is also important to adapt general methods tothis context.
In particular, machine learning techniques are widely usedfor finding duplicate records in general databases, but onlya few have been proposed for bioinformatics. We have eval-uated one such method against a collection of submitter-labelled duplicates in nucleotide databases. The results re-veal that the best rule in the original study can only detect0.2% of the duplicates, and overall results for all the rulesare extremely poor. Our study highlights the need for tech-niques to solve this pressing problem.
1. INTRODUCTIONThe value of a database is tied to the quality of the data
it holds. For databases in general, the presence of duplicateor inconsistent records can have obvious and severe effectson analyses. Duplicate sequences may bias database searchresults [1], This in turn has potential risk to lead to incorrectfunction assignments on new sequences given an underlyingassumption that similar sequences share similar functions.A recent data quality survey identified five key problems:data duplication, inconsistency, inaccuracy, incompleteness,and untimeliness [12]. These problems have been observed
Permission to make digital or hard copies of all or part of this work for personal orclassroom use is granted without fee provided that copies are not made or distributedfor profit or commercial advantage and that copies bear this notice and the full citationon the first page. Copyrights for components of this work owned by others than theauthor(s) must be honored. Abstracting with credit is permitted. To copy otherwise, orrepublish, to post on servers or to redistribute to lists, requires prior specific permissionand/or a fee. Request permissions from [email protected]’15, October 23, 2015, Melbourne, Australia.Copyright is held by the owner/author(s). Publication rights licensed to ACM.ACM 978-1-4503-3787-8/15/10 ...$15.00.DOI: http://dx.doi.org/10.1145/2811163.2811175.
and reported in a range of domains including business [31],health care [3], and molecular biology [29].
These problems apply to bioinformatics as well. The ma-jor bioinformatics databases, in particular GenBank and theEMBL European Nucleotide Archive (ENA), are receivingdata at a rate that means that detailed human scrutiny isutterly infeasible, a problem that will only worsen as se-quencing techniques continue to develop. GenBank’s overallsize doubled every 18 months to 2006 [5]. In 2012, the sizeof the Transcriptome Shotgun Assembly (TSA) collectiontripled in a year [4]. To 2014, the overall annual increaseacross all GenBank records was 43.6%.
In bioinformatics databases, a duplicate arises when mul-tiple records represent the same biological entity – a problemthat is particularly acute because the entity is often not well-defined. Even amongst records that are “correct” (which isalso not well-defined), different laboratories may have dif-ferent approaches to capturing the same information, andthus the same gene may be represented with flanking re-gions of different length; ontologies may change over time,or be inconsistently captured; coding regions can be assesseddifferently; the same gene can be found in, and sequencedfrom, multiple versions of the same genome; different indi-viduals from the same species may have sequence differences;and so on. Furthermore, many records are provisional, andthere are common problems such as incomplete sequences,and inevitably some records contain mistakes or are garbledin some way.
The problem of duplicates in bioinformatics databases hasbeen reported since the early 1990s. In 1996, a range ofdata quality issues were noted, and concerns were raised thatthese errors may impact the interpretation of the data [6],as has also been pointed out in subsequent studies [21]. Al-though the literature is not extensive, studies have alreadyillustrated that duplicates not only introduce redundanciesslowing database search [10], but also lead to inconsisten-cies that affect the outcome of investigations that use thedata [32].
In the general domain, machine learning techniques arecommonly used for anomaly detection, especially for dupli-cate detection methods focusing on accuracy [9, 28]. Toour knowledge, only one study has used machine learning(specifically, association rule mining) as a duplicate discov-ery method for bioinformatics databases [17], although suchtechniques are used successfully in other areas. Subsequentstudies [8, 24] have endorsed the use of machine learningtechniques for this problem, but have applied different ap-proaches such as approximate string matching.
4
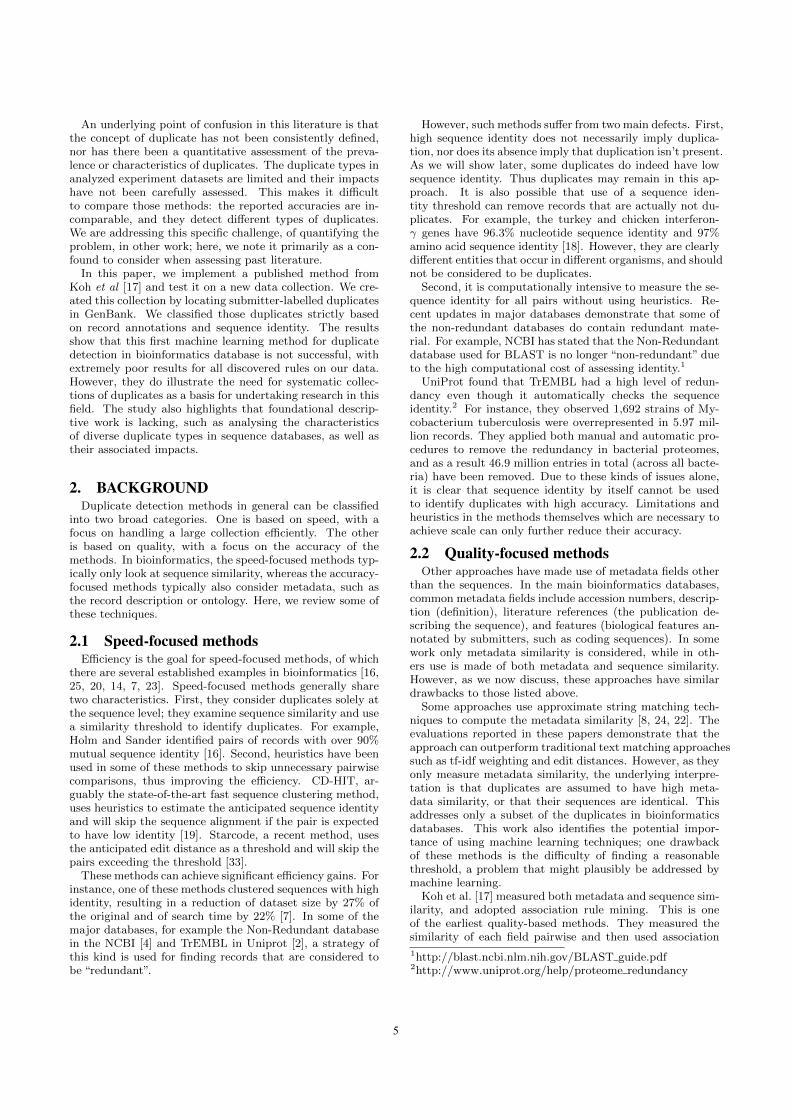
An underlying point of confusion in this literature is thatthe concept of duplicate has not been consistently defined,nor has there been a quantitative assessment of the preva-lence or characteristics of duplicates. The duplicate types inanalyzed experiment datasets are limited and their impactshave not been carefully assessed. This makes it difficultto compare those methods: the reported accuracies are in-comparable, and they detect different types of duplicates.We are addressing this specific challenge, of quantifying theproblem, in other work; here, we note it primarily as a con-found to consider when assessing past literature.
In this paper, we implement a published method fromKoh et al [17] and test it on a new data collection. We cre-ated this collection by locating submitter-labelled duplicatesin GenBank. We classified those duplicates strictly basedon record annotations and sequence identity. The resultsshow that this first machine learning method for duplicatedetection in bioinformatics database is not successful, withextremely poor results for all discovered rules on our data.However, they do illustrate the need for systematic collec-tions of duplicates as a basis for undertaking research in thisfield. The study also highlights that foundational descrip-tive work is lacking, such as analysing the characteristicsof diverse duplicate types in sequence databases, as well astheir associated impacts.
2. BACKGROUNDDuplicate detection methods in general can be classified
into two broad categories. One is based on speed, with afocus on handling a large collection efficiently. The otheris based on quality, with a focus on the accuracy of themethods. In bioinformatics, the speed-focused methods typ-ically only look at sequence similarity, whereas the accuracy-focused methods typically also consider metadata, such asthe record description or ontology. Here, we review some ofthese techniques.
2.1 Speed-focused methodsEfficiency is the goal for speed-focused methods, of which
there are several established examples in bioinformatics [16,25, 20, 14, 7, 23]. Speed-focused methods generally sharetwo characteristics. First, they consider duplicates solely atthe sequence level; they examine sequence similarity and usea similarity threshold to identify duplicates. For example,Holm and Sander identified pairs of records with over 90%mutual sequence identity [16]. Second, heuristics have beenused in some of these methods to skip unnecessary pairwisecomparisons, thus improving the efficiency. CD-HIT, ar-guably the state-of-the-art fast sequence clustering method,uses heuristics to estimate the anticipated sequence identityand will skip the sequence alignment if the pair is expectedto have low identity [19]. Starcode, a recent method, usesthe anticipated edit distance as a threshold and will skip thepairs exceeding the threshold [33].
These methods can achieve significant efficiency gains. Forinstance, one of these methods clustered sequences with highidentity, resulting in a reduction of dataset size by 27% ofthe original and of search time by 22% [7]. In some of themajor databases, for example the Non-Redundant databasein the NCBI [4] and TrEMBL in Uniprot [2], a strategy ofthis kind is used for finding records that are considered tobe “redundant”.
However, such methods suffer from two main defects. First,high sequence identity does not necessarily imply duplica-tion, nor does its absence imply that duplication isn’t present.As we will show later, some duplicates do indeed have lowsequence identity. Thus duplicates may remain in this ap-proach. It is also possible that use of a sequence iden-tity threshold can remove records that are actually not du-plicates. For example, the turkey and chicken interferon-γ genes have 96.3% nucleotide sequence identity and 97%amino acid sequence identity [18]. However, they are clearlydifferent entities that occur in different organisms, and shouldnot be considered to be duplicates.
Second, it is computationally intensive to measure the se-quence identity for all pairs without using heuristics. Re-cent updates in major databases demonstrate that some ofthe non-redundant databases do contain redundant mate-rial. For example, NCBI has stated that the Non-Redundantdatabase used for BLAST is no longer “non-redundant” dueto the high computational cost of assessing identity.1
UniProt found that TrEMBL had a high level of redun-dancy even though it automatically checks the sequenceidentity.2 For instance, they observed 1,692 strains of My-cobacterium tuberculosis were overrepresented in 5.97 mil-lion records. They applied both manual and automatic pro-cedures to remove the redundancy in bacterial proteomes,and as a result 46.9 million entries in total (across all bacte-ria) have been removed. Due to these kinds of issues alone,it is clear that sequence identity by itself cannot be usedto identify duplicates with high accuracy. Limitations andheuristics in the methods themselves which are necessary toachieve scale can only further reduce their accuracy.
2.2 Quality-focused methodsOther approaches have made use of metadata fields other
than the sequences. In the main bioinformatics databases,common metadata fields include accession numbers, descrip-tion (definition), literature references (the publication de-scribing the sequence), and features (biological features an-notated by submitters, such as coding sequences). In somework only metadata similarity is considered, while in oth-ers use is made of both metadata and sequence similarity.However, as we now discuss, these approaches have similardrawbacks to those listed above.
Some approaches use approximate string matching tech-niques to compute the metadata similarity [8, 24, 22]. Theevaluations reported in these papers demonstrate that theapproach can outperform traditional text matching approachessuch as tf-idf weighting and edit distances. However, as theyonly measure metadata similarity, the underlying interpre-tation is that duplicates are assumed to have high meta-data similarity, or that their sequences are identical. Thisaddresses only a subset of the duplicates in bioinformaticsdatabases. This work also identifies the potential impor-tance of using machine learning techniques; one drawbackof these methods is the difficulty of finding a reasonablethreshold, a problem that might plausibly be addressed bymachine learning.
Koh et al. [17] measured both metadata and sequence sim-ilarity, and adopted association rule mining. This is oneof the earliest quality-based methods. They measured thesimilarity of each field pairwise and then used association
1http://blast.ncbi.nlm.nih.gov/BLAST guide.pdf2http://www.uniprot.org/help/proteome redundancy
5
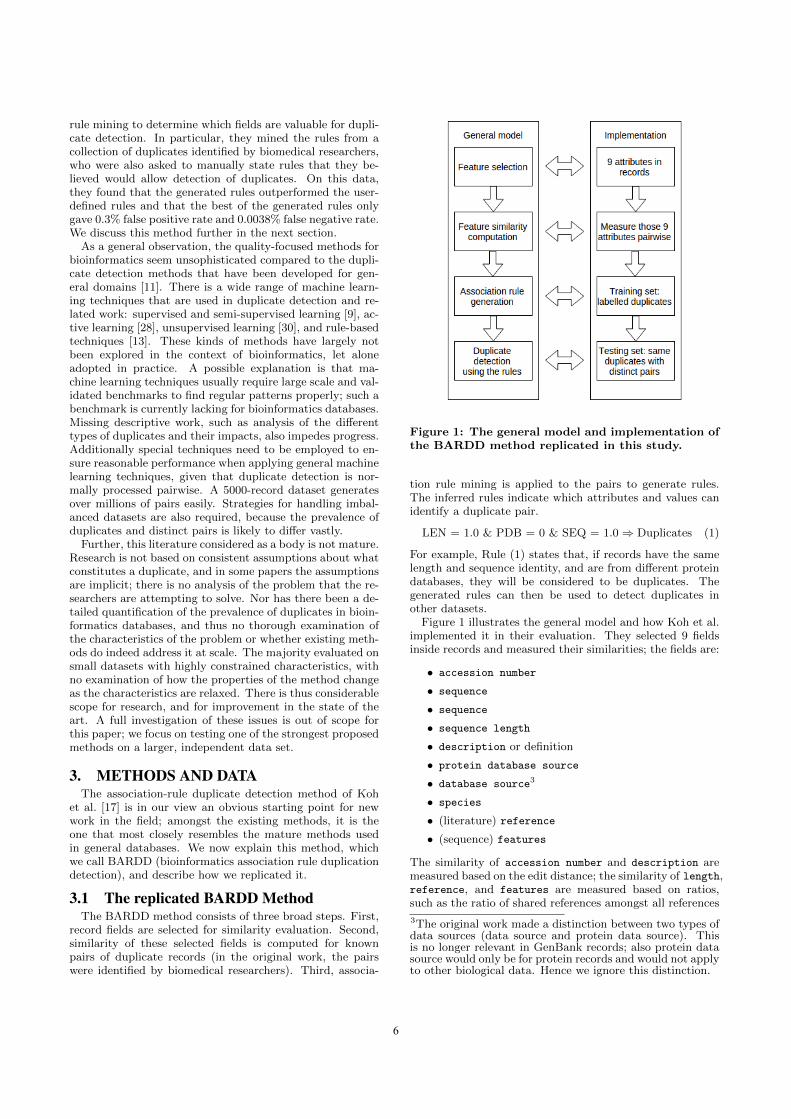
rule mining to determine which fields are valuable for dupli-cate detection. In particular, they mined the rules from acollection of duplicates identified by biomedical researchers,who were also asked to manually state rules that they be-lieved would allow detection of duplicates. On this data,they found that the generated rules outperformed the user-defined rules and that the best of the generated rules onlygave 0.3% false positive rate and 0.0038% false negative rate.We discuss this method further in the next section.
As a general observation, the quality-focused methods forbioinformatics seem unsophisticated compared to the dupli-cate detection methods that have been developed for gen-eral domains [11]. There is a wide range of machine learn-ing techniques that are used in duplicate detection and re-lated work: supervised and semi-supervised learning [9], ac-tive learning [28], unsupervised learning [30], and rule-basedtechniques [13]. These kinds of methods have largely notbeen explored in the context of bioinformatics, let aloneadopted in practice. A possible explanation is that ma-chine learning techniques usually require large scale and val-idated benchmarks to find regular patterns properly; such abenchmark is currently lacking for bioinformatics databases.Missing descriptive work, such as analysis of the differenttypes of duplicates and their impacts, also impedes progress.Additionally special techniques need to be employed to en-sure reasonable performance when applying general machinelearning techniques, given that duplicate detection is nor-mally processed pairwise. A 5000-record dataset generatesover millions of pairs easily. Strategies for handling imbal-anced datasets are also required, because the prevalence ofduplicates and distinct pairs is likely to differ vastly.
Further, this literature considered as a body is not mature.Research is not based on consistent assumptions about whatconstitutes a duplicate, and in some papers the assumptionsare implicit; there is no analysis of the problem that the re-searchers are attempting to solve. Nor has there been a de-tailed quantification of the prevalence of duplicates in bioin-formatics databases, and thus no thorough examination ofthe characteristics of the problem or whether existing meth-ods do indeed address it at scale. The majority evaluated onsmall datasets with highly constrained characteristics, withno examination of how the properties of the method changeas the characteristics are relaxed. There is thus considerablescope for research, and for improvement in the state of theart. A full investigation of these issues is out of scope forthis paper; we focus on testing one of the strongest proposedmethods on a larger, independent data set.
3. METHODS AND DATAThe association-rule duplicate detection method of Koh
et al. [17] is in our view an obvious starting point for newwork in the field; amongst the existing methods, it is theone that most closely resembles the mature methods usedin general databases. We now explain this method, whichwe call BARDD (bioinformatics association rule duplicationdetection), and describe how we replicated it.
3.1 The replicated BARDD MethodThe BARDD method consists of three broad steps. First,
record fields are selected for similarity evaluation. Second,similarity of these selected fields is computed for knownpairs of duplicate records (in the original work, the pairswere identified by biomedical researchers). Third, associa-
Figure 1: The general model and implementation ofthe BARDD method replicated in this study.
tion rule mining is applied to the pairs to generate rules.The inferred rules indicate which attributes and values canidentify a duplicate pair.
LEN = 1.0 & PDB = 0 & SEQ = 1.0⇒ Duplicates (1)
For example, Rule (1) states that, if records have the samelength and sequence identity, and are from different proteindatabases, they will be considered to be duplicates. Thegenerated rules can then be used to detect duplicates inother datasets.
Figure 1 illustrates the general model and how Koh et al.implemented it in their evaluation. They selected 9 fieldsinside records and measured their similarities; the fields are:
• accession number
• sequence
• sequence
• sequence length
• description or definition
• protein database source
• database source3
• species
• (literature) reference
• (sequence) features
The similarity of accession number and description aremeasured based on the edit distance; the similarity of length,reference, and features are measured based on ratios,such as the ratio of shared references amongst all references
3The original work made a distinction between two types ofdata sources (data source and protein data source). Thisis no longer relevant in GenBank records; also protein datasource would only be for protein records and would not applyto other biological data. Hence we ignore this distinction.
6
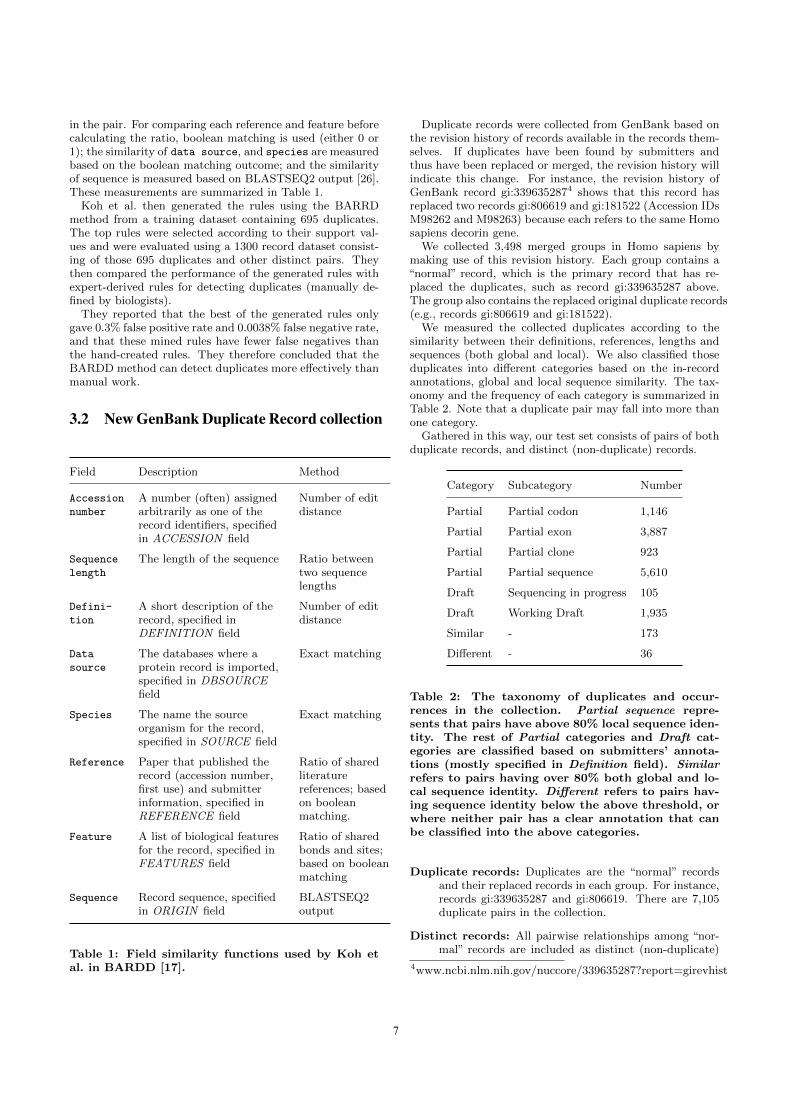
in the pair. For comparing each reference and feature beforecalculating the ratio, boolean matching is used (either 0 or1); the similarity of data source, and species are measuredbased on the boolean matching outcome; and the similarityof sequence is measured based on BLASTSEQ2 output [26].These measurements are summarized in Table 1.
Koh et al. then generated the rules using the BARRDmethod from a training dataset containing 695 duplicates.The top rules were selected according to their support val-ues and were evaluated using a 1300 record dataset consist-ing of those 695 duplicates and other distinct pairs. Theythen compared the performance of the generated rules withexpert-derived rules for detecting duplicates (manually de-fined by biologists).
They reported that the best of the generated rules onlygave 0.3% false positive rate and 0.0038% false negative rate,and that these mined rules have fewer false negatives thanthe hand-created rules. They therefore concluded that theBARDD method can detect duplicates more effectively thanmanual work.
3.2 New GenBank Duplicate Record collection
Field Description Method
Accession
number
A number (often) assignedarbitrarily as one of therecord identifiers, specifiedin ACCESSION field
Number of editdistance
Sequence
length
The length of the sequence Ratio betweentwo sequencelengths
Defini-
tion
A short description of therecord, specified inDEFINITION field
Number of editdistance
Data
source
The databases where aprotein record is imported,specified in DBSOURCEfield
Exact matching
Species The name the sourceorganism for the record,specified in SOURCE field
Exact matching
Reference Paper that published therecord (accession number,first use) and submitterinformation, specified inREFERENCE field
Ratio of sharedliteraturereferences; basedon booleanmatching.
Feature A list of biological featuresfor the record, specified inFEATURES field
Ratio of sharedbonds and sites;based on booleanmatching
Sequence Record sequence, specifiedin ORIGIN field
BLASTSEQ2output
Table 1: Field similarity functions used by Koh etal. in BARDD [17].
Duplicate records were collected from GenBank based onthe revision history of records available in the records them-selves. If duplicates have been found by submitters andthus have been replaced or merged, the revision history willindicate this change. For instance, the revision history ofGenBank record gi:3396352874 shows that this record hasreplaced two records gi:806619 and gi:181522 (Accession IDsM98262 and M98263) because each refers to the same Homosapiens decorin gene.
We collected 3,498 merged groups in Homo sapiens bymaking use of this revision history. Each group contains a“normal” record, which is the primary record that has re-placed the duplicates, such as record gi:339635287 above.The group also contains the replaced original duplicate records(e.g., records gi:806619 and gi:181522).
We measured the collected duplicates according to thesimilarity between their definitions, references, lengths andsequences (both global and local). We also classified thoseduplicates into different categories based on the in-recordannotations, global and local sequence similarity. The tax-onomy and the frequency of each category is summarized inTable 2. Note that a duplicate pair may fall into more thanone category.
Gathered in this way, our test set consists of pairs of bothduplicate records, and distinct (non-duplicate) records.
Category Subcategory Number
Partial Partial codon 1,146
Partial Partial exon 3,887
Partial Partial clone 923
Partial Partial sequence 5,610
Draft Sequencing in progress 105
Draft Working Draft 1,935
Similar - 173
Different - 36
Table 2: The taxonomy of duplicates and occur-rences in the collection. Partial sequence repre-sents that pairs have above 80% local sequence iden-tity. The rest of Partial categories and Draft cat-egories are classified based on submitters’ annota-tions (mostly specified in Definition field). Similarrefers to pairs having over 80% both global and lo-cal sequence identity. Different refers to pairs hav-ing sequence identity below the above threshold, orwhere neither pair has a clear annotation that canbe classified into the above categories.
Duplicate records: Duplicates are the “normal” recordsand their replaced records in each group. For instance,records gi:339635287 and gi:806619. There are 7,105duplicate pairs in the collection.
Distinct records: All pairwise relationships among “nor-mal” records are included as distinct (non-duplicate)
4www.ncbi.nlm.nih.gov/nuccore/339635287?report=girevhist
7
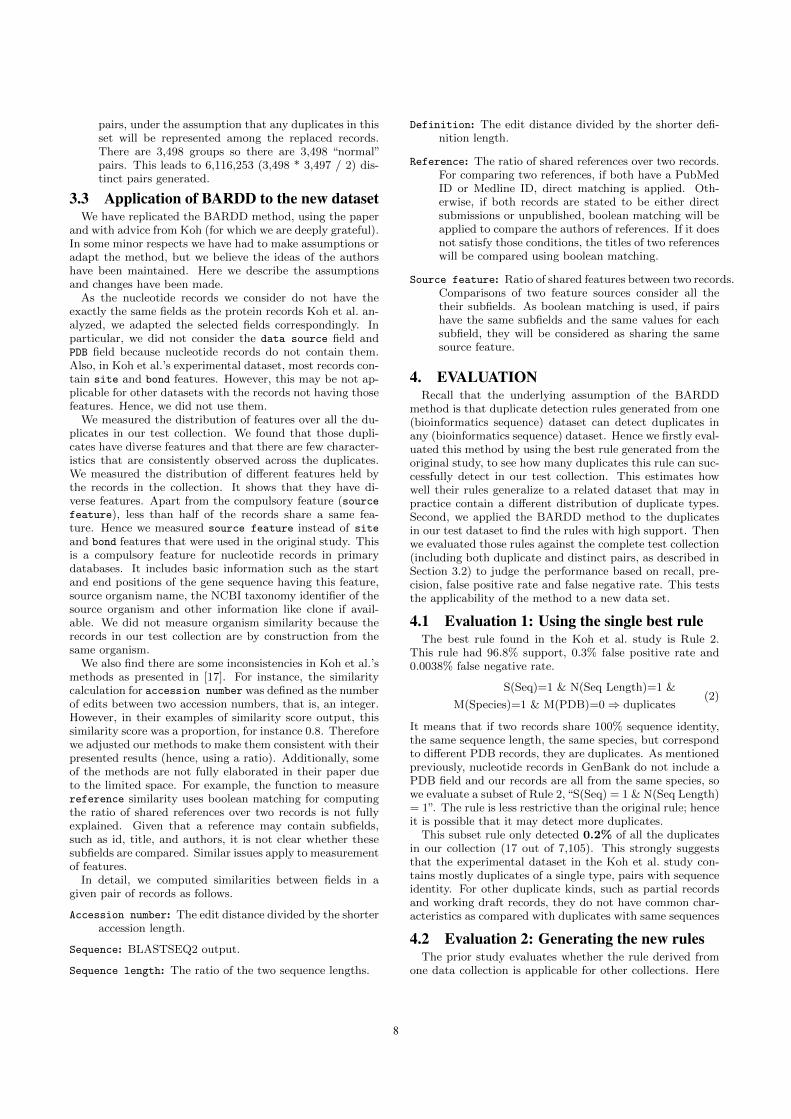
pairs, under the assumption that any duplicates in thisset will be represented among the replaced records.There are 3,498 groups so there are 3,498 “normal”pairs. This leads to 6,116,253 (3,498 * 3,497 / 2) dis-tinct pairs generated.
3.3 Application of BARDD to the new datasetWe have replicated the BARDD method, using the paper
and with advice from Koh (for which we are deeply grateful).In some minor respects we have had to make assumptions oradapt the method, but we believe the ideas of the authorshave been maintained. Here we describe the assumptionsand changes have been made.
As the nucleotide records we consider do not have theexactly the same fields as the protein records Koh et al. an-alyzed, we adapted the selected fields correspondingly. Inparticular, we did not consider the data source field andPDB field because nucleotide records do not contain them.Also, in Koh et al.’s experimental dataset, most records con-tain site and bond features. However, this may be not ap-plicable for other datasets with the records not having thosefeatures. Hence, we did not use them.
We measured the distribution of features over all the du-plicates in our test collection. We found that those dupli-cates have diverse features and that there are few character-istics that are consistently observed across the duplicates.We measured the distribution of different features held bythe records in the collection. It shows that they have di-verse features. Apart from the compulsory feature (sourcefeature), less than half of the records share a same fea-ture. Hence we measured source feature instead of site
and bond features that were used in the original study. Thisis a compulsory feature for nucleotide records in primarydatabases. It includes basic information such as the startand end positions of the gene sequence having this feature,source organism name, the NCBI taxonomy identifier of thesource organism and other information like clone if avail-able. We did not measure organism similarity because therecords in our test collection are by construction from thesame organism.
We also find there are some inconsistencies in Koh et al.’smethods as presented in [17]. For instance, the similaritycalculation for accession number was defined as the numberof edits between two accession numbers, that is, an integer.However, in their examples of similarity score output, thissimilarity score was a proportion, for instance 0.8. Thereforewe adjusted our methods to make them consistent with theirpresented results (hence, using a ratio). Additionally, someof the methods are not fully elaborated in their paper dueto the limited space. For example, the function to measurereference similarity uses boolean matching for computingthe ratio of shared references over two records is not fullyexplained. Given that a reference may contain subfields,such as id, title, and authors, it is not clear whether thesesubfields are compared. Similar issues apply to measurementof features.
In detail, we computed similarities between fields in agiven pair of records as follows.
Accession number: The edit distance divided by the shorteraccession length.
Sequence: BLASTSEQ2 output.
Sequence length: The ratio of the two sequence lengths.
Definition: The edit distance divided by the shorter defi-nition length.
Reference: The ratio of shared references over two records.For comparing two references, if both have a PubMedID or Medline ID, direct matching is applied. Oth-erwise, if both records are stated to be either directsubmissions or unpublished, boolean matching will beapplied to compare the authors of references. If it doesnot satisfy those conditions, the titles of two referenceswill be compared using boolean matching.
Source feature: Ratio of shared features between two records.Comparisons of two feature sources consider all thetheir subfields. As boolean matching is used, if pairshave the same subfields and the same values for eachsubfield, they will be considered as sharing the samesource feature.
4. EVALUATIONRecall that the underlying assumption of the BARDD
method is that duplicate detection rules generated from one(bioinformatics sequence) dataset can detect duplicates inany (bioinformatics sequence) dataset. Hence we firstly eval-uated this method by using the best rule generated from theoriginal study, to see how many duplicates this rule can suc-cessfully detect in our test collection. This estimates howwell their rules generalize to a related dataset that may inpractice contain a different distribution of duplicate types.Second, we applied the BARDD method to the duplicatesin our test dataset to find the rules with high support. Thenwe evaluated those rules against the complete test collection(including both duplicate and distinct pairs, as described inSection 3.2) to judge the performance based on recall, pre-cision, false positive rate and false negative rate. This teststhe applicability of the method to a new data set.
4.1 Evaluation 1: Using the single best ruleThe best rule found in the Koh et al. study is Rule 2.
This rule had 96.8% support, 0.3% false positive rate and0.0038% false negative rate.
S(Seq)=1 & N(Seq Length)=1 &
M(Species)=1 & M(PDB)=0⇒ duplicates(2)
It means that if two records share 100% sequence identity,the same sequence length, the same species, but correspondto different PDB records, they are duplicates. As mentionedpreviously, nucleotide records in GenBank do not include aPDB field and our records are all from the same species, sowe evaluate a subset of Rule 2, “S(Seq) = 1 & N(Seq Length)= 1”. The rule is less restrictive than the original rule; henceit is possible that it may detect more duplicates.
This subset rule only detected 0.2% of all the duplicatesin our collection (17 out of 7,105). This strongly suggeststhat the experimental dataset in the Koh et al. study con-tains mostly duplicates of a single type, pairs with sequenceidentity. For other duplicate kinds, such as partial recordsand working draft records, they do not have common char-acteristics as compared with duplicates with same sequences
4.2 Evaluation 2: Generating the new rulesThe prior study evaluates whether the rule derived from
one data collection is applicable for other collections. Here
8
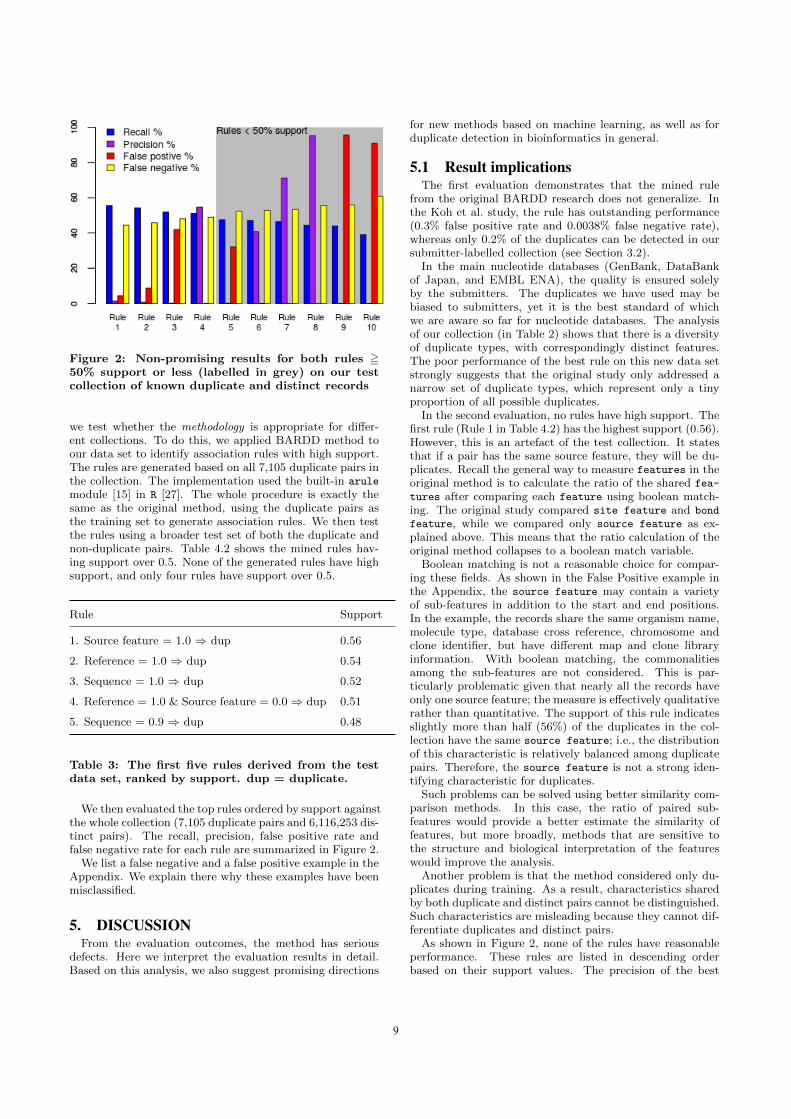
Figure 2: Non-promising results for both rules =50% support or less (labelled in grey) on our testcollection of known duplicate and distinct records
we test whether the methodology is appropriate for differ-ent collections. To do this, we applied BARDD method toour data set to identify association rules with high support.The rules are generated based on all 7,105 duplicate pairs inthe collection. The implementation used the built-in arule
module [15] in R [27]. The whole procedure is exactly thesame as the original method, using the duplicate pairs asthe training set to generate association rules. We then testthe rules using a broader test set of both the duplicate andnon-duplicate pairs. Table 4.2 shows the mined rules hav-ing support over 0.5. None of the generated rules have highsupport, and only four rules have support over 0.5.
Rule Support
1. Source feature = 1.0 ⇒ dup 0.56
2. Reference = 1.0 ⇒ dup 0.54
3. Sequence = 1.0 ⇒ dup 0.52
4. Reference = 1.0 & Source feature = 0.0⇒ dup 0.51
5. Sequence = 0.9 ⇒ dup 0.48
Table 3: The first five rules derived from the testdata set, ranked by support. dup = duplicate.
We then evaluated the top rules ordered by support againstthe whole collection (7,105 duplicate pairs and 6,116,253 dis-tinct pairs). The recall, precision, false positive rate andfalse negative rate for each rule are summarized in Figure 2.
We list a false negative and a false positive example in theAppendix. We explain there why these examples have beenmisclassified.
5. DISCUSSIONFrom the evaluation outcomes, the method has serious
defects. Here we interpret the evaluation results in detail.Based on this analysis, we also suggest promising directions
for new methods based on machine learning, as well as forduplicate detection in bioinformatics in general.
5.1 Result implicationsThe first evaluation demonstrates that the mined rule
from the original BARDD research does not generalize. Inthe Koh et al. study, the rule has outstanding performance(0.3% false positive rate and 0.0038% false negative rate),whereas only 0.2% of the duplicates can be detected in oursubmitter-labelled collection (see Section 3.2).
In the main nucleotide databases (GenBank, DataBankof Japan, and EMBL ENA), the quality is ensured solelyby the submitters. The duplicates we have used may bebiased to submitters, yet it is the best standard of whichwe are aware so far for nucleotide databases. The analysisof our collection (in Table 2) shows that there is a diversityof duplicate types, with correspondingly distinct features.The poor performance of the best rule on this new data setstrongly suggests that the original study only addressed anarrow set of duplicate types, which represent only a tinyproportion of all possible duplicates.
In the second evaluation, no rules have high support. Thefirst rule (Rule 1 in Table 4.2) has the highest support (0.56).However, this is an artefact of the test collection. It statesthat if a pair has the same source feature, they will be du-plicates. Recall the general way to measure features in theoriginal method is to calculate the ratio of the shared fea-
tures after comparing each feature using boolean match-ing. The original study compared site feature and bond
feature, while we compared only source feature as ex-plained above. This means that the ratio calculation of theoriginal method collapses to a boolean match variable.
Boolean matching is not a reasonable choice for compar-ing these fields. As shown in the False Positive example inthe Appendix, the source feature may contain a varietyof sub-features in addition to the start and end positions.In the example, the records share the same organism name,molecule type, database cross reference, chromosome andclone identifier, but have different map and clone libraryinformation. With boolean matching, the commonalitiesamong the sub-features are not considered. This is par-ticularly problematic given that nearly all the records haveonly one source feature; the measure is effectively qualitativerather than quantitative. The support of this rule indicatesslightly more than half (56%) of the duplicates in the col-lection have the same source feature; i.e., the distributionof this characteristic is relatively balanced among duplicatepairs. Therefore, the source feature is not a strong iden-tifying characteristic for duplicates.
Such problems can be solved using better similarity com-parison methods. In this case, the ratio of paired sub-features would provide a better estimate the similarity offeatures, but more broadly, methods that are sensitive tothe structure and biological interpretation of the featureswould improve the analysis.
Another problem is that the method considered only du-plicates during training. As a result, characteristics sharedby both duplicate and distinct pairs cannot be distinguished.Such characteristics are misleading because they cannot dif-ferentiate duplicates and distinct pairs.
As shown in Figure 2, none of the rules have reasonableperformance. These rules are listed in descending orderbased on their support values. The precision of the best
9
rule is only 1.46%, with a false negative rate of around 45%.Some of the other rules have better precision, but the falsenegative rate is still high; for rule 2-10, it is over 45%. Noneof the rules have above 60% recall and 6 rules have below2% precision. Rules 7 and 8 have higher precision (71.10%and 95.18% respectively), and negligible false positives, butthe recall is below 47% and false negative rate around 55%.
These problems have various causes. The most importantone is that there is no stratification in the original method.Different duplicate types have distinct characteristics. Thefrequent patterns cannot be mined properly as the differenttypes of duplicate may share few common characteristics.As a result, the mined rules cannot get high precision. Itwould be better to classify duplicates such that duplicateswith specific characteristics can be analysed separately.
Another likely cause is poor feature representation. In theoriginal study, quantitative feature values have been repre-sented as fixed qualitative values. This cannot convey therange or threshold of a feature value that differentiates dupli-cates from distinct pairs. For example, a pair with sequencesimilarity 0.9212 will be represented as SEQ0.9. However,sequence similarity is a continuous variable, and duplicatesare likely to have sequence similarity in a range of values,hypothetically 0.7 to 1.0. If the rules only find 0.9 as an im-portant factor, it will miss any duplicates having similaritynot approximating to 0.9. It would be better to representthose values quantitatively.
It is also worthwhile to note that there is no significant dif-ference in performance between the rules with high supportand those with low support. As mentioned earlier, the rulewith the highest support is an artefact. The remainder ofthe rules with support above 50% all have extremely low pre-cision and high false negative rates. The rules ranked lowerlike rule 7 and 8, however, have over 70% precision. Thissuggests that better metrics for selecting the rules should beintroduced. Using support as the only metric might resultin loss of rules that might have better performance.
We have observed other issues as well, relating to the ex-perimental methodology in the original work rather than themethod itself. In particular, the duplicates in the trainingset are exactly the same as those in the test set. Given thepoor performance on our new data, it is clear that this issueis a significant one.
5.2 Suggestions for further explorationOn the basis of our exploration of the BARDD method,
we believe the following approaches have potential to over-come the existing defects and provide insights for furtherdevelopment using machine learning techniques:
• Different feature comparison methods should be ex-plored. In the original study, some features are com-pared using exact matching. Approximate matchingcan potentially improve the accuracy. For instance, iftwo literature references have the same authors but indifferent orders, exact matching will not work.
• The training data set should contain (more than) twoclasses of data. This will avoid the misleading use offeature values as indicated above.
• Stratification should be used. The different kinds ofduplicate in nucleotide databases have distinct char-acteristics. Classifying and analysing them separatelyseems to be a promising approach.
• More feature representations should be tried, and abroader spectrum of machine learning techniques. Forexample, a decision tree may have better performanceon finding the split values of quantitative variables.
More generally, through this study we have found that in-vestigation of duplicate detection in bioinformatics databasesis not a mature field. Foundational work is missing, such asthe basic questions of the prevalence of duplicates, and oftheir impact on practical biomedical analyses. Moreover, thebreadth and depth of the techniques used in this domain arefar from the state-of-the-art for databases in general.
In addition, there is no validated, large-scale benchmarkavailable in this domain. This leads to the quality based du-plicate detection method using different data sets – with dif-ferent definitions of (or assumptions concerning) what con-stitutes a duplicate. Thus it is difficult to compare them orjudge their significance.
6. CONCLUSIONWe have replicated a previously published duplicate de-
tection method for bioinformatics databases and evaluatedits performance on a new data set. While this method wasthe first method to consider both metadata and sequence inidentification of duplicates, we have shown that it cannot begeneralized to other data collections and has severe limita-tions. We have analysed those shortcomings and providedsuggestions based on our analyses.
The study shows that there is substantial room for ad-ditional research on this topic. Ground analysis on dupli-cates in bioinformatics databases and more innovations indeveloping duplicate detection methods should be pursuedto bridge the gaps.
AcknowledgementsWe are grateful for Judice LY Koh for explaining her dupli-cate detection work that we replicated and evaluated in thisstudy, and for searching for the data set used in the origi-nal study (which, regrettably, is lost). We also thank AlexRudniy for providing input on his duplicate detection work.
Qingyu Chen’s work is supported by Melbourne Interna-tional Research Scholarship from The University of Mel-bourne. The project receives funding from the AustralianResearch Council through a Discovery Project grant,DP150101550.
7. REFERENCES[1] S. F. Altschul, M. S. Boguski, W. Gish, J. C.
Wootton, et al. Issues in searching molecular sequencedatabases. Nature genetics, 6(2):119–129, 1994.
[2] A. Bairoch, R. Apweiler, C. H. Wu, W. C. Barker,B. Boeckmann, S. Ferro, E. Gasteiger, H. Huang,R. Lopez, M. Magrane, et al. The universal proteinresource (uniprot). Nucleic acids research, 33(suppl1):D154–D159, 2005.
[3] S. Bennett. Blood pressure measurement error: itseffect on cross-sectional and trend analyses. Journal ofclinical epidemiology, 47(3):293–301, 1994.
[4] D. A. Benson, M. Cavanaugh, K. Clark,I. Karsch-Mizrachi, D. J. Lipman, J. Ostell, and E. W.Sayers. Genbank. Nucleic acids research, pagegks1195, 2012.
10
[5] D. A. Benson, I. Karsch-Mizrachi, D. J. Lipman,J. Ostell, and D. L. Wheeler. Genbank. Nucleic acidsresearch, page gks1195, 2006.
[6] P. Bork and A. Bairoch. Go hunting in sequencedatabases but watch out for the traps. Trends inGenetics, 12(10):425–427, 1996.
[7] M. Cameron, Y. Bernstein, and H. E. Williams.Clustered sequence representation for fast homologysearch. Journal of Computational Biology,14(5):594–614, 2007.
[8] S. Chellamuthu and D. M. Punithavalli. Detectingredundancy in biological databases? an efficientapproach. Global Journal of Computer Science andTechnology, 9(4), 2009.
[9] M. Cochinwala, V. Kurien, G. Lalk, and D. Shasha.Efficient data reconciliation. Information Sciences,137(1):1–15, 2001.
[10] D. Devos and A. Valencia. Intrinsic errors in genomeannotation. TRENDS in Genetics, 17(8):429–431,2001.
[11] A. K. Elmagarmid, P. G. Ipeirotis, and V. S. Verykios.Duplicate record detection: A survey. Knowledge andData Engineering, IEEE Transactions on, 19(1):1–16,2007.
[12] W. Fan. Data quality: Theory and practice. InWeb-Age Information Management, pages 1–16.Springer, 2012.
[13] H. Galhardas, D. Florescu, D. Shasha, E. Simon, andC. Saita. Declarative data cleaning: Language, model,and algorithms. Proc. 27th IntaAZl Conf. Very LargeDatabases, 2001.
[14] G. Grillo, M. Attimonelli, S. Liuni, and G. Pesole.Cleanup: a fast computer program for removingredundancies from nucleotide sequence databases.Computer applications in the biosciences: CABIOS,12(1):1–8, 1996.
[15] M. Hahsler, B. Grun, K. Hornik, and C. Buchta.Introduction to arules–a computational environmentfor mining association rules and frequent item sets.The Comprehensive R Archive Network, 2009.
[16] L. Holm and C. Sander. Removing near-neighbourredundancy from large protein sequence collections.Bioinformatics, 14(5):423–429, 1998.
[17] J. L. Koh, M. L. Lee, A. M. Khan, P. T. Tan, andV. Brusic. Duplicate detection in biological data usingassociation rule mining. Locus, 501(P34180):S22388,2004.
[18] S. Lawson, L. Rothwell, B. Lambrecht, K. Howes,K. Venugopal, and P. Kaiser. Turkey and chickeninterferon-γ, which share high sequence identity, arebiologically cross-reactive. Developmental &Comparative Immunology, 25(1):69–82, 2001.
[19] W. Li and A. Godzik. Cd-hit: a fast program forclustering and comparing large sets of protein ornucleotide sequences. Bioinformatics,22(13):1658–1659, 2006.
[20] W. Li, L. Jaroszewski, and A. Godzik. Sequenceclustering strategies improve remote homologyrecognitions while reducing search times. Proteinengineering, 15(8):643–649, 2002.
[21] H. Muller, F. Naumann, and J.-C. Freytag. Dataquality in genome databases. Eighth InternationalConference on Information Quality (IQ 2003), 2003.
[22] A. Rudniy, M. Song, and J. Geller. Detectingduplicate biological entities using shortest path editdistance. International journal of data mining andbioinformatics, 4(4):395–410, 2010.
[23] K. Sikic and O. Carugo. Protein sequence redundancyreduction: comparison of various method.Bioinformation, 5(6):234, 2010.
[24] M. Song and A. Rudniy. Detecting duplicate biologicalentities using markov random field-based editdistance. Knowledge and information systems,25(2):371–387, 2010.
[25] B. E. Suzek, H. Huang, P. McGarvey, R. Mazumder,and C. H. Wu. Uniref: comprehensive andnon-redundant uniprot reference clusters.Bioinformatics, 23(10):1282–1288, 2007.
[26] T. A. Tatusova and T. L. Madden. Blast 2 sequences,a new tool for comparing protein and nucleotidesequences. FEMS microbiology letters, 174(2):247–250,1999.
[27] R. C. Team. R language definition, 2000.
[28] S. Tejada, C. A. Knoblock, and S. Minton. Learningobject identification rules for information integration.Information Systems, 26(8):607–633, 2001.
[29] N. L. Tintle, D. Gordon, F. J. McMahon, and S. J.Finch. Using duplicate genotyped data in geneticanalyses: testing association and estimating errorrates. Statistical applications in genetics and molecularbiology, 6(1), 2007.
[30] V. S. Verykios, A. K. Elmagarmid, and E. N. Houstis.Automating the approximate record-matching process.Information sciences, 126(1):83–98, 2000.
[31] H. J. Watson and B. H. Wixom. The current state ofbusiness intelligence. Computer, 40(9):96–99, 2007.
[32] B. W. Williams, S. R. Gelder, H. C. Proctor, andD. W. Coltman. Molecular phylogeny of northamerican branchiobdellida (annelida: Clitellata).Molecular phylogenetics and evolution, 66(1):30–42,2013.
[33] E. V. Zorita, P. Cusco, and G. Filion. Starcode:sequence clustering based on all-pairs search.Bioinformatics, page btv053, 2015.
11
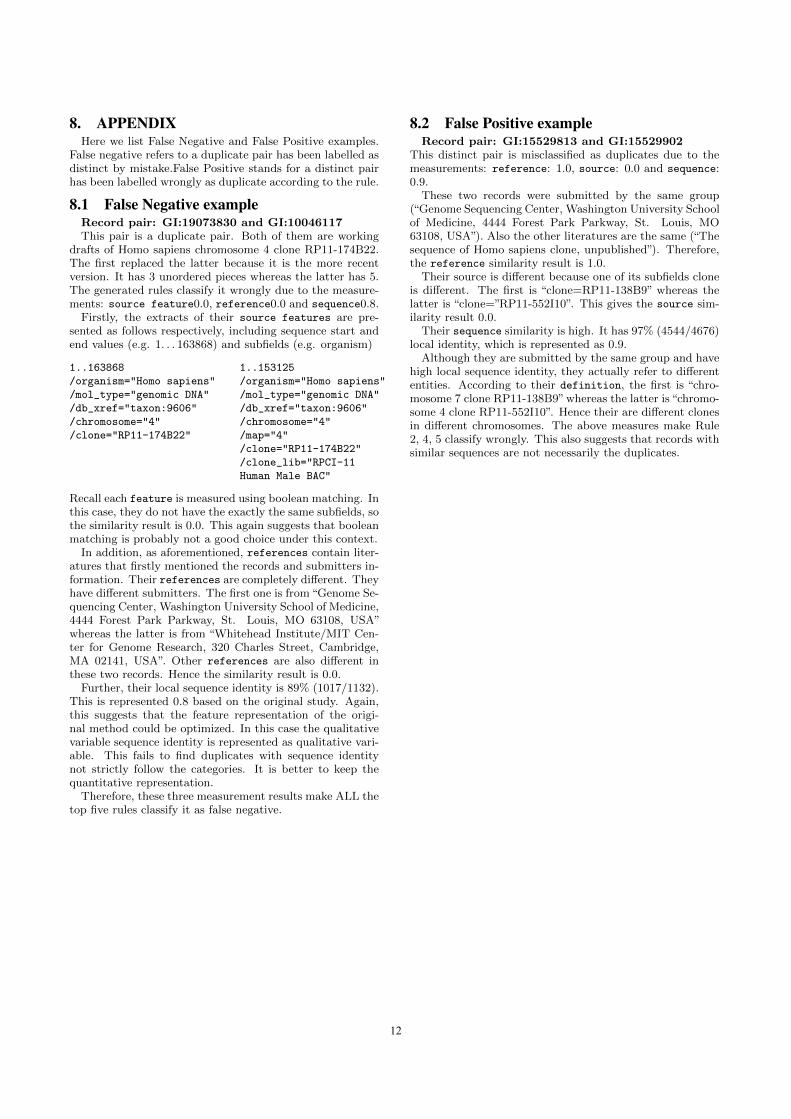
8. APPENDIXHere we list False Negative and False Positive examples.
False negative refers to a duplicate pair has been labelled asdistinct by mistake.False Positive stands for a distinct pairhas been labelled wrongly as duplicate according to the rule.
8.1 False Negative exampleRecord pair: GI:19073830 and GI:10046117This pair is a duplicate pair. Both of them are working
drafts of Homo sapiens chromosome 4 clone RP11-174B22.The first replaced the latter because it is the more recentversion. It has 3 unordered pieces whereas the latter has 5.The generated rules classify it wrongly due to the measure-ments: source feature0.0, reference0.0 and sequence0.8.
Firstly, the extracts of their source features are pre-sented as follows respectively, including sequence start andend values (e.g. 1. . . 163868) and subfields (e.g. organism)
1..163868 1..153125
/organism="Homo sapiens" /organism="Homo sapiens"
/mol_type="genomic DNA" /mol_type="genomic DNA"
/db_xref="taxon:9606" /db_xref="taxon:9606"
/chromosome="4" /chromosome="4"
/clone="RP11-174B22" /map="4"
/clone="RP11-174B22"
/clone_lib="RPCI-11
Human Male BAC"
Recall each feature is measured using boolean matching. Inthis case, they do not have the exactly the same subfields, sothe similarity result is 0.0. This again suggests that booleanmatching is probably not a good choice under this context.
In addition, as aforementioned, references contain liter-atures that firstly mentioned the records and submitters in-formation. Their references are completely different. Theyhave different submitters. The first one is from “Genome Se-quencing Center, Washington University School of Medicine,4444 Forest Park Parkway, St. Louis, MO 63108, USA”whereas the latter is from “Whitehead Institute/MIT Cen-ter for Genome Research, 320 Charles Street, Cambridge,MA 02141, USA”. Other references are also different inthese two records. Hence the similarity result is 0.0.
Further, their local sequence identity is 89% (1017/1132).This is represented 0.8 based on the original study. Again,this suggests that the feature representation of the origi-nal method could be optimized. In this case the qualitativevariable sequence identity is represented as qualitative vari-able. This fails to find duplicates with sequence identitynot strictly follow the categories. It is better to keep thequantitative representation.
Therefore, these three measurement results make ALL thetop five rules classify it as false negative.
8.2 False Positive exampleRecord pair: GI:15529813 and GI:15529902
This distinct pair is misclassified as duplicates due to themeasurements: reference: 1.0, source: 0.0 and sequence:0.9.
These two records were submitted by the same group(“Genome Sequencing Center, Washington University Schoolof Medicine, 4444 Forest Park Parkway, St. Louis, MO63108, USA”). Also the other literatures are the same (“Thesequence of Homo sapiens clone, unpublished”). Therefore,the reference similarity result is 1.0.
Their source is different because one of its subfields cloneis different. The first is “clone=RP11-138B9” whereas thelatter is “clone=”RP11-552I10”. This gives the source sim-ilarity result 0.0.
Their sequence similarity is high. It has 97% (4544/4676)local identity, which is represented as 0.9.
Although they are submitted by the same group and havehigh local sequence identity, they actually refer to differententities. According to their definition, the first is “chro-mosome 7 clone RP11-138B9” whereas the latter is “chromo-some 4 clone RP11-552I10”. Hence their are different clonesin different chromosomes. The above measures make Rule2, 4, 5 classify wrongly. This also suggests that records withsimilar sequences are not necessarily the duplicates.
12
6PAPER 4
OutlineIn this chapter we summarise the results and reflect on the research process based onthe following manuscript:
• Title: Supervised Learning for Detection of Duplicates in Genomic SequenceDatabases.
• Authors: Qingyu Chen, Justin Zobel, Xiuzhen Zhang, and Karin Verspoor.
• Publication venue: PLOS ONE.
• Publication year: 2016
6.1 abstract of the paper
First identified as an issue in 1996, duplication in biological databases introduces re-dundancy and even leads to inconsistency when contradictory information appears. Theamount of data makes purely manual de-duplication impractical, and existing automaticsystems cannot detect duplicates as precisely as can experts. Supervised learning hasthe potential to address such problems by building automatic systems that learn fromexpert curation to detect duplicates precisely and efficiently. While machine learning isa mature approach in other duplicate detection contexts, it has seen only preliminaryapplication in genomic sequence databases.We developed and evaluated a supervised duplicate detection method based on an
expert curated dataset of duplicates, containing over one million pairs across five or-ganisms derived from genomic sequence databases. We selected 22 features to represent
129
130 paper 4
distinct attributes of the database records, and developed a binary model and a multi-class model. Both models achieve promising performance; under cross-validation, thebinary model had over 90% accuracy in each of the five organisms, while the multi-classmodel maintains high accuracy and is more robust in generalisation. We performed anablation study to quantify the impact of different sequence record features, finding thatfeatures derived from meta-data, sequence identity, and alignment quality impact per-formance most strongly. The study demonstrates machine learning can be an effectiveadditional tool for de-duplication of genomic sequence databases. All data are availableas described in the supplementary material. The detailed results and trained models arealso available via https://bitbucket.org/biodbqual/slseqdd/.
6.2 summary and reflection
The evaluation on current supervised learning duplicate detection methods in biologicaldatabases (Chapter 5) shows that there is a pressing need to develop new methods todetect duplicate records precisely. Table 2.11 and Table 2.12 in Chapter 2 also showthat comparing to supervised duplicate detection in general domains, both breadth anddepth of supervised learning techniques are lacking.This work proposes a new supervised learning duplicate detection method, where we
have applied standard supervised learning techniques, including: (1) feature selection,where 22 features were selected, which also considers the cases whether the featurevalues are missing (Table 3 in the paper); (2) a large-scale training set, over a millionlabelled duplicate pairs from five organisms, expert curation based benchmark (Table2); (3) multiple supervised learning techniques: Naïve Bayes, Decision Trees, and SVM,which have been used frequently; (4) feature engineering, a dedicated ablation study toquantify important features; (5) multiclass classification, stratification applied to classifymultiple categories of duplicates; and (6) generalisation, the models trained from oneorganism using cross-validations and tested against other organisms.The results demonstrate substantial promise to apply supervised learning techniques
to detect duplicates: most of the binary classifiers (which classify a pair as duplicate ordistinct) have over 90% accuracy and the AUROC is above 89% (Table 5). In addition,
6.2 summary and reflection 131
the most powerful features based on the results of the ablation study are a combinationof meta-data features (description and literature related features), sequence features (se-quence identity and length ratio) and sequence quality (alignment proportion and expectvalues), shown in Table 6. This shows that meta-data can facilitate precise classifica-tion; using sequence identity with a user-defined threshold can only achieve around 60%AUROC (Table 5). While multiclass classifiers achieve slightly lower accuracy (Table 8),they have better performance than binary classifiers for robustness and generalisation(Figure 4 and 5).
There is substantial opportunity to improve the method. For efficiency, it could useblocking techniques (only compare records pairwise within blocks) to reduce the numberof pairwise comparisons. For effectiveness, it could use ensemble based supervised learn-ing techniques (a combination of multiple classifiers) to increase generalisation results.From the user perspective, since BLAST all-by-all pairwise comparisons are often usedin the de-duplication step (Section 2.5, Chapter 2) and the methods also take sequenceidentity related properties as features, it might be valuable to use the method as aplug-in after all-by-all BLAST alignments. The method can potentially retrieve all thealignment related features, obtain annotation data for the records, use the built modelto classify potential duplicates and highlight them to biocurators.Putting Paper 3 and 4 together, the evaluation (Paper 3) and the method (Paper 4)
mainly address one of the primary notions of duplication, entity-based duplicates (sum-marised in Section 2.7, Chapter 2). It can be used particularly in database submissionand curation, in which there is only one entry per entity, such that users are confusedwith duplicates and biocurators will not spend as much time annotating a duplicaterecord. As we noted in Section 2.7.2, Chapter 2, near duplicates, or redundant recordshaving X% similarities, is another primary notion. The following papers transition fromentity duplicates to near duplicates.
RESEARCH ARTICLE
Supervised Learning for Detection ofDuplicates in Genomic Sequence DatabasesQingyu Chen1, Justin Zobel1, Xiuzhen Zhang2, Karin Verspoor1*
1Department of Computing and Information Systems, The University of Melbourne, Melbourne, Australia,2 School of Science, RMIT University, Melbourne, Australia
Abstract
Motivation
First identified as an issue in 1996, duplication in biological databases introduces redun-
dancy and even leads to inconsistency when contradictory information appears. The
amount of data makes purely manual de-duplication impractical, and existing automatic
systems cannot detect duplicates as precisely as can experts. Supervised learning has the
potential to address such problems by building automatic systems that learn from expert
curation to detect duplicates precisely and efficiently. While machine learning is a mature
approach in other duplicate detection contexts, it has seen only preliminary application in
genomic sequence databases.
Results
We developed and evaluated a supervised duplicate detection method based on an expert
curated dataset of duplicates, containing over one million pairs across five organisms
derived from genomic sequence databases. We selected 22 features to represent distinct
attributes of the database records, and developed a binary model and a multi-class model.
Both models achieve promising performance; under cross-validation, the binary model had
over 90% accuracy in each of the five organisms, while the multi-class model maintains high
accuracy and is more robust in generalisation. We performed an ablation study to quantify
the impact of different sequence record features, finding that features derived from meta-
data, sequence identity, and alignment quality impact performance most strongly. The study
demonstrates machine learning can be an effective additional tool for de-duplication of geno-
mic sequence databases. All Data are available as described in the supplementary material.
IntroductionDuplication is a central data quality problem, impacting the volume of data that must be pro-cessed during data curation and computational analyses and leading to inconsistencies whencontradictory or missing information on a given entity appears in a duplicated record. In
PLOSONE | DOI:10.1371/journal.pone.0159644 August 4, 2016 1 / 20
a11111
OPEN ACCESS
Citation: Chen Q, Zobel J, Zhang X, Verspoor K(2016) Supervised Learning for Detection ofDuplicates in Genomic Sequence Databases. PLoSONE 11(8): e0159644. doi:10.1371/journal.pone.0159644
Editor: Marc Robinson-Rechavi, University ofLausanne, SWITZERLAND
Received: May 5, 2016
Accepted: July 6, 2016
Published: August 4, 2016
Copyright: © 2016 Chen et al. This is an openaccess article distributed under the terms of theCreative Commons Attribution License, which permitsunrestricted use, distribution, and reproduction in anymedium, provided the original author and source arecredited.
Data Availability Statement: All the records used inthe study are publicly available from INSDCnucleotide databases: EMBL ENA, NCBI GenBankand DDBJ. We also provide the accession numbersin https://bitbucket.org/biodbqual/duplicate_detection_repository/.
Funding: This work was supported by the AustralianResearch Council Discovery program, grant numberDP150101550.
Competing Interests: The authors have declaredthat no competing interests exist.
genomic sequence databases, duplication has been a recognised issue since the 1990s [1]. It isnow of even greater concern, due to the rapid growth and wide use of sequence databases, withconsequences such as redundancy, repetition in BLAST search results, and incorrect inferencesthat may be made from records with inconsistent sequences or annotations. It is therefore valu-able to develop methods that can support detection, and eventually flagging or removal of,duplicates.
Existing duplicate detection methods in sequence databases fall into two categories. Onecategory defines duplicates using simple heuristics. These methods are very efficient, but maybe overly simplistic, resulting in high levels of both false positive and false negative detections.For example, records with default 90% sequence identity are considered as duplicates in meth-ods such as CD-HIT [2]. Those methods can efficiently cluster sequences into groups. How-ever, at least two questions remain: (1) Are records with high sequence identity reallyduplicates? This is critical when database curators merge records; only true duplicates shouldbe merged. (2) Is a sequence identity threshold, e.g. 90%, a meaningful constant for all organ-isms? As we explain later, duplicates in one organism may have different types and may furtherdiffer between organisms. The other category aims to detect duplicates precisely, based onexpert curated duplicate sets. However, the datasets consulted have been small and are oftennot representative of the full range of duplicates. For instance, the dataset in one representativemethod only has duplicates with exact sequences [3], whereas duplicates could be fragments oreven sequences with relatively low identity, as we illustrate in this paper.
In this work, we consider an approach designed for precise detection, but tested on a largevolume of representative data. Specifically, we explore the application of supervised learning toduplicate detection in nucleotide databases, building on a large collection of expert curateddata that we have constructed. We make the following contributions: (1) we explore a super-vised duplicate-detection model for pairs of genomic database records, proposing a featurerepresentation based on 22 distinct attributes of record pairs, testing three learning algorithms,and experimenting with both binary and multi-class classification strategies, (2) we train andtest the models with a data set of over one million expert-curated pairs across five organisms,and (3) we demonstrate that our proposed models strongly outperform a genomic sequenceidentity baseline. All the data we used in the study is publicly available.
Materials and Methods
BackgroundThe volumes of data deposited in databases have brought tremendous opportunity for data-driven science and decision making, yet significant data quality issues have emerged. Generaldata quality surveys have identified five main data quality problems: inconsistency (contradic-tory data arising from one or more sources); duplication (more than one record referring to thesame entity); inaccuracy (errors); incompleteness (missing information), and obsolescence(out-of-date values) [4]. These issues can have serious impacts. Credit-card fraud is an illustra-tive case of duplication where different individuals may illegally use the same identity, with sig-nificant implications; the New South Wales state government in Australia reported the cost ofsuch fraud to total over $125 million in the state from 2008 to September 2013 [5].
Data quality in bioinformatics databases is likewise an ongoing problem. In the 1990s,researchers warned that data quality concerns were emerging and should be seriously consid-ered, in spite of efforts to annotate new genome data as quickly as possible [6]. They observed arange of data quality issues in genomic databases such as reading frame inconsistencies, miss-ing start and stop codons, and, specifically, the presence of duplicate records [1]. Recent litera-ture also shows that data quality issues may impact biological studies [7, 8]. Data curation is
Supervised Biological Duplicate Record Detection
PLOS ONE | DOI:10.1371/journal.pone.0159644 August 4, 2016 2 / 20
thus necessary. For example, Swiss-Prot has set up sophisticated expert curation processes toensure high data quality as a core UniProt activity [9]. Expert curation is expensive and time-consuming, but clearly benefits the community [10]. Duplication is a direct data curation issue(typically requiring expert knowledge to identify duplicates) and also affects data curation indi-rectly, by increasing the amount of data that needs to be reviewed and curated.
Duplicate records in genomic sequence databases. Related studies have different defini-tions of “duplicate records”. Some consider duplicates as redundancies—records with veryhigh or 100% similarity; for example, CD-HIT and TrEMBL use 90% (by default) [2] and 100%[9], respectively. In contrast, others consider duplicates with more variations, but which arenot necessarily redundancies. They may use expert curation, identifying duplicates by domainexperts [3, 11]. The identified duplicates are such that both records are (close to) the same, butare not restricted to be so.
Thus the definition of “duplicate records” is context-dependent. We identify at least threerelevant aspects of context:
1. Different biological databases. For example, Swiss-Prot considers duplicates as recordsbelonging to the same gene in the same organism, whereas TrEMBL considers duplicates asrecords having exactly the same sequence in the same organism;
2. Different biological methods. For example, a method addressing gene-name entity recogni-tion may consider duplicates to be records with the same literature IDs in both training andtesting sets, whereas a method for detecting duplicate literature considers duplicates to bethe same publications in one or more biomedical databases, including duplicate recordshaving missing and erroneous fields and duplicate records in different or inconsistentformats;
3. Different biological tasks. For example, curation of the Pfam database labels as duplicatesproteomes of the same organisms having sequence similarity over 90% and having highnumbers of joint records, whereas curation of the Banana Genome Hub considers duplicatesto be genes in duplicated syntenic regions [12], duplicated segments, and duplicated geneswithin the paralogous region.
It is, therefore, unrealistic to expect to have a single and universal definition of duplicates.Different definitions lead to different kinds of duplicates with different characteristics, and arerelevant to different tasks. There is no absolute correct definition—they have different focusesor purposes. A good duplicate detection method, however, must reflect such diversity, and itsperformance must be tested in data sets with different duplicate types derived from multiplesources, where the test data is independent from the method [13]. In the scope of duplicatedetection in biological databases, this diversity implies the need to test against various kinds ofduplicates. Indeed, a simple classification of our collection of duplicates in genomic sequencedatabases already illustrates substantial diversity. To be robust we need to examine the perfor-mance on detection of different types and the generalisation across different organisms.
Arguably the best way to understand duplicates is via expert curation. Human review—experts checking additional resources, and applying their experience and intuition—can bestdecide whether a pair is a duplicate, particularly for pairs whose identity cannot be easily deter-mined automatically [13]. The ultimate goal of an automatic system should be to model expertreview to detect duplicates precisely and efficiently. Indeed, the most effective published dupli-cate detection methods “learn” from expert curation, using (semi-) supervised learning to buildan automatic model by training from a set of expert labelled duplicates [14–16].
In this work, we take a pragmatic approach to identification of duplication. We considerduplication to have occurred when more than one nucleotide coding sequence record is cross-
Supervised Biological Duplicate Record Detection
PLOS ONE | DOI:10.1371/journal.pone.0159644 August 4, 2016 3 / 20
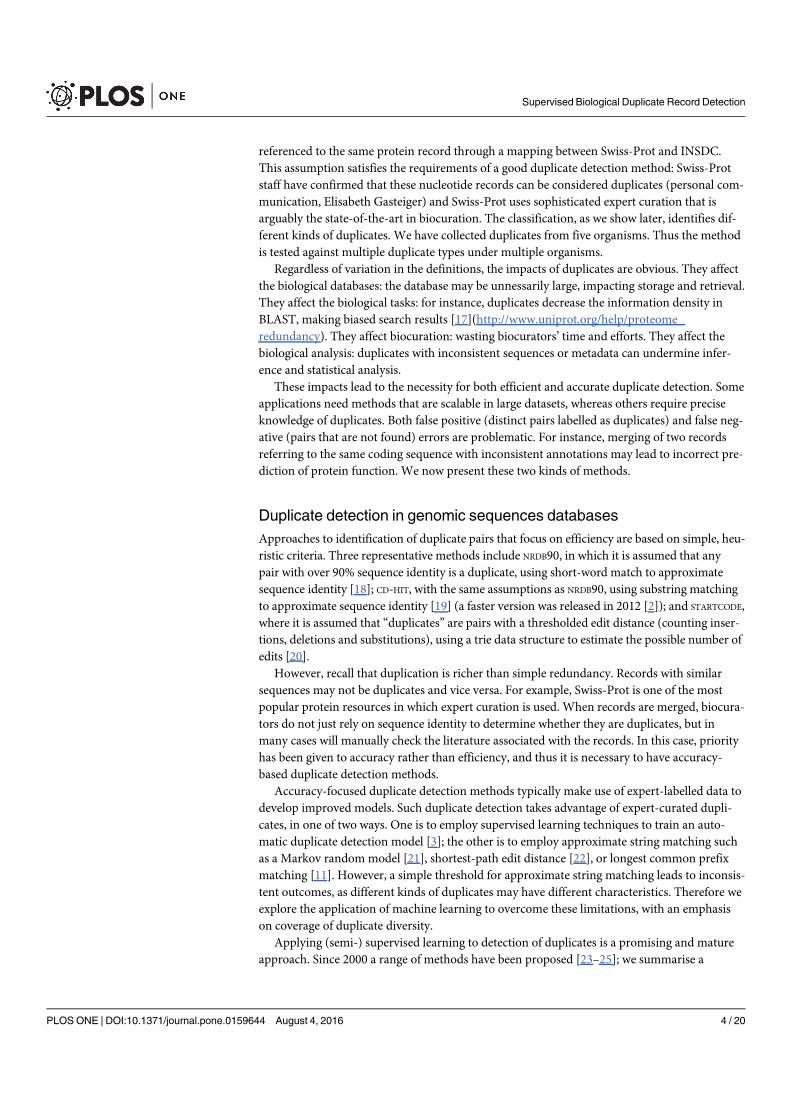
referenced to the same protein record through a mapping between Swiss-Prot and INSDC.This assumption satisfies the requirements of a good duplicate detection method: Swiss-Protstaff have confirmed that these nucleotide records can be considered duplicates (personal com-munication, Elisabeth Gasteiger) and Swiss-Prot uses sophisticated expert curation that isarguably the state-of-the-art in biocuration. The classification, as we show later, identifies dif-ferent kinds of duplicates. We have collected duplicates from five organisms. Thus the methodis tested against multiple duplicate types under multiple organisms.
Regardless of variation in the definitions, the impacts of duplicates are obvious. They affectthe biological databases: the database may be unnessarily large, impacting storage and retrieval.They affect the biological tasks: for instance, duplicates decrease the information density inBLAST, making biased search results [17](http://www.uniprot.org/help/proteome_redundancy). They affect biocuration: wasting biocurators’ time and efforts. They affect thebiological analysis: duplicates with inconsistent sequences or metadata can undermine infer-ence and statistical analysis.
These impacts lead to the necessity for both efficient and accurate duplicate detection. Someapplications need methods that are scalable in large datasets, whereas others require preciseknowledge of duplicates. Both false positive (distinct pairs labelled as duplicates) and false neg-ative (pairs that are not found) errors are problematic. For instance, merging of two recordsreferring to the same coding sequence with inconsistent annotations may lead to incorrect pre-diction of protein function. We now present these two kinds of methods.
Duplicate detection in genomic sequences databasesApproaches to identification of duplicate pairs that focus on efficiency are based on simple, heu-ristic criteria. Three representative methods include NRDB90, in which it is assumed that anypair with over 90% sequence identity is a duplicate, using short-word match to approximatesequence identity [18]; CD-HIT, with the same assumptions as NRDB90, using substring matchingto approximate sequence identity [19] (a faster version was released in 2012 [2]); and STARTCODE,where it is assumed that “duplicates” are pairs with a thresholded edit distance (counting inser-tions, deletions and substitutions), using a trie data structure to estimate the possible number ofedits [20].
However, recall that duplication is richer than simple redundancy. Records with similarsequences may not be duplicates and vice versa. For example, Swiss-Prot is one of the mostpopular protein resources in which expert curation is used. When records are merged, biocura-tors do not just rely on sequence identity to determine whether they are duplicates, but inmany cases will manually check the literature associated with the records. In this case, priorityhas been given to accuracy rather than efficiency, and thus it is necessary to have accuracy-based duplicate detection methods.
Accuracy-focused duplicate detection methods typically make use of expert-labelled data todevelop improved models. Such duplicate detection takes advantage of expert-curated dupli-cates, in one of two ways. One is to employ supervised learning techniques to train an auto-matic duplicate detection model [3]; the other is to employ approximate string matching suchas a Markov random model [21], shortest-path edit distance [22], or longest common prefixmatching [11]. However, a simple threshold for approximate string matching leads to inconsis-tent outcomes, as different kinds of duplicates may have different characteristics. Therefore weexplore the application of machine learning to overcome these limitations, with an emphasison coverage of duplicate diversity.
Applying (semi-) supervised learning to detection of duplicates is a promising and matureapproach. Since 2000 a range of methods have been proposed [23–25]; we summarise a
Supervised Biological Duplicate Record Detection
PLOS ONE | DOI:10.1371/journal.pone.0159644 August 4, 2016 4 / 20
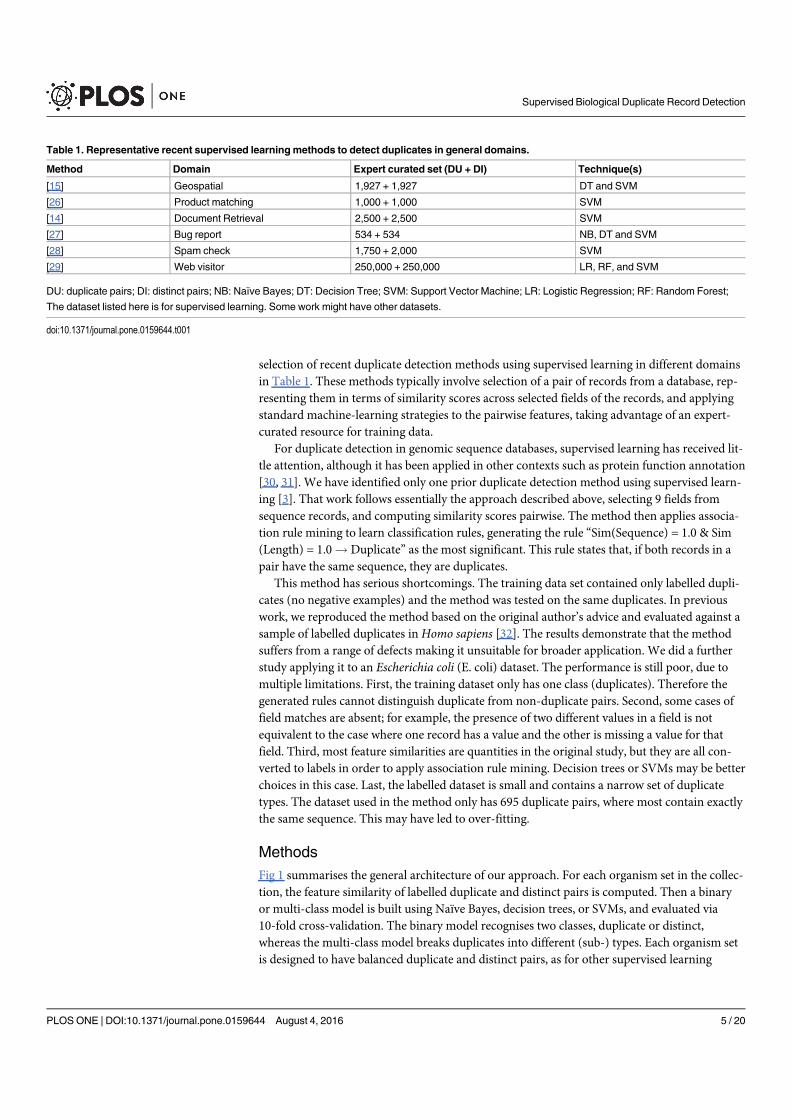
selection of recent duplicate detection methods using supervised learning in different domainsin Table 1. These methods typically involve selection of a pair of records from a database, rep-resenting them in terms of similarity scores across selected fields of the records, and applyingstandard machine-learning strategies to the pairwise features, taking advantage of an expert-curated resource for training data.
For duplicate detection in genomic sequence databases, supervised learning has received lit-tle attention, although it has been applied in other contexts such as protein function annotation[30, 31]. We have identified only one prior duplicate detection method using supervised learn-ing [3]. That work follows essentially the approach described above, selecting 9 fields fromsequence records, and computing similarity scores pairwise. The method then applies associa-tion rule mining to learn classification rules, generating the rule “Sim(Sequence) = 1.0 & Sim(Length) = 1.0! Duplicate” as the most significant. This rule states that, if both records in apair have the same sequence, they are duplicates.
This method has serious shortcomings. The training data set contained only labelled dupli-cates (no negative examples) and the method was tested on the same duplicates. In previouswork, we reproduced the method based on the original author’s advice and evaluated against asample of labelled duplicates inHomo sapiens [32]. The results demonstrate that the methodsuffers from a range of defects making it unsuitable for broader application. We did a furtherstudy applying it to an Escherichia coli (E. coli) dataset. The performance is still poor, due tomultiple limitations. First, the training dataset only has one class (duplicates). Therefore thegenerated rules cannot distinguish duplicate from non-duplicate pairs. Second, some cases offield matches are absent; for example, the presence of two different values in a field is notequivalent to the case where one record has a value and the other is missing a value for thatfield. Third, most feature similarities are quantities in the original study, but they are all con-verted to labels in order to apply association rule mining. Decision trees or SVMs may be betterchoices in this case. Last, the labelled dataset is small and contains a narrow set of duplicatetypes. The dataset used in the method only has 695 duplicate pairs, where most contain exactlythe same sequence. This may have led to over-fitting.
MethodsFig 1 summarises the general architecture of our approach. For each organism set in the collec-tion, the feature similarity of labelled duplicate and distinct pairs is computed. Then a binaryor multi-class model is built using Naïve Bayes, decision trees, or SVMs, and evaluated via10-fold cross-validation. The binary model recognises two classes, duplicate or distinct,whereas the multi-class model breaks duplicates into different (sub-) types. Each organism setis designed to have balanced duplicate and distinct pairs, as for other supervised learning
Table 1. Representative recent supervised learningmethods to detect duplicates in general domains.
Method Domain Expert curated set (DU + DI) Technique(s)
[15] Geospatial 1,927 + 1,927 DT and SVM
[26] Product matching 1,000 + 1,000 SVM
[14] Document Retrieval 2,500 + 2,500 SVM
[27] Bug report 534 + 534 NB, DT and SVM
[28] Spam check 1,750 + 2,000 SVM
[29] Web visitor 250,000 + 250,000 LR, RF, and SVM
DU: duplicate pairs; DI: distinct pairs; NB: Naïve Bayes; DT: Decision Tree; SVM: Support Vector Machine; LR: Logistic Regression; RF: Random Forest;
The dataset listed here is for supervised learning. Some work might have other datasets.
doi:10.1371/journal.pone.0159644.t001
Supervised Biological Duplicate Record Detection
PLOS ONE | DOI:10.1371/journal.pone.0159644 August 4, 2016 5 / 20
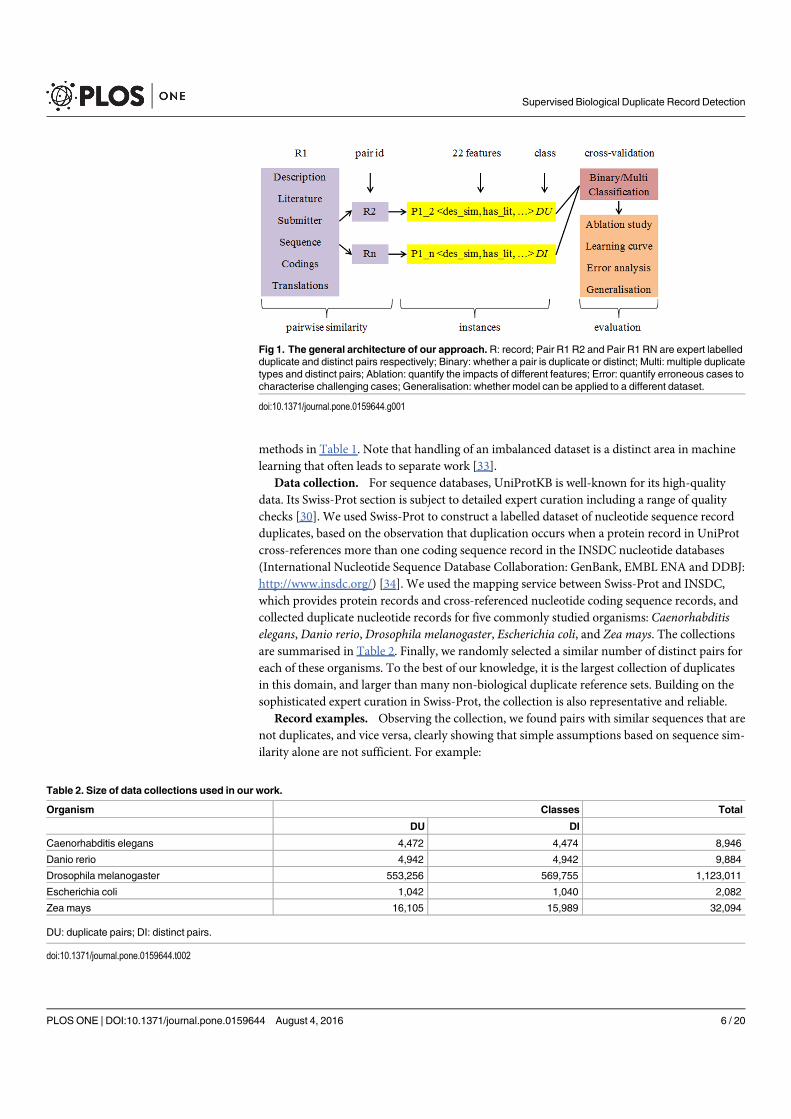
methods in Table 1. Note that handling of an imbalanced dataset is a distinct area in machinelearning that often leads to separate work [33].
Data collection. For sequence databases, UniProtKB is well-known for its high-qualitydata. Its Swiss-Prot section is subject to detailed expert curation including a range of qualitychecks [30]. We used Swiss-Prot to construct a labelled dataset of nucleotide sequence recordduplicates, based on the observation that duplication occurs when a protein record in UniProtcross-references more than one coding sequence record in the INSDC nucleotide databases(International Nucleotide Sequence Database Collaboration: GenBank, EMBL ENA and DDBJ:http://www.insdc.org/) [34]. We used the mapping service between Swiss-Prot and INSDC,which provides protein records and cross-referenced nucleotide coding sequence records, andcollected duplicate nucleotide records for five commonly studied organisms: Caenorhabditiselegans, Danio rerio, Drosophila melanogaster, Escherichia coli, and Zea mays. The collectionsare summarised in Table 2. Finally, we randomly selected a similar number of distinct pairs foreach of these organisms. To the best of our knowledge, it is the largest collection of duplicatesin this domain, and larger than many non-biological duplicate reference sets. Building on thesophisticated expert curation in Swiss-Prot, the collection is also representative and reliable.
Record examples. Observing the collection, we found pairs with similar sequences that arenot duplicates, and vice versa, clearly showing that simple assumptions based on sequence sim-ilarity alone are not sufficient. For example:
Fig 1. The general architecture of our approach. R: record; Pair R1 R2 and Pair R1 RN are expert labelledduplicate and distinct pairs respectively; Binary: whether a pair is duplicate or distinct; Multi: multiple duplicatetypes and distinct pairs; Ablation: quantify the impacts of different features; Error: quantify erroneous cases tocharacterise challenging cases; Generalisation: whether model can be applied to a different dataset.
doi:10.1371/journal.pone.0159644.g001
Table 2. Size of data collections used in our work.
Organism Classes Total
DU DI
Caenorhabditis elegans 4,472 4,474 8,946
Danio rerio 4,942 4,942 9,884
Drosophila melanogaster 553,256 569,755 1,123,011
Escherichia coli 1,042 1,040 2,082
Zea mays 16,105 15,989 32,094
DU: duplicate pairs; DI: distinct pairs.
doi:10.1371/journal.pone.0159644.t002
Supervised Biological Duplicate Record Detection
PLOS ONE | DOI:10.1371/journal.pone.0159644 August 4, 2016 6 / 20
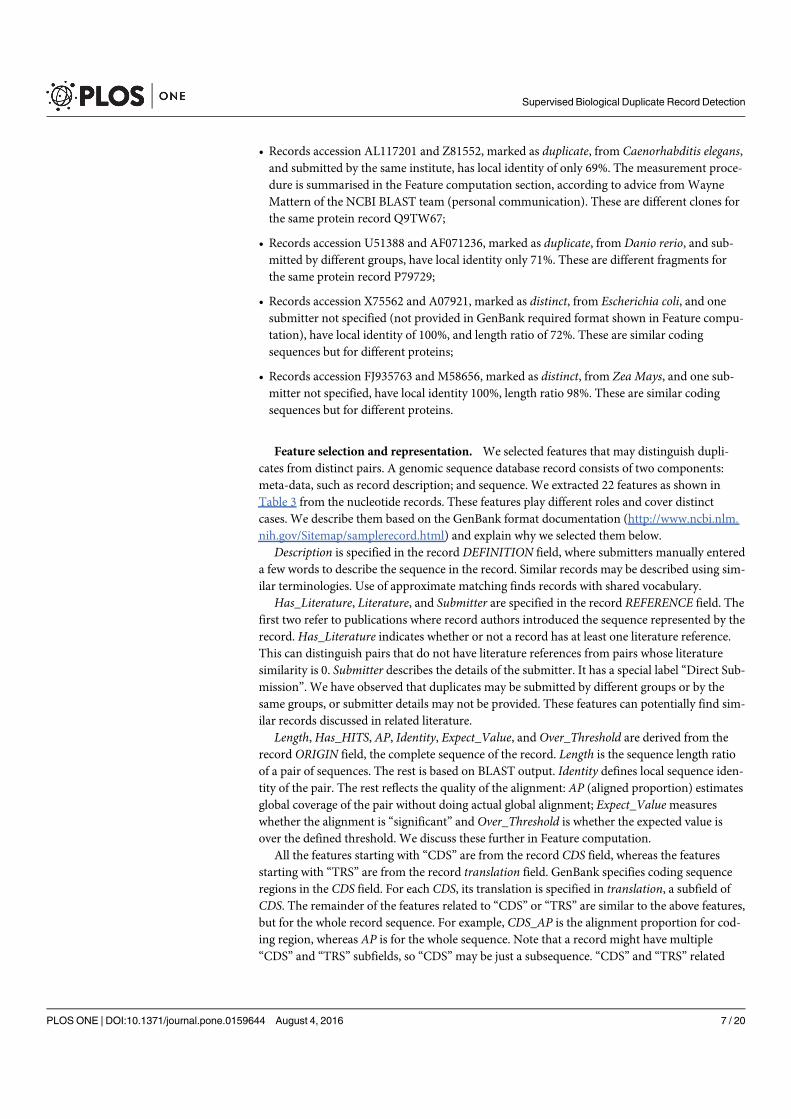
• Records accession AL117201 and Z81552, marked as duplicate, from Caenorhabditis elegans,and submitted by the same institute, has local identity of only 69%. The measurement proce-dure is summarised in the Feature computation section, according to advice fromWayneMattern of the NCBI BLAST team (personal communication). These are different clones forthe same protein record Q9TW67;
• Records accession U51388 and AF071236, marked as duplicate, from Danio rerio, and sub-mitted by different groups, have local identity only 71%. These are different fragments forthe same protein record P79729;
• Records accession X75562 and A07921, marked as distinct, from Escherichia coli, and onesubmitter not specified (not provided in GenBank required format shown in Feature compu-tation), have local identity of 100%, and length ratio of 72%. These are similar codingsequences but for different proteins;
• Records accession FJ935763 and M58656, marked as distinct, from Zea Mays, and one sub-mitter not specified, have local identity 100%, length ratio 98%. These are similar codingsequences but for different proteins.
Feature selection and representation. We selected features that may distinguish dupli-cates from distinct pairs. A genomic sequence database record consists of two components:meta-data, such as record description; and sequence. We extracted 22 features as shown inTable 3 from the nucleotide records. These features play different roles and cover distinctcases. We describe them based on the GenBank format documentation (http://www.ncbi.nlm.nih.gov/Sitemap/samplerecord.html) and explain why we selected them below.
Description is specified in the record DEFINITION field, where submitters manually entereda few words to describe the sequence in the record. Similar records may be described using sim-ilar terminologies. Use of approximate matching finds records with shared vocabulary.
Has_Literature, Literature, and Submitter are specified in the record REFERENCE field. Thefirst two refer to publications where record authors introduced the sequence represented by therecord. Has_Literature indicates whether or not a record has at least one literature reference.This can distinguish pairs that do not have literature references from pairs whose literaturesimilarity is 0. Submitter describes the details of the submitter. It has a special label “Direct Sub-mission”. We have observed that duplicates may be submitted by different groups or by thesame groups, or submitter details may not be provided. These features can potentially find sim-ilar records discussed in related literature.
Length,Has_HITS, AP, Identity, Expect_Value, and Over_Threshold are derived from therecord ORIGIN field, the complete sequence of the record. Length is the sequence length ratioof a pair of sequences. The rest is based on BLAST output. Identity defines local sequence iden-tity of the pair. The rest reflects the quality of the alignment: AP (aligned proportion) estimatesglobal coverage of the pair without doing actual global alignment; Expect_Valuemeasureswhether the alignment is “significant” and Over_Threshold is whether the expected value isover the defined threshold. We discuss these further in Feature computation.
All the features starting with “CDS” are from the record CDS field, whereas the featuresstarting with “TRS” are from the record translation field. GenBank specifies coding sequenceregions in the CDS field. For each CDS, its translation is specified in translation, a subfield ofCDS. The remainder of the features related to “CDS” or “TRS” are similar to the above features,but for the whole record sequence. For example, CDS_AP is the alignment proportion for cod-ing region, whereas AP is for the whole sequence. Note that a record might have multiple“CDS” and “TRS” subfields, so “CDS”may be just a subsequence. “CDS” and “TRS” related
Supervised Biological Duplicate Record Detection
PLOS ONE | DOI:10.1371/journal.pone.0159644 August 4, 2016 7 / 20
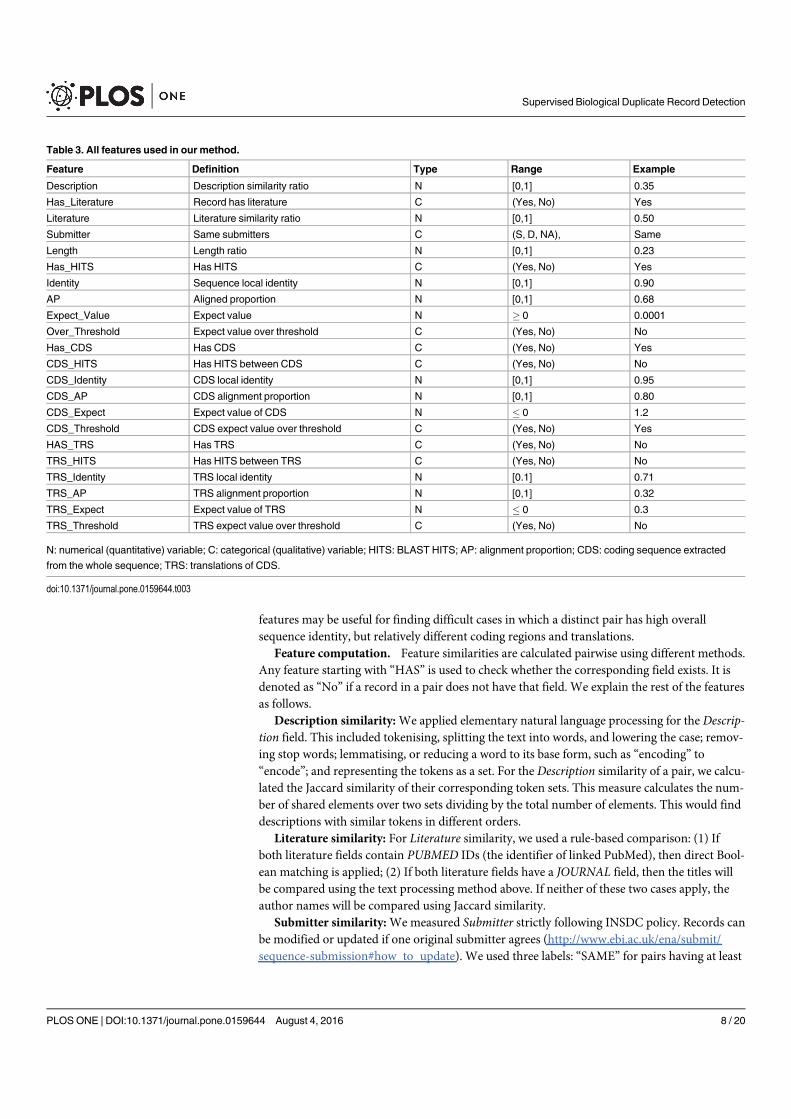
features may be useful for finding difficult cases in which a distinct pair has high overallsequence identity, but relatively different coding regions and translations.
Feature computation. Feature similarities are calculated pairwise using different methods.Any feature starting with “HAS” is used to check whether the corresponding field exists. It isdenoted as “No” if a record in a pair does not have that field. We explain the rest of the featuresas follows.
Description similarity:We applied elementary natural language processing for the Descrip-tion field. This included tokenising, splitting the text into words, and lowering the case; remov-ing stop words; lemmatising, or reducing a word to its base form, such as “encoding” to“encode”; and representing the tokens as a set. For the Description similarity of a pair, we calcu-lated the Jaccard similarity of their corresponding token sets. This measure calculates the num-ber of shared elements over two sets dividing by the total number of elements. This would finddescriptions with similar tokens in different orders.
Literature similarity: For Literature similarity, we used a rule-based comparison: (1) Ifboth literature fields contain PUBMED IDs (the identifier of linked PubMed), then direct Bool-ean matching is applied; (2) If both literature fields have a JOURNAL field, then the titles willbe compared using the text processing method above. If neither of these two cases apply, theauthor names will be compared using Jaccard similarity.
Submitter similarity:Wemeasured Submitter strictly following INSDC policy. Records canbe modified or updated if one original submitter agrees (http://www.ebi.ac.uk/ena/submit/sequence-submission#how_to_update). We used three labels: “SAME” for pairs having at least
Table 3. All features used in our method.
Feature Definition Type Range Example
Description Description similarity ratio N [0,1] 0.35
Has_Literature Record has literature C (Yes, No) Yes
Literature Literature similarity ratio N [0,1] 0.50
Submitter Same submitters C (S, D, NA), Same
Length Length ratio N [0,1] 0.23
Has_HITS Has HITS C (Yes, No) Yes
Identity Sequence local identity N [0,1] 0.90
AP Aligned proportion N [0,1] 0.68
Expect_Value Expect value N � 0 0.0001
Over_Threshold Expect value over threshold C (Yes, No) No
Has_CDS Has CDS C (Yes, No) Yes
CDS_HITS Has HITS between CDS C (Yes, No) No
CDS_Identity CDS local identity N [0,1] 0.95
CDS_AP CDS alignment proportion N [0,1] 0.80
CDS_Expect Expect value of CDS N � 0 1.2
CDS_Threshold CDS expect value over threshold C (Yes, No) Yes
HAS_TRS Has TRS C (Yes, No) No
TRS_HITS Has HITS between TRS C (Yes, No) No
TRS_Identity TRS local identity N [0.1] 0.71
TRS_AP TRS alignment proportion N [0,1] 0.32
TRS_Expect Expect value of TRS N � 0 0.3
TRS_Threshold TRS expect value over threshold C (Yes, No) No
N: numerical (quantitative) variable; C: categorical (qualitative) variable; HITS: BLAST HITS; AP: alignment proportion; CDS: coding sequence extracted
from the whole sequence; TRS: translations of CDS.
doi:10.1371/journal.pone.0159644.t003
Supervised Biological Duplicate Record Detection
PLOS ONE | DOI:10.1371/journal.pone.0159644 August 4, 2016 8 / 20
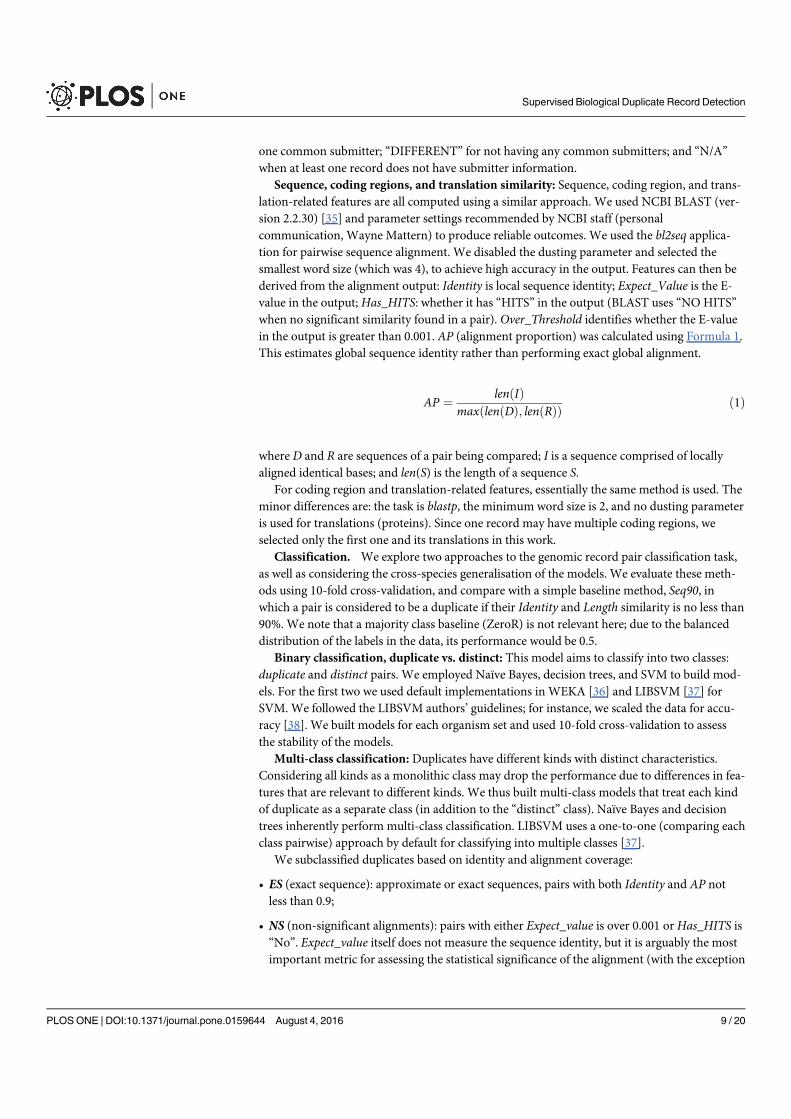
one common submitter; “DIFFERENT” for not having any common submitters; and “N/A”when at least one record does not have submitter information.
Sequence, coding regions, and translation similarity: Sequence, coding region, and trans-lation-related features are all computed using a similar approach. We used NCBI BLAST (ver-sion 2.2.30) [35] and parameter settings recommended by NCBI staff (personalcommunication, Wayne Mattern) to produce reliable outcomes. We used the bl2seq applica-tion for pairwise sequence alignment. We disabled the dusting parameter and selected thesmallest word size (which was 4), to achieve high accuracy in the output. Features can then bederived from the alignment output: Identity is local sequence identity; Expect_Value is the E-value in the output; Has_HITS: whether it has “HITS” in the output (BLAST uses “NOHITS”when no significant similarity found in a pair). Over_Threshold identifies whether the E-valuein the output is greater than 0.001. AP (alignment proportion) was calculated using Formula 1.This estimates global sequence identity rather than performing exact global alignment.
AP ¼ lenðIÞmaxðlenðDÞ; lenðRÞÞ ð1Þ
where D and R are sequences of a pair being compared; I is a sequence comprised of locallyaligned identical bases; and len(S) is the length of a sequence S.
For coding region and translation-related features, essentially the same method is used. Theminor differences are: the task is blastp, the minimum word size is 2, and no dusting parameteris used for translations (proteins). Since one record may have multiple coding regions, weselected only the first one and its translations in this work.
Classification. We explore two approaches to the genomic record pair classification task,as well as considering the cross-species generalisation of the models. We evaluate these meth-ods using 10-fold cross-validation, and compare with a simple baseline method, Seq90, inwhich a pair is considered to be a duplicate if their Identity and Length similarity is no less than90%. We note that a majority class baseline (ZeroR) is not relevant here; due to the balanceddistribution of the labels in the data, its performance would be 0.5.
Binary classification, duplicate vs. distinct: This model aims to classify into two classes:duplicate and distinct pairs. We employed Naïve Bayes, decision trees, and SVM to build mod-els. For the first two we used default implementations in WEKA [36] and LIBSVM [37] forSVM. We followed the LIBSVM authors’ guidelines; for instance, we scaled the data for accu-racy [38]. We built models for each organism set and used 10-fold cross-validation to assessthe stability of the models.
Multi-class classification: Duplicates have different kinds with distinct characteristics.Considering all kinds as a monolithic class may drop the performance due to differences in fea-tures that are relevant to different kinds. We thus built multi-class models that treat each kindof duplicate as a separate class (in addition to the “distinct” class). Naïve Bayes and decisiontrees inherently perform multi-class classification. LIBSVM uses a one-to-one (comparing eachclass pairwise) approach by default for classifying into multiple classes [37].
We subclassified duplicates based on identity and alignment coverage:
• ES (exact sequence): approximate or exact sequences, pairs with both Identity and AP notless than 0.9;
• NS (non-significant alignments): pairs with either Expect_value is over 0.001 orHas_HITS is“No”. Expect_value itself does not measure the sequence identity, but it is arguably the mostimportant metric for assessing the statistical significance of the alignment (with the exception
Supervised Biological Duplicate Record Detection
PLOS ONE | DOI:10.1371/journal.pone.0159644 August 4, 2016 9 / 20
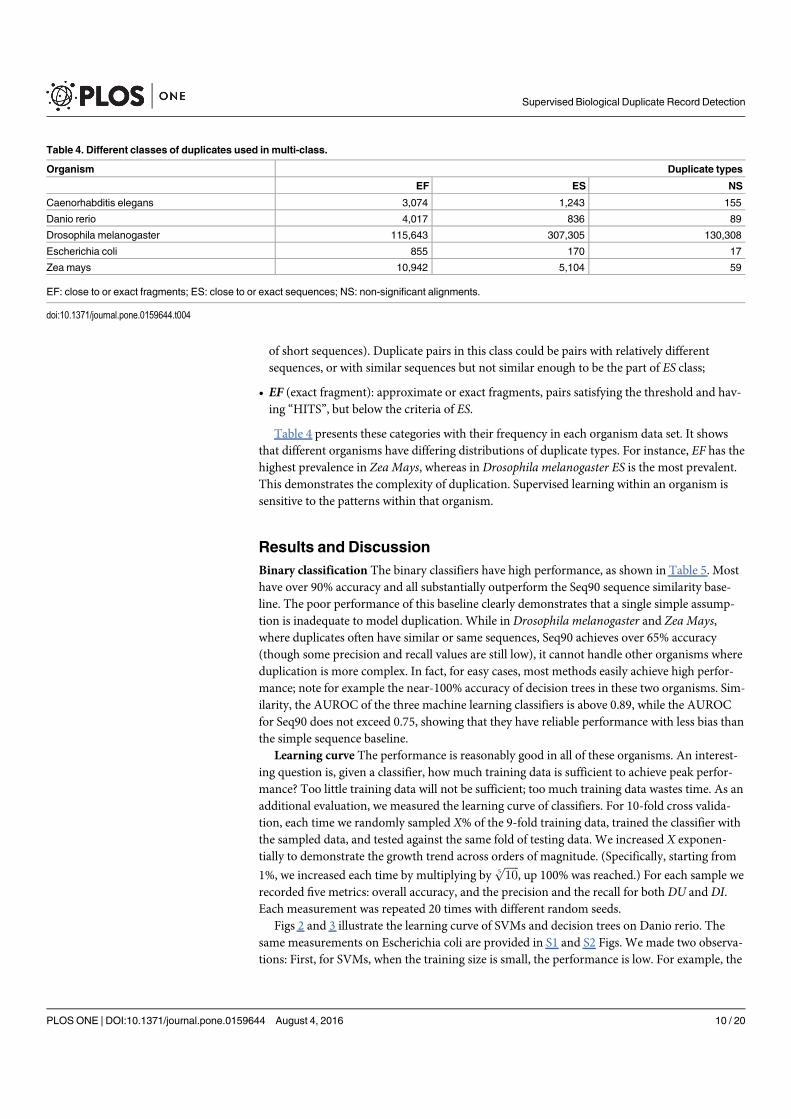
of short sequences). Duplicate pairs in this class could be pairs with relatively differentsequences, or with similar sequences but not similar enough to be the part of ES class;
• EF (exact fragment): approximate or exact fragments, pairs satisfying the threshold and hav-ing “HITS”, but below the criteria of ES.
Table 4 presents these categories with their frequency in each organism data set. It showsthat different organisms have differing distributions of duplicate types. For instance, EF has thehighest prevalence in Zea Mays, whereas in Drosophila melanogaster ES is the most prevalent.This demonstrates the complexity of duplication. Supervised learning within an organism issensitive to the patterns within that organism.
Results and DiscussionBinary classification The binary classifiers have high performance, as shown in Table 5. Mosthave over 90% accuracy and all substantially outperform the Seq90 sequence similarity base-line. The poor performance of this baseline clearly demonstrates that a single simple assump-tion is inadequate to model duplication. While in Drosophila melanogaster and Zea Mays,where duplicates often have similar or same sequences, Seq90 achieves over 65% accuracy(though some precision and recall values are still low), it cannot handle other organisms whereduplication is more complex. In fact, for easy cases, most methods easily achieve high perfor-mance; note for example the near-100% accuracy of decision trees in these two organisms. Sim-ilarity, the AUROC of the three machine learning classifiers is above 0.89, while the AUROCfor Seq90 does not exceed 0.75, showing that they have reliable performance with less bias thanthe simple sequence baseline.
Learning curve The performance is reasonably good in all of these organisms. An interest-ing question is, given a classifier, how much training data is sufficient to achieve peak perfor-mance? Too little training data will not be sufficient; too much training data wastes time. As anadditional evaluation, we measured the learning curve of classifiers. For 10-fold cross valida-tion, each time we randomly sampled X% of the 9-fold training data, trained the classifier withthe sampled data, and tested against the same fold of testing data. We increased X exponen-tially to demonstrate the growth trend across orders of magnitude. (Specifically, starting from
1%, we increased each time by multiplying byffiffiffiffiffi
105p
, up 100% was reached.) For each sample werecorded five metrics: overall accuracy, and the precision and the recall for both DU and DI.Each measurement was repeated 20 times with different random seeds.
Figs 2 and 3 illustrate the learning curve of SVMs and decision trees on Danio rerio. Thesame measurements on Escherichia coli are provided in S1 and S2 Figs. We made two observa-tions: First, for SVMs, when the training size is small, the performance is low. For example, the
Table 4. Different classes of duplicates used in multi-class.
Organism Duplicate types
EF ES NS
Caenorhabditis elegans 3,074 1,243 155
Danio rerio 4,017 836 89
Drosophila melanogaster 115,643 307,305 130,308
Escherichia coli 855 170 17
Zea mays 10,942 5,104 59
EF: close to or exact fragments; ES: close to or exact sequences; NS: non-significant alignments.
doi:10.1371/journal.pone.0159644.t004
Supervised Biological Duplicate Record Detection
PLOS ONE | DOI:10.1371/journal.pone.0159644 August 4, 2016 10 / 20
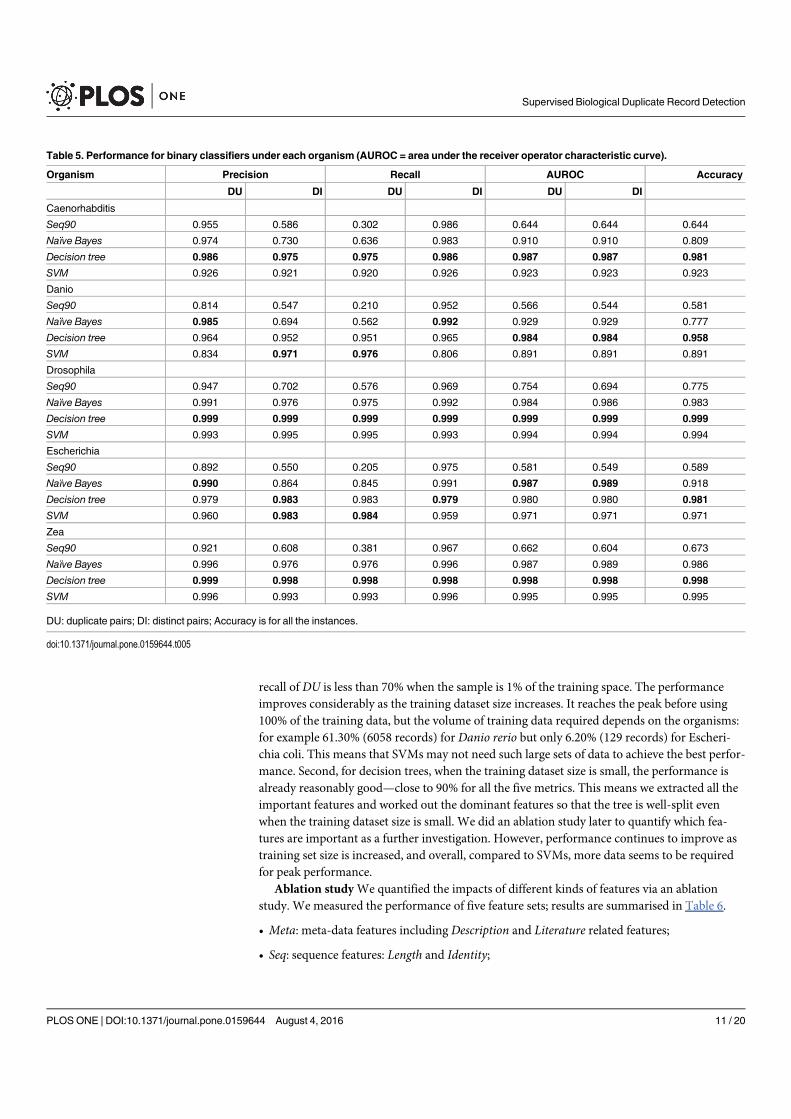
recall of DU is less than 70% when the sample is 1% of the training space. The performanceimproves considerably as the training dataset size increases. It reaches the peak before using100% of the training data, but the volume of training data required depends on the organisms:for example 61.30% (6058 records) for Danio rerio but only 6.20% (129 records) for Escheri-chia coli. This means that SVMs may not need such large sets of data to achieve the best perfor-mance. Second, for decision trees, when the training dataset size is small, the performance isalready reasonably good—close to 90% for all the five metrics. This means we extracted all theimportant features and worked out the dominant features so that the tree is well-split evenwhen the training dataset size is small. We did an ablation study later to quantify which fea-tures are important as a further investigation. However, performance continues to improve astraining set size is increased, and overall, compared to SVMs, more data seems to be requiredfor peak performance.
Ablation studyWe quantified the impacts of different kinds of features via an ablationstudy. We measured the performance of five feature sets; results are summarised in Table 6.
• Meta: meta-data features including Description and Literature related features;
• Seq: sequence features: Length and Identity;
Table 5. Performance for binary classifiers under each organism (AUROC = area under the receiver operator characteristic curve).
Organism Precision Recall AUROC Accuracy
DU DI DU DI DU DI
Caenorhabditis
Seq90 0.955 0.586 0.302 0.986 0.644 0.644 0.644
Naïve Bayes 0.974 0.730 0.636 0.983 0.910 0.910 0.809
Decision tree 0.986 0.975 0.975 0.986 0.987 0.987 0.981
SVM 0.926 0.921 0.920 0.926 0.923 0.923 0.923
Danio
Seq90 0.814 0.547 0.210 0.952 0.566 0.544 0.581
Naïve Bayes 0.985 0.694 0.562 0.992 0.929 0.929 0.777
Decision tree 0.964 0.952 0.951 0.965 0.984 0.984 0.958
SVM 0.834 0.971 0.976 0.806 0.891 0.891 0.891
Drosophila
Seq90 0.947 0.702 0.576 0.969 0.754 0.694 0.775
Naïve Bayes 0.991 0.976 0.975 0.992 0.984 0.986 0.983
Decision tree 0.999 0.999 0.999 0.999 0.999 0.999 0.999
SVM 0.993 0.995 0.995 0.993 0.994 0.994 0.994
Escherichia
Seq90 0.892 0.550 0.205 0.975 0.581 0.549 0.589
Naïve Bayes 0.990 0.864 0.845 0.991 0.987 0.989 0.918
Decision tree 0.979 0.983 0.983 0.979 0.980 0.980 0.981
SVM 0.960 0.983 0.984 0.959 0.971 0.971 0.971
Zea
Seq90 0.921 0.608 0.381 0.967 0.662 0.604 0.673
Naïve Bayes 0.996 0.976 0.976 0.996 0.987 0.989 0.986
Decision tree 0.999 0.998 0.998 0.998 0.998 0.998 0.998
SVM 0.996 0.993 0.993 0.996 0.995 0.995 0.995
DU: duplicate pairs; DI: distinct pairs; Accuracy is for all the instances.
doi:10.1371/journal.pone.0159644.t005
Supervised Biological Duplicate Record Detection
PLOS ONE | DOI:10.1371/journal.pone.0159644 August 4, 2016 11 / 20
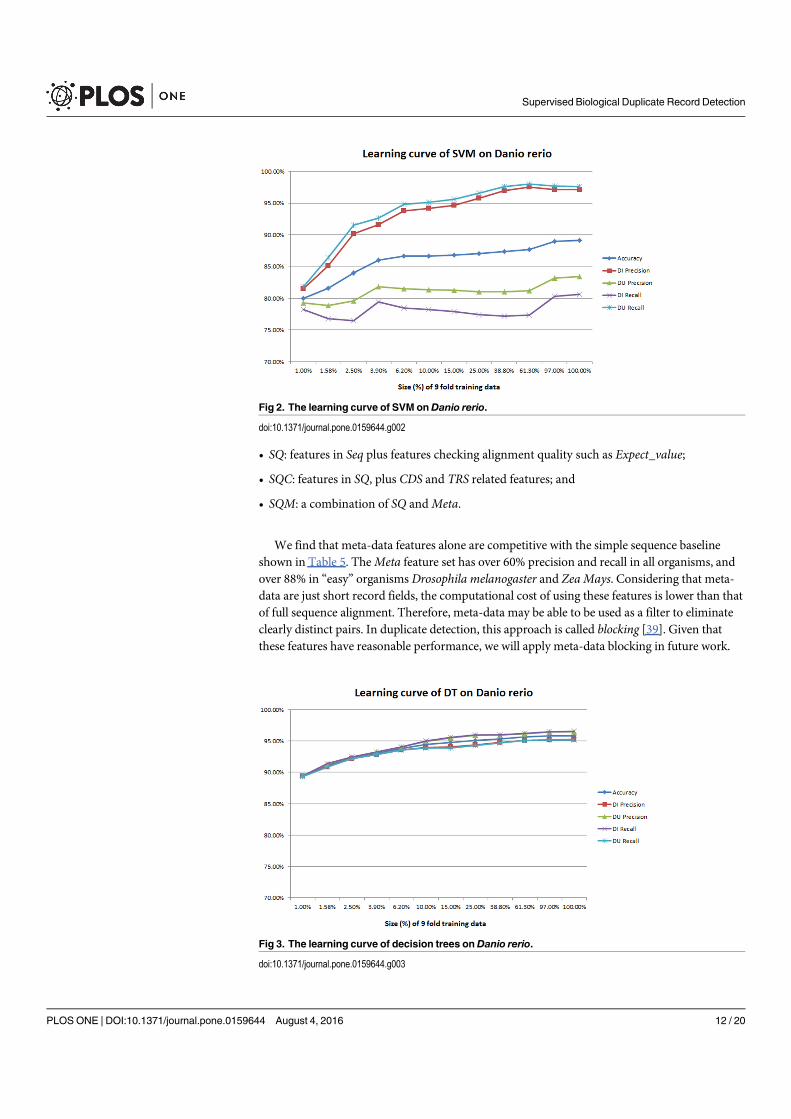
• SQ: features in Seq plus features checking alignment quality such as Expect_value;
• SQC: features in SQ, plus CDS and TRS related features; and
• SQM: a combination of SQ andMeta.
We find that meta-data features alone are competitive with the simple sequence baselineshown in Table 5. TheMeta feature set has over 60% precision and recall in all organisms, andover 88% in “easy” organisms Drosophila melanogaster and Zea Mays. Considering that meta-data are just short record fields, the computational cost of using these features is lower than thatof full sequence alignment. Therefore, meta-data may be able to be used as a filter to eliminateclearly distinct pairs. In duplicate detection, this approach is called blocking [39]. Given thatthese features have reasonable performance, we will apply meta-data blocking in future work.
Fig 2. The learning curve of SVM onDanio rerio.
doi:10.1371/journal.pone.0159644.g002
Fig 3. The learning curve of decision trees onDanio rerio.
doi:10.1371/journal.pone.0159644.g003
Supervised Biological Duplicate Record Detection
PLOS ONE | DOI:10.1371/journal.pone.0159644 August 4, 2016 12 / 20
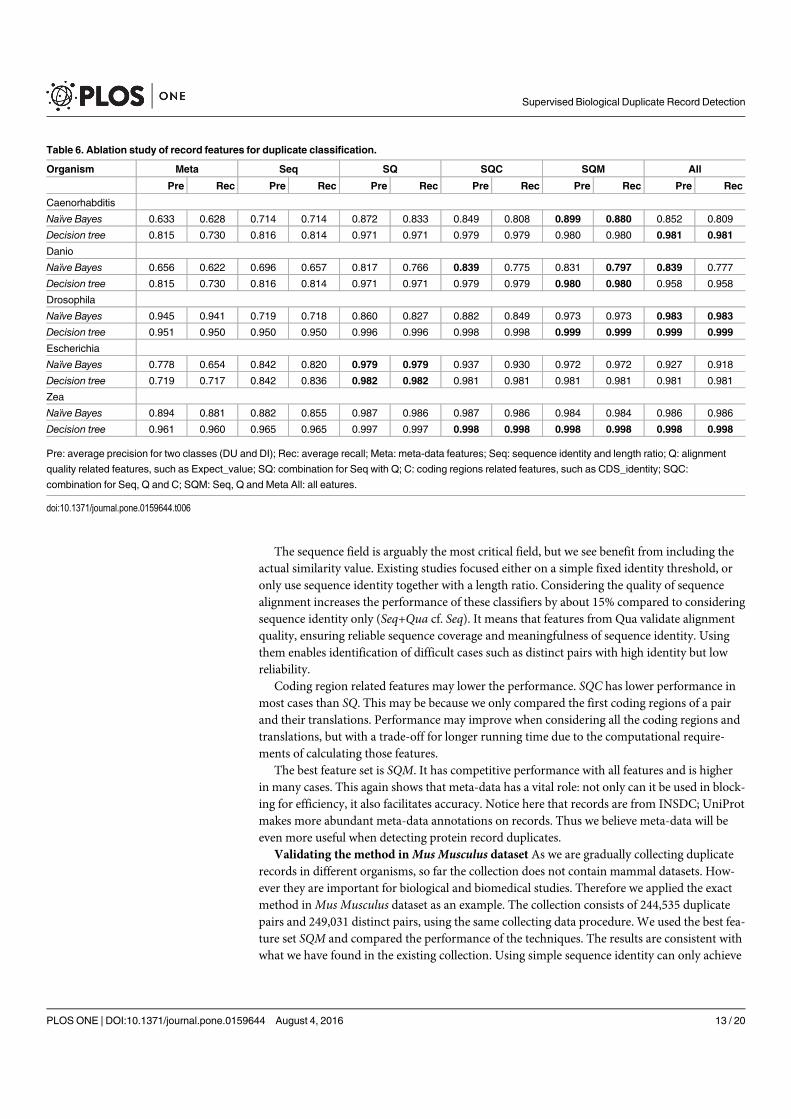
The sequence field is arguably the most critical field, but we see benefit from including theactual similarity value. Existing studies focused either on a simple fixed identity threshold, oronly use sequence identity together with a length ratio. Considering the quality of sequencealignment increases the performance of these classifiers by about 15% compared to consideringsequence identity only (Seq+Qua cf. Seq). It means that features from Qua validate alignmentquality, ensuring reliable sequence coverage and meaningfulness of sequence identity. Usingthem enables identification of difficult cases such as distinct pairs with high identity but lowreliability.
Coding region related features may lower the performance. SQC has lower performance inmost cases than SQ. This may be because we only compared the first coding regions of a pairand their translations. Performance may improve when considering all the coding regions andtranslations, but with a trade-off for longer running time due to the computational require-ments of calculating those features.
The best feature set is SQM. It has competitive performance with all features and is higherin many cases. This again shows that meta-data has a vital role: not only can it be used in block-ing for efficiency, it also facilitates accuracy. Notice here that records are from INSDC; UniProtmakes more abundant meta-data annotations on records. Thus we believe meta-data will beeven more useful when detecting protein record duplicates.
Validating the method inMus Musculus dataset As we are gradually collecting duplicaterecords in different organisms, so far the collection does not contain mammal datasets. How-ever they are important for biological and biomedical studies. Therefore we applied the exactmethod inMus Musculus dataset as an example. The collection consists of 244,535 duplicatepairs and 249,031 distinct pairs, using the same collecting data procedure. We used the best fea-ture set SQM and compared the performance of the techniques. The results are consistent withwhat we have found in the existing collection. Using simple sequence identity can only achieve
Table 6. Ablation study of record features for duplicate classification.
Organism Meta Seq SQ SQC SQM All
Pre Rec Pre Rec Pre Rec Pre Rec Pre Rec Pre Rec
Caenorhabditis
Naïve Bayes 0.633 0.628 0.714 0.714 0.872 0.833 0.849 0.808 0.899 0.880 0.852 0.809
Decision tree 0.815 0.730 0.816 0.814 0.971 0.971 0.979 0.979 0.980 0.980 0.981 0.981
Danio
Naïve Bayes 0.656 0.622 0.696 0.657 0.817 0.766 0.839 0.775 0.831 0.797 0.839 0.777
Decision tree 0.815 0.730 0.816 0.814 0.971 0.971 0.979 0.979 0.980 0.980 0.958 0.958
Drosophila
Naïve Bayes 0.945 0.941 0.719 0.718 0.860 0.827 0.882 0.849 0.973 0.973 0.983 0.983
Decision tree 0.951 0.950 0.950 0.950 0.996 0.996 0.998 0.998 0.999 0.999 0.999 0.999
Escherichia
Naïve Bayes 0.778 0.654 0.842 0.820 0.979 0.979 0.937 0.930 0.972 0.972 0.927 0.918
Decision tree 0.719 0.717 0.842 0.836 0.982 0.982 0.981 0.981 0.981 0.981 0.981 0.981
Zea
Naïve Bayes 0.894 0.881 0.882 0.855 0.987 0.986 0.987 0.986 0.984 0.984 0.986 0.986
Decision tree 0.961 0.960 0.965 0.965 0.997 0.997 0.998 0.998 0.998 0.998 0.998 0.998
Pre: average precision for two classes (DU and DI); Rec: average recall; Meta: meta-data features; Seq: sequence identity and length ratio; Q: alignment
quality related features, such as Expect_value; SQ: combination for Seq with Q; C: coding regions related features, such as CDS_identity; SQC:
combination for Seq, Q and C; SQM: Seq, Q and Meta All: all eatures.
doi:10.1371/journal.pone.0159644.t006
Supervised Biological Duplicate Record Detection
PLOS ONE | DOI:10.1371/journal.pone.0159644 August 4, 2016 13 / 20
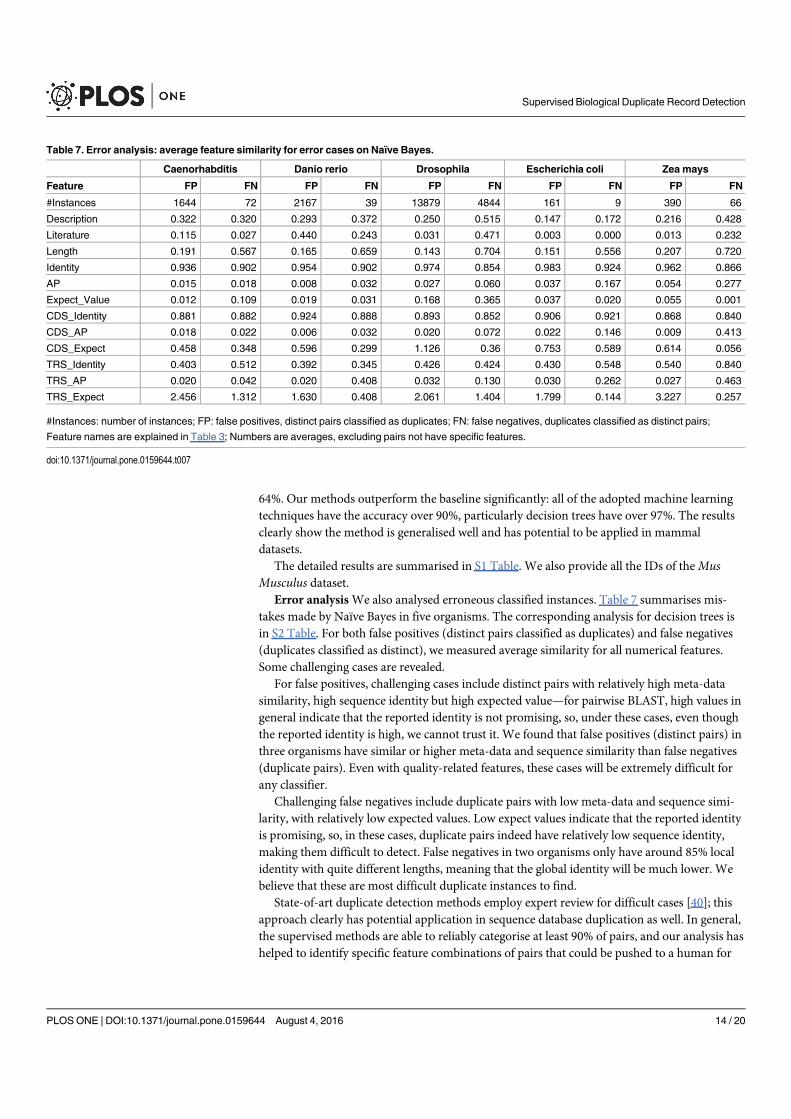
64%. Our methods outperform the baseline significantly: all of the adopted machine learningtechniques have the accuracy over 90%, particularly decision trees have over 97%. The resultsclearly show the method is generalised well and has potential to be applied in mammaldatasets.
The detailed results are summarised in S1 Table. We also provide all the IDs of theMusMusculus dataset.
Error analysisWe also analysed erroneous classified instances. Table 7 summarises mis-takes made by Naïve Bayes in five organisms. The corresponding analysis for decision trees isin S2 Table. For both false positives (distinct pairs classified as duplicates) and false negatives(duplicates classified as distinct), we measured average similarity for all numerical features.Some challenging cases are revealed.
For false positives, challenging cases include distinct pairs with relatively high meta-datasimilarity, high sequence identity but high expected value—for pairwise BLAST, high values ingeneral indicate that the reported identity is not promising, so, under these cases, even thoughthe reported identity is high, we cannot trust it. We found that false positives (distinct pairs) inthree organisms have similar or higher meta-data and sequence similarity than false negatives(duplicate pairs). Even with quality-related features, these cases will be extremely difficult forany classifier.
Challenging false negatives include duplicate pairs with low meta-data and sequence simi-larity, with relatively low expected values. Low expect values indicate that the reported identityis promising, so, in these cases, duplicate pairs indeed have relatively low sequence identity,making them difficult to detect. False negatives in two organisms only have around 85% localidentity with quite different lengths, meaning that the global identity will be much lower. Webelieve that these are most difficult duplicate instances to find.
State-of-art duplicate detection methods employ expert review for difficult cases [40]; thisapproach clearly has potential application in sequence database duplication as well. In general,the supervised methods are able to reliably categorise at least 90% of pairs, and our analysis hashelped to identify specific feature combinations of pairs that could be pushed to a human for
Table 7. Error analysis: average feature similarity for error cases on Naïve Bayes.
Caenorhabditis Danio rerio Drosophila Escherichia coli Zea mays
Feature FP FN FP FN FP FN FP FN FP FN
#Instances 1644 72 2167 39 13879 4844 161 9 390 66
Description 0.322 0.320 0.293 0.372 0.250 0.515 0.147 0.172 0.216 0.428
Literature 0.115 0.027 0.440 0.243 0.031 0.471 0.003 0.000 0.013 0.232
Length 0.191 0.567 0.165 0.659 0.143 0.704 0.151 0.556 0.207 0.720
Identity 0.936 0.902 0.954 0.902 0.974 0.854 0.983 0.924 0.962 0.866
AP 0.015 0.018 0.008 0.032 0.027 0.060 0.037 0.167 0.054 0.277
Expect_Value 0.012 0.109 0.019 0.031 0.168 0.365 0.037 0.020 0.055 0.001
CDS_Identity 0.881 0.882 0.924 0.888 0.893 0.852 0.906 0.921 0.868 0.840
CDS_AP 0.018 0.022 0.006 0.032 0.020 0.072 0.022 0.146 0.009 0.413
CDS_Expect 0.458 0.348 0.596 0.299 1.126 0.36 0.753 0.589 0.614 0.056
TRS_Identity 0.403 0.512 0.392 0.345 0.426 0.424 0.430 0.548 0.540 0.840
TRS_AP 0.020 0.042 0.020 0.408 0.032 0.130 0.030 0.262 0.027 0.463
TRS_Expect 2.456 1.312 1.630 0.408 2.061 1.404 1.799 0.144 3.227 0.257
#Instances: number of instances; FP: false positives, distinct pairs classified as duplicates; FN: false negatives, duplicates classified as distinct pairs;
Feature names are explained in Table 3; Numbers are averages, excluding pairs not have specific features.
doi:10.1371/journal.pone.0159644.t007
Supervised Biological Duplicate Record Detection
PLOS ONE | DOI:10.1371/journal.pone.0159644 August 4, 2016 14 / 20
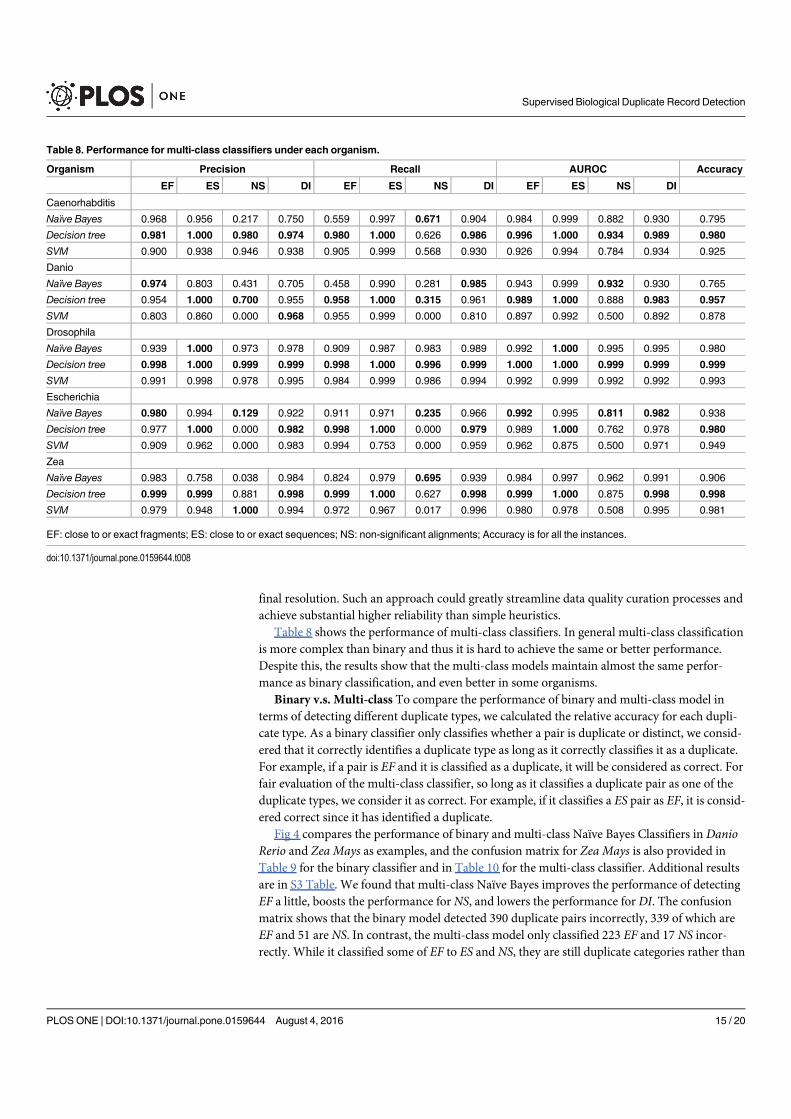
final resolution. Such an approach could greatly streamline data quality curation processes andachieve substantial higher reliability than simple heuristics.
Table 8 shows the performance of multi-class classifiers. In general multi-class classificationis more complex than binary and thus it is hard to achieve the same or better performance.Despite this, the results show that the multi-class models maintain almost the same perfor-mance as binary classification, and even better in some organisms.
Binary v.s. Multi-class To compare the performance of binary and multi-class model interms of detecting different duplicate types, we calculated the relative accuracy for each dupli-cate type. As a binary classifier only classifies whether a pair is duplicate or distinct, we consid-ered that it correctly identifies a duplicate type as long as it correctly classifies it as a duplicate.For example, if a pair is EF and it is classified as a duplicate, it will be considered as correct. Forfair evaluation of the multi-class classifier, so long as it classifies a duplicate pair as one of theduplicate types, we consider it as correct. For example, if it classifies a ES pair as EF, it is consid-ered correct since it has identified a duplicate.
Fig 4 compares the performance of binary and multi-class Naïve Bayes Classifiers in DanioRerio and Zea Mays as examples, and the confusion matrix for Zea Mays is also provided inTable 9 for the binary classifier and in Table 10 for the multi-class classifier. Additional resultsare in S3 Table. We found that multi-class Naïve Bayes improves the performance of detectingEF a little, boosts the performance for NS, and lowers the performance for DI. The confusionmatrix shows that the binary model detected 390 duplicate pairs incorrectly, 339 of which areEF and 51 are NS. In contrast, the multi-class model only classified 223 EF and 17 NS incor-rectly. While it classified some of EF to ES and NS, they are still duplicate categories rather than
Table 8. Performance for multi-class classifiers under each organism.
Organism Precision Recall AUROC Accuracy
EF ES NS DI EF ES NS DI EF ES NS DI
Caenorhabditis
Naïve Bayes 0.968 0.956 0.217 0.750 0.559 0.997 0.671 0.904 0.984 0.999 0.882 0.930 0.795
Decision tree 0.981 1.000 0.980 0.974 0.980 1.000 0.626 0.986 0.996 1.000 0.934 0.989 0.980
SVM 0.900 0.938 0.946 0.938 0.905 0.999 0.568 0.930 0.926 0.994 0.784 0.934 0.925
Danio
Naïve Bayes 0.974 0.803 0.431 0.705 0.458 0.990 0.281 0.985 0.943 0.999 0.932 0.930 0.765
Decision tree 0.954 1.000 0.700 0.955 0.958 1.000 0.315 0.961 0.989 1.000 0.888 0.983 0.957
SVM 0.803 0.860 0.000 0.968 0.955 0.999 0.000 0.810 0.897 0.992 0.500 0.892 0.878
Drosophila
Naïve Bayes 0.939 1.000 0.973 0.978 0.909 0.987 0.983 0.989 0.992 1.000 0.995 0.995 0.980
Decision tree 0.998 1.000 0.999 0.999 0.998 1.000 0.996 0.999 1.000 1.000 0.999 0.999 0.999
SVM 0.991 0.998 0.978 0.995 0.984 0.999 0.986 0.994 0.992 0.999 0.992 0.992 0.993
Escherichia
Naïve Bayes 0.980 0.994 0.129 0.922 0.911 0.971 0.235 0.966 0.992 0.995 0.811 0.982 0.938
Decision tree 0.977 1.000 0.000 0.982 0.998 1.000 0.000 0.979 0.989 1.000 0.762 0.978 0.980
SVM 0.909 0.962 0.000 0.983 0.994 0.753 0.000 0.959 0.962 0.875 0.500 0.971 0.949
Zea
Naïve Bayes 0.983 0.758 0.038 0.984 0.824 0.979 0.695 0.939 0.984 0.997 0.962 0.991 0.906
Decision tree 0.999 0.999 0.881 0.998 0.999 1.000 0.627 0.998 0.999 1.000 0.875 0.998 0.998
SVM 0.979 0.948 1.000 0.994 0.972 0.967 0.017 0.996 0.980 0.978 0.508 0.995 0.981
EF: close to or exact fragments; ES: close to or exact sequences; NS: non-significant alignments; Accuracy is for all the instances.
doi:10.1371/journal.pone.0159644.t008
Supervised Biological Duplicate Record Detection
PLOS ONE | DOI:10.1371/journal.pone.0159644 August 4, 2016 15 / 20
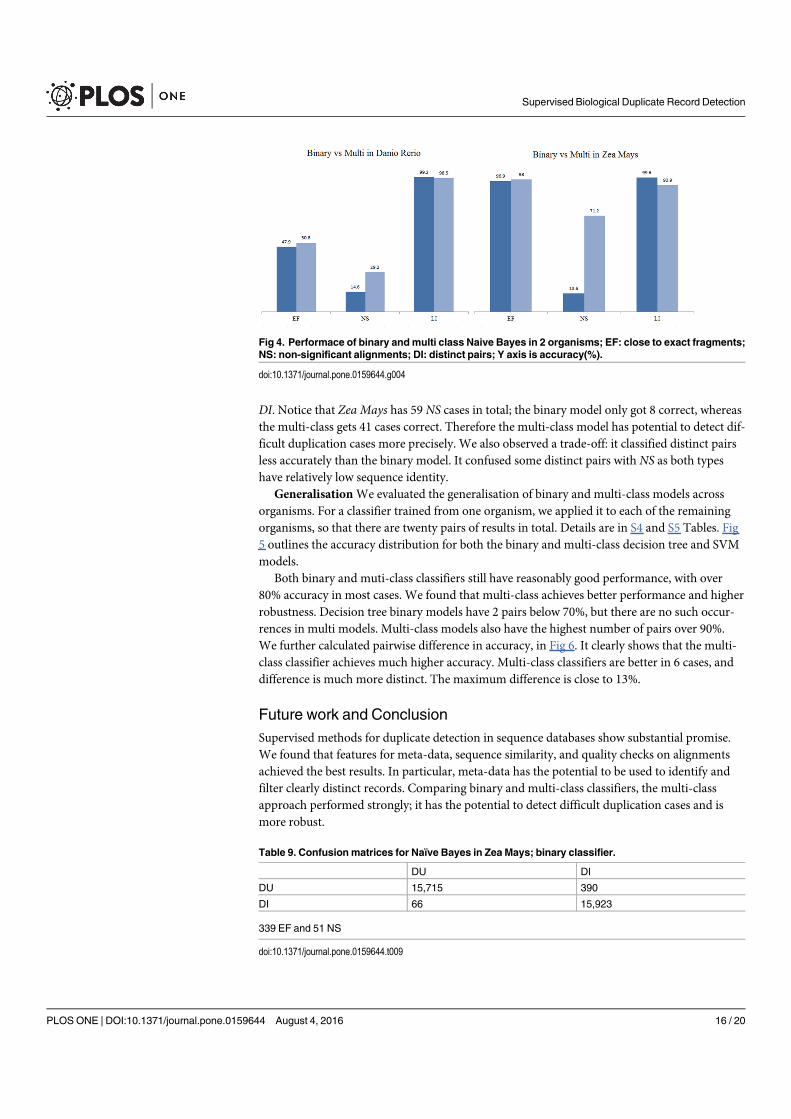
DI. Notice that Zea Mays has 59 NS cases in total; the binary model only got 8 correct, whereasthe multi-class gets 41 cases correct. Therefore the multi-class model has potential to detect dif-ficult duplication cases more precisely. We also observed a trade-off: it classified distinct pairsless accurately than the binary model. It confused some distinct pairs with NS as both typeshave relatively low sequence identity.
GeneralisationWe evaluated the generalisation of binary and multi-class models acrossorganisms. For a classifier trained from one organism, we applied it to each of the remainingorganisms, so that there are twenty pairs of results in total. Details are in S4 and S5 Tables. Fig5 outlines the accuracy distribution for both the binary and multi-class decision tree and SVMmodels.
Both binary and muti-class classifiers still have reasonably good performance, with over80% accuracy in most cases. We found that multi-class achieves better performance and higherrobustness. Decision tree binary models have 2 pairs below 70%, but there are no such occur-rences in multi models. Multi-class models also have the highest number of pairs over 90%.We further calculated pairwise difference in accuracy, in Fig 6. It clearly shows that the multi-class classifier achieves much higher accuracy. Multi-class classifiers are better in 6 cases, anddifference is much more distinct. The maximum difference is close to 13%.
Future work and ConclusionSupervised methods for duplicate detection in sequence databases show substantial promise.We found that features for meta-data, sequence similarity, and quality checks on alignmentsachieved the best results. In particular, meta-data has the potential to be used to identify andfilter clearly distinct records. Comparing binary and multi-class classifiers, the multi-classapproach performed strongly; it has the potential to detect difficult duplication cases and ismore robust.
Fig 4. Performace of binary andmulti class Naive Bayes in 2 organisms; EF: close to exact fragments;NS: non-significant alignments; DI: distinct pairs; Y axis is accuracy(%).
doi:10.1371/journal.pone.0159644.g004
Table 9. Confusion matrices for Naïve Bayes in Zea Mays; binary classifier.
DU DI
DU 15,715 390
DI 66 15,923
339 EF and 51 NS
doi:10.1371/journal.pone.0159644.t009
Supervised Biological Duplicate Record Detection
PLOS ONE | DOI:10.1371/journal.pone.0159644 August 4, 2016 16 / 20
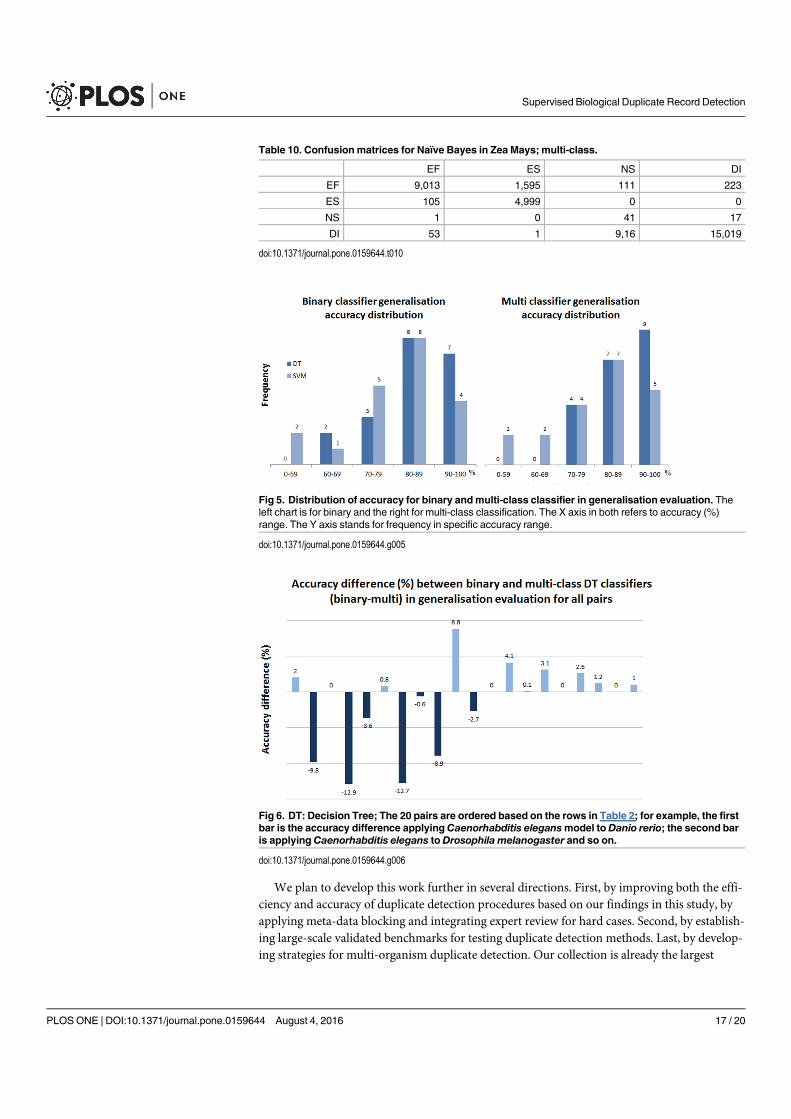
We plan to develop this work further in several directions. First, by improving both the effi-ciency and accuracy of duplicate detection procedures based on our findings in this study, byapplying meta-data blocking and integrating expert review for hard cases. Second, by establish-ing large-scale validated benchmarks for testing duplicate detection methods. Last, by develop-ing strategies for multi-organism duplicate detection. Our collection is already the largest
Table 10. Confusion matrices for Naïve Bayes in Zea Mays; multi-class.
EF ES NS DI
EF 9,013 1,595 111 223
ES 105 4,999 0 0
NS 1 0 41 17
DI 53 1 9,16 15,019
doi:10.1371/journal.pone.0159644.t010
Fig 5. Distribution of accuracy for binary andmulti-class classifier in generalisation evaluation. Theleft chart is for binary and the right for multi-class classification. The X axis in both refers to accuracy (%)range. The Y axis stands for frequency in specific accuracy range.
doi:10.1371/journal.pone.0159644.g005
Fig 6. DT: Decision Tree; The 20 pairs are ordered based on the rows in Table 2; for example, the firstbar is the accuracy difference applyingCaenorhabditis elegansmodel toDanio rerio; the second baris applyingCaenorhabditis elegans to Drosophila melanogaster and so on.
doi:10.1371/journal.pone.0159644.g006
Supervised Biological Duplicate Record Detection
PLOS ONE | DOI:10.1371/journal.pone.0159644 August 4, 2016 17 / 20
available for this task, but we plan to collect duplicates from more organisms and from differ-ent curation perspectives, such as automatic curation in TrEMBL and submitter-based curationin INSDC. We have reported on single organism models. Training on multiple organismssimultaneously has the potential to make the models more robust.
Supporting InformationS1 File. Here we evaluated the method of Koh et al.(PDF)
S1 Fig. Learning curve of SVM on Escherichia coli.(TIF)
S2 Fig. Learning curve of decision trees on Escherichia coli.(TIF)
S1 Table. Validation results onMus musculus.(PDF)
S2 Table. Error analysis on decision trees.(PDF)
S3 Table. Results comparing binary with multi-class in terms of detecting different kindsof duplicates.(PDF)
S4 Table. Generalisation results for binary classification.(PDF)
S5 Table. Generalisation results for multi-class classification.(PDF)
AcknowledgmentsWe sincerely thank Judice LY Koh, the author of the existing duplicate detection method foradvice on the reproduction and evaluation of her published method. We also deeply appreciateElisabeth Gasteiger from UniProtKB/Swiss-Prot, who advised on and confirmed the processthat we used to collect duplicates. We thank Nicole Silvester and Clara Amid from the EMBLENA. They advised on issues related with understanding the merged records in INSDC. Weare grateful to Wayne Mattern from NCBI for advice on how to use BLAST properly.
Author Contributions
Conceived and designed the experiments: QC JZ KV.
Performed the experiments: QC JZ KV.
Analyzed the data: QC JZ XZ KV.
Wrote the paper:QC JZ KV.
References1. Korning PG, Hebsgaard SM, Rouzé P, Brunak S. Cleaning the GenBank Arabidopsis thaliana data set.
Nucleic acids research. 1996; 24(2):316–320. doi: 10.1093/nar/24.2.316 PMID: 8628656
Supervised Biological Duplicate Record Detection
PLOS ONE | DOI:10.1371/journal.pone.0159644 August 4, 2016 18 / 20
2. Fu L, Niu B, Zhu Z, Wu S, Li W. CD-HIT: accelerated for clustering the next-generation sequencingdata. Bioinformatics. 2012; 28(23):3150–3152. doi: 10.1093/bioinformatics/bts565 PMID: 23060610
3. Koh JL, Lee M L, Khan AM, Tan PT, Brusic V. Duplicate detection in biological data using associationrule mining. Locus. 2004; 501(P34180):S22388.
4. FanW. Data quality: Theory and practice. In: Web-Age Information Management. Springer; 2012. p.1–16.
5. Macdonald W, Fitzgerald J. Understanding fraud: The nature of fraud offences recorded by NSWPolice. NSW Bureau of Crime Statistics and Research. 2014;.
6. Smith TF, Zhang X. The challenges of genome sequence annotation or? the devil is in the details?Nature Biotechnology. 1997; 15(12):1222–1223. PMID: 9359093
7. Schnoes AM, Brown SD, Dodevski I, Babbitt PC. Annotation error in public databases: misannotationof molecular function in enzyme superfamilies. PLoS Comput Biol. 2009; 5(12):e1000605. doi: 10.1371/journal.pcbi.1000605 PMID: 20011109
8. Percudani R, Carnevali D, Puggioni V. Ureidoglycolate hydrolase, amidohydrolase, lyase: how errorsin biological databases are incorporated in scientific papers and vice versa. Database. 2013; 2013:bat071. doi: 10.1093/database/bat071 PMID: 24107613
9. UniProt Consortium. UniProt: a hub for protein information. Nucleic acids research. 2015; p. gku989.
10. Poux S, Magrane M, Arighi CN, Bridge A, ODonovan C, Laiho K, et al. Expert curation in UniProtKB: acase study on dealing with conflicting and erroneous data. Database. 2014; 2014:bau016. doi: 10.1093/database/bau016 PMID: 24622611
11. Rudniy A, Song M, Geller J. Mapping biological entities using the longest approximately common prefixmethod. BMC bioinformatics. 2014; 15(1):187. doi: 10.1186/1471-2105-15-187 PMID: 24928653
12. Droc G, Lariviere D, Guignon V, Yahiaoui N, This D, Garsmeur O, et al. The banana genome hub. Data-base. 2013; 2013:bat035. doi: 10.1093/database/bat035 PMID: 23707967
13. Christen P, Goiser K. Quality and complexity measures for data linkage and deduplication. In: QualityMeasures in Data Mining. Springer; 2007. p. 127–151.
14. Lin YS, Liao TY, Lee SJ. Detecting near-duplicate documents using sentence-level features and super-vised learning. Expert Systems with Applications. 2013; 40(5):1467–1476. doi: 10.1016/j.eswa.2012.08.045
15. Martins B. A supervised machine learning approach for duplicate detection over gazetteer records. In:GeoSpatial Semantics. Springer; 2011. p. 34–51.
16. Joffe E, Byrne MJ, Reeder P, Herskovic JR, Johnson CW, McCoy AB, et al. Optimized Dual ThresholdEntity Resolution For Electronic Health Record Databases–Training Set Size And Active Learning. In:AMIA Annual Symposium Proceedings. vol. 2013; 2013. p. 721.
17. Korf I, Yandell M, Bedell J. Blast. O’Reilly Media, Inc.; 2003.
18. Holm L, Sander C. Removing near-neighbour redundancy from large protein sequence collections. Bio-informatics. 1998; 14(5):423–429. doi: 10.1093/bioinformatics/14.5.423 PMID: 9682055
19. Li W, Godzik A. Cd-hit: a fast program for clustering and comparing large sets of protein or nucleotidesequences. Bioinformatics. 2006; 22(13):1658–1659. doi: 10.1093/bioinformatics/btl158 PMID:16731699
20. Zorita EV, Cuscó P, Filion G. Starcode: sequence clustering based on all-pairs search. Bioinformatics.2015; p. btv053.
21. Song M, Rudniy A. Detecting duplicate biological entities using Markov random field-based edit dis-tance. Knowledge and information systems. 2010; 25(2):371–387. doi: 10.1007/s10115-009-0254-7
22. Rudniy A, Song M, Geller J. Detecting duplicate biological entities using shortest path edit distance.International journal of data mining and bioinformatics. 2010; 4(4):395–410. doi: 10.1504/IJDMB.2010.034196 PMID: 20815139
23. Bilenko M, Mooney RJ. Adaptive duplicate detection using learnable string similarity measures. In: Pro-ceedings of the ninth ACM SIGKDD international conference on Knowledge discovery and data mining.ACM; 2003. p. 39–48.
24. Chaudhuri S, Ganjam K, Ganti V, Motwani R. Robust and efficient fuzzy match for online data cleaning.In: Proceedings of the 2003 ACMSIGMOD international conference on Management of data. ACM;2003. p. 313–324.
25. Bilenko M, Mooney R, CohenW, Ravikumar P, Fienberg S. Adaptive namematching in informationintegration. IEEE Intelligent Systems. 2003; 18(5):16–23.
26. Köpcke H, Thor A, Thomas S, Rahm E. Tailoring entity resolution for matching product offers. In: Pro-ceedings of the 15th International Conference on Extending Database Technology. ACM; 2012. p.545–550.
Supervised Biological Duplicate Record Detection
PLOS ONE | DOI:10.1371/journal.pone.0159644 August 4, 2016 19 / 20
27. Feng L, Song L, Sha C, Gong X. Practical duplicate bug reports detection in a large web-based devel-opment community. In: Web Technologies and Applications. Springer; 2013. p. 709–720.
28. Suhara Y, Toda H, Nishioka S, Susaki S. Automatically generated spam detection based on sentence-level topic information. In: Proceedings of the 22nd international conference onWorld WideWeb com-panion; 2013. p. 1157–1160.
29. Saha Roy R, Sinha R, Chhaya N, Saini S. Probabilistic Deduplication of Anonymous Web Traffic. In:Proceedings of the 24th International Conference onWorld WideWeb Companion; 2015. p. 103–104.
30. UniProt Consortium. Activities at the universal protein resource (UniProt). Nucleic acids research.2014; 42(D1):D191–D198. doi: 10.1093/nar/gkt1140 PMID: 24253303
31. Radivojac P, Clark WT, Oron TR, Schnoes AM, Wittkop T, Sokolov A, et al. A large-scale evaluation ofcomputational protein function prediction. Nature Methods. 2013;advance online publication. doi: 10.1038/nmeth.2340 PMID: 23353650
32. Chen Q, Zobel J, Verspoor K. Evaluation of a Machine Learning Duplicate Detection Method for Bioin-formatics Databases. ACMNinth International Workshop on Data and Text Mining in Biomedical Infor-matics at CIKM. 2015;.
33. Japkowicz N, Stephen S. The class imbalance problem: A systematic study. Intelligent data analysis.2002; 6(5):429–449.
34. Huang H, McGarvey PB, Suzek BE, Mazumder R, Zhang J, Chen Y, et al. A comprehensive protein-centric ID mapping service for molecular data integration. Bioinformatics. 2011; 27(8):1190–1191. doi:10.1093/bioinformatics/btr101 PMID: 21478197
35. Camacho C, Coulouris G, Avagyan V, Ma N, Papadopoulos J, Bealer K, et al. BLAST+: architectureand applications. BMC Bioinformatics. 2009; 10(1):421. doi: 10.1186/1471-2105-10-421 PMID:20003500
36. Hall M, Frank E, Holmes G, Pfahringer B, Reutemann P, Witten IH. TheWEKA data mining software:an update. ACM SIGKDD explorations newsletter. 2009; 11(1):10–18. doi: 10.1145/1656274.1656278
37. Chang CC, Lin CJ. LIBSVM: A library for support vector machines. ACM Transactions on IntelligentSystems and Technology. 2011; 2:27:1–27:27. doi: 10.1145/1961189.1961199
38. Hsu CW, Chang CC, Lin CJ. A practical guide to support vector classification. Department of ComputerScience, National Taiwan University; 2003.
39. Elmagarmid AK, Ipeirotis PG, Verykios VS. Duplicate record detection: A survey. IEEE Transactions onknowledge and data engineering. 2007; 19(1):1–16. doi: 10.1109/TKDE.2007.250581
40. Joffe E, Byrne MJ, Reeder P, Herskovic JR, Johnson CW, McCoy AB, et al. A benchmark comparisonof deterministic and probabilistic methods for defining manual review datasets in duplicate records rec-onciliation. Jour American Medical Informatics Association. 2014; 21(1):97–104. doi: 10.1136/amiajnl-2013-001744
Supervised Biological Duplicate Record Detection
PLOS ONE | DOI:10.1371/journal.pone.0159644 August 4, 2016 20 / 20

7PAPER 5
OutlineIn this chapter we summarise the results and reflect on the research process based onthe following manuscript:
• Title: Evaluation of CD-HIT for constructing non-redundant databases.
• Authors: Qingyu Chen, Yu Wan, Yang Lei, Justin Zobel, Karin Verspoor.
• Publication venue: IEEE International Conference on Bioinformatics andBiomedicine (BIBM).
• Publication year: 2016
7.1 abstract of the paper
CD-HIT is one of the most popular tools for reducing sequence redundancy, and is con-sidered to be the state-of-the-art method. It tries to minimise redundancy by reducingan input database into several representative sequences, under a user-defined thresholdof sequence identity. We present a comprehensive assessment of the redundancy in theoutputs of CD-HIT, exploring the impact of different identity thresholds and new evalu-ation data on the redundancy. We demonstrate that the relationship between thresholdand redundancies is surprisingly weak. Applications of CD-HIT that set low identitythreshold values also may suffer from substantial degradation in both efficiency andaccuracy.
153
154 paper 5
7.2 summary and reflection
We have so far focused on the assessment and development of methods for detectionof duplicates in a precise manner (Chapter 5 and 6) – for entity duplicates – which iscritical for database record submission and curation. From this paper, we have startedto look at another primary notion of duplicates: near duplicates, where records sharesome similarity (described in Section 2.7, Chapter 2). Under the context of biologicaldatabases, near duplicates are known as redundant records (explained in Section 2.8,Chapter 2). Redundant records in particular impact database search: when using BLASTon highly redundant records, it will yield many repetitive results, that is, retrievedsequence records that are not independently informative. As explained in Section 2.11,Chapter 2, distance based methods are widely used in detection of redundant records;clustering methods are dominant in detecting redundant biological sequence records.CD-HIT is one of the best known sequence clustering methods in this domain. We haveexplained its method in Section 2.13, Chapter 2. It has been used by at least thousandsof biological studies.This work assesses the efficiency and effectiveness of CD-HIT for clustering biologi-
cal databases, from the purpose of search diversity. Recall that redundant records willgive informative search results. CD-HIT groups similar sequence records into the sameclusters based on user-defined sequence identity. Searching database will effectively besearching the collection of a representative record per cluster (instead of all records); thecollection is called the “non-redundant” database. Since records from different clustersare more distinct, the search results will be in turn more diverse, that is, more informa-tive. CD-HIT authors assessed the efficiency and effectiveness in terms of diversity atthreshold 60% and claimed that the remaining redundancy is only 2%, but we have foundthis evaluation suffers substantial limitations (details are in Section 2.9.2, Chapter 2).We have developed a more robust evaluation pipeline on the full-size UniProtKB/Swiss-Prot database, with over 30 threshold values ranging from 40% to 100% that biologicalstudies often adopt, and an exhaustive slicing window approach to assess the remainingredundancy in different regions.
7.2 summary and reflection 155
The results demonstrate that, as the threshold value decreases, both efficiency andeffectiveness decrease significantly. The running time at 40% threshold is over 100 timesslower than the time at 100% threshold. The main heuristic used by CD-HIT, the wordlength of a k-mer (a substring with a defined length k), appears not to be effective fora threshold of less than 60%. At thresholds higher than 60%, the number of sharedk-mers is a strong indication of whether two records are similar without doing actualsequence alignments, whereas sequence alignments are needed for low threshold values.As shown in Figure 1 of the paper, even if the length of a k-mer is reduced to 2 for lowthreshold values, the algorithm still cannot effectively determine whether records aresimilar without doing actual sequence alignments. Such sequence alignments take time.The remaining redundancy at 40% threshold is close to 16%, whereas it is only about
2% at 90% threshold. Given that many biological studies use CD-HIT at relativelylow thresholds, especially for large-scale biological databases to reduce redundanciesfor database search, we suggest that studies post-process the output of CD-HIT at lowthreshold to decide further.In computer science, the motivation of duplicate detection is clear; in bioinformatics,
I often receive the questions, such as why duplication matters or in what cases does itmatter to biologists. By reading literature and communicating with biological databasestaff and biologists, I found that redundant records significantly impact database search.A main reason that UniProtKB/TrEMBL removed millions of duplicate records (men-tioned in Section 2.7.2, Chapter 2) was because of user dissatisfaction on informativedatabase search results. CD-HIT is one of the best known methods to address redun-dancy under that context. The evaluation of CD-HIT is not sufficient; the evaluationresults were derived from only one threshold and a small sample (explained in Sec-tion 2.9.2). This raises a question: can it address redundancies properly for databaseusers? Thus, I designed a better evaluation accordingly; the preliminary results justifya deeper investigation. This paper presents the preliminary findings and leads to theextended work for the following paper in Chapter 8.
2016 IEEE International Conference on Bioinformatics and Biomedicine (BIBM)
978-1-5090-1610-5/16/$31.00 ©2016 IEEE 703
Evaluation of CD-HIT for constructingnon-redundant databases
Qingyu Chen∗, Yu Wan†, Yang Lei∗, Justin Zobel∗ and Karin Verspoor∗∗Dept. of Computing & Information Systems, University of Melbourne, Parkville, Victoria 3010, Australia
Email: {qingyuc1@student, y.lei4@student, jzobel, karin.verspoor}@unimelb.edu.au†Centre for Systems Genomics, University of Melbourne, Parkville, Victoria 3010, Australia
Email: [email protected]
Abstract—CD-HIT is one of the most popular tools for re-ducing sequence redundancy, and is considered to be the state-of-art method. It tries to minimise redundancy by reducingan input database into several representative sequences, undera user-defined threshold of sequence identity. We present acomprehensive assessment of the redundancy in the outputs ofCD-HIT, exploring the impact of different identity thresholds andnew evaluation data on the redundancy. We demonstrate that therelationship between threshold and redundancies is surprisingweak. Applications of CD-HIT that set low identity thresholdvalues also may suffer from substantial degradation in bothefficiency and accuracy.
I. INTRODUCTION
CD-HIT is arguably the state-of-art and has been usedin thousands of biological studies [1]. It reduces databaseredundancy through producing a non-redundant database thatonly consists of representative sequences. The objective isto produce a subset of a database, where no sequence inthe subset is more similar than a user-defined threshold toany other sequence in the subset. Because an exhaustivepairwise similarity method would be inefficient for these largedatabases, the method tolerates some redundancy in the output,trading some redundancy for speed.
The redundancy ratio of CD-HIT was evaluated in a recentstudy using BLAST [1]. It explored whether there were anyrecords remaining in the generated “non-redundant” databasethat were above the tolerated level of identity specified inthe CD-HIT parameters. The study found that only 2%redundancy remained in the non-redundant database gener-ated from Swiss-Prot at a 60% sequence identity threshold,representing lower remaining redundancy than a competingmethod, UCLUST [2]. The conclusion was that the methodhas very good clustering quality. However, we observe that theprior study suffers from three limitations: (1) It used a fixedthreshold value; (2) It was evaluated only on a single fixeddata sample; and (3) It did not consider the natural sequencealignment identity differences between CD-HIT and BLAST.Therefore we question the general applicability of the results.
In this work we reassessed the redundancy ratio of CD-HIT,following the approach of the prior analysis [1].
The results show that if the tolerance value (the maximumallowed difference between the transformed BLAST globalidentity and the CD-HIT threshold) is 0.5%, the observed re-dundancy at any possible threshold value will always be higher
than the 2% baseline. The redundancy at the 60% thresholdranges from 4% to 15%, varying with tolerance value. We alsoshow that considering a 60% threshold alone does not fullycapture the overall redundancy of the method; the redundancyexceeds 15% when the threshold value approaches 40%.
II. BACKGROUND
The massive numbers of sequence records in nucleotide orprotein databases are clearly tremendous resources. However,from a database perspective, we observe that these resourcessuffer from duplication or redundancy of records, whererecords may correspond to different “entities”, but containsimilar or even the same sequence. Such redundancy createschallenges for database storage and database search. For ex-ample, UniProt recently removed 46.9 million records – nearlyhalf of the original UniProtKB size. It was recognised as oneof the two most significant changes in 2015 for UniProt [3].The software used for this process was CD-HIT.
CD-HIT is arguably the state-of-art sequence clusteringmethod [1], [4]–[8]. So far it has accumulated over 6,000citations in the literature and is therefore the most citedsequence clustering method.
We introduce the following terminologies. A cluster is agroup of records that satisfies a defined similarity measurefunction. In CD-HIT, it is possible for a cluster to have onlyone record. A representative is a record that represents the restof the records in a cluster. In CD-HIT, a cluster must havea representative. The remaining records in the cluster are re-dundant with that representative; the representatives should benon-redundant with each other. Redundant or non-redundantis determined based on the sequence-level identity betweena record and the representative of a cluster. If the sequenceidentity is greater than or equal to a defined threshold, therecord is redundant and will be grouped into that cluster. Forinstance, a 90% threshold specifies that records in clustersshould have at least 90% identity to their representatives; allrepresentatives should have less than 90% sequence identityto each other.
The CD-HIT method has three steps: (1) sort the sequencesin descending length order. The first (longest) sequence is therepresentative of the first cluster; (2) from the second to thelast sequence, each will be determined to be either redundantwith a representative, i.e., similar to the representative above
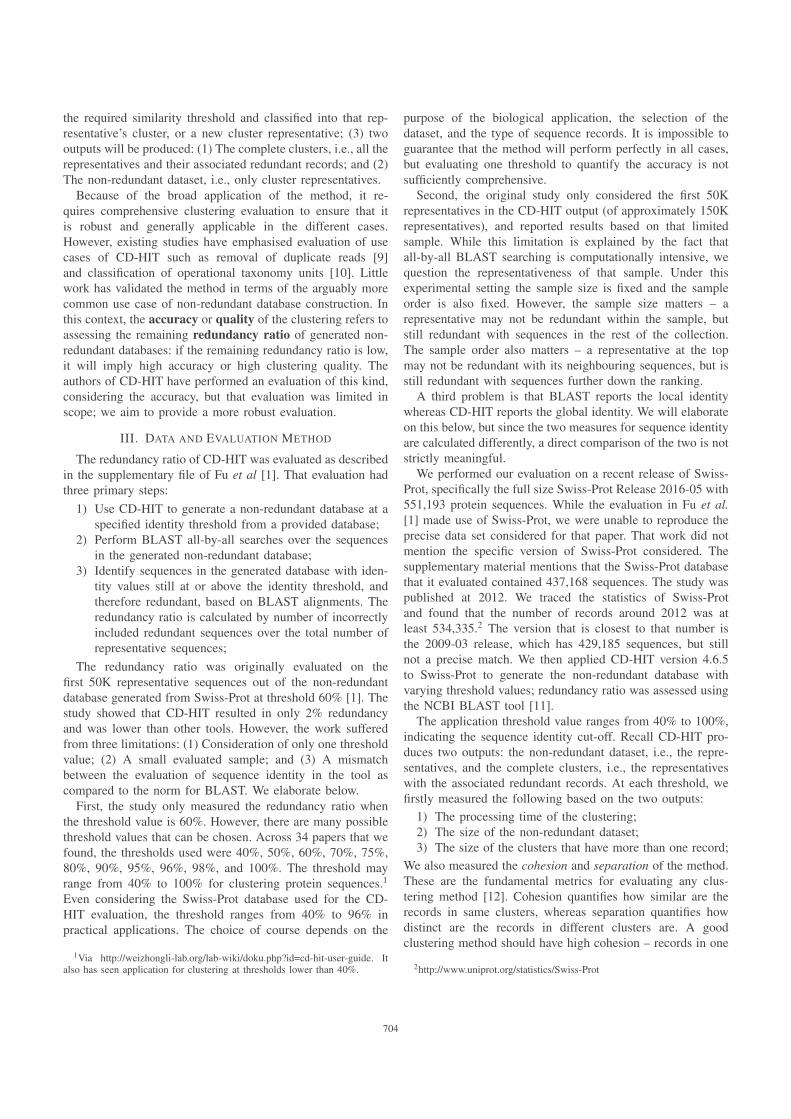
704
the required similarity threshold and classified into that rep-resentative’s cluster, or a new cluster representative; (3) twooutputs will be produced: (1) The complete clusters, i.e., all therepresentatives and their associated redundant records; and (2)The non-redundant dataset, i.e., only cluster representatives.
Because of the broad application of the method, it re-quires comprehensive clustering evaluation to ensure that itis robust and generally applicable in the different cases.However, existing studies have emphasised evaluation of usecases of CD-HIT such as removal of duplicate reads [9]and classification of operational taxonomy units [10]. Littlework has validated the method in terms of the arguably morecommon use case of non-redundant database construction. Inthis context, the accuracy or quality of the clustering refers toassessing the remaining redundancy ratio of generated non-redundant databases: if the remaining redundancy ratio is low,it will imply high accuracy or high clustering quality. Theauthors of CD-HIT have performed an evaluation of this kind,considering the accuracy, but that evaluation was limited inscope; we aim to provide a more robust evaluation.
III. DATA AND EVALUATION METHOD
The redundancy ratio of CD-HIT was evaluated as describedin the supplementary file of Fu et al [1]. That evaluation hadthree primary steps:
1) Use CD-HIT to generate a non-redundant database at aspecified identity threshold from a provided database;
2) Perform BLAST all-by-all searches over the sequencesin the generated non-redundant database;
3) Identify sequences in the generated database with iden-tity values still at or above the identity threshold, andtherefore redundant, based on BLAST alignments. Theredundancy ratio is calculated by number of incorrectlyincluded redundant sequences over the total number ofrepresentative sequences;
The redundancy ratio was originally evaluated on thefirst 50K representative sequences out of the non-redundantdatabase generated from Swiss-Prot at threshold 60% [1]. Thestudy showed that CD-HIT resulted in only 2% redundancyand was lower than other tools. However, the work sufferedfrom three limitations: (1) Consideration of only one thresholdvalue; (2) A small evaluated sample; and (3) A mismatchbetween the evaluation of sequence identity in the tool ascompared to the norm for BLAST. We elaborate below.
First, the study only measured the redundancy ratio whenthe threshold value is 60%. However, there are many possiblethreshold values that can be chosen. Across 34 papers that wefound, the thresholds used were 40%, 50%, 60%, 70%, 75%,80%, 90%, 95%, 96%, 98%, and 100%. The threshold mayrange from 40% to 100% for clustering protein sequences.1
Even considering the Swiss-Prot database used for the CD-HIT evaluation, the threshold ranges from 40% to 96% inpractical applications. The choice of course depends on the
1Via http://weizhongli-lab.org/lab-wiki/doku.php?id=cd-hit-user-guide. Italso has seen application for clustering at thresholds lower than 40%.
purpose of the biological application, the selection of thedataset, and the type of sequence records. It is impossible toguarantee that the method will perform perfectly in all cases,but evaluating one threshold to quantify the accuracy is notsufficiently comprehensive.
Second, the original study only considered the first 50Krepresentatives in the CD-HIT output (of approximately 150Krepresentatives), and reported results based on that limitedsample. While this limitation is explained by the fact thatall-by-all BLAST searching is computationally intensive, wequestion the representativeness of that sample. Under thisexperimental setting the sample size is fixed and the sampleorder is also fixed. However, the sample size matters – arepresentative may not be redundant within the sample, butstill redundant with sequences in the rest of the collection.The sample order also matters – a representative at the topmay not be redundant with its neighbouring sequences, but isstill redundant with sequences further down the ranking.
A third problem is that BLAST reports the local identitywhereas CD-HIT reports the global identity. We will elaborateon this below, but since the two measures for sequence identityare calculated differently, a direct comparison of the two is notstrictly meaningful.
We performed our evaluation on a recent release of Swiss-Prot, specifically the full size Swiss-Prot Release 2016-05 with551,193 protein sequences. While the evaluation in Fu et al.[1] made use of Swiss-Prot, we were unable to reproduce theprecise data set considered for that paper. That work did notmention the specific version of Swiss-Prot considered. Thesupplementary material mentions that the Swiss-Prot databasethat it evaluated contained 437,168 sequences. The study waspublished at 2012. We traced the statistics of Swiss-Protand found that the number of records around 2012 was atleast 534,335.2 The version that is closest to that number isthe 2009-03 release, which has 429,185 sequences, but stillnot a precise match. We then applied CD-HIT version 4.6.5to Swiss-Prot to generate the non-redundant database withvarying threshold values; redundancy ratio was assessed usingthe NCBI BLAST tool [11].
The application threshold value ranges from 40% to 100%,indicating the sequence identity cut-off. Recall CD-HIT pro-duces two outputs: the non-redundant dataset, i.e., the repre-sentatives, and the complete clusters, i.e., the representativeswith the associated redundant records. At each threshold, wefirstly measured the following based on the two outputs:
1) The processing time of the clustering;2) The size of the non-redundant dataset;3) The size of the clusters that have more than one record;
We also measured the cohesion and separation of the method.These are the fundamental metrics for evaluating any clus-tering method [12]. Cohesion quantifies how similar are therecords in same clusters, whereas separation quantifies howdistinct are the records in different clusters are. A goodclustering method should have high cohesion – records in one
2http://www.uniprot.org/statistics/Swiss-Prot
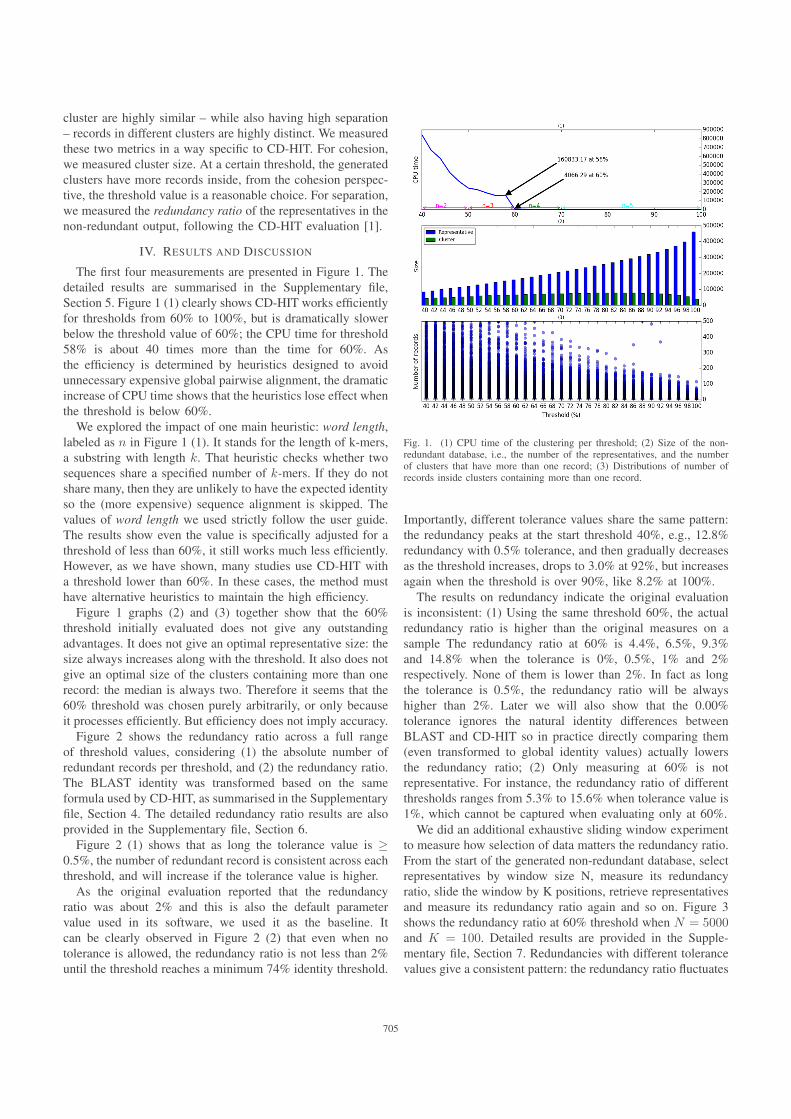
705
cluster are highly similar – while also having high separation– records in different clusters are highly distinct. We measuredthese two metrics in a way specific to CD-HIT. For cohesion,we measured cluster size. At a certain threshold, the generatedclusters have more records inside, from the cohesion perspec-tive, the threshold value is a reasonable choice. For separation,we measured the redundancy ratio of the representatives in thenon-redundant output, following the CD-HIT evaluation [1].
IV. RESULTS AND DISCUSSION
The first four measurements are presented in Figure 1. Thedetailed results are summarised in the Supplementary file,Section 5. Figure 1 (1) clearly shows CD-HIT works efficientlyfor thresholds from 60% to 100%, but is dramatically slowerbelow the threshold value of 60%; the CPU time for threshold58% is about 40 times more than the time for 60%. Asthe efficiency is determined by heuristics designed to avoidunnecessary expensive global pairwise alignment, the dramaticincrease of CPU time shows that the heuristics lose effect whenthe threshold is below 60%.
We explored the impact of one main heuristic: word length,labeled as n in Figure 1 (1). It stands for the length of k-mers,a substring with length k. That heuristic checks whether twosequences share a specified number of k-mers. If they do notshare many, then they are unlikely to have the expected identityso the (more expensive) sequence alignment is skipped. Thevalues of word length we used strictly follow the user guide.The results show even the value is specifically adjusted for athreshold of less than 60%, it still works much less efficiently.However, as we have shown, many studies use CD-HIT witha threshold lower than 60%. In these cases, the method musthave alternative heuristics to maintain the high efficiency.
Figure 1 graphs (2) and (3) together show that the 60%threshold initially evaluated does not give any outstandingadvantages. It does not give an optimal representative size: thesize always increases along with the threshold. It also does notgive an optimal size of the clusters containing more than onerecord: the median is always two. Therefore it seems that the60% threshold was chosen purely arbitrarily, or only becauseit processes efficiently. But efficiency does not imply accuracy.
Figure 2 shows the redundancy ratio across a full rangeof threshold values, considering (1) the absolute number ofredundant records per threshold, and (2) the redundancy ratio.The BLAST identity was transformed based on the sameformula used by CD-HIT, as summarised in the Supplementaryfile, Section 4. The detailed redundancy ratio results are alsoprovided in the Supplementary file, Section 6.
Figure 2 (1) shows that as long the tolerance value is ≥0.5%, the number of redundant record is consistent across eachthreshold, and will increase if the tolerance value is higher.
As the original evaluation reported that the redundancyratio was about 2% and this is also the default parametervalue used in its software, we used it as the baseline. Itcan be clearly observed in Figure 2 (2) that even when notolerance is allowed, the redundancy ratio is not less than 2%until the threshold reaches a minimum 74% identity threshold.
Fig. 1. (1) CPU time of the clustering per threshold; (2) Size of the non-redundant database, i.e., the number of the representatives, and the numberof clusters that have more than one record; (3) Distributions of number ofrecords inside clusters containing more than one record.
Importantly, different tolerance values share the same pattern:the redundancy peaks at the start threshold 40%, e.g., 12.8%redundancy with 0.5% tolerance, and then gradually decreasesas the threshold increases, drops to 3.0% at 92%, but increasesagain when the threshold is over 90%, like 8.2% at 100%.
The results on redundancy indicate the original evaluationis inconsistent: (1) Using the same threshold 60%, the actualredundancy ratio is higher than the original measures on asample The redundancy ratio at 60% is 4.4%, 6.5%, 9.3%and 14.8% when the tolerance is 0%, 0.5%, 1% and 2%respectively. None of them is lower than 2%. In fact as longthe tolerance is 0.5%, the redundancy ratio will be alwayshigher than 2%. Later we will also show that the 0.00%tolerance ignores the natural identity differences betweenBLAST and CD-HIT so in practice directly comparing them(even transformed to global identity values) actually lowersthe redundancy ratio; (2) Only measuring at 60% is notrepresentative. For instance, the redundancy ratio of differentthresholds ranges from 5.3% to 15.6% when tolerance value is1%, which cannot be captured when evaluating only at 60%.
We did an additional exhaustive sliding window experimentto measure how selection of data matters the redundancy ratio.From the start of the generated non-redundant database, selectrepresentatives by window size N, measure its redundancyratio, slide the window by K positions, retrieve representativesand measure its redundancy ratio again and so on. Figure 3shows the redundancy ratio at 60% threshold when N = 5000and K = 100. Detailed results are provided in the Supple-mentary file, Section 7. Redundancies with different tolerancevalues give a consistent pattern: the redundancy ratio fluctuates
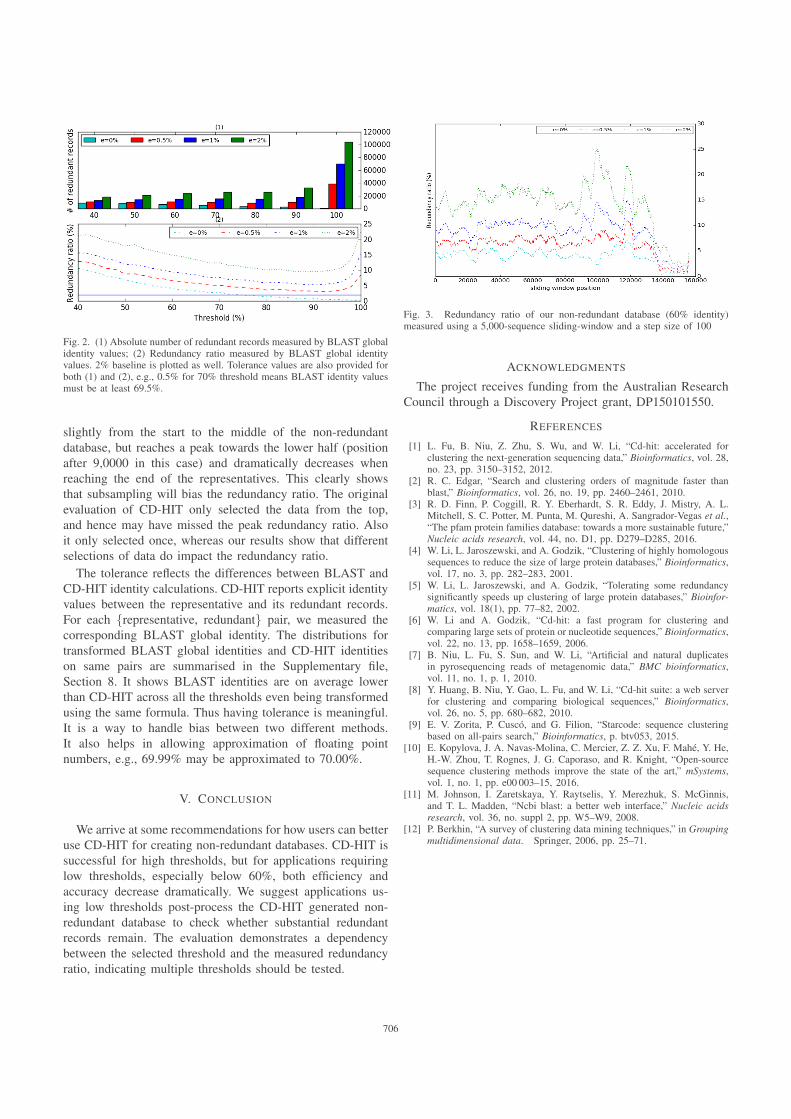
706
Fig. 2. (1) Absolute number of redundant records measured by BLAST globalidentity values; (2) Redundancy ratio measured by BLAST global identityvalues. 2% baseline is plotted as well. Tolerance values are also provided forboth (1) and (2), e.g., 0.5% for 70% threshold means BLAST identity valuesmust be at least 69.5%.
slightly from the start to the middle of the non-redundantdatabase, but reaches a peak towards the lower half (positionafter 9,0000 in this case) and dramatically decreases whenreaching the end of the representatives. This clearly showsthat subsampling will bias the redundancy ratio. The originalevaluation of CD-HIT only selected the data from the top,and hence may have missed the peak redundancy ratio. Alsoit only selected once, whereas our results show that differentselections of data do impact the redundancy ratio.
The tolerance reflects the differences between BLAST andCD-HIT identity calculations. CD-HIT reports explicit identityvalues between the representative and its redundant records.For each {representative, redundant} pair, we measured thecorresponding BLAST global identity. The distributions fortransformed BLAST global identities and CD-HIT identitieson same pairs are summarised in the Supplementary file,Section 8. It shows BLAST identities are on average lowerthan CD-HIT across all the thresholds even being transformedusing the same formula. Thus having tolerance is meaningful.It is a way to handle bias between two different methods.It also helps in allowing approximation of floating pointnumbers, e.g., 69.99% may be approximated to 70.00%.
V. CONCLUSION
We arrive at some recommendations for how users can betteruse CD-HIT for creating non-redundant databases. CD-HIT issuccessful for high thresholds, but for applications requiringlow thresholds, especially below 60%, both efficiency andaccuracy decrease dramatically. We suggest applications us-ing low thresholds post-process the CD-HIT generated non-redundant database to check whether substantial redundantrecords remain. The evaluation demonstrates a dependencybetween the selected threshold and the measured redundancyratio, indicating multiple thresholds should be tested.
Fig. 3. Redundancy ratio of our non-redundant database (60% identity)measured using a 5,000-sequence sliding-window and a step size of 100
ACKNOWLEDGMENTS
The project receives funding from the Australian ResearchCouncil through a Discovery Project grant, DP150101550.
REFERENCES
[1] L. Fu, B. Niu, Z. Zhu, S. Wu, and W. Li, “Cd-hit: accelerated forclustering the next-generation sequencing data,” Bioinformatics, vol. 28,no. 23, pp. 3150–3152, 2012.
[2] R. C. Edgar, “Search and clustering orders of magnitude faster thanblast,” Bioinformatics, vol. 26, no. 19, pp. 2460–2461, 2010.
[3] R. D. Finn, P. Coggill, R. Y. Eberhardt, S. R. Eddy, J. Mistry, A. L.Mitchell, S. C. Potter, M. Punta, M. Qureshi, A. Sangrador-Vegas et al.,“The pfam protein families database: towards a more sustainable future,”Nucleic acids research, vol. 44, no. D1, pp. D279–D285, 2016.
[4] W. Li, L. Jaroszewski, and A. Godzik, “Clustering of highly homologoussequences to reduce the size of large protein databases,” Bioinformatics,vol. 17, no. 3, pp. 282–283, 2001.
[5] W. Li, L. Jaroszewski, and A. Godzik, “Tolerating some redundancysignificantly speeds up clustering of large protein databases,” Bioinfor-matics, vol. 18(1), pp. 77–82, 2002.
[6] W. Li and A. Godzik, “Cd-hit: a fast program for clustering andcomparing large sets of protein or nucleotide sequences,” Bioinformatics,vol. 22, no. 13, pp. 1658–1659, 2006.
[7] B. Niu, L. Fu, S. Sun, and W. Li, “Artificial and natural duplicatesin pyrosequencing reads of metagenomic data,” BMC bioinformatics,vol. 11, no. 1, p. 1, 2010.
[8] Y. Huang, B. Niu, Y. Gao, L. Fu, and W. Li, “Cd-hit suite: a web serverfor clustering and comparing biological sequences,” Bioinformatics,vol. 26, no. 5, pp. 680–682, 2010.
[9] E. V. Zorita, P. Cusco, and G. Filion, “Starcode: sequence clusteringbased on all-pairs search,” Bioinformatics, p. btv053, 2015.
[10] E. Kopylova, J. A. Navas-Molina, C. Mercier, Z. Z. Xu, F. Mahe, Y. He,H.-W. Zhou, T. Rognes, J. G. Caporaso, and R. Knight, “Open-sourcesequence clustering methods improve the state of the art,” mSystems,vol. 1, no. 1, pp. e00 003–15, 2016.
[11] M. Johnson, I. Zaretskaya, Y. Raytselis, Y. Merezhuk, S. McGinnis,and T. L. Madden, “Ncbi blast: a better web interface,” Nucleic acidsresearch, vol. 36, no. suppl 2, pp. W5–W9, 2008.
[12] P. Berkhin, “A survey of clustering data mining techniques,” in Groupingmultidimensional data. Springer, 2006, pp. 25–71.

8PAPER 6
OutlineIn this chapter we summarise the results and reflect on the research process based onthe following manuscript:
• Title: Comparative analysis of sequence clustering methods for de-duplication ofbiological databases.
• Authors: Qingyu Chen, Yu Wan, Xiuzhen Zhang, Lei Yang, Justin Zobel, KarinVerspoor.
• Publication venue: ACM Journal of Data and Information Quality.
• Publication year: To appear.
8.1 abstract of the paper
The massive volumes of data in biological sequence databases provide a remarkable re-source for large-scale biological studies. However the underlying data quality of theseresources is a critical concern. A particular concern is duplication, in which multi-ple records have similar sequences, creating a high level of redundancy that impactsdatabase storage, curation, and search. Biological database de-duplication has two di-rect applications: for database curation, where detected duplicates are removed to im-prove curation efficiency; and for database search, where detected duplicate sequencesmay be flagged but remain available to support analysis. Clustering methods have beenwidely applied to biological sequences for database de-duplication. Given high volumesof data, exhaustive all-by-all pairwise comparison of sequences cannot scale, and thus
161
162 paper 6
heuristics have been used, in particular the use of simple similarity thresholds. We studythe two best-known clustering tools for sequence database de-duplication, CD-HIT andUCLUST. Our contributions include: a detailed assessment of the redundancy remainingafter de-duplication; application of standard clustering evaluation metrics to quantifythe cohesion and separation of the clusters generated by each method; and a biologicalcase study that assesses intra-cluster function annotation consistency, to demonstratethe impact of these factors in practical application of the sequence clustering methods.The results show that the trade-off between efficiency and accuracy becomes acute whenlow threshold values are used and when cluster sizes are large. The evaluation leads topractical recommendations for users for more effective use of the sequence clusteringtools for de-duplication.
8.2 summary and reflection
From the evaluation results in Chapter 7, it is necessary to assess the sequence clusteringmethods in more depth. In this work, we extended the assessment in substantial details,including: (1) Comparative analysis of the two best-known sequence clustering methods,CD-HIT and UCLUST. They are the dominant tools for sequence database curation andsearch; (2) Assessment of the remaining redundancy and applied standard clusteringvalidation metrics to quantify the cohesion and separation of the generated clusters;and (3) Measurement of GO (Gene Ontology) annotation consistencies as a case study.The results further show that the efficiency and effectiveness of clustering methods atlow thresholds degrade substantially. We provided practical recommendations for usersto use the tools more effectively.This paper continues to investigate efficiency and effectiveness of methods for ad-
dressing redundant records, under the context of database search. Thus the reflection interms of the research process is similar to Paper 5 in Chapter 7. This paper, its content,together with Paper 5, focus on assessing the effectiveness of sequence clustering meth-ods to address redundant records under the context of sequence database search. Theyconcentrate on search diversity – whether results are independently informative. Duringthe preparation of this paper, I realised that search completeness, whether search results
8.2 summary and reflection 163
miss important records after de-duplication, is also of concern by large databases Suzeket al. [2014] when reading related literature. This leads to the related study in thefollowing chapter.
1
Comparative analysis of sequence clustering methods forde-duplication of biological databases
QINGYU CHEN, �e University of MelbourneYU WAN, �e University of MelbourneXIUZHEN ZHANG, RMIT UniversityYANG LEI, �e University of MelbourneJUSTIN ZOBEL, �e University of MelbourneKARIN VERSPOOR∗, �e University of Melbourne
�e massive volumes of data in biological sequence databases provide a remarkable resource for large-scalebiological studies. However the underlying data quality of these resources is a critical concern. A particularis duplication, in which multiple records have similar sequences, creating a high level of redundancy thatimpacts database storage, curation, and search. Biological database de-duplication has two direct applications:for database curation, where detected duplicates are removed to improve curation e�ciency; and for databasesearch, where detected duplicate sequences may be �agged but remain available to support analysis.
Clustering methods have been widely applied to biological sequences for database de-duplication. Givenhigh volumes of data, exhaustive all-by-all pairwise comparison of sequences cannot scale, and thus heuristicshave been used, in particular use of simple similarity thresholds. We study the two best-known clusteringtools for sequence database de-duplication, CD-HIT and UCLUST. Our contributions include: a detailedassessment of the redundancy remaining a�er de-duplication; application of standard clustering evaluationmetrics to quantify the cohesion and separation of the clusters generated by each method; and a biologicalcase study that assesses intra-cluster function annotation consistency, to demonstrate the impact of thesefactors in practical application of the sequence clustering methods. �e results show that the trade-o� betweene�ciency and accuracy becomes acute when low threshold values are used and when cluster sizes are large.�e evaluation leads to practical recommendations for users for more e�ective use of the sequence clusteringtools for de-duplication.
CCS Concepts: •Information systems→Deduplication; Data cleaning; Entity resolution; •Computingmethodologies →Cluster analysis; •Applied computing →Bioinformatics;
Additional Key Words and Phrases: Deduplication; Clustering; Validation; Databases
∗Corresponding author, [email protected]
We thank the Protein Information Resources team leader Hongzhan Huang for advice on the design of the case study. Wealso thank Jan Schroder for his discussions of this work. Qingyu Chen’s work is supported by Melbourne InternationalResearch Scholarship from the University of Melbourne. �e project receives funding from the Australian Research Councilthrough a Discovery Project grant, DP150101550.Author’s addresses: Q. Chen, Y. Lei, J. Zobel and K. Verspoor, School of Computing and Information Systems, �e Universityof Melbourne, Parkville, VIC 3010, Australia; Y. Wan, Department of Biochemistry and Molecular Biology, Bio21 MolecularScience and Biotechnology Institute, �e University of Melbourne, Parkville, VIC 3010, Australia; X. Zhang, School ofScience, RMIT University, Melbourne, VIC 3000, Australia.Permission to make digital or hard copies of all or part of this work for personal or classroom use is granted without feeprovided that copies are not made or distributed for pro�t or commercial advantage and that copies bear this notice and thefull citation on the �rst page. Copyrights for components of this work owned by others than the author(s) must be honored.Abstracting with credit is permi�ed. To copy otherwise, or republish, to post on servers or to redistribute to lists, requiresprior speci�c permission and/or a fee. Request permissions from [email protected].© 2017 Copyright held by the owner/author(s). Publication rights licensed to ACM. 1936-1955/2017/3-ART1 $15.00DOI: 0000001.0000001
ACM Journal of Data and Information �ality, Vol. 9, No. 4, Article 1. Publication date: March 2017.
1:2 Qingyu Chen, Yu Wan, Xiuzhen Zhang, Yang Lei, Justin Zobel, and Karin Verspoor
ACM Reference format:Qingyu Chen, Yu Wan, Xiuzhen Zhang, Yang Lei, Justin Zobel, and Karin Verspoor. 2017. Comparative analysisof sequence clustering methods for de-duplication of biological databases. ACM J. Data Inform. �ality 9, 4,Article 1 (March 2017), 28 pages.DOI: 0000001.0000001
1 INTRODUCTIONHigh-throughput sequencing systems have been producing massive quantities of biological se-quence data for decades. Raw sequencing reads are mapped, assembled, annotated, reviewed, andultimately accumulated into sequence databases as records. Correspondingly. sequence databaseshave been growing at an exponential rate: the number of base pairs stored in GenBank (a pri-mary nucleotide sequence database) increased by 43.6% in 2015 [6]; the number of sequences inUniProtKB (a primary protein sequence database) doubled, to around 80 million, in 2014 [88].
�is massive volume of data enables large-scale genome- and proteome-wide studies. However,the underlying quality of this data is of deep concern; data quality has been described as “anotherface of big data” [74]. Poor quality data can impact associated analysis signi�cantly [71]. �reecharacteristics of data quality issues in biological databases can be identi�ed:
• Data quality issues are persistent. Concerns have been raised about data quality for morethan 20 years; the �rst literature on quality issues in biological databases that we areaware of was published in 1996 [47]. Ongoing examinations of the problem [10, 70, 72]demonstrate that it remains unresolved.
• Data quality issues are diverse. Multiple quality issues have been raised, including duplica-tion [15], inconsistency [70], inaccuracy [80], and incompleteness [64]. �ese correspond tothe primary data quality dimensions also identi�ed in databases in other contexts [30, 42].
• Data quality issues can be severe. For example, duplication can lead to repetitive anduninformative sequence database search results [10], while inconsistencies can lead toincorrect function annotation assignments [70]; Due to quality issues, precautions shouldbe taken when performing associated data analysis [73].
In this work, we focus on the challenges presented by duplication. It has recently been causingfor serious concern , particularly in protein databases [10, 89]. �e de�nition of duplicates in thiscase is a pair of records whose sequences share a certain degree of similarity, o�en known asredundant records [10] or near duplicates[91]. It occurs in large volumes, has direct impact on mostdatabase-related tasks (including database storage, curation, and search) [88], and has propagatederrors to other tasks that rely on the databases [31]. In 2015, UniProt database managers removedover 45 million sequence records via de-duplication to address these problems.1
Sequence clustering methods are widely used to detect such duplicates. �ey are used to reducedatabase size by identifying representative sequences, each similar to a group of sequences inthe original database. A non-redundant database can then be produced that only consists ofrepresentative sequences. �e objective is to identify a subset of the original database where nosequence in the subset is more similar than a user-de�ned threshold to any other sequence inthe subset. An exhaustive method for achieving this is through the application of the sequencealignment tool BLAST2 [2] to each pair of sequences in the database (that is, an all-by-all similarityanalysis using BLAST). Sequences above a speci�ed similarity threshold can thereby be identi�ed
1h�p://insideuniprot.blogspot.com.au/2015 05 01 archive.html2 A standard sequence alignment tool, which reports the sequence similarity between a pair. It is one of the most populartools used in biological sequence databases for searching purposes.
ACM Journal of Data and Information �ality, Vol. 9, No. 4, Article 1. Publication date: March 2017.
sequence clustering for database de-duplication 1:3
and �ltered. �is approach is arguably highly accurate, since each pair is speci�cally compared,but it is too slow for processing of large databases.
More commonly used sequence clustering methods, in particular CD-HIT [32] and UCLUST [27],have applied two strategies to allow for faster processing. �e �rst is comparison of sequencesonly against a pre-de�ned representative of a cluster. If the similarity between a sequence and arepresentative is over a user-de�ned threshold, the sequence will be assumed to also be similarto the rest of records in that cluster; �e second is use of heuristics to avoid expensive sequencealignments in as many cases as possible, such as using short-word counting to estimate howmany common subsequences a pair has; if a pair does not have a su�cient number of commonsubsequences, its similarity will be assumed to be less than the de�ned threshold and sequencealignment is not performed. �ese strategies lead to a trade-o� between e�ciency (the number ofsimilarity comparisons) and accuracy (in terms of e�ectiveness in identifying duplicates) that mustbe assessed rigorously.
Typically de-duplication of databases has two direct purposes: One is database curation andcleansing, in which duplicate records are removed and only representatives are kept [18, 85].
�e other is for database search. In this case duplicate records will be kept, but only made availablewhen a given representative is matched. Database users would apply a sequence alignment toolsuch as BLAST to compare a sequence against representative sequences produced by the sequenceclustering methods. As such, the database search takes less time and relatively more diverse searchresults will be retrieved. �en database users can expand the search results by exploring otherrecords belonging to the same cluster. �is might help them to �nd more information related to theproperties of the query sequence [62, 84], including functional annotations for protein sequences.
�e accuracy of database de-duplication is critical. In curation, if redundant records remainin the (supposedly) de-duplicated set, it would increase the workload for biocurators, who mustmanually identify and remove the duplicates. For searching, if the clusters produced by the sequenceclustering method are not biologically cohesive (that is, records are clustered into the same groupsyet have rather distinct properties, such as di�erent functional annotations), database search usersmay make inappropriate inferences relating to their query sequence. For instance, they may assignincorrect functional annotations to uncharacterised sequences.
�erefore, it is necessary to understand the extent of the trade-o� between e�ciency and accuracyfor both cases. Few studies have assessed these trade-o�s in depth. A recent study did examine theremaining redundancy ratio (the �rst case above) of CD-HIT and UCLUST using BLAST [32]. Itexplored whether there were any records remaining in the generated “non-redundant” database thatwere above the tolerated level of identity speci�ed in the clustering method parameters. �e studyfound that only 2% redundancy remained in the non-redundant database generated from Swiss-Protat a 60% sequence identity threshold, representing lower remaining redundancy than a competingmethod, UCLUST [27]. �e conclusion was that the method led to high clustering quality. However,we observe that the prior study su�ers from three limitations: it used a �xed threshold value; itwas evaluated only on a single �xed data sample; and it ignored the natural sequence alignmentidentity di�erences between sequence clustering methods and BLAST. Also it only evaluated thede-duplication for database curation, but did not examine impact of de-duplication on search.
In an earlier study we assessed the remaining redundancy ratio of CD-HIT [12]. �ose preliminaryresults demonstrated the need for more comprehensive experiments. We now extend this initialwork by adding two new tasks to the analysis, as well as considering the UCLUST tool with respectto all three tasks.
Speci�cally, we have performed a comparative analysis on CD-HIT [32] and UCLUST [27] interms of database de-duplication. Our contributions are:
ACM Journal of Data and Information �ality, Vol. 9, No. 4, Article 1. Publication date: March 2017.
1:4 Qingyu Chen, Yu Wan, Xiuzhen Zhang, Yang Lei, Justin Zobel, and Karin Verspoor
• We assessed the remaining redundancy ratio of both methods in a scalable and rigorousmanner, using the full-size Swiss-Prot database of about half a million records, testing themultiple threshold values including boundary cases.
• We assessed the cohesion, that is, whether similar sequences are grouped into same clustersand the separation, that is, whether di�erent sequences are grouped into di�erent clusters, ofgenerated clusters using internal metrics. �ose metrics have been widely used in standardclustering validations [35, 93] and also in other biological tasks that adopt clusteringtechniques [28, 36]. Use of multiple metrics ensures the results are robust and informative.
• We conducted a case study that measures intra-cluster function consistencies, that is,whether records in the same clusters share consistent function annotations, which shouldbe checked a�er use of sequence alignment tools [62, 84].
�e results of this study drive practical recommendations for how users can be�er use these tools,which have been used in many thousands of studies.
2 BACKGROUND�e notion of duplication is complex and varies signi�cantly between contexts or tasks. In thecontext of biological sequence databases, over 400 million duplicate record pairs in 21 organismshave been collected and classi�ed into four main categories. �ese are exact duplicates: recordssharing the same sequences or one sequence is a fragment of another; similar duplicates: recordshaving similar sequences; low-identity duplicates: records having relatively di�erent sequencesyet being considered as duplicates; and domain duplicates: duplicates arising in speci�c biologicalprocesses such as sequencing [14, 15]. In this work we focus on similar duplicates. �ese are alsoreferred to as redundant records in the biological database literature [44, 94] and near-duplicates inother non-biological literature [37, 56, 91]. We use redundant records. While the terms are di�erent,this type of duplicate is o�en de�ned quantitatively in terms of similarity above a given threshold:Given two records a and b, a similarity function s(a, b) ∈ [0, 1] or [0%, 100%], and a threshold t, tworecords a and b are considered as a pair of redundant records if s(a, b) ≥t.
Redundant records in biological databases have been considered as a severe quality issue. Ashas recently been noted for UniProtKB, redundancy impacts almost all critical database tasks:database storage, curation, search and visualisation [89]. As described on the Uniprot website,“high redundancy led to an increase in the size of UniProtKB, and thus to the amount of datato be processed internally and by our users, but also to repetitive results in BLAST searches forover-represented sequences.”3
Such redundancy not only a�ects the database itself, but also propagates to related databases.For instance, it contributes to the curation e�ort and delayed the releases of Pfam [31] (a standardprotein family database); Pfam uses UniProtKB records for creating protein families of evolutionarilyrelated sequences. As described by the Pfam team: “the increasing size of UniProtKB, together withthe computational and curation e�ort of ensuring that each Pfam entry conforms to our internalquality control measures have hampered our ability to produce frequent Pfam releases, with thetime between Pfam 27.0 and 28.0 being close to two years … is unsatisfactory and frustrating bothfor us and for our users” [31]
To address this issue, UniProt recently removed 46.9 million redundant records — nearly half ofthe original UniProtKB size. It was recognised as one of the two most signi�cant changes in 2015for UniProt [31]. �e so�ware used for this process was CD-HIT, a popular sequence clusteringmethod.
3h�p://www.uniprot.org/help/proteome redundancy
ACM Journal of Data and Information �ality, Vol. 9, No. 4, Article 1. Publication date: March 2017.
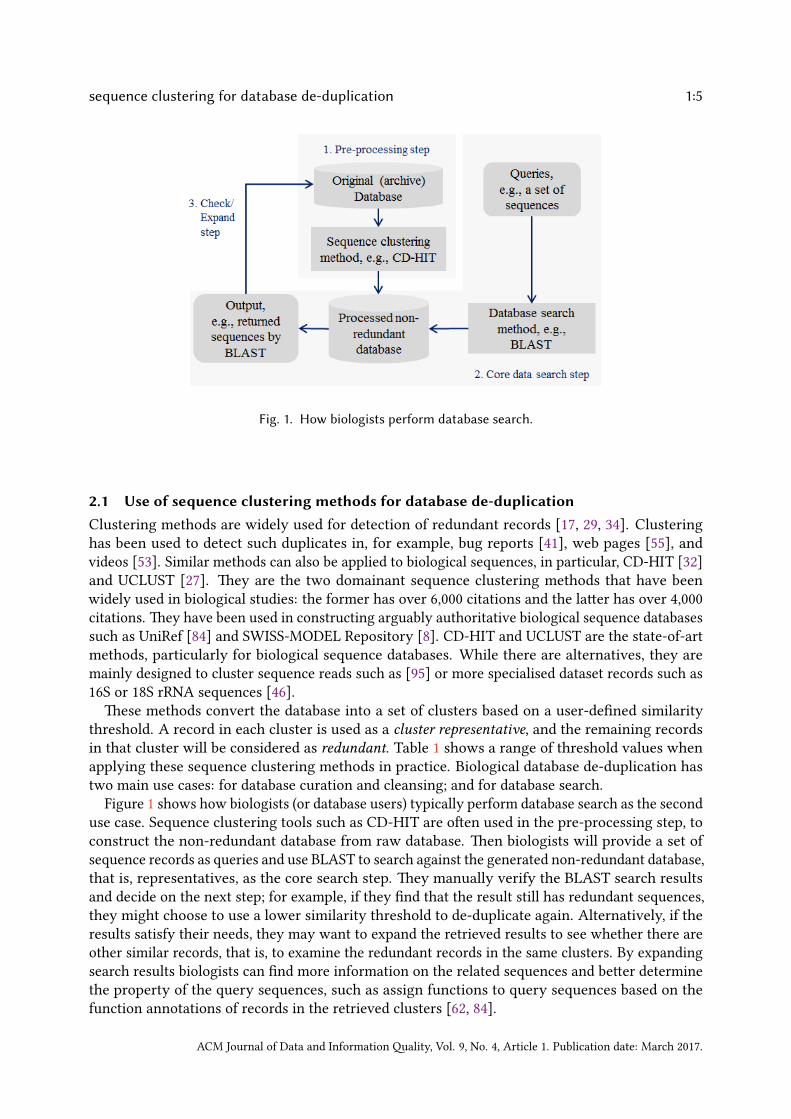
sequence clustering for database de-duplication 1:5
Fig. 1. How biologists perform database search.
2.1 Use of sequence clustering methods for database de-duplicationClustering methods are widely used for detection of redundant records [17, 29, 34]. Clusteringhas been used to detect such duplicates in, for example, bug reports [41], web pages [55], andvideos [53]. Similar methods can also be applied to biological sequences, in particular, CD-HIT [32]and UCLUST [27]. �ey are the two domainant sequence clustering methods that have beenwidely used in biological studies: the former has over 6,000 citations and the la�er has over 4,000citations. �ey have been used in constructing arguably authoritative biological sequence databasessuch as UniRef [84] and SWISS-MODEL Repository [8]. CD-HIT and UCLUST are the state-of-artmethods, particularly for biological sequence databases. While there are alternatives, they aremainly designed to cluster sequence reads such as [95] or more specialised dataset records such as16S or 18S rRNA sequences [46].
�ese methods convert the database into a set of clusters based on a user-de�ned similaritythreshold. A record in each cluster is used as a cluster representative, and the remaining recordsin that cluster will be considered as redundant. Table 1 shows a range of threshold values whenapplying these sequence clustering methods in practice. Biological database de-duplication hastwo main use cases: for database curation and cleansing; and for database search.
Figure 1 shows how biologists (or database users) typically perform database search as the seconduse case. Sequence clustering tools such as CD-HIT are o�en used in the pre-processing step, toconstruct the non-redundant database from raw database. �en biologists will provide a set ofsequence records as queries and use BLAST to search against the generated non-redundant database,that is, representatives, as the core search step. �ey manually verify the BLAST search resultsand decide on the next step; for example, if they �nd that the result still has redundant sequences,they might choose to use a lower similarity threshold to de-duplicate again. Alternatively, if theresults satisfy their needs, they may want to expand the retrieved results to see whether there areother similar records, that is, to examine the redundant records in the same clusters. By expandingsearch results biologists can �nd more information on the related sequences and be�er determinethe property of the query sequences, such as assign functions to query sequences based on thefunction annotations of records in the retrieved clusters [62, 84].
ACM Journal of Data and Information �ality, Vol. 9, No. 4, Article 1. Publication date: March 2017.
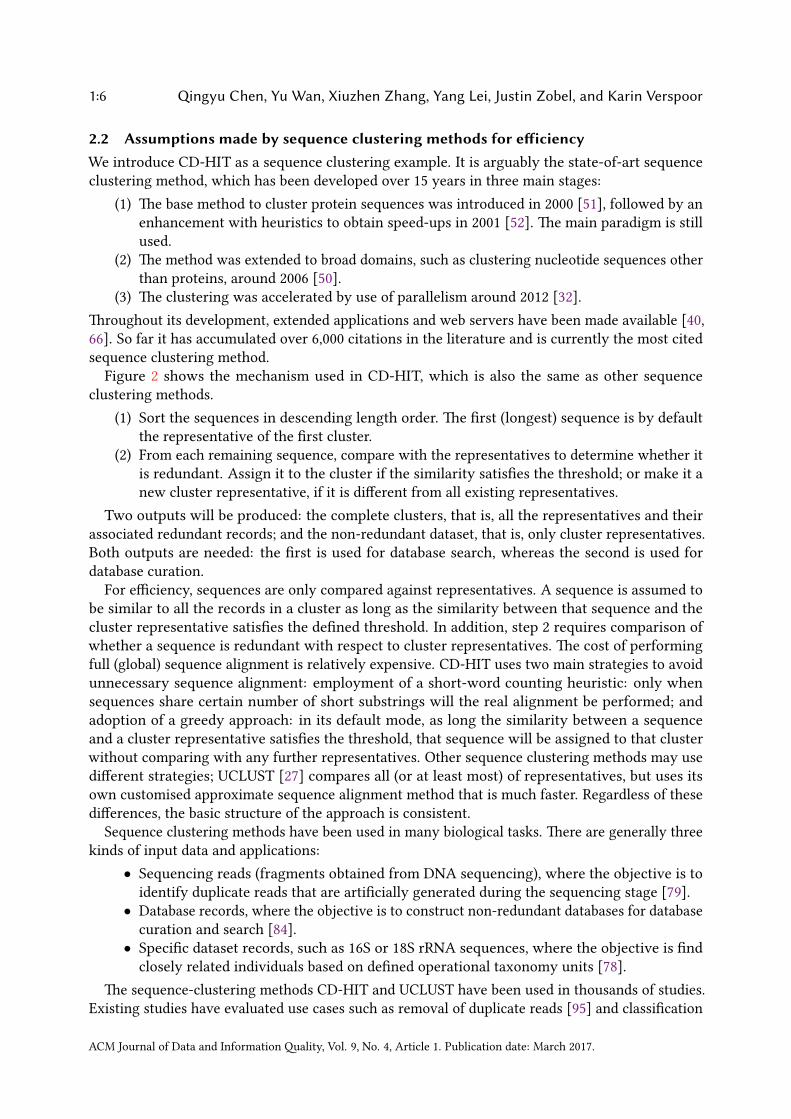
1:6 Qingyu Chen, Yu Wan, Xiuzhen Zhang, Yang Lei, Justin Zobel, and Karin Verspoor
2.2 Assumptions made by sequence clustering methods for e�iciencyWe introduce CD-HIT as a sequence clustering example. It is arguably the state-of-art sequenceclustering method, which has been developed over 15 years in three main stages:
(1) �e base method to cluster protein sequences was introduced in 2000 [51], followed by anenhancement with heuristics to obtain speed-ups in 2001 [52]. �e main paradigm is stillused.
(2) �e method was extended to broad domains, such as clustering nucleotide sequences otherthan proteins, around 2006 [50].
(3) �e clustering was accelerated by use of parallelism around 2012 [32].�roughout its development, extended applications and web servers have been made available [40,66]. So far it has accumulated over 6,000 citations in the literature and is currently the most citedsequence clustering method.
Figure 2 shows the mechanism used in CD-HIT, which is also the same as other sequenceclustering methods.
(1) Sort the sequences in descending length order. �e �rst (longest) sequence is by defaultthe representative of the �rst cluster.
(2) From each remaining sequence, compare with the representatives to determine whether itis redundant. Assign it to the cluster if the similarity satis�es the threshold; or make it anew cluster representative, if it is di�erent from all existing representatives.
Two outputs will be produced: the complete clusters, that is, all the representatives and theirassociated redundant records; and the non-redundant dataset, that is, only cluster representatives.Both outputs are needed: the �rst is used for database search, whereas the second is used fordatabase curation.
For e�ciency, sequences are only compared against representatives. A sequence is assumed tobe similar to all the records in a cluster as long as the similarity between that sequence and thecluster representative satis�es the de�ned threshold. In addition, step 2 requires comparison ofwhether a sequence is redundant with respect to cluster representatives. �e cost of performingfull (global) sequence alignment is relatively expensive. CD-HIT uses two main strategies to avoidunnecessary sequence alignment: employment of a short-word counting heuristic: only whensequences share certain number of short substrings will the real alignment be performed; andadoption of a greedy approach: in its default mode, as long the similarity between a sequenceand a cluster representative satis�es the threshold, that sequence will be assigned to that clusterwithout comparing with any further representatives. Other sequence clustering methods may usedi�erent strategies; UCLUST [27] compares all (or at least most) of representatives, but uses itsown customised approximate sequence alignment method that is much faster. Regardless of thesedi�erences, the basic structure of the approach is consistent.
Sequence clustering methods have been used in many biological tasks. �ere are generally threekinds of input data and applications:
• Sequencing reads (fragments obtained from DNA sequencing), where the objective is toidentify duplicate reads that are arti�cially generated during the sequencing stage [79].
• Database records, where the objective is to construct non-redundant databases for databasecuration and search [84].
• Speci�c dataset records, such as 16S or 18S rRNA sequences, where the objective is �ndclosely related individuals based on de�ned operational taxonomy units [78].
�e sequence-clustering methods CD-HIT and UCLUST have been used in thousands of studies.Existing studies have evaluated use cases such as removal of duplicate reads [95] and classi�cation
ACM Journal of Data and Information �ality, Vol. 9, No. 4, Article 1. Publication date: March 2017.
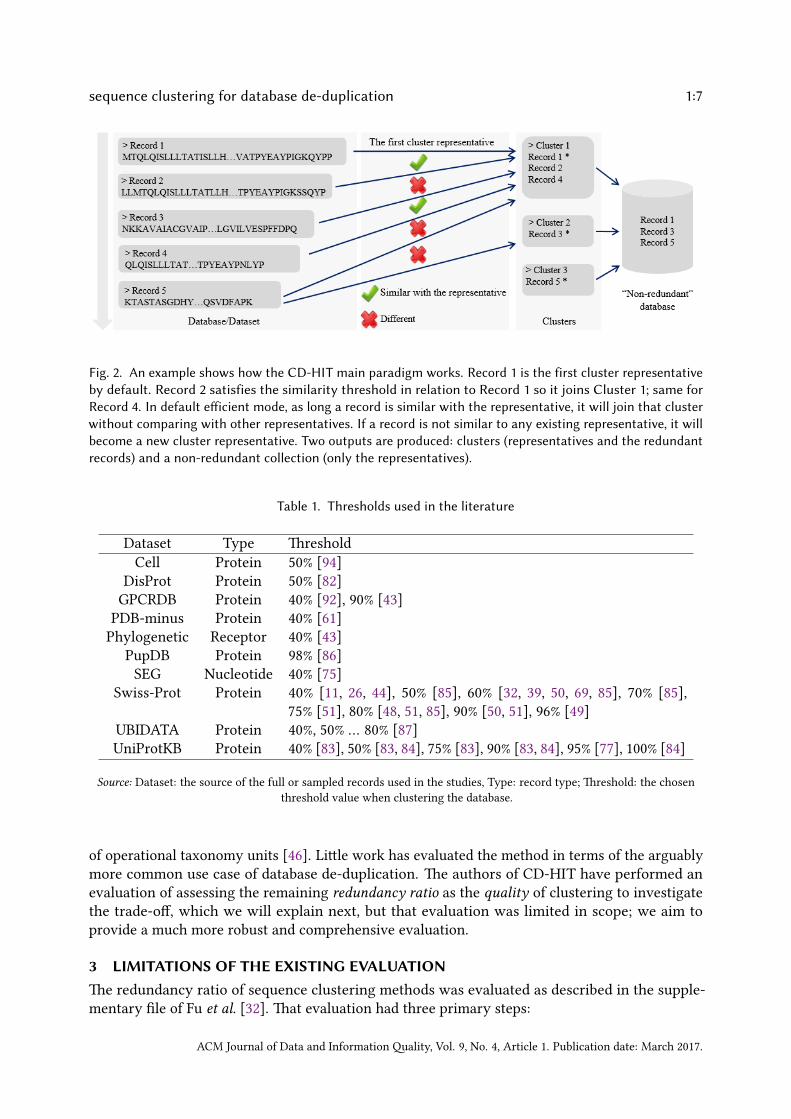
sequence clustering for database de-duplication 1:7
Fig. 2. An example shows how the CD-HIT main paradigm works. Record 1 is the first cluster representativeby default. Record 2 satisfies the similarity threshold in relation to Record 1 so it joins Cluster 1; same forRecord 4. In default e�icient mode, as long a record is similar with the representative, it will join that clusterwithout comparing with other representatives. If a record is not similar to any existing representative, it willbecome a new cluster representative. Two outputs are produced: clusters (representatives and the redundantrecords) and a non-redundant collection (only the representatives).
Table 1. Thresholds used in the literature
Dataset Type �resholdCell Protein 50% [94]
DisProt Protein 50% [82]GPCRDB Protein 40% [92], 90% [43]
PDB-minus Protein 40% [61]Phylogenetic Receptor 40% [43]
PupDB Protein 98% [86]SEG Nucleotide 40% [75]
Swiss-Prot Protein 40% [11, 26, 44], 50% [85], 60% [32, 39, 50, 69, 85], 70% [85],75% [51], 80% [48, 51, 85], 90% [50, 51], 96% [49]
UBIDATA Protein 40%, 50% … 80% [87]UniProtKB Protein 40% [83], 50% [83, 84], 75% [83], 90% [83, 84], 95% [77], 100% [84]
Source: Dataset: the source of the full or sampled records used in the studies, Type: record type; �reshold: the chosenthreshold value when clustering the database.
of operational taxonomy units [46]. Li�le work has evaluated the method in terms of the arguablymore common use case of database de-duplication. �e authors of CD-HIT have performed anevaluation of assessing the remaining redundancy ratio as the quality of clustering to investigatethe trade-o�, which we will explain next, but that evaluation was limited in scope; we aim toprovide a much more robust and comprehensive evaluation.
3 LIMITATIONS OF THE EXISTING EVALUATION�e redundancy ratio of sequence clustering methods was evaluated as described in the supple-mentary �le of Fu et al. [32]. �at evaluation had three primary steps:
ACM Journal of Data and Information �ality, Vol. 9, No. 4, Article 1. Publication date: March 2017.
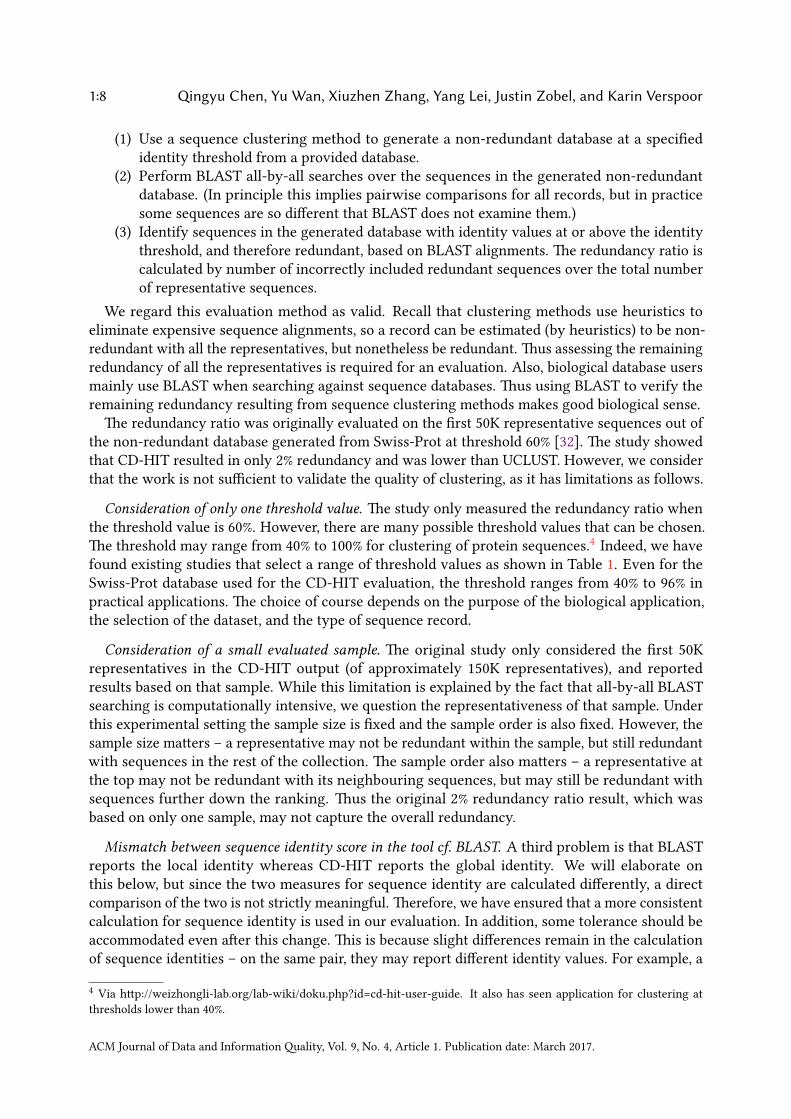
1:8 Qingyu Chen, Yu Wan, Xiuzhen Zhang, Yang Lei, Justin Zobel, and Karin Verspoor
(1) Use a sequence clustering method to generate a non-redundant database at a speci�edidentity threshold from a provided database.
(2) Perform BLAST all-by-all searches over the sequences in the generated non-redundantdatabase. (In principle this implies pairwise comparisons for all records, but in practicesome sequences are so di�erent that BLAST does not examine them.)
(3) Identify sequences in the generated database with identity values at or above the identitythreshold, and therefore redundant, based on BLAST alignments. �e redundancy ratio iscalculated by number of incorrectly included redundant sequences over the total numberof representative sequences.
We regard this evaluation method as valid. Recall that clustering methods use heuristics toeliminate expensive sequence alignments, so a record can be estimated (by heuristics) to be non-redundant with all the representatives, but nonetheless be redundant. �us assessing the remainingredundancy of all the representatives is required for an evaluation. Also, biological database usersmainly use BLAST when searching against sequence databases. �us using BLAST to verify theremaining redundancy resulting from sequence clustering methods makes good biological sense.
�e redundancy ratio was originally evaluated on the �rst 50K representative sequences out ofthe non-redundant database generated from Swiss-Prot at threshold 60% [32]. �e study showedthat CD-HIT resulted in only 2% redundancy and was lower than UCLUST. However, we considerthat the work is not su�cient to validate the quality of clustering, as it has limitations as follows.
Consideration of only one threshold value. �e study only measured the redundancy ratio whenthe threshold value is 60%. However, there are many possible threshold values that can be chosen.�e threshold may range from 40% to 100% for clustering of protein sequences.4 Indeed, we havefound existing studies that select a range of threshold values as shown in Table 1. Even for theSwiss-Prot database used for the CD-HIT evaluation, the threshold ranges from 40% to 96% inpractical applications. �e choice of course depends on the purpose of the biological application,the selection of the dataset, and the type of sequence record.
Consideration of a small evaluated sample. �e original study only considered the �rst 50Krepresentatives in the CD-HIT output (of approximately 150K representatives), and reportedresults based on that sample. While this limitation is explained by the fact that all-by-all BLASTsearching is computationally intensive, we question the representativeness of that sample. Underthis experimental se�ing the sample size is �xed and the sample order is also �xed. However, thesample size ma�ers – a representative may not be redundant within the sample, but still redundantwith sequences in the rest of the collection. �e sample order also ma�ers – a representative atthe top may not be redundant with its neighbouring sequences, but may still be redundant withsequences further down the ranking. �us the original 2% redundancy ratio result, which wasbased on only one sample, may not capture the overall redundancy.
Mismatch between sequence identity score in the tool cf. BLAST. A third problem is that BLASTreports the local identity whereas CD-HIT reports the global identity. We will elaborate onthis below, but since the two measures for sequence identity are calculated di�erently, a directcomparison of the two is not strictly meaningful. �erefore, we have ensured that a more consistentcalculation for sequence identity is used in our evaluation. In addition, some tolerance should beaccommodated even a�er this change. �is is because slight di�erences remain in the calculationof sequence identities – on the same pair, they may report di�erent identity values. For example, a
4 Via h�p://weizhongli-lab.org/lab-wiki/doku.php?id=cd-hit-user-guide. It also has seen application for clustering atthresholds lower than 40%.
ACM Journal of Data and Information �ality, Vol. 9, No. 4, Article 1. Publication date: March 2017.
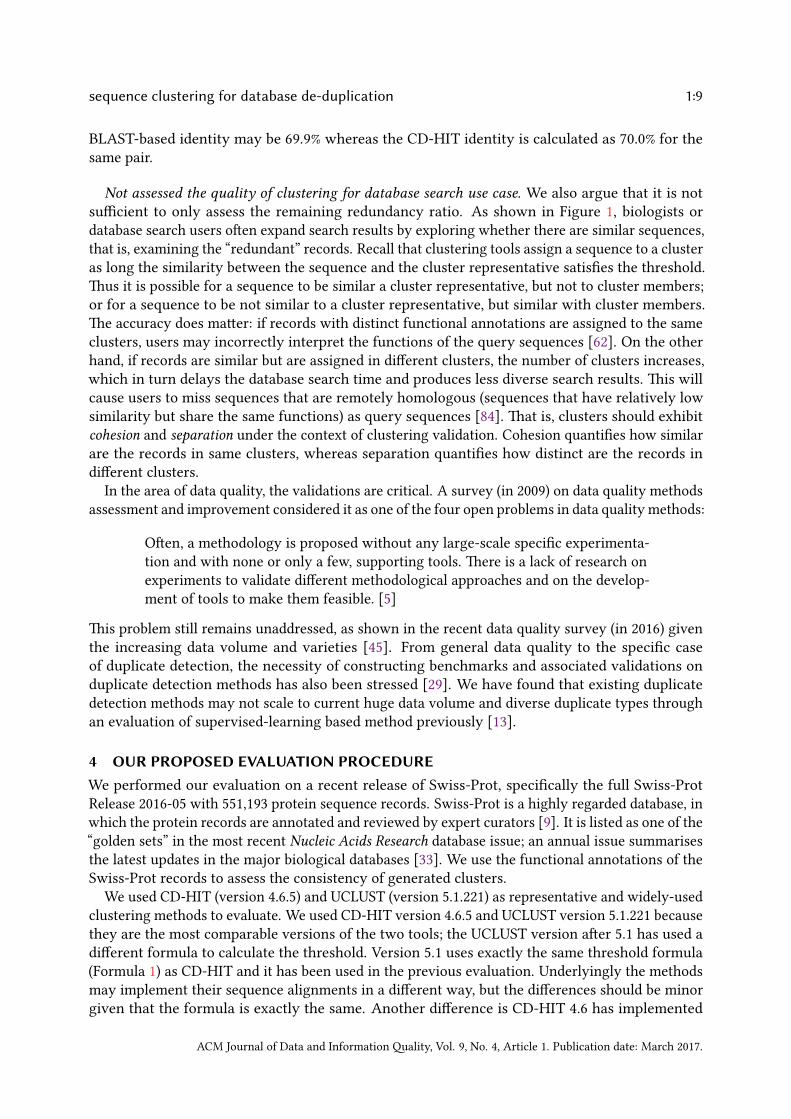
sequence clustering for database de-duplication 1:9
BLAST-based identity may be 69.9% whereas the CD-HIT identity is calculated as 70.0% for thesame pair.
Not assessed the quality of clustering for database search use case. We also argue that it is notsu�cient to only assess the remaining redundancy ratio. As shown in Figure 1, biologists ordatabase search users o�en expand search results by exploring whether there are similar sequences,that is, examining the “redundant” records. Recall that clustering tools assign a sequence to a clusteras long the similarity between the sequence and the cluster representative satis�es the threshold.�us it is possible for a sequence to be similar a cluster representative, but not to cluster members;or for a sequence to be not similar to a cluster representative, but similar with cluster members.�e accuracy does ma�er: if records with distinct functional annotations are assigned to the sameclusters, users may incorrectly interpret the functions of the query sequences [62]. On the otherhand, if records are similar but are assigned in di�erent clusters, the number of clusters increases,which in turn delays the database search time and produces less diverse search results. �is willcause users to miss sequences that are remotely homologous (sequences that have relatively lowsimilarity but share the same functions) as query sequences [84]. �at is, clusters should exhibitcohesion and separation under the context of clustering validation. Cohesion quanti�es how similarare the records in same clusters, whereas separation quanti�es how distinct are the records indi�erent clusters.
In the area of data quality, the validations are critical. A survey (in 2009) on data quality methodsassessment and improvement considered it as one of the four open problems in data quality methods:
O�en, a methodology is proposed without any large-scale speci�c experimenta-tion and with none or only a few, supporting tools. �ere is a lack of research onexperiments to validate di�erent methodological approaches and on the develop-ment of tools to make them feasible. [5]
�is problem still remains unaddressed, as shown in the recent data quality survey (in 2016) giventhe increasing data volume and varieties [45]. From general data quality to the speci�c caseof duplicate detection, the necessity of constructing benchmarks and associated validations onduplicate detection methods has also been stressed [29]. We have found that existing duplicatedetection methods may not scale to current huge data volume and diverse duplicate types throughan evaluation of supervised-learning based method previously [13].
4 OUR PROPOSED EVALUATION PROCEDUREWe performed our evaluation on a recent release of Swiss-Prot, speci�cally the full Swiss-ProtRelease 2016-05 with 551,193 protein sequence records. Swiss-Prot is a highly regarded database, inwhich the protein records are annotated and reviewed by expert curators [9]. It is listed as one of the“golden sets” in the most recent Nucleic Acids Research database issue; an annual issue summarisesthe latest updates in the major biological databases [33]. We use the functional annotations of theSwiss-Prot records to assess the consistency of generated clusters.
We used CD-HIT (version 4.6.5) and UCLUST (version 5.1.221) as representative and widely-usedclustering methods to evaluate. We used CD-HIT version 4.6.5 and UCLUST version 5.1.221 becausethey are the most comparable versions of the two tools; the UCLUST version a�er 5.1 has used adi�erent formula to calculate the threshold. Version 5.1 uses exactly the same threshold formula(Formula 1) as CD-HIT and it has been used in the previous evaluation. Underlyingly the methodsmay implement their sequence alignments in a di�erent way, but the di�erences should be minorgiven that the formula is exactly the same. Another di�erence is CD-HIT 4.6 has implemented
ACM Journal of Data and Information �ality, Vol. 9, No. 4, Article 1. Publication date: March 2017.
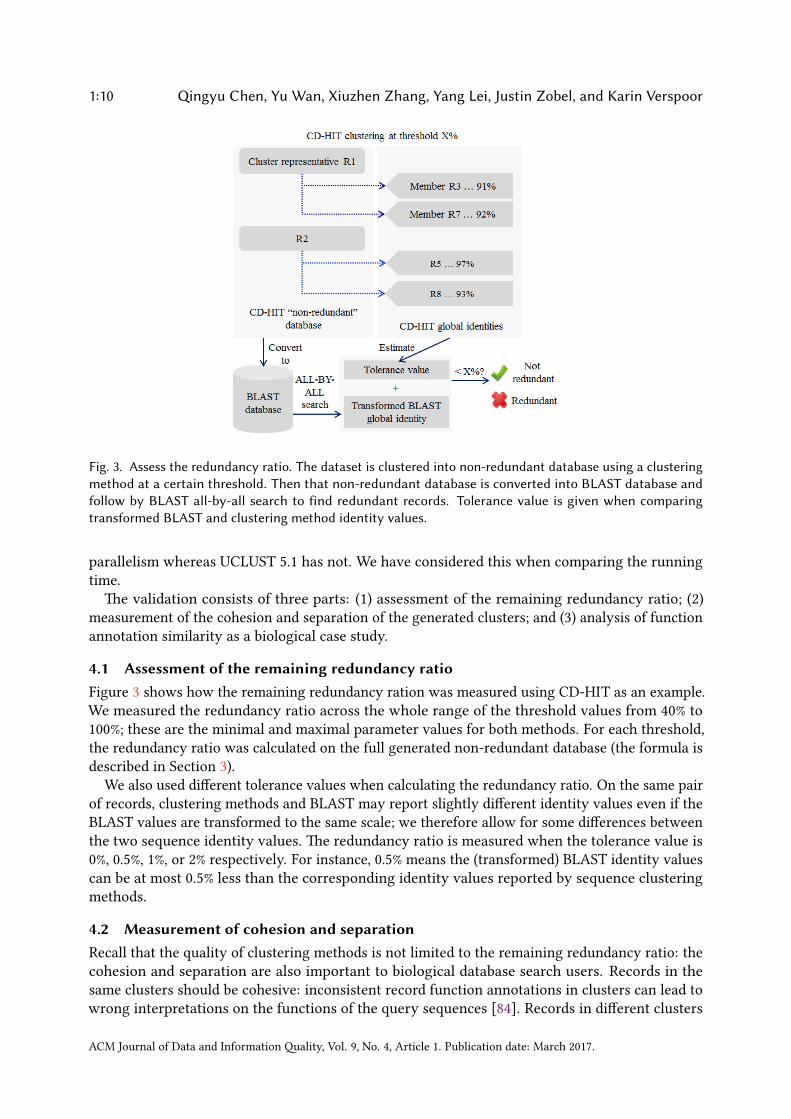
1:10 Qingyu Chen, Yu Wan, Xiuzhen Zhang, Yang Lei, Justin Zobel, and Karin Verspoor
Fig. 3. Assess the redundancy ratio. The dataset is clustered into non-redundant database using a clusteringmethod at a certain threshold. Then that non-redundant database is converted into BLAST database andfollow by BLAST all-by-all search to find redundant records. Tolerance value is given when comparingtransformed BLAST and clustering method identity values.
parallelism whereas UCLUST 5.1 has not. We have considered this when comparing the runningtime.
�e validation consists of three parts: (1) assessment of the remaining redundancy ratio; (2)measurement of the cohesion and separation of the generated clusters; and (3) analysis of functionannotation similarity as a biological case study.
4.1 Assessment of the remaining redundancy ratioFigure 3 shows how the remaining redundancy ration was measured using CD-HIT as an example.We measured the redundancy ratio across the whole range of the threshold values from 40% to100%; these are the minimal and maximal parameter values for both methods. For each threshold,the redundancy ratio was calculated on the full generated non-redundant database (the formula isdescribed in Section 3).
We also used di�erent tolerance values when calculating the redundancy ratio. On the same pairof records, clustering methods and BLAST may report slightly di�erent identity values even if theBLAST values are transformed to the same scale; we therefore allow for some di�erences betweenthe two sequence identity values. �e redundancy ratio is measured when the tolerance value is0%, 0.5%, 1%, or 2% respectively. For instance, 0.5% means the (transformed) BLAST identity valuescan be at most 0.5% less than the corresponding identity values reported by sequence clusteringmethods.
4.2 Measurement of cohesion and separationRecall that the quality of clustering methods is not limited to the remaining redundancy ratio: thecohesion and separation are also important to biological database search users. Records in thesame clusters should be cohesive: inconsistent record function annotations in clusters can lead towrong interpretations on the functions of the query sequences [84]. Records in di�erent clusters
ACM Journal of Data and Information �ality, Vol. 9, No. 4, Article 1. Publication date: March 2017.
sequence clustering for database de-duplication 1:11
should be clearly separated: similar records in di�erent clusters may lead to less diverse searchresults. Herein we have employed four standard clustering internal measure metrics to assess thecohesion and separation. �ey are widely used in general clustering validations [35, 93] and also inother biological tasks using clustering techniques, such as identi�cation of shared regions in geneexpression [36] and analysis of function heterogeneity [28]. �e de�nitions and formulas are asfollows.
CD-HIT and UCLUST calculate the sequence identity between a record and a cluster represen-tative; if the identity is above a given threshold, the record is assigned to the cluster associatedwith that representative. Both use the same formula to calculate sequence identity: given a setof n clusters C = {C1,C2, . . . ,Cn } of sizes (the number of data points in the cluster) s1,s2, . . . ,sn ,generated through applying a sequence clustering method to s records r1,r2, . . . ,rs of sequencelengths l1,l2, . . . ,ls , assuming that a pair of records rx and ry share lxy bases, then the identitybetween rx and ry is calculated by the proportion of common bases in the shorter sequence:
I (rx ,ry ) =lxy
min(lx ,ly )× 100% (1)
�is formula is a variant of the classic Needleman–Wunsch algorithm [65], which calculates theglobal (overall) identity between two sequences; it is also widely applied in duplicate detection meth-ods [29]. We have transformed the BLAST identity for this formula to make identities comparablein this study.
Sequence identity, capturing how similar a sequence pair is, ranges from 0% to 100%. �e distancebetween a record rx and a record ry is thus 100% (the maximum sequence identity) minus theirsequence identity, that is, more similar the record sequences are, the less their distance will be.
D (rx ,ry ) = 100% − I (rx ,ry ) (2)
Measurement of the distance between a cluster pair Ci and Cj can then proceed by accumulatingall the distances of the record pairs amongst the clusters:
W (Ci ,Cj ) =∑
rx ∈ci
∑
ry ∈c jD (rx ,ry ) (3)
It has two kinds of cluster distance: intra-cluster distance, measures the pairs within the cluster; andinter-cluster distance, measures the pairs between the cluster pair. �ey are important for cohesionand separation: high cohesion e�ectively means intra-cluster distance is small; high separationmeans inter-cluster distance is high.
�e accumulated intra-cluster distance for all the clusters C is calculated as follows:
Wintra =12
n∑
i=1W (Ci ,Ci ) (4)
Similarly for the accumulated inter-cluster distances for C:
Winter =
n−1∑
i=1
n∑
j>i
W (Ci ,Cj ) (5)
For a particular clusterCi , we denote its inter-cluster distance asW(Ci ,Ci ). It means the accumu-lated distance between the points in Ci and the points not in Ci .Wintra andWinter may be impacted by cluster size; for example, a cluster with more records is
more likely to have a largerWintra. �e number of intra-cluster pairs and the number of inter-clusterpairs is also tracked, to calculate the averages ofWintra andWinter accordingly. �e total number
ACM Journal of Data and Information �ality, Vol. 9, No. 4, Article 1. Publication date: March 2017.
1:12 Qingyu Chen, Yu Wan, Xiuzhen Zhang, Yang Lei, Justin Zobel, and Karin Verspoor
of intra-cluster pairs is calculated by adding up the number of intra-cluster pairs of every cluster.Similarly, the sum applies to the total number of inter-cluster pairs. �e formulas are as follows:
Nin =12
n∑
i=1si (si − 1) (6)
Nout =12
n∑
i=1
n∑
j=1,j,isisj (7)
Nin and Nout are also used to calculateWmin andWmax. First, all the records are compared pairwise,resulting in N distances where N = Nin + Nout. Second, the distances are sorted in an ascendingorder d (1) ,d (2) , ...,d (N ) , regardless of clustering status. �en, theWmin andWmax are calculated byformulas:
Wmin =
Nin∑
i=1d (i ) (8)
Wmax =
Nout∑
i=Nin+1d (i ) (9)
To assess cohesion and separation of the clusters, we present four metrics that use the output ofthe above formulas as intermediate results: BetaCV (Formula 10), C-index (Formula 11), NormalisedCut (Formula 12), denoted by NC, and Modularity (Formula 13, denoted by Q). �ey assess the sameobjective: the records in the same clusters are highly similar, that is, high cohesion; the recordsin di�erent clusters are highly di�erent, that is, high separation. However, each metric focuseson di�erent aspects. BetaCV quanti�es the ratio of the mean intra-cluster distance over meaninter-cluster distance. C-index measures whether the top similar elements are put in the closestclusters. Normalised Cut, denoted by NC) and Modularity are derived from graph theory. �eformer aims to quantify whether the intra-cluster is much smaller than inter-cluster distance; thela�er aims to minimise the intra-cluster.
�e metrics do have weaknesses. BetaCV measures the ratio between cohesion and separationon average, but it may be impacted by outliers; C-index prioritises very similar or very distinctrecords, but may ignore other cases; NC and Q have an implicit assumption that the dataset canbe modelled as a graph. However, those metrics have been highlighted in general clusteringvalidations [35, 93] and also have been used widely; for instance, C-index was established abouttwo decades ago [22] but still forms the basis of some newly-developed metrics [7]. �ere are manyalternative metrics [3, 54], but our aim is not to identify the best; rather, we aim to use multiplemetrics to obtain consistent results. �ose metrics are o�en used together in cluster validations toachieve reasonable coverage and robustness.
BetaCV =Wintra/Nintra
Winter /Ninter(10)
Cindex =Wintra −Wmin
Wmax/Wmin(11)
NC =n∑
i=1
1W (Ci ,Ci )W (Ci ,Ci )
+ 1(12)
ACM Journal of Data and Information �ality, Vol. 9, No. 4, Article 1. Publication date: March 2017.
sequence clustering for database de-duplication 1:13
Q =n∑
i=1(
W (Ci ,Ci )
2(Wintra +Winter )−W (Ci ,Ci ) +W (Ci ,Ci )
2(Wintra +Winter ))) (13)
4.3 Analysis of function annotation consistencyGiven raw (uncharacterised) protein sequences, biologists may a�empt to predict sequence functionby searching against protein databases to �nd similar sequences, and then use their functionalannotations as references. A�er determining the functional annotations, the sequences and theassociated annotation data are submi�ed to databases together as records. As the same functionscan be described using di�erent terms and thus may lead to ambiguities and inconsistencies, theGene Ontology Consortium provides a controlled vocabulary of terms to describe functions ina consistent manner [19]. �e term names start with GO followed by the identi�ers, such as“GO:0000166”. As such they are o�en known as GO terms and the associated annotation data isreferred as GO annotations. GO terms are classi�ed into three categories: Molecular Function (MF),describing molecular activities of proteins; Cellular Component (CC), describing which parts ofproteins are active; and Biological Process (BP), describing the pathways and large processes amongstmultiple proteins [24]. For example, the functions of Swiss-Prot record P10905 are annotated asa set of six terms5: GO:0055052 (CC), GO:0005886 (CC), GO:0015169 (MF), GO:0001406 (MF) andGO:0015794 (BP) and GO:0001407 (BP). Protein databases focus particularly on intra-cluster MFfunction annotation consistency: whether records in the same clusters have similar MF terms.
We developed a three-step pipeline to measure intra-cluster MF function annotation consistencyon the generated clusters per method. �e steps are listed below.
(1) Collection, pre-processing, and construction a GO annotation dataset speci�cally for Swiss-Prot records. We collected the complete GO annotation dataset from UniProt-GOA, whichprovides the annotation data for all the UniProt databases [20]. Each row of the datasetis identi�ed by a tuple of database name, record id, GO term id, Assigned institute. �usdi�erent rows may represent the same records, and repetitive GO terms may be assignedto the same record more than once by di�erent institutes. We pre-processed the databy merging rows such that each unique record has a set of distinct GO terms. �en weextracted annotations for Swiss-Prot records.
(2) Extraction of MF terms by mapping to controlled vocabularies provided by Gene OntologyConsortium. �e above dataset may contain a mixed of MF, CC, and BP terms. Wedownloaded a complete list of MF terms from Gene Ontology Consortium6 and extractedMF terms accordingly. �e �rst and the second step together brings a cleansed and completeMF term dataset for Swiss-Prot records.
(3) Measurement of the intra-cluster function consistencies. Many metrics have been proposedto measure the similarity of GO terms for a pair of protein records. Each metric focuses ondi�erent aspects of the terms and report a similarity score between [0,1] (or [0%,100%]).�e higher the score, the more similar of those terms are and in turn more consistent ofthe function annotations are. Protein databases have used those metrics to assess the intra-cluster function consistencies. We selected four representative metrics: LAVG, XNABM,UGIC and NTO. �ey are explained below.
GO terms are structured as a directed acyclic graph (DAG) [4]; metrics essentially measurethe distance between the corresponding nodes in the graph in di�erent ways. Broadly, metrics
5h�p://www.uniprot.org/uniprot/P109056h�p://geneontology.org/
ACM Journal of Data and Information �ality, Vol. 9, No. 4, Article 1. Publication date: March 2017.
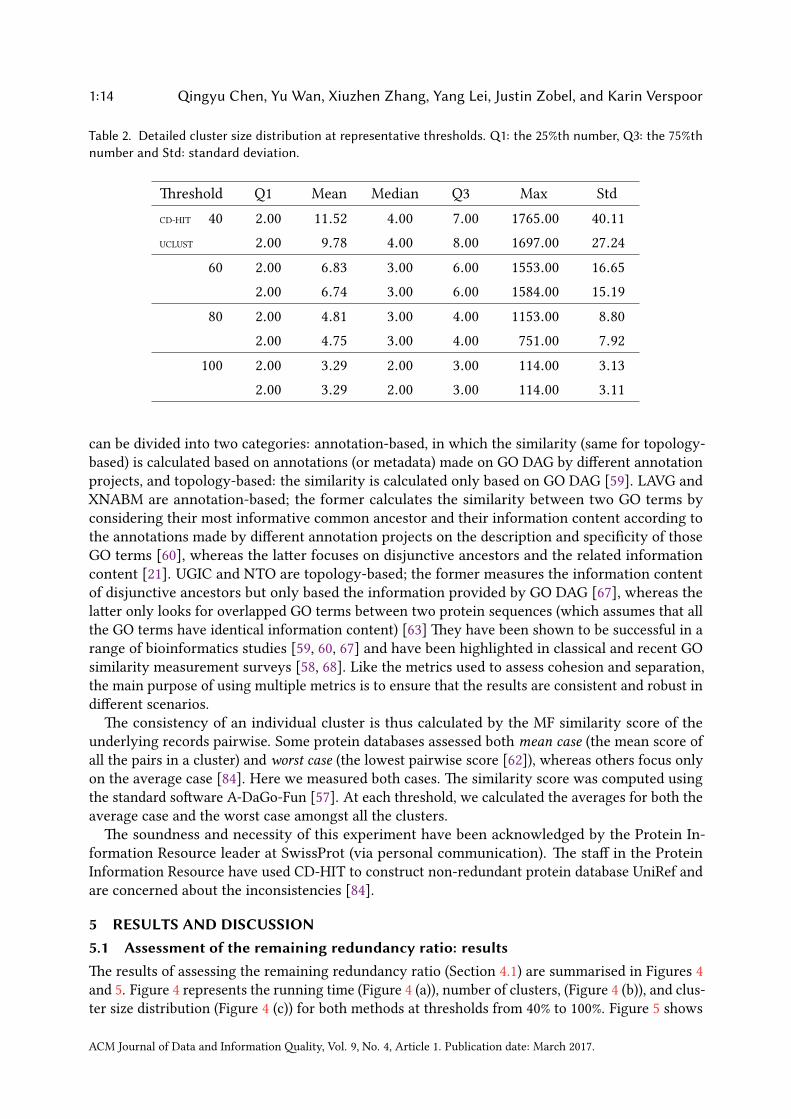
1:14 Qingyu Chen, Yu Wan, Xiuzhen Zhang, Yang Lei, Justin Zobel, and Karin Verspoor
Table 2. Detailed cluster size distribution at representative thresholds. Q1: the 25%th number, Q3: the 75%thnumber and Std: standard deviation.
�reshold Q1 Mean Median Q3 Max StdCD-HIT 40 2.00 11.52 4.00 7.00 1765.00 40.11UCLUST 2.00 9.78 4.00 8.00 1697.00 27.24
60 2.00 6.83 3.00 6.00 1553.00 16.652.00 6.74 3.00 6.00 1584.00 15.19
80 2.00 4.81 3.00 4.00 1153.00 8.802.00 4.75 3.00 4.00 751.00 7.92
100 2.00 3.29 2.00 3.00 114.00 3.132.00 3.29 2.00 3.00 114.00 3.11
can be divided into two categories: annotation-based, in which the similarity (same for topology-based) is calculated based on annotations (or metadata) made on GO DAG by di�erent annotationprojects, and topology-based: the similarity is calculated only based on GO DAG [59]. LAVG andXNABM are annotation-based; the former calculates the similarity between two GO terms byconsidering their most informative common ancestor and their information content according tothe annotations made by di�erent annotation projects on the description and speci�city of thoseGO terms [60], whereas the la�er focuses on disjunctive ancestors and the related informationcontent [21]. UGIC and NTO are topology-based; the former measures the information contentof disjunctive ancestors but only based the information provided by GO DAG [67], whereas thela�er only looks for overlapped GO terms between two protein sequences (which assumes that allthe GO terms have identical information content) [63] �ey have been shown to be successful in arange of bioinformatics studies [59, 60, 67] and have been highlighted in classical and recent GOsimilarity measurement surveys [58, 68]. Like the metrics used to assess cohesion and separation,the main purpose of using multiple metrics is to ensure that the results are consistent and robust indi�erent scenarios.
�e consistency of an individual cluster is thus calculated by the MF similarity score of theunderlying records pairwise. Some protein databases assessed both mean case (the mean score ofall the pairs in a cluster) and worst case (the lowest pairwise score [62]), whereas others focus onlyon the average case [84]. Here we measured both cases. �e similarity score was computed usingthe standard so�ware A-DaGo-Fun [57]. At each threshold, we calculated the averages for both theaverage case and the worst case amongst all the clusters.
�e soundness and necessity of this experiment have been acknowledged by the Protein In-formation Resource leader at SwissProt (via personal communication). �e sta� in the ProteinInformation Resource have used CD-HIT to construct non-redundant protein database UniRef andare concerned about the inconsistencies [84].
5 RESULTS AND DISCUSSION5.1 Assessment of the remaining redundancy ratio: results�e results of assessing the remaining redundancy ratio (Section 4.1) are summarised in Figures 4and 5. Figure 4 represents the running time (Figure 4 (a)), number of clusters, (Figure 4 (b)), and clus-ter size distribution (Figure 4 (c)) for both methods at thresholds from 40% to 100%. Figure 5 shows
ACM Journal of Data and Information �ality, Vol. 9, No. 4, Article 1. Publication date: March 2017.
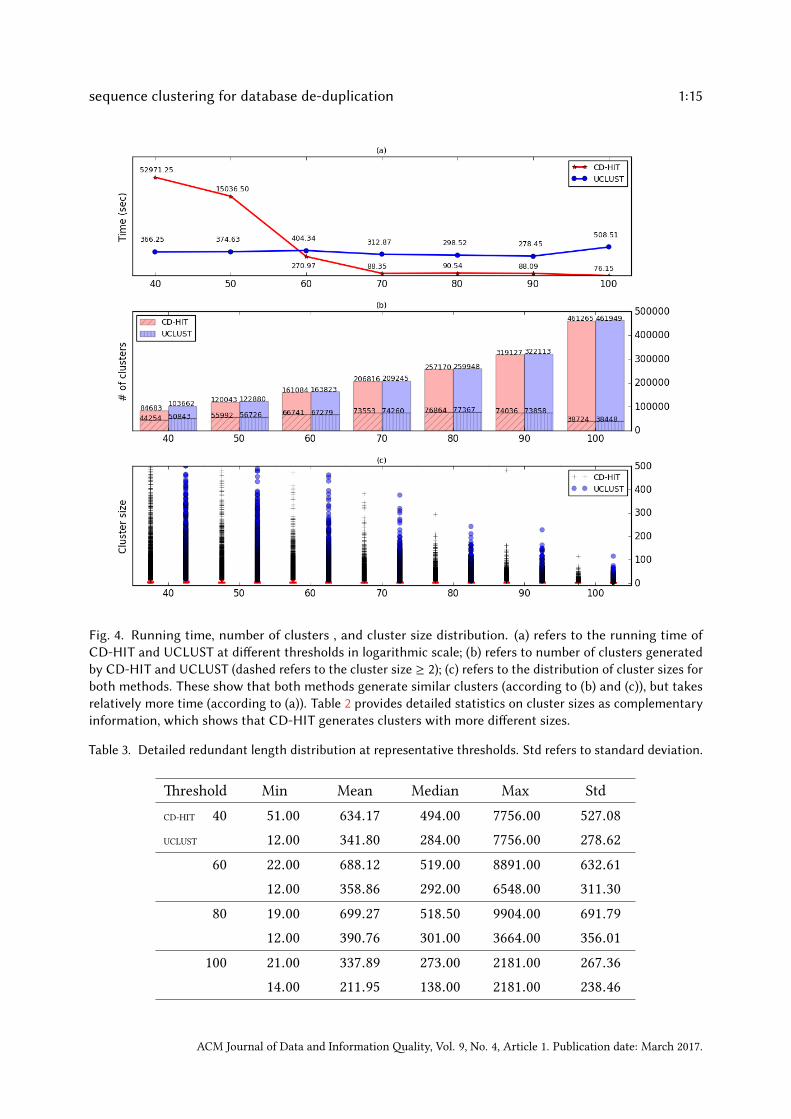
sequence clustering for database de-duplication 1:15
Fig. 4. Running time, number of clusters , and cluster size distribution. (a) refers to the running time ofCD-HIT and UCLUST at di�erent thresholds in logarithmic scale; (b) refers to number of clusters generatedby CD-HIT and UCLUST (dashed refers to the cluster size ≥ 2); (c) refers to the distribution of cluster sizes forboth methods. These show that both methods generate similar clusters (according to (b) and (c)), but takesrelatively more time (according to (a)). Table 2 provides detailed statistics on cluster sizes as complementaryinformation, which shows that CD-HIT generates clusters with more di�erent sizes.
Table 3. Detailed redundant length distribution at representative thresholds. Std refers to standard deviation.
�reshold Min Mean Median Max StdCD-HIT 40 51.00 634.17 494.00 7756.00 527.08UCLUST 12.00 341.80 284.00 7756.00 278.62
60 22.00 688.12 519.00 8891.00 632.6112.00 358.86 292.00 6548.00 311.30
80 19.00 699.27 518.50 9904.00 691.7912.00 390.76 301.00 3664.00 356.01
100 21.00 337.89 273.00 2181.00 267.3614.00 211.95 138.00 2181.00 238.46
ACM Journal of Data and Information �ality, Vol. 9, No. 4, Article 1. Publication date: March 2017.
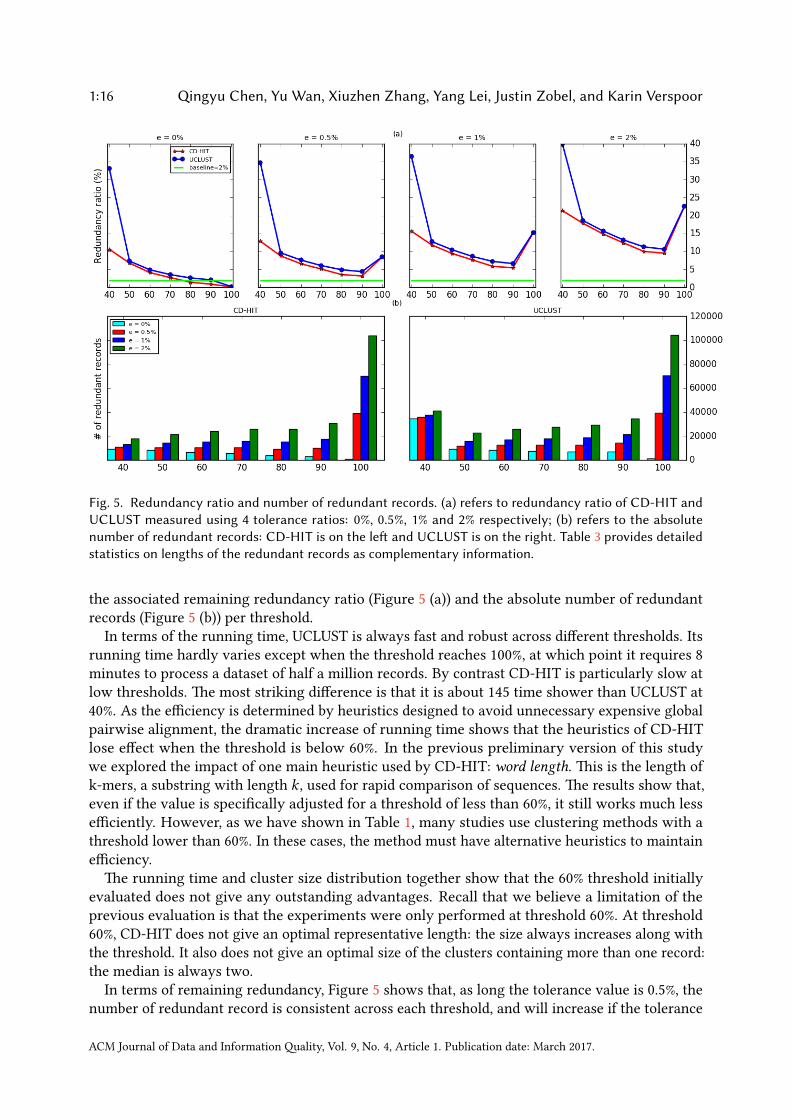
1:16 Qingyu Chen, Yu Wan, Xiuzhen Zhang, Yang Lei, Justin Zobel, and Karin Verspoor
Fig. 5. Redundancy ratio and number of redundant records. (a) refers to redundancy ratio of CD-HIT andUCLUST measured using 4 tolerance ratios: 0%, 0.5%, 1% and 2% respectively; (b) refers to the absolutenumber of redundant records: CD-HIT is on the le� and UCLUST is on the right. Table 3 provides detailedstatistics on lengths of the redundant records as complementary information.
the associated remaining redundancy ratio (Figure 5 (a)) and the absolute number of redundantrecords (Figure 5 (b)) per threshold.
In terms of the running time, UCLUST is always fast and robust across di�erent thresholds. Itsrunning time hardly varies except when the threshold reaches 100%, at which point it requires 8minutes to process a dataset of half a million records. By contrast CD-HIT is particularly slow atlow thresholds. �e most striking di�erence is that it is about 145 time shower than UCLUST at40%. As the e�ciency is determined by heuristics designed to avoid unnecessary expensive globalpairwise alignment, the dramatic increase of running time shows that the heuristics of CD-HITlose e�ect when the threshold is below 60%. In the previous preliminary version of this studywe explored the impact of one main heuristic used by CD-HIT: word length. �is is the length ofk-mers, a substring with length k , used for rapid comparison of sequences. �e results show that,even if the value is speci�cally adjusted for a threshold of less than 60%, it still works much lesse�ciently. However, as we have shown in Table 1, many studies use clustering methods with athreshold lower than 60%. In these cases, the method must have alternative heuristics to maintaine�ciency.
�e running time and cluster size distribution together show that the 60% threshold initiallyevaluated does not give any outstanding advantages. Recall that we believe a limitation of theprevious evaluation is that the experiments were only performed at threshold 60%. At threshold60%, CD-HIT does not give an optimal representative length: the size always increases along withthe threshold. It also does not give an optimal size of the clusters containing more than one record:the median is always two.
In terms of remaining redundancy, Figure 5 shows that, as long the tolerance value is 0.5%, thenumber of redundant record is consistent across each threshold, and will increase if the tolerance
ACM Journal of Data and Information �ality, Vol. 9, No. 4, Article 1. Publication date: March 2017.
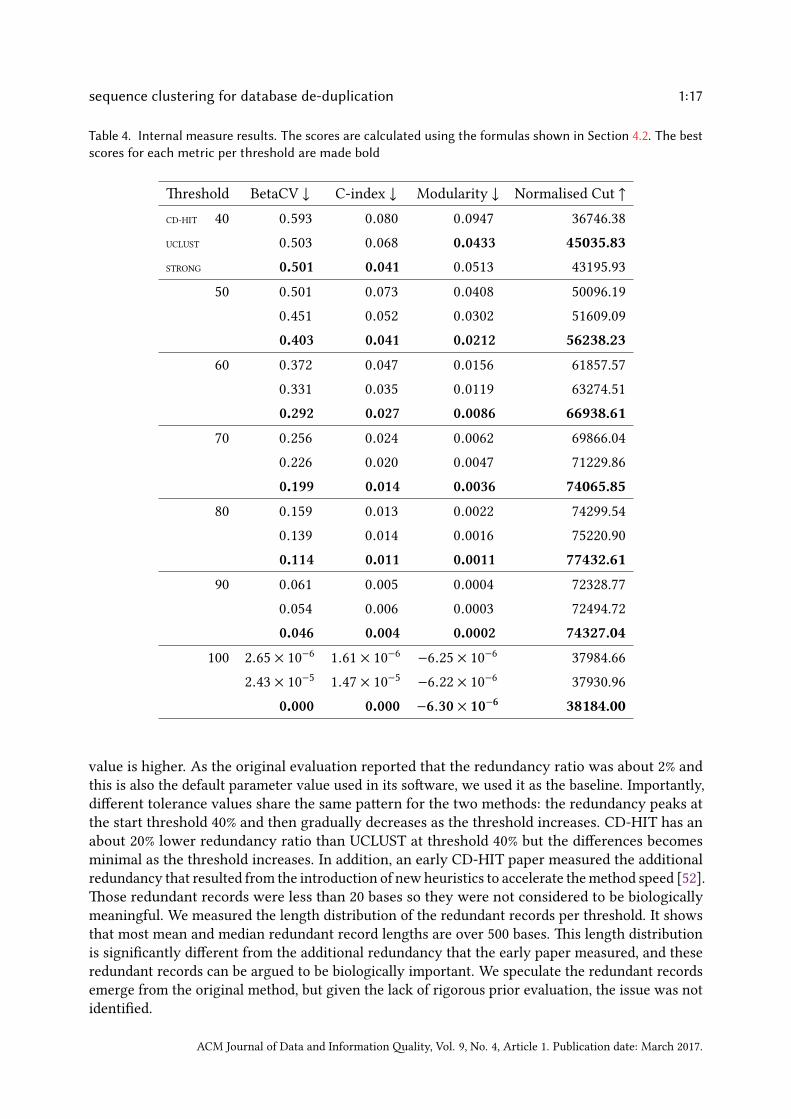
sequence clustering for database de-duplication 1:17
Table 4. Internal measure results. The scores are calculated using the formulas shown in Section 4.2. The bestscores for each metric per threshold are made bold
�reshold BetaCV ↓ C-index ↓ Modularity ↓ Normalised Cut ↑CD-HIT 40 0.593 0.080 0.0947 36746.38UCLUST 0.503 0.068 0.0433 45035.83STRONG 0.501 0.041 0.0513 43195.93
50 0.501 0.073 0.0408 50096.190.451 0.052 0.0302 51609.090.403 0.041 0.0212 56238.23
60 0.372 0.047 0.0156 61857.570.331 0.035 0.0119 63274.510.292 0.027 0.0086 66938.61
70 0.256 0.024 0.0062 69866.040.226 0.020 0.0047 71229.860.199 0.014 0.0036 74065.85
80 0.159 0.013 0.0022 74299.540.139 0.014 0.0016 75220.900.114 0.011 0.0011 77432.61
90 0.061 0.005 0.0004 72328.770.054 0.006 0.0003 72494.720.046 0.004 0.0002 74327.04
100 2.65 × 10⁻⁶ 1.61 × 10⁻⁶ −6.25 × 10⁻⁶ 37984.662.43 × 10−5 1.47 × 10⁻⁵ −6.22 × 10⁻⁶ 37930.96
0.000 0.000 −6.30 × 10⁻⁶ 38184.00
value is higher. As the original evaluation reported that the redundancy ratio was about 2% andthis is also the default parameter value used in its so�ware, we used it as the baseline. Importantly,di�erent tolerance values share the same pa�ern for the two methods: the redundancy peaks atthe start threshold 40% and then gradually decreases as the threshold increases. CD-HIT has anabout 20% lower redundancy ratio than UCLUST at threshold 40% but the di�erences becomesminimal as the threshold increases. In addition, an early CD-HIT paper measured the additionalredundancy that resulted from the introduction of new heuristics to accelerate the method speed [52].�ose redundant records were less than 20 bases so they were not considered to be biologicallymeaningful. We measured the length distribution of the redundant records per threshold. It showsthat most mean and median redundant record lengths are over 500 bases. �is length distributionis signi�cantly di�erent from the additional redundancy that the early paper measured, and theseredundant records can be argued to be biologically important. We speculate the redundant recordsemerge from the original method, but given the lack of rigorous prior evaluation, the issue was notidenti�ed.
ACM Journal of Data and Information �ality, Vol. 9, No. 4, Article 1. Publication date: March 2017.
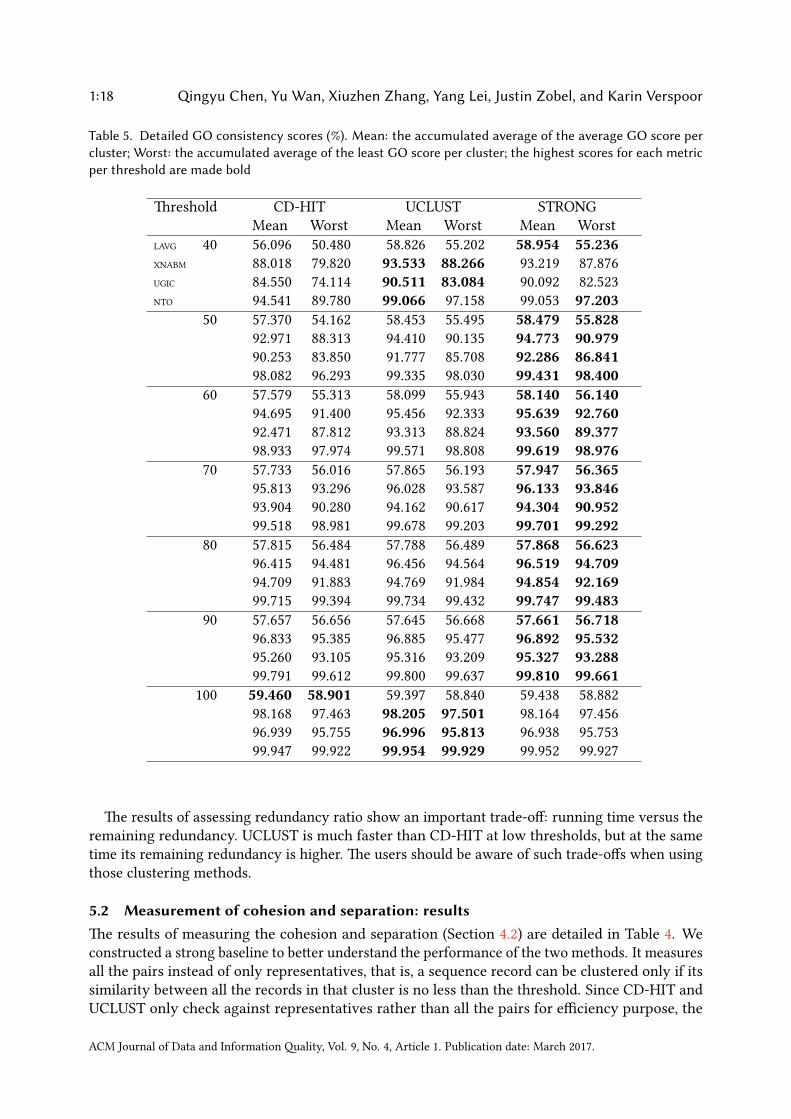
1:18 Qingyu Chen, Yu Wan, Xiuzhen Zhang, Yang Lei, Justin Zobel, and Karin Verspoor
Table 5. Detailed GO consistency scores (%). Mean: the accumulated average of the average GO score percluster; Worst: the accumulated average of the least GO score per cluster; the highest scores for each metricper threshold are made bold
�reshold CD-HIT UCLUST STRONGMean Worst Mean Worst Mean Worst
LAVG 40 56.096 50.480 58.826 55.202 58.954 55.236XNABM 88.018 79.820 93.533 88.266 93.219 87.876UGIC 84.550 74.114 90.511 83.084 90.092 82.523NTO 94.541 89.780 99.066 97.158 99.053 97.203
50 57.370 54.162 58.453 55.495 58.479 55.82892.971 88.313 94.410 90.135 94.773 90.97990.253 83.850 91.777 85.708 92.286 86.84198.082 96.293 99.335 98.030 99.431 98.400
60 57.579 55.313 58.099 55.943 58.140 56.14094.695 91.400 95.456 92.333 95.639 92.76092.471 87.812 93.313 88.824 93.560 89.37798.933 97.974 99.571 98.808 99.619 98.976
70 57.733 56.016 57.865 56.193 57.947 56.36595.813 93.296 96.028 93.587 96.133 93.84693.904 90.280 94.162 90.617 94.304 90.95299.518 98.981 99.678 99.203 99.701 99.292
80 57.815 56.484 57.788 56.489 57.868 56.62396.415 94.481 96.456 94.564 96.519 94.70994.709 91.883 94.769 91.984 94.854 92.16999.715 99.394 99.734 99.432 99.747 99.483
90 57.657 56.656 57.645 56.668 57.661 56.71896.833 95.385 96.885 95.477 96.892 95.53295.260 93.105 95.316 93.209 95.327 93.28899.791 99.612 99.800 99.637 99.810 99.661
100 59.460 58.901 59.397 58.840 59.438 58.88298.168 97.463 98.205 97.501 98.164 97.45696.939 95.755 96.996 95.813 96.938 95.75399.947 99.922 99.954 99.929 99.952 99.927
�e results of assessing redundancy ratio show an important trade-o�: running time versus theremaining redundancy. UCLUST is much faster than CD-HIT at low thresholds, but at the sametime its remaining redundancy is higher. �e users should be aware of such trade-o�s when usingthose clustering methods.
5.2 Measurement of cohesion and separation: results�e results of measuring the cohesion and separation (Section 4.2) are detailed in Table 4. Weconstructed a strong baseline to be�er understand the performance of the two methods. It measuresall the pairs instead of only representatives, that is, a sequence record can be clustered only if itssimilarity between all the records in that cluster is no less than the threshold. Since CD-HIT andUCLUST only check against representatives rather than all the pairs for e�ciency purpose, the
ACM Journal of Data and Information �ality, Vol. 9, No. 4, Article 1. Publication date: March 2017.
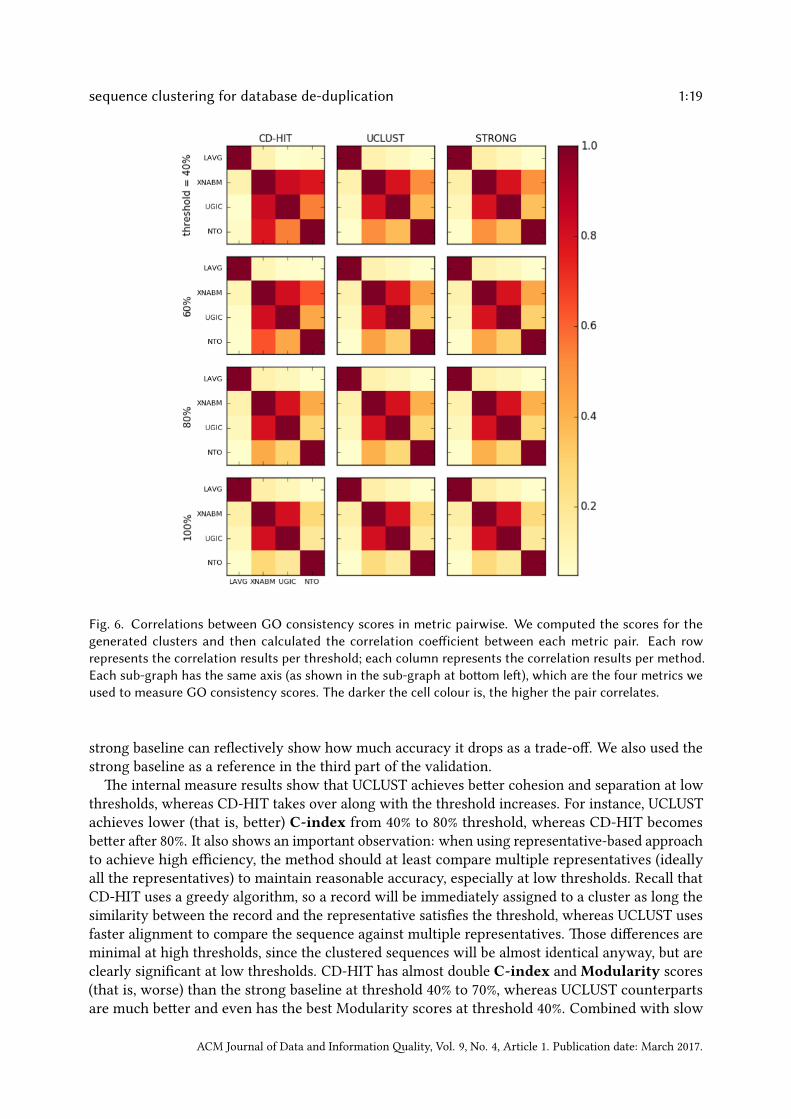
sequence clustering for database de-duplication 1:19
Fig. 6. Correlations between GO consistency scores in metric pairwise. We computed the scores for thegenerated clusters and then calculated the correlation coe�icient between each metric pair. Each rowrepresents the correlation results per threshold; each column represents the correlation results per method.Each sub-graph has the same axis (as shown in the sub-graph at bo�om le�), which are the four metrics weused to measure GO consistency scores. The darker the cell colour is, the higher the pair correlates.
strong baseline can re�ectively show how much accuracy it drops as a trade-o�. We also used thestrong baseline as a reference in the third part of the validation.
�e internal measure results show that UCLUST achieves be�er cohesion and separation at lowthresholds, whereas CD-HIT takes over along with the threshold increases. For instance, UCLUSTachieves lower (that is, be�er) C-index from 40% to 80% threshold, whereas CD-HIT becomesbe�er a�er 80%. It also shows an important observation: when using representative-based approachto achieve high e�ciency, the method should at least compare multiple representatives (ideallyall the representatives) to maintain reasonable accuracy, especially at low thresholds. Recall thatCD-HIT uses a greedy algorithm, so a record will be immediately assigned to a cluster as long thesimilarity between the record and the representative satis�es the threshold, whereas UCLUST usesfaster alignment to compare the sequence against multiple representatives. �ose di�erences areminimal at high thresholds, since the clustered sequences will be almost identical anyway, but areclearly signi�cant at low thresholds. CD-HIT has almost double C-index and Modularity scores(that is, worse) than the strong baseline at threshold 40% to 70%, whereas UCLUST counterpartsare much be�er and even has the best Modularity scores at threshold 40%. Combined with slow
ACM Journal of Data and Information �ality, Vol. 9, No. 4, Article 1. Publication date: March 2017.
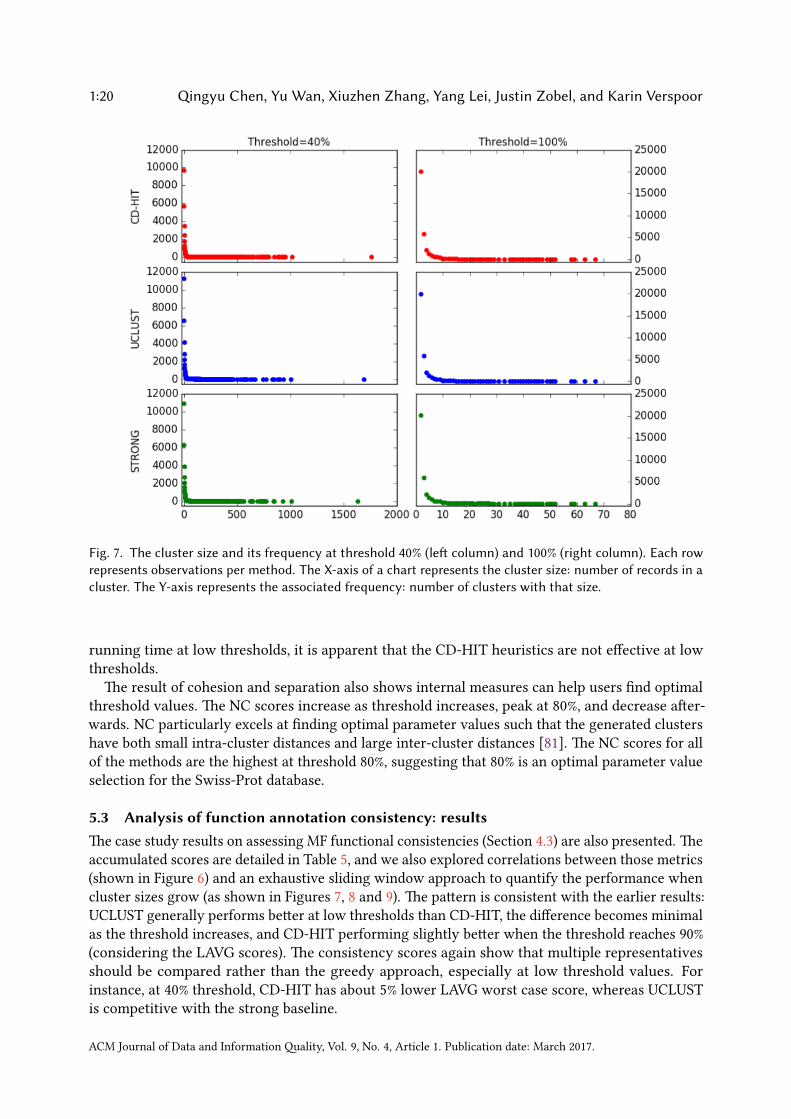
1:20 Qingyu Chen, Yu Wan, Xiuzhen Zhang, Yang Lei, Justin Zobel, and Karin Verspoor
Fig. 7. The cluster size and its frequency at threshold 40% (le� column) and 100% (right column). Each rowrepresents observations per method. The X-axis of a chart represents the cluster size: number of records in acluster. The Y-axis represents the associated frequency: number of clusters with that size.
running time at low thresholds, it is apparent that the CD-HIT heuristics are not e�ective at lowthresholds.
�e result of cohesion and separation also shows internal measures can help users �nd optimalthreshold values. �e NC scores increase as threshold increases, peak at 80%, and decrease a�er-wards. NC particularly excels at �nding optimal parameter values such that the generated clustershave both small intra-cluster distances and large inter-cluster distances [81]. �e NC scores for allof the methods are the highest at threshold 80%, suggesting that 80% is an optimal parameter valueselection for the Swiss-Prot database.
5.3 Analysis of function annotation consistency: results�e case study results on assessing MF functional consistencies (Section 4.3) are also presented. �eaccumulated scores are detailed in Table 5, and we also explored correlations between those metrics(shown in Figure 6) and an exhaustive sliding window approach to quantify the performance whencluster sizes grow (as shown in Figures 7, 8 and 9). �e pa�ern is consistent with the earlier results:UCLUST generally performs be�er at low thresholds than CD-HIT, the di�erence becomes minimalas the threshold increases, and CD-HIT performing slightly be�er when the threshold reaches 90%(considering the LAVG scores). �e consistency scores again show that multiple representativesshould be compared rather than the greedy approach, especially at low threshold values. Forinstance, at 40% threshold, CD-HIT has about 5% lower LAVG worst case score, whereas UCLUSTis competitive with the strong baseline.
ACM Journal of Data and Information �ality, Vol. 9, No. 4, Article 1. Publication date: March 2017.
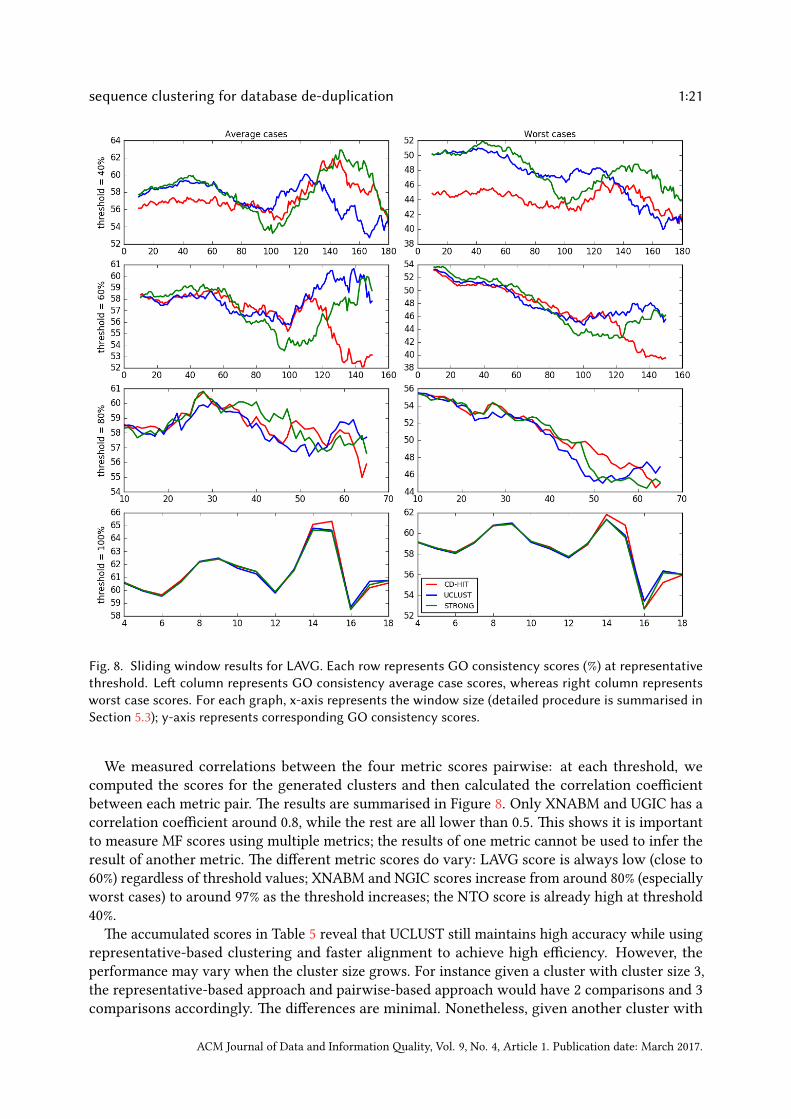
sequence clustering for database de-duplication 1:21
Fig. 8. Sliding window results for LAVG. Each row represents GO consistency scores (%) at representativethreshold. Le� column represents GO consistency average case scores, whereas right column representsworst case scores. For each graph, x-axis represents the window size (detailed procedure is summarised inSection 5.3); y-axis represents corresponding GO consistency scores.
We measured correlations between the four metric scores pairwise: at each threshold, wecomputed the scores for the generated clusters and then calculated the correlation coe�cientbetween each metric pair. �e results are summarised in Figure 8. Only XNABM and UGIC has acorrelation coe�cient around 0.8, while the rest are all lower than 0.5. �is shows it is importantto measure MF scores using multiple metrics; the results of one metric cannot be used to infer theresult of another metric. �e di�erent metric scores do vary: LAVG score is always low (close to60%) regardless of threshold values; XNABM and NGIC scores increase from around 80% (especiallyworst cases) to around 97% as the threshold increases; the NTO score is already high at threshold40%.
�e accumulated scores in Table 5 reveal that UCLUST still maintains high accuracy while usingrepresentative-based clustering and faster alignment to achieve high e�ciency. However, theperformance may vary when the cluster size grows. For instance given a cluster with cluster size 3,the representative-based approach and pairwise-based approach would have 2 comparisons and 3comparisons accordingly. �e di�erences are minimal. Nonetheless, given another cluster with
ACM Journal of Data and Information �ality, Vol. 9, No. 4, Article 1. Publication date: March 2017.
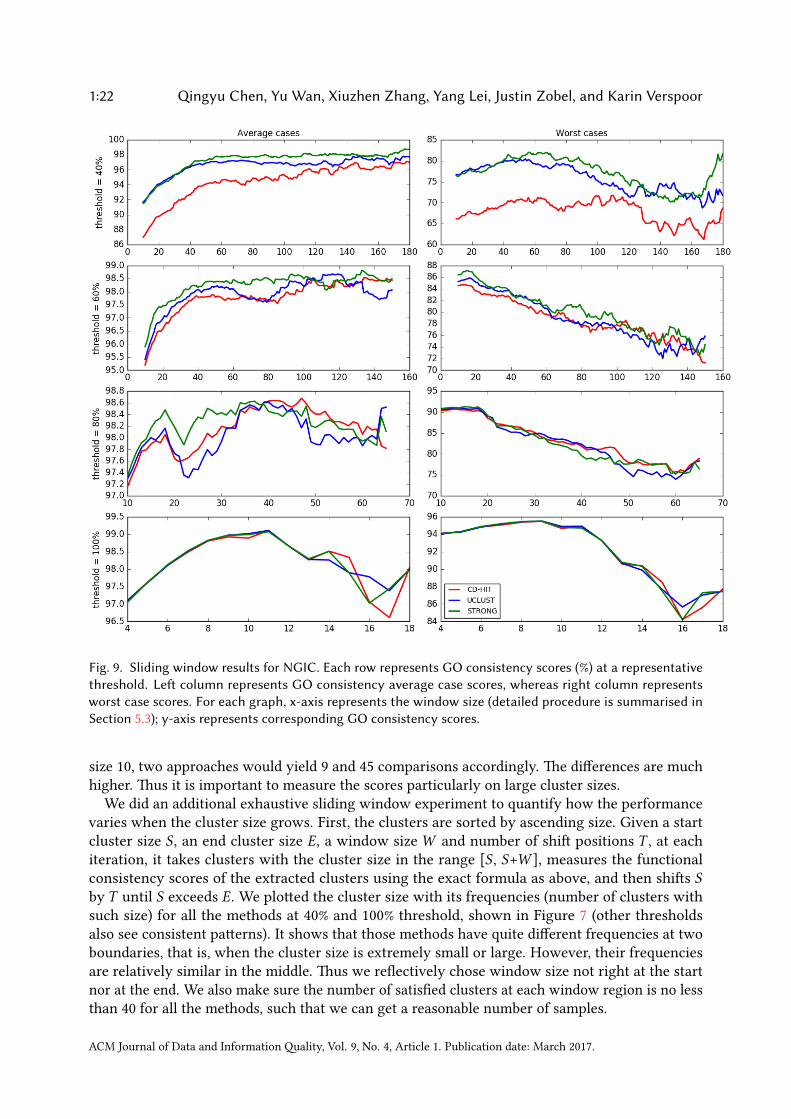
1:22 Qingyu Chen, Yu Wan, Xiuzhen Zhang, Yang Lei, Justin Zobel, and Karin Verspoor
Fig. 9. Sliding window results for NGIC. Each row represents GO consistency scores (%) at a representativethreshold. Le� column represents GO consistency average case scores, whereas right column representsworst case scores. For each graph, x-axis represents the window size (detailed procedure is summarised inSection 5.3); y-axis represents corresponding GO consistency scores.
size 10, two approaches would yield 9 and 45 comparisons accordingly. �e di�erences are muchhigher. �us it is important to measure the scores particularly on large cluster sizes.
We did an additional exhaustive sliding window experiment to quantify how the performancevaries when the cluster size grows. First, the clusters are sorted by ascending size. Given a startcluster size S , an end cluster size E, a window size W and number of shi� positions T , at eachiteration, it takes clusters with the cluster size in the range [S , S+W ], measures the functionalconsistency scores of the extracted clusters using the exact formula as above, and then shi�s Sby T until S exceeds E. We plo�ed the cluster size with its frequencies (number of clusters withsuch size) for all the methods at 40% and 100% threshold, shown in Figure 7 (other thresholdsalso see consistent pa�erns). It shows that those methods have quite di�erent frequencies at twoboundaries, that is, when the cluster size is extremely small or large. However, their frequenciesare relatively similar in the middle. �us we re�ectively chose window size not right at the startnor at the end. We also make sure the number of satis�ed clusters at each window region is no lessthan 40 for all the methods, such that we can get a reasonable number of samples.
ACM Journal of Data and Information �ality, Vol. 9, No. 4, Article 1. Publication date: March 2017.
sequence clustering for database de-duplication 1:23
�e sliding window results are summarised in Figure 8 and 9. �e di�erences are minimal at highthresholds. �is is because cluster size will be smaller when threshold becomes larger. For smallcluster sizes, representative-based and pairwise-based have similar number of pairs to compare.Also higher thresholds will cluster sequences with higher sequence identities, this will naturallymake the function annotations more consistent, given that functions are o�en determined bysequence identity. However, at low threshold, the accuracy of representative-based approach isdistinctly lower than the strong baseline. For instance, as shown in Figure 8, when the cluster sizeis around 20, both LAVG average and worst case scores for UCLUST and the strong baseline atthe 40% threshold is almost identical, but as the cluster size grows, the di�erences become ditinct:at cluster size around 150, the average and worst case scores of the strong baseline are about 5%and 8% higher than UCLUST respectively. Same applies to the NGIC worst case score at 40%. �issuggests users should check the consistency of large clusters.
�e sliding window results also reinforce the previous �ndings: representative-based approachcan maintain the accuracy only if it compares the representatives as many as possible. �e scores ofCD-HIT are generally lower, showing that greedy approach drops considerable accuracy. WhereasUCLUST achieves higher scores than CD-HIT in general and in some windows is even higher thanthe strong baseline, showing that comparing as many representatives have potential to maintainthe accuracy while dramatically increase the e�ciency.
6 RECOMMENDATIONS FOR SEQUENCE DATABASE DE-DUPLICATION USERS�e evaluation brings practical recommendations for users. Users who wish to use sequenceclustering methods for database de-duplication need to spend some time de�ning their requirementsbeforehand. Note that there is no one-size-�ts-all suggestion, but we outline the primary ones thatusers should consider before using the method.
• First, decide the scope. What is the aim of the de-duplication? Is it purely for removing theduplicates for database curation, or is it also necessary to retain the duplicates as clustersfor database search? In the former case it is only necessary to care about the representatives,such as the remaining redundancy ratio. However, in the la�er case it is also necessary toconsider the consistencies of intra-clusters. As an example, CD-HIT has lower redundancybetween representatives (as shown in Figure 5), and hence may be a reasonable choice forthe former case. In contrast, UCLUST has higher consistency of intra-clusters (as shown inTable 4), which may be suitable for the la�er case.
• Second, choose the threshold values. �reshold values impact both e�ciency and accuracy.For e�ciency, both methods are competitive at high thresholds, but CD-HIT is considerablyslower than UCLUST at low thresholds (as shown in Figure 4). �us, UCLUST can be areasonable candidate to cluster sequences at low thresholds. For accuracy, both methodsachieve promising accuracies at high thresholds, but the accuracy drops considerably atlow thresholds (as shown in Figure 9). In low threshold cases, the accuracy of UCLUST isgenerally higher, but we suggest checking the cluster results for both methods especiallyat low thresholds to determine whether to use post-processing.
In the Swiss-Prot case arguably we can set threshold 70% as a cut-o� (as shown inTable 4). the tools generally work well at thresholds higher than the cut-o� values, but notmuch at lower ones. If you want to use low threshold values, make sure you are aware ofboth e�ciency and accuracy.
• �ird, other factors may also ma�er. For instance, CD-HIT is a free open source tool,whereas the free version of UCLUST only allows �xed amount of memory. �us thedecision may also depend on the size of the dataset and budget.
ACM Journal of Data and Information �ality, Vol. 9, No. 4, Article 1. Publication date: March 2017.
1:24 Qingyu Chen, Yu Wan, Xiuzhen Zhang, Yang Lei, Justin Zobel, and Karin Verspoor
To summarise, the validation has shown both e�ciency and accuracy su�ers at low threshold val-ues; the accuracy drops as the cluster size increases. �ose are the cases certainly to check carefully.Broadly speaking, wherever there is a trade-o� (such as comparing against only representatives fore�ciency), we should be cautious. It may be necessary to post-process the outputs rather than usethe direct outputs. For example, the output representatives are always the longest sequences basedon the clustering method design. However, the longest sequences are not necessarily most infor-mative. �e “removed” redundant records may have richer annotations or brings more interestingbiological insights. In practice protein databases o�en use clustering tools to generate cluster �rstand then select the most informative record for each cluster to be the updated representatives [84].
7 CONCLUSIONIn this study, we comparatively analysed the performance of two well-known sequence clusteringmethods in terms of their ability to de-duplicating biological databases, for both database curationand search purposes. �e comparative analysis reveals high e�ciency and accuracy at highthresholds, but also challenges: both e�ciency and accuracy dropped dramatically at low thresholds,or with large clusters.
Our results agree with �ndings of other studies that compare di�erent clustering methods indi�erent domains, such as in a recent survey on search result diversi�cation [76]. Given queriesthat are entered by search engine users, search result diversi�cation aims to retrieve the relevantdocuments that are independently informative; this reduces much redundancies where very similardocuments may be retrieved for the same query [1]. Clustering is one diversi�cation approach: itgroups similar documents (some work also cluster queries [23]) such that documents from di�erentclusters are represented as retrieved results [25]. �e survey �nds that clustering methods mayhave potential to underpin the e�ectiveness of web search but rely on the choices of con�gurationsor parameters; that is why clustering-based methods o�en underperform other state-of-art methods.Earlier literature also concerns designing methods to model the similarity between documents andthe corresponding e�ciencies [90].
Anticipated future work has two directions. First, the sequence clustering validations need to beapplied to di�erent types of biological sequence databases such as nucleotides; and on di�erenttypes of biological tasks, such as pan-genome construction (where redundancy may ma�er) [38].Second, we plan to develop new methods to facilitate de-duplication. For example, there are manytypes of duplicates as mentioned. One of them is low-identity duplicates, where records arerather di�erent but refer to the same entities. Such duplicate type are common in database recordsubmission (di�erent submi�ers submit same entities) and database integration (same entities fromdi�erent databases are integrated into one source). Accuracy is thus critical for detecting thatduplicate type. Existing approaches o�en use pairwise comparisons to ensure accuracy [16]. Webelieve that clustering-based approach be used as blocking rules to make detection of that duplicatetype more e�cient.
REFERENCES[1] Rakesh Agrawal, Sreenivas Gollapudi, Alan Halverson, and Samuel Ieong. 2009. Diversifying search results. In
Proceedings of the second ACM international conference on web search and data mining. ACM, 5–14.[2] Stephen F Altschul, Warren Gish, Webb Miller, Eugene W Myers, and David J Lipman. 1990. Basic local alignment
search tool. Journal of molecular biology 215, 3 (1990), 403–410.[3] Olatz Arbelaitz, Ibai Gurrutxaga, Javier Muguerza, Jesus M Perez, and Inigo Perona. 2013. An extensive comparative
study of cluster validity indices. Pa�ern Recognition 46, 1 (2013), 243–256.[4] Michael Ashburner, Catherine A Ball, Judith A Blake, David Botstein, Heather Butler, J Michael Cherry, Allan P Davis,
Kara Dolinski, Selina S Dwight, Janan T Eppig, and others. 2000. Gene Ontology: tool for the uni�cation of biology.Nature genetics 25, 1 (2000), 25–29.
ACM Journal of Data and Information �ality, Vol. 9, No. 4, Article 1. Publication date: March 2017.
sequence clustering for database de-duplication 1:25
[5] Carlo Batini, Cinzia Cappiello, Chiara Francalanci, and Andrea Maurino. 2009. Methodologies for data qualityassessment and improvement. ACM computing surveys (CSUR) 41, 3 (2009), 16.
[6] Dennis A Benson, Karen Clark, Ilene Karsch-Mizrachi, David J Lipman, James Ostell, and Eric W Sayers. 2015. GenBank.Nucleic acids research 43, Database issue (2015), D30.
[7] James C Bezdek, Masud Moshtaghi, �omas Runkler, and Christopher Leckie. 2016. �e Generalized C Index forInternal Fuzzy Cluster Validity. IEEE Transactions on Fuzzy Systems 24, 6 (2016), 1500–1512.
[8] Stefan Bienert, Andrew Waterhouse, Tjaart AP de Beer, Gerardo Tauriello, Gabriel Studer, Lorenza Bordoli, and TorstenSchwede. 2016. �e SWISS-MODEL Repository – new features and functionality. Nucleic acids research 45, D1 (2016),D313–D319.
[9] Emmanuel Boutet, Damien Lieberherr, Michael Tognolli, Michel Schneider, Parit Bansal, Alan J Bridge, Sylvain Poux,Lydie Bougueleret, and Ioannis Xenarios. 2016. UniProtKB/Swiss-Prot, the manually annotated section of the UniProtKnowledgeBase: how to use the entry view. Plant Bioinformatics: Methods and Protocols (2016), 23–54.
[10] Borisas Bursteinas, Ramona Bri�o, Benoit Bely, Andrea Auchincloss, Catherine Rivoire, Nicole Redaschi, ClaireO’Donovan, and Maria Jesus Martin. 2016. Minimizing proteome redundancy in the UniProt Knowledgebase. Database:�e Journal of Biological Databases and Curation 2016 (2016).
[11] Yu-dong Cai and Shuo Liang Lin. 2003. Support vector machines for predicting rRNA-, RNA-, and DNA-bindingproteins from amino acid sequence. Biochimica et Biophysica Acta (BBA)-Proteins and Proteomics 1648, 1 (2003),127–133.
[12] Qingyu Chen, Yu Wan, Yang Lei, Justin Zobel, and Karin Verspoor. 2016. Evaluation of CD-HIT for constructingnon-redundant databases. In Bioinformatics and Biomedicine (BIBM), 2016 IEEE International Conference on. IEEE,703–706.
[13] Qingyu Chen, Justin Zobel, and Karin Verspoor. 2015. Evaluation of a Machine Learning Duplicate Detection Methodfor Bioinformatics Databases. In Proceedings of the ACM Ninth International Workshop on Data and Text Mining inBiomedical Informatics. ACM, 4–12.
[14] Qingyu Chen, Justin Zobel, and Karin Verspoor. 2017. Benchmarks for Measurement of Duplicate Detection Methodsin Nucleotide Databases. Database: �e Journal of Biological Databases and Curation (2017), baw164.
[15] Qingyu Chen, Justin Zobel, and Karin Verspoor. 2017. Duplicates, redundancies, and inconsistencies in the primarynucleotide databases: a descriptive study. Database: �e Journal of Biological Databases and Curation (2017), baw163.
[16] Qingyu Chen, Justin Zobel, Xiuzhen Zhang, and Karin Verspoor. 2016. Supervised Learning for Detection of Duplicatesin Genomic Sequence Databases. PloS one 11, 8 (2016), e0159644.
[17] Peter Christen. 2012. A survey of indexing techniques for scalable record linkage and deduplication. IEEE transactionson knowledge and data engineering 24, 9 (2012), 1537–1555.
[18] Christian Cole, Jonathan D Barber, and Geo�rey J Barton. 2008. �e Jpred 3 secondary structure prediction server.Nucleic acids research 36, suppl 2 (2008), W197–W201.
[19] Gene Ontology Consortium and others. 2017. Expansion of the Gene Ontology knowledgebase and resources. Nucleicacids research 45, D1 (2017), D331–D338.
[20] Melanie Courtot, Aleksandra Shypitsyna, Elena Spere�a, Alexander Holmes, Tony Sawford, Tony Wardell, Maria JesusMartin, and Claire O’Donovan. 2015. UniProt-GOA: A central resource for data integration and GO annotation.. InSWAT4LS. 227–228.
[21] Francisco M Couto and Mario J Silva. 2011. Disjunctive shared information between ontology concepts: application toGene Ontology. Journal of biomedical semantics 2, 1 (2011), 5.
[22] EC Dalrymple-Alford. 1970. Measurement of clustering in free recall. Psychological Bulletin 74, 1 (1970), 32.[23] Van Dang, Xiaobing Xue, and W Bruce Cro�. 2011. Inferring query aspects from reformulations using clustering. In
Proceedings of the 20th ACM international conference on Information and knowledge management. ACM, 2117–2120.[24] Christophe Dessimoz and Nives Skunca. 2016. �e Gene Ontology Handbook. Methods in molecular biology (2016).[25] Antonio Di Marco and Roberto Navigli. 2013. Clustering and diversifying web search results with graph-based word
sense induction. Computational Linguistics 39, 3 (2013), 709–754.[26] Hui Ding, Liaofu Luo, and Hao Lin. 2009. Prediction of cell wall lytic enzymes using Chou’s amphiphilic pseudo amino
acid composition. Protein and peptide le�ers 16, 4 (2009), 351–355.[27] Robert C Edgar. 2010. Search and clustering orders of magnitude faster than BLAST. Bioinformatics 26, 19 (2010),
2460–2461.[28] Simon B Eickho�, Angela R Laird, Peter T Fox, Danilo Bzdok, and Lukas Hensel. 2016. Functional segregation of the
human dorsomedial prefrontal cortex. Cerebral cortex 26, 1 (2016), 304–321.[29] Ahmed K Elmagarmid, Panagiotis G Ipeirotis, and Vassilios S Verykios. 2007. Duplicate record detection: A survey.
IEEE Transactions on knowledge and data engineering 19, 1 (2007).[30] Wenfei Fan. 2015. Data quality: from theory to practice. ACM SIGMOD Record 44, 3 (2015), 7–18.
ACM Journal of Data and Information �ality, Vol. 9, No. 4, Article 1. Publication date: March 2017.
1:26 Qingyu Chen, Yu Wan, Xiuzhen Zhang, Yang Lei, Justin Zobel, and Karin Verspoor
[31] Robert D Finn, Penelope Coggill, Ruth Y Eberhardt, Sean R Eddy, Jaina Mistry, Alex L Mitchell, Simon C Po�er, MarcoPunta, Matloob �reshi, Amaia Sangrador-Vegas, and others. 2016. �e Pfam protein families database: towards amore sustainable future. Nucleic acids research 44, D1 (2016), D279–D285.
[32] Limin Fu, Beifang Niu, Zhengwei Zhu, Sitao Wu, and Weizhong Li. 2012. CD-HIT: accelerated for clustering thenext-generation sequencing data. Bioinformatics 28, 23 (2012), 3150–3152.
[33] Michael Y Galperin, Xose M Fernandez-Suarez, and Daniel J Rigden. 2017. �e 24th annual Nucleic Acids Researchdatabase issue: a look back and upcoming changes. Nucleic Acids Research 45, D1 (2017), D1–D11.
[34] Lise Getoor and Ashwin Machanavajjhala. 2012. Entity resolution: theory, practice & open challenges. Proceedings ofthe VLDB Endowment 5, 12 (2012), 2018–2019.
[35] Jiawei Han, Jian Pei, and Micheline Kamber. 2011. Data mining: concepts and techniques. Elsevier.[36] Julia Handl, Joshua Knowles, and Douglas B Kell. 2005. Computational cluster validation in post-genomic data analysis.
Bioinformatics 21, 15 (2005), 3201–3212.[37] Yanbin Hao, Tingting Mu, Richang Hong, Meng Wang, Ning An, and John Y Goulermas. 2017. Stochastic Multiview
Hashing for Large-Scale Near-Duplicate Video Retrieval. IEEE Transactions on Multimedia 19, 1 (2017), 1–14.[38] Kathryn E Holt, Heiman Wertheim, and others. 2015. Genomic analysis of diversity, population structure, virulence,
and antimicrobial resistance in Klebsiella pneumoniae, an urgent threat to public health. Proceedings of the NationalAcademy of Sciences (2015). DOI:h�p://dx.doi.org/10.1073/pnas.1501049112
[39] Jing Hu and Xianghe Yan. 2012. BS-KNN: An e�ective algorithm for predicting protein subchloroplast localization.Evolutionary bioinformatics online 8 (2012), 79.
[40] Ying Huang, Beifang Niu, Ying Gao, Limin Fu, and Weizhong Li. 2010. CD-HIT Suite: a web server for clustering andcomparing biological sequences. Bioinformatics 26, 5 (2010), 680–682.
[41] Nicholas Jalbert and Westley Weimer. 2008. Automated duplicate detection for bug tracking systems. In DependableSystems and Networks With FTCS and DCC, 2008. DSN 2008. IEEE International Conference on. IEEE, 52–61.
[42] Vimukthi Jayawardene, Shazia Sadiq, and Marta Indulska. 2013. �e curse of dimensionality in data quality. In ACIS2013: 24th Australasian Conference on Information Systems. RMIT University, 1–11.
[43] Yanping Ji, Zhen Zhang, and Yinghe Hu. 2009. �e repertoire of G-protein-coupled receptors in Xenopus tropicalis.BMC genomics 10, 1 (2009).
[44] Juhyun Jung, Taewoo Ryu, Yongdeuk Hwang, Eunjung Lee, and Doheon Lee. 2010. Prediction of extracellular matrixproteins based on distinctive sequence and domain characteristics. Journal of Computational Biology 17, 1 (2010),97–105.
[45] Sallie Keller, Gizem Korkmaz, Mark Orr, Aaron Schroeder, and Stephanie Shipp. 2016. �e Evolution of Data �ality:Understanding the Transdisciplinary Origins of Data �ality Concepts and Approaches. Annual Review of Statisticsand Its Application 0 (2016).
[46] Evguenia Kopylova, Jose A Navas-Molina, Celine Mercier, Zhenjiang Zech Xu, Frederic Mahe, Yan He, Hong-Wei Zhou,Torbjørn Rognes, J Gregory Caporaso, and Rob Knight. 2016. Open-source sequence clustering methods improve thestate of the art. mSystems 1, 1 (2016), e00003–15.
[47] Peter G Korning, Stefan M Hebsgaard, Pierre Rouze, and Søren Brunak. 1996. Cleaning the GenBank Arabidopsisthaliana data set. Nucleic acids research 24, 2 (1996), 316–320.
[48] Manish Kumar, Varun �akur, and Gajendra PS Raghava. 2008. COPid: composition based protein identi�cation. Insilico biology 8, 2 (2008), 121–128.
[49] Ivica Letunic, Tobias Doerks, and Peer Bork. 2009. SMART 6: recent updates and new developments. Nucleic acidsresearch 37, suppl 1 (2009), D229–D232.
[50] Weizhong Li and Adam Godzik. 2006. Cd-hit: a fast program for clustering and comparing large sets of protein ornucleotide sequences. Bioinformatics 22, 13 (2006), 1658–1659.
[51] Weizhong Li, Lukasz Jaroszewski, and Adam Godzik. 2001. Clustering of highly homologous sequences to reduce thesize of large protein databases. Bioinformatics 17, 3 (2001), 282–283.
[52] Weizhong Li, Lukasz Jaroszewski, and Adam Godzik. 2002. Tolerating some redundancy signi�cantly speeds upclustering of large protein databases. Bioinformatics 18(1) (2002), 77–82.
[53] Jiajun Liu, Zi Huang, Hongyun Cai, Heng Tao Shen, Chong Wah Ngo, and Wei Wang. 2013. Near-duplicate videoretrieval: Current research and future trends. ACM Computing Surveys (CSUR) 45, 4 (2013), 44.
[54] Yanchi Liu, Zhongmou Li, Hui Xiong, Xuedong Gao, and Junjie Wu. 2010. Understanding of internal clusteringvalidation measures. In Data Mining (ICDM), 2010 IEEE 10th International Conference on. IEEE, 911–916.
[55] Gurmeet Singh Manku, Arvind Jain, and Anish Das Sarma. 2007. Detecting near-duplicates for web crawling. InProceedings of the 16th international conference on World Wide Web. ACM, 141–150.
[56] Bruno Martins. 2011. A supervised machine learning approach for duplicate detection over gaze�eer records. InInternational Conference on GeoSpatial Sematics. Springer, 34–51.
ACM Journal of Data and Information �ality, Vol. 9, No. 4, Article 1. Publication date: March 2017.
sequence clustering for database de-duplication 1:27
[57] Gaston K Mazandu, Emile R Chimusa, Mamana Mbiyavanga, and Nicola J Mulder. 2016. A-DaGO-Fun: an adaptableGene Ontology semantic similarity-based functional analysis tool. Bioinformatics 32, 3 (2016), 477–479.
[58] Gaston K Mazandu, Emile R Chimusa, and Nicola J Mulder. 2016. Gene Ontology semantic similarity tools: survey onfeatures and challenges for biological knowledge discovery. Brie�ngs in Bioinformatics (2016), bbw067.
[59] Gaston K Mazandu and Nicola J Mulder. 2013. Information content-based gene ontology semantic similarity approaches:toward a uni�ed framework theory. BioMed research international 2013 (2013).
[60] Gaston K Mazandu and Nicola J Mulder. 2014. Information content-based Gene Ontology functional similaritymeasures: which one to use for a given biological data type? PloS one 9, 12 (2014), e113859.
[61] Andrew V McDonnell, Taijiao Jiang, Amy E Keating, and Bonnie Berger. 2006. Paircoil2: improved prediction of coiledcoils from sequence. Bioinformatics 22, 3 (2006), 356–358.
[62] Milot Mirdita, Lars von den Driesch, Clovis Galiez, Maria J Martin, Johannes Soding, and Martin Steinegger. 2016.Uniclust databases of clustered and deeply annotated protein sequences and alignments. Nucleic Acids Research (2016),gkw1081.
[63] Meeta Mistry and Paul Pavlidis. 2008. Gene Ontology term overlap as a measure of gene functional similarity. BMCbioinformatics 9, 1 (2008), 327.
[64] Heiko Muller, Felix Naumann, and Johann-Christoph Freytag. 2003. Data quality in genome databases. (2003).[65] Saul B Needleman and Christian D Wunsch. 1970. A general method applicable to the search for similarities in the
amino acid sequence of two proteins. Journal of molecular biology 48, 3 (1970), 443–453.[66] Beifang Niu, Limin Fu, Shulei Sun, and Weizhong Li. 2010. Arti�cial and natural duplicates in pyrosequencing reads
of metagenomic data. BMC bioinformatics 11, 1 (2010), 1.[67] Catia Pesquita, Daniel Faria, Hugo Bastos, Antonio EN Ferreira, Andre O Falcao, and Francisco M Couto. 2008. Metrics
for GO based protein semantic similarity: a systematic evaluation. BMC bioinformatics 9, 5 (2008), S4.[68] Catia Pesquita, Daniel Faria, Andre O Falcao, Phillip Lord, and Francisco M Couto. 2009. Semantic similarity in
biomedical ontologies. PLoS comput biol 5, 7 (2009), e1000443.[69] Dariusz Plewczynski, Lukasz Slabinski, Adrian Tkacz, Laszlo Kajan, Liisa Holm, Krzysztof Ginalski, and Leszek
Rychlewski. 2007. �e RPSP: Web server for prediction of signal peptides. Polymer 48, 19 (2007), 5493–5496.[70] Sylvain Poux, Michele Magrane, Cecilia N Arighi, Alan Bridge, Claire O�Donovan, Kati Laiho, UniProt Consortium,
and others. 2014. Expert curation in UniProtKB: a case study on dealing with con�icting and erroneous data. Database2014 (2014), bau016.
[71] �eodoros Rekatsinas, Xin Luna Dong, Lise Getoor, and Divesh Srivastava. 2015. Finding �ality in �antity: �eChallenge of Discovering Valuable Sources for Integration.. In CIDR.
[72] Richard L Marchese Robinson, Iseult Lynch, Willie Peijnenburg, John Rumble, Fred Klaessig, Clarissa Marquardt,Hubert Rauscher, Tomasz Puzyn, Ronit Purian, Christo�er Aberg, and others. 2016. How should the completeness andquality of curated nanomaterial data be evaluated? Nanoscale 8, 19 (2016), 9919–9943.
[73] Marta Rosikiewicz, Aurelie Comte, Anne Niknejad, Marc Robinson-Rechavi, and Frederic B Bastian. 2013. Uncoveringhidden duplicated content in public transcriptomics data. Database 2013 (2013), bat010.
[74] Barna Saha and Divesh Srivastava. 2014. Data quality: �e other face of big data. In Data Engineering (ICDE), 2014IEEE 30th International Conference on. IEEE, 1294–1297.
[75] Meena K Sakharkar, VT Chow, Kingshuk Ghosh, Iti Chaturvedi, Pern Chern Lee, Sundara Perumal Bagavathi, PaulShapshak, Subramanian Subbiah, and Pandjassarame Kangueane. 2005. Computational prediction of SEG (single exongene) function in humans. Front Biosci 10 (2005), 1382–1395.
[76] Rodrygo LT Santos, Craig Macdonald, Iadh Ounis, and others. 2015. Search result diversi�cation. Foundations andTrends® in Information Retrieval 9, 1 (2015), 1–90.
[77] Ina Maria Schedina, Stefanie Hartmann, Detlef Groth, Ingo Schlupp, and Ralph Tiedemann. 2014. Comparative analysisof the gonadal transcriptomes of the all-female species Poecilia formosa and its maternal ancestor Poecilia mexicana.BMC research notes 7, 1 (2014), 1.
[78] Patrick D Schloss and Sarah L Westco�. 2011. Assessing and improving methods used in operational taxonomicunit-based approaches for 16S rRNA gene sequence analysis. Applied and environmental microbiology 77, 10 (2011),3219–3226.
[79] Robert Schmieder and Robert Edwards. 2011. Fast identi�cation and removal of sequence contamination from genomicand metagenomic datasets. PloS one 6, 3 (2011), e17288.
[80] Alexandra M Schnoes, Shoshana D Brown, Igor Dodevski, and Patricia C Babbi�. 2009. Annotation error in publicdatabases: misannotation of molecular function in enzyme superfamilies. PLoS Comput Biol 5, 12 (2009), e1000605.
[81] Jianbo Shi and Jitendra Malik. 2000. Normalized cuts and image segmentation. IEEE Transactions on pa�ern analysisand machine intelligence 22, 8 (2000), 888–905.
[82] Megan Sickmeier, Justin A Hamilton, Tanguy LeGall, Vladimir Vacic, Marc S Cortese, Agnes Tantos, Beata Szabo,Peter Tompa, Jake Chen, Vladimir N Uversky, and others. 2007. DisProt: the database of disordered proteins. Nucleic
ACM Journal of Data and Information �ality, Vol. 9, No. 4, Article 1. Publication date: March 2017.
1:28 Qingyu Chen, Yu Wan, Xiuzhen Zhang, Yang Lei, Justin Zobel, and Karin Verspoor
acids research 35, suppl 1 (2007), D786–D793.[83] Kresimir Sikic and Oliviero Carugo. 2010. Protein sequence redundancy reduction: comparison of various method.
Bioinformation 5, 6 (2010), 234–239.[84] Baris Suzek, Yuqi Wang, Hongzhan Huang, Peter McGarvey, Cathy Wu, UniProt Consortium, and others. 2014. UniRef
clusters: a comprehensive and scalable alternative for improving sequence similarity searches. Bioinformatics btu739(2014).
[85] Michael L Tress, Domenico Cozze�o, Anna Tramontano, and Alfonso Valencia. 2006. An analysis of the Sargasso Searesource and the consequences for database composition. BMC bioinformatics 7, 1 (2006), 1.
[86] Chun-Wei Tung. 2012. PupDB: a database of pupylated proteins. BMC bioinformatics 13, 1 (2012), 1.[87] Chun-Wei Tung and Shinn-Ying Ho. 2008. Computational identi�cation of ubiquitylation sites from protein sequences.
BMC bioinformatics 9, 1 (2008), 1.[88] UniProt Consortium. 2014. UniProt: a hub for protein information. Nucleic acids research (2014), gku989.[89] UniProt Consortium and others. 2014. Activities at the universal protein resource (UniProt). Nucleic acids research 42,
D1 (2014), D191–D198.[90] Peter Wille�. 1988. Recent trends in hierarchic document clustering: a critical review. Information Processing &
Management 24, 5 (1988), 577–597.[91] Chuan Xiao, Wei Wang, Xuemin Lin, Je�rey Xu Yu, and Guoren Wang. 2011. E�cient similarity joins for near-duplicate
detection. ACM Transactions on Database Systems (TODS) 36, 3 (2011), 15.[92] Xuan Xiao, Pu Wang, and Kuo-Chen Chou. 2009. GPCR-CA: A cellular automaton image approach for predicting
G-protein–coupled receptor functional classes. Journal of computational chemistry 30, 9 (2009), 1414–1423.[93] Mohammed J Zaki, Wagner Meira Jr, and Wagner Meira. 2014. Data mining and analysis: fundamental concepts and
algorithms. Cambridge University Press.[94] Yanqiong Zhang, Tao Li, CY Yang, Dong Li, Yu Cui, Ying Jiang, LQ Zhang, YP Zhu, and FC He. 2011. Prelocabc: a
novel predictor of protein sub-cellular localization using a bayesian classi�er. J Proteomics Bioinform 4, 1 (2011).[95] Eduard Valera Zorita, Pol Cusco, and Guillaume Filion. 2015. Starcode: sequence clustering based on all-pairs search.
Bioinformatics (2015), btv053.
Received February 2007; revised March 2009; accepted June 2009
ACM Journal of Data and Information �ality, Vol. 9, No. 4, Article 1. Publication date: March 2017.

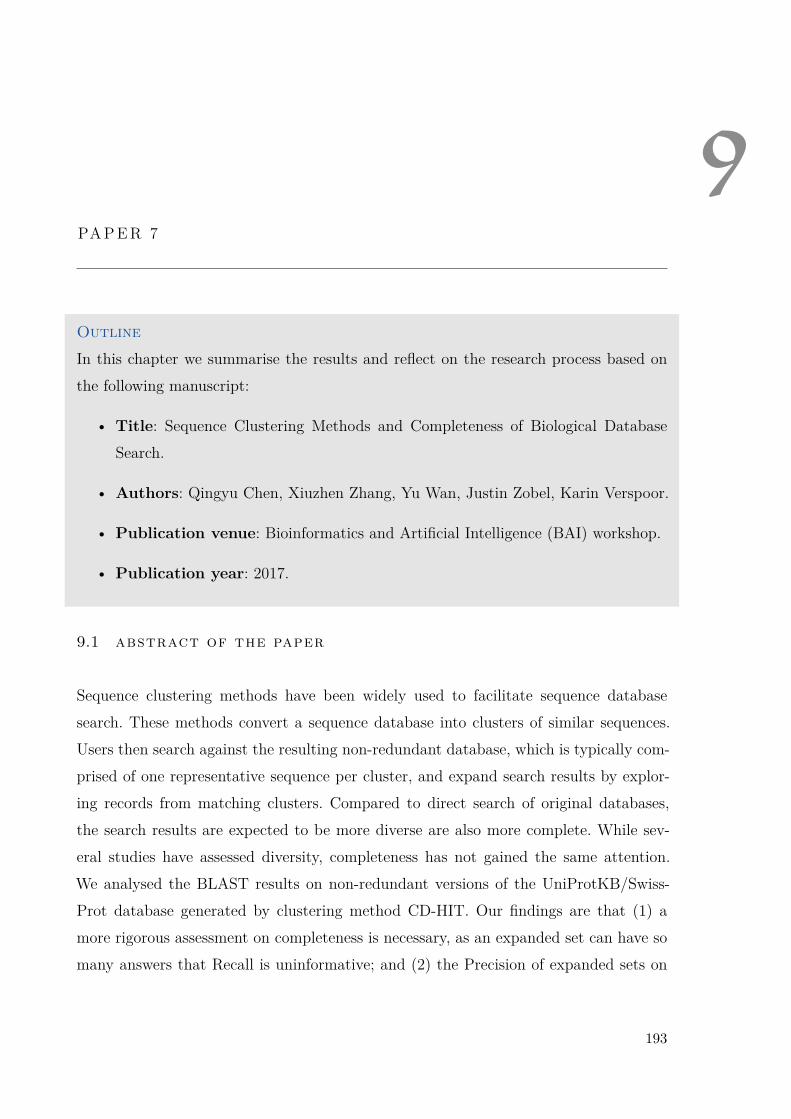
9PAPER 7
OutlineIn this chapter we summarise the results and reflect on the research process based onthe following manuscript:
• Title: Sequence Clustering Methods and Completeness of Biological DatabaseSearch.
• Authors: Qingyu Chen, Xiuzhen Zhang, Yu Wan, Justin Zobel, Karin Verspoor.
• Publication venue: Bioinformatics and Artificial Intelligence (BAI) workshop.
• Publication year: 2017.
9.1 abstract of the paper
Sequence clustering methods have been widely used to facilitate sequence databasesearch. These methods convert a sequence database into clusters of similar sequences.Users then search against the resulting non-redundant database, which is typically com-prised of one representative sequence per cluster, and expand search results by explor-ing records from matching clusters. Compared to direct search of original databases,the search results are expected to be more diverse are also more complete. While sev-eral studies have assessed diversity, completeness has not gained the same attention.We analysed the BLAST results on non-redundant versions of the UniProtKB/Swiss-Prot database generated by clustering method CD-HIT. Our findings are that (1) amore rigorous assessment on completeness is necessary, as an expanded set can have somany answers that Recall is uninformative; and (2) the Precision of expanded sets on
193
194 paper 7
top-ranked representatives drops by 7%. We propose a simple solution that returns auser-specified proportion of top similar records, modelled by a ranking function that ag-gregates sequence and annotation similarities. It removes millions of returned sequences,increases Precision by 3%, and does not need additional processing time.
9.2 summary and reflection
Chapter 7, Chapter 8, and this chapter focus on redundant records under the importantbiological case of database search. The previous two chapters look at search diversity:how distinct are the search results after reducing redundancies; this chapter looks atsearch completeness: whether “non-redundant” databases can bring complete search re-sults compared to search against the original databases. Recall that clustering methodsassign similar records into the same groups; one record from each group, called represen-tatives, constitutes “non-redundant” databases. Searching “non-redundant” databaseswill retrieve representatives, which gives more diverse search results (since represen-tatives from different groups are more distinct); expansion of records from the sameclusters as representatives will give more complete search results. Existing studies werelargely concerned with the diversity perspective, but few looked into the completenessperspective.In this study, we performed BLAST all-by-all search against full-size UniProtKB/Swiss-
Prot and used the search results as the gold standard. Then we applied CD-HIT tocluster the database and measure the differences of search results by using standardInformation Retrieval metrics such as precision and recall. The results demonstratedthat the precision drops by 7% when expanding the clusters. We proposed a simplesolution that ranks the similarity of records in a cluster based on sequence and annota-tion similarities and returns a user-defined proportion of top ranked records. By such,users can view the highest similar records when expanding the clusters and do not needto manually explore all the records in the clusters. This simple solution increases theprecision by 3% and helps users avoid manual exploration of millions of sequences.As mentioned in the previous chapter, I realised that effective sequence database
search concerns two components: search diversity and search completeness. This paper

9.2 summary and reflection 195
focuses on search completeness, by assessing the existing method for addressing redun-dant records and proposing a simple yet effective solution.
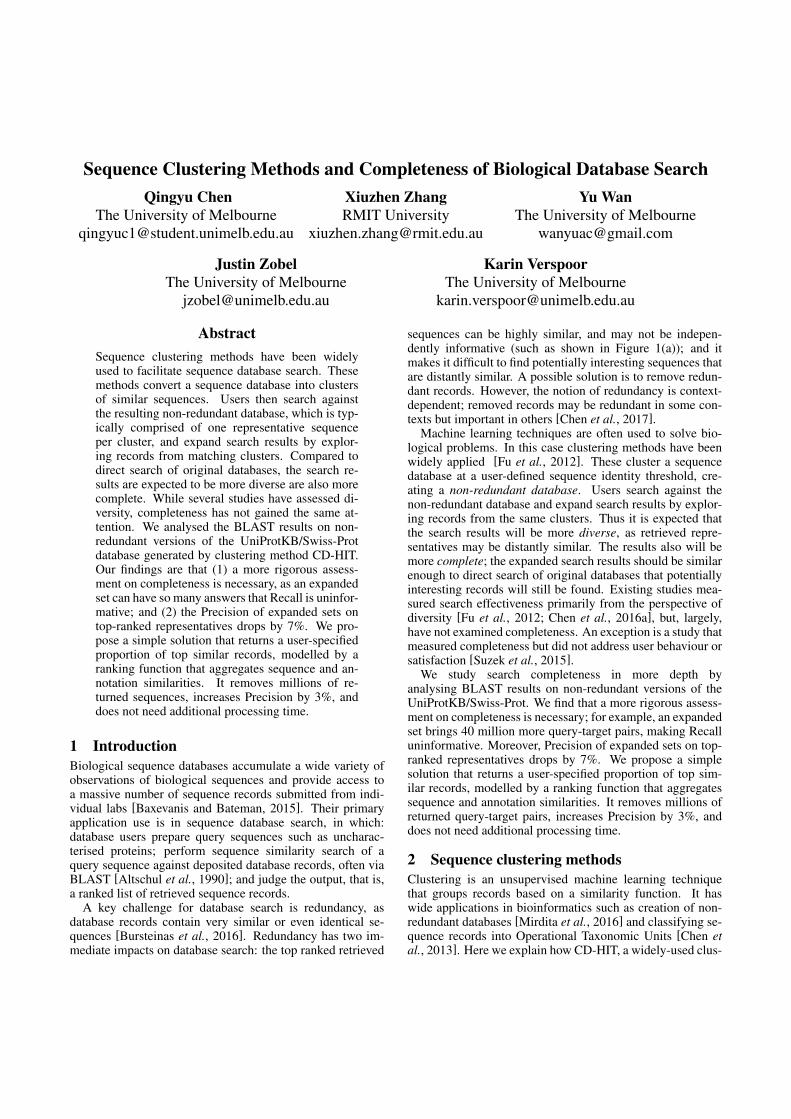
Sequence Clustering Methods and Completeness of Biological Database SearchQingyu Chen
The University of [email protected]
Xiuzhen ZhangRMIT University
Yu WanThe University of Melbourne
Justin ZobelThe University of Melbourne
Karin VerspoorThe University of Melbourne
AbstractSequence clustering methods have been widelyused to facilitate sequence database search. Thesemethods convert a sequence database into clustersof similar sequences. Users then search againstthe resulting non-redundant database, which is typ-ically comprised of one representative sequenceper cluster, and expand search results by explor-ing records from matching clusters. Compared todirect search of original databases, the search re-sults are expected to be more diverse are also morecomplete. While several studies have assessed di-versity, completeness has not gained the same at-tention. We analysed the BLAST results on non-redundant versions of the UniProtKB/Swiss-Protdatabase generated by clustering method CD-HIT.Our findings are that (1) a more rigorous assess-ment on completeness is necessary, as an expandedset can have so many answers that Recall is uninfor-mative; and (2) the Precision of expanded sets ontop-ranked representatives drops by 7%. We pro-pose a simple solution that returns a user-specifiedproportion of top similar records, modelled by aranking function that aggregates sequence and an-notation similarities. It removes millions of re-turned sequences, increases Precision by 3%, anddoes not need additional processing time.
1 IntroductionBiological sequence databases accumulate a wide variety ofobservations of biological sequences and provide access toa massive number of sequence records submitted from indi-vidual labs [Baxevanis and Bateman, 2015]. Their primaryapplication use is in sequence database search, in which:database users prepare query sequences such as uncharac-terised proteins; perform sequence similarity search of aquery sequence against deposited database records, often viaBLAST [Altschul et al., 1990]; and judge the output, that is,a ranked list of retrieved sequence records.
A key challenge for database search is redundancy, asdatabase records contain very similar or even identical se-quences [Bursteinas et al., 2016]. Redundancy has two im-mediate impacts on database search: the top ranked retrieved
sequences can be highly similar, and may not be indepen-dently informative (such as shown in Figure 1(a)); and itmakes it difficult to find potentially interesting sequences thatare distantly similar. A possible solution is to remove redun-dant records. However, the notion of redundancy is context-dependent; removed records may be redundant in some con-texts but important in others [Chen et al., 2017].
Machine learning techniques are often used to solve bio-logical problems. In this case clustering methods have beenwidely applied [Fu et al., 2012]. These cluster a sequencedatabase at a user-defined sequence identity threshold, cre-ating a non-redundant database. Users search against thenon-redundant database and expand search results by explor-ing records from the same clusters. Thus it is expected thatthe search results will be more diverse, as retrieved repre-sentatives may be distantly similar. The results also will bemore complete; the expanded search results should be similarenough to direct search of original databases that potentiallyinteresting records will still be found. Existing studies mea-sured search effectiveness primarily from the perspective ofdiversity [Fu et al., 2012; Chen et al., 2016a], but, largely,have not examined completeness. An exception is a study thatmeasured completeness but did not address user behaviour orsatisfaction [Suzek et al., 2015].
We study search completeness in more depth byanalysing BLAST results on non-redundant versions of theUniProtKB/Swiss-Prot. We find that a more rigorous assess-ment on completeness is necessary; for example, an expandedset brings 40 million more query-target pairs, making Recalluninformative. Moreover, Precision of expanded sets on top-ranked representatives drops by 7%. We propose a simplesolution that returns a user-specified proportion of top sim-ilar records, modelled by a ranking function that aggregatessequence and annotation similarities. It removes millions ofreturned query-target pairs, increases Precision by 3%, anddoes not need additional processing time.
2 Sequence clustering methodsClustering is an unsupervised machine learning techniquethat groups records based on a similarity function. It haswide applications in bioinformatics such as creation of non-redundant databases [Mirdita et al., 2016] and classifying se-quence records into Operational Taxonomic Units [Chen etal., 2013]. Here we explain how CD-HIT, a widely-used clus-
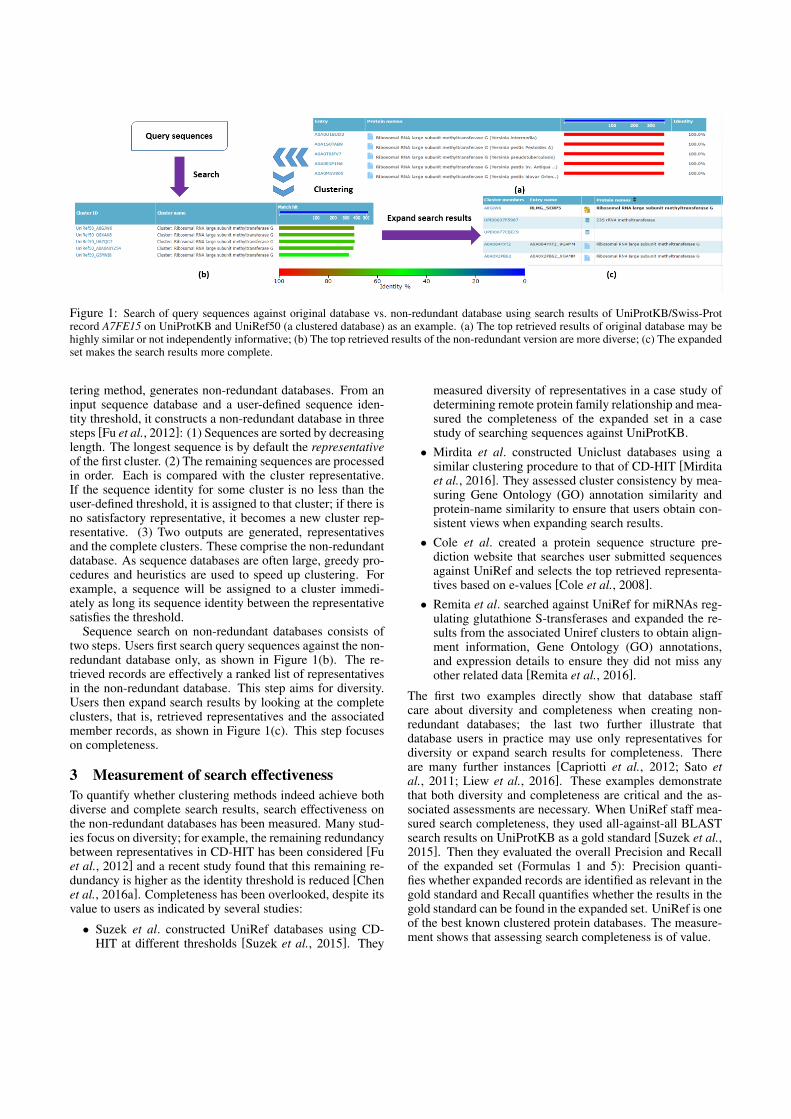
Figure 1: Search of query sequences against original database vs. non-redundant database using search results of UniProtKB/Swiss-Protrecord A7FE15 on UniProtKB and UniRef50 (a clustered database) as an example. (a) The top retrieved results of original database may behighly similar or not independently informative; (b) The top retrieved results of the non-redundant version are more diverse; (c) The expandedset makes the search results more complete.
tering method, generates non-redundant databases. From aninput sequence database and a user-defined sequence iden-tity threshold, it constructs a non-redundant database in threesteps [Fu et al., 2012]: (1) Sequences are sorted by decreasinglength. The longest sequence is by default the representativeof the first cluster. (2) The remaining sequences are processedin order. Each is compared with the cluster representative.If the sequence identity for some cluster is no less than theuser-defined threshold, it is assigned to that cluster; if there isno satisfactory representative, it becomes a new cluster rep-resentative. (3) Two outputs are generated, representativesand the complete clusters. These comprise the non-redundantdatabase. As sequence databases are often large, greedy pro-cedures and heuristics are used to speed up clustering. Forexample, a sequence will be assigned to a cluster immedi-ately as long its sequence identity between the representativesatisfies the threshold.
Sequence search on non-redundant databases consists oftwo steps. Users first search query sequences against the non-redundant database only, as shown in Figure 1(b). The re-trieved records are effectively a ranked list of representativesin the non-redundant database. This step aims for diversity.Users then expand search results by looking at the completeclusters, that is, retrieved representatives and the associatedmember records, as shown in Figure 1(c). This step focuseson completeness.
3 Measurement of search effectivenessTo quantify whether clustering methods indeed achieve bothdiverse and complete search results, search effectiveness onthe non-redundant databases has been measured. Many stud-ies focus on diversity; for example, the remaining redundancybetween representatives in CD-HIT has been considered [Fuet al., 2012] and a recent study found that this remaining re-dundancy is higher as the identity threshold is reduced [Chenet al., 2016a]. Completeness has been overlooked, despite itsvalue to users as indicated by several studies:
• Suzek et al. constructed UniRef databases using CD-HIT at different thresholds [Suzek et al., 2015]. They
measured diversity of representatives in a case study ofdetermining remote protein family relationship and mea-sured the completeness of the expanded set in a casestudy of searching sequences against UniProtKB.• Mirdita et al. constructed Uniclust databases using a
similar clustering procedure to that of CD-HIT [Mirditaet al., 2016]. They assessed cluster consistency by mea-suring Gene Ontology (GO) annotation similarity andprotein-name similarity to ensure that users obtain con-sistent views when expanding search results.• Cole et al. created a protein sequence structure pre-
diction website that searches user submitted sequencesagainst UniRef and selects the top retrieved representa-tives based on e-values [Cole et al., 2008].• Remita et al. searched against UniRef for miRNAs reg-
ulating glutathione S-transferases and expanded the re-sults from the associated Uniref clusters to obtain align-ment information, Gene Ontology (GO) annotations,and expression details to ensure they did not miss anyother related data [Remita et al., 2016].
The first two examples directly show that database staffcare about diversity and completeness when creating non-redundant databases; the last two further illustrate thatdatabase users in practice may use only representatives fordiversity or expand search results for completeness. Thereare many further instances [Capriotti et al., 2012; Sato etal., 2011; Liew et al., 2016]. These examples demonstratethat both diversity and completeness are critical and the as-sociated assessments are necessary. When UniRef staff mea-sured search completeness, they used all-against-all BLASTsearch results on UniProtKB as a gold standard [Suzek et al.,2015]. Then they evaluated the overall Precision and Recallof the expanded set (Formulas 1 and 5): Precision quanti-fies whether expanded records are identified as relevant in thegold standard and Recall quantifies whether the results in thegold standard can be found in the expanded set. UniRef is oneof the best known clustered protein databases. The measure-ment shows that assessing search completeness is of value.
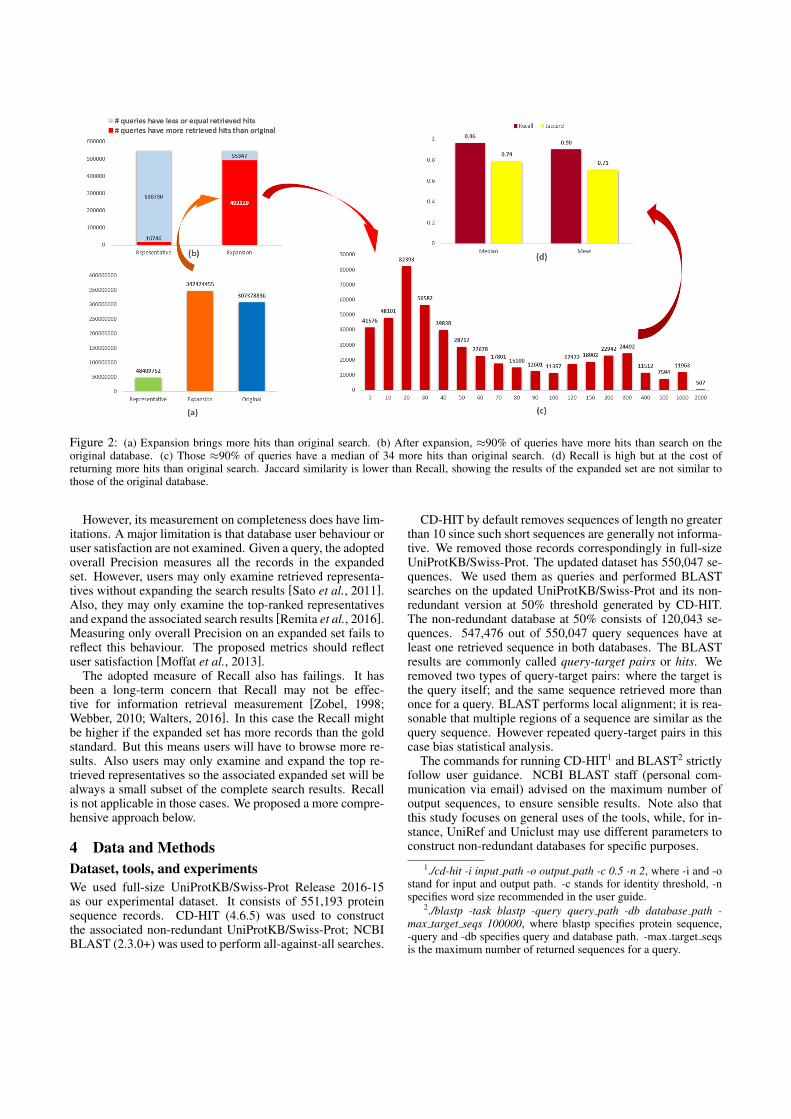
Figure 2: (a) Expansion brings more hits than original search. (b) After expansion, ≈90% of queries have more hits than search on theoriginal database. (c) Those ≈90% of queries have a median of 34 more hits than original search. (d) Recall is high but at the cost ofreturning more hits than original search. Jaccard similarity is lower than Recall, showing the results of the expanded set are not similar tothose of the original database.
However, its measurement on completeness does have lim-itations. A major limitation is that database user behaviour oruser satisfaction are not examined. Given a query, the adoptedoverall Precision measures all the records in the expandedset. However, users may only examine retrieved representa-tives without expanding the search results [Sato et al., 2011].Also, they may only examine the top-ranked representativesand expand the associated search results [Remita et al., 2016].Measuring only overall Precision on an expanded set fails toreflect this behaviour. The proposed metrics should reflectuser satisfaction [Moffat et al., 2013].
The adopted measure of Recall also has failings. It hasbeen a long-term concern that Recall may not be effec-tive for information retrieval measurement [Zobel, 1998;Webber, 2010; Walters, 2016]. In this case the Recall mightbe higher if the expanded set has more records than the goldstandard. But this means users will have to browse more re-sults. Also users may only examine and expand the top re-trieved representatives so the associated expanded set will bealways a small subset of the complete search results. Recallis not applicable in those cases. We proposed a more compre-hensive approach below.
4 Data and MethodsDataset, tools, and experimentsWe used full-size UniProtKB/Swiss-Prot Release 2016-15as our experimental dataset. It consists of 551,193 proteinsequence records. CD-HIT (4.6.5) was used to constructthe associated non-redundant UniProtKB/Swiss-Prot; NCBIBLAST (2.3.0+) was used to perform all-against-all searches.
CD-HIT by default removes sequences of length no greaterthan 10 since such short sequences are generally not informa-tive. We removed those records correspondingly in full-sizeUniProtKB/Swiss-Prot. The updated dataset has 550,047 se-quences. We used them as queries and performed BLASTsearches on the updated UniProtKB/Swiss-Prot and its non-redundant version at 50% threshold generated by CD-HIT.The non-redundant database at 50% consists of 120,043 se-quences. 547,476 out of 550,047 query sequences have atleast one retrieved sequence in both databases. The BLASTresults are commonly called query-target pairs or hits. Weremoved two types of query-target pairs: where the target isthe query itself; and the same sequence retrieved more thanonce for a query. BLAST performs local alignment; it is rea-sonable that multiple regions of a sequence are similar as thequery sequence. However repeated query-target pairs in thiscase bias statistical analysis.
The commands for running CD-HIT1 and BLAST2 strictlyfollow user guidance. NCBI BLAST staff (personal com-munication via email) advised on the maximum number ofoutput sequences, to ensure sensible results. Note also thatthis study focuses on general uses of the tools, while, for in-stance, UniRef and Uniclust may use different parameters toconstruct non-redundant databases for specific purposes.
1./cd-hit -i input path -o output path -c 0.5 -n 2, where -i and -ostand for input and output path. -c stands for identity threshold, -nspecifies word size recommended in the user guide.
2./blastp -task blastp -query query path -db database path -max target seqs 100000, where blastp specifies protein sequence,-query and -db specifies query and database path. -max target seqsis the maximum number of returned sequences for a query.
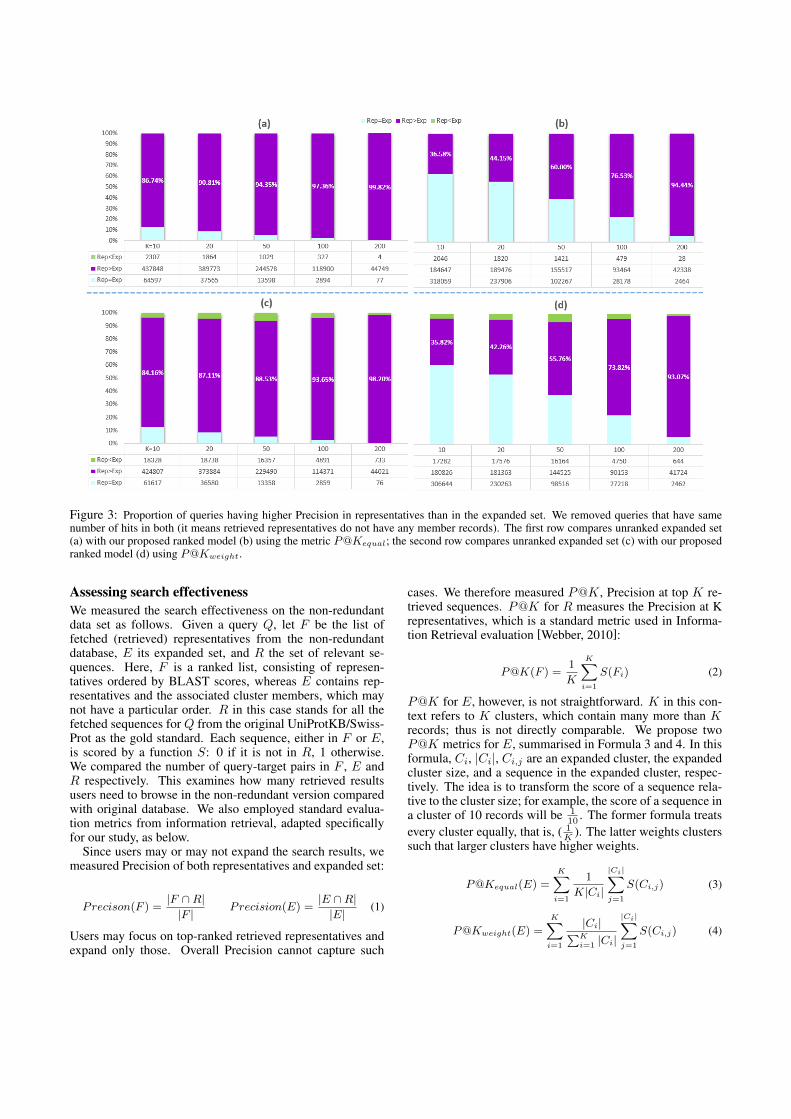
Figure 3: Proportion of queries having higher Precision in representatives than in the expanded set. We removed queries that have samenumber of hits in both (it means retrieved representatives do not have any member records). The first row compares unranked expanded set(a) with our proposed ranked model (b) using the metric P@Kequal; the second row compares unranked expanded set (c) with our proposedranked model (d) using P@Kweight.
Assessing search effectivenessWe measured the search effectiveness on the non-redundantdata set as follows. Given a query Q, let F be the list offetched (retrieved) representatives from the non-redundantdatabase, E its expanded set, and R the set of relevant se-quences. Here, F is a ranked list, consisting of represen-tatives ordered by BLAST scores, whereas E contains rep-resentatives and the associated cluster members, which maynot have a particular order. R in this case stands for all thefetched sequences for Q from the original UniProtKB/Swiss-Prot as the gold standard. Each sequence, either in F or E,is scored by a function S: 0 if it is not in R, 1 otherwise.We compared the number of query-target pairs in F , E andR respectively. This examines how many retrieved resultsusers need to browse in the non-redundant version comparedwith original database. We also employed standard evalua-tion metrics from information retrieval, adapted specificallyfor our study, as below.
Since users may or may not expand the search results, wemeasured Precision of both representatives and expanded set:
Precison(F ) =|F ∩R||F | Precision(E) =
|E ∩R||E| (1)
Users may focus on top-ranked retrieved representatives andexpand only those. Overall Precision cannot capture such
cases. We therefore measured P@K, Precision at top K re-trieved sequences. P@K for R measures the Precision at Krepresentatives, which is a standard metric used in Informa-tion Retrieval evaluation [Webber, 2010]:
P@K(F ) =1
K
K∑
i=1
S(Fi) (2)
P@K for E, however, is not straightforward. K in this con-text refers to K clusters, which contain many more than Krecords; thus is not directly comparable. We propose twoP@K metrics for E, summarised in Formula 3 and 4. In thisformula, Ci, |Ci|, Ci,j are an expanded cluster, the expandedcluster size, and a sequence in the expanded cluster, respec-tively. The idea is to transform the score of a sequence rela-tive to the cluster size; for example, the score of a sequence ina cluster of 10 records will be 1
10 . The former formula treatsevery cluster equally, that is, ( 1
K ). The latter weights clusterssuch that larger clusters have higher weights.
P@Kequal(E) =K∑
i=1
1
K|Ci|
|Ci|∑
j=1
S(Ci,j) (3)
P@Kweight(E) =K∑
i=1
|Ci|∑Ki=1 |Ci|
|Ci|∑
j=1
S(Ci,j) (4)
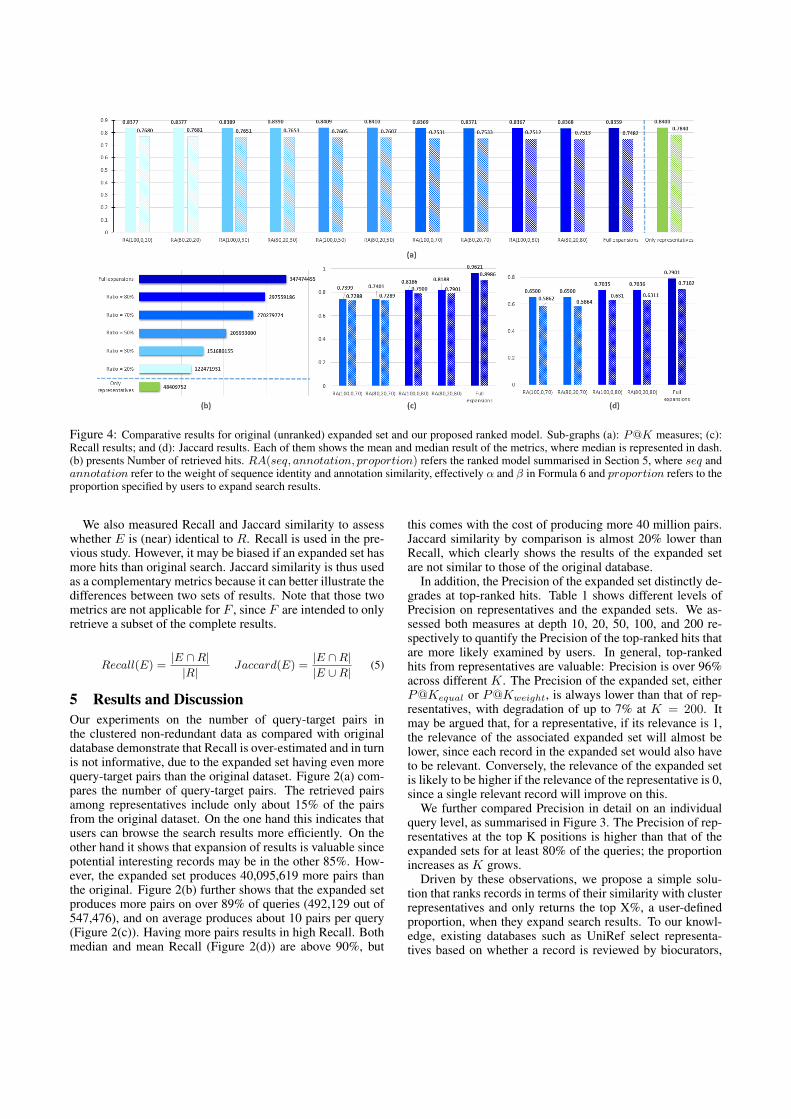
Figure 4: Comparative results for original (unranked) expanded set and our proposed ranked model. Sub-graphs (a): P@K measures; (c):Recall results; and (d): Jaccard results. Each of them shows the mean and median result of the metrics, where median is represented in dash.(b) presents Number of retrieved hits. RA(seq, annotation, proportion) refers the ranked model summarised in Section 5, where seq andannotation refer to the weight of sequence identity and annotation similarity, effectively α and β in Formula 6 and proportion refers to theproportion specified by users to expand search results.
We also measured Recall and Jaccard similarity to assesswhether E is (near) identical to R. Recall is used in the pre-vious study. However, it may be biased if an expanded set hasmore hits than original search. Jaccard similarity is thus usedas a complementary metrics because it can better illustrate thedifferences between two sets of results. Note that those twometrics are not applicable for F , since F are intended to onlyretrieve a subset of the complete results.
Recall(E) =|E ∩R||R| Jaccard(E) =
|E ∩R||E ∪R| (5)
5 Results and DiscussionOur experiments on the number of query-target pairs inthe clustered non-redundant data as compared with originaldatabase demonstrate that Recall is over-estimated and in turnis not informative, due to the expanded set having even morequery-target pairs than the original dataset. Figure 2(a) com-pares the number of query-target pairs. The retrieved pairsamong representatives include only about 15% of the pairsfrom the original dataset. On the one hand this indicates thatusers can browse the search results more efficiently. On theother hand it shows that expansion of results is valuable sincepotential interesting records may be in the other 85%. How-ever, the expanded set produces 40,095,619 more pairs thanthe original. Figure 2(b) further shows that the expanded setproduces more pairs on over 89% of queries (492,129 out of547,476), and on average produces about 10 pairs per query(Figure 2(c)). Having more pairs results in high Recall. Bothmedian and mean Recall (Figure 2(d)) are above 90%, but
this comes with the cost of producing more 40 million pairs.Jaccard similarity by comparison is almost 20% lower thanRecall, which clearly shows the results of the expanded setare not similar to those of the original database.
In addition, the Precision of the expanded set distinctly de-grades at top-ranked hits. Table 1 shows different levels ofPrecision on representatives and the expanded sets. We as-sessed both measures at depth 10, 20, 50, 100, and 200 re-spectively to quantify the Precision of the top-ranked hits thatare more likely examined by users. In general, top-rankedhits from representatives are valuable: Precision is over 96%across different K. The Precision of the expanded set, eitherP@Kequal or P@Kweight, is always lower than that of rep-resentatives, with degradation of up to 7% at K = 200. Itmay be argued that, for a representative, if its relevance is 1,the relevance of the associated expanded set will almost belower, since each record in the expanded set would also haveto be relevant. Conversely, the relevance of the expanded setis likely to be higher if the relevance of the representative is 0,since a single relevant record will improve on this.
We further compared Precision in detail on an individualquery level, as summarised in Figure 3. The Precision of rep-resentatives at the top K positions is higher than that of theexpanded sets for at least 80% of the queries; the proportionincreases as K grows.
Driven by these observations, we propose a simple solu-tion that ranks records in terms of their similarity with clusterrepresentatives and only returns the top X%, a user-definedproportion, when they expand search results. To our knowl-edge, existing databases such as UniRef select representa-tives based on whether a record is reviewed by biocurators,
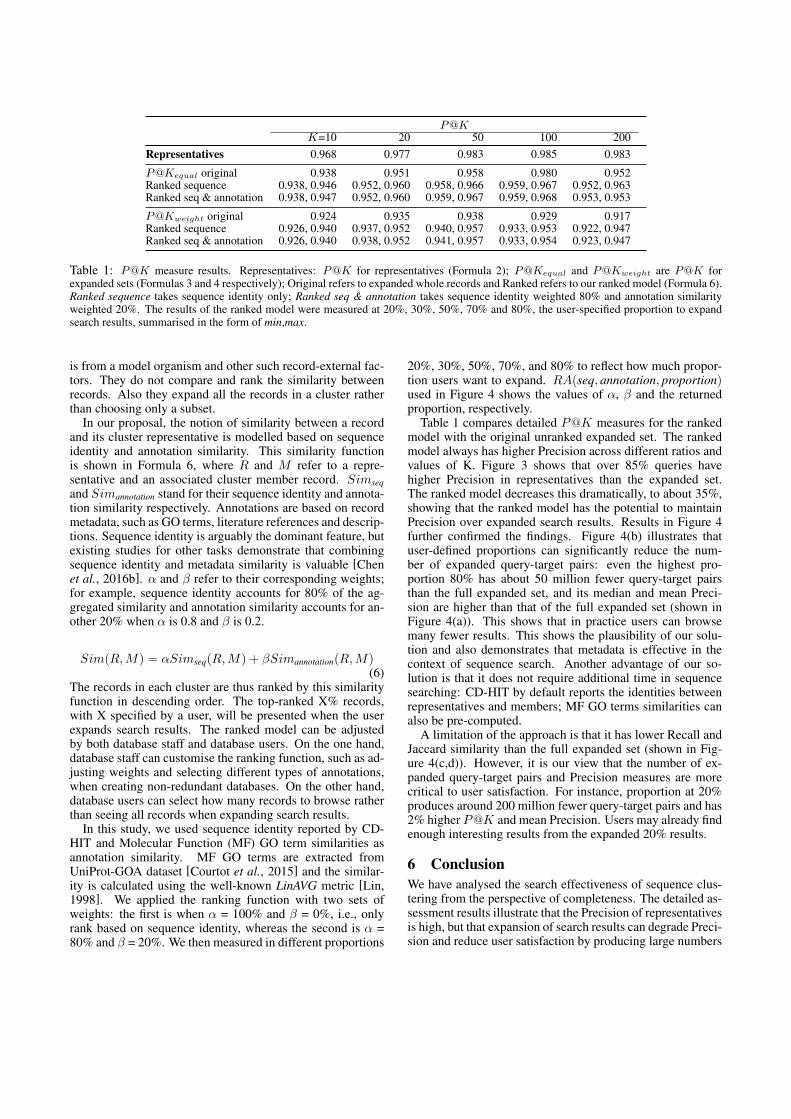
P@KK=10 20 50 100 200
Representatives 0.968 0.977 0.983 0.985 0.983
P@Kequal original 0.938 0.951 0.958 0.980 0.952Ranked sequence 0.938, 0.946 0.952, 0.960 0.958, 0.966 0.959, 0.967 0.952, 0.963Ranked seq & annotation 0.938, 0.947 0.952, 0.960 0.959, 0.967 0.959, 0.968 0.953, 0.953
P@Kweight original 0.924 0.935 0.938 0.929 0.917Ranked sequence 0.926, 0.940 0.937, 0.952 0.940, 0.957 0.933, 0.953 0.922, 0.947Ranked seq & annotation 0.926, 0.940 0.938, 0.952 0.941, 0.957 0.933, 0.954 0.923, 0.947
Table 1: P@K measure results. Representatives: P@K for representatives (Formula 2); P@Kequal and P@Kweight are P@K forexpanded sets (Formulas 3 and 4 respectively); Original refers to expanded whole records and Ranked refers to our ranked model (Formula 6).Ranked sequence takes sequence identity only; Ranked seq & annotation takes sequence identity weighted 80% and annotation similarityweighted 20%. The results of the ranked model were measured at 20%, 30%, 50%, 70% and 80%, the user-specified proportion to expandsearch results, summarised in the form of min,max.
is from a model organism and other such record-external fac-tors. They do not compare and rank the similarity betweenrecords. Also they expand all the records in a cluster ratherthan choosing only a subset.
In our proposal, the notion of similarity between a recordand its cluster representative is modelled based on sequenceidentity and annotation similarity. This similarity functionis shown in Formula 6, where R and M refer to a repre-sentative and an associated cluster member record. Simseqand Simannotation stand for their sequence identity and annota-tion similarity respectively. Annotations are based on recordmetadata, such as GO terms, literature references and descrip-tions. Sequence identity is arguably the dominant feature, butexisting studies for other tasks demonstrate that combiningsequence identity and metadata similarity is valuable [Chenet al., 2016b]. α and β refer to their corresponding weights;for example, sequence identity accounts for 80% of the ag-gregated similarity and annotation similarity accounts for an-other 20% when α is 0.8 and β is 0.2.
Sim(R,M) = αSimseq(R,M) + βSimannotation(R,M)(6)
The records in each cluster are thus ranked by this similarityfunction in descending order. The top-ranked X% records,with X specified by a user, will be presented when the userexpands search results. The ranked model can be adjustedby both database staff and database users. On the one hand,database staff can customise the ranking function, such as ad-justing weights and selecting different types of annotations,when creating non-redundant databases. On the other hand,database users can select how many records to browse ratherthan seeing all records when expanding search results.
In this study, we used sequence identity reported by CD-HIT and Molecular Function (MF) GO term similarities asannotation similarity. MF GO terms are extracted fromUniProt-GOA dataset [Courtot et al., 2015] and the similar-ity is calculated using the well-known LinAVG metric [Lin,1998]. We applied the ranking function with two sets ofweights: the first is when α = 100% and β = 0%, i.e., onlyrank based on sequence identity, whereas the second is α =80% and β = 20%. We then measured in different proportions
20%, 30%, 50%, 70%, and 80% to reflect how much propor-tion users want to expand. RA(seq, annotation, proportion)used in Figure 4 shows the values of α, β and the returnedproportion, respectively.
Table 1 compares detailed P@K measures for the rankedmodel with the original unranked expanded set. The rankedmodel always has higher Precision across different ratios andvalues of K. Figure 3 shows that over 85% queries havehigher Precision in representatives than the expanded set.The ranked model decreases this dramatically, to about 35%,showing that the ranked model has the potential to maintainPrecision over expanded search results. Results in Figure 4further confirmed the findings. Figure 4(b) illustrates thatuser-defined proportions can significantly reduce the num-ber of expanded query-target pairs: even the highest pro-portion 80% has about 50 million fewer query-target pairsthan the full expanded set, and its median and mean Preci-sion are higher than that of the full expanded set (shown inFigure 4(a)). This shows that in practice users can browsemany fewer results. This shows the plausibility of our solu-tion and also demonstrates that metadata is effective in thecontext of sequence search. Another advantage of our so-lution is that it does not require additional time in sequencesearching: CD-HIT by default reports the identities betweenrepresentatives and members; MF GO terms similarities canalso be pre-computed.
A limitation of the approach is that it has lower Recall andJaccard similarity than the full expanded set (shown in Fig-ure 4(c,d)). However, it is our view that the number of ex-panded query-target pairs and Precision measures are morecritical to user satisfaction. For instance, proportion at 20%produces around 200 million fewer query-target pairs and has2% higher P@K and mean Precision. Users may already findenough interesting results from the expanded 20% results.
6 ConclusionWe have analysed the search effectiveness of sequence clus-tering from the perspective of completeness. The detailed as-sessment results illustrate that the Precision of representativesis high, but that expansion of search results can degrade Preci-sion and reduce user satisfaction by producing large numbers
of additional hits. We proposed a simple solution that ranksrecords in terms of sequence identity and annotation similar-ity. The comparative results show that it has the potential tobring more precise results while still providing users with ex-panded results.
AcknowledgmentsWe appreciate the advice of the NCBI BLAST team onBLAST related commands and parameters. Qingyu Chen’swork is supported by Melbourne International ResearchScholarship from the University of Melbourne. The projectreceives funding from the Australian Research Councilthrough a Discovery Project grant, DP150101550.
References[Altschul et al., 1990] Stephen F Altschul, Warren Gish,
Webb Miller, Eugene W Myers, and David J Lipman. Ba-sic local alignment search tool. Journal of molecular biol-ogy, 215(3):403–410, 1990.
[Baxevanis and Bateman, 2015] Andreas D Baxevanis andAlex Bateman. The importance of biological databases inbiological discovery. Current protocols in bioinformatics,pages 1–1, 2015.
[Bursteinas et al., 2016] Borisas Bursteinas, Ramona Britto,Benoit Bely, Andrea Auchincloss, Catherine Rivoire,Nicole Redaschi, Claire O’Donovan, and Maria JesusMartin. Minimizing proteome redundancy in the uniprotknowledgebase. Database: The Journal of BiologicalDatabases and Curation, 2016.
[Capriotti et al., 2012] Emidio Capriotti, Nathan L Nehrt,Maricel G Kann, and Yana Bromberg. Bioinformatics forpersonal genome interpretation. Briefings in bioinformat-ics, 13(4):495–512, 2012.
[Chen et al., 2013] Wei Chen, Clarence K Zhang, YongmeiCheng, Shaowu Zhang, and Hongyu Zhao. A compari-son of methods for clustering 16s rrna sequences into otus.PloS one, 8(8):e70837, 2013.
[Chen et al., 2016a] Qingyu Chen, Yu Wan, Yang Lei, JustinZobel, and Karin Verspoor. Evaluation of cd-hit for con-structing non-redundant databases. In Bioinformatics andBiomedicine (BIBM), 2016 IEEE International Confer-ence on, pages 703–706. IEEE, 2016.
[Chen et al., 2016b] Qingyu Chen, Justin Zobel, XiuzhenZhang, and Karin Verspoor. Supervised learning for de-tection of duplicates in genomic sequence databases. PloSone, 11(8):e0159644, 2016.
[Chen et al., 2017] Qingyu Chen, Justin Zobel, and KarinVerspoor. Duplicates, redundancies and inconsistenciesin the primary nucleotide databases: a descriptive study.Database: The Journal of Biological Databases and Cu-ration, 2017(1), 2017.
[Cole et al., 2008] Christian Cole, Jonathan D Barber, andGeoffrey J Barton. The jpred 3 secondary structure pre-diction server. Nucleic acids research, 36(suppl 2):W197–W201, 2008.
[Courtot et al., 2015] Melanie Courtot, Aleksandra Shypit-syna, Elena Speretta, Alexander Holmes, Tony Sawford,Tony Wardell, Maria Jesus Martin, and Claire O’Donovan.Uniprot-goa: A central resource for data integration and goannotation. In SWAT4LS, pages 227–228, 2015.
[Fu et al., 2012] Limin Fu, Beifang Niu, Zhengwei Zhu,Sitao Wu, and Weizhong Li. Cd-hit: accelerated for clus-tering the next-generation sequencing data. Bioinformat-ics, 28(23):3150–3152, 2012.
[Liew et al., 2016] Yi Jin Liew, Taewoo Ryu, ManuelAranda, and Timothy Ravasi. mirna repertoires of de-mosponges stylissa carteri and xestospongia testudinaria.PloS one, 11(2):e0149080, 2016.
[Lin, 1998] Dekang Lin. An information-theoretic definitionof similarity. In ICML, volume 98, pages 296–304, 1998.
[Mirdita et al., 2016] Milot Mirdita, Lars von den Driesch,Clovis Galiez, Maria J Martin, Johannes Soding, and Mar-tin Steinegger. Uniclust databases of clustered and deeplyannotated protein sequences and alignments. Nucleic acidsresearch, 45(D1):170–176, 2016.
[Moffat et al., 2013] Alistair Moffat, Paul Thomas, and FalkScholer. Users versus models: What observation tells usabout effectiveness metrics. In Proceedings of the 22ndACM international conference on Information & Knowl-edge Management, pages 659–668. ACM, 2013.
[Remita et al., 2016] Mohamed Amine Remita, EtienneLord, Zahra Agharbaoui, Mickael Leclercq, Mohamed ABadawi, Fathey Sarhan, and Abdoulaye Banire Diallo.A novel comprehensive wheat mirna database, includingrelated bioinformatics software. Current Plant Biology,7:31–33, 2016.
[Sato et al., 2011] Shusei Sato, Hideki Hirakawa, SachikoIsobe, Eigo Fukai, Akiko Watanabe, Midori Kato, Ku-miko Kawashima, Chiharu Minami, Akiko Muraki, NaomiNakazaki, et al. Sequence analysis of the genome of an oil-bearing tree, jatropha curcas l. DNA research, 18(1):65–76, 2011.
[Suzek et al., 2015] Baris E Suzek, Yuqi Wang, HongzhanHuang, Peter B McGarvey, and Cathy H Wu. Unirefclusters: a comprehensive and scalable alternative forimproving sequence similarity searches. Bioinformatics,31(6):926–932, 2015.
[Walters, 2016] William H Walters. Beyond use statistics:Recall, precision, and relevance in the assessment andmanagement of academic libraries. Journal of Librarian-ship and Information Science, 48(4):340–352, 2016.
[Webber, 2010] William Edward Webber. Measurement ininformation retrieval evaluation. PhD thesis, 2010.
[Zobel, 1998] Justin Zobel. How reliable are the results oflarge-scale information retrieval experiments? In Pro-ceedings of the 21st annual international ACM SIGIR con-ference on Research and development in information re-trieval, pages 307–314. ACM, 1998.
10CONCLUS ION
OutlineIn this chapter, we review the contributions and outline the further directions of thisthesis.
Our work demonstrates that duplication is indeed of concern and its impacts can besevere. The lack of foundational analysis on the definitions and the impacts in previousstudies underestimates its importance; moreover, it limits the development of relatedduplicate detection methods. This PhD project refines the definitions, quantifies theimpacts and proposes better methods. Ultimately it contributes to the broader biologicaldatabase and curation area. Here we summarise the contributions:
• We refine the definitions of duplication by taking consideration of what duplicationmatters to database stakeholders, database staff and end users. Database staffmanage database records; end users submit or download records. They are indeedthe real biological data consumers so it is important to understand what recordsthey regard as duplicates. Paper 1 (Chapter 3) provides a taxonomy of duplicatesmerged by database staff and submitters. It reveals that duplicate records are notjust records with similar sequences; for example, records with relatively distinctsequences can also be duplicates. The diverse types of duplicates also lead todiverse impacts of duplications. The impacts can be categorised as redundancyand inconsistency.
• We establish three benchmarks, containing hundreds of millions of duplicate pairsfrom different perspectives (submitter-based, expert curation, and automatic cu-ration). The benchmarks in Paper 2 (Chapter 4) have two primary implications.First, many potential duplicates remain undetected or unlabelled in INSDC databases;
203
204 conclusion
the two benchmarks from expert curation and automatic curation revealing manymore duplicate records supports this argument. Second, the benchmarks form thebasis to assess and develop duplicate detection methods, in particular for detectingentity duplicates. Recall that lacking benchmarks is often a bottleneck in dupli-cate detection; these benchmarks provide initiatives and motivations for furthermethods.
• We develop better methods for detection of both entity duplicates and redundantrecords. For entity duplicates, the evaluation in Paper 3 (Chapter 5) shows thatthe existing entity duplicate detection method suffers from serious shortcomingsand cannot detect diverse types of duplicates precisely; Paper 4 (Chapter 6) devel-ops a new supervised learning method that detects in a much more precise manner.For redundant records, the assessment and comparative analysis in Paper 5 (Chap-ter 7) and Paper 6 (Chapter 8) demonstrates the limitations of current sequenceclustering methods; Paper 7 proposes solutions for more effective database search.
As explained in the Introduction (Chapter 1), the research questions of the projectare about definitions (what records are duplicates), impacts (why duplicates are sig-nificant) and solutions (how to address duplication). As the work shows, duplicationhas diverse definitions – its impacts are of concern – existing methods have substantiallimitations. We speculate that duplication will be even more severe due to ever increas-ing data volume and diverse data types. Substantial space remains to develop betterduplicate detection methods to facilitate biological database curation and user analysis.Furthermore, the importance of data quality has often been underestimated; a broadercommunity effort is required to recognise and support data quality and curation relatedstudies.
10.1 future work
We anticipate three further directions can be taken from this project. First, it is im-portant to develop more efficient entity duplicate detection methods. As reflected inPaper 4 (Chapter 4), the high precision of the work is achieved at the cost of pairwise
10.1 future work 205
comparison, which is not feasible for large-scale biological databases or datasets. As wenoted, blocking techniques can reduce a massive number of pairwise comparisons.Second, more precise redundant record detection methods should be developed, es-
pecially for low user-defined thresholds. This requires more investigation. Since suchmethods are mostly used in biological database searches, it is vital to understand howdatabase users search biological databases and how they examine the retrieved results;this forms the basis to develop better redundant record detection methods.Third, studies on the impacts of biological data quality and curation are needed.
For example, besides duplication, what other data quality issues matter to biologicaldatabase users and how to address them? Biological databases are the contributionsmade by researchers worldwide over decades. Data quality and curation related studiescan maximise the values of biological databases; users can use reliable database recordsand learn from comprehensive annotations made by biocurators. To conclude, let usshare one of the concerns raised by the International Society of Biocuration1 (the officialbiocuration community):
Despite the billions spent each year on generating biological data, there isstill a reluctance to invest in the relatively small fraction of funding neededto maximize the use of this data through curation. Next time you downloada dataset for your work, spare a thought for the hardworking biocurator thathas made your life so much easier. [Bateman, 2010]
1https://biocuration.org/

APPENDIX
207

AAPPENDIX
This appendix provides a sequence record in both GenBank Flat File (GBFF) formatand FASTA format. As described, FASTA format mainly focuses on sequence data;GBFF contains annotation data and sequence data.
a.1 sample record in fasta format
An example of a record in FASTA format is as follows, from https://www.ncbi.nlm.
nih.gov/protein/SCU49845.1?report=fasta:
>tr|A2BC19|A2BC19_HELPX GTPase
NISHKTLKTIAILGQPNVGKSSLFNRLARERIAITSDFAGTTRDINKRKIALNGHEVELL
DTGGMAKDALLSKEIKALNLKAAQMSDLILYVVDGKSIPSDEDIKLFREVFKTNPNCFLV
INKIDNDKEKERAYAFSSFGAPKSFNISVSHNRGISALIDAVLNALNLNQ
a.2 sample record in gbff format
An example of a record in GBFF format is as follows, from https://www.ncbi.nlm.
nih.gov/Sitemap/samplerecord.html:
LOCUS SCU49845 5028 bp DNA PLN 21-JUN-1999
DEFINITION Saccharomyces cerevisiae TCP1-beta gene, partial cds, and Axl2p
(AXL2) and Rev7p (REV7) genes, complete cds.
ACCESSION U49845
VERSION U49845.1 GI:1293613
KEYWORDS .
SOURCE Saccharomyces cerevisiae (baker’s yeast)
209
210 appendix
ORGANISM Saccharomyces cerevisiae
Eukaryota; Fungi; Ascomycota; Saccharomycotina; Saccharomycetes;
Saccharomycetales; Saccharomycetaceae; Saccharomyces.
REFERENCE 1 (bases 1 to 5028)
AUTHORS Torpey,L.E., Gibbs,P.E., Nelson,J. and Lawrence,C.W.
TITLE Cloning and sequence of REV7, a gene whose function is required for
DNA damage-induced mutagenesis in Saccharomyces cerevisiae
JOURNAL Yeast 10 (11), 1503-1509 (1994)
PUBMED 7871890
REFERENCE 2 (bases 1 to 5028)
AUTHORS Roemer,T., Madden,K., Chang,J. and Snyder,M.
TITLE Selection of axial growth sites in yeast requires Axl2p, a novel
plasma membrane glycoprotein
JOURNAL Genes Dev. 10 (7), 777-793 (1996)
PUBMED 8846915
REFERENCE 3 (bases 1 to 5028)
AUTHORS Roemer,T.
TITLE Direct Submission
JOURNAL Submitted (22-FEB-1996) Terry Roemer, Biology, Yale University, New
Haven, CT, USA
FEATURES Location/Qualifiers
source 1..5028
/organism="Saccharomyces cerevisiae"
/db_xref="taxon:4932"
/chromosome="IX"
/map="9"
CDS <1..206
/codon_start=3
/product="TCP1-beta"
/protein_id="AAA98665.1"
/db_xref="GI:1293614"
A.2 sample record in gbff format 211
/translation="SSIYNGISTSGLDLNNGTIADMRQLGIVESYKLKRAVVSSASEA
AEVLLRVDNIIRARPRTANRQHM"
gene 687..3158
/gene="AXL2"
CDS 687..3158
/gene="AXL2"
/note="plasma membrane glycoprotein"
/codon_start=1
/function="required for axial budding pattern of S.
cerevisiae"
/product="Axl2p"
/protein_id="AAA98666.1"
/db_xref="GI:1293615"
/translation="MTQLQISLLLTATISLLHLVVATPYEAYPIGKQYPPVARVNESF
TFQISNDTYKSSVDKTAQITYNCFDLPSWLSFDSSSRTFSGEPSSDLLSDANTTLYFN
VILEGTDSADSTSLNNTYQFVVTNRPSISLSSDFNLLALLKNYGYTNGKNALKLDPNE
VFNVTFDRSMFTNEESIVSYYGRSQLYNAPLPNWLFFDSGELKFTGTAPVINSAIAPE
TSYSFVIIATDIEGFSAVEVEFELVIGAHQLTTSIQNSLIINVTDTGNVSYDLPLNYV
YLDDDPISSDKLGSINLLDAPDWVALDNATISGSVPDELLGKNSNPANFSVSIYDTYG
DVIYFNFEVVSTTDLFAISSLPNINATRGEWFSYYFLPSQFTDYVNTNVSLEFTNSSQ
DHDWVKFQSSNLTLAGEVPKNFDKLSLGLKANQGSQSQELYFNIIGMDSKITHSNHSA
NATSTRSSHHSTSTSSYTSSTYTAKISSTSAAATSSAPAALPAANKTSSHNKKAVAIA
CGVAIPLGVILVALICFLIFWRRRRENPDDENLPHAISGPDLNNPANKPNQENATPLN
NPFDDDASSYDDTSIARRLAALNTLKLDNHSATESDISSVDEKRDSLSGMNTYNDQFQ
SQSKEELLAKPPVQPPESPFFDPQNRSSSVYMDSEPAVNKSWRYTGNLSPVSDIVRDS
YGSQKTVDTEKLFDLEAPEKEKRTSRDVTMSSLDPWNSNISPSPVRKSVTPSPYNVTK
HRNRHLQNIQDSQSGKNGITPTTMSTSSSDDFVPVKDGENFCWVHSMEPDRRPSKKRL
VDFSNKSNVNVGQVKDIHGRIPEML"
gene complement(3300..4037)
/gene="REV7"
CDS complement(3300..4037)
212 appendix
/gene="REV7"
/codon_start=1
/product="Rev7p"
/protein_id="AAA98667.1"
/db_xref="GI:1293616"
/translation="MNRWVEKWLRVYLKCYINLILFYRNVYPPQSFDYTTYQSFNLPQ
FVPINRHPALIDYIEELILDVLSKLTHVYRFSICIINKKNDLCIEKYVLDFSELQHVD
KDDQIITETEVFDEFRSSLNSLIMHLEKLPKVNDDTITFEAVINAIELELGHKLDRNR
RVDSLEEKAEIERDSNWVKCQEDENLPDNNGFQPPKIKLTSLVGSDVGPLIIHQFSEK
LISGDDKILNGVYSQYEEGESIFGSLF"
ORIGIN
1 gatcctccat atacaacggt atctccacct caggtttaga tctcaacaac ggaaccattg
61 ccgacatgag acagttaggt atcgtcgaga gttacaagct aaaacgagca gtagtcagct
121 ctgcatctga agccgctgaa gttctactaa gggtggataa catcatccgt gcaagaccaa
181 gaaccgccaa tagacaacat atgtaacata tttaggatat acctcgaaaa taataaaccg
241 ccacactgtc attattataa ttagaaacag aacgcaaaaa ttatccacta tataattcaa
301 agacgcgaaa aaaaaagaac aacgcgtcat agaacttttg gcaattcgcg tcacaaataa
361 attttggcaa cttatgtttc ctcttcgagc agtactcgag ccctgtctca agaatgtaat
421 aatacccatc gtaggtatgg ttaaagatag catctccaca acctcaaagc tccttgccga
481 gagtcgccct cctttgtcga gtaattttca cttttcatat gagaacttat tttcttattc
541 tttactctca catcctgtag tgattgacac tgcaacagcc accatcacta gaagaacaga
601 acaattactt aatagaaaaa ttatatcttc ctcgaaacga tttcctgctt ccaacatcta
661 cgtatatcaa gaagcattca cttaccatga cacagcttca gatttcatta ttgctgacag
721 ctactatatc actactccat ctagtagtgg ccacgcccta tgaggcatat cctatcggaa
781 aacaataccc cccagtggca agagtcaatg aatcgtttac atttcaaatt tccaatgata
841 cctataaatc gtctgtagac aagacagctc aaataacata caattgcttc gacttaccga
901 gctggctttc gtttgactct agttctagaa cgttctcagg tgaaccttct tctgacttac
961 tatctgatgc gaacaccacg ttgtatttca atgtaatact cgagggtacg gactctgccg
1021 acagcacgtc tttgaacaat acataccaat ttgttgttac aaaccgtcca tccatctcgc
1081 tatcgtcaga tttcaatcta ttggcgttgt taaaaaacta tggttatact aacggcaaaa
1141 acgctctgaa actagatcct aatgaagtct tcaacgtgac ttttgaccgt tcaatgttca
A.2 sample record in gbff format 213
1201 ctaacgaaga atccattgtg tcgtattacg gacgttctca gttgtataat gcgccgttac
1261 ccaattggct gttcttcgat tctggcgagt tgaagtttac tgggacggca ccggtgataa
1321 actcggcgat tgctccagaa acaagctaca gttttgtcat catcgctaca gacattgaag
1381 gattttctgc cgttgaggta gaattcgaat tagtcatcgg ggctcaccag ttaactacct
1441 ctattcaaaa tagtttgata atcaacgtta ctgacacagg taacgtttca tatgacttac
1501 ctctaaacta tgtttatctc gatgacgatc ctatttcttc tgataaattg ggttctataa
1561 acttattgga tgctccagac tgggtggcat tagataatgc taccatttcc gggtctgtcc
1621 cagatgaatt actcggtaag aactccaatc ctgccaattt ttctgtgtcc atttatgata
1681 cttatggtga tgtgatttat ttcaacttcg aagttgtctc cacaacggat ttgtttgcca
1741 ttagttctct tcccaatatt aacgctacaa ggggtgaatg gttctcctac tattttttgc
1801 cttctcagtt tacagactac gtgaatacaa acgtttcatt agagtttact aattcaagcc
1861 aagaccatga ctgggtgaaa ttccaatcat ctaatttaac attagctgga gaagtgccca
1921 agaatttcga caagctttca ttaggtttga aagcgaacca aggttcacaa tctcaagagc
1981 tatattttaa catcattggc atggattcaa agataactca ctcaaaccac agtgcgaatg
2041 caacgtccac aagaagttct caccactcca cctcaacaag ttcttacaca tcttctactt
2101 acactgcaaa aatttcttct acctccgctg ctgctacttc ttctgctcca gcagcgctgc
2161 cagcagccaa taaaacttca tctcacaata aaaaagcagt agcaattgcg tgcggtgttg
2221 ctatcccatt aggcgttatc ctagtagctc tcatttgctt cctaatattc tggagacgca
2281 gaagggaaaa tccagacgat gaaaacttac cgcatgctat tagtggacct gatttgaata
2341 atcctgcaaa taaaccaaat caagaaaacg ctacaccttt gaacaacccc tttgatgatg
2401 atgcttcctc gtacgatgat acttcaatag caagaagatt ggctgctttg aacactttga
2461 aattggataa ccactctgcc actgaatctg atatttccag cgtggatgaa aagagagatt
2521 ctctatcagg tatgaataca tacaatgatc agttccaatc ccaaagtaaa gaagaattat
2581 tagcaaaacc cccagtacag cctccagaga gcccgttctt tgacccacag aataggtctt
2641 cttctgtgta tatggatagt gaaccagcag taaataaatc ctggcgatat actggcaacc
2701 tgtcaccagt ctctgatatt gtcagagaca gttacggatc acaaaaaact gttgatacag
2761 aaaaactttt cgatttagaa gcaccagaga aggaaaaacg tacgtcaagg gatgtcacta
2821 tgtcttcact ggacccttgg aacagcaata ttagcccttc tcccgtaaga aaatcagtaa
2881 caccatcacc atataacgta acgaagcatc gtaaccgcca cttacaaaat attcaagact
2941 ctcaaagcgg taaaaacgga atcactccca caacaatgtc aacttcatct tctgacgatt
3001 ttgttccggt taaagatggt gaaaattttt gctgggtcca tagcatggaa ccagacagaa
214 appendix
3061 gaccaagtaa gaaaaggtta gtagattttt caaataagag taatgtcaat gttggtcaag
3121 ttaaggacat tcacggacgc atcccagaaa tgctgtgatt atacgcaacg atattttgct
3181 taattttatt ttcctgtttt attttttatt agtggtttac agatacccta tattttattt
3241 agtttttata cttagagaca tttaatttta attccattct tcaaatttca tttttgcact
3301 taaaacaaag atccaaaaat gctctcgccc tcttcatatt gagaatacac tccattcaaa
3361 attttgtcgt caccgctgat taatttttca ctaaactgat gaataatcaa aggccccacg
3421 tcagaaccga ctaaagaagt gagttttatt ttaggaggtt gaaaaccatt attgtctggt
3481 aaattttcat cttcttgaca tttaacccag tttgaatccc tttcaatttc tgctttttcc
3541 tccaaactat cgaccctcct gtttctgtcc aacttatgtc ctagttccaa ttcgatcgca
3601 ttaataactg cttcaaatgt tattgtgtca tcgttgactt taggtaattt ctccaaatgc
3661 ataatcaaac tatttaagga agatcggaat tcgtcgaaca cttcagtttc cgtaatgatc
3721 tgatcgtctt tatccacatg ttgtaattca ctaaaatcta aaacgtattt ttcaatgcat
3781 aaatcgttct ttttattaat aatgcagatg gaaaatctgt aaacgtgcgt taatttagaa
3841 agaacatcca gtataagttc ttctatatag tcaattaaag caggatgcct attaatggga
3901 acgaactgcg gcaagttgaa tgactggtaa gtagtgtagt cgaatgactg aggtgggtat
3961 acatttctat aaaataaaat caaattaatg tagcatttta agtataccct cagccacttc
4021 tctacccatc tattcataaa gctgacgcaa cgattactat tttttttttc ttcttggatc
4081 tcagtcgtcg caaaaacgta taccttcttt ttccgacctt ttttttagct ttctggaaaa
4141 gtttatatta gttaaacagg gtctagtctt agtgtgaaag ctagtggttt cgattgactg
4201 atattaagaa agtggaaatt aaattagtag tgtagacgta tatgcatatg tatttctcgc
4261 ctgtttatgt ttctacgtac ttttgattta tagcaagggg aaaagaaata catactattt
4321 tttggtaaag gtgaaagcat aatgtaaaag ctagaataaa atggacgaaa taaagagagg
4381 cttagttcat cttttttcca aaaagcaccc aatgataata actaaaatga aaaggatttg
4441 ccatctgtca gcaacatcag ttgtgtgagc aataataaaa tcatcacctc cgttgccttt
4501 agcgcgtttg tcgtttgtat cttccgtaat tttagtctta tcaatgggaa tcataaattt
4561 tccaatgaat tagcaatttc gtccaattct ttttgagctt cttcatattt gctttggaat
4621 tcttcgcact tcttttccca ttcatctctt tcttcttcca aagcaacgat ccttctaccc
4681 atttgctcag agttcaaatc ggcctctttc agtttatcca ttgcttcctt cagtttggct
4741 tcactgtctt ctagctgttg ttctagatcc tggtttttct tggtgtagtt ctcattatta
4801 gatctcaagt tattggagtc ttcagccaat tgctttgtat cagacaattg actctctaac
4861 ttctccactt cactgtcgag ttgctcgttt ttagcggaca aagatttaat ctcgttttct
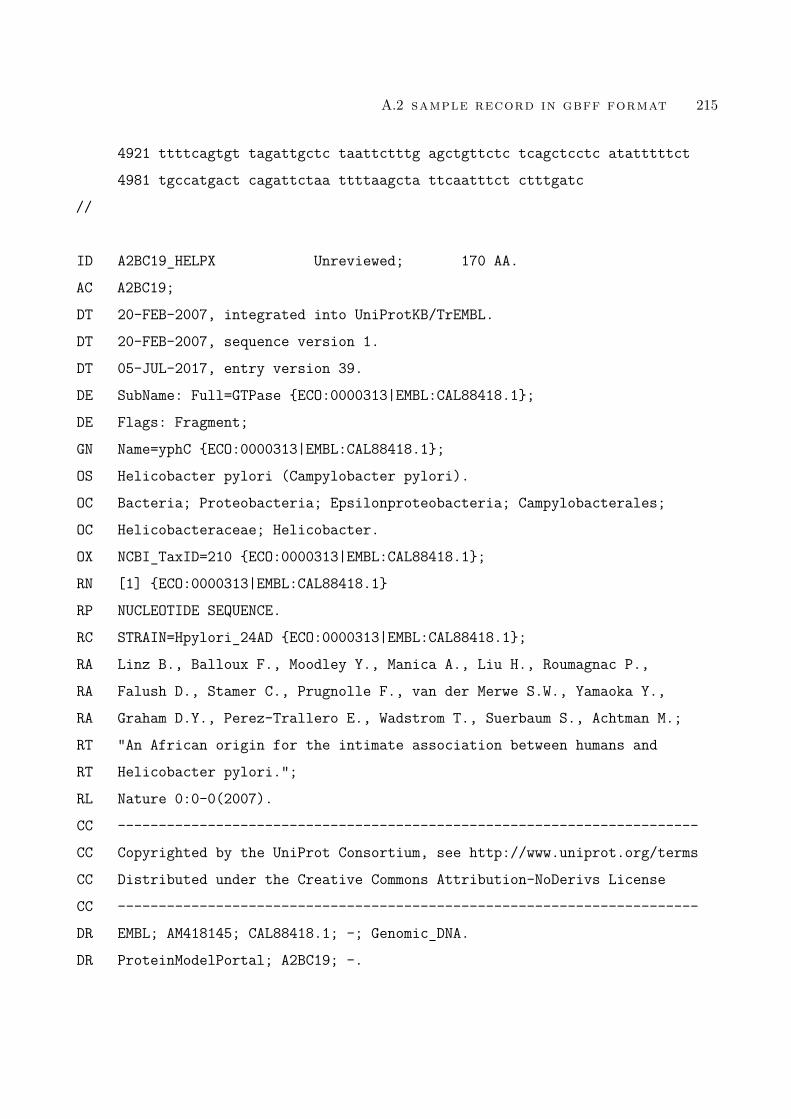
A.2 sample record in gbff format 215
4921 ttttcagtgt tagattgctc taattctttg agctgttctc tcagctcctc atatttttct
4981 tgccatgact cagattctaa ttttaagcta ttcaatttct ctttgatc
//
ID A2BC19_HELPX Unreviewed; 170 AA.
AC A2BC19;
DT 20-FEB-2007, integrated into UniProtKB/TrEMBL.
DT 20-FEB-2007, sequence version 1.
DT 05-JUL-2017, entry version 39.
DE SubName: Full=GTPase {ECO:0000313|EMBL:CAL88418.1};
DE Flags: Fragment;
GN Name=yphC {ECO:0000313|EMBL:CAL88418.1};
OS Helicobacter pylori (Campylobacter pylori).
OC Bacteria; Proteobacteria; Epsilonproteobacteria; Campylobacterales;
OC Helicobacteraceae; Helicobacter.
OX NCBI_TaxID=210 {ECO:0000313|EMBL:CAL88418.1};
RN [1] {ECO:0000313|EMBL:CAL88418.1}
RP NUCLEOTIDE SEQUENCE.
RC STRAIN=Hpylori_24AD {ECO:0000313|EMBL:CAL88418.1};
RA Linz B., Balloux F., Moodley Y., Manica A., Liu H., Roumagnac P.,
RA Falush D., Stamer C., Prugnolle F., van der Merwe S.W., Yamaoka Y.,
RA Graham D.Y., Perez-Trallero E., Wadstrom T., Suerbaum S., Achtman M.;
RT "An African origin for the intimate association between humans and
RT Helicobacter pylori.";
RL Nature 0:0-0(2007).
CC -----------------------------------------------------------------------
CC Copyrighted by the UniProt Consortium, see http://www.uniprot.org/terms
CC Distributed under the Creative Commons Attribution-NoDerivs License
CC -----------------------------------------------------------------------
DR EMBL; AM418145; CAL88418.1; -; Genomic_DNA.
DR ProteinModelPortal; A2BC19; -.
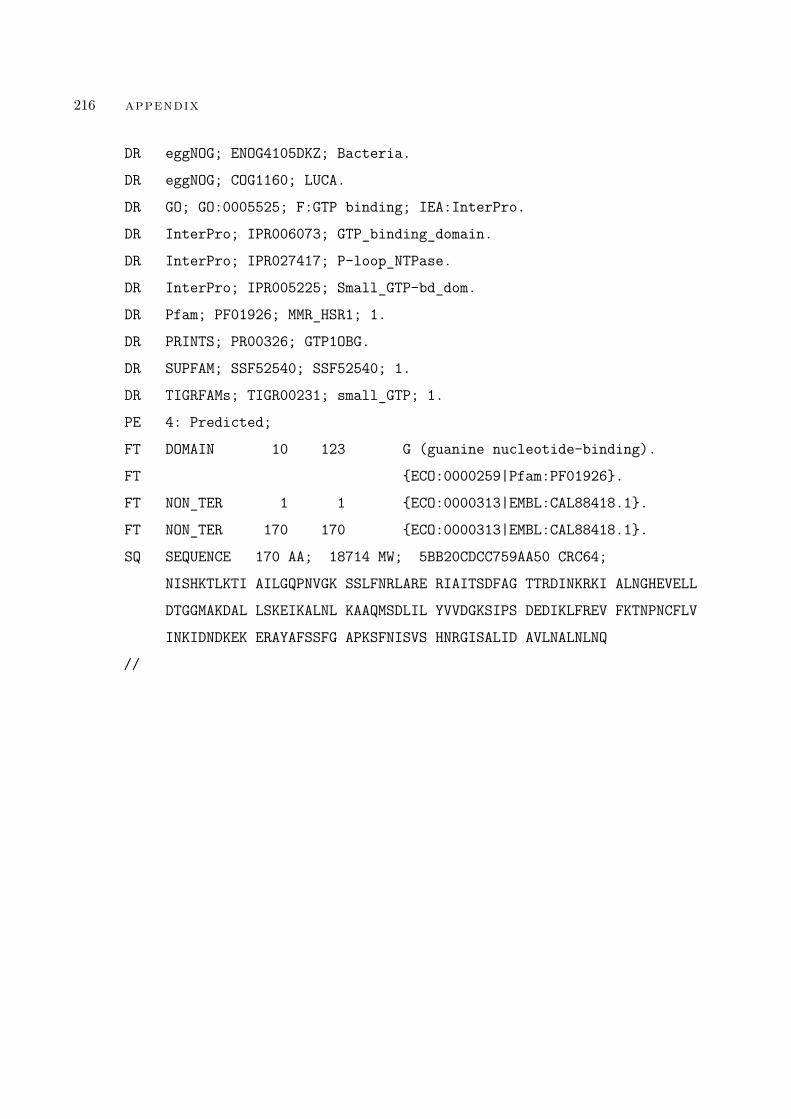
216 appendix
DR eggNOG; ENOG4105DKZ; Bacteria.
DR eggNOG; COG1160; LUCA.
DR GO; GO:0005525; F:GTP binding; IEA:InterPro.
DR InterPro; IPR006073; GTP_binding_domain.
DR InterPro; IPR027417; P-loop_NTPase.
DR InterPro; IPR005225; Small_GTP-bd_dom.
DR Pfam; PF01926; MMR_HSR1; 1.
DR PRINTS; PR00326; GTP1OBG.
DR SUPFAM; SSF52540; SSF52540; 1.
DR TIGRFAMs; TIGR00231; small_GTP; 1.
PE 4: Predicted;
FT DOMAIN 10 123 G (guanine nucleotide-binding).
FT {ECO:0000259|Pfam:PF01926}.
FT NON_TER 1 1 {ECO:0000313|EMBL:CAL88418.1}.
FT NON_TER 170 170 {ECO:0000313|EMBL:CAL88418.1}.
SQ SEQUENCE 170 AA; 18714 MW; 5BB20CDCC759AA50 CRC64;
NISHKTLKTI AILGQPNVGK SSLFNRLARE RIAITSDFAG TTRDINKRKI ALNGHEVELL
DTGGMAKDAL LSKEIKALNL KAAQMSDLIL YVVDGKSIPS DEDIKLFREV FKTNPNCFLV
INKIDNDKEK ERAYAFSSFG APKSFNISVS HNRGISALID AVLNALNLNQ
//
REFERENCES
S. Abiteboul, X. L. Dong, O. Etzioni, D. Srivastava, G. Weikum, J. Stoyanovich, andF. M. Suchanek. The elephant in the room: getting value from big data. In Proceedingsof the 18th International Workshop on Web and Databases, pages 1–5, 2015. (Citedon page 35.)
B. L. Aken, P. Achuthan, W. Akanni, M. R. Amode, F. Bernsdorff, J. Bhai, K. Billis,D. Carvalho-Silva, C. Cummins, P. Clapham, et al. Ensembl 2017. Nucleic AcidsResearch, page gkw1104, 2016. (Cited on page 23.)
S. F. Altschul, T. L. Madden, A. A. Schäffer, J. Zhang, Z. Zhang, W. Miller, and D. J.Lipman. Gapped blast and psi-blast: a new generation of protein database searchprograms. Nucleic Acids Research, 25(17):3389–3402, 1997. (Cited on pages xxiand 26.)
M. Andrade, C. Ponting, T. Gibson, and P. Bork. Identification of protein repeats andstatistical significance of sequence comparisons. Journal of Molecular Biology, 298:521–537, 2000. (Cited on pages xxi and 26.)
E. Babb. Implementing a relational database by means of specialzed hardware. ACMTransactions on Database Systems, 4(1):1–29, 1979. (Cited on page 41.)
S. Bagewadi, S. Adhikari, A. Dhrangadhariya, A. K. Irin, C. Ebeling, A. A. Namasi-vayam, M. Page, M. Hofmann-Apitius, and P. Senger. Neurotransdb: highly curatedand structured transcriptomic metadata for neurodegenerative diseases. Database,2015:bav099, 2015. (Cited on page 51.)
T. Barrett, S. E. Wilhite, P. Ledoux, C. Evangelista, I. F. Kim, M. Tomashevsky, K. A.Marshall, K. H. Phillippy, P. M. Sherman, M. Holko, et al. Ncbi geo: archive for
217
218
functional genomics data sets – update. Nucleic Acids Research, 41(D1):D991–D995,2012. (Cited on page 1.)
A. Basharat, Y. Zhai, and M. Shah. Content based video matching using spatiotemporalvolumes. Computer Vision and Image Understanding, 110(3):360–377, 2008. (Citedon page 46.)
F. Bastian, G. Parmentier, J. Roux, S. Moretti, V. Laudet, and M. Robinson-Rechavi.Bgee: integrating and comparing heterogeneous transcriptome data among species.In International Workshop on Data Integration in the Life Sciences, pages 124–131.Springer, 2008. (Cited on pages xxii, 2, 32, and 51.)
S. Basu, P. Fey, Y. Pandit, R. Dodson, W. A. Kibbe, and R. L. Chisholm. Dictybase2013: integrating multiple dictyostelid species. Nucleic Acids Research, 41(D1):D676–D683, 2012. (Cited on page 1.)
A. Bateman. Curators of the world unite: the international society of biocuration.Bioinformatics, 2010. (Cited on page 205.)
C. Batini and M. Scannapieco. Data and Information Quality: Dimensions, Principlesand Techniques. Springer, 2016. (Cited on pages 38, 42, and 49.)
A. Baxevanis and A. Bateman. The importance of biological databases in biologicaldiscovery. Current Protocols in Bioinformatics, 50:1–1, 2015. (Cited on pages 1, 5,and 18.)
S. Bennett. Blood pressure measurement error: its effect on cross-sectional and trendanalyses. Journal of Clinical Epidemiology, 47(3):293–301, 1994. (Cited on page 49.)
D. A. Benson, M. Boguski, D. J. Lipman, and J. Ostell. Genbank. Nucleic AcidsResearch, 22(17):3441, 1994. (Cited on pages xviii and 19.)
D. A. Benson, M. S. Boguski, D. J. Lipman, J. Ostell, B. F. Ouellette, B. A. Rapp,and D. L. Wheeler. Genbank. Nucleic Acids Research, 27(1):12–17, 1999. (Cited onpages xviii and 19.)
219
D. A. Benson, I. Karsch-Mizrachi, D. J. Lipman, J. Ostell, B. A. Rapp, and D. L.Wheeler. Genbank. Nucleic Acids Research, 28(1):15–18, 2000. (Cited on pages xviiiand 19.)
D. A. Benson, I. Karsch-Mizrachi, D. J. Lipman, J. Ostell, B. A. Rapp, and D. L.Wheeler. Genbank. Nucleic Acids Research, 30(1):17, 2002. (Cited on pages xviiiand 19.)
D. A. Benson, I. Karsch-Mizrachi, D. J. Lipman, J. Ostell, and D. L. Wheeler. Genbank.Nucleic Acids Research, 31(1):23, 2003. (Cited on pages xviii and 19.)
D. A. Benson, I. Karsch-Mizrachi, D. J. Lipman, J. Ostell, and D. L. Wheeler. Genbank.Nucleic Acids Research, 33(suppl 1):D34–D38, 2005. (Cited on pages xviii and 19.)
D. A. Benson, I. Karsch-Mizrachi, D. J. Lipman, J. Ostell, and E. W. Sayers. Genbank.Nucleic Acids Research, 37(suppl 1):D26, 2009. (Cited on pages xviii and 19.)
D. A. Benson, M. Cavanaugh, K. Clark, I. Karsch-Mizrachi, D. J. Lipman, J. Ostell,and E. W. Sayers. Genbank. Nucleic Acids Research, 41(D1):D36–D42, 2013. (Citedon pages xviii and 19.)
D. A. Benson, M. Cavanaugh, K. Clark, I. Karsch-Mizrachi, D. J. Lipman, J. Ostell,and E. W. Sayers. Genbank. Nucleic Acids Research, 45(Database issue):D37, 2017.(Cited on pages xvii, 1, 13, and 20.)
Y. Bernstein and J. Zobel. A scalable system for identifying co-derivative documents. InInternational Symposium on String Processing and Information Retrieval, volume 4,pages 55–67. Springer, 2004. (Cited on page 44.)
Y. Bernstein and J. Zobel. Redundant documents and search effectiveness. In Pro-ceedings of the 14th ACM international Conference on Information and KnowledgeManagement, pages 736–743. ACM, 2005. (Cited on pages 44, 49, and 62.)
I. Bhattacharya and L. Getoor. Iterative record linkage for cleaning and integration. InProceedings of the 9th ACM SIGMOD workshop on Research Issues in Data Miningand Knowledge Discovery, pages 11–18. ACM, 2004. (Cited on page 60.)
220
I. Bhattacharya and L. Getoor. Collective entity resolution in relational data. ACMTransactions on Knowledge Discovery from Data (TKDD), 1(1):5, 2007. (Cited onpage 42.)
H. S. Bilofsky and B. Christian. The genbank® genetic sequence data bank. NucleicAcids Research, 16(5):1861–1863, 1988. (Cited on pages xviii and 19.)
H. S. Bilofsky, C. Burks, J. W. Fickett, W. B. Goad, F. I. Lewitter, W. P. Rindone,C. D. Swindell, and C.-S. Tung. The genbank genetic sequence databank. NucleicAcids Research, 14(1):1–4, 1986. (Cited on pages xviii, 16, and 19.)
D. Bitton and D. J. DeWitt. Duplicate record elimination in large data files. ACMTransactions on Database Systems, 8(2):255–265, 1983. (Cited on page 41.)
J. A. Blake, J. T. Eppig, J. A. Kadin, J. E. Richardson, C. L. Smith, C. J. Bult, M. G. D.Group, et al. Mouse genome database (mgd)-2017: community knowledge resourcefor the laboratory mouse. Nucleic Acids Research, page gkw1040, 2016. (Cited onpages xxii and 32.)
J. Bleiholder and F. Naumann. Data fusion. ACM Computing Surveys (CSUR), 41(1):1, 2009. (Cited on page 57.)
G. M. Boratyn, A. A. Schäffer, R. Agarwala, S. F. Altschul, D. J. Lipman, and T. L.Madden. Domain enhanced lookup time accelerated blast. Biology direct, 7(1):12,2012. (Cited on page 20.)
G. M. Boratyn, C. Camacho, P. S. Cooper, G. Coulouris, A. Fong, N. Ma, T. L. Madden,W. T. Matten, S. D. McGinnis, Y. Merezhuk, et al. Blast: a more efficient report withusability improvements. Nucleic Acids Research, 41(W1):W29–W33, 2013. (Cited onpage 20.)
P. Bork and A. Bairoch. Go hunting in sequence databases but watch out for the traps.Trends in Genetics, 12(10):425–427, 1996. (Cited on page 2.)
221
T. Botsis, G. Hartvigsen, F. Chen, and C. Weng. Secondary use of ehr: data qualityissues and informatics opportunities. Summit on Translational Bioinformatics, 2010:1, 2010. (Cited on page 39.)
M. R. Bouadjenek, K. Verspoor, and J. Zobel. Literature consistency of bioinformaticssequence databases is effective for assessing record quality. Database, 2017(1):bax021,2017. (Cited on page 3.)
M. Bouffard, M. S. Phillips, A. M. Brown, S. Marsh, J.-C. Tardif, and T. van Rooij.Damming the genomic data flood using a comprehensive analysis and storage datastructure. Database, 2010:baq029, 2010. (Cited on page 51.)
E. Boutet, D. Lieberherr, M. Tognolli, M. Schneider, P. Bansal, A. J. Bridge, S. Poux,L. Bougueleret, and I. Xenarios. Uniprotkb/swiss-prot, the manually annotated sec-tion of the uniprot knowledgebase: how to use the entry view. Plant Bioinformatics:Methods and Protocols, pages 23–54, 2016. (Cited on pages 18 and 23.)
G. E. Box and G. C. Tiao. Bayesian inference in statistical analysis, volume 40. JohnWiley & Sons, 2011. (Cited on page 61.)
S. E. Brenner. Errors in genome annotation. Trends in Genetics, 15(4):132–133, 1999.(Cited on page 40.)
D. G. Brizan and A. U. Tansel. A. survey of entity resolution and record linkagemethodologies. Communications of the IIMA, 6(3):5, 2015. (Cited on page 41.)
M. L. Brodie. Data quality in information systems. Information & Management, 3(6):245–258, 1980. (Cited on pages 33 and 35.)
P. F. Brown, P. V. Desouza, R. L. Mercer, V. J. D. Pietra, and J. C. Lai. Class-basedn-gram models of natural language. Computational Linguistics, 18(4):467–479, 1992.(Cited on page 59.)
S. Brunak, A. Danchin, M. Hattori, H. Nakamura, K. Shinozaki, T. Matise, andD. Preuss. Nucleotide sequence database policies. Science, 298(5597):1333–1334,2002. (Cited on page 16.)
222
S. Burge, T. K. Attwood, A. Bateman, T. Z. Berardini, M. Cherry, C. O’Donovan,l. Xenarios, and P. Gaudet. Biocurators and biocuration: surveying the 21st centurychallenges. Database, 2012:bar059, 2012. (Cited on page 12.)
C. Burks, M. Cassidy, M. J. Cinkosky, K. E. Cumella, P. Gilna, J. E.-D. Hayden, G. M.Keen, T. A. Kelley, M. Kelly, D. Kristofferson, et al. Genbank. Nucleic Acids Research,19(suppl):2221–2225, 1991. (Cited on pages xviii and 19.)
C. Burks, M. J. Cinkosky, W. M. Fischer, P. Gilna, J. E.-D. Hayden, G. M. Keen,M. Kelly, D. Kristofferson, and J. Lawrence. Genbank. Nucleic Acids Research, 20(suppl):2065–2069, 1992. (Cited on pages xviii and 19.)
B. Bursteinas, R. Britto, B. Bely, A. Auchincloss, C. Rivoire, N. Redaschi, C. O’Donovan,and M. J. Martin. Minimizing proteome redundancy in the uniprot knowledgebase.Database, 2016, 2016. (Cited on pages 3, 40, and 52.)
Y.-d. Cai and S. L. Lin. Support vector machines for predicting rrna-, rna-, and dna-binding proteins from amino acid sequence. Biochimica et Biophysica Acta (BBA)-Proteins and Proteomics, 1648(1):127–133, 2003. (Cited on page 69.)
C. Camacho, G. Coulouris, V. Avagyan, N. Ma, J. Papadopoulos, K. Bealer, and T. L.Madden. Blast+: architecture and applications. BMC Bioinformatics, 10(1):421, 2009.(Cited on page 20.)
M. Cameron, Y. Bernstein, and H. E. Williams. Clustered sequence representation forfast homology search. Journal of Computational Biology, 14(5):594–614, 2007. (Citedon page 53.)
P. P. Chan and T. M. Lowe. Gtrnadb 2.0: an expanded database of transfer rna genesidentified in complete and draft genomes. Nucleic Acids Research, 44(D1):D184–D189,2016. (Cited on pages xxii and 32.)
S. Chellamuthu and D. M. Punithavalli. Detecting redundancy in biological databases?an efficient approach. Global Journal of Computer Science and Technology, 9(4), 2009.(Cited on pages 4, 55, and 56.)
223
M. Chen, S. Mao, and Y. Liu. Big data: A survey. Mobile Networks and Applications,19(2):171–209, 2014. (Cited on page 41.)
Q. Chen, J. Zobel, and K. Verspoor. Evaluation of a machine learning duplicate detec-tion method for bioinformatics databases. In Proceedings of the ACM Ninth Inter-national Workshop on Data and Text Mining in Biomedical Informatics, pages 4–12.ACM, 2015. (Cited on page 8.)
Q. Chen, Y. Wan, Y. Lei, J. Zobel, and K. Verspoor. Evaluation of cd-hit for constructingnon-redundant databases. In 2016 IEEE International Conference on Bioinformaticsand Biomedicine, pages 703–706. IEEE, 2016a. (Cited on page 8.)
Q. Chen, J. Zobel, X. Zhang, and K. Verspoor. Supervised learning for detection ofduplicates in genomic sequence databases. PloS one, 11(8):e0159644, 2016b. (Citedon page 8.)
Q. Chen, Y. Wan, X. Zhang, J. Zobel, and K. Verspoor. Sequence clustering methodsand completeness of biological database search. Proceedings of the Bioinformaticsand Artificial Intelligence workshop, pages 1–7, 2017a. (Cited on page 9.)
Q. Chen, J. Zobel, and K. Verspoor. Benchmarks for measurement of duplicate detectionmethods in nucleotide databases. Database, page baw164, 2017b. (Cited on page 8.)
Q. Chen, J. Zobel, and K. Verspoor. Duplicates, redundancies and inconsistencies in theprimary nucleotide databases: a descriptive study. Database, 2017(1), 2017c. (Citedon page 8.)
Q. Chen, Y. Wan, X. Zhang, Y. Lei, J. Zobel, and K. Verspoor. Comparative analysis ofsequence clustering methods for de-duplication of biological databases. ACM Journalof Data and Information Quality, to appear. (Cited on page 8.)
M. Cherubini, R. De Oliveira, and N. Oliver. Understanding near-duplicate videos: auser-centric approach. In Proceedings of the 17th ACM International Conference onMultimedia, pages 35–44. ACM, 2009. (Cited on pages 3, 46, 47, 48, 49, and 54.)
224
M. C. Chibucos, C. J. Mungall, R. Balakrishnan, K. R. Christie, R. P. Huntley, O. White,J. A. Blake, S. E. Lewis, and M. Giglio. Standardized description of scientific evidenceusing the evidence ontology (eco). Database, 2014:bau075, 2014. (Cited on pages xxi,26, and 31.)
M. Choi, H. Liu, W. Baumgartner, J. Zobel, and K. Verspoor. Coreference resolutionimproves extraction of biological expression language statements from texts. Database,2016:baw076, 2016. (Cited on page 30.)
P. Christen. Data matching: concepts and techniques for record linkage, entity resolution,and duplicate detection. Springer Science & Business Media, 2012a. (Cited on pages 3,38, 42, 49, 58, 61, and 62.)
P. Christen. A survey of indexing techniques for scalable record linkage and dedupli-cation. IEEE Transactions on Knowledge and Data Engineering, 24(9):1537–1555,2012b. (Cited on page 42.)
P. Christen and K. Goiser. Quality and complexity measures for data linkage anddeduplication. In Quality Measures in Data Mining, pages 127–151. Springer, 2007.(Cited on page 54.)
K. Clark, I. Karsch-Mizrachi, D. J. Lipman, J. Ostell, and E. W. Sayers. Genbank.Nucleic Acids Research, page gkv1276, 2015. (Cited on pages xviii and 19.)
G. Cochrane, R. Akhtar, P. Aldebert, N. Althorpe, A. Baldwin, K. Bates, S. Bhat-tacharyya, J. Bonfield, L. Bower, P. Browne, et al. Priorities for nucleotide trace,sequence and annotation data capture at the ensembl trace archive and the emblnucleotide sequence database. Nucleic Acids Research, 36(suppl 1):D5–D12, 2008.(Cited on page 16.)
G. Cochrane, I. Karsch-Mizrachi, T. Takagi, and I. N. Sequence Database Collaboration.The international nucleotide sequence database collaboration. Nucleic Acids Research,44(D1):D48–D50, 2015. (Cited on page 1.)
225
G. Cochrane, I. Karsch-Mizrachi, T. Takagi, I. N. S. D. Collaboration, et al. Theinternational nucleotide sequence database collaboration. Nucleic Acids Research, 44(D1):D48–D50, 2016. (Cited on page 16.)
C. Cole, J. D. Barber, and G. J. Barton. The jpred 3 secondary structure predictionserver. Nucleic Acids Research, 36(suppl_2):W197–W201, 2008. (Cited on page 53.)
T. M. Connolly and C. E. Begg. Database systems: a practical approach to design,implementation, and management. Pearson Education, 2005. (Cited on pages 11, 12,and 20.)
J. G. Conrad, X. S. Guo, and C. P. Schriber. Online duplicate document detection:signature reliability in a dynamic retrieval environment. In Proceedings of the TwelfthInternational Conference on Information and Knowledge Management, pages 443–452.ACM, 2003. (Cited on pages 3, 43, 54, and 58.)
C. Coronel and S. Morris. Database systems: design, implementation, & management.Cengage Learning, 2016. (Cited on pages 11 and 12.)
K. Coussement, F. A. Van den Bossche, and K. W. De Bock. Data accuracy’s im-pact on segmentation performance: Benchmarking rfm analysis, logistic regression,and decision trees. Journal of Business Research, 67(1):2751–2758, 2014. (Cited onpage 35.)
A. M. Dai. Bayesian nonparametric models for name disambiguation and supervisedlearning. PhD thesis, University of Edinburgh, 2013. (Cited on page 60.)
M. Dayho, R. Schwartz, and B. Oreutt. A model of evolutionary change in proteins.Atlas of Protein Sequence and Structure, pages 89–100, 1966. (Cited on page 17.)
R. De Oliveira, M. Cherubini, and N. Oliver. Human perception of near-duplicatevideos. Human-Computer Interaction–INTERACT 2009, pages 21–24, 2009. (Citedon pages 46, 47, 49, and 54.)
226
A. P. Dempster, N. M. Laird, and D. B. Rubin. Maximum likelihood from incompletedata via the em algorithm. Journal of the Royal Statistical Society. Series B (method-ological), pages 1–38, 1977. (Cited on page 61.)
H. Ding, L. Luo, and H. Lin. Prediction of cell wall lytic enzymes using chou’s am-phiphilic pseudo amino acid composition. Protein and Peptide Letters, 16(4):351–355,2009. (Cited on page 69.)
R. C. Edgar. Muscle: multiple sequence alignment with high accuracy and high through-put. Nucleic Acids Research, 32(5):1792–1797, 2004. (Cited on pages xxi and 26.)
R. C. Edgar. Search and clustering orders of magnitude faster than blast. Bioinformatics,26(19):2460–2461, 2010. (Cited on page 60.)
A. K. Elmagarmid, P. G. Ipeirotis, and V. S. Verykios. Duplicate record detection: Asurvey. IEEE Transactions on knowledge and data engineering, 19(1), 2007. (Citedon pages 3, 4, 41, 42, 58, 59, 60, and 61.)
O. Emanuelsson, S. Brunak, G. Von Heijne, and H. Nielsen. Locating proteins in thecell using targetp, signalp and related tools. Nature Protocols, 2(4):953–971, 2007.(Cited on pages xxi and 26.)
M. Errami, Z. Sun, T. C. Long, A. C. George, and H. R. Garner. Deja vu: a databaseof highly similar citations in the scientific literature. Nucleic Acids Research, 37(suppl_1):D921–D924, 2008. (Cited on page 52.)
N. Eswar, D. Eramian, B. Webb, M.-Y. Shen, and A. Sali. Protein structure modelingwith modeller. Structural proteomics: high-throughput methods, pages 145–159, 2008.(Cited on page 24.)
P. Evans. Scaling and assessment of data quality. Acta Crystallographica Section D:Biological Crystallography, 62(1):72–82, 2006. (Cited on page 57.)
W. Fan. Data quality: from theory to practice. ACM SIGMOD Record, 44(3):7–18,2015. (Cited on pages xxii, 2, 34, 36, and 37.)
227
W. Fan and F. Geerts. Foundations of data quality management. Synthesis Lectures onData Management, 4(5):1–217, 2012. (Cited on pages 58, 60, and 61.)
C. M. Farrell, N. A. OâĂŹLeary, R. A. Harte, J. E. Loveland, L. G. Wilming, C. Wallin,M. Diekhans, D. Barrell, S. M. Searle, B. Aken, et al. Current status and new featuresof the consensus coding sequence database. Nucleic Acids Research, 42(D1):D865–D872, 2014. (Cited on page 23.)
S. Federhen, K. Clark, T. Barrett, H. Parkinson, J. Ostell, Y. Kodama, J. Mashima,Y. Nakamura, G. Cochrane, and I. Karsch-Mizrachi. Toward richer metadata for mi-crobial sequences: replacing strain-level ncbi taxonomy taxids with bioproject, biosam-ple and assembly records. Standards in Genomic Sciences, 9(3):1275, 2014. (Citedon page 16.)
L. Feng, L. Song, C. Sha, and X. Gong. Practical duplicate bug reports detection ina large web-based development community. In Asia-Pacific Web Conference, pages709–720. Springer, 2013. (Cited on page 61.)
J. H. Finger, C. M. Smith, T. F. Hayamizu, I. J. McCright, J. Xu, M. Law, D. R. Shaw,R. M. Baldarelli, J. S. Beal, O. Blodgett, et al. The mouse gene expression database(gxd): 2017 update. Nucleic Acids Research, 45(D1):D730–D736, 2017. (Cited onpages xxii and 32.)
R. D. Finn, P. Coggill, R. Y. Eberhardt, S. R. Eddy, J. Mistry, A. L. Mitchell, S. C.Potter, M. Punta, M. Qureshi, A. Sangrador-Vegas, et al. The pfam protein familiesdatabase: towards a more sustainable future. Nucleic Acids Research, 44(D1):D279–D285, 2016. (Cited on pages 1 and 3.)
R. D. Finn, T. K. Attwood, P. C. Babbitt, A. Bateman, P. Bork, A. J. Bridge, H.-Y.Chang, Z. Dosztányi, S. El-Gebali, M. Fraser, et al. Interpro in 2017 – beyond proteinfamily and domain annotations. Nucleic Acids Research, 45(D1):D190–D199, 2017.(Cited on pages xxi, 24, and 26.)
J. Fisher, P. Christen, Q. Wang, and E. Rahm. A clustering-based framework to controlblock sizes for entity resolution. In Proceedings of the 21th ACM SIGKDD Interna-
228
tional Conference on Knowledge Discovery and Data Mining, pages 279–288. ACM,2015. (Cited on pages 60 and 62.)
W. Fleischmann, A. Gateau, R. Apweiler, et al. A novel method for automatic functionalannotation of proteins. Bioinformatics, 15(3):228–233, 1999. (Cited on page 24.)
C. Fox, A. Levitin, and T. Redman. The notion of data and its quality dimensions.Information processing & management, 30(1):9–19, 1994. (Cited on page 33.)
L. Fu, B. Niu, Z. Zhu, S. Wu, and W. Li. Cd-hit: accelerated for clustering thenext-generation sequencing data. Bioinformatics, 28(23):3150–3152, 2012. (Citedon pages 66, 68, 69, 70, and 71.)
S. Garcia, A. Kovařík, A. R. Leitch, and T. Garnatje. Cytogenetic features of rrnagenes across land plants: analysis of the plant rdna database. The Plant Journal,2016. (Cited on pages xxii and 32.)
H. Garcia-Molina. Database systems: the complete book. Pearson Education India, 2008.(Cited on pages 11 and 12.)
Gene Ontology Consortium et al. Expansion of the gene ontology knowledgebase andresources. Nucleic Acids Research, 45(D1):D331–D338, 2017. (Cited on pages xxiand 26.)
D. G. George, R. J. Dodson, J. S. Garavelli, D. H. Haft, L. T. Hunt, C. R. Marzec, B. C.Orcutt, K. E. Sidman, G. Y. Srinivasarao, L.-S. L. Yeh, et al. The protein informationresource (pir) and the pir-international protein sequence database. Nucleic AcidsResearch, 25(1):24–27, 1997. (Cited on page 17.)
L. Getoor and A. Machanavajjhala. Entity resolution: theory, practice & open challenges.Proceedings of the VLDB Endowment, 5(12):2018–2019, 2012. (Cited on page 42.)
M. K. Gilson, T. Liu, M. Baitaluk, G. Nicola, L. Hwang, and J. Chong. Bindingdbin 2015: A public database for medicinal chemistry, computational chemistry andsystems pharmacology. Nucleic Acids Research, 44(D1):D1045–D1053, 2016. (Citedon page 51.)
229
J. C. Ginsburg. Creation and commercial value: Copyright protection of works of infor-mation. Columbia Law Review, 90(7):1865–1938, 1990. (Cited on page 48.)
L. E. Goldman, P. W. Chu, D. Osmond, and A. Bindman. The accuracy of present-on-admission reporting in administrative data. Health services research, 46(6pt1):1946–1962, 2011. (Cited on page 39.)
J. Gong, C. Liu, W. Liu, Y. Xiang, L. Diao, A.-Y. Guo, and L. Han. Lncediting: adatabase for functional effects of rna editing in lncrnas. Nucleic Acids Research, pagegkw835, 2016. (Cited on pages xxii and 32.)
L. S. Gramates, S. J. Marygold, G. dos Santos, J.-M. Urbano, G. Antonazzo, B. B.Matthews, A. J. Rey, C. J. Tabone, M. A. Crosby, D. B. Emmert, et al. Flybase at25: looking to the future. Nucleic Acids Research, page gkw1016, 2016. (Cited onpages xxii and 32.)
G. Grillo, M. Attimonelli, S. Liuni, and G. Pesole. Cleanup: a fast computer program forremoving redundancies from nucleotide sequence databases. Computer applicationsin the biosciences: CABIOS, 12(1):1–8, 1996. (Cited on page 53.)
T. Groza, S. Köhler, S. Doelken, N. Collier, A. Oellrich, D. Smedley, F. M. Couto,G. Baynam, A. Zankl, and P. N. Robinson. Automatic concept recognition using thehuman phenotype ontology reference and test suite corpora. Database, 2015:bav005,2015. (Cited on page 51.)
S. Guha, N. Koudas, A. Marathe, and D. Srivastava. Merging the results of approximatematch operations. In Proceedings of the Thirtieth international conference on Verylarge data bases-Volume 30, pages 636–647. VLDB Endowment, 2004. (Cited onpage 60.)
P. Gupta, S. Naithani, M. K. Tello-Ruiz, K. Chougule, P. DâĂŹEustachio, A. Fabregat,Y. Jiao, M. Keays, Y. K. Lee, S. Kumari, et al. Gramene database: Navigating plantcomparative genomics resources. Current Plant Biology, 7:10–15, 2016. (Cited onpages xxii and 32.)
230
S. C. Guptill and J. L. Morrison. Elements of spatial data quality. Elsevier, 2013. (Citedon page 35.)
G. Hamm and K. Stübert. Embl nucleotide sequence data library. Nucleotide SequenceData Library News, 1:2–8, 1982. (Cited on page 16.)
Y. Hao, T. Mu, R. Hong, M. Wang, N. An, and J. Y. Goulermas. Stochastic multi-view hashing for large-scale near-duplicate video retrieval. IEEE Transactions onMultimedia, 19(1):1–14, 2017. (Cited on pages 3, 46, and 47.)
A. Haug, F. Zachariassen, and D. Van Liempd. The costs of poor data quality. Journalof Industrial Engineering and Management, 4(2):168–193, 2011. (Cited on page 40.)
A. Haug, J. Stentoft Arlbjørn, F. Zachariassen, and J. Schlichter. Master data qualitybarriers: an empirical investigation. Industrial Management & Data Systems, 113(2):234–249, 2013. (Cited on page 40.)
J. Herrero, M. Muffato, K. Beal, S. Fitzgerald, L. Gordon, M. Pignatelli, A. J. Vilella,S. M. Searle, R. Amode, S. Brent, et al. Ensembl comparative genomics resources.Database, 2016:bav096, 2016. (Cited on pages xxi and 26.)
T. N. Herzog, F. J. Scheuren, and W. E. Winkler. Data quality and record linkagetechniques. Springer Science & Business Media, 2007. (Cited on pages 57 and 58.)
C. Hoare. Data reliability. In acm sigplan Notices, volume 10, pages 528–533. ACM,1975. (Cited on page 33.)
G. L. Holliday, A. Bairoch, P. G. Bagos, A. Chatonnet, D. J. Craik, R. D. Finn, B. Hen-rissat, D. Landsman, G. Manning, N. Nagano, et al. Key challenges for the creationand maintenance of specialist protein resources. Proteins: Structure, Function, andBioinformatics, 83(6):1005–1013, 2015. (Cited on page 14.)
L. Holm and C. Sander. Removing near-neighbour redundancy from large protein se-quence collections. Bioinformatics, 14(5):423–429, 1998. (Cited on page 53.)
231
E. L. Hong, C. A. Sloan, E. T. Chan, J. M. Davidson, V. S. Malladi, J. S. Strattan,B. C. Hitz, I. Gabdank, A. K. Narayanan, M. Ho, et al. Principles of metadataorganization at the encode data coordination center. Database, 2016:baw001, 2016.(Cited on page 51.)
J. Hortal, J. M. Lobo, and A. JIMÉNEZ-VALVERDE. Limitations of biodiversitydatabases: case study on seed-plant diversity in tenerife, canary islands. ConservationBiology, 21(3):853–863, 2007. (Cited on page 40.)
D. Howe, M. Costanzo, P. Fey, T. Gojobori, L. Hannick, W. Hide, D. P. Hill, R. Kania,M. Schaeffer, S. St Pierre, et al. Big data: The future of biocuration. Nature, 455(7209):47–50, 2008. (Cited on page 6.)
D. G. Howe, Y. M. Bradford, A. Eagle, D. Fashena, K. Frazer, P. Kalita, P. Mani,R. Martin, S. T. Moxon, H. Paddock, et al. The zebrafish model organism database:new support for human disease models, mutation details, gene expression phenotypesand searching. Nucleic Acids Research, 45(D1):D758–D768, 2017. (Cited on pages xxiiand 32.)
K. L. Howe, B. J. Bolt, M. Shafie, P. Kersey, and M. Berriman. Wormbase parasite- acomprehensive resource for helminth genomics. Molecular and Biochemical Parasitol-ogy, 2016. (Cited on page 51.)
J. Hu and X. Yan. Bs-knn: An effective algorithm for predicting protein subchloroplastlocalization. Evolutionary Bioinformatics Online, 8:79, 2012. (Cited on page 69.)
Y. Huang, B. Niu, Y. Gao, L. Fu, and W. Li. Cd-hit suite: a web server for clusteringand comparing biological sequences. Bioinformatics, 26(5):680–682, 2010a. (Cited onpage 67.)
Z. Huang, H. T. Shen, J. Shao, B. Cui, and X. Zhou. Practical online near-duplicate sub-sequence detection for continuous video streams. IEEE Transactions on Multimedia,12(5):386–398, 2010b. (Cited on page 48.)
Y. Huh, F. Keller, T. C. Redman, and A. Watkins. Data quality. Information andSoftware Technology, 32(8):559–565, 1990. (Cited on page 33.)
232
R. P. Huntley, D. Sitnikov, M. Orlic-Milacic, R. Balakrishnan, P. D’Eustachio, M. E.Gillespie, D. Howe, A. Z. Kalea, L. Maegdefessel, D. Osumi-Sutherland, et al. Guide-lines for the functional annotation of micrornas using the gene ontology. RNA, 22(5):667–676, 2016. (Cited on page 3.)
L. N. Hutchins, Y. Ding, J. P. Szatkiewicz, R. V. Smith, H. Yang, F. P.-M. de Villena,G. A. Churchill, and J. H. Graber. Cgdsnpdb: a database resource for error-checkedand imputed mouse snps. Database, 2010:baq008, 2010. (Cited on page 51.)
T. Imieliński and W. Lipski Jr. Incomplete information in relational databases. Journalof the ACM (JACM), 31(4):761–791, 1984. (Cited on page 33.)
H. Jagadish, J. Gehrke, A. Labrinidis, Y. Papakonstantinou, J. M. Patel, R. Ramakr-ishnan, and C. Shahabi. Big data and its technical challenges. Communications ofthe ACM, 57(7):86–94, 2014. (Cited on page 38.)
A. Jaimes, S.-F. Chang, and A. C. Loui. Duplicate detection in consumer photogra-phy and news video. In Proceedings of the tenth ACM International Conference onMultimedia, pages 423–424. ACM, 2002. (Cited on pages 45 and 47.)
A. K. Jain and R. C. Dubes. Algorithms for clustering data. Prentice-Hall, Inc., 1988.(Cited on page 72.)
D. G. Jamieson, P. M. Roberts, D. L. Robertson, B. Sidders, and G. Nenadic. Cata-loging the biomedical world of pain through semi-automated curation of molecularinteractions. Database, 2013:bat033, 2013. (Cited on page 52.)
Y. Jang, H. B. Kon, and Y.-Y. R. Wang. A Data Consumer-based Approach to Support-ing Data Quality Judgement. Alfred P. Sloan School of Management, MassachusettsInstitute of Technology, 1992. (Cited on page 37.)
M. A. Jaro. Advances in record-linkage methodology as applied to matching the 1985census of tampa, florida. Journal of the American Statistical Association, 84(406):414–420, 1989. (Cited on page 60.)
233
V. Jayawardene, S. Sadiq, and M. Indulska. The curse of dimensionality in data quality.In ACIS 2013: 24th Australasian Conference on Information Systems, pages 1–11.RMIT University, 2013. (Cited on pages 36 and 38.)
S. Jeon, B. Hong, J. Kwon, Y.-s. Kwak, and S.-i. Song. Redundant data removal tech-nique for efficient big data search processing. Int. J. Softw. Eng. Appl, 7(4):427–436,2013. (Cited on page 41.)
Y. Ji, Z. Zhang, and Y. Hu. The repertoire of g-protein-coupled receptors in xenopustropicalis. BMC genomics, 10(1), 2009. (Cited on page 69.)
Y.-G. Jiang, Y. Jiang, and J. Wang. Vcdb: a large-scale database for partial copydetection in videos. In European Conference on Computer Vision, pages 357–371.Springer, 2014. (Cited on pages 46 and 47.)
E. Joffe, M. J. Byrne, P. Reeder, J. R. Herskovic, C. W. Johnson, A. B. McCoy, andE. V. Bernstam. Optimized dual threshold entity resolution for electronic healthrecord databases–training set size and active learning. In AMIA Annual SymposiumProceedings, volume 2013, page 721. American Medical Informatics Association, 2013.(Cited on pages 54, 58, 60, and 62.)
A. Joly, C. Frélicot, and O. Buisson. Robust content-based video copy identification in alarge reference database. In International Conference on Image and Video Retrieval,pages 414–424. Springer, 2003. (Cited on pages 45 and 47.)
K. Julenius, A. Mølgaard, R. Gupta, and S. Brunak. Prediction, conservation analy-sis, and structural characterization of mammalian mucin-type o-glycosylation sites.Glycobiology, 15(2):153–164, 2005. (Cited on pages xxi and 26.)
J. Jung, T. Ryu, Y. Hwang, E. Lee, and D. Lee. Prediction of extracellular matrixproteins based on distinctive sequence and domain characteristics. Journal of Com-putational Biology, 17(1):97–105, 2010. (Cited on page 69.)
S. Jupe, B. Jassal, M. Williams, and G. Wu. A controlled vocabulary for pathwayentities and events. Database, 2014:bau060, 2014. (Cited on pages 52 and 54.)
234
H. Jürges. Unemployment, life satisfaction and retrospective error. Journal of theRoyal Statistical Society: Series A (Statistics in Society), 170(1):43–61, 2007. (Citedon page 38.)
M. Kanehisa, M. Furumichi, M. Tanabe, Y. Sato, and K. Morishima. Kegg: new per-spectives on genomes, pathways, diseases and drugs. Nucleic Acids Research, 45(D1):D353–D361, 2017. (Cited on pages xxii and 32.)
S. Kim, W. Kim, C.-H. Wei, Z. Lu, and W. J. Wilbur. Prioritizing pubmed articles forthe comparative toxicogenomic database utilizing semantic information. Database,2012:bas042, 2012. (Cited on page 52.)
Y. Kodama, M. Shumway, and R. Leinonen. The sequence read archive: explosivegrowth of sequencing data. Nucleic Acids Research, 40(D1):D54–D56, 2012. (Citedon page 16.)
J. Koh. Correlation-based methods for biological data cleaning. PhD thesis, NationalUniversity of Singapore, 2007. (Cited on page 55.)
J. Koh, M. L. Lee, A. M. Khan, P. Tan, and V. Brusic. Duplicate detection in biologicaldata using association rule mining. Locus, 501(P34180):S22388, 2004. (Cited onpages 4, 50, 55, 56, and 60.)
N. Kolesnikov, E. Hastings, M. Keays, O. Melnichuk, Y. A. Tang, E. Williams, M. Dylag,N. Kurbatova, M. Brandizi, T. Burdett, et al. Arrayexpress update – simplifying datasubmissions. Nucleic Acids Research, 43(D1):D1113–D1116, 2014. (Cited on page 1.)
N. Kolesnikov, E. Hastings, M. Keays, O. Melnichuk, Y. A. Tang, E. Williams, M. Dylag,N. Kurbatova, M. Brandizi, T. Burdett, et al. Arrayexpress updateâĂŤsimplifyingdata submissions. Nucleic Acids Research, 43(D1):D1113–D1116, 2015. (Cited onpages xxii and 32.)
H. B. Kon, J. Lee, and Y. R. Wang. A process view of data quality. Total data qualitymanagement (tdqm) research program, Sloan School of Management, MassachusettsInstitute of Technology, 1993. (Cited on page 37.)
235
H. Köpcke, A. Thor, S. Thomas, and E. Rahm. Tailoring entity resolution for matchingproduct offers. In Proceedings of the 15th International Conference on ExtendingDatabase Technology, pages 545–550. ACM, 2012. (Cited on pages 60 and 61.)
E. Kopylova, J. A. Navas-Molina, C. Mercier, Z. Z. Xu, F. Mahé, Y. He, H.-W. Zhou,T. Rognes, J. G. Caporaso, and R. Knight. Open-source sequence clustering methodsimprove the state of the art. mSystems, 1(1):e00003–15, 2016. (Cited on page 68.)
P. G. Korning, S. M. Hebsgaard, P. Rouzé, and S. Brunak. Cleaning the genbankarabidopsis thaliana data set. Nucleic Acids Research, 24(2):316–320, 1996. (Citedon pages 40, 50, and 55.)
S. B. Kotsiantis, I. Zaharakis, and P. Pintelas. Supervised machine learning: A reviewof classification techniques, 2007. (Cited on page 62.)
N. Koudas, A. Marathe, and D. Srivastava. Flexible string matching against largedatabases in practice. In Proceedings of the Thirtieth international conference onVery large data bases-Volume 30, pages 1078–1086. VLDB Endowment, 2004. (Citedon pages 60 and 62.)
N. Koudas, S. Sarawagi, and D. Srivastava. Record linkage: similarity measures andalgorithms. In Proceedings of the 2006 ACM SIGMOD International Conference onManagement of Data, pages 802–803. ACM, 2006. (Cited on page 41.)
A. Krogh, B. Larsson, G. Von Heijne, and E. L. Sonnhammer. Predicting transmem-brane protein topology with a hidden markov model: application to complete genomes.Journal of Molecular Biology, 305(3):567–580, 2001. (Cited on pages xxi and 26.)
M. Kumar, V. Thakur, and G. P. Raghava. Copid: composition based protein identifi-cation. Silico Biology, 8(2):121–128, 2008. (Cited on page 69.)
F. Lai, D. Li, and C.-T. Hsieh. Fighting identity theft: The coping perspective. DecisionSupport Systems, 52(2):353–363, 2012. (Cited on page 38.)
M. Landau. Redundancy, rationality, and the problem of duplication and overlap. PublicAdministration Review, 29(4):346–358, 1969. (Cited on page 41.)
236
M. J. Landrum, J. M. Lee, M. Benson, G. Brown, C. Chao, S. Chitipiralla, B. Gu,J. Hart, D. Hoffman, J. Hoover, et al. Clinvar: public archive of interpretations ofclinically relevant variants. Nucleic Acids Research, 44(D1):D862–D868, 2016. (Citedon pages xxii and 32.)
P. Langley, W. Iba, K. Thompson, et al. An analysis of bayesian classifiers. In AAAI,volume 90, pages 223–228, 1992. (Cited on page 61.)
D. T. Larose. Discovering knowledge in data: an introduction to data mining. JohnWiley & Sons, 2014. (Cited on page 57.)
K. C. Laudon. Data quality and due process in large interorganizational record systems.Communications of the ACM, 29(1):4–11, 1986. (Cited on page 33.)
S. J. Laulederkind, W. Liu, J. R. Smith, G. T. Hayman, S.-J. Wang, R. Nigam, V. Petri,T. F. Lowry, J. de Pons, M. R. Dwinell, et al. Phenominer: quantitative phenotypecuration at the rat genome database. Database, 2013:bat015, 2013. (Cited on page 51.)
J. Law-To, O. Buisson, V. Gouet-Brunet, and N. Boujemaa. Robust voting algorithmbased on labels of behavior for video copy detection. In Proceedings of the 14thACM International Conference on Multimedia, pages 835–844. ACM, 2006. (Cited onpages 42 and 47.)
R. Leinonen, F. G. Diez, D. Binns, W. Fleischmann, R. Lopez, and R. Apweiler. Uniprotarchive. Bioinformatics, 20(17):3236–3237, 2004. (Cited on pages 21 and 50.)
I. Letunic, T. Doerks, and P. Bork. Smart 6: recent updates and new developments.Nucleic Acids Research, 37(suppl 1):D229–D232, 2009. (Cited on page 69.)
V. I. Levenshtein. Binary codes capable of correcting deletions, insertions, and reversals.In Soviet Physics Doklady, volume 10, pages 707–710, 1966. (Cited on page 59.)
W. Li and A. Godzik. Cd-hit: a fast program for clustering and comparing large sets ofprotein or nucleotide sequences. Bioinformatics, 22(13):1658–1659, 2006. (Cited onpages 53, 60, 66, and 69.)
237
W. Li, L. Jaroszewski, and A. Godzik. Clustering of highly homologous sequences toreduce the size of large protein databases. Bioinformatics, 17(3):282–283, 2001. (Citedon pages 66 and 69.)
W. Li, L. Jaroszewski, and A. Godzik. Sequence clustering strategies improve remotehomology recognitions while reducing search times. Protein Engineering, 15(8):643–649, 2002a. (Cited on page 53.)
W. Li, L. Jaroszewski, and A. Godzik. Tolerating some redundancy significantly speedsup clustering of large protein databases. Bioinformatics, 18(1):77–82, 2002b. (Citedon page 66.)
W. Li, A. Cowley, M. Uludag, T. Gur, H. McWilliam, S. Squizzato, Y. M. Park, N. Buso,and R. Lopez. The embl-ebi bioinformatics web and programmatic tools framework.Nucleic Acids Research, 43(W1):W580–W584, 2015. (Cited on page 6.)
Y.-S. Lin, T.-Y. Liao, and S.-J. Lee. Detecting near-duplicate documents using sentence-level features and supervised learning. Expert Systems with Applications, 40(5):1467–1476, 2013. (Cited on pages 60 and 61.)
J. Liu, Z. Huang, H. T. Shen, and B. Cui. Correlation-based retrieval for heavily changednear-duplicate videos. ACM Transactions on Information Systems (TOIS), 29(4):21,2011. (Cited on page 47.)
J. Liu, Z. Huang, H. Cai, H. T. Shen, C. W. Ngo, and W. Wang. Near-duplicate videoretrieval: Current research and future trends. ACM Computing Surveys (CSUR), 45(4):44, 2013. (Cited on pages 3, 47, 49, and 54.)
L. Liu, W. Lai, X.-S. Hua, and S.-Q. Yang. Video histogram: A novel video signature forefficient web video duplicate detection. In International Conference on MultimediaModeling, pages 94–103. Springer, 2007. (Cited on pages 45 and 47.)
T. L. Madden, R. L. Tatusov, and J. Zhang. Applications of network blast server.Methods in Enzymology, 266:131–141, 1996. (Cited on page 20.)
238
T. Madej, C. J. Lanczycki, D. Zhang, P. A. Thiessen, R. C. Geer, A. Marchler-Bauer, andS. H. Bryant. Mmdb and vast+: tracking structural similarities between macromolec-ular complexes. Nucleic Acids Research, page gkt1208, 2013. (Cited on pages xviiand 13.)
M. Magrane, UniProt Consortium, et al. Uniprot knowledgebase: a hub of integratedprotein data. Database, 2011:bar009, 2011. (Cited on pages 17, 21, 23, and 28.)
M. D. Mailman, M. Feolo, Y. Jin, M. Kimura, K. Tryka, R. Bagoutdinov, L. Hao,A. Kiang, J. Paschall, L. Phan, et al. The ncbi dbgap database of genotypes andphenotypes. Nature Genetics, 39(10):1181–1186, 2007. (Cited on pages xxii and 32.)
C. D. Manning, H. Schütze, et al. Foundations of statistical natural language processing,volume 999. MIT Press, 1999. (Cited on page 57.)
Y. Mao and Z. Lu. Mesh now: automatic mesh indexing at pubmed scale via learning torank. Journal of Biomedical Semantics, 8(1):15, 2017. (Cited on pages xxii and 32.)
S. Markel and D. León. Sequence Analysis in a Nutshell: A Guide to Tools: A Guide toCommon Tools and Databases. O’Reilly Media, Inc., 2003. (Cited on page 20.)
R. Marsh. Drowning in dirty data? it’s time to sink or swim: A four-stage methodologyfor total data quality management. Journal of Database Marketing & CustomerStrategy Management, 12(2):105–112, 2005. (Cited on page 39.)
B. Martins. A supervised machine learning approach for duplicate detection overgazetteer records. GeoSpatial Semantics, pages 34–51, 2011. (Cited on pages 54,60, and 61.)
J. Mashima, Y. Kodama, T. Kosuge, T. Fujisawa, T. Katayama, H. Nagasaki, Y. Okuda,E. Kaminuma, O. Ogasawara, K. Okubo, et al. Dna data bank of japan (ddbj) progressreport. Nucleic Acids Research, 44(D1):D51–D57, 2015. (Cited on page 1.)
A. V. McDonnell, T. Jiang, A. E. Keating, and B. Berger. Paircoil2: improved predictionof coiled coils from sequence. Bioinformatics, 22(3):356–358, 2006. (Cited on page 69.)
239
M. D. McDowall, M. A. Harris, A. Lock, K. Rutherford, D. M. Staines, J. Bähler, P. J.Kersey, S. G. Oliver, and V. Wood. Pombase 2015: updates to the fission yeastdatabase. Nucleic Acids Research, 43(D1):D656–D661, 2014. (Cited on page 1.)
M. D. McDowall, M. A. Harris, A. Lock, K. Rutherford, D. M. Staines, J. Bähler, P. J.Kersey, S. G. Oliver, and V. Wood. Pombase 2015: updates to the fission yeastdatabase. Nucleic Acids Research, 43(D1):D656–D661, 2015. (Cited on pages xxiiand 32.)
D. McGilvray. Executing data quality projects: Ten steps to quality data and trustedinformation (TM). Elsevier, 2008. (Cited on pages xxii, 34, 36, and 37.)
S. McGinnis and T. L. Madden. Blast: at the core of a powerful and diverse set ofsequence analysis tools. Nucleic Acids Research, 32(suppl 2):W20–W25, 2004. (Citedon page 20.)
D. W. Miller Jr, J. D. Yeast, and R. L. Evans. Missing prenatal records at a birth cen-ter: A communication problem quantified. In AMIA Annual Symposium Proceedings,volume 2005, page 535. American Medical Informatics Association, 2005. (Cited onpage 39.)
M. Mirdita, L. von den Driesch, C. Galiez, M. J. Martin, J. Söding, and M. Steineg-ger. Uniclust databases of clustered and deeply annotated protein sequences andalignments. Nucleic Acids Research, 45(D1):D170–D176, 2016. (Cited on page 53.)
M. Mitzenmacher, R. Pagh, and N. Pham. Efficient estimation for high similaritiesusing odd sketches. In Proceedings of the 23rd International Conference on WorldWide Web, pages 109–118. ACM, 2014. (Cited on page 42.)
F. Monigatti, E. Gasteiger, A. Bairoch, and E. Jung. The sulfinator: predicting tyrosinesulfation sites in protein sequences. Bioinformatics, 18(5):769–770, 2002. (Cited onpages xxi and 26.)
H. Müller, F. Naumann, and J.-C. Freytag. Data quality in genome databases. Inter-national Conference on Information Quality, 2003. (Cited on pages 4, 40, and 56.)
240
H.-M. Müller, E. E. Kenny, and P. W. Sternberg. Textpresso: an ontology-based in-formation retrieval and extraction system for biological literature. PLoS Biol, 2(11):e309, 2004. (Cited on pages xxi and 26.)
R. Nanduri, I. Bhutani, A. K. Somavarapu, S. Mahajan, R. Parkesh, and P. Gupta.OnrldbâĂŤmanually curated database of experimentally validated ligands for orphannuclear receptors: insights into new drug discovery. Database, 2015:bav112, 2015.(Cited on page 51.)
D. A. Natale, C. Vinayaka, and C. H. Wu. Large-scale, classification-driven, rule-basedfunctional annotation of proteins. Encyclopedia of Genetics, Genomics, Proteomicsand Bioinformatics, 2004. (Cited on page 24.)
F. Naumann and M. Herschel. An introduction to duplicate detection. Synthesis Lec-tures on Data Management, 2(1):1–87, 2010. (Cited on pages 58, 59, and 61.)
E. P. Nawrocki, S. W. Burge, A. Bateman, J. Daub, R. Y. Eberhardt, S. R. Eddy,E. W. Floden, P. P. Gardner, T. A. Jones, J. Tate, et al. Rfam 12.0: updates to therna families database. Nucleic Acids Research, 43(D1):D130–D137, 2014. (Cited onpage 1.)
E. P. Nawrocki, S. W. Burge, A. Bateman, J. Daub, R. Y. Eberhardt, S. R. Eddy,E. W. Floden, P. P. Gardner, T. A. Jones, J. Tate, et al. Rfam 12.0: updates to therna families database. Nucleic Acids Research, 43(D1):D130–D137, 2015. (Cited onpages xxii and 32.)
R. C. NCBI. Database resources of the national center for biotechnology information.Nucleic Acids Research, 44(D1):D7, 2016. (Cited on pages xxi, xxii, 20, 26, 32, 50,and 71.)
S. B. Needleman and C. D. Wunsch. A general method applicable to the search forsimilarities in the amino acid sequence of two proteins. Journal of molecular biology,48(3):443–453, 1970. (Cited on page 59.)
A. Nellore, A. E. Jaffe, J.-P. Fortin, J. Alquicira-Hernández, L. Collado-Torres, S. Wang,R. A. Phillips III, N. Karbhari, K. D. Hansen, B. Langmead, et al. Human splicing
241
diversity and the extent of unannotated splice junctions across human rna-seq sampleson the sequence read archive. Genome Biology, 17(1):266, 2016. (Cited on page 3.)
H. B. Newcombe, J. M. Kennedy, S. Axford, and A. P. James. Automatic linkage ofvital records. Science, 130(3381):954–959, 1959. (Cited on page 60.)
C.-W. Ngo, W.-L. Zhao, and Y.-G. Jiang. Fast tracking of near-duplicate keyframes inbroadcast domain with transitivity propagation. In Proceedings of the 14th ACM In-ternational Conference on Multimedia, pages 845–854. ACM, 2006. (Cited on page 48.)
A. N. Nikolskaya, C. N. Arighi, H. Huang, W. C. Barker, and C. H. Wu. Pirsf familyclassification system for protein functional and evolutionary analysis. EvolutionaryBioinformatics, 2, 2006. (Cited on page 24.)
B. Niu, L. Fu, S. Sun, and W. Li. Artificial and natural duplicates in pyrosequencingreads of metagenomic data. BMC Bioinformatics, 11(1):187, 2010. (Cited on page 67.)
C. Notredame, D. G. Higgins, and J. Heringa. T-coffee: A novel method for fast andaccurate multiple sequence alignment. Journal of molecular biology, 302(1):205–217,2000. (Cited on pages xxi and 26.)
S. Ohno, U. Wolf, and N. B. Atkin. Evolution from fish to mammals by gene duplication.Hereditas, 59(1):169–187, 1968. (Cited on page 5.)
G. Ohring, J. Tansock, W. Emery, J. Butler, L. Flynn, F. Weng, K. S. Germain,B. Wielicki, C. Cao, M. Goldberg, et al. Achieving satellite instrument calibrationfor climate change. EOS, Transactions American Geophysical Union, 88(11):136–136,2007. (Cited on page 38.)
N. A. O’Leary, M. W. Wright, J. R. Brister, S. Ciufo, D. Haddad, R. McVeigh, B. Ra-jput, B. Robbertse, B. Smith-White, D. Ako-Adjei, et al. Reference sequence (refseq)database at ncbi: current status, taxonomic expansion, and functional annotation.Nucleic Acids Research, page gkv1189, 2015. (Cited on pages 17, 23, and 50.)
242
R. D. Oliveira, M. Cherubini, and N. Oliver. Looking at near-duplicate videos from ahuman-centric perspective. ACM Transactions on Multimedia Computing, Commu-nications, and Applications (TOMM), 6(3):15, 2010. (Cited on page 49.)
R. Oughtred, A. Chatr-aryamontri, B.-J. Breitkreutz, C. S. Chang, J. M. Rust, C. L.Theesfeld, S. Heinicke, A. Breitkreutz, D. Chen, J. Hirschman, et al. Biogrid: aresource for studying biological interactions in yeast. Cold Spring Harbor Protocols,2016(1):pdb–top080754, 2016. (Cited on pages xxii and 32.)
I. Pedruzzi, C. Rivoire, A. H. Auchincloss, E. Coudert, G. Keller, E. De Castro,D. Baratin, B. A. Cuche, L. Bougueleret, S. Poux, et al. Hamap in 2015: updates tothe protein family classification and annotation system. Nucleic Acids Research, 43(D1):D1064–D1070, 2015. (Cited on page 24.)
Y. Peng, C.-H. Wei, and Z. Lu. Improving chemical disease relation extraction with richfeatures and weakly labeled data. Journal of Cheminformatics, 8(1):53, 2016. (Citedon page 30.)
D. Plewczynski, L. Slabinski, A. Tkacz, L. Kajan, L. Holm, K. Ginalski, and L. Rych-lewski. The rpsp: Web server for prediction of signal peptides. Polymer, 48(19):5493–5496, 2007. (Cited on page 69.)
S. Poux, C. N. Arighi, M. Magrane, A. Bateman, C.-H. Wei, Z. Lu, E. Boutet, H. Bye-A-Jee, M. L. Famiglietti, and B. Roechert. On expert curation and sustainability:Uniprotkb/swiss-prot as a case study. bioRxiv, page 094011, 2016. (Cited on page 23.)
J. R. Quinlan. C4. 5: programs for machine learning. Elsevier, 2014. (Cited on page 24.)
T. C. Redman. The impact of poor data quality on the typical enterprise. Communica-tions of the ACM, 41(2):79–82, 1998. (Cited on page 39.)
T. Rekatsinas, X. L. Dong, L. Getoor, and D. Srivastava. Finding quality in quantity:The challenge of discovering valuable sources for integration. In the Conference onInnovative Data Systems Research, 2015. (Cited on page 33.)
243
T. Rodrigues, F. Benevenuto, V. Almeida, J. Almeida, and M. Gonçalves. Equal but dif-ferent: a contextual analysis of duplicated videos on youtube. Journal of the BrazilianComputer Society, 16(3):201–214, 2010. (Cited on pages 47, 49, and 54.)
P. W. Rose, A. Prlić, A. Altunkaya, C. Bi, A. R. Bradley, C. H. Christie, L. Di Costanzo,J. M. Duarte, S. Dutta, Z. Feng, et al. The rcsb protein data bank: integrative viewof protein, gene and 3d structural information. Nucleic Acids Research, 45(D1):D271–D281, 2017. (Cited on pages 1, 17, 24, and 50.)
M. Rosikiewicz, A. Comte, A. Niknejad, M. Robinson-Rechavi, and F. B. Bastian. Un-covering hidden duplicated content in public transcriptomics data. Database, 2013:bat010, 2013. (Cited on pages 2 and 52.)
A. Rudniy, M. Song, and J. Geller. Detecting duplicate biological entities using shortestpath edit distance. International Journal of Data Mining and Bioinformatics, 4(4):395–410, 2010. (Cited on page 55.)
A. Rudniy, M. Song, and J. Geller. Mapping biological entities using the longest ap-proximately common prefix method. BMC Bioinformatics, 15(1):187, 2014. (Citedon page 54.)
R. C. Russell. Index., Apr. 2 1918. US Patent 1,261,167. (Cited on page 60.)
R. C. Russell and U. Russell Index. Patent 1,435,663;", 1922. (Cited on page 60.)
S. Sadiq and M. Indulska. Open data: Quality over quantity. International Journal ofInformation Management, 37(3):150–154, 2017. (Cited on page 35.)
S. Sadiq and P. Papotti. Big data quality-whose problem is it? In IEEE 32nd Inter-national Conference on Data Engineering, pages 1446–1447. IEEE, 2016. (Cited onpage 35.)
R. Saha Roy, R. Sinha, N. Chhaya, and S. Saini. Probabilistic deduplication of anony-mous web traffic. In Proceedings of the 24th International Conference on World WideWeb, pages 103–104. ACM, 2015. (Cited on page 61.)
244
M. Sahami, S. Dumais, D. Heckerman, and E. Horvitz. A bayesian approach to filteringjunk e-mail. In Learning for Text Categorization: Papers from the 1998 workshop,volume 62, pages 98–105, 1998. (Cited on page 61.)
M. K. Sakharkar, V. Chow, K. Ghosh, I. Chaturvedi, P. C. Lee, S. P. Bagavathi, P. Shap-shak, S. Subbiah, and P. Kangueane. Computational prediction of seg (single exongene) function in humans. Front Biosci, 10:1382–1395, 2005. (Cited on page 69.)
H. Salgado, A. Santos-Zavaleta, S. Gama-Castro, M. Peralta-Gil, M. I. Peñaloza-Spínola,A. Martínez-Antonio, P. D. Karp, and J. Collado-Vides. The comprehensive updatedregulatory network of escherichia coli k-12. BMC Bioinformatics, 7(1):5, 2006. (Citedon page 51.)
S. A. Sam, J. Teel, A. N. Tegge, A. Bharadwaj, and T. Murali. Xtalkdb: a databaseof signaling pathway crosstalk. Nucleic Acids Research, 45(D1):D432–D439, 2017.(Cited on pages xxii and 32.)
M. A. Santos, A. L. Turinsky, S. Ong, J. Tsai, M. F. Berger, G. Badis, S. Talukder,A. R. Gehrke, M. L. Bulyk, T. R. Hughes, et al. Objective sequence-based subfamilyclassifications of mouse homeodomains reflect their in vitro dna-binding preferences.Nucleic Acids Research, 38(22):7927–7942, 2010. (Cited on pages 52 and 54.)
S. Sarawagi and A. Bhamidipaty. Interactive deduplication using active learning. InProceedings of the eighth ACM SIGKDD International Conference on Knowledge Dis-covery and Data Mining, pages 269–278. ACM, 2002. (Cited on page 60.)
I. M. Schedina, S. Hartmann, D. Groth, I. Schlupp, and R. Tiedemann. Comparativeanalysis of the gonadal transcriptomes of the all-female species poecilia formosa andits maternal ancestor poecilia mexicana. BMC Research Notes, 7(1):1, 2014. (Citedon page 69.)
A. M. Schnoes, S. D. Brown, I. Dodevski, and P. C. Babbitt. Annotation error inpublic databases: misannotation of molecular function in enzyme superfamilies. PLoSComput Biol, 5(12):e1000605, 2009. (Cited on pages 3 and 40.)
245
T. B. sequence analysis tool. Madden, Thomas. National Center for BiotechnologyInformation (US), 2013. (Cited on page 20.)
B. Settles. Active learning literature survey. University of Wisconsin, Madison, 52(55-66):11, 2010. (Cited on page 62.)
R. Shah. Improvement of soundex algorithm for indian language based on phoneticmatching. International Journal of Computer Science, Engineering and Applications,4(3):31, 2014. (Cited on page 60.)
H. T. Shen, X. Zhou, Z. Huang, J. Shao, and X. Zhou. Uqlips: a real-time near-duplicatevideo clip detection system. In Proceedings of the 33rd international conference onVery large data bases, pages 1374–1377. VLDB Endowment, 2007. (Cited on pages 45and 47.)
M. Sickmeier, J. A. Hamilton, T. LeGall, V. Vacic, M. S. Cortese, A. Tantos, B. Szabo,P. Tompa, J. Chen, V. N. Uversky, et al. Disprot: the database of disordered proteins.Nucleic Acids Research, 35(suppl 1):D786–D793, 2007. (Cited on page 69.)
K. Sikic and O. Carugo. Protein sequence redundancy reduction: comparison of variousmethod. Bioinformation, 5(6):234–239, 2010. (Cited on pages 53 and 69.)
D. Sirim, F. Wagner, L. Wang, R. D. Schmid, and J. Pleiss. The laccase engineeringdatabase: a classification and analysis system for laccases and related multicopperoxidases. Database, 2011:bar006, 2011. (Cited on page 51.)
A. F. Smeaton, P. Over, and W. Kraaij. Evaluation campaigns and trecvid. In Proceed-ings of the 8th ACM International Workshop on Multimedia Information Retrieval,pages 321–330. ACM, 2006. (Cited on page 48.)
T. F. Smith and M. S. Waterman. Identification of common molecular subsequences.Journal of Molecular Biology, 147(1):195–197, 1981. (Cited on page 59.)
J. Song, Y. Yang, Z. Huang, H. T. Shen, and R. Hong. Multiple feature hashing forreal-time large scale near-duplicate video retrieval. In Proceedings of the 19th ACM In-
246
ternational Conference on Multimedia, pages 423–432. ACM, 2011. (Cited on pages 46and 47.)
J. Song, Y. Yang, Z. Huang, H. T. Shen, and J. Luo. Effective multiple feature hashingfor large-scale near-duplicate video retrieval. IEEE Transactions on Multimedia, 15(8):1997–2008, 2013. (Cited on page 48.)
M. Song and A. Rudniy. Detecting duplicate biological entities using markov randomfield-based edit distance. In IEEE International Conference on Bioinformatics andBiomedicine, pages 457–460. IEEE, 2008. (Cited on page 60.)
M. Song and A. Rudniy. Detecting duplicate biological entities using markov randomfield-based edit distance. Knowledge and Information Systems, 25(2):371–387, 2010.(Cited on page 55.)
M. Spannagl, T. Nussbaumer, K. C. Bader, M. M. Martis, M. Seidel, K. G. Kugler,H. Gundlach, and K. F. Mayer. Pgsb plantsdb: updates to the database frameworkfor comparative plant genome research. Nucleic Acids Research, 44(D1):D1141–D1147,2016. (Cited on pages xxii and 32.)
M. Stanke and S. Waack. Gene prediction with a hidden markov model and a newintron submodel. Bioinformatics, 19(suppl_2):ii215–ii225, 2003. (Cited on page 14.)
L. Stein. Creating databases for biological information: an introduction. Current Pro-tocols in Bioinformatics, pages 9–1, 2013. (Cited on page 12.)
G. Stelzer, N. Rosen, I. Plaschkes, S. Zimmerman, M. Twik, S. Fishilevich, T. I. Stein,R. Nudel, I. Lieder, Y. Mazor, et al. The genecards suite: from gene data mining todisease genome sequence analyses. Current Protocols in Bioinformatics, pages 1–30,2016. (Cited on page 51.)
P. D. Stenson, M. Mort, E. V. Ball, K. Evans, M. Hayden, S. Heywood, M. Hussain,A. D. Phillips, and D. N. Cooper. The human gene mutation database: towards acomprehensive repository of inherited mutation data for medical research, geneticdiagnosis and next-generation sequencing studies. Human Genetics, pages 1–13, 2017.(Cited on pages xxii and 32.)
247
C. Stephenson. The methodology of historical census record linkage: A user’s guide tothe soundex. Journal of Family History, 5(1):112–115, 1980. (Cited on page 60.)
J. A. L. Sterling. World Copyright Law: protection of authors’ works, performances,phonograms, films, video, broadcasts and published editions in national, internationaland regional law. London (UK) Sweet and Maxwell, 1998. (Cited on page 48.)
B. J. Strasser. The experimenter’s museum: Genbank, natural history, and the moraleconomies of biomedicine. Isis, 102(1):60–96, 2011. (Cited on page 18.)
D. M. Strong, Y. W. Lee, and R. Y. Wang. Data quality in context. Communicationsof the ACM, 40(5):103–110, 1997. (Cited on page 37.)
Y. Suhara, H. Toda, S. Nishioka, and S. Susaki. Automatically generated spam detectionbased on sentence-level topic information. In Proceedings of the 22nd InternationalConference on World Wide Web, pages 1157–1160. ACM, 2013. (Cited on page 61.)
V. Šupak Smolčić and L. Bilić-Zulle. How do we handle self-plagiarism in submittedmanuscripts? Biochemia Medica, 23(2):150–153, 2013. (Cited on page 41.)
B. E. Suzek, Y. Wang, H. Huang, P. B. McGarvey, C. H. Wu, UniProt Consortium,et al. Uniref clusters: a comprehensive and scalable alternative for improving sequencesimilarity searches. Bioinformatics, page btu739, 2014. (Cited on pages 21, 50, 53,69, 71, and 163.)
Y. Tateno, K. Fukami-Kobayashi, S. Miyazaki, H. Sugawara, and T. Gojobori. Dnadata bank of japan at work on genome sequence data. Nucleic Acids Research, 26(1):16–20, 1998. (Cited on page 16.)
T. A. Tatusova and T. L. Madden. Blast 2 sequences, a new tool for comparing proteinand nucleotide sequences. FEMS microbiology letters, 174(2):247–250, 1999. (Citedon page 65.)
M. Tavallaee, E. Bagheri, W. Lu, and A. A. Ghorbani. A detailed analysis of the kddcup 99 data set. In Computational Intelligence for Security and Defense Applications,2009. CISDA 2009. IEEE Symposium on, pages 1–6. IEEE, 2009. (Cited on page 49.)
248
G. K. Tayi and D. P. Ballou. Examining data quality. Communications of the ACM, 41(2):54–57, 1998. (Cited on page 36.)
S. Tejada, C. A. Knoblock, and S. Minton. Learning domain-independent string trans-formation weights for high accuracy object identification. In Proceedings of the EighthACM SIGKDD International Conference on Knowledge Discovery and Data Mining,pages 350–359. ACM, 2002. (Cited on page 41.)
M. Theobald, J. Siddharth, and A. Paepcke. Spotsigs: robust and efficient near du-plicate detection in large web collections. In Proceedings of the 31st Annual In-ternational ACM SIGIR Conference on Research and Development in InformationRetrieval, pages 563–570. ACM, 2008. (Cited on page 42.)
J. D. Thompson, D. G. Higgins, and T. J. Gibson. Clustal w: improving the sensitivity ofprogressive multiple sequence alignment through sequence weighting, position-specificgap penalties and weight matrix choice. Nucleic Acids Research, 22(22):4673–4680,1994. (Cited on pages xxi and 26.)
P. Thompson, H. Turtle, B. Yang, and J. Flood. Trec-3 ad hoc retrieval and routingexperiments using the win system. NIST SPECIAL PUBLICATION SP, pages 211–211, 1995. (Cited on pages 3 and 43.)
A. L. Toribio, B. Alako, C. Amid, A. Cerdeño-Tarrága, L. Clarke, I. Cleland, S. Fairley,R. Gibson, N. Goodgame, P. ten Hoopen, et al. European nucleotide archive in 2016.Nucleic Acids Research, 45(D1):D32–D36, 2017. (Cited on page 1.)
M. L. Tress, D. Cozzetto, A. Tramontano, and A. Valencia. An analysis of the sargassosea resource and the consequences for database composition. BMC Bioinformatics, 7(1):1, 2006. (Cited on page 69.)
C.-W. Tung. Pupdb: a database of pupylated proteins. BMC Bioinformatics, 13(1):1,2012. (Cited on page 69.)
C.-W. Tung and S.-Y. Ho. Computational identification of ubiquitylation sites fromprotein sequences. BMC Bioinformatics, 9(1):1, 2008. (Cited on page 69.)
249
H. Turtle and W. B. Croft. Inference networks for document retrieval. In Proceedings ofthe 13th Annual International ACM SIGIR Conference on Research and Developmentin Information Retrieval, pages 1–24. ACM, 1989. (Cited on pages 3 and 43.)
C. Tyner, G. P. Barber, J. Casper, H. Clawson, M. Diekhans, C. Eisenhart, C. M. Fischer,D. Gibson, J. N. Gonzalez, L. Guruvadoo, et al. The ucsc genome browser database:2017 update. Nucleic Acids Research, page gkw1134, 2016. (Cited on pages xxiiand 32.)
E. Ukkonen. Approximate string-matching with q-grams and maximal matches. Theo-retical Computer Science, 92(1):191–211, 1992. (Cited on page 59.)
UniProt Consortium. Uniprot: a hub for protein information. Nucleic Acids Research,page gku989, 2014. (Cited on page 71.)
UniProt Consortium et al. Activities at the universal protein resource (uniprot). NucleicAcids Research, 42(D1):D191–D198, 2014. (Cited on page 25.)
UniProt Consortium et al. Uniprot: the universal protein knowledgebase. Nucleic AcidsResearch, 45(D1):D158–D169, 2017. (Cited on pages 1, 17, and 50.)
K. Vaiapury, P. K. Atrey, M. S. Kankanhalli, and K. Ramakrishnan. Non-identicalduplicate video detection using the sift method. International Conference on VisualInformation in Engineering, 2006. (Cited on page 45.)
J.-C. Valderrama-Zurián, R. Aguilar-Moya, D. Melero-Fuentes, and R. Aleixandre-Benavent. A systematic analysis of duplicate records in scopus. Journal of Infor-metrics, 9(3):570–576, 2015. (Cited on page 49.)
V. S. Verykios, G. V. Moustakides, and M. G. Elfeky. A bayesian decision model forcost optimal record matching. The International Journal on Very Large Data Bases,12(1):28–40, 2003. (Cited on page 60.)
A.-L. Veuthey, A. Bridge, J. Gobeill, P. Ruch, J. R. McEntyre, L. Bougueleret, andI. Xenarios. Application of text-mining for updating protein post-translational mod-
250
ification annotation in uniprotkb. BMC Bioinformatics, 14(1):104, 2013. (Cited onpages xxi and 26.)
A. Walenstein, M. El-Ramly, J. R. Cordy, W. S. Evans, K. Mahdavi, M. Pizka, G. Ra-malingam, and J. W. von Gudenberg. Similarity in programs. In Dagstuhl Semi-nar Proceedings. Schloss Dagstuhl-Leibniz-Zentrum für Informatik, 2007. (Cited onpage 41.)
Y. Wand and R. Y. Wang. Anchoring data quality dimensions in ontological foundations.Communications of the ACM, 39(11):86–95, 1996. (Cited on page 37.)
H. Wang, T. Tian, M. Ma, and J. Wu. Joint compression of near-duplicate videos. IEEETransactions on Multimedia, 2016. (Cited on pages 41 and 47.)
J. Wang, T. Kraska, M. J. Franklin, and J. Feng. Crowder: Crowdsourcing entityresolution. Proceedings of the VLDB Endowment, 5(11):1483–1494, 2012. (Cited onpage 42.)
R. Y. Wang. A product perspective on total data quality management. Communicationsof the ACM, 41(2):58–65, 1998. (Cited on page 33.)
R. Y. Wang and D. M. Strong. Beyond accuracy: What data quality means to dataconsumers. Journal of management information systems, 12(4):5–33, 1996. (Cited onpages xxii, 34, 35, 36, 37, and 49.)
R. Y. Wang, V. C. Storey, and C. P. Firth. A framework for analysis of data qualityresearch. IEEE Transactions on Knowledge and Data Engineering, 7(4):623–640, 1995.(Cited on page 35.)
R. Y. Wang, M. Ziad, and Y. W. Lee. Data quality, volume 23. Springer Science &Business Media, 2006. (Cited on page 37.)
C.-H. Wei, H.-Y. Kao, and Z. Lu. Pubtator: a web-based text mining tool for assistingbiocuration. Nucleic Acids Research, page gkt441, 2013. (Cited on pages xxi and 26.)
251
W. Wei, Y.-N. Ye, S. Luo, Y.-Y. Deng, D. Lin, and F.-B. Guo. Ifim: a database of inte-grated fitness information for microbial genes. Database, 2014:bau052, 2014. (Citedon page 51.)
B. H. Wixom and H. J. Watson. An empirical investigation of the factors affecting datawarehousing success. MIS quarterly, pages 17–41, 2001. (Cited on page 35.)
X. Wu, A. G. Hauptmann, and C.-W. Ngo. Practical elimination of near-duplicatesfrom web video search. In Proceedings of the 15th ACM International Conference onMultimedia, pages 218–227. ACM, 2007. (Cited on pages 41, 45, and 49.)
C. Xiao, W. Wang, X. Lin, J. X. Yu, and G. Wang. Efficient similarity joins for near-duplicate detection. ACM Transactions on Database Systems, 36(3):15, 2011. (Citedon pages 3, 42, and 53.)
X. Xiao, P. Wang, and K.-C. Chou. Gpcr-ca: A cellular automaton image approach forpredicting g-protein–coupled receptor functional classes. Journal of ComputationalChemistry, 30(9):1414–1423, 2009. (Cited on page 69.)
T. Yan and H. Garcia-Molina. Duplicate detection in information dissemination. VeryLarge Databases (VLDB), 1995. (Cited on pages 42, 49, and 54.)
H. Yang, C. Qin, Y. H. Li, L. Tao, J. Zhou, C. Y. Yu, F. Xu, Z. Chen, F. Zhu, andY. Z. Chen. Therapeutic target database update 2016: enriched resource for benchto clinical drug target and targeted pathway information. Nucleic Acids Research, 44(D1):D1069–D1074, 2016. (Cited on pages xxii and 32.)
Z.-Q. Yang, X.-Y. Wei, Z. Yi, and G. Friedland. Contextual noise reduction for do-main adaptive near-duplicate retrieval on merchandize images. IEEE Transactionson Image Processing, 2017. (Cited on page 41.)
N. K. Yeganeh, S. Sadiq, and M. A. Sharaf. A framework for data quality aware querysystems. Information Systems, 46:24–44, 2014. (Cited on page 35.)
252
J. Zhang and T. L. Madden. Powerblast: a new network blast application for interactiveor automated sequence analysis and annotation. Genome Research, 7(6):649–656,1997. (Cited on page 20.)
X. Zhang, Y. Yao, Y. Ji, and B. Fang. Effective and fast near duplicate detection viasignature-based compression metrics. Mathematical Problems in Engineering, 2016,2016. (Cited on page 41.)
Y. Zhang, J. Callan, and T. Minka. Novelty and redundancy detection in adaptivefiltering. In Proceedings of the 25th Annual International ACM SIGIR Conference onResearch and Development in Information Retrieval, pages 81–88. ACM, 2002. (Citedon page 62.)
Y. Zhang, T. Li, C. Yang, D. Li, Y. Cui, Y. Jiang, L. Zhang, Y. Zhu, and F. He. Prelo-cabc: a novel predictor of protein sub-cellular localization using a bayesian classifier.Journal of Proteomics Bioinform, 4(1), 2011. (Cited on page 69.)
W.-L. Zhao, C.-W. Ngo, H.-K. Tan, and X. Wu. Near-duplicate keyframe identificationwith interest point matching and pattern learning. IEEE Transactions on Multimedia,9(5):1037–1048, 2007. (Cited on page 48.)
H. Zhu and R. Y. Wang. Information quality framework for verifiable intelligence prod-ucts. In Data Engineering, pages 315–333. Springer, 2009. (Cited on page 38.)
J. Zobel and Y. Bernstein. The case of the duplicate documents measurement, search,and science. Frontiers of WWW Research and Development-APWeb 2006, pages 26–39, 2006. (Cited on page 44.)
J. Zobel and T. C. Hoad. Detection of video sequences using compact signatures. ACMTransactions on Information Systems (TOIS), 24(1):1–50, 2006. (Cited on page 44.)
E. V. Zorita, P. Cuscó, and G. Filion. Starcode: sequence clustering based on all-pairssearch. Bioinformatics, page btv053, 2015. (Cited on page 68.)
Minerva Access is the Institutional Repository of The University of Melbourne
Author/s:Chen, Qingyu
Title:Duplication in biological databases: definitions, impacts and methods
Date:2017
Persistent Link:http://hdl.handle.net/11343/197466
Terms and Conditions:Terms and Conditions: Copyright in works deposited in Minerva Access is retained by thecopyright owner. The work may not be altered without permission from the copyright owner.Readers may only download, print and save electronic copies of whole works for their ownpersonal non-commercial use. Any use that exceeds these limits requires permission fromthe copyright owner. Attribution is essential when quoting or paraphrasing from these works.