Chapter 2 Concepts and definitions
47
Concepts and definitions Statistics Canada - Catalogue no. 13-017 Guide to the Income and Expenditure Accounts 19 Chapter 2 Concepts and definitions Production and aggregate economic activity Production, output and product Basic concepts 2.1 Gross domestic product (GDP) is the key measure in the Canadian System of National Accounts. GDP lies at the centre of the two architectures of the Canadian System of National Accounts (CSNA) — the industry-based Input-Output Tables that provide a value added measure, and the sector-based Income and Expenditure Accounts that provide both income-based and expenditure-based measures. GDP reflects the aggregate production of an economy. Production is an activity which uses inputs (labour, capital, goods and services) to produce outputs (goods and services). It excludes purely natural processes without any human involvement or direction, such as the unmanaged growth of fish stocks (whereas fish farming is production). 2.2 Output consists of those goods or services that are produced within an establishment 1 that become available for use outside that establishment. 2 The output includes work in progress whenever a process of production extends over two or more accounting periods as well as any goods or services produced for its own final use. The gross value added is defined as the value of total output less the value of all goods and services used in the production process (intermediate consumption). GDP (at basic prices) for the economy is equivalent to the sum of the value added by all resident producers. GDP at market prices is the aggregate GDP plus taxes, less subsidies, on products. 2.3 The relationship between output and value added gives an idea of the extent of transformations taking place in the economy. Product or GDP, regardless of how it is measured in the CSNA, is the end result of productive activities. Classification of productive activities 2.4 Understanding the production boundary is central to measuring gross domestic product as the level of GDP is affected where the boundary is drawn. Table 2.1 presents a diagram demarcating production. 1. An establishment is an enterprise or part of an enterprise, that is situated in a single location and in which only a single (non-ancillary) productive activity is carried out or in which the principal productive activity accounts for most of the value added, according to paragraphs 5.21 and 6.80 of System of National Accounts 1993. Establishments are grouped into industries. 2. See paragraph 6.38 of System of National Accounts 1993.
-
Upload
khangminh22 -
Category
Documents
-
view
1 -
download
0
Transcript of Chapter 2 Concepts and definitions

Concepts and definitions
Statistics Canada - Catalogue no. 13-017 Guide to the Income and Expenditure Accounts 19
Chapter 2 Concepts and definitions
Production and aggregate economic activity
Production, output and product
Basic concepts
2.1 Gross domestic product (GDP) is the key measure in the Canadian System of National Accounts. GDP lies atthe centre of the two architectures of the Canadian System of National Accounts (CSNA) — the industry-basedInput-Output Tables that provide a value added measure, and the sector-based Income and Expenditure Accountsthat provide both income-based and expenditure-based measures. GDP reflects the aggregate production of aneconomy. Production is an activity which uses inputs (labour, capital, goods and services) to produce outputs(goods and services). It excludes purely natural processes without any human involvement or direction, such asthe unmanaged growth of fish stocks (whereas fish farming is production).
2.2 Output consists of those goods or services that are produced within an establishment1 that become available
for use outside that establishment.2 The output includes work in progress whenever a process of productionextends over two or more accounting periods as well as any goods or services produced for its own final use. Thegross value added is defined as the value of total output less the value of all goods and services used in theproduction process (intermediate consumption). GDP (at basic prices) for the economy is equivalent to the sum ofthe value added by all resident producers. GDP at market prices is the aggregate GDP plus taxes, less subsidies,on products.
2.3 The relationship between output and value added gives an idea of the extent of transformations taking place inthe economy. Product or GDP, regardless of how it is measured in the CSNA, is the end result of productiveactivities.
Classification of productive activities
2.4 Understanding the production boundary is central to measuring gross domestic product as the level of GDP isaffected where the boundary is drawn. Table 2.1 presents a diagram demarcating production.
1. An establishment is an enterprise or part of an enterprise, that is situated in a single location and in which only a single (non-ancillary)productive activity is carried out or in which the principal productive activity accounts for most of the value added, according to paragraphs5.21 and 6.80 of System of National Accounts 1993. Establishments are grouped into industries.
2. See paragraph 6.38 of System of National Accounts 1993.

Concepts and definitions
20 Statistics Canada - Catalogue no. 13-017 Guide to the Income and Expenditure Accounts
Table 2.1 Demarcation of production in the Canadian System of National Accounts
2.5 The output resulting from production is classified as either market or non-market. Market output is output thatis sold, or intended for sale, at economically significant prices. Non-market output consists of other output whosecharacteristic is that it is not exchanged, disposed of or sold at an economically significant price.
Marketoutput
Official
• traditional commercial activities
Concealed and underground production
• black market construction• services provided to households and small businesses• etc.
Illegal production
• contraband• production and distribution of Illegal drugs• prostitution• etc.
Capital formation
Own-accountproduction
• own-account building construction• machinery and tools self-fabrication• internal software development• etc.
Output produced for own final use
• goods
Non-market output
• agricultural production• primary products production (salt, peat, supply of water, etc.)• agricultural product transformation (grain threshing, milling, etc.)• other kinds of process (weaving, tailoring, pottery, etc.)
• services
• unpaid domestic and personal services• owner-occupied production of housing services
Collective goods
Other non-marketoutput
• general government• defence• etc.
Price not economically significant
• education• health care• meals to homeless• etc.
Note: Italicized items are excluded from production in the Canadian System of National Accounts.

Concepts and definitions
Statistics Canada - Catalogue no. 13-017 Guide to the Income and Expenditure Accounts 21
2.6 Market output is generally sold at an economically significant price, that is, a price that has a significantinfluence on the amounts that producers are willing to supply and the amounts that purchasers wish to buy.Transactions are settled in cash or cash substitutes (that is trade payables or receivables) by barter or in kind.Market output includes:
• the total value of goods and services sold or marketed (at an economically significant price);• the total value of goods and services bartered;• the total value of goods and services used for payments in kind, including remuneration in kind;• the total value of goods and services provided to another establishment within the same enterprise; and,• the value of changes in inventories of finished goods and work in progress intended for one or another of
the above uses.
2.7 The productive activity that results in market output is sometimes unreported or concealed.3 Economic activitywhere the scale is small enough that traditional sources of information may not pick it up is referred to as theinformal economy. Informal activity is relatively insignificant in Canada. Concealed production includes productiveactivities that are authorized by law but are not reported, for various reasons, such as to avoid paying income taxesor other taxes, or to avoid particular legal obligations, etc. Lastly, illegal production is also concealed activity. Itconsists of the production of goods and services whose sale, distribution or possession is forbidden by law but iscarried out, by mutual agreement between the parties. Examples of such activities include the manufacture anddistribution of narcotics, smuggling of goods and prostitution. The different aspects of market production are shownin the upper part of Table 2.1. It should be noted that even though no explicit adjustment is made to include illegalactivity some illegal activity may enter the market economy through money laundering.
2.8 Non-market output consists of other types of output whose common characteristic is that they are notmarketed, exchanged, disposed of or sold at an economically significant price. There are two types of non-marketoutput: own account output and other non-market output.
2.9 The own-account output consists of goods retained by institutional units for their own final consumption or theirown capital formation. For business and governments, own-account production takes the form of gross fixedcapital formation. For example, the manufacture of specialized tools by an engineering firm when the tools willsubsequently be used in the production process.
2.10 The other non-market output includes individual or collective goods and services to which the pricemechanism cannot apply. It also includes goods and services that a producing institutional unit has decided tosupply to other institutional units either for free or for prices that are not economically significant. Generalgovernment administration and national defence are examples of output for which the price mechanism does notfunction freely. The different aspects of non-market production are shown in the lower part of Table 2.1.
2.11 In the case of households, own-account production corresponds to final consumption. For example, somecrops produced by farmers may be used for final consumption by the farmer’s household. Clothing or pottery maybe produced by households for own-consumption.
2.12 Unpaid personal and domestic services are excluded from the production boundary, but occasional estimates
are available.4 Examples of these are:• Cleaning, decorating and maintenance of the dwelling occupied by the household, including minor
repairs usually done by renters or owners;• Cleaning, maintenance and repair of durable consumer goods or other goods, including vehicles used
for the needs of the household;
3. This is often referred to as the underground economy, but the more recent and broader term is the unmeasured economy. Two separatestudies have been published on the underground economy: “Assessing the Size of the Underground Economy: The Statistics CanadaPerspective”, Income and Expenditure Accounts Technical Series no. 28, May 1994; and, “The Size of the Underground Economy inCanada”, Studies in National Accounting, June 1994, catalogue no. 13-603, no 2.
4. “The Value of Household Work in Canada, 1992”, Income and Expenditure Accounts Technical Series no. 27, March 1994.

Concepts and definitions
22 Statistics Canada - Catalogue no. 13-017 Guide to the Income and Expenditure Accounts
• Meal preparation and table service;• The care, education and training of children;• The care of ill, disabled or elderly persons;• Transportation of household members or their goods.
CSNA production boundary
2.13 As can be seen from Table 2.1 the production boundary in the CSNA is very close to the System of NationalAccounts 1993 (SNA 1993). In the domain of market output, the CSNA currently excludes illegal production exceptsmuggling activity, where significant. Smuggling of cigarettes is an example of where the CSNA includes anestimate.
2.14 Among the own-account production, the excluded items are: the production and processing of agriculturaland related products; other kinds of processing, such as production and alteration of clothes, semi-durable ordurable goods such as furniture. The production of these goods can easily be sold on the market. The rationale forexclusion of household and personal services produced by households for their own consumption follows thatprovided in paragraphs 6.19 to 6.21 of the System of National Accounts 1993:
• These are “self-contained activity with limited repercussions on the rest of the economy”;• As “there are typically no suitable market prices that can be used to value such services”;• “Imputed values have a different economic significance from monetary values... if the incomes were to
be available in cash, the resulting expenditures might be quite different”;
2.15 However, it is worth noting that paid household and personal services (performed by domestic staff) areincluded in production, since this is a form of market output.
2.16 The own-account housing services produced and consumed by owner-occupants is included. The housingservices of owner-occupants are similar to rental housing services, which are included in market output. For thehousing services produced and consumed by owner-occupants, the System of National Accounts 1993 providesthis explanation to justify inclusion:
“The ratio of owner-occupied to rented dwellings can vary significantly between countries and even overshort periods of time within a single country, so that both international and inter-temporal comparisons of theproduction and consumption of housing services could be distorted if no imputation were made for the valueof own-account housing services. The imputed value of the income generated by such production is taxed in
some countries.”5
Analytical definitions applied to GDP
Net or gross GDP
2.17 Economic production involves the using up of productive capital assets–the “consumption” of capital.Because capital assets are highly durable, this using up is a gradual process, typically occurring over many years.Fixed capital consumption, often called depreciation, represents the reduction in the value of fixed assets used inproduction during the accounting period, resulting from physical deterioration or normal obsolescence. Thisconvention parallels financial accounting, as businesses customarily allocate to each period’s operating expensesa depreciation charge designed to cover the wearing out of capital assets during the period in question.Depreciation is therefore both an economic and a business cost, which is included in the market price of goods andservices sold to final users.
5. System of National Accounts 1993, paragraph 6.29.

Concepts and definitions
Statistics Canada - Catalogue no. 13-017 Guide to the Income and Expenditure Accounts 23
2.18 GDP therefore includes capital consumption allowances. The term gross is used to indicate that the
consumption of fixed capital,6 is part of the measure. The term net signifies that the consumption of fixed capital isexcluded from the definition of production, yielding net domestic product (NDP). Some analysts contend that thegross measure is more useful for some analyses, because in the short term the replacement of capital can bepostponed. Consequently, it is gross product that is used for final consumption. However, the continuousconsumption of gross product, without replacement of the assets used, would gradually reduce the country’swealth. Other analysts are focused on net net national product (NNP), arguing that it provides a better picture ofthe nation’s economic progress since it measures the amount of output that is left after providing for maintenanceof the stock of productive capital.
National or domestic product
2.19 In national accounting, an economy is defined by the entire set of resident institutional units. An institutionalunit is resident in a country when it has a centre of economic interest in that country’s economic territory. A centreof economic interest is a location—a dwelling, place of production or office—from which it engages, and intends tocontinue to engage, in economic activities and transactions on a significant scale either indefinitely or over a finite
but long period of time.7 It includes production within diplomatic enclaves.
2.20 Gross domestic product (GDP) is the sum of gross value added across all resident units— industries orinstitutions regardless of the ownership (Canadian or foreign) of the factors of production. The GDP measure, asthe key macroeconomic aggregate, allows for better correspondence to domestic employment and domesticprices.
2.21 Gross national product (GNP) or gross national income (GNI) is a measure of the total unduplicated value ofproduction of goods and services of Canadian residents at market prices (it excludes the activity related to non-resident factors of production). The concept of national refers to the economic activities of the resident economicunits, in their capacity as owners of the factors of production within a country or region. Otherwise stated, GNP(GNI) represents the income received by resident economic units due to their ownership of the factors ofproduction, regardless of where the production takes place. GNP (GNI) is more closely associated with the IEAsector-based accounts of the CSNA. It is equivalent to GDP plus compensation of employees and investmentincome received from non-residents minus compensation of employees and investment income paid to non-residents.
2.22 Until 1986, the central concept of the Canadian System of National Accounts was gross national product.Since then, gross domestic product has supplanted it. This change was introduced in order to facilitate analysis ofthe economic situation and statistical integration of the components of the national accounts. The advantages ofthe domestic measure over the national measure are as follows: GDP is more closely related to employment anddomestic prices than is GNI; it is easier to reconcile the components of the Canadian System of National Accounts;regional and national measures are better integrated; and, most countries emphasize GDP as the primarymeasure of product. That being said, GNI is making a comeback as a main indicator in recent times, whereglobalization and other current events are causing analysts to look more closely at the ownership of factors ofproduction.
GDP at market price or at basic price
2.23 GDP is valued at both basic price8 and at market price. Aggregates expressed at market prices are valued atthe prices actually paid by purchasers, meaning that they include all taxes less subsidies on products, such as:
6. Fixed capital consumption represents the reduction in the value of the fixed assets used in production during the accounting period,resulting from physical deterioration, normal obsolescence or normal accidental damage. See paragraph 10.27 of SNA 1993. Fixed capitalconsumption is the term recognized in international accounting. In Canada, the term capital consumption allowance or depreciation is alsoused.
7. The concept of residence in national accounting is identical to the concept described in the Balance of Payments Manual of theInternational Monetary Fund (IMF). It is explained in that manual and also in paragraphs 4.15 and 4.16 and Chapter XIV of System ofNational Accounts 1993.

Concepts and definitions
24 Statistics Canada - Catalogue no. 13-017 Guide to the Income and Expenditure Accounts
• the Goods and Services Tax (GST) and the Harmonized Sales Tax (HST);• sales taxes;• fuel taxes;• import duties and taxes;• excise taxes on tobacco and alcoholic beverages;• subsidies paid on agricultural products;• subsidies paid on transportation services and energy.
2.24 They also include taxes less subsidies on factors of production, such as:• property taxes;• capital taxes;• payroll taxes;• subsidies for job creation and training.
2.25 Estimates at basic prices are obtained by leaving out taxes less subsidies on products.
2.26 The two concepts meet different analytical needs. Valuation at market prices is better suited to analysing finaldemand, where the focus is more on the price that purchasers actually pay. Valuation at basic prices is bettersuited to analysing the content of the resources incorporated into different goods or services or resource allocation.It represents the sum of the incomes from the factors of production as measured by the cost of the labour andcapital factors, including net taxes on the factors of production, used in the production process. In economic terms,the concept of basic prices is considered the most useful concept for analysing the production and relativedistribution of primary resources between industries.
Alternative approaches to calculating aggregate GDP
2.27 Gross domestic product can be measured in three ways. The first and most intuitive method is called theproduction or value added approach. It consists of summing the gross value added of all industries (resident
sectors).9 For each industry, this involves subtracting intermediate consumption from the industry output. The GDP
at market price is obtained by adding taxes less subsidies10 on products to the sum total of value added. In oursimplified hypothetical example that follows, we assume that there is no government and therefore taxes do notexist.
2.28 The second method, the income approach, consists in summing all the factor incomes generated in theproduction process plus net taxes on products and on production. In our simplified example that follows, workersare compensated by wages and the owners of capital are compensated by profits.
2.29 The third approach, the final expenditure approach, consists of summing the expenditures of thosepurchasing final goods and services. In the example, this includes final consumption expenditures, and exportsminus imports, assuming no capital formation. Table 2.3 shows that the three approaches yield the same value forfinal output in the economy.
8. Canadian basic prices in the Input-Output Tables do not correspond exactly to international basic prices. In the Canadian System ofNational Accounts, the concept of modified basic prices is used. It refers to the price at the factory gate of the producing establishment,excluding sales and excise taxes collected after the final processing stage. The modified basic price of a product is equal to the pricereceivable from the purchaser minus any transport margins and trade margins at the time of delivery of the product to the purchaser andany taxes on products. In Canada, the modified basic price is the subsidized price on products, while in the System of National Accounts1993, it is the real price plus subsidies.
9. Resident units are grouped in homogenous sectors.10. The net taxes are added because they are not included in the values of the outputs and value added of resident producers.
Concepts and definitions
Statistics Canada - Catalogue no. 13-017 Guide to the Income and Expenditure Accounts 25
A hypothetical economy with no government and no capital
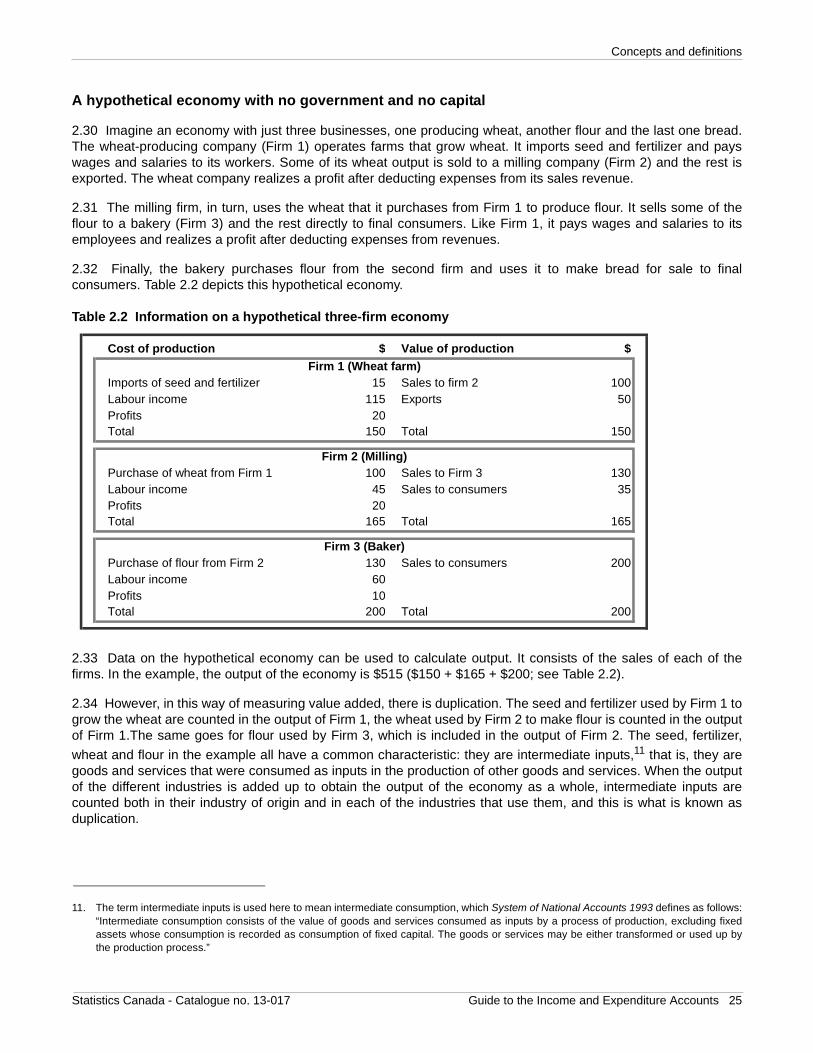
2.30 Imagine an economy with just three businesses, one producing wheat, another flour and the last one bread.The wheat-producing company (Firm 1) operates farms that grow wheat. It imports seed and fertilizer and payswages and salaries to its workers. Some of its wheat output is sold to a milling company (Firm 2) and the rest isexported. The wheat company realizes a profit after deducting expenses from its sales revenue.
2.31 The milling firm, in turn, uses the wheat that it purchases from Firm 1 to produce flour. It sells some of theflour to a bakery (Firm 3) and the rest directly to final consumers. Like Firm 1, it pays wages and salaries to itsemployees and realizes a profit after deducting expenses from revenues.
2.32 Finally, the bakery purchases flour from the second firm and uses it to make bread for sale to finalconsumers. Table 2.2 depicts this hypothetical economy.
Table 2.2 Information on a hypothetical three-firm economy
2.33 Data on the hypothetical economy can be used to calculate output. It consists of the sales of each of thefirms. In the example, the output of the economy is $515 ($150 + $165 + $200; see Table 2.2).
2.34 However, in this way of measuring value added, there is duplication. The seed and fertilizer used by Firm 1 togrow the wheat are counted in the output of Firm 1, the wheat used by Firm 2 to make flour is counted in the outputof Firm 1.The same goes for flour used by Firm 3, which is included in the output of Firm 2. The seed, fertilizer,
wheat and flour in the example all have a common characteristic: they are intermediate inputs,11 that is, they aregoods and services that were consumed as inputs in the production of other goods and services. When the outputof the different industries is added up to obtain the output of the economy as a whole, intermediate inputs arecounted both in their industry of origin and in each of the industries that use them, and this is what is known asduplication.
11. The term intermediate inputs is used here to mean intermediate consumption, which System of National Accounts 1993 defines as follows:“Intermediate consumption consists of the value of goods and services consumed as inputs by a process of production, excluding fixedassets whose consumption is recorded as consumption of fixed capital. The goods or services may be either transformed or used up bythe production process.”
Cost of production $ Value of production $
Imports of seed and fertilizer 15 Sales to firm 2 100Labour income 115 Exports 50Profits 20Total 150 Total 150
Purchase of wheat from Firm 1 100 Sales to Firm 3 130Labour income 45 Sales to consumers 35Profits 20Total 165 Total 165
Purchase of flour from Firm 2 130 Sales to consumers 200Labour income 60Profits 10Total 200 Total 200
Firm 3 (Baker)
Firm 1 (Wheat farm)
Firm 2 (Milling)

Concepts and definitions
26 Statistics Canada - Catalogue no. 13-017 Guide to the Income and Expenditure Accounts
2.35 Another feature of output is that it includes not only domestic output (that which is produced in Canada) butalso a portion of foreign output. In the example, seed and fertilizer are imported, and hence are produced abroad,but they are included as output and must be deducted to obtain domestic GDP.
2.36 Using the data on the hypothetical economy, we can calculate the value added of each firm. They are:• Firm 1: $150 - $15 = $135• Firm 2: $165 - $100 = $65• Firm 3: $200 - $130 = $70
2.37 Table 2.3 illustrates the three approaches to calculating GDP.
Table 2.3 Gross domestic product (GDP): three methods of calculation – example in a hypothetical economy
2.38 This simple example illustrates how Canada’s GDP is calculated. The sum of incomes(135 + 65 + 70 = 270) and sum of final expenditure (50 + 35 + 200 - 15 = 270) methods are both used in the IEAand they yield two essentially independent estimates of GDP. The sum of value added (135 + 65 + 70 = 270)used in the Input-Output Tables provides a third estimate of GDP.
Value oftotal output
Purchases fromother enterprises
and imports
Net value added of production
Value added approachdollars dollars
Firm 1 (50 + 100) = 150 15 (150 - 15) = 135Firm 2 (130 + 35) = 165 100 (165 - 100) = 65Firm 3 200 130 (200 - 130) = 70Total 515 245 (515 - 245) = 270
Income approachdollars
Firm 1 Labour income and profits (115 + 20) = 135Firm 2 Labour income and profits (45 + 20) = 65Firm 3 Labour income and profits (60 + 10) = 70Total income earned in current production 270
Final expenditure approachdollars
Firm 1 Exports 50Firm 2 Sales to consumers 35Firm 3 Sales to consumers 200Sub-total 285Less: Imports 15Total final sales from current production 270

Concepts and definitions
Statistics Canada - Catalogue no. 13-017 Guide to the Income and Expenditure Accounts 27
Institutional sectors dimension of the CSNA – The Income and Expenditure Accounts
2.39 Economists use the circular flow of income diagram as a tool to illustrate the interactions among the differenteconomic agents in the economy. One of the fundamental characteristics of such a representation of the economyis that it condenses information on markets and economic agents into an ordered framework.
2.40 The underlying idea of this representation is to group together economic agents (institutional units) that havesimilar behaviour and motivation. Households consume and supply the labour input. Companies sell the goods thatthey produce in order to make a profit. Governments provide public goods and attend to the redistribution ofincome within society. Non-residents sell goods and services to residents of the country and purchase goods andservices from them in order to benefit from the comparative advantages related to trade.
2.41 National accounting uses a similar approach. In the SNA, groups of economic agents are called institutionalsectors. The creation of institutional sectors in the compilation of national accounting statistics provides analystswith “ordered and usable” statistics for analysing the functioning of the economy and identifying relationshipsamong its various components.
2.42 The System of National Accounts 1993 (SNA 1993) defines an institutional unit as “an economic entity that iscapable, in its own right, of owning assets, incurring liabilities and engaging in economic activities and intransactions with other entities”. Institutional units may either be physical persons (or groups of persons) or legal orsocial entities. Households belong to the first class, while non-profit institutions (NPIs), governments andcorporations (businesses) belong to the second. The two classes are mutually exclusive, and institutional sectorsare mutually exclusive.
2.43 The Canadian System of National Accounts identifies three resident institutional sectors and a non-residentsector. The different accounts in the system are articulated for each of these four sectors. Each sector has sub-sectors.
The institutional sectors
2.44 The Income and Expenditure Accounts (IEA) presents a full sequence of accounts for the sectors shown inTable 2.4. As may be seen, there are minor difference in sectoring between the CSNA and the SNA 1993. InCanada, the household sector is more precisely called the persons and unincorporated business sector as itincludes non-profit institutions serving households (NPISHs).The financial corporation and non-financialcorporation sectors are called the corporate and government business enterprise sector. Lastly, the rest of theworld sector is called the non-resident sector.
2.45 In the CSNA, non-profit institutions serving households (NPISH) are included in the persons andunincorporated business sector. However, since 2004, Canadian statisticians in the Income and Expenditure
Accounts Division have set up a satellite account12 covering all non-profit institutions, whether they servehouseholds or they are classified in the government sector or in the corporate sector. This more comprehensiveapproach to the treatment of non-profit institutions is more desirable from an analytical standpoint, and indeed it isan approach that is being examined by international statistical organizations.
12. Satellite Account of Nonprofit Institutions and Volunteering, catalogue no. 13-015.

Concepts and definitions
28 Statistics Canada - Catalogue no. 13-017 Guide to the Income and Expenditure Accounts
Table 2.4 Sectors and sub-sectors in the Income and Expenditure Accounts
The persons and unincorporated business sector
2.46 This sector includes all persons or households as well as associations of individuals and certain collectiveinvestment schemes. Associations of individuals include not only non-profit institutions serving households, butalso selected components of fraternal organizations, credit unions and mutual life insurance companies. The sametreatment is accorded certain collective investment schemes, including non-mutual life insurance companies,trusteed pension plans and mutual funds. The sector also includes institutional units in the business sector that arenot legally incorporated. This group includes: independent business operators; unincorporated farmers; self-employed fishermen; self-employed professionals (consultants, notaries, etc.); and, unincorporated landlords,including owner-occupants as providers of housing services.
The corporate and government business enterprise sector
2.47 The corporate and government business enterprise sector covers institutional units that are legallyincorporated businesses or special funds, and includes government business enterprises. These corporationscover all institutional units producing goods and services sold at an economically significant price that are legallyincorporated, including: legally incorporated businesses selling non-financial goods and services (non-financialcorporations); and, legally incorporated businesses providing financial goods and services (financial institutions).The saving of certain types of financial institutions are partially accounted for in the personal sector (as indicated inparagraph 2.46), but their capital and financial accounts are included in the corporate sector.
2.48 Government business enterprises include non-financial and financial government business enterprises andagencies operating on a for-profit or cost-recovery basis whose motivation is similar to that of private businesses.Among the best known are the Bank of Canada, the Canada Post Corporation, the Canada Mortgage and HousingCorporation, the Export Development Corporation, the Canadian Wheat Board, the various port authorities, Hydro-Québec, the Caisse de dépôts et placements du Québec, and metropolitan transportation agencies.
Sector Sub-sector
Persons and unincorporated businesses
Corporations and government business enterprises
Corporations and government business enterprises: non-financial
Corporations and government business enterprises: financial
Government
Federal government1
Provincial governments1
Local governments1
Canada and Quebec pension plans2
Non-residents
__________________
1. For these sub-sectors the Income and Expenditure Accounts do not produce a Financial Account.
2. For this sub-sector, the Income and Expenditure Accounts do not produce either a Capital Account or a Financial Account.
Concepts and definitions
Statistics Canada - Catalogue no. 13-017 Guide to the Income and Expenditure Accounts 29
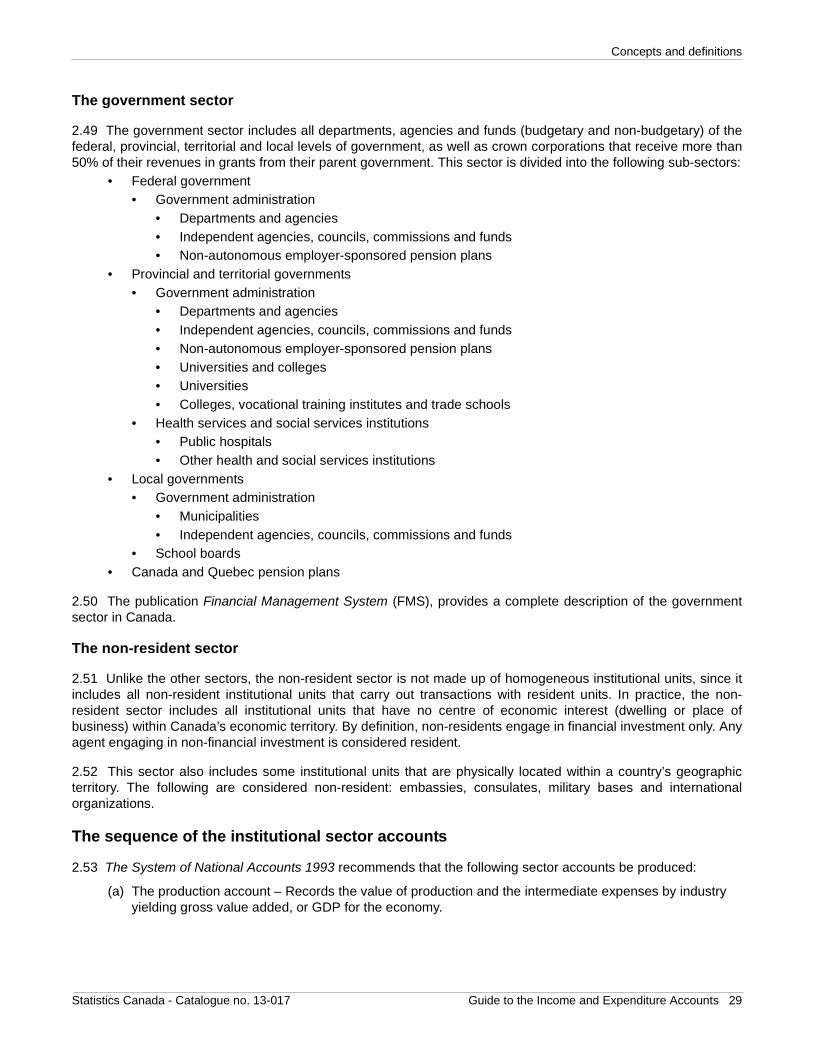
The government sector
2.49 The government sector includes all departments, agencies and funds (budgetary and non-budgetary) of thefederal, provincial, territorial and local levels of government, as well as crown corporations that receive more than50% of their revenues in grants from their parent government. This sector is divided into the following sub-sectors:
• Federal government• Government administration
• Departments and agencies• Independent agencies, councils, commissions and funds• Non-autonomous employer-sponsored pension plans
• Provincial and territorial governments• Government administration
• Departments and agencies• Independent agencies, councils, commissions and funds • Non-autonomous employer-sponsored pension plans • Universities and colleges• Universities• Colleges, vocational training institutes and trade schools
• Health services and social services institutions• Public hospitals• Other health and social services institutions
• Local governments• Government administration
• Municipalities• Independent agencies, councils, commissions and funds
• School boards• Canada and Quebec pension plans
2.50 The publication Financial Management System (FMS), provides a complete description of the governmentsector in Canada.
The non-resident sector
2.51 Unlike the other sectors, the non-resident sector is not made up of homogeneous institutional units, since itincludes all non-resident institutional units that carry out transactions with resident units. In practice, the non-resident sector includes all institutional units that have no centre of economic interest (dwelling or place ofbusiness) within Canada’s economic territory. By definition, non-residents engage in financial investment only. Anyagent engaging in non-financial investment is considered resident.
2.52 This sector also includes some institutional units that are physically located within a country’s geographicterritory. The following are considered non-resident: embassies, consulates, military bases and internationalorganizations.
The sequence of the institutional sector accounts
2.53 The System of National Accounts 1993 recommends that the following sector accounts be produced:
(a) The production account – Records the value of production and the intermediate expenses by industry yielding gross value added, or GDP for the economy.

Concepts and definitions
30 Statistics Canada - Catalogue no. 13-017 Guide to the Income and Expenditure Accounts
(b) The primary distribution of income account – Records the generation of income into its various income components: wages and salaries, supplementary labour income, net taxes on production, mixed income and operating surplus.
(c) The secondary distribution of income account – Records, in addition to the income from the allocation of primary income accounts, the transfers between the sectors.
(d) The use of income account – Focuses on how resident institutional sectors allocate their disposable income between current expenditure and saving.
(e) The capital account – Comprises the second accumulation account that focuses on non-financial assets.
(f) The financial account – Comprises the second accumulation account that focuses on financial transactions.
(g) Other changes in assets account – Comprises the third accumulation account that articulates capital gains and losses and other volume changes e.g., resource discoveries, destruction of assets due to catastrophic events.
(h) The balance sheet account – Is the wealth statement, detailing assets, liabilities and net worth.
2.54 The CSNA-IEA provides a slightly modified version of the international standard, as follows:
(a) The gross domestic product account. The Income and Expenditure Accounts does not produce a production account by sector or by industry (GDP by industry is available from the Input-Output Tables). At an aggregate level for the economy (without sectoring), the Income and Expenditure Accounts presents GDP by types of income and by types of expenditure. The income details correspond to the primary distribution of income account (see Table 2.5).
(b) The income and outlay account of each of the sectors traces current incomes and outlays related to the production process and current transfers between sectors. The difference between incomes and outlays constitutes the saving of the sector. This item balances the account. This account combines allocation of income account and secondary distribution of income account, as well as use of income account. It is produced for the four main institutional sectors described in Table 2.4.
(c) The capital account of each sector traces, on the one hand, the resources available for acquiring non- financial capital (saving, capital consumption allowance and net transfers of capital) and on the other hand, the acquisition of non-financial capital. This account is produced for five sectors where corporations are disaggregated into financial and non-financial corporations. The gap between resources and acquisitions is called the net lending of the sector. This item balances the account.
(d) The financial account of each of the sectors traces both the transactions on financial assets and the transactions on financial liabilities taking place during a given period. This account is recorded for the
five sectors of the economy in the National Income and Expenditure Accounts.13 In addition, financial accounts are published for 35 detailed sub-sectors in the Financial Flow Accounts. The balance between financial asset and liability flows consists of the net financial investment of the sector. In theory, net financial investment from this account and net lending from the capital account are equal, with each measuring a different side of the same coin. In practice, statistical imperfections generate a gap between the two measures.
2.55 The balance sheet reflects the result of accumulation of wealth in the economy, by recording the assets,liabilities and net worth of the sectors. As such, it is inclusive of the other changes in assets. It is published as theNational Balance Sheet Accounts, at both the 5 sector and 35 sector level.
13. In fact, the National Income and Expenditure Accounts presents a combined Capital and Financial Account.

Concepts and definitions
Statistics Canada - Catalogue no. 13-017 Guide to the Income and Expenditure Accounts 31
Table 2.5 Structure of the Income and Expenditure Accounts
Gross domestic product measured by income and expenditure
2.56 The first two tables in the Income and Expenditure Accounts present GDP calculated using the income andthe expenditure approaches. The balancing item between the two measures of GDP is the statistical discrepancy.
Statistical discrepancy
2.57 In principle, when GDP is calculated using the income approach, and again using the expenditure approach,the two totals should be the same. In practice, this is never so because of the different sources of informationunderlying both approaches. This, in turn, gives rise to measurement errors. The difference between the two
Persons and unincorporated businesses
Corporations and government business enterprises
Governments Non-residents
Table 5 Tables 6,7,8 Tables 9, 10, 11, 12, 13 Table 14
Persons and unincorporated businesses
Corporations and government business enterprises
Governments Non-residents
Table 5 Tables 6,7,8 Tables 9, 10, 11, 12, 13 Table 14
Persons and unincorporated businesses
Corporations and government business enterprises
Governments Non-residents
Table 5 Tables 6,7,8 Table 9 Table 14
_________________
Measures of gross domestic product (GDP)Table 1 Income-based GDP
Table 2 Expenditure-based GDP
Note: This corresponds to table numbers as they appear in the National Income and Expenditure Accounts , Catalogue no. 13-001.
Income and outlay account Income and outlay account Income and outlay account Income and outlay account
Capital account Capital account Capital account Capital account
Financial account Financial account Financial account Financial account

Concepts and definitions
32 Statistics Canada - Catalogue no. 13-017 Guide to the Income and Expenditure Accounts
methods of measuring GDP is divided in two, with one half subtracted from the highest estimate and one halfadded to the lowest estimate. This amount is shown in tables 1 and 2 of the publication National Income andExpenditure Accounts under the name of statistical discrepancy.
2.58 A small statistical discrepancy is a desired result, since it implies that the two estimates of GDP derivedindependently, have turned out almost the same.
Income-based GDP aggregates
2.59 GDP measured by the income approach is shown in Table 1 of National Income and Expenditure Accounts.The methods of estimating income categories are described in detail in the following chapters. The paragraphsbelow provide a brief description of these aggregates.
2.60 The first category is wages, salaries and supplementary labour income. Wages and salaries are the totalcompensation, in cash or in kind, paid to workers for work performed. This item is entered before any deduction forincome tax, pensions, employment insurance or other social insurance plans. Wages and salaries also includecommissions, tips, performance premiums, directors’ fees, and vacation and sick leave allowances, as well asmilitary pay and allowances. Supplementary labour income includes employers’ social contributions. The followingare examples of supplementary labour income: retiring allowances, employment insurance contributions, andcontributions to the Canada and Quebec pension plans, contributions to other pension plans, occupational healthand safety funds, health insurance, dental care plans, etc. Wages, salaries and supplementary labour income ispresented in tables 1 and 5 of National Income and Expenditure Accounts. Monthly estimates, by province and byindustry, are also available in Estimates of Labour Income.
2.61 Corporation profits before taxes and government business enterprise profits before taxes represent net
earnings resulting from the economic activity of private and select14 public corporations, respectively. Net earningsare measured after deduction of capital consumption allowances. Corporation profits before taxes and governmentbusiness enterprise profits before taxes are analyzed in tables 1 and 6 of National Income and ExpenditureAccounts. Table 32 of the same publication reconciles corporation profits before taxes with undistributedcorporation profits.
2.62 Interest and miscellaneous investment income comprise the interest paid by businesses to households15,
governments and non-residents to compensate them for the loan or rental of financial or non-financial assets16 foruse in production. Information on interest and miscellaneous investment income is presented in Table 1 and inmore sector detail in tables 5, 6, 9, 10, 11, 12, 13 and 14 of National Income and Expenditure Accounts. Appendix2B explains the link between the aggregate and its distribution in the incomes and outlays of the institutionalsectors.
2.63 Accrued net income received by farm operators from farm production refers to the net farm proceeds that goto unincorporated farm operators. The estimate is obtained by deducting expenditures from receipts. Receiptsinclude gross sales of farm products, the imputed value of farm output consumed by farming households,investment in farm inventories and the distributed and undistributed portions of earnings arising out of theoperations of the Canadian Wheat Board. Expenditures include farm operating expenditures and capitalconsumption allowances. Accrued net income received by farm operators from farm production is presented intables 1 and 5 of National Income and Expenditure Accounts.
2.64 Net income of non-farm unincorporated business, including rent, consists of the earnings of unincorporatedproprietors, except farm operators, from their own business. It also includes the net income of independentmembers of professions, such as physicians, dentists, lawyers and engineers. Lastly, it includes the net rentalincome of persons (but not corporations). This includes rents paid or imputed, after deduction of expenses, on
14. This covers public corporations not consolidated within the government sector, which are referred to as government business enterprises.15. This includes collective investment schemes.16. Land is included in non-financial assets.

Concepts and definitions
Statistics Canada - Catalogue no. 13-017 Guide to the Income and Expenditure Accounts 33
residential properties and net rents paid on non-residential properties. Imputation for rents is explained by the factthat in national accounting, owner-occupants are considered as producers of housing services who rent a dwellingto themselves (more fully discussed in Chapter 5). Net income of non-farm unincorporated business, includingrent, is presented in tables 1 and 5 of National Income and Expenditure Accounts.
2.65 The inventory valuation adjustment represents the net holding gain or loss incurred by businesses as a resultof price changes. This is an adjustment to profits, since gains or losses on inventories are included in thecorporation profits before taxes. This gain (or loss) must be removed in order to measure current output. Theinventory valuation adjustment is available in tables 1 and 6 of National Income and Expenditure Accounts.
2.66 Taxes less subsidies, on factors of production refer to taxes received and subsidies paid by government.These taxes and subsidies are payable or paid regardless of the quantity or value of the goods and servicesproduced or sold. Capital taxes, licences and permits, property taxes and payroll taxes are examples of taxesincluded in this aggregate. Information on taxes less subsidies, on factors of production is presented in tables 1and 9 to 12 of National Income and Expenditure Accounts.
2.67 Taxes less subsidies on products, refer to taxes received and subsidies paid by government. These taxes andsubsidies are payable or paid, based on the quantity or value of goods and services produced or sold. Thisaggregate includes sales taxes, fuel taxes, import duties and taxes, and excise taxes on tobacco and alcoholicproducts. Taxes less subsidies, on products, is presented in tables 1 and 9 to 12 of National Income andExpenditure Accounts.
2.68 Capital consumption allowances are allowances for the using up of buildings, machinery and equipment andother assets in the productive process. This item also includes miscellaneous valuation adjustments bringingbusiness accounting records into conformity with national accounting definitions. Capital consumption allowancesis presented in tables 1 and 5 to 12 of National Income and Expenditure Accounts.
Expenditure-based GDP aggregates
2.69 GDP measured on the basis of final expenditures in current dollars is shown in Table 2 of National Incomeand Expenditure Accounts. Volume-based estimates for the same components appear in Table 3. The methods ofestimating expenditure aggregates are described in later chapters. The following paragraphs provide a briefdescription of these aggregates.
2.70 Personal expenditure on consumer goods and services measure household expenditures on durable, semi-durable and non-durable goods as well as services. The aggregate also includes the operating expenses of non-profit organizations serving households. Personal expenditure on consumer goods and services is presented at ahighly aggregated level in tables 2, 3, 4 and 5 of National Income and Expenditure Accounts. Tables 16, 17 and 18show the aggregate in more detail.
2.71 Government current expenditure on goods and services includes current expenditure on goods and services(including military spending for strictly military purposes), compensation paid to government employees, and otherpurchases of goods and services, except capital goods. The aggregate also includes an imputation for capitalconsumption allowances. This aggregate is presented net of sales to avoid duplication. Government currentexpenditure on goods and services is presented at a highly aggregated level in tables 2, 3 and 4 of NationalIncome and Expenditure Accounts. Detailed data also appears on a gross basis in tables 9, 10, 11 and 12, theinstitutional sector accounts.
2.72 Government and business gross fixed capital formation includes the expenditures of the business andgovernment sectors on goods with an expected economic life of one year or more, and on buildings andengineering construction of any kind. This item also includes residential construction, alterations andimprovements made to the building stock and transfer costs associated with the sale of existing assets.Government and business gross fixed capital formation is presented at a highly aggregated level in tables 2, 3 and4 of National Income and Expenditure Accounts. Tables 19 to 24 of the same publication provide more detail onthese aggregates. The data also appears in tables 5 to 13 of the institutional sector accounts.

Concepts and definitions
34 Statistics Canada - Catalogue no. 13-017 Guide to the Income and Expenditure Accounts
2.73 Business and government investment in inventories refers to the change in the volume of the inventories ofthe business sector and the government sector, valued at average market prices for the period. This itemrepresents the difference between demand and supply. A decrease in this aggregate indicates that part of thecurrent demand has been met by supply from a previous period. Conversely, an increase in this item indicates thatthe current supply was greater than the current demand. Business and government investment in inventories ispresented at a highly aggregated level in tables 2, 3 and 4 of the publication National Income and ExpenditureAccounts. Tables 28 and 29 present more detail on business investment in inventories. The data also appears intables 5 to 10, the institutional sector accounts.
2.74 Exports of goods and services include current receipts arising from exports of goods and services. The travelexpenditures of non-residents in Canada are included in exports of services. In turn, imports of goods and servicesinclude current payments arising out of imports of goods and services. Canadians’ travel expenditures abroad areincluded in imports of services. Imports are subtracted in computing GDP, because the goal is to measuredomestic output. Imports and exports are available at a highly aggregated level in tables 2, 3 and 4 of thepublication National Income and Expenditure Accounts. Tables 25 to 27 present more detail on exports and importsof goods and services. The data also appears in Table 14 of the institutional sector accounts.
2.75 For provincial and territorial estimates, international exports are distinguished from interprovincial exports. Aswith exports, the provincial and territorial estimates distinguish between international imports and interprovincialimports. Estimates of interprovincial trade appear only in the publication Provincial Economic Accounts.
The income and outlay account
2.76 These accounts are a statistical summary of the current income and outlays of each sector. The incomes andoutlays of each institutional sector are of two types: they arise either from productive activity or from currenttransfers. Income from productive activity can in turn be classified into factor incomes and property incomes.Incomes and outlays arising from productive activity are tied to the expenditure and income-based measures ofGDP. The other type of incomes and outlays consists of inter-sector transfers. These are unrequited transactions,that is, transactions involving a unilateral transfer with no compensation. In this category, for example, are incometax paid by individuals to government or employment insurance benefits paid by government to unemployedworkers. The structure of the income and outlay account is the same for each of the four institutional sectors(illustrated in Table 2.6).
Table 2.6 Logical structure of the income and outlay accounts of the institutional sectors
Income Xr = Yr + Zr Xd = Yd + Zd Outlay
Revenues Yr Yd Expenditures
Current transfers Zr Zd Current transfers
Saving (income - outlay) E = Xr - Xd
Element(s) from income-based GDP
Income from other institutional sectors not requiring compensation
Elements(s) from expenditure-based GDP
Payments to other institutional sectors without compensation

Concepts and definitions
Statistics Canada - Catalogue no. 13-017 Guide to the Income and Expenditure Accounts 35
2.77 The difference between current incomes and outlays represents the saving of each of the institutionalsectors. This balance is carried down to the capital account of each of the sectors as a source of funding for grossfixed capital formation.
The income and outlay account for persons and unincorporated businesses
2.78 Table 2.7 shows the income and outlay account of the persons and unincorporated business sector.Production-related aggregates link to the income-based and expenditure-based GDP tables. Interest, dividendsand miscellaneous investment income is not found directly in the GDP measure. Thus, to reconcile this item withthe interest and miscellaneous investment income aggregate of income-based GDP, information must be drawnfrom all sectors (see Appendix 2B).
2.79 Transfer income is described in the paragraphs below. Descriptions of transfer payments are provided in thesections dealing with the other institutional sectors.
Table 2.7 Income and outlay account – Persons and unincorporated businesses, 2000
2.80 Income from government includes income redistributed by the federal government, the provincial andterritorial governments, local governments and the Canada and Quebec pension plans.
2.81 Transfers from the federal government to persons and unincorporated businesses include the following:
840,382 810,463 Outlay726,067 596,009 Expenditures
Unincorporated business net income 66,187
Farm production 1,243
114,315 214,454 Current transfers
From government 110,487 200,815 To government
Employment insurance benefits 9,615 143,951 Income taxes
Social security and other benefits 100,872 49,748 Contributions to social insurance
From corporations 1,467 7,116 Other current transfers
From non-residents 2,361 11,732 To corporations
1,907 To non-residents
29,919
Revenues
545,204 596,009 Personal expenditure on consumer goods and services
millions of dollars
Source: National Income and Expenditure Acccounts, Catalogue no. 13-001, tables 1 and 5.
Wages, salaries and supplementary labour income
Other unincorporated businesses, including rent
Interest, dividends and miscellaneous investment receipts
114,676
Current transfers
Income
64,944
Saving (income - outlay)

Concepts and definitions
36 Statistics Canada - Catalogue no. 13-017 Guide to the Income and Expenditure Accounts
• family and youth allowances;• child tax benefit;• child tax credit;• employment insurance benefits;• payments from the Old Age Security Fund;• grants to aboriginal people and their organizations;• goods and services tax credit;• pensions, World Wars I and II;• veterans’ allowances;• national associations;• Canada Council for the Arts;• adult vocational training;• scholarships and research grants; and• miscellaneous other transfer payments to persons, such as athletes and athletic associations,
community organizations and arts and culture organizations.
2.82 Transfers from provincial and territorial governments to persons and unincorporated businesses include thefollowing:
• social assistance–income maintenance;• social assistance–other;• workers’ compensation benefits;• payments to non-profit organizations; and• other transfers to persons.
2.83 Transfers from local governments to persons and unincorporated businesses include the following: • social assistance;• payments to non-profit organizations; and • other current transfers to persons.
2.84 Transfers from corporations and government business enterprises include the following:• charitable gifts; • miscellaneous other contributions; and• write-off of bad debts.
2.85 Lastly, transfers from non-residents include: • retirement benefits paid by foreign governments to residents of Canada;• institutional payments for assistance, research or other (wartime compensation payments, other
transfers from non-residents to residents of Canada, etc.); and• other transfers from non-residents to Canadian residents, such as personal gifts.
2.86 Transfers to other sectors are dominated by income tax and social contributions and appear in the sectionsthat follow (refer to 2.94, 2.96 to 2.98).
The income and outlay account for corporations and government business enterprises
2.87 Table 2.8 shows the income and outlay account for the corporations and government business enterprisesector. Production-related aggregates link to the income-based and expenditure-based GDP tables. Interest,dividends and direct receipts and interest on public debt are not found directly in the GDP measure. Thus, toreconcile these items with the interest and miscellaneous investment income aggregate of GDP by incomeapproach, information must be drawn from all sectors (see Appendix 2B).

Concepts and definitions
Statistics Canada - Catalogue no. 13-017 Guide to the Income and Expenditure Accounts 37
2.88 In income from current transfers, there is only one item: interest on consumer debt. This is the non-productive portion of interest paid by persons on account of liabilities incurred to finance personal expenditure onconsumer goods and services. It is considered that part of the interest on the consumer debt is the cost ofrendering service to borrowers, while the other part (the non-productive portion) is merely a transfer betweensectors. The transfer portion is income for the corporate and government business enterprise sector andexpenditure for the persons and unincorporated businesses sector. The productive portion is found in personal
expenditure on consumer services.17
2.89 The descriptions of transfer expenditures appear in the sections dealing with the other institutional sectors(refer to paragraphs 2.84, 2.92 and 2.98).
Table 2.8 Income and outlay account – Corporations and government business enterprises, 2000
17. The productive portion is found in the personal expenditure series: financial intermediaries, implicit loan charges and credit unions, implicitloan charges.
292,675 240,459 Outlay280,943 190,502 Expenditures
Inventory valuation adjustment -2,439
Interest on public debt 62,494
11,732 49,957 Current transfers
Interest on consumer debt 11,732 48,175 Direct taxes
1,782 Other current transfers
1,467 To persons
315 To non-residents
52,216
Undistributed corporation profits 49,996
Inventory valuation adjustment -2,439
135,978 Corporation profits before taxes
11,329
millions of dollars
Income Revenues
Interest, dividends and miscellaneous payments
Source: National Income and Expenditure Acccounts, Catalogue no. 13-001, tables 1 and 6.
Government business enterprises profits before taxes
Interest, dividends and miscellaneous receipts
Unremitted profits of government business enterprises
Current transfers
Saving (income - outlay)
190,502
73,581
4,659

Concepts and definitions
38 Statistics Canada - Catalogue no. 13-017 Guide to the Income and Expenditure Accounts
The income and outlay account for governments
2.90 Table 2.9 shows the income and outlay account of the government sector. The production-related aggregateslink to the income-based and expenditure-based GDP tables. In this category, interest, dividends and directreceipts and interest on public debt are not found directly in the GDP measure. Thus, to reconcile them with theincome-based GDP aggregate interest and miscellaneous investment income, information must be drawn from allsectors (see Appendix 2B). Current government expenditure on goods and services is obtained by calculating thedifference between current expenditure on goods and services (gross) and the proceeds of sales of goods andservices by governments. Similarly, the sum of the aggregates taxes less subsidies, on factors of production andon products, is obtained by differentiating taxes on production and products from current transfers to business(subsidies).
2.91 Because of the role played by government in income distribution, transfers occupy an important place ingovernment income and outlay accounts. Transfers that appear on the outlay side are dealt with in the section onpersons and unincorporated businesses (refer to 2.81, 2.82, 2.83,) and the section on non-residents (refer to 2.95).
2.92 Taxes on income from persons include income taxes and wealth transfer taxes that are paid to the federaland provincial governments. Taxes on incomes from corporations include direct taxes from corporations andgovernment business enterprises paid to the federal government and provincial governments. Added to this areprovincial taxes on mining and forestry. Lastly, taxes on incomes from non-residents are entirely allocated to thefederal government.
Table 2.9 Income and outlay account – Government, 2000
2.93 Contributions to social insurance plans include: • contributions of employers and employees to employment insurance (federal government);• contributions of employers to workers’ compensation funds (provincial governments);
468,669 433,904 OutlayRevenues 215,924 320,647 Expenditures
Taxes on production and imports 138,998 10,658 Current transfers to business (subsidies)
Investment income 43,512 76,491 Interest on public debt
Current transfers 252,745 113,257 Current transfers
Taxes on income 195,881 110,487 To persons
From persons 143,951 2,770 To non-residents
From non-residents 3,755
Contributions to social insurance plans 49,748
Other current transfers from persons 7,116
34,765
From corporations and government business enterprises
Gross current expenditures on goods and services
Source: National Income and Expenditure Acccounts, Catalogue no. 13-001, Table 9.
millions of dollars
Income
233,49833,414 Sales of goods and services
Saving (income - outlay)
48,175

Concepts and definitions
Statistics Canada - Catalogue no. 13-017 Guide to the Income and Expenditure Accounts 39
• employer and employee contributions to industrial employees' vacations (provincial governments); and • contributions of employers and employees to the Canada and Quebec pension plans.
2.94 Other current transfers from persons include various transfers to the federal government and localgovernments. These transfers are larger for provincial governments. They include motor vehicle licences anddriver’s licences as well as health insurance premiums and other miscellaneous transfers.
The income and outlay account for non-residents
2.95 Table 2.10 shows the income and outlay account for the non-resident sector. Production-related aggregateslink to the income-based and expenditure-based GDP tables. In this category, interest, dividends and directreceipts is not found directly in the GDP measure. Thus, to reconcile these items with the interest andmiscellaneous investment income aggregate of income-based GDP, information must be drawn from all sectors(see Appendix 2B).
2.96 Current transfers from persons include payments by Canadian residents (in particular by religious orcharitable organizations) to non-residents and withholding tax paid abroad.
2.97 Current transfers from government include official contributions from Canada to non-residents and pensionspaid abroad.
Table 2.10 Income and outlay account – Non-residents, 2000
2.98 Current transfers from businesses include pensions paid by businesses abroad.
Saving: the balancing item in the current accounts
2.99 In the income and outlay account of the institutional sectors, saving is the share of income generated duringthe current period which is not spent in the current period, but which becomes available in subsequent periods’consumption. Saving is a source of funds for investment in the current period. As such, saving is carried down as aresource to the capital account of the institutional sectors.
490,921 525,947 Outlay
Revenues 485,929 519,831 Expenditures
Sales of goods (imports) 362,337 429,375 Purchases of goods (exports)
Sales of services (imports) 66,417 61,313 Purchases of services (exports)
Current transfers 4,992 6,116 Current transfers
From persons 1,907 2,361 To persons
From corporations 315 3,755 To governments
From governments 2,770
Saving (income - outlay) -35,026
Source: National Income and Expenditure Acccounts, Catalogue no. 13-001, tables 5, 9, 14 and 32.
Interest, dividends and miscellaneous receipts
Interest, dividends and miscellaneous payments
millions of dollars
Income
29,14357,175

Concepts and definitions
40 Statistics Canada - Catalogue no. 13-017 Guide to the Income and Expenditure Accounts
The capital account
2.100 There is a capital account for each institutional sector and sub-sector. This account presents resources andthe uses to which they are put. The resources are gross saving and capital transfers. The uses consist ofacquisitions of non-financial capital. Net lending (or borrowing) is the balancing item for this account. It records thedifference between sources of funds internal to a sector and expenditures on non-financial capital. A positivedifference is lent to other institutional sectors via financial transactions. Conversely, a negative difference indicatesthat the sector must borrow funds from other sectors through financial transactions.
2.101 For the economy as a whole (the sum of all institutional sectors), gross saving and capital transfers is equalto acquisitions of non-financial capital. Net lending for the economy as a whole is therefore zero.
Gross saving and capital transfers
2.102 The gross saving and capital transfers aggregate includes all resources available for the acquisition of non-financial assets. It includes, firstly, the saving made available by each sector—that is, the share of incomegenerated during the current period which is not spent in the current period. Saving is derived from the precedingIEA account, namely the income and outlay accounts of each of the different institutional sectors. Added to thisitem are capital consumption allowances (CCA). The latter are a cost reflecting the reduction in the value of fixedassets used up in production during the period (i.e., depreciation). Even so, they constitute available resources,since in practice, CCA is merely an accounting entry. CCA also includes miscellaneous valuation adjustments, ofwhich the most significant is the claim portion of business and residential insurance. And lastly, net capital transfersare also considered to be available resources.
2.103 Capital transfers consist of either a transfer of funds from one unit to another (cash transfer for the purposesof acquiring an asset); or, a transfer of ownership of a good or non-cash asset, the cancellation of a liability bymutual agreement, or the provision of a service without a counter part transaction. In all cases, this amounts to atransfer of wealth from one sector to another. Net capital transfers between the non-resident sector and thepersons and unincorporated business sector consist mainly of net amounts paid or received abroad on migrants’estates and capital. Other capital transfers could be a gift of land to developers as an incentive to create a businessor undertake construction, or debt forgiveness of parent governments towards their government businessenterprises.
Non-financial capital acquisition
2.104 Acquisitions of non-financial capital may take three forms: acquisition of fixed capital; investment ininventory; and, acquisition of existing assets. Acquisition of fixed capital corresponds to new gross fixed capitalformation in the GDP by expenditure tables and are included in final domestic demand. Investment in inventoryalso appears in the tables on expenditure-based GDP. These two components were defined in the section onmeasuring GDP (refer to 2.72, 2.73).
2.105 In order to fully reflect the acquisition of fixed capital by any institutional sector, expenditures on both newand existing capital as well as on both produced and non-produced assets in a period must be taken into account.Net acquisition of existing assets corresponds to purchases and sales among institutional sectors of existingresidential and non-residential structures, machinery and equipment and/or land. Expenditures on existing capitalassets or land are not included in that period’s macro-economic activity, or GDP.
2.106 The acquisition of non-financial capital applies only to domestic institutional sectors. By definition, the non-resident sector makes only financial investments, since non-residents do not have a centre of economic interestwithin the country’s economic territory.

Concepts and definitions
Statistics Canada - Catalogue no. 13-017 Guide to the Income and Expenditure Accounts 41
The financial account (the financing of economic activity)
2.107 The sector accounts of the National Income and Expenditure Accounts extend the capital account with apicture of financial activity, thus producing a capital and financial account for each sector–a sources and uses offunds statement. These two accounts, sometimes referred to as accumulation accounts, comprise the transaction-driven changes to sector net worth. This section describes the financial account.
2.108 The two measures of GDP, as well as the underlying detail in both the income and outlay account and thecapital account of the institutional sectors, describe economic activity in terms of transactions on goods andservices. It is also possible to track the economy by observing the financial transactions associated with economicactivity. The financial account of the institutional sectors provides this perspective.
2.109 From a financial standpoint, the difference between transactions in financial assets and liabilities for anysector is the amount that sector puts at the disposal of other institutional sectors (lending) or the amount that itrequires from other institutional sectors (borrowing). This is the same concept as the net lending-borrowingdescribed with respect to the capital account, but in this case it is applied to the financial aspect of the economy. Todistinguish it from net lending, this balancing item in the financial account is referred to as net financial investment.
2.110 The financial account of the different institutional sectors are a condensed version of the Financial FlowAccounts, which record the financial transactions of the economy (in conjunction with capital transactions) in greatasset-liability and sector detail. The information on this account and on the resulting wealth positions can be foundin the publication Guide to the Financial Flow and Balance Sheet Accounts. The paragraphs that follow provide abrief description of asset and liability categories in the financial account.
Types of transactions on financial assets and liabilities
2.111 The financial accounts of the institutional sectors, presented in tables 5, 6, 7, 8, 9 and 14 and SupplementaryTable 1 of the publication National Income and Expenditure Accounts include several categories of financial assets
and liabilities. These items are briefly described in the following paragraphs.18
2.112 Official reserves cover a number of different components. Official holdings of gold and foreign exchange,includes gold, U.S. dollar, sterling and other foreign convertible currency denominated deposits and securities heldas assets by the monetary authorities. The International Monetary Fund (IMF) general account, encompassesloans by Canada to the IMF. Special drawing rights (SDRs) include both the allocation of new SDRs and themovement of existing rights between Canada and the rest of the world.
2.113 Currency and deposits includes three main sub-components: Canadian currency and deposits in charteredbanks, deposits in other institutions and foreign currency and deposits. Checking and saving accounts of differenttypes and terms are included in deposits.
2.114 Consumer credit includes personal loans, for the purposes of acquiring consumer goods and services,made by chartered banks and near-banks. Also included are policy loans advanced by life insurance companies,as well as loans to persons advanced by sales finance and consumer loan companies. Loans for other purposescover bank and other loans and include negotiated loans, advances and overdrafts booked in Canada by Canadianchartered banks and other lending institutions. Mortgage loans include loans and agreements of sale secured byreal property, mostly residential buildings.
2.115 Life insurance and pensions is a broad category that covers the liability of life insurance companies to itspolicy-holders as well as the liabilities of employer-sponsored pension schemes towards members of the plan.
18. The following definitions are a condensed version of those that appear in the Guide to the Financial Flow and National Balance SheetAccounts – Definitions, Concepts, Sources, Methods, catalogue no. 13-585.

Concepts and definitions
42 Statistics Canada - Catalogue no. 13-017 Guide to the Income and Expenditure Accounts
2.116 Debt instruments comprise short-term paper and bonds. Bonds cover federal, provincial and municipalbonds, as well as corporate bonds and debentures (including guaranteed bonds of government businessenterprises), and other bonds (e.g., non-profit institutions) as well as asset-backed securities. Bonds are typicallymarketable, with an original term to maturity in excess of one year. Money market instruments include federalshort-term paper and other marketable short-term notes issued by a variety of financial and non-financialcorporations and sectors. Short-term paper can be described as negotiable bearer promissory notes with anoriginal term to maturity of less than one year, issued at a discount without coupons.
2.117 Shares include marketable and non-marketable common and preferred shares, plus investment fund units.Foreign investments are defined as all marketable financial instruments that are liabilities of non-resident entities.
2.118 Trade accounts (payables/receivables) include short-term credit granted or received in the ordinary courseof business by suppliers or purchasers of goods and services. Other financial assets/liabilities comprise a variety ofitems not included in the other components of financial flows.
The Balance Sheet Account (the result of economic activity and gains/losses)
2.119 The opening and closing positions in the CSNA sequence of accounts are articulated (by institutional sectorand for the economy as a whole) in the National Balance Sheet Account (NBSA). The NBSA is the final componentof the CSNA sequence of accounts. Unlike the accounts described previously, which measure the flow of activitiesover a given period, the balance sheet account measures the impact of those activities on the stock of assets andliabilities and net worth at the end of a given period. It provides a snapshot of the state of the nation’s economic-financial position. The balance sheet account evolves as the result of capital and financial transactions on the onehand, and capital gains/losses on assets-liabilities on the other.
2.120 In the balance sheet account, sector estimates of net worth are calculated as the value of financial and non-financial assets minus liabilities. The NBSA also provides an important aggregate: the nation’s wealth, or nationalnet worth. National wealth is the sum of the nation’s non-financial assets (both produced and non-produced).National net worth is equal to national wealth adjusted for the nation’s net international investment position (if oneexists), alternatively, national net worth can be derived as the sum of resident sector net worth.
2.121 The NBSA has the same overall structure and sector detail as the Financial Flow Accounts.
Other aspects of the Income and Expenditure Accounts data
Measures of volume and prices in the Income and Expenditure Accounts
2.122 Growth in the current dollar gross domestic product (GDP) or any other nominal value aggregate can bedecomposed into two elements: a price element, or the part of the growth linked to inflation, and a volume element,which covers the change in quantities and quality of the aggregate. The volume element is presented in theSystem of National Accounts by what is referred to as the real economic activity series (such as the real GDP).Real GDP is the key economic indicator, on the trend-cycle growth pattern of the economy. Calculating real GDPand its expenditure components is, therefore, an important undertaking.
2.123 The volume element is measured to a very large extent by deflating the nominal value of a given series by
an appropriate price index.19 This is referred to as the deflation method.
2.124 Within the Canadian System of National Accounts the deflation of a series (such as exports of machineryand equipment) occurs at the lowest possible level for which a representative price index can be found. Thedeflated series can then be aggregated together to derive various totals. For example, 435 series are deflated andthen aggregated together in order to calculate real quarterly GDP.
19. Exceptions to the deflation approach in the estimation of volume measures will be noted where relevant in the chapters dealing withexpenditure side GDP components (refer also to 2.140).

Concepts and definitions
Statistics Canada - Catalogue no. 13-017 Guide to the Income and Expenditure Accounts 43
2.125 There are several ways to aggregate deflated series in order to calculate the volume aggregate. Indexnumber theory offers a wide range of tools to this end. Since the spring of 2001, the Canadian System of NationalAccounts (CSNA) has adopted the chain Fisher index. This measure is theoretically superior to the formerfixed-base Laspeyres measure and also makes the Canadian data comparable with the U.S. official measure ofreal economic activity. Furthermore, it offers compliance with the recommendations of the System of NationalAccounts 1993 (SNA 1993).
2.126 The following paragraphs provide a simplified explanation of the methods used by the CSNA to measure thecountry’s real economic activity.
2.127 The level of detail—that is, the number of components used in each of the aggregates—is determined bythe availability of data and by certain determinants of overall quality (such as the stability of seasonality). At thenational level, 435 series in current dollars and the same number of corresponding price series, are used tocalculate real GDP using the chain Fisher index. Table 2.11 shows how these series are distributed between thevarious aggregates presented in Table 3 of the publication National Income and Expenditure Accounts.
Table 2.11 Level of detail at the national level
number of series
Personal expenditure on consumer goods and services 130
Durable goods 22
Semi-durable goods 15
Non-durable goods 14
Services 79
Government current expenditure on goods and services 24
Government gross fixed capital formation 14
Government investment in inventory 1
Business gross fixed capital formation 18
Residential structures 4
Non-residential structures and equipment 14
Non-residential structures 4
Machinery and equipment 10
Business investment in inventory 110
Non-farm 76
Farm 34
Exports of goods and services 69
Goods 64
Services 5
Imports of goods and services 68
Goods 63
Services 5
Statistical discrepancy 1
Gross domestic product at market prices 435
Final domestic demand 186

Concepts and definitions
44 Statistics Canada - Catalogue no. 13-017 Guide to the Income and Expenditure Accounts
2.128 Real gross domestic product (GDP) is estimated from 435 series. The values in those series are derivedfrom surveys and administrative sources (see the chapters on sources and methods). The price indexesassociated with each of the 435 series are taken from various sources, primarily consumer price indexes, industryproduct price indexes, raw materials price indexes, farm price indexes, export price indexes, import price indexes,foreign price indexes, and wage rates.
2.129 Personal consumption expenditure on goods and services includes 130 categories of goods and services.In most cases, consumer price indexes are associated with those goods and services.
2.130 There are 24 series for government current expenditure on consumer goods and services (see Chapter 8 forinformation on the deflation of government data). Volume estimates for the 10 labour income series are derivedfrom hours worked, and the price indexes for the series are implicit. The 10 series for government capitalconsumption allowances are deflated with indexes based on information from the Investment and Capital StockDivision, while a number of sources are used to construct the other 4 price indexes.
2.131 The 32 series that make up gross fixed capital formation are mainly based on industry product priceindexes, raw materials price indexes, machinery and equipment price indexes and import price indexes.
2.132 Business investment in inventories includes 55 components,20 whereas government investment ininventories is based on just one series. The price indexes are mainly industry price indexes and farm price indexes.
2.133 International imports consists of 68 import price indexes, while 69 different price indexes are used to deflateinternational exports.
2.134 The price index associated with the value of the statistical discrepancy is the aggregate implicit expenditure-side GDP price index (constructed by excluding the statistical discrepancy).
Chain Fisher volume indexes
2.135 The quarterly Income and Expenditure Accounts adopted the Fisher index formula, chained quarterly, as theofficial measure of expenditure based real gross domestic product in May 2001. This formula was also adopted forthe Provincial Economic Accounts, chained annually, in October 2002.
2.136 There were two reasons for adopting this formula: to provide users with a more accurate measure of realgrowth for GDP and its components between two consecutive periods and to make the Canadian measurecomparable with the National Income and Product Accounts (NIPA) of the United States, which has used the chainFisher index formula to measure real GDP since 1996.
Building an index and chaining
2.137 A given nominal aggregate (GDP or other) represents a summation of quantities evaluated in the samemonetary unit, at the prices of the current period. Note: When we refer to quantities we are implicitly including anyquality change as well. To use GDP as an example, this summation can be expressed as GDP = Σpq which is the
sum of all quantities of goods and services transacted in the economy, multiplied by their respective prices. The
change or variation in nominal GDP, between a period 0 and a period t, can therefore be expressed in index21 formby:
20. Each component is used twice in computing the aggregates, once as beginning-of-period inventory and a second time as end-of-periodinventory.
21. That is, by establishing a ratio between the value of the current period and the value of a preceding period.

Concepts and definitions
Statistics Canada - Catalogue no. 13-017 Guide to the Income and Expenditure Accounts 45
Equation 2.1
2.138 The change obtained by this formula may theoretically be divided into a change in prices and a change involume. If there were an average GDP price then it would be quite simple to divide the change in GDP (given byEquation 2.1) by this average price to obtain the change in quantities. In the Canadian System of NationalAccounts, there is no such average price. Thus, the total change in quantities can only be calculated by adding thechanges in quantities in the economy.
2.139 However, creating such a summation is problematic in that it is not possible to add quantities with physicallydifferent units, such as cars and telephones. This means that the quantities have to be re-evaluated using acommon unit. In a currency-based economy, the simplest solution is to express quantities in monetary terms. Onceevaluated, that is, multiplied by their prices, quantities can be easily aggregated.
2.140 An intuitive way to measure changes in quantity over time is to take the prices available for a given periodand to multiply the quantities from the subsequent periods by these same prices. It amounts to re-evaluatingcurrent quantities at prices fixed in time, which essentially removes the price effect. In mathematical terms, this canbe expressed by the formula for the fixed-base Laspeyres index:
Equation 2.2
2.141 The only difference from Equation 2.1 is in the numerator, where the quantities at time t are multiplied thistime by the prices at time 0.
2.142 It is clear with such a formula that the results are highly dependent on the structure of prices at time 0.Should this structure change with time, for example, as a result of a drop in the price of one component comparedwith the others, then the index from Equation 2.2 will eventually be biased by the fact that it is dependent on anoutdated price structure.
ΔGDPt o⁄
ptqt∑p0q0∑
------------------=
where: ΔGDPt/o is the GDP variation index
pt is the price at time t
p0 is the price at time 0
qt is the quantity at time t
q0 is the quantity at time 0
LQt o⁄
p0qt∑p0q0∑
------------------=
where: LQt/0 is the Laspeyres quantity index
p0 is the price at time 0
qt is the quantity at time t
q0 is the quantity at 0

Concepts and definitions
46 Statistics Canada - Catalogue no. 13-017 Guide to the Income and Expenditure Accounts
2.143 One way to overcome this type of problem is to periodically update the weighting base to bring it in line withthe current period. This technique was used in the past by the Canadian System of National Accounts (CSNA)when the real series was rebased every five or ten years to reflect changes in the price structure.
2.144 It is possible, however, for the price structure to change more quickly. The weighting base then becomesoutdated quickly, making it preferable to increase the frequency of the rebasing. Ultimately, the weighting base canbe systematically moved from period to period so that it is defined as being the period preceding the current period:
Equation 2.3
where we find pt-1, in place of P0 from Equation 2.2. For the current period t, this mobile-base index gives the growth in volume weighted according to prices t-1. To some extent, it incorporates the frequency of the reba-sing, thereby eliminating the arbitrariness of rebasing done only on an as required basis.
2.145 In the short term, this type of index can be adapted to cover several periods. Equation 2.3 can be chained bysuccessive multiplications, that is, in each period, it can be multiplied by the results obtained from the precedingperiod. This is called chaining. The prices used for weighting in the resulting chain are very recent prices and neverbecome obsolete. Using our example, a chain index would have the following form:
Equation 2.4
Equation 2.5
2.146 The System of National Accounts 1993 recommends using chain indexes. Systematic chaining allows forconstant renewal of the weighting base, thus avoiding the problem of outdated data associated with a fixed-baseindex.
LQt t⁄ 1–
pt 1– qt∑pt 1– qt 1–∑
-----------------------------=
where: n is the number of periods over which the chain index extends.
Equation 2.4 can also be written as:
LQc
p0q1∑p0q0∑
------------------p1q2∑p1q1∑
------------------× …pt 1– qt∑
pt 1– qt 1–∑-----------------------------×× …
pn 1– qn∑pn 1– qn 1–∑
-------------------------------××=
0 1 1 2 1 1/0 0 0 1/0 2/1 / 1 / 1
0 0 1 1 1 1 1 1
... ...t t n nc t t n n
t t n n
p q p q p q p qLQ Q Q LQ LQ LQ LQ
p q p q p q p q− −
− −− − − −
= × × × × × = × × × × ×∑ ∑ ∑ ∑∑ ∑ ∑ ∑
where: LQc/0 = Q0 x pq1
Q0 is an arbitrary constant, usually 1 or 100, used as a reference point.
LQc/0 is the chain Laspeyres quantity index for period 0 to period n.

Concepts and definitions
Statistics Canada - Catalogue no. 13-017 Guide to the Income and Expenditure Accounts 47
Choice of index – Towards the chain fisher index
2.147 The previous section refers to a Laspeyres-type index. However, index number theory provides numerousother indices that differ in the way the components are weighted. For example, while the quantities in theLaspeyres index are weighted with the prices of a previous period, in the Paasche index they are weighted with theprices of the current period:
Equation 2.6
2.148 This index is in fact the reciprocal of the Laspeyres index. Used in its fixed-base form, it presents the sameproblem as that described earlier, but the inverse. It does not adequately reflect changes in the structure of theeconomy for previous periods. However, the Paasche index can be chained in the same way as the Laspeyresindex (as in Equation 2.4).
2.149 It can be shown that, in general, a Laspeyres quantity index will generate a larger increase over time than aPaasche quantity index. This occurs when prices and quantities are negatively correlated, that is, when goods orservices that had become relatively more expensive are replaced by goods and services that have becomerelatively less expensive. This common substitution effect implies that the Laspeyres and Paasche indexes setupper and lower limits for a theoretically ideal, less biased, index.
2.150 This theoretical index can be approached by a Fisher-type index, representing the geometric mean of aLaspeyres and Paasche index:
Equation 2.7
2.151 This index is not only superior theoretically, but it also includes a number of desirable properties from thestandpoint of the Canadian System of National Accounts. For example, it is reversible over time, that is, the indexshowing the change between period 0 and period t is the reciprocal of the index showing the change betweenperiod t and period 0. Another interesting feature is the reversibility of factors by which the product of the price andquantity indexes is equal to the index of the change in current values:
Equation 2.8
PQt 0⁄
ptqt∑ptq0∑
-----------------=
where: PQt/0 is the Paasche quantity index.
FQt 0⁄ LQt 0⁄ PQt 0⁄×p0qt∑p0q0∑
------------------ptqt∑ptq0∑
-----------------×= =
where: FQt/0 is the Fisher quantity index.
FPt 0⁄ FQt 0⁄
ptq0∑p0q0∑
------------------ptqt∑p0qt∑
-----------------×p0qt∑p0q0∑
------------------ptqt∑ptq0∑
-----------------×ptqt∑p0q0∑
------------------=×=×

Concepts and definitions
48 Statistics Canada - Catalogue no. 13-017 Guide to the Income and Expenditure Accounts
2.152 This brings us back to our index of nominal change in Equation 2.1 and the decomposition of the priceelement and volume element discussed earlier. From there, it is quite easy to find the implicit Fisher price of GDPby dividing GDP in current dollars by real GDP using the Fisher formula. The Laspeyres and Paasche indexes donot have either of these two properties.
2.153 Statistics Canada uses the chain Fisher index as a measure of real GDP. Following the same sequence thatwe used with Equation 2.4, chaining Equation 2.7 gives us:
Equation 2.9
2.154 This is the formula used as the basis of the calculations of real GDP for the national and provincial accounts.
Application to the Income and Expenditure Accounts
2.155 In practice, the formulas provided above cannot be used as is, given the absence of data on quantities andprice levels. The accounts have only current value (C) series and price indexes (thus, relative prices). Formulashave to be transformed using the fact that the price multiplied by the quantity (ptqt) equals the series in currentdollars (Ct). We then get formulas expressed in terms of nominal series (Ct) and relative prices (pt/pt-1 or thereverse). This then gives us, for Laspeyres (using Equation 2.3):
Equation 2.10
… for Paasche (using Equation 2.6):
Equation 2.11
… and lastly, for Fisher (geometric mean of equations 2.10 and 2.11):
FQc 0⁄ Q0 FQ1 0⁄ FQ2 1⁄ … FQt t⁄ 1–× FQn n⁄ 1–××××=
where: n is the number of periods covered by the chain index.
Q0 is an arbitrary constant, usually 1 or 100.
FQc/0 is the chain Fisher quantity index for period 0 to period n.
LVt t⁄ 1–
pt 1–
pt-----------⎝ ⎠⎛ ⎞Ct∑
Ct 1–∑-----------------------------=
PVt t⁄ 1–
Ct∑pt
pt 1–-----------⎝ ⎠⎛ ⎞Ct 1–∑
------------------------------------=

Concepts and definitions
Statistics Canada - Catalogue no. 13-017 Guide to the Income and Expenditure Accounts 49
Equation 2.12
2.156 It is this formula, chained, that is used in practice. Since the series are no longer expressed in terms ofquantities, we refer to this as a volume index. The concept of volume is broader than that of quantity, because itincludes variations in quality and ultimately, changes in the composition of the economy.
2.157 Table 2.12 provides an example of the calculation that the Income and Expenditure Accounts Division(IEAD) performs to produce the GDP volume estimates. The calculation is based on current-dollar data and priceindexes for four commodities. In the second part of the table, the Paasche, Laspeyres and Fisher volume indexes,both chained and non-chained, are computed for the AB and CD aggregates and the total. The third part of thetable deals with converting volume indexes into chained dollars.
FVt t⁄ 1–
pt 1–
pt-----------⎝ ⎠⎛ ⎞Ct∑
Ct 1–∑-----------------------------
Ct∑pt
pt 1–-----------⎝ ⎠⎛ ⎞Ct 1–∑
------------------------------------×=

Concepts and definitions
50 Statistics Canada - Catalogue no. 13-017 Guide to the Income and Expenditure Accounts
Table 2.12 Sample calculation of a contributions to growth for period 3 – The case of volume estimates based on chain fisher formula
Aggregates t0 t1 t2 t3
A 80 90 72 48
B 180 210 240 255
C 250 450 455 504
D 100 150 150 135
AB 260 300 312 303
CD 350 600 605 639
Total 610 900 917 942
A 100 75.0 50.0 25.0
B 100 116.7 125.0 125.0
C 100 150.0 130.0 140.0
D 100 120.0 120.0 100.0
AB (Paasche) 100 111.1 109.5 109.8
CD (Paasche) 100 121.2 112.0 103.9
Total (Paasche) 100 117.6 111.2 105.7
AB (Laspeyres) 100 115.4 110.7 112.5
CD (Laspeyres) 100 121.4 112.5 104.1
Total (Laspeyres) 100 118.9 111.9 107.0
AB (Fisher) 100 113.2 110.1 111.1
CD (Fisher) 100 121.3 112.3 104.0
Total (Fisher) 100 118.2 111.5 106.3
AB (Fisher) 100 113.2 124.6 138.5
CD (Fisher) 100 121.3 136.2 141.7
Total (Fisher) 100 118.2 131.9 140.2
Growthrate
Calculation using the
published
formula1
Aggregates t0 t1 t2 t3 (t3 vs t2) %Δxi,t W 1 W 2
A (C/P * 100) 60.0 90.0 108.0 144.0 33.33% 1.98% 33.33% 0.08 0.76 1.98%
B (C/P * 100) 210.0 210.0 224.0 238.0 6.25% 1.66% 6.25% 0.26 1.01 1.66%
C (C/P * 100) 375.0 450.0 525.0 540.0 2.86% 1.49% 2.86% 0.50 1.05 1.49%
D (C/P * 100) 120.0 150.0 150.0 162.0 8.00% 1.22% 8.00% 0.16 0.93 1.22%
AB (Fisher) 265.0 300.0 330.2 367.0 11.13%
CD (Fisher) 494.6 600.0 673.6 700.7 4.02%
TOTAL (Fisher) 761.1 900.0 1003.7 1067.4 6.35%
Sum of aggregates (A+B+C+D) 6.35% 1.00 3.75 6.35%
Sum of sub-aggregates (A+B) 3.64% 0.34 1.77 3.64%
Sum of sub-aggregates (C+D) 2.71% 0.66 1.98 2.71%
volume measures (unlinked indexes)
Results in t3
Results in t3
On the left side, the series A, B, C, D are the lowest level of aggregation, in current dollars. Series AB and CD are sub-aggregates while the Total series is the sum of series A, B, C, D.
In current dollars, aggregates and sub-aggregates are perfectly additive for each period.
Paasche and Laspeyres indexes are the basic indexes used to construct the Fisher volume index. The Paasche index is weighted using the relative value (current dollars) of the final period while the Laspeyres index uses the relative value of the initial period.
The Fisher index is the geometric mean of the Paasche and Laspeyres indices.
On the left side are price indexes at the lowest level of aggregation. These prices take the value 100 in t0 .
current dollars
price indexes
Contribution to growth formula and remarks
The indexes on the left side are unlinked. They represent growth between two adjacent periods.
Chained indexes represent the growth in volume between the current period and the reference period (t0 in this case).
volume measures (real dollars, reference period = t1)
volume measures (linked indexes)
Calculation illustrating the
weighting2

Concepts and definitions
Statistics Canada - Catalogue no. 13-017 Guide to the Income and Expenditure Accounts 51
Table 2.12 Sample calculation of a contributions to growth for period 3 – The case of volume estimates based on chain fisher formula (concluded)
Inventories
2.158 For most of the items, the Fisher calculation does not present any real technical problems, however, this isnot the case for the investment in inventory series, which are first-difference series. Since these series fluctuatearound zero, it happens that the Laspeyres and Paasche indexes take opposite signs—since Fisher is thegeometric mean of these two indexes, it becomes indeterminate.
2.159 As published by the IEAD, real investment in inventories is not the result of a direct chained Fishercalculation as shown above, but rather an approximation. The approach used by IEAD is based on the fact that aninvestment in inventories represents the variation of a total stock, which is always positive. In principle, a Fisherindex can be calculated on a total stock series. One for the inventory level at the end of period t (e.g., March 31,2005) and the other for the inventory level at the beginning of period t (e.g., January 1, 2005). The differencebetween the two real stock estimates (end-of-period inventories minus beginning-of-period inventories) representsthe real investment in inventories. Chapter 10 (Investment in inventories) contains a section on how to calculate theFisher index for investment in inventories.
Provincial and Territorial Economic Accounts
2.160 At the provincial level, real values are calculated the same way as they are at the national level, but on anannual basis. Investment in inventories is calculated according to the methodology described above, on an annualbasis, with average prices for the year.
2.161 The level of detail of the provincial accounts differs from that of the quarterly national accounts. For eachprovince, 502 series are used in calculating real GDP. Table 2.13 shows the distribution of these series through theitems in Table 3 of the publication Provincial Economic Accounts. This distribution is slightly different than thenational structure because of the different availability and quality of provincial data.
Note 1: Published formula used to calculate the contribution of each aggregate to total growth
and where:
Note 2: The following formula illustrates that the contribution is the growth rate of the aggregate (ΔX) weighted by a factor W. In the case of volume estimates, this factor corresponds to the relative value between the aggregate and the total at period t-1 in current dollars, as in the calculation in current dollars. An additional factor of correction (W) is then applied.
, 1 , 1 2% 100 %i t t i tX W W− →Δ = × Δ × ×
1
1
2
1
1
jitjt
t i jt tj
t
t
CPFV
P CW
FV
PV
−
−
⎡ ⎤⎢ + × × ⎥⎢ ⎥
= ⎢ ⎥⎢ ⎥+⎢ ⎥⎣ ⎦
∑∑1
11
it
jtj
CW
C−
−
=∑

Concepts and definitions
52 Statistics Canada - Catalogue no. 13-017 Guide to the Income and Expenditure Accounts
Table 2.13 Level of detail at the provincial and territorial level
Estimates in “millions of chained (2002) dollars”
2.162 The base period of a volume index is the period for which the relative prices are chosen for the purpose ofevaluating the index. For example, when quantity changes are valued at 2002 prices, the index is a Laspeyresvolume index with base year 2002. With chained indexes, the base period is changed periodically. The period inwhich the value of a series in real terms is equal to the value of the same series in current dollars is the referenceperiod.
2.163 In the old measure of real GDP by the fixed-base Laspeyres method, the reference period and the baseperiod were the same. In a chain volume measure, on the other hand, the two periods do not necessarily coincide.For example, the chain Fisher series in our publication currently has 2002 as their reference year (estimates incurrent dollars are equal to estimates in real terms for 2002), but the base period is a combination of the currentperiod and the period immediately preceding the current period, since they are Fisher indexes, which are chainedquarterly. Consequently, the reference period is used only to re-calibrate the indexes, and a change in thereference period has absolutely no effect on growth rates. The only change is in the levels, which are re-calibratedto a different scale.
number of series
Personal expenditure on consumer goods and services 130
Durable goods 22
Semi-durable goods 15
Non-durable goods 14
Services 79
Government current expenditure on goods and services 24
Government gross fixed capital formation 3
Structures 2
Machinery and equipment 1
Government investment in inventory 1
Business gross fixed capital formation 5
Residential structures 3
Non-residential structures 1
Machinery and equipment 1
Business investment in inventory 110
Non-farm 76
Farm 34
Exports of goods and services 114
Exports to other countries 57
Exports to other provinces 57
Imports of goods and services 114
Imports to other countries 57
Imports to other provinces 57
Statistical discrepancy 1
Gross domestic product at market prices 502
Final domestic demand 162

Concepts and definitions
Statistics Canada - Catalogue no. 13-017 Guide to the Income and Expenditure Accounts 53
2.164 It cannot be said that the currently published chain Fisher series are at 2002 prices, since the prices for thereference period are not included in the calculations for the quarters preceding or following the reference year. It is,however, safe to say that the Fisher series are expressed in real terms, that is, free of price effects, at a level suchthat the series are equal to the level of the nominal aggregate for 2002, which is why the title of Table 3 in thepublication refers to millions of chained (2002) dollars.
Non-additivity
2.165 The chain Fisher series published by the Income and Expenditure Accounts Division are not additive, andthis non-additivity increases with the distance from the reference period. Non-additivity of real series comes bothfrom chaining and from the Fisher formula itself. Chaining destroys the additive consistency of accountingequations and the Fisher formula (as opposed to the Laspeyres formula) doesn’t have the additivity property. Table2.14 shows explicitly the non-additivity between the sum of components and the total in the following example:
Table 2.14 Illustration of non-additivity of real series estimates based on the chain Fisher formula
2.166 The fact that the real aggregates are not additive makes them more difficult to manipulate than in the past,when the calculations were based on a fixed-base Laspeyres index. For example, it becomes difficult to measurethe contribution of an individual aggregate or sector to the total, knowing that the sum of the aggregates does notadd up to the total. It is also imprudent to create aggregates as summations of other aggregates.
2.167 There are a variety of ways to overcome this additivity issue. For some summary analysis, current dollardata may be sufficient or even desirable, because they reflect the economic structure at current prices. This isespecially true if the aggregates being studied do not exhibit large price variations or if these variations arerelatively uniform.
2.168 For those who want to use real data and create aggregations, one solution is to calculate Fisher indexesusing existing Fisher data. In 1978 Diewert demonstrated that a Fisher index was approximately consistent, andthat therefore it was possible to calculate Fisher indexes from aggregates already in Fisher, what he called a
“Fisher of Fishers”.22 This solution provides a valid approximation provided that the aggregates used in thecalculation are relatively consistent in terms of prices (this solution should not be used, for example, if thecalculation involves inventory series).
2.169 A more structural solution is to accelerate the benchmarking frequency. Since additivity decreases withdistance from the reference year, re-benchmarking the series to bring the reference year closer may alleviate partof the problem without, however, making the whole strictly additive. It is important to note that, in the case of realdata based on chain Fisher index calculations, changing the reference period does not have any impact on thegrowth rates of real series.
22. Diewert, W. E., “Superlative Index Numbers and Consistency in Aggregation,” Econometrica 46(4), 1978, pp. 883-900.
t0 t1 t2 t3
AB (chain Fisher) 260.0 294.4 324.0 360.1
CD (chain Fisher) 350.0 424.6 476.7 495.9
Total (chain Fisher) 610.0 721.3 804.4 855.5
AB + CD 610.0 719.0 800.7 856.0
Difference 0.0 2.3 3.7 -0.5

Concepts and definitions
54 Statistics Canada - Catalogue no. 13-017 Guide to the Income and Expenditure Accounts
2.170 Since it is not possible to make the levels additive, the IEAD, following the lead of the Bureau of EconomicAnalysis in the United States, suggests a strictly additive decomposition of the variations of the aggregates fortables published from real data. The formula re-weights the contributions to the series in such a way that theybecome strictly additive at the total variation of the aggregate:
Equation 2.13
or, in a form that applies to nominal series and to prices,
Equation 2.14
2.171 This formula is the basis of the contribution to change series published by the CSNA.
2.172 The contribution of an aggregate to the percentage change in GDP in real terms is presented in Table 4 of
the quarterly publication.23 Contribution-to-change tables are also calculated for various large aggregates (seeTables 18, 21, 24 and 27 of the same publication).
2.173 Each of these tables follows the layout of the corresponding real data table. Instead of real data, they showthe contribution to the percentage change of the reference aggregate mentioned in the table’s title. For example,Table 4 of our quarterly publication follows the layout of Table 3 and shows the contribution of the aggregates inTable 3 to the percentage change in real GDP. These contributions are not presented as proportions, but directly aspercentage points. A contribution of the aggregate of personal consumption expenditure of 0.453 to real GDPgrowth of 1.473% for example means that 0.453 percentage points of the 1.473 are due to personal consumptionexpenditure.
2.174 The formula for contribution to percentage change (Equation 2.13) applies only to a single period. To usethe same formula over a longer period of time, a Fisher non-chained value is required where the weighting basescorrespond to the periods to be analysed. For example, to analyse the growth in durable consumer goods betweenthe fourth quarter of 1996 and the fourth quarter of 2000, it is possible to calculate a Fisher index in which theweighting is explicitly a function of the prices in the fourth quarter of 1996 and of the fourth quarter of 2000. Tosome degree, it amounts to a fixed-base Fisher index. Once this index has been calculated, the percentagecontribution to variation formula can be used directly.
23. National Income and Expenditure Accounts, catalogue no. 13-001.
Δ%it 1 t⁄– 100pt 1–
i pti FPt⁄+( ) qt
i qt 1–i–( )×
pt 1–i pt
i FPt⁄+( ) qt 1–i×
i∑
--------------------------------------------------------------------------×=
%Δ it 1 t⁄– 100
Ct
i∑ Ct 1–
i∑⁄⎝ ⎠
⎜ ⎟⎛ ⎞
Cti pt 1–
i pti⁄( ) Ct 1–
i–( ) FVt Cti Ct 1–
i pti pt 1–
i⁄( )–( )+×
Ct FVt Ct 1–
i∑ pt
i pt 1–i⁄( )+
i∑
----------------------------------------------------------------------------------------------------------------------------------------------------------------------------×=
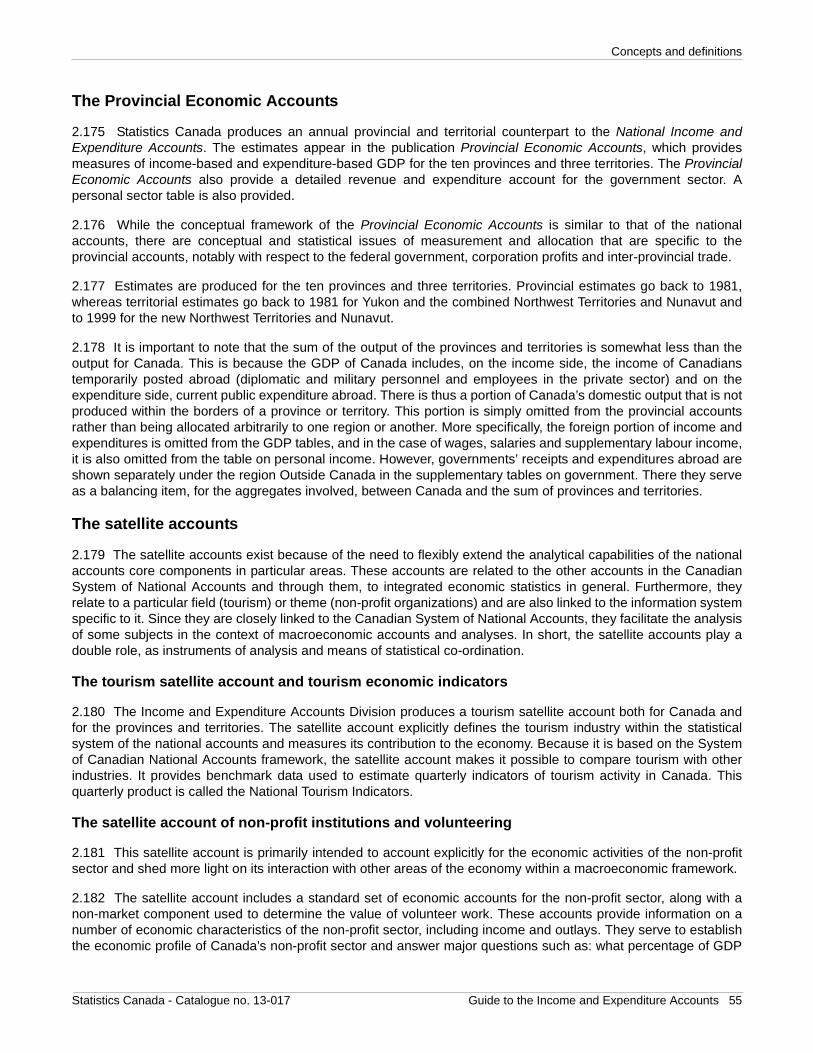
Concepts and definitions
Statistics Canada - Catalogue no. 13-017 Guide to the Income and Expenditure Accounts 55
The Provincial Economic Accounts
2.175 Statistics Canada produces an annual provincial and territorial counterpart to the National Income andExpenditure Accounts. The estimates appear in the publication Provincial Economic Accounts, which providesmeasures of income-based and expenditure-based GDP for the ten provinces and three territories. The ProvincialEconomic Accounts also provide a detailed revenue and expenditure account for the government sector. Apersonal sector table is also provided.
2.176 While the conceptual framework of the Provincial Economic Accounts is similar to that of the nationalaccounts, there are conceptual and statistical issues of measurement and allocation that are specific to theprovincial accounts, notably with respect to the federal government, corporation profits and inter-provincial trade.
2.177 Estimates are produced for the ten provinces and three territories. Provincial estimates go back to 1981,whereas territorial estimates go back to 1981 for Yukon and the combined Northwest Territories and Nunavut andto 1999 for the new Northwest Territories and Nunavut.
2.178 It is important to note that the sum of the output of the provinces and territories is somewhat less than theoutput for Canada. This is because the GDP of Canada includes, on the income side, the income of Canadianstemporarily posted abroad (diplomatic and military personnel and employees in the private sector) and on theexpenditure side, current public expenditure abroad. There is thus a portion of Canada’s domestic output that is notproduced within the borders of a province or territory. This portion is simply omitted from the provincial accountsrather than being allocated arbitrarily to one region or another. More specifically, the foreign portion of income andexpenditures is omitted from the GDP tables, and in the case of wages, salaries and supplementary labour income,it is also omitted from the table on personal income. However, governments’ receipts and expenditures abroad areshown separately under the region Outside Canada in the supplementary tables on government. There they serveas a balancing item, for the aggregates involved, between Canada and the sum of provinces and territories.
The satellite accounts
2.179 The satellite accounts exist because of the need to flexibly extend the analytical capabilities of the nationalaccounts core components in particular areas. These accounts are related to the other accounts in the CanadianSystem of National Accounts and through them, to integrated economic statistics in general. Furthermore, theyrelate to a particular field (tourism) or theme (non-profit organizations) and are also linked to the information systemspecific to it. Since they are closely linked to the Canadian System of National Accounts, they facilitate the analysisof some subjects in the context of macroeconomic accounts and analyses. In short, the satellite accounts play adouble role, as instruments of analysis and means of statistical co-ordination.
The tourism satellite account and tourism economic indicators
2.180 The Income and Expenditure Accounts Division produces a tourism satellite account both for Canada andfor the provinces and territories. The satellite account explicitly defines the tourism industry within the statisticalsystem of the national accounts and measures its contribution to the economy. Because it is based on the Systemof Canadian National Accounts framework, the satellite account makes it possible to compare tourism with otherindustries. It provides benchmark data used to estimate quarterly indicators of tourism activity in Canada. Thisquarterly product is called the National Tourism Indicators.
The satellite account of non-profit institutions and volunteering
2.181 This satellite account is primarily intended to account explicitly for the economic activities of the non-profitsector and shed more light on its interaction with other areas of the economy within a macroeconomic framework.
2.182 The satellite account includes a standard set of economic accounts for the non-profit sector, along with anon-market component used to determine the value of volunteer work. These accounts provide information on anumber of economic characteristics of the non-profit sector, including income and outlays. They serve to establishthe economic profile of Canada’s non-profit sector and answer major questions such as: what percentage of GDP

Concepts and definitions
56 Statistics Canada - Catalogue no. 13-017 Guide to the Income and Expenditure Accounts
does the non-profit sector represent in Canada? In what fields do non-profit organizations contribute to the well-being of Canadian society? How financially stable or vulnerable is the non-profit sector? How much does thissector depend on paid work rather than the contribution of volunteers?
Pension satellite account
2.183 The pension satellite account is currently under development. It will allow for enhanced analysis of theeconomic impact(s) of an aging population.

Appendix 2A
Statistics Canada - Catalogue no. 13-017 Guide to the Income and Expenditure Accounts 57
Appendix 2A The presentation of product and output in the Canadian System of National Accounts Input-Output Tables
2A.1 In the Canadian System of National Accounts, the estimates of GDP for Canada and the regions are shownin two sets of accounts: the Input-Output Tables (IOT) and the Income and Expenditure Accounts (IEA). These twoaccounts are inter-related. For the purposes of this guide, data from a hypothetical economy are used to illustratethe structure and logic of each of these accounts.
Output and product in the Input-Output Tables
2A.2 The Canadian Input-Output Tables consist of three matrices that describe the output and the uses of goodsand services by the different industries and final demand, during a given period.
Overview of the Input-Output Tables
2A.3 The data of the hypothetical economy are presented in three matrices: the output matrix, the use matrix andthe final demand matrix.
2A.4 The output matrix shows the goods and services produced by each industry (Table 2A.1). The column totalsindicates the output of each industry. The row totals show the output of each good in the economy. The output ofthe economy as a whole is measured by the sum of the outputs of the industries or the sum of the output of goodsand services.
Table 2A.1 Simplified representation of the output matrix in the Input-Output Tables–Fictive estimates
IndustriesFarming Milling Baking Total
Wheat 150 0 0 150
Flour 0 165 0 165
Bread 0 0 200 200
Seed, fertilizer 0 0 0 0
Profits 0 0 0 0
Wages 0 0 0 0
Total 150 165 200 515
Goods and services produced
Primary inputs, (payments for labour and capital) in the production process, always 0 in this matrix
Milling industry produces $165 of flour
The output of the milling industry is $165 since it only produces flour
The production of flour is $165, it is entirely produced by the milling industry
The production of the economy corresponds to the sum of goods and services produced and to the sum of the production of the industries

Appendix 2A
58 Statistics Canada - Catalogue no. 13-017 Guide to the Income and Expenditure Accounts
2A.5 The use matrix represents the technology used by an industry to produce the output. It details the coststructure of production. For each industry, the uses of intermediate inputs (goods and services) and primary inputs(which include not only factors of production such as wages, salaries and supplementary labour income andoperating surpluses but also net indirect taxes on primary factors like property taxes and payroll taxes). The sum ofprimary inputs is equivalent to value added at basic values (Table 2A.2).
Table 2A.2 Simplified representation of the use matrix in the Input-Output Tables–Fictive estimates
2A.6 The final demand matrix displays the final uses of the goods and services in the economy (Table 2A.3). Inother words, goods and services may either enter into the production of other goods and services or be consumedby final users. In the former case, we have intermediate consumption of goods and services, found in the usematrix. In the latter case, we have final consumption of goods and services, including the following:
• personal expenditure on consumer goods and services;• government current expenditure on goods and services;• government and business gross fixed capital formation;• government and business investment in inventories; and• net international exports of goods and services (exports minus imports).
2A.7 This information is found in the final demand matrix (Table 2A.3).
IndustriesFarming Milling Baking Total
Wheat 0 100 0 100Flour 0 0 130 130Bread 0 0 0 0Seed, fertilizer 15 0 0 15Profits 20 20 10 50Wages 115 45 60 220Total 150 165 200 515
The industry uses $100 of wheat to produce $165 of flour
The value added in the economy is the sum of the value added of each industry, $270
Goods and services used in production
Primary inputs (payments for labour and capital) in the production process
The intermediate use of flour is $130
The intermediate use in the economy is $245. It is composed of $100 of wheat + $130 of flour and $15 of seed and fertilizer
To produce $165 of flour, the industry pays $45 in wages and $20 in profits. This corresponds to the value added of the industry
The uses of the milling industry is $165. For each industry, production equals use

Appendix 2A
Statistics Canada - Catalogue no. 13-017 Guide to the Income and Expenditure Accounts 59
Table 2A.3 Simplified representation of the final demand matrix in the Input-Output Tables–Fictive estimates
Final demand categoriesPersonal Exports Imports Total
Wheat 0 50 0 50
Flour 35 0 0 35
Bread 200 0 0 200
Seed, fertilizer 0 0 -15 -15
Profits 0 0 0 0
Wages 0 0 0 0
Total 235 50 -15 270
Households consume $35 of flour
The gross domestic product (GDP) for the economy corresponds to the sum of final use of goods and services and to the sum of the final demand categories
Goods and services consumed
Primary inputs (payments for labour and capital) in the process of production (only indirect taxes on products in this matrix)
The final use of flour is worth $35, it is entirely consumed by the household sector
Personal expenditures of households amount to $235: $35 wheat and $200 bread
International exports amount to $50

Appendix 2A
60 Statistics Canada - Catalogue no. 13-017 Guide to the Income and Expenditure Accounts
The three ways of measuring GDP in Input-Output Tables
2A.8 In the Input-Output Tables, GDP can be presented in the three ways. GDP by the income approach obtainedby summing the profits and wages in the use matrix and the final demand matrix (Table 2A.4). It thereforeconstitutes the total primary inputs used in the production process.
Table 2A.4 Measurement of GDP by the income approach in the Input-Output Tables – Fictive estimates
Output matrix
Goods and services Farming Milling Baking Total
Wheat 150 0 0 150
Flour 0 165 0 165
Bread 0 0 200 200
0 0 0 0
Profits 0 0 0 0
Wages 0 0 0 0
Total 150 165 200 515
Use matrix (input) and final demand matrix
Total
Industries Final demand categoriesGoods and services Farming Milling Baking Personal Exports Imports Total
Wheat 0 100 0 100 0 50 0 50 150
Flour 0 0 130 130 35 0 0 35 165
Bread 0 0 0 0 200 0 0 200 200
15 0 0 15 0 0 -15 -15 0
Profits 20 20 10 50 0 0 0 0 50
Wages 115 45 60 220 0 0 0 0 220
Total 150 165 200 515 235 50 -15 270
Industries
intermediate inputs
Uses and final
demand
Seed and fertilizer
Seed and fertilizer
The income-based GDP is the sum of primary inputs in the final demand matrix ($0 + $0 = $0) and those in the use (input) matrix ($50 + $220 = $270). Thus, GDP is $0 + $270 = $270

Appendix 2A
Statistics Canada - Catalogue no. 13-017 Guide to the Income and Expenditure Accounts 61
2A.9 GDP by the final expenditure approach is obtained by summation of the final demand matrix of Table 2A.5.The final demand categories are related to the final expenditure aggregates in the Income and ExpenditureAccounts.
Table 2A.5 Measurement of GDP by expenditure approach in the Input-Output Tables–Fictive estimates
Output matrix
Goods and services Farming Milling Baking Total
Wheat 150 0 0 150
Flour 0 165 0 165
Bread 0 0 200 200Seed and fertilizer 0 0 0 0
Profits 0 0 0 0
Wages 0 0 0 0
Total 150 165 200 515
Use matrix (input) and final demand matrix
Total
Industries Final demand categoriesGoods and services Farming Milling Baking Personal Exports Imports Total
Wheat 0 100 0 100 0 50 0 50 150
Flour 0 0 130 130 35 0 0 35 165
Bread 0 0 0 0 200 0 0 200 200Seed and fertilizer 15 0 0 15 0 0 -15 -15 0
Profits 20 20 10 50 0 0 0 0 50
Wages 115 45 60 220 0 0 0 0 220
Total 150 165 200 515 235 50 -15 270
Industries
Uses and final
demandintermediate
inputs
The expenditure-based GDP is obtained by adding final spending on goods and services ($50 + $35 + $200 - $15 = $270) or by summing final demand categories ($235 + $50 - $15 = $270).

Appendix 2A
62 Statistics Canada - Catalogue no. 13-017 Guide to the Income and Expenditure Accounts
2A.10 GDP by the value added approach is obtained by taking the difference between the intermediate expenses(in the use matrix) from production (in the output matrix) in Table 2A.6. Value added is calculated by industry aswell as summed over the industries for the economy as a whole.
Table 2A.6 Measurement of GDP by the value added approach in the Input-Output Tables–Fictive estimates
GDP in the Income and Expenditure Accounts
2A.11 In the Income and Expenditure Accounts (IEA), GDP is measured using both the income approach and theexpenditure approach. The data on the hypothetical economy are presented in Table 2A.7 as in the IEA. Readersfamiliar with the IEA will recognize this as a simplified version of Tables 1 and 2 of the publication National Incomeand Expenditure Accounts.
Output matrix
Goods and services Farming Milling Baking Total
Wheat 150 0 0 150
Flour 0 165 0 165
Bread 0 0 200 200Seed and fertilizer 0 0 0 0
Profits 0 0 0 0
Wages 0 0 0 0
Total 150 165 200 515
Use matrix (input) and final demand matrix
Total
Industries Final demand categoriesGoods and services Farming Milling Baking Personal Exports Imports Total
Wheat 0 100 0 100 0 50 0 50 150
Flour 0 0 130 130 35 0 0 35 165
Bread 0 0 0 0 200 0 0 200 200Seed and fertilizer 15 0 0 15 0 0 -15 -15 0
Profits 20 20 10 50 0 0 0 0 50
Wages 115 45 60 220 0 0 0 0 220
Total 150 165 200 515 235 50 -15 270
Industries
Uses and final
demandintermediate
inputs
Value added GDP is obtained by deducting intermediate expenses ($100 + $130 + $15 = $245) from production ($150 + $165 + $200 = $515). The value added GDP is thus calculated as : $515 - $245 = $270

Appendix 2A
Statistics Canada - Catalogue no. 13-017 Guide to the Income and Expenditure Accounts 63
Table 2A.7 Income and expenditure-based GDP in the Income and Expenditure Accounts–Fictive estimates
Income-based GDP Expenditure-based GDP
(similar to IEA Table 1) (similar to IEA Table 2)
dollars dollars
Wages 220 Personal expenditure 235
Profits 50 Exports 50
Less: imports -15
Income-based GDP 270 Expenditure-based GDP 270
Note: Refer to Table 1 and 2 of National Income and Expenditure Accounts, catalogue no. 13-001.

Appendix 2B
64 Statistics Canada - Catalogue no. 13-017Guide to the Income and Expenditure Accounts
Appendix 2B Interest and miscellaneous investment income in the income and outlay accounts of the institutional sectors
2B.1 Most of the items that appear in the income-based and expenditure-based GDP tables are easily identifiablein the income and outlay accounts of the institutional sectors. Interest and miscellaneous investment income, oneof the income aggregates used in calculating GDP, is an exception. The table below shows that reconciliation mustbe done by assembling information on interest income and outlays, dividends and other investments in all theinstitutional sectors.
Table 2B.1 Reconciliation of interest and miscellaneous investment income of the income-based GDP with investment income and receipts and payments in the income and outlay accounts, 2000
2B.2 Dividends are not explicitly identified as an income-based component appearing in the calculation of GDP.Dividends are treated as a redistribution of the income (corporation profits) to the shareholders of corporations.However, unlike loan capital, which generates interest, capital in the form of shares does not give rise to a liabilitythat is fixed in monetary terms, and it does not entitle holders of shares of a corporation to a fixed or predetermined
income.1 This is why it is considered a current transfer. In the income and outlay accounts of the institutionalsectors, dividends net out across sectors. Dividends are paid by corporations and government businessenterprises and by non-residents to the other institutional sectors.
Income Outlay
Millions of dollars
Persons and unincorporated business sector
Interest, dividends and miscellaneous investment receipts 114,676
Corporations and government business enterprise sector
Interest, dividends and miscellaneous receipts 73,581 190,502 Interest, dividends and miscellaneous payments
Interest on public debt 62,494
Government sector
Investment income 43,512 76,491 Interest on public debt
Non-residents sector
Interest, dividends and miscellaneous receipts 57,175 29,143 Interest, dividends and miscellaneous payments
All sectors 351,438 296,136
Interest and miscellaneous investment income (GDP) 55,302
Source: National Income and Expenditure Accounts, catalogue no. 13-001, tables 1, 5 to 14.
1. Based on paragraph 7.113 of System of National Accounts 1993.

Appendix 2B
Statistics Canada - Catalogue no. 13-017 Guide to the Income and Expenditure Accounts 65
2B.3 Interest on public debt appears twice. This item, which represents the commitments of the governmentsector, constitutes a government expenditure ($76,491 million in 2000). The same item appears as income of thecorporations and government business enterprise sector but the amount is lower, corresponding to thedomestically paid portion of interest on the public debt. The non-domestic portion is included in the income of non-residents as interest, dividends and miscellaneous receipts. The equality between the expenditures and incomerelated to interest on public debt shows that the latter is considered a current transfer. This treatment differs fromthe treatment of other interest payments in the economy, which are considered productive. There are two reasonsfor the special treatment reserved for interest on public debt. First, government borrowings are mainly used tofinance current spending rather than capital. Second, the shifting financing policies of governments should notaffect GDP. If service of the public debt were considered productive (and were hence included in GDP),governments could then increase or reduce GDP at will by switching between financing through income taxes
(which is a transfer) and financing through borrowing.2
2. On this subject, see the articles of Crozier, Robert B., The treatment of Interest on the Public Debt in the National Accounts, Canadian Journal of Economics and Political Science, Volume 25, November 1959, pp. 501-503 (1959) and Sunga, P. (1967, 1984) and Sunga, P., An Alternative to the Current Treatment of Interest as a Transfer in the United Nations and Canadian System of National Accounts, Review of Income and Wealth, Volume 30, December 1984, pp. 385-402, and The Treatment of Interest and Net Rents in the National Accounts Framework, Review of Income and Wealth, Volume 13, March 1967, pp. 26-35.