Chapter 1 BASIC CONCEPTS IN OCEANOGRAPHY
23
Chapter 1 XA0101461 BASIC CONCEPTS IN OCEANOGRAPHY L.F. SMALL College of Oceanic and Atmospheric Sciences, Oregon State University, Corvallis, Oregon, United States of America Abstract Basic concepts in oceanography include major wind patterns that drive ocean currents, and the effects that the earth's rotation, positions of land masses, and temperature and salinity have on oceanic circulation and hence global distribution of radioactivity. Special attention is given to coastal and near-coastal processes such as upwelling, tidal effects, and small-scale processes, as radionuclide distributions are currently most associated with coastal regions. 1.1. INTRODUCTION Introductory information on ocean currents, on ocean and coastal processes, and on major systems that drive the ocean currents are important to an understanding of the temporal and spatial distributions of radionuclides in the world ocean. 1.2. GLOBAL PROCESSES 1.2.1 Global Wind Patterns and Ocean Currents The wind systems that drive aerosols and atmospheric radioactivity around the globe eventually deposit a lot of those materials in the oceans or in rivers. The winds also are largely responsible for driving the surface circulation of the world ocean, and thus help redistribute materials over the ocean's surface. The major wind systems are the Trade Winds in equatorial latitudes, and the Westerly Wind Systems that drive circulation in the north and south temperate and sub-polar regions (Fig. 1). It is no surprise that major circulations of surface currents have basically the same patterns as the winds that drive them (Fig. 2). Note that the Trade Wind System drives an Equatorial Current-Countercurrent system, for example. There is a North Equatorial Current running from east to west in every ocean: Indian, Pacific and Atlantic (although monsoon winds affect the currents in the Indian Ocean, as we'll see later). There is a South Equatorial Current, just into the southern hemisphere, running in the same direction, from east to west. There is an Equatorial Countercurrent, running in the opposite direction, that essentially splits the two. At about 40 to 60°S and N, the Westerly Wind systems prevail (Fig. 1). The southern- hemisphere westerlies essentially blow completely around the globe almost unimpeded by land. The current system established by these winds (West Wind Drift) thus is driven completely around the globe, almost unobstructed by land (Fig. 2). Comparable to this, in the northern hemisphere, the North Pacific and North Atlantic Currents move from west to east. In the Indian Ocean there is no comparable northern westerly current because of the Asian land mass. The ocean flows coupling the equatorial and westerly current systems are the Kuroshio and California Currents in the north Pacific, and the East Australian and Peru Currents in the south Pacific (Fig. 2). In the north Atlantic, the Florida Current/Gulf Stream is comparable to the Kuroshio in the Pacific, and the Canary Current is comparable to the California. In the south Atlantic, the Falkland/Brazil Current and the Benguela Current connect the equatorial and westerly currents.
-
Upload
khangminh22 -
Category
Documents
-
view
0 -
download
0
Transcript of Chapter 1 BASIC CONCEPTS IN OCEANOGRAPHY

Chapter 1 X A 0 1 0 1 4 6 1
BASIC CONCEPTS IN OCEANOGRAPHY
L.F. SMALLCollege of Oceanic and Atmospheric Sciences,Oregon State University,Corvallis, Oregon, United States of America
Abstract
Basic concepts in oceanography include major wind patterns that drive ocean currents, andthe effects that the earth's rotation, positions of land masses, and temperature and salinity have onoceanic circulation and hence global distribution of radioactivity. Special attention is given tocoastal and near-coastal processes such as upwelling, tidal effects, and small-scale processes, asradionuclide distributions are currently most associated with coastal regions.
1.1. INTRODUCTION
Introductory information on ocean currents, on ocean and coastal processes, and on majorsystems that drive the ocean currents are important to an understanding of the temporal andspatial distributions of radionuclides in the world ocean.
1.2. GLOBAL PROCESSES
1.2.1 Global Wind Patterns and Ocean Currents
The wind systems that drive aerosols and atmospheric radioactivity around the globeeventually deposit a lot of those materials in the oceans or in rivers. The winds also are largelyresponsible for driving the surface circulation of the world ocean, and thus help redistributematerials over the ocean's surface. The major wind systems are the Trade Winds in equatoriallatitudes, and the Westerly Wind Systems that drive circulation in the north and south temperateand sub-polar regions (Fig. 1). It is no surprise that major circulations of surface currents havebasically the same patterns as the winds that drive them (Fig. 2). Note that the Trade WindSystem drives an Equatorial Current-Countercurrent system, for example. There is a NorthEquatorial Current running from east to west in every ocean: Indian, Pacific and Atlantic(although monsoon winds affect the currents in the Indian Ocean, as we'll see later). There is aSouth Equatorial Current, just into the southern hemisphere, running in the same direction, fromeast to west. There is an Equatorial Countercurrent, running in the opposite direction, thatessentially splits the two.
At about 40 to 60°S and N, the Westerly Wind systems prevail (Fig. 1). The southern-hemisphere westerlies essentially blow completely around the globe almost unimpeded by land.The current system established by these winds (West Wind Drift) thus is driven completelyaround the globe, almost unobstructed by land (Fig. 2). Comparable to this, in the northernhemisphere, the North Pacific and North Atlantic Currents move from west to east. In the IndianOcean there is no comparable northern westerly current because of the Asian land mass. Theocean flows coupling the equatorial and westerly current systems are the Kuroshio and CaliforniaCurrents in the north Pacific, and the East Australian and Peru Currents in the south Pacific (Fig.2). In the north Atlantic, the Florida Current/Gulf Stream is comparable to the Kuroshio in thePacific, and the Canary Current is comparable to the California. In the south Atlantic, theFalkland/Brazil Current and the Benguela Current connect the equatorial and westerly currents.

FIG. J. Prevailing winds over the ocean in (a) February, and (b) August [1].

femms•j==ir>i A/i =-. .TH ~ = 4*L-ifee- ¿^
(•-\, ' Vil • «V i.vJPiS '£ v "
o u ^<i:.'X::'?«c!!:V:::I:::^:>jy «V
ARC-Arctlc convergence
STC-Subtropieal convergence
ANC-Anurctic convergence
AND-Antarctic divergence
FIG. 2. Surface ocean currents in February-March. Length and thickness of arrows denote relative current speeds. Note the major easterly andwesterly currents, and the mid-ocean gyres [1].

SURFACE WINDS . . » - ,AUGUST
\' / I . ' . " SURF ACE CURRENTS
'••, •'! Southwest K;.;>.-..:v•'.':•' '•-'' Monsoon'<•;• -.
FIG. 3. Surface winds (a) and currents (b) in summer during the Southwest Monsoon [1].
10

SURFACE WINDS -FEBRUARY
w ̂ kr. ^ y wiam
SURFACE CURRENTSFEBRUARY
¥. Surface winds (a) and currents (b) in winter during the Northeast Monsoon [1J.
11

In Fig. 2, one can see that the current systems circumscribe large oval regions in each oceanbasin. These oval regions are the open-ocean gyres. The gyre systems essentially are the parts ofthe ocean usually described as oligotrophic, or with relatively little biological productivity in thesurface waters (although recent work suggests they are more productive than originally thought).The gyres actually have a different topography than the regions of major currents. The sea surfaceis slightly higher in the center of each gyre than it is in other places, and that is important fordistributions of properties, including radioactivity.
In the high polar regions, particularly in the northern hemisphere where there is no landmass comparable to the Antarctic continent, easterly winds (Polar Easterlies, Fig. 1) move surfacecurrents eastward (Fig. 2); however, because of land interference, easterly currents are oftenturned into complex patterns (see Atlantic and Pacific Oceans above 60°N, for example).
The basic pattern is thus one of major wind systems driving surface currents around theperimeters of each ocean basin in each hemisphere on the earth's surface, piling water up a bit inthe central gyres. Complexities in this simple pattern occur because of the positions of thecontinents with respect to the wind/current systems, and sometimes because of major changes inthe wind systems themselves either on a seasonal basis (as in the Indian Ocean monsoons) or onless frequent time scales (as in El Nino-Southern Oscillation events).
1.2.2. Seasonal Monsoons
The most striking seasonal changes in current pattern usually occur in the Indian Ocean,and these are intimately tied in with monsoon winds. During summer (generally May toSeptember), the land mass of Asia is greatly warmed relative to the adjacent Indian Ocean. Whenthe land mass is warm and the ocean is cold, the continental air rises and draws the cooler air offthe marine system. The air drawn from the ocean to the land creates the Southwest Monsoon (Fig.3). At this time of year surface currents in the western Indian Ocean move northward while thosein the eastern Indian Ocean generally move southward to join the westward-moving SouthEquatorial Current (Fig. 3). This Southwest Monsoonal circulation becomes very important fromthe standpoint of biological productivity, as we'll see later. When the land mass of Asia cools inthe winter, the situation reverses. The high heat capacity of the water causes the air mass abovethe Indian Ocean to warm, and thus to rise and draw the colder air off the land mass (Fig. 4). Thiscreates the Northeast Monsoonal circulation of the sea surface (Fig. 4). The general pattern shownin Fig. 2, with the North Equatorial Current and Equatorial Countercurrent reformed, is thusreestablished.
1.2.3. Other Seasonal Changes
There are other seasonal shifts that occur, which can be very important to the distributionsand redistributions of radionuclides and other materials, and therefore to the potential effectsthese radionuclides may have on marine life. Patterns of sea ice change seasonally in both polarregions, for example. Seasonal changes in prevailing wind directions along coastlines other thanthose in the Indian Ocean often create movements of surface water away from or toward thecoasts, thus either transporting materials away from the land or onto the beaches. We will dealwith some of these effects later. However, it is important to recognize that meteorological high-and low-pressure systems do vary in position by season over the surface of the Earth, therebyseasonally re-positioning major and minor wind systems (Fig. 1), which in turn affect thepositioning and strengths of most ocean currents on a seasonal basis.
1.2.4. The Coriolis Effect
The Earth's rotation about its axis causes the winds and surface ocean currents to followcurved paths instead of the straight ones that we might witness if the Earth were not rotating. This
12

60c
30c
FIG. 5. Apparent deflection to the right of a hypothetical parcel of water moving from the equator tothe North Pole, due to Coriolis effect. The deflection would be to the left for the water parcel movingfrom the equator to the South Pole. Note that these deflections are due to the decreasing speeds of theEarth's surface at higher latitudes as the Earth rotates in an eastward direction flj.
13

apparent curvature is accounted for by the Coriolis effect. To give an example of the Corioliseffect, let us presume that we have an air mass resting at the equator. While sitting at the equator,the air mass is moving east at 1670 km/hr, because that is the speed of the Earth's rotation at theequator (Fig. 5). If the air mass is put into motion toward the North Pole (i.e., if we create anorthward-blowing wind), that air mass still moves eastward at 1670 km/hr, in addition to itsspeed toward the North Pole. As the air mass proceeds northward it moves over portions of theEarth's surface rotating at ever decreasing speeds; e.g., at 30°N the Earth's surface is rotating atonly 1446 km/hr, and at 60°N only 835 km/hr (Fig. 5). The northward-moving air mass stillmaintains its 1670 km/hr eastward speed, however, and is therefore moving eastward at a speedfaster than the Earth beneath it. To a person standing at the Equator, at the initial site of the airmass, the air mass appears to veer ever more to the right as it proceeds ever more northward. Aperson on a stationary platform in space, however, would see that the air mass actually travels in astraight line, with the Earth turning beneath it. had the air mass at the equator been put in motiontoward the South Pole, the deflection would still be eastward but would appear to the personstanding at the equator to veer to the left, not the right (Fig. 5). Had the equatorial air mass beenput into motion along the equator rather than perpendicular to it, it would have moved in astraight line, with no veering. There is no Coriolis effect at the equator.
The coupling of the winds to the surface ocean currents, given the Coriolis effect, makesthe surface currents veer to the right of the wind direction in the northern hemisphere and to theleft of the wind direction in the southern hemisphere. With the equatorial Trade Winds blowingfrom east to west, and the higher-latitude Westerlies blowing from west to east in bothhemispheres (Fig. 1), the global surface current systems tend to turn in a clockwise direction inthe northern hemisphere and in a counterclockwise direction in the southern hemisphere (Fig. 2).Seasonal changes in wind direction, such as the different monsoons in the Indian Ocean, canchange the direction of surface flows, as we've seen.
1.2.5. Ekman Spiral and Ekman Transport
The ocean is a three-dimensional system, and distributions of surface-injected radionuclidesare affected not only by atmospheric-oceanic interactions at the immediate surface, but also bythe interaction of surface waters with water layers below. In the northern hemisphere, the averagedeflection of surface waters from the prevailing wind direction is about 45° to the right, due to theCoriolis effect (in the southern hemisphere it averages 45° to the left). Frictional drag of thesurface layer on the next layer below it causes that next layer to decrease in current speed and tochange direction slightly further to the right. Proceeding downward through succeeding waterlayers yields ever-decreasing current speeds with continual directional change to the right (Fig.6). At some depth the current, now greatly reduced in velocity, actually reverses direction, andeventually a depth is reached whereby no energy is left to produce any current at all. Thisspiralling phenomenon is called the Ekman spiral, after the scientist who first described it, and thedepth range from the water surface to the depth of no measurable wind-induced energy is calledthe Ekman layer. Depth of the Ekman layer varies depending mainly on the wind strengthimparted to the ocean surface. If one calculates the net directional movement of all water in theEkman layer, one finds that it is approximately 90° to the right of the surface wind direction inthe northern hemisphere (90° to the left in the southern hemisphere). The amount of watertransported in the Ekman layer over some horizontal distance has been called the Ekmantransport. One can see how knowledge of Ekman transport would be vital to predictingdistributions of surface-injected radionuclides throughout the top layers of ocean waters. In mostcases the Ekman layer does not exceed about 100 m depths, so Ekman transport is still a near-surface feature; however, the upper 100 m usually encompasses all, or most, of the lighted zone(euphotic zone) of the sea, where all photosynthetic production by single-celled algae(phytoplankton) takes place, and of course it is the interactive link between the atmosphere andthe ocean, as we've seen. Thus, the Ekman layer is an extraordinarily significant, though small,part of the total volume of the global ocean, accounting for much of the dispersal of all manner oforganic and inorganic materials.
14

WindSurface current
FIG. 6. Schematic representation of the Ekman spiral formed by a wind-driven current in deep water.Note the change in current direction and speed with increased depth below the surface [1].
15

(a) Upwelling(n. hemisphere)
Net water movement
(Ekman transport)
Surface current
Wind
(b) Downwelling(n. hemisphere)
Wind
FIG. 7. Schematic representation of coastal upwelling (a) and downwelling (b) in the northernhemisphere. The directions of the surface current and Ekman transport relative to wind directionwould be reversed in the southern hemisphere, for both upwelling and downwelling events.
16

1.2.6. Coastal Upwelling and Downwelling
Surface winds which generally move surface currents 45° to the right (or left), and Ekmantransport which averages 90° to the right (or left) of the prevailing wind direction, help establishsignificant circulation patterns when land masses "interfere with" or "disrupt" classical wind-induced circulations unimpeded by land. A wind blowing from the north or northwest along awestern coastline in the northern hemisphere, for example, will move surface water away fromthe coast at an approximate 45° angle (Fig. 7a), and will move water from the Ekman layer awayfrom the coast at an angle of about 90°. Mass balance must take place, so water to replace thatmoved away from the coast must come from somewhere. It is brought up from a depth below theEkman layer, in a process called coastal upwelling. Off the northwest coast of North America, asan example, the prevailing wind in spring and summer is from the NNW. Surface waters againstthe coast are thus moved offshore at this time, and colder, nutrient-rich water from below upwellsto replace that surface water moved offshore. In addition, the large Columbia River Estuaryempties into this upwelling system between the states of Washington and Oregon in northwesternUSA. Some years ago the Hanford Nuclear Site on the Columbia River discharged small amountsof several radionuclides into the river, and the river carried those nuclides into the coastal ocean.In spring and summer, the tongue of Columbia River water at sea could be identified on thesurface by its signature of radioactivity. The tongue proceeded in a general south-southwesterlydirection, about 45° to the right of the wind, as expected. Because these same NNW windsdelivered non-radioactive, upwelled waters to the surface waters immediately adjacent to thecoast, however, a fairly sharp gradient between the relatively warm, fresh, radioactive river waterand the colder, saltier upwelled water was established; that is, the river water could not spreadtoward the coast at the surface, and the upwelled water could not spread seaward at the surface,creating a distinct frontal region. These and other scenarios will be treated later in more detail, butthe illustration is given to show that the effects given by the positions of land masses and by suchthings as river discharges into the oceans, can greatly contort general circulation patternsexpected under a given wind regime. These contorting effects are particularly noticeable in therelatively shallow waters over continental shelves — and of course these are the regions havingmost direct impact on humans, and on which humans have the greatest impact.
During the autumn and winter, the prevailing winds off northwestern USA blow from thesouth. Coriolis effect remains the same (to the right of the wind), so transport of surface and near-surface waters is toward the coast (this is the time of year for beachcombing, as materials arebrought onto the coast and often stranded there). At this time the Columbia River tongue, with itsradioactive signature, is moved north and kept tightly against the coast of Washington state.Upwelling ceases because surface water is not moved away from the coast, but tends to pile uptoward the coast, as mentioned previously. At this time there can be downwelling of water (Fig.7b) as some of that which tends to pile up at the coast must sink to maintain mass balance (somealso moves laterally along the coast, intensifying a winter-time coastal current called theDavidson Current).
1.2.7. Convergence and Divergence Systems
As water is transported to the right of the prevailing wind systems in the northernhemisphere, and to the left in the southern hemisphere on our rotating Earth, there is a tendencyfor surface water coming from opposing directions to pile up slightly in subtropical regions(particularly on the western sides of ocean basins in the sub-tropics), where winds are lighter thanthose in the polar regions. As the surface water tends to pile into a slight "hill", the pycnocline (alayer of strong density discontinuity below the surface) becomes depressed into a "valley". Thiscreates a convergence (Fig. 8a, top panel). The most prominent convergences are the subtropicalconvergences between 20-40° N and S and the Antarctic convergence between 40-50°S (Fig. 2).These mid-ocean convergences are very hard to detect, because the elevations of the watersurface, and depressions of the pycnocline, are very small over large lateral distances.
17

CONVERGENCE
(b)
DIVERGENCE
FIG. 8. Schematic representation of oceanic convergence (a) and divergence (b) regions.
Conversely, where water is moved away in opposite directions in a given region (by windsyielding Ekman transports in opposite directions), subsurface waters move to the surface toreplace the surface waters that have been moved away, creating an oceanic divergence (Fig. 8b).It should be recognized that an oceanic divergence develops through a process similar to coastalupwelling, but with no coastal land barrier. Two prominent oceanic divergences are the Antarcticdivergence (65-70°S) and the equatorial divergence created by the NE and SE Trade Windsimparting NW and SW Ekman transports to near-surface waters near the equator. We will discussthese more fully later. Divergences are usually easier to spot than convergences because theyoften are rich with phytoplankton growth sustained by the nutrients being brought into surfacewaters from below (Fig. 8b). In this sense, open-ocean divergence zones again are similar tocoastal upwelling regions.
18

1.2.8. Geostrophic Currents
So-called geostrophic currents can arise as water from the slightly elevated portions of theocean (the "hills") tends to run down toward the more depressed regions (the "valleys") under theinfluence of gravity. However, the Coriolis effect also is in play, so that the eventual current thatensues is a result of the balance between these two forces. The current does not run straight"downhill" into the "valley", as forced by gravity, nor does it run around the "hill" in one plane,under the sole influence of Coriolis: rather, it tends to describe a curving path down the "hill"toward the "valley". Satellite techniques are now used to accurately measure the sea-surface"hills" and "valleys", and thus more accurately map geostrophic currents in the world ocean.
1.2.9. Global Thermohaline Circulation and Water Mass Movement
A final type of global water movement, large-scale thermohaline circulation, needs to beaddressed, because this, too, redistributes huge volumes of water and therefore redistributes allmanner of dissolved and tiny paniculate matter (including radionuclides and pollutants). Globalthermohaline circulation largely involves vertical water movements that initiate the horizontalmovement of water from polar regions (particularly the North Atlantic and Antarctic Oceans).This circulation phenomenon controls temperature and salinity distribution in the deep ocean, andhas a profound effect on distribution of other properties as well.
This massive vertical circulation is not caused by regional winds, but by density differencesof different water masses. Density is controlled by temperature and salinity, with warm, freshwaters being less dense than cold, salty waters. When the density of water at the surface exceedsthe density at depths below the surface (when surface water cools as a result of cooling airtemperatures, for example), the water column becomes unstable and the more dense water sinks,displacing the less dense water immediately below it; hence a vertical circulation is set up. Thewater sinks until it reaches a depth of slightly more dense water, at which time the sinking massmoves laterally. On a global scale, particularly in the Atlantic Ocean near Greenland and inwaters near Antarctica, large water masses of very low temperature and high salt content becomevery dense and sink quickly to depth. The Antarctic system provides a good example (Fig. 9).Antarctic Bottom Water (AABW) is extremely cold (0-1° C) and salty enough so as not to freezeat those temperatures — it is the coldest water on Earth. It is slightly more dense than the coldNorth Atlantic Deep Water (NADW), so this latter water mass flows southward to replace, andoverride, the AABW. The AABW penetrates northward along the sea floor to about 45° Slatitude before it loses its identity through wanning and mixing with other water masses.Similarly, Antarctic Intermediate Water (AAIW) overrides the denser NADW, and the warmersurface subantarctic water makes up the top layers. Enormous amounts of heat are transportedinto the system by the NADW, and lesser amounts are carried away from the Antarctic in AABW.Heat balance is generally maintained because huge quantities of heat are lost to the atmosphere atthe Antarctic Convergence (Figs. 2 and 9), with relatively small heat gains from solar radiation.The Antarctic system is thus an enormous heat exchanger for the global ocean, and thethermohaline circulation is also responsible for large movements of dissolved gases and othermaterials. Extensive mixing with waters in the West Wind Drift around Antarctica (the AntarcticCircumpolar Current) allows large volumes of Antarctic water to be carried into the PacificOcean. The Pacific itself is not so intensely charged with cold, dense water as the Atlantic, asNorth Pacific waters are less salty than North Atlantic Waters and so do not sink as deeply asthose in the North Atlantic. Nor is the southerly excursion of the densest North Pacific water soprominent as that of the North Atlantic. North Atlantic Deep Water reaches the Antarctic region(Fig. 9), whereas sinking North Pacific water does not reach the equator. Knowledge of thesevast, deep circulation patterns is crucial to understanding potential effects and hazards of deep-seawaste disposal.
19

FIG. 9. Schematic representation of the complex current flow in the Southern Ocean. Figures at theleft are estimates of the amount of heat, in calories, transported annually by the deep and bottomwaters. Figures at the top show that the annual heat given off to the atmosphere by the SouthernOcean greatly exceeds the heat received from the sun. (From: The Antarctic Oceans, by V.C. Kort.Copyright © 1962 by Scientific American, Inc. All rights reserved.) [2).
1.3. COASTAL AND NEAR-SURFACE PROCESSES
1.3.1. Significance of Coastal Processes
Now, knowing something about large-scale wind-driven surface circulation, geostrophiccurrents, and deep thermohaline circulation, which affect redistributions of materials in the globalocean, we can look more closely at smaller-scale coastal processes that affect radionuclidedistributions. Coastal processes often become relatively more significant than open-oceanprocesses because mankind is most closely associated with coastal environments, through fishing,recreational pursuits, transportation routing, mineral extraction (including oil and gas), anddumping of wastes.
20
w
Ocean
FIG. 10. Major coastal upwelling areas of the world, and the atmospheric pressure systems andprevailing oceanic currents associated with them.

t - o T o x * c s u c HI STATIONS TMOI*»SOH tax m STAIXXC
F/G. 77. The gradient of dissolved nitrate (fig-atom/liter) in selected coastal up-welling areas [3].
1.3.2. Significance of Coastal Upwelling Systems
Coastal upwelling has already been introduced, but it clearly is one of the most significantcoastal processes and deserves further treatment. Major upwelling areas of the world oceanrepresent only about 0.1% of the ocean's surface area, but perhaps 50% of its fish production.Coastal upwelling areas are characteristically associated with eastern boundary currents (westernsides of continents in the Atlantic and Pacific Oceans), although the upwelling zone off theSomali coast is an exception, a product of the SW (summer) monsoon system (Fig. 10). Moreminor or more ephemeral upwelling systems can be found anywhere that winds, in concert withthe Coriolis effect, move surface waters away from a coastline (with subsequent replacement ofthose waters with waters upwelled from greater depths). The most persistent systems (Fig. 10) arethose in which the prevailing winds are steady enough over long enough time periods to keep theupwelling process active for long periods. Long-term upwelling continues to resupply surfacewaters with dissolved nutrients from below the Ekman layer, thus providing the fertilizernecessary to sustain luxurious phytoplankton growth, which in turn supports food webs stableenough to allow large production of fish biomass. Upwelling areas in the westerly wind belts(western North America, northwest and southwest Africa) are seasonal, as the atmospheric high-pressure systems generating the upwelling-favorable winds themselves are seasonal in position,
22

and the Somali upwelling system is seasonal because of the seasonally of the monsoon winds, asnoted earlier. Within any given season upwelling-favorable winds may disappear for shortperiods, thus turning off the upwelling circulation with its supply of nutrients to the euphoticzone; however, upwelling-favorable winds are the predominant winds during the summer seasonsin the westerly wind belts, so that upwelling circulation is persistent enough to maintain aproductive food web. The most productive upwelling system is that off northwestern SouthAmerica, principally Peru and Ecuador (Fig. 10). This system is driven by the Trade Winds,which, although relatively light, are nevertheless persistent throughout the year. This systemboasts some of the highest fish production in the world, although overfishing and El Nino eventshave reduced stocks to very low levels in recent years.
The major upwelling areas have somewhat different patterns of distribution of nutrients,and therefore different patterns of phytoplankton growth and food web structure. These differentpatterns are brought about by the different configurations of bathymetry and coastal topographyin the different areas (Fig. 11), as well as by different wind intensities and persistence. It is clearthat disposal of radioactive or other wastes into any upwelling system, or locating processingplants in an upwelling region, would be harmful. The systems are relatively shallow, veryproductive, and would tend to redistribute near-bottom materials back toward the coast.
1.3.3. Tides and Tidal Currents
Coastal areas also experience tides and tidal currents, capable of locally redistributingmaterials injected into estuarine or nearshore waters. Tide-generating forces include gravitationalattraction between the Earth and moon, centrifugal forces created by the rotation of the Earth andmoon, and gravitational forces between the Earth/moon system and the sun. A parcel of water onthe Earth's surface nearest the moon is about 3% closer to the moon than a parcel on the Earth'ssurface farthest from the moon; hence, the moon's gravitational attraction is greatest on the waternearest the moon, and least on the water farthest from the moon. Centrifugal forces are equal overthe Earth's surface, however. Thus, on the side nearest the moon, the gravitational attraction ofthe moon exceeds the centrifugal force, so that the water is pulled out toward the moon. On theside furthest from the moon, the centrifugal force exceeds the gravitational pull, so that there, too,the water is pulled away from the earth. A slightly oval water envelope is thus created around thesphere of the Earth in this idealized scenario (Fig. 12a), with the bulge of the oval on both sides ofthe Earth being the high tides, and the slightly flattened sides of the oval being the low tides.Remember that the earth revolves under its water covering, so that the tidal bulge (high tide), tosomeone standing at a fixed point on the revolving Earth, seems to appear (increase) anddisappear (decrease) over a fixed period of time. If, for example, the moon is in the plane of theEarth's equator, the two tidal bulges on opposite sides of the Earth will be centered at the equator(Fig. 12a). After the Earth rotates 90°, the same point on the equator would register a low tide.Continual 90° rotations yield successive, equal-sized high and low tides from the fixed point -two high tides and two low tides over a period slightly greater than one full day.
The moon does not maintain a fixed position relative to the Earth, however; i.e., the moonis not always in the plane of the equator, creating tides of equal magnitude each tidal day.Therefore, a person at a fixed position on Earth would see two high tides and two low tides duringeach tidal day, as before, but over a period of successive days the height of the high tides anddepth of the low tides would be different as the position of the moon changed relative to a fixedpoint on the Earth; thus, higher high tides and lower low tides are registered relative to othertimes (Fig. 12b).
The sun also exerts a gravitational effect on the Earth's water envelope, but it is more than50% weaker than that of the moon because of the enormous distance between the Earth and thesun. Also, solar tides have a 12 hr period (the time between two high tides, or between two lowtides), while the lunar period is about 12.5 hours. Finally, the Earth takes a full year to cycle the
23

MOONEARTH MOON
(C)
Spring Tides
EARTH
FullMoon
lunar tide
solar tide
SUN
NewMoon
(d)1st QUARTER
Moon
EARTH
solar tide
lunar tide
Neap Tides 3rd QUARTERMoon
FIG. 12. Schematic representation showing how tides are created.
24
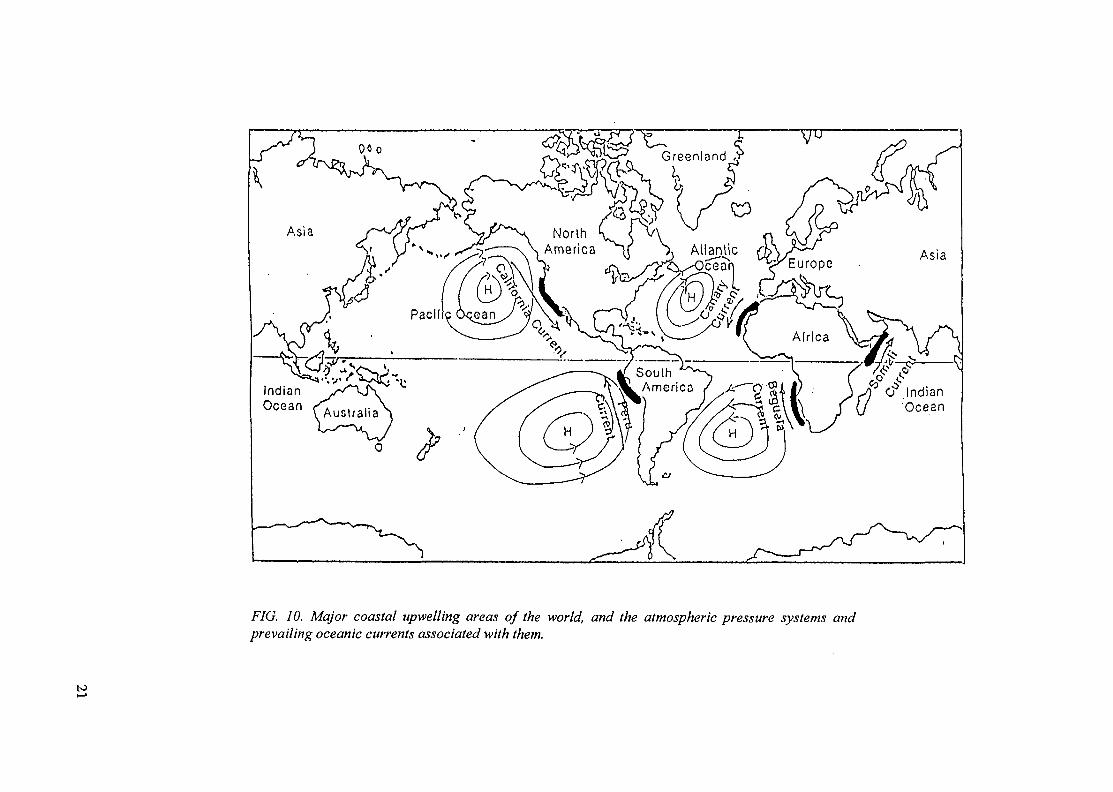
sun, whereas the moon cycles the Earth once per month. Solar and lunar tides acting together orin opposition create spring tides or neap tides, respectively (Fig. 12c,d)- Spring tides, which occurapproximately every two weeks around the times of the new moon and full moon, occur when thesun and moon line up with the Earth, so that their tide-generating forces act together to createextra large bulges in the tidal envelope (i.e., extra high tides). Conversely, during the first andthird quarters of the moon, the solar and lunar tide-generating forces partially counteract eachother by acting in different directions, resulting in the lowest tidal range - the neap tides. Thereare further complexities to tides than the above so-called "equilibrium theory" presents, but theabove should be enough for our purposes here.
The tide in every marginal sea, bay, harbor, or estuary is greatly influenced not only by themagnitude of the ocean tide at the mouth, but also by the natural period of the basin and the cross-section of the mouth. The small tidal range in the Mediterranean Sea (about 0.5 meter), forexample, can be explained by the small opening through the Strait of Gibraltar into the Atlantic,relative to the size and depth of the Mediterranean basin. The effect of tides on distributingradionuclides in the Mediterranean is vanishingly small. On the other hand, in the Bay of Fundy(New Brunswick, Canada), where the natural period of the basin is near the tidal period (12hours), large standing waves are set up (see below), which course back and forth through thebasin giving an extreme tidal range (ranges on the spring tide are about 15 m in the Bay ofFundy). Movement of materials by these tidal bores is extremely great. Thus, tidal effects incoastal areas can be either great or small, alternately exposing and covering great areas of beachor shoreline, or not making much difference at all. Knowledge of the tidal features in a given areaof coast or estuary is exceedingly important when considering radionuclide waste discharge orother discharges.
1.3.4. Nearshore Surface Waves, Internal Waves, and Surf
Surface waves are not particularly significant in distribution of materials until they crestover to form surf adjacent to beaches. Surf is lateral movement of surface waters, and thus candistribute materials onto beaches. Internal waves, however, can redistribute much heat, dissolvedgases, and other materials in the ocean's interior. In principle they are like surface waves, but theyare usually found at the interface of water layers of different density. Internal waves can be muchhigher, longer, and move much more slowly (with longer period) than surface waves, because thedensity differences between two water layers are much less than between water and air.
1.3.5. Standing Waves and Tsunamis
At times the whole water mass in an enclosed basin (e.g., the Red Sea or the Bay of Fundy)can slosh back and forth, much as water in a bathtub can be made to slosh back and forth byapplying and releasing some pressure on the water at one end of the tub. An earthquake or someother major phenomenon can often set off these standing waves in a natural basin. The edges of astanding wave at the shore alternately exposes and inundates large areas of shoreline, thuspotentially redistributing near-shore materials. The ultimate standing waves are seismic seawaves, or tsunamis, which can be devastating when they occur; however, they are rare. Tsunamisare usually caused by large earthquakes beneath the sea floor which act to accelerate a wall ofwater in some direction. The tsunami is similar to a shallow-water standing wave, but originatesin deep water and thus can transport an enormous volume of water very rapidly (up to 800 km/hr).Tsunamis are often undetectable by ships at sea, and only wreak havoc when they encounter aland mass.
1.3.6. Small-Scale Thermohaline Circulation
Thermohaline circulation, on a smaller vertical scale than that addressed earlier, isresponsible for much water movement and distribution of properties in the coastal ocean and in
25

(a) TEMPERATURE (b) SALINITY (c) DENSITY
xh-0.LUQ 2 -
3 -
ThermoclineHalocline
TPycnocline
(d) TEMPERATURE (°C)6 8 10 12 14 16
(e
LUQ
)o:
20
40
60
80
nn
> 41 i
_March-
-
-
, 1
TEMPERATURE6 8 10I
•April
f
1 [
•May
J-June
12 'i •
-July
I
4 16i ' i
-August •
-
-
-
i , i
FIG. 13. Schematic representation of a thermocline (a), halocline (b), pycnocline (c), fall-winterdecay of a thermocline (d), and spring-summer establishment of a thermocline (e).
upper layers of the open temperate ocean. Because radionuclides and most other materials enterthe ocean through the surface layers, these upper-water circulations are very significant. Thecirculations are generated when stable, near-surface water columns are disrupted (usuallyseasonally due to seasonal changes in temperature and salinity of those waters). Relatively stableupper-water columns occur when surface waters, warmed by the sun, form a relatively thin mixedlayer over a region of fairly rapid temperature change with depth. This layer of temperaturediscontinuity is the thermocline (Fig. 13a). Below the thermocline temperatures remain cold, andchange very little all the way to the sea floor. Sometimes salt is the principal agent of stability ofnear-surface waters in the ocean, so that a shallow region of low-salinity water overrides a zoneof maximum salinity change with depth (the halocline), which in turn overrides deep waters withhigh salinity that changes very little with depth (Fig. 13b). The combined effects of temperatureand salinity are responsible for the density of the water, so that a stable water column features ashallow surface layer of low-density water (relatively warm and fresh) which overrides a zone ofmaximum density change with depth (the pycnocline), which in turn overrides the densest water(relatively cold and salty) (Fig. 13 c). Waters of different densities resist mixing, so that anyradionuclides put into surface waters overriding a well-established pycnocline would remain inthose surface waters for a long time, if physical processes were the only processes involved inradionuclide distribution (in fact, physical processes are not the only ones involved, and this willbe examined later).
26

In tropical waters, upper water columns can remain relatively stable for long periods oftime, the stability mainly being upset by episodic events such as storms at sea, or by internalwaves along interfaces between the pycnocline and waters above or below it. In temperate seas,winter lowering of atmospheric temperatures, and/or rainfall and river runoff in the coastal ocean,causes the water-column stability of summer to break down (Fig. 13d). As autumn air begins tocool the immediate water surface layer, that water sinks until it reaches water of equal density.Further cooling of the air acts to cool more surface water, which also sinks. This processcontinues, setting up a vertical convection of cooler water sinking through the slightly warmerwater until the upper layers become equally dense and therefore capable of mixing easily. Asspring approaches, the progression reverses (Fig. 13e); i.e., the winter water column begins towarm at the surface. This warmer surface layer resists mixing with the slightly colder water justbelow it, initiating the formation of a thermocline. As the surface waters continue to warm, thethermocline deepens until the incoming summer radiation attains its maximum possible effect.The progression then begins to reverse again (Fig. 13d). It should be noted that thesethermohaline circulations are identical to global thermohaline circulations involving masstransports of deep water, except the former are near-surface phenomena usually occurring on aseasonal basis in temperate and subpolar seas. Seasonal thermohaline circulations rarely involvedepths beyond 100 m or so, but note that this depth zone is the approximate productive zone ofthe sea and the one contiguous with the atmosphere and with river and coastal discharges.
1.4. SMALL-SCALE PROCESSES
1.4.1. Scaling for Sampling Protocols
When studying oceanic water movements relative to distributions of radionuclides, thetendency is always to present the large-scale processes and ignore the small-scale processes.However, from the standpoint of knowing how to sample, when to sample, and how often tosample water for valid distributional analysis of radioactivity at sea, it is imperative to have someunderstanding of time and space scales of physical processes (such as mixing and diffusion)relative to biological and radiochemical processes of interest.
Simple formulae can often be used to determine characteristic scales; for example,
T- -J- = characteristic time (T)for sampling quantity (q),(—}
where q = concentration of a long-lived radionuclide in the water, for example, and dq/dt = thetime rate of change of quantity q in that water (e.g., ug/m3 -s- u.g/m3/hr = hrs). T is the number ofhours one has to sample q before q is dissipated to generally unmeasurable levels by dispersion,sinking, biological uptake, or other mechanisms (presuming q is a one-time input to the samplingregion). If q is a radionuclide with short half-life, then radioactive decay must also be accountedfor. Knowledge of space scales required for sampling are also important, and this involvesselection of the numbers and spacing of sampling sites to adequately represent the spatial domainof interest.
1.4.2. Reynolds Number
One dimensionless number that has proved useful in delineating time and space scalessignificant for a particular sampling scheme is the Reynolds number. This number gives therelationship between turbulent processes and molecular processes in a fluid, and is defined as:
27

where u £ - a characteristic length scale (£) times a characteristic velocity (u), of water, aparticle, or an organism; and V= kinematic viscosity of the fluid (for water, kinematic viscosity =viscosity/density « 10"2 cm^ see"*, a measure of molecular motions). A low Re represents moreviscous, laminar flow, while a high Re represents turbulent flow. A one-micron-sized particle offallout radioactivity, for example, operates in a very low-Re environment (very tiny "length" scaleand very weak sinking velocity relative to the kinematic viscosity of the water in which it wasdeposited). A zooplankton organism 1mm in length also operates in a relatively low-Reenvironment (the short length and slow swimming speed of the zooplankter relative to thekinematic viscosity of the water in effect gives the same mobility problem to the zooplankter as ahuman being would have trying to swim through thick molasses). On the other hand, a full-growntuna lives in a high-Re environment (long length and rapid swimming ability of the fish relativeto the kinematic viscosity of the water). Clearly one would not design a similar sampling programfor fallout particles, zooplankton and tuna; however, would one design the same program for 1 urnand lOOjam particles (e.g., fallout particles and diatoms), for lmm zooplankton and 10mmzooplankton. Small-scale processes are important, and correct sampling scales are required toadequately assess them.
1.4.3. Richardson Number
The Richardson number (Ri) is another dimensionless number, relating a stabilizingbuoyancy to a destabilizing shear. This measure is important in determining when a stable upperwater column turns into a mixed water column, and to what extent:
Ri =du
where the numerator is a measure of buoyancy (a sink for turbulent energy, the so-called Brunt-Vaisala number), and the denominator is a measure of shear (a source of turbulent energy). In theformula, g = acceleration due to gravity, e = density of the water, u = velocity, and z = depth.Richardson numbers between zero and one denote the region where shear overcomes stability,leading to a turbulent condition (0.25 is approximately the balance point where neither shear norbuoyancy controls). An Ri greater than one is a stable water column (a greater sink than sourcefor turbulent energy).
REFERENCES
[1] GROSS, M.G., Oceanography, 2nd ed., Prentice-Hall, Inc., Englewood Cliffs, New Jersey(1977) 497 pp.
[2] KORT, V.G., The Antarctic Ocean, Scientific American 207 (1962) 113-128.
[3] THOMPSON, J.D., "Ocean deserts and ocean oases", Desertification (GLANTZ, M.H. Ed.),Westview Press, Boulder, Colorado (1977) 103-139.
[4] WALSH, J.J., Herbivory as a factor in patterns of nutrient utilization in the sea, Limnol.Oceanogr. 21 (1976) 1-13.
28

BIBLIOGRAPHY
ANIKOUCHINE, W.A., STERNBERG, R.W., The World Ocean. An Introduction toOceanography 2nd ed., Prentice-Hall, Inc., Englewood Cliffs, New Jersey (1981) 513 pp.
HARVEY, J.G., Atmosphere and ocean: Our Fluid Environments, Artemis Press, Ltd., Sussex(1976) 143 pp.
McLELLAN, H.J., Elements of Physical Oceanography, Pergamon, London (1965) 150 pp.
WEYL, P.K., Oceanography: An Introduction to the Marine Environment, John Wiley & Sons,New York (1970) 535 pp.
29