Gene Duplication and the Evolution of Hemoglobin Isoform ...
17
University of Nebraska - Lincoln University of Nebraska - Lincoln DigitalCommons@University of Nebraska - Lincoln DigitalCommons@University of Nebraska - Lincoln Jay F. Storz Publications Papers in the Biological Sciences 11-2012 Gene Duplication and the Evolution of Hemoglobin Isoform Gene Duplication and the Evolution of Hemoglobin Isoform Differentiation in Birds Differentiation in Birds Michael T. Grispo University of Nebraska-Lincoln, [email protected] Chandrasekhar Natarajan University of Nebraska-Lincoln, [email protected] Joana Projecto-Garcia University of Nebraska–Lincoln Hideaki Moriyama University of Nebraska-Lincoln, [email protected] Roy E. Weber Aarhus University, Denmark See next page for additional authors Follow this and additional works at: https://digitalcommons.unl.edu/bioscistorz Grispo, Michael T.; Natarajan, Chandrasekhar; Projecto-Garcia, Joana; Moriyama, Hideaki; Weber, Roy E.; and Storz, Jay F., "Gene Duplication and the Evolution of Hemoglobin Isoform Differentiation in Birds" (2012). Jay F. Storz Publications. 61. https://digitalcommons.unl.edu/bioscistorz/61 This Article is brought to you for free and open access by the Papers in the Biological Sciences at DigitalCommons@University of Nebraska - Lincoln. It has been accepted for inclusion in Jay F. Storz Publications by an authorized administrator of DigitalCommons@University of Nebraska - Lincoln. brought to you by CORE View metadata, citation and similar papers at core.ac.uk provided by DigitalCommons@University of Nebraska
-
Upload
khangminh22 -
Category
Documents
-
view
1 -
download
0
Transcript of Gene Duplication and the Evolution of Hemoglobin Isoform ...
University of Nebraska - Lincoln University of Nebraska - Lincoln
DigitalCommons@University of Nebraska - Lincoln DigitalCommons@University of Nebraska - Lincoln
Jay F. Storz Publications Papers in the Biological Sciences
11-2012
Gene Duplication and the Evolution of Hemoglobin Isoform Gene Duplication and the Evolution of Hemoglobin Isoform
Differentiation in Birds Differentiation in Birds
Michael T. Grispo University of Nebraska-Lincoln, [email protected]
Chandrasekhar Natarajan University of Nebraska-Lincoln, [email protected]
Joana Projecto-Garcia University of Nebraska–Lincoln
Hideaki Moriyama University of Nebraska-Lincoln, [email protected]
Roy E. Weber Aarhus University, Denmark
See next page for additional authors
Follow this and additional works at: https://digitalcommons.unl.edu/bioscistorz
Grispo, Michael T.; Natarajan, Chandrasekhar; Projecto-Garcia, Joana; Moriyama, Hideaki; Weber, Roy E.; and Storz, Jay F., "Gene Duplication and the Evolution of Hemoglobin Isoform Differentiation in Birds" (2012). Jay F. Storz Publications. 61. https://digitalcommons.unl.edu/bioscistorz/61
This Article is brought to you for free and open access by the Papers in the Biological Sciences at DigitalCommons@University of Nebraska - Lincoln. It has been accepted for inclusion in Jay F. Storz Publications by an authorized administrator of DigitalCommons@University of Nebraska - Lincoln.
brought to you by COREView metadata, citation and similar papers at core.ac.uk
provided by DigitalCommons@University of Nebraska
Authors Authors Michael T. Grispo, Chandrasekhar Natarajan, Joana Projecto-Garcia, Hideaki Moriyama, Roy E. Weber, and Jay F. Storz
This article is available at DigitalCommons@University of Nebraska - Lincoln: https://digitalcommons.unl.edu/bioscistorz/61

Abstract. The majority of bird species co-express two func-tionally distinct hemoglobin (Hb) isoforms in definitive eryth-rocytes as follows: HbA (the major adult Hb isoform, with α-chain subunits encoded by the αA-globin gene) and HbD (the minor adult Hb isoform, with α-chain subunits encoded by the αD-globin gene). The αD-globin gene originated via tan-dem duplication of an embryonic α-like globin gene in the stem lineage of tetrapod vertebrates, which suggests the pos-sibility that functional differentiation between the HbA and HbD isoforms may be attributable to a retained ancestral char-acter state in HbD that harkens back to a primordial, embry-onic function. To investigate this possibility, we conducted a combined analysis of protein biochemistry and sequence evo-lution to characterize the structural and functional basis of Hb isoform differentiation in birds. Functional experiments in-volving purified HbA and HbD isoforms from 11 different bird species revealed that HbD is characterized by a consis-tently higher O2 affinity in the presence of allosteric effectors such as organic phosphates and Cl− ions. In the case of both HbA and HbD, analyses of oxygenation properties under the two-state Monod-Wyman-Changeux allosteric model revealed that the pH dependence of Hb-O2 affinity stems primarily from changes in the O2 association constant of deoxy (T-state)-Hb. Ancestral sequence reconstructions revealed that the amino acid substitutions that distinguish the adult-expressed Hb isoforms are not attributable to the retention of an ances-tral (pre-duplication) character state in the αD-globin gene that is shared with the embryonic α-like globin gene.
Keywords. evolution, hemoglobin, molecular evolution, oxy-gen transport, protein evolution, avian genome, gene family evolution, globin gene family
Abbreviations. isoHb = Hb isoforms; IHP = inositol hexa-phosphate; CBD = constant-but-different; RACE = rapid am-plification of cDNA end
Hemoglobin (Hb) is one of the most extensively studied proteins in terms of structure-function relationships, and
comparative studies of Hbs from non-human animals have made important contributions to this knowledge base (1–4). Despite this detailed understanding, a number of vexing ques-tions about Hb function continue to challenge comparative biochemists and physiologists. One such question concerns the functional and adaptive significance of co-expressing mul-tiple, structurally distinct Hb isoforms (isoHbs) (2, 5–9). Most vertebrate species express functionally distinct isoHbs during different stages of pre-natal development, and in many groups it is also common to co-express different isoHbs during post-natal life. The majority of birds and nonavian reptiles co-ex-press two functionally distinct isoHbs in definitive erythro-cytes as follows: HbA (the major adult isoHb, with α-chain subunits encoded by the αA-globin gene) and HbD (the minor adult isoHb, with α-chains encoded by the αD-globin gene). HbD typically accounts for ~10–30% of total Hb in definitive erythrocytes, and available evidence indicates that it is gener-ally characterized by an elevated O2 affinity relative to HbA (10–20).
Insights into the physiological division of labor between the HbA and HbD isoforms may help to explain why the du-plicated αA- and αD-globin genes have been retained and why the adult expression of αD-globin has persisted in the major-ity of avian lineages. Because the HbA and HbD isoforms ex-hibit consistent differences in O2-binding properties, regula-tory changes in intra-erythrocytic isoHb stoichiometry could provide a mechanism for modulating blood-O2 affinity in re-sponse to changes in O2 availability or changes in internal metabolic demand (11, 20, 21).
Another distinction between the two avian isoHbs is that tetrameric HbDs self-associate upon deoxygenation, which results in super-cooperativity (Hill coefficients >4.0) because higher order allosteric interactions between HbD tetramers are
Published in Journal of Biological Chemistry 287:45 (November 2, 2012), pp. 37647-37658; doi: 10.1074/jbc.M112.375600
Copyright © 2012 The American Society for Biochemistry and Molecular Biology, Inc. Used by permission.
Submitted April 24, 2012; revised September 6, 2012; published online September 8, 2012.
This work was supported by National Institutes of Health Grants R01 HL087216 and HL087216-S1 from NHLBI, and also by National Science Foundation Grant IOS-0949931 and the Science Faculty, Aarhus University.
The nucleotide sequences reported in this paper have been submitted to the GenBankTM/EBI Data Bank with accession number(s) JQ405307–JQ405317, JQ405319–JQ405326, JQ697045–JQ 97070, JQ405317, and JQ824132.
Supplemental Tables S1 and S2 and additional references are presented following the References.
Gene Duplication and the Evolution of Hemoglobin Isoform Differentiation in BirdsMichael T. Grispo,1 Chandrasekhar Natarajan,1 Joana Projecto-Garcia,1 Hideaki Moriyama,1 Roy E. Weber,2 and Jay F. Storz1
1. School of Biological Sciences, University of Nebraska–Lincoln, Lincoln, Nebraska 68588, USA 2. Zoophysiology, Institute for Bioscience, Aarhus University, DK-8000 Aarhus C, Denmark Corresponding author — J. F. Storz, tel 402 472-1114, fax 402 472-2083, email [email protected]
Background: The functional significance of hemoglobin heterogeneity remains a mystery. Results: In adult birds, the HbD isoform (related to embryonic hemoglobin) exhibits distinct oxygenation properties relative to the major HbA isoform. Conclusion: Substitutions that distinguish HbD from HbA are not shared with embryonic hemoglobin. Significance: Differences between isoforms stem from derived (nonancestral) changes in duplicated genes, not from the retention of an ancestral
condition.
37647

37648 Gr i s p o e t a l . i n Jo u r n a l o f B i o l o g i c a l ch e m i s t ry 287 (2012)
superimposed on the subunit-subunit interaction within tet-ramers (16, 22–24). In principle, the enhanced cooperativity could facilitate efficient O2 unloading over an especially nar-row range of blood O2 tensions (25).
It is also possible that the physiological benefits of Hb het-erogeneity are unrelated to O2-binding properties. If isoHbs with different isoelectric points co-occur in the same eryth-rocytes, then Hb heterogeneity may enhance solubility (and hence, corpuscular Hb concentration), thereby increasing the O2-carrying capacity of the blood (26–28). isoHbs with differ-ent charges would also indirectly influence the distribution of protons and other ions across the red cell membrane by alter-ing the Donnan equilibrium, and this could play an important role in the allosteric regulation of Hb-O2 affinity and cellular metabolism (29, 30). These considerations led Ingermann (8) to conclude that it “… seems unlikely that the presence of elec-trophoretically distinguishable Hb multiplicity represents se-lectively neutral variations in Hb structure and function.”
Available evidence suggests that the tetrapod common an-cestor possessed three tandemly linked gene duplicates that encode the α-chain subunits of the α2β2 Hb tetramer, 5′-αE–αD–αA-3′ (31–33). In the stem lineage of tetrapods, the proto-αE- and αA-globin genes originated via tandem duplication of an ancestral α-like globin gene, and αD-globin originated subse-quently via tandem duplication of the proto-αE-globin gene (31). In tetrapod vertebrates, the αE-globin gene is exclu-sively expressed in larval/embryonic erythroid cells, and the αA-globin gene is expressed in definitive erythroid cells dur-ing later stages of prenatal development and postnatal life. In birds and nonavian reptiles that have been studied to date, the αD-globin gene is expressed in both primitive and definitive erythroid cells (34–36). HbD does not appear to be expressed in the definitive erythrocytes of crocodilians (37–39), and the αD-globin gene has been inactivated or deleted independently in amphibians and mammals (31, 40, 41).
Given that HbA and HbD share the same β-chain subunits, functional differences between the two isoHbs must be attrib-utable to amino acid substitutions in the αA- and/or αD-globin genes. In light of what is known about the phylogenetic his-
tory of the α-like globin genes in tetrapods (31, 32), functional differentiation between the HbA and HbD isoforms may be attributable to post-duplication substitutions that occurred in the αA-globin and/or αD-globin gene lineages (Figure 1, A–C), they could be attributable to substitutions that occurred in the single copy, pre-duplication ancestor of the αE- and αD-globin genes (Figure 1D), or they could be attributable to a combi-nation of pre- and post-duplication substitutions (Figure 1, E and F). Because embryonic and adult-expressed Hbs exhibit a number of consistent functional differences (42), the scenarios depicted in Figure 1, D–F, suggest the possibility that HbA/D isoform differentiation may be attributable to a retained an-cestral character state in HbD that harkens back to a primor-dial, embryonic function. To investigate this possibility and to examine the functional evolution of the α-like globin genes, we conducted a combined analysis of protein biochemis-try and sequence evolution to characterize the structural and functional basis of Hb isoform differentiation in birds. The main objectives were as follows: (i) to characterize the O2-binding properties of HbA and HbD in species that are rep-resentative of several major avian lineages; (ii) to gain insight into the structural basis of the observed functional differen-tiation between the HbA and HbD isoforms; and (iii) to de-termine whether functional differentiation between the HbA and HbD isoforms is primarily attributable to post-duplica-tion substitutions or the retention of ancestral character states shared by HbD and embryonic Hb. Functional experiments involving purified HbA and HbD isoforms from 11 different bird species confirmed that HbD is characterized by a consis-tently higher O2 affinity in the presence of allosteric effectors such as organic phosphates and Cl− ions. Results of the com-parative sequence analysis revealed that isoHb differentia-tion is attributable to roughly equal numbers of post-dupli-cation amino acid substitutions that occurred in the αA- and αD-globin genes.
Experimental ProceduresExperimental Measures of Hemoglobin Function. To
characterize the nature of isoHb differentiation in birds, we
Figure 1. Hypothetical scenarios depicting the phylogenetic distribution of amino acid substitutions that are responsible for functional differen-tiation between the co-expressed HbA and HbD isoforms in birds. The phylogeny represented in each panel depicts the known branching rela-tionships among the αA-, αD-, and αE-globin genes. At any given site, fixed differences between the αA- and αD-globin genes could be attributable to a substitution that occurred on the branch leading to αA-globin (A), a substitution that occurred on the post-duplication branch leading to αD-globin (B), substitutions that occurred on the branch leading to αA-globin and on the post-duplication branch leading to αD-globin (C), a substitu-tion that occurred on the pre-duplication branch leading to the single-copy progenitor of αD- and αE-globin (D), substitutions that occurred on the branch leading to αA-globin and on the pre-duplication branch leading to the αD/αE ancestor (E), or substitutions that occurred on the pre-duplica-tion branch leading to the αD/αE ancestor and on the post-duplication branch leading to αD-globin (F).
Ge n e Du p l i c at i o n a n D t h e ev o l u t i o n o f he m o G l o b i n is o f o r m Di f f e r e n t i at i o n i n b i r D s 37649
measured O2-binding properties of purified HbA and HbD isoforms from a total of 11 avian species representing each of six orders as follows: griffon vulture, Gyps fulvus (Accip-itriformes, Accipitridae); greylag goose, Anser anser (Anseri-formes, Anatidae); amazilia hummingbird, Amazilia amazilia (Apodiformes, Trochilidae); green-and-white humming-bird, Amazilia viridicauda (Apodiformes, Trochilidae); vio-let-throated starfrontlet, Coeligena violifer (Apodiformes, Tro-chilidae); giant hummingbird, Patagona gigas (Apodiformes, Trochilidae); great-billed hermit, Phaethornis malaris (Apod-iformes, Trochilidae); common pheasant, Phasianus colchicus (Galliformes, Phasianidae); rook, Corvus frugilegus (Passeri-formes, Corvidae); house wren, Troglodytes aedon (Passeri-formes, Troglodytidae); and ostrich, Struthio camelus (Stru-thioformes:, Struthionidae). We examined Hbs from a disproportionate number of hummingbirds because Apodi-formes is the most speciose order of birds after the passer-ines, and because this group is under-represented in previ-ously published studies of avian Hb function.
Blood samples were obtained according to methods de-scribed by Weber et al. (20) and Nothum et al. (14). Washed red cells were frozen at −70 °C and were subsequently thawed by adding 2 volumes of distilled water and ⅓ volume of 1 m Tris/HCl buffer, pH 7.5. For each individual specimen, Hb isoform composition was characterized by means of alkaline PAGE and/or thin layer isoelectric focusing (PhastSystem, GE Healthcare Biosciences). Depending on the species, the HbA and HbD isoforms were separated by fast protein liquid chro-matography (FPLC), DEAE anion-exchange chromatogra-phy, CM-Sepharose cation-exchange chromatography, and/or preparative electrofocusing, as described previously (11, 36, 43, 44). The separate isoHbs were further stripped of organic phosphate and other ions by passing the samples through a mixed bed resin column (MB-1 AG501-X8; Bio-Rad) using FPLC. Hb solutions were then saturated with carbon monox-ide and dialyzed at 5 °C for at least 24 h against three changes of CO-saturated 0.01 m Tris/HCl buffer, pH 7.5, containing 0.5 mm EDTA. In cases where partial oxidation (metHb for-mation) was evident, Hb was reduced by adding sodium di-thionite, followed by dialysis against Tris buffer containing EDTA, as described by Weber et al. (20). For the Hbs of the house wrens and the five hummingbird species, we used 10 mm HEPES as the dialysis buffer.
We measured O2 equilibrium curves for purified HbA and HbD isoforms using a modified gas diffusion cham-ber coupled to cascaded Wösthoff pumps for mixing pure N2 (99.998%), O2, and atmospheric air (9). Changes in the absor-bance spectra of thin layer Hb solutions (4 μl) were measured in conjunction with stepwise changes in the partial pressure of O2 (PO2) inside the chamber. Values of P50 (the PO2 at which heme is 50% saturated) and n50 (Hill’s cooperativity coeffi-cient at 50% saturation) were interpolated from linear plots of log(Y/(Y − 1)) versus logPO2 for at least four values of Y (frac-tional saturation) between 0.25 and 0.75. To assess variation in the sensitivity of Hb-O2 affinity to allosteric effectors (ligands that alter Hb-O2 affinity by reversibly binding to sites remote from the active site), we measured O2 equilibrium curves of Hbs suspended in 0.10 m NaHEPES buffer, in the absence of added effectors (“stripped”), in the presence of inositol hex-aphosphate (IHP (IHP/Hb tetramer ratio = 2.0)), in the pres-ence of 0.10 m Cl− ions (added as potassium chloride, KCl),
and in the presence of both effectors ([heme], 0.3 mm, unless otherwise specified). IHP is a chemical analog of inositol pen-taphosphate, which is the most potent allosteric effector mole-cule in avian red cells (21, 45).
In the case of pheasant HbA and HbD, we conducted a de-tailed analysis of allosteric interactions based on measure-ments of O2 equilibria that included extremely high and ex-tremely low saturation values. This allowed us to analyze the data in terms of the two-state Monod-Wyman-Changeux al-losteric model (46), which relates Hb-O2 saturation (Y) to the partial pressure of O2 (P), the O2 association constants for “R-state” oxyHb and “T-state” deoxy-Hb (KR and KT, respec-tively), the allosteric constant (L), and the number of interact-ing O2-binding sites (q) as shown in Equation 1.
Y = LKT P {1 + KTP }(q – 1) + KRP {1 + KRP }(q – 1) (1)
L(1 + KTP)q + (1 + KRP)q
This equation was fit to the data in the form log (Y/1 − Y) ver-sus log P (end-weighting), and parameters were estimated us-ing the curve-fitting procedure described by Weber et al. (47). In separate analyses, values of q were estimated from the data or were fixed at 4, as applies to tetrameric Hb. The two-state Monod-Wyman-Changeux parameters derived for q = 4 were used to calculate the intrinsic Adair constants that characterize the affinities of four successive heme oxygenation steps (48, 49) as shown in Equation 2.
k1 = (KR + LKT) / (1 + L)
k2 = (KR2 + LKT
2 ) / (KR + LKT)
k3 = (KR3 + LKT
3 ) / (KR2 + LKT
2 )
k4 = (KR4 + LKT
4 ) / (KR3 + LKT
3 ) (2)
The half-saturation value, P50, was calculated as the PO2 at log [Y/(1 − Y)] = 0, and the median PO2, Pm, was calculated as shown in Equation 3,
Pm =
{ 1 } ( L + 1 ) 1/q
KR Lcq + 1 (3)
where c = KT/KR (50). The maximum slope of the log-log plot, nmax, was calculated by first solving for PO2 in Equation 4,
d2 { log
( s ) } 1 – s = 0
d{log(PO2)}2 (4)
and then using that value to calculate d(log[Y/(1 − Y)]/d(logPO2). The free energy of cooperativity, ΔG, was calcu-lated as in Equation 5.
ΔG =
RT ln{(L + 1)(Lcq + 1)}(Lc + 1)(Lcq –1 + 1) (5)
Our O2 binding data are not strictly comparable with those of some previously published studies because some workers measured O2 equilibria using ionic buffers that change Hb-O2

37650 Gr i s p o e t a l . i n Jo u r n a l o f B i o l o g i c a l ch e m i s t ry 287 (2012)
affinity via pH-dependent perturbations in the free concentra-tion of allosteric effectors (51). Nonetheless, measurements of O2-binding properties for HbA and HbD should be internally consistent within a given study, so it is possible to compare relative levels of isoHb differentiation among studies. Thus, for the purpose of making broad scale comparisons of isoHb differentiation among species, we surveyed published stud-ies of avian Hbs and compiled measures of the difference in log-transformed P50 values between HbA and HbD in the presence and absence of IHP.
Molecular Modeling. We built homology-based struc-tural models of pheasant HbA and HbD isoforms using SWISS-MODEL (52). We used deoxyhemoglobin (Protein Data Bank ID, 2HHB) as a template to maintain consistency with the results of Riccio et al. (53) and Tamburrini et al. (18). The root mean square deviations between the templates and models of the αA-, αD-, and β-chains were less than 0.08, 0.09, and 0.10 Å, respectively. These structures were used to cal-culate surface potentials using the PBEQ solver found on the CHARMM GUI server (54). We used the Swiss Institute of Bioinformatics ExPASy proteomics server (55) to estimate the isoelectric point (pI) of the observed and reconstructed α-chain globin structures. Finally, we conducted molecu-lar dynamics simulations to predict O2 and IHP binding en-ergies using AutoDock Vina (56). The search box for IHP (3HXN) was 25 Å cubic centered on the α-chain dyad cleft and that for O2 (1DN2) was 5 Å cubic centered on the O2-binding heme iron.
Taxon Sampling for the Molecular Evolution Analysis. Our phylogenetic survey of amino acid divergence among the avian α-like globin genes included a total of 54 species, including 10 of the 11 species that were used as subjects for the experimental studies of Hb function (supplemental Table S1). We cloned and sequenced the αA-, αD-, and/or αE-globin genes from 28 of the bird species, and we retrieved the re-maining sequences from public databases. We also included 98 homologous α-like globin sequences from species that are representative of the other main tetrapod lineages (amphibi-ans, nonavian reptiles, and mammals) as well as teleost fish (supplemental Table S2).
Molecular Cloning and Sequencing. Genomic DNA was isolated from frozen liver tissues using the DNeasy kit, and RNA was isolated from frozen whole blood or frozen pecto-ral muscle using the RNeasy kit (Qiagen, Valencia, CA). We designed paralog-specific PCR primer combinations for the αE-, αD-, and αA-globin genes by using multispecies align-ments of orthologous sequences that have been annotated in avian genome assemblies (32, 41, 57). For each species, the αE-globin gene was PCR-amplified from genomic DNA using the Invitrogen Taq polymerase native kit (Invitrogen) and the following thermal cycling protocol: 94 °C (10 min) initial denaturing (94 °C (30 s), 54–62.5 °C (30 s), and 72 °C (1 min)) for 34 cycles, followed by a final extension at 72 °C (7 min). The αD- and αA-globin genes were PCR-amplified from ge-nomic DNA, as described above, or cDNAs were amplified from RNA using the Qiagen OneStep RT-PCR kit (Qiagen, Valencia, CA). Reverse transcriptase (RT)-PCRs were con-ducted according to the following thermal cycling protocol: 50 °C (30 min) followed by a 94 °C (15 min) initial denatur-ing, (94 °C (30 s), 55 °C (30 s), 72 °C (1 min)) for 34 cycles, fol-lowed by a final extension at 72 °C (3 min).
For some species, we sequenced the αA- and αD-globin coding regions by using rapid amplification of cDNA ends (RACE). Primers were designed in the conserved ex-onic regions of the αA- and αD-globin genes, and the first strand synthesis was carried out using SuperScriptTM II re-verse transcriptase (Invitrogen). Both 5′- and 3′-RACE were performed according to the manufacturer’s protocol. Se-quences of all PCR, RT-PCR, and RACE primers are avail-able upon request.
PCR products were electrophoretically separated on a 1.2% agarose gel (100 volts) and were then excised and eluted from the gel following the protocol in the QIAquick gel extraction kit (Qiagen, Valencia, CA). PCR amplicons were cloned into pCR4-TOPO vector (Invitrogen), which was then used to transfect One-shot TOP10 chemically compe-tent Escherichia coli cells (Invitrogen). Positive clones were se-quenced on an ABI 3730XL high throughput capillary DNA analyzer (Applied Biosystems, Foster City, CA) using inter-nal T7/T3 primers. All sequences were deposited in Gen-BankTM under the accession numbers: JQ405307–JQ405317, JQ405319–JQ405326, JQ697045–JQ697070, JQ405318, and JQ824132.
Prediction of Functionally Divergent Sites. To nomi-nate candidate sites for functional divergence between the avian αA- and αD-globin sequences, we identified residue po-sitions that were highly conserved within each paralogous clade but differed between the two clades. Such sites were termed “constant-but-different” (CBD) sites by Gribaldo et al. (58) and were termed “type II” divergent sites by Gu (59). Our analysis of functional divergence was based on a total of 92 sequences (47 avian αA-globin sequences and 45 avian αD-globin sequences). To quantify the conservation of phys-icochemical properties at each residue position within the separate sets of αA- and αD-globin sequences, we calculated site-specific entropy values (60) as shown in Equation 6,
iHj = – ∑ pj logb pj (6)
j
where pj is the frequency of a particular physicochemical state at site j, and b = 8 such that calculated values fall within the interval (0, 1). In addition to considering single-residue insertions or deletions, we considered eight possible physi-cochemical states for each residue position as follows: hydro-phobic (Ala, Val, Ile, and Leu), hydrophilic (Ser, Thr, Asn, and Gln), sulfur-containing (Met and Cys), glycine (Gly), proline (Pro), acidic (Asp and Glu), basic (His, Lys, and Arg), and aromatic (Phe, Trp, and Tyr). We identified CBD sites as residue positions that were highly conserved within each set of orthologous sequences (Hi <0.5) but exhibited a con-sistent physicochemical difference between the αA- and αD-globin sequences. CBD sites do not necessarily represent fixed amino acid differences between the αA- and αD-globin paralogs, because a given site could be variable for an inter-changeable set of isomorphous residues within each set of or-thologous sequences.
Ancestral Sequence Reconstruction. To infer the phy-logenetic distribution of amino acid substitutions that con-tributed to functional differentiation between the avian HbA and HbD isoforms, we reconstructed ancestral sequences at
Ge n e Du p l i c at i o n a n D t h e ev o l u t i o n o f he m o G l o b i n is o f o r m Di f f e r e n t i at i o n i n b i r D s 37651
four separate nodes in the phylogeny of α-like globin genes as follows: (i) the single-copy proto-α-globin gene in the stem lineage of tetrapod vertebrates; (ii) the ancestral αA-globin in the stem lineage of birds; (iii) the single-copy an-cestor of the αE- and αD-globin paralogs in the stem lineage of tetrapods; and (iv) the ancestral αD-globin in the stem lin-eage of birds. To reconstruct ancestral α-chain sequences, we applied the maximum likelihood approach of Yang et al. (61) using the WAG + F model of amino acid substitution (62, 63) as implemented in PAML 4.4 (64). Amino acid se-quences were aligned using the default parameters in Mus-cle (65). The ancestral sequence reconstruction was based on a phylogeny of α-like globin sequences from a representa-tive set of mammals, birds, nonavian reptiles, and amphib-ians, and the tree was rooted with α-globin sequences from teleost fishes. Ancestral states of individual sites were re-constructed independently, and we restricted the analysis to sites that had posterior probabilities ≥0.8 for a given residue or physicochemical property.
In the phylogeny of α-like globin genes, (αA (αD and αE)), site-specific amino acid differences between the avian αA- and αD-globin sequences could be attributable to substitutions on (i) the branch leading to αA, (ii) the post-duplication branch leading to αD, and/or (iii) the pre-duplication branch leading to the single copy ancestor of αD and αE (Figure 1). Accord-ingly, we identified all amino acid substitutions that distin-guish the avian αA- and αD-globin paralogs, and after recon-structing ancestral states at relevant nodes of the phylogeny, we mapped the observed substitutions onto the branches men-tioned above. Mapping charge-changing substitutions onto branches of the phylogeny also allowed us to reconstruct the causes of divergence in isoelectric point (pI) between the HbA and HbD isoforms.
ResultsRelative Abundance of HbA and HbD. Ten of the bird
species included in our study expressed two main Hb iso-forms that were clearly referable to HbA and HbD. The grif-fon vulture, G. fulvus, expressed three isoHbs, one of which is clearly identifiable as HbD, and the other two incorporated the products of duplicated αA-globin genes (HbA and HbA′). The species that we examined generally expressed the HbA and HbD isoforms in a 2:1–4:1 ratio, which is consistent with re-sults from previous studies (8). The pheasant represented the sole exception to this pattern, as HbD was present at a higher concentration than HbA (69 versus 31%). HbD expression has been secondarily lost in representatives of six avian orders (Ci-coniiformes, Columbiformes, Coraciformes, Cuculiformes, Psittaciformes, and Sphenisciformes), and parsimony-based character-state mapping (using the phylogeny of Hackett et al. (66)) suggests that each of these losses occurred independently (data not shown).
Functional Properties of Avian HbA and HbD Iso-forms. O2-equilibrium measurements revealed consistent functional differences between the HbA and HbD isoforms, as HbD was generally characterized by a higher O2 affinity (lower P50) in the presence of IHP (2-fold molar excess over Hb) and in the presence of IHP + 0.1 m Cl− (Table 1). This pattern of isoHb differentiation is consistent with previously published results for avian Hbs (Table 2). HbD was generally
characterized by a higher intrinsic O2 affinity than HbA, but there were several exceptions. In the griffon vulture, HbD showed a much lower O2 affinity than HbA in the absence of effectors but a higher affinity in the presence of IHP (Table 1). Likewise, in 4 of the 5 hummingbird species that we ex-amined (amazilia hummingbird, green-and-white humming-bird, violet-throated starfrontlet, and great-billed hermit), the HbA isoform exhibited a slightly higher intrinsic O2 affinity than HbD. In all cases these differences in O2 affinity were reversed in the presence of IHP (Table 2). Vandecasserie et al. (19) also reported that the HbA isoforms of mallard duck, pheasant, and turkey had higher intrinsic O2 affinities than the co-expressed HbD isoforms, and again, this was reversed in the presence of anionic effectors (Table 2). Contrary to the results reported by Vandecasserie et al. (19), our O2-equilib-rium measurements on pheasant Hbs revealed a lower O2 af-finity in HbA than in co-expressed HbD in the presence and in the absence of anionic effectors, as found in most other species that express both isoforms (Tables 1 and 2). Whereas our O2-binding experiments were carried out using zwitter-ionic HEPES buffer, those by Vandecasserie et al. (19) were carried out using an ionic Tris/HCl buffer that may perturb the measurements of O2 affinity by reducing the concentra-tion of free anionic effectors in a pH-dependent manner (51). Our results and those of Vandecasserie et al. (19) are in agree-ment that the O2 affinity of HbA is lower than that of HbD in the presence of anionic effectors, the state that is most rele-vant to in vivo conditions.
The O2 affinities of pheasant HbA and HbD were modu-lated by pH in a similar fashion, as estimated Bohr factors were virtually identical for both isoHbs (φ = Δlog P50/ΔpH = −0.43 at 25 °C and pH 7.0–7.5). The Bohr factor was slightly reduced at 37 °C (φ for HbA = −0.37), in accordance with the temperature dependence of proton dissociation, but it was strongly increased in the presence IHP (φ = −0.63 at 37 °C), which is consistent with the induction of basic proton bind-ing groups by this anionic effector (67). When stripped of al-losteric effectors, HbA and HbD exhibited similar cooper-ativity coefficients (n50 ~ 2.0 at 37 °C and pH 7.0–7.5) that increased in the presence of IHP (n50 ~ 2.6). The mixture of purified HbA and HbD isoforms exhibited P50 values that were intermediate to those of the individual isoHbs at phys-iological pH (Figure 2), which indicates the absence of func-tionally significant intracellular interaction between the two isoforms, as observed previously for chicken Hb at high Hb concentration (16). This lack of interaction, in conjunction with the observed symmetry of O2-binding curves (reflected by the correspondence between nmax and n50 values and be-tween Pm and P50 values; Table 3), justifies the quantifica-tion of the allosteric interactions of both isoforms in terms of shifts in P50 values (68).
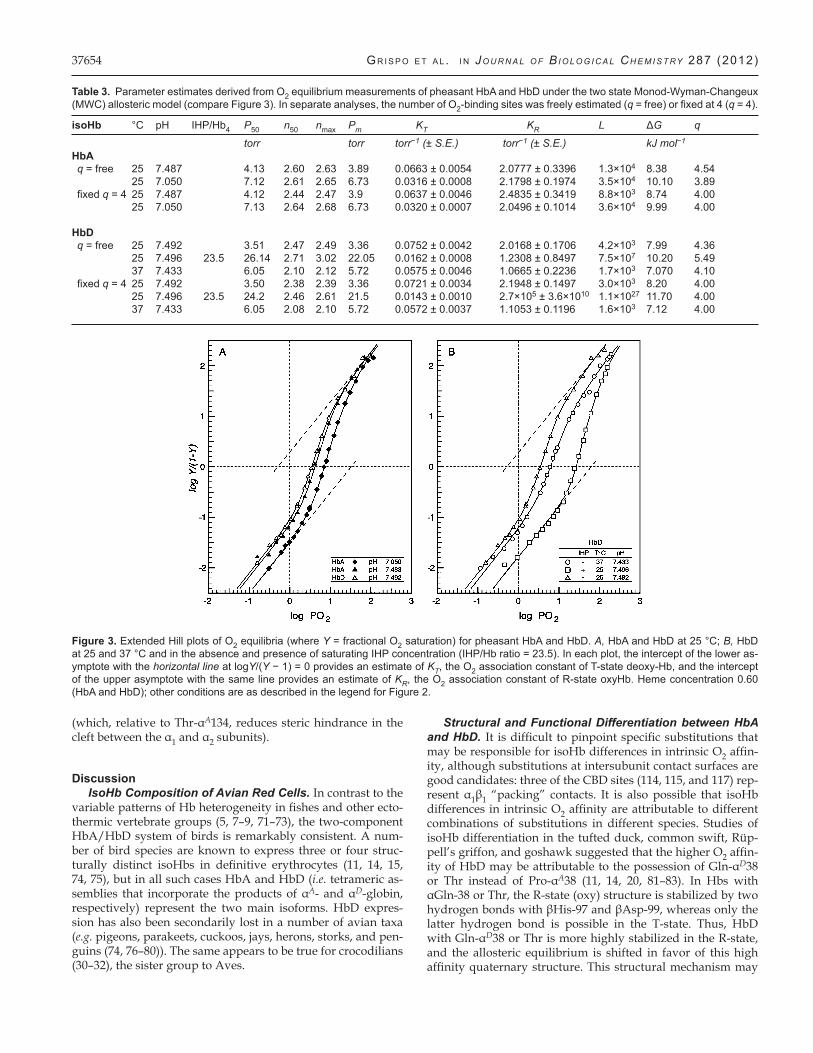
Extended Hill plots for the HbA and HbD isoforms (Fig-ure 3) and estimates of the Monod-Wyman-Changeux param-eters (Table 3) elucidate the allosteric control mechanisms that underlie the observed hetero- and homotropic effects. When measured at the same pH, extended Hill plots for HbA and HbD are almost superimposed, revealing nearly identical as-sociation constants in the deoxygenated and oxygenated states (KT and KR, which can be interpolated from the intercepts of the lower and the upper asymptotes, respectively, of the ex-tended Hill plots with the vertical line at log PO2 = 0; Figure

37652 Gr i s p o e t a l . i n Jo u r n a l o f B i o l o g i c a l ch e m i s t ry 287 (2012)
3A). Thus, both isoHbs are characterized by similar free en-ergies of Hb cooperativity (ΔG = ~8.4 and ~8.0 for HbA and HbD, respectively, with q = free at pH ~7.5; Table 3). Whereas increased proton activity (decreased pH) reduces O2 affinity by lowering KT without markedly affecting KR, IHP decreases O2 affinity by lowering KT more than KR, such that both ef-fectors raise ΔG. The effect of IHP on both KT and KR (Fig-ure 3B), indicates that this effector binds to the deoxy as well as the oxy structures. Similar effects of IHP have been docu-mented in human and fish Hbs, although physiological levels of the autochthonous phosphate effectors (2,3-diphosphoglyc-erate and ATP, respectively) primarily modulate KT (69, 70). As shown in Figure 3B, increased temperature lowers KR more than KT, thereby decreasing the free energy of heme-heme cooperativity.
The allosteric T-state → R-state transitions of pheasant HbA and HbD and their dependence on modulating factors are fur-ther illustrated by the Adair association constants (k1–4) for the four successive oxygenation steps. In stripped HbA and HbD at pH ~7.5, the similar k1 and k2 constants and the markedly increased k3 and k4 values indicate that the allosteric transition occurs only after binding the second and third O2 molecules (Figure 4). This also applies at low pH (~7.0), where lower k1 and k2 values show that proton binding reduces the affinities for binding the 1st and 2nd O2 molecules. In the presence of IHP, the even lower values of k1, k2, and k3 combined with a
drastically increased k4 (Figure 4) indicate that IHP suppresses the affinities of unliganded hemes for the 1st, 2nd, and 3rd O2 molecules but has little effect on the affinity of the remaining unliganded heme. This indicates that IHP-binding delays the T-state → R-state transition in quaternary structure until the fi-nal oxygenation step.
Insights into the Evolutionary Origins of Hb Isoform Dif-ferentiation. Comparison of avian αA and αD sequences yielded a Poisson-corrected amino acid divergence of 35.6%. We iden-tified a total of 39 candidate sites that may contribute to func-tional divergence between the avian αA- and αD-globin genes (Figure 5), 33 of which are CBD sites (both paralogs having Hi values <0.50; sites 1, 8, 9, 11, 12, 28, 53, 57, 67, 68, 71, 72, 75, 77, 78, 82, 85, 89, 90, 102, 106, 113–117, 124, 125, 130, 133, 134, 137, and 138). The remaining six sites were more variable in one or both sets of orthologous sequences (sites 5, 15, 18, 21, 30, and 50). Ancestral sequence reconstructions revealed that roughly equal numbers of substitutions occurred on the post-dupli-cation branches leading to αA- and αD-globin. Substitutions at 11 sites were consistent with the scenario depicted in Fig-ure 1A; substitutions at 12 sites were consistent with Figure 1B, and substitutions at five sites were consistent with Figure 1C. None of the divergent sites between the αD- and αA-globin se-quences were consistent with the scenarios depicted in Figure 1, D and E or F. The pattern was similar when we considered the complete set of 39 substitutions (including sites for which
Table 1. O2 affinities (P50, torr) and cooperativity coefficients (n50) of purified HbA and HbD isoforms from 11 bird species. O2 equilibria were measured in 0.1 mm HEPES buffer at pH 7.4 (± 0.01) and 37 °C in the absence (stripped) and presence of allosteric effectors ([Cl−], 0.1 m; [HEPES], 0.1 m; IHP/Hb tetramer ratio, 2.0. P50 and n50 values were derived from single O2 equilibrium curves, where each value was interpolated from linear Hill plots (correlation coefficient r> 0.995) based on four or more equilibrium steps between 25 and 75% saturation.
Stripped + KCl + IHP + KCl + IHPSpecies IsoHb [Heme], mm P50 N50 P50 n50 P50 n50 P50 n50
Accipitriformes Gyps fulvus HbA 0.30 6.46 1.62 28.84 1.98 HbD 0.07 15.86 1.82 26.61 1.99
Anseriformes Anser anser HbA 1.00 4.78 2.51 43.95a 3.00a
HbD 0.72 3.59 1.90 29.79a 2.51a
Apodiformes A. amazilia HbA 0.30 3.14 1.38 5.28 1.90 36.77 2.16 29.84 2.42 HbD 0.30 3.36 1.70 4.79 2.08 28.61 2.63 23.20 2.40 A. viridicauda HbA 0.30 2.62 1.43 4.47 1.81 28.49 2.13 24.24 2.07 HbD 0.30 2.78 1.34 3.90 1.64 21.83 2.22 20.36 2.29 C. violifer HbA 0.30 2.12 1.29 3.74 1.65 23.55 1.96 19.12 1.70 HbD 0.30 2.48 1.40 3.65 1.80 17.70 2.30 17.01 2.46 P. gigas HbA 0.30 2.52 1.46 4.14 1.63 29.97 2.28 25.86 2.49 HbD 0.30 2.45 1.41 3.19 1.97 17.44 2.24 16.56 2.56 P. malaris HbA 0.30 2.83 1.39 4.70 1.83 37.00 2.27 28.13 2.04 HbD 0.30 3.06 1.62 5.02 2.11 26.03 2.47 24.92 2.72
Galliformes Phasianus colchicus HbA 0.08 5.62 1.86 44.67a 2.31a
HbD 0.11 5.54 1.73 HbA 0.60 4.12b 2.47b 29.51b 2.55b
HbD 0.60 3.50b 2.38b 24.24a,b 2.46a,b
Passeriformes Corvus frugilegus HbA 0.06 5.60 1.50 HbD 0.04 4.15 1.46 Troglodytes aedon HbA 0.30 2.80 1.48 4.57 1.91 33.90 1.98 25.87 2.11 HbD 0.30 1.58 1.47 2.67 1.92 22.59 2.39 16.28 2.36
Struthioformes Struthio camelus HbA 0.58 3.55 1.90 32.73a 2.85 HbD 0.58 2.63 1.75 22.90a 2.44
a. Saturating IHP/Hb4 ratio is >20. b. These values are taken from Table 3 (Monod-Wyman-Changeux parameters), temperature = 25 °C.

Ge n e Du p l i c at i o n a n D t h e ev o l u t i o n o f he m o G l o b i n is o f o r m Di f f e r e n t i at i o n i n b i r D s 37653
ancestral state reconstructions had posterior probabilities <0.8). The sole exception is that the inferred history of substitution at site α9 was consistent with the scenario depicted in Figure 1D.
Charge-changing substitutions at 17 solvent-exposed resi-due positions account for the observed difference in net sur-face charge between HbA (mean pI = 8.67) and HbD (mean pI = 7.09). Substitutions at eight sites were consistent with the scenario depicted in Figure 1A (71, 89, 90, 116, 117, 130, and 138), substitutions at eight sites were consistent with the sce-nario depicted in Figure 1B (11, 30, 53, 68, 75, 82, 85, and 115), and substitutions at two sites were consistent with the sce-nario depicted in Figure 1C (8 and 15).
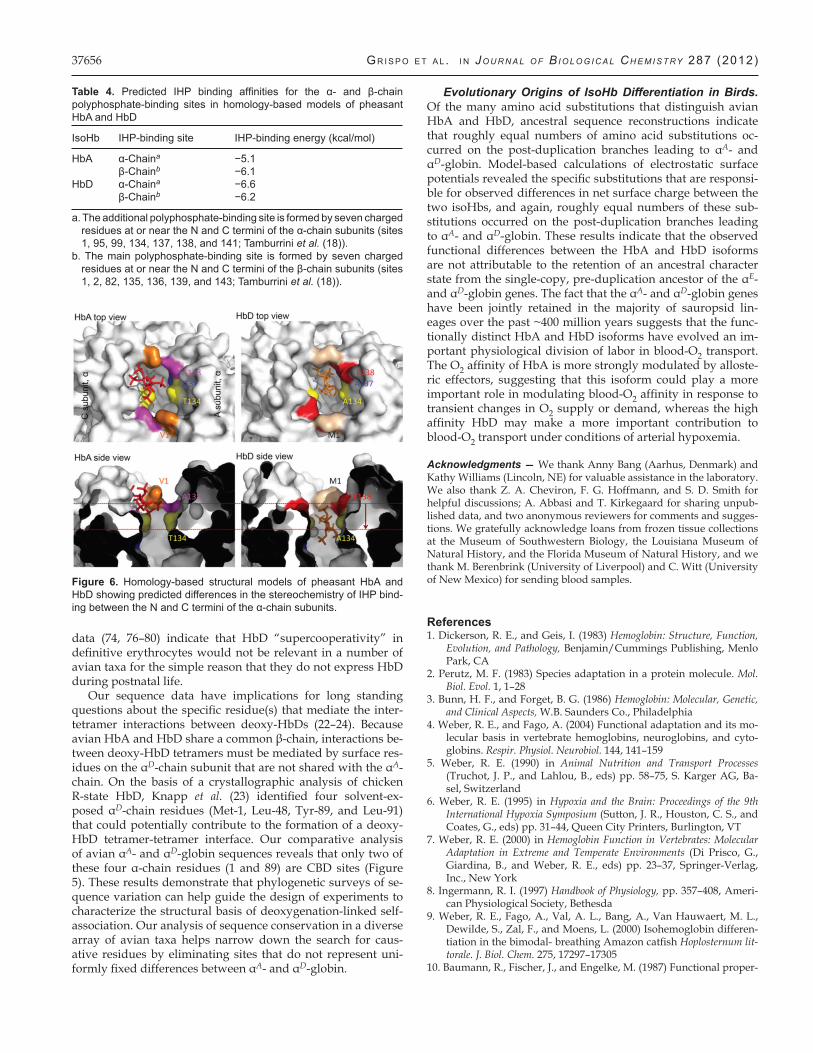
Insights into the Structural Basis of Hb Isoform Differ-entiation. The simulation-based autodocking experiments predicted a slightly lower O2-binding energy (and hence higher O2 affinity) for the α-chain heme groups of HbD rela-tive to those of HbA, −0.5 kcal/mol versus −0.4 kcal/mol, re-spectively. The molecular dynamics simulations also predicted that the “additional” α-chain phosphate-binding site of HbD (sensu Tamburrini et al. (18) and Riccio et al. (53)) has a slightly lower IHP-binding energy relative to that of HbA (Table 4) and that the bound IHP molecule is lodged more deeply in the α-chain binding cleft of HbD (Figure 6). This isoform differ-ence in the stereochemistry of IHP binding is mainly attribut-able to substitutions at three symmetry-related pairs of amino acid residues as follows: Met-αD1 (which reduces electrostatic repulsion relative to Val-αA1), Glu-αD138 (which increases electrostatic attraction relative to Ala-αA138), and Ala-αD134
Figure 2. O2 affinity and cooperativity (P50 and n50, respectively) of pheasant HbA and HbD as a function of pH, temperature, and in the absence and presence of IHP (IHP/H4B ratio = 23.5). O2 equilibria were measured in 0.1 m NaHEPES buffer containing 0.1 m KCl. Heme concentration, 0.08 mm (HbA) and 0.11 mm (HbD) and 0.10 (HbA +D).
Table 2. O2 affinity differences between avian HbA and HbD isoforms in the absence of allosteric effectors (stripped) and in the presence of IHP. IHP was present at saturating concentrations (IHP/Hb4 ratio >20), except where indicated.
ΔlogP50 (HbA - HbD) Species Stripped/+KCl +IHP °C pH Buffer Ref.
Accipitriformes Gyps fulvus −0.37a 0.06a 37 7.4 0.1 m NaHEPES, 0.1 m KCl This study −0.41b 37 7.4 0.1 m NaHEPES, 0.1 m KCl This study Gyps ruppellii 0.20a ~0.40a 38 7.5 0.1 m NaHEPES, 0.1 m KCl Weber et al. (20) 0.09b ~0.20b 38 7.5 0.1 m NaHEPES, 0.1 m KCl Weber et al. (20) Trigonoceps occipitalis 0.10 0.06 38 7.5 0.1 m NaHEPES, 0.1 m KCl Hiebl et al. (12)
Anseriformes Anas platyrhinchos −0.32 0.45c 20 7.0 0.025 m TrisHCl/0.1 m NaCl Vandecasserie et al. (19) Anser anser 0.17 37 7.4 0.1 m NaHEPES, 0.1 m KCl Present study Apus apus 0.23 0.54 38 7.5 0.02 m TrisHCl/0.1 m NaCl Nothum et al. (14)
Apodiformes A. amazilia −0.03 0.11 37 7.4 0.1 m NaHEPES, 0.1 m KCl Present study A. viridicauda −0.03 0.12 37 7.4 0.1 m NaHEPES, 0.1 m KCl Present study C. violifer −0.07 0.12 37 7.4 0.1 m NaHEPES, 0.1 m KCl Present study P. gigas 0.01 0.24 37 7.4 0.1 m NaHEPES, 0.1 m KCl Present study P. malaris −0.03 0.15 37 7.4 0.1 m NaHEPES, 0.1 m KCl Present study
Charadriiformes Catharacta maccormicki 0.20 ~0.15 37 7.5 0.1 m NaHepes /0.1 m NaCl Tamburrini et al. (18)
Galliformes Gallus gallus 0.14 0.61c 20 7.0 0.025 m TrisHCl/0.1 m NaCl Vandecasserie et al. (19) 0.55 0.88 25 7.0 0.1 m NaHEPES, 0.1 m KCl Weber et al. (44) Meleagris gallopavo −0.27 0.35c 20 7.0 0.025 m TrisHCl/0.1 m NaCl Vandecasserie et al. (19) Phasianus colchicus −0.37 0.20c 20 7.0 0.025 m TrisHCl/0.1 m NaCl Vandecasserie et al. (19) 0.01 37 7.4 0.1 m NaHEPES, 0.1 m KCl Present study 0.07 0.09 25 7.5 0.1 m NaHEPES, 0.1 m KCl Present study
Passeriformes Corvus frugilegus 0.13 37 7.4 0.1 m NaHEPES, 0.1 m KCl Present study Troglodytes aedon 0.25 0.18 37 7.4 0.1 m NaHEPES, 0.1 m KCl Present study
Phoenicopteriformes Phoenicopterus roseus 0.24 ~0.50 20 7.5 0.05 m TrisHCl/0.1 m NaCl Sanna et al. (17)
Struthioniformes Struthio camelus 0.30 0.48c 37 7.4 0.05 m TrisHCl/0.2 m NaCl Oberthür et al. (15) 0.13 0.16 37 7.4 0.1 m NaHEPES, 0.1 m KCl Present study
a. Comparison was between HbA and HbD. b. Comparison was between HbA′ and HbD. c. IHP/Hb tetramer ratio is 1:1.
37654 Gr i s p o e t a l . i n Jo u r n a l o f B i o l o g i c a l ch e m i s t ry 287 (2012)
(which, relative to Thr-αA134, reduces steric hindrance in the cleft between the α1 and α2 subunits).
DiscussionIsoHb Composition of Avian Red Cells. In contrast to the
variable patterns of Hb heterogeneity in fishes and other ecto-thermic vertebrate groups (5, 7–9, 71–73), the two-component HbA/HbD system of birds is remarkably consistent. A num-ber of bird species are known to express three or four struc-turally distinct isoHbs in definitive erythrocytes (11, 14, 15, 74, 75), but in all such cases HbA and HbD (i.e. tetrameric as-semblies that incorporate the products of αA- and αD-globin, respectively) represent the two main isoforms. HbD expres-sion has also been secondarily lost in a number of avian taxa (e.g. pigeons, parakeets, cuckoos, jays, herons, storks, and pen-guins (74, 76–80)). The same appears to be true for crocodilians (30–32), the sister group to Aves.
Structural and Functional Differentiation between HbA and HbD. It is difficult to pinpoint specific substitutions that may be responsible for isoHb differences in intrinsic O2 affin-ity, although substitutions at intersubunit contact surfaces are good candidates: three of the CBD sites (114, 115, and 117) rep-resent α1β1 “packing” contacts. It is also possible that isoHb differences in intrinsic O2 affinity are attributable to different combinations of substitutions in different species. Studies of isoHb differentiation in the tufted duck, common swift, Rüp-pell’s griffon, and goshawk suggested that the higher O2 affin-ity of HbD may be attributable to the possession of Gln-αD38 or Thr instead of Pro-αA38 (11, 14, 20, 81–83). In Hbs with αGln-38 or Thr, the R-state (oxy) structure is stabilized by two hydrogen bonds with βHis-97 and βAsp-99, whereas only the latter hydrogen bond is possible in the T-state. Thus, HbD with Gln-αD38 or Thr is more highly stabilized in the R-state, and the allosteric equilibrium is shifted in favor of this high affinity quaternary structure. This structural mechanism may
Figure 3. Extended Hill plots of O2 equilibria (where Y = fractional O2 saturation) for pheasant HbA and HbD. A, HbA and HbD at 25 °C; B, HbD at 25 and 37 °C and in the absence and presence of saturating IHP concentration (IHP/Hb ratio = 23.5). In each plot, the intercept of the lower as-ymptote with the horizontal line at logY/(Y − 1) = 0 provides an estimate of KT, the O2 association constant of T-state deoxy-Hb, and the intercept of the upper asymptote with the same line provides an estimate of KR, the O2 association constant of R-state oxyHb. Heme concentration 0.60 (HbA and HbD); other conditions are as described in the legend for Figure 2.
Table 3. Parameter estimates derived from O2 equilibrium measurements of pheasant HbA and HbD under the two state Monod-Wyman-Changeux (MWC) allosteric model (compare Figure 3). In separate analyses, the number of O2-binding sites was freely estimated (q = free) or fixed at 4 (q = 4).
isoHb °C pH IHP/Hb4 P50 n50 nmax Pm KT KR L ΔG q
torr torr torr−1 (± S.E.) torr−1 (± S.E.) kJ mol−1 HbA q = free 25 7.487 4.13 2.60 2.63 3.89 0.0663 ± 0.0054 2.0777 ± 0.3396 1.3×10⁴ 8.38 4.54 25 7.050 7.12 2.61 2.65 6.73 0.0316 ± 0.0008 2.1798 ± 0.1974 3.5×10⁴ 10.10 3.89 fixed q = 4 25 7.487 4.12 2.44 2.47 3.9 0.0637 ± 0.0046 2.4835 ± 0.3419 8.8×10³ 8.74 4.00 25 7.050 7.13 2.64 2.68 6.73 0.0320 ± 0.0007 2.0496 ± 0.1014 3.6×10⁴ 9.99 4.00
HbD q = free 25 7.492 3.51 2.47 2.49 3.36 0.0752 ± 0.0042 2.0168 ± 0.1706 4.2×10³ 7.99 4.36 25 7.496 23.5 26.14 2.71 3.02 22.05 0.0162 ± 0.0008 1.2308 ± 0.8497 7.5×10⁷ 10.20 5.49 37 7.433 6.05 2.10 2.12 5.72 0.0575 ± 0.0046 1.0665 ± 0.2236 1.7×10³ 7.070 4.10 fixed q = 4 25 7.492 3.50 2.38 2.39 3.36 0.0721 ± 0.0034 2.1948 ± 0.1497 3.0×10³ 8.20 4.00 25 7.496 23.5 24.2 2.46 2.61 21.5 0.0143 ± 0.0010 2.7×10⁵ ± 3.6×10¹⁰ 1.1×1027 11.70 4.00 37 7.433 6.05 2.08 2.10 5.72 0.0572 ± 0.0037 1.1053 ± 0.1196 1.6×10³ 7.12 4.00

Ge n e Du p l i c at i o n a n D t h e ev o l u t i o n o f he m o G l o b i n is o f o r m Di f f e r e n t i at i o n i n b i r D s 37655
contribute to O2 affinity differences between HbA and HbD in the particular species mentioned above, but it does not pro-vide a general explanation for the observed patterns of func-tional differentiation between avian HbA and HbD because the majority of bird species retain the ancestral Gln residue at this intersubunit contact site in both αA- and αD-globin.
In addition to the isoHb differences in intrinsic O2 affinity, HbD also exhibits a consistently higher O2 affinity in the pres-ence of IHP (Tables 1 and 2). This indicates that HbD is less re-sponsive to the inhibitory effects of IHP, a potent allosteric ef-fector that preferentially binds and stabilizes the low affinity T-state quaternary structure of the Hb tetramer. The uniform difference in IHP sensitivity between HbA and HbD is surpris-ing because the main polyphosphate-binding site is formed by a cluster of positively charged β-chain residues that line the interior of the central cavity (18, 84). Because HbA and HbD share identical β-chain subunits (and thus share the same phos-phate-binding sites), the observed isoform differences in IHP sensitivity must be attributable to one or more substitutions
between αA- and αD-globin that do not directly affect the main phosphate-binding site. Experimental evidence sug-gests that an additional polyphosphate-binding site is formed by seven residues from each α-chain (sites 1, 95, 99, 134, 137, 138, and 141), which stabilize IHP via charge-charge interactions (18, 85, 86). Specifically, αLys-99 and charged residues at the α-chain N and C termini of avian HbA and HbD are predicted to form six salt bridges with the nega-tively charged phosphate groups of IHP (18, 53). This addi-tional phosphate-binding site is hypothesized to serve as an “entry/leaving site,” which modulates Hb-O2 affinity by en-hancing phosphate uptake and transfer to the main oxygen-ation-linked binding site between the β-chain subunits (18, 53). Of the seven α-chain residues that compose this addi-tional phosphate-binding site, four represent CBD sites that distinguish avian αA- and αD-globin sequences (1, 134, 137, and 138). The role of αVal-1 in this additional phosphate-binding site is implicated by the fact that carbamylation of the α-chain N termini produces a 40% reduction in IHP affin-ity (85). However, even though HbD exhibits a consistently higher O2 affinity than HbA in the presence of IHP (Tables 1 & 2), our molecular dynamics simulations predict that the additional phosphate-binding site of HbD actually has a slightly lower IHP binding energy (and hence, higher IHP af-finity) than that of HbA (Table 4). An alternative hypothesis suggested by results of the molecular dynamics simulations (Figure 6) is that IHP binding between the α1 and α2 subunits of HbD produces a second-order perturbation of quaternary structure that is propagated to the main phosphate-binding site between the β-chain subunits.
Deoxygenation-linked Self-association of HbD. Our measures of Hb-O2 equilibria were conducted under standard conditions ([heme] = 0.3 mm (50)) where intrinsic functional differences between tetrameric HbA and HbD were not ob-scured by possible effects of deoxygenation-linked self-asso-ciation. Measurements of oxygenation properties under these conditions moreover permit meaningful comparisons with data from previously published studies (Tables 1 and 2). The Hb concentrations used in our experiments greatly exceeded the threshold at which tetrameric vertebrate Hbs dissociate to dimers and monomers (87) but were below the threshold at which deoxygenation-linked self-association of HbD is ex-pected to occur. Thus, our experimental data do not shed light on the prevalence or physiological relevance of HbD self-asso-ciation in avian red cells. However, available protein expression
Figure 4. Adair constants (k1, k2, k3, and k4) for pheasant HbA and HbD as a function of temperature, pH, and the absence and presence of IHP (derived from data shown in Figure 2).
Figure 5. Reconstructed ancestral states of 39 sites that distinguish the αA- and αD-globin polypeptides. As shown in the inset phylogeny of α-like globin genes, ancestral states for each of the 39 sites were reconstructed for four separate nodes in the tree.
37656 Gr i s p o e t a l . i n Jo u r n a l o f B i o l o g i c a l ch e m i s t ry 287 (2012)
data (74, 76–80) indicate that HbD “supercooperativity” in definitive erythrocytes would not be relevant in a number of avian taxa for the simple reason that they do not express HbD during postnatal life.
Our sequence data have implications for long standing questions about the specific residue(s) that mediate the inter-tetramer interactions between deoxy-HbDs (22–24). Because avian HbA and HbD share a common β-chain, interactions be-tween deoxy-HbD tetramers must be mediated by surface res-idues on the αD-chain subunit that are not shared with the αA-chain. On the basis of a crystallographic analysis of chicken R-state HbD, Knapp et al. (23) identified four solvent-ex-posed αD-chain residues (Met-1, Leu-48, Tyr-89, and Leu-91) that could potentially contribute to the formation of a deoxy-HbD tetramer-tetramer interface. Our comparative analysis of avian αA- and αD-globin sequences reveals that only two of these four α-chain residues (1 and 89) are CBD sites (Figure 5). These results demonstrate that phylogenetic surveys of se-quence variation can help guide the design of experiments to characterize the structural basis of deoxygenation-linked self-association. Our analysis of sequence conservation in a diverse array of avian taxa helps narrow down the search for caus-ative residues by eliminating sites that do not represent uni-formly fixed differences between αA- and αD-globin.
Evolutionary Origins of IsoHb Differentiation in Birds. Of the many amino acid substitutions that distinguish avian HbA and HbD, ancestral sequence reconstructions indicate that roughly equal numbers of amino acid substitutions oc-curred on the post-duplication branches leading to αA- and αD-globin. Model-based calculations of electrostatic surface potentials revealed the specific substitutions that are responsi-ble for observed differences in net surface charge between the two isoHbs, and again, roughly equal numbers of these sub-stitutions occurred on the post-duplication branches leading to αA- and αD-globin. These results indicate that the observed functional differences between the HbA and HbD isoforms are not attributable to the retention of an ancestral character state from the single-copy, pre-duplication ancestor of the αE- and αD-globin genes. The fact that the αA- and αD-globin genes have been jointly retained in the majority of sauropsid lin-eages over the past ~400 million years suggests that the func-tionally distinct HbA and HbD isoforms have evolved an im-portant physiological division of labor in blood-O2 transport. The O2 affinity of HbA is more strongly modulated by alloste-ric effectors, suggesting that this isoform could play a more important role in modulating blood-O2 affinity in response to transient changes in O2 supply or demand, whereas the high affinity HbD may make a more important contribution to blood-O2 transport under conditions of arterial hypoxemia.
Acknowledgments — We thank Anny Bang (Aarhus, Denmark) and Kathy Williams (Lincoln, NE) for valuable assistance in the laboratory. We also thank Z. A. Cheviron, F. G. Hoffmann, and S. D. Smith for helpful discussions; A. Abbasi and T. Kirkegaard for sharing unpub-lished data, and two anonymous reviewers for comments and sugges-tions. We gratefully acknowledge loans from frozen tissue collections at the Museum of Southwestern Biology, the Louisiana Museum of Natural History, and the Florida Museum of Natural History, and we thank M. Berenbrink (University of Liverpool) and C. Witt (University of New Mexico) for sending blood samples.
References 1. Dickerson, R. E., and Geis, I. (1983) Hemoglobin: Structure, Function,
Evolution, and Pathology, Benjamin/Cummings Publishing, Menlo Park, CA
2. Perutz, M. F. (1983) Species adaptation in a protein molecule. Mol. Biol. Evol. 1, 1–28
3. Bunn, H. F., and Forget, B. G. (1986) Hemoglobin: Molecular, Genetic, and Clinical Aspects, W.B. Saunders Co., Philadelphia
4. Weber, R. E., and Fago, A. (2004) Functional adaptation and its mo-lecular basis in vertebrate hemoglobins, neuroglobins, and cyto-globins. Respir. Physiol. Neurobiol. 144, 141–159
5. Weber, R. E. (1990) in Animal Nutrition and Transport Processes (Truchot, J. P., and Lahlou, B., eds) pp. 58–75, S. Karger AG, Ba-sel, Switzerland
6. Weber, R. E. (1995) in Hypoxia and the Brain: Proceedings of the 9th International Hypoxia Symposium (Sutton, J. R., Houston, C. S., and Coates, G., eds) pp. 31–44, Queen City Printers, Burlington, VT
7. Weber, R. E. (2000) in Hemoglobin Function in Vertebrates: Molecular Adaptation in Extreme and Temperate Environments (Di Prisco, G., Giardina, B., and Weber, R. E., eds) pp. 23–37, Springer-Verlag, Inc., New York
8. Ingermann, R. I. (1997) Handbook of Physiology, pp. 357–408, Ameri-can Physiological Society, Bethesda
9. Weber, R. E., Fago, A., Val, A. L., Bang, A., Van Hauwaert, M. L., Dewilde, S., Zal, F., and Moens, L. (2000) Isohemoglobin differen-tiation in the bimodal- breathing Amazon catfish Hoplosternum lit-torale. J. Biol. Chem. 275, 17297–17305
10. Baumann, R., Fischer, J., and Engelke, M. (1987) Functional proper-
Figure 6. Homology-based structural models of pheasant HbA and HbD showing predicted differences in the stereochemistry of IHP bind-ing between the N and C termini of the α-chain subunits.
Table 4. Predicted IHP binding affinities for the α- and β-chain polyphosphate-binding sites in homology-based models of pheasant HbA and HbD
IsoHb IHP-binding site IHP-binding energy (kcal/mol)
HbA α-Chaina −5.1 β-Chainb −6.1HbD α-Chaina −6.6 β-Chainb −6.2
a. The additional polyphosphate-binding site is formed by seven charged residues at or near the N and C termini of the α-chain subunits (sites 1, 95, 99, 134, 137, 138, and 141; Tamburrini et al. (18)).
b. The main polyphosphate-binding site is formed by seven charged residues at or near the N and C termini of the β-chain subunits (sites 1, 2, 82, 135, 136, 139, and 143; Tamburrini et al. (18)).

Ge n e Du p l i c at i o n a n D t h e ev o l u t i o n o f he m o G l o b i n is o f o r m Di f f e r e n t i at i o n i n b i r D s 37657
ties of primitive and definitive red cells from chick embryo. Oxy-gen-binding characteristics, pH, and membrane potential and re-sponse to hypoxia. J. Exp. Zool. Suppl. 1, 227–238
11. Hiebl, I., Weber, R. E., Schneeganss, D., Kösters, J., and Braunitzer, G. (1988) High altitude respiration of birds. Structural adaptations in the major and minor hemoglobin component of adult Rüppell’s griffon (Gyps rueppellii, Aegypiinae). A new molecular pattern for hypoxic tolerance. Biol. Chem. Hoppe-Seyler 369, 217–232
12. Hiebl, I., Weber, R. E., Schneeganss, D., and Braunitzer, G. (1989) High altitude respiration of Falconiformes. The primary struc-ture and functional properties of the major and minor hemoglobin components of the adult white-headed vulture (Trigonoceps occipi-talis, Aegypiinae). Biol. Chem. Hoppe-Seyler 370, 699–706
13. Isaacks, R. E., Harkness, D. R., Adler, J. L., and Goldman, P. H. (1976) Studies on avian erythrocyte metabolism. Effect of organic phosphates on oxygen affinity of embryonic and adult-type hemo-globins of the chick embryo. Arch. Biochem. Biophys. 173, 114–120
14. Nothum, R., Weber, R. E., Kösters, J., Schneeganss, D., and Braunitzer, G. (1989) Amino acid sequences and functional dif-ferentiation of hemoglobins A and D from swift (Apus, Apodi-formes). Biol. Chem. Hoppe-Seyler 370, 1197–1207
15. Oberthür, W., Braunitzer, G., Baumann, R., and Wright, P. G. (1983) Primary structures of the _- and _-chains from the major he-moglobin component of the ostrich (Struthio camelus) and Ameri-can rhea (Rhea americana) (Struthioformes). Aspects of respiratory physiology and taxonomy. Hoppe-Seyler’s Z. Physiol. Chem. 363, 119–134
16. Rana, M. S., Knapp, J. E., Holland, R. A., and Riggs, A. F. (2008) Component D of chicken hemoglobin and the hemoglobin of the embryonic Tammar wallaby (Macropus eugenii) self-associate upon deoxygenation. Effect on oxygen binding. Proteins 70, 553–561
17. Sanna, M. T., Manconi, B., Podda, G., Olianas, A., Pellegrini, M., Castagnola, M., Messana, I., and Giardina, B. (2007) Alkaline Bohr effect of bird hemoglobins. The case of the flamingo. Biol. Chem. 388, 787–795
18. Tamburrini, M., Riccio, A., Romano, M., Giardina, B., and di Prisco, G. (2000) Structural and functional analysis of the two hemoglo-bins of the Antarctic seabird Catharacta maccormicki. Characteriza-tion of an additional phosphate-binding site by molecular model-ing. Eur. J. Biochem. 267, 6089–6098
19. Vandecasserie, C., Paul, C., Schnek, A. G., and Le´onis, J. (1973) Oxygen affinity of avian hemoglobins. Comp. Biochem. Physiol. A 44, 711–718
20. Weber, R. E., Hiebl, I., and Braunitzer, G. (1988) High altitude and hemoglobin function in the vultures Gyps rueppellii and Aegypius monachus. Biol. Chem. Hoppe-Seyler 369, 233–240
21. Lutz, P. L. (1980) On the oxygen affinity of bird blood. Am. Zool. 20, 187–198
22. Cobb, J. A., Manning, D., Kolatkar, P. R., Cox, D. J., and Riggs, A. F. (1992) Deoxygenation-linked association of a tetrameric compo-nent of chicken hemoglobin. J. Biol. Chem. 267, 1183–1189
23. Knapp, J. E., Oliveira, M. A., Xie, Q., Ernst, S. R., Riggs, A. F., and Hackert, M. L. (1999) The structural and functional analysis of the hemoglobin D component from chicken. J. Biol. Chem. 274, 6411–6420
24. Rana, M. S., and Riggs, A. F. (2011) Indefinite noncooperative self-association of chicken deoxy hemoglobin D. Proteins 79, 1499–1512
25. Riggs, A. F. (1998) Self-association, cooperativity, and superco-operativity of oxygen binding by hemoglobins. J. Exp. Biol. 201, 1073–1084
26. Perutz, M. F., Steinkraus, L. K., Stockell, A., and Bangham, A. D. (1959) Chemical and crystallographic study of the two fractions of adult horse hemoglobin. J. Mol. Biol. 1, 402–404
27. Riggs, A. (1976) Factors in the evolution of hemoglobin function. Fed. Proc. 35, 2115–2118
28. Riggs, A. (1979) Studies of the hemoglobins of Amazonian fishes. Overview. Comp. Biochem. Physiol. 62, 257–272
29. Nikinmaa, M. (2001) Hemoglobin function in vertebrates. Evolu-tionary changes in cellular regulation in hypoxia. Respir. Physiol. 128, 317–329
30. Jensen, F. B. (2004) Red blood cell pH, the Bohr effect, and other oxygenation- linked phenomena in blood O2 and CO2 transport. Acta Physiol. Scand. 182, 215–227
31. Hoffmann, F. G., and Storz, J. F. (2007) The _D-globin gene origi-nated via duplication of an embryonic_-like globin gene in the an-cestor of tetrapod vertebrates. Mol. Biol. Evol. 24, 1982–1990
32. Hoffmann, F. G., Storz, J. F., Gorr, T. A., and Opazo, J. C. (2010) Lineagespecific patterns of functional diversification in the α- and β-globin gene families of tetrapod vertebrates. Mol. Biol. Evol. 27, 1126–1138
33. Storz, J. F., Opazo, J. C., and Hoffmann, F. G. (2011) Phyloge-netic diversification of the globin gene superfamily in chordates. IUBMB Life 63, 313–322
34. Cirotto, C., Panara, F., and Arangi, I. (1987) The minor hemoglo-bins of primitive and definitive erythrocytes of the chicken em-bryo. Evidence for hemoglobin L. Development 101, 805–813
35. Alev, C., Shinmyozu, K., McIntyre, B. A., and Sheng, G. (2009) Ge-nomic organization of zebra finch α- and β-globin genes and their expression in primitive and definitive blood in comparison with globins in chicken. Dev. Genes Evol. 219, 353–360
36. Storz, J. F., Hoffmann, F. G., Opazo, J. C., Sanger, T. J., and Mori-yama, H. (2011) Developmental regulation of hemoglobin synthe-sis in the green anole lizard, Anolis carolinensis. J. Exp. Biol. 214, 575–581
37. Weber, R. E., and White, F. N. (1986) Oxygen binding in alligator blood related to temperature, diving, and “alkaline tide.” Am. J. Physiol. 251, R901–R908
38. Weber, R., and White, F. (1994) Chloride-dependent organic phos-phate sensitivity of the oxygenation reaction in crocodilian hemo-globins. J. Exp. Biol. 192, 1–11
39. Grigg, G. C., Wells, R. M. G., and Beard, L. A. (1993) Allosteric con-trol of oxygen binding by hemoglobin during development in the crocodile Crocodylus porosus. The role of red cell organic phos-phates and carbon dioxide. J. Exp. Biol. 175, 15–32
40. Hoffmann, F. G., Opazo, J. C., and Storz, J. F. (2008) Rapid rates of lineagespecific gene duplication and deletion in the α-globin gene family. Mol. Biol. Evol. 25, 591–602
41. Hoffmann, F. G., Opazo, J. C., and Storz, J. F. (2011) Differential loss and retention of myoglobin, cytoglobin, and globin-E during the radiation of vertebrates. Genome Biol. Evol. 3, 588–600
42. Brittain, T. (2002) Molecular aspects of embryonic hemoglobin function. Mol. Aspects Med. 23, 293–342
43. Weber, R. E., Ostojic, H., Fago, A., Dewilde, S., Van Hauwaert, M. L., Moens, L., and Monge, C. (2002) Novel mechanism for high altitude adaptation in hemoglobin of the Andean frog Telma-tobius peruvianus. Am. J. Physiol. Regul. Integr. Comp. Physiol. 283, R1052–R1060
44. Weber, R. E., Voelter, W., Fago, A., Echner, H., Campanella, E., and Low, P. S. (2004) Modulation of red cell glycolysis. Interactions be-tween vertebrate hemoglobins and cytoplasmic domains of band 3 red cell membrane proteins. Am. J. Physiol. Regul. Integr. Comp. Physiol. 287, R454–R464
45. Brygier, J., and Paul, C. (1976) Oxygen equilibrium of chicken he-moglobin in the presence of organic phosphates. Biochimie 58, 755–756
46. Monod, J., Wyman, J., and Changeux, J. P. (1965) On the nature of allosteric transitions. A plausible model. J. Mol. Biol. 12, 88–118
47. Weber, R. E., Malte, H., Braswell, E. H., Oliver, R. W., Green, B. N., Sharma, P. K., Kuchumov, A., and Vinogradov, S. N. (1995) Mass spectrometric composition, molecular mass, and oxygen binding of Macrobdella decora hemoglobin and its tetramer and monomer subunits. J. Mol. Biol. 251, 703–720
48. Adair, G. S. (1925) The hemoglobin system. IV. The oxygen dissoci-ation curve of hemoglobin. J. Biol. Chem. 63, 529–545
49. Ferry, M. F., and Green, A. A. (1929) Studies in the chemistry of he-moglobin. III. The equilibrium between oxygen and hemoglobin and its relation to changing hydrogen ion activity. J. Biol. Chem. 81, 175–203
50. Imai, K. (1982) Allosteric Effects in Hemoglobin, Cambridge Univer-sity, Press, Cambridge, UK
37658 Gr i s p o e t a l . i n Jo u r n a l o f B i o l o g i c a l ch e m i s t ry 287 (2012)
51. Weber, R. E. (1992) Use of ionic and zwitterionic (Tris/BisTris and HEPES) buffers in studies on hemoglobin function. J. Appl. Physiol. 72, 1611–1615
52. Arnold, K., Bordoli, L., Kopp, J., and Schwede, T. (2006) The SWISSMODEL Workspace. A web-based environment for protein structure homology modeling. Bioinformatics 22, 195–201
53. Riccio, A., Tamburrini, M., Giardina, B., and di Prisco G. (2001) Mo-lecular dynamics analysis of a second phosphate site in the hemo-globins of the seabird, south polar skua. Is there a site-site migra-tory mechanism along the central cavity? Biophys. J. 81, 1938–1946
54. Jo, S., Kim, T., Iyer, V. G., and Im, W. (2008) CHARMM-GUI. A webbased graphical user interface for CHARMM. J. Comput. Chem. 29, 1859–1865
55. Gasteiger, E., Gattiker, A., Hoogland, C., Ivanyi, I., Appel, R. D., and Bairoch, A. (2003) ExPASy. The proteomics server for in-depth protein knowledge and analysis. Nucleic Acids Res. 31, 3784–3788
56. Trott, O., and Olson, A. J. (2010) AutoDock Vina. Improving the speed and accuracy of docking with a new scoring function, ef-ficient optimization, and multithreading. J. Comput. Chem. 31, 455–461
57. Hoffmann, F. G., Opazo, J. C., and Storz, J. F. (2012) Whole-genome duplication spurred the functional diversification of the globin gene superfamily in vertebrates. Mol. Biol. Evol. 29, 303–312
58. Gribaldo, S., Casane, D., Lopez, P., and Philippe, H. (2003) Func-tional divergence prediction from evolutionary analysis. A case study of vertebrate hemoglobin. Mol. Biol. Evol. 20, 1754–1759
59. Gu, X. (2001) Maximum-likelihood approach for gene family evo-lution under functional divergence. Mol. Biol. Evol. 18, 453–464
60. Shannon, C. E. (1948) A mathematical theory of communication. Bell System Tech. J. 27, 379–423, 623–656
61. Yang, Z., Kumar, S., and Nei, M. (1995) A new method of infer-ence of ancestral nucleotide and amino acid sequences. Genetics 141, 1641–1650
62. Cao, Y., Adachi, J., Janke, A., Pa¨a¨bo, S., and Hasegawa, M. (1994) Phylogenetic relationships among eutherian orders estimated from inferred sequences of mitochondrial proteins. Instability of a tree based on a single gene. J. Mol. Evol. 39, 519–527
63. Whelan, S., and Goldman, N. (2001) A general empirical model of protein evolution derived from multiple protein families using a maximum-likelihood approach. Mol. Biol. Evol. 18, 691–699
64. Yang, Z. (2007) PAML 4. Phylogenetic analysis by maximum likeli-hood. Mol. Biol. Evol. 24, 1586–1591
65. Edgar, R. C. (2004) MUSCLE. Multiple sequence alignment with high accuracy and high throughput. Nucleic Acids Res. 32, 1792–1797
66. Hackett, S. J., Kimball, R. T., Reddy, S., Bowie, R. C., Braun, E. L., Braun, M. J., Chojnowski, J. L., Cox, W. A., Han, K. L., Harshman, J., Huddleston, C. J., Marks, B. D., Miglia, K. J., Moore, W. S., Shel-don, F. H., Steadman, D. W., Witt, C. C., and Yuri, T. (2008) A phy-logenomic study of birds reveals their evolutionary history. Sci-ence 320, 1763–1768
67. Gill, S. J., Gaud, H. T., and Barisas, B. G. (1980) Calorimetric studies of carbon monoxide and inositol hexaphosphate binding to hemo-globin A. J. Biol. Chem. 255, 7855–7857
68. Wyman, J., Jr. (1964) Linked functions and reciprocal effects in he-moglobin. A second look. Adv. Protein Chem. 19, 223–286
69. Tyuma, I., Imai, K., and Shimizu, K. (1973) Analysis of oxygen equilibrium of hemoglobin and control mechanism of organic phosphates. Biochemistry 12, 1491–1498
70. Weber, R. E., Jensen, F. B., and Cox, R. P. (1987) Analysis of teleost hemoglobin by Adair and Monod-Wyman-Changeux models. Ef-fects of nucleoside triphosphates and pH on oxygenation of tench hemoglobin. J. Comp. Physiol. B 157, 145–152
71. Binotti, I., Giovenco, S., Giardina, B., Antonini, E., Brunori, M., and Wyman, J. (1971) Studies on the functional properties of fish he-moglobins. II. The oxygen equilibrium of the isolated hemoglobin components from trout blood. Arch. Biochem. Biophys. 142, 274–280
72. Weber, R. E., and Jensen, F. B. (1988) Functional adaptations in he-moglobins from ectothermic vertebrates. Annu. Rev. Physiol. 50, 161–179
73. Weber, R. E. (1996) in Physiology and Biochemistry of the Fishes of the Amazon (Val, A. L., Almeida-Val, V. M., and Randall, D. J., eds) pp. 75–90, INPA, Brazil
74. Saha, A., and Ghosh, J. (1965) Comparative studies on avian hemo-globins. Comp. Biochem. Physiol. 15, 217–235
75. Lee, K. S., Huang, P. C., and Cohen, B. H. (1976) Further resolution of adult chick hemoglobins by isoelectric focusing in polyacryl-amide gel. Biochim. Biophys. Acta 427, 178–196
76. Godovac-Zimmermann, J., and Braunitzer, G. (1984) Hemoglo-bin of the adult white stork (Ciconia, Ciconiiformes). The primary structure of αA- and β-chains from the only present hemoglobin component. Hoppe-Seyler’s Z. Physiol. Chem. 365, 1107–1113
77. Godovac-Zimmermann, J., and Braunitzer, G. (1985) The primary structure of αA- and β-chains from blue-and-yellow macaw (Ara ararauna, Psittaci) hemoglobin. No evidence for expression of αD-chains. Biol. Chem. Hoppe-Seyler 366, 503–508
78. Oberthür, W., Godovac-Zimmermann, J., and Braunitzer, G. (1986) The expression of αD-chains in the hemoglobin of adult ostrich (Struthio camelus) and American rhea (Rhea americana). The dif-ferent evolution of adult bird αA-, αD-, and β-chains. Biol. Chem. Hoppe-Seyler 367, 507–514
79. Sultana, C., Abbasi, A., and Zaidi, Z. H. (1989) Primary structure of hemoglobin α-chain of Columba livia (gray wild pigeon). J. Protein Chem. 8, 629–646
80. Tamburrini, M., Condò, S. G., di Prisco, G., and Giardina, B. (1994) Adaptation to extreme environments. Structure-function relation-ships in emperor penguin hemoglobin. J. Mol. Biol. 237, 615–621
81. Hiebl, I., Kösters, J., and Braunitzer, G. (1987) The primary struc-tures of the major and minor hemoglobin component of adult gos-hawk (Accipiter gentilis, Accipitrinae). Biol. Chem. Hoppe-Seyler 368, 333–342
82. Abbasi, A., and Lutfullah, G. (2002) Molecular basis of bird respira-tion. Primary hemoglobin structure component from tufted duck (Aythya fuligula, Anseriformes). Role of αArg-99 in formation of a complex salt bridge network. Biochem. Biophys. Res. Commun. 291, 176–184
83. Lutfullah, G., Ali, S. A., and Abbasi, A. (2005) Molecular mecha-nism of high altitude respiration. Primary structure of a minor he-moglobin component from tufted duck (Aythya fuligula, Anseri-formes). Biochem. Biophys. Res. Commun. 326, 123–130
84. Arnone, A., and Perutz, M. F. (1974) Structure of inositol hexaphos-phatehuman deoxyhemoglobin complex. Nature 249, 34–36
85. Zuiderweg, E. R., Hamers, L. F., Rollema, H. S., de Bruin, S. H., and Hilbers, C. W. (1981) 31P NMR study of the kinetics of bind-ing of myo-inositol hexakisphosphate to human hemoglobin. Ob-servation of fast exchange kinetics in high affinity systems. Eur. J. Biochem. 118, 95–104
86. Amiconi, G., Bertollini, A., Bellelli, A., Coletta, M., Condò, S. G., and Brunori, M. (1985) Evidence for two oxygen-linked binding sites for polyanions in dromedary hemoglobin. Eur. J. Biochem. 150, 387–393
87. Mills, F. C., Johnson, M. L., and Ackers, G. K. (1976) Oxygenation-linked subunit interactions in human hemoglobin. Experimental studies on the concentration dependence of oxygenation curves. Biochemistry 15, 5350–5362

Ge n e Du p l i c at i o n a n D t h e ev o l u t i o n o f he m o G l o b i n is o f o r m Di f f e r e n t i at i o n i n b i r D s Suppl.-1
Supplementary Tables
Table S1. Accession numbers for avian α-like globin sequences.
Order Family Species Accession number
Accipitriformes Accipitridae Northern goshawk, Accipiter gentilis P08850.2, P08849.1Accipitriformes Accipitridae Black vulture, Aegypius monachus P07417.2, P68059.1Accipitriformes Accipitridae Rüppell’s griffon, Gyps rueppellii P08256.1, P08257.1Accipitriformes Accipitridae White-headed vulture, Trigonoceps occipitalis P19832.1, P68060.1 Anseriformes Anatidae Mallard duck, Anas platyrhynchos P01988.2, P04442.1, K01942.1Anseriformes Anatidae Graylag goose, Anser anser P01989.2, P04238.1Anseriformes Anatidae Bar-headed goose, Anser indicus P01990.2, P04239.1Anseriformes Anatidae Tufted duck, Aythya fuligula P84790.2, P84791.1Anseriformes Anatidae Canada goose, Branta canadensis ACT80863.1, P04240.1Anseriformes Anatidae Muscovy duck, Cairina moschata P01987.2, P02003.1, P04243.2Anseriformes Anatidae Andean goose, Chloephaga melanoptera ACT80387.1, P07035.1Apodiformes Apodidae Common swift, Apus apus P15162.2, P15164.1Apodiformes Trochilidae Speckled hummingbird, Adelomyia melanogenys JQ697045, JQ697061Apodiformes Trochilidae White-tufted sunbeam, Aglaeactis castelnaudii JQ697046, JQ697062Apodiformes Trochilidae Amazilia hummingbird, Amazilia amazilia JQ697047, JQ697063Apodiformes Trochilidae Green-and-white hummingbird, Amazilia viridicauda JQ697048, JQ697064Apodiformes Trochilidae Bronzy inca, Coeligena coeligena JQ697049, JQ697065Apodiformes Trochilidae Violet-throated starfrontlet, Coeligena violifer JQ697050, JQ697066Apodiformes Trochilidae Andean hillstar, Oreotrochilus estella JQ697051, JQ405318Apodiformes Trochilidae Black-breasted hillstar, Oreotrochilus melanogaster JQ697052, JQ697067Apodiformes Trochilidae Giant hummingbird, Patagona gigas JQ697054, JQ697060Apodiformes Trochilidae Great-billed hermit, Phaethornis malaris JQ697053 , JQ697059Charadriiformes Stercorariidae South polar skua, Catharacta maccormicki P82111.1, P82112.1Columbiformes Columbidae Rock pigeon, Columba livia P21871.2, O12985.1, JQ405311Cuculiformes Cuculidae Common cuckoo, Cuculus canorus BAC57968, BAC57969.1Falconiformes Falconidae Prairie falcon, Falco mexicanus JQ405314Galliformes Phasianidae Japanese quail, Coturnix japonica P24589.2, P30892.1Galliformes Phasianidae Chicken, Gallus gallus NP_001004376, NP_001004375.1, NP_001004374.1Galliformes Phasianidae Wild turkey, Meleagris gallopavo P81023.2, P81024.1, XP_003210789.1Galliformes Phasianidae Common pheasant, Phasianus colchicus P01995.1, P02002.1Gruiformes Gruidae Sandhill crane, Grus canadensis JQ405312Opisthocomiformes Opisthocomidae Hoatzin, Opisthocomus hoazin JQ405310Passeriformes Corvidae Hooded crow, Corvus cornix JQ697055, JQ405319Passeriformes Emberizidae Rufous-collared sparrow, Zonotrichia capensis JQ405316, JQ405315Passeriformes Estrildidae Zebra finch, Taeniopygia guttata XP_002196132.1, XP_002196147.1, NP_001191174.1Passeriformes Furnariidae Wren-like rushbird, Phleocryptes melanops JQ405307, JQ405317Passeriformes Passeridae Tree sparrow, Passer montanus P07407.1, P07413.1, JQ405308Passeriformes Sturnidae Yellow-faced myna, Mino dumontii JQ697056, JQ697069Passeriformes Sturnidae Common starling, Sturnus vulgaris P01997.1, P02004.1, JQ405313Passeriformes Troglodytidae House wren, Troglodytes aedon JQ405324, JQ697068Passeriformes Turdidae Common blackbird, Turdus merula P14522.1, P14523.1Pelecaniformes Pelecanidae Dalmatian pelican, Pelecanus crispus JQ405326, JQ405322Pelecaniformes Pelecanidae Great white pelican, Pelecanus onocrotalus JQ405325, JQ824132Pelecaniformes Phalacrocoracidae Great cormorant, Phalacrocorax carbo P10780.1, P10781.1, JQ405309Phoenicopteriformes Phoenicopteridae Greater flamingo, Phoenicopterus roseus JQ697057, JQ697070Phoenicopteriformes Phoenicopteridae American flamingo, Phoenicopterus ruber P01984.2, JQ405321Psittaciformes Psittacidae Budgerigar, Melopsittacus undulatus JQ697058Psittaciformes Psittacidae Rose-ringed parakeet, Psittacula krameri P19831.1Strigiformes Strigidae Eurasian eagle owl, Bubo bubo JQ405323, JQ405320Struthioniformes Rheidae Greater rhea, Rhea americana P01982.1, P04241.1Struthioformes Struthionidae Ostrich, Struthio camelus P01981.1, P04242.1
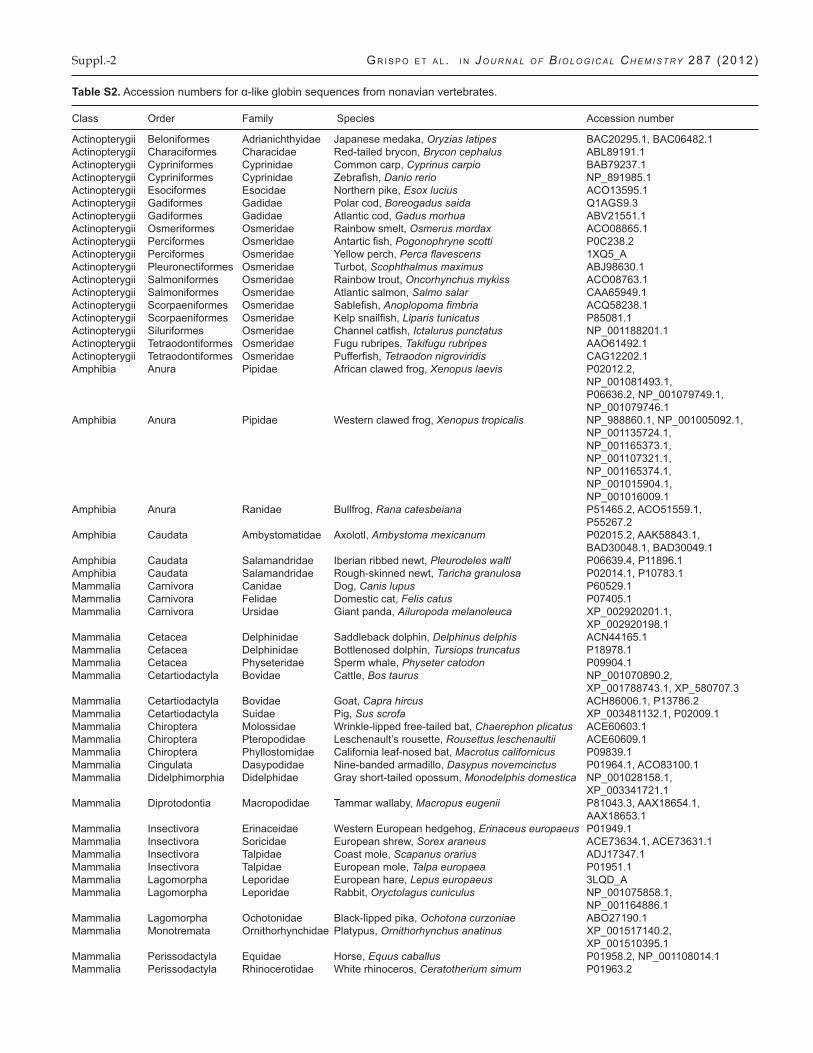
Suppl.-2 Gr i s p o e t a l . i n Jo u r n a l o f B i o l o g i c a l ch e m i s t ry 287 (2012)
Table S2. Accession numbers for α-like globin sequences from nonavian vertebrates. Class Order Family Species Accession number
Actinopterygii Beloniformes Adrianichthyidae Japanese medaka, Oryzias latipes BAC20295.1, BAC06482.1Actinopterygii Characiformes Characidae Red-tailed brycon, Brycon cephalus ABL89191.1Actinopterygii Cypriniformes Cyprinidae Common carp, Cyprinus carpio BAB79237.1Actinopterygii Cypriniformes Cyprinidae Zebrafish, Danio rerio NP_891985.1Actinopterygii Esociformes Esocidae Northern pike, Esox lucius ACO13595.1Actinopterygii Gadiformes Gadidae Polar cod, Boreogadus saida Q1AGS9.3Actinopterygii Gadiformes Gadidae Atlantic cod, Gadus morhua ABV21551.1Actinopterygii Osmeriformes Osmeridae Rainbow smelt, Osmerus mordax ACO08865.1Actinopterygii Perciformes Osmeridae Antartic fish, Pogonophryne scotti P0C238.2Actinopterygii Perciformes Osmeridae Yellow perch, Perca flavescens 1XQ5_AActinopterygii Pleuronectiformes Osmeridae Turbot, Scophthalmus maximus ABJ98630.1Actinopterygii Salmoniformes Osmeridae Rainbow trout, Oncorhynchus mykiss ACO08763.1Actinopterygii Salmoniformes Osmeridae Atlantic salmon, Salmo salar CAA65949.1Actinopterygii Scorpaeniformes Osmeridae Sablefish, Anoplopoma fimbria ACQ58238.1Actinopterygii Scorpaeniformes Osmeridae Kelp snailfish, Liparis tunicatus P85081.1Actinopterygii Siluriformes Osmeridae Channel catfish, Ictalurus punctatus NP_001188201.1Actinopterygii Tetraodontiformes Osmeridae Fugu rubripes, Takifugu rubripes AAO61492.1Actinopterygii Tetraodontiformes Osmeridae Pufferfish, Tetraodon nigroviridis CAG12202.1Amphibia Anura Pipidae African clawed frog, Xenopus laevis P02012.2, NP_001081493.1, P06636.2, NP_001079749.1, NP_001079746.1Amphibia Anura Pipidae Western clawed frog, Xenopus tropicalis NP_988860.1, NP_001005092.1, NP_001135724.1, NP_001165373.1, NP_001107321.1, NP_001165374.1, NP_001015904.1, NP_001016009.1 Amphibia Anura Ranidae Bullfrog, Rana catesbeiana P51465.2, ACO51559.1, P55267.2Amphibia Caudata Ambystomatidae Axolotl, Ambystoma mexicanum P02015.2, AAK58843.1, BAD30048.1, BAD30049.1Amphibia Caudata Salamandridae Iberian ribbed newt, Pleurodeles waltl P06639.4, P11896.1Amphibia Caudata Salamandridae Rough-skinned newt, Taricha granulosa P02014.1, P10783.1Mammalia Carnivora Canidae Dog, Canis lupus P60529.1Mammalia Carnivora Felidae Domestic cat, Felis catus P07405.1Mammalia Carnivora Ursidae Giant panda, Ailuropoda melanoleuca XP_002920201.1, XP_002920198.1Mammalia Cetacea Delphinidae Saddleback dolphin, Delphinus delphis ACN44165.1Mammalia Cetacea Delphinidae Bottlenosed dolphin, Tursiops truncatus P18978.1Mammalia Cetacea Physeteridae Sperm whale, Physeter catodon P09904.1Mammalia Cetartiodactyla Bovidae Cattle, Bos taurus NP_001070890.2, XP_001788743.1, XP_580707.3Mammalia Cetartiodactyla Bovidae Goat, Capra hircus ACH86006.1, P13786.2Mammalia Cetartiodactyla Suidae Pig, Sus scrofa XP_003481132.1, P02009.1Mammalia Chiroptera Molossidae Wrinkle-lipped free-tailed bat, Chaerephon plicatus ACE60603.1Mammalia Chiroptera Pteropodidae Leschenault’s rousette, Rousettus leschenaultii ACE60609.1Mammalia Chiroptera Phyllostomidae California leaf-nosed bat, Macrotus californicus P09839.1Mammalia Cingulata Dasypodidae Nine-banded armadillo, Dasypus novemcinctus P01964.1, ACO83100.1Mammalia Didelphimorphia Didelphidae Gray short-tailed opossum, Monodelphis domestica NP_001028158.1, XP_003341721.1Mammalia Diprotodontia Macropodidae Tammar wallaby, Macropus eugenii P81043.3, AAX18654.1, AAX18653.1Mammalia Insectivora Erinaceidae Western European hedgehog, Erinaceus europaeus P01949.1Mammalia Insectivora Soricidae European shrew, Sorex araneus ACE73634.1, ACE73631.1Mammalia Insectivora Talpidae Coast mole, Scapanus orarius ADJ17347.1Mammalia Insectivora Talpidae European mole, Talpa europaea P01951.1Mammalia Lagomorpha Leporidae European hare, Lepus europaeus 3LQD_AMammalia Lagomorpha Leporidae Rabbit, Oryctolagus cuniculus NP_001075858.1, NP_001164886.1Mammalia Lagomorpha Ochotonidae Black-lipped pika, Ochotona curzoniae ABO27190.1Mammalia Monotremata Ornithorhynchidae Platypus, Ornithorhynchus anatinus XP_001517140.2, XP_001510395.1Mammalia Perissodactyla Equidae Horse, Equus caballus P01958.2, NP_001108014.1Mammalia Perissodactyla Rhinocerotidae White rhinoceros, Ceratotherium simum P01963.2

Ge n e Du p l i c at i o n a n D t h e ev o l u t i o n o f he m o G l o b i n is o f o r m Di f f e r e n t i at i o n i n b i r D s Suppl.-3
Table S2. Accession numbers for α-like globin sequences from nonavian vertebrates (continued). Class Order Family Species Accession number
Mammalia Perissodactyla Tapiridae Brazilian tapir, Tapirus terrestris P01962.1Mammalia Primates Hominidae Human, Homo sapiens NP_000508.1, NP_005323.1Mammalia Primates Atelidae Black-handed spider monkey, Ateles geoffroyi P67817.2Mammalia Primates Cebidae White-tufted-ear marmoset, Callithrix jacchus XP_002755769.1, ABZ80335.1Mammalia Proboscidea Elephantidae Asiatic elephant, Elephas maximus ACV41393.1Mammalia Proboscidea Elephantidae African savanna elephant, Loxodonta africana XP_003417852.1, XP_003417854.1Mammalia Rodentia Cricetidae Chinese hamster, Cricetulus griseus XP_003501524.1, XP_003511891.1Mammalia Rodentia Cricetidae Deer mouse, Peromyscus maniculatus ABN71059.1, ABN71228.1 Mammalia Rodentia Muridae Norway rat, Rattus norvegicus NP_001013875.1, NP_001166316.1Reptilia Crocodylia Crocodylidae Nile crocodile, Crocodylus niloticus P01998.1Reptilia Crocodylia Crocodylidae American alligator, Alligator mississippiensis P01999.2Reptilia Crocodylia Crocodylidae Spectacled caiman, Caiman crocodilus 0901255A, P02000.1Reptilia Sphenodontia Sphenodontidae Tuatara, Sphenodon punctatus P10059.1, P10062.1Reptilia Squamata Colubridae Texas indigo snake, Drymarchon corais P0C0U6.1, P0C0U7.1Reptilia Squamata Iguanidae Marine iguana, Amblyrhynchus cristatus Gorr (1)Reptilia Squamata Iguanidae Green anole, Anolis carolinensis Hoffman et al. (2)Reptilia Testudines Cheloniidae Loggerhead turtle, Caretta caretta Q10732.1Reptilia Testudines Emydidae Western painted turtle, Chrysemys picta P13273.1, P02005.1Reptilia Testudines Emydidae Red-eared slider turtle, Trachemys scripta FG341498.1Reptilia Testudines Testudinidae Brazilian giant tortoise, Geochelone denticulata AAM18964.1Reptilia Testudines Testudinidae Galápagos giant tortoise, Geochelone nigra P83135.2Reptilia Testudines Chelidae Snake-necked turtle, Phrynops hilarii P02006.1
References - Supplementary Material
1. Gorr, T. (1993) Haemoglobine: Sequenz und Phylogenie. Die Primärstruktur von Globinketten des Quastenflossers (Latimeria chalumnae) sowie folgender Reptilien: Galapagos-Meerechse (Amblyrhynchus cristatus), Grüner Leguan (Iguana iguana), Indigonatter (Drymarchon corais), Glattstirnkaiman (Paleosuchus palpebrosus). Ph.D. Thesis, University of Munich, Germany.
2. Hoffmann, F.G., Storz, J.F., Gorr, T.A., and Opazo, J.C. (2010) Lineage-specific patterns of functional diversification in the α- and β-globin gene families of tetrapod vertebrates. Mol. Biol. Evol. 27, 1126-1138