International Equity Insights Funds - Permanent Capital ...
100
Goldman Sachs Funds Annual Report October 31, 2021 International Equity Insights Funds Emerging Markets Equity Insights International Equity Insights International Small Cap Insights
-
Upload
khangminh22 -
Category
Documents
-
view
0 -
download
0
Transcript of International Equity Insights Funds - Permanent Capital ...

Goldman Sachs Funds
Annual Report October 31, 2021
International Equity Insights FundsEmerging Markets Equity Insights
International Equity Insights
International Small Cap Insights

Goldman Sachs International EquityInsights Funds
� EMERGING MARKETS EQUITY INSIGHTS
� INTERNATIONAL EQUITY INSIGHTS
� INTERNATIONAL SMALL CAP INSIGHTS
TABLE OF CONTENTS
Investment Process 1
Market Review 2
Portfolio Management Discussions and Performance Summaries 6
Schedules of Investments 21
Financial Statements 42
Financial Highlights 46
Emerging Markets Equity Insights 46
International Equity Insights 53
International Small Cap Insights 61
Notes to the Financial Statements 67
Report of Independent Registered Public Accounting Firm 85
Other Information 86
NOT FDIC-INSURED May Lose Value No Bank Guarantee

G O L D M A N S A C H S I N T E R N A T I O N A L E Q U I T Y I N S I G H T S F U N D S
Enhancements Made to Proprietary Quantitative Model during the 12-Month
Period Ended October 31, 2021We continuously look for ways to improve our investment process. Accordingly, we introduced a number of enhancements
to our proprietary quantitative model during the 12-month period ended October 31, 2021 (the “Reporting Period”).
During the last months of 2020, we introduced new signals within our High Quality Business Models investment theme. The
first signal evaluates the overlap in the tenure of a company’s C-suite executives as well as other management positions, as
we believe companies that exhibit less turnover in their senior-most management teams are likely to outperform in the long
run. The second signal seeks to identify a company’s exposure to U.S. states based on search engine activity, as we believe
that companies can be impacted by the economic conditions of regions beyond where their subsidiaries, offices or otherwise
general businesses are physically located. We also introduced a strategic climate-aware tilt with longer-term return
expectations within our overall portfolio construction process that is designed to reduce exposure to carbon transition risk
using two proprietary measures of emissions intensity. We believe that the transition to a low-carbon economy is likely to
become even more important in determining the attractiveness of companies in the future.
During the first half of 2021, we introduced new signals within our Sentiment Analysis investment theme, which we rolled
out across the majority of regions, including the U.S., emerging markets, Japan and Europe. These signals are an extension to
our existing suite of signals that focus on institutional positioning and capture sentiment associated with outstanding short-
interest for specific names. The new signals focus on short positions by institutional investors and seek to identify which
ones may have been covered prematurely or maintained beyond their optimal duration. Additionally, within our High Quality
Business Models investment theme, we introduced another signal to our existing suite of alternative growth signals across
multiple regions, including the U.S., emerging markets, Japan and Europe. The new signal seeks to identify companies that
exhibit elevated levels of demand for their products and services based on trends identified from consumer Internet activity
data. While we believe that these types of trends can help provide additional insight on the global demand for certain
products and services, we have also closely focused on developing our own process to identify which individual companies
are most highly exposed to specific trends.
1

M A R K E T R E V I E W
Goldman Sachs International EquityInsights Funds
Market ReviewDuring the 12-month period ended October 31, 2021 (the “Reporting Period”), emerging markets equities and international equities
broadly recorded gains, with the major influences being an economic recovery from the depths of the COVID-19 pandemic as well
as continued fiscal stimulus and ongoing accommodative monetary policies from central banks and governments around the world.
Emerging Markets Equities
Emerging markets equities, as represented by the MSCI Emerging Markets Standard Index (Net, USD, Unhedged) (the “MSCI EM
Index”), generated a positive absolute return of 16.96%.1
As the Reporting Period began in the last two months of 2020, emerging markets equities advanced in the wake of U.S. elections
and the release of successful COVID-19 vaccine results by multiple companies. There was additional positive news, as COVID-19
vaccines started being distributed across the world. Emerging markets equity funds experienced strong investment inflows.
However, toward the end of calendar year 2020, the emergence of a new, more contagious strain of COVID-19 slightly dampened
investor sentiment and caused several countries to reinstate some restrictions. South Korea and Brazil were among the top
performing countries in the MSCI EM Index during the last two months of 2020. South Korea was at the forefront of COVID-19
testing and, as a result, was able to keep cases low. Brazil showed a strong rebound in its consumption of fuel, which recovered to
higher than pre-pandemic levels. India also performed well. India, which was struggling to recover from the fallout of the
COVID-19 pandemic, launched a massive vaccination drive. China was among the weakest performers in the MSCI EM Index, as
tensions between China and the U.S. flared up after the U.S. announced plans to delist some Chinese stocks from the New York
Stock Exchange. In Europe, Greece was a weak performer though it posted positive absolute returns. Greece’s equity market was
pressured by the country entering another lockdown as it struggled to contain the spread of COVID-19.
Emerging markets equities were up modestly for the first quarter of 2021 overall but fell in March, as COVID-19 vaccine rollouts
slowed in some countries. Investor optimism and risk tolerance waned during the quarter, as consensus expectations of higher
inflation and rising yields caused heightened volatility in equities across regions. Emerging markets equity fund investment flows
remained positive, but momentum slowed. Earnings estimates for the MSCI EM Index were revised down slightly in March 2021.
Saudi Arabia and Mexico were among the top performing countries in the MSCI EM Index during the first calendar quarter. Oil
prices rose given the Organization of the Petroleum Exporting Countries’ (“OPEC”) agreements for countries, including Saudi
Arabia, to maintain lower levels of production. Mexico benefited from the new United States-Mexico-Canada (“USMCA”) trade
deal and also reaped benefits from the U.S. government’s $1.9 trillion stimulus plan, both of which led economic growth estimates
for Mexico to increase for calendar year 2021. China was among the weakest performers in the MSCI EM Index, as investor
sentiment was dampened by rising inflation as well as by early signs of the government tightening its stimulus policies. Egypt and
Turkey were also weak performers. Egypt in particular suffered amid the fallout of the Suez Canal blockage that resulted in a stall
in global shipping.
Emerging markets equities markets rose more solidly in the second quarter of 2021, as both COVID-19 vaccine availability and
distribution continued to increase, though the global spread of the Delta variant slightly dampened recovery optimism. Still,
favorable investor sentiment around a return to normalcy outweighed both these concerns and worries about rising interest rates
and the possibility of tightening fiscal policies. Brazil was one of the top performing countries in the MSCI EM Index during the
quarter, driven by an acceleration in the COVID-19 vaccine rollout. Russia and Saudi Arabia were also strong performers, as their
economies and domestic businesses benefited from higher crude oil prices. India also performed well, as the nation’s daily
COVID-19 infections seemed to have peaked and were steadily decreasing. China’s equity market was only slightly positive
during the second calendar quarter, as regulatory concerns, mainly in the technology sector, continued to weigh on investor
sentiment.
In the third quarter of 2021, emerging markets equities declined, as the global spread of the Delta variant dampened economic
recovery optimism and investor concerns grew over regulations in China. Though they rose slightly in August 2021 on
reassurances by the U.S. Federal Reserve (the “Fed”), accommodative monetary policy in India and declining infection rates in
Asia, emerging markets equities experienced significant sell-offs in July and September, as investors focused on concerns around
1 All Index returns are expressed in U.S. dollar terms.
2

M A R K E T R E V I E W
rising interest rates and the possibility of tightening fiscal policies. China was among the weakest markets in the MSCI EM Index
during the quarter, as regulatory concerns, mainly in the technology sector, continued to weigh on sentiment. Investors were
confronted with increased regulatory scrutiny on companies focused on e-commerce, online education and cybersecurity. India was
one of the top performing countries in the MSCI EM Index, driven by steady government spending and company valuations. Also,
positively, the nation’s daily COVID-19 infections continued to decline. Russia and Saudi Arabia were also strong performers
during the quarter, as their economies and domestic businesses continued to benefit from higher crude oil prices.
Emerging markets equities rose slightly in October 2021, as COVID-19 vaccination rates increased and the global spread of the
Delta variant slowed in most regions. Also, emerging markets equities were expected by the consensus to see a strong earnings
recovery through the end of 2021. Asia’s factory activity stepped up a gear in October, as emerging economies saw COVID-19
infections subside, but rising input costs, material shortages and slowing Chinese economic growth clouded the outlook. China’s
factory activity expanded at its fastest pace in four months during October, but a sub-index for output showed that production
shrank for the third straight month due to power shortages and rising costs. India’s equity market posted a negative return for the
month, driven by investor concerns about steep valuations and liquidity normalization signals by the country’s central bank.
Brazil’s equity market also fell in October, mostly due to inflation concerns and doubts about the economic policy of the nation’s
government and its intention to relax fiscal rules to increase social spending. Russia was a strong performer during the month,
again benefiting from higher crude oil prices.
For the Reporting Period as a whole, energy, materials and financials were the strongest sectors in the MSCI EM Index, each
posting a robust double-digit positive absolute return. Consumer discretionary, real estate and communication services were the
weakest performing sectors in the MSCI EM Index, each generating a negative absolute return during the Reporting Period.
From a country perspective, the Czech Republic, Russia, Hungary, Argentina and Poland were the best performing individual
constituents of the MSCI EM Index for the Reporting Period, each of which posted a robust double-digit absolute gain.
Conversely, the only constituents of the MSCI EM Index to post negative absolute returns for the Reporting Period overall were
China and Pakistan. Egypt, Malaysia and Peru were also among the weakest performers but posted modestly positive absolute
returns during the Reporting Period.
International Equities
International equities, as represented by the MSCI Europe, Australasia, Far East (“EAFE”) Standard Index (Net, USD, Unhedged)
(the “MSCI EAFE Index”), recorded a positive absolute return of 34.18%.1
As the Reporting Period began in November 2020, international equities rebounded following two months of declines in
September and October 2020, with cyclical and value-oriented stocks outperforming growth-oriented stocks. Equity markets rallied
early in the month as U.S. election results brought some clarity. The announcement of promising data from multiple COVID-19
vaccine developers gave further boost to investor sentiment in the last two months of 2020 as did the prospects of a global
economic recovery. While European equities faced some headwinds from increasing COVID-19 cases and heightened lockdown
restrictions, spillover optimism from the U.S. elections boosted European stocks. In the U.K., third quarter Gross Domestic Product
(“GDP”) rose in its sharpest quarterly expansion on record. The Japanese equity market rallied, driven by global cues, particularly
around COVID-19 vaccine and U.S. Presidential election news.
International equity markets overcame bouts of volatility during the first quarter of 2021 to surge to new highs in March, driven by
two key themes — the accelerating rollout of the COVID-19 vaccines globally and the ongoing commitment from central banks
around the world to support the economic recovery. Accelerating economic growth, normalizing inflation and steepening yield
curves laid the foundation for the “reflation trade,” as investors started to price in a brighter future. (Reflation is the inflation that
typically comes immediately after a low-point in the economic cycle, often after economic stimulus, and the reflation trade is the
purchase of specific stocks or sectors believed to outperform in that type of environment.) Investors took a sharp turn away from
momentum stocks and favored cyclical sectors, many of which tend to be more value oriented. European equities were less
impacted by inflation fears, as reopening progress pushed travel and leisure stocks higher, and U.K. equities were additionally
buoyed by gains in energy prices. Markets welcomed the European Central Bank’s (“ECB”) decision to increase the pace of its1 All Index returns are expressed in U.S. dollar terms.
3

M A R K E T R E V I E W
Pandemic Emergency Purchase Programme asset purchases in response to the bond sell-off there. Markets also overcame pressure
as AstraZeneca vaccine safety concerns and new local lockdown measures in France dampened near-term recovery prospects.
March’s Euro-area Manufacturing Purchasing Managers Index posted a historical high. Japanese equities rose during the first
calendar quarter, rallying on the back of a sharp rotation from growth to value stocks. Investor sentiment was also supported by the
consistent weakness of the Japanese yen against the U.S. dollar and by a rally in U.S. equities.
The rotation from growth to value stocks took a breather in April 2021, with international growth stocks outperforming their value
counterparts. Starting in May 2021, international equities were impacted by rising commodity prices, which stoked investor fears
of earlier than consensus expected interest rate hikes from central banks, particularly the U.S. Fed. In June, international equities
rallied following a weaker than consensus expected U.S. payrolls report that eased concerns of a shift to tighter monetary policy.
Overall, discussions during the quarter centered on central bank liquidity tailwinds, fiscal stimulus, COVID-19 vaccine progress,
economic reopening momentum, strong corporate profits and robust equity inflows. While inflation concerns were fairly pervasive,
the Fed remained consistent in its messaging around expectations that price pressures would be transitory. European equities
advanced for the fifth straight quarter amid a sharp rebound in economic growth, an accelerating COVID-19 vaccine rollout and
significantly better than consensus expected first quarter 2021 corporate earnings. Cyclical stocks generated the best returns,
although sector performance was broadly positive. The ECB maintained its accommodative monetary policy stance, while also
upgrading its GDP growth forecast and raising its inflation forecast for both 2021 and 2022. In the U.K., the Bank of England
(“BOE”) raised its economic growth forecast for 2021 and tapered its pace of asset purchases. In Japan, state of emergency
measures following a third wave of COVID-19 cases that had begun in March 2021 and slowing COVID-19 vaccine rollouts
weighed on investor sentiment for the majority of the second calendar quarter. However, the Japanese equity market rallied
strongly during the first half of June, likely driven by the increased pace of inoculations. This exuberance was short-lived,
however, as the direction of the Japanese equity market again turned sharply down in the middle of June in step with U.S. equity
markets.
International equities fell during the third quarter of 2021 for the first time in six calendar quarters. During the first half of the
quarter, the international equity markets delivered strong returns, continuing the trend from the second calendar quarter along with
additional focus on positive corporate earnings and the accommodative monetary policies of global central banks. Pandemic-
related pressures appeared to be easing, and economic activity appeared to be increasing. However, the markets receded in the
second half of the third calendar quarter, primarily due to the U.S. Fed’s announcements about its plans to taper monthly asset
purchase plans but also because of heightened investor worries around an increase in interest rates, global supply chain concerns,
COVID-19 Delta variant cases and Chinese government regulations on Chinese stocks. Then, a debt crisis at one of China’s largest
property developers further unsettled investors. All that said, European equities advanced for the sixth straight calendar quarter, as
investor risk sentiment was bolstered by robust corporate earnings, solid economic growth and an accommodative policy
environment. The ECB signaled it would maintain interest rates at record lows for a longer period to support the economic
recovery and unveiled a new flexible inflation policy framework. In the U.K., the BOE left monetary policy unchanged but
signaled it was moving closer to raising its interest rates. Japanese equities also advanced during the quarter, rebounding largely on
the Tokyo Olympics that began in July 2021 and on the appointment of a new prime minister, who is widely expected to compile a
sizable fiscal package to shore up the Japanese economy. Bringing the MSCI EAFE Index into negative territory for the quarter
were the equity markets of Germany and the Pacific Basin ex-Japan, which declined.
Many of the concerns that dominated the international equity markets in September 2021 ebbed somewhat in October, and the
MSCI EAFE Index returned to positive territory, supported in Europe and the U.K. particularly by favorable third calendar quarter
corporate earnings reports. The Japanese equity market declined in October ahead of the general election that took place on
October 31. Global news flow was generally negative in the first half of October, especially from China, but the sustained strength
of U.S. equity markets provided some support for Japan. Equity markets in the Pacific Basin ex-Japan rose, rallying on both
positive corporate earnings guidance and a continuing decline in the number of new COVID-19 cases in many countries in the
region. However, shares were weaker toward the end of the month with continued concerns around rising energy prices, higher
inflation and ongoing tensions between the U.S. and China weighing on investor sentiment.
For the Reporting Period as a whole, energy, financials and information technology were the strongest performing sectors in the
MSCI EAFE Index, each producing a robust double-digit positive absolute return. The weakest performing sectors in the MSCI
4
M A R K E T R E V I E W
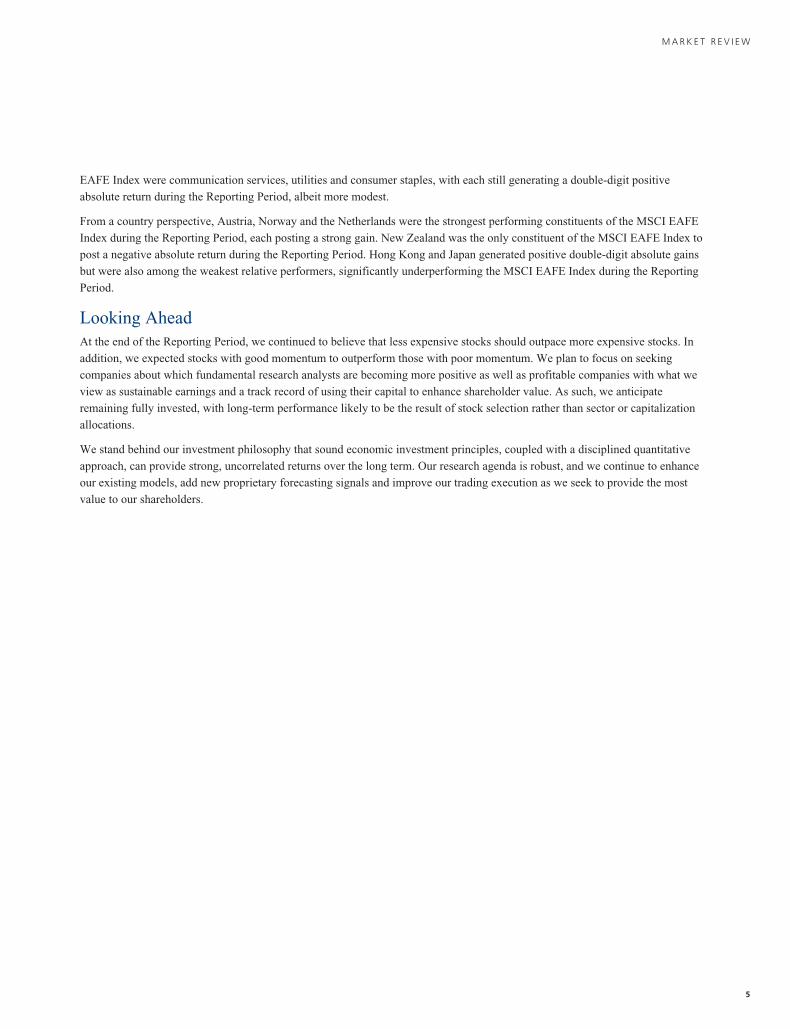
EAFE Index were communication services, utilities and consumer staples, with each still generating a double-digit positive
absolute return during the Reporting Period, albeit more modest.
From a country perspective, Austria, Norway and the Netherlands were the strongest performing constituents of the MSCI EAFE
Index during the Reporting Period, each posting a strong gain. New Zealand was the only constituent of the MSCI EAFE Index to
post a negative absolute return during the Reporting Period. Hong Kong and Japan generated positive double-digit absolute gains
but were also among the weakest relative performers, significantly underperforming the MSCI EAFE Index during the Reporting
Period.
Looking AheadAt the end of the Reporting Period, we continued to believe that less expensive stocks should outpace more expensive stocks. In
addition, we expected stocks with good momentum to outperform those with poor momentum. We plan to focus on seeking
companies about which fundamental research analysts are becoming more positive as well as profitable companies with what we
view as sustainable earnings and a track record of using their capital to enhance shareholder value. As such, we anticipate
remaining fully invested, with long-term performance likely to be the result of stock selection rather than sector or capitalization
allocations.
We stand behind our investment philosophy that sound economic investment principles, coupled with a disciplined quantitative
approach, can provide strong, uncorrelated returns over the long term. Our research agenda is robust, and we continue to enhance
our existing models, add new proprietary forecasting signals and improve our trading execution as we seek to provide the most
value to our shareholders.
5

P O R T F O L I O R E S U L T S
Goldman Sachs Emerging Markets EquityInsights Fund
Investment Objective
The Fund seeks long-term growth of capital.
Portfolio Management Discussion and AnalysisBelow, the Goldman Sachs Quantitative Investment Strategies Team discusses the Goldman Sachs Emerging Markets
Equity Insights Fund’s (the “Fund”) performance and positioning for the 12-month period ended October 31, 2021 (the
“Reporting Period”).
Q How did the Fund perform during the ReportingPeriod?
A During the Reporting Period, the Fund’s Class A, Class C,
Institutional, Investor, Class R6, Class R and Class P Shares
generated average annual total returns, without sales charges,
of 16.60%, 15.74%, 17.07%, 16.96%, 17.10%, 16.43% and
17.10%, respectively. These returns compare to the 16.96%
average annual total return of the Fund’s benchmark, the
MSCI Emerging Markets Standard Index (Net, USD,
Unhedged) (the “Index”), during the same period.
Q What key factors were most responsible for theFund’s performance during the Reporting Period?
A The Fund uses a quantitative style of management, in
combination with a qualitative overlay, that emphasizes
fundamentally-based stock and country/currency selection,
careful portfolio construction and efficient implementation.
To manage the Fund, we use two distinct strategies — a
bottom-up stock selection strategy and a top-down country/
currency selection strategy. These strategies are uncorrelated,
that is, they tend to perform independently of each other over
time, which enables us to greater diversify the portfolio.
During the Reporting Period, the Fund generated mixed
results versus the Index, with some share classes
underperforming and others outperforming. Within our stock
selection strategy, certain individual investments detracted
from relative performance. Our country/currency strategy
contributed positively.
Q Which investment themes helped and which hurtwithin the Team’s stock selection strategy?
A In keeping with our investment approach, we use our
quantitative model and four investment themes to take a
long-term view of market patterns and look for
inefficiencies, selecting stocks for the Fund and
overweighting or underweighting the ones chosen by the
model. Over time and by design, the performance of any one
of the model’s investment themes tends to have a low
correlation with the model’s other themes, demonstrating the
diversification benefit of the Fund’s theme-driven
quantitative model. The variance in performance supports
our research indicating that the diversification provided by
our different investment themes is a significant investment
advantage over the long term, even though the Fund may
experience underperformance in the short term. Of course,
diversification does not protect an investor from market risk
nor does it ensure a profit.
During the Reporting Period, two of our investment themes
hurt the Fund’s relative performance. Fundamental
Mispricings was our worst performing investment theme,
followed at some distance by High Quality Business Models.
Fundamental Mispricings seeks to identify high quality
businesses trading at a fair price, which we believe may lead
to strong performance over the long run. High Quality
Business Models seeks to identify companies that are
generating high quality revenues with sustainable business
models and aligned management incentives.
The Fund benefited from our Market Themes & Trends
investment theme during the Reporting Period. Market
Themes & Trends seeks to identify companies positively
positioned to benefit from themes and trends in the market
and macroeconomic environment.
The impact of our Sentiment Analysis investment theme was
rather neutral during the Reporting Period. Sentiment
Analysis seeks to identify stocks experiencing improvements
in their overall market sentiment.
Q How did the Fund’s sector and industryallocations affect relative performance?
A In constructing the Fund’s portfolio, our quantitative model
focuses on stock selection rather than on making sector or6
P O R T F O L I O R E S U L T S
industry bets. Consequently, the Fund is similar to the Index
in terms of its sector and industry allocations and style.
Relative performance is primarily driven by stock selection,
not by sector or industry allocations.
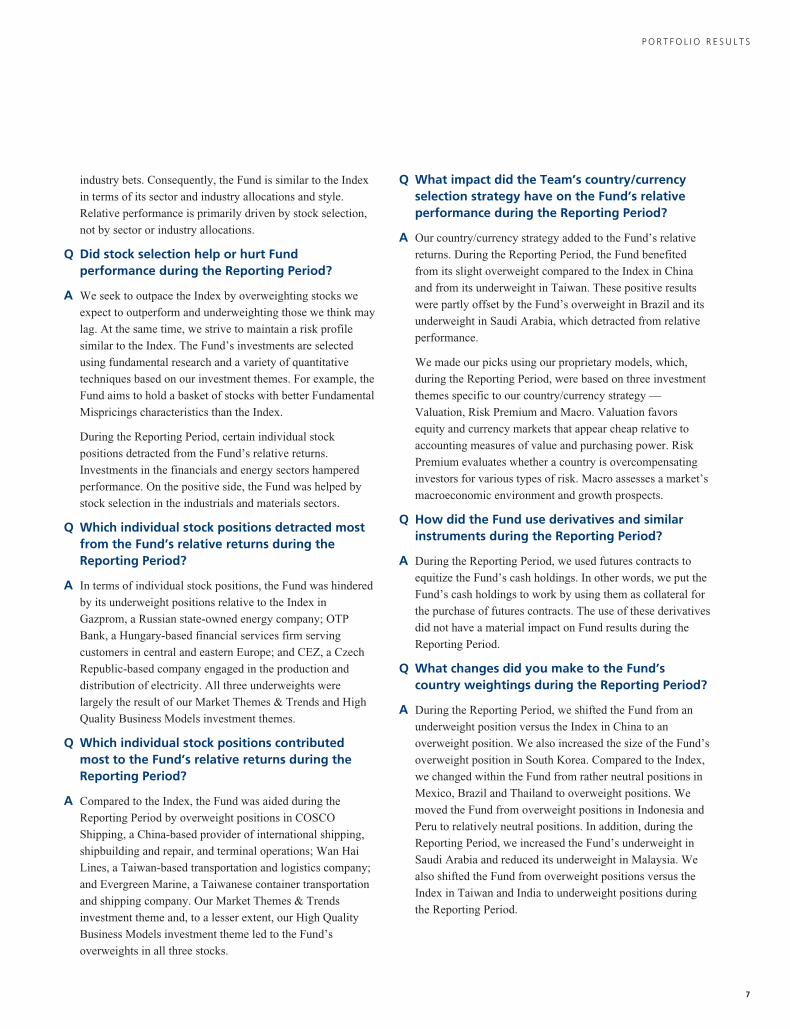
Q Did stock selection help or hurt Fundperformance during the Reporting Period?
A We seek to outpace the Index by overweighting stocks we
expect to outperform and underweighting those we think may
lag. At the same time, we strive to maintain a risk profile
similar to the Index. The Fund’s investments are selected
using fundamental research and a variety of quantitative
techniques based on our investment themes. For example, the
Fund aims to hold a basket of stocks with better Fundamental
Mispricings characteristics than the Index.
During the Reporting Period, certain individual stock
positions detracted from the Fund’s relative returns.
Investments in the financials and energy sectors hampered
performance. On the positive side, the Fund was helped by
stock selection in the industrials and materials sectors.
Q Which individual stock positions detracted mostfrom the Fund’s relative returns during theReporting Period?
A In terms of individual stock positions, the Fund was hindered
by its underweight positions relative to the Index in
Gazprom, a Russian state-owned energy company; OTP
Bank, a Hungary-based financial services firm serving
customers in central and eastern Europe; and CEZ, a Czech
Republic-based company engaged in the production and
distribution of electricity. All three underweights were
largely the result of our Market Themes & Trends and High
Quality Business Models investment themes.
Q Which individual stock positions contributedmost to the Fund’s relative returns during theReporting Period?
A Compared to the Index, the Fund was aided during the
Reporting Period by overweight positions in COSCO
Shipping, a China-based provider of international shipping,
shipbuilding and repair, and terminal operations; Wan Hai
Lines, a Taiwan-based transportation and logistics company;
and Evergreen Marine, a Taiwanese container transportation
and shipping company. Our Market Themes & Trends
investment theme and, to a lesser extent, our High Quality
Business Models investment theme led to the Fund’s
overweights in all three stocks.
Q What impact did the Team’s country/currencyselection strategy have on the Fund’s relativeperformance during the Reporting Period?
A Our country/currency strategy added to the Fund’s relative
returns. During the Reporting Period, the Fund benefited
from its slight overweight compared to the Index in China
and from its underweight in Taiwan. These positive results
were partly offset by the Fund’s overweight in Brazil and its
underweight in Saudi Arabia, which detracted from relative
performance.
We made our picks using our proprietary models, which,
during the Reporting Period, were based on three investment
themes specific to our country/currency strategy —
Valuation, Risk Premium and Macro. Valuation favors
equity and currency markets that appear cheap relative to
accounting measures of value and purchasing power. Risk
Premium evaluates whether a country is overcompensating
investors for various types of risk. Macro assesses a market’s
macroeconomic environment and growth prospects.
Q How did the Fund use derivatives and similarinstruments during the Reporting Period?
A During the Reporting Period, we used futures contracts to
equitize the Fund’s cash holdings. In other words, we put the
Fund’s cash holdings to work by using them as collateral for
the purchase of futures contracts. The use of these derivatives
did not have a material impact on Fund results during the
Reporting Period.
Q What changes did you make to the Fund’scountry weightings during the Reporting Period?
A During the Reporting Period, we shifted the Fund from an
underweight position versus the Index in China to an
overweight position. We also increased the size of the Fund’s
overweight position in South Korea. Compared to the Index,
we changed within the Fund from rather neutral positions in
Mexico, Brazil and Thailand to overweight positions. We
moved the Fund from overweight positions in Indonesia and
Peru to relatively neutral positions. In addition, during the
Reporting Period, we increased the Fund’s underweight in
Saudi Arabia and reduced its underweight in Malaysia. We
also shifted the Fund from overweight positions versus the
Index in Taiwan and India to underweight positions during
the Reporting Period.
7

P O R T F O L I O R E S U L T S
Q What were the Fund’s sector and countryweightings at the end of the Reporting Period?
A At the end of the Reporting Period, the Fund was overweight
relative to the Index in the industrials, materials, utilities and
information technology sectors. Compared to the Index, the
Fund was underweight the consumer staples, consumer
discretionary, communication services, real estate and energy
sectors. It was rather neutral versus the Index in the health
care and financials sectors at the conclusion of the Reporting
Period.
In terms of countries, the Fund was overweight relative to the
Index in South Korea, China, Brazil, Mexico and Thailand at
the end of the Reporting Period. Compared to the Index, the
Fund was underweight Saudi Arabia, Taiwan, India, South
Africa and Malaysia. The Fund was relatively neutral in
Qatar, Turkey, United Arab Emirates, Chile, Indonesia, Peru,
Russia, Hungary, Greece, Pakistan, Egypt, Czech Republic,
Argentina, Colombia, Poland and the Philippines at the end
of the Reporting Period.
8
F U N D B A S I C S
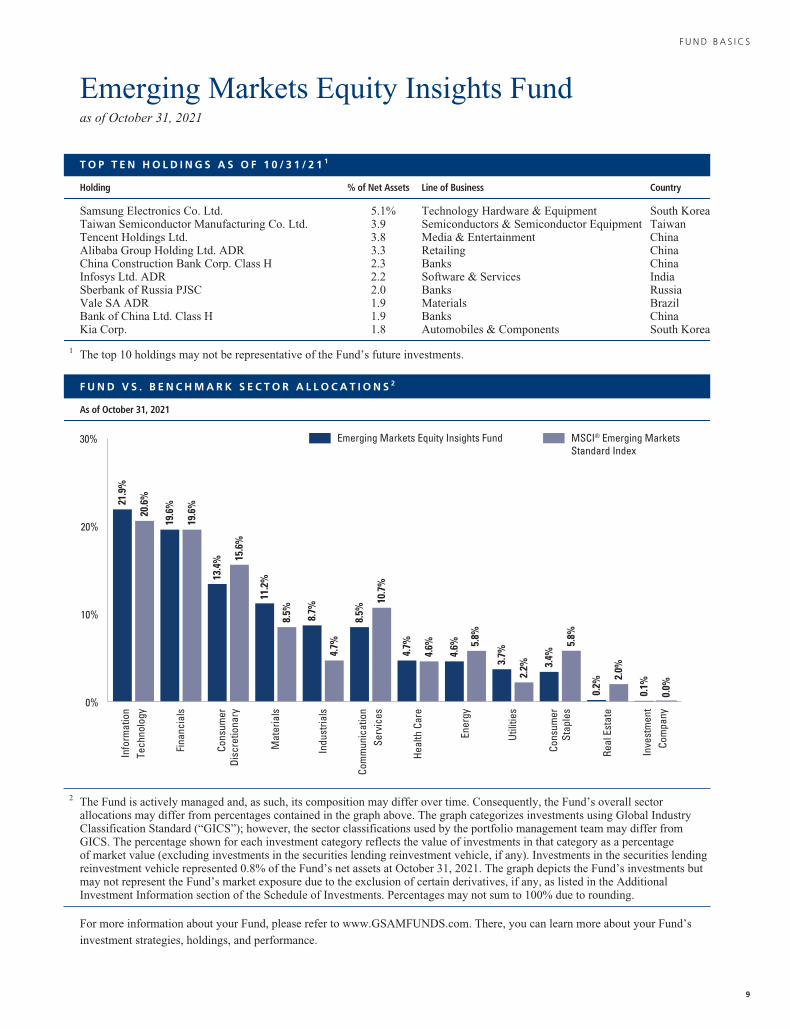
Emerging Markets Equity Insights Fundas of October 31, 2021
T O P T E N H O L D I N G S A S O F 1 0 / 3 1 / 2 1 1
Holding % of Net Assets Line of Business Country
Samsung Electronics Co. Ltd. 5.1% Technology Hardware & Equipment South KoreaTaiwan Semiconductor Manufacturing Co. Ltd. 3.9 Semiconductors & Semiconductor Equipment TaiwanTencent Holdings Ltd. 3.8 Media & Entertainment ChinaAlibaba Group Holding Ltd. ADR 3.3 Retailing ChinaChina Construction Bank Corp. Class H 2.3 Banks ChinaInfosys Ltd. ADR 2.2 Software & Services IndiaSberbank of Russia PJSC 2.0 Banks RussiaVale SA ADR 1.9 Materials BrazilBank of China Ltd. Class H 1.9 Banks ChinaKia Corp. 1.8 Automobiles & Components South Korea
1 The top 10 holdings may not be representative of the Fund’s future investments.
F U N D V S . B E N C H M A R K S E C T O R A L L O C A T I O N S 2
As of October 31, 2021
MSCI® Emerging MarketsStandard Index
Emerging Markets Equity Insights Fund
Com
mun
icat
ion
Serv
ices
Real
Est
ate
Info
rmat
ion
Tech
nolo
gy20
.6%
19.6
%
19.6
%
13.4
%
11.2
%
8.5% 8.7%
4.7%
8.5%
10.7
%
4.7%
4.6%
4.6%
15.6
%
21.9
%
Fina
ncia
ls
Mat
eria
ls
Heal
th C
are
Cons
umer
Disc
retio
nary
Utili
ties
Ener
gy
0%
10%
20%
30%
Cons
umer
Stap
les
Inve
stm
ent
Com
pany
Indu
stria
ls
5.8%
3.7%
2.2% 3.
4%
0.2%
2.0%
0.1%
0.0%
5.8%
2 The Fund is actively managed and, as such, its composition may differ over time. Consequently, the Fund’s overall sectorallocations may differ from percentages contained in the graph above. The graph categorizes investments using Global IndustryClassification Standard (“GICS”); however, the sector classifications used by the portfolio management team may differ fromGICS. The percentage shown for each investment category reflects the value of investments in that category as a percentageof market value (excluding investments in the securities lending reinvestment vehicle, if any). Investments in the securities lendingreinvestment vehicle represented 0.8% of the Fund’s net assets at October 31, 2021. The graph depicts the Fund’s investments butmay not represent the Fund’s market exposure due to the exclusion of certain derivatives, if any, as listed in the AdditionalInvestment Information section of the Schedule of Investments. Percentages may not sum to 100% due to rounding.
For more information about your Fund, please refer to www.GSAMFUNDS.com. There, you can learn more about your Fund’s
investment strategies, holdings, and performance.
9

G O L D M A N S A C H S E M E R G I N G M A R K E T S E Q U I T Y I N S I G H T S F U N D
Performance SummaryOctober 31, 2021
The following graph shows the value, as of October 31, 2021, of a $1,000,000 investment made on November 1, 2011 in
Institutional Shares at NAV. For comparative purposes, the performance of the Fund’s benchmark, the MSCI® Emerging Markets
Standard Index (the “MSCI® EM Index”) (Net, USD, unhedged), is shown. Performance reflects applicable fee waivers and/or
expense limitations in effect during the periods shown and in their absence, performance would be reduced. Returns do not reflect
the deduction of taxes that a shareholder would pay on Fund distributions or the redemption of Fund shares. The returns set forth
below represent past performance. Past performance does not guarantee future results. The Fund’s investment return and principal
value will fluctuate so that an investor’s shares, when redeemed, may be worth more or less than their original cost. Current
performance may be lower or higher than the performance quoted below. Please visit our web site at www.GSAMFUNDS.com to
obtain the most recent month-end returns.
Emerging Markets Equity Insights Fund’s 10 Year Performance
Performance of a $1,000,000 Investment, with distributions reinvested, from November 1, 2011 through October 31, 2021.
$500,000
$1,000,000
$1,500,000
$2,500,000
$2,000,000
$1,805,870
$1,609,941
11/1/11 10/20 10/2110/19
Institutional Shares
MSCI® EM Index
10/1810/1710/1610/1510/1410/1310/12
Average Annual Total Return through October 31, 2021* One Year Five Years Ten Years Since Inception
Class AExcluding sales charges 16.60% 8.98% 5.68% —Including sales charges 10.15% 7.75% 5.09% —
Class CExcluding contingent deferred sales charges 15.74% 8.18% 4.89% —Including contingent deferred sales charges 14.74% 8.18% 4.89% —
Institutional 17.07% 9.39% 6.08% —
Investor 16.96% 9.26% 5.95% —
Class R6 (Commenced July 31, 2015) 17.10% 9.42% N/A 7.95%
Class R (Commenced February 28, 2014) 16.43% 8.73% N/A 6.37%
Class P (Commenced April 16, 2018) 17.10% N/A N/A 4.11%
* These returns assume reinvestment of all distributions at NAV and reflect a maximum initial sales charge of 5.50% for Class A and the assumedcontingent deferred sales charge for Class C Shares (1% if redeemed within 12 months of purchase). Because Institutional, Investor, Class R6,Class R and Class P Shares do not involve a sales charge, such a charge is not applied to their Average Annual Total Returns.
10

P O R T F O L I O R E S U L T S
Goldman Sachs International Equity Insights Fund
Investment Objective
The Fund seeks long-term growth of capital.
Portfolio Management Discussion and AnalysisBelow, the Goldman Sachs Quantitative Investment Strategies Team discusses the Goldman Sachs International Equity
Insights Fund’s (the “Fund”) performance and positioning for the 12-month period ended October 31, 2021 (the
“Reporting Period”).
Q How did the Fund perform during the ReportingPeriod?
A During the Reporting Period, the Fund’s Class A, Class C,
Institutional, Service, Investor, Class R6, Class R and
Class P Shares generated average annual total returns,
without sales charges, of 31.50%, 30.53%, 31.93%, 31.25%,
31.90%, 31.97%, 31.19% and 32.00%, respectively. These
returns compare to the 34.18% average annual total return of
the Fund’s benchmark, the MSCI EAFE Standard Index
(Net, USD, Unhedged) (the “Index”), during the same
period.
Q What key factors were most responsible for theFund’s performance during the Reporting Period?
A The Fund uses a quantitative style of management, in
combination with a qualitative overlay, that emphasizes
fundamentally-based stock and country/currency selection,
careful portfolio construction and efficient implementation.
To manage the Fund, we use two distinct strategies — a
bottom-up stock selection strategy and a top-down country/
currency selection strategy. These strategies are uncorrelated,
that is, they tend to perform independently of each other over
time, which enables us to greater diversify the portfolio.
During the Reporting Period, the Fund underperformed the
Index, with certain individual investments detracting from
relative performance. Our country/currency strategy also hurt
relative performance.
Q Which investment themes helped and which hurtwithin the Team’s stock selection strategy?
A In keeping with our investment approach, we use our
quantitative model and four investment themes to take a
long-term view of market patterns and look for
inefficiencies, selecting stocks for the Fund and
overweighting or underweighting the ones chosen by the
model. Over time and by design, the performance of any one
of the model’s investment themes tends to have a low
correlation with the model’s other themes, demonstrating the
diversification benefit of the Fund’s theme-driven
quantitative model. The variance in performance supports
our research indicating that the diversification provided by
our different investment themes is a significant investment
advantage over the long term, even though the Fund may
experience underperformance in the short term. Of course,
diversification does not protect an investor from market risk
nor does it ensure a profit.
During the Reporting Period, two of our investment
themes — High Quality Business Models and Market
Themes & Trends — detracted from the Fund’s relative
returns. High Quality Business Models seeks to identify
companies that are generating high quality revenues with
sustainable business models and aligned management
incentives. Market Themes & Trends seeks to identify
companies positively positioned to benefit from themes and
trends in the market and macroeconomic environment.
The Fund was helped by our Sentiment Analysis and
Fundamental Mispricings investment themes during the
Reporting Period. Sentiment Analysis seeks to identify
stocks experiencing improvements in their overall market
sentiment. Fundamental Mispricings seeks to identify high
quality businesses trading at a fair price, which we believe
may lead to strong performance over the long run.
Q How did the Fund’s sector and industryallocations affect relative performance?
A In constructing the Fund’s portfolio, our quantitative model
focuses on stock selection rather than on making sector or
industry bets. Consequently, the Fund is similar to the Index
in terms of its sector and industry allocations and style.
Relative performance is primarily driven by stock selection,
not by sector or industry allocations.11

P O R T F O L I O R E S U L T S
Q Did stock selection help or hurt Fundperformance during the Reporting Period?
A We seek to outpace the Index by overweighting stocks we
expect to outperform and underweighting those we think may
lag. At the same time, we strive to maintain a risk profile
similar to the Index. The Fund’s investments are selected
using fundamental research and a variety of quantitative
techniques based on our investment themes. For example, the
Fund aims to hold a basket of stocks with better Fundamental
Mispricings characteristics than the Index.
During the Reporting Period, certain individual stock
positions detracted from the Fund’s relative returns.
Specifically, the Fund was hurt by stock selection in the
consumer discretionary sector and, to a lesser extent, by stock
selection in the energy and communication services sectors.
On the positive side, the Fund benefited from stock selection
in the information technology and industrials sectors.
Q Which individual stock positions detracted mostfrom the Fund’s relative returns during theReporting Period?
A In terms of individual stock positions, the Fund was
hampered by its overweight positions relative to the Index in
Luxembourg-based laboratory services company Eurofin
Scientific and Japan-based electronic commerce and
settlement finance services provider Z Holdings. An
underweight in Swiss nutrition, health and wellness company
Nestle also detracted from relative returns. Our Sentiment
Analysis investment theme led to the Fund’s overweight in
Eurofin Scientific. The Fund was overweight Z Holdings
primarily because of our Market Themes & Trends
investment theme. The underweight in Nestle was largely
due to our High Quality Business Models investment theme.
Q Which individual stock positions contributedmost to the Fund’s relative returns during theReporting Period?
A During the Reporting Period, the Fund was aided by
overweight positions versus the Index in ASM International,
a Netherlands-headquartered supplier of semiconductor
process equipment; Nippon Yusen, a Japan-based
transportation and logistics company; and Norsk Hydro, a
Norwegian supplier of aluminum and aluminum products.
The Fund’s overweights in ASM International and Nippon
Yusen were mainly the result of our Market Themes &
Trends and Sentiment Analysis investment themes. The
overweight in Norsk Hydro was based mostly on our Market
Themes & Trends investment theme.
Q What impact did the Team’s country/currencyselection strategy have on the Fund’s relativeperformance during the Reporting Period?
A Our country/currency selection strategy detracted from the
Fund’s relative performance during the Reporting Period.
Compared to the Index, the Fund was hindered by underweight
positions in Switzerland and the U.K. and by an overweight
position in Japan. On the positive side, the Fund benefited from
an overweight versus the Index in the Netherlands.
We made our picks using our proprietary models, which, during
the Reporting Period, were based on five investment themes
specific to our country/currency strategy — Valuation,
Momentum, Risk Premium, Fund Flows and Macro. Valuation
favors equity and currency markets that appear cheap relative to
accounting measures of value and purchasing power.
Momentum favors countries and currencies that have had
strong recent outperformance. Risk Premium evaluates whether
a country is overcompensating investors for various types of
risk, while Fund Flows evaluates the strength of capital market
inflows. Finally, Macro assesses a market’s macroeconomic
environment and growth prospects.
Q How did the Fund use derivatives and similarinstruments during the Reporting Period?
A During the Reporting Period, we used futures contracts to
equitize the Fund’s cash holdings. In other words, we put the
Fund’s cash holdings to work by using them as collateral for
the purchase of futures contracts. We also used forward
foreign currency exchange contracts to avoid unintended
local currency exposure when buying and selling stocks. The
use of these derivatives did not have a material impact on
Fund results during the Reporting Period.
Q What changes did you make to the Fund’scountry weightings during the Reporting Period?
A During the Reporting Period, we increased the Fund’s
overweight positions relative to the Index in Japan and
Norway. We shifted the Fund from an overweight in
Switzerland to an underweight position and from an
underweight position in France to an overweight. Compared
to the Index, we increased the Fund’s underweight positions
in the U.K. and Spain. We changed the Fund from rather
neutral positions in Germany and Sweden to overweight
positions. Additionally, we shifted the Fund from
overweights in the Netherlands and Italy to rather neutral
positions. We also moved the Fund from a rather neutral
position versus the Index in Australia to an underweight
during the Reporting Period.12
P O R T F O L I O R E S U L T S
Q What were the Fund’s sector and countryweightings at the end of the Reporting Period?
A At the end of the Reporting Period, the Fund was overweight
relative to the Index in the information technology, materials
and industrials sectors. Compared to the Index, the Fund was
underweight the consumer staples, real estate and utilities
sectors. The Fund was relatively neutral versus the Index in
the energy, consumer discretionary, financials, health care
and communication services sectors at the end of the
Reporting Period.
In terms of countries, the Fund was overweight relative to the
Index in Japan, Germany, France, Sweden and Norway at the
end of the Reporting Period. Compared to the Index, the
Fund was underweight the U.K., Switzerland, Australia and
Spain. The Fund was relatively neutral versus the Index in
Austria, Finland, Denmark, Portugal, New Zealand, the
Netherlands, Ireland, Israel, Belgium, Italy, Singapore and
Hong Kong at the end of the Reporting Period.
13

F U N D B A S I C S
International Equity Insights Fundas of October 31, 2021
T O P T E N H O L D I N G S A S O F 1 0 / 3 1 / 2 1 1 , 2
Holding % of Net Assets Line of Business Country
ASML Holding NV 2.2% Semiconductors & Semiconductor Equipment NetherlandsRoche Holding AG 2.0 Pharmaceuticals, Biotechnology & Life Sciences SwitzerlandLVMH Moet Hennessy Louis Vuitton SE 1.9 Consumer Durables & Apparel FranceNovo Nordisk A/S Class B 1.9 Pharmaceuticals, Biotechnology & Life Sciences DenmarkSchneider Electric SE 1.2 Capital Goods United StatesDeutsche Post AG (Registered) 1.2 Transportation GermanyMerck KGaA 1.1 Pharmaceuticals, Biotechnology & Life Sciences GermanyBASF SE 1.1 Materials GermanyASM International NV 1.0 Semiconductors & Semiconductor Equipment NetherlandsBritish American Tobacco plc 1.0 Food, Beverage & Tobacco United Kingdom
1 The top 10 holdings may not be representative of the Fund’s future investments.2 The Fund’s overall top 10 holdings differ from the table above due to the exclusion of the Goldman Sachs Financial Square
Government Fund (a short-term investment fund), which represents approximately 1.2% of the Fund’s net assets as of 10/31/21.
F U N D V S . B E N C H M A R K S E C T O R A L L O C A T I O N S 3
As of October 31, 2021
MSCI® EAFE Standard Index(Net, USD, Unhedged)
International Equity Insights Fund
Mat
eria
ls
Indu
stria
ls15
.7% 16
.9%
17.4
%
12.3
%
12.7
%
12.7
%
12.0
%
9.7%
9.3%
7.3%
8.7%
10.3
%
5.0%
4.6%
2.8% 3.
5%
2.1%
3.4%
2.8%
1.6%
12.1
%
17.2
%
Fina
ncia
ls
Cons
umer
Disc
retio
nary
Cons
umer
Stap
les
Heal
th C
are
Ener
gy
Com
mun
icat
ion
Serv
ices
0%
10%
15%
5%
20%
Utili
ties
Real
Est
ate
Info
rmat
ion
Tech
nolo
gy
3 The Fund is actively managed and, as such, its composition may differ over time. Consequently, the Fund’s overall sectorallocations may differ from percentages contained in the graph above. The graph categorizes investments using Global IndustryClassification Standard (“GICS”), however, the sector classifications used by the portfolio management team may differ fromGICS. The percentage shown for each investment category reflects the value of investments in that category as a percentageof market value (excluding investments in the securities lending reinvestment vehicle, if any). Investments in the securities lendingreinvestment vehicle represented 1.2% of the Fund’s net assets at October 31, 2021. The graph depicts the Fund’s investments butmay not represent the Fund’s market exposure due to the exclusion of certain derivatives, if any, as listed in the AdditionalInvestment Information section of the Schedule of Investments. Percentages may not sum to 100% due to rounding.
For more information about your Fund, please refer to www.GSAMFUNDS.com. There, you can learn more about your Fund’s
investment strategies, holdings, and performance.
14

G O L D M A N S A C H S I N T E R N A T I O N A L E Q U I T Y I N S I G H T S F U N D
Performance SummaryOctober 31, 2021
The following graph shows the value, as of October 31, 2021, of a $1,000,000 investment made on November 1, 2011 in
Institutional Shares at NAV. For comparative purposes, the performance of the Fund’s benchmark, the MSCI® EAFE Standard
Index (Net, USD, Unhedged), is shown. Performance reflects applicable fee waivers and/or expense limitations in effect during the
periods shown and in their absence, performance would be reduced. Returns do not reflect the deduction of taxes that a shareholder
would pay on Fund distributions or the redemption of Fund shares. The returns set forth below represent past performance. Past
performance does not guarantee future results. The Fund’s investment return and principal value will fluctuate so that an investor’s
shares, when redeemed, may be worth more or less than their original cost. Current performance may be lower or higher than the
performance quoted below. Please visit our web site at www.GSAMFUNDS.com to obtain the most recent month-end returns.
International Equity Insights Fund’s 10 Year Performance
Performance of a $1,000,000 Investment, with distributions reinvested, from November 1, 2011 through October 31, 2021.
$500,000
$1,000,000
$1,500,000
$2,500,000
$2,000,000
$2,183,823
$2,035,803
11/1/11 10/2110/2010/19
Institutional Shares
MSCI® EAFE Standard Index(Net, USD, Unhedged)
10/1810/1710/1610/1510/1410/1310/12
Average Annual Total Return through October 31, 2021* One Year Five Years Ten Years Since Inception
Class AExcluding sales charges 31.50% 8.91% 7.70% —Including sales charges 24.30% 7.69% 7.10% —
Class CExcluding contingent deferred sales charges 30.53% 8.10% 6.90% —Including contingent deferred sales charges 29.52% 8.10% 6.90% —
Institutional 31.93% 9.31% 8.12% —
Service 31.25% 8.75% 7.57% —
Investor 31.90% 9.20% 7.97% —
Class R6 (Commenced July 31, 2015) 31.97% 9.32% N/A 6.99%
Class R 31.19% 8.64% 7.44% —
Class P (Commenced April 16, 2018) 32.00% N/A N/A 4.65%
* These returns assume reinvestment of all distributions at NAV and reflect a maximum initial sales charge of 5.50% for Class A and the assumedcontingent deferred sales charge for Class C Shares (1% if redeemed within 12 months of purchase). Because Institutional, Service, Investor,Class R6, Class R and Class P Shares do not involve a sales charge, such a charge is not applied to their Average Annual Total Returns.
15

P O R T F O L I O R E S U L T S
Goldman Sachs International Small CapInsights Fund
Investment Objective
The Fund seeks long-term growth of capital.
Portfolio Management Discussion and AnalysisBelow, the Goldman Sachs Quantitative Investment Strategies Team discusses the Goldman Sachs International Small
Cap Insights Fund’s (the “Fund”) performance and positioning for the 12-month period ended October 31, 2021 (the
“Reporting Period”).
Q How did the Fund perform during the ReportingPeriod?
A During the Reporting Period, the Fund’s Class A, Class C,Institutional, Investor, Class R6 and Class P Shares generatedaverage annual total returns, without sales charges, of32.65%, 31.67%, 33.11%, 32.88%, 33.12% and 33.15%,respectively. These returns compare to the 35.77% averageannual total return of the Fund’s benchmark, the MSCIEAFE Small Cap Index (Net, USD, Unhedged) (the“Index”), during the same period.
Q What key factors were most responsible for theFund’s performance during the Reporting Period?
A The Fund uses a quantitative style of management, incombination with a qualitative overlay, that emphasizesfundamentally-based stock selection, careful portfolioconstruction and efficient implementation. The Fund’sinvestments are selected using fundamental research and avariety of quantitative techniques based on certaininvestment themes, including Fundamental Mispricings,High Quality Business Models, Sentiment Analysis andMarket Themes & Trends.
During the Reporting Period, the Fund underperformed theIndex, with two of our quantitative model’s four investmentthemes detracting from results. Stock selection driven bythese investment themes hindered relative returns.
Q What impact did the Fund’s investment themeshave on performance during the Reporting Period?
A In keeping with our investment approach, we use ourquantitative model and four investment themes to take along-term view of market patterns and look forinefficiencies, selecting stocks for the Fund andoverweighting or underweighting the ones chosen by themodel. Over time and by design, the performance of any oneof the model’s investment themes tends to have a lowcorrelation with the model’s other themes, demonstrating the
diversification benefit of the Fund’s theme-drivenquantitative model. The variance in performance supportsour research indicating that the diversification provided byour different investment themes is a significant investmentadvantage over the long term, even though the Fund mayexperience underperformance in the short term. Of course,diversification does not protect an investor from market risknor does it ensure a profit.
During the Reporting Period, two of our investment themes —High Quality Business Models and Fundamental Mispricings —diminished the Fund’s relative performance. High Quality BusinessModels seeks to identify companies that are generating high qualityrevenues with sustainable business models and alignedmanagement incentives. Fundamental Mispricings seeks to identifyhigh quality businesses trading at a fair price, which we believemay lead to strong performance over the long run.
The impact of our Sentiment Analysis and Market Themes &Trends investment themes was rather neutral during theReporting Period. Sentiment Analysis seeks to identifystocks experiencing improvements in their overall marketsentiment. Market Themes and Trends seeks to identifycompanies positively positioned to benefit from themes andtrends in the market and macroeconomic environment.
Q How did the Fund’s sector and industryallocations affect relative performance?
A In constructing the Fund’s portfolio, our quantitative modelfocuses on stock selection rather than on making sector orindustry bets. Consequently, the Fund is similar to the Indexin terms of its sector and industry allocations and style.Relative performance is primarily driven by stock selection,not by sector or industry allocations.
Q Did stock selection help or hurt Fundperformance during the Reporting Period?
A We seek to outpace the Index by overweighting stocks weexpect to outperform and underweighting those we think may
16

P O R T F O L I O R E S U L T S
lag. At the same time, we strive to maintain a risk profilesimilar to the Index. The Fund’s investments are selectedusing fundamental research and a variety of quantitativetechniques based on our investment themes. For example, theFund aims to hold a basket of stocks with better FundamentalMispricings characteristics than the Index.
During the Reporting Period, stock selection had a negativeimpact on the Fund’s relative performance. Investments inthe consumer discretionary sector detracted most fromreturns, followed by holdings in the communication servicesand financials sectors. The Fund benefited from stockselection in the health care, information technology andindustrials sectors.
Q Which individual stock positions detracted mostfrom the Fund’s relative returns during theReporting Period?
A In terms of individual stock positions, the Fund was hurtduring the Reporting Period by overweight positions relativeto the Index in Kohnan Shoji, a Japanese home improvementcenter chain; PostNL, a Netherlands-based provider of postaland package services; and DCM Holdings, a Japan-basedholding company that operates home center chain stores. OurFundamental Mispricings and Market Themes & Trendsinvestment themes were largely responsible for the Fund’soverweights in Kohnan Shoji and DCM Holdings. Theoverweight in PostNL was primarily due to our MarketThemes & Trends investment theme.
Q Which individual stock positions contributedmost to the Fund’s relative results during theReporting Period?
A During the Reporting Period, overweight positions in SITCInternational, D’Ieteren Group and ASM Internationalcontributed positively to the Fund’s relative performance.The overweight in SITC International, a Hong Kong-basedprovider of transportation and logistics solutions, was drivenmainly by our Market Themes & Trends investment theme.The overweight in D’Ieteren Group, a Belgian vehicleimporter and distributor, was based mostly on ourFundamental Mispricings and Market Themes & Trendsinvestment themes. The Fund was overweight ASMInternational, a Netherlands-headquartered supplier ofsemiconductor process equipment, largely because of ourMarket Themes & Trends and Sentiment Analysisinvestment themes.
Q What impact did country selection have on theFund’s relative performance during the ReportingPeriod?
A To construct the Fund’s portfolio, our quantitative modelfocuses on stock selection rather than on making country
bets. As a result, the Fund is similar to the Index in terms ofits country allocations. Relative performance is primarilydriven by stock selection, not by country allocations.
Q How did the Fund use derivatives and similarinstruments during the Reporting Period?
A During the Reporting Period, we used futures contracts toequitize the Fund’s cash holdings. In other words, we put theFund’s cash holdings to work by using them as collateral forthe purchase of futures contracts. The use of these derivativesdid not have a material impact on Fund results during theReporting Period.
Q What changes did you make to the Fund’scountry weightings during the Reporting Period?
A As mentioned previously, changes in the Fund’s countryweightings are generally the result of our quantitativemodel’s stock selection. During the Reporting Period, theFund’s overweight relative to the Index in Japan increasedand its overweight in Italy decreased. Its overweight in theNetherlands changed to a rather neutral position, while itsneutral positions in Spain and Australia became overweightpositions. Compared to the Index, the Fund’s underweightpositions in Israel, the U.K. and Singapore increased. Itsunderweights in Sweden, Denmark and New Zealandchanged to rather neutral positions during the ReportingPeriod.
Q What were the Fund’s sector and countryweightings at the end of the Reporting Period?
A At the end of the Reporting Period, the Fund was overweightrelative to the Index in the industrials, informationtechnology, financials and materials sectors. Compared to theIndex, the Fund was underweight the utilities, consumerstaples, real estate, communication services and energysectors. The Fund was relatively neutral compared to theIndex in the consumer discretionary and health care sectorsat the end of the Reporting Period.
In terms of countries, the Fund was overweight Japan, Spain,Italy and Australia at the end of the Reporting Period.Compared to the Index, the Fund was underweight Israel, theU.K. and Singapore. It was relatively neutral compared to theIndex in the Netherlands, Austria, Sweden, Ireland, NewZealand, Belgium, Denmark, Finland, Norway, Germany,Switzerland, France, Portugal and Hong Kong at the end ofthe Reporting Period.
17

F U N D B A S I C S
International Small Cap Insights Fundas of October 31, 2021
T O P T E N H O L D I N G S A S O F 1 0 / 3 1 / 2 1 1
Holding % of Net Assets Line of Business Country
Getinge AB Class B 1.2% Health Care Equipment & Services SwedenMitsui OSK Lines Ltd. 1.2 Transportation JapanCharter Hall Group (REIT) 1.1 Real Estate AustraliaTecan Group AG (Registered) 1.0 Pharmaceuticals, Biotechnology & Life Sciences SwitzerlandTritax Big Box REIT plc (REIT) 1.0 Real Estate United KingdomShowa Denko KK 1.0 Materials JapanMineral Resources Ltd. 1.0 Materials AustraliaMan Group plc 1.0 Diversified Financials United KingdomAmada Co. Ltd. 0.9 Capital Goods JapanSumitomo Forestry Co. Ltd. 0.9 Consumer Durables & Apparel Japan
1 The top 10 holdings may not be representative of the Fund’s future investments.
F U N D V S . B E N C H M A R K S E C T O R A L L O C A T I O N S 2
As of October 31, 2021
MSCI® EAFE Small Cap Index(Net, USD, Unhedged)
International Small Cap Insights Fund
Real
Est
ate
Indu
stria
ls25
.0%
24.0
%
12.9
%
10.7
% 12.6
%
12.6
%
12.4
%
10.1
%
11.0
%
8.8%
10.5
% 12.0
%
7.9%
7.4%
3.5%
5.6%
2.9% 4.
4%
0.9%
2.9%
0.4% 1.
6%
Fina
ncia
ls
Info
rmat
ion
Tech
nolo
gy
Heal
th C
are
Cons
umer
Disc
retio
nary
Com
mun
icat
ion
Serv
ices
Cons
umer
Stap
les
0%
10%
30%
20%
Utili
ties
Ener
gy
Mat
eria
ls
2 The Fund is actively managed and, as such, its composition may differ over time. Consequently, the Fund’s overall sectorallocations may differ from percentages contained in the graph above. The graph categorizes investments using Global IndustryClassification Standard (“GICS”); however, the sector classifications used by the portfolio management team may differ fromGICS. The percentage shown for each investment category reflects the value of investments in that category as a percentageof market value (excluding investments in the securities lending reinvestment vehicle, if any). Investments in the securities lendingreinvestment vehicle represented 0.1% of the Fund’s net assets at October 31, 2021. The graph depicts the Fund’s investments butmay not represent the Fund’s market exposure due to the exclusion of certain derivatives, if any, as listed in the AdditionalInvestment Information section of the Schedule of Investments. Percentages may not sum to 100% due to rounding.
For more information about your Fund, please refer to www.GSAMFUNDS.com. There, you can learn more about your Fund’s
investment strategies, holdings, and performance.
18
G O L D M A N S A C H S I N T E R N A T I O N A L S M A L L C A P I N S I G H T S F U N D
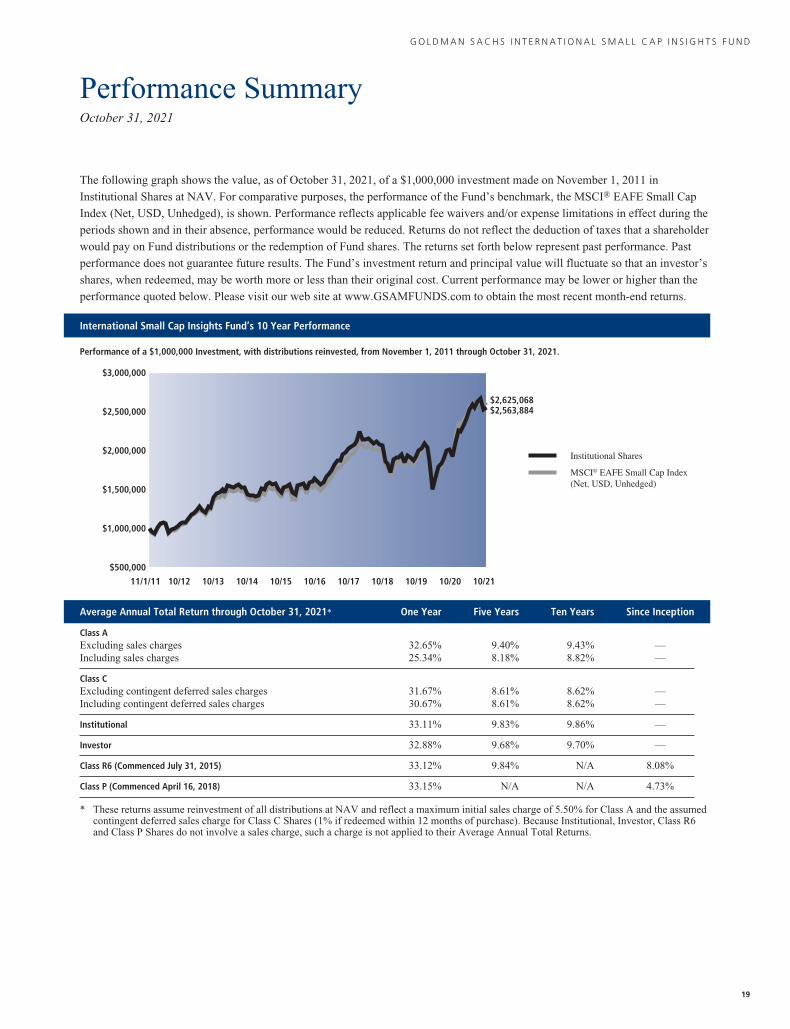
Performance SummaryOctober 31, 2021
The following graph shows the value, as of October 31, 2021, of a $1,000,000 investment made on November 1, 2011 in
Institutional Shares at NAV. For comparative purposes, the performance of the Fund’s benchmark, the MSCI® EAFE Small Cap
Index (Net, USD, Unhedged), is shown. Performance reflects applicable fee waivers and/or expense limitations in effect during the
periods shown and in their absence, performance would be reduced. Returns do not reflect the deduction of taxes that a shareholder
would pay on Fund distributions or the redemption of Fund shares. The returns set forth below represent past performance. Past
performance does not guarantee future results. The Fund’s investment return and principal value will fluctuate so that an investor’s
shares, when redeemed, may be worth more or less than their original cost. Current performance may be lower or higher than the
performance quoted below. Please visit our web site at www.GSAMFUNDS.com to obtain the most recent month-end returns.
International Small Cap Insights Fund’s 10 Year Performance
Performance of a $1,000,000 Investment, with distributions reinvested, from November 1, 2011 through October 31, 2021.
$500,000
$1,000,000
$1,500,000
$3,000,000
$2,500,000
$2,000,000
$2,625,068$2,563,884
11/1/11 10/2110/2010/19
Institutional Shares
MSCI® EAFE Small Cap Index(Net, USD, Unhedged)
10/1810/1710/1610/1510/1410/1310/12
Average Annual Total Return through October 31, 2021* One Year Five Years Ten Years Since Inception
Class AExcluding sales charges 32.65% 9.40% 9.43% —Including sales charges 25.34% 8.18% 8.82% —
Class CExcluding contingent deferred sales charges 31.67% 8.61% 8.62% —Including contingent deferred sales charges 30.67% 8.61% 8.62% —
Institutional 33.11% 9.83% 9.86% —
Investor 32.88% 9.68% 9.70% —
Class R6 (Commenced July 31, 2015) 33.12% 9.84% N/A 8.08%
Class P (Commenced April 16, 2018) 33.15% N/A N/A 4.73%
* These returns assume reinvestment of all distributions at NAV and reflect a maximum initial sales charge of 5.50% for Class A and the assumedcontingent deferred sales charge for Class C Shares (1% if redeemed within 12 months of purchase). Because Institutional, Investor, Class R6and Class P Shares do not involve a sales charge, such a charge is not applied to their Average Annual Total Returns.
19

F U N D B A S I C S
Index Definitions
The MSCI Emerging Markets Standard Index (Net, USD, Unhedged) is a free float-adjusted market capitalization index that is designedto measure equity market performance of emerging markets. As of November 30, 2021, the MSCI® Emerging Markets Standard Index(Net, USD, Unhedged) consists of the following 27 emerging market country indices: Argentina, Brazil, Chile, China, Colombia, CzechRepublic, Egypt, Greece, Hungary, India, Indonesia, Korea, Kuwait, Malaysia, Mexico, Pakistan, Peru, Philippines, Poland, Qatar, Russia,Saudi Arabia, South Africa, Taiwan, Thailand, Turkey and United Arab Emirates. The MSCI® Emerging Markets Standard Index (Net, USD,Unhedged) figures do not reflect any deduction for fees, expenses or taxes. It is not possible to invest directly in an index.
The MSCI® EAFE Standard Index (Net, USD, Unhedged) is a market capitalization weighted composite of securities in 21 developedmarkets. As of November 30, 2021, the MSCI® EAFE Standard Index (Net, USD, Unhedged) consists of the following 21 developedcountries: Australia, Austria, Belgium, Denmark, Finland, France, Germany, Hong Kong, Ireland, Israel, Italy, Japan, the Netherlands, NewZealand, Norway, Portugal, Singapore, Spain, Sweden, Switzerland and the United Kingdom. The MSCI® EAFE Standard Index (Net, USD,Unhedged) figures do not reflect any deduction for fees, expenses or taxes. It is not possible to invest directly in an index.
The MSCI® EAFE Small Cap Index (Net, USD, Unhedged) is a free float-adjusted market capitalization index that is designed to measuredeveloped market equity performance, excluding the U.S. and Canada. The MSCI® EAFE Small Cap Index (Net, USD, Unhedged) selects themost liquid securities across developed markets relative to their market capitalization, and targets for index inclusion 40% of the fullmarket capitalization of the eligible small cap universe within each industry group, within each country. Its returns include net reinvesteddividends but, unlike Fund returns, do not reflect the payment of sales commissions or other expenses incurred in the purchase or sale ofthe securities included in the MSCI® EAFE Small Cap Index (Net, USD, Unhedged). It is not possible to invest directly in an index.
It is not possible to invest directly in an unmanaged index.
20
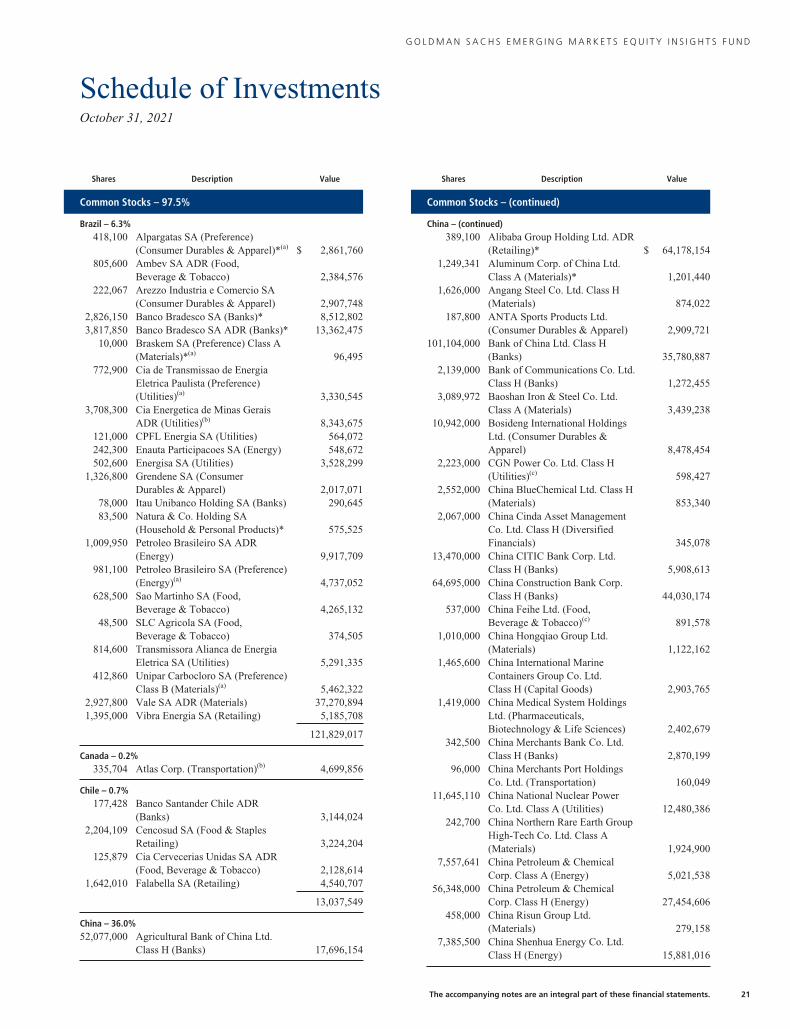
G O L D M A N S A C H S E M E R G I N G M A R K E T S E Q U I T Y I N S I G H T S F U N D
Schedule of InvestmentsOctober 31, 2021
Shares Description Value
Common Stocks – 97.5%
Brazil – 6.3%418,100 Alpargatas SA (Preference)
(Consumer Durables & Apparel)*(a) $ 2,861,760805,600 Ambev SA ADR (Food,
Beverage & Tobacco) 2,384,576222,067 Arezzo Industria e Comercio SA
(Consumer Durables & Apparel) 2,907,7482,826,150 Banco Bradesco SA (Banks)* 8,512,8023,817,850 Banco Bradesco SA ADR (Banks)* 13,362,475
10,000 Braskem SA (Preference) Class A(Materials)*(a) 96,495
772,900 Cia de Transmissao de EnergiaEletrica Paulista (Preference)(Utilities)(a) 3,330,545
3,708,300 Cia Energetica de Minas GeraisADR (Utilities)(b) 8,343,675
121,000 CPFL Energia SA (Utilities) 564,072242,300 Enauta Participacoes SA (Energy) 548,672502,600 Energisa SA (Utilities) 3,528,299
1,326,800 Grendene SA (ConsumerDurables & Apparel) 2,017,071
78,000 Itau Unibanco Holding SA (Banks) 290,64583,500 Natura & Co. Holding SA
(Household & Personal Products)* 575,5251,009,950 Petroleo Brasileiro SA ADR
(Energy) 9,917,709981,100 Petroleo Brasileiro SA (Preference)
(Energy)(a) 4,737,052628,500 Sao Martinho SA (Food,
Beverage & Tobacco) 4,265,13248,500 SLC Agricola SA (Food,
Beverage & Tobacco) 374,505814,600 Transmissora Alianca de Energia
Eletrica SA (Utilities) 5,291,335412,860 Unipar Carbocloro SA (Preference)
Class B (Materials)(a) 5,462,3222,927,800 Vale SA ADR (Materials) 37,270,8941,395,000 Vibra Energia SA (Retailing) 5,185,708
121,829,017
Canada – 0.2%335,704 Atlas Corp. (Transportation)(b) 4,699,856
Chile – 0.7%177,428 Banco Santander Chile ADR
(Banks) 3,144,0242,204,109 Cencosud SA (Food & Staples
Retailing) 3,224,204125,879 Cia Cervecerias Unidas SA ADR
(Food, Beverage & Tobacco) 2,128,6141,642,010 Falabella SA (Retailing) 4,540,707
13,037,549
China – 36.0%52,077,000 Agricultural Bank of China Ltd.
Class H (Banks) 17,696,154
Shares Description Value
Common Stocks – (continued)
China – (continued)389,100 Alibaba Group Holding Ltd. ADR
(Retailing)* $ 64,178,1541,249,341 Aluminum Corp. of China Ltd.
Class A (Materials)* 1,201,4401,626,000 Angang Steel Co. Ltd. Class H
(Materials) 874,022187,800 ANTA Sports Products Ltd.
(Consumer Durables & Apparel) 2,909,721101,104,000 Bank of China Ltd. Class H
(Banks) 35,780,8872,139,000 Bank of Communications Co. Ltd.
Class H (Banks) 1,272,4553,089,972 Baoshan Iron & Steel Co. Ltd.
Class A (Materials) 3,439,23810,942,000 Bosideng International Holdings
Ltd. (Consumer Durables &Apparel) 8,478,454
2,223,000 CGN Power Co. Ltd. Class H(Utilities)(c) 598,427
2,552,000 China BlueChemical Ltd. Class H(Materials) 853,340
2,067,000 China Cinda Asset ManagementCo. Ltd. Class H (DiversifiedFinancials) 345,078
13,470,000 China CITIC Bank Corp. Ltd.Class H (Banks) 5,908,613
64,695,000 China Construction Bank Corp.Class H (Banks) 44,030,174
537,000 China Feihe Ltd. (Food,Beverage & Tobacco)(c) 891,578
1,010,000 China Hongqiao Group Ltd.(Materials) 1,122,162
1,465,600 China International MarineContainers Group Co. Ltd.Class H (Capital Goods) 2,903,765
1,419,000 China Medical System HoldingsLtd. (Pharmaceuticals,Biotechnology & Life Sciences) 2,402,679
342,500 China Merchants Bank Co. Ltd.Class H (Banks) 2,870,199
96,000 China Merchants Port HoldingsCo. Ltd. (Transportation) 160,049
11,645,110 China National Nuclear PowerCo. Ltd. Class A (Utilities) 12,480,386
242,700 China Northern Rare Earth GroupHigh-Tech Co. Ltd. Class A(Materials) 1,924,900
7,557,641 China Petroleum & ChemicalCorp. Class A (Energy) 5,021,538
56,348,000 China Petroleum & ChemicalCorp. Class H (Energy) 27,454,606
458,000 China Risun Group Ltd.(Materials) 279,158
7,385,500 China Shenhua Energy Co. Ltd.Class H (Energy) 15,881,016
The accompanying notes are an integral part of these financial statements. 21

G O L D M A N S A C H S E M E R G I N G M A R K E T S E Q U I T Y I N S I G H T S F U N D
Schedule of Investments (continued)October 31, 2021
Shares Description Value
Common Stocks – (continued)
China – (continued)1,357,000 China Suntien Green Energy Corp.
Ltd. Class H (Energy) $ 1,078,4986,634,500 China Yongda Automobiles
Services Holdings Ltd. (Retailing) 10,555,9894,066,000 CITIC Ltd. (Capital Goods) 4,073,3041,128,000 CITIC Securities Co. Ltd. Class H
(Diversified Financials) 2,863,9451,596,000 COSCO SHIPPING Development
Co. Ltd. Class H (Capital Goods) 310,139906,841 COSCO SHIPPING Holdings Co.
Ltd. Class A (Transportation)* 2,340,6852,734,250 COSCO SHIPPING Holdings Co.
Ltd. Class H (Transportation)*(b) 4,235,100510,000 COSCO SHIPPING Ports Ltd.
(Transportation) 424,5174,590,000 CSPC Pharmaceutical Group Ltd.
(Pharmaceuticals, Biotechnology &Life Sciences) 4,789,665
25,500 Daqo New Energy Corp. ADR(Semiconductors & SemiconductorEquipment)* 1,983,645
518,000 Dongfeng Motor Group Co. Ltd.Class H (Automobiles &Components) 482,443
1,383,000 Dongyue Group Ltd. (Materials) 3,217,705476,573 FAW Jiefang Group Co. Ltd.
(Automobiles & Components) 776,870234,000 FinVolution Group ADR
(Diversified Financials) 1,432,0801,442,200 GF Securities Co. Ltd. Class H
(Diversified Financials) 2,446,140210,000 Guangzhou Baiyunshan
Pharmaceutical Holdings Co. Ltd.Class H (Pharmaceuticals,Biotechnology & Life Sciences) 530,917
1,288,000 Haitian International Holdings Ltd.(Capital Goods) 3,753,871
1,834,400 Haitong Securities Co. Ltd. Class H(Diversified Financials) 1,631,921
466,000 Huafon Chemical Co. Ltd. Class A(Materials) 866,962
53,082,000 Industrial & Commercial Bank ofChina Ltd. Class H (Banks) 29,097,550
948,713 Industrial Bank Co. Ltd. Class A(Banks) 2,761,060
5,200 JD.com, Inc. ADR (Retailing)* 407,05630,300 JiuGui Liquor Co. Ltd. Class A
(Food, Beverage & Tobacco) 1,013,9322,164,500 Kingboard Holdings Ltd.
(Technology Hardware &Equipment) 9,432,471
15,324,000 Kunlun Energy Co. Ltd. (Utilities) 13,956,794151,600 Legend Holdings Corp. Class H
(Technology Hardware &Equipment)(c) 266,463
Shares Description Value
Common Stocks – (continued)
China – (continued)16,448,000 Lenovo Group Ltd. (Technology
Hardware & Equipment) $ 17,862,006878,000 Li Ning Co. Ltd. (Consumer
Durables & Apparel) 9,688,7875,954,000 Lifetech Scientific Corp. (Health
Care Equipment & Services)* 2,765,235451,822 Luxi Chemical Group Co. Ltd.
Class A (Materials) 1,159,402259,791 Luzhou Laojiao Co. Ltd. Class A
(Food, Beverage & Tobacco) 9,267,5511,940,000 Maanshan Iron & Steel Co. Ltd.
Class H (Materials) 824,956586,100 Meituan Class B (Retailing)* 19,944,18777,000 NetEase, Inc. ADR (Media &
Entertainment) 7,514,430311,900 NIO, Inc. ADR (Automobiles &
Components)* 12,291,9792,188,000 People’s Insurance Co. Group of
China Ltd. (The) Class H(Insurance) 682,489
4,327,300 PetroChina Co. Ltd. Class A(Energy) 3,703,508
3,602,000 PetroChina Co. Ltd. Class H(Energy) 1,736,696
711,900 Pharmaron Beijing Co. Ltd.Class H (Pharmaceuticals,Biotechnology & Life Sciences)(c) 15,403,389
3,726,000 PICC Property & Casualty Co. Ltd.Class H (Insurance) 3,468,704
60,400 Pinduoduo, Inc. ADR (Retailing)* 5,370,7681,784,000 Rongsheng Petrochemical Co. Ltd.
Class A (Materials) 4,804,864472,580 Shandong Hualu Hengsheng
Chemical Co. Ltd. Class A(Materials) 2,298,399
17,783,148 Shanghai International Port GroupCo. Ltd. Class A (Transportation) 15,712,625
155,900 Shanghai Pharmaceuticals HoldingCo. Ltd. Class H (Health CareEquipment & Services) 285,333
331,800 Shanxi Meijin Energy Co. Ltd.Class A (Energy)* 585,973
35,606 Shenzhen Mindray Bio-MedicalElectronics Co. Ltd. Class A(Health Care Equipment &Services) 2,086,427
300,900 Shenzhou International GroupHoldings Ltd. (ConsumerDurables & Apparel) 6,482,651
2,478,000 Sinotrans Ltd. Class H(Transportation) 814,573
1,372,000 Sinotruk Hong Kong Ltd. (CapitalGoods) 1,893,739
5,064,000 SITC International Holdings Co.Ltd. (Transportation) 17,115,526
22 The accompanying notes are an integral part of these financial statements.
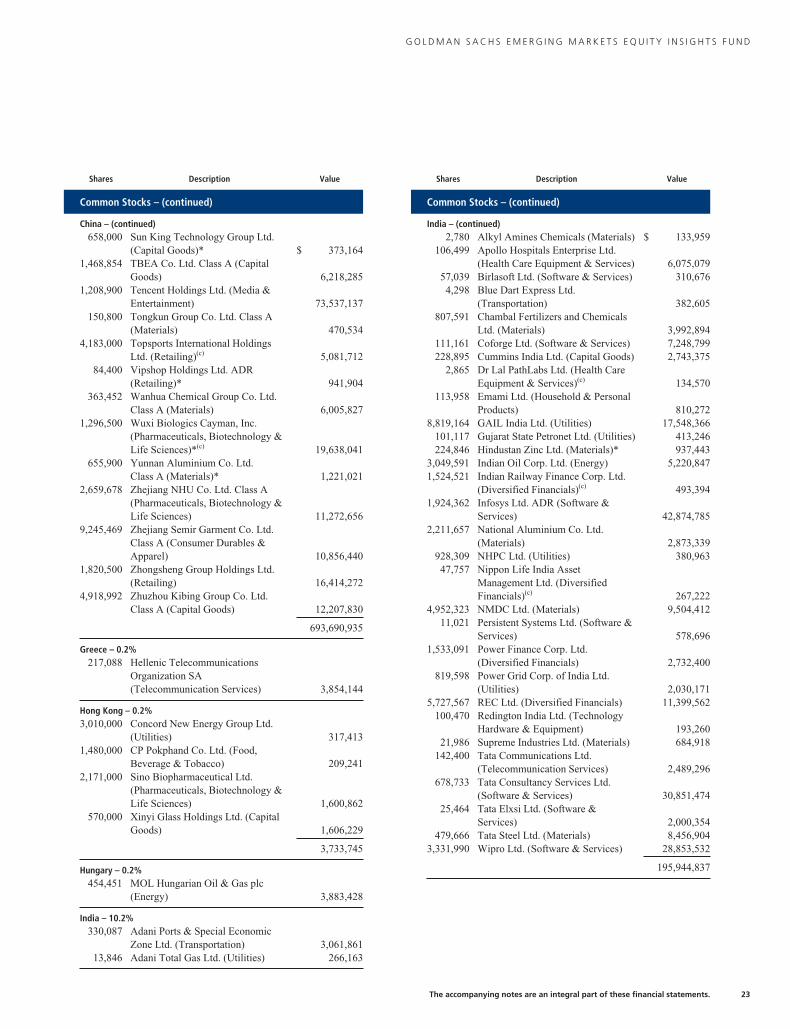
G O L D M A N S A C H S E M E R G I N G M A R K E T S E Q U I T Y I N S I G H T S F U N D
Shares Description Value
Common Stocks – (continued)
China – (continued)658,000 Sun King Technology Group Ltd.
(Capital Goods)* $ 373,1641,468,854 TBEA Co. Ltd. Class A (Capital
Goods) 6,218,2851,208,900 Tencent Holdings Ltd. (Media &
Entertainment) 73,537,137150,800 Tongkun Group Co. Ltd. Class A
(Materials) 470,5344,183,000 Topsports International Holdings
Ltd. (Retailing)(c) 5,081,71284,400 Vipshop Holdings Ltd. ADR
(Retailing)* 941,904363,452 Wanhua Chemical Group Co. Ltd.
Class A (Materials) 6,005,8271,296,500 Wuxi Biologics Cayman, Inc.
(Pharmaceuticals, Biotechnology &Life Sciences)*(c) 19,638,041
655,900 Yunnan Aluminium Co. Ltd.Class A (Materials)* 1,221,021
2,659,678 Zhejiang NHU Co. Ltd. Class A(Pharmaceuticals, Biotechnology &Life Sciences) 11,272,656
9,245,469 Zhejiang Semir Garment Co. Ltd.Class A (Consumer Durables &Apparel) 10,856,440
1,820,500 Zhongsheng Group Holdings Ltd.(Retailing) 16,414,272
4,918,992 Zhuzhou Kibing Group Co. Ltd.Class A (Capital Goods) 12,207,830
693,690,935
Greece – 0.2%217,088 Hellenic Telecommunications
Organization SA(Telecommunication Services) 3,854,144
Hong Kong – 0.2%3,010,000 Concord New Energy Group Ltd.
(Utilities) 317,4131,480,000 CP Pokphand Co. Ltd. (Food,
Beverage & Tobacco) 209,2412,171,000 Sino Biopharmaceutical Ltd.
(Pharmaceuticals, Biotechnology &Life Sciences) 1,600,862
570,000 Xinyi Glass Holdings Ltd. (CapitalGoods) 1,606,229
3,733,745
Hungary – 0.2%454,451 MOL Hungarian Oil & Gas plc
(Energy) 3,883,428
India – 10.2%330,087 Adani Ports & Special Economic
Zone Ltd. (Transportation) 3,061,86113,846 Adani Total Gas Ltd. (Utilities) 266,163
Shares Description Value
Common Stocks – (continued)
India – (continued)2,780 Alkyl Amines Chemicals (Materials) $ 133,959
106,499 Apollo Hospitals Enterprise Ltd.(Health Care Equipment & Services) 6,075,079
57,039 Birlasoft Ltd. (Software & Services) 310,6764,298 Blue Dart Express Ltd.
(Transportation) 382,605807,591 Chambal Fertilizers and Chemicals
Ltd. (Materials) 3,992,894111,161 Coforge Ltd. (Software & Services) 7,248,799228,895 Cummins India Ltd. (Capital Goods) 2,743,375
2,865 Dr Lal PathLabs Ltd. (Health CareEquipment & Services)(c) 134,570
113,958 Emami Ltd. (Household & PersonalProducts) 810,272
8,819,164 GAIL India Ltd. (Utilities) 17,548,366101,117 Gujarat State Petronet Ltd. (Utilities) 413,246224,846 Hindustan Zinc Ltd. (Materials)* 937,443
3,049,591 Indian Oil Corp. Ltd. (Energy) 5,220,8471,524,521 Indian Railway Finance Corp. Ltd.
(Diversified Financials)(c) 493,3941,924,362 Infosys Ltd. ADR (Software &
Services) 42,874,7852,211,657 National Aluminium Co. Ltd.
(Materials) 2,873,339928,309 NHPC Ltd. (Utilities) 380,96347,757 Nippon Life India Asset
Management Ltd. (DiversifiedFinancials)(c) 267,222
4,952,323 NMDC Ltd. (Materials) 9,504,41211,021 Persistent Systems Ltd. (Software &
Services) 578,6961,533,091 Power Finance Corp. Ltd.
(Diversified Financials) 2,732,400819,598 Power Grid Corp. of India Ltd.
(Utilities) 2,030,1715,727,567 REC Ltd. (Diversified Financials) 11,399,562
100,470 Redington India Ltd. (TechnologyHardware & Equipment) 193,260
21,986 Supreme Industries Ltd. (Materials) 684,918142,400 Tata Communications Ltd.
(Telecommunication Services) 2,489,296678,733 Tata Consultancy Services Ltd.
(Software & Services) 30,851,47425,464 Tata Elxsi Ltd. (Software &
Services) 2,000,354479,666 Tata Steel Ltd. (Materials) 8,456,904
3,331,990 Wipro Ltd. (Software & Services) 28,853,532
195,944,837
The accompanying notes are an integral part of these financial statements. 23
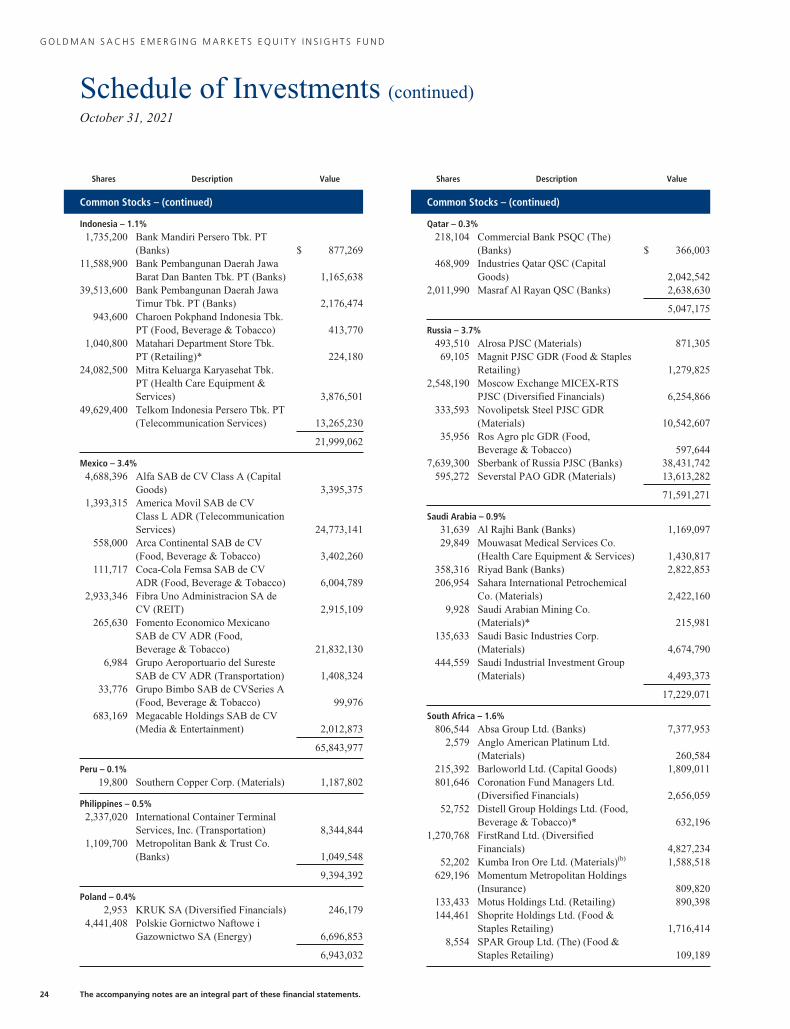
G O L D M A N S A C H S E M E R G I N G M A R K E T S E Q U I T Y I N S I G H T S F U N D
Schedule of Investments (continued)October 31, 2021
Shares Description Value
Common Stocks – (continued)
Indonesia – 1.1%1,735,200 Bank Mandiri Persero Tbk. PT
(Banks) $ 877,26911,588,900 Bank Pembangunan Daerah Jawa
Barat Dan Banten Tbk. PT (Banks) 1,165,63839,513,600 Bank Pembangunan Daerah Jawa
Timur Tbk. PT (Banks) 2,176,474943,600 Charoen Pokphand Indonesia Tbk.
PT (Food, Beverage & Tobacco) 413,7701,040,800 Matahari Department Store Tbk.
PT (Retailing)* 224,18024,082,500 Mitra Keluarga Karyasehat Tbk.
PT (Health Care Equipment &Services) 3,876,501
49,629,400 Telkom Indonesia Persero Tbk. PT(Telecommunication Services) 13,265,230
21,999,062
Mexico – 3.4%4,688,396 Alfa SAB de CV Class A (Capital
Goods) 3,395,3751,393,315 America Movil SAB de CV
Class L ADR (TelecommunicationServices) 24,773,141
558,000 Arca Continental SAB de CV(Food, Beverage & Tobacco) 3,402,260
111,717 Coca-Cola Femsa SAB de CVADR (Food, Beverage & Tobacco) 6,004,789
2,933,346 Fibra Uno Administracion SA deCV (REIT) 2,915,109
265,630 Fomento Economico MexicanoSAB de CV ADR (Food,Beverage & Tobacco) 21,832,130
6,984 Grupo Aeroportuario del SuresteSAB de CV ADR (Transportation) 1,408,324
33,776 Grupo Bimbo SAB de CVSeries A(Food, Beverage & Tobacco) 99,976
683,169 Megacable Holdings SAB de CV(Media & Entertainment) 2,012,873
65,843,977
Peru – 0.1%19,800 Southern Copper Corp. (Materials) 1,187,802
Philippines – 0.5%2,337,020 International Container Terminal
Services, Inc. (Transportation) 8,344,8441,109,700 Metropolitan Bank & Trust Co.
(Banks) 1,049,548
9,394,392
Poland – 0.4%2,953 KRUK SA (Diversified Financials) 246,179
4,441,408 Polskie Gornictwo Naftowe iGazownictwo SA (Energy) 6,696,853
6,943,032
Shares Description Value
Common Stocks – (continued)
Qatar – 0.3%218,104 Commercial Bank PSQC (The)
(Banks) $ 366,003468,909 Industries Qatar QSC (Capital
Goods) 2,042,5422,011,990 Masraf Al Rayan QSC (Banks) 2,638,630
5,047,175
Russia – 3.7%493,510 Alrosa PJSC (Materials) 871,30569,105 Magnit PJSC GDR (Food & Staples
Retailing) 1,279,8252,548,190 Moscow Exchange MICEX-RTS
PJSC (Diversified Financials) 6,254,866333,593 Novolipetsk Steel PJSC GDR
(Materials) 10,542,60735,956 Ros Agro plc GDR (Food,
Beverage & Tobacco) 597,6447,639,300 Sberbank of Russia PJSC (Banks) 38,431,742
595,272 Severstal PAO GDR (Materials) 13,613,282
71,591,271
Saudi Arabia – 0.9%31,639 Al Rajhi Bank (Banks) 1,169,09729,849 Mouwasat Medical Services Co.
(Health Care Equipment & Services) 1,430,817358,316 Riyad Bank (Banks) 2,822,853206,954 Sahara International Petrochemical
Co. (Materials) 2,422,1609,928 Saudi Arabian Mining Co.
(Materials)* 215,981135,633 Saudi Basic Industries Corp.
(Materials) 4,674,790444,559 Saudi Industrial Investment Group
(Materials) 4,493,373
17,229,071
South Africa – 1.6%806,544 Absa Group Ltd. (Banks) 7,377,953
2,579 Anglo American Platinum Ltd.(Materials) 260,584
215,392 Barloworld Ltd. (Capital Goods) 1,809,011801,646 Coronation Fund Managers Ltd.
(Diversified Financials) 2,656,05952,752 Distell Group Holdings Ltd. (Food,
Beverage & Tobacco)* 632,1961,270,768 FirstRand Ltd. (Diversified
Financials) 4,827,23452,202 Kumba Iron Ore Ltd. (Materials)(b) 1,588,518
629,196 Momentum Metropolitan Holdings(Insurance) 809,820
133,433 Motus Holdings Ltd. (Retailing) 890,398144,461 Shoprite Holdings Ltd. (Food &
Staples Retailing) 1,716,4148,554 SPAR Group Ltd. (The) (Food &
Staples Retailing) 109,189
24 The accompanying notes are an integral part of these financial statements.

G O L D M A N S A C H S E M E R G I N G M A R K E T S E Q U I T Y I N S I G H T S F U N D
Shares Description Value
Common Stocks – (continued)
South Africa – (continued)908,075 Standard Bank Group Ltd. (Banks) $ 8,046,839260,588 Truworths International Ltd.
(Retailing) 919,863309,318 Vukile Property Fund Ltd. (REIT) 246,789
31,890,867
South Korea – 15.2%127,245 Daewoo Engineering & Construction
Co. Ltd. (Capital Goods)* 681,25962,480 Dentium Co. Ltd. (Health Care
Equipment & Services) 3,703,781609,614 DGB Financial Group, Inc. (Banks) 5,401,684
1,064 DI Dong Il Corp. (ConsumerDurables & Apparel) 261,732
442,159 Hana Financial Group, Inc. (Banks) 17,049,58119,101 Hyosung TNC Corp. (Consumer
Durables & Apparel) 9,820,1375,213 Hyundai Engineering & Construction
Co. Ltd. (Capital Goods) 225,359277,106 JB Financial Group Co. Ltd. (Banks) 2,106,559369,650 KB Financial Group, Inc. (Banks) 17,892,496
680 KCC Corp. (Materials) 194,4107,826 KCC Glass Corp. (Capital Goods) 404,090
469,252 Kia Corp. (Automobiles &Components) 34,242,412
1,126 Korea Investment Holdings Co. Ltd.(Diversified Financials) 84,215
68,432 Kumho Petrochemical Co. Ltd.(Materials) 10,068,904
43,754 LF Corp. (Consumer Durables &Apparel) 685,665
21,295 LG Chem Ltd. (Materials) 15,280,3349,117 LG Corp. (Capital Goods) 712,744
283,003 LG Uplus Corp. (TelecommunicationServices) 3,482,965
13,655 LIG Nex1 Co. Ltd. (Capital Goods) 547,39547,648 LOTTE Fine Chemical Co. Ltd.
(Materials) 3,478,68238,279 Meritz Financial Group, Inc.
(Diversified Financials) 1,094,90423,453 Meritz Fire & Marine Insurance Co.
Ltd. (Insurance) 557,472187,411 Meritz Securities Co. Ltd. (Diversified
Financials) 748,872976,448 Mirae Asset Securities Co. Ltd.
(Diversified Financials) 7,284,837284,543 Mirae Asset Securities Co. Ltd.
(Preference) (Diversified Financials)(a) 1,180,345327,852 NH Investment & Securities Co. Ltd.
(Diversified Financials) 3,703,0061,123 Osstem Implant Co. Ltd. (Health Care
Equipment & Services) 119,04033,537 PI Advanced Materials Co. Ltd.
(Materials) 1,298,994
Shares Description Value
Common Stocks – (continued)
South Korea – (continued)44,222 Samsung C&T Corp. (Capital
Goods) $ 4,329,9271,634,034 Samsung Electronics Co. Ltd.
(Technology Hardware &Equipment) 97,834,734
217,547 Samsung Electronics Co. Ltd.(Preference) (TechnologyHardware & Equipment)(a) 11,951,169
8,303 Samsung SDI Co. Ltd. (Preference)(Technology Hardware &Equipment)(a) 2,691,483
24,038 Samsung Securities Co. Ltd.(Diversified Financials) 977,229
4,775 Shinsegae, Inc. (Retailing) 1,015,70176,726 SK Telecom Co. Ltd.
(Telecommunication Services) 20,316,022603,951 TK Chemical Corp. (Consumer
Durables & Apparel)* 3,598,34847,417 Tongyang Life Insurance Co. Ltd.
(Insurance) 277,43830,483 Unid Co. Ltd. (Materials) 3,048,28269,132 Value Added Technology Co. Ltd.
(Health Care Equipment & Services) 2,401,31088,656 Woori Financial Group, Inc. (Banks) 1,007,85561,982 Yuanta Securities Korea Co. Ltd.
(Diversified Financials) 239,378
292,000,750
Taiwan – 12.0%165,000 ASE Technology Holding Co. Ltd.
(Semiconductors & SemiconductorEquipment) 590,208
1,523,000 Asia Polymer Corp. (Materials) 2,145,0002,753,000 Brighton-Best International Taiwan,
Inc. (Capital Goods) 3,439,6301,055,000 Capital Securities Corp. (Diversified
Financials) 575,815738,000 Cathay Financial Holding Co. Ltd.
(Insurance) 1,538,3561,419,000 Chailease Holding Co. Ltd.
(Diversified Financials) 13,590,548944,000 China General Plastics Corp.
(Materials) 1,261,900297,000 China Motor Corp. (Automobiles &
Components) 739,87030,000 Cleanaway Co. Ltd. (Commercial &
Professional Services) 230,976793,000 Elite Semiconductor
Microelectronics Technology, Inc.(Semiconductors & SemiconductorEquipment) 4,077,560
2,422,000 Evergreen Marine Corp. Taiwan Ltd.(Transportation) 8,716,009
The accompanying notes are an integral part of these financial statements. 25

G O L D M A N S A C H S E M E R G I N G M A R K E T S E Q U I T Y I N S I G H T S F U N D
Schedule of Investments (continued)October 31, 2021
Shares Description Value
Common Stocks – (continued)
Taiwan – (continued)97,000 Far EasTone Telecommunications
Co. Ltd. (TelecommunicationServices) $ 213,442
647,000 FocalTech Systems Co. Ltd.(Semiconductors & SemiconductorEquipment) 3,729,423
2,255,400 Fubon Financial Holding Co. Ltd.(Insurance) 5,961,978
132,000 Global Mixed Mode Technology,Inc. (Semiconductors &Semiconductor Equipment) 1,069,925
571,000 Greatek Electronics, Inc.(Semiconductors & SemiconductorEquipment) 1,636,012
493,000 Himax Technologies, Inc. ADR(Semiconductors & SemiconductorEquipment)(b) 5,206,080
85,000 Holtek Semiconductor, Inc.(Semiconductors & SemiconductorEquipment) 315,906
257,000 King’s Town Bank Co. Ltd. (Banks) 383,7481,328,000 Lite-On Technology Corp.
(Technology Hardware &Equipment) 2,930,605
374,000 MediaTek, Inc. (Semiconductors &Semiconductor Equipment) 12,309,349
397,000 Nan Ya Plastics Corp. (Materials) 1,218,338892,000 Nantex Industry Co. Ltd. (Materials) 2,622,587
2,109,000 Novatek Microelectronics Corp.(Semiconductors & SemiconductorEquipment) 31,632,764
73,000 O-TA Precision Industry Co. Ltd.(Consumer Durables & Apparel) 457,619
1,004,840 President Securities Corp.(Diversified Financials) 818,568
215,000 Realtek Semiconductor Corp.(Semiconductors & SemiconductorEquipment) 3,867,344
344,000 Sitronix Technology Corp.(Semiconductors & SemiconductorEquipment) 3,302,994
45,000 TaiDoc Technology Corp. (HealthCare Equipment & Services) 283,186
121,000 Taiwan Mobile Co. Ltd.(Telecommunication Services) 426,789
3,525,000 Taiwan SemiconductorManufacturing Co. Ltd.(Semiconductors & SemiconductorEquipment) 74,801,589
4,370,000 United Microelectronics Corp.(Semiconductors & SemiconductorEquipment) 9,072,012
4,723,500 Wan Hai Lines Ltd. (Transportation) 27,250,322
Shares Description Value
Common Stocks – (continued)
Taiwan – (continued)977,000 Winbond Electronics Corp.
(Semiconductors & SemiconductorEquipment) $ 926,336
122,000 Wisdom Marine Lines Co. Ltd.(Transportation) 287,162
358,000 Yang Ming Marine Transport Corp.(Transportation)* 1,249,716
2,811,000 Yuanta Financial Holding Co. Ltd.(Diversified Financials) 2,498,650
231,378,316
Thailand – 3.0%4,801,300 Bangkok Chain Hospital PCL
(Health Care Equipment &Services) 2,944,111
52,818,000 Chularat Hospital PCL Class F(Health Care Equipment &Services) 6,066,764
6,108,500 Indorama Ventures PCL(Materials) 7,754,217
647,800 Kiatnakin Phatra Bank PCL(Banks) 1,173,579
5,404,200 Precious Shipping PCL(Transportation) 2,959,619
10,864,400 PTT Global Chemical PCL(Materials) 20,561,053
3,152,900 Regional Container Lines PCL(Transportation) 4,173,680
178,700 Siam Cement PCL (The)(Materials) 2,127,209
1,938,100 Siam Commercial Bank PCL (The)(Banks) 7,368,985
2,346,100 SPCG PCL (Utilities) 1,258,5121,872,600 Sri Trang Agro-Industry PCL
(Automobiles & Components) 1,835,531
58,223,260
Turkey – 1.1%1,263,524 Aksa Akrilik Kimya Sanayii A/S
(Consumer Durables & Apparel) 3,103,420188,017 Coca-Cola Icecek A/S (Food,
Beverage & Tobacco) 1,660,921364,315 Enka Insaat ve Sanayi A/S (Capital
Goods) 420,671102,009 Ford Otomotiv Sanayi A/S
(Automobiles & Components) 1,969,302145,433 Logo Yazilim Sanayi ve Ticaret
A/S (Software & Services) 642,9066,839,525 Turk Telekomunikasyon A/S
(Telecommunication Services) 5,356,940397,458 Turk Traktor ve Ziraat Makineleri
A/S (Capital Goods) 6,839,5521,224,895 Turkcell Iletisim Hizmetleri A/S
(Telecommunication Services) 1,948,060
21,941,772
26 The accompanying notes are an integral part of these financial statements.

G O L D M A N S A C H S E M E R G I N G M A R K E T S E Q U I T Y I N S I G H T S F U N D
Shares Description Value
Common Stocks – (continued)
United Arab Emirates – 0.1%751,435 Abu Dhabi Islamic Bank PJSC
(Banks) $ 1,196,427
United States – 0.1%232,200 JBS SA (Food, Beverage & Tobacco) 1,606,614
TOTAL COMMON STOCKS(Cost $1,771,228,195) $1,878,147,299
SharesDividend
Rate Value
Investment Company(d) – 0.1%
Goldman Sachs Financial Square Government Fund –Institutional Shares
1,812,123 0.026% $ 1,812,123(Cost $1,812,123)
TOTAL INVESTMENTS BEFORE SECURITIES LENDINGREINVESTMENT VEHICLE(Cost $1,773,040,318) $1,879,959,422
Securities Lending Reinvestment Vehicle(d) – 0.8%
Goldman Sachs Financial Square Government Fund –Institutional Shares
16,271,799 0.026% $ 16,271,799(Cost $16,271,799)
TOTAL INVESTMENTS – 98.4%(Cost $1,789,312,117) $1,896,231,221
OTHER ASSETS IN EXCESS OFLIABIL IT IES – 1.6% 30,270,204
NET ASSETS – 100.0% $1,926,501,425
The percentage shown for each investment categoryreflects the value of investments in that category as apercentage of net assets.* Security is currently in default and/or non-income producing.
(a) Preference Shares are a special type of equity investment that shares inthe earnings of the company, has limited voting rights, and receives agreater dividend than applicable Common Shares.
(b) All or a portion of security is on loan.
(c) Exempt from registration under Rule 144A of the Securities Act of1933.
(d) Represents an Affiliated Issuer.
Investment Abbreviations:ADR—American Depositary ReceiptGDR—Global Depositary ReceiptREIT—Real Estate Investment Trust
A D D I T I O N A L I N V E S T M E N T I N F O R M A T I O N
FUTURES CONTRACTS — At October 31, 2021, the Fund had the following futures contracts:
DescriptionNumber ofContracts
ExpirationDate
NotionalAmount
UnrealizedAppreciation/(Depreciation)
Long position contracts:MSCI Emerging Markets E-Mini Index 517 12/17/2021 $32,622,700 $367,755
The accompanying notes are an integral part of these financial statements. 27

G O L D M A N S A C H S I N T E R N A T I O N A L E Q U I T Y I N S I G H T S F U N D
Schedule of InvestmentsOctober 31, 2021
Shares Description Value
Common Stocks – 97.3%
Australia – 7.0%891,537 Australia & New Zealand Banking
Group Ltd. (Banks) $ 18,972,339835,758 BHP Group plc (Materials) 22,073,671251,787 Charter Hall Group (REIT) 3,303,425302,141 Commonwealth Bank of Australia
(Banks) 23,948,37163,086 Domino’s Pizza Enterprises Ltd.
(Consumer Services) 6,471,243183,517 Endeavour Group Ltd. (Food &
Staples Retailing) 942,9971,947,434 Glencore plc (Materials)* 9,738,299
73,762 Goodman Group (REIT) 1,221,269412,714 Mineral Resources Ltd. (Materials) 12,133,090108,467 Premier Investments Ltd. (Retailing) 2,517,317376,514 Rio Tinto plc ADR (Materials)(a)(b) 23,822,041278,166 Sonic Healthcare Ltd. (Health Care
Equipment & Services) 8,440,8065,430,041 Telstra Corp. Ltd.
(Telecommunication Services) 15,695,4231,810,802 Treasury Wine Estates Ltd. (Food,
Beverage & Tobacco) 15,800,208442,015 Woolworths Group Ltd. (Food &
Staples Retailing) 12,732,160
177,812,659
Austria – 0.2%12,077 BAWAG Group AG (Banks)(c) 759,58672,264 Erste Group Bank AG (Banks) 3,099,093
3,858,679
Belgium – 0.1%9,435 D’ieteren Group (Retailing) 1,626,824
Brazil – 0.3%159,682 Yara International ASA (Materials) 8,345,441
China – 0.3%2,029,800 Chow Tai Fook Jewellery Group
Ltd. (Retailing) 4,139,981843,000 SITC International Holdings Co.
Ltd. (Transportation) 2,849,208
6,989,189
Denmark – 2.9%1,794 AP Moller – Maersk A/S Class A
(Transportation) 4,925,7136,864 AP Moller – Maersk A/S Class B
(Transportation) 19,891,51712,859 Dfds A/S (Transportation)* 665,431
438,700 Novo Nordisk A/S Class B(Pharmaceuticals, Biotechnology &Life Sciences) 48,105,610
73,588,271
Shares Description Value
Common Stocks – (continued)
Finland – 1.6%524,018 Kesko OYJ Class B (Food & Staples
Retailing) $ 17,053,9051,108,024 Nokia OYJ (Technology
Hardware & Equipment)* 6,359,515965,170 Nordea Bank Abp (Banks) 11,820,26367,003 Sampo OYJ Class A (Insurance) 3,561,96953,146 TietoEVRY OYJ (Software &
Services) 1,629,845
40,425,497
France – 11.8%121,238 Arkema SA (Materials) 16,584,642770,098 AXA SA (Insurance) 22,404,45636,945 Capgemini SE (Software &
Services) 8,614,209293,603 Cie de Saint-Gobain (Capital Goods) 20,262,295311,878 Dassault Systemes SE (Software &
Services) 18,212,8708,883 Eiffage SA (Capital Goods) 914,284
435,295 Electricite de France SA (Utilities) 6,415,3621,411,304 Engie SA (Utilities) 20,076,014
33,802 Gecina SA (REIT) 4,730,21132,249 Kering SA (Consumer Durables &
Apparel) 24,204,00295,703 Legrand SA (Capital Goods) 10,440,25313,358 L’Oreal SA (Household & Personal
Products) 6,110,68162,479 LVMH Moet Hennessy Louis
Vuitton SE (Consumer Durables &Apparel) 48,991,137
4,921 Nexans SA (Capital Goods) 493,74288,065 Pernod Ricard SA (Food,
Beverage & Tobacco) 20,260,261269,861 Publicis Groupe SA (Media &
Entertainment) 18,116,698841,142 Rexel SA (Capital Goods)* 16,718,71034,555 Sartorius Stedim Biotech
(Pharmaceuticals, Biotechnology &Life Sciences) 19,045,722
561,173 Societe Generale SA (Banks) 18,745,3975,284 Trigano SA (Automobiles &
Components) 991,877
302,332,823
Germany – 11.5%376,782 BASF SE (Materials) 27,118,381211,175 Bayerische Motoren Werke AG
(Automobiles & Components) 21,336,286202,481 Brenntag SE (Capital Goods) 19,263,708230,463 Covestro AG (Materials)(c) 14,758,546522,654 Deutsche Bank AG (Registered)
(Diversified Financials)* 6,713,657480,126 Deutsche Post AG (Registered)
(Transportation) 29,723,176146,763 Deutsche Telekom AG (Registered)
(Telecommunication Services) 2,729,374
28 The accompanying notes are an integral part of these financial statements.

G O L D M A N S A C H S I N T E R N A T I O N A L E Q U I T Y I N S I G H T S F U N D
Shares Description Value
Common Stocks – (continued)
Germany – (continued)40,148 DWS Group GmbH & Co. KGaA
(Diversified Financials)(c) $ 1,736,6241,660,290 E.ON SE (Utilities) 21,052,167
70,816 Gerresheimer AG (Pharmaceuticals,Biotechnology & Life Sciences) 6,497,557
3,049 Hapag-Lloyd AG (Transportation)(c) 656,01273,932 HelloFresh SE (Retailing)* 5,991,369
202,944 Henkel AG & Co. KGaA(Preference) (Household & PersonalProducts)(d) 18,181,250
425,653 Infineon Technologies AG(Semiconductors & SemiconductorEquipment) 19,933,908
115,055 Merck KGaA (Pharmaceuticals,Biotechnology & Life Sciences) 27,190,369
19,710 Muenchener Rueckversicherungs-Gesellschaft AG in Muenchen(Registered) (Insurance) 5,835,867
51,305 Rheinmetall AG (Capital Goods) 4,977,968124,397 SAP SE (Software & Services) 18,014,076264,551 Siemens Healthineers AG (Health
Care Equipment & Services)(c) 17,594,215105,247 Volkswagen AG (Preference)
(Automobiles & Components)(d) 23,620,747
292,925,257
Hong Kong – 1.1%1,460,600 AIA Group Ltd. (Insurance) 16,368,961
201,800 ASM Pacific Technology Ltd.(Semiconductors & SemiconductorEquipment) 2,183,559
224,200 Link REIT (REIT) 1,986,286482,000 Sun Hung Kai Properties Ltd. (Real
Estate) 6,390,517
26,929,323
Ireland – 0.3%46,218 Flutter Entertainment plc (Consumer
Services)* 8,721,659
Israel – 0.2%256,249 Plus500 Ltd. (Diversified Financials) 4,613,261
Italy – 0.7%325,636 Azimut Holding SpA (Diversified
Financials) 9,377,766143,832 Banca Mediolanum SpA
(Diversified Financials) 1,449,411498,509 Banco BPM SpA (Banks) 1,550,260113,118 BFF Bank SpA (Diversified
Financials)(c) 1,012,86325,070 Reply SpA (Software & Services) 4,866,172
18,256,472
Japan – 26.0%65,800 Advantest Corp. (Semiconductors &
Semiconductor Equipment) 5,394,806
Shares Description Value
Common Stocks – (continued)
Japan – (continued)223,000 Aeon Co. Ltd. (Food & Staples
Retailing) $ 5,130,0371,471,100 Amada Co. Ltd. (Capital Goods) 14,533,688
28,600 Aozora Bank Ltd. (Banks) 654,225477,200 Canon, Inc. (Technology
Hardware & Equipment) 10,851,229279,100 Casio Computer Co. Ltd. (Consumer
Durables & Apparel) 3,949,575287,500 CyberAgent, Inc. (Media &
Entertainment) 4,817,2199,200 Daito Trust Construction Co. Ltd.
(Real Estate) 1,140,654552,900 Daiwa House Industry Co. Ltd.
(Real Estate) 18,240,2811,557,800 Daiwa Securities Group, Inc.
(Diversified Financials) 8,751,955324,000 Dentsu Group, Inc. (Media &
Entertainment) 11,840,16422,800 Disco Corp. (Semiconductors &
Semiconductor Equipment) 6,146,8269,900 Ebara Corp. (Capital Goods) 540,212
1,635,300 ENEOS Holdings, Inc. (Energy) 6,593,94079,300 Fujitsu Ltd. (Software & Services) 13,705,40047,900 Hoya Corp. (Health Care
Equipment & Services) 7,051,290105,700 Iida Group Holdings Co. Ltd.
(Consumer Durables & Apparel) 2,605,982919,300 Isuzu Motors Ltd. (Automobiles &
Components) 12,367,165243,900 ITOCHU Corp. (Capital Goods) 6,956,240234,800 Kansai Electric Power Co., Inc.
(The) (Utilities) 2,161,830340,700 Kao Corp. (Household & Personal
Products) 19,272,74141,800 KDDI Corp. (Telecommunication
Services) 1,278,244735,700 Kirin Holdings Co. Ltd. (Food,
Beverage & Tobacco) 12,805,481122,200 Konami Holdings Corp. (Media &
Entertainment) 6,724,73625,500 Marui Group Co. Ltd. (Retailing) 500,405
1,070,200 Mazda Motor Corp. (Automobiles &Components)* 9,625,670
170,700 MINEBEA MITSUMI, Inc. (CapitalGoods) 4,321,619
116,600 Mitsubishi Estate Co. Ltd. (RealEstate) 1,771,969
3,067,800 Mitsubishi HC Capital, Inc.(Diversified Financials) 15,382,565
970,300 Mitsui & Co. Ltd. (Capital Goods) 22,204,84468,000 Mitsui Chemicals, Inc. (Materials) 2,021,901
265,800 Mitsui OSK Lines Ltd.(Transportation) 16,759,085
1,187,400 Mizuho Financial Group, Inc.(Banks) 15,671,279
The accompanying notes are an integral part of these financial statements. 29

G O L D M A N S A C H S I N T E R N A T I O N A L E Q U I T Y I N S I G H T S F U N D
Schedule of Investments (continued)October 31, 2021
Shares Description Value
Common Stocks – (continued)
Japan – (continued)132,400 MS&AD Insurance Group Holdings,
Inc. (Insurance) $ 4,277,494325,300 NEC Corp. (Software & Services) 16,656,023884,700 NGK Insulators Ltd. (Capital
Goods) 14,731,27934,600 Nippon Electric Glass Co. Ltd.
(Technology Hardware &Equipment) 883,440
24,000 Nippon Express Co. Ltd.(Transportation) 1,502,268
460,900 Nippon Telegraph & TelephoneCorp. (Telecommunication Services) 12,913,931
276,100 Nippon Yusen KK (Transportation) 19,895,0141,042,700 Nissan Motor Co. Ltd.
(Automobiles & Components)* 5,307,198103,600 Nitto Denko Corp. (Materials) 8,095,321
3,638,100 Nomura Holdings, Inc. (DiversifiedFinancials) 17,326,515
33,800 Nomura Real Estate Holdings, Inc.(Real Estate) 824,023
106,700 Nomura Research Institute Ltd.(Software & Services) 4,271,635
1,059,800 NTT Data Corp. (Software &Services) 21,260,464
195,900 Olympus Corp. (Health CareEquipment & Services) 4,243,790
22,500 Oracle Corp. Japan (Software &Services) 2,129,052
5,100 Oriental Land Co. Ltd. (ConsumerServices) 805,493
1,102,900 ORIX Corp. (Diversified Financials) 21,921,57923,000 Persol Holdings Co. Ltd.
(Commercial & ProfessionalServices) 618,209
817,800 Renesas Electronics Corp.(Semiconductors & SemiconductorEquipment)* 10,060,109
1,165,500 Ricoh Co. Ltd. (TechnologyHardware & Equipment) 11,349,453
27,900 Rohm Co. Ltd. (Semiconductors &Semiconductor Equipment) 2,551,108
16,100 Sawai Group Holdings Co. Ltd.(Pharmaceuticals, Biotechnology &Life Sciences) 710,240
188,900 SBI Holdings, Inc. (DiversifiedFinancials) 4,896,187
12,300 SCREEN Holdings Co. Ltd.(Semiconductors & SemiconductorEquipment) 1,143,276
833,600 Sekisui House Ltd. (ConsumerDurables & Apparel) 17,331,196
469,900 Showa Denko KK (Materials) 11,785,107341,000 SoftBank Group Corp.
(Telecommunication Services) 18,460,8551,295,400 Sumitomo Corp. (Capital Goods) 18,459,016
Shares Description Value
Common Stocks – (continued)
Japan – (continued)539,500 Sumitomo Dainippon Pharma Co.
Ltd. (Pharmaceuticals,Biotechnology & Life Sciences) $ 7,629,376
293,200 Sumitomo Forestry Co. Ltd.(Consumer Durables & Apparel) 5,600,400
29,000 Sumitomo Heavy Industries Ltd.(Capital Goods) 746,620
662,600 Sumitomo Mitsui Financial Group,Inc. (Banks) 21,501,142
326,400 Suntory Beverage & Food Ltd.(Food, Beverage & Tobacco) 12,665,113
300,800 Takeda Pharmaceutical Co. Ltd.(Pharmaceuticals, Biotechnology &Life Sciences) 8,442,202
60,900 TIS, Inc. (Software & Services) 1,659,091397,100 Tokio Marine Holdings, Inc.
(Insurance) 20,915,273201,800 Tokyo Gas Co. Ltd. (Utilities) 3,501,823158,400 Tokyo Seimitsu Co. Ltd.
(Semiconductors & SemiconductorEquipment) 6,449,422
784,000 Tosoh Corp. (Materials) 13,203,363105,000 Toyota Motor Corp. (Automobiles &
Components) 1,852,637166,300 Toyota Tsusho Corp. (Capital
Goods) 7,213,46489,500 Trend Micro, Inc. (Software &
Services) 5,058,57573,900 Ulvac, Inc. (Semiconductors &
Semiconductor Equipment) 4,146,16054,000 USS Co. Ltd. (Retailing) 870,388
553,600 Yamaha Motor Co. Ltd.(Automobiles & Components) 15,430,946
663,068,527
Luxembourg – 0.8%177,621 Eurofins Scientific SE
(Pharmaceuticals, Biotechnology &Life Sciences) 20,961,944
Netherlands – 5.9%58,009 ASM International NV
(Semiconductors & SemiconductorEquipment) 26,253,985
67,773 ASML Holding NV(Semiconductors & SemiconductorEquipment) 55,092,690
104,420 Flow Traders (DiversifiedFinancials)(c) 3,544,031
662,453 Koninklijke Ahold Delhaize NV(Food & Staples Retailing) 21,551,229
37,494 OCI NV (Materials)* 1,062,8991,003,940 PostNL NV (Transportation) 4,357,224
147,101 Randstad NV (Commercial &Professional Services) 10,568,833
649,099 Royal Dutch Shell plc Class A(Energy) 14,955,921
30 The accompanying notes are an integral part of these financial statements.

G O L D M A N S A C H S I N T E R N A T I O N A L E Q U I T Y I N S I G H T S F U N D
Shares Description Value
Common Stocks – (continued)
Netherlands – (continued)151,844 Royal Dutch Shell plc Class B ADR
(Energy) $ 6,960,529129,944 Signify NV (Capital Goods)(c) 6,296,619
150,643,960
New Zealand – 0.0%149,768 Fletcher Building Ltd. (Capital
Goods) 770,304
Norway – 1.9%394,423 Aker BP ASA (Energy) 15,134,770650,461 Golden Ocean Group Ltd.
(Transportation) 5,882,9052,800,239 Norsk Hydro ASA (Materials) 20,569,070
701,595 Orkla ASA (Food, Beverage &Tobacco) 6,824,005
48,410,750
Portugal – 0.4%898,780 Galp Energia SGPS SA (Energy) 9,336,476
Singapore – 0.2%715,600 Oversea-Chinese Banking Corp. Ltd.
(Banks) 6,255,657
South Africa – 1.0%662,813 Anglo American plc (Materials) 25,215,398
Spain – 1.0%626,295 Acerinox SA (Materials) 8,719,484
1,363,176 Banco de Sabadell SA (Banks)* 1,097,0821,035,991 Bankinter SA (Banks) 5,704,182
332,902 Grifols SA (Pharmaceuticals,Biotechnology & Life Sciences) 7,617,803
11,876 Laboratorios Farmaceuticos RoviSA (Pharmaceuticals,Biotechnology & Life Sciences) 831,957
220,971 Repsol SA (Energy) 2,830,315
26,800,823
Sweden – 5.0%43,870 Boliden AB (Materials) 1,546,602
305,998 Getinge AB Class B (Health CareEquipment & Services) 13,693,976
37,589 Industrivarden AB Class A(Diversified Financials) 1,239,994
430,386 Investor AB Class A (DiversifiedFinancials) 9,957,220
712,060 Investor AB Class B (DiversifiedFinancials) 16,430,033
77,933 Kinnevik AB Class B (DiversifiedFinancials)* 3,058,934
346,670 Lundin Energy AB (Energy) 13,691,187774,494 Sandvik AB (Capital Goods) 19,640,172680,586 SSAB AB Class B (Materials)* 3,401,677289,241 Svenska Handelsbanken AB Class A
(Banks) 3,315,379
Shares Description Value
Common Stocks – (continued)
Sweden – (continued)854,554 Swedbank AB Class A (Banks)(b) $ 18,534,169926,292 Telefonaktiebolaget LM Ericsson
Class B (Technology Hardware &Equipment) 10,110,855
595,667 Volvo AB Class B (Capital Goods) 13,890,450
128,510,648
Switzerland – 7.3%697,829 ABB Ltd. (Registered) (Capital
Goods) 23,086,440305,092 Adecco Group AG (Registered)
(Commercial & ProfessionalServices) 15,370,553
8,824 Bachem Holding AG (Registered)Class B (Pharmaceuticals,Biotechnology & Life Sciences) 7,102,958
5,395 Baloise Holding AG (Registered)(Insurance) 859,748
53,919 Kuehne + Nagel International AG(Registered) (Transportation) 16,981,816
21,751 Lonza Group AG (Registered)(Pharmaceuticals, Biotechnology &Life Sciences) 17,874,981
133,946 Roche Holding AG(Pharmaceuticals, Biotechnology &Life Sciences) 51,889,903
1,613 Siegfried Holding AG (Registered)(Pharmaceuticals, Biotechnology &Life Sciences)* 1,551,452
26,399 Swatch Group AG (The) (ConsumerDurables & Apparel) 7,266,185
30,393 Tecan Group AG (Registered)(Pharmaceuticals, Biotechnology &Life Sciences) 18,621,871
1,417,109 UBS Group AG (Registered)(Diversified Financials) 25,795,194
186,401,101
Ukraine – 0.0%210,344 Ferrexpo plc (Materials) 897,305
United Kingdom – 7.3%182,597 3i Group plc (Diversified Financials) 3,410,001
3,245,186 Aviva plc (Insurance) 17,510,761102,634 Bellway plc (Consumer Durables &
Apparel) 4,656,902748,543 British American Tobacco plc
(Food, Beverage & Tobacco) 26,037,6232,151,000 CK Hutchison Holdings Ltd.
(Capital Goods) 14,421,213129,482 IG Group Holdings plc (Diversified
Financials) 1,406,103843,330 Imperial Brands plc (Food,
Beverage & Tobacco) 17,795,24999,562 InterContinental Hotels Group plc
(Consumer Services)* 6,974,028
The accompanying notes are an integral part of these financial statements. 31

G O L D M A N S A C H S I N T E R N A T I O N A L E Q U I T Y I N S I G H T S F U N D
Schedule of Investments (continued)October 31, 2021
Shares Description Value
Common Stocks – (continued)
United Kingdom – (continued)13,205 Intertek Group plc (Commercial &
Professional Services) $ 884,3117,831,421 ITV plc (Media & Entertainment)* 11,526,280
460,452 JD Sports Fashion plc (Retailing) 6,862,9851,761,491 Legal & General Group plc
(Insurance) 6,946,937803,635 Man Group plc (Diversified
Financials) 2,559,269901,314 Melrose Industries plc (Capital
Goods) 1,944,625151,700 Next plc (Retailing) 16,533,699134,410 Persimmon plc (Consumer
Durables & Apparel) 5,007,890377,671 Prudential plc (Insurance) 7,707,48880,123 Spectris plc (Technology
Hardware & Equipment) 4,122,498198,600 Tate & Lyle plc (Food, Beverage &
Tobacco) 1,761,7693,298,165 Taylor Wimpey plc (Consumer
Durables & Apparel) 6,978,2871,350,471 Vodafone Group plc ADR
(Telecommunication Services) 20,189,541
185,237,459
United States – 2.5%21,945 Ferguson plc (Capital Goods) 3,301,920
174,367 QIAGEN NV (Pharmaceuticals,Biotechnology & Life Sciences)* 9,592,633
173,256 Schneider Electric SE (CapitalGoods) 29,872,484
1,090,445 Stellantis NV (Automobiles &Components) 21,770,142
64,537,179
TOTAL INVESTMENTS BEFORE SECURITIES LENDINGREINVESTMENT VEHICLE(Cost $2,209,504,537) $2,483,472,886
SharesDividend
Rate Value
Securities Lending Reinvestment Vehicle(e) – 1.2%
Goldman Sachs Financial Square Government Fund –Institutional Shares
30,644,800 0.026% $ 30,644,800(Cost $30,644,800)
TOTAL INVESTMENTS – 98.5%(Cost $2,240,149,337) $2,514,117,686
OTHER ASSETS IN EXCESS OFLIABIL IT IES – 1.5% 37,054,868
NET ASSETS – 100.0% $2,551,172,554
The percentage shown for each investment categoryreflects the value of investments in that category as apercentage of net assets.* Security is currently in default and/or non-income producing.
(a) All or a portion of security is segregated as collateral for initial marginrequirements on futures transactions.
(b) All or a portion of security is on loan.
(c) Exempt from registration under Rule 144A of the Securities Act of1933.
(d) Preference Shares are a special type of equity investment that shares inthe earnings of the company, has limited voting rights, and receives agreater dividend than applicable Common Shares.
(e) Represents an Affiliated Issuer.
Investment Abbreviations:ADR—American Depositary ReceiptREIT—Real Estate Investment Trust
A D D I T I O N A L I N V E S T M E N T I N F O R M A T I O N
FUTURES CONTRACTS — At October 31, 2021, the Fund had the following futures contracts:
DescriptionNumber ofContracts
ExpirationDate
NotionalAmount
UnrealizedAppreciation/(Depreciation)
Long position contracts:EURO STOXX 50 Index 485 12/17/2021 $23,755,164 $ 321,539FTSE 100 Index 88 12/17/2021 8,700,037 200,911Hang Seng Index 13 11/29/2021 2,113,952 (65,961)MSCI Singapore Index 26 11/29/2021 709,529 (3,455)SPI 200 Index 28 12/16/2021 3,833,466 (45,154)TOPIX Index 70 12/09/2021 12,237,333 (413,626)
Total Futures Contracts $ (5,746)
32 The accompanying notes are an integral part of these financial statements.

G O L D M A N S A C H S I N T E R N A T I O N A L S M A L L C A P I N S I G H T S F U N D
Schedule of InvestmentsOctober 31, 2021
Shares Description Value
Common Stocks – 96.9%
Australia – 9.4%1,177,675 ALS Ltd. (Commercial &
Professional Services) $ 11,811,84126,300,067 AMP Ltd. (Diversified Financials)* 21,517,402
170,322 AUB Group Ltd. (Insurance) 2,807,13335,117 Australian Ethical Investment Ltd.
(Diversified Financials) 362,8932,863,563 Bega Cheese Ltd. (Food,
Beverage & Tobacco) 11,729,072999,915 Bendigo & Adelaide Bank Ltd.
(Banks) 7,003,314573,126 BWP Trust (REIT) 1,836,25399,118 carsales.com Ltd. (Media &
Entertainment) 1,854,9094,206,537 Centuria Capital Group (REIT) 10,223,4842,671,939 Centuria Industrial REIT (REIT) 7,369,945
175,173 Challenger Ltd. (DiversifiedFinancials) 920,153
828,434 Champion Iron Ltd. (Materials)* 2,767,1803,163,917 Charter Hall Group (REIT) 41,510,328
141,277 Charter Hall Retail REIT (REIT) 438,292920,708 Charter Hall Social Infrastructure
REIT (REIT) 2,649,744316,550 Codan Ltd. (Technology
Hardware & Equipment) 2,413,8472,547,650 CSR Ltd. (Materials) 11,436,9021,581,090 Data#3 Ltd. (Software & Services) 6,775,8081,048,622 Downer EDI Ltd. (Commercial &
Professional Services) 5,013,62137,868 Eagers Automotive Ltd. (Retailing) 425,45951,941 Elders Ltd. (Food, Beverage &
Tobacco) 471,8691,044,475 Genworth Mortgage Insurance
Australia Ltd. (Banks) 1,814,510920,883 GrainCorp Ltd. Class A (Food &
Staples Retailing) 4,376,5961,841,030 IGO Ltd. (Materials) 13,481,5313,568,394 Iluka Resources Ltd. (Materials) 25,458,3532,202,800 Ingenia Communities Group
(REIT) 10,891,0742,914,889 Inghams Group Ltd. (Food,
Beverage & Tobacco) 8,176,4687,943 Lovisa Holdings Ltd. (Retailing) 130,925
38,641 McMillan Shakespeare Ltd.(Commercial & ProfessionalServices) 399,828
5,992,527 Metcash Ltd. (Food & StaplesRetailing) 18,468,743
1,310,934 Mineral Resources Ltd. (Materials) 38,539,230735,932 Pendal Group Ltd. (Diversified
Financials) 3,722,346541,075 Perpetual Ltd. (Diversified
Financials) 15,465,3121,037,951 Pinnacle Investment Management
Group Ltd. (Diversified Financials) 13,499,547988,321 Premier Investments Ltd.
(Retailing) 22,937,086
Shares Description Value
Common Stocks – (continued)
Australia – (continued)150,984 Pro Medicus Ltd. (Health Care
Equipment & Services) $ 6,097,2552,756,095 Sandfire Resources Ltd. (Materials) 11,609,761
496,772 SeaLink Travel Group Ltd.(Transportation)* 2,752,118
353,956 Super Retail Group Ltd. (Retailing) 3,472,4361,925,614 Uniti Group Ltd.
(Telecommunication Services)* 5,934,59242,094 Worley Ltd. (Energy) 345,853
149,174 Zip Co. Ltd. (DiversifiedFinancials)* 737,267
359,650,280
Austria – 0.2%100,531 BAWAG Group AG (Banks)(a) 6,322,92332,862 Oesterreichische Post AG
(Transportation)(b) 1,386,57913,558 Semperit AG Holding (Capital
Goods) 456,86911,434 Zumtobel Group AG (Capital
Goods) 117,638
8,284,009
Belgium – 2.0%8,864 Ackermans & van Haaren NV
(Diversified Financials) 1,524,308263,048 Bekaert SA (Materials) 11,521,958195,619 D’ieteren Group (Retailing) 33,729,48161,954 Melexis NV (Semiconductors &
Semiconductor Equipment) 7,145,556495,382 Warehouses De Pauw CVA (REIT) 22,557,984
76,479,287
China – 0.2%92,000 Kerry Logistics Network Ltd.
(Transportation) 223,482454,000 VSTECS Holdings Ltd.
(Technology Hardware &Equipment) 428,438
10,274,110 Yanlord Land Group Ltd. (RealEstate) 8,541,146
9,193,066
Denmark – 1.4%131,657 Chemometec A/S
(Pharmaceuticals, Biotechnology &Life Sciences) 19,964,063
330,611 D/S Norden A/S (Transportation) 7,978,848220,902 Dfds A/S (Transportation)* 11,431,292
2,642 Per Aarsleff Holding A/S (CapitalGoods) 113,932
38,746 Royal Unibrew A/S (Food,Beverage & Tobacco) 4,813,238
The accompanying notes are an integral part of these financial statements. 33

G O L D M A N S A C H S I N T E R N A T I O N A L S M A L L C A P I N S I G H T S F U N D
Schedule of Investments (continued)October 31, 2021
Shares Description Value
Common Stocks – (continued)
Denmark – (continued)306,720 Scandinavian Tobacco Group A/S
Class A (Food, Beverage &Tobacco)(a) $ 6,892,263
103,803 Sydbank A/S (Banks) 3,567,203
54,760,839
Finland – 1.4%885,098 TietoEVRY OYJ (Software &
Services) 27,143,576650,990 Tokmanni Group Corp. (Retailing) 14,811,893393,512 Uponor OYJ (Capital Goods) 9,612,060
51,567,529
France – 3.2%79,385 Alten SA (Software & Services) 12,792,128
947,148 Coface SA (Insurance) 13,542,144956,026 Derichebourg SA (Commercial &
Professional Services)* 10,879,85513,695 Eramet SA (Materials)* 1,144,493
110,071 IPSOS (Media & Entertainment) 5,158,758124,960 Mercialys SA (REIT) 1,357,465
2,570 Mersen SA (Capital Goods) 96,412251,161 Nexans SA (Capital Goods) 25,199,889241,526 Nexity SA (Real Estate) 11,041,89483,157 Quadient SA (Technology
Hardware & Equipment) 1,988,0251,477,486 Rexel SA (Capital Goods)* 29,366,812
1,414 Sopra Steria Group SACA(Software & Services) 278,018
43,174 Trigano SA (Automobiles &Components) 8,104,331
1,955 Virbac SA (Pharmaceuticals,Biotechnology & Life Sciences) 990,897
121,941,121
Georgia – 0.0%6,808 Bank of Georgia Group plc (Banks) 141,282
Germany – 4.4%115,242 AURELIUS Equity Opportunities
SE & Co. KGaA (DiversifiedFinancials) 3,336,069
98,200 Bilfinger SE (Commercial &Professional Services) 3,451,231
53,686 CANCOM SE (Software &Services) 3,711,581
99,401 Deutz AG (Capital Goods)* 833,134162,534 ElringKlinger AG (Automobiles &
Components)* 2,296,20734,195 Encavis AG (Utilities) 716,588
149,982 Freenet AG (TelecommunicationServices) 3,862,823
371,417 Gerresheimer AG (Pharmaceuticals,Biotechnology & Life Sciences) 34,078,499
Shares Description Value
Common Stocks – (continued)
Germany – (continued)97,349 HUGO BOSS AG (Consumer
Durables & Apparel) $ 6,095,726186,540 Jungheinrich AG (Preference)
(Capital Goods)(c) 9,459,9217,960 K+S AG (Registered) (Materials)* 137,169
1,836,828 Kloeckner & Co. SE (CapitalGoods)* 24,678,839
878,963 METRO AG (Food & StaplesRetailing) 11,111,089
575,171 ProSiebenSat.1 Media SE(Media & Entertainment) 9,634,547
228,470 Rheinmetall AG (Capital Goods) 22,167,749747,342 TUI AG (Consumer Services)* 2,502,687
9,506 Varta AG (Capital Goods)(b) 1,464,945163,560 Wacker Chemie AG (Materials) 29,556,433
169,095,237
Guernsey – 0.0%330,807 BMO Commercial Property
Trust Ltd. (REIT) 463,591
Hong Kong – 1.8%2,586,100 ASM Pacific Technology Ltd.
(Semiconductors & SemiconductorEquipment) 27,982,666
1,373,600 Bank of East Asia Ltd. (The)(Banks) 2,255,822
2,816,000 Fortune REIT (REIT) 2,920,8982,004,000 Hang Lung Group Ltd. (Real
Estate) 4,692,470103,000 Hysan Development Co. Ltd. (Real
Estate) 358,0948,331,000 K Wah International Holdings Ltd.
(Real Estate) 3,332,521577,500 Kerry Properties Ltd. (Real Estate) 1,632,420
1,229,000 Luk Fook Holdings InternationalLtd. (Retailing) 3,349,498
37,383,000 Pacific Basin Shipping Ltd.(Transportation) 17,252,507
599,000 Sun Hung Kai & Co. Ltd.(Diversified Financials) 311,799
5,188,000 United Laboratories InternationalHoldings Ltd. (The)(Pharmaceuticals, Biotechnology &Life Sciences) 3,287,300
67,375,995
Ireland – 0.0%754,819 Hibernia REIT plc (REIT) 1,099,439
Israel – 0.6%1,328,076 Plus500 Ltd. (Diversified
Financials) 23,909,40771,652 Tremor International Ltd.
(Media & Entertainment)* 666,803
24,576,210
34 The accompanying notes are an integral part of these financial statements.

G O L D M A N S A C H S I N T E R N A T I O N A L S M A L L C A P I N S I G H T S F U N D
Shares Description Value
Common Stocks – (continued)
Italy – 4.3%44,283 ACEA SpA (Utilities) $ 960,346
591,077 Anima Holding SpA (DiversifiedFinancials)(a) 3,140,655
1,055,475 Azimut Holding SpA (DiversifiedFinancials) 30,395,893
487,905 Banca Generali SpA (DiversifiedFinancials)* 22,953,360
352,039 Banca IFIS SpA (DiversifiedFinancials) 6,509,776
526,896 Banca Mediolanum SpA(Diversified Financials) 5,309,590
112,619 Banca Popolare di Sondrio SCPA(Banks) 489,388
6,964,758 Banco BPM SpA (Banks) 21,658,9601,785,070 BFF Bank SpA (Diversified
Financials)(a) 15,983,591251,948 Biesse SpA (Capital Goods)* 7,798,767587,949 BPER Banca (Banks) 1,289,118136,235 El.En. SpA (Health Care
Equipment & Services) 2,724,53615,595 ERG SpA (Utilities) 563,353
841,189 Hera SpA (Utilities) 3,441,51164,783 Illimity Bank SpA (Banks)* 1,022,539
575,047 Piaggio & C SpA (Automobiles &Components) 1,927,754
174,326 Reply SpA (Software & Services) 33,837,26877,907 Unipol Gruppo SpA (Insurance) 447,450
1,036,867 Webuild SpA (Capital Goods)(b) 2,566,899
163,020,754
Japan – 29.8%27,200 Aica Kogyo Co. Ltd. (Capital
Goods) 833,702553,900 Air Water, Inc. (Materials) 8,474,72030,300 Alpen Co. Ltd. (Retailing) 739,091
3,630,000 Amada Co. Ltd. (Capital Goods) 35,862,4771,017,300 Aozora Bank Ltd. (Banks) 23,270,731
989,500 Autobacs Seven Co. Ltd. (Retailing) 12,797,66315,600 BML, Inc. (Health Care
Equipment & Services) 548,33751,300 Canon Marketing Japan, Inc.
(Technology Hardware &Equipment) 1,016,270
58,500 Central Glass Co. Ltd. (CapitalGoods) 1,089,365
4,677,700 Citizen Watch Co. Ltd. (TechnologyHardware & Equipment) 20,399,747
28,900 Coca-Cola Bottlers Japan Holdings,Inc. (Food, Beverage & Tobacco) 397,709
660 Comforia Residential REIT, Inc.(REIT) 1,922,527
88,400 Credit Saison Co. Ltd. (DiversifiedFinancials) 1,083,759
28,400 Daicel Corp. (Materials) 212,638151,600 Daido Steel Co. Ltd. (Materials) 5,808,225
Shares Description Value
Common Stocks – (continued)
Japan – (continued)14,700 Daihen Corp. (Capital Goods) $ 613,59925,200 Daiichi Jitsugyo Co. Ltd. (Capital
Goods) 1,172,166119,500 Daiseki Co. Ltd. (Commercial &
Professional Services) 5,577,875754 Daiwa Office Investment Corp.
(REIT) 4,866,99253,100 DeNA Co. Ltd. (Media &
Entertainment) 980,873474,700 Dexerials Corp. (Technology
Hardware & Equipment) 9,602,825529,700 DIC Corp. (Materials) 14,024,74371,600 Digital Garage, Inc. (Software &
Services) 3,344,724163,700 Doshisha Co. Ltd. (Retailing) 2,564,947202,800 Dowa Holdings Co. Ltd. (Materials) 8,469,726140,700 DTS Corp. (Software & Services) 3,121,94825,300 Eagle Industry Co. Ltd.
(Automobiles & Components) 270,24548,200 Ebara Corp. (Capital Goods) 2,630,12416,200 Eizo Corp. (Technology
Hardware & Equipment) 619,55117,000 EXEO Group, Inc. (Capital Goods) 392,940
511,900 Ferrotec Holdings Corp.(Semiconductors & SemiconductorEquipment) 17,171,457
1,377,300 Financial Products Group Co. Ltd.(Diversified Financials) 7,971,844
482,000 Fuji Corp. (Capital Goods) 11,243,1647,900 Fuji Kyuko Co. Ltd. (Consumer
Services) 318,26674,500 Fujibo Holdings, Inc. (Consumer
Durables & Apparel) 2,702,047197,700 Furukawa Electric Co. Ltd. (Capital
Goods) 4,325,893230,400 Future Corp. (Software & Services) 6,738,558252,800 Gakken Holdings Co. Ltd. (Media &
Entertainment) 2,474,6795,619 Global One Real Estate Investment
Corp. (REIT) 5,787,46542,800 GS Yuasa Corp. (Capital Goods) 931,741
1,171,400 Gunma Bank Ltd. (The) (Banks) 3,616,45151,900 Gunze Ltd. (Consumer Durables &
Apparel) 2,000,340186,200 H.U. Group Holdings, Inc. (Health
Care Equipment & Services) 4,591,92874,800 Hachijuni Bank Ltd. (The) (Banks) 249,99666,600 Hanwa Co. Ltd. (Capital Goods) 2,000,56752,600 Heiwa Corp. (Consumer Durables &
Apparel) 937,91486,300 Heiwa Real Estate Co. Ltd. (Real
Estate) 2,724,5792,390 Heiwa Real Estate REIT, Inc.
(REIT) 3,336,81727,700 Idec Corp. (Capital Goods) 587,048
621,200 IDOM, Inc. (Retailing) 4,254,724
The accompanying notes are an integral part of these financial statements. 35

G O L D M A N S A C H S I N T E R N A T I O N A L S M A L L C A P I N S I G H T S F U N D
Schedule of Investments (continued)October 31, 2021
Shares Description Value
Common Stocks – (continued)
Japan – (continued)200,400 Inabata & Co. Ltd. (Capital Goods) $ 2,966,668
1,104,700 J Front Retailing Co. Ltd. (Retailing) 10,239,376183,600 JAC Recruitment Co. Ltd.
(Commercial & ProfessionalServices) 3,602,319
222,200 JAFCO Group Co. Ltd. (DiversifiedFinancials) 14,077,974
208,200 Japan Aviation Electronics IndustryLtd. (Technology Hardware &Equipment) 3,452,123
1,418 Japan Logistics Fund, Inc. (REIT) 4,236,27119,200 Japan Petroleum Exploration Co.
Ltd. (Energy) 349,396483 Japan Prime Realty Investment
Corp. (REIT) 1,771,60010,800 JM Holdings Co. Ltd. (Food &
Staples Retailing) 177,27616,400 Kaga Electronics Co. Ltd.
(Technology Hardware &Equipment) 450,787
48,400 Kamigumi Co. Ltd. (Transportation) 974,532239,500 Kaneka Corp. (Materials) 9,184,567938,800 Kanematsu Corp. (Capital Goods) 10,902,46117,400 Kanematsu Electronics Ltd.
(Software & Services) 568,3091,473 Kenedix Office Investment Corp.
(REIT) 9,326,6572,787 Kenedix Retail REIT Corp. (REIT) 7,111,172
28,700 Kewpie Corp. (Food, Beverage &Tobacco) 629,516
45,300 Koa Corp. (Technology Hardware &Equipment) 612,378
635,200 Kobe Steel Ltd. (Materials) 3,732,049214,300 Kokuyo Co. Ltd. (Commercial &
Professional Services) 3,261,404400,100 Kuraray Co. Ltd. (Materials) 3,620,529163,200 Kyokuto Kaihatsu Kogyo Co. Ltd.
(Capital Goods) 2,230,43390,700 Lintec Corp. (Materials) 2,024,738
556,200 Macnica Fuji Electronics Holdings,Inc. (Technology Hardware &Equipment) 13,076,078
268,600 Makino Milling Machine Co. Ltd.(Capital Goods) 9,663,716
1,355,000 Marui Group Co. Ltd. (Retailing) 26,590,1345,400 Matsuda Sangyo Co. Ltd.
(Commercial & ProfessionalServices) 161,344
87,900 Matsui Securities Co. Ltd.(Diversified Financials) 630,598
306,200 Maxell Ltd. (TechnologyHardware & Equipment) 3,684,585
17,900 Milbon Co. Ltd. (Household &Personal Products) 1,071,745
397,200 Mitsubishi Logistics Corp.(Transportation) 11,091,991
Shares Description Value
Common Stocks – (continued)
Japan – (continued)148,500 Mitsubishi Research Institute, Inc.
(Software & Services) $ 5,546,428126,400 Mitsui Mining & Smelting Co. Ltd.
(Materials) 3,627,073702,800 Mitsui OSK Lines Ltd.
(Transportation) 44,312,58330,500 Mizuno Corp. (Consumer
Durables & Apparel) 709,834375,600 Monex Group, Inc. (Diversified
Financials) 2,445,880170,600 Nachi-Fujikoshi Corp. (Capital
Goods) 6,462,36557,700 Nagase & Co. Ltd. (Capital Goods) 976,6189,700 Nakanishi, Inc. (Health Care
Equipment & Services) 224,9941,500,500 NEC Networks & System
Integration Corp. (Software &Services) 24,143,751
766,700 NGK Spark Plug Co. Ltd.(Automobiles & Components) 12,248,033
102,200 Nichias Corp. (Capital Goods) 2,502,365103,600 Nihon Unisys Ltd. (Software &
Services) 2,910,826436,200 Nikkon Holdings Co. Ltd.
(Transportation) 8,522,179494,600 Nikon Corp. (Consumer Durables &
Apparel) 5,453,341340,400 Nippon Electric Glass Co. Ltd.
(Technology Hardware &Equipment) 8,691,416
32,300 Nippon Kayaku Co. Ltd. (Materials) 340,186415,820 Nippon Light Metal Holdings Co.
Ltd. (Materials) 6,901,476452,300 Nippon Parking Development Co.
Ltd. (Commercial & ProfessionalServices) 571,613
6,347 NIPPON REIT Investment Corp.(REIT) 24,399,199
217,200 Nippon Shokubai Co. Ltd.(Materials) 11,347,558
46,800 Nippon Steel Trading Corp. (CapitalGoods) 2,116,287
300,700 Nisshin Oillio Group Ltd. (The)(Food, Beverage & Tobacco) 7,970,992
32,100 Nojima Corp. (Retailing) 703,986896,300 NOK Corp. (Automobiles &
Components) 10,404,04428,700 NS Solutions Corp. (Software &
Services) 964,703402,600 NS United Kaiun Kaisha Ltd.
(Transportation) 12,678,923576,900 NTN Corp. (Capital Goods)* 1,251,025739,800 Okamura Corp. (Commercial &
Professional Services) 9,763,063331,300 OKUMA Corp. (Capital Goods) 15,785,980
36 The accompanying notes are an integral part of these financial statements.

G O L D M A N S A C H S I N T E R N A T I O N A L S M A L L C A P I N S I G H T S F U N D
Shares Description Value
Common Stocks – (continued)
Japan – (continued)46,600 Open Door, Inc. (Consumer
Services)* $ 1,030,08611,600 Optex Group Co. Ltd. (Technology
Hardware & Equipment) 147,748228,500 Paramount Bed Holdings Co. Ltd.
(Health Care Equipment & Services) 4,263,607144,600 Pasona Group, Inc. (Commercial &
Professional Services) 4,038,065618,200 Relo Group, Inc. (Real Estate) 12,858,473116,000 Resorttrust, Inc. (Consumer
Services) 2,055,654145,600 Rohto Pharmaceutical Co. Ltd.
(Household & Personal Products) 4,448,6181,546,700 Round One Corp. (Consumer
Services) 18,611,02445,000 S Foods, Inc. (Food, Beverage &
Tobacco) 1,303,07217,900 Sankyo Co. Ltd. (Consumer
Durables & Apparel) 434,467202,200 Sato Holdings Corp. (Commercial &
Professional Services) 4,660,649398,100 Sawai Group Holdings Co. Ltd.
(Pharmaceuticals, Biotechnology &Life Sciences) 17,561,895
77,000 SCREEN Holdings Co. Ltd.(Semiconductors & SemiconductorEquipment) 7,157,097
34,900 Seiko Holdings Corp. (ConsumerDurables & Apparel) 736,012
1,537,000 Seino Holdings Co. Ltd.(Transportation) 18,622,137
977,000 Senko Group Holdings Co. Ltd.(Transportation) 8,690,061
173,200 Shibaura Machine Co. Ltd. (CapitalGoods) 4,037,471
1,242,800 Shikoku Electric Power Co., Inc.(Utilities) 8,094,091
96,700 Shimamura Co. Ltd. (Retailing) 8,187,823199,300 Shin-Etsu Polymer Co. Ltd.
(Materials) 1,800,23186,100 Shinko Electric Industries Co. Ltd.
(Semiconductors & SemiconductorEquipment) 3,468,726
9,100 Shochiku Co. Ltd. (Media &Entertainment)* 990,193
1,538,200 Showa Denko KK (Materials) 38,578,1054,139,900 SKY Perfect JSAT Holdings, Inc.
(Media & Entertainment) 15,525,754154,800 Skylark Holdings Co. Ltd.
(Consumer Services)* 2,097,477530,700 Sodick Co. Ltd. (Capital Goods) 4,091,07514,301 Star Asia Investment Corp. (REIT) 7,586,786
291,600 Star Micronics Co. Ltd. (CapitalGoods) 3,827,141
44,500 Starts Corp., Inc. (Real Estate) 1,069,368
Shares Description Value
Common Stocks – (continued)
Japan – (continued)1,793,500 Sumitomo Forestry Co. Ltd.
(Consumer Durables & Apparel) $ 34,257,561587,800 Sumitomo Heavy Industries Ltd.
(Capital Goods) 15,133,210251,800 Sumitomo Warehouse Co. Ltd.
(The) (Transportation) 4,048,117131,100 Takara Holdings, Inc. (Food,
Beverage & Tobacco) 1,793,2196,714 Takara Leben Real Estate
Investment Corp. (REIT) 6,545,5581,959,800 Takashimaya Co. Ltd. (Retailing) 18,146,374
260,700 Toagosei Co. Ltd. (Materials) 2,913,60678,500 Tokai Rika Co. Ltd. (Automobiles &
Components) 1,098,819755,600 Tokyo Seimitsu Co. Ltd.
(Semiconductors & SemiconductorEquipment) 30,765,047
27,900 Tokyo Steel Manufacturing Co. Ltd.(Materials) 310,464
1,310,600 Tokyo Tatemono Co. Ltd. (RealEstate) 19,263,727
458,300 Tokyotokeiba Co. Ltd. (ConsumerServices) 18,158,558
1,282,100 Tokyu Fudosan Holdings Corp.(Real Estate) 7,429,018
561,400 Toyo Seikan Group Holdings Ltd.(Materials) 6,666,086
348,500 Toyo Tanso Co. Ltd. (CapitalGoods) 9,474,138
223,200 Transcosmos, Inc. (Software &Services) 6,729,953
1,095,100 TS Tech Co. Ltd. (Automobiles &Components) 14,652,489
138,400 Tsubakimoto Chain Co. (CapitalGoods) 4,089,354
523,600 Tsugami Corp. (Capital Goods) 7,198,546273,300 TV Asahi Holdings Corp. (Media &
Entertainment) 4,147,366117,600 UACJ Corp. (Materials)* 2,725,643478,300 Ulvac, Inc. (Semiconductors &
Semiconductor Equipment) 26,835,0241,772,400 Ushio, Inc. (Capital Goods) 31,708,939
81,200 Wacoal Holdings Corp. (ConsumerDurables & Apparel) 1,626,133
66,900 West Holdings Corp. (Utilities) 3,739,158155,700 Yamazaki Baking Co. Ltd. (Food,
Beverage & Tobacco) 2,365,208215,800 Yellow Hat Ltd. (Retailing) 3,515,99619,700 Zensho Holdings Co. Ltd.
(Consumer Services) 455,00491,000 Zeon Corp. (Materials) 1,079,624
111,500 ZIGExN Co. Ltd. (Media &Entertainment) 396,848
1,145,366,857
The accompanying notes are an integral part of these financial statements. 37

G O L D M A N S A C H S I N T E R N A T I O N A L S M A L L C A P I N S I G H T S F U N D
Schedule of Investments (continued)October 31, 2021
Shares Description Value
Common Stocks – (continued)
Malta – 0.0%47,393 Kambi Group plc (Consumer
Services)* $ 1,290,754
Netherlands – 3.0%144,035 Aalberts NV (Capital Goods) 7,972,144142,660 Arcadis NV (Capital Goods) 6,953,34647,922 ASR Nederland NV (Insurance) 2,240,07645,514 BE Semiconductor Industries NV
(Semiconductors & SemiconductorEquipment) 4,158,425
23,470 Brunel International NV(Commercial & ProfessionalServices) 322,490
575,222 Flow Traders (DiversifiedFinancials)(a) 19,523,127
656,489 OCI NV (Materials)* 18,610,4854,619,894 PostNL NV (Transportation) 20,050,911
657,835 Signify NV (Capital Goods)(a) 31,876,32149,549 TKH Group NV CVA (Capital
Goods) 2,822,66223,315 Van Lanschot Kempen NV CVA
(Diversified Financials) 646,851
115,176,838
New Zealand – 0.5%257,214 Contact Energy Ltd. (Utilities) 1,509,290
3,519,084 Fletcher Building Ltd. (CapitalGoods) 18,099,769
19,609,059
Norway – 2.2%1,589,525 Aker Solutions ASA (Energy)* 4,510,682
57,838 Atea ASA (Software & Services)* 1,080,761638,468 DNO ASA (Energy)* 930,992143,415 Elkem ASA (Materials)*(a) 570,056
1,982,566 Europris ASA (Retailing)(a) 14,680,8413,197,313 Golden Ocean Group Ltd.
(Transportation) 28,917,164120,223 Kongsberg Gruppen ASA (Capital
Goods) 3,945,368471,703 Nordic Semiconductor ASA
(Semiconductors & SemiconductorEquipment)* 14,014,398
151,455 Selvaag Bolig ASA (Real Estate) 930,470260,774 SpareBank 1 SMN (Banks) 4,343,54529,625 SpareBank 1 SR-Bank ASA
(Banks) 454,35030,572 TOMRA Systems ASA
(Commercial & ProfessionalServices) 1,975,890
334,908 Veidekke ASA (Capital Goods) 4,820,703497,519 Wallenius Wilhelmsen ASA
(Transportation)* 2,267,366
83,442,586
Portugal – 0.3%10,138,582 Sonae SGPS SA (Food & Staples
Retailing) 11,160,395
Shares Description Value
Common Stocks – (continued)
Singapore – 0.3%400,700 AIMS APAC REIT (REIT) $ 427,889
1,571,200 ComfortDelGro Corp. Ltd.(Transportation) 1,821,002
637,700 Keppel DC REIT (REIT) 1,129,164302,000 Mapletree Industrial Trust (REIT) 616,493125,600 Sasseur REIT (REIT) 79,169
5,330,500 Singapore Press Holdings Ltd.(Media & Entertainment) 7,891,860
11,965,577
South Africa – 0.1%152,669 Scatec ASA (Utilities)(a) 3,011,391
Spain – 5.0%2,420,408 Acerinox SA (Materials) 33,697,711
604,182 Applus Services SA(Commercial & ProfessionalServices) 5,468,741
36,429,645 Banco de Sabadell SA (Banks)* 29,318,5155,702,746 Bankinter SA (Banks) 31,399,407
194,202 Befesa SA (Commercial &Professional Services)(a) 14,448,569
1,055,795 Cia de Distribucion IntegralLogista Holdings SA(Transportation) 22,501,847
628,015 Fluidra SA (Capital Goods) 23,985,785887,973 Indra Sistemas SA (Software &
Services)* 10,739,442147,844 Laboratorios Farmaceuticos Rovi
SA (Pharmaceuticals,Biotechnology & Life Sciences) 10,357,005
233,720 Linea Directa Aseguradora SA Ciade Seguros y Reaseguros(Insurance) 469,224
711,179 Mediaset Espana ComunicacionSA (Media & Entertainment)* 3,699,553
567,350 Merlin Properties Socimi SA(REIT) 6,144,219
9,461 Viscofan SA (Food, Beverage &Tobacco) 646,919
192,876,937
Sweden – 7.2%2,462,464 Arjo AB Class B (Health Care
Equipment & Services) 33,581,2551,576,126 Betsson AB Class B (Consumer
Services)* 11,001,394191,400 Bilia AB Class A (Retailing) 3,403,375679,982 Biotage AB (Pharmaceuticals,
Biotechnology & Life Sciences) 21,979,856514,870 Bonava AB Class B (Consumer
Durables & Apparel) 5,086,512132,145 Bravida Holding AB
(Commercial & ProfessionalServices)(a) 1,987,639
19,204 Castellum AB (Real Estate) 511,856
38 The accompanying notes are an integral part of these financial statements.

G O L D M A N S A C H S I N T E R N A T I O N A L S M A L L C A P I N S I G H T S F U N D
Shares Description Value
Common Stocks – (continued)
Sweden – (continued)238,074 Dios Fastigheter AB (Real Estate) $ 2,770,784
1,037,147 Getinge AB Class B (Health CareEquipment & Services) 46,414,244
2,221,999 Hexpol AB (Materials) 26,003,312160,800 Indutrade AB (Capital Goods) 4,687,555819,555 Inwido AB (Capital Goods) 15,025,548482,376 Lindab International AB (Capital
Goods) 15,803,981408,783 Mekonomen AB (Retailing)* 8,425,08137,193 MIPS AB (Consumer Durables &
Apparel) 4,491,050286,461 New Wave Group AB Class B
(Consumer Durables & Apparel)* 4,856,628102,171 Nobia AB (Consumer Durables &
Apparel) 629,7231,256,512 Nobina AB (Transportation)(a) 12,035,500
507,671 Ratos AB Class B (DiversifiedFinancials) 2,922,770
96,006 Resurs Holding AB (DiversifiedFinancials)(a) 517,369
47,418 Saab AB Class B (Capital Goods) 1,321,92982,088 Sagax AB Class B (Real Estate) 3,212,877
5,565,942 SSAB AB Class B (Materials)* 27,819,466422,510 Trelleborg AB Class B (Capital
Goods) 9,670,255566,673 Wihlborgs Fastigheter AB (Real
Estate) 13,434,825
277,594,784
Switzerland – 5.6%36,460 ALSO Holding AG (Registered)
(Technology Hardware &Equipment)* 10,820,043
5,469,449 Aryzta AG (Food, Beverage &Tobacco)* 7,151,944
99,157 Ascom Holding AG (Registered)(Health Care Equipment &Services)* 1,543,434
39,376 Bachem Holding AG (Registered)Class B (Pharmaceuticals,Biotechnology & Life Sciences) 31,696,066
19,829 Bossard Holding AG (Registered)Class A (Capital Goods) 7,282,821
29,433 Bucher Industries AG (Registered)(Capital Goods) 14,854,601
45,561 Comet Holding AG (Registered)(Technology Hardware &Equipment) 16,952,855
24,776 DKSH Holding AG (Commercial &Professional Services) 1,985,913
4,293 Georg Fischer AG (Registered)(Capital Goods) 6,495,537
110,945 Huber + Suhner AG (Registered)(Capital Goods) 9,863,393
258,759 PSP Swiss Property AG (Registered)(Real Estate) 32,346,454
Shares Description Value
Common Stocks – (continued)
Switzerland – (continued)12,549 Siegfried Holding AG (Registered)
(Pharmaceuticals, Biotechnology &Life Sciences)* $ 12,070,161
10,963 Stadler Rail AG (Capital Goods)(b) 481,33732,816 Swissquote Group Holding SA
(Registered) (Diversified Financials) 6,656,70363,631 Tecan Group AG (Registered)
(Pharmaceuticals, Biotechnology &Life Sciences) 38,986,881
20,684 u-blox Holding AG(Semiconductors & SemiconductorEquipment)* 1,513,574
113,478 Zehnder Group AG (Capital Goods) 12,214,671
212,916,388
Ukraine – 0.5%4,384,080 Ferrexpo plc (Materials) 18,702,013
United Kingdom – 12.5%558,967 Bellway plc (Consumer Durables &
Apparel) 25,362,495253,830 Brewin Dolphin Holdings plc
(Diversified Financials) 1,307,8822,979,130 Cairn Energy plc (Energy) 7,437,738
881,332 Capital & Counties Properties plc(REIT) 1,987,779
680,816 Central Asia Metals plc (Materials) 2,287,399201,492 Chemring Group plc (Capital
Goods) 803,429345,423 CMC Markets plc (Diversified
Financials)(a) 1,186,796451,080 Computacenter plc (Software &
Services) 16,583,865991,774 Crest Nicholson Holdings plc
(Consumer Durables & Apparel) 4,831,9612,273,331 Currys plc (Retailing) 3,779,990
69,018 Derwent London plc (REIT) 3,192,482244,533 Diploma plc (Capital Goods) 10,049,60622,017 Euromoney Institutional Investor plc
(Media & Entertainment) 314,91525,674 Fevertree Drinks plc (Food,
Beverage & Tobacco) 797,239373,516 Grainger plc (Real Estate) 1,570,948124,701 Greggs plc (Consumer Services) 5,212,120
2,198,640 Halfords Group plc (Retailing) 8,015,8402,797,437 IG Group Holdings plc (Diversified
Financials) 30,378,61141,804 IMI plc (Capital Goods) 933,561
2,813,647 Inchcape plc (Retailing) 31,806,0931,040,947 Indivior plc (Pharmaceuticals,
Biotechnology & Life Sciences)* 3,464,598276,679 Intermediate Capital Group plc
(Diversified Financials) 8,298,978602,289 IP Group plc (Diversified
Financials) 994,061
The accompanying notes are an integral part of these financial statements. 39

G O L D M A N S A C H S I N T E R N A T I O N A L S M A L L C A P I N S I G H T S F U N D
Schedule of Investments (continued)October 31, 2021
Shares Description Value
Common Stocks – (continued)
United Kingdom – (continued)18,900,441 ITV plc (Media & Entertainment)* $ 27,817,655
1,205 Judges Scientific plc (CapitalGoods) 121,834
2,905,764 Just Group plc (Insurance)* 3,635,708437,861 Kainos Group plc (Software &
Services) 11,864,8472,355,023 LondonMetric Property plc (REIT) 8,422,844
11,993,028 Man Group plc (DiversifiedFinancials) 38,193,187
1,299,942 Moneysupermarket.com Group plc(Retailing) 3,774,048
56,796 Morgan Advanced Materials plc(Capital Goods) 268,939
234,821 Morgan Sindall Group plc (CapitalGoods) 7,275,088
111,439 NCC Group plc (Software &Services) 378,987
22,717 Oxford Biomedica plc(Pharmaceuticals, Biotechnology &Life Sciences)* 473,180
269,227 Pagegroup plc (Commercial &Professional Services) 2,446,512
1,715,704 Paragon Banking Group plc(Banks) 12,878,927
762,431 Pennon Group plc (Utilities) 12,161,19297,159 Picton Property Income Ltd. (The)
(REIT) 129,1113,418,505 Reach plc (Media & Entertainment) 14,825,601
762,895 Redde Northgate plc(Transportation) 4,155,359
327,904 Redrow plc (Consumer Durables &Apparel) 2,887,107
138,039 Renishaw plc (TechnologyHardware & Equipment) 9,498,304
293,300 Rotork plc (Capital Goods) 1,417,84231,326 S4 Capital plc (Media &
Entertainment)* 311,104927,300 Safestore Holdings plc (REIT) 15,254,058260,624 Savills plc (Real Estate) 5,057,680122,665 Serica Energy plc (Energy) 345,819664,442 Spectris plc (Technology
Hardware & Equipment) 34,186,952925,908 Spirent Communications plc
(Technology Hardware &Equipment) 3,649,396
782,890 Stagecoach Group plc(Transportation)* 853,389
537,708 SThree plc (Commercial &Professional Services) 4,334,335
2,816,011 Tate & Lyle plc (Food, Beverage &Tobacco) 24,980,668
311,493 Travis Perkins plc (Capital Goods) 6,585,22512,560,697 Tritax Big Box REIT plc (REIT) 38,654,732
164,222 UNITE Group plc (The) (REIT) 2,451,964471,604 Vesuvius plc (Capital Goods) 3,040,789
Shares Description Value
Common Stocks – (continued)
United Kingdom – (continued)374,730 Vistry Group plc (Consumer
Durables & Apparel) $ 6,275,116
479,205,885
United States – 1.0%124,072 Carnival plc ADR (Consumer
Services)* 2,543,4766,702,279 Reliance Worldwide Corp. Ltd.
(Capital Goods) 29,470,680105,157 RHI Magnesita NV (Materials) 4,832,585
36,846,741
TOTAL INVESTMENTS BEFORE SECURITIES LENDINGREINVESTMENT VEHICLE(Cost $3,318,866,573) $3,716,814,844
SharesDividend
Rate Value
Securities Lending Reinvestment Vehicle(d) – 0.1%
Goldman Sachs Financial Square Government Fund –Institutional Shares
4,960,133 0.026% $ 4,960,133(Cost $4,960,133)
TOTAL INVESTMENTS – 97.0%(Cost $3,323,826,706) $3,721,774,977
OTHER ASSETS IN EXCESS OFLIABIL IT IES – 3.0% 116,173,074
NET ASSETS – 100.0% $3,837,948,051
The percentage shown for each investment categoryreflects the value of investments in that category as apercentage of net assets.* Security is currently in default and/or non-income producing.
(a) Exempt from registration under Rule 144A of the Securities Act of1933.
(b) All or a portion of security is on loan.
(c) Preference Shares are a special type of equity investment that shares inthe earnings of the company, has limited voting rights, and receives agreater dividend than applicable Common Shares.
(d) Represents an Affiliated Issuer.
Investment Abbreviations:ADR—American Depositary ReceiptCVA—Dutch CertificationREIT—Real Estate Investment Trust
40 The accompanying notes are an integral part of these financial statements.

G O L D M A N S A C H S I N T E R N A T I O N A L S M A L L C A P I N S I G H T S F U N D
A D D I T I O N A L I N V E S T M E N T I N F O R M A T I O N
FUTURES CONTRACTS — At October 31, 2021, the Fund had the following futures contracts:
DescriptionNumber ofContracts
ExpirationDate
NotionalAmount
UnrealizedAppreciation/(Depreciation)
Long position contracts:EURO STOXX 50 Index 737 12/17/2021 $36,098,054 $1,619,112FTSE 100 Index 162 12/17/2021 16,015,977 359,735Hang Seng Index 26 11/29/2021 4,227,903 (131,919)MSCI Singapore Index 62 11/29/2021 1,691,954 (8,239)SPI 200 Index 64 12/16/2021 8,762,208 (34,641)TOPIX Index 146 12/09/2021 25,523,580 (507,287)
Total Futures Contracts $1,296,761
The accompanying notes are an integral part of these financial statements. 41
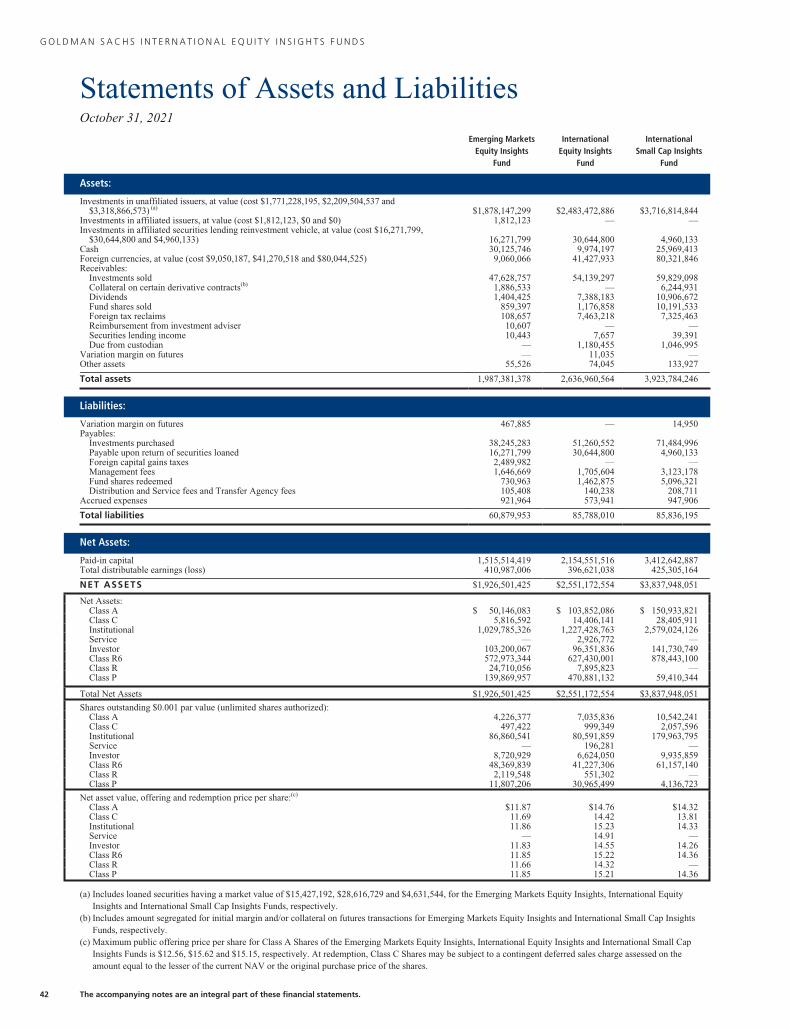
G O L D M A N S A C H S I N T E R N A T I O N A L E Q U I T Y I N S I G H T S F U N D S
Statements of Assets and LiabilitiesOctober 31, 2021
Emerging MarketsEquity Insights
Fund
InternationalEquity Insights
Fund
InternationalSmall Cap Insights
Fund
Assets:
Investments in unaffiliated issuers, at value (cost $1,771,228,195, $2,209,504,537 and$3,318,866,573) (a) $1,878,147,299 $2,483,472,886 $3,716,814,844
Investments in affiliated issuers, at value (cost $1,812,123, $0 and $0) 1,812,123 — —Investments in affiliated securities lending reinvestment vehicle, at value (cost $16,271,799,
$30,644,800 and $4,960,133) 16,271,799 30,644,800 4,960,133Cash 30,125,746 9,974,197 25,969,413Foreign currencies, at value (cost $9,050,187, $41,270,518 and $80,044,525) 9,060,066 41,427,933 80,321,846Receivables:
Investments sold 47,628,757 54,139,297 59,829,098Collateral on certain derivative contracts(b) 1,886,533 — 6,244,931Dividends 1,404,425 7,388,183 10,906,672Fund shares sold 859,397 1,176,858 10,191,533Foreign tax reclaims 108,657 7,463,218 7,325,463Reimbursement from investment adviser 10,607 — —Securities lending income 10,443 7,657 39,391Due from custodian — 1,180,455 1,046,995
Variation margin on futures — 11,035 —Other assets 55,526 74,045 133,927
Total assets 1,987,381,378 2,636,960,564 3,923,784,246
Liabilities:
Variation margin on futures 467,885 — 14,950Payables:
Investments purchased 38,245,283 51,260,552 71,484,996Payable upon return of securities loaned 16,271,799 30,644,800 4,960,133Foreign capital gains taxes 2,489,982 — —Management fees 1,646,669 1,705,604 3,123,178Fund shares redeemed 730,963 1,462,875 5,096,321Distribution and Service fees and Transfer Agency fees 105,408 140,238 208,711
Accrued expenses 921,964 573,941 947,906
Total liabilities 60,879,953 85,788,010 85,836,195
Net Assets:
Paid-in capital 1,515,514,419 2,154,551,516 3,412,642,887Total distributable earnings (loss) 410,987,006 396,621,038 425,305,164
NET ASSETS $1,926,501,425 $2,551,172,554 $3,837,948,051
Net Assets:Class A $ 50,146,083 $ 103,852,086 $ 150,933,821Class C 5,816,592 14,406,141 28,405,911Institutional 1,029,785,326 1,227,428,763 2,579,024,126Service — 2,926,772 —Investor 103,200,067 96,351,836 141,730,749Class R6 572,973,344 627,430,001 878,443,100Class R 24,710,056 7,895,823 —Class P 139,869,957 470,881,132 59,410,344
Total Net Assets $1,926,501,425 $2,551,172,554 $3,837,948,051
Shares outstanding $0.001 par value (unlimited shares authorized):Class A 4,226,377 7,035,836 10,542,241Class C 497,422 999,349 2,057,596Institutional 86,860,541 80,591,859 179,963,795Service — 196,281 —Investor 8,720,929 6,624,050 9,935,859Class R6 48,369,839 41,227,306 61,157,140Class R 2,119,548 551,302 —Class P 11,807,206 30,965,499 4,136,723
Net asset value, offering and redemption price per share:(c)
Class A $11.87 $14.76 $14.32Class C 11.69 14.42 13.81Institutional 11.86 15.23 14.33Service — 14.91 —Investor 11.83 14.55 14.26Class R6 11.85 15.22 14.36Class R 11.66 14.32 —Class P 11.85 15.21 14.36
(a) Includes loaned securities having a market value of $15,427,192, $28,616,729 and $4,631,544, for the Emerging Markets Equity Insights, International EquityInsights and International Small Cap Insights Funds, respectively.
(b) Includes amount segregated for initial margin and/or collateral on futures transactions for Emerging Markets Equity Insights and International Small Cap InsightsFunds, respectively.
(c) Maximum public offering price per share for Class A Shares of the Emerging Markets Equity Insights, International Equity Insights and International Small CapInsights Funds is $12.56, $15.62 and $15.15, respectively. At redemption, Class C Shares may be subject to a contingent deferred sales charge assessed on theamount equal to the lesser of the current NAV or the original purchase price of the shares.
42 The accompanying notes are an integral part of these financial statements.

G O L D M A N S A C H S I N T E R N A T I O N A L E Q U I T Y I N S I G H T S F U N D S
Statements of OperationsFor the Fiscal Year Ended October 31, 2021
EmergingMarkets EquityInsights Fund
InternationalEquity Insights
Fund
InternationalSmall Cap
Insights Fund
Investment income:
Dividends — unaffiliated issuers (net of foreign taxes withheld of $7,969,476, $4,423,042and $8,535,500) $ 59,511,454 $ 73,117,710 $100,305,026
Securities lending income — affiliated issuer 220,106 328,214 613,748
Dividends — affiliated issuers 1,810 63 784
Other income — 1,655,999 115,424
Total investment income 59,733,370 75,101,986 101,034,982
Expenses:
Management fees 20,053,334 18,816,968 25,676,495
Custody, accounting and administrative services 1,418,707 676,326 1,030,272
Transfer Agency fees(a) 973,798 1,220,390 1,562,093
Distribution and Service (12b-1) fees(a) 333,369 483,053 586,971
Printing and mailing costs 230,105 173,529 533,483
Professional fees 199,359 152,978 181,418
Registration fees 102,041 132,706 129,212
Trustee fees 22,216 22,761 23,591
Service fees — Class C 16,303 37,033 77,870
Shareholder administration fees — Service Shares — 10,037 —
Other 137,327 54,819 63,206
Total expenses 23,486,559 21,780,600 29,864,611
Less — expense reductions (1,030,253) (1,126,993) (1,557,945)
Net expenses 22,456,306 20,653,607 28,306,666
NET INVESTMENT INCOME 37,277,064 54,448,379 72,728,316
Realized and unrealized gain (loss):
Net realized gain (loss) from:
Investments — unaffiliated issuers 519,143,786 443,891,567 536,080,077
Futures contracts 2,427,183 5,666,529 7,928,635
Forward foreign currency exchange contracts 67,105 — —
Foreign currency transactions (2,239,033) 476,142 (316,264)
Net change in unrealized gain (loss) on:
Investments — unaffiliated issuers (including the effects of the net change in the foreigncapital gains tax liability of $128,266, $0 and $0) (254,053,938) 158,286,370 199,008,747
Futures contracts 335,486 12,675 3,165,557
Foreign currency translation (1,278,913) (122,210) (88,277)
Net realized and unrealized gain 264,401,676 608,211,073 745,778,475
NET INCREASE IN NET ASSETS RESULTING FROM OPERATIONS $ 301,678,740 $662,659,452 $818,506,791
(a) Class specific Distribution and/or Service, and Transfer Agency fees were as follows:
Distribution and/or (12b-1) Service Fees Transfer Agency Fees
Fund Class A Class C Service Class R Class A Class C Institutional Service Investor Class R6 Class R Class P
Emerging Markets Equity Insights $ 138,892 $ 48,908 $ — $ 145,569 $ 88,891 $ 10,434 $ 445,044 $ — $ 173,636 $ 167,420 $ 46,583 $ 41,790International Equity Insights 316,361 111,100 10,035 45,557 202,473 23,701 453,949 1,606 199,749 189,202 14,578 135,132International Small Cap Insights 353,358 233,613 — — 226,151 49,838 842,278 — 232,868 194,416 — 16,542
The accompanying notes are an integral part of these financial statements. 43

G O L D M A N S A C H S I N T E R N A T I O N A L E Q U I T Y I N S I G H T S F U N D S
Statements of Changes in Net Assets
Emerging Markets Equity Insights Fund International Equity Insights Fund
For the FiscalYear Ended
October 31, 2021
For the FiscalYear Ended
October 31, 2020
For the FiscalYear Ended
October 31, 2021
For the FiscalYear Ended
October 31, 2020
From operations:
Net investment income $ 37,277,064 $ 24,562,473 $ 54,448,379 $ 39,638,051
Net realized gain (loss) 519,399,041 (59,219,048) 450,034,238 (138,209,793)
Net change in unrealized gain (loss) (254,997,365) 201,153,791 158,176,835 (66,737,522)
Net increase (decrease) in net assets resulting fromoperations 301,678,740 166,497,216 662,659,452 (165,309,264)
Distributions to shareholders:
From distributable earnings:
Class A Shares (416,421) (1,170,011) (3,661,413) (6,053,941)
Class C Shares — (56,474) (112,935) (273,424)
Institutional Shares (12,590,250) (19,988,850) (17,452,273) (30,508,959)
Service Shares — — (57,944) (105,545)
Investor Shares (1,039,734) (2,202,457) (1,748,151) (14,717,983)
Class R6 Shares (6,059,820) (9,800,344) (11,124,915) (15,101,395)
Class R Shares (214,543) (438,620) (133,553) (176,443)
Class P Shares (1,464,922) (2,563,794) (7,760,380) (9,256,226)
Total distributions to shareholders (21,785,690) (36,220,550) (42,051,564) (76,193,916)
From share transactions:
Proceeds from sales of shares 456,165,404 518,724,358 613,851,340 948,110,037
Reinvestment of distributions 20,103,969 33,859,109 32,493,972 61,919,453
Cost of shares redeemed (545,794,919) (749,322,930) (947,885,594) (1,585,726,253)
Net decrease in net assets resulting from sharetransactions (69,525,546) (196,739,463) (301,540,282) (575,696,763)
TOTAL INCREASE (DECREASE) 210,367,504 (66,462,797) 319,067,606 (817,199,943)
Net Assets:
Beginning of year 1,716,133,921 1,782,596,718 2,232,104,948 3,049,304,891
End of year $1,926,501,425 $1,716,133,921 $2,551,172,554 $ 2,232,104,948
44 The accompanying notes are an integral part of these financial statements.

G O L D M A N S A C H S I N T E R N A T I O N A L E Q U I T Y I N S I G H T S F U N D S
Statements of Changes in Net Assets (continued)
International Small Cap Insights Fund
For the FiscalYear Ended
October 31, 2021
For the FiscalYear Ended
October 31, 2020
From operations:
Net investment income $ 72,728,316 $ 36,410,662
Net realized gain (loss) 543,692,448 (209,823,673)
Net change in unrealized gain (loss) 202,086,027 (35,926,530)
Net increase (decrease) in net assets resulting from operations 818,506,791 (209,339,541)
Distributions to shareholders:
From distributable earnings:
Class A Shares (2,062,155) (5,023,326)
Class C Shares (217,691) (1,160,269)
Institutional Shares (34,889,859) (75,418,332)
Investor Shares (2,520,745) (8,589,904)
Class R6 Shares (10,388,113) (41,125,645)
Class P Shares (897,729) (2,779,660)
Total distributions to shareholders (50,976,292) (134,097,136)
From share transactions:
Proceeds from sales of shares 1,280,534,656 839,452,474
Reinvestment of distributions 48,546,591 123,448,591
Cost of shares redeemed (1,155,660,041) (1,619,152,181)
Net increase (decrease) in net assets resulting from share transactions 173,421,206 (656,251,116)
TOTAL INCREASE (DECREASE) 940,951,705 (999,687,793)
Net Assets:
Beginning of year 2,896,996,346 3,896,684,139
End of year $ 3,837,948,051 $ 2,896,996,346
The accompanying notes are an integral part of these financial statements. 45

G O L D M A N S A C H S E M E R G I N G M A R K E T S E Q U I T Y I N S I G H T S F U N D
Financial HighlightsSelected Data for a Share Outstanding Throughout Each Year
Goldman Sachs Emerging Markets Equity Insights Fund
Class A Shares
Year Ended October 31,
2021 2020 2019 2018 2017
Per Share Data
Net asset value, beginning of year $ 10.25 $ 9.34 $ 8.98 $ 11.00 $ 8.54
Net investment income(a) 0.18 0.10 0.15 0.18 0.13
Net realized and unrealized gain (loss) 1.53 0.96 0.36 (1.66) 2.41
Total from investment operations 1.71 1.06 0.51 (1.48) 2.54
Distributions to shareholders from net investment income (0.09) (0.15) (0.15) (0.12) (0.08)
Distributions to shareholders from net realized gains — — — (0.42) —
Total distributions (0.09) (0.15) (0.15) (0.54) (0.08)
Net asset value, end of year $ 11.87 $ 10.25 $ 9.34 $ 8.98 $ 11.00
Total return(b) 16.60% 11.56% 5.74% (14.11)% 30.15%
Net assets, end of year (in 000s) $50,146 $52,068 $72,886 $82,726 $95,930
Ratio of net expenses to average net assets 1.46% 1.47% 1.48% 1.48% 1.52%
Ratio of total expenses to average net assets 1.51% 1.53% 1.56% 1.54% 1.55%
Ratio of net investment income to average net assets 1.45% 1.13% 1.61% 1.72% 1.36%
Portfolio turnover rate(c) 189% 178% 165% 147% 172%
(a) Calculated based on the average shares outstanding methodology.(b) Assumes investment at the net asset value at the beginning of the year, reinvestment of all distributions, a complete redemption of the investment at the net asset
value at the end of the year and no sales or redemption charges (if any). Total returns would be reduced if a sales or redemption charge was taken into account.Returns do not reflect the impact of taxes to shareholders relating to Fund distributions or the redemption of Fund shares.
(c) The Fund’s portfolio turnover rate is calculated in accordance with regulatory requirements, without regard to transactions involving short term investments andcertain derivatives. If such transactions were included, the Fund’s portfolio turnover rate may be higher.
46 The accompanying notes are an integral part of these financial statements.

G O L D M A N S A C H S E M E R G I N G M A R K E T S E Q U I T Y I N S I G H T S F U N D
Financial Highlights (continued)Selected Data for a Share Outstanding Throughout Each Year
Goldman Sachs Emerging Markets Equity Insights Fund
Class C Shares
Year Ended October 31,
2021 2020 2019 2018 2017
Per Share Data
Net asset value, beginning of year $10.10 $ 9.19 $ 8.83 $ 10.88 $ 8.45
Net investment income(a) 0.09 0.04 0.08 0.10 0.07
Net realized and unrealized gain (loss) 1.50 0.94 0.36 (1.64) 2.39
Total from investment operations 1.59 0.98 0.44 (1.54) 2.46
Distributions to shareholders from net investment income — (0.07) (0.08) (0.09) (0.03)
Distributions to shareholders from net realized gains — — — (0.42) —
Total distributions — (0.07) (0.08) (0.51) (0.03)
Net asset value, end of year $11.69 $10.10 $ 9.19 $ 8.83 $10.88
Total return(b) 15.74% 10.65% 5.09% (14.80)% 29.20%
Net assets, end of year (in 000s) $5,817 $5,905 $8,303 $ 8,975 $7,563
Ratio of net expenses to average net assets 2.21% 2.21% 2.23% 2.23% 2.26%
Ratio of total expenses to average net assets 2.26% 2.28% 2.31% 2.29% 2.29%
Ratio of net investment income to average net assets 0.74% 0.41% 0.85% 0.98% 0.72%
Portfolio turnover rate(c) 189% 178% 165% 147% 172%
(a) Calculated based on the average shares outstanding methodology.(b) Assumes investment at the net asset value at the beginning of the year, reinvestment of all distributions, a complete redemption of the investment at the net asset
value at the end of the year and no sales or redemption charges (if any). Total returns would be reduced if a sales or redemption charge was taken into account.Returns do not reflect the impact of taxes to shareholders relating to Fund distributions or the redemption of Fund shares.
(c) The Fund’s portfolio turnover rate is calculated in accordance with regulatory requirements, without regard to transactions involving short term investments andcertain derivatives. If such transactions were included, the Fund’s portfolio turnover rate may be higher.
The accompanying notes are an integral part of these financial statements. 47

G O L D M A N S A C H S E M E R G I N G M A R K E T S E Q U I T Y I N S I G H T S F U N D
Financial Highlights (continued)Selected Data for a Share Outstanding Throughout Each Year
Goldman Sachs Emerging Markets Equity Insights Fund
Institutional Shares
Year Ended October 31,
2021 2020 2019 2018 2017
Per Share Data
Net asset value, beginning of year $ 10.24 $ 9.33 $ 8.99 $ 11.01 $ 8.54
Net investment income(a) 0.23 0.14 0.19 0.19 0.17
Net realized and unrealized gain (loss) 1.52 0.96 0.35 (1.64) 2.41
Total from investment operations 1.75 1.10 0.54 (1.45) 2.58
Distributions to shareholders from net investment income (0.13) (0.19) (0.20) (0.15) (0.11)
Distributions to shareholders from net realized gains — — — (0.42) —
Total distributions (0.13) (0.19) (0.20) (0.57) (0.11)
Net asset value, end of year $ 11.86 $ 10.24 $ 9.33 $ 8.99 $ 11.01
Total return(b) 17.07% 11.90% 6.18% (13.83)% 30.67%
Net assets, end of year (in 000s) $1,029,785 $961,138 $938,157 $981,091 $1,488,246
Ratio of net expenses to average net assets 1.09% 1.09% 1.10% 1.10% 1.15%
Ratio of total expenses to average net assets 1.14% 1.16% 1.18% 1.14% 1.15%
Ratio of net investment income to average net assets 1.88% 1.53% 2.01% 1.84% 1.74%
Portfolio turnover rate(c) 189% 178% 165% 147% 172%
(a) Calculated based on the average shares outstanding methodology.(b) Assumes investment at the net asset value at the beginning of the year, reinvestment of all distributions, a complete redemption of the investment at the net asset
value at the end of the year and no sales or redemption charges (if any). Total returns would be reduced if a sales or redemption charge was taken into account.Returns do not reflect the impact of taxes to shareholders relating to Fund distributions or the redemption of Fund shares.
(c) The Fund’s portfolio turnover rate is calculated in accordance with regulatory requirements, without regard to transactions involving short term investments andcertain derivatives. If such transactions were included, the Fund’s portfolio turnover rate may be higher.
48 The accompanying notes are an integral part of these financial statements.

G O L D M A N S A C H S E M E R G I N G M A R K E T S E Q U I T Y I N S I G H T S F U N D
Financial Highlights (continued)Selected Data for a Share Outstanding Throughout Each Year
Goldman Sachs Emerging Markets Equity Insights Fund
Investor Shares(a)
Year Ended October 31,
2021 2020 2019 2018 2017
Per Share Data
Net asset value, beginning of year $ 10.22 $ 9.32 $ 8.97 $ 10.99 $ 8.53
Net investment income(b) 0.22 0.13 0.18 0.21 0.18
Net realized and unrealized gain (loss) 1.51 0.95 0.36 (1.66) 2.38
Total from investment operations 1.73 1.08 0.54 (1.45) 2.56
Distributions to shareholders from net investment income (0.12) (0.18) (0.19) (0.15) (0.10)
Distributions to shareholders from net realized gains — — — (0.42) —
Total distributions (0.12) (0.18) (0.19) (0.57) (0.10)
Net asset value, end of year $ 11.83 $ 10.22 $ 9.32 $ 8.97 $ 10.99
Total return(c) 16.96% 11.76% 6.06% (13.90)% 30.47%
Net assets, end of year (in 000s) $103,200 $89,556 $118,727 $96,779 $67,068
Ratio of net expenses to average net assets 1.21% 1.22% 1.23% 1.23% 1.26%
Ratio of total expenses to average net assets 1.26% 1.28% 1.31% 1.29% 1.29%
Ratio of net investment income to average net assets 1.78% 1.39% 1.92% 1.99% 1.81%
Portfolio turnover rate(d) 189% 178% 165% 147% 172%
(a) Effective August 15, 2017, Class IR changed its name to Investor Shares.(b) Calculated based on the average shares outstanding methodology.(c) Assumes investment at the net asset value at the beginning of the year, reinvestment of all distributions, a complete redemption of the investment at the net asset
value at the end of the year and no sales or redemption charges (if any). Total returns would be reduced if a sales or redemption charge was taken into account.Returns do not reflect the impact of taxes to shareholders relating to Fund distributions or the redemption of Fund shares.
(d) The Fund’s portfolio turnover rate is calculated in accordance with regulatory requirements, without regard to transactions involving short term investments andcertain derivatives. If such transactions were included, the Fund’s portfolio turnover rate may be higher.
The accompanying notes are an integral part of these financial statements. 49

G O L D M A N S A C H S E M E R G I N G M A R K E T S E Q U I T Y I N S I G H T S F U N D
Financial Highlights (continued)Selected Data for a Share Outstanding Throughout Each Year
Goldman Sachs Emerging Markets Equity Insights Fund
Class R6 Shares
Year Ended October 31,
2021 2020 2019 2018 2017
Per Share Data
Net asset value, beginning of year $ 10.23 $ 9.33 $ 8.98 $ 11.00 $ 8.53
Net investment income(a) 0.23 0.14 0.17 0.29 0.19
Net realized and unrealized gain (loss) 1.52 0.95 0.38 (1.73) 2.39
Total from investment operations 1.75 1.09 0.55 (1.44) 2.58
Distributions to shareholders from net investment income (0.13) (0.19) (0.20) (0.16) (0.11)
Distributions to shareholders from net realized gains — — — (0.42) —
Total distributions (0.13) (0.19) (0.20) (0.58) (0.11)
Net asset value, end of year $ 11.85 $ 10.23 $ 9.33 $ 8.98 $ 11.00
Total return(b) 17.10% 11.81% 6.32% (13.84)% 30.74%
Net assets, end of year (in 000s) $572,973 $465,604 $491,306 $621,590 $13,164
Ratio of net expenses to average net assets 1.08% 1.08% 1.09% 1.08% 1.13%
Ratio of total expenses to average net assets 1.13% 1.15% 1.17% 1.15% 1.13%
Ratio of net investment income to average net assets 1.90% 1.53% 1.89% 2.78% 1.87%
Portfolio turnover rate(c) 189% 178% 165% 147% 172%
(a) Calculated based on the average shares outstanding methodology.(b) Assumes investment at the net asset value at the beginning of the year, reinvestment of all distributions, a complete redemption of the investment at the net asset
value at the end of the year and no sales or redemption charges (if any). Total returns would be reduced if a sales or redemption charge was taken into account.Returns do not reflect the impact of taxes to shareholders relating to Fund distributions or the redemption of Fund shares.
(c) The Fund’s portfolio turnover rate is calculated in accordance with regulatory requirements, without regard to transactions involving short term investments andcertain derivatives. If such transactions were included, the Fund’s portfolio turnover rate may be higher.
50 The accompanying notes are an integral part of these financial statements.
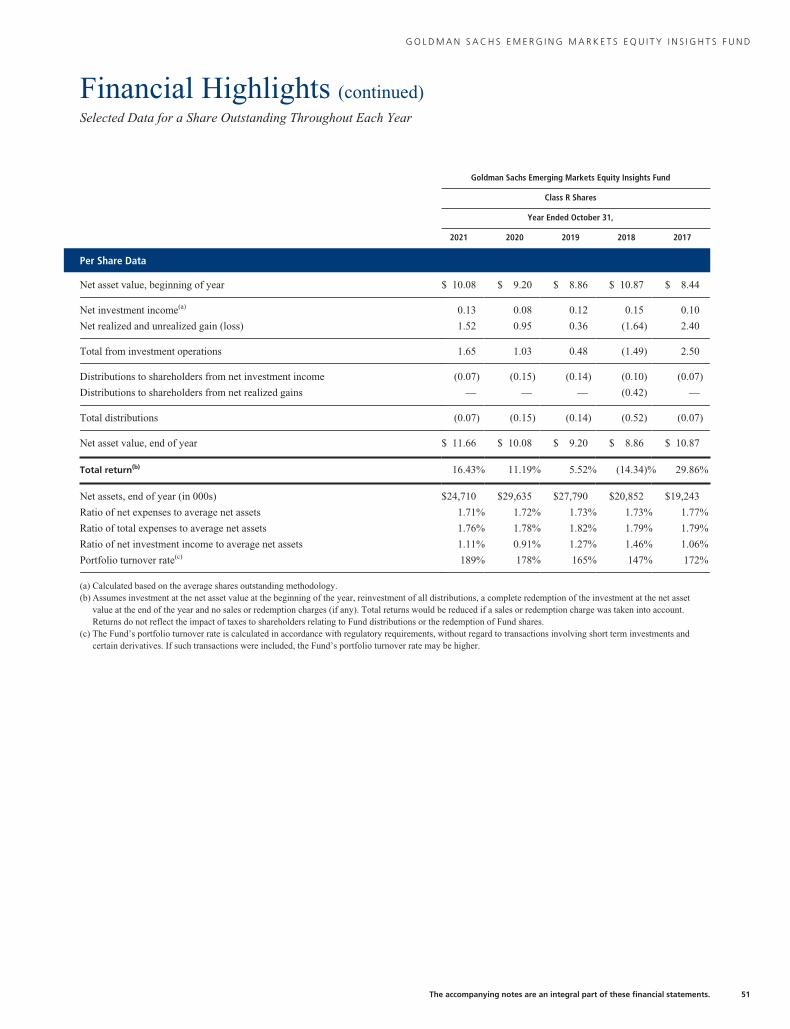
G O L D M A N S A C H S E M E R G I N G M A R K E T S E Q U I T Y I N S I G H T S F U N D
Financial Highlights (continued)Selected Data for a Share Outstanding Throughout Each Year
Goldman Sachs Emerging Markets Equity Insights Fund
Class R Shares
Year Ended October 31,
2021 2020 2019 2018 2017
Per Share Data
Net asset value, beginning of year $ 10.08 $ 9.20 $ 8.86 $ 10.87 $ 8.44
Net investment income(a) 0.13 0.08 0.12 0.15 0.10
Net realized and unrealized gain (loss) 1.52 0.95 0.36 (1.64) 2.40
Total from investment operations 1.65 1.03 0.48 (1.49) 2.50
Distributions to shareholders from net investment income (0.07) (0.15) (0.14) (0.10) (0.07)
Distributions to shareholders from net realized gains — — — (0.42) —
Total distributions (0.07) (0.15) (0.14) (0.52) (0.07)
Net asset value, end of year $ 11.66 $ 10.08 $ 9.20 $ 8.86 $ 10.87
Total return(b) 16.43% 11.19% 5.52% (14.34)% 29.86%
Net assets, end of year (in 000s) $24,710 $29,635 $27,790 $20,852 $19,243
Ratio of net expenses to average net assets 1.71% 1.72% 1.73% 1.73% 1.77%
Ratio of total expenses to average net assets 1.76% 1.78% 1.82% 1.79% 1.79%
Ratio of net investment income to average net assets 1.11% 0.91% 1.27% 1.46% 1.06%
Portfolio turnover rate(c) 189% 178% 165% 147% 172%
(a) Calculated based on the average shares outstanding methodology.(b) Assumes investment at the net asset value at the beginning of the year, reinvestment of all distributions, a complete redemption of the investment at the net asset
value at the end of the year and no sales or redemption charges (if any). Total returns would be reduced if a sales or redemption charge was taken into account.Returns do not reflect the impact of taxes to shareholders relating to Fund distributions or the redemption of Fund shares.
(c) The Fund’s portfolio turnover rate is calculated in accordance with regulatory requirements, without regard to transactions involving short term investments andcertain derivatives. If such transactions were included, the Fund’s portfolio turnover rate may be higher.
The accompanying notes are an integral part of these financial statements. 51

G O L D M A N S A C H S E M E R G I N G M A R K E T S E Q U I T Y I N S I G H T S F U N D
Financial Highlights (continued)Selected Data for a Share Outstanding Throughout Each Period
Goldman Sachs Emerging Markets Equity Insights Fund
Class P Shares
Year Ended October 31, April 16, 2018*to
October 31, 20182021 2020 2019
Per Share Data
Net asset value, beginning of period $ 10.23 $ 9.33 $ 8.98 $ 10.84
Net investment income(a) 0.24 0.14 0.18 0.18
Net realized and unrealized gain (loss) 1.51 0.95 0.37 (2.04)
Total from investment operations 1.75 1.09 0.55 (1.86)
Distributions to shareholders from net investment income (0.13) (0.19) (0.20) —
Net asset value, end of period $ 11.85 $ 10.23 $ 9.33 $ 8.98
Total return(b) 17.10% 11.80% 6.33% (17.16)%
Net assets, end of period (in 000s) $139,870 $112,229 $125,429 $130,763
Ratio of net expenses to average net assets 1.08% 1.08% 1.09% 1.08%(c)
Ratio of total expenses to average net assets 1.13% 1.15% 1.17% 1.17%(c)
Ratio of net investment income to average net assets 1.92% 1.48% 1.96% 3.36%(c)
Portfolio turnover rate(d) 189% 178% 165% 147%
* Commencement of operations.(a) Calculated based on the average shares outstanding methodology.(b) Assumes investment at the net asset value at the beginning of the period, reinvestment of all distributions, a complete redemption of the investment at the net asset
value at the end of the period and no sales or redemption charges (if any). Total returns would be reduced if a sales or redemption charge was taken into account.Returns do not reflect the impact of taxes to shareholders relating to Fund distributions or the redemption of Fund shares. Total returns for periods less than one fullyear are not annualized.
(c) Annualized.(d) The Fund’s portfolio turnover rate is calculated in accordance with regulatory requirements, without regard to transactions involving short term investments and
certain derivatives. If such transactions were included, the Fund’s portfolio turnover rate may be higher.
52 The accompanying notes are an integral part of these financial statements.
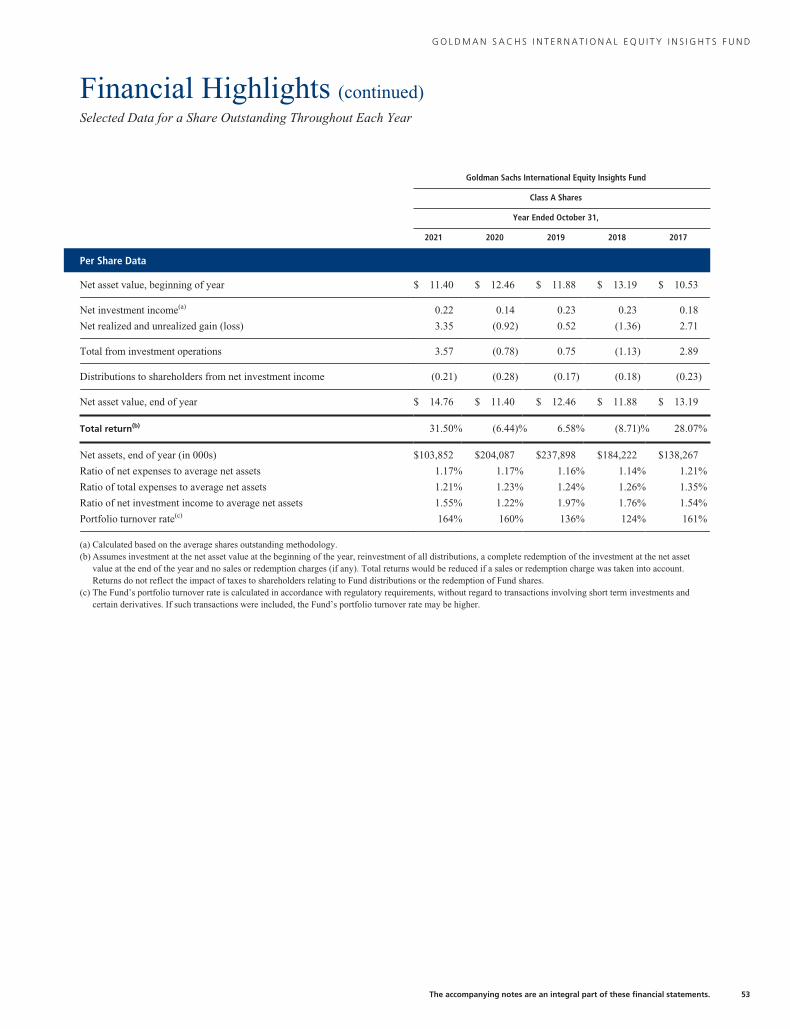
G O L D M A N S A C H S I N T E R N A T I O N A L E Q U I T Y I N S I G H T S F U N D
Financial Highlights (continued)Selected Data for a Share Outstanding Throughout Each Year
Goldman Sachs International Equity Insights Fund
Class A Shares
Year Ended October 31,
2021 2020 2019 2018 2017
Per Share Data
Net asset value, beginning of year $ 11.40 $ 12.46 $ 11.88 $ 13.19 $ 10.53
Net investment income(a) 0.22 0.14 0.23 0.23 0.18
Net realized and unrealized gain (loss) 3.35 (0.92) 0.52 (1.36) 2.71
Total from investment operations 3.57 (0.78) 0.75 (1.13) 2.89
Distributions to shareholders from net investment income (0.21) (0.28) (0.17) (0.18) (0.23)
Net asset value, end of year $ 14.76 $ 11.40 $ 12.46 $ 11.88 $ 13.19
Total return(b) 31.50% (6.44)% 6.58% (8.71)% 28.07%
Net assets, end of year (in 000s) $103,852 $204,087 $237,898 $184,222 $138,267
Ratio of net expenses to average net assets 1.17% 1.17% 1.16% 1.14% 1.21%
Ratio of total expenses to average net assets 1.21% 1.23% 1.24% 1.26% 1.35%
Ratio of net investment income to average net assets 1.55% 1.22% 1.97% 1.76% 1.54%
Portfolio turnover rate(c) 164% 160% 136% 124% 161%
(a) Calculated based on the average shares outstanding methodology.(b) Assumes investment at the net asset value at the beginning of the year, reinvestment of all distributions, a complete redemption of the investment at the net asset
value at the end of the year and no sales or redemption charges (if any). Total returns would be reduced if a sales or redemption charge was taken into account.Returns do not reflect the impact of taxes to shareholders relating to Fund distributions or the redemption of Fund shares.
(c) The Fund’s portfolio turnover rate is calculated in accordance with regulatory requirements, without regard to transactions involving short term investments andcertain derivatives. If such transactions were included, the Fund’s portfolio turnover rate may be higher.
The accompanying notes are an integral part of these financial statements. 53

G O L D M A N S A C H S I N T E R N A T I O N A L E Q U I T Y I N S I G H T S F U N D
Financial Highlights (continued)Selected Data for a Share Outstanding Throughout Each Year
Goldman Sachs International Equity Insights Fund
Class C Shares
Year Ended October 31,
2021 2020 2019 2018 2017
Per Share Data
Net asset value, beginning of year $ 11.13 $ 12.13 $ 11.56 $ 12.91 $ 10.32
Net investment income(a) 0.15 0.05 0.14 0.14 0.09
Net realized and unrealized gain (loss) 3.24 (0.90) 0.52 (1.34) 2.66
Total from investment operations 3.39 (0.85) 0.66 (1.20) 2.75
Distributions to shareholders from net investment income (0.10) (0.15) (0.09) (0.15) (0.16)
Net asset value, end of year $ 14.42 $ 11.13 $ 12.13 $ 11.56 $ 12.91
Total return(b) 30.53% (7.08)% 5.79% (9.45)% 27.11%
Net assets, end of year (in 000s) $14,406 $13,484 $22,427 $32,338 $14,886
Ratio of net expenses to average net assets 1.92% 1.92% 1.91% 1.89% 1.95%
Ratio of total expenses to average net assets 1.96% 1.98% 1.99% 2.01% 2.09%
Ratio of net investment income to average net assets 1.05% 0.42% 1.25% 1.11% 0.79%
Portfolio turnover rate(c) 164% 160% 136% 124% 161%
(a) Calculated based on the average shares outstanding methodology.(b) Assumes investment at the net asset value at the beginning of the year, reinvestment of all distributions, a complete redemption of the investment at the net asset
value at the end of the year and no sales or redemption charges (if any). Total returns would be reduced if a sales or redemption charge was taken into account.Returns do not reflect the impact of taxes to shareholders relating to Fund distributions or the redemption of Fund shares.
(c) The Fund’s portfolio turnover rate is calculated in accordance with regulatory requirements, without regard to transactions involving short term investments andcertain derivatives. If such transactions were included, the Fund’s portfolio turnover rate may be higher.
54 The accompanying notes are an integral part of these financial statements.

G O L D M A N S A C H S I N T E R N A T I O N A L E Q U I T Y I N S I G H T S F U N D
Financial Highlights (continued)Selected Data for a Share Outstanding Throughout Each Year
Goldman Sachs International Equity Insights Fund
Institutional Shares
Year Ended October 31,
2021 2020 2019 2018 2017
Per Share Data
Net asset value, beginning of year $ 11.76 $ 12.83 $ 12.22 $ 13.57 $ 10.82
Net investment income(a) 0.33 0.18 0.29 0.28 0.23
Net realized and unrealized gain (loss) 3.40 (0.93) 0.54 (1.41) 2.79
Total from investment operations 3.73 (0.75) 0.83 (1.13) 3.02
Distributions to shareholders from net investment income (0.26) (0.32) (0.22) (0.22) (0.27)
Net asset value, end of year $ 15.23 $ 11.76 $ 12.83 $ 12.22 $ 13.57
Total return(b) 31.93% (6.07)% 7.07% (8.48)% 28.57%
Net assets, end of year (in 000s) $1,227,429 $810,510 $1,256,782 $1,323,745 $1,012,010
Ratio of net expenses to average net assets 0.80% 0.79% 0.79% 0.81% 0.85%
Ratio of total expenses to average net assets 0.84% 0.85% 0.85% 0.87% 0.94%
Ratio of net investment income to average net assets 2.25% 1.54% 2.41% 2.08% 1.92%
Portfolio turnover rate(c) 164% 160% 136% 124% 161%
(a) Calculated based on the average shares outstanding methodology.(b) Assumes investment at the net asset value at the beginning of the year, reinvestment of all distributions, a complete redemption of the investment at the net asset
value at the end of the year and no sales or redemption charges (if any). Total returns would be reduced if a sales or redemption charge was taken into account.Returns do not reflect the impact of taxes to shareholders relating to Fund distributions or the redemption of Fund shares.
(c) The Fund’s portfolio turnover rate is calculated in accordance with regulatory requirements, without regard to transactions involving short term investments andcertain derivatives. If such transactions were included, the Fund’s portfolio turnover rate may be higher.
The accompanying notes are an integral part of these financial statements. 55

G O L D M A N S A C H S I N T E R N A T I O N A L E Q U I T Y I N S I G H T S F U N D
Financial Highlights (continued)Selected Data for a Share Outstanding Throughout Each Year
Goldman Sachs International Equity Insights Fund
Service Shares
Year Ended October 31,
2021 2020 2019 2018 2017
Per Share Data
Net asset value, beginning of year $11.52 $12.57 $11.98 $13.32 $10.63
Net investment income(a) 0.25 0.12 0.23 0.21 0.18
Net realized and unrealized gain (loss) 3.33 (0.91) 0.52 (1.38) 2.73
Total from investment operations 3.58 (0.79) 0.75 (1.17) 2.91
Distributions to shareholders from net investment income (0.19) (0.26) (0.16) (0.17) (0.22)
Net asset value, end of year $14.91 $11.52 $12.57 $11.98 $13.32
Total return(b) 31.25% (6.50)% 6.45% (8.92)% 27.89%
Net assets, end of year (in 000s) $2,927 $3,675 $5,386 $4,538 $4,073
Ratio of net expenses to average net assets 1.30% 1.29% 1.29% 1.31% 1.35%
Ratio of total expenses to average net assets 1.34% 1.35% 1.35% 1.37% 1.45%
Ratio of net investment income to average net assets 1.71% 1.03% 1.93% 1.57% 1.51%
Portfolio turnover rate(c) 164% 160% 136% 124% 161%
(a) Calculated based on the average shares outstanding methodology.(b) Assumes investment at the net asset value at the beginning of the year, reinvestment of all distributions, a complete redemption of the investment at the net asset
value at the end of the year and no sales or redemption charges (if any). Total returns would be reduced if a sales or redemption charge was taken into account.Returns do not reflect the impact of taxes to shareholders relating to Fund distributions or the redemption of Fund shares.
(c) The Fund’s portfolio turnover rate is calculated in accordance with regulatory requirements, without regard to transactions involving short term investments andcertain derivatives. If such transactions were included, the Fund’s portfolio turnover rate may be higher.
56 The accompanying notes are an integral part of these financial statements.

G O L D M A N S A C H S I N T E R N A T I O N A L E Q U I T Y I N S I G H T S F U N D
Financial Highlights (continued)Selected Data for a Share Outstanding Throughout Each Year
Goldman Sachs International Equity Insights Fund
Investor Shares(a)
Year Ended October 31,
2021 2020 2019 2018 2017
Per Share Data
Net asset value, beginning of year $ 11.19 $ 12.23 $ 11.67 $ 12.97 $ 10.36
Net investment income(b) 0.25 0.16 0.27 0.27 0.23
Net realized and unrealized gain (loss) 3.30 (0.89) 0.50 (1.35) 2.64
Total from investment operations 3.55 (0.73) 0.77 (1.08) 2.87
Distributions to shareholders from net investment income (0.19) (0.31) (0.21) (0.22) (0.26)
Net asset value, end of year $ 14.55 $ 11.19 $ 12.23 $ 11.67 $ 12.97
Total return(c) 31.90% (6.21)% 6.90% (8.52)% 28.44%
Net assets, end of year (in 000s) $96,352 $311,446 $549,732 $393,993 $147,186
Ratio of net expenses to average net assets 0.92% 0.92% 0.91% 0.89% 0.94%
Ratio of total expenses to average net assets 0.96% 0.98% 0.99% 1.01% 1.07%
Ratio of net investment income to average net assets 1.86% 1.42% 2.29% 2.09% 1.87%
Portfolio turnover rate(d) 164% 160% 136% 124% 161%
(a) Effective August 15, 2017, Class IR changed its name to Investor Shares.(b) Calculated based on the average shares outstanding methodology.(c) Assumes investment at the net asset value at the beginning of the year, reinvestment of all distributions, a complete redemption of the investment at the net asset
value at the end of the year and no sales or redemption charges (if any). Total returns would be reduced if a sales or redemption charge was taken into account.Returns do not reflect the impact of taxes to shareholders relating to Fund distributions or the redemption of Fund shares.
(d) The Fund’s portfolio turnover rate is calculated in accordance with regulatory requirements, without regard to transactions involving short term investments andcertain derivatives. If such transactions were included, the Fund’s portfolio turnover rate may be higher.
The accompanying notes are an integral part of these financial statements. 57
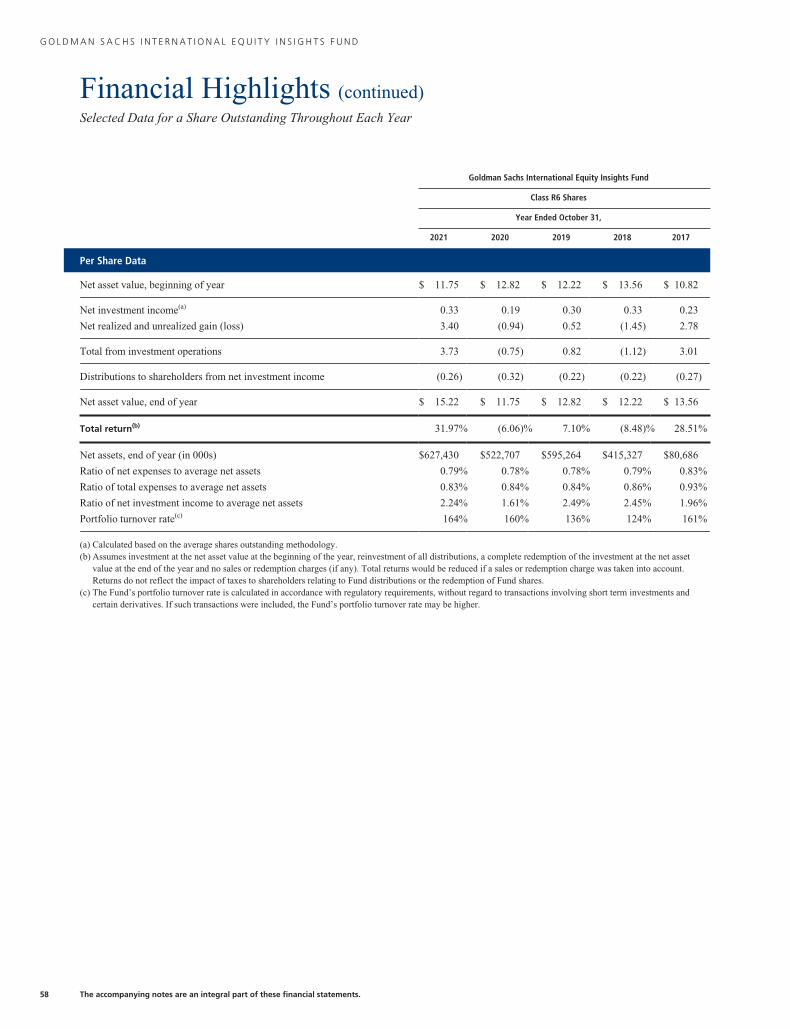
G O L D M A N S A C H S I N T E R N A T I O N A L E Q U I T Y I N S I G H T S F U N D
Financial Highlights (continued)Selected Data for a Share Outstanding Throughout Each Year
Goldman Sachs International Equity Insights Fund
Class R6 Shares
Year Ended October 31,
2021 2020 2019 2018 2017
Per Share Data
Net asset value, beginning of year $ 11.75 $ 12.82 $ 12.22 $ 13.56 $ 10.82
Net investment income(a) 0.33 0.19 0.30 0.33 0.23
Net realized and unrealized gain (loss) 3.40 (0.94) 0.52 (1.45) 2.78
Total from investment operations 3.73 (0.75) 0.82 (1.12) 3.01
Distributions to shareholders from net investment income (0.26) (0.32) (0.22) (0.22) (0.27)
Net asset value, end of year $ 15.22 $ 11.75 $ 12.82 $ 12.22 $ 13.56
Total return(b) 31.97% (6.06)% 7.10% (8.48)% 28.51%
Net assets, end of year (in 000s) $627,430 $522,707 $595,264 $415,327 $80,686
Ratio of net expenses to average net assets 0.79% 0.78% 0.78% 0.79% 0.83%
Ratio of total expenses to average net assets 0.83% 0.84% 0.84% 0.86% 0.93%
Ratio of net investment income to average net assets 2.24% 1.61% 2.49% 2.45% 1.96%
Portfolio turnover rate(c) 164% 160% 136% 124% 161%
(a) Calculated based on the average shares outstanding methodology.(b) Assumes investment at the net asset value at the beginning of the year, reinvestment of all distributions, a complete redemption of the investment at the net asset
value at the end of the year and no sales or redemption charges (if any). Total returns would be reduced if a sales or redemption charge was taken into account.Returns do not reflect the impact of taxes to shareholders relating to Fund distributions or the redemption of Fund shares.
(c) The Fund’s portfolio turnover rate is calculated in accordance with regulatory requirements, without regard to transactions involving short term investments andcertain derivatives. If such transactions were included, the Fund’s portfolio turnover rate may be higher.
58 The accompanying notes are an integral part of these financial statements.

G O L D M A N S A C H S I N T E R N A T I O N A L E Q U I T Y I N S I G H T S F U N D
Financial Highlights (continued)Selected Data for a Share Outstanding Throughout Each Year
Goldman Sachs International Equity Insights Fund
Class R Shares
Year Ended October 31,
2021 2020 2019 2018 2017
Per Share Data
Net asset value, beginning of year $11.08 $12.10 $11.54 $12.85 $10.29
Net investment income(a) 0.21 0.11 0.21 0.19 0.16
Net realized and unrealized gain (loss) 3.21 (0.89) 0.50 (1.33) 2.64
Total from investment operations 3.42 (0.78) 0.71 (1.14) 2.80
Distributions to shareholders from net investment income (0.18) (0.24) (0.15) (0.17) (0.24)
Net asset value, end of year $14.32 $11.08 $12.10 $11.54 $12.85
Total return(b) 31.19% (6.69)% 6.36% (9.01)% 27.81%
Net assets, end of year (in 000s) $7,896 $8,321 $9,281 $7,548 $7,071
Ratio of net expenses to average net assets 1.42% 1.42% 1.41% 1.40% 1.45%
Ratio of total expenses to average net assets 1.46% 1.48% 1.49% 1.51% 1.59%
Ratio of net investment income to average net assets 1.56% 0.99% 1.79% 1.49% 1.39%
Portfolio turnover rate(c) 164% 160% 136% 124% 161%
(a) Calculated based on the average shares outstanding methodology.(b) Assumes investment at the net asset value at the beginning of the year, reinvestment of all distributions, a complete redemption of the investment at the net asset
value at the end of the year and no sales or redemption charges (if any). Total returns would be reduced if a sales or redemption charge was taken into account.Returns do not reflect the impact of taxes to shareholders relating to Fund distributions or the redemption of Fund shares.
(c) The Fund’s portfolio turnover rate is calculated in accordance with regulatory requirements, without regard to transactions involving short term investments andcertain derivatives. If such transactions were included, the Fund’s portfolio turnover rate may be higher.
The accompanying notes are an integral part of these financial statements. 59

G O L D M A N S A C H S I N T E R N A T I O N A L E Q U I T Y I N S I G H T S F U N D
Financial Highlights (continued)Selected Data for a Share Outstanding Throughout Each Period
Goldman Sachs International Equity Insights Fund
Class P Shares
Year Ended October 31, April 16, 2018*to
October 31, 20182021 2020 2019
Per Share Data
Net asset value, beginning of period $ 11.74 $ 12.81 $ 12.21 $ 13.79
Net investment income(a) 0.33 0.19 0.30 0.12
Net realized and unrealized gain (loss) 3.40 (0.94) 0.52 (1.70)
Total from investment operations 3.73 (0.75) 0.82 (1.58)
Distributions to shareholders from net investment income (0.26) (0.32) (0.22) —
Net asset value, end of period $ 15.21 $ 11.74 $ 12.81 $ 12.21
Total return(b) 32.00% (6.06)% 7.03% (11.46)%
Net assets, end of period (in 000s) $470,881 $357,875 $372,536 $245,618
Ratio of net expenses to average net assets 0.79% 0.78% 0.78% 0.78%(c)
Ratio of total expenses to average net assets 0.83% 0.84% 0.84% 0.87%(c)
Ratio of net investment income to average net assets 2.24% 1.62% 2.43% 1.65%(c)
Portfolio turnover rate(d) 164% 160% 136% 124%
* Commencement of operations.(a) Calculated based on the average shares outstanding methodology.(b) Assumes investment at the net asset value at the beginning of the period, reinvestment of all distributions, a complete redemption of the investment at the net asset
value at the end of the period and no sales or redemption charges (if any). Total returns would be reduced if a sales or redemption charge was taken into account.Returns do not reflect the impact of taxes to shareholders relating to Fund distributions or the redemption of Fund shares. Total returns for periods less than one fullyear are not annualized.
(c) Annualized.(d) The Fund’s portfolio turnover rate is calculated in accordance with regulatory requirements, without regard to transactions involving short term investments and
certain derivatives. If such transactions were included, the Fund’s portfolio turnover rate may be higher.
60 The accompanying notes are an integral part of these financial statements.

G O L D M A N S A C H S I N T E R N A T I O N A L S M A L L C A P I N S I G H T S F U N D
Financial Highlights (continued)Selected Data for a Share Outstanding Throughout Each Year
Goldman Sachs International Small Cap Insights Fund
Class A Shares
Year Ended October 31,
2021 2020 2019 2018 2017
Per Share Data
Net asset value, beginning of year $ 10.96 $ 11.77 $ 11.16 $ 13.39 $ 10.71
Net investment income(a) 0.27 0.08 0.17 0.17 0.14
Net realized and unrealized gain (loss) 3.28 (0.52) 0.55 (1.39) 2.79
Total from investment operations 3.55 (0.44) 0.72 (1.22) 2.93
Distributions to shareholders from net investment income (0.19) (0.37) (0.11) (0.18) (0.25)
Distributions to shareholders from net realized gains — — — (0.83) —
Total distributions (0.19) (0.37) (0.11) (1.01) (0.25)
Net asset value, end of year $ 14.32 $ 10.96 $ 11.77 $ 11.16 $ 13.39
Total return(b) 32.65% (3.98)% 6.68% (9.88)% 28.01%
Net assets, end of year (in 000s) $150,934 $120,602 $163,427 $193,465 $211,268
Ratio of net expenses to average net assets 1.24% 1.25% 1.26% 1.26% 1.29%
Ratio of total expenses to average net assets 1.30% 1.31% 1.33% 1.31% 1.34%
Ratio of net investment income to average net assets 1.96% 0.76% 1.52% 1.34% 1.18%
Portfolio turnover rate(c) 185% 149% 131% 110% 129%
(a) Calculated based on the average shares outstanding methodology.(b) Assumes investment at the net asset value at the beginning of the year, reinvestment of all distributions, a complete redemption of the investment at the net asset
value at the end of the year and no sales or redemption charges (if any). Total returns would be reduced if a sales or redemption charge was taken into account.Returns do not reflect the impact of taxes to shareholders relating to Fund distributions or the redemption of Fund shares.
(c) The Fund’s portfolio turnover rate is calculated in accordance with regulatory requirements, without regard to transactions involving short term investments andcertain derivatives. If such transactions were included, the Fund’s portfolio turnover rate may be higher.
The accompanying notes are an integral part of these financial statements. 61
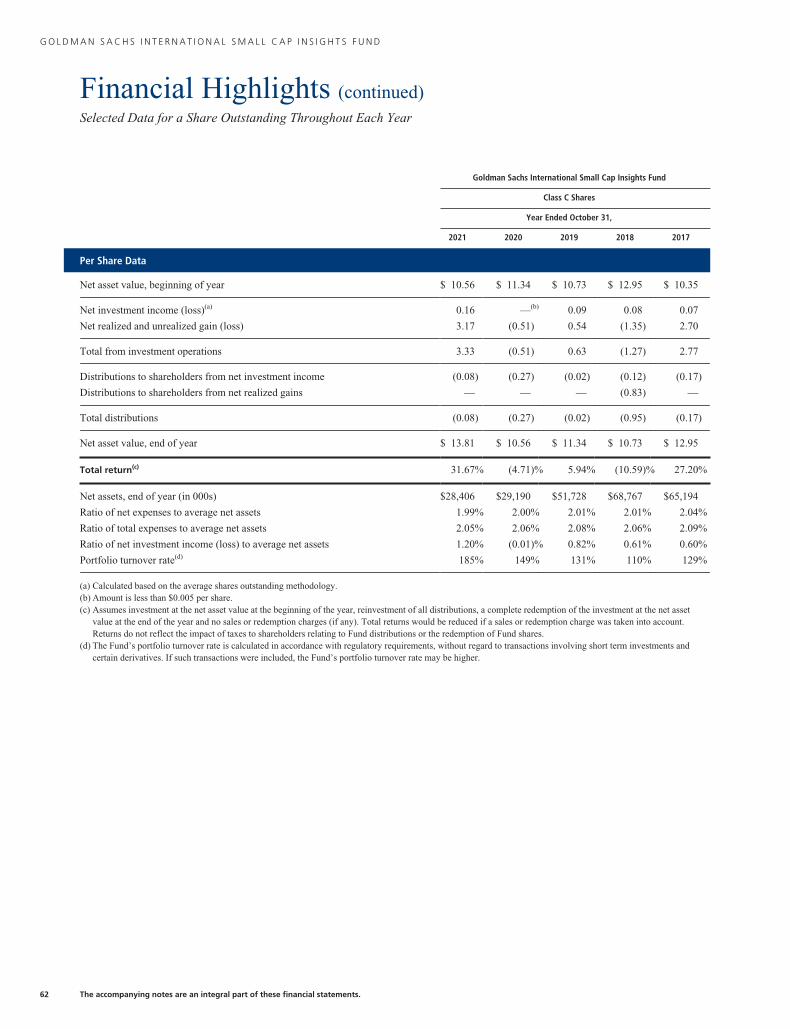
G O L D M A N S A C H S I N T E R N A T I O N A L S M A L L C A P I N S I G H T S F U N D
Financial Highlights (continued)Selected Data for a Share Outstanding Throughout Each Year
Goldman Sachs International Small Cap Insights Fund
Class C Shares
Year Ended October 31,
2021 2020 2019 2018 2017
Per Share Data
Net asset value, beginning of year $ 10.56 $ 11.34 $ 10.73 $ 12.95 $ 10.35
Net investment income (loss)(a) 0.16 —(b) 0.09 0.08 0.07
Net realized and unrealized gain (loss) 3.17 (0.51) 0.54 (1.35) 2.70
Total from investment operations 3.33 (0.51) 0.63 (1.27) 2.77
Distributions to shareholders from net investment income (0.08) (0.27) (0.02) (0.12) (0.17)
Distributions to shareholders from net realized gains — — — (0.83) —
Total distributions (0.08) (0.27) (0.02) (0.95) (0.17)
Net asset value, end of year $ 13.81 $ 10.56 $ 11.34 $ 10.73 $ 12.95
Total return(c) 31.67% (4.71)% 5.94% (10.59)% 27.20%
Net assets, end of year (in 000s) $28,406 $29,190 $51,728 $68,767 $65,194
Ratio of net expenses to average net assets 1.99% 2.00% 2.01% 2.01% 2.04%
Ratio of total expenses to average net assets 2.05% 2.06% 2.08% 2.06% 2.09%
Ratio of net investment income (loss) to average net assets 1.20% (0.01)% 0.82% 0.61% 0.60%
Portfolio turnover rate(d) 185% 149% 131% 110% 129%
(a) Calculated based on the average shares outstanding methodology.(b) Amount is less than $0.005 per share.(c) Assumes investment at the net asset value at the beginning of the year, reinvestment of all distributions, a complete redemption of the investment at the net asset
value at the end of the year and no sales or redemption charges (if any). Total returns would be reduced if a sales or redemption charge was taken into account.Returns do not reflect the impact of taxes to shareholders relating to Fund distributions or the redemption of Fund shares.
(d) The Fund’s portfolio turnover rate is calculated in accordance with regulatory requirements, without regard to transactions involving short term investments andcertain derivatives. If such transactions were included, the Fund’s portfolio turnover rate may be higher.
62 The accompanying notes are an integral part of these financial statements.

G O L D M A N S A C H S I N T E R N A T I O N A L S M A L L C A P I N S I G H T S F U N D
Financial Highlights (continued)Selected Data for a Share Outstanding Throughout Each Year
Goldman Sachs International Small Cap Insights Fund
Institutional Shares
Year Ended October 31,
2021 2020 2019 2018 2017
Per Share Data
Net asset value, beginning of year $ 10.97 $ 11.78 $ 11.19 $ 13.42 $ 10.73
Net investment income(a) 0.33 0.12 0.22 0.21 0.21
Net realized and unrealized gain (loss) 3.27 (0.52) 0.54 (1.38) 2.77
Total from investment operations 3.60 (0.40) 0.76 (1.17) 2.98
Distributions to shareholders from net investment income (0.24) (0.41) (0.17) (0.23) (0.29)
Distributions to shareholders from net realized gains — — — (0.83) —
Total distributions (0.24) (0.41) (0.17) (1.06) (0.29)
Net asset value, end of year $ 14.33 $ 10.97 $ 11.78 $ 11.19 $ 13.42
Total return(b) 33.11% (3.61)% 7.10% (9.53)% 28.59%
Net assets, end of year (in 000s) $2,579,024 $1,608,195 $2,134,382 $2,250,288 $1,796,887
Ratio of net expenses to average net assets 0.87% 0.87% 0.87% 0.87% 0.90%
Ratio of total expenses to average net assets 0.92% 0.93% 0.95% 0.92% 0.94%
Ratio of net investment income to average net assets 2.39% 1.13% 1.96% 1.67% 1.77%
Portfolio turnover rate(c) 185% 149% 131% 110% 129%
(a) Calculated based on the average shares outstanding methodology.(b) Assumes investment at the net asset value at the beginning of the year, reinvestment of all distributions, a complete redemption of the investment at the net asset
value at the end of the year and no sales or redemption charges (if any). Total returns would be reduced if a sales or redemption charge was taken into account.Returns do not reflect the impact of taxes to shareholders relating to Fund distributions or the redemption of Fund shares.
(c) The Fund’s portfolio turnover rate is calculated in accordance with regulatory requirements, without regard to transactions involving short term investments andcertain derivatives. If such transactions were included, the Fund’s portfolio turnover rate may be higher.
The accompanying notes are an integral part of these financial statements. 63

G O L D M A N S A C H S I N T E R N A T I O N A L S M A L L C A P I N S I G H T S F U N D
Financial Highlights (continued)Selected Data for a Share Outstanding Throughout Each Year
Goldman Sachs International Small Cap Insights Fund
Investor Shares(a)
Year Ended October 31,
2021 2020 2019 2018 2017
Per Share Data
Net asset value, beginning of year $ 10.92 $ 11.72 $ 11.12 $ 13.36 $ 10.68
Net investment income(b) 0.30 0.10 0.19 0.21 0.21
Net realized and unrealized gain (loss) 3.26 (0.51) 0.56 (1.40) 2.75
Total from investment operations 3.56 (0.41) 0.75 (1.19) 2.96
Distributions to shareholders from net investment income (0.22) (0.39) (0.15) (0.22) (0.28)
Distributions to shareholders from net realized gains — — — (0.83) —
Total distributions (0.22) (0.39) (0.15) (1.05) (0.28)
Net asset value, end of year $ 14.26 $ 10.92 $ 11.72 $ 11.12 $ 13.36
Total return(c) 32.88% (3.72)% 7.01% (9.72)% 28.48%
Net assets, end of year (in 000s) $141,731 $131,558 $274,079 $532,484 $344,700
Ratio of net expenses to average net assets 0.99% 1.00% 1.01% 1.01% 1.04%
Ratio of total expenses to average net assets 1.05% 1.06% 1.08% 1.06% 1.09%
Ratio of net investment income to average net assets 2.21% 0.95% 1.74% 1.68% 1.76%
Portfolio turnover rate(d) 185% 149% 131% 110% 129%
(a) Effective August 15, 2017, Class IR changed its name to Investor Shares.(b) Calculated based on the average shares outstanding methodology.(c) Assumes investment at the net asset value at the beginning of the year, reinvestment of all distributions, a complete redemption of the investment at the net asset
value at the end of the year and no sales or redemption charges (if any). Total returns would be reduced if a sales or redemption charge was taken into account.Returns do not reflect the impact of taxes to shareholders relating to Fund distributions or the redemption of Fund shares.
(d) The Fund’s portfolio turnover rate is calculated in accordance with regulatory requirements, without regard to transactions involving short term investments andcertain derivatives. If such transactions were included, the Fund’s portfolio turnover rate may be higher.
64 The accompanying notes are an integral part of these financial statements.
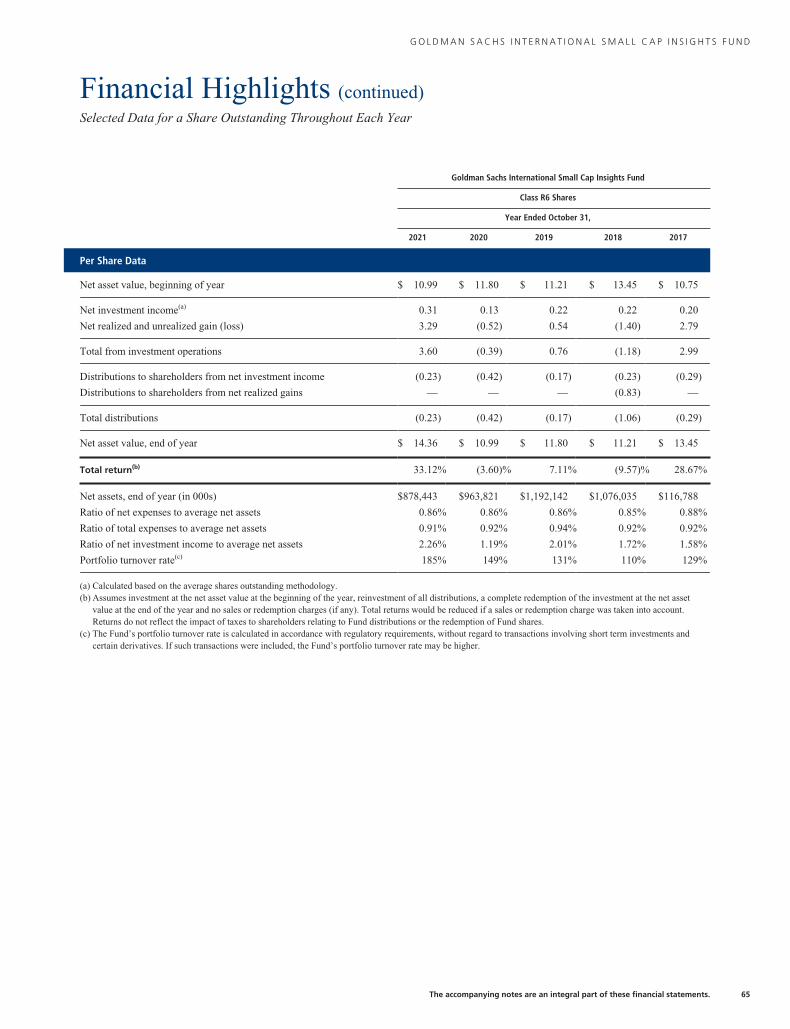
G O L D M A N S A C H S I N T E R N A T I O N A L S M A L L C A P I N S I G H T S F U N D
Financial Highlights (continued)Selected Data for a Share Outstanding Throughout Each Year
Goldman Sachs International Small Cap Insights Fund
Class R6 Shares
Year Ended October 31,
2021 2020 2019 2018 2017
Per Share Data
Net asset value, beginning of year $ 10.99 $ 11.80 $ 11.21 $ 13.45 $ 10.75
Net investment income(a) 0.31 0.13 0.22 0.22 0.20
Net realized and unrealized gain (loss) 3.29 (0.52) 0.54 (1.40) 2.79
Total from investment operations 3.60 (0.39) 0.76 (1.18) 2.99
Distributions to shareholders from net investment income (0.23) (0.42) (0.17) (0.23) (0.29)
Distributions to shareholders from net realized gains — — — (0.83) —
Total distributions (0.23) (0.42) (0.17) (1.06) (0.29)
Net asset value, end of year $ 14.36 $ 10.99 $ 11.80 $ 11.21 $ 13.45
Total return(b) 33.12% (3.60)% 7.11% (9.57)% 28.67%
Net assets, end of year (in 000s) $878,443 $963,821 $1,192,142 $1,076,035 $116,788
Ratio of net expenses to average net assets 0.86% 0.86% 0.86% 0.85% 0.88%
Ratio of total expenses to average net assets 0.91% 0.92% 0.94% 0.92% 0.92%
Ratio of net investment income to average net assets 2.26% 1.19% 2.01% 1.72% 1.58%
Portfolio turnover rate(c) 185% 149% 131% 110% 129%
(a) Calculated based on the average shares outstanding methodology.(b) Assumes investment at the net asset value at the beginning of the year, reinvestment of all distributions, a complete redemption of the investment at the net asset
value at the end of the year and no sales or redemption charges (if any). Total returns would be reduced if a sales or redemption charge was taken into account.Returns do not reflect the impact of taxes to shareholders relating to Fund distributions or the redemption of Fund shares.
(c) The Fund’s portfolio turnover rate is calculated in accordance with regulatory requirements, without regard to transactions involving short term investments andcertain derivatives. If such transactions were included, the Fund’s portfolio turnover rate may be higher.
The accompanying notes are an integral part of these financial statements. 65

G O L D M A N S A C H S I N T E R N A T I O N A L S M A L L C A P I N S I G H T S F U N D
Financial Highlights (continued)Selected Data for a Share Outstanding Throughout Each Period
Goldman Sachs International Small Cap Insights Fund
Class P Shares
Year Ended October 31, April 16, 2018*to
October 31, 20182021 2020 2019
Per Share Data
Net asset value, beginning of period $ 10.99 $ 11.80 $ 11.21 $ 13.08
Net investment income(a) 0.33 0.12 0.22 0.08
Net realized and unrealized gain (loss) 3.28 (0.51) 0.54 (1.95)
Total from investment operations 3.61 (0.39) 0.76 (1.87)
Distributions to shareholders from net investment income (0.24) (0.42) (0.17) —
Net asset value, end of period $ 14.36 $ 10.99 $ 11.80 $ 11.21
Total return(b) 33.15% (3.60)% 7.11% (14.30)%
Net assets, end of period (in 000s) $59,410 $43,631 $80,926 $90,943
Ratio of net expenses to average net assets 0.86% 0.86% 0.86% 0.85%(c)
Ratio of total expenses to average net assets 0.92% 0.92% 0.94% 0.93%(c)
Ratio of net investment income to average net assets 2.41% 1.08% 1.96% 1.20%(c)
Portfolio turnover rate(d) 185% 149% 131% 110%
* Commencement of operations.(a) Calculated based on the average shares outstanding methodology.(b) Assumes investment at the net asset value at the beginning of the period, reinvestment of all distributions, a complete redemption of the investment at the net asset
value at the end of the period and no sales or redemption charges (if any). Total returns would be reduced if a sales or redemption charge was taken into account.Returns do not reflect the impact of taxes to shareholders relating to Fund distributions or the redemption of Fund shares. Total returns for periods less than one fullyear are not annualized.
(c) Annualized.(d) The Fund’s portfolio turnover rate is calculated in accordance with regulatory requirements, without regard to transactions involving short term investments and
certain derivatives. If such transactions were included, the Fund’s portfolio turnover rate may be higher.
66 The accompanying notes are an integral part of these financial statements.

G O L D M A N S A C H S I N T E R N A T I O N A L E Q U I T Y I N S I G H T S F U N D S
Notes to Financial StatementsOctober 31, 2021
1 . O R G A N I Z A T I O N
Goldman Sachs Trust (the “Trust”) is a Delaware statutory trust registered under the Investment Company Act of 1940, as
amended (the “Act”), as an open-end management investment company. The following table lists those series of the Trust that are
included in this report (collectively, the “Funds” or individually a “Fund”), along with their corresponding share classes and
respective diversification status under the Act:
Fund Share Classes OfferedDiversified/
Non-diversified
Emerging Markets Equity Insights A, C, Institutional, Investor, R6, R and P Non-diversified
International Equity Insights A, C, Institutional, Service, Investor, R6, R and P Diversified
International Small Cap Insights A, C, Institutional, Investor, R6 and P Diversified
Class A Shares are sold with a front-end sales charge of up to 5.50%. Class C Shares are sold with a contingent deferred sales
charge (“CDSC”) of 1.00%, which is imposed on redemptions made within 12 months of purchase. Institutional, Service, Investor,
Class R6, Class R and Class P Shares are not subject to a sales charge.
Goldman Sachs Asset Management, L.P. (“GSAM”), an affiliate of Goldman Sachs & Co. LLC (“Goldman Sachs”), serves as
investment adviser to the Funds pursuant to a management agreement (the “Agreement”) with the Trust.
2 . S I G N I F I C A N T A C C O U N T I N G P O L I C I E S
The financial statements have been prepared in accordance with accounting principles generally accepted in the United States of
America (“GAAP”) and require management to make estimates and assumptions that may affect the reported amounts and
disclosures. Actual results may differ from those estimates and assumptions. Each Fund is an investment company under GAAP
and follows the accounting and reporting guidance applicable to investment companies.
A. Investment Valuation — The Funds’ valuation policy is to value investments at fair value.
B. Investment Income and Investments — Investment income includes interest income, dividend income, and securities
lending income, if any. Interest income is accrued daily and adjusted for amortization of premiums and accretion of discounts.
Dividend income is recognized on ex-dividend date or, for certain foreign securities, as soon as such information is obtained
subsequent to the ex-dividend date. Non-cash dividends, if any, are recorded at the fair market value of the securities received.
Investment transactions are reflected on trade date. Realized gains and losses are calculated using identified cost. Investment
transactions are recorded on the following business day for daily net asset value (“NAV”) calculations. Investment income is
recorded net of any foreign withholding taxes, less any amounts reclaimable. The Funds may file withholding tax reclaims in
certain jurisdictions to recover a portion of amounts previously withheld. These reclaims, if any, are recorded when the amount is
known and there are no significant uncertainties on collectability. Such amounts recovered, if any, are reflected as other income in
the Statements of Operations. Any foreign capital gains tax is accrued daily based upon net unrealized gains, and is payable upon
sale of such investments.
For derivative contracts, realized gains and losses are recorded upon settlement of the contract.
C. Class Allocations and Expenses — Investment income, realized and unrealized gain (loss), if any, and non-class specific
expenses of each Fund are allocated daily based upon the proportion of net assets of each class. Non-class specific expenses
directly incurred by a Fund are charged to that Fund, while such expenses incurred by the Trust are allocated across the applicable
Funds on a straight-line and/or pro-rata basis depending upon the nature of the expenses. Class specific expenses, where
applicable, are borne by the respective share classes and include Distribution and Service, Transfer Agency and Service and
Shareholder Administration fees.
D. Federal Taxes and Distributions to Shareholders — It is each Fund’s policy to comply with the requirements of the
Internal Revenue Code of 1986, as amended (the “Code”), applicable to regulated investment companies and to distribute each
67

G O L D M A N S A C H S I N T E R N A T I O N A L E Q U I T Y I N S I G H T S F U N D S
Notes to Financial Statements (continued)October 31, 2021
2 . S I G N I F I C A N T A C C O U N T I N G P O L I C I E S ( c o n t i n u e d )
year substantially all of its investment company taxable income and capital gains to its shareholders. Accordingly, each Fund is not
required to make any provisions for the payment of federal income tax. Distributions to shareholders are recorded on the
ex-dividend date. Income and capital gains distributions, if any, are declared and paid at least annually.
Net capital losses, if any, are carried forward to future fiscal years and may be used to the extent allowed by the Code to offset
any future capital gains. Losses that are carried forward will retain their character as either short-term or long-term capital losses.
Utilization of capital loss carryforwards will reduce the requirement of future capital gains distributions.
The characterization of distributions to shareholders for financial reporting purposes is determined in accordance with federal
income tax rules, which may differ from GAAP. The source of each Fund’s distributions may be shown in the accompanying
financial statements as either from distributable earnings or capital. Certain components of the Funds’ net assets on the Statements
of Assets and Liabilities reflect permanent GAAP/tax differences based on the appropriate tax character.
E. Foreign Currency Translation — The accounting records and reporting currency of a Fund are maintained in United States
(“U.S.”) dollars. Assets and liabilities denominated in foreign currencies are translated into U.S. dollars using the current exchange
rates at the close of each business day. The effect of changes in foreign currency exchange rates on investments is included within
net realized and unrealized gain (loss) on investments. Changes in the value of other assets and liabilities as a result of fluctuations
in foreign exchange rates are included in the Statements of Operations within net change in unrealized gain (loss) on foreign
currency translation. Transactions denominated in foreign currencies are translated into U.S. dollars on the date the transaction
occurred, the effects of which are included within net realized gain (loss) on foreign currency transactions.
3 . I N V E S T M E N T S A N D F A I R V A L U E M E A S U R E M E N T S
U.S. GAAP defines the fair value of a financial instrument as the amount that would be received to sell an asset or paid to transfer
a liability in an orderly transaction between market participants at the measurement date (i.e., the exit price); the Funds’ policy is to
use the market approach. GAAP establishes a fair value hierarchy that prioritizes the inputs to valuation techniques used to
measure fair value. The hierarchy gives the highest priority to unadjusted quoted prices in active markets for identical assets or
liabilities (Level 1 measurements) and the lowest priority to unobservable inputs (Level 3 measurements). The level in the fair
value hierarchy within which the fair value measurement in its entirety falls shall be determined based on the lowest level input
that is significant to the fair value measurement in its entirety. The levels used for classifying investments are not necessarily an
indication of the risk associated with investing in these investments. The three levels of the fair value hierarchy are described
below:
Level 1 — Unadjusted quoted prices in active markets that are accessible at the measurement date for identical, unrestricted
assets or liabilities;
Level 2 — Quoted prices in markets that are not active or financial instruments for which significant inputs are observable
(including, but not limited to, quoted prices for similar investments, interest rates, foreign exchange rates, volatility and credit
spreads), either directly or indirectly;
Level 3 — Prices or valuations that require significant unobservable inputs (including GSAM’s assumptions in determining
fair value measurement).
The Board of Trustees (“Trustees”) has approved Valuation Procedures that govern the valuation of the portfolio investments held
by the Funds, including investments for which market quotations are not readily available. The Trustees have delegated to GSAM
day-to-day responsibility for implementing and maintaining internal controls and procedures related to the valuation of the Funds’
investments. To assess the continuing appropriateness of pricing sources and methodologies, GSAM regularly performs price
verification procedures and issues challenges as necessary to third party pricing vendors or brokers, and any differences are
reviewed in accordance with the Valuation Procedures.
68

G O L D M A N S A C H S I N T E R N A T I O N A L E Q U I T Y I N S I G H T S F U N D S
3 . I N V E S T M E N T S A N D F A I R V A L U E M E A S U R E M E N T S ( c o n t i n u e d )
A. Level 1 and Level 2 Fair Value Investments — The valuation techniques and significant inputs used in determining the
fair values for investments classified as Level 1 and Level 2 are as follows:
Equity Securities — Equity securities traded on a U.S. securities exchange or the NASDAQ system, or those located on certain
foreign exchanges, including but not limited to the Americas, are valued daily at their last sale price or official closing price on the
principal exchange or system on which they are traded. If there is no sale or official closing price or such price is believed by
GSAM to not represent fair value, equity securities will be valued at the valid closing bid price for long positions and at the valid
closing ask price for short positions (i.e. where there is sufficient volume, during normal exchange trading hours). If no valid bid/
ask price is available, the equity security will be valued pursuant to the Valuation Procedures approved by the Trustees and
consistent with applicable regulatory guidance. To the extent these investments are actively traded, they are classified as Level 1 of
the fair value hierarchy, otherwise they are generally classified as Level 2. Certain equity securities containing unique attributes
may be classified as Level 2.
Unlisted equity securities for which market quotations are available are valued at the last sale price on the valuation date, or if
no sale occurs, at the last bid price for long positions or the last ask price for short positions, and are generally classified as Level 2.
Securities traded on certain foreign securities exchanges are valued daily at fair value determined by an independent fair value
service (if available) under Fair Valuation Procedures approved by the Trustees and consistent with applicable regulatory guidance.
The independent fair value service takes into account multiple factors including, but not limited to, movements in the securities
markets, certain depositary receipts, futures contracts and foreign currency exchange rates that have occurred subsequent to the
close of the foreign securities exchange. These investments are generally classified as Level 2 of the fair value hierarchy.
Money Market Funds — Investments in the Goldman Sachs Financial Square Government Fund (“Underlying Money Market
Fund”) are valued at the NAV per share of the Institutional Share class on the day of valuation. These investments are generally
classified as Level 1 of the fair value hierarchy. For information regarding the Underlying Money Market Fund’s accounting
policies and investment holdings, please see the Underlying Money Market Fund’s shareholder report.
Derivative Contracts — A derivative is an instrument whose value is derived from underlying assets, indices, reference rates or
a combination of these factors. A Fund enters into derivative transactions to hedge against changes in interest rates, securities
prices, and/or currency exchange rates, to increase total return, or to gain access to certain markets or attain exposure to other
underliers. For financial reporting purposes, cash collateral that has been pledged to cover obligations of a Fund and cash collateral
received, if any, is reported separately on the Statements of Assets and Liabilities as receivables/payables for collateral on certain
derivatives contracts. Non-cash collateral pledged by a Fund, if any, is noted in the Schedules of Investments.
Exchange-traded derivatives, including futures and options contracts, are generally valued at the last sale or settlement price
on the exchange where they are principally traded. Exchange-traded options without settlement prices are generally valued at the
midpoint of the bid and ask prices on the exchange where they are principally traded (or, in the absence of two-way trading, at the
last bid price for long positions and the last ask price for short positions). Exchange-traded derivatives typically fall within Level 1
of the fair value hierarchy. Over-the-counter (“OTC”) and centrally cleared derivatives are valued using market transactions and
other market evidence, including market-based inputs to models, calibration to market-clearing transactions, broker or dealer
quotations, or other alternative pricing sources. Where models are used, the selection of a particular model to value OTC and
centrally cleared derivatives depends upon the contractual terms of, and specific risks inherent in, the instrument, as well as the
availability of pricing information in the market. Valuation models require a variety of inputs, including contractual terms, market
prices, yield curves, credit curves, measures of volatility, voluntary and involuntary prepayment rates, loss severity rates and
correlations of such inputs. For OTC and centrally cleared derivatives that trade in liquid markets, model inputs can generally be
verified and model selection does not involve significant management judgment. OTC and centrally cleared derivatives are
classified within Level 2 of the fair value hierarchy when significant inputs are corroborated by market evidence.
i. Forward Contracts — A forward contract is a contract between two parties to buy or sell an asset at a specified price on a
future date. A forward contract settlement can occur on a cash or delivery basis. Forward contracts are marked-to-market daily
using independent vendor prices, and the change in value, if any, is recorded as an unrealized gain or loss. Cash and certain
investments may be used to collateralize forward contracts.
69

G O L D M A N S A C H S I N T E R N A T I O N A L E Q U I T Y I N S I G H T S F U N D S
Notes to Financial Statements (continued)October 31, 2021
3 . I N V E S T M E N T S A N D F A I R V A L U E M E A S U R E M E N T S ( c o n t i n u e d )
A forward foreign currency exchange contract is a forward contract in which a Fund agrees to receive or deliver a fixed
quantity of one currency for another, at a pre-determined price at a future date. All forward foreign currency exchange
contracts are marked to market daily by using the outright forward rates or interpolating based upon maturity dates, where
available. Non-deliverable forward foreign currency exchange contracts are settled with the counterparty in cash without the
delivery of foreign currency.
ii. Futures Contracts — Futures contracts are contracts to buy or sell a standardized quantity of a specified commodity or
security. Upon entering into a futures contract, a Fund deposits cash or securities in an account on behalf of the broker in an
amount sufficient to meet the initial margin requirement. Subsequent payments are made or received by a Fund equal to the
daily change in the contract value and are recorded as variation margin receivable or payable with a corresponding offset to
unrealized gains or losses.
B. Level 3 Fair Value Investments — To the extent that significant inputs to valuation models and other alternative pricing
sources are unobservable, or if quotations are not readily available, or if GSAM believes that such quotations do not accurately
reflect fair value, the fair value of a Fund’s investments may be determined under Valuation Procedures approved by the Trustees.
GSAM, consistent with its procedures and applicable regulatory guidance, may make an adjustment to the most recent valuation
prices of either domestic or foreign securities in light of significant events to reflect what it believes to be the fair value of the
securities at the time of determining a Fund’s NAV. To the extent investments are valued using single source broker quotations
obtained directly from the broker or passed through from third party pricing vendors, such investments are classified as Level 3
investments.
C. Fair Value Hierarchy — The following is a summary of the Funds’ investments and derivatives classified in the fair value
hierarchy as of October 31, 2021:
EMERGING MARKETS EQUITY INSIGHTS
Investment Type Level 1 Level 2 Level 3
Assets
Common Stock and/or Other Equity Investments(a)
Africa $ 9,171,338 $ 22,719,529 $ —
Asia 176,470,570 1,446,900,443 —
Europe 246,179 14,434,425 —
North America 72,150,447 — —
South America 119,566,194 16,488,174 —
Investment Company 1,812,123 — —
Securities Lending Reinvestment Vehicle 16,271,799 — —
Total $395,688,650 $1,500,542,571 $ —
Derivative Type
Assets(b)
Futures Contracts $ 367,755 $ — $ —
(a) Amounts are disclosed by continent to highlight the impact of time zone differences between local market close and the calculation of NAV. Security valuations arebased on the principal exchange or system on which they are traded, which may differ from country of domicile. The Funds utilize fair value model prices providedby an independent fair value service for certain international equity securities, resulting in a Level 2 classification.
(b) Amount shown represents unrealized gain (loss) at fiscal year end.
70

G O L D M A N S A C H S I N T E R N A T I O N A L E Q U I T Y I N S I G H T S F U N D S
3 . I N V E S T M E N T S A N D F A I R V A L U E M E A S U R E M E N T S ( c o n t i n u e d )
INTERNATIONAL EQUITY INSIGHTS
Investment Type Level 1 Level 2 Level 3
Assets
Common Stock and/or Other Equity Investments(a)
Africa $ — $ 25,215,398 $ —
Asia — 707,855,957 —
Australia and Oceania 23,822,041 154,760,922 —
Europe 46,396,181 1,452,539,767 —
North America 9,592,633 54,944,546 —
South America — 8,345,441 —
Securities Lending Reinvestment Vehicle 30,644,800 — —
Total $110,455,655 $2,403,662,031 $ —
Derivative Type
Assets(b)
Futures Contracts $ 522,450 $ — $ —
Liabilities(b)
Futures Contracts $ (528,196) $ — $ —
INTERNATIONAL SMALL CAP INSIGHTS
Investment Type Level 1 Level 2 Level 3
Assets
Common Stock and/or Other Equity Investments(a)
Africa $ — $ 3,011,391 $ —
Asia 11,513,334 1,246,964,371 —
Australia and Oceania — 379,259,339 —
Europe 347,864,411 1,691,355,257 —
North America 7,376,061 29,470,680 —
Securities Lending Reinvestment Vehicle 4,960,133 — —
Total $371,713,939 $3,350,061,038 $ —
Derivative Type
Assets(b)
Futures Contracts $ 1,978,847 $ — $ —
Liabilities(b)
Futures Contracts $ (682,086) $ — $ —
(a) Amounts are disclosed by continent to highlight the impact of time zone differences between local market close and the calculation of NAV. Security valuations arebased on the principal exchange or system on which they are traded, which may differ from country of domicile. The Funds utilize fair value model prices providedby an independent fair value service for certain international equity securities, resulting in a Level 2 classification.
(b) Amount shown represents unrealized gain (loss) at fiscal year end.
For further information regarding security characteristics, see the Schedules of Investments.
71
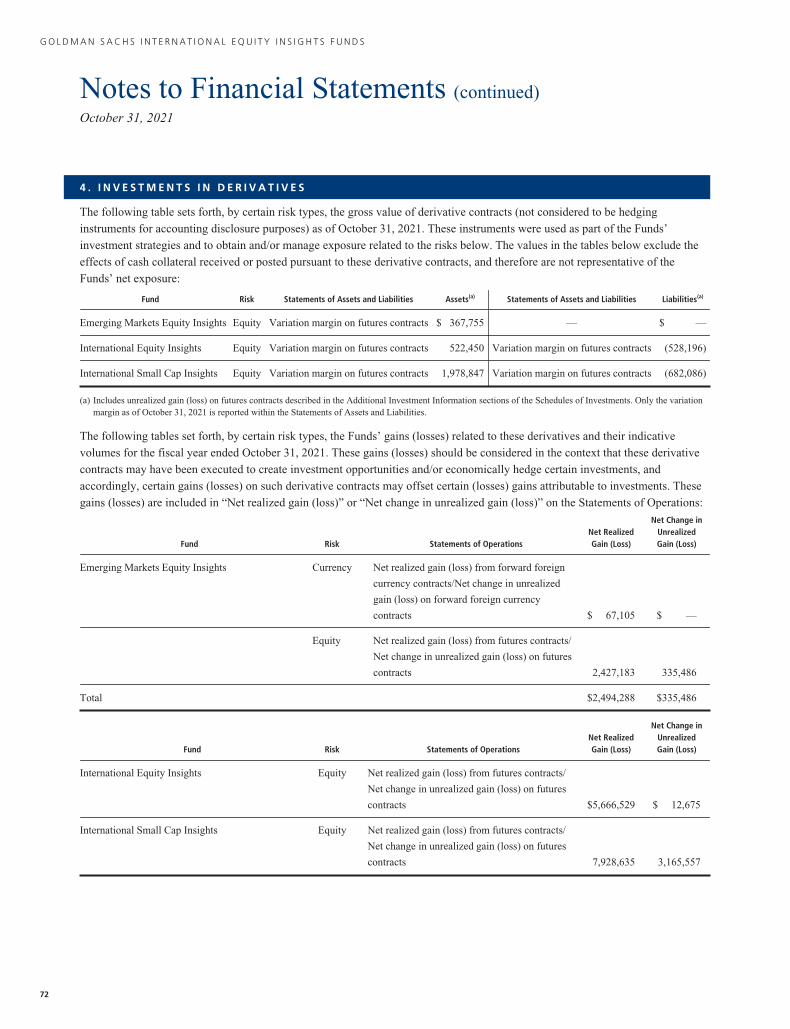
G O L D M A N S A C H S I N T E R N A T I O N A L E Q U I T Y I N S I G H T S F U N D S
Notes to Financial Statements (continued)October 31, 2021
4 . I N V E S T M E N T S I N D E R I V A T I V E S
The following table sets forth, by certain risk types, the gross value of derivative contracts (not considered to be hedging
instruments for accounting disclosure purposes) as of October 31, 2021. These instruments were used as part of the Funds’
investment strategies and to obtain and/or manage exposure related to the risks below. The values in the tables below exclude the
effects of cash collateral received or posted pursuant to these derivative contracts, and therefore are not representative of the
Funds’ net exposure:
Fund Risk Statements of Assets and Liabilities Assets(a) Statements of Assets and Liabilities Liabilities(a)
Emerging Markets Equity Insights Equity Variation margin on futures contracts $ 367,755 — $ —
International Equity Insights Equity Variation margin on futures contracts 522,450 Variation margin on futures contracts (528,196)
International Small Cap Insights Equity Variation margin on futures contracts 1,978,847 Variation margin on futures contracts (682,086)
(a) Includes unrealized gain (loss) on futures contracts described in the Additional Investment Information sections of the Schedules of Investments. Only the variationmargin as of October 31, 2021 is reported within the Statements of Assets and Liabilities.
The following tables set forth, by certain risk types, the Funds’ gains (losses) related to these derivatives and their indicative
volumes for the fiscal year ended October 31, 2021. These gains (losses) should be considered in the context that these derivative
contracts may have been executed to create investment opportunities and/or economically hedge certain investments, and
accordingly, certain gains (losses) on such derivative contracts may offset certain (losses) gains attributable to investments. These
gains (losses) are included in “Net realized gain (loss)” or “Net change in unrealized gain (loss)” on the Statements of Operations:
Fund Risk Statements of OperationsNet RealizedGain (Loss)
Net Change inUnrealizedGain (Loss)
Emerging Markets Equity Insights Currency Net realized gain (loss) from forward foreign
currency contracts/Net change in unrealized
gain (loss) on forward foreign currency
contracts $ 67,105 $ —
Equity Net realized gain (loss) from futures contracts/
Net change in unrealized gain (loss) on futures
contracts 2,427,183 335,486
Total $2,494,288 $335,486
Fund Risk Statements of OperationsNet RealizedGain (Loss)
Net Change inUnrealizedGain (Loss)
International Equity Insights Equity Net realized gain (loss) from futures contracts/
Net change in unrealized gain (loss) on futures
contracts $5,666,529 $ 12,675
International Small Cap Insights Equity Net realized gain (loss) from futures contracts/
Net change in unrealized gain (loss) on futures
contracts 7,928,635 3,165,557
72

G O L D M A N S A C H S I N T E R N A T I O N A L E Q U I T Y I N S I G H T S F U N D S
4 . I N V E S T M E N T S I N D E R I V A T I V E S ( c o n t i n u e d )
For the fiscal year ended October 31, 2021, the relevant values for each derivative type were as follows:
Average Number of Contracts or Notional Amounts(1)
Fund Futures Contracts Forward Contracts
Emerging Markets Equity Insights 367 $186,874
International Equity Insights 444 —
International Small Cap Insights 853 —
(1) Amounts disclosed represent average number of contracts for futures or notional amounts for forward contracts, based on absolute values, which is indicative ofvolume of this derivative type, for the months that the Fund held such derivatives during the year ended October 31, 2021.
5 . A G R E E M E N T S A N D A F F I L I A T E D T R A N S A C T I O N S
A. Management Agreement — Under the Agreement, GSAM manages the Funds, subject to the general supervision of the
Trustees.
As compensation for the services rendered pursuant to the Agreement, the assumption of the expenses related thereto and
administration of the Funds’ business affairs, including providing facilities, GSAM is entitled to a management fee, accrued daily
and paid monthly, equal to an annual percentage rate of each Fund’s average daily net assets.
For the fiscal year ended October 31, 2021, contractual and effective net management fees with GSAM were at the following
rates:
Contractual Management RateEffective NetManagement
Rate^FundFirst
$1 billionNext
$1 billionNext
$3 billionNext
$3 billionOver
$8 billionEffective
Rate
Emerging Markets Equity Insights 1.00% 1.00% 0.90% 0.86% 0.84% 1.00% 1.00%
International Equity Insights 0.81 0.73 0.69 0.68 0.67 0.75 0.75
International Small Cap Insights 0.85 0.85 0.77 0.73 0.72 0.82 0.82
^ Effective Net Management Rate includes the impact of management fee waivers of affiliated underlying funds, if any.
The Emerging Markets Equity Insights, International Equity Insights and International Small Cap Insights Funds invest in
Institutional Shares of the Goldman Sachs Financial Square Government Fund, which is an affiliated Underlying Fund. GSAM has
agreed to waive a portion of its management fee payable by the Funds in an amount equal to the management fee it earns as an
investment adviser to the affiliated Underlying Fund in which the Funds invest, except those management fees it earns from the
Funds’ investments of cash collateral received in connection with securities lending transactions in the Goldman Sachs Financial
Square Government Fund. For the fiscal year ended October 31, 2021, GSAM waived $3,157, $108 and $1,194 of the Emerging
Markets Equity Insights, International Equity Insights and International Small Cap Insights Funds’ management fees, respectively.
B. Distribution and/or Service (12b-1) Plans — The Trust, on behalf of Class A and Class R Shares of each applicable Fund,
has adopted Distribution and Service Plans subject to Rule 12b-1 under the Act. Under the Distribution and Service Plans,
Goldman Sachs, which serves as distributor (the “Distributor”), is entitled to a fee accrued daily and paid monthly for distribution
services and personal and account maintenance services, which may then be paid by Goldman Sachs to authorized dealers. These
fees are equal to an annual percentage rate of the average daily net assets attributable to Class A or Class R Shares of the Funds, as
applicable, as set forth below.
73
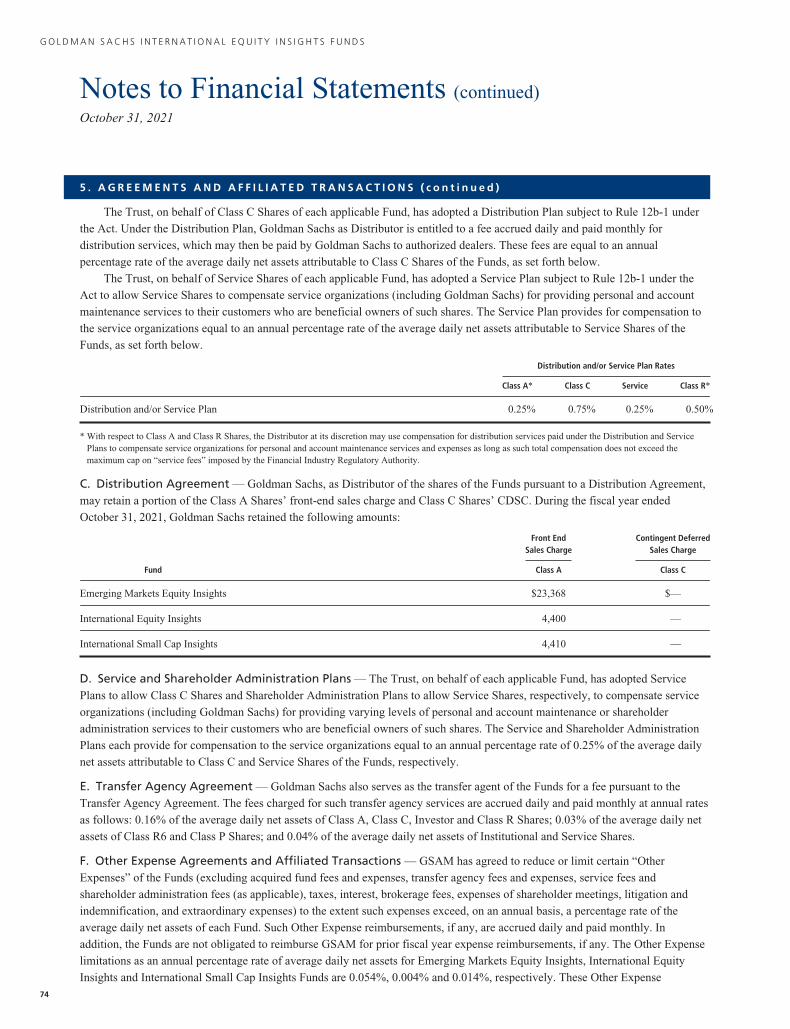
G O L D M A N S A C H S I N T E R N A T I O N A L E Q U I T Y I N S I G H T S F U N D S
Notes to Financial Statements (continued)October 31, 2021
5 . A G R E E M E N T S A N D A F F I L I A T E D T R A N S A C T I O N S ( c o n t i n u e d )
The Trust, on behalf of Class C Shares of each applicable Fund, has adopted a Distribution Plan subject to Rule 12b-1 under
the Act. Under the Distribution Plan, Goldman Sachs as Distributor is entitled to a fee accrued daily and paid monthly for
distribution services, which may then be paid by Goldman Sachs to authorized dealers. These fees are equal to an annual
percentage rate of the average daily net assets attributable to Class C Shares of the Funds, as set forth below.
The Trust, on behalf of Service Shares of each applicable Fund, has adopted a Service Plan subject to Rule 12b-1 under the
Act to allow Service Shares to compensate service organizations (including Goldman Sachs) for providing personal and account
maintenance services to their customers who are beneficial owners of such shares. The Service Plan provides for compensation to
the service organizations equal to an annual percentage rate of the average daily net assets attributable to Service Shares of the
Funds, as set forth below.
Distribution and/or Service Plan Rates
Class A* Class C Service Class R*
Distribution and/or Service Plan 0.25% 0.75% 0.25% 0.50%
* With respect to Class A and Class R Shares, the Distributor at its discretion may use compensation for distribution services paid under the Distribution and ServicePlans to compensate service organizations for personal and account maintenance services and expenses as long as such total compensation does not exceed themaximum cap on “service fees” imposed by the Financial Industry Regulatory Authority.
C. Distribution Agreement — Goldman Sachs, as Distributor of the shares of the Funds pursuant to a Distribution Agreement,
may retain a portion of the Class A Shares’ front-end sales charge and Class C Shares’ CDSC. During the fiscal year ended
October 31, 2021, Goldman Sachs retained the following amounts:
Front EndSales Charge
Contingent DeferredSales Charge
Fund Class A Class C
Emerging Markets Equity Insights $23,368 $—
International Equity Insights 4,400 —
International Small Cap Insights 4,410 —
D. Service and Shareholder Administration Plans — The Trust, on behalf of each applicable Fund, has adopted Service
Plans to allow Class C Shares and Shareholder Administration Plans to allow Service Shares, respectively, to compensate service
organizations (including Goldman Sachs) for providing varying levels of personal and account maintenance or shareholder
administration services to their customers who are beneficial owners of such shares. The Service and Shareholder Administration
Plans each provide for compensation to the service organizations equal to an annual percentage rate of 0.25% of the average daily
net assets attributable to Class C and Service Shares of the Funds, respectively.
E. Transfer Agency Agreement — Goldman Sachs also serves as the transfer agent of the Funds for a fee pursuant to the
Transfer Agency Agreement. The fees charged for such transfer agency services are accrued daily and paid monthly at annual rates
as follows: 0.16% of the average daily net assets of Class A, Class C, Investor and Class R Shares; 0.03% of the average daily net
assets of Class R6 and Class P Shares; and 0.04% of the average daily net assets of Institutional and Service Shares.
F. Other Expense Agreements and Affiliated Transactions — GSAM has agreed to reduce or limit certain “Other
Expenses” of the Funds (excluding acquired fund fees and expenses, transfer agency fees and expenses, service fees and
shareholder administration fees (as applicable), taxes, interest, brokerage fees, expenses of shareholder meetings, litigation and
indemnification, and extraordinary expenses) to the extent such expenses exceed, on an annual basis, a percentage rate of the
average daily net assets of each Fund. Such Other Expense reimbursements, if any, are accrued daily and paid monthly. In
addition, the Funds are not obligated to reimburse GSAM for prior fiscal year expense reimbursements, if any. The Other Expense
limitations as an annual percentage rate of average daily net assets for Emerging Markets Equity Insights, International Equity
Insights and International Small Cap Insights Funds are 0.054%, 0.004% and 0.014%, respectively. These Other Expense74

G O L D M A N S A C H S I N T E R N A T I O N A L E Q U I T Y I N S I G H T S F U N D S
5 . A G R E E M E N T S A N D A F F I L I A T E D T R A N S A C T I O N S ( c o n t i n u e d )
limitations will remain in place through at least February 28, 2022, and prior to such date GSAM may not terminate the
arrangements without the approval of the Trustees. In addition, the Funds have entered into certain offset arrangements with the
custodian and the transfer agent, which may result in a reduction of the Funds’ expenses and are received irrespective of the
application of the “Other Expense” limitations described above.
For the fiscal year ended October 31, 2021, these expense reductions, including any fee waivers and Other Expense
reimbursements, were as follows:
FundManagementFee Waiver
OtherExpense
Reimbursement
TotalExpense
Reductions
Emerging Markets Equity Insights $3,157 $1,027,096 $1,030,253
International Equity Insights 108 1,126,885 1,126,993
International Small Cap Insights 1,194 1,556,751 1,557,945
G. Line of Credit Facility — As of October 31, 2021, the Funds participated in a $1,000,000,000 committed, unsecured
revolving line of credit facility (the “facility”) together with other funds of the Trust and certain registered investment companies
having management agreements with GSAM or its affiliates. This facility is to be used for temporary emergency purposes, or to
allow for an orderly liquidation of securities to meet redemption requests. The interest rate on borrowings is based on the federal
funds rate. The facility also requires a fee to be paid by the Funds based on the amount of the commitment that has not been
utilized. For the fiscal year ended October 31, 2021, the Funds did not have any borrowings under the facility. Prior to April 26,
2021 the facility was $700,000,000.
H. Other Transactions with Affiliates — For the fiscal year ended October 31, 2021, Goldman Sachs earned $162 in
brokerage commissions from portfolio transactions, on behalf of the Emerging Markets Equity Insights Fund.
The following table provides information about the Funds’ investments in the Goldman Sachs Financial Square Government
Fund as of and for the fiscal year ended October 31, 2021:
Fund
BeginningValue as of
October 31, 2020Purchases
at CostProceeds
from Sales
EndingValue as of
October 31, 2021Shares as of
October 31, 2021DividendIncome
Emerging Markets Equity Insights $ — $546,693,040 $(544,880,917) $1,812,123 1,812,123 $1,810
International Equity Insights — 48,420,399 (48,420,399) — — 63
International Small Cap Insights — 428,875,913 (428,875,913) — — 784
As of October 31, 2021, the following Goldman Sachs Tax-Advantaged Global Equity Portfolio was a beneficial owner of 5%
or more of total outstanding shares of the following Fund:
Fund
Goldman SachsTax-Advantaged
Global EquityPortfolio
Emerging Markets Equity Insights 10%
75
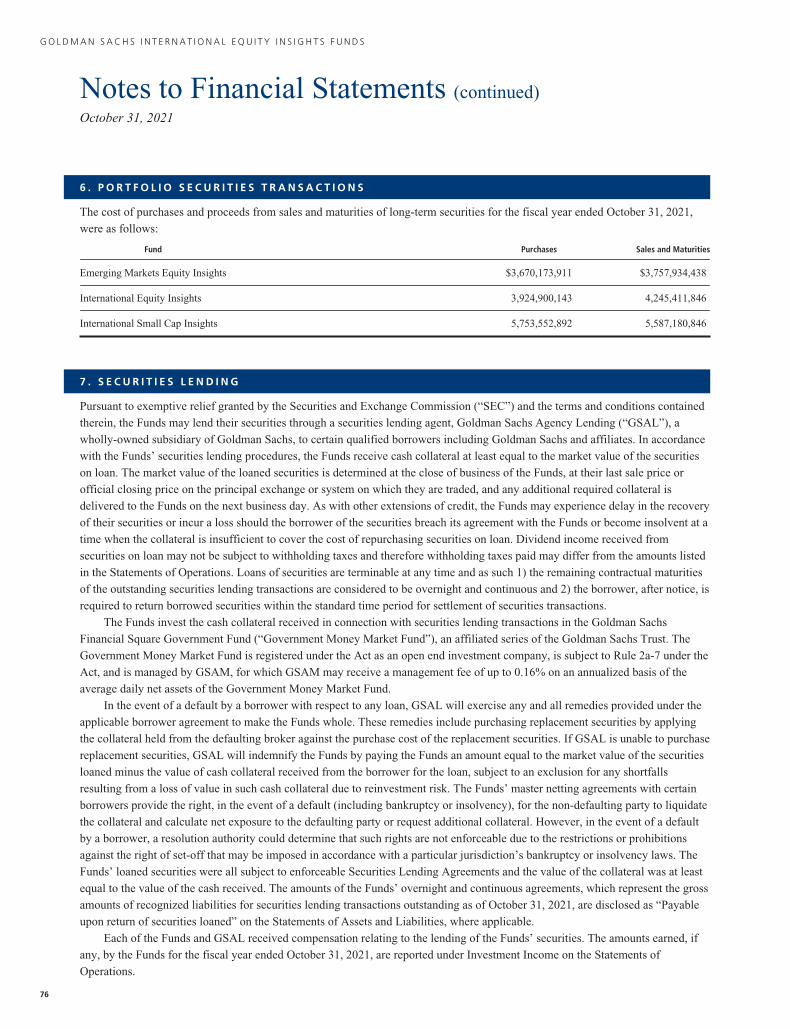
G O L D M A N S A C H S I N T E R N A T I O N A L E Q U I T Y I N S I G H T S F U N D S
Notes to Financial Statements (continued)October 31, 2021
6 . P O R T F O L I O S E C U R I T I E S T R A N S A C T I O N S
The cost of purchases and proceeds from sales and maturities of long-term securities for the fiscal year ended October 31, 2021,
were as follows:
Fund Purchases Sales and Maturities
Emerging Markets Equity Insights $3,670,173,911 $3,757,934,438
International Equity Insights 3,924,900,143 4,245,411,846
International Small Cap Insights 5,753,552,892 5,587,180,846
7 . S E C U R I T I E S L E N D I N G
Pursuant to exemptive relief granted by the Securities and Exchange Commission (“SEC”) and the terms and conditions contained
therein, the Funds may lend their securities through a securities lending agent, Goldman Sachs Agency Lending (“GSAL”), a
wholly-owned subsidiary of Goldman Sachs, to certain qualified borrowers including Goldman Sachs and affiliates. In accordance
with the Funds’ securities lending procedures, the Funds receive cash collateral at least equal to the market value of the securities
on loan. The market value of the loaned securities is determined at the close of business of the Funds, at their last sale price or
official closing price on the principal exchange or system on which they are traded, and any additional required collateral is
delivered to the Funds on the next business day. As with other extensions of credit, the Funds may experience delay in the recovery
of their securities or incur a loss should the borrower of the securities breach its agreement with the Funds or become insolvent at a
time when the collateral is insufficient to cover the cost of repurchasing securities on loan. Dividend income received from
securities on loan may not be subject to withholding taxes and therefore withholding taxes paid may differ from the amounts listed
in the Statements of Operations. Loans of securities are terminable at any time and as such 1) the remaining contractual maturities
of the outstanding securities lending transactions are considered to be overnight and continuous and 2) the borrower, after notice, is
required to return borrowed securities within the standard time period for settlement of securities transactions.
The Funds invest the cash collateral received in connection with securities lending transactions in the Goldman Sachs
Financial Square Government Fund (“Government Money Market Fund”), an affiliated series of the Goldman Sachs Trust. The
Government Money Market Fund is registered under the Act as an open end investment company, is subject to Rule 2a-7 under the
Act, and is managed by GSAM, for which GSAM may receive a management fee of up to 0.16% on an annualized basis of the
average daily net assets of the Government Money Market Fund.
In the event of a default by a borrower with respect to any loan, GSAL will exercise any and all remedies provided under the
applicable borrower agreement to make the Funds whole. These remedies include purchasing replacement securities by applying
the collateral held from the defaulting broker against the purchase cost of the replacement securities. If GSAL is unable to purchase
replacement securities, GSAL will indemnify the Funds by paying the Funds an amount equal to the market value of the securities
loaned minus the value of cash collateral received from the borrower for the loan, subject to an exclusion for any shortfalls
resulting from a loss of value in such cash collateral due to reinvestment risk. The Funds’ master netting agreements with certain
borrowers provide the right, in the event of a default (including bankruptcy or insolvency), for the non-defaulting party to liquidate
the collateral and calculate net exposure to the defaulting party or request additional collateral. However, in the event of a default
by a borrower, a resolution authority could determine that such rights are not enforceable due to the restrictions or prohibitions
against the right of set-off that may be imposed in accordance with a particular jurisdiction’s bankruptcy or insolvency laws. The
Funds’ loaned securities were all subject to enforceable Securities Lending Agreements and the value of the collateral was at least
equal to the value of the cash received. The amounts of the Funds’ overnight and continuous agreements, which represent the gross
amounts of recognized liabilities for securities lending transactions outstanding as of October 31, 2021, are disclosed as “Payable
upon return of securities loaned” on the Statements of Assets and Liabilities, where applicable.
Each of the Funds and GSAL received compensation relating to the lending of the Funds’ securities. The amounts earned, if
any, by the Funds for the fiscal year ended October 31, 2021, are reported under Investment Income on the Statements of
Operations.
76

G O L D M A N S A C H S I N T E R N A T I O N A L E Q U I T Y I N S I G H T S F U N D S
7 . S E C U R I T I E S L E N D I N G ( c o n t i n u e d )
The table below details securities lending activity with affiliates of Goldman Sachs:
For the fiscal year ended October 31, 2021Amount Payable to
Goldman Sachsupon Return of
Securities Loaned asof October 31, 2021Fund
Earnings of GSALRelating toSecuritiesLoaned
Amounts Receivedby the Funds
from Lending toGoldman Sachs
Emerging Markets Equity Insights $24,502 $53,201 $1,673,540
International Equity Insights 39,608 804 —
International Small Cap Insights 74,871 60,850 —
The following table provides information about the Funds’ investment in the Government Money Market Fund for the fiscal
year ended October 31, 2021:
Fund
BeginningValue as of
October 31, 2020Purchases
at CostProceeds
from Sales
EndingValue as of
October 31, 2021
Emerging Markets Equity Insights $ 500,400 $131,606,558 $(115,835,159) $16,271,799
International Equity Insights 25,795,600 395,403,029 (390,553,829) 30,644,800
International Small Cap Insights 29,274,156 326,100,841 (350,414,864) 4,960,133
8 . T A X I N F O R M A T I O N
The tax character of distributions paid during the fiscal year ended October 31, 2021, was as follows:
Emerging MarketsEquity Insights
InternationalEquity Insights
InternationalSmall Cap Insights
Distributions paid from:
Ordinary income $21,785,690 $42,051,564 $50,976,292
The tax character of distributions paid during the fiscal year ended October 31, 2020, was as follows:
Emerging MarketsEquity Insights
InternationalEquity Insights
InternationalSmall Cap Insights
Distributions paid from:
Ordinary income $36,220,550 $76,193,916 $134,097,136
77

G O L D M A N S A C H S I N T E R N A T I O N A L E Q U I T Y I N S I G H T S F U N D S
Notes to Financial Statements (continued)October 31, 2021
8 . T A X I N F O R M A T I O N ( c o n t i n u e d )
As of October 31, 2021, the components of accumulated earnings (losses) on a tax-basis were as follows:
Emerging MarketsEquity Insights
InternationalEquity Insights
InternationalSmall Cap Insights
Undistributed ordinary income — net $140,098,209 $ 73,374,112 $119,290,446
Undistributed long-term capital gains 191,314,675 75,614,604 —
Total undistributed earnings $331,412,884 $148,988,716 $119,290,446
Capital loss carryforwards:(1)
Perpetual long-term $ — $ — $ —
Perpetual short-term — — (43,199,247)
Total capital loss carryforwards $ — $ — $ (43,199,247)
Timing differences (Foreign Tax Reclaims Accrued but not Received) 1,580,427 45,542
Unrealized gains — net 79,574,122 246,051,895 349,168,423
Total accumulated earnings — net $410,987,006 $396,621,038 $425,305,164
(1) The Emerging Markets Equity Insights, International Equity Insights and International Small Cap Insights Funds utilized $235,390,403, $361,819,691 and$493,310,927 of capital losses in the current fiscal year, respectively.
As of October 31, 2021, the Funds’ aggregate security unrealized gains and losses based on cost for U.S. federal income tax
purposes were as follows:
Emerging MarketsEquity Insights
InternationalEquity Insights
InternationalSmall Cap Insights
Tax cost $1,814,707,002 $2,268,151,855 $3,374,073,047
Gross unrealized gain 198,180,462 327,866,227 471,566,828
Gross unrealized loss (118,606,340) (81,814,332) (122,398,405)
Net unrealized gain $ 79,574,122 $ 246,051,895 $ 349,168,423
The difference between GAAP-basis and tax-basis unrealized gains (losses) is attributable primarily to wash sales, net mark to
market gains (losses) on regulated futures, net mark to market gains (losses) on foreign currency contracts and differences in the
tax treatment of passive foreign investment company investments.
GSAM has reviewed the Funds’ tax positions for all open tax years (the current and prior three years, as applicable) and has
concluded that no provision for income tax is required in the Funds’ financial statements. Such open tax years remain subject to
examination and adjustment by tax authorities.
9 . O T H E R R I S K S
The Funds’ risks include, but are not limited to, the following:
Derivatives Risk — The Funds’ use of derivatives may result in loss. Derivative instruments, which may pose risks in addition to
and greater than those associated with investing directly in securities, currencies or other instruments, may be illiquid or less liquid,
volatile, difficult to price and leveraged so that small changes in the value of the underlying instruments may produce
disproportionate losses to the Funds. Derivatives are also subject to counterparty risk, which is the risk that the other party in the
transaction will not fulfill its contractual obligation. The use of derivatives is a highly specialized activity that involves investment
techniques and risks different from those associated with investments in more traditional securities and instruments. Losses from
derivatives can also result from a lack of correlation between changes in the value of derivative instruments and the portfolio assets
(if any) being hedged.78

G O L D M A N S A C H S I N T E R N A T I O N A L E Q U I T Y I N S I G H T S F U N D S
9 . O T H E R R I S K S ( c o n t i n u e d )
Foreign and Emerging Countries Risk — Investing in foreign markets may involve special risks and considerations not
typically associated with investing in the U.S. Foreign securities may be subject to risk of loss because of more or less foreign
government regulation, less public information; less stringent investor protections; less stringent accounting, corporate governance,
financial reporting and disclosure standards; and less economic, political and social stability in the countries in which a Fund
invests. The imposition of exchange controls (including repatriation restrictions), confiscation of assets and property, trade
restrictions (including tariffs) and other government restrictions by the U.S. or other governments, or problems with registration,
settlement or custody, may also result in losses. Foreign risk also involves the risk of negative foreign currency rate fluctuations,
which may cause the value of securities denominated in such foreign currency (or other instruments through which a Fund has
exposure to foreign currencies) to decline in value. Currency exchange rates may fluctuate significantly over short periods of time.
To the extent that a Fund also invests in securities of issuers located in, or economically tied to, emerging markets, these risks may
be more pronounced.
Foreign Custody Risk — A Fund invests in foreign securities, and as such the Fund may hold such securities and cash with
foreign banks, agents, and securities depositories appointed by the Fund’s custodian (each a “Foreign Custodian”). Some foreign
custodians may be recently organized or new to the foreign custody business. In some countries, Foreign Custodians may be
subject to little or no regulatory oversight over, or independent evaluation of, their operations. Further, the laws of certain countries
may place limitations on a Fund’s ability to recover its assets if a Foreign Custodian enters bankruptcy. Investments in emerging
markets may be subject to even greater custody risks than investments in more developed markets. Custody services in emerging
market countries are very often undeveloped and may be considerably less well regulated than in more developed countries, and
thus may not afford the same level of investor protection as would apply in developed countries.
Investments in Other Investment Companies Risk — As a shareholder of another investment company, a Fund will
indirectly bear its proportionate share of any net management fees and other expenses paid by such other investment companies, in
addition to the fees and expenses regularly borne by the Fund.
Large Shareholder Transactions Risk — A Fund may experience adverse effects when certain large shareholders, such as
other funds, institutional investors (including those trading by use of non-discretionary mathematical formulas), financial
intermediaries (who may make investment decisions on behalf of underlying clients and/or include a Fund in their investment
model), individuals, accounts and Goldman Sachs affiliates, purchase or redeem large amounts of shares of a Fund. Such large
shareholder redemptions, which may occur rapidly or unexpectedly, may cause a Fund to sell portfolio securities at times when it
would not otherwise do so, which may negatively impact a Fund’s NAV and liquidity. These transactions may also accelerate the
realization of taxable income to shareholders if such sales of investments resulted in gains, and may also increase transaction costs.
In addition, a large redemption could result in a Fund’s current expenses being allocated over a smaller asset base, leading to an
increase in the Fund’s expense ratio. Similarly, large Fund share purchases may adversely affect a Fund’s performance to the
extent that the Fund is delayed in investing new cash or otherwise maintains a larger cash position than it ordinarily would.
Liquidity Risk — A Fund may make investments that are illiquid or that may become less liquid in response to market
developments or adverse investor perceptions. Illiquid investments may be more difficult to value. Liquidity risk may also refer to
the risk that a Fund will not be able to pay redemption proceeds within the allowable time period or without significant dilution to
remaining investors’ interests because of unusual market conditions, an unusually high volume of redemption requests, or other
reasons. To meet redemption requests, a Fund may be forced to sell investments at an unfavorable time and/or under unfavorable
conditions. If a Fund is forced to sell securities at an unfavorable time and/or under unfavorable conditions, such sales may
adversely affect the Fund’s NAV and dilute remaining investors’ interests. These risks may be more pronounced in connection
with the Funds’ investments in securities of issuers located in emerging market countries. Redemptions by large shareholders may
have a negative impact on a Fund’s liquidity.
Market and Credit Risks — In the normal course of business, a Fund trades financial instruments and enters into financial
transactions where risk of potential loss exists due to changes in the market (market risk). The value of the securities in which a
Fund invests may go up or down in response to the prospects of individual companies, particular sectors or governments and/or
79

G O L D M A N S A C H S I N T E R N A T I O N A L E Q U I T Y I N S I G H T S F U N D S
Notes to Financial Statements (continued)October 31, 2021
9 . O T H E R R I S K S ( c o n t i n u e d )
general economic conditions throughout the world due to increasingly interconnected global economies and financial markets.
Events such as war, acts of terrorism, social unrest, natural disasters, the spread of infectious illness or other public health threats
could also significantly impact a Fund and its investments. Additionally, a Fund may also be exposed to credit risk in the event that
an issuer or guarantor fails to perform or that an institution or entity with which the Fund has unsettled or open transactions
defaults.
Non-Diversification Risk — Emerging Markets Equity Insights Fund is non-diversified, meaning that it is permitted to invest a
larger percentage of its assets in fewer issuers than diversified mutual funds. Thus, the Fund may be more susceptible to adverse
developments affecting any single issuer held in its portfolio, and may be more susceptible to greater losses because of these
developments.
1 0 . I N D E M N I F I C A T I O N S
Under the Trust’s organizational documents, its Trustees, officers, employees and agents are indemnified, to the extent permitted
by the Act and state law, against certain liabilities that may arise out of performance of their duties to the Funds. Additionally, in
the course of business, the Funds enter into contracts that contain a variety of indemnification clauses. The Funds’ maximum
exposure under these arrangements is unknown, as this would involve future claims that may be made against the Funds that have
not yet occurred. However, GSAM believes the risk of loss under these arrangements to be remote.
1 1 . S U B S E Q U E N T E V E N T S
Subsequent events after the Statements of Assets and Liabilities date have been evaluated, and GSAM has concluded that there is
no impact requiring adjustment or disclosure in the financial statements.
80

G O L D M A N S A C H S I N T E R N A T I O N A L E Q U I T Y I N S I G H T S F U N D S
1 2 . S U M M A R Y O F S H A R E T R A N S A C T I O N S
Share activity is as follows:
Emerging Markets Equity Insights Fund
For the Fiscal Year EndedOctober 31, 2021
For the Fiscal Year EndedOctober 31, 2020
Shares Dollars Shares Dollars
Class A SharesShares sold 1,324,816 $ 16,294,291 1,401,438 $ 12,758,250
Reinvestment of distributions 36,210 415,329 118,920 1,159,473
Shares redeemed (2,216,318) (27,128,058) (4,245,371) (38,963,400)
(855,292) (10,418,438) (2,725,013) (25,045,677)
Class C SharesShares sold 45,497 564,663 48,145 455,875
Reinvestment of distributions — — 5,799 56,079
Shares redeemed (132,966) (1,594,414) (372,569) (3,394,246)
(87,469) (1,029,751) (318,625) (2,882,292)
Institutional SharesShares sold 21,839,140 268,136,552 38,269,703 338,251,447
Reinvestment of distributions 1,005,185 11,479,207 1,872,307 18,180,104
Shares redeemed (29,843,944) (372,402,951) (46,792,105) (409,780,368)
(6,999,619) (92,787,192) (6,650,095) (53,348,817)
Investor SharesShares sold 2,323,143 28,596,840 2,339,668 20,910,745
Reinvestment of distributions 90,785 1,036,768 226,625 2,198,257
Shares redeemed (2,454,743) (30,210,098) (6,550,280) (57,883,865)
(40,815) (576,490) (3,983,987) (34,774,863)
Class R6 SharesShares sold 9,885,269 121,090,710 11,869,424 108,770,757
Reinvestment of distributions 481,437 5,493,200 954,926 9,262,782
Shares redeemed (7,503,302) (91,186,499) (19,995,919) (178,540,794)
2,863,404 35,397,411 (7,171,569) (60,507,255)
Class R SharesShares sold 487,856 5,941,268 673,190 5,988,282
Reinvestment of distributions 19,003 214,543 45,642 438,620
Shares redeemed (1,327,242) (16,785,106) (798,602) (7,249,768)
(820,383) (10,629,295) (79,770) (822,866)
Class P SharesShares sold 1,255,341 15,541,080 3,768,611 31,589,002
Reinvestment of distributions 128,389 1,464,922 264,309 2,563,794
Shares redeemed (544,878) (6,487,793) (6,512,741) (53,510,489)
838,852 10,518,209 (2,479,821) (19,357,693)
NET DECREASE (5,101,322) $ (69,525,546) (23,408,880) $(196,739,463)
81

G O L D M A N S A C H S I N T E R N A T I O N A L E Q U I T Y I N S I G H T S F U N D S
Notes to Financial Statements (continued)October 31, 2021
1 2 . S U M M A R Y O F S H A R E T R A N S A C T I O N S ( c o n t i n u e d )
Share activity is as follows:
International Equity Insights Fund
For the Fiscal Year EndedOctober 31, 2021
For the Fiscal Year EndedOctober 31, 2020
Shares Dollars Shares Dollars
Class A SharesShares sold 1,417,226 $ 19,755,218 7,926,994 $ 89,401,590Reinvestment of distributions 250,858 3,336,409 440,242 5,547,046Shares redeemed (12,528,302) (167,727,703) (9,566,000) (103,652,103)
(10,860,218) (144,636,076) (1,198,764) (8,703,467)
Class C SharesShares sold 91,531 1,260,249 143,956 1,656,858Reinvestment of distributions 7,365 96,259 19,114 236,629Shares redeemed (311,058) (4,246,853) (800,332) (8,829,816)
(212,162) (2,890,345) (637,262) (6,936,329)
Institutional SharesShares sold 31,304,317 450,174,099 23,320,158 271,120,005Reinvestment of distributions 695,950 9,520,592 1,453,083 18,817,424Shares redeemed (20,341,719) (297,907,746) (53,834,133) (629,253,649)
11,658,548 161,786,945 (29,060,892) (339,316,220)
Service SharesShares sold 70,409 1,006,325 48,006 557,250Reinvestment of distributions 4,118 55,391 7,944 101,205Shares redeemed (197,347) (2,896,166) (165,325) (1,972,728)
(122,820) (1,834,450) (109,375) (1,314,273)
Investor SharesShares sold 1,465,638 19,663,724 18,708,329 204,405,376Reinvestment of distributions 133,647 1,748,099 1,192,705 14,717,983Shares redeemed (22,805,003) (290,920,623) (37,036,531) (417,050,165)
(21,205,718) (269,508,800) (17,135,497) (197,926,806)
Class R6 SharesShares sold 5,715,945 82,452,861 12,481,283 149,814,870Reinvestment of distributions 720,183 9,844,905 1,011,031 13,082,737Shares redeemed (9,697,850) (141,144,260) (15,450,179) (185,491,737)
(3,261,722) (48,846,494) (1,957,865) (22,594,130)
Class R SharesShares sold 97,389 1,337,005 264,386 2,684,056Reinvestment of distributions 10,204 131,937 13,067 160,204Shares redeemed (307,654) (4,266,758) (293,188) (3,307,807)
(200,061) (2,797,816) (15,735) (463,547)
Class P SharesShares sold 2,597,903 38,201,859 22,761,785 228,470,032Reinvestment of distributions 568,110 7,760,380 715,872 9,256,225Shares redeemed (2,683,872) (38,775,485) (22,083,845) (236,168,248)
482,141 7,186,754 1,393,812 1,558,009
NET DECREASE (23,722,012) $(301,540,282) (48,721,578) $(575,696,763)
82

G O L D M A N S A C H S I N T E R N A T I O N A L E Q U I T Y I N S I G H T S F U N D S
1 2 . S U M M A R Y O F S H A R E T R A N S A C T I O N S ( c o n t i n u e d )
Share activity is as follows:
International Small Cap Insights Fund
For the Fiscal Year EndedOctober 31, 2021
For the Fiscal Year EndedOctober 31, 2020
Shares Dollars Shares Dollars
Class A Shares
Shares sold 2,448,685 $ 33,474,118 2,509,564 $ 25,278,690
Reinvestment of distributions 150,353 1,874,899 391,583 4,659,839
Shares redeemed (3,058,568) (41,366,848) (5,785,416) (59,662,985)
(459,530) (6,017,831) (2,884,269) (29,724,456)
Class C Shares
Shares sold 89,719 1,208,876 67,454 728,845
Reinvestment of distributions 17,735 214,601 96,844 1,117,582
Shares redeemed (813,730) (10,661,059) (1,963,466) (20,056,232)
(706,276) (9,237,582) (1,799,168) (18,209,805)
Institutional Shares
Shares sold 58,587,612 824,933,074 54,461,158 554,649,638
Reinvestment of distributions 2,655,507 33,034,503 5,638,318 66,926,830
Shares redeemed (27,868,028) (372,394,193) (94,722,054) (932,342,859)
33,375,091 485,573,384 (34,622,578) (310,766,391)
Investor Shares
Shares sold 2,036,645 28,143,329 1,891,399 19,680,694
Reinvestment of distributions 203,421 2,520,385 726,038 8,589,026
Shares redeemed (4,353,122) (58,408,160) (13,956,319) (145,994,812)
(2,113,056) (27,744,446) (11,338,882) (117,725,092)
Class R6 Shares
Shares sold 26,986,066 386,482,826 22,721,529 235,744,909
Reinvestment of distributions 802,927 10,004,474 3,311,662 39,375,654
Shares redeemed (54,296,259) (668,104,389) (39,367,794) (427,706,335)
(26,507,266) (271,617,089) (13,334,603) (152,585,772)
Class P Shares
Shares sold 461,075 6,292,433 294,571 3,369,698
Reinvestment of distributions 72,049 897,729 233,781 2,779,660
Shares redeemed (364,802) (4,725,392) (3,416,736) (33,388,958)
168,322 2,464,770 (2,888,384) (27,239,600)
NET INCREASE (DECREASE) 3,757,285 $ 173,421,206 (66,867,884) $(656,251,116)
83
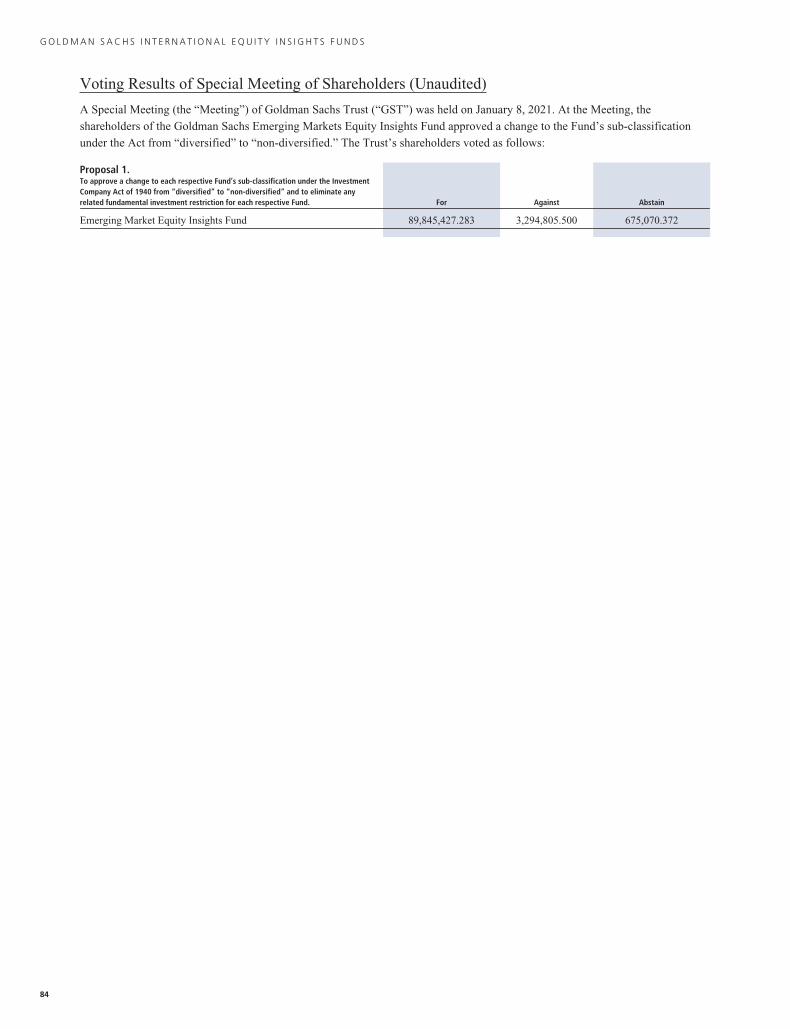
G O L D M A N S A C H S I N T E R N A T I O N A L E Q U I T Y I N S I G H T S F U N D S
Voting Results of Special Meeting of Shareholders (Unaudited)
A Special Meeting (the “Meeting”) of Goldman Sachs Trust (“GST”) was held on January 8, 2021. At the Meeting, the
shareholders of the Goldman Sachs Emerging Markets Equity Insights Fund approved a change to the Fund’s sub-classification
under the Act from “diversified” to “non-diversified.” The Trust’s shareholders voted as follows:
Proposal 1.To approve a change to each respective Fund’s sub-classification under the InvestmentCompany Act of 1940 from “diversified” to “non-diversified” and to eliminate anyrelated fundamental investment restriction for each respective Fund. For Against Abstain
Emerging Market Equity Insights Fund 89,845,427.283 3,294,805.500 675,070.372
84
Report of Independent Registered PublicAccounting Firm
To the Board of Trustees of Goldman Sachs Trust and Shareholders of Goldman Sachs Emerging Markets Equity InsightsFund, Goldman Sachs International Equity Insights Fund, and Goldman Sachs International Small Cap Insights Fund
Opinions on the Financial Statements
We have audited the accompanying statements of assets and liabilities, including the schedules of investments, of GoldmanSachs Emerging Markets Equity Insights Fund, Goldman Sachs International Equity Insights Fund, and Goldman SachsInternational Small Cap Insights Fund (three of the funds constituting Goldman Sachs Trust, hereafter collectively referredto as the “Funds”) as of October 31, 2021, the related statements of operations for the year ended October 31, 2021, thestatements of changes in net assets for each of the two years in the period ended October 31, 2021, including the relatednotes, and the financial highlights for each of the periods indicated therein (collectively referred to as the “financialstatements”). In our opinion, the financial statements present fairly, in all material respects, the financial position of each ofthe Funds as of October 31, 2021, the results of each of their operations for the year then ended, the changes in each of theirnet assets for each of the two years in the period ended October 31, 2021 and each of the financial highlights for each of theperiods indicated therein in conformity with accounting principles generally accepted in the United States of America.
Basis for Opinions
These financial statements are the responsibility of the Funds’ management. Our responsibility is to express an opinion onthe Funds’ financial statements based on our audits. We are a public accounting firm registered with the Public CompanyAccounting Oversight Board (United States) (PCAOB) and are required to be independent with respect to the Funds inaccordance with the U.S. federal securities laws and the applicable rules and regulations of the Securities and ExchangeCommission and the PCAOB.
We conducted our audits of these financial statements in accordance with the standards of the PCAOB. Those standardsrequire that we plan and perform the audit to obtain reasonable assurance about whether the financial statements are free ofmaterial misstatement, whether due to error or fraud.
Our audits included performing procedures to assess the risks of material misstatement of the financial statements, whetherdue to error or fraud, and performing procedures that respond to those risks. Such procedures included examining, on a testbasis, evidence regarding the amounts and disclosures in the financial statements. Our audits also included evaluating theaccounting principles used and significant estimates made by management, as well as evaluating the overall presentation ofthe financial statements. Our procedures included confirmation of securities owned as of October 31, 2021 bycorrespondence with the custodian, transfer agent and brokers; when replies were not received from brokers, we performedother auditing procedures. We believe that our audits provide a reasonable basis for our opinions.
/s/ PricewaterhouseCoopers LLP
Boston, MassachusettsDecember 23, 2021
We have served as the auditor of one or more investment companies in the Goldman Sachs fund complex since 2000.
85

GO
LD
MA
NS
AC
HS
INT
ER
NA
TIO
NA
LE
QU
ITY
INS
IGH
TS
FU
ND
S
Fun
dE
xpen
ses
—Si
xM
onth
Per
iod
End
edO
ctob
er31
,202
1(U
naud
ited
)A
sa
shar
ehol
der
ofC
lass
A,
Cla
ssC
,In
stit
utio
nal,
Ser
vice
,In
vest
or,
Cla
ssR
6,C
lass
Ror
Cla
ssP
Sha
res
ofa
Fun
dyo
uin
cur
two
type
sof
cost
s:(1
)tr
ansa
ctio
nco
sts,
incl
udin
gsa
les
char
ges
onpu
rcha
sepa
ymen
ts(w
ith
resp
ect
toC
lass
AS
hare
s)an
dco
ntin
gent
defe
rred
sale
sch
arge
son
rede
mpt
ions
(wit
hre
spec
tto
Cla
ssC
Sha
res)
;an
d(2
)on
goin
gco
sts,
incl
udin
gm
anag
emen
tfe
es;
dist
ribu
tion
and/
orse
rvic
e(1
2b-1
)fe
es(w
ith
resp
ect
toC
lass
A,
Cla
ssC
,S
ervi
cean
dC
lass
RS
hare
s);
and
othe
rF
und
expe
nses
.T
his
exam
ple
isin
tend
edto
help
you
unde
rsta
ndyo
uron
goin
gco
sts
(in
doll
ars)
ofin
vest
ing
inC
lass
A,C
lass
C,I
nsti
tuti
onal
,Ser
vice
,Inv
esto
r,C
lass
R6,
Cla
ssR
and
Cla
ssP
Sha
res
ofth
eF
unds
and
toco
mpa
reth
ese
cost
sw
ith
the
ongo
ing
cost
sof
inve
stin
gin
othe
rm
utua
lfun
ds.
The
exam
ple
isba
sed
onan
inve
stm
ent
of$1
,000
inve
sted
atth
ebe
ginn
ing
ofth
epe
riod
and
held
for
the
enti
repe
riod
from
May
01,2
021
thro
ugh
Oct
ober
31,2
021,
whi
chre
pres
ents
ape
riod
of18
4da
ysof
a36
5da
yye
ar.
Act
ual
Exp
ense
s—
The
firs
tlin
eun
der
each
shar
ecl
ass
inth
eta
ble
belo
wpr
ovid
esin
form
atio
nab
out
actu
alac
coun
tva
lues
and
actu
alex
pens
es.Y
oum
ayus
eth
ein
form
atio
nin
this
line
,tog
ethe
rw
ith
the
amou
ntyo
uin
vest
ed,t
oes
tim
ate
the
expe
nses
that
you
paid
over
the
peri
od.S
impl
ydi
vide
your
acco
untv
alue
by$1
,000
(for
exam
ple,
an$8
,600
acco
untv
alue
divi
ded
by$1
,000
=8.
6),t
hen
mul
tipl
yth
ere
sult
byth
enu
mbe
rin
the
firs
tlin
eun
der
the
head
ing
enti
tled
“Exp
ense
sP
aid”
toes
tim
ate
the
expe
nses
you
paid
onyo
urac
coun
tdur
ing
this
peri
od.
Hyp
othe
tica
lExa
mpl
efo
rC
ompa
riso
nP
urpo
ses
—T
hese
cond
line
unde
rea
chsh
are
clas
sin
the
tabl
ebe
low
prov
ides
info
rmat
ion
abou
thyp
othe
tica
lacc
ount
valu
esan
dhy
poth
etic
alex
pens
esba
sed
onth
eF
unds
’ac
tual
net
expe
nse
rati
oan
dan
assu
med
rate
ofre
turn
of5%
per
year
befo
reex
pens
es,w
hich
isno
tth
eF
unds
’ac
tual
retu
rn.T
hehy
poth
etic
alac
coun
tva
lues
and
expe
nses
may
not
beus
edto
esti
mat
eth
eac
tual
endi
ngac
coun
tbal
ance
orex
pens
esyo
upa
idfo
rth
epe
riod
.You
may
use
this
info
rmat
ion
toco
mpa
reth
eon
goin
gco
sts
ofin
vest
ing
inth
eF
unds
and
othe
rfu
nds.
To
doso
,com
pare
this
5%hy
poth
etic
alex
ampl
ew
ith
the
5%hy
poth
etic
alex
ampl
esth
atap
pear
inth
esh
areh
olde
rre
port
sof
the
othe
rfu
nds.
Ple
ase
note
that
the
expe
nses
show
nin
the
tabl
ear
em
eant
tohi
ghli
ght
your
ongo
ing
cost
son
lyan
ddo
not
refl
ect
any
tran
sact
iona
lco
sts,
such
assa
les
char
ges,
rede
mpt
ion
fees
orex
chan
gefe
es.
The
refo
re,
the
seco
ndli
neof
the
tabl
eis
usef
ulin
com
pari
ngon
goin
gco
sts
only
,an
dw
ill
not
help
you
dete
rmin
eth
ere
lati
veto
tal
cost
sof
owni
ngdi
ffer
ent
fund
s.In
addi
tion
,if
thes
etr
ansa
ctio
nal
cost
sw
ere
incl
uded
,you
rco
sts
wou
ldha
vebe
enhi
gher
.
Emer
ging
Mar
kets
Equi
tyIn
sigh
tsFu
ndIn
tern
atio
nalE
quit
yIn
sigh
tsFu
ndIn
tern
atio
nalS
mal
lCap
Insi
ghts
Fund
Shar
eCl
ass
Begi
nnin
gA
ccou
ntVa
lue
05/0
1/20
21
Endi
ngA
ccou
ntVa
lue
10/3
1/20
21
Expe
nses
Paid
for
the
6M
onth
sEn
ded
10/3
1/20
21*
Begi
nnin
gA
ccou
ntVa
lue
05/0
1/20
21
Endi
ngA
ccou
ntVa
lue
10/3
1/20
21
Expe
nses
Paid
for
the
6M
onth
sEn
ded
10/3
1/20
21*
Begi
nnin
gA
ccou
ntVa
lue
05/0
1/20
21
Endi
ngA
ccou
ntVa
lue
10/3
1/20
21
Expe
nses
Paid
for
the
6M
onth
sEn
ded
10/3
1/20
21*
Cla
ssA
Act
ual
$1,0
00$
927.
30$
7.09
$1,0
00$1
,030
.70
$5.9
9$1
,000
$1,0
09.2
0$
6.28
Hyp
othe
tica
l5%
retu
rn1,
000
1,01
7.85
+7.
431,
000
1,01
9.31
+5.
961,
000
1,01
8.95
+6.
31C
lass
CA
ctua
l1,
000
924.
1010
.72
1,00
01,
027.
109.
811,
000
1,00
5.80
10.0
6H
ypot
heti
cal5
%re
turn
1,00
01,
014.
06+
11.2
21,
000
1,01
5.53
+9.
751,
000
1,01
5.17
+10
.11
Inst
itu
tio
nal
Act
ual
1,00
092
9.40
5.30
1,00
01,
032.
504.
101,
000
1,01
1.30
4.41
Hyp
othe
tica
l5%
retu
rn1,
000
1,01
9.71
+5.
551,
000
1,02
1.17
+4.
081,
000
1,02
0.82
+4.
43Se
rvic
eA
ctua
lN
/AN
/AN
/A1,
000
1,02
9.70
6.65
N/A
N/A
N/A
Hyp
othe
tica
l5%
retu
rnN
/AN
/AN
/A1,
000
1,01
8.65
+6.
61N
/AN
/AN
/AIn
vest
or
Act
ual
1,00
092
8.60
5.88
1,00
01,
032.
604.
711,
000
1,00
9.90
5.02
Hyp
othe
tica
l5%
retu
rn1,
000
1,01
9.11
+6.
161,
000
1,02
0.57
+4.
691,
000
1,02
0.21
+5.
04C
lass
R6
Act
ual
1,00
092
9.40
5.25
1,00
01,
032.
604.
051,
000
1,01
1.30
4.36
Hyp
othe
tica
l5%
retu
rn1,
000
1,01
9.76
+5.
501,
000
1,02
1.22
+4.
021,
000
1,02
0.87
+4.
38C
lass
RA
ctua
l1,
000
926.
908.
311,
000
1,02
9.50
7.26
N/A
N/A
N/A
Hyp
othe
tica
l5%
retu
rn1,
000
1,01
6.59
+8.
691,
000
1,01
8.05
+7.
22N
/AN
/AN
/AC
lass
PA
ctua
l1,
000
929.
405.
251,
000
1,03
3.30
4.05
1,00
01,
011.
304.
36H
ypot
heti
cal5
%re
turn
1,00
01,
019.
76+
5.50
1,00
01,
021.
22+
4.02
1,00
01,
020.
87+
4.38
+H
ypot
heti
cale
xpen
ses
are
base
don
each
Fun
d’s
actu
alan
nual
ized
nete
xpen
sera
tios
and
anas
sum
edra
teof
retu
rnof
5%pe
rye
arbe
fore
expe
nses
.*
Exp
ense
sar
eca
lcul
ated
usin
gea
chF
und’
san
nual
ized
nete
xpen
sera
tio
for
each
clas
s,w
hich
repr
esen
tsth
eon
goin
gex
pens
esas
ape
rcen
tage
ofne
tass
ets
for
the
six
mon
ths
ende
dO
ctob
erl3
1,20
21.E
xpen
ses
are
calc
ulat
edby
mul
tipl
ying
the
annu
aliz
edne
tex
pens
era
tio
byth
eav
erag
eac
coun
tva
lue
for
the
peri
od;
then
mul
tipl
ying
the
resu
ltby
the
num
ber
ofda
ysin
the
mos
tre
cent
fisc
alha
lfye
ar;
and
then
divi
ding
that
resu
ltby
the
num
ber
ofda
ysin
the
fisc
alye
ar.T
hean
nual
ized
nete
xpen
sera
tios
for
the
peri
odw
ere
asfo
llow
s:
Fund
Clas
sA
Clas
sC
Inst
itut
iona
lSe
rvic
eIn
vest
orCl
ass
R6Cl
ass
RCl
ass
P
Em
ergi
ngM
arke
tsE
quit
yIn
sigh
ts1.
46%
2.21
%1.
09%
N/A
1.21
%1.
08%
1.71
%1.
08%
Inte
rnat
iona
lEqu
ity
Insi
ghts
1.17
1.92
0.80
1.30
0.92
0.79
1.42
0.79
Inte
rnat
iona
lSm
allC
apIn
sigh
ts1.
241.
990.
87N
/A0.
990.
86N
/A0.
86
86

G O L D M A N S A C H S I N T E R N A T I O N A L E Q U I T Y I N S I G H T S F U N D S
Statement Regarding Basis for Approval of Management Agreement (Unaudited)
BackgroundThe Goldman Sachs Emerging Markets Equity Insights Fund, Goldman Sachs International Equity Insights Fund, and
Goldman Sachs International Small Cap Insights Fund (the “Funds”) are investment portfolios of Goldman Sachs Trust (the
“Trust”). The Board of Trustees oversees the management of the Trust and reviews the investment performance and expenses of
the Funds at regularly scheduled meetings held throughout the year. In addition, the Board of Trustees determines annually
whether to approve the continuance of the Trust’s investment management agreement (the “Management Agreement”) with
Goldman Sachs Asset Management, L.P. (the “Investment Adviser”) on behalf of the Funds.
The Management Agreement was most recently approved for continuation until June 30, 2022 by the Board of Trustees,
including those Trustees who are not parties to the Management Agreement or “interested persons” (as defined in the Investment
Company Act of 1940, as amended) of any party thereto (the “Independent Trustees”), at a meeting held on June 15-16, 2021 (the
“Annual Meeting”).
The review process undertaken by the Trustees spans the course of the year and culminates with the Annual Meeting. To
assist the Trustees in their deliberations, the Trustees have established a Contract Review Committee (the “Committee”),
comprised of the Independent Trustees. The Committee held two meetings over the course of the year since the Management
Agreement was last approved. At those Committee meetings, regularly scheduled Board or other committee meetings, and/or the
Annual Meeting, matters relevant to the renewal of the Management Agreement were considered by the Board, or the Independent
Trustees, as applicable. With respect to each Fund, such matters included:
(a) the nature and quality of the advisory, administrative, and other services provided to the Fund by the Investment Adviser
and its affiliates, including information about:
(i) the structure, staff, and capabilities of the Investment Adviser and its portfolio management teams;
(ii) the groups within the Investment Adviser and its affiliates that support the portfolio management teams or provide
other types of necessary services, including fund services groups (e.g., accounting and financial reporting, tax,
shareholder services, and operations); controls and risk management groups (e.g., legal, compliance, valuation
oversight, credit risk management, internal audit, compliance testing, market risk analysis, finance, and central
funding); sales and distribution support groups, and others (e.g., information technology and training);
(iii) trends in employee headcount;
(iv) the Investment Adviser’s financial resources and ability to hire and retain talented personnel and strengthen its
operations; and
(v) the parent company’s support of the Investment Adviser and its mutual fund business, as expressed by the firm’s
senior management;
(b) information on the investment performance of the Fund, including comparisons to the performance of similar mutual
funds, as provided by a third-party mutual fund data provider engaged as part of the contract review process (the
“Outside Data Provider”), a benchmark performance index, and (in the case of the Emerging Markets Equity Insights
Fund and International Small Cap Insights Fund) a composite of accounts with comparable investment strategies
managed by the Investment Adviser; and information on general investment outlooks in the markets in which the Fund
invests;
(c) information provided by the Investment Adviser indicating the Investment Adviser’s views on whether the Fund’s peer
group and/or benchmark index had high, medium, or low relevance given the Fund’s particular investment strategy;
(d) the terms of the Management Agreement and other agreements with affiliated service providers entered into by the Trust
on behalf of the Fund;
(e) fee and expense information for the Fund, including:
(i) the relative management fee and expense levels of the Fund as compared to those of comparable funds managed by
other advisers, as provided by the Outside Data Provider;
(ii) the Fund’s expense trends over time; and
(iii) to the extent the Investment Adviser manages other types of accounts (such as bank collective trusts, private wealth
management accounts, institutional separate accounts, sub-advised mutual funds, and non-U.S. funds) having
investment objectives and policies similar to those of the Fund, comparative information on the advisory fees
charged and services provided to those accounts by the Investment Adviser;
(f) with respect to the extensive investment performance and expense comparison data provided by the Outside Data
Provider, its processes in producing that data for the Fund;
(g) the undertakings of the Investment Adviser and its affiliates to implement fee waivers and/or expense limitations;
(h) information relating to the profitability of the Management Agreement and the transfer agency and distribution and
service arrangements of the Fund to the Investment Adviser and its affiliates;
87

G O L D M A N S A C H S I N T E R N A T I O N A L E Q U I T Y I N S I G H T S F U N D S
Statement Regarding Basis for Approval of Management Agreement (Unaudited) (continued)
(i) whether the Fund’s existing management fee schedule adequately addressed any economies of scale;
(j) a summary of the “fall-out” benefits derived by the Investment Adviser and its affiliates from their relationships with the
Fund, including the fees received by the Investment Adviser’s affiliates from the Fund for transfer agency, securities
lending, portfolio trading, distribution and other services;
(k) a summary of potential benefits derived by the Fund as a result of its relationship with the Investment Adviser;
(l) information regarding commissions paid by the Fund and broker oversight, other information regarding portfolio trading,
and how the Investment Adviser carries out its duty to seek best execution;
(m) portfolio manager ownership of Fund shares; the manner in which portfolio manager compensation is determined; and
the number and types of accounts managed by the portfolio managers;
(n) the nature and quality of the services provided to the Fund by its unaffiliated service providers, and the Investment
Adviser’s general oversight and evaluation (including reports on due diligence) of those service providers as part of the
administrative services provided under the Management Agreement; and
(o) the Investment Adviser’s processes and policies addressing various types of potential conflicts of interest; its approach to
risk management; the annual review of the effectiveness of the Fund’s compliance program; and periodic compliance
reports.
The Trustees also received an overview of the Funds’ distribution arrangements. They received information regarding the
Funds’ assets, share purchase and redemption activity, and payment of distribution, service, and shareholder administration fees, as
applicable. Information was also provided to the Trustees relating to revenue sharing payments made by and services provided by
the Investment Adviser and its affiliates to intermediaries that promote the sale, distribution, and/or servicing of Fund shares. The
Independent Trustees also discussed the broad range of other investment choices that are available to Fund investors, including the
availability of comparable funds managed by other advisers.
The presentations made at the Board and Committee meetings and at the Annual Meeting encompassed the Funds and other
mutual funds for which the Board of Trustees has responsibility. In evaluating the Management Agreement at the Annual Meeting,
the Trustees relied upon their knowledge, resulting from their meetings and other interactions throughout the year, of the
Investment Adviser and its affiliates, their services, and the Funds. In conjunction with these meetings, the Trustees received
written materials and oral presentations on the topics covered, and the Investment Adviser addressed the questions and concerns of
the Trustees, including concerns regarding the investment performance of certain of the funds they oversee. The Independent
Trustees were advised by their independent legal counsel regarding their responsibilities and other regulatory requirements related
to the approval and continuation of mutual fund investment management agreements under applicable law. In addition, the
Investment Adviser and its affiliates provided the Independent Trustees with a written response to a formal request for information
sent on behalf of the Independent Trustees by their independent legal counsel. During the course of their deliberations, the
Independent Trustees met in executive sessions with their independent legal counsel, without representatives of the Investment
Adviser or its affiliates present.
Nature, Extent, and Quality of the Services Provided Under the Management AgreementAs part of their review, the Trustees considered the nature, extent, and quality of the services provided to the Funds by the
Investment Adviser. In this regard, the Trustees considered both the investment advisory services and non-advisory services that
are provided by the Investment Adviser and its affiliates. The Trustees noted the transition in the leadership and changes in
personnel of various of the Investment Adviser’s portfolio management teams that had occurred in recent periods, and the ongoing
recruitment efforts aimed at bringing high quality investment talent to the Investment Adviser. They also noted the Investment
Adviser’s commitment to maintaining high quality systems and expending substantial resources to respond to ongoing changes to
the market, regulatory and control environment in which the Funds and their service providers operate, including changes
associated with the COVID-19 pandemic, as well as the efforts of the Investment Adviser and its affiliates to combat cyber security
risks. The Trustees also considered information regarding the Investment Adviser’s business continuity planning and remote
operations capabilities. The Trustees concluded that the Investment Adviser continued to commit substantial financial and
operational resources to the Funds and expressed confidence that the Investment Adviser would continue to do so in the future. The
Trustees also recognized that the Investment Adviser had made significant commitments to address regulatory compliance
requirements applicable to the Funds and the Investment Adviser and its affiliates.
Investment PerformanceThe Trustees also considered the investment performance of the Funds. In this regard, they compared the investment
performance of each Fund to its peers using rankings and ratings compiled by the Outside Data Provider as of December 31, 2020,
and updated performance information prepared by the Investment Adviser using the peer group identified by the Outside Data
88

G O L D M A N S A C H S I N T E R N A T I O N A L E Q U I T Y I N S I G H T S F U N D S
Statement Regarding Basis for Approval of Management Agreement (Unaudited) (continued)
Provider as of March 31, 2021. The information on each Fund’s investment performance was provided for the one-, three-, five-,
and ten-year periods ending on the applicable dates. The Trustees also reviewed each Fund’s investment performance relative to its
performance benchmark. As part of this review, they considered the investment performance trends of the Funds over time, and
reviewed the investment performance of each Fund in light of its investment objective and policies and market conditions. The
Trustees also received information comparing the Emerging Markets Equity Insights Fund’s and International Small Cap Insights
Fund’s performance to that of composites of accounts with comparable investment strategies managed by the Investment Adviser.
In addition, the Trustees considered materials prepared and presentations made by the Investment Adviser’s senior
management and portfolio management personnel in which Fund performance was assessed. The Trustees also considered the
Investment Adviser’s periodic reports with respect to the Funds’ risk profiles, and how the Investment Adviser’s approach to risk
monitoring and management influences portfolio management. They noted the efforts of the Funds’ portfolio management team to
continue to enhance the investment models used in managing the Funds.
The Trustees observed that the Emerging Markets Equity Insights Fund’s Institutional Shares had placed in the top half of the
Fund’s peer group for the one-, three-, five-, and ten-year periods, and had outperformed the Fund’s benchmark index for the one-,
five-, and ten-year periods and underperformed for the three-year period ended March 31, 2021. They noted that the International
Equity Insights Fund’s Institutional Shares had placed in the top half of the Fund’s peer group for the one- and ten-year periods, in
the third quartile for the five-year period, and in the fourth quartile for the three-year period, and had outperformed the Fund’s
benchmark index for the one-, five-, ten-year periods and underperformed for the three-year period ended March 31, 2021. The
Trustees considered that the International Small Cap Insights Fund’s Institutional Shares had placed in the top half of the Fund’s
peer group for the five- and ten-year periods and in the third quartile for the one- and three-year periods, and had underperformed
the Fund’s benchmark index for the one-, three-, five-, and ten-year periods ended March 31, 2021.
Costs of Services Provided and Competitive InformationThe Trustees considered the contractual terms of the Management Agreement and the fee rates payable by each Fund
thereunder. In this regard, the Trustees considered information on the services rendered by the Investment Adviser to the Funds,
which included both advisory and administrative services that were directed to the needs and operations of the Funds as registered
mutual funds.
In particular, the Trustees reviewed analyses prepared by the Outside Data Provider regarding the expense rankings of the
Funds. The analyses provided a comparison of each Fund’s management fee and breakpoints to those of a relevant peer group and
category universe; an expense analysis which compared each Fund’s overall net and gross expenses to a peer group and a category
universe; and data comparing each Fund’s net expenses to the peer and category medians. The analyses also compared each Fund’s
other expenses and fee waivers/reimbursements to those of the peer group and category medians. The Trustees concluded that the
comparisons provided by the Outside Data Provider were useful in evaluating the reasonableness of the management fees and total
expenses paid by the Funds.
In addition, the Trustees considered the Investment Adviser’s undertakings to implement fee waivers and/or expense
limitations. They also considered, to the extent that the Investment Adviser manages other types of accounts having investment
objectives and policies similar to those of the Funds, comparative fee information for services provided by the Investment Adviser
to those accounts, and information that indicated that services provided to the Funds differed in various significant respects from
the services provided to other types of accounts which, in many cases, operated under less stringent legal and regulatory structures,
required fewer services from the Investment Adviser to a smaller number of client contact points, and were less time-intensive.
In addition, the Trustees noted that shareholders are able to redeem their Fund shares at any time if shareholders believe that
the Fund fees and expenses are too high or if they are dissatisfied with the performance of the Fund.
ProfitabilityThe Trustees reviewed each Fund’s contribution to the Investment Adviser’s revenues and pre-tax profit margins. In this
regard the Trustees noted that they had received, among other things, profitability analyses and summaries, revenue and expense
schedules by Fund and by function (i.e., investment management, transfer agency and distribution and service), and information on
the Investment Adviser’s expense allocation methodology. They observed that the profitability and expense figures are
substantially similar to those used by the Investment Adviser for many internal purposes, including compensation decisions among
89

G O L D M A N S A C H S I N T E R N A T I O N A L E Q U I T Y I N S I G H T S F U N D S
Statement Regarding Basis for Approval of Management Agreement (Unaudited) (continued)
various business groups, and are thus subject to a vigorous internal debate about how certain revenue and expenses should be
allocated. The Trustees also noted that the internal audit group within the Goldman Sachs organization periodically audits the
expense allocation methodology and that the internal audit group was satisfied with the reasonableness, consistency, and accuracy
of the Investment Adviser’s expense allocation methodology. Profitability data for each Fund was provided for 2020 and 2019, and
the Trustees considered this information in relation to the Investment Adviser’s overall profitability.
Economies of ScaleThe Trustees considered the information that had been provided regarding whether there have been economies of scale with
respect to the management of the Funds. The Trustees also considered the breakpoints in the fee rate payable under the
Management Agreement for each of the Funds at the following annual percentage rates of the average daily net assets of the Funds:
Emerging MarketsEquity
Insights Fund
InternationalEquity
Insights Fund
InternationalSmall Cap
Insights Fund
First $1 billion 1.00% 0.81% 0.85%
Next $1 billion 1.00 0.73 0.85
Next $3 billion 0.90 0.69 0.77
Next $3 billion 0.86 0.68 0.73
Over $8 billion 0.84 0.67 0.72
The Trustees noted that the breakpoints were designed to share potential economies of scale, if any, with the Funds and their
shareholders as assets under management reach those asset levels. The Trustees considered the amounts of assets in the Funds; the
Funds’ recent share purchase and redemption activity; the information provided by the Investment Adviser relating to the costs of
the services provided by the Investment Adviser and its affiliates and their realized profits; information comparing fee rates
charged by the Investment Adviser with fee rates charged to other funds in the peer groups; and the Investment Adviser’s
undertaking to limit certain expenses of the Funds that exceed specified levels. Upon reviewing these matters at the Annual
Meeting, the Trustees concluded that the fee breakpoints represented a means of assuring that benefits of scalability, if any, would
be passed along to shareholders at the specified asset levels. They also noted that the Investment Adviser had passed along savings
to shareholders of the International Equity Insights Fund and International Small Cap Insights Fund, each of which had asset levels
above at least the first breakpoint during the prior fiscal year.
Other Benefits to the Investment Adviser and Its AffiliatesThe Trustees also considered the other benefits derived by the Investment Adviser and its affiliates from their relationships
with the Funds as stated above, including: (a) transfer agency fees received by Goldman Sachs & Co. LLC (“Goldman Sachs”); (b)
brokerage and futures commissions earned by Goldman Sachs for executing securities and futures transactions on behalf of the
Funds; (c) trading efficiencies resulting from aggregation of orders of the Funds with those for other funds or accounts managed by
the Investment Adviser; (d) fees earned by Goldman Sachs Agency Lending (“GSAL”), an affiliate of the Investment Adviser, as
securities lending agent (and fees earned by the Investment Adviser for managing the fund in which the Funds’ cash collateral is
invested); (e) the Investment Adviser’s ability to leverage the infrastructure designed to service the Funds on behalf of its other
clients; (f) the Investment Adviser’s ability to cross-market other products and services to Fund shareholders; (g) Goldman Sachs’
retention of certain fees as Fund Distributor; (h) the Investment Adviser’s ability to negotiate better pricing with custodians on
behalf of its other clients, as a result of the relationship with the Funds; (i) the investment of cash and cash collateral in money
market funds managed by the Investment Adviser that will result in increased assets under management for those money market
funds; (j) the investment in exchange-traded funds (“ETFs”) managed by the Investment Adviser that will result in increased assets
under management for those ETFs and may facilitate the development of the Investment Adviser’s ETF advisory business; and
(k) the possibility that the working relationship between the Investment Adviser and the Funds’ third-party service providers may
cause those service providers to be more likely to do business with other areas of Goldman Sachs. In the course of considering the
foregoing, the Independent Trustees requested and received further information quantifying certain of these fall-out benefits.
Other Benefits to the Funds and Their ShareholdersThe Trustees also noted that the Funds receive certain other potential benefits as a result of their relationship with the
Investment Adviser, including: (a) trading efficiencies resulting from aggregation of orders of the Funds with those of other funds
90

G O L D M A N S A C H S I N T E R N A T I O N A L E Q U I T Y I N S I G H T S F U N D S
Statement Regarding Basis for Approval of Management Agreement (Unaudited) (continued)
or accounts managed by the Investment Adviser; (b) enhanced servicing from vendors due to the volume of business generated by
the Investment Adviser and its affiliates; (c) enhanced servicing from broker-dealers due to the volume of business generated by
the Investment Adviser and its affiliates; (d) the Investment Adviser’s ability to negotiate favorable terms with derivatives
counterparties on behalf of the Funds as a result of the size and reputation of the Goldman Sachs organization; (e) the advantages
received from the Investment Adviser’s knowledge and experience gained from managing other accounts and products; (f) the
Investment Adviser’s ability to hire and retain qualified personnel to provide services to the Funds because of the reputation of the
Goldman Sachs organization; (g) the Funds’ access, through the Investment Adviser, to certain firm-wide resources (e.g.,
proprietary risk management systems and databases), subject to certain restrictions; (h) the Funds’ ability to participate in the
securities lending program administered by GSAL, as measured by the revenue received by the Funds in connection with the
program; and (i) the Funds’ access to certain affiliated distribution channels. In addition, the Trustees noted the competitive nature
of the mutual fund marketplace, and considered that many of the Funds’ shareholders invested in the Funds in part because of the
Funds’ relationship with the Investment Adviser and that those shareholders have a general expectation that the relationship will
continue.
ConclusionIn connection with their consideration of the Management Agreement, the Trustees gave weight to each of the factors described
above, but did not identify any particular factor as controlling their decision. After deliberation and consideration of all of theinformation provided, including the factors described above, the Trustees concluded, in the exercise of their business judgment,that the management fees paid by each of the Funds were reasonable in light of the services provided to it by the InvestmentAdviser, the Investment Adviser’s costs and each Fund’s current and reasonably foreseeable asset levels. The Trusteesunanimously concluded that the Investment Adviser’s continued management likely would benefit each Fund and its shareholdersand that the Management Agreement should be approved and continued with respect to each Fund until June 30, 2022.
91

G O L D M A N S A C H S I N T E R N A T I O N A L E Q U I T Y I N S I G H T S F U N D S
Trustees and Officers (Unaudited)Independent Trustees
Name,Address and Age1
Position(s) Heldwith the Trust
Term ofOffice andLength ofTime Served2
Principal Occupation(s)During Past 5 Years
Number ofPortfolios inFund ComplexOverseen byTrustee3
OtherDirectorshipsHeld by Trustee4
Jessica PalmerAge: 72
Chair of the Boardof Trustees
Since 2018(Trusteesince 2007)
Ms. Palmer is retired. She was formerlyConsultant, Citigroup Human ResourcesDepartment (2007-2008); Managing Director,Citigroup Corporate and Investment Banking(previously, Salomon Smith Barney/SalomonBrothers) (1984-2006). Ms. Palmer was a Memberof the Board of Trustees of Indian MountainSchool (private elementary and secondary school)(2004-2009).
Chair of the Board of Trustees — Goldman SachsTrust and Goldman Sachs Variable InsuranceTrust.
109 None
Dwight L. BushAge: 64
Trustee Since 2020 Ambassador Bush is President and CEO of D.L.Bush & Associates (a financial advisory andprivate investment firm) (2002-2014 and 2017-present); Director of MoneyLion Inc. (an operatorof a data-driven, digital financial platform (2021-present); and was formerly U.S. Ambassador tothe Kingdom of Morocco (2014-2017) and aMember of the Board of Directors of SantanderBank, N.A. (2018-2019). Previously, AmbassadorBush served as an Advisory Board Member ofGoldman Sachs Trust and Goldman Sachs VariableInsurance Trust (October 2019-January 2020).
Trustee — Goldman Sachs Trust and GoldmanSachs Variable Insurance Trust.
109 None
Kathryn A. CassidyAge: 67
Trustee Since 2015 Ms. Cassidy is retired. Formerly, she was Advisorto the Chairman (May 2014-December 2014); andSenior Vice President and Treasurer (2008-2014),General Electric Company & General ElectricCapital Corporation (technology and financialservices companies).
Trustee — Goldman Sachs Trust and GoldmanSachs Variable Insurance Trust.
109 None
Diana M. DanielsAge: 72
Trustee Since 2007 Ms. Daniels is retired. Formerly, she was VicePresident, General Counsel and Secretary, TheWashington Post Company (1991-2006).Ms. Daniels is a Trustee Emeritus and serves as aPresidential Councillor of Cornell University(2013-Present); former Member of the LegalAdvisory Board, New York Stock Exchange (2003-2006) and of the Corporate Advisory Board,Standish Mellon Management Advisors (2006-2007).
Trustee — Goldman Sachs Trust and GoldmanSachs Variable Insurance Trust.
109 None
Joaquin DelgadoAge: 61
Trustee Since 2020 Dr. Delgado is retired. He is Director, Hexion Inc.(a specialty chemical manufacturer) (2019-present); and Director, Stepan Company (aspecialty chemical manufacturer) (2011-present);and was formerly Executive Vice President,Consumer Business Group of 3M Company(July 2016-July 2019); and Executive VicePresident, Health Care Business Group of 3MCompany (October 2012-July 2016). Previously,Dr. Delgado served as an Advisory Board Memberof Goldman Sachs Trust and Goldman SachsVariable Insurance Trust (October 2019-January2020).
Trustee — Goldman Sachs Trust and GoldmanSachs Variable Insurance Trust.
109 Hexion Inc. (a specialtychemical manufacturer);Stepan Company (aspecialty chemicalmanufacturer)
92
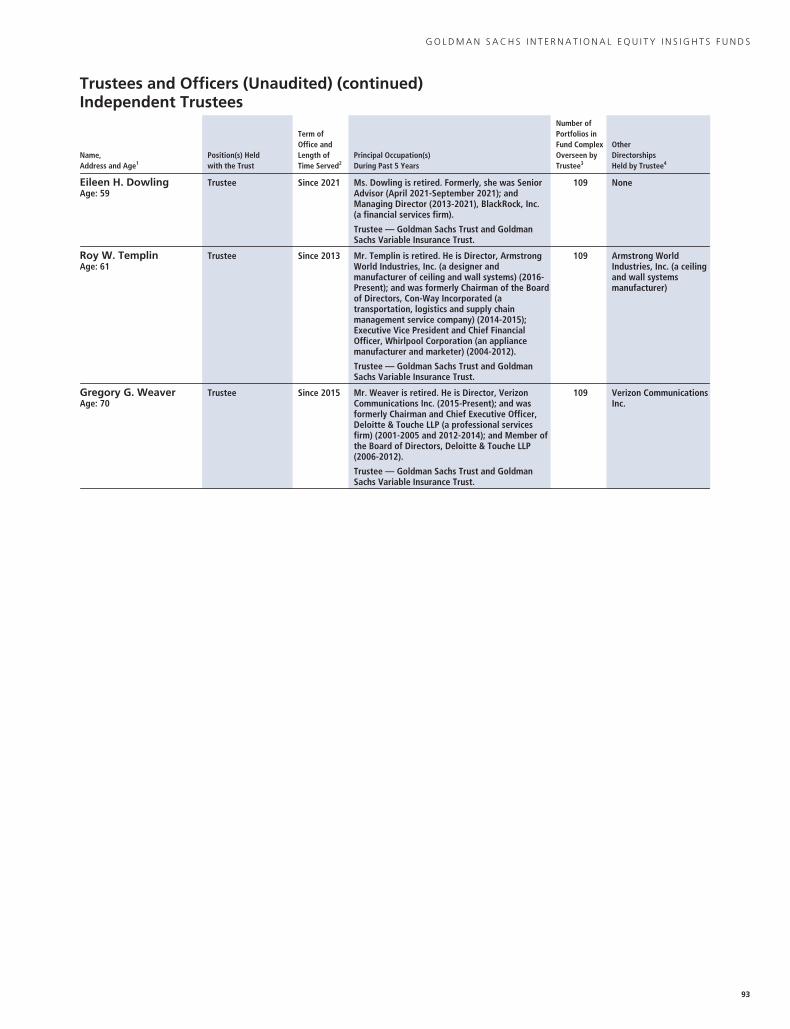
G O L D M A N S A C H S I N T E R N A T I O N A L E Q U I T Y I N S I G H T S F U N D S
Trustees and Officers (Unaudited) (continued)Independent Trustees
Name,Address and Age1
Position(s) Heldwith the Trust
Term ofOffice andLength ofTime Served2
Principal Occupation(s)During Past 5 Years
Number ofPortfolios inFund ComplexOverseen byTrustee3
OtherDirectorshipsHeld by Trustee4
Eileen H. DowlingAge: 59
Trustee Since 2021 Ms. Dowling is retired. Formerly, she was SeniorAdvisor (April 2021-September 2021); andManaging Director (2013-2021), BlackRock, Inc.(a financial services firm).
Trustee — Goldman Sachs Trust and GoldmanSachs Variable Insurance Trust.
109 None
Roy W. TemplinAge: 61
Trustee Since 2013 Mr. Templin is retired. He is Director, ArmstrongWorld Industries, Inc. (a designer andmanufacturer of ceiling and wall systems) (2016-Present); and was formerly Chairman of the Boardof Directors, Con-Way Incorporated (atransportation, logistics and supply chainmanagement service company) (2014-2015);Executive Vice President and Chief FinancialOfficer, Whirlpool Corporation (an appliancemanufacturer and marketer) (2004-2012).
Trustee — Goldman Sachs Trust and GoldmanSachs Variable Insurance Trust.
109 Armstrong WorldIndustries, Inc. (a ceilingand wall systemsmanufacturer)
Gregory G. WeaverAge: 70
Trustee Since 2015 Mr. Weaver is retired. He is Director, VerizonCommunications Inc. (2015-Present); and wasformerly Chairman and Chief Executive Officer,Deloitte & Touche LLP (a professional servicesfirm) (2001-2005 and 2012-2014); and Member ofthe Board of Directors, Deloitte & Touche LLP(2006-2012).
Trustee — Goldman Sachs Trust and GoldmanSachs Variable Insurance Trust.
109 Verizon CommunicationsInc.
93

G O L D M A N S A C H S I N T E R N A T I O N A L E Q U I T Y I N S I G H T S F U N D S
Trustees and Officers (Unaudited) (continued)Interested Trustee*
Name,Address and Age1
Position(s) Heldwith the Trust
Term ofOffice andLength ofTime Served2
Principal Occupation(s)During Past 5 Years
Number ofPortfolios inFund ComplexOverseen byTrustee3
OtherDirectorshipsHeld by Trustee4
James A. McNamaraAge: 59
Trustee andPresident
Since 2007 Advisory Director, Goldman Sachs (January 2018-Present); Managing Director, Goldman Sachs(January 2000-December 2017); Director ofInstitutional Fund Sales, GSAM (April 1998-December 2000); and Senior Vice President andManager, Dreyfus Institutional ServiceCorporation (January 1993-April 1998).
President and Trustee — Goldman Sachs Trust;Goldman Sachs Variable Insurance Trust;Goldman Sachs Trust II; Goldman Sachs MLP andEnergy Renaissance Fund; Goldman Sachs ETFTrust; Goldman Sachs Credit Income Fund; andGoldman Sachs Real Estate Diversified IncomeFund.
168 None
* Mr. McNamara is considered to be an “Interested Trustee” because he holds positions with Goldman Sachs and owns securities issued by The Goldman Sachs Group,Inc. Mr. McNamara holds comparable positions with certain other companies of which Goldman Sachs, GSAM or an affiliate thereof is the investment adviser,administrator and/or distributor.
1 Each Trustee may be contacted by writing to the Trustee, c/o Goldman Sachs, 200 West Street, New York, New York, 10282, Attn: Caroline Kraus. Information isprovided as of October 31, 2021.
2 Subject to such policies as may be adopted by the Board from time-to-time, each Trustee holds office for an indefinite term, until the earliest of: (a) the election of hisor her successor; (b) the date the Trustee resigns or is removed by the Board or shareholders, in accordance with the Trust’s Declaration of Trust; or (c) thetermination of the Trust. The Board has adopted policies which provide that each Independent Trustee shall retire as of December 31st of the calendar year in whichhe or she reaches (a) his or her 75th birthday or (b) the 15th anniversary of the date he or she became a Trustee, whichever is earlier, unless a waiver of suchrequirements shall have been adopted by a majority of the other Trustees. These policies may be changed by the Trustees without shareholder vote.
3 The Goldman Sachs Fund Complex includes certain other companies listed above for each respective Trustee. As of October 31, 2021, Goldman Sachs Trust consistedof 92 portfolios (90 of which offered shares to the public); Goldman Sachs Variable Insurance Trust consisted of 17 portfolios (13 of which offered shares to thepublic); Goldman Sachs Trust II consisted of 18 portfolios (16 of which offered shares to the public); Goldman Sachs ETF Trust consisted of 38 portfolios (21 ofwhich offered shares to the public); and Goldman Sachs MLP and Energy Renaissance Fund, Goldman Sachs Credit Income Fund and Goldman Sachs Real EstateDiversified Income Fund each consisted of one portfolio. Goldman Sachs Credit Income Fund did not offer shares to the public.
4 This column includes only directorships of companies required to report to the Securities and Exchange Commission under the Securities Exchange Act of 1934(i.e., “public companies”) or other investment companies registered under the Act.
Additional information about the Trustees is available in the Funds’ Statement of Additional Information, which can be obtained from Goldman Sachs free of charge bycalling this toll-free number (in the United States of America): 1-800-526-7384.
94

G O L D M A N S A C H S I N T E R N A T I O N A L E Q U I T Y I N S I G H T S F U N D S
Trustees and Officers (Unaudited) (continued)Officers of the Trust*
Name, Address and Age1Position(s) Heldwith the Trust
Term ofOffice andLength ofTime Served2 Principal Occupation(s) During Past 5 Years
James A. McNamara200 West StreetNew York, NY 10282Age: 59
Trustee andPresident
Since 2007 Advisory Director, Goldman Sachs (January 2018-Present); Managing Director, GoldmanSachs (January 2000-December 2017); Director of Institutional Fund Sales, GSAM (April1998-December 2000); and Senior Vice President and Manager, Dreyfus InstitutionalService Corporation (January 1993-April 1998).
President and Trustee — Goldman Sachs Trust; Goldman Sachs Variable Insurance Trust;Goldman Sachs Trust II; Goldman Sachs MLP and Energy Renaissance Fund; Goldman SachsETF Trust; Goldman Sachs Credit Income Fund; and Goldman Sachs Real Estate DiversifiedIncome Fund.
Caroline L. Kraus200 West StreetNew York, NY 10282Age: 44
Secretary Since 2012 Managing Director, Goldman Sachs (January 2016-Present); Vice President, Goldman Sachs(August 2006-December 2015); Senior Counsel, Goldman Sachs (January 2020-Present);Associate General Counsel, Goldman Sachs (2012-December 2019); Assistant GeneralCounsel, Goldman Sachs (August 2006-December 2011); and Associate, Weil, Gotshal &Manges, LLP (2002-2006).
Secretary — Goldman Sachs Trust (previously Assistant Secretary (2012)); Goldman SachsVariable Insurance Trust (previously Assistant Secretary (2012)); Goldman Sachs Trust II;Goldman Sachs BDC, Inc.; Goldman Sachs Private Middle Market Credit LLC; GoldmanSachs Private Middle Market Credit II LLC; Goldman Sachs Middle Market Lending Corp.;Goldman Sachs MLP and Energy Renaissance Fund; Goldman Sachs ETF Trust; GoldmanSachs Credit Income Fund; and Goldman Sachs Real Estate Diversified Income Fund.
Joseph F. DiMaria30 Hudson StreetJersey City, NJ 07302Age: 53
Treasurer, PrincipalFinancial Officer andPrincipal AccountingOfficer
Since 2017(Treasurerand PrincipalFinancialOfficer since2019)
Managing Director, Goldman Sachs (November 2015-Present) and Vice President —Mutual Fund Administration, Columbia Management Investment Advisers, LLC(May 2010-October 2015).
Treasurer, Principal Financial Officer and Principal Accounting Officer — Goldman SachsTrust (previously Assistant Treasurer (2016)); Goldman Sachs Variable Insurance Trust(previously Assistant Treasurer (2016)); Goldman Sachs Trust II (previously AssistantTreasurer (2017)); Goldman Sachs MLP and Energy Renaissance Fund (previously AssistantTreasurer (2017)); Goldman Sachs ETF Trust (previously Assistant Treasurer (2017));Goldman Sachs Credit Income Fund; and Goldman Sachs Real Estate Diversified IncomeFund.
* Represents a partial list of officers of the Trust. Additional information about all the officers is available in the Funds’ Statement of Additional Information, which canbe obtained from Goldman Sachs free of charge by calling this toll-free number (in the United States): 1-800-526-7384.
1 Information is provided as of October 31, 2021.2 Officers hold office at the pleasure of the Board of Trustees or until their successors are duly elected and qualified. Each officer holds comparable positions with
certain other companies of which Goldman Sachs, GSAM or an affiliate thereof is the investment adviser, administrator and/or distributor.
Goldman Sachs Trust — International Equity Insights Funds — Tax Information (Unaudited)
From distributions paid during the year ended October 31, 2021, the total amount of income receivedby the Emerging Markets Equity Insights, International Equity Insights, and International Small Cap InsightsFunds from sources within foreign countries and possessions of the United States was $0.1710, $0.2539, and$0.2020 per share, respectively, all of which is attributable to qualified passive income. The percentage of netinvestment income dividends paid from foreign sources by the Emerging Markets Equity Insights,International Equity Insights, and International Small Cap Insights Funds were 97.38%, 91.27%, and 81.81%,respectively. The total amount of taxes paid by the Emerging Markets Equity Insights, International EquityInsights and International Small Cap Insights Funds to such countries was $0.0292, $0.0304, and $0.0276 pershare, respectively.
For the year ended October 31, 2021, 100%, 100%, and 87.29% of the dividends paid from netinvestment company taxable income by the Emerging Markets Equity Insights, International Equity Insights,and International Small Cap Insights Funds, respectively, qualify for the reduced tax rate under the Jobs andGrowth Tax Relief and Reconciliation Act of 2003.
95

(This page intentionally left blank)

F U N D S P R O F I L E
Goldman Sachs Funds
Goldman Sachs is a premier financial services firm, known since 1869 for creating thoughtful and customized investment solutionsin complex global markets.
Today, the Asset Management Division of Goldman Sachs serves a diverse set of clients worldwide, including private institutions,public entities and individuals. With approximately $2.14 trillion in assets under supervision as of September 30, 2021, GoldmanSachs Asset Management has portfolio management teams located around the world and our investment professionals bringfirsthand knowledge of local markets to every investment decision. Assets under supervision includes assets under managementand other client assets for which Goldman Sachs does not have full discretion. Goldman Sachs Asset Management leverages theresources of Goldman Sachs & Co. LLC subject to legal, internal and regulatory restrictions.
Money MarketFinancial Square FundsSM
� Financial Square Treasury SolutionsFund1
� Financial Square Government Fund1
� Financial Square Money Market Fund2
� Financial Square Prime Obligations Fund2
� Financial Square Treasury InstrumentsFund1
� Financial Square Treasury ObligationsFund1
� Financial Square Federal InstrumentsFund1
Investor FundsSM
� Investor Money Market Fund3
� Investor Tax-Exempt Money MarketFund3
Fixed IncomeShort Duration and Government� Enhanced Income Fund� High Quality Floating Rate Fund� Short-Term Conservative Income Fund� Short Duration Government Fund� Short Duration Bond Fund4
� Government Income Fund� Inflation Protected Securities FundMulti-Sector� Bond Fund� Core Fixed Income Fund� Global Core Fixed Income Fund� Income Fund� Strategic Income FundMunicipal and Tax-Free� High Yield Municipal Fund
� Dynamic Municipal Income Fund� Short Duration Tax-Free Fund� Municipal Income Completion FundSingle Sector� Investment Grade Credit Fund� U.S. Mortgages Fund� High Yield Fund� High Yield Floating Rate Fund� Emerging Markets Debt Fund� Local Emerging Markets Debt FundFixed Income Alternatives� Long Short Credit Strategies Fund
Fundamental Equity� Equity Income Fund� Small Cap Growth Fund� Small Cap Value Fund� Small/Mid Cap Value Fund� Mid Cap Value Fund� Large Cap Value Fund� Focused Value Fund� Capital Growth Fund� Strategic Growth Fund� Small/Mid Cap Growth Fund� Flexible Cap Fund� Concentrated Growth Fund� Technology Opportunities Fund� Growth Opportunities Fund� Rising Dividend Growth Fund� U.S. Equity ESG Fund� Income Builder Fund
Tax-Advantaged Equity� U.S. Tax-Managed Equity Fund� International Tax-Managed Equity Fund
� U.S. Equity Dividend and Premium Fund� International Equity Dividend and
Premium Fund
Equity Insights� Small Cap Equity Insights Fund� U.S. Equity Insights Fund� Small Cap Growth Insights Fund� Large Cap Growth Insights Fund� Large Cap Value Insights Fund� Small Cap Value Insights Fund� International Small Cap Insights Fund� International Equity Insights Fund� Emerging Markets Equity Insights Fund
Fundamental Equity International� International Equity Income Fund� International Equity ESG Fund� China Equity Fund� Emerging Markets Equity Fund� ESG Emerging Markets Equity Fund
Alternative� Real Estate Securities Fund� International Real Estate Securities Fund� Commodity Strategy Fund� Global Real Estate Securities Fund� Alternative Premia Fund� Absolute Return Tracker Fund� Managed Futures Strategy Fund� MLP Energy Infrastructure Fund� Energy Infrastructure Fund� Multi-Manager Alternatives Fund� Global Infrastructure Fund� Clean Energy Income Fund� Defensive Equity Fund
Total Portfolio Solutions� Global Managed Beta Fund� Multi-Manager Non-Core Fixed Income
Fund� Multi-Manager Global Equity Fund� Multi-Manager International Equity Fund� Tactical Tilt Overlay Fund� Balanced Strategy Portfolio� Multi-Manager U.S. Small Cap Equity Fund� Multi-Manager Real Assets Strategy
Fund� Growth and Income Strategy Portfolio� Growth Strategy Portfolio� Dynamic Global Equity Fund� Satellite Strategies Portfolio� Enhanced Dividend Global Equity
Portfolio� Tax-Advantaged Global Equity Portfolio� Strategic Factor Allocation Fund� Strategic Volatility Premium Fund� Target Date Retirement Portfolio� Target Date 2025 Portfolio� Target Date 2030 Portfolio� Target Date 2035 Portfolio� Target Date 2040 Portfolio� Target Date 2045 Portfolio� Target Date 2050 Portfolio� Target Date 2055 Portfolio� Target Date 2060 Portfolio� GQG Partners International
Opportunities Fund
1 You could lose money by investing in the Fund. Although the Fund seeks to preserve the value of your investment at $1.00 per share, itcannot guarantee it will do so. An investment in the Fund is not a deposit of a bank and is not insured or guaranteed by the FederalDeposit Insurance Corporation or any other government agency. The Fund’s sponsor has no legal obligation to provide financial supportto the Fund, and you should not expect that the sponsor will provide financial support to the Fund at any time.
2 You could lose money by investing in the Fund. Because the share price of the Fund will fluctuate, when you sell your shares they may beworth more or less than what you originally paid for them. The Fund may impose a fee upon sale of your shares or may temporarilysuspend your ability to sell shares if the Fund’s liquidity falls below required minimums because of market conditions or other factors. Aninvestment in the Fund is not a deposit of a bank and is not insured or guaranteed by the Federal Deposit Insurance Corporation or anyother government agency. The Fund’s sponsor has no legal obligation to provide financial support to the Fund, and you should not expectthat the sponsor will provide financial support to the Fund at any time.
3 You could lose money by investing in the Fund. Although the Fund seeks to preserve the value of your investment at $1.00 per share, itcannot guarantee it will do so. The Fund may impose a fee upon sale of your shares or may temporarily suspend your ability to sell sharesif the Fund’s liquidity falls below required minimums because of market conditions or other factors. An investment in the Fund is not adeposit of a bank and is not insured or guaranteed by the Federal Deposit Insurance Corporation or any other government agency. TheFund’s sponsor has no legal obligation to provide financial support to the Fund, and you should not expect that the sponsor will providefinancial support to the Fund at any time.
4 Effective after the close of business on July 29, 2021, the Goldman Sachs Short Duration Income Fund was renamed the Goldman Sachs ShortDuration Bond Fund.Financial Square FundsSM and Investor FundsSM are registered service marks of Goldman Sachs & Co. LLC.
*This list covers open-end funds only. Please visit our website at www.GSAMFUNDS.com to learn about our closed-end funds andexchange-traded funds.

TRUSTEESJessica Palmer, ChairDwight L. BushKathryn A. CassidyDiana M. DanielsEileen H. DowlingJoaquin DelgadoJames A. McNamaraRoy W. TemplinGregory G. Weaver
OFFICERSJames A. McNamara, PresidentJoseph F. DiMaria,Principal Financial Officer,Principal Accounting Officer and TreasurerCaroline L. Kraus, Secretary
GOLDMAN SACHS & CO. LLCDistributor and Transfer Agent
GOLDMAN SACHS ASSET MANAGEMENT, L.P.Investment Adviser
Visit our Website at www.GSAMFUNDS.com to obtain the most recent month-end returns.
Goldman Sachs Asset Management, L.P., 200 West Street, New York, New York 10282
The reports concerning the Funds included in this shareholder report may contain certain forward-looking statements about the factors that may affect the performance ofthe Funds in the future. These statements are based on Fund management’s predictions and expectations concerning certain future events and their expected impact on theFunds, such as performance of the economy as a whole and of specific industry sectors, changes in the levels of interest rates, the impact of developing world events, andother factors that may influence the future performance of the Funds. Management believes these forward-looking statements to be reasonable, although they are inherentlyuncertain and difficult to predict. Actual events may cause adjustments in portfolio management strategies from those currently expected to be employed.A description of the policies and procedures that the Funds use to determine how to vote proxies relating to portfolio securities and information regarding how a Fund votedproxies relating to portfolio securities during the most recent 12-month period ended June 30 is available (i) without charge, upon request by calling 1-800-526-7384 (forRetail Shareholders) or 1-800-621-2550 (for Institutional Shareholders); and (ii) on the Securities and Exchange Commission web site at http://www.sec.gov.Economic and market forecasts presented herein reflect a series of assumptions and judgments as of the date of this presentation and are subject to change without notice.These forecasts do not take into account the specific investment objectives, restrictions, tax and financial situation or other needs of any specific client. Actual data will varyand may not be reflected here. These forecasts are subject to high levels of uncertainty that may affect actual performance. Accordingly, these forecasts should be viewed asmerely representative of a broad range of possible outcomes. These forecasts are estimated, based on assumptions, and are subject to significant revision and may changematerially as economic and market conditions change. Goldman Sachs has no obligation to provide updates or changes to these forecasts. Case studies and examples are forillustrative purposes only.The Global Industry Classification Standard (GICS) was developed by and is the exclusive property and a service mark of Morgan Stanley Capital International Inc. (MSCI) andStandard & Poor’s, a division of The McGraw-Hill Companies, Inc. (S&P) and is licensed for use by Goldman Sachs. Neither MSCI, S&P nor any other party involved in makingor compiling the GICS or any GICS classifications makes any express or implied warranties or representations with respect to such standard or classification (or the results tobe obtained by the use thereof), and all such parties hereby expressly disclaim all warranties of originality, accuracy, completeness, merchantability or fitness for a particularpurpose with respect to any of such standard or classification. Without limiting any of the foregoing, in no event shall MSCI, S&P, any of their affiliates or any third partyinvolved in making or compiling the GICS or any GICS classifications have any liability for any direct, indirect, special, punitive, consequential or any other damages (includinglost profits) even if notified of the possibility of such damages.The Funds will file their portfolio holdings for each month in a fiscal quarter within 60 days after the end of the relevant fiscal quarter on Form N-PORT. Portfolioholdings information for the third month of each fiscal quarter will be made available on the SEC’s web site at http://www.sec.gov. Portfolio holdings informationmay be obtained upon request and without charge by calling 1-800-526-7384 (for Retail Shareholders) or 1-800-621-2550 (for Institutional Shareholders).Fund holdings and allocations shown are unaudited, and may not be representative of current or future investments. Fund holdings and allocations may not include the Fund’sentire investment portfolio, which may change at any time. Fund holdings should not be relied on in making investment decisions and should not be construed as research orinvestment advice regarding particular securities. Current and future holdings are subject to risk.The portfolio risk management process includes an effort to monitor and manage risk, but does not imply low risk. Diversification does not protect an investor from marketrisk and does not ensure a profit.This material is not authorized for distribution to prospective investors unless preceded or accompanied by a current Prospectus or summaryprospectus, if applicable. Investors should consider a Fund’s objective, risks, and charges and expenses, and read the summary prospectus, ifavailable, and/or the Prospectus carefully before investing or sending money. The summary prospectus, if available, and the Prospectuscontain this and other information about a Fund and may be obtained from your authorized dealer or from Goldman Sachs & Co. LLC by calling(retail – 1-800-526-7384) (institutional – 1-800-621-2550).© 2021 Goldman Sachs. All rights reserved. 263306-OTU-1529196 INTINSAR-21