NORTHERN EQUITY INDEX FUNDS - Bright Directions
160
NORTHERN EQUITY INDEX FUNDS ANNUAL REPORT MARCH 31, 2021
-
Upload
khangminh22 -
Category
Documents
-
view
1 -
download
0
Transcript of NORTHERN EQUITY INDEX FUNDS - Bright Directions
N O R T H E R N E Q U I T Y I N D E X F U N D S
A N N UA L R E P O R T
M A RC H 31, 2 0 21
Global equities delivered very strongreturns during the 12-month periodended March 31, 2021. At the start of theperiod, stocks were just days beyond thelows established in the coronavirus-driven downturn that occurred in the firstquarter of 2020. The early stages of themarket’s recovery derived mainly fromthe swift and aggressive monetary andfiscal stimulus provided by globalgovernments and central banks. TheU.S. Federal Reserve (the “Fed”) cutshort-term rates to near zero, andCongress passed a $2 trillion stimuluspackage. Investors, seeing a path to whenthe economic effects of COVID-19 coulddissipate, began to bargain hunt in amarket that was well off its prior peak.The ensuing rally gained momentumthrough the summer of 2020, propellingmajor large-cap equity indices above theirpre-pandemic highs by late August 2020.
Stock prices paused in early autumndue in part to a resurgence in COVID-19cases and uncertainty surrounding theU.S. election. However, markets resumedtheir advance in November 2020following the eventual conclusion of theU.S. election and announcements thattwo coronavirus vaccines had beenapproved by U.S. regulatory agencies.Investors were further encouraged by thepassage of a new round of U.S. fiscalstimulus in early 2021, as well as byexpectations that a significantinfrastructure package might also emergefrom Congress. The rally continuedthrough the end of the 12-month periodended March 31, 2021, as the prospect ofimproving economic growth, rising
corporate earnings and ongoing Fedaccommodation provided a firmfoundation for investor risk appetite.
The approval of the first COVID-19vaccine not only boosted the equitymarket as a whole, but also led to animportant change in market leadership.From the March 2020 low through earlyNovember 2020, gains for the leading U.S.and global indices had been driven largelyby growth stocks, as well as by a smallnumber of mega-cap technologycompanies. With so much uncertaintysurrounding the path of the virus and thetrajectory of global growth, investorsgravitated to the relative safety ofcompanies that they believed couldmaintain steady earnings in any economicenvironment. Once the vaccines wereapproved, investors began to look aroundfor improved relative performance fromeconomically-sensitive segments that hadpreviously lagged, including value stocksand smaller companies.
In combination, these developmentshelped major equity indices to deliverremarkable 12-month returns. Forexample, the large-cap Russell 1000 Indexand the small-cap Russell 2000 Indexposted dramatically strong one-yearreturns of 60.59% and 94.85%,respectively, as of March 31, 2021. Basedon the MSCI EAFE Index and the MSCIEmerging Markets Index, developed- andemerging-market international stocks,though they lagged U.S. indices,nonetheless delivered robust gains of44.57% and 58.39%, respectively. It ishighly unlikely that these returns can bereplicated in the next 12-month period.Still, with COVID-19 cases and
hospitalizations beginning to decline,the vaccine rollout underway, additionalfiscal stimulus apparently on the waylater in the year, and broadening marketleadership, the investment backdropremained supportive for stocks atperiod end.
In closing, we would like torecognize the planning and dedicationof those who have helped NorthernTrust Asset Management navigate theunprecedented challenges of the past 12months. Our commitment to our clientsremains unwavering as the businessenvironment continues to evolve in themonths ahead.
Sincerely,
Darek Wojnar, CFAHead of Funds and Managed AccountsGroup,Northern Trust Asset Management*
The views in this letter were as ofMarch 31, 2021 and may not necessarilyreflect the same views on the date thisletter is first published or any timethereafter. These views are intended tohelp shareholders in understanding theFunds’ investment methodology and donot constitute investment advice.
This report is submitted for thegeneral information of the shareholders ofthe Funds. It is not authorized fordistribution to prospective investors unlesspreceded or accompanied by an effectiveprospectus, which includes informationregarding the Funds’ risks, objectives, feesand expenses, experience of itsmanagement, and other information.
*Northern Trust Asset Management is the branding name of the asset management business of Northern Trust Corporation, a financial holdingcompany and publicly traded company.
D e a r S h a re h o l d e r :
2 PORTFOLIO MANAGEMENT COMMENTARY
10 STATEMENTS OF ASSETS AND LIABILITIES
12 STATEMENTS OF OPERATIONS
14 STATEMENTS OF CHANGES IN NET ASSETS
16 FINANCIAL HIGHLIGHTS
24 SCHEDULES OF INVESTMENTS
24 EMERGING MARKETS EQUITY INDEX FUNDTicker Symbol: NOEMX
48 GLOBAL REAL ESTATE INDEX FUNDTicker Symbol: NGREX
59 GLOBAL SUSTAINABILITY INDEX FUNDTicker Symbols:
Class I: NSRIXClass K: NSRKX
71 INTERNATIONAL EQUITY INDEX FUNDTicker Symbol: NOINX
85 MID CAP INDEX FUNDTicker Symbol: NOMIX
92 SMALL CAP INDEX FUNDTicker Symbol: NSIDX
119 STOCK INDEX FUNDTicker Symbol: NOSIX
128 NOTES TO THE FINANCIAL STATEMENTS
143 REPORT OF INDEPENDENT REGISTERED PUBLICACCOUNTING FIRM
144 TAX INFORMATION
145 LIQUIDITY RISK MANAGEMENT PROGRAM
146 FUND EXPENSES
148 TRUSTEES AND OFFICERS
152 INVESTMENT CONSIDERATIONS
156 FOR MORE INFORMATION
This report has been prepared for the generalinformation of Northern Funds shareholders. Itis not authorized for distribution to prospectiveinvestors unless accompanied or preceded bya current Northern Funds summary prospectusor prospectus, which contains more completeinformation about a fund’s investmentobjectives, risks, fees and expenses. Investorsare reminded to read a summary prospectusor prospectus carefully before investing orsending money.
This report contains certain forward-lookingstatements about factors that may affect theperformance of the Funds in the future. Thesestatements are based on Northern Funds’management predictions and expectationsconcerning certain future events, such asperformance of the economy as a whole andof specific industry sectors, changes in thelevels of interest rates, the impact ofdeveloping world events, and other factors.Management believes these forward-lookingstatements to be reasonable, although theyare inherently uncertain and difficult topredict. Actual events may cause adjustmentsin Northern Funds’ management strategiesfrom those currently expected to be employed.
Northern Funds are distributed by Northern FundsDistributors, LLC, Three Canal Plaza, Suite 100,Portland, Maine 04101, not affiliated with NorthernTrust.
NOT FDIC INSURED
May lose value / No bank guarantee
E Q U I T Y I N D E X F U N D S
TA B L E O F C O N T E N T S
NORTHERN FUNDS ANNUAL REPORT 1 EQUIT Y INDEX FUNDS
P O R T F O L I O M A N AG E M E N T C O M M E N TA RY
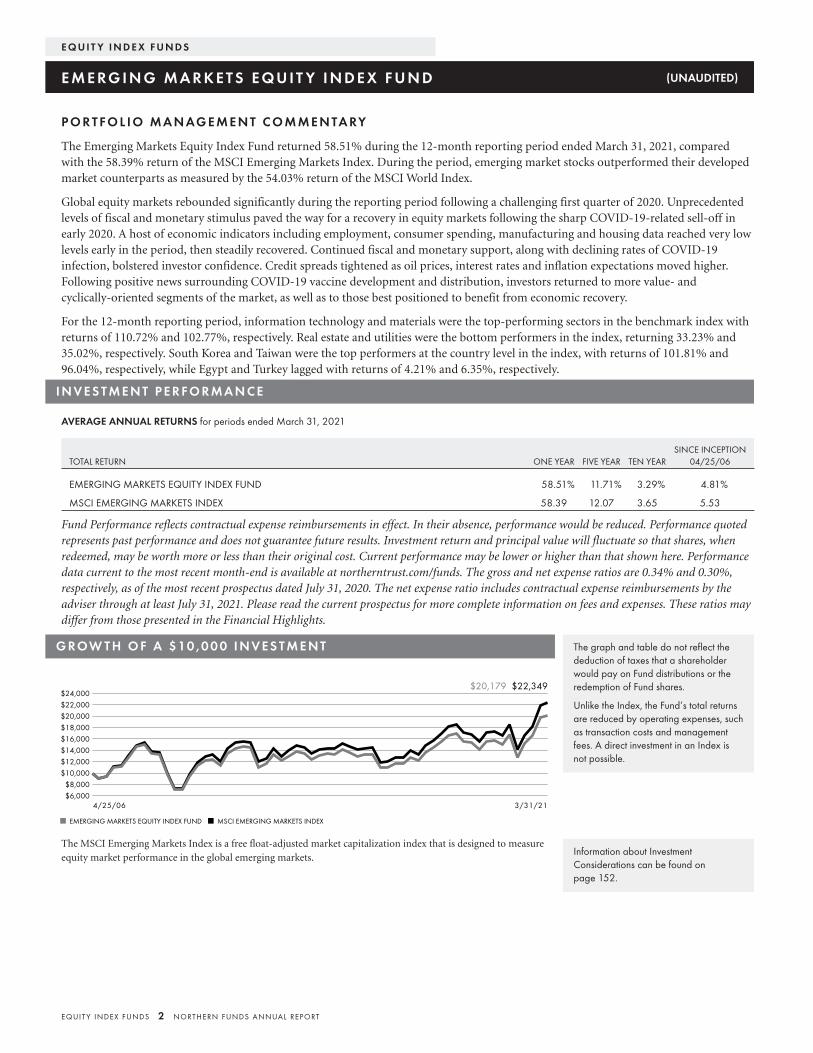
The Emerging Markets Equity Index Fund returned 58.51% during the 12-month reporting period ended March 31, 2021, comparedwith the 58.39% return of the MSCI Emerging Markets Index. During the period, emerging market stocks outperformed their developedmarket counterparts as measured by the 54.03% return of the MSCI World Index.
Global equity markets rebounded significantly during the reporting period following a challenging first quarter of 2020. Unprecedentedlevels of fiscal and monetary stimulus paved the way for a recovery in equity markets following the sharp COVID-19-related sell-off inearly 2020. A host of economic indicators including employment, consumer spending, manufacturing and housing data reached very lowlevels early in the period, then steadily recovered. Continued fiscal and monetary support, along with declining rates of COVID-19infection, bolstered investor confidence. Credit spreads tightened as oil prices, interest rates and inflation expectations moved higher.Following positive news surrounding COVID-19 vaccine development and distribution, investors returned to more value- andcyclically-oriented segments of the market, as well as to those best positioned to benefit from economic recovery.
For the 12-month reporting period, information technology and materials were the top-performing sectors in the benchmark index withreturns of 110.72% and 102.77%, respectively. Real estate and utilities were the bottom performers in the index, returning 33.23% and35.02%, respectively. South Korea and Taiwan were the top performers at the country level in the index, with returns of 101.81% and96.04%, respectively, while Egypt and Turkey lagged with returns of 4.21% and 6.35%, respectively.
I N V E S T M E N T P E R F O R M A N C E
AVERAGE ANNUAL RETURNS for periods ended March 31, 2021
TOTAL RETURN ONE YEAR FIVE YEAR TEN YEARSINCE INCEPTION
04/25/06
EMERGING MARKETS EQUITY INDEX FUND 58.51% 11.71% 3.29% 4.81%
MSCI EMERGING MARKETS INDEX 58.39 12.07 3.65 5.53
Fund Performance reflects contractual expense reimbursements in effect. In their absence, performance would be reduced. Performance quotedrepresents past performance and does not guarantee future results. Investment return and principal value will fluctuate so that shares, whenredeemed, may be worth more or less than their original cost. Current performance may be lower or higher than that shown here. Performancedata current to the most recent month-end is available at northerntrust.com/funds. The gross and net expense ratios are 0.34% and 0.30%,respectively, as of the most recent prospectus dated July 31, 2020. The net expense ratio includes contractual expense reimbursements by theadviser through at least July 31, 2021. Please read the current prospectus for more complete information on fees and expenses. These ratios maydiffer from those presented in the Financial Highlights.
G ROW T H O F A $ 10 , 0 0 0 I N V E S T M E N T
$6,000$8,000
$10,000$12,000$14,000$16,000$18,000$20,000$22,000$24,000
4/25/06 3/31/21
EMERGING MARKETS EQUITY INDEX FUND MSCI EMERGING MARKETS INDEX
$22,349$20,179
The MSCI Emerging Markets Index is a free float-adjusted market capitalization index that is designed to measureequity market performance in the global emerging markets.
The graph and table do not reflect thededuction of taxes that a shareholderwould pay on Fund distributions or theredemption of Fund shares.
Unlike the Index, the Fund’s total returnsare reduced by operating expenses, suchas transaction costs and managementfees. A direct investment in an Index isnot possible.
Information about InvestmentConsiderations can be found onpage 152.
E Q U I T Y I N D E X F U N D S
E M E RG I N G M A R K E T S E Q U I T Y I N D E X F U N D (UNAUDITED)
EQUIT Y INDEX FUNDS 2 NORTHERN FUNDS ANNUAL REPORT
P O R T F O L I O M A N AG E M E N T C O M M E N TA RY
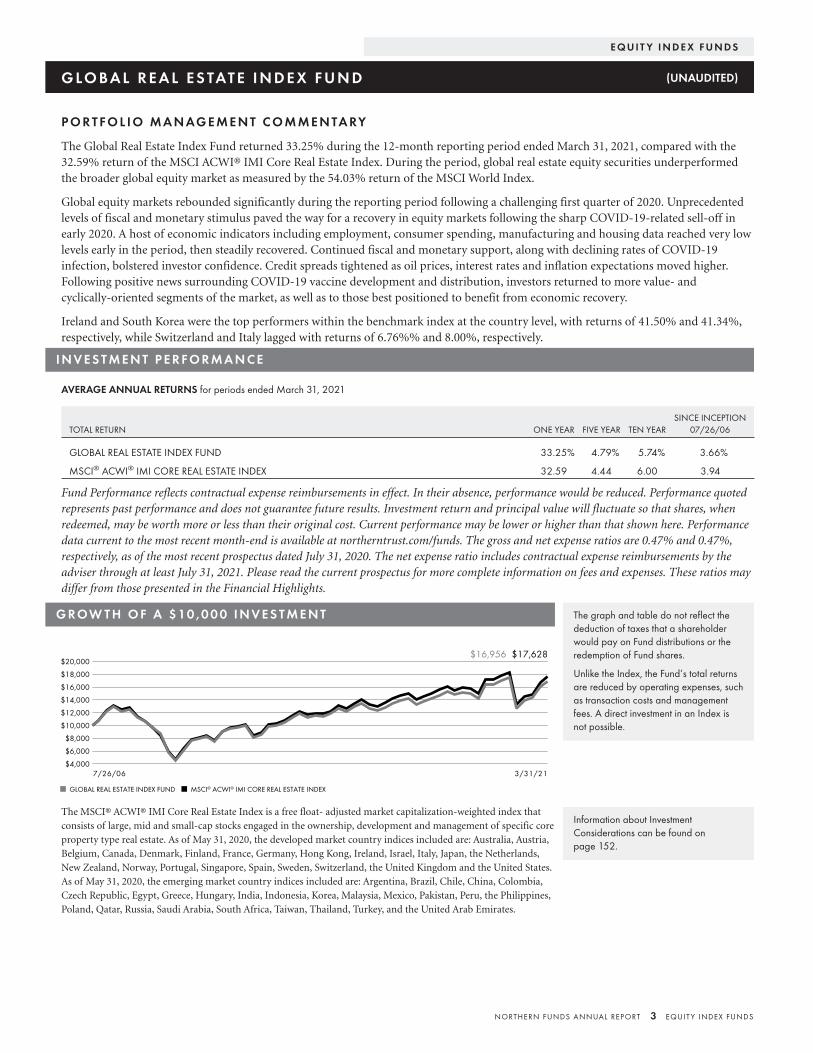
The Global Real Estate Index Fund returned 33.25% during the 12-month reporting period ended March 31, 2021, compared with the32.59% return of the MSCI ACWI® IMI Core Real Estate Index. During the period, global real estate equity securities underperformedthe broader global equity market as measured by the 54.03% return of the MSCI World Index.
Global equity markets rebounded significantly during the reporting period following a challenging first quarter of 2020. Unprecedentedlevels of fiscal and monetary stimulus paved the way for a recovery in equity markets following the sharp COVID-19-related sell-off inearly 2020. A host of economic indicators including employment, consumer spending, manufacturing and housing data reached very lowlevels early in the period, then steadily recovered. Continued fiscal and monetary support, along with declining rates of COVID-19infection, bolstered investor confidence. Credit spreads tightened as oil prices, interest rates and inflation expectations moved higher.Following positive news surrounding COVID-19 vaccine development and distribution, investors returned to more value- andcyclically-oriented segments of the market, as well as to those best positioned to benefit from economic recovery.
Ireland and South Korea were the top performers within the benchmark index at the country level, with returns of 41.50% and 41.34%,respectively, while Switzerland and Italy lagged with returns of 6.76%% and 8.00%, respectively.
I N V E S T M E N T P E R F O R M A N C E
AVERAGE ANNUAL RETURNS for periods ended March 31, 2021
TOTAL RETURN ONE YEAR FIVE YEAR TEN YEARSINCE INCEPTION
07/26/06
GLOBAL REAL ESTATE INDEX FUND 33.25% 4.79% 5.74% 3.66%
MSCI® ACWI® IMI CORE REAL ESTATE INDEX 32.59 4.44 6.00 3.94
Fund Performance reflects contractual expense reimbursements in effect. In their absence, performance would be reduced. Performance quotedrepresents past performance and does not guarantee future results. Investment return and principal value will fluctuate so that shares, whenredeemed, may be worth more or less than their original cost. Current performance may be lower or higher than that shown here. Performancedata current to the most recent month-end is available at northerntrust.com/funds. The gross and net expense ratios are 0.47% and 0.47%,respectively, as of the most recent prospectus dated July 31, 2020. The net expense ratio includes contractual expense reimbursements by theadviser through at least July 31, 2021. Please read the current prospectus for more complete information on fees and expenses. These ratios maydiffer from those presented in the Financial Highlights.
G ROW T H O F A $ 10 , 0 0 0 I N V E S T M E N T
$4,000
$6,000
$8,000
$10,000
$12,000
$14,000
$16,000
$18,000
$20,000
7/26/06 3/31/21
GLOBAL REAL ESTATE INDEX FUND MSCI® ACWI® IMI CORE REAL ESTATE INDEX
$17,628$16,956
The MSCI® ACWI® IMI Core Real Estate Index is a free float- adjusted market capitalization-weighted index thatconsists of large, mid and small-cap stocks engaged in the ownership, development and management of specific coreproperty type real estate. As of May 31, 2020, the developed market country indices included are: Australia, Austria,Belgium, Canada, Denmark, Finland, France, Germany, Hong Kong, Ireland, Israel, Italy, Japan, the Netherlands,New Zealand, Norway, Portugal, Singapore, Spain, Sweden, Switzerland, the United Kingdom and the United States.As of May 31, 2020, the emerging market country indices included are: Argentina, Brazil, Chile, China, Colombia,Czech Republic, Egypt, Greece, Hungary, India, Indonesia, Korea, Malaysia, Mexico, Pakistan, Peru, the Philippines,Poland, Qatar, Russia, Saudi Arabia, South Africa, Taiwan, Thailand, Turkey, and the United Arab Emirates.
The graph and table do not reflect thededuction of taxes that a shareholderwould pay on Fund distributions or theredemption of Fund shares.
Unlike the Index, the Fund’s total returnsare reduced by operating expenses, suchas transaction costs and managementfees. A direct investment in an Index isnot possible.
Information about InvestmentConsiderations can be found onpage 152.
E Q U I T Y I N D E X F U N D S
G LO BA L R E A L E S TAT E I N D E X F U N D (UNAUDITED)
NORTHERN FUNDS ANNUAL REPORT 3 EQUIT Y INDEX FUNDS
P O R T F O L I O M A N AG E M E N T C O M M E N TA RY
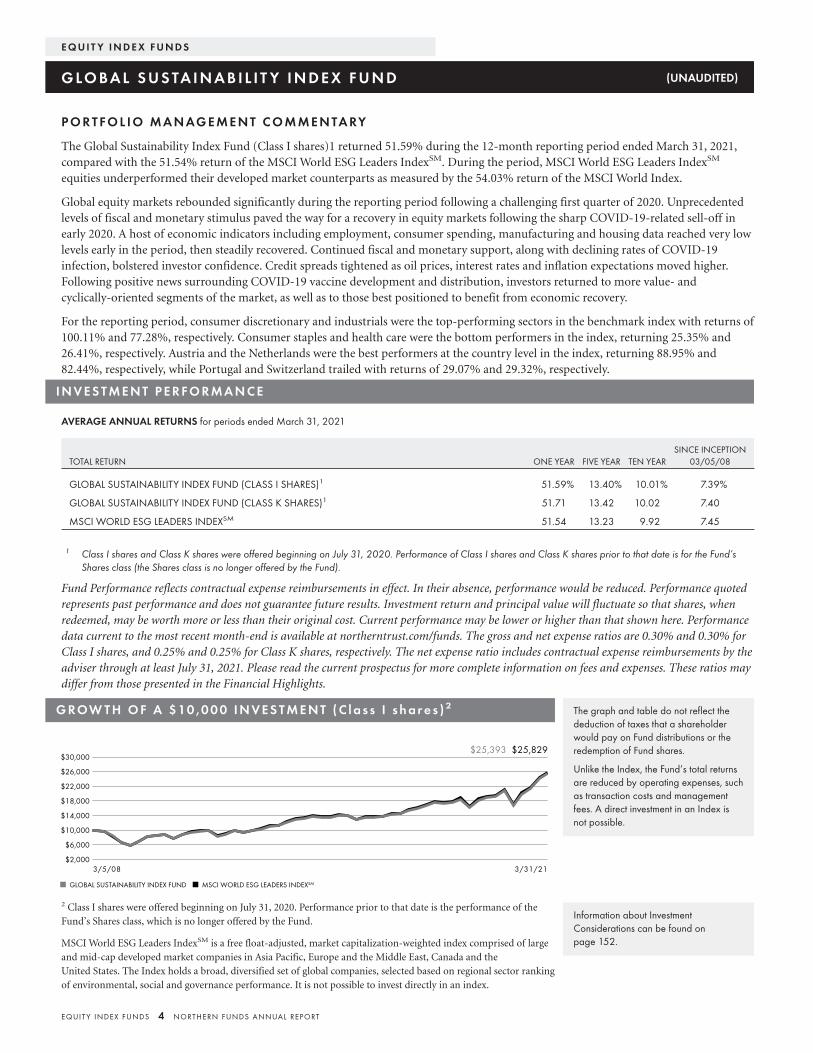
The Global Sustainability Index Fund (Class I shares)1 returned 51.59% during the 12-month reporting period ended March 31, 2021,compared with the 51.54% return of the MSCI World ESG Leaders IndexSM. During the period, MSCI World ESG Leaders IndexSM
equities underperformed their developed market counterparts as measured by the 54.03% return of the MSCI World Index.
Global equity markets rebounded significantly during the reporting period following a challenging first quarter of 2020. Unprecedentedlevels of fiscal and monetary stimulus paved the way for a recovery in equity markets following the sharp COVID-19-related sell-off inearly 2020. A host of economic indicators including employment, consumer spending, manufacturing and housing data reached very lowlevels early in the period, then steadily recovered. Continued fiscal and monetary support, along with declining rates of COVID-19infection, bolstered investor confidence. Credit spreads tightened as oil prices, interest rates and inflation expectations moved higher.Following positive news surrounding COVID-19 vaccine development and distribution, investors returned to more value- andcyclically-oriented segments of the market, as well as to those best positioned to benefit from economic recovery.
For the reporting period, consumer discretionary and industrials were the top-performing sectors in the benchmark index with returns of100.11% and 77.28%, respectively. Consumer staples and health care were the bottom performers in the index, returning 25.35% and26.41%, respectively. Austria and the Netherlands were the best performers at the country level in the index, returning 88.95% and82.44%, respectively, while Portugal and Switzerland trailed with returns of 29.07% and 29.32%, respectively.
I N V E S T M E N T P E R F O R M A N C E
AVERAGE ANNUAL RETURNS for periods ended March 31, 2021
TOTAL RETURN ONE YEAR FIVE YEAR TEN YEARSINCE INCEPTION
03/05/08
GLOBAL SUSTAINABILITY INDEX FUND (CLASS I SHARES)1 51.59% 13.40% 10.01% 7.39%
GLOBAL SUSTAINABILITY INDEX FUND (CLASS K SHARES)1 51.71 13.42 10.02 7.40
MSCI WORLD ESG LEADERS INDEXSM 51.54 13.23 9.92 7.45
1 Class I shares and Class K shares were offered beginning on July 31, 2020. Performance of Class I shares and Class K shares prior to that date is for the Fund’sShares class (the Shares class is no longer offered by the Fund).
Fund Performance reflects contractual expense reimbursements in effect. In their absence, performance would be reduced. Performance quotedrepresents past performance and does not guarantee future results. Investment return and principal value will fluctuate so that shares, whenredeemed, may be worth more or less than their original cost. Current performance may be lower or higher than that shown here. Performancedata current to the most recent month-end is available at northerntrust.com/funds. The gross and net expense ratios are 0.30% and 0.30% forClass I shares, and 0.25% and 0.25% for Class K shares, respectively. The net expense ratio includes contractual expense reimbursements by theadviser through at least July 31, 2021. Please read the current prospectus for more complete information on fees and expenses. These ratios maydiffer from those presented in the Financial Highlights.
G ROW T H O F A $ 10 , 0 0 0 I N V E S T M E N T ( C l a s s I s h a r e s ) 2
$2,000
$6,000
$10,000
$14,000
$18,000
$22,000
$26,000
$30,000
3/5/08 3/31/21
GLOBAL SUSTAINABILITY INDEX FUND MSCI WORLD ESG LEADERS INDEXSM
$25,829$25,393
2 Class I shares were offered beginning on July 31, 2020. Performance prior to that date is the performance of theFund’s Shares class, which is no longer offered by the Fund.
MSCI World ESG Leaders IndexSM is a free float-adjusted, market capitalization-weighted index comprised of largeand mid-cap developed market companies in Asia Pacific, Europe and the Middle East, Canada and theUnited States. The Index holds a broad, diversified set of global companies, selected based on regional sector rankingof environmental, social and governance performance. It is not possible to invest directly in an index.
The graph and table do not reflect thededuction of taxes that a shareholderwould pay on Fund distributions or theredemption of Fund shares.
Unlike the Index, the Fund’s total returnsare reduced by operating expenses, suchas transaction costs and managementfees. A direct investment in an Index isnot possible.
Information about InvestmentConsiderations can be found onpage 152.
E Q U I T Y I N D E X F U N D S
G LO BA L S U S TA I N A B I L I T Y I N D E X F U N D (UNAUDITED)
EQUIT Y INDEX FUNDS 4 NORTHERN FUNDS ANNUAL REPORT
P O R T F O L I O M A N AG E M E N T C O M M E N TA RY
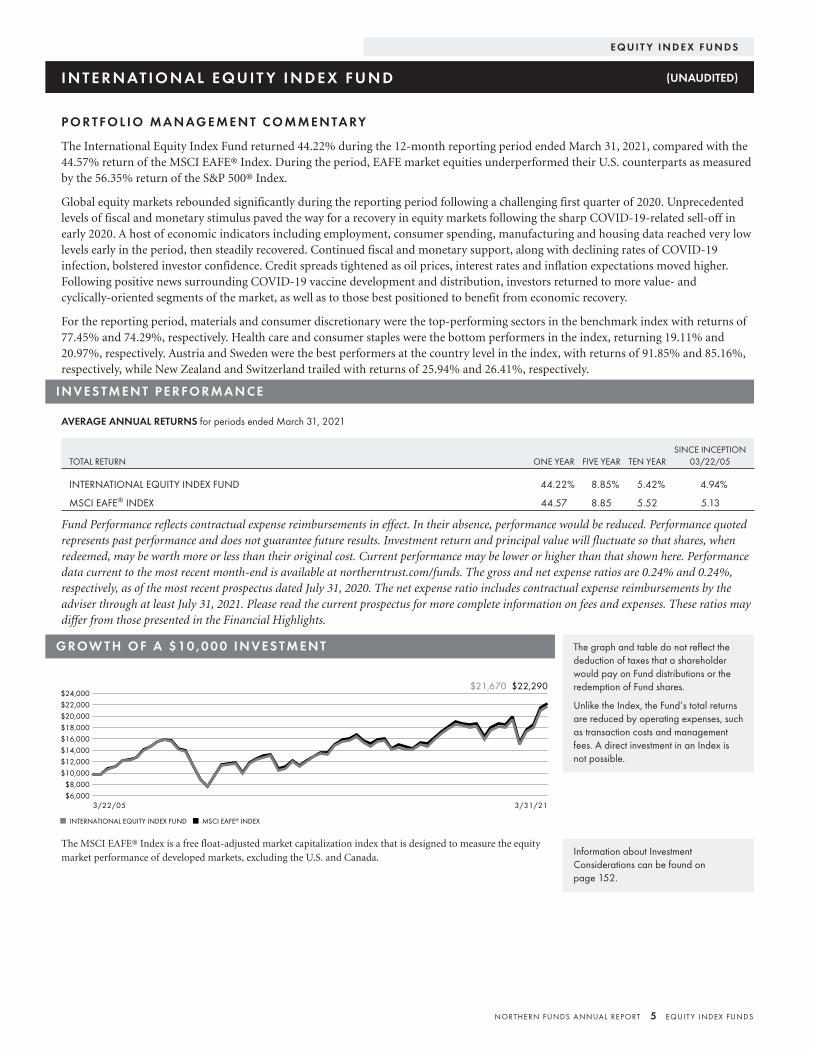
The International Equity Index Fund returned 44.22% during the 12-month reporting period ended March 31, 2021, compared with the44.57% return of the MSCI EAFE® Index. During the period, EAFE market equities underperformed their U.S. counterparts as measuredby the 56.35% return of the S&P 500® Index.
Global equity markets rebounded significantly during the reporting period following a challenging first quarter of 2020. Unprecedentedlevels of fiscal and monetary stimulus paved the way for a recovery in equity markets following the sharp COVID-19-related sell-off inearly 2020. A host of economic indicators including employment, consumer spending, manufacturing and housing data reached very lowlevels early in the period, then steadily recovered. Continued fiscal and monetary support, along with declining rates of COVID-19infection, bolstered investor confidence. Credit spreads tightened as oil prices, interest rates and inflation expectations moved higher.Following positive news surrounding COVID-19 vaccine development and distribution, investors returned to more value- andcyclically-oriented segments of the market, as well as to those best positioned to benefit from economic recovery.
For the reporting period, materials and consumer discretionary were the top-performing sectors in the benchmark index with returns of77.45% and 74.29%, respectively. Health care and consumer staples were the bottom performers in the index, returning 19.11% and20.97%, respectively. Austria and Sweden were the best performers at the country level in the index, with returns of 91.85% and 85.16%,respectively, while New Zealand and Switzerland trailed with returns of 25.94% and 26.41%, respectively.
I N V E S T M E N T P E R F O R M A N C E
AVERAGE ANNUAL RETURNS for periods ended March 31, 2021
TOTAL RETURN ONE YEAR FIVE YEAR TEN YEARSINCE INCEPTION
03/22/05
INTERNATIONAL EQUITY INDEX FUND 44.22% 8.85% 5.42% 4.94%
MSCI EAFE® INDEX 44.57 8.85 5.52 5.13
Fund Performance reflects contractual expense reimbursements in effect. In their absence, performance would be reduced. Performance quotedrepresents past performance and does not guarantee future results. Investment return and principal value will fluctuate so that shares, whenredeemed, may be worth more or less than their original cost. Current performance may be lower or higher than that shown here. Performancedata current to the most recent month-end is available at northerntrust.com/funds. The gross and net expense ratios are 0.24% and 0.24%,respectively, as of the most recent prospectus dated July 31, 2020. The net expense ratio includes contractual expense reimbursements by theadviser through at least July 31, 2021. Please read the current prospectus for more complete information on fees and expenses. These ratios maydiffer from those presented in the Financial Highlights.
G ROW T H O F A $ 10 , 0 0 0 I N V E S T M E N T
$6,000$8,000
$10,000$12,000$14,000$16,000$18,000$20,000$22,000$24,000
3/22/05 3/31/21
INTERNATIONAL EQUITY INDEX FUND MSCI EAFE® INDEX
$22,290$21,670
The MSCI EAFE® Index is a free float-adjusted market capitalization index that is designed to measure the equitymarket performance of developed markets, excluding the U.S. and Canada.
The graph and table do not reflect thededuction of taxes that a shareholderwould pay on Fund distributions or theredemption of Fund shares.
Unlike the Index, the Fund’s total returnsare reduced by operating expenses, suchas transaction costs and managementfees. A direct investment in an Index isnot possible.
Information about InvestmentConsiderations can be found onpage 152.
E Q U I T Y I N D E X F U N D S
I N T E R N AT I O N A L E Q U I T Y I N D E X F U N D (UNAUDITED)
NORTHERN FUNDS ANNUAL REPORT 5 EQUIT Y INDEX FUNDS
P O R T F O L I O M A N AG E M E N T C O M M E N TA RY
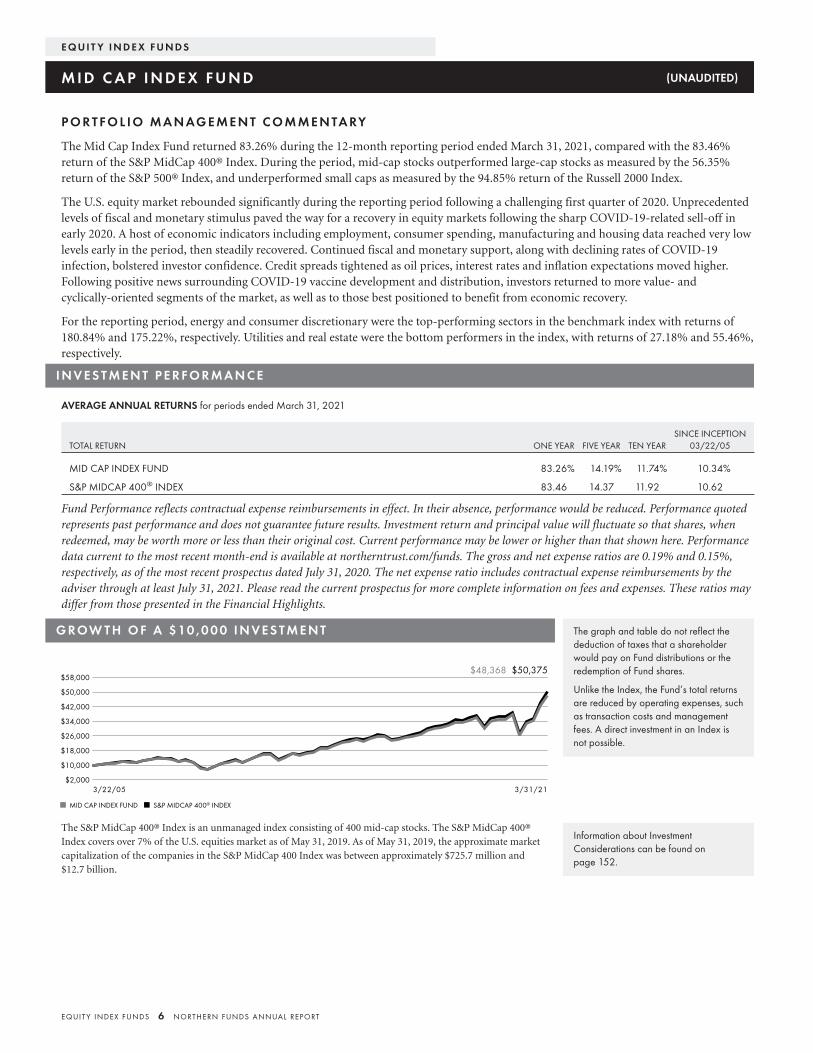
The Mid Cap Index Fund returned 83.26% during the 12-month reporting period ended March 31, 2021, compared with the 83.46%return of the S&P MidCap 400® Index. During the period, mid-cap stocks outperformed large-cap stocks as measured by the 56.35%return of the S&P 500® Index, and underperformed small caps as measured by the 94.85% return of the Russell 2000 Index.
The U.S. equity market rebounded significantly during the reporting period following a challenging first quarter of 2020. Unprecedentedlevels of fiscal and monetary stimulus paved the way for a recovery in equity markets following the sharp COVID-19-related sell-off inearly 2020. A host of economic indicators including employment, consumer spending, manufacturing and housing data reached very lowlevels early in the period, then steadily recovered. Continued fiscal and monetary support, along with declining rates of COVID-19infection, bolstered investor confidence. Credit spreads tightened as oil prices, interest rates and inflation expectations moved higher.Following positive news surrounding COVID-19 vaccine development and distribution, investors returned to more value- andcyclically-oriented segments of the market, as well as to those best positioned to benefit from economic recovery.
For the reporting period, energy and consumer discretionary were the top-performing sectors in the benchmark index with returns of180.84% and 175.22%, respectively. Utilities and real estate were the bottom performers in the index, with returns of 27.18% and 55.46%,respectively.
I N V E S T M E N T P E R F O R M A N C E
AVERAGE ANNUAL RETURNS for periods ended March 31, 2021
TOTAL RETURN ONE YEAR FIVE YEAR TEN YEARSINCE INCEPTION
03/22/05
MID CAP INDEX FUND 83.26% 14.19% 11.74% 10.34%
S&P MIDCAP 400® INDEX 83.46 14.37 11.92 10.62
Fund Performance reflects contractual expense reimbursements in effect. In their absence, performance would be reduced. Performance quotedrepresents past performance and does not guarantee future results. Investment return and principal value will fluctuate so that shares, whenredeemed, may be worth more or less than their original cost. Current performance may be lower or higher than that shown here. Performancedata current to the most recent month-end is available at northerntrust.com/funds. The gross and net expense ratios are 0.19% and 0.15%,respectively, as of the most recent prospectus dated July 31, 2020. The net expense ratio includes contractual expense reimbursements by theadviser through at least July 31, 2021. Please read the current prospectus for more complete information on fees and expenses. These ratios maydiffer from those presented in the Financial Highlights.
G ROW T H O F A $ 10 , 0 0 0 I N V E S T M E N T
$2,000
$10,000
$18,000
$26,000
$34,000
$42,000
$50,000
$58,000
3/22/05 3/31/21
MID CAP INDEX FUND S&P MIDCAP 400® INDEX
$50,375$48,368
The S&P MidCap 400® Index is an unmanaged index consisting of 400 mid-cap stocks. The S&P MidCap 400®Index covers over 7% of the U.S. equities market as of May 31, 2019. As of May 31, 2019, the approximate marketcapitalization of the companies in the S&P MidCap 400 Index was between approximately $725.7 million and$12.7 billion.
The graph and table do not reflect thededuction of taxes that a shareholderwould pay on Fund distributions or theredemption of Fund shares.
Unlike the Index, the Fund’s total returnsare reduced by operating expenses, suchas transaction costs and managementfees. A direct investment in an Index isnot possible.
Information about InvestmentConsiderations can be found onpage 152.
E Q U I T Y I N D E X F U N D S
M I D C A P I N D E X F U N D (UNAUDITED)
EQUIT Y INDEX FUNDS 6 NORTHERN FUNDS ANNUAL REPORT
P O R T F O L I O M A N AG E M E N T C O M M E N TA RY
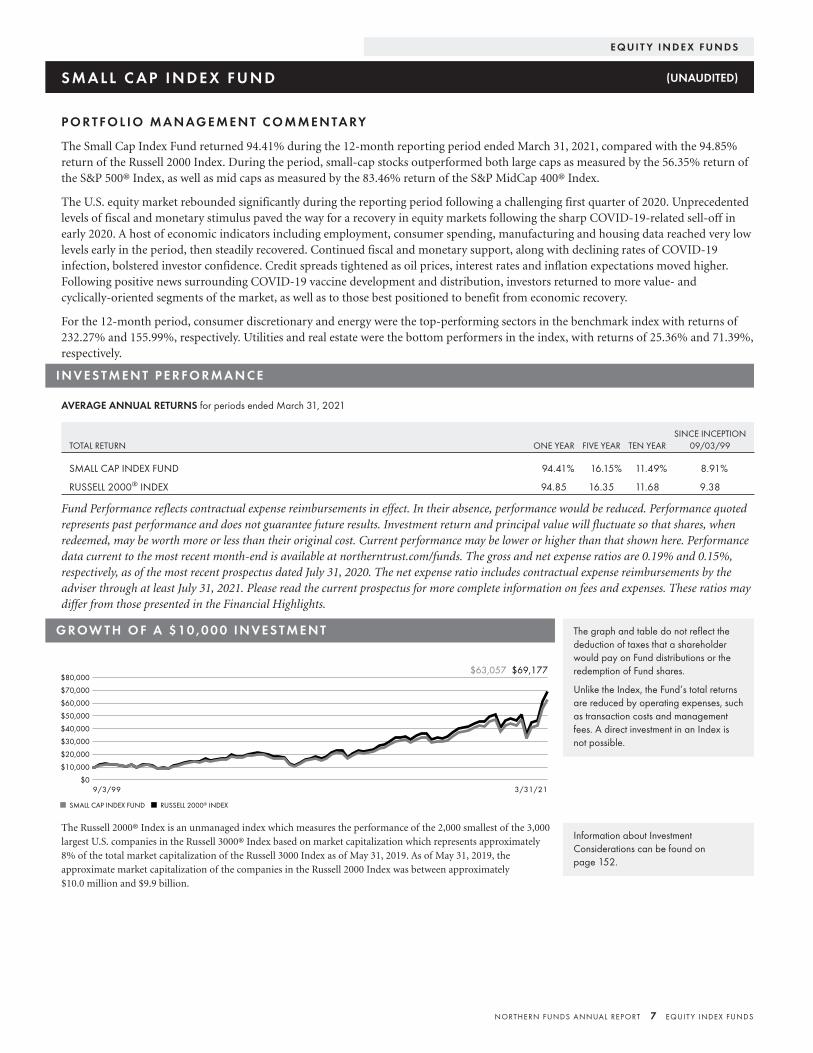
The Small Cap Index Fund returned 94.41% during the 12-month reporting period ended March 31, 2021, compared with the 94.85%return of the Russell 2000 Index. During the period, small-cap stocks outperformed both large caps as measured by the 56.35% return ofthe S&P 500® Index, as well as mid caps as measured by the 83.46% return of the S&P MidCap 400® Index.
The U.S. equity market rebounded significantly during the reporting period following a challenging first quarter of 2020. Unprecedentedlevels of fiscal and monetary stimulus paved the way for a recovery in equity markets following the sharp COVID-19-related sell-off inearly 2020. A host of economic indicators including employment, consumer spending, manufacturing and housing data reached very lowlevels early in the period, then steadily recovered. Continued fiscal and monetary support, along with declining rates of COVID-19infection, bolstered investor confidence. Credit spreads tightened as oil prices, interest rates and inflation expectations moved higher.Following positive news surrounding COVID-19 vaccine development and distribution, investors returned to more value- andcyclically-oriented segments of the market, as well as to those best positioned to benefit from economic recovery.
For the 12-month period, consumer discretionary and energy were the top-performing sectors in the benchmark index with returns of232.27% and 155.99%, respectively. Utilities and real estate were the bottom performers in the index, with returns of 25.36% and 71.39%,respectively.
I N V E S T M E N T P E R F O R M A N C E
AVERAGE ANNUAL RETURNS for periods ended March 31, 2021
TOTAL RETURN ONE YEAR FIVE YEAR TEN YEARSINCE INCEPTION
09/03/99
SMALL CAP INDEX FUND 94.41% 16.15% 11.49% 8.91%
RUSSELL 2000® INDEX 94.85 16.35 11.68 9.38
Fund Performance reflects contractual expense reimbursements in effect. In their absence, performance would be reduced. Performance quotedrepresents past performance and does not guarantee future results. Investment return and principal value will fluctuate so that shares, whenredeemed, may be worth more or less than their original cost. Current performance may be lower or higher than that shown here. Performancedata current to the most recent month-end is available at northerntrust.com/funds. The gross and net expense ratios are 0.19% and 0.15%,respectively, as of the most recent prospectus dated July 31, 2020. The net expense ratio includes contractual expense reimbursements by theadviser through at least July 31, 2021. Please read the current prospectus for more complete information on fees and expenses. These ratios maydiffer from those presented in the Financial Highlights.
G ROW T H O F A $ 10 , 0 0 0 I N V E S T M E N T
$0
$10,000
$20,000
$30,000
$40,000
$50,000
$60,000
$70,000
$80,000
9/3/99 3/31/21
SMALL CAP INDEX FUND RUSSELL 2000® INDEX
$69,177$63,057
The Russell 2000® Index is an unmanaged index which measures the performance of the 2,000 smallest of the 3,000largest U.S. companies in the Russell 3000® Index based on market capitalization which represents approximately8% of the total market capitalization of the Russell 3000 Index as of May 31, 2019. As of May 31, 2019, theapproximate market capitalization of the companies in the Russell 2000 Index was between approximately$10.0 million and $9.9 billion.
The graph and table do not reflect thededuction of taxes that a shareholderwould pay on Fund distributions or theredemption of Fund shares.
Unlike the Index, the Fund’s total returnsare reduced by operating expenses, suchas transaction costs and managementfees. A direct investment in an Index isnot possible.
Information about InvestmentConsiderations can be found onpage 152.
E Q U I T Y I N D E X F U N D S
S M A L L C A P I N D E X F U N D (UNAUDITED)
NORTHERN FUNDS ANNUAL REPORT 7 EQUIT Y INDEX FUNDS

P O R T F O L I O M A N AG E M E N T C O M M E N TA RY
The Stock Index Fund returned 56.22% during the 12-month reporting period ended March 31, 2021, compared with the 56.35% returnof the S&P 500® Index. During the period, large-cap stocks as measured by the S&P 500® Index underperformed both mid- andsmall-cap equities as measured by the 83.46% return of the S&P MidCap 400® Index and the 94.85% return of the Russell 2000 Index,respectively.
The U.S. equity market rebounded significantly during the reporting period following a challenging first quarter of 2020. Unprecedentedlevels of fiscal and monetary stimulus paved the way for a recovery in equity markets following the sharp COVID-19-related sell-off inearly 2020. A host of economic indicators including employment, consumer spending, manufacturing and housing data reached very lowlevels early in the period, then steadily recovered. Continued fiscal and monetary support, along with declining rates of COVID-19infection, bolstered investor confidence. Credit spreads tightened as oil prices, interest rates and inflation expectations moved higher.Following positive news surrounding COVID-19 vaccine development and distribution, investors returned to more value- andcyclically-oriented segments of the market, as well as to those best positioned to benefit from economic recovery.
For the reporting period, materials and energy were the top-performing sectors in the benchmark index, with returns of 86.92% and83.67%, respectively. Within the index, utilities and consumer staples trailed with returns of 27.21% and 30.76%, respectively.
I N V E S T M E N T P E R F O R M A N C E
AVERAGE ANNUAL RETURNS for periods ended March 31, 2021
TOTAL RETURN ONE YEAR FIVE YEAR TEN YEARSINCE INCEPTION
10/07/96
STOCK INDEX FUND 56.22% 16.17% 13.78% 9.04%
S&P 500® INDEX 56.35 16.29 13.91 9.47
Fund Performance reflects contractual expense reimbursements in effect. In their absence, performance would be reduced. Performance quotedrepresents past performance and does not guarantee future results. Investment return and principal value will fluctuate so that shares, whenredeemed, may be worth more or less than their original cost. Current performance may be lower or higher than that shown here. Performancedata current to the most recent month-end is available at northerntrust.com/funds. The gross and net expense ratios are 0.13% and 0.10%,respectively, as of the most recent prospectus dated July 31, 2020. The net expense ratio includes contractual expense reimbursements by theadviser through at least July 31, 2021. Please read the current prospectus for more complete information on fees and expenses. These ratios maydiffer from those presented in the Financial Highlights.
G ROW T H O F A $ 10 , 0 0 0 I N V E S T M E N T
-$10,000
$10,000
$30,000
$50,000
$70,000
$90,000
$110,000
10/7/96 3/31/21
STOCK INDEX FUND S&P 500® INDEX
$91,642$83,244
The S&P 500® Index is an unmanaged index consisting of 500 stocks and is a widely recognized common measure ofthe performance of the overall U.S. stock market. As of May 31, 2019, the approximate market capitalization of thecompanies in the S&P 500 Index was between approximately $2.3 billion and $948.9 billion.
The graph and table do not reflect thededuction of taxes that a shareholderwould pay on Fund distributions or theredemption of Fund shares.
Unlike the Index, the Fund’s total returnsare reduced by operating expenses, suchas transaction costs and managementfees. A direct investment in an Index isnot possible.
Information about InvestmentConsiderations can be found onpage 152.
E Q U I T Y I N D E X F U N D S
S TO C K I N D E X F U N D (UNAUDITED)
EQUIT Y INDEX FUNDS 8 NORTHERN FUNDS ANNUAL REPORT

E Q U I T Y I N D E X F U N D S
THIS PAGE INTENTIONALLY LEFT BL ANK
NORTHERN FUNDS ANNUAL REPORT 9 EQUIT Y INDEX FUNDS
Amounts in thousands, except per share data
EMERGING MARKETSEQUITY
INDEX FUND
GLOBAL REALESTATE INDEX
FUND
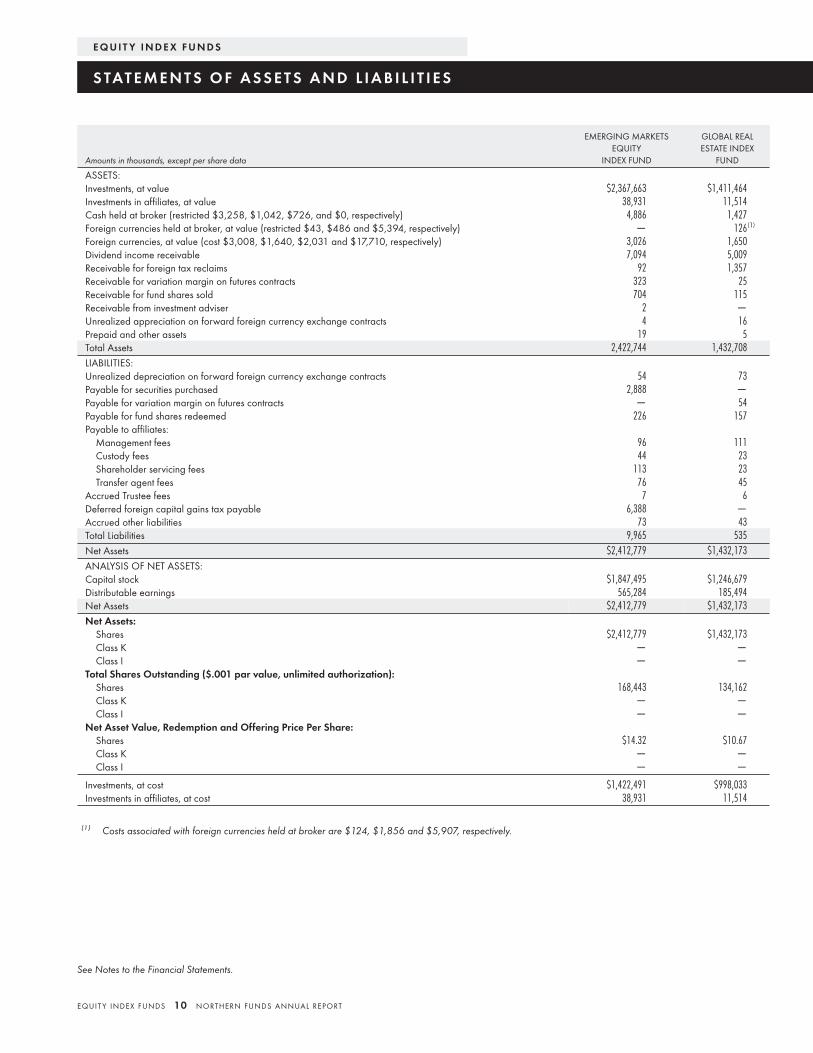
ASSETS:Investments, at value $2,367,663 $1,411,464Investments in affiliates, at value 38,931 11,514Cash held at broker (restricted $3,258, $1,042, $726, and $0, respectively) 4,886 1,427Foreign currencies held at broker, at value (restricted $43, $486 and $5,394, respectively) — 126(1)
Foreign currencies, at value (cost $3,008, $1,640, $2,031 and $17,710, respectively) 3,026 1,650Dividend income receivable 7,094 5,009Receivable for foreign tax reclaims 92 1,357Receivable for variation margin on futures contracts 323 25Receivable for fund shares sold 704 115Receivable from investment adviser 2 —Unrealized appreciation on forward foreign currency exchange contracts 4 16Prepaid and other assets 19 5Total Assets 2,422,744 1,432,708LIABILITIES:Unrealized depreciation on forward foreign currency exchange contracts 54 73Payable for securities purchased 2,888 —Payable for variation margin on futures contracts — 54Payable for fund shares redeemed 226 157Payable to affiliates:
Management fees 96 111Custody fees 44 23Shareholder servicing fees 113 23Transfer agent fees 76 45
Accrued Trustee fees 7 6Deferred foreign capital gains tax payable 6,388 —Accrued other liabilities 73 43Total Liabilities 9,965 535Net Assets $2,412,779 $1,432,173ANALYSIS OF NET ASSETS:Capital stock $1,847,495 $1,246,679Distributable earnings 565,284 185,494Net Assets $2,412,779 $1,432,173Net Assets:
Shares $2,412,779 $1,432,173Class K — —Class I — —
Total Shares Outstanding ($.001 par value, unlimited authorization):Shares 168,443 134,162Class K — —Class I — —
Net Asset Value, Redemption and Offering Price Per Share:Shares $14.32 $10.67Class K — —Class I — —
Investments, at cost $1,422,491 $998,033Investments in affiliates, at cost 38,931 11,514
(1) Costs associated with foreign currencies held at broker are $124, $1,856 and $5,907, respectively.
E Q U I T Y I N D E X F U N D S
S TAT E M E N T S O F A S S E T S A N D L I A B I L I T I E S
See Notes to the Financial Statements.
EQUIT Y INDEX FUNDS 10 NORTHERN FUNDS ANNUAL REPORT
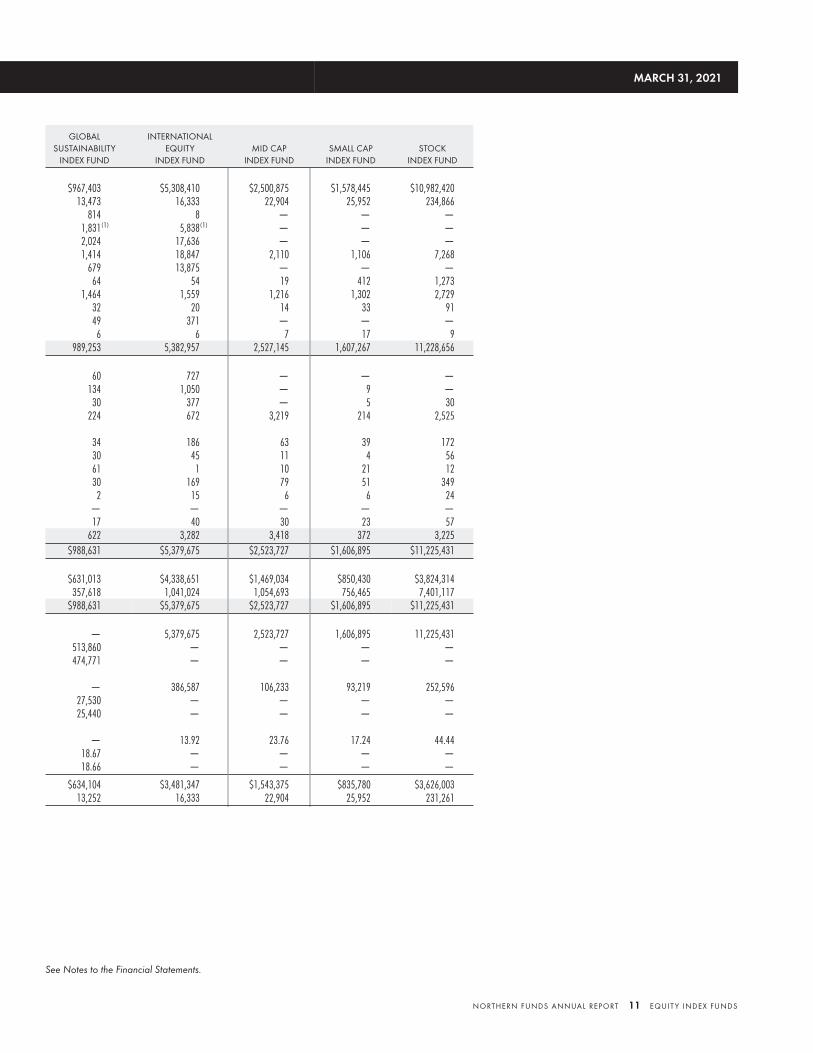
GLOBALSUSTAINABILITY
INDEX FUND
INTERNATIONALEQUITY
INDEX FUNDMID CAP
INDEX FUNDSMALL CAP
INDEX FUNDSTOCK
INDEX FUND
$967,403 $5,308,410 $2,500,875 $1,578,445 $10,982,42013,473 16,333 22,904 25,952 234,866
814 8 — — —1,831(1) 5,838(1) — — —2,024 17,636 — — —1,414 18,847 2,110 1,106 7,268
679 13,875 — — —64 54 19 412 1,273
1,464 1,559 1,216 1,302 2,72932 20 14 33 9149 371 — — —6 6 7 17 9
989,253 5,382,957 2,527,145 1,607,267 11,228,656
60 727 — — —134 1,050 — 9 —30 377 — 5 30
224 672 3,219 214 2,525
34 186 63 39 17230 45 11 4 5661 1 10 21 1230 169 79 51 3492 15 6 6 24
— — — — —17 40 30 23 57
622 3,282 3,418 372 3,225$988,631 $5,379,675 $2,523,727 $1,606,895 $11,225,431
$631,013 $4,338,651 $1,469,034 $850,430 $3,824,314357,618 1,041,024 1,054,693 756,465 7,401,117
$988,631 $5,379,675 $2,523,727 $1,606,895 $11,225,431
— 5,379,675 2,523,727 1,606,895 11,225,431513,860 — — — —474,771 — — — —
— 386,587 106,233 93,219 252,59627,530 — — — —25,440 — — — —
— 13.92 23.76 17.24 44.4418.67 — — — —18.66 — — — —
$634,104 $3,481,347 $1,543,375 $835,780 $3,626,00313,252 16,333 22,904 25,952 231,261
MARCH 31, 2021
See Notes to the Financial Statements.
NORTHERN FUNDS ANNUAL REPORT 11 EQUIT Y INDEX FUNDS
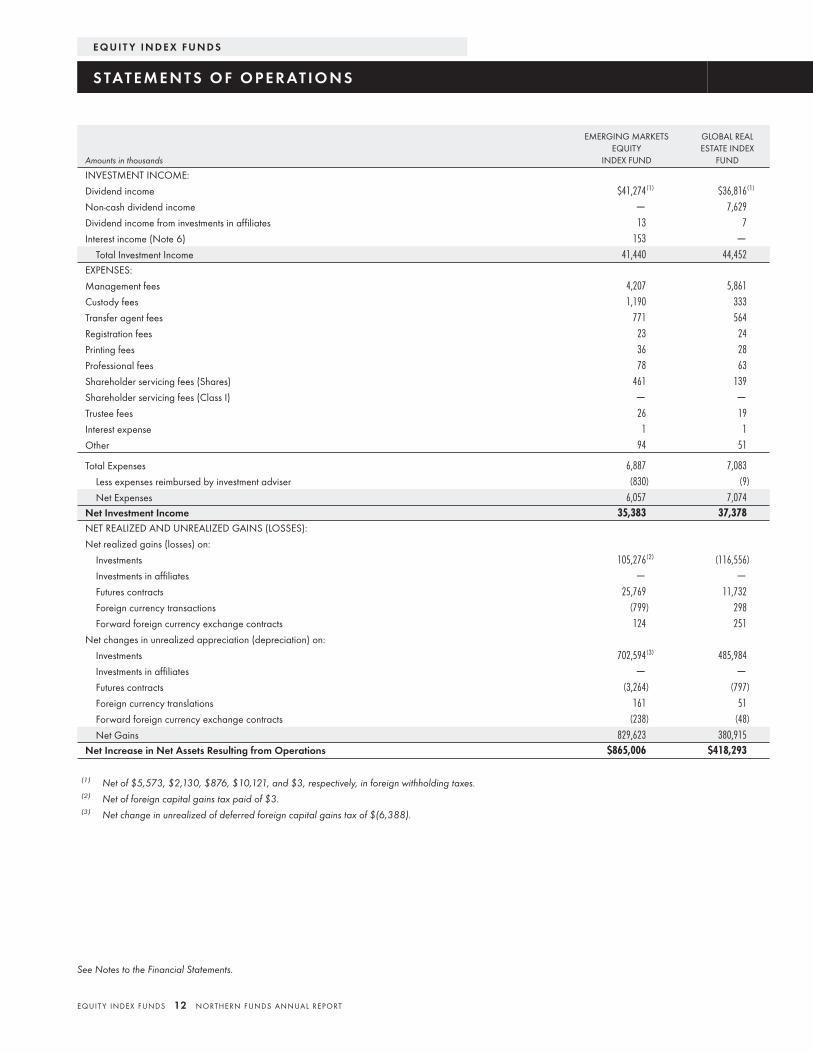
Amounts in thousands
EMERGING MARKETSEQUITY
INDEX FUND
GLOBAL REALESTATE INDEX
FUND
INVESTMENT INCOME:
Dividend income $41,274(1) $36,816(1)
Non-cash dividend income — 7,629
Dividend income from investments in affiliates 13 7
Interest income (Note 6) 153 —
Total Investment Income 41,440 44,452EXPENSES:
Management fees 4,207 5,861
Custody fees 1,190 333
Transfer agent fees 771 564
Registration fees 23 24
Printing fees 36 28
Professional fees 78 63
Shareholder servicing fees (Shares) 461 139
Shareholder servicing fees (Class I) — —
Trustee fees 26 19
Interest expense 1 1
Other 94 51
Total Expenses 6,887 7,083
Less expenses reimbursed by investment adviser (830) (9)
Net Expenses 6,057 7,074Net Investment Income 35,383 37,378NET REALIZED AND UNREALIZED GAINS (LOSSES):
Net realized gains (losses) on:
Investments 105,276(2) (116,556)
Investments in affiliates — —
Futures contracts 25,769 11,732
Foreign currency transactions (799) 298
Forward foreign currency exchange contracts 124 251
Net changes in unrealized appreciation (depreciation) on:
Investments 702,594(3) 485,984
Investments in affiliates — —
Futures contracts (3,264) (797)
Foreign currency translations 161 51
Forward foreign currency exchange contracts (238) (48)
Net Gains 829,623 380,915Net Increase in Net Assets Resulting from Operations $865,006 $418,293
(1) Net of $5,573, $2,130, $876, $10,121, and $3, respectively, in foreign withholding taxes.(2) Net of foreign capital gains tax paid of $3.(3) Net change in unrealized of deferred foreign capital gains tax of $(6,388).
E Q U I T Y I N D E X F U N D S
S TAT E M E N T S O F O P E R AT I O N S
See Notes to the Financial Statements.
EQUIT Y INDEX FUNDS 12 NORTHERN FUNDS ANNUAL REPORT
GLOBALSUSTAINABILITY
INDEX FUND
INTERNATIONALEQUITY
INDEX FUNDMID CAP
INDEX FUNDSMALL CAP
INDEX FUNDSTOCK
INDEX FUND
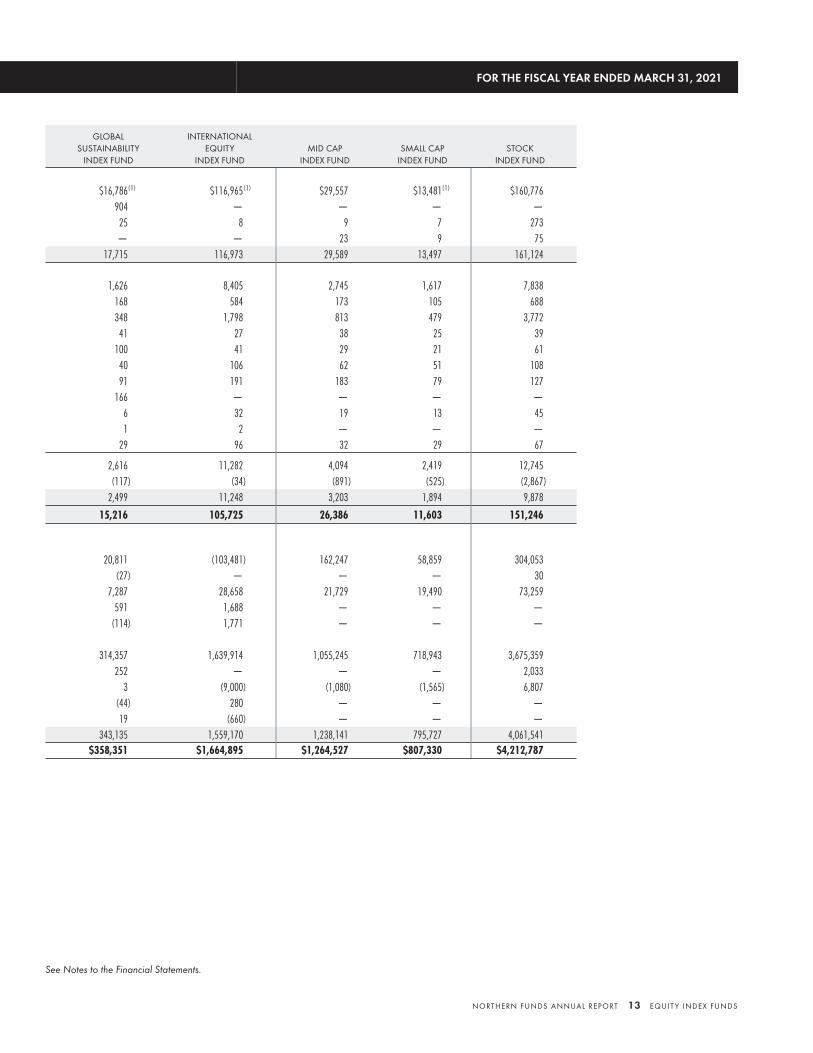
$16,786(1) $116,965(1) $29,557 $13,481(1) $160,776
904 — — — —
25 8 9 7 273
— — 23 9 75
17,715 116,973 29,589 13,497 161,124
1,626 8,405 2,745 1,617 7,838
168 584 173 105 688
348 1,798 813 479 3,772
41 27 38 25 39
100 41 29 21 61
40 106 62 51 108
91 191 183 79 127
166 — — — —
6 32 19 13 45
1 2 — — —
29 96 32 29 67
2,616 11,282 4,094 2,419 12,745
(117) (34) (891) (525) (2,867)
2,499 11,248 3,203 1,894 9,878
15,216 105,725 26,386 11,603 151,246
20,811 (103,481) 162,247 58,859 304,053
(27) — — — 30
7,287 28,658 21,729 19,490 73,259
591 1,688 — — —
(114) 1,771 — — —
314,357 1,639,914 1,055,245 718,943 3,675,359
252 — — — 2,033
3 (9,000) (1,080) (1,565) 6,807
(44) 280 — — —
19 (660) — — —
343,135 1,559,170 1,238,141 795,727 4,061,541$358,351 $1,664,895 $1,264,527 $807,330 $4,212,787
FOR THE FISCAL YEAR ENDED MARCH 31, 2021
See Notes to the Financial Statements.
NORTHERN FUNDS ANNUAL REPORT 13 EQUIT Y INDEX FUNDS
EMERGING MARKETSEQUITY
INDEX FUND
GLOBAL REALESTATE INDEX
FUND
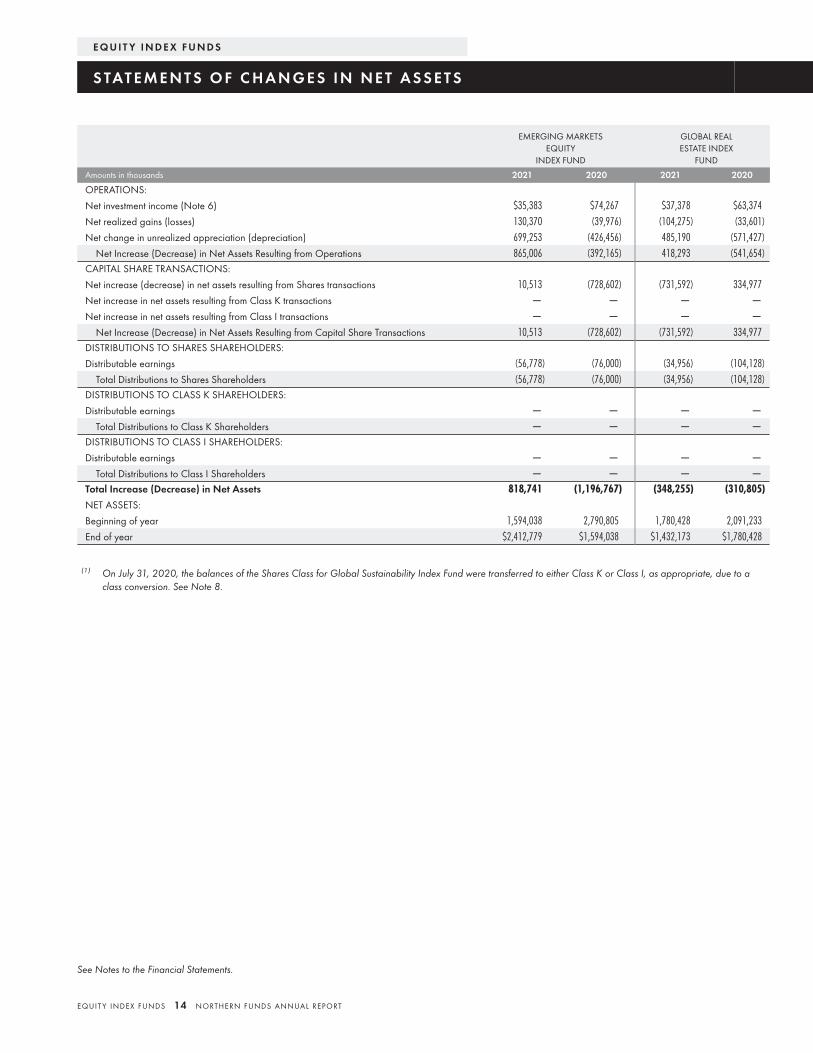
Amounts in thousands 2021 2020 2021 2020
OPERATIONS:
Net investment income (Note 6) $35,383 $74,267 $37,378 $63,374
Net realized gains (losses) 130,370 (39,976) (104,275) (33,601)
Net change in unrealized appreciation (depreciation) 699,253 (426,456) 485,190 (571,427)
Net Increase (Decrease) in Net Assets Resulting from Operations 865,006 (392,165) 418,293 (541,654)CAPITAL SHARE TRANSACTIONS:
Net increase (decrease) in net assets resulting from Shares transactions 10,513 (728,602) (731,592) 334,977
Net increase in net assets resulting from Class K transactions — — — —
Net increase in net assets resulting from Class I transactions — — — —
Net Increase (Decrease) in Net Assets Resulting from Capital Share Transactions 10,513 (728,602) (731,592) 334,977DISTRIBUTIONS TO SHARES SHAREHOLDERS:
Distributable earnings (56,778) (76,000) (34,956) (104,128)
Total Distributions to Shares Shareholders (56,778) (76,000) (34,956) (104,128)DISTRIBUTIONS TO CLASS K SHAREHOLDERS:
Distributable earnings — — — —
Total Distributions to Class K Shareholders — — — —DISTRIBUTIONS TO CLASS I SHAREHOLDERS:
Distributable earnings — — — —
Total Distributions to Class I Shareholders — — — —Total Increase (Decrease) in Net Assets 818,741 (1,196,767) (348,255) (310,805)NET ASSETS:
Beginning of year 1,594,038 2,790,805 1,780,428 2,091,233
End of year $2,412,779 $1,594,038 $1,432,173 $1,780,428
(1) On July 31, 2020, the balances of the Shares Class for Global Sustainability Index Fund were transferred to either Class K or Class I, as appropriate, due to aclass conversion. See Note 8.
E Q U I T Y I N D E X F U N D S
S TAT E M E N T S O F C H A N G E S I N N E T A S S E T S
See Notes to the Financial Statements.
EQUIT Y INDEX FUNDS 14 NORTHERN FUNDS ANNUAL REPORT
GLOBALSUSTAINABILITY
INDEX FUND
INTERNATIONALEQUITY
INDEX FUNDMID CAP
INDEX FUNDSMALL CAP
INDEX FUNDSTOCK
INDEX FUND
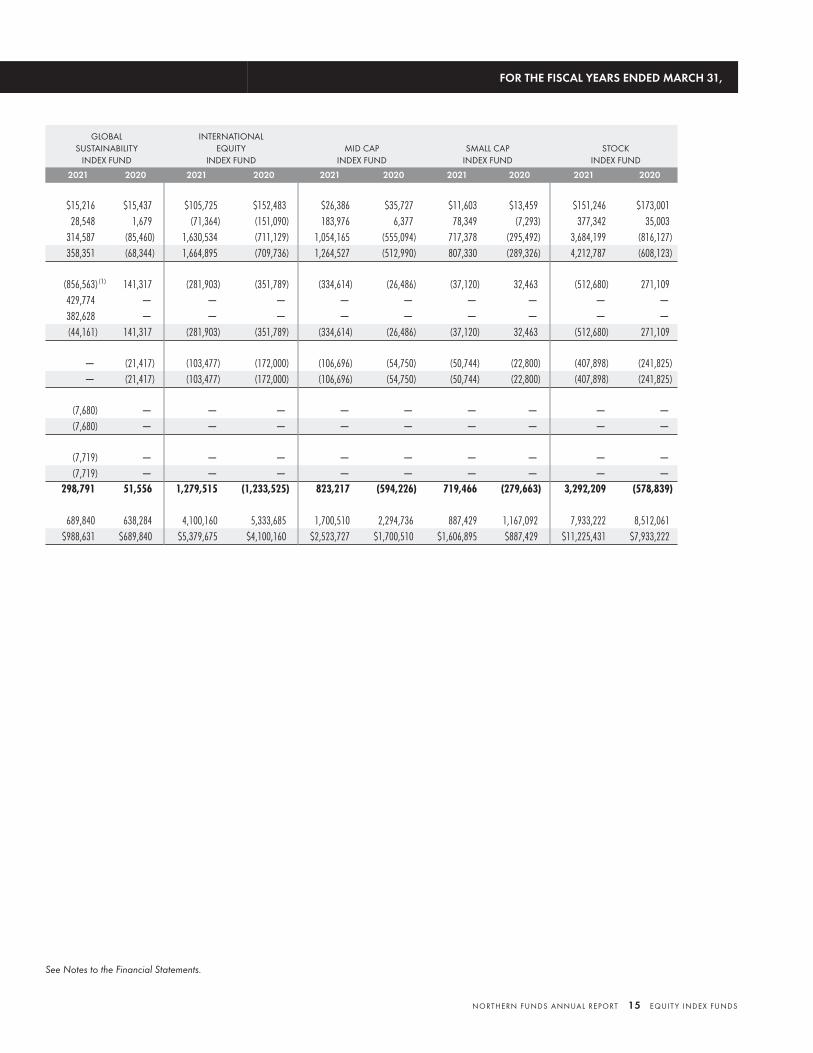
2021 2020 2021 2020 2021 2020 2021 2020 2021 2020
$15,216 $15,437 $105,725 $152,483 $26,386 $35,727 $11,603 $13,459 $151,246 $173,001
28,548 1,679 (71,364) (151,090) 183,976 6,377 78,349 (7,293) 377,342 35,003
314,587 (85,460) 1,630,534 (711,129) 1,054,165 (555,094) 717,378 (295,492) 3,684,199 (816,127)
358,351 (68,344) 1,664,895 (709,736) 1,264,527 (512,990) 807,330 (289,326) 4,212,787 (608,123)
(856,563)(1) 141,317 (281,903) (351,789) (334,614) (26,486) (37,120) 32,463 (512,680) 271,109
429,774 — — — — — — — — —
382,628 — — — — — — — — —
(44,161) 141,317 (281,903) (351,789) (334,614) (26,486) (37,120) 32,463 (512,680) 271,109
— (21,417) (103,477) (172,000) (106,696) (54,750) (50,744) (22,800) (407,898) (241,825)
— (21,417) (103,477) (172,000) (106,696) (54,750) (50,744) (22,800) (407,898) (241,825)
(7,680) — — — — — — — — —
(7,680) — — — — — — — — —
(7,719) — — — — — — — — —
(7,719) — — — — — — — — —298,791 51,556 1,279,515 (1,233,525) 823,217 (594,226) 719,466 (279,663) 3,292,209 (578,839)
689,840 638,284 4,100,160 5,333,685 1,700,510 2,294,736 887,429 1,167,092 7,933,222 8,512,061
$988,631 $689,840 $5,379,675 $4,100,160 $2,523,727 $1,700,510 $1,606,895 $887,429 $11,225,431 $7,933,222
FOR THE FISCAL YEARS ENDED MARCH 31,
See Notes to the Financial Statements.
NORTHERN FUNDS ANNUAL REPORT 15 EQUIT Y INDEX FUNDS
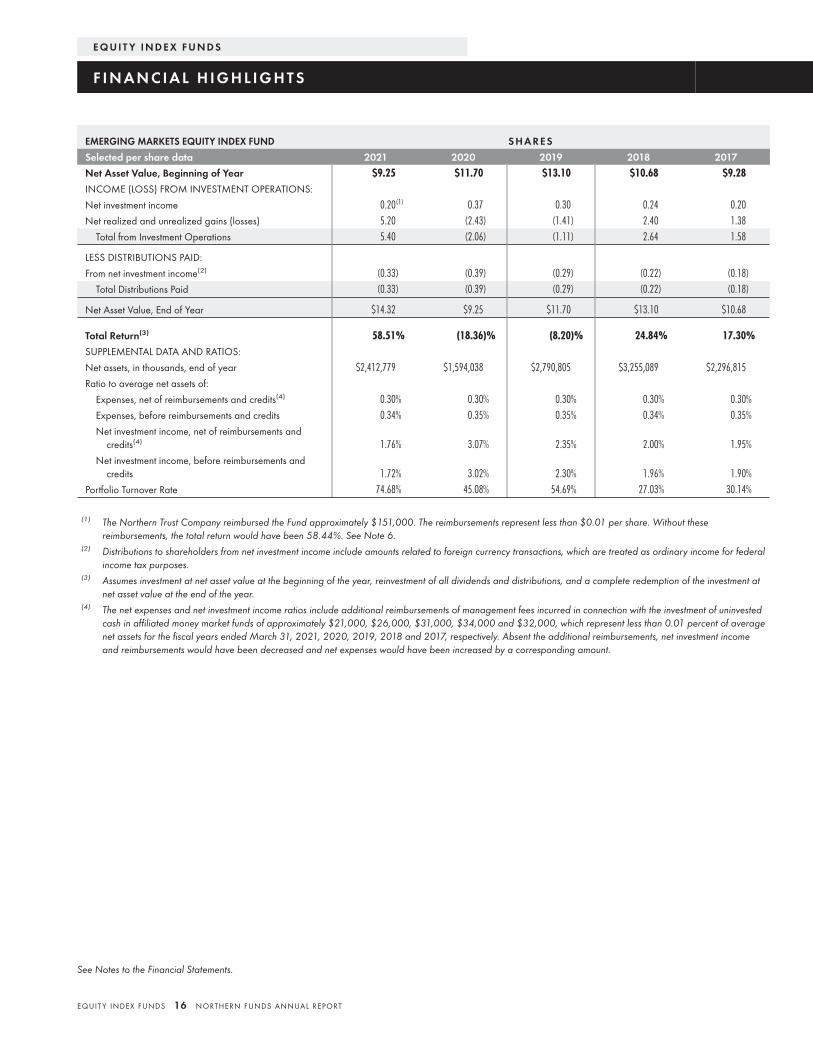
EMERGING MARKETS EQUITY INDEX FUND S H A R E S
Selected per share data 2021 2020 2019 2018 2017
Net Asset Value, Beginning of Year $9.25 $11.70 $13.10 $10.68 $9.28INCOME (LOSS) FROM INVESTMENT OPERATIONS:
Net investment income 0.20(1) 0.37 0.30 0.24 0.20
Net realized and unrealized gains (losses) 5.20 (2.43) (1.41) 2.40 1.38
Total from Investment Operations 5.40 (2.06) (1.11) 2.64 1.58
LESS DISTRIBUTIONS PAID:
From net investment income(2) (0.33) (0.39) (0.29) (0.22) (0.18)
Total Distributions Paid (0.33) (0.39) (0.29) (0.22) (0.18)
Net Asset Value, End of Year $14.32 $9.25 $11.70 $13.10 $10.68
Total Return(3) 58.51% (18.36)% (8.20)% 24.84% 17.30%SUPPLEMENTAL DATA AND RATIOS:
Net assets, in thousands, end of year $2,412,779 $1,594,038 $2,790,805 $3,255,089 $2,296,815
Ratio to average net assets of:
Expenses, net of reimbursements and credits(4) 0.30% 0.30% 0.30% 0.30% 0.30%
Expenses, before reimbursements and credits 0.34% 0.35% 0.35% 0.34% 0.35%
Net investment income, net of reimbursements andcredits(4) 1.76% 3.07% 2.35% 2.00% 1.95%
Net investment income, before reimbursements andcredits 1.72% 3.02% 2.30% 1.96% 1.90%
Portfolio Turnover Rate 74.68% 45.08% 54.69% 27.03% 30.14%
(1) The Northern Trust Company reimbursed the Fund approximately $151,000. The reimbursements represent less than $0.01 per share. Without thesereimbursements, the total return would have been 58.44%. See Note 6.
(2) Distributions to shareholders from net investment income include amounts related to foreign currency transactions, which are treated as ordinary income for federalincome tax purposes.
(3) Assumes investment at net asset value at the beginning of the year, reinvestment of all dividends and distributions, and a complete redemption of the investment atnet asset value at the end of the year.
(4) The net expenses and net investment income ratios include additional reimbursements of management fees incurred in connection with the investment of uninvestedcash in affiliated money market funds of approximately $21,000, $26,000, $31,000, $34,000 and $32,000, which represent less than 0.01 percent of averagenet assets for the fiscal years ended March 31, 2021, 2020, 2019, 2018 and 2017, respectively. Absent the additional reimbursements, net investment incomeand reimbursements would have been decreased and net expenses would have been increased by a corresponding amount.
E Q U I T Y I N D E X F U N D S
F I N A N C I A L H I G H L I G H T S
See Notes to the Financial Statements.
EQUIT Y INDEX FUNDS 16 NORTHERN FUNDS ANNUAL REPORT
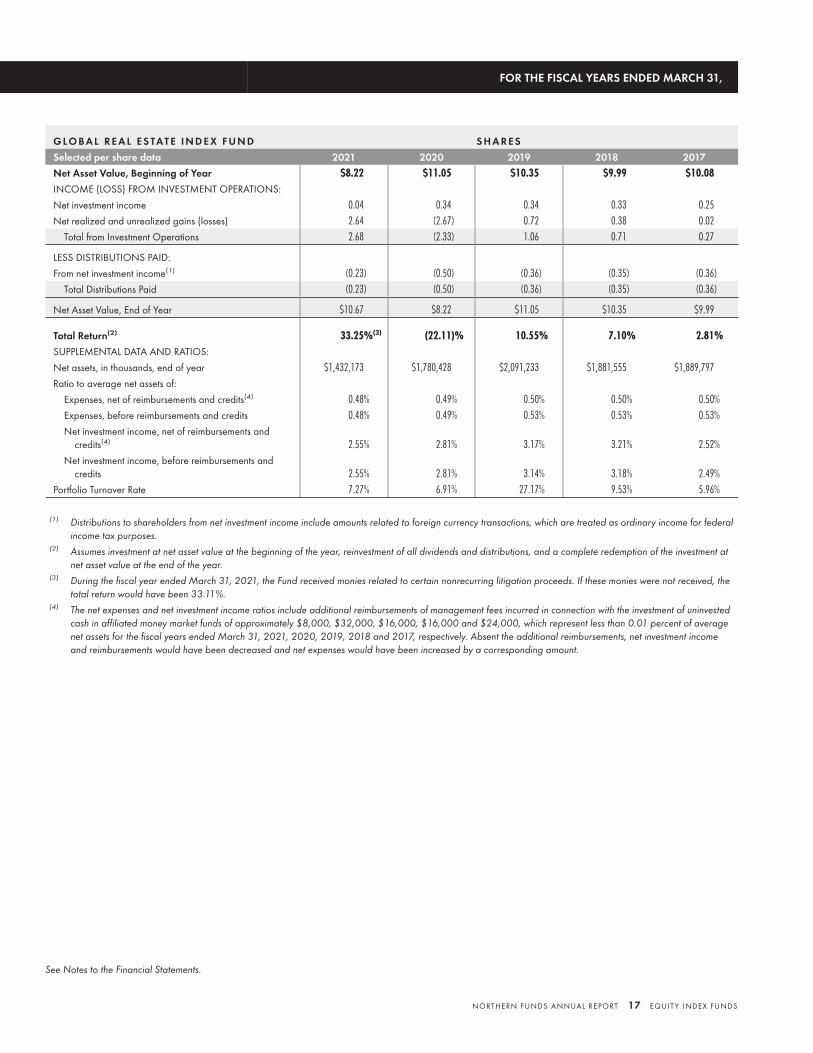
G LO BA L R E A L E S TAT E I N D E X F U N D S H A R E S
Selected per share data 2021 2020 2019 2018 2017
Net Asset Value, Beginning of Year $8.22 $11.05 $10.35 $9.99 $10.08INCOME (LOSS) FROM INVESTMENT OPERATIONS:
Net investment income 0.04 0.34 0.34 0.33 0.25
Net realized and unrealized gains (losses) 2.64 (2.67) 0.72 0.38 0.02
Total from Investment Operations 2.68 (2.33) 1.06 0.71 0.27
LESS DISTRIBUTIONS PAID:
From net investment income(1) (0.23) (0.50) (0.36) (0.35) (0.36)
Total Distributions Paid (0.23) (0.50) (0.36) (0.35) (0.36)
Net Asset Value, End of Year $10.67 $8.22 $11.05 $10.35 $9.99
Total Return(2) 33.25%(3) (22.11)% 10.55% 7.10% 2.81%SUPPLEMENTAL DATA AND RATIOS:
Net assets, in thousands, end of year $1,432,173 $1,780,428 $2,091,233 $1,881,555 $1,889,797
Ratio to average net assets of:
Expenses, net of reimbursements and credits(4) 0.48% 0.49% 0.50% 0.50% 0.50%
Expenses, before reimbursements and credits 0.48% 0.49% 0.53% 0.53% 0.53%
Net investment income, net of reimbursements andcredits(4) 2.55% 2.81% 3.17% 3.21% 2.52%
Net investment income, before reimbursements andcredits 2.55% 2.81% 3.14% 3.18% 2.49%
Portfolio Turnover Rate 7.27% 6.91% 27.17% 9.53% 5.96%
(1) Distributions to shareholders from net investment income include amounts related to foreign currency transactions, which are treated as ordinary income for federalincome tax purposes.
(2) Assumes investment at net asset value at the beginning of the year, reinvestment of all dividends and distributions, and a complete redemption of the investment atnet asset value at the end of the year.
(3) During the fiscal year ended March 31, 2021, the Fund received monies related to certain nonrecurring litigation proceeds. If these monies were not received, thetotal return would have been 33.11%.
(4) The net expenses and net investment income ratios include additional reimbursements of management fees incurred in connection with the investment of uninvestedcash in affiliated money market funds of approximately $8,000, $32,000, $16,000, $16,000 and $24,000, which represent less than 0.01 percent of averagenet assets for the fiscal years ended March 31, 2021, 2020, 2019, 2018 and 2017, respectively. Absent the additional reimbursements, net investment incomeand reimbursements would have been decreased and net expenses would have been increased by a corresponding amount.
FOR THE FISCAL YEARS ENDED MARCH 31,
See Notes to the Financial Statements.
NORTHERN FUNDS ANNUAL REPORT 17 EQUIT Y INDEX FUNDS
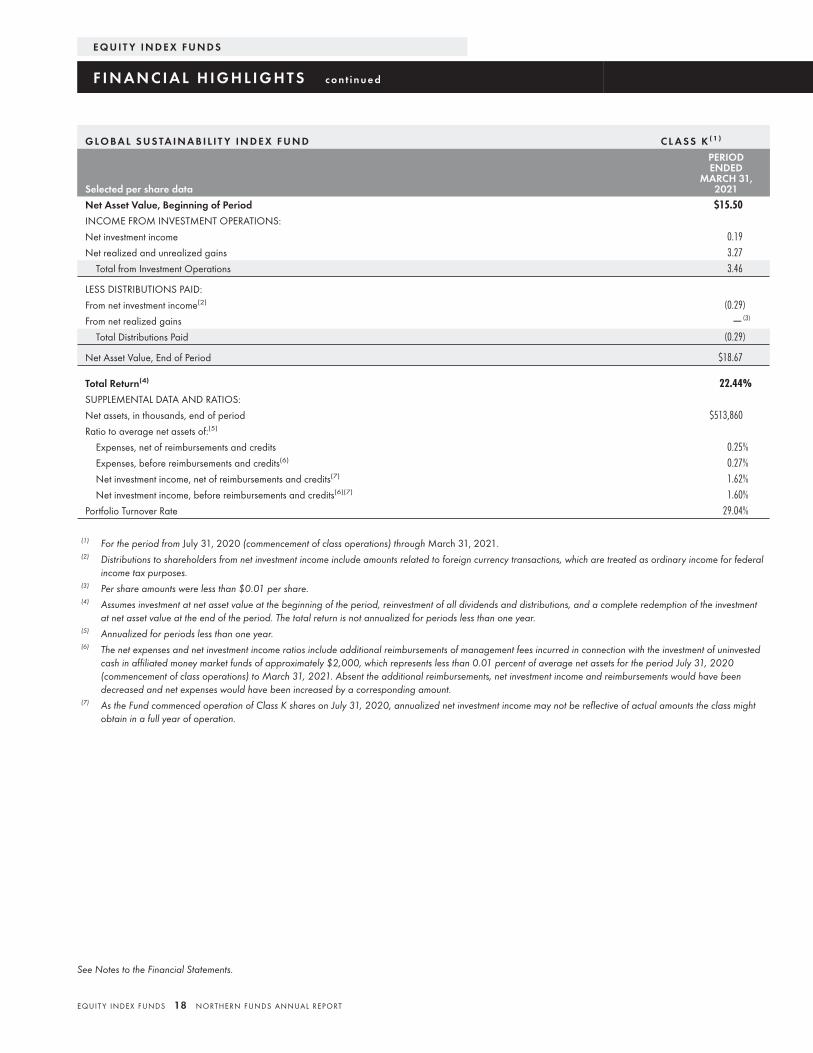
G LO BA L S U S TA I N A B I L I T Y I N D E X F U N D C L A S S K ( 1 )
Selected per share data
PERIODENDED
MARCH 31,2021
Net Asset Value, Beginning of Period $15.50INCOME FROM INVESTMENT OPERATIONS:
Net investment income 0.19
Net realized and unrealized gains 3.27
Total from Investment Operations 3.46
LESS DISTRIBUTIONS PAID:
From net investment income(2) (0.29)
From net realized gains —(3)
Total Distributions Paid (0.29)
Net Asset Value, End of Period $18.67
Total Return(4) 22.44%SUPPLEMENTAL DATA AND RATIOS:
Net assets, in thousands, end of period $513,860
Ratio to average net assets of:(5)
Expenses, net of reimbursements and credits 0.25%
Expenses, before reimbursements and credits(6) 0.27%
Net investment income, net of reimbursements and credits(7) 1.62%
Net investment income, before reimbursements and credits(6)(7) 1.60%
Portfolio Turnover Rate 29.04%
(1) For the period from July 31, 2020 (commencement of class operations) through March 31, 2021.(2) Distributions to shareholders from net investment income include amounts related to foreign currency transactions, which are treated as ordinary income for federal
income tax purposes.(3) Per share amounts were less than $0.01 per share.(4) Assumes investment at net asset value at the beginning of the period, reinvestment of all dividends and distributions, and a complete redemption of the investment
at net asset value at the end of the period. The total return is not annualized for periods less than one year.(5) Annualized for periods less than one year.(6) The net expenses and net investment income ratios include additional reimbursements of management fees incurred in connection with the investment of uninvested
cash in affiliated money market funds of approximately $2,000, which represents less than 0.01 percent of average net assets for the period July 31, 2020(commencement of class operations) to March 31, 2021. Absent the additional reimbursements, net investment income and reimbursements would have beendecreased and net expenses would have been increased by a corresponding amount.
(7) As the Fund commenced operation of Class K shares on July 31, 2020, annualized net investment income may not be reflective of actual amounts the class mightobtain in a full year of operation.
E Q U I T Y I N D E X F U N D S
F I N A N C I A L H I G H L I G H T S c o n t i n u e d
See Notes to the Financial Statements.
EQUIT Y INDEX FUNDS 18 NORTHERN FUNDS ANNUAL REPORT
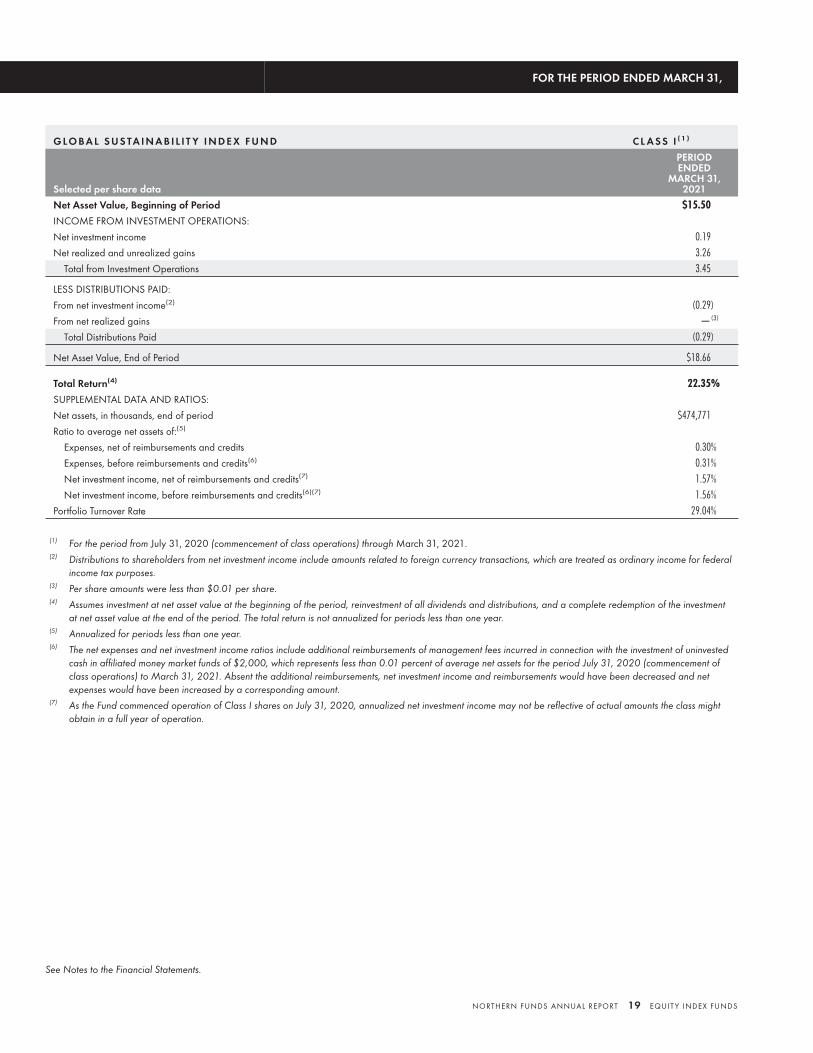
G LO BA L S U S TA I N A B I L I T Y I N D E X F U N D C L A S S I ( 1 )
Selected per share data
PERIODENDED
MARCH 31,2021
Net Asset Value, Beginning of Period $15.50INCOME FROM INVESTMENT OPERATIONS:
Net investment income 0.19
Net realized and unrealized gains 3.26
Total from Investment Operations 3.45
LESS DISTRIBUTIONS PAID:
From net investment income(2) (0.29)
From net realized gains —(3)
Total Distributions Paid (0.29)
Net Asset Value, End of Period $18.66
Total Return(4) 22.35%SUPPLEMENTAL DATA AND RATIOS:
Net assets, in thousands, end of period $474,771
Ratio to average net assets of:(5)
Expenses, net of reimbursements and credits 0.30%
Expenses, before reimbursements and credits(6) 0.31%
Net investment income, net of reimbursements and credits(7) 1.57%
Net investment income, before reimbursements and credits(6)(7) 1.56%
Portfolio Turnover Rate 29.04%
(1) For the period from July 31, 2020 (commencement of class operations) through March 31, 2021.(2) Distributions to shareholders from net investment income include amounts related to foreign currency transactions, which are treated as ordinary income for federal
income tax purposes.(3) Per share amounts were less than $0.01 per share.(4) Assumes investment at net asset value at the beginning of the period, reinvestment of all dividends and distributions, and a complete redemption of the investment
at net asset value at the end of the period. The total return is not annualized for periods less than one year.(5) Annualized for periods less than one year.(6) The net expenses and net investment income ratios include additional reimbursements of management fees incurred in connection with the investment of uninvested
cash in affiliated money market funds of $2,000, which represents less than 0.01 percent of average net assets for the period July 31, 2020 (commencement ofclass operations) to March 31, 2021. Absent the additional reimbursements, net investment income and reimbursements would have been decreased and netexpenses would have been increased by a corresponding amount.
(7) As the Fund commenced operation of Class I shares on July 31, 2020, annualized net investment income may not be reflective of actual amounts the class mightobtain in a full year of operation.
FOR THE PERIOD ENDED MARCH 31,
See Notes to the Financial Statements.
NORTHERN FUNDS ANNUAL REPORT 19 EQUIT Y INDEX FUNDS
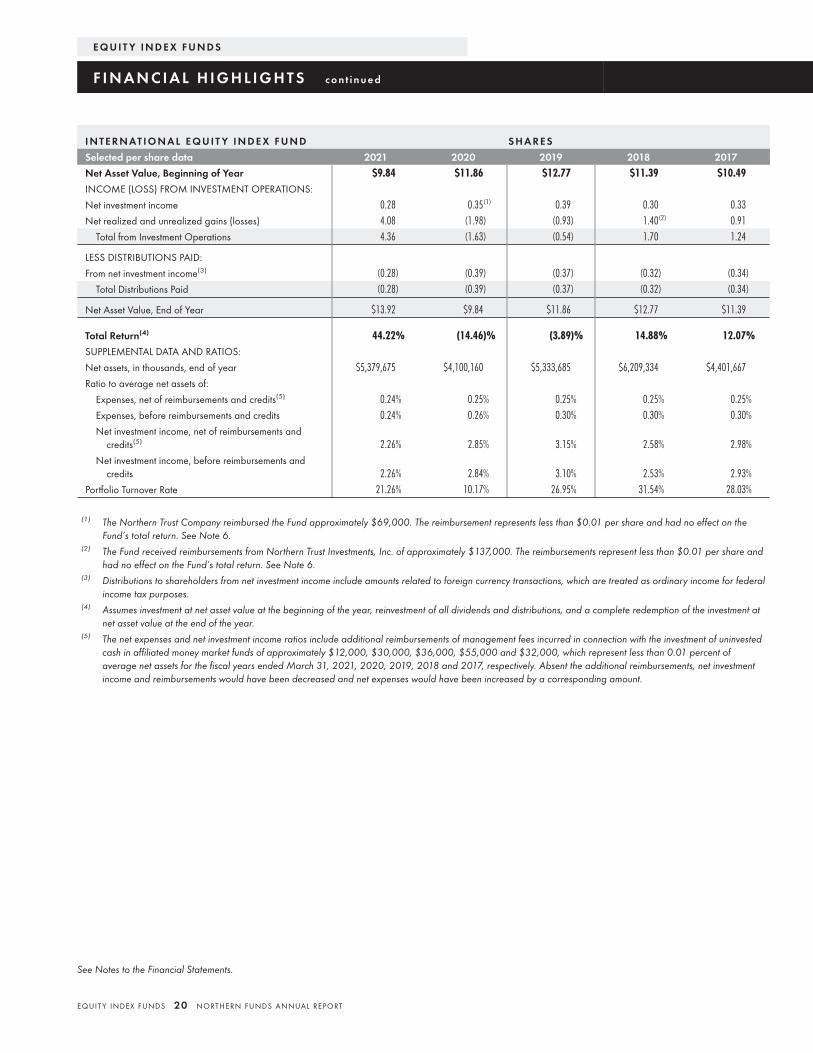
I N T E R N AT I O N A L E Q U I T Y I N D E X F U N D S H A R E S
Selected per share data 2021 2020 2019 2018 2017
Net Asset Value, Beginning of Year $9.84 $11.86 $12.77 $11.39 $10.49INCOME (LOSS) FROM INVESTMENT OPERATIONS:
Net investment income 0.28 0.35(1) 0.39 0.30 0.33
Net realized and unrealized gains (losses) 4.08 (1.98) (0.93) 1.40(2) 0.91
Total from Investment Operations 4.36 (1.63) (0.54) 1.70 1.24
LESS DISTRIBUTIONS PAID:
From net investment income(3) (0.28) (0.39) (0.37) (0.32) (0.34)
Total Distributions Paid (0.28) (0.39) (0.37) (0.32) (0.34)
Net Asset Value, End of Year $13.92 $9.84 $11.86 $12.77 $11.39
Total Return(4) 44.22% (14.46)% (3.89)% 14.88% 12.07%SUPPLEMENTAL DATA AND RATIOS:
Net assets, in thousands, end of year $5,379,675 $4,100,160 $5,333,685 $6,209,334 $4,401,667
Ratio to average net assets of:
Expenses, net of reimbursements and credits(5) 0.24% 0.25% 0.25% 0.25% 0.25%
Expenses, before reimbursements and credits 0.24% 0.26% 0.30% 0.30% 0.30%
Net investment income, net of reimbursements andcredits(5) 2.26% 2.85% 3.15% 2.58% 2.98%
Net investment income, before reimbursements andcredits 2.26% 2.84% 3.10% 2.53% 2.93%
Portfolio Turnover Rate 21.26% 10.17% 26.95% 31.54% 28.03%
(1) The Northern Trust Company reimbursed the Fund approximately $69,000. The reimbursement represents less than $0.01 per share and had no effect on theFund’s total return. See Note 6.
(2) The Fund received reimbursements from Northern Trust Investments, Inc. of approximately $137,000. The reimbursements represent less than $0.01 per share andhad no effect on the Fund’s total return. See Note 6.
(3) Distributions to shareholders from net investment income include amounts related to foreign currency transactions, which are treated as ordinary income for federalincome tax purposes.
(4) Assumes investment at net asset value at the beginning of the year, reinvestment of all dividends and distributions, and a complete redemption of the investment atnet asset value at the end of the year.
(5) The net expenses and net investment income ratios include additional reimbursements of management fees incurred in connection with the investment of uninvestedcash in affiliated money market funds of approximately $12,000, $30,000, $36,000, $55,000 and $32,000, which represent less than 0.01 percent ofaverage net assets for the fiscal years ended March 31, 2021, 2020, 2019, 2018 and 2017, respectively. Absent the additional reimbursements, net investmentincome and reimbursements would have been decreased and net expenses would have been increased by a corresponding amount.
E Q U I T Y I N D E X F U N D S
F I N A N C I A L H I G H L I G H T S c o n t i n u e d
See Notes to the Financial Statements.
EQUIT Y INDEX FUNDS 20 NORTHERN FUNDS ANNUAL REPORT

M I D C A P I N D E X F U N D S H A R E S
Selected per share data 2021 2020 2019 2018 2017
Net Asset Value, Beginning of Year $13.59 $17.95 $19.17 $18.59 $16.39INCOME (LOSS) FROM INVESTMENT OPERATIONS:
Net investment income 0.26 0.28 0.27 0.26 0.23
Net realized and unrealized gains (losses) 10.91 (4.21) (0.04) 1.76 3.12
Total from Investment Operations 11.17 (3.93) 0.23 2.02 3.35
LESS DISTRIBUTIONS PAID:
From net investment income (0.26) (0.27) (0.28) (0.24) (0.24)
From net realized gains (0.74) (0.16) (1.17) (1.20) (0.91)
Total Distributions Paid (1.00) (0.43) (1.45) (1.44) (1.15)
Net Asset Value, End of Year $23.76 $13.59 $17.95 $19.17 $18.59
Total Return(1) 83.26% (22.61)% 2.38% 10.80% 20.71%SUPPLEMENTAL DATA AND RATIOS:
Net assets, in thousands, end of year $2,523,727 $1,700,510 $2,294,736 $2,320,034 $2,175,963
Ratio to average net assets of:
Expenses, net of reimbursements and credits(2) 0.15% 0.15% 0.15% 0.15% 0.15%
Expenses, before reimbursements and credits 0.19% 0.18% 0.17% 0.18% 0.18%
Net investment income, net of reimbursements andcredits(2) 1.25% 1.52% 1.39% 1.35% 1.35%
Net investment income, before reimbursements andcredits 1.21% 1.49% 1.37% 1.32% 1.32%
Portfolio Turnover Rate 18.73% 18.15% 20.59% 16.02% 19.71%
(1) Assumes investment at net asset value at the beginning of the year, reinvestment of all dividends and distributions, and a complete redemption of the investment atnet asset value at the end of the year.
(2) The net expenses and net investment income ratios include additional reimbursements of management fees incurred in connection with the investment of uninvestedcash in affiliated money market funds of approximately $17,000, $72,000, $77,000, $44,000 and $87,000, which represent less than 0.01 percent of averagenet assets for the fiscal years ended March 31, 2021, 2020, 2019, 2018 and 2017, respectively. Absent the additional reimbursements, net investment incomeand reimbursements would have been decreased and net expenses would have been increased by a corresponding amount.
FOR THE FISCAL YEARS ENDED MARCH 31,
See Notes to the Financial Statements.
NORTHERN FUNDS ANNUAL REPORT 21 EQUIT Y INDEX FUNDS
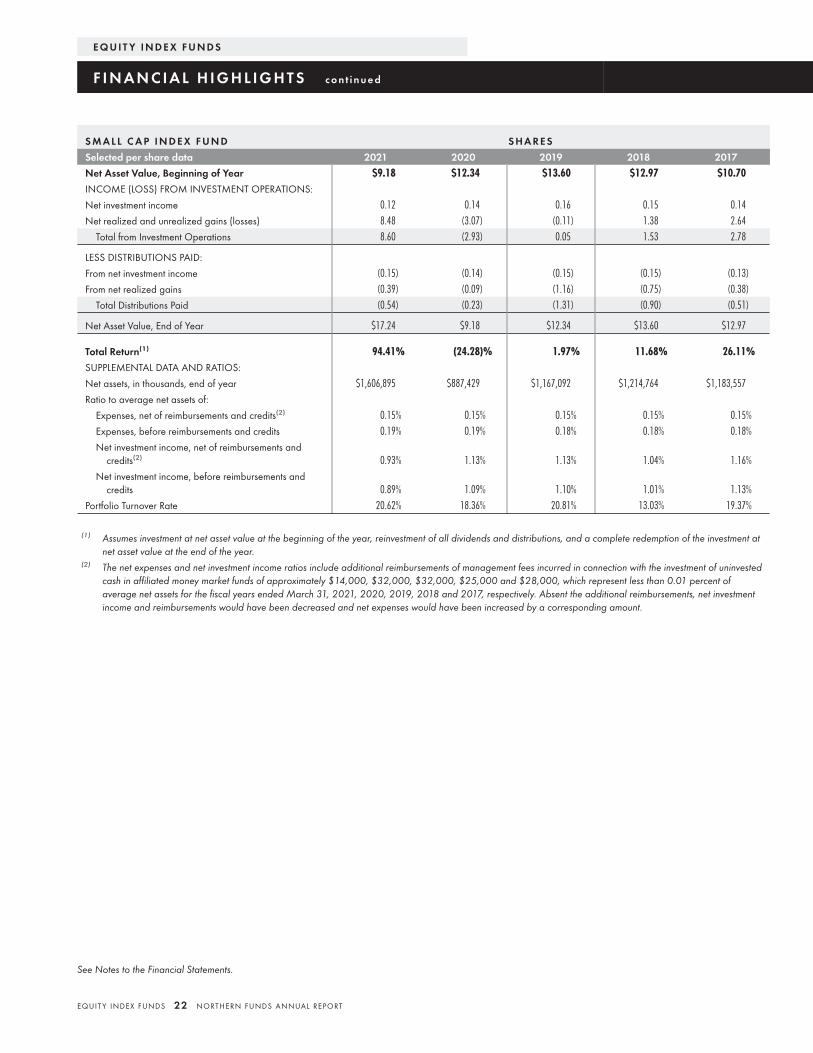
S M A L L C A P I N D E X F U N D S H A R E S
Selected per share data 2021 2020 2019 2018 2017
Net Asset Value, Beginning of Year $9.18 $12.34 $13.60 $12.97 $10.70INCOME (LOSS) FROM INVESTMENT OPERATIONS:
Net investment income 0.12 0.14 0.16 0.15 0.14
Net realized and unrealized gains (losses) 8.48 (3.07) (0.11) 1.38 2.64
Total from Investment Operations 8.60 (2.93) 0.05 1.53 2.78
LESS DISTRIBUTIONS PAID:
From net investment income (0.15) (0.14) (0.15) (0.15) (0.13)
From net realized gains (0.39) (0.09) (1.16) (0.75) (0.38)
Total Distributions Paid (0.54) (0.23) (1.31) (0.90) (0.51)
Net Asset Value, End of Year $17.24 $9.18 $12.34 $13.60 $12.97
Total Return(1) 94.41% (24.28)% 1.97% 11.68% 26.11%SUPPLEMENTAL DATA AND RATIOS:
Net assets, in thousands, end of year $1,606,895 $887,429 $1,167,092 $1,214,764 $1,183,557
Ratio to average net assets of:
Expenses, net of reimbursements and credits(2) 0.15% 0.15% 0.15% 0.15% 0.15%
Expenses, before reimbursements and credits 0.19% 0.19% 0.18% 0.18% 0.18%
Net investment income, net of reimbursements andcredits(2) 0.93% 1.13% 1.13% 1.04% 1.16%
Net investment income, before reimbursements andcredits 0.89% 1.09% 1.10% 1.01% 1.13%
Portfolio Turnover Rate 20.62% 18.36% 20.81% 13.03% 19.37%
(1) Assumes investment at net asset value at the beginning of the year, reinvestment of all dividends and distributions, and a complete redemption of the investment atnet asset value at the end of the year.
(2) The net expenses and net investment income ratios include additional reimbursements of management fees incurred in connection with the investment of uninvestedcash in affiliated money market funds of approximately $14,000, $32,000, $32,000, $25,000 and $28,000, which represent less than 0.01 percent ofaverage net assets for the fiscal years ended March 31, 2021, 2020, 2019, 2018 and 2017, respectively. Absent the additional reimbursements, net investmentincome and reimbursements would have been decreased and net expenses would have been increased by a corresponding amount.
E Q U I T Y I N D E X F U N D S
F I N A N C I A L H I G H L I G H T S c o n t i n u e d
See Notes to the Financial Statements.
EQUIT Y INDEX FUNDS 22 NORTHERN FUNDS ANNUAL REPORT
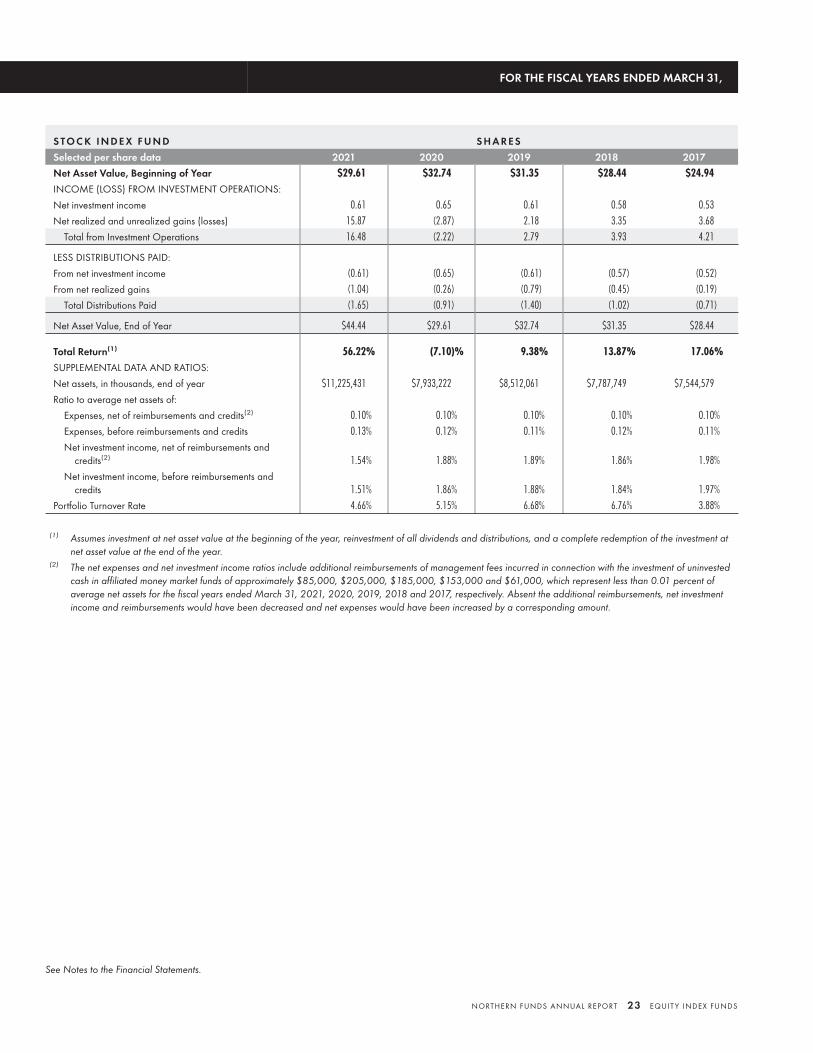
S TO C K I N D E X F U N D S H A R E S
Selected per share data 2021 2020 2019 2018 2017
Net Asset Value, Beginning of Year $29.61 $32.74 $31.35 $28.44 $24.94INCOME (LOSS) FROM INVESTMENT OPERATIONS:
Net investment income 0.61 0.65 0.61 0.58 0.53
Net realized and unrealized gains (losses) 15.87 (2.87) 2.18 3.35 3.68
Total from Investment Operations 16.48 (2.22) 2.79 3.93 4.21
LESS DISTRIBUTIONS PAID:
From net investment income (0.61) (0.65) (0.61) (0.57) (0.52)
From net realized gains (1.04) (0.26) (0.79) (0.45) (0.19)
Total Distributions Paid (1.65) (0.91) (1.40) (1.02) (0.71)
Net Asset Value, End of Year $44.44 $29.61 $32.74 $31.35 $28.44
Total Return(1) 56.22% (7.10)% 9.38% 13.87% 17.06%SUPPLEMENTAL DATA AND RATIOS:
Net assets, in thousands, end of year $11,225,431 $7,933,222 $8,512,061 $7,787,749 $7,544,579
Ratio to average net assets of:
Expenses, net of reimbursements and credits(2) 0.10% 0.10% 0.10% 0.10% 0.10%
Expenses, before reimbursements and credits 0.13% 0.12% 0.11% 0.12% 0.11%
Net investment income, net of reimbursements andcredits(2) 1.54% 1.88% 1.89% 1.86% 1.98%
Net investment income, before reimbursements andcredits 1.51% 1.86% 1.88% 1.84% 1.97%
Portfolio Turnover Rate 4.66% 5.15% 6.68% 6.76% 3.88%
(1) Assumes investment at net asset value at the beginning of the year, reinvestment of all dividends and distributions, and a complete redemption of the investment atnet asset value at the end of the year.
(2) The net expenses and net investment income ratios include additional reimbursements of management fees incurred in connection with the investment of uninvestedcash in affiliated money market funds of approximately $85,000, $205,000, $185,000, $153,000 and $61,000, which represent less than 0.01 percent ofaverage net assets for the fiscal years ended March 31, 2021, 2020, 2019, 2018 and 2017, respectively. Absent the additional reimbursements, net investmentincome and reimbursements would have been decreased and net expenses would have been increased by a corresponding amount.
FOR THE FISCAL YEARS ENDED MARCH 31,
See Notes to the Financial Statements.
NORTHERN FUNDS ANNUAL REPORT 23 EQUIT Y INDEX FUNDS
NUMBEROF SHARES
VALUE(000S)
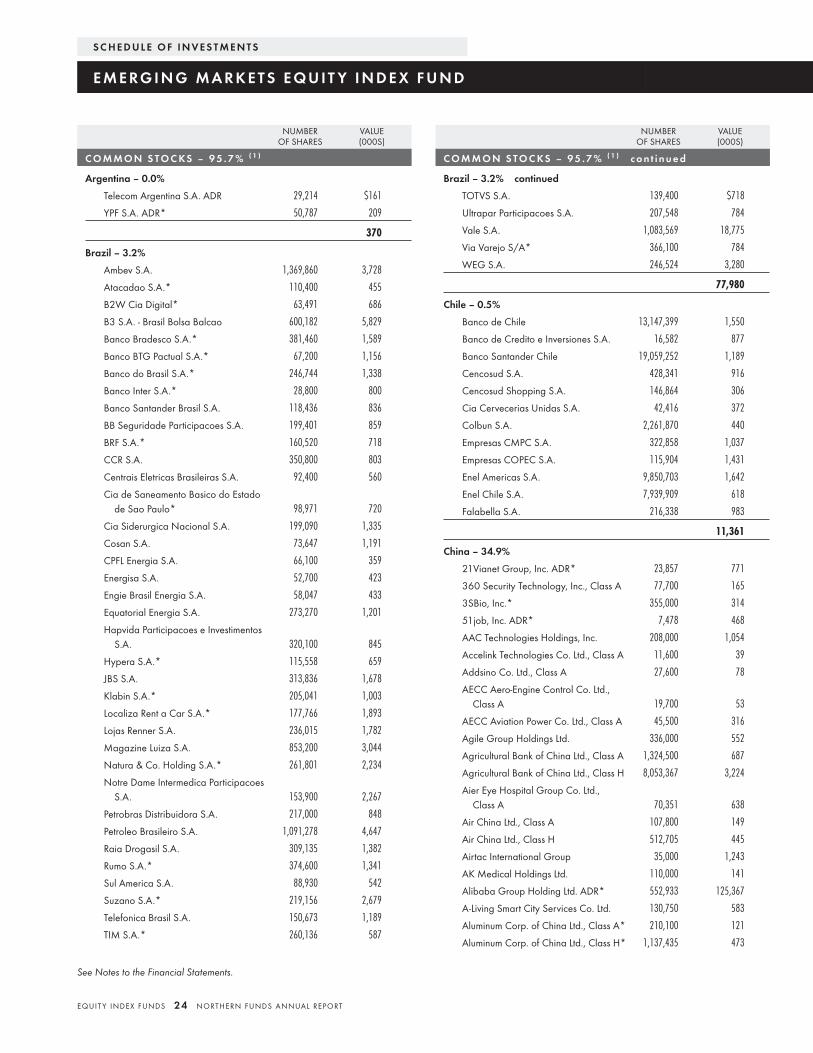
C O M M O N S TO C KS – 9 5 . 7 % ( 1 )
Argentina – 0.0%
Telecom Argentina S.A. ADR 29,214 $161
YPF S.A. ADR* 50,787 209
370
Brazil – 3.2%
Ambev S.A. 1,369,860 3,728
Atacadao S.A.* 110,400 455
B2W Cia Digital* 63,491 686
B3 S.A. - Brasil Bolsa Balcao 600,182 5,829
Banco Bradesco S.A.* 381,460 1,589
Banco BTG Pactual S.A.* 67,200 1,156
Banco do Brasil S.A.* 246,744 1,338
Banco Inter S.A.* 28,800 800
Banco Santander Brasil S.A. 118,436 836
BB Seguridade Participacoes S.A. 199,401 859
BRF S.A.* 160,520 718
CCR S.A. 350,800 803
Centrais Eletricas Brasileiras S.A. 92,400 560
Cia de Saneamento Basico do Estadode Sao Paulo* 98,971 720
Cia Siderurgica Nacional S.A. 199,090 1,335
Cosan S.A. 73,647 1,191
CPFL Energia S.A. 66,100 359
Energisa S.A. 52,700 423
Engie Brasil Energia S.A. 58,047 433
Equatorial Energia S.A. 273,270 1,201
Hapvida Participacoes e InvestimentosS.A. 320,100 845
Hypera S.A.* 115,558 659
JBS S.A. 313,836 1,678
Klabin S.A.* 205,041 1,003
Localiza Rent a Car S.A.* 177,766 1,893
Lojas Renner S.A. 236,015 1,782
Magazine Luiza S.A. 853,200 3,044
Natura & Co. Holding S.A.* 261,801 2,234
Notre Dame Intermedica ParticipacoesS.A. 153,900 2,267
Petrobras Distribuidora S.A. 217,000 848
Petroleo Brasileiro S.A. 1,091,278 4,647
Raia Drogasil S.A. 309,135 1,382
Rumo S.A.* 374,600 1,341
Sul America S.A. 88,930 542
Suzano S.A.* 219,156 2,679
Telefonica Brasil S.A. 150,673 1,189
TIM S.A.* 260,136 587
NUMBEROF SHARES
VALUE(000S)
C O M M O N S TO C KS – 9 5 . 7 % ( 1 ) c o n t i n u e d
Brazil – 3.2% continued
TOTVS S.A. 139,400 $718
Ultrapar Participacoes S.A. 207,548 784
Vale S.A. 1,083,569 18,775
Via Varejo S/A* 366,100 784
WEG S.A. 246,524 3,280
77,980
Chile – 0.5%
Banco de Chile 13,147,399 1,550
Banco de Credito e Inversiones S.A. 16,582 877
Banco Santander Chile 19,059,252 1,189
Cencosud S.A. 428,341 916
Cencosud Shopping S.A. 146,864 306
Cia Cervecerias Unidas S.A. 42,416 372
Colbun S.A. 2,261,870 440
Empresas CMPC S.A. 322,858 1,037
Empresas COPEC S.A. 115,904 1,431
Enel Americas S.A. 9,850,703 1,642
Enel Chile S.A. 7,939,909 618
Falabella S.A. 216,338 983
11,361
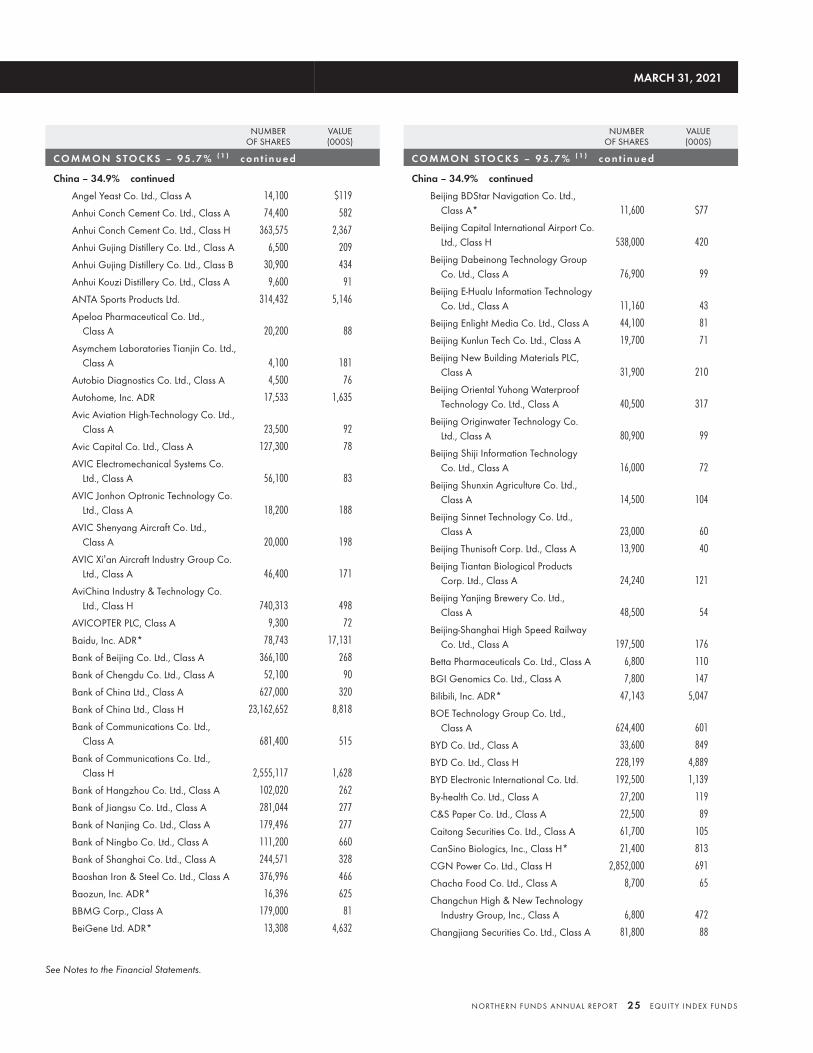
China – 34.9%
21Vianet Group, Inc. ADR* 23,857 771
360 Security Technology, Inc., Class A 77,700 165
3SBio, Inc.* 355,000 314
51job, Inc. ADR* 7,478 468
AAC Technologies Holdings, Inc. 208,000 1,054
Accelink Technologies Co. Ltd., Class A 11,600 39
Addsino Co. Ltd., Class A 27,600 78
AECC Aero-Engine Control Co. Ltd.,Class A 19,700 53
AECC Aviation Power Co. Ltd., Class A 45,500 316
Agile Group Holdings Ltd. 336,000 552
Agricultural Bank of China Ltd., Class A 1,324,500 687
Agricultural Bank of China Ltd., Class H 8,053,367 3,224
Aier Eye Hospital Group Co. Ltd.,Class A 70,351 638
Air China Ltd., Class A 107,800 149
Air China Ltd., Class H 512,705 445
Airtac International Group 35,000 1,243
AK Medical Holdings Ltd. 110,000 141
Alibaba Group Holding Ltd. ADR* 552,933 125,367
A-Living Smart City Services Co. Ltd. 130,750 583
Aluminum Corp. of China Ltd., Class A* 210,100 121
Aluminum Corp. of China Ltd., Class H* 1,137,435 473
S C H E D U L E O F I N V E S T M E N T S
E M E RG I N G M A R K E T S E Q U I T Y I N D E X F U N D
See Notes to the Financial Statements.
EQUIT Y INDEX FUNDS 24 NORTHERN FUNDS ANNUAL REPORT
NUMBEROF SHARES
VALUE(000S)
C O M M O N S TO C KS – 9 5 . 7 % ( 1 ) c o n t i n u e d
China – 34.9% continued
Angel Yeast Co. Ltd., Class A 14,100 $119
Anhui Conch Cement Co. Ltd., Class A 74,400 582
Anhui Conch Cement Co. Ltd., Class H 363,575 2,367
Anhui Gujing Distillery Co. Ltd., Class A 6,500 209
Anhui Gujing Distillery Co. Ltd., Class B 30,900 434
Anhui Kouzi Distillery Co. Ltd., Class A 9,600 91
ANTA Sports Products Ltd. 314,432 5,146
Apeloa Pharmaceutical Co. Ltd.,Class A 20,200 88
Asymchem Laboratories Tianjin Co. Ltd.,Class A 4,100 181
Autobio Diagnostics Co. Ltd., Class A 4,500 76
Autohome, Inc. ADR 17,533 1,635
Avic Aviation High-Technology Co. Ltd.,Class A 23,500 92
Avic Capital Co. Ltd., Class A 127,300 78
AVIC Electromechanical Systems Co.Ltd., Class A 56,100 83
AVIC Jonhon Optronic Technology Co.Ltd., Class A 18,200 188
AVIC Shenyang Aircraft Co. Ltd.,Class A 20,000 198
AVIC Xi’an Aircraft Industry Group Co.Ltd., Class A 46,400 171
AviChina Industry & Technology Co.Ltd., Class H 740,313 498
AVICOPTER PLC, Class A 9,300 72
Baidu, Inc. ADR* 78,743 17,131
Bank of Beijing Co. Ltd., Class A 366,100 268
Bank of Chengdu Co. Ltd., Class A 52,100 90
Bank of China Ltd., Class A 627,000 320
Bank of China Ltd., Class H 23,162,652 8,818
Bank of Communications Co. Ltd.,Class A 681,400 515
Bank of Communications Co. Ltd.,Class H 2,555,117 1,628
Bank of Hangzhou Co. Ltd., Class A 102,020 262
Bank of Jiangsu Co. Ltd., Class A 281,044 277
Bank of Nanjing Co. Ltd., Class A 179,496 277
Bank of Ningbo Co. Ltd., Class A 111,200 660
Bank of Shanghai Co. Ltd., Class A 244,571 328
Baoshan Iron & Steel Co. Ltd., Class A 376,996 466
Baozun, Inc. ADR* 16,396 625
BBMG Corp., Class A 179,000 81
BeiGene Ltd. ADR* 13,308 4,632
NUMBEROF SHARES
VALUE(000S)
C O M M O N S TO C KS – 9 5 . 7 % ( 1 ) c o n t i n u e d
China – 34.9% continued
Beijing BDStar Navigation Co. Ltd.,Class A* 11,600 $77
Beijing Capital International Airport Co.Ltd., Class H 538,000 420
Beijing Dabeinong Technology GroupCo. Ltd., Class A 76,900 99
Beijing E-Hualu Information TechnologyCo. Ltd., Class A 11,160 43
Beijing Enlight Media Co. Ltd., Class A 44,100 81
Beijing Kunlun Tech Co. Ltd., Class A 19,700 71
Beijing New Building Materials PLC,Class A 31,900 210
Beijing Oriental Yuhong WaterproofTechnology Co. Ltd., Class A 40,500 317
Beijing Originwater Technology Co.Ltd., Class A 80,900 99
Beijing Shiji Information TechnologyCo. Ltd., Class A 16,000 72
Beijing Shunxin Agriculture Co. Ltd.,Class A 14,500 104
Beijing Sinnet Technology Co. Ltd.,Class A 23,000 60
Beijing Thunisoft Corp. Ltd., Class A 13,900 40
Beijing Tiantan Biological ProductsCorp. Ltd., Class A 24,240 121
Beijing Yanjing Brewery Co. Ltd.,Class A 48,500 54
Beijing-Shanghai High Speed RailwayCo. Ltd., Class A 197,500 176
Betta Pharmaceuticals Co. Ltd., Class A 6,800 110
BGI Genomics Co. Ltd., Class A 7,800 147
Bilibili, Inc. ADR* 47,143 5,047
BOE Technology Group Co. Ltd.,Class A 624,400 601
BYD Co. Ltd., Class A 33,600 849
BYD Co. Ltd., Class H 228,199 4,889
BYD Electronic International Co. Ltd. 192,500 1,139
By-health Co. Ltd., Class A 27,200 119
C&S Paper Co. Ltd., Class A 22,500 89
Caitong Securities Co. Ltd., Class A 61,700 105
CanSino Biologics, Inc., Class H* 21,400 813
CGN Power Co. Ltd., Class H 2,852,000 691
Chacha Food Co. Ltd., Class A 8,700 65
Changchun High & New TechnologyIndustry Group, Inc., Class A 6,800 472
Changjiang Securities Co. Ltd., Class A 81,800 88
MARCH 31, 2021
See Notes to the Financial Statements.
NORTHERN FUNDS ANNUAL REPORT 25 EQUIT Y INDEX FUNDS
NUMBEROF SHARES
VALUE(000S)
C O M M O N S TO C KS – 9 5 . 7 % ( 1 ) c o n t i n u e d
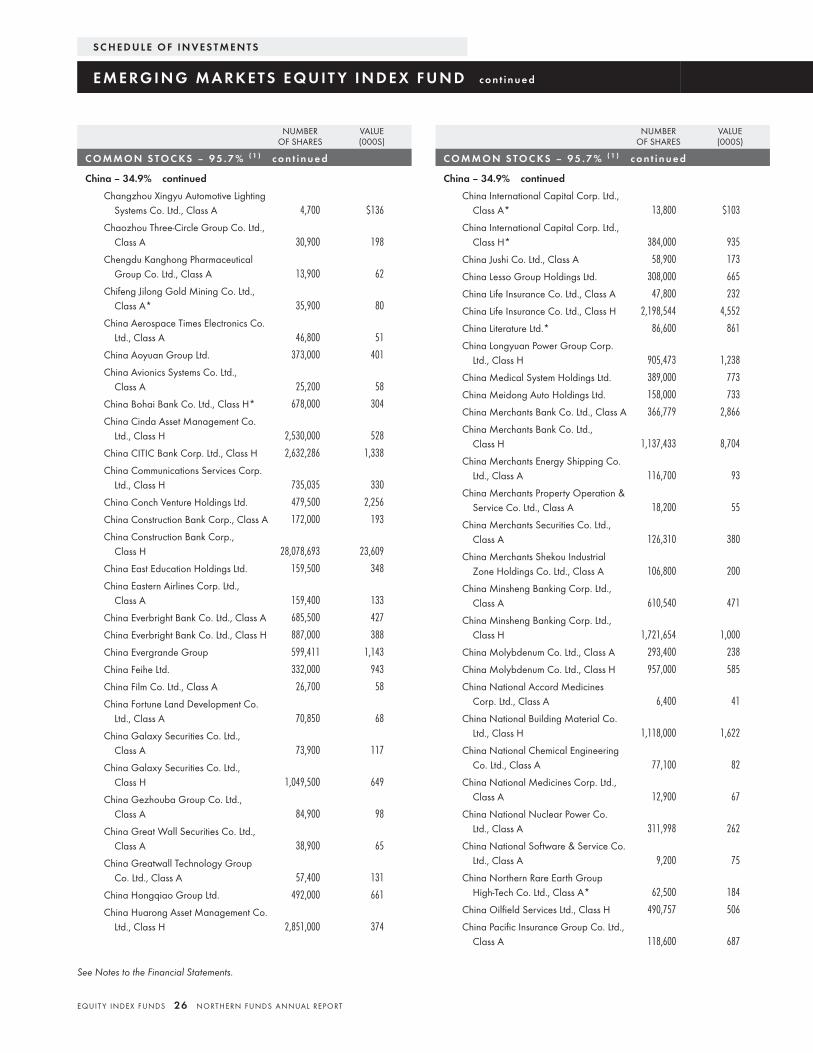
China – 34.9% continued
Changzhou Xingyu Automotive LightingSystems Co. Ltd., Class A 4,700 $136
Chaozhou Three-Circle Group Co. Ltd.,Class A 30,900 198
Chengdu Kanghong PharmaceuticalGroup Co. Ltd., Class A 13,900 62
Chifeng Jilong Gold Mining Co. Ltd.,Class A* 35,900 80
China Aerospace Times Electronics Co.Ltd., Class A 46,800 51
China Aoyuan Group Ltd. 373,000 401
China Avionics Systems Co. Ltd.,Class A 25,200 58
China Bohai Bank Co. Ltd., Class H* 678,000 304
China Cinda Asset Management Co.Ltd., Class H 2,530,000 528
China CITIC Bank Corp. Ltd., Class H 2,632,286 1,338
China Communications Services Corp.Ltd., Class H 735,035 330
China Conch Venture Holdings Ltd. 479,500 2,256
China Construction Bank Corp., Class A 172,000 193
China Construction Bank Corp.,Class H 28,078,693 23,609
China East Education Holdings Ltd. 159,500 348
China Eastern Airlines Corp. Ltd.,Class A 159,400 133
China Everbright Bank Co. Ltd., Class A 685,500 427
China Everbright Bank Co. Ltd., Class H 887,000 388
China Evergrande Group 599,411 1,143
China Feihe Ltd. 332,000 943
China Film Co. Ltd., Class A 26,700 58
China Fortune Land Development Co.Ltd., Class A 70,850 68
China Galaxy Securities Co. Ltd.,Class A 73,900 117
China Galaxy Securities Co. Ltd.,Class H 1,049,500 649
China Gezhouba Group Co. Ltd.,Class A 84,900 98
China Great Wall Securities Co. Ltd.,Class A 38,900 65
China Greatwall Technology GroupCo. Ltd., Class A 57,400 131
China Hongqiao Group Ltd. 492,000 661
China Huarong Asset Management Co.Ltd., Class H 2,851,000 374
NUMBEROF SHARES
VALUE(000S)
C O M M O N S TO C KS – 9 5 . 7 % ( 1 ) c o n t i n u e d
China – 34.9% continued
China International Capital Corp. Ltd.,Class A* 13,800 $103
China International Capital Corp. Ltd.,Class H* 384,000 935
China Jushi Co. Ltd., Class A 58,900 173
China Lesso Group Holdings Ltd. 308,000 665
China Life Insurance Co. Ltd., Class A 47,800 232
China Life Insurance Co. Ltd., Class H 2,198,544 4,552
China Literature Ltd.* 86,600 861
China Longyuan Power Group Corp.Ltd., Class H 905,473 1,238
China Medical System Holdings Ltd. 389,000 773
China Meidong Auto Holdings Ltd. 158,000 733
China Merchants Bank Co. Ltd., Class A 366,779 2,866
China Merchants Bank Co. Ltd.,Class H 1,137,433 8,704
China Merchants Energy Shipping Co.Ltd., Class A 116,700 93
China Merchants Property Operation &Service Co. Ltd., Class A 18,200 55
China Merchants Securities Co. Ltd.,Class A 126,310 380
China Merchants Shekou IndustrialZone Holdings Co. Ltd., Class A 106,800 200
China Minsheng Banking Corp. Ltd.,Class A 610,540 471
China Minsheng Banking Corp. Ltd.,Class H 1,721,654 1,000
China Molybdenum Co. Ltd., Class A 293,400 238
China Molybdenum Co. Ltd., Class H 957,000 585
China National Accord MedicinesCorp. Ltd., Class A 6,400 41
China National Building Material Co.Ltd., Class H 1,118,000 1,622
China National Chemical EngineeringCo. Ltd., Class A 77,100 82
China National Medicines Corp. Ltd.,Class A 12,900 67
China National Nuclear Power Co.Ltd., Class A 311,998 262
China National Software & Service Co.Ltd., Class A 9,200 75
China Northern Rare Earth GroupHigh-Tech Co. Ltd., Class A* 62,500 184
China Oilfield Services Ltd., Class H 490,757 506
China Pacific Insurance Group Co. Ltd.,Class A 118,600 687
S C H E D U L E O F I N V E S T M E N T S
E M E RG I N G M A R K E T S E Q U I T Y I N D E X F U N D c o n t i n u e d
See Notes to the Financial Statements.
EQUIT Y INDEX FUNDS 26 NORTHERN FUNDS ANNUAL REPORT

NUMBEROF SHARES
VALUE(000S)
C O M M O N S TO C KS – 9 5 . 7 % ( 1 ) c o n t i n u e d
China – 34.9% continued
China Pacific Insurance Group Co. Ltd.,Class H 807,337 $3,180
China Petroleum & Chemical Corp.,Class A 472,000 312
China Petroleum & Chemical Corp.,Class H 7,094,628 3,790
China Railway Group Ltd., Class A 360,800 326
China Railway Group Ltd., Class H 1,085,827 576
China Resources Pharmaceutical GroupLtd. 415,000 260
China Resources Sanjiu Medical &Pharmaceutical Co. Ltd., Class A 21,100 79
China Shenhua Energy Co. Ltd.,Class A 95,600 294
China Shenhua Energy Co. Ltd.,Class H 1,004,136 2,074
China Shipbuilding Industry Co. Ltd.,Class A* 392,600 245
China South Publishing & Media GroupCo. Ltd., Class A 35,800 57
China Southern Airlines Co. Ltd.,Class A* 176,800 186
China Southern Airlines Co. Ltd.,Class H* 504,530 375
China State Construction EngineeringCorp. Ltd., Class A 733,280 581
China Tourism Group Duty Free Corp.Ltd., Class A 34,600 1,623
China Tower Corp. Ltd., Class H 13,058,000 1,937
China TransInfo Technology Co. Ltd.,Class A 27,400 66
China Vanke Co. Ltd., Class A 180,400 827
China Vanke Co. Ltd., Class H 483,872 1,897
China Yangtze Power Co. Ltd., Class A 393,800 1,288
China Yuhua Education Corp. Ltd. 334,000 262
China Zheshang Bank Co. Ltd., Class A 275,100 171
Chongqing Brewery Co. Ltd., Class A 7,500 128
Chongqing Changan Automobile Co.Ltd., Class A* 74,400 161
Chongqing Fuling Zhacai Group Co.Ltd., Class A 15,300 98
Chongqing Rural Commercial Bank Co.Ltd., Class A 136,800 89
Chongqing Rural Commercial Bank Co.Ltd., Class H 684,434 295
Chongqing Zhifei Biological ProductsCo. Ltd., Class A 27,400 724
NUMBEROF SHARES
VALUE(000S)
C O M M O N S TO C KS – 9 5 . 7 % ( 1 ) c o n t i n u e d
China – 34.9% continued
CIFI Holdings Group Co. Ltd. 940,973 $916
CITIC Ltd. 1,715,803 1,627
CITIC Securities Co. Ltd., Class A 195,900 715
CITIC Securities Co. Ltd., Class H 622,000 1,431
Contemporary Amperex TechnologyCo. Ltd., Class A 40,900 2,021
COSCO SHIPPING EnergyTransportation Co. Ltd., Class A 59,600 60
COSCO SHIPPING Holdings Co. Ltd.,Class A* 171,600 356
COSCO SHIPPING Holdings Co. Ltd.,Class H* 750,500 972
Country Garden Holdings Co. Ltd. 2,246,879 2,889
Country Garden Services Holdings Co.Ltd. 427,000 4,355
CSC Financial Co. Ltd., Class A 47,600 231
CSPC Pharmaceutical Group Ltd. 2,671,360 3,241
Da An Gene Co. Ltd. of Sun Yat-SenUniversity, Class A 15,100 70
Dali Foods Group Co. Ltd. 593,000 337
Daqin Railway Co. Ltd., Class A 255,900 274
Daqo New Energy Corp. ADR* 15,405 1,163
DaShenLin Pharmaceutical Group Co.Ltd., Class A 12,600 161
DHC Software Co. Ltd., Class A 72,400 82
Dong-E-E-Jiao Co. Ltd., Class A 11,200 65
Dongfang Electric Corp. Ltd., Class A 60,600 118
Dongfeng Motor Group Co. Ltd.,Class H 777,169 725
Dongxing Securities Co. Ltd., Class A 35,200 59
DouYu International Holdings Ltd.ADR* 27,952 291
East Group Co. Ltd., Class A 37,600 37
East Money Information Co. Ltd.,Class A 154,320 644
Ecovacs Robotics Co. Ltd., Class A* 7,800 163
ENN Energy Holdings Ltd. 230,779 3,707
Eve Energy Co. Ltd., Class A 32,596 376
Ever Sunshine Lifestyle Services GroupLtd. 188,000 476
Everbright Securities Co. Ltd., Class A 65,098 162
Fangda Carbon New Material Co. Ltd.,Class A* 55,582 69
FAW Jiefang Group Co. Ltd., Class A* 49,000 82
Fiberhome TelecommunicationTechnologies Co. Ltd., Class A 23,200 65
MARCH 31, 2021
See Notes to the Financial Statements.
NORTHERN FUNDS ANNUAL REPORT 27 EQUIT Y INDEX FUNDS

NUMBEROF SHARES
VALUE(000S)
C O M M O N S TO C KS – 9 5 . 7 % ( 1 ) c o n t i n u e d
China – 34.9% continued
Financial Street Holdings Co. Ltd.,Class A 40,800 $43
First Capital Securities Co. Ltd., Class A 72,300 85
Focus Media Information TechnologyCo. Ltd., Class A 248,400 353
Foshan Haitian Flavouring & Food Co.Ltd., Class A 46,404 1,134
Fosun International Ltd. 734,365 1,029
Founder Securities Co. Ltd., Class A* 133,500 177
Foxconn Industrial Internet Co. Ltd.,Class A 121,600 267
Fu Jian Anjoy Foods Co. Ltd., Class A 4,100 131
Fujian Sunner Development Co. Ltd.,Class A 25,600 101
Fuyao Glass Industry Group Co. Ltd.,Class A 34,392 243
Fuyao Glass Industry Group Co. Ltd.,Class H 144,000 861
Ganfeng Lithium Co. Ltd., Class A 18,800 272
G-bits Network Technology Xiamen Co.Ltd., Class A 1,300 74
GCL System Integration TechnologyCo. Ltd., Class A* 78,000 39
GDS Holdings Ltd. ADR* 26,051 2,112
GEM Co. Ltd., Class A 78,800 104
Gemdale Corp., Class A 77,700 143
Genscript Biotech Corp. 314,000 555
GF Securities Co. Ltd., Class A 98,593 236
GF Securities Co. Ltd., Class H 368,000 565
Giant Network Group Co. Ltd., Class A 39,100 87
Gigadevice Semiconductor Beijing,Inc., Class A 7,700 202
GoerTek, Inc., Class A 56,900 237
GOME Retail Holdings Ltd.* 3,522,970 654
Gotion High-tech Co. Ltd., Class A* 20,200 112
Great Wall Motor Co. Ltd., Class A 41,600 192
Great Wall Motor Co. Ltd., Class H 906,296 2,531
Greenland Holdings Corp. Ltd., Class A 152,500 130
Greentown China Holdings Ltd. 253,000 328
Greentown Service Group Co. Ltd. 414,000 630
GRG Banking Equipment Co. Ltd.,Class A 41,400 72
GSX Techedu, Inc. ADR* 22,729 770
Guangdong Haid Group Co. Ltd.,Class A 27,200 324
NUMBEROF SHARES
VALUE(000S)
C O M M O N S TO C KS – 9 5 . 7 % ( 1 ) c o n t i n u e d
China – 34.9% continued
Guangdong HEC Technology HoldingCo. Ltd., Class A* 41,300 $31
Guangdong Hongda Blasting Co. Ltd.,Class A 12,100 57
Guangdong Kinlong HardwareProducts Co. Ltd., Class A 6,400 162
Guangdong Xinbao ElectricalAppliances Holdings Co. Ltd.,Class A 11,200 60
Guanghui Energy Co. Ltd., Class A* 102,200 48
Guangzhou Automobile Group Co.Ltd., Class H 843,664 710
Guangzhou Baiyun InternationalAirport Co. Ltd., Class A 45,000 92
Guangzhou BaiyunshanPharmaceutical Holdings Co. Ltd.,Class A 21,900 93
Guangzhou Haige CommunicationsGroup, Inc. Co., Class A 35,000 54
Guangzhou Kingmed DiagnosticsGroup Co. Ltd., Class A 7,000 136
Guangzhou R&F Properties Co. Ltd.,Class H 485,214 641
Guangzhou Shiyuan ElectronicTechnology Co. Ltd., Class A 11,900 237
Guangzhou Tinci Materials TechnologyCo. Ltd., Class A 11,200 140
Guangzhou Wondfo Biotech Co. Ltd.,Class A 5,900 74
Guangzhou Yuexiu Financial HoldingsGroup Co. Ltd., Class A 45,900 98
Guolian Securities Co. Ltd., Class A* 33,300 77
Guosen Securities Co. Ltd., Class A 71,700 131
Guotai Junan Securities Co. Ltd.,Class A 129,400 321
Guoyuan Securities Co. Ltd., Class A 79,560 94
Haidilao International Holding Ltd. 239,000 1,639
Haier Smart Home Co. Ltd., Class A 115,397 550
Haier Smart Home Co. Ltd., Class H* 574,200 2,313
Haitian International Holdings Ltd. 200,000 799
Haitong Securities Co. Ltd., Class A 166,200 280
Haitong Securities Co. Ltd., Class H 818,433 758
Hangzhou First Applied Material Co.Ltd., Class A 9,300 123
Hangzhou Robam Appliances Co. Ltd.,Class A 16,300 91
S C H E D U L E O F I N V E S T M E N T S
E M E RG I N G M A R K E T S E Q U I T Y I N D E X F U N D c o n t i n u e d
See Notes to the Financial Statements.
EQUIT Y INDEX FUNDS 28 NORTHERN FUNDS ANNUAL REPORT
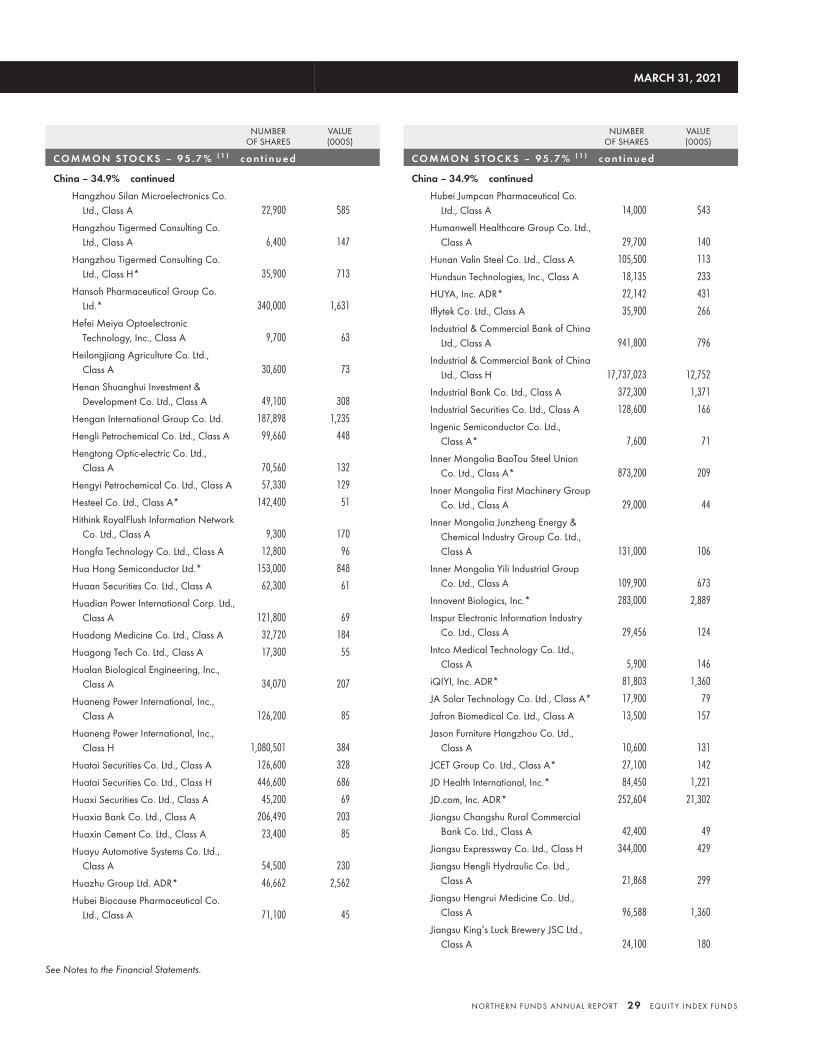
NUMBEROF SHARES
VALUE(000S)
C O M M O N S TO C KS – 9 5 . 7 % ( 1 ) c o n t i n u e d
China – 34.9% continued
Hangzhou Silan Microelectronics Co.Ltd., Class A 22,900 $85
Hangzhou Tigermed Consulting Co.Ltd., Class A 6,400 147
Hangzhou Tigermed Consulting Co.Ltd., Class H* 35,900 713
Hansoh Pharmaceutical Group Co.Ltd.* 340,000 1,631
Hefei Meiya OptoelectronicTechnology, Inc., Class A 9,700 63
Heilongjiang Agriculture Co. Ltd.,Class A 30,600 73
Henan Shuanghui Investment &Development Co. Ltd., Class A 49,100 308
Hengan International Group Co. Ltd. 187,898 1,235
Hengli Petrochemical Co. Ltd., Class A 99,660 448
Hengtong Optic-electric Co. Ltd.,Class A 70,560 132
Hengyi Petrochemical Co. Ltd., Class A 57,330 129
Hesteel Co. Ltd., Class A* 142,400 51
Hithink RoyalFlush Information NetworkCo. Ltd., Class A 9,300 170
Hongfa Technology Co. Ltd., Class A 12,800 96
Hua Hong Semiconductor Ltd.* 153,000 848
Huaan Securities Co. Ltd., Class A 62,300 61
Huadian Power International Corp. Ltd.,Class A 121,800 69
Huadong Medicine Co. Ltd., Class A 32,720 184
Huagong Tech Co. Ltd., Class A 17,300 55
Hualan Biological Engineering, Inc.,Class A 34,070 207
Huaneng Power International, Inc.,Class A 126,200 85
Huaneng Power International, Inc.,Class H 1,080,501 384
Huatai Securities Co. Ltd., Class A 126,600 328
Huatai Securities Co. Ltd., Class H 446,600 686
Huaxi Securities Co. Ltd., Class A 45,200 69
Huaxia Bank Co. Ltd., Class A 206,490 203
Huaxin Cement Co. Ltd., Class A 23,400 85
Huayu Automotive Systems Co. Ltd.,Class A 54,500 230
Huazhu Group Ltd. ADR* 46,662 2,562
Hubei Biocause Pharmaceutical Co.Ltd., Class A 71,100 45
NUMBEROF SHARES
VALUE(000S)
C O M M O N S TO C KS – 9 5 . 7 % ( 1 ) c o n t i n u e d
China – 34.9% continued
Hubei Jumpcan Pharmaceutical Co.Ltd., Class A 14,000 $43
Humanwell Healthcare Group Co. Ltd.,Class A 29,700 140
Hunan Valin Steel Co. Ltd., Class A 105,500 113
Hundsun Technologies, Inc., Class A 18,135 233
HUYA, Inc. ADR* 22,142 431
Iflytek Co. Ltd., Class A 35,900 266
Industrial & Commercial Bank of ChinaLtd., Class A 941,800 796
Industrial & Commercial Bank of ChinaLtd., Class H 17,737,023 12,752
Industrial Bank Co. Ltd., Class A 372,300 1,371
Industrial Securities Co. Ltd., Class A 128,600 166
Ingenic Semiconductor Co. Ltd.,Class A* 7,600 71
Inner Mongolia BaoTou Steel UnionCo. Ltd., Class A* 873,200 209
Inner Mongolia First Machinery GroupCo. Ltd., Class A 29,000 44
Inner Mongolia Junzheng Energy &Chemical Industry Group Co. Ltd.,Class A 131,000 106
Inner Mongolia Yili Industrial GroupCo. Ltd., Class A 109,900 673
Innovent Biologics, Inc.* 283,000 2,889
Inspur Electronic Information IndustryCo. Ltd., Class A 29,456 124
Intco Medical Technology Co. Ltd.,Class A 5,900 146
iQIYI, Inc. ADR* 81,803 1,360
JA Solar Technology Co. Ltd., Class A* 17,900 79
Jafron Biomedical Co. Ltd., Class A 13,500 157
Jason Furniture Hangzhou Co. Ltd.,Class A 10,600 131
JCET Group Co. Ltd., Class A* 27,100 142
JD Health International, Inc.* 84,450 1,221
JD.com, Inc. ADR* 252,604 21,302
Jiangsu Changshu Rural CommercialBank Co. Ltd., Class A 42,400 49
Jiangsu Expressway Co. Ltd., Class H 344,000 429
Jiangsu Hengli Hydraulic Co. Ltd.,Class A 21,868 299
Jiangsu Hengrui Medicine Co. Ltd.,Class A 96,588 1,360
Jiangsu King’s Luck Brewery JSC Ltd.,Class A 24,100 180
MARCH 31, 2021
See Notes to the Financial Statements.
NORTHERN FUNDS ANNUAL REPORT 29 EQUIT Y INDEX FUNDS
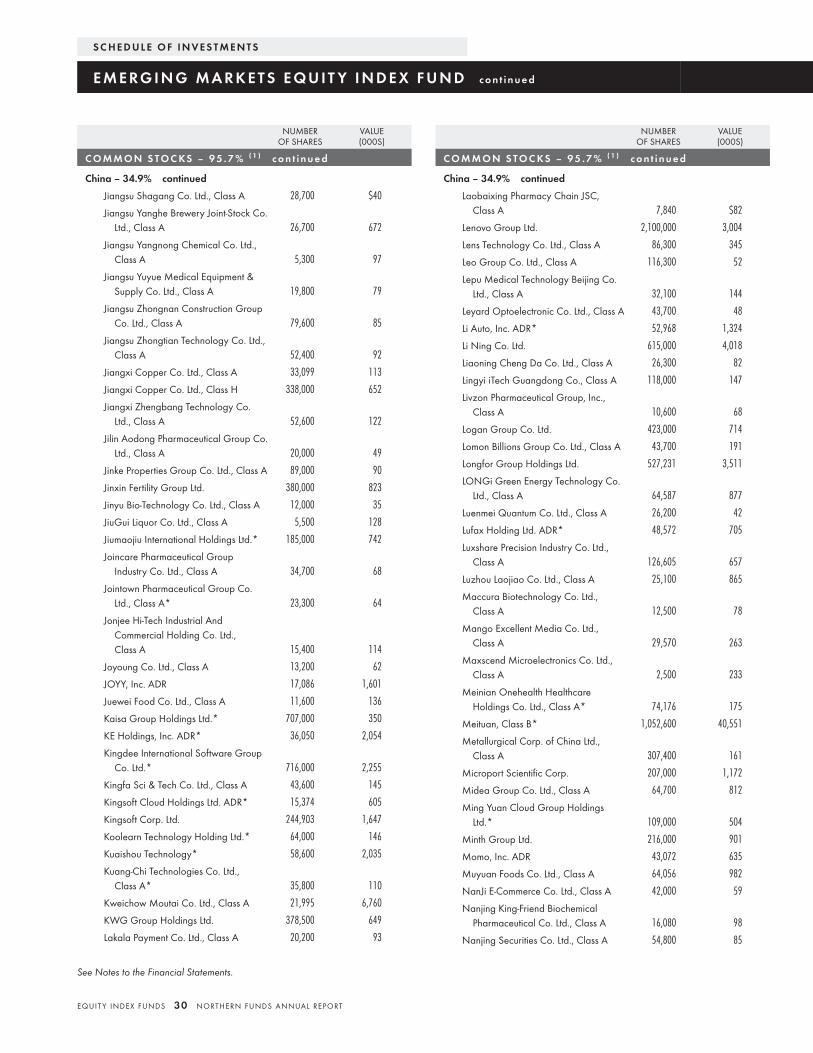
NUMBEROF SHARES
VALUE(000S)
C O M M O N S TO C KS – 9 5 . 7 % ( 1 ) c o n t i n u e d
China – 34.9% continued
Jiangsu Shagang Co. Ltd., Class A 28,700 $40
Jiangsu Yanghe Brewery Joint-Stock Co.Ltd., Class A 26,700 672
Jiangsu Yangnong Chemical Co. Ltd.,Class A 5,300 97
Jiangsu Yuyue Medical Equipment &Supply Co. Ltd., Class A 19,800 79
Jiangsu Zhongnan Construction GroupCo. Ltd., Class A 79,600 85
Jiangsu Zhongtian Technology Co. Ltd.,Class A 52,400 92
Jiangxi Copper Co. Ltd., Class A 33,099 113
Jiangxi Copper Co. Ltd., Class H 338,000 652
Jiangxi Zhengbang Technology Co.Ltd., Class A 52,600 122
Jilin Aodong Pharmaceutical Group Co.Ltd., Class A 20,000 49
Jinke Properties Group Co. Ltd., Class A 89,000 90
Jinxin Fertility Group Ltd. 380,000 823
Jinyu Bio-Technology Co. Ltd., Class A 12,000 35
JiuGui Liquor Co. Ltd., Class A 5,500 128
Jiumaojiu International Holdings Ltd.* 185,000 742
Joincare Pharmaceutical GroupIndustry Co. Ltd., Class A 34,700 68
Jointown Pharmaceutical Group Co.Ltd., Class A* 23,300 64
Jonjee Hi-Tech Industrial AndCommercial Holding Co. Ltd.,Class A 15,400 114
Joyoung Co. Ltd., Class A 13,200 62
JOYY, Inc. ADR 17,086 1,601
Juewei Food Co. Ltd., Class A 11,600 136
Kaisa Group Holdings Ltd.* 707,000 350
KE Holdings, Inc. ADR* 36,050 2,054
Kingdee International Software GroupCo. Ltd.* 716,000 2,255
Kingfa Sci & Tech Co. Ltd., Class A 43,600 145
Kingsoft Cloud Holdings Ltd. ADR* 15,374 605
Kingsoft Corp. Ltd. 244,903 1,647
Koolearn Technology Holding Ltd.* 64,000 146
Kuaishou Technology* 58,600 2,035
Kuang-Chi Technologies Co. Ltd.,Class A* 35,800 110
Kweichow Moutai Co. Ltd., Class A 21,995 6,760
KWG Group Holdings Ltd. 378,500 649
Lakala Payment Co. Ltd., Class A 20,200 93
NUMBEROF SHARES
VALUE(000S)
C O M M O N S TO C KS – 9 5 . 7 % ( 1 ) c o n t i n u e d
China – 34.9% continued
Laobaixing Pharmacy Chain JSC,Class A 7,840 $82
Lenovo Group Ltd. 2,100,000 3,004
Lens Technology Co. Ltd., Class A 86,300 345
Leo Group Co. Ltd., Class A 116,300 52
Lepu Medical Technology Beijing Co.Ltd., Class A 32,100 144
Leyard Optoelectronic Co. Ltd., Class A 43,700 48
Li Auto, Inc. ADR* 52,968 1,324
Li Ning Co. Ltd. 615,000 4,018
Liaoning Cheng Da Co. Ltd., Class A 26,300 82
Lingyi iTech Guangdong Co., Class A 118,000 147
Livzon Pharmaceutical Group, Inc.,Class A 10,600 68
Logan Group Co. Ltd. 423,000 714
Lomon Billions Group Co. Ltd., Class A 43,700 191
Longfor Group Holdings Ltd. 527,231 3,511
LONGi Green Energy Technology Co.Ltd., Class A 64,587 877
Luenmei Quantum Co. Ltd., Class A 26,200 42
Lufax Holding Ltd. ADR* 48,572 705
Luxshare Precision Industry Co. Ltd.,Class A 126,605 657
Luzhou Laojiao Co. Ltd., Class A 25,100 865
Maccura Biotechnology Co. Ltd.,Class A 12,500 78
Mango Excellent Media Co. Ltd.,Class A 29,570 263
Maxscend Microelectronics Co. Ltd.,Class A 2,500 233
Meinian Onehealth HealthcareHoldings Co. Ltd., Class A* 74,176 175
Meituan, Class B* 1,052,600 40,551
Metallurgical Corp. of China Ltd.,Class A 307,400 161
Microport Scientific Corp. 207,000 1,172
Midea Group Co. Ltd., Class A 64,700 812
Ming Yuan Cloud Group HoldingsLtd.* 109,000 504
Minth Group Ltd. 216,000 901
Momo, Inc. ADR 43,072 635
Muyuan Foods Co. Ltd., Class A 64,056 982
NanJi E-Commerce Co. Ltd., Class A 42,000 59
Nanjing King-Friend BiochemicalPharmaceutical Co. Ltd., Class A 16,080 98
Nanjing Securities Co. Ltd., Class A 54,800 85
S C H E D U L E O F I N V E S T M E N T S
E M E RG I N G M A R K E T S E Q U I T Y I N D E X F U N D c o n t i n u e d
See Notes to the Financial Statements.
EQUIT Y INDEX FUNDS 30 NORTHERN FUNDS ANNUAL REPORT
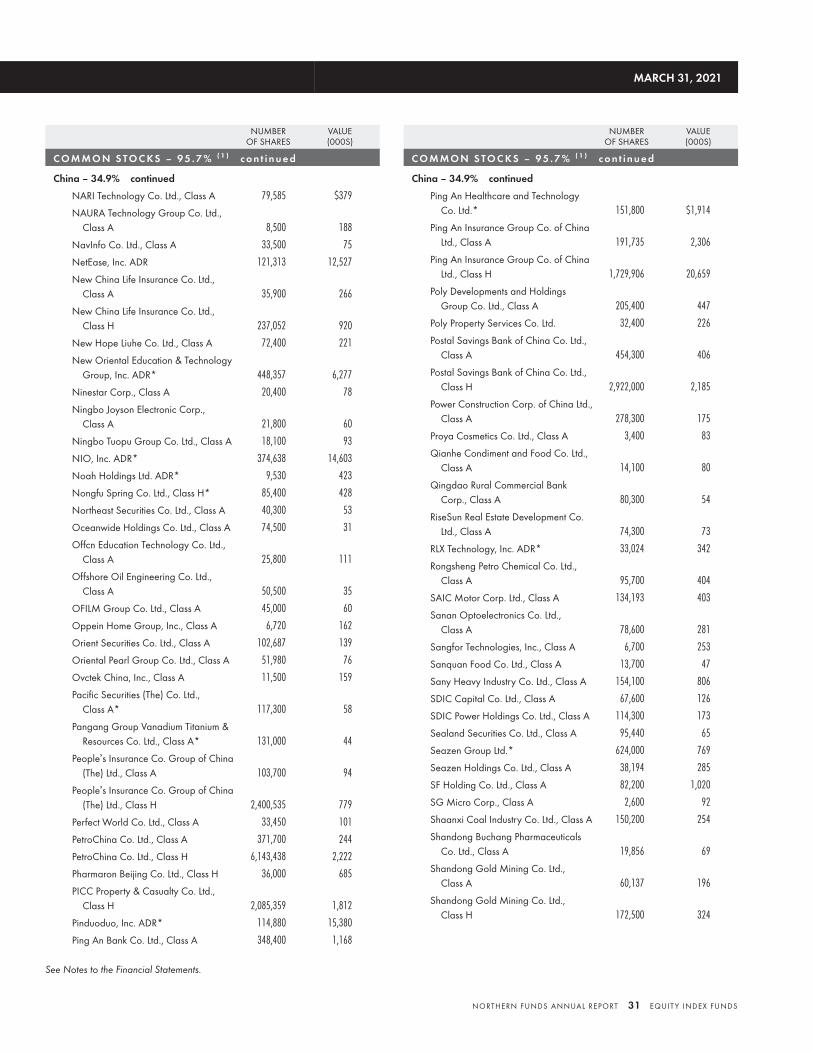
NUMBEROF SHARES
VALUE(000S)
C O M M O N S TO C KS – 9 5 . 7 % ( 1 ) c o n t i n u e d
China – 34.9% continued
NARI Technology Co. Ltd., Class A 79,585 $379
NAURA Technology Group Co. Ltd.,Class A 8,500 188
NavInfo Co. Ltd., Class A 33,500 75
NetEase, Inc. ADR 121,313 12,527
New China Life Insurance Co. Ltd.,Class A 35,900 266
New China Life Insurance Co. Ltd.,Class H 237,052 920
New Hope Liuhe Co. Ltd., Class A 72,400 221
New Oriental Education & TechnologyGroup, Inc. ADR* 448,357 6,277
Ninestar Corp., Class A 20,400 78
Ningbo Joyson Electronic Corp.,Class A 21,800 60
Ningbo Tuopu Group Co. Ltd., Class A 18,100 93
NIO, Inc. ADR* 374,638 14,603
Noah Holdings Ltd. ADR* 9,530 423
Nongfu Spring Co. Ltd., Class H* 85,400 428
Northeast Securities Co. Ltd., Class A 40,300 53
Oceanwide Holdings Co. Ltd., Class A 74,500 31
Offcn Education Technology Co. Ltd.,Class A 25,800 111
Offshore Oil Engineering Co. Ltd.,Class A 50,500 35
OFILM Group Co. Ltd., Class A 45,000 60
Oppein Home Group, Inc., Class A 6,720 162
Orient Securities Co. Ltd., Class A 102,687 139
Oriental Pearl Group Co. Ltd., Class A 51,980 76
Ovctek China, Inc., Class A 11,500 159
Pacific Securities (The) Co. Ltd.,Class A* 117,300 58
Pangang Group Vanadium Titanium &Resources Co. Ltd., Class A* 131,000 44
People’s Insurance Co. Group of China(The) Ltd., Class A 103,700 94
People’s Insurance Co. Group of China(The) Ltd., Class H 2,400,535 779
Perfect World Co. Ltd., Class A 33,450 101
PetroChina Co. Ltd., Class A 371,700 244
PetroChina Co. Ltd., Class H 6,143,438 2,222
Pharmaron Beijing Co. Ltd., Class H 36,000 685
PICC Property & Casualty Co. Ltd.,Class H 2,085,359 1,812
Pinduoduo, Inc. ADR* 114,880 15,380
Ping An Bank Co. Ltd., Class A 348,400 1,168
NUMBEROF SHARES
VALUE(000S)
C O M M O N S TO C KS – 9 5 . 7 % ( 1 ) c o n t i n u e d
China – 34.9% continued
Ping An Healthcare and TechnologyCo. Ltd.* 151,800 $1,914
Ping An Insurance Group Co. of ChinaLtd., Class A 191,735 2,306
Ping An Insurance Group Co. of ChinaLtd., Class H 1,729,906 20,659
Poly Developments and HoldingsGroup Co. Ltd., Class A 205,400 447
Poly Property Services Co. Ltd. 32,400 226
Postal Savings Bank of China Co. Ltd.,Class A 454,300 406
Postal Savings Bank of China Co. Ltd.,Class H 2,922,000 2,185
Power Construction Corp. of China Ltd.,Class A 278,300 175
Proya Cosmetics Co. Ltd., Class A 3,400 83
Qianhe Condiment and Food Co. Ltd.,Class A 14,100 80
Qingdao Rural Commercial BankCorp., Class A 80,300 54
RiseSun Real Estate Development Co.Ltd., Class A 74,300 73
RLX Technology, Inc. ADR* 33,024 342
Rongsheng Petro Chemical Co. Ltd.,Class A 95,700 404
SAIC Motor Corp. Ltd., Class A 134,193 403
Sanan Optoelectronics Co. Ltd.,Class A 78,600 281
Sangfor Technologies, Inc., Class A 6,700 253
Sanquan Food Co. Ltd., Class A 13,700 47
Sany Heavy Industry Co. Ltd., Class A 154,100 806
SDIC Capital Co. Ltd., Class A 67,600 126
SDIC Power Holdings Co. Ltd., Class A 114,300 173
Sealand Securities Co. Ltd., Class A 95,440 65
Seazen Group Ltd.* 624,000 769
Seazen Holdings Co. Ltd., Class A 38,194 285
SF Holding Co. Ltd., Class A 82,200 1,020
SG Micro Corp., Class A 2,600 92
Shaanxi Coal Industry Co. Ltd., Class A 150,200 254
Shandong Buchang PharmaceuticalsCo. Ltd., Class A 19,856 69
Shandong Gold Mining Co. Ltd.,Class A 60,137 196
Shandong Gold Mining Co. Ltd.,Class H 172,500 324
MARCH 31, 2021
See Notes to the Financial Statements.
NORTHERN FUNDS ANNUAL REPORT 31 EQUIT Y INDEX FUNDS
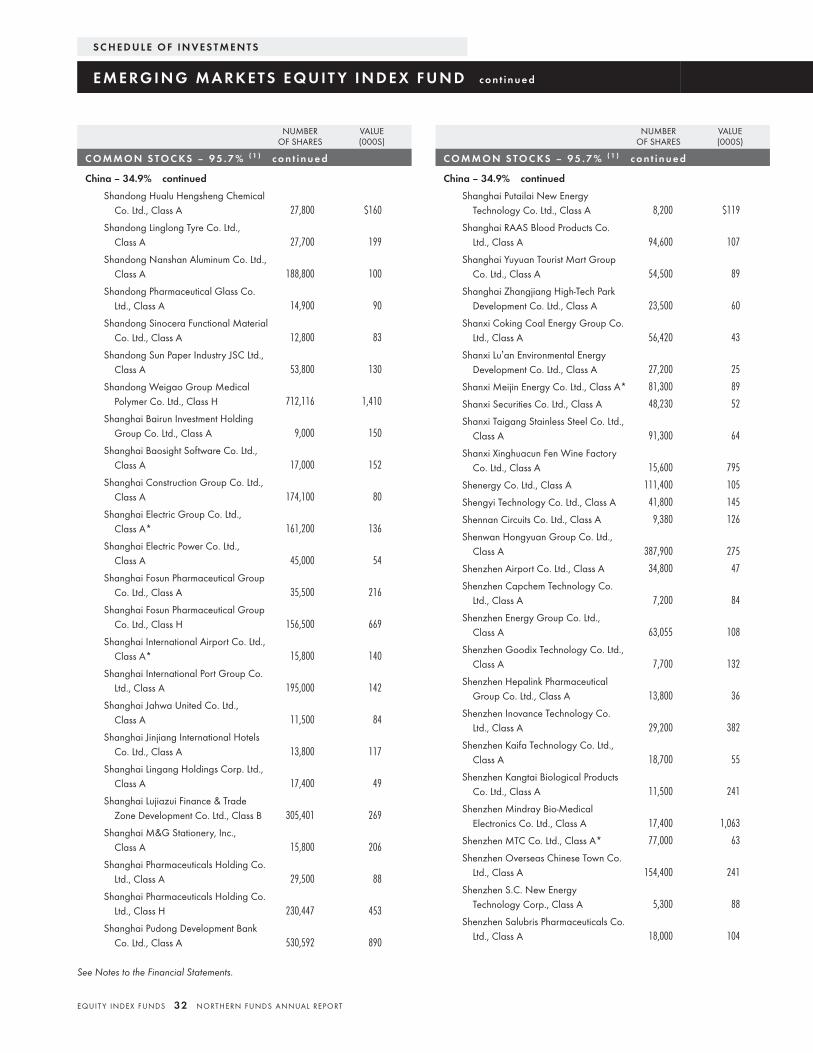
NUMBEROF SHARES
VALUE(000S)
C O M M O N S TO C KS – 9 5 . 7 % ( 1 ) c o n t i n u e d
China – 34.9% continued
Shandong Hualu Hengsheng ChemicalCo. Ltd., Class A 27,800 $160
Shandong Linglong Tyre Co. Ltd.,Class A 27,700 199
Shandong Nanshan Aluminum Co. Ltd.,Class A 188,800 100
Shandong Pharmaceutical Glass Co.Ltd., Class A 14,900 90
Shandong Sinocera Functional MaterialCo. Ltd., Class A 12,800 83
Shandong Sun Paper Industry JSC Ltd.,Class A 53,800 130
Shandong Weigao Group MedicalPolymer Co. Ltd., Class H 712,116 1,410
Shanghai Bairun Investment HoldingGroup Co. Ltd., Class A 9,000 150
Shanghai Baosight Software Co. Ltd.,Class A 17,000 152
Shanghai Construction Group Co. Ltd.,Class A 174,100 80
Shanghai Electric Group Co. Ltd.,Class A* 161,200 136
Shanghai Electric Power Co. Ltd.,Class A 45,000 54
Shanghai Fosun Pharmaceutical GroupCo. Ltd., Class A 35,500 216
Shanghai Fosun Pharmaceutical GroupCo. Ltd., Class H 156,500 669
Shanghai International Airport Co. Ltd.,Class A* 15,800 140
Shanghai International Port Group Co.Ltd., Class A 195,000 142
Shanghai Jahwa United Co. Ltd.,Class A 11,500 84
Shanghai Jinjiang International HotelsCo. Ltd., Class A 13,800 117
Shanghai Lingang Holdings Corp. Ltd.,Class A 17,400 49
Shanghai Lujiazui Finance & TradeZone Development Co. Ltd., Class B 305,401 269
Shanghai M&G Stationery, Inc.,Class A 15,800 206
Shanghai Pharmaceuticals Holding Co.Ltd., Class A 29,500 88
Shanghai Pharmaceuticals Holding Co.Ltd., Class H 230,447 453
Shanghai Pudong Development BankCo. Ltd., Class A 530,592 890
NUMBEROF SHARES
VALUE(000S)
C O M M O N S TO C KS – 9 5 . 7 % ( 1 ) c o n t i n u e d
China – 34.9% continued
Shanghai Putailai New EnergyTechnology Co. Ltd., Class A 8,200 $119
Shanghai RAAS Blood Products Co.Ltd., Class A 94,600 107
Shanghai Yuyuan Tourist Mart GroupCo. Ltd., Class A 54,500 89
Shanghai Zhangjiang High-Tech ParkDevelopment Co. Ltd., Class A 23,500 60
Shanxi Coking Coal Energy Group Co.Ltd., Class A 56,420 43
Shanxi Lu’an Environmental EnergyDevelopment Co. Ltd., Class A 27,200 25
Shanxi Meijin Energy Co. Ltd., Class A* 81,300 89
Shanxi Securities Co. Ltd., Class A 48,230 52
Shanxi Taigang Stainless Steel Co. Ltd.,Class A 91,300 64
Shanxi Xinghuacun Fen Wine FactoryCo. Ltd., Class A 15,600 795
Shenergy Co. Ltd., Class A 111,400 105
Shengyi Technology Co. Ltd., Class A 41,800 145
Shennan Circuits Co. Ltd., Class A 9,380 126
Shenwan Hongyuan Group Co. Ltd.,Class A 387,900 275
Shenzhen Airport Co. Ltd., Class A 34,800 47
Shenzhen Capchem Technology Co.Ltd., Class A 7,200 84
Shenzhen Energy Group Co. Ltd.,Class A 63,055 108
Shenzhen Goodix Technology Co. Ltd.,Class A 7,700 132
Shenzhen Hepalink PharmaceuticalGroup Co. Ltd., Class A 13,800 36
Shenzhen Inovance Technology Co.Ltd., Class A 29,200 382
Shenzhen Kaifa Technology Co. Ltd.,Class A 18,700 55
Shenzhen Kangtai Biological ProductsCo. Ltd., Class A 11,500 241
Shenzhen Mindray Bio-MedicalElectronics Co. Ltd., Class A 17,400 1,063
Shenzhen MTC Co. Ltd., Class A* 77,000 63
Shenzhen Overseas Chinese Town Co.Ltd., Class A 154,400 241
Shenzhen S.C. New EnergyTechnology Corp., Class A 5,300 88
Shenzhen Salubris Pharmaceuticals Co.Ltd., Class A 18,000 104
S C H E D U L E O F I N V E S T M E N T S
E M E RG I N G M A R K E T S E Q U I T Y I N D E X F U N D c o n t i n u e d
See Notes to the Financial Statements.
EQUIT Y INDEX FUNDS 32 NORTHERN FUNDS ANNUAL REPORT
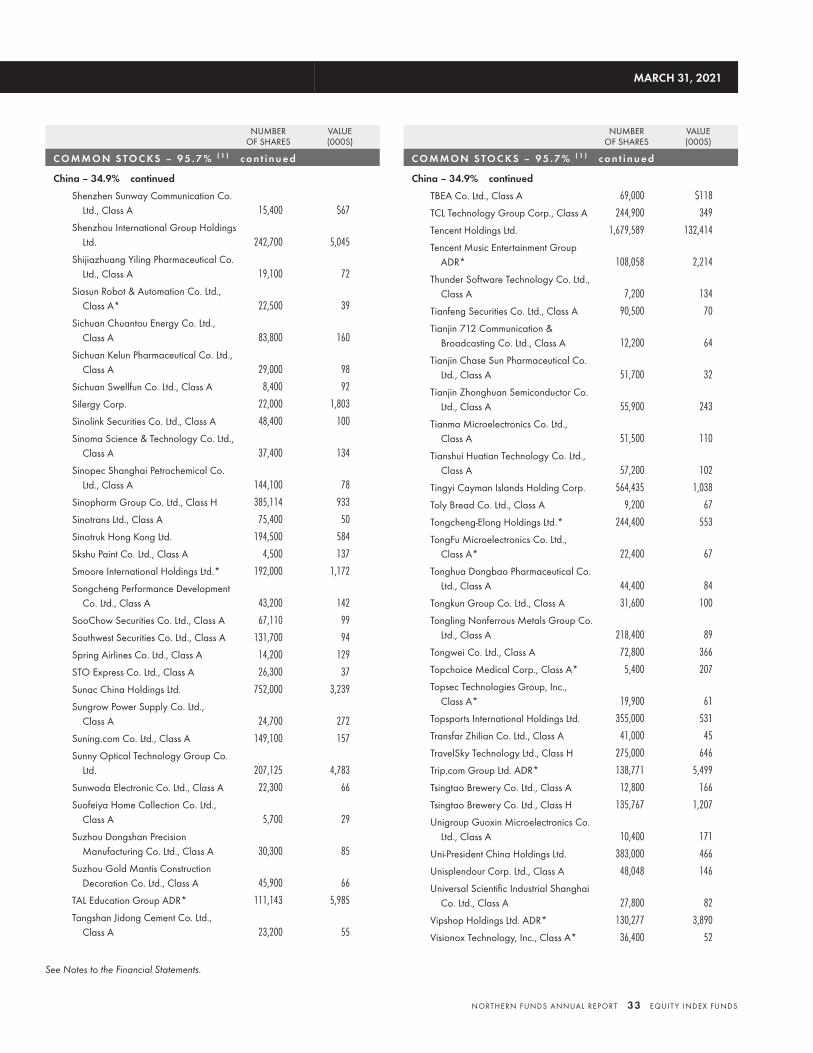
NUMBEROF SHARES
VALUE(000S)
C O M M O N S TO C KS – 9 5 . 7 % ( 1 ) c o n t i n u e d
China – 34.9% continued
Shenzhen Sunway Communication Co.Ltd., Class A 15,400 $67
Shenzhou International Group HoldingsLtd. 242,700 5,045
Shijiazhuang Yiling Pharmaceutical Co.Ltd., Class A 19,100 72
Siasun Robot & Automation Co. Ltd.,Class A* 22,500 39
Sichuan Chuantou Energy Co. Ltd.,Class A 83,800 160
Sichuan Kelun Pharmaceutical Co. Ltd.,Class A 29,000 98
Sichuan Swellfun Co. Ltd., Class A 8,400 92
Silergy Corp. 22,000 1,803
Sinolink Securities Co. Ltd., Class A 48,400 100
Sinoma Science & Technology Co. Ltd.,Class A 37,400 134
Sinopec Shanghai Petrochemical Co.Ltd., Class A 144,100 78
Sinopharm Group Co. Ltd., Class H 385,114 933
Sinotrans Ltd., Class A 75,400 50
Sinotruk Hong Kong Ltd. 194,500 584
Skshu Paint Co. Ltd., Class A 4,500 137
Smoore International Holdings Ltd.* 192,000 1,172
Songcheng Performance DevelopmentCo. Ltd., Class A 43,200 142
SooChow Securities Co. Ltd., Class A 67,110 99
Southwest Securities Co. Ltd., Class A 131,700 94
Spring Airlines Co. Ltd., Class A 14,200 129
STO Express Co. Ltd., Class A 26,300 37
Sunac China Holdings Ltd. 752,000 3,239
Sungrow Power Supply Co. Ltd.,Class A 24,700 272
Suning.com Co. Ltd., Class A 149,100 157
Sunny Optical Technology Group Co.Ltd. 207,125 4,783
Sunwoda Electronic Co. Ltd., Class A 22,300 66
Suofeiya Home Collection Co. Ltd.,Class A 5,700 29
Suzhou Dongshan PrecisionManufacturing Co. Ltd., Class A 30,300 85
Suzhou Gold Mantis ConstructionDecoration Co. Ltd., Class A 45,900 66
TAL Education Group ADR* 111,143 5,985
Tangshan Jidong Cement Co. Ltd.,Class A 23,200 55
NUMBEROF SHARES
VALUE(000S)
C O M M O N S TO C KS – 9 5 . 7 % ( 1 ) c o n t i n u e d
China – 34.9% continued
TBEA Co. Ltd., Class A 69,000 $118
TCL Technology Group Corp., Class A 244,900 349
Tencent Holdings Ltd. 1,679,589 132,414
Tencent Music Entertainment GroupADR* 108,058 2,214
Thunder Software Technology Co. Ltd.,Class A 7,200 134
Tianfeng Securities Co. Ltd., Class A 90,500 70
Tianjin 712 Communication &Broadcasting Co. Ltd., Class A 12,200 64
Tianjin Chase Sun Pharmaceutical Co.Ltd., Class A 51,700 32
Tianjin Zhonghuan Semiconductor Co.Ltd., Class A 55,900 243
Tianma Microelectronics Co. Ltd.,Class A 51,500 110
Tianshui Huatian Technology Co. Ltd.,Class A 57,200 102
Tingyi Cayman Islands Holding Corp. 564,435 1,038
Toly Bread Co. Ltd., Class A 9,200 67
Tongcheng-Elong Holdings Ltd.* 244,400 553
TongFu Microelectronics Co. Ltd.,Class A* 22,400 67
Tonghua Dongbao Pharmaceutical Co.Ltd., Class A 44,400 84
Tongkun Group Co. Ltd., Class A 31,600 100
Tongling Nonferrous Metals Group Co.Ltd., Class A 218,400 89
Tongwei Co. Ltd., Class A 72,800 366
Topchoice Medical Corp., Class A* 5,400 207
Topsec Technologies Group, Inc.,Class A* 19,900 61
Topsports International Holdings Ltd. 355,000 531
Transfar Zhilian Co. Ltd., Class A 41,000 45
TravelSky Technology Ltd., Class H 275,000 646
Trip.com Group Ltd. ADR* 138,771 5,499
Tsingtao Brewery Co. Ltd., Class A 12,800 166
Tsingtao Brewery Co. Ltd., Class H 135,767 1,207
Unigroup Guoxin Microelectronics Co.Ltd., Class A 10,400 171
Uni-President China Holdings Ltd. 383,000 466
Unisplendour Corp. Ltd., Class A 48,048 146
Universal Scientific Industrial ShanghaiCo. Ltd., Class A 27,800 82
Vipshop Holdings Ltd. ADR* 130,277 3,890
Visionox Technology, Inc., Class A* 36,400 52
MARCH 31, 2021
See Notes to the Financial Statements.
NORTHERN FUNDS ANNUAL REPORT 33 EQUIT Y INDEX FUNDS
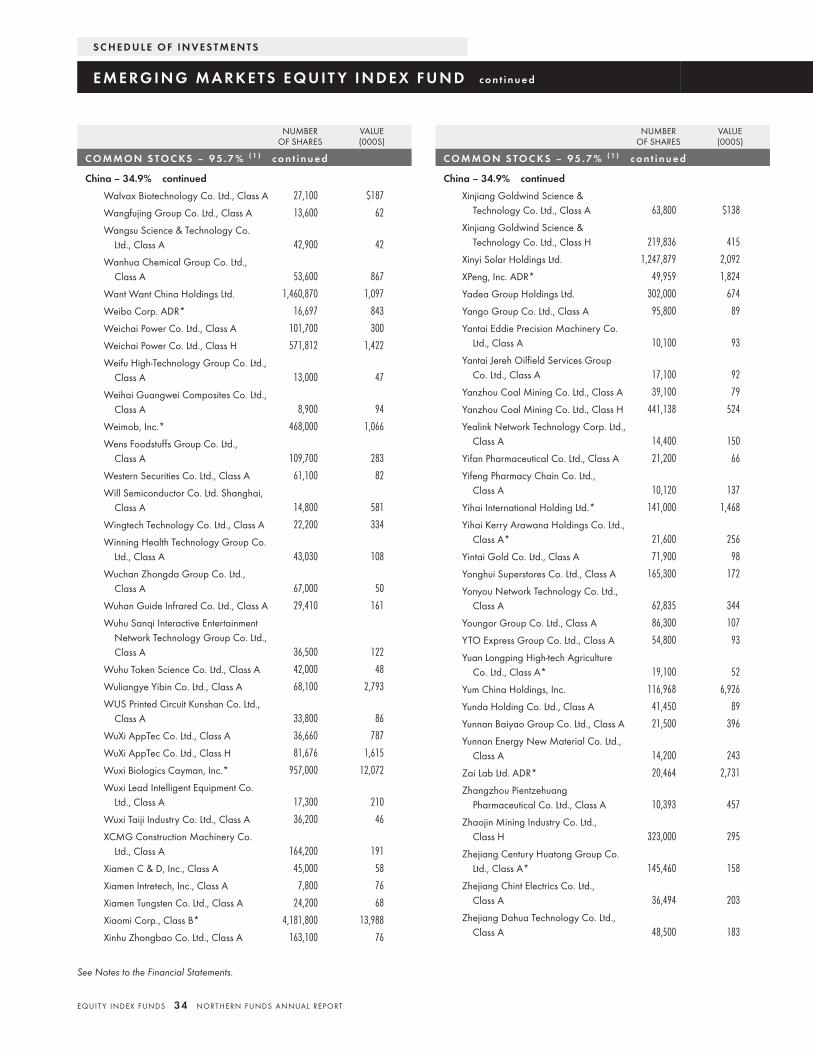
NUMBEROF SHARES
VALUE(000S)
C O M M O N S TO C KS – 9 5 . 7 % ( 1 ) c o n t i n u e d
China – 34.9% continued
Walvax Biotechnology Co. Ltd., Class A 27,100 $187
Wangfujing Group Co. Ltd., Class A 13,600 62
Wangsu Science & Technology Co.Ltd., Class A 42,900 42
Wanhua Chemical Group Co. Ltd.,Class A 53,600 867
Want Want China Holdings Ltd. 1,460,870 1,097
Weibo Corp. ADR* 16,697 843
Weichai Power Co. Ltd., Class A 101,700 300
Weichai Power Co. Ltd., Class H 571,812 1,422
Weifu High-Technology Group Co. Ltd.,Class A 13,000 47
Weihai Guangwei Composites Co. Ltd.,Class A 8,900 94
Weimob, Inc.* 468,000 1,066
Wens Foodstuffs Group Co. Ltd.,Class A 109,700 283
Western Securities Co. Ltd., Class A 61,100 82
Will Semiconductor Co. Ltd. Shanghai,Class A 14,800 581
Wingtech Technology Co. Ltd., Class A 22,200 334
Winning Health Technology Group Co.Ltd., Class A 43,030 108
Wuchan Zhongda Group Co. Ltd.,Class A 67,000 50
Wuhan Guide Infrared Co. Ltd., Class A 29,410 161
Wuhu Sanqi Interactive EntertainmentNetwork Technology Group Co. Ltd.,Class A 36,500 122
Wuhu Token Science Co. Ltd., Class A 42,000 48
Wuliangye Yibin Co. Ltd., Class A 68,100 2,793
WUS Printed Circuit Kunshan Co. Ltd.,Class A 33,800 86
WuXi AppTec Co. Ltd., Class A 36,660 787
WuXi AppTec Co. Ltd., Class H 81,676 1,615
Wuxi Biologics Cayman, Inc.* 957,000 12,072
Wuxi Lead Intelligent Equipment Co.Ltd., Class A 17,300 210
Wuxi Taiji Industry Co. Ltd., Class A 36,200 46
XCMG Construction Machinery Co.Ltd., Class A 164,200 191
Xiamen C & D, Inc., Class A 45,000 58
Xiamen Intretech, Inc., Class A 7,800 76
Xiamen Tungsten Co. Ltd., Class A 24,200 68
Xiaomi Corp., Class B* 4,181,800 13,988
Xinhu Zhongbao Co. Ltd., Class A 163,100 76
NUMBEROF SHARES
VALUE(000S)
C O M M O N S TO C KS – 9 5 . 7 % ( 1 ) c o n t i n u e d
China – 34.9% continued
Xinjiang Goldwind Science &Technology Co. Ltd., Class A 63,800 $138
Xinjiang Goldwind Science &Technology Co. Ltd., Class H 219,836 415
Xinyi Solar Holdings Ltd. 1,247,879 2,092
XPeng, Inc. ADR* 49,959 1,824
Yadea Group Holdings Ltd. 302,000 674
Yango Group Co. Ltd., Class A 95,800 89
Yantai Eddie Precision Machinery Co.Ltd., Class A 10,100 93
Yantai Jereh Oilfield Services GroupCo. Ltd., Class A 17,100 92
Yanzhou Coal Mining Co. Ltd., Class A 39,100 79
Yanzhou Coal Mining Co. Ltd., Class H 441,138 524
Yealink Network Technology Corp. Ltd.,Class A 14,400 150
Yifan Pharmaceutical Co. Ltd., Class A 21,200 66
Yifeng Pharmacy Chain Co. Ltd.,Class A 10,120 137
Yihai International Holding Ltd.* 141,000 1,468
Yihai Kerry Arawana Holdings Co. Ltd.,Class A* 21,600 256
Yintai Gold Co. Ltd., Class A 71,900 98
Yonghui Superstores Co. Ltd., Class A 165,300 172
Yonyou Network Technology Co. Ltd.,Class A 62,835 344
Youngor Group Co. Ltd., Class A 86,300 107
YTO Express Group Co. Ltd., Class A 54,800 93
Yuan Longping High-tech AgricultureCo. Ltd., Class A* 19,100 52
Yum China Holdings, Inc. 116,968 6,926
Yunda Holding Co. Ltd., Class A 41,450 89
Yunnan Baiyao Group Co. Ltd., Class A 21,500 396
Yunnan Energy New Material Co. Ltd.,Class A 14,200 243
Zai Lab Ltd. ADR* 20,464 2,731
Zhangzhou PientzehuangPharmaceutical Co. Ltd., Class A 10,393 457
Zhaojin Mining Industry Co. Ltd.,Class H 323,000 295
Zhejiang Century Huatong Group Co.Ltd., Class A* 145,460 158
Zhejiang Chint Electrics Co. Ltd.,Class A 36,494 203
Zhejiang Dahua Technology Co. Ltd.,Class A 48,500 183
S C H E D U L E O F I N V E S T M E N T S
E M E RG I N G M A R K E T S E Q U I T Y I N D E X F U N D c o n t i n u e d
See Notes to the Financial Statements.
EQUIT Y INDEX FUNDS 34 NORTHERN FUNDS ANNUAL REPORT
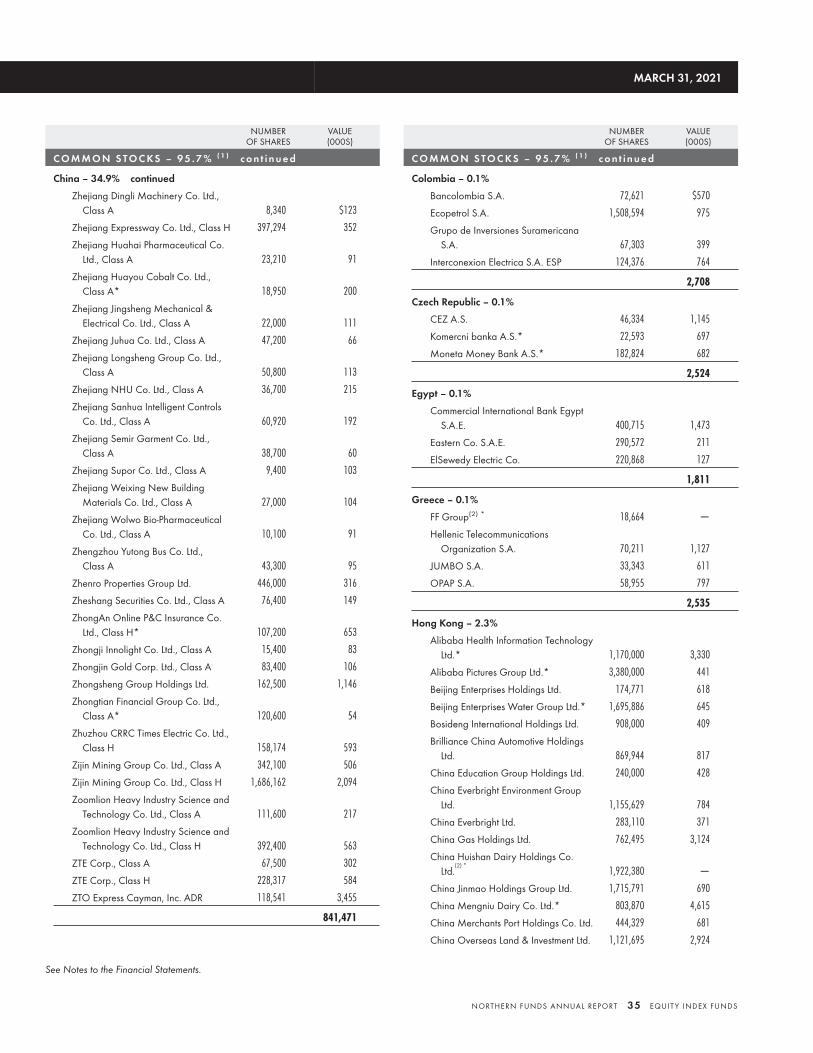
NUMBEROF SHARES
VALUE(000S)
C O M M O N S TO C KS – 9 5 . 7 % ( 1 ) c o n t i n u e d
China – 34.9% continued
Zhejiang Dingli Machinery Co. Ltd.,Class A 8,340 $123
Zhejiang Expressway Co. Ltd., Class H 397,294 352
Zhejiang Huahai Pharmaceutical Co.Ltd., Class A 23,210 91
Zhejiang Huayou Cobalt Co. Ltd.,Class A* 18,950 200
Zhejiang Jingsheng Mechanical &Electrical Co. Ltd., Class A 22,000 111
Zhejiang Juhua Co. Ltd., Class A 47,200 66
Zhejiang Longsheng Group Co. Ltd.,Class A 50,800 113
Zhejiang NHU Co. Ltd., Class A 36,700 215
Zhejiang Sanhua Intelligent ControlsCo. Ltd., Class A 60,920 192
Zhejiang Semir Garment Co. Ltd.,Class A 38,700 60
Zhejiang Supor Co. Ltd., Class A 9,400 103
Zhejiang Weixing New BuildingMaterials Co. Ltd., Class A 27,000 104
Zhejiang Wolwo Bio-PharmaceuticalCo. Ltd., Class A 10,100 91
Zhengzhou Yutong Bus Co. Ltd.,Class A 43,300 95
Zhenro Properties Group Ltd. 446,000 316
Zheshang Securities Co. Ltd., Class A 76,400 149
ZhongAn Online P&C Insurance Co.Ltd., Class H* 107,200 653
Zhongji Innolight Co. Ltd., Class A 15,400 83
Zhongjin Gold Corp. Ltd., Class A 83,400 106
Zhongsheng Group Holdings Ltd. 162,500 1,146
Zhongtian Financial Group Co. Ltd.,Class A* 120,600 54
Zhuzhou CRRC Times Electric Co. Ltd.,Class H 158,174 593
Zijin Mining Group Co. Ltd., Class A 342,100 506
Zijin Mining Group Co. Ltd., Class H 1,686,162 2,094
Zoomlion Heavy Industry Science andTechnology Co. Ltd., Class A 111,600 217
Zoomlion Heavy Industry Science andTechnology Co. Ltd., Class H 392,400 563
ZTE Corp., Class A 67,500 302
ZTE Corp., Class H 228,317 584
ZTO Express Cayman, Inc. ADR 118,541 3,455
841,471
NUMBEROF SHARES
VALUE(000S)
C O M M O N S TO C KS – 9 5 . 7 % ( 1 ) c o n t i n u e d
Colombia – 0.1%
Bancolombia S.A. 72,621 $570
Ecopetrol S.A. 1,508,594 975
Grupo de Inversiones SuramericanaS.A. 67,303 399
Interconexion Electrica S.A. ESP 124,376 764
2,708
Czech Republic – 0.1%
CEZ A.S. 46,334 1,145
Komercni banka A.S.* 22,593 697
Moneta Money Bank A.S.* 182,824 682
2,524
Egypt – 0.1%
Commercial International Bank EgyptS.A.E. 400,715 1,473
Eastern Co. S.A.E. 290,572 211
ElSewedy Electric Co. 220,868 127
1,811
Greece – 0.1%
FF Group(2) * 18,664 —
Hellenic TelecommunicationsOrganization S.A. 70,211 1,127
JUMBO S.A. 33,343 611
OPAP S.A. 58,955 797
2,535
Hong Kong – 2.3%
Alibaba Health Information TechnologyLtd.* 1,170,000 3,330
Alibaba Pictures Group Ltd.* 3,380,000 441
Beijing Enterprises Holdings Ltd. 174,771 618
Beijing Enterprises Water Group Ltd.* 1,695,886 645
Bosideng International Holdings Ltd. 908,000 409
Brilliance China Automotive HoldingsLtd. 869,944 817
China Education Group Holdings Ltd. 240,000 428
China Everbright Environment GroupLtd. 1,155,629 784
China Everbright Ltd. 283,110 371
China Gas Holdings Ltd. 762,495 3,124
China Huishan Dairy Holdings Co.Ltd.
(2) *1,922,380 —
China Jinmao Holdings Group Ltd. 1,715,791 690
China Mengniu Dairy Co. Ltd.* 803,870 4,615
China Merchants Port Holdings Co. Ltd. 444,329 681
China Overseas Land & Investment Ltd. 1,121,695 2,924
MARCH 31, 2021
See Notes to the Financial Statements.
NORTHERN FUNDS ANNUAL REPORT 35 EQUIT Y INDEX FUNDS
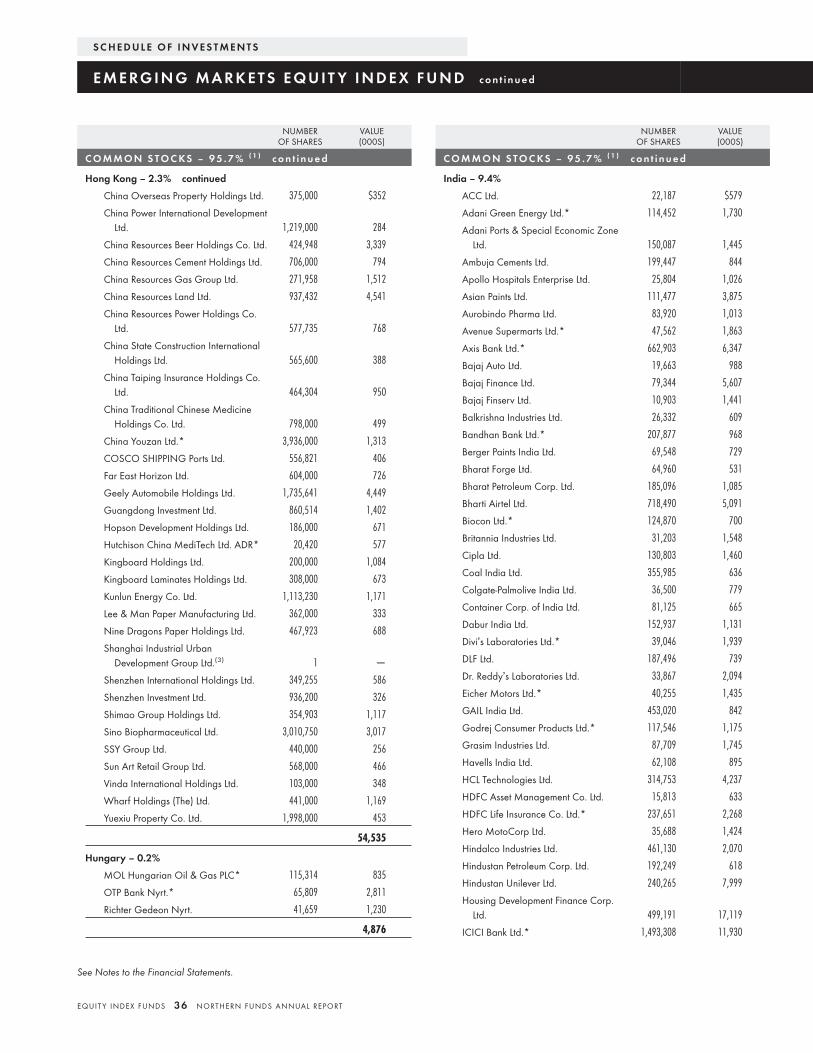
NUMBEROF SHARES
VALUE(000S)
C O M M O N S TO C KS – 9 5 . 7 % ( 1 ) c o n t i n u e d
Hong Kong – 2.3% continued
China Overseas Property Holdings Ltd. 375,000 $352
China Power International DevelopmentLtd. 1,219,000 284
China Resources Beer Holdings Co. Ltd. 424,948 3,339
China Resources Cement Holdings Ltd. 706,000 794
China Resources Gas Group Ltd. 271,958 1,512
China Resources Land Ltd. 937,432 4,541
China Resources Power Holdings Co.Ltd. 577,735 768
China State Construction InternationalHoldings Ltd. 565,600 388
China Taiping Insurance Holdings Co.Ltd. 464,304 950
China Traditional Chinese MedicineHoldings Co. Ltd. 798,000 499
China Youzan Ltd.* 3,936,000 1,313
COSCO SHIPPING Ports Ltd. 556,821 406
Far East Horizon Ltd. 604,000 726
Geely Automobile Holdings Ltd. 1,735,641 4,449
Guangdong Investment Ltd. 860,514 1,402
Hopson Development Holdings Ltd. 186,000 671
Hutchison China MediTech Ltd. ADR* 20,420 577
Kingboard Holdings Ltd. 200,000 1,084
Kingboard Laminates Holdings Ltd. 308,000 673
Kunlun Energy Co. Ltd. 1,113,230 1,171
Lee & Man Paper Manufacturing Ltd. 362,000 333
Nine Dragons Paper Holdings Ltd. 467,923 688
Shanghai Industrial UrbanDevelopment Group Ltd.(3) 1 —
Shenzhen International Holdings Ltd. 349,255 586
Shenzhen Investment Ltd. 936,200 326
Shimao Group Holdings Ltd. 354,903 1,117
Sino Biopharmaceutical Ltd. 3,010,750 3,017
SSY Group Ltd. 440,000 256
Sun Art Retail Group Ltd. 568,000 466
Vinda International Holdings Ltd. 103,000 348
Wharf Holdings (The) Ltd. 441,000 1,169
Yuexiu Property Co. Ltd. 1,998,000 453
54,535
Hungary – 0.2%
MOL Hungarian Oil & Gas PLC* 115,314 835
OTP Bank Nyrt.* 65,809 2,811
Richter Gedeon Nyrt. 41,659 1,230
4,876
NUMBEROF SHARES
VALUE(000S)
C O M M O N S TO C KS – 9 5 . 7 % ( 1 ) c o n t i n u e d
India – 9.4%
ACC Ltd. 22,187 $579
Adani Green Energy Ltd.* 114,452 1,730
Adani Ports & Special Economic ZoneLtd. 150,087 1,445
Ambuja Cements Ltd. 199,447 844
Apollo Hospitals Enterprise Ltd. 25,804 1,026
Asian Paints Ltd. 111,477 3,875
Aurobindo Pharma Ltd. 83,920 1,013
Avenue Supermarts Ltd.* 47,562 1,863
Axis Bank Ltd.* 662,903 6,347
Bajaj Auto Ltd. 19,663 988
Bajaj Finance Ltd. 79,344 5,607
Bajaj Finserv Ltd. 10,903 1,441
Balkrishna Industries Ltd. 26,332 609
Bandhan Bank Ltd.* 207,877 968
Berger Paints India Ltd. 69,548 729
Bharat Forge Ltd. 64,960 531
Bharat Petroleum Corp. Ltd. 185,096 1,085
Bharti Airtel Ltd. 718,490 5,091
Biocon Ltd.* 124,870 700
Britannia Industries Ltd. 31,203 1,548
Cipla Ltd. 130,803 1,460
Coal India Ltd. 355,985 636
Colgate-Palmolive India Ltd. 36,500 779
Container Corp. of India Ltd. 81,125 665
Dabur India Ltd. 152,937 1,131
Divi’s Laboratories Ltd.* 39,046 1,939
DLF Ltd. 187,496 739
Dr. Reddy’s Laboratories Ltd. 33,867 2,094
Eicher Motors Ltd.* 40,255 1,435
GAIL India Ltd. 453,020 842
Godrej Consumer Products Ltd.* 117,546 1,175
Grasim Industries Ltd. 87,709 1,745
Havells India Ltd. 62,108 895
HCL Technologies Ltd. 314,753 4,237
HDFC Asset Management Co. Ltd. 15,813 633
HDFC Life Insurance Co. Ltd.* 237,651 2,268
Hero MotoCorp Ltd. 35,688 1,424
Hindalco Industries Ltd. 461,130 2,070
Hindustan Petroleum Corp. Ltd. 192,249 618
Hindustan Unilever Ltd. 240,265 7,999
Housing Development Finance Corp.Ltd. 499,191 17,119
ICICI Bank Ltd.* 1,493,308 11,930
S C H E D U L E O F I N V E S T M E N T S
E M E RG I N G M A R K E T S E Q U I T Y I N D E X F U N D c o n t i n u e d
See Notes to the Financial Statements.
EQUIT Y INDEX FUNDS 36 NORTHERN FUNDS ANNUAL REPORT
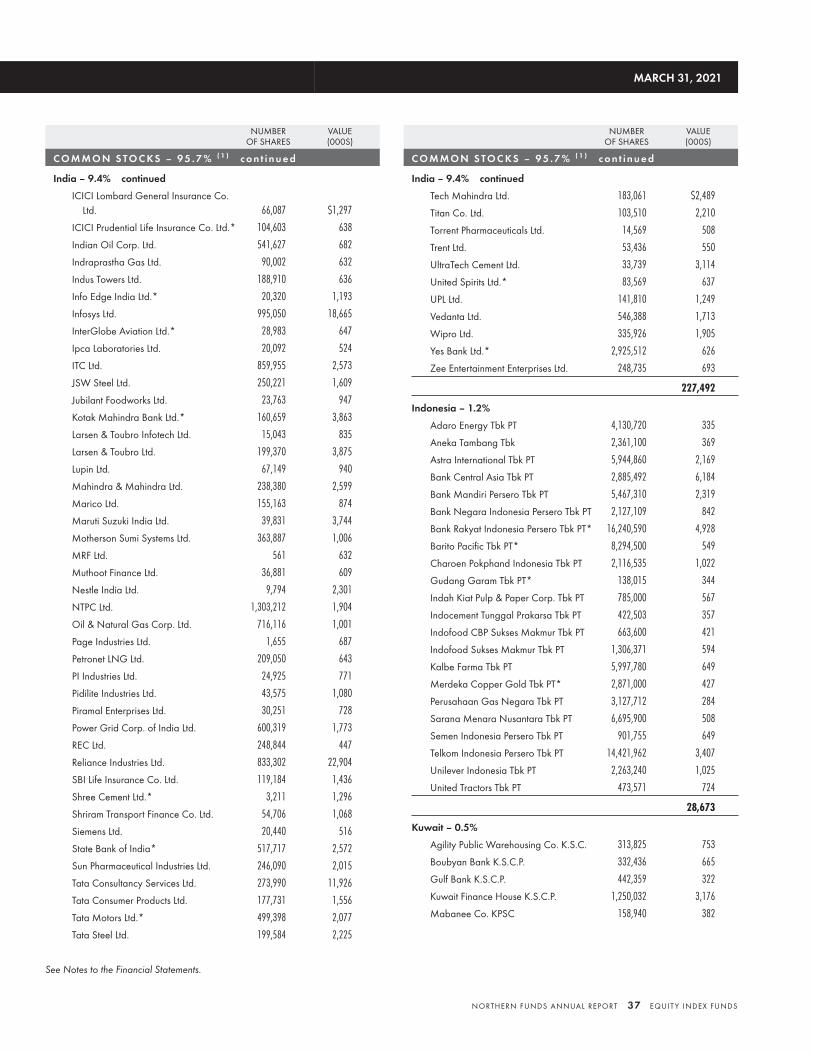
NUMBEROF SHARES
VALUE(000S)
C O M M O N S TO C KS – 9 5 . 7 % ( 1 ) c o n t i n u e d
India – 9.4% continued
ICICI Lombard General Insurance Co.Ltd. 66,087 $1,297
ICICI Prudential Life Insurance Co. Ltd.* 104,603 638
Indian Oil Corp. Ltd. 541,627 682
Indraprastha Gas Ltd. 90,002 632
Indus Towers Ltd. 188,910 636
Info Edge India Ltd.* 20,320 1,193
Infosys Ltd. 995,050 18,665
InterGlobe Aviation Ltd.* 28,983 647
Ipca Laboratories Ltd. 20,092 524
ITC Ltd. 859,955 2,573
JSW Steel Ltd. 250,221 1,609
Jubilant Foodworks Ltd. 23,763 947
Kotak Mahindra Bank Ltd.* 160,659 3,863
Larsen & Toubro Infotech Ltd. 15,043 835
Larsen & Toubro Ltd. 199,370 3,875
Lupin Ltd. 67,149 940
Mahindra & Mahindra Ltd. 238,380 2,599
Marico Ltd. 155,163 874
Maruti Suzuki India Ltd. 39,831 3,744
Motherson Sumi Systems Ltd. 363,887 1,006
MRF Ltd. 561 632
Muthoot Finance Ltd. 36,881 609
Nestle India Ltd. 9,794 2,301
NTPC Ltd. 1,303,212 1,904
Oil & Natural Gas Corp. Ltd. 716,116 1,001
Page Industries Ltd. 1,655 687
Petronet LNG Ltd. 209,050 643
PI Industries Ltd. 24,925 771
Pidilite Industries Ltd. 43,575 1,080
Piramal Enterprises Ltd. 30,251 728
Power Grid Corp. of India Ltd. 600,319 1,773
REC Ltd. 248,844 447
Reliance Industries Ltd. 833,302 22,904
SBI Life Insurance Co. Ltd. 119,184 1,436
Shree Cement Ltd.* 3,211 1,296
Shriram Transport Finance Co. Ltd. 54,706 1,068
Siemens Ltd. 20,440 516
State Bank of India* 517,717 2,572
Sun Pharmaceutical Industries Ltd. 246,090 2,015
Tata Consultancy Services Ltd. 273,990 11,926
Tata Consumer Products Ltd. 177,731 1,556
Tata Motors Ltd.* 499,398 2,077
Tata Steel Ltd. 199,584 2,225
NUMBEROF SHARES
VALUE(000S)
C O M M O N S TO C KS – 9 5 . 7 % ( 1 ) c o n t i n u e d
India – 9.4% continued
Tech Mahindra Ltd. 183,061 $2,489
Titan Co. Ltd. 103,510 2,210
Torrent Pharmaceuticals Ltd. 14,569 508
Trent Ltd. 53,436 550
UltraTech Cement Ltd. 33,739 3,114
United Spirits Ltd.* 83,569 637
UPL Ltd. 141,810 1,249
Vedanta Ltd. 546,388 1,713
Wipro Ltd. 335,926 1,905
Yes Bank Ltd.* 2,925,512 626
Zee Entertainment Enterprises Ltd. 248,735 693
227,492
Indonesia – 1.2%
Adaro Energy Tbk PT 4,130,720 335
Aneka Tambang Tbk 2,361,100 369
Astra International Tbk PT 5,944,860 2,169
Bank Central Asia Tbk PT 2,885,492 6,184
Bank Mandiri Persero Tbk PT 5,467,310 2,319
Bank Negara Indonesia Persero Tbk PT 2,127,109 842
Bank Rakyat Indonesia Persero Tbk PT* 16,240,590 4,928
Barito Pacific Tbk PT* 8,294,500 549
Charoen Pokphand Indonesia Tbk PT 2,116,535 1,022
Gudang Garam Tbk PT* 138,015 344
Indah Kiat Pulp & Paper Corp. Tbk PT 785,000 567
Indocement Tunggal Prakarsa Tbk PT 422,503 357
Indofood CBP Sukses Makmur Tbk PT 663,600 421
Indofood Sukses Makmur Tbk PT 1,306,371 594
Kalbe Farma Tbk PT 5,997,780 649
Merdeka Copper Gold Tbk PT* 2,871,000 427
Perusahaan Gas Negara Tbk PT 3,127,712 284
Sarana Menara Nusantara Tbk PT 6,695,900 508
Semen Indonesia Persero Tbk PT 901,755 649
Telkom Indonesia Persero Tbk PT 14,421,962 3,407
Unilever Indonesia Tbk PT 2,263,240 1,025
United Tractors Tbk PT 473,571 724
28,673
Kuwait – 0.5%
Agility Public Warehousing Co. K.S.C. 313,825 753
Boubyan Bank K.S.C.P. 332,436 665
Gulf Bank K.S.C.P. 442,359 322
Kuwait Finance House K.S.C.P. 1,250,032 3,176
Mabanee Co. KPSC 158,940 382
MARCH 31, 2021
See Notes to the Financial Statements.
NORTHERN FUNDS ANNUAL REPORT 37 EQUIT Y INDEX FUNDS
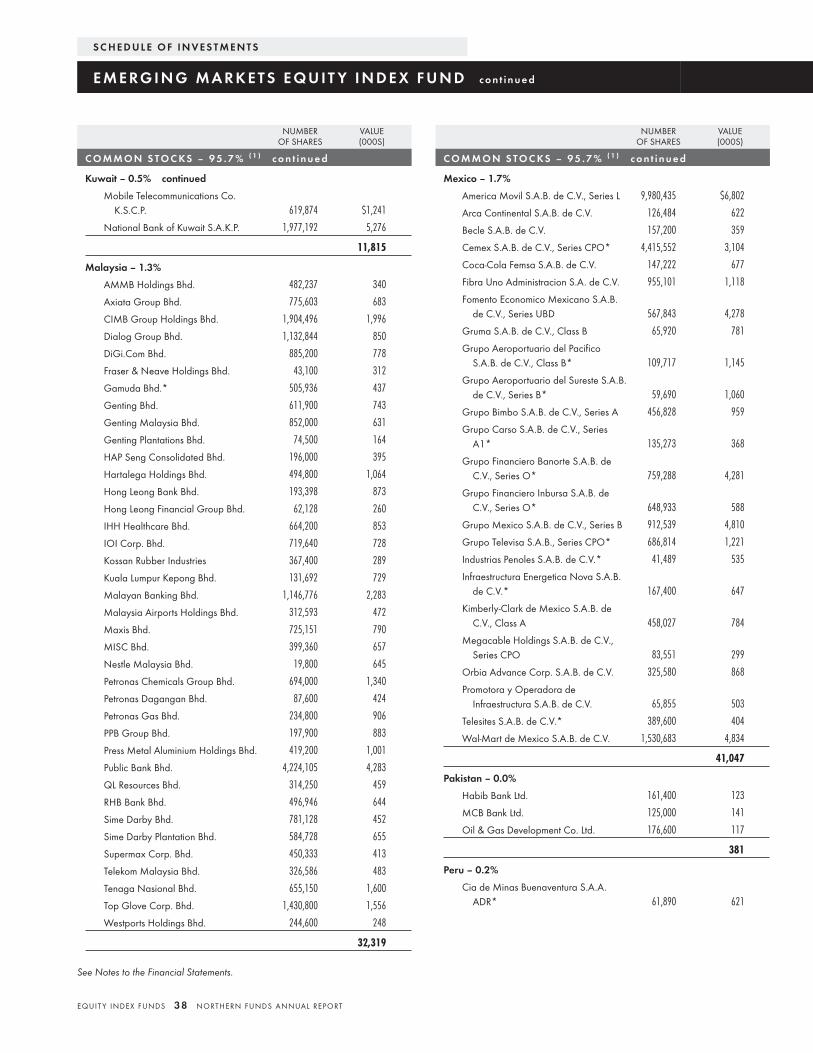
NUMBEROF SHARES
VALUE(000S)
C O M M O N S TO C KS – 9 5 . 7 % ( 1 ) c o n t i n u e d
Kuwait – 0.5% continued
Mobile Telecommunications Co.K.S.C.P. 619,874 $1,241
National Bank of Kuwait S.A.K.P. 1,977,192 5,276
11,815
Malaysia – 1.3%
AMMB Holdings Bhd. 482,237 340
Axiata Group Bhd. 775,603 683
CIMB Group Holdings Bhd. 1,904,496 1,996
Dialog Group Bhd. 1,132,844 850
DiGi.Com Bhd. 885,200 778
Fraser & Neave Holdings Bhd. 43,100 312
Gamuda Bhd.* 505,936 437
Genting Bhd. 611,900 743
Genting Malaysia Bhd. 852,000 631
Genting Plantations Bhd. 74,500 164
HAP Seng Consolidated Bhd. 196,000 395
Hartalega Holdings Bhd. 494,800 1,064
Hong Leong Bank Bhd. 193,398 873
Hong Leong Financial Group Bhd. 62,128 260
IHH Healthcare Bhd. 664,200 853
IOI Corp. Bhd. 719,640 728
Kossan Rubber Industries 367,400 289
Kuala Lumpur Kepong Bhd. 131,692 729
Malayan Banking Bhd. 1,146,776 2,283
Malaysia Airports Holdings Bhd. 312,593 472
Maxis Bhd. 725,151 790
MISC Bhd. 399,360 657
Nestle Malaysia Bhd. 19,800 645
Petronas Chemicals Group Bhd. 694,000 1,340
Petronas Dagangan Bhd. 87,600 424
Petronas Gas Bhd. 234,800 906
PPB Group Bhd. 197,900 883
Press Metal Aluminium Holdings Bhd. 419,200 1,001
Public Bank Bhd. 4,224,105 4,283
QL Resources Bhd. 314,250 459
RHB Bank Bhd. 496,946 644
Sime Darby Bhd. 781,128 452
Sime Darby Plantation Bhd. 584,728 655
Supermax Corp. Bhd. 450,333 413
Telekom Malaysia Bhd. 326,586 483
Tenaga Nasional Bhd. 655,150 1,600
Top Glove Corp. Bhd. 1,430,800 1,556
Westports Holdings Bhd. 244,600 248
32,319
NUMBEROF SHARES
VALUE(000S)
C O M M O N S TO C KS – 9 5 . 7 % ( 1 ) c o n t i n u e d
Mexico – 1.7%
America Movil S.A.B. de C.V., Series L 9,980,435 $6,802
Arca Continental S.A.B. de C.V. 126,484 622
Becle S.A.B. de C.V. 157,200 359
Cemex S.A.B. de C.V., Series CPO* 4,415,552 3,104
Coca-Cola Femsa S.A.B. de C.V. 147,222 677
Fibra Uno Administracion S.A. de C.V. 955,101 1,118
Fomento Economico Mexicano S.A.B.de C.V., Series UBD 567,843 4,278
Gruma S.A.B. de C.V., Class B 65,920 781
Grupo Aeroportuario del PacificoS.A.B. de C.V., Class B* 109,717 1,145
Grupo Aeroportuario del Sureste S.A.B.de C.V., Series B* 59,690 1,060
Grupo Bimbo S.A.B. de C.V., Series A 456,828 959
Grupo Carso S.A.B. de C.V., SeriesA1* 135,273 368
Grupo Financiero Banorte S.A.B. deC.V., Series O* 759,288 4,281
Grupo Financiero Inbursa S.A.B. deC.V., Series O* 648,933 588
Grupo Mexico S.A.B. de C.V., Series B 912,539 4,810
Grupo Televisa S.A.B., Series CPO* 686,814 1,221
Industrias Penoles S.A.B. de C.V.* 41,489 535
Infraestructura Energetica Nova S.A.B.de C.V.* 167,400 647
Kimberly-Clark de Mexico S.A.B. deC.V., Class A 458,027 784
Megacable Holdings S.A.B. de C.V.,Series CPO 83,551 299
Orbia Advance Corp. S.A.B. de C.V. 325,580 868
Promotora y Operadora deInfraestructura S.A.B. de C.V. 65,855 503
Telesites S.A.B. de C.V.* 389,600 404
Wal-Mart de Mexico S.A.B. de C.V. 1,530,683 4,834
41,047
Pakistan – 0.0%
Habib Bank Ltd. 161,400 123
MCB Bank Ltd. 125,000 141
Oil & Gas Development Co. Ltd. 176,600 117
381
Peru – 0.2%
Cia de Minas Buenaventura S.A.A.ADR* 61,890 621
S C H E D U L E O F I N V E S T M E N T S
E M E RG I N G M A R K E T S E Q U I T Y I N D E X F U N D c o n t i n u e d
See Notes to the Financial Statements.
EQUIT Y INDEX FUNDS 38 NORTHERN FUNDS ANNUAL REPORT
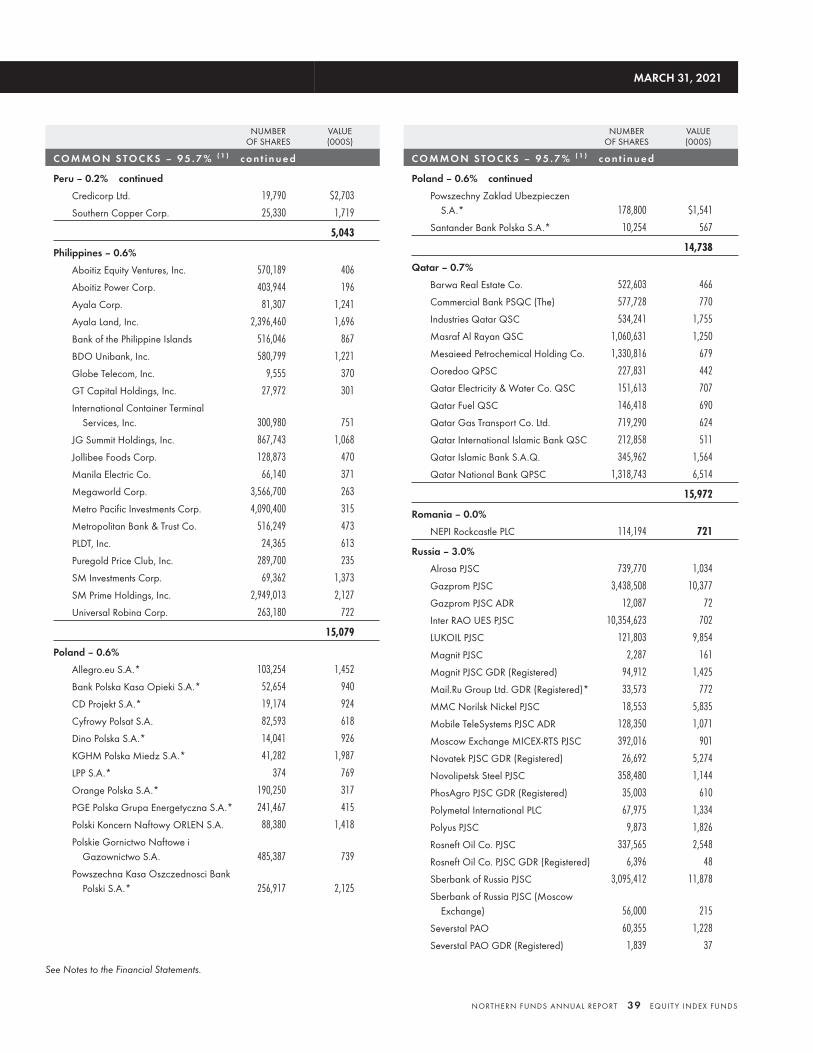
NUMBEROF SHARES
VALUE(000S)
C O M M O N S TO C KS – 9 5 . 7 % ( 1 ) c o n t i n u e d
Peru – 0.2% continued
Credicorp Ltd. 19,790 $2,703
Southern Copper Corp. 25,330 1,719
5,043
Philippines – 0.6%
Aboitiz Equity Ventures, Inc. 570,189 406
Aboitiz Power Corp. 403,944 196
Ayala Corp. 81,307 1,241
Ayala Land, Inc. 2,396,460 1,696
Bank of the Philippine Islands 516,046 867
BDO Unibank, Inc. 580,799 1,221
Globe Telecom, Inc. 9,555 370
GT Capital Holdings, Inc. 27,972 301
International Container TerminalServices, Inc. 300,980 751
JG Summit Holdings, Inc. 867,743 1,068
Jollibee Foods Corp. 128,873 470
Manila Electric Co. 66,140 371
Megaworld Corp. 3,566,700 263
Metro Pacific Investments Corp. 4,090,400 315
Metropolitan Bank & Trust Co. 516,249 473
PLDT, Inc. 24,365 613
Puregold Price Club, Inc. 289,700 235
SM Investments Corp. 69,362 1,373
SM Prime Holdings, Inc. 2,949,013 2,127
Universal Robina Corp. 263,180 722
15,079
Poland – 0.6%
Allegro.eu S.A.* 103,254 1,452
Bank Polska Kasa Opieki S.A.* 52,654 940
CD Projekt S.A.* 19,174 924
Cyfrowy Polsat S.A. 82,593 618
Dino Polska S.A.* 14,041 926
KGHM Polska Miedz S.A.* 41,282 1,987
LPP S.A.* 374 769
Orange Polska S.A.* 190,250 317
PGE Polska Grupa Energetyczna S.A.* 241,467 415
Polski Koncern Naftowy ORLEN S.A. 88,380 1,418
Polskie Gornictwo Naftowe iGazownictwo S.A. 485,387 739
Powszechna Kasa Oszczednosci BankPolski S.A.* 256,917 2,125
NUMBEROF SHARES
VALUE(000S)
C O M M O N S TO C KS – 9 5 . 7 % ( 1 ) c o n t i n u e d
Poland – 0.6% continued
Powszechny Zaklad UbezpieczenS.A.* 178,800 $1,541
Santander Bank Polska S.A.* 10,254 567
14,738
Qatar – 0.7%
Barwa Real Estate Co. 522,603 466
Commercial Bank PSQC (The) 577,728 770
Industries Qatar QSC 534,241 1,755
Masraf Al Rayan QSC 1,060,631 1,250
Mesaieed Petrochemical Holding Co. 1,330,816 679
Ooredoo QPSC 227,831 442
Qatar Electricity & Water Co. QSC 151,613 707
Qatar Fuel QSC 146,418 690
Qatar Gas Transport Co. Ltd. 719,290 624
Qatar International Islamic Bank QSC 212,858 511
Qatar Islamic Bank S.A.Q. 345,962 1,564
Qatar National Bank QPSC 1,318,743 6,514
15,972
Romania – 0.0%
NEPI Rockcastle PLC 114,194 721
Russia – 3.0%
Alrosa PJSC 739,770 1,034
Gazprom PJSC 3,438,508 10,377
Gazprom PJSC ADR 12,087 72
Inter RAO UES PJSC 10,354,623 702
LUKOIL PJSC 121,803 9,854
Magnit PJSC 2,287 161
Magnit PJSC GDR (Registered) 94,912 1,425
Mail.Ru Group Ltd. GDR (Registered)* 33,573 772
MMC Norilsk Nickel PJSC 18,553 5,835
Mobile TeleSystems PJSC ADR 128,350 1,071
Moscow Exchange MICEX-RTS PJSC 392,016 901
Novatek PJSC GDR (Registered) 26,692 5,274
Novolipetsk Steel PJSC 358,480 1,144
PhosAgro PJSC GDR (Registered) 35,003 610
Polymetal International PLC 67,975 1,334
Polyus PJSC 9,873 1,826
Rosneft Oil Co. PJSC 337,565 2,548
Rosneft Oil Co. PJSC GDR (Registered) 6,396 48
Sberbank of Russia PJSC 3,095,412 11,878
Sberbank of Russia PJSC (MoscowExchange) 56,000 215
Severstal PAO 60,355 1,228
Severstal PAO GDR (Registered) 1,839 37
MARCH 31, 2021
See Notes to the Financial Statements.
NORTHERN FUNDS ANNUAL REPORT 39 EQUIT Y INDEX FUNDS

NUMBEROF SHARES
VALUE(000S)
C O M M O N S TO C KS – 9 5 . 7 % ( 1 ) c o n t i n u e d
Russia – 3.0% continued
Surgutneftegas PJSC 2,069,567 $946
Surgutneftegas PJSC ADR 4,629 21
Tatneft PJSC 405,261 3,204
Tatneft PJSC ADR 1,663 78
TCS Group Holding PLC GDR(Registered) 34,991 2,040
VTB Bank PJSC 800,566,738 451
VTB Bank PJSC GDR(4) (5) 11,036 13
VTB Bank PJSC GDR (Registered) 67,875 74
X5 Retail Group N.V. GDR (Registered) 34,956 1,129
Yandex N.V., Class A* 87,982 5,718
72,020
Saudi Arabia – 2.7%
Abdullah Al Othaim Markets Co. 12,656 427
Advanced Petrochemical Co. 30,924 602
Al Rajhi Bank 357,419 9,417
Alinma Bank* 284,587 1,396
Almarai Co. JSC 71,254 988
Arab National Bank 173,390 966
Bank AlBilad 110,114 1,032
Bank Al-Jazira 115,310 481
Banque Saudi Fransi 169,958 1,512
Bupa Arabia for Cooperative InsuranceCo.* 16,800 535
Co for Cooperative Insurance (The)* 17,476 366
Dar Al Arkan Real Estate DevelopmentCo.* 154,388 379
Dr. Sulaiman Al Habib MedicalServices Group Co. 16,259 538
Emaar Economic City* 109,771 313
Etihad Etisalat Co.* 114,408 902
Jarir Marketing Co. 17,663 857
Mobile Telecommunications Co. SaudiArabia* 137,050 548
National Commercial Bank 429,134 6,076
National Industrialization Co.* 94,064 381
Rabigh Refining & Petrochemical Co.* 62,849 283
Riyad Bank 396,101 2,368
SABIC Agri-Nutrients Co. 59,000 1,548
Sahara International Petrochemical Co. 102,232 603
Samba Financial Group 285,699 2,935
Saudi Airlines Catering Co. 11,114 225
Saudi Arabian Mining Co.* 126,792 1,928
Saudi Arabian Oil Co. 639,899 6,142
NUMBEROF SHARES
VALUE(000S)
C O M M O N S TO C KS – 9 5 . 7 % ( 1 ) c o n t i n u e d
Saudi Arabia – 2.7% continued
Saudi Basic Industries Corp. 263,347 $8,242
Saudi British Bank (The) 235,688 1,655
Saudi Cement Co. 21,013 372
Saudi Electricity Co. 246,737 1,546
Saudi Industrial Investment Group 64,563 560
Saudi Kayan Petrochemical Co.* 207,779 883
Saudi Telecom Co. 176,016 5,946
Savola Group (The) 77,791 815
Yanbu National Petrochemical Co. 75,636 1,396
65,163
Singapore – 0.0%
BOC Aviation Ltd. 59,400 576
South Africa – 3.7%
Absa Group Ltd. 212,509 1,812
African Rainbow Minerals Ltd. 35,355 668
Anglo American Platinum Ltd. 15,510 2,273
AngloGold Ashanti Ltd. 120,119 2,627
Aspen Pharmacare Holdings Ltd.* 111,433 1,089
Bid Corp. Ltd.* 98,631 1,911
Bidvest Group (The) Ltd. 82,824 956
Capitec Bank Holdings Ltd.* 20,395 1,962
Clicks Group Ltd. 71,493 1,165
Discovery Ltd.* 113,604 1,020
Exxaro Resources Ltd. 72,060 849
FirstRand Ltd. 1,396,978 4,882
Gold Fields Ltd. 260,230 2,453
Growthpoint Properties Ltd. 1,010,214 904
Harmony Gold Mining Co. Ltd.* 159,898 679
Impala Platinum Holdings Ltd. 227,268 4,212
Kumba Iron Ore Ltd. 18,486 762
Mr Price Group Ltd. 73,990 971
MTN Group 496,206 2,917
MultiChoice Group 126,920 1,108
Naspers Ltd., Class N 127,231 30,512
Nedbank Group Ltd. 107,706 1,021
Northam Platinum Ltd.* 103,103 1,798
Old Mutual Ltd. 1,339,337 1,146
Rand Merchant Investment HoldingsLtd. 216,879 450
Reinet Investments S.C.A. 42,439 840
Remgro Ltd. 158,362 1,116
Sanlam Ltd. 532,601 2,148
Sasol Ltd.* 165,318 2,395
Shoprite Holdings Ltd. 143,825 1,531
S C H E D U L E O F I N V E S T M E N T S
E M E RG I N G M A R K E T S E Q U I T Y I N D E X F U N D c o n t i n u e d
See Notes to the Financial Statements.
EQUIT Y INDEX FUNDS 40 NORTHERN FUNDS ANNUAL REPORT
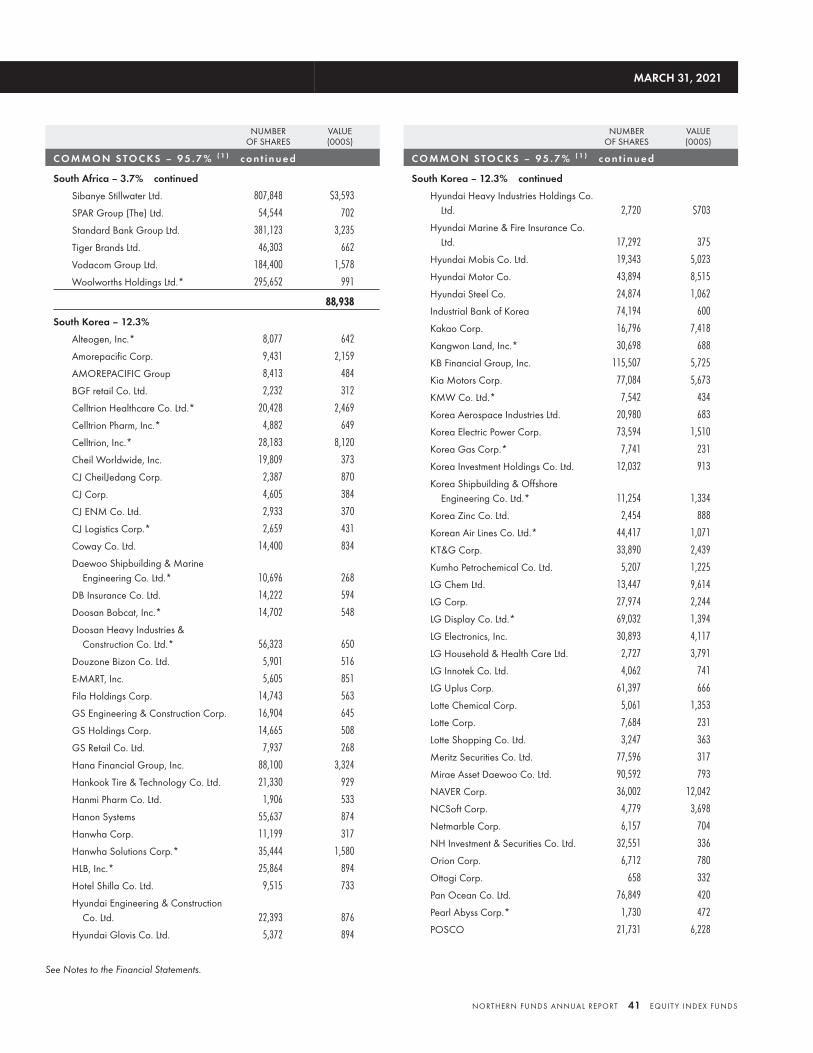
NUMBEROF SHARES
VALUE(000S)
C O M M O N S TO C KS – 9 5 . 7 % ( 1 ) c o n t i n u e d
South Africa – 3.7% continued
Sibanye Stillwater Ltd. 807,848 $3,593
SPAR Group (The) Ltd. 54,544 702
Standard Bank Group Ltd. 381,123 3,235
Tiger Brands Ltd. 46,303 662
Vodacom Group Ltd. 184,400 1,578
Woolworths Holdings Ltd.* 295,652 991
88,938
South Korea – 12.3%
Alteogen, Inc.* 8,077 642
Amorepacific Corp. 9,431 2,159
AMOREPACIFIC Group 8,413 484
BGF retail Co. Ltd. 2,232 312
Celltrion Healthcare Co. Ltd.* 20,428 2,469
Celltrion Pharm, Inc.* 4,882 649
Celltrion, Inc.* 28,183 8,120
Cheil Worldwide, Inc. 19,809 373
CJ CheilJedang Corp. 2,387 870
CJ Corp. 4,605 384
CJ ENM Co. Ltd. 2,933 370
CJ Logistics Corp.* 2,659 431
Coway Co. Ltd. 14,400 834
Daewoo Shipbuilding & MarineEngineering Co. Ltd.* 10,696 268
DB Insurance Co. Ltd. 14,222 594
Doosan Bobcat, Inc.* 14,702 548
Doosan Heavy Industries &Construction Co. Ltd.* 56,323 650
Douzone Bizon Co. Ltd. 5,901 516
E-MART, Inc. 5,605 851
Fila Holdings Corp. 14,743 563
GS Engineering & Construction Corp. 16,904 645
GS Holdings Corp. 14,665 508
GS Retail Co. Ltd. 7,937 268
Hana Financial Group, Inc. 88,100 3,324
Hankook Tire & Technology Co. Ltd. 21,330 929
Hanmi Pharm Co. Ltd. 1,906 533
Hanon Systems 55,637 874
Hanwha Corp. 11,199 317
Hanwha Solutions Corp.* 35,444 1,580
HLB, Inc.* 25,864 894
Hotel Shilla Co. Ltd. 9,515 733
Hyundai Engineering & ConstructionCo. Ltd. 22,393 876
Hyundai Glovis Co. Ltd. 5,372 894
NUMBEROF SHARES
VALUE(000S)
C O M M O N S TO C KS – 9 5 . 7 % ( 1 ) c o n t i n u e d
South Korea – 12.3% continued
Hyundai Heavy Industries Holdings Co.Ltd. 2,720 $703
Hyundai Marine & Fire Insurance Co.Ltd. 17,292 375
Hyundai Mobis Co. Ltd. 19,343 5,023
Hyundai Motor Co. 43,894 8,515
Hyundai Steel Co. 24,874 1,062
Industrial Bank of Korea 74,194 600
Kakao Corp. 16,796 7,418
Kangwon Land, Inc.* 30,698 688
KB Financial Group, Inc. 115,507 5,725
Kia Motors Corp. 77,084 5,673
KMW Co. Ltd.* 7,542 434
Korea Aerospace Industries Ltd. 20,980 683
Korea Electric Power Corp. 73,594 1,510
Korea Gas Corp.* 7,741 231
Korea Investment Holdings Co. Ltd. 12,032 913
Korea Shipbuilding & OffshoreEngineering Co. Ltd.* 11,254 1,334
Korea Zinc Co. Ltd. 2,454 888
Korean Air Lines Co. Ltd.* 44,417 1,071
KT&G Corp. 33,890 2,439
Kumho Petrochemical Co. Ltd. 5,207 1,225
LG Chem Ltd. 13,447 9,614
LG Corp. 27,974 2,244
LG Display Co. Ltd.* 69,032 1,394
LG Electronics, Inc. 30,893 4,117
LG Household & Health Care Ltd. 2,727 3,791
LG Innotek Co. Ltd. 4,062 741
LG Uplus Corp. 61,397 666
Lotte Chemical Corp. 5,061 1,353
Lotte Corp. 7,684 231
Lotte Shopping Co. Ltd. 3,247 363
Meritz Securities Co. Ltd. 77,596 317
Mirae Asset Daewoo Co. Ltd. 90,592 793
NAVER Corp. 36,002 12,042
NCSoft Corp. 4,779 3,698
Netmarble Corp. 6,157 704
NH Investment & Securities Co. Ltd. 32,551 336
Orion Corp. 6,712 780
Ottogi Corp. 658 332
Pan Ocean Co. Ltd. 76,849 420
Pearl Abyss Corp.* 1,730 472
POSCO 21,731 6,228
MARCH 31, 2021
See Notes to the Financial Statements.
NORTHERN FUNDS ANNUAL REPORT 41 EQUIT Y INDEX FUNDS
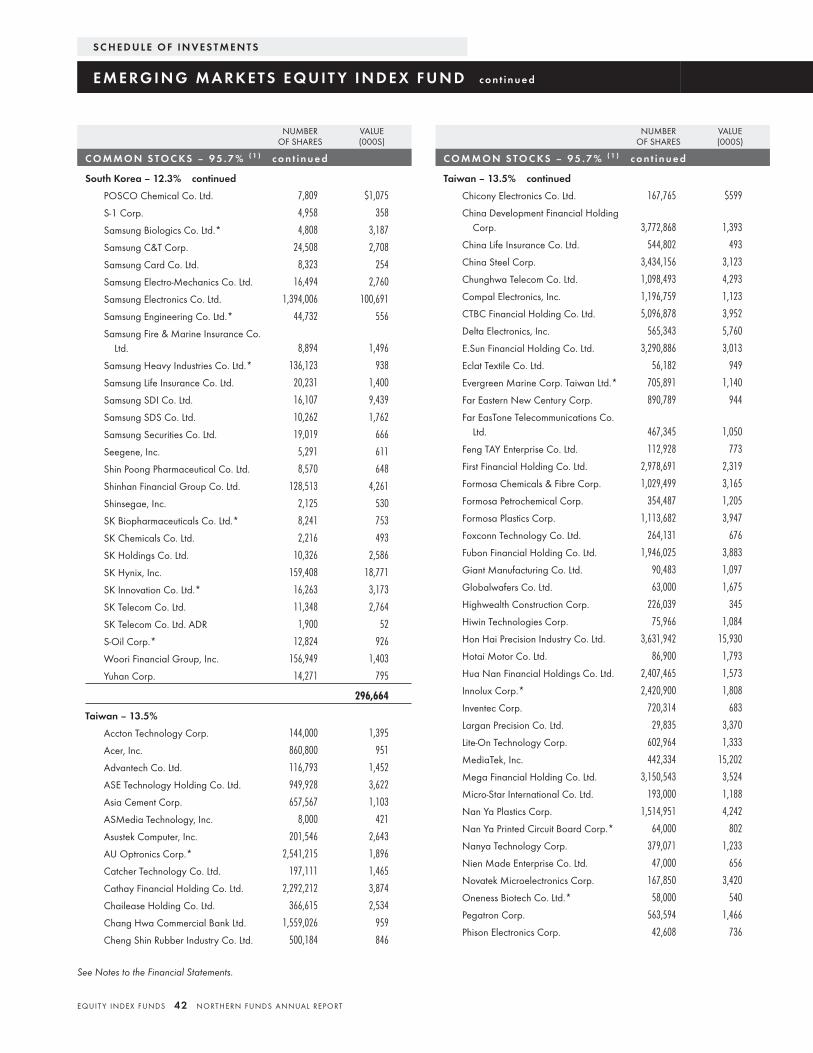
NUMBEROF SHARES
VALUE(000S)
C O M M O N S TO C KS – 9 5 . 7 % ( 1 ) c o n t i n u e d
South Korea – 12.3% continued
POSCO Chemical Co. Ltd. 7,809 $1,075
S-1 Corp. 4,958 358
Samsung Biologics Co. Ltd.* 4,808 3,187
Samsung C&T Corp. 24,508 2,708
Samsung Card Co. Ltd. 8,323 254
Samsung Electro-Mechanics Co. Ltd. 16,494 2,760
Samsung Electronics Co. Ltd. 1,394,006 100,691
Samsung Engineering Co. Ltd.* 44,732 556
Samsung Fire & Marine Insurance Co.Ltd. 8,894 1,496
Samsung Heavy Industries Co. Ltd.* 136,123 938
Samsung Life Insurance Co. Ltd. 20,231 1,400
Samsung SDI Co. Ltd. 16,107 9,439
Samsung SDS Co. Ltd. 10,262 1,762
Samsung Securities Co. Ltd. 19,019 666
Seegene, Inc. 5,291 611
Shin Poong Pharmaceutical Co. Ltd. 8,570 648
Shinhan Financial Group Co. Ltd. 128,513 4,261
Shinsegae, Inc. 2,125 530
SK Biopharmaceuticals Co. Ltd.* 8,241 753
SK Chemicals Co. Ltd. 2,216 493
SK Holdings Co. Ltd. 10,326 2,586
SK Hynix, Inc. 159,408 18,771
SK Innovation Co. Ltd.* 16,263 3,173
SK Telecom Co. Ltd. 11,348 2,764
SK Telecom Co. Ltd. ADR 1,900 52
S-Oil Corp.* 12,824 926
Woori Financial Group, Inc. 156,949 1,403
Yuhan Corp. 14,271 795
296,664
Taiwan – 13.5%
Accton Technology Corp. 144,000 1,395
Acer, Inc. 860,800 951
Advantech Co. Ltd. 116,793 1,452
ASE Technology Holding Co. Ltd. 949,928 3,622
Asia Cement Corp. 657,567 1,103
ASMedia Technology, Inc. 8,000 421
Asustek Computer, Inc. 201,546 2,643
AU Optronics Corp.* 2,541,215 1,896
Catcher Technology Co. Ltd. 197,111 1,465
Cathay Financial Holding Co. Ltd. 2,292,212 3,874
Chailease Holding Co. Ltd. 366,615 2,534
Chang Hwa Commercial Bank Ltd. 1,559,026 959
Cheng Shin Rubber Industry Co. Ltd. 500,184 846
NUMBEROF SHARES
VALUE(000S)
C O M M O N S TO C KS – 9 5 . 7 % ( 1 ) c o n t i n u e d
Taiwan – 13.5% continued
Chicony Electronics Co. Ltd. 167,765 $599
China Development Financial HoldingCorp. 3,772,868 1,393
China Life Insurance Co. Ltd. 544,802 493
China Steel Corp. 3,434,156 3,123
Chunghwa Telecom Co. Ltd. 1,098,493 4,293
Compal Electronics, Inc. 1,196,759 1,123
CTBC Financial Holding Co. Ltd. 5,096,878 3,952
Delta Electronics, Inc. 565,343 5,760
E.Sun Financial Holding Co. Ltd. 3,290,886 3,013
Eclat Textile Co. Ltd. 56,182 949
Evergreen Marine Corp. Taiwan Ltd.* 705,891 1,140
Far Eastern New Century Corp. 890,789 944
Far EasTone Telecommunications Co.Ltd. 467,345 1,050
Feng TAY Enterprise Co. Ltd. 112,928 773
First Financial Holding Co. Ltd. 2,978,691 2,319
Formosa Chemicals & Fibre Corp. 1,029,499 3,165
Formosa Petrochemical Corp. 354,487 1,205
Formosa Plastics Corp. 1,113,682 3,947
Foxconn Technology Co. Ltd. 264,131 676
Fubon Financial Holding Co. Ltd. 1,946,025 3,883
Giant Manufacturing Co. Ltd. 90,483 1,097
Globalwafers Co. Ltd. 63,000 1,675
Highwealth Construction Corp. 226,039 345
Hiwin Technologies Corp. 75,966 1,084
Hon Hai Precision Industry Co. Ltd. 3,631,942 15,930
Hotai Motor Co. Ltd. 86,900 1,793
Hua Nan Financial Holdings Co. Ltd. 2,407,465 1,573
Innolux Corp.* 2,420,900 1,808
Inventec Corp. 720,314 683
Largan Precision Co. Ltd. 29,835 3,370
Lite-On Technology Corp. 602,964 1,333
MediaTek, Inc. 442,334 15,202
Mega Financial Holding Co. Ltd. 3,150,543 3,524
Micro-Star International Co. Ltd. 193,000 1,188
Nan Ya Plastics Corp. 1,514,951 4,242
Nan Ya Printed Circuit Board Corp.* 64,000 802
Nanya Technology Corp. 379,071 1,233
Nien Made Enterprise Co. Ltd. 47,000 656
Novatek Microelectronics Corp. 167,850 3,420
Oneness Biotech Co. Ltd.* 58,000 540
Pegatron Corp. 563,594 1,466
Phison Electronics Corp. 42,608 736
S C H E D U L E O F I N V E S T M E N T S
E M E RG I N G M A R K E T S E Q U I T Y I N D E X F U N D c o n t i n u e d
See Notes to the Financial Statements.
EQUIT Y INDEX FUNDS 42 NORTHERN FUNDS ANNUAL REPORT
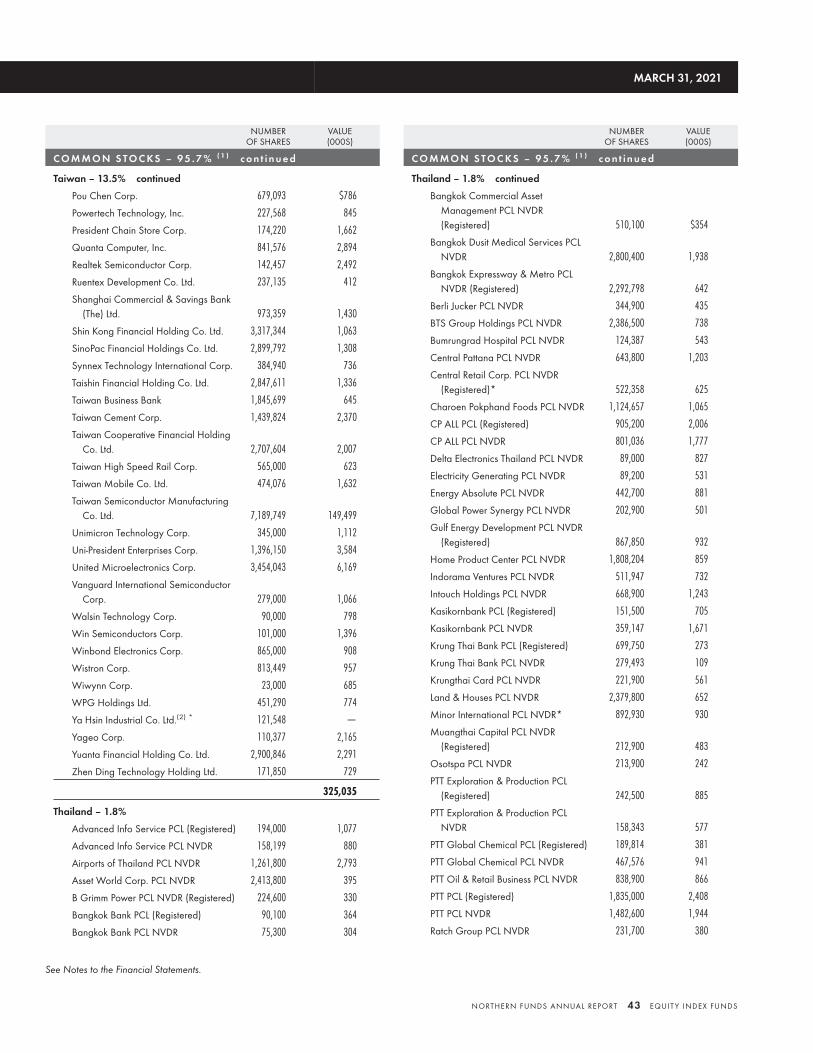
NUMBEROF SHARES
VALUE(000S)
C O M M O N S TO C KS – 9 5 . 7 % ( 1 ) c o n t i n u e d
Taiwan – 13.5% continued
Pou Chen Corp. 679,093 $786
Powertech Technology, Inc. 227,568 845
President Chain Store Corp. 174,220 1,662
Quanta Computer, Inc. 841,576 2,894
Realtek Semiconductor Corp. 142,457 2,492
Ruentex Development Co. Ltd. 237,135 412
Shanghai Commercial & Savings Bank(The) Ltd. 973,359 1,430
Shin Kong Financial Holding Co. Ltd. 3,317,344 1,063
SinoPac Financial Holdings Co. Ltd. 2,899,792 1,308
Synnex Technology International Corp. 384,940 736
Taishin Financial Holding Co. Ltd. 2,847,611 1,336
Taiwan Business Bank 1,845,699 645
Taiwan Cement Corp. 1,439,824 2,370
Taiwan Cooperative Financial HoldingCo. Ltd. 2,707,604 2,007
Taiwan High Speed Rail Corp. 565,000 623
Taiwan Mobile Co. Ltd. 474,076 1,632
Taiwan Semiconductor ManufacturingCo. Ltd. 7,189,749 149,499
Unimicron Technology Corp. 345,000 1,112
Uni-President Enterprises Corp. 1,396,150 3,584
United Microelectronics Corp. 3,454,043 6,169
Vanguard International SemiconductorCorp. 279,000 1,066
Walsin Technology Corp. 90,000 798
Win Semiconductors Corp. 101,000 1,396
Winbond Electronics Corp. 865,000 908
Wistron Corp. 813,449 957
Wiwynn Corp. 23,000 685
WPG Holdings Ltd. 451,290 774
Ya Hsin Industrial Co. Ltd.(2) * 121,548 —
Yageo Corp. 110,377 2,165
Yuanta Financial Holding Co. Ltd. 2,900,846 2,291
Zhen Ding Technology Holding Ltd. 171,850 729
325,035
Thailand – 1.8%
Advanced Info Service PCL (Registered) 194,000 1,077
Advanced Info Service PCL NVDR 158,199 880
Airports of Thailand PCL NVDR 1,261,800 2,793
Asset World Corp. PCL NVDR 2,413,800 395
B Grimm Power PCL NVDR (Registered) 224,600 330
Bangkok Bank PCL (Registered) 90,100 364
Bangkok Bank PCL NVDR 75,300 304
NUMBEROF SHARES
VALUE(000S)
C O M M O N S TO C KS – 9 5 . 7 % ( 1 ) c o n t i n u e d
Thailand – 1.8% continued
Bangkok Commercial AssetManagement PCL NVDR(Registered) 510,100 $354
Bangkok Dusit Medical Services PCLNVDR 2,800,400 1,938
Bangkok Expressway & Metro PCLNVDR (Registered) 2,292,798 642
Berli Jucker PCL NVDR 344,900 435
BTS Group Holdings PCL NVDR 2,386,500 738
Bumrungrad Hospital PCL NVDR 124,387 543
Central Pattana PCL NVDR 643,800 1,203
Central Retail Corp. PCL NVDR(Registered)* 522,358 625
Charoen Pokphand Foods PCL NVDR 1,124,657 1,065
CP ALL PCL (Registered) 905,200 2,006
CP ALL PCL NVDR 801,036 1,777
Delta Electronics Thailand PCL NVDR 89,000 827
Electricity Generating PCL NVDR 89,200 531
Energy Absolute PCL NVDR 442,700 881
Global Power Synergy PCL NVDR 202,900 501
Gulf Energy Development PCL NVDR(Registered) 867,850 932
Home Product Center PCL NVDR 1,808,204 859
Indorama Ventures PCL NVDR 511,947 732
Intouch Holdings PCL NVDR 668,900 1,243
Kasikornbank PCL (Registered) 151,500 705
Kasikornbank PCL NVDR 359,147 1,671
Krung Thai Bank PCL (Registered) 699,750 273
Krung Thai Bank PCL NVDR 279,493 109
Krungthai Card PCL NVDR 221,900 561
Land & Houses PCL NVDR 2,379,800 652
Minor International PCL NVDR* 892,930 930
Muangthai Capital PCL NVDR(Registered) 212,900 483
Osotspa PCL NVDR 213,900 242
PTT Exploration & Production PCL(Registered) 242,500 885
PTT Exploration & Production PCLNVDR 158,343 577
PTT Global Chemical PCL (Registered) 189,814 381
PTT Global Chemical PCL NVDR 467,576 941
PTT Oil & Retail Business PCL NVDR 838,900 866
PTT PCL (Registered) 1,835,000 2,408
PTT PCL NVDR 1,482,600 1,944
Ratch Group PCL NVDR 231,700 380
MARCH 31, 2021
See Notes to the Financial Statements.
NORTHERN FUNDS ANNUAL REPORT 43 EQUIT Y INDEX FUNDS
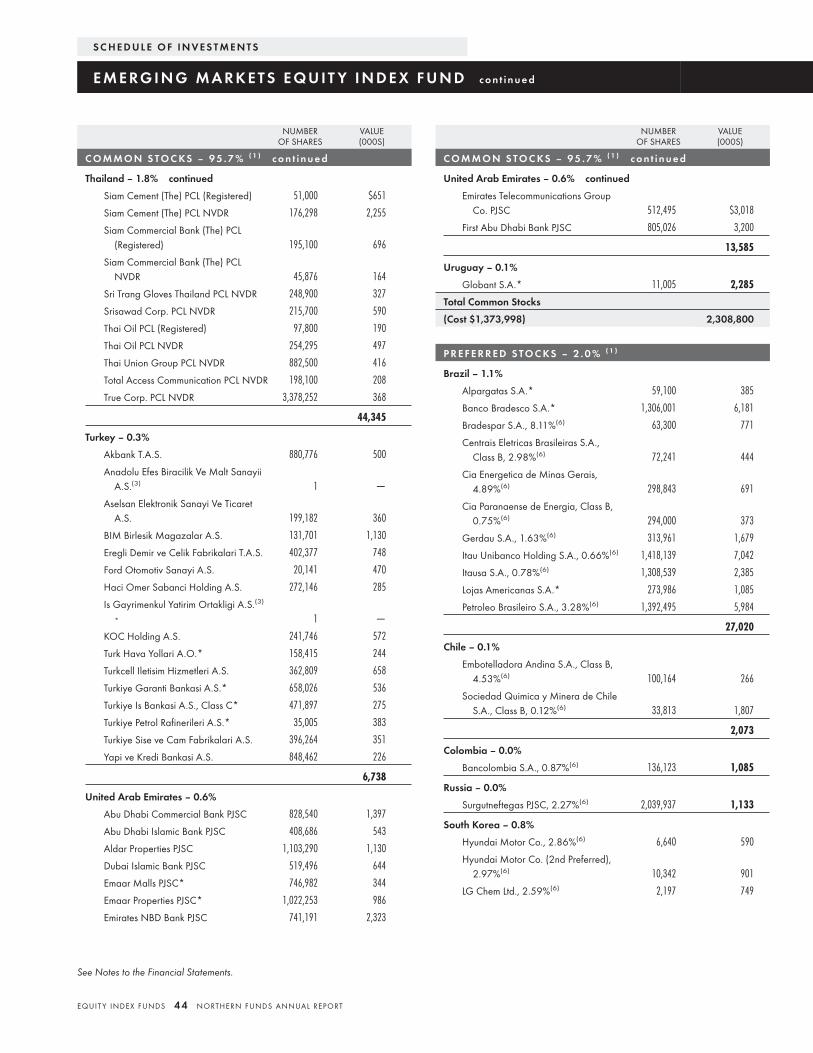
NUMBEROF SHARES
VALUE(000S)
C O M M O N S TO C KS – 9 5 . 7 % ( 1 ) c o n t i n u e d
Thailand – 1.8% continued
Siam Cement (The) PCL (Registered) 51,000 $651
Siam Cement (The) PCL NVDR 176,298 2,255
Siam Commercial Bank (The) PCL(Registered) 195,100 696
Siam Commercial Bank (The) PCLNVDR 45,876 164
Sri Trang Gloves Thailand PCL NVDR 248,900 327
Srisawad Corp. PCL NVDR 215,700 590
Thai Oil PCL (Registered) 97,800 190
Thai Oil PCL NVDR 254,295 497
Thai Union Group PCL NVDR 882,500 416
Total Access Communication PCL NVDR 198,100 208
True Corp. PCL NVDR 3,378,252 368
44,345
Turkey – 0.3%
Akbank T.A.S. 880,776 500
Anadolu Efes Biracilik Ve Malt SanayiiA.S.(3) 1 —
Aselsan Elektronik Sanayi Ve TicaretA.S. 199,182 360
BIM Birlesik Magazalar A.S. 131,701 1,130
Eregli Demir ve Celik Fabrikalari T.A.S. 402,377 748
Ford Otomotiv Sanayi A.S. 20,141 470
Haci Omer Sabanci Holding A.S. 272,146 285
Is Gayrimenkul Yatirim Ortakligi A.S.(3)
* 1 —
KOC Holding A.S. 241,746 572
Turk Hava Yollari A.O.* 158,415 244
Turkcell Iletisim Hizmetleri A.S. 362,809 658
Turkiye Garanti Bankasi A.S.* 658,026 536
Turkiye Is Bankasi A.S., Class C* 471,897 275
Turkiye Petrol Rafinerileri A.S.* 35,005 383
Turkiye Sise ve Cam Fabrikalari A.S. 396,264 351
Yapi ve Kredi Bankasi A.S. 848,462 226
6,738
United Arab Emirates – 0.6%
Abu Dhabi Commercial Bank PJSC 828,540 1,397
Abu Dhabi Islamic Bank PJSC 408,686 543
Aldar Properties PJSC 1,103,290 1,130
Dubai Islamic Bank PJSC 519,496 644
Emaar Malls PJSC* 746,982 344
Emaar Properties PJSC* 1,022,253 986
Emirates NBD Bank PJSC 741,191 2,323
NUMBEROF SHARES
VALUE(000S)
C O M M O N S TO C KS – 9 5 . 7 % ( 1 ) c o n t i n u e d
United Arab Emirates – 0.6% continued
Emirates Telecommunications GroupCo. PJSC 512,495 $3,018
First Abu Dhabi Bank PJSC 805,026 3,200
13,585
Uruguay – 0.1%
Globant S.A.* 11,005 2,285
Total Common Stocks
(Cost $1,373,998) 2,308,800
P R E F E R R E D S TO C KS – 2 . 0 % ( 1 )
Brazil – 1.1%
Alpargatas S.A.* 59,100 385
Banco Bradesco S.A.* 1,306,001 6,181
Bradespar S.A., 8.11%(6) 63,300 771
Centrais Eletricas Brasileiras S.A.,Class B, 2.98%(6) 72,241 444
Cia Energetica de Minas Gerais,4.89%(6) 298,843 691
Cia Paranaense de Energia, Class B,0.75%(6) 294,000 373
Gerdau S.A., 1.63%(6) 313,961 1,679
Itau Unibanco Holding S.A., 0.66%(6) 1,418,139 7,042
Itausa S.A., 0.78%(6) 1,308,539 2,385
Lojas Americanas S.A.* 273,986 1,085
Petroleo Brasileiro S.A., 3.28%(6) 1,392,495 5,984
27,020
Chile – 0.1%
Embotelladora Andina S.A., Class B,4.53%(6) 100,164 266
Sociedad Quimica y Minera de ChileS.A., Class B, 0.12%(6) 33,813 1,807
2,073
Colombia – 0.0%
Bancolombia S.A., 0.87%(6) 136,123 1,085
Russia – 0.0%
Surgutneftegas PJSC, 2.27%(6) 2,039,937 1,133
South Korea – 0.8%
Hyundai Motor Co., 2.86%(6) 6,640 590
Hyundai Motor Co. (2nd Preferred),2.97%(6) 10,342 901
LG Chem Ltd., 2.59%(6) 2,197 749
S C H E D U L E O F I N V E S T M E N T S
E M E RG I N G M A R K E T S E Q U I T Y I N D E X F U N D c o n t i n u e d
See Notes to the Financial Statements.
EQUIT Y INDEX FUNDS 44 NORTHERN FUNDS ANNUAL REPORT
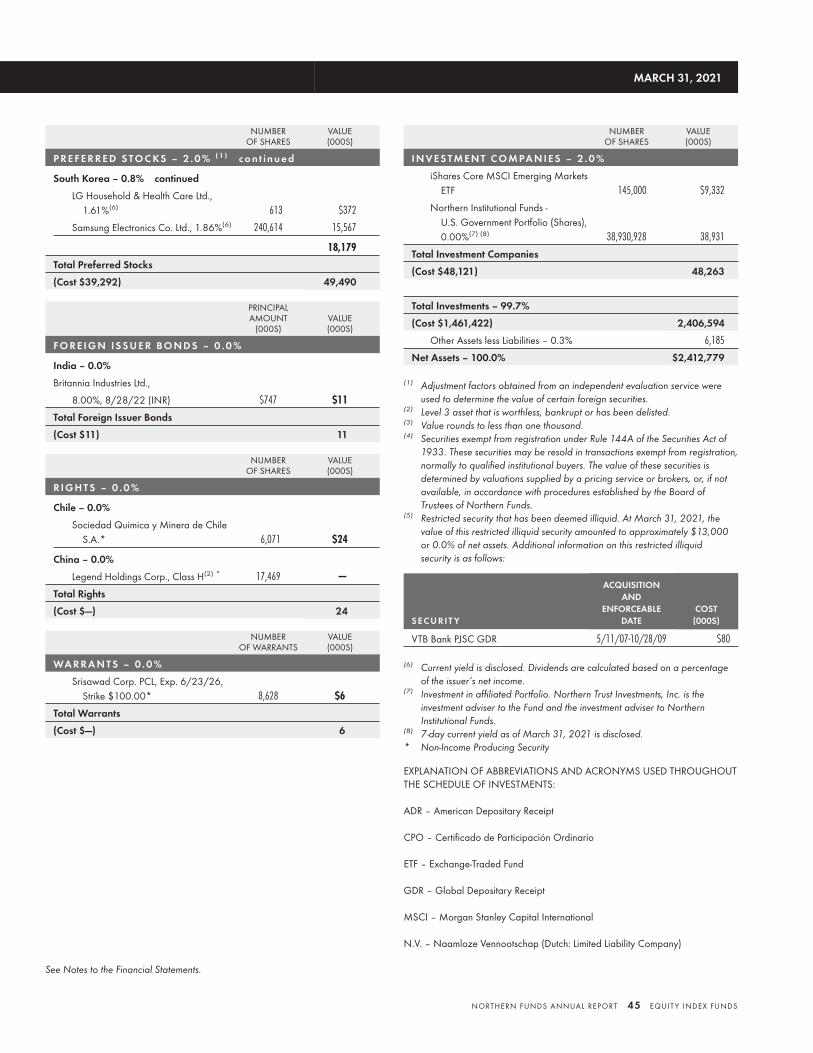
NUMBEROF SHARES
VALUE(000S)
P R E F E R R E D S TO C KS – 2 . 0 % ( 1 ) c o n t i n u e d
South Korea – 0.8% continued
LG Household & Health Care Ltd.,1.61%(6) 613 $372
Samsung Electronics Co. Ltd., 1.86%(6) 240,614 15,567
18,179
Total Preferred Stocks
(Cost $39,292) 49,490
PRINCIPALAMOUNT
(000S)VALUE(000S)
F O R E I G N I S S U E R BO N D S – 0 . 0 %
India – 0.0%
Britannia Industries Ltd.,
8.00%, 8/28/22 (INR) $747 $11
Total Foreign Issuer Bonds
(Cost $11) 11
NUMBEROF SHARES
VALUE(000S)
R I G H T S – 0 . 0 %
Chile – 0.0%
Sociedad Quimica y Minera de ChileS.A.* 6,071 $24
China – 0.0%
Legend Holdings Corp., Class H(2) * 17,469 —
Total Rights
(Cost $—) 24
NUMBEROF WARRANTS
VALUE(000S)
WA R R A N T S – 0 . 0 %
Srisawad Corp. PCL, Exp. 6/23/26,Strike $100.00* 8,628 $6
Total Warrants
(Cost $—) 6
NUMBEROF SHARES
VALUE(000S)
I N V E S T M E N T C O M PA N I E S – 2 . 0 %
iShares Core MSCI Emerging MarketsETF 145,000 $9,332
Northern Institutional Funds -U.S. Government Portfolio (Shares),0.00%(7) (8) 38,930,928 38,931
Total Investment Companies
(Cost $48,121) 48,263
Total Investments – 99.7%
(Cost $1,461,422) 2,406,594
Other Assets less Liabilities – 0.3% 6,185
Net Assets – 100.0% $2,412,779
(1) Adjustment factors obtained from an independent evaluation service wereused to determine the value of certain foreign securities.
(2) Level 3 asset that is worthless, bankrupt or has been delisted.(3) Value rounds to less than one thousand.(4) Securities exempt from registration under Rule 144A of the Securities Act of
1933. These securities may be resold in transactions exempt from registration,normally to qualified institutional buyers. The value of these securities isdetermined by valuations supplied by a pricing service or brokers, or, if notavailable, in accordance with procedures established by the Board ofTrustees of Northern Funds.
(5) Restricted security that has been deemed illiquid. At March 31, 2021, thevalue of this restricted illiquid security amounted to approximately $13,000or 0.0% of net assets. Additional information on this restricted illiquidsecurity is as follows:
S E C U R I T Y
ACQUISITIONAND
ENFORCEABLEDATE
COST(000S)
VTB Bank PJSC GDR 5/11/07-10/28/09 $80
(6) Current yield is disclosed. Dividends are calculated based on a percentageof the issuer’s net income.
(7) Investment in affiliated Portfolio. Northern Trust Investments, Inc. is theinvestment adviser to the Fund and the investment adviser to NorthernInstitutional Funds.
(8) 7-day current yield as of March 31, 2021 is disclosed.* Non-Income Producing Security
EXPLANATION OF ABBREVIATIONS AND ACRONYMS USED THROUGHOUTTHE SCHEDULE OF INVESTMENTS:
ADR – American Depositary Receipt
CPO – Certificado de Participación Ordinario
ETF – Exchange-Traded Fund
GDR – Global Depositary Receipt
MSCI – Morgan Stanley Capital International
N.V. – Naamloze Vennootschap (Dutch: Limited Liability Company)
MARCH 31, 2021
See Notes to the Financial Statements.
NORTHERN FUNDS ANNUAL REPORT 45 EQUIT Y INDEX FUNDS

NVDR – Non-Voting Depositary Receipt
PCL – Public Company Limited
PJSC – Public Joint-Stock Company
PLC – Public Limited Company
S.A. – Société Anonyme (French: Public Limited Company)
S.A.B. de C.V. – Sociedad Anónima Bursátil de Capital Variable (Mexico: PublicCompany)
INR - Indian Rupee
Percentages shown are based on Net Assets.
At March 31, 2021, the Fund had outstanding forward foreign currencyexchange contracts as follows:
COUNTERPARTY
CONTRACTSTO
DELIVERCURRENCY
AMOUNT(LOCAL
CURRENCY)(000S)
INEXCHANGE
FORCURRENCY
AMOUNT(LOCAL
CURRENCY)(000S)
SETTLEMENTDATE
UNREALIZEDAPPRECIATION
(DEPRECIATION)(000S)
Citibank Indian Rupee 27,953 United States Dollar 378 6/16/21 $—*
Citibank Taiwan Dollar 12,379 United States Dollar 442 6/16/21 4
Subtotal Appreciation 4
BNP South African Rand 3,183 United States Dollar 207 6/17/21 (6)
Citibank Brazilian Real 1,792 United States Dollar 305 6/16/21 (12)
Citibank Korean Won 4,837,400 United States Dollar 4,254 6/16/21 (35)
Toronto-Dominion Bank United States Dollar 485 Hong Kong Dollar 3,766 6/16/21 (1)
Subtotal Depreciation (54)
Total $ (50)
* Amount rounds to less than one thousand.
At March 31, 2021, the Fund had open futures contracts as follows:
TYPENUMBER OFCONTRACTS
NOTIONALAMOUNT
(000S)CONTRACTPOSITION
CONTRACTEXP.
VALUE ANDUNREALIZED
APPRECIATION(DEPRECIATION)
(000S)(1)
MSCIEmergingMarkets Index(United StatesDollar) 759 $50,189 Long 6/21 $(649)
(1) Includes cumulative appreciation/depreciation on futures contracts. Only thecurrent day’s variation margin is reported within the Statements of Assets andLiabilities.
At March 31, 2021, the industry sectors for the Fund were:
I N D U S T RY S E C TO R% OF NET
ASSETS
Communication Services 11.5%
Consumer Discretionary 17.2
Consumer Staples 5.5
Energy 4.7
Financials 18.2
Health Care 4.3
Industrials 4.2
Information Technology 20.5
Materials 7.9
Real Estate 2.1
Short-Term Investments 1.6
Utilities 2.0
Total Investments 99.7
Other Assets less Liabilities 0.3
Net Assets 100.0%
At March 31, 2021, the Fund’s investments were denominated in the followingcurrencies:
C O N C E N T R AT I O N BY C U R R E N C Y% OF NET
ASSETS
Hong Kong Dollar 21.2%
United States Dollar 14.1
Taiwan Dollar 13.6
Korean Won 13.0
Indian Rupee 9.4
All other currencies less than 5% 28.4
Total Investments 99.7
Other Assets less Liabilities 0.3
Net Assets 100.0%
Various inputs are used in determining the value of the Fund’s investments. Theseinputs are summarized in three levels listed below:
Level 1 - Unadjusted quoted market prices in active markets for identical securitieson the measurement date.Level 2 - Other observable inputs (e.g., quoted prices in active markets for similarsecurities, securities valuations based on commonly quoted benchmark interestrates and yield curves, maturities, ratings and/or securities indices). The Fundadjusted the price of certain foreign equity securities held in its portfolio onMarch 31, 2021 using adjustment factors designed to reflect more accurately thefair value of the securities. See Note 2 for a discussion of this procedure. The fairvaluation of these securities resulted in their categorization as Level 2 investments.Level 3 - Significant unobservable inputs (e.g., information about assumptions,including risk, market participants would use in pricing a security).
S C H E D U L E O F I N V E S T M E N T S
E M E RG I N G M A R K E T S E Q U I T Y I N D E X F U N D c o n t i n u e d
See Notes to the Financial Statements.
EQUIT Y INDEX FUNDS 46 NORTHERN FUNDS ANNUAL REPORT
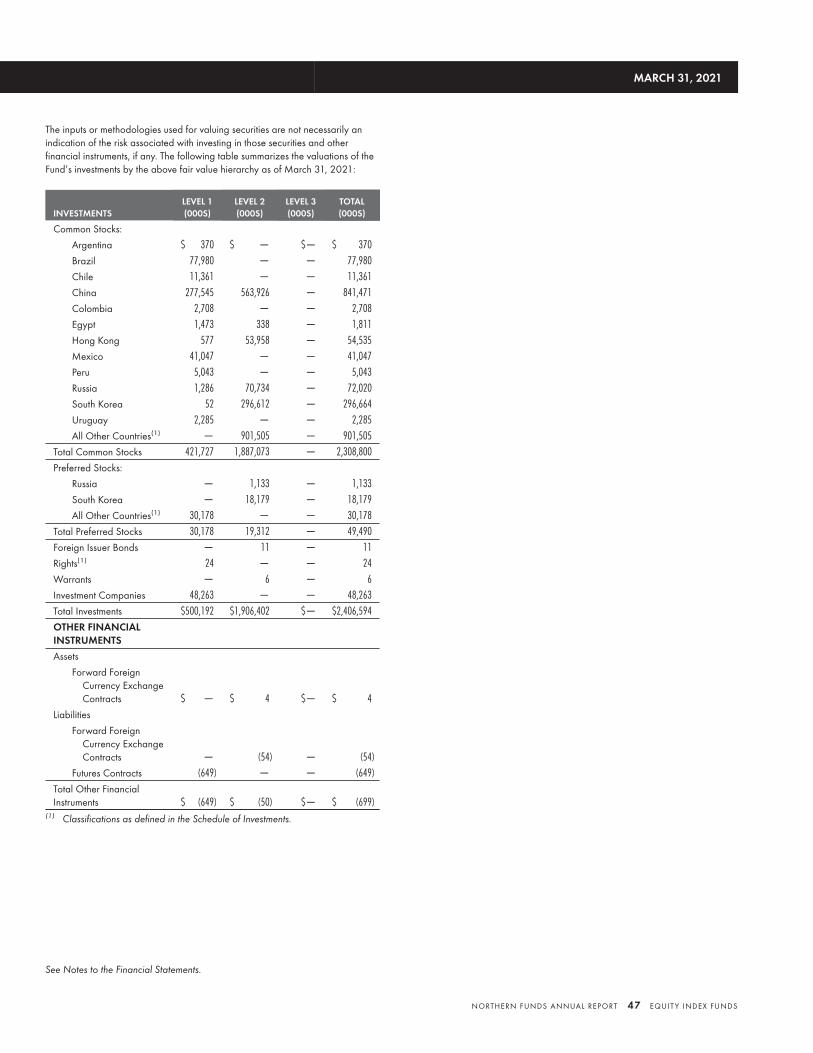
The inputs or methodologies used for valuing securities are not necessarily anindication of the risk associated with investing in those securities and otherfinancial instruments, if any. The following table summarizes the valuations of theFund’s investments by the above fair value hierarchy as of March 31, 2021:
INVESTMENTSLEVEL 1(000S)
LEVEL 2(000S)
LEVEL 3(000S)
TOTAL(000S)
Common Stocks:
Argentina $ 370 $ — $— $ 370
Brazil 77,980 — — 77,980
Chile 11,361 — — 11,361
China 277,545 563,926 — 841,471
Colombia 2,708 — — 2,708
Egypt 1,473 338 — 1,811
Hong Kong 577 53,958 — 54,535
Mexico 41,047 — — 41,047
Peru 5,043 — — 5,043
Russia 1,286 70,734 — 72,020
South Korea 52 296,612 — 296,664
Uruguay 2,285 — — 2,285
All Other Countries(1) — 901,505 — 901,505
Total Common Stocks 421,727 1,887,073 — 2,308,800
Preferred Stocks:
Russia — 1,133 — 1,133
South Korea — 18,179 — 18,179
All Other Countries(1) 30,178 — — 30,178
Total Preferred Stocks 30,178 19,312 — 49,490
Foreign Issuer Bonds — 11 — 11
Rights(1) 24 — — 24
Warrants — 6 — 6
Investment Companies 48,263 — — 48,263
Total Investments $500,192 $1,906,402 $— $2,406,594
OTHER FINANCIALINSTRUMENTS
Assets
Forward ForeignCurrency ExchangeContracts $ — $ 4 $— $ 4
Liabilities
Forward ForeignCurrency ExchangeContracts — (54) — (54)
Futures Contracts (649) — — (649)
Total Other FinancialInstruments $ (649) $ (50) $— $ (699)
(1) Classifications as defined in the Schedule of Investments.
MARCH 31, 2021
See Notes to the Financial Statements.
NORTHERN FUNDS ANNUAL REPORT 47 EQUIT Y INDEX FUNDS
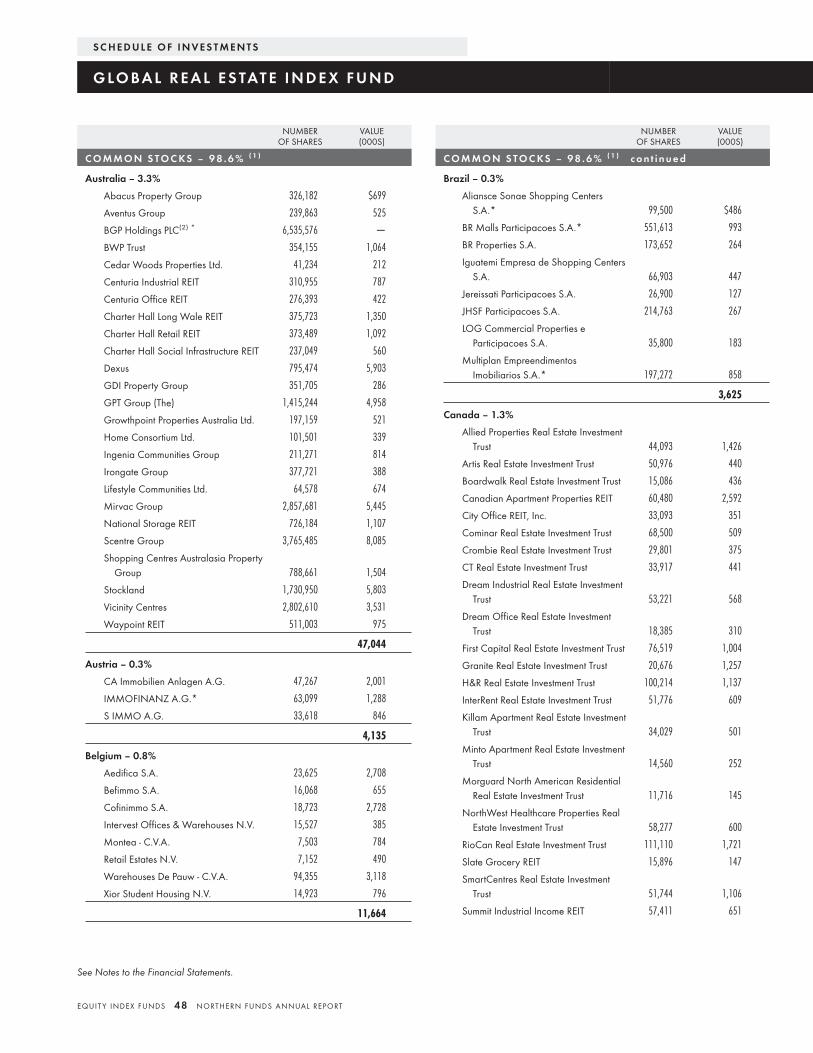
NUMBEROF SHARES
VALUE(000S)
C O M M O N S TO C KS – 9 8 . 6 % ( 1 )
Australia – 3.3%
Abacus Property Group 326,182 $699
Aventus Group 239,863 525
BGP Holdings PLC(2) * 6,535,576 —
BWP Trust 354,155 1,064
Cedar Woods Properties Ltd. 41,234 212
Centuria Industrial REIT 310,955 787
Centuria Office REIT 276,393 422
Charter Hall Long Wale REIT 375,723 1,350
Charter Hall Retail REIT 373,489 1,092
Charter Hall Social Infrastructure REIT 237,049 560
Dexus 795,474 5,903
GDI Property Group 351,705 286
GPT Group (The) 1,415,244 4,958
Growthpoint Properties Australia Ltd. 197,159 521
Home Consortium Ltd. 101,501 339
Ingenia Communities Group 211,271 814
Irongate Group 377,721 388
Lifestyle Communities Ltd. 64,578 674
Mirvac Group 2,857,681 5,445
National Storage REIT 726,184 1,107
Scentre Group 3,765,485 8,085
Shopping Centres Australasia PropertyGroup 788,661 1,504
Stockland 1,730,950 5,803
Vicinity Centres 2,802,610 3,531
Waypoint REIT 511,003 975
47,044
Austria – 0.3%
CA Immobilien Anlagen A.G. 47,267 2,001
IMMOFINANZ A.G.* 63,099 1,288
S IMMO A.G. 33,618 846
4,135
Belgium – 0.8%
Aedifica S.A. 23,625 2,708
Befimmo S.A. 16,068 655
Cofinimmo S.A. 18,723 2,728
Intervest Offices & Warehouses N.V. 15,527 385
Montea - C.V.A. 7,503 784
Retail Estates N.V. 7,152 490
Warehouses De Pauw - C.V.A. 94,355 3,118
Xior Student Housing N.V. 14,923 796
11,664
NUMBEROF SHARES
VALUE(000S)
C O M M O N S TO C KS – 9 8 . 6 % ( 1 ) c o n t i n u e d
Brazil – 0.3%
Aliansce Sonae Shopping CentersS.A.* 99,500 $486
BR Malls Participacoes S.A.* 551,613 993
BR Properties S.A. 173,652 264
Iguatemi Empresa de Shopping CentersS.A. 66,903 447
Jereissati Participacoes S.A. 26,900 127
JHSF Participacoes S.A. 214,763 267
LOG Commercial Properties eParticipacoes S.A. 35,800 183
Multiplan EmpreendimentosImobiliarios S.A.* 197,272 858
3,625
Canada – 1.3%
Allied Properties Real Estate InvestmentTrust 44,093 1,426
Artis Real Estate Investment Trust 50,976 440
Boardwalk Real Estate Investment Trust 15,086 436
Canadian Apartment Properties REIT 60,480 2,592
City Office REIT, Inc. 33,093 351
Cominar Real Estate Investment Trust 68,500 509
Crombie Real Estate Investment Trust 29,801 375
CT Real Estate Investment Trust 33,917 441
Dream Industrial Real Estate InvestmentTrust 53,221 568
Dream Office Real Estate InvestmentTrust 18,385 310
First Capital Real Estate Investment Trust 76,519 1,004
Granite Real Estate Investment Trust 20,676 1,257
H&R Real Estate Investment Trust 100,214 1,137
InterRent Real Estate Investment Trust 51,776 609
Killam Apartment Real Estate InvestmentTrust 34,029 501
Minto Apartment Real Estate InvestmentTrust 14,560 252
Morguard North American ResidentialReal Estate Investment Trust 11,716 145
NorthWest Healthcare Properties RealEstate Investment Trust 58,277 600
RioCan Real Estate Investment Trust 111,110 1,721
Slate Grocery REIT 15,896 147
SmartCentres Real Estate InvestmentTrust 51,744 1,106
Summit Industrial Income REIT 57,411 651
S C H E D U L E O F I N V E S T M E N T S
G LO BA L R E A L E S TAT E I N D E X F U N D
See Notes to the Financial Statements.
EQUIT Y INDEX FUNDS 48 NORTHERN FUNDS ANNUAL REPORT
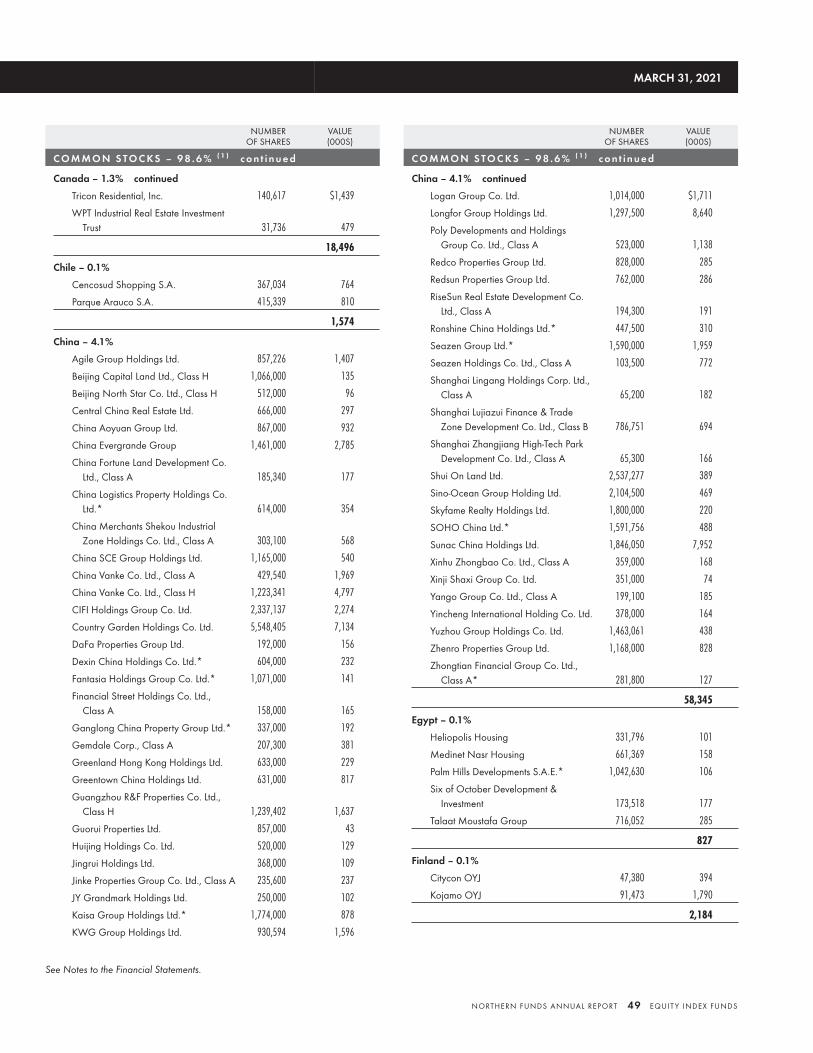
NUMBEROF SHARES
VALUE(000S)
C O M M O N S TO C KS – 9 8 . 6 % ( 1 ) c o n t i n u e d
Canada – 1.3% continued
Tricon Residential, Inc. 140,617 $1,439
WPT Industrial Real Estate InvestmentTrust 31,736 479
18,496
Chile – 0.1%
Cencosud Shopping S.A. 367,034 764
Parque Arauco S.A. 415,339 810
1,574
China – 4.1%
Agile Group Holdings Ltd. 857,226 1,407
Beijing Capital Land Ltd., Class H 1,066,000 135
Beijing North Star Co. Ltd., Class H 512,000 96
Central China Real Estate Ltd. 666,000 297
China Aoyuan Group Ltd. 867,000 932
China Evergrande Group 1,461,000 2,785
China Fortune Land Development Co.Ltd., Class A 185,340 177
China Logistics Property Holdings Co.Ltd.* 614,000 354
China Merchants Shekou IndustrialZone Holdings Co. Ltd., Class A 303,100 568
China SCE Group Holdings Ltd. 1,165,000 540
China Vanke Co. Ltd., Class A 429,540 1,969
China Vanke Co. Ltd., Class H 1,223,341 4,797
CIFI Holdings Group Co. Ltd. 2,337,137 2,274
Country Garden Holdings Co. Ltd. 5,548,405 7,134
DaFa Properties Group Ltd. 192,000 156
Dexin China Holdings Co. Ltd.* 604,000 232
Fantasia Holdings Group Co. Ltd.* 1,071,000 141
Financial Street Holdings Co. Ltd.,Class A 158,000 165
Ganglong China Property Group Ltd.* 337,000 192
Gemdale Corp., Class A 207,300 381
Greenland Hong Kong Holdings Ltd. 633,000 229
Greentown China Holdings Ltd. 631,000 817
Guangzhou R&F Properties Co. Ltd.,Class H 1,239,402 1,637
Guorui Properties Ltd. 857,000 43
Huijing Holdings Co. Ltd. 520,000 129
Jingrui Holdings Ltd. 368,000 109
Jinke Properties Group Co. Ltd., Class A 235,600 237
JY Grandmark Holdings Ltd. 250,000 102
Kaisa Group Holdings Ltd.* 1,774,000 878
KWG Group Holdings Ltd. 930,594 1,596
NUMBEROF SHARES
VALUE(000S)
C O M M O N S TO C KS – 9 8 . 6 % ( 1 ) c o n t i n u e d
China – 4.1% continued
Logan Group Co. Ltd. 1,014,000 $1,711
Longfor Group Holdings Ltd. 1,297,500 8,640
Poly Developments and HoldingsGroup Co. Ltd., Class A 523,000 1,138
Redco Properties Group Ltd. 828,000 285
Redsun Properties Group Ltd. 762,000 286
RiseSun Real Estate Development Co.Ltd., Class A 194,300 191
Ronshine China Holdings Ltd.* 447,500 310
Seazen Group Ltd.* 1,590,000 1,959
Seazen Holdings Co. Ltd., Class A 103,500 772
Shanghai Lingang Holdings Corp. Ltd.,Class A 65,200 182
Shanghai Lujiazui Finance & TradeZone Development Co. Ltd., Class B 786,751 694
Shanghai Zhangjiang High-Tech ParkDevelopment Co. Ltd., Class A 65,300 166
Shui On Land Ltd. 2,537,277 389
Sino-Ocean Group Holding Ltd. 2,104,500 469
Skyfame Realty Holdings Ltd. 1,800,000 220
SOHO China Ltd.* 1,591,756 488
Sunac China Holdings Ltd. 1,846,050 7,952
Xinhu Zhongbao Co. Ltd., Class A 359,000 168
Xinji Shaxi Group Co. Ltd. 351,000 74
Yango Group Co. Ltd., Class A 199,100 185
Yincheng International Holding Co. Ltd. 378,000 164
Yuzhou Group Holdings Co. Ltd. 1,463,061 438
Zhenro Properties Group Ltd. 1,168,000 828
Zhongtian Financial Group Co. Ltd.,Class A* 281,800 127
58,345
Egypt – 0.1%
Heliopolis Housing 331,796 101
Medinet Nasr Housing 661,369 158
Palm Hills Developments S.A.E.* 1,042,630 106
Six of October Development &Investment 173,518 177
Talaat Moustafa Group 716,052 285
827
Finland – 0.1%
Citycon OYJ 47,380 394
Kojamo OYJ 91,473 1,790
2,184
MARCH 31, 2021
See Notes to the Financial Statements.
NORTHERN FUNDS ANNUAL REPORT 49 EQUIT Y INDEX FUNDS
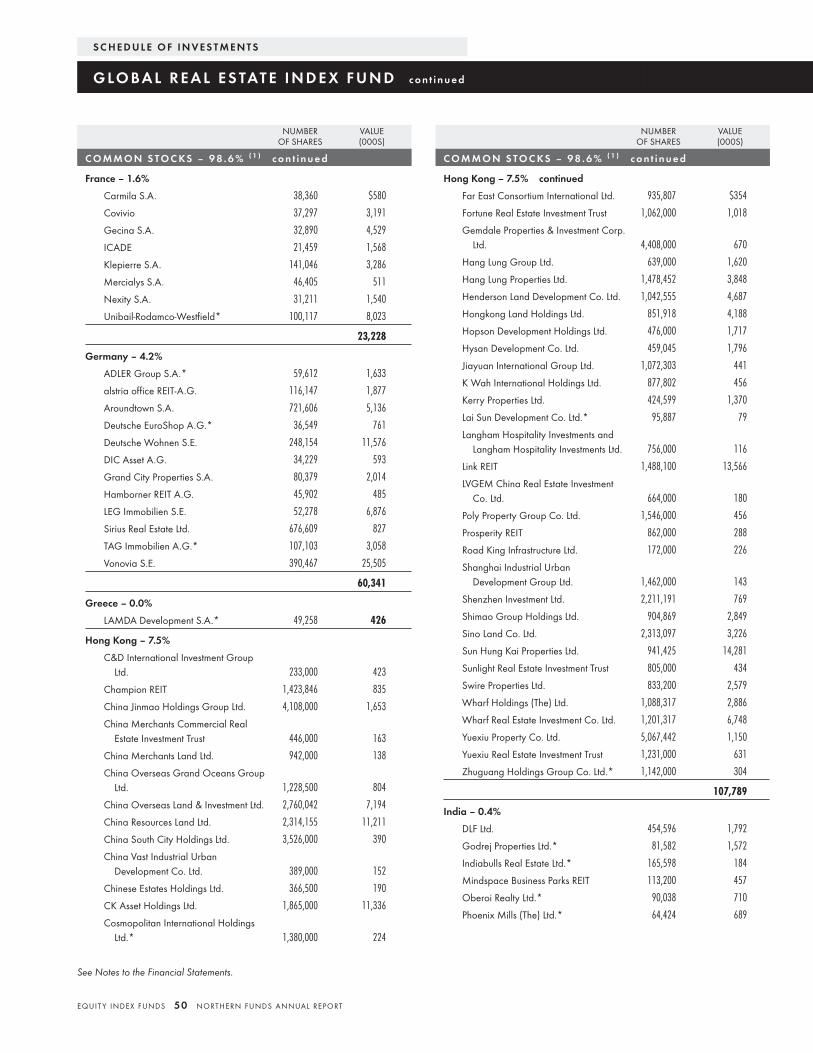
NUMBEROF SHARES
VALUE(000S)
C O M M O N S TO C KS – 9 8 . 6 % ( 1 ) c o n t i n u e d
France – 1.6%
Carmila S.A. 38,360 $580
Covivio 37,297 3,191
Gecina S.A. 32,890 4,529
ICADE 21,459 1,568
Klepierre S.A. 141,046 3,286
Mercialys S.A. 46,405 511
Nexity S.A. 31,211 1,540
Unibail-Rodamco-Westfield* 100,117 8,023
23,228
Germany – 4.2%
ADLER Group S.A.* 59,612 1,633
alstria office REIT-A.G. 116,147 1,877
Aroundtown S.A. 721,606 5,136
Deutsche EuroShop A.G.* 36,549 761
Deutsche Wohnen S.E. 248,154 11,576
DIC Asset A.G. 34,229 593
Grand City Properties S.A. 80,379 2,014
Hamborner REIT A.G. 45,902 485
LEG Immobilien S.E. 52,278 6,876
Sirius Real Estate Ltd. 676,609 827
TAG Immobilien A.G.* 107,103 3,058
Vonovia S.E. 390,467 25,505
60,341
Greece – 0.0%
LAMDA Development S.A.* 49,258 426
Hong Kong – 7.5%
C&D International Investment GroupLtd. 233,000 423
Champion REIT 1,423,846 835
China Jinmao Holdings Group Ltd. 4,108,000 1,653
China Merchants Commercial RealEstate Investment Trust 446,000 163
China Merchants Land Ltd. 942,000 138
China Overseas Grand Oceans GroupLtd. 1,228,500 804
China Overseas Land & Investment Ltd. 2,760,042 7,194
China Resources Land Ltd. 2,314,155 11,211
China South City Holdings Ltd. 3,526,000 390
China Vast Industrial UrbanDevelopment Co. Ltd. 389,000 152
Chinese Estates Holdings Ltd. 366,500 190
CK Asset Holdings Ltd. 1,865,000 11,336
Cosmopolitan International HoldingsLtd.* 1,380,000 224
NUMBEROF SHARES
VALUE(000S)
C O M M O N S TO C KS – 9 8 . 6 % ( 1 ) c o n t i n u e d
Hong Kong – 7.5% continued
Far East Consortium International Ltd. 935,807 $354
Fortune Real Estate Investment Trust 1,062,000 1,018
Gemdale Properties & Investment Corp.Ltd. 4,408,000 670
Hang Lung Group Ltd. 639,000 1,620
Hang Lung Properties Ltd. 1,478,452 3,848
Henderson Land Development Co. Ltd. 1,042,555 4,687
Hongkong Land Holdings Ltd. 851,918 4,188
Hopson Development Holdings Ltd. 476,000 1,717
Hysan Development Co. Ltd. 459,045 1,796
Jiayuan International Group Ltd. 1,072,303 441
K Wah International Holdings Ltd. 877,802 456
Kerry Properties Ltd. 424,599 1,370
Lai Sun Development Co. Ltd.* 95,887 79
Langham Hospitality Investments andLangham Hospitality Investments Ltd. 756,000 116
Link REIT 1,488,100 13,566
LVGEM China Real Estate InvestmentCo. Ltd. 664,000 180
Poly Property Group Co. Ltd. 1,546,000 456
Prosperity REIT 862,000 288
Road King Infrastructure Ltd. 172,000 226
Shanghai Industrial UrbanDevelopment Group Ltd. 1,462,000 143
Shenzhen Investment Ltd. 2,211,191 769
Shimao Group Holdings Ltd. 904,869 2,849
Sino Land Co. Ltd. 2,313,097 3,226
Sun Hung Kai Properties Ltd. 941,425 14,281
Sunlight Real Estate Investment Trust 805,000 434
Swire Properties Ltd. 833,200 2,579
Wharf Holdings (The) Ltd. 1,088,317 2,886
Wharf Real Estate Investment Co. Ltd. 1,201,317 6,748
Yuexiu Property Co. Ltd. 5,067,442 1,150
Yuexiu Real Estate Investment Trust 1,231,000 631
Zhuguang Holdings Group Co. Ltd.* 1,142,000 304
107,789
India – 0.4%
DLF Ltd. 454,596 1,792
Godrej Properties Ltd.* 81,582 1,572
Indiabulls Real Estate Ltd.* 165,598 184
Mindspace Business Parks REIT 113,200 457
Oberoi Realty Ltd.* 90,038 710
Phoenix Mills (The) Ltd.* 64,424 689
S C H E D U L E O F I N V E S T M E N T S
G LO BA L R E A L E S TAT E I N D E X F U N D c o n t i n u e d
See Notes to the Financial Statements.
EQUIT Y INDEX FUNDS 50 NORTHERN FUNDS ANNUAL REPORT
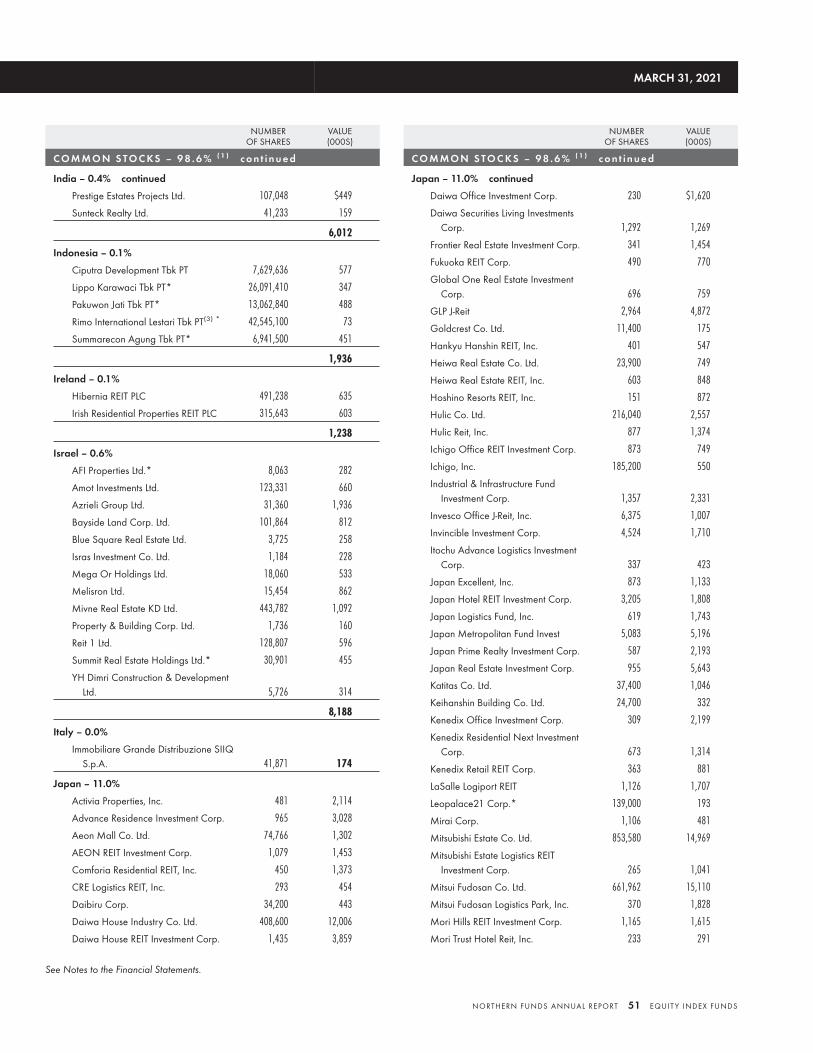
NUMBEROF SHARES
VALUE(000S)
C O M M O N S TO C KS – 9 8 . 6 % ( 1 ) c o n t i n u e d
India – 0.4% continued
Prestige Estates Projects Ltd. 107,048 $449
Sunteck Realty Ltd. 41,233 159
6,012
Indonesia – 0.1%
Ciputra Development Tbk PT 7,629,636 577
Lippo Karawaci Tbk PT* 26,091,410 347
Pakuwon Jati Tbk PT* 13,062,840 488
Rimo International Lestari Tbk PT(3) * 42,545,100 73
Summarecon Agung Tbk PT* 6,941,500 451
1,936
Ireland – 0.1%
Hibernia REIT PLC 491,238 635
Irish Residential Properties REIT PLC 315,643 603
1,238
Israel – 0.6%
AFI Properties Ltd.* 8,063 282
Amot Investments Ltd. 123,331 660
Azrieli Group Ltd. 31,360 1,936
Bayside Land Corp. Ltd. 101,864 812
Blue Square Real Estate Ltd. 3,725 258
Isras Investment Co. Ltd. 1,184 228
Mega Or Holdings Ltd. 18,060 533
Melisron Ltd. 15,454 862
Mivne Real Estate KD Ltd. 443,782 1,092
Property & Building Corp. Ltd. 1,736 160
Reit 1 Ltd. 128,807 596
Summit Real Estate Holdings Ltd.* 30,901 455
YH Dimri Construction & DevelopmentLtd. 5,726 314
8,188
Italy – 0.0%
Immobiliare Grande Distribuzione SIIQS.p.A. 41,871 174
Japan – 11.0%
Activia Properties, Inc. 481 2,114
Advance Residence Investment Corp. 965 3,028
Aeon Mall Co. Ltd. 74,766 1,302
AEON REIT Investment Corp. 1,079 1,453
Comforia Residential REIT, Inc. 450 1,373
CRE Logistics REIT, Inc. 293 454
Daibiru Corp. 34,200 443
Daiwa House Industry Co. Ltd. 408,600 12,006
Daiwa House REIT Investment Corp. 1,435 3,859
NUMBEROF SHARES
VALUE(000S)
C O M M O N S TO C KS – 9 8 . 6 % ( 1 ) c o n t i n u e d
Japan – 11.0% continued
Daiwa Office Investment Corp. 230 $1,620
Daiwa Securities Living InvestmentsCorp. 1,292 1,269
Frontier Real Estate Investment Corp. 341 1,454
Fukuoka REIT Corp. 490 770
Global One Real Estate InvestmentCorp. 696 759
GLP J-Reit 2,964 4,872
Goldcrest Co. Ltd. 11,400 175
Hankyu Hanshin REIT, Inc. 401 547
Heiwa Real Estate Co. Ltd. 23,900 749
Heiwa Real Estate REIT, Inc. 603 848
Hoshino Resorts REIT, Inc. 151 872
Hulic Co. Ltd. 216,040 2,557
Hulic Reit, Inc. 877 1,374
Ichigo Office REIT Investment Corp. 873 749
Ichigo, Inc. 185,200 550
Industrial & Infrastructure FundInvestment Corp. 1,357 2,331
Invesco Office J-Reit, Inc. 6,375 1,007
Invincible Investment Corp. 4,524 1,710
Itochu Advance Logistics InvestmentCorp. 337 423
Japan Excellent, Inc. 873 1,133
Japan Hotel REIT Investment Corp. 3,205 1,808
Japan Logistics Fund, Inc. 619 1,743
Japan Metropolitan Fund Invest 5,083 5,196
Japan Prime Realty Investment Corp. 587 2,193
Japan Real Estate Investment Corp. 955 5,643
Katitas Co. Ltd. 37,400 1,046
Keihanshin Building Co. Ltd. 24,700 332
Kenedix Office Investment Corp. 309 2,199
Kenedix Residential Next InvestmentCorp. 673 1,314
Kenedix Retail REIT Corp. 363 881
LaSalle Logiport REIT 1,126 1,707
Leopalace21 Corp.* 139,000 193
Mirai Corp. 1,106 481
Mitsubishi Estate Co. Ltd. 853,580 14,969
Mitsubishi Estate Logistics REITInvestment Corp. 265 1,041
Mitsui Fudosan Co. Ltd. 661,962 15,110
Mitsui Fudosan Logistics Park, Inc. 370 1,828
Mori Hills REIT Investment Corp. 1,165 1,615
Mori Trust Hotel Reit, Inc. 233 291
MARCH 31, 2021
See Notes to the Financial Statements.
NORTHERN FUNDS ANNUAL REPORT 51 EQUIT Y INDEX FUNDS
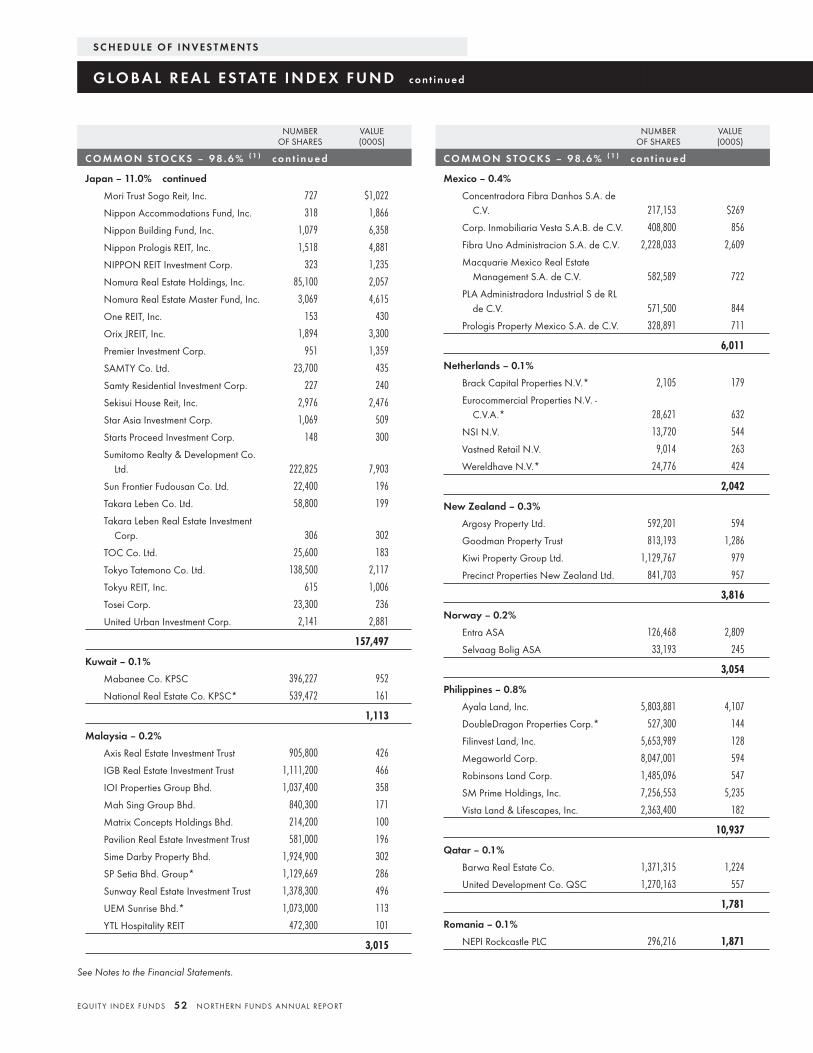
NUMBEROF SHARES
VALUE(000S)
C O M M O N S TO C KS – 9 8 . 6 % ( 1 ) c o n t i n u e d
Japan – 11.0% continued
Mori Trust Sogo Reit, Inc. 727 $1,022
Nippon Accommodations Fund, Inc. 318 1,866
Nippon Building Fund, Inc. 1,079 6,358
Nippon Prologis REIT, Inc. 1,518 4,881
NIPPON REIT Investment Corp. 323 1,235
Nomura Real Estate Holdings, Inc. 85,100 2,057
Nomura Real Estate Master Fund, Inc. 3,069 4,615
One REIT, Inc. 153 430
Orix JREIT, Inc. 1,894 3,300
Premier Investment Corp. 951 1,359
SAMTY Co. Ltd. 23,700 435
Samty Residential Investment Corp. 227 240
Sekisui House Reit, Inc. 2,976 2,476
Star Asia Investment Corp. 1,069 509
Starts Proceed Investment Corp. 148 300
Sumitomo Realty & Development Co.Ltd. 222,825 7,903
Sun Frontier Fudousan Co. Ltd. 22,400 196
Takara Leben Co. Ltd. 58,800 199
Takara Leben Real Estate InvestmentCorp. 306 302
TOC Co. Ltd. 25,600 183
Tokyo Tatemono Co. Ltd. 138,500 2,117
Tokyu REIT, Inc. 615 1,006
Tosei Corp. 23,300 236
United Urban Investment Corp. 2,141 2,881
157,497
Kuwait – 0.1%
Mabanee Co. KPSC 396,227 952
National Real Estate Co. KPSC* 539,472 161
1,113
Malaysia – 0.2%
Axis Real Estate Investment Trust 905,800 426
IGB Real Estate Investment Trust 1,111,200 466
IOI Properties Group Bhd. 1,037,400 358
Mah Sing Group Bhd. 840,300 171
Matrix Concepts Holdings Bhd. 214,200 100
Pavilion Real Estate Investment Trust 581,000 196
Sime Darby Property Bhd. 1,924,900 302
SP Setia Bhd. Group* 1,129,669 286
Sunway Real Estate Investment Trust 1,378,300 496
UEM Sunrise Bhd.* 1,073,000 113
YTL Hospitality REIT 472,300 101
3,015
NUMBEROF SHARES
VALUE(000S)
C O M M O N S TO C KS – 9 8 . 6 % ( 1 ) c o n t i n u e d
Mexico – 0.4%
Concentradora Fibra Danhos S.A. deC.V. 217,153 $269
Corp. Inmobiliaria Vesta S.A.B. de C.V. 408,800 856
Fibra Uno Administracion S.A. de C.V. 2,228,033 2,609
Macquarie Mexico Real EstateManagement S.A. de C.V. 582,589 722
PLA Administradora Industrial S de RLde C.V. 571,500 844
Prologis Property Mexico S.A. de C.V. 328,891 711
6,011
Netherlands – 0.1%
Brack Capital Properties N.V.* 2,105 179
Eurocommercial Properties N.V. -C.V.A.* 28,621 632
NSI N.V. 13,720 544
Vastned Retail N.V. 9,014 263
Wereldhave N.V.* 24,776 424
2,042
New Zealand – 0.3%
Argosy Property Ltd. 592,201 594
Goodman Property Trust 813,193 1,286
Kiwi Property Group Ltd. 1,129,767 979
Precinct Properties New Zealand Ltd. 841,703 957
3,816
Norway – 0.2%
Entra ASA 126,468 2,809
Selvaag Bolig ASA 33,193 245
3,054
Philippines – 0.8%
Ayala Land, Inc. 5,803,881 4,107
DoubleDragon Properties Corp.* 527,300 144
Filinvest Land, Inc. 5,653,989 128
Megaworld Corp. 8,047,001 594
Robinsons Land Corp. 1,485,096 547
SM Prime Holdings, Inc. 7,256,553 5,235
Vista Land & Lifescapes, Inc. 2,363,400 182
10,937
Qatar – 0.1%
Barwa Real Estate Co. 1,371,315 1,224
United Development Co. QSC 1,270,163 557
1,781
Romania – 0.1%
NEPI Rockcastle PLC 296,216 1,871
S C H E D U L E O F I N V E S T M E N T S
G LO BA L R E A L E S TAT E I N D E X F U N D c o n t i n u e d
See Notes to the Financial Statements.
EQUIT Y INDEX FUNDS 52 NORTHERN FUNDS ANNUAL REPORT
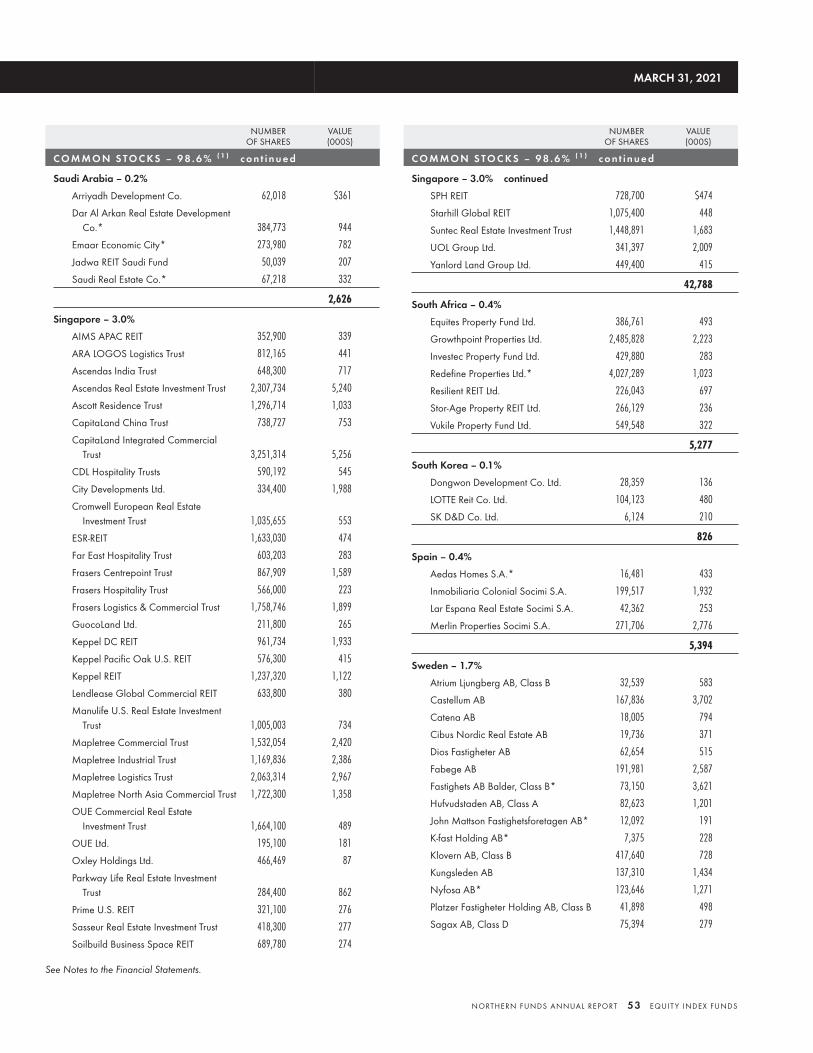
NUMBEROF SHARES
VALUE(000S)
C O M M O N S TO C KS – 9 8 . 6 % ( 1 ) c o n t i n u e d
Saudi Arabia – 0.2%
Arriyadh Development Co. 62,018 $361
Dar Al Arkan Real Estate DevelopmentCo.* 384,773 944
Emaar Economic City* 273,980 782
Jadwa REIT Saudi Fund 50,039 207
Saudi Real Estate Co.* 67,218 332
2,626
Singapore – 3.0%
AIMS APAC REIT 352,900 339
ARA LOGOS Logistics Trust 812,165 441
Ascendas India Trust 648,300 717
Ascendas Real Estate Investment Trust 2,307,734 5,240
Ascott Residence Trust 1,296,714 1,033
CapitaLand China Trust 738,727 753
CapitaLand Integrated CommercialTrust 3,251,314 5,256
CDL Hospitality Trusts 590,192 545
City Developments Ltd. 334,400 1,988
Cromwell European Real EstateInvestment Trust 1,035,655 553
ESR-REIT 1,633,030 474
Far East Hospitality Trust 603,203 283
Frasers Centrepoint Trust 867,909 1,589
Frasers Hospitality Trust 566,000 223
Frasers Logistics & Commercial Trust 1,758,746 1,899
GuocoLand Ltd. 211,800 265
Keppel DC REIT 961,734 1,933
Keppel Pacific Oak U.S. REIT 576,300 415
Keppel REIT 1,237,320 1,122
Lendlease Global Commercial REIT 633,800 380
Manulife U.S. Real Estate InvestmentTrust 1,005,003 734
Mapletree Commercial Trust 1,532,054 2,420
Mapletree Industrial Trust 1,169,836 2,386
Mapletree Logistics Trust 2,063,314 2,967
Mapletree North Asia Commercial Trust 1,722,300 1,358
OUE Commercial Real EstateInvestment Trust 1,664,100 489
OUE Ltd. 195,100 181
Oxley Holdings Ltd. 466,469 87
Parkway Life Real Estate InvestmentTrust 284,400 862
Prime U.S. REIT 321,100 276
Sasseur Real Estate Investment Trust 418,300 277
Soilbuild Business Space REIT 689,780 274
NUMBEROF SHARES
VALUE(000S)
C O M M O N S TO C KS – 9 8 . 6 % ( 1 ) c o n t i n u e d
Singapore – 3.0% continued
SPH REIT 728,700 $474
Starhill Global REIT 1,075,400 448
Suntec Real Estate Investment Trust 1,448,891 1,683
UOL Group Ltd. 341,397 2,009
Yanlord Land Group Ltd. 449,400 415
42,788
South Africa – 0.4%
Equites Property Fund Ltd. 386,761 493
Growthpoint Properties Ltd. 2,485,828 2,223
Investec Property Fund Ltd. 429,880 283
Redefine Properties Ltd.* 4,027,289 1,023
Resilient REIT Ltd. 226,043 697
Stor-Age Property REIT Ltd. 266,129 236
Vukile Property Fund Ltd. 549,548 322
5,277
South Korea – 0.1%
Dongwon Development Co. Ltd. 28,359 136
LOTTE Reit Co. Ltd. 104,123 480
SK D&D Co. Ltd. 6,124 210
826
Spain – 0.4%
Aedas Homes S.A.* 16,481 433
Inmobiliaria Colonial Socimi S.A. 199,517 1,932
Lar Espana Real Estate Socimi S.A. 42,362 253
Merlin Properties Socimi S.A. 271,706 2,776
5,394
Sweden – 1.7%
Atrium Ljungberg AB, Class B 32,539 583
Castellum AB 167,836 3,702
Catena AB 18,005 794
Cibus Nordic Real Estate AB 19,736 371
Dios Fastigheter AB 62,654 515
Fabege AB 191,981 2,587
Fastighets AB Balder, Class B* 73,150 3,621
Hufvudstaden AB, Class A 82,623 1,201
John Mattson Fastighetsforetagen AB* 12,092 191
K-fast Holding AB* 7,375 228
Klovern AB, Class B 417,640 728
Kungsleden AB 137,310 1,434
Nyfosa AB* 123,646 1,271
Platzer Fastigheter Holding AB, Class B 41,898 498
Sagax AB, Class D 75,394 279
MARCH 31, 2021
See Notes to the Financial Statements.
NORTHERN FUNDS ANNUAL REPORT 53 EQUIT Y INDEX FUNDS
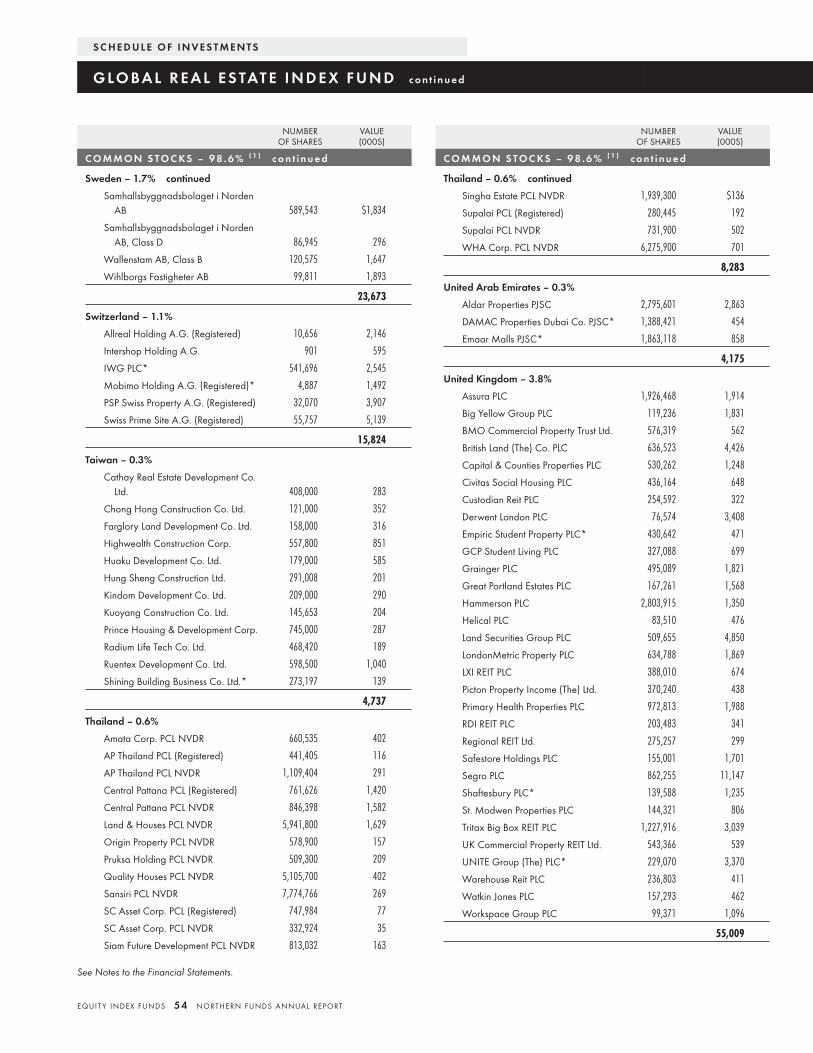
NUMBEROF SHARES
VALUE(000S)
C O M M O N S TO C KS – 9 8 . 6 % ( 1 ) c o n t i n u e d
Sweden – 1.7% continued
Samhallsbyggnadsbolaget i NordenAB 589,543 $1,834
Samhallsbyggnadsbolaget i NordenAB, Class D 86,945 296
Wallenstam AB, Class B 120,575 1,647
Wihlborgs Fastigheter AB 99,811 1,893
23,673
Switzerland – 1.1%
Allreal Holding A.G. (Registered) 10,656 2,146
Intershop Holding A.G. 901 595
IWG PLC* 541,696 2,545
Mobimo Holding A.G. (Registered)* 4,887 1,492
PSP Swiss Property A.G. (Registered) 32,070 3,907
Swiss Prime Site A.G. (Registered) 55,757 5,139
15,824
Taiwan – 0.3%
Cathay Real Estate Development Co.Ltd. 408,000 283
Chong Hong Construction Co. Ltd. 121,000 352
Farglory Land Development Co. Ltd. 158,000 316
Highwealth Construction Corp. 557,800 851
Huaku Development Co. Ltd. 179,000 585
Hung Sheng Construction Ltd. 291,008 201
Kindom Development Co. Ltd. 209,000 290
Kuoyang Construction Co. Ltd. 145,653 204
Prince Housing & Development Corp. 745,000 287
Radium Life Tech Co. Ltd. 468,420 189
Ruentex Development Co. Ltd. 598,500 1,040
Shining Building Business Co. Ltd.* 273,197 139
4,737
Thailand – 0.6%
Amata Corp. PCL NVDR 660,535 402
AP Thailand PCL (Registered) 441,405 116
AP Thailand PCL NVDR 1,109,404 291
Central Pattana PCL (Registered) 761,626 1,420
Central Pattana PCL NVDR 846,398 1,582
Land & Houses PCL NVDR 5,941,800 1,629
Origin Property PCL NVDR 578,900 157
Pruksa Holding PCL NVDR 509,300 209
Quality Houses PCL NVDR 5,105,700 402
Sansiri PCL NVDR 7,774,766 269
SC Asset Corp. PCL (Registered) 747,984 77
SC Asset Corp. PCL NVDR 332,924 35
Siam Future Development PCL NVDR 813,032 163
NUMBEROF SHARES
VALUE(000S)
C O M M O N S TO C KS – 9 8 . 6 % ( 1 ) c o n t i n u e d
Thailand – 0.6% continued
Singha Estate PCL NVDR 1,939,300 $136
Supalai PCL (Registered) 280,445 192
Supalai PCL NVDR 731,900 502
WHA Corp. PCL NVDR 6,275,900 701
8,283
United Arab Emirates – 0.3%
Aldar Properties PJSC 2,795,601 2,863
DAMAC Properties Dubai Co. PJSC* 1,388,421 454
Emaar Malls PJSC* 1,863,118 858
4,175
United Kingdom – 3.8%
Assura PLC 1,926,468 1,914
Big Yellow Group PLC 119,236 1,831
BMO Commercial Property Trust Ltd. 576,319 562
British Land (The) Co. PLC 636,523 4,426
Capital & Counties Properties PLC 530,262 1,248
Civitas Social Housing PLC 436,164 648
Custodian Reit PLC 254,592 322
Derwent London PLC 76,574 3,408
Empiric Student Property PLC* 430,642 471
GCP Student Living PLC 327,088 699
Grainger PLC 495,089 1,821
Great Portland Estates PLC 167,261 1,568
Hammerson PLC 2,803,915 1,350
Helical PLC 83,510 476
Land Securities Group PLC 509,655 4,850
LondonMetric Property PLC 634,788 1,869
LXI REIT PLC 388,010 674
Picton Property Income (The) Ltd. 370,240 438
Primary Health Properties PLC 972,813 1,988
RDI REIT PLC 203,483 341
Regional REIT Ltd. 275,257 299
Safestore Holdings PLC 155,001 1,701
Segro PLC 862,255 11,147
Shaftesbury PLC* 139,588 1,235
St. Modwen Properties PLC 144,321 806
Tritax Big Box REIT PLC 1,227,916 3,039
UK Commercial Property REIT Ltd. 543,366 539
UNITE Group (The) PLC* 229,070 3,370
Warehouse Reit PLC 236,803 411
Watkin Jones PLC 157,293 462
Workspace Group PLC 99,371 1,096
55,009
S C H E D U L E O F I N V E S T M E N T S
G LO BA L R E A L E S TAT E I N D E X F U N D c o n t i n u e d
See Notes to the Financial Statements.
EQUIT Y INDEX FUNDS 54 NORTHERN FUNDS ANNUAL REPORT
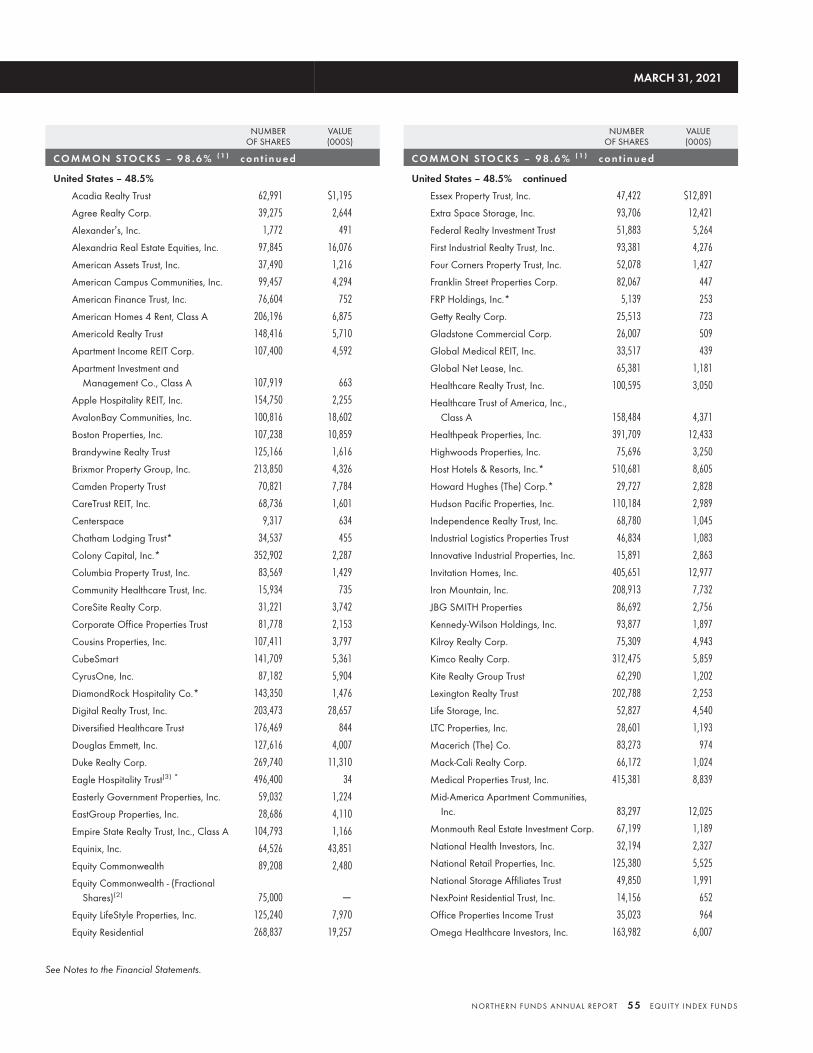
NUMBEROF SHARES
VALUE(000S)
C O M M O N S TO C KS – 9 8 . 6 % ( 1 ) c o n t i n u e d
United States – 48.5%
Acadia Realty Trust 62,991 $1,195
Agree Realty Corp. 39,275 2,644
Alexander’s, Inc. 1,772 491
Alexandria Real Estate Equities, Inc. 97,845 16,076
American Assets Trust, Inc. 37,490 1,216
American Campus Communities, Inc. 99,457 4,294
American Finance Trust, Inc. 76,604 752
American Homes 4 Rent, Class A 206,196 6,875
Americold Realty Trust 148,416 5,710
Apartment Income REIT Corp. 107,400 4,592
Apartment Investment andManagement Co., Class A 107,919 663
Apple Hospitality REIT, Inc. 154,750 2,255
AvalonBay Communities, Inc. 100,816 18,602
Boston Properties, Inc. 107,238 10,859
Brandywine Realty Trust 125,166 1,616
Brixmor Property Group, Inc. 213,850 4,326
Camden Property Trust 70,821 7,784
CareTrust REIT, Inc. 68,736 1,601
Centerspace 9,317 634
Chatham Lodging Trust* 34,537 455
Colony Capital, Inc.* 352,902 2,287
Columbia Property Trust, Inc. 83,569 1,429
Community Healthcare Trust, Inc. 15,934 735
CoreSite Realty Corp. 31,221 3,742
Corporate Office Properties Trust 81,778 2,153
Cousins Properties, Inc. 107,411 3,797
CubeSmart 141,709 5,361
CyrusOne, Inc. 87,182 5,904
DiamondRock Hospitality Co.* 143,350 1,476
Digital Realty Trust, Inc. 203,473 28,657
Diversified Healthcare Trust 176,469 844
Douglas Emmett, Inc. 127,616 4,007
Duke Realty Corp. 269,740 11,310
Eagle Hospitality Trust(3) * 496,400 34
Easterly Government Properties, Inc. 59,032 1,224
EastGroup Properties, Inc. 28,686 4,110
Empire State Realty Trust, Inc., Class A 104,793 1,166
Equinix, Inc. 64,526 43,851
Equity Commonwealth 89,208 2,480
Equity Commonwealth - (FractionalShares)(2) 75,000 —
Equity LifeStyle Properties, Inc. 125,240 7,970
Equity Residential 268,837 19,257
NUMBEROF SHARES
VALUE(000S)
C O M M O N S TO C KS – 9 8 . 6 % ( 1 ) c o n t i n u e d
United States – 48.5% continued
Essex Property Trust, Inc. 47,422 $12,891
Extra Space Storage, Inc. 93,706 12,421
Federal Realty Investment Trust 51,883 5,264
First Industrial Realty Trust, Inc. 93,381 4,276
Four Corners Property Trust, Inc. 52,078 1,427
Franklin Street Properties Corp. 82,067 447
FRP Holdings, Inc.* 5,139 253
Getty Realty Corp. 25,513 723
Gladstone Commercial Corp. 26,007 509
Global Medical REIT, Inc. 33,517 439
Global Net Lease, Inc. 65,381 1,181
Healthcare Realty Trust, Inc. 100,595 3,050
Healthcare Trust of America, Inc.,Class A 158,484 4,371
Healthpeak Properties, Inc. 391,709 12,433
Highwoods Properties, Inc. 75,696 3,250
Host Hotels & Resorts, Inc.* 510,681 8,605
Howard Hughes (The) Corp.* 29,727 2,828
Hudson Pacific Properties, Inc. 110,184 2,989
Independence Realty Trust, Inc. 68,780 1,045
Industrial Logistics Properties Trust 46,834 1,083
Innovative Industrial Properties, Inc. 15,891 2,863
Invitation Homes, Inc. 405,651 12,977
Iron Mountain, Inc. 208,913 7,732
JBG SMITH Properties 86,692 2,756
Kennedy-Wilson Holdings, Inc. 93,877 1,897
Kilroy Realty Corp. 75,309 4,943
Kimco Realty Corp. 312,475 5,859
Kite Realty Group Trust 62,290 1,202
Lexington Realty Trust 202,788 2,253
Life Storage, Inc. 52,827 4,540
LTC Properties, Inc. 28,601 1,193
Macerich (The) Co. 83,273 974
Mack-Cali Realty Corp. 66,172 1,024
Medical Properties Trust, Inc. 415,381 8,839
Mid-America Apartment Communities,Inc. 83,297 12,025
Monmouth Real Estate Investment Corp. 67,199 1,189
National Health Investors, Inc. 32,194 2,327
National Retail Properties, Inc. 125,380 5,525
National Storage Affiliates Trust 49,850 1,991
NexPoint Residential Trust, Inc. 14,156 652
Office Properties Income Trust 35,023 964
Omega Healthcare Investors, Inc. 163,982 6,007
MARCH 31, 2021
See Notes to the Financial Statements.
NORTHERN FUNDS ANNUAL REPORT 55 EQUIT Y INDEX FUNDS
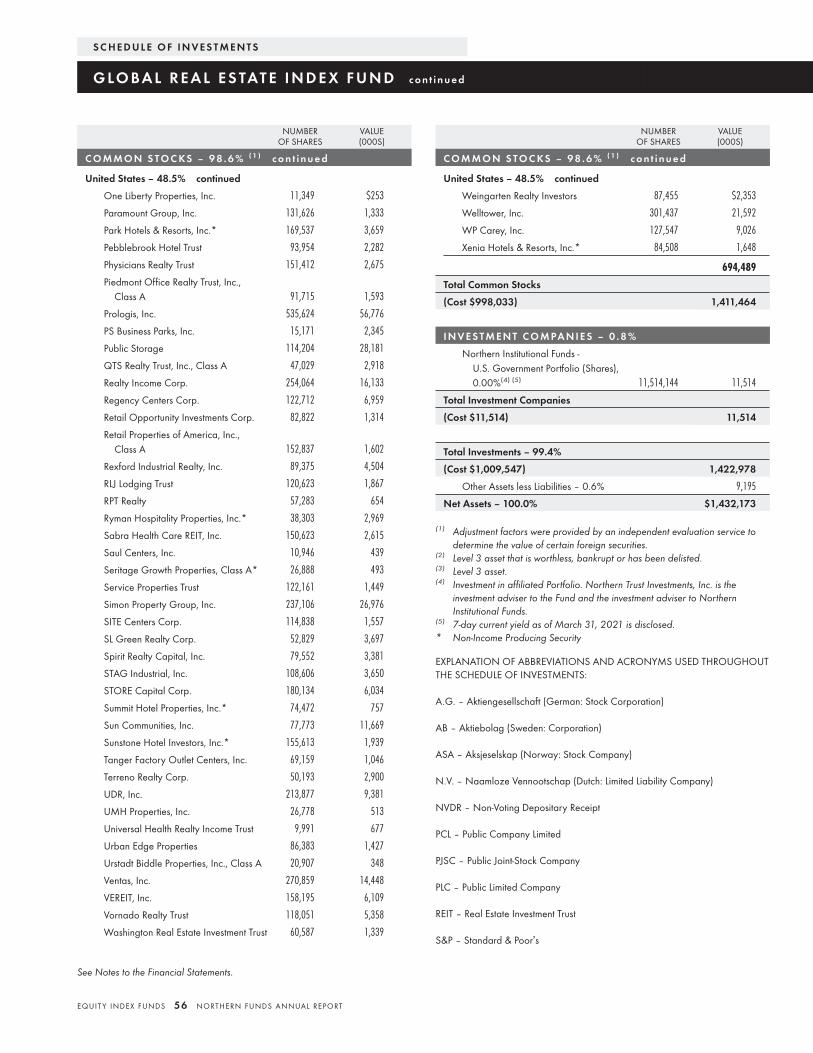
NUMBEROF SHARES
VALUE(000S)
C O M M O N S TO C KS – 9 8 . 6 % ( 1 ) c o n t i n u e d
United States – 48.5% continued
One Liberty Properties, Inc. 11,349 $253
Paramount Group, Inc. 131,626 1,333
Park Hotels & Resorts, Inc.* 169,537 3,659
Pebblebrook Hotel Trust 93,954 2,282
Physicians Realty Trust 151,412 2,675
Piedmont Office Realty Trust, Inc.,Class A 91,715 1,593
Prologis, Inc. 535,624 56,776
PS Business Parks, Inc. 15,171 2,345
Public Storage 114,204 28,181
QTS Realty Trust, Inc., Class A 47,029 2,918
Realty Income Corp. 254,064 16,133
Regency Centers Corp. 122,712 6,959
Retail Opportunity Investments Corp. 82,822 1,314
Retail Properties of America, Inc.,Class A 152,837 1,602
Rexford Industrial Realty, Inc. 89,375 4,504
RLJ Lodging Trust 120,623 1,867
RPT Realty 57,283 654
Ryman Hospitality Properties, Inc.* 38,303 2,969
Sabra Health Care REIT, Inc. 150,623 2,615
Saul Centers, Inc. 10,946 439
Seritage Growth Properties, Class A* 26,888 493
Service Properties Trust 122,161 1,449
Simon Property Group, Inc. 237,106 26,976
SITE Centers Corp. 114,838 1,557
SL Green Realty Corp. 52,829 3,697
Spirit Realty Capital, Inc. 79,552 3,381
STAG Industrial, Inc. 108,606 3,650
STORE Capital Corp. 180,134 6,034
Summit Hotel Properties, Inc.* 74,472 757
Sun Communities, Inc. 77,773 11,669
Sunstone Hotel Investors, Inc.* 155,613 1,939
Tanger Factory Outlet Centers, Inc. 69,159 1,046
Terreno Realty Corp. 50,193 2,900
UDR, Inc. 213,877 9,381
UMH Properties, Inc. 26,778 513
Universal Health Realty Income Trust 9,991 677
Urban Edge Properties 86,383 1,427
Urstadt Biddle Properties, Inc., Class A 20,907 348
Ventas, Inc. 270,859 14,448
VEREIT, Inc. 158,195 6,109
Vornado Realty Trust 118,051 5,358
Washington Real Estate Investment Trust 60,587 1,339
NUMBEROF SHARES
VALUE(000S)
C O M M O N S TO C KS – 9 8 . 6 % ( 1 ) c o n t i n u e d
United States – 48.5% continued
Weingarten Realty Investors 87,455 $2,353
Welltower, Inc. 301,437 21,592
WP Carey, Inc. 127,547 9,026
Xenia Hotels & Resorts, Inc.* 84,508 1,648
694,489
Total Common Stocks
(Cost $998,033) 1,411,464
I N V E S T M E N T C O M PA N I E S – 0 . 8 %
Northern Institutional Funds -U.S. Government Portfolio (Shares),0.00%(4) (5) 11,514,144 11,514
Total Investment Companies
(Cost $11,514) 11,514
Total Investments – 99.4%
(Cost $1,009,547) 1,422,978
Other Assets less Liabilities – 0.6% 9,195
Net Assets – 100.0% $1,432,173
(1) Adjustment factors were provided by an independent evaluation service todetermine the value of certain foreign securities.
(2) Level 3 asset that is worthless, bankrupt or has been delisted.(3) Level 3 asset.(4) Investment in affiliated Portfolio. Northern Trust Investments, Inc. is the
investment adviser to the Fund and the investment adviser to NorthernInstitutional Funds.
(5) 7-day current yield as of March 31, 2021 is disclosed.* Non-Income Producing Security
EXPLANATION OF ABBREVIATIONS AND ACRONYMS USED THROUGHOUTTHE SCHEDULE OF INVESTMENTS:
A.G. – Aktiengesellschaft (German: Stock Corporation)
AB – Aktiebolag (Sweden: Corporation)
ASA – Aksjeselskap (Norway: Stock Company)
N.V. – Naamloze Vennootschap (Dutch: Limited Liability Company)
NVDR – Non-Voting Depositary Receipt
PCL – Public Company Limited
PJSC – Public Joint-Stock Company
PLC – Public Limited Company
REIT – Real Estate Investment Trust
S&P – Standard & Poor’s
S C H E D U L E O F I N V E S T M E N T S
G LO BA L R E A L E S TAT E I N D E X F U N D c o n t i n u e d
See Notes to the Financial Statements.
EQUIT Y INDEX FUNDS 56 NORTHERN FUNDS ANNUAL REPORT
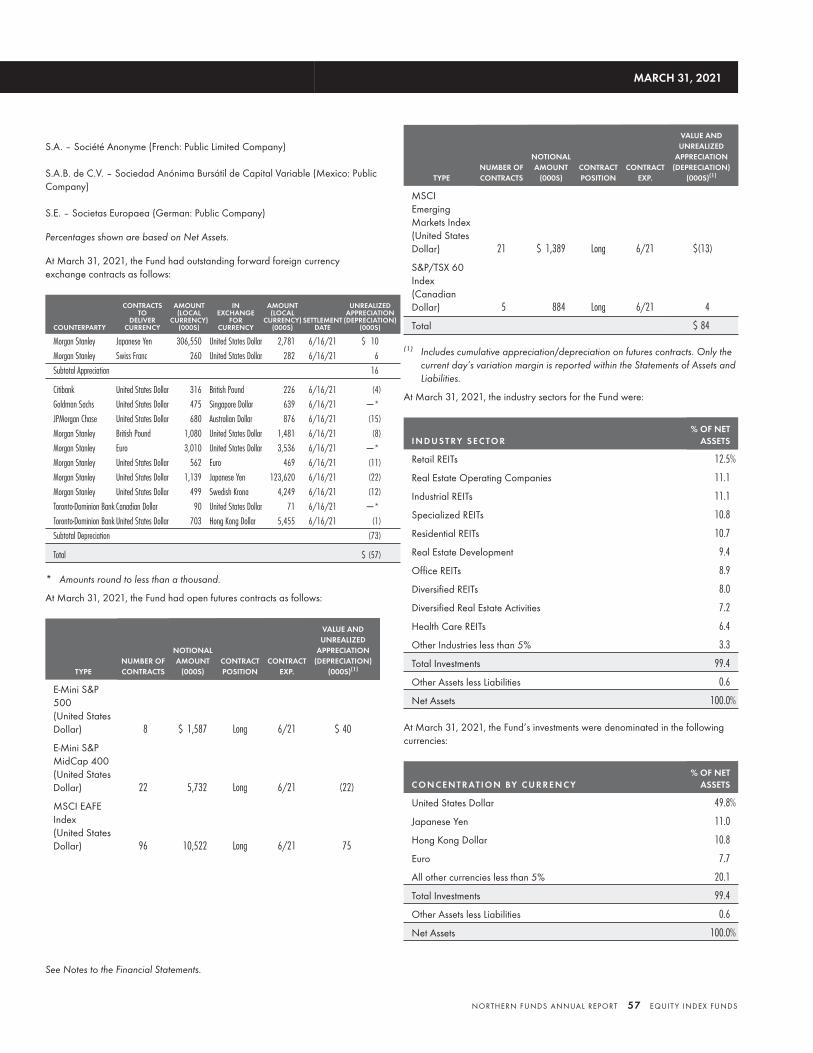
S.A. – Société Anonyme (French: Public Limited Company)
S.A.B. de C.V. – Sociedad Anónima Bursátil de Capital Variable (Mexico: PublicCompany)
S.E. – Societas Europaea (German: Public Company)
Percentages shown are based on Net Assets.
At March 31, 2021, the Fund had outstanding forward foreign currencyexchange contracts as follows:
COUNTERPARTY
CONTRACTSTO
DELIVERCURRENCY
AMOUNT(LOCAL
CURRENCY)(000S)
INEXCHANGE
FORCURRENCY
AMOUNT(LOCAL
CURRENCY)(000S)
SETTLEMENTDATE
UNREALIZEDAPPRECIATION
(DEPRECIATION)(000S)
Morgan Stanley Japanese Yen 306,550 United States Dollar 2,781 6/16/21 $ 10
Morgan Stanley Swiss Franc 260 United States Dollar 282 6/16/21 6
Subtotal Appreciation 16
Citibank United States Dollar 316 British Pound 226 6/16/21 (4)
Goldman Sachs United States Dollar 475 Singapore Dollar 639 6/16/21 —*
JPMorgan Chase United States Dollar 680 Australian Dollar 876 6/16/21 (15)
Morgan Stanley British Pound 1,080 United States Dollar 1,481 6/16/21 (8)
Morgan Stanley Euro 3,010 United States Dollar 3,536 6/16/21 —*
Morgan Stanley United States Dollar 562 Euro 469 6/16/21 (11)
Morgan Stanley United States Dollar 1,139 Japanese Yen 123,620 6/16/21 (22)
Morgan Stanley United States Dollar 499 Swedish Krona 4,249 6/16/21 (12)
Toronto-Dominion Bank Canadian Dollar 90 United States Dollar 71 6/16/21 —*
Toronto-Dominion Bank United States Dollar 703 Hong Kong Dollar 5,455 6/16/21 (1)
Subtotal Depreciation (73)
Total $ (57)
* Amounts round to less than a thousand.
At March 31, 2021, the Fund had open futures contracts as follows:
TYPENUMBER OFCONTRACTS
NOTIONALAMOUNT
(000S)CONTRACTPOSITION
CONTRACTEXP.
VALUE ANDUNREALIZED
APPRECIATION(DEPRECIATION)
(000S)(1)
E-Mini S&P500(United StatesDollar) 8 $ 1,587 Long 6/21 $ 40
E-Mini S&PMidCap 400(United StatesDollar) 22 5,732 Long 6/21 (22)
MSCI EAFEIndex(United StatesDollar) 96 10,522 Long 6/21 75
TYPENUMBER OFCONTRACTS
NOTIONALAMOUNT
(000S)CONTRACTPOSITION
CONTRACTEXP.
VALUE ANDUNREALIZED
APPRECIATION(DEPRECIATION)
(000S)(1)
MSCIEmergingMarkets Index(United StatesDollar) 21 $ 1,389 Long 6/21 $(13)
S&P/TSX 60Index(CanadianDollar) 5 884 Long 6/21 4
Total $ 84
(1) Includes cumulative appreciation/depreciation on futures contracts. Only thecurrent day’s variation margin is reported within the Statements of Assets andLiabilities.
At March 31, 2021, the industry sectors for the Fund were:
I N D U S T RY S E C TO R% OF NET
ASSETS
Retail REITs 12.5%
Real Estate Operating Companies 11.1
Industrial REITs 11.1
Specialized REITs 10.8
Residential REITs 10.7
Real Estate Development 9.4
Office REITs 8.9
Diversified REITs 8.0
Diversified Real Estate Activities 7.2
Health Care REITs 6.4
Other Industries less than 5% 3.3
Total Investments 99.4
Other Assets less Liabilities 0.6
Net Assets 100.0%
At March 31, 2021, the Fund’s investments were denominated in the followingcurrencies:
C O N C E N T R AT I O N BY C U R R E N C Y% OF NET
ASSETS
United States Dollar 49.8%
Japanese Yen 11.0
Hong Kong Dollar 10.8
Euro 7.7
All other currencies less than 5% 20.1
Total Investments 99.4
Other Assets less Liabilities 0.6
Net Assets 100.0%
MARCH 31, 2021
See Notes to the Financial Statements.
NORTHERN FUNDS ANNUAL REPORT 57 EQUIT Y INDEX FUNDS
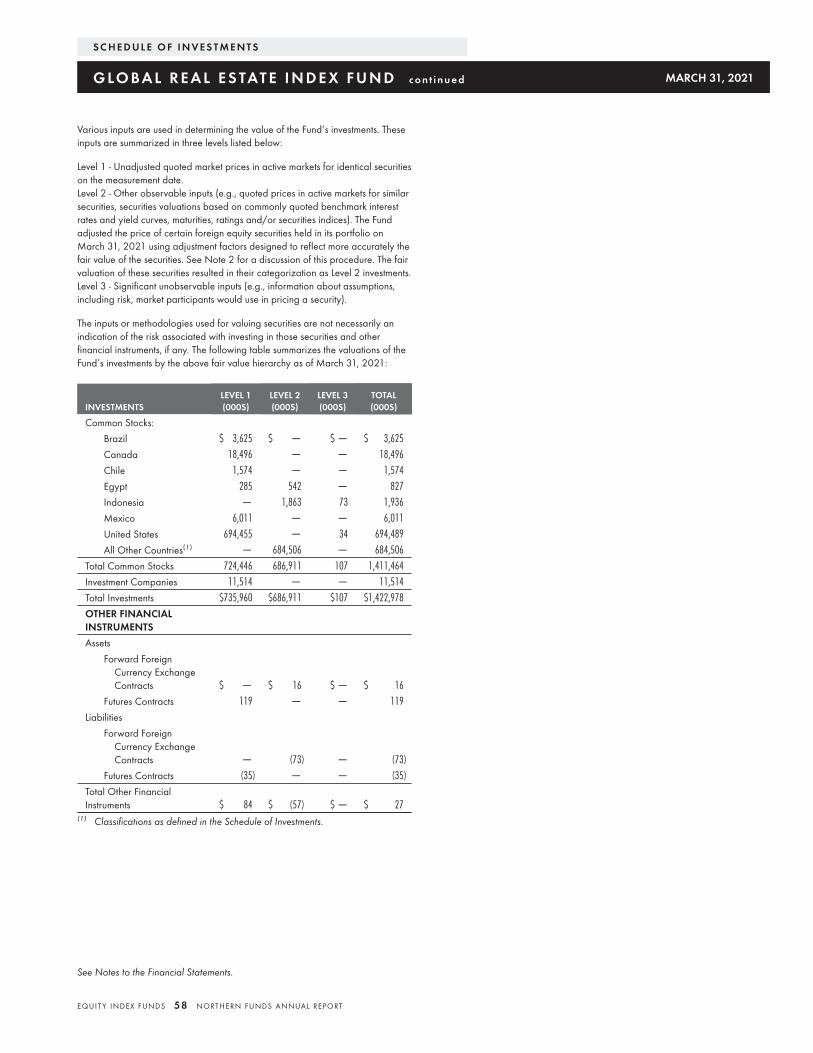
Various inputs are used in determining the value of the Fund’s investments. Theseinputs are summarized in three levels listed below:
Level 1 - Unadjusted quoted market prices in active markets for identical securitieson the measurement date.Level 2 - Other observable inputs (e.g., quoted prices in active markets for similarsecurities, securities valuations based on commonly quoted benchmark interestrates and yield curves, maturities, ratings and/or securities indices). The Fundadjusted the price of certain foreign equity securities held in its portfolio onMarch 31, 2021 using adjustment factors designed to reflect more accurately thefair value of the securities. See Note 2 for a discussion of this procedure. The fairvaluation of these securities resulted in their categorization as Level 2 investments.Level 3 - Significant unobservable inputs (e.g., information about assumptions,including risk, market participants would use in pricing a security).
The inputs or methodologies used for valuing securities are not necessarily anindication of the risk associated with investing in those securities and otherfinancial instruments, if any. The following table summarizes the valuations of theFund’s investments by the above fair value hierarchy as of March 31, 2021:
INVESTMENTSLEVEL 1(000S)
LEVEL 2(000S)
LEVEL 3(000S)
TOTAL(000S)
Common Stocks:
Brazil $ 3,625 $ — $ — $ 3,625
Canada 18,496 — — 18,496
Chile 1,574 — — 1,574
Egypt 285 542 — 827
Indonesia — 1,863 73 1,936
Mexico 6,011 — — 6,011
United States 694,455 — 34 694,489
All Other Countries(1) — 684,506 — 684,506
Total Common Stocks 724,446 686,911 107 1,411,464
Investment Companies 11,514 — — 11,514
Total Investments $735,960 $686,911 $107 $1,422,978
OTHER FINANCIALINSTRUMENTS
Assets
Forward ForeignCurrency ExchangeContracts $ — $ 16 $ — $ 16
Futures Contracts 119 — — 119
Liabilities
Forward ForeignCurrency ExchangeContracts — (73) — (73)
Futures Contracts (35) — — (35)
Total Other FinancialInstruments $ 84 $ (57) $ — $ 27
(1) Classifications as defined in the Schedule of Investments.
S C H E D U L E O F I N V E S T M E N T S
G LO BA L R E A L E S TAT E I N D E X F U N D c o n t i n u e d MARCH 31, 2021
See Notes to the Financial Statements.
EQUIT Y INDEX FUNDS 58 NORTHERN FUNDS ANNUAL REPORT
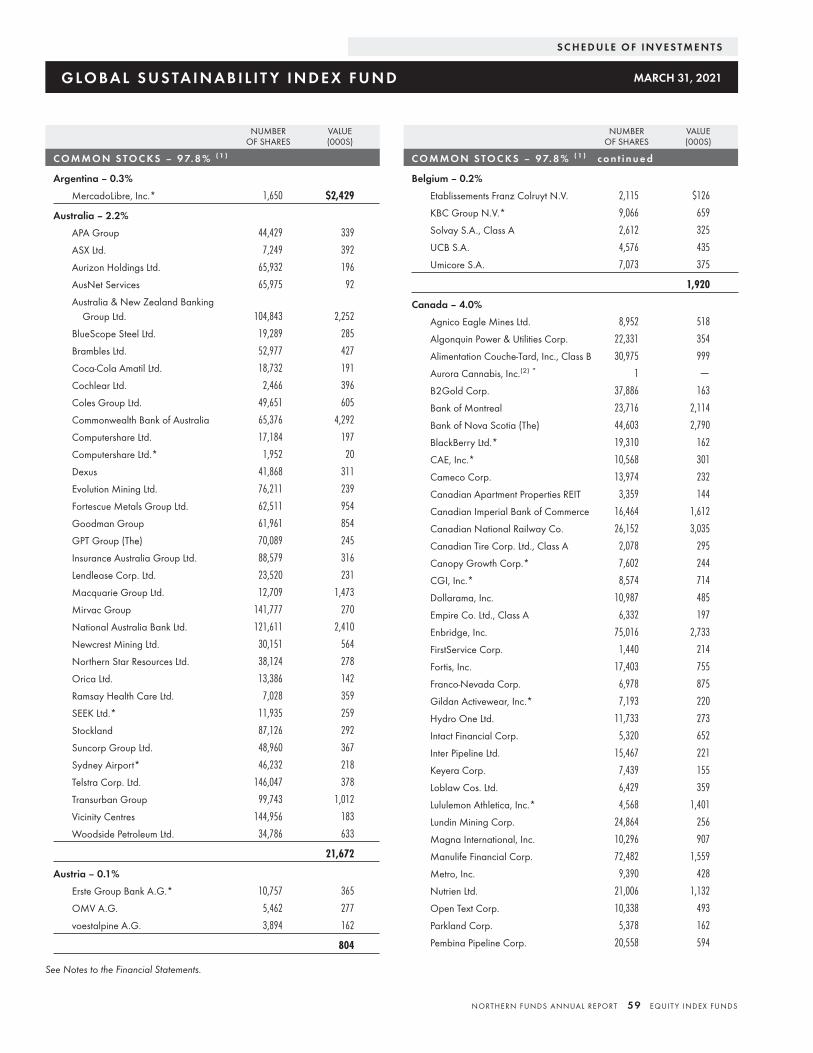
NUMBEROF SHARES
VALUE(000S)
C O M M O N S TO C KS – 9 7. 8 % ( 1 )
Argentina – 0.3%
MercadoLibre, Inc.* 1,650 $2,429
Australia – 2.2%
APA Group 44,429 339
ASX Ltd. 7,249 392
Aurizon Holdings Ltd. 65,932 196
AusNet Services 65,975 92
Australia & New Zealand BankingGroup Ltd. 104,843 2,252
BlueScope Steel Ltd. 19,289 285
Brambles Ltd. 52,977 427
Coca-Cola Amatil Ltd. 18,732 191
Cochlear Ltd. 2,466 396
Coles Group Ltd. 49,651 605
Commonwealth Bank of Australia 65,376 4,292
Computershare Ltd. 17,184 197
Computershare Ltd.* 1,952 20
Dexus 41,868 311
Evolution Mining Ltd. 76,211 239
Fortescue Metals Group Ltd. 62,511 954
Goodman Group 61,961 854
GPT Group (The) 70,089 245
Insurance Australia Group Ltd. 88,579 316
Lendlease Corp. Ltd. 23,520 231
Macquarie Group Ltd. 12,709 1,473
Mirvac Group 141,777 270
National Australia Bank Ltd. 121,611 2,410
Newcrest Mining Ltd. 30,151 564
Northern Star Resources Ltd. 38,124 278
Orica Ltd. 13,386 142
Ramsay Health Care Ltd. 7,028 359
SEEK Ltd.* 11,935 259
Stockland 87,126 292
Suncorp Group Ltd. 48,960 367
Sydney Airport* 46,232 218
Telstra Corp. Ltd. 146,047 378
Transurban Group 99,743 1,012
Vicinity Centres 144,956 183
Woodside Petroleum Ltd. 34,786 633
21,672
Austria – 0.1%
Erste Group Bank A.G.* 10,757 365
OMV A.G. 5,462 277
voestalpine A.G. 3,894 162
804
NUMBEROF SHARES
VALUE(000S)
C O M M O N S TO C KS – 9 7. 8 % ( 1 ) c o n t i n u e d
Belgium – 0.2%
Etablissements Franz Colruyt N.V. 2,115 $126
KBC Group N.V.* 9,066 659
Solvay S.A., Class A 2,612 325
UCB S.A. 4,576 435
Umicore S.A. 7,073 375
1,920
Canada – 4.0%
Agnico Eagle Mines Ltd. 8,952 518
Algonquin Power & Utilities Corp. 22,331 354
Alimentation Couche-Tard, Inc., Class B 30,975 999
Aurora Cannabis, Inc.(2) * 1 —
B2Gold Corp. 37,886 163
Bank of Montreal 23,716 2,114
Bank of Nova Scotia (The) 44,603 2,790
BlackBerry Ltd.* 19,310 162
CAE, Inc.* 10,568 301
Cameco Corp. 13,974 232
Canadian Apartment Properties REIT 3,359 144
Canadian Imperial Bank of Commerce 16,464 1,612
Canadian National Railway Co. 26,152 3,035
Canadian Tire Corp. Ltd., Class A 2,078 295
Canopy Growth Corp.* 7,602 244
CGI, Inc.* 8,574 714
Dollarama, Inc. 10,987 485
Empire Co. Ltd., Class A 6,332 197
Enbridge, Inc. 75,016 2,733
FirstService Corp. 1,440 214
Fortis, Inc. 17,403 755
Franco-Nevada Corp. 6,978 875
Gildan Activewear, Inc.* 7,193 220
Hydro One Ltd. 11,733 273
Intact Financial Corp. 5,320 652
Inter Pipeline Ltd. 15,467 221
Keyera Corp. 7,439 155
Loblaw Cos. Ltd. 6,429 359
Lululemon Athletica, Inc.* 4,568 1,401
Lundin Mining Corp. 24,864 256
Magna International, Inc. 10,296 907
Manulife Financial Corp. 72,482 1,559
Metro, Inc. 9,390 428
Nutrien Ltd. 21,006 1,132
Open Text Corp. 10,338 493
Parkland Corp. 5,378 162
Pembina Pipeline Corp. 20,558 594
S C H E D U L E O F I N V E S T M E N T S
G LO BA L S U S TA I N A B I L I T Y I N D E X F U N D MARCH 31, 2021
See Notes to the Financial Statements.
NORTHERN FUNDS ANNUAL REPORT 59 EQUIT Y INDEX FUNDS
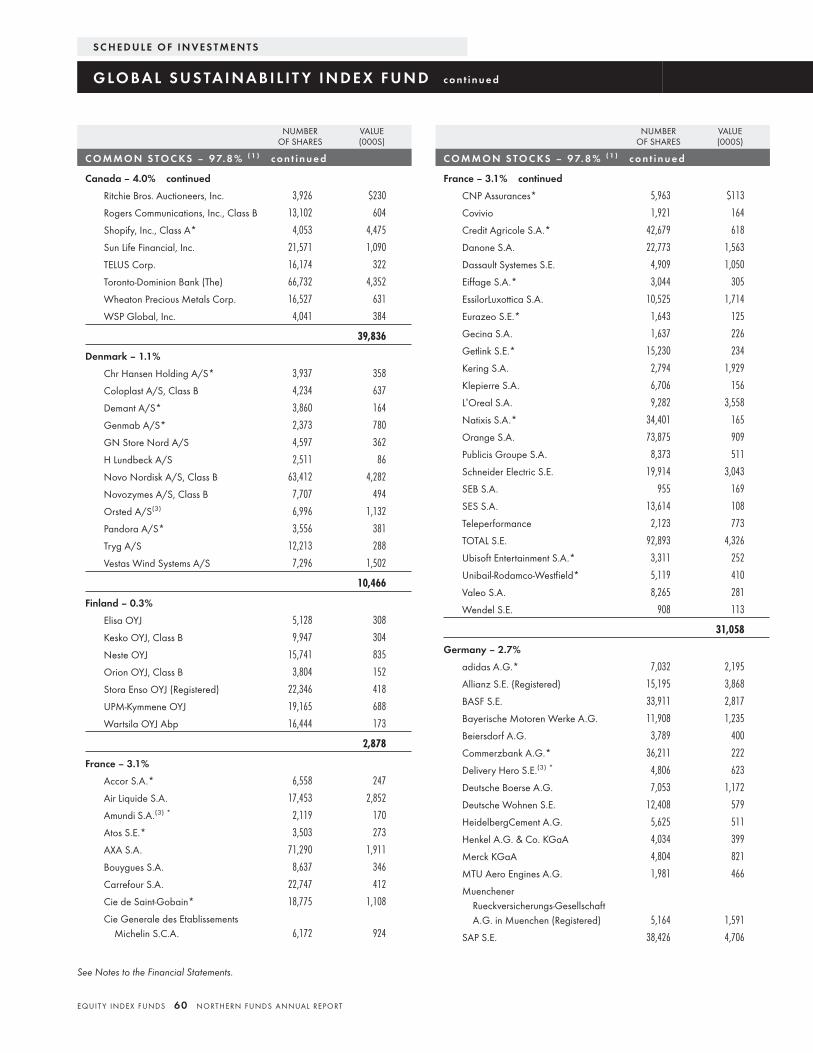
NUMBEROF SHARES
VALUE(000S)
C O M M O N S TO C KS – 9 7. 8 % ( 1 ) c o n t i n u e d
Canada – 4.0% continued
Ritchie Bros. Auctioneers, Inc. 3,926 $230
Rogers Communications, Inc., Class B 13,102 604
Shopify, Inc., Class A* 4,053 4,475
Sun Life Financial, Inc. 21,571 1,090
TELUS Corp. 16,174 322
Toronto-Dominion Bank (The) 66,732 4,352
Wheaton Precious Metals Corp. 16,527 631
WSP Global, Inc. 4,041 384
39,836
Denmark – 1.1%
Chr Hansen Holding A/S* 3,937 358
Coloplast A/S, Class B 4,234 637
Demant A/S* 3,860 164
Genmab A/S* 2,373 780
GN Store Nord A/S 4,597 362
H Lundbeck A/S 2,511 86
Novo Nordisk A/S, Class B 63,412 4,282
Novozymes A/S, Class B 7,707 494
Orsted A/S(3) 6,996 1,132
Pandora A/S* 3,556 381
Tryg A/S 12,213 288
Vestas Wind Systems A/S 7,296 1,502
10,466
Finland – 0.3%
Elisa OYJ 5,128 308
Kesko OYJ, Class B 9,947 304
Neste OYJ 15,741 835
Orion OYJ, Class B 3,804 152
Stora Enso OYJ (Registered) 22,346 418
UPM-Kymmene OYJ 19,165 688
Wartsila OYJ Abp 16,444 173
2,878
France – 3.1%
Accor S.A.* 6,558 247
Air Liquide S.A. 17,453 2,852
Amundi S.A.(3) * 2,119 170
Atos S.E.* 3,503 273
AXA S.A. 71,290 1,911
Bouygues S.A. 8,637 346
Carrefour S.A. 22,747 412
Cie de Saint-Gobain* 18,775 1,108
Cie Generale des EtablissementsMichelin S.C.A. 6,172 924
NUMBEROF SHARES
VALUE(000S)
C O M M O N S TO C KS – 9 7. 8 % ( 1 ) c o n t i n u e d
France – 3.1% continued
CNP Assurances* 5,963 $113
Covivio 1,921 164
Credit Agricole S.A.* 42,679 618
Danone S.A. 22,773 1,563
Dassault Systemes S.E. 4,909 1,050
Eiffage S.A.* 3,044 305
EssilorLuxottica S.A. 10,525 1,714
Eurazeo S.E.* 1,643 125
Gecina S.A. 1,637 226
Getlink S.E.* 15,230 234
Kering S.A. 2,794 1,929
Klepierre S.A. 6,706 156
L’Oreal S.A. 9,282 3,558
Natixis S.A.* 34,401 165
Orange S.A. 73,875 909
Publicis Groupe S.A. 8,373 511
Schneider Electric S.E. 19,914 3,043
SEB S.A. 955 169
SES S.A. 13,614 108
Teleperformance 2,123 773
TOTAL S.E. 92,893 4,326
Ubisoft Entertainment S.A.* 3,311 252
Unibail-Rodamco-Westfield* 5,119 410
Valeo S.A. 8,265 281
Wendel S.E. 908 113
31,058
Germany – 2.7%
adidas A.G.* 7,032 2,195
Allianz S.E. (Registered) 15,195 3,868
BASF S.E. 33,911 2,817
Bayerische Motoren Werke A.G. 11,908 1,235
Beiersdorf A.G. 3,789 400
Commerzbank A.G.* 36,211 222
Delivery Hero S.E.(3) * 4,806 623
Deutsche Boerse A.G. 7,053 1,172
Deutsche Wohnen S.E. 12,408 579
HeidelbergCement A.G. 5,625 511
Henkel A.G. & Co. KGaA 4,034 399
Merck KGaA 4,804 821
MTU Aero Engines A.G. 1,981 466
MuenchenerRueckversicherungs-GesellschaftA.G. in Muenchen (Registered) 5,164 1,591
SAP S.E. 38,426 4,706
S C H E D U L E O F I N V E S T M E N T S
G LO BA L S U S TA I N A B I L I T Y I N D E X F U N D c o n t i n u e d
See Notes to the Financial Statements.
EQUIT Y INDEX FUNDS 60 NORTHERN FUNDS ANNUAL REPORT
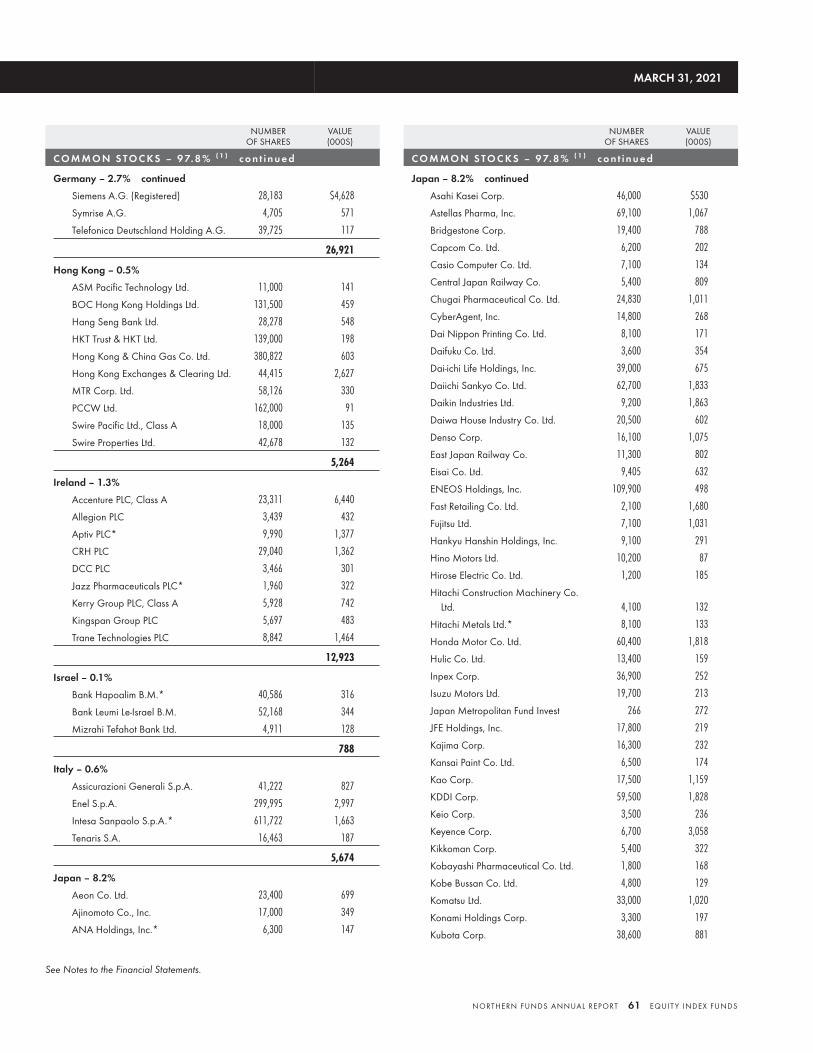
NUMBEROF SHARES
VALUE(000S)
C O M M O N S TO C KS – 9 7. 8 % ( 1 ) c o n t i n u e d
Germany – 2.7% continued
Siemens A.G. (Registered) 28,183 $4,628
Symrise A.G. 4,705 571
Telefonica Deutschland Holding A.G. 39,725 117
26,921
Hong Kong – 0.5%
ASM Pacific Technology Ltd. 11,000 141
BOC Hong Kong Holdings Ltd. 131,500 459
Hang Seng Bank Ltd. 28,278 548
HKT Trust & HKT Ltd. 139,000 198
Hong Kong & China Gas Co. Ltd. 380,822 603
Hong Kong Exchanges & Clearing Ltd. 44,415 2,627
MTR Corp. Ltd. 58,126 330
PCCW Ltd. 162,000 91
Swire Pacific Ltd., Class A 18,000 135
Swire Properties Ltd. 42,678 132
5,264
Ireland – 1.3%
Accenture PLC, Class A 23,311 6,440
Allegion PLC 3,439 432
Aptiv PLC* 9,990 1,377
CRH PLC 29,040 1,362
DCC PLC 3,466 301
Jazz Pharmaceuticals PLC* 1,960 322
Kerry Group PLC, Class A 5,928 742
Kingspan Group PLC 5,697 483
Trane Technologies PLC 8,842 1,464
12,923
Israel – 0.1%
Bank Hapoalim B.M.* 40,586 316
Bank Leumi Le-Israel B.M. 52,168 344
Mizrahi Tefahot Bank Ltd. 4,911 128
788
Italy – 0.6%
Assicurazioni Generali S.p.A. 41,222 827
Enel S.p.A. 299,995 2,997
Intesa Sanpaolo S.p.A.* 611,722 1,663
Tenaris S.A. 16,463 187
5,674
Japan – 8.2%
Aeon Co. Ltd. 23,400 699
Ajinomoto Co., Inc. 17,000 349
ANA Holdings, Inc.* 6,300 147
NUMBEROF SHARES
VALUE(000S)
C O M M O N S TO C KS – 9 7. 8 % ( 1 ) c o n t i n u e d
Japan – 8.2% continued
Asahi Kasei Corp. 46,000 $530
Astellas Pharma, Inc. 69,100 1,067
Bridgestone Corp. 19,400 788
Capcom Co. Ltd. 6,200 202
Casio Computer Co. Ltd. 7,100 134
Central Japan Railway Co. 5,400 809
Chugai Pharmaceutical Co. Ltd. 24,830 1,011
CyberAgent, Inc. 14,800 268
Dai Nippon Printing Co. Ltd. 8,100 171
Daifuku Co. Ltd. 3,600 354
Dai-ichi Life Holdings, Inc. 39,000 675
Daiichi Sankyo Co. Ltd. 62,700 1,833
Daikin Industries Ltd. 9,200 1,863
Daiwa House Industry Co. Ltd. 20,500 602
Denso Corp. 16,100 1,075
East Japan Railway Co. 11,300 802
Eisai Co. Ltd. 9,405 632
ENEOS Holdings, Inc. 109,900 498
Fast Retailing Co. Ltd. 2,100 1,680
Fujitsu Ltd. 7,100 1,031
Hankyu Hanshin Holdings, Inc. 9,100 291
Hino Motors Ltd. 10,200 87
Hirose Electric Co. Ltd. 1,200 185
Hitachi Construction Machinery Co.Ltd. 4,100 132
Hitachi Metals Ltd.* 8,100 133
Honda Motor Co. Ltd. 60,400 1,818
Hulic Co. Ltd. 13,400 159
Inpex Corp. 36,900 252
Isuzu Motors Ltd. 19,700 213
Japan Metropolitan Fund Invest 266 272
JFE Holdings, Inc. 17,800 219
Kajima Corp. 16,300 232
Kansai Paint Co. Ltd. 6,500 174
Kao Corp. 17,500 1,159
KDDI Corp. 59,500 1,828
Keio Corp. 3,500 236
Keyence Corp. 6,700 3,058
Kikkoman Corp. 5,400 322
Kobayashi Pharmaceutical Co. Ltd. 1,800 168
Kobe Bussan Co. Ltd. 4,800 129
Komatsu Ltd. 33,000 1,020
Konami Holdings Corp. 3,300 197
Kubota Corp. 38,600 881
MARCH 31, 2021
See Notes to the Financial Statements.
NORTHERN FUNDS ANNUAL REPORT 61 EQUIT Y INDEX FUNDS
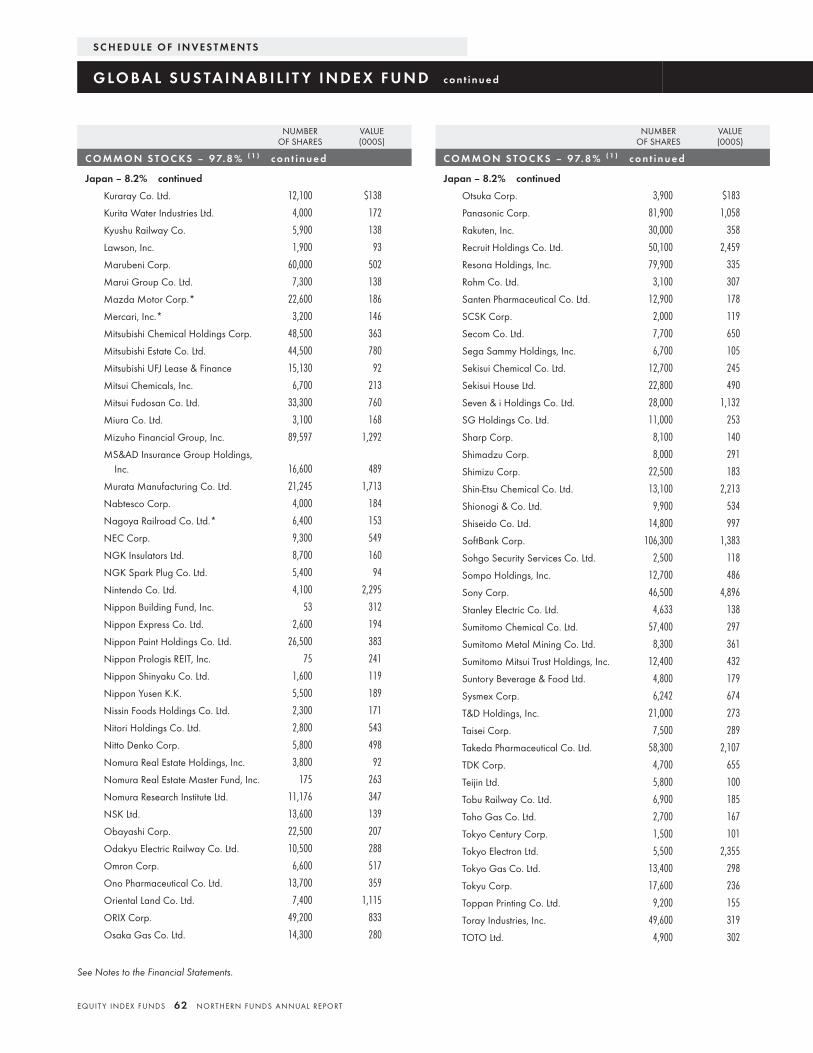
NUMBEROF SHARES
VALUE(000S)
C O M M O N S TO C KS – 9 7. 8 % ( 1 ) c o n t i n u e d
Japan – 8.2% continued
Kuraray Co. Ltd. 12,100 $138
Kurita Water Industries Ltd. 4,000 172
Kyushu Railway Co. 5,900 138
Lawson, Inc. 1,900 93
Marubeni Corp. 60,000 502
Marui Group Co. Ltd. 7,300 138
Mazda Motor Corp.* 22,600 186
Mercari, Inc.* 3,200 146
Mitsubishi Chemical Holdings Corp. 48,500 363
Mitsubishi Estate Co. Ltd. 44,500 780
Mitsubishi UFJ Lease & Finance 15,130 92
Mitsui Chemicals, Inc. 6,700 213
Mitsui Fudosan Co. Ltd. 33,300 760
Miura Co. Ltd. 3,100 168
Mizuho Financial Group, Inc. 89,597 1,292
MS&AD Insurance Group Holdings,Inc. 16,600 489
Murata Manufacturing Co. Ltd. 21,245 1,713
Nabtesco Corp. 4,000 184
Nagoya Railroad Co. Ltd.* 6,400 153
NEC Corp. 9,300 549
NGK Insulators Ltd. 8,700 160
NGK Spark Plug Co. Ltd. 5,400 94
Nintendo Co. Ltd. 4,100 2,295
Nippon Building Fund, Inc. 53 312
Nippon Express Co. Ltd. 2,600 194
Nippon Paint Holdings Co. Ltd. 26,500 383
Nippon Prologis REIT, Inc. 75 241
Nippon Shinyaku Co. Ltd. 1,600 119
Nippon Yusen K.K. 5,500 189
Nissin Foods Holdings Co. Ltd. 2,300 171
Nitori Holdings Co. Ltd. 2,800 543
Nitto Denko Corp. 5,800 498
Nomura Real Estate Holdings, Inc. 3,800 92
Nomura Real Estate Master Fund, Inc. 175 263
Nomura Research Institute Ltd. 11,176 347
NSK Ltd. 13,600 139
Obayashi Corp. 22,500 207
Odakyu Electric Railway Co. Ltd. 10,500 288
Omron Corp. 6,600 517
Ono Pharmaceutical Co. Ltd. 13,700 359
Oriental Land Co. Ltd. 7,400 1,115
ORIX Corp. 49,200 833
Osaka Gas Co. Ltd. 14,300 280
NUMBEROF SHARES
VALUE(000S)
C O M M O N S TO C KS – 9 7. 8 % ( 1 ) c o n t i n u e d
Japan – 8.2% continued
Otsuka Corp. 3,900 $183
Panasonic Corp. 81,900 1,058
Rakuten, Inc. 30,000 358
Recruit Holdings Co. Ltd. 50,100 2,459
Resona Holdings, Inc. 79,900 335
Rohm Co. Ltd. 3,100 307
Santen Pharmaceutical Co. Ltd. 12,900 178
SCSK Corp. 2,000 119
Secom Co. Ltd. 7,700 650
Sega Sammy Holdings, Inc. 6,700 105
Sekisui Chemical Co. Ltd. 12,700 245
Sekisui House Ltd. 22,800 490
Seven & i Holdings Co. Ltd. 28,000 1,132
SG Holdings Co. Ltd. 11,000 253
Sharp Corp. 8,100 140
Shimadzu Corp. 8,000 291
Shimizu Corp. 22,500 183
Shin-Etsu Chemical Co. Ltd. 13,100 2,213
Shionogi & Co. Ltd. 9,900 534
Shiseido Co. Ltd. 14,800 997
SoftBank Corp. 106,300 1,383
Sohgo Security Services Co. Ltd. 2,500 118
Sompo Holdings, Inc. 12,700 486
Sony Corp. 46,500 4,896
Stanley Electric Co. Ltd. 4,633 138
Sumitomo Chemical Co. Ltd. 57,400 297
Sumitomo Metal Mining Co. Ltd. 8,300 361
Sumitomo Mitsui Trust Holdings, Inc. 12,400 432
Suntory Beverage & Food Ltd. 4,800 179
Sysmex Corp. 6,242 674
T&D Holdings, Inc. 21,000 273
Taisei Corp. 7,500 289
Takeda Pharmaceutical Co. Ltd. 58,300 2,107
TDK Corp. 4,700 655
Teijin Ltd. 5,800 100
Tobu Railway Co. Ltd. 6,900 185
Toho Gas Co. Ltd. 2,700 167
Tokyo Century Corp. 1,500 101
Tokyo Electron Ltd. 5,500 2,355
Tokyo Gas Co. Ltd. 13,400 298
Tokyu Corp. 17,600 236
Toppan Printing Co. Ltd. 9,200 155
Toray Industries, Inc. 49,600 319
TOTO Ltd. 4,900 302
S C H E D U L E O F I N V E S T M E N T S
G LO BA L S U S TA I N A B I L I T Y I N D E X F U N D c o n t i n u e d
See Notes to the Financial Statements.
EQUIT Y INDEX FUNDS 62 NORTHERN FUNDS ANNUAL REPORT
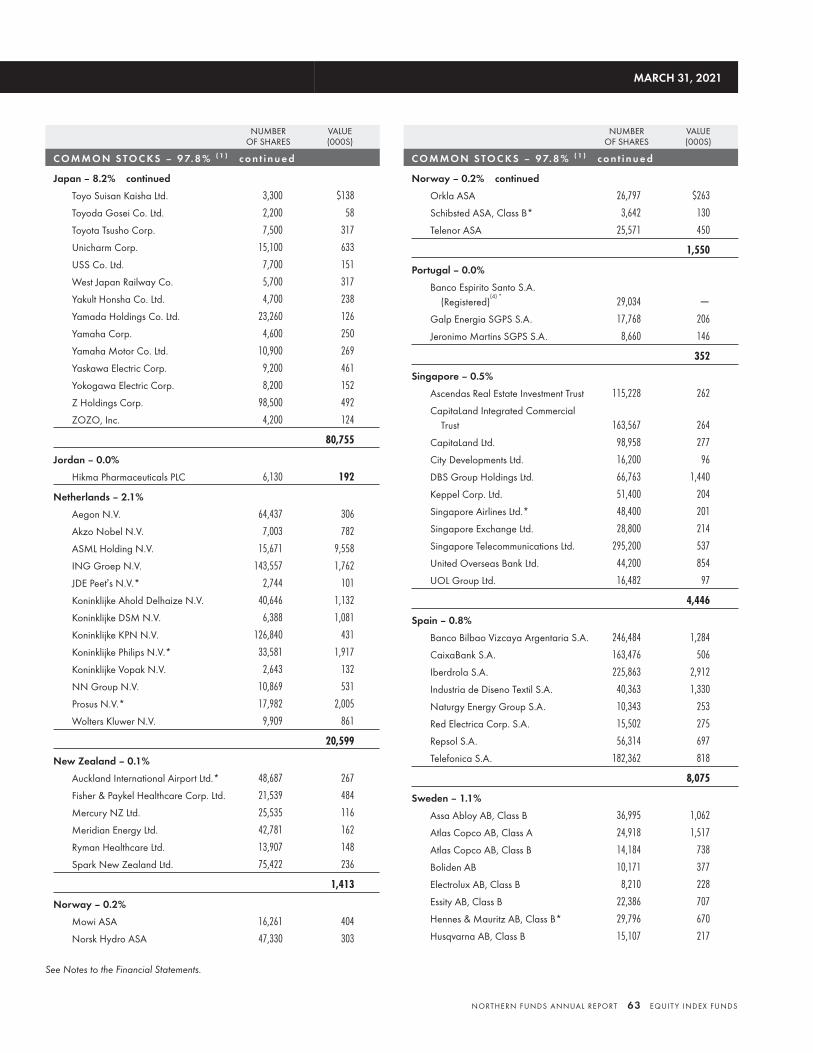
NUMBEROF SHARES
VALUE(000S)
C O M M O N S TO C KS – 9 7. 8 % ( 1 ) c o n t i n u e d
Japan – 8.2% continued
Toyo Suisan Kaisha Ltd. 3,300 $138
Toyoda Gosei Co. Ltd. 2,200 58
Toyota Tsusho Corp. 7,500 317
Unicharm Corp. 15,100 633
USS Co. Ltd. 7,700 151
West Japan Railway Co. 5,700 317
Yakult Honsha Co. Ltd. 4,700 238
Yamada Holdings Co. Ltd. 23,260 126
Yamaha Corp. 4,600 250
Yamaha Motor Co. Ltd. 10,900 269
Yaskawa Electric Corp. 9,200 461
Yokogawa Electric Corp. 8,200 152
Z Holdings Corp. 98,500 492
ZOZO, Inc. 4,200 124
80,755
Jordan – 0.0%
Hikma Pharmaceuticals PLC 6,130 192
Netherlands – 2.1%
Aegon N.V. 64,437 306
Akzo Nobel N.V. 7,003 782
ASML Holding N.V. 15,671 9,558
ING Groep N.V. 143,557 1,762
JDE Peet’s N.V.* 2,744 101
Koninklijke Ahold Delhaize N.V. 40,646 1,132
Koninklijke DSM N.V. 6,388 1,081
Koninklijke KPN N.V. 126,840 431
Koninklijke Philips N.V.* 33,581 1,917
Koninklijke Vopak N.V. 2,643 132
NN Group N.V. 10,869 531
Prosus N.V.* 17,982 2,005
Wolters Kluwer N.V. 9,909 861
20,599
New Zealand – 0.1%
Auckland International Airport Ltd.* 48,687 267
Fisher & Paykel Healthcare Corp. Ltd. 21,539 484
Mercury NZ Ltd. 25,535 116
Meridian Energy Ltd. 42,781 162
Ryman Healthcare Ltd. 13,907 148
Spark New Zealand Ltd. 75,422 236
1,413
Norway – 0.2%
Mowi ASA 16,261 404
Norsk Hydro ASA 47,330 303
NUMBEROF SHARES
VALUE(000S)
C O M M O N S TO C KS – 9 7. 8 % ( 1 ) c o n t i n u e d
Norway – 0.2% continued
Orkla ASA 26,797 $263
Schibsted ASA, Class B* 3,642 130
Telenor ASA 25,571 450
1,550
Portugal – 0.0%
Banco Espirito Santo S.A.(Registered)
(4) *29,034 —
Galp Energia SGPS S.A. 17,768 206
Jeronimo Martins SGPS S.A. 8,660 146
352
Singapore – 0.5%
Ascendas Real Estate Investment Trust 115,228 262
CapitaLand Integrated CommercialTrust 163,567 264
CapitaLand Ltd. 98,958 277
City Developments Ltd. 16,200 96
DBS Group Holdings Ltd. 66,763 1,440
Keppel Corp. Ltd. 51,400 204
Singapore Airlines Ltd.* 48,400 201
Singapore Exchange Ltd. 28,800 214
Singapore Telecommunications Ltd. 295,200 537
United Overseas Bank Ltd. 44,200 854
UOL Group Ltd. 16,482 97
4,446
Spain – 0.8%
Banco Bilbao Vizcaya Argentaria S.A. 246,484 1,284
CaixaBank S.A. 163,476 506
Iberdrola S.A. 225,863 2,912
Industria de Diseno Textil S.A. 40,363 1,330
Naturgy Energy Group S.A. 10,343 253
Red Electrica Corp. S.A. 15,502 275
Repsol S.A. 56,314 697
Telefonica S.A. 182,362 818
8,075
Sweden – 1.1%
Assa Abloy AB, Class B 36,995 1,062
Atlas Copco AB, Class A 24,918 1,517
Atlas Copco AB, Class B 14,184 738
Boliden AB 10,171 377
Electrolux AB, Class B 8,210 228
Essity AB, Class B 22,386 707
Hennes & Mauritz AB, Class B* 29,796 670
Husqvarna AB, Class B 15,107 217
MARCH 31, 2021
See Notes to the Financial Statements.
NORTHERN FUNDS ANNUAL REPORT 63 EQUIT Y INDEX FUNDS
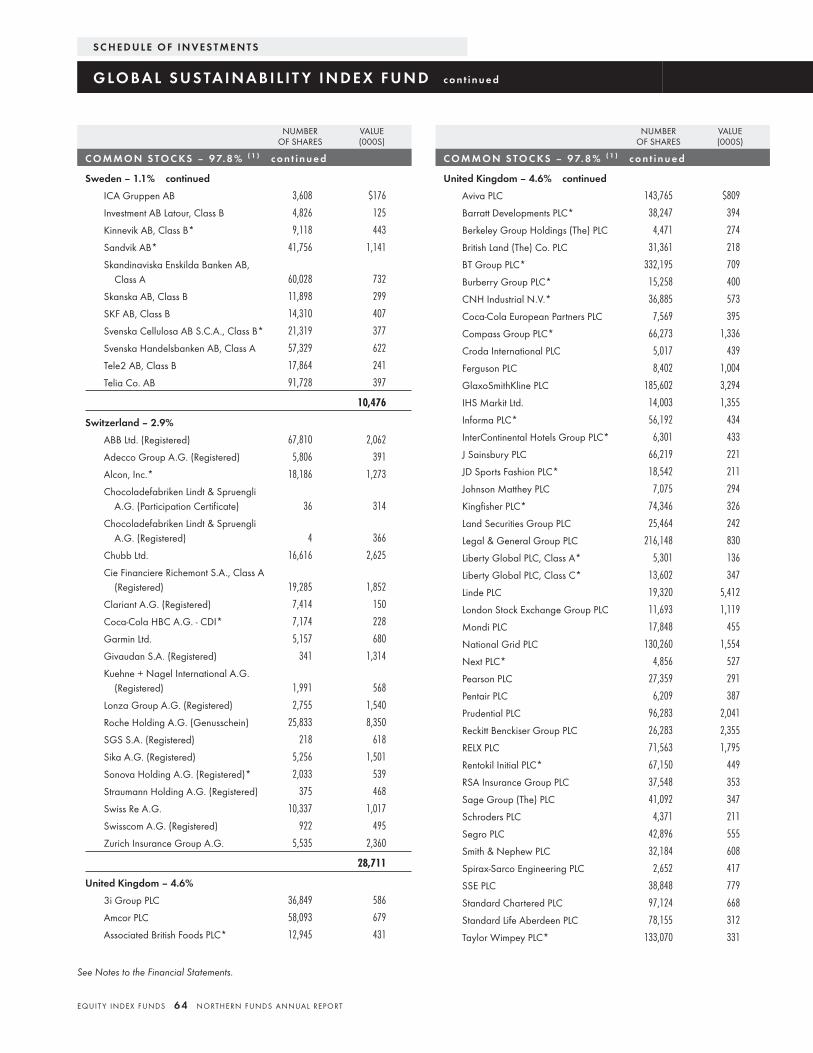
NUMBEROF SHARES
VALUE(000S)
C O M M O N S TO C KS – 9 7. 8 % ( 1 ) c o n t i n u e d
Sweden – 1.1% continued
ICA Gruppen AB 3,608 $176
Investment AB Latour, Class B 4,826 125
Kinnevik AB, Class B* 9,118 443
Sandvik AB* 41,756 1,141
Skandinaviska Enskilda Banken AB,Class A 60,028 732
Skanska AB, Class B 11,898 299
SKF AB, Class B 14,310 407
Svenska Cellulosa AB S.C.A., Class B* 21,319 377
Svenska Handelsbanken AB, Class A 57,329 622
Tele2 AB, Class B 17,864 241
Telia Co. AB 91,728 397
10,476
Switzerland – 2.9%
ABB Ltd. (Registered) 67,810 2,062
Adecco Group A.G. (Registered) 5,806 391
Alcon, Inc.* 18,186 1,273
Chocoladefabriken Lindt & SpruengliA.G. (Participation Certificate) 36 314
Chocoladefabriken Lindt & SpruengliA.G. (Registered) 4 366
Chubb Ltd. 16,616 2,625
Cie Financiere Richemont S.A., Class A(Registered) 19,285 1,852
Clariant A.G. (Registered) 7,414 150
Coca-Cola HBC A.G. - CDI* 7,174 228
Garmin Ltd. 5,157 680
Givaudan S.A. (Registered) 341 1,314
Kuehne + Nagel International A.G.(Registered) 1,991 568
Lonza Group A.G. (Registered) 2,755 1,540
Roche Holding A.G. (Genusschein) 25,833 8,350
SGS S.A. (Registered) 218 618
Sika A.G. (Registered) 5,256 1,501
Sonova Holding A.G. (Registered)* 2,033 539
Straumann Holding A.G. (Registered) 375 468
Swiss Re A.G. 10,337 1,017
Swisscom A.G. (Registered) 922 495
Zurich Insurance Group A.G. 5,535 2,360
28,711
United Kingdom – 4.6%
3i Group PLC 36,849 586
Amcor PLC 58,093 679
Associated British Foods PLC* 12,945 431
NUMBEROF SHARES
VALUE(000S)
C O M M O N S TO C KS – 9 7. 8 % ( 1 ) c o n t i n u e d
United Kingdom – 4.6% continued
Aviva PLC 143,765 $809
Barratt Developments PLC* 38,247 394
Berkeley Group Holdings (The) PLC 4,471 274
British Land (The) Co. PLC 31,361 218
BT Group PLC* 332,195 709
Burberry Group PLC* 15,258 400
CNH Industrial N.V.* 36,885 573
Coca-Cola European Partners PLC 7,569 395
Compass Group PLC* 66,273 1,336
Croda International PLC 5,017 439
Ferguson PLC 8,402 1,004
GlaxoSmithKline PLC 185,602 3,294
IHS Markit Ltd. 14,003 1,355
Informa PLC* 56,192 434
InterContinental Hotels Group PLC* 6,301 433
J Sainsbury PLC 66,219 221
JD Sports Fashion PLC* 18,542 211
Johnson Matthey PLC 7,075 294
Kingfisher PLC* 74,346 326
Land Securities Group PLC 25,464 242
Legal & General Group PLC 216,148 830
Liberty Global PLC, Class A* 5,301 136
Liberty Global PLC, Class C* 13,602 347
Linde PLC 19,320 5,412
London Stock Exchange Group PLC 11,693 1,119
Mondi PLC 17,848 455
National Grid PLC 130,260 1,554
Next PLC* 4,856 527
Pearson PLC 27,359 291
Pentair PLC 6,209 387
Prudential PLC 96,283 2,041
Reckitt Benckiser Group PLC 26,283 2,355
RELX PLC 71,563 1,795
Rentokil Initial PLC* 67,150 449
RSA Insurance Group PLC 37,548 353
Sage Group (The) PLC 41,092 347
Schroders PLC 4,371 211
Segro PLC 42,896 555
Smith & Nephew PLC 32,184 608
Spirax-Sarco Engineering PLC 2,652 417
SSE PLC 38,848 779
Standard Chartered PLC 97,124 668
Standard Life Aberdeen PLC 78,155 312
Taylor Wimpey PLC* 133,070 331
S C H E D U L E O F I N V E S T M E N T S
G LO BA L S U S TA I N A B I L I T Y I N D E X F U N D c o n t i n u e d
See Notes to the Financial Statements.
EQUIT Y INDEX FUNDS 64 NORTHERN FUNDS ANNUAL REPORT
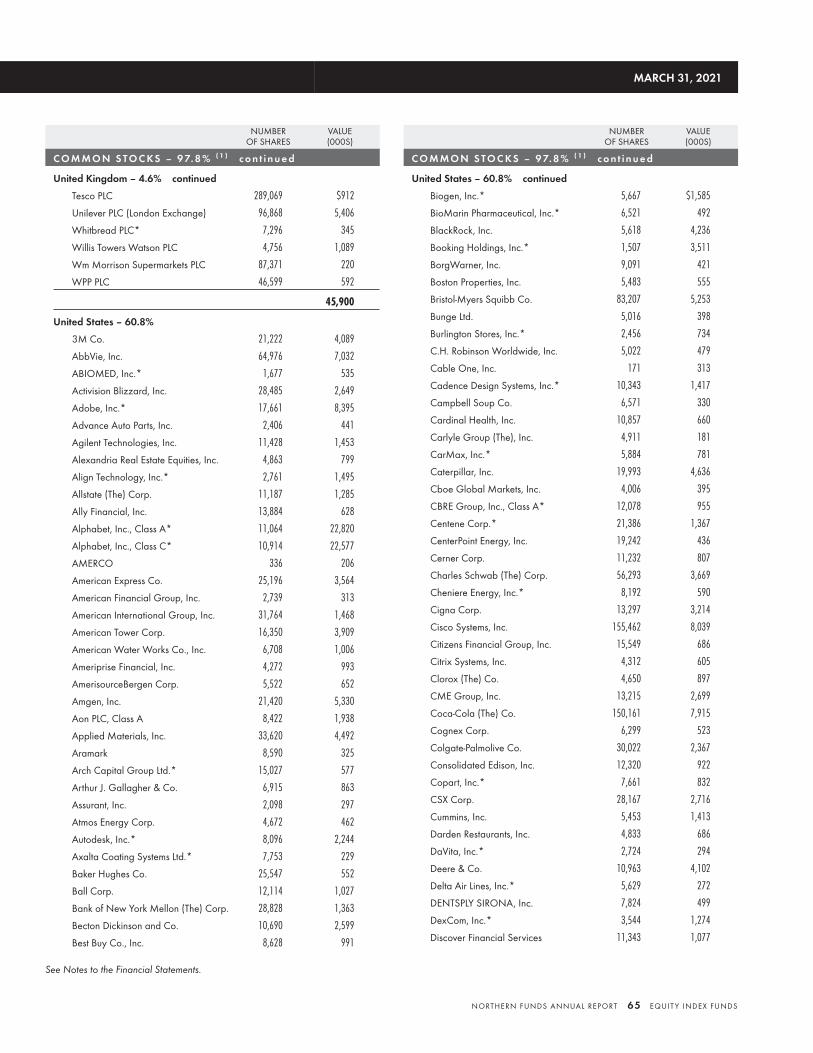
NUMBEROF SHARES
VALUE(000S)
C O M M O N S TO C KS – 9 7. 8 % ( 1 ) c o n t i n u e d
United Kingdom – 4.6% continued
Tesco PLC 289,069 $912
Unilever PLC (London Exchange) 96,868 5,406
Whitbread PLC* 7,296 345
Willis Towers Watson PLC 4,756 1,089
Wm Morrison Supermarkets PLC 87,371 220
WPP PLC 46,599 592
45,900
United States – 60.8%
3M Co. 21,222 4,089
AbbVie, Inc. 64,976 7,032
ABIOMED, Inc.* 1,677 535
Activision Blizzard, Inc. 28,485 2,649
Adobe, Inc.* 17,661 8,395
Advance Auto Parts, Inc. 2,406 441
Agilent Technologies, Inc. 11,428 1,453
Alexandria Real Estate Equities, Inc. 4,863 799
Align Technology, Inc.* 2,761 1,495
Allstate (The) Corp. 11,187 1,285
Ally Financial, Inc. 13,884 628
Alphabet, Inc., Class A* 11,064 22,820
Alphabet, Inc., Class C* 10,914 22,577
AMERCO 336 206
American Express Co. 25,196 3,564
American Financial Group, Inc. 2,739 313
American International Group, Inc. 31,764 1,468
American Tower Corp. 16,350 3,909
American Water Works Co., Inc. 6,708 1,006
Ameriprise Financial, Inc. 4,272 993
AmerisourceBergen Corp. 5,522 652
Amgen, Inc. 21,420 5,330
Aon PLC, Class A 8,422 1,938
Applied Materials, Inc. 33,620 4,492
Aramark 8,590 325
Arch Capital Group Ltd.* 15,027 577
Arthur J. Gallagher & Co. 6,915 863
Assurant, Inc. 2,098 297
Atmos Energy Corp. 4,672 462
Autodesk, Inc.* 8,096 2,244
Axalta Coating Systems Ltd.* 7,753 229
Baker Hughes Co. 25,547 552
Ball Corp. 12,114 1,027
Bank of New York Mellon (The) Corp. 28,828 1,363
Becton Dickinson and Co. 10,690 2,599
Best Buy Co., Inc. 8,628 991
NUMBEROF SHARES
VALUE(000S)
C O M M O N S TO C KS – 9 7. 8 % ( 1 ) c o n t i n u e d
United States – 60.8% continued
Biogen, Inc.* 5,667 $1,585
BioMarin Pharmaceutical, Inc.* 6,521 492
BlackRock, Inc. 5,618 4,236
Booking Holdings, Inc.* 1,507 3,511
BorgWarner, Inc. 9,091 421
Boston Properties, Inc. 5,483 555
Bristol-Myers Squibb Co. 83,207 5,253
Bunge Ltd. 5,016 398
Burlington Stores, Inc.* 2,456 734
C.H. Robinson Worldwide, Inc. 5,022 479
Cable One, Inc. 171 313
Cadence Design Systems, Inc.* 10,343 1,417
Campbell Soup Co. 6,571 330
Cardinal Health, Inc. 10,857 660
Carlyle Group (The), Inc. 4,911 181
CarMax, Inc.* 5,884 781
Caterpillar, Inc. 19,993 4,636
Cboe Global Markets, Inc. 4,006 395
CBRE Group, Inc., Class A* 12,078 955
Centene Corp.* 21,386 1,367
CenterPoint Energy, Inc. 19,242 436
Cerner Corp. 11,232 807
Charles Schwab (The) Corp. 56,293 3,669
Cheniere Energy, Inc.* 8,192 590
Cigna Corp. 13,297 3,214
Cisco Systems, Inc. 155,462 8,039
Citizens Financial Group, Inc. 15,549 686
Citrix Systems, Inc. 4,312 605
Clorox (The) Co. 4,650 897
CME Group, Inc. 13,215 2,699
Coca-Cola (The) Co. 150,161 7,915
Cognex Corp. 6,299 523
Colgate-Palmolive Co. 30,022 2,367
Consolidated Edison, Inc. 12,320 922
Copart, Inc.* 7,661 832
CSX Corp. 28,167 2,716
Cummins, Inc. 5,453 1,413
Darden Restaurants, Inc. 4,833 686
DaVita, Inc.* 2,724 294
Deere & Co. 10,963 4,102
Delta Air Lines, Inc.* 5,629 272
DENTSPLY SIRONA, Inc. 7,824 499
DexCom, Inc.* 3,544 1,274
Discover Financial Services 11,343 1,077
MARCH 31, 2021
See Notes to the Financial Statements.
NORTHERN FUNDS ANNUAL REPORT 65 EQUIT Y INDEX FUNDS
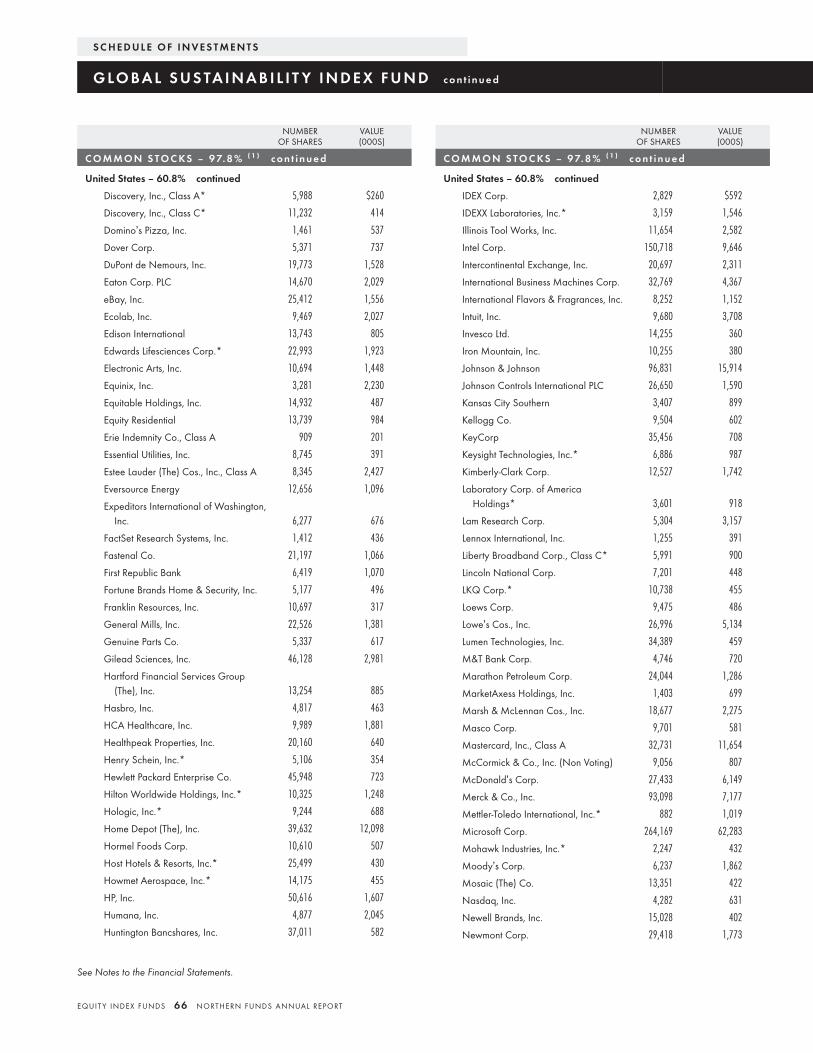
NUMBEROF SHARES
VALUE(000S)
C O M M O N S TO C KS – 9 7. 8 % ( 1 ) c o n t i n u e d
United States – 60.8% continued
Discovery, Inc., Class A* 5,988 $260
Discovery, Inc., Class C* 11,232 414
Domino’s Pizza, Inc. 1,461 537
Dover Corp. 5,371 737
DuPont de Nemours, Inc. 19,773 1,528
Eaton Corp. PLC 14,670 2,029
eBay, Inc. 25,412 1,556
Ecolab, Inc. 9,469 2,027
Edison International 13,743 805
Edwards Lifesciences Corp.* 22,993 1,923
Electronic Arts, Inc. 10,694 1,448
Equinix, Inc. 3,281 2,230
Equitable Holdings, Inc. 14,932 487
Equity Residential 13,739 984
Erie Indemnity Co., Class A 909 201
Essential Utilities, Inc. 8,745 391
Estee Lauder (The) Cos., Inc., Class A 8,345 2,427
Eversource Energy 12,656 1,096
Expeditors International of Washington,Inc. 6,277 676
FactSet Research Systems, Inc. 1,412 436
Fastenal Co. 21,197 1,066
First Republic Bank 6,419 1,070
Fortune Brands Home & Security, Inc. 5,177 496
Franklin Resources, Inc. 10,697 317
General Mills, Inc. 22,526 1,381
Genuine Parts Co. 5,337 617
Gilead Sciences, Inc. 46,128 2,981
Hartford Financial Services Group(The), Inc. 13,254 885
Hasbro, Inc. 4,817 463
HCA Healthcare, Inc. 9,989 1,881
Healthpeak Properties, Inc. 20,160 640
Henry Schein, Inc.* 5,106 354
Hewlett Packard Enterprise Co. 45,948 723
Hilton Worldwide Holdings, Inc.* 10,325 1,248
Hologic, Inc.* 9,244 688
Home Depot (The), Inc. 39,632 12,098
Hormel Foods Corp. 10,610 507
Host Hotels & Resorts, Inc.* 25,499 430
Howmet Aerospace, Inc.* 14,175 455
HP, Inc. 50,616 1,607
Humana, Inc. 4,877 2,045
Huntington Bancshares, Inc. 37,011 582
NUMBEROF SHARES
VALUE(000S)
C O M M O N S TO C KS – 9 7. 8 % ( 1 ) c o n t i n u e d
United States – 60.8% continued
IDEX Corp. 2,829 $592
IDEXX Laboratories, Inc.* 3,159 1,546
Illinois Tool Works, Inc. 11,654 2,582
Intel Corp. 150,718 9,646
Intercontinental Exchange, Inc. 20,697 2,311
International Business Machines Corp. 32,769 4,367
International Flavors & Fragrances, Inc. 8,252 1,152
Intuit, Inc. 9,680 3,708
Invesco Ltd. 14,255 360
Iron Mountain, Inc. 10,255 380
Johnson & Johnson 96,831 15,914
Johnson Controls International PLC 26,650 1,590
Kansas City Southern 3,407 899
Kellogg Co. 9,504 602
KeyCorp 35,456 708
Keysight Technologies, Inc.* 6,886 987
Kimberly-Clark Corp. 12,527 1,742
Laboratory Corp. of AmericaHoldings* 3,601 918
Lam Research Corp. 5,304 3,157
Lennox International, Inc. 1,255 391
Liberty Broadband Corp., Class C* 5,991 900
Lincoln National Corp. 7,201 448
LKQ Corp.* 10,738 455
Loews Corp. 9,475 486
Lowe’s Cos., Inc. 26,996 5,134
Lumen Technologies, Inc. 34,389 459
M&T Bank Corp. 4,746 720
Marathon Petroleum Corp. 24,044 1,286
MarketAxess Holdings, Inc. 1,403 699
Marsh & McLennan Cos., Inc. 18,677 2,275
Masco Corp. 9,701 581
Mastercard, Inc., Class A 32,731 11,654
McCormick & Co., Inc. (Non Voting) 9,056 807
McDonald’s Corp. 27,433 6,149
Merck & Co., Inc. 93,098 7,177
Mettler-Toledo International, Inc.* 882 1,019
Microsoft Corp. 264,169 62,283
Mohawk Industries, Inc.* 2,247 432
Moody’s Corp. 6,237 1,862
Mosaic (The) Co. 13,351 422
Nasdaq, Inc. 4,282 631
Newell Brands, Inc. 15,028 402
Newmont Corp. 29,418 1,773
S C H E D U L E O F I N V E S T M E N T S
G LO BA L S U S TA I N A B I L I T Y I N D E X F U N D c o n t i n u e d
See Notes to the Financial Statements.
EQUIT Y INDEX FUNDS 66 NORTHERN FUNDS ANNUAL REPORT
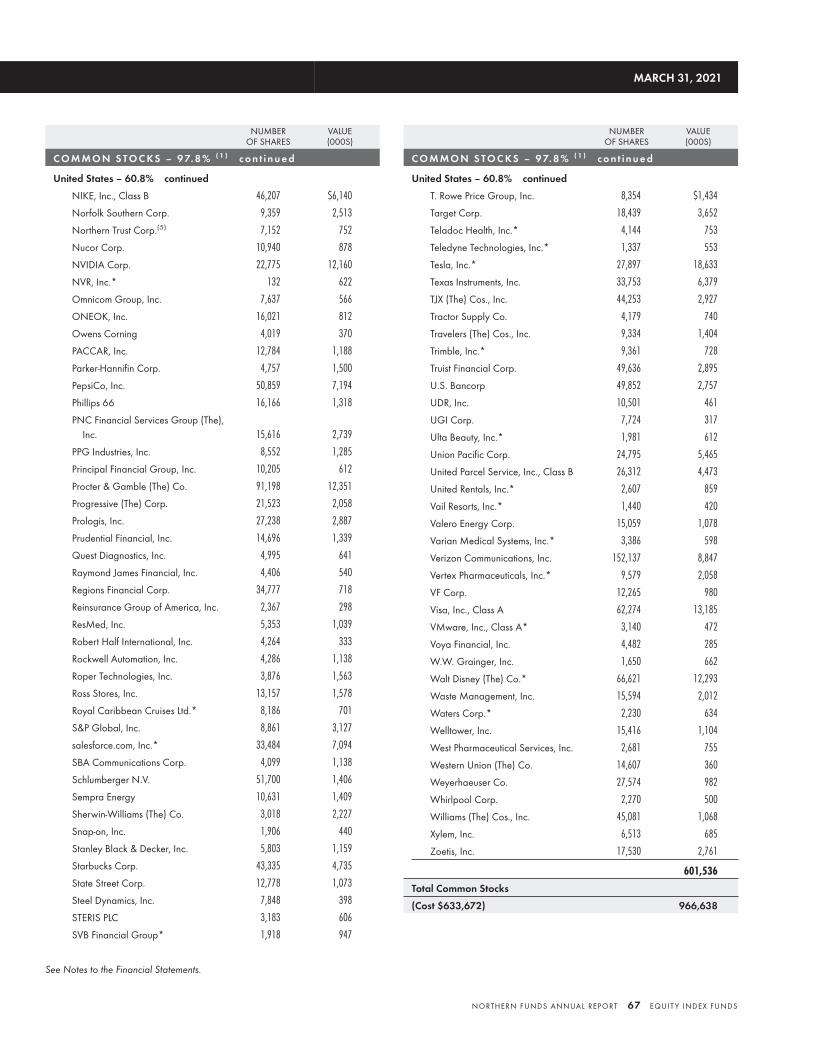
NUMBEROF SHARES
VALUE(000S)
C O M M O N S TO C KS – 9 7. 8 % ( 1 ) c o n t i n u e d
United States – 60.8% continued
NIKE, Inc., Class B 46,207 $6,140
Norfolk Southern Corp. 9,359 2,513
Northern Trust Corp.(5) 7,152 752
Nucor Corp. 10,940 878
NVIDIA Corp. 22,775 12,160
NVR, Inc.* 132 622
Omnicom Group, Inc. 7,637 566
ONEOK, Inc. 16,021 812
Owens Corning 4,019 370
PACCAR, Inc. 12,784 1,188
Parker-Hannifin Corp. 4,757 1,500
PepsiCo, Inc. 50,859 7,194
Phillips 66 16,166 1,318
PNC Financial Services Group (The),Inc. 15,616 2,739
PPG Industries, Inc. 8,552 1,285
Principal Financial Group, Inc. 10,205 612
Procter & Gamble (The) Co. 91,198 12,351
Progressive (The) Corp. 21,523 2,058
Prologis, Inc. 27,238 2,887
Prudential Financial, Inc. 14,696 1,339
Quest Diagnostics, Inc. 4,995 641
Raymond James Financial, Inc. 4,406 540
Regions Financial Corp. 34,777 718
Reinsurance Group of America, Inc. 2,367 298
ResMed, Inc. 5,353 1,039
Robert Half International, Inc. 4,264 333
Rockwell Automation, Inc. 4,286 1,138
Roper Technologies, Inc. 3,876 1,563
Ross Stores, Inc. 13,157 1,578
Royal Caribbean Cruises Ltd.* 8,186 701
S&P Global, Inc. 8,861 3,127
salesforce.com, Inc.* 33,484 7,094
SBA Communications Corp. 4,099 1,138
Schlumberger N.V. 51,700 1,406
Sempra Energy 10,631 1,409
Sherwin-Williams (The) Co. 3,018 2,227
Snap-on, Inc. 1,906 440
Stanley Black & Decker, Inc. 5,803 1,159
Starbucks Corp. 43,335 4,735
State Street Corp. 12,778 1,073
Steel Dynamics, Inc. 7,848 398
STERIS PLC 3,183 606
SVB Financial Group* 1,918 947
NUMBEROF SHARES
VALUE(000S)
C O M M O N S TO C KS – 9 7. 8 % ( 1 ) c o n t i n u e d
United States – 60.8% continued
T. Rowe Price Group, Inc. 8,354 $1,434
Target Corp. 18,439 3,652
Teladoc Health, Inc.* 4,144 753
Teledyne Technologies, Inc.* 1,337 553
Tesla, Inc.* 27,897 18,633
Texas Instruments, Inc. 33,753 6,379
TJX (The) Cos., Inc. 44,253 2,927
Tractor Supply Co. 4,179 740
Travelers (The) Cos., Inc. 9,334 1,404
Trimble, Inc.* 9,361 728
Truist Financial Corp. 49,636 2,895
U.S. Bancorp 49,852 2,757
UDR, Inc. 10,501 461
UGI Corp. 7,724 317
Ulta Beauty, Inc.* 1,981 612
Union Pacific Corp. 24,795 5,465
United Parcel Service, Inc., Class B 26,312 4,473
United Rentals, Inc.* 2,607 859
Vail Resorts, Inc.* 1,440 420
Valero Energy Corp. 15,059 1,078
Varian Medical Systems, Inc.* 3,386 598
Verizon Communications, Inc. 152,137 8,847
Vertex Pharmaceuticals, Inc.* 9,579 2,058
VF Corp. 12,265 980
Visa, Inc., Class A 62,274 13,185
VMware, Inc., Class A* 3,140 472
Voya Financial, Inc. 4,482 285
W.W. Grainger, Inc. 1,650 662
Walt Disney (The) Co.* 66,621 12,293
Waste Management, Inc. 15,594 2,012
Waters Corp.* 2,230 634
Welltower, Inc. 15,416 1,104
West Pharmaceutical Services, Inc. 2,681 755
Western Union (The) Co. 14,607 360
Weyerhaeuser Co. 27,574 982
Whirlpool Corp. 2,270 500
Williams (The) Cos., Inc. 45,081 1,068
Xylem, Inc. 6,513 685
Zoetis, Inc. 17,530 2,761
601,536
Total Common Stocks
(Cost $633,672) 966,638
MARCH 31, 2021
See Notes to the Financial Statements.
NORTHERN FUNDS ANNUAL REPORT 67 EQUIT Y INDEX FUNDS
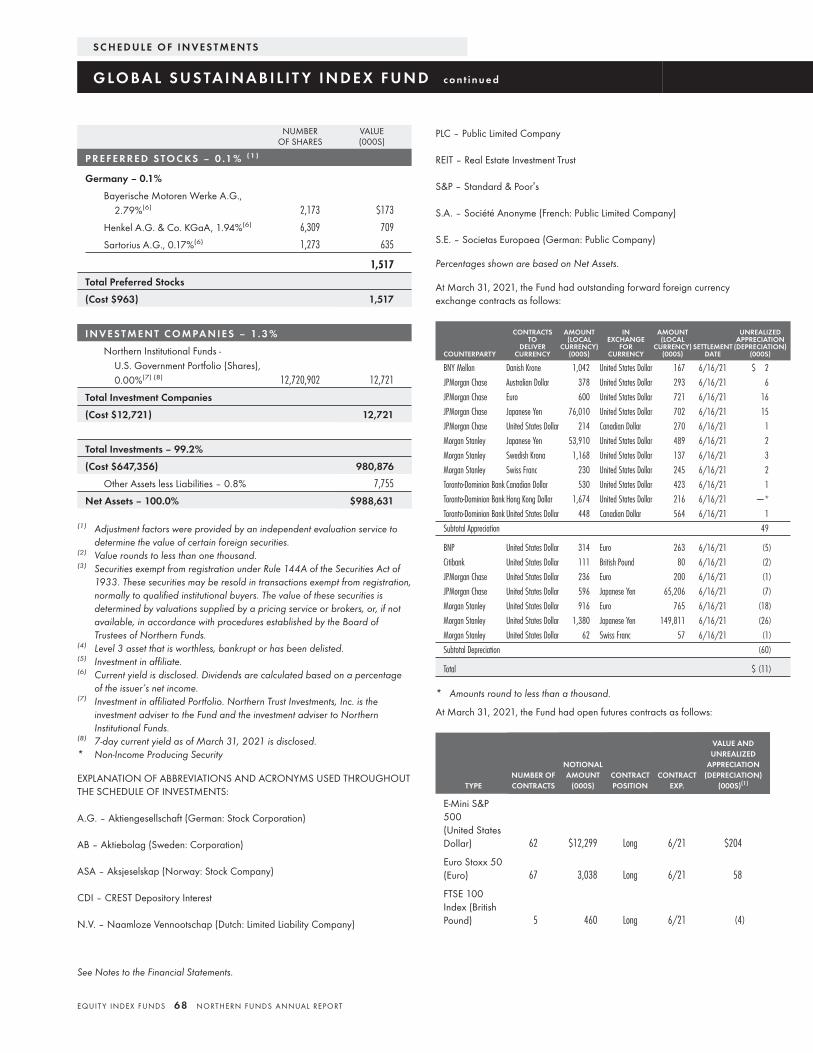
NUMBEROF SHARES
VALUE(000S)
P R E F E R R E D S TO C KS – 0 .1 % ( 1 )
Germany – 0.1%
Bayerische Motoren Werke A.G.,2.79%(6) 2,173 $173
Henkel A.G. & Co. KGaA, 1.94%(6) 6,309 709
Sartorius A.G., 0.17%(6) 1,273 635
1,517
Total Preferred Stocks
(Cost $963) 1,517
I N V E S T M E N T C O M PA N I E S – 1. 3 %
Northern Institutional Funds -U.S. Government Portfolio (Shares),0.00%(7) (8) 12,720,902 12,721
Total Investment Companies
(Cost $12,721) 12,721
Total Investments – 99.2%
(Cost $647,356) 980,876
Other Assets less Liabilities – 0.8% 7,755
Net Assets – 100.0% $988,631
(1) Adjustment factors were provided by an independent evaluation service todetermine the value of certain foreign securities.
(2) Value rounds to less than one thousand.(3) Securities exempt from registration under Rule 144A of the Securities Act of
1933. These securities may be resold in transactions exempt from registration,normally to qualified institutional buyers. The value of these securities isdetermined by valuations supplied by a pricing service or brokers, or, if notavailable, in accordance with procedures established by the Board ofTrustees of Northern Funds.
(4) Level 3 asset that is worthless, bankrupt or has been delisted.(5) Investment in affiliate.(6) Current yield is disclosed. Dividends are calculated based on a percentage
of the issuer’s net income.(7) Investment in affiliated Portfolio. Northern Trust Investments, Inc. is the
investment adviser to the Fund and the investment adviser to NorthernInstitutional Funds.
(8) 7-day current yield as of March 31, 2021 is disclosed.* Non-Income Producing Security
EXPLANATION OF ABBREVIATIONS AND ACRONYMS USED THROUGHOUTTHE SCHEDULE OF INVESTMENTS:
A.G. – Aktiengesellschaft (German: Stock Corporation)
AB – Aktiebolag (Sweden: Corporation)
ASA – Aksjeselskap (Norway: Stock Company)
CDI – CREST Depository Interest
N.V. – Naamloze Vennootschap (Dutch: Limited Liability Company)
PLC – Public Limited Company
REIT – Real Estate Investment Trust
S&P – Standard & Poor’s
S.A. – Société Anonyme (French: Public Limited Company)
S.E. – Societas Europaea (German: Public Company)
Percentages shown are based on Net Assets.
At March 31, 2021, the Fund had outstanding forward foreign currencyexchange contracts as follows:
COUNTERPARTY
CONTRACTSTO
DELIVERCURRENCY
AMOUNT(LOCAL
CURRENCY)(000S)
INEXCHANGE
FORCURRENCY
AMOUNT(LOCAL
CURRENCY)(000S)
SETTLEMENTDATE
UNREALIZEDAPPRECIATION
(DEPRECIATION)(000S)
BNY Mellon Danish Krone 1,042 United States Dollar 167 6/16/21 $ 2
JPMorgan Chase Australian Dollar 378 United States Dollar 293 6/16/21 6
JPMorgan Chase Euro 600 United States Dollar 721 6/16/21 16
JPMorgan Chase Japanese Yen 76,010 United States Dollar 702 6/16/21 15
JPMorgan Chase United States Dollar 214 Canadian Dollar 270 6/16/21 1
Morgan Stanley Japanese Yen 53,910 United States Dollar 489 6/16/21 2
Morgan Stanley Swedish Krona 1,168 United States Dollar 137 6/16/21 3
Morgan Stanley Swiss Franc 230 United States Dollar 245 6/16/21 2
Toronto-Dominion Bank Canadian Dollar 530 United States Dollar 423 6/16/21 1
Toronto-Dominion Bank Hong Kong Dollar 1,674 United States Dollar 216 6/16/21 —*
Toronto-Dominion Bank United States Dollar 448 Canadian Dollar 564 6/16/21 1
Subtotal Appreciation 49
BNP United States Dollar 314 Euro 263 6/16/21 (5)
Citibank United States Dollar 111 British Pound 80 6/16/21 (2)
JPMorgan Chase United States Dollar 236 Euro 200 6/16/21 (1)
JPMorgan Chase United States Dollar 596 Japanese Yen 65,206 6/16/21 (7)
Morgan Stanley United States Dollar 916 Euro 765 6/16/21 (18)
Morgan Stanley United States Dollar 1,380 Japanese Yen 149,811 6/16/21 (26)
Morgan Stanley United States Dollar 62 Swiss Franc 57 6/16/21 (1)
Subtotal Depreciation (60)
Total $ (11)
* Amounts round to less than a thousand.
At March 31, 2021, the Fund had open futures contracts as follows:
TYPENUMBER OFCONTRACTS
NOTIONALAMOUNT
(000S)CONTRACTPOSITION
CONTRACTEXP.
VALUE ANDUNREALIZED
APPRECIATION(DEPRECIATION)
(000S)(1)
E-Mini S&P500(United StatesDollar) 62 $12,299 Long 6/21 $204
Euro Stoxx 50(Euro) 67 3,038 Long 6/21 58
FTSE 100Index (BritishPound) 5 460 Long 6/21 (4)
S C H E D U L E O F I N V E S T M E N T S
G LO BA L S U S TA I N A B I L I T Y I N D E X F U N D c o n t i n u e d
See Notes to the Financial Statements.
EQUIT Y INDEX FUNDS 68 NORTHERN FUNDS ANNUAL REPORT
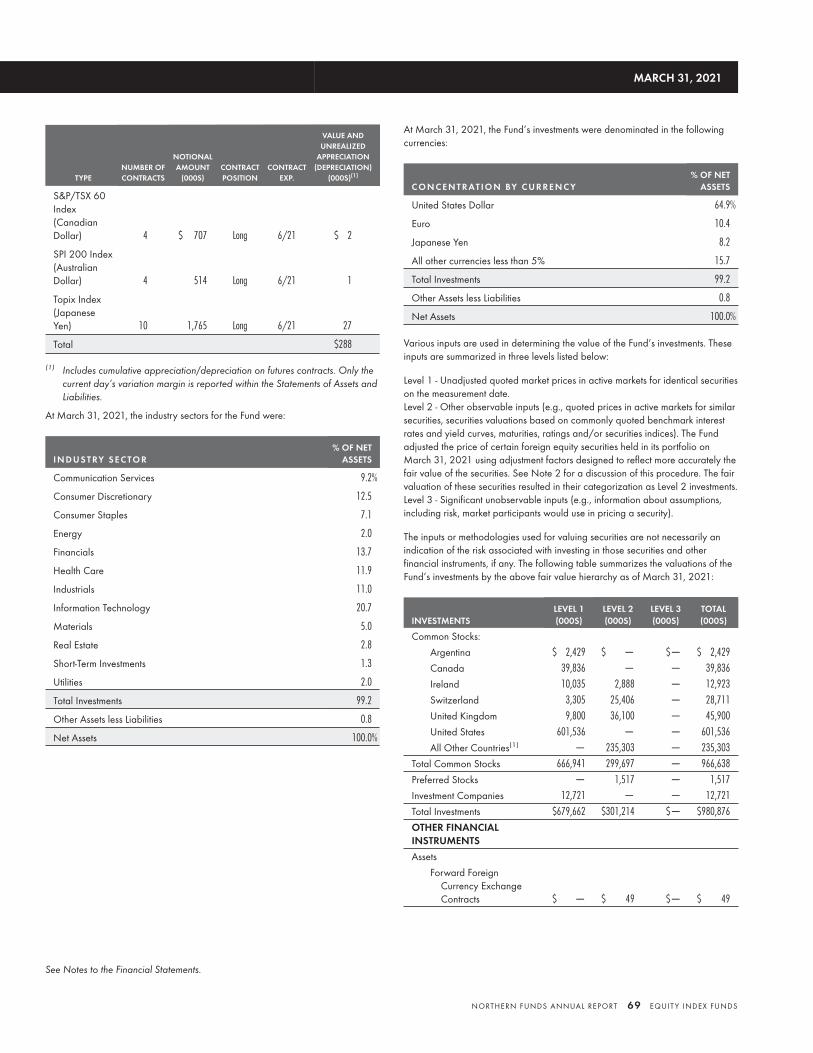
TYPENUMBER OFCONTRACTS
NOTIONALAMOUNT
(000S)CONTRACTPOSITION
CONTRACTEXP.
VALUE ANDUNREALIZED
APPRECIATION(DEPRECIATION)
(000S)(1)
S&P/TSX 60Index(CanadianDollar) 4 $ 707 Long 6/21 $ 2
SPI 200 Index(AustralianDollar) 4 514 Long 6/21 1
Topix Index(JapaneseYen) 10 1,765 Long 6/21 27
Total $288
(1) Includes cumulative appreciation/depreciation on futures contracts. Only thecurrent day’s variation margin is reported within the Statements of Assets andLiabilities.
At March 31, 2021, the industry sectors for the Fund were:
I N D U S T RY S E C TO R% OF NET
ASSETS
Communication Services 9.2%
Consumer Discretionary 12.5
Consumer Staples 7.1
Energy 2.0
Financials 13.7
Health Care 11.9
Industrials 11.0
Information Technology 20.7
Materials 5.0
Real Estate 2.8
Short-Term Investments 1.3
Utilities 2.0
Total Investments 99.2
Other Assets less Liabilities 0.8
Net Assets 100.0%
At March 31, 2021, the Fund’s investments were denominated in the followingcurrencies:
C O N C E N T R AT I O N BY C U R R E N C Y% OF NET
ASSETS
United States Dollar 64.9%
Euro 10.4
Japanese Yen 8.2
All other currencies less than 5% 15.7
Total Investments 99.2
Other Assets less Liabilities 0.8
Net Assets 100.0%
Various inputs are used in determining the value of the Fund’s investments. Theseinputs are summarized in three levels listed below:
Level 1 - Unadjusted quoted market prices in active markets for identical securitieson the measurement date.Level 2 - Other observable inputs (e.g., quoted prices in active markets for similarsecurities, securities valuations based on commonly quoted benchmark interestrates and yield curves, maturities, ratings and/or securities indices). The Fundadjusted the price of certain foreign equity securities held in its portfolio onMarch 31, 2021 using adjustment factors designed to reflect more accurately thefair value of the securities. See Note 2 for a discussion of this procedure. The fairvaluation of these securities resulted in their categorization as Level 2 investments.Level 3 - Significant unobservable inputs (e.g., information about assumptions,including risk, market participants would use in pricing a security).
The inputs or methodologies used for valuing securities are not necessarily anindication of the risk associated with investing in those securities and otherfinancial instruments, if any. The following table summarizes the valuations of theFund’s investments by the above fair value hierarchy as of March 31, 2021:
INVESTMENTSLEVEL 1(000S)
LEVEL 2(000S)
LEVEL 3(000S)
TOTAL(000S)
Common Stocks:
Argentina $ 2,429 $ — $— $ 2,429
Canada 39,836 — — 39,836
Ireland 10,035 2,888 — 12,923
Switzerland 3,305 25,406 — 28,711
United Kingdom 9,800 36,100 — 45,900
United States 601,536 — — 601,536
All Other Countries(1) — 235,303 — 235,303
Total Common Stocks 666,941 299,697 — 966,638
Preferred Stocks — 1,517 — 1,517
Investment Companies 12,721 — — 12,721
Total Investments $679,662 $301,214 $— $980,876
OTHER FINANCIALINSTRUMENTS
Assets
Forward ForeignCurrency ExchangeContracts $ — $ 49 $— $ 49
MARCH 31, 2021
See Notes to the Financial Statements.
NORTHERN FUNDS ANNUAL REPORT 69 EQUIT Y INDEX FUNDS

INVESTMENTSLEVEL 1(000S)
LEVEL 2(000S)
LEVEL 3(000S)
TOTAL(000S)
Futures Contracts $ 292 $ — $— $ 292
Liabilities
Forward ForeignCurrency ExchangeContracts — (60) — (60)
Futures Contracts (4) — — (4)
Total Other FinancialInstruments $ 288 $ (11) $— $ 277
(1) Classifications as defined in the Schedule of Investments.
S C H E D U L E O F I N V E S T M E N T S
G LO BA L S U S TA I N A B I L I T Y I N D E X F U N D c o n t i n u e d MARCH 31, 2021
See Notes to the Financial Statements.
EQUIT Y INDEX FUNDS 70 NORTHERN FUNDS ANNUAL REPORT
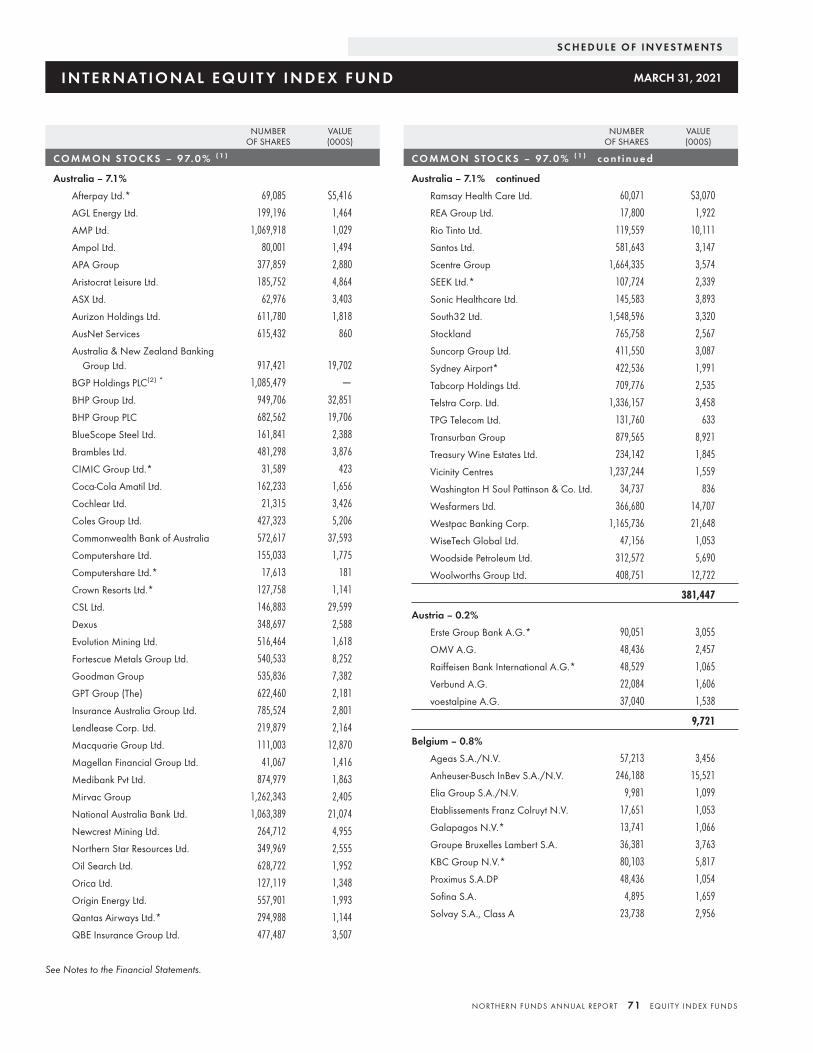
NUMBEROF SHARES
VALUE(000S)
C O M M O N S TO C KS – 9 7. 0 % ( 1 )
Australia – 7.1%
Afterpay Ltd.* 69,085 $5,416
AGL Energy Ltd. 199,196 1,464
AMP Ltd. 1,069,918 1,029
Ampol Ltd. 80,001 1,494
APA Group 377,859 2,880
Aristocrat Leisure Ltd. 185,752 4,864
ASX Ltd. 62,976 3,403
Aurizon Holdings Ltd. 611,780 1,818
AusNet Services 615,432 860
Australia & New Zealand BankingGroup Ltd. 917,421 19,702
BGP Holdings PLC(2) * 1,085,479 —
BHP Group Ltd. 949,706 32,851
BHP Group PLC 682,562 19,706
BlueScope Steel Ltd. 161,841 2,388
Brambles Ltd. 481,298 3,876
CIMIC Group Ltd.* 31,589 423
Coca-Cola Amatil Ltd. 162,233 1,656
Cochlear Ltd. 21,315 3,426
Coles Group Ltd. 427,323 5,206
Commonwealth Bank of Australia 572,617 37,593
Computershare Ltd. 155,033 1,775
Computershare Ltd.* 17,613 181
Crown Resorts Ltd.* 127,758 1,141
CSL Ltd. 146,883 29,599
Dexus 348,697 2,588
Evolution Mining Ltd. 516,464 1,618
Fortescue Metals Group Ltd. 540,533 8,252
Goodman Group 535,836 7,382
GPT Group (The) 622,460 2,181
Insurance Australia Group Ltd. 785,524 2,801
Lendlease Corp. Ltd. 219,879 2,164
Macquarie Group Ltd. 111,003 12,870
Magellan Financial Group Ltd. 41,067 1,416
Medibank Pvt Ltd. 874,979 1,863
Mirvac Group 1,262,343 2,405
National Australia Bank Ltd. 1,063,389 21,074
Newcrest Mining Ltd. 264,712 4,955
Northern Star Resources Ltd. 349,969 2,555
Oil Search Ltd. 628,722 1,952
Orica Ltd. 127,119 1,348
Origin Energy Ltd. 557,901 1,993
Qantas Airways Ltd.* 294,988 1,144
QBE Insurance Group Ltd. 477,487 3,507
NUMBEROF SHARES
VALUE(000S)
C O M M O N S TO C KS – 9 7. 0 % ( 1 ) c o n t i n u e d
Australia – 7.1% continued
Ramsay Health Care Ltd. 60,071 $3,070
REA Group Ltd. 17,800 1,922
Rio Tinto Ltd. 119,559 10,111
Santos Ltd. 581,643 3,147
Scentre Group 1,664,335 3,574
SEEK Ltd.* 107,724 2,339
Sonic Healthcare Ltd. 145,583 3,893
South32 Ltd. 1,548,596 3,320
Stockland 765,758 2,567
Suncorp Group Ltd. 411,550 3,087
Sydney Airport* 422,536 1,991
Tabcorp Holdings Ltd. 709,776 2,535
Telstra Corp. Ltd. 1,336,157 3,458
TPG Telecom Ltd. 131,760 633
Transurban Group 879,565 8,921
Treasury Wine Estates Ltd. 234,142 1,845
Vicinity Centres 1,237,244 1,559
Washington H Soul Pattinson & Co. Ltd. 34,737 836
Wesfarmers Ltd. 366,680 14,707
Westpac Banking Corp. 1,165,736 21,648
WiseTech Global Ltd. 47,156 1,053
Woodside Petroleum Ltd. 312,572 5,690
Woolworths Group Ltd. 408,751 12,722
381,447
Austria – 0.2%
Erste Group Bank A.G.* 90,051 3,055
OMV A.G. 48,436 2,457
Raiffeisen Bank International A.G.* 48,529 1,065
Verbund A.G. 22,084 1,606
voestalpine A.G. 37,040 1,538
9,721
Belgium – 0.8%
Ageas S.A./N.V. 57,213 3,456
Anheuser-Busch InBev S.A./N.V. 246,188 15,521
Elia Group S.A./N.V. 9,981 1,099
Etablissements Franz Colruyt N.V. 17,651 1,053
Galapagos N.V.* 13,741 1,066
Groupe Bruxelles Lambert S.A. 36,381 3,763
KBC Group N.V.* 80,103 5,817
Proximus S.A.DP 48,436 1,054
Sofina S.A. 4,895 1,659
Solvay S.A., Class A 23,738 2,956
S C H E D U L E O F I N V E S T M E N T S
I N T E R N AT I O N A L E Q U I T Y I N D E X F U N D MARCH 31, 2021
See Notes to the Financial Statements.
NORTHERN FUNDS ANNUAL REPORT 71 EQUIT Y INDEX FUNDS
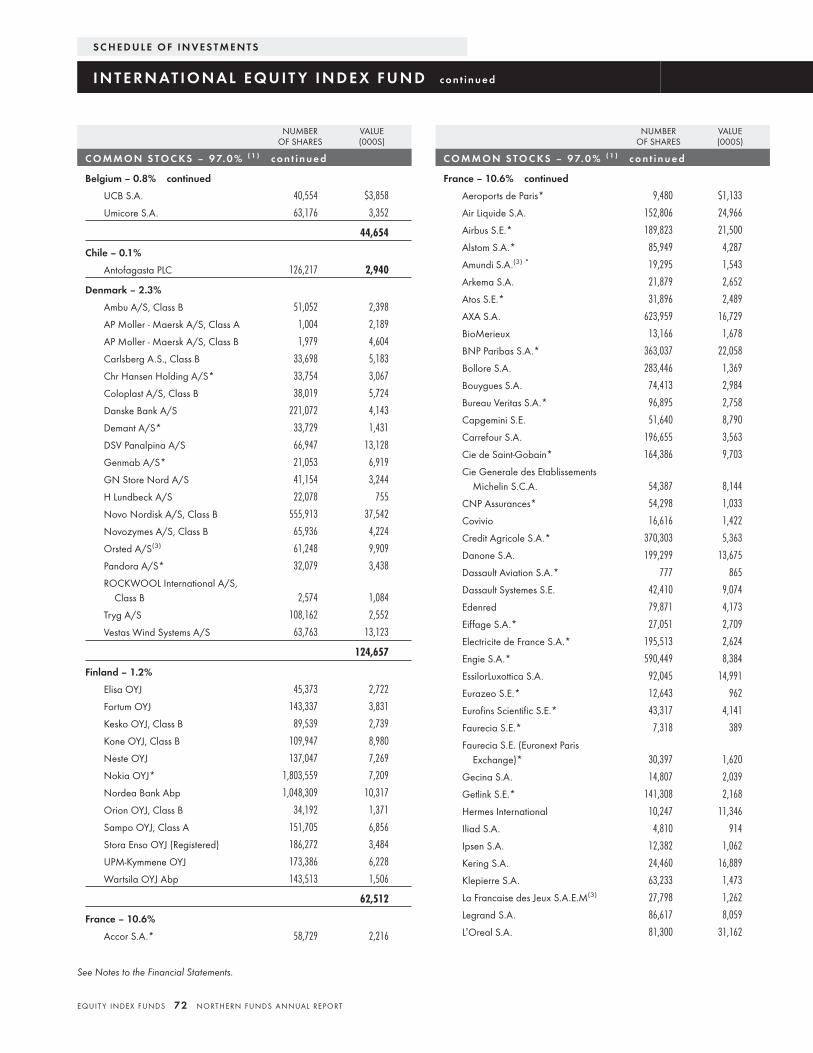
NUMBEROF SHARES
VALUE(000S)
C O M M O N S TO C KS – 9 7. 0 % ( 1 ) c o n t i n u e d
Belgium – 0.8% continued
UCB S.A. 40,554 $3,858
Umicore S.A. 63,176 3,352
44,654
Chile – 0.1%
Antofagasta PLC 126,217 2,940
Denmark – 2.3%
Ambu A/S, Class B 51,052 2,398
AP Moller - Maersk A/S, Class A 1,004 2,189
AP Moller - Maersk A/S, Class B 1,979 4,604
Carlsberg A.S., Class B 33,698 5,183
Chr Hansen Holding A/S* 33,754 3,067
Coloplast A/S, Class B 38,019 5,724
Danske Bank A/S 221,072 4,143
Demant A/S* 33,729 1,431
DSV Panalpina A/S 66,947 13,128
Genmab A/S* 21,053 6,919
GN Store Nord A/S 41,154 3,244
H Lundbeck A/S 22,078 755
Novo Nordisk A/S, Class B 555,913 37,542
Novozymes A/S, Class B 65,936 4,224
Orsted A/S(3) 61,248 9,909
Pandora A/S* 32,079 3,438
ROCKWOOL International A/S,Class B 2,574 1,084
Tryg A/S 108,162 2,552
Vestas Wind Systems A/S 63,763 13,123
124,657
Finland – 1.2%
Elisa OYJ 45,373 2,722
Fortum OYJ 143,337 3,831
Kesko OYJ, Class B 89,539 2,739
Kone OYJ, Class B 109,947 8,980
Neste OYJ 137,047 7,269
Nokia OYJ* 1,803,559 7,209
Nordea Bank Abp 1,048,309 10,317
Orion OYJ, Class B 34,192 1,371
Sampo OYJ, Class A 151,705 6,856
Stora Enso OYJ (Registered) 186,272 3,484
UPM-Kymmene OYJ 173,386 6,228
Wartsila OYJ Abp 143,513 1,506
62,512
France – 10.6%
Accor S.A.* 58,729 2,216
NUMBEROF SHARES
VALUE(000S)
C O M M O N S TO C KS – 9 7. 0 % ( 1 ) c o n t i n u e d
France – 10.6% continued
Aeroports de Paris* 9,480 $1,133
Air Liquide S.A. 152,806 24,966
Airbus S.E.* 189,823 21,500
Alstom S.A.* 85,949 4,287
Amundi S.A.(3) * 19,295 1,543
Arkema S.A. 21,879 2,652
Atos S.E.* 31,896 2,489
AXA S.A. 623,959 16,729
BioMerieux 13,166 1,678
BNP Paribas S.A.* 363,037 22,058
Bollore S.A. 283,446 1,369
Bouygues S.A. 74,413 2,984
Bureau Veritas S.A.* 96,895 2,758
Capgemini S.E. 51,640 8,790
Carrefour S.A. 196,655 3,563
Cie de Saint-Gobain* 164,386 9,703
Cie Generale des EtablissementsMichelin S.C.A. 54,387 8,144
CNP Assurances* 54,298 1,033
Covivio 16,616 1,422
Credit Agricole S.A.* 370,303 5,363
Danone S.A. 199,299 13,675
Dassault Aviation S.A.* 777 865
Dassault Systemes S.E. 42,410 9,074
Edenred 79,871 4,173
Eiffage S.A.* 27,051 2,709
Electricite de France S.A.* 195,513 2,624
Engie S.A.* 590,449 8,384
EssilorLuxottica S.A. 92,045 14,991
Eurazeo S.E.* 12,643 962
Eurofins Scientific S.E.* 43,317 4,141
Faurecia S.E.* 7,318 389
Faurecia S.E. (Euronext ParisExchange)* 30,397 1,620
Gecina S.A. 14,807 2,039
Getlink S.E.* 141,308 2,168
Hermes International 10,247 11,346
Iliad S.A. 4,810 914
Ipsen S.A. 12,382 1,062
Kering S.A. 24,460 16,889
Klepierre S.A. 63,233 1,473
La Francaise des Jeux S.A.E.M(3) 27,798 1,262
Legrand S.A. 86,617 8,059
L’Oreal S.A. 81,300 31,162
S C H E D U L E O F I N V E S T M E N T S
I N T E R N AT I O N A L E Q U I T Y I N D E X F U N D c o n t i n u e d
See Notes to the Financial Statements.
EQUIT Y INDEX FUNDS 72 NORTHERN FUNDS ANNUAL REPORT
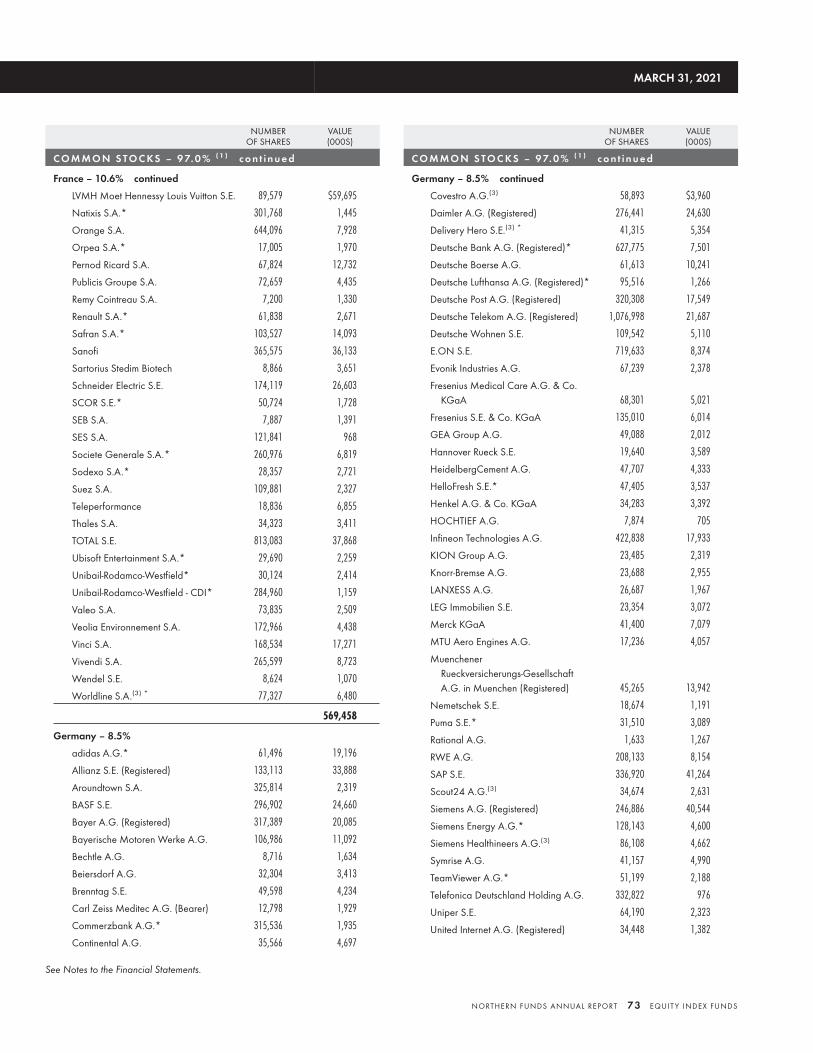
NUMBEROF SHARES
VALUE(000S)
C O M M O N S TO C KS – 9 7. 0 % ( 1 ) c o n t i n u e d
France – 10.6% continued
LVMH Moet Hennessy Louis Vuitton S.E. 89,579 $59,695
Natixis S.A.* 301,768 1,445
Orange S.A. 644,096 7,928
Orpea S.A.* 17,005 1,970
Pernod Ricard S.A. 67,824 12,732
Publicis Groupe S.A. 72,659 4,435
Remy Cointreau S.A. 7,200 1,330
Renault S.A.* 61,838 2,671
Safran S.A.* 103,527 14,093
Sanofi 365,575 36,133
Sartorius Stedim Biotech 8,866 3,651
Schneider Electric S.E. 174,119 26,603
SCOR S.E.* 50,724 1,728
SEB S.A. 7,887 1,391
SES S.A. 121,841 968
Societe Generale S.A.* 260,976 6,819
Sodexo S.A.* 28,357 2,721
Suez S.A. 109,881 2,327
Teleperformance 18,836 6,855
Thales S.A. 34,323 3,411
TOTAL S.E. 813,083 37,868
Ubisoft Entertainment S.A.* 29,690 2,259
Unibail-Rodamco-Westfield* 30,124 2,414
Unibail-Rodamco-Westfield - CDI* 284,960 1,159
Valeo S.A. 73,835 2,509
Veolia Environnement S.A. 172,966 4,438
Vinci S.A. 168,534 17,271
Vivendi S.A. 265,599 8,723
Wendel S.E. 8,624 1,070
Worldline S.A.(3) * 77,327 6,480
569,458
Germany – 8.5%
adidas A.G.* 61,496 19,196
Allianz S.E. (Registered) 133,113 33,888
Aroundtown S.A. 325,814 2,319
BASF S.E. 296,902 24,660
Bayer A.G. (Registered) 317,389 20,085
Bayerische Motoren Werke A.G. 106,986 11,092
Bechtle A.G. 8,716 1,634
Beiersdorf A.G. 32,304 3,413
Brenntag S.E. 49,598 4,234
Carl Zeiss Meditec A.G. (Bearer) 12,798 1,929
Commerzbank A.G.* 315,536 1,935
Continental A.G. 35,566 4,697
NUMBEROF SHARES
VALUE(000S)
C O M M O N S TO C KS – 9 7. 0 % ( 1 ) c o n t i n u e d
Germany – 8.5% continued
Covestro A.G.(3) 58,893 $3,960
Daimler A.G. (Registered) 276,441 24,630
Delivery Hero S.E.(3) * 41,315 5,354
Deutsche Bank A.G. (Registered)* 627,775 7,501
Deutsche Boerse A.G. 61,613 10,241
Deutsche Lufthansa A.G. (Registered)* 95,516 1,266
Deutsche Post A.G. (Registered) 320,308 17,549
Deutsche Telekom A.G. (Registered) 1,076,998 21,687
Deutsche Wohnen S.E. 109,542 5,110
E.ON S.E. 719,633 8,374
Evonik Industries A.G. 67,239 2,378
Fresenius Medical Care A.G. & Co.KGaA 68,301 5,021
Fresenius S.E. & Co. KGaA 135,010 6,014
GEA Group A.G. 49,088 2,012
Hannover Rueck S.E. 19,640 3,589
HeidelbergCement A.G. 47,707 4,333
HelloFresh S.E.* 47,405 3,537
Henkel A.G. & Co. KGaA 34,283 3,392
HOCHTIEF A.G. 7,874 705
Infineon Technologies A.G. 422,838 17,933
KION Group A.G. 23,485 2,319
Knorr-Bremse A.G. 23,688 2,955
LANXESS A.G. 26,687 1,967
LEG Immobilien S.E. 23,354 3,072
Merck KGaA 41,400 7,079
MTU Aero Engines A.G. 17,236 4,057
MuenchenerRueckversicherungs-GesellschaftA.G. in Muenchen (Registered) 45,265 13,942
Nemetschek S.E. 18,674 1,191
Puma S.E.* 31,510 3,089
Rational A.G. 1,633 1,267
RWE A.G. 208,133 8,154
SAP S.E. 336,920 41,264
Scout24 A.G.(3) 34,674 2,631
Siemens A.G. (Registered) 246,886 40,544
Siemens Energy A.G.* 128,143 4,600
Siemens Healthineers A.G.(3) 86,108 4,662
Symrise A.G. 41,157 4,990
TeamViewer A.G.* 51,199 2,188
Telefonica Deutschland Holding A.G. 332,822 976
Uniper S.E. 64,190 2,323
United Internet A.G. (Registered) 34,448 1,382
MARCH 31, 2021
See Notes to the Financial Statements.
NORTHERN FUNDS ANNUAL REPORT 73 EQUIT Y INDEX FUNDS
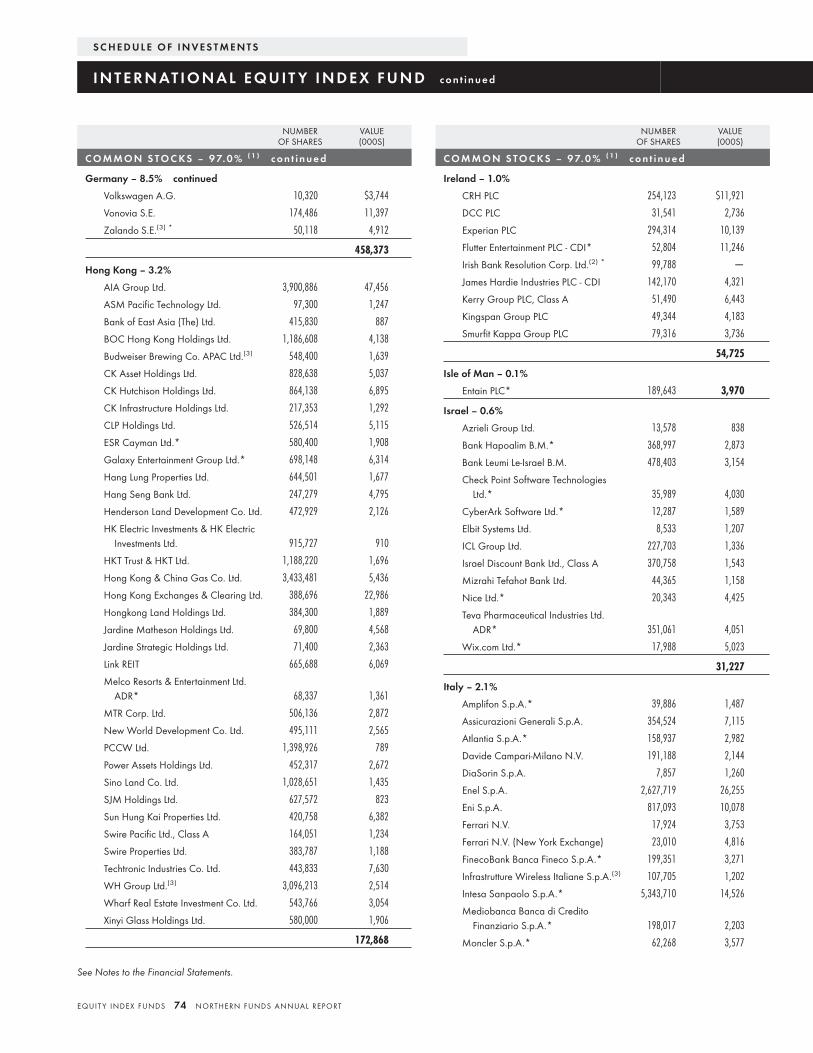
NUMBEROF SHARES
VALUE(000S)
C O M M O N S TO C KS – 9 7. 0 % ( 1 ) c o n t i n u e d
Germany – 8.5% continued
Volkswagen A.G. 10,320 $3,744
Vonovia S.E. 174,486 11,397
Zalando S.E.(3) * 50,118 4,912
458,373
Hong Kong – 3.2%
AIA Group Ltd. 3,900,886 47,456
ASM Pacific Technology Ltd. 97,300 1,247
Bank of East Asia (The) Ltd. 415,830 887
BOC Hong Kong Holdings Ltd. 1,186,608 4,138
Budweiser Brewing Co. APAC Ltd.(3) 548,400 1,639
CK Asset Holdings Ltd. 828,638 5,037
CK Hutchison Holdings Ltd. 864,138 6,895
CK Infrastructure Holdings Ltd. 217,353 1,292
CLP Holdings Ltd. 526,514 5,115
ESR Cayman Ltd.* 580,400 1,908
Galaxy Entertainment Group Ltd.* 698,148 6,314
Hang Lung Properties Ltd. 644,501 1,677
Hang Seng Bank Ltd. 247,279 4,795
Henderson Land Development Co. Ltd. 472,929 2,126
HK Electric Investments & HK ElectricInvestments Ltd. 915,727 910
HKT Trust & HKT Ltd. 1,188,220 1,696
Hong Kong & China Gas Co. Ltd. 3,433,481 5,436
Hong Kong Exchanges & Clearing Ltd. 388,696 22,986
Hongkong Land Holdings Ltd. 384,300 1,889
Jardine Matheson Holdings Ltd. 69,800 4,568
Jardine Strategic Holdings Ltd. 71,400 2,363
Link REIT 665,688 6,069
Melco Resorts & Entertainment Ltd.ADR* 68,337 1,361
MTR Corp. Ltd. 506,136 2,872
New World Development Co. Ltd. 495,111 2,565
PCCW Ltd. 1,398,926 789
Power Assets Holdings Ltd. 452,317 2,672
Sino Land Co. Ltd. 1,028,651 1,435
SJM Holdings Ltd. 627,572 823
Sun Hung Kai Properties Ltd. 420,758 6,382
Swire Pacific Ltd., Class A 164,051 1,234
Swire Properties Ltd. 383,787 1,188
Techtronic Industries Co. Ltd. 443,833 7,630
WH Group Ltd.(3) 3,096,213 2,514
Wharf Real Estate Investment Co. Ltd. 543,766 3,054
Xinyi Glass Holdings Ltd. 580,000 1,906
172,868
NUMBEROF SHARES
VALUE(000S)
C O M M O N S TO C KS – 9 7. 0 % ( 1 ) c o n t i n u e d
Ireland – 1.0%
CRH PLC 254,123 $11,921
DCC PLC 31,541 2,736
Experian PLC 294,314 10,139
Flutter Entertainment PLC - CDI* 52,804 11,246
Irish Bank Resolution Corp. Ltd.(2) * 99,788 —
James Hardie Industries PLC - CDI 142,170 4,321
Kerry Group PLC, Class A 51,490 6,443
Kingspan Group PLC 49,344 4,183
Smurfit Kappa Group PLC 79,316 3,736
54,725
Isle of Man – 0.1%
Entain PLC* 189,643 3,970
Israel – 0.6%
Azrieli Group Ltd. 13,578 838
Bank Hapoalim B.M.* 368,997 2,873
Bank Leumi Le-Israel B.M. 478,403 3,154
Check Point Software TechnologiesLtd.* 35,989 4,030
CyberArk Software Ltd.* 12,287 1,589
Elbit Systems Ltd. 8,533 1,207
ICL Group Ltd. 227,703 1,336
Israel Discount Bank Ltd., Class A 370,758 1,543
Mizrahi Tefahot Bank Ltd. 44,365 1,158
Nice Ltd.* 20,343 4,425
Teva Pharmaceutical Industries Ltd.ADR* 351,061 4,051
Wix.com Ltd.* 17,988 5,023
31,227
Italy – 2.1%
Amplifon S.p.A.* 39,886 1,487
Assicurazioni Generali S.p.A. 354,524 7,115
Atlantia S.p.A.* 158,937 2,982
Davide Campari-Milano N.V. 191,188 2,144
DiaSorin S.p.A. 7,857 1,260
Enel S.p.A. 2,627,719 26,255
Eni S.p.A. 817,093 10,078
Ferrari N.V. 17,924 3,753
Ferrari N.V. (New York Exchange) 23,010 4,816
FinecoBank Banca Fineco S.p.A.* 199,351 3,271
Infrastrutture Wireless Italiane S.p.A.(3) 107,705 1,202
Intesa Sanpaolo S.p.A.* 5,343,710 14,526
Mediobanca Banca di CreditoFinanziario S.p.A.* 198,017 2,203
Moncler S.p.A.* 62,268 3,577
S C H E D U L E O F I N V E S T M E N T S
I N T E R N AT I O N A L E Q U I T Y I N D E X F U N D c o n t i n u e d
See Notes to the Financial Statements.
EQUIT Y INDEX FUNDS 74 NORTHERN FUNDS ANNUAL REPORT
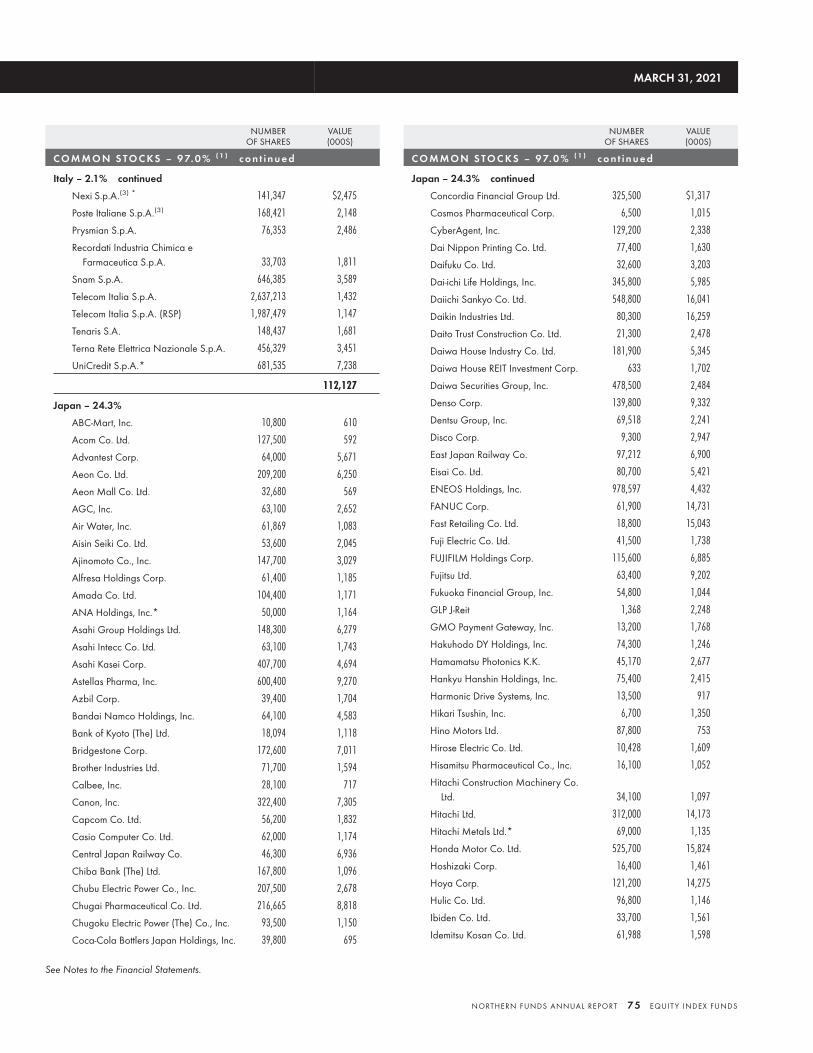
NUMBEROF SHARES
VALUE(000S)
C O M M O N S TO C KS – 9 7. 0 % ( 1 ) c o n t i n u e d
Italy – 2.1% continued
Nexi S.p.A.(3) * 141,347 $2,475
Poste Italiane S.p.A.(3) 168,421 2,148
Prysmian S.p.A. 76,353 2,486
Recordati Industria Chimica eFarmaceutica S.p.A. 33,703 1,811
Snam S.p.A. 646,385 3,589
Telecom Italia S.p.A. 2,637,213 1,432
Telecom Italia S.p.A. (RSP) 1,987,479 1,147
Tenaris S.A. 148,437 1,681
Terna Rete Elettrica Nazionale S.p.A. 456,329 3,451
UniCredit S.p.A.* 681,535 7,238
112,127
Japan – 24.3%
ABC-Mart, Inc. 10,800 610
Acom Co. Ltd. 127,500 592
Advantest Corp. 64,000 5,671
Aeon Co. Ltd. 209,200 6,250
Aeon Mall Co. Ltd. 32,680 569
AGC, Inc. 63,100 2,652
Air Water, Inc. 61,869 1,083
Aisin Seiki Co. Ltd. 53,600 2,045
Ajinomoto Co., Inc. 147,700 3,029
Alfresa Holdings Corp. 61,400 1,185
Amada Co. Ltd. 104,400 1,171
ANA Holdings, Inc.* 50,000 1,164
Asahi Group Holdings Ltd. 148,300 6,279
Asahi Intecc Co. Ltd. 63,100 1,743
Asahi Kasei Corp. 407,700 4,694
Astellas Pharma, Inc. 600,400 9,270
Azbil Corp. 39,400 1,704
Bandai Namco Holdings, Inc. 64,100 4,583
Bank of Kyoto (The) Ltd. 18,094 1,118
Bridgestone Corp. 172,600 7,011
Brother Industries Ltd. 71,700 1,594
Calbee, Inc. 28,100 717
Canon, Inc. 322,400 7,305
Capcom Co. Ltd. 56,200 1,832
Casio Computer Co. Ltd. 62,000 1,174
Central Japan Railway Co. 46,300 6,936
Chiba Bank (The) Ltd. 167,800 1,096
Chubu Electric Power Co., Inc. 207,500 2,678
Chugai Pharmaceutical Co. Ltd. 216,665 8,818
Chugoku Electric Power (The) Co., Inc. 93,500 1,150
Coca-Cola Bottlers Japan Holdings, Inc. 39,800 695
NUMBEROF SHARES
VALUE(000S)
C O M M O N S TO C KS – 9 7. 0 % ( 1 ) c o n t i n u e d
Japan – 24.3% continued
Concordia Financial Group Ltd. 325,500 $1,317
Cosmos Pharmaceutical Corp. 6,500 1,015
CyberAgent, Inc. 129,200 2,338
Dai Nippon Printing Co. Ltd. 77,400 1,630
Daifuku Co. Ltd. 32,600 3,203
Dai-ichi Life Holdings, Inc. 345,800 5,985
Daiichi Sankyo Co. Ltd. 548,800 16,041
Daikin Industries Ltd. 80,300 16,259
Daito Trust Construction Co. Ltd. 21,300 2,478
Daiwa House Industry Co. Ltd. 181,900 5,345
Daiwa House REIT Investment Corp. 633 1,702
Daiwa Securities Group, Inc. 478,500 2,484
Denso Corp. 139,800 9,332
Dentsu Group, Inc. 69,518 2,241
Disco Corp. 9,300 2,947
East Japan Railway Co. 97,212 6,900
Eisai Co. Ltd. 80,700 5,421
ENEOS Holdings, Inc. 978,597 4,432
FANUC Corp. 61,900 14,731
Fast Retailing Co. Ltd. 18,800 15,043
Fuji Electric Co. Ltd. 41,500 1,738
FUJIFILM Holdings Corp. 115,600 6,885
Fujitsu Ltd. 63,400 9,202
Fukuoka Financial Group, Inc. 54,800 1,044
GLP J-Reit 1,368 2,248
GMO Payment Gateway, Inc. 13,200 1,768
Hakuhodo DY Holdings, Inc. 74,300 1,246
Hamamatsu Photonics K.K. 45,170 2,677
Hankyu Hanshin Holdings, Inc. 75,400 2,415
Harmonic Drive Systems, Inc. 13,500 917
Hikari Tsushin, Inc. 6,700 1,350
Hino Motors Ltd. 87,800 753
Hirose Electric Co. Ltd. 10,428 1,609
Hisamitsu Pharmaceutical Co., Inc. 16,100 1,052
Hitachi Construction Machinery Co.Ltd. 34,100 1,097
Hitachi Ltd. 312,000 14,173
Hitachi Metals Ltd.* 69,000 1,135
Honda Motor Co. Ltd. 525,700 15,824
Hoshizaki Corp. 16,400 1,461
Hoya Corp. 121,200 14,275
Hulic Co. Ltd. 96,800 1,146
Ibiden Co. Ltd. 33,700 1,561
Idemitsu Kosan Co. Ltd. 61,988 1,598
MARCH 31, 2021
See Notes to the Financial Statements.
NORTHERN FUNDS ANNUAL REPORT 75 EQUIT Y INDEX FUNDS
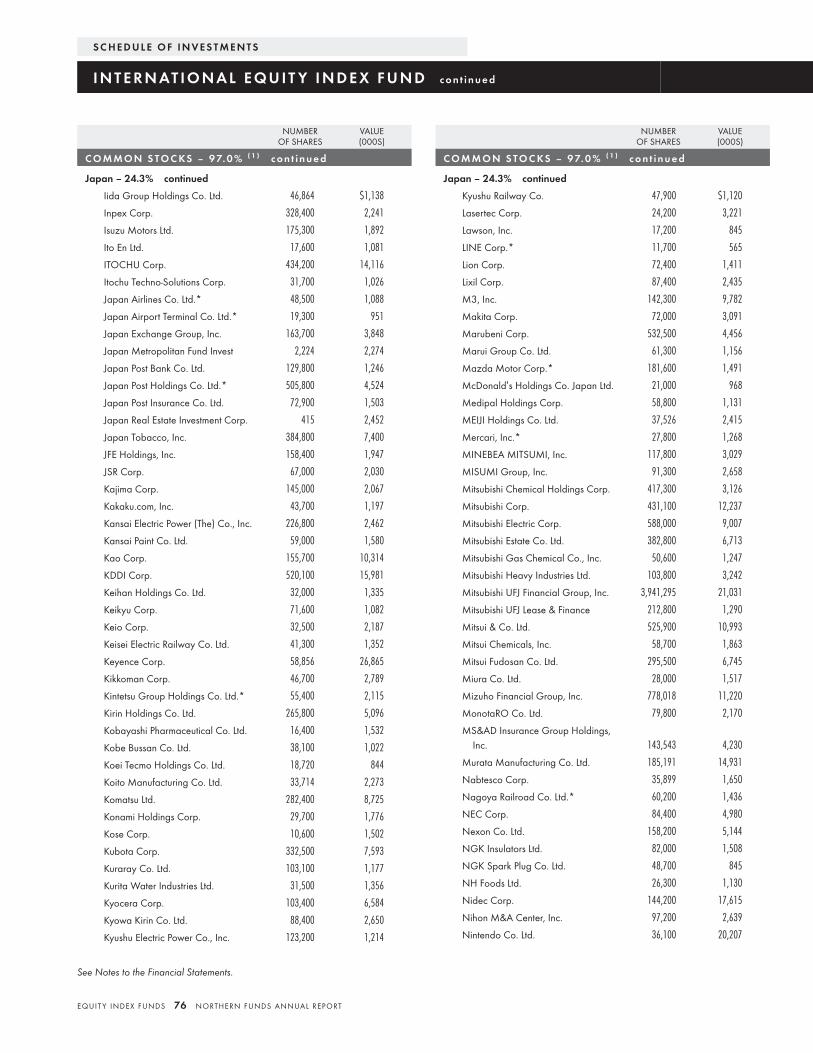
NUMBEROF SHARES
VALUE(000S)
C O M M O N S TO C KS – 9 7. 0 % ( 1 ) c o n t i n u e d
Japan – 24.3% continued
Iida Group Holdings Co. Ltd. 46,864 $1,138
Inpex Corp. 328,400 2,241
Isuzu Motors Ltd. 175,300 1,892
Ito En Ltd. 17,600 1,081
ITOCHU Corp. 434,200 14,116
Itochu Techno-Solutions Corp. 31,700 1,026
Japan Airlines Co. Ltd.* 48,500 1,088
Japan Airport Terminal Co. Ltd.* 19,300 951
Japan Exchange Group, Inc. 163,700 3,848
Japan Metropolitan Fund Invest 2,224 2,274
Japan Post Bank Co. Ltd. 129,800 1,246
Japan Post Holdings Co. Ltd.* 505,800 4,524
Japan Post Insurance Co. Ltd. 72,900 1,503
Japan Real Estate Investment Corp. 415 2,452
Japan Tobacco, Inc. 384,800 7,400
JFE Holdings, Inc. 158,400 1,947
JSR Corp. 67,000 2,030
Kajima Corp. 145,000 2,067
Kakaku.com, Inc. 43,700 1,197
Kansai Electric Power (The) Co., Inc. 226,800 2,462
Kansai Paint Co. Ltd. 59,000 1,580
Kao Corp. 155,700 10,314
KDDI Corp. 520,100 15,981
Keihan Holdings Co. Ltd. 32,000 1,335
Keikyu Corp. 71,600 1,082
Keio Corp. 32,500 2,187
Keisei Electric Railway Co. Ltd. 41,300 1,352
Keyence Corp. 58,856 26,865
Kikkoman Corp. 46,700 2,789
Kintetsu Group Holdings Co. Ltd.* 55,400 2,115
Kirin Holdings Co. Ltd. 265,800 5,096
Kobayashi Pharmaceutical Co. Ltd. 16,400 1,532
Kobe Bussan Co. Ltd. 38,100 1,022
Koei Tecmo Holdings Co. Ltd. 18,720 844
Koito Manufacturing Co. Ltd. 33,714 2,273
Komatsu Ltd. 282,400 8,725
Konami Holdings Corp. 29,700 1,776
Kose Corp. 10,600 1,502
Kubota Corp. 332,500 7,593
Kuraray Co. Ltd. 103,100 1,177
Kurita Water Industries Ltd. 31,500 1,356
Kyocera Corp. 103,400 6,584
Kyowa Kirin Co. Ltd. 88,400 2,650
Kyushu Electric Power Co., Inc. 123,200 1,214
NUMBEROF SHARES
VALUE(000S)
C O M M O N S TO C KS – 9 7. 0 % ( 1 ) c o n t i n u e d
Japan – 24.3% continued
Kyushu Railway Co. 47,900 $1,120
Lasertec Corp. 24,200 3,221
Lawson, Inc. 17,200 845
LINE Corp.* 11,700 565
Lion Corp. 72,400 1,411
Lixil Corp. 87,400 2,435
M3, Inc. 142,300 9,782
Makita Corp. 72,000 3,091
Marubeni Corp. 532,500 4,456
Marui Group Co. Ltd. 61,300 1,156
Mazda Motor Corp.* 181,600 1,491
McDonald’s Holdings Co. Japan Ltd. 21,000 968
Medipal Holdings Corp. 58,800 1,131
MEIJI Holdings Co. Ltd. 37,526 2,415
Mercari, Inc.* 27,800 1,268
MINEBEA MITSUMI, Inc. 117,800 3,029
MISUMI Group, Inc. 91,300 2,658
Mitsubishi Chemical Holdings Corp. 417,300 3,126
Mitsubishi Corp. 431,100 12,237
Mitsubishi Electric Corp. 588,000 9,007
Mitsubishi Estate Co. Ltd. 382,800 6,713
Mitsubishi Gas Chemical Co., Inc. 50,600 1,247
Mitsubishi Heavy Industries Ltd. 103,800 3,242
Mitsubishi UFJ Financial Group, Inc. 3,941,295 21,031
Mitsubishi UFJ Lease & Finance 212,800 1,290
Mitsui & Co. Ltd. 525,900 10,993
Mitsui Chemicals, Inc. 58,700 1,863
Mitsui Fudosan Co. Ltd. 295,500 6,745
Miura Co. Ltd. 28,000 1,517
Mizuho Financial Group, Inc. 778,018 11,220
MonotaRO Co. Ltd. 79,800 2,170
MS&AD Insurance Group Holdings,Inc. 143,543 4,230
Murata Manufacturing Co. Ltd. 185,191 14,931
Nabtesco Corp. 35,899 1,650
Nagoya Railroad Co. Ltd.* 60,200 1,436
NEC Corp. 84,400 4,980
Nexon Co. Ltd. 158,200 5,144
NGK Insulators Ltd. 82,000 1,508
NGK Spark Plug Co. Ltd. 48,700 845
NH Foods Ltd. 26,300 1,130
Nidec Corp. 144,200 17,615
Nihon M&A Center, Inc. 97,200 2,639
Nintendo Co. Ltd. 36,100 20,207
S C H E D U L E O F I N V E S T M E N T S
I N T E R N AT I O N A L E Q U I T Y I N D E X F U N D c o n t i n u e d
See Notes to the Financial Statements.
EQUIT Y INDEX FUNDS 76 NORTHERN FUNDS ANNUAL REPORT
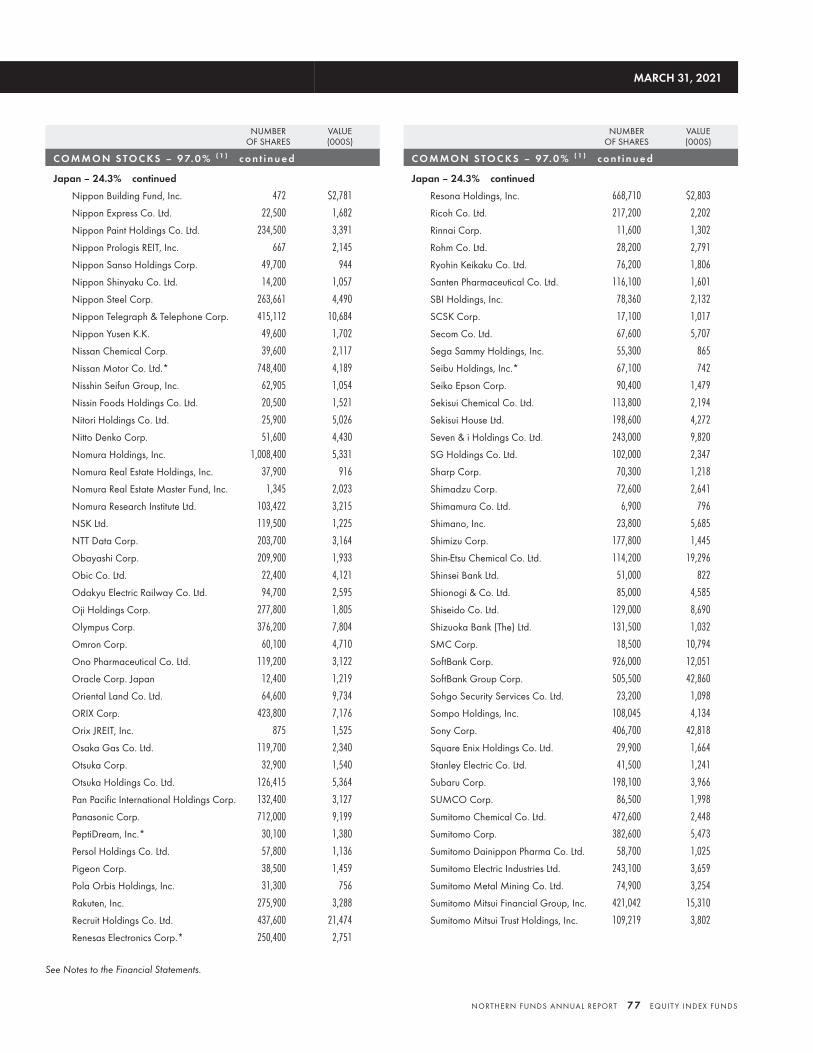
NUMBEROF SHARES
VALUE(000S)
C O M M O N S TO C KS – 9 7. 0 % ( 1 ) c o n t i n u e d
Japan – 24.3% continued
Nippon Building Fund, Inc. 472 $2,781
Nippon Express Co. Ltd. 22,500 1,682
Nippon Paint Holdings Co. Ltd. 234,500 3,391
Nippon Prologis REIT, Inc. 667 2,145
Nippon Sanso Holdings Corp. 49,700 944
Nippon Shinyaku Co. Ltd. 14,200 1,057
Nippon Steel Corp. 263,661 4,490
Nippon Telegraph & Telephone Corp. 415,112 10,684
Nippon Yusen K.K. 49,600 1,702
Nissan Chemical Corp. 39,600 2,117
Nissan Motor Co. Ltd.* 748,400 4,189
Nisshin Seifun Group, Inc. 62,905 1,054
Nissin Foods Holdings Co. Ltd. 20,500 1,521
Nitori Holdings Co. Ltd. 25,900 5,026
Nitto Denko Corp. 51,600 4,430
Nomura Holdings, Inc. 1,008,400 5,331
Nomura Real Estate Holdings, Inc. 37,900 916
Nomura Real Estate Master Fund, Inc. 1,345 2,023
Nomura Research Institute Ltd. 103,422 3,215
NSK Ltd. 119,500 1,225
NTT Data Corp. 203,700 3,164
Obayashi Corp. 209,900 1,933
Obic Co. Ltd. 22,400 4,121
Odakyu Electric Railway Co. Ltd. 94,700 2,595
Oji Holdings Corp. 277,800 1,805
Olympus Corp. 376,200 7,804
Omron Corp. 60,100 4,710
Ono Pharmaceutical Co. Ltd. 119,200 3,122
Oracle Corp. Japan 12,400 1,219
Oriental Land Co. Ltd. 64,600 9,734
ORIX Corp. 423,800 7,176
Orix JREIT, Inc. 875 1,525
Osaka Gas Co. Ltd. 119,700 2,340
Otsuka Corp. 32,900 1,540
Otsuka Holdings Co. Ltd. 126,415 5,364
Pan Pacific International Holdings Corp. 132,400 3,127
Panasonic Corp. 712,000 9,199
PeptiDream, Inc.* 30,100 1,380
Persol Holdings Co. Ltd. 57,800 1,136
Pigeon Corp. 38,500 1,459
Pola Orbis Holdings, Inc. 31,300 756
Rakuten, Inc. 275,900 3,288
Recruit Holdings Co. Ltd. 437,600 21,474
Renesas Electronics Corp.* 250,400 2,751
NUMBEROF SHARES
VALUE(000S)
C O M M O N S TO C KS – 9 7. 0 % ( 1 ) c o n t i n u e d
Japan – 24.3% continued
Resona Holdings, Inc. 668,710 $2,803
Ricoh Co. Ltd. 217,200 2,202
Rinnai Corp. 11,600 1,302
Rohm Co. Ltd. 28,200 2,791
Ryohin Keikaku Co. Ltd. 76,200 1,806
Santen Pharmaceutical Co. Ltd. 116,100 1,601
SBI Holdings, Inc. 78,360 2,132
SCSK Corp. 17,100 1,017
Secom Co. Ltd. 67,600 5,707
Sega Sammy Holdings, Inc. 55,300 865
Seibu Holdings, Inc.* 67,100 742
Seiko Epson Corp. 90,400 1,479
Sekisui Chemical Co. Ltd. 113,800 2,194
Sekisui House Ltd. 198,600 4,272
Seven & i Holdings Co. Ltd. 243,000 9,820
SG Holdings Co. Ltd. 102,000 2,347
Sharp Corp. 70,300 1,218
Shimadzu Corp. 72,600 2,641
Shimamura Co. Ltd. 6,900 796
Shimano, Inc. 23,800 5,685
Shimizu Corp. 177,800 1,445
Shin-Etsu Chemical Co. Ltd. 114,200 19,296
Shinsei Bank Ltd. 51,000 822
Shionogi & Co. Ltd. 85,000 4,585
Shiseido Co. Ltd. 129,000 8,690
Shizuoka Bank (The) Ltd. 131,500 1,032
SMC Corp. 18,500 10,794
SoftBank Corp. 926,000 12,051
SoftBank Group Corp. 505,500 42,860
Sohgo Security Services Co. Ltd. 23,200 1,098
Sompo Holdings, Inc. 108,045 4,134
Sony Corp. 406,700 42,818
Square Enix Holdings Co. Ltd. 29,900 1,664
Stanley Electric Co. Ltd. 41,500 1,241
Subaru Corp. 198,100 3,966
SUMCO Corp. 86,500 1,998
Sumitomo Chemical Co. Ltd. 472,600 2,448
Sumitomo Corp. 382,600 5,473
Sumitomo Dainippon Pharma Co. Ltd. 58,700 1,025
Sumitomo Electric Industries Ltd. 243,100 3,659
Sumitomo Metal Mining Co. Ltd. 74,900 3,254
Sumitomo Mitsui Financial Group, Inc. 421,042 15,310
Sumitomo Mitsui Trust Holdings, Inc. 109,219 3,802
MARCH 31, 2021
See Notes to the Financial Statements.
NORTHERN FUNDS ANNUAL REPORT 77 EQUIT Y INDEX FUNDS

NUMBEROF SHARES
VALUE(000S)
C O M M O N S TO C KS – 9 7. 0 % ( 1 ) c o n t i n u e d
Japan – 24.3% continued
Sumitomo Realty & Development Co.Ltd. 99,300 $3,522
Sundrug Co. Ltd. 22,800 836
Suntory Beverage & Food Ltd. 46,000 1,713
Suzuken Co. Ltd. 22,836 894
Suzuki Motor Corp. 118,100 5,378
Sysmex Corp. 54,298 5,867
T&D Holdings, Inc. 177,700 2,307
Taiheiyo Cement Corp. 38,800 1,024
Taisei Corp. 60,700 2,340
Taisho Pharmaceutical Holdings Co.Ltd. 11,600 750
Takeda Pharmaceutical Co. Ltd. 508,366 18,369
TDK Corp. 41,900 5,843
Teijin Ltd. 56,500 973
Terumo Corp. 207,500 7,522
THK Co. Ltd. 38,200 1,322
TIS, Inc. 72,000 1,721
Tobu Railway Co. Ltd. 60,300 1,621
Toho Co. Ltd. 36,200 1,473
Toho Gas Co. Ltd. 24,000 1,486
Tohoku Electric Power Co., Inc. 140,200 1,327
Tokio Marine Holdings, Inc. 203,700 9,753
Tokyo Century Corp. 14,100 952
Tokyo Electric Power Co. Holdings,Inc.* 461,300 1,542
Tokyo Electron Ltd. 48,200 20,637
Tokyo Gas Co. Ltd. 121,000 2,689
Tokyu Corp. 159,300 2,132
Tokyu Fudosan Holdings Corp. 198,100 1,179
Toppan Printing Co. Ltd. 82,700 1,397
Toray Industries, Inc. 446,800 2,876
Toshiba Corp. 126,000 4,269
Tosoh Corp. 82,800 1,585
TOTO Ltd. 46,100 2,846
Toyo Suisan Kaisha Ltd. 28,300 1,188
Toyoda Gosei Co. Ltd. 20,900 552
Toyota Industries Corp. 47,600 4,256
Toyota Motor Corp. 683,944 53,435
Toyota Tsusho Corp. 69,000 2,916
Trend Micro, Inc. 43,400 2,176
Tsuruha Holdings, Inc. 11,800 1,521
Unicharm Corp. 129,600 5,432
United Urban Investment Corp. 945 1,272
NUMBEROF SHARES
VALUE(000S)
C O M M O N S TO C KS – 9 7. 0 % ( 1 ) c o n t i n u e d
Japan – 24.3% continued
USS Co. Ltd. 69,700 $1,366
Welcia Holdings Co. Ltd. 29,700 1,019
West Japan Railway Co. 52,600 2,923
Yakult Honsha Co. Ltd. 40,800 2,069
Yamada Holdings Co. Ltd. 235,790 1,274
Yamaha Corp. 43,500 2,368
Yamaha Motor Co. Ltd. 90,600 2,239
Yamato Holdings Co. Ltd. 94,000 2,580
Yamazaki Baking Co. Ltd. 39,405 636
Yaskawa Electric Corp. 77,400 3,876
Yokogawa Electric Corp. 75,400 1,396
Z Holdings Corp. 861,600 4,302
ZOZO, Inc. 36,800 1,090
1,307,182
Jordan – 0.0%
Hikma Pharmaceuticals PLC 56,744 1,780
Macau – 0.1%
Sands China Ltd.* 777,499 3,899
Wynn Macau Ltd.* 495,346 966
4,865
Mexico – 0.0%
Fresnillo PLC 58,676 699
Netherlands – 5.5%
ABN AMRO Bank N.V. - C.V.A.* 134,814 1,636
Adyen N.V.(3) * 5,895 13,216
Aegon N.V. 582,455 2,763
Akzo Nobel N.V. 62,167 6,947
ArcelorMittal S.A.* 229,878 6,671
Argenx S.E.* 14,356 3,944
ASM International N.V. 15,036 4,400
ASML Holding N.V. 137,378 83,792
EXOR N.V. 35,317 2,990
Heineken Holding N.V. 36,975 3,291
Heineken N.V. 83,899 8,622
ING Groep N.V. 1,258,980 15,450
JDE Peet’s N.V.* 23,964 880
Just Eat Takeaway.com N.V.* 40,602 3,753
Koninklijke Ahold Delhaize N.V. 355,499 9,902
Koninklijke DSM N.V. 55,892 9,458
Koninklijke KPN N.V. 1,135,486 3,861
Koninklijke Philips N.V.* 294,200 16,797
Koninklijke Vopak N.V. 22,420 1,117
NN Group N.V. 95,516 4,665
S C H E D U L E O F I N V E S T M E N T S
I N T E R N AT I O N A L E Q U I T Y I N D E X F U N D c o n t i n u e d
See Notes to the Financial Statements.
EQUIT Y INDEX FUNDS 78 NORTHERN FUNDS ANNUAL REPORT
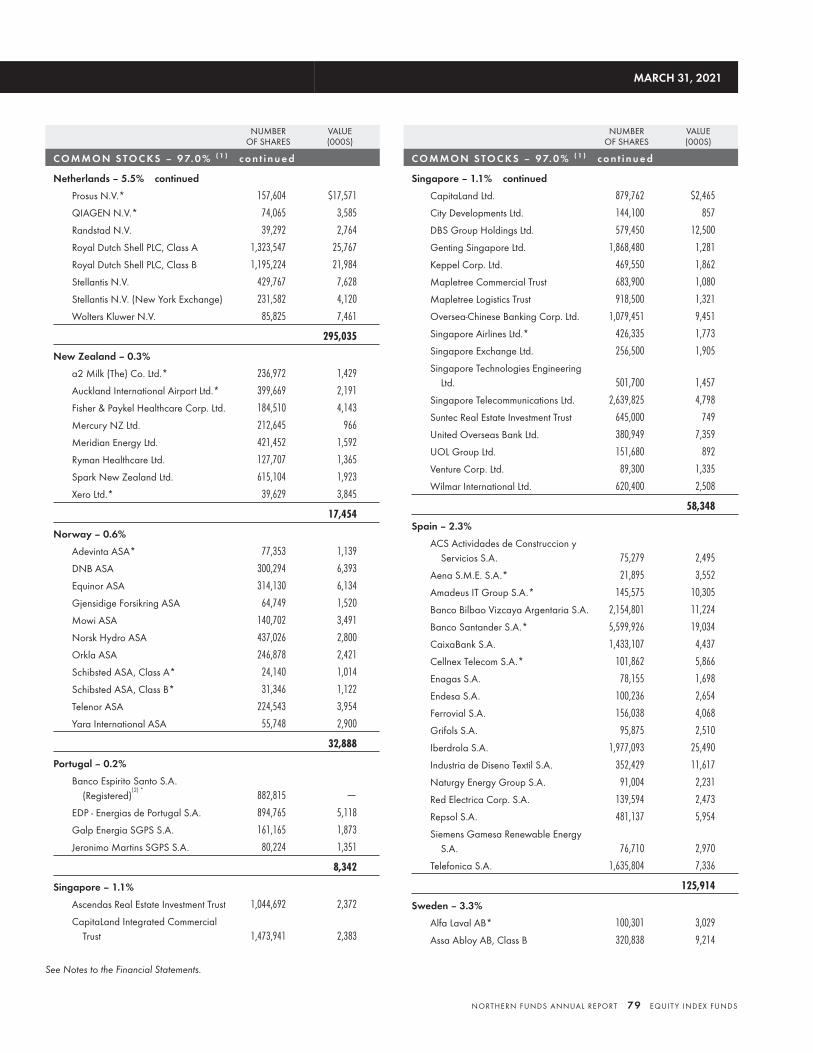
NUMBEROF SHARES
VALUE(000S)
C O M M O N S TO C KS – 9 7. 0 % ( 1 ) c o n t i n u e d
Netherlands – 5.5% continued
Prosus N.V.* 157,604 $17,571
QIAGEN N.V.* 74,065 3,585
Randstad N.V. 39,292 2,764
Royal Dutch Shell PLC, Class A 1,323,547 25,767
Royal Dutch Shell PLC, Class B 1,195,224 21,984
Stellantis N.V. 429,767 7,628
Stellantis N.V. (New York Exchange) 231,582 4,120
Wolters Kluwer N.V. 85,825 7,461
295,035
New Zealand – 0.3%
a2 Milk (The) Co. Ltd.* 236,972 1,429
Auckland International Airport Ltd.* 399,669 2,191
Fisher & Paykel Healthcare Corp. Ltd. 184,510 4,143
Mercury NZ Ltd. 212,645 966
Meridian Energy Ltd. 421,452 1,592
Ryman Healthcare Ltd. 127,707 1,365
Spark New Zealand Ltd. 615,104 1,923
Xero Ltd.* 39,629 3,845
17,454
Norway – 0.6%
Adevinta ASA* 77,353 1,139
DNB ASA 300,294 6,393
Equinor ASA 314,130 6,134
Gjensidige Forsikring ASA 64,749 1,520
Mowi ASA 140,702 3,491
Norsk Hydro ASA 437,026 2,800
Orkla ASA 246,878 2,421
Schibsted ASA, Class A* 24,140 1,014
Schibsted ASA, Class B* 31,346 1,122
Telenor ASA 224,543 3,954
Yara International ASA 55,748 2,900
32,888
Portugal – 0.2%
Banco Espirito Santo S.A.(Registered)
(2) *882,815 —
EDP - Energias de Portugal S.A. 894,765 5,118
Galp Energia SGPS S.A. 161,165 1,873
Jeronimo Martins SGPS S.A. 80,224 1,351
8,342
Singapore – 1.1%
Ascendas Real Estate Investment Trust 1,044,692 2,372
CapitaLand Integrated CommercialTrust 1,473,941 2,383
NUMBEROF SHARES
VALUE(000S)
C O M M O N S TO C KS – 9 7. 0 % ( 1 ) c o n t i n u e d
Singapore – 1.1% continued
CapitaLand Ltd. 879,762 $2,465
City Developments Ltd. 144,100 857
DBS Group Holdings Ltd. 579,450 12,500
Genting Singapore Ltd. 1,868,480 1,281
Keppel Corp. Ltd. 469,550 1,862
Mapletree Commercial Trust 683,900 1,080
Mapletree Logistics Trust 918,500 1,321
Oversea-Chinese Banking Corp. Ltd. 1,079,451 9,451
Singapore Airlines Ltd.* 426,335 1,773
Singapore Exchange Ltd. 256,500 1,905
Singapore Technologies EngineeringLtd. 501,700 1,457
Singapore Telecommunications Ltd. 2,639,825 4,798
Suntec Real Estate Investment Trust 645,000 749
United Overseas Bank Ltd. 380,949 7,359
UOL Group Ltd. 151,680 892
Venture Corp. Ltd. 89,300 1,335
Wilmar International Ltd. 620,400 2,508
58,348
Spain – 2.3%
ACS Actividades de Construccion yServicios S.A. 75,279 2,495
Aena S.M.E. S.A.* 21,895 3,552
Amadeus IT Group S.A.* 145,575 10,305
Banco Bilbao Vizcaya Argentaria S.A. 2,154,801 11,224
Banco Santander S.A.* 5,599,926 19,034
CaixaBank S.A. 1,433,107 4,437
Cellnex Telecom S.A.* 101,862 5,866
Enagas S.A. 78,155 1,698
Endesa S.A. 100,236 2,654
Ferrovial S.A. 156,038 4,068
Grifols S.A. 95,875 2,510
Iberdrola S.A. 1,977,093 25,490
Industria de Diseno Textil S.A. 352,429 11,617
Naturgy Energy Group S.A. 91,004 2,231
Red Electrica Corp. S.A. 139,594 2,473
Repsol S.A. 481,137 5,954
Siemens Gamesa Renewable EnergyS.A. 76,710 2,970
Telefonica S.A. 1,635,804 7,336
125,914
Sweden – 3.3%
Alfa Laval AB* 100,301 3,029
Assa Abloy AB, Class B 320,838 9,214
MARCH 31, 2021
See Notes to the Financial Statements.
NORTHERN FUNDS ANNUAL REPORT 79 EQUIT Y INDEX FUNDS
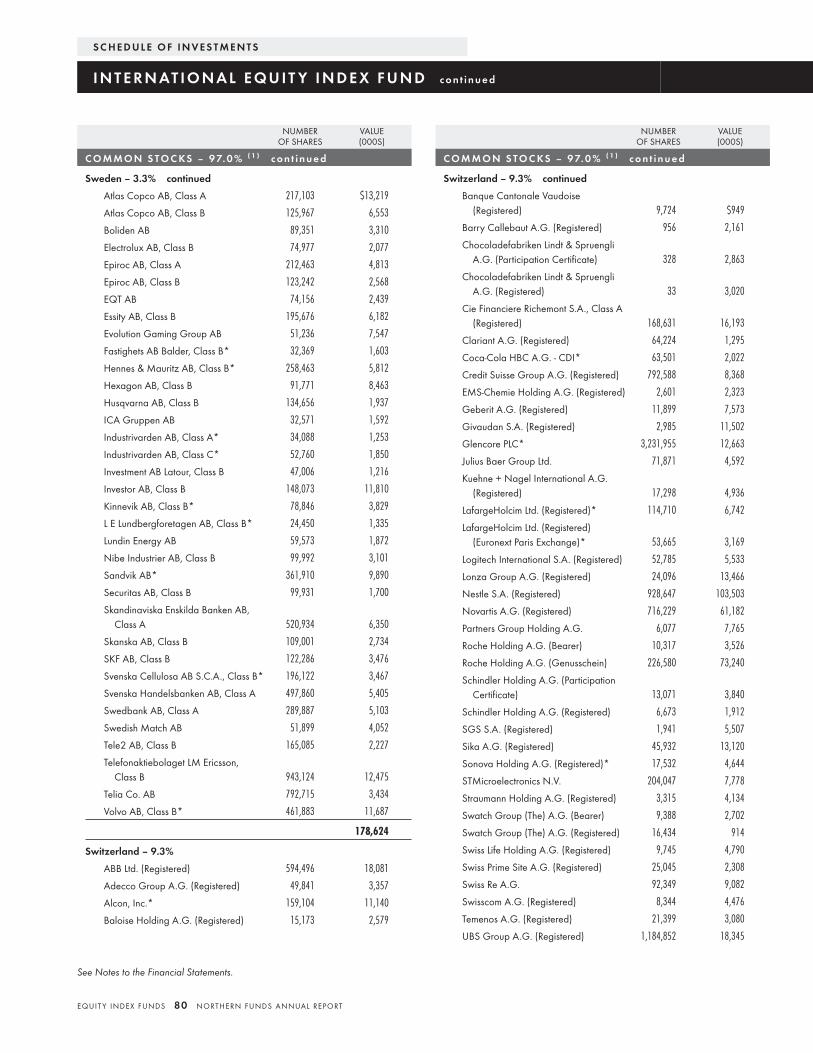
NUMBEROF SHARES
VALUE(000S)
C O M M O N S TO C KS – 9 7. 0 % ( 1 ) c o n t i n u e d
Sweden – 3.3% continued
Atlas Copco AB, Class A 217,103 $13,219
Atlas Copco AB, Class B 125,967 6,553
Boliden AB 89,351 3,310
Electrolux AB, Class B 74,977 2,077
Epiroc AB, Class A 212,463 4,813
Epiroc AB, Class B 123,242 2,568
EQT AB 74,156 2,439
Essity AB, Class B 195,676 6,182
Evolution Gaming Group AB 51,236 7,547
Fastighets AB Balder, Class B* 32,369 1,603
Hennes & Mauritz AB, Class B* 258,463 5,812
Hexagon AB, Class B 91,771 8,463
Husqvarna AB, Class B 134,656 1,937
ICA Gruppen AB 32,571 1,592
Industrivarden AB, Class A* 34,088 1,253
Industrivarden AB, Class C* 52,760 1,850
Investment AB Latour, Class B 47,006 1,216
Investor AB, Class B 148,073 11,810
Kinnevik AB, Class B* 78,846 3,829
L E Lundbergforetagen AB, Class B* 24,450 1,335
Lundin Energy AB 59,573 1,872
Nibe Industrier AB, Class B 99,992 3,101
Sandvik AB* 361,910 9,890
Securitas AB, Class B 99,931 1,700
Skandinaviska Enskilda Banken AB,Class A 520,934 6,350
Skanska AB, Class B 109,001 2,734
SKF AB, Class B 122,286 3,476
Svenska Cellulosa AB S.C.A., Class B* 196,122 3,467
Svenska Handelsbanken AB, Class A 497,860 5,405
Swedbank AB, Class A 289,887 5,103
Swedish Match AB 51,899 4,052
Tele2 AB, Class B 165,085 2,227
Telefonaktiebolaget LM Ericsson,Class B 943,124 12,475
Telia Co. AB 792,715 3,434
Volvo AB, Class B* 461,883 11,687
178,624
Switzerland – 9.3%
ABB Ltd. (Registered) 594,496 18,081
Adecco Group A.G. (Registered) 49,841 3,357
Alcon, Inc.* 159,104 11,140
Baloise Holding A.G. (Registered) 15,173 2,579
NUMBEROF SHARES
VALUE(000S)
C O M M O N S TO C KS – 9 7. 0 % ( 1 ) c o n t i n u e d
Switzerland – 9.3% continued
Banque Cantonale Vaudoise(Registered) 9,724 $949
Barry Callebaut A.G. (Registered) 956 2,161
Chocoladefabriken Lindt & SpruengliA.G. (Participation Certificate) 328 2,863
Chocoladefabriken Lindt & SpruengliA.G. (Registered) 33 3,020
Cie Financiere Richemont S.A., Class A(Registered) 168,631 16,193
Clariant A.G. (Registered) 64,224 1,295
Coca-Cola HBC A.G. - CDI* 63,501 2,022
Credit Suisse Group A.G. (Registered) 792,588 8,368
EMS-Chemie Holding A.G. (Registered) 2,601 2,323
Geberit A.G. (Registered) 11,899 7,573
Givaudan S.A. (Registered) 2,985 11,502
Glencore PLC* 3,231,955 12,663
Julius Baer Group Ltd. 71,871 4,592
Kuehne + Nagel International A.G.(Registered) 17,298 4,936
LafargeHolcim Ltd. (Registered)* 114,710 6,742
LafargeHolcim Ltd. (Registered)(Euronext Paris Exchange)* 53,665 3,169
Logitech International S.A. (Registered) 52,785 5,533
Lonza Group A.G. (Registered) 24,096 13,466
Nestle S.A. (Registered) 928,647 103,503
Novartis A.G. (Registered) 716,229 61,182
Partners Group Holding A.G. 6,077 7,765
Roche Holding A.G. (Bearer) 10,317 3,526
Roche Holding A.G. (Genusschein) 226,580 73,240
Schindler Holding A.G. (ParticipationCertificate) 13,071 3,840
Schindler Holding A.G. (Registered) 6,673 1,912
SGS S.A. (Registered) 1,941 5,507
Sika A.G. (Registered) 45,932 13,120
Sonova Holding A.G. (Registered)* 17,532 4,644
STMicroelectronics N.V. 204,047 7,778
Straumann Holding A.G. (Registered) 3,315 4,134
Swatch Group (The) A.G. (Bearer) 9,388 2,702
Swatch Group (The) A.G. (Registered) 16,434 914
Swiss Life Holding A.G. (Registered) 9,745 4,790
Swiss Prime Site A.G. (Registered) 25,045 2,308
Swiss Re A.G. 92,349 9,082
Swisscom A.G. (Registered) 8,344 4,476
Temenos A.G. (Registered) 21,399 3,080
UBS Group A.G. (Registered) 1,184,852 18,345
S C H E D U L E O F I N V E S T M E N T S
I N T E R N AT I O N A L E Q U I T Y I N D E X F U N D c o n t i n u e d
See Notes to the Financial Statements.
EQUIT Y INDEX FUNDS 80 NORTHERN FUNDS ANNUAL REPORT
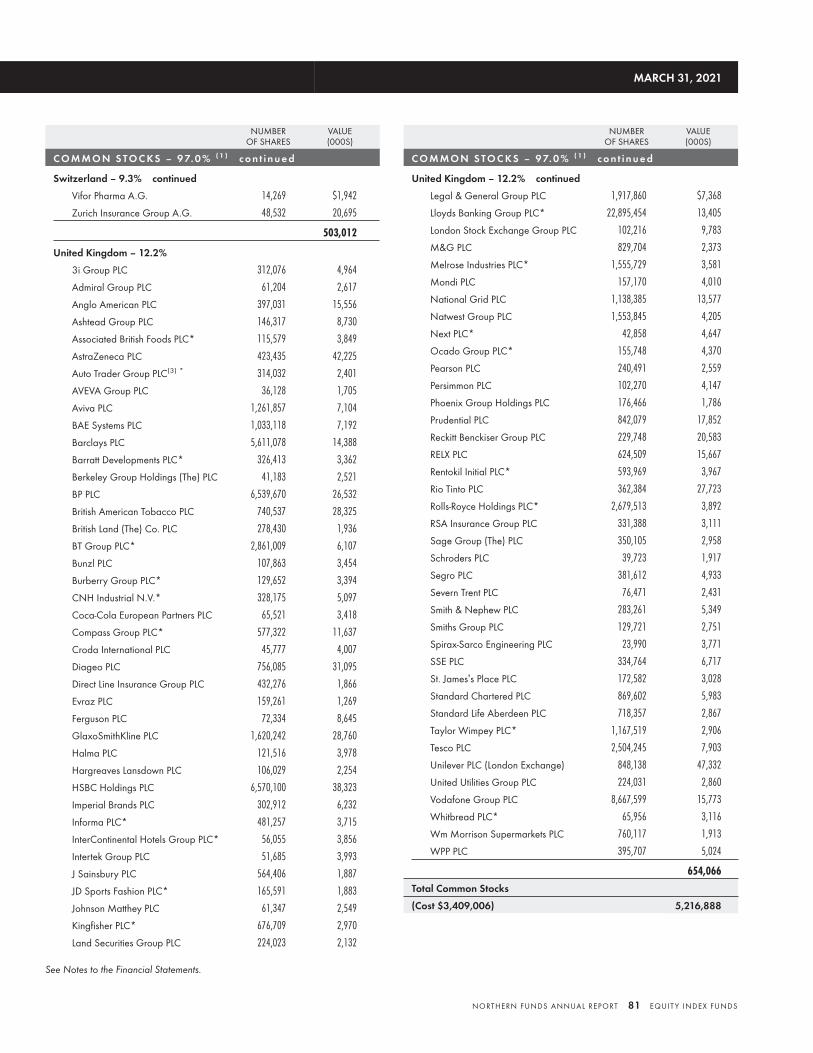
NUMBEROF SHARES
VALUE(000S)
C O M M O N S TO C KS – 9 7. 0 % ( 1 ) c o n t i n u e d
Switzerland – 9.3% continued
Vifor Pharma A.G. 14,269 $1,942
Zurich Insurance Group A.G. 48,532 20,695
503,012
United Kingdom – 12.2%
3i Group PLC 312,076 4,964
Admiral Group PLC 61,204 2,617
Anglo American PLC 397,031 15,556
Ashtead Group PLC 146,317 8,730
Associated British Foods PLC* 115,579 3,849
AstraZeneca PLC 423,435 42,225
Auto Trader Group PLC(3) * 314,032 2,401
AVEVA Group PLC 36,128 1,705
Aviva PLC 1,261,857 7,104
BAE Systems PLC 1,033,118 7,192
Barclays PLC 5,611,078 14,388
Barratt Developments PLC* 326,413 3,362
Berkeley Group Holdings (The) PLC 41,183 2,521
BP PLC 6,539,670 26,532
British American Tobacco PLC 740,537 28,325
British Land (The) Co. PLC 278,430 1,936
BT Group PLC* 2,861,009 6,107
Bunzl PLC 107,863 3,454
Burberry Group PLC* 129,652 3,394
CNH Industrial N.V.* 328,175 5,097
Coca-Cola European Partners PLC 65,521 3,418
Compass Group PLC* 577,322 11,637
Croda International PLC 45,777 4,007
Diageo PLC 756,085 31,095
Direct Line Insurance Group PLC 432,276 1,866
Evraz PLC 159,261 1,269
Ferguson PLC 72,334 8,645
GlaxoSmithKline PLC 1,620,242 28,760
Halma PLC 121,516 3,978
Hargreaves Lansdown PLC 106,029 2,254
HSBC Holdings PLC 6,570,100 38,323
Imperial Brands PLC 302,912 6,232
Informa PLC* 481,257 3,715
InterContinental Hotels Group PLC* 56,055 3,856
Intertek Group PLC 51,685 3,993
J Sainsbury PLC 564,406 1,887
JD Sports Fashion PLC* 165,591 1,883
Johnson Matthey PLC 61,347 2,549
Kingfisher PLC* 676,709 2,970
Land Securities Group PLC 224,023 2,132
NUMBEROF SHARES
VALUE(000S)
C O M M O N S TO C KS – 9 7. 0 % ( 1 ) c o n t i n u e d
United Kingdom – 12.2% continued
Legal & General Group PLC 1,917,860 $7,368
Lloyds Banking Group PLC* 22,895,454 13,405
London Stock Exchange Group PLC 102,216 9,783
M&G PLC 829,704 2,373
Melrose Industries PLC* 1,555,729 3,581
Mondi PLC 157,170 4,010
National Grid PLC 1,138,385 13,577
Natwest Group PLC 1,553,845 4,205
Next PLC* 42,858 4,647
Ocado Group PLC* 155,748 4,370
Pearson PLC 240,491 2,559
Persimmon PLC 102,270 4,147
Phoenix Group Holdings PLC 176,466 1,786
Prudential PLC 842,079 17,852
Reckitt Benckiser Group PLC 229,748 20,583
RELX PLC 624,509 15,667
Rentokil Initial PLC* 593,969 3,967
Rio Tinto PLC 362,384 27,723
Rolls-Royce Holdings PLC* 2,679,513 3,892
RSA Insurance Group PLC 331,388 3,111
Sage Group (The) PLC 350,105 2,958
Schroders PLC 39,723 1,917
Segro PLC 381,612 4,933
Severn Trent PLC 76,471 2,431
Smith & Nephew PLC 283,261 5,349
Smiths Group PLC 129,721 2,751
Spirax-Sarco Engineering PLC 23,990 3,771
SSE PLC 334,764 6,717
St. James’s Place PLC 172,582 3,028
Standard Chartered PLC 869,602 5,983
Standard Life Aberdeen PLC 718,357 2,867
Taylor Wimpey PLC* 1,167,519 2,906
Tesco PLC 2,504,245 7,903
Unilever PLC (London Exchange) 848,138 47,332
United Utilities Group PLC 224,031 2,860
Vodafone Group PLC 8,667,599 15,773
Whitbread PLC* 65,956 3,116
Wm Morrison Supermarkets PLC 760,117 1,913
WPP PLC 395,707 5,024
654,066
Total Common Stocks
(Cost $3,409,006) 5,216,888
MARCH 31, 2021
See Notes to the Financial Statements.
NORTHERN FUNDS ANNUAL REPORT 81 EQUIT Y INDEX FUNDS
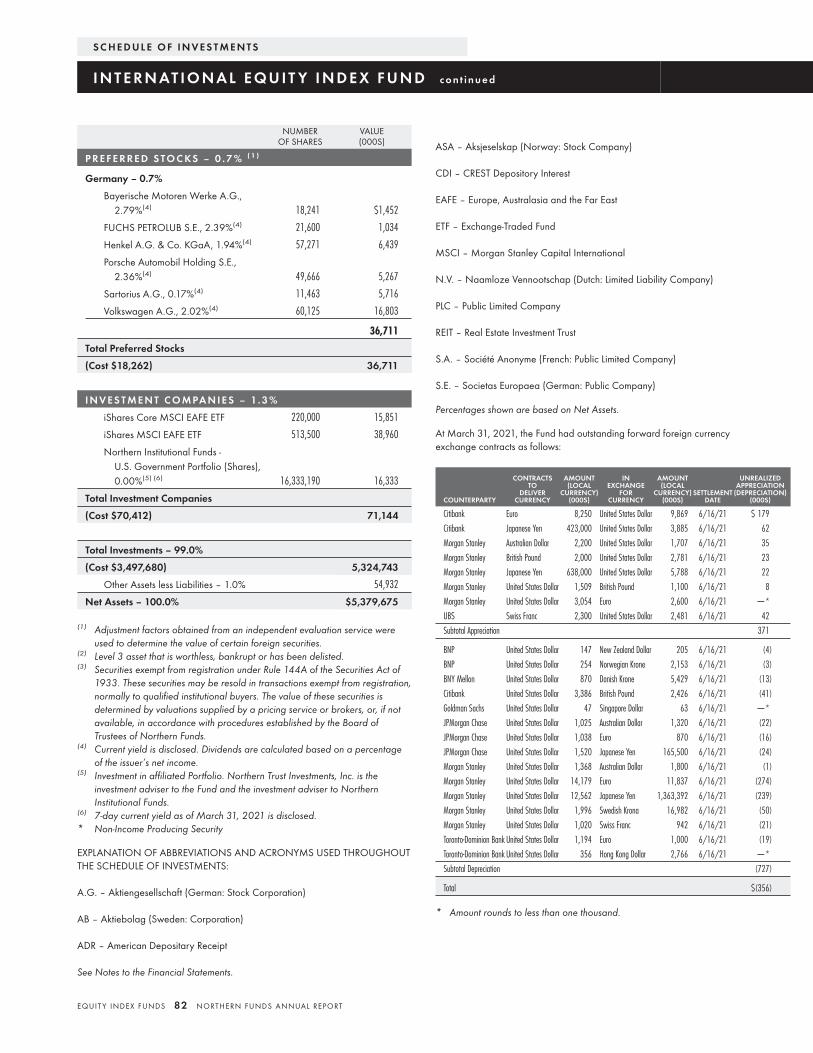
NUMBEROF SHARES
VALUE(000S)
P R E F E R R E D S TO C KS – 0 . 7 % ( 1 )
Germany – 0.7%
Bayerische Motoren Werke A.G.,2.79%(4) 18,241 $1,452
FUCHS PETROLUB S.E., 2.39%(4) 21,600 1,034
Henkel A.G. & Co. KGaA, 1.94%(4) 57,271 6,439
Porsche Automobil Holding S.E.,2.36%(4) 49,666 5,267
Sartorius A.G., 0.17%(4) 11,463 5,716
Volkswagen A.G., 2.02%(4) 60,125 16,803
36,711
Total Preferred Stocks
(Cost $18,262) 36,711
I N V E S T M E N T C O M PA N I E S – 1. 3 %
iShares Core MSCI EAFE ETF 220,000 15,851
iShares MSCI EAFE ETF 513,500 38,960
Northern Institutional Funds -U.S. Government Portfolio (Shares),0.00%(5) (6) 16,333,190 16,333
Total Investment Companies
(Cost $70,412) 71,144
Total Investments – 99.0%
(Cost $3,497,680) 5,324,743
Other Assets less Liabilities – 1.0% 54,932
Net Assets – 100.0% $5,379,675
(1) Adjustment factors obtained from an independent evaluation service wereused to determine the value of certain foreign securities.
(2) Level 3 asset that is worthless, bankrupt or has been delisted.(3) Securities exempt from registration under Rule 144A of the Securities Act of
1933. These securities may be resold in transactions exempt from registration,normally to qualified institutional buyers. The value of these securities isdetermined by valuations supplied by a pricing service or brokers, or, if notavailable, in accordance with procedures established by the Board ofTrustees of Northern Funds.
(4) Current yield is disclosed. Dividends are calculated based on a percentageof the issuer’s net income.
(5) Investment in affiliated Portfolio. Northern Trust Investments, Inc. is theinvestment adviser to the Fund and the investment adviser to NorthernInstitutional Funds.
(6) 7-day current yield as of March 31, 2021 is disclosed.* Non-Income Producing Security
EXPLANATION OF ABBREVIATIONS AND ACRONYMS USED THROUGHOUTTHE SCHEDULE OF INVESTMENTS:
A.G. – Aktiengesellschaft (German: Stock Corporation)
AB – Aktiebolag (Sweden: Corporation)
ADR – American Depositary Receipt
ASA – Aksjeselskap (Norway: Stock Company)
CDI – CREST Depository Interest
EAFE – Europe, Australasia and the Far East
ETF – Exchange-Traded Fund
MSCI – Morgan Stanley Capital International
N.V. – Naamloze Vennootschap (Dutch: Limited Liability Company)
PLC – Public Limited Company
REIT – Real Estate Investment Trust
S.A. – Société Anonyme (French: Public Limited Company)
S.E. – Societas Europaea (German: Public Company)
Percentages shown are based on Net Assets.
At March 31, 2021, the Fund had outstanding forward foreign currencyexchange contracts as follows:
COUNTERPARTY
CONTRACTSTO
DELIVERCURRENCY
AMOUNT(LOCAL
CURRENCY)(000S)
INEXCHANGE
FORCURRENCY
AMOUNT(LOCAL
CURRENCY)(000S)
SETTLEMENTDATE
UNREALIZEDAPPRECIATION
(DEPRECIATION)(000S)
Citibank Euro 8,250 United States Dollar 9,869 6/16/21 $ 179
Citibank Japanese Yen 423,000 United States Dollar 3,885 6/16/21 62
Morgan Stanley Australian Dollar 2,200 United States Dollar 1,707 6/16/21 35
Morgan Stanley British Pound 2,000 United States Dollar 2,781 6/16/21 23
Morgan Stanley Japanese Yen 638,000 United States Dollar 5,788 6/16/21 22
Morgan Stanley United States Dollar 1,509 British Pound 1,100 6/16/21 8
Morgan Stanley United States Dollar 3,054 Euro 2,600 6/16/21 —*
UBS Swiss Franc 2,300 United States Dollar 2,481 6/16/21 42
Subtotal Appreciation 371
BNP United States Dollar 147 New Zealand Dollar 205 6/16/21 (4)
BNP United States Dollar 254 Norwegian Krone 2,153 6/16/21 (3)
BNY Mellon United States Dollar 870 Danish Krone 5,429 6/16/21 (13)
Citibank United States Dollar 3,386 British Pound 2,426 6/16/21 (41)
Goldman Sachs United States Dollar 47 Singapore Dollar 63 6/16/21 —*
JPMorgan Chase United States Dollar 1,025 Australian Dollar 1,320 6/16/21 (22)
JPMorgan Chase United States Dollar 1,038 Euro 870 6/16/21 (16)
JPMorgan Chase United States Dollar 1,520 Japanese Yen 165,500 6/16/21 (24)
Morgan Stanley United States Dollar 1,368 Australian Dollar 1,800 6/16/21 (1)
Morgan Stanley United States Dollar 14,179 Euro 11,837 6/16/21 (274)
Morgan Stanley United States Dollar 12,562 Japanese Yen 1,363,392 6/16/21 (239)
Morgan Stanley United States Dollar 1,996 Swedish Krona 16,982 6/16/21 (50)
Morgan Stanley United States Dollar 1,020 Swiss Franc 942 6/16/21 (21)
Toronto-Dominion Bank United States Dollar 1,194 Euro 1,000 6/16/21 (19)
Toronto-Dominion Bank United States Dollar 356 Hong Kong Dollar 2,766 6/16/21 —*
Subtotal Depreciation (727)
Total $(356)
* Amount rounds to less than one thousand.
S C H E D U L E O F I N V E S T M E N T S
I N T E R N AT I O N A L E Q U I T Y I N D E X F U N D c o n t i n u e d
See Notes to the Financial Statements.
EQUIT Y INDEX FUNDS 82 NORTHERN FUNDS ANNUAL REPORT
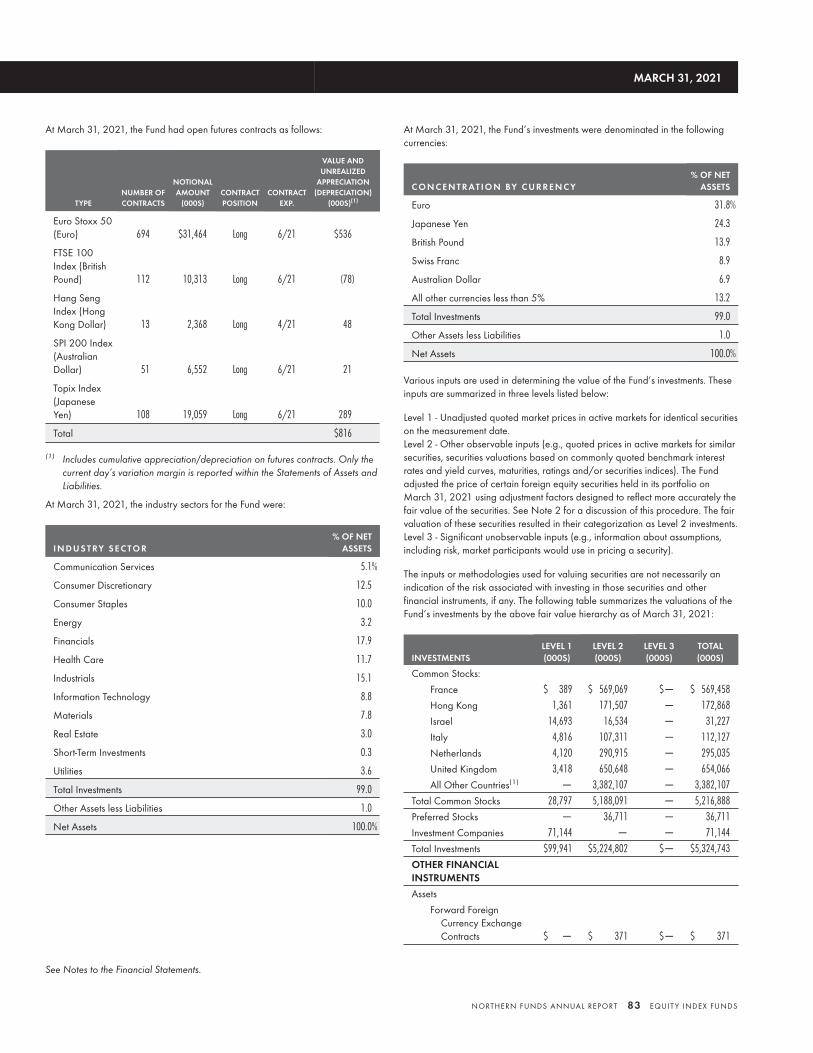
At March 31, 2021, the Fund had open futures contracts as follows:
TYPENUMBER OFCONTRACTS
NOTIONALAMOUNT
(000S)CONTRACTPOSITION
CONTRACTEXP.
VALUE ANDUNREALIZED
APPRECIATION(DEPRECIATION)
(000S)(1)
Euro Stoxx 50(Euro) 694 $31,464 Long 6/21 $536
FTSE 100Index (BritishPound) 112 10,313 Long 6/21 (78)
Hang SengIndex (HongKong Dollar) 13 2,368 Long 4/21 48
SPI 200 Index(AustralianDollar) 51 6,552 Long 6/21 21
Topix Index(JapaneseYen) 108 19,059 Long 6/21 289
Total $816
(1) Includes cumulative appreciation/depreciation on futures contracts. Only thecurrent day’s variation margin is reported within the Statements of Assets andLiabilities.
At March 31, 2021, the industry sectors for the Fund were:
I N D U S T RY S E C TO R% OF NET
ASSETS
Communication Services 5.1%
Consumer Discretionary 12.5
Consumer Staples 10.0
Energy 3.2
Financials 17.9
Health Care 11.7
Industrials 15.1
Information Technology 8.8
Materials 7.8
Real Estate 3.0
Short-Term Investments 0.3
Utilities 3.6
Total Investments 99.0
Other Assets less Liabilities 1.0
Net Assets 100.0%
At March 31, 2021, the Fund’s investments were denominated in the followingcurrencies:
C O N C E N T R AT I O N BY C U R R E N C Y% OF NET
ASSETS
Euro 31.8%
Japanese Yen 24.3
British Pound 13.9
Swiss Franc 8.9
Australian Dollar 6.9
All other currencies less than 5% 13.2
Total Investments 99.0
Other Assets less Liabilities 1.0
Net Assets 100.0%
Various inputs are used in determining the value of the Fund’s investments. Theseinputs are summarized in three levels listed below:
Level 1 - Unadjusted quoted market prices in active markets for identical securitieson the measurement date.Level 2 - Other observable inputs (e.g., quoted prices in active markets for similarsecurities, securities valuations based on commonly quoted benchmark interestrates and yield curves, maturities, ratings and/or securities indices). The Fundadjusted the price of certain foreign equity securities held in its portfolio onMarch 31, 2021 using adjustment factors designed to reflect more accurately thefair value of the securities. See Note 2 for a discussion of this procedure. The fairvaluation of these securities resulted in their categorization as Level 2 investments.Level 3 - Significant unobservable inputs (e.g., information about assumptions,including risk, market participants would use in pricing a security).
The inputs or methodologies used for valuing securities are not necessarily anindication of the risk associated with investing in those securities and otherfinancial instruments, if any. The following table summarizes the valuations of theFund’s investments by the above fair value hierarchy as of March 31, 2021:
INVESTMENTSLEVEL 1(000S)
LEVEL 2(000S)
LEVEL 3(000S)
TOTAL(000S)
Common Stocks:
France $ 389 $ 569,069 $— $ 569,458
Hong Kong 1,361 171,507 — 172,868
Israel 14,693 16,534 — 31,227
Italy 4,816 107,311 — 112,127
Netherlands 4,120 290,915 — 295,035
United Kingdom 3,418 650,648 — 654,066
All Other Countries(1) — 3,382,107 — 3,382,107
Total Common Stocks 28,797 5,188,091 — 5,216,888
Preferred Stocks — 36,711 — 36,711
Investment Companies 71,144 — — 71,144
Total Investments $99,941 $5,224,802 $— $5,324,743
OTHER FINANCIALINSTRUMENTS
Assets
Forward ForeignCurrency ExchangeContracts $ — $ 371 $— $ 371
MARCH 31, 2021
See Notes to the Financial Statements.
NORTHERN FUNDS ANNUAL REPORT 83 EQUIT Y INDEX FUNDS
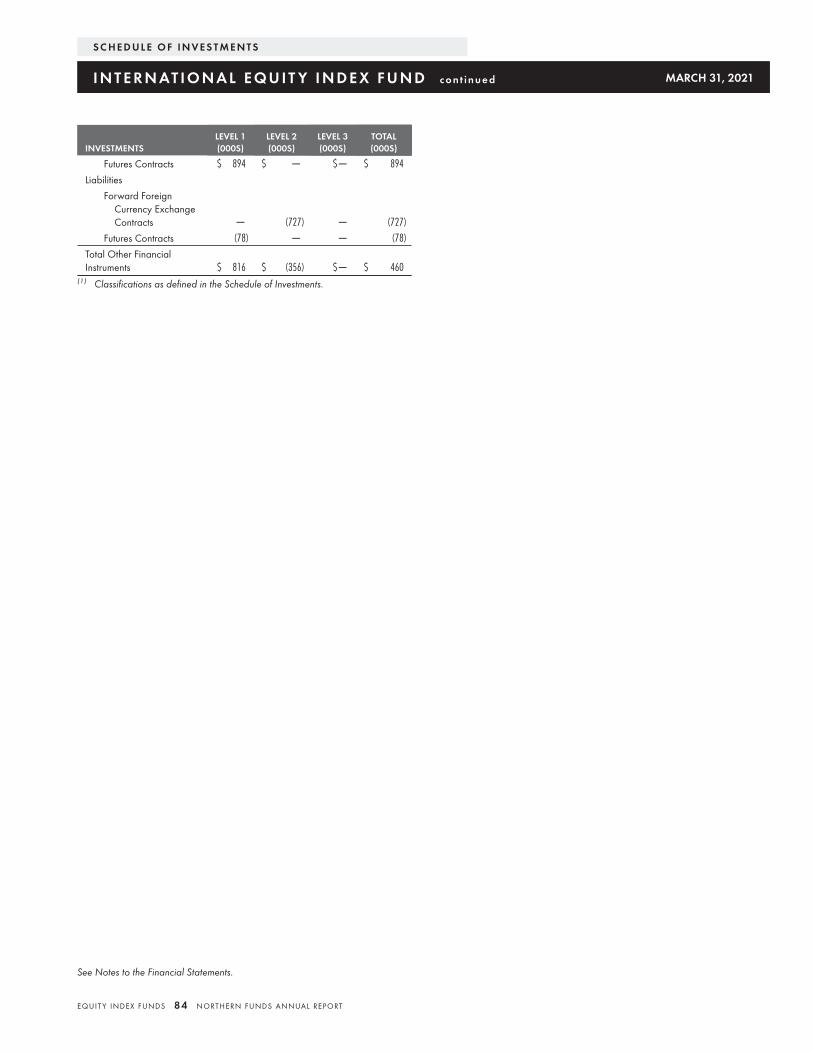
INVESTMENTSLEVEL 1(000S)
LEVEL 2(000S)
LEVEL 3(000S)
TOTAL(000S)
Futures Contracts $ 894 $ — $— $ 894
Liabilities
Forward ForeignCurrency ExchangeContracts — (727) — (727)
Futures Contracts (78) — — (78)
Total Other FinancialInstruments $ 816 $ (356) $— $ 460
(1) Classifications as defined in the Schedule of Investments.
S C H E D U L E O F I N V E S T M E N T S
I N T E R N AT I O N A L E Q U I T Y I N D E X F U N D c o n t i n u e d MARCH 31, 2021
See Notes to the Financial Statements.
EQUIT Y INDEX FUNDS 84 NORTHERN FUNDS ANNUAL REPORT
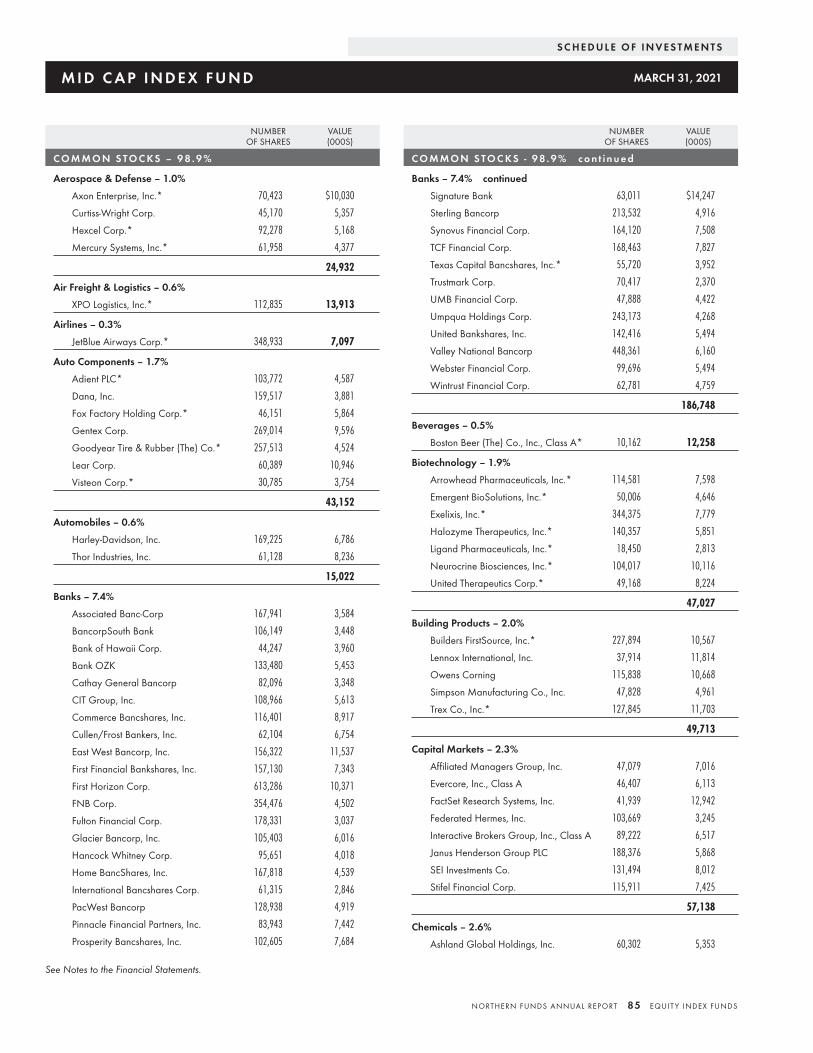
NUMBEROF SHARES
VALUE(000S)
C O M M O N S TO C KS – 9 8 . 9 %
Aerospace & Defense – 1.0%
Axon Enterprise, Inc.* 70,423 $10,030
Curtiss-Wright Corp. 45,170 5,357
Hexcel Corp.* 92,278 5,168
Mercury Systems, Inc.* 61,958 4,377
24,932
Air Freight & Logistics – 0.6%
XPO Logistics, Inc.* 112,835 13,913
Airlines – 0.3%
JetBlue Airways Corp.* 348,933 7,097
Auto Components – 1.7%
Adient PLC* 103,772 4,587
Dana, Inc. 159,517 3,881
Fox Factory Holding Corp.* 46,151 5,864
Gentex Corp. 269,014 9,596
Goodyear Tire & Rubber (The) Co.* 257,513 4,524
Lear Corp. 60,389 10,946
Visteon Corp.* 30,785 3,754
43,152
Automobiles – 0.6%
Harley-Davidson, Inc. 169,225 6,786
Thor Industries, Inc. 61,128 8,236
15,022
Banks – 7.4%
Associated Banc-Corp 167,941 3,584
BancorpSouth Bank 106,149 3,448
Bank of Hawaii Corp. 44,247 3,960
Bank OZK 133,480 5,453
Cathay General Bancorp 82,096 3,348
CIT Group, Inc. 108,966 5,613
Commerce Bancshares, Inc. 116,401 8,917
Cullen/Frost Bankers, Inc. 62,104 6,754
East West Bancorp, Inc. 156,322 11,537
First Financial Bankshares, Inc. 157,130 7,343
First Horizon Corp. 613,286 10,371
FNB Corp. 354,476 4,502
Fulton Financial Corp. 178,331 3,037
Glacier Bancorp, Inc. 105,403 6,016
Hancock Whitney Corp. 95,651 4,018
Home BancShares, Inc. 167,818 4,539
International Bancshares Corp. 61,315 2,846
PacWest Bancorp 128,938 4,919
Pinnacle Financial Partners, Inc. 83,943 7,442
Prosperity Bancshares, Inc. 102,605 7,684
NUMBEROF SHARES
VALUE(000S)
C O M M O N S TO C KS - 9 8 . 9 % c o n t i n u e d
Banks – 7.4% continued
Signature Bank 63,011 $14,247
Sterling Bancorp 213,532 4,916
Synovus Financial Corp. 164,120 7,508
TCF Financial Corp. 168,463 7,827
Texas Capital Bancshares, Inc.* 55,720 3,952
Trustmark Corp. 70,417 2,370
UMB Financial Corp. 47,888 4,422
Umpqua Holdings Corp. 243,173 4,268
United Bankshares, Inc. 142,416 5,494
Valley National Bancorp 448,361 6,160
Webster Financial Corp. 99,696 5,494
Wintrust Financial Corp. 62,781 4,759
186,748
Beverages – 0.5%
Boston Beer (The) Co., Inc., Class A* 10,162 12,258
Biotechnology – 1.9%
Arrowhead Pharmaceuticals, Inc.* 114,581 7,598
Emergent BioSolutions, Inc.* 50,006 4,646
Exelixis, Inc.* 344,375 7,779
Halozyme Therapeutics, Inc.* 140,357 5,851
Ligand Pharmaceuticals, Inc.* 18,450 2,813
Neurocrine Biosciences, Inc.* 104,017 10,116
United Therapeutics Corp.* 49,168 8,224
47,027
Building Products – 2.0%
Builders FirstSource, Inc.* 227,894 10,567
Lennox International, Inc. 37,914 11,814
Owens Corning 115,838 10,668
Simpson Manufacturing Co., Inc. 47,828 4,961
Trex Co., Inc.* 127,845 11,703
49,713
Capital Markets – 2.3%
Affiliated Managers Group, Inc. 47,079 7,016
Evercore, Inc., Class A 46,407 6,113
FactSet Research Systems, Inc. 41,939 12,942
Federated Hermes, Inc. 103,669 3,245
Interactive Brokers Group, Inc., Class A 89,222 6,517
Janus Henderson Group PLC 188,376 5,868
SEI Investments Co. 131,494 8,012
Stifel Financial Corp. 115,911 7,425
57,138
Chemicals – 2.6%
Ashland Global Holdings, Inc. 60,302 5,353
S C H E D U L E O F I N V E S T M E N T S
M I D C A P I N D E X F U N D MARCH 31, 2021
See Notes to the Financial Statements.
NORTHERN FUNDS ANNUAL REPORT 85 EQUIT Y INDEX FUNDS

NUMBEROF SHARES
VALUE(000S)
C O M M O N S TO C KS - 9 8 . 9 % c o n t i n u e d
Chemicals – 2.6% continued
Avient Corp. 100,745 $4,762
Cabot Corp. 62,190 3,261
Chemours (The) Co. 182,289 5,088
Ingevity Corp.* 44,662 3,373
Minerals Technologies, Inc. 37,581 2,831
NewMarket Corp. 8,063 3,065
Olin Corp. 157,666 5,987
RPM International, Inc. 143,709 13,200
Scotts Miracle-Gro (The) Co. 44,913 11,002
Sensient Technologies Corp. 46,738 3,645
Valvoline, Inc. 200,300 5,222
66,789
Commercial Services & Supplies – 1.8%
Brink’s (The) Co. 54,631 4,329
Clean Harbors, Inc.* 55,572 4,671
Healthcare Services Group, Inc. 82,986 2,326
Herman Miller, Inc. 65,505 2,696
IAA, Inc.* 148,511 8,189
KAR Auction Services, Inc.* 144,057 2,161
MSA Safety, Inc. 40,123 6,019
Stericycle, Inc.* 101,057 6,822
Tetra Tech, Inc. 59,865 8,125
45,338
Communications Equipment – 0.9%
Ciena Corp.* 171,253 9,371
Lumentum Holdings, Inc.* 83,543 7,632
NetScout Systems, Inc.* 81,554 2,296
ViaSat, Inc.* 71,777 3,450
22,749
Construction & Engineering – 1.4%
AECOM* 163,077 10,455
Dycom Industries, Inc.* 33,719 3,131
EMCOR Group, Inc. 60,495 6,785
Fluor Corp.* 138,006 3,187
MasTec, Inc.* 62,256 5,833
Valmont Industries, Inc. 23,428 5,568
34,959
Construction Materials – 0.2%
Eagle Materials, Inc. 46,291 6,222
Consumer Finance – 0.7%
FirstCash, Inc. 45,219 2,969
LendingTree, Inc.* 12,102 2,578
Navient Corp. 203,411 2,911
NUMBEROF SHARES
VALUE(000S)
C O M M O N S TO C KS - 9 8 . 9 % c o n t i n u e d
Consumer Finance – 0.7% continued
PROG Holdings, Inc. 74,664 $3,232
SLM Corp. 370,093 6,651
18,341
Containers & Packaging – 0.9%
AptarGroup, Inc. 71,970 10,196
Greif, Inc., Class A 29,457 1,679
Silgan Holdings, Inc. 86,204 3,623
Sonoco Products Co. 110,858 7,017
22,515
Diversified Consumer Services – 1.1%
Adtalem Global Education, Inc.* 55,699 2,202
Graham Holdings Co., Class B 4,485 2,523
Grand Canyon Education, Inc.* 51,712 5,538
H&R Block, Inc. 202,199 4,408
Service Corp. International 186,951 9,544
Strategic Education, Inc. 27,114 2,492
WW International, Inc.* 52,867 1,654
28,361
Diversified Financial Services – 0.3%
Jefferies Financial Group, Inc. 223,599 6,730
Diversified Telecommunication Services – 0.2%
Iridium Communications, Inc.* 130,381 5,378
Electric Utilities – 1.1%
ALLETE, Inc. 57,288 3,849
Hawaiian Electric Industries, Inc. 120,592 5,358
IDACORP, Inc. 55,774 5,576
OGE Energy Corp. 220,864 7,147
PNM Resources, Inc. 94,756 4,648
26,578
Electrical Equipment – 1.8%
Acuity Brands, Inc. 39,767 6,561
EnerSys 47,048 4,272
Hubbell, Inc. 59,969 11,208
nVent Electric PLC 185,605 5,180
Regal Beloit Corp. 44,870 6,402
Sunrun, Inc.* 176,699 10,687
44,310
Electronic Equipment, Instruments & Components – 3.3%
Arrow Electronics, Inc.* 82,353 9,126
Avnet, Inc. 109,657 4,552
Belden, Inc. 49,599 2,201
Cognex Corp. 194,346 16,129
S C H E D U L E O F I N V E S T M E N T S
M I D C A P I N D E X F U N D c o n t i n u e d
See Notes to the Financial Statements.
EQUIT Y INDEX FUNDS 86 NORTHERN FUNDS ANNUAL REPORT
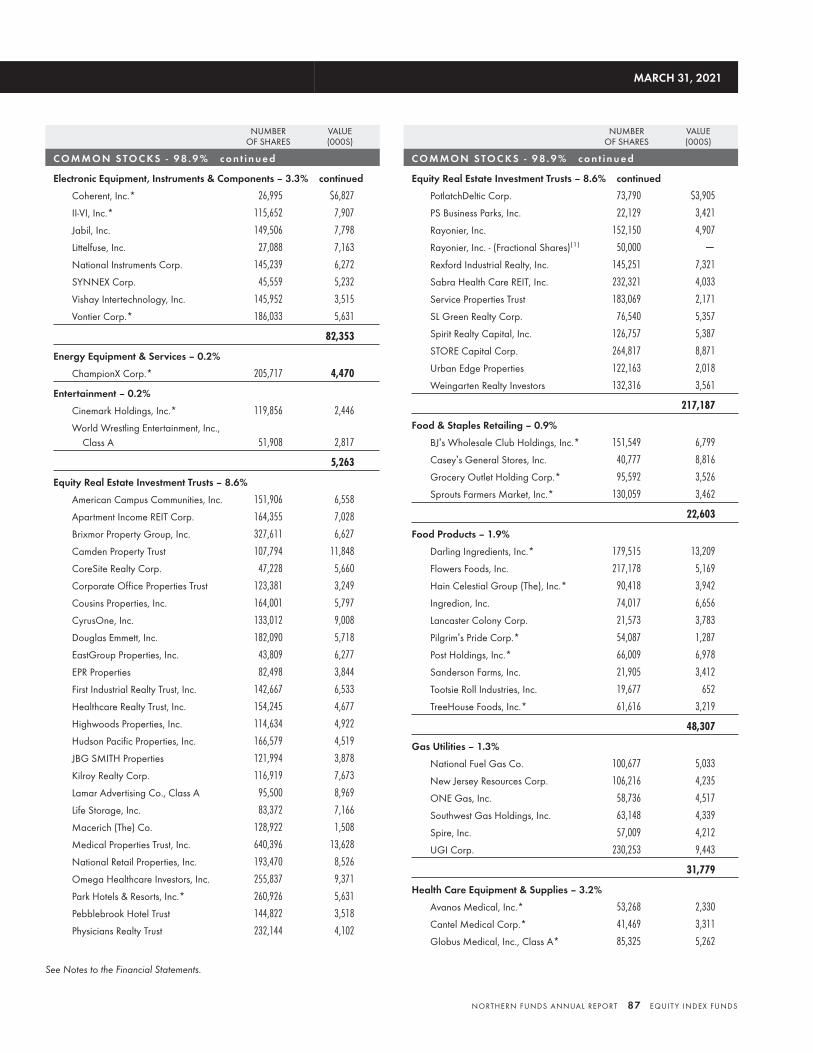
NUMBEROF SHARES
VALUE(000S)
C O M M O N S TO C KS - 9 8 . 9 % c o n t i n u e d
Electronic Equipment, Instruments & Components – 3.3% continued
Coherent, Inc.* 26,995 $6,827
II-VI, Inc.* 115,652 7,907
Jabil, Inc. 149,506 7,798
Littelfuse, Inc. 27,088 7,163
National Instruments Corp. 145,239 6,272
SYNNEX Corp. 45,559 5,232
Vishay Intertechnology, Inc. 145,952 3,515
Vontier Corp.* 186,033 5,631
82,353
Energy Equipment & Services – 0.2%
ChampionX Corp.* 205,717 4,470
Entertainment – 0.2%
Cinemark Holdings, Inc.* 119,856 2,446
World Wrestling Entertainment, Inc.,Class A 51,908 2,817
5,263
Equity Real Estate Investment Trusts – 8.6%
American Campus Communities, Inc. 151,906 6,558
Apartment Income REIT Corp. 164,355 7,028
Brixmor Property Group, Inc. 327,611 6,627
Camden Property Trust 107,794 11,848
CoreSite Realty Corp. 47,228 5,660
Corporate Office Properties Trust 123,381 3,249
Cousins Properties, Inc. 164,001 5,797
CyrusOne, Inc. 133,012 9,008
Douglas Emmett, Inc. 182,090 5,718
EastGroup Properties, Inc. 43,809 6,277
EPR Properties 82,498 3,844
First Industrial Realty Trust, Inc. 142,667 6,533
Healthcare Realty Trust, Inc. 154,245 4,677
Highwoods Properties, Inc. 114,634 4,922
Hudson Pacific Properties, Inc. 166,579 4,519
JBG SMITH Properties 121,994 3,878
Kilroy Realty Corp. 116,919 7,673
Lamar Advertising Co., Class A 95,500 8,969
Life Storage, Inc. 83,372 7,166
Macerich (The) Co. 128,922 1,508
Medical Properties Trust, Inc. 640,396 13,628
National Retail Properties, Inc. 193,470 8,526
Omega Healthcare Investors, Inc. 255,837 9,371
Park Hotels & Resorts, Inc.* 260,926 5,631
Pebblebrook Hotel Trust 144,822 3,518
Physicians Realty Trust 232,144 4,102
NUMBEROF SHARES
VALUE(000S)
C O M M O N S TO C KS - 9 8 . 9 % c o n t i n u e d
Equity Real Estate Investment Trusts – 8.6% continued
PotlatchDeltic Corp. 73,790 $3,905
PS Business Parks, Inc. 22,129 3,421
Rayonier, Inc. 152,150 4,907
Rayonier, Inc. - (Fractional Shares)(1) 50,000 —
Rexford Industrial Realty, Inc. 145,251 7,321
Sabra Health Care REIT, Inc. 232,321 4,033
Service Properties Trust 183,069 2,171
SL Green Realty Corp. 76,540 5,357
Spirit Realty Capital, Inc. 126,757 5,387
STORE Capital Corp. 264,817 8,871
Urban Edge Properties 122,163 2,018
Weingarten Realty Investors 132,316 3,561
217,187
Food & Staples Retailing – 0.9%
BJ’s Wholesale Club Holdings, Inc.* 151,549 6,799
Casey’s General Stores, Inc. 40,777 8,816
Grocery Outlet Holding Corp.* 95,592 3,526
Sprouts Farmers Market, Inc.* 130,059 3,462
22,603
Food Products – 1.9%
Darling Ingredients, Inc.* 179,515 13,209
Flowers Foods, Inc. 217,178 5,169
Hain Celestial Group (The), Inc.* 90,418 3,942
Ingredion, Inc. 74,017 6,656
Lancaster Colony Corp. 21,573 3,783
Pilgrim’s Pride Corp.* 54,087 1,287
Post Holdings, Inc.* 66,009 6,978
Sanderson Farms, Inc. 21,905 3,412
Tootsie Roll Industries, Inc. 19,677 652
TreeHouse Foods, Inc.* 61,616 3,219
48,307
Gas Utilities – 1.3%
National Fuel Gas Co. 100,677 5,033
New Jersey Resources Corp. 106,216 4,235
ONE Gas, Inc. 58,736 4,517
Southwest Gas Holdings, Inc. 63,148 4,339
Spire, Inc. 57,009 4,212
UGI Corp. 230,253 9,443
31,779
Health Care Equipment & Supplies – 3.2%
Avanos Medical, Inc.* 53,268 2,330
Cantel Medical Corp.* 41,469 3,311
Globus Medical, Inc., Class A* 85,325 5,262
MARCH 31, 2021
See Notes to the Financial Statements.
NORTHERN FUNDS ANNUAL REPORT 87 EQUIT Y INDEX FUNDS
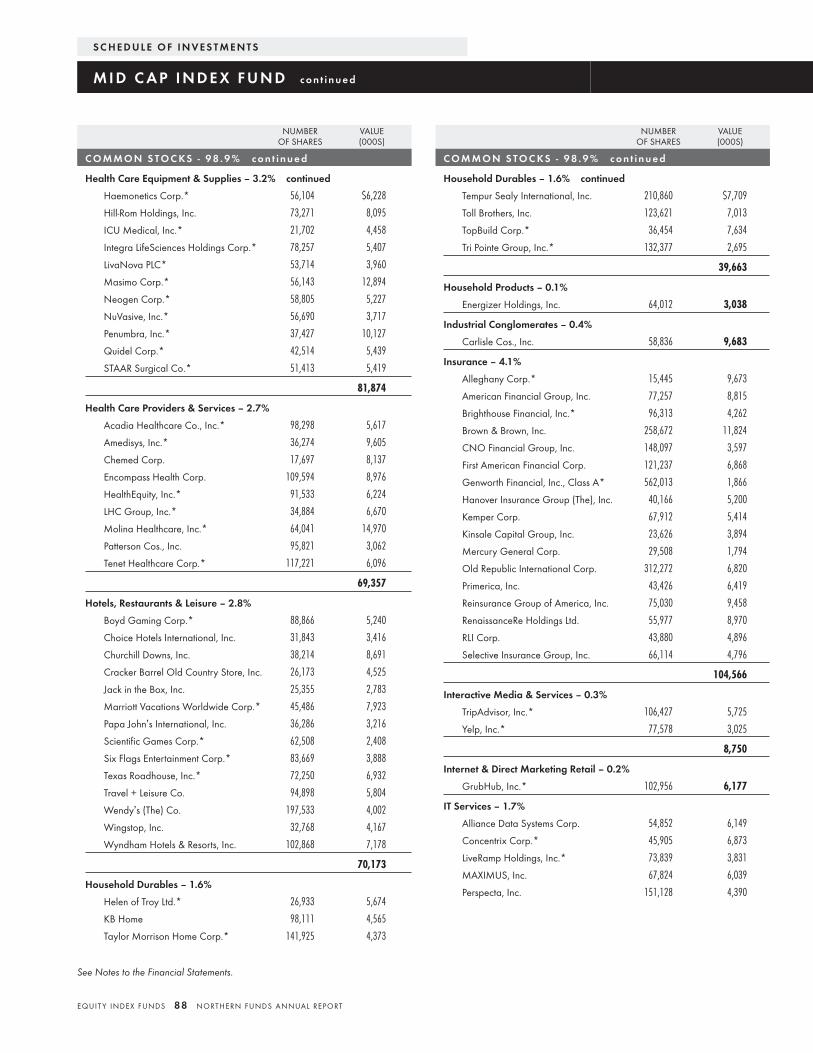
NUMBEROF SHARES
VALUE(000S)
C O M M O N S TO C KS - 9 8 . 9 % c o n t i n u e d
Health Care Equipment & Supplies – 3.2% continued
Haemonetics Corp.* 56,104 $6,228
Hill-Rom Holdings, Inc. 73,271 8,095
ICU Medical, Inc.* 21,702 4,458
Integra LifeSciences Holdings Corp.* 78,257 5,407
LivaNova PLC* 53,714 3,960
Masimo Corp.* 56,143 12,894
Neogen Corp.* 58,805 5,227
NuVasive, Inc.* 56,690 3,717
Penumbra, Inc.* 37,427 10,127
Quidel Corp.* 42,514 5,439
STAAR Surgical Co.* 51,413 5,419
81,874
Health Care Providers & Services – 2.7%
Acadia Healthcare Co., Inc.* 98,298 5,617
Amedisys, Inc.* 36,274 9,605
Chemed Corp. 17,697 8,137
Encompass Health Corp. 109,594 8,976
HealthEquity, Inc.* 91,533 6,224
LHC Group, Inc.* 34,884 6,670
Molina Healthcare, Inc.* 64,041 14,970
Patterson Cos., Inc. 95,821 3,062
Tenet Healthcare Corp.* 117,221 6,096
69,357
Hotels, Restaurants & Leisure – 2.8%
Boyd Gaming Corp.* 88,866 5,240
Choice Hotels International, Inc. 31,843 3,416
Churchill Downs, Inc. 38,214 8,691
Cracker Barrel Old Country Store, Inc. 26,173 4,525
Jack in the Box, Inc. 25,355 2,783
Marriott Vacations Worldwide Corp.* 45,486 7,923
Papa John’s International, Inc. 36,286 3,216
Scientific Games Corp.* 62,508 2,408
Six Flags Entertainment Corp.* 83,669 3,888
Texas Roadhouse, Inc.* 72,250 6,932
Travel + Leisure Co. 94,898 5,804
Wendy’s (The) Co. 197,533 4,002
Wingstop, Inc. 32,768 4,167
Wyndham Hotels & Resorts, Inc. 102,868 7,178
70,173
Household Durables – 1.6%
Helen of Troy Ltd.* 26,933 5,674
KB Home 98,111 4,565
Taylor Morrison Home Corp.* 141,925 4,373
NUMBEROF SHARES
VALUE(000S)
C O M M O N S TO C KS - 9 8 . 9 % c o n t i n u e d
Household Durables – 1.6% continued
Tempur Sealy International, Inc. 210,860 $7,709
Toll Brothers, Inc. 123,621 7,013
TopBuild Corp.* 36,454 7,634
Tri Pointe Group, Inc.* 132,377 2,695
39,663
Household Products – 0.1%
Energizer Holdings, Inc. 64,012 3,038
Industrial Conglomerates – 0.4%
Carlisle Cos., Inc. 58,836 9,683
Insurance – 4.1%
Alleghany Corp.* 15,445 9,673
American Financial Group, Inc. 77,257 8,815
Brighthouse Financial, Inc.* 96,313 4,262
Brown & Brown, Inc. 258,672 11,824
CNO Financial Group, Inc. 148,097 3,597
First American Financial Corp. 121,237 6,868
Genworth Financial, Inc., Class A* 562,013 1,866
Hanover Insurance Group (The), Inc. 40,166 5,200
Kemper Corp. 67,912 5,414
Kinsale Capital Group, Inc. 23,626 3,894
Mercury General Corp. 29,508 1,794
Old Republic International Corp. 312,272 6,820
Primerica, Inc. 43,426 6,419
Reinsurance Group of America, Inc. 75,030 9,458
RenaissanceRe Holdings Ltd. 55,977 8,970
RLI Corp. 43,880 4,896
Selective Insurance Group, Inc. 66,114 4,796
104,566
Interactive Media & Services – 0.3%
TripAdvisor, Inc.* 106,427 5,725
Yelp, Inc.* 77,578 3,025
8,750
Internet & Direct Marketing Retail – 0.2%
GrubHub, Inc.* 102,956 6,177
IT Services – 1.7%
Alliance Data Systems Corp. 54,852 6,149
Concentrix Corp.* 45,905 6,873
LiveRamp Holdings, Inc.* 73,839 3,831
MAXIMUS, Inc. 67,824 6,039
Perspecta, Inc. 151,128 4,390
S C H E D U L E O F I N V E S T M E N T S
M I D C A P I N D E X F U N D c o n t i n u e d
See Notes to the Financial Statements.
EQUIT Y INDEX FUNDS 88 NORTHERN FUNDS ANNUAL REPORT

NUMBEROF SHARES
VALUE(000S)
C O M M O N S TO C KS - 9 8 . 9 % c o n t i n u e d
IT Services – 1.7% continued
Sabre Corp.* 350,326 $5,188
WEX, Inc.* 48,777 10,205
42,675
Leisure Products – 1.2%
Brunswick Corp. 85,874 8,190
Mattel, Inc.* 384,469 7,659
Polaris, Inc. 64,315 8,586
YETI Holdings, Inc.* 82,777 5,977
30,412
Life Sciences Tools & Services – 2.6%
Bio-Techne Corp. 42,837 16,361
Charles River LaboratoriesInternational, Inc.* 54,942 15,924
Medpace Holdings, Inc.* 30,376 4,983
PRA Health Sciences, Inc.* 71,262 10,927
Repligen Corp.* 56,250 10,935
Syneos Health, Inc.* 91,230 6,920
66,050
Machinery – 5.2%
AGCO Corp. 68,117 9,785
Colfax Corp.* 127,268 5,576
Crane Co. 54,577 5,125
Donaldson Co., Inc. 139,212 8,097
Flowserve Corp. 143,722 5,578
Graco, Inc. 186,361 13,347
ITT, Inc. 95,527 8,684
Kennametal, Inc. 92,054 3,679
Lincoln Electric Holdings, Inc. 65,892 8,101
Middleby (The) Corp.* 61,432 10,182
Nordson Corp. 59,670 11,855
Oshkosh Corp. 75,508 8,960
Terex Corp. 76,471 3,523
Timken (The) Co. 75,223 6,106
Toro (The) Co. 118,877 12,261
Trinity Industries, Inc. 91,197 2,598
Woodward, Inc. 64,722 7,808
131,265
Marine – 0.2%
Kirby Corp.* 66,257 3,994
Media – 1.0%
Cable One, Inc. 5,993 10,957
John Wiley & Sons, Inc., Class A 48,354 2,621
NUMBEROF SHARES
VALUE(000S)
C O M M O N S TO C KS - 9 8 . 9 % c o n t i n u e d
Media – 1.0% continued
New York Times (The) Co., Class A 159,953 $8,097
TEGNA, Inc. 242,142 4,559
26,234
Metals & Mining – 2.2%
Cleveland-Cliffs, Inc. 506,639 10,188
Commercial Metals Co. 132,313 4,081
Compass Minerals International, Inc. 37,729 2,366
Reliance Steel & Aluminum Co. 70,178 10,687
Royal Gold, Inc. 72,352 7,787
Steel Dynamics, Inc. 221,151 11,226
United States Steel Corp. 289,753 7,583
Worthington Industries, Inc. 38,263 2,567
56,485
Multiline Retail – 0.8%
Kohl’s Corp. 174,033 10,374
Nordstrom, Inc.* 120,182 4,551
Ollie’s Bargain Outlet Holdings, Inc.* 62,811 5,465
20,390
Multi-Utilities – 0.6%
Black Hills Corp. 69,291 4,626
MDU Resources Group, Inc. 221,410 6,999
NorthWestern Corp. 55,731 3,634
15,259
Oil, Gas & Consumable Fuels – 1.1%
Antero Midstream Corp. 317,706 2,869
Cimarex Energy Co. 113,314 6,730
CNX Resources Corp.* 242,368 3,563
EQT Corp.* 307,764 5,718
Equitrans Midstream Corp. 449,889 3,671
Murphy Oil Corp. 160,271 2,630
World Fuel Services Corp. 70,070 2,466
27,647
Paper & Forest Products – 0.3%
Domtar Corp. 61,152 2,260
Louisiana-Pacific Corp. 117,582 6,521
8,781
Personal Products – 0.2%
Coty, Inc., Class A* 315,120 2,839
Nu Skin Enterprises, Inc., Class A 55,999 2,962
5,801
MARCH 31, 2021
See Notes to the Financial Statements.
NORTHERN FUNDS ANNUAL REPORT 89 EQUIT Y INDEX FUNDS
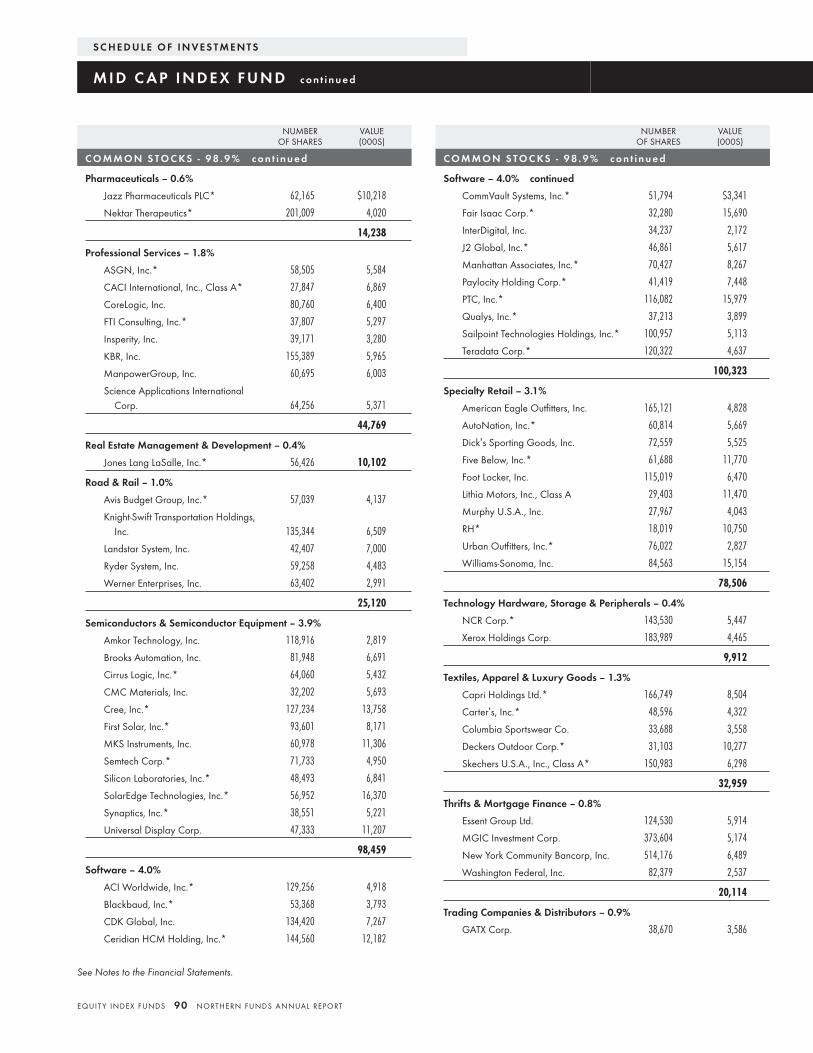
NUMBEROF SHARES
VALUE(000S)
C O M M O N S TO C KS - 9 8 . 9 % c o n t i n u e d
Pharmaceuticals – 0.6%
Jazz Pharmaceuticals PLC* 62,165 $10,218
Nektar Therapeutics* 201,009 4,020
14,238
Professional Services – 1.8%
ASGN, Inc.* 58,505 5,584
CACI International, Inc., Class A* 27,847 6,869
CoreLogic, Inc. 80,760 6,400
FTI Consulting, Inc.* 37,807 5,297
Insperity, Inc. 39,171 3,280
KBR, Inc. 155,389 5,965
ManpowerGroup, Inc. 60,695 6,003
Science Applications InternationalCorp. 64,256 5,371
44,769
Real Estate Management & Development – 0.4%
Jones Lang LaSalle, Inc.* 56,426 10,102
Road & Rail – 1.0%
Avis Budget Group, Inc.* 57,039 4,137
Knight-Swift Transportation Holdings,Inc. 135,344 6,509
Landstar System, Inc. 42,407 7,000
Ryder System, Inc. 59,258 4,483
Werner Enterprises, Inc. 63,402 2,991
25,120
Semiconductors & Semiconductor Equipment – 3.9%
Amkor Technology, Inc. 118,916 2,819
Brooks Automation, Inc. 81,948 6,691
Cirrus Logic, Inc.* 64,060 5,432
CMC Materials, Inc. 32,202 5,693
Cree, Inc.* 127,234 13,758
First Solar, Inc.* 93,601 8,171
MKS Instruments, Inc. 60,978 11,306
Semtech Corp.* 71,733 4,950
Silicon Laboratories, Inc.* 48,493 6,841
SolarEdge Technologies, Inc.* 56,952 16,370
Synaptics, Inc.* 38,551 5,221
Universal Display Corp. 47,333 11,207
98,459
Software – 4.0%
ACI Worldwide, Inc.* 129,256 4,918
Blackbaud, Inc.* 53,368 3,793
CDK Global, Inc. 134,420 7,267
Ceridian HCM Holding, Inc.* 144,560 12,182
NUMBEROF SHARES
VALUE(000S)
C O M M O N S TO C KS - 9 8 . 9 % c o n t i n u e d
Software – 4.0% continued
CommVault Systems, Inc.* 51,794 $3,341
Fair Isaac Corp.* 32,280 15,690
InterDigital, Inc. 34,237 2,172
J2 Global, Inc.* 46,861 5,617
Manhattan Associates, Inc.* 70,427 8,267
Paylocity Holding Corp.* 41,419 7,448
PTC, Inc.* 116,082 15,979
Qualys, Inc.* 37,213 3,899
Sailpoint Technologies Holdings, Inc.* 100,957 5,113
Teradata Corp.* 120,322 4,637
100,323
Specialty Retail – 3.1%
American Eagle Outfitters, Inc. 165,121 4,828
AutoNation, Inc.* 60,814 5,669
Dick’s Sporting Goods, Inc. 72,559 5,525
Five Below, Inc.* 61,688 11,770
Foot Locker, Inc. 115,019 6,470
Lithia Motors, Inc., Class A 29,403 11,470
Murphy U.S.A., Inc. 27,967 4,043
RH* 18,019 10,750
Urban Outfitters, Inc.* 76,022 2,827
Williams-Sonoma, Inc. 84,563 15,154
78,506
Technology Hardware, Storage & Peripherals – 0.4%
NCR Corp.* 143,530 5,447
Xerox Holdings Corp. 183,989 4,465
9,912
Textiles, Apparel & Luxury Goods – 1.3%
Capri Holdings Ltd.* 166,749 8,504
Carter’s, Inc.* 48,596 4,322
Columbia Sportswear Co. 33,688 3,558
Deckers Outdoor Corp.* 31,103 10,277
Skechers U.S.A., Inc., Class A* 150,983 6,298
32,959
Thrifts & Mortgage Finance – 0.8%
Essent Group Ltd. 124,530 5,914
MGIC Investment Corp. 373,604 5,174
New York Community Bancorp, Inc. 514,176 6,489
Washington Federal, Inc. 82,379 2,537
20,114
Trading Companies & Distributors – 0.9%
GATX Corp. 38,670 3,586
S C H E D U L E O F I N V E S T M E N T S
M I D C A P I N D E X F U N D c o n t i n u e d
See Notes to the Financial Statements.
EQUIT Y INDEX FUNDS 90 NORTHERN FUNDS ANNUAL REPORT
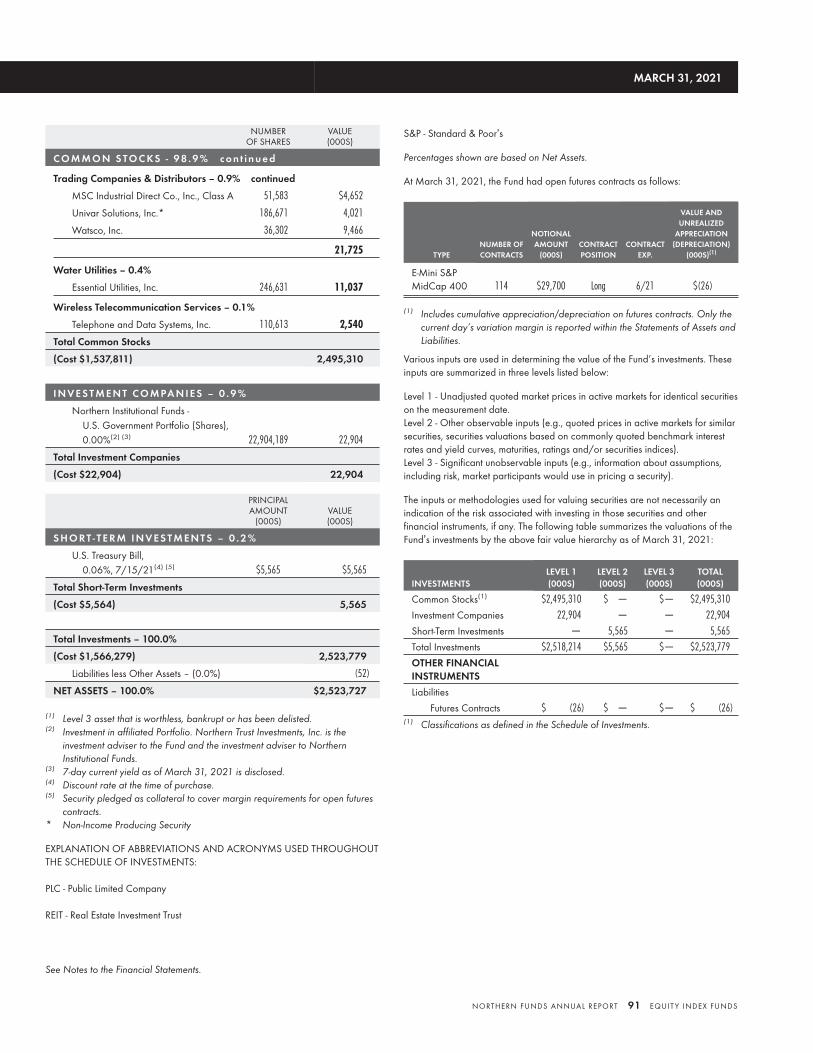
NUMBEROF SHARES
VALUE(000S)
C O M M O N S TO C KS - 9 8 . 9 % c o n t i n u e d
Trading Companies & Distributors – 0.9% continued
MSC Industrial Direct Co., Inc., Class A 51,583 $4,652
Univar Solutions, Inc.* 186,671 4,021
Watsco, Inc. 36,302 9,466
21,725
Water Utilities – 0.4%
Essential Utilities, Inc. 246,631 11,037
Wireless Telecommunication Services – 0.1%
Telephone and Data Systems, Inc. 110,613 2,540
Total Common Stocks
(Cost $1,537,811) 2,495,310
I N V E S T M E N T C O M PA N I E S – 0 . 9 %
Northern Institutional Funds -U.S. Government Portfolio (Shares),0.00%(2) (3) 22,904,189 22,904
Total Investment Companies
(Cost $22,904) 22,904
PRINCIPALAMOUNT
(000S)VALUE(000S)
S H O R T - T E R M I N V E S T M E N T S – 0 . 2 %
U.S. Treasury Bill,0.06%, 7/15/21(4) (5) $5,565 $5,565
Total Short-Term Investments
(Cost $5,564) 5,565
Total Investments – 100.0%
(Cost $1,566,279) 2,523,779
Liabilities less Other Assets – (0.0%) (52)
NET ASSETS – 100.0% $2,523,727
(1) Level 3 asset that is worthless, bankrupt or has been delisted.(2) Investment in affiliated Portfolio. Northern Trust Investments, Inc. is the
investment adviser to the Fund and the investment adviser to NorthernInstitutional Funds.
(3) 7-day current yield as of March 31, 2021 is disclosed.(4) Discount rate at the time of purchase.(5) Security pledged as collateral to cover margin requirements for open futures
contracts.* Non-Income Producing Security
EXPLANATION OF ABBREVIATIONS AND ACRONYMS USED THROUGHOUTTHE SCHEDULE OF INVESTMENTS:
PLC - Public Limited Company
REIT - Real Estate Investment Trust
S&P - Standard & Poor’s
Percentages shown are based on Net Assets.
At March 31, 2021, the Fund had open futures contracts as follows:
TYPENUMBER OFCONTRACTS
NOTIONALAMOUNT
(000S)CONTRACTPOSITION
CONTRACTEXP.
VALUE ANDUNREALIZED
APPRECIATION(DEPRECIATION)
(000S)(1)
E-Mini S&PMidCap 400 114 $29,700 Long 6/21 $(26)
(1) Includes cumulative appreciation/depreciation on futures contracts. Only thecurrent day’s variation margin is reported within the Statements of Assets andLiabilities.
Various inputs are used in determining the value of the Fund’s investments. Theseinputs are summarized in three levels listed below:
Level 1 - Unadjusted quoted market prices in active markets for identical securitieson the measurement date.Level 2 - Other observable inputs (e.g., quoted prices in active markets for similarsecurities, securities valuations based on commonly quoted benchmark interestrates and yield curves, maturities, ratings and/or securities indices).Level 3 - Significant unobservable inputs (e.g., information about assumptions,including risk, market participants would use in pricing a security).
The inputs or methodologies used for valuing securities are not necessarily anindication of the risk associated with investing in those securities and otherfinancial instruments, if any. The following table summarizes the valuations of theFund’s investments by the above fair value hierarchy as of March 31, 2021:
INVESTMENTSLEVEL 1(000S)
LEVEL 2(000S)
LEVEL 3(000S)
TOTAL(000S)
Common Stocks(1) $2,495,310 $ — $— $2,495,310
Investment Companies 22,904 — — 22,904
Short-Term Investments — 5,565 — 5,565
Total Investments $2,518,214 $5,565 $— $2,523,779
OTHER FINANCIALINSTRUMENTS
Liabilities
Futures Contracts $ (26) $ — $— $ (26)(1) Classifications as defined in the Schedule of Investments.
MARCH 31, 2021
See Notes to the Financial Statements.
NORTHERN FUNDS ANNUAL REPORT 91 EQUIT Y INDEX FUNDS
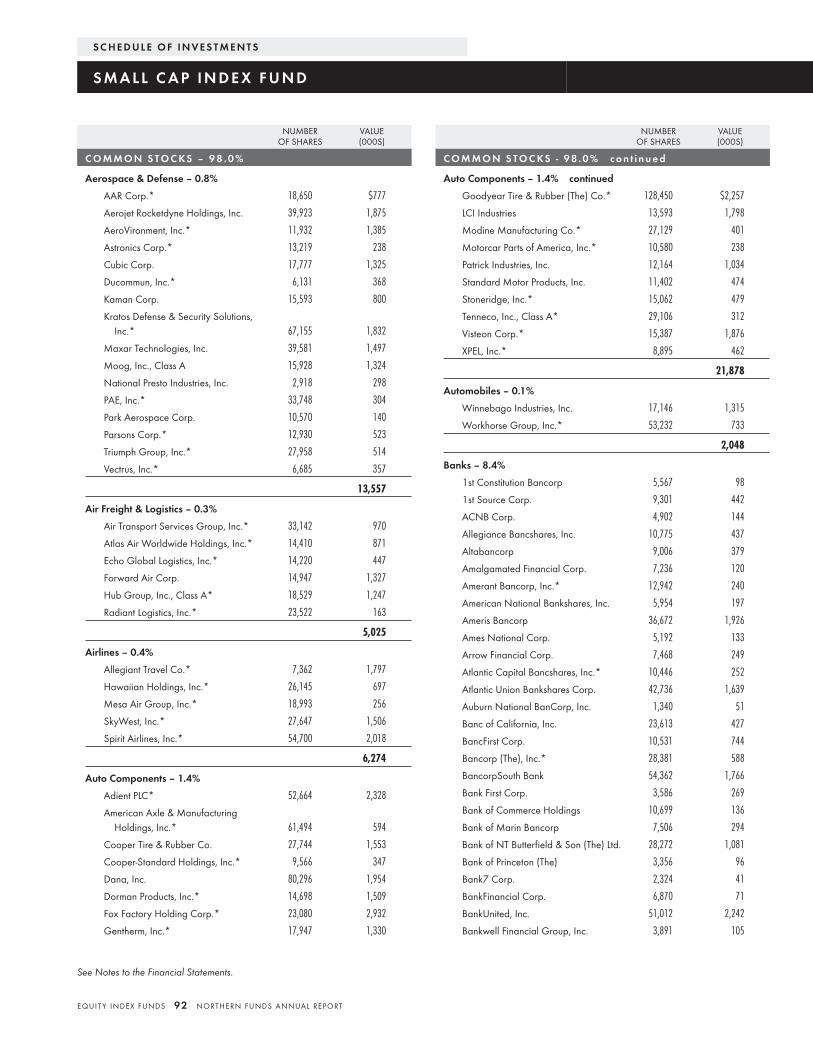
NUMBEROF SHARES
VALUE(000S)
C O M M O N S TO C KS – 9 8 . 0 %
Aerospace & Defense – 0.8%
AAR Corp.* 18,650 $777
Aerojet Rocketdyne Holdings, Inc. 39,923 1,875
AeroVironment, Inc.* 11,932 1,385
Astronics Corp.* 13,219 238
Cubic Corp. 17,777 1,325
Ducommun, Inc.* 6,131 368
Kaman Corp. 15,593 800
Kratos Defense & Security Solutions,Inc.* 67,155 1,832
Maxar Technologies, Inc. 39,581 1,497
Moog, Inc., Class A 15,928 1,324
National Presto Industries, Inc. 2,918 298
PAE, Inc.* 33,748 304
Park Aerospace Corp. 10,570 140
Parsons Corp.* 12,930 523
Triumph Group, Inc.* 27,958 514
Vectrus, Inc.* 6,685 357
13,557
Air Freight & Logistics – 0.3%
Air Transport Services Group, Inc.* 33,142 970
Atlas Air Worldwide Holdings, Inc.* 14,410 871
Echo Global Logistics, Inc.* 14,220 447
Forward Air Corp. 14,947 1,327
Hub Group, Inc., Class A* 18,529 1,247
Radiant Logistics, Inc.* 23,522 163
5,025
Airlines – 0.4%
Allegiant Travel Co.* 7,362 1,797
Hawaiian Holdings, Inc.* 26,145 697
Mesa Air Group, Inc.* 18,993 256
SkyWest, Inc.* 27,647 1,506
Spirit Airlines, Inc.* 54,700 2,018
6,274
Auto Components – 1.4%
Adient PLC* 52,664 2,328
American Axle & ManufacturingHoldings, Inc.* 61,494 594
Cooper Tire & Rubber Co. 27,744 1,553
Cooper-Standard Holdings, Inc.* 9,566 347
Dana, Inc. 80,296 1,954
Dorman Products, Inc.* 14,698 1,509
Fox Factory Holding Corp.* 23,080 2,932
Gentherm, Inc.* 17,947 1,330
NUMBEROF SHARES
VALUE(000S)
C O M M O N S TO C KS - 9 8 . 0 % c o n t i n u e d
Auto Components – 1.4% continued
Goodyear Tire & Rubber (The) Co.* 128,450 $2,257
LCI Industries 13,593 1,798
Modine Manufacturing Co.* 27,129 401
Motorcar Parts of America, Inc.* 10,580 238
Patrick Industries, Inc. 12,164 1,034
Standard Motor Products, Inc. 11,402 474
Stoneridge, Inc.* 15,062 479
Tenneco, Inc., Class A* 29,106 312
Visteon Corp.* 15,387 1,876
XPEL, Inc.* 8,895 462
21,878
Automobiles – 0.1%
Winnebago Industries, Inc. 17,146 1,315
Workhorse Group, Inc.* 53,232 733
2,048
Banks – 8.4%
1st Constitution Bancorp 5,567 98
1st Source Corp. 9,301 442
ACNB Corp. 4,902 144
Allegiance Bancshares, Inc. 10,775 437
Altabancorp 9,006 379
Amalgamated Financial Corp. 7,236 120
Amerant Bancorp, Inc.* 12,942 240
American National Bankshares, Inc. 5,954 197
Ameris Bancorp 36,672 1,926
Ames National Corp. 5,192 133
Arrow Financial Corp. 7,468 249
Atlantic Capital Bancshares, Inc.* 10,446 252
Atlantic Union Bankshares Corp. 42,736 1,639
Auburn National BanCorp, Inc. 1,340 51
Banc of California, Inc. 23,613 427
BancFirst Corp. 10,531 744
Bancorp (The), Inc.* 28,381 588
BancorpSouth Bank 54,362 1,766
Bank First Corp. 3,586 269
Bank of Commerce Holdings 10,699 136
Bank of Marin Bancorp 7,506 294
Bank of NT Butterfield & Son (The) Ltd. 28,272 1,081
Bank of Princeton (The) 3,356 96
Bank7 Corp. 2,324 41
BankFinancial Corp. 6,870 71
BankUnited, Inc. 51,012 2,242
Bankwell Financial Group, Inc. 3,891 105
S C H E D U L E O F I N V E S T M E N T S
S M A L L C A P I N D E X F U N D
See Notes to the Financial Statements.
EQUIT Y INDEX FUNDS 92 NORTHERN FUNDS ANNUAL REPORT
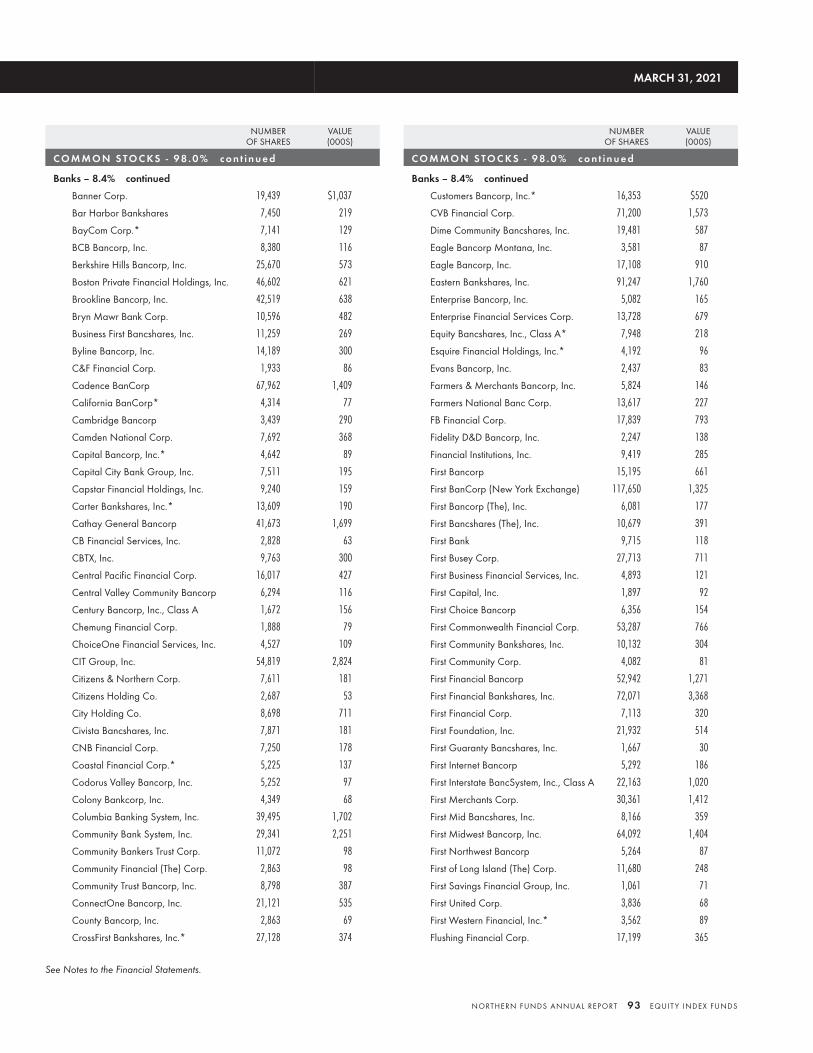
NUMBEROF SHARES
VALUE(000S)
C O M M O N S TO C KS - 9 8 . 0 % c o n t i n u e d
Banks – 8.4% continued
Banner Corp. 19,439 $1,037
Bar Harbor Bankshares 7,450 219
BayCom Corp.* 7,141 129
BCB Bancorp, Inc. 8,380 116
Berkshire Hills Bancorp, Inc. 25,670 573
Boston Private Financial Holdings, Inc. 46,602 621
Brookline Bancorp, Inc. 42,519 638
Bryn Mawr Bank Corp. 10,596 482
Business First Bancshares, Inc. 11,259 269
Byline Bancorp, Inc. 14,189 300
C&F Financial Corp. 1,933 86
Cadence BanCorp 67,962 1,409
California BanCorp* 4,314 77
Cambridge Bancorp 3,439 290
Camden National Corp. 7,692 368
Capital Bancorp, Inc.* 4,642 89
Capital City Bank Group, Inc. 7,511 195
Capstar Financial Holdings, Inc. 9,240 159
Carter Bankshares, Inc.* 13,609 190
Cathay General Bancorp 41,673 1,699
CB Financial Services, Inc. 2,828 63
CBTX, Inc. 9,763 300
Central Pacific Financial Corp. 16,017 427
Central Valley Community Bancorp 6,294 116
Century Bancorp, Inc., Class A 1,672 156
Chemung Financial Corp. 1,888 79
ChoiceOne Financial Services, Inc. 4,527 109
CIT Group, Inc. 54,819 2,824
Citizens & Northern Corp. 7,611 181
Citizens Holding Co. 2,687 53
City Holding Co. 8,698 711
Civista Bancshares, Inc. 7,871 181
CNB Financial Corp. 7,250 178
Coastal Financial Corp.* 5,225 137
Codorus Valley Bancorp, Inc. 5,252 97
Colony Bankcorp, Inc. 4,349 68
Columbia Banking System, Inc. 39,495 1,702
Community Bank System, Inc. 29,341 2,251
Community Bankers Trust Corp. 11,072 98
Community Financial (The) Corp. 2,863 98
Community Trust Bancorp, Inc. 8,798 387
ConnectOne Bancorp, Inc. 21,121 535
County Bancorp, Inc. 2,863 69
CrossFirst Bankshares, Inc.* 27,128 374
NUMBEROF SHARES
VALUE(000S)
C O M M O N S TO C KS - 9 8 . 0 % c o n t i n u e d
Banks – 8.4% continued
Customers Bancorp, Inc.* 16,353 $520
CVB Financial Corp. 71,200 1,573
Dime Community Bancshares, Inc. 19,481 587
Eagle Bancorp Montana, Inc. 3,581 87
Eagle Bancorp, Inc. 17,108 910
Eastern Bankshares, Inc. 91,247 1,760
Enterprise Bancorp, Inc. 5,082 165
Enterprise Financial Services Corp. 13,728 679
Equity Bancshares, Inc., Class A* 7,948 218
Esquire Financial Holdings, Inc.* 4,192 96
Evans Bancorp, Inc. 2,437 83
Farmers & Merchants Bancorp, Inc. 5,824 146
Farmers National Banc Corp. 13,617 227
FB Financial Corp. 17,839 793
Fidelity D&D Bancorp, Inc. 2,247 138
Financial Institutions, Inc. 9,419 285
First Bancorp 15,195 661
First BanCorp (New York Exchange) 117,650 1,325
First Bancorp (The), Inc. 6,081 177
First Bancshares (The), Inc. 10,679 391
First Bank 9,715 118
First Busey Corp. 27,713 711
First Business Financial Services, Inc. 4,893 121
First Capital, Inc. 1,897 92
First Choice Bancorp 6,356 154
First Commonwealth Financial Corp. 53,287 766
First Community Bankshares, Inc. 10,132 304
First Community Corp. 4,082 81
First Financial Bancorp 52,942 1,271
First Financial Bankshares, Inc. 72,071 3,368
First Financial Corp. 7,113 320
First Foundation, Inc. 21,932 514
First Guaranty Bancshares, Inc. 1,667 30
First Internet Bancorp 5,292 186
First Interstate BancSystem, Inc., Class A 22,163 1,020
First Merchants Corp. 30,361 1,412
First Mid Bancshares, Inc. 8,166 359
First Midwest Bancorp, Inc. 64,092 1,404
First Northwest Bancorp 5,264 87
First of Long Island (The) Corp. 11,680 248
First Savings Financial Group, Inc. 1,061 71
First United Corp. 3,836 68
First Western Financial, Inc.* 3,562 89
Flushing Financial Corp. 17,199 365
MARCH 31, 2021
See Notes to the Financial Statements.
NORTHERN FUNDS ANNUAL REPORT 93 EQUIT Y INDEX FUNDS
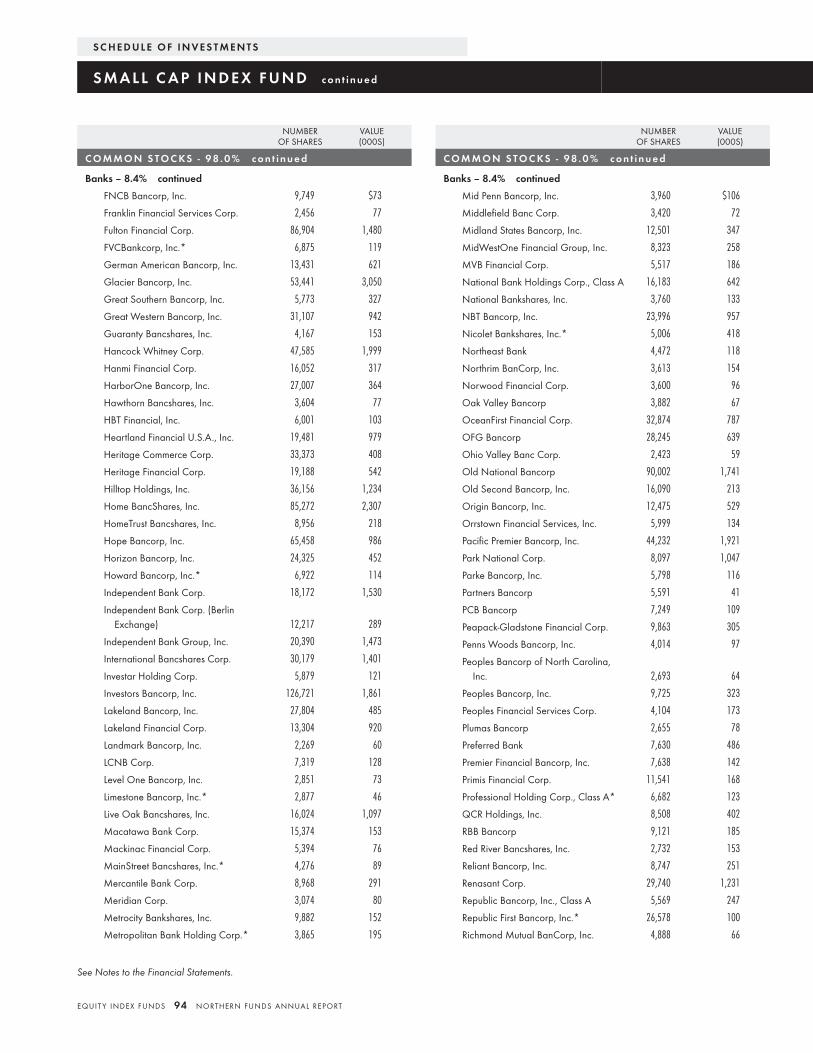
NUMBEROF SHARES
VALUE(000S)
C O M M O N S TO C KS - 9 8 . 0 % c o n t i n u e d
Banks – 8.4% continued
FNCB Bancorp, Inc. 9,749 $73
Franklin Financial Services Corp. 2,456 77
Fulton Financial Corp. 86,904 1,480
FVCBankcorp, Inc.* 6,875 119
German American Bancorp, Inc. 13,431 621
Glacier Bancorp, Inc. 53,441 3,050
Great Southern Bancorp, Inc. 5,773 327
Great Western Bancorp, Inc. 31,107 942
Guaranty Bancshares, Inc. 4,167 153
Hancock Whitney Corp. 47,585 1,999
Hanmi Financial Corp. 16,052 317
HarborOne Bancorp, Inc. 27,007 364
Hawthorn Bancshares, Inc. 3,604 77
HBT Financial, Inc. 6,001 103
Heartland Financial U.S.A., Inc. 19,481 979
Heritage Commerce Corp. 33,373 408
Heritage Financial Corp. 19,188 542
Hilltop Holdings, Inc. 36,156 1,234
Home BancShares, Inc. 85,272 2,307
HomeTrust Bancshares, Inc. 8,956 218
Hope Bancorp, Inc. 65,458 986
Horizon Bancorp, Inc. 24,325 452
Howard Bancorp, Inc.* 6,922 114
Independent Bank Corp. 18,172 1,530
Independent Bank Corp. (BerlinExchange) 12,217 289
Independent Bank Group, Inc. 20,390 1,473
International Bancshares Corp. 30,179 1,401
Investar Holding Corp. 5,879 121
Investors Bancorp, Inc. 126,721 1,861
Lakeland Bancorp, Inc. 27,804 485
Lakeland Financial Corp. 13,304 920
Landmark Bancorp, Inc. 2,269 60
LCNB Corp. 7,319 128
Level One Bancorp, Inc. 2,851 73
Limestone Bancorp, Inc.* 2,877 46
Live Oak Bancshares, Inc. 16,024 1,097
Macatawa Bank Corp. 15,374 153
Mackinac Financial Corp. 5,394 76
MainStreet Bancshares, Inc.* 4,276 89
Mercantile Bank Corp. 8,968 291
Meridian Corp. 3,074 80
Metrocity Bankshares, Inc. 9,882 152
Metropolitan Bank Holding Corp.* 3,865 195
NUMBEROF SHARES
VALUE(000S)
C O M M O N S TO C KS - 9 8 . 0 % c o n t i n u e d
Banks – 8.4% continued
Mid Penn Bancorp, Inc. 3,960 $106
Middlefield Banc Corp. 3,420 72
Midland States Bancorp, Inc. 12,501 347
MidWestOne Financial Group, Inc. 8,323 258
MVB Financial Corp. 5,517 186
National Bank Holdings Corp., Class A 16,183 642
National Bankshares, Inc. 3,760 133
NBT Bancorp, Inc. 23,996 957
Nicolet Bankshares, Inc.* 5,006 418
Northeast Bank 4,472 118
Northrim BanCorp, Inc. 3,613 154
Norwood Financial Corp. 3,600 96
Oak Valley Bancorp 3,882 67
OceanFirst Financial Corp. 32,874 787
OFG Bancorp 28,245 639
Ohio Valley Banc Corp. 2,423 59
Old National Bancorp 90,002 1,741
Old Second Bancorp, Inc. 16,090 213
Origin Bancorp, Inc. 12,475 529
Orrstown Financial Services, Inc. 5,999 134
Pacific Premier Bancorp, Inc. 44,232 1,921
Park National Corp. 8,097 1,047
Parke Bancorp, Inc. 5,798 116
Partners Bancorp 5,591 41
PCB Bancorp 7,249 109
Peapack-Gladstone Financial Corp. 9,863 305
Penns Woods Bancorp, Inc. 4,014 97
Peoples Bancorp of North Carolina,Inc. 2,693 64
Peoples Bancorp, Inc. 9,725 323
Peoples Financial Services Corp. 4,104 173
Plumas Bancorp 2,655 78
Preferred Bank 7,630 486
Premier Financial Bancorp, Inc. 7,638 142
Primis Financial Corp. 11,541 168
Professional Holding Corp., Class A* 6,682 123
QCR Holdings, Inc. 8,508 402
RBB Bancorp 9,121 185
Red River Bancshares, Inc. 2,732 153
Reliant Bancorp, Inc. 8,747 251
Renasant Corp. 29,740 1,231
Republic Bancorp, Inc., Class A 5,569 247
Republic First Bancorp, Inc.* 26,578 100
Richmond Mutual BanCorp, Inc. 4,888 66
S C H E D U L E O F I N V E S T M E N T S
S M A L L C A P I N D E X F U N D c o n t i n u e d
See Notes to the Financial Statements.
EQUIT Y INDEX FUNDS 94 NORTHERN FUNDS ANNUAL REPORT
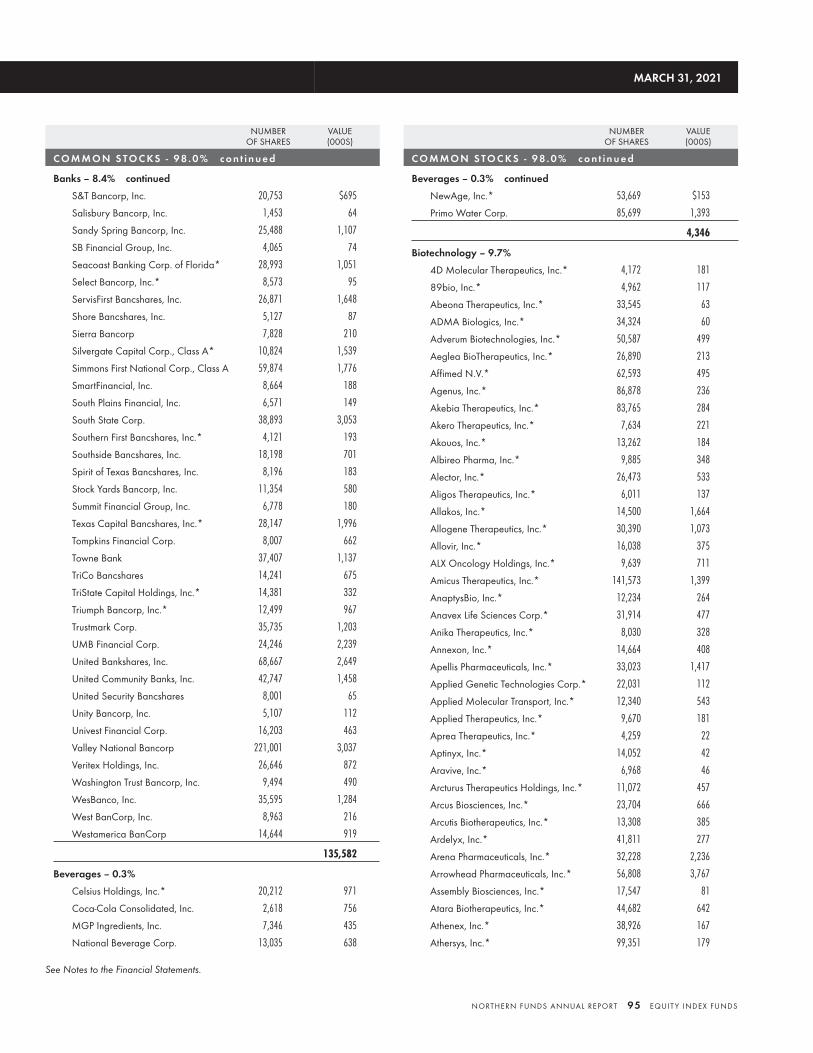
NUMBEROF SHARES
VALUE(000S)
C O M M O N S TO C KS - 9 8 . 0 % c o n t i n u e d
Banks – 8.4% continued
S&T Bancorp, Inc. 20,753 $695
Salisbury Bancorp, Inc. 1,453 64
Sandy Spring Bancorp, Inc. 25,488 1,107
SB Financial Group, Inc. 4,065 74
Seacoast Banking Corp. of Florida* 28,993 1,051
Select Bancorp, Inc.* 8,573 95
ServisFirst Bancshares, Inc. 26,871 1,648
Shore Bancshares, Inc. 5,127 87
Sierra Bancorp 7,828 210
Silvergate Capital Corp., Class A* 10,824 1,539
Simmons First National Corp., Class A 59,874 1,776
SmartFinancial, Inc. 8,664 188
South Plains Financial, Inc. 6,571 149
South State Corp. 38,893 3,053
Southern First Bancshares, Inc.* 4,121 193
Southside Bancshares, Inc. 18,198 701
Spirit of Texas Bancshares, Inc. 8,196 183
Stock Yards Bancorp, Inc. 11,354 580
Summit Financial Group, Inc. 6,778 180
Texas Capital Bancshares, Inc.* 28,147 1,996
Tompkins Financial Corp. 8,007 662
Towne Bank 37,407 1,137
TriCo Bancshares 14,241 675
TriState Capital Holdings, Inc.* 14,381 332
Triumph Bancorp, Inc.* 12,499 967
Trustmark Corp. 35,735 1,203
UMB Financial Corp. 24,246 2,239
United Bankshares, Inc. 68,667 2,649
United Community Banks, Inc. 42,747 1,458
United Security Bancshares 8,001 65
Unity Bancorp, Inc. 5,107 112
Univest Financial Corp. 16,203 463
Valley National Bancorp 221,001 3,037
Veritex Holdings, Inc. 26,646 872
Washington Trust Bancorp, Inc. 9,494 490
WesBanco, Inc. 35,595 1,284
West BanCorp, Inc. 8,963 216
Westamerica BanCorp 14,644 919
135,582
Beverages – 0.3%
Celsius Holdings, Inc.* 20,212 971
Coca-Cola Consolidated, Inc. 2,618 756
MGP Ingredients, Inc. 7,346 435
National Beverage Corp. 13,035 638
NUMBEROF SHARES
VALUE(000S)
C O M M O N S TO C KS - 9 8 . 0 % c o n t i n u e d
Beverages – 0.3% continued
NewAge, Inc.* 53,669 $153
Primo Water Corp. 85,699 1,393
4,346
Biotechnology – 9.7%
4D Molecular Therapeutics, Inc.* 4,172 181
89bio, Inc.* 4,962 117
Abeona Therapeutics, Inc.* 33,545 63
ADMA Biologics, Inc.* 34,324 60
Adverum Biotechnologies, Inc.* 50,587 499
Aeglea BioTherapeutics, Inc.* 26,890 213
Affimed N.V.* 62,593 495
Agenus, Inc.* 86,878 236
Akebia Therapeutics, Inc.* 83,765 284
Akero Therapeutics, Inc.* 7,634 221
Akouos, Inc.* 13,262 184
Albireo Pharma, Inc.* 9,885 348
Alector, Inc.* 26,473 533
Aligos Therapeutics, Inc.* 6,011 137
Allakos, Inc.* 14,500 1,664
Allogene Therapeutics, Inc.* 30,390 1,073
Allovir, Inc.* 16,038 375
ALX Oncology Holdings, Inc.* 9,639 711
Amicus Therapeutics, Inc.* 141,573 1,399
AnaptysBio, Inc.* 12,234 264
Anavex Life Sciences Corp.* 31,914 477
Anika Therapeutics, Inc.* 8,030 328
Annexon, Inc.* 14,664 408
Apellis Pharmaceuticals, Inc.* 33,023 1,417
Applied Genetic Technologies Corp.* 22,031 112
Applied Molecular Transport, Inc.* 12,340 543
Applied Therapeutics, Inc.* 9,670 181
Aprea Therapeutics, Inc.* 4,259 22
Aptinyx, Inc.* 14,052 42
Aravive, Inc.* 6,968 46
Arcturus Therapeutics Holdings, Inc.* 11,072 457
Arcus Biosciences, Inc.* 23,704 666
Arcutis Biotherapeutics, Inc.* 13,308 385
Ardelyx, Inc.* 41,811 277
Arena Pharmaceuticals, Inc.* 32,228 2,236
Arrowhead Pharmaceuticals, Inc.* 56,808 3,767
Assembly Biosciences, Inc.* 17,547 81
Atara Biotherapeutics, Inc.* 44,682 642
Athenex, Inc.* 38,926 167
Athersys, Inc.* 99,351 179
MARCH 31, 2021
See Notes to the Financial Statements.
NORTHERN FUNDS ANNUAL REPORT 95 EQUIT Y INDEX FUNDS
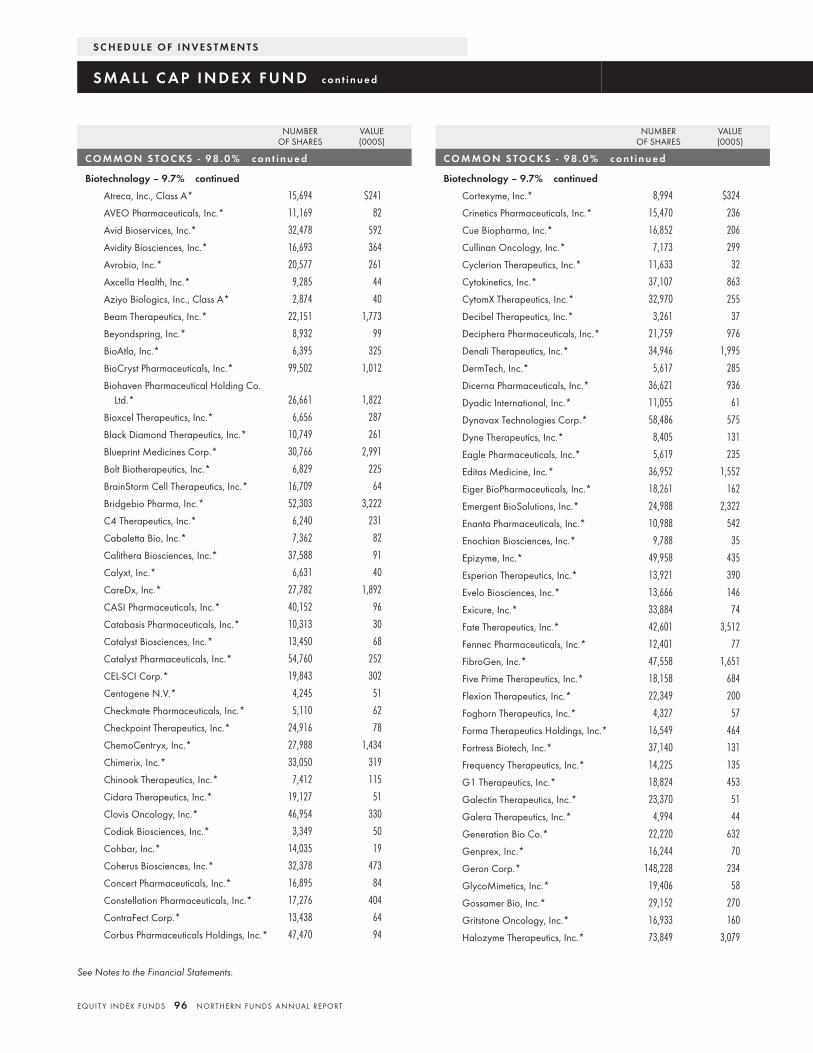
NUMBEROF SHARES
VALUE(000S)
C O M M O N S TO C KS - 9 8 . 0 % c o n t i n u e d
Biotechnology – 9.7% continued
Atreca, Inc., Class A* 15,694 $241
AVEO Pharmaceuticals, Inc.* 11,169 82
Avid Bioservices, Inc.* 32,478 592
Avidity Biosciences, Inc.* 16,693 364
Avrobio, Inc.* 20,577 261
Axcella Health, Inc.* 9,285 44
Aziyo Biologics, Inc., Class A* 2,874 40
Beam Therapeutics, Inc.* 22,151 1,773
Beyondspring, Inc.* 8,932 99
BioAtla, Inc.* 6,395 325
BioCryst Pharmaceuticals, Inc.* 99,502 1,012
Biohaven Pharmaceutical Holding Co.Ltd.* 26,661 1,822
Bioxcel Therapeutics, Inc.* 6,656 287
Black Diamond Therapeutics, Inc.* 10,749 261
Blueprint Medicines Corp.* 30,766 2,991
Bolt Biotherapeutics, Inc.* 6,829 225
BrainStorm Cell Therapeutics, Inc.* 16,709 64
Bridgebio Pharma, Inc.* 52,303 3,222
C4 Therapeutics, Inc.* 6,240 231
Cabaletta Bio, Inc.* 7,362 82
Calithera Biosciences, Inc.* 37,588 91
Calyxt, Inc.* 6,631 40
CareDx, Inc.* 27,782 1,892
CASI Pharmaceuticals, Inc.* 40,152 96
Catabasis Pharmaceuticals, Inc.* 10,313 30
Catalyst Biosciences, Inc.* 13,450 68
Catalyst Pharmaceuticals, Inc.* 54,760 252
CEL-SCI Corp.* 19,843 302
Centogene N.V.* 4,245 51
Checkmate Pharmaceuticals, Inc.* 5,110 62
Checkpoint Therapeutics, Inc.* 24,916 78
ChemoCentryx, Inc.* 27,988 1,434
Chimerix, Inc.* 33,050 319
Chinook Therapeutics, Inc.* 7,412 115
Cidara Therapeutics, Inc.* 19,127 51
Clovis Oncology, Inc.* 46,954 330
Codiak Biosciences, Inc.* 3,349 50
Cohbar, Inc.* 14,035 19
Coherus Biosciences, Inc.* 32,378 473
Concert Pharmaceuticals, Inc.* 16,895 84
Constellation Pharmaceuticals, Inc.* 17,276 404
ContraFect Corp.* 13,438 64
Corbus Pharmaceuticals Holdings, Inc.* 47,470 94
NUMBEROF SHARES
VALUE(000S)
C O M M O N S TO C KS - 9 8 . 0 % c o n t i n u e d
Biotechnology – 9.7% continued
Cortexyme, Inc.* 8,994 $324
Crinetics Pharmaceuticals, Inc.* 15,470 236
Cue Biopharma, Inc.* 16,852 206
Cullinan Oncology, Inc.* 7,173 299
Cyclerion Therapeutics, Inc.* 11,633 32
Cytokinetics, Inc.* 37,107 863
CytomX Therapeutics, Inc.* 32,970 255
Decibel Therapeutics, Inc.* 3,261 37
Deciphera Pharmaceuticals, Inc.* 21,759 976
Denali Therapeutics, Inc.* 34,946 1,995
DermTech, Inc.* 5,617 285
Dicerna Pharmaceuticals, Inc.* 36,621 936
Dyadic International, Inc.* 11,055 61
Dynavax Technologies Corp.* 58,486 575
Dyne Therapeutics, Inc.* 8,405 131
Eagle Pharmaceuticals, Inc.* 5,619 235
Editas Medicine, Inc.* 36,952 1,552
Eiger BioPharmaceuticals, Inc.* 18,261 162
Emergent BioSolutions, Inc.* 24,988 2,322
Enanta Pharmaceuticals, Inc.* 10,988 542
Enochian Biosciences, Inc.* 9,788 35
Epizyme, Inc.* 49,958 435
Esperion Therapeutics, Inc.* 13,921 390
Evelo Biosciences, Inc.* 13,666 146
Exicure, Inc.* 33,884 74
Fate Therapeutics, Inc.* 42,601 3,512
Fennec Pharmaceuticals, Inc.* 12,401 77
FibroGen, Inc.* 47,558 1,651
Five Prime Therapeutics, Inc.* 18,158 684
Flexion Therapeutics, Inc.* 22,349 200
Foghorn Therapeutics, Inc.* 4,327 57
Forma Therapeutics Holdings, Inc.* 16,549 464
Fortress Biotech, Inc.* 37,140 131
Frequency Therapeutics, Inc.* 14,225 135
G1 Therapeutics, Inc.* 18,824 453
Galectin Therapeutics, Inc.* 23,370 51
Galera Therapeutics, Inc.* 4,994 44
Generation Bio Co.* 22,220 632
Genprex, Inc.* 16,244 70
Geron Corp.* 148,228 234
GlycoMimetics, Inc.* 19,406 58
Gossamer Bio, Inc.* 29,152 270
Gritstone Oncology, Inc.* 16,933 160
Halozyme Therapeutics, Inc.* 73,849 3,079
S C H E D U L E O F I N V E S T M E N T S
S M A L L C A P I N D E X F U N D c o n t i n u e d
See Notes to the Financial Statements.
EQUIT Y INDEX FUNDS 96 NORTHERN FUNDS ANNUAL REPORT
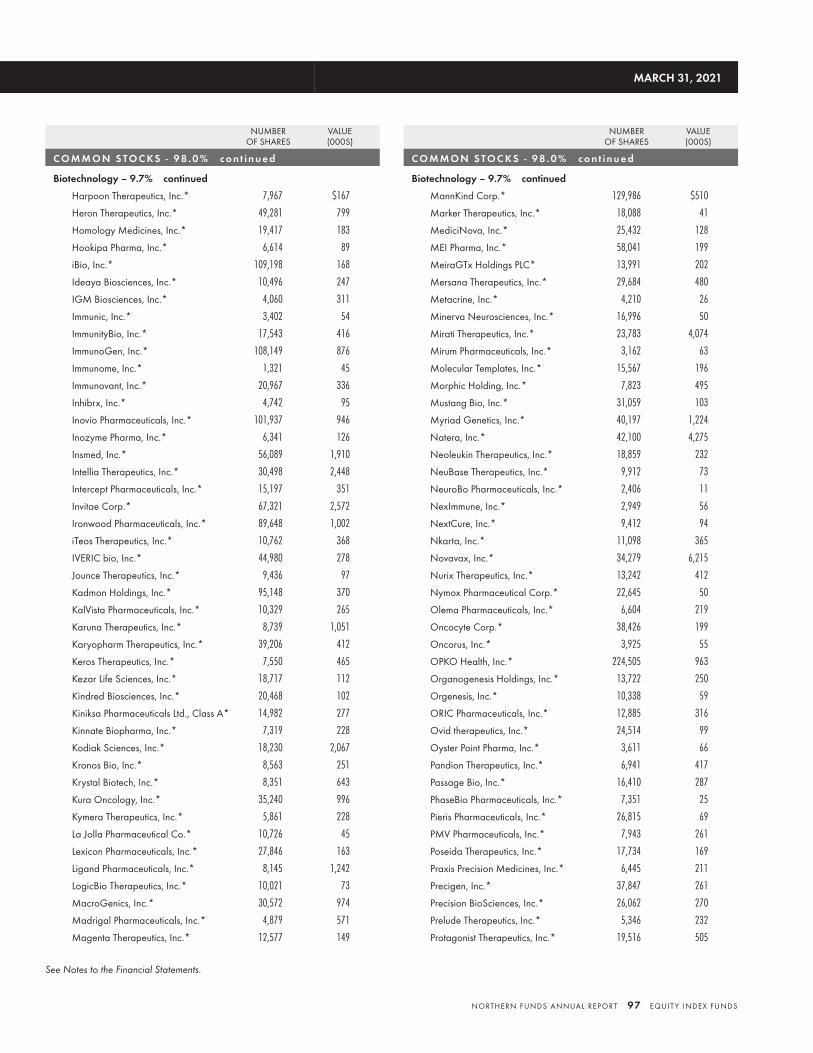
NUMBEROF SHARES
VALUE(000S)
C O M M O N S TO C KS - 9 8 . 0 % c o n t i n u e d
Biotechnology – 9.7% continued
Harpoon Therapeutics, Inc.* 7,967 $167
Heron Therapeutics, Inc.* 49,281 799
Homology Medicines, Inc.* 19,417 183
Hookipa Pharma, Inc.* 6,614 89
iBio, Inc.* 109,198 168
Ideaya Biosciences, Inc.* 10,496 247
IGM Biosciences, Inc.* 4,060 311
Immunic, Inc.* 3,402 54
ImmunityBio, Inc.* 17,543 416
ImmunoGen, Inc.* 108,149 876
Immunome, Inc.* 1,321 45
Immunovant, Inc.* 20,967 336
Inhibrx, Inc.* 4,742 95
Inovio Pharmaceuticals, Inc.* 101,937 946
Inozyme Pharma, Inc.* 6,341 126
Insmed, Inc.* 56,089 1,910
Intellia Therapeutics, Inc.* 30,498 2,448
Intercept Pharmaceuticals, Inc.* 15,197 351
Invitae Corp.* 67,321 2,572
Ironwood Pharmaceuticals, Inc.* 89,648 1,002
iTeos Therapeutics, Inc.* 10,762 368
IVERIC bio, Inc.* 44,980 278
Jounce Therapeutics, Inc.* 9,436 97
Kadmon Holdings, Inc.* 95,148 370
KalVista Pharmaceuticals, Inc.* 10,329 265
Karuna Therapeutics, Inc.* 8,739 1,051
Karyopharm Therapeutics, Inc.* 39,206 412
Keros Therapeutics, Inc.* 7,550 465
Kezar Life Sciences, Inc.* 18,717 112
Kindred Biosciences, Inc.* 20,468 102
Kiniksa Pharmaceuticals Ltd., Class A* 14,982 277
Kinnate Biopharma, Inc.* 7,319 228
Kodiak Sciences, Inc.* 18,230 2,067
Kronos Bio, Inc.* 8,563 251
Krystal Biotech, Inc.* 8,351 643
Kura Oncology, Inc.* 35,240 996
Kymera Therapeutics, Inc.* 5,861 228
La Jolla Pharmaceutical Co.* 10,726 45
Lexicon Pharmaceuticals, Inc.* 27,846 163
Ligand Pharmaceuticals, Inc.* 8,145 1,242
LogicBio Therapeutics, Inc.* 10,021 73
MacroGenics, Inc.* 30,572 974
Madrigal Pharmaceuticals, Inc.* 4,879 571
Magenta Therapeutics, Inc.* 12,577 149
NUMBEROF SHARES
VALUE(000S)
C O M M O N S TO C KS - 9 8 . 0 % c o n t i n u e d
Biotechnology – 9.7% continued
MannKind Corp.* 129,986 $510
Marker Therapeutics, Inc.* 18,088 41
MediciNova, Inc.* 25,432 128
MEI Pharma, Inc.* 58,041 199
MeiraGTx Holdings PLC* 13,991 202
Mersana Therapeutics, Inc.* 29,684 480
Metacrine, Inc.* 4,210 26
Minerva Neurosciences, Inc.* 16,996 50
Mirati Therapeutics, Inc.* 23,783 4,074
Mirum Pharmaceuticals, Inc.* 3,162 63
Molecular Templates, Inc.* 15,567 196
Morphic Holding, Inc.* 7,823 495
Mustang Bio, Inc.* 31,059 103
Myriad Genetics, Inc.* 40,197 1,224
Natera, Inc.* 42,100 4,275
Neoleukin Therapeutics, Inc.* 18,859 232
NeuBase Therapeutics, Inc.* 9,912 73
NeuroBo Pharmaceuticals, Inc.* 2,406 11
NexImmune, Inc.* 2,949 56
NextCure, Inc.* 9,412 94
Nkarta, Inc.* 11,098 365
Novavax, Inc.* 34,279 6,215
Nurix Therapeutics, Inc.* 13,242 412
Nymox Pharmaceutical Corp.* 22,645 50
Olema Pharmaceuticals, Inc.* 6,604 219
Oncocyte Corp.* 38,426 199
Oncorus, Inc.* 3,925 55
OPKO Health, Inc.* 224,505 963
Organogenesis Holdings, Inc.* 13,722 250
Orgenesis, Inc.* 10,338 59
ORIC Pharmaceuticals, Inc.* 12,885 316
Ovid therapeutics, Inc.* 24,514 99
Oyster Point Pharma, Inc.* 3,611 66
Pandion Therapeutics, Inc.* 6,941 417
Passage Bio, Inc.* 16,410 287
PhaseBio Pharmaceuticals, Inc.* 7,351 25
Pieris Pharmaceuticals, Inc.* 26,815 69
PMV Pharmaceuticals, Inc.* 7,943 261
Poseida Therapeutics, Inc.* 17,734 169
Praxis Precision Medicines, Inc.* 6,445 211
Precigen, Inc.* 37,847 261
Precision BioSciences, Inc.* 26,062 270
Prelude Therapeutics, Inc.* 5,346 232
Protagonist Therapeutics, Inc.* 19,516 505
MARCH 31, 2021
See Notes to the Financial Statements.
NORTHERN FUNDS ANNUAL REPORT 97 EQUIT Y INDEX FUNDS
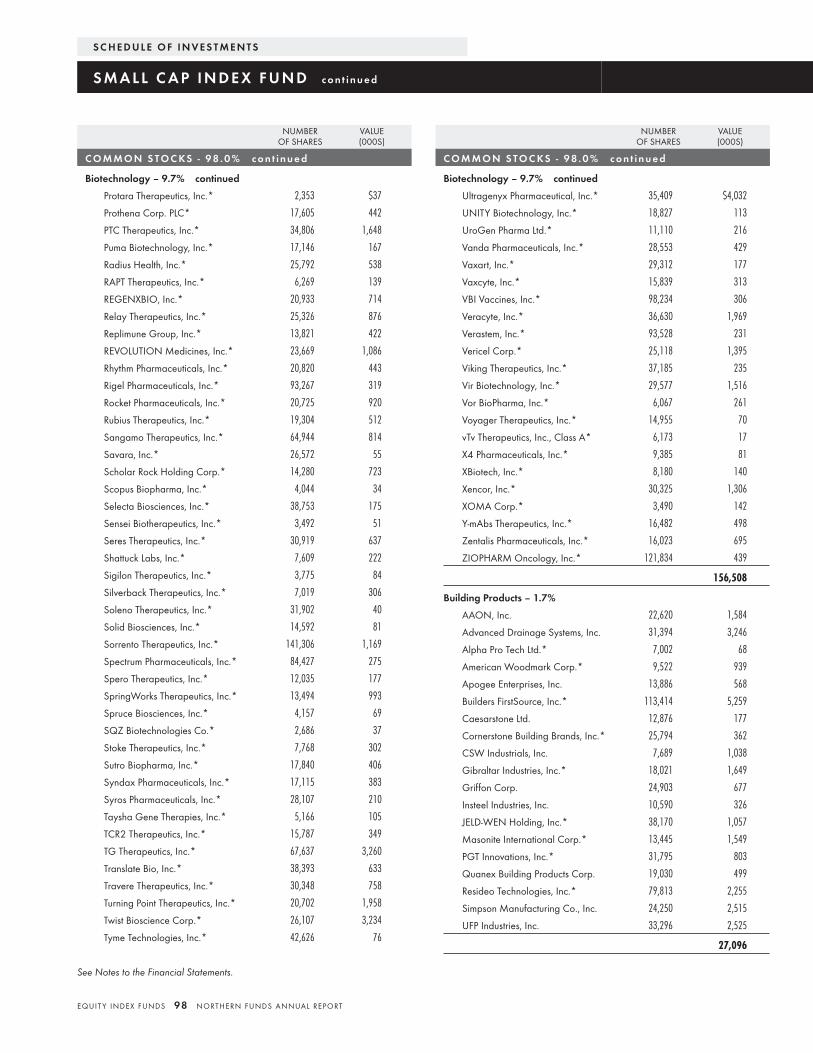
NUMBEROF SHARES
VALUE(000S)
C O M M O N S TO C KS - 9 8 . 0 % c o n t i n u e d
Biotechnology – 9.7% continued
Protara Therapeutics, Inc.* 2,353 $37
Prothena Corp. PLC* 17,605 442
PTC Therapeutics, Inc.* 34,806 1,648
Puma Biotechnology, Inc.* 17,146 167
Radius Health, Inc.* 25,792 538
RAPT Therapeutics, Inc.* 6,269 139
REGENXBIO, Inc.* 20,933 714
Relay Therapeutics, Inc.* 25,326 876
Replimune Group, Inc.* 13,821 422
REVOLUTION Medicines, Inc.* 23,669 1,086
Rhythm Pharmaceuticals, Inc.* 20,820 443
Rigel Pharmaceuticals, Inc.* 93,267 319
Rocket Pharmaceuticals, Inc.* 20,725 920
Rubius Therapeutics, Inc.* 19,304 512
Sangamo Therapeutics, Inc.* 64,944 814
Savara, Inc.* 26,572 55
Scholar Rock Holding Corp.* 14,280 723
Scopus Biopharma, Inc.* 4,044 34
Selecta Biosciences, Inc.* 38,753 175
Sensei Biotherapeutics, Inc.* 3,492 51
Seres Therapeutics, Inc.* 30,919 637
Shattuck Labs, Inc.* 7,609 222
Sigilon Therapeutics, Inc.* 3,775 84
Silverback Therapeutics, Inc.* 7,019 306
Soleno Therapeutics, Inc.* 31,902 40
Solid Biosciences, Inc.* 14,592 81
Sorrento Therapeutics, Inc.* 141,306 1,169
Spectrum Pharmaceuticals, Inc.* 84,427 275
Spero Therapeutics, Inc.* 12,035 177
SpringWorks Therapeutics, Inc.* 13,494 993
Spruce Biosciences, Inc.* 4,157 69
SQZ Biotechnologies Co.* 2,686 37
Stoke Therapeutics, Inc.* 7,768 302
Sutro Biopharma, Inc.* 17,840 406
Syndax Pharmaceuticals, Inc.* 17,115 383
Syros Pharmaceuticals, Inc.* 28,107 210
Taysha Gene Therapies, Inc.* 5,166 105
TCR2 Therapeutics, Inc.* 15,787 349
TG Therapeutics, Inc.* 67,637 3,260
Translate Bio, Inc.* 38,393 633
Travere Therapeutics, Inc.* 30,348 758
Turning Point Therapeutics, Inc.* 20,702 1,958
Twist Bioscience Corp.* 26,107 3,234
Tyme Technologies, Inc.* 42,626 76
NUMBEROF SHARES
VALUE(000S)
C O M M O N S TO C KS - 9 8 . 0 % c o n t i n u e d
Biotechnology – 9.7% continued
Ultragenyx Pharmaceutical, Inc.* 35,409 $4,032
UNITY Biotechnology, Inc.* 18,827 113
UroGen Pharma Ltd.* 11,110 216
Vanda Pharmaceuticals, Inc.* 28,553 429
Vaxart, Inc.* 29,312 177
Vaxcyte, Inc.* 15,839 313
VBI Vaccines, Inc.* 98,234 306
Veracyte, Inc.* 36,630 1,969
Verastem, Inc.* 93,528 231
Vericel Corp.* 25,118 1,395
Viking Therapeutics, Inc.* 37,185 235
Vir Biotechnology, Inc.* 29,577 1,516
Vor BioPharma, Inc.* 6,067 261
Voyager Therapeutics, Inc.* 14,955 70
vTv Therapeutics, Inc., Class A* 6,173 17
X4 Pharmaceuticals, Inc.* 9,385 81
XBiotech, Inc.* 8,180 140
Xencor, Inc.* 30,325 1,306
XOMA Corp.* 3,490 142
Y-mAbs Therapeutics, Inc.* 16,482 498
Zentalis Pharmaceuticals, Inc.* 16,023 695
ZIOPHARM Oncology, Inc.* 121,834 439
156,508
Building Products – 1.7%
AAON, Inc. 22,620 1,584
Advanced Drainage Systems, Inc. 31,394 3,246
Alpha Pro Tech Ltd.* 7,002 68
American Woodmark Corp.* 9,522 939
Apogee Enterprises, Inc. 13,886 568
Builders FirstSource, Inc.* 113,414 5,259
Caesarstone Ltd. 12,876 177
Cornerstone Building Brands, Inc.* 25,794 362
CSW Industrials, Inc. 7,689 1,038
Gibraltar Industries, Inc.* 18,021 1,649
Griffon Corp. 24,903 677
Insteel Industries, Inc. 10,590 326
JELD-WEN Holding, Inc.* 38,170 1,057
Masonite International Corp.* 13,445 1,549
PGT Innovations, Inc.* 31,795 803
Quanex Building Products Corp. 19,030 499
Resideo Technologies, Inc.* 79,813 2,255
Simpson Manufacturing Co., Inc. 24,250 2,515
UFP Industries, Inc. 33,296 2,525
27,096
S C H E D U L E O F I N V E S T M E N T S
S M A L L C A P I N D E X F U N D c o n t i n u e d
See Notes to the Financial Statements.
EQUIT Y INDEX FUNDS 98 NORTHERN FUNDS ANNUAL REPORT
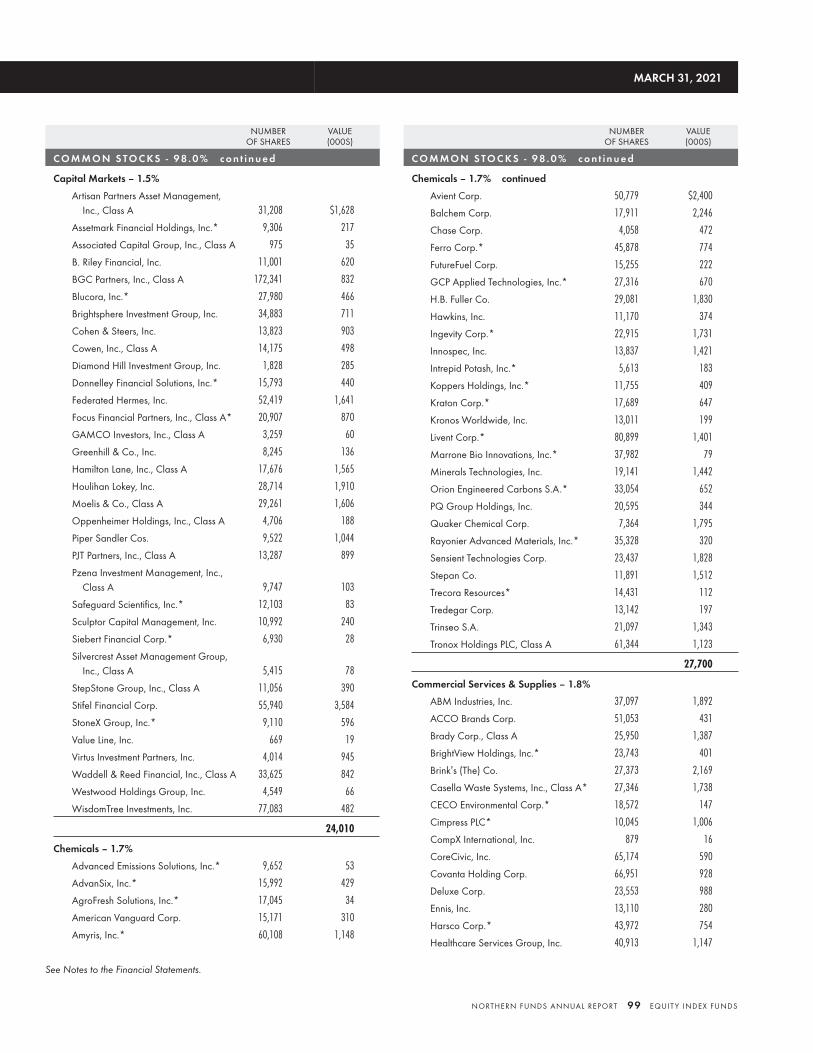
NUMBEROF SHARES
VALUE(000S)
C O M M O N S TO C KS - 9 8 . 0 % c o n t i n u e d
Capital Markets – 1.5%
Artisan Partners Asset Management,Inc., Class A 31,208 $1,628
Assetmark Financial Holdings, Inc.* 9,306 217
Associated Capital Group, Inc., Class A 975 35
B. Riley Financial, Inc. 11,001 620
BGC Partners, Inc., Class A 172,341 832
Blucora, Inc.* 27,980 466
Brightsphere Investment Group, Inc. 34,883 711
Cohen & Steers, Inc. 13,823 903
Cowen, Inc., Class A 14,175 498
Diamond Hill Investment Group, Inc. 1,828 285
Donnelley Financial Solutions, Inc.* 15,793 440
Federated Hermes, Inc. 52,419 1,641
Focus Financial Partners, Inc., Class A* 20,907 870
GAMCO Investors, Inc., Class A 3,259 60
Greenhill & Co., Inc. 8,245 136
Hamilton Lane, Inc., Class A 17,676 1,565
Houlihan Lokey, Inc. 28,714 1,910
Moelis & Co., Class A 29,261 1,606
Oppenheimer Holdings, Inc., Class A 4,706 188
Piper Sandler Cos. 9,522 1,044
PJT Partners, Inc., Class A 13,287 899
Pzena Investment Management, Inc.,Class A 9,747 103
Safeguard Scientifics, Inc.* 12,103 83
Sculptor Capital Management, Inc. 10,992 240
Siebert Financial Corp.* 6,930 28
Silvercrest Asset Management Group,Inc., Class A 5,415 78
StepStone Group, Inc., Class A 11,056 390
Stifel Financial Corp. 55,940 3,584
StoneX Group, Inc.* 9,110 596
Value Line, Inc. 669 19
Virtus Investment Partners, Inc. 4,014 945
Waddell & Reed Financial, Inc., Class A 33,625 842
Westwood Holdings Group, Inc. 4,549 66
WisdomTree Investments, Inc. 77,083 482
24,010
Chemicals – 1.7%
Advanced Emissions Solutions, Inc.* 9,652 53
AdvanSix, Inc.* 15,992 429
AgroFresh Solutions, Inc.* 17,045 34
American Vanguard Corp. 15,171 310
Amyris, Inc.* 60,108 1,148
NUMBEROF SHARES
VALUE(000S)
C O M M O N S TO C KS - 9 8 . 0 % c o n t i n u e d
Chemicals – 1.7% continued
Avient Corp. 50,779 $2,400
Balchem Corp. 17,911 2,246
Chase Corp. 4,058 472
Ferro Corp.* 45,878 774
FutureFuel Corp. 15,255 222
GCP Applied Technologies, Inc.* 27,316 670
H.B. Fuller Co. 29,081 1,830
Hawkins, Inc. 11,170 374
Ingevity Corp.* 22,915 1,731
Innospec, Inc. 13,837 1,421
Intrepid Potash, Inc.* 5,613 183
Koppers Holdings, Inc.* 11,755 409
Kraton Corp.* 17,689 647
Kronos Worldwide, Inc. 13,011 199
Livent Corp.* 80,899 1,401
Marrone Bio Innovations, Inc.* 37,982 79
Minerals Technologies, Inc. 19,141 1,442
Orion Engineered Carbons S.A.* 33,054 652
PQ Group Holdings, Inc. 20,595 344
Quaker Chemical Corp. 7,364 1,795
Rayonier Advanced Materials, Inc.* 35,328 320
Sensient Technologies Corp. 23,437 1,828
Stepan Co. 11,891 1,512
Trecora Resources* 14,431 112
Tredegar Corp. 13,142 197
Trinseo S.A. 21,097 1,343
Tronox Holdings PLC, Class A 61,344 1,123
27,700
Commercial Services & Supplies – 1.8%
ABM Industries, Inc. 37,097 1,892
ACCO Brands Corp. 51,053 431
Brady Corp., Class A 25,950 1,387
BrightView Holdings, Inc.* 23,743 401
Brink’s (The) Co. 27,373 2,169
Casella Waste Systems, Inc., Class A* 27,346 1,738
CECO Environmental Corp.* 18,572 147
Cimpress PLC* 10,045 1,006
CompX International, Inc. 879 16
CoreCivic, Inc. 65,174 590
Covanta Holding Corp. 66,951 928
Deluxe Corp. 23,553 988
Ennis, Inc. 13,110 280
Harsco Corp.* 43,972 754
Healthcare Services Group, Inc. 40,913 1,147
MARCH 31, 2021
See Notes to the Financial Statements.
NORTHERN FUNDS ANNUAL REPORT 99 EQUIT Y INDEX FUNDS
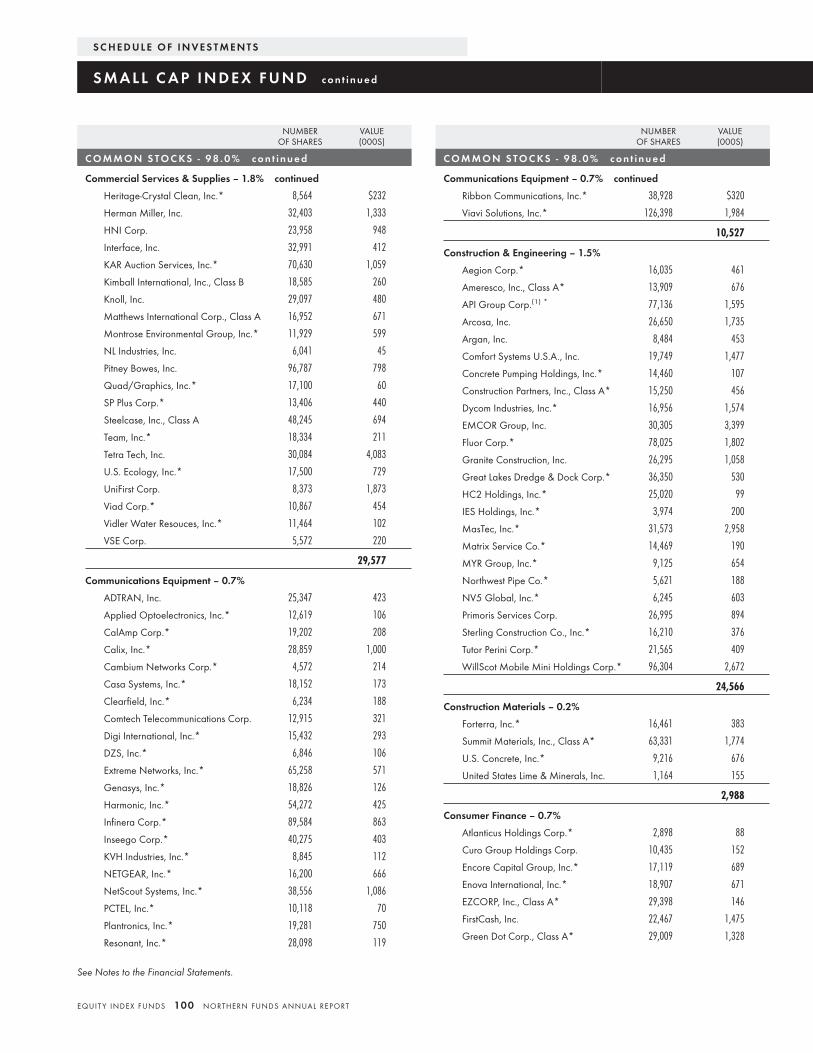
NUMBEROF SHARES
VALUE(000S)
C O M M O N S TO C KS - 9 8 . 0 % c o n t i n u e d
Commercial Services & Supplies – 1.8% continued
Heritage-Crystal Clean, Inc.* 8,564 $232
Herman Miller, Inc. 32,403 1,333
HNI Corp. 23,958 948
Interface, Inc. 32,991 412
KAR Auction Services, Inc.* 70,630 1,059
Kimball International, Inc., Class B 18,585 260
Knoll, Inc. 29,097 480
Matthews International Corp., Class A 16,952 671
Montrose Environmental Group, Inc.* 11,929 599
NL Industries, Inc. 6,041 45
Pitney Bowes, Inc. 96,787 798
Quad/Graphics, Inc.* 17,100 60
SP Plus Corp.* 13,406 440
Steelcase, Inc., Class A 48,245 694
Team, Inc.* 18,334 211
Tetra Tech, Inc. 30,084 4,083
U.S. Ecology, Inc.* 17,500 729
UniFirst Corp. 8,373 1,873
Viad Corp.* 10,867 454
Vidler Water Resouces, Inc.* 11,464 102
VSE Corp. 5,572 220
29,577
Communications Equipment – 0.7%
ADTRAN, Inc. 25,347 423
Applied Optoelectronics, Inc.* 12,619 106
CalAmp Corp.* 19,202 208
Calix, Inc.* 28,859 1,000
Cambium Networks Corp.* 4,572 214
Casa Systems, Inc.* 18,152 173
Clearfield, Inc.* 6,234 188
Comtech Telecommunications Corp. 12,915 321
Digi International, Inc.* 15,432 293
DZS, Inc.* 6,846 106
Extreme Networks, Inc.* 65,258 571
Genasys, Inc.* 18,826 126
Harmonic, Inc.* 54,272 425
Infinera Corp.* 89,584 863
Inseego Corp.* 40,275 403
KVH Industries, Inc.* 8,845 112
NETGEAR, Inc.* 16,200 666
NetScout Systems, Inc.* 38,556 1,086
PCTEL, Inc.* 10,118 70
Plantronics, Inc.* 19,281 750
Resonant, Inc.* 28,098 119
NUMBEROF SHARES
VALUE(000S)
C O M M O N S TO C KS - 9 8 . 0 % c o n t i n u e d
Communications Equipment – 0.7% continued
Ribbon Communications, Inc.* 38,928 $320
Viavi Solutions, Inc.* 126,398 1,984
10,527
Construction & Engineering – 1.5%
Aegion Corp.* 16,035 461
Ameresco, Inc., Class A* 13,909 676
API Group Corp.(1) * 77,136 1,595
Arcosa, Inc. 26,650 1,735
Argan, Inc. 8,484 453
Comfort Systems U.S.A., Inc. 19,749 1,477
Concrete Pumping Holdings, Inc.* 14,460 107
Construction Partners, Inc., Class A* 15,250 456
Dycom Industries, Inc.* 16,956 1,574
EMCOR Group, Inc. 30,305 3,399
Fluor Corp.* 78,025 1,802
Granite Construction, Inc. 26,295 1,058
Great Lakes Dredge & Dock Corp.* 36,350 530
HC2 Holdings, Inc.* 25,020 99
IES Holdings, Inc.* 3,974 200
MasTec, Inc.* 31,573 2,958
Matrix Service Co.* 14,469 190
MYR Group, Inc.* 9,125 654
Northwest Pipe Co.* 5,621 188
NV5 Global, Inc.* 6,245 603
Primoris Services Corp. 26,995 894
Sterling Construction Co., Inc.* 16,210 376
Tutor Perini Corp.* 21,565 409
WillScot Mobile Mini Holdings Corp.* 96,304 2,672
24,566
Construction Materials – 0.2%
Forterra, Inc.* 16,461 383
Summit Materials, Inc., Class A* 63,331 1,774
U.S. Concrete, Inc.* 9,216 676
United States Lime & Minerals, Inc. 1,164 155
2,988
Consumer Finance – 0.7%
Atlanticus Holdings Corp.* 2,898 88
Curo Group Holdings Corp. 10,435 152
Encore Capital Group, Inc.* 17,119 689
Enova International, Inc.* 18,907 671
EZCORP, Inc., Class A* 29,398 146
FirstCash, Inc. 22,467 1,475
Green Dot Corp., Class A* 29,009 1,328
S C H E D U L E O F I N V E S T M E N T S
S M A L L C A P I N D E X F U N D c o n t i n u e d
See Notes to the Financial Statements.
EQUIT Y INDEX FUNDS 100 NORTHERN FUNDS ANNUAL REPORT
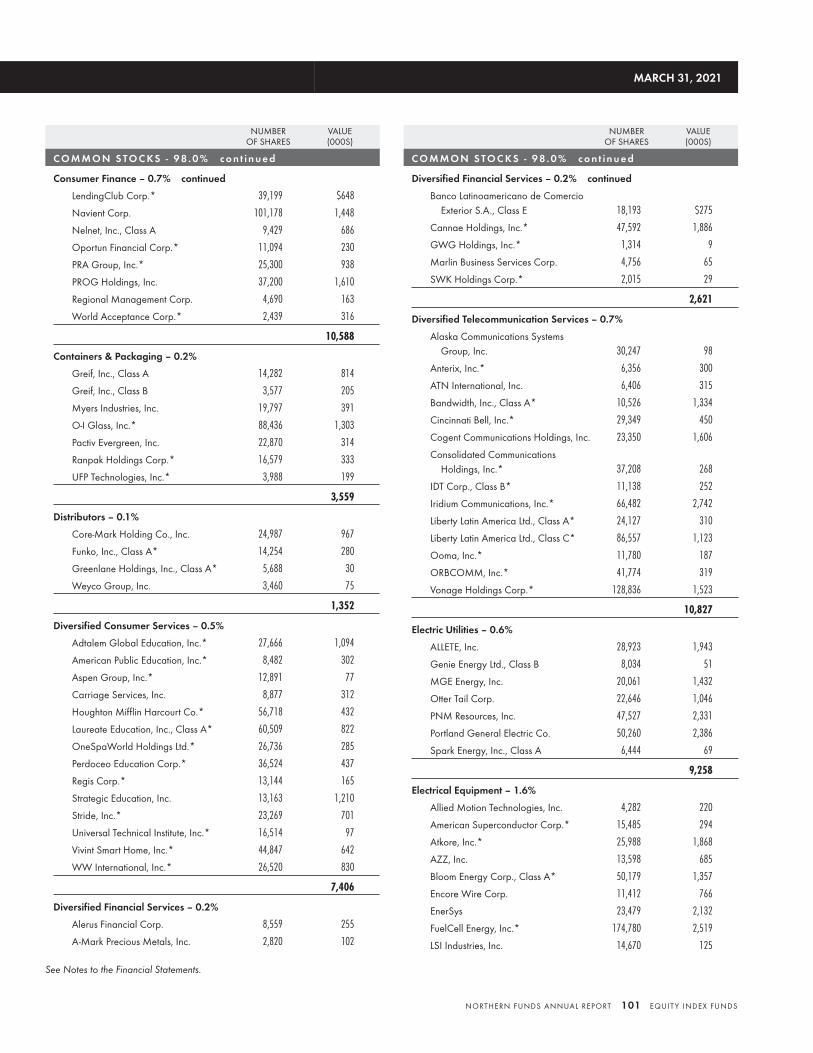
NUMBEROF SHARES
VALUE(000S)
C O M M O N S TO C KS - 9 8 . 0 % c o n t i n u e d
Consumer Finance – 0.7% continued
LendingClub Corp.* 39,199 $648
Navient Corp. 101,178 1,448
Nelnet, Inc., Class A 9,429 686
Oportun Financial Corp.* 11,094 230
PRA Group, Inc.* 25,300 938
PROG Holdings, Inc. 37,200 1,610
Regional Management Corp. 4,690 163
World Acceptance Corp.* 2,439 316
10,588
Containers & Packaging – 0.2%
Greif, Inc., Class A 14,282 814
Greif, Inc., Class B 3,577 205
Myers Industries, Inc. 19,797 391
O-I Glass, Inc.* 88,436 1,303
Pactiv Evergreen, Inc. 22,870 314
Ranpak Holdings Corp.* 16,579 333
UFP Technologies, Inc.* 3,988 199
3,559
Distributors – 0.1%
Core-Mark Holding Co., Inc. 24,987 967
Funko, Inc., Class A* 14,254 280
Greenlane Holdings, Inc., Class A* 5,688 30
Weyco Group, Inc. 3,460 75
1,352
Diversified Consumer Services – 0.5%
Adtalem Global Education, Inc.* 27,666 1,094
American Public Education, Inc.* 8,482 302
Aspen Group, Inc.* 12,891 77
Carriage Services, Inc. 8,877 312
Houghton Mifflin Harcourt Co.* 56,718 432
Laureate Education, Inc., Class A* 60,509 822
OneSpaWorld Holdings Ltd.* 26,736 285
Perdoceo Education Corp.* 36,524 437
Regis Corp.* 13,144 165
Strategic Education, Inc. 13,163 1,210
Stride, Inc.* 23,269 701
Universal Technical Institute, Inc.* 16,514 97
Vivint Smart Home, Inc.* 44,847 642
WW International, Inc.* 26,520 830
7,406
Diversified Financial Services – 0.2%
Alerus Financial Corp. 8,559 255
A-Mark Precious Metals, Inc. 2,820 102
NUMBEROF SHARES
VALUE(000S)
C O M M O N S TO C KS - 9 8 . 0 % c o n t i n u e d
Diversified Financial Services – 0.2% continued
Banco Latinoamericano de ComercioExterior S.A., Class E 18,193 $275
Cannae Holdings, Inc.* 47,592 1,886
GWG Holdings, Inc.* 1,314 9
Marlin Business Services Corp. 4,756 65
SWK Holdings Corp.* 2,015 29
2,621
Diversified Telecommunication Services – 0.7%
Alaska Communications SystemsGroup, Inc. 30,247 98
Anterix, Inc.* 6,356 300
ATN International, Inc. 6,406 315
Bandwidth, Inc., Class A* 10,526 1,334
Cincinnati Bell, Inc.* 29,349 450
Cogent Communications Holdings, Inc. 23,350 1,606
Consolidated CommunicationsHoldings, Inc.* 37,208 268
IDT Corp., Class B* 11,138 252
Iridium Communications, Inc.* 66,482 2,742
Liberty Latin America Ltd., Class A* 24,127 310
Liberty Latin America Ltd., Class C* 86,557 1,123
Ooma, Inc.* 11,780 187
ORBCOMM, Inc.* 41,774 319
Vonage Holdings Corp.* 128,836 1,523
10,827
Electric Utilities – 0.6%
ALLETE, Inc. 28,923 1,943
Genie Energy Ltd., Class B 8,034 51
MGE Energy, Inc. 20,061 1,432
Otter Tail Corp. 22,646 1,046
PNM Resources, Inc. 47,527 2,331
Portland General Electric Co. 50,260 2,386
Spark Energy, Inc., Class A 6,444 69
9,258
Electrical Equipment – 1.6%
Allied Motion Technologies, Inc. 4,282 220
American Superconductor Corp.* 15,485 294
Atkore, Inc.* 25,988 1,868
AZZ, Inc. 13,598 685
Bloom Energy Corp., Class A* 50,179 1,357
Encore Wire Corp. 11,412 766
EnerSys 23,479 2,132
FuelCell Energy, Inc.* 174,780 2,519
LSI Industries, Inc. 14,670 125
MARCH 31, 2021
See Notes to the Financial Statements.
NORTHERN FUNDS ANNUAL REPORT 101 EQUIT Y INDEX FUNDS
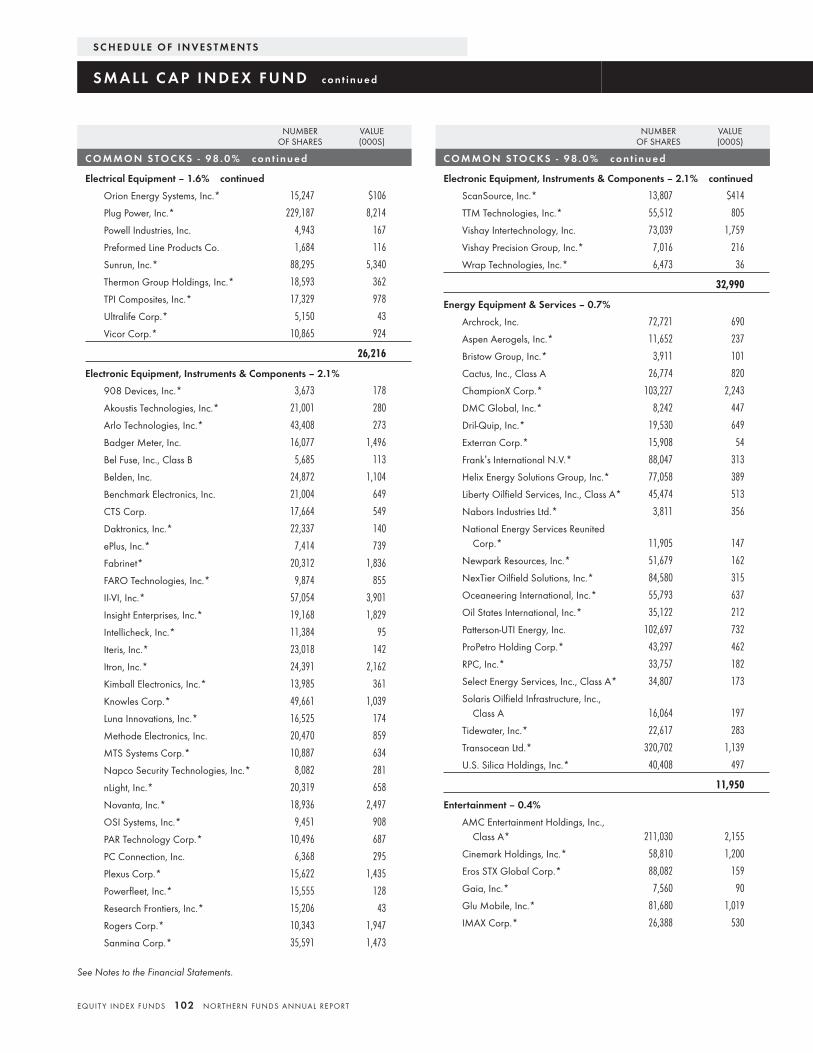
NUMBEROF SHARES
VALUE(000S)
C O M M O N S TO C KS - 9 8 . 0 % c o n t i n u e d
Electrical Equipment – 1.6% continued
Orion Energy Systems, Inc.* 15,247 $106
Plug Power, Inc.* 229,187 8,214
Powell Industries, Inc. 4,943 167
Preformed Line Products Co. 1,684 116
Sunrun, Inc.* 88,295 5,340
Thermon Group Holdings, Inc.* 18,593 362
TPI Composites, Inc.* 17,329 978
Ultralife Corp.* 5,150 43
Vicor Corp.* 10,865 924
26,216
Electronic Equipment, Instruments & Components – 2.1%
908 Devices, Inc.* 3,673 178
Akoustis Technologies, Inc.* 21,001 280
Arlo Technologies, Inc.* 43,408 273
Badger Meter, Inc. 16,077 1,496
Bel Fuse, Inc., Class B 5,685 113
Belden, Inc. 24,872 1,104
Benchmark Electronics, Inc. 21,004 649
CTS Corp. 17,664 549
Daktronics, Inc.* 22,337 140
ePlus, Inc.* 7,414 739
Fabrinet* 20,312 1,836
FARO Technologies, Inc.* 9,874 855
II-VI, Inc.* 57,054 3,901
Insight Enterprises, Inc.* 19,168 1,829
Intellicheck, Inc.* 11,384 95
Iteris, Inc.* 23,018 142
Itron, Inc.* 24,391 2,162
Kimball Electronics, Inc.* 13,985 361
Knowles Corp.* 49,661 1,039
Luna Innovations, Inc.* 16,525 174
Methode Electronics, Inc. 20,470 859
MTS Systems Corp.* 10,887 634
Napco Security Technologies, Inc.* 8,082 281
nLight, Inc.* 20,319 658
Novanta, Inc.* 18,936 2,497
OSI Systems, Inc.* 9,451 908
PAR Technology Corp.* 10,496 687
PC Connection, Inc. 6,368 295
Plexus Corp.* 15,622 1,435
Powerfleet, Inc.* 15,555 128
Research Frontiers, Inc.* 15,206 43
Rogers Corp.* 10,343 1,947
Sanmina Corp.* 35,591 1,473
NUMBEROF SHARES
VALUE(000S)
C O M M O N S TO C KS - 9 8 . 0 % c o n t i n u e d
Electronic Equipment, Instruments & Components – 2.1% continued
ScanSource, Inc.* 13,807 $414
TTM Technologies, Inc.* 55,512 805
Vishay Intertechnology, Inc. 73,039 1,759
Vishay Precision Group, Inc.* 7,016 216
Wrap Technologies, Inc.* 6,473 36
32,990
Energy Equipment & Services – 0.7%
Archrock, Inc. 72,721 690
Aspen Aerogels, Inc.* 11,652 237
Bristow Group, Inc.* 3,911 101
Cactus, Inc., Class A 26,774 820
ChampionX Corp.* 103,227 2,243
DMC Global, Inc.* 8,242 447
Dril-Quip, Inc.* 19,530 649
Exterran Corp.* 15,908 54
Frank’s International N.V.* 88,047 313
Helix Energy Solutions Group, Inc.* 77,058 389
Liberty Oilfield Services, Inc., Class A* 45,474 513
Nabors Industries Ltd.* 3,811 356
National Energy Services ReunitedCorp.* 11,905 147
Newpark Resources, Inc.* 51,679 162
NexTier Oilfield Solutions, Inc.* 84,580 315
Oceaneering International, Inc.* 55,793 637
Oil States International, Inc.* 35,122 212
Patterson-UTI Energy, Inc. 102,697 732
ProPetro Holding Corp.* 43,297 462
RPC, Inc.* 33,757 182
Select Energy Services, Inc., Class A* 34,807 173
Solaris Oilfield Infrastructure, Inc.,Class A 16,064 197
Tidewater, Inc.* 22,617 283
Transocean Ltd.* 320,702 1,139
U.S. Silica Holdings, Inc.* 40,408 497
11,950
Entertainment – 0.4%
AMC Entertainment Holdings, Inc.,Class A* 211,030 2,155
Cinemark Holdings, Inc.* 58,810 1,200
Eros STX Global Corp.* 88,082 159
Gaia, Inc.* 7,560 90
Glu Mobile, Inc.* 81,680 1,019
IMAX Corp.* 26,388 530
S C H E D U L E O F I N V E S T M E N T S
S M A L L C A P I N D E X F U N D c o n t i n u e d
See Notes to the Financial Statements.
EQUIT Y INDEX FUNDS 102 NORTHERN FUNDS ANNUAL REPORT
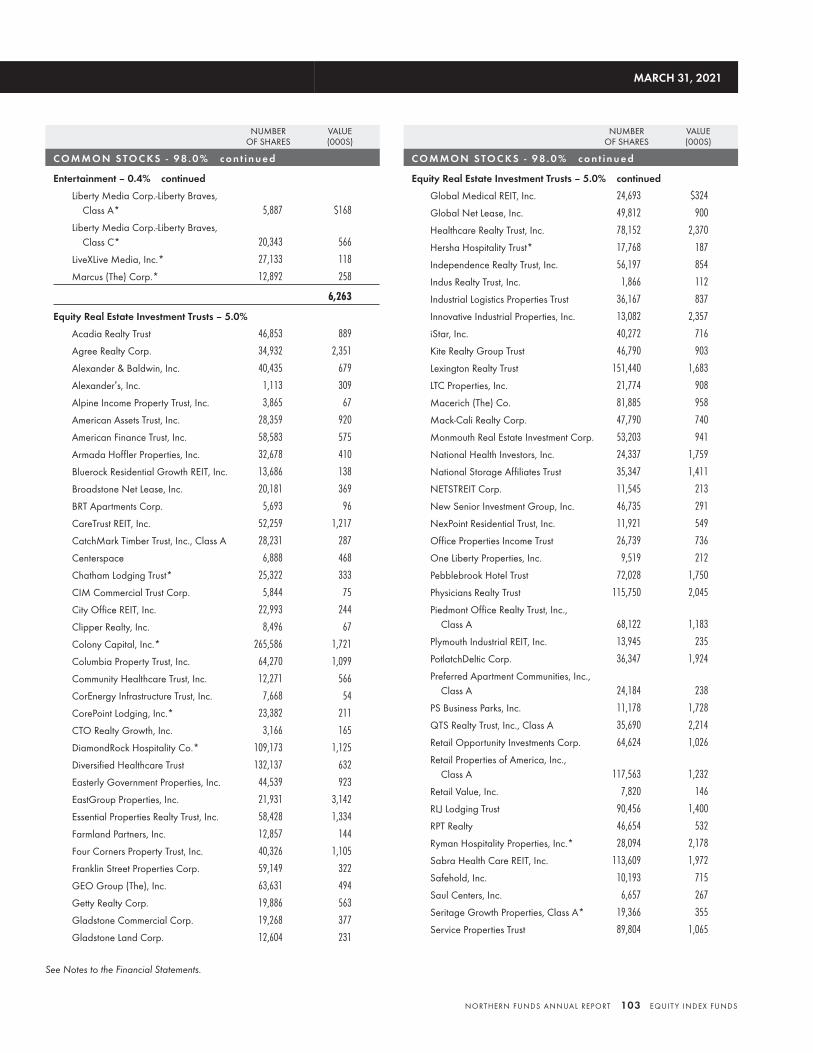
NUMBEROF SHARES
VALUE(000S)
C O M M O N S TO C KS - 9 8 . 0 % c o n t i n u e d
Entertainment – 0.4% continued
Liberty Media Corp.-Liberty Braves,Class A* 5,887 $168
Liberty Media Corp.-Liberty Braves,Class C* 20,343 566
LiveXLive Media, Inc.* 27,133 118
Marcus (The) Corp.* 12,892 258
6,263
Equity Real Estate Investment Trusts – 5.0%
Acadia Realty Trust 46,853 889
Agree Realty Corp. 34,932 2,351
Alexander & Baldwin, Inc. 40,435 679
Alexander’s, Inc. 1,113 309
Alpine Income Property Trust, Inc. 3,865 67
American Assets Trust, Inc. 28,359 920
American Finance Trust, Inc. 58,583 575
Armada Hoffler Properties, Inc. 32,678 410
Bluerock Residential Growth REIT, Inc. 13,686 138
Broadstone Net Lease, Inc. 20,181 369
BRT Apartments Corp. 5,693 96
CareTrust REIT, Inc. 52,259 1,217
CatchMark Timber Trust, Inc., Class A 28,231 287
Centerspace 6,888 468
Chatham Lodging Trust* 25,322 333
CIM Commercial Trust Corp. 5,844 75
City Office REIT, Inc. 22,993 244
Clipper Realty, Inc. 8,496 67
Colony Capital, Inc.* 265,586 1,721
Columbia Property Trust, Inc. 64,270 1,099
Community Healthcare Trust, Inc. 12,271 566
CorEnergy Infrastructure Trust, Inc. 7,668 54
CorePoint Lodging, Inc.* 23,382 211
CTO Realty Growth, Inc. 3,166 165
DiamondRock Hospitality Co.* 109,173 1,125
Diversified Healthcare Trust 132,137 632
Easterly Government Properties, Inc. 44,539 923
EastGroup Properties, Inc. 21,931 3,142
Essential Properties Realty Trust, Inc. 58,428 1,334
Farmland Partners, Inc. 12,857 144
Four Corners Property Trust, Inc. 40,326 1,105
Franklin Street Properties Corp. 59,149 322
GEO Group (The), Inc. 63,631 494
Getty Realty Corp. 19,886 563
Gladstone Commercial Corp. 19,268 377
Gladstone Land Corp. 12,604 231
NUMBEROF SHARES
VALUE(000S)
C O M M O N S TO C KS - 9 8 . 0 % c o n t i n u e d
Equity Real Estate Investment Trusts – 5.0% continued
Global Medical REIT, Inc. 24,693 $324
Global Net Lease, Inc. 49,812 900
Healthcare Realty Trust, Inc. 78,152 2,370
Hersha Hospitality Trust* 17,768 187
Independence Realty Trust, Inc. 56,197 854
Indus Realty Trust, Inc. 1,866 112
Industrial Logistics Properties Trust 36,167 837
Innovative Industrial Properties, Inc. 13,082 2,357
iStar, Inc. 40,272 716
Kite Realty Group Trust 46,790 903
Lexington Realty Trust 151,440 1,683
LTC Properties, Inc. 21,774 908
Macerich (The) Co. 81,885 958
Mack-Cali Realty Corp. 47,790 740
Monmouth Real Estate Investment Corp. 53,203 941
National Health Investors, Inc. 24,337 1,759
National Storage Affiliates Trust 35,347 1,411
NETSTREIT Corp. 11,545 213
New Senior Investment Group, Inc. 46,735 291
NexPoint Residential Trust, Inc. 11,921 549
Office Properties Income Trust 26,739 736
One Liberty Properties, Inc. 9,519 212
Pebblebrook Hotel Trust 72,028 1,750
Physicians Realty Trust 115,750 2,045
Piedmont Office Realty Trust, Inc.,Class A 68,122 1,183
Plymouth Industrial REIT, Inc. 13,945 235
PotlatchDeltic Corp. 36,347 1,924
Preferred Apartment Communities, Inc.,Class A 24,184 238
PS Business Parks, Inc. 11,178 1,728
QTS Realty Trust, Inc., Class A 35,690 2,214
Retail Opportunity Investments Corp. 64,624 1,026
Retail Properties of America, Inc.,Class A 117,563 1,232
Retail Value, Inc. 7,820 146
RLJ Lodging Trust 90,456 1,400
RPT Realty 46,654 532
Ryman Hospitality Properties, Inc.* 28,094 2,178
Sabra Health Care REIT, Inc. 113,609 1,972
Safehold, Inc. 10,193 715
Saul Centers, Inc. 6,657 267
Seritage Growth Properties, Class A* 19,366 355
Service Properties Trust 89,804 1,065
MARCH 31, 2021
See Notes to the Financial Statements.
NORTHERN FUNDS ANNUAL REPORT 103 EQUIT Y INDEX FUNDS
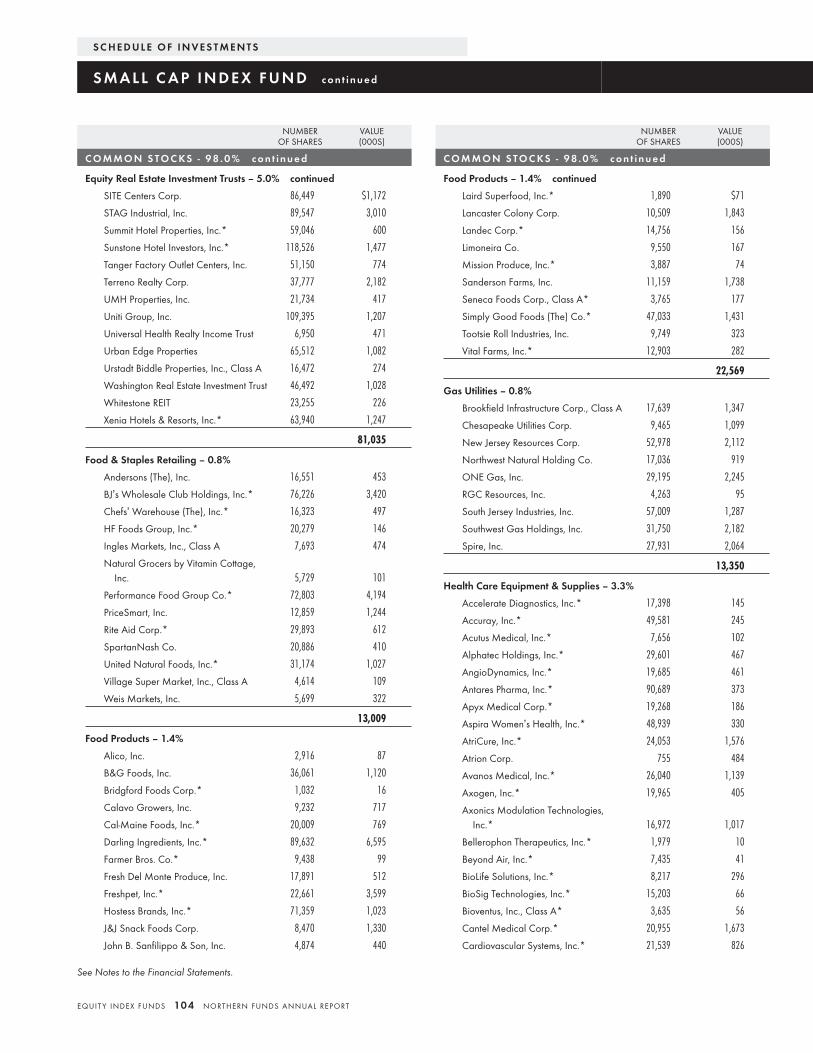
NUMBEROF SHARES
VALUE(000S)
C O M M O N S TO C KS - 9 8 . 0 % c o n t i n u e d
Equity Real Estate Investment Trusts – 5.0% continued
SITE Centers Corp. 86,449 $1,172
STAG Industrial, Inc. 89,547 3,010
Summit Hotel Properties, Inc.* 59,046 600
Sunstone Hotel Investors, Inc.* 118,526 1,477
Tanger Factory Outlet Centers, Inc. 51,150 774
Terreno Realty Corp. 37,777 2,182
UMH Properties, Inc. 21,734 417
Uniti Group, Inc. 109,395 1,207
Universal Health Realty Income Trust 6,950 471
Urban Edge Properties 65,512 1,082
Urstadt Biddle Properties, Inc., Class A 16,472 274
Washington Real Estate Investment Trust 46,492 1,028
Whitestone REIT 23,255 226
Xenia Hotels & Resorts, Inc.* 63,940 1,247
81,035
Food & Staples Retailing – 0.8%
Andersons (The), Inc. 16,551 453
BJ’s Wholesale Club Holdings, Inc.* 76,226 3,420
Chefs’ Warehouse (The), Inc.* 16,323 497
HF Foods Group, Inc.* 20,279 146
Ingles Markets, Inc., Class A 7,693 474
Natural Grocers by Vitamin Cottage,Inc. 5,729 101
Performance Food Group Co.* 72,803 4,194
PriceSmart, Inc. 12,859 1,244
Rite Aid Corp.* 29,893 612
SpartanNash Co. 20,886 410
United Natural Foods, Inc.* 31,174 1,027
Village Super Market, Inc., Class A 4,614 109
Weis Markets, Inc. 5,699 322
13,009
Food Products – 1.4%
Alico, Inc. 2,916 87
B&G Foods, Inc. 36,061 1,120
Bridgford Foods Corp.* 1,032 16
Calavo Growers, Inc. 9,232 717
Cal-Maine Foods, Inc.* 20,009 769
Darling Ingredients, Inc.* 89,632 6,595
Farmer Bros. Co.* 9,438 99
Fresh Del Monte Produce, Inc. 17,891 512
Freshpet, Inc.* 22,661 3,599
Hostess Brands, Inc.* 71,359 1,023
J&J Snack Foods Corp. 8,470 1,330
John B. Sanfilippo & Son, Inc. 4,874 440
NUMBEROF SHARES
VALUE(000S)
C O M M O N S TO C KS - 9 8 . 0 % c o n t i n u e d
Food Products – 1.4% continued
Laird Superfood, Inc.* 1,890 $71
Lancaster Colony Corp. 10,509 1,843
Landec Corp.* 14,756 156
Limoneira Co. 9,550 167
Mission Produce, Inc.* 3,887 74
Sanderson Farms, Inc. 11,159 1,738
Seneca Foods Corp., Class A* 3,765 177
Simply Good Foods (The) Co.* 47,033 1,431
Tootsie Roll Industries, Inc. 9,749 323
Vital Farms, Inc.* 12,903 282
22,569
Gas Utilities – 0.8%
Brookfield Infrastructure Corp., Class A 17,639 1,347
Chesapeake Utilities Corp. 9,465 1,099
New Jersey Resources Corp. 52,978 2,112
Northwest Natural Holding Co. 17,036 919
ONE Gas, Inc. 29,195 2,245
RGC Resources, Inc. 4,263 95
South Jersey Industries, Inc. 57,009 1,287
Southwest Gas Holdings, Inc. 31,750 2,182
Spire, Inc. 27,931 2,064
13,350
Health Care Equipment & Supplies – 3.3%
Accelerate Diagnostics, Inc.* 17,398 145
Accuray, Inc.* 49,581 245
Acutus Medical, Inc.* 7,656 102
Alphatec Holdings, Inc.* 29,601 467
AngioDynamics, Inc.* 19,685 461
Antares Pharma, Inc.* 90,689 373
Apyx Medical Corp.* 19,268 186
Aspira Women’s Health, Inc.* 48,939 330
AtriCure, Inc.* 24,053 1,576
Atrion Corp. 755 484
Avanos Medical, Inc.* 26,040 1,139
Axogen, Inc.* 19,965 405
Axonics Modulation Technologies,Inc.* 16,972 1,017
Bellerophon Therapeutics, Inc.* 1,979 10
Beyond Air, Inc.* 7,435 41
BioLife Solutions, Inc.* 8,217 296
BioSig Technologies, Inc.* 15,203 66
Bioventus, Inc., Class A* 3,635 56
Cantel Medical Corp.* 20,955 1,673
Cardiovascular Systems, Inc.* 21,539 826
S C H E D U L E O F I N V E S T M E N T S
S M A L L C A P I N D E X F U N D c o n t i n u e d
See Notes to the Financial Statements.
EQUIT Y INDEX FUNDS 104 NORTHERN FUNDS ANNUAL REPORT
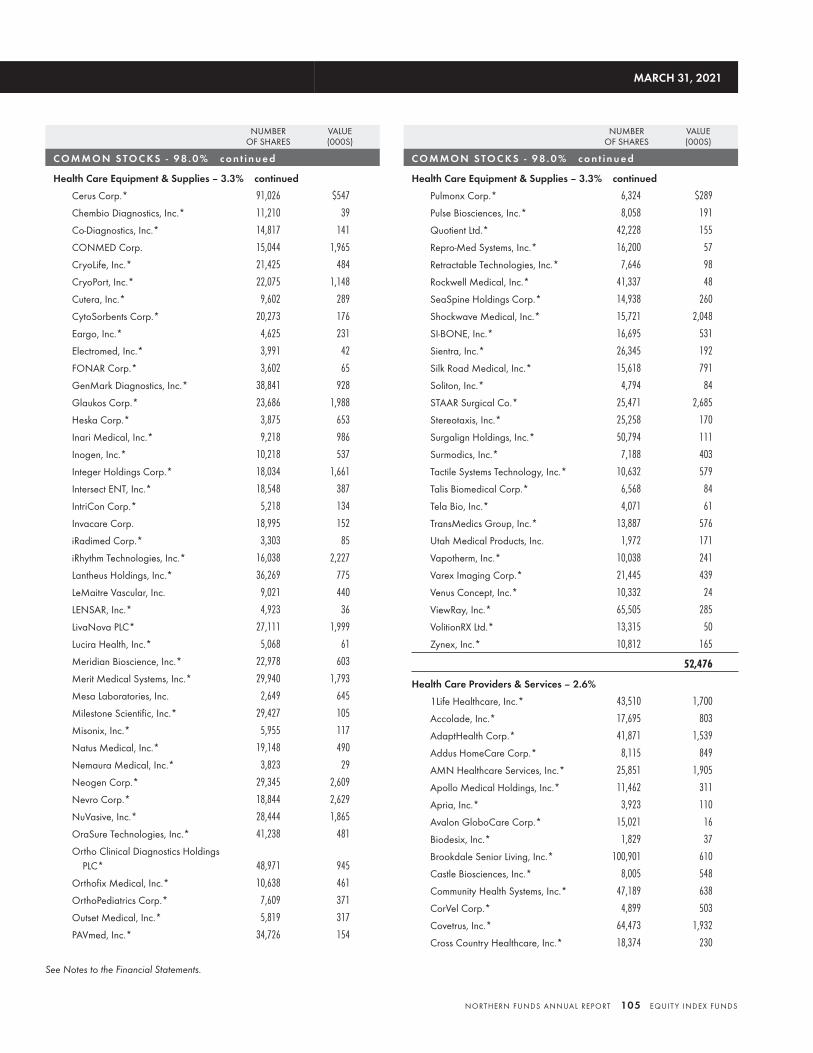
NUMBEROF SHARES
VALUE(000S)
C O M M O N S TO C KS - 9 8 . 0 % c o n t i n u e d
Health Care Equipment & Supplies – 3.3% continued
Cerus Corp.* 91,026 $547
Chembio Diagnostics, Inc.* 11,210 39
Co-Diagnostics, Inc.* 14,817 141
CONMED Corp. 15,044 1,965
CryoLife, Inc.* 21,425 484
CryoPort, Inc.* 22,075 1,148
Cutera, Inc.* 9,602 289
CytoSorbents Corp.* 20,273 176
Eargo, Inc.* 4,625 231
Electromed, Inc.* 3,991 42
FONAR Corp.* 3,602 65
GenMark Diagnostics, Inc.* 38,841 928
Glaukos Corp.* 23,686 1,988
Heska Corp.* 3,875 653
Inari Medical, Inc.* 9,218 986
Inogen, Inc.* 10,218 537
Integer Holdings Corp.* 18,034 1,661
Intersect ENT, Inc.* 18,548 387
IntriCon Corp.* 5,218 134
Invacare Corp. 18,995 152
iRadimed Corp.* 3,303 85
iRhythm Technologies, Inc.* 16,038 2,227
Lantheus Holdings, Inc.* 36,269 775
LeMaitre Vascular, Inc. 9,021 440
LENSAR, Inc.* 4,923 36
LivaNova PLC* 27,111 1,999
Lucira Health, Inc.* 5,068 61
Meridian Bioscience, Inc.* 22,978 603
Merit Medical Systems, Inc.* 29,940 1,793
Mesa Laboratories, Inc. 2,649 645
Milestone Scientific, Inc.* 29,427 105
Misonix, Inc.* 5,955 117
Natus Medical, Inc.* 19,148 490
Nemaura Medical, Inc.* 3,823 29
Neogen Corp.* 29,345 2,609
Nevro Corp.* 18,844 2,629
NuVasive, Inc.* 28,444 1,865
OraSure Technologies, Inc.* 41,238 481
Ortho Clinical Diagnostics HoldingsPLC* 48,971 945
Orthofix Medical, Inc.* 10,638 461
OrthoPediatrics Corp.* 7,609 371
Outset Medical, Inc.* 5,819 317
PAVmed, Inc.* 34,726 154
NUMBEROF SHARES
VALUE(000S)
C O M M O N S TO C KS - 9 8 . 0 % c o n t i n u e d
Health Care Equipment & Supplies – 3.3% continued
Pulmonx Corp.* 6,324 $289
Pulse Biosciences, Inc.* 8,058 191
Quotient Ltd.* 42,228 155
Repro-Med Systems, Inc.* 16,200 57
Retractable Technologies, Inc.* 7,646 98
Rockwell Medical, Inc.* 41,337 48
SeaSpine Holdings Corp.* 14,938 260
Shockwave Medical, Inc.* 15,721 2,048
SI-BONE, Inc.* 16,695 531
Sientra, Inc.* 26,345 192
Silk Road Medical, Inc.* 15,618 791
Soliton, Inc.* 4,794 84
STAAR Surgical Co.* 25,471 2,685
Stereotaxis, Inc.* 25,258 170
Surgalign Holdings, Inc.* 50,794 111
Surmodics, Inc.* 7,188 403
Tactile Systems Technology, Inc.* 10,632 579
Talis Biomedical Corp.* 6,568 84
Tela Bio, Inc.* 4,071 61
TransMedics Group, Inc.* 13,887 576
Utah Medical Products, Inc. 1,972 171
Vapotherm, Inc.* 10,038 241
Varex Imaging Corp.* 21,445 439
Venus Concept, Inc.* 10,332 24
ViewRay, Inc.* 65,505 285
VolitionRX Ltd.* 13,315 50
Zynex, Inc.* 10,812 165
52,476
Health Care Providers & Services – 2.6%
1Life Healthcare, Inc.* 43,510 1,700
Accolade, Inc.* 17,695 803
AdaptHealth Corp.* 41,871 1,539
Addus HomeCare Corp.* 8,115 849
AMN Healthcare Services, Inc.* 25,851 1,905
Apollo Medical Holdings, Inc.* 11,462 311
Apria, Inc.* 3,923 110
Avalon GloboCare Corp.* 15,021 16
Biodesix, Inc.* 1,829 37
Brookdale Senior Living, Inc.* 100,901 610
Castle Biosciences, Inc.* 8,005 548
Community Health Systems, Inc.* 47,189 638
CorVel Corp.* 4,899 503
Covetrus, Inc.* 64,473 1,932
Cross Country Healthcare, Inc.* 18,374 230
MARCH 31, 2021
See Notes to the Financial Statements.
NORTHERN FUNDS ANNUAL REPORT 105 EQUIT Y INDEX FUNDS
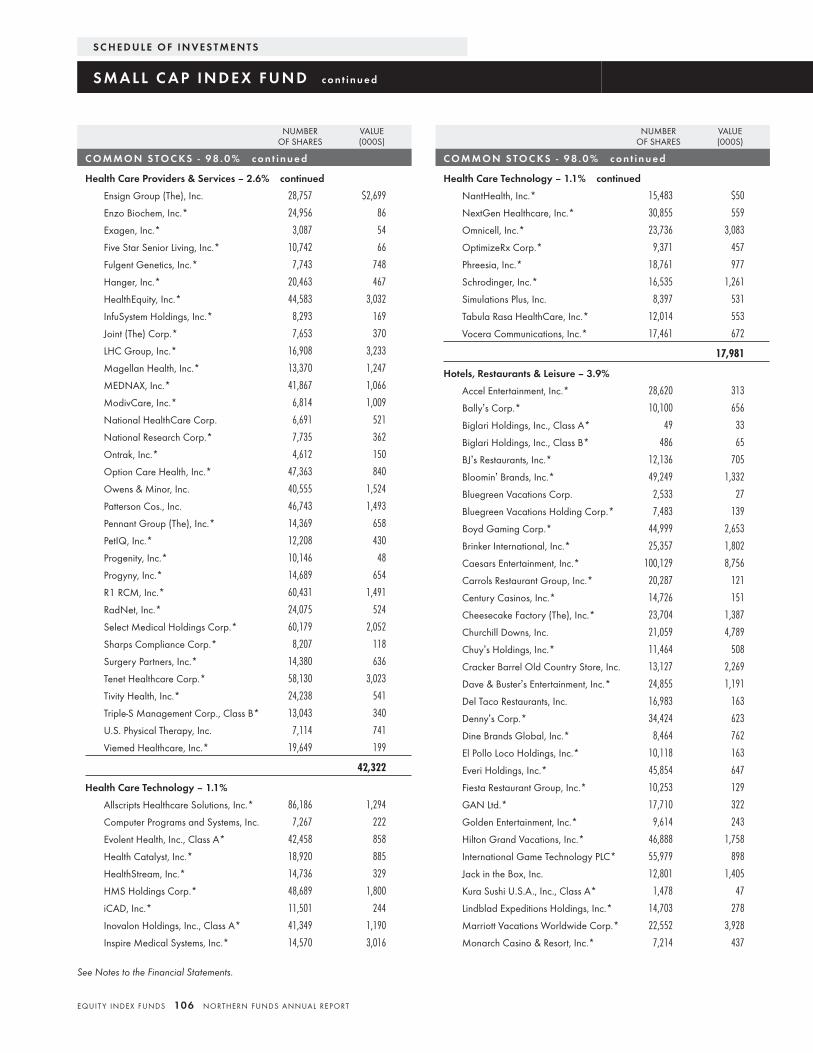
NUMBEROF SHARES
VALUE(000S)
C O M M O N S TO C KS - 9 8 . 0 % c o n t i n u e d
Health Care Providers & Services – 2.6% continued
Ensign Group (The), Inc. 28,757 $2,699
Enzo Biochem, Inc.* 24,956 86
Exagen, Inc.* 3,087 54
Five Star Senior Living, Inc.* 10,742 66
Fulgent Genetics, Inc.* 7,743 748
Hanger, Inc.* 20,463 467
HealthEquity, Inc.* 44,583 3,032
InfuSystem Holdings, Inc.* 8,293 169
Joint (The) Corp.* 7,653 370
LHC Group, Inc.* 16,908 3,233
Magellan Health, Inc.* 13,370 1,247
MEDNAX, Inc.* 41,867 1,066
ModivCare, Inc.* 6,814 1,009
National HealthCare Corp. 6,691 521
National Research Corp.* 7,735 362
Ontrak, Inc.* 4,612 150
Option Care Health, Inc.* 47,363 840
Owens & Minor, Inc. 40,555 1,524
Patterson Cos., Inc. 46,743 1,493
Pennant Group (The), Inc.* 14,369 658
PetIQ, Inc.* 12,208 430
Progenity, Inc.* 10,146 48
Progyny, Inc.* 14,689 654
R1 RCM, Inc.* 60,431 1,491
RadNet, Inc.* 24,075 524
Select Medical Holdings Corp.* 60,179 2,052
Sharps Compliance Corp.* 8,207 118
Surgery Partners, Inc.* 14,380 636
Tenet Healthcare Corp.* 58,130 3,023
Tivity Health, Inc.* 24,238 541
Triple-S Management Corp., Class B* 13,043 340
U.S. Physical Therapy, Inc. 7,114 741
Viemed Healthcare, Inc.* 19,649 199
42,322
Health Care Technology – 1.1%
Allscripts Healthcare Solutions, Inc.* 86,186 1,294
Computer Programs and Systems, Inc. 7,267 222
Evolent Health, Inc., Class A* 42,458 858
Health Catalyst, Inc.* 18,920 885
HealthStream, Inc.* 14,736 329
HMS Holdings Corp.* 48,689 1,800
iCAD, Inc.* 11,501 244
Inovalon Holdings, Inc., Class A* 41,349 1,190
Inspire Medical Systems, Inc.* 14,570 3,016
NUMBEROF SHARES
VALUE(000S)
C O M M O N S TO C KS - 9 8 . 0 % c o n t i n u e d
Health Care Technology – 1.1% continued
NantHealth, Inc.* 15,483 $50
NextGen Healthcare, Inc.* 30,855 559
Omnicell, Inc.* 23,736 3,083
OptimizeRx Corp.* 9,371 457
Phreesia, Inc.* 18,761 977
Schrodinger, Inc.* 16,535 1,261
Simulations Plus, Inc. 8,397 531
Tabula Rasa HealthCare, Inc.* 12,014 553
Vocera Communications, Inc.* 17,461 672
17,981
Hotels, Restaurants & Leisure – 3.9%
Accel Entertainment, Inc.* 28,620 313
Bally’s Corp.* 10,100 656
Biglari Holdings, Inc., Class A* 49 33
Biglari Holdings, Inc., Class B* 486 65
BJ’s Restaurants, Inc.* 12,136 705
Bloomin’ Brands, Inc.* 49,249 1,332
Bluegreen Vacations Corp. 2,533 27
Bluegreen Vacations Holding Corp.* 7,483 139
Boyd Gaming Corp.* 44,999 2,653
Brinker International, Inc.* 25,357 1,802
Caesars Entertainment, Inc.* 100,129 8,756
Carrols Restaurant Group, Inc.* 20,287 121
Century Casinos, Inc.* 14,726 151
Cheesecake Factory (The), Inc.* 23,704 1,387
Churchill Downs, Inc. 21,059 4,789
Chuy’s Holdings, Inc.* 11,464 508
Cracker Barrel Old Country Store, Inc. 13,127 2,269
Dave & Buster’s Entertainment, Inc.* 24,855 1,191
Del Taco Restaurants, Inc. 16,983 163
Denny’s Corp.* 34,424 623
Dine Brands Global, Inc.* 8,464 762
El Pollo Loco Holdings, Inc.* 10,118 163
Everi Holdings, Inc.* 45,854 647
Fiesta Restaurant Group, Inc.* 10,253 129
GAN Ltd.* 17,710 322
Golden Entertainment, Inc.* 9,614 243
Hilton Grand Vacations, Inc.* 46,888 1,758
International Game Technology PLC* 55,979 898
Jack in the Box, Inc. 12,801 1,405
Kura Sushi U.S.A., Inc., Class A* 1,478 47
Lindblad Expeditions Holdings, Inc.* 14,703 278
Marriott Vacations Worldwide Corp.* 22,552 3,928
Monarch Casino & Resort, Inc.* 7,214 437
S C H E D U L E O F I N V E S T M E N T S
S M A L L C A P I N D E X F U N D c o n t i n u e d
See Notes to the Financial Statements.
EQUIT Y INDEX FUNDS 106 NORTHERN FUNDS ANNUAL REPORT
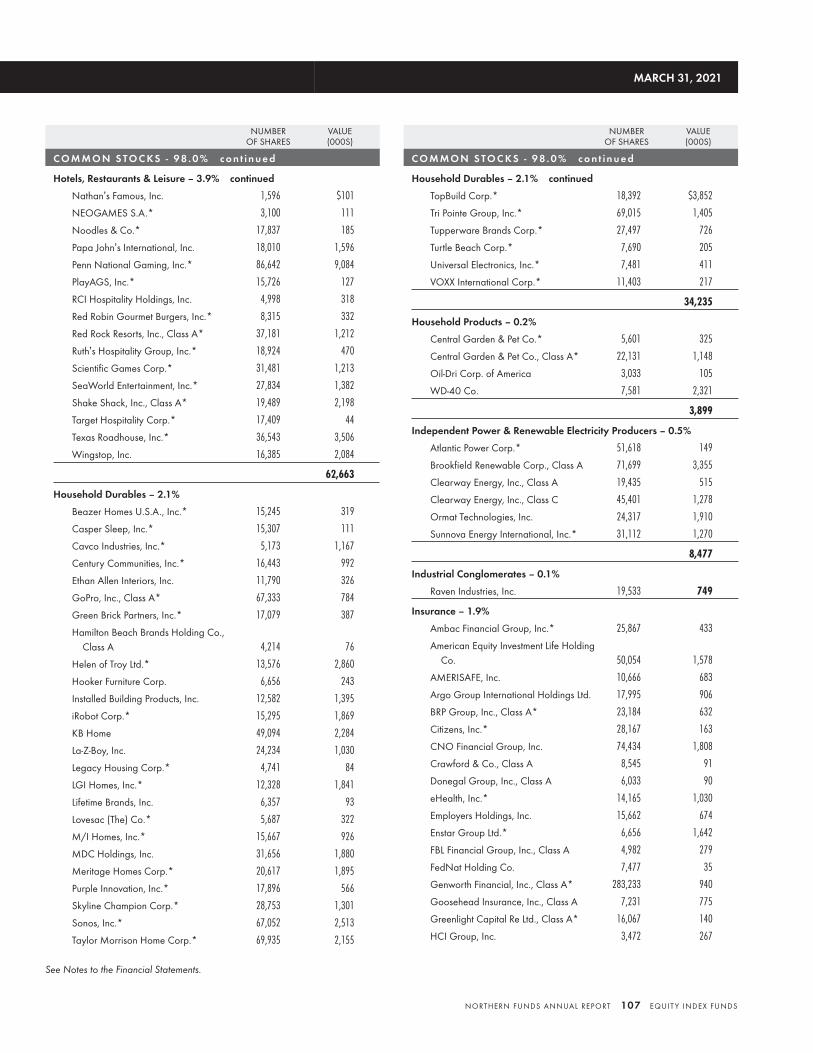
NUMBEROF SHARES
VALUE(000S)
C O M M O N S TO C KS - 9 8 . 0 % c o n t i n u e d
Hotels, Restaurants & Leisure – 3.9% continued
Nathan’s Famous, Inc. 1,596 $101
NEOGAMES S.A.* 3,100 111
Noodles & Co.* 17,837 185
Papa John’s International, Inc. 18,010 1,596
Penn National Gaming, Inc.* 86,642 9,084
PlayAGS, Inc.* 15,726 127
RCI Hospitality Holdings, Inc. 4,998 318
Red Robin Gourmet Burgers, Inc.* 8,315 332
Red Rock Resorts, Inc., Class A* 37,181 1,212
Ruth’s Hospitality Group, Inc.* 18,924 470
Scientific Games Corp.* 31,481 1,213
SeaWorld Entertainment, Inc.* 27,834 1,382
Shake Shack, Inc., Class A* 19,489 2,198
Target Hospitality Corp.* 17,409 44
Texas Roadhouse, Inc.* 36,543 3,506
Wingstop, Inc. 16,385 2,084
62,663
Household Durables – 2.1%
Beazer Homes U.S.A., Inc.* 15,245 319
Casper Sleep, Inc.* 15,307 111
Cavco Industries, Inc.* 5,173 1,167
Century Communities, Inc.* 16,443 992
Ethan Allen Interiors, Inc. 11,790 326
GoPro, Inc., Class A* 67,333 784
Green Brick Partners, Inc.* 17,079 387
Hamilton Beach Brands Holding Co.,Class A 4,214 76
Helen of Troy Ltd.* 13,576 2,860
Hooker Furniture Corp. 6,656 243
Installed Building Products, Inc. 12,582 1,395
iRobot Corp.* 15,295 1,869
KB Home 49,094 2,284
La-Z-Boy, Inc. 24,234 1,030
Legacy Housing Corp.* 4,741 84
LGI Homes, Inc.* 12,328 1,841
Lifetime Brands, Inc. 6,357 93
Lovesac (The) Co.* 5,687 322
M/I Homes, Inc.* 15,667 926
MDC Holdings, Inc. 31,656 1,880
Meritage Homes Corp.* 20,617 1,895
Purple Innovation, Inc.* 17,896 566
Skyline Champion Corp.* 28,753 1,301
Sonos, Inc.* 67,052 2,513
Taylor Morrison Home Corp.* 69,935 2,155
NUMBEROF SHARES
VALUE(000S)
C O M M O N S TO C KS - 9 8 . 0 % c o n t i n u e d
Household Durables – 2.1% continued
TopBuild Corp.* 18,392 $3,852
Tri Pointe Group, Inc.* 69,015 1,405
Tupperware Brands Corp.* 27,497 726
Turtle Beach Corp.* 7,690 205
Universal Electronics, Inc.* 7,481 411
VOXX International Corp.* 11,403 217
34,235
Household Products – 0.2%
Central Garden & Pet Co.* 5,601 325
Central Garden & Pet Co., Class A* 22,131 1,148
Oil-Dri Corp. of America 3,033 105
WD-40 Co. 7,581 2,321
3,899
Independent Power & Renewable Electricity Producers – 0.5%
Atlantic Power Corp.* 51,618 149
Brookfield Renewable Corp., Class A 71,699 3,355
Clearway Energy, Inc., Class A 19,435 515
Clearway Energy, Inc., Class C 45,401 1,278
Ormat Technologies, Inc. 24,317 1,910
Sunnova Energy International, Inc.* 31,112 1,270
8,477
Industrial Conglomerates – 0.1%
Raven Industries, Inc. 19,533 749
Insurance – 1.9%
Ambac Financial Group, Inc.* 25,867 433
American Equity Investment Life HoldingCo. 50,054 1,578
AMERISAFE, Inc. 10,666 683
Argo Group International Holdings Ltd. 17,995 906
BRP Group, Inc., Class A* 23,184 632
Citizens, Inc.* 28,167 163
CNO Financial Group, Inc. 74,434 1,808
Crawford & Co., Class A 8,545 91
Donegal Group, Inc., Class A 6,033 90
eHealth, Inc.* 14,165 1,030
Employers Holdings, Inc. 15,662 674
Enstar Group Ltd.* 6,656 1,642
FBL Financial Group, Inc., Class A 4,982 279
FedNat Holding Co. 7,477 35
Genworth Financial, Inc., Class A* 283,233 940
Goosehead Insurance, Inc., Class A 7,231 775
Greenlight Capital Re Ltd., Class A* 16,067 140
HCI Group, Inc. 3,472 267
MARCH 31, 2021
See Notes to the Financial Statements.
NORTHERN FUNDS ANNUAL REPORT 107 EQUIT Y INDEX FUNDS
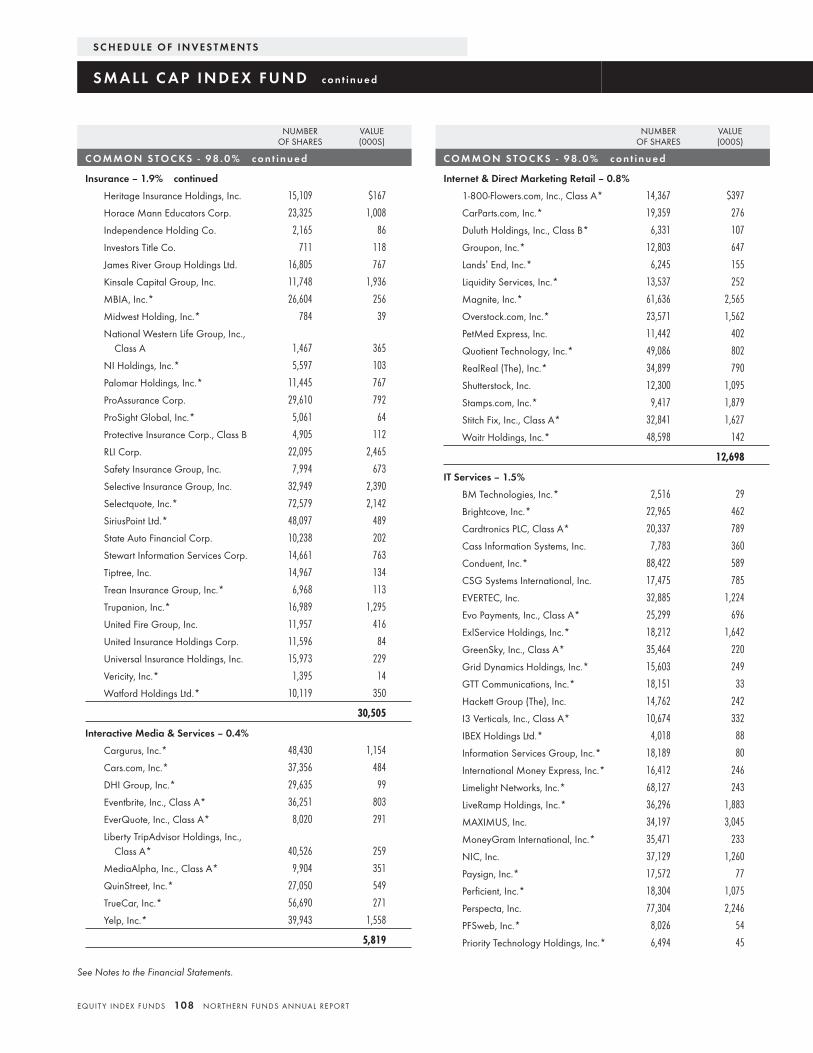
NUMBEROF SHARES
VALUE(000S)
C O M M O N S TO C KS - 9 8 . 0 % c o n t i n u e d
Insurance – 1.9% continued
Heritage Insurance Holdings, Inc. 15,109 $167
Horace Mann Educators Corp. 23,325 1,008
Independence Holding Co. 2,165 86
Investors Title Co. 711 118
James River Group Holdings Ltd. 16,805 767
Kinsale Capital Group, Inc. 11,748 1,936
MBIA, Inc.* 26,604 256
Midwest Holding, Inc.* 784 39
National Western Life Group, Inc.,Class A 1,467 365
NI Holdings, Inc.* 5,597 103
Palomar Holdings, Inc.* 11,445 767
ProAssurance Corp. 29,610 792
ProSight Global, Inc.* 5,061 64
Protective Insurance Corp., Class B 4,905 112
RLI Corp. 22,095 2,465
Safety Insurance Group, Inc. 7,994 673
Selective Insurance Group, Inc. 32,949 2,390
Selectquote, Inc.* 72,579 2,142
SiriusPoint Ltd.* 48,097 489
State Auto Financial Corp. 10,238 202
Stewart Information Services Corp. 14,661 763
Tiptree, Inc. 14,967 134
Trean Insurance Group, Inc.* 6,968 113
Trupanion, Inc.* 16,989 1,295
United Fire Group, Inc. 11,957 416
United Insurance Holdings Corp. 11,596 84
Universal Insurance Holdings, Inc. 15,973 229
Vericity, Inc.* 1,395 14
Watford Holdings Ltd.* 10,119 350
30,505
Interactive Media & Services – 0.4%
Cargurus, Inc.* 48,430 1,154
Cars.com, Inc.* 37,356 484
DHI Group, Inc.* 29,635 99
Eventbrite, Inc., Class A* 36,251 803
EverQuote, Inc., Class A* 8,020 291
Liberty TripAdvisor Holdings, Inc.,Class A* 40,526 259
MediaAlpha, Inc., Class A* 9,904 351
QuinStreet, Inc.* 27,050 549
TrueCar, Inc.* 56,690 271
Yelp, Inc.* 39,943 1,558
5,819
NUMBEROF SHARES
VALUE(000S)
C O M M O N S TO C KS - 9 8 . 0 % c o n t i n u e d
Internet & Direct Marketing Retail – 0.8%
1-800-Flowers.com, Inc., Class A* 14,367 $397
CarParts.com, Inc.* 19,359 276
Duluth Holdings, Inc., Class B* 6,331 107
Groupon, Inc.* 12,803 647
Lands’ End, Inc.* 6,245 155
Liquidity Services, Inc.* 13,537 252
Magnite, Inc.* 61,636 2,565
Overstock.com, Inc.* 23,571 1,562
PetMed Express, Inc. 11,442 402
Quotient Technology, Inc.* 49,086 802
RealReal (The), Inc.* 34,899 790
Shutterstock, Inc. 12,300 1,095
Stamps.com, Inc.* 9,417 1,879
Stitch Fix, Inc., Class A* 32,841 1,627
Waitr Holdings, Inc.* 48,598 142
12,698
IT Services – 1.5%
BM Technologies, Inc.* 2,516 29
Brightcove, Inc.* 22,965 462
Cardtronics PLC, Class A* 20,337 789
Cass Information Systems, Inc. 7,783 360
Conduent, Inc.* 88,422 589
CSG Systems International, Inc. 17,475 785
EVERTEC, Inc. 32,885 1,224
Evo Payments, Inc., Class A* 25,299 696
ExlService Holdings, Inc.* 18,212 1,642
GreenSky, Inc., Class A* 35,464 220
Grid Dynamics Holdings, Inc.* 15,603 249
GTT Communications, Inc.* 18,151 33
Hackett Group (The), Inc. 14,762 242
I3 Verticals, Inc., Class A* 10,674 332
IBEX Holdings Ltd.* 4,018 88
Information Services Group, Inc.* 18,189 80
International Money Express, Inc.* 16,412 246
Limelight Networks, Inc.* 68,127 243
LiveRamp Holdings, Inc.* 36,296 1,883
MAXIMUS, Inc. 34,197 3,045
MoneyGram International, Inc.* 35,471 233
NIC, Inc. 37,129 1,260
Paysign, Inc.* 17,572 77
Perficient, Inc.* 18,304 1,075
Perspecta, Inc. 77,304 2,246
PFSweb, Inc.* 8,026 54
Priority Technology Holdings, Inc.* 6,494 45
S C H E D U L E O F I N V E S T M E N T S
S M A L L C A P I N D E X F U N D c o n t i n u e d
See Notes to the Financial Statements.
EQUIT Y INDEX FUNDS 108 NORTHERN FUNDS ANNUAL REPORT
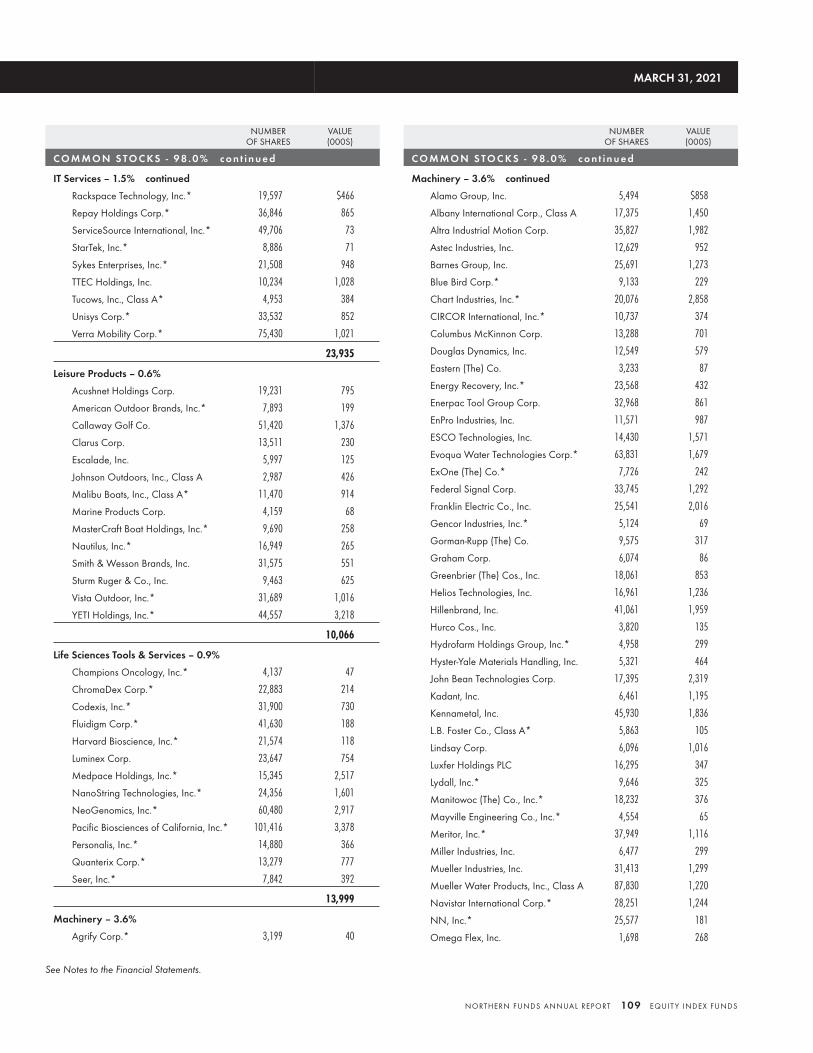
NUMBEROF SHARES
VALUE(000S)
C O M M O N S TO C KS - 9 8 . 0 % c o n t i n u e d
IT Services – 1.5% continued
Rackspace Technology, Inc.* 19,597 $466
Repay Holdings Corp.* 36,846 865
ServiceSource International, Inc.* 49,706 73
StarTek, Inc.* 8,886 71
Sykes Enterprises, Inc.* 21,508 948
TTEC Holdings, Inc. 10,234 1,028
Tucows, Inc., Class A* 4,953 384
Unisys Corp.* 33,532 852
Verra Mobility Corp.* 75,430 1,021
23,935
Leisure Products – 0.6%
Acushnet Holdings Corp. 19,231 795
American Outdoor Brands, Inc.* 7,893 199
Callaway Golf Co. 51,420 1,376
Clarus Corp. 13,511 230
Escalade, Inc. 5,997 125
Johnson Outdoors, Inc., Class A 2,987 426
Malibu Boats, Inc., Class A* 11,470 914
Marine Products Corp. 4,159 68
MasterCraft Boat Holdings, Inc.* 9,690 258
Nautilus, Inc.* 16,949 265
Smith & Wesson Brands, Inc. 31,575 551
Sturm Ruger & Co., Inc. 9,463 625
Vista Outdoor, Inc.* 31,689 1,016
YETI Holdings, Inc.* 44,557 3,218
10,066
Life Sciences Tools & Services – 0.9%
Champions Oncology, Inc.* 4,137 47
ChromaDex Corp.* 22,883 214
Codexis, Inc.* 31,900 730
Fluidigm Corp.* 41,630 188
Harvard Bioscience, Inc.* 21,574 118
Luminex Corp. 23,647 754
Medpace Holdings, Inc.* 15,345 2,517
NanoString Technologies, Inc.* 24,356 1,601
NeoGenomics, Inc.* 60,480 2,917
Pacific Biosciences of California, Inc.* 101,416 3,378
Personalis, Inc.* 14,880 366
Quanterix Corp.* 13,279 777
Seer, Inc.* 7,842 392
13,999
Machinery – 3.6%
Agrify Corp.* 3,199 40
NUMBEROF SHARES
VALUE(000S)
C O M M O N S TO C KS - 9 8 . 0 % c o n t i n u e d
Machinery – 3.6% continued
Alamo Group, Inc. 5,494 $858
Albany International Corp., Class A 17,375 1,450
Altra Industrial Motion Corp. 35,827 1,982
Astec Industries, Inc. 12,629 952
Barnes Group, Inc. 25,691 1,273
Blue Bird Corp.* 9,133 229
Chart Industries, Inc.* 20,076 2,858
CIRCOR International, Inc.* 10,737 374
Columbus McKinnon Corp. 13,288 701
Douglas Dynamics, Inc. 12,549 579
Eastern (The) Co. 3,233 87
Energy Recovery, Inc.* 23,568 432
Enerpac Tool Group Corp. 32,968 861
EnPro Industries, Inc. 11,571 987
ESCO Technologies, Inc. 14,430 1,571
Evoqua Water Technologies Corp.* 63,831 1,679
ExOne (The) Co.* 7,726 242
Federal Signal Corp. 33,745 1,292
Franklin Electric Co., Inc. 25,541 2,016
Gencor Industries, Inc.* 5,124 69
Gorman-Rupp (The) Co. 9,575 317
Graham Corp. 6,074 86
Greenbrier (The) Cos., Inc. 18,061 853
Helios Technologies, Inc. 16,961 1,236
Hillenbrand, Inc. 41,061 1,959
Hurco Cos., Inc. 3,820 135
Hydrofarm Holdings Group, Inc.* 4,958 299
Hyster-Yale Materials Handling, Inc. 5,321 464
John Bean Technologies Corp. 17,395 2,319
Kadant, Inc. 6,461 1,195
Kennametal, Inc. 45,930 1,836
L.B. Foster Co., Class A* 5,863 105
Lindsay Corp. 6,096 1,016
Luxfer Holdings PLC 16,295 347
Lydall, Inc.* 9,646 325
Manitowoc (The) Co., Inc.* 18,232 376
Mayville Engineering Co., Inc.* 4,554 65
Meritor, Inc.* 37,949 1,116
Miller Industries, Inc. 6,477 299
Mueller Industries, Inc. 31,413 1,299
Mueller Water Products, Inc., Class A 87,830 1,220
Navistar International Corp.* 28,251 1,244
NN, Inc.* 25,577 181
Omega Flex, Inc. 1,698 268
MARCH 31, 2021
See Notes to the Financial Statements.
NORTHERN FUNDS ANNUAL REPORT 109 EQUIT Y INDEX FUNDS
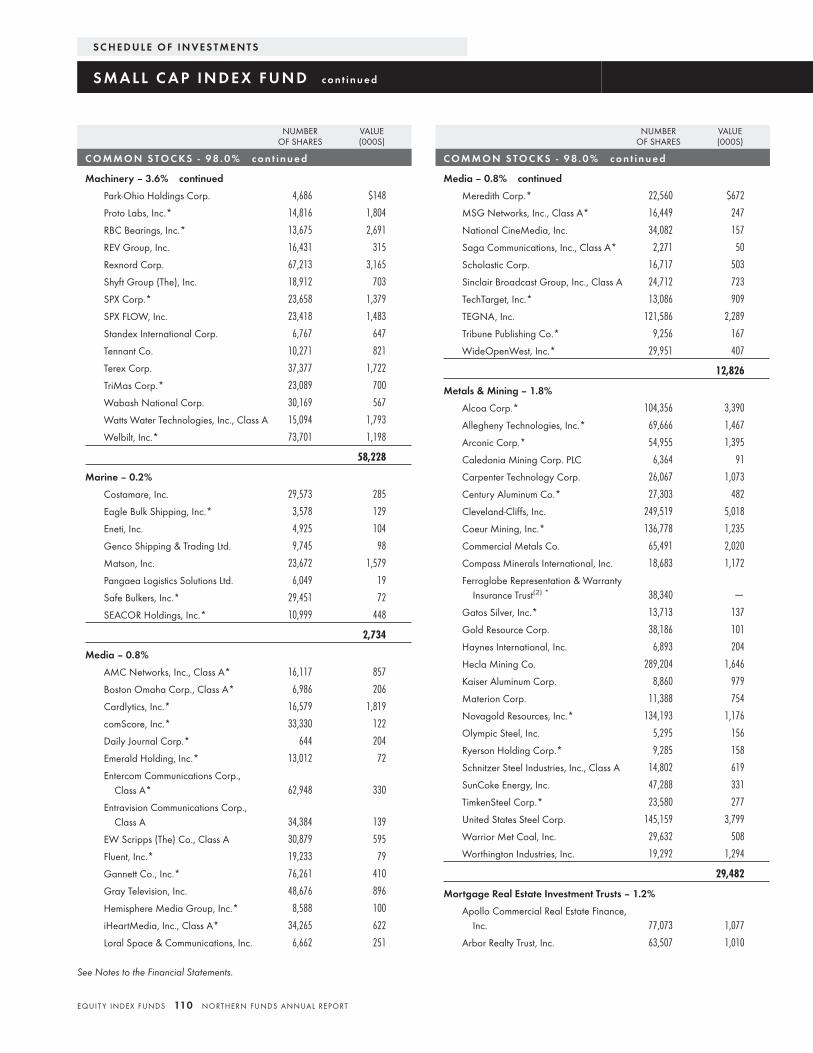
NUMBEROF SHARES
VALUE(000S)
C O M M O N S TO C KS - 9 8 . 0 % c o n t i n u e d
Machinery – 3.6% continued
Park-Ohio Holdings Corp. 4,686 $148
Proto Labs, Inc.* 14,816 1,804
RBC Bearings, Inc.* 13,675 2,691
REV Group, Inc. 16,431 315
Rexnord Corp. 67,213 3,165
Shyft Group (The), Inc. 18,912 703
SPX Corp.* 23,658 1,379
SPX FLOW, Inc. 23,418 1,483
Standex International Corp. 6,767 647
Tennant Co. 10,271 821
Terex Corp. 37,377 1,722
TriMas Corp.* 23,089 700
Wabash National Corp. 30,169 567
Watts Water Technologies, Inc., Class A 15,094 1,793
Welbilt, Inc.* 73,701 1,198
58,228
Marine – 0.2%
Costamare, Inc. 29,573 285
Eagle Bulk Shipping, Inc.* 3,578 129
Eneti, Inc. 4,925 104
Genco Shipping & Trading Ltd. 9,745 98
Matson, Inc. 23,672 1,579
Pangaea Logistics Solutions Ltd. 6,049 19
Safe Bulkers, Inc.* 29,451 72
SEACOR Holdings, Inc.* 10,999 448
2,734
Media – 0.8%
AMC Networks, Inc., Class A* 16,117 857
Boston Omaha Corp., Class A* 6,986 206
Cardlytics, Inc.* 16,579 1,819
comScore, Inc.* 33,330 122
Daily Journal Corp.* 644 204
Emerald Holding, Inc.* 13,012 72
Entercom Communications Corp.,Class A* 62,948 330
Entravision Communications Corp.,Class A 34,384 139
EW Scripps (The) Co., Class A 30,879 595
Fluent, Inc.* 19,233 79
Gannett Co., Inc.* 76,261 410
Gray Television, Inc. 48,676 896
Hemisphere Media Group, Inc.* 8,588 100
iHeartMedia, Inc., Class A* 34,265 622
Loral Space & Communications, Inc. 6,662 251
NUMBEROF SHARES
VALUE(000S)
C O M M O N S TO C KS - 9 8 . 0 % c o n t i n u e d
Media – 0.8% continued
Meredith Corp.* 22,560 $672
MSG Networks, Inc., Class A* 16,449 247
National CineMedia, Inc. 34,082 157
Saga Communications, Inc., Class A* 2,271 50
Scholastic Corp. 16,717 503
Sinclair Broadcast Group, Inc., Class A 24,712 723
TechTarget, Inc.* 13,086 909
TEGNA, Inc. 121,586 2,289
Tribune Publishing Co.* 9,256 167
WideOpenWest, Inc.* 29,951 407
12,826
Metals & Mining – 1.8%
Alcoa Corp.* 104,356 3,390
Allegheny Technologies, Inc.* 69,666 1,467
Arconic Corp.* 54,955 1,395
Caledonia Mining Corp. PLC 6,364 91
Carpenter Technology Corp. 26,067 1,073
Century Aluminum Co.* 27,303 482
Cleveland-Cliffs, Inc. 249,519 5,018
Coeur Mining, Inc.* 136,778 1,235
Commercial Metals Co. 65,491 2,020
Compass Minerals International, Inc. 18,683 1,172
Ferroglobe Representation & WarrantyInsurance Trust(2) * 38,340 —
Gatos Silver, Inc.* 13,713 137
Gold Resource Corp. 38,186 101
Haynes International, Inc. 6,893 204
Hecla Mining Co. 289,204 1,646
Kaiser Aluminum Corp. 8,860 979
Materion Corp. 11,388 754
Novagold Resources, Inc.* 134,193 1,176
Olympic Steel, Inc. 5,295 156
Ryerson Holding Corp.* 9,285 158
Schnitzer Steel Industries, Inc., Class A 14,802 619
SunCoke Energy, Inc. 47,288 331
TimkenSteel Corp.* 23,580 277
United States Steel Corp. 145,159 3,799
Warrior Met Coal, Inc. 29,632 508
Worthington Industries, Inc. 19,292 1,294
29,482
Mortgage Real Estate Investment Trusts – 1.2%
Apollo Commercial Real Estate Finance,Inc. 77,073 1,077
Arbor Realty Trust, Inc. 63,507 1,010
S C H E D U L E O F I N V E S T M E N T S
S M A L L C A P I N D E X F U N D c o n t i n u e d
See Notes to the Financial Statements.
EQUIT Y INDEX FUNDS 110 NORTHERN FUNDS ANNUAL REPORT
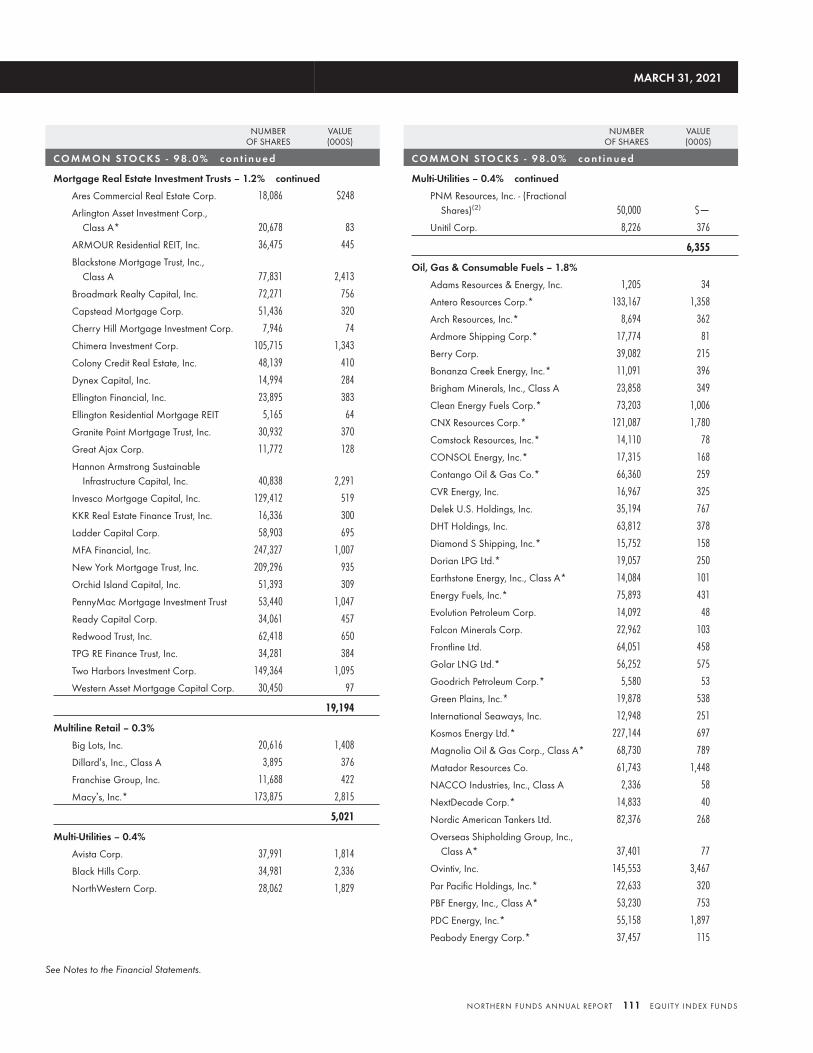
NUMBEROF SHARES
VALUE(000S)
C O M M O N S TO C KS - 9 8 . 0 % c o n t i n u e d
Mortgage Real Estate Investment Trusts – 1.2% continued
Ares Commercial Real Estate Corp. 18,086 $248
Arlington Asset Investment Corp.,Class A* 20,678 83
ARMOUR Residential REIT, Inc. 36,475 445
Blackstone Mortgage Trust, Inc.,Class A 77,831 2,413
Broadmark Realty Capital, Inc. 72,271 756
Capstead Mortgage Corp. 51,436 320
Cherry Hill Mortgage Investment Corp. 7,946 74
Chimera Investment Corp. 105,715 1,343
Colony Credit Real Estate, Inc. 48,139 410
Dynex Capital, Inc. 14,994 284
Ellington Financial, Inc. 23,895 383
Ellington Residential Mortgage REIT 5,165 64
Granite Point Mortgage Trust, Inc. 30,932 370
Great Ajax Corp. 11,772 128
Hannon Armstrong SustainableInfrastructure Capital, Inc. 40,838 2,291
Invesco Mortgage Capital, Inc. 129,412 519
KKR Real Estate Finance Trust, Inc. 16,336 300
Ladder Capital Corp. 58,903 695
MFA Financial, Inc. 247,327 1,007
New York Mortgage Trust, Inc. 209,296 935
Orchid Island Capital, Inc. 51,393 309
PennyMac Mortgage Investment Trust 53,440 1,047
Ready Capital Corp. 34,061 457
Redwood Trust, Inc. 62,418 650
TPG RE Finance Trust, Inc. 34,281 384
Two Harbors Investment Corp. 149,364 1,095
Western Asset Mortgage Capital Corp. 30,450 97
19,194
Multiline Retail – 0.3%
Big Lots, Inc. 20,616 1,408
Dillard’s, Inc., Class A 3,895 376
Franchise Group, Inc. 11,688 422
Macy’s, Inc.* 173,875 2,815
5,021
Multi-Utilities – 0.4%
Avista Corp. 37,991 1,814
Black Hills Corp. 34,981 2,336
NorthWestern Corp. 28,062 1,829
NUMBEROF SHARES
VALUE(000S)
C O M M O N S TO C KS - 9 8 . 0 % c o n t i n u e d
Multi-Utilities – 0.4% continued
PNM Resources, Inc. - (FractionalShares)(2) 50,000 $—
Unitil Corp. 8,226 376
6,355
Oil, Gas & Consumable Fuels – 1.8%
Adams Resources & Energy, Inc. 1,205 34
Antero Resources Corp.* 133,167 1,358
Arch Resources, Inc.* 8,694 362
Ardmore Shipping Corp.* 17,774 81
Berry Corp. 39,082 215
Bonanza Creek Energy, Inc.* 11,091 396
Brigham Minerals, Inc., Class A 23,858 349
Clean Energy Fuels Corp.* 73,203 1,006
CNX Resources Corp.* 121,087 1,780
Comstock Resources, Inc.* 14,110 78
CONSOL Energy, Inc.* 17,315 168
Contango Oil & Gas Co.* 66,360 259
CVR Energy, Inc. 16,967 325
Delek U.S. Holdings, Inc. 35,194 767
DHT Holdings, Inc. 63,812 378
Diamond S Shipping, Inc.* 15,752 158
Dorian LPG Ltd.* 19,057 250
Earthstone Energy, Inc., Class A* 14,084 101
Energy Fuels, Inc.* 75,893 431
Evolution Petroleum Corp. 14,092 48
Falcon Minerals Corp. 22,962 103
Frontline Ltd. 64,051 458
Golar LNG Ltd.* 56,252 575
Goodrich Petroleum Corp.* 5,580 53
Green Plains, Inc.* 19,878 538
International Seaways, Inc. 12,948 251
Kosmos Energy Ltd.* 227,144 697
Magnolia Oil & Gas Corp., Class A* 68,730 789
Matador Resources Co. 61,743 1,448
NACCO Industries, Inc., Class A 2,336 58
NextDecade Corp.* 14,833 40
Nordic American Tankers Ltd. 82,376 268
Overseas Shipholding Group, Inc.,Class A* 37,401 77
Ovintiv, Inc. 145,553 3,467
Par Pacific Holdings, Inc.* 22,633 320
PBF Energy, Inc., Class A* 53,230 753
PDC Energy, Inc.* 55,158 1,897
Peabody Energy Corp.* 37,457 115
MARCH 31, 2021
See Notes to the Financial Statements.
NORTHERN FUNDS ANNUAL REPORT 111 EQUIT Y INDEX FUNDS
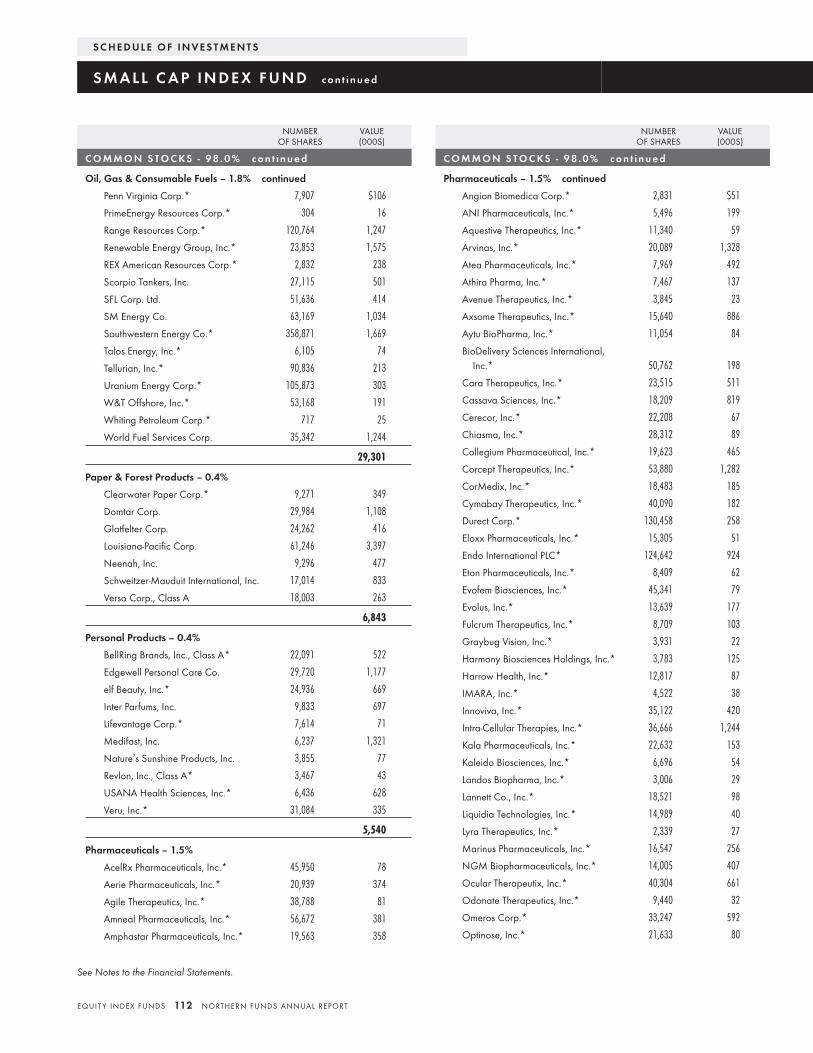
NUMBEROF SHARES
VALUE(000S)
C O M M O N S TO C KS - 9 8 . 0 % c o n t i n u e d
Oil, Gas & Consumable Fuels – 1.8% continued
Penn Virginia Corp.* 7,907 $106
PrimeEnergy Resources Corp.* 304 16
Range Resources Corp.* 120,764 1,247
Renewable Energy Group, Inc.* 23,853 1,575
REX American Resources Corp.* 2,832 238
Scorpio Tankers, Inc. 27,115 501
SFL Corp. Ltd. 51,636 414
SM Energy Co. 63,169 1,034
Southwestern Energy Co.* 358,871 1,669
Talos Energy, Inc.* 6,105 74
Tellurian, Inc.* 90,836 213
Uranium Energy Corp.* 105,873 303
W&T Offshore, Inc.* 53,168 191
Whiting Petroleum Corp.* 717 25
World Fuel Services Corp. 35,342 1,244
29,301
Paper & Forest Products – 0.4%
Clearwater Paper Corp.* 9,271 349
Domtar Corp. 29,984 1,108
Glatfelter Corp. 24,262 416
Louisiana-Pacific Corp. 61,246 3,397
Neenah, Inc. 9,296 477
Schweitzer-Mauduit International, Inc. 17,014 833
Verso Corp., Class A 18,003 263
6,843
Personal Products – 0.4%
BellRing Brands, Inc., Class A* 22,091 522
Edgewell Personal Care Co. 29,720 1,177
elf Beauty, Inc.* 24,936 669
Inter Parfums, Inc. 9,833 697
Lifevantage Corp.* 7,614 71
Medifast, Inc. 6,237 1,321
Nature’s Sunshine Products, Inc. 3,855 77
Revlon, Inc., Class A* 3,467 43
USANA Health Sciences, Inc.* 6,436 628
Veru, Inc.* 31,084 335
5,540
Pharmaceuticals – 1.5%
AcelRx Pharmaceuticals, Inc.* 45,950 78
Aerie Pharmaceuticals, Inc.* 20,939 374
Agile Therapeutics, Inc.* 38,788 81
Amneal Pharmaceuticals, Inc.* 56,672 381
Amphastar Pharmaceuticals, Inc.* 19,563 358
NUMBEROF SHARES
VALUE(000S)
C O M M O N S TO C KS - 9 8 . 0 % c o n t i n u e d
Pharmaceuticals – 1.5% continued
Angion Biomedica Corp.* 2,831 $51
ANI Pharmaceuticals, Inc.* 5,496 199
Aquestive Therapeutics, Inc.* 11,340 59
Arvinas, Inc.* 20,089 1,328
Atea Pharmaceuticals, Inc.* 7,969 492
Athira Pharma, Inc.* 7,467 137
Avenue Therapeutics, Inc.* 3,845 23
Axsome Therapeutics, Inc.* 15,640 886
Aytu BioPharma, Inc.* 11,054 84
BioDelivery Sciences International,Inc.* 50,762 198
Cara Therapeutics, Inc.* 23,515 511
Cassava Sciences, Inc.* 18,209 819
Cerecor, Inc.* 22,208 67
Chiasma, Inc.* 28,312 89
Collegium Pharmaceutical, Inc.* 19,623 465
Corcept Therapeutics, Inc.* 53,880 1,282
CorMedix, Inc.* 18,483 185
Cymabay Therapeutics, Inc.* 40,090 182
Durect Corp.* 130,458 258
Eloxx Pharmaceuticals, Inc.* 15,305 51
Endo International PLC* 124,642 924
Eton Pharmaceuticals, Inc.* 8,409 62
Evofem Biosciences, Inc.* 45,341 79
Evolus, Inc.* 13,639 177
Fulcrum Therapeutics, Inc.* 8,709 103
Graybug Vision, Inc.* 3,931 22
Harmony Biosciences Holdings, Inc.* 3,783 125
Harrow Health, Inc.* 12,817 87
IMARA, Inc.* 4,522 38
Innoviva, Inc.* 35,122 420
Intra-Cellular Therapies, Inc.* 36,666 1,244
Kala Pharmaceuticals, Inc.* 22,632 153
Kaleido Biosciences, Inc.* 6,696 54
Landos Biopharma, Inc.* 3,006 29
Lannett Co., Inc.* 18,521 98
Liquidia Technologies, Inc.* 14,989 40
Lyra Therapeutics, Inc.* 2,339 27
Marinus Pharmaceuticals, Inc.* 16,547 256
NGM Biopharmaceuticals, Inc.* 14,005 407
Ocular Therapeutix, Inc.* 40,304 661
Odonate Therapeutics, Inc.* 9,440 32
Omeros Corp.* 33,247 592
Optinose, Inc.* 21,633 80
S C H E D U L E O F I N V E S T M E N T S
S M A L L C A P I N D E X F U N D c o n t i n u e d
See Notes to the Financial Statements.
EQUIT Y INDEX FUNDS 112 NORTHERN FUNDS ANNUAL REPORT
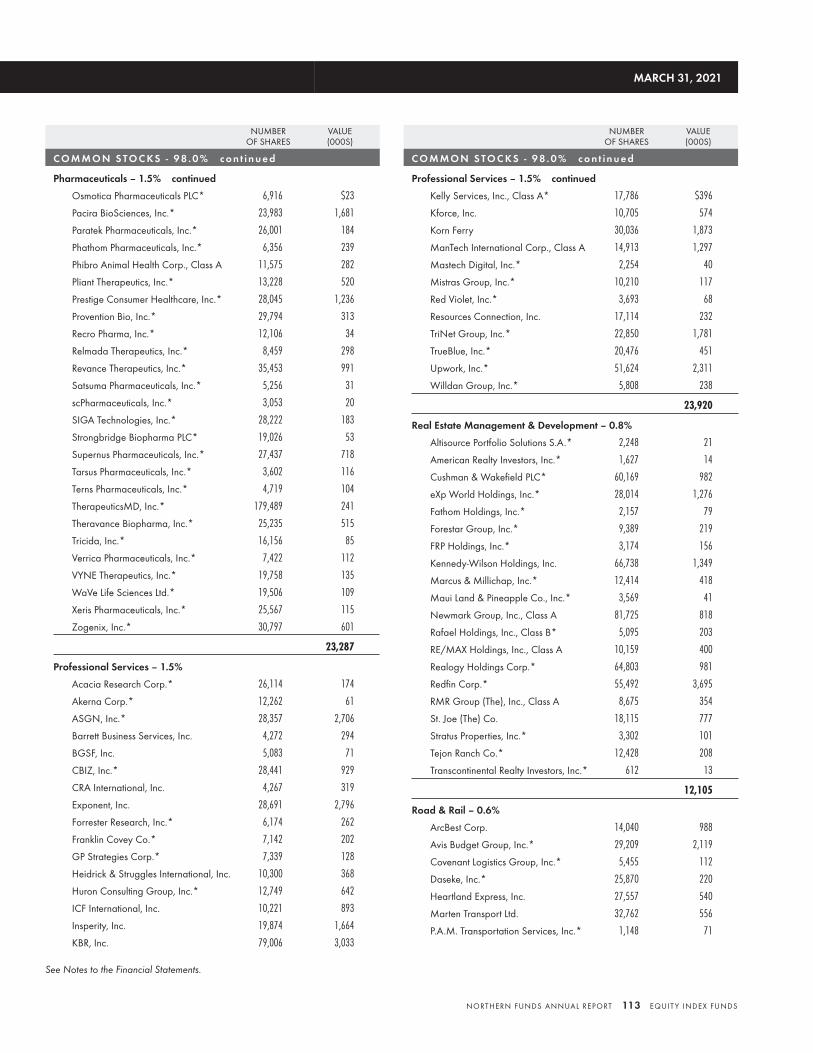
NUMBEROF SHARES
VALUE(000S)
C O M M O N S TO C KS - 9 8 . 0 % c o n t i n u e d
Pharmaceuticals – 1.5% continued
Osmotica Pharmaceuticals PLC* 6,916 $23
Pacira BioSciences, Inc.* 23,983 1,681
Paratek Pharmaceuticals, Inc.* 26,001 184
Phathom Pharmaceuticals, Inc.* 6,356 239
Phibro Animal Health Corp., Class A 11,575 282
Pliant Therapeutics, Inc.* 13,228 520
Prestige Consumer Healthcare, Inc.* 28,045 1,236
Provention Bio, Inc.* 29,794 313
Recro Pharma, Inc.* 12,106 34
Relmada Therapeutics, Inc.* 8,459 298
Revance Therapeutics, Inc.* 35,453 991
Satsuma Pharmaceuticals, Inc.* 5,256 31
scPharmaceuticals, Inc.* 3,053 20
SIGA Technologies, Inc.* 28,222 183
Strongbridge Biopharma PLC* 19,026 53
Supernus Pharmaceuticals, Inc.* 27,437 718
Tarsus Pharmaceuticals, Inc.* 3,602 116
Terns Pharmaceuticals, Inc.* 4,719 104
TherapeuticsMD, Inc.* 179,489 241
Theravance Biopharma, Inc.* 25,235 515
Tricida, Inc.* 16,156 85
Verrica Pharmaceuticals, Inc.* 7,422 112
VYNE Therapeutics, Inc.* 19,758 135
WaVe Life Sciences Ltd.* 19,506 109
Xeris Pharmaceuticals, Inc.* 25,567 115
Zogenix, Inc.* 30,797 601
23,287
Professional Services – 1.5%
Acacia Research Corp.* 26,114 174
Akerna Corp.* 12,262 61
ASGN, Inc.* 28,357 2,706
Barrett Business Services, Inc. 4,272 294
BGSF, Inc. 5,083 71
CBIZ, Inc.* 28,441 929
CRA International, Inc. 4,267 319
Exponent, Inc. 28,691 2,796
Forrester Research, Inc.* 6,174 262
Franklin Covey Co.* 7,142 202
GP Strategies Corp.* 7,339 128
Heidrick & Struggles International, Inc. 10,300 368
Huron Consulting Group, Inc.* 12,749 642
ICF International, Inc. 10,221 893
Insperity, Inc. 19,874 1,664
KBR, Inc. 79,006 3,033
NUMBEROF SHARES
VALUE(000S)
C O M M O N S TO C KS - 9 8 . 0 % c o n t i n u e d
Professional Services – 1.5% continued
Kelly Services, Inc., Class A* 17,786 $396
Kforce, Inc. 10,705 574
Korn Ferry 30,036 1,873
ManTech International Corp., Class A 14,913 1,297
Mastech Digital, Inc.* 2,254 40
Mistras Group, Inc.* 10,210 117
Red Violet, Inc.* 3,693 68
Resources Connection, Inc. 17,114 232
TriNet Group, Inc.* 22,850 1,781
TrueBlue, Inc.* 20,476 451
Upwork, Inc.* 51,624 2,311
Willdan Group, Inc.* 5,808 238
23,920
Real Estate Management & Development – 0.8%
Altisource Portfolio Solutions S.A.* 2,248 21
American Realty Investors, Inc.* 1,627 14
Cushman & Wakefield PLC* 60,169 982
eXp World Holdings, Inc.* 28,014 1,276
Fathom Holdings, Inc.* 2,157 79
Forestar Group, Inc.* 9,389 219
FRP Holdings, Inc.* 3,174 156
Kennedy-Wilson Holdings, Inc. 66,738 1,349
Marcus & Millichap, Inc.* 12,414 418
Maui Land & Pineapple Co., Inc.* 3,569 41
Newmark Group, Inc., Class A 81,725 818
Rafael Holdings, Inc., Class B* 5,095 203
RE/MAX Holdings, Inc., Class A 10,159 400
Realogy Holdings Corp.* 64,803 981
Redfin Corp.* 55,492 3,695
RMR Group (The), Inc., Class A 8,675 354
St. Joe (The) Co. 18,115 777
Stratus Properties, Inc.* 3,302 101
Tejon Ranch Co.* 12,428 208
Transcontinental Realty Investors, Inc.* 612 13
12,105
Road & Rail – 0.6%
ArcBest Corp. 14,040 988
Avis Budget Group, Inc.* 29,209 2,119
Covenant Logistics Group, Inc.* 5,455 112
Daseke, Inc.* 25,870 220
Heartland Express, Inc. 27,557 540
Marten Transport Ltd. 32,762 556
P.A.M. Transportation Services, Inc.* 1,148 71
MARCH 31, 2021
See Notes to the Financial Statements.
NORTHERN FUNDS ANNUAL REPORT 113 EQUIT Y INDEX FUNDS
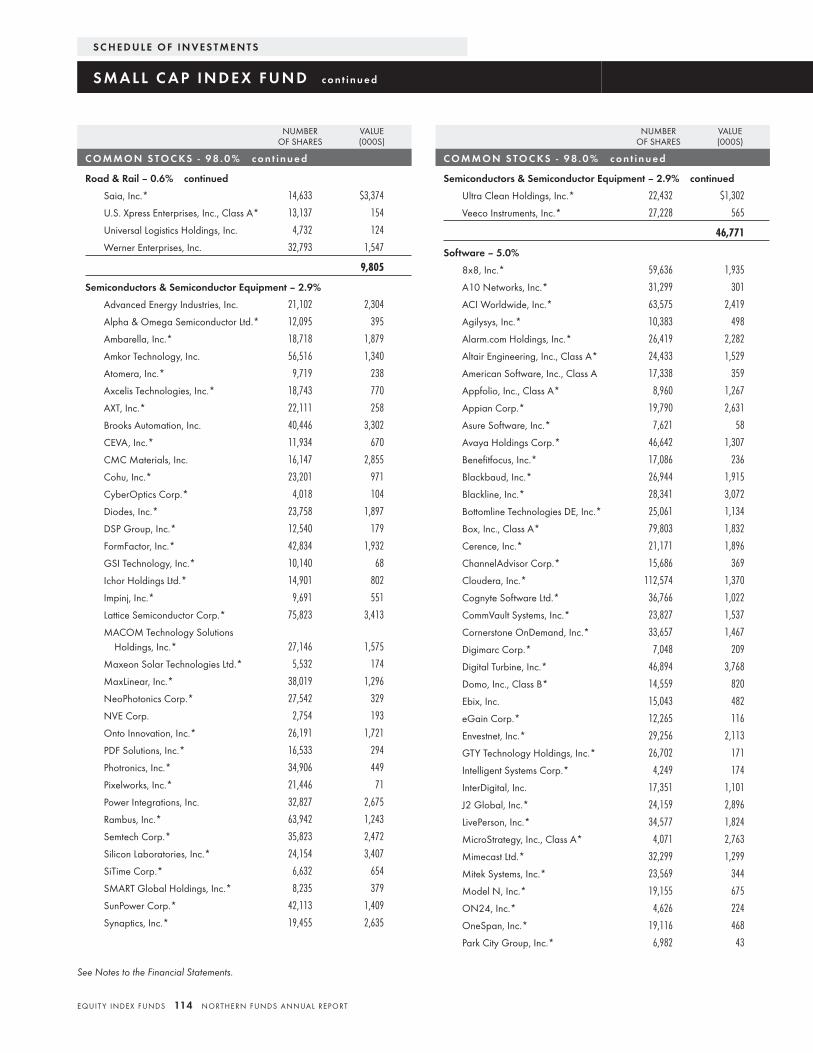
NUMBEROF SHARES
VALUE(000S)
C O M M O N S TO C KS - 9 8 . 0 % c o n t i n u e d
Road & Rail – 0.6% continued
Saia, Inc.* 14,633 $3,374
U.S. Xpress Enterprises, Inc., Class A* 13,137 154
Universal Logistics Holdings, Inc. 4,732 124
Werner Enterprises, Inc. 32,793 1,547
9,805
Semiconductors & Semiconductor Equipment – 2.9%
Advanced Energy Industries, Inc. 21,102 2,304
Alpha & Omega Semiconductor Ltd.* 12,095 395
Ambarella, Inc.* 18,718 1,879
Amkor Technology, Inc. 56,516 1,340
Atomera, Inc.* 9,719 238
Axcelis Technologies, Inc.* 18,743 770
AXT, Inc.* 22,111 258
Brooks Automation, Inc. 40,446 3,302
CEVA, Inc.* 11,934 670
CMC Materials, Inc. 16,147 2,855
Cohu, Inc.* 23,201 971
CyberOptics Corp.* 4,018 104
Diodes, Inc.* 23,758 1,897
DSP Group, Inc.* 12,540 179
FormFactor, Inc.* 42,834 1,932
GSI Technology, Inc.* 10,140 68
Ichor Holdings Ltd.* 14,901 802
Impinj, Inc.* 9,691 551
Lattice Semiconductor Corp.* 75,823 3,413
MACOM Technology SolutionsHoldings, Inc.* 27,146 1,575
Maxeon Solar Technologies Ltd.* 5,532 174
MaxLinear, Inc.* 38,019 1,296
NeoPhotonics Corp.* 27,542 329
NVE Corp. 2,754 193
Onto Innovation, Inc.* 26,191 1,721
PDF Solutions, Inc.* 16,533 294
Photronics, Inc.* 34,906 449
Pixelworks, Inc.* 21,446 71
Power Integrations, Inc. 32,827 2,675
Rambus, Inc.* 63,942 1,243
Semtech Corp.* 35,823 2,472
Silicon Laboratories, Inc.* 24,154 3,407
SiTime Corp.* 6,632 654
SMART Global Holdings, Inc.* 8,235 379
SunPower Corp.* 42,113 1,409
Synaptics, Inc.* 19,455 2,635
NUMBEROF SHARES
VALUE(000S)
C O M M O N S TO C KS - 9 8 . 0 % c o n t i n u e d
Semiconductors & Semiconductor Equipment – 2.9% continued
Ultra Clean Holdings, Inc.* 22,432 $1,302
Veeco Instruments, Inc.* 27,228 565
46,771
Software – 5.0%
8x8, Inc.* 59,636 1,935
A10 Networks, Inc.* 31,299 301
ACI Worldwide, Inc.* 63,575 2,419
Agilysys, Inc.* 10,383 498
Alarm.com Holdings, Inc.* 26,419 2,282
Altair Engineering, Inc., Class A* 24,433 1,529
American Software, Inc., Class A 17,338 359
Appfolio, Inc., Class A* 8,960 1,267
Appian Corp.* 19,790 2,631
Asure Software, Inc.* 7,621 58
Avaya Holdings Corp.* 46,642 1,307
Benefitfocus, Inc.* 17,086 236
Blackbaud, Inc.* 26,944 1,915
Blackline, Inc.* 28,341 3,072
Bottomline Technologies DE, Inc.* 25,061 1,134
Box, Inc., Class A* 79,803 1,832
Cerence, Inc.* 21,171 1,896
ChannelAdvisor Corp.* 15,686 369
Cloudera, Inc.* 112,574 1,370
Cognyte Software Ltd.* 36,766 1,022
CommVault Systems, Inc.* 23,827 1,537
Cornerstone OnDemand, Inc.* 33,657 1,467
Digimarc Corp.* 7,048 209
Digital Turbine, Inc.* 46,894 3,768
Domo, Inc., Class B* 14,559 820
Ebix, Inc. 15,043 482
eGain Corp.* 12,265 116
Envestnet, Inc.* 29,256 2,113
GTY Technology Holdings, Inc.* 26,702 171
Intelligent Systems Corp.* 4,249 174
InterDigital, Inc. 17,351 1,101
J2 Global, Inc.* 24,159 2,896
LivePerson, Inc.* 34,577 1,824
MicroStrategy, Inc., Class A* 4,071 2,763
Mimecast Ltd.* 32,299 1,299
Mitek Systems, Inc.* 23,569 344
Model N, Inc.* 19,155 675
ON24, Inc.* 4,626 224
OneSpan, Inc.* 19,116 468
Park City Group, Inc.* 6,982 43
S C H E D U L E O F I N V E S T M E N T S
S M A L L C A P I N D E X F U N D c o n t i n u e d
See Notes to the Financial Statements.
EQUIT Y INDEX FUNDS 114 NORTHERN FUNDS ANNUAL REPORT
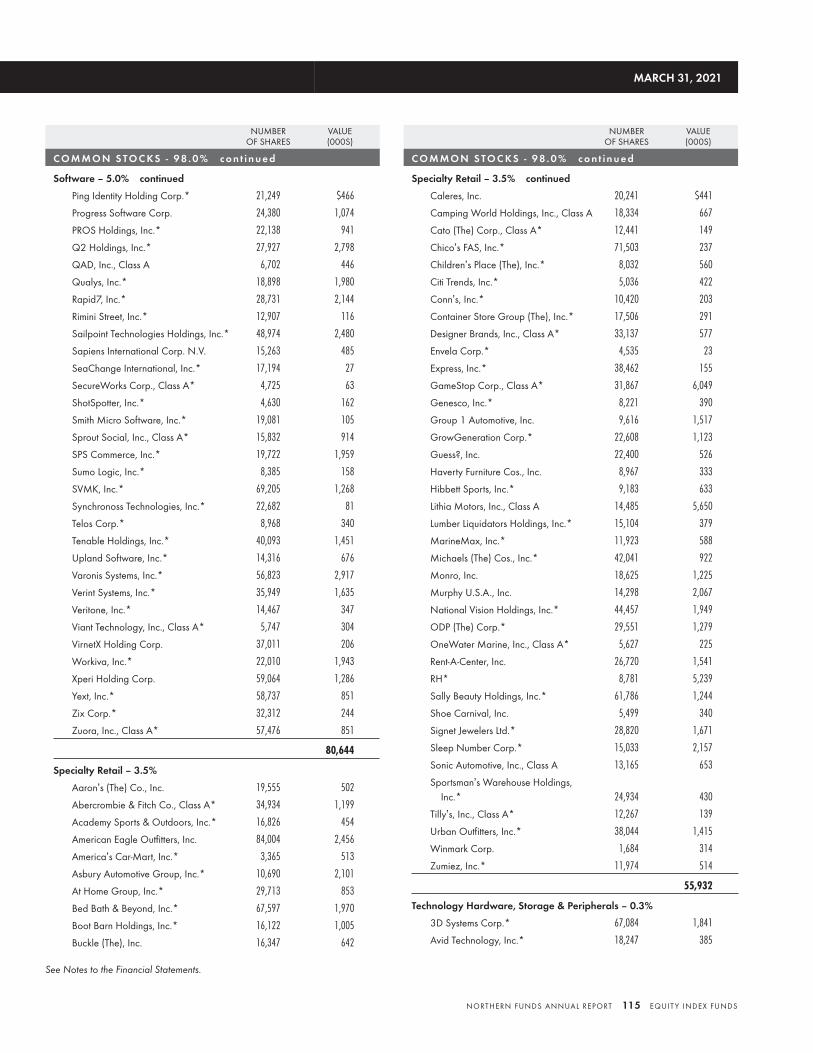
NUMBEROF SHARES
VALUE(000S)
C O M M O N S TO C KS - 9 8 . 0 % c o n t i n u e d
Software – 5.0% continued
Ping Identity Holding Corp.* 21,249 $466
Progress Software Corp. 24,380 1,074
PROS Holdings, Inc.* 22,138 941
Q2 Holdings, Inc.* 27,927 2,798
QAD, Inc., Class A 6,702 446
Qualys, Inc.* 18,898 1,980
Rapid7, Inc.* 28,731 2,144
Rimini Street, Inc.* 12,907 116
Sailpoint Technologies Holdings, Inc.* 48,974 2,480
Sapiens International Corp. N.V. 15,263 485
SeaChange International, Inc.* 17,194 27
SecureWorks Corp., Class A* 4,725 63
ShotSpotter, Inc.* 4,630 162
Smith Micro Software, Inc.* 19,081 105
Sprout Social, Inc., Class A* 15,832 914
SPS Commerce, Inc.* 19,722 1,959
Sumo Logic, Inc.* 8,385 158
SVMK, Inc.* 69,205 1,268
Synchronoss Technologies, Inc.* 22,682 81
Telos Corp.* 8,968 340
Tenable Holdings, Inc.* 40,093 1,451
Upland Software, Inc.* 14,316 676
Varonis Systems, Inc.* 56,823 2,917
Verint Systems, Inc.* 35,949 1,635
Veritone, Inc.* 14,467 347
Viant Technology, Inc., Class A* 5,747 304
VirnetX Holding Corp. 37,011 206
Workiva, Inc.* 22,010 1,943
Xperi Holding Corp. 59,064 1,286
Yext, Inc.* 58,737 851
Zix Corp.* 32,312 244
Zuora, Inc., Class A* 57,476 851
80,644
Specialty Retail – 3.5%
Aaron’s (The) Co., Inc. 19,555 502
Abercrombie & Fitch Co., Class A* 34,934 1,199
Academy Sports & Outdoors, Inc.* 16,826 454
American Eagle Outfitters, Inc. 84,004 2,456
America’s Car-Mart, Inc.* 3,365 513
Asbury Automotive Group, Inc.* 10,690 2,101
At Home Group, Inc.* 29,713 853
Bed Bath & Beyond, Inc.* 67,597 1,970
Boot Barn Holdings, Inc.* 16,122 1,005
Buckle (The), Inc. 16,347 642
NUMBEROF SHARES
VALUE(000S)
C O M M O N S TO C KS - 9 8 . 0 % c o n t i n u e d
Specialty Retail – 3.5% continued
Caleres, Inc. 20,241 $441
Camping World Holdings, Inc., Class A 18,334 667
Cato (The) Corp., Class A* 12,441 149
Chico’s FAS, Inc.* 71,503 237
Children’s Place (The), Inc.* 8,032 560
Citi Trends, Inc.* 5,036 422
Conn’s, Inc.* 10,420 203
Container Store Group (The), Inc.* 17,506 291
Designer Brands, Inc., Class A* 33,137 577
Envela Corp.* 4,535 23
Express, Inc.* 38,462 155
GameStop Corp., Class A* 31,867 6,049
Genesco, Inc.* 8,221 390
Group 1 Automotive, Inc. 9,616 1,517
GrowGeneration Corp.* 22,608 1,123
Guess?, Inc. 22,400 526
Haverty Furniture Cos., Inc. 8,967 333
Hibbett Sports, Inc.* 9,183 633
Lithia Motors, Inc., Class A 14,485 5,650
Lumber Liquidators Holdings, Inc.* 15,104 379
MarineMax, Inc.* 11,923 588
Michaels (The) Cos., Inc.* 42,041 922
Monro, Inc. 18,625 1,225
Murphy U.S.A., Inc. 14,298 2,067
National Vision Holdings, Inc.* 44,457 1,949
ODP (The) Corp.* 29,551 1,279
OneWater Marine, Inc., Class A* 5,627 225
Rent-A-Center, Inc. 26,720 1,541
RH* 8,781 5,239
Sally Beauty Holdings, Inc.* 61,786 1,244
Shoe Carnival, Inc. 5,499 340
Signet Jewelers Ltd.* 28,820 1,671
Sleep Number Corp.* 15,033 2,157
Sonic Automotive, Inc., Class A 13,165 653
Sportsman’s Warehouse Holdings,Inc.* 24,934 430
Tilly’s, Inc., Class A* 12,267 139
Urban Outfitters, Inc.* 38,044 1,415
Winmark Corp. 1,684 314
Zumiez, Inc.* 11,974 514
55,932
Technology Hardware, Storage & Peripherals – 0.3%
3D Systems Corp.* 67,084 1,841
Avid Technology, Inc.* 18,247 385
MARCH 31, 2021
See Notes to the Financial Statements.
NORTHERN FUNDS ANNUAL REPORT 115 EQUIT Y INDEX FUNDS
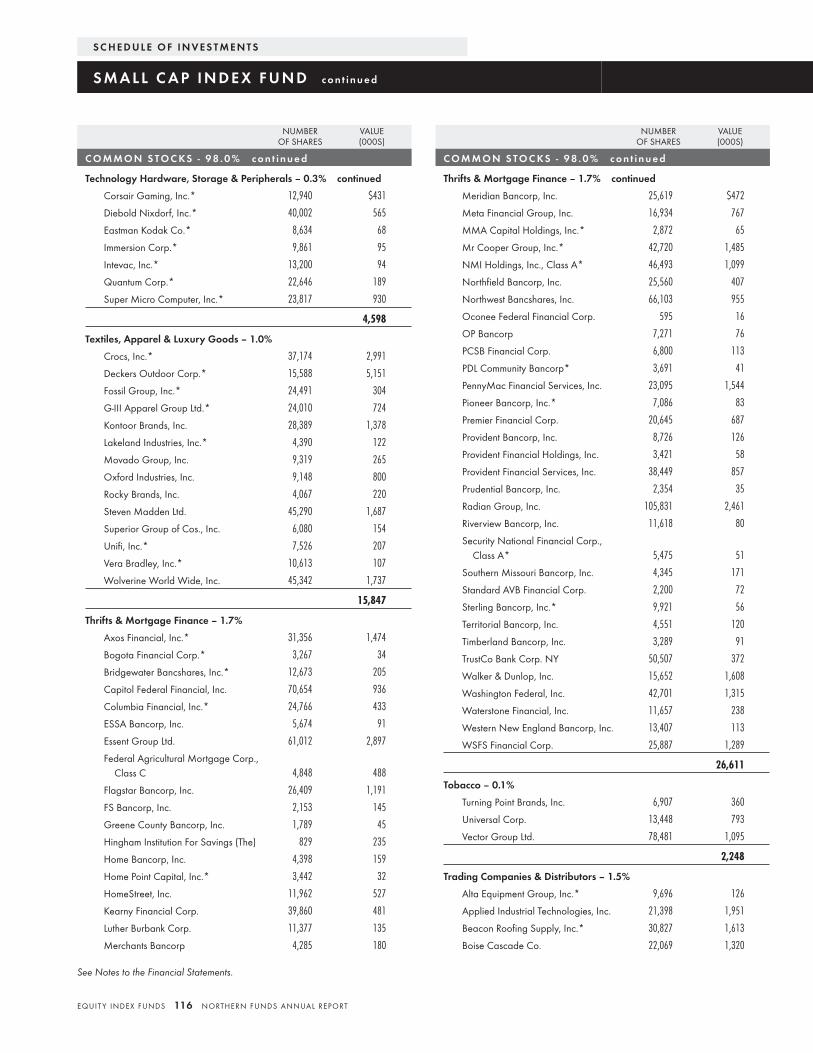
NUMBEROF SHARES
VALUE(000S)
C O M M O N S TO C KS - 9 8 . 0 % c o n t i n u e d
Technology Hardware, Storage & Peripherals – 0.3% continued
Corsair Gaming, Inc.* 12,940 $431
Diebold Nixdorf, Inc.* 40,002 565
Eastman Kodak Co.* 8,634 68
Immersion Corp.* 9,861 95
Intevac, Inc.* 13,200 94
Quantum Corp.* 22,646 189
Super Micro Computer, Inc.* 23,817 930
4,598
Textiles, Apparel & Luxury Goods – 1.0%
Crocs, Inc.* 37,174 2,991
Deckers Outdoor Corp.* 15,588 5,151
Fossil Group, Inc.* 24,491 304
G-III Apparel Group Ltd.* 24,010 724
Kontoor Brands, Inc. 28,389 1,378
Lakeland Industries, Inc.* 4,390 122
Movado Group, Inc. 9,319 265
Oxford Industries, Inc. 9,148 800
Rocky Brands, Inc. 4,067 220
Steven Madden Ltd. 45,290 1,687
Superior Group of Cos., Inc. 6,080 154
Unifi, Inc.* 7,526 207
Vera Bradley, Inc.* 10,613 107
Wolverine World Wide, Inc. 45,342 1,737
15,847
Thrifts & Mortgage Finance – 1.7%
Axos Financial, Inc.* 31,356 1,474
Bogota Financial Corp.* 3,267 34
Bridgewater Bancshares, Inc.* 12,673 205
Capitol Federal Financial, Inc. 70,654 936
Columbia Financial, Inc.* 24,766 433
ESSA Bancorp, Inc. 5,674 91
Essent Group Ltd. 61,012 2,897
Federal Agricultural Mortgage Corp.,Class C 4,848 488
Flagstar Bancorp, Inc. 26,409 1,191
FS Bancorp, Inc. 2,153 145
Greene County Bancorp, Inc. 1,789 45
Hingham Institution For Savings (The) 829 235
Home Bancorp, Inc. 4,398 159
Home Point Capital, Inc.* 3,442 32
HomeStreet, Inc. 11,962 527
Kearny Financial Corp. 39,860 481
Luther Burbank Corp. 11,377 135
Merchants Bancorp 4,285 180
NUMBEROF SHARES
VALUE(000S)
C O M M O N S TO C KS - 9 8 . 0 % c o n t i n u e d
Thrifts & Mortgage Finance – 1.7% continued
Meridian Bancorp, Inc. 25,619 $472
Meta Financial Group, Inc. 16,934 767
MMA Capital Holdings, Inc.* 2,872 65
Mr Cooper Group, Inc.* 42,720 1,485
NMI Holdings, Inc., Class A* 46,493 1,099
Northfield Bancorp, Inc. 25,560 407
Northwest Bancshares, Inc. 66,103 955
Oconee Federal Financial Corp. 595 16
OP Bancorp 7,271 76
PCSB Financial Corp. 6,800 113
PDL Community Bancorp* 3,691 41
PennyMac Financial Services, Inc. 23,095 1,544
Pioneer Bancorp, Inc.* 7,086 83
Premier Financial Corp. 20,645 687
Provident Bancorp, Inc. 8,726 126
Provident Financial Holdings, Inc. 3,421 58
Provident Financial Services, Inc. 38,449 857
Prudential Bancorp, Inc. 2,354 35
Radian Group, Inc. 105,831 2,461
Riverview Bancorp, Inc. 11,618 80
Security National Financial Corp.,Class A* 5,475 51
Southern Missouri Bancorp, Inc. 4,345 171
Standard AVB Financial Corp. 2,200 72
Sterling Bancorp, Inc.* 9,921 56
Territorial Bancorp, Inc. 4,551 120
Timberland Bancorp, Inc. 3,289 91
TrustCo Bank Corp. NY 50,507 372
Walker & Dunlop, Inc. 15,652 1,608
Washington Federal, Inc. 42,701 1,315
Waterstone Financial, Inc. 11,657 238
Western New England Bancorp, Inc. 13,407 113
WSFS Financial Corp. 25,887 1,289
26,611
Tobacco – 0.1%
Turning Point Brands, Inc. 6,907 360
Universal Corp. 13,448 793
Vector Group Ltd. 78,481 1,095
2,248
Trading Companies & Distributors – 1.5%
Alta Equipment Group, Inc.* 9,696 126
Applied Industrial Technologies, Inc. 21,398 1,951
Beacon Roofing Supply, Inc.* 30,827 1,613
Boise Cascade Co. 22,069 1,320
S C H E D U L E O F I N V E S T M E N T S
S M A L L C A P I N D E X F U N D c o n t i n u e d
See Notes to the Financial Statements.
EQUIT Y INDEX FUNDS 116 NORTHERN FUNDS ANNUAL REPORT
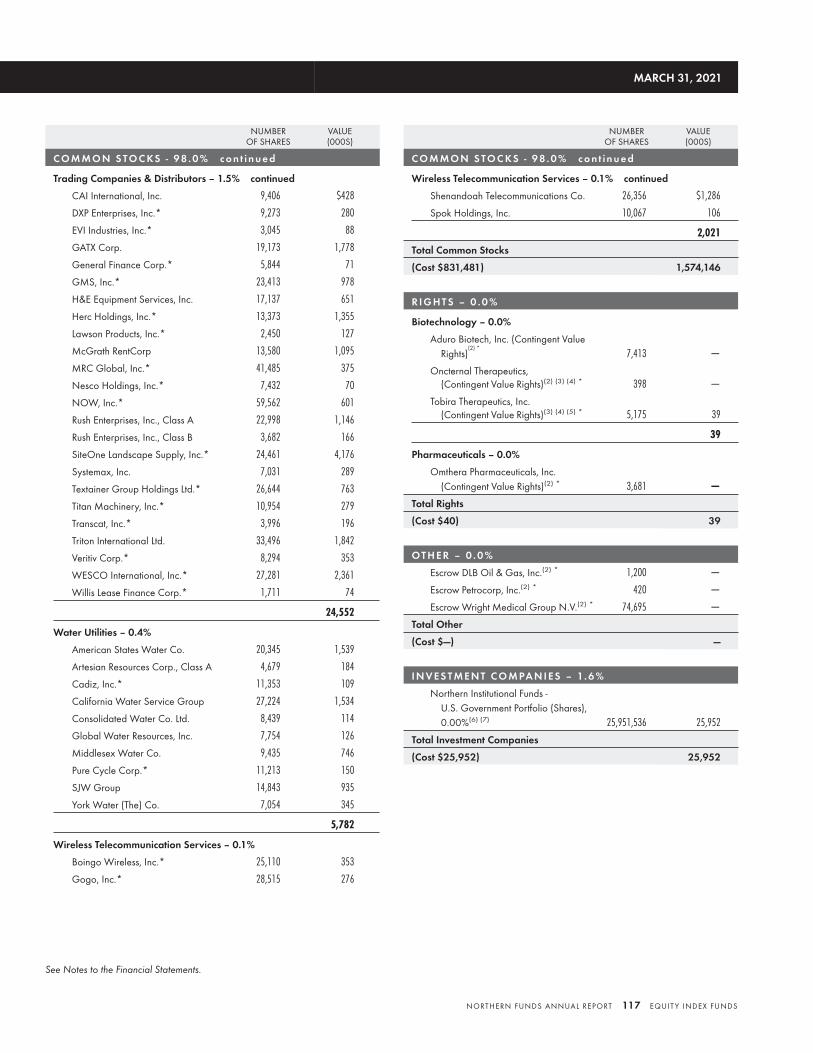
NUMBEROF SHARES
VALUE(000S)
C O M M O N S TO C KS - 9 8 . 0 % c o n t i n u e d
Trading Companies & Distributors – 1.5% continued
CAI International, Inc. 9,406 $428
DXP Enterprises, Inc.* 9,273 280
EVI Industries, Inc.* 3,045 88
GATX Corp. 19,173 1,778
General Finance Corp.* 5,844 71
GMS, Inc.* 23,413 978
H&E Equipment Services, Inc. 17,137 651
Herc Holdings, Inc.* 13,373 1,355
Lawson Products, Inc.* 2,450 127
McGrath RentCorp 13,580 1,095
MRC Global, Inc.* 41,485 375
Nesco Holdings, Inc.* 7,432 70
NOW, Inc.* 59,562 601
Rush Enterprises, Inc., Class A 22,998 1,146
Rush Enterprises, Inc., Class B 3,682 166
SiteOne Landscape Supply, Inc.* 24,461 4,176
Systemax, Inc. 7,031 289
Textainer Group Holdings Ltd.* 26,644 763
Titan Machinery, Inc.* 10,954 279
Transcat, Inc.* 3,996 196
Triton International Ltd. 33,496 1,842
Veritiv Corp.* 8,294 353
WESCO International, Inc.* 27,281 2,361
Willis Lease Finance Corp.* 1,711 74
24,552
Water Utilities – 0.4%
American States Water Co. 20,345 1,539
Artesian Resources Corp., Class A 4,679 184
Cadiz, Inc.* 11,353 109
California Water Service Group 27,224 1,534
Consolidated Water Co. Ltd. 8,439 114
Global Water Resources, Inc. 7,754 126
Middlesex Water Co. 9,435 746
Pure Cycle Corp.* 11,213 150
SJW Group 14,843 935
York Water (The) Co. 7,054 345
5,782
Wireless Telecommunication Services – 0.1%
Boingo Wireless, Inc.* 25,110 353
Gogo, Inc.* 28,515 276
NUMBEROF SHARES
VALUE(000S)
C O M M O N S TO C KS - 9 8 . 0 % c o n t i n u e d
Wireless Telecommunication Services – 0.1% continued
Shenandoah Telecommunications Co. 26,356 $1,286
Spok Holdings, Inc. 10,067 106
2,021
Total Common Stocks
(Cost $831,481) 1,574,146
R I G H T S – 0 . 0 %
Biotechnology – 0.0%
Aduro Biotech, Inc. (Contingent ValueRights)
(2) *7,413 —
Oncternal Therapeutics,(Contingent Value Rights)(2) (3) (4) * 398 —
Tobira Therapeutics, Inc.(Contingent Value Rights)(3) (4) (5) * 5,175 39
39
Pharmaceuticals – 0.0%
Omthera Pharmaceuticals, Inc.(Contingent Value Rights)(2) * 3,681 —
Total Rights
(Cost $40) 39
OT H E R – 0 . 0 %
Escrow DLB Oil & Gas, Inc.(2) * 1,200 —
Escrow Petrocorp, Inc.(2) * 420 —
Escrow Wright Medical Group N.V.(2) * 74,695 —
Total Other
(Cost $—) —
I N V E S T M E N T C O M PA N I E S – 1. 6 %
Northern Institutional Funds -U.S. Government Portfolio (Shares),0.00%(6) (7) 25,951,536 25,952
Total Investment Companies
(Cost $25,952) 25,952
MARCH 31, 2021
See Notes to the Financial Statements.
NORTHERN FUNDS ANNUAL REPORT 117 EQUIT Y INDEX FUNDS
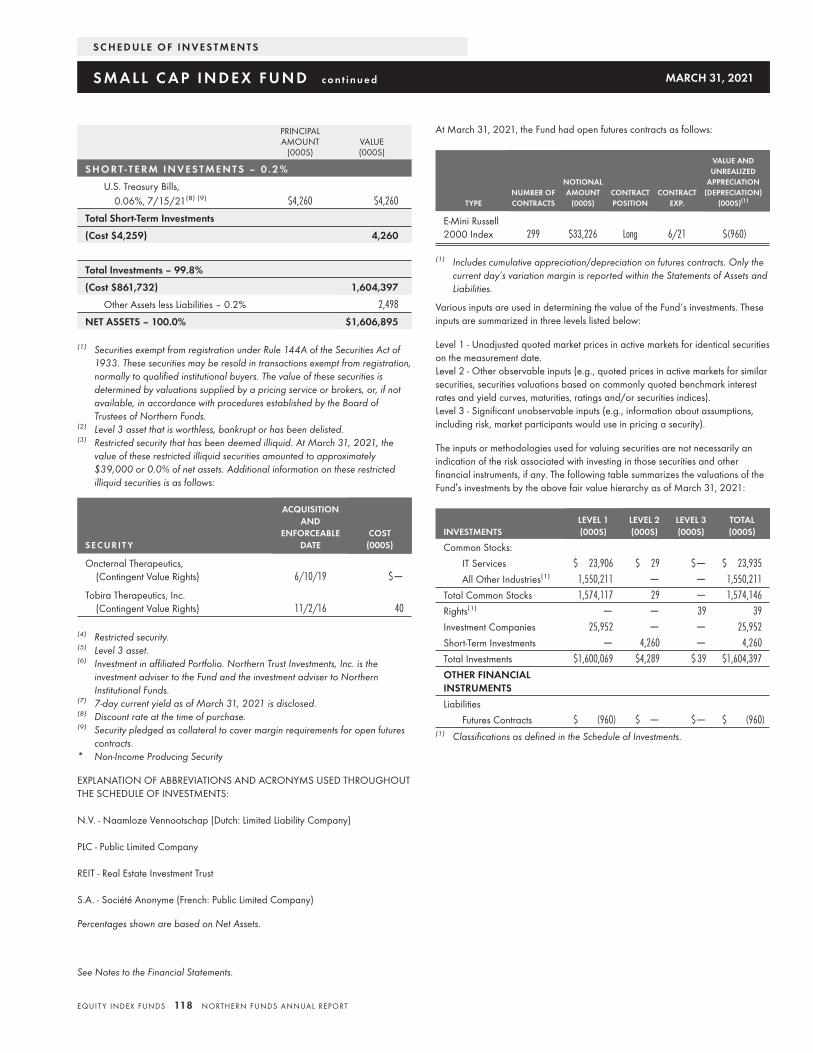
PRINCIPALAMOUNT
(000S)VALUE(000S)
S H O R T - T E R M I N V E S T M E N T S – 0 . 2 %
U.S. Treasury Bills,0.06%, 7/15/21(8) (9) $4,260 $4,260
Total Short-Term Investments
(Cost $4,259) 4,260
Total Investments – 99.8%
(Cost $861,732) 1,604,397
Other Assets less Liabilities – 0.2% 2,498
NET ASSETS – 100.0% $1,606,895
(1) Securities exempt from registration under Rule 144A of the Securities Act of1933. These securities may be resold in transactions exempt from registration,normally to qualified institutional buyers. The value of these securities isdetermined by valuations supplied by a pricing service or brokers, or, if notavailable, in accordance with procedures established by the Board ofTrustees of Northern Funds.
(2) Level 3 asset that is worthless, bankrupt or has been delisted.(3) Restricted security that has been deemed illiquid. At March 31, 2021, the
value of these restricted illiquid securities amounted to approximately$39,000 or 0.0% of net assets. Additional information on these restrictedilliquid securities is as follows:
S E C U R I T Y
ACQUISITIONAND
ENFORCEABLEDATE
COST(000S)
Oncternal Therapeutics,(Contingent Value Rights) 6/10/19 $—
Tobira Therapeutics, Inc.(Contingent Value Rights) 11/2/16 40
(4) Restricted security.(5) Level 3 asset.(6) Investment in affiliated Portfolio. Northern Trust Investments, Inc. is the
investment adviser to the Fund and the investment adviser to NorthernInstitutional Funds.
(7) 7-day current yield as of March 31, 2021 is disclosed.(8) Discount rate at the time of purchase.(9) Security pledged as collateral to cover margin requirements for open futures
contracts.* Non-Income Producing Security
EXPLANATION OF ABBREVIATIONS AND ACRONYMS USED THROUGHOUTTHE SCHEDULE OF INVESTMENTS:
N.V. - Naamloze Vennootschap (Dutch: Limited Liability Company)
PLC - Public Limited Company
REIT - Real Estate Investment Trust
S.A. - Société Anonyme (French: Public Limited Company)
Percentages shown are based on Net Assets.
At March 31, 2021, the Fund had open futures contracts as follows:
TYPENUMBER OFCONTRACTS
NOTIONALAMOUNT
(000S)CONTRACTPOSITION
CONTRACTEXP.
VALUE ANDUNREALIZED
APPRECIATION(DEPRECIATION)
(000S)(1)
E-Mini Russell2000 Index 299 $33,226 Long 6/21 $(960)
(1) Includes cumulative appreciation/depreciation on futures contracts. Only thecurrent day’s variation margin is reported within the Statements of Assets andLiabilities.
Various inputs are used in determining the value of the Fund’s investments. Theseinputs are summarized in three levels listed below:
Level 1 - Unadjusted quoted market prices in active markets for identical securitieson the measurement date.Level 2 - Other observable inputs (e.g., quoted prices in active markets for similarsecurities, securities valuations based on commonly quoted benchmark interestrates and yield curves, maturities, ratings and/or securities indices).Level 3 - Significant unobservable inputs (e.g., information about assumptions,including risk, market participants would use in pricing a security).
The inputs or methodologies used for valuing securities are not necessarily anindication of the risk associated with investing in those securities and otherfinancial instruments, if any. The following table summarizes the valuations of theFund’s investments by the above fair value hierarchy as of March 31, 2021:
INVESTMENTSLEVEL 1(000S)
LEVEL 2(000S)
LEVEL 3(000S)
TOTAL(000S)
Common Stocks:
IT Services $ 23,906 $ 29 $— $ 23,935
All Other Industries(1) 1,550,211 — — 1,550,211
Total Common Stocks 1,574,117 29 — 1,574,146
Rights(1) — — 39 39
Investment Companies 25,952 — — 25,952
Short-Term Investments — 4,260 — 4,260
Total Investments $1,600,069 $4,289 $ 39 $1,604,397
OTHER FINANCIALINSTRUMENTS
Liabilities
Futures Contracts $ (960) $ — $— $ (960)(1) Classifications as defined in the Schedule of Investments.
S C H E D U L E O F I N V E S T M E N T S
S M A L L C A P I N D E X F U N D c o n t i n u e d MARCH 31, 2021
See Notes to the Financial Statements.
EQUIT Y INDEX FUNDS 118 NORTHERN FUNDS ANNUAL REPORT
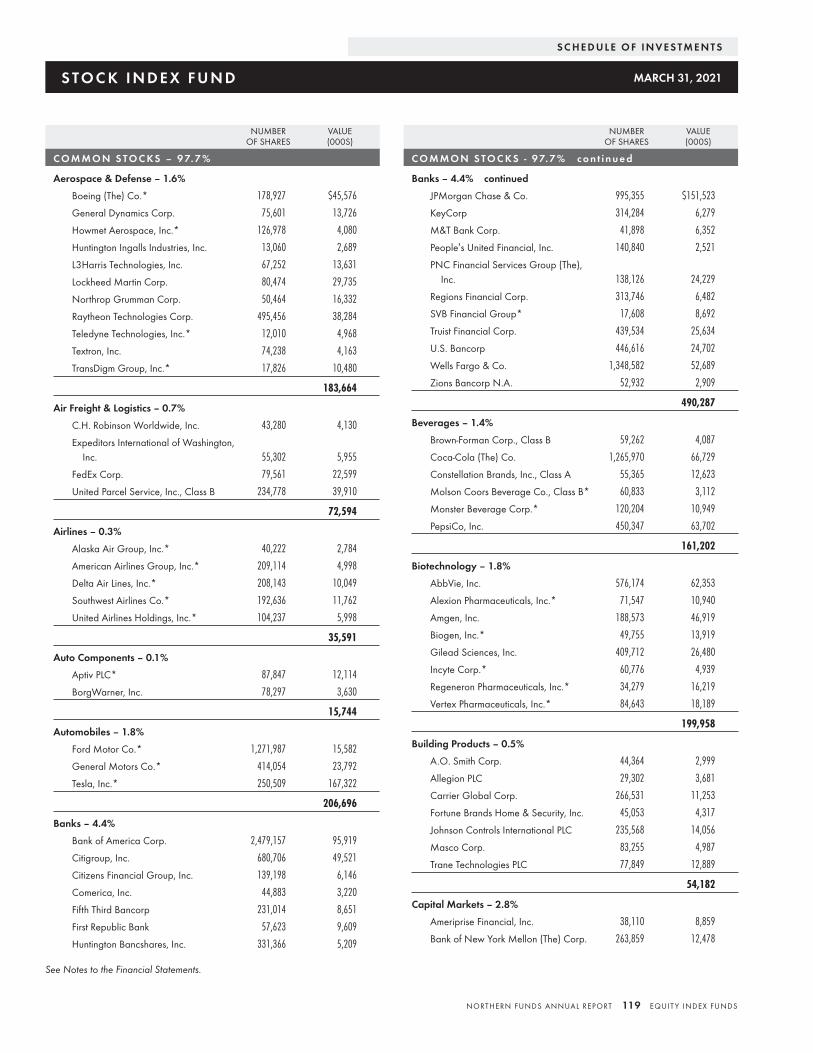
NUMBEROF SHARES
VALUE(000S)
C O M M O N S TO C KS – 9 7. 7 %
Aerospace & Defense – 1.6%
Boeing (The) Co.* 178,927 $45,576
General Dynamics Corp. 75,601 13,726
Howmet Aerospace, Inc.* 126,978 4,080
Huntington Ingalls Industries, Inc. 13,060 2,689
L3Harris Technologies, Inc. 67,252 13,631
Lockheed Martin Corp. 80,474 29,735
Northrop Grumman Corp. 50,464 16,332
Raytheon Technologies Corp. 495,456 38,284
Teledyne Technologies, Inc.* 12,010 4,968
Textron, Inc. 74,238 4,163
TransDigm Group, Inc.* 17,826 10,480
183,664
Air Freight & Logistics – 0.7%
C.H. Robinson Worldwide, Inc. 43,280 4,130
Expeditors International of Washington,Inc. 55,302 5,955
FedEx Corp. 79,561 22,599
United Parcel Service, Inc., Class B 234,778 39,910
72,594
Airlines – 0.3%
Alaska Air Group, Inc.* 40,222 2,784
American Airlines Group, Inc.* 209,114 4,998
Delta Air Lines, Inc.* 208,143 10,049
Southwest Airlines Co.* 192,636 11,762
United Airlines Holdings, Inc.* 104,237 5,998
35,591
Auto Components – 0.1%
Aptiv PLC* 87,847 12,114
BorgWarner, Inc. 78,297 3,630
15,744
Automobiles – 1.8%
Ford Motor Co.* 1,271,987 15,582
General Motors Co.* 414,054 23,792
Tesla, Inc.* 250,509 167,322
206,696
Banks – 4.4%
Bank of America Corp. 2,479,157 95,919
Citigroup, Inc. 680,706 49,521
Citizens Financial Group, Inc. 139,198 6,146
Comerica, Inc. 44,883 3,220
Fifth Third Bancorp 231,014 8,651
First Republic Bank 57,623 9,609
Huntington Bancshares, Inc. 331,366 5,209
NUMBEROF SHARES
VALUE(000S)
C O M M O N S TO C KS - 9 7. 7 % c o n t i n u e d
Banks – 4.4% continued
JPMorgan Chase & Co. 995,355 $151,523
KeyCorp 314,284 6,279
M&T Bank Corp. 41,898 6,352
People’s United Financial, Inc. 140,840 2,521
PNC Financial Services Group (The),Inc. 138,126 24,229
Regions Financial Corp. 313,746 6,482
SVB Financial Group* 17,608 8,692
Truist Financial Corp. 439,534 25,634
U.S. Bancorp 446,616 24,702
Wells Fargo & Co. 1,348,582 52,689
Zions Bancorp N.A. 52,932 2,909
490,287
Beverages – 1.4%
Brown-Forman Corp., Class B 59,262 4,087
Coca-Cola (The) Co. 1,265,970 66,729
Constellation Brands, Inc., Class A 55,365 12,623
Molson Coors Beverage Co., Class B* 60,833 3,112
Monster Beverage Corp.* 120,204 10,949
PepsiCo, Inc. 450,347 63,702
161,202
Biotechnology – 1.8%
AbbVie, Inc. 576,174 62,353
Alexion Pharmaceuticals, Inc.* 71,547 10,940
Amgen, Inc. 188,573 46,919
Biogen, Inc.* 49,755 13,919
Gilead Sciences, Inc. 409,712 26,480
Incyte Corp.* 60,776 4,939
Regeneron Pharmaceuticals, Inc.* 34,279 16,219
Vertex Pharmaceuticals, Inc.* 84,643 18,189
199,958
Building Products – 0.5%
A.O. Smith Corp. 44,364 2,999
Allegion PLC 29,302 3,681
Carrier Global Corp. 266,531 11,253
Fortune Brands Home & Security, Inc. 45,053 4,317
Johnson Controls International PLC 235,568 14,056
Masco Corp. 83,255 4,987
Trane Technologies PLC 77,849 12,889
54,182
Capital Markets – 2.8%
Ameriprise Financial, Inc. 38,110 8,859
Bank of New York Mellon (The) Corp. 263,859 12,478
S C H E D U L E O F I N V E S T M E N T S
S TO C K I N D E X F U N D MARCH 31, 2021
See Notes to the Financial Statements.
NORTHERN FUNDS ANNUAL REPORT 119 EQUIT Y INDEX FUNDS
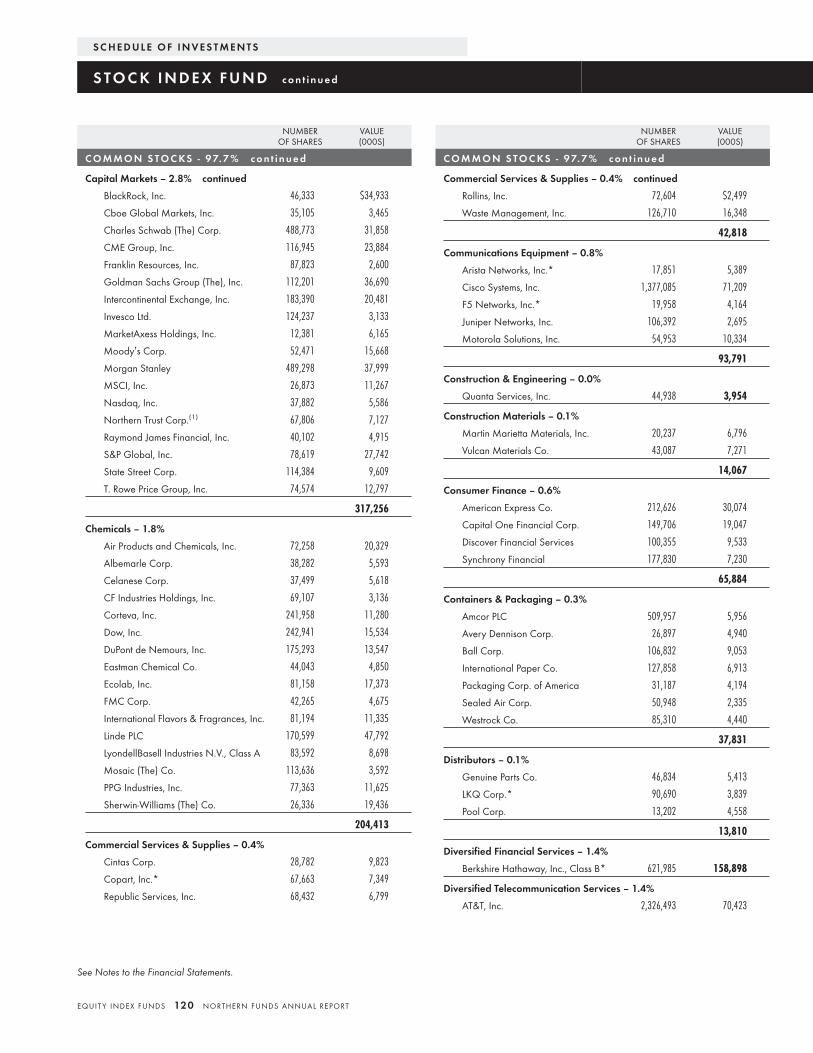
NUMBEROF SHARES
VALUE(000S)
C O M M O N S TO C KS - 9 7. 7 % c o n t i n u e d
Capital Markets – 2.8% continued
BlackRock, Inc. 46,333 $34,933
Cboe Global Markets, Inc. 35,105 3,465
Charles Schwab (The) Corp. 488,773 31,858
CME Group, Inc. 116,945 23,884
Franklin Resources, Inc. 87,823 2,600
Goldman Sachs Group (The), Inc. 112,201 36,690
Intercontinental Exchange, Inc. 183,390 20,481
Invesco Ltd. 124,237 3,133
MarketAxess Holdings, Inc. 12,381 6,165
Moody’s Corp. 52,471 15,668
Morgan Stanley 489,298 37,999
MSCI, Inc. 26,873 11,267
Nasdaq, Inc. 37,882 5,586
Northern Trust Corp.(1) 67,806 7,127
Raymond James Financial, Inc. 40,102 4,915
S&P Global, Inc. 78,619 27,742
State Street Corp. 114,384 9,609
T. Rowe Price Group, Inc. 74,574 12,797
317,256
Chemicals – 1.8%
Air Products and Chemicals, Inc. 72,258 20,329
Albemarle Corp. 38,282 5,593
Celanese Corp. 37,499 5,618
CF Industries Holdings, Inc. 69,107 3,136
Corteva, Inc. 241,958 11,280
Dow, Inc. 242,941 15,534
DuPont de Nemours, Inc. 175,293 13,547
Eastman Chemical Co. 44,043 4,850
Ecolab, Inc. 81,158 17,373
FMC Corp. 42,265 4,675
International Flavors & Fragrances, Inc. 81,194 11,335
Linde PLC 170,599 47,792
LyondellBasell Industries N.V., Class A 83,592 8,698
Mosaic (The) Co. 113,636 3,592
PPG Industries, Inc. 77,363 11,625
Sherwin-Williams (The) Co. 26,336 19,436
204,413
Commercial Services & Supplies – 0.4%
Cintas Corp. 28,782 9,823
Copart, Inc.* 67,663 7,349
Republic Services, Inc. 68,432 6,799
NUMBEROF SHARES
VALUE(000S)
C O M M O N S TO C KS - 9 7. 7 % c o n t i n u e d
Commercial Services & Supplies – 0.4% continued
Rollins, Inc. 72,604 $2,499
Waste Management, Inc. 126,710 16,348
42,818
Communications Equipment – 0.8%
Arista Networks, Inc.* 17,851 5,389
Cisco Systems, Inc. 1,377,085 71,209
F5 Networks, Inc.* 19,958 4,164
Juniper Networks, Inc. 106,392 2,695
Motorola Solutions, Inc. 54,953 10,334
93,791
Construction & Engineering – 0.0%
Quanta Services, Inc. 44,938 3,954
Construction Materials – 0.1%
Martin Marietta Materials, Inc. 20,237 6,796
Vulcan Materials Co. 43,087 7,271
14,067
Consumer Finance – 0.6%
American Express Co. 212,626 30,074
Capital One Financial Corp. 149,706 19,047
Discover Financial Services 100,355 9,533
Synchrony Financial 177,830 7,230
65,884
Containers & Packaging – 0.3%
Amcor PLC 509,957 5,956
Avery Dennison Corp. 26,897 4,940
Ball Corp. 106,832 9,053
International Paper Co. 127,858 6,913
Packaging Corp. of America 31,187 4,194
Sealed Air Corp. 50,948 2,335
Westrock Co. 85,310 4,440
37,831
Distributors – 0.1%
Genuine Parts Co. 46,834 5,413
LKQ Corp.* 90,690 3,839
Pool Corp. 13,202 4,558
13,810
Diversified Financial Services – 1.4%
Berkshire Hathaway, Inc., Class B* 621,985 158,898
Diversified Telecommunication Services – 1.4%
AT&T, Inc. 2,326,493 70,423
S C H E D U L E O F I N V E S T M E N T S
S TO C K I N D E X F U N D c o n t i n u e d
See Notes to the Financial Statements.
EQUIT Y INDEX FUNDS 120 NORTHERN FUNDS ANNUAL REPORT
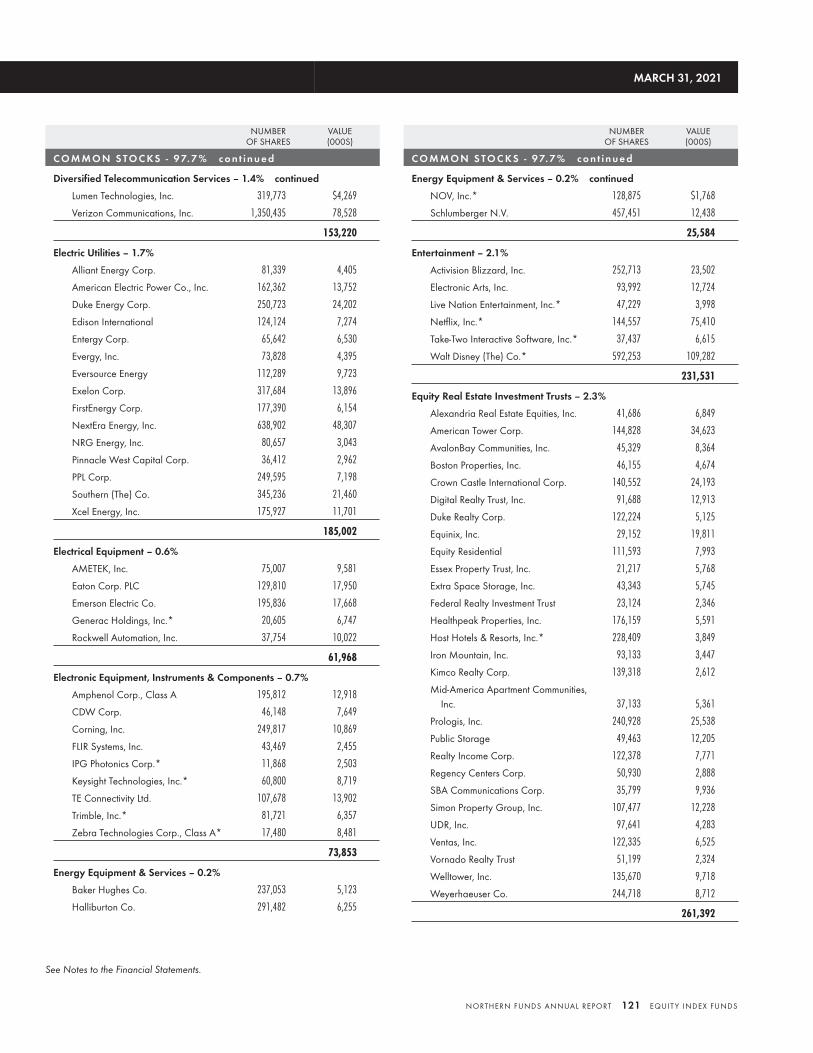
NUMBEROF SHARES
VALUE(000S)
C O M M O N S TO C KS - 9 7. 7 % c o n t i n u e d
Diversified Telecommunication Services – 1.4% continued
Lumen Technologies, Inc. 319,773 $4,269
Verizon Communications, Inc. 1,350,435 78,528
153,220
Electric Utilities – 1.7%
Alliant Energy Corp. 81,339 4,405
American Electric Power Co., Inc. 162,362 13,752
Duke Energy Corp. 250,723 24,202
Edison International 124,124 7,274
Entergy Corp. 65,642 6,530
Evergy, Inc. 73,828 4,395
Eversource Energy 112,289 9,723
Exelon Corp. 317,684 13,896
FirstEnergy Corp. 177,390 6,154
NextEra Energy, Inc. 638,902 48,307
NRG Energy, Inc. 80,657 3,043
Pinnacle West Capital Corp. 36,412 2,962
PPL Corp. 249,595 7,198
Southern (The) Co. 345,236 21,460
Xcel Energy, Inc. 175,927 11,701
185,002
Electrical Equipment – 0.6%
AMETEK, Inc. 75,007 9,581
Eaton Corp. PLC 129,810 17,950
Emerson Electric Co. 195,836 17,668
Generac Holdings, Inc.* 20,605 6,747
Rockwell Automation, Inc. 37,754 10,022
61,968
Electronic Equipment, Instruments & Components – 0.7%
Amphenol Corp., Class A 195,812 12,918
CDW Corp. 46,148 7,649
Corning, Inc. 249,817 10,869
FLIR Systems, Inc. 43,469 2,455
IPG Photonics Corp.* 11,868 2,503
Keysight Technologies, Inc.* 60,800 8,719
TE Connectivity Ltd. 107,678 13,902
Trimble, Inc.* 81,721 6,357
Zebra Technologies Corp., Class A* 17,480 8,481
73,853
Energy Equipment & Services – 0.2%
Baker Hughes Co. 237,053 5,123
Halliburton Co. 291,482 6,255
NUMBEROF SHARES
VALUE(000S)
C O M M O N S TO C KS - 9 7. 7 % c o n t i n u e d
Energy Equipment & Services – 0.2% continued
NOV, Inc.* 128,875 $1,768
Schlumberger N.V. 457,451 12,438
25,584
Entertainment – 2.1%
Activision Blizzard, Inc. 252,713 23,502
Electronic Arts, Inc. 93,992 12,724
Live Nation Entertainment, Inc.* 47,229 3,998
Netflix, Inc.* 144,557 75,410
Take-Two Interactive Software, Inc.* 37,437 6,615
Walt Disney (The) Co.* 592,253 109,282
231,531
Equity Real Estate Investment Trusts – 2.3%
Alexandria Real Estate Equities, Inc. 41,686 6,849
American Tower Corp. 144,828 34,623
AvalonBay Communities, Inc. 45,329 8,364
Boston Properties, Inc. 46,155 4,674
Crown Castle International Corp. 140,552 24,193
Digital Realty Trust, Inc. 91,688 12,913
Duke Realty Corp. 122,224 5,125
Equinix, Inc. 29,152 19,811
Equity Residential 111,593 7,993
Essex Property Trust, Inc. 21,217 5,768
Extra Space Storage, Inc. 43,343 5,745
Federal Realty Investment Trust 23,124 2,346
Healthpeak Properties, Inc. 176,159 5,591
Host Hotels & Resorts, Inc.* 228,409 3,849
Iron Mountain, Inc. 93,133 3,447
Kimco Realty Corp. 139,318 2,612
Mid-America Apartment Communities,Inc. 37,133 5,361
Prologis, Inc. 240,928 25,538
Public Storage 49,463 12,205
Realty Income Corp. 122,378 7,771
Regency Centers Corp. 50,930 2,888
SBA Communications Corp. 35,799 9,936
Simon Property Group, Inc. 107,477 12,228
UDR, Inc. 97,641 4,283
Ventas, Inc. 122,335 6,525
Vornado Realty Trust 51,199 2,324
Welltower, Inc. 135,670 9,718
Weyerhaeuser Co. 244,718 8,712
261,392
MARCH 31, 2021
See Notes to the Financial Statements.
NORTHERN FUNDS ANNUAL REPORT 121 EQUIT Y INDEX FUNDS
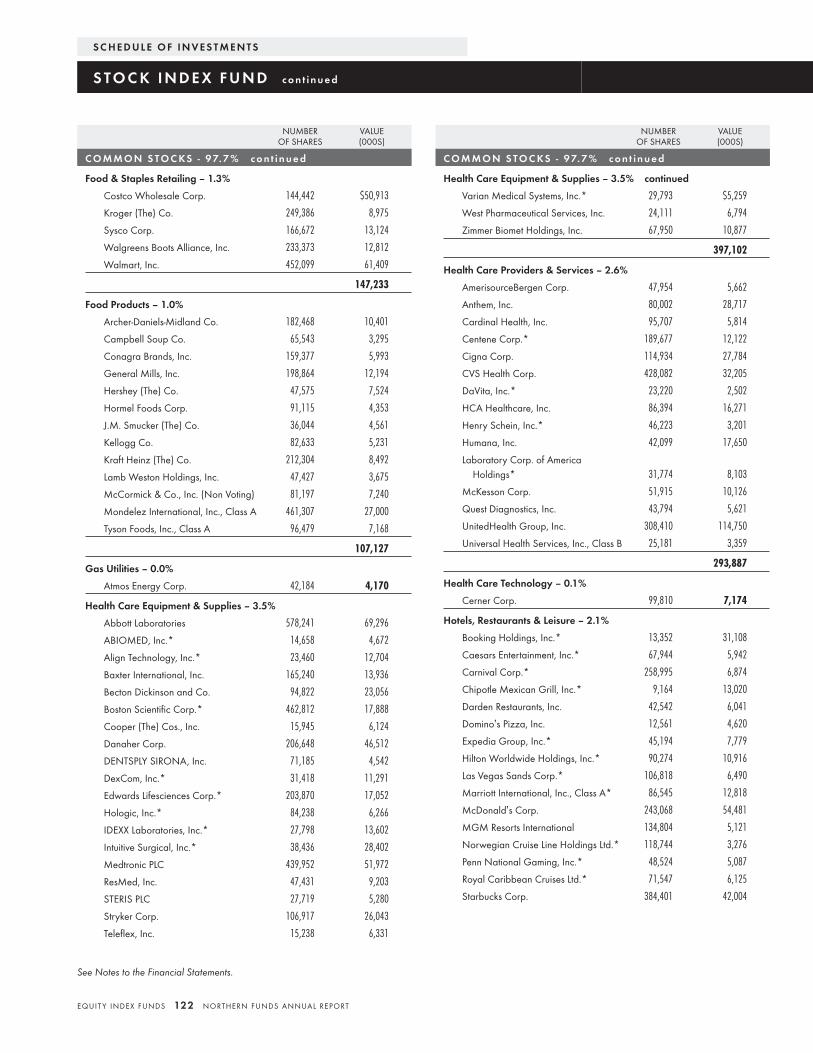
NUMBEROF SHARES
VALUE(000S)
C O M M O N S TO C KS - 9 7. 7 % c o n t i n u e d
Food & Staples Retailing – 1.3%
Costco Wholesale Corp. 144,442 $50,913
Kroger (The) Co. 249,386 8,975
Sysco Corp. 166,672 13,124
Walgreens Boots Alliance, Inc. 233,373 12,812
Walmart, Inc. 452,099 61,409
147,233
Food Products – 1.0%
Archer-Daniels-Midland Co. 182,468 10,401
Campbell Soup Co. 65,543 3,295
Conagra Brands, Inc. 159,377 5,993
General Mills, Inc. 198,864 12,194
Hershey (The) Co. 47,575 7,524
Hormel Foods Corp. 91,115 4,353
J.M. Smucker (The) Co. 36,044 4,561
Kellogg Co. 82,633 5,231
Kraft Heinz (The) Co. 212,304 8,492
Lamb Weston Holdings, Inc. 47,427 3,675
McCormick & Co., Inc. (Non Voting) 81,197 7,240
Mondelez International, Inc., Class A 461,307 27,000
Tyson Foods, Inc., Class A 96,479 7,168
107,127
Gas Utilities – 0.0%
Atmos Energy Corp. 42,184 4,170
Health Care Equipment & Supplies – 3.5%
Abbott Laboratories 578,241 69,296
ABIOMED, Inc.* 14,658 4,672
Align Technology, Inc.* 23,460 12,704
Baxter International, Inc. 165,240 13,936
Becton Dickinson and Co. 94,822 23,056
Boston Scientific Corp.* 462,812 17,888
Cooper (The) Cos., Inc. 15,945 6,124
Danaher Corp. 206,648 46,512
DENTSPLY SIRONA, Inc. 71,185 4,542
DexCom, Inc.* 31,418 11,291
Edwards Lifesciences Corp.* 203,870 17,052
Hologic, Inc.* 84,238 6,266
IDEXX Laboratories, Inc.* 27,798 13,602
Intuitive Surgical, Inc.* 38,436 28,402
Medtronic PLC 439,952 51,972
ResMed, Inc. 47,431 9,203
STERIS PLC 27,719 5,280
Stryker Corp. 106,917 26,043
Teleflex, Inc. 15,238 6,331
NUMBEROF SHARES
VALUE(000S)
C O M M O N S TO C KS - 9 7. 7 % c o n t i n u e d
Health Care Equipment & Supplies – 3.5% continued
Varian Medical Systems, Inc.* 29,793 $5,259
West Pharmaceutical Services, Inc. 24,111 6,794
Zimmer Biomet Holdings, Inc. 67,950 10,877
397,102
Health Care Providers & Services – 2.6%
AmerisourceBergen Corp. 47,954 5,662
Anthem, Inc. 80,002 28,717
Cardinal Health, Inc. 95,707 5,814
Centene Corp.* 189,677 12,122
Cigna Corp. 114,934 27,784
CVS Health Corp. 428,082 32,205
DaVita, Inc.* 23,220 2,502
HCA Healthcare, Inc. 86,394 16,271
Henry Schein, Inc.* 46,223 3,201
Humana, Inc. 42,099 17,650
Laboratory Corp. of AmericaHoldings* 31,774 8,103
McKesson Corp. 51,915 10,126
Quest Diagnostics, Inc. 43,794 5,621
UnitedHealth Group, Inc. 308,410 114,750
Universal Health Services, Inc., Class B 25,181 3,359
293,887
Health Care Technology – 0.1%
Cerner Corp. 99,810 7,174
Hotels, Restaurants & Leisure – 2.1%
Booking Holdings, Inc.* 13,352 31,108
Caesars Entertainment, Inc.* 67,944 5,942
Carnival Corp.* 258,995 6,874
Chipotle Mexican Grill, Inc.* 9,164 13,020
Darden Restaurants, Inc. 42,542 6,041
Domino’s Pizza, Inc. 12,561 4,620
Expedia Group, Inc.* 45,194 7,779
Hilton Worldwide Holdings, Inc.* 90,274 10,916
Las Vegas Sands Corp.* 106,818 6,490
Marriott International, Inc., Class A* 86,545 12,818
McDonald’s Corp. 243,068 54,481
MGM Resorts International 134,804 5,121
Norwegian Cruise Line Holdings Ltd.* 118,744 3,276
Penn National Gaming, Inc.* 48,524 5,087
Royal Caribbean Cruises Ltd.* 71,547 6,125
Starbucks Corp. 384,401 42,004
S C H E D U L E O F I N V E S T M E N T S
S TO C K I N D E X F U N D c o n t i n u e d
See Notes to the Financial Statements.
EQUIT Y INDEX FUNDS 122 NORTHERN FUNDS ANNUAL REPORT
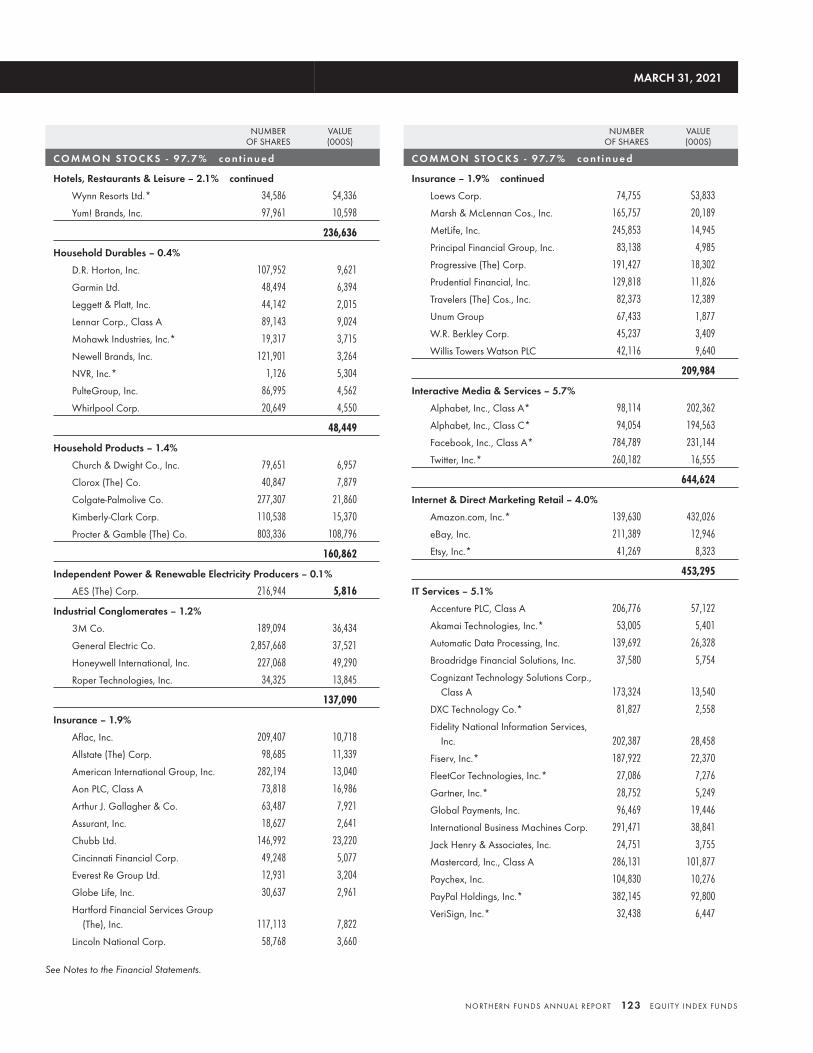
NUMBEROF SHARES
VALUE(000S)
C O M M O N S TO C KS - 9 7. 7 % c o n t i n u e d
Hotels, Restaurants & Leisure – 2.1% continued
Wynn Resorts Ltd.* 34,586 $4,336
Yum! Brands, Inc. 97,961 10,598
236,636
Household Durables – 0.4%
D.R. Horton, Inc. 107,952 9,621
Garmin Ltd. 48,494 6,394
Leggett & Platt, Inc. 44,142 2,015
Lennar Corp., Class A 89,143 9,024
Mohawk Industries, Inc.* 19,317 3,715
Newell Brands, Inc. 121,901 3,264
NVR, Inc.* 1,126 5,304
PulteGroup, Inc. 86,995 4,562
Whirlpool Corp. 20,649 4,550
48,449
Household Products – 1.4%
Church & Dwight Co., Inc. 79,651 6,957
Clorox (The) Co. 40,847 7,879
Colgate-Palmolive Co. 277,307 21,860
Kimberly-Clark Corp. 110,538 15,370
Procter & Gamble (The) Co. 803,336 108,796
160,862
Independent Power & Renewable Electricity Producers – 0.1%
AES (The) Corp. 216,944 5,816
Industrial Conglomerates – 1.2%
3M Co. 189,094 36,434
General Electric Co. 2,857,668 37,521
Honeywell International, Inc. 227,068 49,290
Roper Technologies, Inc. 34,325 13,845
137,090
Insurance – 1.9%
Aflac, Inc. 209,407 10,718
Allstate (The) Corp. 98,685 11,339
American International Group, Inc. 282,194 13,040
Aon PLC, Class A 73,818 16,986
Arthur J. Gallagher & Co. 63,487 7,921
Assurant, Inc. 18,627 2,641
Chubb Ltd. 146,992 23,220
Cincinnati Financial Corp. 49,248 5,077
Everest Re Group Ltd. 12,931 3,204
Globe Life, Inc. 30,637 2,961
Hartford Financial Services Group(The), Inc. 117,113 7,822
Lincoln National Corp. 58,768 3,660
NUMBEROF SHARES
VALUE(000S)
C O M M O N S TO C KS - 9 7. 7 % c o n t i n u e d
Insurance – 1.9% continued
Loews Corp. 74,755 $3,833
Marsh & McLennan Cos., Inc. 165,757 20,189
MetLife, Inc. 245,853 14,945
Principal Financial Group, Inc. 83,138 4,985
Progressive (The) Corp. 191,427 18,302
Prudential Financial, Inc. 129,818 11,826
Travelers (The) Cos., Inc. 82,373 12,389
Unum Group 67,433 1,877
W.R. Berkley Corp. 45,237 3,409
Willis Towers Watson PLC 42,116 9,640
209,984
Interactive Media & Services – 5.7%
Alphabet, Inc., Class A* 98,114 202,362
Alphabet, Inc., Class C* 94,054 194,563
Facebook, Inc., Class A* 784,789 231,144
Twitter, Inc.* 260,182 16,555
644,624
Internet & Direct Marketing Retail – 4.0%
Amazon.com, Inc.* 139,630 432,026
eBay, Inc. 211,389 12,946
Etsy, Inc.* 41,269 8,323
453,295
IT Services – 5.1%
Accenture PLC, Class A 206,776 57,122
Akamai Technologies, Inc.* 53,005 5,401
Automatic Data Processing, Inc. 139,692 26,328
Broadridge Financial Solutions, Inc. 37,580 5,754
Cognizant Technology Solutions Corp.,Class A 173,324 13,540
DXC Technology Co.* 81,827 2,558
Fidelity National Information Services,Inc. 202,387 28,458
Fiserv, Inc.* 187,922 22,370
FleetCor Technologies, Inc.* 27,086 7,276
Gartner, Inc.* 28,752 5,249
Global Payments, Inc. 96,469 19,446
International Business Machines Corp. 291,471 38,841
Jack Henry & Associates, Inc. 24,751 3,755
Mastercard, Inc., Class A 286,131 101,877
Paychex, Inc. 104,830 10,276
PayPal Holdings, Inc.* 382,145 92,800
VeriSign, Inc.* 32,438 6,447
MARCH 31, 2021
See Notes to the Financial Statements.
NORTHERN FUNDS ANNUAL REPORT 123 EQUIT Y INDEX FUNDS
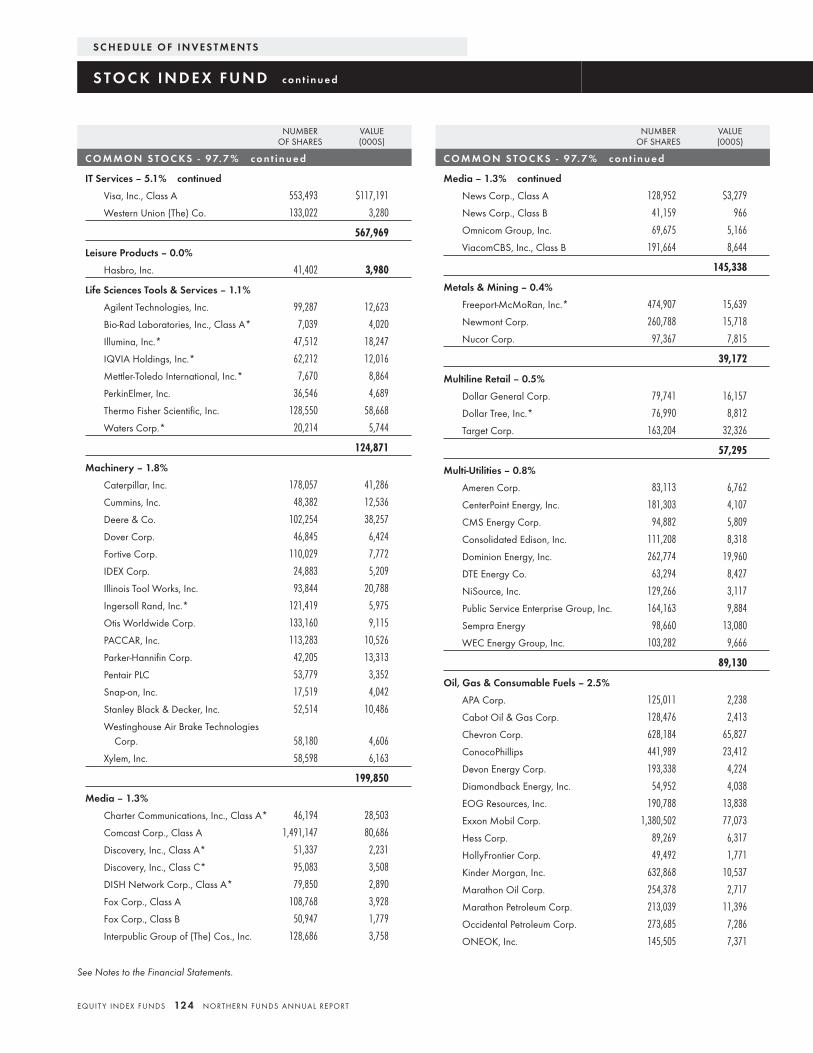
NUMBEROF SHARES
VALUE(000S)
C O M M O N S TO C KS - 9 7. 7 % c o n t i n u e d
IT Services – 5.1% continued
Visa, Inc., Class A 553,493 $117,191
Western Union (The) Co. 133,022 3,280
567,969
Leisure Products – 0.0%
Hasbro, Inc. 41,402 3,980
Life Sciences Tools & Services – 1.1%
Agilent Technologies, Inc. 99,287 12,623
Bio-Rad Laboratories, Inc., Class A* 7,039 4,020
Illumina, Inc.* 47,512 18,247
IQVIA Holdings, Inc.* 62,212 12,016
Mettler-Toledo International, Inc.* 7,670 8,864
PerkinElmer, Inc. 36,546 4,689
Thermo Fisher Scientific, Inc. 128,550 58,668
Waters Corp.* 20,214 5,744
124,871
Machinery – 1.8%
Caterpillar, Inc. 178,057 41,286
Cummins, Inc. 48,382 12,536
Deere & Co. 102,254 38,257
Dover Corp. 46,845 6,424
Fortive Corp. 110,029 7,772
IDEX Corp. 24,883 5,209
Illinois Tool Works, Inc. 93,844 20,788
Ingersoll Rand, Inc.* 121,419 5,975
Otis Worldwide Corp. 133,160 9,115
PACCAR, Inc. 113,283 10,526
Parker-Hannifin Corp. 42,205 13,313
Pentair PLC 53,779 3,352
Snap-on, Inc. 17,519 4,042
Stanley Black & Decker, Inc. 52,514 10,486
Westinghouse Air Brake TechnologiesCorp. 58,180 4,606
Xylem, Inc. 58,598 6,163
199,850
Media – 1.3%
Charter Communications, Inc., Class A* 46,194 28,503
Comcast Corp., Class A 1,491,147 80,686
Discovery, Inc., Class A* 51,337 2,231
Discovery, Inc., Class C* 95,083 3,508
DISH Network Corp., Class A* 79,850 2,890
Fox Corp., Class A 108,768 3,928
Fox Corp., Class B 50,947 1,779
Interpublic Group of (The) Cos., Inc. 128,686 3,758
NUMBEROF SHARES
VALUE(000S)
C O M M O N S TO C KS - 9 7. 7 % c o n t i n u e d
Media – 1.3% continued
News Corp., Class A 128,952 $3,279
News Corp., Class B 41,159 966
Omnicom Group, Inc. 69,675 5,166
ViacomCBS, Inc., Class B 191,664 8,644
145,338
Metals & Mining – 0.4%
Freeport-McMoRan, Inc.* 474,907 15,639
Newmont Corp. 260,788 15,718
Nucor Corp. 97,367 7,815
39,172
Multiline Retail – 0.5%
Dollar General Corp. 79,741 16,157
Dollar Tree, Inc.* 76,990 8,812
Target Corp. 163,204 32,326
57,295
Multi-Utilities – 0.8%
Ameren Corp. 83,113 6,762
CenterPoint Energy, Inc. 181,303 4,107
CMS Energy Corp. 94,882 5,809
Consolidated Edison, Inc. 111,208 8,318
Dominion Energy, Inc. 262,774 19,960
DTE Energy Co. 63,294 8,427
NiSource, Inc. 129,266 3,117
Public Service Enterprise Group, Inc. 164,163 9,884
Sempra Energy 98,660 13,080
WEC Energy Group, Inc. 103,282 9,666
89,130
Oil, Gas & Consumable Fuels – 2.5%
APA Corp. 125,011 2,238
Cabot Oil & Gas Corp. 128,476 2,413
Chevron Corp. 628,184 65,827
ConocoPhillips 441,989 23,412
Devon Energy Corp. 193,338 4,224
Diamondback Energy, Inc. 54,952 4,038
EOG Resources, Inc. 190,788 13,838
Exxon Mobil Corp. 1,380,502 77,073
Hess Corp. 89,269 6,317
HollyFrontier Corp. 49,492 1,771
Kinder Morgan, Inc. 632,868 10,537
Marathon Oil Corp. 254,378 2,717
Marathon Petroleum Corp. 213,039 11,396
Occidental Petroleum Corp. 273,685 7,286
ONEOK, Inc. 145,505 7,371
S C H E D U L E O F I N V E S T M E N T S
S TO C K I N D E X F U N D c o n t i n u e d
See Notes to the Financial Statements.
EQUIT Y INDEX FUNDS 124 NORTHERN FUNDS ANNUAL REPORT
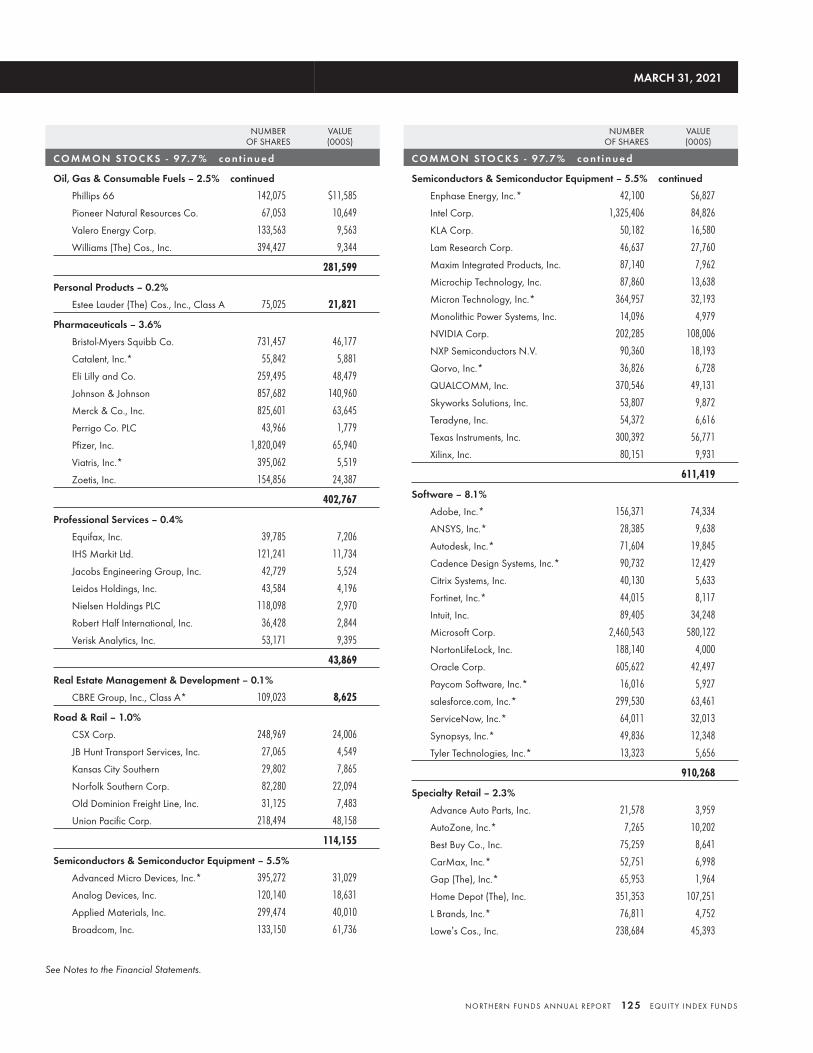
NUMBEROF SHARES
VALUE(000S)
C O M M O N S TO C KS - 9 7. 7 % c o n t i n u e d
Oil, Gas & Consumable Fuels – 2.5% continued
Phillips 66 142,075 $11,585
Pioneer Natural Resources Co. 67,053 10,649
Valero Energy Corp. 133,563 9,563
Williams (The) Cos., Inc. 394,427 9,344
281,599
Personal Products – 0.2%
Estee Lauder (The) Cos., Inc., Class A 75,025 21,821
Pharmaceuticals – 3.6%
Bristol-Myers Squibb Co. 731,457 46,177
Catalent, Inc.* 55,842 5,881
Eli Lilly and Co. 259,495 48,479
Johnson & Johnson 857,682 140,960
Merck & Co., Inc. 825,601 63,645
Perrigo Co. PLC 43,966 1,779
Pfizer, Inc. 1,820,049 65,940
Viatris, Inc.* 395,062 5,519
Zoetis, Inc. 154,856 24,387
402,767
Professional Services – 0.4%
Equifax, Inc. 39,785 7,206
IHS Markit Ltd. 121,241 11,734
Jacobs Engineering Group, Inc. 42,729 5,524
Leidos Holdings, Inc. 43,584 4,196
Nielsen Holdings PLC 118,098 2,970
Robert Half International, Inc. 36,428 2,844
Verisk Analytics, Inc. 53,171 9,395
43,869
Real Estate Management & Development – 0.1%
CBRE Group, Inc., Class A* 109,023 8,625
Road & Rail – 1.0%
CSX Corp. 248,969 24,006
JB Hunt Transport Services, Inc. 27,065 4,549
Kansas City Southern 29,802 7,865
Norfolk Southern Corp. 82,280 22,094
Old Dominion Freight Line, Inc. 31,125 7,483
Union Pacific Corp. 218,494 48,158
114,155
Semiconductors & Semiconductor Equipment – 5.5%
Advanced Micro Devices, Inc.* 395,272 31,029
Analog Devices, Inc. 120,140 18,631
Applied Materials, Inc. 299,474 40,010
Broadcom, Inc. 133,150 61,736
NUMBEROF SHARES
VALUE(000S)
C O M M O N S TO C KS - 9 7. 7 % c o n t i n u e d
Semiconductors & Semiconductor Equipment – 5.5% continued
Enphase Energy, Inc.* 42,100 $6,827
Intel Corp. 1,325,406 84,826
KLA Corp. 50,182 16,580
Lam Research Corp. 46,637 27,760
Maxim Integrated Products, Inc. 87,140 7,962
Microchip Technology, Inc. 87,860 13,638
Micron Technology, Inc.* 364,957 32,193
Monolithic Power Systems, Inc. 14,096 4,979
NVIDIA Corp. 202,285 108,006
NXP Semiconductors N.V. 90,360 18,193
Qorvo, Inc.* 36,826 6,728
QUALCOMM, Inc. 370,546 49,131
Skyworks Solutions, Inc. 53,807 9,872
Teradyne, Inc. 54,372 6,616
Texas Instruments, Inc. 300,392 56,771
Xilinx, Inc. 80,151 9,931
611,419
Software – 8.1%
Adobe, Inc.* 156,371 74,334
ANSYS, Inc.* 28,385 9,638
Autodesk, Inc.* 71,604 19,845
Cadence Design Systems, Inc.* 90,732 12,429
Citrix Systems, Inc. 40,130 5,633
Fortinet, Inc.* 44,015 8,117
Intuit, Inc. 89,405 34,248
Microsoft Corp. 2,460,543 580,122
NortonLifeLock, Inc. 188,140 4,000
Oracle Corp. 605,622 42,497
Paycom Software, Inc.* 16,016 5,927
salesforce.com, Inc.* 299,530 63,461
ServiceNow, Inc.* 64,011 32,013
Synopsys, Inc.* 49,836 12,348
Tyler Technologies, Inc.* 13,323 5,656
910,268
Specialty Retail – 2.3%
Advance Auto Parts, Inc. 21,578 3,959
AutoZone, Inc.* 7,265 10,202
Best Buy Co., Inc. 75,259 8,641
CarMax, Inc.* 52,751 6,998
Gap (The), Inc.* 65,953 1,964
Home Depot (The), Inc. 351,353 107,251
L Brands, Inc.* 76,811 4,752
Lowe’s Cos., Inc. 238,684 45,393
MARCH 31, 2021
See Notes to the Financial Statements.
NORTHERN FUNDS ANNUAL REPORT 125 EQUIT Y INDEX FUNDS
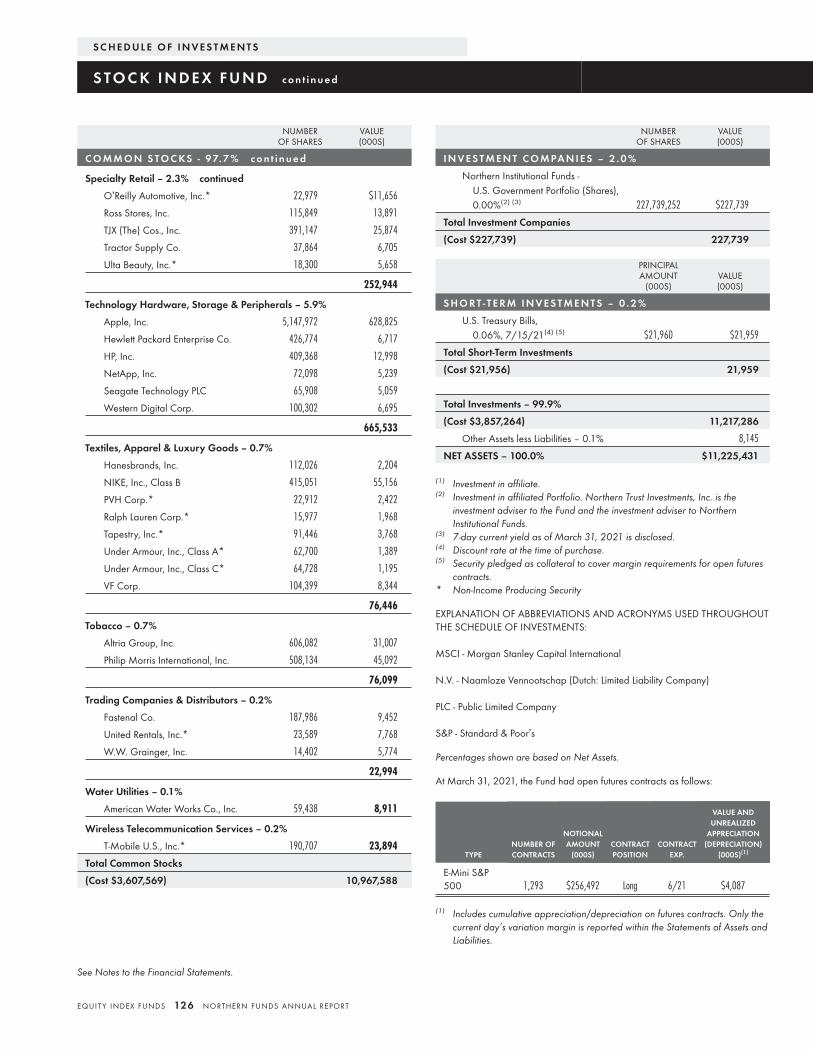
NUMBEROF SHARES
VALUE(000S)
C O M M O N S TO C KS - 9 7. 7 % c o n t i n u e d
Specialty Retail – 2.3% continued
O’Reilly Automotive, Inc.* 22,979 $11,656
Ross Stores, Inc. 115,849 13,891
TJX (The) Cos., Inc. 391,147 25,874
Tractor Supply Co. 37,864 6,705
Ulta Beauty, Inc.* 18,300 5,658
252,944
Technology Hardware, Storage & Peripherals – 5.9%
Apple, Inc. 5,147,972 628,825
Hewlett Packard Enterprise Co. 426,774 6,717
HP, Inc. 409,368 12,998
NetApp, Inc. 72,098 5,239
Seagate Technology PLC 65,908 5,059
Western Digital Corp. 100,302 6,695
665,533
Textiles, Apparel & Luxury Goods – 0.7%
Hanesbrands, Inc. 112,026 2,204
NIKE, Inc., Class B 415,051 55,156
PVH Corp.* 22,912 2,422
Ralph Lauren Corp.* 15,977 1,968
Tapestry, Inc.* 91,446 3,768
Under Armour, Inc., Class A* 62,700 1,389
Under Armour, Inc., Class C* 64,728 1,195
VF Corp. 104,399 8,344
76,446
Tobacco – 0.7%
Altria Group, Inc. 606,082 31,007
Philip Morris International, Inc. 508,134 45,092
76,099
Trading Companies & Distributors – 0.2%
Fastenal Co. 187,986 9,452
United Rentals, Inc.* 23,589 7,768
W.W. Grainger, Inc. 14,402 5,774
22,994
Water Utilities – 0.1%
American Water Works Co., Inc. 59,438 8,911
Wireless Telecommunication Services – 0.2%
T-Mobile U.S., Inc.* 190,707 23,894
Total Common Stocks
(Cost $3,607,569) 10,967,588
NUMBEROF SHARES
VALUE(000S)
I N V E S T M E N T C O M PA N I E S – 2 . 0 %
Northern Institutional Funds -U.S. Government Portfolio (Shares),0.00%(2) (3) 227,739,252 $227,739
Total Investment Companies
(Cost $227,739) 227,739
PRINCIPALAMOUNT
(000S)VALUE(000S)
S H O R T - T E R M I N V E S T M E N T S – 0 . 2 %
U.S. Treasury Bills,0.06%, 7/15/21(4) (5) $21,960 $21,959
Total Short-Term Investments
(Cost $21,956) 21,959
Total Investments – 99.9%
(Cost $3,857,264) 11,217,286
Other Assets less Liabilities – 0.1% 8,145
NET ASSETS – 100.0% $11,225,431
(1) Investment in affiliate.(2) Investment in affiliated Portfolio. Northern Trust Investments, Inc. is the
investment adviser to the Fund and the investment adviser to NorthernInstitutional Funds.
(3) 7-day current yield as of March 31, 2021 is disclosed.(4) Discount rate at the time of purchase.(5) Security pledged as collateral to cover margin requirements for open futures
contracts.* Non-Income Producing Security
EXPLANATION OF ABBREVIATIONS AND ACRONYMS USED THROUGHOUTTHE SCHEDULE OF INVESTMENTS:
MSCI - Morgan Stanley Capital International
N.V. - Naamloze Vennootschap (Dutch: Limited Liability Company)
PLC - Public Limited Company
S&P - Standard & Poor’s
Percentages shown are based on Net Assets.
At March 31, 2021, the Fund had open futures contracts as follows:
TYPENUMBER OFCONTRACTS
NOTIONALAMOUNT
(000S)CONTRACTPOSITION
CONTRACTEXP.
VALUE ANDUNREALIZED
APPRECIATION(DEPRECIATION)
(000S)(1)
E-Mini S&P500 1,293 $256,492 Long 6/21 $4,087
(1) Includes cumulative appreciation/depreciation on futures contracts. Only thecurrent day’s variation margin is reported within the Statements of Assets andLiabilities.
S C H E D U L E O F I N V E S T M E N T S
S TO C K I N D E X F U N D c o n t i n u e d
See Notes to the Financial Statements.
EQUIT Y INDEX FUNDS 126 NORTHERN FUNDS ANNUAL REPORT
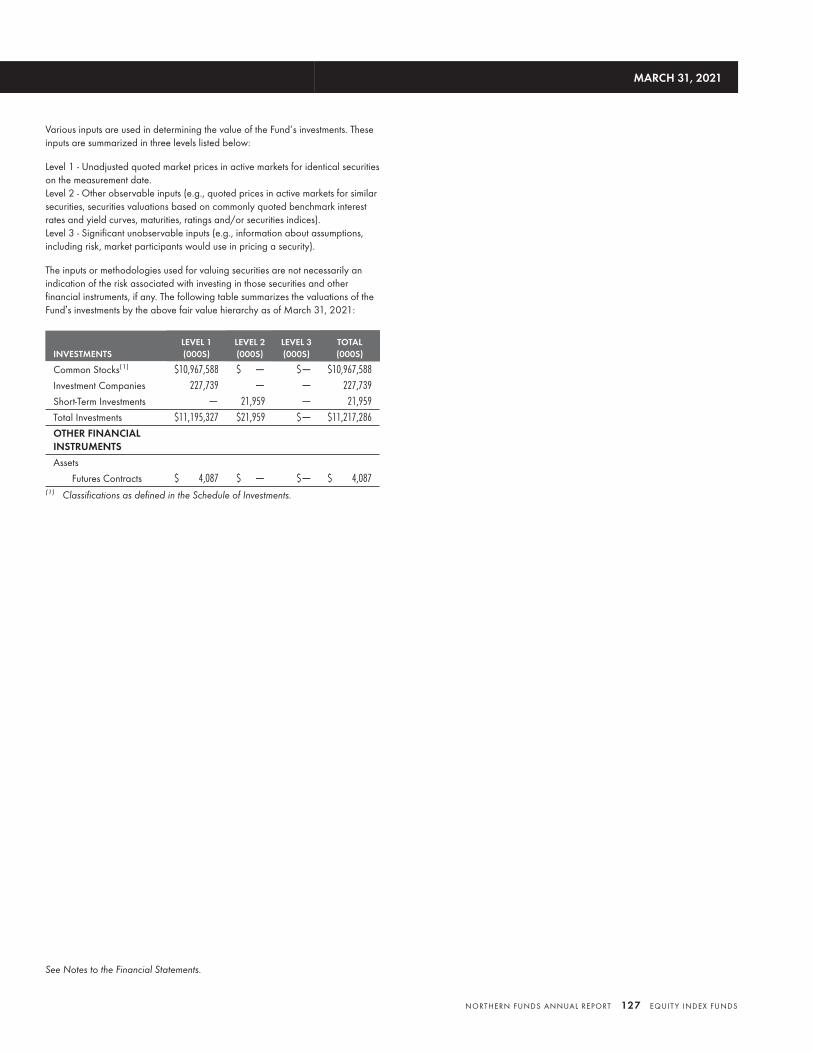
Various inputs are used in determining the value of the Fund’s investments. Theseinputs are summarized in three levels listed below:
Level 1 - Unadjusted quoted market prices in active markets for identical securitieson the measurement date.Level 2 - Other observable inputs (e.g., quoted prices in active markets for similarsecurities, securities valuations based on commonly quoted benchmark interestrates and yield curves, maturities, ratings and/or securities indices).Level 3 - Significant unobservable inputs (e.g., information about assumptions,including risk, market participants would use in pricing a security).
The inputs or methodologies used for valuing securities are not necessarily anindication of the risk associated with investing in those securities and otherfinancial instruments, if any. The following table summarizes the valuations of theFund’s investments by the above fair value hierarchy as of March 31, 2021:
INVESTMENTSLEVEL 1(000S)
LEVEL 2(000S)
LEVEL 3(000S)
TOTAL(000S)
Common Stocks(1) $10,967,588 $ — $— $10,967,588
Investment Companies 227,739 — — 227,739
Short-Term Investments — 21,959 — 21,959
Total Investments $11,195,327 $21,959 $— $11,217,286
OTHER FINANCIALINSTRUMENTS
Assets
Futures Contracts $ 4,087 $ — $— $ 4,087(1) Classifications as defined in the Schedule of Investments.
MARCH 31, 2021
See Notes to the Financial Statements.
NORTHERN FUNDS ANNUAL REPORT 127 EQUIT Y INDEX FUNDS
1. O RGA N I Z AT I O N
Northern Funds (the “Trust”) is a Delaware statutory trust and isregistered under the Investment Company Act of 1940, asamended (the “1940 Act”), as an open-end managementinvestment company. The Trust offers 42 funds as of March 31,2021, each with its own investment objective (e.g., long-termcapital appreciation, total return or income consistent withpreservation of capital). The Emerging Markets Equity Index,Global Real Estate Index, Global Sustainability Index,International Equity Index, Mid Cap Index, Small Cap Index, andStock Index Funds (each a “Fund” and collectively, the “Funds”)are separate, diversified investment portfolios of the Trust.
Each of the Funds is presented herein. Except for the GlobalSustainability Index Fund, each Fund is authorized to issue oneclass of shares designated as the “Shares” class. Effective July 31,2020, the Global Sustainability Index Fund is authorized to issuetwo classes of shares designated as Class K shares and Class Ishares, which replaced the Fund’s Shares class. At March 31, 2021,the Emerging Markets Equity Index, Global Real Estate Index,International Equity Index, Mid Cap Index, Small Cap Index, andStock Index Funds had Shares outstanding; and the GlobalSustainability Index Fund had Class K and Class I sharesoutstanding.
Northern Trust Investments, Inc. (“NTI”), a subsidiary of TheNorthern Trust Company (“Northern Trust”), serves as theinvestment adviser and administrator for each of the Funds.Northern Trust serves as the custodian, transfer agent andsub-administrator for the Trust. Northern Funds Distributors,LLC, not an affiliate of NTI, is the Trust’s distributor.
2 . S I G N I F I C A N T AC C O U N T I N G P O L I C I E S
The Trust, which is an investment company, follows accountingand reporting guidance under Financial Accounting StandardsBoard (“FASB”) Accounting Standards Codification Topic 946,Financial Services-Investment Companies.
The following is a summary of significant accounting policiesconsistently followed by the Funds in the preparation of theirfinancial statements. These policies are in conformity withaccounting principles generally accepted in the United States ofAmerica (“U.S. GAAP”). The preparation of financial statementsin conformity with U.S. GAAP requires management to makeestimates and assumptions that affect the reported amounts ofassets and liabilities and disclosure of contingent assets andliabilities at the date of the financial statements and the reportedamounts of revenues and expenses during the reporting period.Actual results may differ from those estimates.
The net asset value (“NAV”) of each Fund is determined daily asof the close of regular trading on the New York Stock Exchange(“NYSE”), generally 3:00 P.M. Central Time, on each day theNYSE is open for trading.
A) VALUATION OF SECURITIES AND DERIVATIVE CONTRACTS
Securities are valued at their fair value. Securities traded onUnited States (“U.S.”) securities exchanges or in the NASDAQNational Market System are principally valued at the regulartrading session closing price (generally, 3:00 P.M. Central Time)on the exchange or market in which such securities are principallytraded. If any such security is not traded on a valuation date, it isvalued at the most recent quoted bid price. Over-the-countersecurities not reported in the NASDAQ National Market Systemare also generally valued at the most recent quoted bid price. Fixedincome securities, however, may be valued on the basis ofevaluated prices provided by the Funds’ approved independentthird-party pricing services when such prices are believed toreflect the fair value of such securities or broker provided prices.Such prices may be determined by taking into account othersimilar securities’ prices, yields, maturities, call features, ratings,institutional size trading in similar groups of securities anddevelopments related to specific securities.
The values of securities of foreign issuers are generally based uponmarket quotations, which depending upon local convention orregulation, may be the last sale price, the last bid price or themean between the last bid and asked price as of, in each case, theclose of the appropriate exchange or other designated time.Foreign fixed income securities, however, may, like domestic fixedincome securities, be valued based on evaluated prices providedby independent pricing services when such prices are believed toreflect the fair value of such securities.
Shares of open-end investment companies, other thanexchange-traded funds, are valued at their NAV. Spot and forwardforeign currency exchange contracts are generally valued using anindependent pricing service. Exchange-traded financial futuresand options are valued at the settlement price as established by theexchange on which they are traded. The foregoing prices may beobtained from one or more independent pricing services or, asneeded or applicable, independent broker-dealers. Short-terminvestments with a maturity of 60 days or less are valued at theiramortized cost, which NTI, as authorized by the Trust’s Board ofTrustees (the “Board”), has determined approximates fair value.
Any securities for which market quotations are not readilyavailable or are believed to be incorrect are valued at fair value asdetermined in good faith by NTI under the supervision of theBoard. The Trust, in its discretion, may make adjustments to theprices of securities held by a Fund if an event occurs after thepublication of fair values normally used by the Fund but beforethe time as of which the Fund calculates its NAV, depending onthe nature and significance of the event, consistent with applicableregulatory guidance and U.S. GAAP. This may occur particularlywith respect to certain foreign securities held by a Fund, in whichcase the Trust may use adjustment factors obtained from anindependent evaluation service that are intended to reflect moreaccurately the fair value of those securities as of the time theFund’s NAV is calculated.
E Q U I T Y I N D E X F U N D S
N OT E S TO T H E F I N A N C I A L S TAT E M E N T S
EQUIT Y INDEX FUNDS 128 NORTHERN FUNDS ANNUAL REPORT
The use of fair valuation involves the risk that the values used bythe Funds to price their investments may be higher or lower thanthe values used by other unaffiliated investment companies andinvestors to price the same investments.
B) FUTURES CONTRACTS Certain Funds invest in long or shortexchange-traded futures contracts for hedging purposes, toincrease total return (i.e., for speculative purposes) or to maintainliquidity to meet potential shareholder redemptions, to invest cashbalances or dividends or to minimize trading costs. When used asa hedge, a Fund may sell a futures contract in order to offset adecrease in the fair value of its portfolio securities that mightotherwise result from a market decline. A Fund may do so eitherto hedge the value of its portfolio securities as a whole, or toprotect against declines occurring prior to sales of securities in thevalue of the securities to be sold. Conversely, a Fund may purchasea futures contract as a hedge in anticipation of purchases ofsecurities. In addition, a Fund may utilize futures contracts inanticipation of changes in the composition of its portfolioholdings. A Fund bears the market risk arising from changes inthe value of these financial instruments. At the time a Fund entersinto a futures contract, it is generally required to make a margindeposit with the custodian of a specified amount of liquid assets.Futures are marked-to-market each day with the change in valuereflected in the unrealized gains or losses. Risk may arise as aresult of the potential inability of the counterparties to meet theterms of their contracts. Credit risk is mitigated to the extent thatthe exchange on which a particular futures contract is tradedassumes the risk of a counterparty defaulting on its obligationsunder the contract. The Statements of Operations include anyrealized gains or losses on closed futures contracts in Net realizedgains (losses) on futures contracts, and any unrealized gains orlosses on open futures contracts in Net change in unrealizedappreciation (depreciation) on futures contracts.
The contract position and investment strategy utilized during thefiscal year ended March 31, 2021, was as follows:
CONTRACTPOSITION
INVESTMENTSTRATEGY
Emerging Markets Equity Index Long Liquidity
Global Real Estate Index Long Liquidity
Global Sustainability Index Long Liquidity
International Equity Index Long Liquidity
Mid Cap Index Long Liquidity
Small Cap Index Long Liquidity
Stock Index Long Liquidity
At March 31, 2021, the aggregate fair value of securities pledged tocover margin requirements for open positions for the Mid CapIndex, Small Cap Index and Stock Index Funds was approximately$5,565,000, $4,260,000 and $21,959,000, respectively. AtMarch 31, 2021, the aggregate fair value of cash and foreigncurrencies to cover margin requirements for open positions for
the Emerging Markets Equity Index, Global Real Estate Index,Global Sustainability Index and International Equity Index Fundswas approximately $3,258,000, $1,085,000, $1,212,000, and$5,394,000, respectively. Further information on the impact ofthese positions on the Funds’ financial statements can be foundin Note 10.
C) FOREIGN CURRENCY TRANSLATION Values of investmentsdenominated in foreign currencies are converted into U.S. dollarsusing the spot rates on the NYSE, generally at 3:00 P.M. CentralTime. The cost of purchases and proceeds from sales ofinvestments, interest and dividend income are translated into U.S.dollars using the spot rates on the NYSE, generally at 3:00 P.M.Central Time. The gains or losses, if any, on investments fromoriginal purchase date to subsequent sales trade date resultingfrom changes in foreign exchange rates are included in theStatements of Operations in Net realized gains (losses) oninvestments and Net change in unrealized appreciation(depreciation) on investments. The gains or losses, if any, ontranslation of other assets and liabilities denominated in foreigncurrencies and between the trade and settlement dates oninvestment transactions are included in Net realized gains (losses)on foreign currency transactions and Net change in unrealizedappreciation (depreciation) on foreign currency translations inthe Statements of Operations.
D) FORWARD FOREIGN CURRENCY EXCHANGE CONTRACTS
Certain Funds are authorized to enter into forward foreigncurrency exchange contracts, or forward currency exchangecontracts, for the purchase or sale of a specific foreign currency ata specified exchange rate on a future date as a hedge against eitherspecific transactions or portfolio positions, or as a cross-hedgetransaction or for speculative purposes. The objective of a Fund’sforeign currency hedging transactions is to reduce the risk that theU.S. dollar value of a Fund’s foreign currency denominatedsecurities will decline in value due to changes in foreign currencyexchange rates. All forward foreign currency exchange contractsare “marked-to-market” daily at the applicable exchange rates.Any resulting unrealized gains or losses are recorded in Netchange in unrealized appreciation (depreciation) on forwardforeign currency exchange contracts in the Statements ofOperations. Gains or losses are recorded for financial statementpurposes as unrealized until the settlement date. Realized gains orlosses, if any, are included in Net realized gains (losses) onforward foreign currency exchange contracts in the Statements ofOperations.
Risks may arise upon entering into these contracts from thepotential inability of counterparties to meet the terms of theircontracts and from unanticipated movements in the value of aforeign currency relative to the U.S. dollar. The contractualamounts of forward foreign currency exchange contracts do notnecessarily represent the amounts potentially subject to risk. TheFunds bear the market risk from changes in forward foreigncurrency exchange rates and the credit risk if the counterparty tothe contract fails to perform. The institutions that deal in forward
E Q U I T Y I N D E X F U N D S
MARCH 31, 2021
NORTHERN FUNDS ANNUAL REPORT 129 EQUIT Y INDEX FUNDS
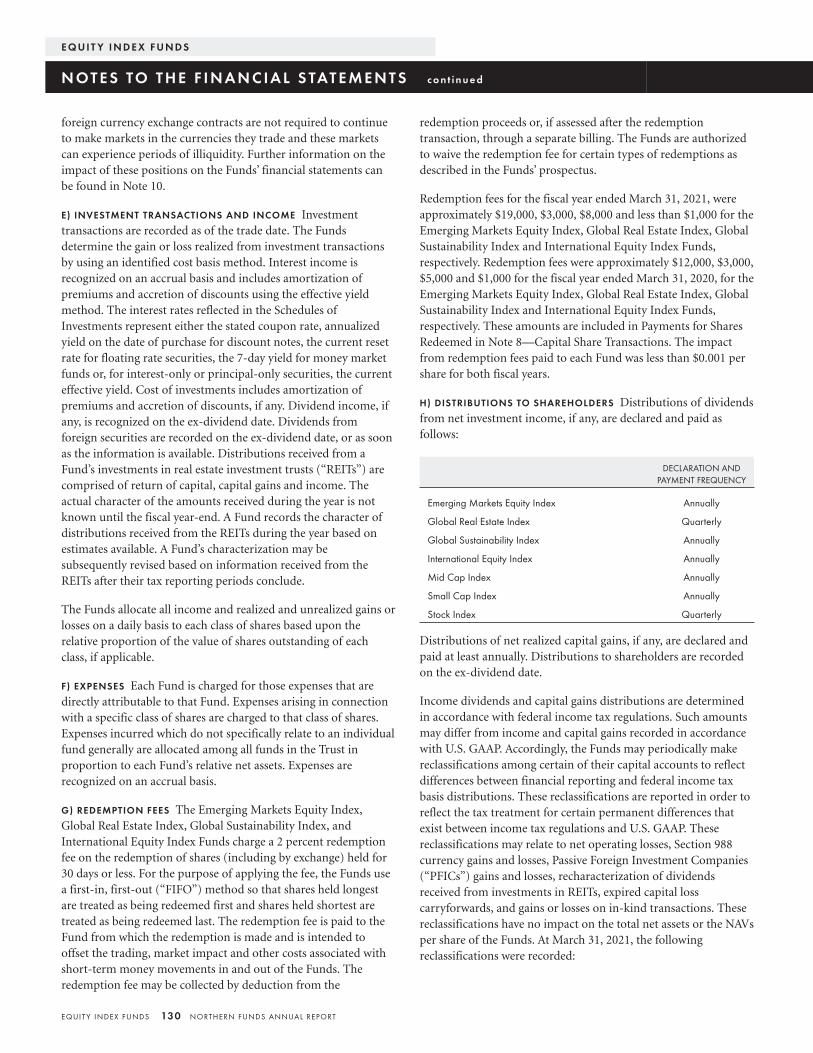
foreign currency exchange contracts are not required to continueto make markets in the currencies they trade and these marketscan experience periods of illiquidity. Further information on theimpact of these positions on the Funds’ financial statements canbe found in Note 10.
E) INVESTMENT TRANSACTIONS AND INCOME Investmenttransactions are recorded as of the trade date. The Fundsdetermine the gain or loss realized from investment transactionsby using an identified cost basis method. Interest income isrecognized on an accrual basis and includes amortization ofpremiums and accretion of discounts using the effective yieldmethod. The interest rates reflected in the Schedules ofInvestments represent either the stated coupon rate, annualizedyield on the date of purchase for discount notes, the current resetrate for floating rate securities, the 7-day yield for money marketfunds or, for interest-only or principal-only securities, the currenteffective yield. Cost of investments includes amortization ofpremiums and accretion of discounts, if any. Dividend income, ifany, is recognized on the ex-dividend date. Dividends fromforeign securities are recorded on the ex-dividend date, or as soonas the information is available. Distributions received from aFund’s investments in real estate investment trusts (“REITs”) arecomprised of return of capital, capital gains and income. Theactual character of the amounts received during the year is notknown until the fiscal year-end. A Fund records the character ofdistributions received from the REITs during the year based onestimates available. A Fund’s characterization may besubsequently revised based on information received from theREITs after their tax reporting periods conclude.
The Funds allocate all income and realized and unrealized gains orlosses on a daily basis to each class of shares based upon therelative proportion of the value of shares outstanding of eachclass, if applicable.
F) EXPENSES Each Fund is charged for those expenses that aredirectly attributable to that Fund. Expenses arising in connectionwith a specific class of shares are charged to that class of shares.Expenses incurred which do not specifically relate to an individualfund generally are allocated among all funds in the Trust inproportion to each Fund’s relative net assets. Expenses arerecognized on an accrual basis.
G) REDEMPTION FEES The Emerging Markets Equity Index,Global Real Estate Index, Global Sustainability Index, andInternational Equity Index Funds charge a 2 percent redemptionfee on the redemption of shares (including by exchange) held for30 days or less. For the purpose of applying the fee, the Funds usea first-in, first-out (“FIFO”) method so that shares held longestare treated as being redeemed first and shares held shortest aretreated as being redeemed last. The redemption fee is paid to theFund from which the redemption is made and is intended tooffset the trading, market impact and other costs associated withshort-term money movements in and out of the Funds. Theredemption fee may be collected by deduction from the
redemption proceeds or, if assessed after the redemptiontransaction, through a separate billing. The Funds are authorizedto waive the redemption fee for certain types of redemptions asdescribed in the Funds’ prospectus.
Redemption fees for the fiscal year ended March 31, 2021, wereapproximately $19,000, $3,000, $8,000 and less than $1,000 for theEmerging Markets Equity Index, Global Real Estate Index, GlobalSustainability Index and International Equity Index Funds,respectively. Redemption fees were approximately $12,000, $3,000,$5,000 and $1,000 for the fiscal year ended March 31, 2020, for theEmerging Markets Equity Index, Global Real Estate Index, GlobalSustainability Index and International Equity Index Funds,respectively. These amounts are included in Payments for SharesRedeemed in Note 8—Capital Share Transactions. The impactfrom redemption fees paid to each Fund was less than $0.001 pershare for both fiscal years.
H) DISTRIBUTIONS TO SHAREHOLDERS Distributions of dividendsfrom net investment income, if any, are declared and paid asfollows:
DECLARATION ANDPAYMENT FREQUENCY
Emerging Markets Equity Index Annually
Global Real Estate Index Quarterly
Global Sustainability Index Annually
International Equity Index Annually
Mid Cap Index Annually
Small Cap Index Annually
Stock Index Quarterly
Distributions of net realized capital gains, if any, are declared andpaid at least annually. Distributions to shareholders are recordedon the ex-dividend date.
Income dividends and capital gains distributions are determinedin accordance with federal income tax regulations. Such amountsmay differ from income and capital gains recorded in accordancewith U.S. GAAP. Accordingly, the Funds may periodically makereclassifications among certain of their capital accounts to reflectdifferences between financial reporting and federal income taxbasis distributions. These reclassifications are reported in order toreflect the tax treatment for certain permanent differences thatexist between income tax regulations and U.S. GAAP. Thesereclassifications may relate to net operating losses, Section 988currency gains and losses, Passive Foreign Investment Companies(“PFICs”) gains and losses, recharacterization of dividendsreceived from investments in REITs, expired capital losscarryforwards, and gains or losses on in-kind transactions. Thesereclassifications have no impact on the total net assets or the NAVsper share of the Funds. At March 31, 2021, the followingreclassifications were recorded:
E Q U I T Y I N D E X F U N D S
N OT E S TO T H E F I N A N C I A L S TAT E M E N T S c o n t i n u e d
EQUIT Y INDEX FUNDS 130 NORTHERN FUNDS ANNUAL REPORT
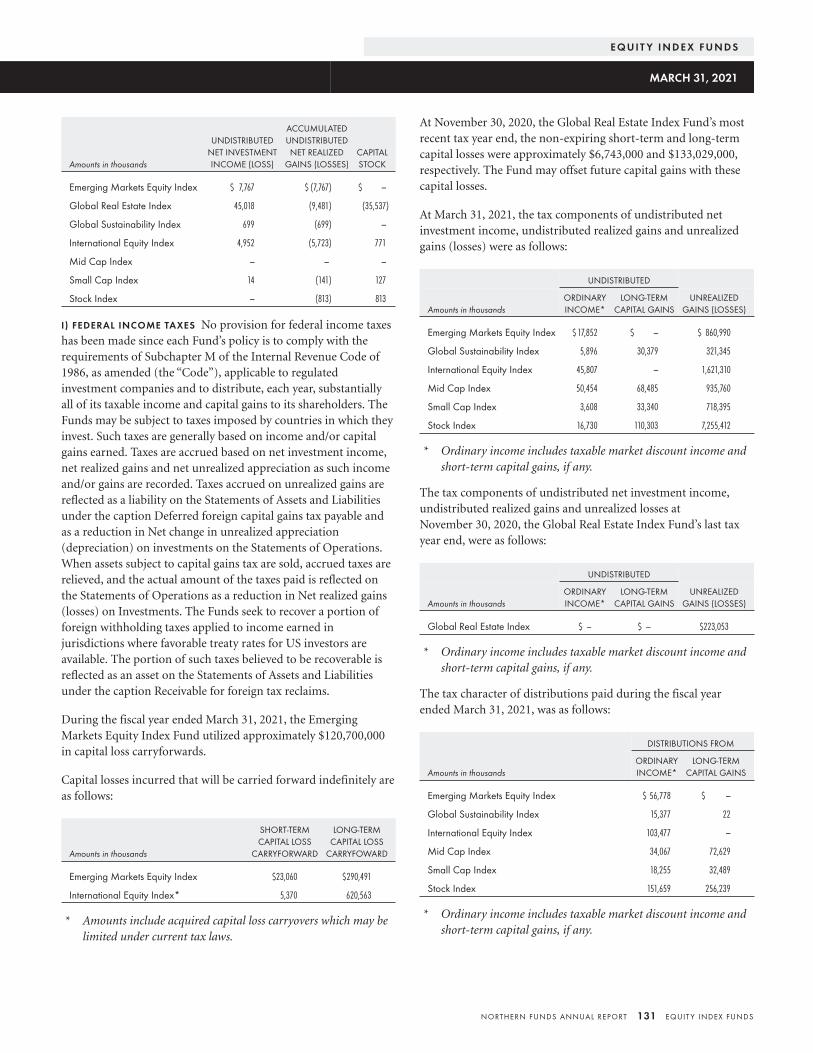
Amounts in thousands
UNDISTRIBUTEDNET INVESTMENTINCOME (LOSS)
ACCUMULATEDUNDISTRIBUTEDNET REALIZED
GAINS (LOSSES)CAPITALSTOCK
Emerging Markets Equity Index $ 7,767 $ (7,767) $ —
Global Real Estate Index 45,018 (9,481) (35,537)
Global Sustainability Index 699 (699) —
International Equity Index 4,952 (5,723) 771
Mid Cap Index — — —
Small Cap Index 14 (141) 127
Stock Index — (813) 813
I) FEDERAL INCOME TAXES No provision for federal income taxeshas been made since each Fund’s policy is to comply with therequirements of Subchapter M of the Internal Revenue Code of1986, as amended (the “Code”), applicable to regulatedinvestment companies and to distribute, each year, substantiallyall of its taxable income and capital gains to its shareholders. TheFunds may be subject to taxes imposed by countries in which theyinvest. Such taxes are generally based on income and/or capitalgains earned. Taxes are accrued based on net investment income,net realized gains and net unrealized appreciation as such incomeand/or gains are recorded. Taxes accrued on unrealized gains arereflected as a liability on the Statements of Assets and Liabilitiesunder the caption Deferred foreign capital gains tax payable andas a reduction in Net change in unrealized appreciation(depreciation) on investments on the Statements of Operations.When assets subject to capital gains tax are sold, accrued taxes arerelieved, and the actual amount of the taxes paid is reflected onthe Statements of Operations as a reduction in Net realized gains(losses) on Investments. The Funds seek to recover a portion offoreign withholding taxes applied to income earned injurisdictions where favorable treaty rates for US investors areavailable. The portion of such taxes believed to be recoverable isreflected as an asset on the Statements of Assets and Liabilitiesunder the caption Receivable for foreign tax reclaims.
During the fiscal year ended March 31, 2021, the EmergingMarkets Equity Index Fund utilized approximately $120,700,000in capital loss carryforwards.
Capital losses incurred that will be carried forward indefinitely areas follows:
Amounts in thousands
SHORT-TERMCAPITAL LOSS
CARRYFORWARD
LONG-TERMCAPITAL LOSS
CARRYFOWARD
Emerging Markets Equity Index $23,060 $290,491
International Equity Index* 5,370 620,563
* Amounts include acquired capital loss carryovers which may belimited under current tax laws.
At November 30, 2020, the Global Real Estate Index Fund’s mostrecent tax year end, the non-expiring short-term and long-termcapital losses were approximately $6,743,000 and $133,029,000,respectively. The Fund may offset future capital gains with thesecapital losses.
At March 31, 2021, the tax components of undistributed netinvestment income, undistributed realized gains and unrealizedgains (losses) were as follows:
UNDISTRIBUTED
Amounts in thousandsORDINARYINCOME*
LONG-TERMCAPITAL GAINS
UNREALIZEDGAINS (LOSSES)
Emerging Markets Equity Index $ 17,852 $ — $ 860,990
Global Sustainability Index 5,896 30,379 321,345
International Equity Index 45,807 — 1,621,310
Mid Cap Index 50,454 68,485 935,760
Small Cap Index 3,608 33,340 718,395
Stock Index 16,730 110,303 7,255,412
* Ordinary income includes taxable market discount income andshort-term capital gains, if any.
The tax components of undistributed net investment income,undistributed realized gains and unrealized losses atNovember 30, 2020, the Global Real Estate Index Fund’s last taxyear end, were as follows:
UNDISTRIBUTED
Amounts in thousandsORDINARYINCOME*
LONG-TERMCAPITAL GAINS
UNREALIZEDGAINS (LOSSES)
Global Real Estate Index $ — $ — $223,053
* Ordinary income includes taxable market discount income andshort-term capital gains, if any.
The tax character of distributions paid during the fiscal yearended March 31, 2021, was as follows:
DISTRIBUTIONS FROM
Amounts in thousandsORDINARYINCOME*
LONG-TERMCAPITAL GAINS
Emerging Markets Equity Index $ 56,778 $ —
Global Sustainability Index 15,377 22
International Equity Index 103,477 —
Mid Cap Index 34,067 72,629
Small Cap Index 18,255 32,489
Stock Index 151,659 256,239
* Ordinary income includes taxable market discount income andshort-term capital gains, if any.
E Q U I T Y I N D E X F U N D S
MARCH 31, 2021
NORTHERN FUNDS ANNUAL REPORT 131 EQUIT Y INDEX FUNDS
The tax character of distributions paid during the fiscal yearended March 31, 2020, was as follows:
DISTRIBUTIONS FROM
Amounts in thousandsORDINARYINCOME*
LONG-TERMCAPITAL GAINS
Emerging Markets Equity Index $ 76,000 $ —
Global Sustainability Index 15,009 6,408
International Equity Index 172,000 —
Mid Cap Index 34,000 20,750
Small Cap Index 15,500 7,300
Stock Index 173,198 68,627
* Ordinary income includes taxable market discount income andshort-term capital gains, if any.
The tax character of distributions paid during the Global RealEstate Index Fund’s tax years ended November 30, 2020 andNovember 30, 2019 was designated for the purpose of thedividends paid deductions as follows:
NOVEMBER 30, 2020 ANDNOVEMBER 30, 2019DISTRIBUTIONS FROM
Amounts in thousandsORDINARYINCOME*
LONG-TERMCAPITAL GAINS
Global Real Estate Index (2020) $95,705 $—
Global Real Estate Index (2019) 53,911 —
* Ordinary income includes taxable market discount income andshort-term capital gains, if any.
The Global Real Estate Index Fund has a tax year end ofNovember 30th. Therefore, the tax character of distributions paidfor the period December 1, 2020 through March 31, 2021 will bedetermined at the end of its tax year.
As of March 31, 2021, no Fund had uncertain tax positions thatwould require financial statement recognition or disclosure. TheFunds’ federal tax returns remain subject to examination by theInternal Revenue Service for three years after they are filed.Interest or penalties incurred, if any, on future unknown,uncertain tax positions taken by the Funds will be recorded asInterest expense and Other expenses, respectively, on theStatements of Operations.
J) OTHER RISKS Certain Funds may invest in emerging marketsecurities. Additional risks are involved when a Fund invests itsassets in countries with emerging economies or securities markets.These countries generally are located in the Asia and Pacificregions, the Middle East, Eastern Europe, Central America, SouthAmerica and Africa. Political and economic structures in many ofthese countries may lack the social, political and economicstability characteristics of more developed countries. In general,the securities markets of these countries are less liquid, subject to
greater price volatility and have smaller market capitalizations. Asa result, the risks presented by investments in these countries areheightened.
3 . S E RV I C E P L A N
The Trust has adopted a Service Plan pursuant to which the Trustmay enter into agreements with Northern Trust, its affiliates orother institutions (together “Service Organizations”) under whichthe Service Organizations agree to provide certain administrativesupport services and, in some cases, personal and accountmaintenance services for their customers, who are beneficialowners of shares of the Funds. As compensation for servicesprovided pursuant to the Service Plan, the Service Organizationsreceive a fee at an annual rate of up to 0.15 percent of the averagedaily net assets of the Shares class of the Funds beneficially ownedby their customers.
Effective July 31, 2020, Service Organizations may receive feesfrom Class I shares of the Global Sustainability Index Fund at anannual rate of up to 0.15% of the average daily NAV of Class Ishares of the Fund beneficially owned by such clients. NTI hascontractually agreed to limit payments of service fees from Class Ishares of the Global Sustainability Index Fund to an annual rate of0.05% of the average NAV of the Class I shares of the Fund. Thereis no service fee payable by Class K shares of the GlobalSustainability Index Fund.
There were no shareholder servicing fees paid by the Funds toNorthern Trust or its affiliates during the fiscal year endedMarch 31, 2021.
Service Plan expenses, if any, are included in the Statements ofOperations under Shareholder servicing fees for the fiscal yearended March 31, 2021.
4 . BA N K B O R ROW I N G S
The Trust and Northern Institutional Funds, a registeredinvestment company also advised by NTI, jointly entered into a$250,000,000 senior unsecured revolving credit facility onNovember 18, 2019, which expired on November 16, 2020 andwas administered by Citibank, N.A., for liquidity and otherpurposes (the “Credit Facility”). The interest rate charged underthe Credit Facility was equal to the sum of (i) the Federal FundsRate plus (ii) if the one month London Interbank Offered Rate(“LIBOR”) on the date of borrowing exceeded such Federal FundsRate, the amount by which it so exceeded, plus (iii) 1.00 percent.In addition, there was an annual commitment fee of 0.15 percenton the unused portion of the credit line under the Credit Facility,payable quarterly in arrears, which is included in Other expenseson the Statements of Operations.
At a meeting held on August 19-20, 2020, the Board approved anagreement to replace the Credit Facility (as replaced, the “NewCredit Facility”). The New Credit Facility is also in the amount of
E Q U I T Y I N D E X F U N D S
N OT E S TO T H E F I N A N C I A L S TAT E M E N T S c o n t i n u e d
EQUIT Y INDEX FUNDS 132 NORTHERN FUNDS ANNUAL REPORT
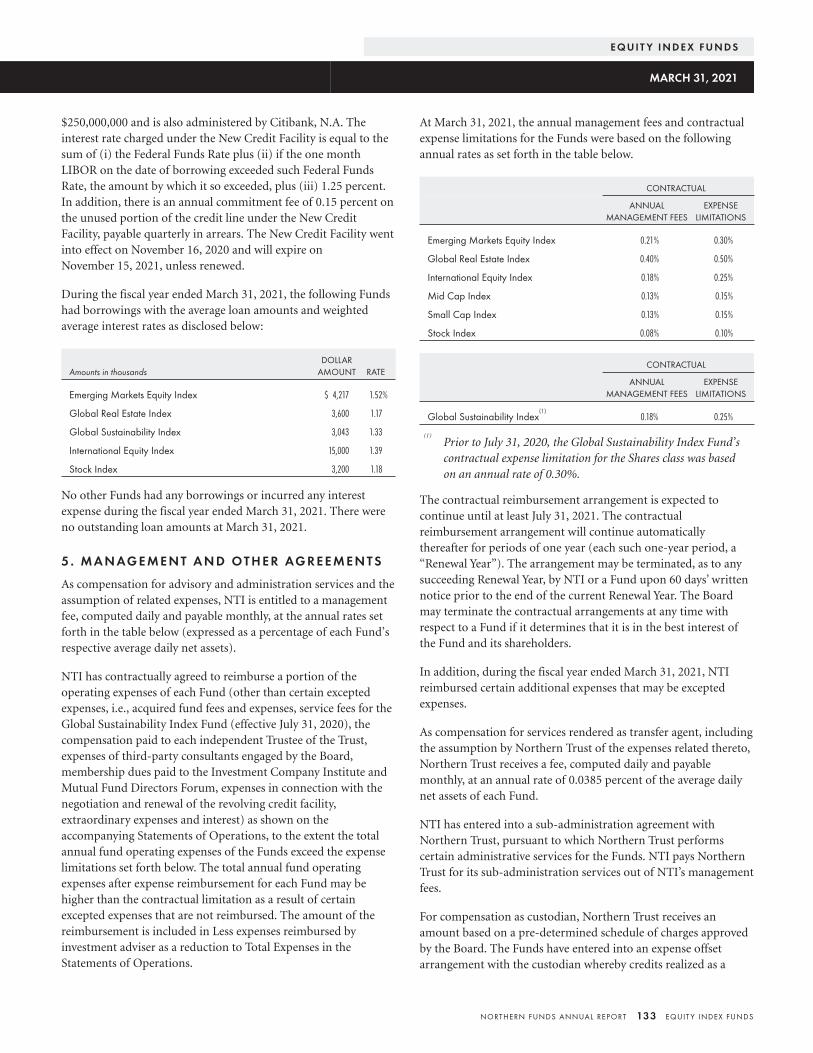
$250,000,000 and is also administered by Citibank, N.A. Theinterest rate charged under the New Credit Facility is equal to thesum of (i) the Federal Funds Rate plus (ii) if the one monthLIBOR on the date of borrowing exceeded such Federal FundsRate, the amount by which it so exceeded, plus (iii) 1.25 percent.In addition, there is an annual commitment fee of 0.15 percent onthe unused portion of the credit line under the New CreditFacility, payable quarterly in arrears. The New Credit Facility wentinto effect on November 16, 2020 and will expire onNovember 15, 2021, unless renewed.
During the fiscal year ended March 31, 2021, the following Fundshad borrowings with the average loan amounts and weightedaverage interest rates as disclosed below:
Amounts in thousandsDOLLAR
AMOUNT RATE
Emerging Markets Equity Index $ 4,217 1.52%
Global Real Estate Index 3,600 1.17
Global Sustainability Index 3,043 1.33
International Equity Index 15,000 1.39
Stock Index 3,200 1.18
No other Funds had any borrowings or incurred any interestexpense during the fiscal year ended March 31, 2021. There wereno outstanding loan amounts at March 31, 2021.
5 . M A N AG E M E N T A N D OT H E R AG R E E M E N T S
As compensation for advisory and administration services and theassumption of related expenses, NTI is entitled to a managementfee, computed daily and payable monthly, at the annual rates setforth in the table below (expressed as a percentage of each Fund’srespective average daily net assets).
NTI has contractually agreed to reimburse a portion of theoperating expenses of each Fund (other than certain exceptedexpenses, i.e., acquired fund fees and expenses, service fees for theGlobal Sustainability Index Fund (effective July 31, 2020), thecompensation paid to each independent Trustee of the Trust,expenses of third-party consultants engaged by the Board,membership dues paid to the Investment Company Institute andMutual Fund Directors Forum, expenses in connection with thenegotiation and renewal of the revolving credit facility,extraordinary expenses and interest) as shown on theaccompanying Statements of Operations, to the extent the totalannual fund operating expenses of the Funds exceed the expenselimitations set forth below. The total annual fund operatingexpenses after expense reimbursement for each Fund may behigher than the contractual limitation as a result of certainexcepted expenses that are not reimbursed. The amount of thereimbursement is included in Less expenses reimbursed byinvestment adviser as a reduction to Total Expenses in theStatements of Operations.
At March 31, 2021, the annual management fees and contractualexpense limitations for the Funds were based on the followingannual rates as set forth in the table below.
CONTRACTUAL
ANNUALMANAGEMENT FEES
EXPENSELIMITATIONS
Emerging Markets Equity Index 0.21% 0.30%
Global Real Estate Index 0.40% 0.50%
International Equity Index 0.18% 0.25%
Mid Cap Index 0.13% 0.15%
Small Cap Index 0.13% 0.15%
Stock Index 0.08% 0.10%
CONTRACTUAL
ANNUALMANAGEMENT FEES
EXPENSELIMITATIONS
Global Sustainability Index(1)
0.18% 0.25%
(1)
Prior to July 31, 2020, the Global Sustainability Index Fund’scontractual expense limitation for the Shares class was basedon an annual rate of 0.30%.
The contractual reimbursement arrangement is expected tocontinue until at least July 31, 2021. The contractualreimbursement arrangement will continue automaticallythereafter for periods of one year (each such one-year period, a“Renewal Year”). The arrangement may be terminated, as to anysucceeding Renewal Year, by NTI or a Fund upon 60 days’ writtennotice prior to the end of the current Renewal Year. The Boardmay terminate the contractual arrangements at any time withrespect to a Fund if it determines that it is in the best interest ofthe Fund and its shareholders.
In addition, during the fiscal year ended March 31, 2021, NTIreimbursed certain additional expenses that may be exceptedexpenses.
As compensation for services rendered as transfer agent, includingthe assumption by Northern Trust of the expenses related thereto,Northern Trust receives a fee, computed daily and payablemonthly, at an annual rate of 0.0385 percent of the average dailynet assets of each Fund.
NTI has entered into a sub-administration agreement withNorthern Trust, pursuant to which Northern Trust performscertain administrative services for the Funds. NTI pays NorthernTrust for its sub-administration services out of NTI’s managementfees.
For compensation as custodian, Northern Trust receives anamount based on a pre-determined schedule of charges approvedby the Board. The Funds have entered into an expense offsetarrangement with the custodian whereby credits realized as a
E Q U I T Y I N D E X F U N D S
MARCH 31, 2021
NORTHERN FUNDS ANNUAL REPORT 133 EQUIT Y INDEX FUNDS
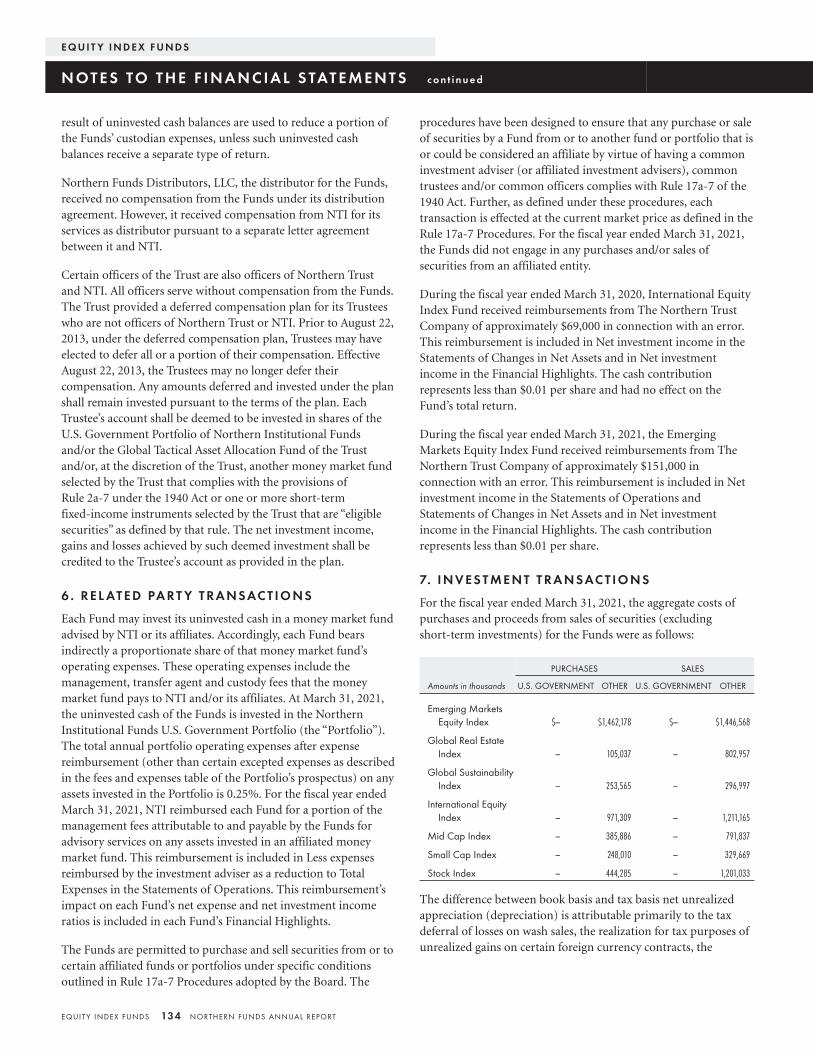
result of uninvested cash balances are used to reduce a portion ofthe Funds’ custodian expenses, unless such uninvested cashbalances receive a separate type of return.
Northern Funds Distributors, LLC, the distributor for the Funds,received no compensation from the Funds under its distributionagreement. However, it received compensation from NTI for itsservices as distributor pursuant to a separate letter agreementbetween it and NTI.
Certain officers of the Trust are also officers of Northern Trustand NTI. All officers serve without compensation from the Funds.The Trust provided a deferred compensation plan for its Trusteeswho are not officers of Northern Trust or NTI. Prior to August 22,2013, under the deferred compensation plan, Trustees may haveelected to defer all or a portion of their compensation. EffectiveAugust 22, 2013, the Trustees may no longer defer theircompensation. Any amounts deferred and invested under the planshall remain invested pursuant to the terms of the plan. EachTrustee’s account shall be deemed to be invested in shares of theU.S. Government Portfolio of Northern Institutional Fundsand/or the Global Tactical Asset Allocation Fund of the Trustand/or, at the discretion of the Trust, another money market fundselected by the Trust that complies with the provisions ofRule 2a-7 under the 1940 Act or one or more short-termfixed-income instruments selected by the Trust that are “eligiblesecurities” as defined by that rule. The net investment income,gains and losses achieved by such deemed investment shall becredited to the Trustee’s account as provided in the plan.
6 . R E L AT E D PA R T Y T R A N SAC T I O N S
Each Fund may invest its uninvested cash in a money market fundadvised by NTI or its affiliates. Accordingly, each Fund bearsindirectly a proportionate share of that money market fund’soperating expenses. These operating expenses include themanagement, transfer agent and custody fees that the moneymarket fund pays to NTI and/or its affiliates. At March 31, 2021,the uninvested cash of the Funds is invested in the NorthernInstitutional Funds U.S. Government Portfolio (the “Portfolio”).The total annual portfolio operating expenses after expensereimbursement (other than certain excepted expenses as describedin the fees and expenses table of the Portfolio’s prospectus) on anyassets invested in the Portfolio is 0.25%. For the fiscal year endedMarch 31, 2021, NTI reimbursed each Fund for a portion of themanagement fees attributable to and payable by the Funds foradvisory services on any assets invested in an affiliated moneymarket fund. This reimbursement is included in Less expensesreimbursed by the investment adviser as a reduction to TotalExpenses in the Statements of Operations. This reimbursement’simpact on each Fund’s net expense and net investment incomeratios is included in each Fund’s Financial Highlights.
The Funds are permitted to purchase and sell securities from or tocertain affiliated funds or portfolios under specific conditionsoutlined in Rule 17a-7 Procedures adopted by the Board. The
procedures have been designed to ensure that any purchase or saleof securities by a Fund from or to another fund or portfolio that isor could be considered an affiliate by virtue of having a commoninvestment adviser (or affiliated investment advisers), commontrustees and/or common officers complies with Rule 17a-7 of the1940 Act. Further, as defined under these procedures, eachtransaction is effected at the current market price as defined in theRule 17a-7 Procedures. For the fiscal year ended March 31, 2021,the Funds did not engage in any purchases and/or sales ofsecurities from an affiliated entity.
During the fiscal year ended March 31, 2020, International EquityIndex Fund received reimbursements from The Northern TrustCompany of approximately $69,000 in connection with an error.This reimbursement is included in Net investment income in theStatements of Changes in Net Assets and in Net investmentincome in the Financial Highlights. The cash contributionrepresents less than $0.01 per share and had no effect on theFund’s total return.
During the fiscal year ended March 31, 2021, the EmergingMarkets Equity Index Fund received reimbursements from TheNorthern Trust Company of approximately $151,000 inconnection with an error. This reimbursement is included in Netinvestment income in the Statements of Operations andStatements of Changes in Net Assets and in Net investmentincome in the Financial Highlights. The cash contributionrepresents less than $0.01 per share.
7. I N V E S T M E N T T R A N SAC T I O N S
For the fiscal year ended March 31, 2021, the aggregate costs ofpurchases and proceeds from sales of securities (excludingshort-term investments) for the Funds were as follows:
PURCHASES SALES
Amounts in thousands U.S. GOVERNMENT OTHER U.S. GOVERNMENT OTHER
Emerging MarketsEquity Index $— $1,462,178 $— $1,446,568
Global Real EstateIndex — 105,037 — 802,957
Global SustainabilityIndex — 253,565 — 296,997
International EquityIndex — 971,309 — 1,211,165
Mid Cap Index — 385,886 — 791,837
Small Cap Index — 248,010 — 329,669
Stock Index — 444,285 — 1,201,033
The difference between book basis and tax basis net unrealizedappreciation (depreciation) is attributable primarily to the taxdeferral of losses on wash sales, the realization for tax purposes ofunrealized gains on certain foreign currency contracts, the
E Q U I T Y I N D E X F U N D S
N OT E S TO T H E F I N A N C I A L S TAT E M E N T S c o n t i n u e d
EQUIT Y INDEX FUNDS 134 NORTHERN FUNDS ANNUAL REPORT
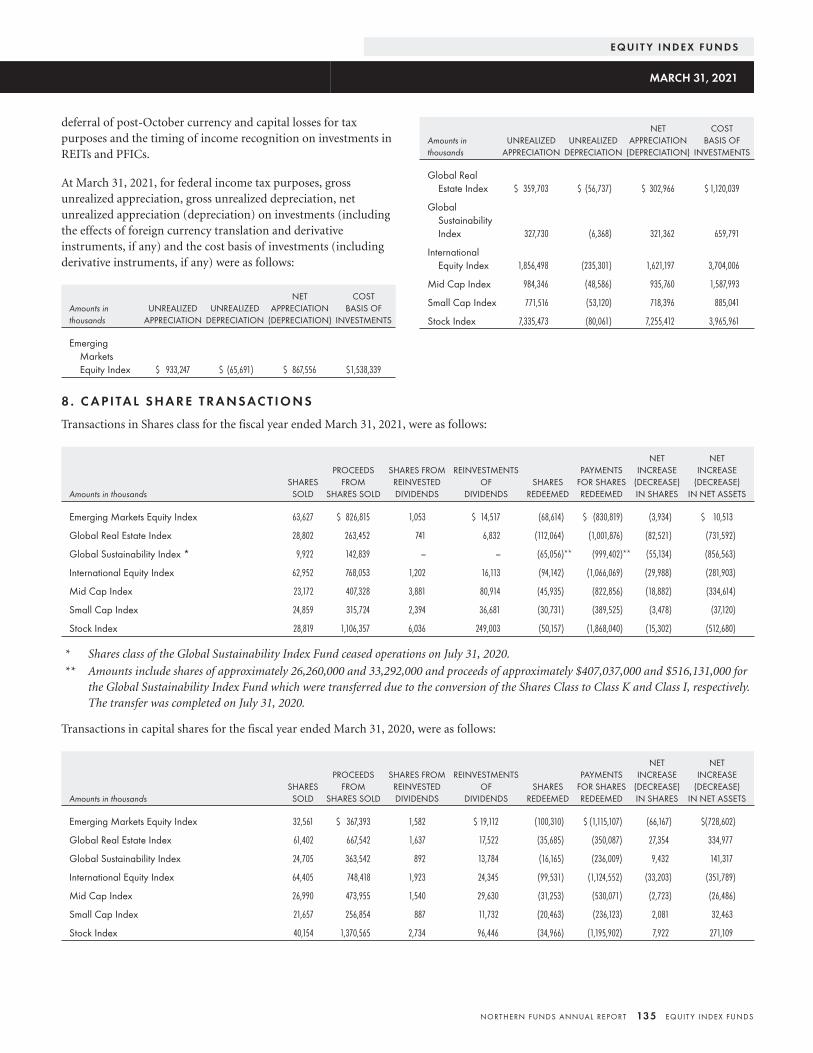
deferral of post-October currency and capital losses for taxpurposes and the timing of income recognition on investments inREITs and PFICs.
At March 31, 2021, for federal income tax purposes, grossunrealized appreciation, gross unrealized depreciation, netunrealized appreciation (depreciation) on investments (includingthe effects of foreign currency translation and derivativeinstruments, if any) and the cost basis of investments (includingderivative instruments, if any) were as follows:
Amounts inthousands
UNREALIZEDAPPRECIATION
UNREALIZEDDEPRECIATION
NETAPPRECIATION
(DEPRECIATION)
COSTBASIS OF
INVESTMENTS
EmergingMarketsEquity Index $ 933,247 $ (65,691) $ 867,556 $1,538,339
Amounts inthousands
UNREALIZEDAPPRECIATION
UNREALIZEDDEPRECIATION
NETAPPRECIATION
(DEPRECIATION)
COSTBASIS OF
INVESTMENTS
Global RealEstate Index $ 359,703 $ (56,737) $ 302,966 $ 1,120,039
GlobalSustainabilityIndex 327,730 (6,368) 321,362 659,791
InternationalEquity Index 1,856,498 (235,301) 1,621,197 3,704,006
Mid Cap Index 984,346 (48,586) 935,760 1,587,993
Small Cap Index 771,516 (53,120) 718,396 885,041
Stock Index 7,335,473 (80,061) 7,255,412 3,965,961
8 . C A P I TA L S H A R E T R A N SAC T I O N S
Transactions in Shares class for the fiscal year ended March 31, 2021, were as follows:
Amounts in thousandsSHARESSOLD
PROCEEDSFROM
SHARES SOLD
SHARES FROMREINVESTEDDIVIDENDS
REINVESTMENTSOF
DIVIDENDSSHARES
REDEEMED
PAYMENTSFOR SHARESREDEEMED
NETINCREASE
(DECREASE)IN SHARES
NETINCREASE
(DECREASE)IN NET ASSETS
Emerging Markets Equity Index 63,627 $ 826,815 1,053 $ 14,517 (68,614) $ (830,819) (3,934) $ 10,513
Global Real Estate Index 28,802 263,452 741 6,832 (112,064) (1,001,876) (82,521) (731,592)
Global Sustainability Index * 9,922 142,839 — — (65,056)** (999,402)** (55,134) (856,563)
International Equity Index 62,952 768,053 1,202 16,113 (94,142) (1,066,069) (29,988) (281,903)
Mid Cap Index 23,172 407,328 3,881 80,914 (45,935) (822,856) (18,882) (334,614)
Small Cap Index 24,859 315,724 2,394 36,681 (30,731) (389,525) (3,478) (37,120)
Stock Index 28,819 1,106,357 6,036 249,003 (50,157) (1,868,040) (15,302) (512,680)
* Shares class of the Global Sustainability Index Fund ceased operations on July 31, 2020.
** Amounts include shares of approximately 26,260,000 and 33,292,000 and proceeds of approximately $407,037,000 and $516,131,000 forthe Global Sustainability Index Fund which were transferred due to the conversion of the Shares Class to Class K and Class I, respectively.The transfer was completed on July 31, 2020.
Transactions in capital shares for the fiscal year ended March 31, 2020, were as follows:
Amounts in thousandsSHARESSOLD
PROCEEDSFROM
SHARES SOLD
SHARES FROMREINVESTEDDIVIDENDS
REINVESTMENTSOF
DIVIDENDSSHARES
REDEEMED
PAYMENTSFOR SHARESREDEEMED
NETINCREASE
(DECREASE)IN SHARES
NETINCREASE
(DECREASE)IN NET ASSETS
Emerging Markets Equity Index 32,561 $ 367,393 1,582 $ 19,112 (100,310) $ (1,115,107) (66,167) $(728,602)
Global Real Estate Index 61,402 667,542 1,637 17,522 (35,685) (350,087) 27,354 334,977
Global Sustainability Index 24,705 363,542 892 13,784 (16,165) (236,009) 9,432 141,317
International Equity Index 64,405 748,418 1,923 24,345 (99,531) (1,124,552) (33,203) (351,789)
Mid Cap Index 26,990 473,955 1,540 29,630 (31,253) (530,071) (2,723) (26,486)
Small Cap Index 21,657 256,854 887 11,732 (20,463) (236,123) 2,081 32,463
Stock Index 40,154 1,370,565 2,734 96,446 (34,966) (1,195,902) 7,922 271,109
E Q U I T Y I N D E X F U N D S
MARCH 31, 2021
NORTHERN FUNDS ANNUAL REPORT 135 EQUIT Y INDEX FUNDS
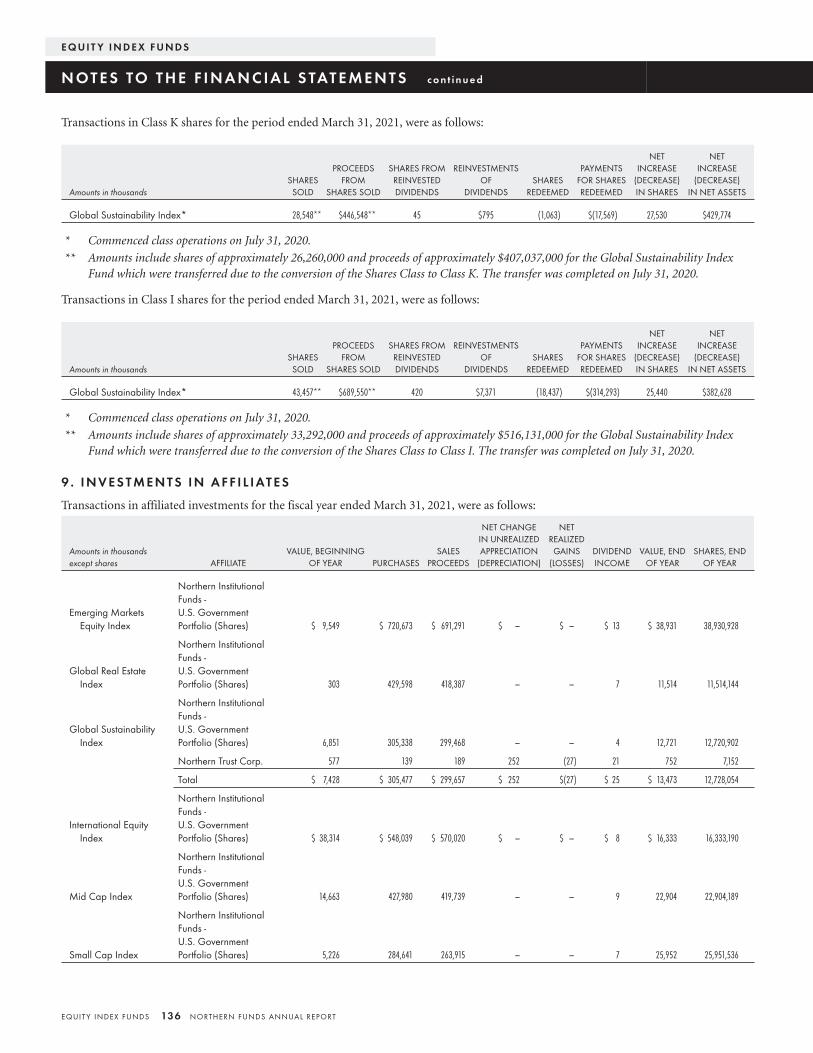
Transactions in Class K shares for the period ended March 31, 2021, were as follows:
Amounts in thousandsSHARESSOLD
PROCEEDSFROM
SHARES SOLD
SHARES FROMREINVESTEDDIVIDENDS
REINVESTMENTSOF
DIVIDENDSSHARES
REDEEMED
PAYMENTSFOR SHARESREDEEMED
NETINCREASE
(DECREASE)IN SHARES
NETINCREASE
(DECREASE)IN NET ASSETS
Global Sustainability Index* 28,548** $446,548** 45 $795 (1,063) $(17,569) 27,530 $429,774
* Commenced class operations on July 31, 2020.
** Amounts include shares of approximately 26,260,000 and proceeds of approximately $407,037,000 for the Global Sustainability IndexFund which were transferred due to the conversion of the Shares Class to Class K. The transfer was completed on July 31, 2020.
Transactions in Class I shares for the period ended March 31, 2021, were as follows:
Amounts in thousandsSHARESSOLD
PROCEEDSFROM
SHARES SOLD
SHARES FROMREINVESTEDDIVIDENDS
REINVESTMENTSOF
DIVIDENDSSHARES
REDEEMED
PAYMENTSFOR SHARESREDEEMED
NETINCREASE
(DECREASE)IN SHARES
NETINCREASE
(DECREASE)IN NET ASSETS
Global Sustainability Index* 43,457** $689,550** 420 $7,371 (18,437) $(314,293) 25,440 $382,628
* Commenced class operations on July 31, 2020.
** Amounts include shares of approximately 33,292,000 and proceeds of approximately $516,131,000 for the Global Sustainability IndexFund which were transferred due to the conversion of the Shares Class to Class I. The transfer was completed on July 31, 2020.
9 . I N V E S T M E N T S I N A F F I L I AT E S
Transactions in affiliated investments for the fiscal year ended March 31, 2021, were as follows:
Amounts in thousandsexcept shares AFFILIATE
VALUE, BEGINNINGOF YEAR PURCHASES
SALESPROCEEDS
NET CHANGEIN UNREALIZEDAPPRECIATION
(DEPRECIATION)
NETREALIZEDGAINS
(LOSSES)DIVIDENDINCOME
VALUE, ENDOF YEAR
SHARES, ENDOF YEAR
Emerging MarketsEquity Index
Northern InstitutionalFunds -U.S. GovernmentPortfolio (Shares) $ 9,549 $ 720,673 $ 691,291 $ — $ — $ 13 $ 38,931 38,930,928
Global Real EstateIndex
Northern InstitutionalFunds -U.S. GovernmentPortfolio (Shares) 303 429,598 418,387 — — 7 11,514 11,514,144
Global SustainabilityIndex
Northern InstitutionalFunds -U.S. GovernmentPortfolio (Shares) 6,851 305,338 299,468 — — 4 12,721 12,720,902
Northern Trust Corp. 577 139 189 252 (27) 21 752 7,152
Total $ 7,428 $ 305,477 $ 299,657 $ 252 $(27) $ 25 $ 13,473 12,728,054
International EquityIndex
Northern InstitutionalFunds -U.S. GovernmentPortfolio (Shares) $ 38,314 $ 548,039 $ 570,020 $ — $ — $ 8 $ 16,333 16,333,190
Mid Cap Index
Northern InstitutionalFunds -U.S. GovernmentPortfolio (Shares) 14,663 427,980 419,739 — — 9 22,904 22,904,189
Small Cap Index
Northern InstitutionalFunds -U.S. GovernmentPortfolio (Shares) 5,226 284,641 263,915 — — 7 25,952 25,951,536
E Q U I T Y I N D E X F U N D S
N OT E S TO T H E F I N A N C I A L S TAT E M E N T S c o n t i n u e d
EQUIT Y INDEX FUNDS 136 NORTHERN FUNDS ANNUAL REPORT
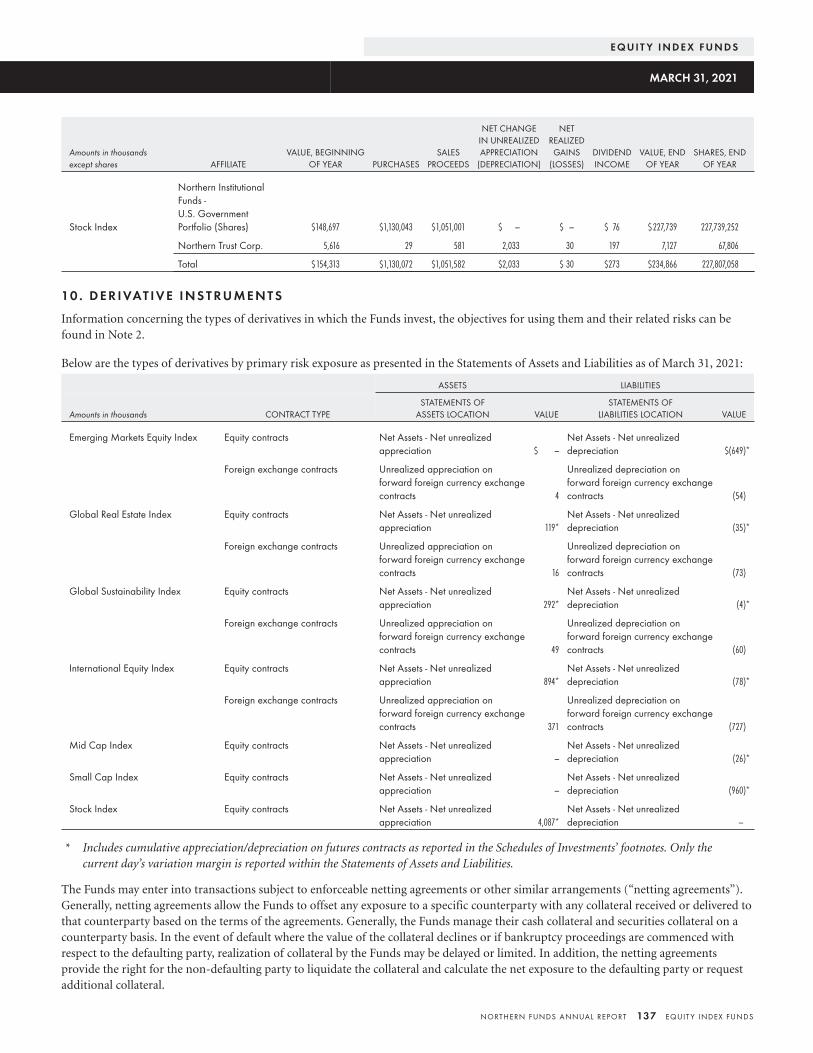
Amounts in thousandsexcept shares AFFILIATE
VALUE, BEGINNINGOF YEAR PURCHASES
SALESPROCEEDS
NET CHANGEIN UNREALIZEDAPPRECIATION
(DEPRECIATION)
NETREALIZEDGAINS
(LOSSES)DIVIDENDINCOME
VALUE, ENDOF YEAR
SHARES, ENDOF YEAR
Stock Index
Northern InstitutionalFunds -U.S. GovernmentPortfolio (Shares) $148,697 $1,130,043 $1,051,001 $ — $ — $ 76 $227,739 227,739,252
Northern Trust Corp. 5,616 29 581 2,033 30 197 7,127 67,806
Total $154,313 $1,130,072 $1,051,582 $2,033 $ 30 $273 $234,866 227,807,058
10 . D E R I VAT I V E I N S T RU M E N T S
Information concerning the types of derivatives in which the Funds invest, the objectives for using them and their related risks can befound in Note 2.
Below are the types of derivatives by primary risk exposure as presented in the Statements of Assets and Liabilities as of March 31, 2021:
ASSETS LIABILITIES
Amounts in thousands CONTRACT TYPESTATEMENTS OF
ASSETS LOCATION VALUESTATEMENTS OF
LIABILITIES LOCATION VALUE
Emerging Markets Equity Index Equity contracts Net Assets - Net unrealizedappreciation $ —
Net Assets - Net unrealizeddepreciation $(649)*
Foreign exchange contracts Unrealized appreciation onforward foreign currency exchangecontracts 4
Unrealized depreciation onforward foreign currency exchangecontracts (54)
Global Real Estate Index Equity contracts Net Assets - Net unrealizedappreciation 119*
Net Assets - Net unrealizeddepreciation (35)*
Foreign exchange contracts Unrealized appreciation onforward foreign currency exchangecontracts 16
Unrealized depreciation onforward foreign currency exchangecontracts (73)
Global Sustainability Index Equity contracts Net Assets - Net unrealizedappreciation 292*
Net Assets - Net unrealizeddepreciation (4)*
Foreign exchange contracts Unrealized appreciation onforward foreign currency exchangecontracts 49
Unrealized depreciation onforward foreign currency exchangecontracts (60)
International Equity Index Equity contracts Net Assets - Net unrealizedappreciation 894*
Net Assets - Net unrealizeddepreciation (78)*
Foreign exchange contracts Unrealized appreciation onforward foreign currency exchangecontracts 371
Unrealized depreciation onforward foreign currency exchangecontracts (727)
Mid Cap Index Equity contracts Net Assets - Net unrealizedappreciation —
Net Assets - Net unrealizeddepreciation (26)*
Small Cap Index Equity contracts Net Assets - Net unrealizedappreciation —
Net Assets - Net unrealizeddepreciation (960)*
Stock Index Equity contracts Net Assets - Net unrealizedappreciation 4,087*
Net Assets - Net unrealizeddepreciation —
* Includes cumulative appreciation/depreciation on futures contracts as reported in the Schedules of Investments’ footnotes. Only thecurrent day’s variation margin is reported within the Statements of Assets and Liabilities.
The Funds may enter into transactions subject to enforceable netting agreements or other similar arrangements (“netting agreements”).Generally, netting agreements allow the Funds to offset any exposure to a specific counterparty with any collateral received or delivered tothat counterparty based on the terms of the agreements. Generally, the Funds manage their cash collateral and securities collateral on acounterparty basis. In the event of default where the value of the collateral declines or if bankruptcy proceedings are commenced withrespect to the defaulting party, realization of collateral by the Funds may be delayed or limited. In addition, the netting agreementsprovide the right for the non-defaulting party to liquidate the collateral and calculate the net exposure to the defaulting party or requestadditional collateral.
E Q U I T Y I N D E X F U N D S
MARCH 31, 2021
NORTHERN FUNDS ANNUAL REPORT 137 EQUIT Y INDEX FUNDS
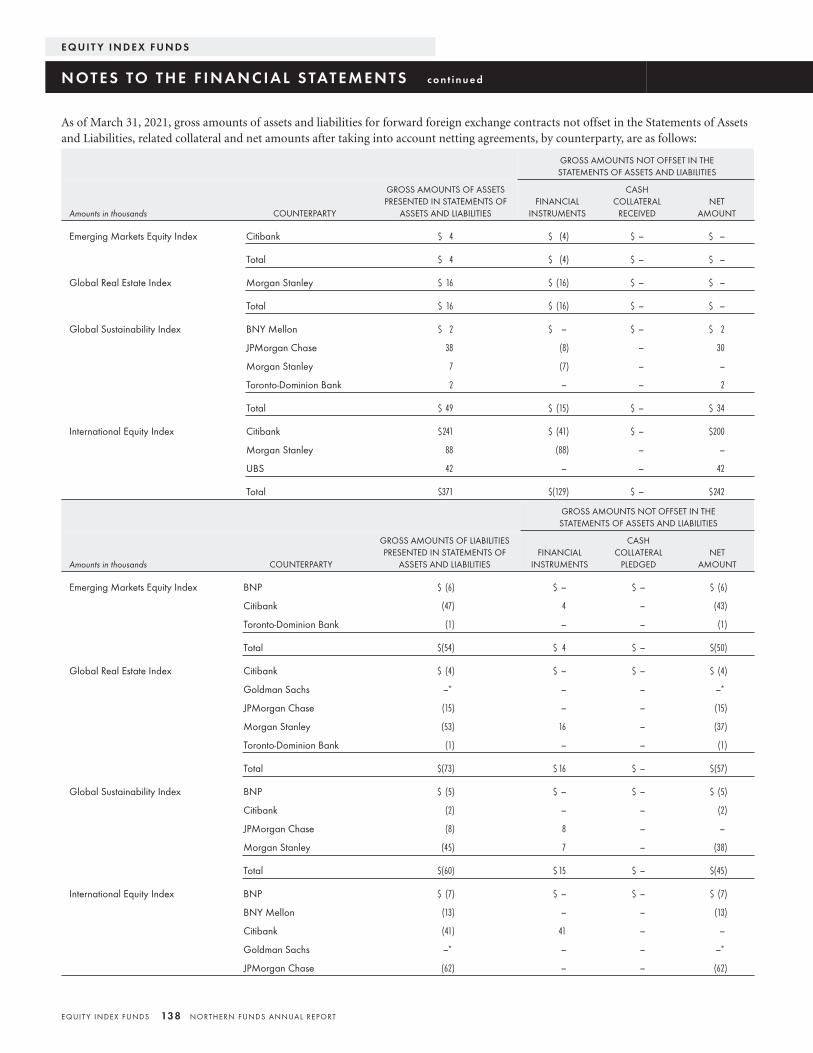
As of March 31, 2021, gross amounts of assets and liabilities for forward foreign exchange contracts not offset in the Statements of Assetsand Liabilities, related collateral and net amounts after taking into account netting agreements, by counterparty, are as follows:
GROSS AMOUNTS NOT OFFSET IN THESTATEMENTS OF ASSETS AND LIABILITIES
Amounts in thousands COUNTERPARTY
GROSS AMOUNTS OF ASSETSPRESENTED IN STATEMENTS OF
ASSETS AND LIABILITIESFINANCIAL
INSTRUMENTS
CASHCOLLATERAL
RECEIVEDNET
AMOUNT
Emerging Markets Equity Index Citibank $ 4 $ (4) $ — $ —
Total $ 4 $ (4) $ — $ —
Global Real Estate Index Morgan Stanley $ 16 $ (16) $ — $ —
Total $ 16 $ (16) $ — $ —
Global Sustainability Index BNY Mellon $ 2 $ — $ — $ 2
JPMorgan Chase 38 (8) — 30
Morgan Stanley 7 (7) — —
Toronto-Dominion Bank 2 — — 2
Total $ 49 $ (15) $ — $ 34
International Equity Index Citibank $241 $ (41) $ — $200
Morgan Stanley 88 (88) — —
UBS 42 — — 42
Total $371 $(129) $ — $242
GROSS AMOUNTS NOT OFFSET IN THESTATEMENTS OF ASSETS AND LIABILITIES
Amounts in thousands COUNTERPARTY
GROSS AMOUNTS OF LIABILITIESPRESENTED IN STATEMENTS OF
ASSETS AND LIABILITIESFINANCIAL
INSTRUMENTS
CASHCOLLATERAL
PLEDGEDNET
AMOUNT
Emerging Markets Equity Index BNP $ (6) $ — $ — $ (6)
Citibank (47) 4 — (43)
Toronto-Dominion Bank (1) — — (1)
Total $(54) $ 4 $ — $(50)
Global Real Estate Index Citibank $ (4) $ — $ — $ (4)
Goldman Sachs —* — — —*
JPMorgan Chase (15) — — (15)
Morgan Stanley (53) 16 — (37)
Toronto-Dominion Bank (1) — — (1)
Total $(73) $ 16 $ — $(57)
Global Sustainability Index BNP $ (5) $ — $ — $ (5)
Citibank (2) — — (2)
JPMorgan Chase (8) 8 — —
Morgan Stanley (45) 7 — (38)
Total $(60) $ 15 $ — $(45)
International Equity Index BNP $ (7) $ — $ — $ (7)
BNY Mellon (13) — — (13)
Citibank (41) 41 — —
Goldman Sachs —* — — —*
JPMorgan Chase (62) — — (62)
E Q U I T Y I N D E X F U N D S
N OT E S TO T H E F I N A N C I A L S TAT E M E N T S c o n t i n u e d
EQUIT Y INDEX FUNDS 138 NORTHERN FUNDS ANNUAL REPORT

GROSS AMOUNTS NOT OFFSET IN THESTATEMENTS OF ASSETS AND LIABILITIES
Amounts in thousands COUNTERPARTY
GROSS AMOUNTS OF LIABILITIESPRESENTED IN STATEMENTS OF
ASSETS AND LIABILITIESFINANCIAL
INSTRUMENTS
CASHCOLLATERAL
PLEDGEDNET
AMOUNT
Morgan Stanley $(585) $ 88 $ — $(497)
Toronto-Dominion Bank (19) — — (19)
Total $(727) $129 $ — $(598)
* Amounts round to less than $1,000.
The following tables set forth, by primary risk exposure, the Funds’ realized gains (losses) and change in unrealized appreciation(depreciation) by type of derivative contract for the fiscal year ended March 31, 2021:
AMOUNT OF REALIZED GAIN (LOSS) ON DERIVATIVE CONTRACTS
Amounts in thousands CONTRACT TYPE STATEMENTS OF OPERATIONS LOCATION VALUE
Emerging Markets Equity Index Equity contracts Net realized gains (losses) on futures contracts $25,769
Foreign exchange contracts Net realized gains (losses) on forward foreign currency exchange contracts 124
Global Real Estate Index Equity contracts Net realized gains (losses) on futures contracts 11,732
Foreign exchange contracts Net realized gains (losses) on forward foreign currency exchange contracts 251
Global Sustainability Index Equity contracts Net realized gains (losses) on futures contracts 7,287
Foreign exchange contracts Net realized gains (losses) on forward foreign currency exchange contracts (114)
International Equity Index Equity contracts Net realized gains (losses) on futures contracts 28,658
Foreign exchange contracts Net realized gains (losses) on forward foreign currency exchange contracts 1,771
Mid Cap Index Equity contracts Net realized gains (losses) on futures contracts 21,729
Small Cap Index Equity contracts Net realized gains (losses) on futures contracts 19,490
Stock Index Equity contracts Net realized gains (losses) on futures contracts 73,259
CHANGE IN UNREALIZED APPRECIATION (DEPRECIATION) ONDERIVATIVE CONTRACTS
Amounts in thousands CONTRACT TYPE STATEMENTS OF OPERATIONS LOCATION VALUE
Emerging Markets Equity Index Equity contracts Net change in unrealized appreciation (depreciation) on futures contracts $(3,264)
Foreign exchange contracts Net change in unrealized appreciation (depreciation) on forward foreign currencyexchange contracts (238)
Global Real Estate Index Equity contracts Net change in unrealized appreciation (depreciation) on futures contracts (797)
Foreign exchange contracts Net change in unrealized appreciation (depreciation) on forward foreign currencyexchange contracts (48)
Global Sustainability Index Equity contracts Net change in unrealized appreciation (depreciation) on futures contracts 3
Foreign exchange contracts Net change in unrealized appreciation (depreciation) on forward foreign currencyexchange contracts 19
International Equity Index Equity contracts Net change in unrealized appreciation (depreciation) on futures contracts (9,000)
Foreign exchange contracts Net change in unrealized appreciation (depreciation) on forward foreign currencyexchange contracts (660)
Mid Cap Index Equity contracts Net change in unrealized appreciation (depreciation) on futures contracts (1,080)
Small Cap Index Equity contracts Net change in unrealized appreciation (depreciation) on futures contracts (1,565)
Stock Index Equity contracts Net change in unrealized appreciation (depreciation) on futures contracts 6,807
E Q U I T Y I N D E X F U N D S
MARCH 31, 2021
NORTHERN FUNDS ANNUAL REPORT 139 EQUIT Y INDEX FUNDS
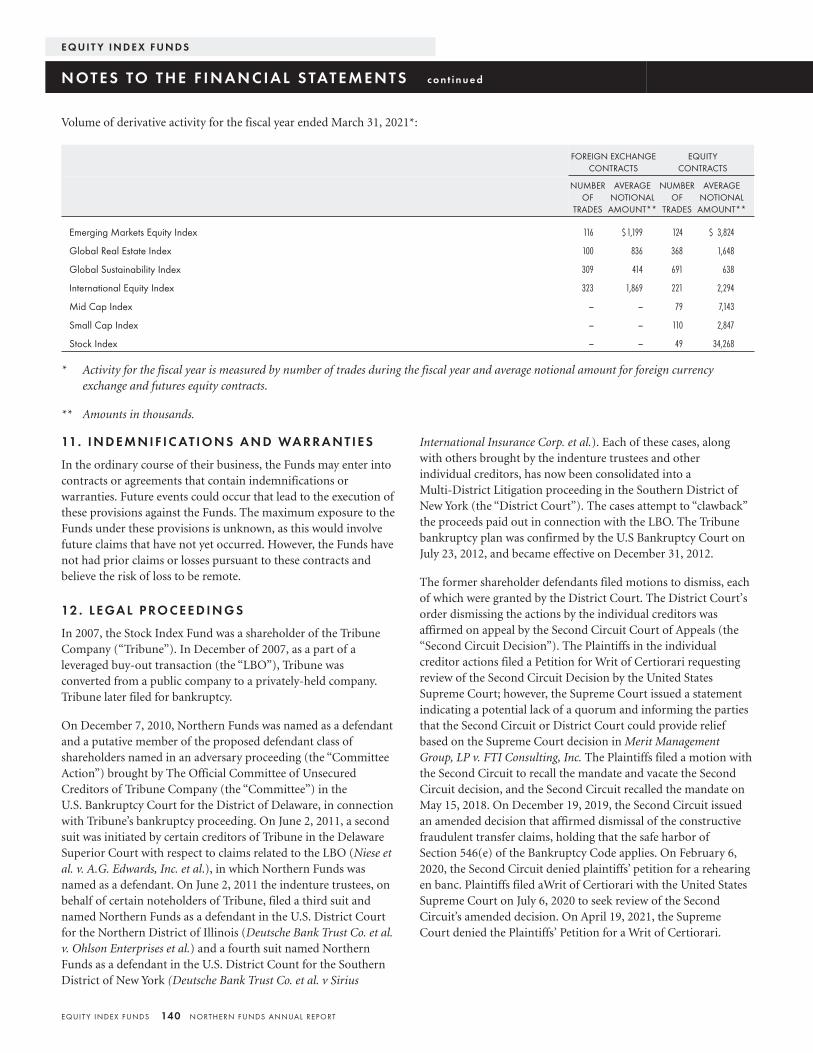
Volume of derivative activity for the fiscal year ended March 31, 2021*:
FOREIGN EXCHANGECONTRACTS
EQUITYCONTRACTS
NUMBEROF
TRADES
AVERAGENOTIONAL
AMOUNT**
NUMBEROF
TRADES
AVERAGENOTIONAL
AMOUNT**
Emerging Markets Equity Index 116 $ 1,199 124 $ 3,824
Global Real Estate Index 100 836 368 1,648
Global Sustainability Index 309 414 691 638
International Equity Index 323 1,869 221 2,294
Mid Cap Index — — 79 7,143
Small Cap Index — — 110 2,847
Stock Index — — 49 34,268
* Activity for the fiscal year is measured by number of trades during the fiscal year and average notional amount for foreign currencyexchange and futures equity contracts.
** Amounts in thousands.
11. I N D E M N I F I C AT I O N S A N D WA R R A N T I E S
In the ordinary course of their business, the Funds may enter intocontracts or agreements that contain indemnifications orwarranties. Future events could occur that lead to the execution ofthese provisions against the Funds. The maximum exposure to theFunds under these provisions is unknown, as this would involvefuture claims that have not yet occurred. However, the Funds havenot had prior claims or losses pursuant to these contracts andbelieve the risk of loss to be remote.
12 . L E GA L P RO C E E D I N G S
In 2007, the Stock Index Fund was a shareholder of the TribuneCompany (“Tribune”). In December of 2007, as a part of aleveraged buy-out transaction (the “LBO”), Tribune wasconverted from a public company to a privately-held company.Tribune later filed for bankruptcy.
On December 7, 2010, Northern Funds was named as a defendantand a putative member of the proposed defendant class ofshareholders named in an adversary proceeding (the “CommitteeAction”) brought by The Official Committee of UnsecuredCreditors of Tribune Company (the “Committee”) in theU.S. Bankruptcy Court for the District of Delaware, in connectionwith Tribune’s bankruptcy proceeding. On June 2, 2011, a secondsuit was initiated by certain creditors of Tribune in the DelawareSuperior Court with respect to claims related to the LBO (Niese etal. v. A.G. Edwards, Inc. et al.), in which Northern Funds wasnamed as a defendant. On June 2, 2011 the indenture trustees, onbehalf of certain noteholders of Tribune, filed a third suit andnamed Northern Funds as a defendant in the U.S. District Courtfor the Northern District of Illinois (Deutsche Bank Trust Co. et al.v. Ohlson Enterprises et al.) and a fourth suit named NorthernFunds as a defendant in the U.S. District Count for the SouthernDistrict of New York (Deutsche Bank Trust Co. et al. v Sirius
International Insurance Corp. et al.). Each of these cases, alongwith others brought by the indenture trustees and otherindividual creditors, has now been consolidated into aMulti-District Litigation proceeding in the Southern District ofNew York (the “District Court”). The cases attempt to “clawback”the proceeds paid out in connection with the LBO. The Tribunebankruptcy plan was confirmed by the U.S Bankruptcy Court onJuly 23, 2012, and became effective on December 31, 2012.
The former shareholder defendants filed motions to dismiss, eachof which were granted by the District Court. The District Court’sorder dismissing the actions by the individual creditors wasaffirmed on appeal by the Second Circuit Court of Appeals (the“Second Circuit Decision”). The Plaintiffs in the individualcreditor actions filed a Petition for Writ of Certiorari requestingreview of the Second Circuit Decision by the United StatesSupreme Court; however, the Supreme Court issued a statementindicating a potential lack of a quorum and informing the partiesthat the Second Circuit or District Court could provide reliefbased on the Supreme Court decision in Merit ManagementGroup, LP v. FTI Consulting, Inc. The Plaintiffs filed a motion withthe Second Circuit to recall the mandate and vacate the SecondCircuit decision, and the Second Circuit recalled the mandate onMay 15, 2018. On December 19, 2019, the Second Circuit issuedan amended decision that affirmed dismissal of the constructivefraudulent transfer claims, holding that the safe harbor ofSection 546(e) of the Bankruptcy Code applies. On February 6,2020, the Second Circuit denied plaintiffs’ petition for a rehearingen banc. Plaintiffs filed aWrit of Certiorari with the United StatesSupreme Court on July 6, 2020 to seek review of the SecondCircuit’s amended decision. On April 19, 2021, the SupremeCourt denied the Plaintiffs’ Petition for a Writ of Certiorari.
E Q U I T Y I N D E X F U N D S
N OT E S TO T H E F I N A N C I A L S TAT E M E N T S c o n t i n u e d
EQUIT Y INDEX FUNDS 140 NORTHERN FUNDS ANNUAL REPORT
The motion to dismiss the Committee Action was also granted bythe District Court. The Plaintiff in the Committee Action alsosought from the District Court leave to amend the complaint withan additional claim for constructive fraudulent transfer basedupon the decision in Merit Management. The motion for leave toamend was denied on April 23, 2019. On June 13, 2019, theDistrict Court entered a final judgment on the claim dismissed.On July 12, 2019, the Trustee filed a notice of appeal stating that itwas appealing the final judgment and the April 23, 2019 decisionand related orders to the Second Circuit Court of Appeals. Theappeal was fully briefed, and argument on the appeal took placeon August 24, 2020. The Second Circuit has not yet issued adecision.
The value of the proceeds received by the Stock Index Fund in theLBO was approximately $790,000, which includes proceeds ofapproximately $372,000 received by the Northern InstitutionalFunds Equity Index Portfolio, which was acquired by the StockIndex Fund in 2012. The Fund cannot predict the outcome ofthese proceedings, but an adverse decision could have a materialimpact on the Fund’s NAV. The Fund intends to vigorously defendthese actions.
On or about February 14, 2020, Marc S. Kirschner, as Trustee forNWHI Litigation Trust (“Litigation Trustee”) and WilmingtonSavings Fund Society, FSB, as indenture Trustee (“IndentureTrustee”) for several series of notes issued by Nine West Holdings,Inc. (“Nine West”), filed separate complaints (docket nos.20-cv-01129 and 20-cv-01136, respectively ) in the United StatesDistrict Court for the Northern District of Illinois against a groupof defendants that includes three Northern Funds that hadinvested in The Jones Group Inc. (“Jones Group”) including theSmall Cap Index Fund. The claim stems from a series of mergertransactions (“Transactions”) entered into by Jones Group, NineWest and others in 2014 that allegedly rendered Jones Groupinsolvent. The matters in these proceedings were transferred fromthe United States District Court for the Northern District ofIllinois to the United States District Court for the SouthernDistrict of New York to centralize the litigation, and were assignedto the Honorable Jed S. Rakoff for coordinated or consolidatedpretrial proceedings. The Fund allegedly received $683,610 as aresult of the Transactions. The Litigation Trustee and IndentureTrustee seek to clawback these proceeds for the benefit of the Trustand the noteholders, respectively, on the basis that they werefraudulent conveyances.On June 29, 2020, the former publicshareholder defendants, including the Funds, filed a motion todismiss on the basis that the payments allegedly made to them inconnection with the Transactions were shielded from thefraudulent conveyance claims under Section 546(e) of theBankruptcy Code. On August 27, 2020, all fraudulent conveyanceclaims against the former public shareholder defendants weredismissed. Plaintiffs appealed from that decision and the actionsare currently on appeal before the U.S. Court of Appeals for theSecond Circuit. The Funds intend to continue to vigorouslydefend themselves against this action.
13 . N E W AC C O U N T I N G P RO N O U N C E M E N T S
In March 2020, the FASB issued Accounting Standards Update(ASU) 2020-04, Reference Rate Reform (Topic 848) “Facilitationof the Effects of Reference Rate Reform on Financial Reporting”(“ASU 2020-04”), which provides optional temporary financialreporting relief from the effect of certain types of contractmodifications due to the planned discontinuation of the LIBORand other interbank-offered based reference rates as of the end of2021. The new guidance is effective for certain referencerate-related contract modifications that occur during the periodMarch 12, 2020 through December 31, 2022, and the adoption ofASU 2020-04 is elective. Management does not believe this updatehas a material impact on the Funds’ financial statements anddisclosures.
14 . L I B O R T R A N S I T I O N
Certain of the Funds’ investments, payment obligations andfinancing terms may be based on floating rates, such as LIBOR,Euro Interbank Offered Rate and other similar types of referencerates (each, a “Reference Rate”). On July 27, 2017, the ChiefExecutive of the UK Financial Conduct Authority (“FCA”), whichregulates LIBOR, announced that the FCA will no longer persuadenor compel banks to submit rates for the calculation of LIBORand certain other Reference Rates after 2021. The FCA and ICEBenchmark Administrator have since announced that mostLIBOR settings will no longer be published after December 31,2021 and a majority of U.S. dollar LIBOR settings will ceasepublication after June 30, 2023. The U.S. Federal Reserve, basedon the recommendations of the New York Federal Reserve’sAlternative Reference Rate Committee (comprised of majorderivative market participants and their regulators), has begunpublishing SOFR that is intended to replace U.S. dollar LIBOR.Proposals for alternative reference rates for other currencies havealso been announced or have already begun publication.Uncertainty related to the liquidity impact of the change in rates,and how to appropriately adjust these rates at the time oftransition, poses risks for the Funds. The effect of any changes to,or discontinuation of, LIBOR on the Funds will depend on,among other things, (1) existing fallback or terminationprovisions in individual contracts and (2) whether, how, andwhen industry participants develop and adopt new reference ratesand fallbacks for both legacy and new instruments and contracts.The expected discontinuation of LIBOR could have a significantimpact on the financial markets in general and may also presentheightened risk to market participants, including publiccompanies, investment advisers, investment companies, andbroker-dealers. The risks associated with this discontinuation andtransition will be exacerbated if the work necessary to effect anorderly transition to an alternative reference rate is not completedin a timely manner. Accordingly, it is difficult to predict the fullimpact of the transition away from LIBOR on the Funds until newreference rates and fallbacks for both legacy and new instrumentsand contracts are commercially accepted and market practicesbecome settled.
E Q U I T Y I N D E X F U N D S
MARCH 31, 2021
NORTHERN FUNDS ANNUAL REPORT 141 EQUIT Y INDEX FUNDS
15 . C O RO N AV I RU S ( C OV I D - 19 ) PA N D E M I C
An outbreak of respiratory disease caused by a novel coronaviruswas first detected in December 2019 and has spread interna-tionally. The outbreak and efforts to contain its spread haveresulted in closing borders and quarantines, restrictinginternational and domestic travel, enhanced health screenings,cancelations, disrupted supply chains and customer activity,responses by businesses (including changes to operations andreducing staff), and have produced general concern anduncertainty. The impact of the coronavirus pandemic, and otherepidemics and pandemics that may arise in the future couldadversely affect national and global economies, individualcompanies and the market in general in a manner and for a periodof time that cannot be foreseen at the present time and mayadversely affect the value, volatility and liquidity of dividend andinterest paying securities. In the event of a pandemic or anoutbreak, there can be no assurance that the Funds and theirservice providers will be able to maintain normal businessoperations for an extended period of time or will not lose theservices of key personnel on a temporary or long-term basis dueto illness or other reasons, and could otherwise disrupt the abilityof the Funds’ service providers to perform essential services.Certain economic and market conditions arising out of apandemic or outbreak could result in a Fund’s inability to achieveits investment objectives, cause the postponement ofreconstitution or rebalance dates for benchmark indices, adverselyaffect the prices and liquidity of the securities and otherinstruments in which a Fund invests, negatively impact a Fund’sperformance, and cause losses on your investment in a Fund.Management is monitoring the development of the pandemic,which was ongoing as of the date of the financial statements, andis evaluating its impact on the financial position and operatingresults of the Funds.
16 . S U B S E Q U E N T E V E N T S
Management has evaluated subsequent events for the Fundsthrough the date the financial statements were issued, and hasconcluded that there are no recognized or non-recognizedsubsequent events relevant for financial statement disclosure.
E Q U I T Y I N D E X F U N D S
N OT E S TO T H E F I N A N C I A L S TAT E M E N T S c o n t i n u e d MARCH 31, 2021
EQUIT Y INDEX FUNDS 142 NORTHERN FUNDS ANNUAL REPORT
To the Shareholders and Board of Trustees of Northern Funds:
Opinion on the Financial Statements and Financial Highlights
We have audited the accompanying statements of assets and liabilities of seven separate portfolios of Northern Funds, comprising theEmerging Markets Equity Index Fund, Global Real Estate Index Fund, Global Sustainability Index Fund, International Equity IndexFund, Mid Cap Index Fund, Small Cap Index Fund, and Stock Index Fund (collectively, the “Funds”), including the schedules ofinvestments, as of March 31, 2021, the related statements of operations for the year then ended, the statements of changes in net assets foreach of the two years in the period then ended, and the financial highlights for each of the five years in the period then ended forEmerging Markets Equity Index Fund, Global Real Estate Index Fund, International Equity Index Fund, Mid Cap Index Fund, Small CapIndex Fund, and Stock Index Fund; the related statement of operations for the year ended March 31, 2021, the statements of changes innet assets for each of the two years in the period then ended, and the financial highlights for the period from July 31, 2020 (com-mencement of class operations) through March 31, 2021 for Global Sustainability Index Fund, and the related notes.
In our opinion, the financial statements and financial highlights present fairly, in all material respects, the financial position of EmergingMarkets Equity Index Fund, Global Real Estate Index Fund, International Equity Index Fund, Mid Cap Index Fund, Small Cap IndexFund, and Stock Index Fund as of March 31, 2021, and the results of their operations for the year then ended, the changes in their netassets for each of the two years in the period then ended, and the financial highlights for each of the five years in the period then ended inconformity with accounting principles generally accepted in the United States of America. Also, in our opinion, the financial statementsand financial highlights present fairly, in all material respects, the financial position of Global Sustainability Index Fund as of March 31,2021, and the results of its operations for the year ended March 31, 2021, the changes in its net assets for each of the two years in theperiod then ended, and the financial highlights for the period from July 31, 2020 (commencement of class operations) through March 31,2021, in conformity with accounting principles generally accepted in the United States of America.
Basis for Opinion
These financial statements and financial highlights are the responsibility of the Funds’ management. Our responsibility is to express anopinion on the Funds’ financial statements and financial highlights based on our audits. We are a public accounting firm registered withthe Public Company Accounting Oversight Board (United States) (PCAOB) and are required to be independent with respect to the Fundsin accordance with the U.S. federal securities laws and the applicable rules and regulations of the Securities and Exchange Commissionand the PCAOB.
We conducted our audits in accordance with the standards of the PCAOB. Those standards require that we plan and perform the audit toobtain reasonable assurance about whether the financial statements and financial highlights are free of material misstatement, whetherdue to error or fraud. The Funds are not required to have, nor were we engaged to perform, an audit of their internal control overfinancial reporting. As part of our audits we are required to obtain an understanding of internal control over financial reporting but notfor the purpose of expressing an opinion on the effectiveness of the Funds’ internal control over financial reporting. Accordingly, weexpress no such opinion.
Our audits included performing procedures to assess the risks of material misstatement of the financial statements and financialhighlights, whether due to error or fraud, and performing procedures that respond to those risks. Such procedures included examining,on a test basis, evidence regarding the amounts and disclosures in the financial statements and financial highlights. Our audits alsoincluded evaluating the accounting principles used and significant estimates made by management, as well as evaluating the overallpresentation of the financial statements and financial highlights. Our procedures included confirmation of securities owned as ofMarch 31, 2021, by correspondence with the custodian and brokers; when replies were not received from brokers, we performed otherauditing procedures. We believe that our audits provide a reasonable basis for our opinion.
/s/ DELOITTE & TOUCHE LLP
Chicago, IllinoisMay 25, 2021
We have served as the auditor of one or more Northern Trust investment companies since 2002.
E Q U I T Y I N D E X F U N D S
R E P O R T O F I N D E P E N D E N T R E G I S T E R E D P U B L I C AC C O U N T I N G F I R M
NORTHERN FUNDS ANNUAL REPORT 143 EQUIT Y INDEX FUNDS
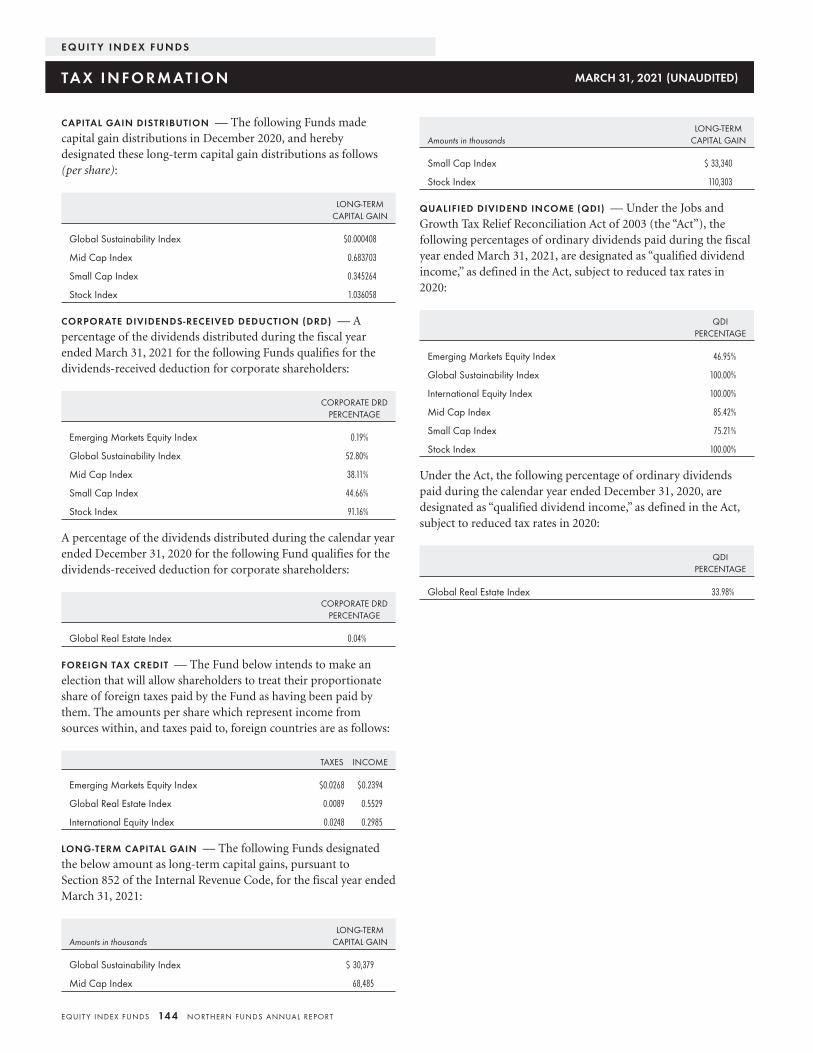
CAPITAL GAIN DISTRIBUTION — The following Funds madecapital gain distributions in December 2020, and herebydesignated these long-term capital gain distributions as follows(per share):
LONG-TERMCAPITAL GAIN
Global Sustainability Index $0.000408
Mid Cap Index 0.683703
Small Cap Index 0.345264
Stock Index 1.036058
CORPORATE DIVIDENDS-RECEIVED DEDUCTION (DRD) — Apercentage of the dividends distributed during the fiscal yearended March 31, 2021 for the following Funds qualifies for thedividends-received deduction for corporate shareholders:
CORPORATE DRDPERCENTAGE
Emerging Markets Equity Index 0.19%
Global Sustainability Index 52.80%
Mid Cap Index 38.11%
Small Cap Index 44.66%
Stock Index 91.16%
A percentage of the dividends distributed during the calendar yearended December 31, 2020 for the following Fund qualifies for thedividends-received deduction for corporate shareholders:
CORPORATE DRDPERCENTAGE
Global Real Estate Index 0.04%
FOREIGN TAX CREDIT — The Fund below intends to make anelection that will allow shareholders to treat their proportionateshare of foreign taxes paid by the Fund as having been paid bythem. The amounts per share which represent income fromsources within, and taxes paid to, foreign countries are as follows:
TAXES INCOME
Emerging Markets Equity Index $0.0268 $0.2394
Global Real Estate Index 0.0089 0.5529
International Equity Index 0.0248 0.2985
LONG-TERM CAPITAL GAIN — The following Funds designatedthe below amount as long-term capital gains, pursuant toSection 852 of the Internal Revenue Code, for the fiscal year endedMarch 31, 2021:
Amounts in thousandsLONG-TERM
CAPITAL GAIN
Global Sustainability Index $ 30,379
Mid Cap Index 68,485
Amounts in thousandsLONG-TERM
CAPITAL GAIN
Small Cap Index $ 33,340
Stock Index 110,303
QUALIFIED DIVIDEND INCOME (QDI) — Under the Jobs andGrowth Tax Relief Reconciliation Act of 2003 (the “Act”), thefollowing percentages of ordinary dividends paid during the fiscalyear ended March 31, 2021, are designated as “qualified dividendincome,” as defined in the Act, subject to reduced tax rates in2020:
QDIPERCENTAGE
Emerging Markets Equity Index 46.95%
Global Sustainability Index 100.00%
International Equity Index 100.00%
Mid Cap Index 85.42%
Small Cap Index 75.21%
Stock Index 100.00%
Under the Act, the following percentage of ordinary dividendspaid during the calendar year ended December 31, 2020, aredesignated as “qualified dividend income,” as defined in the Act,subject to reduced tax rates in 2020:
QDIPERCENTAGE
Global Real Estate Index 33.98%
E Q U I T Y I N D E X F U N D S
TA X I N F O R M AT I O N MARCH 31, 2021 (UNAUDITED)
EQUIT Y INDEX FUNDS 144 NORTHERN FUNDS ANNUAL REPORT
Each Fund has adopted and implemented a Liquidity RiskManagement Program (the “Program”) as required by rule 22e-4under the Investment Company Act of 1940. The Program seeksto assess, manage and review each Fund’s Liquidity Risk.“Liquidity Risk” is defined as the risk that a Fund could not meetrequests to redeem shares issued by the Fund without significantdilution of remaining investors’ interest in the Fund.
The Board has appointed Northern Trust Investments, Inc.(“NTI”), the investment adviser to the Funds, as the programadministrator for the Program. NTI has delegated oversight of theProgram to the Northern Trust Asset Management Credit &Liquidity Risk Committee (the “Committee”).
At a meeting held on November 18-19, 2020, the Board receivedand reviewed the annual written report of the Committee, onbehalf of NTI (the “Report”), concerning the operation of theProgram for the period from October 1, 2019 to September 30,2020 (the “Reporting Period”). The Report addressed theoperation of the Program and assessed its adequacy andeffectiveness of implementation.
The Report summarized the operation of the Program and theinformation and factors considered by the Committee inreviewing the adequacy and effectiveness of the Program’simplementation with respect to each Fund. Such information andfactors included, among other things: (i) the liquidity riskframework used to assess, manage, and periodically review eachFund’s liquidity risk and the results of the assessment; (ii) themethodology and inputs used to classify the liquidity of eachFund’s portfolio investments and the Committee’s assessment thateach Fund’s strategy is appropriate for an open-end mutual fund;(iii) that each Fund held primarily highly liquid assets(investments that the Fund anticipates can be converted to cashwithin 3 business days or less in current market conditionswithout significantly changing their market value); (iv) that noneof the Funds required the establishment of a highly liquidinvestment minimum and the methodology for thatdetermination; (v) confirmation that none of the Funds hadbreached the 15% maximum illiquid security threshold(investments that cannot be sold or disposed of in seven days orless in current market conditions without the sale of theinvestment significantly changing the market value of theinvestment) and the procedures for monitoring compliance withthe limit; and (vi) historical information regarding redemptionsand shareholder concentration in each Fund. The Report alsosummarized the changes made to the Program over the course ofthe year.
Based on the review, the Report concluded that the Program wasbeing effectively implemented and that the Program wasreasonably designed to assess and manage each Fund’s liquidityrisk.
There can be no assurance that the Program will achieve itsobjectives under all circumstances in the future. Please refer toyour Fund’s prospectus for more information regarding theFund’s exposure to liquidity risk and other risks to which it maybe subject.
E Q U I T Y I N D E X F U N D S
L I Q U I D I T Y R I S K M A N AG E M E N T P RO G R A M MARCH 31, 2021 (UNAUDITED)
NORTHERN FUNDS ANNUAL REPORT 145 EQUIT Y INDEX FUNDS
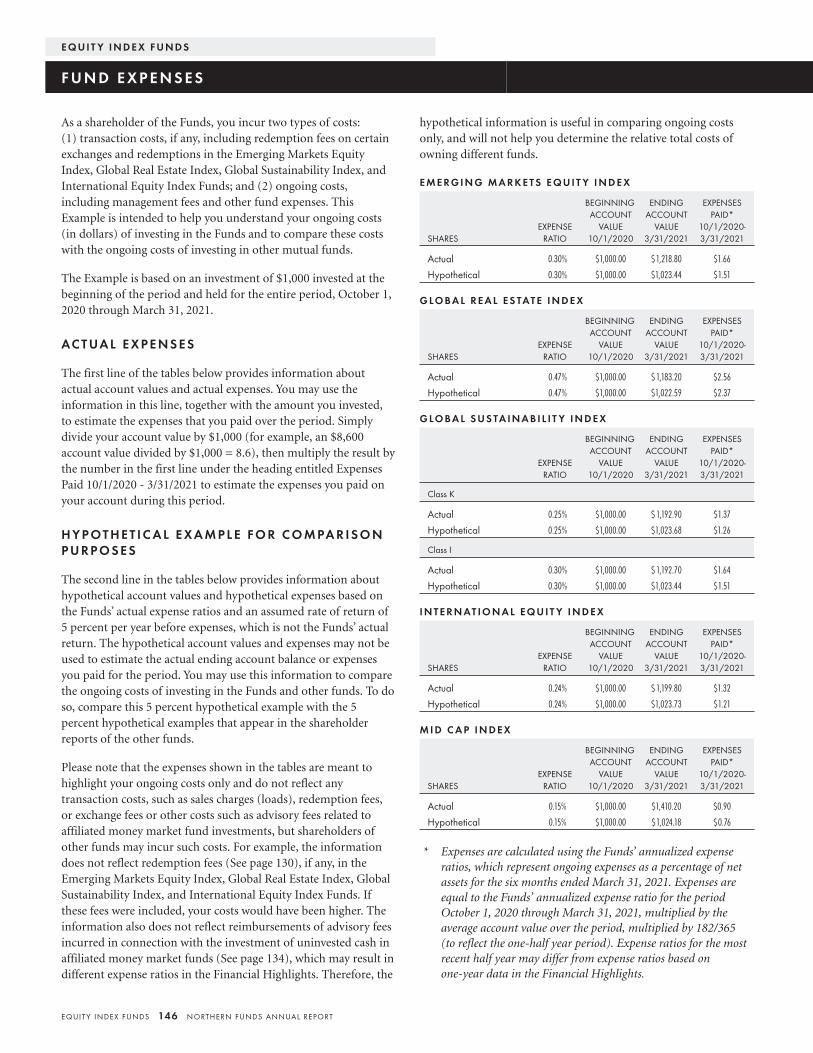
As a shareholder of the Funds, you incur two types of costs:(1) transaction costs, if any, including redemption fees on certainexchanges and redemptions in the Emerging Markets EquityIndex, Global Real Estate Index, Global Sustainability Index, andInternational Equity Index Funds; and (2) ongoing costs,including management fees and other fund expenses. ThisExample is intended to help you understand your ongoing costs(in dollars) of investing in the Funds and to compare these costswith the ongoing costs of investing in other mutual funds.
The Example is based on an investment of $1,000 invested at thebeginning of the period and held for the entire period, October 1,2020 through March 31, 2021.
AC T UA L E X P E N S E S
The first line of the tables below provides information aboutactual account values and actual expenses. You may use theinformation in this line, together with the amount you invested,to estimate the expenses that you paid over the period. Simplydivide your account value by $1,000 (for example, an $8,600account value divided by $1,000 = 8.6), then multiply the result bythe number in the first line under the heading entitled ExpensesPaid 10/1/2020 - 3/31/2021 to estimate the expenses you paid onyour account during this period.
H Y P OT H E T I C A L E X A M P L E F O R C O M PA R I S O NP U R P O S E S
The second line in the tables below provides information abouthypothetical account values and hypothetical expenses based onthe Funds’ actual expense ratios and an assumed rate of return of5 percent per year before expenses, which is not the Funds’ actualreturn. The hypothetical account values and expenses may not beused to estimate the actual ending account balance or expensesyou paid for the period. You may use this information to comparethe ongoing costs of investing in the Funds and other funds. To doso, compare this 5 percent hypothetical example with the 5percent hypothetical examples that appear in the shareholderreports of the other funds.
Please note that the expenses shown in the tables are meant tohighlight your ongoing costs only and do not reflect anytransaction costs, such as sales charges (loads), redemption fees,or exchange fees or other costs such as advisory fees related toaffiliated money market fund investments, but shareholders ofother funds may incur such costs. For example, the informationdoes not reflect redemption fees (See page 130), if any, in theEmerging Markets Equity Index, Global Real Estate Index, GlobalSustainability Index, and International Equity Index Funds. Ifthese fees were included, your costs would have been higher. Theinformation also does not reflect reimbursements of advisory feesincurred in connection with the investment of uninvested cash inaffiliated money market funds (See page 134), which may result indifferent expense ratios in the Financial Highlights. Therefore, the
hypothetical information is useful in comparing ongoing costsonly, and will not help you determine the relative total costs ofowning different funds.
E M E RG I N G M A R K E T S E Q U I T Y I N D E X
SHARESEXPENSE
RATIO
BEGINNINGACCOUNT
VALUE10/1/2020
ENDINGACCOUNT
VALUE3/31/2021
EXPENSESPAID*
10/1/2020-3/31/2021
Actual 0.30% $1,000.00 $1,218.80 $1.66
Hypothetical 0.30% $1,000.00 $1,023.44 $1.51
G LO BA L R E A L E S TAT E I N D E X
SHARESEXPENSE
RATIO
BEGINNINGACCOUNT
VALUE10/1/2020
ENDINGACCOUNT
VALUE3/31/2021
EXPENSESPAID*
10/1/2020-3/31/2021
Actual 0.47% $1,000.00 $ 1,183.20 $2.56
Hypothetical 0.47% $1,000.00 $1,022.59 $2.37
G LO BA L S U S TA I N A B I L I T Y I N D E X
EXPENSERATIO
BEGINNINGACCOUNT
VALUE10/1/2020
ENDINGACCOUNT
VALUE3/31/2021
EXPENSESPAID*
10/1/2020-3/31/2021
Class K
Actual 0.25% $1,000.00 $ 1,192.90 $1.37
Hypothetical 0.25% $1,000.00 $1,023.68 $1.26
Class I
Actual 0.30% $1,000.00 $ 1,192.70 $1.64
Hypothetical 0.30% $1,000.00 $1,023.44 $1.51
I N T E R N AT I O N A L E Q U I T Y I N D E X
SHARESEXPENSE
RATIO
BEGINNINGACCOUNT
VALUE10/1/2020
ENDINGACCOUNT
VALUE3/31/2021
EXPENSESPAID*
10/1/2020-3/31/2021
Actual 0.24% $1,000.00 $ 1,199.80 $1.32
Hypothetical 0.24% $1,000.00 $1,023.73 $1.21
M I D C A P I N D E X
SHARESEXPENSE
RATIO
BEGINNINGACCOUNT
VALUE10/1/2020
ENDINGACCOUNT
VALUE3/31/2021
EXPENSESPAID*
10/1/2020-3/31/2021
Actual 0.15% $1,000.00 $1,410.20 $0.90
Hypothetical 0.15% $1,000.00 $1,024.18 $0.76
* Expenses are calculated using the Funds’ annualized expenseratios, which represent ongoing expenses as a percentage of netassets for the six months ended March 31, 2021. Expenses areequal to the Funds’ annualized expense ratio for the periodOctober 1, 2020 through March 31, 2021, multiplied by theaverage account value over the period, multiplied by 182/365(to reflect the one-half year period). Expense ratios for the mostrecent half year may differ from expense ratios based onone-year data in the Financial Highlights.
E Q U I T Y I N D E X F U N D S
F U N D E X P E N S E S
EQUIT Y INDEX FUNDS 146 NORTHERN FUNDS ANNUAL REPORT
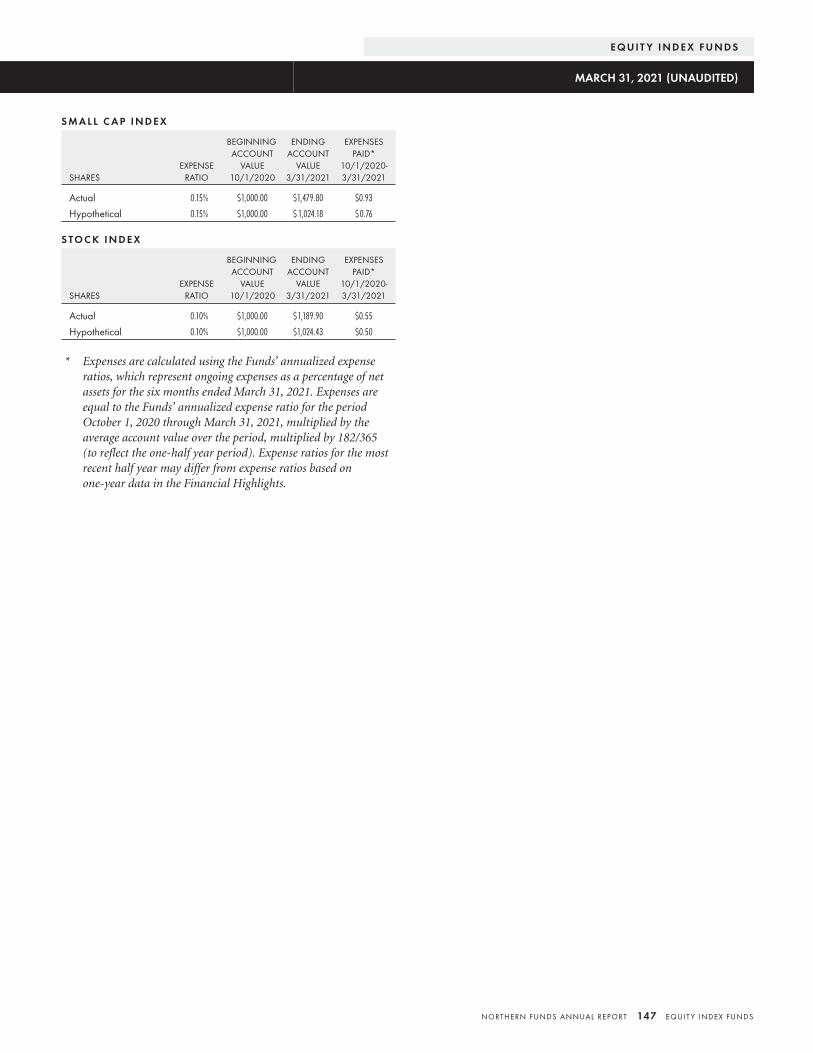
S M A L L C A P I N D E X
SHARESEXPENSE
RATIO
BEGINNINGACCOUNT
VALUE10/1/2020
ENDINGACCOUNT
VALUE3/31/2021
EXPENSESPAID*
10/1/2020-3/31/2021
Actual 0.15% $1,000.00 $1,479.80 $0.93
Hypothetical 0.15% $1,000.00 $ 1,024.18 $0.76
S TO C K I N D E X
SHARESEXPENSE
RATIO
BEGINNINGACCOUNT
VALUE10/1/2020
ENDINGACCOUNT
VALUE3/31/2021
EXPENSESPAID*
10/1/2020-3/31/2021
Actual 0.10% $1,000.00 $1,189.90 $0.55
Hypothetical 0.10% $1,000.00 $1,024.43 $0.50
* Expenses are calculated using the Funds’ annualized expenseratios, which represent ongoing expenses as a percentage of netassets for the six months ended March 31, 2021. Expenses areequal to the Funds’ annualized expense ratio for the periodOctober 1, 2020 through March 31, 2021, multiplied by theaverage account value over the period, multiplied by 182/365(to reflect the one-half year period). Expense ratios for the mostrecent half year may differ from expense ratios based onone-year data in the Financial Highlights.
E Q U I T Y I N D E X F U N D S
MARCH 31, 2021 (UNAUDITED)
NORTHERN FUNDS ANNUAL REPORT 147 EQUIT Y INDEX FUNDS
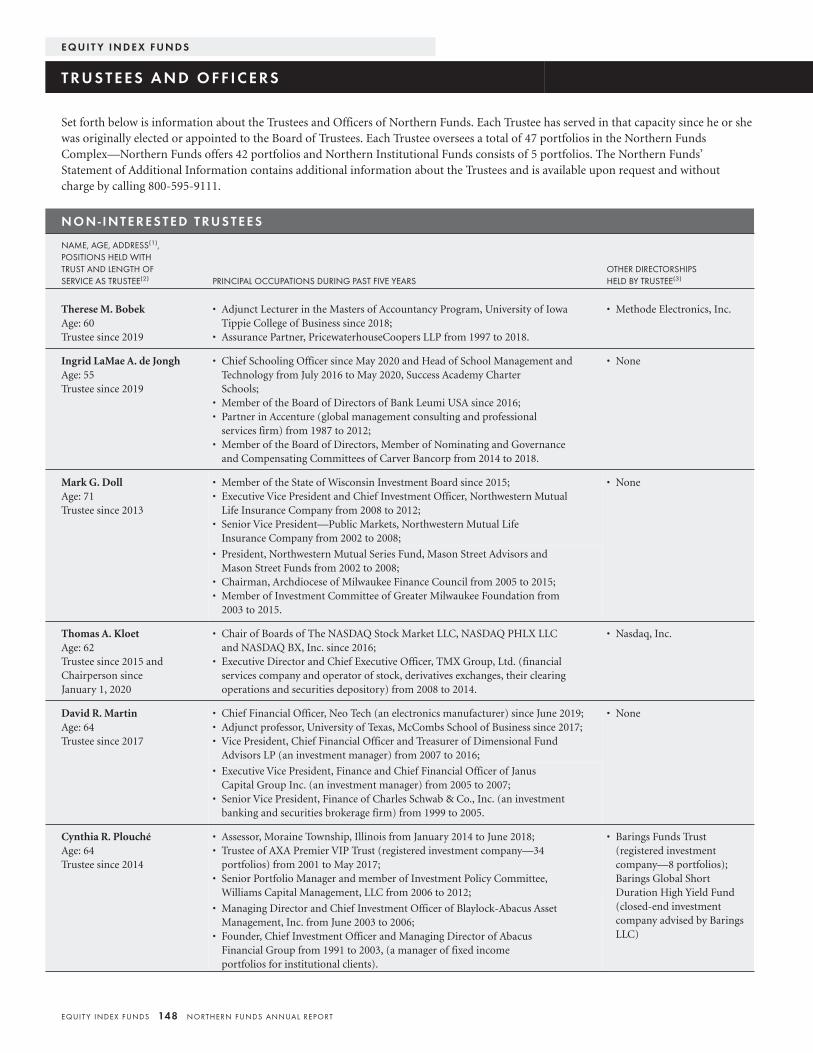
Set forth below is information about the Trustees and Officers of Northern Funds. Each Trustee has served in that capacity since he or shewas originally elected or appointed to the Board of Trustees. Each Trustee oversees a total of 47 portfolios in the Northern FundsComplex—Northern Funds offers 42 portfolios and Northern Institutional Funds consists of 5 portfolios. The Northern Funds’Statement of Additional Information contains additional information about the Trustees and is available upon request and withoutcharge by calling 800-595-9111.
N O N - I N T E R E S T E D T RU S T E E S
NAME, AGE, ADDRESS(1),POSITIONS HELD WITHTRUST AND LENGTH OFSERVICE AS TRUSTEE(2) PRINCIPAL OCCUPATIONS DURING PAST FIVE YEARS
OTHER DIRECTORSHIPSHELD BY TRUSTEE(3)
Therese M. BobekAge: 60Trustee since 2019
• Adjunct Lecturer in the Masters of Accountancy Program, University of IowaTippie College of Business since 2018;
• Assurance Partner, PricewaterhouseCoopers LLP from 1997 to 2018.
• Methode Electronics, Inc.
Ingrid LaMae A. de JonghAge: 55Trustee since 2019
• Chief Schooling Officer since May 2020 and Head of School Management andTechnology from July 2016 to May 2020, Success Academy CharterSchools;
• Member of the Board of Directors of Bank Leumi USA since 2016;• Partner in Accenture (global management consulting and professional
services firm) from 1987 to 2012;• Member of the Board of Directors, Member of Nominating and Governance
and Compensating Committees of Carver Bancorp from 2014 to 2018.
• None
Mark G. DollAge: 71Trustee since 2013
• Member of the State of Wisconsin Investment Board since 2015;• Executive Vice President and Chief Investment Officer, Northwestern Mutual
Life Insurance Company from 2008 to 2012;• Senior Vice President—Public Markets, Northwestern Mutual Life
Insurance Company from 2002 to 2008;
• None
• President, Northwestern Mutual Series Fund, Mason Street Advisors andMason Street Funds from 2002 to 2008;
• Chairman, Archdiocese of Milwaukee Finance Council from 2005 to 2015;• Member of Investment Committee of Greater Milwaukee Foundation from
2003 to 2015.
Thomas A. KloetAge: 62Trustee since 2015 andChairperson sinceJanuary 1, 2020
• Chair of Boards of The NASDAQ Stock Market LLC, NASDAQ PHLX LLCand NASDAQ BX, Inc. since 2016;
• Executive Director and Chief Executive Officer, TMX Group, Ltd. (financialservices company and operator of stock, derivatives exchanges, their clearingoperations and securities depository) from 2008 to 2014.
• Nasdaq, Inc.
David R. MartinAge: 64Trustee since 2017
• Chief Financial Officer, Neo Tech (an electronics manufacturer) since June 2019;• Adjunct professor, University of Texas, McCombs School of Business since 2017;• Vice President, Chief Financial Officer and Treasurer of Dimensional Fund
Advisors LP (an investment manager) from 2007 to 2016;
• None
• Executive Vice President, Finance and Chief Financial Officer of JanusCapital Group Inc. (an investment manager) from 2005 to 2007;
• Senior Vice President, Finance of Charles Schwab & Co., Inc. (an investmentbanking and securities brokerage firm) from 1999 to 2005.
Cynthia R. PlouchéAge: 64Trustee since 2014
• Assessor, Moraine Township, Illinois from January 2014 to June 2018;• Trustee of AXA Premier VIP Trust (registered investment company—34
portfolios) from 2001 to May 2017;• Senior Portfolio Manager and member of Investment Policy Committee,
Williams Capital Management, LLC from 2006 to 2012;
• Barings Funds Trust(registered investmentcompany—8 portfolios);Barings Global ShortDuration High Yield Fund(closed-end investmentcompany advised by BaringsLLC)
• Managing Director and Chief Investment Officer of Blaylock-Abacus AssetManagement, Inc. from June 2003 to 2006;
• Founder, Chief Investment Officer and Managing Director of AbacusFinancial Group from 1991 to 2003, (a manager of fixed incomeportfolios for institutional clients).
E Q U I T Y I N D E X F U N D S
T RU S T E E S A N D O F F I C E R S
EQUIT Y INDEX FUNDS 148 NORTHERN FUNDS ANNUAL REPORT
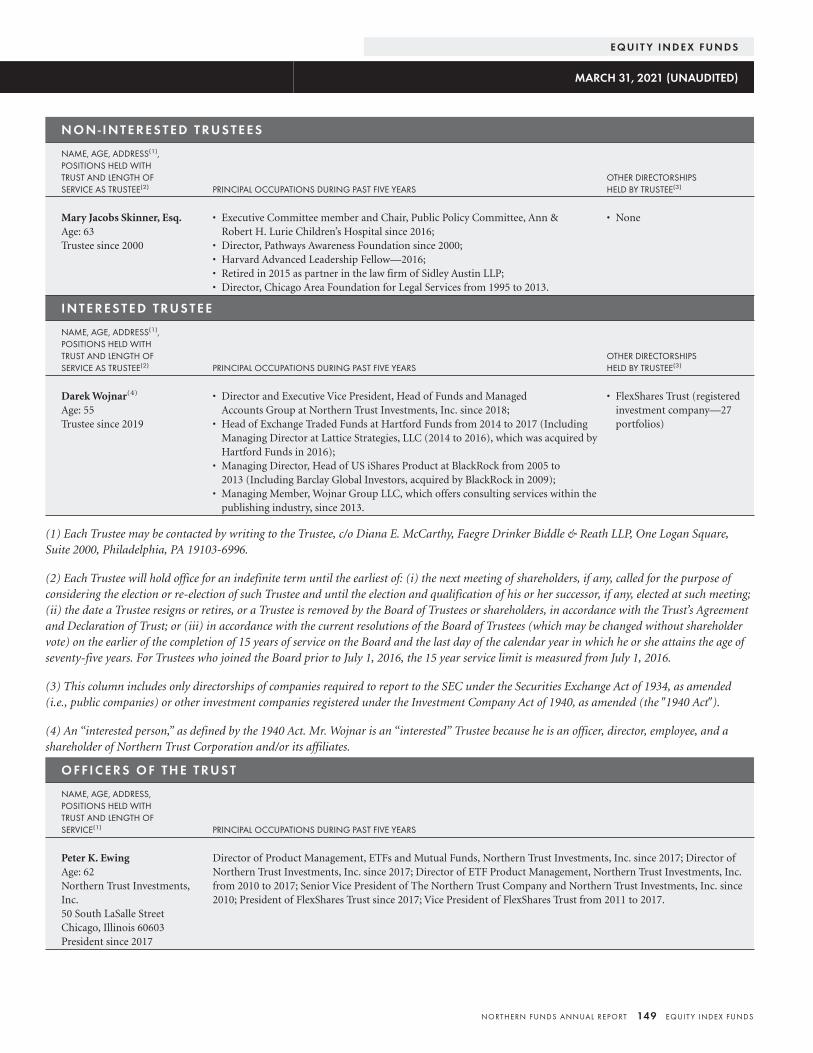
N O N - I N T E R E S T E D T RU S T E E S
NAME, AGE, ADDRESS(1),POSITIONS HELD WITHTRUST AND LENGTH OFSERVICE AS TRUSTEE(2) PRINCIPAL OCCUPATIONS DURING PAST FIVE YEARS
OTHER DIRECTORSHIPSHELD BY TRUSTEE(3)
Mary Jacobs Skinner, Esq.Age: 63Trustee since 2000
• Executive Committee member and Chair, Public Policy Committee, Ann &Robert H. Lurie Children’s Hospital since 2016;
• Director, Pathways Awareness Foundation since 2000;• Harvard Advanced Leadership Fellow—2016;• Retired in 2015 as partner in the law firm of Sidley Austin LLP;• Director, Chicago Area Foundation for Legal Services from 1995 to 2013.
• None
I N T E R E S T E D T RU S T E E
NAME, AGE, ADDRESS(1),POSITIONS HELD WITHTRUST AND LENGTH OFSERVICE AS TRUSTEE(2) PRINCIPAL OCCUPATIONS DURING PAST FIVE YEARS
OTHER DIRECTORSHIPSHELD BY TRUSTEE(3)
Darek Wojnar(4)
Age: 55Trustee since 2019
• Director and Executive Vice President, Head of Funds and ManagedAccounts Group at Northern Trust Investments, Inc. since 2018;
• Head of Exchange Traded Funds at Hartford Funds from 2014 to 2017 (IncludingManaging Director at Lattice Strategies, LLC (2014 to 2016), which was acquired byHartford Funds in 2016);
• Managing Director, Head of US iShares Product at BlackRock from 2005 to2013 (Including Barclay Global Investors, acquired by BlackRock in 2009);
• Managing Member, Wojnar Group LLC, which offers consulting services within thepublishing industry, since 2013.
• FlexShares Trust (registeredinvestment company—27portfolios)
(1) Each Trustee may be contacted by writing to the Trustee, c/o Diana E. McCarthy, Faegre Drinker Biddle & Reath LLP, One Logan Square,Suite 2000, Philadelphia, PA 19103-6996.
(2) Each Trustee will hold office for an indefinite term until the earliest of: (i) the next meeting of shareholders, if any, called for the purpose ofconsidering the election or re-election of such Trustee and until the election and qualification of his or her successor, if any, elected at such meeting;(ii) the date a Trustee resigns or retires, or a Trustee is removed by the Board of Trustees or shareholders, in accordance with the Trust’s Agreementand Declaration of Trust; or (iii) in accordance with the current resolutions of the Board of Trustees (which may be changed without shareholdervote) on the earlier of the completion of 15 years of service on the Board and the last day of the calendar year in which he or she attains the age ofseventy-five years. For Trustees who joined the Board prior to July 1, 2016, the 15 year service limit is measured from July 1, 2016.
(3) This column includes only directorships of companies required to report to the SEC under the Securities Exchange Act of 1934, as amended(i.e., public companies) or other investment companies registered under the Investment Company Act of 1940, as amended (the �1940 Act�).
(4) An “interested person,” as defined by the 1940 Act. Mr. Wojnar is an “interested” Trustee because he is an officer, director, employee, and ashareholder of Northern Trust Corporation and/or its affiliates.
O F F I C E R S O F T H E T RU S T
NAME, AGE, ADDRESS,POSITIONS HELD WITHTRUST AND LENGTH OFSERVICE(1) PRINCIPAL OCCUPATIONS DURING PAST FIVE YEARS
Peter K. EwingAge: 62Northern Trust Investments,Inc.50 South LaSalle StreetChicago, Illinois 60603President since 2017
Director of Product Management, ETFs and Mutual Funds, Northern Trust Investments, Inc. since 2017; Director ofNorthern Trust Investments, Inc. since 2017; Director of ETF Product Management, Northern Trust Investments, Inc.from 2010 to 2017; Senior Vice President of The Northern Trust Company and Northern Trust Investments, Inc. since2010; President of FlexShares Trust since 2017; Vice President of FlexShares Trust from 2011 to 2017.
E Q U I T Y I N D E X F U N D S
MARCH 31, 2021 (UNAUDITED)
NORTHERN FUNDS ANNUAL REPORT 149 EQUIT Y INDEX FUNDS
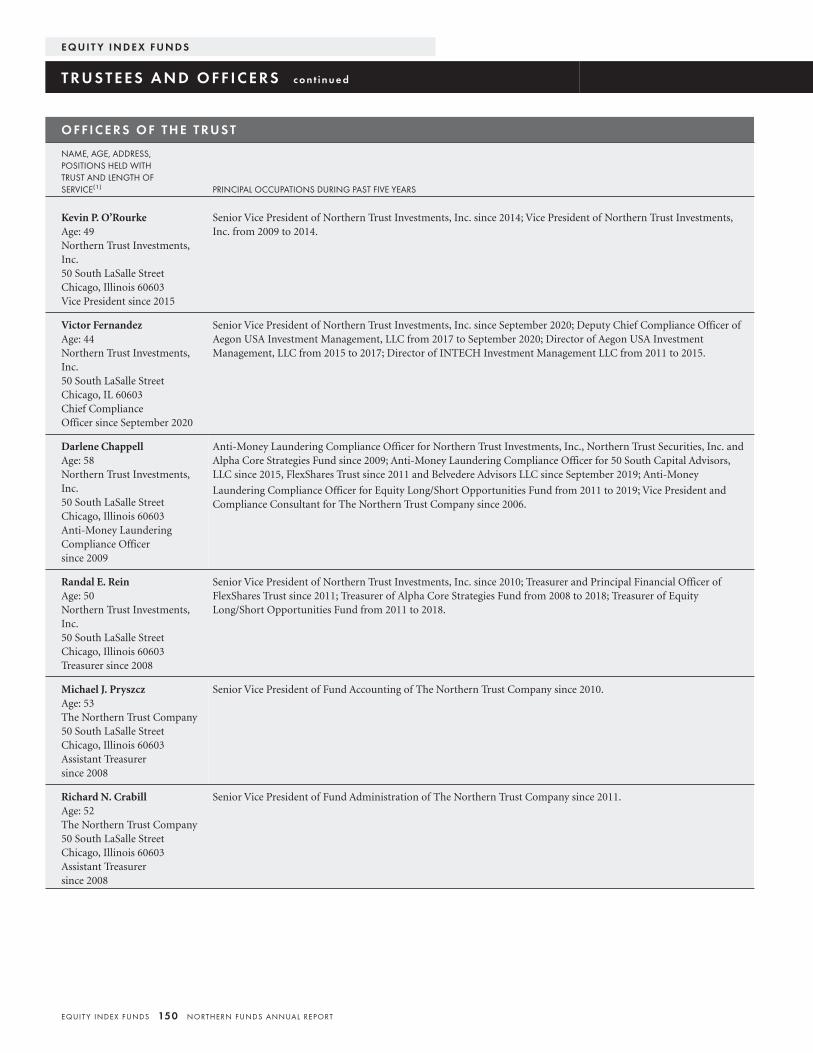
O F F I C E R S O F T H E T RU S T
NAME, AGE, ADDRESS,POSITIONS HELD WITHTRUST AND LENGTH OFSERVICE(1) PRINCIPAL OCCUPATIONS DURING PAST FIVE YEARS
Kevin P. O’RourkeAge: 49Northern Trust Investments,Inc.50 South LaSalle StreetChicago, Illinois 60603Vice President since 2015
Senior Vice President of Northern Trust Investments, Inc. since 2014; Vice President of Northern Trust Investments,Inc. from 2009 to 2014.
Victor FernandezAge: 44Northern Trust Investments,Inc.50 South LaSalle StreetChicago, IL 60603Chief ComplianceOfficer since September 2020
Senior Vice President of Northern Trust Investments, Inc. since September 2020; Deputy Chief Compliance Officer ofAegon USA Investment Management, LLC from 2017 to September 2020; Director of Aegon USA InvestmentManagement, LLC from 2015 to 2017; Director of INTECH Investment Management LLC from 2011 to 2015.
Darlene ChappellAge: 58Northern Trust Investments,Inc.50 South LaSalle StreetChicago, Illinois 60603Anti-Money LaunderingCompliance Officersince 2009
Anti-Money Laundering Compliance Officer for Northern Trust Investments, Inc., Northern Trust Securities, Inc. andAlpha Core Strategies Fund since 2009; Anti-Money Laundering Compliance Officer for 50 South Capital Advisors,LLC since 2015, FlexShares Trust since 2011 and Belvedere Advisors LLC since September 2019; Anti-Money
Laundering Compliance Officer for Equity Long/Short Opportunities Fund from 2011 to 2019; Vice President andCompliance Consultant for The Northern Trust Company since 2006.
Randal E. ReinAge: 50Northern Trust Investments,Inc.50 South LaSalle StreetChicago, Illinois 60603Treasurer since 2008
Senior Vice President of Northern Trust Investments, Inc. since 2010; Treasurer and Principal Financial Officer ofFlexShares Trust since 2011; Treasurer of Alpha Core Strategies Fund from 2008 to 2018; Treasurer of EquityLong/Short Opportunities Fund from 2011 to 2018.
Michael J. PryszczAge: 53The Northern Trust Company50 South LaSalle StreetChicago, Illinois 60603Assistant Treasurersince 2008
Senior Vice President of Fund Accounting of The Northern Trust Company since 2010.
Richard N. CrabillAge: 52The Northern Trust Company50 South LaSalle StreetChicago, Illinois 60603Assistant Treasurersince 2008
Senior Vice President of Fund Administration of The Northern Trust Company since 2011.
E Q U I T Y I N D E X F U N D S
T RU S T E E S A N D O F F I C E R S c o n t i n u e d
EQUIT Y INDEX FUNDS 150 NORTHERN FUNDS ANNUAL REPORT
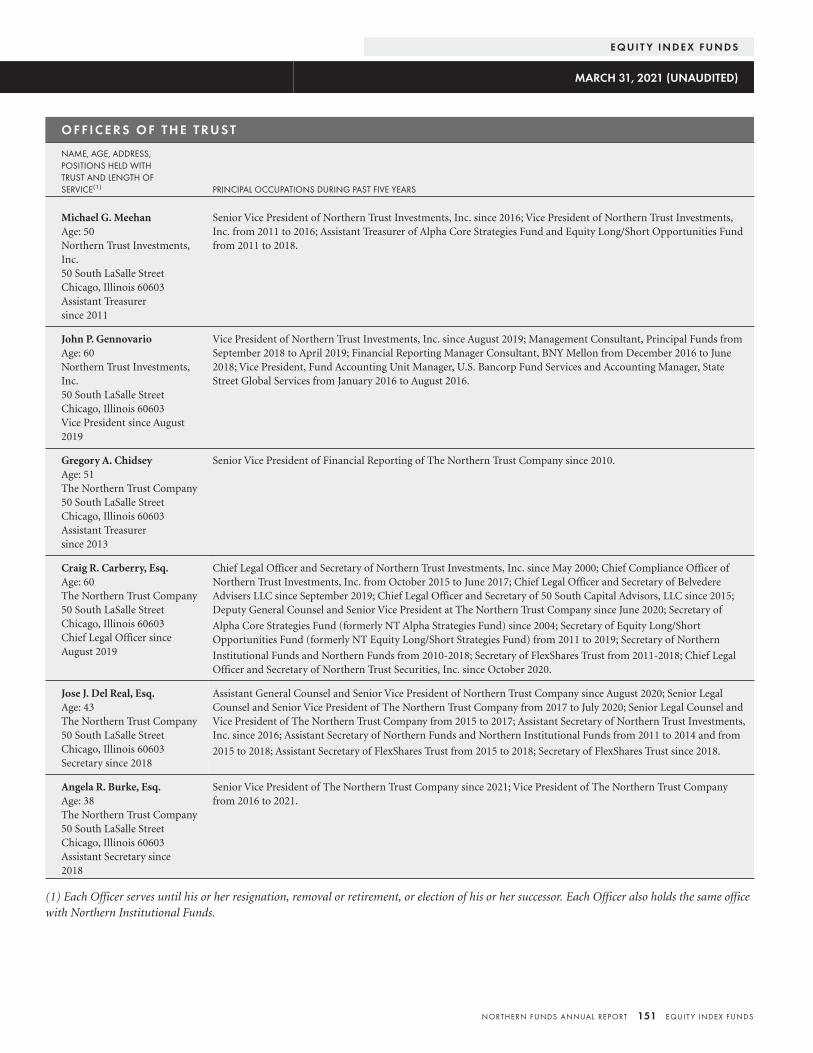
O F F I C E R S O F T H E T RU S T
NAME, AGE, ADDRESS,POSITIONS HELD WITHTRUST AND LENGTH OFSERVICE(1) PRINCIPAL OCCUPATIONS DURING PAST FIVE YEARS
Michael G. MeehanAge: 50Northern Trust Investments,Inc.50 South LaSalle StreetChicago, Illinois 60603Assistant Treasurersince 2011
Senior Vice President of Northern Trust Investments, Inc. since 2016; Vice President of Northern Trust Investments,Inc. from 2011 to 2016; Assistant Treasurer of Alpha Core Strategies Fund and Equity Long/Short Opportunities Fundfrom 2011 to 2018.
John P. GennovarioAge: 60Northern Trust Investments,Inc.50 South LaSalle StreetChicago, Illinois 60603Vice President since August2019
Vice President of Northern Trust Investments, Inc. since August 2019; Management Consultant, Principal Funds fromSeptember 2018 to April 2019; Financial Reporting Manager Consultant, BNY Mellon from December 2016 to June2018; Vice President, Fund Accounting Unit Manager, U.S. Bancorp Fund Services and Accounting Manager, StateStreet Global Services from January 2016 to August 2016.
Gregory A. ChidseyAge: 51The Northern Trust Company50 South LaSalle StreetChicago, Illinois 60603Assistant Treasurersince 2013
Senior Vice President of Financial Reporting of The Northern Trust Company since 2010.
Craig R. Carberry, Esq.Age: 60The Northern Trust Company50 South LaSalle StreetChicago, Illinois 60603Chief Legal Officer sinceAugust 2019
Chief Legal Officer and Secretary of Northern Trust Investments, Inc. since May 2000; Chief Compliance Officer ofNorthern Trust Investments, Inc. from October 2015 to June 2017; Chief Legal Officer and Secretary of BelvedereAdvisers LLC since September 2019; Chief Legal Officer and Secretary of 50 South Capital Advisors, LLC since 2015;Deputy General Counsel and Senior Vice President at The Northern Trust Company since June 2020; Secretary of
Alpha Core Strategies Fund (formerly NT Alpha Strategies Fund) since 2004; Secretary of Equity Long/ShortOpportunities Fund (formerly NT Equity Long/Short Strategies Fund) from 2011 to 2019; Secretary of Northern
Institutional Funds and Northern Funds from 2010-2018; Secretary of FlexShares Trust from 2011-2018; Chief LegalOfficer and Secretary of Northern Trust Securities, Inc. since October 2020.
Jose J. Del Real, Esq.Age: 43The Northern Trust Company50 South LaSalle StreetChicago, Illinois 60603Secretary since 2018
Assistant General Counsel and Senior Vice President of Northern Trust Company since August 2020; Senior LegalCounsel and Senior Vice President of The Northern Trust Company from 2017 to July 2020; Senior Legal Counsel andVice President of The Northern Trust Company from 2015 to 2017; Assistant Secretary of Northern Trust Investments,Inc. since 2016; Assistant Secretary of Northern Funds and Northern Institutional Funds from 2011 to 2014 and from
2015 to 2018; Assistant Secretary of FlexShares Trust from 2015 to 2018; Secretary of FlexShares Trust since 2018.
Angela R. Burke, Esq.Age: 38The Northern Trust Company50 South LaSalle StreetChicago, Illinois 60603Assistant Secretary since2018
Senior Vice President of The Northern Trust Company since 2021; Vice President of The Northern Trust Companyfrom 2016 to 2021.
(1) Each Officer serves until his or her resignation, removal or retirement, or election of his or her successor. Each Officer also holds the same officewith Northern Institutional Funds.
E Q U I T Y I N D E X F U N D S
MARCH 31, 2021 (UNAUDITED)
NORTHERN FUNDS ANNUAL REPORT 151 EQUIT Y INDEX FUNDS
EMERGING MARKETS EQUITY INDEX FUND2,3,4,6,8,10 MID CAP INDEX FUND3,6,10
GLOBAL REAL ESTATE INDEX FUND1,2,3,4,5,6,7,8,10 SMALL CAP INDEX FUND3,8,10
GLOBAL SUSTAINABILITY INDEX FUND1,3,4,5,6,9,10 STOCK INDEX FUND3,5,10
INTERNATIONAL EQUITY INDEX FUND3,4,5,6,8,10
1 Depositary Receipts Risk: Foreign securities may trade in the form of depositary receipts. In addition to investment risks associatedwith the underlying issuer, depositary receipts may expose the Fund to additional risks associated with nonuniform terms that apply todepositary receipt programs, including credit exposure to the depository bank and to the sponsors and other parties with whom thedepository bank establishes the programs, currency, political, economic, market and liquidity risks. Depositary receipts are generallysubject to the same risks as the foreign securities that they evidence or into which they may be converted. Depository receipts may nottrack the price of the underlying foreign securities on which they are based, may have limited voting rights, and may have a distributionsubject to a fee charged by the depository. As a result, equity shares of the underlying issuer may trade at a discount or premium to themarket price of the depository receipts.
2 Emerging Markets Risk: Markets of emerging market countries are less developed and less liquid, subject to greater price volatilityand generally subject to increased economic, political, regulatory and other uncertainties than more developed markets.
3 Equity Market Risk: The value of equity securities owned by the Fund may decline, at times sharply and unpredictably, including inresponse to expected, real or perceived economic, political or financial events in the U.S. or global markets. Equity securities mayfluctuate in value due to economic changes or other events, including but not limited to local or regional events such as war, acts ofterrorism, the spread of infectious illness or other public health issues, recessions or other events or adverse investor sentiment, thataffect individual issuers or large portions of the market.
4 Foreign Securities Risk: Investing in foreign (non-U.S.) securities may result in the Fund experiencing more rapid and extremechanges in value than a fund that invests exclusively in securities of U.S. companies.
5 Large Cap Risk: The stocks of large capitalization companies as a group could fall out of favor with the market, causing the Fund tounderperform investments that focus solely on small- or medium-capitalization stocks.
6 Mid Cap Risk: The stocks of mid-sized companies may be subject to more abrupt or erratic market movements than stocks of larger,more established companies.
7 REIT/Real Estate Risk: Investments in real estate companies will make the Fund more susceptible to risks associated with theownership of real estate and with the real estate industry in general, including lower trading volumes and more abrupt or erratic pricemovements than the overall securities markets. Investing in REITs involves certain unique risks in addition to those risks associated withinvesting in the real estate industry in general.
8 Small Cap Risk: The stocks of smaller companies may be subject to more abrupt, erratic market movements than stocks of larger,more established companies. Small companies may have limited product lines or financial resources, may be dependent on a small orinexperienced management group, and their securities may trade less frequently and in lower volume than the securities of largercompanies, which could lead to higher transaction costs. Generally, the smaller the company size, the greater the risk.
9 Socially Responsible Investment Risk: The socially responsible investment policies of the Fund’s index may restrict the investmentsavailable to the Fund. This could cause the Fund to underperform similar funds that do not have a social responsibility objective.
10 Tracking Risk: The Fund’s performance may vary substantially from the performance of the benchmark index it tracks as a result ofshare purchases and redemptions, transaction costs, expenses and other factors. Market disruptions may have an adverse effect on aFund’s ability to adjust its exposure to the required levels in order to track its index. During periods of market disruption, a Fund’sbenchmark index may postpone periodic rebalancing, causing the index, and in turn the Fund, to deviate from the index statedmethodology and experience returns different from those that would have been achieved under a normal rebalancing or reconstitutionschedule.
E Q U I T Y I N D E X F U N D S
I N V E S T M E N T C O N S I D E R AT I O N S
EQUIT Y INDEX FUNDS 152 NORTHERN FUNDS ANNUAL REPORT
E Q U I T Y I N D E X F U N D S
THIS PAGE INTENTIONALLY LEFT BL ANK
NORTHERN FUNDS ANNUAL REPORT 153 EQUIT Y INDEX FUNDS
E Q U I T Y I N D E X F U N D S
THIS PAGE INTENTIONALLY LEFT BL ANK
EQUIT Y INDEX FUNDS 154 NORTHERN FUNDS ANNUAL REPORT

E Q U I T Y I N D E X F U N D S
THIS PAGE INTENTIONALLY LEFT BL ANK
NORTHERN FUNDS ANNUAL REPORT 155 EQUIT Y INDEX FUNDS
P O R T F O L I O H O L D I N G S
Northern Funds files its complete schedule of portfolio holdingswith the U.S. Securities and Exchange Commission (“SEC”) forthe first and third quarters of each fiscal year as an exhibit to itsreports on Form N-PORT. The Funds’ Forms N-PORT areavailable on the SEC’s web site at sec.gov.
P ROX Y VOT I N G
Northern Funds’ Proxy Voting Policies and Procedures and eachFund’s portfolio securities voting record for the 12-month periodended June 30 are available upon request and without charge byvisiting Northern Funds’ web site at northerntrust.com/funds orthe SEC’s web site at sec.gov or by calling the Northern FundsCenter at 800-595-9111.
E Q U I T Y I N D E X F U N D S
F O R M O R E I N F O R M AT I O N
EQUIT Y INDEX FUNDS 156 NORTHERN FUNDS ANNUAL REPORT
P ROT E C T I N G YO U R P R I VAC Y
Protecting your privacy is important at Northern Funds, which is why we wanted you to know:
▪ We do not sell non-public personal information about our investors or former investors to any outside company.▪ We have policies that limit access to your information to only those people who need it to perform their jobs and provide services to you, and
we have physical, electronic and procedural safeguards that comply with federal standards to guard your personal information.▪ We collect information about you from applications, forms, conversations and your use of our Web site; third parties with your permission;
and your transactions with us, our affiliates and our joint marketing partners.▪ We do not disclose the information we collect about our investors or former investors to anyone, except to companies that perform services
for us, affiliates with whom we have joint marketing agreements such as Northern Trust, (1) for our everyday purposes, such as to processtransactions, maintain accounts, respond to court orders and legal investigations or report to credit bureaus or (2) as permitted by law.
▪ The information includes account balances and account history. You may limit our use or sharing of information about you with our affiliatesand joint marketing partners for marketing purposes by calling 800-595-9111 weekdays from 7:00 a.m. to 5:00 p.m. Central time or bywriting to us at Northern Funds, P.O. Box 75986, Chicago, IL 60675-5986.
If our information sharing practices change, we will send you a revised notice. You can also visit our Web site, northerntrust.com/funds, foran online version of our current privacy notice.
S H A R E H O L D E R CO M M U N I C AT I O N SIn order to help reduce expenses and reduce the amount of mail that you receive, we generally send a single copy of all materials, includingprospectuses, financial reports, proxy statements and information statements to all investors who share the same mailing address, even if morethan one person in a household holds shares of a fund.
If you do not want your mailings combined with those of other members of your household, you may opt-out at any time by contacting theNorthern Funds Center either by telephone at 800-595-9111; by mail at Northern Funds, P.O. Box 75986, Chicago, Illinois 60675-5986; orby sending an e-mail to [email protected].
Not part of the Annual Report
e
SIGN UP FOR E-DELIVERYTo get future shareholder reportsonline and to eliminate mailings, go to:northerntrust.com/e-delivery
IND
XA
NR
(5/2
1)
©2021 Northern Funds