
A feedback-based implementation scheme for batch process optimization

1
Analysis Tools for Integrated Analysis Tools for Integrated Process Optimization: Energy, Process Optimization: Energy,
Emissions, and ThroughputEmissions, and Throughput
33rd World Energy Engineering CongressWashington, DC
December 8-10, 2010
J D Kumana, MS ChEKumana & Associates, Houston, [email protected] (281) 437-5906
2Kumana & Associates, Houston, Texas © 2010
Outline
Background
PEO Methodology
Analysis Tools
Case Study - example
NOTE: “PEO” is a Trademark of ETSI Inc, Candler, NCIt stands for “Process Energy Optimization”

2
3Kumana & Associates, Houston, Texas © 2010
Process Inputs and Outputs
UTILITYSYSTEM
MFGPROCESS
WASTETREATMENTELEC
FUEL
ELEC?
RAW MATGHG
PRODUCT
EFFLUENTDISCHARGE
ENERGY
CONTROLLABLE PARAMETERS• RAW MAT YIELDS
• REACTION KINETICS• UNIT OPERATIONS
• RECYCLE POINTS & RATES• ENERGY CONSUMPTION
PROCESS MODS
HEAT REC + CHP OPT
4Kumana & Associates, Houston, Texas © 2010
Impact on Profits
GHG EMISSIONS
ENERGY COST
WASTE TREATMENT
THROUGHPUT OR CAPACITY
YIELD + KINETICS
ENERGY EFF (SUPPLY)
ENERGY EFF (USAGE)
OPTIMUM RECYCLE
UNIT OPS

3
5Kumana & Associates, Houston, Texas © 2010
Ideally, we should consider both Process and Energy on Integrated Basis
PROCESS MODSBIGGER IMPACT, BUT HIGHER CAP
COST + FINITE POTENTIAL RISK
ENERGY EFFICIENCYSMALLER IMPACT, BUT LOWER CAP
COSTS & ALMOST ZERO RISK
6Kumana & Associates, Houston, Texas © 2010
NOT
MY
JOB
STEAM
POWERELECUTILITY
PARADIGM: Utilities available instantaneously at ZERO costRESULT: Waste Energy in both Process & CHP System
R1
R2 SEP
F1
F2
P1
P2
Y
Process Engineer’s Viewpoint

4
7Kumana & Associates, Houston, Texas © 2010
B1 B2
DA
HRSG
C
Y
GT
condensate
BD
NOTMY
JOB
PARADIGM: Must supply demand at ANY CostRESULT: High Flexibility, Low Efficiency
Utility Engineer’s Viewpoint
8Kumana & Associates, Houston, Texas © 2010
EconomicEnvironment
CHPSystemProcess
• Energy• Emissions• Capacity
Integrated Viewpoint

5
9Kumana & Associates, Houston, Texas © 2010
Process Energy Optimization
Using Energy (fuel + power) to
identify and exploit profitable
opportunities for process
efficiency improvement
10Kumana & Associates, Houston, Texas © 2010
PEO Integrates Process and Energy
Energy Supply,Conversion, &
Distribution Systems
Waste Collection,Reduction, Recovery,
& Discharge
Raw Mat’ls:Feed Stocks,
Coal, etc.
FinishedChemical Products
Chemical Plant“Processing”
Steps (see PFD)
A “high level” view of the Process and Energy Systems
PEOTM looks at the Process and Energy Systems as ONEUnified System
“We had never suspected that using energy differently can improve the process”.
David Broad, Site Mgr. BASF

6
11Kumana & Associates, Houston, Texas © 2010
PEO uses Financial and Technical Models to directly link Engineering w/ Economics
An Engineering Model A Financial Model
THE SYSTEM(EQUIPMENT)
THE PROCESS
¨TEMPERATURES, ETC.¨PRACTICES of PEOPLE¨ TECHNOLOGY
THE BUSINESS UNIT
Power Plant Cost
Center
RAWMATERIALS
ENERGY
SCRAP
DEPRECIATION,TAXES, INSURANCE $
LABOR $
OTHER $
ENERGY $
SCRAP $
NETSALES $
RAW MAT’LEXPENSE $
REWORK
OTHER
LABOR
GROSSSALES $
PROFIT $
G&A andSELLINGEXP$
RETURNS &DISCOUNTS $
REWORK $
• WASTEWATER TREATMENT $,• AIR EMISSIONS $• SOLID WASTEDISPOSAL $
ENVIRONMENTALEMISSIONS
FINISHEDPRODUCT
Optimization Links-- “X% What ifs”: What is the annual K$/yr saving from a 1% or 10% annual improvement in product output, yields, quality, maintenance
effectiveness, operator productivity and energy performance?
Optimization links ?
12Kumana & Associates, Houston, Texas © 2010
PEOTM Methodology
Documentation - process & econ. modelsCorrect product/waste & utility pricingIdentify major $ impacts on Bottom Line, using sensitivity analysis (What If?)Focus on Critical Cost Issues (CCIs)3-phase approach
• Level 1 – rules of thumb, ball park economics • Level 2 – prelim calculations, conceptual design• Level 3 – detailed calcs, vendor quotes

7
13Kumana & Associates, Houston, Texas © 2010
PEO – Key Features
Integrated holistic analysis3-phase approach (increasing levels of effort and accuracy)Collaborative Effort Consultant plays “coach/facilitator” role at Level 1Immediate ResultsImplementation Road MapThorough documentationPlant Ownership and Accountability (KPIs)
14Kumana & Associates, Houston, Texas © 2010
Technical Tool Kit
“COST FLOW” DIAGRAMS for CCIsSTRUCTURED BRAIN-STORMING
PFDs and HMB SIMULATION MODELSOPERATIONAL IMPROVEMENTSEQUIPMENT UPGRADESPINCH ANALYSIS
• PROCESS MODS – higher capacity & yields, less waste• OPTIMIZED HEAT RECOVERY• OPTIMIZED CHP STRUCTURE
ON-LINE UTILITIES MANAGEMENT
Level 1
Levels 2 & 3
Focus of THIS presentation
8
15Kumana & Associates, Houston, Texas © 2010
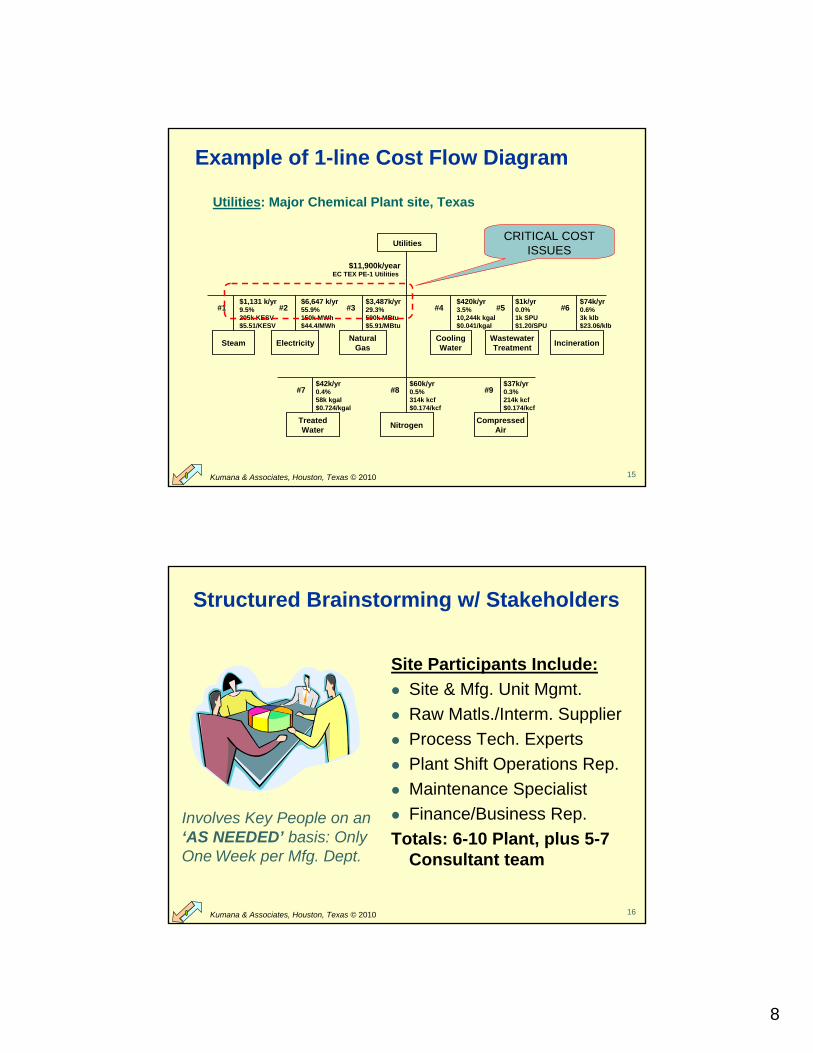
Example of 1-line Cost Flow Diagram
Utilities: Major Chemical Plant site, Texas
#1 #2 #3 #4 #5 #6
#7
Steam Electricity NaturalGas
CoolingWater
WastewaterTreatment Incineration
CompressedAir
TreatedWater
Utilities
$6,647 k/yr55.9%150k MWh$44.4/MWh
$3,487k/yr29.3%590k MBtu$5.91/MBtu
$420k/yr3.5%10,244k kgal$0.041/kgal
$1k/yr0.0%1k SPU$1.20/SPU
$74k/yr0.6%3k klb$23.06/klb
$42k/yr0.4%58k kgal$0.724/kgal
$37k/yr0.3%214k kcf$0.174/kcf
#8$60k/yr0.5%314k kcf$0.174/kcf
$11,900k/yearEC TEX PE-1 Utilities
#9
$1,131 k/yr9.5%205k KESV$5.51/KESV
Nitrogen
CRITICAL COST ISSUES
16Kumana & Associates, Houston, Texas © 2010
Structured Brainstorming w/ Stakeholders
Site Participants Include:Site & Mfg. Unit Mgmt. Raw Matls./Interm. Supplier Process Tech. ExpertsPlant Shift Operations Rep.Maintenance SpecialistFinance/Business Rep.
Totals: 6-10 Plant, plus 5-7 Consultant team
Involves Key People on an ‘AS NEEDED’ basis: OnlyOne Week per Mfg. Dept.

9
17Kumana & Associates, Houston, Texas © 2010
Heat and Material Balance Simulation Models (Process + Utilities)
Essential to get full understanding of where the Raw Materials and Energy goHelps to pin-point areas of opportunitySuggests potential process improvementsServes as design basis for Level 2 Energy Optimization study (process heat recovery as well as CHP system)
18Kumana & Associates, Houston, Texas © 2010
Example PFD – bioprocess plant

10
19Kumana & Associates, Houston, Texas © 2010
Example HMB model – biotech plant
20Kumana & Associates, Houston, Texas © 2010
CHP System Simulation Model

11
21Kumana & Associates, Houston, Texas © 2010
Marginal steam prices - discontinuous
1
1.5
2
2.5
3
3.5
4
4.5
0 25 50 75 100 125 150
Klb/h STEAM GENERATED
Incr
emen
tal S
team
Cos
t, $/
Klb
Target Steam s avings
22Kumana & Associates, Houston, Texas © 2010
Operational Improvements
Establishing & following Best Practices w.r.t. operating proceduresSimple process piping/control modificationsReducing Process variabilityOptimum equipment load allocation policiesMonitoring & TargetingProcess Controls (eg. CHP optimizer, MVC)
Energy Cost savings can be achieved at little or no capital costthrough:

12
23Kumana & Associates, Houston, Texas © 2010
Equipment Efficiency/Capacity Upgrades
PumpsCompressorsMotorsHeat ExchangersFired heaters (furnaces)Boilers (fired and unfired)Steam & Gas TurbinesRefrigeration cycles
Electronic spreadsheet templates are most convenient
24Kumana & Associates, Houston, Texas © 2010
Consumption vs Conversion/Transfer
Energy Consumers:PumpsCompressorsFurnaces (fired heaters)Distillation columns
Energy Converters:BoilersTurbinesMotorsGenerators
• Energy Transfer Devices:Heat exchangers
Efficiency definition is different for each type

13
25Kumana & Associates, Houston, Texas © 2010
Electrical Power Savings, with ASDs
903 MWH/yr
= $24.4 K/yr
ROI = 17.8 %
CONFIDENTIAL
26Kumana & Associates, Houston, Texas © 2010
Pinch Analysis tools
Energy targets Composite CurvesUtilities selection GCCOptimum ∆Tmin Range targetingOptimum HEN design (new) Grid diagram, CP matrix and Driving Force PlotOptimum HEN retrofit RPA, etcProcess Mods appropriate placement, +/- principleOptimum CHP design Total Site analysis

14
27Kumana & Associates, Houston, Texas © 2010
Composite Curves
Qcold
Qhot
Tem
p
Heat Load
Qhot & Qcold are theenergy targets
Pinch Used for Energy
Targeting
Used for Energy
Targeting
28Kumana & Associates, Houston, Texas © 2010
T
CoolingWater
Steam
Process HeatTransfer
DO NOT
• use Steam below Pinch
• use CW above Pinch
• transfer heat from process streams above Pinch to process streams below Pinch
The Pinch Principle

15
29Kumana & Associates, Houston, Texas © 2010
Grand Composite Curve - GCC
T
HREFRIGERATION
COOLING WATER
LP STEAM
HP STEAM
Used for utilities
placement
Used for utilities
placement
30Kumana & Associates, Houston, Texas © 2010
Finding the Global Optimum ∆Tmin
Goal is to identify Near-Optimum ∆Tm range
Total Opercost, K$/yr
∆T
Near-Opt range

16
31Kumana & Associates, Houston, Texas © 2010
Global Economic Optimization
Correct energy pricingAccurate Capital costs, including offsetsRisk-adjusted ROIEnvironmental credits (eg. GHG)Health cost creditsSocial cost credits (eg. disaster relief)Strategic (eg. long-term access to energy sources)
32Kumana & Associates, Houston, Texas © 2010
Grid Diagram identifies Pinch + XP ht tr
H1
H2 C
Pinch
176°
158° 158°
C2140° 140°
C1H 140°
∆Tmin = 18°
XP ht tr is in this HX
212°
248° 86°
104°
356°
266°
17
33Kumana & Associates, Houston, Texas © 2010
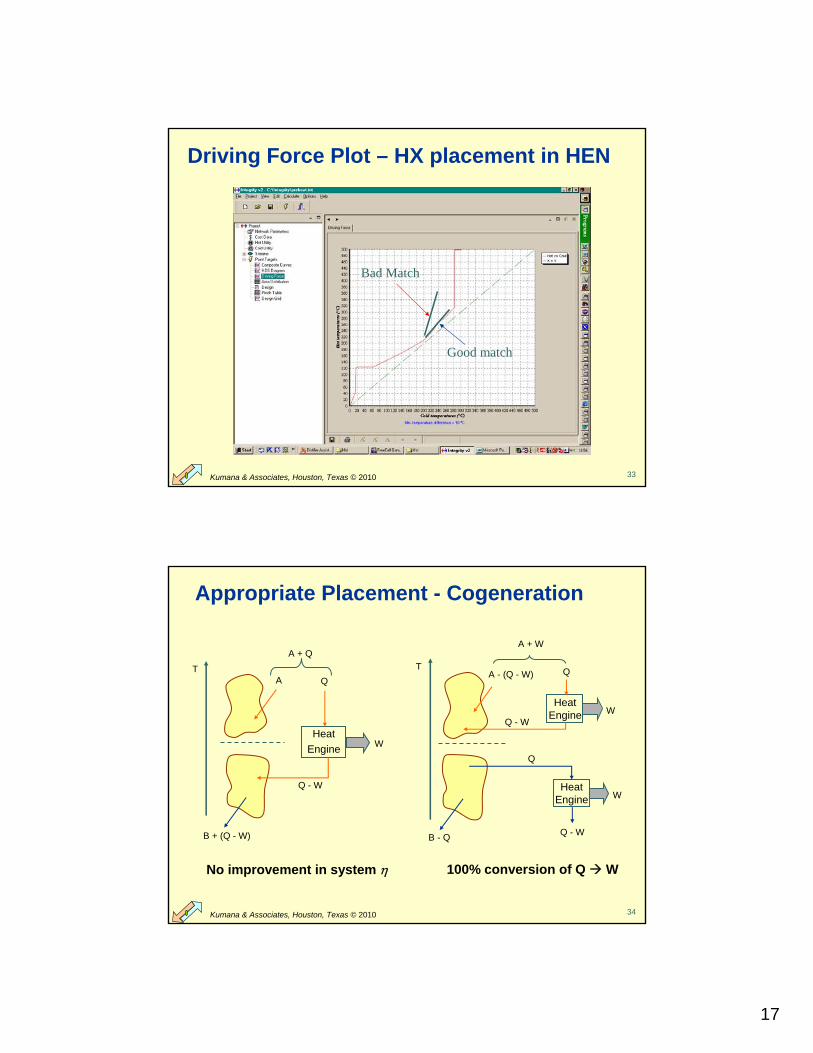
Driving Force Plot – HX placement in HEN
Bad Match
Good match
34Kumana & Associates, Houston, Texas © 2010
100% conversion of Q W
T
HeatEngine W
Q - W
QA - (Q - W)
A + W
HeatEngine W
Q
B - Q Q - W
No improvement in system η
T
HeatEngine W
Q - W
B + (Q - W)
QA
A + Q
Appropriate Placement - Cogeneration

18
35Kumana & Associates, Houston, Texas © 2010
Optimum Utilities: Total Site Analysis
Curves are composites of the RESIDUAL heating and cooling duty segments from the GCCs of individual process units
Net processcooling demand= available heat
Net processheatingdemand
T
wHP
Req. Q
Enthalpy, MMBtu/hCW
BFW
LP stm
36Kumana & Associates, Houston, Texas © 2010
Magnitude of Savings = f (Payback)
Savings vs Payback
0
20
40
60
80
100
120
0 2 4 6 8 10 12
Simple Payback, yr
% o
f Max
Pot
entia
l
Low
High
If you set unrealistic ROI requirements, you will FAIL
Here
or Here?

19
37Kumana & Associates, Houston, Texas © 2010
Why use Pinch Analysis?
Systematic procedure can find best flowsheet structure, even (in fact especially) for very complex plantsQuicker + cheaper than traditional approachRigorous energy targets; we know when to quitSaves energy and capital without sacrificing safety, operating flexibility, or reliabilityFor new plant design, there is an optimum time to do it; but mgmt needs to be educated.
38Kumana & Associates, Houston, Texas © 2010
Ener
gy C
onsu
mpt
ion
Time
PINCH ENABLESSTEP CHANGEIN EFFICIENCYIMPROVEMENT
The Learning Curve …

20
39Kumana & Associates, Houston, Texas © 2010
YES
Traditional Project Workflow
Idea
Data Design
Econ-omics
OK?
Build
NO
• Iteration fromEnd point toBeginning
• Lot of work
• Time consuming
• Expensive
40Kumana & Associates, Houston, Texas © 2010
Project Workflow for PINCH Approach
Idea
Data TargetsTargets
Design
OK?
Build
YES
NO
• Iteration fromIntermediatePoint toBeginning
• Reduced effort
• Faster
• Cheaper
Econ
21
41Kumana & Associates, Houston, Texas © 2010
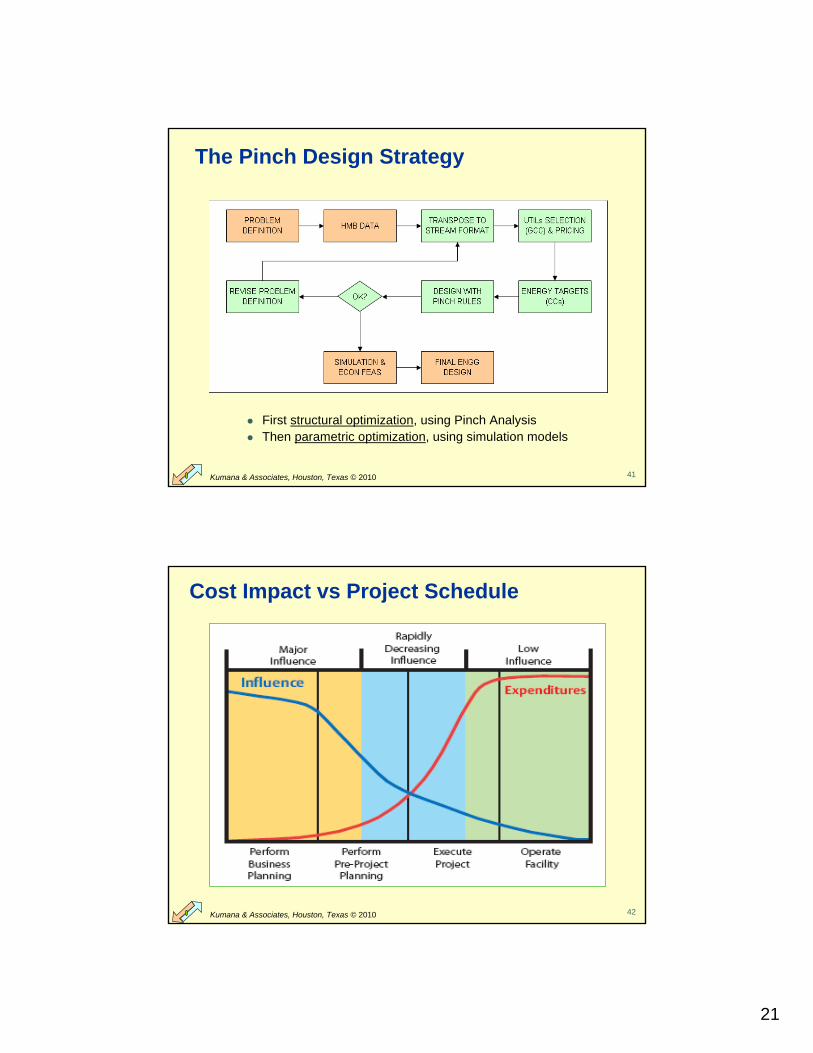
The Pinch Design Strategy
First structural optimization, using Pinch AnalysisThen parametric optimization, using simulation models
42Kumana & Associates, Houston, Texas © 2010
Cost Impact vs Project Schedule

22
43Kumana & Associates, Houston, Texas © 2010
Best Times for PFD Optimization
44Kumana & Associates, Houston, Texas © 2010
Typical On-line CHP s/w Architecture
Hydrogen Fuel Steam Water ElectricityUtility Systems
External Utilities Contracts
Emissions Regulations
ProcessIndustrialSite
Real‐Time Optimizer finds the best way to operate all utilities subject to contractual, environmental and operational constraints
OptimumUtilitiesOperationsReport
Measurements
OptimumSet Points
Key Performance IndicatorsMonitoringand AccountingReports

23
45Kumana & Associates, Houston, Texas © 2010
Case Study – generic BioTech plant
High-value biomass product
Fermentation + evaporation + drying
Design based on scale-up of lab process
8000 hours per yr operation
46Kumana & Associates, Houston, Texas © 2010
Simplified PFD

24
47Kumana & Associates, Houston, Texas © 2010
Base Case Utility Consumption & Costs
What would YOU do to improve process efficiency & economics ?
(includes Dryer steam duty)
48Kumana & Associates, Houston, Texas © 2010
Level 1 PEO idea: Btm Cycle Cogen
• Operate Boiler at max design pr (600 psig)
• Add new superheating section (to 700 F)
• Add new Back Pressure Stm Turbexhausting at 175 psig
PRELIM RESULTGood economicsWarrants more study
STBOILER
KW

25
49Kumana & Associates, Houston, Texas © 2010
Level 2 PEO study: Energy Targets
QH target = 15.2 MMBtu/h, vs 24 MMBtu/h actual use
EVAP OH VAPEVAP DUTY
DRYERVAC JET EXHAUST
50Kumana & Associates, Houston, Texas © 2010
Grand Composite Curve partial MVR
CW
175# steam
MVR Vac jet exhaust
Evap duty
Evap OH vapor
Dryer duty

26
51Kumana & Associates, Houston, Texas © 2010
Revised CCs with right-sized MVR
Vac jet exh Dryer duty
Evaporation duty
MVR disch vapor
Residual EvapOH vapor
52Kumana & Associates, Houston, Texas © 2010
PFD for Optimum Process Configuration

27
53Kumana & Associates, Houston, Texas © 2010
Optimized Utility Costs & Savings
• Minor changes Major opex savings (energy + CO2 + WWT)• New cream separator + recycle improves yield• New fermenter cooling design saved 50% of Rfg (not described)• 60% smaller cogeneration project capital savings• Negligible technical risk; Zero commercial risk• Straight-forward methodology (minimal trial & error)
54Kumana & Associates, Houston, Texas © 2010
Summary
Quickly Present and Implement SolutionsUser Friendly Reports
Jump Starts Program, Instant CredibilityCreates Immediate $$ Results
Identifies Most Valuable SolutionsUses Financial & Technical Tools
Saves Time, Maximizes ResultsFocuses on Critical Cost Issues
Doable Solutions, Commit to ImplementInvolves Your Key People
Lowers Unit Cost of Finished ProductIntegrates Process and Energy
BenefitsFeatures
28
55Kumana & Associates, Houston, Texas © 2010
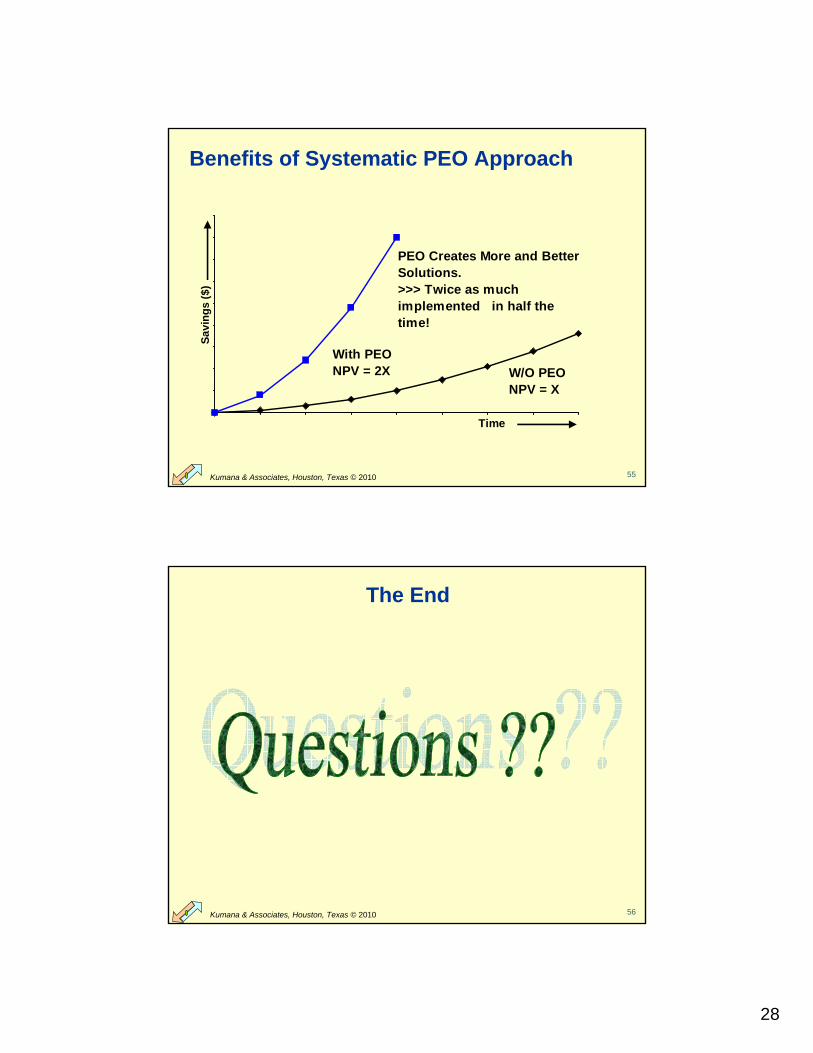
Benefits of Systematic PEO Approach
Time
Savi
ngs
($)
With PEONPV = 2X W/O PEO
NPV = X
PEO Creates More and Better Solutions.>>> Twice as much implemented in half the time!
56Kumana & Associates, Houston, Texas © 2010
The End
Copyright © 2022 FDOKUMEN