Delft University of Technology Process optimization for ...
140
Delft University of Technology Process optimization for polyhydroxyalkanoate (PHA) production from waste via microbial enrichment cultures Korkakaki, Emma DOI 10.4233/uuid:7b757b94-c395-424f-8907-e797f5153c04 Publication date 2017 Document Version Final published version Citation (APA) Korkakaki, E. (2017). Process optimization for polyhydroxyalkanoate (PHA) production from waste via microbial enrichment cultures. https://doi.org/10.4233/uuid:7b757b94-c395-424f-8907-e797f5153c04 Important note To cite this publication, please use the final published version (if applicable). Please check the document version above. Copyright Other than for strictly personal use, it is not permitted to download, forward or distribute the text or part of it, without the consent of the author(s) and/or copyright holder(s), unless the work is under an open content license such as Creative Commons. Takedown policy Please contact us and provide details if you believe this document breaches copyrights. We will remove access to the work immediately and investigate your claim. This work is downloaded from Delft University of Technology. For technical reasons the number of authors shown on this cover page is limited to a maximum of 10.
-
Upload
khangminh22 -
Category
Documents
-
view
0 -
download
0
Transcript of Delft University of Technology Process optimization for ...

Delft University of Technology
Process optimization for polyhydroxyalkanoate (PHA) production from waste via microbialenrichment cultures
Korkakaki, Emma
DOI10.4233/uuid:7b757b94-c395-424f-8907-e797f5153c04Publication date2017Document VersionFinal published versionCitation (APA)Korkakaki, E. (2017). Process optimization for polyhydroxyalkanoate (PHA) production from waste viamicrobial enrichment cultures. https://doi.org/10.4233/uuid:7b757b94-c395-424f-8907-e797f5153c04
Important noteTo cite this publication, please use the final published version (if applicable).Please check the document version above.
CopyrightOther than for strictly personal use, it is not permitted to download, forward or distribute the text or part of it, without the consentof the author(s) and/or copyright holder(s), unless the work is under an open content license such as Creative Commons.
Takedown policyPlease contact us and provide details if you believe this document breaches copyrights.We will remove access to the work immediately and investigate your claim.
This work is downloaded from Delft University of Technology.For technical reasons the number of authors shown on this cover page is limited to a maximum of 10.

Process optimization for
polyhydroxyalkanoates (PHA)
production from waste via microbial
enrichment cultures
Emmanouela (Emma) Korkakaki


Process optimization for
polyhydroxyalkanoates (PHA)
production from waste via microbial
enrichment cultures
Proefschrift
ter verkrijging van de graad van doctor
aan de Technische Universiteit Delft,
op gezag van de Rector Magnificus Prof. ir. K.C.A.M. Luyben,
voorzitter van het College voor Promoties,
in het openbaar te verdedigen op
maandag 9 oktober om 15:00 uur
Door
Emmanouela KORKAKAKI
Master of Science in Chemical Engineering
Aristoteles-Universiteit van Thessaloniki, Griekenland
geboren te Chania, Griekenland.

This dissertation has been approved by the
promotor: Prof.dr.ir. M.C.M. van Loosdrecht and
copromotor: Dr. ir. R. Kleerebezem
Composition of the doctoral committee:
Rector Magnificus, Delft University of Technology, chairperson
Prof.dr.ir. M.C.M. van Loosdrecht, Delft University of Technology, promotor
copromotor: Dr. ir. R. Kleerebezem Delft University of Technology, copromotor
Independent members:
Prof. dr. D. Brdjanovic, Delft University of Technology/IHE Institute
Prof. dr. A. Mosquera-Corral University of Santiago de Compostela, Spain
Dr. A. Soares Cranfield University, UK
Prof. dr. G. Eggink Wageningen University, the Netherlands
Prof. dr. ir. J.B. van Lier Delft University of Technology
Prof. dr. G.J. Witkamp Delft University of Technology, reserve
© 2017, Emmanouela Korkakaki
All rights reserved
ISBN: 978-94-6299-702-8
Published by: Ridderprint

To my parents


TABLE OF CONTENTS
Summary ................................................................................................................................ i
Samenvatting .............................................................................................................................. v
Chapter 1. General introduction ............................................................................................. 1
Chapter 2. PHA production from the organic fraction of municipal solid waste
(OFMSW): overcoming the inhibitory matrix .......................................................................... 11
Chapter 3. Survival of the fastest: selective removal of the side population for enhanced
PHA production in a mixed substrate enrichment ................................................................. 35
Chapter 4. Impact of phosphate limitation on polyhydroxyalkanoate (PHA) production
in a feast-famine process ......................................................................................................... 57
Chapter 5. Storage competition on glucose in short SRTs: an electron acceptor
dynamics study ........................................................................................................................ 75
Chapter 6. General conclusions and outlook ....................................................................... 99
References ............................................................................................................................ 105
About the author ..................................................................................................................... 115
List of publications ................................................................................................................. 117


SUMMARY

Summary
ii
Polyhydroxyalkanoates (PHA) are compounds naturally produced by microorganisms, with many
industrial applications, either as bioplastics or as precursors for production of chemicals. Until
now, industrial PHA production was conducted with pure strains of bacteria fed with well-
defined feedstocks, making the overall process non-economically feasible. The last decades
research on PHA was devoted on producing them in open enrichment cultures using wastewater
as substrate, and making the process continuous, decreasing the production costs. Laboratory
research with well-defined VFA-based substrates enables high accumulation of PHA, up to
90wt% of the total biomass. After demonstrating the potential for PHA production via
enrichment cultures, research was devoted on applying this research. Several wastestreams and
operational conditions were used to test PHA production on pilot scale and maybe on short
notice on industrial scale. Until now, it was shown that also when using fermented industrial
wastewater (e.g. paper mill, food) a high cellular PHA-content could be achieved.
The object of this thesis was to tackle problems associated with PHA production when operating
the process using wastewater and to make it feasible to apply the strategy universally.
In the first chapter general information about PHA (process- and material- based) are given.
In the second chapter leachate from the source separated organic fraction of municipal solid
waste (OFMSW) was evaluated as a substrate for polyhydroxyalkanoates (PHA) production.
Initially, biomass enrichment was conducted directly on leachate in a feast-famine regime.
Maximization of the cellular PHA content of the enriched biomass yielded to a low PHA content
(29 wt%), suggesting that the selection for PHA-producers was unsuccessful. When the substrate
for the enrichment was switched to a synthetic volatile fatty acid (VFA) mixture -resembling the
VFA carbon composition of the leachate- the PHA-producers gained the competitive advantage
and dominated. Subsequent accumulation with leachate in nutrient excess conditions resulted in a
maximum PHA content of 78wt%. Based on the experimental results, enriching a PHA-
producing community in a “clean” VFA stream, and then accumulating PHA from a stream that
does not allow for enrichment but does enable a high cellular PHA content, enables a high
cellular PHA content, contributing to the economic feasibility of the process. The estimated
overall PHA yield on substrate can be increased four-fold, in comparison to direct use of the
complex matrix for both enrichment and accumulation.
The success of enriching PHA-producers in a feast-famine regime strongly depends on the
substrate utilized. A distinction can be made between substrates that select for PHA-producers
(e.g. volatile fatty acids) and substrates that select for growing organisms (e.g. methanol). In the
third chapter the feasibility of using such a mixed substrate for PHA-production was evaluated.
A sedimentation step was introduced in the cycle after acetate depletion and the supernatant

Summary
iii
containing methanol was discharged. This process configuration resulted in an increased
maximum PHA storage capacity of the biomass from 48wt% to 70wt%. A model based on the
experimental results indicated that the length of the pre-settling period and the supernatant
volume that is discharged play a significant role for the elimination of the side population. The
difference of the kinetic properties of the two different populations determines the success of the
proposed strategy.
Double-limitation systems have shown to induce polyhydroxyalkanoates (PHA) production in
chemostat studies limited in e.g. carbon and phosphate. In the fourth chapter the impact of
double substrate limitation on the enrichment of a PHA producing community was studied in a
sequencing batch process. Enrichments at different C/P concentration ratios in the influent were
established and the effect on the PHA production capacity and the enrichment community
structure was investigated. Experimental results demonstrated that when a double limitation is
imposed at a C/P ratio in the influent in a range of 150 (C-mol/mol), the P-content of the
biomass and the specific substrate uptake rates decreased. Nonetheless, the PHA storage capacity
remained high (with a maximum of 84 wt%). At a C/P ratio of 300, competition in the microbial
community is based on phosphate uptake, and the PHA production capacity is lost. Biomass
specific substrate uptake rates are a linear function of the cellular P-content, offering advantages
for scaling-up the PHA production process due to lower oxygen requirements.
In the fifth chapter, PHA accumulating microbial enrichment cultures were established in an
anaerobic/aerobic sequencing batch reactor (SBR) with glucose as sole substrate. The effect of
different solid retention times (SRT; 2 and 4 days) on PHA accumulation were investigated. The
experimental results revealed that at both SRT conditions, glucose was first stored anaerobically
as glycogen with energy generation from lactate fermentation. Subsequently lactate and glycogen
were fermented to acetate and propionate in the anaerobic phase. At 2 d SRT operation, during
the aerobic phase the fermentation products where rapidly sequestered by aerobic PHA
accumulating microorganisms. When (limiting) nutrients were applied under aerobic conditions
PHA formation occurred under anaerobic conditions. At a longer SRT of 4 days the
fermentation products where already sequestered in the anaerobic phase into PHA by glycogen
accumulating organisms (GAO). In all systems the glucose uptake rate was very fast (-2.7 C-
mol/C-mol/h), making it the primary competition factor. Under the conditions tested direct
conversion of glucose to PHA was not possible.
In the sixth chapter some recommendations and questions that remain unanswered are
addressed. As suggested, process could be improved by using a continuous system which would
include a settling tank for the removal of carbon that is slowly consumed and leads to growth of

Summary
iv
“inert” biomass. The possibility of operating the process at lower oxygen concentrations, or
completely anoxically, is also discussed.

SAMENVATTING

Samenvatting
vi
Polyhydroxyalkanoaten (PHA) zijn verbindingen die natuurlijk geproduceerd worden door
micro-organismen, met veel industriële applicaties, zoals bio plastic of als precursor voor de
productie van chemicaliën. Tot nu toe was industriële PHA-productie uitgevoerd met pure
culture stammen van bacteriën, gevoed met goed gedefinieerde toevoer, wat het algehele proces
economisch onhaalbaar maakt. De afgelopen decennia was het onderzoek naar PHA toegespitst
op de productie in open ophopingsculturen met gebruik van afvalwater als substraat, en het
continu maken van het proces, om de productiekosten te reduceren. Laboratoriumonderzoek
met goed-gedefinieerde, op vluchtige vetzuren gebaseerde substraten maakt hoge accumulatie van
PHA mogelijk, tot 90 % w/w van de totale biomassa. Na het demonstreren van de potentie voor
PHA productie via ophopingsculturen, werd het onderzoek gewijd aan het toepassen van deze
bevindingen. Verschillende afvalstromen en operationele omstandigheden zijn gebruikt om PHA
productie te testen op pilot schaal en misschien kan dat op korte termijn op industriële schaal
getest worden. Tot nu toe was aangetoond dat ook wanneer gefermenteerd industrieel afvalwater
wordt gebruikt (bijv. van papierfabriek, eten), een hoge cellulaire PHA-fractie bereikt kan
worden.
Het doel van dit proefschrift is om problemen te tackelen die geassocieerd zijn met PHA
productie wanneer het proces wordt uitgevoerd met afvalwater, het uitvoerbaar te maken en de
strategie universeel toe te passen.
In het eerste hoofdstuk wordt de algemene informatie over PHA (proces en materiaal
gebaseerd) gegeven.
In het tweede hoofdstuk is percolaat, dat gescheiden is van de organische fractie van vast
huishoudelijk afval, geëvalueerd als substraat voor PHA productie. Aanvankelijk werd de
verrijking van biomassa direct uitgevoerd op percolaat in een ‘feast-famine’ regime, waar periodes
van hoge beschikbaarheid van voeding (feast) worden afgewisseld met periodes van afwezigheid
ervan (famine). Maximalisering van de cellulaire PHA fractie in de verrijkte biomassa resulteerde
in een lage PHA fractie (29% w/w), wat suggereerde dat de selectie voor PHA producenten niet
succesvol was. Toen het substraat voor de verrijking werd gewisseld naar een mix van synthetisch
vluchtig vetzuren (VFA), lijkend op de VFA koolstof samenstelling van het percolaat, kregen de
PHA producenten een competitief voordeel en namen ze de overhand. Vervolgens resulteerde de
ophoping, met percolaat en gedurende een overmaat van voedingstoffen, in een maximale PHA
content van 78% w/w. Gebaseerd op de resultaten zorgt verrijking van een PHA-producerende
culture in een “schone” VFA stroom, met ophoping van PHA uit een stroom die niet bijdraagt
aan de verrijking, voor een hoge cellulaire PHA concentratie en draagt het daardoor bij aan de
economische haalbaarheid van het proces. De geschatte overall PHA opbrengst op substraat kan

Samenvatting
vii
verviervoudigd worden, in vergelijking tot direct gebruik van de complexe matrix voor zowel
verrijking als ophoping.
Het succes van de verrijking van PHA-producenten in een ‘feast-famine’ regime is zeer
afhankelijk van het gebruikte substraat. Er kan onderscheid worden gemaakt tussen substraten
die selecteren voor PHA-producenten (zoals vluchtige vetzuren) en substraten die selecteren
voor het groeien van organismen (zoals methanol). In het derde hoofdstuk werd de
haalbaarheid van het gebruik van een combinatie van substraten in PHA productie onderzocht.
Na de acetaat-depletie werd een sedimentatie stap geïntroduceerd en werd het supernatant, met
daarin methanol, afgevoerd. Deze opzet van het proces zorgde voor een stijging in maximale
PHA opslagcapaciteit van de biomassa van 48% w/w naar 70% w/w. Een model, gebaseerd op
de experimentele data, liet zien dat de lengte van de periode voor de sedimentatie en het volume
van het supernatant een significante rol spelen in eliminatie van de nevenpopulatie. Het verschil
in kinetische eigenschappen tussen de twee verschillende populaties bepaald het succes van de
voorgestelde strategie. Van dubbel-limitatie systemen is bekend dat ze PHA-productie induceren
in chemostaatstudies die limiteren in bijvoorbeeld koolstof en fosfaat. In het vierde hoofdstuk
werd de impact van dubbelle limitatie op de verrijking van een PHA-producerende culture
bestudeerd in een discontinu batchproces. Verrijkingen werden opgezet met verschillende C/P
concentratie ratio’s in de invoer en zowel het effect op de PHA-productie capaciteit, als de
structuur van de ophopingsculture werden onderzocht. De experimentele resultaten lieten zien
dat een dubbele limitatie, met een C/P ratio in de invoer van 150(C-mol/mol), zorgde voor een
verlaging zowel van de P-fractie in de biomassa als de opnamesnelheid van het substraat.
Desalniettemin bleef de PHA opslagcapaciteit hoog, met een maximum van 84% w/w. Bij een
C/P ratio van 300 is de competitie in de microbiële culture gebaseerd op de opname van fosfaat
en raakt de PHA productiecapaciteit verloren. De snelheid van biomassa specifieke
substraatopname is lineair aan de cellulaire P-fractie, wat voordelen biedt voor het opschalen van
het PHA productieproces door de lagere zuurstofbehoefte.
In het vijfde hoofdstuk werden PHA ophopende microbiële ophopingscultures opgezet in een
anaerobe/aerobe discontinue batchreactor (SBR), met glucose als enige substraat. Het effect van
verschillende biomassa retentietijden (SRT; 2 en 4 dagen) op PHA ophoping werd onderzocht.
De resultaten toonden aan dat, onder beide SRT condities, glucose eerst anaeroob werd
opgeslagen als glycogeen met energieproductie door lactaatfermentatie. Vervolgens werden
lactaat en glycogeen gefermenteerd tot acetaat en propionaat in de anaerobe fase. Bij een SRT
van 2 dagen werden de fermentatieproducten tijdens de aerobe fase snel opgeslagen door de
aerobe PHA ophopende micro-organismen. Wanneer (gelimiteerde) voedingstoffen werden

Samenvatting
viii
toegevoegd onder aerobe omstandigheden, vond de vorming van PHA plaats onder anaerobe
condities. Bij een langere SRT van 4 dagen, werden de fermentatieproducten al vastgelegd in
PHA tijdens de anaerobe fase door glycogeen accumulerende organismen (GAO). De glucose
opnamesnelheid was zeer hoog (-2.7 C-mol/C-mol/h) in alle systemen, wat het de belangrijkste
competitiefactor maakt. Onder de geteste omstandigheden was de directe omzetting van glucose
naar PHA niet mogelijk.
In het zesde hoofdstuk worden een aantal aanbevelingen en onbeantwoorde vragen behandeld.
Zoals gesuggereerd kan het proces worden verbeterd door gebruik van een continu systeem, met
een bezinkingstank voor het verwijderen van langzaam geconsumeerde koolstof die zorgt voor de
groei van “inerte” biomassa. De mogelijkheid om het proces te laten plaatsvinden onder lage
zuurstofconcentraties, of helemaal zonder zuurstof, wordt ook besproken.

Chapter 1. GENERAL
INTRODUCTION

Chapter 1
2
1.1. Wastewater systems
Modern human evolution and more specifically, formation of societies and industrialization can
be directly related to the amount of generated waste (Figure 1.1). Since people started forming
societies waste disposal became a significant concern, due to the health risks generated from poor
sanitation. Decentralized wastewater system (e.g. privy vaults, cesspools, dry sewage collection)
were predominantly used in urban and rural areas during the ancient times (ancient Greece and
Rome) (Angelakis et al. 2005). However, industrialization led to the wastewater treatment system
upgrade. In the 19th century the sewage system was introduced to urban areas, due to population
growth, construction of public water supplies, and public health concerns. The current
wastewater treatment facilities depend on the country (developed versus developing), the society
needs and the local legislations. Briefly, with regard to developed countries, it is generally
conducted in three basic steps. In the primary treatment step, the soluble pollutants are being
separated from the insoluble ones via physical separation (mainly sedimentation). The separated
liquid phase is directed to the secondary treatment –the so-called biological wastewater
treatment- where the soluble pollutants are removed by microorganisms (activated sludge
process). After this step the effluent is usually clean and can be directly discharged to the natural
ecosystem. However, depending the country’s legislations there might be a need of tertiary
treatment where disinfection occurs before discharge to the natural environment (sea, rivers,
aquifers) (Metcalf et al. 1991).
Traditionally, the main focus on the wastewater treatment is the removal of constituents that
would decrease the dissolved oxygen (DO) level in the water where the treated effluent is
discharged. This decrease results from the metabolism of aquatic microorganisms that consume
pollutants at the expense of oxygen, such as organic compounds, nitrogen, and phosphorus. In
this step, these soluble pollutants are transformed to an innocuous form, such as carbon dioxide
or nitrogen gas, and in biomass, which can be separated by sedimentation.

Chapter 1
3
Figure 1.1: Waste generation over human evolution. Image retrieved from http://www.zerowasteeurope.eu/2013/03/.
With regard to the biological wastewater treatment, the organic carbon is transformed to biomass
and carbon dioxide (Grady et al. 1980). Additionally, nutrient removal is conducted biologically in
zones, under different environmental conditions (aerobic-anaerobic-anoxic, depending the
desired result) for nitrogen and/or phosphorus removal. This zone separation can be
accomplished either in space (separate tanks – continuous stirred tank reactor -CSTR) or in time
(sequencing batch reactors – SBR). Another important process of the biological wastewater
treatment is the anaerobic digestion, where the insoluble organic matter is converted to carbon
dioxide and methane. At this step, also excess biomass that has been generated from the previous
processes is degraded.
However, the increased amount of waste that needs to be treated has generated multiple
problems, since they require large amount of space and water. Additionally, the exhaustion of
natural resources has generated a new perception on the wastewater treatment; the resource
recovery one. The current approach on treating wastewater is focused on saving space, and
recovering mainly water, but also nitrogen, phosphorus and even more complicated compounds,
such as cellulose and alginate. The process has become more compact (i.e. with granular sludge
technology), more efficient and more sustainable (i.e. generation of valuable side-products, such
as biogas, bioethanol, bioplastics and with regard to nutrient removal the anaerobic ammonium
oxidation-Anammox process).

Chapter 1
4
1.2. Microbial competition in biological wastewater treatment
In nature there is continuous battle for resources between the inhabitants from macro till micro-
scale. The common needs that are shared between the microorganisms (either in terms of energy
or elements) lead to a continuous competition in ecosystems. Microorganisms use different
mechanisms to outcompete each other. The mechanisms used have a big spectrum, from kinetic
characteristics, motility, production of toxic substances, or other characteristics (e.g. settling
ability). When designing a biological wastewater treatment plant, the efficiency of a process
depends mainly on the type of microorganisms that will prevail.
Competition is what defines the biomass distribution in the enhanced biological phosphorus
removal (EBPR) process. Feeding carbon anaerobically, requires energy for the uptake of the
substrate. Under these conditions only microorganisms that have the ability to produce somehow
energy (from hydrolysis of an internally stored polymer, such as poly-P or glycogen) can
outcompete other types of biomass (Fuhs et al. 1975, Marais v et al. 1983). However, the winner
of this competition can be either poly-phosphate accumulating organisms (PAOs) or glycogen-
accumulating organisms (GAOs). The first group of microorganisms (PAOs) are the ones that
perform the desirable biological phosphorus removal, while when GAOs dominate, the P
removal efficiency of the process is poor. Research has shown that the winner of this
competition strongly depends on the pH, temperature and carbon over phosphorus ratio in the
influent (Lopez-Vazquez et al. 2009b).
Another representative example of microbial competition in wastewater systems is the feast-
famine regime or intermittent substrate feeding. The general bacterial metabolism comprises of
the uptake of the substrate and then the intracellular metabolism of the imported substrate. The
main advantage for the substrate to be directed towards polyhydroxyalkanoates (PHA) storage
instead of growth is the much higher uptake rate when carbon is flowing towards PHA
production. Additionally, since this operation takes place under substrate limitation, the cells need
to equilibrate their growth all over the cycle. By using solely PHA for growth, the growth rate is
constant even during the famine (lack of external substrate) period (Kleerebezem et al. (2007a)).
1.3. PHA: an important polymer
PHA are polyesters produced by bacteria for energy and carbon storage. Depending the initial
carbon source fed to the bacteria and exact pathway followed different monomers are formed
resulting in a material with a wide range of properties comparable to petrochemical plastics.
Depending the number of carbon atoms of the monomer they are divided into short-chain length
(scl) PHA (3-5 carbon atoms) and medium-chain length (mcl) PHA (6-14 carbon atoms) (Lee

Chapter 1
5
1996) (Figure 1.2). Depending their monomeric structure they display a variety of properties; they
are thermoplastics, biodegradable, piezoelectric, they can be either brittle or elastic, they have
functional groups, they display a big spectrum of molecular weights starting from 20,000 D, they
are non-linear optically active, hydrophobic and gas is not permeable (Chen 2009b).
Figure 1.2: Short- and medium-chain length PHA Chen 2010.
For the aforementioned reasons, these “natural” polymers are of great interest for either
replacing existing plastics, or for serving as precursors for the formation of chemicals (Chen
2009b).
The bacterial metabolism for the formation of PHA is extensively studied, since it was shown to
play a significant role for several (wastewater treatment) processes (Van Loosdrecht et al. 1997).
Four different pathways have been found till now where PHA is produced, but due to the
emphasis on open system, focus will be given on the polyphosphate accumulating
organisms/glycogen accumulating organisms (PAOs/GAOs) metabolism and the feast-famine
regime. The entire metabolism of PHA is related to acetyl-CoA, since it is the driver for 3-
hydroxyalkanoyl-CoA production. In principle, in open systems, what initiates the storage is the
need of the cells to maintain stable growth conditions. For reason of simplicity acetate will be
assumed the model substrate for both cases.
Looking at the first process, the PAO/GAO system, in the environment there is cycling of
electron acceptor, oxygen. During this operation, acetate is fed anaerobically (lack of electron
acceptor). For the transport of acetate there is need for energy (ATP) which is provided either by
the hydrolysis of intracellular stored polyphosphate (if PAOs are dominating the system) or
glycogen (in the case of GAOs). Thus, acetate is transported intracellularly and activated to
acetyl-coA. Two units of acetyl-coA are condensed to acetoacetyl-CoA and further reduced
hydroxybutyryl-CoA which is incorporated to the polymeric chain of PHB. When the cells enter

Chapter 1
6
the aerobic phase, PHA is used for growth and to replenish the glycogen and/or polyphosphate
pools (Figure 1.3).
Figure 1.3: Metabolism of PHA in the PAO/GAO system (Acevedo et al. 2012).
The second case of PHA metabolism in open system is the feast-famine regime. This process is
also known as intermittent carbon feeding. Substrate (acetate in the figure) is provided to the cells
at the beginning of the cycle (feast phase). After the depletion of the substrate, in the lack of the
external carbon source, only the microorganisms that have the ability to store carbon
intracellularly have the ability to survive. On one hand the stable growth rate provided by the
degradation of PHA and on the other hand the shortcut on the metabolism of acetate which
leads to faster uptake rates, gives raise to dominance of PHA producers solely under these
conditions. In this operation the energy needed for acetate/propionate transport and acetyl-coA
activation is provided by oxidative phosphorylation (Figure 1.4) (Beun et al. 2000a, Dias et al.
2008).

Chapter 1
7
Figure 1.4: Feast-famine metabolism for PHA production (Reis et al. 2003a).
Combining the literature with the already existing technology a resource recovery opportunity is
represented in the form of waste conversion to bioplastics. The process with open cultures is
conducted in two steps: the enrichment reactor and PHA production reactor (Figure 1.5). In the
first reactor the selection of the desirable microbial community is conducted, and then this
biomass together with substrate is fed to a separate reactor, the PHA production reactor, where
the operating conditions direct all the substrate towards PHA formation. For high PHA
productivities, the key-feature for the success of the process is the enrichment on PHA-
producing biomass, keeping unwanted biomass away of the process.
Figure 1.5: Simplified process for PHA production in open cultures.

Chapter 1
8
As described before, due to the incorporation of acetyl-coA (or propionyl-coA) in the PHA
metabolism within the cells, the most suitable substrate can be represented in the form of volatile
fatty acids (VFA). A vast amount of lab-scale studies has evaluated the valorization of synthetic
substrates VFA and has proved that the process is successful when the appropriate conditions are
used. Johnson et al. (2009a), Jiang et al. (2011b), Marang et al. (2013b) enriched biomass under
different synthetic carbon streams (acetate, propionate and butyrate) with the capacity of storing
up to 90%wt PHA competing the productivity shown from pure (GMO) cultures (Steinbüchel et
al. 1998).
A big part of the research was also devoted in the PHA production process with real wastewater.
Bengtsson et al. (2008a), Beccari et al. (2009a), Albuquerque et al. (2010a), Morgan-Sagastume et
al. 2010a, (Jiang et al. (2012b) and Tamis et al. 2014a used industrial and sewage wastewater as the
substrate of the process and showed the great potential of converting waste to bioplastics.
However, they also pointed out the main disadvantages of the process that hinder upscaling.
When using real wastewater the possibility of contaminating the enrichment with other non-
storing biomass was the main bottleneck that drops the PHA capacities of the biomass.
1.4. Outline of this thesis
This thesis was funded by the NWO program “Sustainable biofuel production from organic
waste via polyhydroxyalkanoates” (Project No. 700.10.702) and was focused on the storage
competition under SBR operation with different influent streams.
The Chapter 2 deals with an enrichment on real wastewater, leachate. The complexity of the
stream and the many possible inhibitors caused a limited storage activity from the enriched
biomass. However, an alternative strategy is proposed when dealing with such a complex waste
stream: enriching the biomass on a rather clean stream (diluted wastewater/industrial wastewater)
and utilize the largest fraction of it for the PHA production step.
Some substrates, e.g. VFAs, are known to promote PHA production while others support only
growth, e.g. alcohols. When utilizing a mixture of substrates (e.g. VFAs that lead to PHA and
alcohols the are directed to growth), even though the enriched biomass will be reciprocally (based
on the influent) distributed to two independent populations, the carbon fraction that goes for
PHA storage will always be the first to be depleted. This faster kinetic behavior of PHA-
producing biomass can be exploited by using a sedimentation step after the VFA fraction is
depleted, and the supernatant along with the rest of the carbon can be discharged, leading to
increased fraction of PHA producers within the biomass. Chapter 3 deals with this strategy and
suggests that the percentage of the working volume that is discharged, together with a fast PHA
production rate are directly linked to increased PHA productivities.

Chapter 1
9
As mentioned before, PHA production under SBR operation is a two-step process; initially there
is a selection of the biomass in the enrichment reactor and then PHA production occurs in the
so-called accumulation step. A bottleneck for the process upscale is the need of utilizing two
different substrates for the process, a carbon-limited one for the enrichment step, since the
carbon uptake rate is the pressure imposed to the system, while for the accumulation step a
nutrient-limited influent is required, for growth restriction. To simplify the process, a double-
limited substrate would be the perfect candidate for the entire process. A system can be
characterized as double-limited when at the effluent two nutrients are completely exhausted. In
this type of systems there is a niche that defines which compound will be “more” limited creating
the respective selective pressure. In Chapter 4, the boundaries of such a double-limited (carbon
and phosphorus) system are investigated and the many advantages of such a system are discussed.
However, apart from using VFAs, glucose was also tested for PHA production. Glucose as a
carbon source is a strong ATP and electron donor with varied metabolic pathways. For this
study, an anaerobic/aerobic SBR enrichment was set up to investigate what determines and
favors storage (of PHA) in different SRTs (2 and 4 d) and different feeding patterns of nutrients
(anaerobic/aerobic period). What was shown in Chapter 5 is that glucose cannot be directly
stored, due to ATP and electron excess. Nonetheless, if the process occurs in two steps, first
glucose to lactate and glycogen and then further conversion of lactate and glycogen, depending
the operating conditions (at 4 d SRT) the glucose products can be converted to PHA.
In Chapter 6 the main findings and conclusions are summarized. Additionally, some
recommendations and questions that remain unanswered are addressed. As suggested, process
could be improved by using a continuous system which would include a settling tank between
feast and famine, for the selective removal of biomass that cannot store PHA. The possibility of
operating the process at lower oxygen concentrations, or completely anoxically, is also discussed.

Chapter 1
10

Chapter 2. PHA PRODUCTION FROM
THE ORGANIC FRACTION OF
MUNICIPAL SOLID WASTE
(OFMSW): OVERCOMING THE
INHIBITORY MATRIX1
1 Published as:
E. Korkakaki, M. Mulders, A. Veeken, R. Rozendal, M.C.M. van Loosdrecht, R.Kleerebezem, PHA production
from the organic fraction of municipal solid waste (OFMSW): Overcoming the inhibitory matrix', Water Res.,
2016, 96 (1), 74-83.

Chapter 2
12
2.1 Introduction
The elevated daily life demands along with industrialization have led to an enormous increase of
organic waste. The most common treatments for this waste are sanitary landfilling, incineration
and composting. Lately, the resource recovery approach is mainly implemented, coupling waste
management with production of energy or chemicals. Leaching is usually adopted for the
treatment of organic waste since it efficiently converts the waste into volatile fatty acids (VFA)
which can be subsequently used for biogas production (Chugh et al. 1999, Doǧan et al. 2009).
More specifically, Attero (Wijster, the Netherlands), a company that treats 40% of the total
OFMSW of the Netherlands, uses amongst other techniques, a leaching-bed process for the
management of that organic fraction. The aqueous stream that is produced from this leaching-
bed process is used for biogas production in a UASB reactor (Figure 2.1). However, energy (in
terms of biogas) is a low value product, whereas -from a sustainability point of view- production
of chemicals would be more propitious. An example of a valuable product from organic waste is
represented in the form of polyhydroxyalkanoates (PHA) (Reis et al. 2003a).
Figure 2.1: Schematic representation of the leaching process of the organic fraction of municipal solid
waste (OFMSW). The aqueous outflow of the leaching-bed reactor (left unit) is directed to an upflow
anaerobic sludge blanket reactor (UASB, right unit) where it is converted to biogas. The leachate is
recirculated back to the leaching-bed reactor.
The last decade, a variety of waste streams has been utilized for PHA production either by pure
strains or by microbial enrichment cultures. The first option is linked with high productivities and
yields since the microorganism is engineered or specialized on converting the carbon to PHA,
resulting in biomass that is able to store up to 90wt% PHA (Kim 2000, Du et al. 2002, Koller et
al. 2008, Cavalheiro et al. 2012, Passanha et al. 2013). The second option is carried out under
axenic conditions with less defined substrates leading to reduced cost. These undefined

Chapter 2
13
enrichment cultures have been proven to store equally high amounts of PHA (Johnson et al.
2009a). The latter approach is based on the natural selection of the microorganisms by applying
the appropriate selective pressure to the community. The PHA production is conducted in two
steps: the enrichment of the microorganisms on the substrate (e.g. wastewater) and then PHA
maximization within the enriched biomass with the same carbon source under nutrient-limiting
conditions. When industrial wastewater was tested, such as papermill (Bengtsson et al. 2008b,
Jiang et al. 2012a) or candy-bar wastewater (Tamis et al. 2014a), the enriched biomass was able of
storing 50-80wt% of PHA. However, in the case of more complex waste streams, like olive mill
effluent and municipal wastewater, the storage response of the enrichments was significantly
decreased. Beccari et al. 2009b worked with olive mill effluent and selected for an enrichment
that could accumulate up to 35wt% PHA. Morgan-Sagastume et al. 2010b, Morgan-Sagastume et
al. 2014b, and Morgan-Sagastume et al. 2015 utilized municipal wastewater, and in their case the
maximum PHA capacity of the enriched community was 20-45wt%. Hence, the increased
complexity of the matrix complicates the process.
In the present work, the feasibility of PHA production from leachate via the feast-famine regime
was assessed. Long-term experiments on raw, pretreated and diluted leachate were conducted for
the evaluation of the different enrichments. The inhibitive effect of the leachate on PHA
production was investigated and a strategy to overcome this inhibition is proposed. The overall
productivity of the process was estimated from the obtained experimental data.
2.2 Materials and Methods
2.2.1. Culture medium: leachate and synthetic medium
The experiments on leachate were performed with the organic fraction of municipal solid waste
(OFMSW), after leaching (Attero, Venlo, the Netherlands). In principle, the organic fraction of
solid waste was hydrolyzed in acidification tunnels, with water recirculation (Figure 2.1). When
the leachate used was pretreated, extra phosphate was supplied for the enrichment to prevent
nutrient-limiting conditions.
In the cases of synthetic substrate, the carbon medium consisted of a mixture of sodium acetate,
propionate and butyrate with concentrations equal to 60, 14 and 5.5 Cmmol/L respectively
(mimicking the carbon concentration of the leachate). In these runs, nutrient medium was also
dosed to the enrichment with a composition of 9.8 mM NH4Cl, 3.7 mM KH2PO4, 0.8 mM
MgSO4·7H2O, 2 mL/L trace elements solution according to Vishniac et al. 1975, and 0.2mg/L
allylthiourea (to prevent nitrification).
2.2.2. SBR for culture selection

Chapter 2
14
A double-jacket glass bioreactor with a working volume of 2L (Applikon, the Netherlands) was
used for the enrichment of the biomass. Activated sludge from the municipal wastewater
treatment plant Kralingseveer in Rotterdam (the Netherlands) was used to inoculate the SBR.
The basic setup and operation of the reactor was the same as described by Johnson et al. 2009a.
The reactor was operated in a cyclic way (sequential batch reactor, SBR) under fully aerobic
conditions. The different phases of one cycle consisted of: i) feeding phase (10min), ii) reaction
phase (700min), and iii) a mixed effluent phase (10min). The different feeding operations used are
reported in Table 2.1. The sludge retention time (SRT) and the hydraulic retention time (HRT)
were equal to 1 d and the cycle length (CL) was set to 12 h.
Table 2.1: Feeding profile of the long-term enrichments
Period Batch of leachate Substrate
I Raw leachate I (RL-I) 1L of leachate
II Pretreated leachate I (PL-II) 1L of leachate supplemented with
P (PL-II)
IIIa Synthetic medium – Carbon composition
similar to pretreated leachate II (PL-III)
Synthetic medium
IIIb 90% Synthetic medium – 10% PL-III 0.9L synthetic medium – 0.1L
PL-III
IIIc 75% Synthetic medium – 25% PL-III 0.75L synthetic medium – 0.25L
PL-III
The air flowrate in the reactor was set to 1.8LN/min using a mass flow controller (Brooks
Instrument. USA). The temperature in the reactor was controlled at 30±1°C using a thermostat
bath (Lauda, Germany), the pH was maintained at 7.0±0.1 by the addition of 1 M HCl and 1 M
NaOH, and the stirring speed was set at 750 rpm. Biocontrollers (BIOSTAT B plus, Sartorius,
the Netherlands) were used for the pumps, stirrer, and pH control.
The enrichment was considered stable, when the length of the feast phase and the concentration
of total suspended solids (TSS) at the end of the cycle were constant for three consecutive days
with a standard deviation of 5%. When steady-state was reached, cycle experiments were
conducted to characterize each enrichment. In addition, biomass from the SBR was collected for
accumulation experiments and molecular analysis.
2.2.3. PHA production

Chapter 2
15
To evaluate the PHA storage capacity of each enrichment, fed-batch accumulation experiments
were performed in a separate double-jacket glass bioreactor (Applikon, the Netherlands). The
reactor, with a working volume of 2 L, was operated at the same aeration rate, pH, and
temperature as in the SBR operation. At the beginning of each experiment the reactor was filled
with effluent biomass from the enrichment reactor and carbon- and nutrient-free medium to 2 L.
Two different feeding strategies were used, a continuous supply of the carbon substrate, and a
feeding-on-demand (FOD) supply, based on the pH of the reactor. In the FOD experiments the
production of PHA was initiated by a pulse of substrate (mixture acetate-propionate, 3.29 and
0.22 Cmol/L for enrichment II and mixture of acetate-propionate-butyrate, 3, 0.7 and 0.3
Cmol/L for enrichment III (resembling the leachate fed to each enrichment) and the rest of the
carbon was supplied via the acid pump. For the continuous feeding, leachate (PL-III) or synthetic
medium with the same VFA composition of leachate, was dosed to the enrichment with a
flowrate of 2.3 mL/min. In all the accumulation experiments, when the oxygen concentration
reached a stable value, indicating saturation of PHA in biomass, the experiment was stopped.
2.2.4. Analytical methods
For both characterization of the enriched community and PHA production, the profile of the
experiments was monitored online via the DO, temperature, pH, acid and base dosage and off-
gas CO2 and O2, and offline through substrate, ammonium, TSS and PHA measurements.
The general properties, such as VFA concentration, chemical oxygen demand (COD),
ammonium, phosphate, TSS, volatile suspended solids (VSS), pH and conductivity were
measured. The leachate was filtered with a 0.45µm pore size filter (PVDF membrane, Millipore.
Ireland) to remove all solids. COD, NH4+ and PO4
3- were determined with Hach Lange™ kits
(014 or 114, 302, 348). VFA concentrations were measured via high performance liquid
chromatography (HPLC), equipped with a BioRad Aminex HPX-87H column (Waters 2489
UV/RI detector) with a mobile phase (1.5 mM H3PO4) flow rate of 0.6 mL/min and a
temperature of 60 oC. TSS and VSS analysis was done as previously described by Jiang et al.
(2012). The PHA content of the biomass, expressed as the weight percentage PHA of VSS, was
calculated using pure poly-2-hydroxybutyric-co-3-hydroxyvaleric acid (PHV content of 12 wt%)
(Sigma-Aldrich, 403121) as standard, and benzoic acid as internal standard. Washed and freeze
dried biomass was hydrolyzed and esterified in a mixture of hydrochloric acid, 1-propanol and
dichloroethane for 2 h at 100 oC. The propyelesters formed were extracted with water and
analyzed via gas chromatography (GC). The active biomass concentration was determined by
subtraction of PHA from VSS.

Chapter 2
16
2.2.5. Biological Oxygen Monitoring (BOM)
BOM was used for the determination of the activity of PHA-producing biomass under different
salinity, ammonium, VFA (in terms of acetate) and leachate concentration (Table 2.2). An
acetate-fed enrichment culture dominated of P.acidivorans (Johnson et al. 2009a) was used as the
inoculum. The choice of the biomass was based on the fact that these particular bacteria are the
ones selected under the operational conditions used, while their PHA production capability is the
maximum reported for mixed cultures so far. The biomass was collected from a separate SBR
reactor and was incubated in carbon-free nutrient medium, at the same operational conditions as
the SBR operation.
Table 2.2: Experimental conditions of the biological oxygen monitor (BOM) tests. The biomass used for
the tests was an acetate-grown P.acidivorans dominated community.
Tested compound mM (or else indicated)
NaCl 0 36 71 105 143 214.5 286 572
NH4Cl 0 36 71 105 143
(NH4)2SO4 0 36 71 105 143
HAc (Cmmol/L) 12.5 25 40 50 75 100 120 180
Leachate2(vol%) 0 12.5 25 37.5 50 75
In the cases of salt and ammonium concentration effect on the respiration of the biomass, the
tested compound was manually added to the broth. For the VFA tests, pulses of acetate in a
range of concentrations were injected. In the experiments with leachate, VFA-free leachate
replaced part of the synthetic broth after settling and supernatant removal. In all the experiments
the pH was set at 7±0.1.
The setup of the respirometric tests consisted of an airtight chamber, with working volume of 40
mL. The temperature of the chamber was kept at 30±1 oC. A DO probe (Jenway, UK) was
placed inside the measuring chamber with a stopper including an injection shaft for the addition
of substrate. The oxygen profile was continuously measured with an oximeter (Jenway, UK) and
the data were recorded via BOM software. 40 mL of fully aerated inoculum were transferred in
the measuring chamber, and a pulse of 0.5 mL of substrate (acetate) was injected to the biomass.
At this point the oxygen depletion followed a linear decrease until it reached zero. At the end of
each run the broth was collected for active biomass analysis.
2 The leachate utilized was VFA-free pretreated leachate

Chapter 2
17
All the experiments were run in triplicates, including a control experiment for the estimation of
the specific oxygen uptake rate (SOUR) of the tested biomass under normal SBR conditions. All
the results were normalized over the control SOUR.
2.2.6. Data analysis
The data were corrected for the sampling effect, addition of acid and base and inorganic carbon
dissolution, as described in Johnson et al. 2009a.
For the calculation of the specific conversion rates of the compounds, the equation proposed by
Marang et al. 2014a was adapted:
Equation 2.1: Specific conversion rate for compound i �� = ∑ (��(��� − ��(����/(��(��� + ��(������ �� − �
The yields of PHA over VFA (YPHA/VFA), or total COD (YPHA/COD) and total biomass over
substrate (YX/S) were estimated as the fraction of the formed product over the carbon consumed.
For the BOM tests, the oxygen consumption rate (OUR) was equal to the slope of the linear
decrease in the DO concentration after the injection of substrate. The SOUR was calculated by
dividing the oxygen consumption rate (qO2) over the active biomass (X). The oxygen solubility
was corrected according to the average temperature and the conductivity of the liquid phase
according to Weiss 1970.
Equation 2.2: Specific oxygen uptake rate
SOUR = ����
2.2.7. Microbial diversity analysis
For the analysis of the microbial composition of each enrichment, biomass samples were
collected from the SBR and fed-batch reactor. The genomic DNA extraction was conducted with
the Ultra Clean Soil DNA extraction kit (MoBio Laboratories, California) and subsequently used
as template DNA for PCR-DGGE. The extracted DNA was used as a template DNA for PCR.
16s rRNA gene fragments of the community constituents were obtained by a “touchdown” PCR
program with primers 341F with a GC clamp and 907R for DGGE analysis (Schäfer et al. 2001b,
Table 4). The 16S rRNA gene amplicons were loaded onto 8% polyacrylamide gels with a
denaturing gradient from 20% to 70% DNA denaturants (100% denaturants is a mixture of 5.6M
urea and 32% formamide Schäfer et al. 2001b. The DNA was visualized by UV illumination after

Chapter 2
18
staining with SYBR® Safe, and photographed with a digital camera. Individual bands were excised
from the gel with a sterile razor blade and incubated overnight in 50µL water at 4°C. Re-
amplification was performed using the same primer pair (Table 2.3) and the PCR products were
sequenced by a commercial company (Macrogen, South Korea).The sequences have been stored
in GenBank under accession numbers: KU168567-KU168585.
Table 2.3: Oligonucleotide probes for FISH analysis and primers for q-PCR analysis used in this study.
Code Function Sequence (5’-3’) Specificity Reference
EUB338 I Probe gctgcctcccgtaggagt Bacteria Amann et al. 1990
EUB338 II Probe gcagccacccgtaggtgt Bacteria Daims et al. 1999
EUB338 III Probe gctgccacccgtaggtgt Bacteria Daims et al. 1999
UCB823 Probe cctccccaccgtccagtt P. acidivorans Johnson et al. 2009a
341F-GC Primer Cctacgggaggcagcag3 Bacteria Schäfer et al. 2001b
518F Primer ccagcagccgcggtaat Bacteria Muyzer et al. (1993)
907R Primer ccgtcaattcmtttgagttt Bacteria Schäfer et al. 2001b
UCB823R Primer cctccccaccgtccagtt P. acidivorans Jiang et al. 2011c
In addition to PCR-DGGE, FISH was performed to validate the results. A detailed description
of the procedure can be found in Johnson et al. 2009a. The probes used were commercially
synthesized and 5’ labeled with either FLUOS or the sulfoindocyanine dye Cy5 (Thermo Hybaid
interactive, Ulm, Germany, Table 4). The general probe mixture EUB338I-III was used to
visualize all bacteria in the sample, and the specific probe UCB823 to indicate the presence of P.
acidivorans.
2.3. Results
2.3.1. Leachate characteristics
The properties of the different leachate batches received and tested for PHA production are
shown in Table 2.4. The soluble COD concentration had an average value of 9.4 g/L and the
variations were related to the hydrolysis process of the organic waste (e.g. retention time, nature
of the organic fraction, season). The ammonium concentration exceeded 1 gN/L, whereas the
conductivity was higher than 15 mS/cm for all the tested batches.
Table 2.4: Leachate properties over the different batches used.
3 Contains GC-clamp (5’-cgcccgccgcgccccgcgcccgtcccgccgcccccgcccg-3’) at the 5’ end of the primer

Chapter 2
19
Compound Units RLI PLII PLIII
COD 8.14
7.35
10.41
9.52
-1
11.92
VFA 4.5 3 6.2
Acetate gCOD/L 1.5 2.2 4.5
Propionate 1.8 0.4 1.2
Butyrate 0.7 0.4 0.5
Other (valerate,
caproic, etc)
0.5 -
NH4+ gN/L 1.5 1.2 1.9
o-PO4 mgP/L 18.2 2.4 10.2
pH - 7.7 9 9.1
Conductivity mS/cm 15.1 15.8 16.2
Pretreatment for phosphate removal from the leachate was conducted in 150L batches by
aeration for 5 h. Due to CO2 stripping the pH of the leachate increased to around 9 and the
phosphate was precipitated. The loss of organic material (in terms of COD) was negligible
(sCOD loss <5%).
2.3.2. SBR enrichment
A bioreactor was inoculated with activated sludge and operated in SBR mode with raw leachate
from an OFMSW hydrolysis process. Within a week of operation a feast-famine regime
developed in the reactor (Figure 2.2a). In such a typical SBR cycle initially the VFA fraction of
the substrate was taken up for PHA storage and/or growth with the maximum respiration
activity (feast phase). After VFA depletion, in the absence of external substrate, PHA was
degraded and used for energy generation and growth during the famine phase. The transition of
the feast to the famine phase can be readily identified from the DO profile, which shows a rapid
decrease in the respiration rate upon VFA depletion. The time point where respiration is high
and DO is relatively low is defined as the length of the feast phase, and is an important process
indicator directly related to the substrate uptake rate in the system. The feast phase length of the
enrichment that was established during period I (when raw leachate was directly dosed to the
enrichment) was 2.2h. A negligible fraction of non-VFA soluble COD in the leachate was
degraded during the famine phase (<5%). The observed yield of PHA over VFA was equal to
0.3gCOD/gCOD (Table 5).
4The value refers to total sample 5 The value refers to filtered sample

Chapter 2
20
Figure 2.2: SBR cycle profile of A) enrichment established on raw leachate (cycle 62), and B) enrichment
established on synthetic VFA mixture imitating the composition of leachate (cycle 932). (○) VFA, (∆)
active biomass, (◊) PHA, (�) COD, and (-) DO.
When leachate was replaced by a synthetic VFA mixture (Figure 2.2b) with the same composition
as leachate, the feast phase length was significantly reduced to 0.6h. In this case, during the feast
phase biomass growth was also present, but the observed yield of PHA over VFA was increased
to 0.47gCOD/gCOD.

Table 2.5: Observed kinetic and stoichiometric parameters from the different enrichments. Period I represents the enrichment on raw leachate (cycle 62), II on
pretreated leachate (cycle 278), IIIa on synthetic VFA (cycle 392), IIIb on synthetic VFA (90%) and leachate (10%) mixture (Cycle 467), and IIIc on synthetic VFA
(75%) and leachate (25%) mixture (cycle 535). The column with the cycle number refers to the cycle of operation that the biomass was collected for the experiment.
The control experiment refers to an acetate-grown P.acidivorans dominated community, enriched under the same operational conditions as in the experiments.
Period qVFAmax qCOD
max qPHAmax PHAfeast PHAmax,FOD6 PHAmax
synth7 PHAmax
ww8 YPHA/COD YPHA/VFA YX/COD
gCOD/(gCOD.h) wt% Cycle
No
wt% Cycle
No
wt% Cycle
No
gCOD/(gCOD)
I -0.21 -0.24 0.06 20.2 NA NA NA 0.14 0.3 0.2
II -0.06 -0.18 0.02 19.7 29 276 NA NA 0.2 0.38 0.38
IIIa -1.51 - 0.66 41.9 77.6 390 NA NA - 0.47 0.38
IIIb -1.13 - 0.82 39.4 79.2 465 82.2 471 78.4 473 - 0.66 0.39
IIIc -1.14 - 0.86 52.95 74.7 533 87.2 537 77.8 539 - 0.62 0.34
Control -39 - 2.14 644 894 NA 65 0.69 0.45
6 Fed-batch experiment with synthetic VFA fed on demand – based on the pH 7 Fed-batch experiment with continuous supply of VFA 8 Fed-batch experiment with continuous supply of leachate 9 data taken from Johnson, K., Jiang, Y., Kleerebezem, R., Muyzer, G. and van Loosdrecht, M.C. (2009a) Enrichment of a mixed bacterial culture with a high polyhydroxyalkanoate
storage capacity. Biomacromolecules, 670-676, ibid.

Chapter 2
22
The length of the feast phase over the total experimental period is shown in Figure 2.3. During
period I, when raw leachate was directly fed to the reactor, the feast phase was between 2 and 3h.
When the system was fed with pretreated leachate supplemented with phosphate (period II) the
length of the feast phase dramatically increased, fluctuating between 4-5h. In period III, when the
leachate was replaced by synthetic VFA, the feast phase length decreased, to less than 1 h.
Variations in the feast phase length were due to different leachate batches and/or biofilm
formation. The specific substrate uptake rate during period I and II was quite low (-0.21 and -
0.06��������� respectively, Table 2.5), but when the feeding mode was altered to synthetic VFA it
clearly improved (around -1.5��������� for the entire period III). Along with the rates, the increased
storage yields when the substrate was switched to synthetic VFA confirmed the dominance of
storage phenomena (Table 2.5).
Figure 2.3: Length of the feast phase for the different periods of enrichment during the feast-famine SBR
operation. Total cycle length equals to 12h. Period I represents the enrichment on raw leachate, II on
pretreated leachate, IIIa on synthetic VFA, IIIb on synthetic VFA (90%) and pretreated leachate (10%)
mixture, and IIIc on synthetic VFA(75%) and pretreated leachate (25%) mixture.
2.3.3. Toxicity of the leachate
The inhibitory effect of leachate was evaluated with a series of respirometric batch tests with
pretreated leachate and a range of leachate constituents with an acetate grown P. Acidivorans
dominated enrichment. In the case of leachate (Figure 2.4), the results showed that even a small
addition of leachate (12.5 vol%) caused a reduced SOUR (25% drop compared to the control).
Increasing the fraction to 25vol% reduced the respiration rate by 50%.

Chapter 2
23
Figure 2.4: Normalized specific oxygen uptake rate (SOUR) of acetate-grown P.Acidivorans dominated
enrichment over different leachate concentrations.
Conductivity (in terms of NaCl) at the same range as in leachate had an –almost- negligible
impact (less than 15% decrease) on the respiration activity. For concentrations of NaCl more
than 286mM (conductivity of 40mS/cm) the biological activity dropped by 40% (Appendix A:
Biological Oxygen Monitor (BOM) tests). With regard to ammonium, the tests showed that an
ammonium concentration more than 1gN/L decreased the activity of the P.acidivorans enrichment
to half. Further increase of the concentration of the ammonium concentration did not cause any
additional drop to the respiration rate of the biomass.
2.3.4. PHA productivity of the process
The maximum PHA accumulation capacity of the enrichments was evaluated with synthetic VFA
substrate fed-on-demand (FOD) and continuously, while the overall process productivity was
assessed under continuous feeding of raw leachate.
During the FOD experiments, the enrichment of period II showed a relatively low maximum
PHA percentage equal to 29 wt% (Figure 2.5). The enrichment of period IIIa had an increased
maximum PHA content equal to 77.6 wt%, which remained almost stable all over the
enrichments of period III. Continuous feeding of synthetic VFA showed a slightly increased
maximum PHA content of the enriched biomass of period IIIb and c, equal to 82 wt% and 87
wt% respectively (data not shown).

Chapter 2
24
Figure 2.5: Maximum accumulation capacities of the different enrichments under fed-on-demand
synthetic VFA fed-batch experiments. (�) enrichment on pretreated leachate, (●) on synthetic VFA
mixture, (�) on synthetic VFA mixture (90vol%) and leachate (10vol%) and (�) on synthetic VFA
mixture (75vol%) and leachate (25vol%).
Biomass from period IIIb and c was continuously fed with leachate for the evaluation of the
actual process productivity. The maximum PHA percentages reached from these enrichments
remained at the same range as in the FOD experiments (75-78 wt%). However, in this set of
experiments the increasing biomass concentration after 6-7h indicated the presence of growth
(Figure 2.6).

Chapter 2
25
Figure 2.6: PHA production for A) enrichment established on synthetic VFA mixture (90vol%) and
leachate (10vol%), (cycle 71) and B) on synthetic VFA mixture (75vol%) and leachate (25vol%), (cycle
537) under continuous leachate supply. (○) VFA, (∆) active biomass, (◊) PHA and (-)CO2.
2.3.5. Microbial population dynamics
DGGE analysis was used for the analysis of the diversity of the enrichments. During period I the
culture consisted of Brachymonas denitrificans (Figure 2.7, band no.3) and Corynebacterium (Figure 7,
band no.4). When the operation switched to pretreated leachate, the community included
Xanthobacter (Figure 7, band no.9) and Azorhizobium (Figure 2.7, band no.10). At the time when
synthetic VFA were fed, Plasticicumulans acidivorans (Figure 2.7, band no.15) took over and
remained dominant during the entire period III (Figure 2.7, bands no.19, 23). FISH image
analysis (Figure 2.8) was used for the estimation of the fraction of P.Acidivorans. The images
correspond to an overlap of hybridized and stained general Eubacteria and P.acidivorans at the end
of the cycle of period IIIb and IIIc. In both cases the dominance of P.acidivorans was evident, with
main difference the increased part of the side-population during period IIIc.

Chapter 2
26
Figure 2.7: Bacterial specific DGGE analysis of the reactor biomass of the different periods of operation.
Period I represents the SBR operation on raw leachate (cycle 62), period II the enrichment on pretreated
leachate (cycle 278) and period III the enrichment on synthetic VFA (cycles 392, 467 and 535 for a, b, and
c respectively).
Figure 2.8: Fluorescence microscopy images of a) enrichment on synthetic VFA (cycle 392). and b) on
synthetic VFA mixture (90vol%) and leachate (10vol%) mixture (cycle 467), stained with Cy3-labelled
probe for P. Acidivorans (UCB823. red) and Cy5-labelled probe for Eubacteria (EUB338. blue). The pink
color indicates both CY3-labelled probe and CY5-labelled probe hybridized.
2.4. Discussion
2.4.1. Pretreatment of the leachate

Chapter 2
27
General characteristics of the leachate (e.g. high VFA concentration) of OFMSW suggest that it
could serve as a potential feedstock for PHA production. However, the high ammonium-
nitrogen and conductivity values could be problematic for the general bacterial metabolism.
Apart from that, the presence of N and P at non-growth limiting concentration should
complicate the accumulation step of the PHA production process. Pretreatment of leachate for
phosphate removal took place, to establish growth-limiting conditions within the matrix. Lab
tests (data not shown), showed that CO2 stripping led to a rapid pH increase (more than 9), and
the precipitation of phosphate. Hence, the latter leachate batches (PL-I and PL-II) were aerated
for approximately 5h resulting in 80-90% PO4 removal after centrifugation. However, based on
the long-term enrichment profile, it is likely that an essential growth compound should have
served as the counter-ion for phosphate, leading to a troublesome environment with decreased
substrate uptake rates (Period II, Table 2.5).
2.4.2. Effect of leachate on the long-term enrichments
The maximum PHA storage capacity of the enrichments established directly on leachate (period I
and II) was relatively low and within the same range as found previously when complex
wastewaters were utilized (olive mill effluent from Beccari et al. 2009b), municipal wastewater
from (Morgan-Sagastume et al. 2010b, Morgan-Sagastume et al. 2014b, Morgan-Sagastume et al.
2015). VFA uptake, and thus PHA production from such an inhibitory feedstock is potentially
hampered by a reduced activity, and consequently more carbon energy will be directed towards
growth and/or maintenance. The experimental data confirm that the specific substrate uptake
rates were significantly reduced when the biomass selection was conducted with leachate (period
I and II) compared to an equivalent artificial VFA-mixture (period III). The low storage capacity
can be attributed to the low maximum specific substrate uptake rate which limits the competitive
advantage of PHA producers over fast-growers (Kleerebezem et al. 2007b). The extremely high
substrate uptake rate of P. Acidivorans is essential for outcompeting other acetate consuming
microorganisms (Johnson et al. 2009a, Jiang et al. 2011c). Apparently, no microorganism could be
enriched capable of a similar competitive strategy in the leachate environment.
During period IIIa, the operational conditions used enabled enrichment of P.acidivorans. The
much higher uptake rates, along with the high observed PHA on VFA yield confirmed the
dominance of storage phenomena over growth during the feast phase. A small supplementation
of leachate along with the synthetic VFA in the inflow did not seem to affect the enrichment’s
properties. The maximum PHA percentages and the uptake and production rates showed only a
small decline at their maximum values for a leachate fraction of up to 25 vol% in the feed.

Chapter 2
28
The negative effect of the leachate on the microbial activity was also verified from the
respirometric tests. The biological activity of acetate-grown P.acidivorans dropped almost two-fold
when the leachate replaced the broth even at low proportions (e.g. 12.5%,Figure 2.4). Testing the
different possible inhibitors, such as salt, ammonium or VFA concentration suggested that the
main inhibition most probably was caused by the high ammonium content.
2.4.3. Accumulation capacity versus actual process productivity
The maximum PHA storage capacities of each enrichment community significantly increased
when synthetic VFA were supplied to the enrichment. During period II the maximum PHA
percentage reached was relatively low. On the contrary, when the system was successfully
selected with synthetic substrate supplemented with leachate (period III), the production was
enhanced. However, the most crucial question was whether the communities enriched on a
synthetic VFA substrate could reach the same PHA percentages when leachate was supplied in
the so-called accumulation step. As shown in the present study, in the experiments with the
continuous feeding of leachate, PHA production was at the same level as when synthetic
substrate was supplied. The small decline between the experiments with leachate and synthetic
VFA can be mainly attributed to the growth effect, since in these two sets of experiments the
active biomass concentration was continuously increasing, yielding to decreased maximum PHA
percentages.
2.4.4. Upscaling of the process
Previous research on PHA production from complex or inhibitory waste streams, such as
municipal wastewater (Morgan-Sagastume et al. 2014b), waste activated sludge (Morgan-
Sagastume et al. 2014b) or olive mill effluent (Beccari et al. 2009b) showed the negative effect of
the substrate on the selection of the PHA-producers. In such systems there might be a
distribution of carbon for non-storing purposes, such as growth or maintenance (Beccari, et al.
(2009b; Morgan-Sagastume, et al. (2010b;Arcos-Hernández et al. 2013,Beccari et al. 2009b,
Morgan-Sagastume et al. 2010b, Morgan-Sagastume et al. 2014b). In the present study it was
demonstrated that long-term selection for PHA-producers on leachate was unsuccessful. Their
low competitive advantage in such a system made growth dominate. Using only a small
proportion of wastewater for the enrichment, while the rest of it was directed to the production
step, improved the storage characteristics of the community.
The net PHA production on influent COD can be calculated from a COD balance over the
enrichment and accumulation reactor (Figure 2.9, adapted from Bengtsson et al. 2008b). The

Chapter 2
29
wastewater can be divided in two flows (α and β), while an extra VFA-stream (γ) can be used for
the enrichment. The amount of PHA that is produced at the end of the process (Figure 2.9) is
determined by the characteristics of the enrichment (Yx/COD, YPHA/COD, PHAmax).
Figure 2.9: COD balance of the PHA production process, as proposed by Bengtsson et al. 2008b. From
the total wastewater (WW) COD one part (α) is supplied to the enrichment reactor, while the rest of it (β
= α – WW) is directed to the accumulation step. The extra flow (γ) that is fed to the enrichment reactor
expresses the amount of synthetic VFA (in terms of COD) that are supplied to the enrichment reactor.
Solving the set of equations for given yields (e.g. YPHA/COD = 0.6gCOD/gCOD and
YX/COD=0.5gCOD/gCOD, - Appendix B: COD balance and equations of Figure 9), shows that
the overall yield is –almost- linearly related to the maximum PHA capacity of the enrichment
(Figure 2.10a) independent of the γ-flow. Still, the amount of extra VFA (γ-COD) that needs to
be supplied for the enrichment of the biomass remains a critical and cost-effective parameter. As
shown in Figure 2.10b, depending the enrichment’s conditions there is a certain demand for
external COD. For example, when the enrichment is carried out in 100% synthetic VFA (r=0),
the extra COD that needs to be supplied from a clean source is much higher in comparison to
the enrichment on 50% VFA (r=1). However, this difference becomes insignificant when the
enrichment is characterized by high accumulation capacities (e.g. for PHAmax>0.8gCOD/gCOD).
The highest the accumulation capacity, the less biomass is required for the PHA production step,
resulting to less carbon (α+γ) demand for the enrichment step. This leads to more carbon (β)
being directed towards the PHA production step. The experimental results suggested that the

Chapter 2
30
“clean” enrichments (period III) had a remarkably increased accumulation capacity. According to
Figure 2.10b, in this range of PHAmax, the γ-COD requirements are much less, revealing the
trade-off between the amount of synthetic VFA that is supplied and the maximum PHA capacity
of the biomass.
Figure 2.10: a) Theoretical PHA productivity of the process as a function of the maximum PHA capacity
and b) synthetic COD supply as a function of the maximum PHA capacity and the ratio of wastewater
over synthetic used for the enrichment (r=α/γ).
The abovementioned evaluation can be used for the estimation of the theoretical total PHA yield
(PHAyield) of each enrichment (Table 2.6). These results confirm that supplementation of extra
carbon and dilution of leachate enhance the process. More specifically, during the entire period
III (a, b & c), the total PHA productivity was increased at least four-fold in comparison to period
II, as expected and explained above.
Table 2.6: COD balance of the PHA production process according to Figure 9. α: fraction of the leachate
that is used for the enrichment, β: fraction of the leachate that is used for the production (accumulation
step), γ: extra VFA supplied for the enrichment, r: the ratio of leachate over synthetic VFA that are
supplied to the enrichment (α/γ), Xen: the amount of biomass that is formed during the enrichment step,
PHA: the PHA that is produced during the accumulation step, PHAmax: the maximum accumulation
capacity of the enriched biomass.

Chapter 2
31
COD-balance
Equation units
Total COD of leachate divided into the two steps:
enrichment and accumulation
α+β=leachate [gCOD]
Ratio of leachate over synthetic stream for the enrichment r=α/γ [dimensionless]
Biomass production from the enrichment Xen=(α+γ)Yx/COD [gCOD]
PHA production during the accumulation step PHA=βYPHA/COD [gCOD]
Maximum PHA storage capacity of the biomass PHAmax=PHA/(PHA+Xen) [gCOD/gCOD]
Assumptions
The yield of biomass over total biomass is assumed to be the same regardless the type of carbon source
No maintenance requirements
Thus, an alternative approach is proposed for PHA formation in inhibitory environments:
supplementation of extra VFA for the enrichment step and then direct supply of the troublesome
substrate in the accumulation step. A potential low-priced candidate for γ-flow could be food, or
paper mill wastewater. Research previously by Jiang et al. 2012a and Tamis et al. 2014a has shown
that in this environment the selective pressure provides a competitive advantage for PHA-
producers to thrive.
2.5. Appendices
2.5.1. Appendix A: Biological Oxygen Monitor (BOM) tests
Table 2.7: Normalized specific oxygen uptake rate of an acetate-grown P.acidivorans dominated
community under different NaCl concentrations
NaCl [mM] Conductivity
[mS·cm-1]
Normalized SOUR [-]
0 9.85 1
214.5 32.2 0.85
286 39.8 0.77
572 63.4 0.08

Chapter 2
32
Table 2.8: Normalized specific oxygen uptake rate of an acetate-grown P.acidivorans dominated
community under different ammonium concentrations
NH4+ [mM] NH4Cl normalized
SOUR [-]
(conductivity [mS·cm-1])
(NH4)2SO4 normalized SOUR
[-]
(conductivity [mS·cm-1])
0 1 (9.85) 1 (9.85)
36 1 (12.90) 0.8 (12.40)
71 0.6 (16.70) 0.56 (15.21)
105 0.48 (25.90) 0.56 (17.50)
143 0.52 (30.20) 0.48 (26.10)
Table 2.9: Normalized specific oxygen uptake rate of an acetate-grown P.acidivorans dominated
community varying initial acetate concentrations
HAc [Cmmol/L] Normalized SOUR[-]
12.5 1
25 0.89
50 0.86
75 0.82
100 0.69
120 0.70
180 0.65
2.5.2. Appendix B: COD balance and equations of Figure 9
WW: the amount of COD of waste stream (gCOD)
r: the ratio of wastewater over VFA in the enrichment step (gCOD/gCOD)
YPHA/COD: yield of PHA over COD (gCOD/gCOD)
Yx/COD: yield of biomass over COD (gCOD/gCOD)
PHAmax: the maximum PHA storage capacity of the biomass (gCOD-PHA/gCOD-TSS)
α+β=WW (gCOD) Eq. (B.1)
α/γ=r (gCOD/gCOD)Eq. (B.2)
Xen =(α+γ)YX/COD (gCOD) Eq. (B.3)
PHA= βΥPHA/COD (gCOD) Eq. (B.4)
PHAmax=(PHA)/(PHA+Xen) (gCOD/gCOD, dimensionless) Eq. (B.5)
Assumptions:

Chapter 2
33
• The yield of biomass over total COD is assumed the same regardless the type of carbon
source.
• Everything is calculated on a COD-basis
• No maintenance
The system of equations was symbolically solved with MATLAB© software, with the “syms”
function
α=��� !"#$%&('()*+,-�()*+,-�./#$%� !"#$%&'()*+,-� !"#$%&()*+,-�./#$%& (gCOD) Eq. (B.6)
β=��()*+,-� .#$%&(&�()*+,-�./#$%� !"#$%&'()*+,-� !"#$%&()*+,-�./#$%& (gCOD) Eq. (B.7)
γ=��� !"#$%&('()*+,-�()*+,-�./#$%� !"#$%&'()*+,-� !"#$%&()*+,-�./#$%& (gCOD) Eq. (B.8)
PHA=��()*+,-� !"#$%� .#$%(&�()*+,-�./#$%� !"#$%&'()*+,-� !"#$%&()*+,-�./#$%& (gCOD) Eq. (B.9)
where, WW: the amount of COD of wastestream (gCOD)
YPHA/COD: yield of PHA over COD (gCOD/gCOD)
Yx/COD: yield of biomass over COD (gCOD/gCOD)
PHAmax: the maximum PHA storage capacity of the biomass (gCOD-PHA/gCOD-TSS)
r: the ratio of the flows α/γ (wastewater/VFA, gCOD/gCOD)

Chapter 2
34

Chapter 3. SURVIVAL OF THE
FASTEST: SELECTIVE REMOVAL OF
THE SIDE POPULATION FOR
ENHANCED PHA PRODUCTION IN
A MIXED SUBSTRATE ENRICHMENT1
1 Published as:
E. Korkakaki, M.C.M. van Loosdrecht, R. Kleerebezem, Survival of the Fastest: Selective removal of the side population for enhanced PHA production in a mixed substrate enrichment', Bioresource Technol, 2016, doi: 10.1016/j.biortech.2016.05.125

Chapter 3
36
3.1. Introduction
Polyhydroxyalkanoates (PHA) are a family of biodegradable polyesters that can be accumulated
by numerous bacteria under nutrient limitation. Depending on the carbon chain length of the
building blocks of the polyester, they are divided into short-chain length PHA (3-5 carbon atoms)
and medium-chain length PHA (6-14 carbon atoms) (Lee et al. 1999). PHA are intracellularly
stored and serve as energy, carbon and reducing power reserves (Anderson et al. 1990). Their
structure and monomeric composition mainly depend on the substrate properties (Lee et al.
1995). PHA have similar properties to petrochemical plastics, while their biodegradable nature
and production from renewable substrates make them excellent candidates for chemical and
material industry (Poirier et al. 1995).
The current commercial process for PHA production comprises sterilized fermenters operated
batch-wise, with pure cultures of (genetically modified) microorganisms and sugars or agricultural
feedstock as substrate (Chen 2009a). As a consequence, the PHA production costs are up to 5
times higher than conventional plastic production. Due to these high costs along with the shift
towards implementation of low-value feedstocks in the process, research has been lately focused
on mixed culture biotechnology. This concept is based on the selective enrichment of
microorganisms with superior PHA producing capacities, and thus is conducted in open
environment. This approach reduces the energy requirements and offers the possibility to employ
low grade substrates such as wastewater. The most widely utilized and studied approach for the
selection of PHA-producing biomass, due to its high PHA yield, is the feast-famine regime (Reis
et al. 2003b, Dias et al. 2006). However, even when PHA is produced via mixed cultures, the high
costs of the downstream processing due to the polymer fragility remain the main bottleneck.
Economic analysis from showed that high PHA percentages in the biomass yield to higher
purification efficiencies (cost-wise) (Van Wegen et al. 1998).
Lab-scale enrichments of PHA accumulating microbial communities on different defined
substrates showed that when volatile fatty acids (VFA) were used as the substrate, the biomass
could accumulate up to 90wt% PHA (Johnson et al. 2009a, Jiang et al. 2011a, Jiang et al. 2011d).
Nonetheless, when using real wastewater the experimental results indicated that PHA production
is primarily associated with the VFA fraction of the wastewater (Coats et al. 2007, Bengtsson et
al. 2008a, Beccari, et al. (2009), Albuquerque et al. 2010b, Morgan-Sagastume et al. 2010b, Jiang
et al. 2012a, Tamis et al. 2014a, Morgan-Sagastume et al. 2014a, Morgan-Sagastume et al. 2015,
Korkakaki et al. 2016a). This correlation is based on the fact that the VFA carbon fraction serves
as a PHA precursor and efficiently enriches for a PHA accumulating community. Other (non-
VFA) carbon compounds seem to select for a non-PHA-producing microbial community that

Chapter 3
37
solely grows. So, apart from applying the appropriate conditions for enrichment, and thus
selecting the microorganism with the highest PHA storage capacity, a key factor for the process
productivity is the inflow (waste stream) that is used and what part of this stream can serve as a
PHA-precursor.
Marang, et al. (2014) showed in a laboratory reactor that if an equally (in C-mol basis) acetate-
methanol substrate is used for enrichment of a PHA producing community, acetate is taken up
rapidly and stored in the form of PHA, whereas methanol is consumed for growth at a slower
rate, resulting in biomass that consisted of approximately 40% of PHA-producers (P. acidivorans)
and 60% of methanol-growers (Marang et al. 2014b). In these conditions, when acetate was fully
consumed more than 70% of methanol was still present in the broth. Removing the liquid
fraction (including the slower degraded carbon) immediately after the feast phase, would decrease
the non-PHA storing fraction of biomass, favoring the PHA-producing community. In practice
this can be accomplished by adding a sedimentation and supernatant discharge step after the feast
phase. The objective of this research was to demonstrate the improved enrichment of PHA-
producers with the implementation of a sedimentation step after acetate depletion in process fed
with an acetate-methanol mixture. A mathematical model was established in order to evaluate the
sensitivity of several design parameters on the biomass distribution between PHA-producers and
methanol-growers.
3.2. Materials & Methods
3.2.1. Sequential batch reactor (SBR) for culture selection
A double-jacket glass bioreactor with a working volume of 2 L (Applikon, the Netherlands) was
used for the enrichment of the biomass. The basic setup and operation of the reactor was the
same as described by Johnson et al. 2009a. The reactor was operated in a cyclic way (SBR). The
different phases of one SBR cycle are shown in
Figure 3.1, and the different operational conditions tested (SBR I, II and III) are reported in
Table 3.1. The supernatant removed was replaced with tap water to keep the working volume

Chapter 3
38
stable during the entire cycle. When settling was implemented (SBR II and III) the effluent
volume was reduced to 0.8 L in order to maintain a comparable solid retention time (SRT) of 1 d.
Figure 3.1: Schematic representation of the different phases that comprised one SBR cycle
Table 3.1: Operational conditions for the three different SBR systems
SBR Settling SRT Supernatant
volume
Effluent
volume
[days] [L]
I � 1 0 1
II � 1 1 0.8
III � 1 1.5 0.8
The air flowrate supplied to the reactor was set to 0.4 LN/min using a mass flow controller
(Brooks Instrument, USA). The total gas flow rate through the reactor was increased to 1.4
LN/min by partial recirculation of the off-gas. The temperature in the reactor was controlled at
30±1°C using a thermostat bath (Lauda, Germany), the pH was set at 7.0±0.1 by the addition of
1 M HCl and 1 M NaOH, and the stirring speed was set at 750rpm. Biocontrollers (ADI 1030,
Applikon, the Netherlands & BIOSTAT B plus, Sartorius, the Netherlands) were used for
control of the pumps, stirrer, and pH control.
100 mL of aerobic activated sludge from the A stage of the municipal wastewater treatment plant
Dokhaven in Rotterdam (the Netherlands) with sludge age equal to 8 h was used to inoculate the
SBR. During each cycle 100 mL of carbon and nitrogen source, diluted with 800 mL tap water
were dosed into the reactor. The carbon source was a mixture of sodium acetate and methanol
(13.5 and 27 mM respectively). The nutrient medium contained 6.75 mM NH4Cl, 2.49 mM
KH2PO4, 0.55 mM MgSO4·7H2O, 0.72 mM KCl, 1.5 mL/L trace elements solution according to
Vishniac et al. 1975, and 5 mg/L allylthiourea (to prevent nitrification).

Chapter 3
39
The enrichment culture was considered stable, when the length of the feast phase and the
concentration of total suspended solids (TSS) at the end of the cycle were constant for five
consecutive days. When steady-state was reached, experiments were conducted to characterize an
operational cycle. In addition, biomass from the SBR was collected for accumulation experiments
and molecular analysis.
3.2.2. PHA production
To evaluate the PHA storage capacity of each enrichment (in the form of the specific biopolymer
polyhydroxybutyrate, PHB), accumulation experiments were conducted in a separate double-
jacket glass bioreactor (Applikon, the Netherlands). The reactor, with a working volume of 2 L,
was operated at the same aeration rate, pH, and temperature as the enrichment reactor. At the
beginning of each experiment the reactor was filled with 0.8 - 1 L of effluent biomass from the
enrichment reactor and supplemented with carbon- and ammonium-free medium to 2 L. The
production of PHA was initiated by a pulse of substrate (acetate and methanol), and the rest of
the carbon was fed-on-demand via the pH-control in the form of acetic acid and methanol (1.5
M each). When the dissolved oxygen (DO) concentration reached saturation, indicating no
significant biological activity, the experiment was stopped. A more detailed description of the
procedure can be found elsewhere (Marang et al. 2014b).
3.2.3. Analytical methods
For both characterization of the enriched community and PHA production, the profile of the
experiments was monitored online via the DO, temperature, pH, acid and base dosage and off-
gas CO2 and O2, and offline through substrate, ammonium, TSS and PHA measurements.
Filtered (0.45 µm pore size, PVDF membrane, Millipore, Ireland) samples were collected for the
measurement of the soluble compounds (acetate, methanol and ammonium). Acetate was
measured via high performance liquid chromatography (HPLC), and methanol via gas
chromatography (GC). HPLC was equipped with a BioRad Aminex HPX-87H column (Waters
2489 UV/RI detector) with a mobile phase (1.5mM H3PO4) flow rate of 0.6 mL/min and a
temperature of 60 oC. GC was equipped with flame ionization detector (FID) and an HP-
INNOWax column.
TSS and PHA concentrations were analyzed as described in Johnson et al. 2009a and Marang et
al. 2014b. The PHA content of the biomass, expressed as the weight percentage PHA of TSS,
was determined using pure polyhydroxybutyrate (PHB, Sigma-Aldrich, CAS 26063-00-3) as
standard, and benzoic acid as internal standard. The active biomass concentration was

Chapter 3
40
determined by the subtraction of PHB from the TSS, assuming that no other solid product is
formed. Since the carbon substrate consisted solely of acetate and methanol the only expected
product was PHB (Johnson et al. 2009b, Marang et al. 2014b).
3.2.4. Microbial population analysis
For microbial community structure analysis of the enrichment culture, biomass samples were
collected from the SBR and fed-batch reactors. The genomic DNA was extracted using the Ultra
Clean Soil DNA extraction kit (MoBio Laboratories, California) and subsequently used as
template DNA for q-PCR.
The relative abundance of Plasticicumulans acidivorans in the total enrichment culture (fPa.) was
analyzed by q-PCR. The extracted genomic DNA was amplified using two primer pairs:
518F/907R and 518F/UCB823R (Table 3.2). The first was used to quantify the total amount of
bacteria in the samples, and the latter to quantify P. acidivorans. A detailed procedure can be found
elsewhere (Marang et al. 2014b).
Table 3.2: Oligonucleotide probes for FISH analysis and primers for q-PCR analysis used in this study.
Code Function Sequence (5’-3’) Specificity Reference
EUB338 I Probe gctgcctcccgtaggagt Bacteria Amann et al. 1990
EUB338 II Probe gcagccacccgtaggtgt Bacteria Daims et al. 1999
EUB338 III Probe gctgccacccgtaggtgt Bacteria Daims et al. 1999
UCB823 Probe cctccccaccgtccagtt P. acidivorans Johnson et al. 2009a
341F-GC Primer cctacgggaggcagcag* Bacteria Schäfer et al. 2001b
518F Primer ccagcagccgcggtaat Bacteria Muyzer et al. (1993)
907R Primer ccgtcaattcmtttgagttt Bacteria Schäfer et al. 2001b
UCB823R Primer cctccccaccgtccagtt P. acidivorans Jiang et al. 2011c
* Contains GC-clamp (5’-cgcccgccgcgccccgcgcccgtcccgccgcccccgcccg-3’) at the 5’ end of the primer
FISH was performed to validate the q-PCR results. The probes used in this study are listed in
Table 3.2. They were commercially synthesized and 5’ labeled with either FLUOS or the
sulfoindocyanine dye Cy5 (Thermo Hybrid interactive, Ulm, Germany). The general probe
mixture EUB338I-III was used to visualize all bacteria in the sample, and the specific probe
UCB823 to indicate the presence of P. acidivorans.
3.2.5. Data analysis

Chapter 3
41
The data were corrected for the sampling effect, addition of acid and base and inorganic carbon
dissolution, as described in Johnson et al. 2009a. For the calculation of the total conversion rates,
the equation proposed by Marang et al. 2014b was adapted:
Equation 3.1: total conversion rates �� = ∑ (��(��� − ��(����/(��(��� + ��(������ �� − �
where Ci: concentration of compound i (C-mmol/L) and Cx: concentration of total biomass (C-
mmol/L).
The yields of PHB over acetate (YPHB/HAc) and total biomass over substrate (YX/S), were estimated
by dividing of the formed product over the carbon consumed.
The settling efficiency of the solids (Fset) was calculated as the difference between the total TSS
before settling (TSStotal) and the TSS in the supernatant (TSSsupernatant) according to the equation:
Equation 3.2: Settling efficiency of the solids
/012(%� = 41 − 6770891&�:2:�26772;2:< = 100
The same equation was used for the settling efficiency of PHA (/012()*), replacing the TSS value
with the amount of PHA in the supernatant and total samples respectively.
3.2.6. Kinetic model
The model constructed in Matlab® consisted of three different parts: the microbial metabolism,
the mass balances and the SBR operational conditions.
The conversions of acetate and methanol were assumed to be the carbon and energy source for
two independent microbial groups, PHA-producers (P. acidivorans) and methanol-growers as
reported previously by Marang et al. 2014b. Acetate was assumed to be initially converted to
PHB and then to biomass as described previously (Johnson et al. 2009b, Marang et al. 2013a and
Tamis et al. 2014b). Methanol was directly converted to biomass according to Monod kinetics.
The biomass specific conversion rates (q-rates) were obtained from total conversion rate (Ri) and
the estimated fraction of each population. The reaction stoichiometry for PHB production from
acetate was derived from the measurements and the biomass yield on PHB was obtained from
Van Aalst-Van Leeuwen et al. 1994. For methanol, due to lack of experimental data, the
stoichiometric growth yield from Bussineau et al. 1986 was used (Table 3.3). The operational
conditions including the variables tested are reported in Table 3.4.

Chapter 3
42
Table 3.3: Observed and estimated parameters for the model
Parameter Unit Value Reference
YPHB/HAc
[C-mol C-mol-1]
-0.59 this study
YX/HAc,feast 0
YMetOH/X -0.55 Bussineau et al. 1986
YPHB/X, famine -0.65 Van Aalst-Van Leeuwen et al. 1994
qMetOH,max
[C-mol (C-mol h)-1]
-0.41
this study qHAc,max -2.6
r=qHAc/qMetOH 6.3
MWx
[g C-mol-1] 25.1 Beun et al. 2002
MWPHB 21.5 Beun et al. 2002
fPHB,max [C-mol C-mol-1] 6 Marang et al. 2014b
a (PHB inhibition
term) [-] 2 Assumption
KHAc
[C-mmol L-1] 0.001 Assumption
KMetOH 0.001 Assumption
KN [mmol L-1] 0.001 Assumption
mATP [mol (C-mol/L)-1] 0.02 Beun et al. 2002
KPHB [(C-mol C-mol)-1/3h-1] -0.16
this study, according to the model of Tamis et al.
2014b
Table 3.4: Operational conditions of the model
Vr
[L]
2
Veff 1
Vdis 0-2 (variable)
Cycle length (CL)
[h]
12
tpre 0.5-2.5
tpost CL-t1
Feed
HAc [C-mmol/L]
13.5
MetOH 13.5
C/N [C-mol mol-1] 8
For the SBR operational cycle, the system was divided in five different phases, operated in a
cyclic way, until steady-state was reached (approximately 50 cycles) as depicted in

Chapter 3
43
Figure 3.1:
i) start of the cycle i: the concentrations of biomass and PHA are determined by the
effluent discharge volume of the previous cycle (i-1), while acetate, methanol and
ammonium are added in the system,
�02:&2� = (?&1:@2;& − ?1AA<81�2�?&1:@2;& �1�B�'
As initial condition, the assumption of equal amounts of the different parts of
biomass (CX,PHA = C,X,MetOH = 5Cmmol/L each) was made.
ii) pre-settling period: reactions for the time length of the pre-settling phase (tpre)
according to the kinetics of each compound,
iii) settling, supernatant removal and resuspension of the settled solids with water until
final volume equal to 2L. The solids that remain in the system (biomass and PHA,
C(s),set) are a function of the settling efficiency (Fset), while the concentrations of the
soluble compounds (acetate, methanol, ammonium, C(l)) depend on the supernatant
volume that is discharged (Vdis) �(0�,012� = /012�(0�,9&1�
�(<�,012� = (?&1:@2;& − ?B�0�?&1:@2;& �(<�,9&1�
iv) post-settling period: the reactions continue according to the kinetics for the time
length of the post-settling phase (tpost), and
v) effluent period: part of broth is removed from the system. The rest of the broth is
used for the following cycle.
For the solution of the differential equations the built-in function of Matlab® ode15s was used
(Appendix A).
The model was constructed for the evaluation of the impact of the volume discharged after
settling. Since the different operations had completely different response with regard to the
carbon consumption, calibration could not be applied.

Chapter 3
44
3.3. Results and discussion
3.3.1. Settling to increase the fraction of PHA producing bacteria
A bioreactor was inoculated with activated sludge, fed with an acetate - methanol mixture and
operated aerobically as a sequencing batch process resulting in a feast-famine regime within two
weeks of operation. During the first operational period (SBR-I) no settling of biomass after the
feast phase was imposed, and the operation was identical as described previously (Marang et al.
2014b). After the feeding phase the DO concentration decreased sharply indicating the depletion
of the faster consumed carbon, acetate. At the point of acetate depletion PHB concentration
reached its maximum value indicating the end of the feast phase at 108 min. After this time
point the DO value slightly increased, but it kept decreasing until the complete consumption of
the slower consumed substrate, methanol. In absence of external substrate, only PHB
degradation occurred resulting in a much lower oxygen uptake rate and thus, higher DO values
(Figure 3.2A).
In the second operational period (SBR-II), feeding and 1 h of reaction phase was followed by
20min of settling, discharge of 1 L of supernatant volume and resuspension of the settled
biomass until the working volume reached the 2 L. In these conditions, acetate was consumed
before the beginning of the settling phase while 12% of the methanol fed was discharged with
the supernatant (Figure 3.2B).

Chapter 3
45
Figure 3.2: SBR cycle of the three different enrichments: A) SBR-I (without settling), B) SBR-II (settling
after one hour of reaction and discharge of 1L of supernatant volume), C) SBR-III (settling after one hour
of reaction and discharge of 1.5L of supernatant), and D) Fed-batch accumulation experiments of the
enriched biomass of (�) SBR-I, (�) SBR-II, and (�) SBR-III operation. (∎)PHA, (∎) Acetate, (∎)
Methanol, (∎) Active biomass, (—) DO. Dashed lines represent the modeled results, with the same colors
as the experimental data.
During the third period (SBR-III) the supernatant volume was further increased to 1.5 L, while
the effluent volume was maintained as before equal to 0.8 L for an SRT of 1 d. In these
conditions, after 1 h of reaction, acetate was not fully depleted, leading to a negligible amount of
acetate removed (<5%) along with the discharge of the supernatant, while the percentage of
removed methanol was more than 60% (Figure 3.2C).

Chapter 3
46
Table 3.5: Overview of the observed kinetic, stoichiometric and operational characteristics for the three
different systems under the normal SBR cycle.
SBR -RHAc1 -RMetOH
2 RPHB1 PHB YPHB/HAc YX/(HAc+MetOH) Fset Fset
PHA
C-mol (C-mol h)-1 %wt C-mol C-mol-1 wt%
I 0.62 0.28 0.38 33.6 0.61 0.38 - -
II 1.32 0.212 0.81 39.8 0.62 0.38 86.3 92.4
III 1.74 0.172 0.98 33.8 0.55 0.32 91.6 94.3
The removal of methanol with the supernatant after settling can be directly related to an increase
of the fraction of PHA-producers. Nonetheless, additional evidence for the positive effect of the
settling in the biomass distribution can be provided from the PHB maximum storage capacity of
the three different enrichments. Fed-batch experiments were conducted with mixed carbon
substrate (acetate and methanol) without ammonium. The biomass used for the accumulation
experiments was harvested at the end of each SBR operational cycle. Due to excess supply of
ammonium in the SBR, growth-limiting conditions were not established from the beginning of
the fed-batch experiments. For the accumulation experiments with biomass from SBR-I, II, and
III, ammonium was depleted after 3, 5, and 2 hours respectively. According to the experimental
results, indeed the supernatant removal led to an increased maximum PHB content, indicating
that the side population (growing on methanol) was decreased (Figure 3.2D). Especially in the case
of SBR-III this decrease was much more clear, with maximum PHB content equal to almost
70wt% (±1.8) as compared to 49%(±0.9) and 58%(±2.7) during SBR-I and SBR-II respectively.
3.3.2. Selective settling advantage for the PHA-producing biomass?
According to FISH image analysis (Figure 3.3), in the absence of settling (SBR-I) the biomass
consisted of loose flocs, with both PHA-producing biomass (P. acidivorans, pink cells) and general
eubacteria (blue cells). In period II, with settling and removal of suspended cells, the flocs were
more compact, probably due to selection by settling (note the SRT was kept similar). However,
when the system shifted to a higher volume of discharge (¾Vr – SBR-III), the flocs seemed to
consist mainly of PHA-producers, whereas the non-storing bacteria (blue cells) were
predominantly located in the outer layers of the floc, or were suspended in the bulk liquid (data
not shown).
1 The rates are calculated over the total active biomass 2 The methanol uptake rates are calculated for the pre-settling period

Chapter 3
47
Figure 3.3: Fluorescence microscopy images of the biomass enriched in: A) SBR-I, B) SBR-II, and C) SBR-III, stained with Cy3-labelled probe for P. acidivorans (UCB823, red) and Cy5-labelled probe for Eubacteria (EUB338, blue). The pink color indicates both CY3-labelled probe and CY5-labelled probe hybridized.
PHB analysis in settled and supernatant samples showed that the PHB content of the settled
biomass was significantly higher compared to the supernatant, suggesting improved settling of
PHA-producers compared to methanol-degraders. Preferential settling of PHA-producers
compared to methanol-degraders may contribute significantly to the selection of PHA-producers
at the expense of methanol-degraders. PHB containing cells have been proposed to have a higher
density and cell volume compared to empty cells, potentially increasing their settling velocity
(Mas et al. 1985b, Pedrós-Alió et al. 1985). Nonetheless, the overall settling efficiency is also a
function of the extent of aggregation of the different types of microorganisms in the system.
3.3.3. Mathematical evaluation of the influence of process parameters on PHB content of
biomass
A mathematical model was developed for analysis of the impact of settling on the fraction PHA-
producers in a system fed with mixed substrate. The parameters used in the model were obtained
from the experimental data of the current work (SBR-II and III, similar to the parameters
reported previously from Marang et al. 2014b). When settling was implemented (Figure 3.2B and
C), the simulations fit adequately the experimental data, while this does not hold true for the
system without settling. Acetate uptake rates in SBR-I are overestimated by the model, potentially
due to an inadequately long acclimation period. The biomass in SBR-I was predicted to contain
39% of PHA-producers. After implementation of the settling step, the fraction of the PHA-
producers increased to 48% (SBR-II), and 60% when 1.5L of supernatant volume was discharged
(SBR-III). q-PCR analysis on each microbial population, showed a similar increase of the fraction
of P. acidivorans from 40% in SBR-I to 63% when the operation switched to SBR-III (Appendix
3B: Appendix B: q-PCR data).

Chapter 3
48
The model was used to investigate the impact of several operational variables such as the volume
that is discharged after settling and the length of the pre-settling phase. To simplify interpretation
of the model results it was assumed that the settling efficiency (Fset) of the biomass was equal to
100% (no solid removal with the supernatant). For fixed length of pre-settling phase (e.g. 1h,
Figure 3.4), the fraction of PHA-producers increases with increased discharged volume. For the
operation without settling (Vdis=0) the biomass distribution is determined by the two biomass
yields on each carbon source (39% in the present study). When the discharged volume exceeds
the half of the working volume, the proposed process modification (settling) has a significant
impact on the side population removal because more methanol is removed with the supernatant
(SBR-I, II, and III).
Figure 3.4: Predicted biomass fraction of the PHA-producers as a function of the discharged volume
under different lengths of pre-settling phase. The specific uptake rates used were calculated experimentally
from the SBR operation with the settling step (SBR-II and –III), the settling efficiency was assumed to be
equal to 100% (no solid removal with the supernatant) and the cycle length was equal to 12h. The
shadowed area represents the non-applicable discharge volume.
With regard to the length of the pre-settling phase, the modeled results suggested that there is a
negative relation between tpre and the fraction of PHA-producers. Increasing the time leads to a
higher amount of methanol converted to biomass, decreasing the percentage of PHA-producers
within the biomass. This does not hold true if acetate has not been fully depleted (0.5 h in the
figure), due to acetate discharge along with the supernatant. Consequently, the preferred length of

Chapter 3
49
pre-settling phase is the one where acetate has just been depleted, while there is still a large
amount of methanol present in the broth.
3.3.4. Survival of the fastest – exploiting the high biomass specific acetate uptake rates of PHA-
producers
The success of selecting PHA-producers in a feast-famine regime is based on the extremely high
biomass specific uptake rate of PHA-producers compared to microorganisms that use the
substrate directly for growth (Kleerebezem et al. 2007a). This concept is confirmed in the present
research as can be deduced from SBR-I where the specific acetate uptake rate is much faster than
the methanol uptake rate.
The difference in actual substrate uptake rates between the PHA-producers and non-PHA-
producers determines the efficiency of the settling step for elimination of the side population. In
Figure 3.5 the effect of the settling and supernatant removal volume for different ratios of specific
acetate uptake rate over specific methanol uptake rate (qHAc/qMetOH) is shown. In all the cases the
specific acetate uptake rate was kept constant. For reasons of simplicity Fset was assumed to be
equal to 100 wt%. In case qHAc/qMetOH =2, the fraction of the PHA-producing biomass is slightly
decreasing at increasing discharged volumes (Figure 5). This is due to direct growth of the
methanol degrading community resulting in increased methanol uptake rates, whereas acetate is
first stored as PHA and the uptake rate is constant (Appendix C: Supplementary modeled data
for the full cycle). The actual volumetric uptake rate of methanol is doubled during the cycle,
leading to a fast depletion of methanol (0.95 h), while acetate depletion occurs a bit later (1.05h).
However, when qHAc/qMetOH increases, operation with settling dramatically increases the fraction
PHA-producers in the system. More specifically, when the ratio between the two uptake rates is
more than 5, the biomass distribution on PHA-producers follows an almost linear increase over
the volume that is discharged. Nonetheless, if qHAc/qMetOH exceeds a level (in the presented study
10), there is no further advantage of the PHA-producers, but the success of the process depends
solely on the operational parameters (such as discharged volume or time of reaction as discussed
earlier).

Chapter 3
50
Figure 3.5: Predicted biomass fractionation for PHA-producers as a function of the discharged volume for
different ratios of specific acetate uptake rate over specific methanol uptake rate (r=qHAc/qMetOH). The
specific acetate uptake rate used was calculated experimentally from the SBR operation with the settling
step, the settling efficiency was assumed to be equal to 100% (no solid removal with the supernatant) and
the cycle length was equal to 12h. The shadowed area represents the non-applicable discharge volume
When the ratio between the two specific uptake rates is adequately high, the storing processes can
outcompete growth. Research on PHA-production from wastewater has shown that slowly
degradable organic carbon may contribute to a significant fraction of the wastewater COD and is
degraded at a much lower rate in comparison to methanol (qVFA/qnon-VFA-COD > 10) (Bengtsson et
al. 2008a, Jiang et al. 2012a, Tamis et al. 2014a). This suggests that settling after the feast phase
may significantly enhance the productivity of the process for industrial wastewater, but one
should realize that post-treatment of the supernatant is required before discharge to surface
waters.
3.4. Appendices
3.4.1. Appendix A: Matlab® code
The following m-file was generated for the SBR simulation for t_pre=1h under variable V_dis
clear all
clc
global K_ac u_ac_max m_atp K_n Y_phb_ac K_phb m_atp_phb Y_phb_atp...

Chapter 3
51
Y_x_phb u_met_max K_met m_met_atp Y_met_atp Y_met_x ...
Y_ac_atp Y_x_n alfa fPHB_max q_phb_max q_ac_max Y_x_ac X0
% PROCESS PARAMETERS-------------------------------------------------------
RT = 24; % Solid retention time (h)
CL = 12; % Cycle length (h)
V = 2.0; % Working volume reactor (l)
ac_feed = 13.5; % Acetate pulse (Cmmol/l)
met_feed= 13.5; % methanol pulse (Cmmol/l)
CN_ratio = 9; % C:N ratio
N_feed = (ac_feed+met_feed)/ CN_ratio; % Ammonium fed per cycle (mmol)
V_r=2;%working volume of the reactor [L]
Sol_rem=0; %Solid discharge of the biomass in the supernatant [-]
V_eff=1;%effluent volume[L]
V_dis=linspace(0,2,100);%Volume that is being discharged after reaction and settling[L]
%V_dis=0;
t_reac=1;%time of reaction, before the settling starts[h]
t_set=0; %time of settling[h]
% BIOMASS SPECIFIC PARAMETERS: KINETICS------------------------------------
delta = 3.0; % Efficiency of the oxidative phosphorylation
K_n = 0.0001; % Assumed half-saturation constant ammonium (mmol/l)
% Plasticicumulans acidivorans (at 30 degree Celcius and 12 h cycle length)
q_ac_max = 2.6; % Max. specific substrate uptake rate (Cmol/Cmol/h)
u_ac_max = 0; % Max. specific growth rate on ext. substrate (Cmol/Cmol/h)
m_atp = 0.0; % Specific ATP requirement for maintenance (mol/Cmol/h)
alfa = 2; % Exponent of the PHB inhibtion term (-)
K_phb = 0.18; % Rate constant for PHB degradation ((Cmol/Cmol)^(1/3)/h)- calculated from the degradation
during the cycle
K_ac = 0.01; % Half-saturation constant substrate (Cmmol/l)
fPHB_max = 6; % Max. fraction of PHB (Cmol/Cmol)- from accumulation
m_atp_phb = 0.00; %ATP requirements on PHB
%MetOH biomass
u_met_max = 0.18; % Max. specific growth rate (Cmol/Cmol/h), calculated from the maximum uptake substrate
rate multiplied by the yield
K_met = 0.01; % Half-saturation constant methanol (Cmmol/l)
m_met_atp=0.0;%ATP requirements on methanol
q_met_max=0.67;
%STOICHIOMETRIC YIELDS-----------------------------------------------------
% Acetate
Y_x_ac = 0; %Van Aalst-Van Leeuwen
Y_x_n = 0.2;

Chapter 3
52
Y_phb_ac = 0.59; %Experimental data/Average of SBRs
q_phb_max=q_ac_max*Y_phb_ac;
Y_ac_atp = 3;%Johnson
Y_x_phb = 0.65; %Van Aalst-Van Leeuwen
Y_phb_atp = 4.25; %Johnson
% MetOH
% balance already calculated at the Methanol_stoichiometry.xls file
Y_met_x=0.55;
Y_met_n=0.2;
%INITIAL CONDITIONS--------------------------------------------------------
% Initial amounts of Ac, NH4+ PHB, X_Pa, Met, Xmetoh, (Cmmol):
Y0=[0 0 0 5 0 5];
%Number of cycles
Ncycles=50;
start_cycle = zeros(Ncycles,6);
end_cycle = zeros(Ncycles,6);
A0=zeros(length(V_dis),6);
A1=zeros(length(V_dis),6);
A2=zeros(length(V_dis),6);
dy=zeros(6,1); %Initilization
for k=1:length(V_dis);
for i = 1:Ncycles % 40 cycles = 480 h
% Initialization of the cycle--------------------------------------
if i>1
start_cycle(i,:) = (V_r-V_eff)/V_r*end_cycle(i-1,:);
else % Except for the first cycle...
start_cycle(i,:) = Y0;
end
% Add fresh carbon and ammonium
start_cycle(i,1) = start_cycle(i,1) + ac_feed;
start_cycle(i,2) = start_cycle(i,2)+ N_feed;
start_cycle(i,5) = start_cycle(i,5)+ met_feed;
% Run cycle
%Feast-------------------------------------------------------------
Y0=start_cycle(i,:); % Initial conditions-end of the previous cycle+feed
X0=Y0(4);% For PHA degradation - According to Tamis
tspan=linspace(0,t_reac,100); % time: 0-1 hour
options = odeset('AbsTol',1e-6, 'NonNegative',1:6);
[t1,Y1]=ode15s(@kinetics_2,tspan,Y0,options);
A0=Y1(end,:);

Chapter 3
53
%Settling - Discharge----------------------------------------------
Y0=Y1(end,:);
tspan=linspace(t_reac,t_reac+t_set,100); % time: 1-1.79 hour
t2=tspan';
Y2=ones(6,100);
for j=1:6
Y2(j,:)=Y0(j)*Y2(j,:);
end
Y2=Y2';
%Dilution & Famine
% A1=Y2(end,:);
A1(k,1)=Y2(end,1)*(V_r-V_dis(k))/V_r;
A1(k,2)=Y2(end,2)*(V_r-V_dis(k))/V_r;
A1(k,3)=Y2(end,3)*(1-Sol_rem*V_dis(k)/V_r);
A1(k,4)=Y2(end,4)*(1-Sol_rem*V_dis(k)/V_r);
A1(k,5)=Y2(end,5)*(V_r-V_dis(k))/V_r;
A1(k,6)=Y2(end,6)*(1-Sol_rem*V_dis(k)/V_r);
Y0=A1(k,:);
X0=A1(k,4);
tspan=linspace(t_set+t_reac,CL,100); %time: 1.79-12 hour
options = odeset('AbsTol',10e-14, 'NonNegative',1:6);
[t3,Y3] = ode15s(@kinetics_2,tspan,Y0,options);
end_cycle(i,:)=Y3(end,:);
end
A2(k,:)=end_cycle(end,:);
k
end
F_PHA=A2(:,4)./(A2(:,4)+A2(:,6));
%Final values at steady-state - After looping for N_Cycles-XLS-File--------
xlswrite('160209_V_dis_t_set10_solrem0.xls',{'[L]'} ,'Sheet1', 'A3');
xlswrite('160209_V_dis_t_set10_solrem0.xls',V_dis', 1, 'a4');
xlswrite('160209_V_dis_t_set10_solrem0.xls',{'before discharge'}, 'Sheet1', 'b1');
xlswrite('160209_V_dis_t_set10_solrem0.xls',{'Ac', 'N','PHA','X_PHA','Met','X_met'}, 'Sheet1', 'b2');
xlswrite('160209_V_dis_t_set10_solrem0.xls',{'[Cmmol/L]',
'[mmol/L]','[Cmmol/L]','[Cmmol/L]','[Cmmol/L]','[Cmmol/L]'}, 'Sheet1', 'b3');
xlswrite('160209_V_dis_t_set10_solrem0.xls',A1, 1, 'b4');
xlswrite('160209_V_dis_t_set10_solrem0.xls',{'after discharge'}, 'Sheet1', 'b105');
xlswrite('160209_V_dis_t_set10_solrem0.xls',A2, 1, 'b106');
xlswrite('160209_V_dis_t_set10_solrem0.xls',{'total fractionation'}, 'Sheet1', 'i1');
xlswrite('160209_V_dis_t_set10_solrem0.xls',{'[%]'}, 'Sheet1', 'i3');
xlswrite('160209_V_dis_t_set10_solrem0.xls',F_PHA.*100, 1, 'i4');

Chapter 3
54
Tot_Ac=[Y1(:,1);Y2(:,1);Y3(:,1)];
Tot_N=[Y1(:,2);Y2(:,2);Y3(:,2)];
Tot_PHA=[Y1(:,3);Y2(:,3);Y3(:,3)];
Tot_X_ac=[Y1(:,4);Y2(:,4);Y3(:,4)];
Tot_Met=[Y1(:,5);Y2(:,5);Y3(:,5)];
Tot_X_met=[Y1(:,6);Y2(:,6);Y3(:,6)];
Tot_time=[t1;t2;t3];
Tot_X_tot=[Y1(:,6)+Y1(:,4);Y2(:,6)+Y2(:,4);Y3(:,6)+Y3(:,4)];
%Plotting-Modeled data-----------------------------------------------------
figure(1)
plot(Tot_time,Tot_Ac,'-b');
xlabel('time[h]')
ylabel('Acetate concentration [Cmmol/l]')
figure(2)
plot(Tot_time,Tot_N);
xlabel('time[h]')
ylabel('Ammonium concentration[Cmmol/l]')
figure(3)
plot(Tot_time,Tot_PHA);
xlabel('time[h]')
ylabel('PHB concentration[Cmmol/l]')
figure(4)
plot(Tot_time,Tot_X_ac,'-b');
xlabel('time[h]')
ylabel('Xacetate[Cmmol/l]')
figure(5)
plot(Tot_time,Tot_Met,'-b');
xlabel('time[h]')
ylabel('Methanol[Cmmol/l]')
figure(6)
plot(Tot_time,Tot_X_met,'-b');
xlabel('time[h]')
ylabel('Xmethanol[Cmmol/l]')
The kinetics were simulated according to the m-file “kinetics”
function dy=kinetics(~,y)
global K_ac m_atp K_n K_phb m_atp_phb Y_phb_atp...
Y_x_phb u_met_max K_met m_met_atp Y_met_atp Y_met_x ...

Chapter 3
55
Y_ac_atp Y_x_n alfa fPHB_max Y_phb_ac q_ac_max X0
%Model kinetics------------------------------------------------------------
% PHA producing population-with inhibition
m_ac=m_atp/Y_ac_atp; %maintenance on acetate
q_ac=q_ac_max*y(1)/(K_ac+y(1)); %acetate uptake
q_p_phb=Y_phb_ac*(q_ac*(1-(y(3)/y(4)/fPHB_max)^alfa))-m_ac; %PHB production-inhibition
q_c_phb=K_phb*(X0/y(4))^(1/3)*(y(3)/y(4))^(2/3); %PHB degradation, according to Tamis, 2014
m_phb=m_atp_phb/Y_phb_atp; %Maintenance on PHB
u_phb=Y_x_phb*(q_c_phb-m_phb); %Growth on PHB
% Methanol consuming population
u_met=u_met_max*y(2)*y(5)/(K_n+y(2))/(K_met+y(5)); %growth on methanol
m_met=m_met_atp/Y_met_atp; %maintenance on methanol
q_met=u_met/Y_met_x+m_met/Y_met_x; %methanol uptake
%Ammonium consumption
q_n=(u_met+u_phb)*Y_x_n; %growth on acetate, methanol & PHB
%Variables-----------------------------------------------------------------
%1: Acetate
%2: Ammonium
%3: PHB
%4: X_acetate
%5: Methanol
%6: X_methanol
%Balances------------------------------------------------------------------
if y(1)>0.00001
dy=zeros(6,1);
dy(5) = - y(6)*q_met; % Methanol
dy(6) = y(6)*u_met; % X_met
dy(1) = - y(4)*(q_ac); % Ac
dy(3) = y(4)*q_p_phb; % PHB
dy(4) = 0; % X_ac
dy(2) = -y(2)*q_n; % N
else
dy=zeros(6,1);
dy(5) = - y(6)*q_met; % Methanol
dy(6) = y(6)*u_met; % X_met
dy(1) = 0; % Ac
dy(3) = -y(4)*q_c_phb; % PHB
dy(4) = y(4)*u_phb; % X_ac
dy(2) = -y(2)*q_n; % N

Chapter 3
56
end
end
3.4.2. Appendix B: q-PCR data
Table 3.6: q-PCR analysis for the three different enrichments tested. 823 represents the RNA fragments of
P. acidivorans and 907 of general Eubacteria
Sample 823 SQ AvG 907 SQ AvG Fraction of P.
acidivorans
SBR-I 0.13 9.83E-04 0.33 2.65E-03 39%
SBR-II 0.12 2.81E-04 0.22 5.95E-03
53%
SBR-III 0.21 7.77E-03 0.34 1.60E-03 63%
3.4.3. Appendix C: Supplementary modeled data
Ratio between the two specific substrate rates (acetate/methanol) qHAc/qMetOH=2.
Figure 3.6: One cycle of acetate-methanol at steady-state with ratio between the two specific substrate
rates (acetate/methanol) qHAc/qMetOH=2.
0 2 4 6 8 10 120
5
10
15
20
25Cycle Ac-Met, qHAc/qMetOH=2
time [h]
HA
c, M
etO
H,
PH
A,
Xto
tal [
Cm
mol
/L],
NH
4 [m
M]

Chapter 4. IMPACT OF PHOSPHATE
LIMITATION ON
POLYHYDROXYALKANOATE (PHA)
PRODUCTION IN A FEAST-FAMINE
PROCESS1
1 Accepted for publication in Water Research

Chapter 4
58
4.1. Introduction
The 21th century can be defined as the “plastic” century. The majority of the economy is based on
this material. The overuse of plastic has led to an annual demand of 245 million tons of plastic, of
which a big part is floating in the oceans creating a major environmental problem (Andrady
2011). For the reduction of the plastic pollution, many measures have been taken, such as stricter
legislations, recycling facilities, and replacement of the petrochemical plastics with biodegradable
plastics. One of the most promising biodegradable plastics is polyhydroxyalkanoates (PHA) since
it can be produced from renewable resources and has similar properties to petrochemical plastics
(Chen 2009b). In the past decades research has focused on upscaling the PHA production
process, either via metabolic engineering (e.g. pure cultures, genetically modified organisms –
GMOs) or by mixed culture biotechnology. The latter approach provides important advantages
due to its reduced energy demands, while open cultures offer the possibility of being a part of the
general waste and wastewater treatment schemes (resource recovery).
Mixed culture biotechnology is based on the creation of selective cultivation conditions that favor
growth of microorganisms with specific metabolic properties, such as superior PHA storage
capacity (Kleerebezem et al. 2007a). Applying appropriate operational conditions, the most
competitive microbial community can be selected and thrive in non-sterile conditions, since the
environment itself provides the advantage, preventing intruders to survive (Beijerinck 1901).
Different approaches for selecting microorganisms that have a high storage capacity under
sequential operation include: i) alternating absence and presence of electron acceptor, i.e.
polyphosphate accumulating organisms – glycogen accumulating organisms (PAO-GAO system),
where PHA actually serves as an energy and electron storage (Mino et al. 1998), ii) intermittent
carbon feeding (feast-famine regime) where PHA serves as the intracellular carbon source in the
absence of external substrate (Reis et al. 2003a). Regardless the operation chosen for enrichment
of PHA-producing biomass the overall process is conducted in two separate steps: first selection
of the microbial community with a superior PHA producing capacity, followed by maximization
of the cellular PHA content in a fed-batch process under nutrient limitation. The feast famine
regime has shown to have higher PHA productivities compared to the anaerobic-aerobic
enrichment strategy (Reis et al. 2003a). However, the feast-famine regime is operated under fully
aerobic conditions. The low solubility of oxygen generates mass transfer problems at high
biomass concentrations, resulting in scaling-up limitations (Preusting et al. 1993).
The selection of the enrichment culture under the feast-famine regime is based on driving the
competition for carbon uptake in favor of PHA accumulating bacteria. After successful
enrichment of the community with PHA producing bacteria, the selected biomass is transferred

Chapter 4
59
to the second step of the process, the production step, where nutrient (e.g. N or P) limitation is a
prerequisite to prevent growth of a side population and achieve maximization of the cellular PHA
content. Consequently, the ratio of carbon over a growth nutrient in the influent of the process is
of great importance. When this ratio is high (nutrient-limited) a different competitive pressure is
imposed to the system compared to a low ratio (Johnson et al. 2010). When the substrate is
pulse-fed, carbon limitation will result in a feast-famine regime, selecting for organisms that
rapidly take-up substrate and store it as PHA. In case of dual substrate limitation the system
performance is hard to predict (Egli et al. 1993). Cavaillé et al. 2016 showed that a combined
limitation of carbon and phosphate in a chemostat resulted in the enrichment of a microbial
culture with a high PHA accumulation potential. This interesting option for double-limitation has
not yet been explored for sequential batch type of operation for enriching PHA accumulating
communities.
The aim of this study was to investigate the effect of the combined carbon and phosphorus
limitation for the enrichment of PHA-producing biomass in a sequencing batch process. Long-
term enrichments were established on two different influent C/P ratios. Based on the
experimental results, a model that predicts the substrate uptake rates was elaborated and used for
the evaluation of the effect of P limitation.
4.2. Materials and methods
4.2.1. SBR culture enrichment
A double-jacket glass bioreactor with a working volume of 2L (Applikon, the Netherlands) was
used for the enrichment of the biomass. The basic setup and operation of the reactor was the
same as described by Johnson et al. 2009a. The reactor was operated in a cyclic way (sequential
batch reactor, SBR).
The air flowrate supplied to the reactor was set to 0.4 LN/min using a mass flow controller
(Brooks Instrument, USA). The total gas flow rate through the reactor was increased to 1.4
LN/min by partial recirculation of the off-gas. The temperature in the reactor was controlled at
30±1°C using a thermostat bath (Lauda, Germany), the pH was maintained at 7.0±0.1 by the
addition of 1 M HCl and 1 M NaOH, and the stirring speed was set at 750 rpm. Biocontrollers
(ADI 1030, Applikon, the Netherlands & BIOSTAT B plus, Sartorius, the Netherlands) were
used for control of the pumps, stirrer, and pH control.
Activated sludge from the municipal wastewater treatment plant Dokhaven in Rotterdam (the
Netherlands) was used to inoculate the SBR. During each cycle 100 mL of fresh carbon and
nitrogen source were dosed into the reactor. The carbon source consisted of sodium acetate (13.5

Chapter 4
60
mM). The nutrient medium contained 6.75 mM NH4Cl, varied KH2PO4 concentration (Table
4.1), 0.55 mM MgSO4·7H2O, 0.72 mM KCl, 1.5mL/L, 0.02 mM MOPS, trace elements solution
according to Vishniac et al. 1975, and 5 mg/L allylthiourea (to prevent nitrification).
Table 4.1: Substrate characteristics for the tested enrichments
System KH2PO4
concentration C/P in the medium
mM Cmol/mol
I 0.32 167
II 0.16 334
Johnson et al (2009)
(Carbon-limited culture)
2.46 22
The enrichment culture was considered stable, when the length of the feast phase and the
concentration of total suspended solids (TSS) at the end of the cycle were constant for at least
five consecutive days. When steady-state was reached, experiments were conducted to
characterize the operational cycle. In addition, biomass from the SBR was collected for
accumulation experiments and molecular analysis.
4.2.2. Polyhydroxybutyrate (PHB) production
To evaluate the PHB storage capacity of each enrichment accumulation experiments were
conducted in a separate double-jacket glass bioreactor (Applikon, the Netherlands). The reactor,
with a working volume of 2 L, was operated at the same aeration rate, pH, and temperature as the
enrichment reactor. At the beginning of each experiment the reactor was filled with effluent
biomass from the enrichment reactor and carbon- and phosphorus-free medium to 2 L. The
production of PHB was initiated by a pulse of substrate (1.5 M acetate), and the rest of the
carbon was fed-on-demand via the pH-control in the form of acetic acid (1.5 M). When the
dissolved oxygen (DO) concentration reached saturation, indicating no significant biological
activity, the experiment was stopped.
4.2.3. Analytical methods
For both characterization of the enriched community and PHB production, the profile of the
experiments was monitored online via the DO, temperature, pH, acid and base dosage and off-

Chapter 4
61
gas CO2 and O2, and offline through acetate, ammonium, o-phosphate, total phosphorus, TSS
and PHB concentration measurements.
Samples were collected and filtered (0.45 µm pore size, PVDF membrane, Millipore, Ireland) to
remove all solids for the measurement of the soluble compounds (acetate, total phosphorus and
ammonium). Additionally, for the determination of the total phosphorus concentration in the
biomass, TP was also measured in the total samples. Ammonium and phosphorus concentrations
in the total and filtered samples were determined with Hach Lange™ kits (LCK 303 and LCK
348/349). Acetate was measured via high performance liquid chromatography (HPLC), equipped
with a BioRad Aminex HPX-87H column (Waters 2489 UV/RI detector) with a mobile phase
(1.5mM H3PO4) flow rate of 0.6 mL/min and a temperature of 60oC.
The TSS and PHB concentrations were analyzed as described in Marang et al. 2014a and Johnson
et al. 2009a respectively. The PHB content of the biomass, expressed as the weight percentage
PHB of TSS, was calculated using pure polyhydroxybutyrate (PHB, Sigma-Aldrich, CAS 26063-
00-3) as standard, and benzoic acid as internal standard. PHB was the only expected product
since acetate served as the sole carbon source. The active biomass concentration was determined
by the subtraction of PHB from the TSS, assuming that no other solid product was formed.
4.2.4. Molecular analysis
For the analysis of the microbial composition of each enrichment, biomass samples were
collected from the SBR and fed-batch reactor. The genomic DNA extraction was conducted with
the Ultra Clean Soil DNA extraction kit (MoBio Laboratories, California) and subsequently used
as template DNA for PCR-DGGE. 16s rRNA gene fragments of the community constituents
were obtained by a “touchdown” PCR program with primers 341F with a GC clamp and 907R
for DGGE analysis (Schäfer et al. 2001b,Table 4.2). The 16S rRNA gene amplicons were loaded
onto 8% polyacrylamide gels with a denaturing gradient from 20% to 70% DNA denaturants
(100% denaturants is a mixture of 5.6M urea and 32% formamide (Schäfer et al. 2001b). The
DNA was visualized by UV illumination after staining with SYBR® Safe, and photographed with
a digital camera. Individual bands were excised from the gel with a sterile razor blade and
incubated overnight in 50 µL water at 4°C. Re-amplification was performed using the same
primer pair (Table 4.2) and the PCR products were sequenced by a commercial company
(Macrogen, South Korea).The sequences have been stored in GenBank under accession numbers
KY458789-KY458797.

Chapter 4
62
Table 4.2: Primers for PCR analysis used in this study.
Code Function Sequence (5’-3’) Specificity Reference
341F-GC Primer Cctacgggaggcagcag1 Bacteria Schäfer et al. 2001b
907R Primer ccgtcaattcmtttgagttt Bacteria Schäfer et al. 2001b
4.2.5. Data analysis
The data were corrected for the sampling effect, addition of acid and base and inorganic carbon
dissolution, as described in Johnson et al. 2009a. For the calculation of the biomass specific
conversion rates, refer to Korkakaki et al. 2016a.
The yields of PHB over acetate (YPHB/HAc) and total biomass over substrate (YX/S), were estimated
by dividing of the formed product over the carbon consumed. The same concept was used for
the estimation of the P/C content of the biomass were the amount of phosphorus measured in
the total sample (subtracting the soluble phosphorus) was divided by the total amount of solids
after subtraction of PHB.
4.2.6. Modeling the process
A computational model was developed for the investigation of the correlation between the
biomass specific uptake rates and the cellular P content. The model was adapted from Korkakaki
et al. 2016b, with modified mass balances, based on the cellular P-content instead of active
biomass, to fit the experimental data (Table 4.3, balance tab). The process parameters, the
kinetics and the stoichiometry of the (microbial) conversions are reported in Table 4.3 and
Table 4.4.
1 Contains GC-clamp (5’-cgcccgccgcgccccgcgcccgtcccgccgcccccgcccg-3’) at the 5’ end of the primer
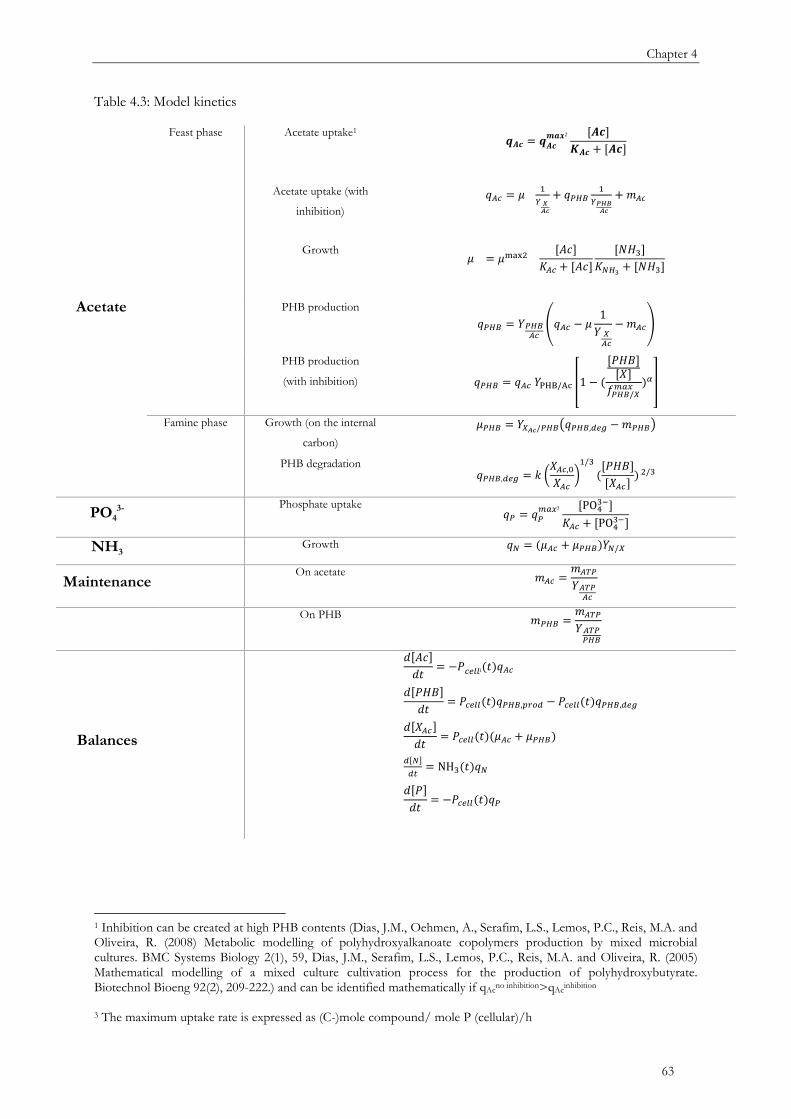
Chapter 4
63
Table 4.3: Model kinetics
Acetate
Feast phase Acetate uptake1 EFG = EFGHIJ2 [FG]NFG + [FG] Acetate uptake (with
inhibition)
�*@ = O � ."P + �()Q � !R"P +S*@ Growth O = OTUVW [XY]Z*@ + [XY] [[\]]Z^)_ + [[\]]
PHB production �()Q = `()Q*@ a�*@ − O 1̀b*@ −S*@c
PHB production
(with inhibition) �()Q = �*@ d̀ef/gh i1 − ( [j\k][�]l()Q/bm:� �no Famine phase Growth (on the internal
carbon)
O()Q = b̀"P/()Qp�()Q,B1� −S()Qq PHB degradation �()Q,B1� = r 4�*@,s�*@ =/] ([j\k][�*@] �W/]
PO43-
Phosphate uptake �( = �(m:�3 [POv]']Z*@ + [POv]'] NH3
Growth �^ = (O*@ + O()Q�`̂ /b
Maintenance On acetate S*@ = S*w(`*w(*@
On PHB S()Q = S*w(`*w(()Q
Balances
x[XY]x� = −j@1<<i(���*@ x[j\k]x� = j@1<<(���()Q,9&;B − j@1<<(���()Q,B1�
x[�*@]x� = j@1<<(��(O*@ + O()Q� B[^]B2 = NH](���^ x[j]x� = −j@1<<(���(
1 Inhibition can be created at high PHB contents (Dias, J.M., Oehmen, A., Serafim, L.S., Lemos, P.C., Reis, M.A. and Oliveira, R. (2008) Metabolic modelling of polyhydroxyalkanoate copolymers production by mixed microbial cultures. BMC Systems Biology 2(1), 59, Dias, J.M., Serafim, L.S., Lemos, P.C., Reis, M.A. and Oliveira, R. (2005) Mathematical modelling of a mixed culture cultivation process for the production of polyhydroxybutyrate. Biotechnol Bioeng 92(2), 209-222.) and can be identified mathematically if qAc
no inhibition>qAcinhibition
3 The maximum uptake rate is expressed as (C-)mole compound/ mole P (cellular)/h

Chapter 4
64
Table 4.4: Model parameters & Stoichiometric yields
Parameter Unit Value Reference
YPHB/Ac [C-mole C-mol-1] -0.63
this study
YX/Hc,feast
-0.06 |}~��� [C-mol Ac (mol P
h)-1] -300
|���� [C-mol Ac (C-mol P
h)-1] -0.67
���� [C-mol Ac (mol P
h)-1] 18
MWx [g C-mol-1]
25.1 Beun et al. 2002
MWPHB 21.5 Beun et al. 2002
fPHB,max [C-mol C-mol-1] 5.4 Marang et al. 2014a
a (PHB
inhibition term) [-] 2
Assumption KAc [C-mmol/L] 0.001
KP [mmol/L]
0.001
KN 0.001
mATP [mol(C-mol/L)-1] 0.02 Beun et al. 2002
KPHB [(C-mol C-mol)-1/3h-
1] -0.16 this study
One modeled cycle was divided in three phases that were consecutively executed in a loop: i)
feeding phase, where a pulse of carbon and nutrients is fed to the system, ii) reaction phase,
where the added substrate is consumed according to kinetics, and iii) effluent phase, where a part
of the volume is discharged according to the operational conditions. The simulation was run until
the steady-state was reached.
4.3. Results
4.3.1. SBR enrichments in the double-limitation regime
Two different enrichments cultures were set up for the evaluation of the double limitation effect
on the PHA production capacity of the enriched biomass. After a start-up period of 20 days,
acetate was rapidly depleted in the first enrichment (CP-I) after approximately 0.8 h, while PHB
was produced (feast phase). Phosphate was consumed at a constant rate and depleted after

Chapter 4
65
approximately 3 h. In the absence of external carbon, PHB was degraded and used for biomass
growth (famine phase). PHB was completely exhausted after 10 h (Figure 4.1A). In the second
system (CP-II), where the amount of dosed P was halved, the enrichment showed a completely
different profile. The soluble phosphate was consumed within 5 min, while acetate was depleted
at a much lower rate (after almost 6 h of reaction) and was used for biomass production as
reflected both in the increase of the biomass concentration and ammonium uptake. Only a small
fraction of acetate was stored as PHB. After the exhaustion of acetate, PHB was slowly degraded
in the famine phase (Figure 4.1B).
Figure 4.1: Conversion in a cycle of the of the enrichment cultures: A) CP-I (C/Pfeed=167 molC/molP). B)
CP-II (C/Pfeed=334). SRT=HRT=1 d, cycle length=12h. Acetate is represented with black color, soluble
phosphate with green, PHA with blue, NH3 with orange, active biomass with red. Solid lines represent
modeled data, while dashed lines represent experimental data.
4.3.2. Maximal PHB storage capacity of the P-limited enrichment culture
To evaluate the maximum PHB storage capacity of the enriched biomass in both systems, fed-
batch experiments were conducted in P-limiting conditions (Figure 4.2). In the case of the
biomass enriched in CP-I, acetate was directly converted to PHB, while at the same time, a small
part of carbon was directed towards biomass production. Despite that no phosphate was present
in the medium, ammonium uptake continued for the entire experiment and the active biomass
concentration doubled, from 0.45 to more than 1 g/L. The PHB content of the biomass reached
60% within the first hour of the experiment, and continued increasing to 84 wt% after 6 h of
acetate feeding (Figure 4.2C). During this operation all the rates where constant until the
complete saturation of the cells on PHB Figure 4.2A).

Chapter 4
66
Figure 4.2: Accumulation experiment of the enrichments: A) CP-I (C/Pfeed=167 during the enrichment).
B) CP-II (C/Pfeed=334 during the enrichment). SRT=HRT=1 day, cycle length=12h. Acetate is
represented with black color, soluble phosphate with green, PHA with blue, NH3 with orange, active
biomass with red, solid lines represent modeled data while dashed lines represent experimental data. C)
Comparison of the maximum PHA percentages of the two enrichments. Closed squares represent the CP-
I enrichment, and open squares the CP-II enrichment.
For the biomass enriched in CP-II, the accumulation experiment confirmed the low PHB storage
potential of the biomass. After 6 h of dosage of acetate the maximum PHA capacity of the
biomass reached 30 wt%, whereas the biomass concentration increased continuously as reflected
by ammonium uptake.
4.3.3. Kinetic and stoichiometric characteristics of the two enrichment cultures
The observed kinetic and stoichiometric parameters of the two enrichment cultures are shown in
Table 4.5. All the data are calculated from the cycle measurements, except for the maximum
PHA content, that was derived from the accumulation experiments.

Table 4.5: Observed yields and specific rates of the biomass enriched in System I. System II and control.
Observed yields Specific rates
Feast phase Total cycle Feast phase Famine
System YPHA/Ac YCO2/Ac YO2/Ac YX/Ac YCO2/Ac YN/X YP/X qAc qP qPHB qO2 µ qPHB qO2 µ PHBmax
[(C-)mmol/(C-mmol)] [(C-)mmol/(C-mmol.h)] wt%
I 0.63 0.31 0.12 0.57 0.44 0.14 0.01 -2.24 -0.005 1.45 -0.26 0.08 -0.13 -0.11 0.04 84.2
II 0.16 0.24 0.4 0.36 0.43 0.12 0.005 -0.54 NA 0.09 -0.23 0.05 -0.02 -0.12 0.04 30.2
Johnson et
al. 2009
0.67 0.32 0.23 0.46 0.49 0.15 NA -3.2 NA 2.1 -0.74 NA NA NA NA 89

Chapter 4
68
For CP-I enrichment substrate storage and CO2 production were the main metabolic activities in
the feast phase, with yields on acetate equal to 0.63 and 0.31 C-mol/C-mol respectively. The
specific substrate (acetate) uptake rate was 2.2 C-mol/C-mol/h. For the CP-II enrichment the
yields of PHA and CO2 over acetate were 0.16 and 0.24 C-mol/C-mol respectively. Under this
operation, in the presence of acetate, growth played a significant role in the metabolism, with a
yield of biomass over acetate (YX/Ac) equal to 0.46 C-mol/C-mol. In the CP-II enrichment culture
the specific acetate uptake rate was only 0.54 C-mol/C-mol/h.
4.3.4. Modeling based evaluation
A computational model was developed that describes the volumetric acetate uptake rate as a first
order reaction in the intracellular phosphate concentration, instead of the active biomass (protein)
concentration. In the regular feast-famine cycle, due to the relatively stable P-concentration
within the cells, the uptake rates were hardly affected, and followed the traditional Monod
kinetics (Figure 4.2A). In the accumulation experiment the experimental data indicated a decrease
in the biomass specific uptake rates with a decreasing P-content of the cells (Figure 4.2A). It was
hypothesized that the stable P-concentration within the cells leads to a first order kinetic behavior
in cellular phosphate concentration, despite the fact that a part of carbon was used for biomass
formation.
4.3.5. Microbial community structure
Once each system reached a steady-state DGGE analysis was used for the analysis of the
microbial community structure (Figure 4.3). The dominance of different microorganisms in the
two different operations is clear from the DGGE bands. More specifically, during the operation
of CP-I, P. acidivorans, a known PHA-producer dominated the system (Figure 4.3, bands 1-3). In
System II, where the phosphate concentration of the influent got further decreased, the
population was dominated by Emticicia, Azorizobium and Xanthobacter (Figure 4.3, bands 4-6).

Chapter 4
69
Figure 4.3: Bacterial specific DGGE analysis of the reactor biomass of the two enrichment cultures.
4.4. Discussion
4.4.1. Double limitation during the feast-famine still creates a selective pressure for PHA
production
According to the experimental results obtained from both the cycle profile and the accumulation
experiment, the double limitation imposed in CP-I, did not seem to influence the general
performance of the P. acidivorans dominated enrichment during cultivation. The main product of
acetate conversion was PHB (and carbon dioxide). Up to that C/P-ratio the microorganisms did
compete for acetate uptake, and P was only mildly limited, not affecting the process. The general
characteristics of the enrichment, such as specific substrate uptake rate and storage yield were in
the same range or slightly lower as obtained previously (Johnson et al. 2009a) when acetate was
the only limiting compound. All these clearly demonstrate that up to a C/P ratio of 150 C-
mol/mol in the feed, PHA production still provides a competitive advantage in terms of
substrate- uptake rate that can be achieved in comparison to direct use of acetate for growth
(Table 4.5).
When the system was operated at a C/P ratio of 300 C-mol/mol (CP-II), the selective pressure
shifted to competition for phosphorus uptake. Phosphate was taken up extremely fast (within 5
min) but the acetate uptake rate was significantly lower compared to the one of CP-I. During the

Chapter 4
70
cycle only a small fraction of acetate was directed towards PHB production, whereas the rest of it
was used for biomass growth. Additionally, the significantly lower overall biomass yield on the
substrate suggested that growth efficiency was reduced (Table 4.5).
In general, the experimental results reveal that as long as carbon is depleted before phosphorus,
PHA production provides a competitive advantage over direct use of carbon for growth. When P
is depleted before carbon, there is no competitive advantage related to PHA production and
carbon will be used directly for growth. In this case the selective pressure is based on the P-
uptake rate, favoring – most probably - P-storage.
4.4.2. Species competition under double-limitation
Double-limited systems have been previously reported (Egli 1991, Egli et al. 1993, Zinn et al.
2004, Johnson et al. 2010, Cavaillé et al. 2016). A system can be considered as multiple-limited
when more than one non-interactive growth nutrients (that do not substitute each other (Bader
1978) are fully exhausted in the effluent. The boundaries of the double limitation regime depend
on the biomass growth yield and the flexibility of the cell to adjust its yield on the respective
nutrients. Egli 1991 conducted studies with double limitation of carbon and nitrogen under
continuous operation with a pure culture. They showed that when a double limited system is
operated at high ratio of C/N (towards single nitrogen limitation), the nitrogen is used for the
essential functions (biomass formation), while the remaining carbon is stored (70 wt% PHA).
Operating the system at low C/N ratios (towards the carbon limitation) nitrogen storage occurs
within the cells (Egli 1991). Cavaillé et al. 2016 took a step further and investigated the impact of
double-limitation of carbon and phosphate in an open continuous/chemostat culture. In the
enrichment culture the same pattern as observed by Egli 1991, storage of PHA at high C/P ratios
(up to 80 wt%), while polyphosphate was stored at low C/P ratios.
Johnson et al. 2010 investigated the double-limitation effect of carbon and nitrogen under SBR
operation. PHB storage capacity seemed to be negatively affected when the limitation was shifted
towards nitrogen limitation. In the present study the same approach was utilized with limiting
compounds carbon and phosphorus. Similar to Johnson et al. 2010 increasing the C/P ratio
(towards phosphate limitation), P is depleted before carbon, and thus genera with the competitive
advantage on phosphate uptake rate are dominating. On the other hand, when the C/P ratio
tends towards lower values, carbon is the first of the two limited compounds to be depleted with
PHA storage as the dominant activity, and P. acidivorans thriving. Comparing these two
operations, SBR versus chemostat, there is a completely different selective environment (when
referring to open cultures). Under continuous operation, the fact that determines the winner of

Chapter 4
71
the competition is the affinity, while in an SBR system the winner lies on the specific uptake rate
of the “most” limited compound.
The key-point of this comparison is that depending on the C/P or C/N ratio in the influent one
of these two approaches can be utilized for PHA production: chemostat when the ratio is high
and SBR when the ratio is low. According to the chemostat studies when the C/(nutrient) ratio is
high (nutrient-limited) the excess of carbon is directed to PHA, while in the SBR operation the
nutrient limitation leads to a competition based on this specific nutrient, and thus selection of
organisms that can more efficiently use this nutrient. More specifically, under SBR operation
lower C/(nutrient) ratios would lead to successful enrichment of PHA producers.
Nonetheless, comparing these two operation SBR seems to be more efficient due to higher PHA
capacities (84 versus 80% wt), while the process can be operated in a continuous mode by
splitting the two stages (feast and famine) in space -with two separate tanks- than in time
(Albuquerque et al. 2010a, Marang et al. 2015).
4.4.3. Specific conversion rates at low P-intracellular content
Double-limitation up to a certain ratio (C/P=150 C-mol/mol in this study) the specific substrate
uptake rate was at the same range as the one obtained from carbon-limited systems Johnson et al.
2009a. However, when biomass system from this system was used in a phosphate limited
accumulation experiment, biomass specific uptake rates decreased significantly and volumetric
uptake rates remained constant (Figure 4.2A). Biomass growth was reflected in both the biomass
increasing concentration and the ammonium uptake. Traditional substrate uptake kinetics are first
order in the concentration of active biomass, which subsequently should lead to an exponential
uptake of substrate (Figure 4.4 - dashed lines). However, as the data suggest, this does not apply
for the enrichment of CP-I.

Chapter 4
72
Figure 4.4: Accumulation experiment of CP-I. Acetate is represented by black squares, PHB by blue
triangles and active biomass by red circles), Pcel-dependent model (solid lines) and typical Monod (active
biomass dependent) model (dashed lines).
In the model used in the present study (Figure 4.1A & Figure 4.2A, represented as solid line) all
the rates are therefore expressed as a function of the intracellular P-content. In the case of the
cycle experiment, the dependence of the rates on the P concentration is minimal. This is an
outcome of the much faster depletion of acetate in comparison to P, that leads to a rather stable
cellular P-concentration. Nonetheless, in the case of the accumulation experiment, since there is
no external P added to the system, while there is significant biomass growth in a period of 10 h,
the correlation of the intracellular P concentration and the uptake rates is obvious.
4.4.4. Linking theory with practice
When the feast-famine regime is used for PHA production, the process consists of two-steps:
enrichment of biomass and, ii) PHA production in the accumulation step. For the latter step,
nutrient limitation is required to avoid growth of side-population and to force all the carbon
towards PHA production (Johnson et al. 2009a, Jiang et al. 2012b). Most of literature so far is
devoted to nitrogen-limitation during this accumulation step, but the majority of waste streams is
not N-limited. Selective removal of (ammonium-) nitrogen is not feasible at low concentrations
encountered in wastewater. Phosphate is an interesting candidate with regard to nutrient
0 2 4 6 8 100
200
400
600
800
1000 acetate
exp
Xexp
PHBexp
acetatemodel - P-lim
Xmodel - P-lim
PHBmodel - P-lim
acetatemodel - no-lim
Xmodel - no-lim
PHB
Ace
tate
upt
ake,
X, P
HB
[C-m
mol
e]
time [h]

Chapter 4
73
limitation. It can be removed from an aqueous solution employing chemical precipitation and
crystallization through dosage of Al, Fe or Mg salts. The precipitated mineral can be easily
separated from the liquid by decanting (Yeoman et al. 1988, Georgantas et al. 2007). Thus, in a
vast majority of waste streams that concept can be applied, leading to P-limited streams.
Typically, in the traditional carbon-limited enrichments the biomass that is used in the
accumulation reactor is generated in the enrichment reactor, since during the production step
growth is restricted. However, the double-limited enrichment (CP-I) was allowed to grow in the
accumulation phase without negatively affecting the cellular PHA content. More specifically, in
the accumulation experiment the biomass concentration was increased two-fold at PHA-contents
exceeding 80 wt%. Additionally, no side population can develop during this step because
phosphate remains limiting at all times. Therefore, from the process design point of view, a
significantly smaller enrichment reactor is required, and the largest fraction of the waste can be
supplied to the accumulation reactor.

Chapter 4
74
An additional advantage of the double-limited enrichment is the linear pattern of the conversion
rates. The kinetic model (and the experimental data) show that all the conversion rates depend
linearly on the cellular P-content and not on the biomass concentration. Therefore, high biomass
and PHA concentrations can be established without oxygen mass transfer limitations, provided
that the cellular P-content is maintained low. Assuming that in an industrial bubble column
reactor the maximum transfer rate of oxygen is 5 kg/m3/d, in the enrichment CP-I (as shown in
Figure 4.5), oxygen limitation will never occur, since the slope of the oxygen uptake never
exceeds that maximum transfer rate (with a constant value of 1.2 kg/m3/d). In theory, higher
concentrations of biomass (up to 4 times more) an be utilized, leading to a respective four-fold
increase of the PHA productivity (resulting in 480 kg PHA/m3/d) at biomass amounts of at least
120 kg/m3/d.

Chapter 5. STORAGE COMPETITION
ON GLUCOSE IN SHORT SRTS: AN
ELECTRON ACCEPTOR DYNAMICS
STUDY

Chapter 5
76
5.1. Introduction
Increasing population and welfare drives society to develop a more resource recovery oriented
circular economy. For wastewater treatment plants this is reflected not only in development of
water reuse technology but also in the recovery of nutrients and chemicals (Van Loosdrecht et al.
2014). A typical –traditional- example is the biogas production unit, where the non-degraded
organics are transformed into biogas/energy, or the composting units, were waste is turned into
fertilizers. However, from a circular economy point of view, recovery of organic compounds with
a higher value should be recovered, such as biopolymers like polyhydroxyalkanoates (PHA) or
extracellular polymeric substances (EPS). Polyhydroxyalkanoates (PHA) are a group of
biodegradable polymers that are produced by numerous groups of bacteria (Chen 2009b). Their
properties depend on the monomeric units with a close similarity to petrochemical-derived
plastics, offering the opportunity of direct usage in the plastic industry. Additionally they can also
serve as precursors for the chemical industry, for the production of antibiotics, vitamins,
aromatics (Chen et al. 2005, Philip et al. 2007).
Previously it has been shown that microbial PHA production in open systems can be achieved
with two different methods; the feast-famine regime, where the process is operated aerobically
under intermittent substrate feeding (mainly carbon), or an anaerobic-aerobic cyclic operation.
The selective pressure in such periodically fed systems is based on the biomass specific uptake
rate, resulting in the selection of microorganisms that have high uptake rates, enabled by rapid
storage of substrate as polyhydroxyalkanoates (PHA), instead of direct converting the substrate
directly into biomass (Van Loosdrecht et al. 1997, Reis et al. 2003a, Kleerebezem et al. 2007a). In
anaerobic/aerobic conditions (or alternatively with electron acceptor dynamics), a similar
competition arise but for organisms that have an alternative energy supply in the absence of an
electron acceptor. Research into PHA production has been mainly oriented towards using
acidified wastewater, with acetate and other VFA as the main carbon substrate (Serafim et al.
2008,Johnson et al. 2009a Albuquerque et al. 2010c Jiang et al. 2011c Marang et al. 2014a
Korkakaki et al. 2016a Korkakaki et al. 2016b). If sugars -such as glucose- could be directly used
for PHA production by enrichment cultures the need for pre-fermentation would be eliminated
(Bengtsson et al. 2008a, Coats et al. 2011 Jiang et al. 2012b Morgan-Sagastume et al. 2014a Tamis
et al. 2014a).
A limited number of studies has investigated glucose as a potential substrate for PHA production
in enrichment cultures. It was shown that under fully aerobic operation glucose was mainly
converted to glycogen. Glycogen storage was proposed to be favored due to its faster production
rate compared to PHA storage (Dircks et al. 2001). Cech et al. 1990 introduced the so-called G-

Chapter 5
77
bacteria that dominate enhanced biological phosphorus removal (EBPR) process when glucose is
present in the influent. In their type of experiments, glucose and acetate were fed to the
enrichments with a long SRT (>18 d) and observed that under their operation glucose was
polymerized to glycogen, outcompeting polyphosphate accumulating organisms (PAOs). Carucci
et al. 1999 conducted series of experiments to identify the EBPR ability of enrichments fed with
different carbon substrates. They showed that when acetate and glucose were dosed to the
enrichment, glucose was stored rapidly as glycogen and partly fermented to lactate by enrichment
cultures at an SRT of 8-10 d. Approximately half of the carbon source was fermented to provide
the energy for the other half of substrate to be used for storage and growth. Wang et al. 2002
used glucose as the sole substrate with a long SRT (8d) and derived the glucose metabolism in
mixed cultures under anaerobic-aerobic cycling in an EBPR process. In their case the so-called
“bio-P bacteria” (or else PAOs) dominated the enrichment, providing the energy required for the
glucose uptake and PHA production by polyphosphate hydrolysis. What was suggested from
their work is that in order to maintain the redox balance PHV was produced.
Theoretically, glucose could be converted to PHA directly by the same microorganism (Figure 5.1
– right part of the figure). According to this simplified model, the reactions that should take place
are: i) glucose uptake, ii) glycolysis to pyruvate, iii) pyruvate conversion to acetyl- and propionyl-
CoA and then iv) PHA formation (the exact polymer composition depends on the amounts of
acetyl- and propionyl-coA). The main aim of this study was therefore to investigate the possibility
of direct glucose conversion to PHA in an anaerobic/aerobic SBR. To maximize the observed
yields the enrichment was operated at low SRTs (2 and 4 d). During the lowest SRT operation the
effect of presence/absence of nutrients (nitrogen/phosphate) during the anaerobic phase was
evaluated.

Chapter 5
78
Figure 5.1: The metabolic conversions in the various enrichments (A) and as originally assumed (B).. Solid
lines represent the enrichment operated at 2 d SRT (nutrient dosage at the beginning of the cycle), dashed
lines represent the enrichment operated at 4 d SRT (nutrient dosage at the beginning of the cycle). On the
right side of the figure is the original proposed glucose metabolism to PHV, the assumption on which this
study was based.
5.2. Materials and methods
5.2.1. Culture medium
The carbon medium consisted of glucose with concentration equal to 30 Cmmol/L and the
nutrient medium had a composition of 7.5 mM NH4Cl, 0.6 mM KH2PO4, 0.62 mM
MgSO4·7H2O, 2 mL/L trace elements solution according to Vishniac et al. 1975, and 0.2 mg/L
allylthiourea (to prevent nitrification).
5.2.2. SBR for culture selection
A double-jacket glass bioreactor with a working volume of 2 L (Applikon, the Netherlands) was
used for the enrichment of the biomass. Activated sludge from the municipal wastewater
treatment plant Kralingseveer in Rotterdam (the Netherlands) was used to inoculate the SBR.

Chapter 5
79
The basic setup and operation of the reactor was the same as described by Johnson et al. 2009a.
The reactor was operated in a cyclic way (sequential batch reactor, SBR) under cycling anaerobic-
aerobic conditions. The different phases of one cycle consisted of: i) feeding phase (10 min,
anaerobically), ii) reaction phase (320 min, anaerobically), iii) reaction phase (360 min,
aerobically), and iv) a mixed effluent phase (10 min, anaerobically). The sludge retention time
(SRT) and the hydraulic retention time (HRT) were equal to 2 or 4 days (depending the
operation) and the cycle length (CL) was set to 12 h. Three different operations were tested: i)
SRT of 2 days with nutrient (ammonium) dosage at the start of the anaerobic (feeding) phase, ii)
SRT of 2 days with nutrient dosed in the aerobic phase (separated from the carbon source), and
iii) SRT of 4 days with nutrient (ammonium) dosage at the start of the anaerobic (feeding) phase.
The N2 and air flowrate in the reactor were set to 1.5 and 0.5 LN/min respectively using a mass
flow controller (Brooks Instrument. USA). The temperature in the reactor was controlled at
30±1°C using a thermostat bath (Lauda, Germany), the pH was maintained at 7.0±0.1 by the
addition of 1 M HCl and 1 M NaOH, and the stirring speed was set at 750 rpm. Biocontrollers
(BIOSTAT B plus, Sartorius, the Netherlands) were used for the pumps, stirrer, and pH control.
The enrichment was considered stable, when the length of the feast phase and the concentration
of total suspended solids (TSS) at the end of the cycle were constant for three consecutive days
with a standard deviation of 5%. When steady-state was reached, cycle experiments were
conducted to characterize each enrichment. In addition, biomass from the SBR was collected for
accumulation experiments and molecular analysis.
5.2.3. Batch experiments
The metabolism of lactate for the three enrichments were investigated via batch experiments with
lactate as the sole carbon source. The concentration of lactate at the beginning of the cycle was
40-60 C-mmol/L, while the nutrient medium was the same as in the normal cycle operation. The
rest of the reactor operation was identical to the SBR operation.
5.2.4. Analytical methods
For both characterization of the enriched community and PHA production, the profile of the
experiments was monitored online via the dissolved oxygen (DO), temperature, pH, acid and
base dosage and off-gas CO2 and O2, and offline through substrate, ammonium, TSS and PHA
measurements.
The general properties, such as glucose and VFA concentrations, chemical oxygen demand
(COD), ammonium, phosphate, TSS, volatile suspended solids (VSS), pH and conductivity were

Chapter 5
80
measured. The samples were filtered with a 0.45µm pore size filter (PVDF membrane, Millipore.
Ireland) to remove all solids. COD, NH4+ and PO4
3- were determined with Hach Lange™ kits
(014 or 114, 302, 348). Glucose and VFA concentrations were measured via high performance
liquid chromatography (HPLC), equipped with a BioRad Aminex HPX-87H column (Waters
2489 UV/RI detector) with a mobile phase (1.5mM H3PO4) flow rate of 0.6mL/min and a
temperature of 60oC. TSS and VSS analysis was done as previously described by Jiang et al.
(2012). The PHA content of the biomass was the sum of PHB and PHV (no other significant
peaks were detected), expressed as the weight percentage PHA of VSS, was calculated using pure
poly-2-hydroxybutyric-co-3-hydroxyvaleric acid (PHV content of 12 wt%) (Sigma-Aldrich,
403121) as standard, and benzoic acid as internal standard. Washed and freeze dried biomass was
hydrolyzed and esterified in a mixture of hydrochloric acid, 1-propanol and dichloroethane for 2h
at 100oC. The propyl-esters formed were extracted with water and analyzed via gas
chromatography (GC). Glycogen was measured according to the method proposed by Smolders
et al. 1994 with digestion time equal to 5h. The active biomass concentration was determined by
subtraction of PHA and glycogen from VSS.
5.2.5. Molecular analysis
In order to analyze the microbial composition of the enrichment under each operational
condition, biomass samples were taken from the SBR. The genomic DNA was extracted with the
Ultra Clean soil DNA extraction kit (MoBio Laboratories, California). For gram-positive bacteria
before the DNA extraction the biomass pellet was suspended in 280 µL of Bead Solution and
transferred into a special sterile bead column with a red let. 20 µL of 50mg/mL lysozyme solution
was added to the bead solution without mixing. After incubation for 30 min at 37 oC, 8 µl of 20%
SDS and 8.5 µl of protein kinase K were added. The samples were incubated for 15 min at 56 oC
and afterwards 50 µl of MD1 was added. The column with bead solution was immersed in liquid
nitrogen for 3 min and was placed at two sterile steel beads and one scoop of lava stones for 3.2
min. Then the column was held in liquid nitrogen for 3 min and beaded again for 3.2 min. The
previous 4 steps after immersion in liquid nitrogen were repeated once more. The resulting lysate
was extracted using the Ultraclean Microbial DNA extraction kit (Mobio, USA).
The extracted genomic DNA was used as template DNA for PCR-DGGE. 16s rRNA gene
fragments of the community constituents were obtained by a “touchdown” PCR program with
primers 341F with a GC clamp and 907R for DGGE analysis (Schäfer et al. 2001a). The 16S
rRNA gene amplicons were loaded onto 8% polyacrylamide gels with a denaturing gradient from
20% to 70% DNA denaturants (100% denaturants is a mixture of 5.6M urea and 32% formamide

Chapter 5
81
Schäfer et al. 2001a. The DNA was visualized via UV illumination after it was staining with
SYBR® Safe, and photographed by a digital camera. With a sterile razor blade, the individual
bands were excised from the gel and then incubated overnight in 50 mL water at 4 oC. Re-
amplification was performed using the same primer pair (Table 5.1) and the PCR products were
sequenced by a commercial company (Macrogen, South Korea). The sequences have been stored
in GenBank under accession numbers: KY458760-KY458783.
Table 5.1: Primers for PCR analysis used in this study.
Code Function Sequence (5’-3’) Specificity Reference
341F-GC Primer Cctacgggaggcagcag18 Bacteria Schäfer et al. 2001b
518F Primer Ccagcagccgcggtaat Bacteria Muyzer et al. 1993
907R Primer Ccgtcaattcmtttgagttt Bacteria Schäfer et al. 2001b
5.2.6. Thin section electron microscopy
Thin section electron microscopy was conducted with cells fixed at 3% (v/v) glutaraldehyde for
1h (-4oC), 3 h in 1% (w/v) OSO4 and 0.5 M NaCl at ambient temperature, incubated overnight
with 1% (w/v) uranyl acetate, dehydrated with ethanol and embedded in Epoxy resin. For
staining, lead acetate (1%) was used (Welles et al. 2017).
5.2.7. Data analysis
The data were corrected for the sampling effect, addition of acid and base and inorganic carbon
dissolution, as described in Johnson et al. 2009a. For the calculation of the specific conversion
rates of the compounds, the equation proposed by Marang et al. 2014a was adapted. The yields of
PHA over substrate (YPHA/S), and total biomass over substrate (YX/S) were estimated as the
fraction of the formed product over the carbon consumed.
5.3. Results
5.3.1. Cycle profile of the enrichment
Three different SBR reactors were started with activated sludge as inoculum. Steady-state
operation was established after approximately 20-50 cycles. Steady-state was assumed when the
TSS was constant, the base/acid dosage time (indicative for the glucose uptake rate and VFA
production/consumption), and the cyclic DO profile (indicative for the aerobic conversion
processes) did not change for at least five consecutive days. The anaerobic phase seemed to
18 Contains GC-clamp (5’-cgcccgccgcgccccgcgcccgtcccgccgcccccgcccg-3’) at the 5’ end of
the primer

Chapter 5
82
consist of two (or three) distinct periods; one when glucose was present and one when lactate and
polyglucose served as the carbon source. The third case was the VFA consumption phase, which
-depending on the operation- could occur either anaerobically or aerobically. With regard to the
aerobic part, a typical aerobic feast-famine regime was observed in all the cases for the uptake of
the acetate and propionate that remained at the end of the anaerobic period. The cycle profile for
the three different enrichment cultures is shown in Figure 5.2, and the total reactions for the
anaerobic period is shown at Table 5.2.
More specifically, for the system with an SRT of 2 d, glucose was rapidly (~0.1 h) converted to
lactate and polyglucose at a ratio of more than 1:2 (C-mol basis). After the complete depletion of
glucose, lactate and polyglucose were fermented to acetate, propionate and small amounts of
PHV and PHB. The produced compounds were not further consumed for the remaining one
hour of the anaerobic period. During the aerobic phase acetate and propionate were rapidly
converted to PHV and PHB, which was subsequently consumed for biomass growth.
In the second system operated at SRT of 2 days with ammonium limitation during the anaerobic
phase glucose was converted in lactate and polyglucose at a ratio of 1:1.7 (C-mol: C-mol). The
glucose uptake rate (Table 5.2) was decreased, while a significant amount of biomass was
produced (~20% of the total carbon) under anaerobic (nutrient limited) conditions. After glucose
depletion, lactate and polyglucose were converted to PHA, acetate and propionate, and biomass.
In the presence of oxygen, the unconverted acetate and propionate were consumed, while PHA
was also degraded for polyglucose and biomass production.
When the system was operated at a longer SRT (4 d) without nutrient limitation, the glucose
depletion time was similar to the system at SRT=2 days (~0.1 h). As in the short SRT operation,
glucose was taken up, converted to polyglucose and lactate with a ratio of 1.7:1; C-mol:C-mol. In
this operation, lactate and polyglucose were subsequently anaerobically converted to
predominantly biomass and PHA. During the aerobic phase, the unconverted acetate was
depleted, while the PHA was consumed and used for biomass and polyglucose formation.
In none of the experiments phosphate release or excessive phosphate uptake was noted.

Figure 5.2: Cycle profile of the anaerobic-aerobic enrichments established on steady-state with operational conditions: I) SRT=2 d, feeding of the nutrient at the
beginning of the anaerobic phase, II) SRT=2, feeding of the nutrients at the beginning of aerobic phase, and III) SRT=4d, feeding of nutrients at the beginning of
the anaerobic phase. (-) Glucose, (ᴏ) Polyglucose, (▲), Active biomass, (∎)PHA, (□) PHV, (⌧) PHB, (�) NH4, (���� )Propionate, (����) Acetate, (���� ) Lactate

84
5.3.2. Lactate as the carbon source for the enriched biomass
In all enrichment cultures glucose was partially fermented to lactate. To evaluate the conversions
of lactate separate batch test were conducted with the enrichment cultures and lactate as the only
carbon substrate (Figure 5.3). The enrichment culture at low SRT without ammonium limitation,
converted lactate and leftover polyglucose primarily to biomass and acetate and propionate.
When the aerobic period started the remaining lactate, acetate and propionate were rapidly
converted to PHA, which was subsequently used for growth. From the observations it appeared
that lactate uptake rates were reduced compared to the uptake in a regular anaerobic period.
(Table 5.2).
The enrichment culture grown under anaerobic nutrient limitation converted lactate directly to
PHV, with a small production of propionate and acetate. The lactate uptake rate was again lower
than the rate observed during the regular SBR cycle. The carbon present when aeration started
was rapidly converted to PHA which was further converted to polyglucose and biomass.
The enrichment culture selected under the SRT of 4 d converted lactate with the leftover
polyglucose predominantly to PHV with similar rates as in the regular operation. In the aerobic
period, the remaining acetate and lactate were used for PHB production. In absence of external
carbon, both PHB and PHV were used as substrate for biomass and polyglucose production.

Figure 5.3: Lactate experiment for the three different enrichments: I) SRT=2 d, feeding of the nutrient at the beginning of the anaerobic phase, II) SRT=2, feeding
of the nutrients at the beginning of aerobic phase, and III) SRT=4d, feeding of nutrients at the beginning of the anaerobic phase. (-) Glucose, (ᴏ) Polyglucose, (▲),
Active biomass, (∎)PHA, (□) PHV, (⌧) PHB, (�) NH4, (���� )Propionate, (����) Acetate, (���� ) Lactate.

Table 5.2 Stoichiometric and kinetic experimental values for the three enrichment cultures. Steady-state refers to the SBR cycle while Lactate batch to the batch
experiment with lactate as the sole carbon substrate.
SRT 2 2 4
Nutrient dosing Anaerobic Aerobic Anaerobic
Steady state Lactate Steady state Lactate batch Steady state Lactate batch
Ana
erob
ic
peri
od qGlu
19 C-mol/C-
mol/h
-2.71 0 -0.55 0 -2.33 0
qLac2 -0.04 -0.02 -0.08 -0.04 -0.03 -0.02
YVFA/Lac C-mol/C-
mol
0.64 0.71 0.85 0.29 0.62 0.34
Total YPHA/Substrate 0,39 0.37 0.24 1.04 0.31 0.82
19 The uptake rate is calculated over the total initial biomass

Chapter 5
87
5.3.3. Microbial community structure
The microbial diversity of each enrichment culture was evaluated by frequent microscopic
observation and DGGE analysis. Additionally, samples are sent for next generation sequencing
to identify undetected species. The SRT=2 days, enrichment culture seemed to consist of two
main types of bacteria, PHA containing coccoid and tetra-shaped bacteria. The simple
community structure allowed analysis by DGGE of the 16S-RNA and the dominant bands
indicated P. acidivorans or Thauera (PHA containing bacteria; Table 5.3), while the tetrad-shaped
community could not be identified. Electron microscopy on a slice of the tetra-shaped bacteria of
this operation showed that –most probably- small amounts of PHA inclusions were stored
(Figure 5.4D).
Nutrient limitation in the anaerobic period and SRT=2 days selected for two main cell types,
both with a tetrad shape. The DGGE results excluded again the presence of the tetra-shaped
bacteria. For the SRT= 4 days enrichment, only fermentative (rod-shaped) microorganisms were
detected (Propioniciclava) from DGGE, while the microscopic picture showed the existence of a –
mainly- uniform tetrad community which again could not be identified (Figure 5.4).
Thin section of the tetrad bacterium from the enrichment culture of 2 d SRT and no nutrient
limitation, indicated that the cell was able of storing small amounts of PHA (white granules in
Figure 5.4D).

Chapter 5
88
Figure 5.4: A1) Microscope image of a sample from the enrichment reactor at 2 d SRT and nutrient
dosage at the beginning of the cycle, B1) Microscope image of a sample from the enrichment reactor at 2
d SRT and nutrient dosage at the beginning of the aerobic phase, C1) Microscope image of a sample from
the enrichment reactor at 4 d SRT and nutrient dosage at the beginning of the cycle, A2) Bacterial specific
DGGE analysis of enrichment reactor at 2 d SRT and nutrient dosage at the beginning of the cycle, B2)
Bacterial specific DGGE analysis of enrichment reactor at 2 d SRT and nutrient dosage at the beginning
of the aerobic period, C2) Bacterial specific DGGE analysis of enrichment reactor at 4 d SRT and nutrient
dosage at the beginning of the cycle, D) electron microscopy image of a thin section of the tetrad-
bacterium, enriched in 2 d SRT and nutrient dosage at the beginning of the cycle.

Chapter 5
89
Table 5.3: Identification results of the bacterial specific DGGE analysis of the enrichment cultures. A) 2 d
SRT and nutrient dosage at the beginning of the cycle, B) 2 d SRT and nutrient dosage at the beginning of
the aerobic phase, and C) 4 d SRT and nutrient dosage at the beginning of the cycle.
Band Sample Closest match % Similarity
22
A
Mollicutes bacterium 99
23
Plasticicumulans acidivorans 99 24
25
26 Thauera linaloolentis 99
1
B
Sphingobacterium sp. 96
2 Haliscomenobacter sp. 90
3 Emticicia sp. 98
4 Leadbetterella byssophila 94
5 Plasticicumulans acidivorans 99
6
7 Tessaracoccus sp 94
8 Zoogloea resiniphila 97
9 Propioniciclava sp. 96
10
C
Niabella terrae 97
11 Bacillus sp 99
12 Fluviicola sp 97
13 Hydrogenophaga electricum 99
14 Propioniciclava sp. 97
5.4. Discussion
5.4.1. Competition on glucose
The present study investigated the potential of PHA production from glucose in an anaerobic-
aerobic SBR system. Glucose, an easy fermentable substrate, is involved in many possible
metabolic pathways, creating dynamics of competition for different substrates and potential
storage polymers in enrichment cultures. The abundance of sugars in a variety of waste streams
(e.g. hydrolysates of lignocellulosic material) would make it a suitable source for bioplastic
production. Additionally, no pre-fermentation step would be required making the process more

Chapter 5
90
economic. In the present study glucose was fed to the anaerobic period of the system. The
reactor was run under cyclic anaerobic and aerobic conditions. At the end of each cycle, a part of
the reactor volume including biomass (depending the operational SRT) was removed and a new
cycle started.
When glucose was fed to the enrichment culture, organisms with a very high biomass specific
uptake rate of glucose were selected. The specific uptake rate of glucose was fast, similar to ones
obtained in enrichment cultures previously run under similar conditions (Jeon et al. 2000).
Comparing this rate to pure strain fermentative cultures (e.g. Lactobacillus rhamnosus; Berry et al.
1999) it is lower (almost halved). However, the uptake rates in the present study were calculated
over the total biomass, while only a part of it should make the conversion. Thus, the real glucose
specific uptake rate is expected to be higher. When the anaerobic growth was limited due to
feeding of the nutrients in the aerobic period a lower specific glucose uptake rate was observed.
Previous studies (Johnson et al. 2010) coincide with these results, confirming that nutrient
limitation leads to decreased uptake rates.
The different operational conditions used did not seem to influence the metabolism of glucose,
which always resulted first in polyglucose and lactate production. Figure 5.1B shows the observed
(simplified) glucose metabolism. In order to allow a very fast uptake rate, storage of the substrate
as a polymer seems to allow much higher rates then when substrate uptake is solely associated to
growth. For glucose, polyglucose is the simplest storage compound to form. Glucose conversion
to polyglucose requires energy (ATP), which is provided via glucose conversion to lactate, which
is a redox neutral. Balancing ATP (Appendix) results in converting a C-mol of glucose into 1/3
C-mole lactate and 2/3 C-mole polyglucose (Dircks et al. 2001). This ratio was indeed observed
experimentally for all the SBR conditions utilized. Small deviations derive most probably from
simultaneous polyglucose degradation to lactate or PHA.
After conversion of glucose to lactate and polyglucose, a combined fermentation of lactate to
acetate, propionate and biomass was observed in all the three operational conditions. Jeon et al.
2000 used an SBR fed with glucose with an SRT of 10 d. In their study the enrichment consisted
of two microbial groups, one that accumulates glucose in the form of polyglucose and the other
that can convert lactate to PHA. To identify whether in the present study the conversions of
glucose to acetate and propionate is performed by one or more groups of bacteria a batch
experiment with lactate as the sole carbon source was conducted. The rate of lactate conversion
seemed to be decreased in absence of glucose, indicating a correlation between the two reactions.
Apparently the enrichment culture did not have the ability to take up lactate at the same rate as in
the steady state without glycogen, even though it is thermodynamically possible. Nonetheless, in

Chapter 5
91
the presence of polyglucose (in the nutrient limited operation and the longer SRT operation) the
kinetic performance was similar to the one of the SBR cycle (Table 5.2). DGGE analysis for the
nutrient limited and longer SRT operation showed that in the latter two cases fermentative
bacteria (Propioniciclava) were present and have been previously identified to ferment glucose to
acetate and propionate (Sugawara et al. 2011).
5.4.2. Competition on VFA
The third (indirect) competition for substrate that was occurring in the present system was on
acetate and propionate that were produced from lactate fermentation. There was a clear
distinction here between the systems at SRTs of 2 or 4 days. At the short SRT (2 d) with the
nutrients being dosed at the beginning of the cycle (anaerobically), anaerobic VFA uptake never
occurred. Experimental data of the operation without nutrient limitation at 2 d SRT suggest that
the overall growth rate of GAOs is too low to be maintained in the system at 2 day SRT (aerobic
SRT equal to 1d). Lopez-Vazquez et al. 2009a showed that the minimum aerobic SRT for PAOs
and GAOs is 1.25 and 1.8 d respectively; indicating that the aerobic SRT was too short to allow
proliferation of GAOs. Acetate and propionate produced via lactate fermentation leached to the
aerobic phase where it was taken up by microorganisms similar to P. acidivorans that have a very
high specific substrate uptake rate and produce PHA from VFAs. When the system was operated
at a longer SRT (4 days), the slower growing GAOs could be maintained in the system (modeled
data of competition between GAOs and feast-famine bacteria are provided in the Appendix
Figure 5.5).
However, an interesting observation of this study is that a GAO-like physiology was responsible
for anaerobic acetate and propionate uptake (Figure 5.4) when the nutrients were dosed in the
aerobic phase. Previous results on enrichments with VFA dosed in anaerobic-aerobic cycles
(without nutrient limitation) (Thomas et al. 2003, Bengtsson et al. 2010, Lopez-Vazquez et al.
2009c, Oehmen et al. 2006) resulted in GAO dominance only with SRTs higher than 4 d,
agreeing with the findings of the present study. However the reason why the GAOs dominated
on the system of the 2d SRT with nutrient limitation still remains unclear.
5.4.3. Direct production of PHA from glucose
The main objective of this study was PHA production from glucose without the need of pre-
fermentation. Looking at the energy and redox balance of such a reaction of the simplified
metabolism of glucose to PHV the reaction can be divided into two steps as mentioned in the
introduction section (in C-mol basis): i) Glycolysis (Glucose � Pyruvate

Chapter 5
92
+1/3ATP+1/3NADH), and ii) PHV production from Pyruvate (Pyruvate +
1/3NADH+1/6ATP�PHV)
Combing these two reactions the overall anaerobic glucose conversion reaction can be written:
���Y��� → j\? + 16X6j
Despite the fact that the reaction is redox neutral, there is some ATP generated that needs to be
directed somewhere. Anabolism (for biomass growth) could be one of the possible ATP sinks.
For unidentified reasons, similar to previous results (Wang et al. 2002), who operated a similar
system with a longer SRT (8 d), direct PHA storage was not observed.. A fast glucose uptake rate
(as shown here) can only be assured by a short pathway to polyglucose and not to the longer
pathway to PHA. As showed previously by Dircks et al. 2001 polyglucose storage is much faster
in comparison to PHA storage, leading to the tested system that is restricted to polyglucose and
lactate formation.
5.5. Appendix
A: Glucose metabolism
Table 5.4: Stoichiometry of the reactions occuring
Reaction Stoichiometry
Polyglucose production 1Glucose + 13ATP → 1Polyglucose Pyruvate formation
from glucose
1Glucose → 1Pyruvate + 13X6j + 13[X�\
Pyruvate formation
from polyglucose
1Polyglucose → 1Pyruvate + 12X6j + 13[X�\
Lactate production 1Pyruvate + 13NADH ↔ 1Lactate AcCoA production 1Pyruvate → 23AcCoA + 13��W + 13[X�\
PrCoA production 1Pyruvate + 1ATP + 23NADH → 1PrCoA
Acetate production 1AcCoA → 1Acetate + ATP
Propionate production 1PrCoA → 1Propionate + 23ATP
Lactate fermentation to
acetate and propionate
Lactate → 29Acetate + 23Propionate + 19��W + 0.62X6j
Growth on AcCoA 1.267XY��X + 0.2[\] + 2.16X6j → 1� + 0.267��W + 0.434[X�\

Chapter 5
93
Growth on PrCoA 1.06j¦��X + 0.2[\] + 1.38X6j → 1� + 0.06��W + 0.373[X�\
PHB production 1XY��X + 0.25[X�\ → j\k
PHV production 0.4XY��X + 0.6j¦��X + 0.2[X�\ → j\?
B: Modeling the process
The conversion of soluble compounds are assumed to follow Monod kinetics with maintenance
contribution according the Herbert-Pirt relation (depending the relation, see table xxx), while for
the solid compounds (polyglucose and PHA in the form of PHB and PHV), kinetics were based
on the shrinking particle model, as described previously(Dircks et al. 2001 and Johnson et al.
2009b).
Table 5.5:Equations that define the model.
Anaerobic period
Population I – fermentative/lactate producing bacteria
Glucose-->Lactate+Polyglucose--> Acetate+Propionate+X
Glucose uptake ��<8(�� = �©<8TUV ���(�����(�� + Z�<8
Polyglucose production ��<ª9&;B(�� = `©<ª©<8��<8(��
Polyglucose (fermenters) degradation ��<ªB1�,A1&m(�� = r«1& ¬ ��A1&m(���:�:1&;®�@(��¯W/]
Lactate production �°:@9&;B(�� = `°:@�<ª��<8(��
Lactate consumption �°:@B1�(�� = �°:@TUV ±²Y(��±²Y(�� + Z°:@
Acetate production �*@9&;B(�� = ` *@°:@�°:@B1�(��
Propionate production �(&9&;B(�� = ` (&°:@�°:@B1�(��
Growth on polyglucose and lactate O«1&m(�� = ` b�<ª��<ªB1�(�� + ` b�<ª�°:@B1�(��
Population II – GAOs (anaerobic metabolism)
Ac + Pr +Gly --> PHV + PHB
Acetate uptake �*@B1�,©*�0(�� = �*@TUV,©*�0XY(��XY(�� + Z³«*
Propionate uptake �(&B1�,©*�0(�� = �(&TUV,©*�0j¦(��j¦(�� + Z³«*
PHB production �()Q9&;B,©*�0(�� = ` !R,´"$µ"P �*@B1�,©*�0(�� +` !R,´"$µ ¶ �(&B1�,©*�0(���(&B1�,©*�0(��

Chapter 5
94
PHV production �()³9&;B,©*�0(�� = `()³,©*�0(& �(&B1�,©*�0(��+ `()³,©*�0*@ �*@B1�,©*�0(��
Polyglucose (GAOs) degradation ��<ªB1�,©*�0(�� = r ¬��©*�0(���©*�0(�� ¯W/]
Aerobic period
Population II – GAOs (aerobic metabolism)
PHA --> X + Gly
PHB degradation �()QB1�,©*�0(�� = r©*�0 ¬j\k(���©*�0(2�¯W/]
PHV degradation �()³B1�,©*�0(�� = r©*�0 4 j\?(���©*�0(��=W/]
Biomass formation O©*�0(�� = ` b()Q,©*�0�()QB1�,©*�0(��+ ` b()³,©*�0�()³B1�,©*�0(��
Polyglucose formation
Population III – PHA producers (feast-famine regime)
VFA --> PHA(feast) -->X (famine)
Acetate uptake �*@9&;B,««(�� = �*@TUV,««XY(��XY(�� + Z³«*
Propionate uptake �(&9&;B,(((�� = �(&TUV,««j¦(��j¦(�� + Z³«*
PHB production �()Q9&;B,««(�� = `()Q,««*@ �*@9&;B,««(��
PHV production �()³9&;B,««(�� = `()³,««(& �(&9&;B,««(��
PHB degradation �()QB1�,««(�� = r«« 4j\k(���««(�� =W/]
PHV degradation �()³B1�,««(�� = r«« 4j\?(���««(�� =W/]
Growth O««(�� = ` b()Q,««�()QB1�,««(�� + ` b()³,««�()³B1�,««(��
Growth
Ammonium uptake �^)_(�� = `^)_b (OA1&m(�� + O©*�0(�� + O««(���
For the feast-famine part of the process the inhibition effect due to PHA saturation was
neglected.

Chapter 5
95
Table 5.6: Stoichiometric and kinetic parameters used in the model.
Stoichiometric constants Kinetic constants
I: Fermentative microorganisms ·¸¹º¸¹»
Cm
ol (C
-mo
l)-1
0.6
7
Stouthamer 1973 �©<8TUV Cmol
(C-mol
h)-1
-5.1 This study
·¼IG¸¹» 0.3
3
Stouthamer 1973 �°:@TUV -0.4 This study
· ½¾¼IG 0.6
7
Seeliger et al. 2002 Z°:@ C-mmol
(L)-1
0.01 Assumption
· FG¼IG 0.2
2
Seeliger et al. 2002 Z©<8 0.01 Assumption
· ¿̧¹º 0.8
8
Dircks et al. 2001 r«1& (C-mol C-
mol)-1/3h-1
0.1 Assumption
· ¿¼IG 0.1
3
Estimated
II: GAOs ·½ÀÁ,¸FÂÃFG
Cm
ol (C
-mo
l)-1
1.3
3
Zeng et al. 2003 �*@TUV,©*�0 Cmol
(C-mol
h)-1
-0.1 Lopez-Vazquez
et al. 2009c ·½ÀÄ,¸FÂý¾ 0.6
4
Oehmen et al. 2006 �(&TUV,©*�0 -0.1 Lopez-Vazquez
et al. 2009c ·½ÀÁ,¸FÂý¾ 0 Z³«* C-mmol
(L)-1
0.01 Assumption
·½ÀÄ,¸FÂÃFG 0 r©*�0 (C-mol C-
mol)-1/3h-1
0.2 Dircks et al.
2001 · ¿½ÀÁ,¸FÂà 0.3 Zeng et al. 2003 Z³«* C-mmol
(L)-1
0.01 Assumption
· ¿½ÀÄ,¸FÂà 0.1
8
Oehmen et al. 2006
· ¸¹º½ÀÁ 0.6
2
Zeng et al. 2003
· ¸¹º½ÀÄ 0.7
2
Oehmen et al. 2006
III: Aerobic feast-famine microorganisms

Chapter 5
96
·½ÀÁ,ÅÅFG
Cm
ol (C
-mo
l)-1
0.6
4
Jiang et al. 2011b �*@TUV,«« Cmol (C-
mol h)-1
-3.2 Johnson et al.
2009a ·½ÀÄ,ÅÅFG 0.4
3
Jiang et al. 2011b �(&TUV,«« -
0.94
Jiang et al.
2011b · ¿½ÀÁ,ÅÅ 0.6
4
Van Aalst-Van Leeuwen
et al. 1997
r«« (C-mol C-
mol)-1/3h-1
0.16 Johnson et al.
2009a · ¿½ÀÄ,ÅÅ 0.2 Jiang et al. 2011b

Figure 5.5: Modeled results for the enrichments: I) SRT=2 d, feeding of the nutrient at the beginning of the anaerobic phase, II) SRT=4d, feeding of nutrients at the
beginning of the anaerobic phase. (-) Glucose, (ᴏ) Polyglucose, (▲), Active biomass, (∎)PHA, (□) PHV, (⌧) PHB, (�) NH4, (-) Propionate, (-) Acetate, (- )
Lactate.


Chapter 6. GENERAL CONCLUSIONS
AND OUTLOOK

Chapter 6
100
The plastic pollution is one of the most challenging problems of our century. On one hand the
over-consumption of plastics and on the other hand their long lifespan has created one of the
major environmental threats. Data from 2014 revealed that more than 250,000 tons of plastic are
floating on the ocean, accumulating at the natural ecosystem (Eriksen et al. 2014). Considering
the amount of waste that is generated, a win-win situation can be achieved; bioplastics
(polyhydroxyalkanoates, PHA) production via waste. PHA can serve as a plastic, is fully
biodegradable, with a short life span (3-4 weeks) in the environment (Sudesh et al. 2011).
The technology for PHA production with mixed cultures has already been developed up to pilot-
scale (Tamis et al. 2014a, Morgan-Sagastume et al. 2014a) but still the waste streams that can be
utilized for the process are mainly industrial with easy degradable organic carbon (such as food,
or paper mill industry). The background for this thesis was to make the process applicable for
more complex organic waste streams, such as municipal organic waste. Different approaches
have been implemented for the investigation of the microbial principles and the potential of the
process.
6.1 Conclusions
The main conclusions of the thesis are:
• Some waste streams, despite the presence of VFA cannot enable effective selection of PHA-
producing bacteria (e.g. leachate form solid waste, Chapter 2). An interesting alternative
proposed here is use of different substrate for the enrichment and the accumulation step of
the PHA production process. For the selection step a high VFA-solution can be used. It was
confirmed that such a process modification can increase the overall PHA production yield
four-fold.
• Several carbon compounds do not select for PHA producing biomass (e.g. methanol). In such
cases a phase (biomass-liquid) separation immediately at the end of the feast phase will give
advantage to the PHA accumulating biomass. The effectiveness of this concept -to prevent
accumulation of non-PHA storing biomass- depends strongly on the relative substrate uptake
rates for the different populations.
• When operating an enrichment reactor under a double C&P limitation, up to certain C/P
ratios in the feed, PHA producing bacteria can be effectively enriched from a natural
inoculum. As long as the carbon is depleted before phosphorus, the selective pressure favors
PHA production.
• Enriching biomass for PHA production under double substrate limitation (e.g. C & P)
improves the process: i) the same influent can be directly used for both enrichment and

Chapter 6
101
accumulation step, ii) growth of a side population is strongly reduced, since growth of this
population gets more restricted then that of the PHA storing population, iii) the specific
oxygen uptake rate is dependent on the P-content of biomass, allowing for higher biomass
concentrations.
• Feeding glucose in an anaerobic-aerobic cyclic process at an SRT of 2 or 4 days selects for a
population accumulating glycogen with lactate fermentation for energy generation. The
glycogen and lactate are subsequently converted to acetate and propionate which can be used
for PHA storage.
6.2 Process enhancements
As mentioned before, the PHA production process with enrichment cultures has been tested and
developed up to pilot plant scale with several influent streams. For further process scale-up there
are several aspects that need to be addressed to make the process sufficiently predictable.
• Salinity and PHA production
Several organic waste streams contain a high concentration of salts (either municipal at coastal
areas, or industrial based on the process). The salt concentration and its effect on the metabolism
of PHA producing microorganisms was briefly investigated in Chapter 2 with respiration tests.
The salts seemed to decrease the respiration rates, and the consequent uptake/production rates,
leading to –most probably- different selective pressure for the enrichment step. Further research
is required to investigate the extent of the salinity on the competitive advantage of PHA storing
microbial communities.
• Continuous operation with sedimentation
In chapter 3 we proposed the operation of a system with a sedimentation step to separate fast-
carbon-consuming biomass (that is usually the PHA producing biomass) from slower-consuming
biomass (non-storing biomass growing on substrates that are not converted into PHA). These
process conditions selected for biomass with a significantly higher PHA storage capacity in
comparison to the system operated without the sedimentation step. To make the process even
more economically feasible a continuous system could be operated like this, where the feast and
famine phase are implemented in separate reactors, while the intermittent sedimentation tank will
select for the faster carbon-consuming biomass.

Chapter 6
102
Figure 6.1: Process flow including the sedimentation step between the feast and the famine period
• PHA producing biomass – advantages in settling
Chapter 3 suggested that potentially the PHA-producing biomass (along with the internal PHA
inclusions) had increased density and thus advantages on settling. However, due to a fixed
settling time in the reactor operation (in order to retain the entire biomass fraction in the system)
and the coagulation of the cells of different species (growers and PHA-producers) there was not
enough evidence. The difference in cell density is relatively small (Mas et al. 1985a), but
theoretically it may increase the settling velocity. Thus, applying the appropriate settling time
would potentially select a strong PHA accumulating biomass.
• Oxygen mass transfer
One of the limiting factors for upscaling PHA production with mixed cultures is the oxygen
needs of the process, when it is operated at high biomass content. In Chapter 4 it was suggested
that the conversion rates are dependent on factors associated to the cell metabolism and more
specifically on the intracellular P-content. This might be a method to prevent oxygen limitation in
dense cultures. It needs to be evaluated if limitation of other compounds can also be used (e.g.
nitrogen limitation). Previous research has shown the same dependence profile between N-
limitation and the rates, but since the limitation was severe, led to another selective pressure to
the enrichment. Applying double carbon and nitrogen limitation to such an extent that would
mainly provoke the cells to compete for the carbon but reduce the cells’ needs in nitrogen could

Chapter 6
103
also potentially lead to decreased rates, thus less oxygen requirements, leaving the margin of
operating the process in higher solid concentrations.
Additionally, with regard to the oxygen transfer rate, an interesting –and low-cost- potential
would be the replacement of oxygen with nitrate as the electron acceptor. Previous research
(Beun et al. 2000b) has shown that PHA-producing enrichments can be established on such a
system (anaerobic aerobic –to prevent nitrite accumulation). So indeed, exploring more
thoroughly this option and confirming the success of the process in such a high solid
concentration would decrease by far the process costs.
6.3. Future of PHA production
Even if the production price of PHA drops at that level that can compete with conventional
plastics, the lack of market applications is of significant importance. The enrichment-culture-
based PHA production processes are technical and economical competitive to current pure
culture GMO based processes. On-going applications from GMO-derived PHA include
packaging (bags, films, paper, and coatings), slow-release fertilizer, and precursors for chiral
compounds. On one hand the health and safety regulations related to the product since it derives
from wastewater and on the other the fluctuating composition and characteristics (due to the
corresponding influent inconsistency) make this product special. Development of products that
make use of unique material properties of PHA is required. To this extent creative collaborations
with material scientists have to be developed, in order to create market-demand for enrichment-
cultured-based PHA.
This study addressed some of the problems that restrict the process upscale. Adding this to the
rest of the research that is running around non-axenic PHA production, the main hope is that
PHA production units will be a part of the general wastewater treatment scheme (like the biogas
units), leading to a more sustainable circular economy.

Chapter 6
104

REFERENCES

References
106
Acevedo, B., Oehmen, A., Carvalho, G., Seco, A., Borrás, L. and Barat, R. (2012) Metabolic shift of polyphosphate-accumulating organisms with different levels of polyphosphate storage. Water Research 46(6), 1889-1900.
Albuquerque, M.G., Concas, S., Bengtsson, S. and Reis, M.A. (2010a) Mixed culture polyhydroxyalkanoates production from sugar molasses: the use of a 2-stage CSTR system for culture selection. Bioresour Technol 101(18), 7123-7133.
Albuquerque, M.G., Torres, C.A. and Reis, M.A. (2010c) Polyhydroxyalkanoate (PHA) production by a mixed microbial culture using sugar molasses: effect of the influent substrate concentration on culture selection. Water Res 44(11), 3419-3433.
Amann, R.I., Krumholz, L.R. and Stahl, D.A. (1990) Fluorescent-oligonucleotide probing of whole cells for determinative, phylogenetic, and environmental studies in microbiology. J Bacteriol, 762-770.
Anderson, A.J. and Dawes, E.A. (1990) Occurrence, metabolism, metabolic role, and industrial uses of bacterial polyhydroxyalkanoates. Microbiological Reviews, 450-472.
Andrady, A.L. (2011) Microplastics in the marine environment. Marine Pollution Bulletin 62(8), 1596-1605.
Angelakis, A.N., Koutsoyiannis, D. and Tchobanoglous, G. (2005) Urban wastewater and stormwater technologies in ancient Greece. Water Research 39(1), 210-220.
Arcos-Hernández, M.V., Pratt, S.J., Laycock, B.G., Johansson, P.T., Werker, A.G. and Lant, P.A. (2013) Waste activated sludge as biomass for production of commercial-grade polyhydroxyalkanoate (PHA). Waste and Biomass Valorization, 117-127.
Bader, F.G. (1978) Analysis of double‐substrate limited growth. Biotechnology and Bioengineering 20(2), 183-202.
Beccari, M., Bertin, L., Dionisi, D., Fava, F., Lampis, S., Majone, M., Valentino, F., Vallini, G. and Villano, M. (2009a) Exploiting olive oil mill effluents as a renewable resource for production of biodegradable polymers through a combined anaerobic-aerobic process. Journal of Chemical Technology & Biotechnology 84(6), 901-908.
Beijerinck, M.W. (1901) Anhaufungsversuche mit Ureumbakterien. Centralblatt f. Bakteriologie II(7), 33-61.
Bengtsson, S., Pisco, A.R., Reis, M.A.M. and Lemos, P.C. (2010) Production of polyhydroxyalkanoates from fermented sugar cane molasses by a mixed culture enriched in glycogen accumulating organisms. Journal of Biotechnology 145(3), 253-263.
Bengtsson, S., Werker, A., Christensson, M. and Welander, T. (2008a) Production of polyhydroxyalkanoates by activated sludge treating a paper mill wastewater. Bioresour Technol 99(3), 509-516.
Berry, A.R., Franco, C.M.M., Zhang, W. and Middelberg, A.P.J. (1999) Growth and lactic acid production in batch culture of Lactobacillus rhamnosus in a defined medium. Biotechnology Letters 21(2), 163-167.
References
107
Beun, J.J., Dircks, K., van Loosdrecht, M.C. and Heijnen, J.J. (2002) Poly-β-hydroxybutyrate metabolism in dynamically fed mixed microbial cultures. Water Research, 1167-1180.
Beun, J.J., Paletta, F., van Loosdrecht, M.M.C.M. and Heijnen, J.J. (2000a) Stoichiometry and kinetics of poly-β-hydroxybutyrate metabolism in aerobic, slow growing, activated sludge cultures. Biotechnol Bioeng 67(4), 379-389.
Beun, J.J., Verhoef, E.V., Van Loosdrecht, M.C.M. and Heijnen, J.J. (2000b) Stoichiometry and kinetics of poly-β-hydroxybutyrate metabolism under denitrifying conditions in activated sludge cultures. Biotechnology and Bioengineering 68(5), 496-507.
Bussineau, C.M. and Papoutsakis, E.T. (1986) Intracellular reaction rates, enzyme activities and biomass yields in Methylomonas L3: growth rate and substrate composition effects. Applied Microbiology and Biotechnology 24(6), 435-442.
Carucci, A., Lindrea, K., Majone, M. and Ramadori, R. (1999) Different mechanisms for the anaerobic storage of organic substrates and their effect on Enhanced Biological Phosphate Removal (EBPR), pp. 21-28.
Cavaillé, L., Albuquerque, M., Grousseau, E., Lepeuple, A.S., Uribelarrea, J.L., Hernandez-Raquet, G. and Paul, E. (2016) Understanding of polyhydroxybutyrate production under carbon and phosphorus-limited growth conditions in non-axenic continuous culture. Bioresource Technology 201, 65-73.
Cavalheiro, J.M.B.T., Raposo, R.S., De Almeida, C.C.M.D., Teresa Cesário, M., Sevrin, C., Grandfils, C. and Da Fonseca, M.M.R. (2012) Effect of cultivation parameters on the production of poly(3-hydroxybutyrate-co-4-hydroxybutyrate) and poly(3-hydroxybutyrate-4-hydroxybutyrate-3-hydroxyvalerate) by Cupriavidus necator using waste glycerol. Bioresour Technol, 391-397.
Cech, J.S. and Hartman, P. (1990) Glucose induced break down of enhanced biological phosphate removal. Environmental Technology 11(7), 651-656.
Chen, G.-Q. (2010) Plastics from Bacteria: Natural Functions and Applications. Chen, G.G.-Q. (ed), pp. 17-37, Springer Berlin Heidelberg, Berlin, Heidelberg.
Chen, G.-Q. and Wu, Q. (2005) The application of polyhydroxyalkanoates as tissue engineering materials. Biomaterials 26(33), 6565-6578.
Chen, G. (2009a) A microbial polyhydroxyalkanoates (PHA) based bio- and materials industry. Chemical Society Reviews, 2434-2446.
Chen, G.Q. (2009b) A microbial polyhydroxyalkanoates (PHA) based bio- and materials industry. Chem Soc Rev 38(8), 2434-2446.
Chugh, S., Chynoweth, D.P., Clarke, W.P., Pullammanappallil, P.C. and Rudolph, V.R. (1999) Degradation of unsorted municipal solid waste by a leach-bed process. Bioresour Technol, 103-115.
Coats, E.R., Loge, F.J., Wolcott, M.P., Englund, K. and McDonald, A.G. (2007) Synthesis of Polyhydroxyalkanoates in Municipal Wastewater Treatment. Water Environment Research 79(12), 2396-2403.

References
108
Coats, E.R., Vandevoort, K.E., Darby, J.L. and Loge, F.J. (2011) Toward polyhydroxyalkanoate production concurrent with municipal wastewater treatment in a sequencing batch reactor system. Journal of Environmental Engineering 137(1), 46-54.
Daims, H., Brühl, A., Amann, R.I., Schleifer, K.H. and Wagner, M. (1999) The domain-specific probe EUB338 is insufficient for the detection of all bacteria: Development and evaluation of a more comprehensive probe set. Systematic and Applied Microbiology, 434-444.
Dias, J.M., Oehmen, A., Serafim, L.S., Lemos, P.C., Reis, M.A. and Oliveira, R. (2008) Metabolic modelling of polyhydroxyalkanoate copolymers production by mixed microbial cultures. BMC Systems Biology 2(1), 59.
Dias, J.M., Serafim, L.S., Lemos, P.C., Reis, M.A. and Oliveira, R. (2005) Mathematical modelling of a mixed culture cultivation process for the production of polyhydroxybutyrate. Biotechnol Bioeng 92(2), 209-222.
Dias, J.M.L., Lemos, P.C., Serafim, L.S., Oliveira, C.M., Eiroa, M., Albuquerque, M.G., Ramos, A.M.D., Oliveira, R.R. and Reis, M.A. (2006) Recent advances in polyhydroxyalkanoate production by mixed aerobic cultures: From the substrate to the final product. Macromolecular Bioscience, 885-906.
Dircks, K., Henze, M., Van Loosdrecht, M.C.M., Mosbæk, H. and Aspegren, H. (2001) Storage and degradation of poly-β-hydroxybutyrate in activated sludge under aerobic conditions. Water Research 35(9), 2277-2285.
Doǧan, E., Dunaev, T.I., Ergüder, T.H.A. and Demirer, G.N. (2009) Performance of leaching bed reactor converting the organic fraction of municipal solid waste to organic acids and alcohols Chemosphere, 797-803.
Du, G. and Yu, J. (2002) Green technology for conversion of food scraps to biodegradable thermoplastic polyhydroxyalkanoates. Environmental Science and Technology, 5511-5516.
Egli, T. (1991) On multiple-nutrient-limited growth of microorganisms, with special reference to dual limitation by carbon and nitrogen substrates. Antonie van Leeuwenhoek 60(3-4), 225-234.
Egli, T., Lendenmann, U. and Snozzi, M. (1993) Kinetics of microbial growth with mixtures of carbon sources. Antonie van Leeuwenhoek 63(3-4), 289-298.
Eriksen, M., Lebreton, L.C.M., Carson, H.S., Thiel, M., Moore, C.J., Borerro, J.C., Galgani, F., Ryan, P.G. and Reisser, J. (2014) Plastic Pollution in the World's Oceans: More than 5 Trillion Plastic Pieces Weighing over 250,000 Tons Afloat at Sea. PLoS ONE 9(12).
Fuhs, G.W. and Chen, M. (1975) Microbiological basis of phosphate removal in the activated sludge process for the treatment of wastewater. Microbial Ecology 2(2), 119-138.
Georgantas, D.A. and Grigoropoulou, H.P. (2007) Orthophosphate and metaphosphate ion removal from aqueous solution using alum and aluminum hydroxide. J Colloid Interface Sci 315(1), 70-79.
Grady, C.P.L. and Lim, H.C. (1980) Biological wastewater treatment : theory and applications, M. Dekker, New York :.

References
109
Jeon, C.O. and Park, J.M. (2000) Enhanced biological phosphorus removal in a sequencing batch reactor supplied with glucose as a sole carbon source. Water Research 34(7), 2160-2170.
Jiang, Yang, Marang, L., Tamis, J., van Loosdrecht, M.C., Dijkman, H. and Kleerebezem, R. (2012a) Waste to resource: Converting paper mill wastewater to bioplastic. Water Res, 5517-5530.
Jiang, Y., Hebly, M., Kleerebezem, R., Muyzer, G. and van Loosdrecht, M.C. (2011a) Metabolic modeling of mixed substrate uptake for polyhydroxyalkanoate (PHA) production. Water Research, 1309-1321.
Jiang, Y., Marang, L., Kleerebezem, R., Muyzer, G. and van Loosdrecht, M.C. (2011c) Effect of temperature and cycle length on microbial competition in PHB-producing sequencing batch reactor.
Jiang, Y., Marang, L., Tamis, J., van Loosdrecht, M.C., Dijkman, H. and Kleerebezem, R. (2012b) Waste to resource: Converting paper mill wastewater to bioplastic. Water Res 46(17), 5517-5530.
Johnson, K., Jiang, Y., Kleerebezem, R., Muyzer, G. and van Loosdrecht, M.C. (2009a) Enrichment of a mixed bacterial culture with a high polyhydroxyalkanoate storage capacity. Biomacromolecules, 670-676.
Johnson, K., Kleerebezem, R. and van Loosdrecht, M.C. (2009b) Model-based data evaluation of polyhydroxybutyrate producing mixed microbial cultures in aerobic sequencing batch and fed-batch reactors. Biotechnol Bioeng 104(1), 50-67.
Johnson, K., Kleerebezem, R. and van Loosdrecht, M.C.M. (2010) Influence of the C/N ratio on the performance of polyhydroxybutyrate (PHB) producing sequencing batch reactors at short SRTs. Water Research 44(7), 2141-2152.
Kim, B.S. (2000) Production of poly(3-hydroxybutyrate) from inexpensive substrates. Enzyme and Microbial Technology, 774-777.
Kleerebezem, R. and van Loosdrecht, M.C. (2007a) Mixed culture biotechnology for bioenergy production. Curr Opin Biotechnol 18(3), 207-212.
Koller, M., Bona, R., Chiellini, E.E., Fernandes, E.G., Horvat, P., Kutschera, C., Hesse, P. and Braunegg, G. (2008) Polyhydroxyalkanoate production from whey by Pseudomonas hydrogenovora. Bioresour Technol, 4854-4863.
Korkakaki, E., Mulders, M., Veeken, A., Rozendal, R., van Loosdrecht, M.C.M. and Kleerebezem, R. (2016a) PHA production from the organic fraction of municipal solid waste (OFMSW): Overcoming the inhibitory matrix. Water Research 96, 74-83.
Korkakaki, E., van Loosdrecht, M.C.M. and Kleerebezem, R. (2016b) Survival of the fastest: Selective removal of the side population for enhanced PHA production in a mixed substrate enrichment. Bioresource Technology 216, 1022-1029.
Lee, E., Jendrossek, D., Schirmer, A., Choi, C. and Steinbüchel, A. (1995) Biosynthesis of copolyesters consisting of 3-hydroxybutyric acid and medium-chain-length 3-hydroxyalkanoic acids from 1,3-butanediol or from 3-hydroxybutyrate by Pseudomonas sp. A33. Applied Microbiology and Biotechnology, 901-909.
Lee, S.Y. (1996) Bacterial polyhydroxyalkanoates. Biotechnology and Bioengineering 49(1), 1-14.

References
110
Lee, S.Y. and Choi, J. (1999) Production and degradation of polyhydroxyalkanoates in waste environment Waste Management, 133-139.
Lopez-Vazquez, C.M., Hooijmans, C.M., Brdjanovic, D., Gijzen, H.J. and van Loosdrecht, M.C.M. (2009a) Temperature effects on glycogen accumulating organisms. Water Research 43(11), 2852-2864.
Lopez-Vazquez, C.M., Oehmen, A., Hooijmans, C.M., Brdjanovic, D., Gijzen, H.J., Yuan, Z. and van Loosdrecht, M.C.M. (2009b) Modeling the PAO-GAO competition: Effects of carbon source, pH and temperature. Water Research 43(2), 450-462.
Marais v, G.R., Loewenthal, R.E. and Siebritz, I.P. (1983) Observations supporting phosphate removal by biological excess uptake. A review. Water Science and Technology 15(3-4), 15-41.
Marang, L., Jiang, Y., Kleerebezem, R. and van Loosdrecht, M. (2013a) Butyrate as preferred substrate for polyhydroxybutyrate production. Bioresource technology, 232-239.
Marang, L., Jiang, Y., van Loosdrecht, M.C. and Kleerebezem, R. (2014a) Impact of non-storing biomass on PHA production: An enrichment culture on acetate and methanol. International Journal of Biological Macromolecules, 74-80.
Marang, L., Jiang, Y., van Loosdrecht, M.C.M. and Kleerebezem, R. (2013b) Butyrate as preferred substrate for polyhydroxybutyrate production. Bioresource Technology 142, 232-239.
Marang, L., van Loosdrecht, M.C.M. and Kleerebezem, R. (2015) Modeling the competition between PHA-producing and non-PHA-producing bacteria in feast-famine SBR and staged CSTR systems. Biotechnology and Bioengineering 112(12), 2475-2484.
Mas, J., Pedros-Alio, C. and Guerrero, R. (1985a) Mathematical model for determining the effects of intracytoplasmic inclusions on volume and density of microorganisms. Journal of Bacteriology 164(2), 749-756.
Metcalf, E., Eddy, H.P. and Tchobanoglous, G. (1991) Wastewater engineering: treatment, disposal and reuse. McGraw-Hill, New York.
Mino, T., Van Loosdrecht, M.C.M. and Heijnen, J.J. (1998) Microbiology and biochemistry of the enhanced biological phosphate removal process. Water Research 32(11), 3193-3207.
Morgan-Sagastume, F., Hjort, M., Cirne, D.G., Gérardin, F., Lacroix, S., Gaval, G., Karabegovic, L., Alexandersson, T., Johansson, P., Karlsson, A., Bengtsson, S., Arcos-Hernández, M.V., Magnusson, P. and Werker, A.G. (2015) Integrated production of polyhydroxyalkanoates (PHAs) with municipal wastewater and sludge treatment at pilot scale. Bioresour Technol, 78-89.
Morgan-Sagastume, F., Karlsson, A., Johansson, P., Pratt, S., Boon, N., Lant, P. and Werker, A. (2010a) Production of polyhydroxyalkanoates in open, mixed cultures from a waste sludge stream containing high levels of soluble organics, nitrogen and phosphorus. Water Res 44(18), 5196-5211.
Morgan-Sagastume, F., Valentino, F., Hjort, M., Cirne, D., Karabegovic, L., Gerardin, F., Johansson, P., Karlsson, A., Magnusson, P., Alexandersson, T., Bengtsson, S., Majone, M. and Werker, A. (2014a) Polyhydroxyalkanoate (PHA) production from sludge and municipal wastewater treatment. Water Sci Technol 69(1), 177-184.

References
111
Muyzer, G., De Waal, E.C. and Uitterlinden, A.G. (1993) Profiling of complex microbial populations by denaturing gradient gel electrophoresis analysis of polymerase chain reaction-amplified genes coding for 16S rRNA. Applied and Environmental Microbiology 59(3), 695-700.
Oehmen, A., Zeng, R.J., Saunders, A.M., Blackall, L.L., Keller, J. and Yuan, Z. (2006) Anaerobic and aerobic metabolism of glycogen-accumulating organisms selected with propionate as the sole carbon source. Microbiology 152(9), 2767-2778.
Passanha, P., Esteves, S.R.R., Kedia, G., Dinsdale, R.M. and Guwy, A.J. (2013) Increasing polyhydroxyalkanoate (PHA) yields from Cupriavidus necator by using filtered digestate liquors. Bioresour Technol, 345-352.
Pedrós-Alió, C., Mas, J. and Guerrero, R. (1985) The influence of poly-β-hydroxybutyrate accumulation on cell volume and buoyant density in alcaligenes eutrophus. Archives of Microbiology, 178-184.
Philip, S., Keshavarz, T. and Roy, I. (2007) Polyhydroxyalkanoates: biodegradable polymers with a range of applications. Journal of Chemical Technology & Biotechnology 82(3), 233-247.
Poirier, Y., Nawrath, C. and Somerville, C.R. (1995) Production of polyhydroxyalkanoates, a family of biodegradable plastics and elastomers, in bacteria and plants. Nature Biotechnology, 142-150.
Preusting, H., van Houten, R., Hoefs, A., van Langenberghe, E.K., Favre‐Bulle, O. and Witholt, B. (1993) High cell density cultivation of Pseudomonas oleovorans: Growth and production of
poly (3‐hydroxyalkanoates) in two‐liquid phase batch and fed‐batch systems. Biotechnology and Bioengineering 41(5), 550-556.
Reis, M.A., Serafim, L.S., Lemos, P.C., Ramos, A.M., Aguiar, F.R. and Van Loosdrecht, M.C. (2003a) Production of polyhydroxyalkanoates by mixed microbial cultures. Bioprocess Biosyst Eng 25(6), 377-385.
Schäfer, H. and Muyzer, G. (2001a) Denaturing gradient gel electrophoresis in marine microbial ecology. Methods in Microbiology 30, 425-468.
Seeliger, S., Janssen, P.H. and Schink, B. (2002) Energetics and kinetics of lactate fermentation to acetate and propionate via methylmalonyl-CoA or acrylyl-CoA. FEMS Microbiology Letters 211(1), 65-70.
Serafim, L.S., Lemos, P.C., Albuquerque, M.G. and Reis, M.A. (2008) Strategies for PHA production by mixed cultures and renewable waste materials. Appl Microbiol Biotechnol 81(4), 615-628.
Smolders, G.J.F., Van Der Meij, J., Van Loosdrecht, M.C.M. and Heijen, J.J. (1994) Stoichiometric model of the aerobic metabolism of the biological phosphorus removal process. Biotechnology and Bioengineering 44(7), 837-848.
Steinbüchel, A. and Füchtenbusch, B. (1998) Bacterial and other biological systems for polyester production. Trends in Biotechnology 16(10), 419-427.
Stouthamer, A.H. (1973) A theoretical study on the amount of ATP required for synthesis of microbial cell material. Antonie van Leeuwenhoek 39(1).

References
112
Sudesh, K., Bhubalan, K., Chuah, J.A., Kek, Y.K., Kamilah, H., Sridewi, N. and Lee, Y.F. (2011) Synthesis of polyhydroxyalkanoate from palm oil and some new applications. Appl Microbiol Biotechnol 89(5), 1373-1386.
Sugawara, Y., Ueki, A., Abe, K., Kaku, N., Watanabe, K. and Ueki, K. (2011) Propioniciclava tarda gen. nov., sp. nov., isolated from a methanogenic reactor treating waste from cattle farms. International Journal of Systematic and Evolutionary Microbiology 61(9), 2298-2303.
Tamis, J., Lužkov, K., Jiang, Y., van Loosdrecht, M.C. and Kleerebezem, R. (2014a) Enrichment of Plasticicumulans acidivorans at pilot-scale for PHA production on industrial wastewater. J Biotechnol, 161-169.
Tamis, J., Marang, L., Jiang, Y., van Loosdrecht, M.C. and Kleerebezem, R. (2014b) Modeling PHA-producing microbial enrichment cultures-towards a generalized model with predictive power. New Biotechnology, 324-334.
Thomas, M., Wright, P., Blackall, L., Urbain, V. and Keller, J. (2003) Optimisation of Noosa BNR plant of improve performance and reduce operating costs, pp. 141-148.
Van Aalst-Van Leeuwen, M., Pot, M., van Loosdrecht, M.C. and Heijnen, J.J. (1994) Kinetic modeling of poly(β-hydroxybutyrate) production and consumption by Paracoccus pantotrophus under dynamic substrate supply. Biotechnology and Bioengineering, 773-782.
Van Loosdrecht, M.C.M. and Brdjanovic, D. (2014) Anticipating the next century of wastewater treatment. Science 344(6191), 1452-1453.
Van Loosdrecht, M.C.M., Pot, M.A. and Heijnen, J.J. (1997) Importance of bacterial storage polymers in bioprocesses, pp. 41-47.
Van Wegen, R.J., Ling, Y. and Middelberg, A.P.J. (1998) Industrial Production of Polyhydroxyalkanoates Using Escherichia Coll: An Economic Analysis. Chemical Engineering Research and Design 76(3), 417-426.
Vishniac, W.V. and Santer, M. (1975) The thiobacilli. Bacteriological reviews, 195-213.
Wang, N., Peng, J. and Hill, G. (2002) Biochemical model of glucose induced enhanced biological phosphorus removal under anaerobic condition. Water Research 36(1), 49-58.
Weiss, R.F. (1970) The solubility of nitrogen, oxygen and argon in water and seawater. Deep-Sea Research and Oceanographic Abstracts, 721-735.
Welles, L., Abbas, B., Sorokin, D.Y., Lopez-Vazquez, C.M., Hooijmans, C.M., van Loosdrecht, M.C.M. and Brdjanovic, D. (2017) Metabolic response of "candidatus accumulibacter phosphatis" clade II C to changes in influent P/C ratio. Frontiers in Microbiology 7(JAN).
Yeoman, S., Stephenson, T., Lester, J.N. and Perry, R. (1988) The removal of phosphorus during wastewater treatment: A review. Environmental Pollution 49(3), 183-233.
Zeng, R.J., Van Loosdrecht, M.C.M., Yuan, Z. and Keller, J. (2003) Metabolic Model for Glycogen-Accumulating Organisms in Anaerobic/Aerobic Activated Sludge Systems. Biotechnology and Bioengineering 81(1), 92-105.

References
113
Zinn, M., Witholt, B. and Egli, T. (2004) Dual nutrient limited growth: models, experimental observations, and applications. Journal of Biotechnology 113(1–3), 263-279.

References
114

ABOUT THE AUTHOR

About the author
116
Emmanouela (Emma) Korkakaki was born the 12th of December of
1986 in Chania, Greece. Being always interested on sciences, with a
focus on mathematics and chemistry she decided to follow an
engineering discipline.
In 2004 she started studying Chemical Engineering at Aristotle
University of Thessaloniki. During her studies the environment and
sustainability factor always played a significant role. She conducted her diploma thesis in the
Petrochemical field, where she studied sorption enhanced steam reforming, a sustainable
approach towards steam reforming, a major oil & gas process from which hydrogen is produced.
After her graduation in March 2010, she decided to focus more on the environment, and so she
followed an MSc in Environmental Engineering at the Technical University of Crete. During her
thesis she conducted field sampling (from the sea) in oil contaminated areas, and tried to isolate
autochthonous microorganisms that are able to degrade crude oil and produce biosurfactants.
Her MSc thesis was funded by the FP7 project “ULIXES”, while after her graduation she
continued working at the same project for six more months.
In 2013 she was appointed as PhD candidate by TU Delft from the Environmental
Biotechnology (EBT) group, under the supervision of Prof. ir. Mark C.M. van Loosdrecht and
Prof. ir. Robbert Kleerebezem. Her PhD thesis was funded by the NWO program “Sustainable
biofuel production from organic waste via polyhydroxyalkanoates” (Project No. 700.10.702) in
collaboration with Tsinghua University of China, and was focused on the valorization of
wastewater in bioplastics.

LIST OF PUBLICATIONS

118
Publications
C.S. Martavaltzi, E.P. Pampaka, E.S. Korkakaki, A.A. Lemonidou, “Hydrogen production via
steam reforming of methane with simultaneous CO2 capture over CaO -Ca12Al14O33", Energy
Fuels, 2010, 24 (4), 2589-2595.
E. Antoniou, S. Fodelianakis, E. Korkakaki, N. Kalogerakis, “Biosurfactant production from
marine hydrocarbon-degrading consortia and pure bacterial strains using crude oil as carbon
source", Front. Microbiol., 2015, doi: 10.3389/fmicb.2015.00274
N. Kalogerakis, S. Fodelianakis, E. Eleftheriou, E. Korkakaki, Polytechneio Kritis, “Production
and application of an innovative bio-strengthening layer acting agains sea oil slicks", Patent
1008475, issued 29 Apr. 2015.
E. Korkakaki, M. Mulders, A. Veeken, R. Rozendal, M.C.M. van Loosdrecht, R. Kleerebezem,
“PHA production from the organic fraction of municipal solid waste (OFMSW): Overcoming
the inhibitory matrix', Water Res., 2016, 96 (1), 74-83.
E. Korkakaki, M.C.M. van Loosdrecht, R. Kleerebezem, “Survival of the Fastest: Selective
removal of the side population for enhanced PHA production in a mixed substrate enrichment',
Bioresource Technol, 2016, doi: 10.1016/j.biortech.2016.05.125
Conferences
“Hydrogen production via steam reforming of methane with simultaneous CO2 capture over
CaO -Ca12Al14O33", C.S. Martavaltzi, E.S. Korkakaki, E. Pampaka, A.A. Lemonidou,
Symposium on New frontiers in chemical and biochemical engineering,Thessaloniki, Greece, 26-
27 November 2009.
“Synergetic hydrogen production and CO2 separation via sorption enhanced reforming of
methane", C.S. Martavaltzi, E.S. Korkakaki, E.P. Pampaka, A.A. Lemonidou, 9th Novel Gas
Conversion Symposium 2010, Lyon, France 30 May-3 June 2010.
“Hydrogen production with simultaneous CO2 separation via sorption enhanced reforming of
methane", C.S. Martavaltzi, E.P. Pampaka, S.Chatoutsidou, E.S. Korkakaki,T Pefkos, A.A.
Lemonidou, International Conference on Hydrogen Production 2011, Thessaloniki, Greece, 19-
22 June 2011.

119
“Biosurfactant production from an isolated marine bacterial community", E. Korkakaki, E.
Antoniou, M. Nikolopoulou, D. Venieri, N. Kalogerakis, Environmental Microbiology and
Biotechnology 2012, Bologna, Italy 10-12 April 2012.
“PHA production from mixed substrate: elimination of the side population", E. Korkakaki, L.
Marang, Y. Jiang, M.C.M. van Loosdrecht, R. Kleerebezem, 5th Workshop on PHA production
by microbial consortia, Toulouse, France 10-11 September 2014.
“Carbon recovery from organic waste as bioplastics", E. Korkakaki, R. Rozendal, A. Veeken,
M.C.M. van Loosdrecht, R. Kleerebezem, 3rd Water Research Conference, Shenzhen, China 11-
14 January 2015.
“A new selection strategy for PHA production from leachate: Overcoming the inhibitory matrix",
E. Korkakaki, M. Mulders, R. Rozendal, A. Veeken, M.C.M. van Loosdrecht, R. Kleerebezem,
8th European Symposium of Biopolymers, Rome, Italy, 15-18 September 2015.

120

Acknowledgments

122
Thinking of my PhD experience right now, I can only describe in one word: “Journey”, both
literally and metaphorically. The past four and half years I could say that they changed me a lot,
both personally and professionally, they made me grow, and people around me contributed in
this journey of “growing up”. First of all, the greatest acknowledgment should go to these two
great men that supervised me, taught me complicated, but also, simple things, made me a critical
and confident individual. Thank you Mark for supporting me when I needed it and for pushing
me, also when I needed it. Thank you Robbert for trusting me, for listening my complaints and
for being my tutor. Without all the advice and support that I got from you, I wouldn’t even have
done 10% of the things I did.
However, apart from work, when a Cretan lives in the Netherlands, the grey days do not help on
getting up from the bed. That’s why I owe special thanks to my “PhD coffee break” group,
Moni and Kika that made me happy of thinking going to work and get the first coffee of the day
in the office. But also, in the Julianalaan 67 – coffee and smoking breaks with Nadia were always
super entartaining, despite the fact that we were usually so full of ourselves during the coffee
break, that we hardly heard to each other’s complaints. Moving to my Greek family here, thank
you Kostas for being there for me, Sotiria, for having all these random conversations and dinners
at sports center, Petros for proving me that even if you are island-originated, you can survive in
Delft for more than 8 consecutive years.. The same applies for “mi hermana perdida”, Sandra (I
hope that I spelled it right this time ☺ ). And I cannot forget my small Bastiaansplein 23 family
that was also quite dynamic. Beakaki, Moni, Marokio and me started the family, but the
connection was spread to Giannis, Cristina. I will miss the safety that I felt every time that I
entered home.
However, the entire “dynamic” EBT environment also contributed well on me finishing this
journey. Technical support from experts like Udo, Ben, Mitchel, with the molecular techniques
which I still cannot understand (seriously now, how can 1 µl οf something work?), Max, Cor and
Johan for helping out with the chemical analysis. But other than that, also lab support in the lab
from my phd fellows, like Leonie, Maaike, Eveline, Jiang are greatly appreciated.
I would also like to special thank my office mates, especially the first two years, Peter, Jelmer and
Gerben, for chilling me and Julio at the 16o C! Julio, thank you for being on the non-dutch side
of the office, and I would like also to thank the new EBT girlie office, with Aina and Ingrid, that
could tolerate my non-stop whining regarding to writing my thesis.

123
I would like to thank the EBT lunch group with the interesting and random conversations,
mainly initiated by Jure, Simon for bringing me tobacco☺, Danny, Morez, Viktor, Jules, Marissa.
Being in such a dynamic environment as EBT, short-staying people were always roaming around,
and the connection was always strong. I would like to specially thank Borja, Jose, Mabel, Andrea,
Clara, Bruno, Francesca for being around and making your three (or more) -months stays in
Delft super entertaining.
However, the most valuable lesson that I got during my PhD was working with students. Trying
to motivate someone was so inspiring and I owe special thanks to my students Michel, Veronica,
Yimeng, Tony and Hannah. Every one of you was completely different, and so you taught me
how to interact with a big variety of people.
About my family, whatever I say is not enough.. I owe everything to my mom, dad, and brothers.
Σας ευχαριστώ για όλα όσα κάνατε για µένα, που µε βοηθήσατε να φτάσω εδώ που είµαι. Θα ήθελα
να ξέρατε ότι νιώθω απέραντη ευγνωµοσύνη και περηφάνεια για το σπίτι µας!!
One of my greatest “thank you” should go to the person that made me feel that I found the
safety of a home 3,000 km away from my actual home. Words cannot describe the gratitude I
feel (and you know how bad I am with words :P ). Thank you Alferio for all the support, for all
the whining that you tolerated and for taking so much care of me. You will always have a special
place in my heart..