Optimization of the Critical Production Process in a Textile ...
108
i Optimization of the Critical Production Process in a Textile Factory using AHP By Md. Tajul Islam Supervised by Dr. A.R.M. Harunur Rashid Associate Professor A thesis submitted to the Department of Mechanical and Production Engineering (MPE) in partial fulfillment of the requirements for the degree of Master of Science in Mechanical Engineering Department of Mechanical and Production Engineering (MPE) Islamic University Of Technology (IUT) November 2020
-
Upload
khangminh22 -
Category
Documents
-
view
1 -
download
0
Transcript of Optimization of the Critical Production Process in a Textile ...

i
Optimization of the Critical Production Process in a
Textile Factory using AHP
By
Md. Tajul Islam
Supervised by
Dr. A.R.M. Harunur Rashid
Associate Professor
A thesis submitted to the Department of Mechanical and Production
Engineering (MPE) in partial fulfillment of the requirements for the
degree of Master of Science in Mechanical Engineering
Department of Mechanical and Production Engineering (MPE)
Islamic University Of Technology (IUT)
November 2020

ii
Certificate of Approval
The thesis titled “ Optimization of the Critical Production Process in a Textile Factory using
AHP’’ submitted by Md. Tajul Islam bearing student No. 161011001 of academic year 2019-
2020 has been found satisfactory and accepted as partial fulfillment of the requirement for the
degree of Masters of Science in Mechanical Engineering on November 21, 2020.
Board of Examiners
_________________________________ Chairman
1. Dr. Abu Raihan Md. Harunur Rashid (Supervisor)
Associate Professor,
Department of Mechanical and Production Engineering (MPE)
Islamic University Of Technology (IUT)
____________________
2. Dr. Md. Zahid Hossain Member
Professor and Head, (Ex-officio) Department of Mechanical and Production Engineering (MPE)
Islamic University Of Technology (IUT)
____________________________
3. Dr. Md. Nurul Absar Chowdhary Member
Professor,
Department of Mechanical and Production Engineering (MPE)
Islamic University Of Technology (IUT)
____________________ Member
4. Dr. Shamsuddin Ahmed
Professor,
Department of Mechanical and Production Engineering (MPE)
Islamic University Of Technology (IUT)
_______________________ Member
5. Dr. Md. Mosharraf Hossain (External)
Professor and Head,
Department of Industrial and Production Engineering (IPE)
Rajshahi University of Engineering Technology (RUET)

iii
Declaration of Candidate
It is hereby declared that this thesis or any part of it has not been submitted elsewhere for the
award of any degree or diploma.
Signature of the Candidate
------------------------
Md. Tajul Islam Academic Year: 2016-2017
Department of Mechanical and Production Engineering (MPE)
Islamic University Of Technology (IUT)
Board Bazar Gazipur-1704, Bangladesh
Signature of the Supervisor
----------------------------------------- Dr. Abu Raihan Md. Harunur Rashid
Associate Professor,
Department of Mechanical and Production Engineering (MPE)
Islamic University Of Technology (IUT)
Board Bazar Gazipur-1704, Bangladesh

iv
DEDICATION
This thesis is dedicated to my beloved parents and family.

v
ACKNOWLEDGEMENT
First and foremost, I thank Almighty Allah (SWT) for my life and for giving me wisdom,
health, and passion to complete all courses as well as the thesis of a postgraduate thesis.
I wish to extend my heartiest gratitude to all my course supervisor for their help and guidance
without which I would not have been able to complete all the courses. I am also extremely
grateful to my supervisor Associate Professor Dr. Abu Raihan Md. Harunur Rashid for his
extended guidance, inspiration, and ideas to make this thesis successful.
And I believe that full credit for my effort must be given to my parents. From behind the
curtain, they make every good thing possible in my life.
Md. Tajul Islam

vi
TABLE OF CONTENTS
CHAPTER TOPIC PAGE
I INTRODUCTION 1
1.1 Background of the study 2
1.2 Statement of the problem 2
1.3 Objectives of the study 2
1.4 Significance of the study 2
1.5 Assumptions 3
1.6 Limitation of the study 3
1.7 Contribution to the study 3
II LITERATURE REVIEW 4 2.1 Production process of the textiles industry 6 2.2 Description of textile production process 7
2.3 Productivity 22
2.4 Optimization 23
2.5 Ishikawa Diagram 23
2.6 5 why method 24
2.7 Analytical Hierarchy Process (AHP) 24
2.8 5S method 26
2.9 Statistical process control chart 29
2.10 Review of related research works 31
2.11 Research gap 37
III RESEARCH METHODOLOGY 38
3.1 Ishikawa Diagram 38 3.2 5 whys method 39 3.3 Procedure for using AHP 41
3.4 Decision Criteria 42 3.5 Questionnaires 44 3.6 Validation 45 3.7 Population 45 3.8 Data Collection Procedure 45 3.9 AHP Calculation 46 3.10 Data analysis 47 3.11 Procedure for 5S implementation 70 3.12 Use of statistical control chart 72

vii
I V
RESULT AND DISCUSSION
76
4.1 Ishikawa Diagram 76
4.2 5 why method 76 4.3 Result of AHP analysis 76 4.4 Summarized Biography of Respondents 76 4.5 Final result of AHP Analysis 77 4.6 5S result 79 4.7 Control Chart 82 4.8 Impact of Optimization 85
V CONCLUTIONS 86
5.1 Conclusions 86
5.2 Recommendation for further studies 86
REFERENCES
94
APPENDIX
A
Questionnaire for Production experts 87
APPENDIX
B
Biographic Details of Respondents 93

viii
LIST OF FIGURES
Figure 2.1 Process Flow diagram of textiles production 7
Figure 2.2 Work flow diagram of Blow room 8
Figure 2.3 Unifloc A11 machine for textiles production 8
Figure 2.4 Uniclean B11 machine 9
Figure 2.5 Unimix B70 machine 9
Figure 2.6 Uniflex B60 machine 10
Figure 2.7 SP-FPU machine 11
Figure 2.8 Condenser A21 machine 12
Figure 2.9 Carding C60 machine 13
Figure 2.10 Breaker Draw frame machine 13
Figure 2.11 Finisher Draw frame machine 14
Figure 2.12 Unilap E5/3 machine 15
Figure 2.13 Comber machine 16
Figure 2.14 Simplex Electrojet machine 17
Figure 2.15 Ring frame machine 18
Figure 2.16 Rotor frame machine 19
Figure 2.17 Winding machine 20
Figure 2.18 Finished product or yarns 21
Figure 3.1 Ishikawa Diagram used in yarns production 38
Figure 3.2 5why question asked in study 40
Figure 3.3 Flow of Steps for AHP Analysis 42
Figure 3.4 Hierarchy for Choice of segment textiles production process 46
Figure 3.5 X bar used in yarns CSP test 74
Figure 3.6 R chart used in used yarns CSP test 75
Figure 4.1 Segment criteria preference ratio 77
Figure 4.2 Main criteria preference ratio 78
Figure 4.2 Main criteria preference ratio 92
Figure 5.1 Before 5S implementation textile factory 80
Figure 5.2 After 5s implementation textile factory 81

ix
LIST of TABLES
Table 3.1 Pair-wise Comparison Matrix for Criteria (by Participant A) 48
Table 3.2 Priority Vector Calculation from Table 3.1 48
Table 3.A.1 Pair-wise Comparison Matrix for Criteria 50
Table 3.A.2 Pair-wise Comparison Matrix for Workforce 51
Table 3.A.3 Pair-wise Comparison Matrix for Maintenance 51
Table 3.A.4 Pair-wise Comparison Matrix for Cost 52
Table 3.A.5 Pair-wise Comparison Matrix for Quality 52
Table 3.A.6 Priority Matrix for Choice of Appropriate segment (Final Result) 53
Table 3.B.1 Pair-wise Comparison Matrix for Criteria 54
Table 3.B.2 Pair-wise Comparison Matrix for Workforce 55
Table 3.B.3 Pair-wise Comparison Matrix for Maintenance 56
Table 3.B.4 Pair-wise Comparison Matrix for Cost 56
Table 3.B.5 Pair-wise Comparison Matrix for Quality 57
Table 3.B.6 Priority Matrix for Choice of Appropriate segment (Final
Result)
57
Table 3.C.1 Pair-wise Comparison Matrix for Criteria 58
Table 3.C.2 Pair-wise Comparison Matrix for Workforce 59
Table 3.C.3 Pair-wise Comparison Matrix for Maintenance 59
Table 3.C.4 Pair-wise Comparison Matrix for Cost 60
Table 3.C.5 Pair-wise Comparison Matrix for Quality 60
Table 3.C.6 Priority Matrix for Choice of Appropriate segment (Final
Result)
61
Table 3.D.1 Pair-wise Comparison Matrix for Criteria 62
Table 3.D.2 Pair-wise Comparison Matrix for Workforce 63
Table 3.D.3 Pair-wise Comparison Matrix for Maintenance 64
Table 3.D.4 Pair-wise Comparison Matrix for Cost 64
Table 3.D.5 Pair-wise Comparison Matrix for Quality 65
Table 3.D.6 Priority Matrix for Choice of Appropriate segment (Final
Result)
65
Table 3.E.1 Pair-wise Comparison Matrix for Criteria 66
Table 3.E.2 Pair-wise Comparison Matrix for Workforce 67
Table 3.E.3 Pair-wise Comparison Matrix for Maintenance 67
Table 3.E.4 Pair-wise Comparison Matrix for Cost 68
Table 3.E.5 Pair-wise Comparison Matrix for Quality 68
Table 3.E.6 Priority Matrix for Choice of Appropriate segment (Final
Result)
69
Table 3.7 Yarns CSP Inspection 73
Table 3.8 Yarns production inspection 73
Table 4.1 Quality Inspection by benchmark 83
Table 4.2 Before optimization and after optimization 85

x
Abstract
The process of converting raw materials, components, or parts into finished goods that meet
customer’s expectations or specifications is called the production process. Manufacturing
commonly uses a man-machine set up with division of labor in a large scale production. It
includes a design to raw material collection to manufacturing to distribution towards its end
of life, including disposal. The textile industry has prominence globally and locally. Also, it
has a vast relation with RMG (Ready Made Garments) production in Bangladesh and other
countries, which is earning a lot of foreign remittance for the economic development for the
country. There are many segments and factors involve in the entire production process.
Therefore, it will be effective and economical if key segments and factors could be identified
for optimization. A standard textile production process comprises spinning, weaving, dyeing,
printing, and finishing. In this study, to find out the most prominent segment of the textiles
industry production process initially Ishikawa diagram, 5 why the method was used for
brainstorming purpose. Then a questionnaire was developed based on the idea received from
the brainstorming part. The questionnaire was sent to the experts. Data received from them
were used to perform analysis using Analytical Hierarchy Process (AHP). The AHP analysis
shows that yarns manufacturing is the most critical segment in the textiles production
process. Later, 5s and statistical process control charts were used to improve selected
parameters of the production process. Data collected shows that productivity increased by
0.88%, maintenance frequency decreased by 20%, the defective number decreased by 20%,
and decreased injured number by 16.66 %.

1
Chapter 1 Introduction
1.1 Background of the Study
In the textile industry, the understanding of the production quality, productivity, maintenance
frequency, defective number, occupational health, and safety are major issues for financial
stability and growth. In a developing country like Bangladesh, there are many textile industries.
They support a substantial portion of the economy of those countries. To stay in the market and
further expansion of the business, the textile industry needs to improve productivity and quality,
at the same time reducing maintenance costs. However, due to a shortage of financial ability,
they could not work in this area. Therefore, if a prominent segment could be identified, then
resources could be concentrated to the improvement of these parameters. It would be
economically viable for these textile industries located in developing countries. Textiles
Industries in Bangladesh, particularly the RMG sector has endeavored to implement this,
however, a little research work has been done concerning its appropriateness.
In a broader sense, optimization means reducing cost and time, increase revenue, quality,
productivity, and health safety management. Finding an alternative with the cost-effective or
highest achievable performance under the constraints, by maximizing the desired segment and
minimizing undesired once.
Accordingly, AHP may be used to identify prominent factors that will help to cost minimization.
A statistical control chart may be used to improve quality and that would be termed as quality
optimization. 5S may be used to organize effectively which may impact overall maintenance
equipment.

2
1.2 Statement of the problem
There were quality and productivity issues in the textile factory. Because of this, there was a
need to improve from this situation. So this improvement needed to be done economically and
effectively.
1.3 Objectives:
Objectives of this research are:
1. Finding the critical segment of the textile production process using AHP.
2. Optimization of the critical textiles production process through the improvement of relevant
industrial engineering parameters by implementing selected tools and methods using 5s and a
control chart.
1.4 Significance of the study
The textile production process is not only an art but also a lengthy process that demands a series
of engagement/decisions, trial & error, simulation with not only size, shape, and aesthetics but
also other variables like productivity, manufacturability, environment, durability, market
feedback, and ergonomics. Emphasis on each variable defines the nature or method of the
production process from the very beginning. Thus the production process is distinguished with a
good explanation in this research work.
Besides, emphasis on the above-mentioned variables varies from production engineers and finish
product to product, which ultimately affects the product’s sales, marketing, pricing, cost-saving,
etc. Thus, the Production process has different effects on the product’s sales, marketing, pricing,
cost-saving, etc. So, there may be some criteria to judge a production process which are to be
clarified. Therefore, a comparative study of the production process based on different criteria
may improve the production system to the next level. AHP could be a useful tool for this
purpose, as it can express qualitative judgments into quantitative judgments. Thus, production
system strategies on prominent segment as suggested by AHP may be reviewed and optimized
economically and effectively

3
1.5 Assumptions
The researcher also assumes that the scope of the study remains within the present circumstances
of Bangladesh for finding out the best-suited production process for textiles manufacturing.
1.6 Limitation of the study
Many organizations in Bangladesh are involved in the textiles business. Some engineers are
working on textiles on the research and development side. The other engineers are serving there
in the production process. And the experts who previously served in the production process are
transferred or promoted to other functions or joined with some other organizations. Furthermore,
industries usually do not allow experts to take part in such research studies due to their
confidentiality policy. So, a few experts are available to carryout AHP related surveys.
1.7 Contribution to the study
Based on the findings, optimization were done in the yarn manufacturing segment using the
relevant method like 5s and statistical process control chart. Significant improvement was found
as measured by different metrics like productivity, maintenance frequency, defective number,
occupational safety & health record.

4
Chapter 2 Literature Review
This chapter comprises the production process of the textiles industry, relevant textiles
production machinery and its process, productivity, optimization, Ishikawa Diagram, 5 why
method, statistical control chart, and 5S method.
2.1 Production of the textiles industry
The production process is the creation of a plan or convention for the construction of different
segment selection. In some cases, the direct construction of an object production engineering,
operations management is also considered. At present, the textile industry encompasses a
significant number and variety of processes that are adding value to fiber. These processes may
range over the yarn making through the garment stitching, fabric embossing, and composite
production [1,2]. However, considering the textile fiber as the basic building unit of any textile
product, textile manufacturing may be identified as conventional and technical textiles. The
conventional textile manufacturing process has a long history of converting natural fiber into
useful products including fabric, home textiles, and apparel, and more recently into a technical
textile through the utilization of special finishing effects. The synthetic and semisynthetic fiber
manufacturing is diversified with the utilization of monomer, chemical agent, precursor, catalyst,
and a variety of auxiliary fibers are perceived as a separate specialized subject and beyond the
scope of this book. Therefore, man-made fiber manufacturing is not discussed. The innovation in
textile manufacturing introduced a variation in raw materials and manufacturing processes.
Therefore, process control to ensure product quality is desired. Monitoring and controlling
process parameters may introduce a reduction in waste, costs, and environmental impact [3]. All
the processing stages in textile manufacturing from fiber production to finished fabric are
experiencing enhancement in process control and evaluation. It includes textile fiber production
and processing through blow room, carding, drawing, and combing; and fabric production
including knitted, woven, nonwoven, and subsequent coloration and finishing and apparel
manufacturing. The global textile industry, in yarn and fabric production, has a strong presence
and experiencing growth. In 2016, the yarn and fabric market was valued at USD 748.1 billion,
where the fabric product was more in consumption and contributed 83.7% and the yarn product
was at 16.3%. The market consumption is forecasted for growth at a CAGR of 5.1% between

5
2016 and 2021, reaching a market value of USD 961.0 billion in 2021. Apparel production is
another important area in textile manufacturing around the textile industry chain. Probably the
apparel is what individuals wear for body coverage, beautification, or comfort. Apparel and
garment terms are used interchangeably. However, the two terms may be differentiated as
apparel is outerwear clothing and garment is any piece of clothing. The study of yarns
manufacturing market includes all the clothing articles except leather, footwear, knitted product,
and technical, household, and made-up items. The worldwide apparel manufacturing market was
valued at USD 785.0 billion in 2016 and estimated to reach the level of USD 992 billion in 2021.
The market enhancement is forecasted to move from 2016 to 2021 at a CAGR of 4.8% [4,5].
Traditionally, yarn manufacturing comprises a series of processes involved in converting the
fiber into yarn. It was rooted in natural fibers obtained from natural plant or animal sources.
Natural fibers are produced with natural impurities that are removed from the yarn in subsequent
pretreatment processes. Possibly, cotton is the fiber that has rooted the yarn manufacturing from
fiber bale opening, followed by the series of continuous operations of blending, mixing,
cleaning, carding, drawing, roving, and spinning. Yarn manufacturing using cotton fibers
through a sequence of processing stages may be shown by the process flow diagram in Figure
2.2 All these operations are mechanical and do not require a chemical application. Each
processing stage in yarn manufacturing used a machine of specialized nature and provided
quality effects in yarn production. The advancement in fiber processing and machine technology
for yarn manufacturing is continuous. The manual picking of cotton fiber is now replaced with
machine picking. However, conventional systems of blending, carding, drawing, roving, and
spinning are indicated important in the future [6]. Yarn diameter, hairiness, linear density,
permeability, strength properties, etc. depend upon the end-use requirement of fabric to be
produced for woven or knitted end products (e.g., apparel or industrial fabrics), sewing thread, or
cordage. Several interesting works on the production of yarn are available that provide details of
the material processing and technological control. Introductory spinning technology is described
by Lawrence [7]. It covers the rudiments of staple-yarn technology, the manufacturing process,
the raw materials, and the production processes for short-staple, worsted, semi-worsted, woolen
spinning, doubling, and specialty yarn. Some of the useful advanced topics discussed are staple-
yarn technology, including new development in fiber preparation technology, carding
technology, roller drafting, ring spinning, open-end rotor spinning, and air-jet spinning. Tobler-

6
Rohr MI [9] described the yarn production technology in combination with economics. The
study is useful for yarn manufacturing and its development in the textile industry. Important
aspects of yarn manufacturing are filament yarn production, carding, and prior processes for
short-staple fibers, sliver preparation, short-staple spinning, long-staple spinning, post-spinning
processes, quality control, and economics of staple-yarn production [8,9,10].
2.2.1 Counting systems of yarn
The following are important parameters for counting system of yarn: Yarn Count: It is the
relationship between the mass and length of the yarn. It describes the linear density of the yarn.
In simpler words is the measure of the thickness of the yarn.
The two numbering systems counts are;
Direct count system
Indirect count system
Mathematical expression = length/Weight
Two systems of numbering indirect system;
Cotton system (Ne) is defined as the number of hanks per pound. (hk/pd)
1 hank = 840 yards.
Metric system (Nm) is defined as the number of hanks per kilogram. (hk/kg).
2.1 Process Flow diagram of textiles production
Different types of machinery are used for the conversion of fibers into yarn, and their functions
are different. A brief functions of the major types of machinery used in the textiles factory
are described in this section.

7
Figure 2.1: Process flow chart of textiles production
2.1 Description of textile production process
Blow Room
Blow room is the starting of the operation of the textile. It is the section where supplied
compressed bale is turned into a uniform lap of a particular length. The basic functions of the
blow room are opening, cleaning, and dust removal, blending, and evenly feeding the
material on the card. The machinery required to carry out these functions are:

8
Figure 2.2: Work flow diagram of Blow room
Bale Opener Machine is the first major machine in the Blow Room. It could be automatic or
manual. The functions of a bale opener machine are open the tuft of cotton, mix & blend the fiber,
remove a considerable amount of trash from fiber which is taken out by fan to FDP and act as a
reservoir for the next machine. Unifloc is an automatic bale opener machine that plucks raw
cotton in lump form and sends these to clean through air transportation for coarse cleaning.
Function: To open the bales into smaller and lighter tuffs or floc
Figure 2.3: Unifloc A11 machine

9
Cleaner machine is an important machine in spinning for opening and cleaning impurities from cotton. This machine is set normally after Bale Opener machine. It main functions are to open & clean the cotton by combinations of opposite spike & the beating action. It also removes the impurities such as leaves, stalk, motes & sand without damaging the fiber.
Function: To remove dust, trash, foreign matters, seed contents etc. from fiber flock.
Figure 2.4: Uniclean B11 machine
This is a process of mixing the same or different category of fibers to get desired
properties and cost effectiveness. Mixing is done after the study of the essential
properties of fiber like staple length, tensile strength, fineness, uniformity etc.
Fibers actually stored in six chambers and mixed up by beating.
Object : Homogeneous & Effective mixing of fibers
Figure 2.5: Unimix B70 machine

10
Traditional methods use more number of machines to open and clean natural fibers. In this section fine cleaning is done through beating and waste products are separated. Mechanical action on fibers causes some deterioration on yarn quality, particularly in terms of neaps.
Function: to optimize waste extraction to suit his the requirements without any mechanical
intervention (VARIO set)
Figure 2.6: Uniflex B60 machine
In every steps of blow room, the main function is cleaning. The most effective protection here
consists of two stages: one of separation of metal heavy parts and burning materials at the start of
cleaner line and one for the specific separation of foreign parts (foreign fiber) at the end of
cleaning line. The wide range of special contamination separator machines makes it possible
.here to find the ideal configuration for each line.
Function: To sort out the Poly propylene (PP) contaminants from fiber using optical method

11
Figure 2.7: SP-FPU machine
The condenser are de-dusting duct remove from chute material by suction air. This chute material sends to the carding machine for further processing via chute line.
Function: To control the width of the fiber strand move to upper line.

12
Figure 2.8: Condenser A21 machine
Carding Section
The carding machine mainly removes the naps, short fibers and remaining impurities in the cotton fiber and forms carded sliver. Mainly impurities are removed at the intake and the naps and short fibers are removed by action between the cylinder and flat. It is called the heart of cotton spinning because the quality of a yarn is greatly dependent upon the carding machine. In carding machine, cotton converted into sliver, which is deposited in sliver can.
Function: To individualize, parallelize, cleaning, reduction of neps, aligning, blending &
elimination of short fibers

13
Figure 2.9 : Carding C60 machine
Drawing Section
Carded sliver are fed into the draw frame. Here silver are stretched and made into a single silver.
Also fiber blending can be done at this stage. Some other task of draw frame, drafting,
parallelizing, blending, dust removal etc. Usually it take 12 silver can as input and give one
sliver can as output.
Function: To stretch or straighten the fed card sliver to one single sliber, blending of different
slivers.
Figure 2.10: Breaker Draw frame machine

14
Function: To arrange the fibers in parallel fashion, to reduce irregularity of silvers by auto
levelling device
Figure 2.11: Finisher Draw frame machine

15
Lap Formers: Forming the interfacing or lap, which is employed to feed the combing machine,
lighter draft is provided here (1.5-2)
Figure 2.12: Unilap E5/3 machine
Combers Section
The process of straightening and parallelizing of fibers and the removal of short
fibers by using combs and this combs assisted by brushes. This processes carried
out in order to improve the quality of the sliver coming out of the card. It also
removes naps and residue impurities. It takes 8 laps from lap former and make a
single sliver can.
Function: To produce smoother, softer sliver by eliminating short fibers

16
Figure 2.13: Comber machine
Simplex Section
In yarn manufacturing system, simplex frame is situated after the drawing frame. The sliver which is produced from the draw frame that is thicker and it is not suitable to feed into the ring frame directly to produce yarn. For this reason, drawn sliver is treated before entering into the ring frame. There are three basic steps in the operation of the roving frame — drafting, twisting and winding. In this process drawn sliver is input and fine Roving is output. The roving is feed into ring frame for yarn production. It is noted that, simplex is essential for the production of cotton yarn in case of ring spinning system. Function: To convert the drawn sliver into much fine sliver called roving by drafting and slight
twist insertion

17
Figure 2.14: Simplex Electrojet machine
Ring Frame
Roving produced in roving frame used in ring frame to obtain the desired yarn. Main function of ring frame is to draft the roving until the required fineness is achieved, then twist the drafted yarn to form yarn of required count and strength. Finally, wind the twisted yarn on the bobbin for further processing. In ring frame, any type of fiber can be spun and wide range of count can be processed. Higher yarn strength can also be achieved through ring frame. Function: To convert the roving into yarn of definite/respective count by creeling, drafting,
blending, twisting, winding and doffing operation

18
Figure 2.15: Ring frame machine
Rotor Frame Section
When a spun yarn end emerges from the draw-off nozzle into the rotor groove, it receives twist
from the rotation of the rotor outside the nozzle, which then continues in the yarn into the interior of
the rotor. The yarn end rotates around its axis and continuously twists-in the fibers deposited in the
rotor groove, assisted by the nozzle, which acts as a twist-retaining element.
Function: To produce yarn from the low quality fibers by the process of open end spinning
19
Figure 2.16: Rotor frame machine
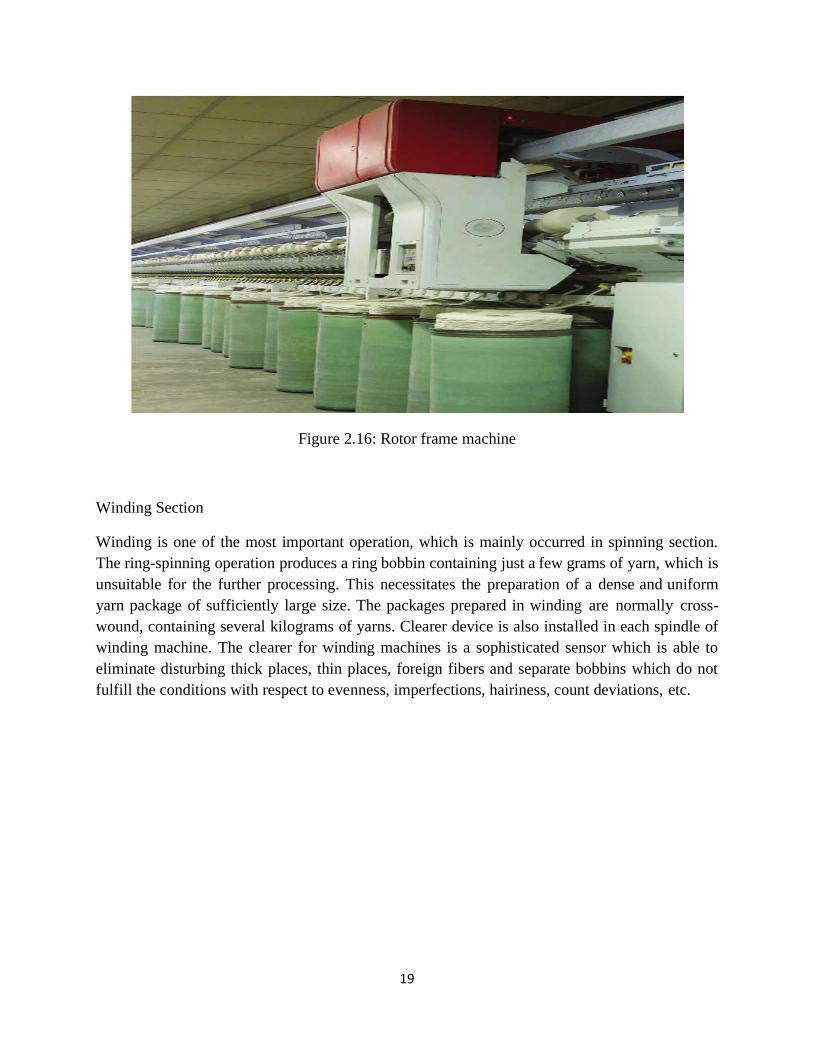
Winding Section
Winding is one of the most important operation, which is mainly occurred in spinning section.
The ring-spinning operation produces a ring bobbin containing just a few grams of yarn, which is
unsuitable for the further processing. This necessitates the preparation of a dense and uniform
yarn package of sufficiently large size. The packages prepared in winding are normally cross-
wound, containing several kilograms of yarns. Clearer device is also installed in each spindle of
winding machine. The clearer for winding machines is a sophisticated sensor which is able to
eliminate disturbing thick places, thin places, foreign fibers and separate bobbins which do not
fulfill the conditions with respect to evenness, imperfections, hairiness, count deviations, etc.
20
Function : To rewound the yarn from ring bobbin into suitable package
Figure 2.17: Winding machine
Heat Setting Section and Finished product
After winding process, the yarn cones are sent to heat setting section. In this
chamber, yarn packages are heated by steam generated from boiler for several
hours. This process reduces the hairiness of the yarn, will give the yarn better
shape and will increase the strength of the yarn. During heat setting, yarn
packages can gain weight up to 2%. After heat settings yarn packages are sent for
packaging.
Function: To increase yarns moisture content

21
+
Figure 2.18: Finished product or yarns

22
2. 3 Productivity
Productivity is the quantitative relation between what we produce and what we use as a resource
to produce them, i.e., the arithmetic ratio of the amount produced (output) to the number of
resources (input). Productivity can be expressed as:
Productivity =Output /Input
Depending upon the individual input partial productivity measures are expressed as:
Partial productivity =Total output/ Individual input
Labor productivity =Total output/ Labor input (in terms of man-hours)
Capital productivity =Total output/ Capital input
Material productivity =Total output/ Material input
Energy productivity =Total output/Energy input
Total productivity =Total output/ Total input
One of the major disadvantages of partial productivity measures is that there is an over emphasis on
one input factor to the extent that other input are underestimated or even ignored [9].

23
2.4 Optimization
Optimization is the art of making good decisions. It is the process of finding an alternative with
the cost-effective or highest achievable performance under the constraints, by maximizing the
desired segment and minimizing undesired once. In comparison, maximization means trying to
attain the top or maximum result or outcome without this cost or expenditure. The good practice
of optimization is restricted by the lack of complete information or data, and the lack of time to
evaluate what data or in is available[10].
Objectives of the optimization are to reduce cost and time, increase revenue, quality,
productivity, and health safety management. Accordingly, AHP may be used to identify
prominent factors that will help to cost minimization. A statistical control chart may be used to
improve quality and that would be termed as quality optimization. 5S may be used to organize
effectively which may impact overall maintenance scenario of the equipment.
2.5 Ishikawa Diagram
Dr. Kaoru Ishikawa, a Japanese quality control expert, is credited with inventing the fishbone
diagram also known as Ishikawa diagram or cause and effect diagram, to help employees avoid
solutions that merely address the symptoms of a much larger problem. Ishikawa diagrams are
considered one of the seven basic quality tools and are used in the "analyze" phase of Six
Sigma's DMAIC (define, measure, analyze, improve, control) approach to problem-solving [12].
Ishikawa diagram also called a cause and effect diagram or a fishbone diagram is a visualization
tool for categorizing the potential causes of a problem to identify its root causes. Typically used
for root cause analysis, a fishbone diagram combines the practice of brainstorming with a type of
mind map template. Ishikawa diagram is useful in product development
and troubleshooting processes that focuses the conversation. After the group has brainstormed all
the possible causes for a problem, the facilitator helps the group to rate the potential causes
according to their level of importance. The design of the diagram looks much like a skeleton of a
fish. Fishbone diagrams are typically worked right to left, with each large "bone" of the fish
branching out to include smaller bones containing more detail [13,14,15].

24
2.6 5 whys method
The technique was originally developed by Sakichi Toyoda and was used within the Toyota
Motor Corporation during the evolution of its manufacturing methodologies. It is a critical
component of problem-solving training, delivered as part of the induction into the Toyota
Production System. The architect of the Toyota Production System, Taiichi Ohno, described the
five whys method as "the basis of Toyota's scientific approach by repeating why five times the
nature of the problem, as well as its solution, becomes clear." The tool has seen widespread use
beyond Toyota and is now used within Kaizen, lean manufacturing, and Six Sigma.
In other companies, it appears in other forms. Under Ricardo Semler, Semco practices "three
whys" and broadens the practice to cover goal setting and decision making [16,17].
2.7 Analytical Hierarchy Process (AHP)
The analytic hierarchy process (AHP) is a structured technique for organizing and
analyzing complex decisions. Based on mathematics and psychology, it was developed
by Thomas L. Saaty in the 1970s and has been extensively studied and refined since
then[16,17].It has particular application in group decision making and is used around the world
in a wide variety of decision situations, in fields such as government, business, industry,
healthcare, and education.
Rather than prescribing a "correct" decision, the AHP helps decision makers find one that best
suits their goal and their understanding of the problem. It provides a comprehensive and rational
framework for structuring a decision problem, representing and quantifying its elements, relating
those elements to overall goals, and evaluating alternative solutions.
Users of the AHP first decompose their decision problem into a hierarchy of more easily
comprehended sub-problems, each of which can be analyzed independently. The elements of the
hierarchy can relate to any aspect of the decision problem—tangible or intangible, carefully
measured or roughly estimated, well- or poorly-understood—anything at all that applies to the
decision at hand[18].
Once the hierarchy is built, the decision-makers systematically evaluate its various elements by
comparing them to one another two at a time, concerning their impact on an element above them

25
in the hierarchy. In making the comparisons, the decision-makers can use concrete data about the
elements, but they typically use their judgments about the elements' relative meaning and
importance. It is the essence of the AHP that human judgments, and not just the underlying
information, can be used in performing the evaluations [19].
The AHP converts these evaluations to numerical values that can be processed and compared
over the entire range of the problem. A numerical weight or priority is derived for each element
of the hierarchy, allowing diverse and often incommensurable elements to be compared to one
another rationally and consistently. This capability distinguishes AHP from other decision-
making techniques [20,21].
In the final step of the process, numerical priorities are calculated for each of the decision
alternatives. These numbers represent the alternatives' relative ability to achieve the decision
goal, so they allow a straightforward consideration of the various courses of action.
AHP has got the following steps:
a) Model the problem as a hierarchy: The first step in the analytic hierarchy process is to
model the problem as a hierarchy. In doing this, participants explore the aspects of the
problem at levels from general to detailed, then express it in the multileveled way that the
AHP requires. As they work to build the hierarchy, they increase their understanding of
the problem, of its context, and each other's thoughts and feelings about both.
b) Evaluate the hierarchy: Once the hierarchy has been constructed, the participants
analyze it through a series of pair-wise comparisons that derive numerical scales of
measurement for the nodes. The criteria are pair-wise compared to the goal for
importance. The alternatives are pair-wise compared against each of the criteria for
preference. The comparisons are processed mathematically, and priorities are derived for
each node.
c) Establish priorities: At last, priorities are established by calculating the values of each
node, which will see in our next chapter.

26
2.8 5S method
Takashi Osada in 1991 coined the original concept of 5S. 5S is the acronym for five
Japanese words Seiri (organization), Seiton (neatness), Seiso (cleanliness), Seiketsu
(standardization) and Shitsuke (discipline) respectively. 5S has been introduced in
Japan mainly in the manufacturing and service industries. Toyota, the major car
manufacturer is one of the pioneering firms who adopted the 5S principles. Japanese
believe that 5S Principles are not only valuable at their workplaces but also improves
their cognitive sense. Osada refers to the 5S as the five pillars to establish and
maintain total quality environment in an organization [23,24].
5S Principles focuses on effective workplace organization, simplification of the work
environment, and minimization of waste while improving quality and safety. The
success of 5S depends upon total employee involvement, its continuous monitoring,
and everyone should work in a team.
5S is regarding make the workplace is an organized one, as problems are really
difficult to define in an unorganized organization.
5S effects on performance in similar organizations, review requirements of the
implementation and deployment of 5S practice, and review of the key success factors
for organizations that have been successful in implementing of 5S and other quality
management systems. [26]
The 5S methodology relies on the creation and keeping of a well-organized, clean,
highly effective, and high-quality workplace. 5S could only improve the result in the
working environment, but it proved also to help the company to gain better
efficiency.
2.8.1 5s Principle
Implementing the 5S rules should begin with training of productive workers in the range of the
5S’s elements and advantages from their usage. All participants of the training must understand
the need of using the 5S rules in their work and will agree on the changes. During training, it is
essential to train the usage of all rules on the clear example so that every participant can
understand the methodology of realization of the 5S’s elements. A very important fact is that
these rules do not refer only to the productive positions, but also refer to the warehouse, office
positions, and others.
The 5S implementation requires commitment both from the top management and
everyone in the organization.

27
5S can be used in any environment to support work-place issues including process,
delivery, safety, quality, stock, and equipment control and improvement targets.
[27,28]. 5S term is shown the folowing Table 2.1.
2.8.2 Benefits of 5S Implementation
Improving organization performance is an ongoing challenge and organizations
benefit best from a holistic approach, and here is an extremely useful roadmap to 5S
implementation [29].
It provides an excellent framework for establishing
The fundamental process for Productivity and Quality Improvements
A firm foundation for Continual Improvement
Best Practices
Key Performance Results
Removing wastes
5S removes instances of the seven wastes within the working environment:
Transport
Inventory
Motion
Waiting
Overproduction
Over Processing
Defects

28
Reduction in delays
5S will reduce delays in process.
Visual management shows when products and tools are missing.
Problems highlighted
Materials out of place.
Leaks and other machine problems.
Reduced setups
Setup times reduced through the same process as increasing production efficiency.
Ergonomic workplace
All tools to hand
Standardized process
Improved quality
The right tools and equipment available
Standardized processes
Improved handling so less damage
Improved reliability of equipment
Safety and Ergonomics
No clutter to create obstacles and hazards
Ergonomic stress-free workplace
No stretching or reaching
No lifting heavy objects
Standardized ways of working

29
Marketing
A highly visual and tidy workplace can give a great impression to a current or potential
customer.
Morale and motivation
Less stress for operators
Safer work environment
Involvement in making own improvements
Empowerment to make changes
Continuous improvement and problem-solving
Implemented correctly 5S will drive continuous improvement of products and
processes.
Abnormalities are immediately visible allowing action to be taken
2.9 Statistical Process Control Chart
Statistics is a science which deals with the collection, summarization, analysis, and drawing of
information from the data. Process: It converts input resources into the desired output (goods or
services) with a combination of people, materials, methods, machines, and measurements.
Control means system, policies, and procedures are in place so that the overall output meets the
requirement [30].
Today’s companies are facing increasing competition and also operational costs, including raw
materials continuously increasing. So for the organizations, it is beneficial if they have control
over their operation [32.]
Organizations must make an effort for continuous improvement in quality, efficiency, and cost
reduction. Many organizations still follow inspection after the production for quality-related
issues.
SPC helps companies to move towards prevention-based quality control instead of detection
based quality controls. By monitoring SPC graphs, organizations can easily predict the behavior
of the process. The visual representation makes it clearer that there are likely subgroups within
the data. The control chart appears to be out of control with a lot of special cause variation but
there is likely a good explanation [32,33].

30
SPC charts measure the output on a continuous scale. It is possible to measure the quality
characteristics of a product by using SPC. There are two widely used SPC charts namely X bar
and R Charts when data is readily available. X bar and R chart are used to monitor the process
performance of continuous data and the data are to be collected in sub groups at a set time. It has
two plots to monitor the process mean and the process variation over time.
.
Statistical Process Control Benefits
The benefits of SPC charts may be summarized as follows:
Increase productivity
Reduce scrap and rework
Improve overall quality
Match process capability to product requirement
Continuously monitor the process of maintaining control
Provide data to support decision making
Streamline the process
Increase in product reliability
Opportunity for company-wide improvements
SPC focuses on optimizing continuous improvement by using statistical tools to analyze data,
make inferences about process behavior, and then make appropriate decisions.
The basic assumption of SPC is that all processes are subject to variation. Variation measures
how data are spread around the central tendency. Moreover, variation may be classified as one of
two types, random or chance cause variation and assignable cause variation[34,35].
Common Cause: A cause of variation in the process is due to chance, but not assignable to any
factor. It is the variation that is inherent in the process. A process under the influence of a
common cause will always be stable and predictable.
Assignable Cause: It is also known as “special cause”. The variation in a process that is not due
to chance therefore can be identified and eliminated. The process under influence of special
cause will not be stable and predictable.

31
2.10 Review of Related Research works
Relevant papers for the last ten years were reviewed. Key points from this paper review are
presented in Table 2.1
Table 2.1: Key points from the review papers.
Author Objective Methodology Result & Findings
Majid
Dekamin,
Morteza
Barmaki,
Amin
kanooni
[10]
Selecting the best
environmental
friendly oilseed
crop by using Life
Cycle Assessment,
water footprint and
analytic hierarchy
process methods
Using analytic
hierarchy process,
Life Cycle
Assessment,
water footprint
methods.
The AHP criteria were selected based on the
two aspects of sustainable development:
environment aspect and economic aspect. The
results indicated that the integration of WF
and LCA methods into AHP for comparing
the agro-environmental efficiency of oilseed
crops can be applied as the starting point for
the assessments of different crop production
systems aiming at cost management, WF and
environmental burden reductions, and
optimization of the oilseed crop production
sector.

32
Author with
publication
year
Objective Methodology Result & Findings
Cebeci,U.
[12]
Fuzzy AHP-based
decision support
system for
selecting ERP
systems in textile
industry by using
balanced scorecard
Using Fuzzy AHP
method with
balanced
scorecard for
selecting
appropriate ERP
In this study, the fuzzy analytic hierarchy
process, a fuzzy extension of the multi-criteria
decision-making technique AHP, was used to
compare these ERP system solutions. The
methodology was applied for a textile
manufacturing company.
S.M. Aqil
Burney,
Syed
Mubashir
Ali[15]
Fuzzy Multi-
Criteria Based
Decision Support
System for
Supplier Selection
in Textile Industry
This research
applied F-AHP
methodology in a
XYZ textile
manufacturing
company in
Pakistan which
produces denim
fabric and cotton
yarn.
This research has done three novel
contributions. First, AHP has been applied in
textile industry in Pakistan for supplier
selection which will gives confidence to the
decision makers and procurement managers
within this industry to perform decision
making with confidence. Second, by
incorporating fuzzy soft computing technique
in AHP analysis enabled the decision maker
to deal with vagueness, imprecision and
linguistic chaos while performing pair-wise
comparison. Lastly, this research can become
a simple decision making tool and a starting
point for other.

33
Author with
publication
year
Objective Methodology Result & Findings
Selim Zaim
et.al [20]
The purpose of
this paper is to
demonstrate the
use of two general
purpose decision-
making techniques
in selecting the
most appropriate
maintenance
strategy for
organizations with
critical production
requirements.
The Analytical
Hierarchical
Process (AHP)
and the Analytical
Network Process
(ANP) are used
for the selection
of the most
appropriate
maintenance
strategy in a local
newspaper
printing facility in
Turkey.
The two methods were shown to be effective
in choosing a strategy for maintaining the
printing machines. The two methods resulted
in almost the same results. Both methods take
into account the specific requirements of the
organization through its own available
expertise.
Punyasloka
Pattnaik
et.al [22]
24 February
2019
Sustainability of
Textile wastewater
management by
using Fuzzy AHP
method
Using FAHP As FAHP is one of the potential multi-criteria
decisions making method benefit the textile
manufacturing sectors by minimizing waste
utilization.

34
Author with
publication
year
Objective Methodology Result & Findings
Ruchi
Mishra
et.al [26]
23 May
2017
Evaluation and
prioritization
of manufacturing
flexibility
alternatives using
integrated AHP
and TOPSIS
method: evidence
from a fashion
apparel firm
This paper
develops an
integrated AHP
and TOPSIS
approach to
ascertain the
importance of
each type of
manufacturing
flexibility with
regard to the
environmental
uncertainty
criterion and sub
criterion.
Therefore, the proposed framework offers a
new valid and reliable approach to evaluate
and prioritize the manufacturing flexibility
with respect to uncertainties present in the
environment. Like all modelling method, the
proposed modelling approach also has certain
limitations.

35
Author with
publication
year
Objective Methodology Result & Findings
S.R.
Dulange
et.al [28]
06 August
2014
Prioritization of
factors impacting
on performance of
power looms using
AHP
Using AHP The paper gives an idea of factors which
influences on performance of power loom
textiles which gives guidelines to the
owners/managers about the potential area of
improvement. The priority for the human
resource is 37.66 %. The labor absenteeism is
observed as 23.97 %, which highly impact the
performance. The absenteeism of workforce
means loss of production. Training facility for
the employee and management is also
important; the effect of this is 20.01 %. To
achieve high performance, a motivated
workforce is an important factor which is
20.02 %. A second important factor is a
product.

36
Author with
publication
year
Objective Methodology Result & Findings
Raghu
Natha reddy
et.al [30]
A comprehensive
study in finding the
risk assessment
using a fuzzy
analytical
hierarchal model in
textile industry.
Using FAHP The proposed approach is valuable for
evaluating improvement, which can prompt
enhancing profitability and manage the upper
hands. In this case study, the sub-criteria of
manufacturing with technical capability has
more risk prioritized. So the organization has
to develop the technical capability workers as
well as supervisors by continuous
improvement.
Ernesto
Mastrocinqu
e
et.al [32]
2016
Manufacturing
Technology
Selection in the
Supply Chain
Context by Means
Of Fuzzy-Ahp: A
Case In The High
Performance
Textile Industry
Using FAHP Full lamination/solvent type turned out to be
the suggested technology option for high
performance textile manufacturing. Finally,
Fuzzy AHP proven to be a fast, simple and
valid decision-making support tool for
technology selection.

37
2.11 Research Gap
In the review of past research works, it has been found that optimization things were done in
other industries except for textiles industries in developing countries. AHP and similar tools have
been used to find out the most prominent factor. So, AHP may be used to find out the prominent
segment of Textile Industry to carry out optimization effectively and economically. Therefore,
the current research works mentioned in this study are expected to fill this research gap.

38
Chapter 3 Research Methodology
This chapter describes the research methodology that includes Ishikawa Diagram, 5 whys
method, AHP analysis, statistical control chart, and 5s method.
3.1 Ishikawa Diagram
An Ishikawa diagram is a diagram that shows the causes of an event and is often used in yarns
manufacturing and finished product development to outline the different steps in a process,
implemented where quality control issues might arise and determine which resources are
required at specific times. The diagram shown in Figure: 3.1 was developed on the initial phase
of the study to find out possible factors for selecting prominent segment for optimization in the
textile production process.
Figure 3.1: Ishikawa Diagram used in yarns production
Manpower Health &
Safety
Measure
Quality
Measure Cost Maintenance Machine &
Methods
Factor for
selecting
prominent for
optimization

39
3.2 5 whys method
The 5 Whys may be used textiles production process or as a part of the fishbone (also known as
the cause and effect or Ishikawa) diagram. The fishbone diagram helps to explore all potential or
real causes that result in a single defect or failure. Once all inputs are established on the fishbone,
the 5 Whys technique is to be drilled down to find out the root causes. The 5 Whys approach to
root cause analysis is by no means new, nor does it originate in Six Sigma [36, 37].
5why method was used in this project. To get an idea about the prominent segment. We used the
5 why method in the textile production process. According to the 5 why procedure a why
question is asked to the participants. Then each response will be converted to the next why
question. In this study, 5why questions as shown in Figure 3.2 were asked to experts.

40
This way we have continued 5 questions.
Figure 3.2 5why question asked in study
What is the critical segment for optimization in textile production process?
Yarns manufacturing
Why do you want to optimize textile production process?
Why do you want to improve productivity?
Increase profit.
Why do you want to enhance profit?
To grow the business and sustain in the long term.
Improve productivity
Because of increase profit value is created to continue textiles business and
expansion.
Why is it important to create value in your business?

41
3.3 Procedure for using AHP
The critical segment for the most appropriate segment of the production process of the textile
industry is a qualitative decision that may vary from engineer to engineer. AHP is used to
convert qualitative decisions into a quantitative decision. Thus responses from various engineers
may lead to a conclusion on the most appropriate segment production process for textile
production on the current perspectives of Bangladesh.
In this research, the following steps of AHP were used to find out the most appropriate critical
segment of the production process of the textile industry [17]
I. Define the decision problem and determine its object [17].
II. Define the decision criteria in the form of a hierarchy of objectives. This hierarchical
structure consists of different levels. The top-level is the objective to be achieved. This
top-level consists of intermediate levels of criteria and sub-criteria, which depend on
subsequent levels. The lowest level consists of a list of alternatives [18].
III. For making pair-wise comparisons, structure a matrix of size (n x n). The number of
judgments required to develop the set of the matrix is given by n (n – 1) / 2 [18].
IV. Obtain the importance of the criteria and sub-criteria from experts’ judgment by making a
pairwise comparison. This comparison is made for all levels. Verbal judgments of
preferences are shown in table 3.1.
V. Determine the weight of each criterion. By hierarchical synthesis, the priority vectors are
calculated. These values are then normalized to eigenvectors of the matrix [18]
VI. The consistency is determined by using the eigenvalue, λmax. For finding the consistency
index, CI, the formula used is; CI = (λmax – n) / (n – 1), where n is the size of the matrix.
The consistency ratio (CR) is simply the ratio of CI to average random consistency (RI).
The CR is acceptable if it does not exceed 0.10. If it is more, the judgment matrix is
inconsistent; then the matrix has to be reviewed to obtain a consistent matrix. These are
calculated for all the matrices structured from the hierarchy. Some computer packages are
available nowadays to implement this calculation procedure. [19,20,21]

42
Figure 3.3: Flow of Steps for AHP Analysis
Define Decision Problem
Form Criteria Hierarchy
Structure Matrix (n x n)
Pair-wise Comparison
Calculate Priority Vector
Check Consistency Ratio
(CR < 0.10)
43
3.4 Decision Criteria
In the beginning, a few criteria were through brainstorming with Ishikawa diagrams and the Five
Whys method. According to most production experts, four criteria were adopted for AHP
analysis because they placed more importance on them.
The choice of the most appropriate segment for a particular product in a particular
market/country may depend on the following criteria as suggested by the experts. There are
different textiles production segments in a typical textile industry. They are as described below
a) Raw Material collection: Valuable raw material collection is characterized by an extensive
range of valuable merino wool yarns and noble fibers (Cashmere, silk, angora, cotton), pure or
blended with man-made fibers used in low percentage to modernized classical products
b) Yarns manufacturing: Yarn is an assemblage of fibers that are twisted or laid together to
form a continuous strand that can be made into a textile fabric. So a yarn is a strand of natural or
manmade fibers or filaments that have been twisted or grouped for use in weaving, knitting, or
other methods of constructing textile fabrics.
c) Finish product & Packaging: Yarn is packaged (or put up) in different forms. For example,
balls, skeins (rhymes with canes), and hanks. The differences in yarn packaging shouldn’t have
much effect on the yarn you choose, but the shape does determine how you work with them.
There are various types of yarn are being produced in textiles industries such as viscose, modal,
polyester, etc.
According to the opinion of the production experts as derived from initial brainstorming, four
criteria were taken to be incorporated in the AHP analysis.
a) Workforce: It basically involves the people who make the workforce in an organization. It is
the total supply of personnel available to complete a particular task. The workforce is the most
important as well as the main resource for any organization to function or work properly and
achieve high productivity.
b) Maintenance: Maintenance management is a concept that describes the successful and
efficient management of maintenance issues involved in the upkeep, operation, and productivity

44
of a factory, manufacturing facility, or plant. So, a better maintenance plan is to increase
productivity and profits through improved operations. It is also an important component of the
yarn production process [22].
c) Cost: Costing for a product directly influences the price & profit as well as it also affects the
lifetime, ergonomics, and environmental outcome of the product.
d) Quality: The yarn has a stable quality only when it is formed by the fiber of close length and
relatively uniform. To get such fibers, the fibers from different production areas and batches
must be mixed. Use cotton opener, cotton mixer, and cotton cleaning machine to open, remove,
and mix all kinds of fibers.
3.5 Questionnaires
Analytical Hierarchy Process (AHP) is a method for situations in which ideas, feelings, and
emotions affecting the decision process are quantified to provide a numeric scale for prioritizing
the alternatives. And this scale might be best captured by a questionnaire which fulfills the
following two objectives:
i. To maximize the proportion of subjects answering our questionnaire that is, the response
rate.
ii. To obtain accurate relevant information for our study & analysis.
A questionnaire with the above two objectives was prepared for data collection. It consists of
several tables that were developed according to AHP. It starts with a few sentences explaining
the purpose of the questionnaire, and what the data will be used for. Much effort was given to
provide a clear structure to the questionnaire and much concentration was also given to make the
questionnaire simple and easy. (Actual Questionnaire is presented with details in Appendix A)

45
3.6 Validation
The validity of the questionnaire was established as follows:
i. It was scrutinized by experienced engineers & experts. Detailed biography of the
engineers are given in Appendix B.
ii. The supervisor of the study provided advice on items to be reshaped, deleted, or added
questions.
3.7 Population
Many engineers are working in different textile industries. It should be kept in mind that, many
other production engineers are working on different products other than the textiles industry in
Bangladesh. In this study, only five engineers were selected for data collection and survey for the
company's confidential policy. Besides, those experts were experience through various
organization on textiles production.
3.8 Data Collection Procedure
The questionnaire was sent to the researcher’s fellow engineers, with whom he worked before. It
was also explained to the participants over prolonged telephonic discussions. As it was voluntary
work and somewhat lengthy/critical, many of the engineers did not respond promptly. In those
cases, the participants were given follow-up.

46
3.9 AHP Calculation
This section presents the method used in finding out the most appropriate segment for the
production process of the textiles industry in the current aspects of Bangladesh by using AHP.
The data from the questionnaire were tabulated on a scale of 0 to 5. Separate tables were used to
compare segments based on different criteria. Before these segment comparisons, those criteria
were also compared among themselves in tabulated format.
Assessment Criteria Hierarchy is as followed:
Figure 3.4: Hierarchy for Choice of segment textiles production process
Criteria
Workforce
Maintenance
Cost
Quality
47
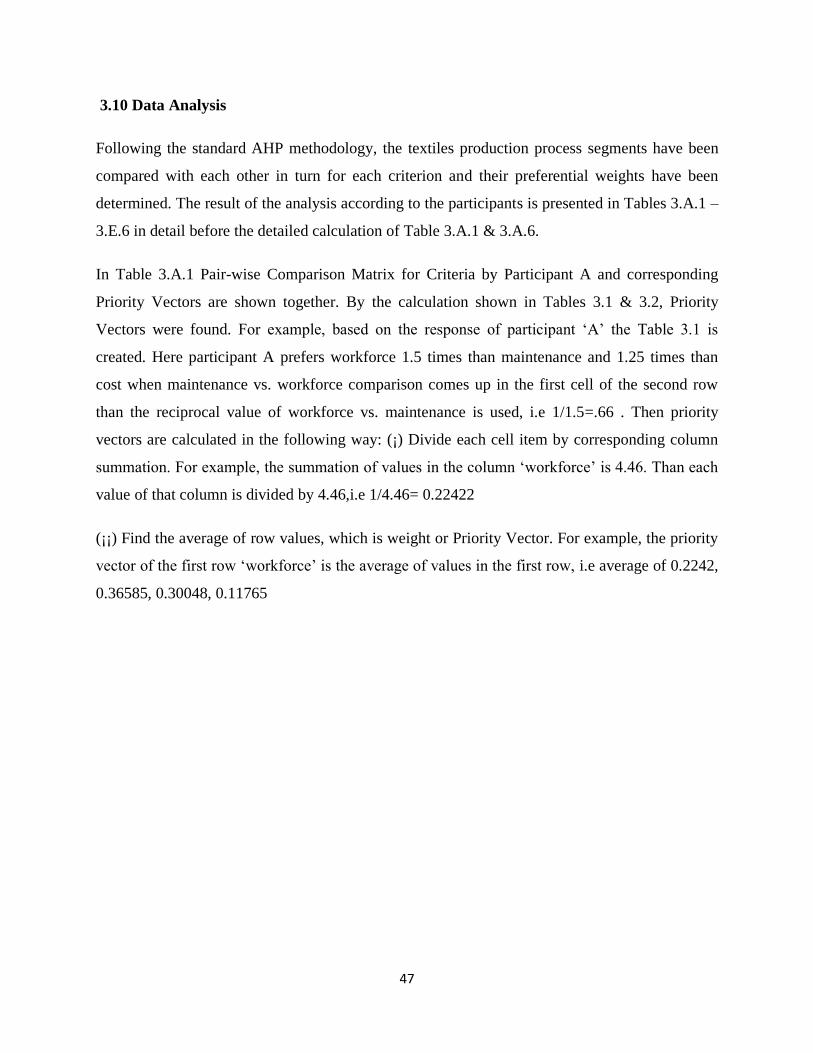
3.10 Data Analysis
Following the standard AHP methodology, the textiles production process segments have been
compared with each other in turn for each criterion and their preferential weights have been
determined. The result of the analysis according to the participants is presented in Tables 3.A.1 –
3.E.6 in detail before the detailed calculation of Table 3.A.1 & 3.A.6.
In Table 3.A.1 Pair-wise Comparison Matrix for Criteria by Participant A and corresponding
Priority Vectors are shown together. By the calculation shown in Tables 3.1 & 3.2, Priority
Vectors were found. For example, based on the response of participant ‘A’ the Table 3.1 is
created. Here participant A prefers workforce 1.5 times than maintenance and 1.25 times than
cost when maintenance vs. workforce comparison comes up in the first cell of the second row
than the reciprocal value of workforce vs. maintenance is used, i.e 1/1.5=.66 . Then priority
vectors are calculated in the following way: (¡) Divide each cell item by corresponding column
summation. For example, the summation of values in the column ‘workforce’ is 4.46. Than each
value of that column is divided by 4.46,i.e 1/4.46= 0.22422
(¡¡) Find the average of row values, which is weight or Priority Vector. For example, the priority
vector of the first row ‘workforce’ is the average of values in the first row, i.e average of 0.2242,
0.36585, 0.30048, 0.11765

48
Table 3.1 Pair-wise Comparison Matrix for Criteria (by Participant A)
Find Column Summation (n = 4)
Workforce Maintenance Cost Quality
Workforce 1 1.5 1.25 .5
Maintenance .66 1 1.25 1.25
Cost .8 .8 1 1.5
Quality 2 .8 .66 1
Column Sum
4.46
4.1 4.16 4.25
Table 3.2: Priority Vector Calculation from Table 3.1
Workforce Maintenance Cost Quality
Avg. of
Row/weight/prior
y vector
Workforce
0.22422 0.36585 0.30048 0.11765
0.25205
Maintenance 0.14798 0.24390 0.30048 0.29412 0.24662
Cost 0.17937 0.19512 0.24038 0.35294 0.24195
Quality 0.44843 0.19512 0.15865 0.23529 0.25938

49
So, the comparison matrix, A =
And the Weight Matrix, W =
λmax = =
λmax= 1.0523075 +1.0384475+1.028516 +1.116863=4.236134
CI = (λmax – n) / (n – 1) = (4.236134-4)/(4-1)=0.236134/3= 0.078711333
RI = 1.98(n – 2) / n = 0.99
RI=1.98(4-2)/4=0.99
Consistency Ratio, CR = CI / RI = 0.079506396
Now, Priority Vectors & CR values are found from Table 4.A.2, 4.A.3, 4.A.4, 4.A.5 & 4.A.6
according to the calculation shown for Table 4.A.1. And from the Priority Vectors of Table
4.A.2, 4.A.3, 4.A.4 & 4.A.5 Priority Matrix or Table 4.A.6 is formed.
1 1.5 1.25 .5
.66 1 1.25 1.25
.8 .8 1 1.5
2 .8 .66 1
0.25205
0.24662
0.24195
0.25938
1 1.5 1.25 .5
.66 1 1.25 1.25
.8 .8 1 1.5
2 .8 .66 1
0.25205
0.24662
0.24195
0.25938
1.0523075
1.0384475
1.028516
1.116863

50
Participant A
Table 3.A.1: Pair-wise Comparison Matrix for Criteria
Workforce Maintenance Cost Quality
Weight/
priority
vector
Workforce 1 1.5 1.25 .5
0.25205
Maintenance .66 1 1.25 1.25 0.24662
Cost .8 .8 1 1.5 0.24195
Quality 2 .8 .66 1 0.25938
CR=0.822

51
Table 3.A.2: Pair-wise Comparison Matrix for workforce
Raw
Material
collection
Yarns
manufacturing
Finish
product
&
Packaging
Weight/
priority
vector
Raw Material
collection 1.00 2 3
0.53929
Yarns
manufacturing .5 1.00 2
0.29742
Finish product
& Packaging .33 .5 1
0.16328
CR=0.0058
Table 4.A.3: Pair-wise Comparison Matrix for maintenance
Raw
Material
collection
Yarns
manufacturing
Finish
product &
Packaging
Weight/
priority
vector
Raw Material
collection 1 1.25 1.5
0.39813
Yarns
manufacturing .8 1 2
0.37776
Finish product
& Packaging .66 .5 1
0.22411
CR=0.0203

52
Table 4.A.4: Pair-wise Comparison Matrix for cost
Raw
Material
collection
Yarns
manufacturing
Finish
product
&
Packaging
Weight/
priority
vector
Raw Material
collection 1
1.25 1.8
0.41836
Yarns
manufacturing 0.8 1 2 0.37358
Finish product
& Packaging 0.55 0.5 1 0.20806
CR=0.0070
Table 4.A.5: Pair-wise Comparison Matrix for quality
Raw
Material
collection
Yarns
manufacturing
Finish
product &
Packaging
Weight/
priority
vector
Raw Material
collection 1 1.75 1.25
0.42282
Yarns
manufacturing .57 1 1.5
0.31125
Finish product
& Packaging .8 .66 1
0.26592
CR=0.046

53
Table 3.A.6: Priority Matrix for Choice of Appropriate Segment Final Result
Workforce Maintenance Cost Quality
Overall
Priority
Vector
Raw Material
collection 0.54 0.40 0.42 0.42 0.45
Yarns
manufacturing 0.30 0.38 0.37 0.31 0.34
Finish product
& Packaging 0.16 0.22 0.21 0.27 0.22
CR=0.03
The overall priority vector is calculated by multiplying the criteria weight with the corresponding
segment weight for that alternative option as shown in Table 3.A.6. For example Overall priority
vector also known as composite weight is calculated for row material collection option as
follows: 0.25025*0.53929+0.24662*0.39813+ 0.24195*0.41836+ 0.25938*0.4228= 0.45

54
Participant B
Criteria Matrix: Table 3.B.1: Pair-wise Comparison Matrix for Criteria
Workforce Maintenance Cost Quality
Weight/
priority
vector
Workforce 1 1.5 1.25 1.75
0.32706
Maintenance .66 1 1.4 1.8 0.27653
Cost .8 .71 1 1.5 0.23320
Quality .57 .55 .66 1 0.16320
CR=0.0078

55
Table 3.B.2: Pair-wise Comparison Matrix for workforce
Raw
Material
collection
Yarns
manufacturing
Finish
product &
Packaging
Weight/
priority
vector
Raw Material
collection 1 .66 1.25
0.30838
Yarns
manufacturing 1.51 1 1.33
0.41421
Finish product &
Packaging .8 .75 1
0.27741
CR=0.0092

56
Table 4.B.3: Pair-wise Comparison Matrix for maintenance
Raw
Material
collection
Yarns
manufacturing
Finish
product &
Packaging
Weight/
priority
vector
Raw Material
collection 1 .8 .75
0.27706
Yarns
manufacturing 1.25 1 1.75
0.42370
Finish product
& Packaging 1.33 .57 1
0.29924
CR=0.0329
Table 4.B.4: Pair-wise Comparison Matrix for cost
Raw
Material
collection
Yarns
manufacturing
Finish
product &
Packaging
Weight/
priority
vector
Raw Material
collection 1 .57 1.25
0.28888
Yarns
manufacturing 1.75 1 1.6
0.45505
Finish product &
Packaging .8 .62 1
0.25607
CR=0.0060

57
Table 4.B.5: Pair-wise Comparison Matrix for quality
Raw
Material
collection
Yarns
manufacturing
Finish
product &
Packaging
Weight/
priority
vector
Raw Material
collection 1 .54 1.25
0.28080
Yarns
manufacturing 1.85 1 1.75
0.47276
Finish product &
Packaging .8 .57 1
0.24644
CR=0.0062
Table 4.B.6: Priority Matrix for Choice of Appropriate Segment Final Result
Workforce Maintenance Cost Quality Overall Priority
Vector
Raw Material
collection 0.31 0.28 0.29 0.28 0.29
Yarns
manufacturing 0.41 0.42 0.46 0.47 0.44
Finish product
& Packaging 0.28 0.30 0.26 0.25 0.27
CR=0.01

58
Participant C
Table 3.C.1: Pair-wise Comparison Matrix for Criteria
Workforce Maintenance Cost Quality
Weight/
priority
vector
Workforce 1 1.5 1.25 1.85
0.33048
Maintenance .66 1 1.5 1.8 0.28059
Cost .8 .66 1 1.5 0.22881
Quality .54 .55 .66 1 0.16013
CR=0.0088

59
Table 3.C.2: Pair-wise Comparison Matrix for workforce
Raw
Material
collection
Yarns
manufacturing
Finish
product &
Packaging
Weight/
priority
vector
Raw Material
collection 1 .57 1.25
0.29218
Yarns
manufacturing 1.75 1 1.33
0.43183
Finish product &
Packaging .8 .75 1
0.27599
CR=0.0205
Table 4.C.3: Pair-wise Comparison Matrix for maintenance
Raw
Material
collection
Yarns
manufacturing
Finish
product &
Packaging
Weight/
priority
vector
Raw Material
collection 1 .66 .75
0.25712
Yarns
manufacturing 1.50 1 1.75
0.44669
Finish product &
Packaging 1.33 .57 1
0.29619
CR=0.0133

60
Table 3.C.4: Pair-wise Comparison Matrix for cost
Raw
Material
collection
Yarns
manufacturing
Finish
product
&
Packaging
Weight/
priority
vector
Raw Material
collection 1 .51 1.25
0.27693
Yarns
manufacturing 1.95 1 1.6
0.46836
Finish product
& Packaging .8 .62 1
0.25472
CR=0.0127
Table 3.C.5: Pair-wise Comparison Matrix for quality
Raw
Material
collection
Yarns
manufacturing
Finish
product &
Packaging
Weight/
priority
vector
Raw Material
collection 1 .51 1.25
0.27479
Yarns
manufacturing 1.95 1 1.75
0.47942
Finish product
& Packaging .8 .57 1
0.24579
CR=0.0082
61
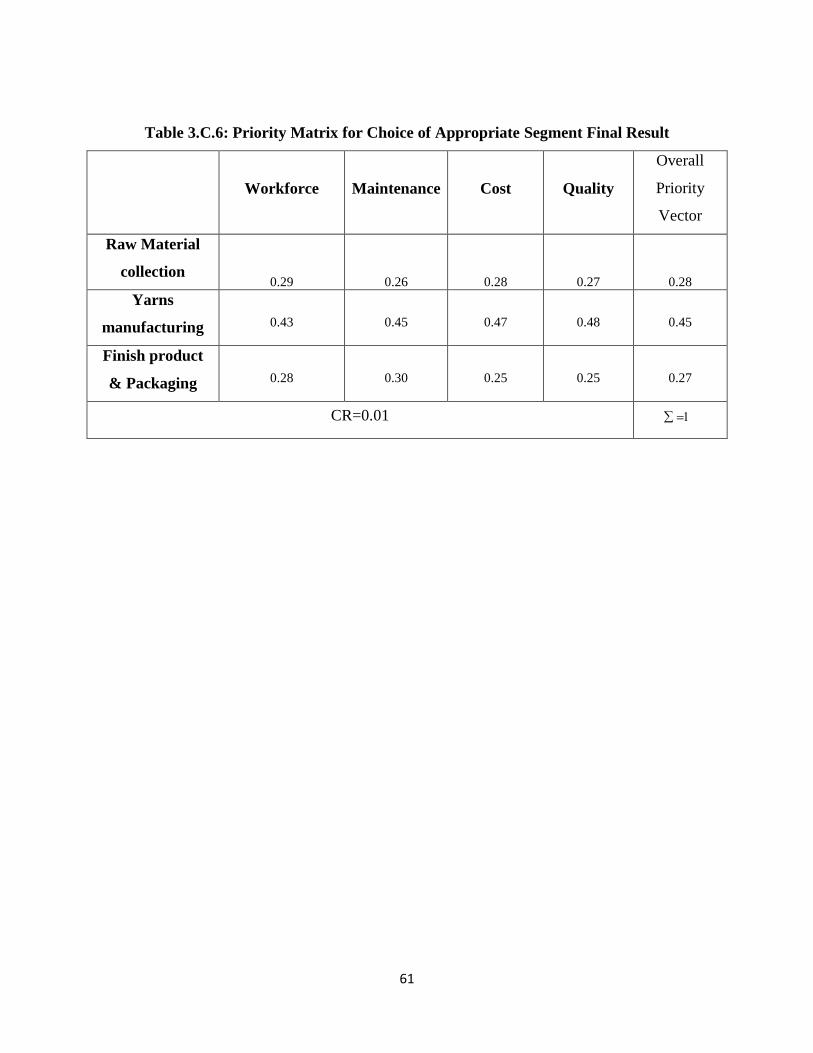
Table 3.C.6: Priority Matrix for Choice of Appropriate Segment Final Result
Workforce Maintenance Cost Quality
Overall
Priority
Vector
Raw Material
collection 0.29 0.26 0.28 0.27 0.28
Yarns
manufacturing 0.43 0.45 0.47 0.48 0.45
Finish product
& Packaging 0.28 0.30 0.25 0.25 0.27
CR=0.01

62
Participant D
Table 3.D.1: Pair-wise Comparison Matrix for Criteria
Workforce Maintenance Cost Quality
Weight/
priority
vector
Workforce 1 1.5 1.25 1.85
0.33148
Maintenance .66 1 1.5 1.8 0.28107
Cost .8 .66 1 1.25 0.21905
Quality .54 .55 .8 1 0.16839
CR=0.0092

63
Table 3.D.2: Pair-wise Comparison Matrix for workforce
Raw
Material
collection
Yarns
manufacturing
Finish
product &
Packaging
Weight/
priority
vector
Raw Material
collection 1 .51 1.25
0.27344
Yarns
manufacturing 1.95 1 1.85
0.48634
Finish product &
Packaging .8 .54 1
0.24022
CR=0.0055

64
Table 3.D.3: Pair-wise Comparison Matrix for maintenance
Raw
Material
collection
Yarns
manufacturing
Finish
product &
Packaging
Weight/
priority
vector
Raw Material
collection 1 .57 1.25
0.28557
Yarns
manufacturing 1.75 1 1.85
0.47270
Finish product &
Packaging .8 .54 1
0.24173
CR=0.0017
Table 3.D.4: Pair-wise Comparison Matrix for cost
Raw
Material
collection
Yarns
manufacturing
Finish
product &
Packaging
Weight/
priority
vector
Raw Material
collection 1 .50 1.25
0.27104
Yarns
manufacturing 2 1 1.85
0.48924
Finish product &
Packaging .8 .54 1
0.23971
CR=0.0082

65
Table 3.D.5: Pair-wise Comparison Matrix for quality
Raw
Material
collection
Yarns
manufacturing
Finish
product &
Packaging
Weight/
priority
vector
Raw Material
collection 1 .50 1.25
0.27240
Yarns
manufacturing 2 1 1.75
0.48230
Finish product &
Packaging .8 .57 1
0.24530
CR=0.0111
Table 3.D.6: Priority Matrix for Choice of Appropriate segment Final Result
Workforce Maintenance Cost Quality
Overall
Priority
Vector
Raw Material
collection 0.27 0.29 0.27 0.27 0.28
Yarns
manufacturing 0.49 0.47 0.49 0.48 0.48
Finish product
& Packaging 0.24 0.24 0.24 0.25 0.24
CR=0.01
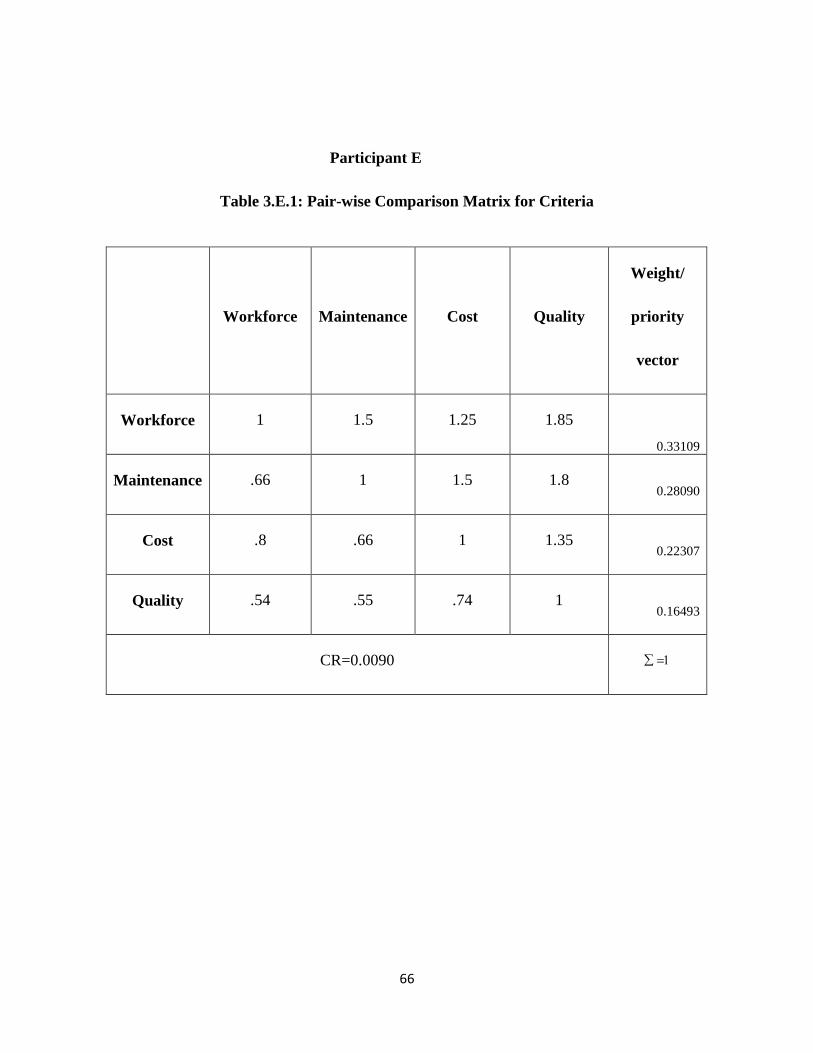
66
Participant E
Table 3.E.1: Pair-wise Comparison Matrix for Criteria
Workforce Maintenance Cost Quality
Weight/
priority
vector
Workforce 1 1.5 1.25 1.85
0.33109
Maintenance .66 1 1.5 1.8 0.28090
Cost .8 .66 1 1.35 0.22307
Quality .54 .55 .74 1 0.16493
CR=0.0090

67
Table 3.E.2: Pair-wise Comparison Matrix for workforce
Raw
Material
collection
Yarns
manufacturing
Finish
product &
Packaging
Weight/
priority
vector
Raw Material
collection 1 .51 1.25
0.27479
Yarns
manufacturing 1.95 1 1.75
0.47942
Finish product &
Packaging .8 .57 1
0.24579
CR=0.0082
Table 3.E.3: Pair-wise Comparison Matrix for maintenance
Raw
Material
collection
Yarns
manufacturing
Finish
product &
Packaging
Weight/
priority
vector
Raw Material
collection 1 .51 1.25
0.27151
Yarns
manufacturing 1.95 1 2
0.49603
Finish product &
Packaging .8 .5 1
0.23246
CR=0.0024

68
Table 3.E.4: Pair-wise Comparison Matrix for cost
Raw
Material
collection
Yarns
manufacturing
Finish
product
&
Packaging
Weight/
priority
vector
Raw Material
collection 1 .54 1.25
0.27760
Yarns
manufacturing 1.85 1 2
0.48921
Finish product
& Packaging .8 .5 1
0.23319
CR=0.0017
Table 3.E.5: Pair-wise Comparison Matrix for quality:
Raw
Material
collection
Yarns
manufacturing
Finish
product &
Packaging
Weight/
priority
vector
Raw Material
collection 1 .51 1.25
0.27151
Yarns
manufacturing 1.95 1 2
0.49603
Finish product
& Packaging .8 .5 1
0.23246
CR=0.0024
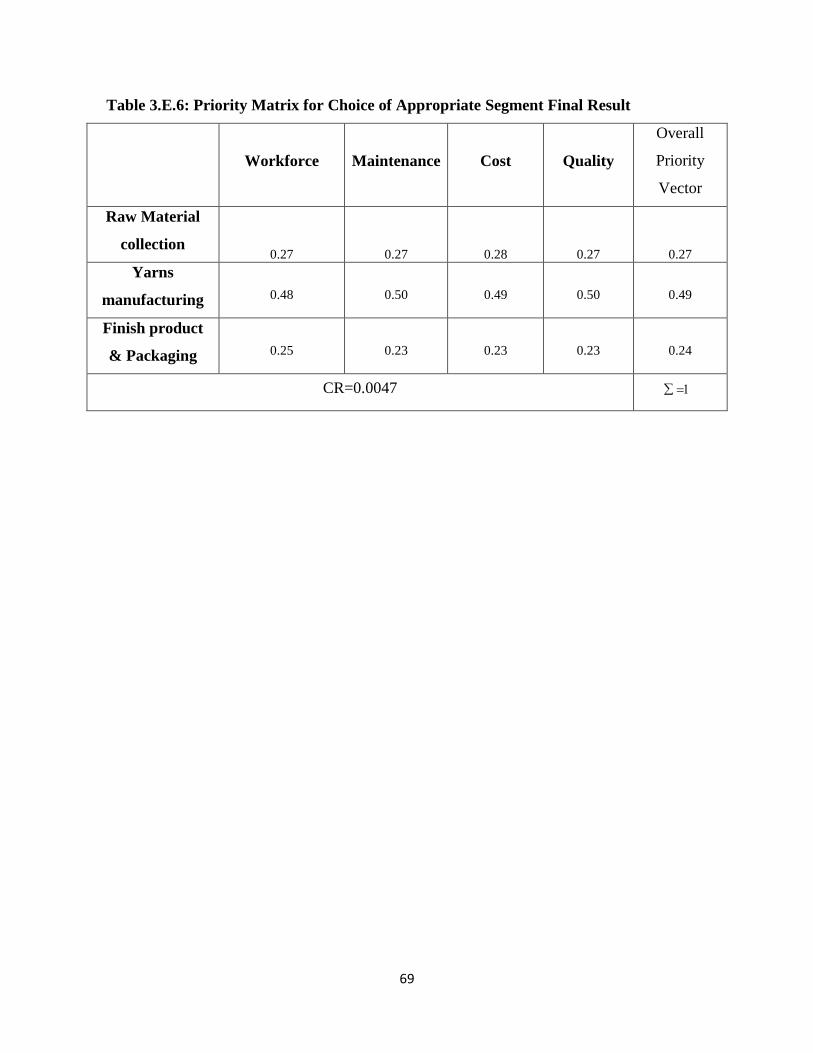
69
Table 3.E.6: Priority Matrix for Choice of Appropriate Segment Final Result
Workforce Maintenance Cost Quality
Overall
Priority
Vector
Raw Material
collection 0.27 0.27 0.28 0.27 0.27
Yarns
manufacturing 0.48 0.50 0.49 0.50 0.49
Finish product
& Packaging 0.25 0.23 0.23 0.23 0.24
CR=0.0047

70
3.11 Procedure for 5S Implementation
Following things are to be done for 5S implementation:
Establishment of a strong Quality Assurance Department.
At least one or two persons are experts in 5S.
Experts in the 5S implementation process will coordinate the whole
implementation process.
“Red Tagging” of unnecessary items
Experts in 5S should conduct a factory wise audit to find out unnecessary items.
These unnecessary items need to be red-tagged.
Using of Quarantine zone and alternative locations
Unwanted items need to be placed in a quarantine area.
Other items may be deemed necessary, but used infrequently and so an
alternative location needs to be found.
Properly organized factory & storage area
Items in factory and storage areas are kept in shelves, racks, or bins and
marked.
Shelf grids are marked with reference numbers/ names for easy retrieval of
items.
All stationery in the cupboards is kept in places, identified with symbols and
marks.
Items are stored in alphabetical order and a logical manner (left to right, top to
bottom).

71
Cleaning schedules available and displayed
Keeping records that show what type of cleaning was completed, when it was
completed, who did the cleaning, and who checked and signed off the
cleaning as acceptable.
Clear instructions outlining the step-by-step process which staff responsible
for cleaning.
The frequency of cleaning e.g. daily, weekly, monthly, or annually.
5s Gap Analysis
Gap analysis needs to be done on monthly basis.
Finding the difference between the desired 5s score and achieved score.
Sort out the reasons for the gap and minimizing it.
Reward and appreciation scheme
Assessment criteria for the 5s competition are prepared and practiced.
An event to appreciate best employers is carried out annually.
Assessment criteria to measure the performance is prepared to select the best
units and the best workers.
An event to appreciate best performing workers and executives need to be
carried out annually.
Training of the workers and executives
Training of both the workers and executives on the 5s process needs to be
done.
The Quality department in charge will take the training of the executives.
One or two selected executives will take the training of the workers.
Training needs to be done on monthly basis.

72
Safety & Security Measures
Electric wires need to be sealed or bundled to prevent accidental contact with
human beings.
All electric devices are required to be placed safely.
Danger sign needs to be applied.
Functional fire extinguishers should be available.
The guideline or protocol for the fire event should also be available.
3.12 Use of Statistical control chart
The data required for the statistical control chart was collected from records of the industry
for January 2020 as shown in table 3. Then control charts are drawn and validated. From here
we found a standard X bar and R chart. In February 2020 relevant data required to check the
product quality were collected as shown in table 4. Use this control chart the quality of the
product was checked for February 2020.
The formula for X bar and R charts as follows:

73
Table 3.7 Yarn CSP quality inspection
Table 3.8 Production quality inspection
S/N X bar, I.E. avg
CSP of that day CL UCL LCL
1 2396.667 2399.63333 2422.44 2376.81
2 2398.333 2399.63333 2422.44 2376.81
3 2396.667 2399.63333 2422.44 2376.81
4 2397.667 2399.63333 2422.44 2376.81
5 2398.667 2399.63333 2422.44 2376.81
6 2399.667 2399.63333 2422.44 2376.81
7 2400.667 2399.63333 2422.44 2376.81
8 2401.667 2399.63333 2422.44 2376.81
9 2402.667 2399.63333 2422.44 2376.81
10 2403.667 2399.63333 2422.44 2376.81
Date
Morning
Shift
CSP
Afternoon
shift CSP
Night
Shift
CSP
X bar,I.E. avg
CSP of that
day
R=Ra
nge
Highest
Value
Lowest
Value
UCL=
X bar
LCL=X
bar
1/7/2019 2390 2395 2405 2396.666667 15 2405 2390
2422.
44 2376.81
2/7/2019 2395 2397 2403 2398.333333 8 2403 2395
UCL=
Rbar
LCL=R
bar
3/7/2019 2385 2395 2410 2396.666667 25 2410 2385 57.42 0
4/7/2019 2386 2396 2411 2397.666667 25 2411 2386
5/7/2019 2387 2397 2412 2398.666667 25 2412 2387
6/7/2019 2388 2398 2413 2399.666667 25 2413 2388
7/7/2019 2389 2399 2414 2400.666667 25 2414 2389
8/7/2019 2390 2400 2415 2401.666667 25 2415 2390
9/7/2019 2391 2401 2416 2402.666667 25 2416 2391
10/7/2019 2392 2402 2417 2403.666667 25 2417 2392
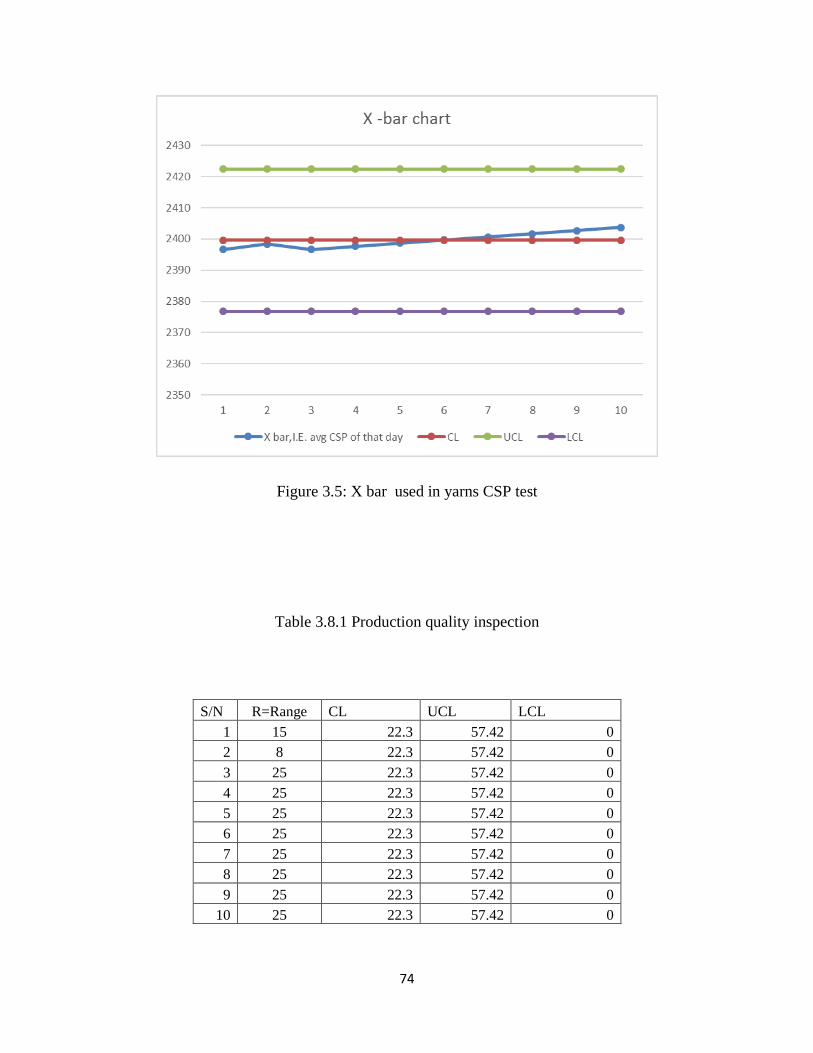
74
Figure 3.5: X bar used in yarns CSP test
Table 3.8.1 Production quality inspection
S/N R=Range CL UCL LCL
1 15 22.3 57.42 0
2 8 22.3 57.42 0
3 25 22.3 57.42 0
4 25 22.3 57.42 0
5 25 22.3 57.42 0
6 25 22.3 57.42 0
7 25 22.3 57.42 0
8 25 22.3 57.42 0
9 25 22.3 57.42 0
10 25 22.3 57.42 0

75
Figure 3.6: R chart used in CSP test

76
Chapter 4 Result and Discussion
This chapter describes of Ishikawa Diagram, 5 why method, Result of AHP analysis,
Summarized Biography of Respondents, Discussion, the impact of optimization, statistical
control chart, and 5s method.
4.1 Ishikawa: Ishikawa diagram has been provided in the previous chapter 03.
4.2 5why: 5why method has been described in previous chapter 03.
4.3 Result of AHP analysis: AHP questionnaires and data analysis have been provided in
chapter 03.
Data analysis in Table - 1.6, 2.6, 3.6, 4.6, 5.6, 6.6 & 7.6 show the final results for each
participant. The overall priority vector shows the preferential ranking of all segments. It appears
that textiles manufacturing is the most preferred option for yarn manufacturing (participant - A,
C, D& E). Besides, an engineer (participant - B) prefers for Raw material collection. So, analysis
from most of the participant’s data (4 out of 5) shows that textiles manufacturing is the most
preferred option for the textiles production process in the context of Bangladesh.
4.4 Summarized Biography of Respondents
Five participants experienced in the textile production process responded to the questionnaires
administered. The biographical details of the engineers have been tabulated (refer to Appendix
B). The engineers who responded to the questionnaires were Bangladeshi males. Their age group
ranged above the 30 plus category. Their experience as production experts ranged between 5 to
12 years. Each engineer has intensive experience in the field with the full ability to answer the
questionnaire. And they have provided effective information to complete the questionnaire
according to their experiences. (Details biography is presented in Appendix C)

77
4.5 Final result of AHP Analysis
Based on the 5 expert opinions as derived from AHP analysis, it was found that 20% preferred
the raw material collection segment, and 80 % preferred the yarns manufacturing segment. As
shown in figure 4.1.
Figure 4.1: Segment criteria preference ratio

78
Here most of the production engineers preferred textiles manufacturing. A comparative study is
shown in Chart 4.1. However, if we analyze the main criteria matrix from table 4.A.1, 4.B.1,
4.C.1, 4.D.1, 4.E.1; we see that the most important factor for prioritizing segment was taken
‘textiles production or yarns manufacturing’ by the most prominent segment of the engineers
(Chart: 4.1). And the importance of the factors behind prioritizing textiles production is very
much influenced by the working environment & resource availability of the organization.
Figure 4.2: Main criteria preference ratio

79
4.6 5S Result
The following works were done through 5s methods.
“Red Tagging” of unnecessary items:
a) Unnecessary tools and materials have been shorted.
b) Labeling was done to help visual control.
Using of Quarantine zone and alternative locations:
The quarantine zone and alternative zone have been arranged. Unnecessary items
were moved into the quarantine zone and infrequently used items were shifted into
the alternative zone.
Properly organized factory & storage area:
a) Raw materials and finished goods (cotton) were being kept in the warehouse.
b) Items in stores and storage areas were kept in shelves, racks, or bins and marked.

80
Figure 5.1: Before 5S implementation of textile factory

81
Figure 5.2: After 5S implementation Textile factory
Cleaning schedules available and displayed
A cleaning schedule was made and it was displayed in a convenient location.
Gap Analysis
A Monthly meeting was conducted to find out actual and desired 5s implementation.
Reward and appreciation scheme
An award was given annually to a department which implemented 5s successfully.
Training of the workers and executives
According to the schedule, training programs of the workers and executive were conducted about 5s.

82
Safety & Security Measures
Properly insulated electric warring and fire extinguisher were placed according to safety guidelines.
Danger signs were placed to alert the staff members. A fire drill was arranged for all staff members for
every month.
4.7 Control Chart
Using in standard control chart derive from chapter 03 we checked the quality of yarns in
February 2020. The data collected in this regard are shown in table 10. All are under control.
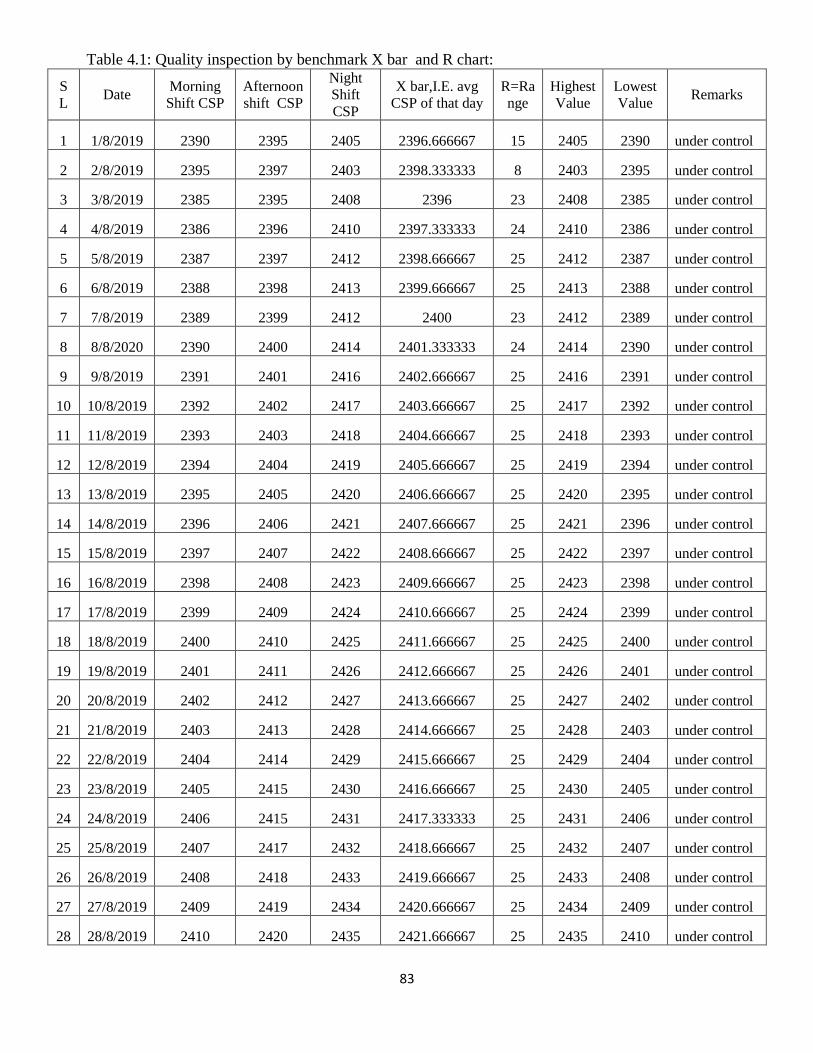
83
Table 4.1: Quality inspection by benchmark X bar and R chart:
S
L Date
Morning
Shift CSP
Afternoon
shift CSP
Night
Shift
CSP
X bar,I.E. avg
CSP of that day
R=Ra
nge
Highest
Value
Lowest
Value Remarks
1 1/8/2019 2390 2395 2405 2396.666667 15 2405 2390 under control
2 2/8/2019 2395 2397 2403 2398.333333 8 2403 2395 under control
3 3/8/2019 2385 2395 2408 2396 23 2408 2385 under control
4 4/8/2019 2386 2396 2410 2397.333333 24 2410 2386 under control
5 5/8/2019 2387 2397 2412 2398.666667 25 2412 2387 under control
6 6/8/2019 2388 2398 2413 2399.666667 25 2413 2388 under control
7 7/8/2019 2389 2399 2412 2400 23 2412 2389 under control
8 8/8/2020 2390 2400 2414 2401.333333 24 2414 2390 under control
9 9/8/2019 2391 2401 2416 2402.666667 25 2416 2391 under control
10 10/8/2019 2392 2402 2417 2403.666667 25 2417 2392 under control
11 11/8/2019 2393 2403 2418 2404.666667 25 2418 2393 under control
12 12/8/2019 2394 2404 2419 2405.666667 25 2419 2394 under control
13 13/8/2019 2395 2405 2420 2406.666667 25 2420 2395 under control
14 14/8/2019 2396 2406 2421 2407.666667 25 2421 2396 under control
15 15/8/2019 2397 2407 2422 2408.666667 25 2422 2397 under control
16 16/8/2019 2398 2408 2423 2409.666667 25 2423 2398 under control
17 17/8/2019 2399 2409 2424 2410.666667 25 2424 2399 under control
18 18/8/2019 2400 2410 2425 2411.666667 25 2425 2400 under control
19 19/8/2019 2401 2411 2426 2412.666667 25 2426 2401 under control
20 20/8/2019 2402 2412 2427 2413.666667 25 2427 2402 under control
21 21/8/2019 2403 2413 2428 2414.666667 25 2428 2403 under control
22 22/8/2019 2404 2414 2429 2415.666667 25 2429 2404 under control
23 23/8/2019 2405 2415 2430 2416.666667 25 2430 2405 under control
24 24/8/2019 2406 2415 2431 2417.333333 25 2431 2406 under control
25 25/8/2019 2407 2417 2432 2418.666667 25 2432 2407 under control
26 26/8/2019 2408 2418 2433 2419.666667 25 2433 2408 under control
27 27/8/2019 2409 2419 2434 2420.666667 25 2434 2409 under control
28 28/8/2019 2410 2420 2435 2421.666667 25 2435 2410 under control
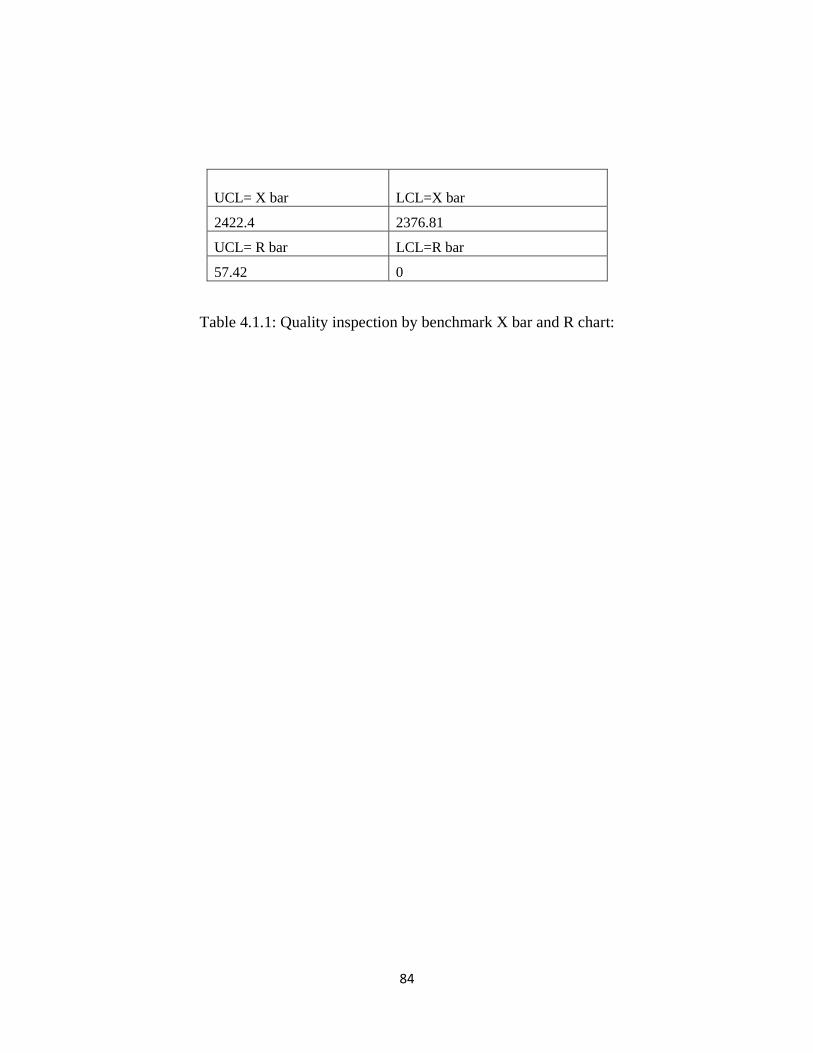
84
Table 4.1.1: Quality inspection by benchmark X bar and R chart:
UCL= X bar LCL=X bar
2422.4 2376.81
UCL= R bar LCL=R bar
57.42 0

85
4.8 Impact of optimization
A comparison of selected parameters before optimization and after optimization is presented in
Table 4.2
Table 4.2: Before optimization and after optimization
S/N Topic Before optimization After optimization
1 Productivity 2.27 2.29
2 Maintenance frequency 5 per month 4 per month
3 Defective number 5 4
4 Occupational Safety & Health
record
12 per year 10 per year
Material productivity: Output /Input.
Input =110 ton (raw material cotton) =110*$2000=220000
Output=100 ton *$5000=500000
Input=110 ton=110*2000=220000
Input =110 ton (raw material cotton) =110*2000=220000,
Output=101 ton *$5000=505000
Before implementation of optimization in the most critical segment for the textiles production,
i.e. yarn manufacturing segment, different performance parameter values were not satisfactory.
So, the 5s and statistical process control charts were implemented to improve these performance
parameters. These performance parameters were productivity, maintenance frequency, defective
number, and Occupational Safety & Health record. Significant improvement on these parameters
was recorded as shown in table 4.6. Data collected shows that productivity increased by 0.88%,
maintenance frequency decreased by 20%, the defective number decreased by 20%, and decreased injured
number by 16.66 %.

86
Chapter 5 Conclusions
5.1 Conclusions
From this study the following conclusions may be drawn:
1. According to the AHP analysis yarn manufacturing is the most critical segment for the
production process of the textiles industry for optimization.
2. Based on the findings optimization were done in the yarn manufacturing segment using the
relevant method like 5s and statistical process control chart. Significant improvement was found
as measured by different metrics like productivity, maintenance frequency, defective number,
occupational safety & health record.
3. Selection of the most appropriate segment of the textiles production process in Bangladesh
was not done before. So, it would be helpful for the textiles industries to use findings from this
study.
5.2 Recommendation for further studies
i. Similar study and analysis might be performed for any other specific manufacturing
industry segment like air-conditioner, fan, motor car, LPG, etc.
ii. Other Countries, developing as well as developed countries, may do similar study and
analysis in the relevant manufacturing sectors.
iii. Criteria other than this study might be used based on requirements and objectives.
87
Appendix A
There are different textile production methodologies. A brief of them are:
Raw Material collection: Valuable raw material collection is characterized by an extensive range of
valuable merino wool yarns and noble fibers (Cashmere, silk, angora, cotton), pure or blended with man-
made fibers used in low percentage to modernized classical products.
Yarns manufacturing: An assemblage of fibers that are twisted or laid together to form a
continuous strand that can be made into a textile fabric. So a yarn is a strand of natural or
manmade fibers or filaments that have been twisted or grouped for use in weaving, knitting, or
other methods of constructing textile fabrics.
Finish product & Packaging: Yarn is packaged (or put up) in different forms: balls, skeins
(rhymes with canes), and hanks. The differences in yarn packaging shouldn’t have much effect
on the yarn you choose, but the shape does determine how you work with them. There are
various types of yarn are being produced in textiles industries such as viscose, modal, polyester,
etc.
The criteria for this study as follows:
Workforce: It basically involves the people who make the workforce in an organization. It is the total
supply of personnel available to complete a particular task. The workforce is the most crucial resource
for any organization to function or work properly and achieve high productivity. Workforce for
Production might be defined as the general engineering concept of the production process where
the main concern of a production engineer is to increase productivity.
Maintenance: Maintenance management is a business concept that describes the successful and
efficient management of maintenance issues involved in the upkeep, operation, and productivity
of a factory, manufacturing facility, or plant. So, a better maintenance plan is to increase
productivity and profits through improved operations. It is also an important component of the
yarn production process.

88
Cost: Costing for a product directly influences the price & profit as well as it also affects the
lifetime, ergonomics, and environmental outcome of the product.
Quality: The yarn has a stable quality only when it is formed by the fiber of close length and relatively
uniform. To get such fibers, the fibers from different production areas and batches must be mixed. Use
cotton opener, cotton mixer, and cotton cleaning machine to open, remove, and mix all kinds of fibers.
Please fill out the following table with a scale of 0 to 5. Read from the left of a row with respect
to the column. If the topic of row and topic of the column seems equally important to you, just
put 1. If row item is 2 times more important than column topic, write 2. If the column item is 2
times important than the row item please put 1/2 and so on.

89
Workforce Maintenance Cost Quality
Workforce 1
Maintenance 1
Cost 1
Quality 1
Please fill out the following table in the same manner (at a scale 0 to 5) considering Workforce
Raw Material
collection Yarns manufacturing
Finish product
& Packaging
Raw Material
collection 1.00
Yarns manufacturing 1.00
Finish product &
Packaging 1.00

90
Please fill out the following table in the same manner (at a scale 0 to 5) considering
Maintenance
Raw Material
collection Yarns manufacturing
Finish product
& Packaging
Raw Material
collection 1
Yarns manufacturing 1
Finish product &
Packaging 1

91
Please fill out the following table in the same manner (at a scale 0 to 5) considering Cost
Raw Material
collection Yarns manufacturing
Finish product
& Packaging
Raw Material
collection 1
Yarns manufacturing 1
Finish product &
Packaging 1

92
Please fill out the following table in the same manner (at a scale 0 to 5) considering Quality
Raw Material
collection Yarns manufacturing
Finish
product &
Packaging
Raw Material
collection 1
Yarns manufacturing 1
Finish product &
Packaging 1

93
Appendix B
Table: Biographic Details of Respondents (up to July, 2019)
Sl. Name Qualification
Approximate
Engineering
Experience (Years)
Approximate
Textiles Industry
Experience (Years)
1 Md Aminul Islam BSc. in EEE 12 7
2 Saad Md Salman BSc. in ME 10 6
3 Md.Tahmid Anjum Nabil BSc. in Textile 4 4
4 Md. Ziaul Haque Shovon BSc in ME 6 6
5 Md Abu Zafor BSc. in ME 5 5

94
References
1. Hossain I, Hossain A, Choudhury IA, Mamun AA. Fuzzy knowledge based expert system for
prediction of color strength of cotton knitted fabrics. Journal of Engineered Fibers and Fabrics.
2016 Sep; `11 (3):155892501601100306.
2. Junior ML, Godinho Filho M. Variations of the kanban system: Literature review and
classification. International Journal of Production Economics. 2010 May 1; 125 (1):13-21.
3. Kavanagh S, Krings D. The 8 Sources of Waste and How to Eliminate Them. Government
Finance Review. 2011 Dec; 27 (6 s 18).
4. Stengg W. The textile and clothing industry in the EU. Enterprise papers. 2001 Jun; 2:4.
5. Rashid MA. Rise of readymade garments industry in Bangladesh: entrepreneurial ingenuity or
public policy. In workshop on Governance and Development, Dhaka 2006 Nov 11 (pp. 11-12).
6. Islam MS. Faculty of Technology Lean Practices in Bangladeshi Textile Industry A Literature
Review.
7. Winston WL, Goldberg JB. Operations research: applications and algorithms. Belmont^ eCalif
Calif: Thomson/Brooks/Cole; 2004 Jan.
8. Ghosh A, Mal P, Majumdar A. Advanced Optimization and Decision-Making Techniques in
Textile Manufacturing. CRC Press; 2019 Mar 18.
9. Tobler-Rohr MI. Handbook of sustainable textile production. Elsevier; 2011 Jun 27.
10. Shetty D, Ali A, Cummings R. Survey‐ based spreadsheet model on lean implementation.
International Journal of Lean Six Sigma. 2010 Nov 22.
11. Modi DB, Thakkar H. Lean thinking: reduction of waste, lead time, cost through lean
manufacturing tools and technique. International journal of emerging technology and advanced
engineering. 2014 Mar; 4 (3):339-4.

95
12. Pattnaik P, Dangayach GS. Sustainability of Textile Wastewater Management by Using
Fuzzy AHP Method. In Proceedings of International Conference on Sustainable Computing in
Science, Technology and Management (SUSCOM), Amity University Rajasthan, Jaipur-India
2019 Feb 26.
13. Bhamu J, Sangwan KS. A framework for lean manufacturing implementation. International
Journal of Services and Operations Management. 2016;25(3):313-33.
14. Motwani J. A business process change framework for examining lean manufacturing: a case
study. Industrial Management & Data Systems. 2003 Jul 1.
15. Baral P. Implementation of 5S methodology on slot line assembly for a Manufacturing
Company located in Minnesota (Doctoral dissertation, University of Wisconsin—Stout, 2012).
16. Taha, H., Operations Research: An Introduction, 10th Edition, Pearson, New Jersey, 2017.
17 .Kabir, A and Shihan, S , Selection of Renewable Energy Sources Using Analytic Hierarchy
Process, Proceedings of ISAHP 2003, Bali, Indonesia, pp. 267-276, August 7-9, 2003
18. Decision Making for Leaders: The Analytic Hierarchy Process for Decisions in a Complex
World, New Edition 2001 (Analytic Hierarchy Process Series, Vol. 2); Saaty, Thomas L. (June
2008).
19. Kumar, S. Anil, and N. Suresh. Production and operations management. New Age
International, 2006.
20. Mustafi, Chandan Kumar. Operations Research methods and practice. New Age
International, 1996.
21. Mustafi, Chandan Kumar. Operations Research methods and practice. New Age
International, 1996.
22. Total Productive Maintenance. Portland, OR: Productivity Press. Office of Quality
Improvement, 2010. Survey Fundamentals: A Guide to Designing and Implementing Surveys.
Madison: University of Wisconsin. Ortiz, C., 2006.

96
23. Classification Scheme for Lean Manufacturing Tools, International Journal of Production
Research, 41(13), pp.3075-3090. Pedersen, E.R.G., Huniche, M., 2011.
24. Determinants of lean success and failure in the Danish public sector: A negotiated order
perspective", International Journal of Public Sector Management, 24 (5), pp.403-420,
https://doi.org/10.1108/09513551111147141 Petersson, P., Johansson, O., Broman, M., Blucher,
D. and Alsterman, H., 2010.
25. Lean- Turn deviations into success! Bromma, Sweden: Part Media, Gronviksvagen. Phan, A.
and Matsui, Y., 2007.
26. Effect of Total Quality Management and Just-In-Time practices on Competitive Performance
- Empirical Evidence. Proceedings of the 18th Annual Conference of Production and Operations
Management Society. Piercy, N. and Rich, N., 2009.
27. Sobuj, M., and Rahman, C., Study and Analysis of the Scope of Value Stream Mapping
(VSM) Technique Application in a Selected Garments Factory of Bangladesh, International
Journal of Engineering Research and General Science, vol. 3, no. 2, pp. 998-1007, 2015.
28. Piercy, Niall, and Nick Rich. "High quality and low cost: the lean service centre." European
Journal of Marketing (2009).
29. Henderson, Kim M., and James R. Evans. "Successful implementation of Six Sigma:
benchmarking general electric company." Benchmarking: an international journal (2000).
30. HINNES, P., M. HOLWEG, and N. RICH. "Learning to evolve: a review of contemporary
lean thinking International Journal of Operations & Production Management." (2004): 994-1011.
31. Hirano, H., 1996. 5s for Operators: 5 Pillars of the Visual Workplace, Portland OR:
Productivity Press. Islam, M.M., Khan, A.M. and Islam, A.M., 2013.
32. International Journal of Scientific & Engineering Research, 4(2). James P. Womack, Daniel
T. Jones, Daniel Roos, & Massachusetts Institute of Technology. (1991).

97
33. The machine that changed the world: The story of lean production. Harper Collins. Jones, R.
M., 2002.
34. Lean Production in Changing Competitive World: A Japanese Perspective, International
Journal of Operations and Production Management, 16(2), pp. 8-23. Kavanagh, S. and Krings,
D., 2011.
35. Toward A Theory of Business Process Change Management. Journal of Management
Information Systems, 12 (1), pp.1-30. Kilpatrick, J., 2003.
36. Gockeln, L. (2014). Fashion Industry Analysis from the Perspective of Business Model
Dynamics.
37. Goyal, M. and Netessine, S..(2011), “Volume Flexibility, Product Flexibility, or Both: The
Role of Demand Correlation and Product Substitution”, Manufacturing & Service Operations
Management, Vol. 13, No. 2, pp. 180-193.
38. Hayes, R. and Wheelwright, S. (1984), Restoring Our Competitive Edge: Competing
Through Manufacturing, Wiley, New York, NY
39. Koberg, J., & Bagnell J. (1991). The universal traveler: A soft systems guide to creativity,
problem-solving and the process of reaching goals. W. Kaufmann.
40. Archer, B. (1974). Design awareness and planned creativity in industry. (p. 87). Toronto:
Thorn Press Limited.
41. Hekkert, P., & Schifferstein, H. (2008). Product experience. Amsterdam: Elsevier Science.
42. Norman, D. (2002). The design of everyday things. (p. 28). New York: Basic Books.
43. Pirkl, James J. (1994). Trans generational Design: Products for an Aging Population. New
York: Vn Nostrand Reinhold. p. 24. ISBN 0-442-01065-6.
44. HungLin, Chi, 5S implementation in Wan Cheng Industry Manufacturing Factory in Taiwan,
MS Technology Management (2011).

98
45. J. Michalska, The usage of the quality-cost analysis in a production process, Journal of
Achievements in Materials and Manufacturing Engineering 16 (2006) 190-198.
46. By Melesse Workneh Wakjira, Ajit Pal Singh, Total Productive Maintenance: A Case Study
in Manufacturing Industry, Global Journal of researches in engineering Industrial engineering,
Volume 12 Issue 1 Version 1.0 February 2012.
47.T. Ahmed and S.M. Ali, M.M Allama, M.S. Parvez, A Total Productive Maintenance (TPM)
Approach to Improve Production Efficiency and Development of Loss Structure in a
Pharmaceutical Industry, Global Journal of Management and Business Research, Vol. 10 Issue 2
(Ver 1.0), April 2010.
48. J.J. Dahlgaard, K. Kristensen, G.K. Kanji, Basis of Quality Management, PWN, Warsaw,
2000.
49.T. Karkoszka, M.Roszak, Quality and environmental aspects in the technological process
management, Proceedings of Conference “Projecting & Managing of the realization of the
production”, Zielona Góra (2005) 63-68 .
50. J. Michalska, 2005 ‘’Factors creating quality management in the company’’ ‘Proceedings of
the Conference INTELLECT’’ Intellectual capital as a chance to improve the quality
management in the global circumstances” UMCS, Lublin, (2005) 187-191.