Pasteurization, regulation, optimization and process design for ...
53
Pasteurization, regulation, optimization and process design for warm swelling fruit drinks A Master of Science thesis performed by Gabriel Andersson 2018/11/05 - 2019/03/25 Dept. of Food Engineering, Technology and Nutrition, Lund University Examiner: Professor Marie Paulsson, Lund University, Sweden Supervisor: Associate professor Åsa Håkansson, Lund University Sweden Co-supervisor: Associate professor Andreas Håkansson, Lund University Sweden Co-supervisor: Joakim Andersson, Österlenmejeriet AB, Lunnarp, Sweden
-
Upload
khangminh22 -
Category
Documents
-
view
1 -
download
0
Transcript of Pasteurization, regulation, optimization and process design for ...

Pasteurization, regulation, optimization and process design for warm swelling fruit drinks
A Master of Science thesis performed by
Gabriel Andersson
2018/11/05 - 2019/03/25
Dept. of Food Engineering, Technology and Nutrition, Lund University
Examiner: Professor Marie Paulsson, Lund University, Sweden
Supervisor: Associate professor Åsa Håkansson, Lund University Sweden
Co-supervisor: Associate professor Andreas Håkansson, Lund University
Sweden
Co-supervisor: Joakim Andersson, Österlenmejeriet AB, Lunnarp, Sweden

Preface As a collaboration between Lund University, Österlenmejeriet AB and Tetra Pak this master thesis project was performed and the majority of the time was spent at the production site in Lunnarp with the exception of a few hours together with my supervisors in Lund being guided through some tough calculations. Primarily I would like to thank my examiner Professor Marie Paulsson at the Department of Food Technology under the faculty of Engineering, Food Engineering and Nutrition, Lund University who was the obvious choice when a project opening occurred at Österlenmejeriet where I had worked during summertime previously. Also I would like to thank Åsa Håkansson and Andreas Håkansson my supervisors at Food Engineering and Nutrition, Lund University for assisting me throughout the project and being a sounding board to pinpoint me in the right direction. I would also like to thank my supervisor at the site Joakim Andersson for always having full control over the situation since day one and who has always known what the next step in the process would be and also for the many shared laughs and coffee breaks. The time spent at the factory in Lunnarp has been a pleasure thanks to all colleagues and employees whom has made me feel very welcome and has assisted me in any questions I have had without hesitation. I am very happy to announce that I have accepted an employment at the factory that commence with handing in this master thesis. Finally, I want to thank my partner Matilda Åberg for all support and encouragement during late nights and early mornings and my bonus kids Nova Åberg and Nellie Åberg for giving me perspective in life and motivation.

Abstract
The purpose of this master thesis project was to compare two pasteurizers (pasteurizer 31 and 52) at Österlenmejeriet AB (ÖMAB) in Lunnarp, which is a part of Danone, France and once the differences were clear the goal was to have them equalized in the aspect of heating effects/temperature treatments/heating load and processing parameters. The products that are mainly pasteurized on these pasteurizers are ProViva, which is a fruit juice with added lactobacillus plantarum. ÖMAB is the only factory in the world that produces ProViva but they also produce Bravo Juice, which comes in many different flavors, for Skånemejerier AB.
A couple of products from ProViva AB are so called soupy flavors, Blåbär (blueberry) and Nypon (rose hip) which have higher viscosity than the other flavors. This caused a problem when pasteurizing on one of the heat exchangers. The problem was that once the product was to be cooled, the heat transfer was not sufficient and the out temperature got to high. At the same time ProViva AB was about to launch a new product called SmOATie which is a smoothie drink with oats. It has an even higher viscosity which resulted in poor heat transfer in not only the cooling section of the pasteurizer but also in the heating section. This resulted in a microbiologically unsafe product since the pasteurization temperature was not reached and the process had to be operated at a lower flow rate.
The outcome of the project was that a larger heat transfer area was required, in the form of extra tubes in the tubular heat exchangers, to be able to pasteurize the products at a flow rate of 8000 L/h. In pasteurizer 31 more area was needed than in pasteurizer 52 since from the start there were less tubes in the two first sections of pasteurizer 31 than in 52. Corrugations in the tubes were not taken into account however if they were the required area were to be reduced as a result of higher overall heat transfer coefficients. The pressure drops in the pasteurizers were also investigated and were within reasonable ranges when no extra tubes were added. However if the extra amount of tubes required were fit into the pasteurizers, the pressure drops were to be too high and so new stronger pumps were probably necessary to overcome these changes.
At the start of the thesis the cooling sections in the pasteurizers utilized both ice water and propylene glycol. The second part of the project was to exchange the propylene glycol and replace it to have the entire process run with only ice water.

Sammanfattning
Syftet med detta examensarbete var att de två pastörerna (pastör 31 och 52) på Österlenmejeriet AB (ÖMAB) i Lunnarp, som är en del Danone, Frankrike, jämförda strukturellt och när skillnaderna var utredda var målet att likställa dem processtekniskt för att klara av en ökad produktivitet. Produkterna som främst är pastöriserade på dessa maskiner är ProViva. ÖMAB är den enda fabriken i världen som producerar ProViva men tillverkar också alla Bravo juicer för Skånemejerier AB. Ett par av produkterna från ProViva AB är så kallade soppiga smaker, Blåbär och Nypon, vilka har en högre viskositet än de andra smakerna. Detta bidrog till ett problem när man pastöriserar på en av maskinerna. Problemet var att när produkten skulle kylas ned räckte inte värmeöverföringen till och uttemperaturen blev för hög. På samma gång skulle ProViva AB lansera en ny produkt som heter SmOATie vilken är en smoothie med havre. Den har en ännu högre viskositet vilket resulterade i dålig värmeöverföring inte bara i kylsektionerna utan även värmesektionen. Detta ledde till en mikrobiologiskt osäker produkt då pastöriseringstemperaturen ej uppnåddes och processen fick operera vid en lägre flödeshastighet. Resultatet av projektet var att det behövdes en större värmeväxlararyta, i form av extra tuber, för att kunna pastörisera produkterna med en flödeshastighet på 8000 L/h. I pastör 31 behövdes det mer area än i pastör 52 då det från början redan var mindre i de två första sektionerna av pastören i pastör 31 än i 52an. I projetet togs det inte hänsys till korrugeringar i rören men om det hade gjort det så hade den behövda värmeväxlararean minskat som resultat av högre värmeöverföringskoefficienter. Tryckfallen i pastörerna undersöktes också och var definitivt innanför gränserna när inga extra tuber var tillagda. Dock om man installerat de extra tuberna som behövdes i pastörerna så hade tryckfallen blivit för stora och nya starkare pumpar hade behövts för att klara av dessa. I början av detta projekt användes både isvatten och propylenglykol för kylning av de båda pastörerna. Den andra delen av projektet var att byta ut propyleneglykolen mot att bara använda isvatten genom hela processen.

Table of Contents Preface ..................................................................................................................................................... 2
Abstract ................................................................................................................................................... 3
Sammanfattning....................................................................................................................................... 4
1 Introduction .......................................................................................................................................... 1
1.1 Pasteurization purpose and problems ............................................................................................ 1
1.2 Aim ................................................................................................................................................ 1
1.3 Disposition..................................................................................................................................... 1
2 Theory .................................................................................................................................................. 2
2.1 Literature review ........................................................................................................................... 2
2.2 Pasteurizers .................................................................................................................................... 2
2.2.1 Holding tube ........................................................................................................................... 3
2.2.2 Tubular Heat Exchanger ......................................................................................................... 5
2.2.5 Pressure drop .......................................................................................................................... 7
2.3 Design of heat exchangers ............................................................................................................. 9
2.4 Heat transfer .................................................................................................................................. 9
3 Materials and Methods ....................................................................................................................... 14
3.1 Food Products .............................................................................................................................. 14
3.2 Tetra SpirafloTM 1998 and Tetra Spiraflo® 2009 ......................................................................... 15
3.3 Product matrix ............................................................................................................................. 16
3.4 Sections ....................................................................................................................................... 17
3.4.1 Section I ................................................................................................................................ 17
3.4.2 Holding tube ......................................................................................................................... 17
3.4.3 Section II .............................................................................................................................. 17
3.4.4 Section III ............................................................................................................................. 17
3.4.5 Section IV ............................................................................................................................. 17
3.4.6 Water heater “Section V” ..................................................................................................... 17
4 Results & Discussion .......................................................................................................................... 19
4.1 Design of pasteurizers ................................................................................................................. 19
4.1.1 Pasteurizer 52 ....................................................................................................................... 19
4.1.2 Pasteurizer 31 ....................................................................................................................... 20
4.2 Calculation results ....................................................................................................................... 20
4.3 Reflections ................................................................................................................................... 30
5 Conclusions ........................................................................................................................................ 31

6 Future work ........................................................................................................................................ 31
7 References .......................................................................................................................................... 32
8 Appendix A ........................................................................................................................................ 34
1
1 Introduction 1.1 Pasteurization purpose and problems Foods and drinks are made microbiologically safe for consumers by heating them up so that the amount of bacteria is reduced to a safe level. For drinks and some foods this is done by using pasteurizers of different kinds. This is important both from a quality point of view as well as from an economic point of view since illness can come from the bacteria that live in the product which has to be prevented in order to be able to sell it. The pasteurization also extends the shelf life of the product which in turn gives a longer opportunity to sell it and a higher price can be utilized. It is of great importance that the pasteurization is done according to the safety levels of the product but also in an energy effective manner to save time and money. Some products are more challenging than others to be pasteurized, e.g., due to high viscosity or complex rheological behavior. Some fruit drinks contain starches which swells during the heat treatment that needs to be taken into account when pasteurizing. In order to overcome problems like these process control and design as well as the behavior of the products has to be examined. This is important to be able to manage and regulate the pasteurizer and also to control the temperatures inside. Today the cooling of the product is done with ice water and propylene glycol and from and energy point of view it is preferable to only use ice water as coolant. 1.2 Aim The aim of this master thesis is to investigate the differences between two pasteurizers, regarding amount of tubes, heat transfer area/coefficients and pressure drop, used for processing fruit juice at a processing facility in southern Sweden. This is necessary information for example to be able to know how many extra tubes has to be purchased to the pasteurizer. It is a special case about two specific tubular heat exchangers that hopefully will increase the flexibility of the process department. A second part is to investigate if it is possible to make changes in the cooling section of the pasteurizers to go from ice water and glycol to only use ice water. An important task is to look into solutions to problems that may be encountered during the way and to finally end up with two pasteurizers that are equally sufficient to handle all ProViva products, new and existing products.
Two products were chosen to be investigated, which were Product 2 (a soupy type) and Product 1 (a smoothie type), since these were the products that were causing the most problem such as not reaching the final temperature or having a sufficient flow rate, during pasteurization, namely they were not heated or cooled sufficiently. Also it was said that if the processing of these products were solved for, the rest should not be a problem either.
1.3 Disposition This master thesis will begin with a theory part which includes information about pasteurizers and calculations connected to the designing of heat exchangers. It is followed by a methodology part presenting the practical part of the project. Results, discussion and

2
conclusion are followed by references and appendices where information and data which could not fit in the report are placed.
2 Theory In the southern part of Skåne in Sweden in a village called Lunnarp a factory named Österlenmejeriet AB is located. The factory was built in 1955 and about 120 employees work with producing fruit juices of different kinds among which one brand is ProViva which is owned by ProViva AB. ProViva is special because it contains a bacteria culture called Lactobacillus plantarum 299v which is said to be good for the stomach. It has been shown that it increases iron uptake for younger women during menstruation Hoppe et al, 2017 and also improves symptoms of irritable bowel syndrome Ducrotté et al, 2012. In 2010 Österlenmejeriet AB and Proviva AB was bought by Danone. Danone is a French company and is one of the largest in the world when it comes to dairy products.
2.1 Literature review In order to find information about dimensioning and designing about pasteurizers and also about pasteurization itself, questions were asked to the supervisors and colleagues at ÖMAB about where to look. With help some very useful books were found such as Tetra Paks Dairy process handbook [1] and The Orange Book [3] which both had great information about design and heat transfer theory for pasteurizers. Also Introduction to Food Engineering [2] was found useful and these three sources were considered reliable and legitimate sources of reference.
Some searches were performed in Scopus such as “pressure drop” AND “tubular heat exchang*” that led to an article about pressure drops with helical baffles on the tubes in a pasteurizer [10]. Another search “(Dimension*) AND (heat exchang*) gave an article about investigation of pasteurizers depending on dimensioning baffle spacing and baffle cuts called “The effects of component dimensions on heat transfer and pressure loss in shell and tube heat exchangers” [7]. However, pressure drop is not included in the master thesis more than the theoretical importance.
Together with a literature search and all information received from supervisors and colleagues one could get a good picture of how pasteurizers operate and what is important to have in mind when designing them.
2.2 Pasteurizers For the following sections, gained knowledge from working with pasteurizers, is utilized to describe processes and theoretic parts otherwise it is referenced.
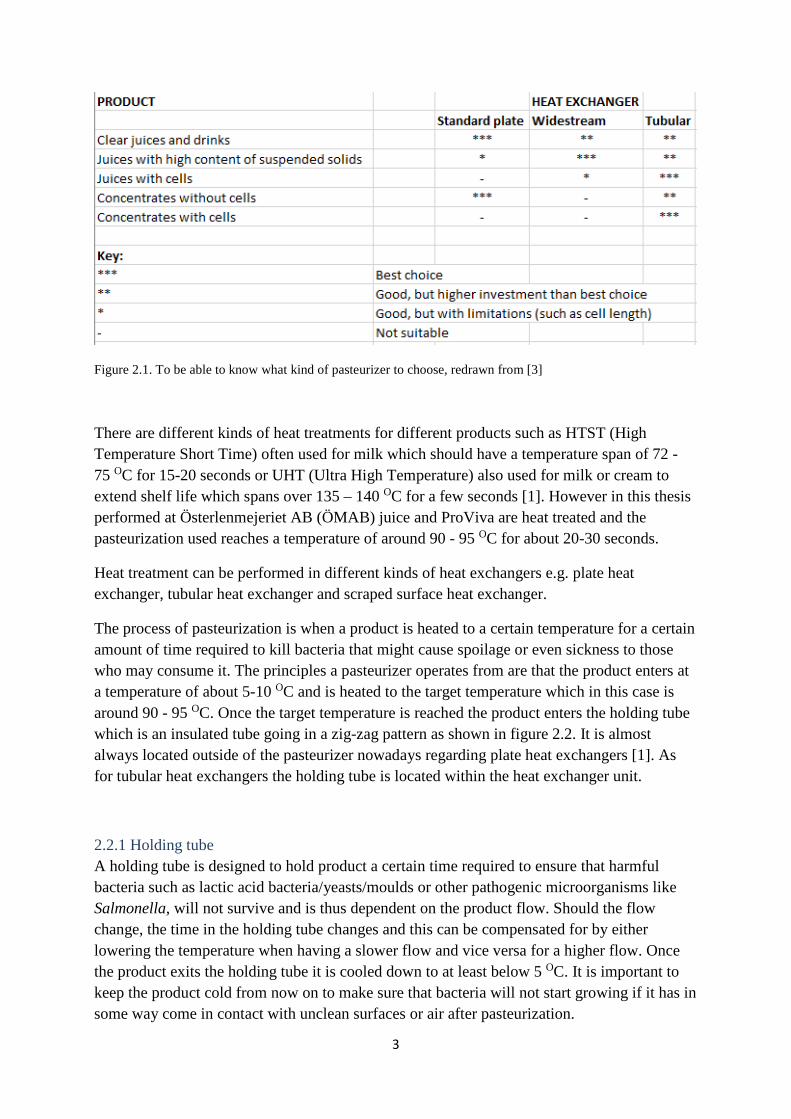
In figure 2.1 it is visualized that a tubular heat exchanger is the best option for ProViva since some of the flavors include pulp.
3
Figure 2.1. To be able to know what kind of pasteurizer to choose, redrawn from [3]
There are different kinds of heat treatments for different products such as HTST (High Temperature Short Time) often used for milk which should have a temperature span of 72 - 75 OC for 15-20 seconds or UHT (Ultra High Temperature) also used for milk or cream to extend shelf life which spans over 135 – 140 OC for a few seconds [1]. However in this thesis performed at Österlenmejeriet AB (ÖMAB) juice and ProViva are heat treated and the pasteurization used reaches a temperature of around 90 - 95 OC for about 20-30 seconds.
Heat treatment can be performed in different kinds of heat exchangers e.g. plate heat exchanger, tubular heat exchanger and scraped surface heat exchanger.
The process of pasteurization is when a product is heated to a certain temperature for a certain amount of time required to kill bacteria that might cause spoilage or even sickness to those who may consume it. The principles a pasteurizer operates from are that the product enters at a temperature of about 5-10 OC and is heated to the target temperature which in this case is around 90 - 95 OC. Once the target temperature is reached the product enters the holding tube which is an insulated tube going in a zig-zag pattern as shown in figure 2.2. It is almost always located outside of the pasteurizer nowadays regarding plate heat exchangers [1]. As for tubular heat exchangers the holding tube is located within the heat exchanger unit.
2.2.1 Holding tube A holding tube is designed to hold product a certain time required to ensure that harmful bacteria such as lactic acid bacteria/yeasts/moulds or other pathogenic microorganisms like Salmonella, will not survive and is thus dependent on the product flow. Should the flow change, the time in the holding tube changes and this can be compensated for by either lowering the temperature when having a slower flow and vice versa for a higher flow. Once the product exits the holding tube it is cooled down to at least below 5 OC. It is important to keep the product cold from now on to make sure that bacteria will not start growing if it has in some way come in contact with unclean surfaces or air after pasteurization.

4
Figure 2.2. Holding tube going in a zig-zag pattern [1]
On the other side of the tube the heating or cooling media is flowing. Flows and temperatures here are calculated to ensure that the product reaches the set temperatures. The holding time and length of the holding tube is calculated with Eq. 1 [1] and Eq. 2 [1]
𝑉𝑉 = ��𝑚∗𝑡𝑡𝐻𝐻3600∗𝜂𝜂
Eq. 1
where ��𝑚 is the flow capacity, tH is the holding time required, η is efficiency factor and V is the volume of milk corresponding to the flow capacity and holding time and
𝐿𝐿 = 𝑉𝑉∗4𝜋𝜋∗𝑑𝑑𝑖𝑖𝑖𝑖𝑖𝑖2
Eq. 2
where dinn is the inner tube diameter and L is the length of the holding tube corresponding to holding time and flow capacity.
There are different kinds of heat exchangers but mainly three types that are commonly used [1]. These are:
• Plate heat exchanger • Tubular heat exchanger • Scraped-surface heat exchanger
However in this master thesis only the tubular heat exchanger was used and will be explained more into detail.

5
2.2.2 Tubular Heat Exchanger Tubular heat exchangers are further referred to as THE in the text.
THEs consisting of tubes with a certain diameter going back and forth in sections stacked on each other as can be seen in figure 2.5. The tubes are stacked together in a compact unit in which the media flows around the tubes in a counter current manner.
Figure 2.5. Tubular heat exchanger where the product flows inside the tubes and the media outside in a counter current manner. Modified from [1]
In the THE it is possible to have larger particles depending on the diameter of the tubes. A higher velocity than in a PHE is required to achieve enough heat transfer. There are mainly two types of THE namely multi/mono tube and concentric tube.
As for the multitube THE the product flows through a group of parallel tubes while the media flows around and in between the tubes shown in figure 2.6. To get an efficient heat transfer from the media to the product turbulent flow is required which is obtained by corrugations on the tubes in a helical manner which also causes different pressure drop depending on dimensions [10]. It is also possible to have smooth tubes without the corrugations.

6
Figure 2.6. Multitube THE where the product flows inside the tubes and is surrounded by cooling medium, modified from [1]
A monotube THE is designed in the same way as the multitube with the difference that it is only one larger corrugated or non-corrugated tube surrounded by cooling medium shown in figure 2.7. This type allows for larger particles in the product up to 50 mm [1].
Figure 2.7. A monotube THE which allows for larger particles in the tubes, modified from [1]
Both multi- and monotube THE are designed for a very high operating pressure and high temperatures.
Concentric tube THE are similar to a monotube THE only there is another tube inside in which the cooling media can flow and so the product is cooled from inside and outside shown in figure 2.8. This type is designed for high viscous products [1].

7
Figure 2.8. Concentric tube THE where the product is cooled from inside and outside, modified from [1]
2.2.5 Pressure drop As a liquid flows through a pipe, energy losses will occur because of friction. Different kinds of frictions such as flowing through a smooth pipe or single losses like a valve or bends are added and together they form the pressure drop over the system. By using a Moody chart, see figure 2.10, the pressure drop can be calculated.
Figure 2.10. Moody diagram where the friction factor can be calculated which in turn gives pressure drop [4]
To be able to use a Moody chart Reynolds number is needed. Reynolds number tells you if the flow inside a tube with a certain diameter is laminar or turbulent. Reynolds number is also dependent on density and dynamic viscosity of the fluid flowing in the tube as can be seen in Eq. 3 [5]
𝑅𝑅𝑅𝑅 = 𝜌𝜌𝜌𝜌𝜌𝜌µ
Eq. 3
8
where ρ is the density of the fluid, D is the diameter of the tube v is the velocity in the tube and µ is the dynamic viscosity of the fluid.
Different materials have different roughness which are taken into account when calculating pressure drop. With this you can follow the diagram to see what friction factor (Fanning or Moody friction factor) which is needed for the pressure drop as can be seen in Eq. 4
𝛥𝛥𝑝𝑝𝑓𝑓 = 4𝑓𝑓 ∗ 𝐿𝐿𝜌𝜌∗ 𝜌𝜌⊽
2
2 Eq. 4
where 𝑓𝑓 is the Fanning friction factor, L is the length of the tube, D is the diameter of the tube, ρ is the density of the fluid, v is the velocity in m/s of the fluid and µ is the dynamic viscosity of the fluid.
The correlation between Fanning and Moody friction factor is according to Eq. 5
𝜆𝜆 = 4𝑓𝑓 Eq. 5
where λ is the Moody friction factor and 𝑓𝑓 is the Fanning friction factor.
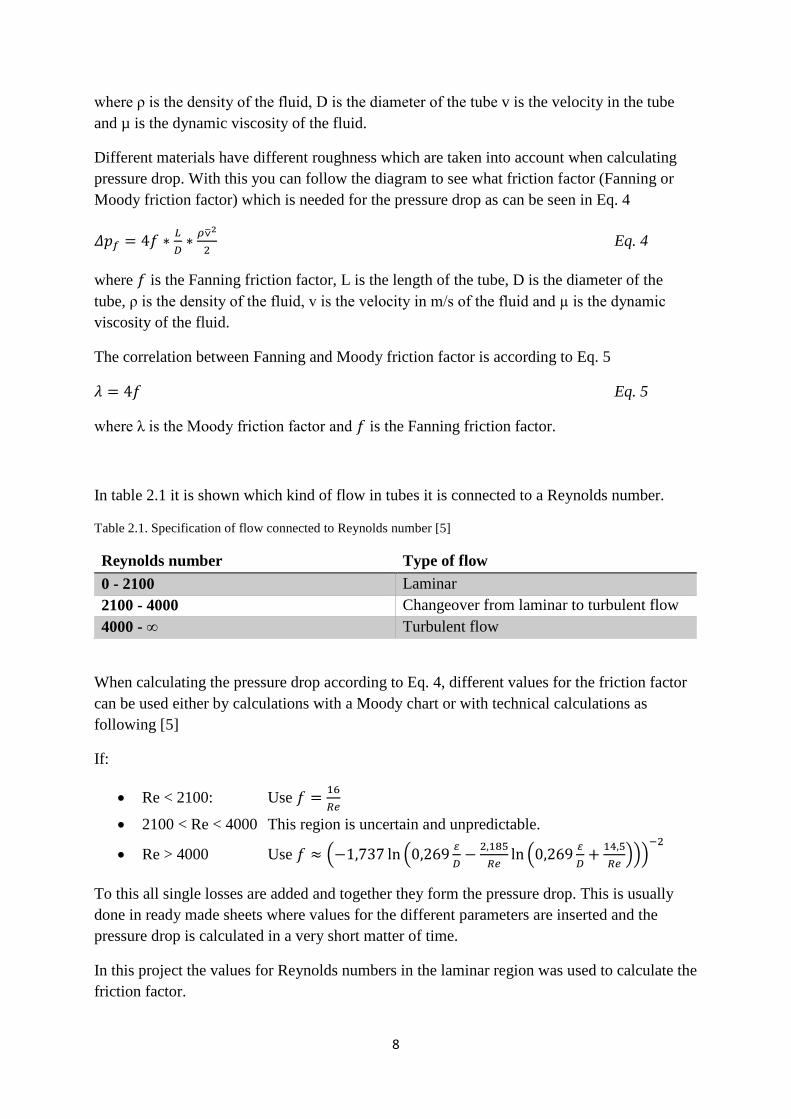
In table 2.1 it is shown which kind of flow in tubes it is connected to a Reynolds number.
Table 2.1. Specification of flow connected to Reynolds number [5]
Reynolds number Type of flow 0 - 2100 Laminar 2100 - 4000 Changeover from laminar to turbulent flow 4000 - ∞ Turbulent flow
When calculating the pressure drop according to Eq. 4, different values for the friction factor can be used either by calculations with a Moody chart or with technical calculations as following [5]
If:
• Re < 2100: Use 𝑓𝑓 = 16𝑅𝑅𝑅𝑅
• 2100 < Re < 4000 This region is uncertain and unpredictable.
• Re > 4000 Use 𝑓𝑓 ≈ �−1,737 ln �0,269 𝜀𝜀𝜌𝜌− 2,185
𝑅𝑅𝑅𝑅ln �0,269 𝜀𝜀
𝜌𝜌+ 14,5
𝑅𝑅𝑅𝑅���
−2
To this all single losses are added and together they form the pressure drop. This is usually done in ready made sheets where values for the different parameters are inserted and the pressure drop is calculated in a very short matter of time.
In this project the values for Reynolds numbers in the laminar region was used to calculate the friction factor.

9
2.3 Design of heat exchangers Designing a heat exchanger is a difficult task and is nowadays almost always done with the help of computer programs. Optimization and iterations are done in a matter of fractions of a second whilst it could take hours to do it by hand. There are many factors to take into account when designing a new HE such as flow of the product, physical properties of both heating/cooling media and product, what temperature spans are needed, how much pressure drop is allowed, the time of pasteurization the product requires and of course the size and design of the HE itself. Another important criteria is that the HE should be easily cleaned as well. Eq. 6 is the general equation for calculating the appropriate size of a HE [1]
𝐴𝐴 = 𝑉𝑉∗𝜌𝜌∗𝐶𝐶𝑃𝑃∗𝛥𝛥𝛥𝛥𝛥𝛥𝛥𝛥𝐿𝐿∗𝑘𝑘
Eq. 6
where A is the HE area, V is the product flow rate, ρ is the product density, CP is the specific heat capacity of the product, ΔT is the temperature difference in the product, ΔTL is the Logarithmic mean temperature difference (LMTD) and k is the overall heat transfer coefficient. This equation is derived from the mass balance over a heat exchanger which is shown in section 2.4 in equations 7 and 8.
The size of the HE is mostly dependent on the flow rate of the product V, the higher the flow the larger HE is required. Density and specific heat capacity is connected to the product and is determined by it. Specific heat capacity, meaning how much energy is required to increase the temperature of a certain substance by 1 OC. [1]
Temperature differences are explained in section 2.5.
For shell and tube HE the baffle spacing, baffle cut and number of tubes are also important factors when designing HE. These factors affects both the pressure drop as well as the overall heat transfer coefficient and impacts the flow of the shell side media [7].
2.4 Heat transfer Pasteurizers is all about heating up a product to a set temperature and also to later on cooling it down to another set temperature. This is all achieved in this case by transferring heat from one liquid to another according to the second law of thermodynamics heat always conduct from high temperature to low temperature which is utilized [2]. The amount of heat transferred is calculated by using fundamental equations which takes heat transfer area, flow rates, specific heat of product and heating/cooling media, heat transfer coefficients and temperature difference into account. All energy which comes in to a system must come out and the same goes for pasteurizers. Some assumptions are made to simplify the calculations for instance that no heat is lost to the surrounding environment which in reality is not true.
The main equations for heat transfer involving mass flows, temperature differences, specific heat capacities and logarithmic mean temperature difference are the following Eq. 7 and Eq. 8

10
𝑄𝑄 = ��𝑚1 ∗ �𝐶𝐶𝑝𝑝1,𝑖𝑖𝑖𝑖 ∗ 𝑇𝑇1,𝑖𝑖𝑖𝑖 − 𝐶𝐶𝑝𝑝1,𝑜𝑜𝑜𝑜𝑜𝑜 ∗ 𝑇𝑇1,𝑜𝑜𝑜𝑜𝑜𝑜� = ��𝑚2 ∗ �𝐶𝐶𝑝𝑝2,𝑜𝑜𝑜𝑜𝑜𝑜 ∗ 𝑇𝑇2,𝑜𝑜𝑜𝑜𝑜𝑜 − 𝐶𝐶𝑝𝑝2,𝑖𝑖𝑖𝑖 ∗ 𝑇𝑇2,𝑖𝑖𝑖𝑖�Eq. 7
where m1 is for example the flow of product while ��𝑚2 is the flow of media and
𝑄𝑄 = 𝑘𝑘 ∗ 𝐴𝐴 ∗ 𝛥𝛥𝑇𝑇𝐿𝐿����� Eq. 8
Where Q is the amount of energy, k is the overall heat transfer coefficient and A is the total area of the HE.
In Eq. 4 temperature differences are included and these are what according to the laws of thermodynamics, drives the heat transfer process inside the HE. ΔT is product temperature in subtracted by product temperature out as can be seen in figure 2.13 with corresponding notations T1,in – T1, out.
The temperature difference between the hot and cold stream varies throughout the HE. The temperature difference is not linear as can be seen in figure 2.12 which is why an average between the temperature differences of incoming and outgoing fluid gives an incorrect value. Therefore a mathematical analysis between the cold and hot flows has been made and the solutions were the logarithmic mean temperature difference (LMTD) which is used for calculations and is named ΔTL. It is calculated using Eq. 9 [8]
𝛥𝛥𝑇𝑇𝐿𝐿����� = (𝛥𝛥1,𝑖𝑖𝑖𝑖 − 𝛥𝛥2,𝑜𝑜𝑜𝑜𝑜𝑜)−(𝛥𝛥1,𝑜𝑜𝑜𝑜𝑜𝑜 − 𝛥𝛥2,𝑖𝑖𝑖𝑖)
𝑙𝑙𝑖𝑖�(𝑇𝑇1,𝑖𝑖𝑖𝑖 − 𝑇𝑇2,𝑜𝑜𝑜𝑜𝑜𝑜)(𝑇𝑇1,𝑜𝑜𝑜𝑜𝑜𝑜 − 𝑇𝑇2,𝑖𝑖𝑖𝑖)�
Eq.9

11
Figure 2.12. Temperature differences of product and media flow for counter current calculations, modified from[1]
The heat transfer coefficient k, measures the efficiency of the heat transfer and how much heat travels through 1 m2 of the partition per 1 OC of differential temperature [1]. For HEs the heat transfer coefficient should be high as it possibly can as can be seen in Eq. 8, the higher k the lower area is needed. The heat transfer coefficient depends on the two fluids which are transferring heat to one another, what material is in between and thickness of the material. The heat transfer coefficient over plane walls is calculated as is shown in Eq. 10 [8]
1𝑘𝑘
= 1𝛼𝛼1
+ 𝑏𝑏𝑜𝑜𝑜𝑜𝑡𝑡𝑡𝑡𝜆𝜆𝑜𝑜𝑜𝑜𝑡𝑡𝑡𝑡
+ 1𝛼𝛼2
Eq. 10
where btube is the thickness of the tube wall and λtube is the thermal conductivity of the tube wall. This follows since it is known that the flow of energy through the surfaces are equal to the flow of energy through the pipe wall.
The heat travels from the warm media through the wall and into the cold product as is illustrated in figure 2.13. α1 is the convection from media to the wall, through the wall the heat conducts which is λ and from the wall to the product the heat is transferred by convection.

12
Figure 2.13. Heat traveling from fluid through the wall and to fluid inside a tubular heat exchanger, redrawn and modified from [5]
To be able to calculate the convective heat transfer coefficients α1 and α2 has to be determined by using Reynolds number (Eq. 1) Prandtl (Eq. 11 [8]) number and Nusselt number (Eq. 12 [9] and Eq. 13 [12]), all in the turbulent region. These can be described as following
𝑃𝑃𝑃𝑃 = µ𝐶𝐶𝑝𝑝𝜆𝜆
Eq. 11
where µ is the dynamic viscosity Cp is the heat capacity and λ is the thermal conductivity.
The definition of the Nusselt value can be seen in Eq. 10 [8] which gives the sought for heat transfer rate. This is done for both outside the tube as well as inside to get both α-values.
𝑁𝑁𝑁𝑁 = 𝛼𝛼𝑑𝑑ℎ𝜆𝜆
Eq. 12

13
where dh is the hydraulic diameter and the equation is rearranged to
𝛼𝛼 =𝑁𝑁𝑁𝑁 ∗ 𝜆𝜆𝑑𝑑ℎ
The following Nusselt equation is and empirical correlation summarized from a large number of experiments to see how Nu, Re and Pr are related. It resulted in equation 13 [12].
𝑁𝑁𝑁𝑁 = 𝑋𝑋 ∗ 𝑅𝑅𝑅𝑅0,8 ∗ 𝑃𝑃𝑃𝑃𝑖𝑖 ∗ �µ𝑡𝑡µ𝑤𝑤�𝐴𝐴
Eq. 13
which is the Dittus-Boelter equation [12] where µb and µw are the absolute viscosity of the bulk (b) and the viscosity of the heating/cooling media near the wall (w). The X,n and A will be used with different values from different literatures as seen in table 2.3. This is an empirical and experimental equation that shows the correlation between the heat transfer coefficient and properties of the fluid which is why the X,n and A are inserted since these values varies depending on the source.
Table 2.3. Different values for X,n and A depending on the source to be inserted to calculate the Nusselt number. 2,8 and 11 are the different sources.
Source Parameter [2] [8] [11]
X (Heating/Cooling)
0.023/0.023 0.023/0.023 0.024/0.027
n (Heating/Cooling)
0.33 0.40/0.30 0.40/0.30
A 0.14 0 0.14
Using Eq. 8 adding the α-values combined with the thickness of the wall and its thermal conductivity the overall heat transfer coefficient is achieved. However heat transfer through a circular wall is a bit more complicated and is calculated according to Eq. 14 [5] which is for the outer k-value and Eq. 15 [5] which is for the inner k-value

14
1𝑘𝑘𝑜𝑜𝑜𝑜𝑜𝑜
= 𝑑𝑑𝑜𝑜𝑜𝑜𝑜𝑜𝑑𝑑𝑖𝑖𝑖𝑖𝑖𝑖∗𝛼𝛼𝑖𝑖𝑖𝑖𝑖𝑖
+ 𝑑𝑑𝑜𝑜𝑜𝑜𝑜𝑜 ∑𝑙𝑙𝑖𝑖�
𝑑𝑑𝑜𝑜𝑜𝑜𝑜𝑜,𝑗𝑗𝑑𝑑𝑖𝑖𝑖𝑖𝑖𝑖,𝑗𝑗
�
2∗𝜆𝜆𝑗𝑗+ 1
𝛼𝛼𝑜𝑜𝑜𝑜𝑜𝑜 Eq. 14
where j is an index for each wall if there are more than one.
1𝑘𝑘𝑖𝑖𝑖𝑖𝑖𝑖
= 𝑑𝑑𝑖𝑖𝑖𝑖𝑖𝑖𝑑𝑑𝑜𝑜𝑜𝑜𝑜𝑜∗𝛼𝛼𝑜𝑜𝑜𝑜𝑜𝑜
+ 𝑑𝑑𝑖𝑖𝑖𝑖𝑖𝑖 ∑𝑙𝑙𝑖𝑖�
𝑑𝑑𝑜𝑜𝑜𝑜𝑜𝑜,𝑗𝑗𝑑𝑑𝑖𝑖𝑖𝑖𝑖𝑖,𝑗𝑗
�
2∗𝜆𝜆𝑗𝑗+ 1
𝛼𝛼𝑖𝑖𝑖𝑖𝑖𝑖 Eq. 15
The only difference between Eq 14 and 15 is what area the k-values is based on. The heat conduction in circular walls are calculated which is what the tubular heat exchangers really are can be calculated with Eq. 16 [8]
𝑄𝑄 = 𝜆𝜆𝑜𝑜𝑜𝑜𝑏𝑏𝑅𝑅2𝜋𝜋𝐿𝐿 𝛥𝛥𝑖𝑖𝑖𝑖𝑖𝑖 − 𝛥𝛥𝑜𝑜𝑜𝑜𝑜𝑜𝑙𝑙𝑖𝑖
𝑑𝑑𝑖𝑖𝑖𝑖𝑖𝑖𝑑𝑑𝑜𝑜𝑜𝑜𝑜𝑜
Eq. 16
where L is the length of the tube.
3 Materials and Methods
3.1 Food Products The soupy flavors contain around 75-80 % water, 10-15 % fruit/berries or powder, sugar, starch oat flour citric acid, vitamin C and the lactobacillus plantarum 299v bacteria culture. In table 3.1 the content of the product per 100 g is shown.
Table 3.1. Content of soupy flavors per 100 g (RDI meaning Recommended Daily Intake).
Content of soupy flavors per 100 g Fat 0.10 g Carbohydrate of which sugars
13 g 11 g
Fibre 0.50 g Protein 0.20 g Salt 0.030 g Vitamin C 35 mg (44 % of RDI)

15
The physical and chemical properties of Product 2 varies with temperature but an approximation of the variables can be seen in table 3.2
Table 3.2. Approximate physical and chemical properties of soupy flavor Product 2.
Approximate physical and chemical properties of the soupy flavor Product 2 Heat capacity 3900 kJ/kg*K Density 1027 kg/m3 Conductivity 0.5900 W/m*K Viscosity 7.650e-02 Pa s
The smoothie flavors contain around 75-80 % water, 20 % fruit purée/concentrate/juices, oat meal, lactic acid, oat fibre and the lactobacillus plantarum 299v bacteria culture. In table 3.3 the content of the product per 100 g is shown.
Table 3.3. Content of soupy flavors per 100 g (RDI meaning Recommended Daily Intake).
Content of soupy flavors per 100 g Fat 0.40 g Carbohydrate of which sugars
12 g 9.0 g
Fibre 0.90 g Protein 0.90 g Salt 0.030 g Vitamin C 35 mg (44 % of RDI)
The physical and chemical properties of Product 1 varies with temperature but an approximation of the variables can be seen in table 3.4
Table 3.4. Approximate physical and chemical properties of soupy flavor Product 2.
Approximate physical and chemical properties of the soupy flavor Product 1 Heat capacity 3850 kJ/kg*K Density 1040 kg/m3 Conductivity 0.5950 W/m*K Viscosity 9.300e-02 Pa s
3.2 Tetra SpirafloTM 1998 and Tetra Spiraflo® 2009 In 1998 one of the pasteurizers was ordered and bought from Tetra Pak which is a Tetra Spiraflo and is named “Pasteurizer 31” here at ÖMAB. Later on in 2009 another pasteurizer

16
was invested in which also is a Tetra Spiraflo and this one is named “Pasteurizer 52”. Both machines can be seen in figure 3.1. These two pasteurizers were not functioning equivalently at the start of this master thesis and so an important task was to first categorize and compare them. This was done by going through old archives present and collecting relevant data. When sufficient amounts of data were not found, Tetra Pak filled in the blanks.
Before the pasteurizers there are two pumps designed on the lines to feed the machines with product at a required rate. One of the pumps set a pressure while the other manages the flow and in which order they were set was investigated to see if it had any impact on the system.
Figure 3.1. The picture to the left shows Pasteurizer 31 and the picture to the right shows Pasteurizer 52.
3.3 Product matrix To be able to determine what changes that needed to be done to the pasteurizers, the first task was to decide what the goal was. By creating a so called “Product matrix”, the actual flow rates, wished for flow rate, temperature ranges, viscosity and eventual problems could be visualized. The difference between actual flow rate and wished for flow rate are what is in reality the flow rate and the “wished for flow rate” is how fast the pasteurization could run if there were no problems. Once this was done it became clear what difficulties that were present and decisions could be made on how to move further on what the requests on how the pasteurizers should operate.

17
3.4 Sections Both pasteurizers at ÖMAB are divided into different sections within as can be seen in figure 3.2. All the sections play an important role and put together they form the process of pasteurization.
3.4.1 Section I Cold product stream enters at around 5-10 OC and is heated up to about 90-95 OC. At the same time hot water of about 100 OC from section V enters and heats the product to a set temperature and leaves at approximately 50 OC.
3.4.2 Holding tube After section I the product has been heated to the target temperature and goes into a holding tube. The product goes through the tube in 20-30 seconds depending on flow rate which is the calculated time required to kill eventual harmful bacteria, such as lactic acid bacteria/yeasts/moulds or pathogenic microorganisms like Salmonella, that might be present before pasteurization. Once passed through the holding tube the product needs to be cooled down which starts in section II.
3.4.3 Section II Section II is also called the regeneration section since this is task. As the warm product goes in from the holding tube, water from section I is pre-heated back to around 70 OC while the product is cooled down to about 50 OC. In this way a substantial amount of heat is put back into the system to be used again. The water then goes back to section V while the product enters the next section.
3.4.4 Section III 50 OC product enters and is cooled to 10-15 OC before it goes to the fourth and final section. Ice water enters on the other side which has a temperature of about 2 OC.
3.4.5 Section IV In this section the product is brought down to below 5 OC. This is done by glycol which holds a temperature of -1 OC.
3.4.6 Water heater “Section V” This is not part of the pasteurizer however in figure 3.2 it is marked out as section V. Here water enter both from the water source as well as water from the pasteurizer which is pre-heated. It is heated up to about 100 OC and sent to section I to heat the product.

18
Figure 3.2. A schematic view of the different sections of a pasteurizer (52) at ÖMAB
The temperature profiles described in the sections are shown in figure 3.3.
Figure 3.3. Temperature profiles in both pasteurizers of the product and cooling/heating media.

19
The pasteurization temperature used for juices e.g. orange juice is 4 – 93 OC [2] with a holding time of 15-30 seconds and is exactly what is used for the Bravo juices at ÖMAB.
The goal was to compare theoretical heat transfer area of the pasteurizers with the actual area to see if it is sufficient or not and to see how many extra tubes were required to satisfy the heat transfer. This was done by calculating the amount of heat needed to be heat transferred for each section. Also the overall heat transfer coefficient was calculated with different values of density, viscosity and thermal conductivity too. One value connected to a high temperature, one connected to a lower temperature and one mean value which was later on used to move further and calculate the heat transfer area. Once the different required areas were calculated they were combined with the actual area and this gave the extra area needed which was translated into amount of extra tubes. All the data was continuously compared with simulated pasteurization performed by Tetra Pak to make sure that all values were within a reasonable range.
4 Results & Discussion
4.1 Design of pasteurizers After evaluation of the purchase documents a clear difference between the pasteurizers were that for pasteurizer 52 it had more tubes in section 1 and 2 compared to pasteurizer 31. This means that since section 1 is the heating section there is less area to ensure that the product hits the target temperature which might be one of the reasons why pasteurizer 31 has a problem with the soupy flavors. It has been a problem for a long time to reach the target temperature when heating and this is why soupy flavors are no longer pasteurized on pasteurizer 31.
4.1.1 Pasteurizer 52 Pasteurizer 52 has a tube description CM 108/19x16C-6 which translates into shell diameter 108 mm with 19 inner pipes that has an outer diameter of 16 mm. Each pipe is about 5930 mm long and the pipe thickness is 0.8 mm. The amount of tubes installed in pasteurizer 52 can be seen in table 4.1. Pasteurizer 52 has two centrifugal pumps mounted before which feeds the machine with product. The first pump sets a pressure while the second one sets the flow that is desired. The pump wheel diameter and motor effect can be seen in table 4.2. It has a holding tube which is 51 mm in diameter however in the beginning it was 63.5 mm and a small part was 51 mm.

20
Table 4.1. Number of tubes per section for pasteurizer 52.
Section 1 Section 2 Section 3 Section 4 Number of tubes 14 8 6 4
Table 4.2. Wheel diameter and motor effect of the pumps for pasteurizer 52.
Pump Wheel diameter (mm) Motor effect (kW) 1 220 11 2 235 18.5
4.1.2 Pasteurizer 31 Pasteurizer 31 has a tube description CM 108/19x16C-6 which translates into shell diameter 108 mm with 19 inner pipes that has an outer diameter of 16 mm. Each pipe is about 5930 mm long and the pipe thickness is 0.8 mm. The amount of tubes installed in pasteurizer 31 can be seen in table 4.3. Pasteurizer 31 has two centrifugal pumps mounted before which feeds the machine with product. The first pump sets a flow that is desired while the second pump runs at full capacity. The pump wheel diameter and motor effect can be seen in table 4.4. It has a holding tube which is 51 mm in diameter.
Table 4.3. Number of tubes per section for pasteurizer 31.
Section 1 Section 2 Section 3 Section 4 Number of tubes 12 6 6 4
Table 4.4. Wheel diameter and motor effect of the pumps for pasteurizer 31. Pump Wheel diameter (mm) Motor effect (kW) 3 220 15 4 200 7.5
4.2 Calculation results Two different products were investigated and these were the most recent product called ProViva Product 1 (smoothie type) and also ProViva Product 2 (soupy type) which is one of the soupy flavors. A wish from ÖMAB was to be able to run the products at a flow rate of 8000 L/h but the current rate of 5000 L/h for Product 1 and 6000 L/h for Product 2 at pasteurizer 52 and none of these were run on pasteurizer 31. However the calculations were made for 5000 L/h for both Product 1 and Product 2.

21
Calculations were done for each section, each flow rate and with the three different equations for the Nusselt value to be compared. The fourth and last section was divided into two parts, one for each cooling media, propylene glycol and ice water.
With the number if tubes with inner pipes and the length of the pipes, the inner area of the heat exchanger sections for each pasteurizer were calculated and can be seen in table 4.5. The calculations can be found in Appendix A. All data for viscosity, heat capacity and density were provided by Tetra Pak. These values changes with temperature and since the product changes temperature throughout the pasteurization a lot of data was required, this data can also be found in Appendix A.
Table 4.5. Inner area per section and total area of each pasteurizer.
Area of pasteurizer
Section 1 (m2)
Section 2 (m2)
Section 3 (m2)
Section 4 (m2)
Total Area (m2)
52 75.3 43.0 32.3 21.5 172 31 64.5 32.3 32.3 21.5 151
The calculations are done with the assumption of that the pipes and tubes are not corrugated but cylindrical. In reality the pipes are in fact corrugated to increase the turbulence which gives a better heat transfer but to simplify the calculations the assumption is made. According to a Dizaji et al, (2014) the heat transfer with corrugated tubes would increase with about 30 % while the friction factor would increase about 25 % as well [13]. This would lead to a smaller heat transfer area but the pressure drop would increase.
The flows of the cold side were calculated and the temperature spans were set for the product and heating/cooling media at each section. The temperature spans can be seen in figure 4.6 and the flows of the heating/cooling media in figure 4.7
Table 4.6. Temperature spans of product as well as heating/cooling media for each section. G stands for glycol and IW stands for ice water.
Temperature spans
Product (OC)
Heating/cooling media (OC)
Section 1 5 → 95 50 ←100 Section 2 95 → 55 70 ← 50 Section 3 55 → 15 10 ← 2 Section 4G 15 → 5 2 ← -1 Section 4IW 15 → 5 5 ← 2
22
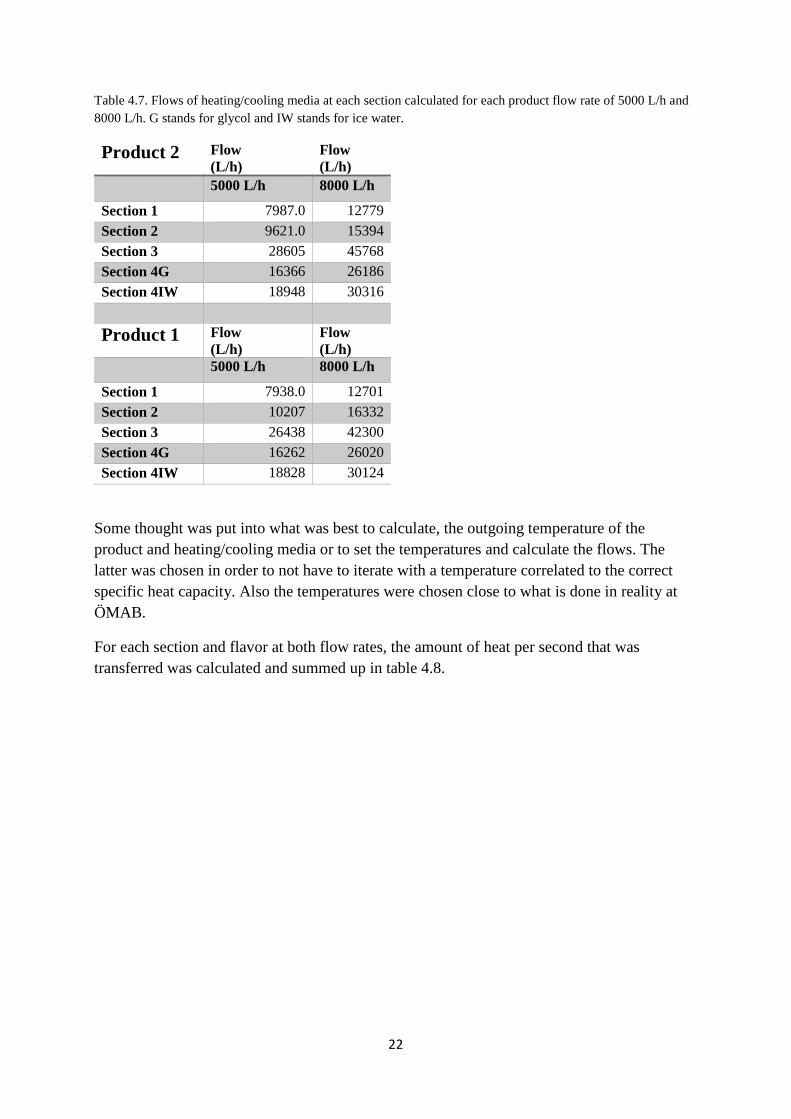
Table 4.7. Flows of heating/cooling media at each section calculated for each product flow rate of 5000 L/h and 8000 L/h. G stands for glycol and IW stands for ice water.
Product 2 Flow (L/h)
Flow (L/h)
5000 L/h 8000 L/h
Section 1 7987.0 12779 Section 2 9621.0 15394 Section 3 28605 45768 Section 4G 16366 26186 Section 4IW 18948 30316
Product 1 Flow (L/h)
Flow (L/h)
5000 L/h 8000 L/h
Section 1 7938.0 12701 Section 2 10207 16332 Section 3 26438 42300 Section 4G 16262 26020 Section 4IW 18828 30124
Some thought was put into what was best to calculate, the outgoing temperature of the product and heating/cooling media or to set the temperatures and calculate the flows. The latter was chosen in order to not have to iterate with a temperature correlated to the correct specific heat capacity. Also the temperatures were chosen close to what is done in reality at ÖMAB.
For each section and flavor at both flow rates, the amount of heat per second that was transferred was calculated and summed up in table 4.8.

23
Table 4.8. Heat transfer Q per section for 5000 L/h and 8000 L/h for each flavor. G stands for glycol and IW stands for ice water.
Product 2 Q (kJ/s)
Q (kJ/s)
5000 L/h 8000 L/h
Section 1 515 823 Section 2 234 374 Section 3 230 368 Section 4G 57.2 91.5 Section 4IW 57.2 91.5
Product 1 Q (kJ/s)
Q (kJ/s)
5000 L/h 8000 L/h
Section 1 513 822 Section 2 249 399 Section 3 214 342 Section 4G 57.1 91.3 Section 4IW 57.1 91.3
The values of section 4G and 4IW are the same since the amount of heat that was transferred is the same no matter which cooling media is used.
With help from Tetra Pak the process calculations were simulated for Product 1 and Product 2 and variables such as overall heat transfer coefficients (k-values) were given together with viscosities, densities and thermal conductivities. The k-values were used only to compare with the values that were calculated using the theoretical equations from previous chapters while the other values were included in the calculations. After calculations the Nusselt correlation that resulted in the best coefficients, meaning that they were closer to what Tetra Pak got, came from source [11]. The k-values can be seen in table 4.9.

24
Table 4.9. k-values for each section and flow rate (F) of product. G stands for glycol and IW stands for ice water.
k-values
Product 2 k (W/m2*K)
k (W/m2*K)
5000 L/h 8000 L/h Section 1 405 588 Section 2 246 357 Section 3 223 323 Section 4G 195 284 Section 4IW 216 313
Product 1 k (W/m2*K)
k (W/m2*K)
5000 L/h 8000 L/h Section 1 460 667 Section 2 187 271 Section 3 170 248 Section 4G 154 224 Section 4IW 167 242
As can be seen in figure 4.9 the k-values range between around 150-500 which are fairly similar to what Tetra Pak got which ranged between around 300-600. This means that since the results of the theoretical values are lower than the compared values, the required heat transfer area will increase resulting in more tubes needed to fulfill the heat transfer load. In reality the area required will be less.
With the temperature spans, the LMTD could be calculated which are necessary to calculate the heat transfer area and are summed up in table 4.10.
Table 4.10. The logarithmic mean temperature difference of each section. G stands for glycol and IW stands for ice water.
∆TL T (OC)
Section 1 17.66 Section 2 12.43 Section 3 25.77 Section 4G 9.050 Section 4IW 5.810

25
With the k-values and the LMTDs the required are could be calculated. This is presented as the required area minus the actual area. This was done for each flavor, each flow rate and for each pasteurizer. In table 4.11 the numbers are summarized for pasteurizer 52 and in table 4.12 for pasteurizer 31. Also included are the extra tubes needed to manage the heat transfer. It is calculated by dividing the area difference with 5,09 m2 which is the inner area of one tube (19 pipes). All numbers are rounded up since it is not possible to install for example half a tube.
Table 4.11. Area differences for each flavor and each flow rate as well as extra tubes required on Pasteurizer 52. G stands for glycol and IW stands for ice water.
Area difference Agg 52 Area (m2)
Extra tubes (nr)
Area difference Agg 52 Area (m2)
Extra tubes (nr)
Product 2 5000 L/h
Product 2 8000 L/h
Section 1 -3.37 0 Section 1 3.98 1 Section 2 33.5 7 Section 2 41.3 8 Section 3 7.76 2 Section 3 11.9 3 Section 4G 10.9 3 Section 4G 14.1 3 Section 4IW 24.1 5 Section 4IW 28.8 6
Area difference Agg 52 Area (m2)
Extra tubes (nr)
Area difference Agg 52 Area (m2)
Extra tubes (nr)
Product 1 5000 L/h
Product 1 8000 L/h
Section 1 -12.1 0 Section 1 -5.56 0 Section 2 64.2 13 Section 2 75.4 15 Section 3 16.5 4 Section 3 21.2 5 Section 4G 19.5 4 Section 4G 23.5 5 Section 4IW 37.3 8 Section 4IW 43.4 9

26
Table 4.12. Area differences for each flavor and each flow rate as well as extra tubes required on Pasteurizer 31. G stands for glycol and IW stands for ice water.
As can be seen in table 4.11 and 4.12 there are negative numbers in the area differences. This means that the heat transfer area is already sufficient and that there is some capacity left if needed. This is the case for all section 1 of pasteurizer 52 (table 4.11) besides from Product 2 at 8000 L/h where 1 extra tube is required. As for all other sections more tubes are required to satisfy the heat transfer load. Section 1 does not require more than 1 extra tube in pasteurizer 52 to manage both flavors at both flow rates which is great and far lower than what is suggested by Tetra Pak. But in pasteurizer 31 Product 2 is reasonable and almost in line with Tetra Pak while Product 1 does not need more than 2 extra tubes at the highest flow rate. In table 4.12 for pasteurizer 31 the only section that is sufficient is section 1 for Product 1 at 5000 L/h, all other sections need extra tubes to be able to pasteurize both flavors. The amount of extra tubes does not seem reasonable since they almost triple at some sections and when comparing to what Tetra Pak suggests this is somewhat too much. This might be due to the fact that the corrugated pipes were not taken into account. Since the k-value would increases with corrugated pipes the area would decrease and thereby less tubes would be required. Section 2 for both pasteurizers are clearly the most affected section where most extra tubes are required which is not supposed to be a problem. Sections 3 and 4G are good and about an extra 4 tubes is close to what Tetra Pak suggested.
Area difference Agg 31 Area (m2)
Extra tubes (nr)
Area difference Agg 31 Area (m2)
Extra tubes (nr)
Product 2 5000 L/h
Product 2 8000 L/h
Section 1 7.43 2 Section 1 14.8 3 Section 2 44.2 9 Section 2 52.1 11 Section 3 7.76 2 Section 3 11.9 3 Section 4G 10.9 3 Section 4G 14.1 3 Section 4IW 24.1 5 Section 4IW 28.8 6
Area difference Agg 31 Area (m2)
Extra tubes (nr)
Area difference Agg 31 Area (m2)
Extra tubes (nr)
Product 1 5000 L/h
Product 1 8000 L/h
Section 1 -1.30 0 Section 1 5.24 2 Section 2 74.9 15 Section 2 86.1 17 Section 3 16.5 4 Section 3 21.2 5 Section 4G 19.5 4 Section 4G 23.5 5 Section 4IW 37.3 8 Section 4IW 43.4 9
27
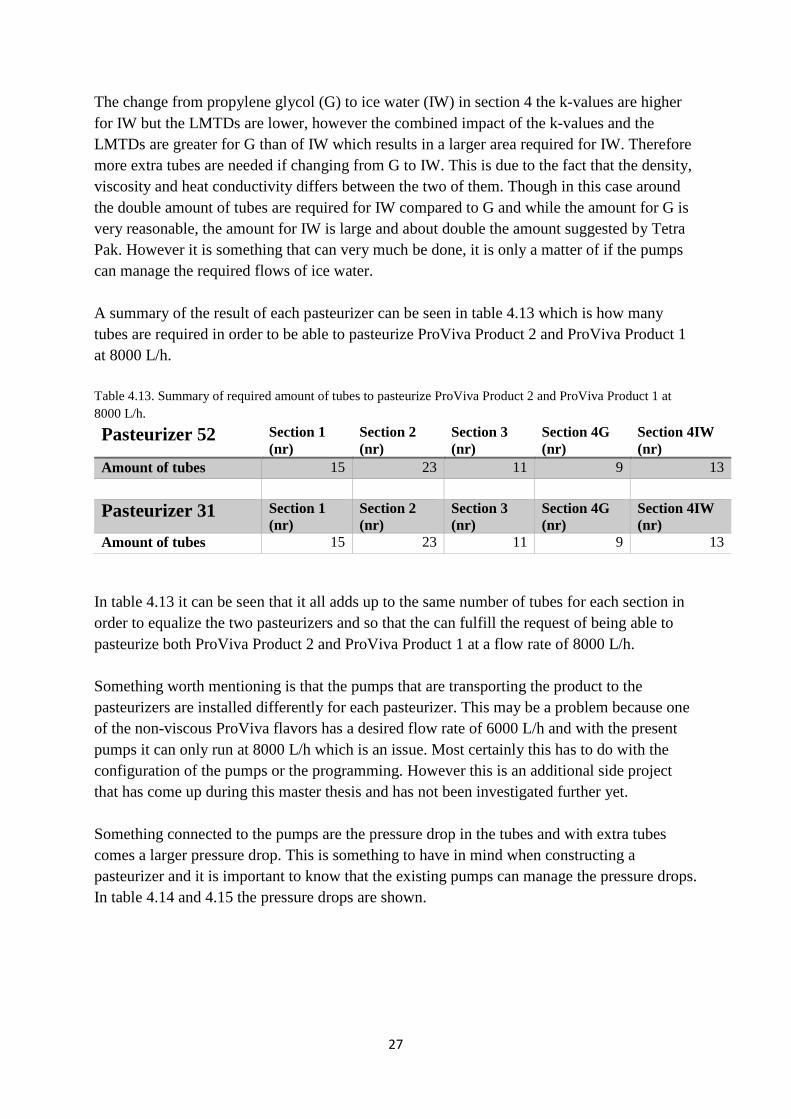
The change from propylene glycol (G) to ice water (IW) in section 4 the k-values are higher for IW but the LMTDs are lower, however the combined impact of the k-values and the LMTDs are greater for G than of IW which results in a larger area required for IW. Therefore more extra tubes are needed if changing from G to IW. This is due to the fact that the density, viscosity and heat conductivity differs between the two of them. Though in this case around the double amount of tubes are required for IW compared to G and while the amount for G is very reasonable, the amount for IW is large and about double the amount suggested by Tetra Pak. However it is something that can very much be done, it is only a matter of if the pumps can manage the required flows of ice water. A summary of the result of each pasteurizer can be seen in table 4.13 which is how many tubes are required in order to be able to pasteurize ProViva Product 2 and ProViva Product 1 at 8000 L/h. Table 4.13. Summary of required amount of tubes to pasteurize ProViva Product 2 and ProViva Product 1 at 8000 L/h.
Pasteurizer 52 Section 1 (nr)
Section 2 (nr)
Section 3 (nr)
Section 4G (nr)
Section 4IW (nr)
Amount of tubes 15 23 11 9 13
Pasteurizer 31 Section 1 (nr)
Section 2 (nr)
Section 3 (nr)
Section 4G (nr)
Section 4IW (nr)
Amount of tubes 15 23 11 9 13 In table 4.13 it can be seen that it all adds up to the same number of tubes for each section in order to equalize the two pasteurizers and so that the can fulfill the request of being able to pasteurize both ProViva Product 2 and ProViva Product 1 at a flow rate of 8000 L/h. Something worth mentioning is that the pumps that are transporting the product to the pasteurizers are installed differently for each pasteurizer. This may be a problem because one of the non-viscous ProViva flavors has a desired flow rate of 6000 L/h and with the present pumps it can only run at 8000 L/h which is an issue. Most certainly this has to do with the configuration of the pumps or the programming. However this is an additional side project that has come up during this master thesis and has not been investigated further yet. Something connected to the pumps are the pressure drop in the tubes and with extra tubes comes a larger pressure drop. This is something to have in mind when constructing a pasteurizer and it is important to know that the existing pumps can manage the pressure drops. In table 4.14 and 4.15 the pressure drops are shown.

28
Table 4.14. Pressure drops in pasteurizer 52 for each section and flow rate. G stands for glycol and IW stands for ice water.
Pasteurizer 52 Product 2 5000L/h Product 2
8000L/h
kPa bar kPa bar Section 1 440 4.40 Section 1 703 7.03 Section 2 252 2.52 Section 2 402 4.03 Section 3 189 1.89 Section 3 301 3.01 Section 4G 126 1.26 Section 4G 201 2.01 Section 4IW 126 1.26 Section 4IW 201 2.01 Total pressure drop
10.1 Total pressure drop
16.1
Product 1 5000L/h Product 1
8000L/h
kPa bar kPa bar Section 1 279 2.79 Section 1 448 4.48 Section 2 451 4.51 Section 2 721 7.21 Section 3 338 3.38 Section 3 541 5.41 Section 4G 226 2.26 Section 4G 361 3.61 Section 4IW 226 2.26 Section 4IW 361 3.61 Total pressure drop
12.9 Total pressure drop
20.7
Table 4.15. Pressure drops in pasteurizer 31 for each section and flow rate. G stands for glycol and IW stands for ice water.
Pasteurizer 31 Product 2 5000L/h Product 2
8000L/h
kPa bar kPa bar Section 1 377 3.77 Section 1 603 6.03 Section 2 189 1.89 Section 2 301 3.01 Section 3 189 1.89 Section 3 301 3.01 Section 4G 126 1.26 Section 4G 201 2.01 Section 4IW 126 1.26 Section 4IW 201 2.01 Total pressure drop
8.80 Total pressure drop
14.1
Product 1 5000L/h Product 1
8000L/h
kPa bar kPa bar Section 1 240 2,40 Section 1 384 3,84 Section 2 338 3,38 Section 2 541 5,41 Section 3 338 3,38 Section 3 541 5,41 Section 4G 226 2,26 Section 4G 361 3,61 Section 4IW 226 2,26 Section 4IW 361 3,61 Total pressure drop
11.7 Total pressure drop
18.3

29
As can be seen in figure 4.14 and 4.15, the total pressure drops are calculated. These are the summed up pressure drops for all sections with only one of the fourth sections added since only one of them are used. The total pressure drop for both pasteurizer 52 and 31 at a flow rate of 5000 L/h is around 10 bar which is perfect and is what the factory aims at. It is slightly higher for pasteurizer 52 since there are more tubes in this machine. At 8000 L/h the pressure drop increases because of the velocity increase and for Product 2 it increases about 6 bar in total which is no problem. However for Product 1 the pressure drop increases to about 20 bar which is starting to get a bit high and this is something that has to be investigated if this is something that the pumps can manage. The same calculations were done for the updated version of a pasteurizer where the extra tubes required are installed and summed up in figure 4.16. This was done to see what pressure drops were to be if extra tubes were to be installed. Table 4.16. Pressure drops in a pasteurizer with extra tubes for each section and flow rate. G stands for glycol and IW stands for ice water. Pasteurizer with Extra tubes
Product 2 5000L/h Product 2 8000L/h
kPa bar kPa bar Section 1 471.7 4.717 Section 1 753.2 7.532 Section 2 723.2 7.232 Section 2 1155 11.55 Section 3 345.9 3.459 Section 3 552.3 5.523 Section 4G 283.0 2.830 Section 4G 451.9 4.519 Section 4IW 408.8 4.088 Section 4IW 652.8 6.528 Total pressure drop (Glycol)
18.24 Total pressure drop (Glycol)
28.83
Total pressure drop (Ice Water)
19.50 Total pressure drop (Ice Water)
30.84
Product 1 5000L/h Product 1
8000L/h
kPa bar kPa bar Section 1 299.4 2.994 Section 1 480.2 4.802 Section 2 1297 12.97 Section 2 2074 20.74 Section 3 620.2 6.202 Section 3 992.0 9.920 Section 4G 507.4 5.074 Section 4G 811.6 8.116 Section 4IW 732.9 7.329 Section 4IW 1172 11.72 Total pressure drop (Glycol)
27.24
Total pressure drop (Glycol)
43.58
Total pressure drop (Ice Water)
29.50 Total pressure drop (Ice Water)
47.18

30
As can be seen in table 4.16 the pressure drops increase very much and without a doubt will it be necessary to invest in new pumps that could manage these high pressure drops. 4.3 Reflections While working on this project at a company it has become much clearer that some tasks are much more complicated in real life than it seems to be in theory. An example is that if the process department could decide, all products should be pasteurized at the highest flow rate possible at all time to save time and to produce as much as possible while the employees at the PU (product development) has a completely different opinion. In this case they meant that if a product like Product 1 were to be pasteurized at a too high flow rate the starches might break while being pumped and so the product might not have the desired properties after pasteurization. And so this project had to be done out of a process department point of view, “what has to be done to be able to run the product as this flow rate” and not “what flow rate is the highest possible with the product still in mind”. A conclusion is that communication is key and it takes time. In order for everyone to have their opinion included, a lot of meetings, conversations, phone calls and e-mails is a necessity and with an important project it should not be rushed. A positive aspect is that the propylene glycol can be disregarded and though it is still an approved chemical, ice water is much safer if it came in contact with the product in the form of leakage than propylene glycol. However if there were to be a leakage the product still would not make it to the customers and be considered safe since the ice water is not clean.

31
5 Conclusions The aim of this master thesis project was to investigate the two pasteurizers used for ProViva at Österlenmejeriet AB to clarify differences between them. Moreover to investigate if it was possible to switch from glycol to ice-water in the last cooling section of the pasteurizers. Mainly there were two large differences namely the amount of tubes in the different sections of the pasteurizer and also how the pumps that pushes the product to them, were set up. The amount of tubes translates to an area available for heat transfer which clearly was larger for pasteurizer 52 since it had more tubes. The situation with the pumps and the sequence they are installed in was not further investigated however it is highly possible that this has to do with the fact that one of the ProViva products cannot be pasteurized at the lower desired flow rate but at a too high one. All calculations resulted in an equal amount of tubes per section for the two pasteurizers which is good however in section two the amount was too high. According to Tetra Pak a value of 18 was deemed enough. The pressure drop that comes along with extra tubes is something that is important to have in mind before installing to make sure that the pumps can manage or if an investment in new ones has to be made. It is definitely possible to change from propylene glycol to ice water though it will cost a bit more investing in more tubes provided that an increased productivity is considered profitable.
6 Future work Future work I would say is to keep contact with Tetra Pak and look into the pump sequence a bit more to know what is the correct setup with respect on whether to have pressure or frequency first followed by the other. It would also be a good thing to send a sample of the product to Tetra Pak for them to make tests on it by themselves to get more accurate variables and to know the properties a bit more thorough. I would also encourage to have more information about machines inhouse to facilitate calculations and investigations performed by those who are employed instead of having to get in contact with the company who designed the machine.

32
7 References [1] Bylund G, Dairy Processing Handbook, 3rd ed., Lund: Tetra Pak Processing Systems
AB, 2015.
[2] Paul Singh R, Heldman Dennis R, Introduction to Food Engineering, 5th ed., Food Science and Technology, 2014.
[3] Ringblom U, The Orange Book, Lund: Tetra Pak Processing Systems AB, 2004.
[4] “Wikipedia – File:Moody diagram.jpg”, Wikimedia Foundation inc, 9 July 2011. [Online]. Available: https://en.wikipedia.org/wiki/File:Moody_diagram.jpg. [Accessed 28 January 2019].
[5] Nilsson B, Transportprocesser, Lund: Department of Chemical Engineering, Faculty of Engineering, Lund University, 2014.
[6] Tetra Pak, Handbook: Cleaning in place: A guide to cleaning technology in the food processing industry, Lund: Tetra Pak Processing Systems AB, 2016.
[7] Kayabasi E, Alperen Munip A, Kurt H, The effects of component dimensions on heat transfer and pressure loss in shell and tube heat exchangers, International Journal of Green Energy Vol. 16 Issue 2 [Online]. Available: https://doi.org/10.1080/15435075.2018.1555162. [Accessed 30 January 2019].
[8] Alveteg M, Handbook – Physical properties, correlations and equations in chemical engineering, Lund: Department of Chemical Engineering, Faculty of Engineering, Lund University, 2015.
[9] Nagy E, Basic Equations of Mass Transport Through a Menmbrane Layer 2nd ed., Veszprém: Research Institute of Biomoelcular and Chemical Engineering, University of Pannonia, Elsevier, 2019
[10] Zhang J-F, Li B, Huang W-J, Lei Y-G, He Y-L, Tao W-Q, Experimental performance comparison of shell-side heat transfer for shell-and-tube heat exchangers with middle-overlapped helical baffles and segmental baffles. Xi’an: State Key Laboratory of Multiphase Flow in Power Engineering, School of Power and Energy Engineering, Xi’an Jiaotong University, Pergamon Press Elvesier, 2009. doi: 10.1016/j.ces.2008.12.018
[11] Robert H Perry, Perry’s chemical engineers’ handbook 8th ed., New York: McGraw-Hill, cop, 2008.

33
[12] Schaschke C, A Dictionary of Chemical Engineering, Oxford University Press, 2014.
[13] Dizaji H S, Jafarmadar S, Mobadersani F, Experimental studies on heat transfer and pressure drop characteristics for new arrangements of corrugated tubes in a double pipe heat exchanger, International Journal of Thermal Sciences Vol. 96, Urmia: Department of Mechanical Engineering, Urmia University, 2014
[14] Hoppe M, Önning G, Hulthén L. Freeze-dried Lactobacillus plantarum 299v increases iron absorption in young females-Double isotope sequential single-blind studies in menstruating women. PLoS One. 2017 Dec 13;12(12):e0189141. doi: 10.1371/journal.pone.0189141. eCollection 2017.
[15] Ducrotté P, Sawant P, Jayanthi V. Clinical trial: Lactobacillus plantarum 299v (DSM 9843) improves symptoms of irritable bowel syndrome. World J Gastroenterol. 2012 Aug 14;18(30):4012-8. doi: 10.3748/wjg.v18.i30.4012.

34
8 Appendix A The outer and inner area of the pasteurizers are calculated as following. The difference between the pasteurizers are the amount of tubes in the different sections which is why the total areas are note the same.
A1 Area Outer area of Pasteurizer 52
1 𝑝𝑝𝑝𝑝𝑝𝑝𝑅𝑅 = 2 ∗ 𝜋𝜋 ∗ 𝑃𝑃 ∗ 𝐿𝐿 = 2 ∗ 𝜋𝜋 ∗ 0,008 ∗ 5,93 = 0,298 𝑚𝑚2
𝑆𝑆𝑅𝑅𝑆𝑆𝑡𝑡𝑝𝑝𝑆𝑆𝑆𝑆 1 = 0,298 ∗ 19 ∗ 14 = 79,3 𝑚𝑚2
𝑆𝑆𝑅𝑅𝑆𝑆𝑡𝑡𝑝𝑝𝑆𝑆𝑆𝑆 2 = 0,298 ∗ 19 ∗ 8 = 45,3 𝑚𝑚2
𝑆𝑆𝑅𝑅𝑆𝑆𝑡𝑡𝑝𝑝𝑆𝑆𝑆𝑆 3 = 0,298 ∗ 19 ∗ 6 = 34,0 𝑚𝑚2
𝑆𝑆𝑅𝑅𝑆𝑆𝑡𝑡𝑝𝑝𝑆𝑆𝑆𝑆 4 = 0,298 ∗ 19 ∗ 4 = 22,6 𝑚𝑚2
𝑇𝑇𝑆𝑆𝑡𝑡𝑇𝑇𝑇𝑇 𝐴𝐴𝑃𝑃𝑅𝑅𝑇𝑇 = 79,3 + 45,3 + 34,0 + 22,6 = 181,2 𝑚𝑚2
Inner area of Pasteurizer 52
1 𝑝𝑝𝑝𝑝𝑝𝑝𝑅𝑅 = 2 ∗ 𝜋𝜋 ∗ 𝑃𝑃 ∗ 𝐿𝐿 = 2 ∗ 𝜋𝜋 ∗ 0,0076 ∗ 5,93 = 0,283 𝑚𝑚2
𝑆𝑆𝑅𝑅𝑆𝑆𝑡𝑡𝑝𝑝𝑆𝑆𝑆𝑆 1 = 0,283 ∗ 19 ∗ 14 = 75,3 𝑚𝑚2
𝑆𝑆𝑅𝑅𝑆𝑆𝑡𝑡𝑝𝑝𝑆𝑆𝑆𝑆 2 = 0,283 ∗ 19 ∗ 8 = 43,0 𝑚𝑚2
𝑆𝑆𝑅𝑅𝑆𝑆𝑡𝑡𝑝𝑝𝑆𝑆𝑆𝑆 3 = 0,283 ∗ 19 ∗ 6 = 32,3 𝑚𝑚2
𝑆𝑆𝑅𝑅𝑆𝑆𝑡𝑡𝑝𝑝𝑆𝑆𝑆𝑆 4 = 0,283 ∗ 19 ∗ 4 = 21,5 𝑚𝑚2
𝑇𝑇𝑆𝑆𝑡𝑡𝑇𝑇𝑇𝑇 𝐴𝐴𝑃𝑃𝑅𝑅𝑇𝑇 = 75,3 + 43,0 + 32,3 + 21,5 = 172,1 𝑚𝑚2
Outer area of Pasteurizer 31
1 𝑝𝑝𝑝𝑝𝑝𝑝𝑅𝑅 = 2 ∗ 𝜋𝜋 ∗ 𝑃𝑃 ∗ 𝐿𝐿 = 2 ∗ 𝜋𝜋 ∗ 0,008 ∗ 5,93 = 0,298 𝑚𝑚2
𝑆𝑆𝑅𝑅𝑆𝑆𝑡𝑡𝑝𝑝𝑆𝑆𝑆𝑆 1 = 0,298 ∗ 19 ∗ 12 = 67,9 𝑚𝑚2
𝑆𝑆𝑅𝑅𝑆𝑆𝑡𝑡𝑝𝑝𝑆𝑆𝑆𝑆 2 = 0,298 ∗ 19 ∗ 6 = 34,0 𝑚𝑚2
𝑆𝑆𝑅𝑅𝑆𝑆𝑡𝑡𝑝𝑝𝑆𝑆𝑆𝑆 3 = 0,298 ∗ 19 ∗ 6 = 34,0 𝑚𝑚2
𝑆𝑆𝑅𝑅𝑆𝑆𝑡𝑡𝑝𝑝𝑆𝑆𝑆𝑆 4 = 0,298 ∗ 19 ∗ 4 = 22,6 𝑚𝑚2
𝑇𝑇𝑆𝑆𝑡𝑡𝑇𝑇𝑇𝑇 𝐴𝐴𝑃𝑃𝑅𝑅𝑇𝑇 = 67,9 + 45,3 + 34,0 + 22,6 = 169,8𝑚𝑚2

35
Inner area of Pasteurizer 31
1 𝑝𝑝𝑝𝑝𝑝𝑝𝑅𝑅 = 2 ∗ 𝜋𝜋 ∗ 𝑃𝑃 ∗ 𝐿𝐿 = 2 ∗ 𝜋𝜋 ∗ 0,0076 ∗ 5,93 = 0,283 𝑚𝑚2
𝑆𝑆𝑅𝑅𝑆𝑆𝑡𝑡𝑝𝑝𝑆𝑆𝑆𝑆 1 = 0,283 ∗ 19 ∗ 12 = 64,5 𝑚𝑚2
𝑆𝑆𝑅𝑅𝑆𝑆𝑡𝑡𝑝𝑝𝑆𝑆𝑆𝑆 2 = 0,283 ∗ 19 ∗ 6 = 32,3𝑚𝑚2
𝑆𝑆𝑅𝑅𝑆𝑆𝑡𝑡𝑝𝑝𝑆𝑆𝑆𝑆 3 = 0,283 ∗ 19 ∗ 6 = 32,3 𝑚𝑚2
𝑆𝑆𝑅𝑅𝑆𝑆𝑡𝑡𝑝𝑝𝑆𝑆𝑆𝑆 4 = 0,283 ∗ 19 ∗ 4 = 21,5 𝑚𝑚2
𝑇𝑇𝑆𝑆𝑡𝑡𝑇𝑇𝑇𝑇 𝐴𝐴𝑃𝑃𝑅𝑅𝑇𝑇 = 67,9 + 45,3 + 34,0 + 22,6 = 150,6 𝑚𝑚2
A2 Product 1 In this part the flow of heating/cooling media is calculated for the different sections and all variables used can be found in figure A.1. This is done by using Eq. 5 first to find the flow and afterwards the amount of heat is calculated with the same equation but now only with the product values. This is done for 5000 L/h and 8000 L/h for both Product 1 and Product 2. The last section is done in two parts, one for propylene glycol and one for Ice water.
Product 1 5000 L/h
Flow of hot water section 1
Prod: 5 → 95 Water: 48 ← 100
𝑚𝑚 ∗ (4.210 ∗ 373,15 − 4.177 ∗ 321,15) = 5000 ∗ (3.888 ∗ 368,15 − 3.836 ∗ 278,15) → 𝑚𝑚= 7938 𝐿𝐿/ℎ
𝑄𝑄 = 5𝑚𝑚3ℎ∗ 1014,5
𝑘𝑘𝑘𝑘𝑚𝑚3
∗ �3.888𝑘𝑘𝑘𝑘
𝑘𝑘𝑘𝑘 ∗ 𝐾𝐾∗ 368,15𝐾𝐾 − 3.836
𝑘𝑘𝑘𝑘𝑘𝑘𝑘𝑘 ∗ 𝐾𝐾
∗ 278,15𝐾𝐾� = 513,4𝑘𝑘𝑘𝑘𝑠𝑠
Flow of Ice water section 2
Prod: 95 → 55 Water: 70 ← 50

36
5000 ∗ (3,888 ∗ 368,15− 3,823 ∗ 328,15) = 𝑚𝑚 ∗ (4,186 ∗ 343,15− 4,177 ∗ 323,15) → 𝑚𝑚= 10207 𝐿𝐿/ℎ
𝑄𝑄 = 5𝑚𝑚3ℎ∗ 1014,5
𝑘𝑘𝑘𝑘𝑚𝑚3
∗ �3.888𝑘𝑘𝑘𝑘
𝑘𝑘𝑘𝑘 ∗ 𝐾𝐾∗ 368,15𝐾𝐾 − 3.823
𝑘𝑘𝑘𝑘𝑘𝑘𝑘𝑘 ∗ 𝐾𝐾
∗ 328,15𝐾𝐾� = 249,2𝑘𝑘𝑘𝑘𝑠𝑠
Flow of ice water section 3
Prod: 55 → 15 Water: 10 ← 2
5000 ∗ (3,823 ∗ 328,15− 3,839 ∗ 288,15) = 𝑚𝑚 ∗ (4,194 ∗ 283,15− 4,214 ∗ 275,15) → 𝑚𝑚= 26438 𝐿𝐿/ℎ
𝑄𝑄 = 5𝑚𝑚3ℎ∗ 1036,8
𝑘𝑘𝑘𝑘𝑚𝑚3
∗ �3.823𝑘𝑘𝑘𝑘
𝑘𝑘𝑘𝑘 ∗ 𝐾𝐾∗ 328,15𝐾𝐾 − 3.839
𝑘𝑘𝑘𝑘𝑘𝑘𝑘𝑘 ∗ 𝐾𝐾
∗ 288,15𝐾𝐾� = 213,6𝑘𝑘𝑘𝑘𝑠𝑠
Flow of propylene glycol section 4
Prod: 15 → 5 Glycol: 2 ← -1
5000 ∗ (3,839 ∗ 288,15− 3,836 ∗ 278,15) = 𝑚𝑚 ∗ (4,02 ∗ 275,15− 4,02 ∗ 272,15) → 𝑚𝑚= 16262 𝐿𝐿/ℎ
𝑄𝑄 = 5𝑚𝑚3ℎ∗ 1047,4
𝑘𝑘𝑘𝑘𝑚𝑚3
∗ �3.839𝑘𝑘𝑘𝑘
𝑘𝑘𝑘𝑘 ∗ 𝐾𝐾∗ 288,15𝐾𝐾 − 3.836
𝑘𝑘𝑘𝑘𝑘𝑘𝑘𝑘 ∗ 𝐾𝐾
∗ 278,15𝐾𝐾� = 57,1𝑘𝑘𝑘𝑘𝑠𝑠
Flow of ice water instead in section 4

37
Prod: 15 → 5 Water: 5 ← 2
5000 ∗ (3,839 ∗ 288,15− 3,836 ∗ 278,15) = 𝑚𝑚 ∗ (4,206 ∗ 278,15− 4,214 ∗ 275,15) → 𝑚𝑚= 18828 𝐿𝐿/ℎ
Product 1 8000 L/h
Flow of hot water section 1
Prod: 5 → 95 Water: 48 ← 100
𝑚𝑚 ∗ (4.210 ∗ 373,15 − 4.177 ∗ 321,15) = 8000 ∗ (3.888 ∗ 368,15 − 3.836 ∗ 278,15) → 𝑚𝑚= 12701 𝐿𝐿/ℎ
𝑄𝑄 = 8𝑚𝑚3ℎ∗ 1014,5
𝑘𝑘𝑘𝑘𝑚𝑚3
∗ �3.888𝑘𝑘𝑘𝑘
𝑘𝑘𝑘𝑘 ∗ 𝐾𝐾∗ 368,15𝐾𝐾 − 3.836
𝑘𝑘𝑘𝑘𝑘𝑘𝑘𝑘 ∗ 𝐾𝐾
∗ 278,15𝐾𝐾� = 821,5𝑘𝑘𝑘𝑘𝑠𝑠
Flow of Ice water section 2
Prod: 95 → 55 Water: 70 ← 50
8000 ∗ (3,888 ∗ 368,15− 3,823 ∗ 328,15) = 𝑚𝑚 ∗ (4,186 ∗ 343,15− 4,177 ∗ 323,15) → 𝑚𝑚= 16332 𝐿𝐿/ℎ
𝑄𝑄 = 8𝑚𝑚3ℎ∗ 1014,5
𝑘𝑘𝑘𝑘𝑚𝑚3
∗ �3.888𝑘𝑘𝑘𝑘
𝑘𝑘𝑘𝑘 ∗ 𝐾𝐾∗ 368,15𝐾𝐾 − 3.823
𝑘𝑘𝑘𝑘𝑘𝑘𝑘𝑘 ∗ 𝐾𝐾
∗ 328,15𝐾𝐾� = 398,7𝑘𝑘𝑘𝑘𝑠𝑠
Flow of ice water section 3
Prod: 55 → 15 Water: 10 ← 2

38
8000 ∗ (3,823 ∗ 328,15− 3,839 ∗ 288,15) = 𝑚𝑚 ∗ (4,194 ∗ 283,15− 4,214 ∗ 275,15 ) → 𝑚𝑚= 42300 𝐿𝐿/ℎ
𝑄𝑄 = 8𝑚𝑚3ℎ∗ 1036,8
𝑘𝑘𝑘𝑘𝑚𝑚3
∗ �3.823𝑘𝑘𝑘𝑘
𝑘𝑘𝑘𝑘 ∗ 𝐾𝐾∗ 328,15𝐾𝐾 − 3.839
𝑘𝑘𝑘𝑘𝑘𝑘𝑘𝑘 ∗ 𝐾𝐾
∗ 288,15𝐾𝐾� = 341,7𝑘𝑘𝑘𝑘𝑠𝑠
Flow of propylene glycol section 4
Prod: 15 → 5 Glycol: 2 ← -1
8000 ∗ (3,839 ∗ 288,15− 3,836 ∗ 278,15) = 𝑚𝑚 ∗ (4,02 ∗ 275,15− 4,02 ∗ 272,15) → 𝑚𝑚= 26020 𝐿𝐿/ℎ
𝑄𝑄 = 8𝑚𝑚3ℎ∗ 1047,4
𝑘𝑘𝑘𝑘𝑚𝑚3
∗ �3.839𝑘𝑘𝑘𝑘
𝑘𝑘𝑘𝑘 ∗ 𝐾𝐾∗ 288,15𝐾𝐾 − 3.836
𝑘𝑘𝑘𝑘𝑘𝑘𝑘𝑘 ∗ 𝐾𝐾
∗ 278,15𝐾𝐾� = 91,3𝑘𝑘𝑘𝑘𝑠𝑠
Flow of ice water instead in section 4
Prod: 15 → 5 Water: 5 ← 2
8000 ∗ (3,839 ∗ 288,15− 3,836 ∗ 278,15) = 𝑚𝑚 ∗ (4,206 ∗ 278,15− 4,214 ∗ 275,15) → 𝑚𝑚= 30124 𝐿𝐿/ℎ
A3 Product 2 This is calculated in the same way describes as for Product 1.
Product 2 5000 L/h

39
Flow of hot water section 1
Prod: 5 → 95 Water: 48 ← 100
𝑚𝑚 ∗ (4.210 ∗ 373,15 − 4.177 ∗ 321,15) = 5000 ∗ (3.913 ∗ 368,15 − 3.861 ∗ 278,15) → 𝑚𝑚= 7987 𝐿𝐿/ℎ
𝑄𝑄 = 5𝑚𝑚3ℎ∗ 1010,4
𝑘𝑘𝑘𝑘𝑚𝑚3
∗ �3.913𝑘𝑘𝑘𝑘
𝑘𝑘𝑘𝑘 ∗ 𝐾𝐾∗ 368,15𝐾𝐾 − 3.861
𝑘𝑘𝑘𝑘𝑘𝑘𝑘𝑘 ∗ 𝐾𝐾
∗ 278,15𝐾𝐾� = 514,5𝑘𝑘𝑘𝑘𝑠𝑠
Flow of Ice water section 2
Prod: 95 → 55 Water: 70 ← 50
5000 ∗ (3,913 ∗ 368,15− 3,882 ∗ 328,15) = 𝑚𝑚 ∗ (4,186 ∗ 343,15− 4,177 ∗ 323,15) → 𝑚𝑚= 9621 𝐿𝐿/ℎ
𝑄𝑄 = 5𝑚𝑚3ℎ∗ 1010,4
𝑘𝑘𝑘𝑘𝑚𝑚3
∗ �3.913𝑘𝑘𝑘𝑘
𝑘𝑘𝑘𝑘 ∗ 𝐾𝐾∗ 368,15𝐾𝐾 − 3.882
𝑘𝑘𝑘𝑘𝑘𝑘𝑘𝑘 ∗ 𝐾𝐾
∗ 328,15𝐾𝐾� = 233,9𝑘𝑘𝑘𝑘𝑠𝑠
Flow of ice water section 3
Prod: 55 → 15 Water: 10 ← 2
5000 ∗ (3,882 ∗ 328,15− 3,864 ∗ 288,15) = 𝑚𝑚 ∗ (4,194 ∗ 283,15− 4,214 ∗ 275,15) → 𝑚𝑚= 28605 𝐿𝐿/ℎ
𝑄𝑄 = 5𝑚𝑚3ℎ∗ 1032,7
𝑘𝑘𝑘𝑘𝑚𝑚3
∗ �3.882𝑘𝑘𝑘𝑘
𝑘𝑘𝑘𝑘 ∗ 𝐾𝐾∗ 328,15𝐾𝐾 − 3.864
𝑘𝑘𝑘𝑘𝑘𝑘𝑘𝑘 ∗ 𝐾𝐾
∗ 288,15𝐾𝐾� = 230,2𝑘𝑘𝑘𝑘𝑠𝑠

40
Flow of propylene glycol section 4
Prod: 15 → 5 Glycol: 2 ← -1
5000 ∗ (3,864 ∗ 288,15− 3,861 ∗ 278,15) = 𝑚𝑚 ∗ (4,02 ∗ 275,15− 4,02 ∗ 272,15) → 𝑚𝑚= 16366 𝐿𝐿/ℎ
𝑄𝑄 = 5𝑚𝑚3ℎ∗ 1043,4
𝑘𝑘𝑘𝑘𝑚𝑚3
∗ �3.864𝑘𝑘𝑘𝑘
𝑘𝑘𝑘𝑘 ∗ 𝐾𝐾∗ 288,15𝐾𝐾 − 3.861
𝑘𝑘𝑘𝑘𝑘𝑘𝑘𝑘 ∗ 𝐾𝐾
∗ 278,15𝐾𝐾� = 57,2𝑘𝑘𝑘𝑘𝑠𝑠
Flow of ice water instead in section 4
Prod: 15 → 5 Water: 5 ← 2
5000 ∗ (3,864 ∗ 288,15− 3,861 ∗ 278,15) = 𝑚𝑚 ∗ (4,206 ∗ 278,15− 4,214 ∗ 275,15) → 𝑚𝑚= 18948 𝐿𝐿/ℎ
Product 2 8000 L/h
Flow of hot water section 1
Prod: 5 → 95 Water: 48 ← 100
𝑚𝑚 ∗ (4.210 ∗ 373,15 − 4.177 ∗ 321,15) = 8000 ∗ (3.913 ∗ 368,15 − 3.861 ∗ 278,15) → 𝑚𝑚= 12779 𝐿𝐿/ℎ
𝑄𝑄 = 8𝑚𝑚3ℎ∗ 1010,4
𝑘𝑘𝑘𝑘𝑚𝑚3
∗ �3.913𝑘𝑘𝑘𝑘
𝑘𝑘𝑘𝑘 ∗ 𝐾𝐾∗ 368,15𝐾𝐾 − 3.861
𝑘𝑘𝑘𝑘𝑘𝑘𝑘𝑘 ∗ 𝐾𝐾
∗ 278,15𝐾𝐾� = 823,2𝑘𝑘𝑘𝑘𝑠𝑠

41
Flow of Ice water section 2
Prod: 95 → 55 Water: 70 ← 50
8000 ∗ (3,913 ∗ 368,15− 3,882 ∗ 328,15) = 𝑚𝑚 ∗ (4,186 ∗ 343,15− 4,177 ∗ 323,15) → 𝑚𝑚= 15394 𝐿𝐿/ℎ
𝑄𝑄 = 8𝑚𝑚3ℎ∗ 1010,4
𝑘𝑘𝑘𝑘𝑚𝑚3
∗ �3.913𝑘𝑘𝑘𝑘
𝑘𝑘𝑘𝑘 ∗ 𝐾𝐾∗ 368,15𝐾𝐾 − 3.882
𝑘𝑘𝑘𝑘𝑘𝑘𝑘𝑘 ∗ 𝐾𝐾
∗ 328,15𝐾𝐾� = 374,3𝑘𝑘𝑘𝑘𝑠𝑠
Flow of ice water section 3
Prod: 55 → 15 Water: 10 ← 2
8000 ∗ (3,882 ∗ 328,15− 3,864 ∗ 288,15) = 𝑚𝑚 ∗ (4,194 ∗ 283,15− 4,214 ∗ 275,15) → 𝑚𝑚= 45768 𝐿𝐿/ℎ
𝑄𝑄 = 8𝑚𝑚3ℎ∗ 1032,7
𝑘𝑘𝑘𝑘𝑚𝑚3
∗ �3.882𝑘𝑘𝑘𝑘
𝑘𝑘𝑘𝑘 ∗ 𝐾𝐾∗ 328,15𝐾𝐾 − 3.864
𝑘𝑘𝑘𝑘𝑘𝑘𝑘𝑘 ∗ 𝐾𝐾
∗ 288,15𝐾𝐾� = 368,3𝑘𝑘𝑘𝑘𝑠𝑠
Flow of propylene glycol section 4
Prod: 15 → 5 Glycol: 2 ← -1
8000 ∗ (3,864 ∗ 288,15− 3,861 ∗ 278,15) = 𝑚𝑚 ∗ (4,02 ∗ 275,15− 4,02 ∗ 272,15) → 𝑚𝑚= 26186 𝐿𝐿/ℎ
𝑄𝑄 = 8𝑚𝑚3ℎ∗ 1043,4
𝑘𝑘𝑘𝑘𝑚𝑚3
∗ �3.864𝑘𝑘𝑘𝑘
𝑘𝑘𝑘𝑘 ∗ 𝐾𝐾∗ 288,15𝐾𝐾 − 3.861
𝑘𝑘𝑘𝑘𝑘𝑘𝑘𝑘 ∗ 𝐾𝐾
∗ 278,15𝐾𝐾� = 91,5𝑘𝑘𝑘𝑘𝑠𝑠

42
Flow of ice water instead in section 4
Prod: 15 → 5 Water: 5 ← 2
8000 ∗ (3,864 ∗ 288,15− 3,861 ∗ 278,15) = 𝑚𝑚 ∗ (4,206 ∗ 278,15− 4,214 ∗ 275,15) → 𝑚𝑚= 30316 𝐿𝐿/ℎ
A4 Logarithmic mean temperature difference (LMTD) The LMTDs are calculated with Eq. 7 based on every sections temperature profiles. This is later on used when determining the required heat transfer area.
Section 1
𝛥𝛥𝑇𝑇𝐿𝐿����� =(100 − 95)− (48 − 5)
𝑇𝑇𝑆𝑆 �(100 − 95)(48 − 5) �
= 17,66
Section 2
𝛥𝛥𝑇𝑇𝐿𝐿����� =(95 − 70) − (55− 50)
𝑇𝑇𝑆𝑆 �(95− 70)(55− 50)�
= 12,43
Section 3
𝛥𝛥𝑇𝑇𝐿𝐿����� =(55− 10) − (15 − 2)
𝑇𝑇𝑆𝑆 �(55− 10)(15 − 2) �
= 25,77
Section 4 G

43
𝛥𝛥𝑇𝑇𝐿𝐿����� =(15− 2) − (5 − (−1))
𝑇𝑇𝑆𝑆 � (15 − 2)(5 − (−1))�
= 9,05
Section 4 IW
𝛥𝛥𝑇𝑇𝐿𝐿����� =(15− 5) − (5 − 2)
𝑇𝑇𝑆𝑆 �(15 − 5)(5 − 2) �
= 5,81
A5 Example of calculating required heat transfer area for Product 2 5000 L/h at 5 OC with one of the Nusselt correlations (inside tube) ρ = 1044,3 kg/m3 µ = µb = 1,25*10-1 Pa s µw = 2,78*10-2 Pa s λ = 0,55 W/m*K F = 5000 L/h = 5 m3/h Dinn = 14,4*10-3 m Ainn = π*(Dinn)2 = 1,63*10-4 m2
X = 0,023 n = 0,33 B = 0,14
𝑣𝑣 =𝐹𝐹𝐴𝐴𝑖𝑖𝑖𝑖𝑖𝑖
=5
3600 ∗ (1,63 ∗ 10−4) ∗ 194,49 ∗ 10−1
𝑚𝑚𝑠𝑠
That it is divided by 3600 is to make it per second and that it is divided by 19 is because the product flows through 19 pipes in a tube.
𝑅𝑅𝑅𝑅𝑅𝑅𝑆𝑆𝑆𝑆𝑇𝑇𝑑𝑑𝑠𝑠 (𝑅𝑅𝑅𝑅) =𝜌𝜌 ∗ 𝑣𝑣 ∗ 𝐷𝐷𝑖𝑖𝑖𝑖𝑖𝑖
µ=
1044,3 ∗ 4,49 ∗ 10−1 ∗ 14,4 ∗ 10−3
1,25 ∗ 10−1= 5,39 ∗ 101
𝑃𝑃𝑃𝑃𝑇𝑇𝑆𝑆𝑑𝑑𝑇𝑇𝑡𝑡 (𝑃𝑃𝑃𝑃) =µ𝐶𝐶𝑃𝑃𝜆𝜆
=1,25 ∗ 10−1
0,55= 8,79 ∗ 102
𝑁𝑁𝑁𝑁𝑠𝑠𝑠𝑠𝑅𝑅𝑇𝑇𝑡𝑡 (𝑁𝑁𝑁𝑁) = 𝑋𝑋 ∗ 𝑅𝑅𝑅𝑅0.8 ∗ 𝑃𝑃𝑃𝑃𝑖𝑖 ∗ �µ𝑏𝑏µ𝑤𝑤�𝐵𝐵
= 0,023 ∗ (5,39 ∗ 101)0,8 ∗ (8,79 ∗ 102)0,33 ∗ �(1,25 ∗ 10−1)2,78 ∗ 10−2 �
0,14
= 6,46

44
𝛼𝛼𝑖𝑖𝑖𝑖 =𝜆𝜆 ∗ 𝑁𝑁𝑁𝑁𝐷𝐷𝑖𝑖𝑖𝑖𝑖𝑖
=0,55 ∗ 6,46
(14,4 ∗ 10−3)= 247
𝑊𝑊𝑚𝑚2 ∗ 𝐾𝐾
The same is done with but for outside the tube to get an αout and they are put into the next formula to get an overall heat transfer coefficient.
rout = 8*10-3 m rin = 7,2*10-3 m λw = 16,3 W/m*K L = 5,93 m αout = 1,59*103 W/m2*K Aout = 2,01*10-4 m2
1𝑘𝑘𝑖𝑖𝑖𝑖𝑖𝑖
=1
𝛼𝛼𝑖𝑖𝑖𝑖𝑖𝑖+𝐴𝐴𝑖𝑖𝑖𝑖𝑖𝑖 ∗ 𝑇𝑇𝑆𝑆 �
𝑃𝑃𝑜𝑜𝑜𝑜𝑜𝑜𝑃𝑃𝑖𝑖𝑖𝑖
�
2 ∗ 𝜋𝜋 ∗ 𝐿𝐿 ∗ 𝜆𝜆𝑤𝑤+
𝐴𝐴𝑖𝑖𝑖𝑖𝑖𝑖𝛼𝛼𝑜𝑜𝑜𝑜𝑜𝑜 ∗ 𝐴𝐴𝑜𝑜𝑜𝑜𝑜𝑜
=1
247+
1,63 ∗ 10−4 ∗ 𝑇𝑇𝑆𝑆� 87,2�
2 ∗ 𝜋𝜋 ∗ 5,93 ∗ 16,3+
1,63 ∗ 10−4
1,50 ∗ 103 ∗ 2,01 ∗ 10−4= 4,64 ∗ 10−3
𝑘𝑘𝑖𝑖𝑖𝑖𝑖𝑖 =1
4,64 ∗ 10−3= 215
With the next equation the theoretical heat transfer area could be calculated accordingly:
Q = 5,15*105 J/s ∆TL = 17,66 kinn = 215
𝐴𝐴 =𝑄𝑄
𝑘𝑘𝑖𝑖𝑖𝑖𝑖𝑖 ∗ ∆𝑇𝑇𝐿𝐿=
5,15 ∗ 105
215 ∗ 17,66= 135,6 𝑚𝑚2
And to get the area that needs to be added to the existing are is to take the difference between the two of them accordingly:
Areal = 75,3 m2 ATheory = 135,6 m2
𝐴𝐴𝑟𝑟𝑅𝑅𝑟𝑟𝑖𝑖𝑟𝑟𝑅𝑅𝑑𝑑 = 𝐴𝐴𝛥𝛥ℎ𝑅𝑅𝑜𝑜𝑟𝑟𝑒𝑒 − 𝐴𝐴𝑟𝑟𝑅𝑅𝑟𝑟𝑙𝑙 = 135,6 − 75,3 = 60,3 𝑚𝑚2
To know how many extra tubes are needed to be installed the total area of one tube needs to be calculated, accordingly:
𝐴𝐴𝑜𝑜𝑜𝑜𝑏𝑏𝑅𝑅 = 2 ∗ 𝜋𝜋 ∗ 𝑃𝑃𝑖𝑖𝑖𝑖𝑖𝑖 ∗ 𝐿𝐿 ∗ 19 = 2 ∗ 𝜋𝜋 ∗ 7,2 ∗ 10−3 ∗ 5,93 ∗ 19 = 5,097

45
Then the area required is divided by the area of a single tube to know how many extra tubes are necessary to add, accordingly:
𝑁𝑁𝑁𝑁𝑚𝑚𝑁𝑁𝑅𝑅𝑃𝑃 𝑆𝑆𝑓𝑓 𝑅𝑅𝑒𝑒𝑡𝑡𝑃𝑃𝑇𝑇 𝑡𝑡𝑁𝑁𝑁𝑁𝑅𝑅𝑠𝑠 𝑃𝑃𝑅𝑅𝑟𝑟𝑁𝑁𝑝𝑝𝑃𝑃𝑅𝑅𝑑𝑑 =𝐴𝐴𝑟𝑟𝑅𝑅𝑟𝑟𝑜𝑜𝑖𝑖𝑟𝑟𝑅𝑅𝑑𝑑𝐴𝐴𝑜𝑜𝑜𝑜𝑏𝑏𝑅𝑅
=60,3
5,097= 11,83 = 12 𝑅𝑅𝑒𝑒𝑡𝑡𝑃𝑃𝑇𝑇 𝑡𝑡𝑁𝑁𝑁𝑁𝑅𝑅𝑠𝑠
12 extra tubes are needed since it is not possible to divide a tube into smaller parts and so all numbers are rounded up to closest integer.
All calculations were made for each of the 5 sections and one for the lower values of the density, viscosity, heat capacity and thermal conductivity, one for the higher values and one for the mean values where later on the mean values were continued with to calculate required areas. Also all calculations for each sections were made for 5000 L/h and 8000 L/h for both Product 2 and Product 1 as well as three different Nusselt correlations.
In figure A1, all variables used in calculations can be found.

46
Figure A1. All variables used for calculations can be seen in this picture.

47
A6 Pressure drop The pressure drop is calculated as an example that follows for Product 2 5000 L/h in pasteurizer 52:
𝛥𝛥𝑝𝑝𝑓𝑓 = 4𝑓𝑓 ∗ 𝐿𝐿𝜌𝜌∗ 𝜌𝜌⊽
2
2 Eq. 2
𝑊𝑊𝑝𝑝𝑡𝑡ℎ 𝑅𝑅𝑅𝑅 < 2100 𝑓𝑓 = 16/𝑅𝑅𝑅𝑅
Section 1
Re 86,8 L 5,93 *Amount of tubes (m) D 0,0144 (m) ρ 1027,4 (kg/m3) v 0,449 (m/s)
𝛥𝛥𝑝𝑝𝑓𝑓 = 4 ∗ ( 1686,8
) ∗ 5,93∗140,0144
∗ �1027,4∗0,4492
2� = 440233,1 𝑃𝑃𝑇𝑇 = 440233,1 𝑃𝑃𝑟𝑟
100000 𝑃𝑃𝑃𝑃𝑡𝑡𝑃𝑃𝑏𝑏= 4,40 𝑁𝑁𝑇𝑇𝑃𝑃
All pressure drops per section were then added together to get a total pressure drop over the pasteurizer.