Process Modeling, Optimization and Cost Analysis of a Sulfur ...
18
mathematics Article Process Modeling, Optimization and Cost Analysis of a Sulfur Recovery Unit by Applying Pinch Analysis on the Claus Process in a Gas Processing Plant Muhammad Arslan Zahid, Muhammad Ahsan * , Iftikhar Ahmad and Muhammad Nouman Aslam Khan Citation: Zahid, M.A.; Ahsan, M.; Ahmad, I.; Khan, M.N.A. Process Modeling, Optimization and Cost Analysis of a Sulfur Recovery Unit by Applying Pinch Analysis on the Claus Process in a Gas Processing Plant. Mathematics 2022, 10, 88. https:// doi.org/10.3390/math10010088 Academic Editors: Mingheng Li and Hui Sun Received: 30 September 2021 Accepted: 24 November 2021 Published: 27 December 2021 Publisher’s Note: MDPI stays neutral with regard to jurisdictional claims in published maps and institutional affil- iations. Copyright: © 2021 by the authors. Licensee MDPI, Basel, Switzerland. This article is an open access article distributed under the terms and conditions of the Creative Commons Attribution (CC BY) license (https:// creativecommons.org/licenses/by/ 4.0/). School of Chemical & Materials Engineering, National University of Sciences & Technology, Islamabad 44000, Pakistan; [email protected] (M.A.Z.); [email protected] (I.A.); [email protected] (M.N.A.K.) * Correspondence: [email protected] Abstract: The Claus process is one of the promising technologies for acid gas processing and sulfur recovery. Hydrogen sulfide primarily exists as a byproduct in the gas processing unit. It must be removed from natural gas. The Environmental Protection Agency (EPA) notices that increasing SO 2 and CO 2 in the air harms the environment. Sulfur generally has an elemental content of 0.1–6 wt % in crude oil, but the value could be higher than 14% for some crude oils and asphalts. It produces SO 2 and CO 2 gases, which damage the environment and atmosphere of the earth, called primary pollutants. When SO 2 gas is reacted with water in the atmosphere, it causes sulphur and nitric acid, called a secondary pollutant. The world countries started desulphurization in 1962 to reduce the amount of sulfur in petroleum products. In this research, the Claus process was modeled in Aspen Plus software (AspenTech, Bedford, MA, USA) and industrial data validated it. The Peng– Robinson method is used for the simulation of hydrocarbon components. The influence of oxygen gas concentration, furnace temperature, the temperature of the first catalytic reactor, and temperature of the second catalytic reactor on the Claus process were studied. The first objective of the research is process modeling and simulation of a chemical process. The second objective is optimizing the process. The optimization tool in the Aspen Plus is used to obtain the best operating parameters. The optimization results show that sulfur recovery increased to 18%. Parametric analysis is studied regarding operating parameters and design parameters for increased production of sulfur. Due to pinch analysis on the Claus process, the operating cost of the heat exchangers is reduced to 40%. The third objective is the cost analysis of the process. Before optimization, it is shown that the production of sulfur recovery increased. In addition, the recovery of sulfur from hydrogen sulfide gas also increased. After optimizing the process, it is shown that the cost of heating and cooling utilities is reduced. In addition, the size of equipment is reduced. The optimization causes 2.5% of the profit on cost analysis. Keywords: optimization; simulation; Claus process; Aspen Plus; sulfur recapture; pinch analysis 1. Introduction Different sour gases contain different impurities such as hydrogen sulfide gas, am- monia, carbon dioxide gas, and other waste materials, including nitrogen gas. There is a high quantity of sulfur content in the petroleum product and other contaminants that must be removed for environmental pollution. The elimination of sulfur is an essential objective in petroleum products such as petrol, diesel, and LPG ETC. The removal of sulfur is a rule of the Environmental Protection Agency (EPA) because it causes environmental pollution. H 2 S is found in the environment and causes harmful effects on human skin and eyes, as well as breathing problems. The H 2 S gas is the raw of dangerous gases such as SO 2 , CO 2 , and NH 3 gases. Methane gas is the primary resource of H 2 S gas. When natural gases are burned in a combustion engine, it causes SO 2 gases and CO 2 gases. Almost all the Mathematics 2022, 10, 88. https://doi.org/10.3390/math10010088 https://www.mdpi.com/journal/mathematics
-
Upload
khangminh22 -
Category
Documents
-
view
1 -
download
0
Transcript of Process Modeling, Optimization and Cost Analysis of a Sulfur ...
mathematics
Article
Process Modeling, Optimization and Cost Analysis of a SulfurRecovery Unit by Applying Pinch Analysis on the ClausProcess in a Gas Processing Plant
Muhammad Arslan Zahid, Muhammad Ahsan * , Iftikhar Ahmad and Muhammad Nouman Aslam Khan
�����������������
Citation: Zahid, M.A.; Ahsan, M.;
Ahmad, I.; Khan, M.N.A. Process
Modeling, Optimization and Cost
Analysis of a Sulfur Recovery Unit by
Applying Pinch Analysis on the Claus
Process in a Gas Processing Plant.
Mathematics 2022, 10, 88. https://
doi.org/10.3390/math10010088
Academic Editors: Mingheng Li and
Hui Sun
Received: 30 September 2021
Accepted: 24 November 2021
Published: 27 December 2021
Publisher’s Note: MDPI stays neutral
with regard to jurisdictional claims in
published maps and institutional affil-
iations.
Copyright: © 2021 by the authors.
Licensee MDPI, Basel, Switzerland.
This article is an open access article
distributed under the terms and
conditions of the Creative Commons
Attribution (CC BY) license (https://
creativecommons.org/licenses/by/
4.0/).
School of Chemical & Materials Engineering, National University of Sciences & Technology,Islamabad 44000, Pakistan; [email protected] (M.A.Z.);[email protected] (I.A.); [email protected] (M.N.A.K.)* Correspondence: [email protected]
Abstract: The Claus process is one of the promising technologies for acid gas processing and sulfurrecovery. Hydrogen sulfide primarily exists as a byproduct in the gas processing unit. It must beremoved from natural gas. The Environmental Protection Agency (EPA) notices that increasing SO2
and CO2 in the air harms the environment. Sulfur generally has an elemental content of 0.1–6 wt %in crude oil, but the value could be higher than 14% for some crude oils and asphalts. It producesSO2 and CO2 gases, which damage the environment and atmosphere of the earth, called primarypollutants. When SO2 gas is reacted with water in the atmosphere, it causes sulphur and nitricacid, called a secondary pollutant. The world countries started desulphurization in 1962 to reducethe amount of sulfur in petroleum products. In this research, the Claus process was modeled inAspen Plus software (AspenTech, Bedford, MA, USA) and industrial data validated it. The Peng–Robinson method is used for the simulation of hydrocarbon components. The influence of oxygengas concentration, furnace temperature, the temperature of the first catalytic reactor, and temperatureof the second catalytic reactor on the Claus process were studied. The first objective of the researchis process modeling and simulation of a chemical process. The second objective is optimizing theprocess. The optimization tool in the Aspen Plus is used to obtain the best operating parameters.The optimization results show that sulfur recovery increased to 18%. Parametric analysis is studiedregarding operating parameters and design parameters for increased production of sulfur. Due topinch analysis on the Claus process, the operating cost of the heat exchangers is reduced to 40%. Thethird objective is the cost analysis of the process. Before optimization, it is shown that the productionof sulfur recovery increased. In addition, the recovery of sulfur from hydrogen sulfide gas alsoincreased. After optimizing the process, it is shown that the cost of heating and cooling utilities isreduced. In addition, the size of equipment is reduced. The optimization causes 2.5% of the profit oncost analysis.
Keywords: optimization; simulation; Claus process; Aspen Plus; sulfur recapture; pinch analysis
1. Introduction
Different sour gases contain different impurities such as hydrogen sulfide gas, am-monia, carbon dioxide gas, and other waste materials, including nitrogen gas. There isa high quantity of sulfur content in the petroleum product and other contaminants thatmust be removed for environmental pollution. The elimination of sulfur is an essentialobjective in petroleum products such as petrol, diesel, and LPG ETC. The removal of sulfuris a rule of the Environmental Protection Agency (EPA) because it causes environmentalpollution. H2S is found in the environment and causes harmful effects on human skin andeyes, as well as breathing problems. The H2S gas is the raw of dangerous gases such asSO2, CO2, and NH3 gases. Methane gas is the primary resource of H2S gas. When naturalgases are burned in a combustion engine, it causes SO2 gases and CO2 gases. Almost all the
Mathematics 2022, 10, 88. https://doi.org/10.3390/math10010088 https://www.mdpi.com/journal/mathematics

Mathematics 2022, 10, 88 2 of 18
refineries in the world use the Claus process to remove sulfur, and many refineries producesulfur at 10 tons per day. Sulfur is the raw material of sulfuric acid [1,2]. An oxygen-basedmodification was used in the Claus process; there was a modification reported on this pro-cess by (1) upgrading the existing systems and introducing a new system; and (2) reducingthe equipment size [3,4]. The Claus process is popular engineering for retrieving sulfurand energy from gases. It is conventionally split into thermal and catalytic stages to obtaina very high conversion of acid gas. In 1993, Lurgi Company conducted an experiment onthe Claus process with a capacity of 10 tons per day and an efficiency of 99.8%. Accordingto Iranian petroleum research, the incinerator process is still used, which exhausts SO2 intothe environment for the Sulfur recovery process.
Many refineries tire out several thousand ppm of air pollution day after day, at-tributable to the transformation of the sulfur element to SO2. A super Claus catalyst wasintroduced, whereby the reactor operates at a low temperature. A temperature reduced to255 ◦C to 200 ◦C and saved utility decreased tail gas [5]. Researchers worked on the sulfurrecovery Claus process to enhance the sulfur recovery level from the natural refinery [6].They worked on the reaction mechanism occurring in sulfur recovery units, the reactionbetween H2S, SO2, and CO2, and side reactions, such as hydrolysis of COS and CS2, andsulfation of catalyst [7–9]. A simulation was performed on MATLAB in which all physicalconditions and chemical characteristics were considered. The amount of sulfur enteringthe first bed was assumed to be 0.1 kmol/h and the amount of Sulfur present in the furnacewas also assumed [10,11]. In 2015 a researcher, Nabikandi, worked on simulation of theClaus process with the kinetic and equilibrium method, and kinetic model can predict thecomposition, temperature, and pressure of the reactor. The reactions mechanism of thisClaus process is complex rather than other processes. The modification of the Claus processto increase sulfur recovery by reduced cost is also reported in the literature [12,13]. Thismodification is a combination of oxygen enrichment and recycled streams. In 2016, Guptahas indicated a comparative kinetic model that can capture the consumption chemistry ofH2S gas and its along with sulfur impurities. It can be improved by changing the chemistryof chemical reactions. In 2016, Mahdipoor worked on the effect of impurities such asmercaptan on the Claus process. The author has built a reaction mechanism of sour gasby using CFD simulation of the furnace reactor and sulfur recovery process [14]. Severalstudies focused on the integration and simulation of Aspen Plus. The sensitivity of differentprocesses was studied [15–17].
Analysis and thermal efficiency were attained at 45% and corresponding CO2 andSOx emissions were 698 kg/MWh and 0.15 g/MWh. The optimum analysis of gasificationcycles was according to pinch analysis [18]. In 2018, the new design of the Claus process,in which H2S absorber is desorbed, and SO2 absorption, the Claus reaction, separation,and recycling in which H2S and flue gas are absorbed in MDEA. The absorbent of MDEAand sodium citrate are regenerated to reduce the cost of a process [19,20]. In 2018, thesolid package of Aspen Plus was used for simulation and optimization of the Claus reactor.Variation in the change in temperature and pressure to observe the H2S conversion intosulfur. Furthermore, to observe H2S conversion and sulfur production, Aspen Plus modelresults calculated and compared the design data [21].
Another study focused on improving the performance of sulfur recovery by usingan Aspen Hysys modified three-stage simulation model to study the behavior of sulfurrecovery and consider a based case. The performance of the base case is 93.89%. In basecase optimization, controlling air demand percent and adjusting the sulfur dew pointmargin. This margin changes Claus’s performance to 98.60% [22]. The effectiveness of eachClaus component would depend on this Claus unit’s reactor stages. The two reactors mustremove sulfur from sour gas capable of 90–96%, or Method Three must perform the samefrom sour gas capable of 95–98%. The clause process is unable to recover a 100% enteredsulfur. Therefore, the total sulfur is not possible to remove from sour gases [23]. AspenPlus takes advantage of exact fashions intended for prediction belonging to the practiceperformance through the proper group thermodynamic fashions and assumes an excellent

Mathematics 2022, 10, 88 3 of 18
design and style from a process [24,25]. These data may be provided in the iterative typeto improve the design. Several studies have been reported on the increased efficiency ofsulfur recovery by using numerical analysis [26]. Researchers worked on simulation andoptimization of pure oxygen processes in which pure oxygen is used instead of air. It hasincreased the efficiency of sulfur recovery substantially [27,28]. In recent years, it has beenpublished that the use of a catalyst increases the production efficiency. In these studies,several mechanisms have been used to multi-objective optimization of chemical reactionconditions based on a kinetic model. In multi-objective optimization, the objective functionis based on the kinetic model of chemical reactions. The NSGA-II algorithm is applied onmulti-objective optimization to optimize this parameter. The purpose of modeling anyprocess is to obtain the optimal point of the process. Any optimal reaction condition isbased on the kinetic model of the reactions [29]. In 2021, Anna Dell discussed the feasibilitystudy of acid gases and economic analysis of the process [30].
In general, prior work is limited to process modeling and simulation of the Clausprocess. Studies on pinch and cost analysis are lacking in the literature. The main objectiveof this study is process modeling and simulation of the Claus process by using the AspenPlus simulator to remove sulfur from H2S gas. The second objective is to optimize theClaus process by using parametric and topological methods. The third objective is to usepinch analysis for the Claus process. Finally, the fourth objective is to perform an economicanalysis of the Claus process. Several questions regarding pinch analysis remain to beaddressed in the literature. This paper investigates several questions related to pinch andcost analysis of the Claus process. This study can be considered a significant step forward inthe process modeling and simulation of the Claus process. The proposed method providesa substantial increase in sulfur recovery compared to the methods available in the literature.
2. Process Methodology
In this Claus process flow diagram, three inlet streams are entering into the process.In the first inlet stream, the temperature is 32 ◦C and the pressure is 10 bars. In the firststream, pure oxygen gas enters the process at 90 kmol/h, and some unwanted ammoniais also entering the process at 4.7 kmol/h. The second inlet stream enters the process ata temperature of 120 ◦C and the pressure is 2.4 bar. The flow rate of H2S is 23.9 kmol/h,a flow rate of CO2 is 16.9 kmol/h, a flow rate of CO is 2.1 kmol/h, a flow rate of H2 is10.2 kmol/h, and final ammonia flow rate is 31.6 kmol/h. In the third inlet stream, thetemperature is 50 ◦C and the pressure is 2.1 bars. The flow rate of H2S gas is 159.1 kmol/h,CO2 is 174.1 kmol/h, and N2 flow rate is 31.3 kmol/h. These three streams enter the flamezone section of the furnace. At the flame zone, there are two primary combustion reactionstaking place.
H2S + 3/2 O2 → SO2 + H2O (1)
NH3 +34
O2 →12
N2 + 3/2 H2O (2)
These highly exothermic reactions increase the temperature substantially. Severalside reactions take place. The side reaction destroys any ammonia not combusted inReaction (2).
H2S + SO2 + H2 S2 + 2H2O (3)
H2S 12
SO2 +H2 (4)
CO2 + H2 CO +H2O (5)
NH3 +34
SO2 12
N2 +3/2 H2O + 3/8 S2 (6)
The flame zone temperature is 345 ◦C, and its pressure is 1.2 bars at anoxic section. S2is formed, sulfur is condensed in the condenser, and a separator separates the sulfur. Thus,in the first furnace section, 16.2 kmol/h sulfur is produced. After sulfur production, twoheat exchangers are installed to decrease the temperature of the sulfur product to 195 ◦C,

Mathematics 2022, 10, 88 4 of 18
and pressure is 1.6 bars. After the separator is installed, the unreacted H2S gas is furtherreheated and moved toward the reactor. In this reactor, the reaction is taking place. Afterthe anoxic section, S2 is formed, sulfur is condensed in the condenser, and a separatorseparates the sulfur. Thus, in the first furnace section, 16.2 kmol/h sulfur is produced.After sulfur production, two heat exchangers are installed to decrease the temperature ofthe sulfur product to 195 ◦C and pressure is 1.6 bars. After the separator is installed, theunreacted H2S gas is further reheated and moved toward the reactor. In this reactor, thereaction is taking place.
After the reactor, sulfur is formed. The feed is moved toward the separator. Sulfuris separated from the bottom and other un-reacted H2S gas is moved toward the secondreactor the same reaction is taking place.
After the 2-reactor, feed is moved toward the separator and other sulfur is separatedthrough the separator. Sulfur is a separator from the bottom and unreacted gases movedfrom the top of the separator.
2.1. First Stage Reaction
Figure 1 shows that hydrogen sulfide gas is reacted with oxygen at high tempera-tures and pressure to form sulfur dioxide and water. In the second phase, the ammoniagases containing impurities and contaminants are reacted with oxygen to form nitrogenand water.
Mathematics 2021, 9, x FOR PEER REVIEW 4 of 18
NH3 + ¾ SO2 ⇌ ½ N2 +3/2 H2O + 3/8 S2 (6)
The flame zone temperature is 345 °C, and its pressure is 1.2 bars at anoxic section.
S2 is formed, sulfur is condensed in the condenser, and a separator separates the sulfur.
Thus, in the first furnace section, 16.2 kmol/h sulfur is produced. After sulfur production,
two heat exchangers are installed to decrease the temperature of the sulfur product to 195
°C, and pressure is 1.6 bars. After the separator is installed, the unreacted H2S gas is fur‐
ther reheated and moved toward the reactor. In this reactor, the reaction is taking place.
After the anoxic section, S2 is formed, sulfur is condensed in the condenser, and a separa‐
tor separates the sulfur. Thus, in the first furnace section, 16.2 kmol/h sulfur is produced.
After sulfur production, two heat exchangers are installed to decrease the temperature of
the sulfur product to 195 °C and pressure is 1.6 bars. After the separator is installed, the
unreacted H2S gas is further reheated and moved toward the reactor. In this reactor, the
reaction is taking place.
After the reactor, sulfur is formed. The feed is moved toward the separator. Sulfur is
separated from the bottom and other un‐reacted H2S gas is moved toward the second re‐
actor the same reaction is taking place.
After the 2‐reactor, feed is moved toward the separator and other sulfur is separated
through the separator. Sulfur is a separator from the bottom and unreacted gases moved
from the top of the separator.
2.1. First Stage Reaction
Figure 1 shows that hydrogen sulfide gas is reacted with oxygen at high temperatures
and pressure to form sulfur dioxide and water. In the second phase, the ammonia gases con‐
taining impurities and contaminants are reacted with oxygen to form nitrogen and water.
Stream 1
Stream 2
Stream 3
Mixer 1
Flame Zone
Mixer 2
Anoxic Zone
Heat Exchanger 1
Separator 1
Heat Exchanger 2
Hydrogenation Reactor 1
Heat Exchanger 3
Sulfur
Separator 2
Hydrogenation Reactor 2
Heat Exchanger 4
Heat Exchanger 5
Separator 3
Sulfur Recovery
Waste Gases
Figure 1. Block Flow diagram of the Claus process.
2.2. Second Stage Reaction
The second phase reactions consist of four different reactions taking place in the re‐
actor. First, the hydrogen sulfide, sulfur dioxide, and hydrogen react to form sulfur and
Figure 1. Block Flow diagram of the Claus process.
2.2. Second Stage Reaction
The second phase reactions consist of four different reactions taking place in thereactor. First, the hydrogen sulfide, sulfur dioxide, and hydrogen react to form sulfur andwater. The second reaction is an equilibrium reaction in which hydrogen sulfide gas isconverted into sulfur and hydrogen. In the third phase reaction, the CO2 and hydrogenreact to form carbon monoxide and water. Finally, in the fourth phase reaction, ammoniaand sulfur dioxide react to form nitrogen, water, and sulfur.
Mathematics 2022, 10, 88 5 of 18
Di-sulfur is converted into octal-sulfur at the same pressure and exact temperaturein these equilibrium phase reactions. In the second stage, hydrogen sulfide gas is reactedwith SO2 to form octal-sulfur and water.
S2 14
S8 (7)
H2S + 1/2 SO2 3/16 S8 +H2O (8)
There is a flame zone in the Claus process in which plug flow reactors are used.Different reactions take place in the plug flow reactor. There is an exothermic reactionthat takes place in the reaction furnace. Furnace reactions cause some technical problems.Due to increased reaction, the formation of ammonia gas causes corrosion in the chemicalequipment. Now, the objective is to minimize the production of ammonia gas in furnacereaction because ammonia has decreased the performance of the Claus process. Theexhaust gases of the furnace are sulfur dioxide gas (SO2) and nitrogen gas (N2), and itsoutlet temperature is 345 ◦C and 1.8 bars pressure. After the furnace reaction, these gasesare cooled with waste heat boiler (WHB).
There are two catalytic reactors used in the Claus process. The two catalysts, titaniumand alumina, increase the reaction rate in a plug flow reactor. In the first reactor, thereaction occurs at 330 ◦C, and the pressure is 10 bars. In the first reactor, the conversion ofH2S gas into sulfur is about 70%. In the first reaction, the catalyst is installed in a differentlayer. In the second reactor, the H2S gas conversion to sulfur is about 92%. In the secondreactor, the reaction occurs at 234 ◦C temperature and the pressure is 8 bars. At the finalstage, the reaction conversion is 92%.
Table 1 shows the inlet composition of gas feed. Ten gases are entered into the feedcomposition for the sulfur recovery unit. In addition, three inlet feeds enter at the sametime for chemical reactions. The oxygen flow rate is 90 kmol/h in the first stream andzero in the second and third streams. Finally, in the third stream, H2S gas is entered intothe reactor.
Table 1. Inlet composition of feed for three different inlet streams.
Composition Gases Stream No 1 Stream No 2 Stream No 3
Hydrogen sulfide 0 23.9 159.1
Sulfur dioxide 0 0 0
Water 0 0 15.6
Carbon Monoxide 0 16.9 174.1
Carbon dioxide 0 2.1 0
Oxygen 90 0 0
Hydrogen 0 10.2 0
Nitrogen 4.7 1.3 31.3
Ammonia 0 31.6 7.9
S2 0 0 0
S8 0 0 0
2.3. Reactions Kinetic of Claus Process
The modeling of a flame reactor consists of two zones, including the oxygen richerzone in which exothermic reactions occur. The second reactor is slower and endothermicreactions take place.
The rate equations are:
− ri = Koi exp [−EiRT
] PH2SPNH3 PO2 (9)

Mathematics 2022, 10, 88 6 of 18
where i is the equation number.Whereas ri is kmol/s/m3, pi is atm and Koi unit varies depending upon temperature
and pressure.The rate of reaction is:
−r3 = 3.58 × 10⁷ exp [−26.0
RT](
PH2SPNH3 PO2− exp [−0.949− 5840T
] PS2 PH2O (10)
−r4 = 9.17 × 10⁵ exp [−45.0
RT](
PH2SPS2− exp [−5.93− 10, 880T
] PS2 PH2 (11)
−r5 = 1.52 × 10¹² exp [−60.3
RT](CCO2 CH2− exp [−3.88 +
4166T
]CcoCh2o
Ch2(12)
− r6 = 2.29 × 10⁴ exp [−27.5
RT] CNH3 CSO2 (13)
Whereas ri is kmol/s/m3 and pi is pressure in atm and Ci are kmol/m3.
Kp = exp [−53.67 +47, 800T(K)
] (14)
In the reactor, there are two different catalysts used in each reactor. In the first reactor,alumina is used, and, in the second reactor, titanium catalysts are used. In addition, thereare highly exothermic reactions in the reactor, where the coolant is used to control thereactor’s temperature. Otherwise, catalyst deactivation takes place and sulfur deposits onthe catalyst.
−7 = 5360 exp[−7.35
RT
](
PH2SPSO2− exp[
8.66− 5550T]PH2O PS8(
1 + 1.14 exp[−0.6
RT]PH2O
) )(15)
The values used in Equations (9)–(15) are given in Table 2.
Table 2. Reaction kinetic values of the Claus process.
i EiKcal/kmol Koi A b c
1 11,000 1.40 × 10⁴ 1 0 1.5
2 40,000 4.43 × 10⁶ 0 1 0.75
Figure 2 shows the process flow diagram of the Claus process in which sulfur recov-ered varies from this unit. Feed is entering into the process in three inlets. The first andsecond streams are mixed in a mixer and they enter the flame zone. The third streamis entering into an anoxic section for chemical reaction. After the flaming zone, somesulfur is formed that is separated at the bottom of the separator. The other unreacted gasesmoving toward the heat exchanger again increased the temperature at 314 ◦C after theheat exchanger. It is moved toward the hydrogenation reactor, in which reaction occurs at314 ◦C at 1.6 atm. After passing through the hydrogenation reaction, about 10.5 kmol/hof sulfur is formed. These sulfurs are extracted separately at the bottom of the separator.After that, more unreacted gases are further moved toward another hydrogenation reactor.The reaction takes place at the same temperature and pressure, at 315 ◦C and 1.6 atm,respectively. After the second reactor, more sulfur is formed at a flow rate of 10.5 kmol/h.After that, all the sulfur streams are mixed at the mixer to reach the final flow rate of25.805 kmol/h.

Mathematics 2022, 10, 88 7 of 18
Mathematics 2021, 9, x FOR PEER REVIEW 7 of 18
second reactor, more sulfur is formed at a flow rate of 10.5 kmol/h. After that, all the sulfur
streams are mixed at the mixer to reach the final flow rate of 25.805 kmol/h.
Figure 2. Process flow diagram of the Claus process.
3. Results and Discussion
3.1. Sensitivity Analysis
This parametric optimization deals with the operating variables of chemical plants,
such as temperature, concentration, and the pressure of chemical equipment. The param‐
eter is selected based on the process’s nature. The critical parameters of this process are a
temperature of a reactor, pressure of reaction, the composition of inlet feed, diameter, and
length of the furnace. In this parametric analysis, the result shows that changing the pa‐
rameter causes a significant effect on the efficiency of a chemical plant. There are four
different types of parametric optimization. First, in the plug flow reactor, diameter is
changed from 10 inches to 70 inches. Second, the length and diameter of the furnace are
changed from 35 inches and 30 inches to 50 inches and 55 inches, respectively. Third, the
oxygen flow rate changes from 90 lb/h to 170 lb/h to optimize the process. Finally, the
temperature of the reactor has increased from 280 °C to 370 °C.
3.2. Effect of Changing Furnace Diameter and Length
When the length of the reactor is increased, it causes an increase in residence time of
the process and has the destruction of ammonia production in a furnace (using t = V/V0, t
= residence time, V = volume of furnace, V0 = flowrate of the gases). The deactivation of
catalyst causes ammonia containment, and it is causes corrosion on the chemical equip‐
ment. Figure 3 shows that when the reactor’s length increases, the ammonia production
decreases, and the production of sulfur increases. The destruction of ammonia is decreas‐
ing due to the conversion of NO and N2 along the length.
Figure 2. Process flow diagram of the Claus process.
3. Results and Discussion3.1. Sensitivity Analysis
This parametric optimization deals with the operating variables of chemical plants,such as temperature, concentration, and the pressure of chemical equipment. The parameteris selected based on the process’s nature. The critical parameters of this process are atemperature of a reactor, pressure of reaction, the composition of inlet feed, diameter,and length of the furnace. In this parametric analysis, the result shows that changingthe parameter causes a significant effect on the efficiency of a chemical plant. There arefour different types of parametric optimization. First, in the plug flow reactor, diameter ischanged from 10 inches to 70 inches. Second, the length and diameter of the furnace arechanged from 35 inches and 30 inches to 50 inches and 55 inches, respectively. Third, theoxygen flow rate changes from 90 lb/h to 170 lb/h to optimize the process. Finally, thetemperature of the reactor has increased from 280 ◦C to 370 ◦C.
3.2. Effect of Changing Furnace Diameter and Length
When the length of the reactor is increased, it causes an increase in residence time ofthe process and has the destruction of ammonia production in a furnace (using t = V/V0,t = residence time, V = volume of furnace, V0 = flowrate of the gases). The deactivation ofcatalyst causes ammonia containment, and it is causes corrosion on the chemical equipment.Figure 3 shows that when the reactor’s length increases, the ammonia production decreases,and the production of sulfur increases. The destruction of ammonia is decreasing due tothe conversion of NO and N2 along the length.
Mathematics 2021, 9, x FOR PEER REVIEW 8 of 18
Figure 3. Effect of change in furnace diameter and length.
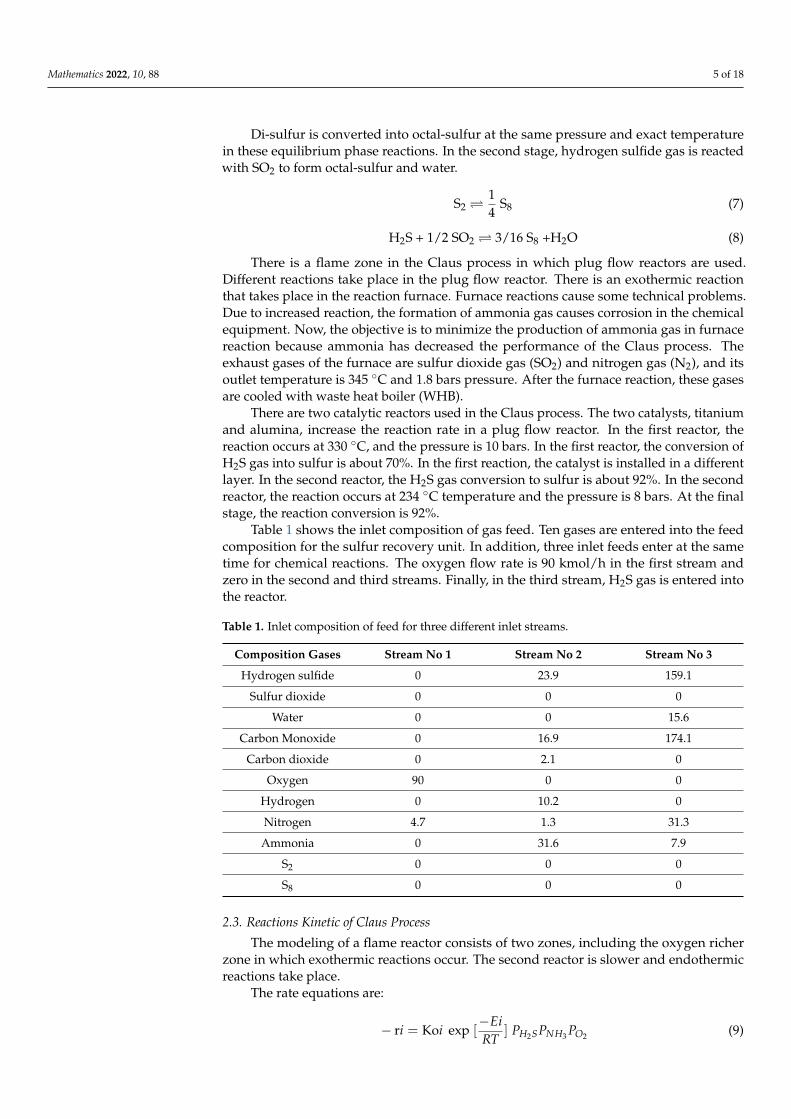
3.3. Effect of Increasing Oxygen Flow Rate on Sulfur Recovery
Oxygen is a limiting reactant of this Claus process. Therefore, the goal is to maximize
the consumption of H2S gas into elemental sulfur in this process. In this primary reaction
of the Claus process, hydrosulfide gas is reacted with oxygen to form water and sulfur.
Therefore, the oxygen flow rate varied for the maximum consumption of H2S gas into
sulfur. The target was 0% unreacted H2S gas coming out from the product. Figure 4 shows
that when the oxygen flow rate increases, the conversion of H2S gas into sulfur increases.
When the flow rate of oxygen is increasing, the unreacted H2S is increasing. The oxygen
is a limiting reactant, providing the oxygen in excess amounts.
Figure 4. Effect of Oxygen on sulfur Recovery.
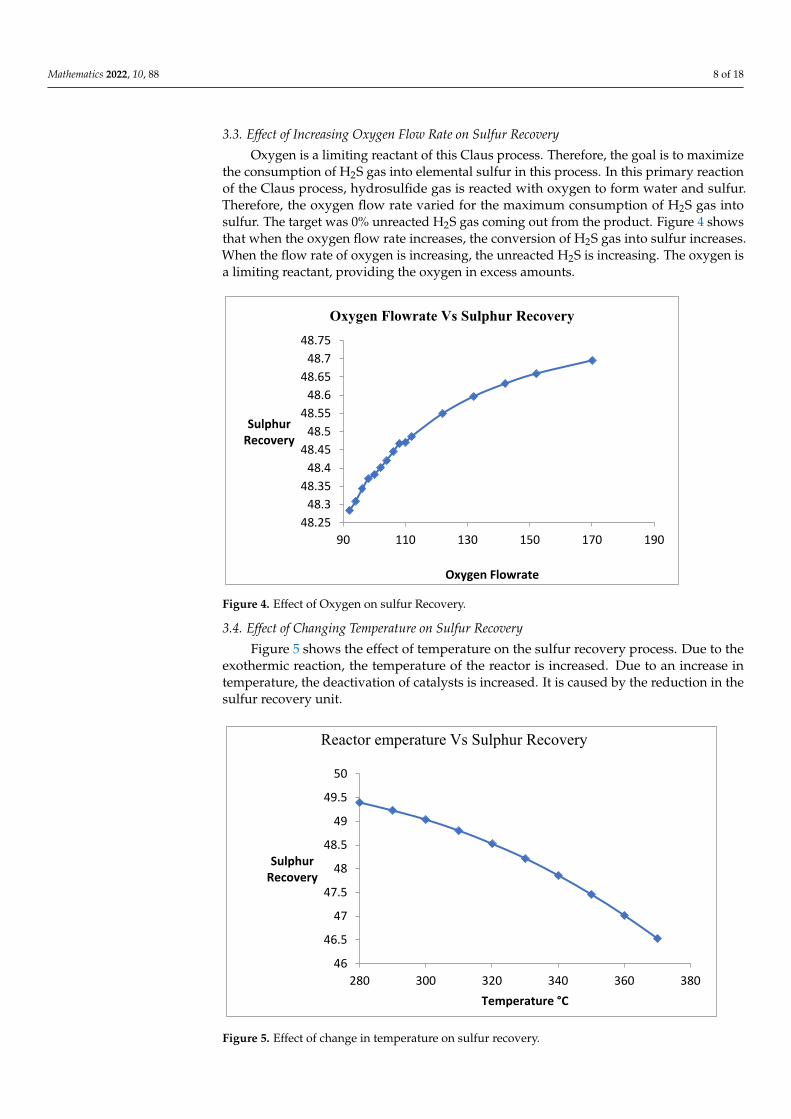
3.4. Effect of Changing Temperature on Sulfur Recovery
Figure 5 shows the effect of temperature on the sulfur recovery process. Due to the
exothermic reaction, the temperature of the reactor is increased. Due to an increase in
temperature, the deactivation of catalysts is increased. It is caused by the reduction in the
sulfur recovery unit.
0
10
20
30
40
50
60
70
80
90
0 10 20 30 40 50 60 70 80
SulfurRecovery
&NH3
Formation
Diameter of Furnace (m)
Sulfur Recovery
NH3 formation
48.25
48.3
48.35
48.4
48.45
48.5
48.55
48.6
48.65
48.7
48.75
90 110 130 150 170 190
Sulphur Recovery
Oxygen Flowrate
Oxygen Flowrate Vs Sulphur Recovery
Figure 3. Effect of change in furnace diameter and length.
Mathematics 2022, 10, 88 8 of 18
3.3. Effect of Increasing Oxygen Flow Rate on Sulfur Recovery
Oxygen is a limiting reactant of this Claus process. Therefore, the goal is to maximizethe consumption of H2S gas into elemental sulfur in this process. In this primary reactionof the Claus process, hydrosulfide gas is reacted with oxygen to form water and sulfur.Therefore, the oxygen flow rate varied for the maximum consumption of H2S gas intosulfur. The target was 0% unreacted H2S gas coming out from the product. Figure 4 showsthat when the oxygen flow rate increases, the conversion of H2S gas into sulfur increases.When the flow rate of oxygen is increasing, the unreacted H2S is increasing. The oxygen isa limiting reactant, providing the oxygen in excess amounts.
Mathematics 2021, 9, x FOR PEER REVIEW 8 of 18
Figure 3. Effect of change in furnace diameter and length.
3.3. Effect of Increasing Oxygen Flow Rate on Sulfur Recovery
Oxygen is a limiting reactant of this Claus process. Therefore, the goal is to maximize
the consumption of H2S gas into elemental sulfur in this process. In this primary reaction
of the Claus process, hydrosulfide gas is reacted with oxygen to form water and sulfur.
Therefore, the oxygen flow rate varied for the maximum consumption of H2S gas into
sulfur. The target was 0% unreacted H2S gas coming out from the product. Figure 4 shows
that when the oxygen flow rate increases, the conversion of H2S gas into sulfur increases.
When the flow rate of oxygen is increasing, the unreacted H2S is increasing. The oxygen
is a limiting reactant, providing the oxygen in excess amounts.
Figure 4. Effect of Oxygen on sulfur Recovery.
3.4. Effect of Changing Temperature on Sulfur Recovery
Figure 5 shows the effect of temperature on the sulfur recovery process. Due to the
exothermic reaction, the temperature of the reactor is increased. Due to an increase in
temperature, the deactivation of catalysts is increased. It is caused by the reduction in the
sulfur recovery unit.
0
10
20
30
40
50
60
70
80
90
0 10 20 30 40 50 60 70 80
SulfurRecovery
&NH3
Formation
Diameter of Furnace (m)
Sulfur Recovery
NH3 formation
48.25
48.3
48.35
48.4
48.45
48.5
48.55
48.6
48.65
48.7
48.75
90 110 130 150 170 190
Sulphur Recovery
Oxygen Flowrate
Oxygen Flowrate Vs Sulphur Recovery
Figure 4. Effect of Oxygen on sulfur Recovery.
3.4. Effect of Changing Temperature on Sulfur Recovery
Figure 5 shows the effect of temperature on the sulfur recovery process. Due to theexothermic reaction, the temperature of the reactor is increased. Due to an increase intemperature, the deactivation of catalysts is increased. It is caused by the reduction in thesulfur recovery unit.
Mathematics 2021, 9, x FOR PEER REVIEW 9 of 18
Figure 5. Effect of change in temperature on sulfur recovery.
3.5. Pinch Analysis
Pinch analysis is a method for minimizing the energy consumption of the chemical
process industry. There is maximum utilization of internal utilization and minimum con‐
sumption of external utilization. The heat exchanger size is changed, and the area of the
heat exchanger is also increased.
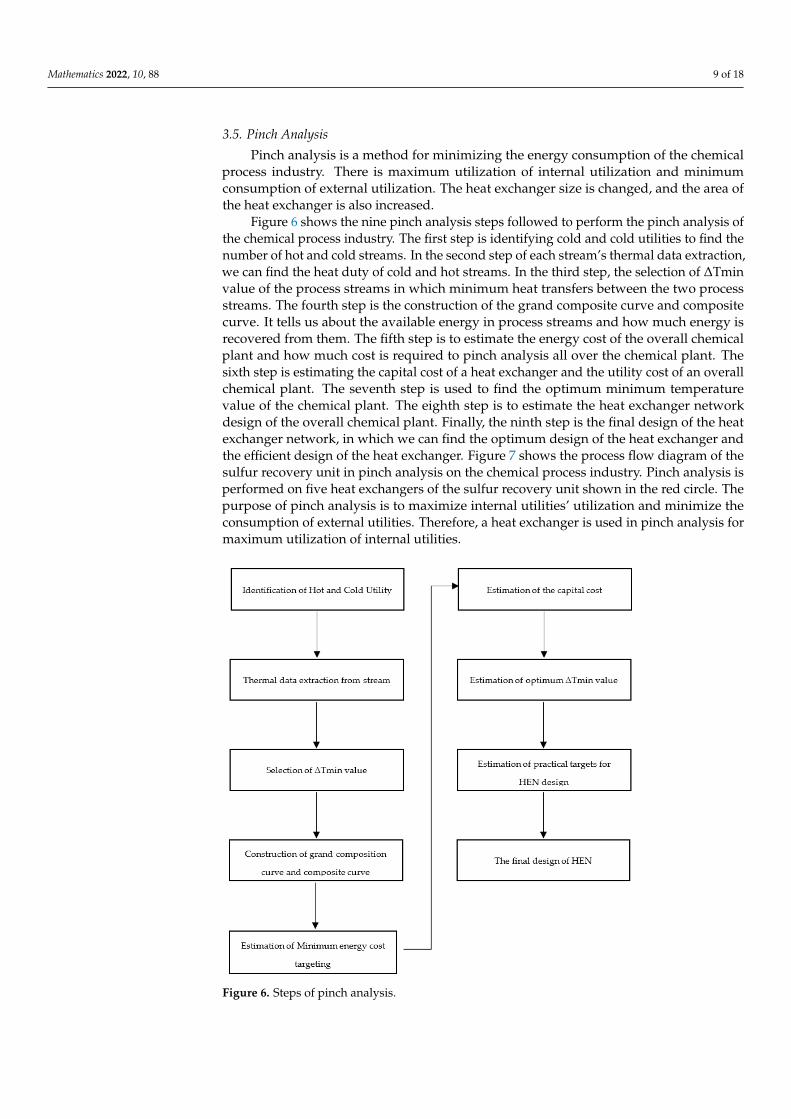
Figure 6 shows the nine pinch analysis steps followed to perform the pinch analysis
of the chemical process industry. The first step is identifying cold and cold utilities to find
the number of hot and cold streams. In the second step of each stream’s thermal data ex‐
traction, we can find the heat duty of cold and hot streams. In the third step, the selection
of ∆Tmin value of the process streams in which minimum heat transfers between the two
process streams. The fourth step is the construction of the grand composite curve and
composite curve. It tells us about the available energy in process streams and how much
energy is recovered from them. The fifth step is to estimate the energy cost of the overall
chemical plant and how much cost is required to pinch analysis all over the chemical
plant. The sixth step is estimating the capital cost of a heat exchanger and the utility cost
of an overall chemical plant. The seventh step is used to find the optimum minimum tem‐
perature value of the chemical plant. The eighth step is to estimate the heat exchanger
network design of the overall chemical plant. Finally, the ninth step is the final design of
the heat exchanger network, in which we can find the optimum design of the heat ex‐
changer and the efficient design of the heat exchanger. Figure 7 shows the process flow
diagram of the sulfur recovery unit in pinch analysis on the chemical process industry.
Pinch analysis is performed on five heat exchangers of the sulfur recovery unit shown in
the red circle. The purpose of pinch analysis is to maximize internal utilities’ utilization
and minimize the consumption of external utilities. Therefore, a heat exchanger is used in
pinch analysis for maximum utilization of internal utilities.
46
46.5
47
47.5
48
48.5
49
49.5
50
280 300 320 340 360 380
Sulphur Recovery
Temperature °C
Reactor emperature Vs Sulphur Recovery
Figure 5. Effect of change in temperature on sulfur recovery.
Mathematics 2022, 10, 88 9 of 18
3.5. Pinch Analysis
Pinch analysis is a method for minimizing the energy consumption of the chemicalprocess industry. There is maximum utilization of internal utilization and minimumconsumption of external utilization. The heat exchanger size is changed, and the area ofthe heat exchanger is also increased.
Figure 6 shows the nine pinch analysis steps followed to perform the pinch analysis ofthe chemical process industry. The first step is identifying cold and cold utilities to find thenumber of hot and cold streams. In the second step of each stream’s thermal data extraction,we can find the heat duty of cold and hot streams. In the third step, the selection of ∆Tminvalue of the process streams in which minimum heat transfers between the two processstreams. The fourth step is the construction of the grand composite curve and compositecurve. It tells us about the available energy in process streams and how much energy isrecovered from them. The fifth step is to estimate the energy cost of the overall chemicalplant and how much cost is required to pinch analysis all over the chemical plant. Thesixth step is estimating the capital cost of a heat exchanger and the utility cost of an overallchemical plant. The seventh step is used to find the optimum minimum temperaturevalue of the chemical plant. The eighth step is to estimate the heat exchanger networkdesign of the overall chemical plant. Finally, the ninth step is the final design of the heatexchanger network, in which we can find the optimum design of the heat exchanger andthe efficient design of the heat exchanger. Figure 7 shows the process flow diagram of thesulfur recovery unit in pinch analysis on the chemical process industry. Pinch analysis isperformed on five heat exchangers of the sulfur recovery unit shown in the red circle. Thepurpose of pinch analysis is to maximize internal utilities’ utilization and minimize theconsumption of external utilities. Therefore, a heat exchanger is used in pinch analysis formaximum utilization of internal utilities.
Mathematics 2021, 9, x FOR PEER REVIEW 10 of 18
Figure 6. Steps of pinch analysis.
Figure 7. Pinch analysis process diagram.
Figure 8 shows the optimum heat exchanger network of the heat exchanger. There
are seven heat exchangers used, which are used to process heat exchangers. The total
number of areas is 5666 m2; the total heating utilities are used at 4.12 × 10⁵ kj/h. The total
cooling utilities are used 3.6 × 10⁷ kj/h. These diagrams show the sizes of a heat exchanger
and the heat duty of each heat exchanger. The blue line shows the cold streams, and the
red line shows the hot streams. The heat exchanger is shown in circles.
Figure 6. Steps of pinch analysis.

Mathematics 2022, 10, 88 10 of 18
Mathematics 2021, 9, x FOR PEER REVIEW 10 of 18
Figure 6. Steps of pinch analysis.
Figure 7. Pinch analysis process diagram.
Figure 8 shows the optimum heat exchanger network of the heat exchanger. There
are seven heat exchangers used, which are used to process heat exchangers. The total
number of areas is 5666 m2; the total heating utilities are used at 4.12 × 10⁵ kj/h. The total
cooling utilities are used 3.6 × 10⁷ kj/h. These diagrams show the sizes of a heat exchanger
and the heat duty of each heat exchanger. The blue line shows the cold streams, and the
red line shows the hot streams. The heat exchanger is shown in circles.
Figure 7. Pinch analysis process diagram.
Figure 8 shows the optimum heat exchanger network of the heat exchanger. There areseven heat exchangers used, which are used to process heat exchangers. The total numberof areas is 5666 m2; the total heating utilities are used at 4.12 × 10⁵ kj/h. The total coolingutilities are used 3.6 × 10⁷ kj/h. These diagrams show the sizes of a heat exchanger andthe heat duty of each heat exchanger. The blue line shows the cold streams, and the redline shows the hot streams. The heat exchanger is shown in circles.
Mathematics 2021, 9, x FOR PEER REVIEW 11 of 18
Figure 8. Heat exchanger network (HEN) design of heat exchanger.
Table 3 shows the number of heat exchangers that are used for pinch analysis. The
first column shows the name of heat exchangers, and the third column shows the types of
heat exchangers, such as a heater or cooler. The fourth column shows the heat duty of the
heat exchanger in (cal/s). The next column shows the inlet temperature and outlet temper‐
ature of hot utility and cold utility.
Table 3. Pinch Analysis temperature interval result by using Aspen Plus.
Heat Exchanger Types Base Duty (cal/s)
Hot Inlet
Temperature
(°C)
Hot Outlet
Temperature
(°C)
Cold Inlet
Temperature
(°C)
Cold Outlet
Temperature
(°C)
B7 Heater 1.885 × 10⁵ 250 249 58.3 195
B9 Heater 1.701 × 10⁵ 1000 400 195 314
B13 Heater 1.553 × 10⁵ 1000 400 195 314
B14_Heat_Exchanger Cooler 1769 314 313.5 249 250
B_10 Heat Exchanger Cooler 2.565 × 10⁶ 314 313.5 249 250
B11 Cooler 1.73 × 10⁶ 314 195 174 175
B15 Cooler 1.566 × 10⁵ 314 194 174 175
Table 4 shows the pinch analysis result and temperature interval. It shows a detailed
study of a heat exchanger. The first column shows the name of the heat exchanger. The
second column shows the heat exchanger’s feather‐like working principle. The fourth col‐
umn shows the heat duty of the heat exchanger, the fifth column shows the recoverable
duty, and the other table shows the inlet and outlet temperature of hot and cold utilities.
Table 4. Pinch analysis and temperature interval result.
Heat Exchanger Types Recovery Duty
(cal/s) Hot Side Fluid Cold Side Fluid
B2 Heater 1.885 × 10⁵ HP Steam 4 to 5
Heater Heater 1.55 × 10⁵ Fire Heater
(1000) 7 to S4
Figure 8. Heat exchanger network (HEN) design of heat exchanger.
Table 3 shows the number of heat exchangers that are used for pinch analysis. Thefirst column shows the name of heat exchangers, and the third column shows the typesof heat exchangers, such as a heater or cooler. The fourth column shows the heat duty ofthe heat exchanger in (cal/s). The next column shows the inlet temperature and outlettemperature of hot utility and cold utility.

Mathematics 2022, 10, 88 11 of 18
Table 3. Pinch Analysis temperature interval result by using Aspen Plus.
Heat Exchanger Types Base Duty(cal/s)
Hot InletTemperature
(◦C)
Hot OutletTemperature
(◦C)
Cold InletTemperature
(◦C)
Cold OutletTemperature
(◦C)
B7 Heater 1.885 × 10⁵ 250 249 58.3 195
B9 Heater 1.701 × 10⁵ 1000 400 195 314
B13 Heater 1.553 × 10⁵ 1000 400 195 314
B14_Heat_Exchanger Cooler 1769 314 313.5 249 250
B_10 Heat Exchanger Cooler 2.565 × 10⁶ 314 313.5 249 250
B11 Cooler 1.73 × 10⁶ 314 195 174 175
B15 Cooler 1.566 × 10⁵ 314 194 174 175
Table 4 shows the pinch analysis result and temperature interval. It shows a detailedstudy of a heat exchanger. The first column shows the name of the heat exchanger. Thesecond column shows the heat exchanger’s feather-like working principle. The fourthcolumn shows the heat duty of the heat exchanger, the fifth column shows the recoverableduty, and the other table shows the inlet and outlet temperature of hot and cold utilities.
Table 4. Pinch analysis and temperature interval result.
Heat Exchanger Types Recovery Duty(cal/s) Hot Side Fluid Cold Side Fluid
B2 Heater 1.885 × 10⁵ HP Steam 4 to 5
Heater Heater 1.55 × 10⁵ Fire Heater(1000) 7 to S4
B13 Heater 1.423 × 10⁵ Fire Heater(1000) S18 to S20
B14 HeatExcahnger Cooler 0 B14_Heat HP steam
generation
B5 HeatExchanger Cooler 0 B5_Heat HP steam
generation
B8 Cooler 0 7A to S17 MP steamgeneration
B10 Cooler 0 S21 to S22 MP steamgeneration
Table 5 shows the energy saving and utility saving during the pinch analysis of theClaus process. The table is divided into three categories; first is energy, greenhouse, andenergy cost saving. In the first energy section, the total hot utilities are 5.13 × 10⁵. Thehot target utilities are 2.73 × 10⁴ cal/s. The potential saving energy by pinch analysis isapproximately 4.865 × 10⁵ cal/s. The energy cost saving is 229,578 USD/yr by using pinchanalysis. By using the pinch analysis, an energy cost saving is about 93.73%.
In Table 6, the first graph shows total utilities, the second shows heating utilities, thethird shows cooling utilities, and the fourth shows carbon utilities. The actual total utilitiesare 3.41 × 10⁶ cal/s and the target utilities are 2.4373 × 10⁶ cal/s. The actual energy savingis 28.53%. The actual heating utilities are 5.13 × 10⁵ cal/s, the target is 2.73 × 10⁶ cal/s,and the actual saving is 94.68%. The actual cooling utilities are 2.8 × 10⁶ (cal/s), the targetis 2.4 × 10⁶ cal/s, and the actual saving is 16.80%.

Mathematics 2022, 10, 88 12 of 18
Table 5. Utilities cost and energy saving by pinch analysis with the help of Aspen Plus.
Type Current(cal/s) Target (cal/s)
SavingPotential
(cal/s)
Energy CostSaving
(USD/yr)
Energy CostSaving (%) ∆Tmin (◦C)
HP Steam 1.884 × 10⁵ 0 1.884 × 10⁵ 62.243 100 10
Fire Heat (1000) 3.254 × 10⁵ 2.73 × 10⁴ 2.981 × 10⁵ 167.336 91.60 25
Total Hot Utilities 5.138 × 10⁵ 2.73 × 10⁴ 4.65 × 10⁵ 229.578 93.73
HP Steam Generation 2.567 × 10⁶ 2.41 × 10⁶ 1.569 × 10⁵ −51.618 −6.11 10
MP steam Generation 3.296 × 10⁵ 0 3.296 × 10⁵ −95.370 −100 10
Total Cold Utilities 2.896 × 10⁶ 2.41 × 10⁶ 4.865 × 10⁵ −146.989 −15.64
Table 6. Total utilities, heating utilities, cooling utilities, and carbon emission.
Type Actual Target AvailableSavings % of Actual
Total Utilities (cal/s) 3.41 × 10⁶ 2.437 × 10⁶ 9.7025 × 10⁵ 28.53
Heating Utilities (cal/s) 51.38 × 10⁵ 2.767 × 10⁴ 4.865 × 10⁵ 94.68
Cooling Utilities 2.896 × 10⁶ 2.41 × 10⁶ 4.86 × 10⁵ 16.80
Carbon Emission (kg/h) 0 0 0 0
Table 7 shows carbon emissions into the atmosphere. The total hot utilities and coldutilities are emitted carbon compounds into the atmosphere. There is zero emission ofcarbon to the atmosphere by hot and cold utilities.
Table 7. Carbon Emission Details.
Type Current(kg/h)
Target(kg/h)
SavingPotential
(kg/h)
EmissionCost Saving
(USD/yr)
EmissionCost Saving
HP steam 0 0 0 0 0.00
Fire Heat (1000) 0 0 0 0 0.0
Total Hot Utilities 0 0 0 0 0.00
HP SteamGeneration 0 0 0 0 0.00
MP SteamGeneration 0 0 0 0 0.00
Total Cold Utilities 0 0 0 0 0.00
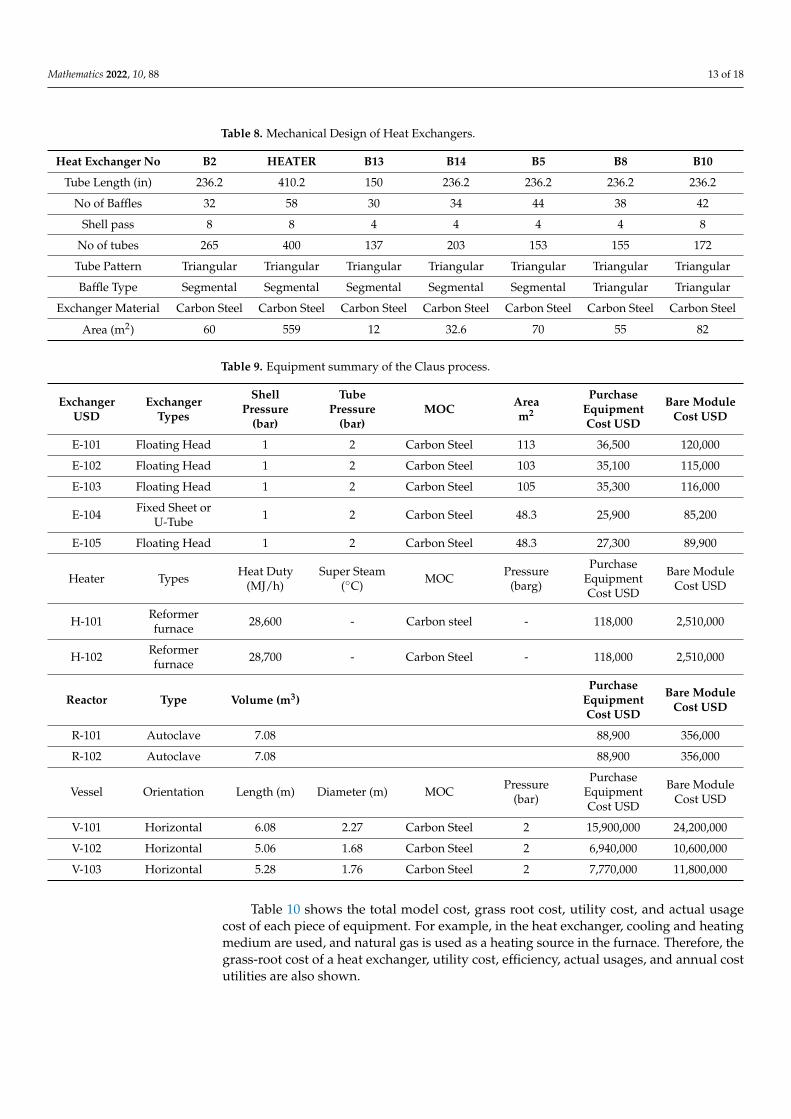
Table 8 shows the mechanical design of the heat exchanger. Theses parameter ofmechanical design plays a vital role in checking the physical stability of heat exchanger tohave a safe design without any failure.
Table 9 shows the name of equipment used in a process flow diagram, the cost, andarea of equipment. The type of equipment used in the process flow diagram, the materialof construction of equipment, and pressure at the tube side and shell side are also shown.
Mathematics 2022, 10, 88 13 of 18
Table 8. Mechanical Design of Heat Exchangers.
Heat Exchanger No B2 HEATER B13 B14 B5 B8 B10
Tube Length (in) 236.2 410.2 150 236.2 236.2 236.2 236.2
No of Baffles 32 58 30 34 44 38 42
Shell pass 8 8 4 4 4 4 8
No of tubes 265 400 137 203 153 155 172
Tube Pattern Triangular Triangular Triangular Triangular Triangular Triangular Triangular
Baffle Type Segmental Segmental Segmental Segmental Segmental Triangular Triangular
Exchanger Material Carbon Steel Carbon Steel Carbon Steel Carbon Steel Carbon Steel Carbon Steel Carbon Steel
Area (m2) 60 559 12 32.6 70 55 82
Table 9. Equipment summary of the Claus process.
ExchangerUSD
ExchangerTypes
ShellPressure
(bar)
TubePressure
(bar)MOC Area
m2
PurchaseEquipmentCost USD
Bare ModuleCost USD
E-101 Floating Head 1 2 Carbon Steel 113 36,500 120,000
E-102 Floating Head 1 2 Carbon Steel 103 35,100 115,000
E-103 Floating Head 1 2 Carbon Steel 105 35,300 116,000
E-104 Fixed Sheet orU-Tube 1 2 Carbon Steel 48.3 25,900 85,200
E-105 Floating Head 1 2 Carbon Steel 48.3 27,300 89,900
Heater Types Heat Duty(MJ/h)
Super Steam(◦C) MOC Pressure
(barg)
PurchaseEquipmentCost USD
Bare ModuleCost USD
H-101 Reformerfurnace 28,600 - Carbon steel - 118,000 2,510,000
H-102 Reformerfurnace 28,700 - Carbon Steel - 118,000 2,510,000
Reactor Type Volume (m3)Purchase
EquipmentCost USD
Bare ModuleCost USD
R-101 Autoclave 7.08 88,900 356,000
R-102 Autoclave 7.08 88,900 356,000
Vessel Orientation Length (m) Diameter (m) MOC Pressure(bar)
PurchaseEquipmentCost USD
Bare ModuleCost USD
V-101 Horizontal 6.08 2.27 Carbon Steel 2 15,900,000 24,200,000
V-102 Horizontal 5.06 1.68 Carbon Steel 2 6,940,000 10,600,000
V-103 Horizontal 5.28 1.76 Carbon Steel 2 7,770,000 11,800,000
Table 10 shows the total model cost, grass root cost, utility cost, and actual usagecost of each piece of equipment. For example, in the heat exchanger, cooling and heatingmedium are used, and natural gas is used as a heating source in the furnace. Therefore, thegrass-root cost of a heat exchanger, utility cost, efficiency, actual usages, and annual costutilities are also shown.

Mathematics 2022, 10, 88 14 of 18
Table 10. Utility summary of the Claus process.
Name Total ModuleCost USD
Grass RootCost USD Utility Cost Efficiency Actual Usage
(MJ/h)Annual CostUtility USD
E-101 256,800 366,000 Cooling water 32,300 10,200
E-102 136,000 194,000 Low-pressure Steam 897 15,150
E-103 137,000 195,000 Cooling water 2900 9100
E-104 100,000 143,000 Medium pressureSteam 759 17,560
E-105 106,000 151,000 Cooling water 1430 4500
H-101 2,960,000 4,220,000 Natural gas 0.9 31,800 836,000
H-102 2,970,000 4,220,000 Natural gas 0.9 31,900 839,000
R-101 420,000 464,000 Low-pressure Steam 897 15,150
R-102 420,000 464,000 Low-pressure Steam 2900 49,000
V-101 28,600,000 28,600,000 N/A
V-102 12,500,000 12,500,000 N/A
V-103 14,000,000 14,000,000 N/A
Total USD 62.5 million 65.4 million 1.89 million
Table 11 shows the material name and its classification. This table shows the price indollars (year 2020) and the flow rate of each component. It is also described the annual costof raw material and product cost.
Table 11. Material of construction cost summary.
Material Name Classification Price (USD/kg) * Flow Rate(kg/h) Annual Cost USD
HydrogenSulfide Raw Material - 5853 -
Oxygen Raw Material 1.50 2880 35.95 million
Sulfur Product 0.19 390 0.61 million
Hydrogen Product 12 718 71.7 million
Nitrogen Product 10 4009 333.69 million
Nitrogen Raw Material 10 1193.73 99.9 million
Ammonia Raw Material 9 1264 94.6 million* All the prices are taken from https://www.alibaba.com/, accessed on 10 November 2020.
Table 12 describes the result of the heat exchanger and heating utility after the pinchanalysis. This result shows that, after the pinch analysis, the size of the heat exchangerincreases, and the utility consumption decreases.
Table 13 shows the revenue from the sale, raw material cost, utilities, and final profit.After the pinch analysis and parametric optimization, it takes 2.2 million USD per year.Furthermore, by comparing both tables after optimization and optimization, a differenceof 2.2 million USD per year is observed.

Mathematics 2022, 10, 88 15 of 18
Table 12. Cost analysis of the Claus process after pinch analysis.
ExchangerUSD
ExchangerTypes
Shell Pressure(bar)
Tube Pressure(bar) MOC Area
m2
PurchaseEquipmentCost USD
E-101 Floating Head 1 2 Carbon Steel 60 28,900
E-102 Floating Head 1 2 Carbon Steel 12.8 26,000
E-103 Floating Head 1 2 Carbon Steel 559 108,000
E-104 Fixed Sheet orU-Tube 1 2 Carbon Steel 32.7 23,800
E-105 Floating Head 1 2 Carbon Steel 70.8 30,400
Heater Types Heat Duty(MJ/h)
Super Steam(◦C) MOC Pressure
PurchaseEquipmentCost USD
H-101 ReformerFurnace 28,600 - Carbon Steel - 118,000
H-102 ReformerFurnace 28,700 - Carbon Steel - 118,000
Reactor Type Volume (m3)Purchase
Equipment CostUSD
Bare ModuleCost USD
R-101 Autoclave 7.08 88,900 356,000
R-102 Autoclave 7.08 88,900 356,000
Vessel Orientation Length (m) Diameter (m) MOCPurchase
Equipment CostUSD
Bare ModuleCost USD
V-101 Horizontal 6.08 2.27 Carbon Steel 15,900,000 24,200,000
V-102 Horizontal 5.06 1.68 Carbon Steel 6,940,000 10,600,000
V-103 Horizontal 5.28 1.76 Carbon Steel 7,770,000 11,800,000
Table 13. Cost comparison before and after optimization of the Claus process.
Type Before OptimizationMillion USD
After OptimizationMillion USD
Revenue from Sale 415.7 424.5
CRM (Raw Material Cost) 229.9 237.9
CUT (Cost of Utilities) 0.144 0.042
CWT (Waste Treatment Cost) - -
COL (Cost of OperatingLabor) 0.937 0.937
Profit 183.1 185.5
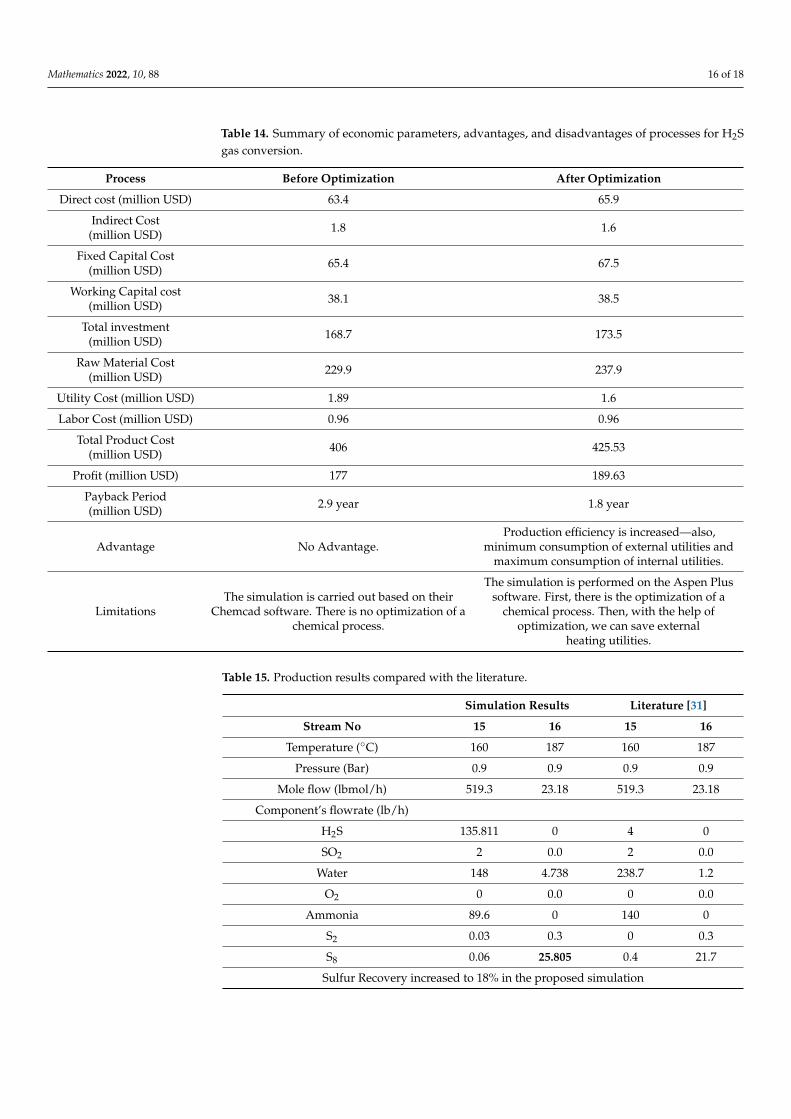
Table 14 shows the comparison between post-optimization of process and pre-optimizationof a chemical process. Before optimizing the process, the direct, indirect, and utility costsare increased compared to the post-optimization column. However, after pinch analysisand parametric optimization, the production efficiency of sulfur recovery increased.
Table 15 shows the comparison between the production result obtained from thesimulation of the Claus process and literature data. This table shows that the sulfurrecovery increased by 18% in the proposed simulation.
Mathematics 2022, 10, 88 16 of 18
Table 14. Summary of economic parameters, advantages, and disadvantages of processes for H2Sgas conversion.
Process Before Optimization After Optimization
Direct cost (million USD) 63.4 65.9
Indirect Cost(million USD) 1.8 1.6
Fixed Capital Cost(million USD) 65.4 67.5
Working Capital cost(million USD) 38.1 38.5
Total investment(million USD) 168.7 173.5
Raw Material Cost(million USD) 229.9 237.9
Utility Cost (million USD) 1.89 1.6
Labor Cost (million USD) 0.96 0.96
Total Product Cost(million USD) 406 425.53
Profit (million USD) 177 189.63
Payback Period(million USD) 2.9 year 1.8 year
Advantage No Advantage.Production efficiency is increased—also,
minimum consumption of external utilities andmaximum consumption of internal utilities.
LimitationsThe simulation is carried out based on their
Chemcad software. There is no optimization of achemical process.
The simulation is performed on the Aspen Plussoftware. First, there is the optimization of a
chemical process. Then, with the help ofoptimization, we can save external
heating utilities.
Table 15. Production results compared with the literature.
Simulation Results Literature [31]
Stream No 15 16 15 16
Temperature (◦C) 160 187 160 187
Pressure (Bar) 0.9 0.9 0.9 0.9
Mole flow (lbmol/h) 519.3 23.18 519.3 23.18
Component’s flowrate (lb/h)
H2S 135.811 0 4 0
SO2 2 0.0 2 0.0
Water 148 4.738 238.7 1.2
O2 0 0.0 0 0.0
Ammonia 89.6 0 140 0
S2 0.03 0.3 0 0.3
S8 0.06 25.805 0.4 21.7
Sulfur Recovery increased to 18% in the proposed simulation

Mathematics 2022, 10, 88 17 of 18
4. Conclusions
This study focused on the three objectives related to the Claus process: processmodeling simulation, optimization, and cost analysis of the Claus process. Aspen Plussoftware was used for process modeling and simulation of the process. After the Clausprocess modeling, the result was compared with the literature result. It is shown thatsulfur recovery increased by 18%. The second objective was optimization; two typesof optimizations were used. The first was parametric optimization and the second wastopological optimization. A parametric optimization was used for operating parametersand design parameters to increase the production of sulfur.
Furthermore, topological optimization was used to deal with the size and amount ofequipment. Pinch analysis has changed the size of equipment to maximize the utilizationof heating and cooling utilities. The pinch analysis on the sulfur recovery unit reduced theoperating cost of a heat exchanger to 28.53%. The third objective was a cost analysis of theClaus process. It has shown that, after optimization, profit can be improved by more than2.5% by process modeling simulation, changing operating conditions, design parameters,and pinch analysis on the Claus process.
Author Contributions: M.A. proposed the main idea and methodology; M.A.Z. performed theanalysis and wrote the manuscript; I.A. and M.N.A.K. provided key suggestions and improved themanuscript. All authors have read and agreed to the published version of the manuscript.
Funding: This research received no external funding.
Institutional Review Board Statement: Not applicable.
Informed Consent Statement: Not applicable.
Data Availability Statement: Not applicable.
Conflicts of Interest: The authors declare that the research was conducted in the absence of anycommercial or financial relationships that could be construed as a potential conflict of interest.
References1. Maclean, D.I.; Wagner, H.G. The structure of the reaction zones of ammonia-oxygen and hydrazine-decomposition flames. Symp.
Int. Combust. 1967, 11, 871–878. [CrossRef]2. Vandooren, J. Comparison of the experimental structure of an ammonia seeded rich-hydrogen-oxygen-argon flame with the
calculated ones along several reaction mechanisms. Combust. Sci. Technol. 1992, 84, 335–344. [CrossRef]3. Glarborg, P.; Kubel, D.; Dam-Johansen, K.; Chiang, H.M.; Bozzelli, J.W. Impact of SO2 and NO on CO oxidation under post-flame
conditions. Int. J. Chem. Kinet. 1996, 28, 773–790. [CrossRef]4. Clark, P.; Dowling, N.; Huang, M. Ammonia destruction in the Claus furnace. In Proceedings of the Name of the Brimstone 1998
Sulphur Recovery Symposium, Tucson, AZ, USA, 1–4 November 1998; pp. 15–18.5. Monnery, W.; Hawboldt, K.; Pollock, A.; Svrcek, W. Ammonia pyrolysis and oxidation in the Claus furnace. Ind. Eng. Chem. Res.
2001, 40, 144–151. [CrossRef]6. Dagaut, P.; Lecomte, F.; Mieritz, J.; Glarborg, P. Experimental and kinetic modeling study of the effect of NO and SO2 on the
oxidation of CO H2 mixtures. Int. J. Chem. Kinet. 2003, 35, 564–575. [CrossRef]7. ZareNezhad, B.; Hosseinpour, N. Evaluation of different alternatives for increasing the reaction furnace temperature of Claus
SRU by chemical equilibrium calculations. Therm. Eng. 2008, 28, 738–744. [CrossRef]8. Mendiara, T.; Glarborg, P. Ammonia chemistry in oxy-fuel combustion of methane. Combust. Flame 2009, 156, 1937–1949.
[CrossRef]9. Selim, H.; Gupta, A.; Sassi, M. Novel error propagation approach for reducing H2S/O2 reaction mechanism. Appl. Energy 2012,
93, 116–124. [CrossRef]10. Duissenov, D. Production and Processing of Sour Crude and Natural Gas-Challenges due to Increasing Stringent Regulations.
Master’s Thesis, Institutt for Petroleumsteknologi Og Anvendt Geofysikk, Trondheim, Norway, 2013.11. Zhou, C.R.; Sendt, K.; Haynes, B.S. Experimental and kinetic modelling study of H2S oxidation. Proc. Combust. Inst. 2013, 34,
625–632. [CrossRef]12. Nabikandi, N.J.; Fatemi, S. Kinetic modelling of a commercial sulfur recovery unit based on Claus straight through process:
Comparison with equilibrium model. J. Ind. Eng. Chem. 2015, 30, 50–63. [CrossRef]13. Gupta, A.; Ibrahim, S.; Al Shoaibi, A. Advances in sulfur chemistry for treatment of acid gases. Prog. Energy Combust. Sci. 2016,
54, 65–92. [CrossRef]

Mathematics 2022, 10, 88 18 of 18
14. Ibrahim, S.; Al Shoaibi, A.; Gupta, A. Role of toluene to acid gas (H2S and CO2) combustion in H2/O2–N2 flame under Clauscondition. Appl. Energy 2015, 149, 62–68. [CrossRef]
15. Rahman, R.K.; Ibrahim, S.; Raj, A. Oxidative destruction of monocyclic and polycyclic aromatic hydrocarbon (PAH) contaminantsin sulfur recovery units. Chem. Eng. Sci. 2016, 155, 348–365. [CrossRef]
16. Weiland, S.; Hatcher, N.; Jones, C.; Weiland, R. Ammonia destruction in the reaction furnace. Pet. Technol. Q. Q 2016, 4, 2016.17. Zarei, S.; Ganji, H.; Sadi, M.; Rashidzadeh, M. Kinetic modeling and optimization of Claus reaction furnace. J. Nat. Gas Sci. Eng.
2016, 31, 747–757. [CrossRef]18. Rahman, R.K.; Raj, A.; Ibrahim, S.; Khan M, I.; Al Muhairi, N.O. Reduction in natural gas consumption in sulfur recovery units
through kinetic simulation using a detailed reaction mechanism. Ind. Eng. Chem. Res. 2018, 57, 1417–1428. [CrossRef]19. Abdoli, P.; Hosseini, S.A.; Mujeebu, M.A. Influence of O2 enrichment in dry air on combustion temperature, contaminant
production and sulfur recovery, in SRU reaction furnace. Forsch. Im Ing. 2018, 82, 99–106. [CrossRef]20. Otomo, J.; Koshi, M.; Mitsumori, T.; Iwasaki, H.; Yamada, K. Chemical kinetic modeling of ammonia oxidation with improved
reaction mechanism for ammonia/air and ammonia/hydrogen/air combustion. Int. J. Hydrogen Energy 2018, 43, 3004–3014.[CrossRef]
21. Al Hamadi, M.; Ibrahim, S.; Raj, A. Effects of Oxygen Enrichment on Natural Gas Consumption and Emissions of Toxic Gases(CO, Aromatics, and SO2) in the Claus Process. Ind. Eng. Chem. Res. 2019, 58, 16489–16501. [CrossRef]
22. Li, D.; Dowling, N.; Marriott, R.; Clark, P. Kinetics and Mechanisms for Destruction of Ammonia in the Claus Furnace; Alberta SulphurResearch Ltd.: Calgary, AB, Canada, 2016.
23. Ibrahim, S.; Rahman, R.K.; Raj, A. Effects of H2O in the feed of sulfur recovery unit on sulfur production and aromatics emissionfrom Claus furnace. Ind. Eng. Chem. Res. 2017, 56, 11713–11725. [CrossRef]
24. Kazempour, H.; Pourfayaz, F.; Mehrpooya, M. Modeling and multi-optimization of thermal section of Claus process based onkinetic model. J. Nat. Gas Sci. Eng. 2017, 38, 235–244. [CrossRef]
25. Ibrahim, S.; Rahman, R.K.; Raj, A. Roles of hydrogen sulfide concentration and fuel gas injection on aromatics emission fromClaus furnace. Chem. Eng. Sci. 2017, 172, 513–527. [CrossRef]
26. Abdoli, P.; Hosseini, S.A.; Mujeebu, M.A. Effect of preheating inlet air and acid gas on the performance of sulfur recoveryunit—CFD simulation and validation. Forschung Im Ingenieurwesen 2019, 83, 81–89. [CrossRef]
27. He, X.; Shu, B.; Nascimento, D.; Moshammer, K.; Costa, M.; Fernandes, R.X. Auto-ignition kinetics of ammonia and ammo-nia/hydrogen mixtures at intermediate temperatures and high pressures. Combust. Flame 2019, 206, 189–200. [CrossRef]
28. Nopmongcol, U.; Beardsley, R.; Kumar, N.; Knipping, E.; Yarwood, G. Changes in United States deposition of nitrogen and sulfurcompounds over five decades from 1970 to 2020. Atmos. Environ. 2019, 209, 144–151. [CrossRef]
29. Okafor, E.C.; Naito, Y.; Colson, S.; Ichikawa, A.; Kudo, T.; Hayakawa, A.; Kobayashi, H. Measurement and modelling of thelaminar burning velocity of methane-ammonia-air flames at high pressures using a reduced reaction mechanism. Combust. Flame2019, 204, 162–175. [CrossRef]
30. Manna, M.V.; Sabia, P.; Ragucci, R.; de Joannon, M. Oxidation and pyrolysis of ammonia mixtures in model reactors. Fuel 2020,264, 116768. [CrossRef]
31. Jones, D.; Bhattacharyya, D.; Turton, R.; Zitney, S.E. Rigorous kinetic modeling and optimization study of a modified claus unitfor an integrated gasification combined cycle (IGCC) power plant with CO2 capture. Ind. Eng. Chem. Res. 2012, 51, 2362–2375.[CrossRef]