
Modeling and Cost Optimization of Combined Cycle Heat ...
11
Proceedings of ASME Turbo Expo 2003 Power of Land, Sea, and Air June 16-19, 2003, Atlanta, Georgia, USA GT2003-38568 MODELING AND COST OPTIMIZATION OF COMBINED CYCLE HEAT RECOVERY GENERATOR SYSTEMS Mr. Yongjun Zhao ‡ , Ms. Hongmei Chen † , Mr. Mark Waters * , Dr. Dimitri N. Mavris • Aerospace Systems Design Laboratory (ASDL) School of Aerospace Engineering Georgia Institute of Technology Atlanta, GA 30332-0150 ABSTRACT The combined cycle power plant is made up of three major systems, the gas turbine engine, the heat recovery steam generator and the steam turbine. Of the major systems the gas turbine engine is a fixed design offered by a manufacturer, and the steam turbine is also a fairly standard design available from a manufacturer, but it may be somewhat customized for the project. In contrast, the heat recovery steam generator (HRSG) offers many different design options, and its design is highly customized and integrated with the steam turbine. The objective of this project is to parametrically investigate the design and cost of the HRSG system, and to demonstrate the impact on the overall cost of electricity (COE) of a combined cycle power plant. There are numerous design parameters that can affect the size and complexity of the HRSG, and it is the plan for the project to identify all the important parameters and to evaluate each. For this study, the design parameter chosen for evaluation is the exhaust gas pressure drop across the HRSG. This parameter affects the performance of both the gas turbine and steam turbine and the size of the heat recovery unit. Single-pressure, two-pressure and three-pressure HRSGs are all investigated, with the tradeoffs between design point size, performance and cost evaluated for each system. A genetic algorithm is used in the design optimization process to minimize the investment cost of the HSRG. ‡ Ph.D. Candidate, ASDL † Graduate Research Assistant, ASDL * Senior Research Engineer, ASDL • Director, Aerospace Systems Design Laboratory, Boeing Professor, AIAA Associate Fellow Several system level metrics are employed to evaluate a design. They are gas turbine net power, steam turbine net power, fuel consumption of the power plant, net cycle efficiency of the power plant, HRSG investment cost, total investment cost of the power plant and the operating cost measured by the cost of electricity (COE). The impacts of HRSG exhaust gas pressure drop and system complexity on these system level metrics are investigated. INTRODUCTION A combined cycle power plant derives its name from the fact that a gas turbine engine, which operates on the Brayton cycle, is combined with a heat recovery and steam turbine system, which operates on the Rankine cycle. The exhaust gas from the gas turbine is nominally at 1000ºF, and it is the source of energy to the heat recovery steam generator (HRSG) to produce superheated steam. In the process, the exhaust gas is reduced to approximately 300ºF. The steam expands through the steam turbine increasing shaft power to the generator, and, as a result, the thermal efficiency of the system is increased significantly – from approximately 33-38% to 50-55%. A HRSG is a series of heat exchangers – economizers to heat water close to saturation, evaporators to produce saturated steam and superheaters to produce superheated steam. A relatively simple HRSG design will operate at a single water/steam pressure through the Rankine cycle circuit, but in an effort to extract the maximum amount of energy from the gas turbine exhaust gas there may be one or two higher pressure circuits added to the system. Each added pressure level increases power output from the steam turbine, but the complexity and cost of the HRSG system and the steam turbine are also increased. 1 Copyright © 2003 by ASME Downloaded From: https://proceedings.asmedigitalcollection.asme.org on 07/01/2019 Terms of Use: http://www.asme.org/about-asme/terms-of-use
-
Upload
khangminh22 -
Category
Documents
-
view
0 -
download
0
Transcript of Modeling and Cost Optimization of Combined Cycle Heat ...
Downlo
Proceedings of ASME Turbo Expo 2003 Power of Land, Sea, and Air
June 16-19, 2003, Atlanta, Georgia, USA
GT2003-38568
MODELING AND COST OPTIMIZATION OF COMBINED CYCLE HEAT RECOVERY GENERATOR SYSTEMS
Mr. Yongjun Zhao‡, Ms. Hongmei Chen†, Mr. Mark Waters*, Dr. Dimitri N. Mavris• Aerospace Systems Design Laboratory (ASDL)
School of Aerospace Engineering Georgia Institute of Technology
Atlanta, GA 30332-0150
ABSTRACT The combined cycle power plant is made up of three major systems, the gas turbine engine, the heat recovery steam generator and the steam turbine. Of the major systems the gas turbine engine is a fixed design offered by a manufacturer, and the steam turbine is also a fairly standard design available from a manufacturer, but it may be somewhat customized for the project. In contrast, the heat recovery steam generator (HRSG) offers many different design options, and its design is highly customized and integrated with the steam turbine. The objective of this project is to parametrically investigate the design and cost of the HRSG system, and to demonstrate the impact on the overall cost of electricity (COE) of a combined cycle power plant. There are numerous design parameters that can affect the size and complexity of the HRSG, and it is the plan for the project to identify all the important parameters and to evaluate each. For this study, the design parameter chosen for evaluation is the exhaust gas pressure drop across the HRSG. This parameter affects the performance of both the gas turbine and steam turbine and the size of the heat recovery unit. Single-pressure, two-pressure and three-pressure HRSGs are all investigated, with the tradeoffs between design point size, performance and cost evaluated for each system. A genetic algorithm is used in the design optimization process to minimize the investment cost of the HSRG. ‡ Ph.D. Candidate, ASDL † Graduate Research Assistant, ASDL * Senior Research Engineer, ASDL • Director, Aerospace Systems Design Laboratory, Boeing Professor, AIAA Associate Fellowaded From: https://proceedings.asmedigitalcollection.asme.org on 07/01/2019 Terms of Use
Several system level metrics are employed to evaluate a design. They are gas turbine net power, steam turbine net power, fuel consumption of the power plant, net cycle efficiency of the power plant, HRSG investment cost, total investment cost of the power plant and the operating cost measured by the cost of electricity (COE). The impacts of HRSG exhaust gas pressure drop and system complexity on these system level metrics are investigated.
INTRODUCTION A combined cycle power plant derives its name from the fact that a gas turbine engine, which operates on the Brayton cycle, is combined with a heat recovery and steam turbine system, which operates on the Rankine cycle. The exhaust gas from the gas turbine is nominally at 1000ºF, and it is the source of energy to the heat recovery steam generator (HRSG) to produce superheated steam. In the process, the exhaust gas is reduced to approximately 300ºF. The steam expands through the steam turbine increasing shaft power to the generator, and, as a result, the thermal efficiency of the system is increased significantly – from approximately 33-38% to 50-55%. A HRSG is a series of heat exchangers – economizers to heat water close to saturation, evaporators to produce saturated steam and superheaters to produce superheated steam. A relatively simple HRSG design will operate at a single water/steam pressure through the Rankine cycle circuit, but in an effort to extract the maximum amount of energy from the gas turbine exhaust gas there may be one or two higher pressure circuits added to the system. Each added pressure level increases power output from the steam turbine, but the complexity and cost of the HRSG system and the steam turbine are also increased.
1 Copyright © 2003 by ASME
: http://www.asme.org/about-asme/terms-of-use
Downlo
The economic viability of a combined cycle power plant depends primarily on how it is to be used. Power and efficiency are improved, but there will be an increase in the plant investment due to the added equipment. Thus, this type of plant is typically used as a “base” plant operating continuously, perhaps 8000 hours per year, with down time only for required maintenance. The basis for an economic study of a combined cycle power plant is the “cost of electricity -- COE,” which is a measure of the operating cost of the plant. The elements that are included in the COE are fuel cost, depreciation cost of the investment and maintenance costs. A complete economic study would also consider the revenues to be produced from the generated power, which requires knowing the value of power. This is a parameter that varies not only with the time of day but also with the time during the year – consider the demand and resulting price for power on hot summer afternoons. However, in this study only costs are evaluated, not revenues. The objective of this project is to evaluate the impacts of HRSG exhaust gas pressure drop and system complexity on the overall COE of a combined cycle power plant. The study uses a fixed gas turbine engine and steam turbines that differ depending on the number of pressure levels in the system. With the emphasis placed on the HRSG design, numerous parameters are varied to optimize the HRSG design. HRSG and steam turbine designs with one, two and three circuit pressures are evaluated in the study. A genetic algorithm (GA) is used in the optimization process, and design methods developed at the Aerospace System Design Laboratory (ASDL) at Georgia Tech are used in the analysis. A good example of this methodology is given in Reference 1.
BACKGROUND/APPROACH Combined Cycle Power Plant Models & Software Programs — Three HRSG—steam turbine models, HRSG01, HRSG03, and HRSG05, are used in the study. These models are built-in with the GateCycle program [2], and they are considered to be representative of a single-pressure, two-pressure, and three-pressure steam turbine and HRSG systems, respectively. These three configurations all use the same gas turbine — the GE MS7231(FA), an engine widely used in industrial power generation. GateCycle does not provide enough information on the cost and physical design of a HRSG. Instead, the HXDSN program [3, 4] is used for this purpose. This program is an analysis tool based on proven methods, which will develop an accurate physical design and investment cost estimate of the HRSG. The analysis is then carried on to give a detailed estimate of the cost of the system[3]. In this research, the required thermodynamic inputs for HXDSN are generated using GateCycle, and additional geometric data for the HRSG design are also input for use in HXDSN. The modeling program iSIGHT is used to couple GateCycle and HXDSN. iSIGHT is a generic software shell that improves productivity in the design process, and its role is to automate the design-evaluate-redesign cycle, which is an essential characteristic of design [5]. System Metrics — Several system level metrics are employed to evaluate a design. They are gas turbine net power, steam turbine net power, fuel consumption of the power plant, net
aded From: https://proceedings.asmedigitalcollection.asme.org on 07/01/2019 Terms of Us
cycle efficiency of the power plant, HRSG investment cost, total investment cost of the power plant and the operating cost measured by the cost of electricity (COE). For investment cost, the gas turbine engine is a fixed parameter in this study, and thus the engine cost is fixed. Steam turbine cost changes depending on the number of pressure levels in the system, and as the HRSG is being resized its cost is recomputed for each design. Cost of Electricity Model — The following elements are included as part of the cost of electricity Capital cost Cost of fuel Variable maintenance and operation costs Fixed maintenance and operation costs Throughout this paper, cost will be discussed, but it should be understood that it is price that is being presented in US$ for the year 2002. Costs of Electricity (COE) is computed in units of US$/MW-hour ($MWh), which is the cost per unit energy. Following the format given in References 6 and 7, the equation for computing COE (YEL) is given by
varu
TPUY
TPTCRY
eq
fixF
eqEL +
⋅++
⋅⋅
=η
ψ
Where,
TCR : Total capital requirement
ψ : Capital charge factor
P : Rated power output
eqT : Equivalent annual utilization at rated power output
FY : Price of fuel
η : Average plant efficiency
fixU : Fixed cost of operation, maintenance and administration
varu : Variable cost of operation, maintenance and repair
For this study it is important to have a breakdown in of the capital investment of the plant into the major elements – gas turbine, steam turbine, HRSG and balance of plant (BOP). The gas turbine is fixed, and with a nominal size of 166 MW (to be shown), cost is set at $32M. The steam turbine will vary depending on the number of pressure levels in the design, and its cost is determined from a database in the HXDSN program. To determine a cost for BOP, data from Reference 8 was used. BOP includes electric generators, sub-system equipment, engineering construction services, plant startup and commissioning. Finally, the HRSG cost is computed for each case using the methodology from the HRSG program. Actual cost is computed in this program, and a profit of 10% is assumed to convert to a price for the HRSG. The capital charge factor, Ψ, the annuity present worth factor, is used to write off the investment of capital. It accounts for the
2 Copyright © 2003 by ASME
e: http://www.asme.org/about-asme/terms-of-use
Downlo
discount rate, i, on capital and the life of the plant, N years. For this study, i = 8% and N = 25 years. Maintenance cost models for both Ufix and uvar were taken directly from Reference 6 for combined cycle power plants. Both of these parameters are modeled as a function of the rated power output of the plant. Thus, as the HRSG design is changed from 1-pressure to 2-pressure and 3-pressure, more power is developed by the system, so slightly higher maintenance costs will be computed. However, it is likely that the true complexity and increased maintenance requirements of going to increased number of pressures and higher pressure levels is not captured adequately by this model. For this study this level of complexity is deemed to be of secondary importance. For the remaining parameters, fuel price is assumed to 30 US$/bbl. A heating value of 18,400 Btu/lb is assumed to convert to $/MWh. Also, the combined cycle is assumed to a base load plant, and an annual utilization of 8000 hours is assumed. Rated power and plant efficiency is computed for each run of the GateCycle program.
HRSG DESIGN & OPTIMIZATION Before the three HRSG configurations are evaluated, it is necessary to make sure that the optimal design of each configuration is achieved. Therefore, the design and optimization of each HRSG is an important step. There are numerous parameters and constraints that must be considered in a complete design study of a HRSG, and to evaluate them all in an optimization study is beyond the scope of this paper. However, the gas side pressure loss across the HRSG is an important parameter in the design of a HRSG, and its effect on HRSG design and cost and the overall effect on COE will be demonstrated. A higher gas side pressure loss will result in a higher exhaust pressure of gas turbine engine, and, therefore, less power output from gas turbine. On the other hand, a higher gas side pressure loss also results in a higher exhaust gas temperature of the gas turbine, and therefore more steam will be produced by the HRSG and more power will be produced from the steam turbines. Therefore, with regard to gas side pressure loss, there is a tradeoff between the power output of the gas turbine and the steam turbine, and, as will be shown, the effect on power output is not major. However, the gas side pressure loss does have a significant effect on the HRSG design. A decrease in the pressure loss through the HRSG can only be achieved with a reduction in the flow velocities through the heat exchangers, and this is done by increasing cross section flow area. Also, reduced velocity decreases the heat transfer coefficients and increased heat transfer surface areas are thus required. The result is an increase in the size and cost of the HRSG. Five levels of gas side pressure loss are selected in the design process. They are 12, 16, 20, 24 and 28 inches of water. For each gas side pressure loss, a HRSG design is optimized using a genetic algorithm. The objective of the optimization is to minimize the investment cost of the HRSG, including the heat exchangers, insulated casing panels and all related components such as the condenser, deaerator and pumps. The optimization is done for a standard day design condition at sea
aded From: https://proceedings.asmedigitalcollection.asme.org on 07/01/2019 Terms of Us
level where the ambient temperature is set as 60 °F, the ambient pressure 14.7 PSIA, and the relative humidity 0.6. Numerous design variables are identified. They are HRSG face width, tube outside diameter of each heat exchangers, fin height of each heat exchanger, fin density of each heat exchanger, and minimum allowable tube spacing/tube diameter of each heat exchanger. For this last parameter, tube spacing is the tip to tip spacing of adjacent finned tubes in a row. A screening test is performed to identify those design variables with significant effects on the responses. For a three-pressure HRSG system, a set of 45 design variables are used in the screening test, and 13 design variables are selected as important design variables, which are manipulated in the optimization. For a two-pressure HRSG system, a set of 25 design variables is identified, and again, 13 of them are chosen for the optimization process. For a single-pressure HRSG system, 13 design variables are identified, and all of them are used in the optimization process. It is important to choose the robust optimization technique for this problem since there are as many as 13 design variables being changed, and these design variables are of different type. Some of them are discrete variables, some of them are integers, while others are real. The genetic algorithm (GA) used to optimize the design is a built-in technique in iSIGHT. GA is an optimization technique that mimics biological reproduction and evolution [9]. In this research it takes advantage of the integration environment of iSIGHT and does not need to create response surface equations (RSEs) to produce responses. Also, it is especially applicable to problems with discrete design variables. It was found that the time consumed in the optimization process was affordable.
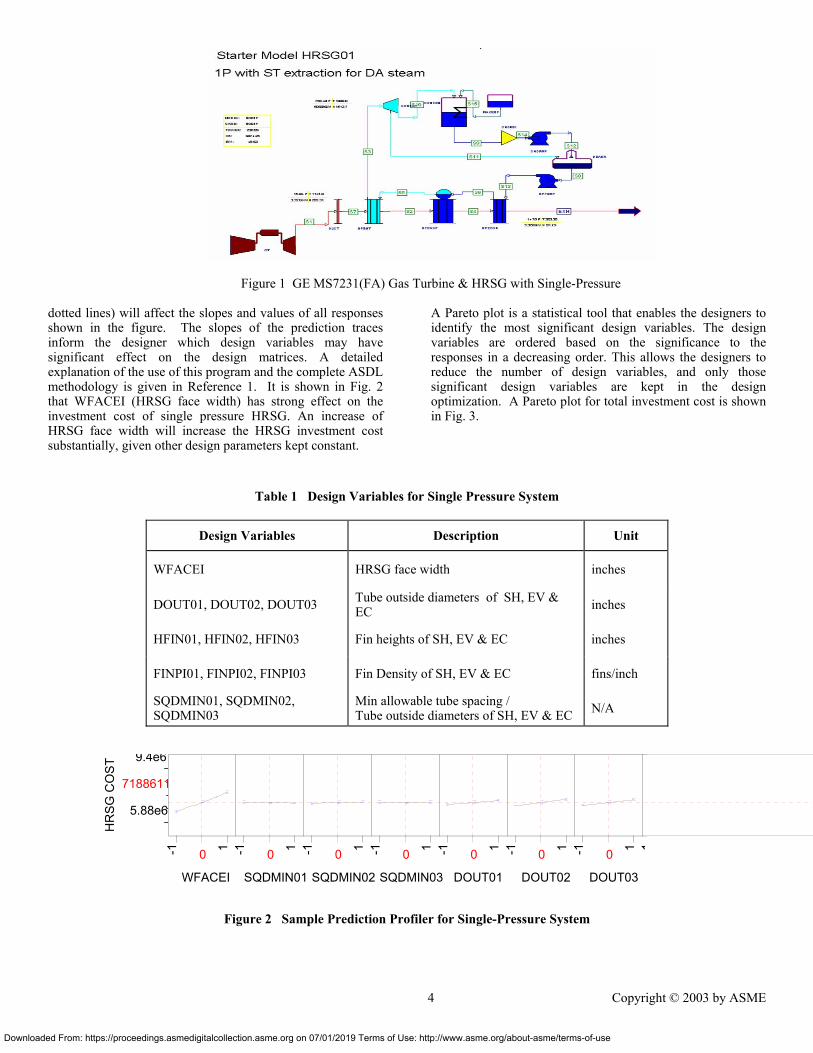
SINGLE PRESSURE SYSTEM System Description — The single-pressure heat recovery system chosen for investigation is the HRSG01, a built-in model in GateCyle program. The system has a gas turbine, the GE MS7231(FA), and three heat exchangers, including a superheater (SH), an evaporator (EV), and an economizer (EC). In addition, there is a single section condensing steam turbine. The detailed GateCycle model shown in Fig. 1 is taken from the GateCycle manual [2]. Screening Test — The purpose of this screening test is to identify the design variables that have the most significant effects on the responses. Thirteen design variables are identified and selected as inputs, and the descriptions of those parameters are listed in Table 1. HRSG investment cost, height of the HRSG and total surface area of heat exchangers are selected as responses. The gas side pressure loss is set as 20 inches of water for the screening test. Standard ambient (ISO) conditions are used, and a design of experiment (DoE) with 129 cases is run. A sample prediction profiler for one of the responses with 7 of the 13 design variables is shown in Fig. 2. This figure is produced in the JMP program, a statistical tool used by ASDL to run the DoE. In actual use, this profile links all input parameters dynamically, and change in the value of any parameter (achieved by moving any one of the vertically
3 Copyright © 2003 by ASME
e: http://www.asme.org/about-asme/terms-of-use
Downloaded From: https://proceedings.asmed
Figure 1 GE MS7231(FA) Gas Turbine & HRSG with Single-Pressure
dotted lines) will affect the slopes and values of all responses shown in the figure. The slopes of the prediction traces inform the designer which design variables may have significant effect on the design matrices. A detailed explanation of the use of this program and the complete ASDL methodology is given in Reference 1. It is shown in Fig. 2 that WFACEI (HRSG face width) has strong effect on the investment cost of single pressure HRSG. An increase of HRSG face width will increase the HRSG investment cost substantially, given other design parameters kept constant.
igitalcollection.asme.org on 07/01/2019 Terms of Use:
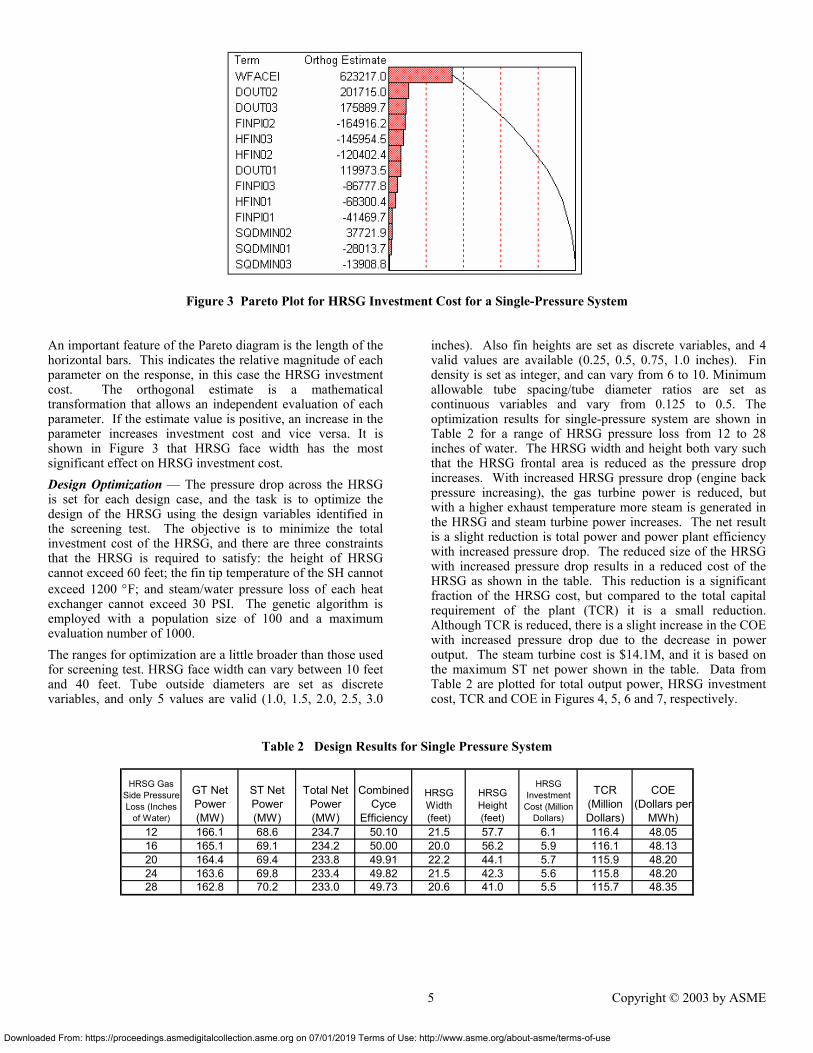
A Pareto plot is a statistical tool that enables the designers to identify the most significant design variables. The design variables are ordered based on the significance to the responses in a decreasing order. This allows the designers to reduce the number of design variables, and only those significant design variables are kept in the design optimization. A Pareto plot for total investment cost is shown in Fig. 3.
Table 1 Design Variables for Single Pressure System
Design Variables Description Unit
WFACEI HRSG face width inches
DOUT01, DOUT02, DOUT03 Tube outside diameters of SH, EV & EC inches
HFIN01, HFIN02, HFIN03 Fin heights of SH, EV & EC inches
FINPI01, FINPI02, FINPI03 Fin Density of SH, EV & EC fins/inch
SQDMIN01, SQDMIN02, SQDMIN03
Min allowable tube spacing / Tube outside diameters of SH, EV & EC N/A
HR
SG C
OST
9.4e6
5.88e6
WFACEI
-1 1
SQDMIN01
-1 1
SQDMIN02
-1 1
SQDMIN03
-1 1
DOUT01
-1 1
DOUT02
-1 1
DOUT03
-1 1 1
Figure 2 Sample Prediction Profiler for Single-Pressure System
7188611
0 0 0 0 0 0 0
4 Copyright © 2003 by ASME
http://www.asme.org/about-asme/terms-of-use
Downloaded From: https://proceedings.as
Figure 3 Pareto Plot for HRSG Investment Cost for a Single-Pressure System
An important feature of the Pareto diagram is the length of the horizontal bars. This indicates the relative magnitude of each parameter on the response, in this case the HRSG investment cost. The orthogonal estimate is a mathematical transformation that allows an independent evaluation of each parameter. If the estimate value is positive, an increase in the parameter increases investment cost and vice versa. It is shown in Figure 3 that HRSG face width has the most significant effect on HRSG investment cost. Design Optimization — The pressure drop across the HRSG is set for each design case, and the task is to optimize the design of the HRSG using the design variables identified in the screening test. The objective is to minimize the total investment cost of the HRSG, and there are three constraints that the HRSG is required to satisfy: the height of HRSG cannot exceed 60 feet; the fin tip temperature of the SH cannot exceed 1200 °F; and steam/water pressure loss of each heat exchanger cannot exceed 30 PSI. The genetic algorithm is employed with a population size of 100 and a maximum evaluation number of 1000. The ranges for optimization are a little broader than those used for screening test. HRSG face width can vary between 10 feet and 40 feet. Tube outside diameters are set as discrete variables, and only 5 values are valid (1.0, 1.5, 2.0, 2.5, 3.0
medigitalcollection.asme.org on 07/01/2019 Terms of U
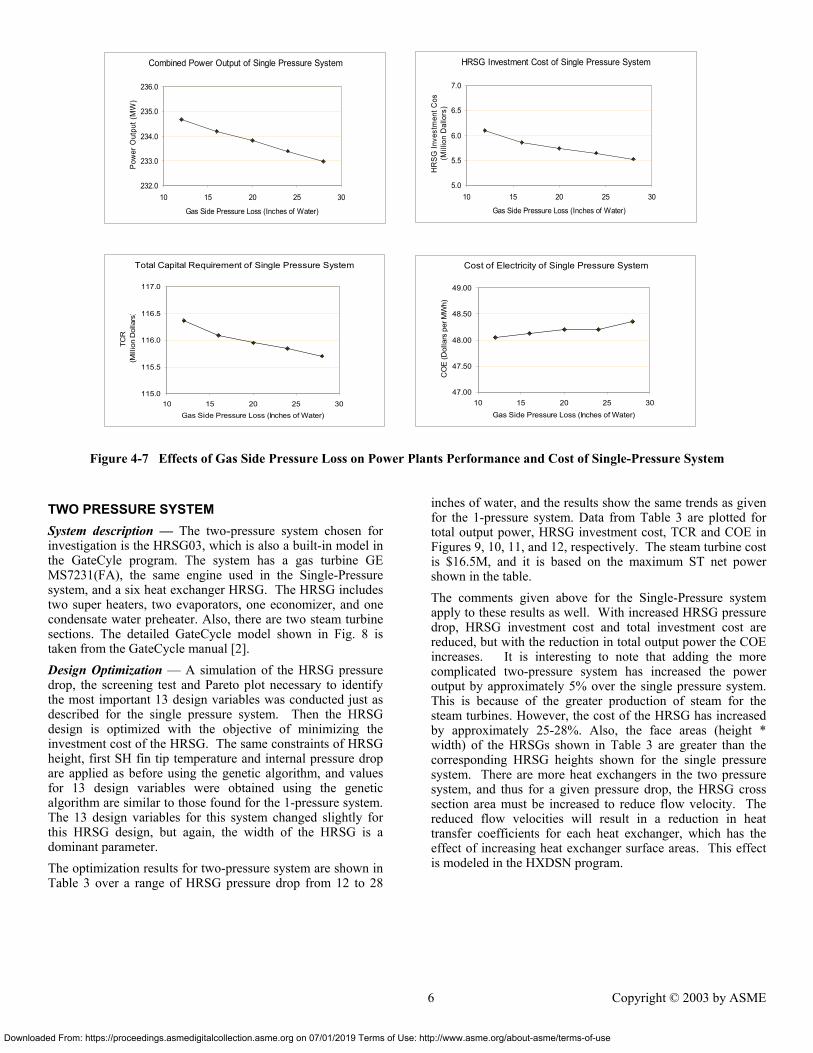
inches). Also fin heights are set as discrete variables, and 4 valid values are available (0.25, 0.5, 0.75, 1.0 inches). Fin density is set as integer, and can vary from 6 to 10. Minimum allowable tube spacing/tube diameter ratios are set as continuous variables and vary from 0.125 to 0.5. The optimization results for single-pressure system are shown in Table 2 for a range of HRSG pressure loss from 12 to 28 inches of water. The HRSG width and height both vary such that the HRSG frontal area is reduced as the pressure drop increases. With increased HRSG pressure drop (engine back pressure increasing), the gas turbine power is reduced, but with a higher exhaust temperature more steam is generated in the HRSG and steam turbine power increases. The net result is a slight reduction is total power and power plant efficiency with increased pressure drop. The reduced size of the HRSG with increased pressure drop results in a reduced cost of the HRSG as shown in the table. This reduction is a significant fraction of the HRSG cost, but compared to the total capital requirement of the plant (TCR) it is a small reduction. Although TCR is reduced, there is a slight increase in the COE with increased pressure drop due to the decrease in power output. The steam turbine cost is $14.1M, and it is based on the maximum ST net power shown in the table. Data from Table 2 are plotted for total output power, HRSG investment cost, TCR and COE in Figures 4, 5, 6 and 7, respectively.
Table 2 Design Results for Single Pressure System
HRSG Gas Side Pressure Loss (Inches
of Water)
GT Net Power (MW)
ST Net Power (MW)
Total Net Power (MW)
Combined Cyce
Efficiency
HRSG Width (feet)
HRSG Height (feet)
HRSG Investment
Cost (Million Dollars)
TCR (Million Dollars)
COE (Dollars per
MWh)12 166.1 68.6 234.7 50.10 21.5 57.7 6.1 116.4 48.0516 165.1 69.1 234.2 50.00 20.0 56.2 5.9 116.1 48.1320 164.4 69.4 233.8 49.91 22.2 44.1 5.7 115.9 48.2024 163.6 69.8 233.4 49.82 21.5 42.3 5.6 115.8 48.2028 162.8 70.2 233.0 49.73 20.6 41.0 5.5 115.7 48.35
5 Copyright © 2003 by ASME
se: http://www.asme.org/about-asme/terms-of-use
Downloaded From
Combined Power Output of Single Pressure System
232.0
233.0
234.0
235.0
236.0
10 15 20 25 30
Gas Side Pressure Loss (Inches of Water)
Pow
er O
utpu
t (M
W)
Cost of Electricity of Single Pressure System
47.00
47.50
48.00
48.50
49.00
10 15 20 25 30Gas Side Pressure Loss (Inches of Water)
CO
E (D
olla
rs p
er M
Wh)
HRSG Investment Cost of Single Pressure System
5.0
5.5
6.0
6.5
7.0
10 15 20 25 30
Gas Side Pressure Loss (Inches of Water)
HR
SG In
vest
men
t Cos
(Mill
ion
Dal
lors
)
Total Capital Requirement of Single Pressure System
115.0
115.5
116.0
116.5
117.0
10 15 20 25 30Gas Side Pressure Loss (Inches of Water)
TCR
(Mill
ion
Dol
lars
)
Figure 4-7 Effects of Gas Side Pressure Loss on Power Plants Performance and Cost of Single-Pressure System
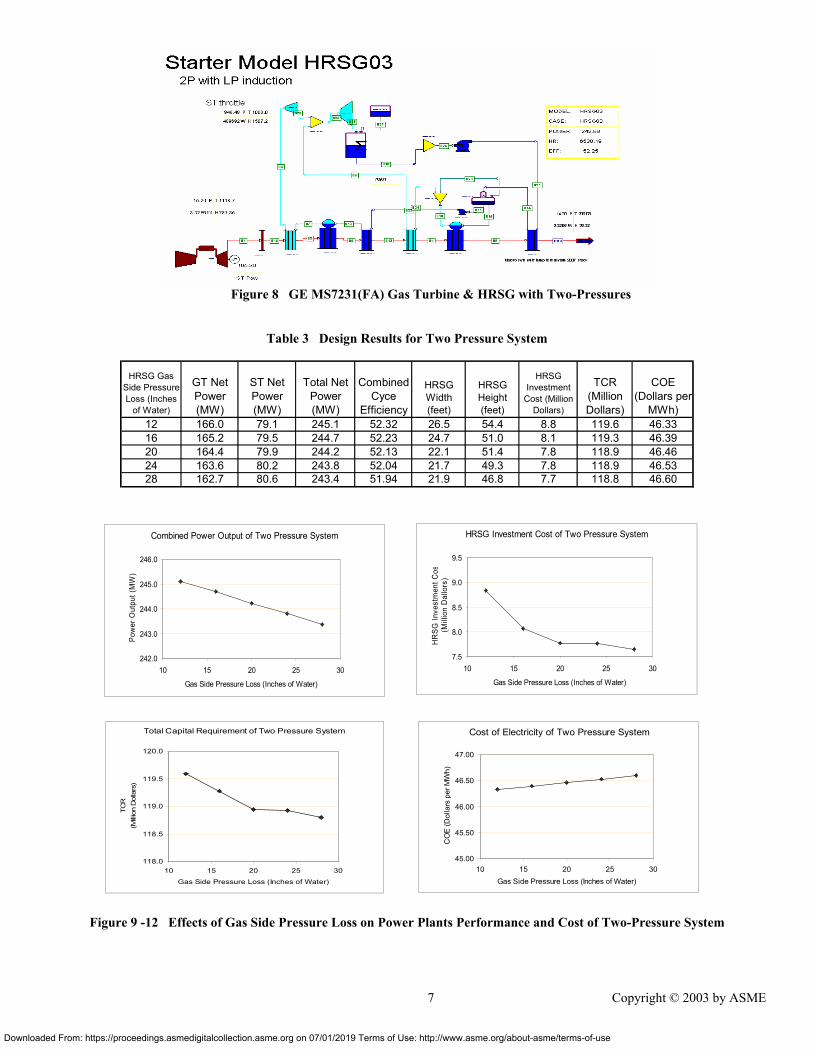
TWO PRESSURE SYSTEM System description — The two-pressure system chosen for investigation is the HRSG03, which is also a built-in model in the GateCyle program. The system has a gas turbine GE MS7231(FA), the same engine used in the Single-Pressure system, and a six heat exchanger HRSG. The HRSG includes two super heaters, two evaporators, one economizer, and one condensate water preheater. Also, there are two steam turbine sections. The detailed GateCycle model shown in Fig. 8 is taken from the GateCycle manual [2]. Design Optimization — A simulation of the HRSG pressure drop, the screening test and Pareto plot necessary to identify the most important 13 design variables was conducted just as described for the single pressure system. Then the HRSG design is optimized with the objective of minimizing the investment cost of the HRSG. The same constraints of HRSG height, first SH fin tip temperature and internal pressure drop are applied as before using the genetic algorithm, and values for 13 design variables were obtained using the genetic algorithm are similar to those found for the 1-pressure system. The 13 design variables for this system changed slightly for this HRSG design, but again, the width of the HRSG is a dominant parameter. The optimization results for two-pressure system are shown in Table 3 over a range of HRSG pressure drop from 12 to 28
: https://proceedings.asmedigitalcollection.asme.org on 07/01/2019 Terms of Us
inches of water, and the results show the same trends as given for the 1-pressure system. Data from Table 3 are plotted for total output power, HRSG investment cost, TCR and COE in Figures 9, 10, 11, and 12, respectively. The steam turbine cost is $16.5M, and it is based on the maximum ST net power shown in the table. The comments given above for the Single-Pressure system apply to these results as well. With increased HRSG pressure drop, HRSG investment cost and total investment cost are reduced, but with the reduction in total output power the COE increases. It is interesting to note that adding the more complicated two-pressure system has increased the power output by approximately 5% over the single pressure system. This is because of the greater production of steam for the steam turbines. However, the cost of the HRSG has increased by approximately 25-28%. Also, the face areas (height * width) of the HRSGs shown in Table 3 are greater than the corresponding HRSG heights shown for the single pressure system. There are more heat exchangers in the two pressure system, and thus for a given pressure drop, the HRSG cross section area must be increased to reduce flow velocity. The reduced flow velocities will result in a reduction in heat transfer coefficients for each heat exchanger, which has the effect of increasing heat exchanger surface areas. This effect is modeled in the HXDSN program.
6 Copyright © 2003 by ASME
e: http://www.asme.org/about-asme/terms-of-use
Downloaded From: h
Figure 8 GE MS7231(FA) Gas Turbine & HRSG with Two-Pressures
Table 3 Design Results for Two Pressure System
HRSG Gas Side Pressure Loss (Inches
of Water)
GT Net Power (MW)
ST Net Power (MW)
Total Net Power (MW)
Combined Cyce
Efficiency
HRSG Width (feet)
HRSG Height (feet)
HRSG Investment
Cost (Million Dollars)
TCR (Million Dollars)
COE (Dollars per
MWh)12 166.0 79.1 245.1 52.32 26.5 54.4 8.8 119.6 46.3316 165.2 79.5 244.7 52.23 24.7 51.0 8.1 119.3 46.3920 164.4 79.9 244.2 52.13 22.1 51.4 7.8 118.9 46.4624 163.6 80.2 243.8 52.04 21.7 49.3 7.8 118.9 46.5328 162.7 80.6 243.4 51.94 21.9 46.8 7.7 118.8 46.60
Combined Power Output of Two Pressure System
242.0
243.0
244.0
245.0
246.0
10 15 20 25 30
Gas Side Pressure Loss (Inches of Water)
Pow
er O
utpu
t (M
W)
Cost of Electricity of Two Pressure System
45.00
45.50
46.00
46.50
47.00
10 15 20 25 30Gas Side Pressure Loss (Inches of Water)
CO
E (D
olla
rs p
er M
Wh)
Total Capital Requirement of Two Pressure System
118.0
118.5
119.0
119.5
120.0
10 15 20 25 30
Gas Side Pressure Loss (Inches of Water)
TCR
(M
illion
Dol
lars
)
HRSG Investment Cost of Two Pressure System
7.5
8.0
8.5
9.0
9.5
10 15 20 25 30
Gas Side Pressure Loss (Inches of Water)
HR
SG In
vest
men
t Cos
(Mill
ion
Dal
lors
)
Figure 9 -12 Effects of Gas Side Pressure Loss on Power Plants Performance and Cost of Two-Pressure System
7 Copyright © 2003 by ASME
ttps://proceedings.asmedigitalcollection.asme.org on 07/01/2019 Terms of Use: http://www.asme.org/about-asme/terms-of-use

Downlo
THREE PRESSURE SYSTEM System Description — The three-pressure system chosen for investigation is the HRSG05, also a built-in model in GateCyle program. Once again the system has the GE MS7231(FA) gas turbine engine. But in this case there are eleven heat exchangers, including four super heaters, three evaporators, three economizers, and a condensate water pre-heater. In addition, there are three steam turbine sections. The detailed GateCycle model shown in Fig. 13 is taken from the GateCycle manual [2]. Design Optimization — Again, a simulation of the HRSG pressure drop was conducted, and a screening test and Pareto plot necessary to identify the most important 13 design variables were developed just as described for the single pressure system. Then the HRSG design is optimized with the objective of minimizing the investment cost of the HRSG. The same constraints of HRSG height, first SH fin tip temperature and internal pressure drop are applied as before using the genetic algorithm, and values for 13 design variables were obtained using the genetic algorithm are similar to those
aded From: https://proceedings.asmedigitalcollection.asme.org on 07/01/2019 Terms of Use
found for the 1-pressure and 2-pressure systems. The 13 design variables for this system changed slightly for this HRSG design, but the width of the HRSG remains as the dominant parameter. The optimization results for three-pressure system are shown in Table 4 over a range of HRSG pressure drop from 12 to 28 inches of water, and the results show the same trends as given for the 1-pressure and 2-pressure systems. The steam turbine cost is $19.5M, and it is based on the maximum ST net power shown in the table. Data from Table 4 are plotted for total output power, HRSG investment cost, TCR and COE in Figures 14, 15, 16 and 17, respectively. This Three-Pressure system has increased the power even further, again due to increased output of the steam turbines. Now the total power output is increased by approximately 7% over the single pressure system, but the investment cost of the HRSG and steam turbines is increased by almost 50%. A more complete comparison of the three HRSG configurations is given in the following section.
Figure 13 GE MS7231(FA) Gas Turbine & HRSG with 3-Pressures
Table 4 Design Results for the Three Pressure System
HRSG Gas Side Pressure Loss (Inches
of Water)
GT Net Power (MW)
ST Net Power (MW)
Total Net Power (MW)
Combined Cyce
Efficiency
HRSG Width (feet)
HRSG Height (feet)
HRSG Investment
Cost (Million Dollars)
TCR (Million Dollars)
COE (Dollars per
MWh)12 166.0 85.5 251.5 53.69 30.6 54.4 10.5 130.5 45.7516 165.2 85.9 251.1 53.61 27.3 52.8 9.9 129.9 45.7920 164.4 86.3 250.7 53.52 24.8 50.6 9.1 128.9 45.8224 163.6 86.7 250.3 53.43 23.2 52.2 8.9 128.7 45.8728 162.8 87.1 249.9 53.34 21.1 53.6 8.6 128.3 45.93
8 Copyright © 2003 by ASME
: http://www.asme.org/about-asme/terms-of-use
Downloaded Fro
Combined Power Output of Three Pressure System
248.0
249.0
250.0
251.0
252.0
10 15 20 25 30
Gas Side Pressure Loss (Inches of Water)
Pow
er O
utpu
t (M
W)
Cost of Electricity of Three Pressure System
45.00
45.50
46.00
46.50
47.00
10 15 20 25 30
Gas Side Pressure Loss (Inches of Water)
CO
E (D
olla
rs p
er M
Wh)
Total Capital Requirement of Three Pressure System
127.0
128.0
129.0
130.0
131.0
10 15 20 25 30
Gas Side Pressure Loss (Inches of Water)
TCR
(M
illio
n D
olla
rs)
HRSG Investment Cost of Three Pressure System
7.0
8.0
9.0
10.0
11.0
10 15 20 25 30Gas Side Pressure Loss (Inches of Water)
HR
SG
Inve
stm
ent C
ost
(Mill
ion
Dal
lors
)
Figure 14-17 Effects of Gas Side Pressure Loss on Power Plants Performance and Cost of Three-Pressure System
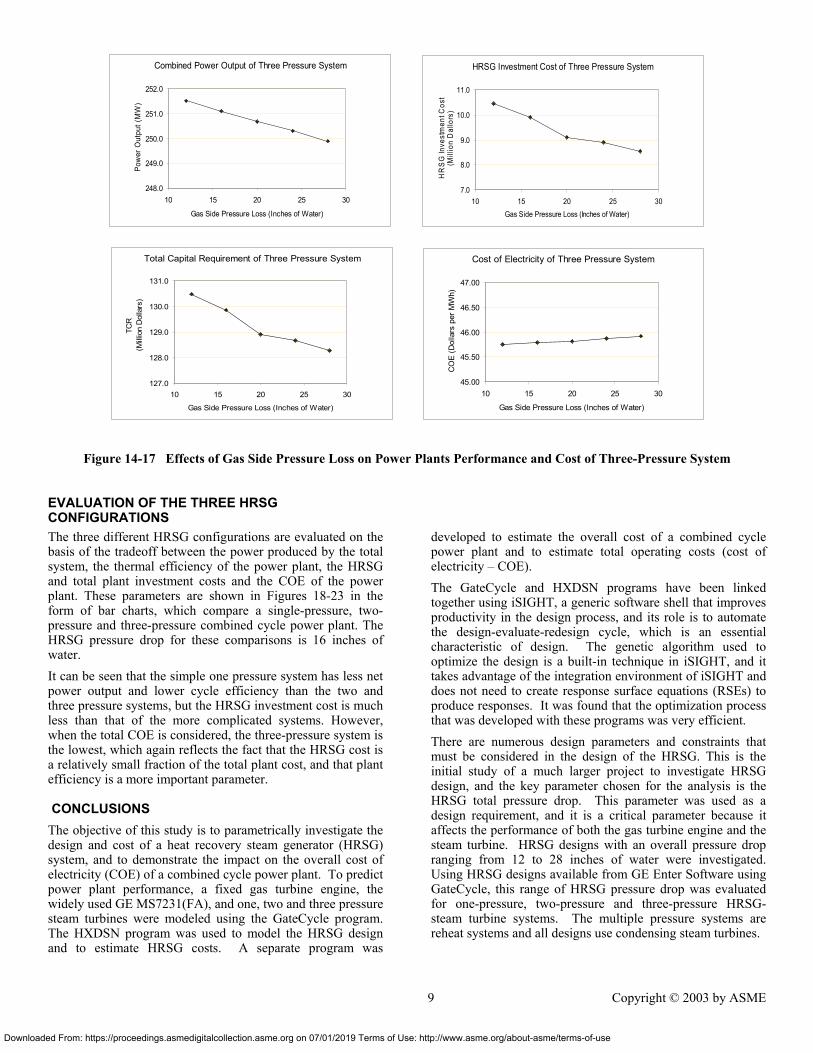
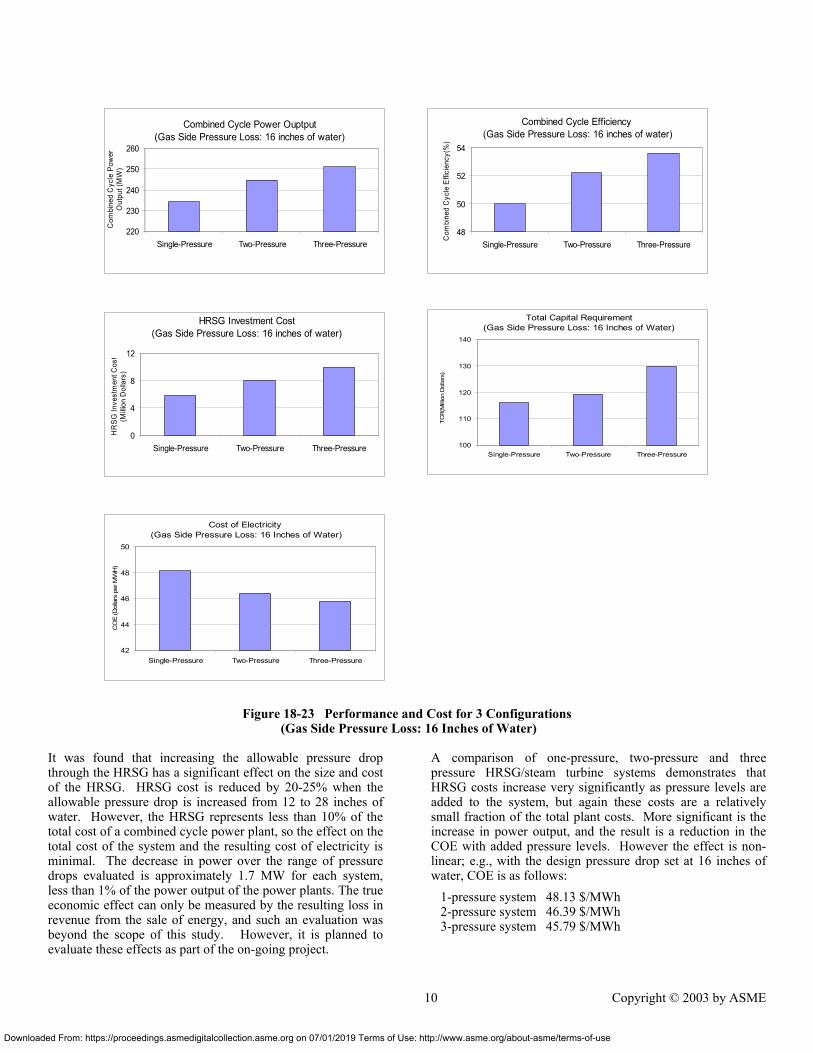
EVALUATION OF THE THREE HRSG CONFIGURATIONS The three different HRSG configurations are evaluated on the basis of the tradeoff between the power produced by the total system, the thermal efficiency of the power plant, the HRSG and total plant investment costs and the COE of the power plant. These parameters are shown in Figures 18-23 in the form of bar charts, which compare a single-pressure, two-pressure and three-pressure combined cycle power plant. The HRSG pressure drop for these comparisons is 16 inches of water. It can be seen that the simple one pressure system has less net power output and lower cycle efficiency than the two and three pressure systems, but the HRSG investment cost is much less than that of the more complicated systems. However, when the total COE is considered, the three-pressure system is the lowest, which again reflects the fact that the HRSG cost is a relatively small fraction of the total plant cost, and that plant efficiency is a more important parameter. CONCLUSIONS The objective of this study is to parametrically investigate the design and cost of a heat recovery steam generator (HRSG) system, and to demonstrate the impact on the overall cost of electricity (COE) of a combined cycle power plant. To predict power plant performance, a fixed gas turbine engine, the widely used GE MS7231(FA), and one, two and three pressure steam turbines were modeled using the GateCycle program. The HXDSN program was used to model the HRSG design and to estimate HRSG costs. A separate program was
m: https://proceedings.asmedigitalcollection.asme.org on 07/01/2019 Terms of Use
developed to estimate the overall cost of a combined cycle power plant and to estimate total operating costs (cost of electricity – COE). The GateCycle and HXDSN programs have been linked together using iSIGHT, a generic software shell that improves productivity in the design process, and its role is to automate the design-evaluate-redesign cycle, which is an essential characteristic of design. The genetic algorithm used to optimize the design is a built-in technique in iSIGHT, and it takes advantage of the integration environment of iSIGHT and does not need to create response surface equations (RSEs) to produce responses. It was found that the optimization process that was developed with these programs was very efficient. There are numerous design parameters and constraints that must be considered in the design of the HRSG. This is the initial study of a much larger project to investigate HRSG design, and the key parameter chosen for the analysis is the HRSG total pressure drop. This parameter was used as a design requirement, and it is a critical parameter because it affects the performance of both the gas turbine engine and the steam turbine. HRSG designs with an overall pressure drop ranging from 12 to 28 inches of water were investigated. Using HRSG designs available from GE Enter Software using GateCycle, this range of HRSG pressure drop was evaluated for one-pressure, two-pressure and three-pressure HRSG-steam turbine systems. The multiple pressure systems are reheat systems and all designs use condensing steam turbines.
9 Copyright © 2003 by ASME
: http://www.asme.org/about-asme/terms-of-use
Downloaded From:
HRSG Investment Cost(Gas Side Pressure Loss: 16 inches of water)
0
4
8
12
Single-Pressure Two-Pressure Three-Pressure
HR
SG In
vest
men
t Cos
t(M
illion
Dol
lars
)Combined Cycle Power Ouptput
(Gas Side Pressure Loss: 16 inches of water)
220
230
240
250
260
Single-Pressure Two-Pressure Three-Pressure
Com
bine
d C
ycle
Pow
erO
utpu
t (M
W)
Cost of Electricity (Gas Side Pressure Loss: 16 Inches of Water)
42
44
46
48
50
Single-Pressure Two-Pressure Three-Pressure
CO
E (D
olla
rs p
er M
WH
)Combined Cycle Efficiency
(Gas Side Pressure Loss: 16 inches of water)
48
50
52
54
Single-Pressure Two-Pressure Three-Pressure
Com
bine
d C
ycle
Effi
cien
cy(%
)
Total Capital Requirement (Gas Side Pressure Loss: 16 Inches of Water)
100
110
120
130
140
Single-Pressure Two-Pressure Three-Pressure
TCR
(Milli
on D
olla
rs)
Figure 18-23 Performance and Cost for 3 Configurations (Gas Side Pressure Loss: 16 Inches of Water)
It was found that increasing the allowable pressure drop through the HRSG has a significant effect on the size and cost of the HRSG. HRSG cost is reduced by 20-25% when the allowable pressure drop is increased from 12 to 28 inches of water. However, the HRSG represents less than 10% of the total cost of a combined cycle power plant, so the effect on the total cost of the system and the resulting cost of electricity is minimal. The decrease in power over the range of pressure drops evaluated is approximately 1.7 MW for each system, less than 1% of the power output of the power plants. The true economic effect can only be measured by the resulting loss in revenue from the sale of energy, and such an evaluation was beyond the scope of this study. However, it is planned to evaluate these effects as part of the on-going project.
https://proceedings.asmedigitalcollection.asme.org on 07/01/2019 Terms of Use
A comparison of one-pressure, two-pressure and three pressure HRSG/steam turbine systems demonstrates that HRSG costs increase very significantly as pressure levels are added to the system, but again these costs are a relatively small fraction of the total plant costs. More significant is the increase in power output, and the result is a reduction in the COE with added pressure levels. However the effect is non-linear; e.g., with the design pressure drop set at 16 inches of water, COE is as follows: 1-pressure system 48.13 $/MWh 2-pressure system 46.39 $/MWh 3-pressure system 45.79 $/MWh
10 Copyright © 2003 by ASME
: http://www.asme.org/about-asme/terms-of-use

Downlo
These results are not sufficient to determine an optimum design. To do so will require a more complete evaluation of the cost of electricity (COE), which will include more details on maintenance costs, coupled with a study of power demand and value. In addition, other HRSG design parameters besides the exhaust gas pressure drop must be evaluated. These parameters include the following:
* Temperature increments between the exhaust gas temperature and the water/steam temperatures such as the pinch point temperature increment in evaporators and approach temperature increments in superheaters and reheaters.
* Pressure levels for one-pressure, two pressure and three pressure systems.
* Integration of catalysts for NOx and CO reduction (these components add to the exhaust gas pressure drop)
* Off design conditions emphasizing the change in exhaust gas temperature and flow rates. In addition, supplementary burning (SB) in the HRSG is a viable off design option. Whether on or off an SB will also affect the exhaust gas pressure drop, and the added steam production when it is on will affect the size of the steam turbine.
Each of these parameters is important design considerations that will affect the size and cost of the heat exchangers in the HRSG, and the economics of the total combined cycle power plant [10]. However, the results presented herein are considered to be an important part of that more complete optimization study.
REFERENCES [1] Mavris, D.N., Kirby, M.R., "Technology Identification, Evaluation, and Selection for Commercial Transport Aircraft," Presented at the 58th Annual Conference of Society of Allied Weight Engineers, San Jose, California, May, 1999 [2] GE Enter Software, LLC, GateCycle manual, Version 5.34, 1994 [3] Energy Planners International, Heat Recovery Steam Generator Evaluation Code Version 4.0, User’s Guide. 1994 [4] Energy Planners International, Use of the HXDSN program to size & estimate the cost of a heat recovery steam generator, EPI TB-102 [5] Engineous Software Inc., iSIGHT Version 5.5, Designer’s Guide, 2000 [6] Kehlhofer, R., Bachmann, R., Nielsen, H., Warner, J., Combined-Cycle Gas & Steam Turbine Power Plants, Penn Well Publishing Company, 1999 [7] Horlock, J. H., Combined Power Plants, Krieger Publishing Company, 2002
1
aded From: https://proceedings.asmedigitalcollection.asme.org on 07/01/2019 Terms of Use: htt
[8] Gas Turbine World 2000-2001 Handbook, Volume 21, Pequot Publication [9] Goldberg D., Genetic Algorithms in Search, Optimization, & Machine Learning, Addison-Wesley, Reading, MA, 1989 [10] Precious, R. W., Pasha, A., “Thermal and Economical Considerations in the Design of Gas Turbine Heat Recovery Systems”, Presented at the Industrial Power Conference, New Orleans, Louisiana, October, 1982
1 Copyright © 2003 by ASME
p://www.asme.org/about-asme/terms-of-use