Exergy analysis of a gas-turbine combined-cycle power plant with precombustion CO2 capture
35
Energy 30 (2005) 5–39 www.elsevier.com/locate/energy Exergy analysis of a gas-turbine combined-cycle power plant with precombustion CO 2 capture Ivar S. Ertesva ˚g a, , Hanne M. Kvamsdal b , Olav Bolland a a Department of Energy and Process Engineering, Norwegian University of Science and Technology, NO-7491 Trondheim, Norway b SINTEF Energy Research, NO-7465 Trondheim, Norway Received 21 November 2003 Abstract A concept for natural-gas (NG) fired power plants with CO 2 capture was investigated using exergy analysis. NG was reformed in an auto-thermal reformer (ATR), and the CO 2 was separated before the hydrogen-rich fuel was used in a conventional combined-cycle (CC) process. The main purpose of the study was to investigate the integration of the reforming process and the combined cycle. A correspond- ing conventional CC power plant with no CO 2 capture was simulated for comparison. A base case with CO 2 capture was specified with turbine-inlet temperature (TIT) of 1250 v C and an air-compressor outlet pressure of 15.6 bar. In this case, the net electric-power production was 48.9% of the lower heating value (LHV) of the NG or 46.9% of its chemical exergy. The captured and compressed CO 2 (200 bar) repre- sented 3.1% of the NG chemical exergy, while the NG, due to its pressure (50 bar), had a physical exergy equal to 1.0% of its chemical exergy. The effects of the changed NG composition and environmental tem- perature were investigated. Higher pressure in the gas turbine and reformer increased the combustion in the ATR and reduced the overall efficiency. Supplementary firing (SF) was investigated as an alternative means of heating the ATR. This also reduced the efficiency. Heating the feeds of the ATR with its pro- duct stream was shown to reduce the irreversibility and improve the efficiency of the plant. Both this, and the effect of increased TIT to 1450 v C were investigated. Combining both measures, the net electric- power production was increased to 53.3% of the NG LHV or 51.1% of the NG chemical exergy. On the other hand, both increased TIT and the ATR product-feed heat exchange reduced the conversion of hydrocarbons to CO 2 . # 2004 Published by Elsevier Ltd. Corresponding author. Tel.: +47-735-938-39; fax: +47-735-935-80. E-mail address: [email protected] (I.S. Ertesva ˚g). 0360-5442/$ - see front matter # 2004 Published by Elsevier Ltd. doi:10.1016/j.energy.2004.05.029
Transcript of Exergy analysis of a gas-turbine combined-cycle power plant with precombustion CO2 capture

� Corresponding author. Tel.: +E-mail address: ivar.s.ertesvag
0360-5442/$ - see front matter #doi:10.1016/j.energy.2004.05.029
47-735-938-39; fax: [email protected] (I.S. Ertesvag).
2004 Published by Elsevier Ltd.
Energy 30 (2005) 5–39
www.elsevier.com/locate/energy
Exergy analysis of a gas-turbine combined-cycle power plantwith precombustion CO2 capture
Ivar S. Ertesvag a,�, Hanne M. Kvamsdal b, Olav Bolland a
a Department of Energy and Process Engineering, Norwegian University of Science and Technology,NO-7491 Trondheim, Norway
b SINTEF Energy Research, NO-7465 Trondheim, Norway
Received 21 November 2003
Abstract
A concept for natural-gas (NG) fired power plants with CO2 capture was investigated using exergyanalysis. NG was reformed in an auto-thermal reformer (ATR), and the CO2 was separated before thehydrogen-rich fuel was used in a conventional combined-cycle (CC) process. The main purpose of thestudy was to investigate the integration of the reforming process and the combined cycle. A correspond-ing conventional CC power plant with no CO2 capture was simulated for comparison. A base case withCO2 capture was specified with turbine-inlet temperature (TIT) of 1250
vC and an air-compressor outlet
pressure of 15.6 bar. In this case, the net electric-power production was 48.9% of the lower heating value(LHV) of the NG or 46.9% of its chemical exergy. The captured and compressed CO2 (200 bar) repre-sented 3.1% of the NG chemical exergy, while the NG, due to its pressure (50 bar), had a physical exergyequal to 1.0% of its chemical exergy. The effects of the changed NG composition and environmental tem-perature were investigated. Higher pressure in the gas turbine and reformer increased the combustion inthe ATR and reduced the overall efficiency. Supplementary firing (SF) was investigated as an alternativemeans of heating the ATR. This also reduced the efficiency. Heating the feeds of the ATR with its pro-duct stream was shown to reduce the irreversibility and improve the efficiency of the plant. Both this, andthe effect of increased TIT to 1450
vC were investigated. Combining both measures, the net electric-
power production was increased to 53.3% of the NG LHV or 51.1% of the NG chemical exergy. On theother hand, both increased TIT and the ATR product-feed heat exchange reduced the conversion ofhydrocarbons to CO2.# 2004 Published by Elsevier Ltd.
I.S. Ertesvag et al. / Energy 30 (2005) 5–396
1. Introduction
Man-made emissions of CO2 and their possible environmental effects cause great concern. Onthe one hand, international agreements imply reduction of CO2 emissions. On the other hand,the general use of electric power, mainly produced from fossil-fuel power plants, has increasedworldwide. One possible remedy is to construct fossil-fuel based power plants that do not emitthe CO2 produced.In order to reduce the CO2 emissions from natural-gas (NG) based power-generation plants,
three different promising approaches have emerged:
(A)
S eparation of CO2 from the exhaust gas of a standard gas-turbine combined cycle (CC),using chemical absorption by amine solutions. This approach has been widely treated inthe literature (see [1–3]) and can be applied to existing, conventional plants.(B)
O xy-fuel CC with a close-to-stoichiometric combustion with high-purity oxygen from anair-separation plant [3,4]. As the combustion products are CO2 and water vapor, in prin-ciple, CO2 can be captured simply by condensing water from the flue gas. In thisapproach, CO2 is used as the main working fluid of the CC. This presents considerablechallenges, especially in combustion technology.(C)
P recombustion decarbonization and CO2 capture, where the carbon of the NG is removedprior to combustion and the fuel heating value is transferred to hydrogen by reforming[5–12]. The hydrogen-rich mixture is combusted in a conventional CC power plant.Some of the work on CO2-emissions reduction is related to coal-fired plants, often with inte-grated gasification of the fuel. This is because coal is the dominating fossil fuel in power stations.However, some of the technology is generic and may be developed for NG firing and later uti-lized for coal firing. There are several reasons why NG firing is studied; three of these are: NGfired combined cycles are much closer to realization as pilot plants with CO2 capture than plantswith coal gasification. Second, it has been argued [3] that the specific cost of CO2 capture islower in an NG-fuelled plant than in a coal-fired plant. Third, the present study was also moti-vated by the specific Norwegian situation, with no coal-fired plants and large resources of NG.Other approaches (e.g., fuel cells) and variants of those mentioned above can be found in
literature. For instance, precombustion decarbonization can be achieved with steam reforming,with partial oxidation, or with auto-thermal reforming, and the subsequent CO2 separation canbe achieved by chemical absorption or by physical absorption [8]. Future alternatives alsoinclude a combination of H2-separating membranes and steam reforming [13].A common challenge for all approaches is the reduced efficiency in terms of net electric-power
production per unit of fuel energy. Moreover, the separated CO2 has to be compressed, trans-ported, and deposited.The present work focuses on approach C: decarbonization prior to combustion (pre-
combustion). The motivation behind this concept is to utilize known technology. In ammoniaproduction, for example, hydrogen is produced by the reforming of NG and the subsequentremoval of the CO2. In the process that is described and analyzed in the following, this tech-nology was used to produce fuel for a conventional CC power plant, and the two processes areintegrated. Some preliminary investigations have been presented in [10–12].

7I.S. Ertesvag et al. / Energy 30 (2005) 5–39
A similar power plant has also been investigated by Lozza and Chiesa [8,9] with reforming bypartial oxidation and by steam reforming. In the present study, a process with auto-thermalreforming is investigated. Auto-thermal reforming uses some steam for reforming, although lessthan in steam reforming. Heat and some water vapor are supplied by burning of some of thefuel; however, less fuel is oxidized than with the partial oxidation method. The study is aninvestigation of the integration between the reformer section and the gas-turbine (GT) andsteam-turbine (ST) power cycles.A detailed second law analysis or exergy analysis has been performed in addition to a first
law analysis in order to analyze this complex energy system more thoroughly. The exergy analy-sis quantifies and localizes the thermodynamic losses (irreversibilities). Such knowledge is usefulin explaining the changes observed in a parameter variation and in explaining the differencesbetween the various processes. This is particularly useful when dealing with new processeswhere little or no experience has been gained. When the detailed breakdown of thermodynamiclosses has been found, appropriate measures can be taken to improve the plant. Moreover, anexergy analysis reveals the thermodynamic value of a separated substance (e.g. captured CO2)and also the value of a pressurized gas (e.g. the supplied NG), which both are not notified in afirst-law analysis.
2. Process description
The flowsheet of the combined-cycle (CC) process with hydrocarbon reforming is shown inFig. 1. NG is reformed to a mixture of CO2, H2, H2O, and N2. The major part of the H2O andCO2 is removed, and the hydrogen-rich fuel is combusted in a GT. The exhaust is ducted througha steam generator with a possibility for supplementary firing (SF). The steam generator is inte-grated with the reforming process, and the steam is utilized in a three-pressure-level power cycle.First, the NG is expanded in an expander from the supply pressure to the pressure of the
reforming section, which is determined by the pressure ratio of the GT. Alternatively, this press-ure reduction may be achieved by throttling. After expansion, the fuel is heated using low-tem-perature heat from cooling water coming from the condenser or the CO2 compressors. The NGexpansion and reheat (prior to stream 1) is not shown in the flowsheet. In the reforming section,NG (stream 1) is merged in the mixer (MIX) with steam (35) at the same pressure and preheatedby the exhaust-gas stream in the preheater before entering the pre-reformer (PRE). Air (8)extracted from the gas-turbine air compressor (AC) and the PRE products (4) are also pre-heated by the exhaust-gas before entering the auto-thermal reformer (ATR). In the presentstudy, the preheater in front of the heat-recovery steam generator (HRSG) was modeled as afour-fluid heat exchanger. Heat is transferred from the turbine-exhaust gas to the PRE feed andthe two ATR feeds (i.e. PRE products and extracted air). In the pre-reformer, most of the heav-ier hydrocarbon components (mainly ethane and propane) are converted to H2, CO, and CO2,whereas the remaining methane is to be converted in the ATR unit. The steam cycle takesadvantage of the reforming process by utilizing the cooling process of the reformer productsdownstream of the ATR to generate additional saturated high-pressure (HP) steam in the heatexchangers H1, H2, and H4 (streams 36–41). Water is pumped from low pressure (LP) to HP(stream 36), heated and evaporated, and the saturated steam (42) is fed into the HP steam drum.

I.S. Ertesvag et al. / Energy 30 (2005) 5–398
Below, a variant configuration (not shown in the flowsheet) will also be investigated, where theATR outlet (11), before entering H1, will be used for preheating the ATR feed (5 and 10).The CO produced in the reforming process is converted to CO2 in the high- and low-tempera-
ture shift reactors (HTS, LTS). Most of the water is removed (stream 43) in the water-removalunit (WR) by condensation at a low temperature. A large fraction of the CO2 content isremoved (44) in the chemical absorber unit (ABS). The captured CO2 is compressed in threesteps with intercooling, then cooled to liquid state, and finally pumped to the transportationpressure. The compression of CO2 (from stream 44) is not shown in the flowsheet in Fig. 1.The required gas-turbine fuel-nozzle pressure is typically 25% higher than the pressure of the
air from the gas-turbine compressor outlet. Thus, an extra pressurization of the fuel is required,and a fuel compressor (FC) is placed downstream the reforming and absorption sections. Thefuel is heated by the LTS feed stream (14) and then fed (23) into the GT combustor. The steamcycle, comprising the HRSG, the steam turbines (ST), and the seawater-cooled condenser(COND), has three pressure levels and steam reheat. In the present simulations, the HRSG wasmodeled as a sequence of a three-fluid heat exchanger for HP and medium-pressure (MP) super-heating, an HP boiler, a four-fluid heat exchanger for combined HP water heating and MPsuperheating, and five heat exchangers for, respectively, LP superheating, MP boiling, MP waterheating, LP boiling, LP water heating, and low-temperature (make-up and LP) water heating.These details, including the arrangement of pumps, are not shown in the flowsheet.
Fig. 1. Process flow diagram of the precombustion CO2-capture power plant.

9I.S. Ertesvag et al. / Energy 30 (2005) 5–39
The reforming process is supplied with pressurized air (stream 8) and steam (35). The powercycles and the reforming process are further integrated with respect to preheating of feedstreams for the reformers (ATR and PRE). The heat required in the reforming process is partlysupplied by preheating of the reformer feed streams, and partly by the exothermic reaction(combustion) between oxygen and NG in the ATR. The combustion may also take place infront of the preheating section of the HRSG by SF. For a conventional CC plant, it is knownthat SF reduces the efficiency. However, this is not so obvious for the process given in Fig. 1.The alternative to SF is increased extraction of air from the gas-turbine compressor to the com-bustion of NG in the ATR, which also decreases the efficiency of the CC. The present studyevaluates methods of supplying heat for the reforming process.The steam used in reforming (stream 35) has to be compensated by make-up water (34). In
effect, this relatively large amount of cold freshwater is evaporated and superheated in the steamcycle to be used in the reforming process. Some of the make-up water can be supplied from thecondensate drained from the reformed fuel (43).The resulting fuel mixture (stream 20) mainly contains H2 and N2. It also contains minor
amounts of CO, CO2, and methane, and trace amounts of other hydrocarbons. Compared withconventional NG firing of gas turbines, the air volumetric flow is reduced by the air extractionfor the reforming section (stream 8). However, this is compensated by the increased fuel volu-metric flow. It is, therefore, possible to maintain the GT pressure ratio at approximately thesame level as for a conventional NG fired gas turbine with no air extraction.It can be noted that the temperature difference in heat exchanger H1 is quite high, as will be
seen below. The ATR outlet at a high temperature exchanges heat with boiling water at HP, i.e.at a much lower temperature. This arrangement, which is common in engineering practice,depends on the material properties. Generally, heat exchange at high temperatures is challengingfor the material. A liquid at one side will keep the temperature of the material close to that of theliquid. The main reason for selecting the arrangement in the present case is metal dusting. This isa corrosion phenomenon which leads to the disintegration of alloys. It particularly occurs whenmetals at a high temperature are exposed to a gas containing hydrogen. Thus, the heat isexchanged with a liquid to avoid a high temperature in the heat exchanger material. The possi-bility of another arrangement, with a presumption of advanced materials or coating, will also beinvestigated.The process shown in Fig. 1 can readily be simplified to a conventional NG fired combined
cycle. Then, NG fuel is expanded from the supply pressure and fed directly into the combustor(23). That is, no steam (35) or air (8) is added, no reforming and no separation take place, andno heat exchange with the fuel takes place except for the possibility of preheating. This conven-tional process was simulated for comparison.
3. Methodology
The process shown in Fig. 1 was modeled in PRO/II v.5.6 (SIMSCI Inc.). The flowsheetsimulations provided data for species mass flows and energy flows. The CO2 compression wassimulated in a separate model set up with the same program.

I.S. Ertesvag et al. / Energy 30 (2005) 5–3910
The gas-turbine (GT) model in the combined cycle (CC) was based on the GTPRO (Thermo-flow Inc.) gas-turbine database for the General Electric (GE) 9351FA technology. This gas tur-bine represents modern technology today, and it is used in a number of plants built in the lastfew years.The pre-reformer (PRE), the main reformer (ATR), and the shift reactors (HTS, LTS) were
assumed to be equilibrium reactors. The GT combustor and the SF were also calculated asequilibrium reactors. However, with high oxygen excess, the result can be regarded as completecombustion.Pressure drops of 3% were assumed in each of the pre-reformer, shift-reactors, and heat
exchangers, whereas a 6% pressure drop was assumed in the ATR. For the GT combustor, theair inlet pressure was set to 1% above the outlet pressure, while the fuel inlet pressure wasapproximately 25% above the outlet pressure.The pressure–volume–temperature relation of the substances was modeled by a Soave–Red-
lich–Kwong equation of state. For mixtures, this was combined with Kay’s rule. These thermo-dynamic models were provided with PRO/II. Gas flows with chemical reactions are oftenmodeled with an ideal-gas approximation. However, at high pressure or with a large content ofwater vapor, there may be considerable real-gas effects.The compression of CO2 was accomplished using a three-step intercooled compression and
subsequent pumping. The compressor polytropic efficiencies ranged from 75% (high pressure) to85% (low pressure). The heat exchangers were modeled with 3% pressure loss as in the rest ofthe study. After each intercooler, condensed water was separated from the CO2 in flash tanks.The generator efficiency was assumed equal to 98.6%. The auxiliary power, mainly power for
cooling-water pumps, was set to 1% of the heat transferred to the coolant in the condenser andthe CO2-compression intercoolers (cf. [8]).The generator losses, auxiliary power, power for compressing of the removed CO2, and
hence, the net electric power production, were calculated separately after the process simulation.The flowsheet simulations also provided the necessary data for calculating the physical (ther-
momechanical) exergy. Based on these data, the chemical exergy was calculated in a separate,in-house program according to the theory given, see, for example [14]. The chemical exergy ofthe individual species in this study was taken from [14] and corrected to the ambient tempera-ture of 8
vC according to the procedure given by Kotas [14,15]. The composition of the dry
atmosphere was defined by the molar fractions (%) N2: 78.03, O2: 20.99, Ar: 0.94, CO2: 0.03.For the present simulations, the content of water vapor corresponds to a relative humidity of82% at 8
vC and 1 atm, which was chosen as the environmental temperature and pressure. This
was the state of the air entrained into the system. The exergy values of all streams were calcu-lated from this. The irreversibility was then found from the exergy balance for each of the indi-vidual unit processes.It should be noted that the chemical exergy was calculated with reference to the atmosphere.
Special care has to be taken when inspecting the values for substances that occur in liquid state,i.e. water in the steam cycle and captured CO2 compressed and liquefied for deposit: for consist-ency throughout the entire process, the chemical exergies of these substances were determinedas if they were gaseous. Then, the negative exergy due to condensing was included in the ther-momechanical exergy. Accordingly, the total exergy might be less than the chemical exergy.

11I.S. Ertesvag et al. / Energy 30 (2005) 5–39
Alternatively, the phase-change exergy could have been included in the chemical exergy. Ineither case, the total exergy will be the same.
4. Present predictions
4.1. Fuel and environment
The chosen composition of the NG was 83.89% methane, 5.34% CO2, 0.01% H2O, and 2.65%nitrogen, 4.87% ethane, 2.12% propane, 0.50% n-butane, 0.28% iso-butane, 0.11% n-pentane,0.12% iso-pentane, 0.06% n-hexane, 0.04% n-heptane, and 0.01% n-octane. This composition isa possible NG from the Norwegian sector. Specifications for traded NG may contain less CO2
and less higher hydrocarbons than that listed here. The lower heating value (LHV) and chemi-cal exergy of this mixture were calculated to 818 901 and 853 085 kJ/kmol, respectively, and themolar mass was 19.674 kg/kmol.The supply pressure and temperature of the NG were set to 50 bar and 4
vC. The thermo-
mechanical exergy at this state was calculated to 8451 kJ/kmol, which was 1.032% of the chemi-cal exergy.Cooling water was assumed to be available at 8
vC, which is a typical year-round temperature
at 50–100 m sea depth in southern Norway. The cooling-water temperature rise was assumed tobe 10
vC. With a condenser temperature of 24.2
vC (saturation pressure 0.030 bar), this means a
temperature difference (LMTD) of 10.5vC.
As noted above, the air was also assumed to have a temperature of 8vC, and with pressure
1.013 bar and relative humidity of 82%. This can be a representative condition for a coastallocation in southern Norway. In any case at this temperature, the specific humidity is low and itis reasonable to assume that a choice of a lower relative humidity would have insignificanteffects on the results.
4.2. Base case with reforming
The base case was defined by choosing the following quantities.The steam-to-carbon ratio (not including fuel CO2) was set to 1.64 at the PRE inlet. From an
efficiency point of view, a lower ratio is desired, as the surplus steam otherwise could be used inthe steam turbine. On the other hand, if the steam-to-carbon ratio is too low, carbonizationmay occur in the ATR. Therefore, this ratio was chosen to ensure that carbonization wasavoided. In addition to the steam that was added, more water vapor will be produced by oxi-dation in the ATR.The PRE feed was preheated to 500
vC. Both feed streams to the ATR, i.e. air and PRE
products, were preheated by the exhaust-gas stream. The temperatures of these two streams(8 and 4) were set to 15
vC below the gas-turbine outlet-stream (24) temperature. The outlet
temperature from the ATR was set to 900vC. The outlet temperature of the WR was set to
25vC. The pressure of the reformer was determined according to the outlet pressure of the AC,
as this delivers air to the ATR.The turbine-inlet temperature (TIT, ISO definition) was set to 1250
vC in the base case, and the
AC-outlet pressure was set to 15.6 bar. These values reflect data from the GE 9 FA gas turbine.

I.S. Ertesvag et al. / Energy 30 (2005) 5–3912
The pressure levels in the triple-pressure reheat steam-turbine cycle were 111, 27, and 4 bar,respectively. This is the current design practice for large conventional CC plants. A limit fortemperatures at the HP and MP steam turbine inlets (streams 26 and 28) was set to 560
vC.
Within this limit, the temperature of the steam was set to 15vC below the exhaust-gas stream
temperature.The cooling of the high-temperature shift-reforming process, i.e. heat exchangers H1, H2, and
H4, was used for heating and boiling HP water for the steam cycle. That is, with a maximumtemperature of 325
vC. This ensures a low temperature in the heat exchanger, as has been dis-
cussed above.The main purpose of this study was to investigate the described concept and details of the
thermal plant, i.e. the reforming section and the power-generation sections and the integrationbetween these. Thus, the CO2 separator (ABS) was not investigated in detail. In the simulations,it was assumed that 90% of the CO2 content was removed (stream 44) in the chemical absorberunit (ABS). The duty in the heat exchanger H5 was assumed to represent the necessary heat ofthe stripper boiler in the absorption/desorption section. Therefore, the temperature out of heatexchanger H4 (stream 17) was required to be above 130
vC. This, and the throttling of the CO2
to 1 atm (stream 44), was assumed to emulate a CO2 separation process with a realistic exergybalance.The compression of CO2 was modeled by three compressors with cooling and water flashing
after each compressor. The compressor-outlet pressures were 4, 15, and 60 bar, respectively.After each compressor, the flow was cooled to 20
vC and some condensed water vapor was
flashed off. The captured CO2 was assumed to contain a small amount of dissolved water, 1.5%,which was reduced to only 0.015% through the compression. After the third compression, theflow was cooled to liquid state and pumped to 200 bar.
4.3. Variation of fuel composition and environmental temperature
The contents of CO2 and hydrocarbons of the fuel may have some effect on the results. Thefuel of the base case had a content of 5.34% CO2 and 8.11% of higher hydrocarbons (C2+). Toindicate these effects, the plant with reforming was simulated in one case with no CO2 in thefuel, while the remaining species was unchanged, and in one case with pure methane as fuel.Traded NG often has a specification that requires the removal of some CO2 from the raw gas.Particularly, in a liquefaction process for LNG, all CO2 has to be removed. In these simu-lations, the molar ratio of steam to carbon in hydrocarbons was maintained. The CO2-free NGcase was equal to the base case in this respect. For the methane-fuelled case, which did not needa pre-reformer for higher hydrocarbons, it was chosen to maintain the ratio in front of theATR, which was 1.61 moles of steam per mole of methane.The environmental state also influences the utilization. The base case had an environmental
temperature of 8vC in the air and cooling water. Two cases were simulated with 4 and 12
vC,
respectively. In these simulations, the cooling-water temperature increase (10vC) and the con-
denser temperature difference (LMTD at 10.7vC) were kept equal to those of the base case.
Thus, the condenser pressure was reduced with lower environmental temperature.In these four cases, the mass flow rate of air to the AC was kept equal to that of the base
case.

13I.S. Ertesvag et al. / Energy 30 (2005) 5–39
4.4. Variation of parameters
For all the following variation of parameters, the mass flow rate and power of the AC wereunchanged. Also, the state of the supplied NG was unchanged.The base case was chosen with an AC-outlet pressure of 15.6 bar, or a pressure ratio of 15.4.
The power plant was also simulated with AC-outlet pressures of 20, 25, 30, and 40 bar. At thepressures of 30 and 40 bar, the steam for the reformer was extracted from the HP turbine. Thetemperature of the steam for reforming (stream 35) was thus lower than in the other caseswhich extracted steam from the MP turbine.The base case had no SF. As noted above, it is not antecedently obvious that SF is benign to
the efficiency of a power plant with an auto-thermal reforming process. The effects were inves-tigated by a series of simulations with increasing amounts of fuel for SF.An alternative arrangement of ATR feed heating by the ATR products was investigated. This
was to reduce the combustion in the ATR and to reduce temperature differences in the coolingof the ATR products. This arrangement requires advanced materials.The development of gas turbines is mainly an issue of increasing the TIT, which is
accomplished by improved turbine-blade materials and localized blade cooling. Simulationswere conducted where the TIT was increased from 1250 to 1350
vC and 1450
vC at all the five
pressure levels specified above. In the computational model, a cooling-air penalty on the gas-turbine efficiency was included.Finally, also the influence of the steam-turbine inlet temperature was studied.
4.5. Conventional combined cycle
The conventional combined cycle without reforming for CO2 capture was simulated for a casecorresponding to the base case, i.e. with TIT 1250
vC, AC-outlet pressure 15.6 bar, and
maximum steam-turbine inlet temperature at 560vC. The steam-cycle pressure levels were the
same as in the base case. This power plant was also simulated with AC-outlet pressures of 20,25, 30, and 40 bar, respectively, and with TIT increased to 1350 and 1450
vC. In these cases, the
NG was expanded from the supply pressure (50 bar) to a pressure that was 25% higher thanthe turbine-inlet pressure and reheated with low-temperature heat. None of these cases had SF.The conventional cycle was also simulated in two cases with environmental temperatures at4 and 12
vC, respectively (cf. Section 4.3).
5. Results and discussion
5.1. The base case
The process described above was simulated, and an energy and exergy analysis was made.The main process stream data are shown in Tables 1 and 3. Results for the corresponding con-ventional CC case without reforming and without CO2 capture are also shown in Tables 2 and3. The exergy values in this table are the exergy flow rates divided by the NG fuel chemicalexergy flow rates. The T–s diagram of the three-pressure-level steam cycle is shown in Fig. 2.

I.S. Ertesvag et al. / Energy 30 (2005) 5–3914
The heat transfer in heat exchangers and power balances for the turbines, compressors, and
pumps are summarized in Table 4 for the base case and for the corresponding conventional case
Table 1Data for selected positions in the flowsheet in Fig. 1: molar flow rate, molar weight, and composition (mole fractions)of the streams. Base case: TIT ¼ 1250
vC, AC-outlet pressure 15.6 bar, no SF
No. M
olarflow(kmol/s)Mw(
olareightkg/kmol)
H2
(%)C(
O%)CO2
(%)C(
H4%)
C2+(%)H(
2O%)O2
(%)N(
2%)
Ar(%)1
1.02 1 9.67 – – 5.34 8 3.89 8.110 0.01 – 2.65 – 2, 3 2.78 1 8.62 – – 1.96 3 0.78 2.979 63.31 – 0.97 – 4, 5 2.96 1 7.47 7.85 0.087 4.85 3 3.03 0.001 53.27 – 0.91 – 6 2 2.69 2 8.90 – – 0.03 – – 1.00 20.74 7 7.30 0.92 8, 10 2.76 2 8.90 – – 0.03 – – 1.00 20.74 7 7.30 0.92 9 2 3.72 2 7.37 0.00 0.00 0.90 0.00 0.000 13.28 11.06 7 3.88 0.88 11, 12 7.08 1 8.58 31.39 1 0.27 5.53 0.18 0.000 21.80 0.00 3 0.47 0.36 13, 14, 15 7.08 1 8.58 38.23 3.43 12.37 0.18 0.000 14.96 0.00 3 0.47 0.36 16, 17, 18 7.08 1 8.58 41.20 0.46 15.34 0.18 0.000 11.99 0.00 3 0.47 0.36 19 6.24 1 8.66 46.75 0.52 17.41 0.21 0.000 0.14 0.00 3 4.57 0.41 20, 22, 23 5.26 1 3.94 55.43 0.62 2.06 0.25 0.000 0.16 0.00 4 0.99 0.48 24, 25 2 3.72 2 7.37 0.00 0.00 0.90 0.00 0.000 13.28 11.06 7 3.88 0.88 26, 27 5.48 1 8.02 – – – – – 1 00 – – – 28, 29 6.95 1 8.02 – – – – – 1 00 – – – 30, 33 6.28 1 8.02 – – – – – 1 00 – – – 34, 35 1.76 1 8.02 – – – – – 1 00 – – – 36, 37, 42 4.52 1 8.02 – – – – – 1 00 – – – 38, 40 0.78 1 8.02 – – – – – 1 00 – – – 39, 41 3.74 1 8.02 – – – – – 1 00 – – – 43 0.84 1 8.02 – – – – – 1 00 – – – 44 0.99 4 3.61 – – 98.49 – – 1.51 – – – 45 0.98 4 3.97 – – 99.84 – – 0.16 – – –Table 2Data for selected positions in a flowsheet simplified from Fig. 1 for a conventional CC case: TIT ¼ 1250
vC, AC-out-
let pressure 15.6 bar, no SF: molar flow rate, molar weight, and composition (mole fractions) of the streams
No. M
olarflow(kmol/s)Molarweight(kg/kmol)
H2
(%)C(
O%)C(
O2%)
CH4(%)
C2+(%)
H2O(%)O(
2%)N(
2%)
Ar(%)1
0.90 19.67 – – 5 .34 83.89 8.11 0.01 – 2.65 – 6, 7 2 2.69 28.90 – – 0 .03 – – 1.00 2 0.74 7 7.30 0.92 24, 25 2 3.65 28.47 0.00 0 .00 4 .49 0.00 0.00 8.47 1 2.09 7 4.07 0.88 26, 27 4.79 18.02 – – – – – 100 – – – 28, 29 5.47 18.02 – – – – – 100 – – – 30, 33 5.95 18.02 – – – – – 100 – – – 34 0 – – – – – – – – – –
15I.S. Ertesvag et al. / Energy 30 (2005) 5–39
(15.6 bar). Here, the heat transfer rates and the power are given in percentage of the NG fuel
LHV. The exergy transfer rates from the hot side of the heat exchangers are given in percentage
Table 3Data for selected positions in the flowsheet, Fig. 1: temperature, pressure, chemical exergy flow rate and total exergyflow rate (in % of the chemical exergy flow rate of the NG fuel supplied), lower heating value (in % of the LHV ofthe NG fuel supplied). Base case and conventional case: TIT ¼ 1250
vC, AC-outlet pressure 15.6 bar, no SF
No. B
ase case with NG reforming Conventional case (no reforming)T (vC) p
(bar) Chemicalexergy (%NG chex)
Totalexergy (%NG chex)
LHV(% NGLHV)
T (vC)
p (bar) C hemicalexergy (%NG chex)
TeN
otalxergy (%G chex)
LNL
HV (%GHV)
1
4.0 16.7 100 100.76 100 4.0 19.5 1 00 1 00.80 1 00 2 257.7 16.6 101.77 104.68 100.01 3 500 16.10 101.77 106.69 100.01 4 439.9 15.61 101.82 106.31 100.86 5 598.4 15.14 101.82 107.92 100.86 6 8.0 1.01 0 0 0 8.0 1.01 0 0 0 7 377.2 15.6 0 23.97 0 377.2 15.6 0 30.80 0 8 377.2 15.6 0 3.32 0 9 1 250.2 15.44 1.85 90.48 0 1250.0 15.44 2.30 1 02.89 0 10 598.4 15.13 0 4.71 0 11 900.2 14.22 85.57 104.11 90.41 12 350.5 13.80 85.57 93.60 90.41 13 429.2 13.38 84.06 93.32 88.02 14 311.6 12.98 84.06 91.47 88.02 15 200.7 12.59 84.06 90.03 88.02 16 236.8 12.22 83.53 89.86 86.99 17 129.7 11.85 83.53 88.72 86.99 18 25.0 11.75 83.53 87.68 86.99 22 86.6 19.50 81.63 85.99 86.99 23 250.0 19.40 81.63 87.03 86.99 24 613.4 1.02 1.85 26.41 0 618.1 1.02 2.30 30.58 0 25 83.0 1.02 1.85 2.60 0 88.7 1.02 2.30 3.27 0 26 501.0 1 11.10 7.01 17.71 0 560.0 112.10 6.91 18.58 0 27 312.7 29.17 7.01 13.67 0 360.7 29.17 6.91 14.18 0 28 501.0 26.62 8.90 20.85 0 560.0 28.29 7.91 19.71 0 29 274.5 4.24 8.03 12.43 0 308.2 4.24 8.59 13.79 0 30 24.2 0.03 8.03 2.02 0 24.2 0.03 8.59 2.19 0 33 24.2 0.03 8.03 0.47 0 24.2 0.03 8.59 0.50 0 34 15.0 3.45 2.25 0.13 0 35 435.9 16.7 2.25 4.76 0 36 91.5 1 22.0 5.78 0.84 0 37 163.0 1 21.5 5.78 1.68 0 40 325.3 1 21.0 0.99 1.89 0 41 325.3 1 21.0 4.78 9.11 0 44 13.6 1.01 2.14 2.14 0 45 47.1 2 00 2.14 1.03 0
I.S. Ertesvag et al. / Energy 30 (2005) 5–3916
of the corresponding heat transfer rate and in percentage of the NG fuel chemical exergy flow
rate. Table 5 shows the corresponding results for an AC-outlet pressure of 40 bar.The utilization of energy and exergy is shown in Table 6 for the base case and in Table 7 for
the conventional case. Here, mechanical power is the sum of shaft power of the gas turbine, the
steam turbines, and the fuel expander when the power to the AC, FC, and water pumps is sub-
tracted. The gross electric power is taken on the generator. The net electric-power output was
obtained by subtracting the auxiliary power consumption and the CO2 compression power from
the gross electric power. The utilized exergy is the sum of net electric-power output and the
chemical and thermomechanical exergy of the captured and compressed CO2. The total lost
exergy is the sum of irreversibilities, exergy lost by the released flue gas, generator losses, and
auxiliary power consumption.In the tables, the chemical energy, i.e. the LHV or negative enthalpy of reaction, of the fuel is
listed as input. The high pressure (50 bar) has a small effect on the enthalpy. Actually, due to
real-gas effects of pressure, the supplied NG had a negative enthalpy (0.11% of the LHV) rela-
tive to the environmental pressure. The temperature (4vC) also had a minor negative contri-
bution (0.02% of the LHV) to the enthalpy relative to the environmental temperature. These
minor contributions were included in the simulations. The chemical exergy of NG is listed in the
tables and used as a reference for normalizing the results. However, the thermomechanical
rsus specific entropy of the steam cycle, base case. The entropy is relative
Fig. 2. Temperature ve to liquid water at thetriple point. The number labels show the states corresponding to streams numbered in Fig. 1 and Tables 1–3. High-pressure water heating and boiling are conducted both in the HRSG (states c-e-f, not numbered in Fig. 1) and in theshift-reaction coolers H4, H2, and H1 (36–37–42, with pump before 36). The location of point 35 varies with the AC-outlet pressure. In the cases where this is 30 or 40 bar, point 35 is found between points 26 and 27.
17I.S. Ertesvag et al. / Energy 30 (2005) 5–39
exergy of the NG is also regarded as input. This was mainly due to the pressure and it accountsfor the possibility of obtaining work from a high-pressure gas. This potential is not included inthe fuel-energy input of an energy analysis. The make-up water (stream 34, Table 3) also addssome exergy. For the processes with reforming of NG, this mass flow should be equal to that ofthe steam mixed with NG (stream 35). Consequently, per unit of mass, the input exergy addedto NG chemical exergy was slightly larger for the base case than for the conventional case. Thetotal of utilized and lost exergy equals the sum of fuel chemical exergy, fuel thermomechanicalexergy, and exergy of the make-up water.The results show that the power plant with NG reforming had considerably lower efficiency.
Higher irreversibilities in the process caused the lower utilization. Furthermore, as 3% of thesupplied exergy was stored in the captured and compressed CO2, the net power production wasreduced correspondingly.More detailed distributions of exergy losses are shown in Table 8. The results for the
increased pressure ratios are also included in these tables. Here, the main units are listed. Fromthe reformer section, the ATR and heat exchanger H1 are listed separately, while the ‘‘otherreforming’’ figure comprises MIX, PRE, preheating of the feed to the reformers (i.e. streams 2,
Table 4Heat and power transfer in the power plant: energy content (% of NG LHV) and exergy transferred from the hotside (in % of the transferred heat and in % of the NG chemical exergy). Base case with reforming and conventionalcase, both with AC-outlet pressure 15.6 bar, TIT ¼ 1250
vC
B
ase case Conventional caseHeat transfer(% LHV)
E(
xergy% heat)Exergy(% chx)
Heat transfer(% LHV)
Exergy(% heat)
E(
xergy% chx)Fuel heater
0.31 0 0 0.31 0 0 Preheater 8.71 66.52 5.56 Reformer heat exchange 25.41 61.27 14.94 H1 of reformer heatexchange16.05
68.23 10.51HRSG
38.92 48.84 18.25 54.13 52.56 2 7.31 HP/MP superheater ofHRSG14.52
60.53 8.44 15.93 65.49 1 0.01Condenser
29.77 5.42 1.55 32.43 5.42 1.69 Intercooling CO2 com-pressor3.05
P
ower(% LHV)P(
ower% chx)Power(% LHV)
Power(% chx)
Fuel expander
0.21 0.20 0.18 0.17 Air compressor � 30.09 � 28.88 �33.96 �32.60 Fuel compressor �1.14 �1.09 Turbine 63.89 61.33 72.12 69.23 Steam turbines 19.27 18.50 21.92 21.04 Pumps �0.20 �0.20 �0.23 �0.22 CO2 compressors �1.93 �1.85
I.S. Ertesvag et al. / Energy 30 (2005) 5–3918
4, and 8), HTS, LTS, heat exchangers H2, H3, and H4, the pump for stream 36, the mixer forstream 42, and FC. The irreversibility of the condenser includes the exergy rejected with coolingwater, and similarly for the coolers of the CO2 compression.As expected, it was seen in all cases that the combustor was the main contributor to irreversi-
bility. In the plant with reforming, the irreversibility of the combustor was lower than in theconventional plant. However, the sum of irreversibilities in the reforming process and the com-bustor was 6–7% points higher than that of the combustor in the conventional plant. The ATRand the heat exchangers, in particular H1, were the major contributors to the increased irre-versibility. Actually, an ATR includes a combustor where some of the pre-reformed NG feed isburned to heat the reactants in the reforming reactions. Internal heat transfer from reactions isknown as a major source of combustion irreversibility. The heat exchangers were operated atrelatively high temperature differences as the coolant was compressed or saturated water for thesteam cycle.The single heat exchanger H1 had an irreversibility that was greater than that of the HRSG.
H1 was a boiler in which high-pressure water was heated and vaporized to saturated steam(approximately 325
vC), and heated with the high-temperature products (900
vC) of the ATR.
Table 5Heat and power transfer in the power plant: energy content (% of NG LHV) and exergy transferred from the hotside (in % of the transferred heat and in % of the NG chemical exergy). Base case with reforming and conventionalcase, both with AC-outlet pressure 40 bar, TIT ¼ 1250
vC
B
ase case Conventional caseHeat transfer(% LHV)
Exergy(% heat)
Exergy(% chx)
Heat transfer(% LHV)
Exergy(% heat)
Exergy(% chx)
Fuel heater
0.06 0 0 0 0 0 Preheater 3.48 32.37 1.08 Reformer heat exchange 27.81 59.66 15.92 H1 of reformer heatexchange16.95
68.21 11.10HRSG
32.92 45.03 14.23 43.86 47.70 20.08 HP/MP superheater ofHRSG8.02
56.76 4.37 7.34 59.77 4.21Condenser
30.12 5.42 1.57 28.54 5.42 1.49 Intercooling CO2 com-pressor2.79
P
ower(% LHV)Power(% chx)
Power(% LHV)
Power(% chx)
Fuel expander
0.03 0.03 Air compressor � 55.68 �53.45 �68.63 �65.88 Fuel compressor �1.05 �1.01 112.68 108.17 Turbine 91.02 87.37 Steam turbine 16.58 15.91 15.46 14.84 Pumps �0.20 �0.19 �0.15 �0.14 CO2 compressors �1.84 �1.77
19I.S. Ertesvag et al. / Energy 30 (2005) 5–39
This thermodynamically ‘‘unwise’’ arrangement follows engineering practice and, as explained
above, is due to the material problems that otherwise would occur. The irreversibility of this
unit was 25–30% of the exergy it transferred to the steam. With improved material technology,
this heat may be utilized for various things, including superheating of steam or preheating of
the ATR feeds.The increased complexity of the plant also leads to increased pressure losses that otherwise
could have been used for power production in an expander. However, this appeared to be a
modest contribution to the total figures. The irreversibility of the base case due to pressure
losses of the gas flowing through the reforming section, the combustor, and the HRSG was esti-
mated to 0.94% of the NG chemical exergy. This figure does not include the flows in the steam
cycle. The main contributors were the combustor (0.38%), the shift reactors and heat exchangers
H1 to H5 (0.36%), and the ATR (0.10%). These pressure-loss contributions were included in the
irreversibilities reported in the tables. For AC-outlet pressures up to 40 bar (see below), these
figures were not substantially changed since they depend on the pressure ratio over each unit
and not on the absolute pressure.
Table 6Energy and exergy utilization and losses for the base case (TIT ¼ 1250
vC) and increased AC-outlet pressure
AC-outlet pressure (bar)
15.6 20.0 25.0 30.0 40.0Fuel LHV flow rate (MW)
834.01 807.66 782.19 757.26 712.44 Mechanical power (MW) 433.15 417.18 403.17 389.37 361.20 Mechanical power (% LHV)a 51.94 51.65 51.54 51.42 50.70 Gross electric power (% LHV) 51.21 50.93 50.82 50.70 49.99 Auxiliary power (% LHV) 0.40 0.40 0.40 0.40 0.40 CO2-compression power (% LHV) 1.93 1.92 1.90 1.88 1.84 Net electric power (% LHV) 48.88 48.61 48.52 48.42 47.75Fuel chemical exergy flow rate (MW)
868.82 841.38 814.84 788.87 742.18 Other exergy inflow (% chx)b 1.15 1.15 1.15 1.15 1.15 Mechanical power (% chx) 49.85 49.58 49.48 49.36 48.67 CO2-compression power (% chx) 1.85 1.84 1.83 1.81 1.77 Auxiliary power (% chx) 0.38 0.38 0.38 0.38 0.39 Net electric power (% chx) 46.92 46.66 46.58 46.48 45.83 Exergy in CO2 (% chx) 3.17 3.17 3.16 3.14 3.11 Chemical exergy in CO2 (% chx) 2.14 2.13 2.13 2.12 2.10 Utilized exergy (% chx) 50.09 49.83 49.74 49.62 48.95 Utilized exergy (% tx)c 49.58 49.32 49.23 49.11 48.45 Total irreversibility (% chx) 47.29 47.55 47.65 47.77 48.41 Exergy outflow (% chx) 2.67 2.67 2.68 2.67 2.72 Generator loss and auxiliary power (% chx) 1.08 1.08 1.08 1.07 1.07 Total lost exergy (% chx) 51.04 51.30 51.40 51.52 52.19a Percentage of fuel (NG) lower heating value (fuel LHV).b Percentage of fuel (NG) chemical exergy.c Percentage of fuel (NG) total exergy at supply state.

I.S. Ertesvag et al. / Energy 30 (2005) 5–3920
The auxiliary power consumption was determined to be 1% of the heat transferred to coolingwater in the condenser and the intercoolers of the CO2 compressors. The latter was approx-imately one-tenth of the former. The auxiliary power of the plant with reforming was slightlyhigher than that of the conventional plant.
5.2. Fuel composition and environmental temperature
The results with CO2-free NG showed small but significant changes from the base case. Themixture of hydrocarbons of the fuel was exactly the same. The amount of steam (stream 35) permole of carbon in hydrocarbons was also maintained. The consumption of hydrocarbons and,accordingly, the input LHV, was slightly lower (0.47%) in the CO2-free NG case than in thebase case, while the compressor and turbine power was unchanged in absolute figures. As thehydrocarbons were not mixed with CO2, the ratio of chemical exergy to LHV was slightlyincreased.The net electric power production was 49.1% of the LHV in the case with no fuel CO2. This
compares to 48.9% of the base case. The main contribution to the overall increase was actuallythat less CO2 had to be captured and compressed and its total exergy was reduced by 0.15% ofthe NG chemical exergy. The fraction of hydrocarbons converted in the reforming process andthe percentage of captured CO2 were virtually unchanged. The changes in irreversibilities were
Table 7Energy and exergy utilization and losses for the conventional case (TIT ¼ 1250
vC) with increased AC-outlet press-
ure
AC-outlet pressure (bar)
15.6 20.0 2 5.0 3 0.0 40.0Fuel LHV flow rate (MW)
738.85 700.48 6 63.65 6 31.79 578.04 Mechanical power (MW) 443.59 422.17 3 99.63 3 79.25 343.21 Mechanical power (% LHV)a 60.04 60.27 60.22 60.03 59.37 Gross electric power (% LHV) 59.20 59.42 59.37 59.19 58.54 Auxiliary power (% LHV) 0.32 0.31 0.30 0.30 0.29 Net electric power (% LHV) 58.87 59.11 59.07 58.89 58.26Fuel chemical exergy flow rate (MW)
769.69 729.72 6 91.35 6 58.16 602.17 Other exergy inflow (% chx)b 1.02 1.02 1.02 1.02 1.02 Mechanical power (% chx) 57.63 57.85 57.80 57.62 57.00 Auxiliary power (% chx) 0.31 0.30 0.29 0.28 0.27 Net electric power (% chx) 56.51 56.74 56.70 56.53 55.92 Utilized exergy (% chx) 56.51 56.74 56.70 56.53 55.92 Utilized exergy (% tx)c 55.94 56.17 56.13 55.95 55.35 Total irreversibility (% chx) 40.12 39.75 39.69 39.75 40.14 Exergy outflow (% chx) 3.27 3.41 3.53 3.64 3.88 Generator loss and auxiliary power (% chx) 1.12 1.11 1.10 1.09 1.07 Total lost exergy (% chx) 44.51 44.28 44.31 44.49 45.09a Percentage of fuel (NG) lower heating value (fuel LHV).b Percentage of fuel (NG) chemical exergy.c Percentage of fuel (NG) total exergy at supply state.

21I.S. Ertesvag et al. / Energy 30 (2005) 5–39
small: it was increased in the combustor by 0.10% of the NG chemical exergy and reduced by0.06% in the ATR, while other changes were smaller.An interesting aspect to discuss is the marginal energetic cost of CO2 removal from NG.
Compared with the case with no fuel CO2, the base case produced 0.18 MW less electricity. TheLHV of extra fuel consumption was 3.96 MW, which could have been converted into 1.94 MWelectric power. This total of 2.12 MW electric power was the cost of capturing and compressing2.20 kg/s CO2 that was mixed with the hydrocarbons. If not converted to electricity, this corre-sponds to 4.33 MW LHV. That is, the energetic cost was 0.27 kWh electricity or 2.0 MJ LHVper kg fuel CO2 captured and compressed. This figure can be compared with the marginal fuelcost of CO2 removal from the fuel at an NG processing plant.The case with pure methane as fuel gave a net electric production of 49.2% LHV. With the
higher H-to-C ratio of the fuel, less CO2 was produced and captured. The fraction of carbonthat was captured was close to those of the base case and the CO2-free NG case. The capturedand compressed CO2 represented 2.94% of the methane chemical exergy or 0.1% point less thanin the CO2-free NG case. Compared with that case, the pure methane case had higher irrever-sibilities in the reforming process (0.20% of the fuel exergy) and lower in the combustor(0.25%). Less heat was transferred to the ATR feeds and, accordingly, more heat and exergy(0.45% of NG chemical exergy) were transferred to the steam cycle.The effect of reducing the environmental temperature, i.e. the air and cooling-water tempera-
ture, from 8 to 4vC, was an increase in net electric power production by 0.35% of the LHV.
The contributions to this improvement were from the AC, which needed less power input (0.6%
Table 8Distribution of exergy losses (in % of NG chemical exergy) on different sections of the system, base case and conven-tional case for increasing AC-outlet pressure (TIT ¼ 1250
vC)
Base case
Conventional caseAC-outlet pressure(bar)
15.6
20 25 30 40 1 5.6 20 2 5 30 40Air compressor
1.56 1.75 1.94 2.11 2.42 1.76 2.02 2.28 2.53 2.98 Combustor 20.55 19.87 19.26 18.83 18.20 2 8.74 28.10 2 7.55 27.11 26.46 Turbine 2.74 3.18 3.43 3.74 4.31 3.08 3.56 4.04 4.48 5.32 Fuel expander/heater 0.08 0.05 0.04 0.02 0.01 0.06 0.04 0.03 0.01 – HRSG 2.12 2.14 2.05 2.05 2.14 2.83 2.59 2.48 2.41 2.35 ST 1.78 1.73 1.70 1.71 1.69 1.96 1.83 1.74 1.66 1.54 Condenser 1.55 1.54 1.52 1.55 1.57 1.69 1.62 1.58 1.54 1.49 ATR 8.52 8.80 9.08 9.32 9.65 H1 2.79 2.85 2.90 2.84 2.84 Other reforming 3.32 3.18 3.10 3.05 2.98 WR 0.40 0.41 0.41 0.41 0.41 ABS 1.09 1.28 1.46 1.38 1.45 CO2 compression 0.80 0.79 0.79 0.77 0.75Sum irreversibilities
47.29 47.55 47.65 47.77 48.41 4 0.12 39.75 3 9.69 39.75 40.14 Flue gas exergy 2.67 2.67 2.68 2.67 2.72 3.27 3.41 3.53 3.64 3.88Sum
49.96 50.23 50.33 50.44 51.13 4 3.39 43.17 4 3.21 43.39 44.01
I.S. Ertesvag et al. / Energy 30 (2005) 5–3922
of LHV) due to denser air, and the steam turbine, which operated over a larger pressure ratioand produced more power (0.2%). On the negative side, the gas turbine produced less power(0.4% of LHV) due to higher fuel consumption to compensate for the lower temperature in thecompressed air.The underlying details are complex. First, it should be noted that the chemical exergy varies
very little with temperature. The reduction of the environmental temperature from 8 to 4vC,
gave a 0.06% reduced specific chemical exergy of the fuel. Ambient air with lower temperaturealso gave lower temperature from the compressor. This either requires more heat for the ATRfeeds or more combustion within the ATR, or both. Therefore, the temperature of the flue gasentering the HRSG was reduced. However, this reduction was less than that of the ambientand, hence, the specific exergy of the flue gas was slightly increased. Also, the heat transfer tothe steam cycle in the HRSG and the reformer coolers was reduced at lower environmental tem-perature, while the corresponding exergy-to-heat ratio and the exergy transfer was increased.The power of the HP and MP steam turbines was somewhat reduced due to lower temperatureof the flue gas, whereas the LP-steam-turbine gave some more power due to the lower con-denser pressure.The case simulated with environmental temperature increased to 12
vC approximately
gave the same changes, although with the opposite sign. The changes observed were modest;however, they were significant. The nearly 0.1% efficiency decrease per degree of increasedenvironmental temperature cannot be linearly extrapolated to the much higher ambient tem-perature of sub-tropical and tropical locations. However, the results are a clear indication ofhow the performance of the plant depends on the climate of the location.Also, for the conventional CC, the reduction of air and cooling-water temperatures from 8 to
4vC gave a 0.35% increase in net electricity production divided by LHV. Here, the AC power
input was reduced with 1.6% of LHV, while the gas-turbine power output decreased with 1.2%of LHV. Increasing the environmental temperature from 8 to 12
vC gave approximately the
same changes with the opposite sign.
5.3. Increased gas-turbine pressure ratio
Details of the process were studied to explain the decreased utilization with the higher press-ure ratio reported in Tables 6–8. As shown in Fig. 3, the power produced per molar flow rate ofH2 burned in the combustor increased with higher pressure. However, the irreversibility in thereformer per mole of H2 also increased, as seen in Fig. 4. This effect occurs in the ATR. The fig-ure shows the increased irreversibility of the ATR per mole of H2 produced in that unit. For theother units of the reformer section, the irreversibility per mole of H2 produced showed onlyminor changes. As will be discussed below, the increased pressure ratio required more NG to beburned with air to produce the same amount of H2. Thus, the content of nitrogen and combus-tion products, CO2 and H2O, in the reformed mixture increased with pressure, Table 9. Moreoxygen was consumed in the ATR, while the accompanying nitrogen dilutes the reformer pro-duct. The increased combustion in the ATR was mainly to compensate for the reduced heattransfer from the flue gas, which exited the turbine at a lower temperature. The temperatures ofthe flue gas at the turbine outlet and at the HRSG inlet (i.e. the preheater outlet) are also shown

23I.S. Ertesvag et al. / Energy 30 (2005) 5–39
in Table 9. Both the increased pressure and the increased amounts of combustion products(CO2 and H2O) tend to reduce the conversion to H2.The reduced heat transfer provided to the reformer feeds led to a higher consumption (i.e.
combustion) of NG in the reformer (ATR) and, consequently, to a higher irreversibility in thesystem. In the conventional GT cycle, the efficiency could increase with some steps of increasedpressure. On the other hand, the pressure increase had a less pronounced effect on the steamcycle of the reforming case than in the conventional case. This was because in the conventionalcase, the turbine outlet flow enters the HRSG directly. The temperature of the flue gas after pre-heating the reformer feeds was reduced less by the pressure increase than the GT-outlet tem-perature (cf. Table 9). This contributes to the reduced efficiency of the conventional plant at thehigher pressure levels.
ical power produced in the total system, by the gas turbine cycle, and by the s
Fig. 3. Net mechan team-turbine cycleper flow rate of H2 in the reformed fuel (MJ/kmol H2) as a function of AC-outlet pressure (bar).ility in the ATR and in the entire reformer section, in MJ per kmol H2 produced
Fig. 4. Irreversib as a function ofAC-outlet pressure (bar).
I.S. Ertesvag et al. / Energy 30 (2005) 5–3924
Another observation is about the species molar fractions of the ATR: the steam-to-carbon
ratio of the reformer-section inlet (stream 2) was kept constant over the series of simulations.
As seen in Table 9, the H2O-to-C ratio after the ATR (stream 11) increases with higher press-
ure, i.e. following increasing combustion in the ATR. This indicates that at higher pressure lev-
els, the inlet steam-to-carbon ratio can be reduced. Some of the required H2O may be provided
by combustion in the first part of the ATR. Reducing the steam addition (stream 35) could
reduce irreversibilities and increase power production. However, this modification has to be
based on detailed knowledge of the flow field and the spatial distribution of reactions in the
ATR, for instance, from computational fluid dynamics (CFD).One of the ‘‘second law commandments’’ (No. 4) of Leites et al. [16] states that if the volume
increases, it is necessary to raise (not to reduce) the pressure in order to minimize the irreversi-
bility. In the present process, the volumetric rate increased through the ATR. When the press-
ure was raised, the irreversibility increased. This may seem to be contradictory to their
commandment. However, when looked at closer, this is not the case. As shown in Table 9 and
discussed above, the temperature of the ATR feeds was reduced and more heating was required
as the pressure was increased. This additional heating, i.e. additional combustion in the ATR,
to bring the feed to the feed temperature of the base case (598vC) was estimated separately. It
was found that the associated exergy loss was larger than the overall increase of irreversibility in
the ATR seen in Table 8. Therefore, if given the same feed temperature, increased pressure
would reduce, not increase, the irreversibility of the ATR. Thus, the results here are in accord-
ance with the fourth commandment of Leites et al. However, in our process, the increased
pressure reduces the amount of thermal energy available for the required heating of the ATR
feeds, and the overall irreversibility increases.
Table 9Temperatures (
vC) and molar ratios in selected streams for the plant with reforming at increasing AC-outlet pressure.
Temperatures for the conventional CC plant
AC-outlet pressure (bar) 1
5.6 20 25 30 40Reforming plant
Temperature (vC) of GT outlet (stream 24) 6
v
13.4 570.5 528.2 497.1 449.5Temperature ( C) in flue gas into HRSG 5v
21.0
498.5 475.0 440.7 416.3 Temperature ( C) ATR feeds (5, 10) 5 98.4 555.5 513.2 484.1 434.5O2-to-C ratio in reformer (streams 1 and 8)
0.51 0.53 0.55 0.56 0.58 H2O-to-C ratio after ATR (stream 11)a 1.36 1.41 1.45 1.41 1.54 CO2-to-C ratio (%) after ATR (stream 11) 34.60 35.63 36.54 35.44 38.41 CO2-to-C ratio (%) after reformer (stream 16) 95.96 95.89 95.60 95.14 94.21 CO-to-C ratio (%) after reformer (stream 16) 2.88 2.47 2.19 1.95 1.62 CH4-to-C ratio (%) after reformer (streams11–16)1.15
1.65 2.21 2.91 4.17Conventional CC plant
Temperature (vC) of GT outlet (stream 24) 6
18.1 572.6 533.0 501.6 454.0a The inflow (stream 3) H2O-to-C ratio was 1.56 when fuel CO2 was included and 1.64 when this was excluded.

25I.S. Ertesvag et al. / Energy 30 (2005) 5–39
5.4. Effects of supplementary firing
Above, it was seen that the ATR required substantial amounts of combustion to heat thefeeds to the reactor temperature and to heat the endothermic reaction. An alternative or sup-plement to combustion within the ATR is SF in the flue gas in front of the preheating sectionprior to the HRSG. For a conventional CC plant, it is known that SF reduces the efficiency.However, this is not so obvious for the process given in Fig. 1. The alternative to SF, morecombustion in the ATR, implicates increased extraction of air from the gas-turbine compressorto the ATR. This also decreases the efficiency of the CC.The influence of SF was investigated by a series of simulations with an increasing amount of
fuel burned in the flue gas after the gas turbine. This flue gas was used for preheating feed tothe reformers before heating steam and water in the HRSG. Results from different cases of SFare shown in Fig. 5 and Table 10. The amounts of fuel for SF are given in percentage of theamount of fuel to the GT. The irreversibilities are collected into five groups: the GT systemcomprising the NG expander, the FC, the AC, the combustor, and the turbine; the ST systemcomprising the HRSG, the steam turbines, and the condenser; the reforming process; and theWR and CO2 capture and compression. The burner for SF is given as a separate unit in thetable. It is seen that the relative irreversibilities of both the GT system and the reforming pro-cess were reduced with SF. The GT-system irreversibility per mole of fuel used in the GT com-bustor showed only minor changes. The reformer irreversibility per mole of fuel reformed wasreduced.The temperatures in the GT exhaust gas after SF are shown in Fig. 6 as a function of the
AC-outlet pressure for the different amounts of fuel to SF. This is before heat exchange with thereformer feeds. For each pressure, the values for zero SF also show the temperature before SF,i.e. the turbine-outlet temperature. The temperature increase due to SF was virtually linear with
wer production (in % of the natural gas LHV flow rate) as a function of a
Fig. 5. Net electric-po mount of fuel to sup-plementary firing (in % of the fuel used in the GT) for five different AC-outlet pressures (bar).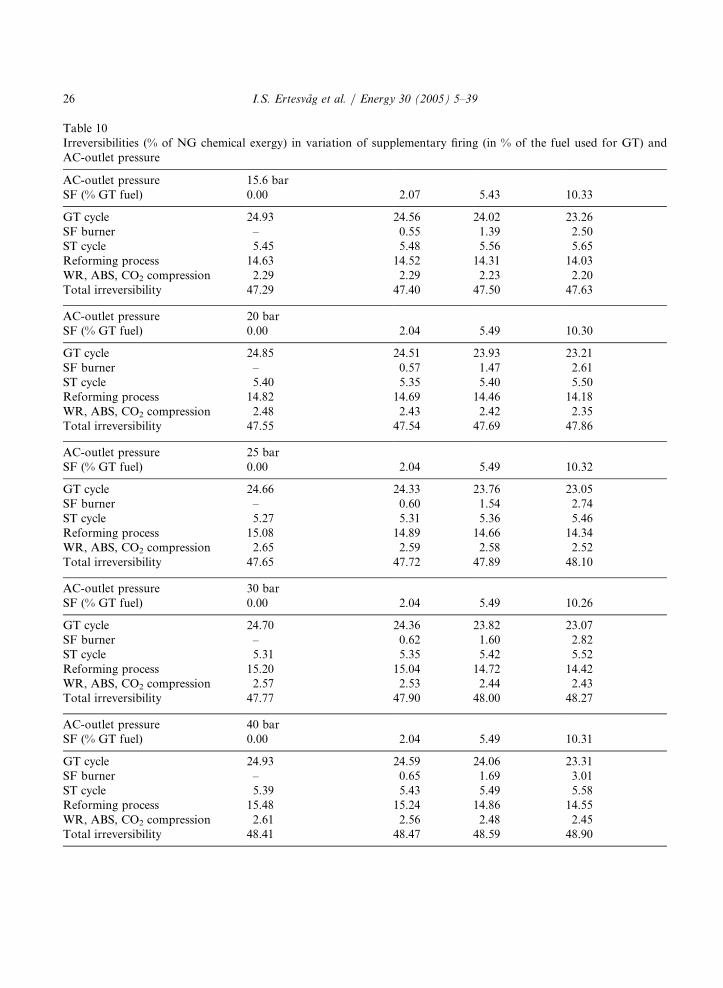
I.S. Ertesvag et al. / Energy 30 (2005) 5–3926
Table 10Irreversibilities (% of NG chemical exergy) in variation of supplementary firing (in % of the fuel used for GT) andAC-outlet pressure
AC-outlet pressure
15.6 bar SF (% GT fuel) 0.00 2.07 5.43 10.33GT cycle
24.93 2 4.56 2 4.02 23.26 SF burner – 0.55 1.39 2.50 ST cycle 5.45 5.48 5.56 5.65 Reforming process 14.63 1 4.52 1 4.31 14.03 WR, ABS, CO2 compression 2.29 2.29 2.23 2.20 Total irreversibility 47.29 4 7.40 4 7.50 47.63AC-outlet pressure
20 bar SF (% GT fuel) 0.00 2.04 5.49 10.30GT cycle
24.85 2 4.51 2 3.93 23.21 SF burner – 0.57 1.47 2.61 ST cycle 5.40 5.35 5.40 5.50 Reforming process 14.82 1 4.69 1 4.46 14.18 WR, ABS, CO2 compression 2.48 2.43 2.42 2.35 Total irreversibility 47.55 4 7.54 4 7.69 47.86AC-outlet pressure
25 bar SF (% GT fuel) 0.00 2.04 5.49 10.32GT cycle
24.66 2 4.33 2 3.76 23.05 SF burner – 0.60 1.54 2.74 ST cycle 5.27 5.31 5.36 5.46 Reforming process 15.08 1 4.89 1 4.66 14.34 WR, ABS, CO2 compression 2.65 2.59 2.58 2.52 Total irreversibility 47.65 4 7.72 4 7.89 48.10AC-outlet pressure
30 bar SF (% GT fuel) 0.00 2.04 5.49 10.26GT cycle
24.70 2 4.36 2 3.82 23.07 SF burner – 0.62 1.60 2.82 ST cycle 5.31 5.35 5.42 5.52 Reforming process 15.20 1 5.04 1 4.72 14.42 WR, ABS, CO2 compression 2.57 2.53 2.44 2.43 Total irreversibility 47.77 4 7.90 4 8.00 48.27AC-outlet pressure
40 bar SF (% GT fuel) 0.00 2.04 5.49 10.31GT cycle
24.93 2 4.59 2 4.06 23.31 SF burner – 0.65 1.69 3.01 ST cycle 5.39 5.43 5.49 5.58 Reforming process 15.48 1 5.24 1 4.86 14.55 WR, ABS, CO2 compression 2.61 2.56 2.48 2.45 Total irreversibility 48.41 4 8.47 4 8.59 48.90
27I.S. Ertesvag et al. / Energy 30 (2005) 5–39
the amount of fuel for SF. However, the increase was reduced with increasing pressure: with10.4% SF, the temperature increase was 82.6 K for the AC-outlet pressure of 15.6 bar and 71.7K for that of 40 bar. This decrease was due to the lower content of combustibles (mainly H2) inthe reformed fuel at higher levels of AC-outlet and reformer pressure.The main finding from these simulations was that the irreversibility of the SF burner increases
more than the reduction in the remaining process. Irreversibility due to throttling in the burnerincreased with the GT pressure ratio (i.e. the pressure after the CO2 capture). However, this wasonly 12–15% of the total irreversibility of the SF burner. The main contribution was due tocombustion.The net electric-power production results, Fig. 5, showed a clear tendency towards reduced
efficiency with increased SF for all five AC pressures. However, the case of pressure equal to 20bar with no SF seemed to be an anomaly. A closer inspection showed that the HRSG, or actu-ally the first heat exchanger, the three-fluid HP/MP superheater, had an irreversibility 0.1%point higher than what should be expected from the other cases. In fact, this is sufficient toexplain the anomaly of this case. However, the detailed analysis of temperatures, pressures, andmass flows of this heat exchanger showed no unexpected values compared to the other cases.Thus, it seems that this case by incidence showed an unfortunate combination of operationalparameters.
5.5. Product-feed heat exchange in the auto-thermal reformer
The analysis of the base case above revealed considerable irreversibility in the heat exchangerH1 following the ATR. The high-temperature ATR outflow was cooled by heat exchange withsaturated water at a much lower temperature in the HP steam cycle. Such arrangements arecommon in engineering practice. A thermodynamically more attractive gas-to-gas heatexchanger may lead to material problems at such high temperatures.
e (vC) in gas-turbine exhaust after supplementary firing, before heat exchange w
Fig. 6. Temperatur ith reformer feed,as a function of AC-outlet pressure (bar) for different amounts of fuel to SF (in % of fuel used for the gas turbine).

I.S. Ertesvag et al. / Energy 30 (2005) 5–3928
If it is assumed that the material problems can be resolved, cooling of the ATR productstream can be used for high-temperature heating. One obvious possibility is to superheat steaminstead of boiling in heat exchanger H1. This would reduce the temperature difference, andhence, the irreversibility. However, heating the ATR inflow appears to be more advantageous:the mass flows are equal, the heating capacities are similar, and the temperatures are not farfrom each other.In the base case, the ATR feeds (streams 5 and 10) had a temperature of 598
vC after pre-
heating by the GT exhaust. The ATR outflow (stream 11) was specified with a temperature of900
vC. In the following simulations, heat was transferred to the feeds from the products before
the latter entered the boiler H1. The amount of heat transfer, and hence, the ATR inlet tem-perature, was increased in steps as shown in Table 11.In these simulations, the amount of compressed air was unchanged. Thus, the power and irre-
versibility rate of the AC were constant. Furthermore, the power production and the irreversi-bility rates of the turbine and the combustor increased slightly (approximately by 0.5%) inabsolute values. The main change was the reduced fuel consumption (6%). This was mainly dueto reduced combustion in the ATR.
Table 11Energy and exergy utilization and losses for the base case (AC-outlet pressure 15.6 bar, TIT ¼ 1250
vC, no SF) and
with product-feed heat exchange in the ATR
ATR inlet temperature (vC)
598a 6 50 700 7 50 800Fuel LHV flow rate (MW)
834.01 8 21.95 807.53 7 94.29 783.78 Mechanical power (MW) 433.15 4 30.21 426.36 4 22.13 419.21 Mechanical power (% LHV)b 51.94 52.34 52.80 53.15 53.49 Gross electric power (% LHV) 51.21 51.61 52.06 52.40 52.74 Auxiliary power (% LHV) 0.40 0.39 0.38 0.37 0.37 CO2-compression power (% LHV) 1.93 1.92 1.91 1.90 1.89 Net electric power (% LHV) 48.88 49.29 49.77 50.13 50.48Fuel chemical exergy flow rate (MW)
868.82 8 56.26 841.24 8 27.45 816.50 Other exergy inflow (% chx)c 1.15 1.15 1.15 1.15 1.15 Mechanical power (% chx) 49.85 50.24 50.68 51.02 51.34 CO2-compression power (% chx) 1.85 1.84 1.83 1.82 1.81 Auxiliary power (% chx) 0.38 0.38 0.37 0.36 0.35 Net electric power (% chx) 46.92 47.32 47.77 48.12 48.46 Exergy in CO2 (% chx) 3.17 3.16 3.14 3.12 3.10 Chemical exergy in CO2 (% chx) 2.14 2.13 2.11 2.10 2.09 Utilized exergy (% chx) 50.09 50.48 50.91 51.24 51.56 Utilized exergy (% tx)d 49.58 49.96 50.39 50.72 51.03 Total irreversibility (% chx) 47.29 46.86 46.36 45.99 45.60 Exergy outflow (% chx) 2.67 2.72 2.78 2.83 2.90 Generator loss and auxiliary power (% chx) 1.08 1.08 1.08 1.07 1.07 Total lost exergy (% chx) 51.04 50.65 50.21 49.89 49.57a Base case, no product-feed heat exchange in the ATR.b Percentage of fuel (NG) lower heating value (LHV).c Percentage of fuel (NG) chemical exergy.d Percentage of fuel (NG) total exergy at supply state.

29I.S. Ertesvag et al. / Energy 30 (2005) 5–39
The irreversibilities are shown in Table 12 in percentage of the NG chemical exergy. The irre-versibilities of the AC, the combustor, and the turbine, which were nearly constant in absolutefigures, increased relative to the NG chemical exergy according to the reduced fuel consumption(approximately 6%). For these three units together, this was seen as a 1.7%-point increase rela-tive to the NG chemical exergy. As expected, the irreversibilities of the ATR and the heatexchanger H1 were reduced. This reduction was nearly by one-third over the series of variationor 2.8% of the NG chemical exergy. The remaining units had minor changes in irreversibilitiesrelative to the fuel exergy. For the total system, over this series of cases, the utilized exergyincreased by 1.5% points to 51.0% of the total fuel exergy and the net electric-power productionincreased by 1.6% points to 50.5% of the LHV.As combustion in the ATR was reduced, the outlet gas was less diluted with combustion
products and nitrogen from the combustion air. This led to higher concentrations of thereformer products and a shift of the equilibrium composition such that more methane and COwere released from the reforming process (stream 16).
5.6. Increased turbine inlet temperature
In the development of gas turbines, increasing the TIT is an important issue. This isaccomplished by improved turbine-blade materials and localized blade cooling. The effect wasinvestigated by simulations where the TIT was increased from the 1250
vC of the base case to
1350 and 1450vC. This can be regarded as an extrapolation of the development in gas turbine
Table 12Distribution of exergy losses (in % of NG chemical exergy) in different sections of the system for the base case (AC-outlet pressure 15.6 bar, TIT ¼ 1250
vC, no SF) and with product-feed heat exchange in the ATR
ATR inlet temperature (vC)
598a 650 700 750 800Air compressor
1.56 1.58 1.61 1.64 1.66 Combustor 20.55 20.85 21.27 21.62 21.96 Turbine 2.74 2.79 2.84 2.89 2.94 Fuel expander/heater 0.08 0.08 0.08 0.08 0.08 HRSG 2.12 2.04 2.08 2.11 2.14 ST 1.78 1.76 1.73 1.70 1.67 Condenser 1.55 1.52 1.49 1.46 1.43 ATR 8.52 8.25 7.88 7.51 7.18 H1 2.79 2.45 1.99 1.63 1.30 Other reforming 3.32 3.30 3.26 3.25 3.22 WR 0.40 0.40 0.38 0.38 0.37 ABS 1.09 1.06 0.98 0.94 0.89 CO2 compression 0.80 0.80 0.79 0.79 0.78Sum irreversibilities
47.29 46.86 46.36 45.99 45.60 Flue gas exergy 2.67 2.72 2.78 2.83 2.90Sum
49.96 49.58 49.14 48.82 48.50a Base case, no product-feed heat exchange in the ATR.

I.S. Ertesvag et al. / Energy 30 (2005) 5–3930
technology. For each value of the TIT, simulations were conducted with AC-outlet pressure of15.6, 20, 25, 30, and 40 bar. This was the same pressure variation investigated and described forthe base case above.The efficiency in terms of net electric power to the grid divided by the LHV of the consumed
NG is shown in Fig. 7. The main result is that the efficiency—as expected—increased with TIT.Furthermore, it is seen that at higher TIT, the efficiency of the plant with reforming was lessaffected by the pressure ratio than the conventional plant. For the latter, the general tendencywas that the efficiency increased with increased pressure ratio.The corresponding irreversibilities are shown in Figs. 8 and 9. Here, the units of the plant are
collected into four groups (two in the conventional CC cases). When details were inspected, itwas observed that the changes in efficiency with higher pressure were a result of reduced irre-versibility in the combustor and in the steam cycle (due to lower temperature of the exhaustinflow to the HRSG), counteracted by increased irreversibility in the AC and the turbine. In thehigh-pressure cases of the conventional CC, the increased irreversibility outnumbered thereduction. Therefore, the upper three curves in Fig. 7 tend to flatten or turn slightly down. Thisbehavior is known from the literature. It is seen that the irreversibility of the steam cycle is onlyslightly reduced at the high pressure ratios and not sufficient to compensate for the increasedirreversibility in the gas turbine. It may be that the low exhaust-gas temperature at this highpressure ratio requires changes in the heat- and mass-flow configuration of the HRSG for opti-mum performance. Further studies are required to clarify these relations.These observations were also made for the plant with reforming and CO2 capture. Here, the
changes in the irreversibility of the turbine and the compressor versus that of the combustor
ower production in percentage of the NG LHV consumption rate as a fu
Fig. 7. Net electric-p nction of AC-outletpressure for three different TITs for the conventional plant (C) and the reforming plant (R).
31I.S. Ertesvag et al. / Energy 30 (2005) 5–39
ties (in % of NG chemical exergy) for all units in groups for the plant with refo
Fig. 8. Irreversibili rming at three dif-ferent TITs and various AC-outlet pressures.ibilities (in % of NG chemical exergy) for all units in groups for the conventional plant
Fig. 9. Irrevers at three differ-ent TIT and various AC-outlet pressures.
I.S. Ertesvag et al. / Energy 30 (2005) 5–3932
more or less counteracted each other. However, the prominent effect in these variations was the
irreversibility of the reforming process. In particular, the irreversibility of the ATR increased by
approximately 1.0% of the fuel chemical exergy for all three TITs (from 8.5%, 8.0%, and 9.0%,
respectively) as the compressor pressure was increased from 15.6 to 40 bar. The reason for this
increase was the increased combustion of fuel in the ATR, as discussed above.Details of the energy and exergy utilization for the base case (AC-outlet pressure 15.6 bar, no
SF) with increased TIT are shown in Table 13, while Table 14 shows the corresponding break-
down of irreversibilities. As expected, the increased TIT reduced the irreversibility both in the
combustor and the rest of the gas-turbine cycle. Due to the higher turbine-outlet temperature,
the reforming process also showed a reduction in irreversibility. Here, a 1.1% point reduction
was noted in the ATR together with the heat exchanger H1 and a 0.2% points increase in the
preheater. The remaining units of the reformer section showed only minor changes. Also, the
HRSG showed slightly reduced irreversibilities, mainly due to the higher temperature of the flue
gas.
Table 13Energy and exergy utilization and losses for the base case (AC-outlet pressure 15.6 bar, no SF) with increased tur-bine-inlet temperature (TIT)
TIT (vC) 1
250 1350 1450 1450aFuel LHV flow rate (MW) 8
34.01 925.90 1017.80 976.36 Mechanical power (MW) 4 33.15 496.72 562.37 549.42 Mechanical power (% LHV)b 51.94 53.65 55.25 56.27 Gross electric power (% LHV) 51.21 52.90 54.48 55.48 Auxiliary power (% LHV) 0.40 0.39 0.38 0.36 CO2-compression power (% LHV) 1.93 1.92 1.90 1.87 Net electric power (% LHV) 48.88 50.59 52.20 53.26Fuel chemical exergy flow rate (MW) 8
68.82 964.56 1060.29 1017.11 Other exergy inflow (% chx)c 1.15 1.16 1.16 1.16 Mechanical power (% chx) 49.85 51.50 53.04 54.02 CO2-compression power (% chx) 1.85 1.84 1.83 1.79 Auxiliary power (% chx) 0.38 0.37 0.36 0.34 Net electric power (% chx) 46.92 48.56 50.11 51.13 Exergy in CO2 (% chx) 3.17 3.15 3.13 3.06 Chemical exergy in CO2 (% chx) 2.14 2.12 2.11 2.06 Utilized exergy (% chx) 50.09 51.71 53.23 54.19 Utilized exergy (%tx)d 49.58 51.18 52.69 53.64 Total irreversibility (% chx) 47.29 45.67 44.11 43.05 Exergy outflow (% chx) 2.67 2.66 2.69 2.80 Generator loss and auxiliary power (% chx) 1.08 1.09 1.10 1.10 Total lost exergy (% chx) 51.04 49.42 47.90 46.94a With ATR-feed preheated to 880vC by heat exchange with the ATR outlet.
b Percentage of fuel (NG) lower heating value (LHV).c Percentage of fuel (NG) chemical exergy.d Percentage of fuel (NG) total exergy at supply state.

33I.S. Ertesvag et al. / Energy 30 (2005) 5–39
The effects of increased TIT on irreversibilities in the conventional combined cycle were some-
what different, as seen in Table 15. Here, the reductions in the combustor and the gas turbine
were larger than in the plant with reforming. On the other hand, the HRSG showed a marked
increase, contrary to the power plant with reforming. A major reason for the latter was that the
limit imposed on the steam-turbine inlet temperature (560vC) prevented the increased flue gas
temperature to be fully utilized.Tables 13 and 14 present the case that combines the advantages of increased TIT and heating
of the ATR outlet–inlet heat exchange (cf. the previous section). Here, the TIT was 1450vC, the
AC-outlet pressure 15.6 bar, and the ATR feed was heated to 880vC by heat exchange with the
ATR products (900vC). The effects seen were similar to those discussed in the previous section.
A general observation for both the plant with reforming and the conventional plant is that
also with the increased TIT, the combustor and other reactors continue to be the dominating
cause of irreversibility in a power plant.
5.7. Increased steam-turbine inlet temperature
As with the gas turbine, the maximum temperature may be a limiting condition in the steam
turbine. In order to investigate the influence of this limit, simulations were made where the
steam-turbine inlet temperature was increased from 560 to 600vC and 630
vC. Here, the advan-
ces of ATR outflow–inflow heat exchange and increased TIT were anticipated. That is, the ATR
Table 14Distribution of exergy losses (in % of NG chemical exergy) in different sections of the system for the base case (AC-outlet pressure 15.6 bar, no SF) with increased turbine-inlet temperature (TIT)
TIT (vC)
1250 1350 1 450 1 450aAir compressor
1.56 1.40 1.28 1.33 Combustor 20.55 20.08 1 9.61 2 0.54 Turbine 2.74 2.48 2.26 2.37 Fuel expander/heater 0.08 0.08 0.08 0.08 HRSG 2.12 2.02 1.83 2.16 ST 1.78 1.77 1.76 1.70 Condenser 1.55 1.51 1.47 1.41 ATR 8.52 8.00 7.51 6.57 H1 2.79 2.73 2.67 1.53 Other reforming 3.32 3.45 3.55 3.49 WR 0.40 0.38 0.38 0.33 ABS 1.09 1.02 0.96 0.78 CO2 compression 0.80 0.79 0.79 0.77Sum irreversibilities
47.29 45.70 4 4.14 4 3.08 Flue gas exergy 2.67 2.66 2.69 2.80Sum
49.96 48.36 4 6.83 4 5.88a With ATR-feed preheated to 880vC by heat exchange with the ATR outlet.

I.S. Ertesvag et al. / Energy 30 (2005) 5–3934
feed was heated to 880vC by the ATR products and the TIT was 1450
vC. The AC-outlet
pressure was 15.6 bar.The effect of this was small but significant: a rise in efficiency of 0.3% of the NG LHV. The
flow rates of air and NG were not changed. The operation of the reactors and the gas turbinewas slightly affected or not affected at all. The main change was that the mass flow of the steamcycle was reduced, as it operated at a greater temperature interval with approximately the sameamount of available heat. The corresponding reduction in irreversibility occurred mainly in theheat transfer from flue gas to steam.
5.8. Real-gas effects
In all simulations presented here, the flowing gas was modeled with a real-gas equation ofstate. Often, the gas flowing through reformers and combustors is modeled as an ideal gas. Thevalue of the compressibility factor, Z ¼ pv=RT , will give an indication of the applicability of theideal-gas approximation. In the base case simulations for AC-outlet pressure 15.6 bar, the devi-ation from unity of the compressibility factor was less than 0.01, except for streams 1, 2, and 3,which had Z values equal to 0.951, 0.982, and 0.978, respectively. For an AC-outlet pressure of40 bar, the compressibility factors in streams 1, 2, and 3 were 0.876, 0.847, and 0.921, respect-ively. The factor was 1.021 for streams 22 and 23, and within 0.015 deviation from unity for theremaining gas streams. For all cases, the NG feed (50 bar) had a compressibility factor of 0.855.These findings indicate that an accurate simulation of the reforming process requires a real-gasmodel.
Table 15Net electric-power production, distribution of exergy losses in different sections of the system for the conventionalplant (AC-outlet pressure 15.6 bar) with increased turbine-inlet temperature (TIT)
TIT (vC) 1
250 1 350 1450Fuel LHV flow rate (MW) 7
38.85 8 37.69 940.92 Net electric power (% LHV) 58.87 60.17 61.04 Net electric power (% chx) 56.51 57.76 58.59Irreversibilities (% chx)
Air compressor 1.76 1.55 1.38 Combustor 28.74 27.72 26.74 Turbine 3.08 2.72 2.45 Fuel expander/heater 0.06 0.06 0.06 HRSG 2.83 3.28 3.88 ST 1.96 2.03 2.09 Condenser 1.69 1.71 1.73Sum irreversibilities
40.12 39.06 38.33 Flue gas exergy 3.27 3.10 2.99Sum exergy loss
43.39 42.16 41.32
35I.S. Ertesvag et al. / Energy 30 (2005) 5–39
5.9. Carbon conversion and separation
The purpose of this study was to investigate the thermal process and the integration betweenthe reforming process and the power cycles. For the CO2 separation process, a relatively simplemodel was used. The exergy that was available for the separation is seen as the sum of thechemical exergy of the captured CO2 and the irreversibility of the absorption process. The irre-versibilities obtained with this model were comparable to those reported in [8,9]. A modest opti-mization is possible, in particular since the exergy of low-temperature heat can replace theexergy of the throttling process in the model and avoid some of the power input in the sub-sequent CO2 compression.A more interesting result in this respect is the content of CO2 versus other forms of carbon
and the concentration of CO2 in the reformed fuel prior to separation (stream 17). These figuresare important for the possibilities of achieving certain goals of carbon capture and for the exer-getic cost of separation.In the simulations, a higher percentage of captured CO2 could have been assumed. However,
the carbon present in the form of CO or hydrocarbons will in any case end up as CO2 in theatmosphere after the combustion. The different variations discussed above showed opposite andcompeting effects on the conversion of hydrocarbons and CO to CO2. Reduced combustion inthe ATR lowered the amount of combustion products, CO2 and H2O, which entered the equi-librium balances. Dilution with nitrogen was reduced, which in turn reduced the conversion ofmethane to CO and H2. Increased pressure also affected this conversion.Higher concentrations of a species reduce the exergetic cost of its separation. However, in the
simulations, the molar fraction of CO2 in the reformed fuel after the WR (stream 19) showedsmall changes. The base case gave 17.4% CO2 in this stream. This figure was slightly reduced(by 0.3% points) at increased pressure. However, a rise in TIT or SF gave insignificantincreases, while the ATR product-to-feed heat exchange resulted in a small increase (by 0.3%points) over the series of variations discussed above.The total effect of pressure increase was a reduced ratio of CO2 to all carbon (CO2, CO, and
methane) after the reforming process. Fig. 10 shows this CO2-to-C ratio as a function of AC-outlet pressure for the three different TITs. For the cases with TIT 1250
vC and no SF, the
reduction was from 96.0% at AC-outlet pressure 15.6 bar to 94.2% at 40 bar, as shown inTable 9. For the cases with TIT 1450
vC, the reduction was from 94.7% to 92.6% for the corre-
sponding pressure increase.SF also reduced the conversion to CO2. For TIT 1250
vC and pressure 15.6 bar, the CO2 was
reduced from 96.0% to 95.3% of all carbon over the increase of SF reported above. At pressure40 bar, the reduction was from 94.2% to 93.1%.The ATR product-to-feed heat exchange for TIT 1250
vC and pressure 15.6 bar reduced the
CO2-to-C ratio from 96.0% to 94.0% when the feed preheat was increased from 598 to 800vC.
Finally, in the case with TIT 1450vC and ATR feed preheated to 880
vC, the ratio of CO2 to
all carbon after reforming was reduced to 92.9%. In the latter case, nearly 97% of the CO2
would have to be separated in the ABS achieve 90% carbon capture.The conversion of hydrogen in hydrocarbon and water vapor to H2 is shown in Fig. 11. The
fraction of all hydrogen found in H2 decreased with increased pressure and increased with TIT.

I.S. Ertesvag et al. / Energy 30 (2005) 5–3936
Furthermore, it was reduced with SF and increased with the ATR product-to-feed heatexchange. These changes followed the changes in ATR combustion discussed above.
5.10. Improvements
Increasing the effective TIT, and thus reducing the combustor irreversibility, seems to be themost prominent measure for improving the efficiency for combined cycles with and without
all carbon that is present in the form of CO2 after reforming (stream 17) as
Fig. 10. Fraction of a function of AC-outlet pressure for three different TITs.all hydrogen that is present in the form of H2 after reforming (stream 17) a
Fig. 11. Fraction of s a function of AC-outlet pressure for three different TITs.
37I.S. Ertesvag et al. / Energy 30 (2005) 5–39
reforming. This is an ongoing development in the gas-turbine industry. Nevertheless, it is worthnoting that although there were some improvements, the combustor remained the main sourceof irreversibility in both the power plant with CO2 capture and the conventional power plant.The second measure in the plant with reforming appears to be to improve the heating of the
ATR feed by using heat from its products. The drawback of both these improvements is thatthe amount of carbon converted to CO2 is reduced. To a limited extent, the conversion of COto CO2 can be improved by reducing the temperature of the LTS. Furthermore, a reduced tem-perature in the ATR will shift the equilibrium composition from methane to CO and H2. How-ever, this will require a catalyst that works at a lower temperature ATR. Since a lowertemperature reduces the possibility of conversion to solid carbon (carbonization), this mayallow lower amounts of steam for the reformer.A third measure is to reduce the amount of steam used in the reforming process (stream 35).
This would reduce the need for ATR-feed preheating and combustion in the ATR. On the otherhand, this will increase the risk of carbonization in the reformer. As less water vapor from com-bustion also decreases the possibility of reducing the amount of steam, this possibility forimprovement has to be utilized with care and based on detailed studies of the reactor.As a general possibility, Leites et al. [16] recommend the recirculation of some products as a
means to improve second law efficiency. In the present case, some of the fuel mixture after ABSand FC (streams 20–23) could have been recirculated into the ATR to increase the conversionof methane to CO and CO2, and hence, improve the separation of CO2. This feed could havebeen heated by the correspondingly increasing ATR-product mass flow. Here, the recirculationwould increase the heat-transfer irreversibilities and require some compressing. The total effectof this and other possible re-configurations would have to be investigated by further simu-lations.The steam cycle may show possible improvements by adjusting the configuration and rela-
tions between the different mass flows. However, this section of the plant contributed only aminor part of the irreversibilities, and the potential improvements are limited.
6. Conclusions
A power-plant concept with decarbonization of NG by auto-thermal reforming and pre-combustion CO2 removal has been investigated. An energy and exergy analysis has been per-formed, and the influences of some parameters have been studied. This concept has also beencompared to a conventional CC process.For the combined-cycle with fuel reforming and CO2 capture, a TIT of 1250
vC and air-
compressor (AC) outlet pressure of 15.6 bar, the net electric power was 48.9% of the LHV ofthe supplied NG. The exergy analysis showed that the net electric-power output and the exergyof the captured and compressed CO2 represented 46.9% and 3.1%, respectively, of the chemicalexergy of the supplied NG. In the corresponding conventional combined cycle with no CO2 cap-ture, the net electric power was 59.2% of the LHV and 56.5% of the chemical exergy of the fuel.The exergy method, contrary to first-law analysis, localizes and quantifies the thermodynamic
losses (irreversibilities). The main contributions to irreversibility were the combustor (20.5% ofthe NG chemical exergy) and the ATR (8.5%). This compares to the combustor (28.7%) in the

I.S. Ertesvag et al. / Energy 30 (2005) 5–3938
conventional plant without reforming. Thus, some of the combustor losses in the conventionalplant were relocated to the reformer in the new plant.Increasing the gas-turbine pressure ratio may improve the performance of conventional com-
bined-cycle processes. However, this was not the case for the process with NG reforming andCO2 capture. The gas turbine yield per amount of fuel consumed in the gas turbine increasedwith an elevated pressure ratio. As the lower flue-gas temperature required more internal com-bustion in the reformer, this led to higher total irreversibilities.It was shown that heating the reforming process by oxidation within the ATR is favorable to
preheating the reformer feed by SF in the gas-turbine exhaust. An increasing amount of fuel toSF raised the total irreversibility, and hence, reduced the net output from the plant. This wasdue to the higher irreversibility caused by SF compared the reduction of irreversibility of theauto-thermal reforming reactor.Heating the feeds of the ATR by its products reduced the need for combustion within the
ATR, and the associated irreversibilities. Also, irreversibilities due to heat exchange werereduced. However, this arrangement requires advanced materials or coatings to avoid materialproblems.An increase of the TIT from 1250 to 1350
vC and 1450
vC increased the net electric-power
production to 50.6% and 52.2%, respectively, of the NG LHV for the plant with reforming andCO2 capture. The corresponding results for the conventional CC plant were 60.2% and 61.0%.For the plant with reforming and CO2 capture, a combination of 1450
vC TIT and ATR pro-
duct-feed heat exchange gave a net electric-power production of 53.3% of the NG LHV. Thismakes a difference of 7.7% LHV compared to the conventional plant, including 3.1% stored asexergy in the captured CO2.The fraction of hydrocarbons that was converted to CO2 in the reformer section was reduced
both by increasing TIT and by ATR product-feed heat exchange. With a TIT of 1250vC and
AC-outlet pressure of 15.6 bar, the CO2 contained 96.0% of all carbon after the reforming sec-tion, before separation. At a TIT of 1450
vC, the fraction was reduced to 94.7%, and when this
TIT was combined with ATR product-feed heat exchange, the fraction was reduced to 92.9%.The remaining carbon was present as CO and methane and was combusted to produce CO2 inthe combustor. Consequently, when measures for efficiency improvements are implemented, spe-cial care has to be taken not to reduce the overall CO2 capture of the power plant.The cases in this study were simulated with a real-gas equation of state. The results indicated
that for flows with a high content of water vapor, such as the mixture of NG and steam in thereforming process, there are significant real-gas effects. These effects increased with rising pressure.The combustor appears to be the greatest source of irreversibility both with and without fuel
reforming, and its reduction seems to be the primary action for increased efficiency. For thereforming process, reducing heat-transfer temperature differences, as well as the internal com-bustion in the ATR, will reduce irreversibilities and improve the total efficiency.
References
[1] Erga O, Juliussen O, Lidal H. Carbon dioxide recovery by means of aqueous amines. Energy ConversionManagement 1995;36(6–9):387–92.

39I.S. Ertesvag et al. / Energy 30 (2005) 5–39
[2] Feron PHM, Jansen AE. The production of carbon dioxide from flue gas by membrane gas absorption. EnergyConversion Management 1997;38(Suppl.):S93–8.
[3] Chisea P, Consonni S. Natural gas fired combined cycles with low CO2 emissions. ASME Journal of Engineeringfor Gas Turbines and Power 2000;122:429–36.
[4] Hendriks CA, Blok K. Carbon dioxide recovery using a dual gas turbine IGCC plant. Energy ConversionManagement 1992;33(5–8):387–96.
[5] Mathieu P. Presentation of an innovative zero-emission cycle for mitigating the global climate change. In: Pro-ceedings of the Fourth International Conference on Greenhouse Gas Control Technologies. Interlaken,Switzerland; 1999, p. 615–20.
[6] Mori Y, Masutani SM, Nihous GC, Vega LA, Kinoshita CM. Precombustion removal of carbon-dioxide fromnatural-gas power-plants and the transition to hydrogen energy-systems. ASME Journal of Energy ResourcesTechnology 1992;114(3):221–6.
[7] Audus A, Kaarstad O, Skinner GC. CO2 capture by pre-combustion decarbonisation of natural gas. In: Pro-ceedings of the Fourth International Conference on Greenhouse Gas Control Technologies. Interlaken,Switzerland; 1999, p. 557–62.
[8] Lozza G, Chiesa P. Natural gas decarbonization to reduce CO2 emission from combined cycles. Part 1: partialoxidation. ASME Journal of Engineering for Gas Turbines and Power 2002;124:82–8.
[9] Lozza G, Chiesa P. Natural gas decarbonization to reduce CO2 emission from combined cycles. Part 2: methane-steam reforming. ASME Journal of Engineering for Gas Turbines and Power 2002;124:89–95.
[10] Andersen T, Kvamsdal HM, Bolland O. Gas turbine combined cycle with CO2 capture using auto-thermalreforming of natural gas. In: ASME Turbo Expo, Munchen, May 8–12, 2000, 2000-GT-162.
[11] Bolland O, Ertesvag IS, Speich D. Exergy analysis of gas-turbine combined cycle with CO2 capture usingauto-thermal reforming of natural gas. In: Power Generation and Sustainable Development, Liege, Belgium, 8–9October 2001.
[12] Kvamsdal HM, Ertesvag IS, Bolland O, Tolstad T. Exergy analysis of gas-turbine combined cycle with CO2 cap-ture using pre-combustion decarbonization of natural gas. In: ASME Turbo Expo, Amsterdam, 3–6 June 2002.ASME Paper No. GT-2002-30411.
[13] Jordal K, Bredesen R, Kvamsdal HM, Bolland O. Integration of H2-separating membrane technology in gas tur-bine processes for CO2 sequestration. In: Proceedings of the Sixth International Conference on Greenhouse GasControl Technologies—GHGT-6. Kyoto, October 2002, Energy 2004; 29:1269–78.
[14] Kotas TJ. The exergy method of thermal plant analysis. 2nd ed. Malabar (FL): Krieger Publishing Company;1995.
[15] Kotas TJ. Exergy concepts for thermal plant. International Journal of Heat Fluid Flow 1980;2(3):105–14.[16] Leites IL, Sama DA, Lior N. The theory and practice of energy saving in the chemical industry: some methods
for reducing thermodynamic irreversibility in chemical technology processes. Energy 2003;28:55–97.