Wind Turbine Lab Report - WordPress.com
21
1 Wind Turbine Lab Report Submitted to: Dr. Bixler GTA Sarah Hulbert Created by: Team P Joseph Blust Jerry Ding Zach Kahlig Dharoov Verma Engineering 1181 The Ohio State University Columbus, OH 4, April 2017
-
Upload
khangminh22 -
Category
Documents
-
view
1 -
download
0
Transcript of Wind Turbine Lab Report - WordPress.com

1
Wind Turbine Lab Report
Submitted to:
Dr. Bixler
GTA Sarah Hulbert
Created by:
Team P
Joseph Blust
Jerry Ding
Zach Kahlig
Dharoov Verma
Engineering 1181
The Ohio State University
Columbus, OH
4, April 2017

Lab Report- Wind Turbine Lab 2
Executive Summary
The purpose of this lab was to explain the different methods and applications that are used in finding the best wind turbine configuration that would be used to power a residential complex. This taught us the different theories and understandings involved in the process. The group assessed and evaluated theories such as Bernoulli's principle and different trends related to wind velocity, wind power, pressure, pressure difference and wind turbine power output. Wind velocity, pressure, wind power, different blade configurations, number of blades, and the angle at which it is located around the center are all central factors in determining the highest turbine power output. Once these ideas were drafted the team then gathered the evidence to produce a wind turbine to meet the specifications provided by the residential complex. This included 40 houses each with an energy demand of 50 KWH/day, 77 meters diameter turbine with a 25% efficiency, and a blade length of 32 meters. We used this to determine if it was sustainable to use wind energy to power the houses.
The results achieved in this lab led to insightful understandings of the mechanisms and relationships between wind speed, pressure, power, and wind turbine efficiency range. First, it was learned that wind speed is indirectly proportional to the pressure because of Bernoulli's principle. As wind speed increases the pressure decreases so that causes the difference in pressure to rise. This is reason that blades spin and a factor in considering what type of blade model to design. Then, the relationship between wind speed and wind power was discovered to be directly proportional. As wind speed increases so does the wind power. These different relationships are displayed in Figures 1,2,3, and 4.
The recommendations that were analyzed in this lab was to essentially find a location that produced the most wind power. This was decided to be at the place of Sandusky, Ohio with an average wind speed of 7 m/s. This was validated to be the largest wind speed situated on the diagram. Operating on that evidence, our group constructed a wind turbine that produces the most wind turbine power output so that it will be able to electrically power the energy needed to power as many houses as possible. To find the greatest power output construct a blade design that created the most power. After that has been established, incorporate as many blades as you can on the wind turbine because it was discovered that more blades equals more power output produced.

Lab Report- Wind Turbine Lab 3
Table of Contents
Introduction ................................................................................................1
Experimental Methodology ........................................................................1
Results .......................................................................................................2
Discussion................................................................................................10
Conclusion and recommendation ............................................................11
Appendix ..................................................................................................11

Lab Report- Wind Turbine Lab 4
Introduction
The Wind Turbine labs introduced students to basic concepts in fluid flow, including the relationship
between pressure, velocity and wind energy, along with generated power and efficiency of wind
turbine, used during the design process. The purpose of this experiment is to determine the amount of
power that can be produced by a 77 m diameter turbine with a 25% efficiency. The blades have a length
of 32 m and the overall height of the turbine is 80 m. The amount of energy needed for a house in this
complex is 50 KWH/Day. A residential complex with 40 houses is looking to power its energy needs using
wind energy. The team has to find out whether this wind turbine power the entire residential complex,
If not, the team has to find out what percentage of the needed power can be supplied by the wind
turbine. Assuming that the wind turbine operates all day and the wind speed is a constant.
Experimental Methodology
Wind Energy in general refers to the kinetic energy present in the wind. The wind push against the blade
and causes the blade to rotate. This kinetic energy in wind is converted to mechanical energy of rotating
rotors. The generator in the wind turbine can then convert this mechanical power into electricity. As the
wind turns the blades it rotates the shaft which turns the gears in the generator to create electricity. The
largest component of the turbine is the rotor which consists of the blades and their point of connection.
As velocity of a body of gas increases, its pressure decreases. This concept is realized in the Bernoulli's
principle. As a result, the blade is lifted and it enhances the rotation of modern wind turbines.
The experiment used the wind tunnel flow tube, wind source fan, pitot tube and static tube to find out
the wind velocity for different radial position and find out the power using this information. Later the
experiment will measure the power of the wind source as a function of wind speed. Then the
experiment is conducted to compare the power output between the two and three blade turbines.
On the second section of the lab, each team member created their own individual turbine blade with
any geometry. The only requirement for the blade was that it could be no longer than 2 inches in order
to fit in the testing tunnel. The blade was inserted into a groove on the hub. Each blade design was
tested at 12V. The turbine blade design that produces the greatest power at 12 V is selected. Using the
selected turbine blade design five more balsawood turbine blades are made. Using the 30 ̊ pitch hub, the
team measured the output for two three and six blade system to determine the arrangement/number
of blades that produces the maximum amount of power. The arrangement that produced the maximum
power was selected and used on the hub with a 45 ̊pitch to find out the power output in that
configuration.
Lab Report- Wind Turbine Lab 5
Results
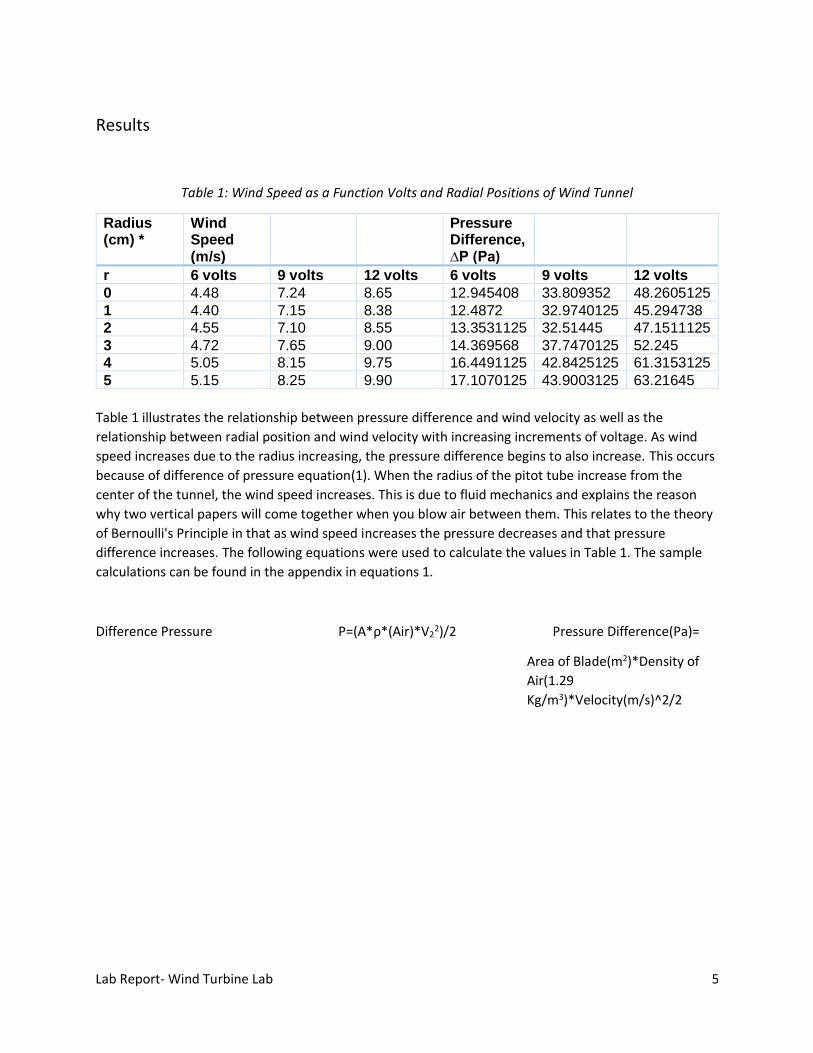
Table 1: Wind Speed as a Function Volts and Radial Positions of Wind Tunnel
Radius (cm) *
Wind Speed (m/s)
Pressure Difference, ∆P (Pa)
r 6 volts 9 volts 12 volts 6 volts 9 volts 12 volts 0 4.48 7.24 8.65 12.945408 33.809352 48.2605125 1 4.40 7.15 8.38 12.4872 32.9740125 45.294738 2 4.55 7.10 8.55 13.3531125 32.51445 47.1511125 3 4.72 7.65 9.00 14.369568 37.7470125 52.245 4 5.05 8.15 9.75 16.4491125 42.8425125 61.3153125 5 5.15 8.25 9.90 17.1070125 43.9003125 63.21645
Table 1 illustrates the relationship between pressure difference and wind velocity as well as the
relationship between radial position and wind velocity with increasing increments of voltage. As wind
speed increases due to the radius increasing, the pressure difference begins to also increase. This occurs
because of difference of pressure equation(1). When the radius of the pitot tube increase from the
center of the tunnel, the wind speed increases. This is due to fluid mechanics and explains the reason
why two vertical papers will come together when you blow air between them. This relates to the theory
of Bernoulli's Principle in that as wind speed increases the pressure decreases and that pressure
difference increases. The following equations were used to calculate the values in Table 1. The sample
calculations can be found in the appendix in equations 1.
Difference Pressure P=(A*ρ*(Air)*V22)/2 Pressure Difference(Pa)=
Area of Blade(m2)*Density of
Air(1.29
Kg/m3)*Velocity(m/s)^2/2

Lab Report- Wind Turbine Lab 6
Figure 1: Wind Velocity vs. Pitot Tube Radial Position
Figure 1 illustrates that the measure of the wind speed that is closer to the walls of the tunnel are higher
than the wind speed near the middle. This also effects the pressure as there is less pressure on the
outside versus the inside. This describes an indirectly proportional relationship. This trend illustrates the
fact of why the blades rotates; difference of pressure.
Figure 2: Pressure Difference vs. Pitot Tube Radial Position
Lab Report- Wind Turbine Lab 7
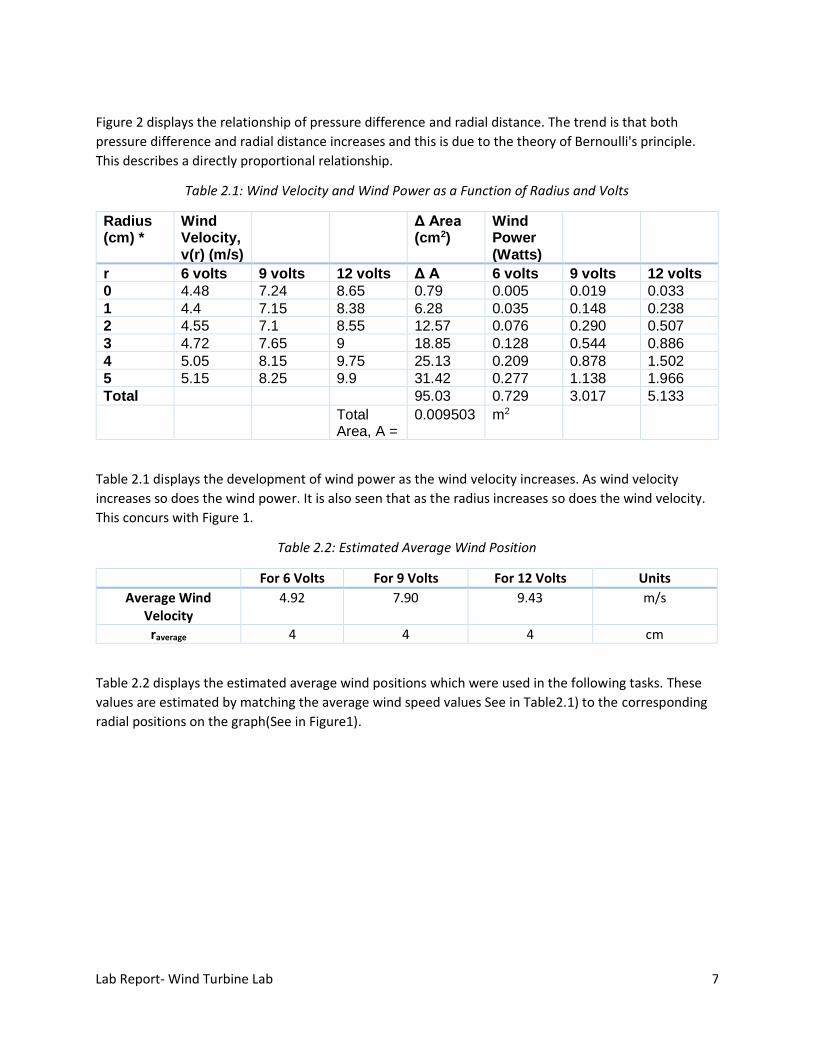
Figure 2 displays the relationship of pressure difference and radial distance. The trend is that both
pressure difference and radial distance increases and this is due to the theory of Bernoulli's principle.
This describes a directly proportional relationship.
Table 2.1: Wind Velocity and Wind Power as a Function of Radius and Volts
Radius (cm) *
Wind Velocity, v(r) (m/s)
Δ Area (cm2)
Wind Power (Watts)
r 6 volts 9 volts 12 volts Δ A 6 volts 9 volts 12 volts 0 4.48 7.24 8.65 0.79 0.005 0.019 0.033 1 4.4 7.15 8.38 6.28 0.035 0.148 0.238 2 4.55 7.1 8.55 12.57 0.076 0.290 0.507 3 4.72 7.65 9 18.85 0.128 0.544 0.886 4 5.05 8.15 9.75 25.13 0.209 0.878 1.502 5 5.15 8.25 9.9 31.42 0.277 1.138 1.966 Total 95.03 0.729 3.017 5.133
Total Area, A =
0.009503 m2
Table 2.1 displays the development of wind power as the wind velocity increases. As wind velocity
increases so does the wind power. It is also seen that as the radius increases so does the wind velocity.
This concurs with Figure 1.
Table 2.2: Estimated Average Wind Position
For 6 Volts For 9 Volts For 12 Volts Units
Average Wind Velocity
4.92 7.90 9.43 m/s
raverage 4 4 4 cm
Table 2.2 displays the estimated average wind positions which were used in the following tasks. These
values are estimated by matching the average wind speed values See in Table2.1) to the corresponding
radial positions on the graph(See in Figure1).

Lab Report- Wind Turbine Lab 8
Table 3: Wind Velocity and Wind Power with varying Voltages Information
Power Supply Voltage
Wind Velocity (m/s)
Calculated Wind Power (W)
Volumetric Flow Rate (m3/s)
Mass Flow Rate (kg/s)
6 4.5 0.558368438 0.04276493 0.05516676 7 6.73 1.867792007 0.063957329 0.082504954 8 7.45 2.533682187 0.070799717 0.091331635 9 8.05 3.196472416 0.076501708 0.098687203 10 8.52 3.7896762 0.080968267 0.104449065 11 9.07 4.571989045 0.086195092 0.111191669 12 9.36 5.024708433 0.088951054 0.11474686
The calculated wind power, volumetric flow rate and mass flow rate with each corresponding power
supply voltage is contained in Table 3. While measuring and recording wind velocity, the raverage from
Table 2 estimated at 6 V was used for the 6, 7 and 8 Volt settings. The raverage at 9 V was used for the 9,
10 and 11 Volt settings. The raverage at 12 V was used for 12V. As shown in the table 3, calculated wind
power, volumetric flow rate and mass flow rate all increasing in accordance with the power supply.
Figure 3: Calculated Wind Power vs. Wind Velocity

Lab Report- Wind Turbine Lab 9
Figure 3 displays the relationship of wind power and wind velocity. As shown in the graph, wind power
increases while wind velocity increases. In addition, although the equation shows that the wind power is
proportional to the cube of wind velocity, the line looks like a straight line since the value of wind power
is incredibly small.
The following equations were used to calculate the values in Table 3. The sample calculations can be
found in the appendix in equations 2,3, and 4.
Wind power P=½ × A × ρ × v3 Wind power(w)=½*Area
of the wind turbine(m2)*Density of
air(kg/m3) *Wind velocity(m/s)3
Volumetric flow rate Q=v × A Volumetric flow rate(m3/s)=
Wind Velocity(m/s)*Area of the
wind turbine(m2)
Mass flow rate m=ρ × Q Mass flowrate (kg/s)=Density
of air(kg/m3)*Volumetric flow
rate(m3/s)
Table 4: Turbine Power as Function of Wind Velocity
Power Supply Voltage
Wind Velocity From Table 3 (m/s)
Wind Turbine Power Output (watts)
2 Blades 3 Blades
6 4.5 0.013 0.017 7 6.73 0.027 0.043 8 7.45 0.038 0.060 9 8.05 0.047 0.072 10 8.52 0.057 0.085 11 9.07 0.065 0.100 12 9.36 0.075 0.120

Lab Report- Wind Turbine Lab 10
Table 4 shows that a configuration of 3 blades produces more power output than a configuration of 2
blades. The relationship between turbine power and wind velocity is directly proportional. Since there
are more blades, the wind turbine is able to spin faster than the 2 blade configuration according to each
wind velocity used in the experiment.
Figure 4: Winds Velocity vs. Wind Turbine Power Output (W)

Lab Report- Wind Turbine Lab 11
As shown in Table 5 below, blade design number 1 generated the highest power output (W) of the four
blade designs tested. As a result of this, the blade design 1 was then used for the rest of the experiment.
(See Appendix for photos of the blade designs)
Table 5: Power Output of Each Group Member's Blade Design
Blade Design No. Power Output (watts) Designer
1 0.0053 Blust 2 0.0039 Kahlig
3 0.0025 Verma
4 0.0049 Ding
Table 6 states the power output of blade design 1 with 2, 3 and 6 blades. As can be seen in the data, 6
blades produced the highest power output in
Table 6: Power Output of Blade Design 1 With 2, 3 and 6 Blades
Design Power Output (watts)
2 Blades 0.031 3 Blades 0.038 6 Blades 0.042
After determining that 6 blades produced the maximum power output with blade design 1, 6 blades
were then tested in a 45° hub (See Appendix "Blade Design 1: 6 Blades 45° Hub"). The values for this
table were determined with the fan motor voltage set at 12 volts.
Table 7: Power Output as a Function of the Angle Hub Information
Angle Power Output (watts)
30o 0.042 45o 0.014
According to the results in Table 7, the angle of 30 degrees is more efficient that the angle of 45 degrees
because it produces more power output.

Lab Report- Wind Turbine Lab 12
Discussion
After experimenting different trials and using different methods to produce the highest power output,
the following analysis can be concluded and analyzed from this lab.
It is inferred from the data that a location of high speed also has high wind power. This is shown in Table
1. Having a greater number of blades produces more wind turbine power output. This is found in Table
6. This trend is described as directly proportional. Another trend is that the 30 degree hub produced
more of a power output than a 45 degree hub.
Numerous faults can be found in this lab that would generate potential error. First, not every blade was
the same that was carved. This can create a small error in the efficiency that each blade would make as
the pressure difference could be different for each blade. To solve this, a machine would be needed to
cut out the same exact design as the first blade. This would reduce inaccuracies. Another error is that
the voltage meter could be calibrated incorrectly and could affect an error in the wind velocity, This, in
turn, would produce inaccurate calculations for wind power. To solve this, make sure the voltage meter
is calibrated to meet the specifications.
As was expected, our experimental values are close to the theoretical values that we were given.
Although this is correct our calculated values for our efficiency is off due to potential error. In Table 6
our power output for a 6 blade configuration is 0.042 Watts. This is when the wind velocity is at 9.36
m/s or at its maximum. The calculated wind power for that situation is 5.024 Watts. Dividing the power
output of the blade by the wind power and times by 100 gives you an efficiency of around 8%. This is
less than the theoretical value of 25% percent that was given. This could be due to the fact that the
technology for a real life turbine would be better and therefore produce a greater efficiency.
According to the map given in the lab procedure the best wind speed is near the Lake Erie by the cost of
Sandusky. Moreover, due to the lake there is a constant temperature difference between the land and
water creating a wind flow. Therefore the team selects this region as the suitable place to install a wind
turbine. The wind speed here is 7 m/s.

Lab Report- Wind Turbine Lab 13
To calculate the power of the wind we can use the following formula.
P=(½)ρAv3
P= wind power
ρ =the density of air at standard temperature and pressure, 1.29 kg/m3
A= the area swept by the turning turbine blade.
The diameter of the turbine is 77m. The blades have a length of 32 m and overall height of the turbine is
80 m.
Therefore the area swept by the turning turbine blade is:
π*(77/2)2-π((77/2)-32)2 = 4523.89m2
Therefore the wind power is:
P = (½)*(ρ*A*v3)
P = (½)*(1.29*4523.89*73)
P=1000843.56 watst
The wind turbine has 25% efficiency.
Therefore, the power output is:
Power output=P*0.25
Power output= 250210.89 watts = 250.21089 kilo watts
The total power generated by the wind turbine is 250.21089 kilo watts.
Total power generated in a day is 6,005.06 kwh/day
Total power required by the 40 houses is 40*50 kwh/day=2000kwh/day
The power generated exceeds the power required therefore the wind turbine can efficiently power 40
houses.

Lab Report- Wind Turbine Lab 14
Conclusions & Recommendations
This lab focused on producing the largest turbine power output to generate enough energy to be able to
power a residential complex. This experiment helped to identify the correct process and methods to
formulate the finest wind turbine. The results that were identified compared the relationships of wind
speed, pressure, wind turbine power output, blade design, number of blades, angle of blade, and wind
power. Wind speed is indirectly proportional to pressure. This causes a pressure difference. Wind power
increases and wind speed rises. Wind turbine power output increases as wind power rises. Increasing
the number of blades produces a greater power output. A 30 degree blade design produced greater
power output than a 45 degree design. With these ideas in mind, the group drafted a windmill that
maximized these specifications. Namely, a wind turbine that would be compiled to have a 30 degree
hub, 6 blades, and at a location and situation that produced the most wind speed.
This produces the most wind power and ultimately the most power output. In Table 6 the power output
of 0.042 Watts is shown to be the greatest and it has a 6 blade configuration. In Table 3, it was shown
that having a higher velocity produced high wind power. This highest wind velocity is 9.36m/s and that
produced the highest wind power of 5.025 Watts. A good recommendation would be to choose a
location that produced the highest wind velocity and to implement a blade design that has the greatest
power output. This is a design that is thick in the center and thin on the outside. This is because the
higher pressure is near the center so have a blade area that is greater there produces more spin. Also
having more blades creates more power output as is shown in Table 6.
Some error that could be resolved is to calibrated the voltage meter properly. This, in turn, would make
the wind power more accurate which would produce more accurate efficiency results for the wind
turbine. Another error is the seal between the motor fan and the tunnel is not perfect. This allows for
some air to escape and ultimately causes the pressure to be different. A way to resolve this is to make
sure there is a strong seal between the two materials.

Lab Report- Wind Turbine Lab 15
References
"Wind Turbine Blade Design" (2012, September 6). <http://www.mdpi.com/1996-1073/5/9/3425/pdf>
Engineering Education Innovation Center: Engineering Summer Experience. “Green Energy &
Sustainability”. Hitchcock Hall, Columbus. 2012. PowerPoint
A Wind Energy Pioneer: Charles F. Brush. Danish Wind Industry Association. Retrieved 2008-12-28.
Barber, David. "Small Wind Turbine Components." eHow. Demand Media, 08 Nov. 2010. Web. 29 June
2012. .
"Wind Energy Basics." Wind Energy Basics. Wind Energy Development Programmatic EIS, n.d. Web. 29
June 2012. .
"How Wind Turbines Work." Wind Program, Department of Energy, 18 Oct. 2011. Web. 10 July 2012. .
"Offshore Development." Ohio.gov. Ohio Energy Resources Division, n.d. Web. 25 July 2012..
Wilke, Dillion. "Charles Brush." Charles Brush. Humboldt State University, 5 May 2011. Web American
Municipal Power, < http://amppartners.org/generation-assets/wind- power/>

Lab Report- Wind Turbine Lab 16
Appendix
Sample Calculation
Difference Pressure Δ P=A*(ρ(Air)V22)/2 Pressure Difference(Pa)=
Δ P=(1.29kg/m * (5.05m/s)2)/2 (Area of blade)*(Density of Air(1.29 Kg/m3)
=16.4491125Pa *Velocity(m/s)^2)/2
(1)
Wind power P=½ × A × ρ × v3 Wind power(w)=½*Area
P= ½ ×0.009503m2× 1.29kg/m × (4.5m/s)3 of the wind turbine(m2)*Density
=0.558368438w of air(kg/m3) *Wind velocity(m/s)3
(2)
Volumetric flow rate Q=v × A Volumetric flow rate(m3/s)=
Q=4.5m/s × 0.009503m2 Wind Velocity(m/s)*Area of the
=0.04276493m3/s wind turbine(m2)
(3)
Mass flow rate m=ρ × Q Mass flowrate (kg/s)=Density
m=1.29kg/m × 0.04276493m3/s of air(kg/m3)*Volumetric flow
=0.05516676kg/s rate(m3/s)
(4)
Blade Design 1: 30° Hub

Lab Report- Wind Turbine Lab 17
Blade Design 1: 3 Blades 30° Hub

Lab Report- Wind Turbine Lab 18
Blade Design 1: 6 Blades 30° Hub
Blade Design 1: 6 Blades 45° Hub
Lab Report- Wind Turbine Lab 19
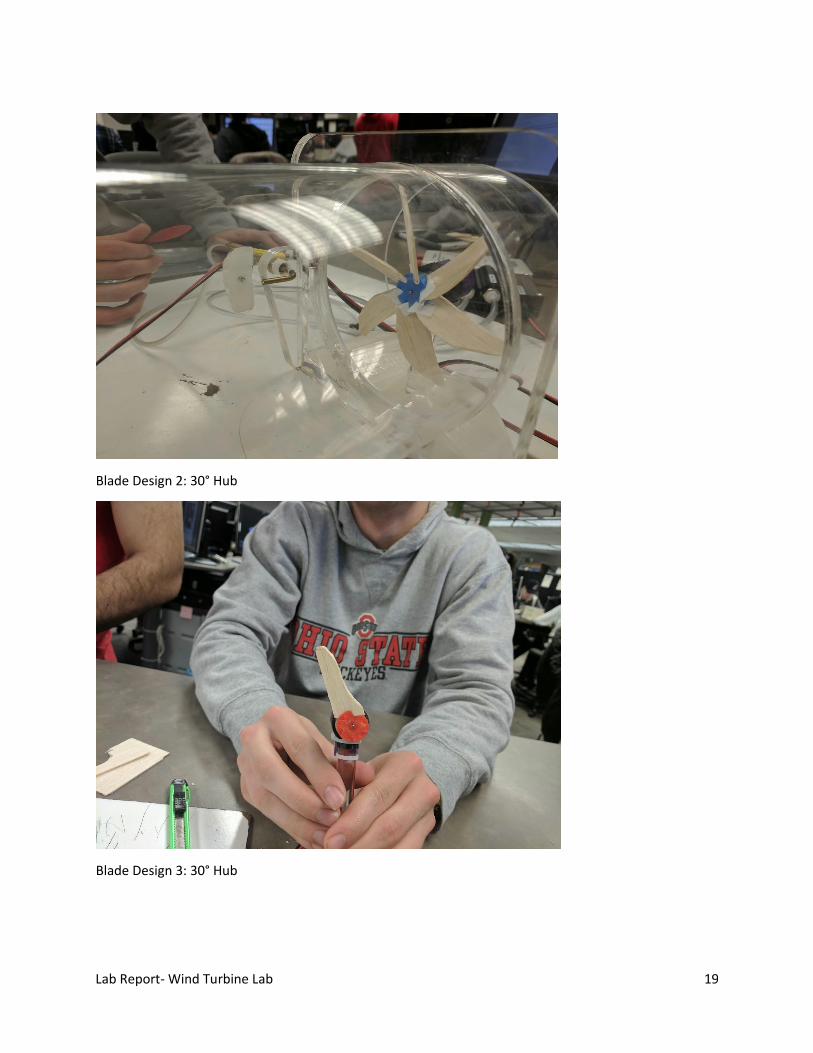
Blade Design 2: 30° Hub
Blade Design 3: 30° Hub

Lab Report- Wind Turbine Lab 20
Blade Design 4: 30° Hub
Team Meeting Notes

Lab Report- Wind Turbine Lab 21
Date: 4/3/2017
Time: 5:30PM (Face-to-Face)
Members Present: Joseph Blust, Jerry Ding, Zach Kahlig, Dahroov Verma
Topics Discussed: Lab 6A and 6B
Objective: Discuss the plan for and complete the Lab Report for Lab 6 (Wind Turbine).
To do/Action items:
• Assigned roles
• Results Section (All group members)
• Tables (Blust, Ding)
• Photos (Blust)
• Figures (Verma, Ding)
• Discussion (Verma, Kahlig)
• Conclusions/Recommendations (Kahlig)
Reflections:
• By understanding our roles and working well as a team, we were able to complete the Lab
Report.