Selection of a 50kW Small Wind Turbine for Calgary - PRISM
162
University of Calgary PRISM: University of Calgary's Digital Repository Graduate Studies The Vault: Electronic Theses and Dissertations 2018-10-10 Selection of a 50kW Small Wind Turbine for Calgary Yan, Tao Yan, Y. (2018). Selection of a 50kW Small Wind Turbine for Calgary (Unpublished master's thesis). University of Calgary, Calgary, AB. doi:10.11575/PRISM/33194 http://hdl.handle.net/1880/108854 master thesis University of Calgary graduate students retain copyright ownership and moral rights for their thesis. You may use this material in any way that is permitted by the Copyright Act or through licensing that has been assigned to the document. For uses that are not allowable under copyright legislation or licensing, you are required to seek permission. Downloaded from PRISM: https://prism.ucalgary.ca
-
Upload
khangminh22 -
Category
Documents
-
view
0 -
download
0
Transcript of Selection of a 50kW Small Wind Turbine for Calgary - PRISM

University of Calgary
PRISM: University of Calgary's Digital Repository
Graduate Studies The Vault: Electronic Theses and Dissertations
2018-10-10
Selection of a 50kW Small Wind Turbine for Calgary
Yan, Tao
Yan, Y. (2018). Selection of a 50kW Small Wind Turbine for Calgary (Unpublished master's
thesis). University of Calgary, Calgary, AB. doi:10.11575/PRISM/33194
http://hdl.handle.net/1880/108854
master thesis
University of Calgary graduate students retain copyright ownership and moral rights for their
thesis. You may use this material in any way that is permitted by the Copyright Act or through
licensing that has been assigned to the document. For uses that are not allowable under
copyright legislation or licensing, you are required to seek permission.
Downloaded from PRISM: https://prism.ucalgary.ca

UNIVERSITY OF CALGARY
Selection of a 50kW Small Wind Turbine for Calgary
by
Tao Yan
A THESIS
SUBMITTED TO THE FACULTY OF GRADUATE STUDIES
IN PARTIAL FULFILMENT OF THE REQUIREMENTS FOR THE
DEGREE OF MASTER OF ENGINEERING
GRADUATE PROGRAM IN MECHANICAL AND MANUFACTURING ENGINEERING
CALGARY, ALBERTA
SEPTEMBER, 2018
© Tao Yan 2018

ii
Abstract
The thesis studies the cost efficiency of wind turbines compared to photovoltaic (PV)
technologies and develops criteria for the selection of cost-efficient and reliable small wind
turbines for sites in Calgary.
The thesis first presents a literature review of wind energy and turbines and describes the
technicalities of large versus small turbines. It studies electrical generation, control systems,
safety systems and certifications.
This thesis analyzes the performance of PV and small wind turbines, and the economic
differences between the two in terms of cost per unit power.
Affordability is another advantage of Chinese turbines; they are usually cheaper than
European. Since no Canadian manufacturers are running as Endurance went bankrupt, Chinese
turbines are selected because they are relatively inexpensive, certified, and not much is known
about them. A detailed framework compares technical and economic performances of turbines
from different Chinese manufacturers.

iii
Table of Contents
Chapter 1 Introduction......................................................................................................1
1.1 Background ....................................................................................................................1
1.2 Research motivation.......................................................................................................1
1.3 Research question ..........................................................................................................2
1.4 Rntroduction to the wind turbines..................................................................................3
1.4.1 wind energy and wind turbines ...............................................................................3
1.4.2 selection criteria for the power generation system – pv system vs. Wind turbine
system ......................................................................................................................4
1.4.3 capacity factor of wind power system ....................................................................7
1.4.4 turbine selection: 50kW small turbine ....................................................................8
1.5 Research objective .........................................................................................................9
1.6 Research tools and information ...................................................................................10
1.6.1 Weibull distribution ..............................................................................................11
1.6.2 Retscreen analysis of wind turbine .......................................................................12
1.7 Research scope .............................................................................................................15
1.8 Thesis outline ...............................................................................................................15
Chapter 2 large and small wind turbines ......................................................................17
2.1 Introduction of small and large turbines ......................................................................17
2.2 Small and large turbine design .....................................................................................21
2.2.1 blades and blade attachment .................................................................................21
2.2.2 generators ..............................................................................................................26
2.2.3 yaw control system ...............................................................................................27
2.2.4 safety system .........................................................................................................28
2.2.5 towers ....................................................................................................................32
2.3 Economic comparison of small wind turbines vs. Large wind turbines ......................36
2.3.1 cost of components ...............................................................................................36
2.3.2 cost of installation and maintenance .....................................................................40
2.3.3 performance and cost assessment of 10kW, 50kW, 100kW turbines. ..................42
2.3.4 cost/average power in calgary ...............................................................................42
2.4 Conclusion ...................................................................................................................46

iv
Chapter 3 compare the manufactures of small wind turbines ....................................47
3.1 introduction and objective of the chapter .....................................................................47
3.2 technical specifications comparison for selected turbine manufacturers .....................47
3.3 non-technical features ..................................................................................................53
3.3.1 wind turbine certificates and standards overview - ..............................................54
3.3.2 assessment of warranty and maintenance contracts ..............................................57
3.3.3 credibility evaluations of the manufacturers .........................................................59
3.3.4 customer service ...................................................................................................61
Chapter 4 performance analysis and results .................................................................64
4.1 Average power calculation ..........................................................................................64
4.1.1 description of weibull input parameters ................................................................64
4.1.2 average power output for calgary .........................................................................64
4.1.3 wind speed probability and average power output for all manufacturers .............65
4.2 Payback calculations for all turbine manufactures ......................................................76
4.3 Analysis for pv technologies in calgary .......................................................................78
Chapter 5 Conclusion ......................................................................................................80
appendix a ghrepower data sheets ......................................................................................89
appendix b hummer data sheets .........................................................................................95
appendix c hengfeng data sheets ......................................................................................104
appendix d shenzhou data sheets .....................................................................................114
appendix e winpower data sheets .....................................................................................121
appendix f trina solar data sheets .....................................................................................131
appendix g payback calculations .....................................................................................136
appendix h maintenance list .............................................................................................144

v
List of Tables
Table 1 Wind extrapolation calculation(Only available heights of turbines are listed.) ......... 11
Table 2 Prices of VAWTS (data from personal communication with sales) ................................ 20
Table 3 Advantages vs. Disadvantages of each type of tower (Danish Wind Industry
Association, Wind Turbine Towers, 2003) ........................................................................... 34
Table 4 Hummer 10kW, 50kW and 100kW Wind Turbine System,FOB price(USD)
(without on-grid inverter)(personal communication with Hummer Sale repressentative) ... 37
Table 5 Landed cost comparison ................................................................................................. 38
Table 6 Overall Cost of each turbine (including installation and transportation cost) ................. 41
Table 7 : Rated Cost/ Power Comparison of 10kW, 50kW, 100kW Wind turbines .................... 42
Table 8 Height Extrapolation calculation base on the average wind speed of 4.4m/s at 10m ...... 43
Table 9 Average power of 10kW turbines .................................................................................... 43
Table 10 Average power of 50kW turbines .................................................................................. 43
Table 11 Average power of 100kW turbines ................................................................................ 44
Table 12: Power Output of Turbines (Manufacturer: Anhui Hummer Dynamo Co. Ltd)
(Hummer wind, 2014) ........................................................................................................... 45
Table 13: Wind Turbine Specifications for Different Commercially Available Sizes
(Manufacturer: Anhui Hummer Dynamo Co. Ltd) (Hummer wind, 2014) .......................... 45
Table 14 Comparison Table for the Assessment of Technical Features of Manufactures ........... 52
Table 15 Organizations issued CE ................................................................................................ 56
Table 16 Certificates comparison ................................................................................................. 57
Table 17 warranty comparison ...................................................................................................... 58
Table 18 Credibility Assessment on Ghrepower .......................................................................... 59
Table 19 Credibility Assessment on Hengfeng HF15.0-50kW .................................................... 60
Table 20 Credibility Assessment of the Anhui Hummer Dynamo Company (Anhui Hummer
Dynamo Co., Ltd., 2015) ...................................................................................................... 60
Table 21 Credibility Assessment on the Yangzhou (Shenzhou)Company.............................. 61

vi
Table 22 Credibility Assessment on the WinPower Group Co .................................................... 61
Table 23 Customer Service of each manufacture ......................................................................... 63
Table 24 Weibull Power Output Estimation for Calgary .............................................................. 65
Table 25 Weibull Statistical Analysis for Ghrepower .................................................................. 66
Table 26 Weibull Statistical Analysis for Hummer ...................................................................... 67
Table 27 Weibull Statistical Analysis for Hengfeng .................................................................... 69
Table 28 Weibull Statistical Analysis for Shenzhou .................................................................... 70
Table 29 Weibull Statistical Analysis for Winpower ................................................................... 72
Table 30 the power output of five turbines (w) ............................................................................ 73
Table 31 Summary of cost and average power output (kW) ........................................................ 74
Table 32 Summary of IRR ............................................................................................................ 77
Table 33 Summary for Cumulated Savings for All Manufacturers, Over the Period of 20
years (2015-2034) ................................................................................................................. 78
Table 34 Cost per unit average power .......................................................................................... 78
Table 35 Payback calculation ....................................................................................................... 79
Table 36 Pay back Calculations for Ghrepower for 20 years (on-grid) ...................................... 136
Table 37 Internal rate of return calculation for Ghrepower for 20 years .................................... 137
Table 38 Pay back Calculations for Hummer for 20 years (on-grid) ......................................... 138
Table 39 Internal rate of return calculation for Hummer for 20 years (on-grid) ....................... 139
Table 40 Pay back Calculations for Hengfeng for 20 years (on-grid) ........................................ 139
Table 41 Internal rate of return calculation for Hengfeng for 20 years (on-grid) ....................... 140
Table 42 Pay back Calculations for Shenzhou for 20 years (on-grid) ........................................ 141
Table 43 Internal rate of return calculation for Shenzhou(on-grid) ...................................... 142
Table 44 Pay back Calculations for WinPower for 20 years for WinPower (on-grid) ............... 143
Table 45 Internal rate of return calculation for Winpower (on-grid) .................................... 144

vii
List of Figures and Illustrations
Figure 1 Dimensions of typical Hummer 50kW turbine foundation (see Appendix B Hummer
Data Sheets) ............................................................................................................................ 6
Figure 2 Dimensions of 200W Photovoltaic Module (GEPVp-200 Panel, 2014) .......................... 7
Figure 3 Steady wind power curve and wind speed probability density. (PelaFlow consulting,
2016) ..................................................................................................................................... 11
Figure 4 Example of Weibull probability density function for V=6 m/s ...................................... 12
Figure 5 RETscreen Parameters .................................................................................................... 13
Figure 6 Power and energy curve generated by RETscreen ......................................................... 14
Figure 7 An example of Financial Analysis from RetScreen showing a cash flow analysis ........ 15
Figure 8 Darrieus vertical axis turbines principle of operation (Jin X et al.,2015) ...................... 19
Figure 9: 50kW Shenzhou Wind Turbine (Shenzhou, 2014) ....................................................... 20
Figure 10: 50kW Ghrepower Wind Turbine (Ghrepower, 2014) ................................................. 21
Figure 11: 50kW Hengfeng Wind Turbine Rotors (Hengfeng Power Generator, 2014) .............. 22
Figure 12 Failure rate proportions attributable to geared-drive onshore wind turbine sub-
assemblies. (Yang W et al.,2014) ......................................................................................... 24
Figure 13: 55kW Shenzhou permanent Generator........................................................................ 26
Figure 14: Shenzhou Company Gearbox ...................................................................................... 26
Figure 15: Hummer direct driven permanent magnetic generators .............................................. 27
Figure 16: 12-50kW Hummer Dogvane ....................................................................................... 28
Figure 17: Ghrepower Vane Assembly......................................................................................... 28
Figure 18: Shenzhou High Speed Shaft Brake (Shenzhou 50kW ON-GRID WIND
TURBINE SYSTEM, 2014) ................................................................................................. 29
Figure 19: Shenzhou Low Speed Shaft Brake (Shenzhou 50kW ON-GRID WIND TURBINE
SYSTEM, 2014) ................................................................................................................... 30
Figure 20: Shenzhou Yawing Brake ............................................................................................. 30
Figure 21 Cp- λ curve for a typical wind turbine.(Kjellin,J et al.,2013) ...................................... 32

viii
Figure 22: A Self-Supporting lattice Tower (Greenheart Energy, 2011) ..................................... 33
Figure 23: Guyed Wired Tower (weiku, 2014) ............................................................................ 33
Figure 24: Monopole Tower (youtube, 2010) with hydraulic system for raising and lowering ... 33
Figure 25: Hydraulic support for the pole of Wind turbine (Hummer) ........................................ 35
Figure 26: Installed Wind Turbine (Hummer) .............................................................................. 35
Figure 27: Installed capital costs for the land-based 1.5MW wind reference turbine. (NREL,
2014) ..................................................................................................................................... 37
Figure 28: Cost of components of 10kW. Anhui Hummer Dynamo Co. Ltd (Prices in USD.) ... 39
Figure 29: Cost of components of 50kW. Anhui Hummer Dynamo Co. Ltd (USD is used as
the currency, as the followings.) ........................................................................................... 39
Figure 30: Cost of components of 100kW. Anhui Hummer Dynamo Co. Ltd (USD is used as
the currency, as the followings.) ........................................................................................... 40
Figure 31 Comparison Model for the Selected Manufacturers ..................................................... 48
Figure 32 Technical Features for Model Evaluation .................................................................... 49
Figure 33 Output Power Curves of Selected Chinese Wind Turbines Manufactures ................... 50
Figure 34 Measured data VS. manfacurer supplied data in Encraft Warwick Wind Trials
Project (Encraft,2009) ........................................................................................................... 51
Figure 35 Commercial Features for Model Evaluation ................................................................ 53
Figure 36 Average Wind Data and solar radiation for Calgary Canada from Retscreen
database ................................................................................................................................. 64
Figure 37 Weibull Power Output Estimation for Calgary ............................................................ 65
Figure 38 Ghrepower: Power (kW) Vs. Average Wind Speed (m/s) ........................................... 66
Figure 39 Ghrepower: Average Power(kW)Vs. Average Wind Speed (m/s) ........................ 67
Figure 40 Hummer: Power Curve ................................................................................................. 68
Figure 41 Hummer: Average Power (kW) Vs. Wind Speed (m/s) ............................................... 68
Figure 42 Hengfeng Power Curve ................................................................................................ 69
Figure 43 Hengfeng: Average Power (kW) Vs. Wind Speed (m/s) ............................................. 70

ix
Figure 44 Shenzhou: Power Curve ............................................................................................... 71
Figure 45 Shenzhou: Average Power(kW)Vs. Wind Speed (m/s) .......................................... 71
Figure 46 Winpower: Power Curve .............................................................................................. 72
Figure 47 Winpower: Average Power (kW) Vs. Wind Speed (m/s) ............................................ 73
Figure 48 the power curves of five turbines ................................................................................. 74
Figure 49 Cost per Average Power Output (USD/kW) ................................................................ 75
1
CHAPTER 1 INTRODUCTION
1.1 Background
Energy is the basis for economic development and it is important to have a reliable
supply of energy for the development of any country. Conventional energy sources, such as coal,
cause greenhouse gas (GHG) problems. Several energy sources, including nuclear, hydropower,
biomass, solar energy, and wind, have been proposed to satisfy the energy demand. Therefore,
some renewable energy systems take up a relatively large proportion of electricity generation in
many countries. For example, in Canada, the hydropower makes up 59% of electricity generation,
wind makes up 4%, and PV makes up 0.5%. (Natural Resource Canada,2018)
Among them, solar photovoltaics have low energy conversion efficiency; however, the
manufacturing cost has dropped significantly which threatens the market for wind turbines
(Milborrow, 2016). Hydroelectric power, which requires a huge investment, requires
construction of dams that submerge considerable areas of land, and large-scale residential
migration may add the cost.
The source of wind energy is its motion, which results from the temperature differences
caused by uneven heating from the sun. It is estimated conservatively that the world’s available
wind resource could be 20,000 TWh/year (Oudah et al., 2014). Both PV and wind turbines can
be considered an inexhaustible source of green energy. Unlike locations for hydro dams, wind
energy systems and PV may be placed almost anywhere.
1.2 Research Motivation
The City of Calgary owns many Occupational Work Centers (OWCs) and other outdoor
sites such as landfills, which may be suitable for the generation of renewable energy through

2
photovoltaic and wind turbines. For example, all landfill and waste facilities in Calgary must
maintain an unused space next to a road as buffers (City of Calgary,2018).
Economies of scale achieved in solar PV manufacturing have reduced the cost and
increased the availability of PV modules. Recently, the technology has achieved increasing
acceptance in the market place (Marigo et al., 2013). Calgary is geographically suitable to utilize
PV as well as wind turbines. For example, the yearly photovoltaic potential in Calgary is 1292
kWh/kW compared to Berlin’s 848 kWh/kW (Natural Resources of Canada, 2013), this means
one kW PV system in Calgary would produce 52% more electricity than the one in Berlin.
Also, The Canadian Wind Energy Atlas calculated the annual average (mean) wind speed
in Northwest Calgary as 5.92m/s (50m height) which is plenty for wind turbines.
Hence, customers in Calgary would have interest in buying PV or turbines by considering
their power output, space requirements, economics, safety, reliability, availability of the energy
source (wind or sun), and other factors relevant to the technologies.
1.3 Research Question
The purpose of this research work is to identify suitable commercial wind turbines for
Calgary in terms of performance and cost. Although European companies make wind turbines of
suitable capacity, products from China are investigated here because they are certified, and
widely utilized in China and African countries, but not largely imported by American countries.
Affordability is perceived as another advantage of Chinese turbines; they are usually cheaper
than European, and this will be discussed in next Chapter.

3
Due to the falling prices of photovoltaic cells, smaller turbines (say 1-10 kW) cannot
compete with PV; however, PV economics do not change much with scale whereas wind gets
considerably cheaper and reach a crossover point where the two technologies are of comparable
cost. (Chung,D et al.,2015)
The question is where the point is. The hypothesis of this research is that the point is
around 50 kW, but the question can only be answered by a detailed technological analysis to
assess the potential power output, cost effectiveness, and safety of turbines in urban settings.
More discussion of this crossover point will be presented later in this chapter.
This research work will locate manufacturers and assess their wind turbines to choose the
most suitable wind turbines for Calgary. The research work aims to provide further information
to determine the point at which PV and wind cost effectiveness are comparable. Such data would
be useful for urban applications claiming MW sized turbines are unlikely to be allowed within
city limits.
The most experienced and popular Chinese manufacturers have been selected for this
study because their products perform well and are likely to be economically feasible.
1.4 Introduction to the Wind Turbines
1.4.1 Wind Energy and Wind Turbines
Among the various renewable energy sources, wind energy is the most promising
technology for large scale commercialization, with the advantages of having an inexhaustible
supply of clean and safe wind energy. In this project, cost per kWh is the primary concern when
evaluating the performance and then the economics of the various technologies.
Wind turbines function by converting the kinetic energy of wind into electrical energy.
The main components are blades, gearboxes, and generators. Based on the orientation of the axes

4
of rotation of turbine blades, wind turbines are classified as horizontal and vertical. Horizontal
turbines have the main rotor shaft pointed into the wind and vertical turbines have the rotor shaft
arranged vertically.
Many important factors must be considered in the selection of wind turbines. Safety is
always a primary concern and the manufactures are responsible for testing the turbines before
massive production. Performance and cost are always evaluated together. The following chapters
will discuss the performance and impact of wind turbines with regard to tower height, wind
speed, cost, noise and visibility, safety and warranties.
Wind energy production and consumption have grown tremendously in the last decade,
and they are expected to continue this expansion. Global wind energy production in 2011
reached 239GW. This is 3% of the total world energy production (WWEA, 2012). It is projected
that by 2020 this share will increase to 10% (WWEA, 2012). According to the International
Energy Agency (2010) 12% of global electricity will be generated from wind by 2050. Energy
from wind will reach even higher percentages in countries not in the Organization for Economic
Cooperation and Development (OECD). The non-OECD economies will have higher global
wind energy productions with 17% of global wind energy and this will be 57% in 2050 (WWEA,
2012).]. According to the Canadian Wind Energy Association, Canada has an installed capacity
of 6,578 MW (WWEA, 2012). The world’s largest wind farm, with 421 turbines covering 47000
acres of land, is in Texas, and rated at 735 MW. The first wind farm was constructed in Alberta
in 1993 and the total capacity in Alberta is over 1100 MW (Canadian Wind Energy Association,
2013). Alberta has the strategic advantage of good wind resources for cost effective wind energy
production (Canadian Wind Energy Association, 2013).
1.4.2 Selection Criteria for the Power Generation System – PV System vs. Wind Turbine

5
System
There are always some tradeoffs when selecting a power generation system. In
comparing solar with wind technology, reliability, physical installation requirements, cost, and
maintenance requirements are the main selection criteria. For example, due to fewer mechanical
components, PV produces much less noise; however, it requires much more ground area than
turbines for the same size. The costs of these two systems are always comparable.
The 50kW PV installed in 2015 at the Bearspaw OWC owned by the City of Calgary cost
$2296 per kW of peak power. This number is from personal communication with Prof.David
Wood.
Reliability is a complex issue. Wind turbines should be tested and certificated before sold
to customers. Turbines can be either tested by the manufactures or by third-party organizations.
For example, the National Wind Technology Center, in Boulder, offers to test the performance
and reliability of blades, turbines, and other components in both laboratory and field
environments (U.S Department of Energy, 2014).
There are also two other important factors when comparing wind power and PV, but not
critical for this project:
Visual and noise impact may be of major concern for the wind turbine. For this project, the
potential sites in Calgary are generally industrial areas well away from residences; therefore,
visual and noise are not the major concerns.
Comparison of the space required for solar modules and wind turbines, to give equal amount
of output is another main factor to consider. Using 200W solar modules requires 250 solar

6
modules to have a rated power of 50kW. However, the land area occupied by one solar module
is nearly same as that of one small wind turbine. From Figure 1 and Figure 2, in order to produce
50kW, 250 solar modules have to be used which would cover an area 252 times larger than used
by one 50kW wind turbine.
Figure 1 Dimensions of typical Hummer 50kW turbine foundation (see Appendix B
Hummer Data Sheets)

7
Figure 2 Dimensions of 200W Photovoltaic Module (GEPVp-200 Panel, 2014)
In terms of the rated power, the space requirement of 50kW turbines is nearly 250 times
less than the arrays of solar modules. This makes it highly feasible to select a small turbine over
the large number of PV arrays to generate 50kW. This comparison is justified as part of a general
comparison of the technologies, because space is not necessarily the primary concern for this
project.
1.4.3 Capacity Factor of Wind Power System
The capacity factor for any system generating electricity is the ratio of the average power
delivered to the rated power (Abed et al., 1997). There is a theoretical maximum efficiency a
wind turbine can achieve; this limit is known as Betz’s limit which 59.3%. In reality, the
capacity factor for large turbines usually ranges between 25-35% depending on the design of the
turbines, location and the technology being used (Carbon Trust, 2008). However, for small
turbines the capacity factor is found to range between 15-20% or even less (Carbon Trust, 2008).

8
The coefficient obtained from a wind turbine is given as:
𝐂𝐩 =𝟐𝐏(𝑽)
𝛒𝐀𝐕𝟑 (1)
Where, Cp is the Coefficient of Power, ρ is the air density, A is the area of the rotor (blades),
and V is the wind speed. The coefficient of power (Cp) is a measurement of how efficiently the
wind turbine converts the wind energy into electricity, Eq (1) is the expression of definition.
The size of the turbines, their height, and the dimensions of the rotor blades, determines the
power output. As the height of the wind turbine increases, the average wind speed increases
(Wood, 2011). From Eq (1), it clears that higher average wind speed increases the power output.
The output power of a wind turbine varies directly with the cube of wind velocity as described
by Eq (1). This equation is only valid for the wind speed range from cut-in to near rated. From
rated speed on the power output is constrained as can be seen from any power curve.
The power curve shows the relationship between the turbine power output and hub height
wind speed. Turbine manufactures draw the power curve by long testing their turbines in
candidate site. (Lydia M et al.,2014)
The height of the tower cannot be increased indefinitely because the ratio of total power
output to installed cost will eventually decrease with increasing tower height.
1.4.4 Turbine Selection: 50kW Small Turbine
Wind Turbines are classified into two main categories based on their rated power output:
small turbines and large wind turbines.
Types of Wind Turbines

9
Small wind turbines: According to the international standard for small wind turbine safety,
IEC61400-2, small wind turbines are defined as having a rotor swept area of less than 200 m2
which corresponds to a rated power of around 50 kW (Institution, B. S..2014).
Large Wind Turbines: Wind turbines with capacity above 50kW are defined as large
turbines (Institution, B. S..2014).
For usage in OWCs located in cities, large wind turbines are assumed to be unacceptable.
1.5 Research Objective
The overall power extraction capability which is indicated by capacity factor is a critical
factor. Generally, large turbines have better CF as mentioned. The hypothesis of this research is
that the crossover point is around 50 kW, a detailed technological analysis of each turbine
including the potential power output, cost effectiveness, and safety of turbines will be performed.
Therefore, this project is to determine whether 50kW wind turbines are an appropriate choice for
Calgary.
The research objectives of this study are as follows:
Primary Objectives
• To develop some criteria for selecting 50 kW wind turbines for Calgary considering
safety, noise, and cost.
• Determine the cost effectiveness of these wind turbines compared to the PV
technologies
• To comparatively study small wind turbines of Chinese Manufacture and solar PV
in terms of feasibility and cost efficiency.
Secondary Objectives

10
• To compare and analyze the performance of different wind turbines.
• To rank available wind turbines based on applicability to Calgary
1.6 Research tools and information
Targeting these research objectives, performance and economic analyses have been
performed for a selected 50kW turbine on a nominal project site at Calgary, Canada. Following
simulation tools and information have been incorporated order to derive the results as the part of
research project.
Tower height and height extrapolation
As the turbine hub height increases, the amount of energy generated increases.
Manufacturers produce towers with different heights; a height extrapolation calculation is used to
evaluate the turbine performance. To perform a height extrapolation, one of the most commonly
used methods is the Hellmann power law expressed as
(2)
where is the wind speed at a given height, H, is the wind speed at the reference height, .
Most wind speed data have been measured at 10 m (Masters, 2013) whereas the hub height of a
50kW turbine is typically more than 15m. At the Calgary International Airport, this wind speed
v0 is about 4.4 m/s at 10m (Government of Canada, 2017), α is a function of the topography
(known as roughness coefficient). For the city of Calgary, 0.3 has been used to calculate the new
wind speed (Ragheb, 2015). For all the turbines the wind speeds at various heights and the power
generated was computed.

11
Table 1 Wind extrapolation calculation(Only available heights of turbines are listed.)
H (m) H/H0 v(H) [m/s]
16 1.6 5.066
18 1.8 5.248
20 2 5.417
36 3.6 6.462
1.6.1 Weibull Distribution
The Figure 3 shows probability density distribution curve and a typical power curve in
steady wind. In this case, small turbines only have flat production after rated power
Figure 3 Steady wind power curve and wind speed probability density. (PelaFlow
consulting, 2016)
The Weibull probability density distribution function (pdf) is often used to approximate
the wind speed (Manwell et al., 2002). The Weibull probability density function is given by
(Manwell et al., 2002):
𝒑(𝒖) = (𝒌
𝒄) (
𝒖
𝒄)
𝒌−𝟏𝒆𝒙𝒑 [− (
𝒖
𝒄)
𝒌] (3)

12
where 𝒌 is the shape factor, 𝒄 is the scale factor, 𝒖 is the wind speed.
The cumulative distribution function is given by (Manwell et al., 2002):
𝒇(𝒖) = 𝟏 − 𝐞𝐱𝐩 [− (𝒖
𝒄)
𝒌] (4)
Figure 4 Example of Weibull probability density function for V=6 m/s
From Figure 4,as the k increases, the probability curve has a sharper peak which means
wind speed varies less(Manwell et al., 2002).
The average wind speed is derived from Eq (3) as follows (Manwell et al., 2002):
�̅� = 𝐶𝛤 (1 +1
𝑘) (5)
Where Γ(x) = ∫ ⅇ−tf x−1 ⅆt∞
0. (Manwell et al., 2002)
Weibull distributions will be used along with the manufacturer’s power curves to
calculate average power output.
1.6.2 RETSCREEN Analysis of Wind Turbine

13
RETScreen is a Clean Energy Management Software system for renewable energy and
project feasibility for the various power technologies (cogeneration) (Natural Resources Canada,
2016). The tool evaluates the annual electricity costs, production costs, and cost per energy unit.
Also, it provides spreadsheets for the financial analysis of a potential installation. To make an
analysis, RETscreen requires parameters input (see Figure 5,), such as hub height, power
capacity, rotor diameter etc.
Figure 5 RETscreen Parameters
After input parameters, power and energy curve is generated accordingly (see Figure 6).

14
Figure 6 Power and energy curve generated by RETscreen
RETScreen generates an economic analysis of a project based on various of factors including
depreciation and taxes, electricity export revenue etc. Investors can clearly see the profits of the
projects. (Natural Resources Canada, 2016).
In this thesis, Financial analysis and cash flow graphs are generated by RETScreen and used
to analyze the rate of returns. (see Figure 7)

15
Figure 7 An example of Financial Analysis from RetScreen showing a cash flow analysis
1.7 Research Scope
The technical scope for this paper is to evaluate the power output of 50 kW turbines for
typical sites in Calgary and to evaluate their suitability in terms of reliability. Limited by time
and materials, only five Chinese wind turbine manufacturers have been selected based on cost
and reputation. This study compares wind turbines from these manufacturers and compares them
with PV performance.
1.8 Thesis Outline
This dissertation is divided into five chapters. The content of the following chapters I
given below.
Chapter 2 provides information on small wind turbines. Technical aspects of wind
turbines, types of wind turbines and comparative design aspects of small and large turbines are
explained. A detailed discussion is presented on how to select a 50kW small wind turbine for
Calgary.

16
Chapter 3 explains how the selection of five Chinese manufacturers was made. The
comparison was based on the technical and commercial features of these companies.
Chapter 4 presents results from probability and software analyses of wind turbine
performance and project cost. Weibull analyzes distributions, turbine power curves, assessments
of different tower heights for small wind turbines, payback calculations and associated
economics.
Chapter 5 provides the overall conclusion based on the research and recommendations
arising from the study.

17
CHAPTER 2 LARGE AND SMALL WIND TURBINES
This section aims to develop a basic understanding of wind turbines of different technical
designs.
2.1 Introduction of small and large turbines
To balance performance and cost, the technical designs of small and large turbines are
different.
For example, to better utilize the wind flow, yaw control system is needed. There are two
types of yaw control system: active yaw system and passive yaw system.
The active yaw systems use software to anticipate the wind direction and rotate the nacelle of
the wind turbine against the tower based on automatic signals from wind direction sensors. The
passive yaw systems adjust the orientation of the wind turbine rotor by utilizing the wind force.
(P Rosenvard et al.,2011)
Large turbines and some small ones use the active yaw control system, which is more precise
than the passive yaw system used in other small turbines (All the turbines considered in this
thesis use active yaw) (Renewable Energy World, 2008). Furling is a general way to control
speed in small turbines whereas brakes are used on the high-speed shaft in large turbines.
Blade pitch adjustment changes the pitch angle of a wind turbine. The turbine's electronic
controller checks the power output of the turbine several times per second. When the turbine is
overload, the blade pitch mechanism turns the rotor blades slightly out of the wind. The blades
are turned back into the wind whenever the power output drops again. (Nielsen et al.,2010)

18
Blade pitch adjustment is popular on large turbines but has been rarely employed on
small turbines because of cost. However, modern 50kW turbines have started to use pitch
adjustment to adjust the blade’s angle and take greater advantage from the prevailing wind
conditions.
The gearbox connects the low-speed shaft to the high-speed shaft and increases the
rotational speeds to above 1000rpm, which is required by most generators to produce electricity
(Liu, W. et al., 2009). Most small wind turbines use direct drive generators to lower cost (Power
cluster. Basic maintenance techniques for wind energy technicians.2011), (Renewable Energy
World, 2008).
Small wind turbines come in a great variety of designs, numbers of blades and
configurations, which produce different power outputs. Different designs are distinguished in
terms of number of blades used, upwind or downwind configurations, vertical axis wind turbines
(VAWTs) or horizontal axis wind turbines (HAWTs).
Darrius VAWTs is taken as an example.

19
Figure 8 Darrieus vertical axis turbines principle of operation (Jin X et al.,2015)
VAWTs have advantages over HAWTs (C Bracken Meyers,2013):
⚫ No yaw mechanisms are needed.
⚫ Lower rotational speeds which may generate less noise
⚫ Since a VAWT can be located nearer the ground, it takes advantage of locations such as
rooftops, mesas, hilltops, ridgelines, and passes funnel the wind and increase wind velocity.
VAWTs are not commonly deployed due to three main reasons (C Bracken Meyers,2013):
⚫ Most VAWTs have an average lower efficiency, because their blades rotate into the wind,
and this causes more drag force.
⚫ Due to the lower tower heights, VAWTs do not take advantage of higher wind speeds.
⚫ Lower rotational speeds require (for the same power output) larger generators and brakes.
Currently, only one Chinese manufacture Richuan from Qingdao is exporting 50kW
VAWTs on Alibaba. The prices including tower are listed below:

20
Table 2 Prices of VAWTS (data from personal communication with sales)
Manufactures Richuan Hummer
FOB Price (USD) 110000 130000
These prices are higher than average HAWTs. Most manufactures are exporting HAWTs,
therefore, this thesis will focus only on HAWTs.
Wind turbines are classified as grid-tied and off grid. Grid-tied systems are those that do not
store the power generated and are connected to the main grid. Off-grid systems work in isolation
from the electric grid and have their own power storage systems. This project only focuses on
grid-tied systems that can be installed in OWCs.
Two turbines considered in this thesis are now described. A 50kW Shenzhou wind
turbine is shown in Figure 9 while a Ghrepower wind turbine of similar rating has been depicted
in Figure 10.
Figure 9: 50kW Shenzhou Wind Turbine (Shenzhou, 2014)

21
Figure 10: 50kW Ghrepower Wind Turbine (Ghrepower, 2014)
2.2 Small and large turbine design
The performance of both small and large wind turbines is affected by many components.
The most significant of them are discussed in detail below.
2.2.1 Blades and blade attachment
The rotor consists of the blades and blade attachment; current rotors usually have two or
three blades, although there are turbines with four and five blades; these are mainly very small
turbines (Lee, 2007).
The only advantage of two-bladed rotors is that the initial price is lower. Even the loads
on both 2 bladed and 3 bladed turbines are similar, 3 bladed turbines usually transmit less
fluctuating torque to the shaft. Figure 11 shows the Hengfeng 50kW wind turbine rotors. The 3
blades are made from GRP. The blade diameter is 15m.

22
Figure 11: 50kW Hengfeng Wind Turbine Rotors (Hengfeng Power Generator, 2014)
Turbine blades use airfoil sections to achieve a high lift to drag ratio (Ahmed, 2012). The
blades must withstand heavy loads, while the design should lead to optimal energy production
and minimize noise. Materials, design and manufacturing procedures and tests are all important
to produce good blades.
Blade Materials
The material parameters include minimum and maximum operating temperatures, and
ability to withstand other environmental conditions (e.g., strength, toughness, density, cold
deformability, ageing characteristics, resistance to rot and sun light).
The material used for the blades is glass fiber reinforced polyester (GRP), carbon fiber
and wood, etc. The materials for manufacturing small and large turbine blades are similar. For
example, timber is an excellent material for small blades, however, timber has a strong
anisotropy and therefore potential variation of its properties (Wood, 2011). The common
materials used for both large and small turbines are GRP (Vazquez et al., 1998). The main
benefit of GRP is that the reinforcement layout can be adjusted to give maximum strength in the
radial direction where it is needed most (Vazquez et al., 1998).

23
Design and main load
Small and large turbines may have different design goals. For example, minimal noise
must be produced by large blades, small blades should be designed to start quickly in low winds.
(Wood, 2011)
The driving force of wind turbines is the lift. Lift acts perpendicular to apparent velocity of
the wind speed at the blades. lift normally increases with angle of attack, while drag force also
increases. The wind turbine will give maximum performance, when lift to drag ratio is maximum.
This is the basic design theory (Schubel et al.,2012).
Blades are designed to withstand several loads. For example, wind pressure causes
flatwise load, and gravitational forces and torque load cause edgewise load. Rotation causes
centrifugal loads. Adequate stiffness is mandatory for all blades to avoid excessive bending
under load.
For small turbines, low inertia is more important for starting. For large blades, structural
strength is more important (Wood, 2011).
Manufacture:
Due to a high level of centrifugal stress, reinforcement is necessary, but it only gives
mainly radial strength. The glass reinforcement in GRP blades is concentrated at the surface is to
maximize the distance from the neutral axis, (Wood, 2011).
Moulds are needed if composite materials are used. Vacuum infusion is implemented to
make lower and upper surfaces. The upper surface is placed in the mould and after adding the
fiberglass layup, resin is vacuumed onto the mould. This manufacturing method needs

24
considerable labor and is suitable for small production (Wood, 2111). A closed-mould process
such as resin-transfer moulding (RTM), is suitable for massive production. A core is placed in
the mould along with the fiberglass. The mould is then closed and resin injected under pressure
(Wood, 2011).
Maintenance:
The faults and damages of wind turbine can be minimized as long as the maintenance work
is implemented in stated maintenance time. The failure rate is listed in Figure 12
Figure 12 Failure rate proportions attributable to geared-drive onshore wind turbine sub-
assemblies. (Yang W et al.,2014)
From Figure 12,power module, rotor module and control system have highest failure rate.
Take Ghrepower turbine as an example, the general maintenance work consists of tower
supports, engine room, generator, impeller and control system. 3 persons shall be required for
maintenance and they can complete the maintenance within one day without exceptional

25
situation. Maintenance plan should be made to list the maintenance work of 15 years after
starting operation of wind turbine. (Ghrepower,2016)
The maintenance time (year) is started from first operation, which can be divided into 4
maintenance periods of A, B, C and X (X1 and X2) according to maintenance contents.
(Ghrepower,2016)
Maintenance codes – X1 and X2 express extension: X1 is the items for maintenance per 3
years and X2 is the items for maintenance per 5 years.
All maintenance items with X1 and X2 in maintenance list shall be implemented in this
maintenance work. (Ghrepower,2016)
1) Maintenance A is the maintenance of 1-3 months after first operation of wind turbine. It is a
single maintenance and will only implement one time in maintenance plan of WTGSs, namely
retighten all bolts. Time error for implementation of Maintenance A is one month.
(Ghrepower,2016)
2) Maintenance B is the maintenance of half year, which time error is the same with
Maintenance A. (Ghrepower,2016)
3) Maintenance C is the maintenance of a year. It is to tighten the bolts as per the numbers
required by torque meter and mark for it to avoid repetition. For any bolt loosed found in
inspection, tighten all bolts related to the items and make marks on it. The time error for
implementation of Maintenance C is the same with maintenance A. (Ghrepower,2016)
4) Maintenance X is the extension of maintenance. (Ghrepower,2016)
All maintenance operations and inspections shall be completely recorded in maintenance
records. Please check maintenance list in Appendix H. (Ghrepower,2016)
The cost will be discussed later.

26
2.2.2 Generators
The broad trend in small turbines is the use of synchronous generators with permanent
magnets (PMG) in all existing power ranges. This generator is simple, efficient, and more robust.
Figure 13 shows a 55kW generator of Shenzhou Company. The rpm of this generator
varies between 69rpm to 1500rpm. This Permanent magnet generator uses a gear box for its
connection with the rotor which is shown in Figure 14.
Figure 13: 55kW Shenzhou permanent Generator
Figure 14: Shenzhou Company Gearbox

27
Figure 15: Hummer direct driven permanent magnetic generators
Figure 15 shows the generator used in Hummer wind turbines. The generator is the direct
driven permanent magnetic type.
2.2.3 Yaw Control System
As discussed in Chapter 2.1, passive and active yaw control systems are commonly used
on turbines.
A Tail fin is a typical passive yaw control system. The tail fin is placed at the end of an
arm and provides a lateral force on the vane, which acts on the arm that yaws the machine to face
the wind. This simpler tail fin reduces the overall cost of small turbines, and is easier to maintain,
but it is not as efficient as active yaw control system (Wood, 2012).
All the selected turbines use active yaw system to improve their performance. For example,
when wind speed exceeds 18m/s, the yaw shaft of Hummer’s turbine will deflect 90 degrees
from wind and then the turbine stops working. After 5 mins protection, their programmable logic
controllers (PLC) module will drive the DC24V regulation motor to seek the wind signal again.

28
Dogvane is part of active yaw system, and is used to show the direction of wind, usually
mounted on the top of the nacelle. For example, Figure 16 shows a typical dogvane used by the
Hummer 12-50kW wind turbine. Figure 17 shows the location of the dogvane on the Ghrepower
turbine. The dogvane measures and indicates wind direction. If the angle between dogvane and
wind generator axes is more than 10 degrees, the yaw motor will drive the blades into the wind.
Figure 16: 12-50kW Hummer Dogvane
Figure 17: Ghrepower Vane Assembly
2.2.4 Safety System

29
Brakes
The turbine must be capable of safely parking when emergency events happen. Any
emergency, such as loss of rotor balance, an electrical failure, and extremely high speeds leads to
an emergency stop.
This braking system consists of a mechanism to slow the rotor to stop, before maximum
wind speed is reached.
All the selected turbines use hydraulic brake systems which are activated by hydraulic
pressure; it is a mechanical brake system that acts on the main shaft.
The brakes used in Shenzhou wind turbines are shown in Figure 18 (high speed shaft brake),
Figure 19 (low speed shaft break) and Figure 20 (Yawing brake).
Figure 18: Shenzhou High Speed Shaft Brake (Shenzhou 50kW ON-GRID WIND
TURBINE SYSTEM, 2014)

30
Figure 19: Shenzhou Low Speed Shaft Brake (Shenzhou 50kW ON-GRID WIND
TURBINE SYSTEM, 2014)
Figure 20: Shenzhou Yawing Brake(Shenzhou 50kW ON-GRID WIND TURBINE
SYSTEM, 2014)
The safety system of large wind turbines is more complex than that of small wind turbines.
Many turbines employ active pitch adjustment to protect the turbines from over-speeding and
keep the power constant. Pitch changes the angle of attack and therefore changes the lift and drag.

31
For small wind turbines, when the wind speed increases, the axial thrust force on the rotor
also increases, and when this force reaches the value that causes pitch adjustment, the pitch
mechanism is activated. all the selected 50kW wind turbines are equipped with pitch adjustment.
Speed regulation
It is not economical to install large electrical generators that can convert all the power
contained in high wind speeds to electricity, because from rated speed on the power output is
constrained as can be seen from any power curve. When this power cannot be absorbed, over-
speed results in high centrifugal forces, excessive and undesirable noise and vibration and
electrical damage.
Several methods control the rotational speed in small turbines. Regulation can be
achieved by furling the rotor of a turbine with a tail fin: The rotor is furled in the horizontal plane
with respect to the wind direction and the rotor collapses towards the tail. Wind flow through the
rotor is reduced by decreasing the area that faces it. Thus, the power extracted from the wind is
reduced.
Turbine blades have a maximum efficiency at a specific ratio of blade-tip speed to wind
speed. Tip/speed ratio (TSR), by definition, is the blade-tip speed divided by the wind
speed. For example, if the blade-tip speed is traveling at 100 km/h and the wind speed is 20
km/h, then the TSR is 5 (100/20). (Ragheb et al.,2011)
The actual power of the wind turbine depends on Cp which is the function of the tip speed
ratio (λ). The tip speed ratio (λ) is defined to be the ratio between the shaft speed and the wind
speed, and is given by:
𝜆 =𝜔𝑅
𝑉 (5)

32
where, is the rotor tip speed.
Figure 21 Cp- λ curve for a typical wind turbine. (Kjellin,J et al.,2013)
Figure 21 is an illustration of the Cp- λ curve for a typical wind turbine. Based on this
curve, there is only one optimal constant value for tip speed ratio, where Cp is maximum. If the
wind turbine is operated at this point, maximum power will be extracted from the available wind.
2.2.5 Towers
The towers can be monopoles or lattice towers. Lattice towers can be self-supporting or
supported by guy wires, however, monopoles can only be self-supporting. Self-supporting
monopole towers are the most preferred for all selected manufactures,
Examples of towers are shown in Figure 22 to Figure 24.

33
Figure 22: A Self-Supporting lattice Tower (Greenheart Energy, 2011)
Figure 23: Guyed Wired Tower (weiku, 2014)
Figure 24: Monopole Tower (youtube, 2010) with hydraulic system for raising and
lowering

34
Table 3 Advantages vs. Disadvantages of each type of tower (Danish Wind Industry
Association, Wind Turbine Towers, 2003)
Type Main advantages Main disadvantages
Monopole • Good aesthetic design
• More steel is required More
expensive to manufacture and
transport
Guyed
• Low manufacturing cost
• Guy wire tension helps adjust tower
natural frequency
• lightning withstands
• Not for urban settings
• Not vandal-proof
Sectional
lattice
• Low cost to transport
• on-site assembly
• Corrosion occurs in joints to shorten
the lifetime
Tubular
lattice
• Easy to manufacture
• Long lifetime without galvanizing
• Protection for electrical cable is minor
It is common for manufacturers to offer different types of towers to suit the needs of the
buyers. For example, Hummer and Winpower offer an optional tower (shown in Figure 25 and
Figure 26) that is raised and lowered hydraulically (named as “hydraulic towers” by them
officially). These towers are freestanding and include tower bases, hydraulic cylinders, and
hydraulic pumps.
Hydraulic towers are unique to Hummer and Winpower of the turbines considered here:
there will be additional cost, so if this feature is wanted, Hummer and Winpower are the only
companies to choose. The following discussion and analysis are based on the basic model
without hydraulics.

35
Figure 25: Hydraulic support for the pole of Wind turbine (Hummer)
Figure 26: Installed Wind Turbine (Hummer)
The towers are also offered in different heights to be selected depending on power output
requirements. The towers must withstand the loads from the turbine as well as the tower self-
weight and the wind load. (Danish Wind Industry Association, Manufacturing Wind Turbine
Towers, 2003)

36
Towers are assembled from tapered subsections which are cut and rolled into shape, and
then welded together. Each subsection is small, so it is usually transported by rail or road. The
transportation cost will be discussed later.
Typical 50m towers, which can mount a turbine with a 44m rotor diameter (600 kW), weigh
40 metric tons; 60 m towers, capable of mounting a 72m rotor diameter (2000 kW), weigh 80
metric tons (Danish Wind Industry Association, Manufacturing Wind Turbine Towers,2003).
2.3 Economic Comparison of Small Wind Turbines vs. Large Wind Turbines
Detailed descriptions of small turbines and large turbines are presented in the above section.
These main criteria are considered for making economical comparisons. In the section, three
turbines from Hummer manufacturer including 10kW,50kW,100kW are compared in terms of
overall cost and cost per average power. USD is the standard currency for following calculation.
All prices are Free on board (FOB) price. Free on board (FOB) is a trade term that indicates
whether the seller or the buyer take responsibility for goods damaged during shipping. "FOB
shipping point" (or FOB) means that the buyer takes responsibility. "FOB destination" means
that the seller takes responsibility until the goods reach the buyer. (Coon J et al.,2016)
2.3.1 Cost of Components

37
The distribution of cost of apparatus for a typical 1.5 MW wind turbine is shown in
Figure 27. It gives a brief cost summary of each component and this figure is also comparable in
the following comparison.
Figure 27: Installed capital costs for the land-based 1.5MW wind reference turbine. (NREL,
2014)
The price comparison from one of the selected manufacturers for the commercial types of
turbines is shown in Table 4 below:
Table 4 Hummer 10kW, 50kW and 100kW Wind Turbine System,FOB price(USD)
(without on-grid inverter)(personal communication with Hummer Sale representative)

38
Transportation is an important part of the overall cost. Wind turbines are transported in both
20ft and 40ft containers. The overall transportation cost of a container from Shanghai to Calgary,
is 3950USD and 4600USD, respectively (data from Hummer sales). For 10kW turbines, only a
20ft Container Load is required. For 50kW turbines, one 20ft and one 40ft container are needed.
For 100kW, two 40ft units are required (data directly from Hummer).
Wind turbines are imported duty free but incur the 5% GST. So, the total landed cost,
excluding installation, is the turbine price, to which must be added transportation cost and a 5%
local sales tax.
Table 5 Landed cost comparison
Turbines 10kW 50kW 100kW
Overall
FOB cost
$14,390*105%+$39
50=19059.5USD
$64,160*105%+$3950+$
4600=75918USD
$141,085*105%+$9200=15
7339.3USD

39
Wind turbine
46%
PLC
5%
Rectifier
3%
Free standing
tower
23%
Transportation
23%
Cost of components of 10kW wind
turbine
Wind turbine
PLC
Rectifier
Free standing tower
Transportation
Figure 28: Cost of components of 10kW. Anhui Hummer Dynamo Co. Ltd (Prices in USD.)
Figure 29: Cost of components of 50kW. Anhui Hummer Dynamo Co. Ltd (USD is used as
the currency, as the followings.)

40
Figure 30: Cost of components of 100kW. Anhui Hummer Dynamo Co. Ltd (USD is used as
the currency, as the followings.)
The price of a 10kW turbine is only 46% of the total cost; transportation cost of 10kW
turbine takes 23% of the overall cost. This is much higher than that of 50kW and 100 kW. As the
capacity of the turbine increases, everything except the turbine itself contributes less to the total
cost. With increasing capacity, turbines cost more. However, when the capacity is larger than
50kW, the percentage of cost of each component does not change very much. The cost per unit
power is discussed later.
2.3.2 Cost of Installation and Maintenance
Small turbines require less installation space compared to large turbines. Cranes are not
always needed for installation of small wind turbines; for example, guyed wired towers can be
erected with a winch, and as shown before, some manufactures have hydraulic erectors to raise

41
the tower. Take Hummer’s 50kW wind turbines as an example. All data is directly from
Hummer’s agent. Local engineers and crane are also required. A professional engineer is
required for 2-4 days to particularize the foundation design to the specific site conditions, train
the local engineers and complete the installation. After the foundation is finished. If an engineer
from the Chinese manufacturer is hired, the cost will be around 200USD/day (all data comes
from the manufacturers). One flight ticket costs about 1000USD. The hotel is assumed to cost
100USD/day. All turbine installation needs a professional engineer from manufacture to work
for 2-4 days (4 is used to calculate). Besides that, other expense including crane rental , local
engineers, and other equipment cost should also be considered.
From personal communication with Hummer agent, the total installation cost for a 50kW
with 30m freestanding tower is about 7000 USD from the foundation construction to the end of
installation. A 10kW turbine costs 4000 USD to install. A 100kW turbine costs 10000 USD to
install. These costs are based on a project in US (directly from communication with Hummer
representative). The vary significantly with different locations, soil types etc. The overall cost of
each turbine is listed in Table 6.
Table 6 Overall Cost of each turbine (including installation and transportation cost)
10kW 50kW 100kW
Overall Cost (USD) 23059.5 82918 167339.3
Local wind turbine manufacturers, such as Endurance, include the installation cost in the
product cost. They are currently installing new turbines in the UK but not in the North American
42
market. The E3120-50kW model from Endurance cost totals 245000 pounds, about 391,623USD.
Even with extra installation costs, the Chinese wind turbines still have a cost advantage.
Maintenance is discussed in Chapter 2.2.1. The maintenance of 50kW wind turbines usually
takes 3-4 days and need 3 engineers. Chinese manufactures charge the labor at 200-300USD/day
as well as the flight ticket and hotel.
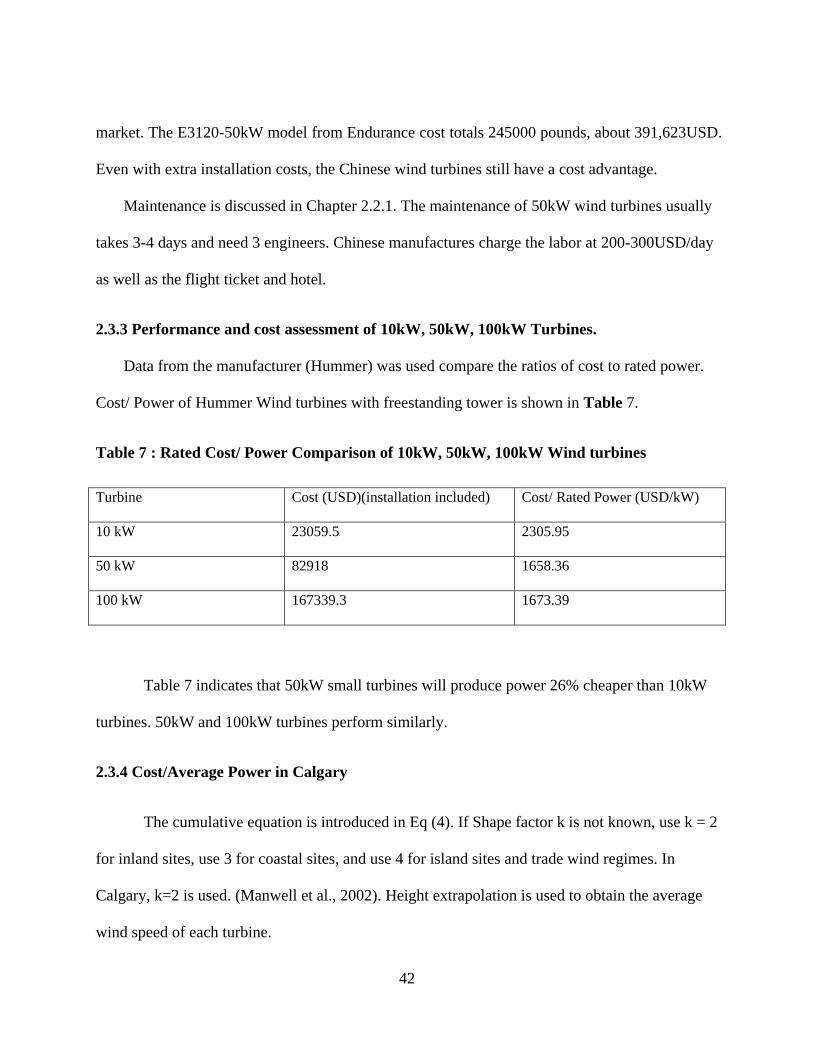
2.3.3 Performance and cost assessment of 10kW, 50kW, 100kW Turbines.
Data from the manufacturer (Hummer) was used compare the ratios of cost to rated power.
Cost/ Power of Hummer Wind turbines with freestanding tower is shown in Table 7.
Table 7 : Rated Cost/ Power Comparison of 10kW, 50kW, 100kW Wind turbines
Turbine Cost (USD)(installation included) Cost/ Rated Power (USD/kW)
10 kW 23059.5 2305.95
50 kW 82918 1658.36
100 kW 167339.3 1673.39
Table 7 indicates that 50kW small turbines will produce power 26% cheaper than 10kW
turbines. 50kW and 100kW turbines perform similarly.
2.3.4 Cost/Average Power in Calgary
The cumulative equation is introduced in Eq (4). If Shape factor k is not known, use k = 2
for inland sites, use 3 for coastal sites, and use 4 for island sites and trade wind regimes. In
Calgary, k=2 is used. (Manwell et al., 2002). Height extrapolation is used to obtain the average
wind speed of each turbine.

43
Table 8 Height Extrapolation calculation base on the average wind speed of 4.4m/s at 10m
Turbine Size 10kW 50kW 100kW
Tower Height (Standard tower type) (m) 15 18 24
New wind speed (reference:4.4m/s at 10m) 4.97 5.26 5.72
The average power is obtained by the method described in Section 1.6 combine as followings:
Table 9 Average power of 10kW turbines
10kW
wind speed(m/s) W(V)(kW) P(V) W(V)P(V)
3.00 0.40 0.17 0.07
4.00 0.90 0.17 0.15
5.00 1.80 0.15 0.26
6.00 3.00 0.11 0.34
7.00 4.30 0.08 0.34
8.00 6.20 0.05 0.30
9.00 8.00 0.03 0.22
10.00 10.00 0.01 0.14
Average power 1.82
Table 10 Average power of 50kW turbines
50kW
wind speed(m/s) W(V)(kW) P(V) W(V)P(V)
3.00 6.42 0.16 1.01

44
4.00 11.80 0.16 1.92
5.00 14.60 0.15 2.14
6.00 19.01 0.12 2.24
7.00 25.11 0.09 2.16
8.00 30.00 0.06 1.71
9.00 40.00 0.03 1.38
10.00 50.00 0.02 0.96
Average power 13.51
Table 11 Average power of 100kW turbines
100kW
wind speed(m/s) W(V)(kW) P(V) W(V)P(V)
3.00 10.80 0.14 1.50
4.00 17.60 0.16 2.86
5.00 25.20 0.15 3.69
6.00 35.20 0.12 4.15
7.00 46.80 0.09 4.02
8.00 59.60 0.06 3.39
9.00 72.50 0.03 2.50
10.00 85.50 0.02 1.65
Average power 23.76

45
Table 12: Power Output of Turbines (Manufacturer: Anhui Hummer Dynamo Co. Ltd)
(Hummer wind, 2014)
Turbine Size 10kW 50kW 100kW
Power(kW) 1.82 13.51 23.76
cost/average
power
(USD/kW)
12665.81 6136.81 7042.78
differences 2.06 1 1.15
From Table 12, both 50kW and 100kW wind turbines from Hummer have cost/ unit
power advantages over 10kW. 50kW is the best.
Table 13: Wind Turbine Specifications for Different Commercially Available Sizes
(Manufacturer: Anhui Hummer Dynamo Co. Ltd) (Hummer wind, 2014)
Parameter 10kW Turbine 50kW Turbine 100kW Turbine
Cut in Speed 3 m/s 3 m/s 3 m/s
Rotor Diameter 8m 16m 20.8m
Generator Weight 287kg 1,237kg 2196kg
Rated Wind Speed 10m/s 10m/s 11.5 m/s
Generator Efficiency >85% >92% >93%
Rotor Blade Material Glass Reinforced Plastics Glass Reinforced Plastics Glass Reinforced Plastics
From Table 13, generator efficiency is size related. The generator efficiency of 50kW is 7%
greater than that of 10kW, but the efficiency of a 50kW generator is only 1% less than that of a
100kW generator. However, generator efficiency is not the main reason for differences in

46
performance; the rotor diameter is the principle factor causing performance differences. 16m
diameter rotors enable 50kW turbines to utilize 4 times more wind energy than 10kW turbines.
Table 12 reveals that the 10kW is the most expensive turbine by unit performance, 10kW
costs 2.06 times than 50kW, 100kW costs 1.15 times than 50kW.
2.4 Conclusion
Manufacturers offer many designs for small and large turbines. Designs offering greater
structural strength is desired for large turbines. To avoid using a gearbox, small turbines use
PMG. Tail fin is a cost-effective solution to orient small turbines, but for large turbines, active
yaw systems are usually used to improve productivity. However, all selected turbines use active
yaw system to improve their performance.
Performance is always the primary concern when choosing small wind turbines, which
are designed differently compared to large turbines. Currently however, small wind turbines are
starting to employ some of the features usually found on large turbines, such as pitch adjustment.
By comparing 10kW, 50kW, 100kW turbines from one manufacturer, 50kW has the best
cost/unit power. In summary, 50kW small turbines are more cost effective than 10 kW turbines,
and closely approach the performance of 100kW turbines. Therefore, this thesis chooses 50kW
turbines from 5 Chinese manufactures for future analysis.

47
CHAPTER 3 COMPARE THE MANUFACTURES OF SMALL WIND TURBINES
3.1 Introduction and Objective of the Chapter
A market and performance comparison have been performed. Following is the list of
small wind turbine manufacturers that have been selected for this work.
⚫ Ghrepower Manufacturing Company: http://www.ghrepower.com/en/
⚫ Hummer Manufacturing Company: http://www.chinahummer.cn/
⚫ Hengfeng Manufacturing Company: http://www.hengfeng-power.com/intro.asp?id=2
⚫ Shenzhou Manufacturing Company: http://www.china-swtgs.com/en/
⚫ Winpower Manufacturing Company: http://www.chinawinpower.com/
The Chinese have been manufacturing small wind turbines (50kW) for several years, and
representatives of Asian companies have experience in foreign countries. These manufacturers
are listed and certified by Alibaba.com, which means they can export products to Canada. This
thesis ranks these manufacturers based on their turbine’s performance and cost at a
representative site in Calgary.
Wind data for Calgary have been collected from RetScreen database. Technical details of
the wind turbines are directly collected from their manufacturer’s data sheets (reproduced in
Appendix A to E). The product reviews and the details of commercial features have been
collected by interviewing the technical representatives of each manufacturer.
Customer feedback has also been taken into consideration. A letter from Iron customer
has also been taken into consideration with respect to the performance of the 50kW Winpower
Turbine (see Appendix E Winpower Data Sheets).
3.2 Technical Specifications comparison for Selected Turbine Manufacturers

48
Figure 31 Comparison Model for the Selected Manufacturers
To compare the turbines for this research, technical features, and non-technical features
for the 50kW small wind turbine are studied and analyzed in detail. The certification of the
turbines is checked and studied. This provides a sound ground for their performance and
provides confidence about their safety. The manufacturers are analyzed, to define a ranking
among them and select the best option for the considered installation.
The following aspects of products from the selected manufacturers have been compared
and analyzed. This study has been performed to specifically rank the turbine manufacturers
regarding safety concerns associated with the mechanical and electronic design of the wind
turbines.

49
Figure 32 Technical Features for Model Evaluation
Control and Protection Method: Turbines are controlled either manually or automatically. As
discussed in 2.2.4, the turbines must be controlled to deliver maximum efficiency.
All selected turbines are equipped with PLC. As discussed in 2.2.3, PLC protect the turbine
by controlling yaw shaft to deflect.
“Yaw brake” is also a protection method, but it does not affect the blades directly. The yaw
brake is a passive friction brake (see Figure 20)(Park et al.,2011). This system is also used to
park turbines for maintenance.
Cut-out speed is the speed at which the turbine blades are brought to stop to avoid damage.
When cut-out speed is reached, protection mode is activated.
For example, there are three protection modes for Hummer’s turbine: over wind speed, over
generator temperature, over RPM of generator. When RPM reaches the limit(180RPM), the rotor
is yawed out from the wind by 30 degrees. If the RPM is still higher than that, the yaw shaft will
deflect another 60 degrees from wind and then the turbine stops rotating. It is working similar for
other alarms. All these are controlled by the PLC control module and do not need any operation

50
of human. These include two sets of hydraulic speed limit brakes on the main shaft and high-
speed shaft.
Accuracy of Measurement of Power Curve: Power curves are provided by the manufacturers
and are often determined by a third-party independent test.
Figure 33 Output Power Curves of Selected Chinese Wind Turbines Manufactures
To determine the power curves and make sure the specification is accurate, each
manufacturer should test the turbine before mass production. All power curves in Figure 33 are
directly from manufacturers and determined by third party. Ghrepower tested their 50kW
turbines in Scotland for over 1 year and certified by Intertek. Hummer tested their turbines for 1
year in Inner Mongolia wind farm and record the data themselves. Hengfeng, Shenzhou test their
turbine in Winpower tested their turbines in their factory for over 1 year.
The problem is only Ghrepower has certified power curve. Other four manufactures draw
the power curves themselves. They only guarantee the accuracy of power curves on paper.

51
Here is a case. During 2007-2008, a project called Encraft Warwick Wind Trials Project
tested turbines from five manufacturers across the UK (Encraft,2009). The results show that the
uncertified power curve data some manufactures provided is not accurate. Significant differences
could happen (see Figure 34). Buyers should beware.
Figure 34 Measured data VS. manufacturer supplied data in Encraft Warwick Wind Trials
Project (Encraft,2009)
The comparison of the technical features of wind turbines is given in Table 14.

52
Table 14 Comparison Table for the Assessment of Technical Features of Manufactures
Technical
Feature
Ghrepower Hummer Hengfeng Shenzhou Windpower
Control
System
Controller &
Inverter
(Supervisory
Control and
Data
Acquisition -
SCADA
optional)
Siemens
Programmable
Logic
Controller with
Touch screen
Siemens,Delta
Programmable Logic
Controller Control
System
Mitsubishi
Programmable
Logic
Controller
Intelligent
Control
Yaw
System
Electrical yaw
system
Pitch
adjustment
Electrical Yaw
control system
Pitch adjustment
Electrical Yaw control
system
Electrical Yaw
control system
Electrical Yaw
control system
Cut – Out
speed
Protection
Methods
Hydraulic
braking,
Hydraulic
Braking,
Hydraulic braking
system,
Hydraulic
braking,
Hydraulic
braking,
Blade
Material
Fiber
Reinforced
Plastics
Fiber Reinforced
Plastics
Fiber Reinforced
Plastics
Fiber
Reinforced
Plastics
Fiber
Reinforced
Plastics
Rated
Wind
Speed
9m/s 11.5 m/s 10m/s 12m/s 12m/s
Tower
Height (m)
36 18 18 18 20
Blade
diameter
(m)
21.5 16.5 15 16 16
Wind
speed (m/s)
(4.4m/s at
10m)
6.46
5.25
5.25
5.25
5.42
Maximum
CP
0.43 0.42 0.48 0.42 0.42
FOB Price
(USD)
215140 87,380 62939(394000RMB) 57507(360000
RMB)
64,780.00
From Table 14, the Ghrepower FD21-50kW has significant advantages over other turbines,
including higher tower height, longer blade diameter. higher tower helps turbine to capture faster

53
wind flow. Hengfeng turbines promised the highest Cp. Winpower turbines have slightly higher
tower height compared to Hummer, Shenzhou, and Hengfeng.
3.3 Non-technical features
Figure 35 Commercial Features for Model Evaluation
The following commercial features are assessed to rank the selected manufacturers:
1. Certificates and Standards: Certificates and Standards are issued by third parties to ensure
the products meet specific quality requirements or assurance.
2. Manufacturer’s Warranty and Maintenance Contract: Warranties of various lengths are
offered to guarantee results claimed. Maintenance Contract is defined either by the parent
company or the local vendor for maintenance of wind turbines and accessories.
3. Market Price: It’s the manufacturer’s price for a complete turbine system. Prices stated by
the manufacturers are always FOB. The transportation costs for the selected turbines are
similar. Each of their installation cost is almost identical.

54
4. Customer Service: For international business, communications are important. Every
customer support team of selected manufactures is different. Responding time and quality of
answer are the two criteria used to evaluate the customer service.
3.3.1 Wind Turbine Certificates and Standards Overview -
For the buyers to evaluate the safety issues, it is the best to check the certification of the
turbines.
The IEC 61400 Series are the most common wind turbine standards and include IEC
61400-1, IEC 61400-2, IEC 61400-11, IEC 61400-21, etc. IEC 61400-2 defines the design
requirements for small wind turbines. (American National Standards Institute,2016). IEC 61400
is also basis for Canadian CAN/CSA C61400-2 and other nationalized versions of the SWT
standard
IEC Safety Standards
The International Electrotechnical Commission (IEC) 61400 is an International Standard
and has defined specific safety standards for wind turbines. This commission has standardized
design requirements, performance measurements, power performance evaluations, mechanical
load, simulation models and many other concerns for the safe installation and workings of wind
turbines (Institution, B. S..2014).
IEC 61400-2 addresses the safety of small wind turbines. It permits the examination of
turbine safety through the “Simple Load Model” (SLM) which provide simple and approximate
equations enable SLM to test for the main turbine loads such as the root bending moment of the
blade, the turbine shaft load, and the turbine and wind force on the tower (Institution, B. S..2014).

55
In Canada, IEC61400-2 is adopted by CSA, “CAN/CSA-C61400-2 Wind turbines — Part
2: Design requirements for small wind turbines” is the same as IEC61400-2.
UL (Underwriters Laboratories)
UL is a global independent safety science company. UL has certified small wind turbines
under the product category Small Wind Turbine Generating Systems (ZGEN), located on page
466 in the 2012 UL White Book. (UL,2012)
This category covers small wind turbine generating systems (WTGS) investigated for risk
of fire and shock, including safety-related control system electrical performance and utility (grid)
interconnection performance for Utility Interactive models. (UL,2012).
Hummer and Ghrepower uses POWERONE inverter which was certified by UL.
ISO 9001: 2008
ISO 9001: 2008 is an international standard related to quality management system and it is
based on eight quality management principles (all fundamental to good business practice). All
requirements of ISO 9001:2008 are generic and are intended to be applicable to all organizations,
regardless of type, size and product provided.
For wind turbine, the process usually takes about 1 year and it includes the implementation
of a formal quality management system, robust employee training on formal operating
procedures, and implementation of measurement systems related to quality. Many third part
offers this certification. Most selected turbines are certified by IQnet and CQM.Ghrepower
turbines are certified by Sira.Hengfeng turbines are certified by Beijing Zhongliantianrun
Certification center.
CE Certificates

56
‘CE’ stands for ‘Conformité Européenne’. CE is a certification mark required for many
products sold in Europe. This mark ensures that the products are certified and meet standards of
EU (European Union) safety, health, and environmental protection, before being placed on the
market. CE is not required for products in North American markets, however, in this case, all
manufacturers already have these certificates since they have done business in Europe for many
years (Ec Europa, 2014).
Table 15 Organizations issued CE
Ghrepower Hummer Hengfeng Shenzhou Winpower
Organizations European
Ceprom
China
CEPREI
APRAGAZ,Belgium/Italian
Ente Certificazione
Macchine Srl
SGS LNMC
ROHs (Restriction of Hazardous Substances)
ROHs is a standard in the European Union. It restricts the use of hazardous substances in
electrical and electronic equipment, and it promotes the collection and recycling of such
equipment (Marrapese et al.,2016). Only Hengfeng has ROHs certification.
Intertek
Intertek offers a wide array of certification and performance testing services for all types of
power conversion equipment used in power generation, including traditional standby generators
with integrated inverters, PV inverters, energy storage systems, as well as wind turbine and fuel
cell inverters. Ghrepower’s inverter and power curve have been certified by Intertek.
(Intertek,2018)
Medium Wind Turbine Certification (MWT)

57
Medium Wind Turbine Certification (MWT) is issued by small turbine certification council.
Unlike other certifications, this certificate represents that the turbine has been evaluated by small
wind certification council (SWCC) concerning Acoustic testing. Only Ghrepower turbines are
certificated by MWT.
Table 16 Certificates comparison
Ghrepower Hengfeng Hummer Shenzhou Winpower
Certificates European CE,
ISO9001:2008.
Medium Wind
Turbine Certification
(MWT)
Intertek (UL)
European CE.
ROHs,
ISO9001:2008.
European CE,
USA UL,
ISO9001:2008
European CE,
ISO9001:2008
European CE,
ISO9001:2008
3.3.2 Assessment of warranty and maintenance contracts
This section is based on data collected from all manufacturers. All data are the latest from
the representatives of each manufacturer.
Ghrepower 50kW Wind Turbine
All components of the system come with a five-year limited warranty. Ghrepower offers
five-year maintenance contracts, but buyers have to pay for travel expenses.
Hummer 50kW Wind Turbine

58
Hummer offers a two-year guarantee for the turbine generator and a 1-year guarantee for the
other components of the turbine. As discussed in Chapter 2.3, the vendor offers free maintenance
for the product, but buyers must pay all travelling expenses.
Hengfeng 50kW Wind Turbine
Hengfeng offers a warranty of 1 year for the whole wind turbine. They claim a product life
span of 20 to 25 years.
Shenzhou 50kW Wind Turbine
Shenzhou claims its 50kW Wind Turbine has an operating life of 15 to 20 years and they
offer a 3-year warranty for the whole turbine.
WinPower 50kW Wind Turbine
Winpower also claims a service-life of 15 – 20 years for their 50kW small turbine but offers
only a 1-year warranty for the whole turbine.
A summary is shown in Figure 17.
Table 17 warranty comparison
Technical Feature Ghrepower Hummer Hengfeng Shenzhou Windpower
Manufacturer’s
Warranty
5-year 2-year Generator
and 1-year other
parts
1-year 3 years 1 year
Maintenance Contract 5-year Free
Maintenance
No Warranty No Warranty No Warranty

59
From Table 17, Ghrepower offers the longest warranty. Regarding with maintenance, only
Ghrepower and Hummer offer maintenance. Hummer offers lifelong free maintenance. Since
none of the companies have engineers in Canada, buyers must pay for travel expenses.
3.3.3 Credibility Evaluations of the Manufacturers
Safety and credibility are critical concerns for customers. Safety evaluation is based on the
certificates companies have and credibility is based on the experience and history of the
manufacturers.
Table 18 Credibility Assessment on Ghrepower
Credibility Assessment on GHREPOWER(Source: Ghrepower, 2013b)
Experience and history Registered capital: 68000000¥
The company began in 2006. Its workshop covers more than 20000 square meters, and it annual
production of wind turbines is over 10MW.
To date, the company has produced and sold more than 15,000 units, from 300 watts to 50kW, in
China, the UK, France, Canada, Korea and African countries. Applications include on-grid/off-grid
power systems, which offer utility connections, battery back-up in homes, water pumping, water
heating and a variety of other uses.
The company employs over 40 engineers for the research and design processes. It owns over 30
technical patents on wind turbine parts.
Products 300W-50kW small wind turbines

60
Table 19 Credibility Assessment on Hengfeng HF15.0-50kW
Credibility Assessment HF15.0-50kW
Experience and History Registered capital: 10000000¥
8 years as an Alibaba “trusted company.”
Total number of turbines produced to date: 1689
Company started in 2004.
Workshop covers more than 5000 square meters.
7 years’ experience in small turbine field.
Export to more than 43 countries for example, Europe, Middle East, Southeast Asia, Australia etc.
Products 15kW to 200kW wind turbines and solar panels (rated power from 2-280w)
Table 20 Credibility Assessment of the Anhui Hummer Dynamo Company (Anhui
Hummer Dynamo Co., Ltd., 2015)
Credibility Assessment of the Anhui Hummer Dynamo Company (Source: Anhui Hummer, 2013)
Experience Registered capital: 11000000¥
Company began 1993
Its workshop covers about 10000 square meters.
The wind power department was founded in 1998 and mass production of 50kW turbines
started in 2010.
The company has about 200 employees.
Over 200 50kW turbines have been installed since 2010. Hummer products have been
exported to 112 countries and areas, since 2005.
Product Range 400W to 100kW wind turbines. Wind-solar power systems

61
Table 21 Credibility Assessment on the Yangzhou (Shenzhou)Company
Credibility Assessment on the Yangzhou (Shenzhou)company (Source Yangzhou, 2013)
Experience Registered capital: 11000000¥
The company entered the field of wind and solar energy in 1996
Workshop covers about 35000 square meters.
In addition to small and medium wind turbines, Yangzhou also manufactures wind-solar hybrid
street lighting systems, wind/solar hybrid home power systems, wind-diesel hybrid systems, etc.
Product Range 300W to kW50kW wind turbines. Solar systems (panel 50-250w, inverter)
Table 22 Credibility Assessment on the WinPower Group Co
Credibility Assessment on the WinPower Group Co (Source: Winpower, 2013)
Experience Registered capital: 120000000¥
The company, established in 2003, specializes in the R&D, manufacture and application
of small and medium size wind turbine generators. It is also a provider of wind-solar
hybrid power supply systems. The workshop covers about 5000 square meters.
Winpower exports products to Germany, Italy, France, Hungary, Poland, Finland, USA
and Brazil. Iran, which imported Winpower products, offers positive feedback and data.
Products 300kW-50kW horizontal and vertical wind turbines
50W-300W Solar modules.
Indoor LED series. Controller & inverter
Credibility assessments are often biased if based on information only from the
manufacturers. Therefore, certification is the most reliable assessment. Ghrepower has the largest
registered capital, 68000000¥, which seems more reliable.
3.3.4 Customer service
It is important to have a responsive and effective customer service.

62
Hummer probably has the best customer service among the five. They provided lots of
useful information and fast responses (usually within 2hrs via email). They also send update
emails regularly. The most important thing is their representatives are professionals, they can
answer questions immediately. For example, I asked how their protection system works, the
representative replied me with 3 protection modes including over speed protection, over
generator temperature protection, over RPM protection and she explained them in details. Only
the representative in Hummers can answer such questions fast and detailed.
Ghrepower provides good customer service as well, but their representatives are not
professionals. Normally, the technical questions will be given to manager or other technicians,
and this takes a day or more. The information they give is accurate and professional. For
example, I sent them a questions sheet about control method and certifications, and the
representative said he must pass this to a technician. I waited several days for the answers.
Winpower provides good customer service. They respond fast and provide accurate and
sufficient information. They answer questions professionally and detailed. The response time is
usually less than a day which is acceptable.
Hengfeng provides average customer service. They provide accurate and professional
answers, but it is very hard to reach the technicians. Their technicians are always busy. Once a
technical question is submitted, it usually takes more than 1 day to receive the answers.
Shenzhou provides less than average customer service. They refused to provide some technical
details before offer is made. They usually answer technical questions within 1 day. The answer

63
quality is less than average. They barely provide very detailed information; however, they prefer
to explain them in a few sentences.
Table 23 Customer Service of each manufacture
Manufactures Hummer Ghrepower Winpower Hengfeng Shenzhou
Customer
Service
Best Good Good Average Below Average

64
CHAPTER 4 PERFORMANCE ANALYSIS AND RESULTS
4.1 Average power calculation
To finalize the selection for a site in Calgary, the average power output is calculated to
evaluate the performance. As discussed in Chapter 1.6, average power is calculated by
combining the power curve and PDF.
The five selected manufacturers of 50kW wind turbines were subjected to the same
statistical analyses to compare unit power (kW/s).
4.1.1 Description of Weibull Input Parameters
Wind Speed and Solar radiation data:
The wind speed data is directly from Retscreen database.
Figure 36 Average Wind Data and solar radiation for Calgary Canada from Retscreen
database
From Figure 36,The average wind speed in Calgary is 4.4m/s at height of 10m.
4.1.2 Average Power Output for Calgary
Input parameters:
Average Wind Speed = 4.4m/s at 10m

65
Shape factor k = 2
Table 24 Weibull Power Output Estimation for Calgary
Wind Speed(m/s) Weibull Probability density function
0.000 0.000
1.000 0.098
2.000 0.168
3.000 0.195
4.000 0.181
5.000 0.142
6.000 0.097
7.000 0.058
8.000 0.030
9.000 0.014
10.000 0.006
11.000 0.002
12.000 0.001
13.000 0.000
14.000 0.000
15.000 0.000 0.991
Figure 37 Weibull Power Output Estimation for Calgary
4.1.3 Wind Speed Probability and Average Power Output for All Manufacturers
The five turbines are analyzed based on standard conditions at the height of the various
towers.
4.1.3.1 Statistical Analysis and Performance Calculations for Ghrepower

66
Weibull statistical analysis and performance calculations for the Ghrepower 50 kW
turbines are presented below. These calculations are based on a tower height of 36m.
Table 25 Weibull Statistical Analysis for Ghrepower
Ghrepower
H/H0 3.600
reference height(m) 10.000
New wind speed(m/s) at 36m 6.462
Wind Speed(m/s) Power(kW) Weibull Probability density function Average Power(kW)
0.000 0.000 0.000
1.000 0.047 0.000
2.000 0.087 0.000
3.000 1.150 0.116 0.133
4.000 2.740 0.131 0.358
5.000 5.350 0.132 0.704
6.000 9.260 0.121 1.124
7.000 14.700 0.104 1.524
8.000 21.950 0.083 1.816
9.000 31.250 0.062 1.936
10.000 42.870 0.044 1.872
11.000 51.000 0.029 1.482
12.000 52.000 0.018 0.950
13.000 51.000 0.011 0.555
14.000 50.000 0.006 0.307
15.000 50.000 0.003 0.164
Total 0.993 12.925
Figure 38 Ghrepower: Power (kW) Vs. Average Wind Speed (m/s)

67
Figure 39 Ghrepower: Average Power(kW)Vs. Average Wind Speed (m/s)
4.1.3.2 Statistical Analysis and Performance Calculations for Hummer
Weibull statistical analysis and performance calculations for Hummer 50 kW turbines are
presented below. These calculations are based on a tower height of 18m.
Table 26 Weibull Statistical Analysis for Hummer
Hummer
H/H0 1.800
reference height(m) 10.000
New wind speed(m/s) at 36m 5.248
Wind Speed(m/s) Power(kW) Weibull Probability density function Average Power(kW)
0.000 0.000 0.000
1.000 0.070 0.000
2.000 0.126 0.000
3.000 6.421 0.157 1.009
4.000 11.804 0.162 1.918
5.000 14.600 0.146 2.139
6.000 19.007 0.118 2.241
7.000 25.114 0.086 2.155
8.000 30.000 0.057 1.707
9.000 40.000 0.035 1.381
10.000 50.000 0.019 0.962
11.000 50.000 0.010 0.494
12.000 50.000 0.005 0.234
13.000 50.000 0.002 0.102
14.000 50.000 0.001 0.041

68
15.000 50.000 0.000 0.015
Total 0.994 14.398
Figure 40 Hummer: Power Curve
Figure 41 Hummer: Average Power (kW) Vs. Wind Speed (m/s)
4.1.3.3 Statistical Analysis and Performance Calculations for Hengfeng
Weibull statistical analysis and performance calculations for the Hengfeng 50 kW turbine
is presented in Table 25. These calculations are based on a tower height of 18 m.

69
Table 27 Weibull Statistical Analysis for Hengfeng
Hengfeng
H/H0 1.800
reference height(m) 10.000
New wind speed(m/s) at 36m 5.248
Wind Speed(m/s) Power(kW) Weibull Probability density function Average Power(kW)
0.000 0.000 0.000 0.000
1.000 0.000 0.070 0.000
2.000 0.000 0.126 0.000
3.000 2.600 0.157 0.408
4.000 3.800 0.162 0.617
5.000 7.700 0.146 1.128
6.000 15.500 0.118 1.828
7.000 24.000 0.086 2.059
8.000 33.000 0.057 1.877
9.000 42.000 0.035 1.450
10.000 50.000 0.019 0.962
11.000 57.000 0.010 0.563
12.000 60.000 0.005 0.281
13.000 55.000 0.002 0.112
14.000 52.000 0.001 0.043
15.000 50.000 0.000 0.015
Total 0.994 11.345
Figure 42 Hengfeng Power Curve

70
Figure 43 Hengfeng: Average Power (kW) Vs. Wind Speed (m/s)
4.1.3.4 Statistical Analysis and Performance Calculations for Shenzhou
Weibull statistical analysis and performance calculations for Shenzhou 50 kW turbines are
presented below. These calculations are based on a tower height of 18 m.
Table 28 Weibull Statistical Analysis for Shenzhou
Shenzhou
H/H0 1.800
reference height(m) 10.000
New wind speed(m/s) at 36m 5.248
Wind Speed(m/s) Power(kW) Weibull Probability density function Average Power(kW)
0.000 0.000 0.000 0.000
1.000 0.000 0.070 0.000
2.000 0.000 0.126 0.000
3.000 2.000 0.157 0.314
4.000 5.000 0.162 0.812
5.000 9.000 0.146 1.318
6.000 12.500 0.118 1.474
7.000 19.800 0.086 1.699
8.000 28.000 0.057 1.593
9.000 35.000 0.035 1.208
10.000 42.000 0.019 0.808
11.000 48.000 0.010 0.474
12.000 51.000 0.005 0.238
13.000 51.000 0.002 0.104
14.000 51.000 0.001 0.042

71
15.000 51.000 0.000 0.016
Total 0.994 10.102
Figure 44 Shenzhou: Power Curve
Figure 45 Shenzhou: Average Power(kW)Vs. Wind Speed (m/s)
4.1.3.5 Statistical Analysis and Performance Calculations for WinPower
Weibull statistical analysis and performance Calculations for the Winpower 50 kW
turbines are presented below. These calculations are based on a tower height of 20 m.

72
Table 29 Weibull Statistical Analysis for Winpower
Winpower
H/H0 2.000
reference height(m) 10.000
New wind speed(m/s) at 36m 5.417
Wind Speed(m/s) Power(kW) Weibull Probability density function Average Power(kW)
0.000 0.000 0.000
1.000 0.066 0.000
2.000 0.119 0.000
3.000 1.014 0.150 0.153
4.000 2.404 0.158 0.380
5.000 4.696 0.145 0.683
6.000 8.114 0.120 0.973
7.000 12.885 0.090 1.157
8.000 19.234 0.062 1.184
9.000 27.385 0.039 1.063
10.000 37.066 0.023 0.837
11.000 44.000 0.012 0.534
12.000 48.000 0.006 0.290
13.000 49.900 0.003 0.139
14.000 51.273 0.001 0.061
15.000 52.003 0.000 0.025
Total 0.994 7.479
Figure 46 Winpower: Power Curve

73
Figure 47 Winpower: Average Power (kW) Vs. Wind Speed (m/s)
4.1.3.6 Summary
Table 30 the power output of five turbines (w)
Wind
Speed(m/s)
Ghrepower
Power(kW)
Hummer
Power(kW)
Hengfeng
Power(kW)
Shenzhou
Power(kW)
Winpower
Power(kW)
0.000 0.000 0.000 0.000 0.000 0.000
1.000 0.000 0.000 0.000 0.000 0.000
2.000 0.000 0.000 0.000 0.000 0.000
3.000 1.150 6.421 2.600 2.000 1.014
4.000 2.740 11.804 3.800 5.000 2.404
5.000 5.350 14.600 7.700 9.000 4.696
6.000 9.260 19.007 15.500 12.500 8.114
7.000 14.700 25.114 24.000 19.800 12.885
8.000 21.950 30.000 33.000 28.000 19.234
9.000 31.250 40.000 42.000 35.000 27.385
10.000 42.870 50.000 50.000 42.000 37.066
11.000 51.000 50.000 57.000 48.000 44.000
12.000 52.000 50.000 60.000 51.000 48.000
13.000 51.000 50.000 55.000 51.000 49.900
14.000 50.000 50.000 52.000 51.000 51.273
15.000 50.000 50.000 50.000 51.000 52.003

74
Figure 48 the power curves of five turbines
Table 31 Summary of cost and average power output (kW)
Hengfeng Shenzhou Hummer Winpower Ghrepower
FOB Price (USD) 62939.00 57507.00 87380.00 64780.00 215140.00
Transportation Cost 9200.00 9200.00 9200.00 9200.00 9200.00
Average Power Output(kW) 11.34 10.10 14.39 7.47 12.92
Average Unit price (USD/kW) 6358.54 6603.08 6707.75 9891.36 17357.62
Unit price Differential 0.000 0.04 0.01 0.47 0.75

75
Figure 49 Cost per Average Power Output (USD/kW)
From Figure 48, Hummer performs best at wind speed from 3 to 7 m/s. Hengfeng performs
best at from 10m/s to 15m/s. Ghrepower,Shenzhou,and Winpower perform similarly.
In Calgary, from Table 31, Hummer wind turbine has the best power output in the average
wind conditions of Calgary. The average unit power price is slightly higher than
Hengfeng(+9.3%) and Shenzhou(+6.7%), but much lower than Ghrepower(-63.5%) and
winpower(-29.9%).
Hengfeng and Shenzhou performs similarly. Their performance ranks in middle, but due to
the lower cost, their average unit prices are lowest.
Winpower performs worst, and this is unexpected. Winpower turbines have second tallest
tower which give them wind speed advantage. Its average power output (7.48kW) is not
competitive and only half that of Hummer (14.40kW). Due to its low performance, the average
unit power price is much higher than Hummer, Hengfeng and Shenzhou.
Ghrepower turbines are disappointing in this regard. They sell at almost triple the price of
the other turbines. They have much higher towers and longer blades. They are even rated at

76
60kW in China, but the performance is worse than Hummer. The average unit power price
(17357.62USD/kW) is much higher than others.
In summary,Hummer,Shenzhou,Hengfeng are good choices based on the average unit power
price. Ghrepower has second best performance, but worst average unit price, because the price is
almost tripled than other turbines. Winpower has the worst performance as well as the average
unit price.
4.2 Payback Calculations for all Turbine Manufactures
To evaluate the economic performance of the turbines, the time it takes for investors to
recover their costs is calculated.
The calculations include data obtained from a personal communication with an Enmax
manager about projected electricity costs over the next 20 years. Existing Wires Cost is the cost
of grid use when turbines are connected on grids.
Simple formulas:
𝑆𝑒𝑙𝑒𝑐𝑡𝑟𝑖𝑐𝑖𝑡𝑦 = ℎ ∗ 𝑃 ∗ 𝐶𝑒𝑙𝑒𝑐𝑡𝑟𝑖𝑐𝑖𝑡𝑦
𝑆𝑤𝑖𝑟𝑒𝑠 = ℎ ∗ 𝑃 ∗ 𝐶𝑤𝑖𝑟𝑒𝑠
where = Electricity savings
= Wires savings
=Total savings

77
=Electricity price (Forward curve)
=Cost of grid use (Existing Wires Cost)
=operation hours
=Average Power of each turbine
Internal Rate of Return (IRR) is important in payback calculation. It is defined as “the
rate at which the project breaks even”. (Berman,K et al.,2013) In this section, the initial FOB
cost of each turbine and the annual electricity savings are used to calculate the IRR.
It is assumed that the lifetime of these turbines is 20 years. The IRR calculation is based on
the period from 2015 to 2034. To minimize the bias, 5.8% inflation is assumed base on the
variation of predicted electric prices from 2015 to 2034.The results are listed in Appendix G
Payback Calculations
Table 32 Summary of IRR
Ghrepower Hummer Hengfeng Shenzhou Winpower
IRR(on grid) 0.273% 10.811% 11.997% 11.651% 6.589%
The IRRs of Hengfeng and Shenzhou rank the best overall, and Hummer’s IRR is slightly
behind. All these three turbines are worth to invest with IRRs over 10%. Ghrepower’s high
capital investment make the turbine hard to pay even.

78
Table 33 Summary for Cumulated Savings for All Manufacturers, Over the Period of 20
years (2015-2034)
Ghrepower Hummer Hengfeng Shenzhou WinPower
Total saving(USD) 222096 247419 206455 183839 136104
How many years to pay even 20 9 9 9 13
Hummer,Hengfeng and Shenzhou buyers are expected to get their money back within 9 year;
Ghrepower buyers are going to be the last to recover their investments.
4.3 Analysis for PV Technologies in Calgary
Trina Solar TSM-PA05.082-250W is selected to compare to five turbines. (see Appendix F
Trina Solar Data Sheets) Trina is a Chinese manufacture that has expanded into Ontario,Canada
since 2012.200 units are used to have a peak power of 50kW.
Cost per unit average power
From Figure 36, the average solar radiation in Calgary is 3.78kWh/m2/d. From Appendix F,
annual power production is 64972kWh, then the average power is 7.41kW. The total initial cost
is 55738 USD. The average unit price is 7522USD/kW.
Table 34 Cost per unit average power
Hengfeng Shenzhou Hummer PV Winpower Ghrepower
Average Unit price (USD/kW) 6358.54 6603.09 6707.75 7521.99 9891.36 17357.62

79
Table 35 Payback calculation
Photovoltaic Hengfeng Hummer Shenzhou Winpower Ghrepower
payback years 11.7 9.5 10.2 9.7 13.2 >project
It takes approximately 11.7 years for Trina solar to break even which is longer than
Hengfeng, Hummer, Shenzhou. From economic perspective, Trina solar TSM-PA05.082-250W
is competitive with 50kW wind turbines based on rate of returns.
Space used is another concern. It takes 1.56 m2 for individual PV module, the total area is
518.2 m2. For comparison, Hummer 50kW wind turbines, the free tower base will only use 144
m2. (see Appendix B Hummer Data Sheets). If space is limited, 50kW wind turbines are better
choices.

80
CHAPTER 5 CONCLUSION
The aim of this thesis was to select a small wind turbine for Calgary, where “small” was
defined as power rated less than 100 kW. Many areas of Calgary are ideal to use these small
turbines to generate electricity, for example, in Calgary, an unused space is required between a
road and a landfill.
Chinese turbines are cheaper than local turbines, such as Endurance E3120-50kW model.
When comparing with 10kW, 100kW turbines, it is shown that 50kW turbines generally have the
lowest cost/unit power. This project evaluated the cost-effectiveness of 50 kW wind turbines
made in China for use within the City of Calgary. The turbine and manufacture information were
found from Alibaba as this is considered the best online platform for Chinese turbine purchase.
Most data were retrieved from the follow-up direct contact with all manufacturers. PV is a
popular renewable energy technology. In comparison to PV, small scale wind is considered
expensive and unreliable. However, many Chinese manufactures are selling similar capacity
turbines at competitive price so far. Therefore, a significant part of this thesis was to evaluate the
power curved, reliability and warranties provided by wind turbine manufactures.
From specifications data sheet provided by manufacturers, Ghrepower has significant
advantages over other turbines, resulting from higher tower height, longer blade diameter. In
addition, the company has the largest registered capital of all those considered, which adds
attributes when dealing with future maintenance and related issues. All the chosen turbines have
both European Conformité Européenne and ISO9001:2008 certifications. Besides that,
Ghrepower has Intertek (UL) certification. For warranty, Ghrepower offers the longest 5-year
warranty and 5-year maintenance and Hummer offers life-long free maintenance.

81
It should have noted that all manufactures provided power curves, but only the Ghrepower
power curve has been certified by Intertek.
By using Weibull statistical analysis, it is shown that Hummer has an average power output
of 14.4 kW which is the best among the five.
The overall cost includes turbine cost, transportation cost, installation cost and foundation
cost. A standard height extrapolation is used to calculate the wind speed at tower height for each
turbine. From Table 34, Hummer, Shenzhou, and Hengfeng turbines have similar average unit
power price at from 6000 to 7000 USD/average kW of power output, and Hengfeng costs the
least at 6358 USD/kW. In Chapter 4.3 it is shown that typical PV costs are 7522 USD/kW which
is higher than Hummer, Shenzhou, and Heng Feng, but lower than Winpower and Ghrepower.
Ghrepower costs the most at 17357 USD/kW.
The average unit price of PV is 7522 USD/kW which ranks in middle among the turbines.
The payback of PV (11.7 years) is slightly longer than Hengfeng (9.5), Hummer (10.2),
Shenzhou (9.7), but shorter than Winpwer (13.2). Comparing with PV, turbines use much less
land space to generate renewable energy. In this case, Hummer 50kW wind turbines used 4 times
more space than 200 Trina solar TSM-PA05.082-250W (50kW total) modules.
Hengfeng, Hummer, Shenzhou turbines are better choices in terms of average unit power
price (USD/kW) and payback time. However, Shenzhou’s customer service refused to provide
all the certificates they claim their turbines have been certified to, and detailed information
before offer made. Hummer has provided the most detailed certificates information. In summary,
Hummer is the first choice.

82
References
Abed, K., & El-Mallah, A. (1997). Capacity factor of wind turbines. Energy, 22(5), 487--491.
Ahmed, M. (2012). Blade sections for wind turbine and tidal current turbine applications-current
status and future challenges. International Journal of Energy Research, 36(7), pp.829-844.
American National Standards Institute. (2016) Wind Turbine Standards. Retrieved on:
https://webstore.ansi.org/energy/wind-turbine/
Anhui Hummer Dynamo Co., Ltd. (2015).Hummer introduction, retrieved from:
http://www.chinahummer.cn/index.php/index/list_m/s_id/1001
Berman, K., Knight, J., & Case, J. (2013). Financial intelligence, revised edition.
C Bracken Meyers,(2013) Types of Wind Turbines, retrieved 09 December 2013, from:
http://centurionenergy.net/types-of-wind-turbines
Canadian Wind Energy Association. (2013). WindVision 2025 - A Strategy for ALBERTA.
Retrieved 21 September 2014, from http://canwea.ca/pdf/canwea-alberta-windvision-FINAL.pdf
Carbon Trust. (2008). Small-scale wind energy: policy insights and practical guidance. Carbon
Trust, London, UK.
Chung, D., Davidson, C., Fu, R., Ardani, K., & Margolis, R. (2015). U.s. photovoltaic prices and
cost breakdowns: q1 2015 benchmarks for residential, commercial, and utility-scale systems.
City of Calgary, (2018), Landfill and Waste Management Facilities Setbacks, retrieved from:
http://www.calgary.ca/PDA/pd/Pages/Landfill-Setbacks.aspx
Conservation Services Group, Inc. (2014). Types of Clean Energy and Renewable Energy
Technologies. Retrieved 21 September 2014, from http://www.csgrp.com/homeowners-
renters/home-energy-efficiency-tips-energy-info/renewable-energy/
Coon, J., & Stewart, H. (2016). Investopedia. Utah Business.

83
CSA Group, (2016),Wind Power Generating Systems , retrieved from:
http://www.csagroup.org/industries/energy-and-resources/renewable-energy/wind-power/
Danish Wind Industry Association, Manufacturing Wind Turbine Towers,Sep 19,2003,retrived
from: http://drømstørre.dk/wp-
content/wind/miller/windpower%20web/en/tour/manu/towerm.htm
Danish Wind Industry Association, Testing Wind Turbine Rotor Blades, Sep 19,2003,retrived
from: http://drømstørre.dk/wp-
content/wind/miller/windpower%20web/en/tour/manu/bladtest.htm
Danish Wind Industry Association, Wind Turbine Towers, Sep 19,2003,retrived from:
http://drømstørre.dk/wp-content/wind/miller/windpower%20web/en/tour/wtrb/tower.htm
Ec Europa, (2014). CE marking - Basics and FAQs - European Commission.Available at:
http://ec.europa.eu/enterprise/policies/single-market-goods/cemarking/about-ce-
marking/index_en.htm
Encraft, (2009). The Warwick Wind Trials report. Available at:
http://www.microwindturbine.be/Rapportering_files/Warwick+Wind+Trials+Final+Report+%28
1%29.pdf
Endurance Windpower, (2014). 50kW Wind Turbine - Endurance E-3120. Available at:
http://www.endurancewindpower.com/e3120.html.
Endurance Windpower, (2014). Endurance Windpower | X-29 225kW Wind Turbine. Available
at: http://www.endurancewindpower.com/x29.html
GEPVp-200 Panel. (2014). GEPVp-200 200W 18V Solar Panel. Altestore. Retrieved 31 August
2014, from http://www.altestore.com/store/Solar-Panels/150-Watts-Up-Solar-Panels/GEPVp-
200-200W-18V-Solar-Panel/p3843/

84
Ghrepower, (2016). Maintenance Manual of FD16 Series WTGS
Ghrepower. (2014). 50kW Wind Turbine - GHREPOWER - Power Your Future. Retrieved 31
August 2014, from http://www.ghrepower.co.uk/50kW-wind-turbines.asp
Government of Canada, (June 1st ,2017), Canadian Climate Normals 1981-2010 Station Data,
retrieved from:
http://climate.weather.gc.ca/climate_normals/results_1981_2010_e.html?stnID=2205&autofwd=
1
Government of Canada, Natural Resources Canada, Energy Sector, CANMET Energy
Technology Centre – Varennes, RETScreen International. Retscreen international home.
Greenheart Energy,(2011),Wind Turbine Previous installations, retrieved from:
http://www.greenheart.co.uk/wind-turbines/previous-installations/
HengFeng Power Generator, (2014). 50KW wind turbine Manufacturer and Supplier. Retrieved
31 August 2014, from http://www.china-wind-turbines.com/50kW-wind-turbine/9.html
HSBC (2011). Climate investment update: Japan's nuclear crisis and the case for clean
energy. HSBC Global Research
http://www.ebay.com/itm/Apollo-MAX-550-W-Watt-12-V-DC-Magnet-PMA-Wind-Turbine-
Generator-Kit-0-5-5-kW-New-/200787169559
Hummerwind. (2014). 100KW Wind Power System: Anhui Hummer Dynamo Co. Ltd. Retrieved
31 August 2014, from
http://hummerwind.manufacturer.globalsources.com/si/6008846411596/pdtl/Wind-
turbine/1078924381/100kW-Wind-Power-System.htm
Hummerwind. (2014). 10kW Wind Turbine Generator Anhui Hummer Dynamo Co. Ltd.
Retrieved 31 August 2014, from

85
http://hummerwind.manufacturer.globalsources.com/si/6008846411596/pdtl/Wind-
turbine/1079709818/10kW-Wind-Turbine-Generator.htm
Hummerwind. (2014). 50kW Wind Turbine Generator: Anhui Hummer Dynamo Co. Ltd.
Retrieved 31 August 2014, from
http://hummerwind.manufacturer.globalsources.com/si/6008846411596/pdtl/Wind-
turbine/1065896529/50kW-Wind-Turbine-Generator.htm
Institution, B. S. .(2014). Bs en 61400-2. wind turbines. part 2. small wind turbines.
Intertek, (2017), ETL Certification, the end to end process, retrieved from:
http://www.intertek.com/uploadedfiles/intertek/divisions/commercial_and_electrical/media/pdf/c
ertifications_and_marks/etl_end_to_end_process.pdf
Intertek, (2018), About us, retrieved from: http://www.intertek.com/about/
Jin, X., Zhao, G., Gao, K. J., & Ju, W. (2015). Darrieus vertical axis wind turbine: basic
research methods. Renewable & Sustainable Energy Reviews, 42, 212-225.
Kjellin, J., Eriksson, S., & Bernhoff, H. (2013). Electric control substituting pitch control for
large wind turbines. Journal of Wind Energy, 2013(1–3).
Lawal Nadabo, S. (2010). Renewable energy as a solution to nigerian, energy crisis. Vaasan
Ammattikorkeakoulu.
Lee, M. (2007). Rotor for wind turbine, U.S. Patent Application 11/975,821.
Liu, W., & Lund, H. (2009). Comparative study of the potential of renewable energy sources and
solutions between denmark and china.
Lydia M, Kumar S S, Selvakumar A I, et al. A comprehensive review on wind turbine power
curve modeling techniques[J]. Renewable & Sustainable Energy Reviews, 2014, 30(2):452-460.

86
M.Ragheb, (2015),Wind Shear Roughness Classes and Turbine Energy Production.
Manwell, J. F., Mcgowan, J. G., & Rogers, A. L. (2002). Wind energy explained. Wiley John +
Sons, 30(2), 169-170.
Marigo, N., & Candelise, C. (2013). What is behind the recent dramatic reductions in
photovoltaic prices? the role of china. Economia E Politica Industriale, 40(3), 5-41.
Marrapese, M. E., & Walker, J. C. (2007). Restriction of the Use of Hazardous Substances
(RoHS) in Electrical and Electronic Equipment.Encyclopedia of Magnetic Resonance.
Masters, G. (2013). Renewable and efficient electric power systems. Wiley & Sons(8), 55 - 62.
Natural Resource Canada. (2018). Electricity facts, retrieved from:
https://www.nrcan.gc.ca/energy/facts/electricity/20068
Natural Resources of Canada, Government of Canada, (2013). Photovoltaic potential and solar
resource maps of Canada. Retrieved 21 August 2014, from http://pv.nrcan.gc.ca/index.php?m=r
Nielsen, T. S. B., & Spruce, C. J. (2010). Wind turbine, a method for damping edgewise
oscillations in one or more blades of a wind turbine by changing the blade pitch and use
hereof. US, US7854589.
NREL, (2014). Up to Wind Speed. Available at:
http://www.nrel.gov/emails/wind/utws_newsletter_2012-06.html
Oudah, A., Mohd, I. I., & Hameed, A. (2014). Wind turbines control: features and
trends. Modern Applied Science, 8(6), 272-295.
Park, J. H., Park, S. S., Yoon, Y. I., Yoo, C. H., & Hwang, J. G. (2011). Design for yaw brake
system in wind turbine. 한국윤활학회 2010년도 제 51회 추계학술대회, 27(4), 204-208.

87
Ragheb, M., & Ragheb, A. M. (2011). Wind Turbines Theory - The Betz Equation and Optimal
Rotor Tip Speed Ratio. Fundamental and Advanced Topics in Wind Power.
Renewable Energy World, (2008). Survey Says 60% of US Wind Turbines May Be Behind in
Maintenance. Available at:
http://www.renewableenergyworld.com/rea/news/article/2008/09/survey-says-60-of-us-wind-
turbines-may-be-behind-in-maintenance-53502.
RETScreen, (March 20th, 2017),Natural Resources of Canada, retrieved from:
http://www.nrcan.gc.ca/energy/software-tools/7465
Rosenvard, P., & Christensen, L. B. (2011). Yaw system for a nacelle of a wind turbine and wind
turbine. US, US7944070.
Schubel, P. J., & Crossley, R. J. (2012). Wind turbine blade design review. Wind
Engineering, 36(4), 3425-3449.
Shenzhou,(2014). Yangzhou Shenzhou Wind-driven Generator Co,Ltd. Retrieved from
http://wind-turbine.com/anbieter/237/yangzhou-shenzhou-wind-driven-generator-co-ltd-
jiangdu.html
Tian, J., (2012). Integrated Optimal Design of Wind Turbine Systems. Open Access
Dissertations. Paper 909.Retrieved 21 September 2014, from
http://scholarlyrepository.miami.edu/oa_dissertations/909
U.S Department of Energy. (2014). Wind Testing and Certification | Department of Energy.
Retrieved 28 August 2014, from http://energy.gov/eere/wind/wind-testing-and-certification
Ul, (2012). GUIDE INFORMATION FOR ELECTRICAL EQUIPMENT THE WHITE BOOK
2012. Available at:

88
https://www.ul.com/global/documents/offerings/perspectives/regulators/2012%20WB%20FINA
L.pdf
Vazquez, J., Silvera, A., Arias, F., & Soria, E. (1998). Fatigue properties of a glass-fibre-
reinforced polyester material used in wind turbine blades.Journal of Strain Analysis for
Engineering Design, 33(3), 183-193.
Weather Statistics for Calgary, Alberta. (2014). Current Weather in Calgary. Retrieved 3 August
2014, from http://calgary.weatherstats.ca
Weiku, (2014), Guy wire tower for wind turbine 5.5m-30m, retrived from:
http://www.weiku.com/products/5662971/guy_wire_tower_for_wind_turbine_5_5m_30m.html
Yang, W., Tavner, P. J., Crabtree, C. J., Feng, Y., & Qiu, Y. (2014). Wind turbine condition
monitoring: technical and commercial challenges. Wind Energy, 17(5), 673–693.
Youtube,Coemi-Skywing Wind Turbine - Raising the Tower, March 29,2010,retrived from:
https://www.youtube.com/watch?v=z0d6oQj8wdE
Zobaa, A., & Bansal, R. (2011). Handbook of renewable energy technology (1st ed.). Singapore:
World Scientific

89
Appendix A Ghrepower Data Sheets
Ghrepower
FD16 50KW
Power
a Rated Output 50 kW
b Rated Voltage DC460 V
c Rated Current 108
Generator
Permanent magnetic
generator
Blades
a. Material FRP
b Number of Blades 3
c. Rotation Direction ClockWise
Blade/Rotor Diameter 16.0 M
Tilt Angle of Rotor Shaft 3
Rated RPM 75
Swept Area 198
Wind Factors
a Start-Up Wind Speed 3
b Rated Wind Speed 11 m/s
c Cut-Out Wind Speed 25
d. Cut-In Wind Speed 3 m/s
e.
Security/Survival Wind
Speed 59.5(3s wind speed)
f Work Speed 3-25m/s
Turbine Type horizontal axis
Control Mode Active pitch
Generator Utilization Ratio/Efficiency/ 0.94
Protection Mode active pitch
mechanical brake
dumpload
Tower Height 36 m
Power Curve
a. Wind Speed 3m/s 1.15 kW
b. Wind Speed 4m/s 2.74 kW
c. Wind Speed 5m/s 5.35 kW
d. Wind Speed 6m/s 9.26 kW
e. Wind Speed 7m/s 14.7 kW
f. Wind Speed 8m/s 21.95 kW
g. Wind Speed 9m/s 31.25 kW

90
h. Wind Speed 10m/s 42.87 kW
i. Wind Speed 11m/s 51 kW
j. Wind Speed 12m/s 52 kW
k. Wind Speed 13m/s 51 kW
l. Wind Speed 14m/s 50 kW
m. Wind Speed 15m/s 50 kW
Annual Energy
Production 169000 kWh(7m/s)
Noise Level <55 dBA
Certificate:

91

92

93

94
RetScreen Data

95
Foundation dimensions:
Appendix B Hummer Data Sheets
Hummer 50kW
H12.0-50000W
Power
a. rated output 50000W

96
c. rated voltage 400V
d. rated current 125A
Generator direct driven permanent magnet generator
with single phase output
Blades
a. material GRP
b. number of blades 3
c. rotation direction clockWise
Rotor diameter 16m
Rated RPM 160
Swept area 200.96m2
Wind factors
rated wind speed 11m/s
cut-out wind speed
18m/s
It is factory default value and users can
reset it by themselves with Touch Screen
of SIEMSN PLC.
cut-in wind speed 2m/s
security/survival wind speed 50m/s
work wind speed 2.5-25m/s
Turine type Upwind
Control mode Manual & Automatic
Generator utilization ratio >0.92
Protection mode Yawing + Electromagnetism braking +
Hydraulic braking
Standard tower height 18m
Nacelle weight Generator weight: 1200kg
Yaw shaft wight: 1250kg
Annual KWH production KWH
3m/s 56250
4m/s 103400
5m/s 127900
6m/s 166500
7m/s 220000
8m/s 262800
9m/s 350400
10m/s 438000
Annaul energy production
Noise level Described noise report
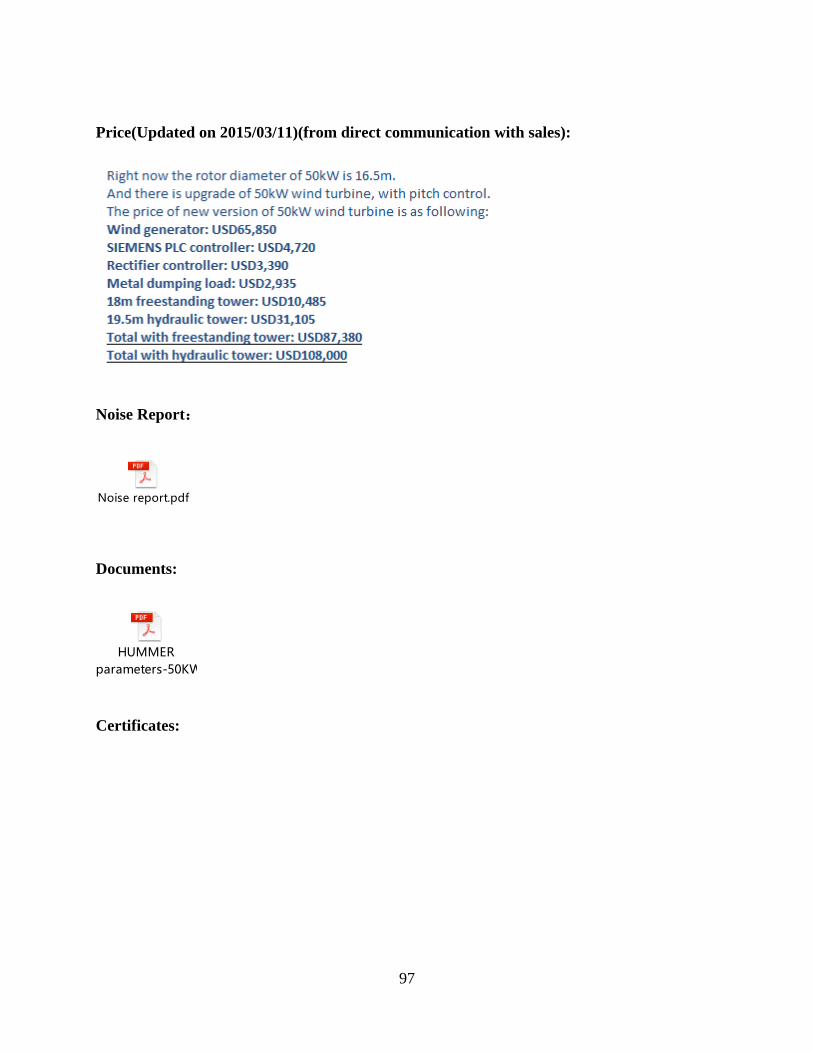
97
Price(Updated on 2015/03/11)(from direct communication with sales):
Noise Report:
Noise report.pdf
Documents:
HUMMER
parameters-50KW.pdf
Certificates:

98

99

100

101

102
Tower base dimension

103
RetScreen Data:

104
Appendix C Hengfeng Data Sheets
Hengfeng
HF50KW
Power a. Rated Output 50,000 w
b Rated Voltage 380 V
c Rated Current 76A

105
Generator direct drive
Blades
a. Material glass fiber reinforced plastics
b Number of Blades 3 pcs
c. Rotation Direction clockWise
Blade/Rotor Diameter 15.0 M
Tilt Angle of Rotor Shaft 6
Rated RPM 100 r/min
Swept Area 177 ㎡
Wind Factors
a. Rated Wind Speed 12 m/s
b Cut-Out Wind Speed 30m/s
c Cut-In Wind Speed 3.5m/s
d. Security/Survival Wind Speed 50 m/s
Turbine Type updraft
Control Mode Micro-computer intelligence controller
Generator Utilization
Ratio/Efficiency/
0.85
Power Factor
Protection Mode yawing, automatic brake and Manual brake
protection
Tower Height ≤18 m
Power curve(kW)
a. Wind Speed 3m/s 2.6
b. Wind Speed 4m/s 3.8
c. Wind Speed 5m/s 7.7
d. Wind Speed 6m/s 15.5
e. Wind Speed 7m/s 24
f. Wind Speed 8m/s 33
g. Wind Speed 9m/s 42
h. Wind Speed 10m/s 50
i. Wind Speed 11m/s 57
j. Wind Speed 12m/s 60
k. Wind Speed 13m/s 55
l. Wind Speed 14m/s 52
m. Wind Speed 15m/s 50
Noise Level ≤40dB
Certificates:

106

107

108

109

110

111
Project case:
project case.ppt
Company introduction

112
Price:

113
hengfeng Price
of 50KW WIND TURBINE with free standing tower.doc
RETScreen:

114
Appendix D Shenzhou Data Sheets
PARAMETERS Shenzhou 50kW
FD16.0-50000
1 Power

115
a. Rated Output 50,000 w
b Rated Voltage 360 DCV
c Rated Current 138 DCA
4 Generator Permanent Magnet
5 Blades
a. Material GFRP
b Number of Blades 3
c. Rotation Direction ClockWise
6 Rotor Diameter 16.0 M
8 Rated RPM 60 r/min
9 Swept Area 200 m2
10 Wind Factors
a Rated Wind Speed 12 m/s
b Cut-Out Wind Speed 20 m/s
c Cut-In Wind Speed 3
d. Security/Survival Wind Speed 60 m/s
11 Turbine Type Upwind
12 Control Mode Manual/Auto
13 Generator Utilization Ratio/Efficiency 0.9
14 Protection Mode Yawing/Dump;
Load/Brake
(fail-safe type)
15 Standard Tower Height 18
16 Nacelle Weight 3
17 Off-Grid could be off-grid
use with different
controller and
inverter
18 Power Curve (kW)
a. Wind Speed 3m/s 0
b. Wind Speed 4m/s 13140
c. Wind Speed 5m/s 30660
d. Wind Speed 6m/s 56940
e. Wind Speed 7m/s 83220
f. Wind Speed 8m/s 109500
g. Wind Speed 9m/s 157680
h. Wind Speed 10m/s 245280
i Wind Speed 11m/s 367920
j Wind Speed 12m/s 420480
k Wind Speed 13m/s 446760

116
l Wind Speed 14m/s 446760
m Wind Speed 15m/s 446760
19 Annual Energy Production(kWh) 56940
20 Noise Level 55db
Certificates:

117

118
Honors:
(High-tech industry certificate, issued by Yangzhou Science and technology bureau)

119
(designated manufacture for “shi wu” event. Issued by State Ethnic Affairs Commission,
China's Ministry of Finance, People's Bank of China)

120
(National Engineering Research Center for small size wind turbines. Issued by Yangzhou
Science and technology bureau )
RETScreen Data:

121
Appendix E Winpower Data Sheets
Winpower
GLB50KW
Power

122
a. Rated Output 50,000 w
b Rated Voltage 380 V
c Rated Current 131
Phases 3
Blades
a. Material GFRP
b Number of Blades 3
c. Rotation Direction clockWise
Blade/Rotor Diameter 16 M
Rated RPM 59 r/min
Swept Area 201m2
Wind Factors
c Rated Wind Speed 12 m/s
d. Cut-Out Wind Speed 20m/s
e. Cut-In Wind Speed 3.5m/s
f. Security/Survival Wind Speed 45 m/s
Control Mode
high technology with
intelligent
Generator Utilization
Ratio/Efficiency/
0.9
Power Factor
Protection Mode hydraulic yaw and
hydraulic
brake keep the security.
Tower Height 20 m
Nacelle Weight 800KG
Off-Grid do not off-grid,on-grid
Annual KwH Production
a. Wind Speed 3m/s 8,883 kWh
b. Wind Speed 4m/s 21,059 kWh
c. Wind Speed 5m/s 41,137 kWh
d. Wind Speed 6m/s 71,079 kWh
e. Wind Speed 7m/s 112,873 kWh
f. Wind Speed 8m/s 168,490 kWh
g. Wind Speed 9m/s 239,893 kWh
h. Wind Speed 10m/s 324,698 kWh
i. Wind Speed 11m/s 385,440 kWh
j. Wind Speed 12m/s 420,480 kWh
k. Wind Speed 13m/s 437,124 kWh
l. Wind Speed 14m/s 449,151 kWh
m. Wind Speed 15m/s 455,546 kWh
Annual Energy Production 72000KWH

123
Noise Level ≤70 dBa
Tower Base:

124
Certificates:

125

126

127

128
Customer’s feedback from the “International Center for Science, High Technology and
Environmental Science” Iran:

129
RETScreen Data:

130

131
Appendix F Trina Solar Data Sheets
Data for Trina Solar TSM-PA05.082-250W, 250 Watt Solar Panel, 60 Cell Poly, Black

132

133
Dimension:
Product Description:
Certificates
The Universal Solution
Currently Trina Solar's most popular panel. Versatile and adaptable, with power output ranging
from 225 to 245Wp, the TSM-PA05.08 is perfect for largescale installations, particularly
ground-mounted and commercial rooftop systems. Using reliable and carefully selected
components that are tested at the Trina Solar Center of Excellence, this panel comes with a 25-
year performance guarantee of 80% power production.
Features
• Module can bear snow loads up to 5400Pa and wind loads up to 2400Pa
• Guaranteed power output (0~+3%)
• High performance under low light conditions (Cloudy days, mornings and evenings)
• Independently certified by international certification bodies
• Manufactured according to International Quality and Environment Management System
(ISO9001, ISO14001)

134
• Black frame provide aesthetic module appearance.
Trina Solar, the best $/kWh value under the sun
Founded in 1997, Trina Solar is a vertically integrated PV manufacturer, producing everything
from ingots to modules, using both mono and multicrystalline technologies. At the end of 2010,
the company will have a nameplate module capacity of 950MW. Trina Solar’s wide range of
products are used in residential, commercial, industrial and public utility applications throughout
the world.
Electrical Data @ STC
Peak Power Watts-PMAX (WP) 250
Power Output Tolerance-PMAX (%) 0/+3
Maximum Power Voltage-VMAX (V) 31
Maximum Power Current-IMPP (A) 8.6
Open Circuit Voltage-VOC (V) 37.4
Short Circuit Current-ISC (A) 8.59
Module Efficiency ηm (%) 15.3
Values at Standard Test Conditions STC (Air Mass AM1.5, Irradiance 1000W/m², Cell
Temperature 25°C)
Mechanical Data
Solar cells Multicrystalline 6 inches (156 x 156mm)
Cells orientation 60 cells (6x10)
Module
dimension
64.95 x 39.05 x 1.57inches (1650 x 992 x 40mm)
Weight 43.0lb (19.5kg)
Glass High transperancy solar glass 0.13inches (3.2mm)

135
Frame Anodized aluminium alloy
J-Box IP 65 rated
Cables/Connector
Photovoltaic Technology cable 0.006inches² (4.0mm²), 39.4inches
(1000mm), MC4
Temperature Ratings
Nominal Operating Cell Temperature (NOCT) 46°C (±2°C)
Temperature Coefficient of Pmpp - 0.45%/°C
Temperature Coefficient of Voc - 0.35%/°C
Temperature Coefficient of Isc 0.05%/°C
Maximum Ratings
Operational Temperature -40~+85°C
Maximum System Voltage 600VDC
Max Series Fuse Rating 15A
Packaging Configuration
Modules per box 25 pcs
Modules per 40’ container 650 pcs
Warranty

136
10 years workmanship warranty
25 years linear performance warranty
Appendix G Payback Calculations
Table 36 Pay back Calculations for Ghrepower for 20 years (on-grid)
Pay back Calculations for
Ghrepower for 20 years(on-grid)
years forward
curve($/kWh)
Existing Wires
Cost($/kWh)
Hours
per
year
Average
Power(kW
)
Total
Saving
s
Cumulate
d Savings
2015.00 0.05 0.00 8760.0
0 12.92
5523.9
7 5523.97
2016.00 0.06 0.00 8760.0
0 12.92
6308.5
8 11832.55
2017.00 0.06 0.00 8760.0
0 12.92
7052.4
3 18884.98
2018.00 0.08 0.00 8760.0
0 12.92
9116.4
2 28001.40
2019.00 0.09 0.00 8760.0
0 12.92
9863.6
7 37865.07
2020.00 0.10 0.00 8760.0
0 12.92
11773.
68 49638.75
2021.00 0.11 0.00 8760.0
0 12.92
12198.
25 61837.00
2022.00 0.08 0.00 8760.0
0 12.92
9547.7
9 71384.78
2023.00 0.09 0.00 8760.0
0 12.92
10025.
57 81410.35
2024.00 0.09 0.00 8760.0
0 12.92
10515.
81 91926.16
2025.00 0.10 0.00 8760.0
0 12.92
11053.
60
102979.7
7
2026.00 0.10 0.00 8760.0
0 12.92
11606.
11
114585.8
8
2027.00 0.11 0.00 8760.0 12.92 11983. 126569.1

137
0 31 9
2028.00 0.11 0.00 8760.0
0 12.92
12372.
77
138941.9
6
2029.00 0.11 0.00 8760.0
0 12.92
12774.
88
151716.8
4
2030.00 0.12 0.00 8760.0
0 12.92
13190.
07
164906.9
1
2031.00 0.12 0.00 8760.0
0 12.92
13618.
74
178525.6
5
2032.00 0.12 0.00 8760.0
0 12.92
14061.
35
192587.0
1
2033.00 0.13 0.00 8760.0
0 12.92
14518.
35
207105.3
6
2034.00 0.13 0.00 8760.0
0 12.92
14990.
19
222095.5
5
Table 37 Internal rate of return calculation for Ghrepower for 20 years
Internal rate of return calculation
(215140.00)
5523.97
6308.58
7052.43
9116.42
9863.67
11773.68
12198.25
9547.79
10025.57
10515.81
11053.60
11606.11
11983.31
12372.77
12774.88
13190.07
13618.74
14061.35
14518.35
14990.19
0.00

138
Table 38 Pay back Calculations for Hummer for 20 years (on-grid)
Pay back Calculations for
Hummer for 20 years(on-grid)
years forward
curve($/kWh)
Existing Wires
Cost($/kWh)
Hours
per year
Average
Power(kW
)
Total
Saving
s
Cumulate
d Savings
2015.00 0.05 0.00 8760.00 14.40 6153.8
3 6153.83
2016.00 0.06 0.00 8760.00 14.40 7027.9
0 13181.73
2017.00 0.06 0.00 8760.00 14.40 7856.5
7 21038.29
2018.00 0.08 0.00 8760.00 14.40 10155.
89 31194.19
2019.00 0.09 0.00 8760.00 14.40 10988.
34 42182.53
2020.00 0.10 0.00 8760.00 14.40 13116.
14 55298.67
2021.00 0.11 0.00 8760.00 14.40 13589.
12 68887.79
2022.00 0.08 0.00 8760.00 14.40 10636.
45 79524.24
2023.00 0.09 0.00 8760.00 14.40 11168.
71 90692.95
2024.00 0.09 0.00 8760.00 14.40 11714.
85 102407.79
2025.00 0.10 0.00 8760.00 14.40 12313.
96 114721.75
2026.00 0.10 0.00 8760.00 14.40 12929.
47 127651.22
2027.00 0.11 0.00 8760.00 14.40 13349.
68 141000.90
2028.00 0.11 0.00 8760.00 14.40 13783.
54 154784.44
2029.00 0.11 0.00 8760.00 14.40 14231.
51 169015.94
2030.00 0.12 0.00 8760.00 14.40 14694.
03 183709.97
2031.00 0.12 0.00 8760.00 14.40 15171.
59 198881.56
2032.00 0.12 0.00 8760.00 14.40 15664.
66 214546.22
2033.00 0.13 0.00 8760.00 14.40 16173.
76 230719.98

139
2034.00 0.13 0.00 8760.00 14.40 16699.
41 247419.39
Table 39 Internal rate of return calculation for Hummer for 20 years (on-grid)
Internal rate of return calculation
(87380.00)
6153.83
7027.90
7856.57
10155.89
10988.34
13116.14
13589.12
10636.45
11168.71
11714.85
12313.96
12929.47
13349.68
13783.54
14231.51
14694.03
15171.59
15664.66
16173.76
16699.41
0.11
Table 40 Pay back Calculations for Hengfeng for 20 years (on-grid)
Pay back Calculations for
Hengfeng for 20 years(on-grid)
years forward
curve($/kWh)
Existing Wires
Cost($/kWh)
Hours
per year
Average
Power(kW
)
Total
Saving
s
Cumulate
d Savings
2015.00 0.05 0.00 8760.00 11.35 4848.9
5 4848.95
2016.00 0.06 0.00 8760.00 11.35 5537.6
8 10386.63
2017.00 0.06 0.00 8760.00 11.35 6190.6
3 16577.26

140
2018.00 0.08 0.00 8760.00 11.35 8002.4
0 24579.66
2019.00 0.09 0.00 8760.00 11.35 8658.3
4 33238.00
2020.00 0.10 0.00 8760.00 11.35 10334.
95 43572.94
2021.00 0.11 0.00 8760.00 11.35 10707.
64 54280.58
2022.00 0.08 0.00 8760.00 11.35 8381.0
6 62661.64
2023.00 0.09 0.00 8760.00 11.35 8800.4
6 71462.09
2024.00 0.09 0.00 8760.00 11.35 9230.7
9 80692.88
2025.00 0.10 0.00 8760.00 11.35 9702.8
6 90395.75
2026.00 0.10 0.00 8760.00 11.35 10187.
86 100583.60
2027.00 0.11 0.00 8760.00 11.35 10518.
96 111102.57
2028.00 0.11 0.00 8760.00 11.35 10860.
83 121963.40
2029.00 0.11 0.00 8760.00 11.35 11213.
81 133177.20
2030.00 0.12 0.00 8760.00 11.35 11578.
26 144755.46
2031.00 0.12 0.00 8760.00 11.35 11954.
55 156710.01
2032.00 0.12 0.00 8760.00 11.35 12343.
07 169053.08
2033.00 0.13 0.00 8760.00 11.35 12744.
22 181797.30
2034.00 0.13 0.00 8760.00 11.35 13158.
41 194955.71
Table 41 Internal rate of return calculation for Hengfeng for 20 years (on-grid)
Internal rate of return calculation
(62939.00)
4848.95
5537.68
6190.63
8002.40

141
8658.34
10334.95
10707.64
8381.06
8800.46
9230.79
9702.86
10187.86
10518.96
10860.83
11213.81
11578.26
11954.55
12343.07
12744.22
13158.41
0.12
Table 42 Pay back Calculations for Shenzhou for 20 years (on-grid)
Pay back Calculations for
Shenzhou for 20 years(on-grid)
years forward
curve($/kWh)
Existing Wires
Cost($/kWh)
Hours
per year
Average
Power(kW
)
Total
Saving
s
Cumulate
d Savings
2015.00 0.05 0.00 8760.00 10.10 4317.7
7 4317.77
2016.00 0.06 0.00 8760.00 10.10 4931.0
5 9248.81
2017.00 0.06 0.00 8760.00 10.10 5512.4
7 14761.29
2018.00 0.08 0.00 8760.00 10.10 7125.7
7 21887.06
2019.00 0.09 0.00 8760.00 10.10 7709.8
5 29596.92
2020.00 0.10 0.00 8760.00 10.10 9202.8
0 38799.71
2021.00 0.11 0.00 8760.00 10.10 9534.6
6 48334.37
2022.00 0.08 0.00 8760.00 10.10 7462.9
5 55797.32
2023.00 0.09 0.00 8760.00 10.10 7836.4
0 63633.72

142
2024.00 0.09 0.00 8760.00 10.10 8219.6
0 71853.32
2025.00 0.10 0.00 8760.00 10.10 8639.9
6 80493.27
2026.00 0.10 0.00 8760.00 10.10 9071.8
2 89565.09
2027.00 0.11 0.00 8760.00 10.10 9366.6
6 98931.75
2028.00 0.11 0.00 8760.00 10.10 9671.0
7 108602.82
2029.00 0.11 0.00 8760.00 10.10 9985.3
8 118588.20
2030.00 0.12 0.00 8760.00 10.10 10309.
91 128898.11
2031.00 0.12 0.00 8760.00 10.10 10644.
98 139543.09
2032.00 0.12 0.00 8760.00 10.10 10990.
94 150534.03
2033.00 0.13 0.00 8760.00 10.10 11348.
15 161882.17
2034.00 0.13 0.00 8760.00 10.10 11716.
96 173599.13
Table 43 Internal rate of return calculation for Shenzhou(on-grid)
Internal rate of return calculation
(57507.00)
4317.77
4931.05
5512.47
7125.77
7709.85
9202.80
9534.66
7462.95
7836.40
8219.60
8639.96
9071.82
9366.66
9671.07
9985.38
10309.91

143
10644.98
10990.94
11348.15
11716.96
0.12
Table 44 Pay back Calculations for WinPower for 20 years for WinPower (on-grid)
Pay back Calculations for
winpower for 20 years(on-grid)
years forward
curve($/kWh)
Existing Wires
Cost($/kWh)
Hours
per year
Average
Power(kW
)
Total
Saving
s
Cumulate
d Savings
2015.00 0.05 0.00 8760.00 7.48 3196.6
4 3196.64
2016.00 0.06 0.00 8760.00 7.48 3650.6
8 6847.31
2017.00 0.06 0.00 8760.00 7.48 4081.1
3 10928.45
2018.00 0.08 0.00 8760.00 7.48 5275.5
3 16203.98
2019.00 0.09 0.00 8760.00 7.48 5707.9
5 21911.93
2020.00 0.10 0.00 8760.00 7.48 6813.2
4 28725.17
2021.00 0.11 0.00 8760.00 7.48 7058.9
4 35784.11
2022.00 0.08 0.00 8760.00 7.48 5525.1
5 41309.26
2023.00 0.09 0.00 8760.00 7.48 5801.6
4 47110.90
2024.00 0.09 0.00 8760.00 7.48 6085.3
4 53196.24
2025.00 0.10 0.00 8760.00 7.48 6396.5
5 59592.79
2026.00 0.10 0.00 8760.00 7.48 6716.2
8 66309.06
2027.00 0.11 0.00 8760.00 7.48 6934.5
6 73243.62
2028.00 0.11 0.00 8760.00 7.48 7159.9
3 80403.55
2029.00 0.11 0.00 8760.00 7.48 7392.6
3 87796.17

144
2030.00 0.12 0.00 8760.00 7.48 7632.8
9 95429.06
2031.00 0.12 0.00 8760.00 7.48 7880.9
6 103310.01
2032.00 0.12 0.00 8760.00 7.48 8137.0
9 111447.10
2033.00 0.13 0.00 8760.00 7.48 8401.5
4 119848.64
2034.00 0.13 0.00 8760.00 7.48 8674.5
9 128523.23
Table 45 Internal rate of return calculation for Winpower (on-grid)
Internal rate of return calculation
(64780.00)
3196.64
3650.68
4081.13
5275.53
5707.95
6813.24
7058.94
5525.15
5801.64
6085.34
6396.55
6716.28
6934.56
7159.93
7392.63
7632.89
7880.96
8137.09
8401.54
8674.59
0.07
Appendix H Maintenance list

145

146

147

148

149

150

151

152