A case study: Application of energy and exergy analysis for ...
19
53 54 55 56 57 58 59 60 61 62 63 64 65 1 **Manuscript Click here to view linked References 1 2 3 4 A case study: Application of energy and exergy analysis for enhancing the process 5 efficiency of a three stage propane pre-cooling cycle of the Cascade LNG process 6 7 Nazreen Begum Najibullah Khan a,b*, Ahmed Barifcani •, Moses Tade •, Vishnu Pareek • 8 9 "Department of Chemical Engineering, Curtin University of Technology, GPO Box U1987, Perth, Western 10 Australia 6001 11 bFaculty of Chemical Engineering and Natural Resources University Malaysia Pahang, Lebuhraya Tun Razak, 12 26300 Gambang, Kuantan, Pahang Darul Makmur, Malaysia 13 14 15 ABSTRACT 16 The propane pre-cooling cycle has been widely used in most LNG plants as the first cooling cycle in 17 18 the natural gas liquefaction process. As LNG plants consume high amounts of energy, enhancements in 19 the process design and plant operation will minimize the overall energy consumption of the plant. The 20 aim of this study is to enhance the process efficiency of.J! three stage propane pre-cooling cycle of the 21 Cascade LNG process for the large-scale LNG train by determining the optimal operating conditions of 2 2 the propane evaporator that will minimize the overall energy consumption. Energy and exergy analysis 23 24 methods are adopted to evaluate the process efficiency of the propane pre-cooling cycle. Six case studies 25 were presented to determine the optimal operating conditions of the propane evaporator that gives 26 maximum energy reduction. The propane pre-cooling cycle is modelled and simulated using Aspen 2 7 HYSYS with detailed thermodynamic information obtained to calculate the exergy loss. The results of 28 the energy and exergy analysis indicate that Case 6 gives the highest coefficient of performance (COP) 2 9 30 and the maximum exergy efficiency compared to the baseline case, which are 15.51% and 18.76% 31 respectively . The results indicate that by reducing the cooling duty at the intermediate stage§. of propane 32 evaporator about 13.5% energy saving can be achieved compared to the baseline case. 3 3 34 35 36 37 38 Keywords: 39 propane pre-cooling 40 41 exergy loss 42 refrigeration 43 cascade cycle 44 energy optimization 45 46 4 7
-
Upload
khangminh22 -
Category
Documents
-
view
6 -
download
0
Transcript of A case study: Application of energy and exergy analysis for ...
53
54
55
56
57
58
59
60
61
62
63
64
65
1
**Manuscript
Click here to view linked References
1
2
3
4 A case study: Application of energy and exergy analysis for enhancing the process 5 efficiency of a three stage propane pre-cooling cycle of the Cascade LNG process 6 7 Nazreen Begum Najibullah Khan a,b*, Ahmed Barifcani •, Moses Tade •, Vishnu Pareek • 8 9 "Department of Chemical Engineering, Curtin University of Technology, GPO Box U1987, Perth, Western
10 Australia 6001 11 bFaculty of Chemical Engineering and Natural Resources University Malaysia Pahang, Lebuhraya Tun Razak, 12 26300 Gambang, Kuantan, Pahang Darul Makmur, Malaysia
13
14
15 ABSTRACT 16 The propane pre-cooling cycle has been widely used in most LNG plants as the first cooling cycle in
17
18 the natural gas liquefaction process. As LNG plants consume high amounts of energy, enhancements in
19 the process design and plant operation will minimize the overall energy consumption of the plant. The
20 aim of this study is to enhance the process efficiency of.J! three stage propane pre-cooling cycle of the
21 Cascade LNG process for the large-scale LNG train by determining the optimal operating conditions of
2 2 the propane evaporator that will minimize the overall energy consumption. Energy and exergy analysis
23
24 methods are adopted to evaluate the process efficiency of the propane pre-cooling cycle. Six case studies
25 were presented to determine the optimal operating conditions of the propane evaporator that gives
26 maximum energy reduction. The propane pre-cooling cycle is modelled and simulated using Aspen
2 7 HYSYS with detailed thermodynamic information obtained to calculate the exergy loss. The results of
28 the energy and exergy analysis indicate that Case 6 gives the highest coefficient of performance (COP)
2 9
30 and the maximum exergy efficiency compared to the baseline case, which are 15.51% and 18.76%
31 respectively . The results indicate that by reducing the cooling duty at the intermediate stage§. of propane
32 evaporator about 13.5% energy saving can be achieved compared to the baseline case.
3 3
34
35
36
37
38 Keywords: 39
propane pre-cooling 40
41 exergy loss
42 refrigeration
43 cascade cycle
44 energy optimization 45
46
4 7

53
54
55
56
57
58
59
60
61
62
63
64
65
1
48
49
50
51
52
1
2
3
52
53
54
55
56
57
58
59
60
61
62
63
64
65
2
4 1. Introduction 5 As the demand on LNG is drastically increasing and the discovery of new large gas fields is 6 continuously taking place worldwide, the pace of change and development in LNG liquefaction
7 technology is becoming more rapid than ever before. LNG production is estimated to hit 320 million 8
9 tonnes per annum (MTPA) by 2015 and to 450 MTPA by 2020 as reported by Wood [l]. In order to
10 meet this escalating demand, most of the existing and new LNG plants are looking for opportunities to 11 make a further increase in their LNG capacity and building larger LNG trains which will provide 12 economic benefits and be process efficient. Since the 1970s, when the kick started for the LNG plant 13 and until the present day, three main LNG processes have been applied in the LNG plants viz. Single 14
15 mixed refrigerant (SMR), Propane precooled mixed refrigerant (C3MR) and cascade liquefaction
16 process [2]. In the last 10 to 15 years, the innovations of LNG technologies have drastically progressed
17 whereby new LNG processes have been introduced such as Mixed fluid cascade (MFC), Air Products
18 (AP-X™), Dual mixed refrigerant (DMR) and Parallel mixed refrigerant (PMR) [3]. Most of the
19 existing LNG plants have three main cooling cycles, namely the pre-cooling, liquefying and sub-cooling 20
21 cycle. Earlier LNG plants that employed the SMR process did not have the pre-cooling cycle, and 2 2 instead the natural gas was cooled directly to -160°C using a single mixed refrigerant. The pre-cooling 23 cycle is the first cycle in an LNG process which removes the heat from natural gas to a temperature 24 range between -30°C to -55°C depending on the pre-cooling technology applied. As a result of 25 technological advancement, the pre-cooling cycle can now be designed using either pure refrigerant or 26
2 7 mixed refrigerant. Castillo, et al. [4] reported that 95% of the current LNG plants employ the pre-cooling
28 cycle; 85% of which are dominated by propane refrigerant compared to mixed refrigerant.
29
30 Thermodynamic analysis has been widely used in the LNG plants to determine the sources and locations
31 of the main process irreversibilities that occur within the process or are due to ill!_individual unit
32 operation. Energy analysis or the first law of thermodynamic method only indicates the energy 3 3
34 conservation of the overall process which is measured using two parameters i.e. COP and specific power
35 (SP). However, to locate the irreversibility that occurs within the unit operation of the process, the 36 exergy analysis method is applied. These methods are widely applied by other scholars to evaluate the
37 energy conversion process efficiency. Vatani, et al. [5], Kanoglu [6], Cipolato, et al. [7], Al-Otaibi, et 38 al. [8] and Mehrpooya, et al. [9] applied the energy and exergy analysis methods for analysing the 39
40 process efficiency of various LNG processes. In a nutshell, these methods are also widely used in some
41 power plants as mentioned in the following references [10-12]. 42
43 Converting natural gas to liquid utilizes an extensive amount of energy. According to Alfadala et al.
44 [13], a typical base load LNG plant consumes about 5.5-6 kWh of energy per kgmole of LNG produced .
45 An energy-efficient refrigeration system will enhance the plant operation and provide economic benefits
46 [14]. Several authors have discussed the area of enhancing the efficiency of the pre-cooling cycle. 4 7
48 Paradowski, et al. [15] discussed two operating parameters of the pre-cooling cycle in the C3MR
49 process that can enhance the process efficiency plus debottleneck the existing LNG plant capacity to
50 5.5 MTPA. The pre-cooling temperature of the low pressure (LP) stage and the propane compressor
51 speed were the operating parameters that were adjusted to meet the new capacity requirement.
1
2
3
61
62
63
64
65
3
36 Castillo et al. [16] studied suitable choices of refrigerants that are applicable for pre-cooling cycle by 37 analysing the effects of various refrigerants (i.e. N2, Cfu, C2H6, C3Hs) on the compressor power using 38 the Linde-Hampson process. It was found that compared to other refrigerants, propane has a higher 39
specific refrigerant effect which makes it the preferred refrigerant to be used in the pre-cooling cycle. 40
Ransbarger [17] studied the comparison between three stage and four stage propane cycles for the 41
cascade LNG process which resulted in a power reduction of 1%; nonetheless the economic evaluations 42
43 did not justify the increased cost associated with the additional stage. Evolution in the design of the
44 propane pre-cooling cycle has emerged in recent decades. In this context, various studies have been
45 presented that were related to the enhancement of the efficiency of the propane cycle with respect to
46 significant changes made in the process configuration. Mortazavi, et al. [18] suggested the replacement
4 7 of the conventional expansion valve in the C3MR process with expanders to improve the liquefaction
48 efficiency. Inanother study, Mortazavi, et al. [19] investigated the usage of waste heat from gas turbines
49 by installing absorption chillers in the propane cycle of the C3MR process. Kalinowski, et al. [20]
50 proposed the replacement of the propane evaporator with an absorption refrigeration system utilizing
51 waste heat from the electrical power generating gas turbines. 52
53 Although many studies have been conducted focusing on the efficiency enhancement of the LNG plants 54 through modification of the process configuration [6, 18-21], there is only very scant information 55 available which focuses on the operation perspective. In this study, we to analyse the impact of changing 56 the operating conditions of the propane evaporator towards the energy consumption of the process. Six 57 case studies are proposed with different operating conditions applied to the propane evaporator. The 58 development of these case studies is discussed in section 2.2 of the manuscript. The sensitivity of the 59
COP, the specific power (SP), and the exergy loss and exergy efficiency are analysed for all case studies 60
presented.
Q refrigeration duty [MW] C2H6 ethane
To ambient temperature [K] C3Hs propane
4
5
6
7
8
9
10
11
12
13
14
15
16
17
18
19
20
21
2 2
23
24
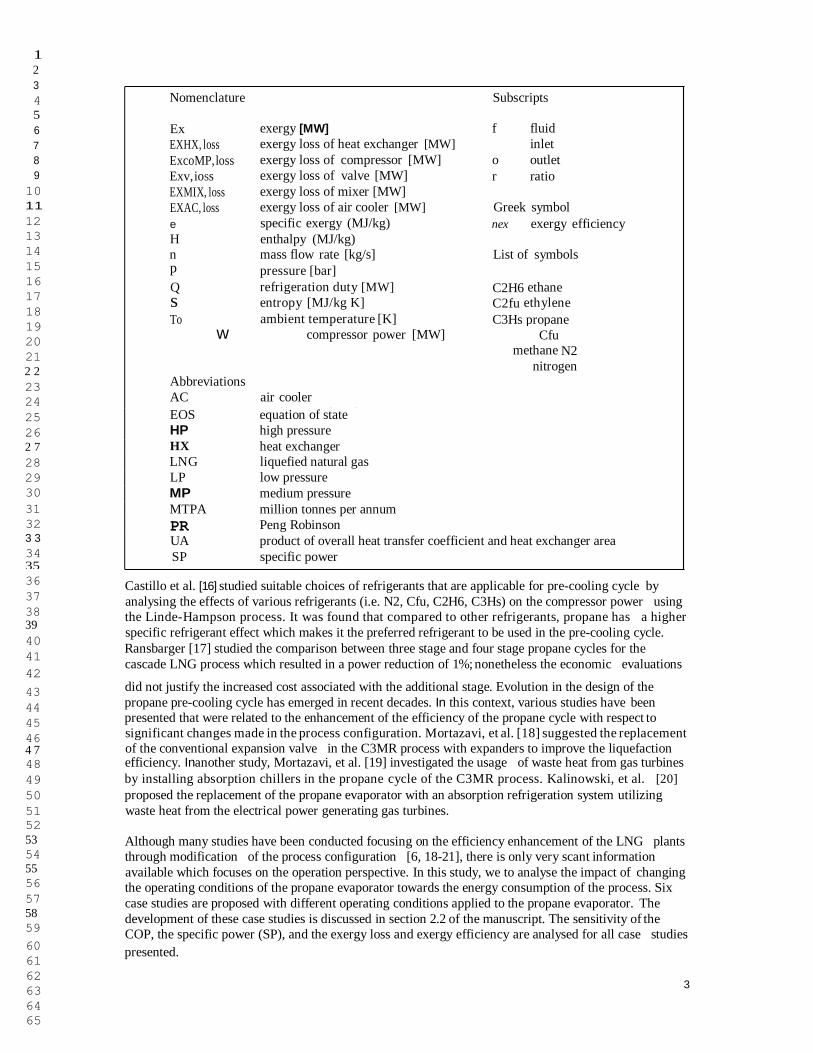
Nomenclature Subscripts
Ex exergy [MW] f fluid
EXHX, loss exergy loss of heat exchanger [MW] inlet
ExcoMP, loss exergy loss of compressor [MW] o outlet
Exv, ioss exergy loss of valve [MW] r ratio
EXMIX, loss exergy loss of mixer [MW]
EXAC, loss exergy loss of air cooler [MW] Greek symbol
e specific exergy (MJ/kg) nex exergy efficiency
H enthalpy (MJ/kg)
n mass flow rate [kg/s] List of symbols p pressure [bar]
s entropy [MJ/kg K] C2fu ethylene
w compressor power [MW] Cfu methane N2
nitrogen Abbreviations
AC air cooler
COP coefficient of performance 25 EOS equation of state
26 HP high pressure
2 7 HX heat exchanger
28 LNG liquefied natural gas
29 LP low pressure 30 MP medium pressure
31 MTPA million tonnes per annum 32 PR Peng Robinson 3 3
34 35
UA
SP
product of overall heat transfer coefficient and heat exchanger area
specific power
1
2
3
61
62
63
64
65
4
42
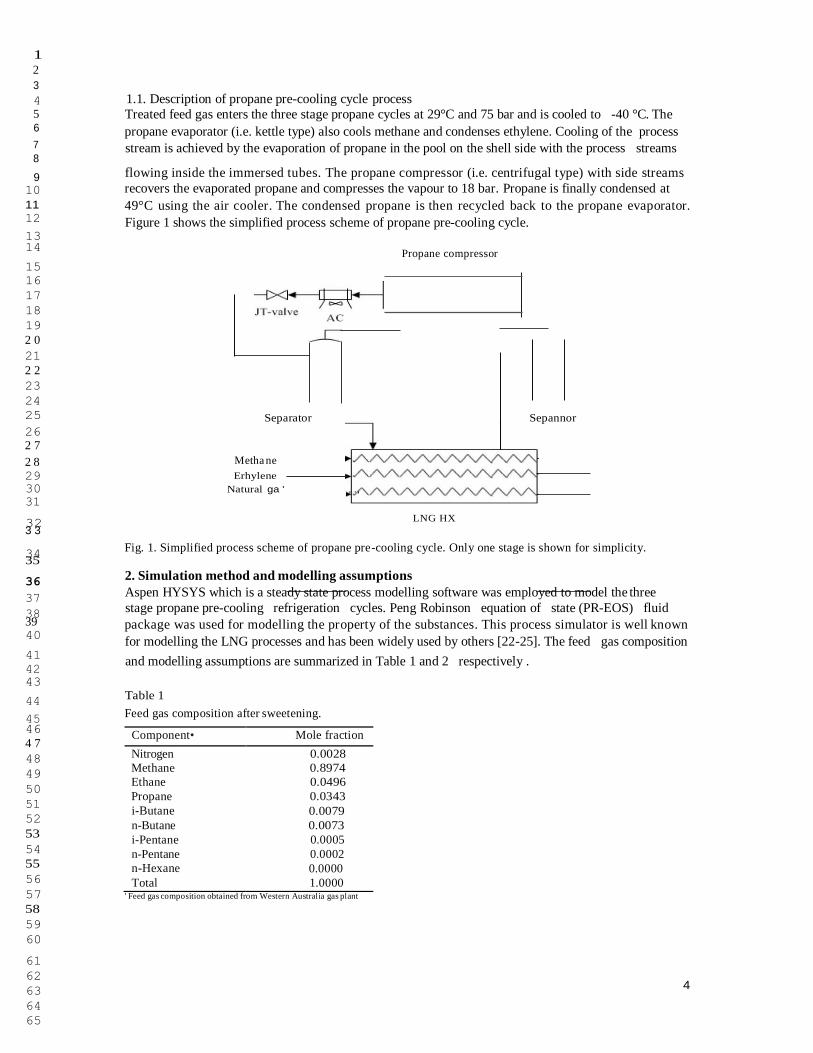
4 1.1. Description of propane pre-cooling cycle process 5 Treated feed gas enters the three stage propane cycles at 29°C and 75 bar and is cooled to -40 °C. The 6 propane evaporator (i.e. kettle type) also cools methane and condenses ethylene. Cooling of the process 7 stream is achieved by the evaporation of propane in the pool on the shell side with the process streams 8
9 flowing inside the immersed tubes. The propane compressor (i.e. centrifugal type) with side streams
10 recovers the evaporated propane and compresses the vapour to 18 bar. Propane is finally condensed at 11 49°C using the air cooler. The condensed propane is then recycled back to the propane evaporator. 12 Figure 1 shows the simplified process scheme of propane pre-cooling cycle. 13 14
Propane compressor
15
16
17
18
19
2 0
21
2 2
23
24
25 Separator Sepannor
26
2 7
2 8 Metha ne
29 Erhylene
30 Natural ga ' , .,
31
32 LNG HX
3 3
34 Fig. 1. Simplified process scheme of propane pre-cooling cycle. Only one stage is shown for simplicity.
35
36 2. Simulation method and modelling assumptions
37 Aspen HYSYS which is a steady state process modelling software was employed to model the three
38 stage propane pre-cooling refrigeration cycles. Peng Robinson equation of state (PR-EOS) fluid 39 package was used for modelling the property of the substances. This process simulator is well known 40
for modelling the LNG processes and has been widely used by others [22-25]. The feed gas composition 41
and modelling assumptions are summarized in Table 1 and 2 respectively .
43
44 Table 1
45 Feed gas composition after sweetening.
46
4 7
48
49
50
51
52
53
54
55
56
57 ' Feed gas composition obtained from Western Australia gas plant
58
59
60
Component• Mole fraction
Nitrogen 0.0028
Methane 0.8974
Ethane 0.0496
Propane 0.0343
i-Butane 0.0079
n-Butane 0.0073
i-Pentane 0.0005
n-Pentane 0.0002
n-Hexane 0.0000
Total 1.0000
1
2
3
58
59
60
61
62
63
64
65
5
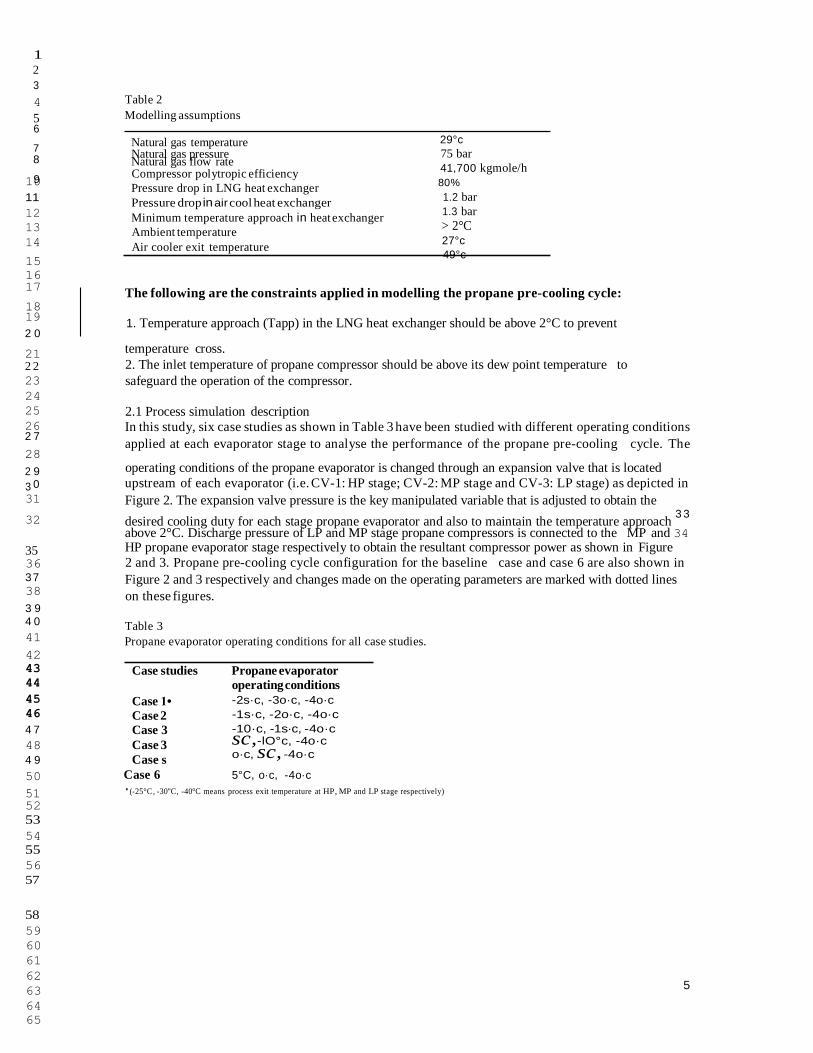
4 Table 2
5 Modelling assumptions 6
7 Natural gas temperature
8 Natural gas pressure Natural gas flow rate
9 Compressor polytropic efficiency
10 Pressure drop in LNG heat exchanger
11 Pressure drop in air cool heat exchanger 12 Minimum temperature approach in heat exchanger 13 Ambient temperature 14 Air cooler exit temperature
15
16
29°c
75 bar
41,700 kgmole/h
80%
1.2 bar
1.3 bar
> 2°C 27°c
49°c
17 The following are the constraints applied in modelling the propane pre-cooling cycle:
18 19
1. Temperature approach (Tapp) in the LNG heat exchanger should be above 2°C to prevent 2 0
21 temperature cross.
2 2 2. The inlet temperature of propane compressor should be above its dew point temperature to
23 safeguard the operation of the compressor. 24
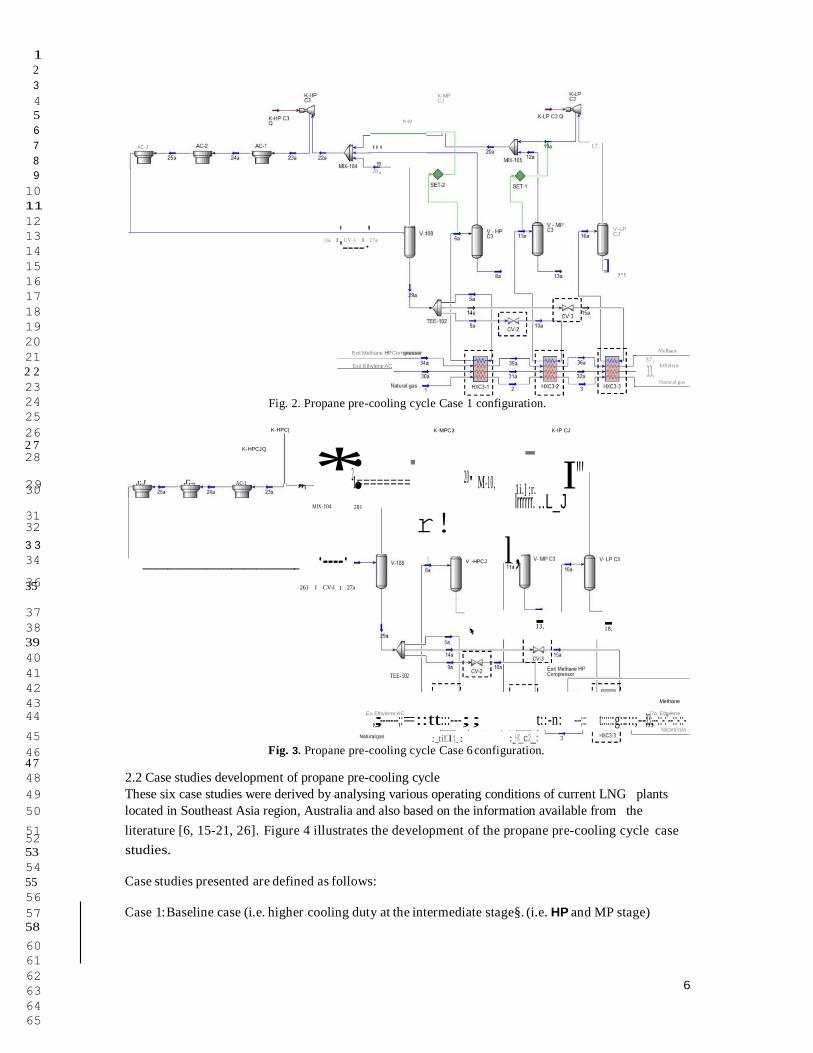
25 2.1 Process simulation description 26 In this study, six case studies as shown in Table 3 have been studied with different operating conditions 2 7
applied at each evaporator stage to analyse the performance of the propane pre-cooling cycle. The 28
2 9 operating conditions of the propane evaporator is changed through an expansion valve that is located
3 0 upstream of each evaporator (i.e. CV-1: HP stage; CV-2: MP stage and CV-3: LP stage) as depicted in
31 Figure 2. The expansion valve pressure is the key manipulated variable that is adjusted to obtain the
32 desired cooling duty for each stage propane evaporator and also to maintain the temperature approach 3 3
above 2°C. Discharge pressure of LP and MP stage propane compressors is connected to the MP and 34
35 HP propane evaporator stage respectively to obtain the resultant compressor power as shown in Figure
36 2 and 3. Propane pre-cooling cycle configuration for the baseline case and case 6 are also shown in 3 7 Figure 2 and 3 respectively and changes made on the operating parameters are marked with dotted lines 38 on these figures. 3 9 4 0 Table 3 41 Propane evaporator operating conditions for all case studies. 42
43 Case studies Propane evaporator 44 operating conditions 45 Case 1• 46 Case 2 4 7 Case 3
48 Case 3
4 9 Case s
-2s·c, -3o·c, -4o·c
-1s·c, -2o·c, -4o·c
-10·c, -1s·c, -4o·c sc,-lO°c, -4o·c
o·c, sc, -4o·c
50 Case 6 5°C, o·c, -4o·c
51 '(-25°C, -30"C, -40°C means process exit temperature at HP, MP and LP stage respectively)
52
53
54
55
56
57
1
2
3
60
61
62
63
64
65
6
K-MP CJ
K-M
AC-J ",,' 28,
17,
I I V-LP CJ
26a I CV-1 I 27a
'----·
L ,.,
Exit Methane HP Compressor Melhane
Exit Ethylene AC 37,
33, Ethylene
Natural gas
Nacural gas
:_ti!Cl1_ : :_HX_c2_:
. -
Ex Ethylene AC J7a Ethylene
31
52
4
5
6
7
8
9
10
11
12
13
14
15
16
17
18
19
20
21
2 2
23
24
25
26 2 7 K-HPCJQ
28
Fig. 2. Propane pre-cooling cycle Case 1 configuration.
K-HPC) K-MPC3 K-lP CJ
29 ,t;.J ,r;., AC-1
30 n, *:21=· ======= 20' M-10,
1i.] ;r. I"' MIX- 104 281 lrrrrrr. ..L_J
32 r! 3 3
34 -------------
36
·----· V -HPCJ l , 35 261 I CV-l 1 27a
37
38
39
40
41
42
43
TEE- 102
,,, -13, -18,
Methane
44 ;,.:,-------;:=::tt:::---;; t::-n: ----;::: t::::::g:::::;--;3,3;:,---::-:'--::-::- 45 Natural gas
46 Fig. 3. Propane pre-cooling cycle Case 6 configuration. 4 7
48 2.2 Case studies development of propane pre-cooling cycle
49 These six case studies were derived by analysing various operating conditions of current LNG plants
50 located in Southeast Asia region, Australia and also based on the information available from the
51 literature [6, 15-21, 26]. Figure 4 illustrates the development of the propane pre-cooling cycle case
53 studies.
54
55 Case studies presented are defined as follows:
56
57 Case 1: Baseline case (i.e. higher cooling duty at the intermediate stage§. (i.e. HP and MP stage) 58

1
2
3
60
61
62
63
64
65
7
59 Case 6:(i.e. lower cooling duty at intermediate stage§.)
1
2
3
60
61
62
63
64
65
8
4
5
6
7
8
9
10
11
12
13
14
15
16
17
18
19
20
21
2 2
23
24
25
26
2 7
28
29
30
31
32
3 3
34
35
36
37
38
39 40
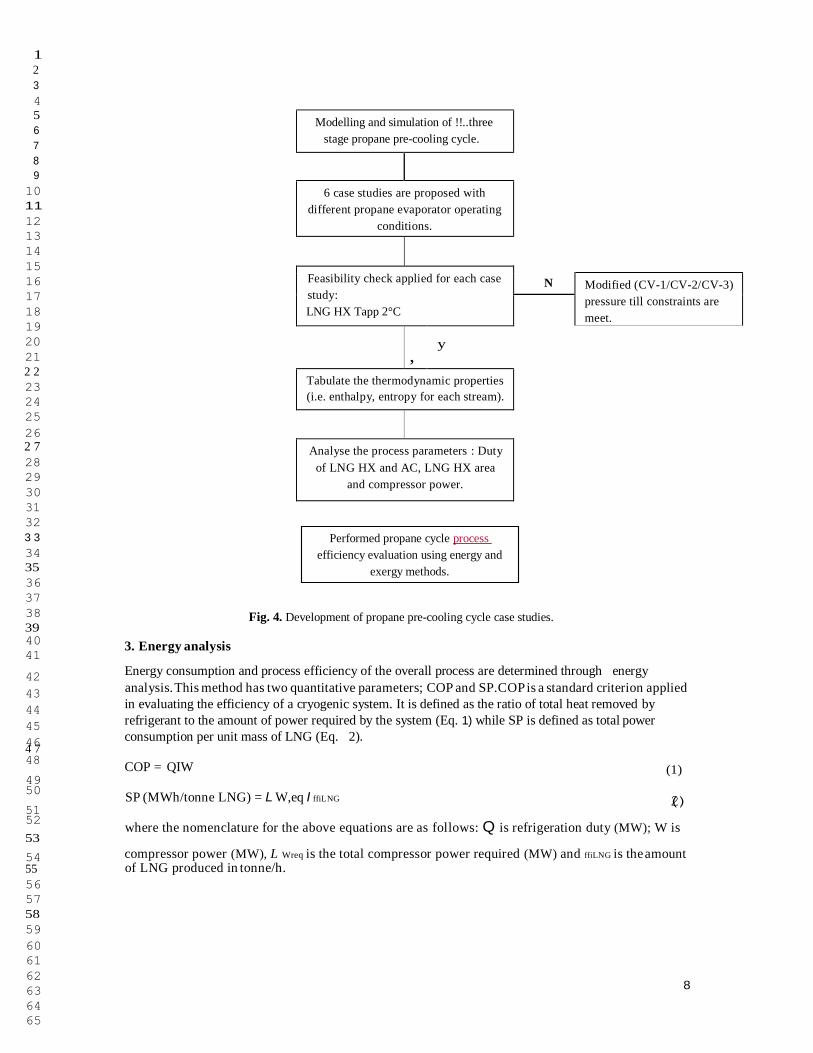
3. Energy analysis 41
Modelling and simulation of !!..three
stage propane pre-cooling cycle.
6 case studies are proposed with
different propane evaporator operating
conditions.
Feasibility check applied for each case
study:
LNG HX Tapp 2°C
N Modified (CV-1/CV-2/CV-3)
pressure till constraints are
meet.
, y
Tabulate the thermodynamic properties
(i.e. enthalpy, entropy for each stream).
Analyse the process parameters : Duty
of LNG HX and AC, LNG HX area
and compressor power.
Fig. 4. Development of propane pre-cooling cycle case studies.
42 Energy consumption and process efficiency of the overall process are determined through energy
43 analysis. This method has two quantitative parameters; COP and SP.COP is a standard criterion applied
44 in evaluating the efficiency of a cryogenic system. It is defined as the ratio of total heat removed by
45 refrigerant to the amount of power required by the system (Eq. 1) while SP is defined as total power
46 consumption per unit mass of LNG (Eq. 2). 4 7 48
COP = QIW 49 50
SP (MWh/tonne LNG) = L W,eq I ffiLNG
51
(1)
(2)
52 where the nomenclature for the above equations are as follows: Q is refrigeration duty (MW); W is
53
54 compressor power (MW), L Wreq is the total compressor power required (MW) and ffiLNG is the amount 55 of LNG produced in tonne/h.
56
57
58
59
Performed propane cycle process
efficiency evaluation using energy and
exergy methods.
1
2
3
53
54
55
56
57
58
59
60
61
62
63
64
65
8
4 3.1. Exergy analysis 5 In this study, exergy analysis is applied to locate the irreversibility that occurs within the unit operations 6 of the propane pre-cooling cycle. This method identifies the individual unit operation that exhibits a 7 higher amount of lost work which gives the process engineer valuable information for improving the 8
9 process from the equipment and process design point of view. Exergy which is derived from the second
10 law of thermodynamics is defined as the amount of reversible work achieved by a system when the 11 system components are brought into thermodynamic equilibrium state with its environment in a 12 reversible process [27]. The exergy change of a system is a function of two main parameters which are 13 the enthalpy and entropy. Change in exergy () between the initial and the final state of a system is 14
15 expressed as: 16
17 (3)
18
19 where T0 is the ambient temperature, H0and S0 represent the enthalpy and entropy of the outlet stream
20 and Hi and Si represent the enthalpy and entropy of the inlet stream respectively . The difference of this
21 property will define whether the processing system requires or produces work as the systems moves 2 2
23 from initial state to final state. If the exergy difference (Lllix) is greater than 0, this indicates that the
24 processing system produces work, whereas if the exergy difference is less than 0, this indicates the
25 processing system requires work from the outer system for the state change [28].
26
2 7 The exergy efficiency of the process is defined as the ratio of the difference between the total 28 compressor power required and the total exergy loss to the total amount of power required by the system 29 (Eq.4). The exergy efficiency is expressed as: 30 31
32 1}ex (%) = U:Wreq - L W1oss) X 100 [6]
3 3 L Wreq
34
35 where L W1oss is the total exergy loss work from each unit operation .
36
(4)
37 The expressions to determine the exergy loss for all the unit operations in this study are summarized in
38 Table 4. 39
40
41
42
43
44
45
46
4 7
48
49
50
51
52
1
2
3
53
54
55
56
57
58
59
60
61
62
63
64
65
9
c2•• -- Cl,.
NG.
1
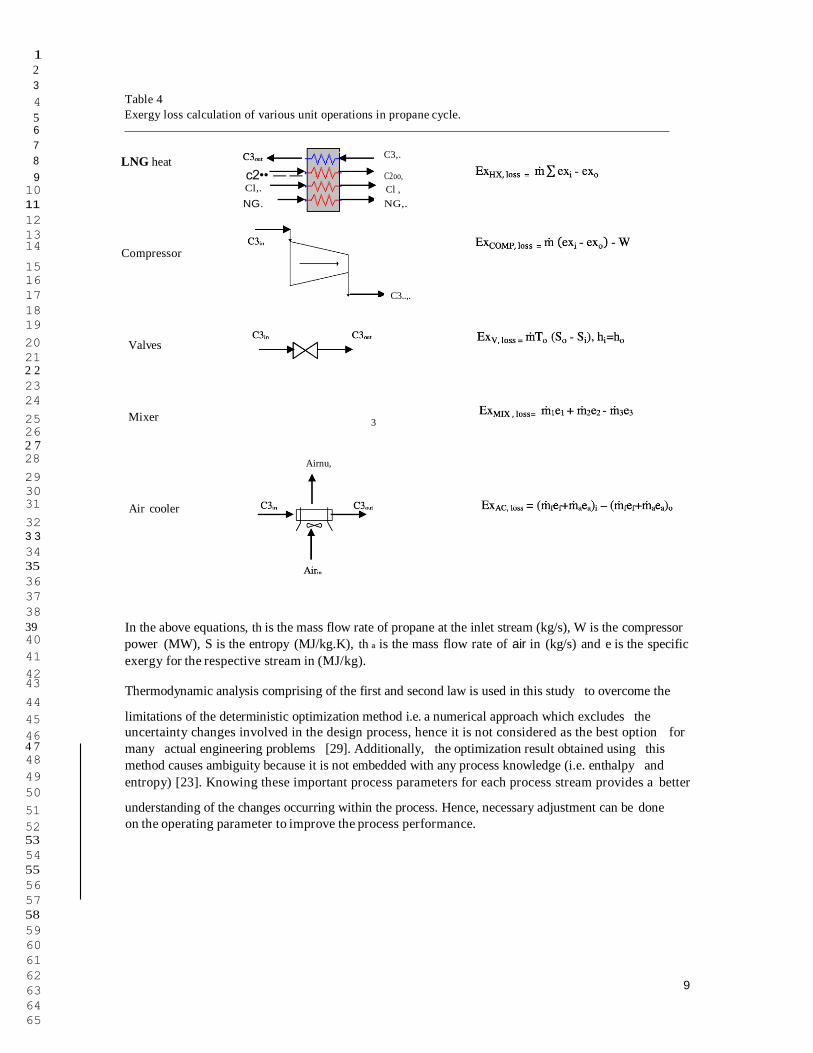
4 Table 4
5 Exergy loss calculation of various unit operations in propane cycle.
6
7 C3,.
LNG heat
9 C2oo,
10 Cl ,
11 NG,.
12
13 14
Compressor 15
16
17 C3..,.
18
19
20 Valves 21
2 2
23
24
25 Mixer 3
26
2 7 28 Airnu,
29
30 31 Air cooler 32
3 3
34
35
36
37
38
39 In the above equations, th is the mass flow rate of propane at the inlet stream (kg/s), W is the compressor 40 power (MW), S is the entropy (MJ/kg.K), th a is the mass flow rate of air in (kg/s) and e is the specific 41 exergy for the respective stream in (MJ/kg). 42 43
Thermodynamic analysis comprising of the first and second law is used in this study to overcome the 44
45 limitations of the deterministic optimization method i.e. a numerical approach which excludes the
46 uncertainty changes involved in the design process, hence it is not considered as the best option for 4 7 many actual engineering problems [29]. Additionally, the optimization result obtained using this 48 method causes ambiguity because it is not embedded with any process knowledge (i.e. enthalpy and 49 entropy) [23]. Knowing these important process parameters for each process stream provides a better 50
51 understanding of the changes occurring within the process. Hence, necessary adjustment can be done
52 on the operating parameter to improve the process performance.
8
1
2
3
55
56
57
58
59
60
61
62
63
64
65
10
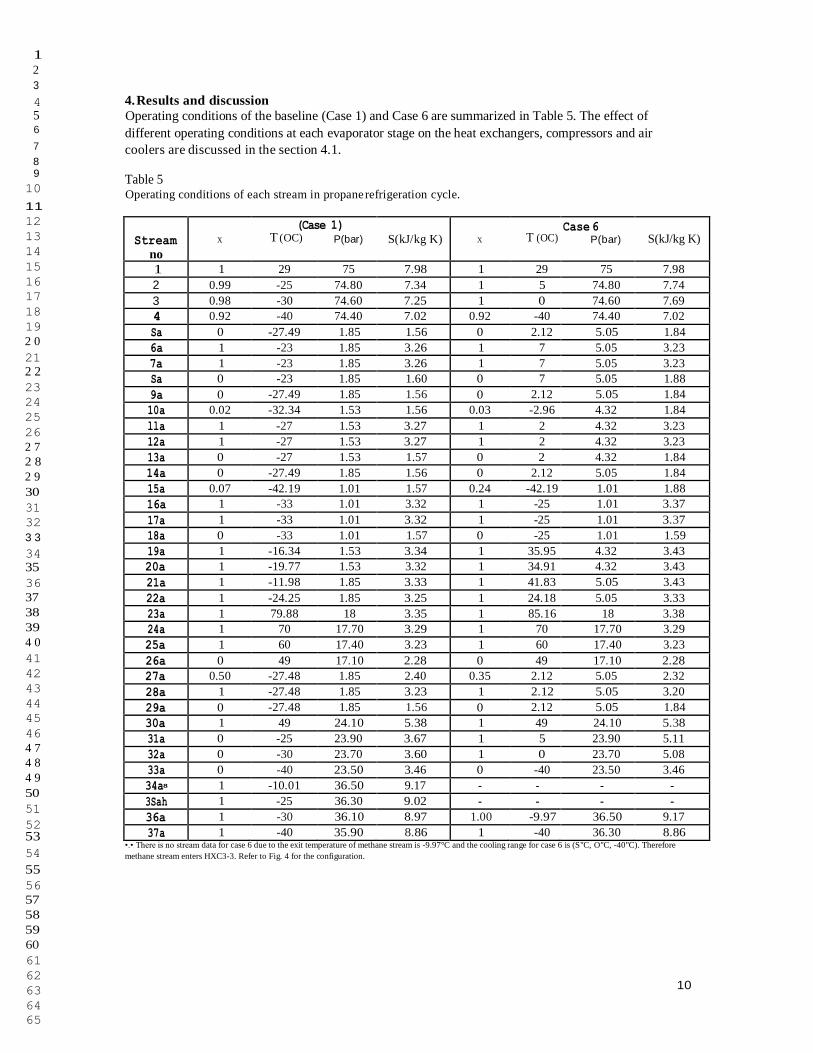
4 4. Results and discussion 5 Operating conditions of the baseline (Case 1) and Case 6 are summarized in Table 5. The effect of 6 different operating conditions at each evaporator stage on the heat exchangers, compressors and air 7 coolers are discussed in the section 4.1. 8 9
Table 5 10
Operating conditions of each stream in propane refrigeration cycle. 11
12
13
14
15
16
17
18
19
2 0
21
2 2
23
24
25
26
2 7
2 8
2 9
30
31
32
3 3
34
35
36
37
38
39
4 0
41
42
43
44
45
46
4 7
4 8
4 9
50
51
52 53
•.• There is no stream data for case 6 due to the exit temperature of methane stream is -9.97°C and the cooling range for case 6 is (S"C, O"C, -40"C). Therefore 54 methane stream enters HXC3-3. Refer to Fig. 4 for the configuration.
Stream no
X
(Case 1) T (OC) P(bar)
S(kJ/kg K)
X
T (OC) Case 6
P(bar)
S(kJ/kg K)
1 1 29 75 7.98 1 29 75 7.98
2 0.99 -25 74.80 7.34 1 5 74.80 7.74
3 0.98 -30 74.60 7.25 1 0 74.60 7.69
4 0.92 -40 74.40 7.02 0.92 -40 74.40 7.02
Sa 0 -27.49 1.85 1.56 0 2.12 5.05 1.84
6a 1 -23 1.85 3.26 1 7 5.05 3.23
7a 1 -23 1.85 3.26 1 7 5.05 3.23
Sa 0 -23 1.85 1.60 0 7 5.05 1.88
9a 0 -27.49 1.85 1.56 0 2.12 5.05 1.84
10a 0.02 -32.34 1.53 1.56 0.03 -2.96 4.32 1.84
lla 1 -27 1.53 3.27 1 2 4.32 3.23
12a 1 -27 1.53 3.27 1 2 4.32 3.23
13a 0 -27 1.53 1.57 0 2 4.32 1.84
14a 0 -27.49 1.85 1.56 0 2.12 5.05 1.84
15a 0.07 -42.19 1.01 1.57 0.24 -42.19 1.01 1.88
16a 1 -33 1.01 3.32 1 -25 1.01 3.37
17a 1 -33 1.01 3.32 1 -25 1.01 3.37
18a 0 -33 1.01 1.57 0 -25 1.01 1.59
19a 1 -16.34 1.53 3.34 1 35.95 4.32 3.43
20a 1 -19.77 1.53 3.32 1 34.91 4.32 3.43
21a 1 -11.98 1.85 3.33 1 41.83 5.05 3.43
22a 1 -24.25 1.85 3.25 1 24.18 5.05 3.33
23a 1 79.88 18 3.35 1 85.16 18 3.38
24a 1 70 17.70 3.29 1 70 17.70 3.29
25a 1 60 17.40 3.23 1 60 17.40 3.23
26a 0 49 17.10 2.28 0 49 17.10 2.28
27a 0.50 -27.48 1.85 2.40 0.35 2.12 5.05 2.32
28a 1 -27.48 1.85 3.23 1 2.12 5.05 3.20
29a 0 -27.48 1.85 1.56 0 2.12 5.05 1.84
30a 1 49 24.10 5.38 1 49 24.10 5.38
31a 0 -25 23.90 3.67 1 5 23.90 5.11
32a 0 -30 23.70 3.60 1 0 23.70 5.08
33a 0 -40 23.50 3.46 0 -40 23.50 3.46
34a8 1 -10.01 36.50 9.17 - - - - 3Sah 1 -25 36.30 9.02 - - - - 36a 1 -30 36.10 8.97 1.00 -9.97 36.50 9.17
37a 1 -40 35.90 8.86 1 -40 36.30 8.86
1
2
3
58
59
60
61
62
63
64
65
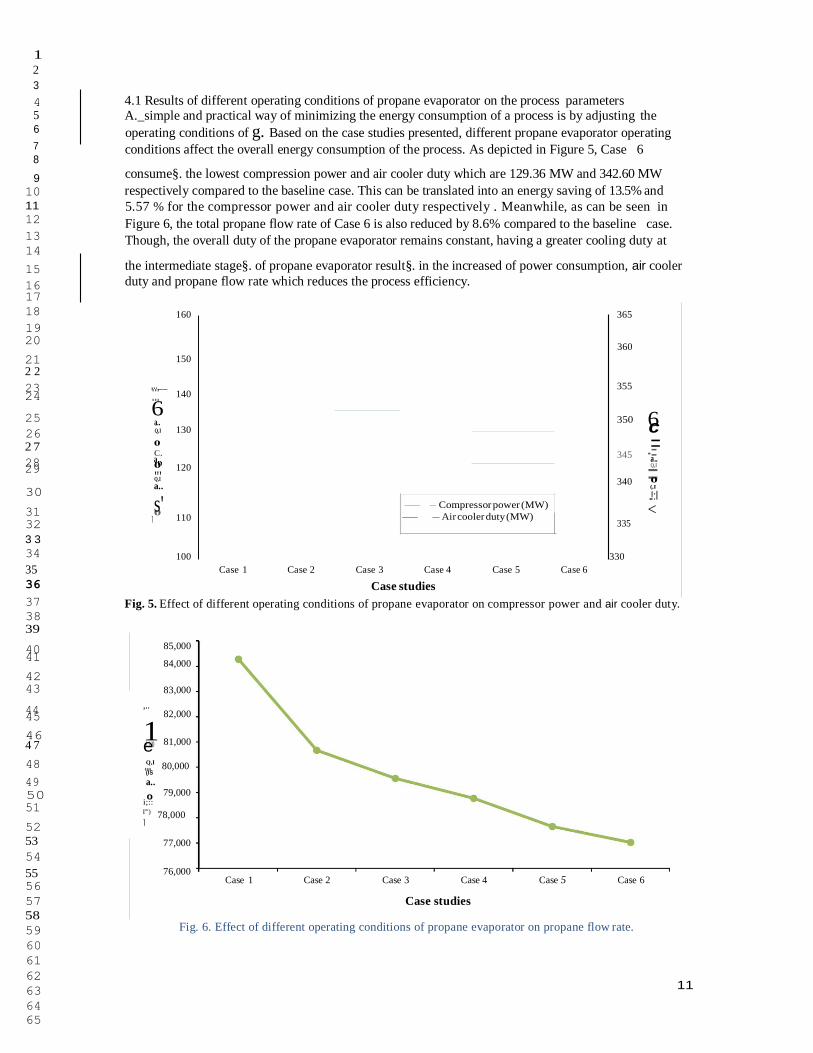
Fig. 6. Effect of different operating conditions of propane evaporator on propane flow rate.
11
:::
= C. 345 -=
l:)J)
...
u
28 Q,I
u 0
4 4.1 Results of different operating conditions of propane evaporator on the process parameters 5 A._simple and practical way of minimizing the energy consumption of a process is by adjusting the 6 operating conditions of g. Based on the case studies presented, different propane evaporator operating 7 conditions affect the overall energy consumption of the process. As depicted in Figure 5, Case 6 8
9 consume§. the lowest compression power and air cooler duty which are 129.36 MW and 342.60 MW
10 respectively compared to the baseline case. This can be translated into an energy saving of 13.5% and 11 5.57 % for the compressor power and air cooler duty respectively . Meanwhile, as can be seen in 12 Figure 6, the total propane flow rate of Case 6 is also reduced by 8.6% compared to the baseline case. 13 Though, the overall duty of the propane evaporator remains constant, having a greater cooling duty at 14
15 the intermediate stage§. of propane evaporator result§. in the increased of power consumption, air cooler
16 duty and propane flow rate which reduces the process efficiency. 17
18 160 365
19 20
360
21 150
2 2
23 ,..__ 355 140 24
6 a..
26 Q,I
130 350 6
c 2 7 0 =
a.. a.. 0 29 "' 120 "Q,I' 0 340
30 a.. (,I
31 s' 32
3 3
110
335
.!:l
<
34 100 330
35 Case 1 Case 2 Case 3 Case 4 Case 5 Case 6
36 Case studies
37 Fig. 5. Effect of different operating conditions of propane evaporator on compressor power and air cooler duty. 38 39
40 85,000
41 84,000
42 43 83,000
44 ,..
45 82,000
46 1 4 7 e
81,000
48 Q,I 80,000
(IS
49 a..
50 0 i;::
79,000
51 I"') 78,000
52
53 77,000
54
55 76,000
56
57
Case 1 Case 2 Case 3 Case 4 Case 5 Case 6
Case studies
- - Compressor power (MW)
- - Air cooler duty (MW)
25
1
2
3
58
59
60
61
62 63
64
65
12
. . .
's
.s c
s
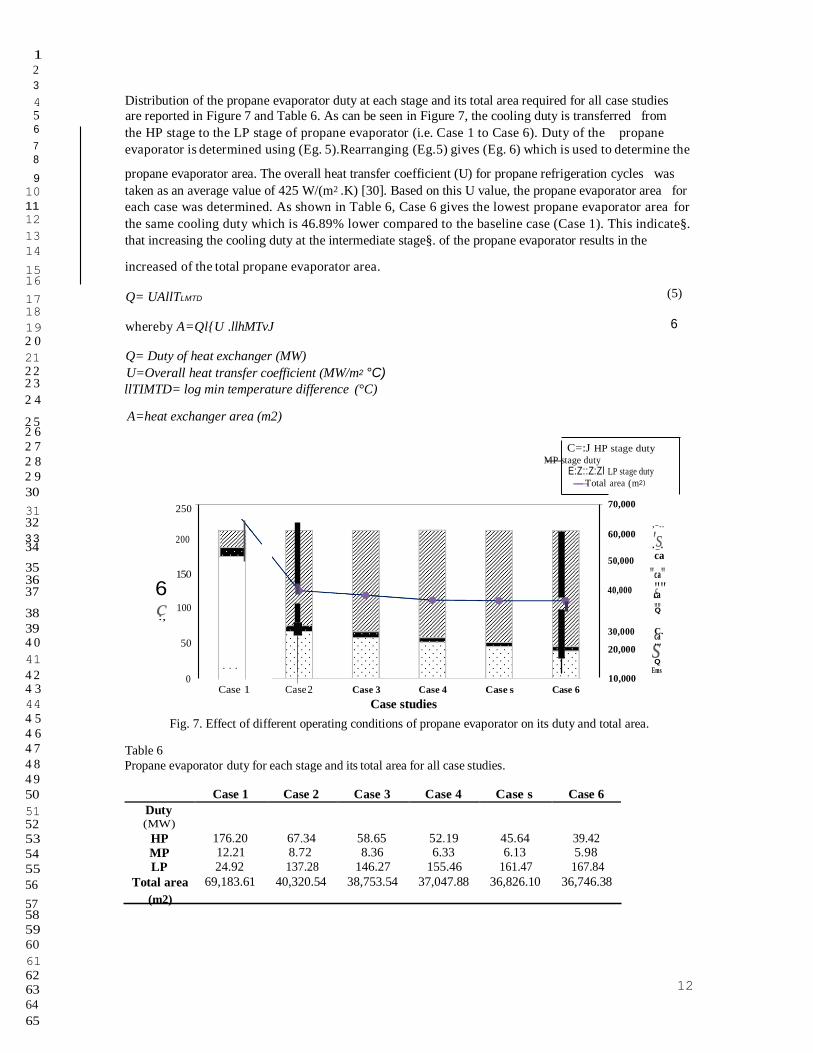
4 Distribution of the propane evaporator duty at each stage and its total area required for all case studies 5 are reported in Figure 7 and Table 6. As can be seen in Figure 7, the cooling duty is transferred from 6 the HP stage to the LP stage of propane evaporator (i.e. Case 1 to Case 6). Duty of the propane 7 evaporator is determined using (Eg. 5).Rearranging (Eg.5) gives (Eg. 6) which is used to determine the 8
9 propane evaporator area. The overall heat transfer coefficient (U) for propane refrigeration cycles was
10 taken as an average value of 425 W/(m2 .K) [30]. Based on this U value, the propane evaporator area for 11 each case was determined. As shown in Table 6, Case 6 gives the lowest propane evaporator area for 12 the same cooling duty which is 46.89% lower compared to the baseline case (Case 1). This indicate§. 13 that increasing the cooling duty at the intermediate stage§. of the propane evaporator results in the 14
15 increased of the total propane evaporator area. 16
17 Q= UAllTLMTD
18
19 whereby A=Ql{U .llhMTvJ 2 0
21 Q= Duty of heat exchanger (MW) 2 2 U=Overall heat transfer coefficient (MW/m2 °C) 2 3 llTIMTD= log min temperature difference (°C) 2 4
2 5 A=heat exchanger area (m2)
2 6
2 7
2 8
2 9
30
31 250
32
(5)
6
70,000
,-..
3 3 200 34
60,000
'-'
35 36 37 6
150
50,000 ca
"ca" 40,000 "" ca
100 :,
39 4 0 50
41
"Q"
30,000 Cc..a.
.
20,000
Q
4 2 0
4 3
44
Case 1 Case 2
Case 3 Case 4
Case studies
Case s
Case 6
10,000 Ems
4 5
4 6
4 7 Table 6
Fig. 7. Effect of different operating conditions of propane evaporator on its duty and total area.
4 8 Propane evaporator duty for each stage and its total area for all case studies. 4 9
56 Total area 69,183.61 40,320.54 38,753.54 37,047.88 36,826.10 36,746.38
57 (m2)
C=:J HP stage duty
-MP stage duty E:Z::Z:Zl LP stage duty
--Total area (m2)
38
50 Case 1 Case 2 Case 3 Case 4 Case s Case 6
51 Duty 52 (MW) 53 HP 176.20 67.34 58.65 52.19 45.64 39.42
54 MP 12.21 8.72 8.36 6.33 6.13 5.98
55 LP 24.92 137.28 146.27 155.46 161.47 167.84
1
2
3
49
50
51
52
53
54
55
56
57
58
59
60
61
62
63
64
65
13
z
32
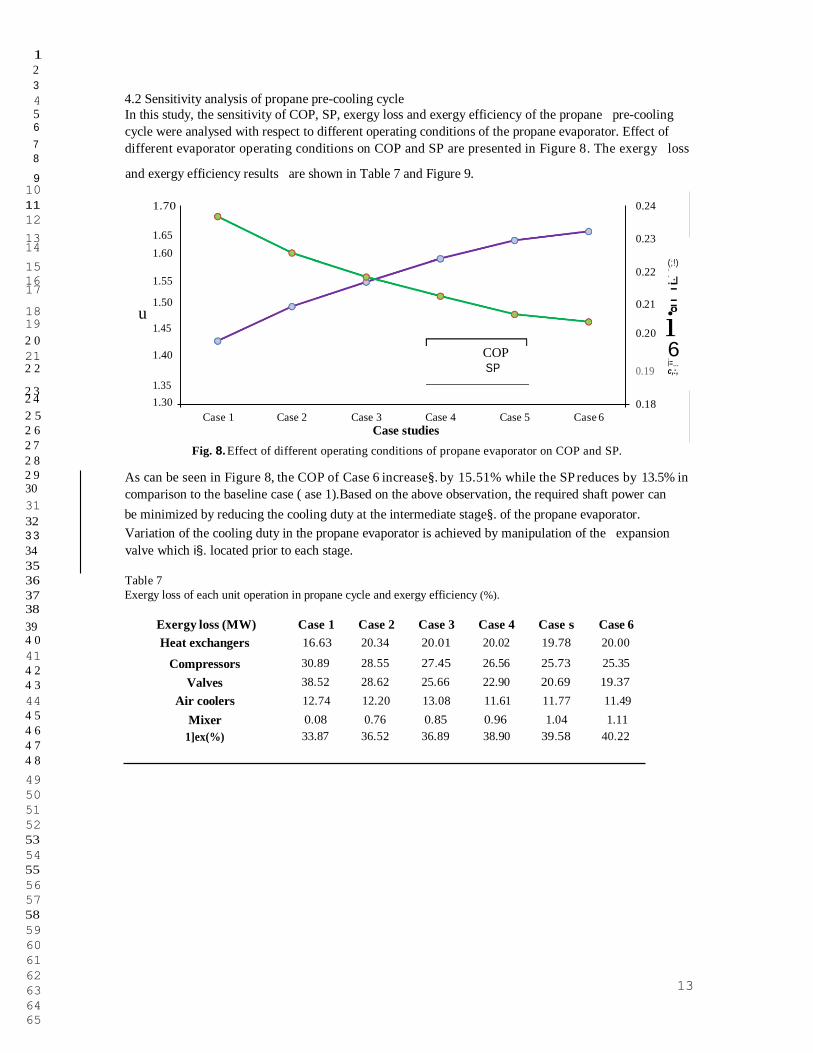
4 4.2 Sensitivity analysis of propane pre-cooling cycle 5 In this study, the sensitivity of COP, SP, exergy loss and exergy efficiency of the propane pre-cooling 6 cycle were analysed with respect to different operating conditions of the propane evaporator. Effect of 7 different evaporator operating conditions on COP and SP are presented in Figure 8. The exergy loss 8
9 and exergy efficiency results are shown in Table 7 and Figure 9.
10
11 1.70
12
13 1.65 14
1.60
15
16 1.55 17
0.24
0.23
0.22
(;!)
..:l = 1.50
u 19 1.45
2 0
21 1.40 2 2
2 3 1.35
2 4 1.30
2 5
2 6
Case 1
Case 2
Case 3 Case 4
Case studies
Case 5
Case 6
0.21 =0
0.20 i 6 i=... c,:,
0.18
2 7 Fig. 8. Effect of different operating conditions of propane evaporator on COP and SP.
2 8
2 9 As can be seen in Figure 8, the COP of Case 6 increase§. by 15.51% while the SP reduces by 13.5% in 30 comparison to the baseline case ( ase 1).Based on the above observation, the required shaft power can 31
be minimized by reducing the cooling duty at the intermediate stage§. of the propane evaporator.
3 3 Variation of the cooling duty in the propane evaporator is achieved by manipulation of the expansion
34 valve which i§. located prior to each stage. 35
36 Table 7
37 Exergy loss of each unit operation in propane cycle and exergy efficiency (%).
38
39 Exergy loss (MW) Case 1 Case 2 Case 3 Case 4 Case s Case 6
4 0
41
4 2
4 3
44
4 5
4 6
4 7
4 8
COP SP
0.19
18
Heat exchangers 16.63 20.34 20.01 20.02 19.78 20.00
Compressors 30.89 28.55 27.45 26.56 25.73 25.35
Valves 38.52 28.62 25.66 22.90 20.69 19.37
Air coolers 12.74 12.20 13.08 11.61 11.77 11.49
Mixer 0.08 0.76 0.85 0.96 1.04 1.11
1]ex(%) 33.87 36.52 36.89 38.90 39.58 40.22
1
2
3
49
50
51
52
53
54
55
56
57
58
59
60
61
62
63
64
65
14
4
5
6
7
8
9
10
11
12
13
14
15
16
17
18
19
20
21 2 2
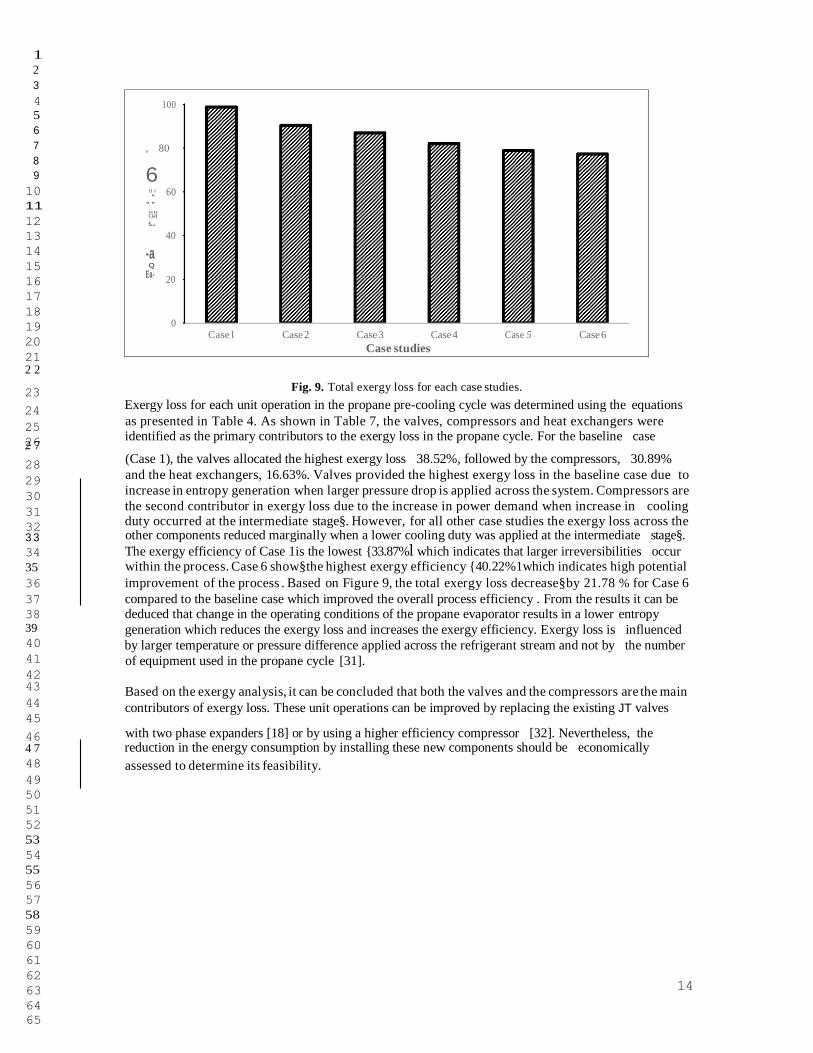
23 Fig. 9. Total exergy loss for each case studies.
24 Exergy loss for each unit operation in the propane pre-cooling cycle was determined using the equations
25 as presented in Table 4. As shown in Table 7, the valves, compressors and heat exchangers were
26 identified as the primary contributors to the exergy loss in the propane cycle. For the baseline case 2 7
28 (Case 1), the valves allocated the highest exergy loss 38.52%, followed by the compressors, 30.89%
29 and the heat exchangers, 16.63%. Valves provided the highest exergy loss in the baseline case due to
30 increase in entropy generation when larger pressure drop is applied across the system. Compressors are
31 the second contributor in exergy loss due to the increase in power demand when increase in cooling
32 duty occurred at the intermediate stage§. However, for all other case studies the exergy loss across the
3 3 other components reduced marginally when a lower cooling duty was applied at the intermediate stage§.
34 The exergy efficiency of Case 1is the lowest {33.87%l which indicates that larger irreversibilities occur
35 within the process. Case 6 show§the highest exergy efficiency {40.22%1which indicates high potential
36 improvement of the process . Based on Figure 9, the total exergy loss decrease§by 21.78 % for Case 6
37 compared to the baseline case which improved the overall process efficiency . From the results it can be 38 deduced that change in the operating conditions of the propane evaporator results in a lower entropy 39 generation which reduces the exergy loss and increases the exergy efficiency. Exergy loss is influenced 40 by larger temperature or pressure difference applied across the refrigerant stream and not by the number 41 of equipment used in the propane cycle [31]. 42 43 Based on the exergy analysis, it can be concluded that both the valves and the compressors are the main 44 contributors of exergy loss. These unit operations can be improved by replacing the existing JT valves 45
46 with two phase expanders [18] or by using a higher efficiency compressor [32]. Nevertheless, the 4 7 reduction in the energy consumption by installing these new components should be economically 48 assessed to determine its feasibility.
100
, 80
6 .."::'
60
.... l:)J)
s...
40
-a Q
Ea- 20
0 Case l Case 2 Case 3 Case 4 Case 5 Case 6
Case studies
1
2
3
49
50
51
52
53
54
55
56
57
58
59
60
61
62
63
64
65
15
2 2
4 5. Conclusion 5 In this study, enhancement in the process efficiency of three stage propane pre-cooling cycle was 6 studied using energy and exergy analysis. The results shows that Case 6 achieve§. the highest COP 7 (l.65), lowest SP (0.205 MWh/tonne of LNG) and highest exergy efficiency .(40.22%). due to low 8
9 cooling duty distribution at the intermediate stage§.. Energy and exergy analysis can be a useful guide
10 in enhancing the process efficiency of the existing LNG plant and also as a reference for future 11 greenfield LNG projects . Changing the operating conditions of propane evaporator stage can be 12 considered as an option to minimize energy consumption of the process which does not involve any 13 additional cost. Additionally, this enhancement not only reduces the propane compression power but 14
15 also reduces the size of the heat exchanger as well as the refrigeration rate. Reducing energy
16 consumption lead§. to smaller equipment sizes which generally reduce the capital and operating costs of
17 the LNG plants. 18 19 6. Recommendations 20 In this study, no consideration is made from economic point of view. As this process is considered as 21 licensed processed, cost related to the proprietary equipment such as compressor and heat exchanger
23 are treated confidential. Thus, the detailed breakdowns on the equipment size, price, licensing fees are
24 not available. Therefore, future work is to be considered which simultaneously provide the trade-off
25 between the capital and operating cost of the plant with exergy analysis. 26
2 7
28 Acknowledgement
29 The authors wish to acknowledge the Ministry of Education (MOE) of Malaysia and University
30 Malaysia Pahang for funding the presented study. The authors also wish to acknowledge the support
31 provided by staff from Curtin University, Australia. 32
3 3
34
35
36
37
38
39
40
41
42
43
44
45
46
4 7
48
1
cycle efficiency with absorption chillers, Energy, 35 (2010) 3877-82.
[20) P.Kalinowski, Y . Hwang, R. Radermacher, S.Al Hashimi, P. Rodgers, Application of waste heat
powered absorption refrigeration system to the LNG recovery process, International Journal of
Refrigeration, 32 (2009) 687-94.
[21) C. Remeljej, A. Hoadley, An exergy analysis of small-scale liquefied natural gas (LNG) liquefaction
processes, Energy, 31 (2006) 2005-19.
[22) P.Hatcher, R. Khalilpour, A. Abbas, Optimisation of LNG mixed-refrigerant processes considering
operation and design objectives, Computers & Chemical Engineering, 41 (2012) 123-33.
50
51
52
53
54
55
56
57
58
59
60
61
62
63
64
65
16
19
2
3
4 References 5 [1] D.A. Wood, A review and outlook for the global LNG trade, Journal of Natural Gas Science and 6
Engineering, 9 (2012) 16-27. 7
[2] W. Lim, K. Choi, I. Moon, Current Status and Perspectives of Liquefied Natural Gas (LNG) Plant 8
9 Design, Industrial & Engineering Chemistry Research, 52 (2013) 3065-88.
10 [3] L. Castillo, R. Nadales, C. Gonzalez, C. Dorao, A. Viloria, Technology selection for liquefied natural
11 gas (LNG) on base-load plants, in: Jornadas de lnvestigaci6n de la Facultad de lngenierfa (JIFI}.
12 Universidad Central de Venezuela, 2010.
13 [4) L. Castillo, M. Majzoub Dahouk, S. Di Scipio, C.A. Dorao, Conceptual analysis of the precooling
14 stage for LNG processes, Energy Conversion and Management, 66 (2013) 41-47.
15 [5] A. Vatani,M. Mehrpooya, A. Palizdar, Energy and exergy analyses of five conventional liquefied
16 natural gas processes, International Journal of Energy Research, (2014) 1843-63.
17 [6] M.Kanoglu, Exergy analysis of multistage cascade refrigeration cycle used for natural gas
18 liquefaction, International Journal of Energy Research, 26 (2002) 763-74.
20 [7) L. Cipolato, M.C.A. Lirani,T.V . Costa, F.M. Fabrega, J.V .H. d'Angelo, Exergetic optimization of a
21 refrigeration cycle for natural gas liquefaction,31 (2012) 440-44 . 2 2 [8] D.A. AI-Otaibi, I. Dincer, M. Kalyon, Thermoeconomic optimization of vapor-compression
23 refrigeration systems, International Communications in Heat and Mass Transfer, 31 (2004) 95-107. 24 [9] M.Mehrpooya, A.Jarrahian, M.R. Pishvaie, Simulation and exergy-method analysis of an
25 industrial refrigeration cycle used in NGL recovery units, International Journal of Energy Research, 30 26
(2006) 1336-51. 2 7
[10) A.Cihan, 0. Hac1haf1zogvlu, K. Kahveci, Energy-exergy analysis and modernization suggestions 28
29 for a combined-cycle power plant, International Journal of Energy Research, 30 (2006) 115-26.
30 [11) I.H.Aljundi, Energy and exergy analysis of a steam power plant in Jordan, Applied Thermal
31 Engineering, 29 (2009) 324-28.
32 [12) S.C. Kaushik,V .S. Reddy,S.K. Tyagi, Energy and exergy analyses of thermal power plants:A
3 3 review, Renewable and Sustainable Energy Reviews, 15 (2011) 1857-72. 34 [13) M.M.F. Hasan, I.A. Karimi, H.E. Alfadala, Optimizing Compressor Operation in an LNG Plant, in: 35 H. Alfadala, G.V .R. Reklaitis, M.M. EI-Halwagi (eds.) Proceedings of the 1st Annual Gas Processing 36
Symposium, Elsevier,Amsterdam, 2009. 37
[14) G. Lee, R.Smith, X . Zhu, Optimal synthesis of mixed-refrigerant systems for low-temperature 38
39 processes,Industrial & engineering chemistry research, 41 (2002) 5016-28.
40 [15) H. Paradowski, M.Bamba, C.Bladanet, Propane Precooling Cycles for Increased LNG Train
41 Capacity, in: 14th International Conference and Exhibitions on Liquefied Natutal Gas Doha, Qatar 21-
42 24 March, 2004, pp. 1-18. 43 [16) L. Castillo, C.A. Dorao, On the conceptual design of pre-cooling stage of LNG plants using 44 propane or an ethane/propane mixture, Energy Conversion and Management, 65 (2013) 140-46 . 45 [17) W. Ransbarger,A fresh look at LNG process efficiency,LNG industry, (2007). 46 [18) A.Mortazavi,C. Somers, Y. Hwang, R. Radermacher, P.Rodgers, S. AI-Hashimi, Performance 4 7
48 enhancement of propane pre-cooled mixed refrigerant LNG plant, Applied Energy, 93 (2012) 125-31.
49 [19) A.Mortazavi,C. Somers,A .Alabdulkarem ,Y . Hwang, R. Radermacher , Enhancement of APCI
1
2
3
56
57
58
59
60
61
62
63
64
65
17
4 [23) M.S. Khan, S. Lee, G.P. Rangaiah, M. Lee, Knowledge based decision making method for the
5 selection of mixed refrigerant systems for energy efficient LNG processes, Applied Energy, 111
6 (2013) 1018-31. 7 [24) A. Aspelund, T. Gundersen, J. Myklebust, M.P. Nowak, A. Tomasgard, An optimization 8 simulation model for a simple LNG process, Computers & Chemical Engineering, 34 (2010) 1606-17. 9 [25) W.-s. Cao, X.-s. Lu, W.-s. Lin, A.-z. Gu, Parameter comparison of two small-scale natural gas
10
11 liquefaction processes in skid-mounted packages, Applied Thermal Engineering, 26 (2006) 898-904.
12 [26) D.-E. Helgestad, Modelling and optimization of the C3MR process for liquefaction of natural gas,
13 Process Systems Engineering, (2009) 44.
14 [27) J. Szargut, International Progress in Second Law Analysis Energy 5(1980) 709-18.
15 [28) X. Xu, J. Liu, C. Jiang, L. Cao, The correlation between mixed refrigerant composition and
16 ambient conditions in the PRICO LNG process, Applied Energy, 102 (2013) 1127-36.
17 [29) S. Mokhatab, Handbook of liquefied natural gas, Elsevier Science, Burlington, 2013.
18 [30) J.M. Campbell, Gas conditioning and processing : volume 2, the equipment modules I by John M.
19 Campbell, 8th ed., John M. Campbell and Company, Norman, Oklahoma, 2004. 20
21 [31) J.-1. Yoon, K.-H. Choi,H.-S. Lee, H.-J. Kim, C.-H. Son, Assessment of the performance of a natural
2 2 gas liquefaction cycle using natural refrigerants, Heat and Mass Transfer, 51 (2014) 95-105.
23 [32) T. He, Y. Ju, Design and Optimization of a Novel Mixed Refrigerant Cycle Integrated with NGL
24 Recovery Process for Small-Scale LNG Plant, Industrial & Engineering Chemistry Research, 53 (2014)
25 5545-53.
26
2 7
28
29
30
31
32
33
34
35
36
37
38
39
40
41
42
43
4 4
45
46
47
48
49
50
51
52
53
54
55