Renovo Energy Center Plan Approval Application ... - PA DEP
588
FRE 361-2788 (PER-02-02-09) RENOVO 137575 (2019-12-27) TD POWER ENGINEERS, INC. 303 U.S. ROUTE ONE FREEPORT, ME 04032 USA PHONE FAX 207-869-1200 207-869-1299 December 27, 2019 Mr. Muhammad Zaman Regional Air Quality Program Manager PA DEP Northcentral Regional Office 208 W. Third Street, Suite 101 Williamsport, PA 17701-6448 Subject: Renovo Energy Center, LLC Plan Approval Application Dear Muhammad: On behalf of Renovo Energy Center, LLC, POWER Engineers, Inc. is submitting three copies of a Plan Approval Application for the proposed Renovo Energy Center, LLC dual fuel fired combined- cycle electric generating plant in Renovo, Clinton County, Pennsylvania. The application consists of the following sections with supporting attachments: Section 1: Project Overview Section 2: Applicable Requirements Section 3: Control Technology Analyses Section 4: Ambient Air Quality Analyses Section 5: PaDEP Plan Approval Application Forms Section 6: Non-attainment Area Requirements Also enclosed is a check in the amount of $29,700 made payable to the Pennsylvania Clean Air Fund for the required application fee. If you have any questions, please contact me at 207-869-1282. Sincerely, Tim Donnelly Senior Project Manager Enclosure(s): c: Rick Franzese, Bechtel Development Company
-
Upload
khangminh22 -
Category
Documents
-
view
0 -
download
0
Transcript of Renovo Energy Center Plan Approval Application ... - PA DEP
FRE 361-2788 (PER-02-02-09) RENOVO 137575 (2019-12-27) TD
POWER ENGINEERS, INC.
303 U.S. ROUTE ONE FREEPORT, ME 04032 USA
PHONE
FAX
207-869-1200
207-869-1299
December 27, 2019
Mr. Muhammad Zaman
Regional Air Quality Program Manager
PA DEP Northcentral Regional Office
208 W. Third Street, Suite 101
Williamsport, PA 17701-6448
Subject: Renovo Energy Center, LLC Plan Approval Application
Dear Muhammad:
On behalf of Renovo Energy Center, LLC, POWER Engineers, Inc. is submitting three copies of a
Plan Approval Application for the proposed Renovo Energy Center, LLC dual fuel fired combined-
cycle electric generating plant in Renovo, Clinton County, Pennsylvania.
The application consists of the following sections with supporting attachments:
Section 1: Project Overview
Section 2: Applicable Requirements
Section 3: Control Technology Analyses
Section 4: Ambient Air Quality Analyses
Section 5: PaDEP Plan Approval Application Forms
Section 6: Non-attainment Area Requirements
Also enclosed is a check in the amount of $29,700 made payable to the Pennsylvania Clean Air
Fund for the required application fee.
If you have any questions, please contact me at 207-869-1282.
Sincerely,
Tim Donnelly
Senior Project Manager
Enclosure(s):
c: Rick Franzese, Bechtel Development Company


December 27, 2019
RENOVO ENERGY CENTER, LLC
Plan Approval Application
Renovo, Clinton County, Pennsylvania
PROJECT NUMBER:
137575
PROJECT CONTACTS:
Tim Donnelly
EMAIL:
PHONE:
(207) 869-1282
Amy Austin
EMAIL:
PHONE:
(207) 869-1257
Tom Rolfson
EMAIL:
PHONE:
(207) 869-1418

POWER ENGINEERS, INC. Plan Approval Application – Renovo Energy Center, LLC
FRE 361-2787 (PER-02-02-09) RENOVO 137575 (2019-12-27) TD
Plan Approval Application
PREPARED FOR: RENOVO ENERGY CENTER, LLC
PREPARED BY: TIM DONNELLY
(207) 869-1282 [email protected]

POWER ENGINEERS, INC. Plan Approval Application – Renovo Energy Center, LLC
PAGE i
TABLE OF CONTENTS
1.0 PROJECT DESCRIPTION ........................................................................................................... 1
1.1 SITE LOCATION ............................................................................................................................. 1 1.2 PROCESS/EQUIPMENT DESCRIPTION ............................................................................................. 1
1.2.1 Combustion Turbine Generators ........................................................................................... 2 1.2.2 Turbine Inlet Evaporative Coolers ........................................................................................ 7 1.2.3 Heat Recovery Steam Generators with Duct Burners ........................................................... 7 1.2.4 Steam Turbine Generator ...................................................................................................... 7 1.2.5 Auxiliary Boilers ................................................................................................................... 7 1.2.6 Fuel Gas Heaters ................................................................................................................... 8 1.2.7 Dew Point Heater .................................................................................................................. 9 1.2.8 Diesel-Fired Emergency Generator....................................................................................... 9 1.2.9 Diesel-Fired Emergency Fire Water Pump ......................................................................... 10 1.2.10 Fuel Oil Storage Tanks ....................................................................................................... 10 1.2.11 Aqueous Ammonia Storage Tank ....................................................................................... 10 1.2.12 Lube Oil Storage Tanks ...................................................................................................... 10 1.2.13 Circuit Breakers .................................................................................................................. 10
1.3 PROJECT SCHEDULE .................................................................................................................... 11 1.4 FACILITY MAXIMUM POTENTIAL EMISSIONS CALCULATIONS ................................................... 11
1.4.1 CTGs/HRSGs ...................................................................................................................... 11 1.4.2 Auxiliary Boilers, Fuel Gas Heaters, and Dew Point Heater .............................................. 14 1.4.3 Emergency Generator and Fire Pump ................................................................................. 16 1.4.4 Facility Wide ....................................................................................................................... 17
2.0 AIR REGULATORY REQUIREMENTS
3.0 BEST AVAILABLE CONTROL TECHNOLOGY/LOWEST ACHIEVABLE EMISSION
RATE/BEST AVAILABLE TECHNOLOGY (BACT/LAER/BAT) ANALYSIS
4.0 AIR DISPERSION MODELING PLAN
5.0 APPLICATION FORMS
6.0 NON-ATTAINMENT AREA REQUIREMENTS
TABLES:
TABLE 1 MAXIMUM POTENTIAL SHORT-TERM EMISSION RATES .............................. 12 TABLE 2 SUSD LIMITATIONS ................................................................................................ 12 TABLE 3 CTGS ANNUAL POTENTIAL-TO-EMIT ................................................................ 14 TABLE 4 AUXILIARY BOILERS EMISSIONS ESTIMATE ................................................... 15 TABLE 5 FUEL GAS HEATERS EMISSIONS ESTIMATE..................................................... 15 TABLE 6 DEW POINT HEATER EMISSIONS ESTIMATE .................................................... 16 TABLE 7 EMERGENCY GENERATOR EMISSIONS ESTIMATE ........................................ 16 TABLE 8 DIESEL FIRE PUMP EMISSIONS ESTIMATE ....................................................... 17 TABLE 9 ANNUAL FACILITY WIDE MAXIMUM POTENTIAL EMISSIONS
(TONS/YEAR) ............................................................................................................ 17 TABLE 10 CTG HAP MAXIMUM POTENTIAL EMISSIONS .................................................. 18

POWER ENGINEERS, INC. Plan Approval Application – Renovo Energy Center, LLC
PAGE ii
APPENDICES:
APPENDIX A FACILITY SITE LOCATION ON USGS TOPOGRAPHICAL MAP APPENDIX B RENOVO ENERGY CENTER SITE PLAN APPENDIX C PROCESS FLOW DIAGRAMS FOR POWER BLOCKS APPENDIX D DETAILED EMISSION CALCULATIONS APPENDIX E POWER BLOCK VENDOR-PROVIDED DATA APPENDIX F FUEL FRACTIONAL ANALYSES APPENDIX G ADVANCED MONITORING AND DIAGNOSTIC SYSTEMS – POWER BLOCKS APPENDIX H COMBUSTION CONTROL DETAILS – POWER BLOCKS APPENDIX I AIR FILTER SPECIFICATIONS APPENDIX J POWER BLOCK OPERATING AND MAINTENANCE DETAILS (GER-3620) APPENDIX K SCR AND OXIDATION CATALYST OPERATING AND MAINTENANCE
DETAILS APPENDIX L AUXILIARY EQUIPMENT MANUFACTURER SPECIFICATION SHEETS APPENDIX M RBLC CLEARINGHOUSE DETERMINATION SUMMARIES APPENDIX N SCR PID APPENDIX O COST ANALYSIS INFORMATION (SCR FOR CTGS AND OXIDATION
CATALYST FOR AUXILIARY BOILERS) APPENDIX P STORAGE TANK INFORMATION APPENDIX Q REGISTRY OF AVAILABLE NOX AND VOC OFFSETS APPENDIX R MUNICIPAL NOTIFICATIONS APPENDIX S CLINTON COUNTY SALDO LETTER, WATER SUPPLY LETTER OF
APPROVAL, PHMC PROJECT REVIEW INFORMATION

POWER ENGINEERS, INC. Plan Approval Application – Renovo Energy Center, LLC
PAGE 1
1.0 PROJECT DESCRIPTION
Renovo Energy Center, LLC (REC) proposes to construct a nominally rated 1,240 MW (net) dual fuel-
fired (natural gas and ultra-low sulfur diesel (ULSD)) combined cycle electric generating plant in
Renovo, Pennsylvania. The proposed REC facility will consist of two 1-on-1 power blocks that include a
Combustion Turbine Generator (CTG), Heat Recovery Steam Generator (HRSG), and a Steam Turbine
(STG) in line to produce electricity for distribution into the transmission grid system. Each combined
cycle system is intended to be fired on natural gas unless there is an interruption in supply. Additionally,
each HRSG is equipped with a natural gas-fired Duct Burner (DB) for supplemental steam production,
and the steam from the HRSGs is routed through the condensing STG. REC will utilize Air Cooled
Condensers (ACCs) for condensing the exhaust steam, which is an environmentally preferred method
when compared to a traditional wet cooling tower.
The proposed REC facility will also include two auxiliary boilers, one diesel-fired emergency generator, a
diesel-fired emergency firewater pump, and natural gas-fired fuel heaters. The HRSG DBs, the auxiliary
boilers, and fuel gas heaters will combust only pipeline quality natural gas. The emergency firewater
pump and emergency generator will utilize ULSD fuel.
In addition to the combustion devices, the REC facility will also have potential air emissions from
petroleum storage tanks, ammonia slip from Selective Catalytic Reduction (SCR) process, and sulfur
hexafluoride (SF6) containing circuit breakers.
1.1 Site Location
REC’s proposed site is a 68-acre parcel located north-northeast of the Town of Renovo between Erie
Avenue and Industrial Park Road. The site is the location of the former PRR/Philadelphia & Erie railroad
car renovation facility.
The approximate UTM coordinates of the proposed site are 269.446 kilometers (km) Easting and
4,578.872 km Northing. The project will be located at a base elevation of approximately 670 feet above
mean sea level. The immediate project site consists of flat terrain in an east-west orientated river valley
with increasing elevated terrain to the north and south of the proposed site. Included in Appendix A is a
USGS topographical map with the project site location identified.
1.2 Process/Equipment Description
Appendix B includes a site plan with the proposed location of the buildings and equipment indicated.
REC is proposing to install and operate the following devices:
• Two GE 7HA.02 natural gas/ULSD fired CTGs (each with maximum heat input capacities of
3,541 million British thermal units per hour (MMBtu/hr) High Heating Value (HHV) when firing
natural gas, and 3,940 MMBtu/hr HHV when firing ULSD) with inlet evaporative coolers;
• Paired with each CTG, one condensing STG and one driven electric generator;
• Two HRSGs with supplementary natural gas-fired DBs, each with maximum heat input capacities
of 1,005 MMBtu/hr HHV;
• Two natural gas-fired auxiliary boilers (one for each power block), each with maximum heat
input capacities of 66 MMBtu/hr;
• One diesel-fired emergency generator rated at 1,500 kW (~14.3 MMBtu/hr heat input);

POWER ENGINEERS, INC. Plan Approval Application – Renovo Energy Center, LLC
PAGE 2
• Three natural gas-fired fuel gas heaters, each with maximum heat input capacities of 15
MMBtu/hr and located 1.25 miles from the site at a pressure reducing station;
• One on-site natural gas-fired dew point heater with a maximum heat input capacity of 3.0
MMBtu/hr;
• One diesel-fired emergency firewater pump, rated at 250 hp (~1.8 MMBtu/hr heat input);
• Two aqueous ammonia aboveground storage tanks with a capacity of 26,000 gallons each;
• ULSD aboveground storage tank with a capacity of 3.5 million gallons;
• Two lube oil aboveground storage tanks each with a capacity of 20,000 gallons; and
• Twelve high voltage circuit breakers containing sulfur hexafluoride (SF6) within the facility’s
electrical switchyard.
While fuel suppliers are typically not selected at this point in the development process, REC has been
conducting a solicitation process for the firm supply of natural gas and has received offers from a number
of well-known suppliers. REC expects to select the preferred supplier and enter into a long-term supply
contract in approximately mid-2020. ULSD is available from several regional suppliers and will be
purchased on the spot market as needed. Fractional analyses for both fuels are provided in Appendix F.
1.2.1 Combustion Turbine Generators
Overview
The CTG is the main component of a combined-cycle power system. In the initial stage, air is filtered,
cooled by the evaporative cooler during warm weather, and compressed in a multiple stage axial flow
compressor. Compressed air and fuel are mixed and combusted in the turbine combustion chamber. Lean
pre-mix dry low-NOx combustors minimize Nitrogen Oxide (NOx) formation during natural gas
combustion. When combusting ULSD, water injection will be employed to reduce thermal NOx
formation. Hot exhaust gases from the combustion chamber are expanded through a multi-stage power
steam turbine that results in energy to drive both the air compressor and electric generator.
In combined-cycle mode, the exhaust gas exiting the CTG is ducted to a boiler commonly known as a
HRSG where steam is produced to generate additional electricity in a STG. The natural gas fired DBs
located within the HRSGs are used for supplementary firing to increase steam and electrical output.
Design Considerations
To maximize electrical generation efficiency, the STG has been designed with advanced 3D
aerodynamics and improved sealing to minimize leakages. Computational fluid dynamics (CFD)
techniques were applied to inlet and exhaust regions to minimize losses. Optimized steam path design and
development of larger/more efficient LP last stages were customized to particular applications to
minimize exhaust losses, and advanced airfoil manufacturing was used to realize efficiency gains.
Steam Bypass
REC proposes a cascade type steam bypass, which will be designed to control the pressure and facilitate
the STG startup. As pressure initially builds in the HRSG during CTG start-up, the steam generated in the
HRSG will be routed to the ACCs until the steam conditions meet the requirements to start the STG. The
steam bypass system and the decoupling of the STG by a clutch allows the CTG to start rapidly to

POWER ENGINEERS, INC. Plan Approval Application – Renovo Energy Center, LLC
PAGE 3
Minimum Emissions Compliance Load (MECL) and then on to full load without the traditional hold
times required by the STG in its warming cycle, thereby limiting startup emissions.
In instances of rapid STG load rejection, the 100-percent capacity cascaded bypass system will allow the
CTG to operate at full load (with evaporative coolers turned off) by diverting 100-percent of the high
pressure and reheat steam flow at rated pressure and 100 percent of the low-pressure steam flow at rated
pressure to the ACC. This will allow a more controlled ramp down of the CTG following such an event.
This steam bypass arrangement supports GE’s Rapid Response Lite plant feature, which is intended to
minimize plant emissions on Start-up and Shutdown (SUSD). The GE Rapid Response Lite plant breaks
the links normally existing between the STG and steam cycle during startup to allow the CTG to start and
load at its own maximum rate, thereby reducing emissions relative to a design that requires a number of
hold points during times of sub-optimum emissions.
Inlet Air Filters
GE provides a self-cleaning filter house with weather hood and moisture separator/coalescing filters
inside the weather hood. The moisture separators are 90% efficient for 50-micron water droplets. The
coalescing filter will also act as a pre-filter with a filtration efficiency of G3 as per EN 779-2002. Final
filter's filtration efficiency is rated F8 as per EN 779-2002. Inlet air filter specifications are provided in
Appendix I.
Operations
Steady-State
REC’s CTGs will operate at very low NOx levels when operating in steady state conditions using dry
low-NOx combustors, proper operation, and SCR technology.
A combined-cycle turbine power train generates power from the CTG while simultaneously recovering
and transferring high temperature exhaust energy to the STG to increase power production and overall
unit efficiency. The benefits of employing combined cycle technology/design is the relatively short SUSD
time and ability to quickly change loads as compared to boiler systems used for generating electricity, and
the significantly higher generating efficiency as compared to a gas turbine in simple cycle mode.
The CTGs/HRSGs will also contain an oxidation catalyst system for reducing exhaust gas emissions of
Carbon Monoxide (CO) and Volatile Organic Compounds (VOCs). The catalyst promotes the oxidation
of CO and VOCs to Carbon Dioxide (CO2) and water as the exhaust gas passes through the oxidation
catalyst bed. There are no reactants used in the catalyst system, the oxidation to CO2 and water
spontaneously occurs.
Startup and Shutdown
During periods of SUSD the emissions from the CTGs are not controlled to the levels of steady state
operation due to flue gas and catalyst temperatures not being high enough to effectively operate the SCR.
Thus, SUSD NOx emissions will be higher than steady state load conditions. The higher, uncontrolled
NOx emissions during SUSD cannot be avoided.
GE’s site specific SUSD procedure for REC is not available at this stage of project development but will
be finalized following delivery of the equipment and prior to initial commissioning. However, the REC

POWER ENGINEERS, INC. Plan Approval Application – Renovo Energy Center, LLC
PAGE 4
Plant will employ GE’s Rapid Response Lite auto-start sequence during startup (the same technology as
is being deployed on the Lackawanna, Moxie Freedom, and Birdsboro plants in PA). GE’s Combined
Cycle Rapid Response technology uses a clutch to decouple the CTG from the STG during start-up and
loading sequences. The CTG can be started and brought to full speed, synchronized to the grid and reach
full load while separated from the STG. During this process the steam generated in the HRSG is bypassed
around the STG to either the cold reheat or directly to the ACC. When suitable matching of steam to
metal temperatures is reached the STG can be brought to speed, coupled and loaded. Other features in
Rapid Response fast start plants are the use of an auxiliary boiler that establishes STG steam seals and
sparging prior to start-up, the use of stack dampers to reduce heat loss from the HRSG during shut-down
and controls to coordinate and enhance plant startup sequences. All of these will be included in REC’s
design.
Prior to initiating startup, the plant is in a ready-to-start condition, i.e. all plant equipment which is needed
to be operating during startup is in a no-fault condition, operational and/or in automatic mode. Water
levels and pressures in drums, hotwell and other vessels are within range and/or not in an alarmed
condition. STG sealing steam is on and condenser vacuum is within the range required for STG startup.
CTG start-up consists of firing the unit and accelerating to full speed (no load), then synchronizing and
loading the unit to minimum load quickly where exhaust levels meet compliance emission levels. Once
the CTG has commenced operation the start of the HRSG consists of warming the unit with the CTG
exhaust flow, quickly bringing the catalyst temperatures to operating level. Since the STG is not a
contributor to emissions, its startup is not so time sensitive. After warming and matching steam to unit
temperatures the STG is accelerated to full speed, the clutch is engaged and the unit is loaded. To avoid
thermal stress, various components of the STG must be brought up to temperature prior to normal STG
operation. In a combined cycle system, the amount of time since previous operation of the STG and
HRSG factors into the temperature of components and dictates the duration of the startup period.
Shutdown consists of reducing CTG load to the desired level and then cutting off all steam to the STG,
then the clutch is disengaged to separate the CTG and STG. The CTG is maintained above MECL until
disconnected from the STG, after which it continues to unload until its electrical output is near zero, then
the breaker is opened and the unit coasted down. The fuel is shut off at approximately 40% speed.
The GE Rapid Response Lite Plant reduces emissions through the decoupling of the STG allowing the
CTG to be quickly unloaded and tripped without the usual concern of protective operation requirements
of the STG. The advantage of Rapid Response Lite relative to conventional start-up is the lower amount
of time spent at low loads, resulting in higher efficiency, less fuel burned and reduced criteria pollutant
emissions during startup.
The event definition of SUSD is taken from the manufactures document “Combined Cycle Systems
Engineering Plant Startup and Shutdown Emissions for 7HA.02 Single Shaft Rapid Response Lite”
(included in Appendix E), which is consistent with the Federal and state definition; Startup is defined as
the time from CTG fire to HRSG stack emissions compliance. Shutdown is defined as the time from the
time that the CTG drops below MECL during shutdown to termination of fuel flow to the CTG.
For the purposes of this application, the following summarizes the time periods that define startups:
• Hot Start = unit has not operated in 8 hours or less
• Warm Start = unit has not operated in between 8 to 72 hours
• Cold Start = unit has not operated in over 72 hours
POWER ENGINEERS, INC. Plan Approval Application – Renovo Energy Center, LLC
PAGE 5
Monitoring and Combustion Controls
Each Power Block will be equipped with GE’s Advanced Monitoring and Diagnostic System (AM&D)
(see Appendix G), which will monitor the performance of the generating equipment. In addition, each
power block will be equipped with a Continuous Emission Monitor System (CEMS) that will evaluate the
emission performance of the CTGs and SCR/oxidation catalysts.
Both the AM&D system and the CEMS have on-site monitors for use by operations personnel in
optimizing plant performance and identifying required maintenance of the plant. Performance is
monitored using incoming measured data as inputs to performance calculations which are compared to
target values to assess proper operation of the systems. Heat balance of the gas turbine produces
additional information regarding the conditions of the ingoing and outgoing streams. This creates detailed
information about the current operating point that is consistent with the mass and energy balances of the
equipment. A performance audit can be conducted comparing current performance against expected
performance based on design and tests. The AM&D system is also monitored, real time, by GE at their
Monitoring and Diagnostic Center in Atlanta, GA. GE employs over 50 engineers at their center to
continuously monitor customer equipment to help optimize performance and improve maintenance.
GE provides an industry proven Dry Lox NOx combustion system to minimize emissions during
operation. Combustion controls are tuned at the time of plant startup and periodically thereafter.
Appendix H contains documentation on the combustion system and the controls used to monitor the
performance of the power block configuration.
Emission Control Equipment
As previously stated, each CTG will be equipped with SCR for control of NOx emissions, and an
oxidation catalyst to control CO and VOC emissions.
The make and model of the specific SCR to be used is not available at this stage of project development
and will not be determined until GE procures this equipment during project execution. GE typically
utilizes honeycomb vanadium/titanium-based catalysts (or equivalent) from a qualified vendor such as
Cormetech, Haldor Topsoe or Hitachi Zosen. Appendix K contains a representative manufacturer’s data
sheet for the SCR unit.
The make and model of the oxidation catalyst to be used are not available at this stage of project
development and will not be determined until GE procures this equipment during project execution. GE
typically utilizes oxidation catalysts from Emerichem, BASF, JMI, or equivalent. Appendix K contains a
representative manufacturer’s data sheet for the oxidation catalyst unit.
Monitoring
The following monitoring will be provided:
• Differential pressure gauges across the SCR catalyst and across the oxidation catalyst with test
ports located upstream and downstream of the oxidation catalyst and SCR catalyst.
• Thermocouples upstream of the oxidation catalyst and thermocouple downstream of the
Ammonia Injection Grid (AIG)/upstream of the SCR catalyst. The differential pressure and
temperatures are not actively controlled with either the gas turbine controller or the Distributed
Control System (DCS) and there is no set point for any control loop.

POWER ENGINEERS, INC. Plan Approval Application – Renovo Energy Center, LLC
PAGE 6
The oxidation catalyst module will be integrated in a suitable temperature window of the HRSG and will
be a gas-tight, self-supporting steel structure. The performance of the catalyst is monitored, but not
actively controlled.
Please see Appendix K for additional information on the active ammonia injection control for the SCR.
Maintenance
Plant specific detailed maintenance and monitoring plans will be prepared during the construction phase
of the project by the plant operators, assisted by REC’s Operations and Maintenance (O&M) Contractor
and consistent with OEM requirements and specifications. These plans will be based on and derived from
the information presented below. All routine covered and unscheduled maintenance will be based on
OEM recommendations and prudent utility practices and implemented through a combination of Long-
Term Services Agreements (LTSA) with OEMs, and a software-based maintenance scheduling system
used by plant maintenance personnel. Additionally, the AM&D will be used to assess plant and
equipment performance on a real time basis to evaluate the need to modify maintenance schedules.
Maintenance for each REC power block and balance of plant emission source equipment will be managed
in three categories:
a. Routine Maintenance – Maintenance of a routine and daily nature, which will be performed by
plant site personnel in accordance with manufacturer’s recommended procedures.
b. Covered Maintenance – Periodic maintenance that includes inspection, overhaul, repair, and
replacement of equipment, which will be performed by the OEM. Specific Equipment O&M
manuals will not be available from the equipment supplier until the equipment is delivered but
will be available prior to the scheduled start of commissioning of the units.
c. Unscheduled/unplanned Maintenance – Maintenance that is unscheduled or unplanned which
arises due to performance shortfalls, indications from AM&D systems or equipment failures will
be performed by the OEM and REC as provided in maintenance agreements.
Maintenance plans for the CTGs, inlet air filters, oxidation catalyst and SCR are provided in the following
appendices:
• Appendix J (GER 3620) brochure provides detail on maintenance planning, maintenance
inspections, and inspection intervals that are common to the GE 7HA.02 gas turbines being
utilized at REC.
• Appendix I (GEK1162969) instructions provides maintenance recommendations for the inlet air
system (starting on page 17). The power augmentation system is media type evaporative coolers
and the corrosive environment is C2 for the maintenance recommendations.
• Appendix K includes a 6-page white paper on Oxidation Catalyst, describing the physical and
chemical deactivation, operating limits, and catalyst maintenance and testing requirements, and a
13-page white paper on SCR Control Philosophy, describing operating theory, equipment
description, maintenance, maintenance schedule and performance evaluation.

POWER ENGINEERS, INC. Plan Approval Application – Renovo Energy Center, LLC
PAGE 7
1.2.2 Turbine Inlet Evaporative Coolers
During hot and humid ambient air conditions, REC will employ evaporative cooling to cool the air
entering the CTG by evaporating water sprayed into the air intake, immediately following the inlet filter.
A mist eliminator will prevent water droplets from reaching the turbine blades. The cooling of the inlet air
increases the density of the air entering the CTG resulting in increased power output capacity. CTGs are
volumetric processes that produce more power with more pounds of air entering the machine. The
evaporative cooler achieves this goal in the summer time by cooling the inlet air when ambient air
temperatures are high.
1.2.3 Heat Recovery Steam Generators with Duct Burners
REC will use two HRSGs, one for each CTG, which will utilize waste heat energy to increase electricity
production. The HRSGs systems extract heat from the exhaust of each gas turbine. The HRSG acts as a
heat exchanger to derive heat energy from the CTG exhaust gas to produce steam that will be used to
drive a steam turbine generator. Exhaust gas entering the HRSG at approximately 1,100°F will be cooled
to approximately 180 °F by the time it exits the HRSG exhaust stack. At times, steam production in the
HRSGs may be augmented using DBs that will be fired by natural gas. The proposed DBs will have a
maximum firing rate of 1,005 MMBtu/hr each.
REC’s SCR and oxidation catalysts will be installed within the HRSG to control NOx and CO,
respectively.
A CEMS for monitoring emissions of NOx, CO, NH3, and concentration of O2 or CO2 will be installed on
REC’s HRSG exhaust stack.
1.2.4 Steam Turbine Generator
Each power block will include a reheat, condensing STG designed for variable pressure operation. The
high-pressure section of the steam turbine receives high-pressure super-heated steam from the HRSGs,
and exhausts to the reheat section of the HRSGs. The steam from the HRSGs reheat section is supplied to
the intermediate-pressure section of the turbine, which expands to the low-pressure section. The low-
pressure section of the turbine also receives excess low-pressure superheated steam from the HRSGs and
exhausts to the condenser for cooling. At ISO conditions, REC’s steam turbine sets are designed to
produce up to approximately 176 MW of electrical output without duct firing, and 273 MW of electrical
output with full duct firing capability.
Additionally, the plant is expected to remain in emissions compliance in combined cycle mode down to a
range of 30 to 40 % of base load (reducing down to 30% load is ambient temperature dependent). The
plant will not utilize the steam bypass to operate in simple cycle mode other than during startup, steam
turbine trip or emergency operation, and in each case for only short periods of time. The plant will not
have a provision to bypass the CTG exhaust gas around the HRSG directly to the stack.
1.2.5 Auxiliary Boilers
The proposed facility will include two auxiliary boilers, one per power block. The auxiliary boilers
provide sealing steam to the steam turbine generator during cold start-up and to warm up the steam
turbine generator rotor. The auxiliary boiler steam will not be used to supplement the power generation of

POWER ENGINEERS, INC. Plan Approval Application – Renovo Energy Center, LLC
PAGE 8
the CTGs or steam turbine. The proposed boilers will be fired with natural gas with maximum heat input
ratings of 66 MMBtu/hr.
Make and model is not available at this stage of project development and will not be determined until
REC procures this equipment during project execution, however REC anticipates the boilers will be
Cleaver Brooks model NB-200D-50 or equivalent. The boilers will be equipped with ultra-low NOx
burners and no additional control devices. The boilers will only operate during the startup of their
respective power train and will not operate during normal plant operation. Appendix L contains
manufacturer data sheets and Appendix D contains maximum potential emission calculations. REC is
proposing to limit the annual operation of each auxiliary boiler to a total of 145,200 MMBtu/year. This
limit would not apply during the shakedown period authorized under the plan approval to provide
flexibility in the event that more startups or longer duration startups are required to shakedown the
facility. The requirement that the auxiliary boilers would only be operated during startup would be in the
plan approval to ensure that the auxiliary boilers are not operated longer than necessary. REC notes that
this heat input limitation is equivalent to 2,200 hours of operation at maximum firing rate per boiler in
any 12 consecutive month period, however REC is not proposing an annual limit in operational hours in
conjunction with the heat input limit.
Auxiliary boilers will be monitored using the OEM supplied control system which will be incorporated
into the overall plant DCS. Auxiliary boiler control parameters and alarms will be displayed in the main
control room, through the main enunciator system, and on the local control panel. The auxiliary boilers
will be operated in accordance with OEM guidelines including periodic testing and start-up to ensure
reliable operation that meets design parameters. Further, whether operating or not, routine maintenance as
specified in the OEM manuals will be performed by a combination of OEM, plant, and contractor
personnel.
The auxiliary boilers will have a programmable logic controller (PLC) based system for combustion
control, draft control, feedwater control, etc. with a trouble alarm to the DCS. Operating parameters such
as fuel flow, air flow, steam flow, steam pressure and temperature and any other parameters
recommended by the manufacturer will be monitored regularly to confirm that the boilers are operating at
their optimal level to maximize efficiency and minimize emissions. Fuel and air flow trends will be
reviewed and operating data such as fuel usage per month will be collected and reviewed to calculate
emissions, determine compliance, and to ensure that the boilers are operating properly. The boilers will be
tuned-up annually, which will include measuring CO and O2 levels in the exhaust and optimizing
emissions of CO.
1.2.6 Fuel Gas Heaters
REC’s proposed facility design includes fuel gas heaters. The heaters will be used to increase the
temperature of the incoming natural gas fuel to prevent freezing of the gas regulating valves under certain
gas system operating conditions. The fuel gas heaters will follow the pressure reduction stage and
individual gas lines will be piped and metered separately to the individual gas turbine controllers. The
fuel gas heaters will each have maximum heat input ratings of 15 MMBtu/hr and will be located
approximately 1.25 miles from the site at the pressure reducing station. At any given time, a maximum of
two heaters will be running. The third heater is for redundancy.
Make and model is not final at this stage of project development and will not be determined until REC
procures this equipment during project execution. However, the application is based on heaters
manufactured by Aether, and each will be equipped with a Power Flame burner with a maximum heat
input of 15 MMBtu/hr. Manufacturer specifications and maximum potential emission rates are contained

POWER ENGINEERS, INC. Plan Approval Application – Renovo Energy Center, LLC
PAGE 9
in Appendix L. Two heaters will operate up to 8,760 hours per year each and maximum potential
emission calculations are provided in Appendix D.
The fuel gas heaters will be monitored and maintained in accordance with the manufacturer’s
recommendations and industry practice pursuant to an O&M plan that will be finalized during the
construction of the project.
1.2.7 Dew Point Heater
In addition to the off-site fuel gas heaters, a Dew Point Heater (DPH) will be included in the plant’s fuel
gas conditioning system to ensure that the fuel gas temperature is above the dew point temperature to
remove excess moisture content. The DPH will have a maximum heat input rating of 3.0 MMBtu/hr.
The DPH will be monitored and maintained in accordance with the manufacturer’s recommendations and
industry practice pursuant to an O&M plan that will be finalized during the construction of the project.
1.2.8 Diesel-Fired Emergency Generator
REC’s proposed facility will include one diesel-fired emergency generator rated at 1,500 kW to be
operated no more than 500 hours per year, including testing and maintenance hours. The emergency
generator will provide power to the plant during emergency situations to allow operation of critical
ancillary equipment (e.g. lube oil pumps, auxiliary cooling water pumps, water supply pumps, etc.). There
are no plans for the emergency diesel generator to provide power for black start, peak shaving or non-
emergency power.
Make and model is not available at this stage of project development and will not be determined until
REC procures this equipment during project execution; however, the generator engine for the basis of this
application is a Caterpillar 5312C diesel engine. The generator will only be used during plant
emergencies, if required, to bring the plant to a safe shutdown. Emissions will be maintained within limits
by proper operation and maintenance. The emergency generator control system will be PLC based and
will monitor, among other parameters, hours of operation, the voltage, current, engine speed, coolant
temperature and oil pressure when the engine is operating. Appendix L contains Caterpillar 5312C data
sheets that includes maximum potential emission rates. The generator will be limited to operating 500
hours per year, with up to 100 of those hours available for use during maintenance and testing operations.
Appendix D’s facility maximum potential emission estimates include the emergency generator’s
emissions.
Start-up and operation of the emergency generator will be incorporated into the plant DCS system, control
room and local control panel. All system alarms and performance parameters will be monitored through
the DCS and at the local control panel. Periodic testing and start-up of the system will be performed as
recommended by the OEM and in accordance with prudent utility practice. Plant personnel will perform
routine maintenance checks of the emergency generator; however, an authorized representative of the
manufacturer will perform all maintenance. Contractual requirements of the Utility Grid Interconnection
Agreement will be incorporated into the operation and maintenance of the emergency generator system.
The emergency generators will be monitored and maintained in accordance with the manufacturer’s
recommendations and industry practice pursuant to an O&M plan that will be finalized during the
construction of the project.

POWER ENGINEERS, INC. Plan Approval Application – Renovo Energy Center, LLC
PAGE 10
1.2.9 Diesel-Fired Emergency Fire Water Pump
The proposed REC project will include a 250 bhp diesel-fired fire water pump operated as a fire water
pump driver. The unit will be limited to 250 hours per year, including monthly testing and maintenance.
Make and model is not available at this stage of project development and will not be determined until
REC procures this equipment during project execution. However, the application is based on a Clarke,
Model JU6H-UFAD88. Emissions will be maintained within limits by proper operation and maintenance.
The fire pump control system will be PLC based with engine speed, hours operated, coolant temperature
and oil pressure among the parameters monitored when the engine is operating. The engine will combust
ULSD and will not be equipped with any add-on emissions controls. Appendix L contains representative
data sheets that includes maximum potential emission rates. It is anticipated the engine will be run weekly
for 30 minutes or less for testing purposes. Otherwise, the engine will be operated for emergency
purposes (loss of power) in the event of a fire where the fire pump requires operation. Appendix D
contains maximum potential emission estimates based on a limit of 250 hours per year.
The fire system pump will be operated and maintained based on OEM recommendations to ensure
reliable operation that meets system requirements. Engine maintenance will be performed based on time
interval (daily/weekly/monthly/yearly) and run-hours as per manufacturer’s recommendations. All system
alarms will be incorporated into the plant DCS and monitored in the main control room and may be
monitored at the remote operations panel. System maintenance requirements will be per the OEMs and
prudent utility practice and incorporated into the plant maintenance database and system. Maintenance
will be performed by a combination of OEM, plant, and contractor personnel to ensure safe, reliable, and
compliant operation of the engine. NFPA requirements will be incorporated into all testing and O&M
procedures.
1.2.10 Fuel Oil Storage Tanks
The proposed REC project will include a 3.5-million-gallon ULSD aboveground storage tank to provide
fuel for CTGs for three days of operation at full load if natural gas supply is curtailed. One 2,500 gallon
and one 350-gallon ULSD storage tank will provide fuel for the emergency generator and fire pump
engine, respectively.
1.2.11 Aqueous Ammonia Storage Tank
REC will include two 26,000 gallon above ground aqueous ammonia storage tanks (one for each power
train) to provide ammonia for the SCR systems on the combined cycle CTGs.
1.2.12 Lube Oil Storage Tanks
REC will include two 20,000 gallon above ground storage tanks for lubrication oil used for the CTGs and
STGs.
1.2.13 Circuit Breakers
REC will have twelve high voltage circuit breakers within the facility’s electrical switchyard. Six circuit
breakers will contain 360 pounds of sulfur hexafluoride (SF6) and the remaining six circuit breakers will
contain 175 pounds of SF6. SF6 is a highly effective electrical insulating dielectric fluid used for
interrupting arcs and is superior to other dielectric fluids. SF6 is a greenhouse gas with a “global warming

POWER ENGINEERS, INC. Plan Approval Application – Renovo Energy Center, LLC
PAGE 11
potential” of 22,800 on a 100-year time horizon, which means its impact as a greenhouse gas is 22,800
times greater than that of CO2.
REC’s circuit breakers will be designed as totally enclosed pressure systems with low potential SF6
fugitive emissions (equipment leaks). Leakage is expected to be minimal and equipment will be built to
low leakage design limits. The International Electrotechnical Commission Standard 62271-1 for new
equipment leakage is 0.5% per year.
REC will implement a SF6 leak detection program to minimize SF6 leaks. Alarm set points will be based
on manufacturer’s recommendations. When the alarm is triggered, it will be sent to the DCS or Utility
Remote Terminal Unit (RTU). The facility shall take corrective action as soon as practicable to fix the
circuit breaker units to a like-new state to prevent the emissions of SF6 to the maximum extent possible.
REC will maintain accurate records on the amount of SF6 dielectric fluid added to each circuit breaker
unit on a monthly basis. The date and time that each alarm associated with the circuit breaker is activated
and corrective action is taken to remedy the problem and the date the corrective action remedied the
problem.
1.3 Project Schedule
REC is submitting this initial application on or about December 27, 2019. REC anticipates commencing
actual construction in the third quarter of 2020. REC’s targeted dates for completing construction and
commercial electrical generation are January 2023 and April – November 2023, respectively.
1.4 Facility Maximum Potential Emissions Calculations
The maximum potential emissions from REC’s facility are primarily products of combustion from the
CTGs and duct burners. To a lesser extent, there will also be emissions from the auxiliary boilers, fuel gas
heater, emergency generators, emergency firewater pump, fuel storage tanks, and circuit breakers.
1.4.1 CTGs/HRSGs
Potential emissions of criteria pollutants from the power blocks vary depending on ambient air
temperature, relative humidity, and operating load of each unit. The CTGs and HRSG will also exhaust
greenhouse gases (GHG), i.e., carbon dioxide, methane, and nitrous oxide. REC will calculate GHG
emissions as outlined in 40 CFR Part 60, Subpart 98. The CTG manufacturer, General Electric (GE), has
provided maximum potential criteria pollutant emissions for various operating loads and ambient
conditions, which are summarized in Appendix D.
SO2 potential emissions are based on use of natural gas with a sulfur content of 0.4 grains per 100
standard cubic feet of gas.
CTGs and DBs maximum potential hourly emission rates ("worst-case" from all operating scenarios) for
each pollutant are listed in the table below.

POWER ENGINEERS, INC. Plan Approval Application – Renovo Energy Center, LLC
PAGE 12
TABLE 1 MAXIMUM POTENTIAL SHORT-TERM EMISSION RATES
POLLUTANT
NATURAL GAS MAXIMUM POTENTIAL EMISSION RATE (LB/HR)
ULSD MAXIMUM POTENTIAL EMISSION RATE (LB/HR)
NOx 25.70 59.60
CO 10.20 18.10
PM10 11.30 48.20
VOC 3.10 10.40
SO2 4.70 7.00
NH3 24.99 28.98
H2SO4 2.97 4.40
GHGs
CO2 477,400 722,700
CH4 7.81 26.06
N2O 0.78 5.21
CO2e 477,827.8 724,904.8 Note: Reflects the maximum short-term emission rate over a range of ambient temperatures; Emissions calculations, methodology, and vendor data are included in Appendices D and E.
REC is proposing the following limits on duration and emission levels during the various SUSD
procedures:
TABLE 2 SUSD LIMITATIONS
NATURAL GAS OPERATIONS
ULSD OPERATIONS
COLD STARTS
Duration (minutes): 60 60
Maximum Potential NOx Emissions (lbs/event): 164.0 294.7
Maximum Potential CO Emissions (lbs/event): 932.0 938.7
Maximum Potential VOC Emissions (lbs/event): 70.7 188.0
Maximum Potential PM Emissions (lbs/event): 11.1 48.0
WARM STARTS
Duration (minutes): 55 55
Maximum Potential NOx Emissions (lbs/event): 111.4 236.5
Maximum Potential CO Emissions (lbs/event): 261.3 393.3
Maximum Potential VOC Emissions (lbs/event): 33.0 45.4
Maximum Potential PM Emissions (lbs/event): 10.0 44.0
HOT STARTS
Duration (minutes): 35 35
Maximum Potential NOx Emissions (lbs/event): 92.8 196.0
Maximum Potential CO Emissions (lbs/event): 309.8 477.8
Maximum Potential VOC Emissions (lbs/event): 38.5 52.5
Maximum Potential PM Emissions (lbs/event): 7.0 28.0
SHUTDOWNS
Duration (minutes): 27 23
Maximum Potential NOx Emissions (lbs/event): 31.5 123.6
Maximum Potential CO Emissions (lbs/event): 342.0 138.0
Maximum Potential VOC Emissions (lbs/event): 42.8 20.1
Maximum Potential PM Emissions (lbs/event): 6.8 28.8

POWER ENGINEERS, INC. Plan Approval Application – Renovo Energy Center, LLC
PAGE 13
REC is proposing to operate for up to 8,760 hours per year per power block, and is proposing only three
run-time limits on the various operational scenarios:
1. A limit of 500 hours of total SUSD events (including both natural gas and ULSD)
2. A limit of 760 hours of total ULSD operations (including both steady-state and SUSD events)
3. A limit of 40 hours of ULSD SUSD events
Thus, there is no limit on the natural gas steady-state operations (which is the lowest-emitting
configuration of the four basic operational categories). REC is proposing the aforementioned limits as a
very conservative estimate, which will provide the operational flexibility required to attract the investors
and lenders necessary to enable construction of the plant. The plant is being designed for baseload
dispatch and not as a peaking plant, however in light of the significant changes in the electricity market
over the past several years (combined with the fact that REC is a merchant plant and must be able to
respond to the needs of the market), these potential hours of SUSD emissions provide the operational
flexibility should electricity markets dictate the plant be called upon to start up and shut down more than
is currently anticipated. Current plans call for REC to interconnect the units to separate ISOs (one to PJM
and one to NYISO), each of which may have differing dispatch profiles leading to additional SUSDs than
if both units were dispatched to the same ISO. The total number of hours a facility estimates for SUSD is
a question of operating flexibility, not one of the level of control and should not impact control
technologies for a specific plant.
The worst-case annual potential-to-emit (PTE) scenario from REC’s power blocks results from the
following:
• 7,540 hours of natural gas steady-state operations
• 460 hours of natural gas SUSD events
• 720 hours of ULSD steady-state operations
• 40 hours of ULSD SUSD events
The following table summarizes the proposed REC project’s annual PTE from each of the four
operational scenarios for this worst-case scenario, for both power blocks combined.

POWER ENGINEERS, INC. Plan Approval Application – Renovo Energy Center, LLC
PAGE 14
TABLE 3 CTGS ANNUAL POTENTIAL-TO-EMIT
POLLUTANT
STEADY-STATE ULSD FIRING [720 HOURS] (TONS)
ULSD SUSD EVENTS [40 HOURS] (TONS)
STEADY-STATE NATURAL GAS FIRING [7,540 HOURS] (TONS)
NATURAL GAS SUSD [460 HOURS] (TONS)
TOTAL PTE FROM BOTH POWER BLOCKS (TONS)
NOx 42.91 10.75 251.08 50.42 355.17
CO 13.03 16.70 145.52 181.52 356.78
PM10 34.70 2.10 169.65 5.47 211.92
VOC 7.49 2.00 78.42 22.82 110.73
SO2 5.04 0.28 45.99 2.16 53.48
NH3 20.87 1.16 243.84 11.50 277.36
H2SO4 3.17 0.18 30.69 1.37 35.40
GHGs
CO2 520,344 28,908 4,644,640 219,604 5,413,496
CH4 18.76 1.04 58.86 3.59 82.26
N2O 3.75 0.21 5.89 0.36 10.21
CO2equivalent 521,931 28,996 4,647,866 219,801 5,418,594
1.4.2 Auxiliary Boilers, Fuel Gas Heaters, and Dew Point Heater
The maximum potential emissions of NOx, CO, and SO2 from the auxiliary boilers, fuel gas heaters, and
dew point heater were calculated based on the proposed LAER/BACT/BAT emission rates for natural
gas-fired boilers and heaters. The auxiliary boilers have heat input capacities of 66 MMBtu/hr each, the
fuel gas heaters’ heat input capacities are 15 MMBtu/hr each, and the dew point heater’s heat input
capacity is 3.0 MMBtu/hr. Maximum potential annual emissions for the boilers are based on 145,200
MMBtu/year each (equivalent to 2,200 hours each at maximum load), and for the fuel gas heaters are
based on 8,760 hours of operation for only two heaters, as three heaters will never operate
simultaneously. Maximum potential emissions for the dew point heater are based on 8,760 hours per year.
Maximum hourly and annual emissions for the devices are summarized in the following tables.

POWER ENGINEERS, INC. Plan Approval Application – Renovo Energy Center, LLC
PAGE 15
TABLE 4 AUXILIARY BOILERS EMISSIONS ESTIMATE
POLLUTANT
EMISSION FACTOR (LB/MMBTU)
MAXIMUM POTENTIAL EMISSION RATE PER BOILER (LB/HR)
MAXIMUM POTENTIAL EMISSIONS PER BOILER (TPY)
TOTAL MAXIMUM POTENTIAL EMISSIONS (TPY)
NOx 0.0060 0.40 0.44 0.87
CO 0.036 2.38 2.61 5.23
PM10 0.0019 0.13 0.14 0.28
VOC 0.0020 0.13 0.15 0.29
SO2 0.00058 0.038 0.042 0.084
H2SO4 9.0E-05 0.0059 0.0065 0.013
NH3 negligible --- --- --- (kg/MMBtu) (tpy) (tpy)
CO2 53.06 8,475 16,949
CH4 1.0E-03 0.16 0.32
N2O 1.0E-04 0.016 0.032
CO2e --- 8,483 16,967
TABLE 5 FUEL GAS HEATERS EMISSIONS ESTIMATE
POLLUTANT
EMISSION FACTOR (LB/MMBTU)
TOTAL MAXIMUM POTENTIAL EMISSIONS (TPY)
NOx 0.011 1.45
CO 0.037 4.86
PM10 0.0019 0.25
VOC 0.0050 0.66
SO2 0.00058 0.076
NH3 negligible --- (kg/MMBtu) (tpy)
CO2 53.06 15,339
CH4 1.0E-03 0.29
N2O 1.0E-04 0.029
CO2e --- 15,354

POWER ENGINEERS, INC. Plan Approval Application – Renovo Energy Center, LLC
PAGE 16
TABLE 6 DEW POINT HEATER EMISSIONS ESTIMATE
POLLUTANT
EMISSION FACTOR (LB/MMSCF)
TOTAL MAXIMUM POTENTIAL EMISSIONS (TPY)
NOx 100 1.27
CO 84 1.07
PM10 1.9 0.024
VOC 5.5 0.070
SO2 0.6 0.0076
NH3 negligible --- (kg/MMBtu) (tpy)
CO2 53.06 1,513
CH4 1.0E-03 0.029
N2O 1.0E-04 0.0029
CO2e --- 1,515
1.4.3 Emergency Generator and Fire Pump
Maximum potential emissions from REC’s emergency generator and emergency fire water pump are
based on the NSPS Subpart IIII limits for Stationary Compression Ignition Internal Combustion Engines
and/or BACT/LAER/BAT. The emergency generators and fire pump will be fired on ULSD having a
maximum sulfur content of 0.0015% by weight consistent with NSPS Subpart IIII requirements.
Maximum potential annual emissions from REC’s emergency generators are based on 500 hours of
operation and the emergency fire water pump is based on 250 hours of operation. Short-term and annual
maximum potential emissions are summarized in the tables below.
TABLE 7 EMERGENCY GENERATOR EMISSIONS ESTIMATE
POLLUTANT
TIER 2 EMISSION FACTOR (G/BHP-HR)
EMISSION RATE (LB/HR)
TOTAL MAXIMUM POTENTIAL EMISSIONS (TPY)
NOx 4.48 21.79 5.45
CO 1.23 5.98 1.50
PM10 0.13 0.63 0.16
VOC 0.80 3.89 0.97
SO2 --- 0.022 0.0055

POWER ENGINEERS, INC. Plan Approval Application – Renovo Energy Center, LLC
PAGE 17
TABLE 8 DIESEL FIRE PUMP EMISSIONS ESTIMATE
POLLUTANT
TIER 3 EMISSION FACTOR (G/BHP-HR)
EMISSION RATE (LB/HR)
TOTAL MAXIMUM POTENTIAL EMISSIONS (TPY)
NOx 2.70 1.41 0.18
CO 0.90 0.47 0.059
PM10 0.10 0.052 0.0065
VOC 0.10 0.052 0.0065
SO2 --- 0.0025 0.00032
1.4.4 Facility Wide
Criteria Pollutants
The following table lists a summary of REC’s maximum potential annual emissions from each emission
unit type.
TABLE 9 ANNUAL FACILITY WIDE MAXIMUM POTENTIAL EMISSIONS (TONS/YEAR)
POLLUTANT POWER-BLOCKS
AUXILIARY BOILERS
DIESEL GENERATOR
DIESEL FIRE PUMP HEATER
ULSD STORAGE TANKS
CIRCUIT BREAKERS
FACILITY-WIDE TOTAL
NOx 355.17 0.87 5.45 0.18 2.72 --- --- 364.4
CO 356.78 5.23 1.50 0.059 5.93 --- --- 369.5
PM10 211.92 0.28 0.16 0.0065 0.27 --- --- 212.6
VOC 110.73 0.29 0.97 0.0065 0.73 0.042 --- 112.8
SO2 53.48 0.084 0.0055 0.00032 0.084 --- --- 53.6
NH3 277.36 --- --- --- --- --- --- 277.4
Lead 0.042 --- --- --- --- --- --- 0.042
CO2 5,413,496 16,949 582.92 33.44 16,852 --- --- 5,447,914
CH4 82.26 0.32 0.024 0.0014 0.32 --- --- 82.9
N2O 10.21 0.032 0.0047 0.00027 0.032 --- --- 10.3
SF6 --- --- --- --- --- --- 0.0080 0.0080
CO2e 5,418,594 16,967 584.92 33.55 16,869 --- 182.97 5,453,232
H2SO4 35.40 0.013 --- --- --- --- --- 35.4
HAPs 19.87 0.27 0.014 0.00078 0.27 --- --- 20.4
Hexane1 7.36 0.26 --- --- 0.25 --- --- 7.9 1Hexane is the single HAP with the highest maximum potential emissions.
Hazardous Air Pollutants
Hazardous air pollutant (HAP) maximum potential emissions were calculated to determine whether the
proposed facility has the potential to be a major source of HAPs under Title III of the Clean Air Act

POWER ENGINEERS, INC. Plan Approval Application – Renovo Energy Center, LLC
PAGE 18
Amendments of 1990. Based on conservative emission factors, HAP maximum potential annual
emissions are summarized in the tables below for the CTGs; detailed emission calculations are provided
in Appendix D. The formaldehyde emission factors were provided by GE while the balance of HAP
emission factors are from EPA’s AP-42 document, and reflect the appropriate level of control from the
oxidation catalyst (50% control for CTG, 45% control for CTG with DB) for organic HAPs. Federal
major HAP emissions listed below are on an annual (tons/yr) basis.
TABLE 10 CTG HAP MAXIMUM POTENTIAL EMISSIONS
HAZARDOUS AIR POLLUTANT
ANNUAL EMISSIONS FROM ULSD FIRING (TONS)
ANNUAL EMISSIONS FROM ULSD SUSD (TONS)
ANNUAL EMISSIONS FROM NG FIRING (TONS)
ANNUAL EMISSIONS FROM NATURAL GAS SUSD (TONS)
TOTAL MAXIMUM POTENTIAL ANNUAL EMISSIONS FROM BOTH POWER BLOCKS (TONS)
1,3-butadiene 0.032 0.0018 0.0057 0.00035 0.040
acetaldehyde 0 0 0.53 0.033 0.56
acrolein 0 0 0.085 0.0052 0.090
benzene 0.11 0.0061 0.17 0.010 0.29
dichlorobenzene 0 0 0.0049 0 0.0049
ethyl benzene 0 0 0.43 0.026 0.45
formaldehyde 0.37 0.021 4.46 0.21 5.06
hexane 0 0 7.36 0 7.36
naphthalene 0.070 0.0039 0.020 0.0011 0.094
PAH 0.079 0.0044 0.029 0.0018 0.11
POM 0 0 0.00036 0 0.00036
propylene oxide 0 0 0.39 0.024 0.41
toluene 0 0 1.74 0.11 1.85
xylenes 0 0 0.86 0.053 0.92
arsenic 0.031 0.0017 0.0015 0 0.034
beryllium 0.00088 0.000049 0.000089 0 0.0010
cadmium 0.014 0.00076 0.0082 0 0.023
chromium 0.031 0.0017 0.010 0 0.043
cobalt 0 0 0.00062 0 0.00062
lead 0.040 0.0022 0 0 0.042
manganese 2.24 0.12 0.0028 0 2.37
mercury 0.0034 0.00019 0.0019 0 0.0055
nickel 0.013 0.00073 0.016 0 0.029
selenium 0.071 0.0039 0.00018 0 0.075
Total HAPs 19.87
Table reflects 8,000 hours/year operating on natural gas and 760 hours/year on ULSD.
Based on the tables above, the maximum potential total collective HAP emissions from the proposed
facility would be less than 25 tons per year; hexane is the individual HAP emitted at the highest rate (less
than 8 tons per year). Major source thresholds for HAPs are 10 tons per year for an individual HAP or 25
tons per year total HAPs. Therefore, REC is not a major source of HAP and is not subject to requirements

POWER ENGINEERS, INC. Plan Approval Application – Renovo Energy Center, LLC
PAGE 19
under 40 CFR Part 63 Subpart YYYY, the CTG Maximum Achievable Control Technology (MACT)
standard.

POWER ENGINEERS, INC. Plan Approval Application – Renovo Energy Center, LLC
2.0 AIR REGULATORY REQUIREMENTS

POWER ENGINEERS, INC. Plan Approval Application – Air Regulatory Requirements – Renovo Energy Center, LLC
PAGE i
TABLE OF CONTENTS
2.0 AIR REGULATORY REQUIREMENTS .................................................................................... 1
2.1 NATIONAL AND STATE AMBIENT AIR QUALITY STANDARDS ...................................................... 1 2.2 NEW SOURCE REVIEW AND AIR PERMITTING ............................................................................... 2 2.3 PREVENTION OF SIGNIFICANT DETERIORATION (PSD)................................................................. 2 2.4 NON-ATTAINMENT NEW SOURCE REVIEW ................................................................................... 3 2.5 MINOR NEW SOURCE REVIEW ...................................................................................................... 4 2.6 NEW SOURCE PERFORMANCE STANDARDS (NSPS) ..................................................................... 4
2.6.1 40 CFR Part 60 Subpart A – General Provisions .................................................................. 4 2.6.2 40 CFR Part 60 Subpart Dc – Standards of Performance for Small Industrial-Commercial-
Institutional Steam Generating Units .................................................................................................... 5 2.6.3 40 CFR Part 60 Subpart IIII – Standards of performance for Stationary Compression
Ignition Combustion Engines ................................................................................................................ 5 2.6.4 40 CR Part 60 Subpart KKKK – Standards of Performance for Stationary Combustion
Turbines 5 2.6.5 40 CFR Part 60 Subpart TTTT – Standards of Performance for Greenhouse Gas Emissions
from New Stationary Sources: Electric Utility Generating Units ........................................................ 6 2.7 40 CFR PART 63 – NATIONAL EMISSION STANDARDS FOR HAZARDOUS AIR POLLUTANTS
(NESHAP) ................................................................................................................................................ 6 2.7.1 40 CFR Part 63 Subpart ZZZZ – Stationary Reciprocating Internal Combustion Engines .. 7
2.8 40 CFR PART 64 – COMPLIANCE ASSURANCE MONITORING ....................................................... 7 2.9 40 CFR PART 70 - OPERATING PERMIT ......................................................................................... 7 2.10 40 CFR PART 72 – PART 75 - ACID RAIN PROGRAM..................................................................... 8 2.11 40 CFR PART 96 NOX BUDGET TRADING PROGRAM AND CAIR NOX AND SO2 TRADING
PROGRAMS FOR STATE IMPLEMENTATION PLANS .................................................................................... 8 2.12 40 CFR PART 97 – CROSS-STATE AIR POLLUTION RULE (CSAPR) ............................................. 8 2.13 40 CFR PART 98 – MANDATORY GREENHOUSE GAS REPORTING ................................................ 9 2.14 PADEP APPLICABLE REQUIREMENTS ........................................................................................... 9 2.15 REQUIREMENTS EVALUATED THAT DO NOT APPLY .................................................................. 12
TABLES:
TABLE 1 NATIONAL AND PENNSYLVANIA AMBIENT AIR QUALITY STANDARDS... 1 TABLE 2 CLINTON COUNTY NAAQS AND PA AAQS ATTAINMENT STATUS ............... 2 TABLE 3 POTENTIAL EMISSIONS COMPARED TO MAJOR SOURCE THRESHOLDS .... 4

POWER ENGINEERS, INC. Plan Approval Application – Air Regulatory Requirements – Renovo Energy Center, LLC
PAGE 1
2.0 AIR REGULATORY REQUIREMENTS
2.1 National and State Ambient Air Quality Standards
EPA has established primary and secondary National Ambient Air Quality Standards (NAAQS) for six
air pollutants (ozone, Carbon Monoxide (CO), Nitrogen Dioxide (NO2), Sulfur Dioxide (SO2), Particulate
Matter (including PM10 and PM2.5), and lead). Primary NAAQS are intended to protect public health
while secondary standards set limits to protect public welfare. The NAAQS promulgated by EPA have
been incorporated, by reference, as part of the Pennsylvania Department of Environmental Protection’s
(PaDEP) standards contained in Pa. Code Chapter 131. PaDEP ambient air quality standards include
standards for settled particulate (total), beryllium, fluorides, and hydrogen sulfide. Federal and State
Ambient Air Quality Standards (AAQS) are summarized in Table 2.1-1 below.
TABLE 1 NATIONAL AND PENNSYLVANIA AMBIENT AIR QUALITY STANDARDS
POLLUTANT STANDARD TYPE
AVERAGING PERIOD STANDARD NOTE
Carbon Monoxide (CO)
primary 1-hour 35 ppm (40,000 µg/m3)
Not to be exceeded more than once per year
primary 8-hour 9 ppm (10,000 µg/m3)
Not to be exceeded more than once per year
Lead (Pb) primary and secondary
Rolling 3-month average
0.15 µg/m3 Not to be exceeded
Nitrogen Dioxide (NO2)
primary 1-hour 100 ppb 98th percentile of 1-hour daily maximum concentrations, averaged over 3 years
primary and secondary
annual 53 ppb Annual mean
Ozone primary and secondary
8-hour 0.07 ppm Annual fourth-highest daily maximum 8-hr concentration, averaged over 3 years
Particulate matter (PM2.5)
primary and secondary
24-hour 35 µg/m3 Not to be exceeded more than once per year on average over 3 years
primary Annual 12 µg/m3 Annual mean, averaged over 3 years
secondary Annual 15 µg/m3 Annual mean, averaged over 3 years
Particulate matter (PM10) primary and secondary
24-hour 150 µg/m3 Not to be exceeded more than once per year on average over 3 years.
Sulfur dioxide (SO2)
primary 1-hour 75 ppb 99th percentile of 1-hour daily maximum concentrations, averaged over 3 years
secondary 3-hour 0.5 ppm Not to be exceeded more than once per year
Settled particulate primary 30-days 1.5 mg/cm2/mo PaDEP AAQS (131.3)
primary annual 0.8 mg/cm2/mo PaDEP AAQS (131.3)
Beryllium primary 30-days 0.01 µg/m3 PaDEP AAQS (131.3)
Fluorides primary 24-hour 5 µg/m3 PaDEP AAQS (131.3)
Hydrogen sulfide primary 1-hour 0.1 ppm PaDEP AAQS (131.3)
primary 24-hour 0.005 ppm PaDEP AAQS (131.3)

POWER ENGINEERS, INC. Plan Approval Application – Air Regulatory Requirements – Renovo Energy Center, LLC
PAGE 2
Geographic areas where the concentration of a given pollutant is at or below the NAAQS are classified as
“attainment” areas for that pollutant. If an area exceeds the NAAQS for a given pollutant then the area is
considered a “nonattainment area”. Areas where there is insufficient monitoring data to determine if the
NAAQS is being met are designated as unclassifiable. For permitting determinations, the unclassifiable
areas are considered attainment areas. The site of the proposed Renovo Energy Center is located in the
town of Renovo in Clinton County. The current federal air quality classifications for the project area in
Clinton County are listed in Table 2.1-2 for each criteria pollutant. These designations were obtained
from 40 CFR Part 81. The project area is designated as attainment or unclassifiable for all criteria
pollutants. PaDEP does not monitor for settled particulate, beryllium, fluorides or hydrogen sulfide.
However, per discussions with PaDEP there are no concerns with attainment of the AAQS for these
pollutants in Clinton County.
The entire Commonwealth of Pennsylvania is located in the Ozone Transport Region (OTR). The
relevance of attainment status and OTR is discussed in the proceeding sections.
TABLE 2 CLINTON COUNTY NAAQS AND PA AAQS ATTAINMENT STATUS
POLLUTANT ATTAINMENT STATUS
Sulfur Dioxide (SO2) Attainment
Carbon Monoxide (CO) Unclassifiable/Attainment
Particulate Matter (PM10) Unclassifiable
Particulate Matter (PM2.5) Unclassifiable/Attainment
Nitrogen Dioxide (NO2) Unclassifiable/Attainment
Ozone (8-hour) Unclassifiable/Attainment
Lead Unclassifiable/Attainment
Settled particulate Attainment (unofficial)
Beryllium Attainment (unofficial)
Fluorides Attainment (unofficial)
Hydrogen sulfide Attainment (unofficial)
2.2 New Source Review and Air Permitting
New air contaminant sources are required to obtain a plan approval prior to construction in accordance
with Pa. Code Chapter 127 of the PaDEP’s Air Resources regulations. The PaDEP’s and EPA’s process
for reviewing new sources of air pollution is the New Source Review (NSR) permitting program.
PaDEP’s NSR requirements are codified in 25 Pa. Code Chapter 127. NSR is applied by pollutant and
depends on whether the area where a proposed facility is located is in attainment of the NAAQS for that
pollutant. A facility classified as a major source is subject to Prevention of Significant Deterioration
(PSD) review if the area is in attainment of the NAAQS for a particular pollutant. A facility classified as
a major source is subject to Non-attainment Area (NAA) NSR if the location is not attaining the NAAQS
for a certain pollutant or, for ozone, is located in the OTR. Since the State of Pennsylvania is within the
OTR, NAA provisions are in effect statewide for major sources of NOx and VOC. A facility is subject to
minor new source review if emissions of a pollutant do not exceed the PSD and Non-attainment NSR
thresholds. Each program is described in the following sections.
2.3 Prevention of Significant Deterioration (PSD)
The PSD requirements are contained in 40 CFR Part 52 and adopted in their entirety by the PaDEP in 25
Pa. Code Chapter 127 Subchapter D. PSD applies to new major stationary sources of air pollutants, which

POWER ENGINEERS, INC. Plan Approval Application – Air Regulatory Requirements – Renovo Energy Center, LLC
PAGE 3
are defined as any one of 28 specific source categories, including fossil fuel-fired steam electric plants
with a heat input capacity greater than 250 MMBtu/hr that have the potential to emit 100 tons per year or
more of any regulated NSR pollutant. Renovo Energy Center (REC) is proposing a fossil-fuel fired steam
electric plant of more than 250 MMBtu/hr heat input and is therefore subject to PSD if it has the potential
to emit 100 tons per year of any one pollutant. Once it is determined that a facility is a major source, the
potential to emit of each pollutant must be compared to the corresponding significant net emissions
increase to determine which pollutants are subject to PSD review. PSD significant net emissions increases
are defined in 40 CFR Part 52 and identified in Table 2.4-1.
PSD review for major stationary sources consists of demonstrating that Best Available Control
Technology (BACT) has been applied to each emission source and demonstrating that the proposed
emissions will not cause or contribute to a violation of the NAAQS or PSD increment. PSD increment is
the maximum allowable increase in concentration that is allowed to occur above a baseline concentration
for a pollutant. PSD increments prevent the air quality in “clean areas” from deteriorating to the level set
by the NAAQS. A demonstration of BACT for Renovo’s PSD pollutants is contained in Section 3 of this
application packet and the air quality impact analyses performed to demonstrate compliance with PSD
increment requirements and NAAQS is presented in Section 4. REC’s PSD pollutants are SO2, PM, CO,
and H2SO4 as outlined in Table 2.4-1. As required by the tailoring rule, the June 23, 2014 U.S. Supreme
Court Decision, and resultant EPA guidance, a BACT analysis is required for stationary sources that are
new major source for a regulated NSR pollutant that is not GHGs and will have the potential to emit
75,000 tpy CO2e. Therefore, a BACT analysis is also required for GHG emissions.
2.4 Non-Attainment New Source Review
A new source is subject to the non-attainment area preconstruction review process if it has the potential to
emit any criteria pollutant in major amounts for which the area has been designated nonattainment. Since
the entire Commonwealth of Pennsylvania is in the ozone transport region it is designated nonattainment
for ozone. NOx and VOC are precursors to ozone formation and the nonattainment major source
thresholds for these pollutants are 100 tpy and 50 tpy, respectively. The nonattainment review
requirements differ from the PSD requirements such that the emission control requirement for
nonattainment areas, Lowest Achievable Emission Rate (LAER), is defined differently than the BACT
emissions control requirements. LAER is defined as the most stringent emission limitation contained in
the implementation plan of any state or the most stringent emission limitation achieved in practice.
Section 3 of this application contains the LAER determinations for NOx and VOC for REC’s emission
sources.
In addition, before construction or operation of a source in a nonattainment area can be commenced the
source must obtain Emission Reduction Credits (ERC) or offsets of the nonattainment pollutant from
other emission sources which impact the same area as the proposed source. Per 25 Pa. Code Chapter
127.210, with the exception of fugitive VOC emissions, the emission offset ratio for both NOx and VOC
in the ozone transport region is 1.15:1. The emission offset ratio for fugitive VOC emissions is 1.3:1.
Therefore REC is required to obtain ERCs for VOC and NOx at a rate of 1.15 times the proposed
emissions for these pollutants emitted from the stacks. Based on emission calculations provided in
Appendix D, there will not be any fugitive VOC emissions.
Thirdly, sources impacting visibility in mandatory class I Federal areas must be reviewed by the
appropriate Federal Land Manager (FLM). In addition, 25 Pa. Code § 127.205(5) requires an analysis to
be conducted of alternative sites, sizes, production processes and environmental control techniques for the
proposed facility, which demonstrates that the benefits of the proposed facility significantly outweigh the
environmental and social costs imposed as a result of it location and construction.

POWER ENGINEERS, INC. Plan Approval Application – Air Regulatory Requirements – Renovo Energy Center, LLC
PAGE 4
A LAER analysis in accordance with the non-attainment NSR requirements is contained in Section 3 of
this application and the alternative sites analysis is contained in Section 6.
TABLE 3 POTENTIAL EMISSIONS COMPARED TO MAJOR SOURCE THRESHOLDS
POLLUTANT
FACILITY POTENTIAL EMISSIONS (TONS/YR)
MAJOR SOURCE THRESHOLDS (TONS/YR)
PSD SIGNIFICANT NET EMISSIONS INCREASE (TONS/YR)
SUBJECT TO PSD REVIEW?
OZONE NONATTAINMENT MAJOR SOURCE THRESHOLD (TONS/YR)
SUBJECT TO NONATTAINMENT NEW SOURCE REVIEW
SO2 53.6 100 40 Yes NA NA
PM10 212.6 100 15 Yes NA NA
PM2.5 212.6 100 10 Yes NA NA
NOx 364.4 100 40 NA 100 Yes
CO 369.5 100 100 Yes NA NA
VOC 112.8 100 40 NA 50 Yes
H2SO4 35.4 100 7 Yes NA NA
Lead 0.042 100 0.6 No NA NA
CO2e 5,447,914 75,000 75,000 Yes NA NA
2.5 Minor New Source Review
All pollutants, whether or not subject to PSD or non-attainment NSR, must comply with the minor source
permitting requirements of Chapter 127. A facility is required to apply Best Available Technology (BAT)
which is similar to BACT required under the PSD program. Further details of the requirements of Chapter
127 are outlined below under Section 2.14 – PaDEP Applicable Requirements.
2.6 New Source Performance Standards (NSPS)
New Source Performance Standards (NSPS) are established by EPA for source categories that cause or
contribute significantly to air pollution. These standards apply to sources that have been constructed or
modified since the proposal of the standard. NSPS are codified in 40 CFR Part 60. There are several
NSPS standards that potentially apply to the REC facility which are outlined in the following subsections.
2.6.1 40 CFR Part 60 Subpart A – General Provisions
General Provisions contained in Subpart A apply to any source that is subject to another subpart. REC is
subject to Subpart Dc, Subpart KKKK, Subpart IIII, and Subpart TTTT, thus specific provisions in
Subpart A will apply. The following Subpart A provisions will apply:
• 60.7 – Initial notification and recordkeeping: The following notifications are required to be
submitted to EPA and PaDEP: a notification of the date of construction commencement and date
of initial startup; a notification of the date the CEMS performance demonstration has
commenced. The following records are required: occurrence and duration of any startup,
shutdown, or malfunction; periods during which a CEMS is inoperative; records of all
measurements including CEMS, performance testing, CEMS calibration checks, CEMS
performance evaluations, and adjustments and maintenance performed on the monitoring system.

POWER ENGINEERS, INC. Plan Approval Application – Air Regulatory Requirements – Renovo Energy Center, LLC
PAGE 5
The following reports are required: semi-annual excess emissions and monitoring system
performance reports.
• 60.8 – Performance Tests: REC will comply with the requirements contained in 60.8 and use the
applicable reference test methods for any performance testing that will apply.
• 60.11 – Compliance with Standards and Maintenance Requirements: Compliance with standards
in Part 60 will be demonstrated with performance testing in accordance with 60.8.
• 60.13 – Monitoring Requirements: CEMS required under applicable subparts will be subject to
the performance specifications under Appendix B and Appendix F of Part 60.
• 60.19 – General Notification and Reporting Requirements: REC will comply with the general
report and notification formats and schedules contained in this section.
2.6.2 40 CFR Part 60 Subpart Dc – Standards of Performance for Small Industrial-Commercial-Institutional Steam Generating Units
Subpart Dc establishes emission limits for steam generating units constructed, modified or reconstructed
after June 9, 1989 with a heat input capacity of 10 - 100 MMBtu/hr. REC is proposing to install two
natural gas fired auxiliary boilers, each with a heat input capacity of 66 MMBtu/hr. The boilers will be
fired with natural gas only. Since the boilers will combust natural gas exclusively, compliance with
Subpart Dc only requires maintaining monthly fuel consumption records and submitting an annual report
to EPA summarizing those records.
2.6.3 40 CFR Part 60 Subpart IIII – Standards of performance for Stationary Compression Ignition Combustion Engines
40 CFR Part 60, Subpart IIII, Standards of performance for Stationary Compression Ignition Internal
Combustion Engines will apply to REC’s emergency generator engine and emergency fire pump engine.
The regulation requires that manufacturers of internal combustion engines certify the engines to specific
emission standards based on model year, engine size and type. Owners and operators of subject engines
are required to operate and maintain the engine in accordance with the manufacturer’s emission related
written instructions.
The diesel fuel fired in REC’s emergency equipment will meet the requirements of 40 CFR 80.510(a)
which limits the sulfur content to 15 ppm. The emergency generator and diesel fire pump will be certified
to meet the applicable emission standards set forth in Subpart IIII. Both of REC’s engines will be
installed with non-resettable hour meters. REC proposes to limit the operation of the emergency
generator to 500 hours per year and 250 hours per year for the fire pump engine. Maintenance checks and
readiness testing will be limited to 100 hours per year per engine.
2.6.4 40 CR Part 60 Subpart KKKK – Standards of Performance for Stationary Combustion Turbines
Subpart KKKK establishes emission limits for combustion turbines (CT) which commence construction
after February 18, 2005 and have a heat input at peak load of 10 MMBtu/hr or greater based on the higher
heating value of the fuel. Only heat input to the combustion turbine is included when determining
whether or not this subpart applies to the proposed turbines. Any additional heat input associated heat

POWER ENGINEERS, INC. Plan Approval Application – Air Regulatory Requirements – Renovo Energy Center, LLC
PAGE 6
recovery steam generators (HRSG) or duct burners is not included when determining the turbine’s peak
heat input. However, Subpart KKKK does apply to emissions from the associated HRSGs and duct
burners. Stationary combustion turbines regulated under Subpart KKKK are exempt from the
requirements of Subpart GG. Heat recovery steam generators and duct burners regulated by Subpart
KKKK are exempt from the requirements of Subparts Da, Db, and Dc.
Under Subpart KKKK, each CT/HRSG train is subject to a NOx emission limit of 15 ppmvd at 15 percent
O2 while firing natural gas and 42 ppmvd at 15 percent O2 while firing ULSD. Compliance is required to
be demonstrated either by annual stack testing or continuous emission monitoring (CEMS). An initial
performance test is required by either conducting a stack test or, if a CEMS is installed, performing a
minimum of nine relative accuracy test audit (RATA) reference method runs. Since REC will be
installing a CEM, the initial performance test will consist of the RATA testing.
REC’s CT/HRSG trains will be subject to a SO2 emission limit of 0.90 pounds per megawatt-hour gross
energy output or 0.060 lb SO2/MMBtu heat input fuel. A facility is exempt from monitoring for SO2 if
sulfur fuel characteristics in a purchase contract, tariff sheet or transportation contract for the fuel specify
that the maximum total sulfur content for natural gas is 20 grains of sulfur or less per 100 standard cubic
feet and for oil is 0.05% or less. As an alternative, REC can provide representative fuel sampling data
which demonstrates that the sulfur content of the fuel does not exceed 0.06 lb/MMBtu. At a minimum,
the amount of fuel sampling data specified in Section 2.3.1.4 or 2.3.2.4 of Appendix D to Part 75 is
required.
Reporting requirements under Subpart KKKK include semi-annual excess emissions and CEMS
downtime reports.
2.6.5 40 CFR Part 60 Subpart TTTT – Standards of Performance for Greenhouse Gas Emissions from New Stationary Sources: Electric Utility Generating Units
REC’s proposed facility is subject to 40 CFR Part 60 Subpart TTTT which was finalized on October 23,
2015. The regulation applies to steam generating units with a base load rating greater than 250 MMBtu/hr
of fossil fuel that serve a generator or generators capable of selling greater than 25 MW of electricity to a
utility power distribution system. Under Subpart TTTT, each CT/HRSG train will be subject to an
emission limit of 1,000 lb CO2 per megawatt-hour of gross energy output or 1,030 lb CO2 per megawatt-
hour of net energy output. REC will be required to follow procedures in Subpart TTTT for calculating
hourly CO2 mass emissions and obtaining generating load data for the output-based standards.
Reporting requirements under Subpart TTTT include quarterly emission reports.
2.7 40 CFR Part 63 – National Emission Standards for Hazardous Air Pollutants (NESHAP)
Appendix D contains a summary of REC’s estimated potential annual emissions of hazardous air
pollutants (HAPs) from the facility. The summary indicates that HAP emissions from the facility will be
less than 10 tons per year for any individual HAP and less than 25 tons per year for combined HAPs.
Therefore, REC’s proposed facility is not classified as a major HAP source (i.e. REC will be non-major or
area source), and the fuel burning and process equipment at the facility will not be subject to any major
source NESHAP promulgated by EPA. However, REC will be subject to the NESHAP for Stationary
Reciprocating Internal Combustion Engines (Subpart ZZZZ) which applies to both major and non-major
sources of HAPs.

POWER ENGINEERS, INC. Plan Approval Application – Air Regulatory Requirements – Renovo Energy Center, LLC
PAGE 7
2.7.1 40 CFR Part 63 Subpart ZZZZ – Stationary Reciprocating Internal Combustion Engines
40 CFR Part 63 Subpart ZZZZ establishes national emission and operating limitations for HAP emissions
from stationary reciprocating internal combustion engines located at major and area sources of HAP
emissions. In accordance with Subpart ZZZZ, new and reconstructed emergency engines at area sources
must comply with 40 CFR Part 60 Subpart IIII. Therefore, as described above, REC’s diesel engine
powered emergency generator and emergency fire pump engine are subject to the requirements of 40 CFR
Part 60 Subpart IIII.
2.8 40 CFR Part 64 – Compliance Assurance Monitoring
The Compliance Assurance Monitoring (CAM) regulation applies to facilities that are required to obtain a
Part 70 Operating Permit (major sources). The CAM requirements are unit and pollutant specific and
apply if the following criteria are met:
1. The unit is subject to an emission limitation or standard (other than an emission limit or standard
that is exempt under paragraph (b)(1) of Part 64);
2. The unit uses a control device to achieve compliance with that standard; and
3. The unit has potential pre-control device emissions exceeding the major source threshold under
the Title V permitting program.
CAM does not apply to the NOx emissions from the powerblocks (CT and HRSG with duct burners) per
40 CFR 64.2(b)(1)(i) because the NOx emissions are subject to emission limitations and standards
pursuant to Section 111 of the Clean Air Act (NSPS Subpart KKKK) and per 64.2(b)(1)(vi) since NOx
will be monitored by a CEMS. CAM does not apply to CO per 64.2(b)(1)(vi), since CO will be
monitored by a CEMS. The powerblocks will have pre-control VOC emissions that exceed the Title V
major source threshold (50 tpy), VOC emissions will be controlled by a control device (oxidation
catalyst), and will be subject to an emission limitation established by the Non-attainment NSR
requirements. REC will be required to submit a CAM plan for VOC emissions from the powerblocks.
REC’s CAM plan will include the use of a CO CEMS data as an indicator of the oxidation catalyst
performance since CO emissions are also being controlled by the catalyst. The CAM plan will be
submitted as part of REC’s initial Title V Operating Permit application.
The CAM rule will not apply to the auxiliary boilers or diesel fired emergency equipment because all
three criteria outlined above and specified in 40 CFR Part 64.2(a)(1-3) will not be met.
2.9 40 CFR Part 70 - Operating Permit
The PaDEP has adopted EPA’s Part 70 – Operating Permit Program (Title V) which is codified as 25 Pa.
Code Chapter 127, Subchapter G. A Title V permit is required for major sources. For Title V
applicability, a major source is defined as source that has the potential to emit 10 tons per year of any
hazardous air pollutant (HAP), 25 tons per year of a combination of HAPs, 50 tpy of VOC and 100 tpy
for any other regulated air pollutant. Based on potential emissions as presented in Section 2 and Appendix
D, REC is a major source and subject to Title V permitting. A Title permit application will be submitted
within 120 days after the PaDEP provides notice that the application is due.

POWER ENGINEERS, INC. Plan Approval Application – Air Regulatory Requirements – Renovo Energy Center, LLC
PAGE 8
2.10 40 CFR Part 72 – Part 75 - Acid Rain Program
Per 40 CFR Section 72.6(a)(3)(i), REC will be subject to the Acid Rain Program since it will be a new
utility unit with a total nameplate capacity of greater than 25 MW as defined by the regulation. A new
unit is defined as a fossil fuel fired combustion device that commences commercial operation on or after
November 15, 1990 and a utility unit is defined as a unit that produces electricity for sale. 72.9(a)
requires the facility to submit a complete Acid Rain permit application at least 24 months prior to
commencing operation. The purpose of Part 75 is to establish requirements for the monitoring,
recordkeeping, and reporting of SO2, NOx, and CO2 emissions, volumetric flow and opacity data from
affected units. For measuring and recording SO2 emissions, REC will follow either 75.11(d)(2):
procedures specified in Appendix D – Optional SO2 Emissions Data Protocol for Gas-fired and Oil-fired
units for determining hourly SO2 emissions and heat input in lieu of continuous SO2 concentration and
flow monitors; or 75.11(e): special considerations during the combustion of gaseous fuels – if the facility
uses a certified flow monitor and a certified diluent gas monitor to measure the heat input rate, during any
hours in which the unit combusts only gaseous fuel, the facility shall determine SO2 emissions in by using
Equation F-23 of Appendix F. The regulation also requires that the facility install a CEMS for NOx and
diluent gas. An opacity monitor is not required as REC will meet the definition of gas-fired unit (a gas-
fired unit combusts natural gas or other gaseous fuel for at least 90 percent of the unit’s average annual
heat input during the previous three calendar years and for at least 85 percent of the annual heat input in
each of those calendar years). In addition, REC will be required to hold SO2 allowances equal to the
actual annual SO2 emissions for the previous calendar year.
2.11 40 CFR Part 96 NOx Budget Trading Program and CAIR NOx and SO2 Trading Programs for State Implementation Plans
40 CFR Part 96 is an outline of the requirements for State Implementation Plans and has been superseded
with the requirements contained in Part 97 as described below.
2.12 40 CFR Part 97 – Cross-State Air Pollution Rule (CSAPR)
The Cross-State Air Pollution Rule (CSAPR) requires twenty-three states to reduce annual SO2 and NOx
emissions to help downwind areas attain the 24-hour and/or annual PM2.5 NAAQS. Twenty-five states
are required to reduce ozone season NOx emission to help downwind areas attain the 8-hour ozone
NAAQS. Pennsylvania is one of the states that must reduce annual SO2 and NOx emissions and ozone
season NOx emissions. Pennsylvania is a Group 1 state required to reduce SO2 emissions in Phase I and
make additional reductions in SO2 emissions in Phase II. Phase I implementation is scheduled for 2015
and Phase II is scheduled for 2017. Given that the application is being filed in 2019, REC will be subject
to Phase II.
CSAPR replaces the Clean Air Interstate Rule (CAIR). CSAPR regulations are contained in 40 CFR Part
97. REC’s proposed units will be subject to Subpart AAAAA – Transport Region (TR) NOx Annual
Trading Program, Subpart BBBBB – TR NOx Ozone Season Trading Program, and Subpart CCCCC –
TR SO2 Group 1 Trading Program. REC will be required to submit a NOx Budget permit application at
least 18 months before the date of commencement of operation. The proposed units are also NOx units,
SO2 units, and NOx Ozone Season units per 40 CFR Section 97.104(a)(1), Section 97.204(a)(1), and
97.304(a)(1), respectively, and thus the facility will be required to submit a complete permit application at
least 18 months prior to commencing construction.

POWER ENGINEERS, INC. Plan Approval Application – Air Regulatory Requirements – Renovo Energy Center, LLC
PAGE 9
REC is subject to the standard requirements contained in Sections 97.406 (TR NOx Annual Trading
Program requirements), 97.506 (TR NOx Ozone Season Trading Program Requirements), and 97.606
(TR SO2 Group 1 Trading Program requirements). Each program requires that the facility assign a
designated representative. Each TR NOx Annual source/unit is required to comply with the monitoring,
reporting, and recordkeeping requirements of 40 CFR 97.430 through 97.435. Emissions data determined
in accordance with 40 CFR 97.430 through 97.435 shall be used to calculate allocations of TR NOx
Annual allowances to determine compliance with the TR NOx Annual emissions limitation and assurance
provisions. As of the allowance transfer deadline for a control period in a given year, the owner or
operator of each TR NOx Annual source/unit shall hold, in the source’s compliance account, TR NOx
Annual allowances available for deduction for the control period. Each TR NOx Ozone Season
source/unit is required to comply with the monitoring, reporting, and recordkeeping requirements of 40
CFR 97.530 through 97.535. Emissions data determined in accordance with 40 CFR 97.530 through
97.535 shall be used to calculate allocations of TR NOx Ozone Season allowances to determine
compliance with the TR NOx Ozone Season emissions limitation and assurance provisions. As of the
allowance transfer deadline for a control period in a given year, the owner or operator of each TR NOx
Ozone Season source/unit shall hold, in the source’s compliance account, TR NOx Ozone Season
allowances available for deduction for the control period. Each TR SO2 Group 1 source/unit is required
to comply with the monitoring, reporting, and recordkeeping requirements of 40 CFR 97.630 through
97.635. Emissions data determined in accordance with 40 CFR 97.630 through 97.635 shall be used to
calculate allocations of TR SO2 Group 1 allowances to determine compliance with the TR SO2 Group 1
emissions limitation and assurance provisions. As of the allowance transfer deadline for a control period
in a given year, the owner or operator of each TR SO2 Group 1 source/unit shall hold, in the source’s
compliance account, TR SO2 Group 1 allowances available for deduction for the control period.
2.13 40 CFR Part 98 – Mandatory Greenhouse Gas Reporting
In accordance with 98.2(a)(1), EPA’s Mandatory Greenhouse Gas Reporting regulation will apply as
REC is classified as a source category listed in Table A-3 of the regulation (Electricity generation units
that report CO2 mass emissions year round through 40 CFR Part 75). Subpart D of 40 CFR Part 98
outlines the requirements for electricity generation units. Subpart C outlines the requirements for fuel
combustion units that apply to the boilers and emergency engines. REC will be required to report annual
emissions of greenhouse gases by March 1 each year for the previous year.
2.14 PaDEP Applicable Requirements
25 Pa. Code Chapter 121 General Provisions
Chapter 121 contains definitions and general administrative requirements provided for the control and
prevention of air pollution.
25 Pa. Code Chapter 122 National Standards of Performance for New Stationary Sources
Chapter 122 adopts Standards of Performance for New Stationary Sources (NSPS) promulgated by EPA
which allows the standards to be enforceable by the PaDEP and delegates authority to the PaDEP. The
NSPS standards that REC is subject to were previously outlined in this section.
25 Pa Code Chapter 123 Standards for Contaminants
REC is subject to the following general emission standards and requirements as set forth in Chapter 123:

POWER ENGINEERS, INC. Plan Approval Application – Air Regulatory Requirements – Renovo Energy Center, LLC
PAGE 10
• Section 123.1 does not permit fugitive emissions in the outdoor air from sources other than the
following:
o Construction or demolition of buildings or structures.
o Grading, paving and maintenance of roads and streets.
o Use of roads and streets
o Clearing of land
o Stockpiling of materials
o Open burning operations.
o Blasting in open pit mines.
o Sources and classes of sources other than those listed above, for which the facility has
obtained a determination from the PaDEP that fugitive emissions meet the following
requirements: emissions are of minor significance with respect to causing air pollution,
and emissions are not preventing or interfering with attainment or maintenance of any
ambient air quality standard.
• Section 123.11 limits particulate matter emissions from combustion sources based on heat input.
The turbines are subject to a limit of 0.1 lb/MMBtu and the auxiliary boilers, emergency
generator, and fire pump engine are subject to a limit of 0.4 lb/MMBtu.
• Section 123.21 and 123.22 establish standards for the control of sulfur dioxide emissions sulfur
content of fuels. Clinton County is in a “non-air basin area” and is therefore subject to the SO2
and sulfur limits contained in 123.22(a). SO2 emissions are limited to 4 lb/MMBtu of heat input
over a 1-hour period. The sulfur content of #2 oil and lighter is limited to 0.05%.
• Section 123.41 limits visible emissions to less than 20% opacity, except for periods of no more
than 3 minutes in any one hour and no more than 60% opacity at any time.
• Section 123.51 requires combustion units with heat inputs greater than 250 MMBtu/hr to install,
operate, and maintain a continuous nitrogen oxides emissions monitoring system
25 Pa. Code Chapter 124 National Emission Standards for Hazardous Air Pollutants (NESHAPs)
Chapter 124 adopts National Emission Standards for Hazardous Air Pollutants (NESHAP) promulgated
by EPA allowing the standards to be enforceable by the PaDEP and delegates authority to the PaDEP.
REC is subject to a NESHAP requirement as previously outlined in this section.
25 Pa. Code Chapter 127 Construction, Modification, Reactivation and Operation of Sources
PaDEP’s Chapter 127 outlines new source permitting and operating permit requirements. Subchapter B
specifies plan approval requirements (new source permitting) which includes the application content
requirements, notification and other administrative tasks and requires a facility to obtain a plan approval
prior to construction. Sections 127.1 and 127.12(a)(5) require new sources to control emissions of air
contaminants to best available technology (BAT) level which applies to major and minor sources and is

POWER ENGINEERS, INC. Plan Approval Application – Air Regulatory Requirements – Renovo Energy Center, LLC
PAGE 11
similar to BACT under the PSD program. BAT is defined as equipment, devices, methods or techniques
which will prevent, reduce or control emissions to the maximum degree possible and which are available
or may be made available.
EPA’s PSD requirements are adopted by the PaDEP through Subchapter D of Chapter 127. REC is
subject to Subpart E for nonattainment NSR. As discussed in Section 2.4 (nonattainment NSR), REC is
major for NOx and CO (NSR pollutants) and is thus subject to Subchapter E. Subchapter E requires REC
to apply LAER and obtain ERC credits at the rate of 1.15 to 1 for NOx and VOC emissions and 1.3:1 for
fugitive VOC emissions. Documentation of REC’s intent to secure NOx and VOC offsets is contained in
Appendix Q. In accordance with 127.205(5), REC is required to submit an analysis of alternative sites,
sizes, production processes and environmental control techniques. This analysis is addressed in Section
6.
Chapter 127, Subchapter G contains Title V Operating Permit Program requirements. As discussed in
Section 2.9, REC is required to obtain a Title V Operating Permit. REC will submit an application for the
operating permit within 120 days after the PaDEP provides notice that the application is due. The Title V
operating permit will not impose additional requirements other than periodic reporting and certification.
Subchapter I outlines the plan approval and operating permit fees that apply to REC as follows:
• Sources requiring approval under Subchapter B: $5,300
• Sources requiring approval under NSPS and/or NESHAP: $1,700
• Sources requiring approval under PSD: $22,700
REC is subject to a total plan approval and operating permit fee of $29,700.
25 Pa. Code Chapter 129 Standards For Sources
Since REC is a major NOx emitting facility and major VOC emitting facility as defined in Chapter 201,
Section 129.91 – Control of major sources of NOx and VOC will apply. REC is required to submit a
RACT proposal prior to installation. However, under nonattainment new source review, REC is subject to
the lowest achievable emission rate for NOx and VOC which is more stringent than RACT and
supersedes RACT.
NOx requirements outlined in Section 129.201 through 129.203 do not apply since REC is not located in
one of the listed counties.
25 Pa. Code Chapter 131 Ambient Air Quality Standards
The NAAQS promulgated by EPA are incorporated by reference as part of the standards in Chapter 131.
Section 131.3 sets forth additional ambient air quality standards established by PA for settled particulate,
beryllium, fluorides, and hydrogen sulfide. The NAAQS and PA AAQS are summarized in Table 2-1.
REC will prepare an air dispersion modeling analysis to demonstrate compliance with all ambient air
quality standards.
25 Pa. Code Chapter 135 Reporting of Sources
Chapter 135 requires air emission sources to report actual emissions by March 1 for the previous year.

POWER ENGINEERS, INC. Plan Approval Application – Air Regulatory Requirements – Renovo Energy Center, LLC
PAGE 12
25 Pa. Code Chapter 137 Air Pollution Episodes
Chapter 137 outlines the requirements for air pollution episodes. If the PaDEP classifies Clinton County
as an area requiring a standby plan, REC will submit a standby plan within 90 days of the PaDEP’s
request.
25 Pa. Code Chapter 139 Sampling and Testing
Chapter 139 provides general requirements and procedures for sampling and testing, reference test
methods, and requirements for source monitoring.
25 Pa. Code Chapter 145 Interstate Pollution Transport Reduction
Since EPA’s CSAPR has been finalized, per 5/12/2015 discussion with PaDEP, the requirements of 40
CFR Part 97 (CSAPR) take precedence over the requirements contained in Chapter 145.
2.15 Requirements Evaluated That Do Not Apply
25 Pa. Code Section 129.56 and 129.57 Storage Tanks Containing VOC
Section 129.56 applies to storage tanks with capacities greater than 40,000 gallons containing volatile
organic compounds (VOCs) with a vapor pressure of greater than 1.5 psia. Section 129.57 applies to
storage tanks greater than 2,000 gallons containing VOC with a vapor pressure of greater than 1.5 psia.
REC is proposing tanks greater than the 2,000/40,000 gallon threshold for the storage of diesel fuel and
lubricating oil. Diesel fuel and lubricating oil have vapor pressures less than 1.5 psia, thus Sections
129.56 and 129.57 do not apply.
40 CFR Part 60 Subpart Kb – Standards of Performance for Volatile Organic Liquid Storage
Vessels
The storage tanks proposes for this facility (one 3.8 million gallon USLD for the turbines, one 2,500-
gallon ULSD tank associated with the generator, one 350-gallon ULSD tank associated with the fire
pump engine, two 20,000-gallon lube oil tanks, and two 26,000 gallon ammonia tanks) are not subject to
the requirements of Subpart Kb since ammonia is not an organic liquid and the vapor pressure of diesel
oil and lubricating oil is less than the 3.5 kPa and 15 kPa as specified by the regulation.
40 CFR Part 63 Subpart UUUUU – National Emission Standards for Hazardous Air Pollutants:
Coal- and Oil-Fired Electric Utility Steam Generating Units
40 CFR Part 63 Subpart UUUUU is also known as the Mercury and Air Toxics Standard (MATS) applies
to coal-fired and oil-fired electric utility steam generating units. REC’s combustion turbines are not
subject to this rule because the turbines do not meet the definition of electric utility steam generating unit
as defined in CAA section 112(a)(8) and Subpart UUUUU (primarily because the turbines do not
generate steam). Steam generating unit is defined as in Subpart UUUUU as follows:
“Steam generating unit means any furnace, boiler, or other device used for combusting fuel for the
purpose of producing steam (including fossil-fuel-fired steam generators associated with integrated
gasification combined cycle gas turbines; nuclear steam generators are not included).”
The HRSG units generate steam from the heat from the combustion turbines and are provided with
additional heat from natural gas fired duct burners. The HRSG units are not subject to Subpart UUUUU

POWER ENGINEERS, INC. Plan Approval Application – Air Regulatory Requirements – Renovo Energy Center, LLC
PAGE 13
because they will not combust coal or oil. The auxiliary boilers are not subject to Subpart UUUUU
because they will not combust coal or oil, nor will they generate electricity.
Subpart DDDDD – National Emission Standards for Hazardous Air Pollutants for Major Sources:
Industrial, Commercial, and Institutional Boilers and Process Heaters
40 CFR Part 63 Subpart DDDDD applies to boilers and process heaters located at major sources of HAP
emissions. Based on the estimated potential annual emissions of HAPs from the REC facility contained
in Appendix D, HAP emissions from the facility will be less than 10 tons per year for any individual HAP
and less than 25 tons per year for combined HAPs. Therefore, REC will not be a major source of HAP
emissions and Subpart DDDDD will not apply.
40 CFR Part 63 Subpart YYYY – National Emission Standard for Hazardous Air Pollutants for
Stationary Combustion Turbines
40 CFR Part 63 Subpart YYYY applies to stationary combustion turbines located at major sources of
HAP emissions. Based on the estimated potential annual emissions of HAPs from the REC facility
contained in Appendix D, HAP emissions from the facility will be less than 10 tons per year for any
individual HAP and less than 25 tons per year for combined HAPs. Therefore, REC will not be a major
source of HAP emissions and Subpart YYYY will not apply.
40 CFR Part 63 Subpart JJJJJJ National Emission Standard for Hazardous Air Pollutants for
Area Sources: Industrial, Commercial, and Institutional Boilers and Process Heaters
40 CFR Part 63 Subpart JJJJJJ does not apply to the auxiliary boilers since the boilers will only combust
natural gas. Per 63.11195(e), gas-fired boilers are exempt from this subpart.
40 CFR Part 76 – Acid Rain Nitrogen Oxide Emission Reduction Program
Part 76 applies to coal-fired utility units subject to the Acid Rain Program. Since REC will not combust
coal, this regulation does not apply.

POWER ENGINEERS, INC. Plan Approval Application – Renovo Energy Center, LLC
3.0 BEST AVAILABLE CONTROL TECHNOLOGY/LOWEST ACHIEVABLE EMISSION RATE/BEST AVAILABLE TECHNOLOGY (BACT/LAER/BAT) ANALYSIS

POWER ENGINEERS, INC. Plan Approval Application – Renovo Energy Center, LLC
PAGE i
TABLE OF CONTENTS
3.0 BEST AVAILABLE CONTROL TECHNOLOGY/LOWEST ACHIEVABLE EMISSION
RATE/BEST AVAILABLE TECHNOLOGY ANALYSIS (BACT/LAER/BAT) ................................ 1
3.1 INTRODUCTION .............................................................................................................................. 1 3.2 EXECUTIVE SUMMARY OF BACT/LAER/BAT DETERMINATIONS .............................................. 2
3.2.1 Turbines ................................................................................................................................ 2 3.3 BACT/LAER/BAT DETERMINATIONS FOR COMBINED CYCLE TURBINES .................................. 3
3.3.1 Nitrogen Oxides (NOx) ......................................................................................................... 3 3.3.2 Particulate Matter (PM10) ...................................................................................................... 6 3.3.3 Carbon Monoxide (CO) and Volatile Organic Compounds (VOC) ..................................... 9 3.3.4 Sulfur Dioxide (SO2) and Sulfuric Acid Mist (H2SO4) ....................................................... 13 3.3.5 Ammonia ............................................................................................................................. 14 3.3.6 Startup and Shutdown Emissions ........................................................................................ 14
3.4 BACT/BAT EVALUATION FOR GREENHOUSE GAS (GHG) EMISSIONS FROM TURBINES .......... 16 3.4.1 Identification and Evaluation of CO2 Control Technologies .............................................. 16 3.4.2 Ranking of Technically Feasible Options ........................................................................... 17 3.4.3 Selection of CO2 Control Technology to Meet BACT/BAT .............................................. 18
3.5 HAZARDOUS AIR POLLUTANTS ................................................................................................... 18 3.5.1 Identification and Evaluation of VOC/HAP Controls......................................................... 19 3.5.2 Selection VOC/HAP Control Technology to Meet BAT .................................................... 19
3.6 BACT/LAER/BAT DETERMINATION AUXILIARY BOILERS ....................................................... 20 3.6.1 Nitrogen Oxides (NOx) ....................................................................................................... 20 3.6.2 Carbon Monoxide (CO) ...................................................................................................... 23 3.6.3 Volatile Organic Compounds (VOC).................................................................................. 26 3.6.4 Particulate Matter (PM) ...................................................................................................... 28 3.6.5 Sulfur Dioxide (SO2) and Sulfuric Acid Mist (H2SO4) ....................................................... 29 3.6.6 Identification of BACT for Greenhouse Gas (GHG) Emissions ......................................... 30
3.7 BACT/LAER/BAT DETERMINATION FOR EMERGENCY GENERATOR AND FIRE PUMP DIESEL
ENGINES .................................................................................................................................................. 30 3.7.1 Identification of Sources with BACT/LAER/BAT ............................................................. 31 3.7.2 Selection of BACT/LAER/BAT For Emergency Generator And Fire Pump Engine ......... 33
3.8 BACT/LAER/BAT DETERMINATION WATER BATH HEATERS .................................................. 34 3.8.1 Nitrogen Oxides (NOx) ....................................................................................................... 34 3.8.2 Carbon Monoxide (CO) ...................................................................................................... 36 3.8.3 Volatile Organic Compounds (VOC).................................................................................. 37 3.8.4 Particulate Matter (PM) ...................................................................................................... 38 3.8.5 Sulfur Dioxide (SO2) and Sulfuric Acid Mist (H2SO4) ....................................................... 39 3.8.6 Identification of BACT for Greenhouse Gas (GHG) Emissions ......................................... 40
3.9 HIGH VOLTAGE CIRCUIT BREAKERS EQUIPMENT LEAKS BACT/BAT ANALYSIS..................... 40 3.9.1 Identification of Control Options ........................................................................................ 40 3.9.2 Evaluation of Control Options ............................................................................................ 40 3.9.3 Selection of BACT/BAT ..................................................................................................... 41
3.10 LAER/BACT/BAT DETERMINATION FOR ULSD STORAGE TANK ............................................ 41 3.10.1 Identification of Sources with BACT/LAER/BAT ............................................................. 41 3.10.2 Selection of BACT/LAER/BAT for ULSD Storage Tank .................................................. 42

POWER ENGINEERS, INC. Plan Approval Application – Renovo Energy Center, LLC
PAGE ii
TABLES:
TABLE 1 COMPARISON OF MAXIMUM ALLOWABLE EMISSIONS TO SIGNIFICANT
ALLOWABLE EMISSIONS ........................................................................................ 1 TABLE 2 PROPOSED BACT/LAER/BAT FOR COMBINED CYCLE TURBINES ................. 3 TABLE 3 IDENTIFICATION OF SIMILAR FACILITIES WITH LAER/BAT FOR NOX ....... 3 TABLE 4 FACILITIES WITH BACT/BAT FOR PM10 ................................................................ 7 TABLE 5 FACILITIES WITH BACT/BAT FOR CO................................................................... 9 TABLE 6 FACILITIES WITH LAER/BAT FOR VOC .............................................................. 10 TABLE 7 FACILITIES WITH BACT/BAT FOR SO2/H2SO4 .................................................... 13 TABLE 8 SUSD EMISSION LIMITS PER POWERBLOCK – NATURAL GAS .................... 15 TABLE 9 SUSD EMISSION LIMITS PER POWERBLOCK – ULSD ..................................... 15 TABLE 10 CO2 EMISSION FACTORS FOR VARIOUS FUEL TYPES .................................... 17 TABLE 11 FACILITIES WITH BAT DETERMINATIONS FOR HAPS ................................... 18 TABLE 12 IDENTIFICATION OF SOURCES WITH BACT/LAER/BAT FOR NOX .............. 21 TABLE 13 IDENTIFICATION OF SOURCES WITH BACT/LAER/BAT FOR CO ................. 23 TABLE 14 OXIDATION CATALYST CAPITAL EXPENSES1 ................................................. 24 TABLE 15 OXIDATION CATALYST ANNUAL OPERATING COSTS1 ................................. 25 TABLE 16 IDENTIFICATION OF SOURCES WITH BACT/LAER/BAT FOR VOC .............. 26 TABLE 17 IDENTIFICATION OF SOURCES WITH BACT/LAER/BAT FOR PM ................. 28 TABLE 18 IDENTIFICATION OF SOURCES WITH BACT/LAER/BAT FOR SO2................. 29 TABLE 19 IDENTIFICATION OF SOURCES WITH BACT/LAER/BAT FOR NOX .............. 31 TABLE 20 IDENTIFICATION OF SOURCES WITH BACT/LAER/BAT FOR CO ................. 32 TABLE 21 IDENTIFICATION OF SOURCES WITH BACT/LAER/BAT FOR VOC .............. 32 TABLE 22 IDENTIFICATION OF SOURCES WITH BACT/LAER/BAT FOR PM ................. 33 TABLE 23 SUMMARY OF PROPOSED BACT/LAER/BAT ..................................................... 33 TABLE 24 POTENTIAL EMISSIONS ......................................................................................... 33 TABLE 25 IDENTIFICATION OF SOURCES WITH BACT/LAER/BAT FOR NOX .............. 35 TABLE 26 IDENTIFICATION OF SOURCES WITH BACT/LAER/BAT FOR CO ................. 36 TABLE 27 IDENTIFICATION OF SOURCES WITH BACT/LAER/BAT FOR VOC .............. 37 TABLE 28 IDENTIFICATION OF SOURCES WITH BACT/LAER/BAT FOR PM ................. 38 TABLE 29 IDENTIFICATION OF SOURCES WITH BACT/LAER/BAT FOR SO2................. 39 TABLE 30 IDENTIFICATION OF SOURCES WITH BACT/LAER/BAT FOR VOC .............. 41

POWER ENGINEERS, INC. Plan Approval Application – Renovo Energy Center, LLC
PAGE 1
3.0 BEST AVAILABLE CONTROL TECHNOLOGY/LOWEST ACHIEVABLE EMISSION RATE/BEST AVAILABLE TECHNOLOGY ANALYSIS (BACT/LAER/BAT)
3.1 Introduction
Renovo Energy Center, LLC (REC) is submitting an air permit application for the installation of a
nominally rated 1240 MW (net) combined cycle electric generating plant to be located in Renovo,
Pennsylvania. The electric generating plant will consist of two 1x1x1 combined cycle turbines, each
consisting of a combustion turbine, HRSG with duct burner, and a steam turbine. REC is proposing to
utilize General Electric 7HA.02 combustion turbines.
The proposed REC project will include for each powerblock an auxiliary boiler, turbine inlet air
conditioner, and air-cooled condenser. REC also will have two natural gas-fuel heaters, an emergency
generator, and a fire water pump engine. The combustion turbines will fire primarily natural gas with
ULSD fuel as back-up. The duct burners, auxiliary boilers, and natural gas-fuel heaters will fire only on
pipeline quality natural gas, while the emergency generator and fire water pump engine will fire ULSD.
REC is classified as a major stationary source due to potential emissions of Nitrogen Oxides (NOx),
Carbon Monoxide (CO), Volatile Organic Compounds (VOC), and Particulate Matter (PM/PM10/PM2.5),
which exceed their respective PSD significant allowable emissions thresholds. In accordance with the
Non-Attainment New Source Review provisions in 25 Pa. Code Chapter 127, REC will be required to
apply Lowest Achievable Emissions Rate (LAER) technology for emissions of NOx and VOC from
REC’s emission sources. In addition, Best Available Control Technology (BACT) must be met for the
attainment emissions greater than significant threshold and Best Available Technology (BAT) must be
applied to satisfy PaDEP requirements. Table 1 presents REC’s calculated allowable (potential) emissions
in comparison to the regulatory thresholds and indicates what levels of control are required.
TABLE 1 COMPARISON OF MAXIMUM ALLOWABLE EMISSIONS TO SIGNIFICANT ALLOWABLE EMISSIONS
POLLUTANT
MAXIMUM ALLOWABLE EMISSIONS (TONS/YR)
SIGNIFICANT ALLOWABLE EMISSIONS (TONS/YR)
BACT, LAER, OR BAT REQUIRED?
Nitrogen Oxides (NOx) 364.4 100 BACT/LAER/BAT
Carbon Monoxide (CO) 369.5 100 BACT/BAT
Volatile Organic Compounds (VOC)
112.8 50 BACT/LAER/BAT
Particulate Matter (PM/PM10/PM2.5) 212.6 15/10 BACT/BAT
Sulfur Dioxide (SO2) 53.6 40 BACT/BAT
Sulfuric Acid (H2SO4) 35.4 7 BACT/BAT
Ammonia (NH3) 277.4 N/A BAT
Hazardous Air Pollutants (HAPs) 20.4/7.9 25/10 BACT/BAT
Greenhouse Gases (CO2e) 5,453,232 100,000 BACT/BAT
As shown in Table 1, REC’s maximum allowable emissions of NOx, CO, PM, PM10, SO2, VOC, sulfuric
acid, and greenhouse gases exceed significant allowable emission levels and therefore BACT, LAER,
and/or BAT must be applied.

POWER ENGINEERS, INC. Plan Approval Application – Renovo Energy Center, LLC
PAGE 2
A BACT analysis is a “top down” procedure to determine the level of pollution control or emission limit
that must be applied to a particular emission unit. The “top down” BACT procedure consists of the
following steps:
• Identify most stringent emission rates and associated control technologies
• Eliminate technically infeasible options
• Rank remaining control technologies by control effectiveness
• Evaluate most effective controls and document results (case-by-case consideration of energy,
environmental and economic impacts)
• Select BACT
The LAER procedure is similar to BACT with the exception that the economic and energy impacts are
not considered. Because LAER is more stringent than BACT or BAT, the LAER analysis will satisfy the
BACT and BAT requirements. PaDEP’s BAT regulations are applicable to all emissions from the project
and are intended as all-encompassing to ensure that all sources apply the best technology available.
To identify LAER, BACT and BAT, REC accessed EPA’s RACT/BACT/LAER Clearinghouse (RBLC).
The RBLC is a compilation of emission limits and controls on emission units from around the United
States that have received air permits from various states and other regulatory agencies. The information is
voluntarily provided by the agencies and entered into the RBLC. Due to the voluntary nature of the
RBLC, not all permits are submitted for inclusion. For this reason, in many cases emission limits and
pollution control information included in the following BACT/LAER/BAT analyses were compiled by
contacting state or local air permit agencies. The facilities determined to be most similar to REC were
selected from facilities that have been issued permits within the last ten years.
3.2 Executive Summary of BACT/LAER/BAT Determinations
3.2.1 Turbines
REC is proposing to install two identical combined cycle units that will each consist of one combustion
turbine, one HRSG with duct burner, one electrical generator and one steam turbine.
Each combustion turbine will combust primarily natural gas and will have the capability of firing ULSD
as a backup fuel. Duct burners, firing only natural gas will be installed in the HRSG. Pollution control
equipment includes dry low-NOx (DLN) burners and Selective Catalytic Reduction (SCR) system for
control of NOx, as well as an oxidation catalyst for control of CO and VOCs. The SCR system and
oxidation catalyst allows REC to meet LAER and BACT for NOx, CO, and VOC.
REC is proposing to combust natural gas with a maximum sulfur content of 0.4 grains per 100 scf (gr
S/100scf) of fuel, and ULSD with a maximum sulfur content of 0.0015% by weight. This allows REC to
comply with BACT/BAT for emissions of SO2 and PM, including coarse (PM10) and fine (PM2.5)
particulates.
To meet BACT/LAER/BAT, REC is proposing the following:

POWER ENGINEERS, INC. Plan Approval Application – Renovo Energy Center, LLC
PAGE 3
TABLE 2 PROPOSED BACT/LAER/BAT FOR COMBINED CYCLE TURBINES
POLLUTANT PROPOSED LIMITS1 CONTROL LEVEL COMPLIANCE METHOD
NOx 2.0 ppm (NG) 4.0 ppm (ULSD)
LAER/BAT Initial stack test, CEMS 3-hour block average
CO 1.3 ppm (NG no DB) 1.9 ppm (NG w/DB) 2.0 ppm (ULSD)
BACT/BAT Initial stack test, CEMS 24-hour block average
VOC 0.7 ppm (NG no DB) 1.8 ppm (NG w/DB) 2.0 ppm (ULSD)
LAER/BAT Initial stack test
PM10 0.0032 lb/MMBtu (NG) 0.013 lb/MMBtu (ULSD)
BACT/BAT Initial stack test, fuel sulfur content monitoring/supplier certifications
SO2 0.4 gr S/100scf (NG) 0.0015% S (ULSD)
BACT/BAT Fuel sulfur content monitoring/supplier certifications
Ammonia 5.0 ppm (NG & ULSD) BAT CEMS 3-hour block average
GHG (CO2) 962 lb/MW-hr BACT/BAT CEMS for CO2, 12-month block average 1ppm on dry volume basis, corrected for 15% oxygen
3.3 BACT/LAER/BAT Determinations for Combined Cycle Turbines
3.3.1 Nitrogen Oxides (NOx)
Emissions of NOx can be considered as having two basic components– “fuel NOx,” which is formed by
fuel-bound nitrogen, and “thermal NOx,” which results from oxidation of nitrogen in high-temperature
regions of the combustion zone. The following subsection describes control technologies that can be
applied to reduce NOx emissions from combined cycle powerblock installations and identifies similar
facilities for comparisons to determine the required LAER rate, as well as the appropriateness of the
control technology selected for this project.
TABLE 3 IDENTIFICATION OF SIMILAR FACILITIES WITH LAER/BAT FOR NOX
FACILITY NAME
TURBINE SIZE (MMBTU/HR)
PERMIT DATE
FUEL TYPE(S)
NOX EMISSION LIMIT (PPM)
AVERAGING PERIOD
NOX CONTROLS
West Deptford Energy, NJ
2,276 5/6/2009 NG 2 3-hour rolling SCR and WI1
Renaissance Energy Center, PA
2,666 8/27/2018 NG 2 1-hour block SCR and DLN2
Brunswick County Power Station, VA
2,942 3/12/2013 NG 2 1-hour average
SCR and DLN2
C4GT, LLC, VA 3,482 4/26/2018 NG 2 1-hour average
SCR and DLN2
Greensville Power Station, VA
3,227 6/17/2016 NG 2 1-hour average
SCR and DLN2
Hill Top Energy Center, PA
3,509 12/1/2017 NG 2 1-hour block SCR and DLN2
Indeck Niles, LLC, MI 3,421 6/26/2018 NG 2 24-hour rolling avg
SCR and DLN2
Moxie Freedom Generation Plant, PA
3,727 9/1/2015 NG 2 3-hour average
SCR and DLN2

POWER ENGINEERS, INC. Plan Approval Application – Renovo Energy Center, LLC
PAGE 4
FACILITY NAME
TURBINE SIZE (MMBTU/HR)
PERMIT DATE
FUEL TYPE(S)
NOX EMISSION LIMIT (PPM)
AVERAGING PERIOD
NOX CONTROLS
Lackawanna Energy Center, PA
3,304 12/23/2015 NG 2 1-hour SCR and DLN2
CPV Three Rivers Energy Center, IL
3,474 7/30/2018 NG ULSD
2 5
3-hour SCR and DLN2
Killingly Energy Center, CT
3,863 6/30/2017 NG ULSD
2 4
1-hour SCR and DLN2
Middlesex Energy Center, NJ
3,462 7/19/2016 NG ULSD
2 4
3-hour rolling SCR and DLN2
CPV Towantic, LLC, CT 2,544 11/30/2015 NG ULSD
2 5
1-hour block SCR and DLN2
1WI = wet injection 2DLN = dry low NOx combustor
Identification and Evaluation of NOx Control Technologies
NOx control techniques are generally organized into two groups: combustion controls and post
combustion controls. Combustion controls affect the combustion conditions to minimize the formation of
NOx, while post-combustion controls remove NOx after it has formed.
Combustion Controls
Fuel-NOx Control
Fuel selection is an important consideration for the control of NOx emissions from combustion turbines.
Both NOx formation processes (“fuel NOx” and “thermal NOx”) must be considered in selecting a fuel
source, as both the flame temperature and fuel-bound nitrogen content must be given consideration.
Distillate fuel oils contain inherently low fuel-bound nitrogen and have relatively high flame
temperatures. Natural gas contains essentially zero fuel bound nitrogen, and has a relatively low flame
temperature in comparison to other fuels. The proposed combined cycle turbines will fire primarily on
natural gas and will only fire ULSD as a back-up fuel option during periods when the natural gas supply
is interrupted.
Dry low-NOx Combustor Design
One method of reducing “thermal NOx” formation is by utilizing a dry low-NOx (DLN) combustor that
premixes the air and fuel prior to entering the primary combustion chamber. This allows for a lower flame
temperature due to the homogeneity of the air/fuel mix, and the lack of a flame front. Advanced
combustor design also includes reducing the combustion zone residence time and limiting the oxygen
available to combine with nitrogen to form NOx. REC’s proposed turbines and duct burners include DLN
combustors.
Wet Injection
As stated previously, the flame temperature of distillate oil is relatively high in comparison to other fuel
sources. The injection of water directly into the combustion chamber lowers the flame temperature by
absorbing heat necessary to vaporize the water and raise the temperature of the steam to that of the
combustion temperature. Steam injection utilizes the same principle, although heat can only be absorbed

POWER ENGINEERS, INC. Plan Approval Application – Renovo Energy Center, LLC
PAGE 5
by the steam in raising the steam’s temperature to that of combustion. Injection of either water or steam
results in lower “thermal NOx” formation.
Proper injection of water or steam is extremely important when considering equipment life, as well as
emissions performance. Too much injection can cause flame instability, excessive thermal stress, as well
as increases in CO and VOC emissions due to incomplete combustion. The amount of water or steam
injected depends largely on the design of the combustor.
Wet injection is typically not used when firing natural gas due to the lower flame temperature as well as
the low nitrogen content of natural gas. When employed on ULSD-fired combustion turbines, wet
injection has an 80% to 85% control efficiency for emissions of NOx. The design under consideration
utilizes wet injection to control emissions of NOx when firing ULSD only.
Catalytic Combustion (XONONTM)
Catalytic combustion (specifically Kawasaki Heavy Industries Ltd.’s XONONTM technology) also offers
the opportunity to lower NOx emissions from combustion turbine applications; however, this technology
is not available for large combustion turbine applications. Thus, catalytic combustion is not a technically
feasible control technology option.
Post-combustion Controls
The available add-on control technologies for NOx control from fuel burning devices are selective non-
catalytic reduction, non-selective catalytic reduction, selective catalytic reduction, and
EMXTM/SCONOXTM. These NOx controls are described below.
Selective Non-Catalytic Reduction (SNCR)
SNCR is a process in which ammonia is injected directly into the exhaust gas stream to produce nitrogen
and water vapor from NOx. The chemical reactions take place without the presence of a catalyst, and due
to reaction temperature considerations, the ammonia or urea injection must occur in a location where the
exhaust gas temperatures are between approximately 1,600°F and 2,000°F. The exhaust gas temperature
range for the proposed units does not allow for SNCR to be a feasible control technology, as the exhaust
temperature for this project is expected to be considerably below this range.
Non-Selective Catalytic Reduction (NSCR)
NSCR is a process that utilizes a catalyst to produce nitrogen and water vapor from NOx without the
presence of a reducing agent. This technology has not yet been developed for large-scale combustion
turbine applications and is currently only utilized in reciprocating internal combustion engines. Thus,
NSCR is considered technically infeasible for this equipment.
Selective Catalytic Reduction (SCR)
SCR is similar to SNCR except that with SCR, a catalyst is present during the chemical reactions that
produce nitrogen and water vapor from NOx. The chemical reactions are as follows:
4NH3 + 4NO + O2 → 4N2 + 6H2O
4NH3 + 2NO2 + O2 → 3N2 + 6H2O

POWER ENGINEERS, INC. Plan Approval Application – Renovo Energy Center, LLC
PAGE 6
The presence of the catalyst (typically consisting of noble metals, base metal oxides, or zeolite-based
materials) decreases the energy required to activate the chemical reactions, and allows for the reducing
agent (ammonia) to be injected at lower temperatures (~600°F to 750°F) in the exhaust gas stream.
Proper injection of ammonia is an important consideration for emissions control, as well as equipment
life. Based on the chemical reactions, a molar ratio of ammonia to NOx of 1 to 1 is required for NOx
removal. Due to imperfections in the injection process (mixing and other factors affecting the reaction),
typically the actual ammonia to NOx molar ratio is greater than 1 to 1.
Another factor that can affect the performance and life of the SCR system is high fuel sulfur content.
Natural gas sulfur contents less than 2 gr S/100scf allow for a reasonable catalyst life, and REC’s
proposed sulfur content of 0.4 gr S/100scf meets the criteria, in conjunction with the limited use of ULSD
as a back-up fuel.
SCR is a widely used control technology for NOx, particularly for large combustion turbine applications
and typically demonstrates removal efficiencies of 80% to 90% whether firing natural gas or ULSD.
EMXTM/SCONOX
TM
EMXTM (formerly known as SCONOX
TM) is a technology that is intended to reduce emissions of NOx,
CO, and VOC simultaneously. CO and NO are both oxidized to form CO2 and NO2, respectively. The
resulting NO2 is then absorbed by the catalyst surface, while the CO2 is emitted into the atmosphere.
Although highly desirable due to the lack of ammonia injection necessary, EMXTM has only been installed
in small powerplants in California (all below 43 MW), and thus is considered technically infeasible for
the proposed REC project.
Selection of NOx Control Technology to Meet LAER/BAT
The most effective control for NOx from a dual fueled combined cycle powerblock is SCR in conjunction
with good combustion practices and DLN combustors, as well as wet injection. The most stringent limit
demonstrated in practice when firing natural gas is 2 ppmvd @ 15% O2 (by numerous facilities), and
when firing ULSD is 4 ppmvd @ 15% O2.
REC therefore proposes to meet LAER for NOx using DLN combustion controls, SCR, and water
injection when firing ULSD. REC proposes a NOx emission limit of 2 ppmvd @ 15% O2 based on a 1-
hour block average when firing natural gas, and 4 ppmvd @ 15% O2 based on a 1-hour block average
when firing ULSD. Compliance with these limits will be demonstrated by a continuous emission
monitoring system installed in compliance with 40 CFR Part 60 and Part 75.
3.3.2 Particulate Matter (PM10)
Particulate matter (PM) emissions from combined cycle turbines are the result of unburned trace
constituents in the fuel, unburned hydrocarbons, and the inlet air supply that may contain dust particles.
PM emissions can also result from the formation of sulfates and nitrates, which are formed when certain
sulfur- and nitrogen-oxide compounds react with ammonia. The following section describes control
technologies that can be applied to reduce PM emissions from combined cycle powerblock applications
and identifies similar facilities for comparisons to determine BACT for this project.

POWER ENGINEERS, INC. Plan Approval Application – Renovo Energy Center, LLC
PAGE 7
Identification of Similar Facilities with BACT/BAT for PM10
TABLE 4 FACILITIES WITH BACT/BAT FOR PM10
FACILITY NAME
TURBINE SIZE (MMBTU/HR)
PERMIT DATE
FUEL TYPE(S)
PM EMISSION LIMIT (LB/MMBTU) PM10 CONTROLS
Filer City Station, MI 1,935 11/17/2017 NG 0.0025 no DB Air filters, good combustion, clean fuels
Jackson Energy Center, IL 3,864 12/31/2018 NG 0.0026 no DB 0.0026 with DB
Good combustion, clean fuels
Warren County Power Station, VA
2,996 6/17/2014 NG 0.0027 no DB 0.004 with DB
Clean fuels
Lackawanna Energy Center, PA
3,304 12/23/2015 NG 0.003 no DB 0.003 with DB
Air filters, good combustion, clean fuels
Brunswick County Power Station, VA
2,942 3/12/2013 NG 0.0033 no DB 0.0047 with DB
Good combustion, clean fuels
Thetford Generating Station, MI
2,587 7/25/2013 NG 0.0033 no DB 0.0066 with DB
Air filters, good combustion, clean fuels
Long Ridge Energy Generation LLC, OH
3,544 11/7/2017 NG 0.0036 no DB 0.004 with DB
Clean fuels
CPV Three Rivers Energy Center, IL
3,474 7/30/2018 NG ULSD
0.0037 no DB 0.0037 with DB 0.0167 ULSD
Good combustion, clean fuels
Greensville Power Station, VA 3,227 6/17/2016 NG 0.003 no DB 0.0039 with DB
Clean fuels
Renaissance Energy Center, PA
2,666 8/27/2018 NG 0.0043 no DB 0.0043 with DB
Clean fuels
CPV Towantic, LLC, CT 2,544 11/30/2015 NG ULSD
0.0065 no DB 0.0081 with DB 0.0319 ULSD
Clean fuels
CPV Valley Energy Center, NY 2,234 8/1/2013 NG ULSD
0.0073 NG 0.0368 ULSD
Clean fuels
CPV Fairview Energy Center, PA
3,338 9/2/2016 NG ULSD
0.0068 no DB 0.005 with DB 0.0415 ULSD
Clean fuels
Killingly Energy Center, CT 3,863 6/30/2017 NG 0.0044 no DB 0.005 with DB 0.0168 ULSD
Good combustion
Identification and Evaluation of PM10 Controls
PM10 control devices applicable to dual fired combustion turbines include combustion controls, the use of
clean fuels (low sulfur/ash), and high efficiency inlet air filters. Add-on control devices such as multi-
clones or electro-static precipitators (ESPs) are considered technically infeasible for combustion turbines
and were not identified in any of the RBLC entries or other permits, whether fired on natural gas or
ULSD.
The most stringent level of particulate matter control for a dual fired combined cycle turbine is achieved
with good combustion controls, the use of high efficiency inlet air filters, and clean fuels. Therefore, a
ranking of their effectiveness is not necessary.

POWER ENGINEERS, INC. Plan Approval Application – Renovo Energy Center, LLC
PAGE 8
The lowest permit value for total PM (filterable) when firing natural gas is 0.0025 lb/MMBtu at Filer City
Station in Michigan. The facility has not been built, nor has Jackson Energy Center proposed for
construction in Illinois with a permit limit of 0.0026 lb/MMBtu. The lowest PM limit for an operating
facility with or without duct burner is Lackawanna Energy Center in Pennsylvania at 0.003 lb/MMBtu.
The lowest value for PM when firing ULSD at an operating facility is CPV Towantic, LLC in
Connecticut at 0.0319 lb/MMBtu/hr. REC is proposing 0.0032 lb/MMBtu when firing natural gas and
0.013 lb/MMBtu when firing ULSD. These values reflect GE emission rates based on historic measured
PM data with the inclusion of recently available emissions testing data. GE has provided the following
justification in support of these limits:
• Measured Particulate Matter is the result of a combined contribution from constituents in the fuel,
introduction of particulate from CT airflow and combustion water injection (for NOx control
during ULSD firing) and the effects of uncertainty and artifacts inherent to the defined
measurement methodologies.
• PM measurement methodology is a complex manual process, conducted in non-ideal conditions
at the top of an operating gas turbine stack, with many opportunities for error in the measurement
process. The testing entails drawing an extracted exhaust stream across a heated measurement
filter and then condensing particulates in that same stream in glass impingers held in an ice bath.
In this process a relatively small particulate sample is collected. This collection is then manually
captured and brought to a laboratory for quantification. Any contamination or introduction of
measurement artifact through this process introduces a high degree of measurement variability
into the measurement results. This inherent measurement variability must be incorporated into the
allowable emission rate.
• Combustion architecture contributes to a variation in emission values across turbine technologies,
but it is not the sole driver of particulate formation. Design and operating factors such as water
injection rate, fuel to water mixing and fuel atomization efficiency will contribute to varying
particulate formation rates. However, the particulate formation due to combustion system
capabilities for any system which operates at a high combustion efficiency, while significant, is
not the primary factor when comparing particulate measurement results across combustion
technologies.
• The best means to determine expected particulate emissions for a particular combustion turbine
and fuel is through field measurements of similar operational equipment. The collection of field
measurement data is a challenge for ULSD firing due to the very limited amount of operation on
this fuel. As a result, there is limited opportunity to capture this measurement data and to
determine the true capability of the emissions and the measurement capability.
• The 7HA.02 is a relatively new gas turbine model with combustion advancements. GE has
limited PM emission data on ULSD across all gas turbine models and simply has no PM emission
data on this specific gas turbine and its specific ULSD combustion technology. The emission
values are extrapolated from available test data.
Selection of PM10 Control Technology to Meet BACT/BAT
REC will meet BACT for PM10 through the use of high efficiency inlet air filters, good combustion
practices, and low sulfur fuels. The total PM (filterable and condensable) emission limit proposed is
0.0032 lb/MMBtu when firing natural gas, and 0.013 lb/MMBtu when firing ULSD. Compliance with

POWER ENGINEERS, INC. Plan Approval Application – Renovo Energy Center, LLC
PAGE 9
these limits will be based on initial stack testing, fuel sulfur content monitoring and fuel supplier
certifications.
3.3.3 Carbon Monoxide (CO) and Volatile Organic Compounds (VOC)
CO and VOC emissions from combined cycle combustion turbines are the result of incomplete
combustion. CO emissions are exacerbated by low oxygen availability, poor mixing of air and fuel, low
combustion temperatures, and short residence time in the combustion zone. VOC emissions are the result
of low combustion temperatures and short combustion zone residence times. The following section
describes control technologies that can be applied to reduce CO and VOC emissions from combined cycle
turbine applications and identifies similar facilities for comparisons to determine the lowest achievable
emission rate and/or best available control technology that will be required.
Identification of Similar Facilities with BACT/BAT for CO and LAER/BAT for VOC
TABLE 5 FACILITIES WITH BACT/BAT FOR CO
FACILITY NAME
TURBINE SIZE (MMBTU/HR)
PERMIT DATE
FUEL TYPE(S)
CO EMISSION LIMIT (PPM) CO CONTROLS
West Deptford Energy Station, NJ
2,276 7/18/2014 NG 0.9 (w/o DB) 1.5 (w/DB)
Oxidation Catalyst, Good Combustion
Killingly Energy Center CT (not operating)
3,863 6/30/2017 NG ULSD
0.9 (w/o DB) 1.7 (W/DB)
Oxidation Catalyst, Good Combustion
Greensville Power Station, VA 3,227 6/17/2016 NG 1.0 (w/o DB) 1.6 (w/DB)
Oxidation Catalyst, Good Combustion
CPV Towantic, LLC, CT 2,544 11/30/2015
NG ULSD
0.9 (w/o DB) 1.7 (W/DB)
Oxidation Catalyst, Good Combustion
C4GT, LLC, VA (not operating)
3,482 4/26/2018 NG 1.0 (w/o DB) 1.6 (W/DB)
Oxidation Catalyst, Good Combustion
Brunswick County Power Station, VA
2,942 3/12/2013 NG 1.5 (w/o DB) 2.4 (W/DB)
Oxidation Catalyst, Good Combustion
Wildcat Point Generation Facility, MD
2,592 4/8/2014 NG 1.5 (w/o DB) 2.0 (W/DB)
Oxidation Catalyst, Good Combustion
Jackson Energy Center, IL 3,864 12/31/2018 NG
1.5 (w/o DB) 2.0 (W/DB)
Oxidation Catalyst, Good Combustion
Liberty Generation Plant, PA 2,890 1/31/2013 NG
2.0 (w/o DB) 2.0 (W/DB)
Oxidation Catalyst, Good Combustion
Patriot Generation Plant, PA 3,007 12/13/2013 NG
2.0 (w/o DB) 2.0 (W/DB)
Oxidation Catalyst, Good Combustion
West Deptford Energy, NJ 2,352 5/6/2009 NG 2.0 (w/o DB) 2.0 (w/DB)
Oxidation Catalyst, Good Combustion
Renaissance Energy Center, PA (not operating)
2,666 8/27/2018 NG 2.0 (w/o DB) 2.0 (w/DB)
Oxidation Catalyst, Good Combustion
Mattawoman Energy Center, MD (not operating)
2,898 11/13/2015 NG 2.0 (w/o DB) 2.0 (w/DB)
Oxidation Catalyst, Good Combustion
Lackawanna Energy Center, PA 3,304 12/23/2015 NG 2.0 (w/o DB) 2.0 (w/DB)
Oxidation Catalyst, Good Combustion
Hill Top Energy Center, PA (not operating)
3,509 12/1/2017 NG 2.0 (w/o DB) 2.0 (w/DB)
Oxidation Catalyst, Good Combustion
Moxie Freedom Generation Plant, PA
3,727 9/1/2015 NG 2.0 (w/o DB) 2.0 (w/DB)
Oxidation Catalyst, Good Combustion

POWER ENGINEERS, INC. Plan Approval Application – Renovo Energy Center, LLC
PAGE 10
FACILITY NAME
TURBINE SIZE (MMBTU/HR)
PERMIT DATE
FUEL TYPE(S)
CO EMISSION LIMIT (PPM) CO CONTROLS
Warren County Power Station, VA
2,996 6/17/2014 NG 1.5 (w/o DB) 2.4 (W/DB)
Oxidation Catalyst, Good Combustion
TABLE 6 FACILITIES WITH LAER/BAT FOR VOC
FACILITY NAME
TURBINE/DUCT BURNER SIZE (MMBTU/HR)
PERMIT DATE
FUEL TYPE(S)
VOC EMISSION LIMIT (PPM) VOC CONTROLS
Killingly Energy Center, CT (not operating)
3,863 (CT) 1,106 (DB)
6/30/2017 NG ULSD
0.7 (NG w/o DB) 1.6 (NG w/DB) 1.8 (ULSD)
Oxidation Catalyst, Good Combustion
Greensville Power Station, VA
3,227 (CT) 500 (DB)
6/17/2016 NG 0.7 (w/o DB) 1.4 (w/DB)
Oxidation Catalyst, Good Combustion
C4GT, LLC, VA (not operating)
3,482 (CT) 475 (DB)
4/26/2018 NG 0.7 (NG w/o DB) 1.4 (NG w/DB)
Oxidation Catalyst, Good Combustion
CPV Valley Energy Center, NY
2,234 (CT) 500 (DB)
8/1/2013 NG ULSD
0.7 (NG w/o DB) 1.8 (NG w/DB) 0.7 (ULSD)
Oxidation Catalyst, Good Combustion
Warren County Power Station, VA
2,996 (CT) 500 (DB)
6/17/2014 NG 0.7 (w/o DB) 1.6 (w/DB)
Oxidation Catalyst, Good Combustion
Wildcat Point Generation Facility, MD
2,592 (CT) 892 (DB)
4/8/2014 NG 0.7 (w/o DB) 1.6 (w/DB)
Oxidation Catalyst, Good Combustion
Brunswick County Power Station, VA
2,942 (CT) 500 (DB)
3/12/2013 NG 0.7 (w/o DB) 1.6 (w/DB)
Oxidation Catalyst, Good Combustion
Renaissance Energy Center, PA (not operating)
2,666 (CT) 914 (DB)
8/27/2018 NG 1.0 (w/o DB) 1.4 (w/DB)
Oxidation Catalyst, Good Combustion
Moxie Patriot Generation Plant, PA
3,007 (CT) 164 (DB)
12/13/2013 NG 1.0 (w/o DB) 1.5 (w/DB)
Oxidation Catalyst, Good Combustion
Moxie Liberty Generation Plant, PA
2,890 (CT) 387 (DB)
1/31/2013 NG 1.0 (w/o DB) 1.5 (w/DB)
Oxidation Catalyst, Good Combustion
Lackawanna Energy Center, PA
3,304 (CT) 659 (DB)
12/23/2015 NG 1.0 (w/o DB) 1.5 (w/DB)
Oxidation Catalyst, Good Combustion
Moxie Freedom Generation Plant, PA
3,727 (CT) 200 (DB)
9/1/2015 NG 1.0 (w/o DB) 1.5 (w/DB)
Oxidation Catalyst, Good Combustion
Mattawoman Energy Center, MD (not operating)
2,898 (CT) 687 (DB)
11/13/2015 NG 1.0 (w/o DB) 1.9 (w/DB)
Oxidation Catalyst, Good Combustion
West Deptford Energy Station, NJ
2,276 (CT) 770 (DB)
2018 NG 1.0 (w/o DB) 1.9 (w/DB)1
Oxidation Catalyst, Good Combustion
CPV Fairview Energy Center, PA
3,338 (CT) 425 (DB)
9/2/2016 NG 1.0 (w/o DB) 1.9 (w/DB)
Oxidation Catalyst, Good Combustion
West Deptford Energy, NJ 2,352 (CT) 775 (DB)
5/6/2009 NG 1.0 (w/o DB) 1.9 (w/DB)
Oxidation Catalyst, Good Combustion
Hickory Run Energy Station, PA (not operating)
2,942 (CT) 500 (DB)
4/23/2013 NG 1.5 (w/o DB) 1.5 (w/DB)
Oxidation Catalyst, Good Combustion
York Energy Center, PA 2,513 (CT) 722 (DB)
6/15/2015 NG 1.5 (w/o DB) 1.9 (w/DB)
Oxidation Catalyst, Good Combustion
Hill Top Energy Center, PA (not operating)
3,509 (CT) 981 (DB)
12/1/2017 NG 1.0 (w/o DB) 2.0 (w/DB)
Oxidation Catalyst, Good Combustion
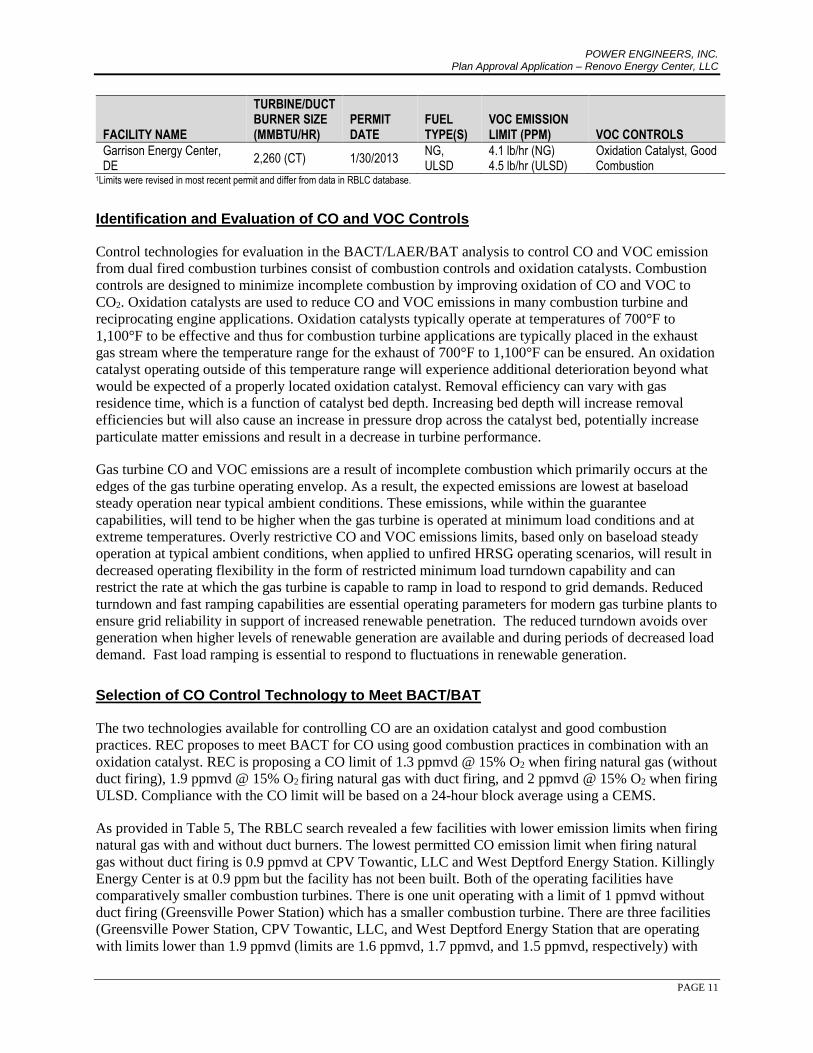
POWER ENGINEERS, INC. Plan Approval Application – Renovo Energy Center, LLC
PAGE 11
FACILITY NAME
TURBINE/DUCT BURNER SIZE (MMBTU/HR)
PERMIT DATE
FUEL TYPE(S)
VOC EMISSION LIMIT (PPM) VOC CONTROLS
Garrison Energy Center, DE
2,260 (CT) 1/30/2013 NG, ULSD
4.1 lb/hr (NG) 4.5 lb/hr (ULSD)
Oxidation Catalyst, Good Combustion
1Limits were revised in most recent permit and differ from data in RBLC database.
Identification and Evaluation of CO and VOC Controls
Control technologies for evaluation in the BACT/LAER/BAT analysis to control CO and VOC emission
from dual fired combustion turbines consist of combustion controls and oxidation catalysts. Combustion
controls are designed to minimize incomplete combustion by improving oxidation of CO and VOC to
CO2. Oxidation catalysts are used to reduce CO and VOC emissions in many combustion turbine and
reciprocating engine applications. Oxidation catalysts typically operate at temperatures of 700°F to
1,100°F to be effective and thus for combustion turbine applications are typically placed in the exhaust
gas stream where the temperature range for the exhaust of 700°F to 1,100°F can be ensured. An oxidation
catalyst operating outside of this temperature range will experience additional deterioration beyond what
would be expected of a properly located oxidation catalyst. Removal efficiency can vary with gas
residence time, which is a function of catalyst bed depth. Increasing bed depth will increase removal
efficiencies but will also cause an increase in pressure drop across the catalyst bed, potentially increase
particulate matter emissions and result in a decrease in turbine performance.
Gas turbine CO and VOC emissions are a result of incomplete combustion which primarily occurs at the
edges of the gas turbine operating envelop. As a result, the expected emissions are lowest at baseload
steady operation near typical ambient conditions. These emissions, while within the guarantee
capabilities, will tend to be higher when the gas turbine is operated at minimum load conditions and at
extreme temperatures. Overly restrictive CO and VOC emissions limits, based only on baseload steady
operation at typical ambient conditions, when applied to unfired HRSG operating scenarios, will result in
decreased operating flexibility in the form of restricted minimum load turndown capability and can
restrict the rate at which the gas turbine is capable to ramp in load to respond to grid demands. Reduced
turndown and fast ramping capabilities are essential operating parameters for modern gas turbine plants to
ensure grid reliability in support of increased renewable penetration. The reduced turndown avoids over
generation when higher levels of renewable generation are available and during periods of decreased load
demand. Fast load ramping is essential to respond to fluctuations in renewable generation.
Selection of CO Control Technology to Meet BACT/BAT
The two technologies available for controlling CO are an oxidation catalyst and good combustion
practices. REC proposes to meet BACT for CO using good combustion practices in combination with an
oxidation catalyst. REC is proposing a CO limit of 1.3 ppmvd @ 15% O2 when firing natural gas (without
duct firing), 1.9 ppmvd @ 15% O2 firing natural gas with duct firing, and 2 ppmvd @ 15% O2 when firing
ULSD. Compliance with the CO limit will be based on a 24-hour block average using a CEMS.
As provided in Table 5, The RBLC search revealed a few facilities with lower emission limits when firing
natural gas with and without duct burners. The lowest permitted CO emission limit when firing natural
gas without duct firing is 0.9 ppmvd at CPV Towantic, LLC and West Deptford Energy Station. Killingly
Energy Center is at 0.9 ppm but the facility has not been built. Both of the operating facilities have
comparatively smaller combustion turbines. There is one unit operating with a limit of 1 ppmvd without
duct firing (Greensville Power Station) which has a smaller combustion turbine. There are three facilities
(Greensville Power Station, CPV Towantic, LLC, and West Deptford Energy Station that are operating
with limits lower than 1.9 ppmvd (limits are 1.6 ppmvd, 1.7 ppmvd, and 1.5 ppmvd, respectively) with

POWER ENGINEERS, INC. Plan Approval Application – Renovo Energy Center, LLC
PAGE 12
duct firing. The turbines and duct burners at these other facilities have significantly lower heat input
capacities and therefore are not appropriate for comparison to REC’s larger gas turbines and burners.
REC will meet BACT with an oxidation catalyst in combination with good combustion practices which is
top control technology of turbines. The proposed limits are consistent with numerous other recent and
past permitted combustion turbines of varying sizes and manufacturers.
Selection of VOC Control Technology to Meet LAER/BAT
The most effective control for VOC is an oxidation catalyst in combination with good combustion. The
lowest permitted VOC emission limit when firing natural gas without duct firing is 0.7 ppm at seven
different facilities identified by the RBLC search. Five of the seven facilities are currently operating and
meeting this limit. REC is proposing to meet 0.7 ppm when firing natural gas without duct firing.
With duct firing, the lowest permitted emission limit for VOC is 1.4 ppm at three facilities only one of
which is operating (Greensville Power Station). Greensville Power Station is equipped with duct burners
that are approximately half the size of the burners proposed by REC. The next highest limit for
combustion turbines with duct firing is 1.5 ppm which is achieved at four facilities currently in
commercial operation. The heat input of these duct burners is much lower (between 164 and 659
MMBtu/hr) than REC’s. There are four facilities with permit limits of 1.6 ppm with duct firing. Three are
in commercial operation, two of which are equipped with duct burners that are less than half the size of
REC’s duct burners. The third facility, Wildcat Point Generation Facility, has a lower duct burner heat
input of 892 MMBtu/hr than REC is proposing (1,005 MMBtu/hr). The next highest limit is 1.8 ppm
which is the limit that REC is proposing for its combustion turbines operating with duct firing.
VOC emission rates vary based on the level of duct burner firing. The amount of duct burner firing varies
with each individual project dependent on the energy demand and electricity the local grid can
accommodate. In addition, the combustion efficiency of a duct burner is lower than that of a turbine.
When duct firing constitutes a higher percentage of the overall heat input, the VOC concentration in the
combined exhaust gas will be higher than that of similar units with lower duct firing.
There is no single established BACT/LAER level for the various combustion turbine/duct burner size
combinations. VOC permit limits during duct firing operation should be determined in relation to the
designed heat capacity as well as anticipated dispatch. Supplemental duct firing capacity is optimized to
suit the capacity needs and operational profile of the installation. Higher levels of duct firing result in
higher levels of VOC emissions and the permitted VOC emissions must consider the amount of duct
firing for the specific installation. As the percent of duct burning increases relative to turbine firing,
VOC/CO emission concentrations of the combined exhaust streams are higher due to fact that duct burner
firing is not able to achieve the same level of emissions performance as compared to the highly efficient
and advanced design of turbine combustors. REC’s proposed duct burners are significantly larger than
most that are currently in commercial operation, thus the OEM’s proposed VOC emission rate of 1.8 ppm
while duct firing is considered to be the most stringent limit for this particular plant design.
In summary, REC proposes to meet LAER for VOC using good combustion practices in combination
with an oxidation catalyst. REC is proposing a VOC limit of 0.7 ppmvd @ 15% O2 when firing natural
gas (without duct firing), 1.8 ppmvd @ 15% O2 firing natural gas with duct firing, and 2 ppmvd @ 15%
O2 when firing ULSD.

POWER ENGINEERS, INC. Plan Approval Application – Renovo Energy Center, LLC
PAGE 13
3.3.4 Sulfur Dioxide (SO2) and Sulfuric Acid Mist (H2SO4)
Emissions of SO2 from fuel combustion result from the oxidation of sulfur compounds present in the fuel.
SO2 emissions from combustion turbines burning natural gas and ULSD are inherently minimized by the
low sulfur content of the fuels. Flue gas desulfurization or scrubber systems are typically used on sulfur-
laden fuels such as coal and residual oil to remove SO2 in the flue gas stream. The following section
describes control technologies that can be applied to reduce SO2 emissions from combined cycle turbines
and identifies similar facilities for comparison to determine the best available control technology that will
be required.
Identification of Similar Facilities with BACT/BAT for SO2/H2SO4
TABLE 7 FACILITIES WITH BACT/BAT FOR SO2/H2SO4
FACILITY NAME
TURBINE SIZE (MMBTU/HR)
PERMIT DATE
FUEL TYPE(S)
FUEL SULFUR LIMIT
SOX CONTROLS
Warren County Power Plant, VA
2,996 6/17/2014 NG 0.32 gr S/100 scf (NG) Low sulfur fuel
Liberty Generation Plant, PA
2,890 10/10/2012 NG 0.4 gr S/100 scf (NG) Low sulfur fuel
Patriot Generation Plant, PA
3,007 12/13/2013 NG 0.4 gr S/100 scf (NG) Low sulfur fuel
Brunswick County Power Station, VA
2,942 3/12/2013 NG 0.4 gr S/100 scf (NG) 0.0011 lb SOx /MMBtu
Low sulfur fuel
C4GT, LLC, VA 3,482 4/26/2018 NG 0.4 gr S/100 scf (NG) 0.0011 lb SOx /MMBtu
Low sulfur fuel
Greensville Power Station, VA
3,227 6/17/2016 NG 0.4 gr S/100 scf (NG) Low sulfur fuel
Oregon Clean Energy Center, OH
2,932 6/18/2013 NG 0.5 gr S/100 scf (NG) Low sulfur fuel
Identification and Evaluation of SO2/H2SO4 Controls
The primary means for controlling emissions of SO2 and H2SO4 from dual fired combustion turbines is to
limit the sulfur content of the fuel. Add-on control technologies that are available to reduce SO2 emissions
include dry sorbent injection, wet scrubbing systems and spray dryer adsorbers. None of these add-on
control devices have been applied to combined cycle turbine applications identified in the RBLC or other
permit searches. For this reason, the BACT limits for SO2 and H2SO4 will be based on the sulfur content
of the fuels, similar to the most recently permitted sources in Pennsylvania.
Selection of SO2/H2SO4 Control Technology to Meet BACT/BAT
The fuel to be used in REC’s combustion turbines will consist of natural gas and ULSD. The SO2 and
H2SO4 emissions produced from combustion of these fuels are sufficiently low that add-on SO2 removal
technologies would not result in a significant environmental benefit or be cost-effective. REC proposes
the use of natural gas with sulfur content no greater than 0.4 gr S/100scf of gas, as well as the use of
ULSD with a maximum sulfur content of 15 ppm.

POWER ENGINEERS, INC. Plan Approval Application – Renovo Energy Center, LLC
PAGE 14
3.3.5 Ammonia
Ammonia will be emitted from the combined cycle turbines as a result of the ammonia injection
associated with the SCR. Greater levels of NOx reduction require greater amounts of ammonia to be
injected. There are no add-on control devices that would be practical for reducing ammonia emissions
from combined cycle turbines, and no add-on control technologies were identified in the RBLC or other
permit searches. Good operating practices are the only practical method of reducing emissions of
ammonia from combined cycle turbines that employ SCR technology.
Identification of Facilities with BAT for Ammonia
An RBLC search was conducted to determine controls recently permitted facilities have employed to
reduce ammonia emissions. It was determined that emission limits of 5 ppm NH3 slip were being
achieved using good operating practices with monitoring of NH3 injection and NOx control, with no add-
on control devices being installed. Two facilities are permitted and operating with an emission limit of 2
ppm NH3 slip (CPV Towantic, LLC and Salem Harbor Station). These are smaller units and not
comparable to REC’s turbines and duct burners. Killingly Energy Center is permitted at 2 ppm, however,
it is not operating.
Identification and Evaluation of Ammonia Controls
Ammonia emissions are primarily a function of the ammonia injection rate for the SCR system. A balance
must be achieved in order to maximize the NOx reductions, while limiting the ammonia emissions.
Ensuring good operating practices that will result in this balance being continuously met is the only
control technology/method practical to be employed in combined cycle turbines similar in nature to this
project.
Selection of Ammonia Control Technology to Meet BAT
REC will use good operating practices in order to meet BAT for emissions of ammonia. These practices
will include continuous monitoring of ammonia slip levels and NOx emissions in order to optimize the
SCR efficiency while minimizing emissions. REC is proposing an ammonia slip limit of 5 ppm when
firing natural gas or ULSD. Compliance will be demonstrated using a CEMS with a 3-hour block
average.
3.3.6 Startup and Shutdown Emissions
The emission limits discussed in the previous sections reflect steady-state operations of the combined
cycle turbines. During startup and/or shutdown (SUSD) of the turbines, the combustors cannot operate at
their maximum efficiency and the add-on control devices (SCR and oxidation catalyst) are not effective
due to the exhaust gas temperatures during SUSD being outside the normal operating range for those
devices. Specific information regarding the duration and operating load where “normal” emissions
compliance can be achieved can be seen in Appendix E. Therefore, the steady-state emission limits are
not appropriate for use during SUSD scenarios, as it would be impossible to consistently achieve the same
emissions performance during SUSD scenarios.
Because BACT limits are determined on a case-by-case basis of achievability (U.S. EPA Responses to
Public Comments on the Proposed PSD Permit for the Desert Rock Energy Facility, July 2008), REC is
proposing secondary BACT limits during periods of SUSD. Thus, the combustion turbines will have

POWER ENGINEERS, INC. Plan Approval Application – Renovo Energy Center, LLC
PAGE 15
emission limits that are both stringent during steady-state operations and achievable during SUSD
scenarios.
Tables 8 and 9 summarize the secondary BACT limits proposed for emissions during periods of SUSD
for natural gas firing and ULSD firing, respectively. Pollutants not included in this table are able to
achieve the primary BACT limits proposed above during periods of SUSD. The proposed secondary
BACT limits are based on mass emissions per event. Compliance with NOx and CO emissions will be
demonstrated using CEMS, and CO will be used as a surrogate for VOC with data gathered during the
initial stack testing. These values have been used in the facility-wide potential emissions estimates
included in this application.
TABLE 8 SUSD EMISSION LIMITS PER POWERBLOCK – NATURAL GAS
COLD STARTS
Time (minutes): 60
NOx Emissions (lbs/event): 164.0
CO Emissions (lbs/event): 932.0
VOC Emissions (lbs/event): 70.7
WARM STARTS
Time (minutes): 55
NOx Emissions (lbs/event): 111.4
CO Emissions (lbs/event): 261.3
VOC Emissions (lbs/event): 33.0
HOT STARTS
Time (minutes): 35
NOx Emissions (lbs/event): 92.8
CO Emissions (lbs/event): 309.8
VOC Emissions (lbs/event): 38.5
SHUTDOWNS
Time (minutes): 27
NOx Emissions (lbs/event): 31.5
CO Emissions (lbs/event): 342.0
VOC Emissions (lbs/event): 42.8
TABLE 9 SUSD EMISSION LIMITS PER POWERBLOCK – ULSD
COLD STARTS
Time (minutes): 60
NOx Emissions (lbs/event): 294.7
CO Emissions (lbs/event): 938.7
VOC Emissions (lbs/event): 188.0
WARM STARTS
Time (minutes): 55
NOx Emissions (lbs/event): 236.5
CO Emissions (lbs/event): 393.3
VOC Emissions (lbs/event): 45.4
HOT STARTS
Time (minutes): 35
NOx Emissions (lbs/event): 196.0
CO Emissions (lbs/event): 477.8
VOC Emissions (lbs/event): 52.5
SHUTDOWNS

POWER ENGINEERS, INC. Plan Approval Application – Renovo Energy Center, LLC
PAGE 16
Time (minutes): 23
NOx Emissions (lbs/event): 123.6
CO Emissions (lbs/event): 138.0
VOC Emissions (lbs/event): 20.1
3.4 BACT/BAT Evaluation For Greenhouse Gas (GHG) Emissions From Turbines
GHG emissions from major stationary sources are regulated by EPA in accordance with the “tailoring
rule” contained in 40 CFR Part 51.166 – Prevention of Significant Deterioration of Air Quality as
amended on June 3, 2010. As of January 2, 2011, GHG emissions are subject to regulation if the source is
a proposed major source for a regulated non-GHG new source review (NSR) pollutant and will have the
potential to emit 75,000 tons or more of GHGs (represented as CO2 equivalent emissions (CO2e)).
Although the U.S. Supreme Court issued a decision that held that the EPA may not treat GHGs as an air
pollutant for the purposes of determining whether a proposed source is subject to PSD requirements, this
does not affect proposed sources that would otherwise be subject to PSD regulations for another pollutant.
For this reason, REC is required to complete a BACT analysis for emissions of GHGs from the combined
cycle turbines.
3.4.1 Identification and Evaluation of CO2 Control Technologies
Carbon capture and storage (CCS)
Current CCS technologies are costly to install and operate due to the large parasitic energy requirement,
reducing the amount of electricity available for sale to the grid. Parasitic loads for current CCS
technologies are reported at between 21% to 32% of the plant output. Other challenges related to CCS
technology include the lack of regulatory framework for storing CO2 and uncertainty regarding liability
for stored CO2.
On February 3, 2010, President Obama established an Interagency Task Force on carbon capture and
storage co-chaired by the Department of Energy (DOE) and the EPA with the mission of proposing a plan
to overcome the barriers to the widespread, cost effective deployment of CCS within 10 years. In August
2010, the Task Force issued a 233 page report, “Report of the Interagency Task Force on Carbon Capture
and Storage” that documents the Task Force’s findings, conclusions and recommendations. The report
states that the application of CCS to coal-fired power plant emissions offers the greatest potential for
GHG reductions.
Known barriers to widespread CCS deployment include:
• Lack of comprehensive climate change legislation - without a carbon price and financial
incentives for new technologies, there is no stable framework for investment in low-carbon
technologies such as CCS.
• Regulatory uncertainty – uncertainty and limited experience exists for the regulating and
permitting of CCS. Potential concerns exist for the long-term liabilities for CO2 storage sites.
• Aggregation of pore space for geologic storage on private lands.

POWER ENGINEERS, INC. Plan Approval Application – Renovo Energy Center, LLC
PAGE 17
• Public awareness and support of CCS is currently unknown and may be project specific.
Since CCS is not commercially available or cost effective and issues exist for its storage and permitting,
REC concludes that it is not a feasible control option for its dual-fueled combined cycle electric
generating facility.
Energy Efficiency
Efficient production of electricity is an important aspect in reducing GHG emissions. Reducing the
amount of fuel required to produce the same amount of electric power results in lower GHG emissions, as
GHG emissions are largely a function of the fuel composition. In addition to proposing one of the most
efficient gas turbines offered by gas turbine manufacturers, REC’s energy efficient design includes
systems to monitor combustion at all times to ensure maximum combustion efficiency. Optimizing
combustion efficiency not only reduces emissions of GHGs, but also results in reduced emissions of other
pollutants as well (NOx in particular). The combined cycle turbines will be equipped with a continuous
emissions monitoring system that will include monitoring for oxygen, a key parameter in determining
combustion efficiency.
Energy efficiency can also be increased by utilizing good combustion practices, which include proper air
and fuel mixing, adequate residence time in the combustion zone, proper maintenance and operation of
the burner, and achieving the proper temperature in the combustion zone. Additionally, ensuring that the
fuel supply is consistent with minimal fluctuations in quality further improves energy efficiency.
Type of Fuel
Utilizing fuels that have low amounts of CO2 is another way to reduce GHG emissions. The following
table lists the CO2 content of various fuels typically used for electricity generation.
TABLE 10 CO2 EMISSION FACTORS FOR VARIOUS FUEL TYPES
FUEL TYPE CO2 CONTENT IN KG/MMBTU
Coal 95.52
Residual Fuel Oil 75.10
Distillate Fuel Oil 73.96
Natural Gas 53.06
The primary use of natural gas will appreciably reduce CO2 emissions when compared to solid or liquid
fuels. The selection of distillate oil as a backup fuel is the most appropriate alternative when considering
CO2 emissions. REC is proposing to combust primarily natural gas, utilizing ULSD as a backup fuel for
times when natural gas may be unavailable and electrical demand requires the plant to operate.
3.4.2 Ranking of Technically Feasible Options
Carbon capture, while technically feasible, is not commercially available or cost effective for natural gas
and ULSD fueled electric generating facilities. EPA and DOE’s Task Force Report concludes that while
CCS can play an important role in GHG emission reductions, current barriers exist that hinder near and
long-term deployment of CCS technology.

POWER ENGINEERS, INC. Plan Approval Application – Renovo Energy Center, LLC
PAGE 18
Energy efficiency, the use of natural gas as the primary fuel with ULSD to be used on a very limited basis
as back-up fuel and good operating and maintenance practices are all technically feasible control options,
all of which REC will implement. As a result, none of these control options needs to be further evaluated
based on energy, environmental, and economic impacts.
3.4.3 Selection of CO2 Control Technology to Meet BACT/BAT
REC will implement energy efficiency, natural gas and ULSD fuel and good operating and maintenance
practices for CO2 control. REC will operate the equipment in accordance with manufacture’s
specifications.
REC is not proposing limits in terms of Btu/kW-hr relative to GHG emissions from the turbines. Several
similar facilities in Pennsylvania were recently issued permits without such an efficiency rate limit
(Hickory Run Energy Station, Berks Hollow Energy Association, Westmoreland Generating Station),
which is due to the difficulty to enforce due to its dependency on ambient temperature and turbine load. A
Btu/kW-hr efficiency rate is also unnecessary with a mass-based emission limit in place that meets the
definition of BACT contained in 40 CFR 52.21(b)(12). In EPA’s comments on the Wisconsin Department
of Natural Resources’ draft of the PSD Permit for Milwaukee Metropolitan Sewerage District Jones
Island Water Reclamation Facility, EPA points out that the definition of BACT allows for the use of a
design standard in lieu of an emission limitation only if imposing an emission limitation is infeasible.
EPA requested that a numerical BACT emission limit be imposed, and suggested units of pounds of CO2e
emitted per megawatt hour of electricity produced, on a 12-month rolling average.
REC is proposing a GHG BACT limit of 962 lb/MW-hr of CO2e, to be demonstrated with a CEMS based
on a 12-month rolling average.
3.5 Hazardous Air Pollutants
Volatile organic compound (VOC) emissions from combined cycle turbines are the result of incomplete
combustion. All hazardous air pollutant (HAP) emissions from natural gas combustion are VOCs.
Negligible amounts of metal HAPs are emitted from the combustion of ultra-low sulfur diesel (ULSD).
Control of metal HAPs is accomplished through the particulate matter BAT/BACT analysis outlined
above. The following section describes potential control technologies that can be applied to reduce
VOC/HAP emissions from REC’s combined cycle turbines and identifies similar facilities for
comparisons to determine the best available control technology that will be required.
TABLE 11 FACILITIES WITH BAT DETERMINATIONS FOR HAPS
FACILITY NAME FACILITY SIZE (MW)
PERMIT DATE
FUEL TYPE(S)
HAP EMISSION LIMIT HAP CONTROLS
Liberty Generation Plant 916-944 1/31/2013 NG 13 tpy Oxidation Catalyst
Patriot Generation Plant 916-944 12/13/2013 NG 12.5 tpy (RBLC) Oxidation Catalyst
Westmoreland Generating Station
930-1,065 4/1/2015 NG HAPs: 22.07 tpy Formaldehyde: 0.986 lb/hr and 8.67 tpy
Oxidation Catalyst
Garrison Energy Center 309 1/30/2013 NG, ULSD
HAPs:1.2 lb/hr (NG) 2.6 lb/hr (ULSD) 5.1 tpy Formaldehyde: 0.6 lb/hr
Oxidation Catalyst
Sunbury Generation LC 1,100 4/1/2013 NG HAPs: 4.63 tpy Oxidation Catalyst

POWER ENGINEERS, INC. Plan Approval Application – Renovo Energy Center, LLC
PAGE 19
FACILITY NAME FACILITY SIZE (MW)
PERMIT DATE
FUEL TYPE(S)
HAP EMISSION LIMIT HAP CONTROLS
Formaldehyde: 0.312 lb/hr
Duke Energy Hanging Rock Energy
172 12/18/2012 NG
Formaldehyde: 0.45 lb/hr
Good Combustion
Kleen Energy Systems, LLC
620 7/2/2013 NG, ULSD
No limits Oxidation Catalyst
Cape Canaveral Energy Center
1,250 1/1/2015 NG, ULSD
No limits Good Combustion
Riviera Beach Energy Center
1,250 1/1/2015 NG, ULSD
No limits Good Combustion
Warren County Power Station
1,329 6/17/2014 NG No limits Oxidation Catalyst, Good Combustion
FPL West County Energy Center
1,250 1/10/2007 NG No limits Good combustion
Empire Power Plant 635 7/1/2014 NG, ULSD
No limits Oxidation Catalyst
3.5.1 Identification and Evaluation of VOC/HAP Controls
As listed in the above table the control technologies for evaluation in the BAT analysis to control volatile
organic HAP emissions from REC’s dual fired combustion turbine turbines consist of oxidation catalysts
and combustion controls. Combustion controls are designed to minimize incomplete combustion by
improving oxidation of volatile organic HAPs to CO2. This is achieved by ensuring that the combustors
are designed and operated to allow complete mixing of the combustion air and fuel at combustion
temperatures with an excess of combustion air. Oxidation catalysts are post combustion controls to reduce
volatile organic HAP emissions in some turbine and reciprocating engine applications. Oxidation
catalysts typically operate at temperatures of 700°F to 1,100°F to be effective and thus for combustion
turbine applications are typically placed in the exhaust gas stream where this temperature range for the
exhaust of 700°F to 1,100°F can be ensured. An oxidation catalyst operating outside of this temperature
range will experience additional deterioration beyond what would be expected of a properly located
oxidation catalyst. Oxidation catalysts have an average efficiency of approximately 50 percent for HAP
reduction.
3.5.2 Selection VOC/HAP Control Technology to Meet BAT
The most effective control for volatile organic HAPs from a combustion turbine is an oxidation catalyst in
combination with good combustion practices.
The only facilities identified in the BAT search with a short term emission rate for HAP emissions are
Garrison Energy Center, Westmoreland Generating Station, Sunbury Generation and Duke Energy.
REC’s HAP emissions are presented in Appendix D of this submittal, including formaldehyde emissions
which is based on a concentration of 45.5 ppbvd corrected to 15% O2.
REC is proposing the following hazardous air pollutant (HAP) limits for each power block:

POWER ENGINEERS, INC. Plan Approval Application – Renovo Energy Center, LLC
PAGE 20
HAZARDOUS AIR POLLUTANT
NATURAL GAS SHORT TERM LIMIT (LB/HR)
ULSD SHORT TERM LIMIT (LB/HR)
ANNUAL LIMIT (TPY)
Formaldehyde 0.54 0.47 2.42
Toluene 0.23 NA 0.87
Manganese 3.7E-4 3.11 1.12
Toluene and manganese emission rates are based on AP-42 emission factors. Formaldehyde limit is based
on vendor data and an oxidation catalyst control efficiency of 50%.
REC will meet BAT for volatile organic HAPs through the use of good combustion practices in
combination with an oxidation catalyst on each combustion turbine. To be a minor source of HAPs, REC
is proposing a limit of 24.9 tons per year for facility-wide total HAPs, and 9.9 tons per year for any
individual HAP.
3.6 BACT/LAER/BAT Determination Auxiliary Boilers
REC is proposing to install two auxiliary “package” boilers each with a maximum rated heat input of 66
MMBtu/hr firing natural gas. Industrial package boilers are pre-assembled units that are delivered to the
site as a prefabricated unit. Package boilers are very compact and utilize a small furnace volume.
The auxiliary boilers’ function is to provide steam to the steam turbine on start-up, during maintenance
shutdown and for the steam turbine sealing process. Due to their function, the boilers will not be run
continuously or for long periods of time; their use will be limited. REC is proposing a limit on total fuel
use of 145,200 MMBtu per year for both boilers.
3.6.1 Nitrogen Oxides (NOx)
Generally NOx is formed during combustion by thermal oxidation of nitrogen in the combustion air
(thermal NOx) and the oxidation of nitrogen in the fuel (fuel-bound NOx). Natural gas contains relatively
small amounts of fuel-bound nitrogen and NOx formation through the fuel NOx mechanism is expected
to be insignificant. The main variables affecting NOx generation in the boilers are temperature, the
availability of nitrogen, the availability of oxygen, and the extent of contact between nitrogen and oxygen
during the combustion process.
Identification of NOx Control Technologies
NOx control techniques are generally organized into two separate categories: combustion controls and
post-combustion controls. Combustion controls affect the combustion conditions to minimize the
formation of NOx, while post-combustion controls remove NOx after it is formed. Combustion control
techniques have been demonstrated as successful in achieving NOx reductions from industrial boilers in a
cost-effective manner. The combustion control methods available to control thermal NOx on boilers
include low and ultra-low NOx burners and flue gas recirculation.
A search of EPA’s RBLC did not identify the application of post-combustion controls to natural gas fired
auxiliary boilers of this size. Table 12 below identifies the facilities in EPA’s RBLC with
BACT/LAER/BAT limits.

POWER ENGINEERS, INC. Plan Approval Application – Renovo Energy Center, LLC
PAGE 21
TABLE 12 IDENTIFICATION OF SOURCES WITH BACT/LAER/BAT FOR NOX
FACILITY NAME BOILER SIZE (MMBTU/HR) PERMIT DATE
NOX EMISSIONS LIMIT NOX CONTROLS
Moxie Freedom Salem Township, PA
55.4 9/1/2015 0.006 lb/MMBtu Ultra-low NOx burner, FGR, good combustion practices
York Energy Center Delta, PA
62 6/15/2015 0.0086 lb/MMBtu Ultra-low NOx burner, FGR, good combustion practices
Keys Energy Center Brandywine, MD
93 10/31/2014 0.01 lb/MMBtu
Ultra-low NOx burner, good combustion practices, efficient boiler design
Hess Newark Energy Center Newark, NJ
51.9 11/1/2012 0.01 lb/MMBtu Low NOx burner and FGR
Wildcat Point Generation Rising Sun, MD
45 4/8/2014 0.01 lb/MMBtu Good combustion practices and pipeline quality natural gas
Mattawoman Energy Center Brandywine, MD
42 11/13/2015 0.01 lb/MMBtu Good combustion practices and pipeline quality natural gas
Hill Top Energy Center Cumberland Township, PA
42 4/12/2017 0.011 lb/MMBtu Ultra-low NOx burner
CPV Fairview Energy Center Johnston, PA
92.4 9/2/2016 0.011 lb/MMBtu Ultra-low NOx burner, FGR, good combustion practices
CPV St. Charles Waldorf, MD
93 4/23/2014 0.011 lb/MMBtu Ultra-low NOx burner, FGR, exclusive use of nat gas
Hickory Run Energy Station Lawrence, PA
40 4/23/2013 0.011 lb/MMBtu Low NOx burner
Berks Hollow Energy Association Berks, Reading, PA
40 12/17/2013 0.011 lb/MMBtu Low NOx burner
Combustion Controls
Low NOx Burner
The “low NOx burner” (LNB) design generally refers to a set of burner components (e.g. burner register,
atomizing nozzle, diffuser) that are intended to achieve lower NOx by mixing the fuel and combustion air
in a way that limits NOx formation. This is generally done by mixing the combustion air and fuel in
multiple stages, and by utilizing a specially designed nozzle and/or diffuser to achieve a particular flame
pattern.
Flue Gas Recirculation (FGR)
Flue gas recirculation, or FGR, has generally been an effective method of reducing NOx emissions from
gas-fired industrial boilers. With FGR, a portion of the boiler’s exhaust gas is recirculated back to the
burner where it is mixed with combustion air and introduced into the combustion zone. The relatively

POWER ENGINEERS, INC. Plan Approval Application – Renovo Energy Center, LLC
PAGE 22
cool flue gas absorbs heat released by the burner flame, thereby lowering peak flame temperatures and
thermal NOx formation. Flue gas recirculation can be accomplished by either using a separate FGR fan to
move the exhaust gases back to the burner, or by using the boiler’s combustion air fan to “induce” the
gases to the burner.
Ultra-Low NOx Burner
Ultra-low NOx burner technology consists of using a combination of lean-premix combustion, fuel
staging, and zoned internal furnace gas recirculation to achieve lower NOx emissions than achieved by
typical low NOx burners and FGR.
Post-combustion Controls
Post-combustion technologies include selective catalytic reduction (SCR) and selective non-catalytic
reduction (SNCR).
SCR uses a catalyst to convert NOx to nitrogen gas. An ammonia-based reagent is injected into the
boiler’s combustion gases upstream of the catalyst, and the reactions to remove NOx occur in the
presence of the catalyst. The catalyst allows the ammonia to reduce NOx levels at lower exhaust
temperatures than selective non-catalytic reduction. The optimum temperature range for SCR technology
is typically 600 to 750° F. Thus, most SCR installations have incorporated the catalyst into the heat
recovery section of the boiler to meet the required temperature window. SCR can result in NOx
reductions of up to 90%. However, SCR has a high capital cost and is not economically feasible on
boilers with a heat input capacity of less than 100 MMBtu/hr with low potential NOx emissions due to the
use of natural gas and limited operating hours.
SNCR is based on the chemical reduction of the NO2 molecule into nitrogen and water vapor. SNCR
involves the injection of an ammonia-based reagent directly into the furnace section of the boiler with a
temperature window of 1,600 to 2,100° F. Under these conditions, the reagent will react with and reduce
NOx emissions without the need for a catalyst. Selective non-catalytic reduction reduces NOx up to 70%
in combination with combustion controls. However, SNCR tends to be less effective at lower levels of
uncontrolled NOx. SNCR requires large furnace volumes and residence time for gas mixing in addition to
a specific and stable temperature window in the furnace where the ammonia-based reagent is injected.
The auxiliary boilers will have limited operation and varied load due to their function as well as small
furnace volume, which is not ideal for the required temperature and mixing time. Therefore, REC
concludes that SNCR is not technically feasible.
Evaluation of Technically Feasible Control Options
At stated above, although SCR may be a technically feasible option, REC has not identified any auxiliary
boilers in the 66 MMBtu/hr size range that are equipped with SCR. In addition, SCR is not an
economically feasible option for boilers of this size/limited use and the use of ultra-low NOx
burners/FGR can achieve an emission rate comparable to that of SCR.
Selection of LAER/BAT for NOx
REC’s two auxiliary boilers will be equipped with ultra-low NOx burners or a combination of low NOx
burner technology with FGR to achieve an emission limit of 0.006 lb/MMBtu. In addition, REC will limit
total fuel use to 145,200 MMBtu per year (both boilers combined).
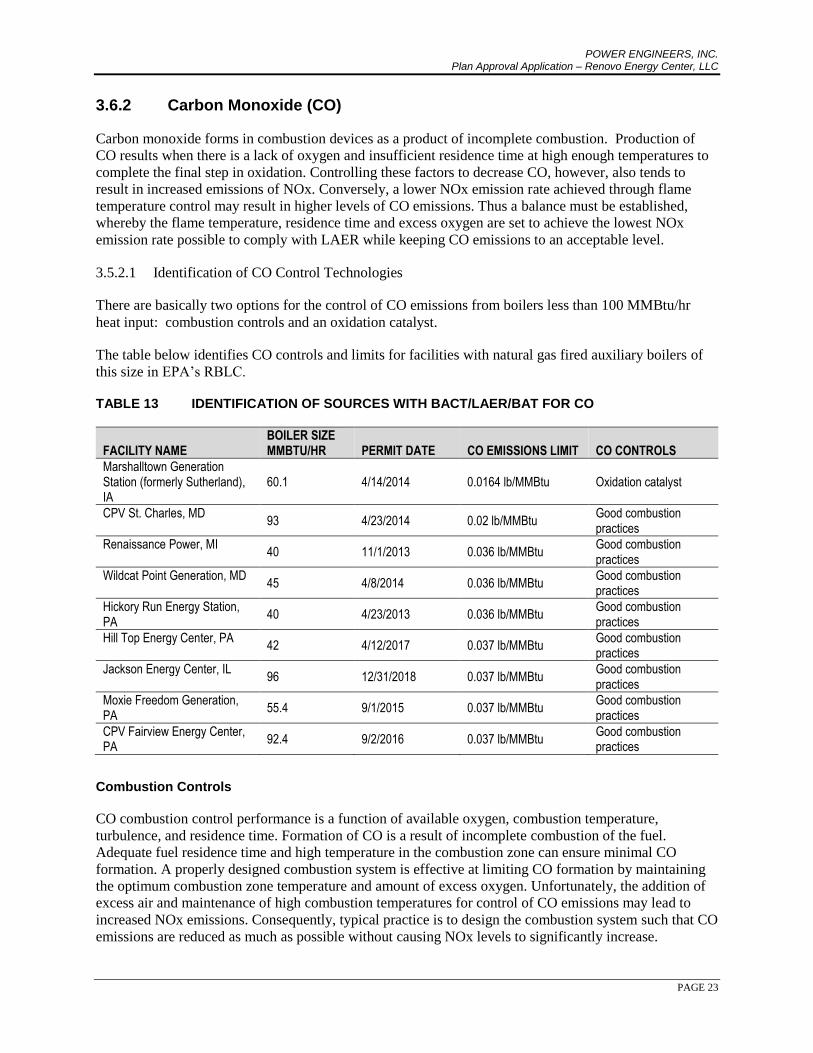
POWER ENGINEERS, INC. Plan Approval Application – Renovo Energy Center, LLC
PAGE 23
3.6.2 Carbon Monoxide (CO)
Carbon monoxide forms in combustion devices as a product of incomplete combustion. Production of
CO results when there is a lack of oxygen and insufficient residence time at high enough temperatures to
complete the final step in oxidation. Controlling these factors to decrease CO, however, also tends to
result in increased emissions of NOx. Conversely, a lower NOx emission rate achieved through flame
temperature control may result in higher levels of CO emissions. Thus a balance must be established,
whereby the flame temperature, residence time and excess oxygen are set to achieve the lowest NOx
emission rate possible to comply with LAER while keeping CO emissions to an acceptable level.
3.5.2.1 Identification of CO Control Technologies
There are basically two options for the control of CO emissions from boilers less than 100 MMBtu/hr
heat input: combustion controls and an oxidation catalyst.
The table below identifies CO controls and limits for facilities with natural gas fired auxiliary boilers of
this size in EPA’s RBLC.
TABLE 13 IDENTIFICATION OF SOURCES WITH BACT/LAER/BAT FOR CO
FACILITY NAME BOILER SIZE MMBTU/HR PERMIT DATE CO EMISSIONS LIMIT CO CONTROLS
Marshalltown Generation Station (formerly Sutherland), IA
60.1 4/14/2014 0.0164 lb/MMBtu Oxidation catalyst
CPV St. Charles, MD 93 4/23/2014 0.02 lb/MMBtu
Good combustion practices
Renaissance Power, MI 40 11/1/2013 0.036 lb/MMBtu
Good combustion practices
Wildcat Point Generation, MD 45 4/8/2014 0.036 lb/MMBtu
Good combustion practices
Hickory Run Energy Station, PA
40 4/23/2013 0.036 lb/MMBtu Good combustion practices
Hill Top Energy Center, PA 42 4/12/2017 0.037 lb/MMBtu
Good combustion practices
Jackson Energy Center, IL 96 12/31/2018 0.037 lb/MMBtu
Good combustion practices
Moxie Freedom Generation, PA
55.4 9/1/2015 0.037 lb/MMBtu Good combustion practices
CPV Fairview Energy Center, PA
92.4 9/2/2016 0.037 lb/MMBtu Good combustion practices
Combustion Controls
CO combustion control performance is a function of available oxygen, combustion temperature,
turbulence, and residence time. Formation of CO is a result of incomplete combustion of the fuel.
Adequate fuel residence time and high temperature in the combustion zone can ensure minimal CO
formation. A properly designed combustion system is effective at limiting CO formation by maintaining
the optimum combustion zone temperature and amount of excess oxygen. Unfortunately, the addition of
excess air and maintenance of high combustion temperatures for control of CO emissions may lead to
increased NOx emissions. Consequently, typical practice is to design the combustion system such that CO
emissions are reduced as much as possible without causing NOx levels to significantly increase.

POWER ENGINEERS, INC. Plan Approval Application – Renovo Energy Center, LLC
PAGE 24
Add-on Emission Controls
The only add-on control device that is commercially available for controlling CO emissions from boilers
is an oxidation catalyst. The catalyst lowers the activation energy necessary for CO to react with available
oxygen in the exhaust to produce CO2. Oxidation catalysts operate optimally at a temperature range of
500° to 700° F and can also reduce volatile organic compounds (VOC) emissions, but to a lesser extent
than CO.
Evaluation of CO Control Options
Boiler with oxidation catalyst
Economic Impacts
An economic analysis was performed to identify the cost effectiveness of installing and operating an
oxidation catalyst to reduce CO emissions by approximately 90%. The total capital cost estimate on a per
boiler basis is presented in Table 14 in a format consistent with the cost estimation procedures in EPA’s
Office of Air Quality Planning and standards (OAQPS) Control Cost Manual, sixth edition (January
2002). The total annualized capital investment and annual cost of operating an oxidation catalyst were
calculated using procedures in the OAQPS Control Cost Manual. The annual costs for the construction
and operation of an oxidation catalyst are presented in Table 15.
TABLE 14 OXIDATION CATALYST CAPITAL EXPENSES1
EQUIPMENT COSTS
Oxidation Catalyst $15,1442
Frame and Housing $15,000
Total System (A) $35,144
Freight (0.05A) $1,757
Taxes (0.05A) $1,757
Total purchased equipment cost (B): $22,000
DIRECT INSTALLATION COSTS
Foundations and Supports (0.08B) $3,374
Handling and Erection (0.14B) $5,904
Electrical (0.01B) $422
Total direct installation cost: $9,700
Total Direct Cost: $51,873
INDIRECT COSTS (INSTALLATION)
Engineering and Supervision (0.10B) $4,217
Construction and Field Expenses (0.05B) $2,109
Contractor Fees (0.10B) $4,217
Startup (0.02B) $843
Performance Test (0.01B) $422
Contingencies (0.03B) $1,265

POWER ENGINEERS, INC. Plan Approval Application – Renovo Energy Center, LLC
PAGE 25
Total Indirect Cost: $13,074
Total Capital Investment (TCI): $64,946 1Appendix O contains cost calculation sheets 2Cost estimate for catalyst, frame and housing is provided by EmeraChem for a 66 MMBtu/hr boiler
TABLE 15 OXIDATION CATALYST ANNUAL OPERATING COSTS1
DIRECT ANNUAL COST
Operating Labor $160
Supervisory Labor ---
Maintenance Labor and Materials $2,250
Catalyst Replacement (3 year life, 7% interest) $5,353
Spent Catalyst Handling ----
Performance Loss $636
Total direct annual cost: $8,399
INDIRECT ANNUAL COSTS
Overhead (60% total labor and materials) $1,350
Administrative Charges (0.02 TCI) $1,299
Insurance (0.01 TCI) $649
Capital Recovery (10 year at 7% interest) $5,838
(TCI - replacement cost of catalyst = 72,047)
(72,047*0.1424)
Total indirect annual cost: $9,137
Total Annual Costs $17,536
AVERAGE COST EFFECTIVENESS
CO Emissions Removed (tons/year) 1.93
Cost Effectiveness (dollars/ton CO removed) $9,110 1Appendix O contains cost calculation sheets Cost analysis was performed in 2017. It was determined to be unnecessary to update with 2019 estimates as the dollar per ton would increase.
Based on the cost analysis shown in Tables 14 and 15, the average cost effectiveness of an oxidation
catalyst equals $9,110 per ton of CO removed. The dollar per ton value does not support the use of an
oxidation catalyst as BACT/BAT for REC’s auxiliary boilers.
Energy and Environmental Impacts
The increase flow resistance created by the oxidation catalyst results in a pressure drop across the
combustion chamber requiring a corresponding increase in fan speed for the inlet air. The estimated
negative energy impact caused by the pressure drop is as follows:
3.79 kW x 2,200 hours per year = 8,338 kW-hours/year
(note: 3.79 kW is the power requirement based on a pressure drop of 3 psia)

POWER ENGINEERS, INC. Plan Approval Application – Renovo Energy Center, LLC
PAGE 26
Environmental impacts would include the increased energy requirements for operation and the waste
generated from the spent catalyst. The marginal environmental benefit associated with reducing CO
emissions by a maximum potential of 1.93 tons per year in the project area does not justify the application
of an oxidation catalyst.
Selection of BACT/BAT for CO
REC proposes good combustion practices and a CO limit of 0.036 lb/MMBtu as BACT/BAT for the
auxiliary boilers.
3.6.3 Volatile Organic Compounds (VOC)
The table below identifies VOC controls and limits for facilities with natural gas fired auxiliary boilers in
EPA’s RBLC with BACT/LAER/BAT limits.
TABLE 16 IDENTIFICATION OF SOURCES WITH BACT/LAER/BAT FOR VOC
FACILITY NAME BOILER SIZE MMBTU/HR PERMIT DATE
VOC EMISSIONS LIMIT VOC CONTROLS
Hickory Run Energy Station Lawrence, PA
40 4/23/2013 0.0015 lb/MMBtu Good combustion practices
Berks Hollow Energy Association Berks, PA
40 12/17/2013 0.0015 lb/MMBtu Good combustion practices
CPV St. Charles Waldorf, MD
93 4/23/2014 0.002 lb/MMBtu Good combustion practices
Keys Energy Center Brandywine, MD
93 10/31/2014 0.002 lb/MMBtu Good combustion practices
Mattawoman Energy Center Brandywine, MD
42 11/13/2015 0.003 lb/MMBtu Good combustion practices
Wildcat Point Generation Rising Sun, MD
45 4/8/2014 0.0033 lb/MMBtu Good combustion controls
CPV Valley Energy Center, NY
73.5 8/1/2013 0.0038 lb/MMBtu Good combustion controls
MEC North and MEC South MI
61.5 6/29/2018 0.004 lb/MMBtu Good combustion practices
York Energy Center, PA 62 6/15/2015 0.004 lb/MMBtu
Good combustion practices
Brunswick County Power Station, VA
66.7 3/12/2013 0.005 lb/MMBtu Good combustion practices
Moxie Freedom, PA 55.4 9/1/2015 0.005 lb/MMBtu
Good combustion practices
Troutdale Energy Center Multnomah, OR
39.8 3/5/2014 0.005 lb/MMBtu Good combustion practices
Marshalltown Generating Station (Sutherland), IA
60.1 4/14/14 0.005 lb/MMBtu Good combustion practices

POWER ENGINEERS, INC. Plan Approval Application – Renovo Energy Center, LLC
PAGE 27
Identification of VOC Control Technologies
Like CO emissions, VOC emissions occur from incomplete combustion. Effective boiler design and post-
combustion control using oxidation catalysts are the available technologies for controlling VOC
emissions from boilers.
Evaluation of VOC Control Options
Similar to CO, the energy, environmental, and economic impacts of an oxidation catalyst do not support
its use. VOC emissions are lower than CO and the removal efficiency is lower, therefore the dollar per ton
value would be higher than that for CO. In addition, REC did not identify any facilities with an oxidation
catalyst for the control of VOC emissions.
Selection of LAER/BAT for VOC
REC proposes good combustion practices and effective boiler design to meet LAER/BAT for the
auxiliary boilers. The Hickory Run Energy Station and Berks Hollow Energy emission limit for VOC is
lower than other BACT/LAER determinations contained in the RBLC database. REC contacted Ed Orris
and Tom Flaherty of PaDEP’s Northwest Regional Office to request further information on Hickory
Run’s auxiliary boiler. Based on Tom Flaherty’s review of the application, the VOC emission limit was
based on vendor data, however vendor specifications were not included in the application. REC contacted
David Wilson of LS Power (the applicant) who indicated that the emission limit in the Hickory Run
application was taken from LS Power’s application for their Berks Hollow Energy facility. Although the
permit for Berks Hollow was issued after the permit for Hickory Run, the application for Berks Hollow
preceded that of Hickory Run. REC then contacted Thomas Hanlon of PaDEP’s Southcentral Regional
Office to obtain more information on the Berks Hollow auxiliary boiler’s VOC limit. Thomas Hanlon
reviewed the application and did not find any vendor specification data to support the 0.0015 lb/MMBtu
limit. Thomas Hanlon further reviewed the application material and the history of the plan approval
development and based on the following facts has concluded that is it quite possible and likely that the
VOC emission limit was transposed from 0.0051 lb/MMBtu from another LAER determination to 0.0015
lb/MMBtu and was established as the VOC limit for Berks Hollow and Hickory Run’s auxiliary boiler.
• No vendor data is available in either Berks Hollow or Hickory Run’s application to support a
VOC limit of 0.0015 lb/MMBtu.
• Berks Hollow application quoted a LAER determination for Plant McDonough in Smyrna,
Georgia. The LAER limit established for Plant McDonough was 0.0051 lb VOC/MMBtu and is
contained in their current permit.
• Further into the Berks Hollow application the LAER determination was identified as 0.0015
lb/MMBtu instead of 0.0051 lb/MMBtu.
• PaDEP presented the 0.0015 value in the draft plan approval for Berks Hollow.
• Since Berks Hollow and Hickory Run applications were nearly identical and submitted by the
same company and the draft plan approvals were being developed around the same timeframe, for
consistency purposes the two regional offices provided the same limits and requirements in each
plan approval. Therefore, a VOC limit of 0.0015 lb/MMBtu was drafted into the plan approval
for Hickory Run.

POWER ENGINEERS, INC. Plan Approval Application – Renovo Energy Center, LLC
PAGE 28
• No comments were received by LS Power for either facility and the 0.0015 lb/MMBtu was
established in the final plan approvals as the VOC limit for the auxiliary boilers.
• Neither facility has been built and the 0.0015 lb/MMBtu limit has not been demonstrated in
practice.
In light of the information summarized above, REC maintains that 0.0015 lb/MMBtu is not LAER for its
auxiliary boilers.
The next lowest emissions limits are for CPV St. Charles and Keys Energy Center. Both facilities are
operating and the VOC limit is 0.002 lb/MMBtu.
REC proposes good combustion practices, effective boiler design, and an emission limit of 0.002
lb/MMBtu as LAER/BAT for its auxiliary boilers.
3.6.4 Particulate Matter (PM)
The table below identifies PM controls and limits for facilities with natural gas fired auxiliary boilers in
EPA’s RBLC with BACT/LAER/BAT limits.
TABLE 17 IDENTIFICATION OF SOURCES WITH BACT/LAER/BAT FOR PM
FACILITY NAME BOILER SIZE MMBTU/HR PERMIT DATE PM EMISSIONS LIMIT PM CONTROLS
Holland Board of Public Works – East 5th St, MI
83.5 12/5/2016 0.0018 lb/MMBtu Good combustion practices
Holland Board of Public Works Ottawa, MI
55 12/4/2013 0.0018 lb/MMBtu Good combustion practices
Holland Board of Public Works Ottawa, MI
95 12/4/2013 0.0018 lb/MMBtu Good combustion practices
Thetford Generating Station, MI
100 7/25/2013 0.0018 lb/MMBtu Good combustion practices
Mattawoman Energy Center, MD
42 11/13/2015 0.0019 lb/MMBtu Low sulfur fuel
CPV St. Charles, MD 93 4/23/2014 0.005 lb/MMBtu
Good combustion practices and pipeline quality natural gas
MEC North and MEC South LLC, MI 61.5 6/29/2018 0.005 lb/MMBtu
Good combustion practices and pipeline quality natural gas
Identification of PM Control Technologies
PM emission rates from natural gas combustion are inherently low because of very high combustion
efficiencies and the clean burning nature of natural gas. Best combustion practices will ensure proper
air/fuel mixing ratios to achieve complete combustion, minimizing emissions of unburned hydrocarbons
that can lead to the formation of PM emissions. There are several post combustion technologies for the
control of PM emissions that are generally available, however none are considered practical or technically
and economically feasible for natural gas fired boilers of this size.

POWER ENGINEERS, INC. Plan Approval Application – Renovo Energy Center, LLC
PAGE 29
Evaluation of PM Control Options
EPA’s RBLC database research indicates that there are no BACT precedents for TSP/PM10 requiring add-
on controls, which supports the only PM control option available for auxiliary boilers of this size is low
sulfur, pipeline quality natural gas and good combustion practices. The emission limit of 0.0018
lb/MMBtu for The Holland Board of Public Works and Thetford Generating Station boilers is based on
EPA’s AP-42.
Selection of BAT for PM
BACT/BAT for TSP/PM10 is proposed to be the use of low sulfur, pipeline quality natural gas and
efficient combustion. REC proposes to meet an emission limit of 0.0019 lb/MMBtu (filterable only)
which is based on an AP-42 emission factor of 1.9 lb/106 SCF. The four RBLC entries of 0.0018
lb/MMBtu are also based on AP-42 with emission factor conversion and rounding the reason for the
slightly lower limit.
3.6.5 Sulfur Dioxide (SO2) and Sulfuric Acid Mist (H2SO4)
The table below identifies SO2 and Sulfuric acid mist controls and limits for facilities with natural gas
fired auxiliary boilers in EPA’s RBLC with BACT/LAER/BAT limits.
TABLE 18 IDENTIFICATION OF SOURCES WITH BACT/LAER/BAT FOR SO2
FACILITY NAME BOILER SIZE MMBTU/HR PERMIT DATE
SO2 EMISSIONS LIMIT SO2 CONTROLS
Wildcat Point Generation, MD 45 4/8/2014 0.0006 lb/MMBtu
Low sulfur fuel
Brunswick County Power Station, MD
66.7 3/12/2013 0.0011 lb/MMBtu Low sulfur fuel
C4GT, LLC 105 4/26/2018 0.0012 lb/MMBtu Low sulfur fuel
Hickory Run Energy Station, PA
40 4/23/2013 0.0021 lb/MMBtu Low sulfur fuel
CVP Valley Energy Center 48.1 8/1/2013 0.0022 lb/MMBtu Low sulfur fuel
FACILITY NAME BOILER SIZE MMBTU/HR PERMIT DATE
H2SO4 EMISSIONS LIMIT H2SO4 CONTROLS
Marshalltown Generating Station, IA
60.1 4/14/2014 8.3 x 10⁻⁵ lb/MMBtu Low sulfur fuel
Harrison Power, OH 44.6 4/19/2018 9.0 x 10⁻⁵ lb/MMBtu Low sulfur fuel
Wildcat Point Generation, MD 45 4/8/2014 9.0 x 10⁻⁵ lb/MMBtu Low sulfur fuel
Moxie Freedom Generation, PA
55.4 9/1/2015 0.0001 lb/MMBtu Low sulfur fuel
Brunswick County Power Station, MD
66.7 3/12/2013 0.00013 lb/MMBtu Low sulfur fuel
Selection of BACT/BAT for SO2 and H2SO4
SO2 and SO3 are formed during the combustion process as a result of thermal oxidation of sulfur
contained in the fuel. SO3 combines with water vapor released during combustion to form sulfuric acid
(H2SO4) vapor. The only technically and economically feasible technology available to control SO2 and
H2SO4 and from auxiliary boilers of this size is the use of low sulfur fuel, in addition to a limit on total

POWER ENGINEERS, INC. Plan Approval Application – Renovo Energy Center, LLC
PAGE 30
fuel use of 145,200 MMBtu per year for both boilers. REC proposes to meet a BACT emission limit for
SO2 of 0.00058 lb/MMBtu and the BACT identified emissions limit of 9.0 x 10⁻⁵ lb/MMbtu for H2SO4
emissions.
3.6.6 Identification of BACT for Greenhouse Gas (GHG) Emissions
The only feasible option for reducing GHG emissions from the auxiliary boilers is to use natural gas,
which is the fuel with the lowest pollutant emissions. In addition, emissions will be minimized since REC
is requesting a limit on fuel use.
3.7 BACT/LAER/BAT Determination For Emergency Generator And Fire Pump Diesel Engines
REC is proposing to install one 1,500 kW diesel emergency generator to supply emergency power for the
facility’s critical electrical loads in the event of a power outage. Diesel fired compression ignition
emergency engine generators are proposed as the only technical feasible option to provide critical
electrical loads during a power outage. Natural gas fired generators are not a practical option because in
the event that a power grid outage and a natural gas outage occur at the same time, REC would not have
the necessary power it would need to operate the facility. In addition, REC is proposing a 237 HP diesel
engine powered fire water pump as required by fire codes to provide backup fire water pumping pressure
in the event of a failure of the primary pump systems.
REC’s emergency generator engine and firewater pump engine will each be fired with ultra-low sulfur
diesel (ULSD) containing no more than 0.0015 percent sulfur by weight. Excluding emergencies, each
diesel engine will operate no more than 100 hours per year for testing and maintenance purposes.
REC reviewed LAER and BACT determinations published in the RBLC, PaDEP’s General Plan
Approval for Diesel Internal Combustion Turbines (BAQ-GPA/GP 9), in addition to guidelines and
determinations from three California districts as follows:
• Bay Area Air Quality Management District (BAAQMD) BACT Guideline for emergency CI
internal combustion (IC) engines >50 hp
http://hank.baaqmd.gov/pmt/bactworkbook/default.htm
• San Joaquin Valley Air Quality Management District (SJVAQMD) BACT Guideline 3.1.1 for
emergency diesel IC engines
www.valleyair.org/busind/pto/bact/chapter3.pdf
• South Coast Air Quality Management District (SCAQMD) LAER/BACT Determinations for
emergency CI engines
http://aqmd.gov/bact/aqmdbactdeterminations.htm
Current BAAQMD, SCAQMD, and SJVAQMD BACT guidelines all require new stationary emergency
CI engines to meet applicable EPA NSPS or CARB tier standards for NOx, CO, PM10, and VOC. These
same guidelines require the use of ULSD to control SO2 emissions.
The potentially available control options for reducing emissions from diesel engine emergency generators
and fire pump engines include combustion controls, selective catalytic reduction SCR), and non-selective
catalytic reduction (NSCR). Combustion controls are implemented in the design of the engine. Typical
design features include electronic engine controls, injection systems, combustion chamber geometry, and
turbocharging systems. New engines are designed with these features as standard equipment.

POWER ENGINEERS, INC. Plan Approval Application – Renovo Energy Center, LLC
PAGE 31
Based on a review of EPA’s RBLC and other permits, no add-on controls were identified for diesel
engines of this size and limited operation (see Tables 19, 20, 21, and 22). SCR is a post-combustion NOx
reduction technology and uses ammonia to react with NOx in the gas stream in the presence of a catalyst
to form nitrogen and water. SCR has not been a demonstrated NOx control technology for emergency use
engines. SCR would not be economically feasible based on a cost per ton of pollutant controlled
considering the minimal emissions due to limited use of the engines. In addition, SCR is not technically
feasible for engines requiring quick start-ups and short operating periods. NSCR is not effective in
controlling emissions from lean burn engines and would not be an appropriate control technology since
diesel engines inherently operate lean. According to EPA’s AP-42 Section 3.2.4.1, “the NSCR technique
is effectively limited to engines with normal exhaust oxygen levels of 4 percent or less. This includes 4-
stroke rich-burn naturally aspirated engines and some 4-stroke rich-burn turbocharged engines. Engines
operating with NSCR require tight air-to-fuel control to maintain high reduction effectiveness without
high hydrocarbon emissions. To achieve effective NOx reduction performance, the engine may need to be
run with a richer fuel adjustment than normal. This exhaust excess oxygen level would probably be closer
to 1 percent. Lean-burn engines could not be retrofitted with NSCR control because of the reduced
exhaust temperatures”. Therefore, the only feasible control technology for the diesel fired emergency
engines is combustion controls.
3.7.1 Identification of Sources with BACT/LAER/BAT
Table 19 provides a summary of the RBLC database findings for NOx; detailed information on each entry
is provided in Appendix M.
TABLE 19 IDENTIFICATION OF SOURCES WITH BACT/LAER/BAT FOR NOX
FACILITY NAME ENGINE SIZE
PERMIT DATE
NOX EMISSION RATE (G/BHP-HR) COMMENTS
EMERGENCY GENERATOR ENGINE
CPV Fairview Energy Center, PA 1500 kW 6/2/2016 4.8 Good combustion practices and NSPS Subpart IIII
CPV St. Charles, MD 1500 kW 4/23/2014 4.8 Good combustion practices and NSPS Subpart IIII
St. Joseph Energy Center, IN 1006 and 2012 hp
12/3/2012 4.8 Good combustion practices and NSPS Subpart IIII
Jackson Energy Center, IL 1500 kW 12/31/2018 4.8 Good combustion practices and NSPS Subpart IIII
Keys Energy Center, MD 1500 kW 10/31/2014 4.8 Good combustion practices and NSPS Subpart IIII
EMERGENCY FIRE PUMP ENGINE
Moxie Energy LLC, Patriot and Asylum, PA
460/460 hp 1/31/2013 10/10/2012
2.6 Good combustion practices
C4GT, LLC, VA 315 hp 4/26/2018 3.0 Good combustion practices
MEC North, LLC and MEC South, LLC MI
300 hp 6/29/2018 3.0 Good combustion practices and NSPS Subpart IIII
Thetford Generating Station 315 hp 7/25/2013 3.0 Proper combustion design
St. Joseph Energy Center 371 hp 12/3/2012 3.0 Combustion design controls and usage limit

POWER ENGINEERS, INC. Plan Approval Application – Renovo Energy Center, LLC
PAGE 32
Table 20 provides a summary of the RBLC database findings for CO; detailed information on each entry
is provided in Appendix M.
TABLE 20 IDENTIFICATION OF SOURCES WITH BACT/LAER/BAT FOR CO
FACILITY NAME ENGINE SIZE PERMIT DATE
CO EMISSION RATE (G/BHP-HR) COMMENTS
EMERGENCY GENERATOR ENGINES
Moxie Energy LLC, Patriot and Asylum, PA
1464/1474 hp 1/31/2013 10/10/2012
0.13 Good combustion practices
Moxie Energy LLC, Freedom, AP 1000 kW 9/1/2015 0.26 Good combustion practices
CPV Valley Energy Center, NY 1495 hp 8/1/2013 0.45 Good combustion practices
Lackawanna Energy Center, PA 2000 kW 12/23/2015 0.6 Good combustion practices
CPV St. Charles, MD 1500 kW 4/23/2014 2.6 Good combustion practices
EMERGENCY FIRE PUMP ENGINE
Lackawanna Energy Center, PA 315 hp 12/23/2015 0.5 Good combustion practices
Moxie Energy LLC, Patriot and Asylum, PA
460/460 hp 1/31/2013 10/10/2012
0.5 Good combustion practices
Moxie Freedom, LLC PA 510 hp 9/1/2015 1 Good combustion practices
CPV St. Charles 300 hp 4/23/2014 2.6 Good combustion practices
Thetford Generating Station, Genesee, MI
315 hp 7/25/2013 2.6 Proper combustion design
Table 21 provides a summary of the RBLC database findings for VOC; detailed information on each
entry is provided in Appendix M.
TABLE 21 IDENTIFICATION OF SOURCES WITH BACT/LAER/BAT FOR VOC
FACILITY NAME ENGINE SIZE PERMIT DATE
VOC EMISSION RATE (G/BHP-HR) COMMENTS
EMERGENCY GENERATOR ENGINES
Moxie Energy LLC, Patriot and Asylum, PA
1464/1474 hp 1/31/2013 12/13/2013
0.01 Good combustion practices
Moxie Freedom 1000 kW 9/1/2015 0.02 Good combustion practices
Lackawanna Energy Center, PA 2000 kW 12/23/2015 0.22 Good combustion practices
Mooreland Generating Station 1341 hp 7/2/2013 0.318 Good combustion practices
Ninemile Point Electric Generating 2000 kW 8/16/2011 1 Good combustion practices
EMERGENCY FIRE PUMP ENGINE
Moxie Energy LLC, Patriot and Asylum, PA
460/460 hp 1/31/2013 10/10/2012
0.1 Good combustion practices
Lackawanna Energy Center, PA 315 hp 12/23/2015 0.12 Combustion controls
Moxie Freedom, LLC PA 510 hp 9/1/2015 0.2 Good combustion practices
Table 22 provides a summary of the RBLC database findings for PM; detailed information on each entry
is provided in Appendix M.

POWER ENGINEERS, INC. Plan Approval Application – Renovo Energy Center, LLC
PAGE 33
TABLE 22 IDENTIFICATION OF SOURCES WITH BACT/LAER/BAT FOR PM
FACILITY NAME ENGINE SIZE PERMIT DATE
PM EMISSION RATE (G/BHP-HR) COMMENTS
EMERGENCY GENERATOR ENGINES
Lackawanna Energy Center, PA 2000 kW 12/23/2015 0.025 Good combustion practices
CPV Valley Energy Center, NY 1495 hp 8/1/2013 0.03 Good combustion practices
CPV St. Charles, MD 1500 kW 4/23/2014 0.15 Good combustion practices
St. Joseph Energy Center, IN 1006 and 2012 hp
12/3/2012 0.15 Good combustion practices
EMERGENCY FIRE PUMP ENGINE
Lackawanna Energy Center, PA 315 hp 12/23/2015 0.11 Good combustion practices
MEC North, LLC and MEC South, LLC MI
300 hp 6/29/2018 0.15 Good combustion practices
CPV St. Charles 300 hp 4/23/2014 0.15 Good combustion practices
Thetford Generating Station, Genesee, MI
315 hp 7/25/2013 0.15 Good combustion practices
3.7.2 Selection of BACT/LAER/BAT For Emergency Generator And Fire Pump Engine
REC is proposing that BACT/LAER/BAT for the emergency generator engine and fire pump engine is
state of the art design with good combustion practices and compliance with the Tier standards contained
in 40 CFR Part 60 Subpart IIII for emergency engines of the sizes proposed. Tier 2 standards will apply to
the emergency generator engine and Tier 3 standards will apply to the fire pump engine. The following
table summarizes REC’s proposed BACT/LAER/BAT emission limits for each device. NOx, CO, and
PM limits for the generator are based on nominal vendor data and EPA’s weighted emissions calculator
for constant speed engines (40 CFR Part 89, Table 2 of Appendix B to Section E). Generator engine VOC
limit is based on maximum calculated emission rate provided by the vendor. For the fire pump engine,
NOx, CO, VOC, and PM limits are based on vendor data.
TABLE 23 SUMMARY OF PROPOSED BACT/LAER/BAT
DEVICE NOX (G/HP-HR)
HC (G/HP-HR)
CO (G/HP-HR)
PM (G/HP-HR)
Emergency generator engine 4.48 0.8 1.23 0.13
Fire pump engine 2.7 0.10 0.90 0.10
REC is proposing to limit the operation of the emergency generator engine to 500 hours per year and the
operation of the fire pump engine to 250 hours per year. Both engines will fire ultra-low sulfur diesel with
a maximum sulfur content of 0.0015%. Based on the proposed limits and operating hours, potential
emissions are provided in Table 24:
TABLE 24 POTENTIAL EMISSIONS
DEVICE NOX (TPY)
HC (TPY)
CO (TPY)
PM (TPY)
SOX (TPY)
Emergency generator engine 5.45 0.97 1.50 0.16 0.0055
Fire pump engine 0.18 0.007 0.06 0.007 0.0003
POWER ENGINEERS, INC. Plan Approval Application – Renovo Energy Center, LLC
PAGE 34
Based on the RBLC review, a few facilities have been identified with emission limits that are lower than
the standards REC is proposing.
The facilities with lower emission limits initially proposed compliance with the NSPS standards and
provided vendor data to support their applications. The vendor data included “nominal” emission rates
which are subject to instrumentation, measurement, facility and engine to engine variations and are not
guaranteed by the vendor. The permitting agencies established the nominal emission rates as limits in the
permit. Based on discussions with engine manufacturer representatives, any emissions data that is
provided by the vendor and is subject to variations is not guaranteed by the manufacturer and should not
be established as emission limits in a permit because the rates may not be able to be demonstrated in
practice for any given engine. Typically, engine manufacturers test one representative engine to
demonstrate compliance with EPA’s Tier Standards. The testing is conducted under specific, controlled
conditions. There is usually a suitable margin between the test results and the standards to allow for
engine deterioration. The engine manufacturers certify to the Tier standards, not to the test results. At this
time, regulatory agencies typically do not require facilities to demonstrate compliance with emergency
engine emission limits, however it is important to establish rates that are reasonably achievable in
practice, in the event that emission testing is required at a future time. Therefore, REC is disregarding the
lower limits since they are based on nominal data and not certified or guaranteed by the manufacturer of
the engines.
In conclusion, REC is proposing to meet BACT/LAER/BAT by complying with proposed emission limits
contained in Table 23. In addition, REC will limit the operating hours of the emergency generator engine
to 500 hours per year and 250 hours per year for the fire pump engine. Both engines will fire ultra-low
sulfur diesel with a maximum sulfur content of 0.0015%. Regarding greenhouse gas emissions,
BACT/LAER/BAT for these engines is limiting the hours of operation.
3.8 BACT/LAER/BAT Determination Water Bath Heaters
REC is proposing to install three water bath heaters each with a maximum rated heat input of 15
MMBtu/hr firing natural gas. Only two heaters will be operating at a given time, the third is for backup
only. The function of the water bath heaters are to provide heat to incoming natural gas pipelines to
increase the temperature of the incoming gas to prevent freezing of the gas regulating valves under certain
gas system operating conditions. The heater will be permitted to operate up to 8,760 hours per year,
although they will not be necessary to operate at full capacity during warmer weather.
3.8.1 Nitrogen Oxides (NOx)
NOx is formed during combustion by thermal oxidation of nitrogen in the combustion air (thermal NOx)
and the oxidation of nitrogen in the fuel (fuel-bound NOx). Natural gas contains relatively small amounts
of fuel-bound nitrogen, thus NOx formation through the fuel NOx mechanism is expected to be
insignificant. The main variables affecting NOx generation in the heater are temperature, the availability
of nitrogen, the availability of oxygen, and the extent of contact between nitrogen and oxygen during the
combustion process.
Identification of NOx Control Technologies
NOx control techniques are generally organized into two separate categories: combustion controls and
post-combustion controls. Combustion controls affect the combustion conditions to minimize the
formation of NOx, while post-combustion controls remove NOx after it is formed. Combustion control

POWER ENGINEERS, INC. Plan Approval Application – Renovo Energy Center, LLC
PAGE 35
techniques have been demonstrated as successful in achieving NOx reductions from heaters in a cost-
effective manner. The combustion control method available to control thermal NOx on water bath heaters
is low NOx burner technology.
A search of EPA’s RBLC did not identify the application of post-combustion controls to natural gas fired
water bath heaters. Table 25 below identifies the facilities in EPA’s RBLC with BACT/LAER/BAT
limits.
TABLE 25 IDENTIFICATION OF SOURCES WITH BACT/LAER/BAT FOR NOX
FACILITY NAME HEATER SIZE (MMBTU/HR) PERMIT DATE
NOX EMISSIONS LIMIT NOX CONTROLS
Jackson Energy Center, IL 13 12/31/2018 0.011 lb/MMBtu
Low NOx combustion technology
CPV Three Rivers Energy Center, IL
12.8 7/30/2018 0.011 lb/MMBtu
Low NOx burners
Moxie Freedom Generation, PA
14.6 9/1/2015 0.011 lb/MMBtu
Good combustion
CPV Fairview Energy Center, PA
13.8 9/2/2016 0.011 lb/MMBtu
Good combustion
Cheyenne Prairie Generating Station, WY
16.1 8/28/2012 0.012 lb/MMBtu
Ultra low NOx burners
Combustion Controls
Low NOx Burner
The “low NOx burner” (LNB) generally refers to a set of burner components (e.g. burner register,
atomizing nozzle, diffuser) that are designed to achieve lower NOx by mixing the fuel and combustion air
in a way that limits NOx formation. This is generally done by mixing the combustion air and fuel in
multiple stages, and by utilizing a specially designed nozzle and/or diffuser to achieve a particular flame
pattern.
Post-combustion Controls
Post-combustion technologies include SCR and SNCR.
SCR uses a catalyst to convert NOx to nitrogen gas. An ammonia-based reagent is injected into the
heater’s combustion gases upstream of the catalyst, and the reactions to remove NOx occur in the
presence of the catalyst. The catalyst allows the ammonia to reduce NOx levels at lower exhaust
temperatures than selective non-catalytic reduction. The optimum temperature range for SCR technology
is typically 600 to 750° F. SCR can result in NOx reductions of up to 90%. However, SCR has a high
capital cost and is not economically feasible on heaters with a heat input capacity of less than 100
MMBtu/hr with low NOx emissions due to the use of natural gas.
SNCR is based on the chemical reduction of the NO2 molecule into nitrogen and water vapor. SNCR
involves the injection of an ammonia-based reagent directly into the furnace section with a temperature
window of 1,600 to 2,100° F. Under these conditions, the reagent will react with and reduce NOx
emissions without the need for a catalyst. Selective non-catalytic reduction reduces NOx up to 70% in
combination with combustion controls. However, SNCR tends to be less effective at lower levels of

POWER ENGINEERS, INC. Plan Approval Application – Renovo Energy Center, LLC
PAGE 36
uncontrolled NOx. SNCR requires large furnace volumes and residence time for gas mixing in addition to
a specific and stable temperature window in the furnace where the ammonia-based reagent is injected.
Due to the large furnace requirements, SNCR is technically feasible. In addition, it is not an economically
feasible option for heaters of this size.
Evaluation of Technically Feasible Control Options
REC has not identified any water bath heaters in the 15 MMBtu/hr size range that are equipped with SCR
or SNCR. In addition, post control technology is not an economically feasible option for heaters of this
size. The use of low NOx burners and good combustion practices are the top control options.
Selection of LAER/BAT for NOx
REC’s water bath heaters will be equipped with low NOx burners to achieve an emission limit of 0.011
lb/MMBtu.
3.8.2 Carbon Monoxide (CO)
Carbon monoxide forms in combustion devices as a product of incomplete combustion. Production of CO
results when there is a lack of oxygen and insufficient residence time at high enough temperatures to
complete the final step in oxidation. Controlling these factors to decrease CO, however, also tends to
result in increased emissions of NOx. Conversely, a lower NOx emission rate achieved through flame
temperature control may result in higher levels of CO emissions. Thus a balance must be established,
whereby the flame temperature, residence time and excess oxygen are set to achieve the lowest NOx
emission rate possible to comply with LAER while keeping CO emissions to an acceptable level.
Identification of CO Control Technologies
There are basically two options for the control of CO emissions from water bath heaters less than 100
MMBtu/hr heat input: combustion controls and oxidation catalyst.
The table below identifies CO controls and limits for facilities with natural gas fired water bath heaters in
EPA’s RBLC with BACT/LAER/BAT limits.
TABLE 26 IDENTIFICATION OF SOURCES WITH BACT/LAER/BAT FOR CO
FACILITY NAME HEATER SIZE MMBTU/HR PERMIT DATE CO EMISSIONS LIMIT CO CONTROLS
Mattawoman Energy Center, MD
13.8 11/13/2015 0.021 lb/MMBtu Good combustion practices
Moxie Freedom Generation Plant, PA
14.6 9/1/2015 0.037 lb/MMBtu Good combustion practices
Sunbury Generation, PA 15 4/1/2013 0.037 lb/MMBtu Good combustion practices
Marshalltown Generating Station, IA
13.32 4/14/2014 0.041 lb/MMBtu Good combustion practices
Cheyenne Prairie Generating Station, WY
16.1 8/28/2012 0.08 lb/MMBtu Good combustion practices

POWER ENGINEERS, INC. Plan Approval Application – Renovo Energy Center, LLC
PAGE 37
Combustion Controls
CO combustion control performance is a function of available oxygen, combustion temperature,
turbulence, and residence time. Formation of CO is a result of incomplete combustion of the fuel.
Adequate fuel residence time and high temperature in the combustion zone can ensure minimal CO
formation. A properly designed combustion system is effective at limiting CO formation by maintaining
the optimum combustion zone temperature and amount of excess oxygen. Unfortunately, the addition of
excess air and maintenance of high combustion temperatures for control of CO emissions may lead to
increased NOx emissions. Consequently, typical practice is to design the combustion system such that CO
emissions are reduced as much as possible without causing NOx levels to significantly increase.
Add-on Emission Controls
The only add-on control device that is commercially available for controlling CO emissions from water
bath heaters is an oxidation catalyst. The catalyst lowers the activation energy necessary for CO to react
with available oxygen in the exhaust to produce CO2. An oxidation catalyst can also reduce VOC
emissions, but to a lesser extent than CO. Oxidation catalysts operate optimally at a temperature range of
500° to 700° F.
Evaluation of CO Control Options
Oxidation catalysts are not an economically feasible option for water bath heaters of this size and REC is
not aware of any current installations on water bath heaters around 15 MMBtu/hr. Good combustion
practices is the BACT/BAT available control option for CO from REC’s water bath heaters.
Selection of BACT/BAT for CO
REC proposes good combustion practices and a CO limit of 0.037 lb/MMBtu as BACT/BAT for the
water bath heaters. The only lower rate identified is for Mattawoman Energy Center that has not been
built.
3.8.3 Volatile Organic Compounds (VOC)
The table below identifies VOC controls and limits for facilities with natural gas fired water bath heaters
in EPA’s RBLC with BACT/LAER/BAT limits.
TABLE 27 IDENTIFICATION OF SOURCES WITH BACT/LAER/BAT FOR VOC
FACILITY NAME HEATER SIZE MMBTU/HR PERMIT DATE
VOC EMISSIONS LIMIT VOC CONTROLS
Guernsey Power Station, OH 15 10/23/2017 0.005 lb/MMBtu Good combustion practices
Seminole Generating Station, FL
9.9 3/21/2018 0.005 lb/MMBtu Good combustion practices
CPV St. Charles, MD 9.5 4/23/2014 0.005 lb/MMBtu Good combustion practices
Mattawoman Energy Center, MD
13.8 11/13/2015 0.0054 lb/MMBtu Good combustion practices
Belle River Combined Cycle Power Plant, MI
20.8 7/16/2018 0.008 lb/MMBtu Good combustion practices

POWER ENGINEERS, INC. Plan Approval Application – Renovo Energy Center, LLC
PAGE 38
FACILITY NAME HEATER SIZE MMBTU/HR PERMIT DATE
VOC EMISSIONS LIMIT VOC CONTROLS
Renaissance Power, MI 20 11/1/2013 0.05 lb/MMBtu Good combustion practices
Identification of VOC Control Technologies
Like CO emissions, VOC emissions occur from incomplete combustion. Effective heater design and post-
combustion control using oxidation catalysts are the available technologies for controlling VOC
emissions from water bath heaters.
Evaluation of VOC Control Options
Similar to CO, the economic impacts of an oxidation catalyst do not support its use. VOC emissions are
lower than CO and the removal efficiency is lower, therefore the dollar per ton value would be higher
than that for CO. In addition, REC did not identify any facilities with an oxidation catalyst for the control
of VOC emissions.
Selection of LAER/BAT for VOC
REC proposes good combustion practices, effective heater design, and an emission limit of 0.005
lb/MMBtu as LAER/BAT for its water bath heaters.
3.8.4 Particulate Matter (PM)
The table below identifies PM controls and limits for facilities with natural gas fired water bath heaters in
EPA’s RBLC with BACT/LAER/BAT limits.
TABLE 28 IDENTIFICATION OF SOURCES WITH BACT/LAER/BAT FOR PM
FACILITY NAME HEATER SIZE MMBTU/HR PERMIT DATE PM EMISSIONS LIMIT PM CONTROLS
Thetford Generating 12 7/25/2013 0.0018 lb/MMBtu Good combustion practices
Mattawoman Energy Center, MD
13.8 11/13/2015 0.0019 lb/MMBtu Good combustion practices
Indeck Niles, LLC, MI 13.5 1/4/2017 0.002 lb/MMBtu Good combustion practices
Renaissance Power, MI 20 11/1/2013 0.009 lb/MMBtu Good combustion practices
Belle River Combined Cycle Power Plant, MI
20.8 7/16/2018 0.15 lb/hr Good combustion practices
Identification of PM Control Technologies
PM emission rates from natural gas combustion are inherently low because of very high combustion
efficiencies and the clean burning nature of natural gas. Best combustion practices will ensure proper
air/fuel mixing ratios to achieve complete combustion, minimizing emissions of unburned hydrocarbons
that can lead to the formation of PM emissions. There are several post combustion technologies for the

POWER ENGINEERS, INC. Plan Approval Application – Renovo Energy Center, LLC
PAGE 39
control of PM emissions that are generally available, however none are considered practical or technically
and economically feasible for water bath heaters of this size.
Evaluation of PM Control Options
EPA’s RBLC database research indicates that there are no BACT precedents for PM requiring add-on
controls for a natural gas fired water bath heaters of this size. Therefore, the only PM control option
available for water bath heaters of this size is low sulfur, pipeline quality natural gas and good
combustion practices.
Selection of BAT for PM
BACT/BAT for PM is proposed to be the use of low sulfur, pipeline quality natural gas and efficient
combustion. REC proposes to meet an emissions limit of 0.0019 lb/MMBtu which is identical to the limit
proposed for the natural gas fired auxiliary boilers and is based on AP-42.
3.8.5 Sulfur Dioxide (SO2) and Sulfuric Acid Mist (H2SO4)
The table below identifies SO2 and sulfuric acid mist controls and limits for facilities with natural gas
fired water bath heaters in EPA’s RBLC with BACT/LAER/BAT limits.
TABLE 29 IDENTIFICATION OF SOURCES WITH BACT/LAER/BAT FOR SO2
FACILITY NAME HEATER SIZE MMBTU/HR PERMIT DATE SO2 EMISSIONS LIMIT SO2 CONTROLS
Berks Hollow Energy, PA 8.5 12/17/2013 0.002 lb/MMBtu Low sulfur pipeline natural gas
CPV Valley Energy Center, NY
9 8/1/2013 0.0022 lb/MMBtu Low sulfur pipeline natural gas
Sunbury Generation LP, PA 15 4/1/2013 0.003 lb/MMBtu
Low sulfur pipeline natural gas
Indeck Niles, LLC, MI 13.5 1/4/2017 0.2 grains/100 scf
Low sulfur pipeline natural gas
FACILITY NAME HEATER SIZE MMBTU/HR PERMIT DATE
H2SO4 EMISSIONS LIMIT H2SO4 CONTROLS
Moxie Freedom Generation Plant, PA
14.6 9/1/2015 0.0001 lb/MMBtu Good combustion practices and pipeline natural gas
Guernsey Power Station, OH 15 10/23/2017 0.0002 lb/MMBtu Good combustion practices and pipeline natural gas
Jackson Energy Center, IL 13 12/31/2018 0.001 lb/MMBtu Good combustion practices and pipeline natural gas
CPV Three Rivers Energy Center, IL
12.8 7/30/2018 0.001 lb/MMBtu Good combustion practices and pipeline natural gas

POWER ENGINEERS, INC. Plan Approval Application – Renovo Energy Center, LLC
PAGE 40
Selection of BACT/BAT for SO2 and H2SO4
SO2 and SO3 are formed during the combustion process as a result of thermal oxidation of sulfur
contained in the fuel. SO3 combines with water vapor released during combustion to form sulfuric acid
(H2SO4) vapor. The only technically and economically feasible technology available to control SO2 and
H2SO4 and from water bath heaters of this size is the use of low sulfur fuel. To allow for consistency with
the BACT/BAT determination for the auxiliary boilers, REC proposes to meet 0.0005 lb/MMBtu for SO2
from the water bath heaters. REC will meet a BACT emission limit for H2SO4 of 0.001 lb/MMbtu. In
addition, emissions will be minimized through the use of low sulfur content natural gas.
3.8.6 Identification of BACT for Greenhouse Gas (GHG) Emissions
The only feasible option for reducing GHG emissions from the water bath heaters is to use natural gas,
which is the fuel with the lowest pollutant emissions.
3.9 High Voltage Circuit Breakers Equipment Leaks BACT/BAT Analysis
REC will have twelve high voltage circuit breakers within the facility’s electrical switchyard. Six circuit
breakers will contain 345 pounds of sulfur hexafluoride (SF6) and the remaining six circuit breakers will
contain 165 pounds of SF6. SF6 is a highly effective electrical insulating dielectric fluid used for
interrupting arcs and is superior to other dielectric fluids. SF6 is a greenhouse gas with a “global warming
potential” of 22,800 on a 100-year time horizon, which means its impact as a greenhouse gas is 22,800
times greater than that of CO2.
REC’s circuit breakers will be designed as totally enclosed pressure systems with low potential SF6
fugitive emissions (equipment leaks). Leakage is expected to be minimal and equipment will be built to
low leakage design limits. The International Electrotechnical Commission Standard 62271-1 for new
equipment leakage is 0.5% per year.
3.9.1 Identification of Control Options
Three control options have been identified for the SF6 emissions from circuit breakers:
• Use of vacuum circuit breakers;
• Use of alternatives to SF6 such as dielectric oil or compressed air (air blast) circuit breakers; and
• Use of state-of-the-art enclosed pressure SF6 circuit breakers with leak detection monitoring.
3.9.2 Evaluation of Control Options
The use of vacuum circuit breakers is not a technically feasible option currently. Vacuum circuit breakers
are used for medium voltage levels and aren’t currently designed for use with high voltage circuit
breakers which are being proposed for REC.
An alternative to SF6 would be the use of a dielectric oil or compressed air (air blast) circuit breakers.
This option is technically feasible, however SF6 has become the predominant insulator and arc quenching
substance because of its superior performance. SF6 breakers replaced oil and air-blast breakers because of
their superior performance, but also because of other issues with oil and air blast breakers. The

POWER ENGINEERS, INC. Plan Approval Application – Renovo Energy Center, LLC
PAGE 41
disadvantage of oil breakers are issues with flammability (safety) and the high maintenance costs
associated with oil replacement requirements. Oil in circuit breakers is degraded by small quantities of
water as well as carbon deposits from the carbonization that occurs when the oil comes into contact with
the electric arc. Air-blast circuit breakers require the installation of expensive compressor stations, are
quite large, and create a high level of noise during operation. The air has relatively lower arc
extinguishing properties and there is a chance of air pressure leakage from the air pipes junction and a
chance of re-striking voltage and current chopping.
EPA’s SF6 Emission Reduction Partnership for Electric Power Systems, a public-private partnership
managed by EPA that is focused on reducing SF6 emissions, does not advocate for a return to oil or air-
blast breakers for high voltage applications, but instead has focused on equipment leak detection and
repair education for SF6 handlers, plus replacement of older SF6 circuit breakers with new SF6 breakers.
The Partnership’s 2014 Annual Report states “Because there is no clear alternative to SF6, Partners reduce
their greenhouse gas emissions through implementing emission reduction strategies such as detecting,
repairing, and/or replacing problem equipment, as well as educating gas handlers on proper handling
techniques of SF6”. (EPA Partnership for Electric Power Systems, 2014 Annual Report, March 2015)
3.9.3 Selection of BACT/BAT
REC proposes the use of state-of-the-art enclosed pressure SF6 circuit breaker technology with a
guaranteed leak rate of less than 0.5% by weight per year as BACT/BAT. In addition, REC’s units will be
equipped with a leak detection monitor that will alarm when a circuit breaker loses 10% of the SF6. REC
will implement routine inspection and maintenance procedures to insure proper circuit breaker operation.
This BACT determination is consistent with other recent determinations for fugitive SF6 emissions from
circuit breakers at power plants, including Jackson Energy Center (Illinois), Shady Hills Combined Cycle
Facility (Florida), CPV Three Rivers Energy Center (Illinois), Dania Beach Energy Center (Florida),
Marshalltown Generating Station (Iowa), and St. Joseph Energy Center (Indiana).
3.10 LAER/BACT/BAT Determination for ULSD Storage Tank
VOC emissions from petroleum storage vessels result from the vaporization of volatile compounds within
the stored product due to changes in temperature, pressure, and liquid level. Several different types of
tank design are available for liquid petroleum storage, depending on the type of liquid petroleum stored.
ULSD is typically stored in fixed roof tanks, with or without an internal floating roof. The presence of an
internal floating roof significantly reduces the space available for the volatile compounds to vaporize, and
evaporative losses only come from deck fittings, seams, and the small amount of space between the deck
and tank wall.
3.10.1 Identification of Sources with BACT/LAER/BAT
Table 30 provides a summary of the RBLC database findings for VOC; detailed information on each
entry is provided in Appendix M.
TABLE 30 IDENTIFICATION OF SOURCES WITH BACT/LAER/BAT FOR VOC
FACILITY NAME TANK SIZE (GALLONS)
PERMIT DATE
LIQUID STORED COMMENTS
Phillips 66 Pipeline 8,400,000 1/23/2015 ULSD Low vapor pressure material
Baton Rouge Junction Facility, LA
10,000,000 11/2/2009 ULSD Submerged fill line

POWER ENGINEERS, INC. Plan Approval Application – Renovo Energy Center, LLC
PAGE 42
FACILITY NAME TANK SIZE (GALLONS)
PERMIT DATE
LIQUID STORED COMMENTS
Lauderdale Plant, FL 3,360,000 6,300,000 3,150,000
4/22/2014 ULSD Pressure relief valves and vapor condensers or floating roof tanks
Lauderdale Plant, FL 3,000,000 (2)
8/25/2015 ULSD Low vapor pressure prevents evaporative losses
Donlin Gold Project 2,500,000 6/30/2017 ULSD Submerged fill line
Troutdale Energy Center, LLC, OR
2,200,000 3/5/2014 ULSD Submerged fill line
3.10.2 Selection of BACT/LAER/BAT for ULSD Storage Tank
REC is proposing the use of an internal floating roof tank (fixed roof) to minimize VOC emissions from
the storage of ULSD. With annual potential emissions of VOC of approximately 0.05 tons, this will
effectively limit the emissions of VOC from the ULSD storage tank.

POWER ENGINEERS, INC. Plan Approval Application – Renovo Energy Center, LLC
4.0 AIR DISPERSION MODELING PLAN

POWER ENGINEERS, INC. Plan Approval Application – Air Dispersion Modeling Plan – Renovo Energy Center, LLC
PAGE 1
4.0 AIR DISPERSION MODELING PLAN
Renovo Energy Center (REC) is submitting an air dispersion modeling protocol to the Pennsylvania
Department of Environmental Protection (PaDEP) simultaneously with this Plan Approval Application.
The protocol outlines the methodologies and assumptions to be used in the refined ambient air quality
impact analysis that will be used to demonstrate compliance with all applicable ambient air quality
standards.
Upon acceptance of the air dispersion modeling protocol, REC will conduct refined dispersion modeling
and will submit a summary report to PaDEP that provides the model results.

POWER ENGINEERS, INC. Plan Approval Application – Renovo Energy Center, LLC
5.0 APPLICATION FORMS

2700-PM-AQ0004 Rev. 6/2006
- 1 -
COMMONWEALTH OF PENNSYLVANIA
DEPARTMENT OF ENVIRONMENTAL PROTECTION
BUREAU OF AIR QUALITY
AIR POLLUTION CONTROL ACT COMPLIANCE REVIEW FORM
Fully and accurately provide the following information, as specified. Attach additional sheets as necessary.
Type of Compliance Review Form Submittal (check all that apply)
Original Filing Date of Last Compliance Review Form Filing:
Amended Filing / /
Type of Submittal
New Plan Approval New Operating Permit Renewal of Operating Permit
Extension of Plan Approval Change of Ownership Periodic Submission (@ 6 mos)
Other:
SECTION A. GENERAL APPLICATION INFORMATION
Name of Applicant/Permittee/(“applicant”)
(non-corporations-attach documentation of legal name)
Renovo Energy Center LLC
Address 12011 Sunset Hills Road, Suite 110-RO1
Reston, VA 20190
Telephone (571) 392-6383 Taxpayer ID# 47-2181250
Permit, Plan Approval or Application ID#
Identify the form of management under which the applicant conducts its business (check appropriate box)
Individual Syndicate Government Agency
Municipality Municipal Authority Joint Venture
Proprietorship Fictitious Name Association
Public Corporation Partnership Other Type of Business, specify below:
Private Corporation Limited Partnership
Describe below the type(s) of business activities performed.
Renovo Energy Center, LLC (REC) proposes to construct a nominally rated 1,240 MW (net) dual fuel (natural gas and ultra-low sulfur diesel) combined cycle electric generating plant in Renovo, PA The proposed REC facility will consist of two 1-on-1 power blocks consisting of a combustion turbine and a steam turbine in line to produce electricity for distribution into the transmission grid system. Each combined cycle system consists of a natural gas fired combustion turbine (CT) and heat recovery steam generator (HRSG) equipped with a natural gas-fired duct burner (DB).

2700-PM-AQ0004 Rev. 6/2006
- 2 -
SECTION B. GENERAL INFORMATION REGARDING “APPLICANT”
If applicant is a corporation or a division or other unit of a corporation, provide the names, principal
places of business, state of incorporation, and taxpayer ID numbers of all domestic and foreign parent
corporations (including the ultimate parent corporation), and all domestic and foreign subsidiary
corporations of the ultimate parent corporation with operations in Pennsylvania. Please include all
corporate divisions or units, (whether incorporated or unincorporated) and privately held corporations. (A
diagram of corporate relationships may be provided to illustrate corporate relationships.) Attach
additional sheets as necessary.
Unit Name Principal Places
of Business
State of
Incorporation Taxpayer ID
Relationship
to Applicant
Bechtel Development Company, Inc.
Virginia Delaware 94-3288883 Parent of Applicant
Bechtel Enterprises Holdings, Inc.
Virginia Delaware 94-2959483 Parent of Bechtel Development Company, Inc.
Bechtel Group, Inc. California Delaware 94-2681915 Parent of Bechtel Enterprises Holdings, Inc.
SECTION C. SPECIFIC INFORMATION REGARDING APPLICANT AND ITS “RELATED PARTIES”
Pennsylvania Facilities. List the name and location (mailing address, municipality, county), telephone
number, and relationship to applicant (parent, subsidiary or general partner) of applicant and all Related
Parties' places of business, and facilities in Pennsylvania. Attach additional sheets as necessary.
Unit Name Street Address
County and
Municipality
Telephone
No.
Relationship
to Applicant
Provide the names and business addresses of all general partners of the applicant and parent and
subsidiary corporations, if any.
Name Business Address

2700-PM-AQ0004 Rev. 6/2006
- 3 -
List the names and business address of persons with overall management responsibility for the process
being permitted (i.e. plant manager).
Name Business Address
Plan Approvals or Operating Permits. List all plan approvals or operating permits issued by the
Department or an approved local air pollution control agency under the APCA to the applicant or related
parties that are currently in effect or have been in effect at any time 5 years prior to the date on which this
form is notarized. This list shall include the plan approval and operating permit numbers, locations,
issuance and expiration dates. Attach additional sheets as necessary.
Air Contamination
Source Plan Approval/
Operating Permit# Location
Issuance
Date
Expiration
Date

2700-PM-AQ0004 Rev. 6/2006
- 4 -
Compliance Background. (Note: Copies of specific documents, if applicable, must be made available to
the Department upon its request.) List all documented conduct of violations or enforcement actions
identified by the Department pursuant to the APCA, regulations, terms and conditions of an operating
permit or plan approval or order by applicant or any related party, using the following format grouped by
source and location in reverse chronological order. Attach additional sheets as necessary. See the
definition of "documented conduct" for further clarification. Unless specifically directed by the
Department, deviations which have been previously reported to the Department in writing, relating to
monitoring and reporting, need not be reported.
Date Location
Plan
Approval/
Operating
Permit#
Nature of
Documented
Conduct
Type of
Department
Action
Status:
Litigation
Existing/Continuing
or
Corrected/Date
Dollar
Amount
Penalty
$
$
$
$
$
$
$
$
$
$
List all incidents of deviations of the APCA, regulations, terms and conditions of an operating permit or
plan approval or order by applicant or any related party, using the following format grouped by source
and location in reverse chronological order. This list must include items both currently known and
unknown to the Department. Attach additional sheets as necessary. See the definition of "deviations" for
further clarification.
Date Location
Plan Approval/
Operating Permit#
Nature of
Deviation
Incident Status:
Litigation
Existing/Continuing
Or
Corrected/Date
CONTINUING OBLIGATION. Applicant is under a continuing obligation to update this form using the
Compliance Review Supplemental Form if any additional deviations occur between the date of
submission and Department action on the application.


1300-PM-BIT0001 5/2012 Form
Page 1 of 7
COMMONWEALTH OF PENNSYLVANIA DEPARTMENT OF ENVIRONMENTAL PROTECTION
GENERAL INFORMATION FORM – AUTHORIZATION APPLICATION
Before completing this General Information Form (GIF), read the step-by-step instructions provided in this application package. This version of the General Information Form (GIF) must be completed and returned with any program-specific application being submitted to the Department.
Related ID#s (If Known) DEP USE ONLY
Client ID# APS ID# Date Received & General Notes
Site ID# Auth ID#
Facility ID#
CLIENT INFORMATION
DEP Client ID# Client Type / Code
Organization Name or Registered Fictitious Name Employer ID# (EIN) Dun & Bradstreet ID#
Renovo Energy Center LLC 47-2181250
Individual Last Name First Name MI Suffix SSN Franzese Richard P
Additional Individual Last Name First Name MI Suffix SSN
Mailing Address Line 1 Mailing Address Line 2 Bechtel Development Company 12011 Sunset Hills Road, Suite 110-RO1
Address Last Line – City State ZIP+4 Country Reston VA 20190 USA
Client Contact Last Name First Name MI Suffix Franzese Richard P
Client Contact Title Phone Ext Director, Power and Energy Development/Project Manager (571) 392-6383
Email Address FAX [email protected]
SITE INFORMATION
DEP Site ID# Site Name
EPA ID# Estimated Number of Employees to be Present at Site
Description of Site Site is approximately 68 acres located in Renovo north of Erie Avenue and South of Industrial Park Road. Site was formerly in use as a railcar reconditioning operation.
County Name Municipality City Boro Twp State Clinton Renovo
County Name Municipality City Boro Twp State Clinton Renovo
Site Location Line 1 Site Location Line 2 Industrial Park Road
Site Location Last Line – City State ZIP+4 Renovo PA 17764
Detailed Written Directions to Site From Williamsport, travel west on I-180/US-220 South, bearing left at fork to stay on US-220 South for approximately 24 miles; Take exit 111 for PA-120 West and proceed approximately 30 miles to right turn onto Stouts Hill Road for 1/10th mile to right onto Mt. Glen Road, continuing straight ahead onto to Industrial Park Road.
Site Contact Last Name First Name MI Suffix
Site Contact Title Site Contact Firm
Mailing Address Line 1 Mailing Address Line 2

1300-PM-BIT0001 5/2012
Page 2 of 7
Mailing Address Last Line – City State ZIP+4
Phone Ext FAX Email Address
NAICS Codes (Two- & Three-Digit Codes – List All That Apply) 6-Digit Code (Optional)
Client to Site Relationship
FACILITY INFORMATION
Modification of Existing Facility Yes No 1. Will this project modify an existing facility, system, or activity? 2. Will this project involve an addition to an existing facility, system, or activity? If “Yes”, check all relevant facility types and provide DEP facility identification numbers below. Facility Type DEP Fac ID# Facility Type DEP Fac ID#
Air Emission Plant Industrial Minerals Mining Operation
Beneficial Use (water) Laboratory Location
Blasting Operation Land Recycling Cleanup Location
Captive Hazardous Waste Operation MineDrainageTrmt/LandRecyProjLocation
Coal Ash Beneficial Use Operation Municipal Waste Operation
Coal Mining Operation Oil & Gas Encroachment Location
Coal Pillar Location Oil & Gas Location
Commercial Hazardous Waste Operation Oil & Gas Water Poll Control Facility
Dam Location Public Water Supply System
Deep Mine Safety Operation -Anthracite Radiation Facility
Deep Mine Safety Operation -Bituminous Residual Waste Operation
Deep Mine Safety Operation -Ind Minerals Storage Tank Location
Encroachment Location (water, wetland) Water Pollution Control Facility
Erosion & Sediment Control Facility Water Resource
Explosive Storage Location Other:
Latitude/Longitude Latitude Longitude
Point of Origin Degrees Minutes Seconds Degrees Minutes Seconds
0/0 41 19 42 77 45 18.47
Horizontal Accuracy Measure Feet --or-- Meters
Horizontal Reference Datum Code North American Datum of 1927 North American Datum of 1983 World Geodetic System of 1984
Horizontal Collection Method Code
Reference Point Code
Altitude Feet --or-- Meters
Altitude Datum Name The National Geodetic Vertical Datum of 1929 The North American Vertical Datum of 1988 (NAVD88)
Altitude (Vertical) Location Datum Collection Method Code
Geometric Type Code
Data Collection Date
Source Map Scale Number Inch(es) = Feet
--or-- Centimeter(s) = Meters
PROJECT INFORMATION
Project Name Renovo Energy Center
Project Description Renovo Energy Center, LLC (REC) proposes to construct a nominally rated 1,240 MW (net) dual fuel (natural gas and ultra-low sulfur diesel) combined cycle electric generating plant in Renovo, PA The proposed REC facility will consist of two 1-on-1 power blocks consisting of a combustion turbine and a steam turbine in line to produce electricity for distribution into the transmission grid system. Each combined cycle system consists of a natural gas fired combustion turbine (CT) and a heat recovery steam generator (HRSG) with duct burner.
Project Consultant Last Name First Name MI Suffix Donnelly Timothy J Mr

1300-PM-BIT0001 5/2012
Page 3 of 7
Project Consultant Title Consulting Firm Senior Project Manager POWER Engineers, Inc
Mailing Address Line 1 Mailing Address Line 2 303 U.S. Route One
Address Last Line – City State ZIP+4 Freeport ME 04032
Phone Ext FAX Email Address 207-869-1282 207-869-1299 [email protected]
Time Schedules Project Milestone (Optional)
1. Have you informed the surrounding community and addressed any concerns prior to submitting the application to the Department?
Yes No
2. Is your project funded by state or federal grants? Yes No
Note: If “Yes”, specify what aspect of the project is related to the grant and provide the grant source, contact person and grant expiration date.
Aspect of Project Related to Grant
Grant Source:
Grant Contact Person:
Grant Expiration Date:
3. Is this application for an authorization on Appendix A of the Land Use Policy? (For referenced list, see Appendix A of the Land Use Policy attached to GIF instructions)
Yes No
Note: If “No” to Question 3, the application is not subject to the Land Use Policy.
If “Yes” to Question 3, the application is subject to this policy and the Applicant should answer the additional questions in the Land Use Information section.
LAND USE INFORMATION
Note: Applicants are encouraged to submit copies of local land use approvals or other evidence of compliance with local comprehensive plans and zoning ordinances.
1. Is there an adopted county or multi-county comprehensive plan? Yes No
2. Is there an adopted municipal or multi-municipal comprehensive plan? Yes No
3. Is there an adopted county-wide zoning ordinance, municipal zoning ordinance or joint municipal zoning ordinance?
Yes No
Note: If the Applicant answers “No” to either Questions 1, 2 or 3, the provisions of the PA MPC are not applicable and the Applicant does not need to respond to questions 4 and 5 below.
If the Applicant answers “Yes” to questions 1, 2 and 3, the Applicant should respond to questions 4 and 5 below.
4. Does the proposed project meet the provisions of the zoning ordinance or does the proposed project have zoning approval? If zoning approval has been
received, attach documentation.
Yes No
5. Have you attached Municipal and County Land Use Letters for the project? Yes No

1300-PM-BIT0001 5/2012
Page 4 of 7
COORDINATION INFORMATION
Note: The PA Historical and Museum Commission must be notified of proposed projects in accordance with DEP Technical Guidance Document 012-0700-001 and the accompanying Cultural Resource Notice Form.
If the activity will be a mining project (i.e., mining of coal or industrial minerals, coal refuse disposal and/or the operation of a coal or industrial minerals preparation/processing facility), respond to questions 1.0 through 2.5 below.
If the activity will not be a mining project, skip questions 1.0 through 2.5 and begin with question 3.0.
1.0 Is this a coal mining project? If “Yes”, respond to 1.1-1.6. If “No”, skip to Question 2.0.
Yes No
1.1 Will this coal mining project involve coal preparation/ processing activities in which the total amount of coal prepared/processed will be equal to or greater than 200 tons/day?
Yes No
1.2 Will this coal mining project involve coal preparation/ processing activities in which the total amount of coal prepared/processed will be greater than 50,000 tons/year?
Yes No
1.3 Will this coal mining project involve coal preparation/ processing activities in which thermal coal dryers or pneumatic coal cleaners will be used?
Yes No
1.4 For this coal mining project, will sewage treatment facilities be constructed and treated waste water discharged to surface waters?
Yes No
1.5 Will this coal mining project involve the construction of a permanent impoundment meeting one or more of the following criteria: (1) a contributory drainage area exceeding 100 acres; (2) a depth of water measured by the upstream toe of the dam at maximum storage elevation exceeding 15 feet; (3) an impounding capacity at maximum storage elevation exceeding 50 acre-feet?
Yes No
1.6 Will this coal mining project involve underground coal mining to be conducted within 500 feet of an oil or gas well?
Yes No
2.0 Is this a non-coal (industrial minerals) mining project? If “Yes”, respond to 2.1-2.6. If “No”, skip to Question 3.0.
Yes No
2.1 Will this non-coal (industrial minerals) mining project involve the crushing and screening of non-coal minerals other than sand and gravel?
Yes No
2.2 Will this non-coal (industrial minerals) mining project involve the crushing and/or screening of sand and gravel with the exception of wet sand and gravel operations (screening only) and dry sand and gravel operations with a capacity of less than 150 tons/hour of unconsolidated materials?
Yes No
2.3 Will this non-coal (industrial minerals) mining project involve the construction, operation and/or modification of a portable non-metallic (i.e., non-coal) minerals processing plant under the authority of the General Permit for Portable Non-metallic Mineral Processing Plants (i.e., BAQ-PGPA/GP-3)?
Yes No
2.4 For this non-coal (industrial minerals) mining project, will sewage treatment facilities be constructed and treated waste water discharged to surface waters?
Yes No
2.5 Will this non-coal (industrial minerals) mining project involve the construction of a permanent impoundment meeting one or more of the following criteria: (1) a contributory drainage area exceeding 100 acres; (2) a depth of water measured by the upstream toe of the dam at maximum storage elevation exceeding 15 feet; (3) an impounding capacity at maximum storage elevation exceeding 50 acre-feet?
Yes No

1300-PM-BIT0001 5/2012
Page 5 of 7
3.0 Will your project, activity, or authorization have anything to do with a well related to oil or gas production, have construction within 200 feet of, affect an oil or gas well, involve the waste from such a well, or string power lines above an oil or gas well? If “Yes”, respond to 3.1-3.3. If “No”, skip to Question 4.0.
Yes No
3.1 Does the oil- or gas-related project involve any of the following: placement of fill, excavation within or placement of a structure, located in, along, across or projecting into a watercourse, floodway or body of water (including wetlands)?
Yes No
3.2 Will the oil- or gas-related project involve discharge of industrial wastewater or stormwater to a dry swale, surface water, ground water or an existing sanitary sewer system or storm water system? If “Yes”, discuss in Project Description.
Yes No
3.3 Will the oil- or gas-related project involve the construction and operation of industrial waste treatment facilities?
Yes No
4.0 Will the project involve a construction activity that results in earth disturbance? If “Yes”, specify the total disturbed acreage.
Yes No
4.0.1 Total Disturbed Acreage 68
5.0 Does the project involve any of the following? If “Yes”, respond to 5.1-5.3. If “No”, skip to Question 6.0.
Yes No
5.1 Water Obstruction and Encroachment Projects – Does the project involve any of the following: placement of fill, excavation within or placement of a structure, located in, along, across or projecting into a watercourse, floodway or body of water?
Yes No
5.2 Wetland Impacts – Does the project involve any of the following: placement of fill, excavation within or placement of a structure, located in, along, across or projecting into a wetland?
Yes No
5.3 Floodplain Projects by the commonwealth, a Political Subdivision of the commonwealth or a Public Utility – Does the project involve any of the following: placement of fill, excavation within or placement of a structure, located in, along, across or projecting into a floodplain?
Yes No
6.0 Will the project involve discharge of stormwater or wastewater from an industrial activity to a dry swale, surface water, ground water or an existing sanitary sewer system or separate storm water system?
Yes No
7.0 Will the project involve the construction and operation of industrial waste treatment facilities?
Yes No
8.0 Will the project involve construction of sewage treatment facilities, sanitary sewers, or sewage pumping stations? If “Yes”, indicate estimated proposed flow (gal/day). Also, discuss the sanitary sewer pipe sizes and the number of pumping stations/treatment facilities/name of downstream sewage facilities in the Project Description, where applicable.
Yes No
8.0.1 Estimated Proposed Flow (gal/day)
9.0 Will the project involve the subdivision of land, or the generation of 800 gpd or more of sewage on an existing parcel of land or the generation of an additional 400 gpd of sewage on an already-developed parcel, or the generation of 800 gpd or more of industrial wastewater that would be discharged to an existing sanitary sewer system?
Yes No
9.0.1 Was Act 537 sewage facilities planning submitted and approved by DEP? If “Yes” attach the approval letter. Approval required prior to 105/NPDES approval.
Yes No
10.0 Is this project for the beneficial use of biosolids for land application within Pennsylvania? If “Yes” indicate how much (i.e. gallons or dry tons per year).
Yes No
10.0.1 Gallons Per Year (residential septage)
10.0.2 Dry Tons Per Year (biosolids)
11.0 Does the project involve construction, modification or removal of a dam? If “Yes”, identify the dam.
Yes No
11.0.1 Dam Name

1300-PM-BIT0001 5/2012
Page 6 of 7
12.0 Will the project interfere with the flow from, or otherwise impact, a dam? If “Yes”, identify the dam.
Yes No
12.0.1 Dam Name
13.0 Will the project involve operations (excluding during the construction period) that produce air emissions (i.e., NOX, VOC, etc.)? If “Yes”, identify each type of emission followed by the amount of that emission.
Yes No
13.0.1 Enter all types & amounts of emissions; separate each set with semicolons.
364.0 TPY NOx, 375.7 TPY CO, 212.6 TPY PM10, 112.6 TPY VOC, 53.6 TPY SO2, 277.4 TPY NH3, 35.4 TPY H2SO4, 5,449,137 TPY CO2e
14.0 Does the project include the construction or modification of a drinking water supply to serve 15 or more connections or 25 or more people, at least 60 days out of the year? If “Yes”, check all proposed sub-facilities.
Yes No
14.0.1 Number of Persons Served
14.0.2 Number of Employee/Guests
14.0.3 Number of Connections
14.0.4 Sub-Fac: Distribution System Yes No
14.0.5 Sub-Fac: Water Treatment Plant Yes No
14.0.6 Sub-Fac: Source Yes No
14.0.7 Sub-Fac: Pump Station Yes No
14.0.8 Sub Fac: Transmission Main Yes No
14.0.9 Sub-Fac: Storage Facility Yes No
15.0 Will your project include infiltration of storm water or waste water to ground water within one-half mile of a public water supply well, spring or infiltration gallery?
Yes No
16.0 Is your project to be served by an existing public water supply? If “Yes”, indicate name of supplier and attach letter from supplier stating that it will serve the project.
Yes No
16.0.1 Supplier’s Name Renovo Borough Water Department
16.0.2 Letter of Approval from Supplier is Attached Yes No
17.0 Will this project involve a new or increased drinking water withdrawal from a stream or other water body? If “Yes”, should reference both Water Supply and Watershed Management.
Yes No
17.0.1 Stream Name
18.0 Will the construction or operation of this project involve treatment, storage, reuse, or disposal of waste? If “Yes”, indicate what type (i.e., hazardous, municipal (including infectious & chemotherapeutic), residual) and the amount to be treated, stored, re-used or disposed.
Yes No
18.0.1 Type & Amount The site is a Brownfield Site under Pennsylvania Act 2. Certain portions of the Site contain areas of contaminated soil, which, once dug up during construction, will have to be disposed of in an appropriate disposal facility.
19.0 Will your project involve the removal of coal, minerals, etc. as part of any earth disturbance activities?
Yes No
20.0 Does your project involve installation of a field constructed underground storage tank? If “Yes”, list each Substance & its Capacity. Note: Applicant may need a Storage Tank Site Specific Installation Permit.
Yes No
20.0.1 Enter all substances & capacity of each; separate each set with semicolons.
21.0 Does your project involve installation of an aboveground storage tank greater than 21,000 gallons capacity at an existing facility? If “Yes”, list each Substance & its Capacity. Note: Applicant may need a Storage Tank Site Specific Installation Permit.
Yes No
21.0.1 Enter all substances & capacity of each; separate each set with semicolons.


2700-PM-AQ0007 Rev. 7/2004
- 2 -
Section B - Processes Information
1. Source Information
Source Description (give type, use, raw materials, product, etc). Attach additional sheets as necessary.
Two identical combined cycle combustion turbines consisting of a combustion turbine, steam turbine, and heat recovery steam generator with duct burners.
Manufacturer General Electric
Model No. 7HA.02
Number of Sources 2
Source Designation CT1 and CT2
Maximum Capacity 3,541 MMBtu/hr CT natural gas 4,529 MMBtu/hr CT & DB nat gas 3,940 MMBtu/hr ULSD
Rated Capacity 3,541 MMBtu/hr CT natural gas 4,529 MMBtu/hr CT & DB nat gas 3,940 MMBtu/hr ULSD
Type of Material Processed natural gas combustion to produce heat and shaft power
Maximum Operating Schedule
Hours/Day 24
Days/Week 7
Days/Year 365
Hours/Year 8760
Operational restrictions existing or requested, if any (e.g., bottlenecks or voluntary restrictions to limit PTE): 760 hours of ULSD firing on a 12-month rolling total basis
Capacity (specify units) - Maximum
Per Hour 3,541 MMBtu CT NG 4,529 MMBtu CT & DB NG 3,940 MMBtu ULSD
Per Day 84,984 MMBtu CT NG 108,696 MMBtu CT & DB 94,560 MMBtu ULSD
Per Week 594,888 MMBtu CT NG 760,872 MMBtu CT & DB NG 661,920 MMBtu ULSD
Per Year 31,019,160 MMBtu CT NG 39,674,040 MMBtu CT & DB 2,994,400 MMBtu ULSD
Operating Schedule
Hours/Day 24
Days/Week 7
Days/Year 365
Hours/Year 8760
Seasonal variations (Months) From to
If variations exist, describe them Maximum capacity of CTs varies as a function of ambient temperature. Maximum capacity typically occurs at the
lowest ambient design temperature (-20° F). See detailed performance specifications and emissions calculations
presented in Appendix D and Appendix E. Note: maximum per hour, per day, and per week capacities based on maximum capacities; maximum per year capacities based on estimated maximum emissions from worst-case of all anticipated operating scenarios.
2. Fuel
Type Quantity Hourly Annually Sulfur
% Ash (Weight) BTU Content
Oil Number #2 (ULSD)
195,747.6 LB/HR @ 60°F
148,768,206.7 LB/YR
0.0015% by wt
negl 20,130 BTU/LB @ 60 °F
Oil Number
GPH @ 60°F
X 103
Gal
% by wt
Btu/Gal. & Lbs./Gal. @ 60 °F
Natural Gas 191,854.1 LB/HR
1,680,642,013
LB/YR
0.4 grain/100
SCF
0 23,607 Btu/LB
Gas (other)
SCFH
X 106
SCF
grain/100
SCF
Btu/SCF
Coal
TPH Tons % by wt Btu/lb
Other *
*Note: Describe and furnish information separately for other fuels in Addendum B.

2700-PM-AQ0007 Rev. 7/2004
- 3 -
Section B - Processes Information (Continued)
3. Burner
Manufacturer GE
Type and Model No. dry low-NOx
Number of Burners 12 per CT
Description: Two identical combined-cycle combustion turbines with duct-fired heat recovery steam generators
Rated Capacity 3,541 MMBtu/hr (CT NG), 4,529 MMBtu/hr (CT & DB) 3,940 MMBtu/hr (ULSD)
Maximum Capacity 3,541 MMBtu/hr (CT NG), 4,529 MMBtu/hr (CT & DB) 3,940 MMBtu/hr (ULSD)
4. Process Storage Vessels
A. For Liquids:
Name of material stored
See attached list of tanks
Tank I.D. No.
Manufacturer
Date Installed
Maximum Pressure
Capacity (gallons/Meter3)
Type of relief device (pressure set vent/conservation vent/emergency vent/open vent)
Relief valve/vent set pressure (psig)
Vapor press. of liquid at storage temp. (psia/kPa)
Type of Roof: Describe:
Total Throughput Per Year
Number of fills per day (fill/day):
Filling Rate (gal./min.):
Duration of fill hr./fill):
B. For Solids
Type: Silo Storage Bin Other, Describe
Name of Material Stored
Silo/Storage Bin I.D. No.
Manufacturer
Date Installed
State whether the material will be stored in loose or bags in silos
Capacity (Tons)
Turn over per year in tons
Turn over per day in tons
Describe fugitive dust control system for loading and handling operations
Describe material handling system
5. Request for Confidentiality
Do you request any information on this application to be treated as “Confidential”? Yes No If yes, include justification for confidentiality. Place such information on separate pages marked “confidential”.

2700-PM-AQ0007 Rev. 7/2004
- 4 -
Section B - Processes Information (Continued)
6. Miscellaneous Information
Attach flow diagram of process giving all (gaseous, liquid and solid) flow rates. Also, list all raw materials charged to process equipment, and the amounts charged (tons/hour, etc.) at rated capacity (give maximum, minimum and average charges describing fully expected variations in production rates). Indicate (on diagram) all points where contaminants are controlled (location of water sprays, collection hoods, or other pickup points, etc.). Describe collection hoods location, design, airflow and capture efficiency. Describe any restriction requested and how it will be monitored.
Appendix C contains a flow diagram for the combustion turbines. Please note flow and temperature information are approximate based on preliminary data.
Describe fully the facilities provided to monitor and to record process operating conditions, which may affect the emission of air contaminants. Show that they are reasonable and adequate.
CEMS will be installed for O2, NOx, and CO. Calibrated natural gas and ULSD fuel flow orifices will provide input flow rates. Emissions of VOC, SO2, PM, and GHGs will be calculated based on fuel flow, fuel test results, and emission factors or stack test data.
Describe each proposed modification to an existing source.
Not applicable
Identify and describe all fugitive emission points, all relief and emergency valves and any by-pass stacks.
There are no fugitive emission points associated with the CT.
Describe how emissions will be minimized especially during start up, shut down, process upsets and/or disruptions.
Emissions are minimized during startups, shutdowns, process upsets and/or disruptions by following the OEM's recommended precedures for these events. REC will follow good combustion practices and will follow the OEM recommended maintenance and testing schedule.
Anticipated Milestones:
i. Expected commencement date of construction/reconstruction/installation: October 2020
ii. Expected completion date of construction/reconstruction/installation: January 2023
iii. Anticipated date of start-up: April – November 2023

2700-PM-AQ0007 Rev. 7/2004
- 5 -
Section C - Air Cleaning Device
1. Precontrol Emissions* All emission calculations are contained in Appendix D. Maximum lb/hr is based on worst case operating scenario during normal operation per CT per fuel type. See Appendix D for emission rates during startup and shutdown. Tons per year are based on the worst-case emissions scenario of 760 hours on ULSD (with 40 of those hours in SUSD events), and 8,000 hours on natural gas (with 460 of those hours in SUSD events). Note that no limit is being proposed on natural gas firing, only ULSD and SUSD.
Pollutant
Maximum Emission Rate Calculation/ Estimation
Method Specify Units Pounds/Hour
Gas/ULSD Hours/Year Tons/Year
PM 22.50 / 48.20 8760 105.96 vendor data
PM10 22.50 / 48.20 8760 105.96 vendor data
SOx 6.10 / 7.00 8760 26.74 vendor data
CO 86.85 / 81.45 8760 911.72 vendor data
NOx 416.25 / 745.0 8760 1,868.05 vendor data
VOC 19.07 / 18.20 8760 90.86 vendor data
Others: (e.g., HAPs) ----- ----- ----- ----- -----
individual HAPs 8760 <10 facility-wide emission factors
total HAPs 8760 <25 facility-wide Emission factors
* These emissions must be calculated based on the requested operating schedule and/or process rate, e.g., operating schedule for maximum limits or restricted hours of operation and/or restricted throughput. Describe how the emission values were determined. Attach calculations.
2. Gas Cooling
Water quenching Yes No Water injection rate 532.1 GPM (only during ULSD firing)
Radiation and convection cooling
Yes No
Air dilution Yes No
If yes, CFM
Forced Draft Yes No Water cooled duct work Yes No
Other
Inlet Volume ACFM
@ °F % Moisture
Outlet Volume ACFM
@ °F % Moisture
Describe the system in detail.

2700-PM-AQ0007 Rev. 7/2004
- 6 -
Section C - Air Cleaning Device (Continued)
3. Settling Chambers (NOT APPLICABLE) Manufacturer
Volume of gas handled
ACFM
@ °F
Gas velocity (ft/sec.)
Length of chamber (ft.)
Width of chamber (ft.)
Height of chamber (ft.)
Number of trays
Water injection Yes No Water injection rate (GPM)
Emissions Data
Inlet Outlet Removal Efficiency (%)
4. Inertial and Cyclone Collectors (NOT APPLICABLE) Manufacturer
Type
Model No.
Pressure drop (in. of water)
Inlet volume ACFM
@ °F
Outlet volume ACFM
@ °F
Number of individual cyclone(s)
Outlet straightening vanes used?
Yes No
Length of Cyclone(s) Cylinder (ft.)
Diameter of Cyclone(s) Cylinder (ft.)
Length of Cyclone(s) cone (ft.)
Inlet Diameter (ft.) or duct area (ft.2) of cyclone(s)
Outlet Diameter (ft.) or duct area (ft.2) of cyclone(s)
If a multi-clone or multi-tube unit is installed, will any of the individual cyclones or cyclone tubes be blanked or blocked off?
Describe any exhaust gas recirculation loop to be employed.
Attach particle size efficiency curve
Emissions Data
Inlet Outlet Removal Efficiency (%)

2700-PM-AQ0007 Rev. 7/2004
- 7 -
Section C - Air Cleaning Device (Continued)
5. Fabric Collector (NOT APPLICABLE) Equipment Specifications
Manufacturer
Model No.
Pressurized Design
Suction Design
Number of Compartments
Number of Filters Per Compartment
Is Baghouse Insulated?
Yes No
Can each compartment be isolated for repairs and/or filter replacement?
Yes No
Are temperature controls provided? (Describe in detail)
Yes No
Dew point at maximum moisture °F Design inlet volume SCFM
Type of Fabric
Material Felted Membrane
Weight oz/sq.yd Woven Others: List:
Thickness in Felted-Woven
Fabric permeability (clean) @ ½” water-∆ P CFM/sq.ft.
Filter dimensions Length Diameter/Width
Effective area per filter Maximum operating temperature (°F)
Effective air to cloth ratio Minimum Maximum
Drawing of Fabric Filter
A sketch of the fabric filter showing all access doors, catwalks, ladders and exhaust ductwork, location of each pressure and temperature indicator should be attached.
Operation and Cleaning
Volume of gases handled
ACFM @ °F
Pressure drop across collector (in. of water). Describe the equipment to be used to monitor the pressure drop.
Type of filter cleaning Manual Cleaning Bag Collapse Reverse Air Jets Mechanical Shakers Sonic Cleaning Other: Pneumatic Shakers Reverse Air Flow
Describe the equipment provided if dry oil free air is required for collector operation
Cleaning Initiated By Timer Frequency if timer actuated
Expected pressure drop range in. of water Other Specify
Does air cleaning device employ hopper heaters, hopper vibrators or hopper level detectors? If yes, describe.
Describe the warning/alarm system that protects against operation when the unit is not meeting design requirements.
Emissions Data
Pollutant Inlet Outlet Removal Efficiency (%)

2700-PM-AQ0007 Rev. 7/2004
- 8 -
Section C - Air Cleaning Device (Continued)
6. Wet Collection Equipment (NOT APPLICABLE) Equipment Specifications
Manufacturer
Type
Model No.
Design Inlet Volume (SCFM)
Relative Particulate/Gas Velocity (ejector scrubbers only)
Describe the internal features (e.g., variable throat, gas/liquid diffusion plates, spray nozzles, liquid redistributors, bed limiters, etc.).
Describe pH monitoring and pH adjustment systems, if applicable.
Describe mist eliminator or separator (type, configuration, backflush capability, frequency).
Attach particulate size efficiency curve.
Operating Parameters
Inlet volume of gases handled (ACFM)
@ °F
Outlet volume of gases handled (ACFM)
@ °F % Moisture
Liquid flow rates. Describe equipment provided to measure liquid flow rates to scrubber (e.g., quenching section, recirculating solution, makeup water, bleed flow, etc.)
Describe scrubber liquid supply system (amount of make-up and recirculating liquid, capacity of recirculating liquid system, etc.)
State pressure drop range (in water) across scrubber (e.g., venturi throat, packed bed, etc.) only. Describe the equipment provide to measure the pressure drop. Do not include duct or de-mister losses.
Describe the warning/alarm system that protects against operation when unit is not meeting design requirements.
Emissions Data
Pollutant Inlet Outlet Removal Efficiency (%)

2700-PM-AQ0007 Rev. 7/2004
- 9 -
Section C - Air Cleaning Device (Continued)
7. Electrostatic Precipitator (NOT APPLICABLE) Equipment Specifications
Manufacturer
Model No.
Wet Dry
Single-Stage Two-Stage
Gas distribution grids Yes No Design Inlet Volume (SCFM)
Maximum operating temperature (°F)
Total collecting surface area sq. ft. Collector plates size length ft. x width ft.
Number of fields Number of collector plates/field
Spacing between collector plates inches.
Maximum gas velocity ft./sec. Minimum gas treatment time: sec.
Total discharge electrode length ft.
Number of discharge electrodes Number of collecting electrode rappers
Rapper control Magnetic Pneumatic Other Describe in detail
Operating Parameters
Inlet gas temperature (°F)
Outlet gas temperature (°F)
State pressure drop range (inches water gauge) across collector only
Describe the equipment
Volume of gas handled (ACFM) Dust resistivity (ohm-cm). Will resistivity vary?
Power requirements
Number and size of Transformer Rectifier sets by electrical field
Field No. No. of Sets Each Transformer
KVA Each Rectifier
KV Ave./Peak Ma DC
Current Density
Micro amperes/ft2.
Corona Power
Watts/1000 ACFM
Corona Power Density
Watts/ft2.
Will a flue gas conditioning system be employed? If yes, describe it.
Does air cleaning device employ hopper heaters, hopper vibrators or hopper level detectors? If yes, describe.
Describe the warning/alarm system that protects against operation when unit is not meeting design requirements.
Emissions Data
Pollutant Inlet Outlet Removal Efficiency (%)

2700-PM-AQ0007 Rev. 7/2004
- 10 -
Section C - Air Cleaning Device (Continued)
8. Adsorption Equipment (NOT APPLICABLE) Equipment Specifications
Manufacturer
Type
Model No.
Design Inlet Volume (SCFM)
Adsorbent charge per adsorber vessel and number of adsorber vessels
Length of Mass Transfer Zone (MTZ), supplied by the manufacturer based upon laboratory data.
Adsorber diameter (ft.) and area ft2.)
Adsorption bed depth (ft.)
Adsorbent information
Adsorbent type and physical properties.
Working capacity of adsorbent (%)
Heel percent or unrecoverable solvent weight % in the adsorbent after regeneration.
Operating Parameters
Inlet volume of gases handled (ACFM) @ °F
Adsorption time per adsorption bed
Breakthrough capacity:
Lbs. of solvent / 100 lbs. of adsorbent =
Vapor pressure of solvents at the inlet temperature
Available steam in pounds to regenerate carbon adsorber (if applicable)
Percent relative saturation of each solvent at the inlet temperature
Attach any additional data including auxiliary equipment and operation details to thoroughly evaluate the control equipment.
Describe the warning/alarm system that protects against operation when unit is not meeting design requirements.
Emissions Data
Pollutant Inlet Outlet Removal Efficiency (%)

2700-PM-AQ0007 Rev. 7/2004
- 11 -
Section C - Air Cleaning Device (Continued)
9. Absorption Equipment (NOT APPLICABLE) Equipment Specifications
Manufacturer
Type
Model No.
Design Inlet Volume (SCFM)
Tower height (ft.) and inside diameter (ft.)
Packing type and size (if applicable)
Height of packing (ft.) (if applicable)
Number of trays (if applicable)
Number of bubble caps (if applicable)
Configuration
Counter-current Cross flow Cocurrent flow
Describe pH and/or other monitoring and controls.
Absorbent information
Absorbent type and concentration.
Retention time (sec.)
Attach equilibrium data for absorption (if applicable)
Attach any additional information regarding auxiliary equipment, absorption solution supply system (once through or recirculating, system capacity, etc.) to thoroughly evaluate the control equipment. Indicate the flow rates for makeup, bleed and recirculation.
Operating Parameters
Volume of gas handled (ACFM)
Inlet temperature (°F)
Pressure drop (in. of water) and liquid flow rate. Describe the monitoring equipment.
State operating range for pH and/or absorbent concentration in scrubber liquid.
Describe the warning/alarm system that protects against operation when unit is not meeting design requirements.
Emissions Data
Pollutant Inlet Outlet Removal Efficiency (%)

2700-PM-AQ0007 Rev. 7/2004
- 12 -
Section C - Air Cleaning Device (Continued)
10. Selective Catalytic Reduction (SCR)
Selective Non-Catalytic Reduction (SNCR)
Non-Selective Catalytic Reduction (NSCR)
Equipment Specifications
Manufacturer
TBD
Type
TBD
Model No.
TBD
Design Inlet Volume (SCFM)
1.0 – 1.5 MMSCFM
Design operating temperature (°F)
605-610
Is the system equipped with process controls for proper mixing/control of the reducing agent in gas stream? If yes, give details.
Yes, the feed forward and feed back loops are used to calculate the amount of reducing agent required. The SCR ammonia flow control shall utilize a feed forward signal generated by inlet NOx analyzer. Outlet NOx analyzer will trim as feedback control.
Attach efficiency and other pertinent information (e.g., ammonia slip)
See Attachment D for detailed calculations and assumptions
Operating Parameters
Volume of gases handled 1.0 – 1.9 MM ACFM (ACFM) @ 605-610 °F
Operating temperature range for the SCR/SNCR/NSCR system (°F) From 605 °F To 610 °F
Reducing agent used, if any
ammonia
Oxidation catalyst used, if any
Yes, CO and VOC oxidation catalyst
State expected range of usage rate and concentration.
flow rate: TBD
concentration: 19% aqueous ammonia
Service life of catalyst
3 years
Ammonia slip (ppm)
5 ppm @ 15% O2
Describe fully with a sketch giving locations of equipment, controls systems, important parameters and method of operation.
Not available at this time
Describe the warning/alarm system that protects against operation when unit is not meeting design requirements.
Alarms will be programed into the facility's DCS for high outlet NOx concentration and ammonia slip. Specific alarm setpoints will be determined.
SCR will be equipped with alarms to ensure proper operation (high/low temperatures, etc.)
See Section 1 and relevant appendices of this Plan Approval Application for more detailed information.
Emissions Data
Pollutant Inlet Outlet Removal Efficiency (%)
NOx 25 ppmvd @ 15% O2 2 ppmvd @ 15% O2 ~92% (NG; normal operation)
CO 9 ppm @ 15% O2 1.9 ppmvd @ 15% O2 ~79% (NG; normal operation)
VOC 1.4 ppm @ 15% O2 0.7 ppmvd @ 15% O2 ~50% (NG; normal operation)

2700-PM-AQ0007 Rev. 7/2004
- 13 -
Section C - Air Cleaning Device (Continued)
11. Oxidizer/Afterburners (NOT APPLICABLE) Equipment Specifications
Manufacturer
Type Thermal Catalytic Model No.
Design Inlet Volume (SCFM)
Combustion chamber dimensions (length, cross-sectional area, effective chamber volume, etc.)
Describe design features, which will ensure mixing in combustion chamber.
Describe method of preheating incoming gases (if applicable).
Describe heat exchanger system used for heat recovery (if applicable).
Catalyst used
Life of catalyst
Expected temperature rise across catalyst (°F)
Dimensions of bed (in inches).
Height:
Diameter or Width:
Depth:
Are temperature sensing devices being provided to measure the temperature rise across the catalyst? Yes No
If yes, describe.
Describe any temperature sensing and/or recording devices (including specific location of temperature probe in a drawing or sketch.
Burner Information
Burner Manufacturer
Model No.
Fuel Used
Number and capacity of burners
Rated capacity (each)
Maximum capacity (each)
Describe the operation of the burner
Attach dimensioned diagram of afterburner
Operating Parameters
Inlet flow rate (ACFM) @ °F Outlet flow rate (ACFM) @ °F
State pressure drop range across catalytic bed (in. of water).
Describe the method adopted for regeneration or disposal of the used catalyst.
Describe the warning/alarm system that protects against operation when unit is not meeting design requirements.
Emissions Data
Pollutant Inlet Outlet Removal Efficiency (%)

2700-PM-AQ0007 Rev. 7/2004
- 14 -
Section C - Air Cleaning Device (Continued)
12. Flares (NOT APPLICABLE) Equipment Specifications
Manufacturer
Type Elevated flare Ground flare
Other Describe
Model No.
Design Volume (SCFM)
Dimensions of stack (ft.)
Diameter Height
Residence time (sec.) and outlet temperature (°F)
Turn down ratio
Burner details
Describe the flare design (air/steam-assisted or nonassisted), essential auxiliaries including pilot flame monitor of proposed flare with a sketch.
Describe the operation of the flare’s ignition system.
Describe the provisions to introduce auxiliary fuel to the flare.
Operation Parameters
Detailed composition of the waste gas
Heat content
Exit velocity
Maximum and average gas flow burned (ACFM)
Operating temperature (°F)
Describe the warning/alarm system that protects against operation when unit is not meeting design requirements.
Emissions Data
Pollutant Inlet Outlet Removal Efficiency (%)

2700-PM-AQ0007 Rev. 7/2004
- 15 -
Section C - Air Cleaning Device (Continued)
13. Other Control Equipment (NOT APPLICABLE) Equipment Specifications
Manufacturer
Type
Model No.
Design Volume (SCFM)
Capacity
Describe pH monitoring and pH adjustment, if any.
Indicate the liquid flow rate and describe equipment provided to measure pressure drop and flow rate, if any.
Attach efficiency curve and/or other efficiency information.
Attach any additional date including auxiliary equipment and operation details to thoroughly evaluate the control equipment.
Operation Parameters
Volume of gas handled
ACFM @ °F % Moisture
Describe fully giving important parameters and method of operation.
Describe the warning/alarm system that protects against operation when unit is not meeting design requirements.
Emissions Data
Pollutant Inlet Outlet Removal Efficiency (%)

2700-PM-AQ0007 Rev. 7/2004
- 16 -
Section C - Air Cleaning Device (Continued)
14. Costs
Indicate cost associated with air cleaning device and its operating cost (attach documentation if necessary)
See Appendix O for cost documentation
Device Direct Cost Indirect Cost Total Cost Annual Operating Cost
SCR/Oxidation Catalyst 1,250,000 431,365 2,142,910 639,395
15. Miscellaneous
Describe in detail the removal, handling and disposal of dust, effluent, etc. from the air cleaning device including proposed methods of controlling fugitive emissions.
Spent catalyst will be returned to manufacturer or regenerating company for disposal or regeneration.
Attach manufacturer’s performance guarantees and/or warranties for each of the major components of the control system (or complete system).
See Appendix E
Attach the maintenance schedule for the control equipment and any part of the process equipment that if in disrepair would increase air contaminant emissions.
REC will follow manufacturer’s recommended operating and maintenance procedures and maintenance schedule for proper operation and maintenance of the equipment. See Section 1 and relevant appendices of this Plan Approval Application for more detailed information.

2700-PM-AQ0007 Rev. 7/2004
- 17 -
Section D - Additional Information
Will the construction, modification, etc. of the sources covered by this application increase emissions from other sources at the facility? If so, describe and quantify.
Not applicable – new facility
If this project is subject to any one of the following, attach a demonstration to show compliance with applicable standards.
See Section 2 for outline of applicable requirements.
a. Prevention of Significant Deterioration permit (PSD), 40 CFR 52? YES NO
b. New Source Review (NSR), 25 Pa. Code Chapter 127, Subchapter E? YES NO
c. New Source Performance Standards (NSPS), 40 CFR Part 60? YES NO
(If Yes, which subpart) KKKK, Dc, IIII, TTTT
d. National Emissions Standards for Hazardous Air Pollutants (NESHAP), YES NO
40 CFR Part 61? (If Yes, which subpart)
e. Maximum Achievable Control Technology (MACT) 40 CFR Part 63? YES NO
(If Yes, which part) ZZZZ
Attach a demonstration showing that the emissions from any new sources will be the minimum attainable through the use of best available technology (BAT).
See Section 3 of the Plan Approval Application
Provide emission increases and decreases in allowable (or potential) and actual emissions within the last five (5) years for applicable PSD pollutant(s) if the facility is an existing major facility (PSD purposes).
Not applicable - new facility

2700-PM-AQ0007 Rev. 7/2004
- 18 -
Section D - Additional Information (Continued)
Indicate emission increases and decreases in tons per year (tpy), for volatile organic compounds (VOCs) and nitrogen oxides (NOx) for NSR applicability since January 1, 1991 or other applicable dates (see other applicable dates in instructions). The emissions increases include all emissions including stack, fugitive, material transfer, other emission generating activities, quantifiable emissions from exempted source(s), etc.
Permit number
(if applicable) Date
issued
Indicate Yes or No if
emission increases and
decreases were used
previously for netting Source I. D. or Name
VOCs NOx
Emission increases
in potential to emit
(tpy)
Creditable emission
decreases in actual
emissions (tpy)
Emission increases
in potential to emit
(tpy)
Creditable emission
decreases in actual
emissions (tpy)
If the source is subject to 25 Pa. Code Chapter 127, Subchapter E, New Source Review requirements, a. Identify Emission Reduction Credits (ERCs) for emission offsets or demonstrate ability to obtain suitable ERCs for
emission offsets. See Appendix Q of Plan Approval Application. b. Provide a demonstration that the lowest achievable emission rate (LAER) control techniques will be employed (if
applicable). See Section 3 of Plan Approval Application c. Provide an analysis of alternate sites, sizes, production processes and environmental control techniques demonstrating
that the benefits of the proposed source outweigh the environmental and social costs (if applicable). See Section 1 of Plan Approval Application
Attach calculations and any additional information necessary to thoroughly evaluate compliance with all the applicable requirements of Article III and applicable requirements of the Clean Air Act adopted thereunder The Department may request additional information to evaluate the application such as a standby plan, a plan for air pollution emergencies, air quality modeling, etc. See Section 1 and Appendix D of Plan Approval Application.

2700-PM-AQ0007 Rev. 7/2004
- 19 -
Section E - Compliance Demonstration
Note: Complete this section if source is not a Title V facility. Title V facilities must complete Addendum A.
Method of Compliance Type: Check all that apply and complete all appropriate sections below
Monitoring Testing Reporting
Recordkeeping Work Practice Standard
Monitoring:
a. Monitoring device type (Parameter, CEM, etc):
b. Monitoring device location:
c. Describe all parameters being monitored along with the frequency and duration of monitoring each parameter:
Testing:
a. Reference Test Method: Citation
b. Reference Test Method: Description
Recordkeeping:
Describe what parameters will be recorded and the recording frequency:
Reporting:
a. Describe what is to be reported and frequency of reporting:
b. Reporting start date:
Work Practice Standard:
Describe each:
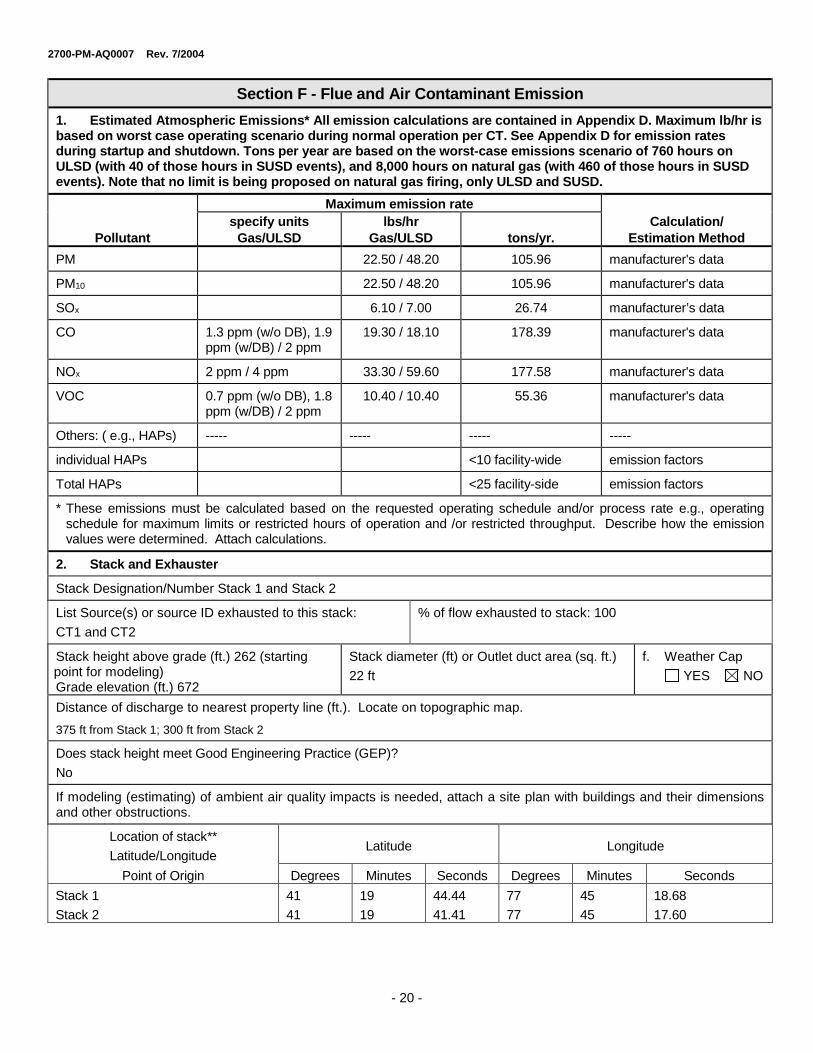
2700-PM-AQ0007 Rev. 7/2004
- 20 -
Section F - Flue and Air Contaminant Emission
1. Estimated Atmospheric Emissions* All emission calculations are contained in Appendix D. Maximum lb/hr is based on worst case operating scenario during normal operation per CT. See Appendix D for emission rates during startup and shutdown. Tons per year are based on the worst-case emissions scenario of 760 hours on ULSD (with 40 of those hours in SUSD events), and 8,000 hours on natural gas (with 460 of those hours in SUSD events). Note that no limit is being proposed on natural gas firing, only ULSD and SUSD.
Pollutant
Maximum emission rate
Calculation/
Estimation Method
specify units
Gas/ULSD
lbs/hr
Gas/ULSD tons/yr.
PM 22.50 / 48.20 105.96 manufacturer's data
PM10 22.50 / 48.20 105.96 manufacturer's data
SOx 6.10 / 7.00 26.74 manufacturer’s data
CO 1.3 ppm (w/o DB), 1.9 ppm (w/DB) / 2 ppm
19.30 / 18.10 178.39 manufacturer's data
NOx 2 ppm / 4 ppm 33.30 / 59.60 177.58 manufacturer's data
VOC 0.7 ppm (w/o DB), 1.8 ppm (w/DB) / 2 ppm
10.40 / 10.40 55.36 manufacturer's data
Others: ( e.g., HAPs) ----- ----- ----- -----
individual HAPs <10 facility-wide emission factors
Total HAPs <25 facility-side emission factors
* These emissions must be calculated based on the requested operating schedule and/or process rate e.g., operating schedule for maximum limits or restricted hours of operation and /or restricted throughput. Describe how the emission values were determined. Attach calculations.
2. Stack and Exhauster
Stack Designation/Number Stack 1 and Stack 2
List Source(s) or source ID exhausted to this stack:
CT1 and CT2
% of flow exhausted to stack: 100
Stack height above grade (ft.) 262 (starting point for modeling) Grade elevation (ft.) 672
Stack diameter (ft) or Outlet duct area (sq. ft.)
22 ft
f. Weather Cap
YES NO
Distance of discharge to nearest property line (ft.). Locate on topographic map.
375 ft from Stack 1; 300 ft from Stack 2
Does stack height meet Good Engineering Practice (GEP)?
No
If modeling (estimating) of ambient air quality impacts is needed, attach a site plan with buildings and their dimensions and other obstructions.
Location of stack**
Latitude/Longitude Latitude Longitude
Point of Origin Degrees Minutes Seconds Degrees Minutes Seconds
Stack 1
Stack 2
41
41
19
19
44.44
41.41
77
77
45
45
18.68
17.60

2700-PM-AQ0007 Rev. 7/2004
- 21 -
Stack exhaust
Volume varies with operating scenarios (See Appendix D, Raw Data) ACFM Temperature varies with operating
scenarios (See Appendix D, Raw Data °F Moisture varies with operating scenarios %
Indicate on an attached sheet the location of sampling ports with respect to exhaust fan, breeching, etc. Give all necessary dimensions. Locations of sampling ports will meet EPA and DEP criteria (40 CFR Part 60 App. A and B) for stack sampling and monitoring.
Exhauster (attach fan curves) NA in. of water HP @ RPM.
** If the data and collection method codes differ from those provided on the General Information Form-Authorization Application, provide the additional detail required by that form on a separate form.

2700-PM-AQ0007 Rev. 7/2004
- 22 -
Section G - Attachments
Number and list all attachments submitted with this application below:
See Table of Contents of Plan Approval Application.


2700-PM-AQ0007 Rev. 7/2004
- 2 -
Section B - Processes Information
1. Source Information
Source Description (give type, use, raw materials, product, etc). Attach additional sheets as necessary.
1500 kW diesel engine powered emergency generator
Manufacturer TBD
Model No. TBD
Number of Sources 1
Source Designation ENG1
Maximum Capacity 1500 kW
Rated Capacity 1500 kW
Type of Material Processed Ultra-low sulfur diesel oil combustion to produce shaft power to drive emergency generator
Maximum Operating Schedule
Hours/Day varies
Days/Week varies
Days/Year varies
Hours/Year 500
Operational restrictions existing or requested, if any (e.g., bottlenecks or voluntary restrictions to limit PTE)
Capacity (specify units)
Per Hour
Per Day
Per Week
Per Year 500 hours per year
Operating Schedule
Hours/Day 0.5
Days/Week 1
Days/Year 52
Hours/Year 500 maximum
Seasonal variations (Months) From to
If variations exist, describe them
2. Fuel
Type Quantity Hourly Annually Sulfur
% Ash (Weight) BTU Content
Oil Number ULSD
104.6 GPH @ 60°F
52.3 X 10³ Gal 0.0015% by wt
negligible 137,000 Btu/Gal. & Lbs./Gal. @ 60 °F
Oil Number
GPH @ 60°F
X 103
Gal
% by wt
Btu/Gal. & Lbs./Gal. @ 60 °F
Natural Gas SCFH
X 106
SCF
grain/100
SCF
Btu/SCF
Gas (other)
SCFH
X 106
SCF
grain/100
SCF
Btu/SCF
Coal
TPH Tons % by wt Btu/lb
Other *
*Note: Describe and furnish information separately for other fuels in Addendum B.

2700-PM-AQ0007 Rev. 7/2004
- 3 -
Section B - Processes Information (Continued)
3. Burner
Manufacturer NA
Type and Model No.
Number of Burners
Description:
Rated Capacity
Maximum Capacity
4. Process Storage Vessels
A. For Liquids:
Name of material stored
Diesel tank will be approximately 2,500 gallons. Diesel has a vapor pressure of less than 1.5 psia.
Tank I.D. No.
Manufacturer
Date Installed
Maximum Pressure
Capacity (gallons/Meter3)
Type of relief device (pressure set vent/conservation vent/emergency vent/open vent)
Relief valve/vent set pressure (psig)
Vapor press. of liquid at storage temp. (psia/kPa)
Type of Roof: Describe:
Total Throughput Per Year
Number of fills per day (fill/day):
Filling Rate (gal./min.):
Duration of fill hr./fill):
B. For Solids
Type: Silo Storage Bin Other, Describe
Name of Material Stored
Silo/Storage Bin I.D. No.
Manufacturer
Date Installed
State whether the material will be stored in loose or bags in silos
Capacity (Tons)
Turn over per year in tons
Turn over per day in tons
Describe fugitive dust control system for loading and handling operations
Describe material handling system
5. Request for Confidentiality
Do you request any information on this application to be treated as “Confidential”? Yes No If yes, include justification for confidentiality. Place such information on separate pages marked “confidential”.

2700-PM-AQ0007 Rev. 7/2004
- 4 -
Section B - Processes Information (Continued)
6. Miscellaneous Information
Attach flow diagram of process giving all (gaseous, liquid and solid) flow rates. Also, list all raw materials charged to process equipment, and the amounts charged (tons/hour, etc.) at rated capacity (give maximum, minimum and average charges describing fully expected variations in production rates). Indicate (on diagram) all points where contaminants are controlled (location of water sprays, collection hoods, or other pickup points, etc.). Describe collection hoods location, design, airflow and capture efficiency. Describe any restriction requested and how it will be monitored.
Not applicable - only flows are diesel fuel and combustion air in and exhaust gas out.
REC requests restricting operating hours to 500 hours per year per generator. Hours will be monitored with a non-resettable hour meter and recorded.
Describe fully the facilities provided to monitor and to record process operating conditions, which may affect the emission of air contaminants. Show that they are reasonable and adequate.
Non-resettable hour meter will be installed to monitor operating hours. REC will maintain records of hours operated and reason for operation.
Describe each proposed modification to an existing source.
Not applicable
Identify and describe all fugitive emission points, all relief and emergency valves and any by-pass stacks.
The only emissions that might be considered fugitive are from the relief vent on the diesel storage tank. Emissions are negligible.
Describe how emissions will be minimized especially during start up, shut down, process upsets and/or disruptions.
Diesel engine will be started up and shut down according to manufacturer instructions. Engine will be run weekly for 30 minutes or less for testing purposes. Otherwise, engine will be operated for emergency purposes only (loss of plant power supply).
Anticipated Milestones:
i. Expected commencement date of construction/reconstruction/installation: October 2020
ii. Expected completion date of construction/reconstruction/installation: January 2023
iii. Anticipated date of start-up: April – November 2023

2700-PM-AQ0007 Rev. 7/2004
- 5 -
Section C - Air Cleaning Device
1. Precontrol Emissions*
Pollutant
Maximum Emission Rate Calculation/ Estimation
Method Specify Units Pounds/Hour Hours/Year Tons/Year
PM 0.63 500 0.16 EPA weighted emissions
PM10 0.63 500 0.16 EPA weighted emissions
SOx 0.022 500 0.005 fuel sulfur
CO 5.98 500 1.50 EPA weighted emissions
NOx 21.79 500 5.45 EPA weighted emissions
VOC 3.89 500 0.97 Vendor data
Others: (e.g., HAPs) ----- ----- ----- ----- -----
Total HAPs 500 1.36E-2 AP-42 factors
* These emissions must be calculated based on the requested operating schedule and/or process rate, e.g., operating schedule for maximum limits or restricted hours of operation and/or restricted throughput. Describe how the emission values were determined. Attach calculations.
2. Gas Cooling
Water quenching Yes No Water injection rate GPM
Radiation and convection cooling
Yes No
Air dilution Yes No
If yes, CFM
Forced Draft Yes No Water cooled duct work Yes No
Other
Inlet Volume ACFM
@ °F % Moisture
Outlet Volume ACFM
@ °F % Moisture
Describe the system in detail.

2700-PM-AQ0007 Rev. 7/2004
- 6 -
Section C - Air Cleaning Device (Continued)
3. Settling Chambers NOT APPLICABLE
Manufacturer
Volume of gas handled
ACFM
@ °F
Gas velocity (ft/sec.)
Length of chamber (ft.)
Width of chamber (ft.)
Height of chamber (ft.)
Number of trays
Water injection Yes No Water injection rate (GPM)
Emissions Data
Inlet Outlet Removal Efficiency (%)
4. Inertial and Cyclone Collectors
Manufacturer
Type
Model No.
Pressure drop (in. of water)
Inlet volume ACFM
@ °F
Outlet volume ACFM
@ °F
Number of individual cyclone(s)
Outlet straightening vanes used?
Yes No
Length of Cyclone(s) Cylinder (ft.)
Diameter of Cyclone(s) Cylinder (ft.)
Length of Cyclone(s) cone (ft.)
Inlet Diameter (ft.) or duct area (ft.2) of cyclone(s)
Outlet Diameter (ft.) or duct area (ft.2) of cyclone(s)
If a multi-clone or multi-tube unit is installed, will any of the individual cyclones or cyclone tubes be blanked or blocked off?
Describe any exhaust gas recirculation loop to be employed.
Attach particle size efficiency curve
Emissions Data
Inlet Outlet Removal Efficiency (%)

2700-PM-AQ0007 Rev. 7/2004
- 7 -
Section C - Air Cleaning Device (Continued)
5. Fabric Collector NOT APPLICABLE
Equipment Specifications
Manufacturer
Model No.
Pressurized Design
Suction Design
Number of Compartments
Number of Filters Per Compartment
Is Baghouse Insulated?
Yes No
Can each compartment be isolated for repairs and/or filter replacement?
Yes No
Are temperature controls provided? (Describe in detail)
Yes No
Dew point at maximum moisture °F Design inlet volume SCFM
Type of Fabric
Material Felted Membrane
Weight oz/sq.yd Woven Others: List:
Thickness in Felted-Woven
Fabric permeability (clean) @ ½” water-∆ P CFM/sq.ft.
Filter dimensions Length Diameter/Width
Effective area per filter Maximum operating temperature (°F)
Effective air to cloth ratio Minimum Maximum
Drawing of Fabric Filter
A sketch of the fabric filter showing all access doors, catwalks, ladders and exhaust ductwork, location of each pressure and temperature indicator should be attached.
Operation and Cleaning
Volume of gases handled
ACFM @ °F
Pressure drop across collector (in. of water). Describe the equipment to be used to monitor the pressure drop.
Type of filter cleaning Manual Cleaning Bag Collapse Reverse Air Jets Mechanical Shakers Sonic Cleaning Other: Pneumatic Shakers Reverse Air Flow
Describe the equipment provided if dry oil free air is required for collector operation
Cleaning Initiated By Timer Frequency if timer actuated
Expected pressure drop range in. of water Other Specify
Does air cleaning device employ hopper heaters, hopper vibrators or hopper level detectors? If yes, describe.
Describe the warning/alarm system that protects against operation when the unit is not meeting design requirements.
Emissions Data
Pollutant Inlet Outlet Removal Efficiency (%)

2700-PM-AQ0007 Rev. 7/2004
- 8 -
Section C - Air Cleaning Device (Continued)
6. Wet Collection Equipment NOT APPLICABLE Equipment Specifications
Manufacturer
Type
Model No.
Design Inlet Volume (SCFM)
Relative Particulate/Gas Velocity (ejector scrubbers only)
Describe the internal features (e.g., variable throat, gas/liquid diffusion plates, spray nozzles, liquid redistributors, bed limiters, etc.).
Describe pH monitoring and pH adjustment systems, if applicable.
Describe mist eliminator or separator (type, configuration, backflush capability, frequency).
Attach particulate size efficiency curve.
Operating Parameters
Inlet volume of gases handled (ACFM)
@ °F
Outlet volume of gases handled (ACFM)
@ °F % Moisture
Liquid flow rates. Describe equipment provided to measure liquid flow rates to scrubber (e.g., quenching section, recirculating solution, makeup water, bleed flow, etc.)
Describe scrubber liquid supply system (amount of make-up and recirculating liquid, capacity of recirculating liquid system, etc.)
State pressure drop range (in water) across scrubber (e.g., venturi throat, packed bed, etc.) only. Describe the equipment provide to measure the pressure drop. Do not include duct or de-mister losses.
Describe the warning/alarm system that protects against operation when unit is not meeting design requirements.
Emissions Data
Pollutant Inlet Outlet Removal Efficiency (%)

2700-PM-AQ0007 Rev. 7/2004
- 9 -
Section C - Air Cleaning Device (Continued)
7. Electrostatic Precipitator NOT APPLICABLE
Equipment Specifications
Manufacturer
Model No.
Wet Dry
Single-Stage Two-Stage
Gas distribution grids Yes No Design Inlet Volume (SCFM)
Maximum operating temperature (°F)
Total collecting surface area sq. ft. Collector plates size length ft. x width ft.
Number of fields Number of collector plates/field
Spacing between collector plates inches.
Maximum gas velocity ft./sec. Minimum gas treatment time: sec.
Total discharge electrode length ft.
Number of discharge electrodes Number of collecting electrode rappers
Rapper control Magnetic Pneumatic Other Describe in detail
Operating Parameters
Inlet gas temperature (°F)
Outlet gas temperature (°F)
State pressure drop range (inches water gauge) across collector only
Describe the equipment
Volume of gas handled (ACFM) Dust resistivity (ohm-cm). Will resistivity vary?
Power requirements
Number and size of Transformer Rectifier sets by electrical field
Field No. No. of Sets Each Transformer
KVA Each Rectifier
KV Ave./Peak Ma DC
Current Density
Micro amperes/ft2.
Corona Power
Watts/1000 ACFM
Corona Power Density
Watts/ft2.
Will a flue gas conditioning system be employed? If yes, describe it.
Does air cleaning device employ hopper heaters, hopper vibrators or hopper level detectors? If yes, describe.
Describe the warning/alarm system that protects against operation when unit is not meeting design requirements.
Emissions Data
Pollutant Inlet Outlet Removal Efficiency (%)

2700-PM-AQ0007 Rev. 7/2004
- 10 -
Section C - Air Cleaning Device (Continued)
8. Adsorption Equipment NOT APPLICABLE
Equipment Specifications
Manufacturer
Type
Model No.
Design Inlet Volume (SCFM)
Adsorbent charge per adsorber vessel and number of adsorber vessels
Length of Mass Transfer Zone (MTZ), supplied by the manufacturer based upon laboratory data.
Adsorber diameter (ft.) and area ft2.)
Adsorption bed depth (ft.)
Adsorbent information
Adsorbent type and physical properties.
Working capacity of adsorbent (%)
Heel percent or unrecoverable solvent weight % in the adsorbent after regeneration.
Operating Parameters
Inlet volume of gases handled (ACFM) @ °F
Adsorption time per adsorption bed
Breakthrough capacity:
Lbs. of solvent / 100 lbs. of adsorbent =
Vapor pressure of solvents at the inlet temperature
Available steam in pounds to regenerate carbon adsorber (if applicable)
Percent relative saturation of each solvent at the inlet temperature
Attach any additional data including auxiliary equipment and operation details to thoroughly evaluate the control equipment.
Describe the warning/alarm system that protects against operation when unit is not meeting design requirements.
Emissions Data
Pollutant Inlet Outlet Removal Efficiency (%)

2700-PM-AQ0007 Rev. 7/2004
- 11 -
Section C - Air Cleaning Device (Continued)
9. Absorption Equipment NOT APPLICABLE
Equipment Specifications
Manufacturer
Type
Model No.
Design Inlet Volume (SCFM)
Tower height (ft.) and inside diameter (ft.)
Packing type and size (if applicable)
Height of packing (ft.) (if applicable)
Number of trays (if applicable)
Number of bubble caps (if applicable)
Configuration
Counter-current Cross flow Cocurrent flow
Describe pH and/or other monitoring and controls.
Absorbent information
Absorbent type and concentration.
Retention time (sec.)
Attach equilibrium data for absorption (if applicable)
Attach any additional information regarding auxiliary equipment, absorption solution supply system (once through or recirculating, system capacity, etc.) to thoroughly evaluate the control equipment. Indicate the flow rates for makeup, bleed and recirculation.
Operating Parameters
Volume of gas handled (ACFM)
Inlet temperature (°F)
Pressure drop (in. of water) and liquid flow rate. Describe the monitoring equipment.
State operating range for pH and/or absorbent concentration in scrubber liquid.
Describe the warning/alarm system that protects against operation when unit is not meeting design requirements.
Emissions Data
Pollutant Inlet Outlet Removal Efficiency (%)

2700-PM-AQ0007 Rev. 7/2004
- 12 -
Section C - Air Cleaning Device (Continued)
10. Selective Catalytic Reduction (SCR)
Selective Non-Catalytic Reduction (SNCR)
Non-Selective Catalytic Reduction (NSCR) NOT APPLICABLE
Equipment Specifications
Manufacturer
Type
Model No.
Design Inlet Volume (SCFM)
Design operating temperature (°F)
Is the system equipped with process controls for proper mixing/control of the reducing agent in gas stream? If yes, give details.
Attach efficiency and other pertinent information (e.g., ammonia slip)
Operating Parameters
Volume of gases handled (ACFM) @ °F
Operating temperature range for the SCR/SNCR/NSCR system (°F) From °F To °F
Reducing agent used, if any
Oxidation catalyst used, if any
State expected range of usage rate and concentration.
Service life of catalyst
Ammonia slip (ppm)
Describe fully with a sketch giving locations of equipment, controls systems, important parameters and method of operation.
Describe the warning/alarm system that protects against operation when unit is not meeting design requirements.
Emissions Data
Pollutant Inlet Outlet Removal Efficiency (%)

2700-PM-AQ0007 Rev. 7/2004
- 13 -
Section C - Air Cleaning Device (Continued)
11. Oxidizer/Afterburners NOT APPLICABLE
Equipment Specifications
Manufacturer
Type Thermal Catalytic Model No.
Design Inlet Volume (SCFM)
Combustion chamber dimensions (length, cross-sectional area, effective chamber volume, etc.)
Describe design features, which will ensure mixing in combustion chamber.
Describe method of preheating incoming gases (if applicable).
Describe heat exchanger system used for heat recovery (if applicable).
Catalyst used
Life of catalyst
Expected temperature rise across catalyst (°F)
Dimensions of bed (in inches).
Height:
Diameter or Width:
Depth:
Are temperature sensing devices being provided to measure the temperature rise across the catalyst? Yes No
If yes, describe.
Describe any temperature sensing and/or recording devices (including specific location of temperature probe in a drawing or sketch.
Burner Information
Burner Manufacturer
Model No.
Fuel Used
Number and capacity of burners
Rated capacity (each)
Maximum capacity (each)
Describe the operation of the burner
Attach dimensioned diagram of afterburner
Operating Parameters
Inlet flow rate (ACFM) @ °F Outlet flow rate (ACFM) @ °F
State pressure drop range across catalytic bed (in. of water).
Describe the method adopted for regeneration or disposal of the used catalyst.
Describe the warning/alarm system that protects against operation when unit is not meeting design requirements.
Emissions Data
Pollutant Inlet Outlet Removal Efficiency (%)

2700-PM-AQ0007 Rev. 7/2004
- 14 -
Section C - Air Cleaning Device (Continued)
12. Flares NOT APPLICABLE
Equipment Specifications
Manufacturer
Type Elevated flare Ground flare
Other Describe
Model No.
Design Volume (SCFM)
Dimensions of stack (ft.)
Diameter Height
Residence time (sec.) and outlet temperature (°F)
Turn down ratio
Burner details
Describe the flare design (air/steam-assisted or nonassisted), essential auxiliaries including pilot flame monitor of proposed flare with a sketch.
Describe the operation of the flare’s ignition system.
Describe the provisions to introduce auxiliary fuel to the flare.
Operation Parameters
Detailed composition of the waste gas
Heat content
Exit velocity
Maximum and average gas flow burned (ACFM)
Operating temperature (°F)
Describe the warning/alarm system that protects against operation when unit is not meeting design requirements.
Emissions Data
Pollutant Inlet Outlet Removal Efficiency (%)

2700-PM-AQ0007 Rev. 7/2004
- 15 -
Section C - Air Cleaning Device (Continued)
13. Other Control Equipment NOT APPLICABLE
Equipment Specifications
Manufacturer
Type
Model No.
Design Volume (SCFM)
Capacity
Describe pH monitoring and pH adjustment, if any.
Indicate the liquid flow rate and describe equipment provided to measure pressure drop and flow rate, if any.
Attach efficiency curve and/or other efficiency information.
Attach any additional date including auxiliary equipment and operation details to thoroughly evaluate the control equipment.
Operation Parameters
Volume of gas handled
ACFM @ °F % Moisture
Describe fully giving important parameters and method of operation.
Describe the warning/alarm system that protects against operation when unit is not meeting design requirements.
Emissions Data
Pollutant Inlet Outlet Removal Efficiency (%)

2700-PM-AQ0007 Rev. 7/2004
- 16 -
Section C - Air Cleaning Device (Continued)
14. Costs NOT APPLICABLE
Indicate cost associated with air cleaning device and its operating cost (attach documentation if necessary)
Device Direct Cost Indirect Cost Total Cost Annual Operating Cost
15. Miscellaneous
Describe in detail the removal, handling and disposal of dust, effluent, etc. from the air cleaning device including proposed methods of controlling fugitive emissions.
Attach manufacturer’s performance guarantees and/or warranties for each of the major components of the control system (or complete system).
Attach the maintenance schedule for the control equipment and any part of the process equipment that if in disrepair would increase air contaminant emissions.

2700-PM-AQ0007 Rev. 7/2004
- 17 -
Section D - Additional Information
Will the construction, modification, etc. of the sources covered by this application increase emissions from other sources at the facility? If so, describe and quantify.
Not applicable - new facility
If this project is subject to any one of the following, attach a demonstration to show compliance with applicable standards.
See Section 2 for identification of applicable requirements
a. Prevention of Significant Deterioration permit (PSD), 40 CFR 52? YES NO
b. New Source Review (NSR), 25 Pa. Code Chapter 127, Subchapter E? YES NO
c. New Source Performance Standards (NSPS), 40 CFR Part 60? YES NO
(If Yes, which subpart) KKKK, Dc, IIII, TTTT
d. National Emissions Standards for Hazardous Air Pollutants (NESHAP), YES NO
40 CFR Part 61? (If Yes, which subpart)
e. Maximum Achievable Control Technology (MACT) 40 CFR Part 63? YES NO
(If Yes, which part) ZZZZ
Attach a demonstration showing that the emissions from any new sources will be the minimum attainable through the use of best available technology (BAT).
See Section 3 of the Plan Approval Application
Provide emission increases and decreases in allowable (or potential) and actual emissions within the last five (5) years for applicable PSD pollutant(s) if the facility is an existing major facility (PSD purposes).
Not applicable

2700-PM-AQ0007 Rev. 7/2004
- 18 -
Section D - Additional Information (Continued)
Indicate emission increases and decreases in tons per year (tpy), for volatile organic compounds (VOCs) and nitrogen oxides (NOx) for NSR applicability since January 1, 1991 or other applicable dates (see other applicable dates in instructions). The emissions increases include all emissions including stack, fugitive, material transfer, other emission generating activities, quantifiable emissions from exempted source(s), etc.
Permit number
(if applicable) Date
issued
Indicate Yes or No if
emission increases and
decreases were used
previously for netting Source I. D. or Name
VOCs NOx
Emission increases
in potential to emit
(tpy)
Creditable emission
decreases in actual
emissions (tpy)
Emission increases
in potential to emit
(tpy)
Creditable emission
decreases in actual
emissions (tpy)
If the source is subject to 25 Pa. Code Chapter 127, Subchapter E, New Source Review requirements, a. Identify Emission Reduction Credits (ERCs) for emission offsets or demonstrate ability to obtain suitable ERCs for
emission offsets. See Appendix Q of Plan Approval Application. b. Provide a demonstration that the lowest achievable emission rate (LAER) control techniques will be employed (if
applicable). See Section 3 of Plan Approval Application. c. Provide an analysis of alternate sites, sizes, production processes and environmental control techniques demonstrating
that the benefits of the proposed source outweigh the environmental and social costs (if applicable).
See Section 1 of Plan Approval Application.
Attach calculations and any additional information necessary to thoroughly evaluate compliance with all the applicable requirements of Article III and applicable requirements of the Clean Air Act adopted thereunder. The Department may request additional information to evaluate the application such as a standby plan, a plan for air pollution emergencies, air quality modeling, etc. See Section 2 and Appendix D of Plan Approval Application.

2700-PM-AQ0007 Rev. 7/2004
- 19 -
Section E - Compliance Demonstration
Note: Complete this section if source is not a Title V facility. Title V facilities must complete Addendum A.
Method of Compliance Type: Check all that apply and complete all appropriate sections below
Monitoring Testing Reporting
Recordkeeping Work Practice Standard
Monitoring:
a. Monitoring device type (Parameter, CEM, etc):
b. Monitoring device location:
c. Describe all parameters being monitored along with the frequency and duration of monitoring each parameter:
Testing:
a. Reference Test Method: Citation
b. Reference Test Method: Description
Recordkeeping:
Describe what parameters will be recorded and the recording frequency:
Reporting:
a. Describe what is to be reported and frequency of reporting:
b. Reporting start date:
Work Practice Standard:
Describe each:

2700-PM-AQ0007 Rev. 7/2004
- 20 -
Section F - Flue and Air Contaminant Emission
1. Estimated Atmospheric Emissions*
Pollutant
Maximum emission rate Calculation/
Estimation Method specify units lbs/hr tons/yr.
PM 0.63 0.16 EPA weighted emissions
PM10 0.63 0.16 EPA weighted emissions
SOx 0.022 0.005 fuel sulfur
CO 5.98 1.50 EPA weighted emissions
NOx 21.79 5.45 EPA weighted emissions
VOC 3.89 0.97 Vendor data
Others: ( e.g., HAPs) ----- ----- ----- -----
individual HAPs <10 EPA AP-42 factors
total HAPs <25 EPA AP-42 factors
* These emissions must be calculated based on the requested operating schedule and/or process rate e.g., operating schedule for maximum limits or restricted hours of operation and /or restricted throughput. Describe how the emission values were determined. Attach calculations.
2. Stack and Exhauster
Stack Designation/Number Stack5
List Source(s) or source ID exhausted to this stack:
ENG1
% of flow exhausted to stack: 100
Stack height above grade (ft.) 16 Grade elevation (ft.) 670
Stack diameter (ft) or Outlet duct area (sq. ft.)
0.833
f. Weather Cap
YES NO
Distance of discharge to nearest property line (ft.). Locate on topographic map.
490 ft from Stack5
Does stack height meet Good Engineering Practice (GEP)?
No
If modeling (estimating) of ambient air quality impacts is needed, attach a site plan with buildings and their dimensions and other obstructions.
Location of stack**
Latitude/Longitude Latitude Longitude
Point of Origin Degrees Minutes Seconds Degrees Minutes Seconds
Stack5 41 19 42.77 77 45 20.61
Stack exhaust
Volume TBD ACFM Temperature TBD °F Moisture TBD %
Indicate on an attached sheet the location of sampling ports with respect to exhaust fan, breeching, etc. Give all necessary dimensions.
Exhauster (attach fan curves) NA in. of water HP @ RPM.
** If the data and collection method codes differ from those provided on the General Information Form-Authorization Application, provide the additional detail required by that form on a separate form.

2700-PM-AQ0007 Rev. 7/2004
- 21 -
Section G - Attachments
Number and list all attachments submitted with this application below:
See Table of Contents of Plan Approval Application


2700-PM-AQ0007 Rev. 7/2004
- 2 -
Section B - Processes Information
1. Source Information
Source Description (give type, use, raw materials, product, etc). Attach additional sheets as necessary.
One 237 HP Diesel Fire Pump Engine
Manufacturer TBD
Model No. TBD
Number of Sources 1
Source Designation ENG2
Maximum Capacity ~1.64 MMBtu/hr
Rated Capacity ~1.64 MMBtu/hr
Type of Material Processed
Maximum Operating Schedule
Hours/Day
Days/Week
Days/Year
Hours/Year 250 (proposed limit)
Operational restrictions existing or requested, if any (e.g., bottlenecks or voluntary restrictions to limit PTE)
Capacity (specify units)
Per Hour
Per Day
Per Week
Per Year 250 (proposed limit)
Operating Schedule
Hours/Day 0.5
Days/Week 1
Days/Year 52
Hours/Year 250
Seasonal variations (Months) From to
If variations exist, describe them
2. Fuel
Type Quantity Hourly Annually Sulfur
% Ash (Weight) BTU Content
Oil Number ULSD
12.0 GPH @ 60°F
3.0 X 10³ Gal
0.0015% by wt
negligible 137,000 Btu/Gal. & Lbs./Gal. @ 60 °F
Oil Number
GPH @ 60°F
X 103
Gal
% by wt
Btu/Gal. & Lbs./Gal. @ 60 °F
Natural Gas SCFH
X 106
SCF
grain/100
SCF
Btu/SCF
Gas (other)
SCFH
X 106
SCF
grain/100
SCF
Btu/SCF
Coal
TPH Tons % by wt Btu/lb
Other *
*Note: Describe and furnish information separately for other fuels in Addendum B.

2700-PM-AQ0007 Rev. 7/2004
- 3 -
Section B - Processes Information (Continued)
3. Burner
Manufacturer NA
Type and Model No.
Number of Burners
Description:
Rated Capacity
Maximum Capacity
4. Process Storage Vessels
A. For Liquids:
Name of material stored
Diesel tank is 350 gallons, which is less than the 2,000 gallon threshold contained in Chapter 129; Diesel has a vapor pressure of less than 1.5 psia.
Tank I.D. No.
Manufacturer
Date Installed
Maximum Pressure
Capacity (gallons/Meter3)
Type of relief device (pressure set vent/conservation vent/emergency vent/open vent)
Relief valve/vent set pressure (psig)
Vapor press. of liquid at storage temp. (psia/kPa)
Type of Roof: Describe:
Total Throughput Per Year
Number of fills per day (fill/day):
Filling Rate (gal./min.):
Duration of fill hr./fill):
B. For Solids
Type: Silo Storage Bin Other, Describe
Name of Material Stored
Silo/Storage Bin I.D. No.
Manufacturer
Date Installed
State whether the material will be stored in loose or bags in silos
Capacity (Tons)
Turn over per year in tons
Turn over per day in tons
Describe fugitive dust control system for loading and handling operations
Describe material handling system
5. Request for Confidentiality
Do you request any information on this application to be treated as “Confidential”? Yes No If yes, include justification for confidentiality. Place such information on separate pages marked “confidential”.

2700-PM-AQ0007 Rev. 7/2004
- 4 -
Section B - Processes Information (Continued)
6. Miscellaneous Information
Attach flow diagram of process giving all (gaseous, liquid and solid) flow rates. Also, list all raw materials charged to process equipment, and the amounts charged (tons/hour, etc.) at rated capacity (give maximum, minimum and average charges describing fully expected variations in production rates). Indicate (on diagram) all points where contaminants are controlled (location of water sprays, collection hoods, or other pickup points, etc.). Describe collection hoods location, design, airflow and capture efficiency. Describe any restriction requested and how it will be monitored.
Not applicable - only flows are diesel fuel and combustion air and exhaust gas out.
REC requests restricting operating hours to 250 hour per year. Hours will be monitored with a non-resettable hour meter and recorded.
Describe fully the facilities provided to monitor and to record process operating conditions, which may affect the emission of air contaminants. Show that they are reasonable and adequate.
Non-resettable hour meter will be installed to monitor operating hours. REC will maintain records of hours operated and reason for operation.
Describe each proposed modification to an existing source.
Not applicable
Identify and describe all fugitive emission points, all relief and emergency valves and any by-pass stacks.
The only emissions that might be considered fugitive are from the relief vent on the diesel storage tank.
Describe how emissions will be minimized especially during start up, shut down, process upsets and/or disruptions.
Diesel engine will be started up and shut down according to manufacturer instructions. Engine will be run weekly for 30 minutes or less for testing purposes. Otherwise, engine will be operated for emergency purposes only (loss of plant power supply).
Anticipated Milestones:
i. Expected commencement date of construction/reconstruction/installation: October 2020
ii. Expected completion date of construction/reconstruction/installation: January 2023
iii. Anticipated date of start-up: April – November 2023

2700-PM-AQ0007 Rev. 7/2004
- 5 -
Section C - Air Cleaning Device
1. Precontrol Emissions*
Pollutant
Maximum Emission Rate Calculation/ Estimation
Method Specify Units Pounds/Hour Hours/Year Tons/Year
PM 0.052 250 0.0065 vendor
PM10 0.052 250 0.0065 vendor
SOx 0.0025 250 0.00032 fuel sulfur
CO 0.47 250 0.059 vendor
NOx 1.41 250 0.18 vendor
VOC 0.052 250 0.0065 vendor
Others: (e.g., HAPs) ----- ----- ----- ----- -----
total HAPs 7.79E-04 AP-42 factors
* These emissions must be calculated based on the requested operating schedule and/or process rate, e.g., operating schedule for maximum limits or restricted hours of operation and/or restricted throughput. Describe how the emission values were determined. Attach calculations.
2. Gas Cooling
Water quenching Yes No Water injection rate GPM
Radiation and convection cooling
Yes No
Air dilution Yes No
If yes, CFM
Forced Draft Yes No Water cooled duct work Yes No
Other
Inlet Volume ACFM
@ °F % Moisture
Outlet Volume ACFM
@ °F % Moisture
Describe the system in detail.

2700-PM-AQ0007 Rev. 7/2004
- 6 -
Section C - Air Cleaning Device (Continued)
3. Settling Chambers NOT APPLICABLE Manufacturer
Volume of gas handled
ACFM
@ °F
Gas velocity (ft/sec.)
Length of chamber (ft.)
Width of chamber (ft.)
Height of chamber (ft.)
Number of trays
Water injection Yes No Water injection rate (GPM)
Emissions Data
Inlet Outlet Removal Efficiency (%)
4. Inertial and Cyclone Collectors
Manufacturer
Type
Model No.
Pressure drop (in. of water)
Inlet volume ACFM
@ °F
Outlet volume ACFM
@ °F
Number of individual cyclone(s)
Outlet straightening vanes used?
Yes No
Length of Cyclone(s) Cylinder (ft.)
Diameter of Cyclone(s) Cylinder (ft.)
Length of Cyclone(s) cone (ft.)
Inlet Diameter (ft.) or duct area (ft.2) of cyclone(s)
Outlet Diameter (ft.) or duct area (ft.2) of cyclone(s)
If a multi-clone or multi-tube unit is installed, will any of the individual cyclones or cyclone tubes be blanked or blocked off?
Describe any exhaust gas recirculation loop to be employed.
Attach particle size efficiency curve
Emissions Data
Inlet Outlet Removal Efficiency (%)

2700-PM-AQ0007 Rev. 7/2004
- 7 -
Section C - Air Cleaning Device (Continued)
5. Fabric Collector NOT APPLICABLE
Equipment Specifications
Manufacturer
Model No.
Pressurized Design
Suction Design
Number of Compartments
Number of Filters Per Compartment
Is Baghouse Insulated?
Yes No
Can each compartment be isolated for repairs and/or filter replacement?
Yes No
Are temperature controls provided? (Describe in detail)
Yes No
Dew point at maximum moisture °F Design inlet volume SCFM
Type of Fabric
Material Felted Membrane
Weight oz/sq.yd Woven Others: List:
Thickness in Felted-Woven
Fabric permeability (clean) @ ½” water-∆ P CFM/sq.ft.
Filter dimensions Length Diameter/Width
Effective area per filter Maximum operating temperature (°F)
Effective air to cloth ratio Minimum Maximum
Drawing of Fabric Filter
A sketch of the fabric filter showing all access doors, catwalks, ladders and exhaust ductwork, location of each pressure and temperature indicator should be attached.
Operation and Cleaning
Volume of gases handled
ACFM @ °F
Pressure drop across collector (in. of water). Describe the equipment to be used to monitor the pressure drop.
Type of filter cleaning Manual Cleaning Bag Collapse Reverse Air Jets Mechanical Shakers Sonic Cleaning Other: Pneumatic Shakers Reverse Air Flow
Describe the equipment provided if dry oil free air is required for collector operation
Cleaning Initiated By Timer Frequency if timer actuated
Expected pressure drop range in. of water Other Specify
Does air cleaning device employ hopper heaters, hopper vibrators or hopper level detectors? If yes, describe.
Describe the warning/alarm system that protects against operation when the unit is not meeting design requirements.
Emissions Data
Pollutant Inlet Outlet Removal Efficiency (%)

2700-PM-AQ0007 Rev. 7/2004
- 8 -
Section C - Air Cleaning Device (Continued)
6. Wet Collection Equipment NOT APPLICABLE
Equipment Specifications
Manufacturer
Type
Model No.
Design Inlet Volume (SCFM)
Relative Particulate/Gas Velocity (ejector scrubbers only)
Describe the internal features (e.g., variable throat, gas/liquid diffusion plates, spray nozzles, liquid redistributors, bed limiters, etc.).
Describe pH monitoring and pH adjustment systems, if applicable.
Describe mist eliminator or separator (type, configuration, backflush capability, frequency).
Attach particulate size efficiency curve.
Operating Parameters
Inlet volume of gases handled (ACFM)
@ °F
Outlet volume of gases handled (ACFM)
@ °F % Moisture
Liquid flow rates. Describe equipment provided to measure liquid flow rates to scrubber (e.g., quenching section, recirculating solution, makeup water, bleed flow, etc.)
Describe scrubber liquid supply system (amount of make-up and recirculating liquid, capacity of recirculating liquid system, etc.)
State pressure drop range (in water) across scrubber (e.g., venturi throat, packed bed, etc.) only. Describe the equipment provide to measure the pressure drop. Do not include duct or de-mister losses.
Describe the warning/alarm system that protects against operation when unit is not meeting design requirements.
Emissions Data
Pollutant Inlet Outlet Removal Efficiency (%)

2700-PM-AQ0007 Rev. 7/2004
- 9 -
Section C - Air Cleaning Device (Continued)
7. Electrostatic Precipitator NOT APPLICABLE
Equipment Specifications
Manufacturer
Model No.
Wet Dry
Single-Stage Two-Stage
Gas distribution grids Yes No Design Inlet Volume (SCFM)
Maximum operating temperature (°F)
Total collecting surface area sq. ft. Collector plates size length ft. x width ft.
Number of fields Number of collector plates/field
Spacing between collector plates inches.
Maximum gas velocity ft./sec. Minimum gas treatment time: sec.
Total discharge electrode length ft.
Number of discharge electrodes Number of collecting electrode rappers
Rapper control Magnetic Pneumatic Other Describe in detail
Operating Parameters
Inlet gas temperature (°F)
Outlet gas temperature (°F)
State pressure drop range (inches water gauge) across collector only
Describe the equipment
Volume of gas handled (ACFM) Dust resistivity (ohm-cm). Will resistivity vary?
Power requirements
Number and size of Transformer Rectifier sets by electrical field
Field No. No. of Sets Each Transformer
KVA Each Rectifier
KV Ave./Peak Ma DC
Current Density
Micro amperes/ft2.
Corona Power
Watts/1000 ACFM
Corona Power Density
Watts/ft2.
Will a flue gas conditioning system be employed? If yes, describe it.
Does air cleaning device employ hopper heaters, hopper vibrators or hopper level detectors? If yes, describe.
Describe the warning/alarm system that protects against operation when unit is not meeting design requirements.
Emissions Data
Pollutant Inlet Outlet Removal Efficiency (%)

2700-PM-AQ0007 Rev. 7/2004
- 10 -
Section C - Air Cleaning Device (Continued)
8. Adsorption Equipment NOT APPLICABLE
Equipment Specifications
Manufacturer
Type
Model No.
Design Inlet Volume (SCFM)
Adsorbent charge per adsorber vessel and number of adsorber vessels
Length of Mass Transfer Zone (MTZ), supplied by the manufacturer based upon laboratory data.
Adsorber diameter (ft.) and area ft2.)
Adsorption bed depth (ft.)
Adsorbent information
Adsorbent type and physical properties.
Working capacity of adsorbent (%)
Heel percent or unrecoverable solvent weight % in the adsorbent after regeneration.
Operating Parameters
Inlet volume of gases handled (ACFM) @ °F
Adsorption time per adsorption bed
Breakthrough capacity:
Lbs. of solvent / 100 lbs. of adsorbent =
Vapor pressure of solvents at the inlet temperature
Available steam in pounds to regenerate carbon adsorber (if applicable)
Percent relative saturation of each solvent at the inlet temperature
Attach any additional data including auxiliary equipment and operation details to thoroughly evaluate the control equipment.
Describe the warning/alarm system that protects against operation when unit is not meeting design requirements.
Emissions Data
Pollutant Inlet Outlet Removal Efficiency (%)

2700-PM-AQ0007 Rev. 7/2004
- 11 -
Section C - Air Cleaning Device (Continued)
9. Absorption Equipment NOT APPLICABLE
Equipment Specifications
Manufacturer
Type
Model No.
Design Inlet Volume (SCFM)
Tower height (ft.) and inside diameter (ft.)
Packing type and size (if applicable)
Height of packing (ft.) (if applicable)
Number of trays (if applicable)
Number of bubble caps (if applicable)
Configuration
Counter-current Cross flow Cocurrent flow
Describe pH and/or other monitoring and controls.
Absorbent information
Absorbent type and concentration.
Retention time (sec.)
Attach equilibrium data for absorption (if applicable)
Attach any additional information regarding auxiliary equipment, absorption solution supply system (once through or recirculating, system capacity, etc.) to thoroughly evaluate the control equipment. Indicate the flow rates for makeup, bleed and recirculation.
Operating Parameters
Volume of gas handled (ACFM)
Inlet temperature (°F)
Pressure drop (in. of water) and liquid flow rate. Describe the monitoring equipment.
State operating range for pH and/or absorbent concentration in scrubber liquid.
Describe the warning/alarm system that protects against operation when unit is not meeting design requirements.
Emissions Data
Pollutant Inlet Outlet Removal Efficiency (%)

2700-PM-AQ0007 Rev. 7/2004
- 12 -
Section C - Air Cleaning Device (Continued)
10. Selective Catalytic Reduction (SCR)
Selective Non-Catalytic Reduction (SNCR)
Non-Selective Catalytic Reduction (NSCR) NOT APPLICABLE
Equipment Specifications
Manufacturer
Type
Model No.
Design Inlet Volume (SCFM)
Design operating temperature (°F)
Is the system equipped with process controls for proper mixing/control of the reducing agent in gas stream? If yes, give details.
Attach efficiency and other pertinent information (e.g., ammonia slip)
Operating Parameters
Volume of gases handled (ACFM) @ °F
Operating temperature range for the SCR/SNCR/NSCR system (°F) From °F To °F
Reducing agent used, if any
Oxidation catalyst used, if any
State expected range of usage rate and concentration.
Service life of catalyst
Ammonia slip (ppm)
Describe fully with a sketch giving locations of equipment, controls systems, important parameters and method of operation.
Describe the warning/alarm system that protects against operation when unit is not meeting design requirements.
Emissions Data
Pollutant Inlet Outlet Removal Efficiency (%)

2700-PM-AQ0007 Rev. 7/2004
- 13 -
Section C - Air Cleaning Device (Continued)
11. Oxidizer/Afterburners NOT APPLICABLE
Equipment Specifications
Manufacturer
Type Thermal Catalytic Model No.
Design Inlet Volume (SCFM)
Combustion chamber dimensions (length, cross-sectional area, effective chamber volume, etc.)
Describe design features, which will ensure mixing in combustion chamber.
Describe method of preheating incoming gases (if applicable).
Describe heat exchanger system used for heat recovery (if applicable).
Catalyst used
Life of catalyst
Expected temperature rise across catalyst (°F)
Dimensions of bed (in inches).
Height:
Diameter or Width:
Depth:
Are temperature sensing devices being provided to measure the temperature rise across the catalyst? Yes No
If yes, describe.
Describe any temperature sensing and/or recording devices (including specific location of temperature probe in a drawing or sketch.
Burner Information
Burner Manufacturer
Model No.
Fuel Used
Number and capacity of burners
Rated capacity (each)
Maximum capacity (each)
Describe the operation of the burner
Attach dimensioned diagram of afterburner
Operating Parameters
Inlet flow rate (ACFM) @ °F Outlet flow rate (ACFM) @ °F
State pressure drop range across catalytic bed (in. of water).
Describe the method adopted for regeneration or disposal of the used catalyst.
Describe the warning/alarm system that protects against operation when unit is not meeting design requirements.
Emissions Data
Pollutant Inlet Outlet Removal Efficiency (%)

2700-PM-AQ0007 Rev. 7/2004
- 14 -
Section C - Air Cleaning Device (Continued)
12. Flares NOT APPLICABLE
Equipment Specifications
Manufacturer
Type Elevated flare Ground flare
Other Describe
Model No.
Design Volume (SCFM)
Dimensions of stack (ft.)
Diameter Height
Residence time (sec.) and outlet temperature (°F)
Turn down ratio
Burner details
Describe the flare design (air/steam-assisted or nonassisted), essential auxiliaries including pilot flame monitor of proposed flare with a sketch.
Describe the operation of the flare’s ignition system.
Describe the provisions to introduce auxiliary fuel to the flare.
Operation Parameters
Detailed composition of the waste gas
Heat content
Exit velocity
Maximum and average gas flow burned (ACFM)
Operating temperature (°F)
Describe the warning/alarm system that protects against operation when unit is not meeting design requirements.
Emissions Data
Pollutant Inlet Outlet Removal Efficiency (%)

2700-PM-AQ0007 Rev. 7/2004
- 15 -
Section C - Air Cleaning Device (Continued)
13. Other Control Equipment NOT APPLICABLE
Equipment Specifications
Manufacturer
Type
Model No.
Design Volume (SCFM)
Capacity
Describe pH monitoring and pH adjustment, if any.
Indicate the liquid flow rate and describe equipment provided to measure pressure drop and flow rate, if any.
Attach efficiency curve and/or other efficiency information.
Attach any additional date including auxiliary equipment and operation details to thoroughly evaluate the control equipment.
Operation Parameters
Volume of gas handled
ACFM @ °F % Moisture
Describe fully giving important parameters and method of operation.
Describe the warning/alarm system that protects against operation when unit is not meeting design requirements.
Emissions Data
Pollutant Inlet Outlet Removal Efficiency (%)

2700-PM-AQ0007 Rev. 7/2004
- 16 -
Section C - Air Cleaning Device (Continued)
14. Costs NOT APPLICABLE
Indicate cost associated with air cleaning device and its operating cost (attach documentation if necessary)
Device Direct Cost Indirect Cost Total Cost Annual Operating Cost
15. Miscellaneous
Describe in detail the removal, handling and disposal of dust, effluent, etc. from the air cleaning device including proposed methods of controlling fugitive emissions.
Attach manufacturer’s performance guarantees and/or warranties for each of the major components of the control system (or complete system).
Attach the maintenance schedule for the control equipment and any part of the process equipment that if in disrepair would increase air contaminant emissions.

2700-PM-AQ0007 Rev. 7/2004
- 17 -
Section D - Additional Information
Will the construction, modification, etc. of the sources covered by this application increase emissions from other sources at the facility? If so, describe and quantify.
Not applicable - new facility
If this project is subject to any one of the following, attach a demonstration to show compliance with applicable standards.
a. Prevention of Significant Deterioration permit (PSD), 40 CFR 52? YES NO
b. New Source Review (NSR), 25 Pa. Code Chapter 127, Subchapter E? YES NO
c. New Source Performance Standards (NSPS), 40 CFR Part 60? YES NO
(If Yes, which subpart) KKKK, Dc, IIII, TTTT
d. National Emissions Standards for Hazardous Air Pollutants (NESHAP), YES NO
40 CFR Part 61? (If Yes, which subpart)
e. Maximum Achievable Control Technology (MACT) 40 CFR Part 63? YES NO
(If Yes, which part) ZZZZ
Attach a demonstration showing that the emissions from any new sources will be the minimum attainable through the use of best available technology (BAT).
See Section 3 of Plan Approval Application
Provide emission increases and decreases in allowable (or potential) and actual emissions within the last five (5) years for applicable PSD pollutant(s) if the facility is an existing major facility (PSD purposes).
Not applicable - new facility

2700-PM-AQ0007 Rev. 7/2004
- 18 -
Section D - Additional Information (Continued)
Indicate emission increases and decreases in tons per year (tpy), for volatile organic compounds (VOCs) and nitrogen oxides (NOx) for NSR applicability since January 1, 1991 or other applicable dates (see other applicable dates in instructions). The emissions increases include all emissions including stack, fugitive, material transfer, other emission generating activities, quantifiable emissions from exempted source(s), etc.
Permit number
(if applicable) Date
issued
Indicate Yes or No if
emission increases and
decreases were used
previously for netting Source I. D. or Name
VOCs NOx
Emission increases
in potential to emit
(tpy)
Creditable emission
decreases in actual
emissions (tpy)
Emission increases
in potential to emit
(tpy)
Creditable emission
decreases in actual
emissions (tpy)
If the source is subject to 25 Pa. Code Chapter 127, Subchapter E, New Source Review requirements, a. Identify Emission Reduction Credits (ERCs) for emission offsets or demonstrate ability to obtain suitable ERCs for
emission offsets. See Appendix Q of Plan Approval Application. b. Provide a demonstration that the lowest achievable emission rate (LAER) control techniques will be employed (if
applicable). See Section 3 of Plan Approval Application c. Provide an analysis of alternate sites, sizes, production processes and environmental control techniques demonstrating
that the benefits of the proposed source outweigh the environmental and social costs (if applicable).
See Section 1 of Plan Approval Application.
Attach calculations and any additional information necessary to thoroughly evaluate compliance with all the applicable requirements of Article III and applicable requirements of the Clean Air Act adopted thereunder The Department may request additional information to evaluate the application such as a standby plan, a plan for air pollution emergencies, air quality modeling, etc. See Section 2 and Appendix D of Plan Approval Application.

2700-PM-AQ0007 Rev. 7/2004
- 19 -
Section E - Compliance Demonstration
Note: Complete this section if source is not a Title V facility. Title V facilities must complete Addendum A.
Method of Compliance Type: Check all that apply and complete all appropriate sections below
Monitoring Testing Reporting
Recordkeeping Work Practice Standard
Monitoring:
a. Monitoring device type (Parameter, CEM, etc):
b. Monitoring device location:
c. Describe all parameters being monitored along with the frequency and duration of monitoring each parameter:
Testing:
a. Reference Test Method: Citation
b. Reference Test Method: Description
Recordkeeping:
Describe what parameters will be recorded and the recording frequency:
Reporting:
a. Describe what is to be reported and frequency of reporting:
b. Reporting start date:
Work Practice Standard:
Describe each:

2700-PM-AQ0007 Rev. 7/2004
- 20 -
Section F - Flue and Air Contaminant Emission
1. Estimated Atmospheric Emissions*
Pollutant
Maximum emission rate Calculation/
Estimation Method specify units lbs/hr tons/yr.
PM 0.052 0.0065 vendor data
PM10 0.052 0.0065 vendor data
SOx 0.0025 0.00032 fuel sulfur limit
CO 0.47 0.059 vendor data
NOx 1.41 0.18 vendor data
VOC 0.052 0.0065 vendor data
Others: ( e.g., HAPs) ----- ----- ----- -----
total HAPs 7.79E-4 AP-42 emission factors
* These emissions must be calculated based on the requested operating schedule and/or process rate e.g., operating schedule for maximum limits or restricted hours of operation and /or restricted throughput. Describe how the emission values were determined. Attach calculations.
2. Stack and Exhauster
Stack Designation/Number Stack6
List Source(s) or source ID exhausted to this stack:
ENG2
% of flow exhausted to stack: 100
Stack height above grade (ft.) 16 Grade elevation (ft.) 670
Stack diameter (ft) or Outlet duct area (sq. ft.)
0.42
f. Weather Cap
YES NO
Distance of discharge to nearest property line (ft.). Locate on topographic map.
145
Does stack height meet Good Engineering Practice (GEP)?
No
If modeling (estimating) of ambient air quality impacts is needed, attach a site plan with buildings and their dimensions and other obstructions.
Location of stack**
Latitude/Longitude Latitude Longitude
Point of Origin Degrees Minutes Seconds Degrees Minutes Seconds
Stack6 41 19 38.31 77 45 25.74
Stack exhaust
Volume TBD ACFM Temperature TBD °F Moisture TBD %
Indicate on an attached sheet the location of sampling ports with respect to exhaust fan, breeching, etc. Give all necessary dimensions.
Exhauster (attach fan curves) NA in. of water HP @ RPM.
** If the data and collection method codes differ from those provided on the General Information Form-Authorization Application, provide the additional detail required by that form on a separate form.

2700-PM-AQ0007 Rev. 7/2004
- 21 -
Section G - Attachments
Number and list all attachments submitted with this application below:
See Table of Contents of Plan Approval Application.


2700-PM-AQ0021 Rev. 6/2004
- 2 -
Section B - Combustion Unit Information
1. Combustion Units: Coal Oil Natural Gas Other:
Description: two identical auxilary boilers
Manufacturer Cleaver Brooks or similar
Model No. TBD
Number of units 2
Maximum heat input (Btu/hr) 66 MMBtu/hr
Rated heat input (Btu/hr) 66 MMBtu/hr
Typical heat input (Btu/hr) 66 MMBtu/hr
Furnace Volume TBD
Grate Area (if applicable) NA
Method of firing NA
Indicate how combustion air is supplied to boiler outdoor air supply
Indicate the Steam Usage: Steam is provided to steam turbine and auxiliary steam system on start-up, during maintenance shutdown, and for the steam turbine sealing system.
Mark and describe soot Cleaning Method: i. Air Blown ii. Steam Blown iii. Brushed and Vacuumed
iv. Other v. Frequency of Cleaning
Maximum Operating schedule
Hours/Day NA
Days/Week NA
Days/Year NA
Hours/Year NA
Operational restrictions taken or requested, if any (e.g., bottlenecks or voluntary restrictions to limit potential to emit)
Capacity (specify units)
Per hour 66 MMBtu/hr per unit
Per day 1,584 MMBtu/day per unit
Per week 11,088 MMBtu/week per unit
Per year 145,200 MMBtu/yr total both boilers (limit)
Typical Operating schedule
Hours/Day as needed
Days/Week as needed
Days/Year as needed
Hours/Year as needed
Seasonal variations (Months): If variations exist, describe them. Operating using primary fuel: NA From to Operating using secondary fuel: Form to Non-operating: From to
2. Specify the primary, secondary and startup fuel. Furnish the details in item 3. primary fuel is natural gas; no secondary fuel

2700-PM-AQ0021 Rev. 6/2004
- 3 -
Section B - Combustion Unit Information (Continued)
3. Fuel
Type Quantity Hourly Annually Sulfur
% Ash (Weight) BTU Content
Oil Number
GPH @ 60°F
X 103 Gal
% by wt
Btu/Gal. & Lbs./Gal. @ 60 °F
Oil Number
GPH @ 60°F
X 103 Gal
% by wt
Btu/Gal. & Lbs./Gal. @ 60 °F
Oil Number
GPH @ 60°F
X 103 Gal
% by wt
Btu/Gal. & Lbs./Gal. @ 60 °F
Natural Gas primary
64,706 SCFH
142.353 cf X
106
0.4 gr/100 SCF 0
1020 Btu/SCF
Gas (other)
SCFH
X 106
Gal
gr/100
SCF
Btu/SCF
Coal
Other*
* Note: Describe and furnish information separately for other fuels in Addendum B.
4. Burner
Manufacturer TBD
Model Number TBD
Type of Atomization (Steam, air, press, mech., rotary cup) NA
Number of Burners 1
Maximum fuel firing rate (all burners) 64,706 cfh
Normal fuel firing rate varies
If oil, temperature and viscosity. NA
Maximum theoretical air requirement TBD
Percent excess air 100% rating TBD
Turndown ratio TBD
Combustion modulation control (on/off, low-high fire, full automatic, manual). Describe. TBD
Main burner flame ignition method (electric spark, auto gas pilot, hand-held torch, other). Describe. spark ignition
5. Nitrogen Oxides (NOx) control Options
Mark and describe the NOx control options adopted
Low excess air (LEA) Over fire air (OFA) Low-NOx burner X Low NOx burners with over fire
air
Flue gas recirculation X Burner out of service Reburning Flue gas treatment (SCR /
SNCR)
Other.

2700-PM-AQ0021 Rev. 6/2004
- 4 -
Section B - Combustion Unit Information (Continued)
6. Miscellaneous Information
Describe fly ash reinjection operation Not applicable
Describe, in detail, the equipment provided to monitor and to record the source(s) operating conditions, which may affect emissions of air contaminants. Show that they are reasonable and adequate.
TBD
Describe each proposed modification to an existing source.
New source - not applicable
Describe how emissions will be minimized especially during start up, shut down, combustion upsets and/or disruptions. Provide emission estimates for start up, shut down and upset conditions. Provide duration of start up and shut down.
Not applicable
Describe in detail with a schematic diagram of the control options adopted for SO2 (if applicable).
Not applicable
Anticipated milestones:
Expected commencement date of construction/reconstruction: October 2020
Expected completion date of construction/reconstruction: January 2023
Anticipated date(s) of start-up: April – November 2023
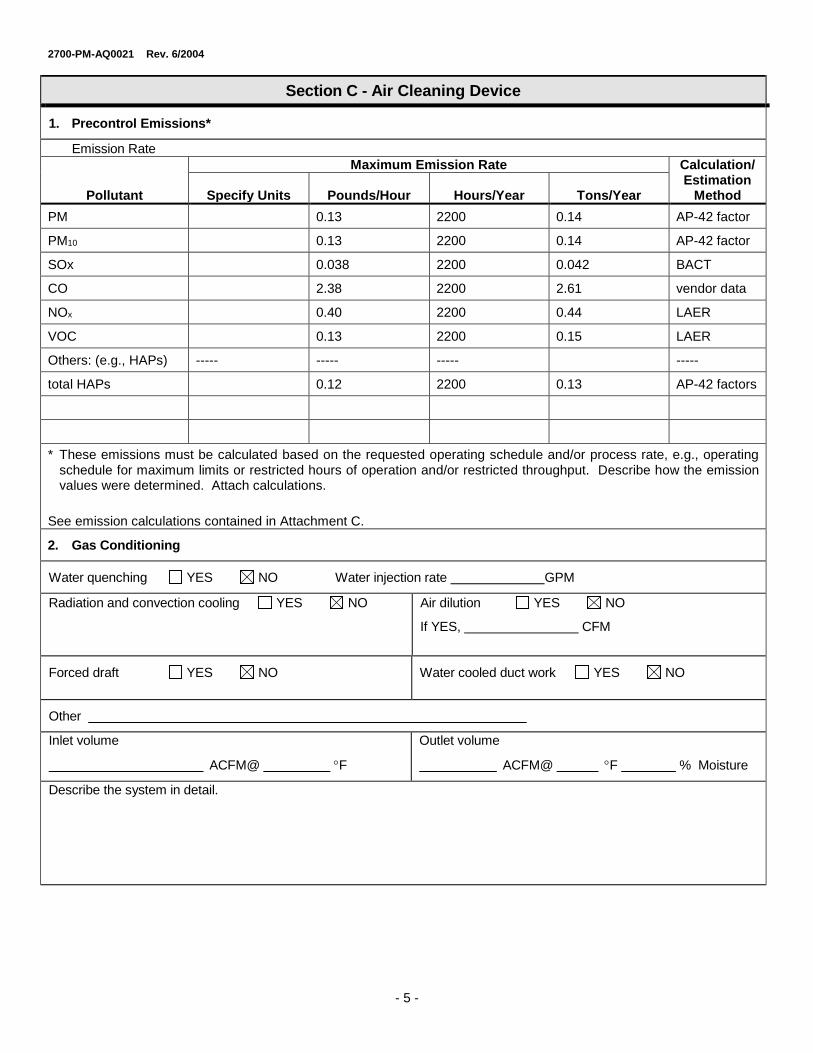
2700-PM-AQ0021 Rev. 6/2004
- 5 -
Section C - Air Cleaning Device
1. Precontrol Emissions*
Emission Rate
Pollutant
Maximum Emission Rate Calculation/ Estimation
Method Specify Units Pounds/Hour Hours/Year Tons/Year
PM 0.13 2200 0.14 AP-42 factor
PM10 0.13 2200 0.14 AP-42 factor
SOx 0.038 2200 0.042 BACT
CO 2.38 2200 2.61 vendor data
NOx 0.40 2200 0.44 LAER
VOC 0.13 2200 0.15 LAER
Others: (e.g., HAPs) ----- ----- ----- -----
total HAPs 0.12 2200 0.13 AP-42 factors
* These emissions must be calculated based on the requested operating schedule and/or process rate, e.g., operating schedule for maximum limits or restricted hours of operation and/or restricted throughput. Describe how the emission values were determined. Attach calculations.
See emission calculations contained in Attachment C.
2. Gas Conditioning
Water quenching YES NO Water injection rate GPM
Radiation and convection cooling YES NO Air dilution YES NO
If YES, CFM
Forced draft YES NO Water cooled duct work YES NO
Other
Inlet volume
ACFM@ °F
Outlet volume
ACFM@ °F % Moisture
Describe the system in detail.

2700-PM-AQ0021 Rev. 6/2004
- 6 -
Section C - Air Cleaning Device (Continued)
3. Inertial and Cyclone Collectors NOT APPLICABLE
Manufacturer
Type
Model No.
Pressure Drop (in. of water)
Inlet Volume
ACFM @ °F
Outlet Volume
ACFM @ °F % Moisture
Number of Individual Cyclone(s) Outlet Straightening Vanes Used? Yes No
Length of Cyclone(s) Cylinder (ft)
Diameter of Cyclone(s) Cylinder
Length of cyclone(s) cone (ft)
Inlet Diameter (ft) or Duct Area (ft2) of Cyclone(s) Outlet Diameter (ft) or Duct area (ft2) of cyclone(s)
If a multi-clone or multi-tube unit is installed, will any of the individual cyclones or cyclone tubes be blanked or blocked off?
Describe any exhaust gas recirculation loop to be employed.
Attach particle size efficiency curve
Emission data
Inlet Outlet Removal Efficiency (%)

2700-PM-AQ0021 Rev. 6/2004
- 7 -
Section C - Air Cleaning Device (Continued)
4. Fabric Collector NOT APPLICABLE
Equipment Specifications
Manufacturer
Model No. Pressurized Design
Suction Design
Number of Compartments
Number of Filters Per Compartment
Is Baghouse Insulated?
Yes No
Can each compartment be isolated for repairs and/or filter replacement?
Yes No
Are temperature controls provided? (Describe in detail)
Yes No
Dew point at maximum moisture °F Design inlet volume SCFM
Type of Fabric
Material Felted Membrane
Weight oz/sq.yd Woven Others: List:
Thickness in Felted-Woven
Fabric permeability (clean) @ ½” water-∆ P CFM/sq.ft.
Filter dimensions Diameter/Width
Effective area per filter Maximum operating temperature (°F)
Effective air to cloth ratio Minimum Maximum
Drawing of Fabric Filter
A sketch of the fabric filter showing all access doors, catwalks, ladders and exhaust ductwork, location of each pressure and temperature indicator should be attached.
Operation and Cleaning
Volume of gases handled
ACFM °F
Pressure drop across collector (in. of water). Describe the equipment to be used to monitor the pressure drop.
Type of filter cleaning Manual Cleaning Bag Collapse Reverse Air Jets Mechanical Shakers Sonic Cleaning Other: Pneumatic Shakers Reverse Air Flow
If compressed air is required for collector operation, describe the equipment with the compressor to provide dry air free from oil.
Cleaning Initiated By Timer Frequency if timer actuated
Expected pressure drop range in. of water Other Specify
Does air cleaning device employ hopper heaters, hopper vibrators or hopper level detectors? If yes, describe.
Describe the warning/alarm system that protects against operation when the unit is not meeting design requirements.
Emissions Data
Pollutant Inlet Outlet Removal Efficiency (%)

2700-PM-AQ0021 Rev. 6/2004
- 8 -
Section C - Air Cleaning Device (Continued)
5. Wet Collection Equipment: NOT APPLICABLE
Equipment Specifications
Manufacturer
Type
Model No.
Design Inlet Volume (SCFM)
Relative Particulate/Gas Velocity (ejector scrubbers only)
Describe the internal features (e.g., variable throat, gas/liquid diffusion plates, spray nozzles, liquid redistributors, bed limiters, etc.).
Describe pH monitoring and pH adjustment systems, if applicable.
Describe mist eliminator or separator (type, configuration, backflush capability, frequency).
Attach particulate size efficiency curve.
Operating Parameters
Inlet volume of gases handled (ACFM)
@ °F
Outlet volume of gases handled (ACFM)
@ °F % Moisture
Liquid flow rates. Describe equipment provided to measure liquid flow rates to scrubber (e.g., quenching section, recirculating solution, makeup water, bleed flow, etc.)
Describe scrubber liquid supply system (amount of make-up and recirculating liquid, capacity of recirculating liquid system, etc).
State pressure drop range (in water) across scrubber (e.g., venturi throat, packed bed, etc.) only. Describe the equipment provide to measure the pressure drop. Do not include duct or de-mister losses.
Describe the warning/alarm system that protects against operation when unit is not meeting design requirements.
Emissions Data
Pollutant Inlet Outlet Removal Efficiency (%)

2700-PM-AQ0021 Rev. 6/2004
- 9 -
Section C - Air Cleaning Device (Continued)
6. Electrostatic Precipitator NOT APPLICABLE
Equipment specifications
Manufacturer
Model No.
Wet Dry
Single-Stage Two-Stage
Gas distribution grids YES NO
Design inlet volume (SCFM) Maximum operating temperature (°F)
Total collecting surface area sq. ft. Collector plates size length ft. x width ft.
Number of fields Number of collector plates/field . Spacing between collector plates inches.
Maximum gas velocity ft/sec. Minimum gas treatment time: sec.
Total discharge electrode length ft.
Number of discharge electrodes Number collecting electrode rappers
Rapper control Magnetic Pneumatic Other
Describe in detail
Operating parameters
Inlet gas temperature (°F)
Outlet gas temperature (°F)
State pressure drop range (water gauge) across collector only. Describe the equipment.
Volume of gas handled (ACFM) Dust resistivity (ohm-cm). Will resistivity vary?
Power requirements
Number and size of Transformer Rectifier sets by electrical field
Field No. No. of Sets Each Transformer
KVA
Each Rectifier
KV Ave./Peak MaDC
Current density Micro amperes/ft2
Corona power Watts/1000 ACFM
Corona power density Watts/ft2
Will a flue gas conditioning system be employed? If yes, describe it.
Does air cleaning device employ hopper heaters, hopper vibrators or hopper level detectors? If yes, describe.
Describe the warning/alarm system that protects against operation when unit is not meeting design requirements.
Emissions data
Pollutant Inlet Outlet Removal Efficiency (%)

2700-PM-AQ0021 Rev. 6/2004
- 10 -
Section C - Air Cleaning Device (Continued)
7. Absorption Equipment: NOT APPLICABLE
Equipment specifications
Manufacturer
Type
Model No
Design inlet volume (SCFM)
Tower height (ft) and inside diameter (ft)
Packing type and size (if applicable)
Height of packing (ft) (if applicable)
Number of trays (if applicable)
Number of bubble caps (if applicable)
Configuration: Counter-current Cross flow Cocurrent flow
Describe pH and/or other monitoring and controls
Absorbent information
Absorbent type and concentration
Sorbent injection rate
Retention time (sec)
Attach equilibrium data for absorption (If applicable).
Attach any additional information regarding auxiliary equipment, reagent (slurry mix) supply system (once through or recirculating, system capacity, etc) to thoroughly evaluate the control equipment. Indicate the flow rates for makeup, bleed and recirculation.
Operating parameters
Volume of gas handled (ACFM)
Inlet temperature (°F)
Pressure drop (in of water) and liquid flow rate. Describe the equipment.
State operating range for pH and/or absorbent concentration in scrubber liquid.
Describe the warning/alarm system that protects against operation when unit is not meeting design requirements.
Emissions data
Pollutant Inlet Outlet Removal Efficiency (%)
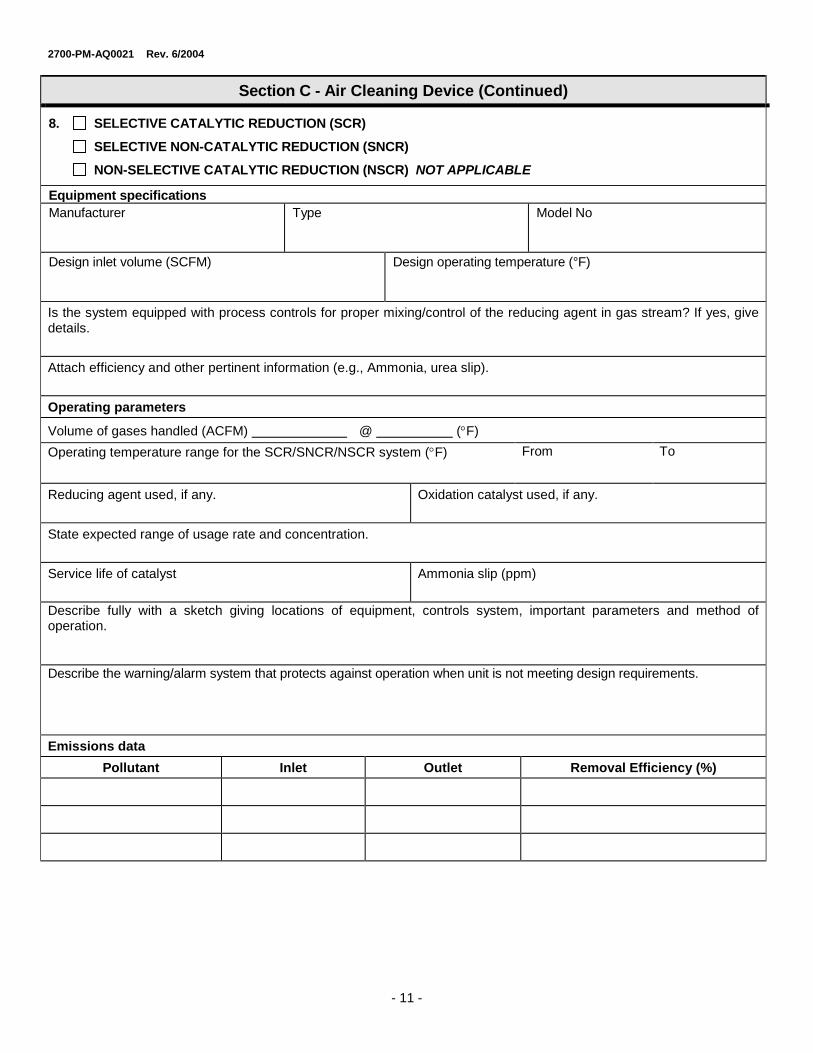
2700-PM-AQ0021 Rev. 6/2004
- 11 -
Section C - Air Cleaning Device (Continued)
8. SELECTIVE CATALYTIC REDUCTION (SCR)
SELECTIVE NON-CATALYTIC REDUCTION (SNCR)
NON-SELECTIVE CATALYTIC REDUCTION (NSCR) NOT APPLICABLE
Equipment specifications
Manufacturer
Type
Model No
Design inlet volume (SCFM)
Design operating temperature (°F)
Is the system equipped with process controls for proper mixing/control of the reducing agent in gas stream? If yes, give details.
Attach efficiency and other pertinent information (e.g., Ammonia, urea slip).
Operating parameters
Volume of gases handled (ACFM) @ (°F)
Operating temperature range for the SCR/SNCR/NSCR system (°F)
From
To
Reducing agent used, if any.
Oxidation catalyst used, if any.
State expected range of usage rate and concentration.
Service life of catalyst
Ammonia slip (ppm)
Describe fully with a sketch giving locations of equipment, controls system, important parameters and method of operation.
Describe the warning/alarm system that protects against operation when unit is not meeting design requirements.
Emissions data
Pollutant Inlet Outlet Removal Efficiency (%)

2700-PM-AQ0021 Rev. 6/2004
- 12 -
Section C - Air Cleaning Device (Continued)
9. Other Control Equipment: NOT APPLICABLE
Equipment specifications
Manufacturer
Type
Model No
Design inlet volume (SCFM)
Capacity
Describe pH monitoring and pH adjustment, if any.
Indicate the liquid flow rate and describe equipment provided to measure pressure drop and flow rate, if any.
Attach efficiency curve and/ or other efficiency information.
Attach any additional data including auxiliary equipment and operation details to thoroughly evaluate the control equipment.
Operating parameters
Volume of gas handled
@ °F % Moisture
Describe, in detail, important parameters and method of operation.
Describe the warning/alarm system that protects against operation when unit is not meeting design requirements.
Emissions data
Pollutant Inlet Outlet Removal Efficiency (%)

2700-PM-AQ0021 Rev. 6/2004
- 13 -
Section C - Air Cleaning Device (Continued)
10. Costs NOT APPLICABLE
Indicate cost associated with air cleaning device and its operating cost (attach documentation if necessary)
Device Direct Cost Indirect Cost Total Cost Operating Cost
11 MISCELLANEOUS
Describe in detail the removal, handling and disposal of dust, effluent, etc. from the air cleaning device including proposed methods of controlling fugitive emissions.
Attach manufacturer's performance guarantees and/or warranties for each of the major components of the control system (or complete system).
Attach the maintenance schedule for the control equipment and any part of the process equipment that, if in disrepair, would increase air contaminant emissions.

2700-PM-AQ0021 Rev. 6/2004
- 14 -
Section D - Additional Information
Will the construction, modification, etc. of the sources covered by this application increase emissions from other sources at the facility? If so, describe and quantify.
Not applicable. New facility.
If this project is subject to any one of the following, attach a demonstration to show compliance with applicable standards
a. Prevention of Significant Deterioration permit (PSD), 40 CFR Part 52? YES NO
b. New Source Review, 25 Pa. Code Chapter 127, Subchapter E? YES NO
c. New Source Performance Standards, 40 CFR Part 60? YES NO
(If Yes, which subpart) KKKK, Dc, IIII, TTTT
d. National Emissions Standards for Hazardous Air Pollutants (NESHAPS), 40 CFR Part 61? YES NO
If Yes, which subpart)
e. Maximum Achievable Control Technology (MACT), 40 CFR Part 63? YES NO
(If Yes, which subpart) ZZZZ
Attach a demonstration showing that the emissions from any new source will be the minimum attainable through the use of best available technology (BAT).
See Section 3 of the Plan Approval Application
Provide emission increases and decreases in allowable (or potential) and actual emissions within the last 5 years for applicable PSD pollutant(s) if the facility is an existing major facility (for PSD purposes)
Not applicable

2700-PM-AQ0021 Rev. 6/2004
- 15 -
Section D - Additional Information (Continued)
Indicate emission increases and decreases in tons per year (tpy), for volatile organic compounds (VOCs) and nitrogen oxides (NOx) for NSR applicability since January 1, 1991 or other applicable dates (See other applicable date in instructions). The emissions increases include all emissions including stack, fugitive, material transfer, other emission generating activities, quantifiable emissions from the exempted source(s), etc.
Permit number
(if applicable)
Date issued
Indicate Yes or No if
emission increases and
decreases were used
previously for netting Source I.D. or Name
VOCs NOx
Emission increases
in potential to emit (tpy)
Creditable emission
decreases in actual
emissions (tpy)
Emission increases
in potential to emit (tpy)
Creditable emission
decreases in actual
emissions (tpy)
If the source is subject to 25 Pa. Code Chapter 127, Subchapter E, New Source Review requirements, a. Identify Emission Reduction Credits (ERCs) for emission offsets or demonstrate ability to obtain suitable ERCs for
emission offsets. See Appendix Q of Plan Approval Application. b. Provide a demonstration that the lowest achievable emission rate (LAER) control techniques will be implemented (if
applicable). See Section 3 of Plan Approval Application. c. Provide an analysis of alternate sites, sizes, production processes and environmental control techniques
demonstrating that the benefits of the proposed source outweigh the environmental and social costs (if applicable). See Section 1 of Plan Approval Application.
Attach calculations and any additional information necessary to thoroughly evaluate compliance with all the applicable requirements of 25 Pa. Code Article III and applicable requirements of the Clean Air Act and regulations adopted there under. The Department may request additional information to evaluate the application such as a stand by plan, a plan for air pollution emergencies, air quality modeling, etc.
See Section 2 and Appendix D of Plan Approval Application.
2700-PM-AQ0021 Rev. 6/2004
- 16 -
Section E - Compliance Demonstration
Note: Complete this section if the facility is not a-Title V facility. Title V facilities must complete Addendum A. Method of Compliance Type: Check all that apply and complete all appropriate sections below.
Monitoring Testing Reporting
Recordkeeping Work Practice Standard
Monitoring: a. Monitoring device type (stack test, CEM etc.): b. Monitoring device location: c. Describe all parameters being monitored along with the frequency and duration of monitoring each parameter:
Testing:
a. Reference Test Method Citation:
b. Reference Test Method Description:
Recordkeeping:
Describe the parameters that will be recorded and the recording frequency:
Reporting:
a. Describe the type of information to be reported and the reporting frequency:
b. Reporting start date:
Work Practice Standard: Describe each

2700-PM-AQ0021 Rev. 6/2004
- 17 -
Section F - Flue and Air Contaminant Emission
1. Estimated Maximum Emissions*
Pollutant
Maximum emission rate Calculation/
Estimation Method specify units lbs/hr tons/yr.
PM 0.0019 lb/MMBtu 0.13 0.14 AP-42 emission factor
PM10 0.0019 lb/MMBtu 0.13 0.14 AP-42 emission factor
SOx 0.00058 lb/MMBtu 0.038 0.042 BACT determination
CO 0.036 lb/MMBtu 2.38 2.61 vendor data
NOx 0.006 lb/MMBtu 0.40 0.44 LAER determination
VOC 0.002 lb/MMBtu 0.13 0.15 LAER determination
Others: ( e.g., HAPs) ----- ----- ----- -----
Total HAPs 0.12 0.13 AP-42 emission factors
* These emissions must be calculated based on the requested operating schedule and/or process rate e.g., operating schedule for maximum limits or restricted hours of operation and /or restricted throughput. Describe how the emission values were determined. Attach calculations.
2. Stack and Exhauster
Stack Designation/Number Stack3 and Stack4
List Source(s) or source ID exhausted to this stack:
auxiliary boiler #1 and auxiliary boiler #2
% of flow exhausted to stack: 100
Stack height above grade (ft.) 50 Grade elevation (ft.) 670
Stack diameter (ft) or Outlet duct area (sq. ft.)
3.0
Weather Cap
YES NO
Distance of discharge to nearest property line (ft.). Locate on topographic map.
440 ft from Stack3 and 230 ft from Stack4
Does stack height meet Good Engineering Practice (GEP)?
No
If modeling (estimating) of ambient air quality impacts is needed, attach a site plan with buildings and their dimensions and other obstructions.
Location of Stack**
Latitude/Longitude
Point of Origin
Latitude Longitude
Degrees Minutes Seconds Degrees Minutes Seconds
Stack3
Stack4
41
41
19
19
43.82
40.79
77
77
45
45
18.41
17.34
Stack Exhaust
Volume TBD ACFM Temperature TBD °F Moisture TBD %
Exhauster (attach fan curves) NA in. of water HP @ RPM.
** If the datum and collection method information and codes differ from those provided on the General Information Form - Authorization Application, provide the additional required by that form on a separate sheet.

2700-PM-AQ0021 Rev. 6/2004
- 18 -
Section G - Attachments
Number and list all attachments submitted with this application below:
See Table of Contents of Plan Approval Application.


2700-PM-AQ0021 Rev. 6/2004
- 2 -
Section B - Combustion Unit Information
1. Combustion Units: Coal Oil Natural Gas Other:
Description: Water Bath Heaters
Manufacturer TBD
Model No. TBD
Number of units 3
Maximum heat input (Btu/hr) 15 MMBtu/hr per heater
Rated heat input (Btu/hr) 15 MMBtu/hr
Typical heat input (Btu/hr) 15 MMBtu/hr
Furnace Volume TBD
Grate Area (if applicable) NA
Method of firing NA
Indicate how combustion air is supplied to boiler outdoor air supply
Indicate the Steam Usage: Unit is a heater. The purpose of the unit is to heat a water bath that in turn heats the natural gas pipes. Three heaters will be installed, however only two will operate at a time. The third is for redundancy.
Mark and describe soot Cleaning Method: i. Air Blown ii. Steam Blown iii. Brushed and Vacuumed
iv. Other v. Frequency of Cleaning
Maximum Operating schedule
Hours/Day 24
Days/Week 7
Days/Year 365
Hours/Year 8,760
Operational restrictions taken or requested, if any (e.g., bottlenecks or voluntary restrictions to limit potential to emit)
Capacity (specify units)
Per hour 15 MMBtu/hr
Per day 360 MMBtu/day
Per week 2,520 MMBtu/week
Per year 131,400 MMBtu/year
Typical Operating schedule
Hours/Day 24
Days/Week 7
Days/Year 365
Hours/Year 8,760
Seasonal variations (Months): If variations exist, describe them. Operating using primary fuel: From to Operating using secondary fuel: Form to Non-operating: From to
2. Specify the primary, secondary and startup fuel. Furnish the details in item 3. primary fuel is natural gas; no secondary fuel

2700-PM-AQ0021 Rev. 6/2004
- 3 -
Section B - Combustion Unit Information (Continued)
3. Fuel
Type Quantity Hourly Annually Sulfur
% Ash (Weight) BTU Content
Oil Number
GPH @ 60°F
X 103 Gal
% by wt
Btu/Gal. & Lbs./Gal. @ 60 °F
Oil Number
GPH @ 60°F
X 103 Gal
% by wt
Btu/Gal. & Lbs./Gal. @ 60 °F
Oil Number
GPH @ 60°F
X 103 Gal
% by wt
Btu/Gal. & Lbs./Gal. @ 60 °F
Natural Gas primary
14,706 SCFH
128.824 X 10⁶
Gal
0.4 gr/100 SCF NA
1,020 Btu/SCF
Gas (other)
SCFH
X 106
Gal
gr/100
SCF
Btu/SCF
Coal
Other*
* Note: Describe and furnish information separately for other fuels in Addendum B.
4. Burner
Manufacturer TBD
Model Number TBD
Type of Atomization (Steam, air, press, mech., rotary cup)
Number of Burners 2
Maximum fuel firing rate (all burners) 15 MMBtu/hr
Normal fuel firing rate 15 MMBtu/hr
If oil, temperature and viscosity. NA
Maximum theoretical air requirement TBD
Percent excess air 100% rating TBD
Turndown ratio TBD
Combustion modulation control (on/off, low-high fire, full automatic, manual). Describe.
Main burner flame ignition method (electric spark, auto gas pilot, hand-held torch, other). Describe. spark ignition
5. Nitrogen Oxides (NOx) control Options
Mark and describe the NOx control options adopted
Low excess air (LEA) Over fire air (OFA) Low-NOx burner X Low NOx burners with over fire
air
Flue gas recirculation Burner out of service Reburning Flue gas treatment (SCR /
SNCR)
Other.

2700-PM-AQ0021 Rev. 6/2004
- 4 -
Section B - Combustion Unit Information (Continued)
6. Miscellaneous Information
Describe fly ash reinjection operation Not applicable
Describe, in detail, the equipment provided to monitor and to record the source(s) operating conditions, which may affect emissions of air contaminants. Show that they are reasonable and adequate.
TBD
Describe each proposed modification to an existing source.
Not applicable
Describe how emissions will be minimized especially during start up, shut down, combustion upsets and/or disruptions. Provide emission estimates for start up, shut down and upset conditions. Provide duration of start up and shut down.
Not applicable
Describe in detail with a schematic diagram of the control options adopted for SO2 (if applicable).
Not applicable
Anticipated milestones:
Expected commencement date of construction/reconstruction: October 2020
Expected completion date of construction/reconstruction: January 2023
Anticipated date(s) of start-up: April – November 2023

2700-PM-AQ0021 Rev. 6/2004
- 5 -
Section C - Air Cleaning Device
1. Precontrol Emissions*
Emission Rate
Pollutant
Maximum Emission Rate Calculation/ Estimation
Method Specify Units Pounds/Hour Hours/Year Tons/Year
PM 0.029 8760 0.12 BACT factor
PM10 0.029 8760 0.12 BACT factor
SOx 0.0087 8760 0.038 BACT factor
CO 0.56 8760 2.43 BACT factor
NOx 0.17 8760 0.72 LAER factor
VOC 0.075 8760 0.33 LAER factor
Others: (e.g., HAPs) ----- ----- ----- -----
Total HAPs 8760 0.12 AP-42 factors
* These emissions must be calculated based on the requested operating schedule and/or process rate, e.g., operating schedule for maximum limits or restricted hours of operation and/or restricted throughput. Describe how the emission values were determined. Attach calculations.
See Appendix D for emission calculations.
2. Gas Conditioning
Water quenching YES NO Water injection rate GPM
Radiation and convection cooling YES NO Air dilution YES NO
If YES, CFM
Forced draft YES NO Water cooled duct work YES NO
Other
Inlet volume
ACFM@ °F
Outlet volume
ACFM@ °F % Moisture
Describe the system in detail.

2700-PM-AQ0021 Rev. 6/2004
- 6 -
Section C - Air Cleaning Device (Continued)
3. Inertial and Cyclone Collectors NOT APPLICABLE
Manufacturer
Type
Model No.
Pressure Drop (in. of water)
Inlet Volume
ACFM @ °F
Outlet Volume
ACFM @ °F % Moisture
Number of Individual Cyclone(s) Outlet Straightening Vanes Used? Yes No
Length of Cyclone(s) Cylinder (ft)
Diameter of Cyclone(s) Cylinder
Length of cyclone(s) cone (ft)
Inlet Diameter (ft) or Duct Area (ft2) of Cyclone(s) Outlet Diameter (ft) or Duct area (ft2) of cyclone(s)
If a multi-clone or multi-tube unit is installed, will any of the individual cyclones or cyclone tubes be blanked or blocked off?
Describe any exhaust gas recirculation loop to be employed.
Attach particle size efficiency curve
Emission data
Inlet Outlet Removal Efficiency (%)

2700-PM-AQ0021 Rev. 6/2004
- 7 -
Section C - Air Cleaning Device (Continued)
4. Fabric Collector NOT APPLICABLE
Equipment Specifications
Manufacturer
Model No. Pressurized Design
Suction Design
Number of Compartments
Number of Filters Per Compartment
Is Baghouse Insulated?
Yes No
Can each compartment be isolated for repairs and/or filter replacement?
Yes No
Are temperature controls provided? (Describe in detail)
Yes No
Dew point at maximum moisture °F Design inlet volume SCFM
Type of Fabric
Material Felted Membrane
Weight oz/sq.yd Woven Others: List:
Thickness in Felted-Woven
Fabric permeability (clean) @ ½” water-∆ P CFM/sq.ft.
Filter dimensions Diameter/Width
Effective area per filter Maximum operating temperature (°F)
Effective air to cloth ratio Minimum Maximum
Drawing of Fabric Filter
A sketch of the fabric filter showing all access doors, catwalks, ladders and exhaust ductwork, location of each pressure and temperature indicator should be attached.
Operation and Cleaning
Volume of gases handled
ACFM °F
Pressure drop across collector (in. of water). Describe the equipment to be used to monitor the pressure drop.
Type of filter cleaning Manual Cleaning Bag Collapse Reverse Air Jets Mechanical Shakers Sonic Cleaning Other: Pneumatic Shakers Reverse Air Flow
If compressed air is required for collector operation, describe the equipment with the compressor to provide dry air free from oil.
Cleaning Initiated By Timer Frequency if timer actuated
Expected pressure drop range in. of water Other Specify
Does air cleaning device employ hopper heaters, hopper vibrators or hopper level detectors? If yes, describe.
Describe the warning/alarm system that protects against operation when the unit is not meeting design requirements.
Emissions Data
Pollutant Inlet Outlet Removal Efficiency (%)
2700-PM-AQ0021 Rev. 6/2004
- 8 -
Section C - Air Cleaning Device (Continued)
5. Wet Collection Equipment: NOT APPLICABLE
Equipment Specifications
Manufacturer
Type
Model No.
Design Inlet Volume (SCFM)
Relative Particulate/Gas Velocity (ejector scrubbers only)
Describe the internal features (e.g., variable throat, gas/liquid diffusion plates, spray nozzles, liquid redistributors, bed limiters, etc.).
Describe pH monitoring and pH adjustment systems, if applicable.
Describe mist eliminator or separator (type, configuration, backflush capability, frequency).
Attach particulate size efficiency curve.
Operating Parameters
Inlet volume of gases handled (ACFM)
@ °F
Outlet volume of gases handled (ACFM)
@ °F % Moisture
Liquid flow rates. Describe equipment provided to measure liquid flow rates to scrubber (e.g., quenching section, recirculating solution, makeup water, bleed flow, etc.)
Describe scrubber liquid supply system (amount of make-up and recirculating liquid, capacity of recirculating liquid system, etc).
State pressure drop range (in water) across scrubber (e.g., venturi throat, packed bed, etc.) only. Describe the equipment provide to measure the pressure drop. Do not include duct or de-mister losses.
Describe the warning/alarm system that protects against operation when unit is not meeting design requirements.
Emissions Data
Pollutant Inlet Outlet Removal Efficiency (%)

2700-PM-AQ0021 Rev. 6/2004
- 9 -
Section C - Air Cleaning Device (Continued)
6. Electrostatic Precipitator NOT APPLICABLE
Equipment specifications
Manufacturer
Model No.
Wet Dry
Single-Stage Two-Stage
Gas distribution grids YES NO
Design inlet volume (SCFM) Maximum operating temperature (°F)
Total collecting surface area sq. ft. Collector plates size length ft. x width ft.
Number of fields Number of collector plates/field . Spacing between collector plates inches.
Maximum gas velocity ft/sec. Minimum gas treatment time: sec.
Total discharge electrode length ft.
Number of discharge electrodes Number collecting electrode rappers
Rapper control Magnetic Pneumatic Other
Describe in detail
Operating parameters
Inlet gas temperature (°F)
Outlet gas temperature (°F)
State pressure drop range (water gauge) across collector only. Describe the equipment.
Volume of gas handled (ACFM) Dust resistivity (ohm-cm). Will resistivity vary?
Power requirements
Number and size of Transformer Rectifier sets by electrical field
Field No. No. of Sets Each Transformer
KVA
Each Rectifier
KV Ave./Peak MaDC
Current density Micro amperes/ft2
Corona power Watts/1000 ACFM
Corona power density Watts/ft2
Will a flue gas conditioning system be employed? If yes, describe it.
Does air cleaning device employ hopper heaters, hopper vibrators or hopper level detectors? If yes, describe.
Describe the warning/alarm system that protects against operation when unit is not meeting design requirements.
Emissions data
Pollutant Inlet Outlet Removal Efficiency (%)
2700-PM-AQ0021 Rev. 6/2004
- 10 -
Section C - Air Cleaning Device (Continued)
7. Absorption Equipment: NOT APPLICABLE
Equipment specifications
Manufacturer
Type
Model No
Design inlet volume (SCFM)
Tower height (ft) and inside diameter (ft)
Packing type and size (if applicable)
Height of packing (ft) (if applicable)
Number of trays (if applicable)
Number of bubble caps (if applicable)
Configuration: Counter-current Cross flow Cocurrent flow
Describe pH and/or other monitoring and controls
Absorbent information
Absorbent type and concentration
Sorbent injection rate
Retention time (sec)
Attach equilibrium data for absorption (If applicable).
Attach any additional information regarding auxiliary equipment, reagent (slurry mix) supply system (once through or recirculating, system capacity, etc) to thoroughly evaluate the control equipment. Indicate the flow rates for makeup, bleed and recirculation.
Operating parameters
Volume of gas handled (ACFM)
Inlet temperature (°F)
Pressure drop (in of water) and liquid flow rate. Describe the equipment.
State operating range for pH and/or absorbent concentration in scrubber liquid.
Describe the warning/alarm system that protects against operation when unit is not meeting design requirements.
Emissions data
Pollutant Inlet Outlet Removal Efficiency (%)

2700-PM-AQ0021 Rev. 6/2004
- 11 -
Section C - Air Cleaning Device (Continued)
8. SELECTIVE CATALYTIC REDUCTION (SCR)
SELECTIVE NON-CATALYTIC REDUCTION (SNCR)
NON-SELECTIVE CATALYTIC REDUCTION (NSCR) NOT APPLICABLE
Equipment specifications
Manufacturer
Type
Model No
Design inlet volume (SCFM)
Design operating temperature (°F)
Is the system equipped with process controls for proper mixing/control of the reducing agent in gas stream? If yes, give details.
Attach efficiency and other pertinent information (e.g., Ammonia, urea slip).
Operating parameters
Volume of gases handled (ACFM) @ (°F)
Operating temperature range for the SCR/SNCR/NSCR system (°F)
From
To
Reducing agent used, if any.
Oxidation catalyst used, if any.
State expected range of usage rate and concentration.
Service life of catalyst
Ammonia slip (ppm)
Describe fully with a sketch giving locations of equipment, controls system, important parameters and method of operation.
Describe the warning/alarm system that protects against operation when unit is not meeting design requirements.
Emissions data
Pollutant Inlet Outlet Removal Efficiency (%)

2700-PM-AQ0021 Rev. 6/2004
- 12 -
Section C - Air Cleaning Device (Continued)
9. Other Control Equipment: NOT APPLICABLE
Equipment specifications
Manufacturer
Type
Model No
Design inlet volume (SCFM)
Capacity
Describe pH monitoring and pH adjustment, if any.
Indicate the liquid flow rate and describe equipment provided to measure pressure drop and flow rate, if any.
Attach efficiency curve and/ or other efficiency information.
Attach any additional data including auxiliary equipment and operation details to thoroughly evaluate the control equipment.
Operating parameters
Volume of gas handled
@ °F % Moisture
Describe, in detail, important parameters and method of operation.
Describe the warning/alarm system that protects against operation when unit is not meeting design requirements.
Emissions data
Pollutant Inlet Outlet Removal Efficiency (%)

2700-PM-AQ0021 Rev. 6/2004
- 13 -
Section C - Air Cleaning Device (Continued)
10. Costs NOT APPLICABLE
Indicate cost associated with air cleaning device and its operating cost (attach documentation if necessary)
Device Direct Cost Indirect Cost Total Cost Operating Cost
11 MISCELLANEOUS
Describe in detail the removal, handling and disposal of dust, effluent, etc. from the air cleaning device including proposed methods of controlling fugitive emissions.
Attach manufacturer's performance guarantees and/or warranties for each of the major components of the control system (or complete system).
Attach the maintenance schedule for the control equipment and any part of the process equipment that, if in disrepair, would increase air contaminant emissions.

2700-PM-AQ0021 Rev. 6/2004
- 14 -
Section D - Additional Information
Will the construction, modification, etc. of the sources covered by this application increase emissions from other sources at the facility? If so, describe and quantify.
Not applicable - new facility
If this project is subject to any one of the following, attach a demonstration to show compliance with applicable standards
a. Prevention of Significant Deterioration permit (PSD), 40 CFR Part 52? YES NO
b. New Source Review, 25 Pa. Code Chapter 127, Subchapter E? YES NO
c. New Source Performance Standards, 40 CFR Part 60? YES NO
(If Yes, which subpart) KKKK, Dc, IIII, TTTT
d. National Emissions Standards for Hazardous Air Pollutants (NESHAPS), 40 CFR Part 61? YES NO
If Yes, which subpart)
e. Maximum Achievable Control Technology (MACT), 40 CFR Part 63? YES NO
(If Yes, which subpart) ZZZZ
Attach a demonstration showing that the emissions from any new source will be the minimum attainable through the use of best available technology (BAT).
See Section 3 of Plan Approval Application
Provide emission increases and decreases in allowable (or potential) and actual emissions within the last 5 years for applicable PSD pollutant(s) if the facility is an existing major facility (for PSD purposes)
Not applicable - new facility

2700-PM-AQ0021 Rev. 6/2004
- 15 -
Section D - Additional Information (Continued)
Indicate emission increases and decreases in tons per year (tpy), for volatile organic compounds (VOCs) and nitrogen oxides (NOx) for NSR applicability since January 1, 1991 or other applicable dates (See other applicable date in instructions). The emissions increases include all emissions including stack, fugitive, material transfer, other emission generating activities, quantifiable emissions from the exempted source(s), etc.
Permit number
(if applicable)
Date issued
Indicate Yes or No if
emission increases and
decreases were used
previously for netting Source I.D. or Name
VOCs NOx
Emission increases
in potential to emit (tpy)
Creditable emission
decreases in actual
emissions (tpy)
Emission increases
in potential to emit (tpy)
Creditable emission
decreases in actual
emissions (tpy)
If the source is subject to 25 Pa. Code Chapter 127, Subchapter E, New Source Review requirements, a. Identify Emission Reduction Credits (ERCs) for emission offsets or demonstrate ability to obtain suitable ERCs for
emission offsets. See Appendix Q of Plan Approval Application. b. Provide a demonstration that the lowest achievable emission rate (LAER) control techniques will be implemented (if
applicable). See Section 3 of Plan Approval Application c. Provide an analysis of alternate sites, sizes, production processes and environmental control techniques
demonstrating that the benefits of the proposed source outweigh the environmental and social costs (if applicable). See Section 1 of Plan Approval Application
Attach calculations and any additional information necessary to thoroughly evaluate compliance with all the applicable requirements of 25 Pa. Code Article III and applicable requirements of the Clean Air Act and regulations adopted there under. The Department may request additional information to evaluate the application such as a stand by plan, a plan for air pollution emergencies, air quality modeling, etc.
See Section 2 and Appendix D of Plan Approval Application.

2700-PM-AQ0021 Rev. 6/2004
- 16 -
Section E - Compliance Demonstration
Note: Complete this section if the facility is not a-Title V facility. Title V facilities must complete Addendum A. Method of Compliance Type: Check all that apply and complete all appropriate sections below.
Monitoring Testing Reporting
Recordkeeping Work Practice Standard
Monitoring: a. Monitoring device type (stack test, CEM etc.): b. Monitoring device location: c. Describe all parameters being monitored along with the frequency and duration of monitoring each parameter:
Testing:
a. Reference Test Method Citation:
b. Reference Test Method Description:
Recordkeeping:
Describe the parameters that will be recorded and the recording frequency:
Reporting:
a. Describe the type of information to be reported and the reporting frequency:
b. Reporting start date:
Work Practice Standard: Describe each

2700-PM-AQ0021 Rev. 6/2004
- 17 -
Section F - Flue and Air Contaminant Emission
1. Estimated Maximum Emissions*
Pollutant
Maximum emission rate Calculation/
Estimation Method specify units lbs/hr tons/yr.
PM 0.029 0.12 BACT factor
PM10 0.029 0.12 BACT factor
SOx 0.0087 0.038 BACT factor
CO 0.56 2.43 BACT factor
NOx 0.17 0.72 LAER factor
VOC 0.075 0.33 LAER factor
Others: ( e.g., HAPs) ----- ----- ----- -----
Total HAPs 0.12 AP-42 factors
* These emissions must be calculated based on the requested operating schedule and/or process rate e.g., operating schedule for maximum limits or restricted hours of operation and /or restricted throughput. Describe how the emission values were determined. Attach calculations.
2. Stack and Exhauster
Stack Designation/Number HTR
List Source(s) or source ID exhausted to this stack:
Water bath heater
% of flow exhausted to stack: 100
Stack height above grade (ft.) 15’ Grade elevation (ft.) 670
Stack diameter (ft) or Outlet duct area (sq. ft.)
8”
Weather Cap
YES NO
Distance of discharge to nearest property line (ft.). Locate on topographic map.
TBD
Does stack height meet Good Engineering Practice (GEP)?
No
If modeling (estimating) of ambient air quality impacts is needed, attach a site plan with buildings and their dimensions and other obstructions.
Location of Stack**
Latitude/Longitude
Point of Origin
Latitude Longitude
Degrees Minutes Seconds Degrees Minutes Seconds
TBD
Stack Exhaust
Volume TBD ACFM Temperature TBD °F Moisture TBD %
Exhauster (attach fan curves) NA in. of water HP @ RPM.
** If the datum and collection method information and codes differ from those provided on the General Information Form - Authorization Application, provide the additional required by that form on a separate sheet.

2700-PM-AQ0021 Rev. 6/2004
- 18 -
Section G - Attachments
Number and list all attachments submitted with this application below:
See Table of Contents of Plan Approval Application.

POWER ENGINEERS, INC. Plan Approval Application – Renovo Energy Center, LLC
6.0 NON-ATTAINMENT AREA REQUIREMENTS

POWER ENGINEERS, INC. Plan Approval Application – Non-Attainment Area Requirements – Renovo Energy Center, LLC
PAGE i
TABLE OF CONTENTS
6.0 NON-ATTAINMENT AREA REQUIREMENTS ....................................................................... 1
6.1 EMISSION REDUCTION CREDITS (ERCS) ....................................................................................... 1 6.2 COMPLIANCE WITH LOWEST ACHIEVABLE EMISSION RATE (LAER) .......................................... 1 6.3 COMPLIANCE WITH ALL APPLICABLE EMISSION LIMITS AND STANDARDS IN PENNSYLVANIA ... 2 6.4 ANALYSIS OF ALTERNATIVE SITES, SIZES, PROCESSES, AND CONTROL TECHNIQUES ................. 2
6.4.1 Alternative Sites .................................................................................................................... 2 6.4.2 Alternative Sizes ................................................................................................................... 3 6.4.3 Alternative Processes ............................................................................................................ 4 6.4.4 Alternative Control Techniques ............................................................................................ 4
6.5 CONCLUSION ................................................................................................................................. 4

POWER ENGINEERS, INC. Plan Approval Application – Non-Attainment Area Requirements – Renovo Energy Center, LLC
PAGE 1
6.0 NON-ATTAINMENT AREA REQUIREMENTS
To obtain a permit to construct and operate a nominally rated 1,240 MW (net) combined cycle electric generating plant in Renovo, PA, which is part of the Ozone Transport Region (OTR), Renovo Energy Center LLC (REC) must meet the requirements for locating in a non-attainment area as found in Part D, Subpart 1, Section 173 of the Federal Clean Air Act. Section 173 and PaDEP Chapter 127 requires that prior to issuance of a permit to construct and operate, applicants must:
• Prior to commencement of operations, applicant must demonstrate that sufficient emissions offsets have been obtained such that the total allowable emissions from existing sources in the region, new or modified minor sources, and from the proposed sources will be sufficiently less than emissions from existing sources prior to application for such permit to construct and operate the sources;
• Comply with lowest achievable emission rate for non-attainment pollutants;
• Demonstrate that owner or operator of the proposed sources demonstrates that all major sources owned or operated by such entity in Pennsylvania are in compliance, or on a schedule for compliance, with all applicable limitations and standards; and
• Conduct an analysis of alternative sites, sizes, processes, and environmental controls that demonstrate the benefits of the proposed sources significantly outweigh the environmental and social costs of its location and construction.
The balance of this section addresses the requirements listed above.
6.1 Emission Reduction Credits (ERCs)
REC’s maximum potential Nitrogen Oxides (NOx) and Volatile Organic Compounds (VOC) emissions are summarized in Section 1 of this application. Based on the preliminary estimates contained in Section 1 and Attachment D, REC will be required to obtain offsets for both NOx and VOC as the potential emissions are greater than the Pennsylvania Code 127.201 thresholds of 100 tons and 50 tons per year, respectively.
REC has reviewed the Pennsylvania Emissions Reduction Credit registry to identify potential sources for obtaining ERCs to offset potential project emissions. REC will obtain the necessary ERCs at the Pennsylvania Code 127.210 offset ratio of 1.15:1 for NOx emissions and VOC flue emissions and 1.3:1 for fugitive VOC emissions.
REC has included the currently available ERCs for use in Pennsylvania in Appendix Q.
6.2 Compliance with Lowest Achievable Emission Rate (LAER)
REC has prepared BACT/LAER/BAT analyses for all combustion equipment that are contained in Section 3 of this application. LAER determinations for NOx and VOC are included in these analyses and summarized in Section 3.

POWER ENGINEERS, INC. Plan Approval Application – Non-Attainment Area Requirements – Renovo Energy Center, LLC
PAGE 2
6.3 Compliance with All Applicable Emission Limits and Standards in Pennsylvania
REC does not own or operate any facilities in Pennsylvania, thus there are no compliance issues with any emission limits or standards.
6.4 Analysis of Alternative Sites, Sizes, Processes, and Control Techniques
6.4.1 Alternative Sites
Due to the forecasted increase in electricity demand in the service area, the anticipated retirements of old, inefficient coal units in the next 10+ years, and the increased production and reliable availability of shale gas, REC focused on the PJM region for siting a large-scale natural gas combined cycle (NGCC) generation facility. Information was gathered relative to electrical transmission line mapping, gas line mapping and existing generating facilities and competitive development.
Energy Security Analysis, Inc. (ESAI) was engaged in February 2014 to provide support in helping to identify the most optimal locations in PJM to potentially develop plants. ESAI evaluated favorable energy and capacity prices, transmission capacities and availability of natural gas supplies in order to rank the regions and sites.
REC focused primarily on Pennsylvania and high population areas such as Kearney, NJ (Newark), Pensauken, NJ (Philadelphia) and Baltimore, MD. Pensauken had major limitations on gas supply while Kearney and Baltimore were expected to require excessively long and expensive development; further, ESAI’s overall evaluation for these three sites indicated that the PA sites were more attractive, primarily attributable to the local shale gas resource, thus REC’s focus was limited to the PA areas. Although central and western Pennsylvania have plenty of 230-kilovolt (kV) and higher lines networking through the area, major gas lines are of lesser number and accessibility is made very difficult by extremely steep terrain. One must also consider a good part of the western portion of the state has been heavily undermined for coal, making the identification of a suitable site for a power plant very difficult.
For assessment purposes, the state was divided into four areas:
• Homer City (old coal plants that could be displaced by new highly efficiency NGCC plants); • Juniata (old coal plants that could be displaced by new highly efficiency NGCC plants); • Moshannon/Leidy/Milesburg (abundant low-cost gas); and • Susquehanna (proximity to population centers).
In March 2014 REC conducted an assessment over a wide geographical region focusing on the areas of Homer City, Juniata, Leidy – Milesburg, and Susquehanna, visiting more than 16 potential sites. The Susquehanna area ranked lowest in ESAI’s evaluation and was also competing on the 230-kV system with the two Panda projects (Patriot and Liberty), Sunbury Repowering, and Good Springs, at a minimum. Major gas lines in the area of Susquehanna were identified to the south but REC’s search did not identify any sites with suitable gas, power and terrain in the Susquehanna area.
The Homer City area was divided into four search areas to the north and four to the south. The areas north of Homer City were either very hilly with considerable residential development, steep terrain with very

POWER ENGINEERS, INC. Plan Approval Application – Non-Attainment Area Requirements – Renovo Energy Center, LLC
PAGE 3
poor roads, suitable land with residential development/no support, or very remote with steep/undulating terrain; no suitable site for the project was identified in any of the four northern search areas.
Two of the Homer City south areas were located on 230-kV lines that cross the Texas Eastern gas line in very remote areas. Roads and topography are so poor that construction would be imprudently costly. The other two Homer City south search areas were similar to the previous two south areas, but a potential site was identified in New Florence a few miles north of the Seward and Conemaugh existing power plants. The site was level, large enough and next to a 500-kV line and major gas line on the site. However, after consulting coal mining maps it was discovered that the entire area was mined with long wall mining years ago, thus it was not suitable for the construction of a power plant.
REC also assessed the Juniata/Roxbury/Lewistown/Harrisburg area. While the general area did have access to a 500-kV line as well as a 30” gas line, a combination of residential area and large productive farms made the siting of a power plant difficult. In addition, previous efforts at developing independent power plants met strong local opposition. Any potential sites identified in the general area located away from residential or farms were extremely steep and un-buildable terrain.
REC also searched the Moshannon/Leidy Hub area, initially focusing on the areas where the existing gas and transmission lines are close together, however no flat land of adequate size was identified. A potential site was discovered in Renovo at the abandoned Industrial Park, which was the former P&E railyard. This is the site being proposed in this application.
6.4.2 Alternative Sizes
All major combustion turbine manufacturers offer model units in a variety of electrical output sizes. Each time a more efficient model is introduced from each manufacturer, the units are larger with more gross electrical output. Currently the most efficient models from the major manufacturers are all in the 500-600 Megawatt (MW) range for a single unit in combined cycle configuration. While smaller sized units are available, they are older technology and less efficient.
Given REC’s commitment to choose from among the most efficient combustion turbine technologies currently available, REC had to pick in increments of approximately 500-600 MW and decide on number of units for the facility. In general, a 500-600 MW single unit plant is not nearly as economical to build and operate as a multi-unit plant and will require above market electric pricing to survive. The 1,000-1,200 MW range is the most common in many cases due to ability to export the power on nearby transmission lines. Larger plants in the 1,500-1,800 MW range are extremely difficult to site. This difficulty is mainly due to lack of available connection to high voltage transmission lines (345-kV or 500-kV), as well as the need for more make-up water, fuel and land.
REC selected a two-unit, 1,240 MW facility, utilizing among the most efficient technology available today, due to the limited transmission line capacity for exporting additional electrical power and the physical limitation on the site acreage, both of which prevented going to a larger plant. REC was also influenced by the market’s ability to more readily absorb a plant of this size versus a three-unit, 1,500-1,800 MW design. Single unit plants (i.e., approximately 500-600 MW) do not routinely meet the financial requirements of investors and lenders.

POWER ENGINEERS, INC. Plan Approval Application – Non-Attainment Area Requirements – Renovo Energy Center, LLC
PAGE 4
6.4.3 Alternative Processes
Modern NGCC plants are considered an efficient technology for generating large scale electricity, in particular when compared to the traditional boiler/steam cycle. Some advantages of the NGCC technology include:
• NGCC plant has higher efficiency than a turbine cycle or steam cycle plant; • NGCC plants meet rapid start and shutdown demands when compared to the steam power plant,
making NGCC ideal for quickly accepting load variations, which helps in maintaining the stability of the electrical grid;
• NGCC plant capital costs are slightly higher than a simple combustion turbine plant and well below the cost of a traditional steam turbine power plant;
• NGCC plant cooling water demands are much less than conventional steam turbine power plant; • NGCC plants have high ratio of power output to the physical plant footprint/area, thus a NGCC
requires less space for equal output; • NGCC plants have lower operational, maintenance, and personnel costs; • NGCC plants typically have higher dispatch availability than a traditional steam turbine plant;
and • NGCC plants have lower pollutant emissions on a lb/MW output, especially CO2.
For the reasons listed above, REC has not identified an alternative process that warrants consideration.
6.4.4 Alternative Control Techniques
REC is proposing state of the art control technologies, including low NOx combustors, selective catalytic reduction (SCR), and an oxidation catalyst that will control potential emissions to meet stringent LAER/BACT/BAT limits. No technically feasible alternative control techniques have been identified that will provide better pollution control performance. Section 3 contains REC’s LAER/BACT/BAT analysis.
6.5 Conclusion
Following an assessment of alternative sites, alternative sizes, alternative processes, and alternative control technologies, REC proposes to construct a nominally rated 1,240 MW (net) dual fuel (natural gas and ultra-low sulfur diesel) combined cycle electric generating plant in Renovo, Pennsylvania. REC’s proposed plant will meet LAER for NOx and VOC and will offset emissions of these non-attainment pollutants by obtaining ERCs in amounts that satisfy all appropriate offset ratios.

POWER ENGINEERS, INC. Plan Approval Application – Renovo Energy Center, LLC
APPENDIX A FACILITY SITE LOCATION ON USGS TOPOGRAPHICAL MAP

!
Renovo Energy Center LLC
Ü
Facility Location
Name:
Date:
Scale:
12/17/20191:24,0001" = 2,000 ft
Location:
Caption:
Renovo, PAFacility location: 41.328114°, -77.756102°
Renovo Energy Center LLCRenovo, PASite Location Map
!
Facility Location
West Virginia
Ohio
New York
MarylandNew
Jersey
Pennsylvania
Virginia

POWER ENGINEERS, INC. Plan Approval Application – Renovo Energy Center, LLC
APPENDIX B RENOVO ENERGY CENTER SITE PLAN

0 100 200 300FT
A
B
C
D
23456
REV
SCALE DESIGNED DRAWNCHIEF
ENGR
NO. DATE REVISIONS BY CHKDESIGN
SUPVENGR
PROJ
ENGR
DRAWING NO.JOB NO.
LEVELS12345678 0 23 678901234567890123456789012345678901234567890123
1 11 111122222222223333333333444444444455555555 56666PSC= :1 :
1
5
REF DFN=[ ] . DFN=[ ] . 22 x 34 "D" SIZE
9
5
PLOT PLAN
P1-0010-00001
A
B
C
D
E
F
N
NNE
NE
ENE
E
ESE
SE
SSES
SSW
SW
WSW
W
WNW
NW
NNW
LABELS OF PERCENT FREQUENCY ON NORTH AXIS
1-5 KNOTS6-14 KNOTS15-24 KNOTS
WIND ROSE
B D F
C
C
A
RENOVO ENERGY CENTERCLINTON COUNTY, PA
A
26081-000
G
G
SW -
C
N 423,500.00
E 1,967,075.00
SWAS NOTED SW
E
E
EXISTING STORM
WATER PIPE
EXISTING STORM
WATER PIPE
ISSUED FOR REVIEW
N 423,190.83
E 1,967,157.56
INCOMING GAS PIPELINE
WETLANDS
EMERGENCY PATHWAY
JVGJVG - VS08
0216
MISC. Electrical Testing EQUIPMENT
STG EXCITATION
STEAM TURBINE EQUIPMENT
MISC. Electrical Testing EQUIPMENT
STG EXCITATION
STEAM TURBINE EQUIPMENT
RESERVED SPACE
FOR BUILD. UTILITIES
SPAREEQUIPSPACE
B ISSUED FOR REVIEW SW JVG JVG - VS08
0516
C ISSUED FOR REVIEW DB DB -12
2019
RAPJRB

A
B
C
D
23456
REV
SCALE DESIGNED DRAWNCHIEF
ENGR
NO. DATE REVISIONS BY CHKDESIGN
SUPVENGR
PROJ
ENGR
DRAWING NO.JOB NO.
LEVELS1 2 3 4 5 6 7 8 0 1 2 3 6 7 8 9 0 1 2 3 4 5 6 7 8 9 0 1 2 3 4 5 6 7 8 9 0 1 2 3 4 5 6 7 8 9 0 1 2 3 4 5 6 7 8 9 0 1 2 3
1 1 1 1 1 1 1 1 2 2 2 2 2 2 2 2 2 2 3 3 3 3 3 3 3 3 3 3 4 4 4 4 4 4 4 4 4 4 5 5 5 5 5 5 5 5 5 6 6 6 6PSC= :1 :
BECHTEL
1 1
4 5
REF DFN=[ ] . DFN=[ ] . 22 x 34 "D" SIZE
FREDERICK, MARYLAND
9
5
RENOVO ENERGY CENTERCLINTON COUNTY, PA
A
26081-000
-
0 100 200 300FT
P1-0090-00001
REFERENCE DRAWING:
26081-000-P1-0010-00001 - PLOT PLAN
FUEL OIL STORAGE TANK (OPTION)ADMINSTRATIVE \ WAREHOUSE BUILDING
HEAT RECOVERY STEAM GENERATOR (HRSG)
ELEV 262.00 FT
TURBINE BUILDING
ELEV 83.00 FTELEV 93.00 FT
DEMINERALIZED WATER STORAGE TANK
WASTE WATER STORAGE TANK
AIR COOLED CONDENSER (ACC)
ELEV 0.00 FT
ELEV 106.00 FT
TURBINE BUILDING HEAT RECOVERY STEAM GENERATOR (HRSG)
LOW BAY
TURBINE BUILDING
BOILER FEEDPUMP
BUILDING
ISOPHASE BUS
MAIN SWITCHGEAR BUILDING
FIRE WALL MAIN TRANSFORMER
B
LKG EAST
LKG NORTH
ISSUED FOR REVIEW
ELEV 0.00 FT
ELEV 18.05 FT
MAIN SWITCHGEAR AND BATTERY ROOM
STEAM DUCT
SERVICE WATER \ FIRE WATER STORAGE TANK
ELEV 50.00 FT
WATER TREATMENT BUILDING
STEAM DUCT
COMBUSTION TURBINE
AIR INLET FILTER
LEC COMBINED
LCI MODULE
LEC \ LCI BUILDING MAIN TRANSFORMER
ELEVATION VIEWS
ELEVATION B
ELEVATION A
AUXILARY BOILER
ELEV 45.00 FT
ELEV 20.00 FT
922
16JVG JVGVS VS
ISSUED FOR REVIEW DBDBB -
-
B
AUX BOILER STACK
JRB RAP12
2019

POWER ENGINEERS, INC. Plan Approval Application – Renovo Energy Center, LLC
APPENDIX C PROCESS FLOW DIAGRAMS FOR POWER BLOCKS

HP Steam
Natural 38,410 lb/hr
Gas 150,000 lb/hr
Hot Reheat Steam
ULSD 0 lb/hr Cold Reheat Steam
(backup)
Water LP Steam
(backup)
6,047,500 lb/hr
176 F
StackExhaust(CEMS)
Air
Cooled
Condenser MakeupAir Water
Duct
Burner
Ammonia Injection
Notes:1. ULSD = Ultra Low Sulfur Diesel
2. For a single shaft unit, there is no separate generator for the steam turbine; the steam
turbine drives the same generator as the gas turbine.
3. GT water injection used only for ULSD operation.
4. Data shown reflects operation at 59oF ambient temperature. Rev Sheet # of
B 1 2
Inlet Air Cooler
Steam Turbine
Electricity
Electricity
Gas Turbine
SCR &
CO
Catalyst
December 19, 2019
Heat Recovery
Steam GeneratorWater
Renovo Energy Center
Cycle Schematic
GE 7HA.02 (Natural Gas Operation)
Date

HP Steam
Natural 0 lb/hr
Gas 0 lb/hr
Hot Reheat Steam
ULSD 194,470 lb/hr Cold Reheat Steam
(backup)
Water LP Steam
(backup)6,152,600 lb/hr
281 F
StackExhaust(CEMS)
Air
Cooled
Condenser MakeupAir Water
Duct
Burner
Ammonia Injection
Notes:1. ULSD = Ultra Low Sulfur Diesel
2. For a single shaft unit, there is no separate generator for the steam turbine; the steam
turbine drives the same generator as the gas turbine.
3. GT water injection used only for ULSD operation.
4. Data shown reflects operation at 59oF ambient temperature. Rev Sheet # of
B 1 2
Inlet Air Cooler
Steam Turbine
Electricity
Electricity
Gas Turbine
SCR &
CO
Catalyst
December 16, 2019
Heat Recovery
Steam GeneratorWater
Renovo Energy Center
Cycle Schematic
GE 7HA.02 (ULSD Operation)
Date

POWER ENGINEERS, INC. Plan Approval Application – Renovo Energy Center, LLC
APPENDIX D DETAILED EMISSION CALCULATIONS

Renovo Energy CenterFacility-Wide Maximum Potential EmissionsTons Per Year
PollutantPower-blocks
Auxiliary Boilers
Diesel Generator
Diesel Fire Pump Heater
ULSD storage tank
Circuit Breakers
Facility-Wide Total
NOx 355.17 0.87 5.45 0.18 2.72 --- --- 364.4CO 356.78 5.23 1.50 0.059 5.93 --- --- 369.5PM10 211.92 0.28 0.16 0.0065 0.27 --- --- 212.6VOC 110.73 0.29 0.97 0.0065 0.73 0.042 --- 112.8SO2 53.48 0.084 0.0055 0.00032 0.084 --- --- 53.6NH3 277.36 --- --- --- --- --- --- 277.4Lead 0.042 --- --- --- --- --- --- 0.042CO2 5,413,496 16,949 582.92 33.44 16,852 --- --- 5,447,914CH4 82.26 0.32 0.024 0.0014 0.32 --- --- 82.9N2O 10.21 0.032 0.0047 0.00027 0.032 --- --- 10.3SF6 --- --- --- --- --- --- 0.0080 0.0080CO2e 5,418,594 16,967 584.92 33.55 16,869 --- 182.97 5,453,232H2SO4 35.40 0.013 --- --- --- --- --- 35.4HAPs 19.87 0.27 0.014 0.00078 0.27 --- --- 20.4Hexane1 7.36 0.26 --- --- 0.25 --- --- 7.91 Hexane is the single HAP with the highest potential emissions.
December 2019

Renovo Energy CenterRaw Data for General Electric Equipment
OPERATING POINT 1 2 3 4 5 6 7 8 9 10 11 12 13 14 15 16 17 18 19 20 21Ambient Temperature °F -20 95.8 59 95.8 -0.7 59 95.8 -20 35 59 95.8 -0.7 59 95.8 -20 95.8 59 95.8 -20 59 95.8Ambient Pressure psia 14.35 14.35 14.35 14.35 14.35 14.35 14.35 14.35 14.35 14.35 14.35 14.35 14.35 14.35 14.35 14.35 14.35 14.35 14.35 14.35 14.35Ambient Relative Humidity % 60 35 60 35 60 60 35 60 60 60 35 60 60 35 60 35 60 35 60 60 35
PLANT STATUSSCR/CO Catalyst Operating Operating Operating Operating Operating Operating Operating Operating Operating Operating Operating Operating Operating Operating Operating Operating Operating Operating Operating Operating OperatingEvaporative Cooler State1 on/off Off Off On On Off Off Off Off Off Off Off Off Off Off Off Off On On Off On OnGas Turbine Load % 100% 100% 100% 100% 38% 30% 32% 100% 100% 100% 100% 60% 50% 50% 100% 100% 100% 100% 100% 100% 100%Duct Burner Status on/off Off Off Off Off Off Off Off Off Off Off Off Off Off Off On On On On On Off OffTurbine Diluent Injection Type None None None None None None None Water Water Water Water Water Water Water None None None None None Water WaterDiluent Injection Flow klb/hr -- -- -- -- -- -- -- 260.8 266.4 266.4 249.8 151.8 120.1 109.8 -- -- -- -- -- 266.4 254.2
FUEL DATAFuel Type NG NG NG NG NG NG NG DO DO DO DO DO DO DO NG NG NG NG NG DO DOHHV Btu/lb 23,607 23,607 23,607 23,607 23,607 23,607 23,607 20,130 20,130 20,130 20,130 20,130 20,130 20,130 23,607 23,607 23,607 23,607 23,607 20,130 20,130LHV Btu/lb 21,292 21,292 21,292 21,292 21,292 21,292 21,292 18,300 18,300 18,300 18,300 18,300 18,300 18,300 21,292 21,292 21,292 21,292 21,292 18,300 18,300Fuel Molecular Weight lb/lbmole 16.52 16.52 16.52 16.52 16.52 16.52 16.52 n/a n/a n/a n/a n/a n/a n/a 16.52 16.52 16.52 16.52 16.52 n/a n/aFuel Bound Nitrogen Wt % 0 0 0 0 0 0 0 ≤ 0.015% ≤ 0.015% ≤ 0.015% ≤ 0.015% ≤ 0.015% ≤ 0.015% ≤ 0.015% 0 0 0 0 0 ≤ 0.015% ≤ 0.015%Fuel Sulfur Content ppmw 13.1 13.1 13.1 13.1 13.1 13.1 13.1 15 15 15 15 15 15 15 13.1 13.1 13.1 13.1 13.1 15 15GT Heat Consumption2 MMBtu/hr HHV 3,523.8 3,230.1 3,541.1 3,459.2 1,837.7 1,516.3 1,470.6 3,940.4 3,892.8 3,848.4 3,588.7 2,646.6 2,258.0 2,109.7 3,523.8 3,230.1 3,541.1 3,459.2 3,523.8 3,914.6 3,824.7DB Heat Consumption2 MMBtu/hr HHV 0.0 0.0 0.0 0.0 0.0 0.0 0.0 0.0 0.0 0.0 0.0 0.0 0.0 0.0 1,001.9 821.6 906.8 878.2 1,005.3 0.0 0.0Total Heat Consumption MMBtu/hr HHV 3,523.8 3,230.1 3,541.1 3,459.2 1,837.7 1,516.3 1,470.6 3,940.4 3,892.8 3,848.4 3,588.7 2,646.6 2,258.0 2,109.7 4,525.7 4,051.7 4,447.9 4,337.4 4,529.1 3,914.6 3,824.7
HRSG EXIT EXHAUST GASStack N2 mole fraction - 0.7474 0.7326 0.7374 0.7266 0.75 0.7445 0.7377 0.7058 0.7001 0.6947 0.6889 0.7147 0.7113 0.7071 0.738 0.7244 0.7289 0.7184 0.738 0.6938 0.6862Stack O2 mole fraction - 0.1149 0.1115 0.1108 0.1086 0.1233 0.126 0.1262 0.09819 0.09532 0.09332 0.09369 0.1035 0.103 0.1052 0.08825 0.08783 0.08635 0.0846 0.08816 0.09297 0.09254Stack AR mole fraction - 0.0089 0.008724 0.008781 0.008653 0.008932 0.008865 0.008785 0.008406 0.008338 0.008274 0.008205 0.008511 0.008471 0.008422 0.008788 0.008626 0.008679 0.008554 0.008788 0.008263 0.008172Stack H2O mole fraction - 0.0852 0.1039 0.09875 0.1122 0.07808 0.0831 0.09079 0.1243 0.132 0.1391 0.1459 0.1121 0.1163 0.1205 0.1092 0.125 0.1206 0.1335 0.1093 0.1402 0.1496Stack CO2 mole fraction - 0.04344 0.04314 0.04418 0.04381 0.03958 0.03744 0.03641 0.06314 0.06407 0.06444 0.06312 0.06111 0.06083 0.05857 0.05561 0.05397 0.05533 0.05478 0.05565 0.06453 0.0634Molecular Weight lb/lbmole 28.42 28.21 28.28 28.13 28.46 28.39 28.29 28.27 28.19 28.12 28.03 28.38 28.33 28.26 28.26 28.08 28.14 27.99 28.26 28.11 28.00Temperature °F 185.2 190.5 181.4 194 163.1 160.3 166.9 291.5 284.5 280 288.3 259.6 243.4 251.2 172.8 178.6 176.3 182.2 180.5 281.3 293.8Mass Flow lb/hr 6,111,200 5,598,900 6,007,200 5,885,500 3,505,200 3,050,800 3,032,500 6,366,300 6,181,400 6,059,300 5,751,100 4,436,300 3,795,900 3,674,700 6,155,800 5,635,400 6,047,500 5,924,500 6,155,900 6,152,600 6,093,500Volume Flow scf/hr (60°F) 81,604,584 75,312,363 80,617,373 79,407,353 46,734,281 40,781,955 40,670,960 85,461,030 83,198,246 81,767,914 77,853,532 59,317,047 50,841,652 49,342,117 82,648,282 76,168,273 81,562,002 80,322,176 82,651,792 83,061,790 82,598,636
acf/hr 103,700,000 96,501,000 101,850,000 102,280,000 57,353,000 49,823,000 50,219,000 126,510,000 122,010,000 119,190,000 114,760,000 84,074,000 70,446,000 69,122,000 103,010,000 95,811,000 102,230,000 101,600,000 104,270,000 121,290,000 122,650,000acf/min 1,728,333 1,608,350 1,697,500 1,704,667 955,883 830,383 836,983 2,108,500 2,033,500 1,986,500 1,912,667 1,401,233 1,174,100 1,152,033 1,716,833 1,596,850 1,703,833 1,693,333 1,737,833 2,021,500 2,044,167fps 75.778 70.517 74.426 74.740 41.910 36.408 36.697 92.446 89.157 87.097 83.860 61.436 51.478 50.510 75.273 70.013 74.703 74.243 76.194 88.631 89.625
HRSG EXIT EXHAUST GAS EMISSIONSppmvd @ 15% O2 25 25 25 25 25 25 25 42 42 42 42 42 42 42 25 25 25 25 25 42 42lb/hr as NO2 320.00 292.50 321.25 313.75 166.25 137.50 133.75 745.00 736.25 727.50 678.75 500.00 426.25 398.75 416.25 371.25 408.75 397.50 416.25 740.00 722.50ppmvd @ 15% O2 2 2 2 2 2 2 2 4 4 4 4 4 4 4 2 2 2 2 2 4 4
lb/MMBtu 0.0073 0.0072 0.0073 0.0073 0.0072 0.0073 0.0073 0.015 0.015 0.015 0.015 0.015 0.015 0.015 0.0074 0.0073 0.0074 0.0073 0.0074 0.015 0.015lb/hr as NO2 25.6 23.4 25.7 25.1 13.3 11 10.7 59.6 58.9 58.2 54.3 40 34.1 31.9 33.3 29.7 32.7 31.8 33.3 59.2 57.8ppmvd @ 15% O2 9 9 9 9 9 9 9 25 25 25 25 25 25 25 9 9 9 9 9 25 25
lb/hr 45.45 41.85 45.90 44.55 23.85 19.80 18.90 81.45 80.55 79.65 74.25 54.90 46.80 43.65 86.40 77.40 85.05 82.80 86.85 81.00 79.20ppmvd @ 15% O2 1.3 1.3 1.3 1.3 1.3 1.3 1.3 2 2 2 2 2 2 2 1.9 1.9 1.9 1.9 1.9 2 2
lb/MMBtu 0.0029 0.0029 0.0029 0.0029 0.0029 0.0029 0.0029 0.0046 0.0046 0.0046 0.0046 0.0046 0.0046 0.0046 0.0042 0.0042 0.0042 0.0042 0.0043 0.0046 0.0046lb/hr 10.10 9.30 10.20 9.90 5.30 4.40 4.20 18.10 17.90 17.70 16.50 12.20 10.40 9.70 19.20 17.20 18.90 18.40 19.30 18.00 17.60ppmvd @ 15% O2 1.4 1.4 1.4 1.4 1.4 1.4 1.4 3.5 3.5 3.5 3.5 3.5 3.5 3.5 3.3 3.3 3.3 3.3 3.3 3.5 3.5
lb/hr as methane 6.20 5.80 6.20 6.20 3.20 2.60 2.60 18.20 18.03 17.68 16.63 12.25 10.50 9.80 19.07 17.05 18.88 18.33 19.07 18.03 17.68ppmvd @ 15% O2 0.7 0.7 0.7 0.7 0.7 0.7 0.7 2 2 2 2 2 2 2 1.8 1.8 1.8 1.8 1.8 2 2
lb/MMBtu 0.0009 0.0009 0.0009 0.0009 0.0009 0.0009 0.0009 0.0026 0.0026 0.0026 0.0026 0.0026 0.0027 0.0027 0.0023 0.0023 0.0023 0.0023 0.0023 0.0026 0.0026lb/hr as methane 3.10 2.90 3.10 3.10 1.60 1.30 1.30 10.40 10.30 10.10 9.50 7.00 6.00 5.60 10.40 9.30 10.30 10.00 10.40 10.30 10.10lb/hr 432,000 396,000 434,000 424,000 225,000 186,000 180,000 657,000 649,000 642,000 598,000 441,000 377,000 352,000 560,000 501,000 550,000 536,000 560,000 653,000 638,000lb/MMBtu w/margin 134.9 134.9 134.8 134.8 134.7 134.9 134.6 183.4 183.4 183.5 183.3 183.3 183.7 183.5 136.1 136.0 136.0 135.9 136.0 183.5 183.5lb/hr w/10% margin4 475,200 435,600 477,400 466,400 247,500 204,600 198,000 722,700 713,900 706,200 657,800 485,100 414,700 387,200 616,000 551,100 605,000 589,600 616,000 718,300 701,800lb/MW-hr 836 819 813 821 931 953 979 1,259 1,228 1,223 1,235 1,282 1,283 1,315 894 874 872 876 892 1,210 1,220ppmvd @ 15% O2 5 5 5 5 5 5 5 5 5 5 5 5 5 5 5 5 5 5 5 5 5
lb/MMBtu 0.0067 0.0067 0.0067 0.0067 0.0067 0.0067 0.0067 0.0070 0.0070 0.0070 0.0070 0.0070 0.0070 0.0070 0.0068 0.0068 0.0068 0.0068 0.0068 0.0070 0.0070lb/hr 23.7 21.7 23.8 23.2 12.3 10.2 9.9 27.6 27.2 26.9 25.1 18.5 15.8 14.8 30.8 27.5 30.2 29.5 30.8 27.4 26.8lb/hr w/5% margin4 24.89 22.79 24.99 24.36 12.92 10.71 10.40 28.98 28.56 28.25 26.36 19.43 16.59 15.54 32.34 28.88 31.71 30.98 32.34 28.77 28.14
SOx5 lb/hr as SO2 (+20%) 4.70 4.30 4.70 4.60 2.40 2.00 2.00 7.00 7.00 6.90 6.40 4.70 4.00 3.80 6.10 5.40 6.00 5.80 6.10 7.00 6.80
lb/hr 11.3 11.1 11.3 11.3 10.0 9.7 9.7 48.2 48.2 48.1 47.9 39.6 39.2 39.0 22.5 20.3 21.5 21.1 22.5 48.2 48.1lb/MMBtu 0.0032 0.0034 0.0032 0.0033 0.0054 0.0064 0.0066 0.0122 0.0124 0.0125 0.0133 0.0150 0.0174 0.0185 0.0050 0.0050 0.0048 0.0049 0.0050 0.0123 0.0126lb/hr 2.60 2.40 2.70 2.60 1.40 1.10 1.10 4.00 3.90 3.90 3.60 2.70 2.30 2.10 3.70 3.30 3.70 3.60 3.70 3.90 3.90lb/hr w/10% margin4 2.86 2.64 2.97 2.86 1.54 1.21 1.21 4.40 4.29 4.29 3.96 2.97 2.53 2.31 4.07 3.63 4.07 3.96 4.07 4.29 4.29ppbvd @ 15% O2 45.5 45.5 45.5 45.5 45.5 45.5 45.5 45.5 45.5 45.5 45.5 45.5 45.5 45.5 45.5 45.5 45.5 45.5 45.5 45.5 45.5
lb/MMBtu 0.00012 0.00012 0.00012 0.00012 0.00012 0.00012 0.00012 0.00012 0.00012 0.00012 0.00012 0.00012 0.00012 0.00012 0.00012 0.00012 0.00012 0.00012 0.00012 0.00012 0.00012lb/hr 0.42 0.38 0.42 0.41 0.22 0.18 0.17 0.47 0.46 0.46 0.43 0.31 0.27 0.25 0.54 0.48 0.53 0.52 0.54 0.46 0.45lb/hr w/10% margin4 0.46 0.42 0.46 0.45 0.24 0.20 0.19 0.51 0.51 0.50 0.47 0.35 0.30 0.28 0.59 0.53 0.58 0.57 0.59 0.51 0.50
NOx (pre-control)3
CO (pre-control)3
VOC (pre-control)3
CH2O6
NOx (post-control)
CO (post-control)
H2SO4
NH3
VOC (post-control)
PM
CO2
December 2019

Renovo Energy CenterRaw Data for General Electric EquipmentNotes
1 Operating points included list evaporative coolers as "off," however evaporative coolers may be operated when firing ULSD.
2 The heat consumption provided by G.E. included a ~5% margin to account for equipment degradation and site variability.
3 Pre-control emissions rates when firing natural gas were provided by G.E. on a ppm basis. The same control efficiency for ppm values was used for the lb/hr pre-control emission rates. For emission rates when firing ULSD, the same control efficiency as determined for natural gas emissions was used to determine pre-control emissions when firing ULSD.
4 A 10% margin was added to lb/hr emission values of CO2, H2SO4, NH3, and CH2O to account for equipment degradation and site variability.
5 SOx emission rates provided by G.E. included a margin of 20% to account for fuel and site variability.6 CH2O emission rate of 91 ppb @ 15% O2 is the turbine outlet concentration provided by G.E. (91 ppb) with a 50%
control efficiency applied for the oxidation catalyst.
December 2019
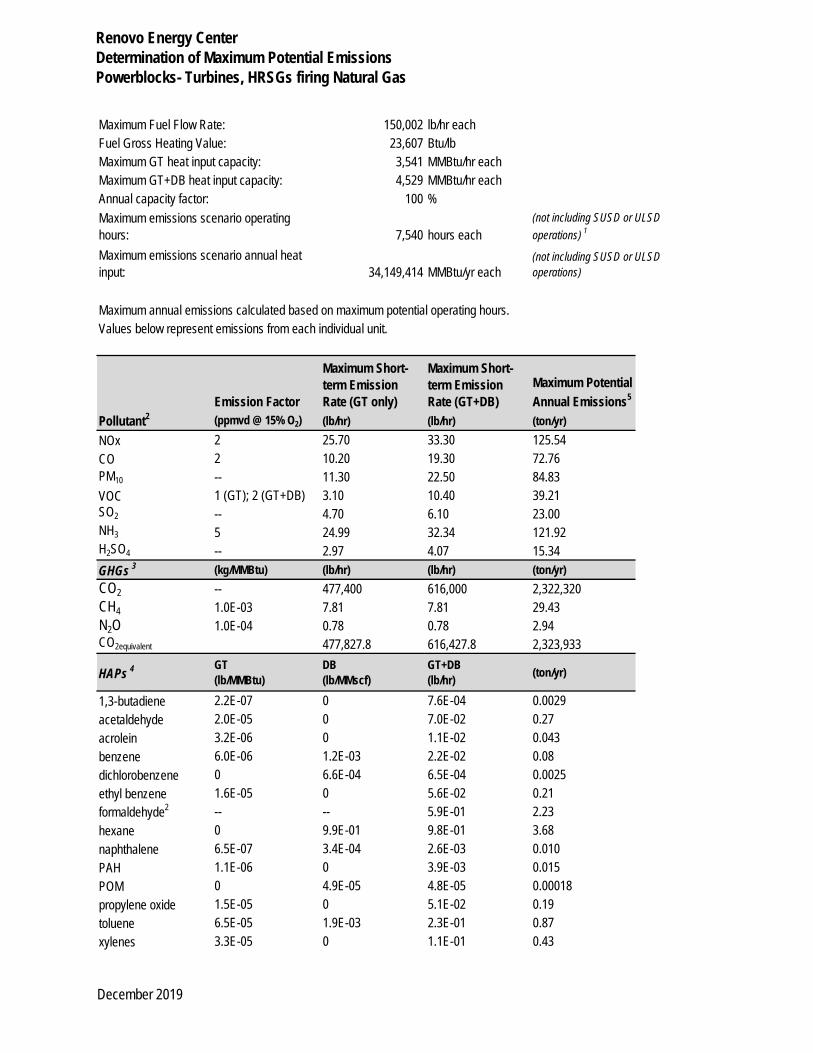
Renovo Energy CenterDetermination of Maximum Potential EmissionsPowerblocks- Turbines, HRSGs firing Natural Gas
Maximum Fuel Flow Rate: 150,002 lb/hr eachFuel Gross Heating Value: 23,607 Btu/lbMaximum GT heat input capacity: 3,541 MMBtu/hr eachMaximum GT+DB heat input capacity: 4,529 MMBtu/hr eachAnnual capacity factor: 100 %
7,540 hours each
34,149,414 MMBtu/yr each
Maximum annual emissions calculated based on maximum potential operating hours.Values below represent emissions from each individual unit.
(ppmvd @ 15% O2) (lb/hr) (lb/hr) (ton/yr)NOx 2 25.70 33.30 125.54CO 2 10.20 19.30 72.76PM10 -- 11.30 22.50 84.83VOC 1 (GT); 2 (GT+DB) 3.10 10.40 39.21SO2 -- 4.70 6.10 23.00NH3 5 24.99 32.34 121.92H2SO4 -- 2.97 4.07 15.34GHGs 3 (kg/MMBtu) (lb/hr) (lb/hr) (ton/yr)CO2 -- 477,400 616,000 2,322,320CH4 1.0E-03 7.81 7.81 29.43N2O 1.0E-04 0.78 0.78 2.94CO2equivalent 477,827.8 616,427.8 2,323,933
HAPs 4 GT(lb/MMBtu)
DB(lb/MMscf)
GT+DB(lb/hr) (ton/yr)
1,3-butadiene 2.2E-07 0 7.6E-04 0.0029acetaldehyde 2.0E-05 0 7.0E-02 0.27acrolein 3.2E-06 0 1.1E-02 0.043benzene 6.0E-06 1.2E-03 2.2E-02 0.08dichlorobenzene 0 6.6E-04 6.5E-04 0.0025ethyl benzene 1.6E-05 0 5.6E-02 0.21formaldehyde2 -- -- 5.9E-01 2.23hexane 0 9.9E-01 9.8E-01 3.68naphthalene 6.5E-07 3.4E-04 2.6E-03 0.010PAH 1.1E-06 0 3.9E-03 0.015POM 0 4.9E-05 4.8E-05 0.00018propylene oxide 1.5E-05 0 5.1E-02 0.19toluene 6.5E-05 1.9E-03 2.3E-01 0.87xylenes 3.3E-05 0 1.1E-01 0.43
(not including SUSD or ULSD operations) 1
(not including SUSD or ULSD operations)
Maximum emissions scenario operating hours:Maximum emissions scenario annual heat input:
Maximum Short-term Emission Rate (GT only)Emission Factor
Maximum Potential Annual Emissions5
Maximum Short-term Emission Rate (GT+DB)
Pollutant2
December 2019
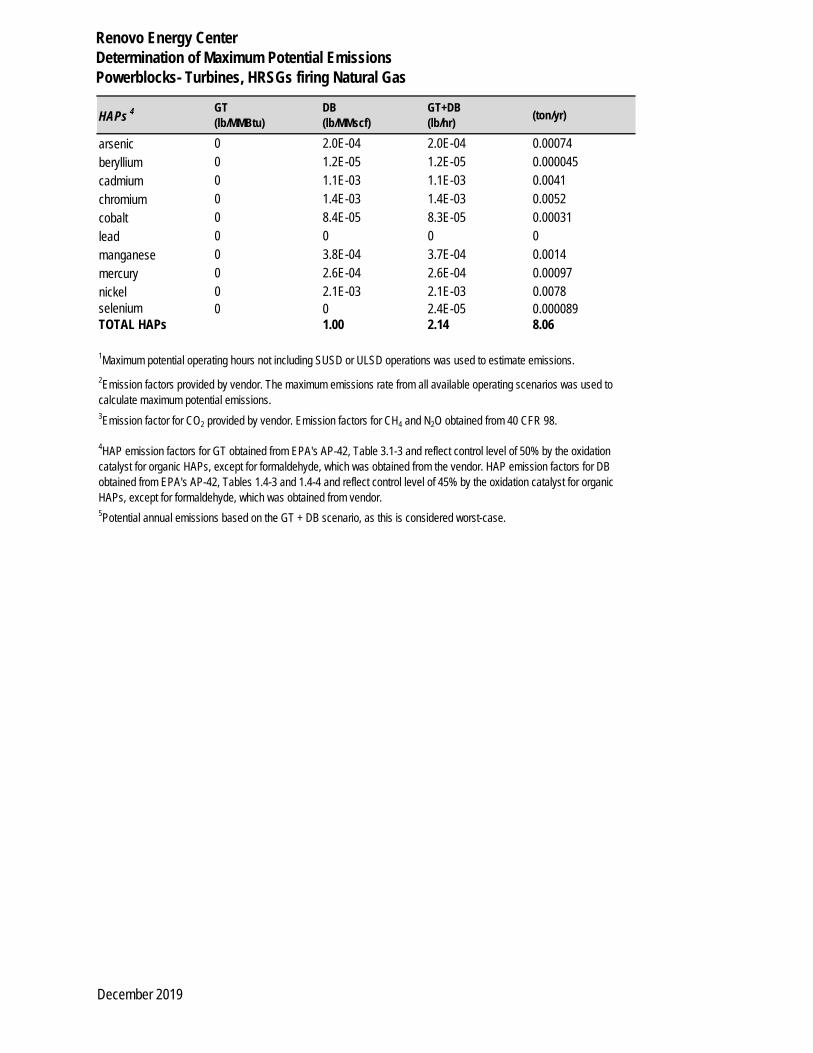
Renovo Energy CenterDetermination of Maximum Potential EmissionsPowerblocks- Turbines, HRSGs firing Natural Gas
HAPs 4 GT(lb/MMBtu)
DB(lb/MMscf)
GT+DB(lb/hr) (ton/yr)
arsenic 0 2.0E-04 2.0E-04 0.00074beryllium 0 1.2E-05 1.2E-05 0.000045cadmium 0 1.1E-03 1.1E-03 0.0041chromium 0 1.4E-03 1.4E-03 0.0052cobalt 0 8.4E-05 8.3E-05 0.00031lead 0 0 0 0manganese 0 3.8E-04 3.7E-04 0.0014mercury 0 2.6E-04 2.6E-04 0.00097nickel 0 2.1E-03 2.1E-03 0.0078selenium 0 0 2.4E-05 0.000089TOTAL HAPs 1.00 2.14 8.06
3Emission factor for CO2 provided by vendor. Emission factors for CH4 and N2O obtained from 40 CFR 98.
4HAP emission factors for GT obtained from EPA's AP-42, Table 3.1-3 and reflect control level of 50% by the oxidation catalyst for organic HAPs, except for formaldehyde, which was obtained from the vendor. HAP emission factors for DB obtained from EPA's AP-42, Tables 1.4-3 and 1.4-4 and reflect control level of 45% by the oxidation catalyst for organic HAPs, except for formaldehyde, which was obtained from vendor.5Potential annual emissions based on the GT + DB scenario, as this is considered worst-case.
1Maximum potential operating hours not including SUSD or ULSD operations was used to estimate emissions.2Emission factors provided by vendor. The maximum emissions rate from all available operating scenarios was used to calculate maximum potential emissions.
December 2019

Renovo Energy CenterDetermination of Maximum Potential EmissionsPowerblocks- Turbines firing ULSD
Maximum Fuel Flow Rate: 195,748 lb/hr eachFuel Gross Heating Value: 20,130 Btu/lbMaximum heat input capacity: 3,940 MMBtu/hr eachAnnual capacity factor: 100 %Maximum potential operating hours: 720 hours each (not including SUSD) 1
Maximum annual heat input: 2,837,088 MMBtu/yr (not including SUSD)
Maximum annual emissions calculated based on maximum potential operating hours.Values below represent emissions from each individual unit.
(ppmvd @ 15% O2) (lb/hr) (ton/yr)NOx 4 59.60 21.46CO 2 18.10 6.52PM10 -- 48.20 17.35VOC 2 10.40 3.74SO2 -- 7.00 2.52NH3 5 28.98 10.43H2SO4 -- 4.40 1.58GHGs 3 (kg/MMBtu) (lb/hr) (ton/yr)
CO2 -- 722,700 260,172CH4 3.0E-03 26.06 9.38N2O 6.0E-04 5.21 1.88CO2equivalent -- 724,904.8 260,966HAPs 4 (lb/MMBtu) (lb/hr) (ton/yr)1,3-butadiene 1.1E-05 4.4E-02 0.016acetaldehyde 0 0 0acrolein 0 0 0benzene 3.9E-05 1.5E-01 0.055dichlorobenzene 0 0 0ethyl benzene 0 0 0formaldehyde2 -- 5.1E-01 0.19hexane 0 0 0naphthalene 2.5E-05 9.7E-02 0.035PAH 2.8E-05 1.1E-01 0.040POM 0 0 0propylene oxide 0 0 0toluene 0 0 0xylenes 0 0 0arsenic 1.1E-05 4.3E-02 0.016beryllium 3.1E-07 1.2E-03 0.00044cadmium 4.8E-06 1.9E-02 0.0068chromium 1.1E-05 4.3E-02 0.016cobalt 0 0 0lead 1.4E-05 5.5E-02 0.020
Pollutant2Emission Factor
Maximum Short-Term Emission Rate
Maximum Potential Annual Emissions
December 2019

Renovo Energy CenterDetermination of Maximum Potential EmissionsPowerblocks- Turbines firing ULSD
HAPs 4 (lb/MMBtu) (lb/hr) (ton/yr)manganese 7.9E-04 3.11 1.12mercury 1.2E-06 4.7E-03 0.0017nickel 4.6E-06 1.8E-02 0.0065selenium 2.5E-05 9.9E-02 0.035TOTAL HAPs 4.31 1.55
4HAP emission factors obtained from EPA's AP-42, Tables 3.1-4 and 3.1-5 and reflect control level of 30% by the oxidation catalyst for organic HAPs, except for formaldehyde, which was obtained from the vendor.
3Emission factor for CO2 provided by vendor. Emission factors for CH4 and N2O obtained from 40 CFR 98.
2Emission factors provided by vendor. The maximum emissions rate from all available operating scenarios was used to calculate maximum potential emissions.
1Maximum potential operating hours not including SUSD was used to estimate emissions.
December 2019

Renovo Energy CenterStartup and Shutdown Operations Emissions DataNatural Gas Firing
SUSD Parameter
Amount per Event - GE Provided
Pro-Rated Amount per Hour
Amount per Event with Time Increase1
Cold StartTime from Ignition until Compliance (minutes) 45 -- 60Fuel Consumed (lb) 39,451 52,602 52,602Fuel Consumed (MMBtu LHV) 840 1,120 1,120Fuel Consumed (MMBtu HHV) 931 1,242 1,242Maximum Potential NOx Emissions (lb) 123.0 164.0 164.0Maximum Potential CO Emissions (lb) 699.0 932.0 932.0Maximum Potential VOC Emissions (lb) 53.0 70.7 70.7Maximum Potential PM10/2.5 Emissions (lb) 8.3 11.1 11.1Warm StartTime from Ignition until Compliance (minutes) 40 -- 55Fuel Consumed (lb) 38,277 57,416 52,631Fuel Consumed (MMBtu LHV) 815 1,223 1,121Fuel Consumed (MMBtu HHV) 904 1,355 1,242Maximum Potential NOx Emissions (lb) 81.0 121.5 111.4Maximum Potential CO Emissions (lb) 190.0 285.0 261.3Maximum Potential VOC Emissions (lb) 24.0 36.0 33.0Maximum Potential PM10/2.5 Emissions (lb) 7.3 11.0 10.0Hot StartTime from Ignition until Compliance (minutes) 20 -- 35Fuel Consumed (lb) 15,264 45,792 26,712Fuel Consumed (MMBtu LHV) 325 975 569Fuel Consumed (MMBtu HHV) 360 1,081 631Maximum Potential NOx Emissions (lb) 53.0 159.0 92.8Maximum Potential CO Emissions (lb) 177.0 531.0 309.8Maximum Potential VOC Emissions (lb) 22.0 66.0 38.5Maximum Potential PM10/2.5 Emissions (lb) 4.0 12.0 7.0Shutdown from 50% loadTime to Shutdown (minutes) 12 -- 27Fuel Consumed (lb) 9,393 46,966 21,135Fuel Consumed (MMBtu LHV) 200 1,000 450Fuel Consumed (MMBtu HHV) 222 1,109 499Maximum Potential NOx Emissions (lb) 14.0 70.0 31.5Maximum Potential CO Emissions (lb) 152.0 760.0 342.0Maximum Potential VOC Emissions (lb) 19.0 95.0 42.8Maximum Potential PM10/2.5 Emissions (lb) 3.0 15.0 6.8Annual Totals2
Total SUSD Operating Hour Limitation Per Unit: 460 hrsTotal Annual SUSD Fuel Consumption Per Unit: 25,302,027 lbsTotal Annual SUSD Heat Input Per Unit: 538,731 MMBtu LHVTotal Annual SUSD Heat Input Per Unit: 597,305 MMBtu HHVTotal Maximum Potential NOx Emissions Per Unit: 25.2 tonsTotal Maximum Potential CO Emissions Per Unit: 90.8 tonsTotal Maximum Potential VOC Emissions Per Unit: 11.4 tonsTotal Maximum Potential PM10/2.5 Emissions Per Unit: 2.7 tonsDecember 2019

Renovo Energy CenterStartup and Shutdown Operations Emissions DataULSD Firing
SUSD Parameter
Amount per Event - GE Provided
Pro-Rated Amount per Hour
Amount per Event with Time Increase1
Cold StartTime from Ignition until Compliance (minutes) 45 -- 60Fuel Consumed (lb) 54,208 72,277 72,277Fuel Consumed (MMBtu LHV) 992 1,323 1,323Fuel Consumed (MMBtu HHV) 1,100 1,466 1,466Maximum Potential NOx Emissions (lb) 221.0 294.7 294.7Maximum Potential CO Emissions (lb) 704.0 938.7 938.7Maximum Potential VOC Emissions (lb) 141.0 188.0 188.0Maximum Potential PM10/2.5 Emissions (lb) 36.0 48.0 48.0Warm StartTime from Ignition until Compliance (minutes) 40 -- 55Fuel Consumed (lb) 54,645 81,967 75,137Fuel Consumed (MMBtu LHV) 1,000 1,500 1,375Fuel Consumed (MMBtu HHV) 1,109 1,663 1,525Maximum Potential NOx Emissions (lb) 172.0 258.0 236.5Maximum Potential CO Emissions (lb) 286.0 429.0 393.3Maximum Potential VOC Emissions (lb) 33.0 49.5 45.4Maximum Potential PM10/2.5 Emissions (lb) 32.0 48.0 44.0Hot StartTime from Ignition until Compliance (minutes) 20 -- 35Fuel Consumed (lb) 18,579 55,738 32,514Fuel Consumed (MMBtu LHV) 340 1,020 595Fuel Consumed (MMBtu HHV) 377.0 1,131 660Maximum Potential NOx Emissions (lb) 112.0 336.0 196.0Maximum Potential CO Emissions (lb) 273.0 819.0 477.8Maximum Potential VOC Emissions (lb) 30.0 90.0 52.5Maximum Potential PM10/2.5 Emissions (lb) 16.0 48.0 28.0Shutdown from 50% loadTime to Shutdown (minutes) 8 -- 23Fuel Consumed (lb) 7,213 54,098 20,738Fuel Consumed (MMBtu LHV) 132 990 380Fuel Consumed (MMBtu HHV) 146 1,098 421Maximum Potential NOx Emissions (lb) 43.0 322.5 123.6Maximum Potential CO Emissions (lb) 48.0 360.0 138.0Maximum Potential VOC Emissions (lb) 7.0 52.5 20.1Maximum Potential PM10/2.5 Emissions (lb) 10.0 75.0 28.8Annual Totals2
Total SUSD Operating Hour Limitation Per Unit: 40 hrsTotal Annual SUSD Fuel Consumption Per Unit: 3,092,896 lbsTotal Annual SUSD Heat Input Per Unit: 56,600 MMBtu LHVTotal Annual SUSD Heat Input Per Unit: 62,755 MMBtu HHVTotal Maximum Potential NOx Emissions Per Unit: 5.4 tonsTotal Maximum Potential CO Emissions Per Unit: 8.4 tonsTotal Maximum Potential VOC Emissions Per Unit: 1.0 tonsTotal Maximum Potential PM10/2.5 Emissions Per Unit: 1.1 tonsDecember 2019

Renovo Energy CenterStartup and Shutdown Operations Emissions Data and Modeling ParametersNotes
1 REC is proposing to add 15 minutes of margin to each SUSD scenario in order to allow operational flexibility in order to ensure that the SUSD can be completed in the permitted length of time. All heat input and emission parameters have been pro-rated for the increased time.
2Annual totals are based on warm starts and the corresponding amount of shutdowns. For the natural gas scenarios, 460 hours of SUSD corresponds to 308.5 hours of warm starts and 151.5 hours of shutdowns. For the ULSD scenarios, 40 hours of SUSD corresponds to 28.2 hours of warm starts and 11.8 hours of shutdowns.
December 2019

Renovo Energy CenterSummary of Worst-Case Maximum Potential Annual Emissions ScenarioPowerblocks- Turbines, HRSGs
720 each powerblock40 each powerblock
7,540 each powerblock460 each powerblock
Total Operating Hours: 8,760 each powerblock
Pollutant
Annual Emissions from ULSD Firing1
(tons)
Annual Emissions from ULSD SUSD2
(tons)
Annual Emissions from NG Firing3
(tons)
Annual Emissions from Natural Gas SUSD4 (tons)
Total Maximum Potential Annual Emissions from Both Powerblocks (tons)
Total Maximum Potential Annual Emissions from Each Powerblock (tons)
NOx 42.91 10.75 251.08 50.42 355.17 177.58CO 13.03 16.70 145.52 181.52 356.78 178.39PM10 34.70 2.10 169.65 5.47 211.92 105.96VOC 7.49 2.00 78.42 22.82 110.73 55.36SO2 5.04 0.28 45.99 2.16 53.48 26.74NH3 20.87 1.16 243.84 11.50 277.36 138.68H2SO4 3.17 0.18 30.69 1.37 35.40 17.70GHGsCO2 520,344 28,908 4,644,640 219,604 5,413,496 2,706,748CH4 18.76 1.04 58.86 3.59 82.26 41.13N2O 3.75 0.21 5.89 0.36 10.21 5.10CO2equivalent 521,931 28,996 4,647,866 219,801 5,418,594 2,709,297HAPs1,3-butadiene 0.032 0.0018 0.0057 0.00035 0.040 0.020acetaldehyde 0 0 0.53 0.033 0.56 0.28acrolein 0 0 0.085 0.0052 0.09 0.045benzene 0.11 0.0061 0.17 0.010 0.29 0.15dichlorobenzene 0 0 0.0049 0 0.0049 0.0025
Natural Gas Normal Operating Hours:ULSD SUSD Operating Hours:
ULSD Normal Operating Hours:
Natural Gas SUSD Operating Hours:
December 2019

Renovo Energy CenterSummary of Worst-Case Maximum Potential Annual Emissions ScenarioPowerblocks- Turbines, HRSGs
Pollutant
Annual Emissions from ULSD Firing1
(tons)
Annual Emissions from ULSD SUSD2
(tons)
Annual Emissions from NG Firing3
(tons)
Annual Emissions from Natural Gas SUSD4 (tons)
Total Maximum Potential Annual Emissions from Both Powerblocks (tons)
Total Maximum Potential Annual Emissions from Each Powerblock (tons)
ethyl benzene 0 0 0.43 0.026 0.45 0.23formaldehyde 0.37 0.021 4.46 0.21 5.06 2.53hexane 0 0 7.36 0 7.36 3.68naphthalene 0.070 0.0039 0.020 0.0011 0.09 0.047PAH 0.079 0.0044 0.029 0.0018 0.11 0.057POM 0 0 0.00036 0 0.00036 0.00018propylene oxide 0 0 0.39 0.024 0.41 0.20toluene 0 0 1.74 0.11 1.85 0.92xylenes 0 0 0.86 0.053 0.92 0.46arsenic 0.031 0.0017 0.0015 0 0.034 0.017beryllium 0.00088 0.000049 0.000089 0 0.0010 0.00051cadmium 0.014 0.00076 0.0082 0 0.023 0.011chromium 0.031 0.0017 0.010 0 0.043 0.022cobalt 0 0 0.00062 0 0.00062 0.00031lead 0.040 0.0022 0 0 0.042 0.021manganese 2.24 0.12 0.0028 0 2.37 1.18mercury 0.0034 0.00019 0.0019 0 0.0055 0.0028nickel 0.013 0.00073 0.016 0 0.029 0.015selenium 0.071 0.0039 0.00018 0 0.075 0.038TOTAL HAPs 3.11 16.12 19.87 9.93
4Annual Emissions from Natural Gas SUSD based on 460 SUSD hours per powerblock when firing natural gas, using emission rates for Warm Starts and Shutdowns for emissions of NOx, CO, PM, and VOC. All other pollutant emissions based on the maximum emission rate for all operating loads when firing natural gas.
3Annual Emissions from Natural Gas Firing based on 7,540 normal operating hours firing natural gas in the CT and DB for each powerblock.
2Annual Emissions from ULSD SUSD based on 40 SUSD hours per powerblock when firing ULSD, using emission rates for Warm Starts and Shutdowns for emissions of NOx, CO, PM, and VOC. All other pollutant emissions based on the maximum emission rate for all operating loads when firing ULSD.
1Annual Emissions from ULSD Firing based on 720 nornal operating hours on ULSD for each powerblock.
December 2019

Renovo Energy CenterCalculations for CO2 BACT LimitPowerblocks- Turbines, HRSGs
SITE CONDITIONSAmbient Temperature °F 59 59 59Ambient Pressure psia 14.35 14.35 14.35Ambient Relative Humidity % 60.00 60.00 60.00PLANT STATUSHRSG Duct Burner Off On OffSCR Operating Operating OperatingCO Catalyst Operating Operating OperatingEvaporative Cooler state (On or Off) On On OffGas Turbine Load % Base Base BaseGas Turbines Operating 1 1 1GT Diluent Injection Type None None WaterGT Diluent Injection Flow (per GT) 103 lb/hr 0 0 266.4FUEL DATAFuel Type NG NG DOHHV BTU/lb 23,607 23,607 19,649LHV BTU/lb 21,292 21,292 18,300GT Heat Consumption per unit MMBTU/hr, HHV 3,541.1 3,541.1 3,848.4Duct Burner Heat Consumption MMBTU/hr, HHV 0 906.8 0Total Heat Consumption MMBTU/hr, HHV 3,541.1 4,447.9 3,848.4HRSG DATA (PER UNIT)HRSG EXIT EXHAUST GASTemperature °F 181 176 280Mass Flow with Permitting Margin lb/hr 6,007,200 6,047,500 6,059,300Std Volume Flow SCF/hr (60°F) 80,617,373 81,562,002 81,767,914Actual Volume Flow Actual ft3/hr 101,850,000 102,230,000 119,190,000HRSG EXIT EXHAUST GAS EMISSIONSCO2 lb/hr 434,000 550,000 642,000 (provided by GE)CH4 kg/MMBtu 1.0E-03 1.0E-03 3.0E-03 (40 CFR 98 emission factor)
lb/hr 7.81 9.81 25.45N2O kg/MMBtu 1.0E-04 1.0E-04 6.0E-04 (40 CFR 98 emission factor)
lb/hr 0.78 0.98 5.09CO2e lb/hr 434,428 550,537 644,153 (CH 4 GWP= 25, N 2 O GWP= 298)Powerblock Net Output MW 534 631 525 (provided by GE)CO2e Emission Factor lb/MW-hr 813.5 872.5 1,227.2Annual Hours of Operation hrs 4,020.0 4,020.0 720Annual CO2e Emission FactorWith 10% OEM-recommended Margin(see attached notes from G.E.)
875 lb/MW-hr962 lb/MW-hr
December 2019

Renovo Energy CenterDetermination of Maximum Potential EmissionsAuxiliary Boilers
Two natural gas fired auxiliary boilersMaximum heat input capacity: 66 MMBtu/hr per boiler
Equivalent to: 64,706 scf/hr per boilerMaximum proposed annual heat input per boiler: 145,200 MMBtu/yr
Equivalent to: 2,200 hours at 100% loadMaximum annual heat input total: 290,400 MMBtu/yr totalMaximum fuel input per boiler: 142 MMcf/yr
Emission Factor
Maximum Potential Emission Rate per Boiler
Maximum Potential Emissions for One Boiler
Total Maximum Potential Emissions
(lb/MMBtu) (lb/hr) (tpy) (tpy)NOx 0.0060 0.40 0.44 0.87CO 0.036 2.38 2.61 5.23PM10 0.0019 0.13 0.14 0.28VOC 0.0020 0.13 0.15 0.29SO2 0.00058 0.038 0.042 0.084H2SO4 9.0E-05 0.0059 0.0065 0.013NH3 negligible --- ---GHGs (kg/MMBtu) (tpy) (tpy)CO2 53.06 8,474.74 16,949.49CH4 1.00E-03 0.16 0.32N2O 1.00E-04 0.016 0.032CO2e -- 8,483.50 16,966.99
Emission Factor
Maximum Potential Emission Rate per Boiler
Maximum Potential Emissions for One Boiler
Total Maximum Potential Emissions
(lb/MMcf) (lb/hr) (tpy) (tpy)benzene 2.10E-03 1.36E-04 1.5E-04 0.00030formaldehyde 7.50E-02 4.85E-03 5.3E-03 0.011hexane 1.8 1.16E-01 1.3E-01 0.26naphthalene 6.10E-04 3.95E-05 4.3E-05 0.000087toluene 3.40E-03 2.20E-04 2.4E-04 0.00048POM 8.82E-05 5.71E-06 6.3E-06 0.000013Total HAP emissions: 0.12 0.13 0.27
Pollutant
HAPs
Emission factors for CO2, CH4 and N2O are provided by Tables C-1 and C-2 of 40 CFR Part 98 - Mandatory Reporting of Greenhouse Gases
Emission factor for SO2 and H2SO4 are based on RBLC database entries for BACT/BAT
Emission factors for PM and HAPs are based on AP-42, Section 1.4. PM factor is for filterable portion only (1.9 lb/MMcf/1,020 Btu/cf = 0.0019 lb/MMBtu)
Emission factors for NOx, CO, and VOC are vendor estimates and/or LAER/BACT limits.
December 2019

Renovo Energy CenterDetermination of Maximum Potential EmissionsDiesel Engines
Emergency GeneratorMaximum rating: 1500 kW
2206 hpMaximum operating hours: 500 hrMaximum fuel firing rate: 104.6 gal/hrMaximum heat input rate: 14.33 MMBtu/hr
(g/hp-hr) (lb/hr) (tpy)NOx 4.48 21.79 5.45CO 1.23 5.98 1.50PM10 0.13 0.63 0.16VOC 0.80 3.89 0.97SO2
1 --- 0.022 0.0055
SO2 emissions are based on ultra low diesel fuel not to exceed 15 ppm sulfur.
Fire Pump EngineMaximum rating: 237 hpMaximum operating hours: 250 hrMaximum fuel firing rate: 12 gal/hrMaximum firing rate: 1.64 MMBtu/hr
(g/hp-hr) (lb/hr) (tpy)NOx 2.7 1.41 0.18CO 0.9 0.47 0.059PM10 0.10 0.052 0.0065VOC 0.10 0.052 0.0065SO2
1 --- 0.0025 0.00032Emissions for NOx, CO, VOC, and PM10 are based on vendor dataSO2 emissions are based on ultra low diesel fuel not to exceed 15 ppm sulfur.
Pollutant
Maximum Potential Emissions
VOC emission rate is based on maximum calculated emission rate provide by CAT for a 3512C engine.
Emission rates for NOx, CO, and PM10 are based on EPA Weighted Emissions Calculator for Constant Speed Engines - 40 CFR 89, Table 2 of Appendix B to Section E.
Tier 2 Emission Factor
Emission Rate
1(15 lb S/ 106 lb fuel) ( 64 lb SO2/32 lb S) (7 lb/gal) ( gal/137,000 Btu) (14.33 MMBtu/hr) = 0.022 lb SO2/hr
Pollutant
Maximum Potential Emissions
1(15 lb S/ 106 lb fuel) ( 64 lb SO2/32 lb S) (7 lb/gal) ( gal/137,000 Btu) (1.75 MMBtu/hr) = 0.003 lb SO2/hr
Emission Factor
Emission Rate
December 2019

Renovo Energy CenterDetermination of Maximum Potential EmissionsDiesel Engines
(lb/MMBtu) (tpy) (tpy) (tpy)
benzene 9.33E-04 3.34E-03 1.92E-04 3.53E-03toluene 4.09E-04 1.47E-03 8.40E-05 1.55E-03xylene 2.85E-04 1.02E-03 5.86E-05 1.08E-031,3 butadiene 3.91E-05 1.40E-04 8.04E-06 1.48E-04formaldehyde 1.18E-03 4.23E-03 2.42E-04 4.47E-03acetaldehyde 7.67E-04 2.75E-03 1.58E-04 2.91E-03acrolein 9.25E-05 3.31E-04 1.90E-05 3.50E-04naphthalene 8.48E-05 3.04E-04 1.74E-05 3.21E-04
Total 1.36E-02 7.79E-04 1.44E-02
1HAP emission factors are based on AP-42, Section 3.
Maximum Potential Fire Pump Emissions
Maximum Potantial Generator Emissions
Emission Factor
HAP Emissions1
Combined Maximum Potential Emissions
December 2019

Renovo Energy CenterDetermination of Maximum Potential EmissionsHeaters
Two natural gas water bath heaters (located 1.25 miles from site at pressure reducing station)Maximum heat input capacity (each): 15 MMBtu/hrMaximum potential operating hours: 8,760 hours
(lb/MMBtu) (lb/hr) (tpy)NOx 0.011 0.17 1.45CO 0.037 0.56 4.86PM10 0.0019 0.029 0.25VOC 0.0050 0.075 0.66SO2 0.00058 0.0087 0.076NH3 negligible ---GHGs (kg/MMBtu) (tpy)CO2 53.06 15,338.58CH4 1.00E-03 0.29N2O 1.00E-04 0.029CO2e -- 15,354.43
(lb/MMcf) (tpy)
benzene 2.10E-03 2.7E-04formaldehyde 7.50E-02 0.0097hexane 1.8 0.23naphthalene 6.10E-04 7.9E-05toluene 3.40E-03 0.00044POM 8.82E-05 1.1E-05
Total HAP emissions: 0.24
Emission factors for NOx, CO, VOC, PM10 and SO2 are based on RBLC database entries for BACT/BAT
Emission factors for HAPs are based on AP-42, Section 1.4.
Note: Site will be equipped with three heaters. Third heater is for standby/redundancy only. Only two heaters will be operated at the same time.
Combined Maximum Potential Emissions
Maximum Potential Emission Rate per UnitEmission Factor
Pollutant
Maximum Potential EmissionsEmission Factor
HAPs
Emission factors for CO2, CH4 and N2O are provided by Tables C-1 and C-2 of 40 CFR Part 98 - Mandatory Reporting of Greenhouse Gases
December 2019

Renovo Energy CenterDetermination of Maximum Potential EmissionsHeaters
One natural gas dew point heater
Maximum heat input capacity: 2.96 MMBtu/hrMaximum potential operating hours: 8,760 hours
(lb/MMcf) (tpy)
NOx 100 1.27CO 84 1.07PM10 1.9 0.024VOC 5.5 0.070SO2 0.6 0.0076NH3 negligible ---GHGs (kg/MMBtu) (tpy)CO2 53.06 1,513.41CH4 1.00E-03 0.029N2O 1.00E-04 0.0029CO2e -- 1,514.97
(lb/MMcf) (tpy)
benzene 2.10E-03 2.7E-05formaldehyde 7.50E-02 9.5E-04hexane 1.8 2.3E-02naphthalene 6.10E-04 7.8E-06toluene 3.40E-03 4.3E-05POM 8.82E-05 1.1E-06
Total HAP emissions: 0.024
Emission factors for criteria pollutants and HAPs are based on AP-42, Section 1.4.
Since heater is exempt from permitting (natural gas, less than 10 MMBtu/hr), BAT/BACT/LAER emission rates are not required. Emissions are provided for inclusion in facility-wide potential emissions.
Potential EmissionsEmission Factor
Pollutant
Maximum Potential EmissionsEmission Factor
HAPs
Emission factors for CO2, CH4 and N2O are provided by Tables C-1 and C-2 of 40 CFR Part 98 - Mandatory Reporting of Greenhouse Gases
December 2019
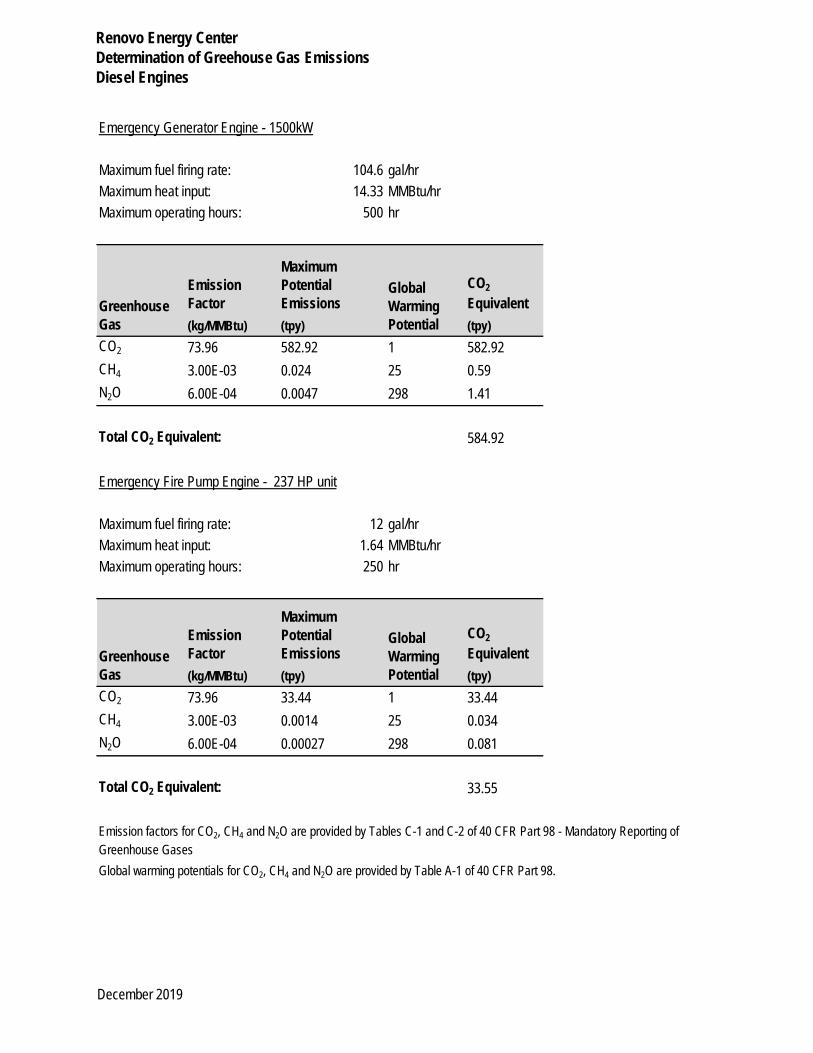
Renovo Energy CenterDetermination of Greehouse Gas EmissionsDiesel Engines
Emergency Generator Engine - 1500kW
Maximum fuel firing rate: 104.6 gal/hrMaximum heat input: 14.33 MMBtu/hrMaximum operating hours: 500 hr
(kg/MMBtu) (tpy) (tpy)CO2 73.96 582.92 1 582.92CH4 3.00E-03 0.024 25 0.59N2O 6.00E-04 0.0047 298 1.41
Total CO2 Equivalent: 584.92
Emergency Fire Pump Engine - 237 HP unit
Maximum fuel firing rate: 12 gal/hrMaximum heat input: 1.64 MMBtu/hrMaximum operating hours: 250 hr
(kg/MMBtu) (tpy) (tpy)CO2 73.96 33.44 1 33.44CH4 3.00E-03 0.0014 25 0.034N2O 6.00E-04 0.00027 298 0.081
Total CO2 Equivalent: 33.55
Emission factors for CO2, CH4 and N2O are provided by Tables C-1 and C-2 of 40 CFR Part 98 - Mandatory Reporting of Greenhouse GasesGlobal warming potentials for CO2, CH4 and N2O are provided by Table A-1 of 40 CFR Part 98.
CO2
EquivalentGlobal Warming Potential
Maximum Potential Emissions
Emission FactorGreenhouse
Gas
CO2
EquivalentGlobal Warming Potential
Maximum Potential Emissions
Emission FactorGreenhouse
Gas
December 2019

Renovo Energy CenterDetermination of Potential EmissionsULSD Storage Tank
TANKS 4.0.9dEmissions Report - Summary Format Tank Indentification and Physical Characteristics
REC Tank_1WilliamsportPennsylvaniaRenovo Energy CenterInternal Floating Roof TankULSD Storage Tank for Combustion Turbines
1203,500,000 (based on 72 hours of ULSD firing capability per powerblock)
10 (based on 720 hours of ULSD firing per powerblock)N71
Internal Shell Condition: Light RustShell Color/Shade: White/WhiteShell Condition GoodRoof Color/Shade: White/WhiteRoof Condition: Good
City:
IdentificationUser Identification:
Paint Characteristics
State:Company:Type of Tank:Description:
Tank DimensionsDiameter (ft):Volume (gallons):Turnovers:Self Supp. Roof? (y/n):No. of Columns:Eff. Col. Diam. (ft):
December 2019

Renovo Energy CenterDetermination of Potential EmissionsULSD Storage Tank
Primary Seal: Liquid-mountedSecondary Seal None
Deck Fitting Category: TypicalDeck Type: Welded
Quantity
1171
4111
Meterological Data used in Emissions Calculations: Williamsport, Pennsylvania (Avg Atmospheric Pressure = 14.47 psia)
Vacuum Breaker (10-in. Diam.)/Weighted Mech. Actuation, Gask.
Rim-Seal System
Deck Characteristics
Deck Fitting/Status
Access Hatch (24-in. Diam.)/Unbolted Cover, UngasketedAutomatic Gauge Float Well/Unbolted Cover, UngasketedColumn Well (24-in. Diam.)/Built-Up Col.-Sliding Cover, Ungask.Ladder Well (36-in. Diam.)/Sliding Cover, UngasketedRoof Leg or Hanger Well/AdjustableSample Pipe or Well (24-in. Diam.)/Slit Fabric Seal 10% Open
December 2019
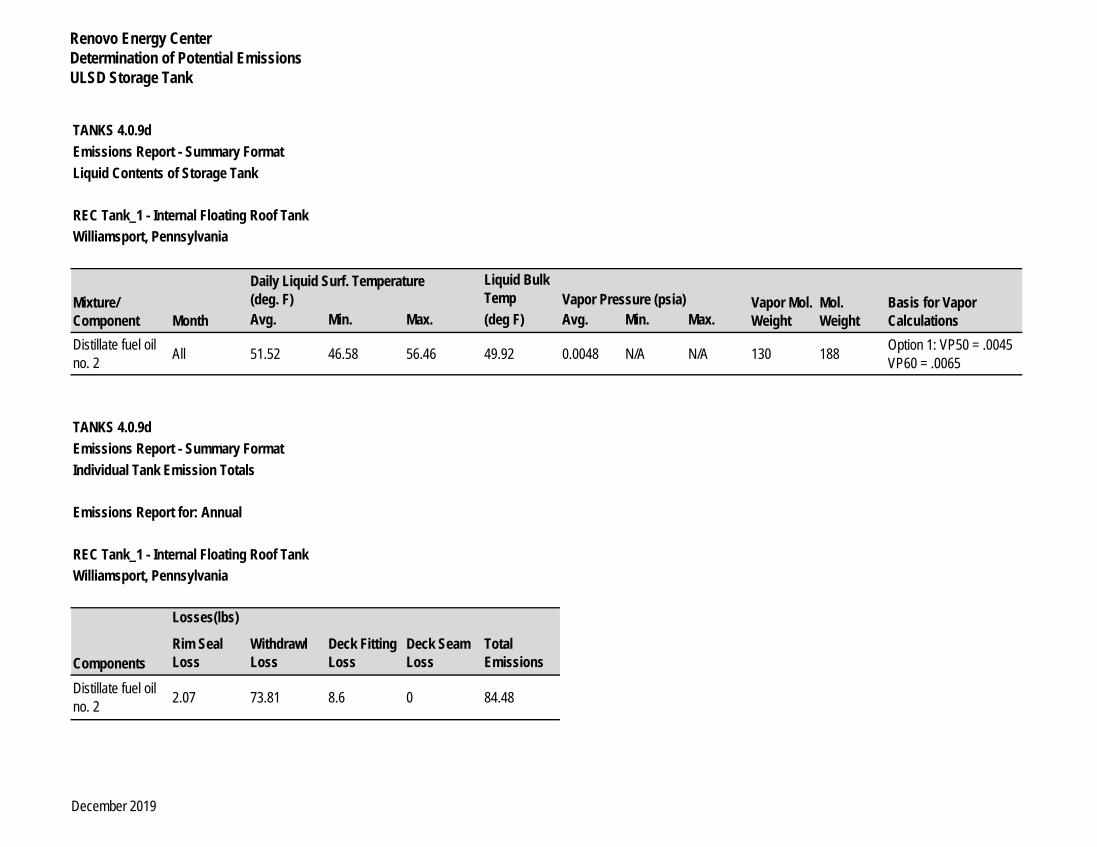
Renovo Energy CenterDetermination of Potential EmissionsULSD Storage Tank
TANKS 4.0.9dEmissions Report - Summary Format Liquid Contents of Storage Tank
REC Tank_1 - Internal Floating Roof TankWilliamsport, Pennsylvania
Liquid Bulk Temp
Avg. Min. Max. (deg F) Avg. Min. Max.Distillate fuel oil no. 2 All 51.52 46.58 56.46 49.92 0.0048 N/A N/A 130 188
TANKS 4.0.9dEmissions Report - Summary Format Individual Tank Emission Totals
Emissions Report for: Annual
REC Tank_1 - Internal Floating Roof TankWilliamsport, Pennsylvania
Rim Seal Loss
Withdrawl Loss
Deck Fitting Loss
Deck Seam Loss
Total Emissions
Distillate fuel oil no. 2 2.07 73.81 8.6 0 84.48
Losses(lbs)
Components
Option 1: VP50 = .0045 VP60 = .0065
Daily Liquid Surf. Temperature(deg. F)
MonthMixture/ Component
Basis for Vapor Calculations
Mol. Weight
Vapor Mol. Weight
Vapor Pressure (psia)
December 2019

Renovo Energy CenterDetermination of Greehouse Gas EmissionsCircuit Breakers
(tons/yr) (tpy)Circuit Breakers (345 kV) 360 6 0.0054 22,800 123.12Circuit Breakers (230 kV) 175 6 0.0026 22,800 59.85Totals -- -- 0.0080 182.97
Emissions are based on a leak rate of 0.5% per year
CO2
EquivalentGlobal Warming Potential
SF6 Maximum Potential EmissionsAmount SF6
(lb)Number of Units
December 2019

POWER ENGINEERS, INC. Plan Approval Application – Renovo Energy Center, LLC
APPENDIX E POWER BLOCK VENDOR-PROVIDED DATA

SIZE DWG NO SH REV
A 1 C
REVDATE
(dd-mmm-yyyy)APPROVED
- Preliminary Issue 01-Oct-2019 A. Dicke
A Preliminary Issue 08-Oct-2019 A. Dicke
B Preliminary Issue 22-Nov-2019 A. Dicke
C Preliminary Issue 11-Dec-2019 A. Dicke
SIZE A CAGE CODE NONE DWG NO
SCALE NONE SHEET 1
7HA.02
THIS DOCUMENT SHALL BE REVISED
IN ITS ENTIRETY ALL SHEETS OF
THIS DOCUMENT ARE THE SAME
REVISION LEVEL AS INDICATED IN
THE REVISION BLOCK
REVISIONS
DESCRIPTION
Combined Cycle Systems
Combined Cycle Systems Emissions Estimates
© COPYRIGHT 2019 General Electric - Proprietary Information
All Rights Reserved. This document contains proprietary information. No part of this document may be used by or disclosed to others without the prior written permission
of the General Electric Company. Permission must be granted by the General Electric Company for the inclusion of this document in a permitting application.
PREPARED BY
SYSTEM ENGINEER
ISSUED
PROJECT ENGINEER
SIGNATURESDATE
(dd-mmm-yyyy)
GE PowerGENERAL ELECTRIC COMPANY
GENERAL ELECTRIC
INTERNATIONAL, INC. POWER PLANT SYSTEMS
Renovo
01-Oct-2019
01-Oct-2019
01-Oct-2019
01-Oct-2019
DT-7NCopyright 2019, General Electric Company
and its Affiliates
Non-Public
GE Proprietary Information
Renovo
Mike Boisclair
n/a
n/a
Andrew Dicke MADE FOR: IPS # 1270381
FIRST MADE FOR:
MDL - T218

g GE Power Renovo Spec. No. T218
Drawing Revision Status
Revision Date Description
- 01-Oct-2019 Initial issue
A 08-Oct-2019 Additional cases
B 22-Nov-2019 Reduce VOC
C 11-Dec-2019 Reduce CO/VOC increased ULSD Stack Temp
Drawing Number: Non-Public
GE Proprietary Information
Page 2
Date: 11-Dec-2019 Rev. C
By : Mike Boisclair

g GE Power Renovo Spec. No. T218
Combined Cycle Systems Emissions Estimates: Renovo
Operating Point 1 2 3Case Description 1 GT @ 100%
1 GT @ 100%
1 GT @ 100%
Ambient ConditionsAmbient Temperature °F -20.0 95.8 59.0
Ambient Pressure psia 14.350 14.350 14.350
Ambient Relative Humidity % 60 35 60
Gas TurbineGT Fuel Type Gas Gas Gas
GT load fraction - 1 1 1
Evap Cooler status off off On
Gas turbine water injection flow rate klb/h 0.0 0.0 0.0
Plant Performance (not guaranteed)CC Net Plant output kW 516571 482965 533150
Abatement StatusCO Catalyst Operating status Operating Operating Operating
SCR Operating status Operating Operating Operating
GT Fuel Gas Turbine fuel LHV Btu/lb 21292 21292 21292
Gas Turbine fuel HHV Btu/lb 23607 23607 23607
Gas Turbine gas fuel molecular weight lb/lbmole 16.52 16.52 16.52
Gas Turbine sulfur ppm (by mass) ppm 13.1 13.1 13.1
Duct BurnerDuct Burner fuel LHV Btu/lb 21292 21292 21292
Duct Burner fuel HHV Btu/lb 23607 23607 23607
Duct Burner fuel molecular weight lb/lbmole 16.52 16.52 16.52
Duct Burner fuel sulfur content (by mass) ppm 13.1 13.1 13.1
Duct Burner status Off Off Off
Duct Burner gas fuel flow lb/h 0.0 0.0 0.0
Duct Burner load fraction % 0.0 0.0 0.0
Heat Consumption for permitting (per unit)GT Heat Cons (HHV), with permitting margin MMBtu/h 3523.8 3230.1 3541.1
DB Heat Cons (HHV) MMBtu/h 0.0 0.0 0.0
HRSG Exit Exhaust gas (per unit)Stack N2 mole fraction - 0.7474 0.7326 0.7374
Stack O2 mole fraction - 0.1149 0.1115 0.1108
Stack AR mole fraction - 0.0089 0.008724 0.008781
Stack H2O mole fraction - 0.0852 0.1039 0.09875
Stack CO2 mole fraction - 0.04344 0.04314 0.04418
Stack Molecular Weight lb/lbmole 28.42 28.21 28.28
Stack Temperature °F 185.2 190.5 181.4
Stack Mass flow, including Permitting Margin, per stack lb/h 6111200 5598900 6007200
Margined exhaust vol flow (incl. permitting margin) Mft3/h 103.7 96.501 101.85
Normalized vol flow, SCF @ 60F (incl. permitting margin) SCF/h 81604464 75312253 80617252
HRSG Exit Emissions (per unit)NOx Volume fraction, dry, at 15 % O2 ppm 2 2 2
NOx mass flow rate (as NO2) lb/h 25.6 23.4 25.7
CO Volume fraction, dry, at 15 % O2 ppm 1.3 1.3 1.3
CO mass flow rate lb/h 10.1 9.3 10.2
VOC Volume fraction, dry, at 15 % O2 ppm 0.7 0.7 0.7
VOC mass flow rate (as methane) lb/h 3.1 2.9 3.1
NH3 Volume fraction, dry, at 15 % O2 ppm 5 5 5
NH3 mass flow rate lb/h 23.7 21.7 23.8
SOx mass flow rate (as SO2) lb/h 4.7 4.3 4.7
Total Particulates lb/h 11.3 11.1 11.3
Sulfur Mist as H2SO4 lb/h 2.6 2.4 2.7
Stack CO2 mass flow rate, including Permitting margin lb/h 432000 396000 434000
Stack CO2 rate (per Net Plant CC Power per stack) lb/MWh 836 819 813
The notes page is an integral part of this document and must be reviewed prior to use of this data.
Drawing Number: Non-Public
GE Proprietary Information
Page 3
Date: 11-Dec-2019 Rev. C
By : Mike Boisclair

g GE Power Renovo Spec. No. T218
4 5 6 7 8 9 10 11 121 GT @ 100%
1 GT @ 38% load,
1 GT @ 30% load,
1 GT @ 32% load,
1 GT @ 100%
1 GT @ 100%
1 GT @ 100%
1 GT @ 100%
1 GT @ 60% load,
95.8 -0.7 59.0 95.8 -20.0 35.0 59.0 95.8 -0.7
14.350 14.350 14.350 14.350 14.350 14.350 14.350 14.350 14.350
35 60 60 35 60 60 60 35 60
Gas Gas Gas Gas Liquid Liquid Liquid Liquid Liquid
1 0.38 0.3 0.32 1 1 1 1 0.6
On off off off off off off off off
0.0 0.0 0.0 0.0 260.8 266.4 266.4 249.8 151.8
516252 241852 194994 184161 521793 528537 524694 484380 344384
Operating Operating Operating Operating Operating Operating Operating Operating Operating
Operating Operating Operating Operating Operating Operating Operating Operating Operating
21292 21292 21292 21292 18300 18300 18300 18300 18300
23607 23607 23607 23607 20130 20130 20130 20130 20130
16.52 16.52 16.52 16.52 n.a. n.a. n.a. n.a. n.a.
13.1 13.1 13.1 13.1 15.0 15.0 15.0 15.0 15.0
21292 21292 21292 21292 21292 21292 21292 21292 21292
23607 23607 23607 23607 23607 23607 23607 23607 23607
16.52 16.52 16.52 16.52 16.52 16.52 16.52 16.52 16.52
13.1 13.1 13.1 13.1 13.1 13.1 13.1 13.1 13.1
Off Off Off Off Off Off Off Off Off
0.0 0.0 0.0 0.0 0.0 0.0 0.0 0.0 0.0
0.0 0.0 0.0 0.0 0.0 0.0 0.0 0.0 0.0
3459.2 1837.7 1516.3 1470.6 3940.4 3892.8 3848.4 3588.7 2646.6
0.0 0.0 0.0 0.0 0.0 0.0 0.0 0.0 0.0
0.7266 0.75 0.7445 0.7377 0.7058 0.7001 0.6947 0.6889 0.7147
0.1086 0.1233 0.126 0.1262 0.09819 0.09532 0.09332 0.09369 0.1035
0.008653 0.008932 0.008865 0.008785 0.008406 0.008338 0.008274 0.008205 0.008511
0.1122 0.07808 0.0831 0.09079 0.1243 0.132 0.1391 0.1459 0.1121
0.04381 0.03958 0.03744 0.03641 0.06314 0.06407 0.06444 0.06312 0.06111
28.13 28.46 28.39 28.29 28.27 28.19 28.12 28.03 28.38
194.0 163.1 160.3 166.9 291.5 284.5 280.0 288.3 259.6
5885500 3505200 3050800 3032500 6366300 6181400 6059300 5751100 4436300
102.28 57.353 49.823 50.219 126.51 122.01 119.19 114.76 84.074
79407236 46734218 40781904 40670910 85461030 83198246 81767914 77853532 59317047
2 2 2 2 4 4 4 4 4
25.1 13.3 11.0 10.7 59.6 58.9 58.2 54.3 40.0
1.3 1.3 1.3 1.3 2 2 2 2 2
9.9 5.3 4.4 4.2 18.1 17.9 17.7 16.5 12.2
0.7 0.7 0.7 0.7 2.0 2.0 2.0 2.0 2.0
3.1 1.6 1.3 1.3 10.4 10.3 10.1 9.5 7.0
5 5 5 5 5 5 5 5 5
23.2 12.3 10.2 9.9 27.6 27.2 26.9 25.1 18.5
4.6 2.4 2.0 2.0 7.0 7.0 6.9 6.4 4.7
11.3 9.97 9.72 9.68 48.2 48.2 48.1 47.9 46.8
2.6 1.4 1.1 1.1 4.0 3.9 3.9 3.6 2.7
424000 225000 186000 180000 657000 649000 642000 598000 441000
821 931 953 979 1259 1228 1223 1235 1282
Drawing Number: Non-Public
GE Proprietary Information
Page 4
Date: 11-Dec-2019 Rev. C
By : Mike Boisclair
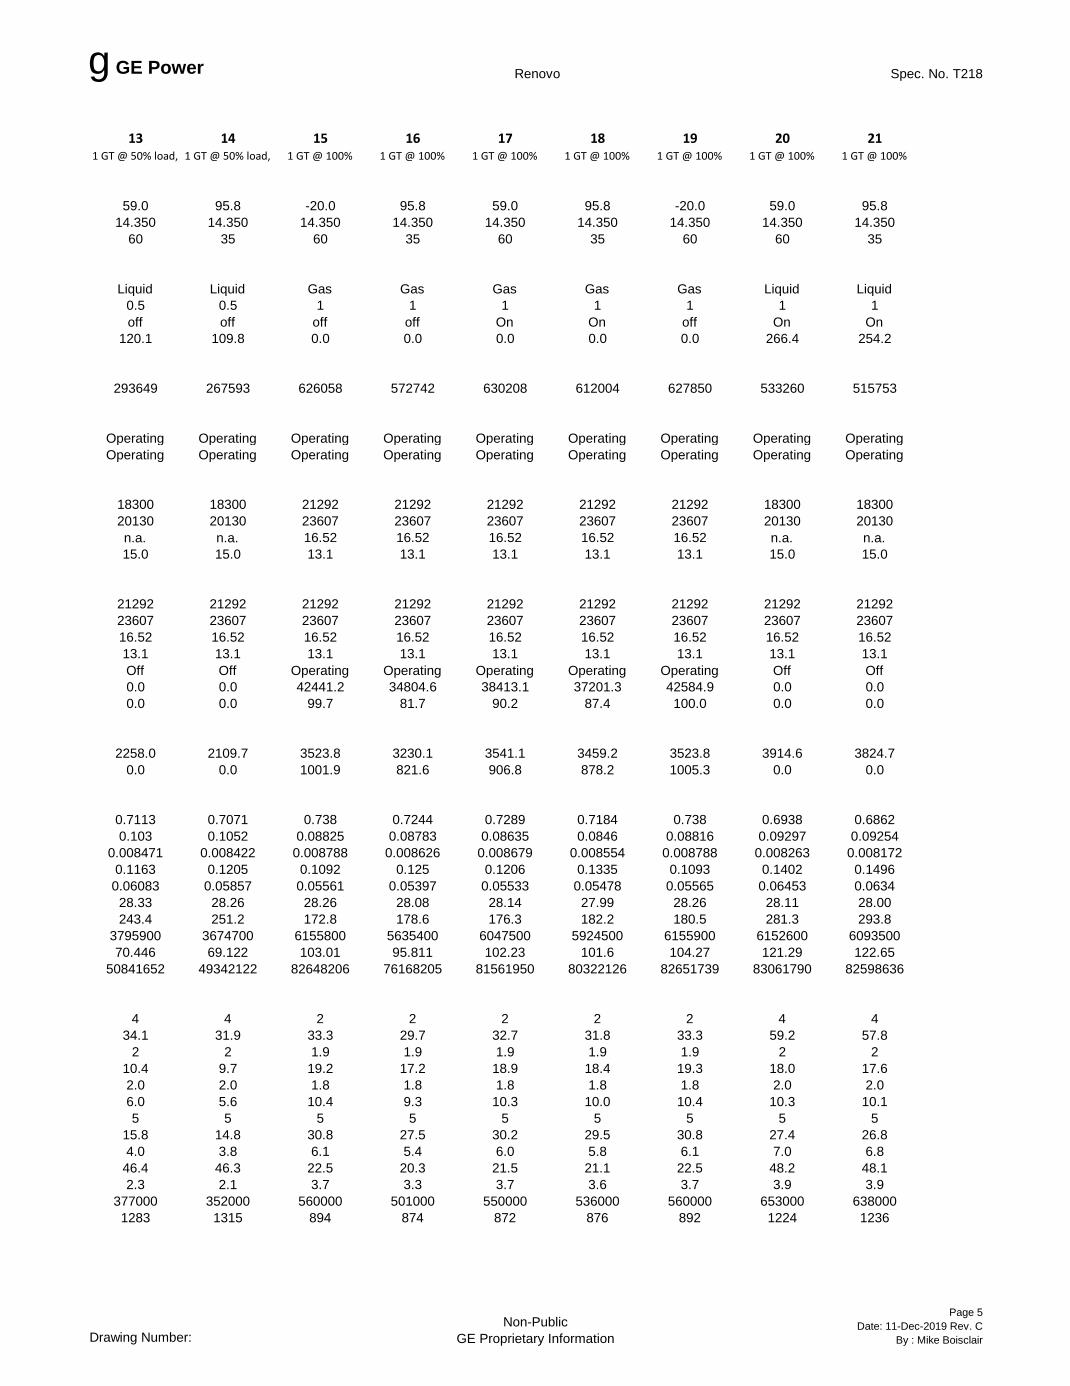
g GE Power Renovo Spec. No. T218
13 14 15 16 17 18 19 20 211 GT @ 50% load,
1 GT @ 50% load,
1 GT @ 100%
1 GT @ 100%
1 GT @ 100%
1 GT @ 100%
1 GT @ 100%
1 GT @ 100%
1 GT @ 100%
59.0 95.8 -20.0 95.8 59.0 95.8 -20.0 59.0 95.8
14.350 14.350 14.350 14.350 14.350 14.350 14.350 14.350 14.350
60 35 60 35 60 35 60 60 35
Liquid Liquid Gas Gas Gas Gas Gas Liquid Liquid
0.5 0.5 1 1 1 1 1 1 1
off off off off On On off On On
120.1 109.8 0.0 0.0 0.0 0.0 0.0 266.4 254.2
293649 267593 626058 572742 630208 612004 627850 533260 515753
Operating Operating Operating Operating Operating Operating Operating Operating Operating
Operating Operating Operating Operating Operating Operating Operating Operating Operating
18300 18300 21292 21292 21292 21292 21292 18300 18300
20130 20130 23607 23607 23607 23607 23607 20130 20130
n.a. n.a. 16.52 16.52 16.52 16.52 16.52 n.a. n.a.
15.0 15.0 13.1 13.1 13.1 13.1 13.1 15.0 15.0
21292 21292 21292 21292 21292 21292 21292 21292 21292
23607 23607 23607 23607 23607 23607 23607 23607 23607
16.52 16.52 16.52 16.52 16.52 16.52 16.52 16.52 16.52
13.1 13.1 13.1 13.1 13.1 13.1 13.1 13.1 13.1
Off Off Operating Operating Operating Operating Operating Off Off
0.0 0.0 42441.2 34804.6 38413.1 37201.3 42584.9 0.0 0.0
0.0 0.0 99.7 81.7 90.2 87.4 100.0 0.0 0.0
2258.0 2109.7 3523.8 3230.1 3541.1 3459.2 3523.8 3914.6 3824.7
0.0 0.0 1001.9 821.6 906.8 878.2 1005.3 0.0 0.0
0.7113 0.7071 0.738 0.7244 0.7289 0.7184 0.738 0.6938 0.6862
0.103 0.1052 0.08825 0.08783 0.08635 0.0846 0.08816 0.09297 0.09254
0.008471 0.008422 0.008788 0.008626 0.008679 0.008554 0.008788 0.008263 0.008172
0.1163 0.1205 0.1092 0.125 0.1206 0.1335 0.1093 0.1402 0.1496
0.06083 0.05857 0.05561 0.05397 0.05533 0.05478 0.05565 0.06453 0.0634
28.33 28.26 28.26 28.08 28.14 27.99 28.26 28.11 28.00
243.4 251.2 172.8 178.6 176.3 182.2 180.5 281.3 293.8
3795900 3674700 6155800 5635400 6047500 5924500 6155900 6152600 6093500
70.446 69.122 103.01 95.811 102.23 101.6 104.27 121.29 122.65
50841652 49342122 82648206 76168205 81561950 80322126 82651739 83061790 82598636
4 4 2 2 2 2 2 4 4
34.1 31.9 33.3 29.7 32.7 31.8 33.3 59.2 57.8
2 2 1.9 1.9 1.9 1.9 1.9 2 2
10.4 9.7 19.2 17.2 18.9 18.4 19.3 18.0 17.6
2.0 2.0 1.8 1.8 1.8 1.8 1.8 2.0 2.0
6.0 5.6 10.4 9.3 10.3 10.0 10.4 10.3 10.1
5 5 5 5 5 5 5 5 5
15.8 14.8 30.8 27.5 30.2 29.5 30.8 27.4 26.8
4.0 3.8 6.1 5.4 6.0 5.8 6.1 7.0 6.8
46.4 46.3 22.5 20.3 21.5 21.1 22.5 48.2 48.1
2.3 2.1 3.7 3.3 3.7 3.6 3.7 3.9 3.9
377000 352000 560000 501000 550000 536000 560000 653000 638000
1283 1315 894 874 872 876 892 1224 1236
Drawing Number: Non-Public
GE Proprietary Information
Page 5
Date: 11-Dec-2019 Rev. C
By : Mike Boisclair

g GE Power Renovo Spec. No. T218
Estimated Steady State Emission Notes
HRSG Emission Notes:
1. Gas turbine(s) and steam plant are in steady-state operation.
2. Steady State Emissions data above are estimated values based on GE recommended measurements and analysis procedures, per GEK 28172.
3. Reference conditions for exhaust gas SCF are: 68°F, and 14.6959 psia.
4. Reference conditions for gas fuel SCF are: 60°F, and 14.6959 psia.
5. SO2 emission values have been estimated by assuming that all the sulfur in the fuel is converted to SO2.
6. Consistent with previous emission calculations, the SO2 and sulfur mist emission values are based on maximum sulfur content of 13.1 ppm (0.4 grains/100 scf) for gas and 15 ppm for liquid fuel.
7. SO2 and sulfur mist values are margined by 20 % to account for variation in fuel sulfur content and measurement error.
8. The CO2 estimate derived from the heat rate does not include any margin for measurement errors assuming that the compliance will be demonstrated using the heat rate from the performance test results. If CO2 compliance is to be demonstrated using actual CO2 measurements from the HRSG stack, GE recommends adding 10% margin to the estimated values.
9. Sulfur mist emission calculations conservatively assume that all SO3 combines with water to form sulfur mist. In actuality, some SO3 may form other chemical species. This would include ammonium sulfates in the presence of NH3. The maximum sulfur mist is reported to be conservative.
10. The estimated values for heat consumption and exhaust flows are margined in this document to account for equipment variations, site operating conditions, and life-cycle operating parameters.The Plant Performance section does not include permitting margin, for more information on performance please refer to the Heat Balance.
11. Distillate oil fuel-bound nitrogen is less than or equal to 0.015 % by weight.
Additional Notes for Particulate Emissions
1. Particulate Matter estimates over the entire emissions compliance region of GT operation are based on field data obtained at base load for the GT. In reality, particulate matter emissions measured in lb/h are expected to decrease at part load operation and the lb/MMBTU values at part load operation are expected not to exceed the lb/MMBTU value for PM at baseload.
2. PM10 and PM2.5 are estimated at the same rate as Total Particulates.
3. Consistent with previous emission calculations, the PM estimates are based on maximum S content in the fuel of 13.1 ppm (0.4 grains/100 scf) for gas fuel and 15 ppm for liquid fuel.
Drawing Number: Non-Public
GE Proprietary Information
Page 6
Date: 11-Dec-2019 Rev. C
By : Mike Boisclair

1 Estimated Emissions for 7HA.02 Rapid Response Lite
Proprietary Information & Confidential Information, 2019 General Electric Company, All Rights Reserved
Combined Cycle Startup/Shutdown Emissions for 207HA.02, Rapid Response Lite
October 2019
Per GT/HRSG Stack NOx CO VOC as
Methane
Total PMNOTE
5
Heat Consumption Duration
Cold Start (Table Note 1) 123 699 53 8.3 840 45
Warm Start (48 hrs median) See Below Table Note 2
81 190 24 7.3 815 40
Hot Start (Table Note 1) 53 177 22 4.0 325 20
Shutdown 14 152 19 3 200 12 Pounds [lb] per Event MMBtu Minutes
Table 1: 7HA.02, Natural Gas Fuel
Per GT/HRSG Stack NOx CO VOC as
Methane
Total PMNOTE
5
Heat Consumption Duration
Cold Start (Table Note 1) 221 704 141 36 992 45
Warm Start (48 hrs median) See Below Table Note 2
172 286 33 32 1000 40
Hot Start (Table Note 1) 112 273 30 16 340 20
Shutdown 43 48 7 10 132 8 Pounds [lb] per Event MMBtu Minutes
Table 2: 7HA.02, Distillate Oil Fuel
Table Notes:
(1) Hot starts are defined as taking place within 8 hours of the previous shutdown. Cold starts are preceded by over 72 hours of shutdown. Cold Start and Hot Start values can be used for both typical estimates and not-to-exceed permit limits.
(2) WARM START PERMITTING NOTE – Warm Start cool down duration ranges from >8 to <72 hours after shutdown. The Warm Start emissions will vary depending on duration of the cool down period ranging between the Hot Start and Cold Start values. Warm Start values in Table 1 are based on a 48 hours cool down period as a median point. Warm Starts with less than a 48 hours cool down period will have lower emissions and Warm Starts with a greater than 48 hours cool down period will have higher emissions. For Warm Start emission estimates, the 48 hours median value

2 Estimated Emissions for 7HA.02 Rapid Response Lite
Proprietary Information & Confidential Information, 2019 General Electric Company, All Rights Reserved
should be used. For Warm Start not-to-exceed permit limits, the Cold Start values should be used.
End Table 1 & 2 Basis 1. The table above represents the emissions during startup and shutdown events.
2. Emissions assume no contribution from pollutants present in the GT inlet air.
Notes specific for Natural Gas
3. An average HRSG stack temperature of 174 deg F may be assumed during starts and shutdown when the LP economizer is in service. An average HRSG stack temperature of 214 deg F may be assumed during starts and shutdown when the LP economizer is bypassed.
4. Emissions assume methane as the natural gas fuel in compliance with General Electric Gas Fuel Specification GEI-41040.
5. Particulates emissions account for sulfates resulting from 0.4gr/100SCF total fuel sulfur content. Higher fuel sulfur content will increase particulate emissions.
6. During the start-up event, an average HRSG stack flow rate of 960 lb/second may be assumed.
Notes specific for Liquid Fuel
7. An average HRSG stack temperature of 270 deg F may be assumed during starts and shutdown when the LP economizer is bypassed.
8. Liquid Fuel is assumed to be in compliance with General Electric Liquid Fuel Specification GEI 41047 and is assumed to have 0.015% fuel bound nitrogen or less.
9. Particulate emissions account for sulfates resulting from 15 ppmw total fuel sulfur content. Higher fuel sulfur content will increase particulate emissions.
10. During the start-up event, an average HRSG stack flow rate of 1050 lb/second may be assumed.
General Notes
11. The information is based on a GE designed and supplied extended scope power plant. Design, manufacture, construction, and commissioning of equipment outside of this scope of supply such as auxiliary boiler must meet GE functional requirements.
12. Event duration: Startup is from the time a non-zero value is measured at the HRSG stack (of a pollutant which is guaranteed) to the time of compliance. Emission compliance is verified by 10 subsequent consecutive compliant CEMS readings however this is only a verification measurement and not counted as part of startup emission mass or duration.

3 Estimated Emissions for 7HA.02 Rapid Response Lite
Proprietary Information & Confidential Information, 2019 General Electric Company, All Rights Reserved
Shutdown is from the time that the HRSG stack is out of emissions compliance until the time that the GT fuel valve has closed.
13. There is OpFlex SCR Ammonia control, which optimizes ammonia injection and the resulting transient emissions during the startup transient. For this, ammonia vaporizer is assumed to be electrically pre-heated and ready to inject ammonia at GT fire.
14. NOx and CO Emissions are per HRSG stack and measured at the HRSG stack using CEMS, following the CEMs calibration and commissioning. Emissions concentration (ppm) signal from the HRSG stack CEMS at 15-second or smaller sampling intervals will be converted to emissions mass flow (lb/hr) using a mutually agreed upon method per the emissions test protocol.
15. The plant is started using GE’s Rapid Response Lite auto-start sequence. Prior to start, the plant is in a ready-to-start condition, i.e. all plant equipment which is needed to be operating during startup is in a no-fault condition, operational and/or in automatic mode. Water levels and pressures in drums, hotwell and other vessels are within range and/or not in an alarmed condition. GT and HRSG Purge credit are available.
16. The plant is previously shut down from steady state operation at base load using normal shutdown sequence in accordance with General Electric’s recommendations. The duration of the shutdown/non-operational/standby period for the purpose of defining the start begins at termination of fuel flow to the GT during the plant shutdown. During the standby period, the plant is maintained as per GE-recommended procedures.
17. The GT is kept at MECL load level until stack compliance is achieved.
18. HRSG drum steam is not bled off for auxiliary services, steam seals, etc. during shutdown.
19. HRSG stack damper remains closed during the shutdown period.
20. No steam purity holds are included. No sequence holds or rate reductions caused by operator intervention are allowed.
21. Turbine insulation and enclosures are installed per GE acceptance of drawings and instructions.
22. A GT start-up fuel heater is applied and the GT is kept at MECL load level until HRSG stack compliance is achieved.
End of Startup and Shutdown Estimates
Andrew Dicke
Revision Date Purpose
- 10/21/2019 Initial Issue
A 11/22/2019 Reduced VOC emissions

POWER ENGINEERS, INC. Plan Approval Application – Renovo Energy Center, LLC
APPENDIX F FUEL FRACTIONAL ANALYSES

NG fractional analyses
Component Values Methane 96.943 Ethane 2.524 Propane 0.124 Iso Butane 0.007 Normal Butane 0.012 Iso Pentane 0.003 Normal Pentane 0.002 Neo Pentane 0.000 Hexane Plus 0.013 N2 0.234 CO2 0.138 Total of Constituents 100

LIQUID FUEL – FRACTIONAL ANALYSIS
Property ASTM Method Value LHV, Btu/lb D 4809/D 240 ~18300 Kin. Viscosity, cSt, 100°F (37.8°C) D 445 1.8 – 5.8 Specific Gravity, 60°F (15.6°C) D 1298 ≤0.9 Pour Point, °F (° C) D 97 ≤-11°F (-24°C) Flash Point, °F (° C) D 93 100 - 140°F (38 - 60°C) Distillation Temp, 90% Point, (°F) D 86 ≤640°F Sulfur D 4294/D 129 <15ppmw Nitrogen, Wt. % - ≤0.015 Trace Metals , ppmw Sodium + Potassium - ≤1 Vanadium - ≤0.5 Calcium - ≤2 Lead - ≤1 Other Metals over 5 ppmw - None Other Sediment and Water Vol. % D 2709 / D 1796 ≤0.1 Water, Vol. % D 95 ≤0.1

POWER ENGINEERS, INC. Plan Approval Application – Renovo Energy Center, LLC
APPENDIX G ADVANCED MONITORING AND DIAGNOSTIC SYSTEMS – POWER BLOCKS

1Monitoring & Diagnostics
4/24/2012
Advanced Sensors and Monitoring & Diagnostics (M&D) for Gas Turbines

Abstract
Advanced sensing and analytics are being used increasingly in power systems, to improve diagnostic and prognostic capabilities for expensive power generation equipment, increase performance and operability, estimate remaining useful life, and manage risk. A wide variety of technologies, from recent sensing technologies to advanced analytics, are being used by power generation equipment manufacturers, and utilities.
This talk will focus on sensor and monitoring & diagnostics (M&D) technologies for gas turbines. A case study in the development and field deployment of sensor and M&D technologies, covering the aspects of signal processing, feature extraction, anomaly detection, and real-world implementation issues will be described in detail.

3Monitoring & Diagnostics
4/24/12
Outline
� Principles of Monitoring & Diagnostics
� Case study of a real-life M&D application with advanced sensors for gas turbine compressor health monitoring
� Summary

How M&D fits into the big picture
Sensors, M&D/PHM & Analytics provide data that enables new products & services … and generate revenue over the life of the asset
High-Value Assets
Sensors, Data Collection & Control
Signal Processing, M&D &Analytics
Intelligent Business Processes, New Products & Services
Prevent catastrophic
failures & forced outages
Part Life Management
Performance Optimization
Better designs & retrofits
Operational Risk Mgmt

Failure
Avoidance
Parts life
Extension
Optimized
Operation
Uses of M&D
Requirements
� Prevent catastrophic
failure
� Get closer to
performance
entitlement
� Support lifing models
� Design validation
Motivation, Goals& Business Impact

6Monitoring & Diagnostics
4/24/2012
Impact of good detection capability on asset downtime
0
200
400
600
800
1000
1200
0
57
113
170
226
283
339
396
453
509
566
622
679
735
792
Downtime (hrs)F
requency
0
50
100
150
200
250
0
57
113
170
226
283
339
396
453
509
566
622
679
735
792
Downtime (hrs)
Fre
quency
System OK
Failure
Detected, “Planned” Event
Not detection“Unplanned” Event
Example … we have a system with an onboard sensor / anomaly detection algorithm that detects failures in advance with some Probability of Detection (PoD). If failure indications are detected early on, associated risks, downtime durations & failure costs are typically much lower.
Simulation-based trade studies can be used to optimize the sensor suite (PoD, false alarm rate, time to detect, etc.) with the asset being monitored. This significantly improves reliability, reduces outage durations and reduces overall system operational risk.
Downtime HistogramPoD = 0%
0
100
200
300
400
500
600
0
57
113
170
226
283
339
396
453
509
566
622
679
735
792
Downtime (hrs)
Fre
quency
Downtime HistogramPoD = 50%
Downtime HistogramPoD =100%
Data & results for illustrative purposes only

What is M&D?A set of algorithms, processes & tools that allow monitoring the health of an asset – detect faults before they turn into failures.
time
cost
defect
fault
failure
software
bug
error
message
system
crash
material
defect
crack
machine
destroyed
design, manufacturing
& inspection
sensing, M&D,
control
diagnostics(current
State) prognostics(future state)

8Monitoring & Diagnostics
4/24/2012
Preventable failures via M&D
example of a gas turbine compressor blade liberationfollowed by extensive secondary damage

9Monitoring & Diagnostics
4/24/12
Background on Combined Cycle Power Plants
Simple cycle operation: 211 MW
Combine cycle operation: 632 MW
Sufficient to power 250,000 homes
Heavy Duty GT
Principles of GT Operation

Compressor Stator Vane crack detection
Compressor Blade crack detection
Metal Corrosion Detection
Hot gas path component degradation
GT Monitoring Opportunities
Combustor liner cracking & thermal barrier coating
spallation
FuelContaminant
Monitoring – hot gas path degradation
Hot gas path environment is very harsh~ 2400°F~ 14 atm.

11Monitoring & Diagnostics
4/24/2012
Design of an M&D system

Fossil RM&D Overview
• Collect data from asset
• Process locally; Transmit data remotely over network/internet
• Archive, process more & visualize
• Run anomaly detection algorithms
• Validate and escalateArchive
Power Plant
Plant DataAcquisition
Remote M&D Architecture
Monitor
• Identify problem cause• Predict expected future behavior• Recommend Service Actions
Diagnose &Assess
Diagnostic Assessment
• Identify problem cause• Recommend Service Actions
Communicate

13Monitoring & Diagnostics
4/24/12
Sensing is the fundamental enabler of an M&D system
Mark
VI
level
temperature
pressure
flow
strain
gas properties
position
speed acceleration
Sense Acquire
plant
& turbine
controllers
other
assorted
data
acquisition
systems

14Monitoring & Diagnostics
4/24/12
Data acquisition & pre-processing
Images from National Instruments
Analog-to-Digital Conversion is the key first processing step;
Translates the analog real-world to the digital world of the computer

15Monitoring & Diagnostics
4/24/12
Feature extraction & Anomaly Detection –major approaches
• Statistical Methods: various standard statistical measures, such as higher order moments of key parameters, moving statistical calculations, clustering and pattern recognition
• Time Series Analysis: time evolving nature of the major monitored parameters
• Deviation from expected values: track for deviations from set-point for failure modes and incipient failures detection
• Model based methods: increasing differences between models and observed values can give insights into impending failures and isolation using appropriate classification models

16Monitoring & Diagnostics
4/24/12
Alarming – threshold setting� Threshold development is critical
� Hypothesis testing (False Alarms/Misses) – a key M&D concept
� most real-world anomalies are not discretely separated, they overlap
� need to make decisions with overlapping distributions between True and False
Ho : Null Hypothesis (good)
Ha : Alternate Hypothesis (bad)
False Alarms (Type I)Misses (Type II)
threshold
no win
HaHo HaHo
better
HaHo
best – but unrealistic
select features to maximize separation – key algorithmic challenge
Ho
Ha
Ho Ha

Case Study
Compressor Blade Health Monitoring (BHM)

18Monitoring & Diagnostics
4/24/12
Typical failure drivers & mechanisms for turbine blades
� High cycle fatigue (HCF)
� Normal corrosion can initiate tiny pits in metal
� Continuous flexing of blades during operation can grow cracks from pits (high cycle fatigue)
� When a crack gets large enough, the centrifugal force can pull blade apart (liberation)
� Foreign Object Damage (FOD):
� Debris gets sucked in and damages blades
� Rubs
� A liberation could cause significant secondary damage -> millions of dollars
examplestressregions
continuous vibration – flutter, resonances
typical gas turbine
compressor blade
crack initiationlocations

19Monitoring & Diagnostics
4/24/2012
Expected signatures
M&D Approach– model driven diagnostics
model based expectations of feature changes
(validated via seeded fault tests)
sensor
Blade static & dynamic deflection features & clearance are computed in real-time, for� every blade� every rotation
0 0.2 0.4 0.6 0.8 1 1.2 1.4 1.6
0 0.2 0.4 0.6 0.8 1 1.2 1.4 1.6
crack size
LE
sta
tic
de
f
Static deflection
Resonant Frequency Detuning
Crack size
Crack size
FE crack models
root LE SSDT Tip LE
Resonance
detection:commonlyused structuralhealth monitoringfeature

20Monitoring & Diagnostics
4/24/2012
Monitoring System Overview
bladeprobes
installedon compressor
casing
A/D converter
Blade tip timingcalculation
DataAcquisitionSystem
Deflections of blades measured
Amplitude, Volts
Time, Milliseconds
Measured Blade Passing
Signal
Expected
Blade VibrationAnalysis
On-site (plant)
Off-site
R0 Blades R1 Blades R2 Blades
1/rev. probe
7.5 Mbytes/sec
400:1
data
reduction

21Monitoring & Diagnostics
4/24/2012
Sensing blade position
R0 R1 R2
sensors monitorblade passage in real-time(tips move near speed of sound)
passive reluctance
probe
induced voltageby blade passing - Blade Passing Signal (BPS)

22Monitoring & Diagnostics
4/24/12
DAQ Data Processing Architecture
DAQ
Pre-processing:� Digitize blade passing
signal
(> 300 kHz)
� Filter signal
� Process and find the Time-of-Arrival (TOA) of each blade in real-time (every 500 microseconds)
Mag
LE2
LE3
TE1
Compressor SensorsPC Buffer (Circular)
Producer Thread
Consumer Thread

23Monitoring & Diagnostics
4/24/2012
Time-of-Arrival Calculation
Single raw BPS from a sensor
Smoothing filter applied (red
trace) -based on a moving
window polynomial
regression
Filtered BPS

24Monitoring & Diagnostics
4/24/2012
TOA calculation - Interpolation & Centroid Calculation
index
Threshold
x1,x,x2
• Time of Arrival/Departure is measured in terms of the A/D sampling index count.
• Algorithm=(y2-y1/x2-x1)=(y-y1/x-x1). Find X for Y=1.5 volts (example).
• Interpolation needed to reduce quantization error on the DAQ A/D and any residual noise.
First data value > Threshold
First data point
< Threshold
BPSvolts
y1
y2
Time of Departure
TOArr TODep
Peak
TOA = (TOArr+TODep)/2
Time of Arrival
Interpolation
Centroid

25Monitoring & Diagnostics
4/24/12
Blade Time of Arrival (TOA)
Static
Deflection
VibrationExpected TOA
NoiseMeasured TOA
• Speed Variation • Sensor and Key Phasor Relative Location
• Blade Geometry Variation• IGV/Load Variation• Blade Re-seating
• Asynchronous Vibration(Dynamic Deflection)• Synchronous Vibration(Resonance Parameters)
Blade Delta TOA
SensorBlade – No Vibration
Vibrating Blade
Blade Time
of Arrival
Difference
Field Signal

26Monitoring & Diagnostics
4/24/2012
Key Blade “Health” Features
Static
Deflection
VibrationExpected TOA
NoiseMeasured TOA
Static blade deflection tracked continuously
Blade Time-of-Arrival
establishedat start of resonance andsteady state condition Campbell
definedresonance

27Monitoring & Diagnostics
4/24/2012
Feature Trending & Thresholding
Resonances Static Deflection
Thresholds are established prior to monitoring

Feature Extraction server
File Transfer server
Backup server
Oracle server
Processed data back up
Computation server
File transfer server
BHM 24x7 Computing Infrastructure
Storage

29Monitoring & Diagnostics
4/24/12
Field Validation - anomaly detection
Conclusions
Observed by BHM July 2011
• Shift observed in static deflection on R0 -Blade 1
• No change in vibration or performance
• Borescope inspection recommended
• Tip FOD on R0-1 confirmed
Findings
• FOD based tip damage
• Repairable damage
BHM Signal Change
R0 FOD

30GE Title or job number
4/24/2012
M&D – the future…
� Use of M&D is increasing rapidly across many industries and applications
� Sensors are getting smaller, cheaper, smarter and pervasive
� Computing becoming cheaper exponentially
� Wireless and portable visualization hardware (iEverything) will enable wider deployment
� Provides significant payback
� The next frontier is Prognostics
� Prediction of time to failure
� Analytics will play an increasingly larger role in processing the oncoming data deluge (“Internet of Things”)

POWER ENGINEERS, INC. Plan Approval Application – Renovo Energy Center, LLC
APPENDIX H COMBUSTION CONTROL DETAILS – POWER BLOCKS

GE Power Systems
Dry Low NOx CombustionSystems for GE Heavy-DutyGas Turbines
L.B. DavisS.H. BlackGE Power SystemsSchenectady, NY
GER-3568G
g

Contents
Abstract . . . . . . . . . . . . . . . . . . . . . . . . . . . . . . . . . . . . . . . . . . . . . . . . . . . . . . . . . . . . . . . . . . . . . 1Introduction . . . . . . . . . . . . . . . . . . . . . . . . . . . . . . . . . . . . . . . . . . . . . . . . . . . . . . . . . . . . . . . . . . 1Dry Low NOx Systems . . . . . . . . . . . . . . . . . . . . . . . . . . . . . . . . . . . . . . . . . . . . . . . . . . . . . . . . . 1
Dry Low NOx Product Plan . . . . . . . . . . . . . . . . . . . . . . . . . . . . . . . . . . . . . . . . . . . . . . . . . . . . 1DLN-1 System . . . . . . . . . . . . . . . . . . . . . . . . . . . . . . . . . . . . . . . . . . . . . . . . . . . . . . . . . . . . . . . . 3DLN-1 Combustor . . . . . . . . . . . . . . . . . . . . . . . . . . . . . . . . . . . . . . . . . . . . . . . . . . . . . . . . . . . . . 3
Mode/Operating Range . . . . . . . . . . . . . . . . . . . . . . . . . . . . . . . . . . . . . . . . . . . . . . . . . . . . . . 4DLN-1 Controls and Accessories . . . . . . . . . . . . . . . . . . . . . . . . . . . . . . . . . . . . . . . . . . . . . . . . 6DLN-1 Emissions . . . . . . . . . . . . . . . . . . . . . . . . . . . . . . . . . . . . . . . . . . . . . . . . . . . . . . . . . . . . . . 6DLN-1 Experience . . . . . . . . . . . . . . . . . . . . . . . . . . . . . . . . . . . . . . . . . . . . . . . . . . . . . . . . . . . . . 7DLN-2 System . . . . . . . . . . . . . . . . . . . . . . . . . . . . . . . . . . . . . . . . . . . . . . . . . . . . . . . . . . . . . . . . 8DLN-2 Combustion System. . . . . . . . . . . . . . . . . . . . . . . . . . . . . . . . . . . . . . . . . . . . . . . . . . . . . . 9
Primary . . . . . . . . . . . . . . . . . . . . . . . . . . . . . . . . . . . . . . . . . . . . . . . . . . . . . . . . . . . . . . . . . . 10Lean-Lean. . . . . . . . . . . . . . . . . . . . . . . . . . . . . . . . . . . . . . . . . . . . . . . . . . . . . . . . . . . . . . . . 10Premix Transfer. . . . . . . . . . . . . . . . . . . . . . . . . . . . . . . . . . . . . . . . . . . . . . . . . . . . . . . . . . . . 10Piloted Premix. . . . . . . . . . . . . . . . . . . . . . . . . . . . . . . . . . . . . . . . . . . . . . . . . . . . . . . . . . . . . 10Premix . . . . . . . . . . . . . . . . . . . . . . . . . . . . . . . . . . . . . . . . . . . . . . . . . . . . . . . . . . . . . . . . . . 10Tertiary Full Speed No Load (FSNL). . . . . . . . . . . . . . . . . . . . . . . . . . . . . . . . . . . . . . . . . . . . . 11
DLN-2 Controls and Accessories . . . . . . . . . . . . . . . . . . . . . . . . . . . . . . . . . . . . . . . . . . . . . . . 11DLN-2 Emissions Performance . . . . . . . . . . . . . . . . . . . . . . . . . . . . . . . . . . . . . . . . . . . . . . . . . 11DLN-2 Experience . . . . . . . . . . . . . . . . . . . . . . . . . . . . . . . . . . . . . . . . . . . . . . . . . . . . . . . . . . . . 11DLN-2.6 Evolution . . . . . . . . . . . . . . . . . . . . . . . . . . . . . . . . . . . . . . . . . . . . . . . . . . . . . . . . . . . . 12DLN-2+ Evolution . . . . . . . . . . . . . . . . . . . . . . . . . . . . . . . . . . . . . . . . . . . . . . . . . . . . . . . . . . . . 14Conclusion . . . . . . . . . . . . . . . . . . . . . . . . . . . . . . . . . . . . . . . . . . . . . . . . . . . . . . . . . . . . . . . . . . 16Appendix . . . . . . . . . . . . . . . . . . . . . . . . . . . . . . . . . . . . . . . . . . . . . . . . . . . . . . . . . . . . . . . . . . . 16
Gas Turbine Combustion Systems. . . . . . . . . . . . . . . . . . . . . . . . . . . . . . . . . . . . . . . . . . . . . . 16Equivalence Ratio . . . . . . . . . . . . . . . . . . . . . . . . . . . . . . . . . . . . . . . . . . . . . . . . . . . . . . . . . . 16Flame Stability . . . . . . . . . . . . . . . . . . . . . . . . . . . . . . . . . . . . . . . . . . . . . . . . . . . . . . . . . . . . 17Operational Stability. . . . . . . . . . . . . . . . . . . . . . . . . . . . . . . . . . . . . . . . . . . . . . . . . . . . . . . . 17
Gas Turbine Emissions . . . . . . . . . . . . . . . . . . . . . . . . . . . . . . . . . . . . . . . . . . . . . . . . . . . . . . . . 18Emissions Control Methods . . . . . . . . . . . . . . . . . . . . . . . . . . . . . . . . . . . . . . . . . . . . . . . . . . . . 20References . . . . . . . . . . . . . . . . . . . . . . . . . . . . . . . . . . . . . . . . . . . . . . . . . . . . . . . . . . . . . . . . . . 21List of Figures . . . . . . . . . . . . . . . . . . . . . . . . . . . . . . . . . . . . . . . . . . . . . . . . . . . . . . . . . . . . . . . 22
Dry Low NOx Combustion Systems for GE Heavy-Duty Gas Turbines
GE Power Systems ■ GER-3568G ■ (10/00) i

Dry Low NOx Combustion Systems for GE Heavy-Duty Gas Turbines
GE Power Systems ■ GER-3568G ■ (10/00) ii

AbstractState-of-the-art emissions control technology forheavy-duty gas turbines is reviewed with empha-sis on the operating characteristics and fieldexperience of Dry Low NOx (DLN) combustorsfor E and F technology machines. The lean pre-mixed DLN systems for gas fuel have demon-strated their ability to meet the ever-lower emis-sion levels required today. Lean premixed tech-nology has also been demonstrated on oil fueland is also discussed.
IntroductionThe regulatory requirements for low emissionsfrom gas turbine power plants have increasedduring the past 10 years. Environmental agen-cies throughout the world are now requiringeven lower rates of emissions of NOx and otherpollutants from both new and existing gas tur-bines. Traditional methods of reducing NOx
emissions from combustion turbines (water andsteam injection) are limited in their ability toreach the extremely low levels required in manylocalities. GE’s involvement in the developmentof both the traditional methods (References 1through 6) and the newer Dry Low NOx (DLN)technology (References 7 and 8) has been welldocumented. This paper focuses on DLN.
Since the commercial introduction of GE’sDLN combustion systems for natural-gas-firedheavy-duty gas turbines in 1991, systems havebeen installed in more than 222 machines, fromthe most modern FA+e technology (firing tem-perature class of 2420 F/1326 C) to field retro-fits of older machines. As of May 1999, thesemachines have operated more than 4.8 millionhours with DLN; and more than 1.4 millionhours have been in the F technology. To meetmarketplace demands, GE has developed DLNproducts broadly classified as either DLN-1,which was developed for E-technology
(2000°F/1093°C firing temperature class)machines, or DLN-2, which was developedspecifically for the F technology machines andis also being applied to the EC and H machines.
Development of these products has required anintensive engineering effort involving both GEPower Systems and GE Corporate Research andDevelopment. This collaboration will continueas DLN is applied to the H machines and com-bustor development for Dry Low NOx on oil(“dry oil”) continues.
This paper presents the current status of DLN-1technology and experience, including dry oil,and of DLN-2 technology and experience.Background information about gas turbineemissions and emissions control is contained inthe Appendix.
Dry Low NOx Systems
Dry Low NOx Product Plan Figure 1 shows GE’s Dry Low NOx product of-ferings for its new and existing machines inthree major groupings. The first group includesthe MS3002J, MS5001/2 and MS6001B prod-ucts. The 6B DLN-1 is the technology flagshipproduct for this group and, as can be noted, isavailable to meet 9 ppm NOx requirements.Such low NOx emissions are generally notattainable on lower firing temperaturemachines such as the MS3002s and MS5001/2sbecause carbon monoxide (CO) would beexcessive.
The second major group includes theMS7001B/E, MS7001EA and MS9001Emachines with the 9 ppm 7EA DLN-1 as theflagship product.
The dry oil program focuses initially on thisgroup.
The third group combines all of the DLN-2products and includes the FA, EC, and H
Dry Low NOx Combustion Systems for GE Heavy-Duty Gas Turbines
GE Power Systems ■ GER-3568G ■ (10/00) 1

machines, with the 7FA product as the flagship.
As shown in Figures 2 and 3, most of these prod-ucts are capable of power augmentation and ofpeak firing with increased NOx emissions. With
gas fuel, power augmentation with steam is inthe premixed mode for both DLN-1 and DLN-2systems.
The GE DLN systems integrate a staged pre-mixed combustor, the gas turbine’sSPEEDTRONIC™ controls and the fuel andassociated systems. There are two principalmeasures of performance. The first is meetingthe emission levels required at baseload on bothgas and oil fuel and controlling the variation ofthese levels across the load range of the gas tur-bine.
The second measure is system operability, withemphasis placed on the smoothness and relia-bility of combustor mode changes, ability toload and unload the machine without restric-tion, capability to switch from one fuel to anoth-er and back again, and system response to rapidtransients (e.g., generator breaker open eventsor rapid swings in load). GE’s design goal is tomake the DLN system operate so the gas tur-bine operator does not know whether a DLN orconventional combustion system has beeninstalled (i.e., its operation is “transparent tothe user”). A significant portion of the DLNdesign and development effort has focused onsystem operability. As operational experience
Dry Low NOx Combustion Systems for GE Heavy-Duty Gas Turbines
GE Power Systems ■ GER-3568G ■ (10/00) 2
9 25
Turbine Model
MS6001(B)
MS7001(EA)
MS7001(FA) 9
25
9
25
9
NOx@15% O2(ppmvd)
OperatingMode Diluent
NOx atMax D/F(ppmvd)
MaximumDiluent/Fuel
COMax D/F(ppmvd)
Premix
Premix
Premix
Premix
Premix Steam
Steam
Steam
Steam
Steam 2.5/1
2.5/1
2.5/1
2.5/1
GT24556B.ppt
2.1/1 12
25 15
15
9 25
25 15
Figure 2. DLN power augmentation summary
MS6001(B)
MS7001(EA)
MS7001(FA)
MS9001(E)
9
25
18
50
25
15
6
4
9
25
25
25
25
15
18
50
35 15
40 15
6
4
6
6
NOx-Base(ppmvd)
NOx-Peak(ppmvd)
CO-Base(ppmvd)
CO-Peak(ppmvd)
GT24557A . ppt
Figure 3. DLN peak firing emissions - natural gasfuel
Gas Distillate
Turbine Model NOx (ppmvd) CO (ppmvd) Diluent NOx (ppmvd) CO (ppmd) Diluent
MS3002(J)-RC 33 25 Dry N/A N/A N/A
MS3002(J)-SC 42 50 Dry N/A N/A N/A
MS5001P 25 50 Dry 65 20 W ater
MS5001R 42 50 Dry 65 20 W ater
MS5002C 42 50 Dry 65 20 W ater
MS6001B 9 25 Dry 42 30 W ater
MS7001B/E Conv. 25 25 Dry 42 30 W ater
MS7001EA 9 25 Dry 42 30 W ater
MS9001E 15 25 Dry 42 20 W ater
25 25 Dry 90 20 Dry
MS6001FA 25 15 Dry 42/65 20 W ater/Steam
MS7001FA 25 15 Dry 42/65 20 W ater/Steam
9 9 Dry 42/65 30 W ater/Steam
MS7001FB 25 15 Dry 42 20 W ater
MS7001H 9 9 Dry 42/65 30 W ater/Steam
MS9001EC 25 15 Dry 42/65 20 W ater/Steam
MS9001FA 25 15 Dry 42/65 20 W ater
MS9001FB 25 15 Dry 42 20 W ater
MS9001H 25 15 Dry 42 20 W ater
Figure 1. Dry Low NOx product plan

has increased, design and development effortshave moved towards hardware durability andextending combustor inspection intervals.
Design of a successful DLN combustor for aheavy-duty gas turbine also requires the design-er to develop hardware features and opera-tional methods that simultaneously allow theequivalence ratio and residence time in theflame zone to be low enough to achieve lowNOx, but with acceptable levels of combustionnoise (dynamics), stability at part-load opera-tion and sufficient residence time for CO burn-out, hence the designation of DLN combustiondesign as a “four-sided box” (See Figure 4).
A scientific and engineering development pro-gram by GE’s Corporate Research andDevelopment, Power Systems business andAircraft Engine business has focused on under-standing and controlling dynamics in lean pre-mixed flows. The objectives have been to:
■ Gather and analyze machine and labo-ratory data to create a comprehensivedynamics data base
■ Create analytical models of gas turbinecombustion systems that can be used tounderstand dynamics behavior
■ Use the analytical models and experi-mental methods to develop methods tocontrol dynamics
These efforts have resulted in a large number ofhardware and control features that limit dynam-ics, plus analytical tools that are used to predictsystem behavior. The latter are particularly use-ful in correlating laboratory test data from fullscale combustors with actual gas turbine data.
DLN-1 SystemDLN-1 development began in the 1970s withthe goal of producing a dry oil system to meetthe United States Environmental ProtectionAgency’s New Source Performance Standardsof 75 ppmvd NOx at 15% O2. As noted inReference 7, this system was tested on both oiland gas fuel at Houston Lighting & Power in1980 and met its emission goals. Subsequent tothis, DLN program goals changed in responseto stricter environmental regulations and thepace of the program accelerated in the late1980s.
DLN-1 CombustorThe GE DLN-1 combustor (shown in cross sec-tion in Figure 5 and described in Reference 8) is atwo-stage premixed combustor designed for usewith natural gas fuel and capable of operationon liquid fuel. As shown, the combustion systemincludes four major components: fuel injectionsystem, liner, venturi and cap/centerbodyassembly.
Dry Low NOx Combustion Systems for GE Heavy-Duty Gas Turbines
GE Power Systems ■ GER-3568G ■ (10/00) 3
GT23812B
NOx
CO
Turndown
Dynamics
Figure 4. DLN technology - a four sided box Figure 5. Dry Low NOx combustor

The GE DLN-1 combustion system operates infour distinct modes, illustrated in Figure 6, dur-ing premixed natural gas or oil fuel operation:
These components form two stages in the com-bustor. In the premixed mode, the first stagethoroughly mixes the fuel and air and delivers auniform, lean, unburned fuel-air mixture to thesecond stage.
Mode/Operating Range■ Primary – Fuel to the primary nozzles
only. Flame is in the primary stageonly. This mode of operation is usedto ignite, accelerate and operate themachine over low- to mid-loads, up toa pre-selected combustion referencetemperature.
■ Lean-Lean – Fuel to both the primaryand secondary nozzles. Flame is inboth the primary and secondarystages. This mode of operation is usedfor intermediate loads between twopre-selected combustion referencetemperatures.
■ Secondary – Fuel to the secondarynozzle only. Flame is in the secondaryzone only. This mode is a transitionstate between lean-lean and premix
modes. This mode is necessary toextinguish the flame in the primaryzone, before fuel is reintroduced intowhat becomes the primary premixingzone.
■ Premix – Fuel to both primary andsecondary nozzles. Flame is in thesecondary stage only. This mode ofoperation is achieved at and near thecombustion reference temperaturedesign point. Optimum emissions aregenerated in premix mode.
The load range associated with these modes var-ies with the degree of inlet guide vane modula-tion and, to a smaller extent, with the ambienttemperature. At ISO ambient, the premix oper-ating range is 50% to 100% load with IGV mod-ulation down to 42°, and 75% to 100% loadwith IGV modulation down to 57°. The 42° IGVminimum requires an inlet bleed heat system.
If required, both the primary and secondaryfuel nozzles can be dual-fuel nozzles, thus allow-ing automatic transfer from gas to oil through-out the load range. When burning either natu-ral gas or distillate oil, the system can operate tofull load in the lean-lean mode (Figure 6). Thisallows wet abatement of NOx on oil fuel andpower augmentation with water on gas.
Dry Low NOx Combustion Systems for GE Heavy-Duty Gas Turbines
GE Power Systems ■ GER-3568G ■ (10/00) 4
Primary Operation• Ignition to 20% Load
GT20885B. ppt
Lean-Lean Operation• 20 to 50% Load
Second-Stage Burning• Transient During Transfer to Premixed
Premixed Operation• 50 to 100% Load
Fuel100%
Fuel100%
Fuel70%
Fuel83%
17%
30%
Figure 6. Fuel-staged Dry Low NOx operating modes

The spark plug and flame detector arrange-ments in a DLN-1 combustor are different fromthose used in a conventional combustor. Sincethe first stage must be re-ignited at high load inorder to transfer from the premixed mode backto lean-lean operation, the spark plugs do notretract. One plug is mounted near a primaryzone cup in each of two combustors. The systemuses flame detectors to view the primary stage ofselected chambers (similar to conventional sys-tems), and secondary flame detectors that lookthrough the centerbody and into the secondstage.
The primary fuel injection system is used dur-ing ignition and part load operation. The sys-tem also injects most of the fuel during pre-mixed operation and must be capable of stabi-lizing the flame. For this reason, the DLN-1 pri-mary fuel nozzle is similar to GE’s MS7001EAmulti-nozzle combustor with multiple swirl-sta-bilized fuel injectors. The GE DLN-1 systemuses five primary fuel nozzles for the MS6001Band smaller machines and six primary fuel noz-zles for the larger machines. This design is capa-ble of providing a well-stabilized diffusion flamethat burns efficiently at ignition and duringpart load operation.
In addition, the multi-nozzle fuel injection sys-tem provides a satisfactory spatial distributionof fuel flow entering the first-stage mixer. Theprimary fuel-air mixing section is bound by thecombustor first-stage wall, the cap/centerbodyand the forward cone of the venturi. This vol-ume serves as a combustion zone when thecombustor operates in the primary and lean-lean modes. Since ignition occurs in this stage,crossfire tubes are installed to propagate flameand to balance pressures between adjacentchambers. Film slots on the liner walls providecooling, as they do in a standard combustor.
In order to achieve good emissions perform-
ance in premixed operation, the fuel-air equiv-alence ratio of the mixture exiting the first-stagemixer must be very lean. Efficient and stableburning in the second stage is achieved by pro-viding continuous ignition sources at both theinner and outer surfaces of this flow. The threeelements of this stage comprise a piloting flame,an associated aerodynamic device to force inter-action between the pilot flame and the innersurface of the main stage flow, and an aerody-namic device to create a stable flame zone onthe outer surface of the main stage flow exitingthe first stage.
The piloting flame is generated by the second-ary fuel nozzle, which premixes a portion of thenatural gas fuel and air (nominally, 17% at full-load operation) and injects the mixturethrough a swirler into a cup where it is burned.Burning an even smaller amount of fuel (lessthan 2% of the total fuel flow) stabilizes thisflame as a diffusion flame in the cup. The sec-ondary nozzle, which is mounted in the capcenterbody, is simple and highly effective forcreating a stable flame.
A swirler mounted on the downstream end ofthe cap/centerbody surrounds the secondarynozzle. This creates a swirling flow that stirs theinterface region between the piloting flame andthe main-stage flow and ensures that the flameis continuously propagated from the pilot to theinner surface of the fuel-air mixture exiting thefirst stage. Operation on oil fuel is similarexcept that all of the secondary oil is burned ina diffusion flame in the current dry oil design.
The sudden expansion at the throat of the ven-turi creates a toroidal re-circulation zone overthe downstream conical surface of the venturi.This zone, which entrains a portion of the ven-turi cooling air, is a stable burning zone thatacts as an ignition source for the main stagefuel-air mixture. The cone angle and axial loca-
Dry Low NOx Combustion Systems for GE Heavy-Duty Gas Turbines
GE Power Systems ■ GER-3568G ■ (10/00) 5

tion of the venturi cooling air dump have sig-nificant effects on the efficacy of this ignitionsource. Finally, the dilution zone (the region ofthe combustor immediately downstream fromthe flame zone in the secondary) provides aregion for CO burnout and for shaping the gastemperature profile exiting the combustion sys-tem.
DLN-1 Controls and Accessories The gas turbine accessories and control systemsare configured so that operation on a DLN-equipped turbine is essentially identical to thatof a turbine equipped with a conventional com-bustor. This is accomplished by controlling theturbines in identical fashions, with the exhausttemperature, speed and compressor dischargepressure establishing the fuel flow and com-pressor inlet-guide-vane position.
A turbine with a conventional diffusion com-bustor that uses diluent injection for NOx con-trol will use an underlying algorithm to controlsteam or water injection. This algorithm will usetop level control variables (exhaust tempera-ture, speed, etc.) to establish a steam-to-fuel orwater-to-fuel ratio to control NOx.
In a similar fashion, the same variables are usedto divide the total turbine fuel flow between theprimary and secondary stages of a DLN com-bustor. The fuel division is accomplished bycommanding a calibrated splitter valve to moveto a set position based on the calculated com-bustion reference temperature (Figure 7). Figure8 shows a schematic of the gas fuel system for aDLN-equipped turbine.
The only special control sequences required arefor protection of the turbine during a generatorbreaker open trip, or for a Primary ZoneIgnition or Primary Re-Ignition (PRI) (i.e.,flame is established in first stage during pre-mixed operation). When either the breaker
opens at load or a PRI is sensed by ultravioletflame detectors looking into the first stage, thesplitter valve is commanded to move to a pre-determined position. For the breaker openevent the combustor returns to normal opera-tion in primary mode at full speed no load(FSNL). In the case of a PRI there is no hard-ware damage and the combustor maintains loadbut operates in extended lean-lean mode withhigh emissions.
DLN-1 EmissionsThe emissions performance of the GE DLN sys-tem can be illustrated as a function of load for agiven ambient temperature and turbine config-uration. Figures 9 and 10 show the NOx and COemissions from typical MS7001EA andMS6001B DLN systems designed for 9 ppmvdNOx and 25 ppm CO when operated on natural
GE Power Systems ■ GER-3568G ■ (10/00) 6
Dry Low NOx Combustion Systems for GE Heavy-Duty Gas Turbines
Lean-Lean
Secondary Mode
Premix Mode
202019501600 º F
11041066871 º C
CombustionReference
Temperature
100
90
0
10
20
30
40
50
60
70
80
% P
rim
ary
Fu
el S
plit
GT20327D
Primary Mode
Figure 7. Typical DLN-1 fuel gas split schedule
Figure 8. Dry Low NOx gas fuel system

gas fuel. Note that in premixed operation, NOx
is generally highest at higher loads and CO onlyapproaches 25 ppm at lower premixed loads.The MS9001E DLN system has very similarbehavior but with somewhat higher NOx emis-sions (See Figure 1). Figures 11 and 12 show NOx
and CO emissions for the same systems operat-ed on oil fuel with water injection for NOx con-trol, rather than premixed oil. These figures arefor units equipped with inlet bleed heat andextended IGV modulation.
At loads less than 20% of baseload, NOx andCO emissions from the DLN are similar to thosefrom standard combustion systems. This resultis expected because both systems are operatingas diffusion flame combustors in this range.Between 20% and 50% load, the DLN system isoperated in the lean-lean mode. On gas fuel theflow split between the primary fuel nozzles and
secondary nozzle may be varied to optimizeemissions, while on oil fuel the flow split isfixed.
From 50% to 100% load, the DLN system oper-ates as a lean premixed combustor when operat-ed on gas fuel, and as a diffusion flame combus-tor with water injection when operated on oilfuel. As shown in Figures 9–12, NOx emissionsare significantly reduced, while CO emissionsare comparable to those from the standard sys-tem.
DLN-1 ExperienceGE’s first DLN-1 system was tested at HoustonLighting and Power in 1980 (Reference 7). A pro-totype DLN system using the combustor designdiscussed above was tested on an MS9001E atthe Electricity Supply Board’s (ESB) NorthwallStation in Dublin, Ireland, between October
Dry Low NOx Combustion Systems for GE Heavy-Duty Gas Turbines
GE Power Systems ■ GER-3568G ■ (10/00) 7
Figure 10. MS6001B emissions - natural gas
Figure 12. MS6001B emissions distillate oil fuel
Figure 11. MS7001EA Dry Low NOx combustionsystem performance on distillate oil
Figure 9. MS7001EA/MS9001E emissions - natural gas fuel

1989 and July 1990. A comprehensive engineer-ing test of the prototype DLN combustor, con-trols and associated systems was conducted withNOx levels of 32 ppmvd (at 15% O2) obtainedat baseload. The results were incorporated intothe design of prototype systems for theMS7001E and MS6001B.
The 7E DLN-1 prototype was tested atAnchorage Municipal Light and Power (AMLP)in early 1991 and entered commercial serviceshortly afterward. Since then, development ofadvanced combustor configurations have beencarried out at AMLP. These results have beenincorporated into production hardware.
The MS6001B prototype system was first oper-ated at Jersey Central Power & Light’s ForkedRiver Station in early 1991. A series of addition-al tests culminated in the demonstration of a 9ppm combustor at Jersey Central in November1993.
As of May 1999, 44 MS6001B machines areequipped with DLN-1 systems. In total, theyhave accumulated more than 1.4 million hoursof operation. There are, in addition, 4MS7001E, 8 MS7001B/E, 39 MS7001EA, 27MS9001E, 2 MS5001P and 4 MS3002J DLN-1machines that have collectively operated formore than 2 million hours. Excellent emissionresults have been obtained in all cases, with sin-gle-digit NOx and CO achieved on manyMS7001EAs. Several MS7001E/EA machineshave the capability to power augment withsteam injection in premixed mode.
Starting in early 1992, eight MS7001F machinesequipped with GE DLN systems were placed inservice at Korea Electric Power Company’sSeoinchon site. These F technology machineshave achieved better than 55% (gross) efficien-cy in combined-cycle operation, and the DLNsystems are currently operating between 30 and40 ppmvd NOx on gas fuel (the guarantee level
is 50 ppmvd). These units have operated formore than 250,000 hours. Four additional Ftechnology DLN-1 systems were commissionedat Scottish Hydro’s Keadby site and at NationalPower’s Little Barford site. These 9F machineshave operated more than 80,000 hours at lessthan 60 ppm NOx.
The combustion laboratory’s testing and fieldoperation have shown that the DLN-1 systemcan achieve single digit NOx and CO levels on Etechnology machines operating on gas fuel.Current DLN-1 development activity focuseson:
■ Application of single-digit technologyto the MS6001B and MS7001EAuprates.
■ Application of DLN-1 technology forretrofitting existing field machines(including MS3002s and MS5000s,some of which will require upgradebefore DLN retrofit)
■ Completing the development of steampower augmentation as needed by themarket
■ Completing the development of leanpremixed oil fuel DLN-1 products.
■ Increasing combustion inspection intervals.
■ Improving overall system reliabilityand operability for operation on oilfuel.
DLN-2 SystemAs F-technology gas turbines became availablein the late 1980s, studies were conducted toestablish what type of DLN combustor would beneeded for these new higher firing temperaturemachines. Studies concluded that that air usagein the combustor (e.g., for cooling) other thanfor mixing with fuel would have to be strictly
Dry Low NOx Combustion Systems for GE Heavy-Duty Gas Turbines
GE Power Systems ■ GER-3568G ■ (10/00) 8

limited. A team of engineers from GE PowerSystems, GE Corporate Research andDevelopment and GE Aircraft Engines pro-posed a design that repackaged DLN-1 premix-ing technology but eliminated the venturi andcenterbody assemblies that require cooling air.
The resulting combustor is called DLN-2, whichis the standard system for the 6FA, 7FA, and 9FAmachines. Fourteen combustors are installed inthe 7FA, 18 in the 9FA, and six in the 6FA. Twoadditional variants of the DLN-2 system havebeen developed to meet the additional designrequirements imposed by either new machinecycles or reduced emissions levels. These com-bustors, the DLN-2.6 and the DLN-2+, will bedescribed briefly in later sections.
DLN-2 Combustion System The DLN-2 combustion system shown in Figure13 is a single-stage dual-mode combustor thatcan operate on both gaseous and liquid fuel.On gas, the combustor operates in a diffusionmode at low loads (< 50% load), and a pre-mixed mode at high loads (> 50% load). Whilethe combustor can operate in the diffusionmode across the load range, diluent injectionwould be required for NOx abatement. Oiloperation on this combustor is in the diffusionmode across the entire load range, with diluentinjection used for NOx control.
Each DLN-2 combustor system has a singleburning zone formed by the combustor linerand the face of the cap. In low emissions opera-tion, 90% of the gas fuel is injected throughradial gas injection spokes in the premixer, andcombustion air is mixed with the fuel in tubessurrounding each of the five fuel nozzles. Thepremixer tubes are part of the cap assembly.The fuel and air are thoroughly mixed, flow outof the five tubes at high velocity and enter theburning zone where lean, low-NOx combustionoccurs. The vortex breakdown from the swirlingflow exiting the premixers, along with the sud-den expansion in the liner, are mechanisms forflame stabilization. The DLN-2 fuel nozzle/pre-mixer tube arrangement is similar in designand technology to the secondary nozzle/cen-terbody of a DLN-1. Five nozzle/premixer tubeassemblies are located on the head end of thecombustor. A quaternary fuel manifold is locat-ed on the circumference of the combustion cas-ing to bring the remaining fuel flow to casinginjection pegs located radially around the cas-ing.
Figure 14 shows a cross-section of a DLN-2 fuelnozzle. As noted, the nozzle has passages for dif-fusion gas, premixed gas, oil and water. Whenmounted on the end cover, as shown in Figure15, the diffusion passages of four of the fuelnozzles are fed from a common manifold,called the primary, that is built into the endcover. The premixed passages of the same fournozzles are fed from another internal manifoldcalled the secondary. The pre-mixed passages ofthe remaining nozzle are supplied by the terti-ary fuel system; the diffusion passage of thatnozzle is always purged with compressor dis-charge air and passes no fuel.
Figure 15 shows the fuel nozzles installed on thecombustion chamber end cover and the con-nections for the primary, secondary and tertiaryfuel systems. DLN-2 fuel streams are:
Dry Low NOx Combustion Systems for GE Heavy-Duty Gas Turbines
GE Power Systems ■ GER-3568G ■ (10/00) 9
Figure 13. DLN-2 combustion system

■ Primary fuel – fuel gas enteringthrough the diffusion gas holes in theswirler assembly of each of theoutboard four fuel nozzles
■ Secondary fuel – premix fuel gasentering through the gas meteringholes in the fuel gas injector spokes ofeach of the outboard four fuel nozzles
■ Tertiary fuel – premix fuel gas deliveredby the metering holes in the fuel gasinjector spokes of the inboard fuelnozzle
■ The quaternary system – injects a smallamount of fuel into the airstream justup-stream from the fuel nozzle swirlers
The DLN-2 combustion system can operate inseveral different modes.
Primary Fuel only to the primary side of the four fuelnozzles; diffusion flame. Primary mode is usedfrom ignition to 81% corrected speed.
Lean-Lean Fuel to the primary (diffusion) fuel nozzles andsingle tertiary (premixing) fuel nozzle. Thismode is used from 81% corrected speed to apre-selected combustion reference tempera-ture. The percentage of primary fuel flow ismodulated throughout the range of operationas a function of combustion reference tempera-ture. If necessary, lean-lean mode can be oper-ated throughout the entire load range of theturbine. Selecting “lean-lean base on” locks outpremix operation and enables the machine tobe taken to base load in lean-lean.
Premix Transfer Transition state between lean-lean and premixmodes. Throughout this mode, the primaryand secondary gas control valves modulate totheir final position for the next mode. The pre-mix splitter valve is also modulated to hold aconstant tertiary flow split.
Piloted Premix Fuel is directed to the primary, secondary andtertiary fuel nozzles. This mode exists whileoperating with temperature control off as anintermediate mode between lean-lean and pre-mix mode. This mode also exists as a defaultmode out of premix mode and, in the eventthat premix operating is not desired, pilotedpremix can be selected and operated to base-load. Primary, secondary and tertiary fuel splitare constant during this mode of operation.
Premix Fuel is directed to the secondary, tertiary andquaternary fuel passages and premixed flameexists in the combustor. The minimum load for
Dry Low NOx Combustion Systems for GE Heavy-Duty Gas Turbines
GE Power Systems ■ GER-3568G ■ (10/00) 10
Figure 14. Cross-section of a DLN-2 fuel nozzle
Figure 15. External view of DLN-2 fuel nozzlesmounted

premixed operation is set by the combustionreference temperature and IGV position. It typ-ically ranges from 50% with inlet bleed heat onto 65% with inlet bleed heat off. Mode transi-tion from premix to piloted premix or pilotedpremix to premix, can occur whenever the com-bustion reference temperature is greater than2200 F/1204 C. Optimum emissions are gener-ated in premix mode.
Tertiary Full Speed No Load (FSNL) Initiated upon a breaker open event from anyload > 12.5%. Fuel is directed to the tertiarynozzle only and the unit operates in secondaryFSNL mode for a minimum of 20 seconds, thentransfers to lean-lean mode.
Figure 16 illustrates the fuel flow scheduling as-sociated with DLN-2 operation. Fuel staging de-pends on combustion reference temperatureand IGV temperature control operation mode.
DLN-2 Controls and Accessories The DLN-2 control system regulates the fuel dis-tribution to the primary, secondary, tertiary andquaternary fuel system. The fuel flow distribu-tion to each combustion fuel system is a func-tion of combustion reference temperature andIGV temperature control mode. Diffusion,piloted premix and premix flame are estab-lished by changing the distribution of fuel flowin the combustor. The gas fuel system (Figure
17) consists of the gas fuel stop-ratio valve, pri-mary gas control valve, secondary gas controlvalve premix splitter valve and quaternary gascontrol valve. The stop-ratio valve is designed tomaintain a predetermined pressure at the con-trol-valve inlet.
The primary, secondary and quaternary gascontrol valves regulate the desired gas fuel flowdelivered to the turbine in response to the fuelcommand from the SPEEDTRONIC™ controls.
The premix splitter valve controls the fuel flowsplit between the secondary and tertiary fuelsystem.
DLN-2 Emissions PerformanceFigures 18 and 19 show the emissions perform-ance for a DLN-2-equipped 7FA/9FA for gasfuel and for oil fuel with water injection.
DLN-2 ExperienceThe first DLN-2 systems were placed in serviceat Florida Power and Light’s Martin Station withcommissioning beginning in September 1993,and the first two (of four) 7FA units enteredcommercial service in February 1994. Duringcommissioning, quaternary fuel was added andother combustor modifications were made tocontrol dynamic pressure oscillations in thecombustor.
Dry Low NOx Combustion Systems for GE Heavy-Duty Gas Turbines
GE Power Systems ■ GER-3568G ■ (10/00) 11
GT24671
Primary
Secondary
Tertiary
Quaternary
Premix ModeLean-LeanMode
PrimaryMode
235022002135
Combustion Reference Temperature
100
70
60
50
40
30
20
10
0
% o
f Bas
e Lo
ad F
uel F
low
16% Speed 1000 20 40 60 80 100
% Load Typical
Figure 16. Typical DLN-2 gas fuel split schedule
Figure 17. DLN-2 gas fuel system

After the 7FA DLN-2 entered commercial serv-ice the 9FA DLN-2 was introduced. Subsequentfleet experience indicated that to achieve ade-quate operational robustness against the entirerange of site specific events, an improvement inpremixer flashback resistance was needed.Under certain transient conditions flashbackcan occur where flame “holds” or is supportedin the recirculation zone downstream of thepremixed gas pegs. This region is not designedto withstand the abnormally high temperaturesresulting from the presence of a flame. In theevent of a flashback, the metal temperaturesincrease to unacceptable levels and hardware
damage occurs. In some cases, these eventshave caused forced outages and adverselyimpacted availability. The solution chosen wasto install full “fairings” on the downstream sideof the cylindrical fuel injection pegs.Laboratory testing and subsequent fleet experi-ence has demonstrated that full fairings arehighly effective in reducing the probability offuel nozzle flash-back. The fairings improve thepeg aerodynamics in order to reduce the size ofthe recirculation zone downstream of the pegs.The result is to significantly reduce the proba-bility of flame holding or attachment to the pre-mixed pegs. Figure 20 shows the original DLN-2fuel nozzle while Figure 21 illustrates the samenozzle with the addition of the fuel-peg fairings.
As of May 1999 there were 8 6FA, 26 7FA and 389FA units equipped with DLN-2 in commercialservice. They have accumulated more than 1.1million hours of operation.
DLN-2.6 EvolutionRegulatory pressures in the U.S. market in theearly 1990s led to the need to develop a 9 ppmcombustion system for the Frame 7FA. Theresult of this development is the DLN-2.6, whichwas first placed into service in March 1996 atPublic Service of Colorado.
Reduction of NOx levels from the DLN-2 at 25ppm to 9 ppm required that approximately 6%
Dry Low NOx Combustion Systems for GE Heavy-Duty Gas Turbines
GE Power Systems ■ GER-3568G ■ (10/00) 12
Figure 20. Un-faired DLN-2 fuel nozzle
Figure 19. Distillate oil emissions with waterinjection above 50% load
Figure 18. Gas fuel emissions in diffusion andpremixed

additional air was needed to pass through thepremixers in the combustor (see Appendix fordescription of the NOx and temperature rela-tionship). This change in air splits was accom-plished through reductions in cap and linercooling air flows, requiring increased coolingeffectiveness. However, without changes in theoperation of the DLN-2 system, certain penal-ties would have been incurred for achieving 9ppm baseload performance. The turndown of aDLN-2 combustor tuned to 9/9 operation wasestimated to be about 70% load, compared to40% load for the 25/15 system. A new combus-tor configuration was conceived based on theDLN-2 burner, but overcoming these difficul-ties. The DLN-2 burner was carried forward asthe basis of the new combustor because of itsexcellent flame stabilization characteristics andthe large database of knowledge, which hadbeen accumulated on the parameters affectingcombustion dynamics.
The key feature of the new configuration is theaddition of a sixth burner located in the centerof the five existing DLN-2 burners. The pres-ence of the center nozzle enables the DLN-2.6to extend its 9/9 turndown well beyond the fivenozzle DLN-2. By fueling the center nozzle sep-arately from the outer nozzles, the fuel-air ratiocan be modulated relative to the outer nozzlesleading to approximately 200°F of turndownfrom baseload with 9 ppm NOx. Turning the
fuel down in the center burner does not resultin any additional CO generation.
Absent any other changes in the DLN-2 otherthan the addition of the center nozzle, theDLN-2.6 combustor would have required fivefuel manifolds, compared to four on the DLN-2. An alternative scheme was proposed to oper-ate the machine at startup and low load, whicheliminated diffusion mode. The result was apremixed-only combustor with 4 manifolds: 3premixed manifolds staging fuel to the sixburners, and a fourth premixed manifold forinjecting quaternary fuel for dynamics abate-ment, (See Figure 22). The first three premixedmanifolds, designated PM1, PM2, and PM3, areconfigured such that any number (1 to 6) ofburners can be operated at any time. The PM1manifold fuels the center nozzle, the PM2 man-ifold fuels the two outer nozzles located at thecross-fire tubes, and the PM3 manifold fuels theremaining three outer nozzles. The five outernozzles are identical to those used for the DLN-2, while the center nozzle is similar but with sim-plified geometry to fit within the availablespace.
With the elimination of the diffusion mode theDLN-2.6 loads and unloads very differently thanthe DLN-2. The loading and unloading strate-gies are shown in Figures 23 and 24. The addi-tional mode changes are necessary to maintainthe premixed flames within their burnablezones and so prevent combustor blowout. The
Dry Low NOx Combustion Systems for GE Heavy-Duty Gas Turbines
GE Power Systems ■ GER-3568G ■ (10/00) 13
PM3
PM2
PM3
PM2
PM3
PM1
q
q
q
q
q
q
q
q
PM2 (2 nozzles)located at crossfire tubes PM3
(3 nozzles)
PM1(1 nozzle)
Quaternary (15 pegs)
6 Premix Burners - Five identical outerburners, one smaller center nozzle.
During different machine cycle conditions,PM1, PM2, PM3 are flowed in varyingcombinations to give low F/A.
Quaternary Pegs are locatedcircumferentially around the combustioncasing.
q
q
q
Figure 22. DLN-2.6 fuel nozzle arrangement
Fairing
~Fused Tip
Figure 21. Fully faired (flashback resistant) fuelnozzle

gas fuel control system is also changed relativeto the DLN-2. Control is accomplished with onestop ratio valve and four individual gas controlvalves, (See Figure 25). The splitter valve utilizedin both the DLN-1 and DLN-2 combustion sys-tems is eliminated.
Emissions performance of the DLN-2.6depends on the operational mode (See Figures26 and 27). As can be seen, the emissions goal
of 9 ppm NOx and CO over a 50% load rangewas met. Since its introduction in 1996 theDLN-2.6 has been installed on 8 machines andaccumulated approximately 17,000 hours ofoperation.
DLN-2+ EvolutionIn late 1996 an uprated version of the Frame9FA was introduced. Called the 9FA+e, the cyclefor this machine increased the air and fuel flowto the combustion system by approximately10%. In addition, the machine was intended foruse with gas fuels ranging in heat content from
Dry Low NOx Combustion Systems for GE Heavy-Duty Gas Turbines
GE Power Systems ■ GER-3568G ■ (10/00) 14
BREAKEROPENEVENT
UNIT FLAM E-OUT
DLN-2.6TYPICALUN-LOADINGSEQUENCE
STOP
PM1+PM3
PM1+PM2
PM2+PM3+Q
PM1+PM2+PM3+Q
PM1
PM1+PM2
(FSNL operating mode)
Figure 24. DLN-2.6 unloading and fired shutdownsequence
Mode 1
Mode 3
Mode 4
Mode 5Q
Mode 6Q
1
10
100
1000
0% 50% 100%
Load (MW)
CO
(p
pm
)
Figure 27. CO level vs. percent load
GCV3 GAS CONTROL PM3
SRV SPEED/RATIO VALVE
GCV1 GAS CONTROL PM1
GCV2 GAS CONTROL PM2
GAS SKID
SRV
GCV4
GCV2
GCV1
GCV3
PM3 - 3 NOZ. PRE-MIX ONLY
PM2 - 2 NOZ. PRE-MIX ONLY
PM1 - 1 NOZ. PRE-MIX ONLY
Q - QUAT MANIFOLD, CASING, PRE-MIX ONLY
PM2
Q
6 BURNERS
TURBINE COMPARTMENT
BURNINGSINGLE
ZONE
PM1
PM3
GCV4 GAS CONTROL Quaternary
Figure 25. DLN-2.6 fuel distribution and controlssystem
Mode 1Mode 3
Mode 4
Mode 5QMode 6Q
0
20
40
60
80
0% 50% 100%% Baseload
ISO NOx
(ppm)
Figure 26. NOx at 15% O2 vs. percent load
PM1+PM2
PM1
DLN-2.6TYPICALLOADINGSEQUENCE
START
PM1+PM3
PM1+PM2
PM2+PM3+Q
PM1+PM2+PM3+Q
(firing and initial crossfire)
PM2+PM3
PM2 (Complete crossfire to 95 % speed)
(95 % speed to TTRF1 switch #1 at 10 percent load)
(TTRF1 switch #1 to #2 at 25 percent load
(TTRF1 switch #2 to #3 at 40 percent load
(TTRF1 switch #3, brief duration)
(TTRF1 switch #3 + a time delay to #4 at 45 percent load)
(Above TTRF1 switch #4 to base load)
Figure 23. DLN-2.6 ignition, crossfire, accelera-tion, and loading strategy

approximately 70–100% of natural gas whilestill maintaining low emissions.
To meet these requirements an updated versionof the DLN-2, called the DLN-2+, was devel-oped. The DLN-2+ retains the basic architec-ture of the DLN-2 with adaptations for both thenew requirements and to improve the operabil-ity and robustness of the existing system. Incomparison to the DLN-2, the major changesare concentrated in the fuel nozzle and end-cover arrangement (See Figure 28). Both theendcover and fuel nozzle have substantiallyenlarged fuel passages for the increased volu-metric flow of fuel. In addition the fuel nozzle(See Figure 29), was redesigned for furtherimprovements in flame holding margin,reduced pressure drop, and improved diffu-sion-flame stability.
flow entering the premixer, while downstreaman integral outer shroud eliminates any poten-
tial flow disturbances after the point of fuelinjection. The improvement in aerodynamicsalso reduces the overall system pressure drop tothe level required by the new cycle.
The nozzle-tip geometry and the improvementsin diffusion flame stability allow the use of a dif-fusion flame on every nozzle. This eliminatesthe lean-lean mode of the DLN-2 and results inthe simplified staging methodology shown inFigure 30.
A further simplification illustrated in Figure 30 isthe elimination of the DLN-2 Quaternary fuelsystem. This is achieved through the use of bi-radial fuel staging in each swirler vane. In thisdesign the radial fuel injection balance can beadjusted via fixed orifices on the endcover aspart of the system setup procedure.
Overall, the fuel nozzle and endcover arrange-ment of the DLN-2+ can accept fuels withWobbe Index ranging from 28 to 52. The fuel
Dry Low NOx Combustion Systems for GE Heavy-Duty Gas Turbines
GE Power Systems ■ GER-3568G ■ (10/00) 15
Figure 28. Parts highly modified for DLN-2+ ascompared to DLN-2
Figure 29. DLN-2+ fuel nozzle
D5IGNITION to LOW LOAD
D5 + PM1 + PM4LOW LOAD toPREMIX TRANSFER
PM1 + PM4 PREMIX TRANSFER to BASE LOAD
D5 - Diffusion Flame on AllPM4 - Premixed Flame on “4”PM1 - Premixed Flame on “1”
PM4 PM1
D51
4
4
4
4
Load Reject to Underlined Mode
Premix Dynamics Control: PM4/PM1 Fuel Split
Figure 30. DLN-2+ staging methodology
The additional gains in flame-holding velocitymargin result from cleaner aerodynamics in thepremixers. This is achieved via a new swirlerdesign, which incorporates fuel injection direct-ly from the swirler surface. Each swirler vanecomprises a turning vane and an upstreamstraight section. The straight section is hollowand houses the fuel manifolds plus the discreteinjection holes. Upstream of the swirler an inletflow conditioner improves the character of the

delivery system is very similar to the one usedfor the DLN-2.6, with a stop ratio valve andindependent gas control valves for each of thethree gas fuel circuits.
The first installation and startup of a 9FA+e wasin early 1999 at the Sutton Bridge Power Stationin the UK. Emissions measured during thestartup were well within design goals (See Figures30 and 31). Additional machines will be com-missioned throughout 1999.
ConclusionGE’s Dry Low NOx Program continues to focuson the development of systems capable of theextremely low NOx levels required to meettoday’s regulations and to prepare for morestringent requirements in the future. New unit
production needs and the requirements ofexisting machines are being addressed. GEDLN systems are operating on more than 222machines and have accumulated more than 4.8million service hours. GE is the only manufac-turer with F technology machines operatingbelow 15 ppmvd.
Appendix
Gas Turbine Combustion Systems A gas turbine combustor mixes large quantitiesof fuel and air and burns the resulting mixture.In concept the combustor is comprised of a fuelinjector and a wall to contain the flame. Thereare three fundamental factors and practicalconcerns that complicate the design of the com-bustor: equivalence ratio, flame stability, andability to operate from ignition through fullload.
Equivalence Ratio A flame burns best when there is just enoughfuel to react with the available oxygen. With thisstoichiometric mixture (equivalence ratio of1.0) the flame temperature is the highest andthe chemical reactions are the fastest, com-pared to cases where there is either more oxy-gen (“fuel lean,” < 1.0) or less oxygen (“fuelrich,” > 1.0) for the amount of fuel present.
In a gas turbine, the maximum temperature ofthe hot gases exiting the combustor is limited bythe tolerance of the turbine nozzles and buck-ets. This temperature corresponds to an equiva-lence ratio of 0.4 to 0.5 (40% to 50% of the sto-ichiometric fuel flow). In the combustors usedon modern gas turbines, this fuel-air mixturewould be too lean for stable and efficient burn-ing. Therefore, only a portion of the compres-sor discharge air is introduced directly into thecombustor reaction zone (flame zone) to bemixed with the fuel and burned. The balance of
Dry Low NOx Combustion Systems for GE Heavy-Duty Gas Turbines
GE Power Systems ■ GER-3568G ■ (10/00) 16
0
200
400
600
800
1000
1200
0 50 100 150 200 250 300
GT load (MW)
CO
(ra
w)
Figure 32. DLN-2+ combustion system NOx emissions
0.0
10.0
20.0
30.0
40.0
50.0
60.0
70.0
80.0
90.0
100.0
0 50 100 150 200 250 300
GT load (MW)
ISO
No
x @
15%
Figure 31. DLN-2+ combustion system NOx emissions

the airflow either quenches the flame prior tothe combustor discharge entering the turbineor cools the wall of the combustor.
Flame Stability Even with only part of the air being introducedinto the reaction zone, flow velocities in thezone are higher than the turbulent flame speedat which a flame propagates through the fuel-airmixture. Special mechanical or aerodynamicdevices must be used to stabilize the flame byproviding a low velocity region. Modern com-bustors employ a combination of swirlers andjets to achieve a good mix and to stabilize theflame.
Operational Stability The combustor must be able to ignite and tosupport acceleration and operation of the gasturbine over the entire load range of themachine. For a single-shaft generator-drivemachine, speed is constant under load and,therefore, so is the airflow for a fixed ambienttemperature. There will be a five-to-one or six-to-one turndown in fuel flow over the loadrange. A combustor whose reaction zone equiv-alence ratio is optimized for full-load operationwill be very lean at the lower loads.Nevertheless, the flame must be stable and thecombustion process must be efficient at allloads.
GE uses multiple-combustion chamber assem-blies in its heavy-duty gas turbines to achievereli-able and efficient turbine operation. Asshown in Figure A-1, each combustion chamberassembly comprises a cylindrical combustor, afuel-injection system and a transition piece thatguides the flow of the hot gas from the combus-tor to the inlet of the turbine. Figure A-2 illus-trates the multiple-combustor concept.
There are several reasons for using the multi-ple-chamber arrangement instead of large silo-type combustors:
■ The configuration permits the entireturbine to be factory assembled, testedand shipped without interimdisassembly
■ The turbine inlet temperature can bebetter controlled, thus providing forlonger turbine life with reducedturbine cooling air requirements
■ Smaller parts can be handled moreeasily during routine maintenance
■ Smaller transition pieces are lesssusceptible to damage from dynamicforces generated in the combustor;furthermore, the shorter combustionsystem length ensures that acousticnatural frequencies are higher and lesslikely to couple with the pressureoscillations in the flame
Dry Low NOx Combustion Systems for GE Heavy-Duty Gas Turbines
GE Power Systems ■ GER-3568G ■ (10/00) 17
GT21897A .ppt
Figure A-1. MS7001E Dry Low NOx combustionsystem
GT18556
Figure A-2. Exploded view of combustion chamber

■ Smaller combustors generate less NOx
because of much better mixing andshorter residence time
■ As turbine inlet temperatures haveincreased to improve efficiency, thesize of the combustors has decreasedto minimize cooling requirements, asin aircraft gas turbine combustors
■ Small can-type combustors can becompletely developed in thelaboratory through a combination ofboth atmospheric and full-pressure,full-flow tests. Therefore, there is ahigher degree of confidence that acombustor will perform as designedacross all load ranges before it isinstalled and tested in a machine.
Gas Turbine EmissionsThe significant products of combustion in gasturbine emissions are:
■ Oxides of nitrogen (NO and NO2,collectively called NOx)
■ Carbon monoxide (CO)
■ Unburned hydrocarbons or UHCs(usually expressed as equivalentmethane [CH4] parti-cles and arisefrom incomplete combustion)
■ Oxides of sulfur (SO2 and SO3)particulates.
Unburned hydrocarbons include both volatileorganic compounds (VOCs), which contributeto the formation of atmospheric ozone, andcompounds, such as methane, that do not.
There are two sources of NOx emissions in theexhaust of a gas turbine. Most of the NOx is gen-erated by the fixation of atmospheric nitrogenin the flame, which is called thermal NOx.Nitrogen oxides are also generated by the con-
version of a fraction of any nitrogen chemicallybound in the fuel (called fuel-bound nitrogenor FBN). Lower-quality distillates and low-Btucoal gases from gasifiers with hot gas cleanupcarry various amounts of fuel-bound nitrogenthat must be taken into account when emissionscalculations are made. The methods describedbelow to control thermal NOx emissions areineffective in controlling the conversion of FBNto NOx.
Thermal NOx is generated by a chemical reac-tion sequence called the Zeldovich Mechanism(Reference 6). This set of well-verified chemicalreactions postulates that the generation of ther-mal NOx is an exponential function of the tem-perature of the flame and a linear function ofthe time which the hot gases are at flame tem-perature. Thus, temperature and residencetime determine thermal NOx emissions levelsand are the principal variables that a gas tur-bine designer can adjust to control emission lev-els.
For a given fuel, since the flame temperature isa unique function of the equivalence ratio, therate of NOx generation can be cast as a functionof the equivalence ratio. Figure A-3 shows thatthe highest rate of NOx production occurs at anequivalence ratio of 1.0, when the temperatureis equal to the stoichiometric, adiabatic flametemperature.
To the left of the maximum temperature point(Figure A-3), more oxygen is available (theequivalence ratio is < 1.0) and the resultingflame temperature is lower. This is a fuel-leanoperation. Since the rate of NOx formation is afunction of temperature and time, it followsthat some difference in NOx emissions can beexpected when different fuels are burned in agiven combustion system. Since distillate oil andnatural gas have approximately a 100°F/38°Cflame temperature difference, a significant dif-
Dry Low NOx Combustion Systems for GE Heavy-Duty Gas Turbines
GE Power Systems ■ GER-3568G ■ (10/00) 18
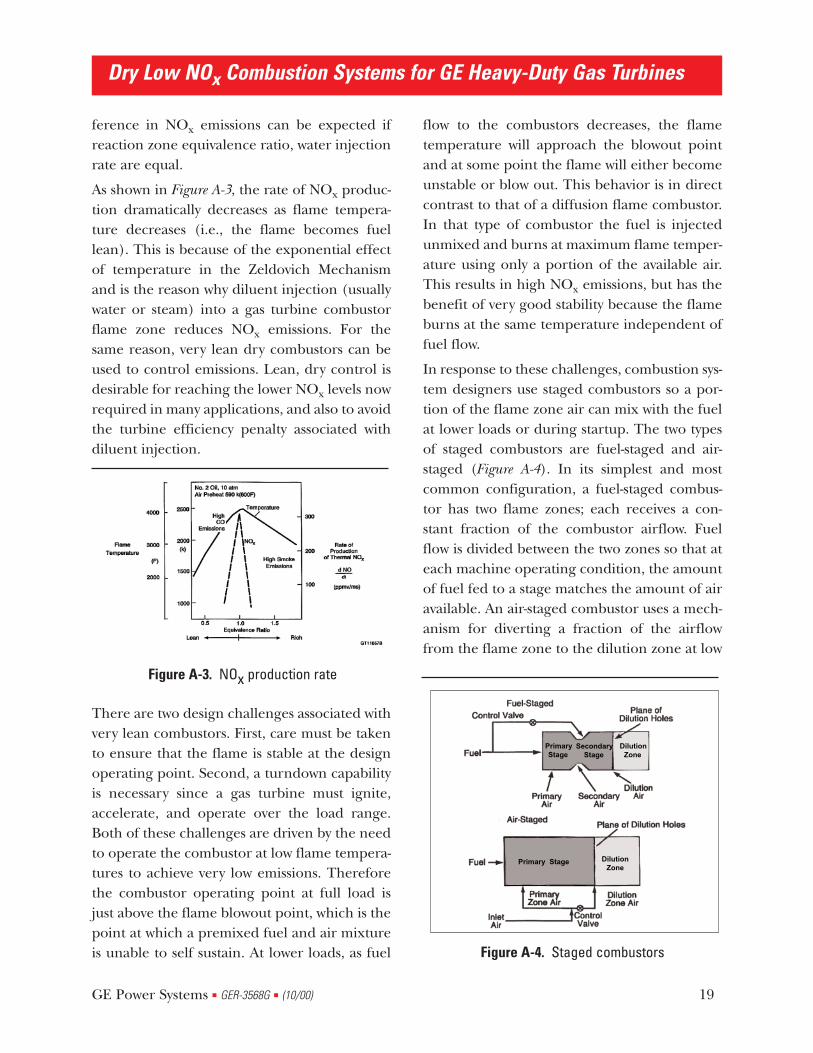
ference in NOx emissions can be expected ifreaction zone equivalence ratio, water injectionrate are equal.
As shown in Figure A-3, the rate of NOx produc-tion dramatically decreases as flame tempera-ture decreases (i.e., the flame becomes fuellean). This is because of the exponential effectof temperature in the Zeldovich Mechanismand is the reason why diluent injection (usuallywater or steam) into a gas turbine combustorflame zone reduces NOx emissions. For thesame reason, very lean dry combustors can beused to control emissions. Lean, dry control isdesirable for reaching the lower NOx levels nowrequired in many applications, and also to avoidthe turbine efficiency penalty associated withdiluent injection.
There are two design challenges associated withvery lean combustors. First, care must be takento ensure that the flame is stable at the designoperating point. Second, a turndown capabilityis necessary since a gas turbine must ignite,accelerate, and operate over the load range.Both of these challenges are driven by the needto operate the combustor at low flame tempera-tures to achieve very low emissions. Thereforethe combustor operating point at full load isjust above the flame blowout point, which is thepoint at which a premixed fuel and air mixtureis unable to self sustain. At lower loads, as fuel
flow to the combustors decreases, the flametemperature will approach the blowout pointand at some point the flame will either becomeunstable or blow out. This behavior is in directcontrast to that of a diffusion flame combustor.In that type of combustor the fuel is injectedunmixed and burns at maximum flame temper-ature using only a portion of the available air.This results in high NOx emissions, but has thebenefit of very good stability because the flameburns at the same temperature independent offuel flow.
In response to these challenges, combustion sys-tem designers use staged combustors so a por-tion of the flame zone air can mix with the fuelat lower loads or during startup. The two typesof staged combustors are fuel-staged and air-staged (Figure A-4). In its simplest and mostcommon configuration, a fuel-staged combus-tor has two flame zones; each receives a con-stant fraction of the combustor airflow. Fuelflow is divided between the two zones so that ateach machine operating condition, the amountof fuel fed to a stage matches the amount of airavailable. An air-staged combustor uses a mech-anism for diverting a fraction of the airflowfrom the flame zone to the dilution zone at low
Dry Low NOx Combustion Systems for GE Heavy-Duty Gas Turbines
GE Power Systems ■ GER-3568G ■ (10/00) 19
PrimaryStage
SecondaryStage
DilutionZone
DilutionZone
Primary Stage
Figure A-4. Staged combustors
Figure A-3. NOx production rate

load to increase turndown. These methods canbe combined, but both work to achieve thesame objective, to maintain a stable flame tem-perature just above the blowout point.
Emissions Control MethodsThere are three principal methods for control-ling gas turbine emissions:
■ Injection of a diluent such as water orsteam into the burning zone of aconventional (diffusion flame)combustor
■ Catalytic clean-up of NOx and COfrom the gas turbine exhaust (usuallyused in conjunction with the other twomethods)
■ Design of the combustor to limit theformation of pollutants in the burningzone by utilizing “lean-premixed”combustion technology
The last method includes both DLN combus-tors and catalytic combustors. GE has consider-able experience with each of these three meth-ods.
Since September 1979, when regulationsrequired that NOx emissions be limited to 75ppmvd (parts per million by volume, dry),more than 300 GE heavy-duty gas turbines haveaccumulated more than 2.5 million operatinghours using either steam or water-injection tomeet required NOx emissions levels, sometimesproducing levels even lower than required. Theamount of water required to accomplish this isapproximately one-half of the fuel flow.However, there is a 1.8% heat rate penalty asso-ciated with using water to control NOx emis-sions for oil-fired simple-cycle gas turbines.Output increases by approximately 3%, makingwater (or steam) injection for power augmenta-tion economically attractive in some circum-
stances (such as peaking applications).
Single-nozzle combustors that use water orsteam injection are limited in their ability toreduce NOx levels below 42 ppmvd on gas fueland 65 ppmvd on oil fuel. GE developed multi-nozzle quiet combustors (MNQC) for theMS7001EA and MS7001FA capable of achieving25 ppmvd on gas fuel and 42 ppmvd on oil,using either water or steam injection. SinceOctober 1987, more than 26 MNQC-equippedMS7001s that use water or steam injection havebeen placed in service. One unit that uses steaminjection has operated nearly 50,000 hours at 25ppmvd NOx (at 15% O2).
Frequent combustion inspections anddecreased hardware life are undesirable sideeffects that can result from the use of diluentinjection to reduce NOx emissions from com-bustion turbines. For applications that requireNOx emissions below 42 ppmvd (or 25 ppmvdin the case of the MS7001EA or MS7001FAMNQC), or to avoid the significant cycle effi-ciency penalties incurred when water or steaminjection is used for NOx control, one of theother two principal methods of NOx controlmentioned above must be used.
Selective catalytic reduction (SCR) converts NOand NO2 in the gas turbine exhaust stream tomolecular nitrogen and oxygen by reacting theNOx with ammonia in the presence of a catalyst.Conventional SCR technology requires that thetemperature of the exhaust stream remain in anarrow range (550°F to 750°F or 288°C to399°C) and is restricted to applications with aheat recovery system installed in the exhaust.The SCR is installed at a location in the boilerwhere the exhaust gas temperature hasdecreased to the above temperature range. Newhigh-temperature SCR technology is beingdeveloped that may allow SCRs to be used forapplications without heat recovery boilers.
Dry Low NOx Combustion Systems for GE Heavy-Duty Gas Turbines
GE Power Systems ■ GER-3568G ■ (10/00) 20

For an MS7001EA gas turbine, an SCR designedto remove 90% of the NOx from the gas turbineexhaust stream has a volume of approximately175 cubic meters and weighs 111 tons. It is com-prised of segments stacked in the exhaust duct.Each segment has a honeycomb pattern withpassages that are aligned in the direction of theexhaust gas flow. A catalyst, such as vanadiumpentoxide, is deposited on the surface of thehoneycomb.
SCR systems are sensitive to fuels containingmore than 1,000 ppm of sulfur (light distillateoils may have up to 0.8% sulfur). There are tworeasons for this sensitivity.
First, sulfur poisons the catalyst being used inSCRs. Second, the ammonia will react with sul-fur in the presence of the catalyst to formammonium bisulfate, which is extremely corro-sive, particularly near the discharge of a heatrecovery boiler. Special catalyst materials thatare less sensitive to sulfur have been identified,and there are some theories as to how to inhib-it the formation of ammonium bisulfate. This,however, remains an open issue with SCRs.
More than 100 GE units have accumulatedmore than 100,000 operating hours with SCRsinstalled. Twenty of the units are in Japan; oth-ers are located in California, New Jersey, NewYork and several other eastern U.S. states. Unitsoperating with SCRs include MS9000s,MS7000s, MS6000s, LM2500s and LM5000s.
Lean premixed combustion is the basis forachieving low emissions from Dry Low NOx andcatalytic combustors. GE has participated in thedevelopment of catalytic combustors for manyyears. These systems use a catalytic reactor bedmounted within the combustor to burn a verylean fuel-air mixture. They have the potential toachieve extremely low emissions levels withoutresorting to exhaust gas cleanup. Technicalchallenges in the combustor and in the catalystand reactor bed materials must be overcome in
order to develop an operational catalytic com-bustor. GE has development programs in placewith both ceramic and catalyst manufacturers toaddress these challenges.
References1. Washam, R. M., “Dry Low NOx
Combustion System for Utility GasTurbine,” ASME Paper 83-JPGC-GT-13,Sept. 1983.
2. Davis, L. B. and Washam, R. M., “Develop-ment of a Dry Low NOx Combustor,”ASME Paper No. 89-GT-255, June 1989.
3. Dibelius, N.R., Hilt, M.B., and Johnson,R.H., “Reduction of Nitrogen Oxides fromGas Turbines by Steam Injection,” ASMEPaper No. 71-GT-58, Dec. 1970.
4. Miller, H. E., “Development of the QuietCombustor and Other Design Changes toBenefit Air Quality,” AmericanCogeneration Association, San Francisco,March 1988.
5. Cutrone, M. B., Hilt, M. B., Goyal, A.,Ekstedt, E. E., and Notardonato, J.,“Evaluation of Advanced Combustor forDry NOx Suppression with NitrogenBearing Fuels in Utility and Industrial GasTurbines,” ASME Paper 81-GT-125, March1981.
6. Zeldovich, J., “The Oxidation of Nitrogenin Combustion and Explosions,” Acta Phys-icochimica USSR, Vol. 21, No. 4, 1946, pp577-628.
7. Washam, R. M., “Dry Low NOx
Combustion System for Utility GasTurbine,” ASME Paper 83-JPGC-GT-13,Sept. 1983.
8. Davis, L. B., and Washam, R. M., “Develop-ment of a Dry Low NOx Combustor,”ASME Paper No. 89-GT-255, June 1989.
Dry Low NOx Combustion Systems for GE Heavy-Duty Gas Turbines
GE Power Systems ■ GER-3568G ■ (10/00) 21

List of FiguresFigure 1. Dry Low NOx product plan
Figure 2. DLN power augmentation summary
Figure 3. DLN peak firing emissions - natural gas fuel
Figure 4. DLN technology - a four sided box
Figure 5. Dry Low NOx combustor
Figure 6. Fuel-staged Dry Low NOx operating modes
Figure 7. Typical DLN-1 fuel gas split schedule
Figure 8. Dry low NOx gas fuel system
Figure 9. MS7001EA/MS9001E emissions - natural gas fuel
Figure 10. MS6001B emissions - natural gas
Figure 11. MS7001EA Dry Low NOx combustion system performance on distillate oil
Figure 12. MS6001B emissions distillate oil fuel
Figure 13. DLN-2 combustion system
Figure 14. Cross-section of a DLN-2 fuel nozzle
Figure 15. External view of DLN-2 fuel nozzles mounted
Figure 16. Typical DLN-2 gas fuel split schedule
Figure 17. DLN-2 gas fuel system
Figure 18. Gas fuel emissions in diffusion and premixed
Figure 19. Distillate oil emissions with water injection above 50% load
Figure 20. Un-faired fuel nozzle
Figure 21. Fully faired (flashback resistant) fuel nozzle
Figure 22. DLN-2.6 fuel nozzle arrangement
Figure 23. DLN-2.6 ignition, crossfire, acceleration, and loading strategy
Figure 24. DLN-2.6 unloading and fired shutdown sequence
Figure 25. DLN-2.6 fuel distribution and controls system
Figure 26. NOx at 15% O2 vs. percent load
Figure 27. CO level vs. percent load
Figure 28. Parts highly modified for DLN-2+ as compared to DLN-2
Figure 29. DLN-2+ fuel nozzle
Figure 30. DLN-2+ staging methodology
Figure 31. DLN-2+ combustion system NOx emissions
Figure 32. DLN-2+ combustion system NOx emissions
Figure A-1. MS7001E Dry Low NOx combustion system
Figure A-2. Exploded view of combustion chamber
Figure A-3. NOx production rate
Figure A-4. Staged combustors
Dry Low NOx Combustion Systems for GE Heavy-Duty Gas Turbines
GE Power Systems ■ GER-3568G ■ (10/00) 22

POWER ENGINEERS, INC. Plan Approval Application – Renovo Energy Center, LLC
APPENDIX I AIR FILTER SPECIFICATIONS

g GEK 116269
October 2008
GE Energy
These instructions do not purport to cover all details or variations in equipment nor to provide for every possible contingency to be met in connection with installation, operation or maintenance. Should further information be desired or should particular problems arise which are not covered sufficiently for the purchaser's purposes the matter should be referred to the GE Company.
© General Electric Company, 2008. GE Proprietary Information. All Rights Reserved.
Gas Turbine Inlet Air Specification

GEK 116269 Gas Turbine Inlet Air Specification
2 © General Electric Company, 2008. GE Proprietary Information. All Rights Reserved.
TABLE OF CONTENTS
I. INTRODUCTION TO GAS TURBINE INLET AIR SPECIFICATION............................................. 4 II. CLASSIFICATION OF ATMOSPHERIC CORROSIVITY ................................................................ 5
A. Purpose of Section ................................................................................................................................. 5 B. Introduction: Atmospheric Corrosion and Corrosion Factors................................................................ 5 C. Environmental Classification of Corrosivity: C1-C5m.......................................................................... 7 D. Methods to Establish Corrosivity Classes C1-C5m............................................................................... 7
III. IMPACT OF ENVIRONMENTAL CORROSIVITY ON ENGINE HEALTH................................. 13 A. Impact of C1 Corrosive Environment.................................................................................................. 13 B. Impact of C2 Corrosive Environment.................................................................................................. 13 C. Impact of C3 Corrosive Environment.................................................................................................. 13 D. Impact of C4 Corrosive Environment.................................................................................................. 14 E. Impact of C5i and C5m Corrosive Environments................................................................................ 14 F. General Environmental Identification Recommendations ................................................................... 15
IV. GAS TURBINE MAINTENANCE RECOMMENDATIONS FOR DIFFERENT CORROSIVE ENVIRONMENTS............................................................................................................................................. 17
A. This Sections Outlines and Summarizes Corrosion-Specific Maintenance for c1 to c5 Rated Environments. Maintenance Recommendation for c1 and c2 Environments ...................................... 17
B. Maintenance Recommendation for C3 Environment........................................................................... 17 C. Maintenance Recommendation for C4 Environment........................................................................... 17 D. Maintenance Recommendation for C5i and C5m Environments ........................................................ 17
V. INLET FILTRATION SYSTEM RECOMMENDATIONS FOR DIFFERENT CORROSIVE ENVIRONMENTS............................................................................................................................................. 18
A. Background on Inlet Filtration............................................................................................................. 19 B. Filter System Recommendation for C4, C5i, and C5m Environments ................................................ 19
VI. POWER AUGMENTATION SYSTEM MAINTENANCE RECOMMENDATIONS ..................... 21 A. Introduction.......................................................................................................................................... 21 B. Media Type Evaporative Coolers ........................................................................................................ 22 C. Chiller Coils ......................................................................................................................................... 23 D. Spray Type Evaporative Coolers ......................................................................................................... 23
VII. MEASUREMENT AND MONITORING OF CORROSIVE NATURE OF ENVIRONMENT ...... 24 A. Batch Measurement (Average over Time)........................................................................................... 24
VIII. REFERENCES ......................................................................................................................................... 29 A. All relevant GE documentation ........................................................................................................... 29 B. Non-GE documents for reference: ....................................................................................................... 29

Gas Turbine Inlet Air Specification GEK 116269
© General Electric Company, 2008. GE Proprietary Information. All Rights Reserved. 3
LIST OF FIGURES
Figure 1. ISO 9223 Standard Coupon Mounting Example .................................................................................... 9 Figure 2 & 3. Deposits on the Self-Cleaning Filter Pulse Pipes May be a Sign of Water Carryover .................. 15 Figure 4 & 5. Deposits on the Clean Airside of Self-Cleaning Filters................................................................. 15 Figure 6. Corroded Mesh of a Self-Cleaning Filter Element ............................................................................... 15 Figure 7 & 8. Water Quality Issues and Water Carryover From Evaporative Cooler ......................................... 16 Figure 9 & 10. Leaking Gaskets and Seals .......................................................................................................... 16 Figure 11. Cooling Tower Mist Entering the Inlet ............................................................................................... 16 Figure 12. Inlet Configuration for Corrosive Environment with Moderate Dust................................................. 20 Figure 13. Inlet configuration for Corrosive Environment with Moderate Dust and Icing.................................. 20 Figure 14. Inlet Configuration for Corrosive Environment with High Dust ........................................................ 21 Figure 15. Inlet Configuration for Corrosive Environment with High Dust and Icing ........................................ 21 Figure 16. GE Clean Air ISO Standard Coupon Exposure Unit .......................................................................... 26 Figure 17. Typical Sample Probe......................................................................................................................... 28
LIST OF TABLES
Table 1. List of ISO Standards Pertaining to Atmospheric Corrosivity................................................................. 7 Table 2. Sample Classifications Based on Carbon Steel Exposure........................................................................ 7 Table 3. Corrosion Rates (Mass or Thickness Loss) of Metals for First Year of Exposure for C1-C5m Classes 8 Table 4. Time of Wetness Categories .................................................................................................................. 10 Table 5. Classification of SO2 Deposition............................................................................................................ 10 Table 6. Classification of Chloride Deposition .................................................................................................... 11 Table 7. Classification Based on Previously Established TOW and SO2, and Chlorides
Deposition Categories............................................................................................................................ 11 Table 8. Summary of Some Pollutant Factors...................................................................................................... 12

GEK 116269 Gas Turbine Inlet Air Specification
4 © General Electric Company, 2008. GE Proprietary Information. All Rights Reserved.
I. INTRODUCTION TO GAS TURBINE INLET AIR SPECIFICATION
Air quality can be considered in terms of quantity of particulate matter contained in the air stream as well as the elemental concentration and content of that matter. Historically, the quality of the air entering the gas turbine has mainly been driven by considerations for hot gas path corrosion. Advances in compressor technology, higher operating stresses, and reduced clearances have led to greater attention to maintenance as well as corrosion and erosion mitigation for compressor components, in addition to the hot gas path.
The availability, reliability, and performance of a gas turbine compressor depend upon its operating environment, its air inlet filtration system, related maintenance practices and blade material selection. Maintenance practices include inspections of inlet structure (internal and external), inlet filter house and system, filters, water wash systems, power augmentation systems, and forward compressor stages. Given a specified material, operating environment, maintenance practices and filtration technology may be viewed as the three factors driving corrosion and erosion.
This GEK is aimed at describing the requirements of the gas turbine inlet air system, with consideration of these risk factors, as it pertains specifically to corrosion and erosion of the compressor itself. Improper filtration and maintenance, along with compromised inlet system integrity and insufficient filtration can potentially lead to compressor corrosion. It has been stated in earlier GER documents that erosion may be controlled by filtration since erosion is typically caused by larger size particle that may be removed with proper filters (particles > 5 microns in size).
This inlet air specification and any future revisions will provide data-driven maintenance and inspection recommendations that take into consideration site-specific environment data, inlet filtration system application and on-site power augmentation options. Specifically, this GEK describes the corrosivity classes of the environment upstream (“dirty air side”) of the filter system, the gas turbine maintenance and filtration system recommendations for the higher corrosivity environmental classes, and power augmentation system corrosion and erosion-related maintenance recommendations.
In efforts to move beyond these recommendations, GE has ongoing field inspection and monitoring programs at selected customer sites to improve its current database of site-specific maintenance practices, environmental factors, filtration systems and power augmentation options.
The remainder of the GEK document contains the following sections:
Section 2 discusses the classification of all ambient environments into 6 different categories of corrosion C1 to C5m and explains how these can be determined for a given location, with reference to ISO 9223 – 9226 standards.
Section 3 describes the potential impact of environments classified as C1 to C5m on the gas turbine engine and provides some visual indication of issues that could highlight potential corrosion in the engine. GE has observed that the environments classified as C3 or lower tend to experience minimal corrosion issues, when GE issued maintenance practices and guidelines for machine operation are followed. In the higher corrosive environments, C4, C5i and C5m, additional precautionary measures may be taken as highlighted in this section.
Section 4 describes the maintenance recommendations to mitigate corrosion issues in each of the six corrosive environmental categories.

Gas Turbine Inlet Air Specification GEK 116269
© General Electric Company, 2008. GE Proprietary Information. All Rights Reserved. 5
Section 5 highlights the current inlet filter system recommendations for each of the highly corrosive environmental categories.
Section 6 describes the corrosion and erosion-related recommendations for the power augmentation system options.
Section 7 of this GEK highlights the need for air monitoring and describes the instrument options to establish corrosivity rating of upstream (“dirty air side”) and downstream (“clean air side”) of filter system.
Section 8 lists the reference documents.
The recommendations in this GEK are meant as a further addendum and addition to the knowledge pool that already exists in GE issued documentation.
GE recommends that existing sites characterize the corrosive nature of their environment as per GE recommendations in section II & section VII and new sites under consideration start evaluating the corrosive nature of their environment during power plant planning phase. This will enable the site to be classified into either of C1 to C5m categories as per ISO standard and help develop operational and maintenance schedules for the power plant hardware. GE can support this environmental classification and study of different corrosives at site as per section II and section VII of this GEK, this can be done so by placing a site analysis request to the local CPM or GE site representative.
Characterization of air quality at site is the customer responsibility.
II. CLASSIFICATION OF ATMOSPHERIC CORROSIVITY
A. Purpose of Section
The aim is to quantify ambient atmospheric corrosive potential in terms of standard corrosion classes. This GEK describes the methods that GE employs for this corrosion classification, which includes the International Standards Organization (ISO) methodologies, as well as GE design practices.
B. Introduction: Atmospheric Corrosion and Corrosion Factors
Atmospheric corrosion can be defined as the corrosion of materials exposed to air and pollutants. Atmospheric corrosion can be further classified into dry, damp and wet categories. With respect to the applicability of aqueous corrosion to the compressor-operating environment, this document will consider only damp and wet categories, which are associated respectively with corrosion in the presence of microscopic electrolyte (or “moisture”) films and visible electrolyte layers on the metal surface. The damp moisture films are created at a certain critical relative humidity value through water adsorption while the wet films are associated with dew, rainwater and ocean spray. The film and the corrosion rate in the film are affected by factors such as the amount of available moisture, temperature, contaminants, wind conditions, sun and site location.
A brief introduction to these corrosion variables is provided below.
1. Moisture
Time of wetness (TOW): TOW may be defined practically as the time period during which the metallic surface is covered by electrolyte film capable of causing atmospheric corrosion. There is a critical relative humidity level for ferrous materials above which accelerated corrosion begins to occur. This value is not constant, and is a function of the hygroscopic nature of corrosion

GEK 116269 Gas Turbine Inlet Air Specification
6 © General Electric Company, 2008. GE Proprietary Information. All Rights Reserved.
products and contaminants (salts). For atmospheric corrosion classification, International Standards Organization (ISO) defines this critical relative humidity value as 80% (temperature >0ºC) and TOW is defined as the amount of time a site spends above this critical value. Due to temperature depression at the inlet of the gas turbine, compressor blades start operating wet when ambient relative humidity > 50%, with significant wetness on blades at 75%.
Rain vs. Surface Condensation: While rainwater can provide electrolytes for corrosion reactions, it can act in a beneficial manner by washing away surface contaminants and reducing corrosion rates. Condensation provides moisture but does not dilute away contaminants, possibly increasing corrosion rates.
2. Temperature
The effect of temperature on atmospheric corrosion rates is complex. Raising the temperature will increase the rate of electrochemical reactions and diffusion processes, thus stimulating corrosion attack. For constant humidity level, increasing temperature will increase corrosion rate. However, increasing the temperature generally leads to decreasing relative humidity and increased evaporation of surface electrolytes. When the TOW is reduced in this manner, the overall corrosion rate tends to decrease.
3. Contaminants
Natural or man-made contaminants can accelerate corrosion. For example, salt can come from road de-icing or airborne ocean salts. Sulfur dioxide (SO2) can enter the air from coal burning plants or volcanic emissions. Table 8 lists sample contaminants, contaminant sources, and affected materials.
Atmospheric salinity distinctly increases corrosion rates. Hygroscopic salts (NaCl, KCl, CaCl2, and MgCl2) enhance surface electrolyte formation through participation of chloride ions in the corrosion reactions.
Sulfur dioxide adsorbs onto metal surfaces and forms sulfate ions in the surface moisture film by oxidation. These sulfate ions are considered the primary corrosion-accelerating effect of SO2.
Other contaminants include hydrogen sulfide, sulfuric acid, hydrochloric acid, chlorine, and nitrogen compounds. Although these species are related to industrial emissions in specific microenvironments and can be considered local pollutants, they can intensify corrosion damage since they acidify surface moisture and break down protective oxides on metal surfaces, accelerating corrosion rates.
4. Wind, Sun, and Site Location
Wind direction and velocity affect rate of accumulation of particles on a surface. The amount of sunshine influences TOW and affects coating performance by ultraviolet degradation. Photosensitive corrosion reactions can occur on metals like copper and steel. Site distance from seashore and altitude above sea level can also affect levels of atmospheric moisture and pollutants.

Gas Turbine Inlet Air Specification GEK 116269
© General Electric Company, 2008. GE Proprietary Information. All Rights Reserved. 7
C. Environmental Classification of Corrosivity: C1-C5m
The nature and rate of corrosive damage depend on the composition and properties of the film surface electrolyte. These in turn are largely affected by the time of wetness and concentration of gaseous and particulate pollutants in the atmosphere. A standard classification of environmental corrosivity provides a basis for specifying suitable materials and corrosion protective measures at the design phase and for asset maintenance management to ensure service life.
The ISO organization has defined and validated a comprehensive corrosivity classification system, and its categorization methods are specified in ISO 9223, 9224, 9225 and 9226. These categories do not address specific service atmospheres.
Table 1. List of ISO Standards Pertaining to Atmospheric Corrosivity
ISO Standard Title ISO 9223 Classification – Corrosivity of Atmospheres ISO 9224 Guiding Values for the Corrosivity Categories of Atmospheres ISO 9225 Measurement of Pollution ISO 9226 Determination of Corrosion Rate of Standard Specimens
Each classification is associated with an amount of metal loss due to corrosion for one year in the given environment. Specifically, standard metallic specimens made of carbon steel, zinc, copper, and aluminum are exposed for one year, and their weight loss is translated directly to environment classification. Long-term predictions should not be extrapolated based on these corrosion rates. Table 2 shows corrosion class based on mass loss of low carbon steel for a period of 1 year.
Table 2. Sample Classifications Based on Carbon Steel Exposure
Mass Loss Typical Examples in Temperate Climate Corrosion
Class Description (g/m2) Typical Exterior Exposures
C1 Very Low ≤10 --- C2 Low >10 to 200 Atmospheres (mostly rural) with low level of pollution.
C3 Medium >200 to 400 Urban and industrial atmospheres, moderate SO2 pollution. Coastal areas with low salinity.
C4 High >400 to 650 Industrial areas and coastal areas with moderate salinity.
C5-i Very High (Industrial) >650 to 1500 Industrial areas with high humidity and aggressive
atmosphere.
C5-m Very High (Marine) >650 to 1500 Coastal and offshore areas with high salinity.
For coastal areas in hot/humid zones, mass losses can exceed the limits of C5-M. In such cases, special precautions shall be taken when selecting protective systems for the prevention of corrosion.
D. Methods to Establish Corrosivity Classes C1-C5m
This GEK document presents 3 methods to determine the corrosion class of a given customer site.
1. Exposure of standard metallic specimens.
2. Calculation based on measured factors (TOW, SO2, Chlorides).
3. Estimation based on environmental and corrosion data sources.

GEK 116269 Gas Turbine Inlet Air Specification
8 © General Electric Company, 2008. GE Proprietary Information. All Rights Reserved.
1. Method 1: Exposure of Standard Metallic Specimens
Exposure of standard specimens is deemed the most accurate method to determine corrosion class at a given location (dirty air side corrosivity classification).
As per ISO 9226, metallic standard specimens, either flat plate or open helix type, are exposed to the environment for one year. Methods for preparation, exposure, and removal of the specimens can be found in ISO 8565 and ISO 8407. At the end of the exposure, the corrosion rate, in terms of mass or thickness loss, can be calculated per ISO 9226. A corrosion class can then be determined from ISO 9223. Table 3 indicates the corrosion rates of metals for the first year of exposure for the different corrosivity categories.
Table 3. Corrosion Rates (Mass or Thickness Loss) of Metals for First Year of Exposure for C1-C5m Classes
Corrosion rates (rcorr) of metals Corrosion Class Units Carbon Steel Zinc Copper Aluminum C1 g/(m2.a)
µm/a* rcorr < 10 rcorr < 1.3
rcorr < 0.7 rcorr < 0.1
rcorr < 0.9 rcorr < 0.1
Negligible ---
C2 g/(m2.a) µm/a
10 < rcorr < 200 1.3 < rcorr < 25
0.7 < rcorr < 5 0.1 < rcorr < 0.7
0.9 < rcorr < 5 0.1 < rcorr < 0.6
rcorr < 0.6 ---
C3 g/(m2.a) µm/a
200 < rcorr < 400 25 < rcorr < 50
5 < rcorr < 15 0.7 < rcorr < 2.1
5 < rcorr < 12 0.6 < rcorr < 1.3
0.6 < rcorr < 2 ---
C4 g/(m2.a) µm/a
400 < rcorr < 650 50 < rcorr < 80
15 < rcorr < 30 2.1 < rcorr < 4.2
12 < rcorr < 25 1.3 < rcorr < 2.8
2 < rcorr < 5 ---
C5i /C5m g/(m2.a) µm/a
650 < rcorr < 1500 80 < rcorr < 200
30 < rcorr < 60 4.2 < rcorr < 8.4
25 < rcorr < 50 2.8 < rcorr < 5.6
5 < rcorr < 10 ---
A disadvantage of specimen exposure measurements is the lengthy exposure times required to obtain meaningful data. Extrapolation of the mass or thickness losses to one year from shorter exposure times, or back-extrapolation from longer times, will not give reliable results. Corrosion rates exceeding the upper limits in C5 represent environments beyond the scope of ISO 9223.
This method utilizes a simple mounting system to hold the specimens for the duration of the evaluation, an example of which can be seen in the photo below.
* The unit “a” refers to annual time period
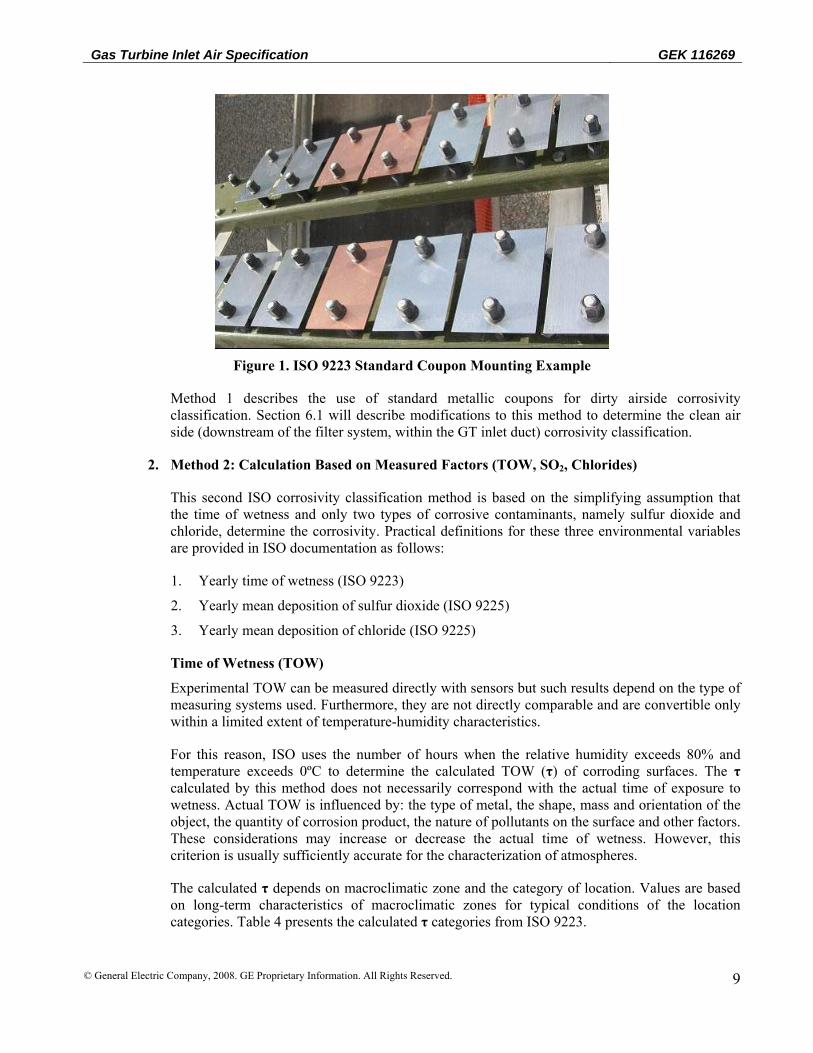
Gas Turbine Inlet Air Specification GEK 116269
© General Electric Company, 2008. GE Proprietary Information. All Rights Reserved. 9
Figure 1. ISO 9223 Standard Coupon Mounting Example
Method 1 describes the use of standard metallic coupons for dirty airside corrosivity classification. Section 6.1 will describe modifications to this method to determine the clean air side (downstream of the filter system, within the GT inlet duct) corrosivity classification.
2. Method 2: Calculation Based on Measured Factors (TOW, SO2, Chlorides)
This second ISO corrosivity classification method is based on the simplifying assumption that the time of wetness and only two types of corrosive contaminants, namely sulfur dioxide and chloride, determine the corrosivity. Practical definitions for these three environmental variables are provided in ISO documentation as follows:
1. Yearly time of wetness (ISO 9223)
2. Yearly mean deposition of sulfur dioxide (ISO 9225)
3. Yearly mean deposition of chloride (ISO 9225)
Time of Wetness (TOW)
Experimental TOW can be measured directly with sensors but such results depend on the type of measuring systems used. Furthermore, they are not directly comparable and are convertible only within a limited extent of temperature-humidity characteristics.
For this reason, ISO uses the number of hours when the relative humidity exceeds 80% and temperature exceeds 0ºC to determine the calculated TOW (τ) of corroding surfaces. The τ calculated by this method does not necessarily correspond with the actual time of exposure to wetness. Actual TOW is influenced by: the type of metal, the shape, mass and orientation of the object, the quantity of corrosion product, the nature of pollutants on the surface and other factors. These considerations may increase or decrease the actual time of wetness. However, this criterion is usually sufficiently accurate for the characterization of atmospheres.
The calculated τ depends on macroclimatic zone and the category of location. Values are based on long-term characteristics of macroclimatic zones for typical conditions of the location categories. Table 4 presents the calculated τ categories from ISO 9223.

GEK 116269 Gas Turbine Inlet Air Specification
10 © General Electric Company, 2008. GE Proprietary Information. All Rights Reserved.
Table 4. Time of Wetness Categories
Time of Wetness Category
Hours/year % Example Macroclimate Zones
τ 1 Τ < 10 T < 0.1 Internal microclimates with climatic control, and no condensation. τ 2 10 < T <250 0.1 < T < 3 Internal microclimates without climatic control except for internal
non-air-conditioned spaces in damp climates The probability of liquid forming on the metallic surface is low.
Τ 3 250< T <2500 3 < T <30 Outdoor atmospheres in dry, cold climates and part of temperate climates; properly ventilated sheds in temperate climates. Includes periods of condensation and precipitation.
τ 4 2500 < T < 5500 30 < T < 60 Outdoor atmospheres in all climates (except for dry and cold climates); ventilated sheds in humid conditions; unventilated sheds in temperature climates. Includes periods of condensation and precipitation
τ 5 5500 < T 60 < T Part of damp climates, unventilated sheds in humid conditions. Includes periods of condensation and precipitation.
Weather data for the exact site should be obtained, and the hours spent above 80%relative humidity at >0ºC should be tabulated for 1 year. The following factors shall be used to adjust τ:
• Sheltered surfaces in marine atmospheres where chlorides are deposited may have substantially increased τ, due to the presence of hygroscopic salts and should be classified in category τ5.
• Indoor atmospheres without climate control, τ3- τ5 can occur when water vapor sources are present.
• For τ 1 and τ 2, probability of corrosion is higher for dusty surfaces. Consider increasing to τ 3 if excessive dust will be present.
Deposition of Sulfur Dioxide and Chloride Contaminants
The most important factor within a particular category of TOW is the pollution level caused by sulfur dioxide (SO2) and airborne salinity. Deposition rate and concentration are calculated from continuous measurements during at least one year and are expressed as annual averages. Short-term measurements are highly variable and should not be extrapolated to yearly averages.
Sulfur Dioxide: Methods for measuring SO2 by sulfonation plate are specified in ISO 9225. Classification of pollution by sulfur-containing substances represented by SO2 deposition categories are provided in ISO 9223 and reproduced as Table 5.
Table 5. Classification of SO2 Deposition
SO2 deposition rate SO2 concentration mg/(m2.d) µg/m3 Category Description
Pd < 10 Pc < 12 P0 Background concentration. Insignificant from point of view of corrosive attack
10 < Pd < 35 12 < Pc < 40 P1 Significant pollution by SO2 35 < Pd < 80 40 < Pc < 90 P2 Near extreme pollution by SO2
80 < Pd < 200 90 < Pc < 250 P3 Extreme pollution by SO2. Typical of operational microclimates beyond scope of ISO 9223.

Gas Turbine Inlet Air Specification GEK 116269
© General Electric Company, 2008. GE Proprietary Information. All Rights Reserved. 11
Salinity: Classification of airborne salinity given in ISO 9223, reproduced as Table 6 below, is based on the wet candle method. There are other established methods to determine salt content in the atmosphere, but ISO notes that these methods are not always directly convertible and comparable. Extreme pollution by chloride, typical of marine splash and spray, is beyond the scope of ISO 9223.
Table 6. Classification of Chloride Deposition
Chloride Deposition Rate
mg/(m2 . d) Category Description
S < 3 S0 Background concentration. Insignificant from point of view of corrosive attack
3 < S < 60 S1 Significant pollution by chloride 60 < S < 300 S2 Near extreme pollution by chloride
300 < S < 1500 S3 Extreme pollution by Chloride. Typical of marine splash/spray and beyond scope of ISO 9223.
Practical Classification of Environmental Corrosivity
After the time of wetness and the sulfur dioxide and chloride deposition categories have been determined, the overall atmosphere corrosion class can be determined via Table 7.
Table 7. Classification Based on Previously Established TOW and SO2, and Chlorides Deposition Categories
Unalloyed carbon steel τ 1 τ 2 τ 3 τ 4 τ 5 S0,S1 S2 S3 S0,S1 S2 S3 S0,S1 S2 S3 S0,S1 S2 S3 S0,S1 S2 S3 P0-P1
1 1 1or2 1 2 3or4 3or3 3or4 4 3 4 5 3or4 5 5
P2 1 1 1or2 1or2 2or3 3or4 3or4 3or4 4or5 4 4 5 4or5 5 5 P3 1or2 1or2 2 2 3 4 4 4or5 5 5 5 5 5 5 5 Zinc and Copper S0,S1 S2 S3 S0,S1 S2 S3 S0,S1 S2 S3 S0,S1 S2 S3 S0,S1 S2 S3 P0-P1
1 1 1 1 1or2 3 3 3 3or4 3 4 5 3or4 5 5
P2 1 1 1or2 1or2 2 3 3 3or4 4 3or4 4 5 4or5 5 5 P3 1 1or2 2 2 3 3or4 3 3or4 4 4or5 5 5 5 5 5 Aluminum S0,S1 S2 S3 S0,S1 S2 S3 S0,S1 S2 S3 S0,S1 S2 S3 S0,S1 S2 S3 P0-P1
1 2 2 1 2or3 4 3 3or4 3or4 3 3or4 5 4 5 5
P2 1 2 2or3 1or2 3or4 4 3 4 4or5 3or4 4 5 4or5 5 5 P3 1 2or3 3 3or4 4 4 3or4 4or5 5 4or5 5 5 5 5 5 Corrosivity is expressed as the numerical part of the corrosion class code (for example 1 instead of C1).
3. Method 3: Estimation Based on Environmental and Corrosion Data Sources
If it is not possible to expose standard metallic specimens in the actual environment of interest, and if measured sulfur dioxide and chloride deposition data are not available, the classification of corrosivity may be estimated by measuring the time of wetness and pollution levels of sulfur dioxide and chlorides through published site corrosion data and environmental databases for climate and pollution data.

GEK 116269 Gas Turbine Inlet Air Specification
12 © General Electric Company, 2008. GE Proprietary Information. All Rights Reserved.
4. Other Corrosion-Accelerating Factors
Aside from the key corrosivity factors of TOW, sulfur dioxide and chloride, there are other factors that may cause accelerated corrosion. While it is important to note macro-level environments according to corrosivity classes, specific local pollution data on the micro level also needs to be acquired to improve fidelity of the corrosion assessment.
Corrosion rates can be greatly increased by airborne pollutants such as acids, alkalis, salts, organic solvents, aggressive gases, and dust particles. These pollutants occur in the vicinity of industrial operations such as coking works, pickling shops, electroplating plants, coal or gas fired power plants, incinerators, dye mills, wood-pulp works, tanneries, oil refineries, etc.
A sample list of important chemical contaminants with typical emission sources, and materials susceptible to these chemicals is presented in Table 8.
Table 8. Summary of Some Pollutant Factors
Polluant Sources Susceptible Metals Sulfur Dioxide (SO2) Contributes to acid rain. Can be deposited far from origin, but generally max SO2 close to source.
¼ natural, and by human activities Industries: Fossil fuel/coal burning, petrochemical, pulp and paper, metal producing (smelting metal sulfide ores to obtain pure metals Zn, Ni, Cu) Organic decay, biomass burning, volcanic activity
Most metals.
Chloride (Cl-) Sea salt mist, road salt areas, cooling towers Most metals. Chlorine (CL2), CL containing gases
Bleaching plants, metal production, PVC plants, cleaning agents
Most metals. Synergistic with other pollutants.
Nitrogen Dioxide (NO2)
Fossil fuel combustion, various industries NOx is the generic term for a group of highly reactive gases, all of which contain nitrogen and oxygen in varying amounts
Copper, brass, synergistic with SO2.
Hydrogen Sulfide (H2S) Industries: Pulp and paper, chemical, sewage plants, garbage dumps, oil refineries, animal shelters, concentrated livestock, volcanic activity, swamp areas, marine tidal areas
All copper and silver based metals.
Soot (Carbon) Combustion, auto and truck emissions, steel production, coal burning
Synergistic with other pollutants; provides cathodic sites for most metals.
Ammonia and it’s salts: (NH3, NH4+)
Fertilizer (production or use), animal and human activity, detergents
All copper based alloys, nickel, and silver.
Ozone Formed in polluted areas, highest concentrations in smog
Strong oxidant to produce acids that attack most metals.
Mineral acids (H2SO4, HCl, HF, HNO3)
Industries: Pickling, chemical, metals production, semiconductor, cooling towers
Most metals, glass, ceramics.
Organic acids Wood, packing material, animals, preservatives
Long term effects on some metals.
Dust Various industries, nearby deserts, farming areas, construction sites
Increase surface moisture film and pollutant levels.

Gas Turbine Inlet Air Specification GEK 116269
© General Electric Company, 2008. GE Proprietary Information. All Rights Reserved. 13
III. IMPACT OF ENVIRONMENTAL CORROSIVITY ON ENGINE HEALTH
Section 2 categorized the operating environment of gas turbines in various categories of corrosion C1, C2, C3, C4, C5i and C5m as per ISO 9223.
This section provides general guidelines to operators on the corrosivity impact of different environments on the engine health. Section 4 of this specification highlights maintenance recommendations for the different environmental corrosion classes.
GE gas turbines operate in a variety of environments spanning combined cycle plants located on the coast within large chemical and industrial complexes, to power plants in an arctic environment with very low levels of pollutants. Best practices and lessons learned to date from the inspection of gas turbine units in diverse environments are discussed in this section, along with typical examples of environment type.
A. Impact of C1 Corrosive Environment
This environment is identified in Section 2 of this specification. Weight loss for the sample metallic specimen when exposed for 1 year should < 10g/m2.
This is the least corrosive environment class and it is well understood by the gas turbine community that power plants are rarely sited in such benign environments.
No examples for this environment exist.
B. Impact of C2 Corrosive Environment
This environment is identified in Section 2 of this specification. Weight loss for the sample metallic specimen when exposed for 1 year should be > 10g/m2 and < 200 g/m2.
Examples would be rural atmospheres with low level of industrialization, low humidity, rainfall and significant distance from large bodies of water.
Gas turbines in this environment have shown little to no indication of corrosion. These are considered low corrosion environments and following the established GE guidelines on Inlet inspection as per GE documentation on air inlets and water wash will mitigate the impact of corrosion on the machine.
Section 4 of this specification provides recommendations to mitigate corrosion issues in gas turbine operation in C2 environments.
C. Impact of C3 Corrosive Environment
C3 corrosive environment is described in Section 2 of this specification. Weight loss for the sample metallic specimen when exposed for 1 year should be > 200g/m2 and < 400 g/m2.
Typical examples would include power plants in urban and semi-industrial settings, within a relatively dry climate with moderate sulfur dioxide pollution levels, and coastal areas with low salinity level.
Potential for pitting on blades due to corrosion (corrosion pits) exists in this environment. It is highly recommended in these environments that GE established guidelines for water washing and inlet inspection be followed on a regular basis. Both online and offline water wash may remove corrosive

GEK 116269 Gas Turbine Inlet Air Specification
14 © General Electric Company, 2008. GE Proprietary Information. All Rights Reserved.
deposits on the blades, which over time in a C3 environment, may collect in significant quantities on the blades potentially leading to corrosion.
It is expected that gas turbines operating in C3 environments can potentially develop corrosion pits on the blades when the OEMs and operators have not followed GE established guidelines on inlet filter system maintenance and water wash, both online and offline.
Section 4 of this specification provides recommendations to mitigate corrosion issues in gas turbine operation in C3 environments.
D. Impact of C4 Corrosive Environment
This environment is identified in Section 2 of this specification. Weight loss for the sample metallic specimen when exposed for 1 year should be > 400g/m2 and < 650 g/m2. This is considered a high corrosive environment.
Examples of C4 corrosive environment include heavy industrial areas and coastal areas with moderate salinity, high propensity of rainfall and humidity with salt.
It is expected that gas turbines operating in C4 high corrosive environments can develop corrosion pits on the blades.
In general, most of the corrosion issues in C4 rated environment can be attributed to maintenance, poor or inadequate filtration system, with inadequate water removal mechanism, and inadequate online and offline water washing. Section 4 of this specification provides recommendations to mitigate corrosion issues in gas turbines operation in C4 environments.
It highlights the need for a water removal filtration system and regular online and offline water washing. Section 5 of the specification recommends the optimal filter system for a C4 environment.
E. Impact of C5i and C5m Corrosive Environments
This environment is identified in Section 2 of this specification. Weight loss for the sample metallic specimen when exposed for 1 year should be > 650g/m2 and < 1500 g/m2. This is considered an extreme corrosive environment. Highest corrosion exists in a C5 rating environment.
Examples of C5 corrosive environment include heavy industrial areas and high humidity and aggressive atmosphere, coastal and offshore areas with high salinity.
Propensity for corrosion pits on the blades is the highest in a C5 rated environment and corrosion in a C5 environment can be accelerated further by exposure to elevated temperatures for prolonged periods of time. It has been noted at one particular site that the highly corrosive nature of C5 environment degraded the inlet filter media over time, and reduced the filtration efficiency, resulting in increased fouling and higher levels of corrosive elements entering the machine.
Regular maintenance and inspection are highly recommended for C4 and C5 rated environments. Recommendations for C5 rated environment, highlighted in Section 4 of the specification, comprise new filtration systems coupled with water wash schedules and cycles. Section 5 discussed the need for upgrading the filter system if a power plant operates in C5 environment.

Gas Turbine Inlet Air Specification GEK 116269
© General Electric Company, 2008. GE Proprietary Information. All Rights Reserved. 15
F. General Environmental Identification Recommendations
Visual inspection and a walk-around the power plant hardware and inlet system may provide a quick means to assess the corrosive nature of the operating environment. Below are some pictures of visual indicators of extreme corrosive environments for which plant operators should look.
Figure 2 & 3. Deposits on the Self-Cleaning Filter Pulse Pipes May be a Sign of Water Carryover
Figure 4 & 5. Deposits on the Clean Airside of Self-Cleaning Filters
Figure 6. Corroded Mesh of a Self-Cleaning Filter Element
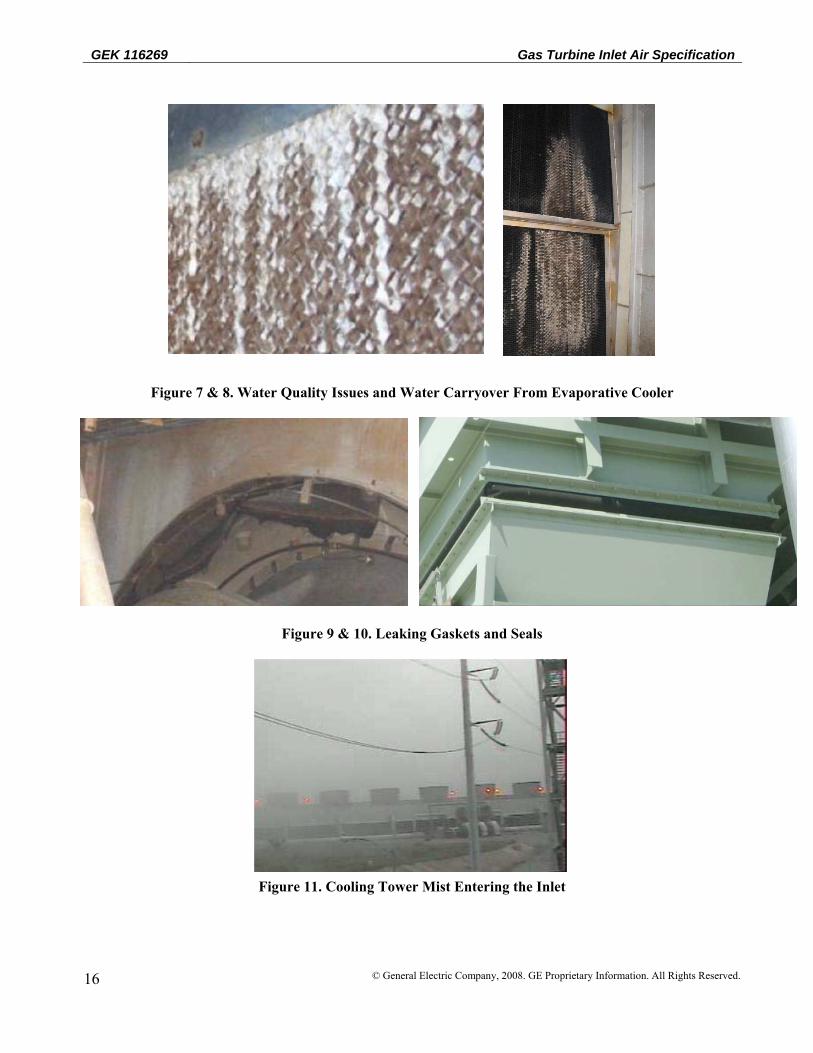
GEK 116269 Gas Turbine Inlet Air Specification
16 © General Electric Company, 2008. GE Proprietary Information. All Rights Reserved.
Figure 7 & 8. Water Quality Issues and Water Carryover From Evaporative Cooler
Figure 9 & 10. Leaking Gaskets and Seals
Figure 11. Cooling Tower Mist Entering the Inlet
Gas Turbine Inlet Air Specification GEK 116269
© General Electric Company, 2008. GE Proprietary Information. All Rights Reserved. 17
IV. GAS TURBINE MAINTENANCE RECOMMENDATIONS FOR DIFFERENT CORROSIVE ENVIRONMENTS
A. This Sections Outlines and Summarizes Corrosion-Specific Maintenance for c1 to c5 Rated Environments. Maintenance Recommendation for c1 and c2 Environments
Follow GE recommended inspection practices, maintenance schedules for online and offline water wash and any other additional GE documentation for maintenance of equipment.
B. Maintenance Recommendation for C3 Environment
Corrosion issues in these environments can develop due to inadequate maintenance. GE recommends the following
1. Daily Online Water Wash, as per GE Guidelines for the particular gas turbine class as per the applicable GE documentation.
2. Schedule Offline water wash at every outage as per applicable GE documentation.
3. Maintenance as per standard GE documentation for the equipment.
C. Maintenance Recommendation for C4 Environment
Corrosion issues in these environments can develop due to inadequate maintenance and inadequate water removal filtration system. GE recommends the following;
1. Daily Online Water Wash, as per GE Guidelines for the particular gas turbine class as per applicable GE documentation.
2. Schedule Offline water wash at every possible opportunity as per applicable GE documentation. Use Mono Propylene glycol in offline water wash in cold ambient as per GE specification.
3. Augment filter system with water removal filtration as noted in section 5 for a C4 Corrosive environment.
4. Installation of corrosion monitoring / detection system in inlet.
5. GE site survey and inspection of the compressor.
6. Strict adherence to all GE maintenance documentation.
D. Maintenance Recommendation for C5i and C5m Environments
Corrosion in C5 environment is the highest and can be attributed to excessive amounts of corrosives in the air stream, inadequate maintenance and inadequate salt and water removal filter system. GE recommends the following:
1. Daily Online Water Wash, as per GE Guidelines for the particular gas turbine class as per applicable GE documentation.
2. Schedule offline water wash at every possible opportunity as per applicable GE documentation. Use Mono Propylene Glycol in offline water wash in cold ambient as per GE specification.

GEK 116269 Gas Turbine Inlet Air Specification
18 © General Electric Company, 2008. GE Proprietary Information. All Rights Reserved.
3. Online Water wash before schedule shutdown on peaking units, so that the blades are relatively clean of corrosive deposits while the unit is not operating. Offline water at every possible opportunity to remove corrosive deposits from the blades.
4. Upgrade to salt and water removal filter system as per GE recommendations for C5 Environment.
5. GE inspection of the power plant to determine source and nature of corrosives including air sampling, deposit collections from stages 0 to 3 and offline water wash sample collection.
6. Installation of corrosion monitoring / detection system in inlet. Refer Section 7.
7. GE Borescope and Dental Molds of R0 to S3 blades to determine presence and depth of any erosion and corrosion damage at every available opportunity when casing is removed.
8. Strict adherence to all GE maintenance documentation.
V. INLET FILTRATION SYSTEM RECOMMENDATIONS FOR DIFFERENT CORROSIVE ENVIRONMENTS
Gas turbine inlet filtration is designed to remove dust and dirt particles that cause erosion, fouling of the gas turbine, and cause hot gas path cooling holes to plug up. There are a variety of inlet filter system components available, that leads to a significant diversity in inlet filtration system configurations offered by GE. The recommendations in this filtration section of the GEK are an addendum to the list relevant inlet filtration documentation issued by GE Energy.
To provide corrosion mitigation to the gas turbine engine, the design of the inlet filtration system should reduce the amount of corrosives entering the gas turbine. These corrosives can exist in 3 states, as they enter the gas turbine.
• Solid Particulate Corrosive elements – Examples include: salt and oxide particles, which can be removed by high efficiency filters.
• Liquid (Aqueous) Corrosives elements - Examples include aqueous chlorides or acids for which general particulate filters are not efficient in removing this corrosive element, but specialist filtration is available that is effective. Two main transfer mechanisms are;
1. Solid salts deposited on particulate filters can deliquesce when the humidity of ambient air rises beyond ~60% relative humidity or when the filter elements get wet due to water. Once the salt absorbs moisture and becomes liquid, it may pass or leach through the filter elements, and enter the gas turbine.
2. Salts entering in dissolved state via rain, fog, mist, aerosol and other sources of water entering the inlet air stream. In addition to liquid salts entering, once this salt solution passes through the final filters there is a potential for the liquid to dry and salt to precipitate out of solution. This salt precipitate or crystallized salt can now enter into the gas turbine.
• Gaseous Corrosive Elements – Examples include acid vapors. Current inlet filtration technology does not exist to remove these corrosives gases.

Gas Turbine Inlet Air Specification GEK 116269
© General Electric Company, 2008. GE Proprietary Information. All Rights Reserved. 19
A. Background on Inlet Filtration
Historical high efficiency filters have a high level of filtration efficiency for dry particulates. However, if the filters get wet due to moisture ingress, leaks, condensation, and/or high relative humidity; water-soluble particulates in the filter element dust cake may deliquesce (take on water and become liquid), or dissolve into solution and pass through the final filter into the clean airside of the inlet system. These water-soluble particulates may eventually make their way into the compressor and potentially result in an accelerated rate of corrosion of the compressor. By addressing water bypassing the total inlet filtration system, in addition to maintaining a high particulate efficiency, you may effectively remove the salt from the air stream.
If a site is located in a C4, C5i or C5m environment, a more robust water filtration system is recommended, in addition to a good compressor maintenance program, as noted in section 4 of this specification. Many older units, located in a C4, C5-i or C5-m environments have no moisture removal in the inlet system, other than weather hoods. These units have high possibility of salt migration into the compressor. Some units have basic water removal capabilities with moisture separators/droplet catchers (in the weather hoods), vane separators, and/or coalescing filters. However, the final filters may not be water tight, and deliquescence of water-soluble particulates can still occur.
B. Filter System Recommendation for C4, C5i, and C5m Environments
In a robust water removal filtration system, there are multiple stages used to achieve the desired goal of no water (salt) going past the final filters. These stages have to be selected in sequential combination to achieve the desired filtration system for a C4, C5i or C5m environment. The core water filtration components are:
• Moisture Separator/Droplet Catcher - This is inertial water removal equipment that is provided in the weather hoods, to mitigate the amount of ambient water that could enter into the gas turbine inlet. It is used to remove large water droplets (bulk water), such as wind driven rain, and would be the first stage of a water removal system.
• Vane Separator - This is inertial water removal equipment and would be used instead of a Moisture Separator/Droplet Catcher, which is provided at the face of the filter house, to mitigate the amount of ambient water that could enter into the gas turbine inlet. It is used to remove large water droplets (bulk water), such as wind driven rain, and would be the first stage of a water removal system. Vane separators have higher water removal efficiency than moisture separators/droplet catchers; so weather hoods are not required with vane separators.
• Coalescing Filters - The function of this type of static coalescing filter is to coalesce small droplets (aerosol / mist / spray) into larger ones, which will then drain down the media, or drop out of the air stream. This would be the second stage of any water removal system. This type of filter exists in three configurations: Panel type coalescing pads in weather hoods, panel type coalescing filter in vertical grid and coalescing bag type pre-filter in vertical grid.
• Static Water Tight Final Filters - The static type of watertight final filter is made from a media that is watertight, i.e. does not let water to pass through, while still letting air to pass. It is rated F9 by the EN779-2002 filtration standard, for particulate efficiency and is the final filter. This high level of filtration efficiency allows it to remove very fine dust and dry salt (> 0.3 microns). Being watertight means that it will also remove finer drops of water that may have passed through the earlier stages of filtration (coalescing filters, vane separators, pulse filter etc) and prevent any deliquesced salts passing through.

GEK 116269 Gas Turbine Inlet Air Specification
20 © General Electric Company, 2008. GE Proprietary Information. All Rights Reserved.
Some filters may claim to have hydrophobic coatings on their media, but this does not necessarily mean they are water tight, but rather the media does not soak up water, yet water may still pass through the filter itself.
The individual components described in the section above are combined in sequence for different environments to form four basic salt and water removal configurations to mitigate the chance of corrosion for the gas turbine engine. This section is a brief discussion on the functionality and application of these 4 basic configurations to a corrosive environment.
Recommendation for C4, C5i & C5m Corrosive Environments with Moderate or Low Dust.
This configuration can be used in corrosive environments with zero to moderate levels of dust. The F9 final watertight filter prevents water and salt from going downstream into the gas turbine. This can be used when ambient temperatures are greater than 40ºF or there is low possibility of icing.
Figure 12. Inlet Configuration for Corrosive Environment with Moderate Dust
Recommendation for C4, C5i & C5m Corrosive Environments with Moderate or Low Dust and Icing Conditions, Excluding Heavy Snow.
This configuration can be used in corrosive environments with zero to moderate levels of dust and when ambient temperatures are lower than 40ºF or there is possiblity of ice formation on filter elements. This configuration is similar to the configuration above except that there is an anti-icing system designed to prevent ice formation on the filter elements.
Figure 13. Inlet configuration for Corrosive Environment with Moderate Dust and Icing
Vane
F9 Final Water Tight Filter
Coalescing Bag Prefilter
Corrosive Environment w/ Moderate Dust
Bag Prefilter Vane
F9 Final Water Tight Filter
Coalescing Bag Prefilter Vane
Anti - icing
Corrosive Environment w/ Mod. Dust + Icing

Gas Turbine Inlet Air Specification GEK 116269
© General Electric Company, 2008. GE Proprietary Information. All Rights Reserved. 21
Recommendation for C4, C5i & C5m Corrosive Environments with High Dust Conditions.
This configuration can be used in corrosive environments with high dust levels that have temperatures greater than 40ºF. The self-cleaning filter elements reject most of the dust and the F9 watertight final filter will remove water and salt that passes through the self-cleaning filter element. In months that have fogging season, the weather hoods of the inlet are to be fitted with coalescers and moisture separators to prevent wet dust from sticking to the pulse filter.
Figure 14. Inlet Configuration for Corrosive Environment with High Dust
Recommendation for C4, C5i & C5m Corrosive Environments with High Dust and Icing Conditions, Including Heavy Snow
This configuration can be used in corrosive environments with high dust levels that have temperatures lower than 40ºF and / or Snow. The self-cleaning filter elements reject most of the dust and / or snow and the ice that will form on the filter elements, while an anti-icing system is needed to prevent ice formation on the final static F9 watertight filter, which is designed to remove water, and salt that passes through the self-cleaning filter elements.
Figure 15. Inlet Configuration for Corrosive Environment with High Dust and Icing
VI. POWER AUGMENTATION SYSTEM MAINTENANCE RECOMMENDATIONS
A. Introduction
Optional cooling systems may be integrated into the design of the air inlet compartment, and this is a cost-effective way to increase turbine output during warmer summer months or in warm environments. The power augmentation (cooling) module is typically provided downstream of the filtration stages. Module size and material construction will vary depending on design constraints, contract requirements, and site-specific challenges. Power augmentation in the inlet filter compartment has been typically provided in the form of media-type evaporative coolers or chiller coils. Power augmentation in the inlet ductwork has been typically provided in the form of spray-type evaporative coolers (foggers).
Power augmentation through inlet air conditioning may provide significant performance benefits for gas turbines. The levels of performance benefit, in the form of increased power or heat rate, is dependent on site environmental conditions, i.e., ambient temperatures, relative humidity, etc., and the type of power augmentation used. These benefits typically have trade-offs in the way of increased pressure drops, parasitic loads, parts life, and other considerations. These trade-offs need to be
Weather
hood Self - Cleaning
Filter
Corrosive Environment w/ High Dust D tWeather
hood Self - Cleaning
Filter
F9 Final Water Tight Filter
Weather
hood Self - Cleaning
Filter Anti - Icing Weather
hood Self - Cleaning
Filter
Corrosive Environment w/ High Dust + Icing
Anti - Icing
F9 Final Water Tight Filter
GEK 116269 Gas Turbine Inlet Air Specification
22 © General Electric Company, 2008. GE Proprietary Information. All Rights Reserved.
considered for a complete system evaluation addressing both short and long-term life cycle costs along with net performance benefits.
Additionally, power augmentation equipment if not maintained may potentially have a significant impact on the health of the gas turbine by generating an inlet air condition that could potentially cause excessive erosion, corrosion, or out-of-spec temperature distortions. The following gives a brief description of each and lists some of the more common benefits and pitfalls around the application of these three power augmentation options:
1. Media Type Evaporative Coolers
2. Chiller Coils
3. Spray Type Evaporative Coolers (Foggers)
B. Media Type Evaporative Coolers
Evaporation of water is one of the simplest and oldest methods of cooling air.
Traditional media type evaporative coolers consist of recirculated water sprayed over an extended surface media mounted downstream from the inlet air filters. A moisture eliminator is then mounted immediately downstream of the cooler media to remove any free moisture carryover from the cooler itself. As inlet air passes through the water soaked evaporative cooler media, evaporation occurs.
Energy in the form of heat is removed from the air by evaporating water in the media, which causes cooling and subsequent increase in the density of air, which in turn increases the mass flow and output of the gas turbine.
The correct installation, setup and checkout of the evaporative cooler are critical to its operation, and particularly to the prevention of water carryover (drift) of liquid droplets in the gas turbine airflow path. The installation instructions provided by the manufacturer of the evaporative cooler need to be followed to ensure the health of the gas turbine. In addition, all evaporative coolers shall undergo commissioning per the GE Evaporative Cooler Commissioning procedure prior to initial start up and, during service, a minimum of once a year, at the beginning of the evaporative cooler use season. A copy of the evaporative cooler commissioning procedure is available in the gas turbine Operational and Maintenance (O&M) manual.
The use of suitable water is essential in reducing carryover, mitigating corrosion and scale formation and in obtaining the expected service life and performance from the evaporative cooler. If suitable water treatment guidelines are not established and followed, the evaporative cooler and its media may need more frequent maintenance and/or replacement. Furthermore, poor water quality and/or the mis-operation of the cooler may result in contamination of the gas turbine and may result in forced outage time needed for maintenance, repair and replacement of gas path components. For this reason, it is important that recommended water quality requirements are adhered to GE recommendation and guidelines for media maintenance and water monitoring are followed in order to ensure proper operation of the evaporative cooler. Such Guidelines are established and discussed in detail in the Water Supply Requirement for Gas Turbine Inlet Air Evaporative Coolers document.

Gas Turbine Inlet Air Specification GEK 116269
© General Electric Company, 2008. GE Proprietary Information. All Rights Reserved. 23
C. Chiller Coils
The heat exchangers used within the inlet system consist of a set of finned tubes installed in the inlet filter compartment downstream from the filtration stage. A moisture eliminator is then mounted immediately downstream of the coil to remove any free moisture carryover from the cooler itself, such as condensate.
The cooling / working fluid (ammonia, ethylene glycol or propylene glycol) is circulated through the coils to cool the inlet air entering the gas turbine below ambient conditions, often below the air saturation point, to increase the mass flow and power output of the gas turbine.
Chiller coils offer significant advantages over evaporative cooler systems in that they offer net output increase with quicker startup and response times, while not being limited by the surrounding ambient conditions. Chiller coils can provide consistent net power output, and heat rate improvement regardless of environmental limitations such as high outside ambient air temperatures and/or high relative humidity conditions.
Units with chiller coils shall be inspected at a minimum at the beginning and end of the running season (twice per running season) to verify that there are no leaks or debris present in the system that could result in potential damage to the gas turbine. Inlet chiller coil leaks may be potentially dangerous to the gas turbine due to the nature of the coolant fluid (water with ethylene glycol or propylene glycol or in some cases ammonia). Care must be taken to ensure that inlet drains are not blocked, and that they are safely routed to appropriate locations in case of leak from the chiller coil system.
Due to the location of the coils themselves (downstream of the filtration system) concerns over water carryover and/or bypass are applicable. Water carryover is the term used to describe water droplets that become entrained in the airflow stream and travel through the coils and drift eliminators. Water bypass is the term used to describe water droplets that become entrained in the airflow and travel around the drift eliminators and flashing. It is often the result of manufacturing and/or installation defects such as poor caulking, welding, or gaps in between adjacent pieces of drift eliminators. It is generally characterized by location (sidewalls, module interfaces, structural member, etc.) and relatively large droplet size. At no time shall any of the cooling fluid flow outside of the areas designated for its containment within the chiller coil. All drains and associated piping shall be inspected on a regular basis to remove any debris that may impede draining. All internal and external piping shall be checked for leaks and replaced / repaired, as appropriate.
All access hatches (including the external doors on the plenum viewing hatches when applicable) shall be closed and sealed prior to turbine start up. The inlet filter compartment must be completely clean and free of debris upon completion of inspection and prior to commissioning of the turbine. Please contact your local GE Product Services representative for copies of the latest commissioning procedure and/or filter compartment O&M manual, as applicable.
D. Spray Type Evaporative Coolers
Spray-type evaporative coolers or foggers evolved in the late 1990s as a way to meet or exceed the evaporative cooling effectiveness of their media-type counterparts (approximately 85%) without the associated parasitic losses inherent in the additional inlet air pressure drop. The fogger system is one way to enhance gas turbine warm weather output. If not designed properly, a fogger system may have an adverse effect on gas turbine compressor life.

GEK 116269 Gas Turbine Inlet Air Specification
24 © General Electric Company, 2008. GE Proprietary Information. All Rights Reserved.
High-pressure water spray is injected into the inlet ductwork through a network of manifolds and nozzles creating cooling and additional mass flow to turbine. Spray mixes with inlet air in a long straight run of inlet ductwork prior to entering the compressor inlet bell mouth. High-purity or de-mineralized water is used in fogger systems in order to reduce concerns related to contamination.
Units with foggers shall be inspected at every possible interval to verify that there are no leaks, debris or plugging present in the system that could result in potential damage to the gas turbine. Water pumps, control devices (filters, isolation valves, flow meters, etc.), and interconnecting piping provided as part as the fogger system shall be tested and verified to meet specified parameters per the gas turbine Operational and Maintenance (O&M) manual.
Fogger manifolds and nozzles shall be inspected for plugging and/or bending that may preclude optimal mixing of water and airflow. Excessive water accumulation on the ductwork floors shall be investigated, understood and eliminated to the fullest extent possible. In case of leakage, system drains provided as part of the inlet ductwork and plenum shall be verified to ensure that these drains and gutters are not blocked, and that they are fully functional in order to minimize possibility of damage to the compressor and gas turbine.
All access hatches (including plenum viewing hatches when applicable) shall be closed and sealed prior to turbine start up. The inlet filter compartment must be clean and free of debris upon completion of inspection and prior to commissioning of the turbine.
VII. MEASUREMENT AND MONITORING OF CORROSIVE NATURE OF ENVIRONMENT
Determination of the possibility of compressor corrosion at a particular site requires the understanding of the following 3 elements:
1. Air quality of the local Environment
2. Filtration System Performance
3. Maintenance Practices carried out on the Gas Turbine
An ideal situation would be for these elements to be monitored on a continuous real-time basis and even a direct measure of compressor corrosion. However, using technology available today, it is only possible to quantify elements 1 and 2 by batch measurement (average over time), with element 3 understood in terms of what is carried out, but not its effectiveness at a particular site with respect to compressor corrosion.
A. Batch Measurement (Average over Time)
The following batch measurement techniques provide measurement of key corrosion drivers:
Coupon Placement
• Corrosion rating of the environment being analyzed for various metal types, as detailed within ISO 9223, based upon an annual average
• Average Time of Wetness
• Average Sulfide deposition rate, three month average
• Average Chloride deposition rate, three month average

Gas Turbine Inlet Air Specification GEK 116269
© General Electric Company, 2008. GE Proprietary Information. All Rights Reserved. 25
Air Sampling
• Average dust concentration, dirty air and clean air side
• Average chemical element concentration, dirty air and clean air side
• Average filter efficiency vs. dust experienced at site
• Average filter efficiency vs. various chemical elements experienced at site Off Line Water Wash Drainage Water Sampling
• Levels of chemical elements relative to one another impacted on the surface of the compressor blades, i.e. identification of the major pollutants that affect the compressor at a specific site.
• pH level, which is meaningless in isolation, but useful when compared with other Fleet machines for the same drainage water sample.
1. Coupon Placement
Dirty Air Side Corrosivity Classification – previously described in Section 1.4.1 “Method 1: Exposure of Standard Metallic Specimens.”
Clean Air Side Corrosivity Classification
The clean air path within the GT air inlet downstream of the filter system is a sensitive environment to the safe and reliable operation of the gas turbine and as such, mounting standard coupons, as defined within ISO standard 9223 to 9226, is not appropriate, as it raises the possibility of FOD and flow distortion to unacceptable levels.
GE has defined a proprietary method for exposing standard coupons as defined within ISO 9223 to 9226, utilizing coupon exposure unit as described in figure 16, which draws air out of the GT inlet system, passes it over the coupons and then returns it to the inlet system. The coupon exposure unit provides the following specifically designed features to ensure a high quality and representative measurement.
• Contains a built in pump to drive air across the coupons
• Designed to provide uniform flow across all the coupons
• Extracts air from the inlet system passes it over the coupons and then re-injects it and so is unaffected by the duct under pressure
• Provides a sealed environment
• Test chamber is insulated from external heat to ensure same temperature and humidity conditions as inside the inlet duct
• Electrically isolates coupons from each other
• Mesh on inlet and outlet to prevent risk from FOD
• Provides ability to remove coupons while installed
• Can be opened while online to view the condition of the coupons without interrupting the test or risking contamination
• Intrinsically safe

GEK 116269 Gas Turbine Inlet Air Specification
26 © General Electric Company, 2008. GE Proprietary Information. All Rights Reserved.
• Completely stainless steel construction
• Supplied with weather / sun shield
Figure 16. GE Clean Air ISO Standard Coupon Exposure Unit
GE is continuing to define correlations between the results gained utilizing ISO 9223 to 9226 and the exposure method defined in the standard, and those obtained utilizing the Coupon Exposure Unit.
2. Air Sampling
The objective of this technique is to capture the contaminant within a known volume of sampled air, onto a sample filter, which can then be analyzed for content.
In its simplest form this GE proprietary technique utilizes a probe within the airstream, attached to a very high efficiency sample filter, sample extraction pump and flow rate or total flow measuring device, see schematic below.
Total
Rate
Vacuum pump
Probe
Flow measurement Sample Filter
Air Flow Direction

Gas Turbine Inlet Air Specification GEK 116269
© General Electric Company, 2008. GE Proprietary Information. All Rights Reserved. 27
The probe is placed within the airstream to be sampled, e.g., in the clean air duct of the GT inlet system. A sample of the air is drawn out of the duct via the probe, and passed through the sample filter, where contaminants present in the sample air are deposited. The sample air then passes through the airflow rate, or total meter, to enable a measurement of the quantity of air sampled. Finally, the sample air passes through the sample pump, which is driving the sample flow rate.
A single sample is typically run for a set period of time, with the longer the period, the better the average. Typical values range from several hours to about 1 month, with the later being preferred.
If two sampling exercises are carried out simultaneously, with one being upstream (dirty side) of the GT inlet filters and the second being downstream (clean air side) of the GT inlet filters, then it is possible to determine the actual, in-service filtration efficiency of the filters.
Sampling Duration
Within any given day, there can be many variations of the contaminants within the airstream entering the GT inlet, due to local external factors, such as weather conditions, prevailing wind direction, frequency and duration of nearby pollution sources, such as gas flares, major highways etc. It is therefore desirable to capture a sample that represents a true average of all events. The aim being a continuously renewed sample for a 12-month period.
While the equipment may appear to be relatively simple to carryout this type of analysis, there are some important specifics to the design and configuration of the apparatus to ensure a representative and safe sampling exercise.
Probe Design
The inlet ducting of a GT air inlet is a possible risk area for the continued safe operation of a GE machine. As such the design of a probe should be suitable for this type of environment, this would include such items as no loose fixings, calculation of the distortion of the air flowing past, eddy shedding etc.
The airflow conditions at the probe entrance and through the probe tubing are also important to ensure a representative sample of inlet air is obtained.

GEK 116269 Gas Turbine Inlet Air Specification
28 © General Electric Company, 2008. GE Proprietary Information. All Rights Reserved.
Figure 17. Typical Sample Probe
Sampler Design
The design of the air sampler (filter, pump and flow meter) should be suitably configured for use with a GT inlet. The specific environment must be considered, in terms of likely operating weather conditions, but also with regards to the types of services available on site, i.e., electric mains, compressed air etc, as well as any safety or hazardous requirements, such as being “Intrinsically Safe”.
Sample Analysis
A variety of analysis techniques can be utilized. Typically, semi quantative X-ray Fluorescence is used to establish the levels of various elements. If the sampling equipment used takes multiple samples at the same time, further detailed analysis can then be carried out depending upon the initial results.
3. Off Line Water Wash Drainage Water Sampling
During an off line water wash, water and water containing a detergent is injected into the machine to clean contaminants that have become attached to the compressor rotor and stator blades. The resulting dirty water is then piped straight to a site drain. This drain water can then provide information as to what substances are being deposited on the compressor blades.
The standard water wash cycle is carried out as follows
1. First wash cycle pulse with water only.
2. Start the off-line water wash program automatically. (This consists of 7 wash pulse with a mixture of water/detergent.)
3. After the 7 pulses, let the mix of water and soap rest in the compressor for 20 minutes before starting the rinse cycle.

Gas Turbine Inlet Air Specification GEK 116269
© General Electric Company, 2008. GE Proprietary Information. All Rights Reserved. 29
4. The compressor will go through 35 rinsing pulses (or more if needed) until it reaches a conductivity that is 5ms or less different that the water in the water tank or has steady readings for more than 5 rinse pulses.
One sample should be taken at the end of step 1, 2, and 3 resulting in a total of three samples.
VIII. REFERENCES
A. All relevant GE documentation
B. Non-GE documents for reference:
1. P. Roberge, “Handbook of Corrosion Engineering”, chapter 2, Atmospheric Corrosion, McGraw-Hill (2000).
2. ISO 9223 (1992 edition), Corrosion of metals and alloys – Corrosivity of atmospheres – Classification.
3. ISO 9224 (1992 edition), Corrosion of metals and alloys – Corrosivity of atmospheres – Guiding values for the corrosivity categories.
4. ISO 9225 (1992 edition), Corrosion of metals and alloys – Corrosivity of atmospheres – Measurement of pollution.
5. ISO 9226 (1992 edition), Corrosion of metals and alloys – Corrosivity of atmospheres – Determination of corrosion rate of standard specimens for the evaluation of corrosivity.

GEK 116269 Gas Turbine Inlet Air Specification
30 © General Electric Company, 2008. GE Proprietary Information. All Rights Reserved.
g GE Energy General Electric Company
www.gepower.com

POWER ENGINEERS, INC. Plan Approval Application – Renovo Energy Center, LLC
APPENDIX J POWER BLOCK OPERATING AND MAINTENANCE DETAILS (GER-3620)

GE Power & Water
Heavy-Duty Gas Turbine Operating and Maintenance ConsiderationsGER-3620M (02/15)
Jamison Janawitz
James Masso
Christopher Childs
GE Power & WaterAtlanta, GA

GE Power & Water | GER-3620M (02/15) i
Contents
Introduction . . . . . . . . . . . . . . . . . . . . . . . . . . . . . . . . . . . . . . . . . . . . . . . . . . . . . . . . . . . . . . . . . . . . . . . . . . . . . . . . . . . . 1
Maintenance Planning . . . . . . . . . . . . . . . . . . . . . . . . . . . . . . . . . . . . . . . . . . . . . . . . . . . . . . . . . . . . . . . . . . . . . . . . . . . 1
Gas Turbine Design Maintenance Features . . . . . . . . . . . . . . . . . . . . . . . . . . . . . . . . . . . . . . . . . . . . . . . . . . . . . . . . 2Borescope Inspections . . . . . . . . . . . . . . . . . . . . . . . . . . . . . . . . . . . . . . . . . . . . . . . . . . . . . . . . . . . . . . . . . . . . . . . . . . . . . . . . . . . . . . . . . . . . . . . . . . . . . . . . . 3
Major Factors Influencing Maintenance and Equipment Life . . . . . . . . . . . . . . . . . . . . . . . . . . . . . . . . . . . . . . . . . 5Starts and Hours Criteria . . . . . . . . . . . . . . . . . . . . . . . . . . . . . . . . . . . . . . . . . . . . . . . . . . . . . . . . . . . . . . . . . . . . . . . . . . . . . . . . . . . . . . . . . . . . . . . . . . . . . . 5
Service Factors . . . . . . . . . . . . . . . . . . . . . . . . . . . . . . . . . . . . . . . . . . . . . . . . . . . . . . . . . . . . . . . . . . . . . . . . . . . . . . . . . . . . . . . . . . . . . . . . . . . . . . . . . . . . . . . . 7
Fuel . . . . . . . . . . . . . . . . . . . . . . . . . . . . . . . . . . . . . . . . . . . . . . . . . . . . . . . . . . . . . . . . . . . . . . . . . . . . . . . . . . . . . . . . . . . . . . . . . . . . . . . . . . . . . . . . . . . . . . . . . . . 7
Firing Temperatures . . . . . . . . . . . . . . . . . . . . . . . . . . . . . . . . . . . . . . . . . . . . . . . . . . . . . . . . . . . . . . . . . . . . . . . . . . . . . . . . . . . . . . . . . . . . . . . . . . . . . . . . . . . 9
Steam/Water Injection . . . . . . . . . . . . . . . . . . . . . . . . . . . . . . . . . . . . . . . . . . . . . . . . . . . . . . . . . . . . . . . . . . . . . . . . . . . . . . . . . . . . . . . . . . . . . . . . . . . . . . . . 9
Cyclic Effects and Fast Starts . . . . . . . . . . . . . . . . . . . . . . . . . . . . . . . . . . . . . . . . . . . . . . . . . . . . . . . . . . . . . . . . . . . . . . . . . . . . . . . . . . . . . . . . . . . . . . . . . 10
Hot Gas Path Parts . . . . . . . . . . . . . . . . . . . . . . . . . . . . . . . . . . . . . . . . . . . . . . . . . . . . . . . . . . . . . . . . . . . . . . . . . . . . . . . . . . . . . . . . . . . . . . . . . . . . . . . . . . . 11
Rotor Parts . . . . . . . . . . . . . . . . . . . . . . . . . . . . . . . . . . . . . . . . . . . . . . . . . . . . . . . . . . . . . . . . . . . . . . . . . . . . . . . . . . . . . . . . . . . . . . . . . . . . . . . . . . . . . . . . . . . 13
Combustion Parts . . . . . . . . . . . . . . . . . . . . . . . . . . . . . . . . . . . . . . . . . . . . . . . . . . . . . . . . . . . . . . . . . . . . . . . . . . . . . . . . . . . . . . . . . . . . . . . . . . . . . . . . . . . . 15
Casing Parts . . . . . . . . . . . . . . . . . . . . . . . . . . . . . . . . . . . . . . . . . . . . . . . . . . . . . . . . . . . . . . . . . . . . . . . . . . . . . . . . . . . . . . . . . . . . . . . . . . . . . . . . . . . . . . . . . 16
Exhaust Diffuser Parts . . . . . . . . . . . . . . . . . . . . . . . . . . . . . . . . . . . . . . . . . . . . . . . . . . . . . . . . . . . . . . . . . . . . . . . . . . . . . . . . . . . . . . . . . . . . . . . . . . . . . . . . 17
Off-Frequency Operation . . . . . . . . . . . . . . . . . . . . . . . . . . . . . . . . . . . . . . . . . . . . . . . . . . . . . . . . . . . . . . . . . . . . . . . . . . . . . . . . . . . . . . . . . . . . . . . . . . . . . 17
Compressor Condition and Performance . . . . . . . . . . . . . . . . . . . . . . . . . . . . . . . . . . . . . . . . . . . . . . . . . . . . . . . . . . . . . . . . . . . . . . . . . . . . . . . . . . . . . . 18
Lube Oil Cleanliness . . . . . . . . . . . . . . . . . . . . . . . . . . . . . . . . . . . . . . . . . . . . . . . . . . . . . . . . . . . . . . . . . . . . . . . . . . . . . . . . . . . . . . . . . . . . . . . . . . . . . . . . . . 19
Moisture Intake . . . . . . . . . . . . . . . . . . . . . . . . . . . . . . . . . . . . . . . . . . . . . . . . . . . . . . . . . . . . . . . . . . . . . . . . . . . . . . . . . . . . . . . . . . . . . . . . . . . . . . . . . . . . . . 19
Maintenance Inspections . . . . . . . . . . . . . . . . . . . . . . . . . . . . . . . . . . . . . . . . . . . . . . . . . . . . . . . . . . . . . . . . . . . . . . . 20Standby Inspections . . . . . . . . . . . . . . . . . . . . . . . . . . . . . . . . . . . . . . . . . . . . . . . . . . . . . . . . . . . . . . . . . . . . . . . . . . . . . . . . . . . . . . . . . . . . . . . . . . . . . . . . . . 20
Running Inspections . . . . . . . . . . . . . . . . . . . . . . . . . . . . . . . . . . . . . . . . . . . . . . . . . . . . . . . . . . . . . . . . . . . . . . . . . . . . . . . . . . . . . . . . . . . . . . . . . . . . . . . . . . 20
Rapid Cool-Down . . . . . . . . . . . . . . . . . . . . . . . . . . . . . . . . . . . . . . . . . . . . . . . . . . . . . . . . . . . . . . . . . . . . . . . . . . . . . . . . . . . . . . . . . . . . . . . . . . . . . . . . . . . . . 22
Combustion Inspection . . . . . . . . . . . . . . . . . . . . . . . . . . . . . . . . . . . . . . . . . . . . . . . . . . . . . . . . . . . . . . . . . . . . . . . . . . . . . . . . . . . . . . . . . . . . . . . . . . . . . . . 22
Hot Gas Path Inspection . . . . . . . . . . . . . . . . . . . . . . . . . . . . . . . . . . . . . . . . . . . . . . . . . . . . . . . . . . . . . . . . . . . . . . . . . . . . . . . . . . . . . . . . . . . . . . . . . . . . . . 24
Major Inspection . . . . . . . . . . . . . . . . . . . . . . . . . . . . . . . . . . . . . . . . . . . . . . . . . . . . . . . . . . . . . . . . . . . . . . . . . . . . . . . . . . . . . . . . . . . . . . . . . . . . . . . . . . . . . 26
Parts Planning . . . . . . . . . . . . . . . . . . . . . . . . . . . . . . . . . . . . . . . . . . . . . . . . . . . . . . . . . . . . . . . . . . . . . . . . . . . . . . . . . 28
Inspection Intervals . . . . . . . . . . . . . . . . . . . . . . . . . . . . . . . . . . . . . . . . . . . . . . . . . . . . . . . . . . . . . . . . . . . . . . . . . . . . 30Borescope Inspection Interval . . . . . . . . . . . . . . . . . . . . . . . . . . . . . . . . . . . . . . . . . . . . . . . . . . . . . . . . . . . . . . . . . . . . . . . . . . . . . . . . . . . . . . . . . . . . . . . . . 30
Combustion Inspection Interval . . . . . . . . . . . . . . . . . . . . . . . . . . . . . . . . . . . . . . . . . . . . . . . . . . . . . . . . . . . . . . . . . . . . . . . . . . . . . . . . . . . . . . . . . . . . . . . 30
Hot Gas Path Inspection Interval . . . . . . . . . . . . . . . . . . . . . . . . . . . . . . . . . . . . . . . . . . . . . . . . . . . . . . . . . . . . . . . . . . . . . . . . . . . . . . . . . . . . . . . . . . . . . . 32
Rotor Inspection Interval . . . . . . . . . . . . . . . . . . . . . . . . . . . . . . . . . . . . . . . . . . . . . . . . . . . . . . . . . . . . . . . . . . . . . . . . . . . . . . . . . . . . . . . . . . . . . . . . . . . . . 32
Personnel Planning . . . . . . . . . . . . . . . . . . . . . . . . . . . . . . . . . . . . . . . . . . . . . . . . . . . . . . . . . . . . . . . . . . . . . . . . . . . . . 34
Conclusion . . . . . . . . . . . . . . . . . . . . . . . . . . . . . . . . . . . . . . . . . . . . . . . . . . . . . . . . . . . . . . . . . . . . . . . . . . . . . . . . . . . . 34
References . . . . . . . . . . . . . . . . . . . . . . . . . . . . . . . . . . . . . . . . . . . . . . . . . . . . . . . . . . . . . . . . . . . . . . . . . . . . . . . . . . . . 35

ii
Appendix . . . . . . . . . . . . . . . . . . . . . . . . . . . . . . . . . . . . . . . . . . . . . . . . . . . . . . . . . . . . . . . . . . . . . . . . . . . . . . . . . . . . . . 36A .1) Example 1 – Hot Gas Path Maintenance Interval Calculation . . . . . . . . . . . . . . . . . . . . . . . . . . . . . . . . . . . . . . . . . . . . . . . . . . . . . . . . . . . . . . . . 36
A .2) Example 2 – Hot Gas Path Factored Starts Calculation . . . . . . . . . . . . . . . . . . . . . . . . . . . . . . . . . . . . . . . . . . . . . . . . . . . . . . . . . . . . . . . . . . . . . 37
B) Examples – Combustion Maintenance Interval Calculations . . . . . . . . . . . . . . . . . . . . . . . . . . . . . . . . . . . . . . . . . . . . . . . . . . . . . . . . . . . . . . . . . . 38
C) Definitions . . . . . . . . . . . . . . . . . . . . . . . . . . . . . . . . . . . . . . . . . . . . . . . . . . . . . . . . . . . . . . . . . . . . . . . . . . . . . . . . . . . . . . . . . . . . . . . . . . . . . . . . . . . . . . . . . 39
D) Estimated Repair and Replacement Intervals (Natural Gas Only) . . . . . . . . . . . . . . . . . . . . . . . . . . . . . . . . . . . . . . . . . . . . . . . . . . . . . . . . . . . . . 40
E) Borescope Inspection Ports . . . . . . . . . . . . . . . . . . . . . . . . . . . . . . . . . . . . . . . . . . . . . . . . . . . . . . . . . . . . . . . . . . . . . . . . . . . . . . . . . . . . . . . . . . . . . . . . . 44
F) Turning Gear/Ratchet Running Guidelines . . . . . . . . . . . . . . . . . . . . . . . . . . . . . . . . . . . . . . . . . . . . . . . . . . . . . . . . . . . . . . . . . . . . . . . . . . . . . . . . . . . 45
G) B/E- and F-class Gas Turbine Naming . . . . . . . . . . . . . . . . . . . . . . . . . . . . . . . . . . . . . . . . . . . . . . . . . . . . . . . . . . . . . . . . . . . . . . . . . . . . . . . . . . . . . . 46
Revision History . . . . . . . . . . . . . . . . . . . . . . . . . . . . . . . . . . . . . . . . . . . . . . . . . . . . . . . . . . . . . . . . . . . . . . . . . . . . . . . 48

GE Power & Water | GER-3620M (02/15) 1
IntroductionMaintenance costs and machine availability are two of the most
important concerns to a heavy-duty gas turbine equipment
owner. Therefore, a well thought out maintenance program that
reduces the owner’s costs while increasing equipment availability
should be instituted. For this maintenance program to be effective,
owners should develop a general understanding of the relationship
between the operating plans and priorities for the plant, the skill
level of operating and maintenance personnel, and all equipment
manufacturer’s recommendations regarding the number and
types of inspections, spare parts planning, and other major factors
affecting component life and proper operation of the equipment.
In this document, operating and maintenance practices for
heavy-duty gas turbines will be reviewed, with emphasis placed
on types of inspections plus operating factors that influence
maintenance schedules.
Note:
• The operation and maintenance practices outlined in this
document are based on full utilization of GE-approved parts,
repairs, and services.
• The operating and maintenance discussions presented
are generally applicable to all GE heavy-duty gas turbines;
i.e., Frames 3, 5, 6, 7, and 9. Appendix G provides a list of common
B/E- and F-class heavy-duty gas turbines with current and
former naming conventions. For purposes of illustration, the
GE GT-7E.03 was chosen for most components except exhaust
systems, which are illustrated using different gas turbine models
as indicated. Also, the operating and maintenance discussions
presented for all B/E-class units are generally applicable to
Frame 3 and Frame 5 units unless otherwise indicated.
Consult the GE Operation and Maintenance (O&M) Manual
for specific questions on a given machine, or contact the
local GE service representative.
Maintenance PlanningAdvanced planning for maintenance is necessary for utility,
industrial, independent power, and cogeneration plant operators
in order to maintain reliability and availability. The correct
implementation of planned maintenance and inspection provides
direct benefits in the avoidance of forced outages, unscheduled
Heavy-Duty Gas Turbine Operating and Maintenance Considerations
repairs, and downtime. The primary factors that affect the
maintenance planning process are shown in Figure 1. The
owners’ operating mode and practices will determine how each
factor is weighted. Gas turbine parts requiring the most careful
attention are those associated with the combustion process,
together with those exposed to the hot gases discharged from the
combustion system. These are called the combustion section and
hot gas path parts, and they include combustion liners, end caps,
fuel nozzle assemblies, crossfire tubes, transition pieces, turbine
nozzles, turbine stationary shrouds, and turbine buckets.
Additional, longer-term areas for consideration and planning
are the lives of the compressor rotor, turbine rotor, casings, and
exhaust diffuser. The basic design and recommended maintenance
of GE heavy-duty gas turbines are oriented toward:
• Maximum periods of operation between inspections
and overhauls
• In-place, on-site inspection and maintenance
• Use of local trade skills to disassemble, inspect, and re-assemble
gas turbine components
In addition to maintenance of the basic gas turbine, other station
auxiliaries require periodic servicing including the control devices,
fuel-metering equipment, gas turbine auxiliaries, and load package.
The primary maintenance effort involves five basic systems:
controls and accessories, combustion, turbine, generator, and
balance-of-plant. Controls and accessories are typically serviced
in outages of short duration, whereas the other four systems are
maintained through less frequent outages of longer duration.
This document is focused on maintenance planning for the basic
gas turbine, which includes the combustion and turbine systems.
The other systems, while outside the scope of this document, also
need to be considered for successful plant maintenance.
The inspection and repair requirements, outlined in the O&M
Manual provided to each owner, lend themselves to establishing
a pattern of inspections. These inspection patterns will vary from
site to site, because factors such as air and fuel quality are used
to develop an inspection and maintenance program. In addition,
supplementary information is provided through a system of
Technical Information Letters (TILs) associated with specific gas
turbines after shipment. This updated information, in addition
to the O&M Manual, assures optimum installation, operation,

2
and maintenance of the turbine. (See Figure 2.) Many of the TILs
contain advisory technical recommendations to help resolve
issues and improve the operation, maintenance, safety, reliability,
or availability of the turbine. The recommendations contained in
TILs should be reviewed and factored into the overall maintenance
planning program.
• O&M Manual
– Turbine-specific manual provided to customer
– Includes outline of recommended Inspection andRepair requirements
– Helps customers to establish a pattern of systematicinspections for their site
• Technical Information Letters (TILs)*
– Issued after shipment of turbine
– Provides O&M updates related to turbine installation,maintenance, and operation
– Provides advisory technical recommendations to helpresolve potential issues
* Specific smaller frame turbines are issued service letters known as Customer Information Notices (NICs) instead of TILs
Figure 2 . Key technical reference documents to include in maintenance planning
Gas Turbine Design Maintenance FeaturesThe GE heavy-duty gas turbine is designed to withstand severe
duty and to be maintained on-site, with off-site repair required
only on certain combustion components, hot gas path parts, and
rotor assemblies needing specialized shop service. The following
features are designed into GE heavy-duty gas turbines to facilitate
on-site maintenance:
• All casings, shells and frames are split on machine horizontal
centerline. Upper halves may be lifted individually for access to
internal parts.
• With upper-half compressor casings removed, all stationary
vanes can be slid circumferentially out of the casings for
inspection or replacement without rotor removal.
• With the upper-half of the turbine shell lifted, each half of the
first stage nozzle assembly can be removed for inspection,
repair, or replacement without rotor removal. On some units,
upper-half, later-stage nozzle assemblies are lifted with the
turbine shell, also allowing inspection and/or removal of
the turbine buckets.
Figure 1 . Key factors affecting maintenance planning
Manufacturer’sRecommendedMaintenance
Program
Diagnostics &Expert Systems
Reliability Need
On-SiteMaintenance
Capability
Design Features Duty CycleCost of
Downtime
Type of Fuel
ReplacementParts
Availability/Investment
ReserveRequirementsEnvironmentUtilization Need
MaintenancePlanning

GE Power & Water | GER-3620M (02/15) 3
• All turbine buckets are moment-weighed and computer charted
in sets for rotor spool assembly so that they may be replaced
without the need to remove or rebalance the rotor assembly.
• All bearing housings and liners are split on the horizontal
centerline so that they may be inspected and replaced when
necessary. The lower half of the bearing liner can be removed
without removing the rotor.
• All seals and shaft packings are separate from the main
bearing housings and casing structures and may be readily
removed and replaced.
• On most designs, fuel nozzles, combustion liners and flow
sleeves can be removed for inspection, maintenance, or
replacement without lifting any casings. All major accessories,
including filters and coolers, are separate assemblies that are
readily accessible for inspection or maintenance. They may
also be individually replaced as necessary.
• Casings can be inspected during any outage or any shutdown
when the unit enclosure is cool enough for safe entry. The
exterior of the inlet, compressor case, compressor discharge
case, turbine case, and exhaust frame can be inspected during
any outage or period when the enclosure is accessible. The
interior surfaces of these cases can be inspected to various
degrees depending on the type of outage performed. All interior
surfaces can be inspected during a major outage when the rotor
has been removed.
• Exhaust diffusers can be inspected during any outage by
entering the diffuser through the stack or Heat Recovery
Steam Generator (HRSG) access doors. The flow path surfaces,
flex seals, and other flow path hardware can be visually
inspected with or without the use of a borescope. Diffusers
can be weld-repaired without the need to remove the exhaust
frame upper half.
• Inlets can be inspected during any outage or shutdown.
As an alternative to on-site maintenance, in some cases plant
availability can be improved by applying gas turbine modular
replacements. This is accomplished by exchanging engine modules
or even the complete gas turbine with new or refurbished units.
The removed modules/engines can then be sent to an alternate
location for maintenance.
Provisions have been built into GE heavy-duty gas turbines to
facilitate several special inspection procedures. These special
procedures provide for the visual inspection and clearance
measurement of some of the critical internal components
without removal of the casings. These procedures include gas
path borescope inspection (BI), radial clearance measurements,
and turbine nozzle axial clearance measurements.
A GE gas turbine is a fully integrated design consisting of stationary
and rotating mechanical, fluid, thermal, and electrical systems.
The turbine’s performance, as well as the performance of each
component within the turbine, is dependent upon the operating
interrelationship between internal components and the total
operating systems. GE’s engineering process evaluates how new
designs, design changes, and repairs affect components and
systems. This design, evaluation, testing, and approval assures
the proper balance and interaction between all components and
systems for safe, reliable, and economical operation.
The introduction of new, repaired, or modified parts must be
evaluated in order to avoid negative effects on the operation
and reliability of the entire system. The use of non-GE approved
parts, repairs, and maintenance practices may represent a
significant risk. Pursuant to the governing terms and conditions,
warranties and performance guarantees are predicated upon
proper storage, installation, operation, and maintenance,
conforming to GE approved operating instruction manuals
and repair/modification procedures.
Borescope InspectionsAn effective borescope inspection program monitors the condition
of internal components without casing removal. Borescope
inspections should be scheduled with consideration given to the
operation and environment of the gas turbine and information
from the O&M Manual and TILs.
GE heavy-duty gas turbine designs incorporate provisions in
both compressor and turbine casings for borescope inspection
of intermediate compressor rotor stages, first, second and third-
stage turbine buckets, and turbine nozzle partitions. These
provisions are radially aligned holes through the compressor
casings, turbine shell, and internal stationary turbine shrouds
that allow the penetration of an optical borescope into the
compressor or turbine flow path area, as shown in Figure 3.

4
Borescope inspection access locations for F-class gas turbines
can be found in Appendix E.
Figure 4 provides a recommended interval for a planned
borescope inspection program following initial baseline
inspections. It should be recognized that these borescope
inspection intervals are based on average unit operating modes.
Adjustment of these borescope intervals may be made based
on operating experience, mode of operation, fuels used, and the
results of previous borescope inspections.
In general, an annual or semiannual borescope inspection uses
all the available access points to verify the condition of the
internal hardware. This should include, but is not limited to, signs
of excessive gas path fouling, symptoms of surface degradation
(such as erosion, corrosion, or spalling), displaced components,
deformation or object damage, material loss, nicks, dents, cracking,
indications of contact or rubbing, or other anomalous conditions.
Borescope
Gas and Distillate Fuel Oil
At combustion inspection or annually, whichever occurs first
Heavy Fuel Oil
At combustion inspection or semiannually, whichever occurs first
Figure 4 . Borescope inspection planning
During BIs and similar inspections, the condition of the upstream
components should be verified, including all systems from the filter
house to the compressor inlet.
The application of a borescope monitoring program will assist with
the scheduling of outages and preplanning of parts requirements,
resulting in outage preparedness, lower maintenance costs, and
higher availability and reliability of the gas turbine.
Primary Inspection Access (Normal Inspection)
Secondary Inspection Access (Additional Stators & Nozzles)
Access for Eddy-current & Nozzle Deflection Inspection
LegendLE = Leading EdgeTE = Trailling Edge
18º
18º
18º
Compressor-4th Stage
Compressor-12th Stage
Compressor-17th Stage
1st Nozzle TE1st Bucket LE
32º
1st Bucket TE2nd Nozzle LE
34º
2nd Nozzle TE2nd Bucket LE
42º
2nd Bucket TE3rd Nozzle LE
34º
3rd Nozzle TE3rd Bucket LE
42º
Figure 3 . 7E.03 gas turbine borescope inspection access locations

GE Power & Water | GER-3620M (02/15) 5
Major Factors Influencing Maintenance and Equipment LifeThere are many factors that can influence equipment life,
and these must be understood and accounted for in the
owner’s maintenance planning. Starting cycle (hours per start),
power setting, fuel, level of steam or water injection, and
site environmental conditions are some of the key factors in
determining maintenance interval requirements, as these factors
directly influence the life of replaceable gas turbine parts.
Non-consumable components and systems, such as the
compressor airfoils, may be affected by site environmental
conditions as well as plant and accessory system effects. Other
factors affecting maintenance planning are shown in Figure 1.
Operators should consider these external factors to prevent the
degradation and shortened life of non-consumable components.
GE provides supplementary documentation to assist in this regard.
In the GE approach to maintenance planning, a natural gas fuel
unit that operates at base load with no water or steam injection
is established as the baseline condition, which sets the maximum
recommended maintenance intervals. For operation that differs
from the baseline, maintenance factors (MF) are established to
quantify the effect on component lives and provide the increased
frequency of maintenance required. For example, a maintenance
factor of two would indicate a maintenance interval that is half of
the baseline interval.
Starts and Hours CriteriaGas turbines wear differently in continuous duty application and
cyclic duty application, as shown in Figure 5. Thermal mechanical
fatigue is the dominant life limiter for peaking machines, while
creep, oxidation, and corrosion are the dominant life limiters for
continuous duty machines. Interactions of these mechanisms
are considered in the GE design criteria but to a great extent
are second-order effects. For that reason, GE bases gas turbine
maintenance requirements on independent counts of starts and
hours. Whichever criteria limit is first reached determines the
maintenance interval. A graphical display of the GE approach
is shown in Figure 6. In this figure, the inspection interval
recommendation is defined by the rectangle established
by the starts and hours criteria. These recommendations
for inspection fall within the design life expectations and are
selected such that components acceptable for continued use
at the inspection point will have low risk of failure during the
subsequent operating interval.
• Continuous Duty Application
– Rupture
– Creep Deflection
– Corrosion
– Oxidation
– Erosion
– High-Cycle Fatigue
– Rubs/Wear
– Foreign Object Damage
• Cyclic Duty Application
– Thermal MechanicalFatigue
– High-Cycle Fatigue
– Rubs/Wear
– Foreign Object Damage
Figure 5 . Causes of wear – hot gas path components
An alternative to the GE approach, which is sometimes employed
by other manufacturers, converts each start cycle to an equivalent
number of operating hours (EOH) with inspection intervals based
on the equivalent hours count. For the reasons previously stated,
GE does not use this approach. While this logic can create the
impression of longer intervals, it actually may result in more
frequent maintenance inspections, since separate effects are
considered additive. Referring again to Figure 6, the starts and
hours inspection “rectangle” is reduced by half as defined by the
diagonal line from the starts limit at the upper left hand corner
to the hours limit at the lower right hand corner. Midrange duty
applications, with hours-per-start ratios of 30-50, are particularly
penalized by this approach.
This is further illustrated in Figure 7 for the example of a 7E.03
gas turbine operating on natural gas fuel, at base load conditions
with no steam or water injection or trips from load. The unit
operates 4000 hours and 300 starts per year. Following GE’s
recommendations, the operator would perform the hot gas path
inspection after four years of operation, with starts being the
limiting condition. Performing maintenance on this same unit
based on an equivalent hours criteria would require a hot gas
path inspection after 2.4 years. Similarly, for a continuous duty
application operating 8000 hours and 160 starts per year, the
GE recommendation would be to perform the hot gas path
inspection after three years of operation with the operating
hours being the limiting condition for this case. The equivalent
hours criteria would set the hot gas path inspection after
2.1 years of operation for this application.

6
Figure 7 . Hot gas path maintenance interval comparisons. GE method vs. EOH method
GE vs. Equivalent Operating Hours (EOH) Approach
1400
1200
1000
800
600
400
200
00 4 8 12 16 20 24 28
Thousands of Fired Hours
Star
ts
Case 28,000 Hrs/Yr
160 Starts/Yr
GE Every 3 Yr
EOH Every 2.1 Yr
Case 14,000 Hrs/Yr
GE Method
300 Starts/Yr
GE Every 4 Yr
EOH Every 2.4 Yr
Continuous
Unit
Figure 6 . GE bases gas turbine maintenance requirements on independent counts of starts and hours

GE Power & Water | GER-3620M (02/15) 7
Service FactorsWhile GE does not subscribe to the equivalency of starts to hours,
there are equivalencies within a wear mechanism that must be
considered. As shown in Figure 8, influences such as fuel type and
quality, firing temperature setting, and the amount of steam or
water injection are considered with regard to the hours-based
criteria. Startup rate and the number of trips are considered with
regard to the starts-based criteria. In both cases, these influences
may reduce the maintenance intervals.
Typical baseline inspection intervals (6B.03/7E.03):
Hot gas path inspection 24,000 hrs or 1200 starts
Major inspection 48,000 hrs or 2400 starts
Criterion is hours or starts (whichever occurs first)
Factors affecting maintenance:
Hours-Based Factors
• Fuel type
• Peak load
• Diluent (water or steam injection)
Starts-Based Factors
• Start type (conventional or peaking-fast)
• Start load (max. load achieved during start cycle, e.g. part, base, or peak load)
• Trips
Figure 8 . Maintenance factors
When these service or maintenance factors are involved in a unit’s
operating profile, the hot gas path maintenance “rectangle” that
describes the specific maintenance criteria for this operation is
reduced from the ideal case, as illustrated in Figure 9. The following
discussion will take a closer look at the key operating factors
and how they can affect maintenance intervals as well as parts
refurbishment/replacement intervals.
FuelFuels burned in gas turbines range from clean natural gas to
residual oils and affect maintenance, as illustrated in Figure 10.
Although Figure 10 provides the basic relationship between fuel
severity factor and hydrogen content of the fuel, there are other
fuel constituents that should be considered. Selection of fuel
Increasing Hydrogen Content in Fuel
Incr
easi
ng F
uel S
ever
ity F
acto
r
Natural Gas
Distillates
Residual
LightHeavy
Figure 10 . Estimated effect of fuel type on maintenance
4 8 12 160 20 24 28
1,400
1,200
1,000
800
600
400
200
0
Hours-Based Factors• Fuel type• Peak load• Diluent
Starts-Based Factors• Start type• Start load• Trips
Star
ts
Thousands of Fired Hours
Maintenance Factors Reduce Maintenance Interval
Figure 9 . GE maintenance intervals

8
severity factor typically requires a comprehensive understanding
of fuel constituents and how they affect system maintenance.
The selected fuel severity factor should also be adjusted based
on inspection results and operating experience.
Heavier hydrocarbon fuels have a maintenance factor ranging
from three to four for residual fuels and two to three for crude
oil fuels. This maintenance factor is adjusted based on the
water-to-fuel ratio in cases when water injection for NOx
abatement is used. These fuels generally release a higher
amount of radiant thermal energy, which results in a subsequent
reduction in combustion hardware life, and frequently contain
corrosive elements such as sodium, potassium, vanadium, and
lead that can cause accelerated hot corrosion of turbine nozzles
and buckets. In addition, some elements in these fuels can
cause deposits either directly or through compounds formed
with inhibitors that are used to prevent corrosion. These
deposits affect performance and can require more frequent
maintenance.
Distillates, as refined, do not generally contain high levels of
these corrosive elements, but harmful contaminants can be
present in these fuels when delivered to the site. Two common
ways of contaminating number two distillate fuel oil are: salt-
water ballast mixing with the cargo during sea transport, and
contamination of the distillate fuel when transported to site in
tankers, tank trucks, or pipelines that were previously used to
transport contaminated fuel, chemicals, or leaded gasoline. GE’s
experience with distillate fuels indicates that the hot gas path
maintenance factor can range from as low as one (equivalent
to natural gas) to as high as three. Unless operating experience
suggests otherwise, it is recommended that a hot gas path
maintenance factor of 1.5 be used for operation on distillate oil.
Note also that contaminants in liquid fuels can affect the life
of gas turbine auxiliary components such as fuel pumps and
flow dividers.
Not shown in Figure 10 are alternative fuels such as industrial
process gas, syngas, and bio-fuel. A wide variety of alternative
fuels exist, each with their own considerations for combustion in
a gas turbine. Although some alternative fuels can have a neutral
effect on gas turbine maintenance, many alternative fuels require
unit-specific intervals and fuel severity factors to account for their
fuel constituents or water/steam injection requirements.
As shown in Figure 10, natural gas fuel that meets GE specification
is considered the baseline, optimum fuel with regard to turbine
maintenance. Proper adherence to GE fuel specifications in
GEI-41040 and GEI-41047 is required to allow proper combustion
system operation and to maintain applicable warranties. Liquid
hydrocarbon carryover can expose the hot gas path hardware to
severe overtemperature conditions that can result in significant
reductions in hot gas path parts lives or repair intervals.
Liquid hydrocarbon carryover is also responsible for upstream
displacement of flame in combustion chambers, which can lead
to severe combustion hardware damage. Owners can control
this potential issue by using effective gas scrubber systems and
by superheating the gaseous fuel prior to use to approximately
50°F (28°C) above the hydrocarbon dew point temperature at
the turbine gas control valve connection. For exact superheat
requirement calculations, please review GEI 41040. Integral to the
system, coalescing filters installed upstream of the performance
gas heaters is a best practice and ensures the most efficient
removal of liquids and vapor phase constituents.
Undetected and untreated, a single shipment of contaminated
fuel can cause substantial damage to the gas turbine hot gas
path components. Potentially high maintenance costs and loss
of availability can be minimized or eliminated by:
• Placing a proper fuel specification on the fuel supplier.
For liquid fuels, each shipment should include a report that
identifies specific gravity, flash point, viscosity, sulfur content,
pour point and ash content of the fuel.
• Providing a regular fuel quality sampling and analysis program.
As part of this program, continuous monitoring of water
content in fuel oil is recommended, as is fuel analysis that,
at a minimum, monitors vanadium, lead, sodium, potassium,
calcium, and magnesium.
• Providing proper maintenance of the fuel treatment system
when burning heavier fuel oils.
• Providing cleanup equipment for distillate fuels when there
is a potential for contamination.
In addition to their presence in the fuel, contaminants can
also enter the turbine via inlet air, steam/water injection, and
carryover from evaporative coolers. In some cases, these
sources of contaminants have been found to cause hot gas path

GE Power & Water | GER-3620M (02/15) 9
degradation equal to that seen with fuel-related contaminants.
GE specifications define limits for maximum concentrations of
contaminants for fuel, air, and steam/water.
In addition to fuel quality, fuel system operation is also a factor in
equipment maintenance. Liquid fuel should not remain unpurged
or in contact with hot combustion components after shutdown
and should not be allowed to stagnate in the fuel system when
strictly gas fuel is run for an extended time. To minimize varnish
and coke accumulation, dual fuel units (gas and liquid capable)
should be shutdown running gas fuel whenever possible. Likewise,
during extended operation on gas, regular transfers from gas to
liquid are recommended to exercise the system components and
minimize coking.
Contamination and build-up may prevent the system from
removing fuel oil and other liquids from the combustion,
compressor discharge, turbine, and exhaust sections when
the unit is shut down or during startup. Liquid fuel oil trapped
in the system piping also creates a safety risk. Correct functioning
of the false start drain system (FSDS) should be ensured through
proper maintenance and inspection per GE procedures.
Firing TemperaturesPeak load is defined as operation above base load and is
achieved by increasing turbine operating temperatures.
Significant operation at peak load will require more frequent
maintenance and replacement of hot gas path and combustion
components. Figure 11 defines the parts life effect corresponding
to increases in firing temperature. It should be noted that this is
not a linear relationship, and this equation should not be used for
decreases in firing temperature.
It is important to recognize that a reduction in load does not
always mean a reduction in firing temperature. For example, in
heat recovery applications, where steam generation drives overall
plant efficiency, load is first reduced by closing variable inlet
guide vanes to reduce inlet airflow while maintaining maximum
exhaust temperature. For these combined cycle applications,
firing temperature does not decrease until load is reduced below
approximately 80% of rated output. Conversely, a non-DLN turbine
running in simple cycle mode maintains fully open inlet guide
vanes during a load reduction to 80% and will experience over a
200°F/111°C reduction in firing temperature at this output level.
The hot gas path parts life changes for different modes of
operation. This turbine control effect is illustrated in Figure 12.
Turbines with DLN combustion systems use inlet guide vane
turndown as well as inlet bleed heat to extend operation of
low NOx premix operation to part load conditions.
Firing temperature effects on hot gas path maintenance, as
described above, relate to clean burning fuels, such as natural
gas and light distillates, where creep rupture of hot gas path
components is the primary life limiter and is the mechanism
that determines the hot gas path maintenance interval impact.
With ash-bearing heavy fuels, corrosion and deposits are
the primary influence and a different relationship with firing
temperature exists.
Steam/Water InjectionWater or steam injection for emissions control or power
augmentation can affect part life and maintenance intervals
even when the water or steam meets GE specifications. This
relates to the effect of the added water on the hot gas transport
properties. Higher gas conductivity, in particular, increases the
B/E-class
Max IGV (open)
Min IGV
IGVs close max to minat constant TF
IGVs close max to minat constant TX
Heat RecoverySimple CycleBase LoadPeak Load
2500
2000
1500
1000
1200
1000
800
600
°F°C
FiringTemp.
% Load60 80 100 1204020
Figure 12 . Firing temperature and load relationship – heat recovery vs. simple cycle operation
B/E-class: Ap = e (0.018*ΔTf )
F-class: Ap = e (0.023*ΔTf )
Ap = Peak fire severity factor
ΔTf = Peak firing temperature adder (in °F)
Figure 11 . Peak fire severity factors - natural gas and light distillates

10
heat transfer to the buckets and nozzles and can lead to higher
metal temperature and reduced part life.
Part life reduction from steam or water injection is directly
affected by the way the turbine is controlled. The control system
on most base load applications reduces firing temperature as
water or steam is injected. This is known as dry control curve
operation, which counters the effect of the higher heat transfer
on the gas side and results in no net effect on bucket life. This
is the standard configuration for all gas turbines, both with and
without water or steam injection. On some installations, however,
the control system is designed to keep firing temperature constant
with water or steam injection. This is known as wet control curve
operation, which results in additional unit output but decreases
parts life as previously described. Units controlled in this way
are generally in peaking applications where annual operating
hours are low or where operators have determined that reduced
parts lives are justified by the power advantage. Figure 13
illustrates the wet and dry control curve and the performance
differences that result from these two different modes of control.
An additional factor associated with water or steam injection
relates to the higher aerodynamic loading on the turbine
components that results from the injected flow increasing the
cycle pressure ratio. This additional loading can increase the
downstream deflection rate of the second- and third-stage nozzles,
which would reduce the repair interval for these components.
However, the introduction of high creep strength stage two and
three nozzle (S2N/S3N) alloys, such as GTD-222™ and GTD-241™,
has reduced this factor in comparison to previously applied
materials such as FSX-414 and N-155.
Water injection for NOx abatement should be performed according
to the control schedule implemented in the controls system.
Forcing operation of the water injection system at high loads
can lead to combustion and HGP hardware damage due to
thermal shock.
Cyclic Effects and Fast StartsIn the previous discussion, operating factors that affect the
hours-based maintenance criteria were described. For the
starts-based maintenance criteria, operating factors associated
with the cyclic effects induced during startup, operation, and
shutdown of the turbine must be considered. Operating conditions
other than the standard startup and shutdown sequence can
potentially reduce the cyclic life of the gas turbine components
and may require more frequent maintenance including part
refurbishment and/or replacement.
Fast starts are common deviations from the standard startup
sequence. GE has introduced a number of different fast start
systems, each applicable to particular gas turbine models. Fast
starts may include any combination of Anticipated Start Purge,
fast acceleration (light-off to FSNL), and fast loading. Some fast
start methods do not affect inspection interval maintenance
factors. Fast starts that do affect maintenance factors are
referred to as peaking-fast starts or simply peaking starts.
The effect of peaking-fast starts on the maintenance interval
depends on the gas turbine model, the unit configuration, and
the particular start characteristics. For example, simple cycle
7F.03 units with fast start capability can perform a peaking start
in which the unit is brought from light-off to full load in less than
15 minutes. Conversely, simple cycle 6B and other smaller frame
units can perform conventional starts that are less than 15
minutes without affecting any maintenance factors. For units
that have peaking-fast start capability, Figure 14 shows
conservative peaking-start factors that may apply.
Because the peaking-fast start factors can vary by unit and
by system, the baseline factors may not apply to all units. For
example, the latest 7F.03 peaking-fast start system has the start
factors shown in Figure 15. For comparison, the 7F.03 nominal
fast start that does not affect maintenance is also listed. Consult
applicable unit-specific documentation or your GE service
representative to verify the start factors that apply.
Exha
ust T
empe
ratu
re °F
Compressor Discharge Pressure (psig)
Dry Control
Wet Control
The Wet Control Curve Maintains Constant TF
Steam Injection for 25 pmm NOx
3% Steam Inj.TF = 2020°F (1104°C)
Load Ratio = 1.10
3% Steam Inj.TF = 1994°F (1090°C)
Load Ratio = 1.08
0% Steam Inj.TF = 2020°F (1104°C)
Load Ratio = 1.0
Figure 13 . Exhaust temperature control curve – dry vs. wet control 7E.03

GE Power & Water | GER-3620M (02/15) 11
Starts-Based Combustion Inspection
As = 4.0 for B/E-class
As = 2.0 for F-class
Starts-Based Hot Gas Path Inspection
Ps = 3.5 for B/E-class
Ps = 1.2 for F-class
Starts-Based Rotor Inspection
Fs = 2.0 for F-class*
* See Figure 22 for details
Figure 14 . Peaking-fast start factors
7F .03 Starts-Based Combustion Inspection
As = 1.0 for 7F nominal fast start
As = 1.0 for 7F peaking-fast start
7F .03 Starts-Based Hot Gas Path Inspection
Ps = Not applicable for 7F nominal fast start (counted as normal starts)
Ps = 0.5 for 7F peaking-fast start
7F .03 Starts-Based Rotor Inspection
Fs = 1.0 for 7F nominal fast start
Fs = 2.0 for 7F peaking-fast start*
* See Figure 23 for details
Figure 15 . 7F.03 fast start factors
Hot Gas Path PartsFigure 16 illustrates the firing temperature changes occurring
over a normal startup and shutdown cycle. Light-off, acceleration,
loading, unloading, and shutdown all produce gas and metal
temperature changes. For rapid changes in gas temperature,
the edges of the bucket or nozzle respond more quickly than
the thicker bulk section, as pictured in Figure 17. These gradients,
in turn, produce thermal stresses that, when cycled, can eventually
lead to cracking.
Figure 18 describes the temperature/strain history of a 7E.03
stage 1 bucket during a normal startup and shutdown cycle.
Light-off and acceleration produce transient compressive strains
in the bucket as the fast responding leading edge heats up more
quickly than the thicker bulk section of the airfoil. At full load
conditions, the bucket reaches its maximum metal temperature
and a compressive strain is produced from the normal steady
state temperature gradients that exist in the cooled part. At
shutdown, the conditions reverse and the faster responding
edges cool more quickly than the bulk section, which results
in a tensile strain at the leading edge.
Thermal mechanical fatigue testing has found that the number
of cycles that a part can withstand before cracking occurs is
strongly influenced by the total strain range and the maximum
metal temperature. Any operating condition that significantly
increases the strain range and/or the maximum metal temperature
over the normal cycle conditions will reduce the fatigue life and
increase the starts-based maintenance factor. For example,
TimeStartup Shutdown
Tem
pera
ture
Base Load
Acceleration
Light-Off
Warm-Up Fired Shutdown
Full SpeedNo LoadFull Speed
No Load
Unload Ramp
Trip
Load Ramp
Figure 16 . Turbine start/stop cycle – firing temperature changes
Cold
Hot
Figure 17 . Second stage bucket transient temperature distribution

12
Figure 19 compares a normal operating cycle with one that
includes a trip from full load. The significant increase in the
strain range for a trip cycle results in a life effect that equates
to eight normal start/stop cycles, as shown. Trips from part
load will have a reduced effect because of the lower metal
temperatures at the initiation of the trip event. Figure 20
illustrates that while a trip from between 80% and 100% load
has an 8:1 trip severity factor, a trip from full speed no load (FSNL)
has a trip severity factor of 2:1. Similarly, overfiring of the unit
during peak load operation leads to increased component
0
Key Parameters
Fired
Shutdown
• Max Strain Range
• Max Metal Temperature
FSNL
Light Off
& Warm-up
Acceleration
Base Load
Metal Temperature
TMAX
% S
trai
n
∆εMAX
Figure 18 . Bucket low cycle fatigue (LCF)
+
-
Normal Startup/Shutdown
Temperature
∆εMAX
Strain ~ %
+
-
Strain ~ %
Leading Edge Temperature/Strain
TMAX
Normal Start & Trip
1 Trip Cycle = 8 Normal Shutdown Cycles
Temperature∆εMAX
TMAX
TeTempmpereratatururee
∆∆εMAMAXX
Figure 19 . Low cycle fatigue life sensitivities – first stage bucket

GE Power & Water | GER-3620M (02/15) 13
metal temperatures. As a result, a trip from peak load has
a trip severity factor of 10:1.
Trips are to be assessed in addition to the regular startup/shutdown
cycles as starts adders. As such, in the factored starts equation
of Figure 43, one is subtracted from the severity factor so that the
net result of the formula (Figure 43) is the same as that dictated
by the increased strain range. For example, a startup and trip
from base load would count as eight total cycles (one cycle for
startup to base load plus 8-1=7 cycles for trip from base load),
just as indicated by the 8:1 maintenance factor.
Similarly to trips from load, peaking-fast starts will affect the
starts-based maintenance interval. Like trips, the effects of
a peaking-fast start on the machine are considered separate
from a normal cycle and their effects must be tabulated in
addition to the normal start/stop cycle. However, there is no
-1 applied to these factors, so a 7F.03 peaking-fast start during
a base load cycle would have a total effect of 1.5 cycles.
Refer to Appendix A for factored starts examples, and consult
unit-specific documentation to determine if an alternative
hot gas path peaking-fast start factor applies.
While the factors described above will decrease the starts-based
maintenance interval, part load operating cycles allow for an
extension of the maintenance interval. Figure 21 can be used in
considering this type of operation. For example, two operating
cycles to maximum load levels of less than 60% would equate
to one start to a load greater than 60% or, stated another way,
would have a maintenance factor of 0.5.
Factored starts calculations are based upon the maximum load
achieved during operation. Therefore, if a unit is operated at part
load for three weeks, and then ramped up to base load for the last
ten minutes, then the unit’s total operation would be described as a
base load start/stop cycle.
Rotor PartsThe maintenance and refurbishment requirements of the rotor
structure, like the hot gas path components, are affected by
the cyclic effects of startup, operation, and shutdown, as well as
loading and off-load characteristics. Maintenance factors specific
to the operating profile and rotor design must be incorporated into
the operator’s maintenance planning. Disassembly and inspection
of all rotor components is required when the accumulated rotor
starts or hours reach the inspection limit. (See Figure 44 and
Figure 45 in the Inspection Intervals section.)
The thermal condition when the startup sequence is initiated
is a major factor in determining the rotor maintenance interval
and individual rotor component life. Rotors that are cold when
the startup commences experience transient thermal stresses
as the turbine is brought on line. Large rotors with their longer
thermal time constants develop higher thermal stresses than
smaller rotors undergoing the same startup time sequence. High
thermal stresses reduce thermal mechanical fatigue life and the
inspection interval.
Though the concept of rotor maintenance factors is applicable
to all gas turbine rotors, only F-class rotors will be discussed in
detail. For all other rotors, reference unit-specific documentation
to determine additional maintenance factors that may apply.
10
8
6
4
2
0
a T – T
rip
Seve
rity
Fac
tor
% Load0 20 40 60 80 100
Base
FSNL
Note:• For Trips During Startup Accel Assume aT=2
• For Trips from Peak Load Assume aT=10
F-class and B/E-class units with
Inlet Bleed Heat
Units withoutInlet Bleed Heat
Figure 20 . Maintenance factor – trips from load
1.4
1.2
1.0
0.8
0.6
0.4
0.2
0.0
Mai
nten
ance
Fac
tor
% Load0 20 40 60 80 100
Figure 21 . Maintenance factor – effect of start cycle maximum load level

14
The rotor maintenance factor for a startup is a function of the
downtime following a previous period of operation. As downtime
increases, the rotor metal temperature approaches ambient
conditions, and thermal fatigue during a subsequent startup
increases. As such, cold starts are assigned a rotor maintenance
factor of two and hot starts a rotor maintenance factor of less
than one due to the lower thermal stress under hot conditions.
This effect varies from one location in the rotor structure to
another. The most limiting location determines the overall rotor
maintenance factor.
Initial rotor thermal condition is not the only operating factor
that influences rotor maintenance intervals and component
life. Peaking-fast starts, where the turbine is ramped quickly
to load, increase thermal gradients on the rotor. Trips from
load, particularly trips followed by immediate restarts, and hot
restarts reduce the rotor maintenance interval. Figure 22 lists
recommended operating factors that should be used to determine
the rotor’s overall maintenance factor for certain F-class rotors.
F-class* Rotors
Rotor Maintenance Factors
Peaking-Fast Start**
Normal Start
Hot 1 Start Factor (0–1 Hr. Down)
4.0 2.0
Hot 2 Start Factor (1–4 Hrs. Down)
1.0 0.5
Warm 1 Start Factor (4–20 Hrs. Down)
1.8 0.9
Warm 2 Start Factor (20–40 Hrs. Down)
2.8 1.4
Cold Start Factor (>40 Hrs. Down)
4.0 2.0
Trip from Load Factor 4.0 4.0
*Other factors may apply to early 9F.03 units
**An F-class peaking-fast start is typically a start in which the unit is brought from light-off to full load in less than 15 minutes.
Figure 22 . Operation-related maintenance factors
The significance of each of these factors is dependent on the unit
operation. There are three categories of operation that are typical
of most gas turbine applications. These are peaking, cyclic, and
continuous duty as described below:
• Peaking units have a relatively high starting frequency and a low
number of hours per start. Operation follows a seasonal demand.
Peaking units will generally see a high percentage of warm and
cold starts.
• Cyclic units start daily with weekend shutdowns. Twelve to
sixteen hours per start is typical, which results in a warm rotor
condition for a large percentage of the starts. Cold starts are
generally seen only after a maintenance outage or following a
two-day weekend outage.
• Continuous duty applications see a high number of hours
per start. Most starts are cold because outages are generally
maintenance driven. While the percentage of cold starts is high,
the total number of starts is low. The rotor maintenance interval
on continuous duty units will be determined by operating hours
rather than starts.
Figure 23 lists operating profiles on the high end of each of
these three general categories of gas turbine applications. These
duty cycles have different combinations of hot, warm, and cold
starts with each starting condition having a different effect on
rotor maintenance interval as previously discussed. As a result,
the starts-based rotor maintenance interval will depend on an
application’s specific duty cycle. In the Rotor Inspection Interval
section, a method will be described to determine a maintenance
factor that is specific to the operation’s duty cycle. The application’s
integrated maintenance factor uses the rotor maintenance factors
described above in combination with the actual duty cycle of a
specific application and can be used to determine rotor inspection
intervals. In this calculation, the reference duty cycle that yields
a starts-based maintenance factor equal to one is defined in
Figure 24. Duty cycles different from the Figure 24 definition,
in particular duty cycles with more cold starts or a high number
of trips, will have a maintenance factor greater than one.
Turning gear or ratchet operation after shutdown and before
starting/restarting is a crucial part of normal operating procedure.
After a shutdown, turning of the warm rotor is essential to avoid
bow, or bend, in the rotor. Initiating a start with the rotor in a
bowed condition could lead to high vibrations and excessive rubs.

GE Power & Water | GER-3620M (02/15) 15
Figure F-1 describes turning gear/ratchet scenarios and operation
guidelines (See Appendix). Relevant operating instructions and
TILs should be adhered to where applicable. As a best practice,
units should remain on turning gear or ratchet following a planned
shutdown until wheelspace temperatures have stabilized at or
near ambient temperature. If the unit is to see no further activity
for 48 hours after cool-down is completed, then it may be taken
off of turning gear.
Figure F-1 also provides guidelines for hot restarts. When an
immediate restart is required, it is recommended that the rotor
be placed on turning gear for one hour following a trip from load,
trip from full speed no load, or normal shutdown. This will allow
transient thermal stresses to subside before superimposing a
startup transient. If the machine must be restarted in less than
one hour, a start factor of 2 will apply.
Longer periods of turning gear operation may be necessary prior to
a cold start or hot restart if bow is detected. Vibration data taken
while at crank speed can be used to confirm that rotor bow is at
acceptable levels and the start sequence can be initiated. Users
should reference the O&M Manual and appropriate TILs for specific
instructions and information for their units.
Combustion PartsA typical combustion system contains transition pieces,
combustion liners, flow sleeves, head-end assemblies containing
fuel nozzles and cartridges, end caps and end covers, and assorted
other hardware including cross-fire tubes, spark plugs and flame
detectors. In addition, there can be various fuel and air delivery
components such as purge or check valves and flex hoses. GE
provides several types of combustion systems including standard
combustors, Multi-Nozzle Quiet Combustors (MNQC), Integrated
Gasification Combined Cycle (IGCC) combustors, and Dry Low NOx
(DLN) combustors. Each of these combustion systems has unique
operating characteristics and modes of operation with differing
responses to operational variables affecting maintenance and
refurbishment requirements.
DLN combustion systems use various combustion modes to reach
base load operation. The system transfers from one combustion
mode to the next when the combustion reference temperature
increases to the required value, or transfer temperature, for the
next mode.
Peaking Cyclic Continuous
Hot 2 Start (Down 1-4 Hr.)
3% 1% 10%
Warm 1 Start (Down 4-20 hr.)
10% 82% 5%
Warm 2 Start (Down 20-40 Hr.)
37% 13% 5%
Cold Start (Down >40 Hr.)
50% 4% 80%
Hours/Start 4 16 400
Hours/Year 600 4800 8200
Starts/Year 150 300 21
Percent Trips 3% 1% 20%
Trips/Year 5 3 4
Typical Maintenance Factor (Starts-Based)
1 .7 1 .0 NA
• Operational Profile is Application Specific
• Inspection Interval is Application Specific
Figure 23 . 7F gas turbine typical operational profile
Baseline Unit
Cyclic Duty
6 Starts/Week
16 Hours/Start
4 Outage/Year Maintenance
50 Weeks/Year
4800 Hours/Year
300 Starts/Year
0 Trips/Year
1 Maintenance Factor
12 Cold Starts/Year (down >40 Hr.) 4%
39 Warm 2 Starts/Year (Down 20-40 Hr.) 13%
246 Warm 1 Starts/Year (Down 4-20 Hr.) 82%
3 Hot 2 Starts/Year (Down 1-4 Hr.) 1%
Baseline Unit Achieves Maintenance Factor = 1
Figure 24 . Baseline for starts-based maintenance factor definition

16
• Continuous mode operation is defined as operation in a
combustion mode for longer than what is required during normal
startup/shutdown.
• Extended mode operation is defined as operation in a
combustion mode at a firing temperature greater than the
transfer temperature to the next combustion mode.
The DLN combustion mode recommended for continuous mode
operation is the premixed combustion mode (PM), as it achieves
lowest possible emissions and maximum possible part life.
Continuous and extended mode operation in non-PM combustion
modes is not recommended due to its effect on combustion
hardware life as shown in Figure 25. The use of non-PM combustion
modes has the following effects on maintenance:
• DLN-1/DLN-1+ extended lean-lean operation results in a
maintenance factor of 10 (excluding Frame 5 units where MF=2).
• DLN 2.0/DLN 2+ extended piloted premixed operation results in a
maintenance factor of 10.
• Continuous mode operation in lean-lean (L-L), sub-piloted
premixed (sPPM), or piloted premixed (PPM) modes is not
recommended as it will accelerate combustion hardware
degradation.
• In addition, cyclic operation between piloted premixed and
premixed modes leads to thermal loads on the combustion liner
and transition piece similar to the loads encountered during the
startup/shutdown cycle.
Figure 25 . DLN combustion mode effect on combustion hardware life
Continuous mode operation of DLN 2.6/DLN 2.6+ combustors will
not accelerate combustion hardware degradation.
Another factor that can affect combustion system maintenance
is acoustic dynamics. Acoustic dynamics are pressure oscillations
generated by the combustion system, which, if high enough
in magnitude, can lead to significant wear and cracking of
combustion or hot gas path components. GE practice is to
~85% TNH FSNL Full Load
Combustor Combustion mode effect on hardware life
DLN 1/1+ Primary L-LPremixed
Extended L-L
DLN 2.0/2+ Diffusion L-L/sPPM PPMPremixed
Extended PPM
Severity
High
Low
tune the combustion system to levels of acoustic dynamics low
enough to ensure that the maintenance practices described here
are not compromised. In addition, GE encourages monitoring of
combustion dynamics during turbine operation throughout the
full range of ambient temperatures and loads.
Combustion disassembly is performed, during scheduled
combustion inspections (CI). Inspection interval guidelines are
included in Figure 39. It is expected, and recommended, that
intervals be modified based on specific experience. Replacement
intervals are usually defined by a recommended number of
combustion (or repair) intervals and are usually combustion
component specific. In general, the replacement interval as a
function of the number of combustion inspection intervals is
reduced if the combustion inspection interval is extended. For
example, a component having an 8,000-hour CI interval, and a
six CI replacement interval, would have a replacement interval of
four CI intervals if the inspection interval were increased to 12,000
hours (to maintain a 48,000-hour replacement interval).
For combustion parts, the baseline operating conditions that result
in a maintenance factor of one are fired startup and shutdown to
base load on natural gas fuel without steam or water injection.
Factors that increase the hours-based maintenance factor include
peak load operation, distillate or heavy fuels, and steam or water
injection. Factors that increase starts-based maintenance factor
include peak load start/stop cycles, distillate or heavy fuels, steam
or water injection, trips, and peaking-fast starts.
Casing PartsMost GE gas turbines have inlet, compressor, compressor
discharge, and turbine cases in addition to exhaust frames. Inner
barrels are typically attached to the compressor discharge case.
These cases provide the primary support for the bearings, rotor,
and gas path hardware.
The exterior of all casings should be visually inspected for cracking,
loose hardware, and casing slippage at each combustion, hot
gas path, and major outage. The interior of all casings should
be inspected whenever possible. The level of the outage
determines which casing interiors are accessible for visual
inspection. Borescope inspections are recommended for the
inlet cases, compressor cases, and compressor discharge cases

GE Power & Water | GER-3620M (02/15) 17
during gas path borescope inspections. All interior case surfaces
should be visually inspected during a major outage.
Key inspection areas for casings are listed below.
• Bolt holes
• Shroud pin and borescope holes in the turbine shell (case)
• Compressor stator hooks
• Turbine shell shroud hooks
• Compressor discharge case struts
• Inner barrel and inner barrel bolts
• Inlet case bearing surfaces and hooks
• Inlet case and exhaust frame gibs and trunions
• Extraction manifolds (for foreign objects)
Exhaust Diffuser PartsGE exhaust diffusers come in either axial or radial configurations
as shown in Figures 26 and 27 below. Both types of diffusers are
composed of a forward and aft section. Forward diffusers are
normally axial diffusers, while aft diffusers can be either axial or
radial. Axial diffusers are used in the F-class gas turbines, while
radial diffusers are used in B/E-class gas turbines.
Exhaust diffusers are subject to high gas path temperatures and
vibration due to normal gas turbine operation. Because of the
extreme operating environment and cyclic operating nature of
gas turbines, exhaust diffusers may develop cracks in the sheet
metal surfaces and weld joints used for diffuser construction.
Additionally, erosion may occur due to extended operation at high
temperatures. Exhaust diffusers should be inspected for cracking
and erosion at every combustion, hot gas path and major outage.
In addition, flex seals, L-seals, and horizontal joint gaskets should
be visually/borescope inspected for signs of wear or damage
at every combustion, hot gas path, and major outage. GE
recommends that seals with signs of wear or damage be replaced.
To summarize, key areas that should be inspected are listed below.
Any damage should be reported to GE for recommended repairs.
• Forward diffuser carrier flange (6F)
• Diffuser strut airfoil leading and trailing edges
• Turning vanes in radial diffusers (B/E-class)
• Insulation packs on interior or exterior surfaces
• Clamp ring attachment points to exhaust frame
(major outage only)
• Flex seals and L-seals
• Horizontal joint gaskets
Off-Frequency OperationGE heavy-duty single shaft gas turbines are engineered to operate
at 100% speed with the capability to operate over a 95% to
105% speed range. Operation at other than rated speed has the
potential to affect maintenance requirements. Depending on the
industry code requirements, the specifics of the turbine design,
and the turbine control philosophy employed, operating conditions
can result that will accelerate life consumption of gas turbine
components, particularly rotating flowpath hardware. Where this
is true, the maintenance factor associated with this operation must
be understood. These off-frequency events must be analyzed and
recorded in order to include them in the maintenance plan for the
gas turbine.
Figure 26 . F-class axial diffuser
Figure 27 . E-class radial diffuser

18
Some turbines are required to meet operational requirements
that are aimed at maintaining grid stability under sudden load
or capacity changes. Most codes require turbines to remain on
line in the event of a frequency disturbance. For under-frequency
operation, the turbine output may decrease with a speed decrease,
and the net effect on the turbine is minimal.
In some cases of under-frequency operation, turbine output must
be increased in order to meet the specification-defined output
requirement. If the normal output fall-off with speed results in loads
less than the defined minimum, the turbine must compensate.
Turbine overfiring is the most obvious compensation option, but
other means, such as water-wash, inlet fogging, or evaporative
cooling also provide potential means for compensation. A
maintenance factor may need to be applied for some of these
methods. In addition, off-frequency operation, including rapid grid
transients, may expose the blading to excitations that could result in
blade resonant response and reduced fatigue life.
It is important to understand that operation at over-frequency
conditions will not trade one-for-one for periods at under-
frequency conditions. As was discussed in the firing temperature
section above, operation at peak firing conditions has a nonlinear,
logarithmic relationship with maintenance factor.
Over-frequency or high speed operation can also introduce
conditions that affect turbine maintenance and part replacement
intervals. If speed is increased above the nominal rated speed,
the rotating components see an increase in mechanical stress
proportional to the square of the speed increase. If firing
temperature is held constant at the overspeed condition, the
life consumption rate of hot gas path rotating components will
increase as illustrated in Figure 28 where one hour of operation at
105% speed is equivalent to two hours at rated speed.
If overspeed operation represents a small fraction of a turbine’s
operating profile, this effect on parts life can sometimes be
ignored. However, if significant operation at overspeed is expected
and rated firing temperature is maintained, the accumulated hours
must be recorded and included in the calculation of the turbine’s
overall maintenance factor and the maintenance schedule
adjusted to reflect the overspeed operation.
Compressor Condition and PerformanceMaintenance and operating costs are also influenced by the quality
of the air that the turbine consumes. In addition to the negative
effects of airborne contaminants on hot gas path components,
contaminants such as dust, salt, and oil can cause compressor
blade erosion, corrosion, and fouling.
Fouling can be caused by submicron dirt particles entering the
compressor as well as from ingestion of oil vapor, smoke, sea salt,
and industrial vapors. Corrosion of compressor blading causes
pitting of the blade surface, which, in addition to increasing the
surface roughness, also serves as potential sites for fatigue crack
initiation. These surface roughness and blade contour changes
will decrease compressor airflow and efficiency, which in turn
reduces the gas turbine output and overall thermal efficiency.
Generally, axial flow compressor deterioration is the major cause
of loss in gas turbine output and efficiency. Recoverable losses,
attributable to compressor blade fouling, typically account for
70-85% percent of the performance losses seen. As Figure 29
illustrates, compressor fouling to the extent that airflow is
reduced by 5%, will reduce output by up to 8% and increase heat
rate by up to 3%. Fortunately, much can be done through proper
operation and maintenance procedures both to minimize fouling
type losses and to limit the deposit of corrosive elements. On-line
compressor wash systems are available to maintain compressor
efficiency by washing the compressor while at load, before
significant fouling has occurred. Off-line compressor wash
systems are used to clean heavily fouled compressors. Other
procedures include maintaining the inlet filtration system, inlet
% Speed
Over Speed OperationConstant Tfire
100 101 102 103 104 105
Mai
nten
ance
Fac
tor
(MF)
MF = 2
10.0
1.0
Figure 28 . Maintenance factor for overspeed operation ~constant TF
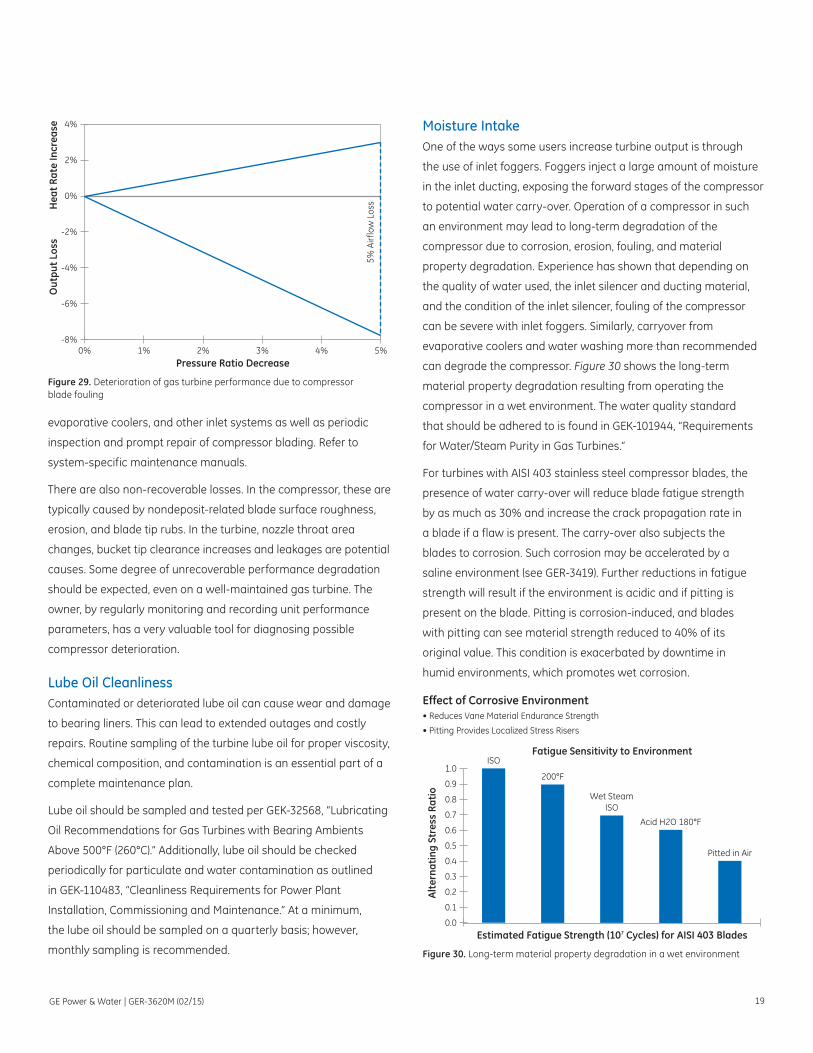
GE Power & Water | GER-3620M (02/15) 19
evaporative coolers, and other inlet systems as well as periodic
inspection and prompt repair of compressor blading. Refer to
system-specific maintenance manuals.
There are also non-recoverable losses. In the compressor, these are
typically caused by nondeposit-related blade surface roughness,
erosion, and blade tip rubs. In the turbine, nozzle throat area
changes, bucket tip clearance increases and leakages are potential
causes. Some degree of unrecoverable performance degradation
should be expected, even on a well-maintained gas turbine. The
owner, by regularly monitoring and recording unit performance
parameters, has a very valuable tool for diagnosing possible
compressor deterioration.
Lube Oil CleanlinessContaminated or deteriorated lube oil can cause wear and damage
to bearing liners. This can lead to extended outages and costly
repairs. Routine sampling of the turbine lube oil for proper viscosity,
chemical composition, and contamination is an essential part of a
complete maintenance plan.
Lube oil should be sampled and tested per GEK-32568, “Lubricating
Oil Recommendations for Gas Turbines with Bearing Ambients
Above 500°F (260°C).” Additionally, lube oil should be checked
periodically for particulate and water contamination as outlined
in GEK-110483, “Cleanliness Requirements for Power Plant
Installation, Commissioning and Maintenance.” At a minimum,
the lube oil should be sampled on a quarterly basis; however,
monthly sampling is recommended.
Moisture IntakeOne of the ways some users increase turbine output is through
the use of inlet foggers. Foggers inject a large amount of moisture
in the inlet ducting, exposing the forward stages of the compressor
to potential water carry-over. Operation of a compressor in such
an environment may lead to long-term degradation of the
compressor due to corrosion, erosion, fouling, and material
property degradation. Experience has shown that depending on
the quality of water used, the inlet silencer and ducting material,
and the condition of the inlet silencer, fouling of the compressor
can be severe with inlet foggers. Similarly, carryover from
evaporative coolers and water washing more than recommended
can degrade the compressor. Figure 30 shows the long-term
material property degradation resulting from operating the
compressor in a wet environment. The water quality standard
that should be adhered to is found in GEK-101944, “Requirements
for Water/Steam Purity in Gas Turbines.”
For turbines with AISI 403 stainless steel compressor blades, the
presence of water carry-over will reduce blade fatigue strength
by as much as 30% and increase the crack propagation rate in
a blade if a flaw is present. The carry-over also subjects the
blades to corrosion. Such corrosion may be accelerated by a
saline environment (see GER-3419). Further reductions in fatigue
strength will result if the environment is acidic and if pitting is
present on the blade. Pitting is corrosion-induced, and blades
with pitting can see material strength reduced to 40% of its
original value. This condition is exacerbated by downtime in
humid environments, which promotes wet corrosion.
4%
2%
0%
-2%
-4%
-6%
-8%
Out
put L
oss
Hea
t Rat
e In
crea
se
Pressure Ratio Decrease0% 1% 2% 3% 4% 5%
5% A
irflo
w L
oss
Figure 29 . Deterioration of gas turbine performance due to compressor blade fouling
ISO
200°F
Acid H2O 180°F
Wet SteamISO
Pitted in Air
Effect of Corrosive Environment• Reduces Vane Material Endurance Strength
• Pitting Provides Localized Stress Risers
Fatigue Sensitivity to Environment
Alte
rnat
ing
Stre
ss R
atio
Estimated Fatigue Strength (107 Cycles) for AISI 403 Blades
1.0
0.9
0.8
0.7
0.6
0.5
0.4
0.3
0.2
0.1
0.0
Figure 30 . Long-term material property degradation in a wet environment
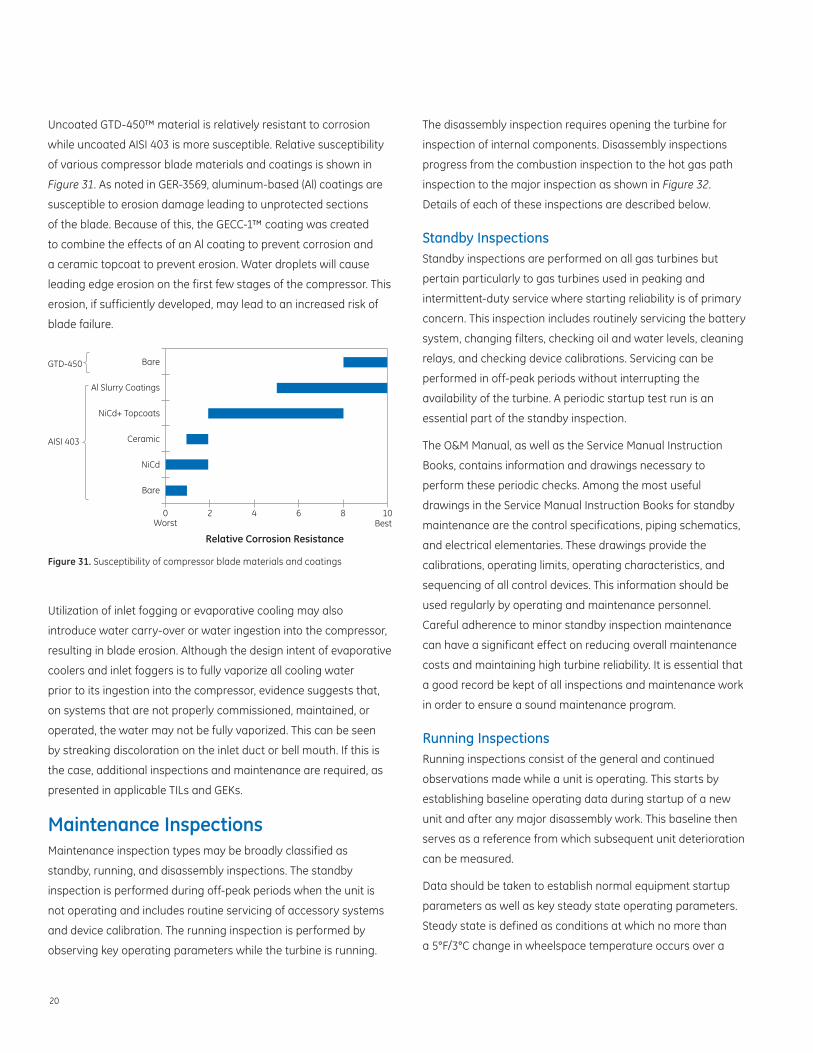
20
Uncoated GTD-450™ material is relatively resistant to corrosion
while uncoated AISI 403 is more susceptible. Relative susceptibility
of various compressor blade materials and coatings is shown in
Figure 31. As noted in GER-3569, aluminum-based (Al) coatings are
susceptible to erosion damage leading to unprotected sections
of the blade. Because of this, the GECC-1™ coating was created
to combine the effects of an Al coating to prevent corrosion and
a ceramic topcoat to prevent erosion. Water droplets will cause
leading edge erosion on the first few stages of the compressor. This
erosion, if sufficiently developed, may lead to an increased risk of
blade failure.
Utilization of inlet fogging or evaporative cooling may also
introduce water carry-over or water ingestion into the compressor,
resulting in blade erosion. Although the design intent of evaporative
coolers and inlet foggers is to fully vaporize all cooling water
prior to its ingestion into the compressor, evidence suggests that,
on systems that are not properly commissioned, maintained, or
operated, the water may not be fully vaporized. This can be seen
by streaking discoloration on the inlet duct or bell mouth. If this is
the case, additional inspections and maintenance are required, as
presented in applicable TILs and GEKs.
Maintenance InspectionsMaintenance inspection types may be broadly classified as
standby, running, and disassembly inspections. The standby
inspection is performed during off-peak periods when the unit is
not operating and includes routine servicing of accessory systems
and device calibration. The running inspection is performed by
observing key operating parameters while the turbine is running.
The disassembly inspection requires opening the turbine for
inspection of internal components. Disassembly inspections
progress from the combustion inspection to the hot gas path
inspection to the major inspection as shown in Figure 32.
Details of each of these inspections are described below.
Standby InspectionsStandby inspections are performed on all gas turbines but
pertain particularly to gas turbines used in peaking and
intermittent-duty service where starting reliability is of primary
concern. This inspection includes routinely servicing the battery
system, changing filters, checking oil and water levels, cleaning
relays, and checking device calibrations. Servicing can be
performed in off-peak periods without interrupting the
availability of the turbine. A periodic startup test run is an
essential part of the standby inspection.
The O&M Manual, as well as the Service Manual Instruction
Books, contains information and drawings necessary to
perform these periodic checks. Among the most useful
drawings in the Service Manual Instruction Books for standby
maintenance are the control specifications, piping schematics,
and electrical elementaries. These drawings provide the
calibrations, operating limits, operating characteristics, and
sequencing of all control devices. This information should be
used regularly by operating and maintenance personnel.
Careful adherence to minor standby inspection maintenance
can have a significant effect on reducing overall maintenance
costs and maintaining high turbine reliability. It is essential that
a good record be kept of all inspections and maintenance work
in order to ensure a sound maintenance program.
Running InspectionsRunning inspections consist of the general and continued
observations made while a unit is operating. This starts by
establishing baseline operating data during startup of a new
unit and after any major disassembly work. This baseline then
serves as a reference from which subsequent unit deterioration
can be measured.
Data should be taken to establish normal equipment startup
parameters as well as key steady state operating parameters.
Steady state is defined as conditions at which no more than
a 5°F/3°C change in wheelspace temperature occurs over a
Bare
Al Slurry Coatings
NiCd+ Topcoats
Ceramic
NiCd
Bare
0 2 4 6 8 10Worst Best
GTD-450
AISI 403
Relative Corrosion Resistance
Figure 31 . Susceptibility of compressor blade materials and coatings

GE Power & Water | GER-3620M (02/15) 21
15-minute time period. Data must be taken at regular intervals
and should be recorded to permit an evaluation of the turbine
performance and maintenance requirements as a function of
operating time. This operating inspection data, summarized in
Figure 33, includes: load versus exhaust temperature, vibration
level, fuel flow and pressure, bearing metal temperature, lube
oil pressure, exhaust gas temperatures, exhaust temperature
spread variation, startup time, and coast-down time. This list
is only a minimum and other parameters should be used as
necessary. A graph of these parameters will help provide a basis
for judging the conditions of the system. Deviations from the
norm help pinpoint impending issues, changes in calibration, or
damaged components.
A sudden abnormal change in running conditions or a severe trip
event could indicate damage to internal components. Conditions
that may indicate turbine damage include high vibration, high
exhaust temperature spreads, compressor surge, abnormal
changes in health monitoring systems, and abnormal changes
in other monitoring systems. It is recommended to conduct a
borescope inspection after such events whenever component
damage is suspected.
Disassembly Inspections• Combustion
• Hot Gas Path
• Major
Major Inspection
Hot Gas PathInspection
CombustionInspection
Figure 32 . 7E.03 heavy-duty gas turbine – disassembly inspections
• Speed
• Load
• Fired Starts
• Fired Hours
• Temperatures– Inlet Ambient
– Compressor Discharge
– Turbine Exhaust
– Turbine Wheelspace
– Lube Oil Header
– Lube Oil Tank
– Bearing Metal
– Bearing Drains
– Exhaust Spread
• Pressures– Compressor Discharge
– Lube Pump(s)
– Bearing Header
– Barometric
– Cooling Water
– Fuel
– Filters (Fuel, Lube, Inlet Air)
• Vibration
• Generator– Output Voltage
– Phase Current
– VARS
– Load
– Field Voltage
– Field Current
– Stator Temp.
– Vibration
• Startup Time
• Coast-Down Time
Figure 33 . Operating inspection data parameters

22
Load vs. Exhaust Temperature
The general relationship between load and exhaust temperature
should be observed and compared to previous data. Ambient
temperature and barometric pressure will have some effect
upon the exhaust temperature. High exhaust temperature can
be an indicator of deterioration of internal parts, excessive leaks
or a fouled air compressor. For mechanical drive applications,
it may also be an indication of increased power required by
the driven equipment.
Vibration Level
The vibration signature of the unit should be observed and
recorded. Minor changes will occur with changes in operating
conditions. However, large changes or a continuously increasing
trend give indications of the need to apply corrective action.
Fuel Flow and Pressure
The fuel system should be observed for the general fuel flow
versus load relationship. Fuel pressures through the system
should be observed. Changes in fuel pressure can indicate that
the fuel nozzle passages are plugged or that fuel-metering
elements are damaged or out of calibration.
Exhaust Temperature and Spread Variation
The most important control function to be monitored is the
exhaust temperature fuel override system and the back-up over
temperature trip system. Routine verification of the operation
and calibration of these functions will minimize wear on the
hot gas path parts.
Startup Time
Startup time is a reference against which subsequent operating
parameters can be compared and evaluated. A curve of the
starting parameters of speed, fuel signal, exhaust temperature,
and critical sequence bench marks versus time will provide a good
indication of the condition of the control system. Deviations from
normal conditions may indicate impending issues, changes in
calibration, or damaged components.
Coast-Down Time
Coast-down time is an indicator of bearing alignment and bearing
condition. The time period from when the fuel is shut off during a
normal shutdown until the rotor comes to turning gear speed can
be compared and evaluated.
Close observation and monitoring of these operating parameters
will serve as the basis for effectively planning maintenance
work and material requirements needed for subsequent
shutdown periods.
Rapid Cool-DownPrior to an inspection, a common practice is to force cool the unit
to speed the cool-down process and shorten outage time. Force
cooling involves turning the unit at crank speed for an extended
period of time to continue flowing ambient air through the
machine. This is permitted, although a natural cool-down cycle
on turning gear or ratchet is preferred for normal shutdowns
when no outage is pending.
Forced cooling should be limited since it imposes additional
thermal stresses on the unit that may result in a reduction of
parts life.
Opening the compartment doors during any cool-down
operation is prohibited unless an emergency situation requires
immediate compartment inspection. Cool-down times should not
be accelerated by opening the compartment doors or lagging
panels, since uneven cooling of the outer casings may result in
excessive case distortion and heavy blade rubs.
Combustion InspectionThe combustion inspection is a relatively short disassembly
inspection of fuel nozzles, liners, transition pieces, crossfire
tubes and retainers, spark plug assemblies, flame detectors,
and combustor flow sleeves. This inspection concentrates on the
combustion liners, transition pieces, fuel nozzles, and end caps,
which are recognized as being the first to require replacement
and repair in a good maintenance program. Proper inspection,
maintenance, and repair (Figure 34) of these items will contribute
to a longer life of the downstream parts, such as turbine nozzles
and buckets.
Figure 32 illustrates the section of a 7E.03 unit that is disassembled
for a combustion inspection. The combustion liners, transition
pieces, and fuel nozzle assemblies should be removed and
replaced with new or repaired components to minimize downtime.
The removed liners, transition pieces, and fuel nozzles can then be
cleaned and repaired after the unit is returned to operation and
be available for the next combustion inspection interval. Typical
combustion inspection requirements are:

GE Power & Water | GER-3620M (02/15) 23
• Inspect combustion chamber components.
• Inspect each crossfire tube, retainer and combustion liner.
• Inspect combustion liner for TBC spalling, wear, and cracks.
• Inspect combustion system and discharge casing for debris and
foreign objects.
• Inspect flow sleeve welds for cracking.
• Inspect transition piece for wear and cracks.
• Inspect fuel nozzles for plugging at tips, erosion of tip holes, and
safety lock of tips.
• Inspect impingement sleeves for cracks (where applicable).
• Inspect all fluid, air, and gas passages in nozzle assembly for
plugging, erosion, burning, etc.
• Inspect spark plug assembly for freedom from binding; check
condition of electrodes and insulators.
• Replace all consumables and normal wear-and-tear items such
as seals, lockplates, nuts, bolts, gaskets, etc.
• Perform visual inspection of first-stage turbine nozzle partitions
and borescope inspect (Figure 3) turbine buckets to mark the
progress of wear and deterioration of these parts. This inspection
will help establish the schedule for the hot gas path inspection.
• Perform borescope inspection of compressor.
Figure 34 . Combustion inspection – key elements
Combustion Inspection
Key Hardware Inspect For Potential Action
Combustion liners Foreign object damage (FOD) Repair/refurbish/replace
Combustion end covers Abnormal wear • TransitionPieces
– Strip and recoat
– Weld repair
– Creep repair
• Liners
– Strip and recoat
– Weld repair
– Hula sealreplacement
– Repair out-of-roundness
• Fuelnozzles
– Weld repair
– Flow test
– Leak test
Fuel nozzles Cracking
End caps Liner cooling hole plugging
Transition pieces TBC coating condition
Cross fire tubes Oxidation/corrosion/erosion
Flow sleeves Hot spots/burning
Purge valves Missing hardware
Check valves Clearance limits
Spark plugs
Flame detectors
Flex hoses
IGVs and bushings
Compressor and turbine (borescope)
Exhaust diffuser Cracks Weld repair
Exhaust diffuser Insulation Loose/missing parts Replace/tighten parts
Forward diffuser flex seal Wear/cracked parts Replace seals
Compressor discharge case Cracks Repair or monitor
Cases – exterior Cracks Repair or monitor
Criteria• O&MManual • TILs• GEFieldEngineer
Inspection Methods• Visual • LiquidPenetrant• Borescope
Availability of On-Site Spares is Key to Minimizing Downtime

24
• Visually inspect the compressor inlet, checking the condition
of the inlet guide vanes (IGVs), IGV bushings, and first stage
rotating blades.
• Check the condition of IGV actuators and rack-and-pinion gearing.
• Verify the calibration of the IGVs.
• Visually inspect compressor discharge case struts for signs
of cracking.
• Visually inspect compressor discharge case inner barrel
if accessible.
• Visually inspect the last-stage buckets and shrouds.
• Visually inspect the exhaust diffuser for any cracks in flow
path surfaces. Inspect insulated surfaces for loose or missing
insulation and/or attachment hardware in internal and external
locations. In B/E-class machines, inspect the insulation on the
radial diffuser and inside the exhaust plenum as well.
• Inspect exhaust frame flex seals, L-seals, and horizontal joint
gaskets for any signs of wear or damage.
• Verify proper operation of purge and check valves. Confirm
proper setting and calibration of the combustion controls.
• Inspect turbine inlet systems including filters, evaporative
coolers, silencers, etc. for corrosion, cracks, and loose parts.
After the combustion inspection is complete and the unit is
returned to service, the removed combustion hardware can
be inspected by a qualified GE field service representative and,
if necessary, sent to a qualified GE Service Center for repairs.
It is recommended that repairs and fuel nozzle flow testing be
performed at qualified GE service centers.
See the O&M Manual for additional recommendations and unit
specific guidance.
Hot Gas Path InspectionThe purpose of a hot gas path inspection is to examine those parts
exposed to high temperatures from the hot gases discharged from
the combustion process. The hot gas path inspection outlined
in Figure 35 includes the full scope of the combustion inspection
and, in addition, a detailed inspection of the turbine nozzles,
Figure 35 . Hot gas path inspection – key elements
Hot Gas Path InspectionCombustion Inspection Scope—Plus:
Key Hardware Inspect For Potential Action
Nozzles (1, 2, 3) Foreign object damage Repair/refurbish/replace
Buckets (1, 2, 3) Oxidation/corrosion/erosion • Nozzles
– Weld repair
– Reposition
– Recoat
• Statorshrouds
– Weld repair
– Blend
– Recoat
• Buckets
– Strip & recoat
– Weld repair
– Blend
Stator shrouds Cracking
Compressor blading (borescope) Cooling hole plugging
Remaining coating life
Nozzle deflection/distortion
Abnormal deflection/distortion
Abnormal wear
Missing hardware
Clearance limits
Evidence of creep
Turbine shell Cracks Repair or monitor
Criteria• O&MManual • TILs• GEFieldEngineer
Inspection Methods• Visual • LiquidPenetrant• Borescope
Availability of On-Site Spares is Key to Minimizing Downtime

GE Power & Water | GER-3620M (02/15) 25
stator shrouds, and turbine buckets. To perform this inspection,
the top half of the turbine shell must be removed. Prior to shell
removal, proper machine centerline support using mechanical
jacks is necessary to assure proper alignment of rotor to stator,
obtain accurate half-shell clearances, and prevent twisting of
the stator casings. Reference the O&M Manual for unit-specific
jacking procedures.
Special inspection procedures apply to specific components
in order to ensure that parts meet their intended life. These
inspections may include, but are not limited to, dimensional
inspections, Fluorescent Penetrant Inspection (FPI), Eddy Current
Inspection (ECI), and other forms of non-destructive testing (NDT).
The type of inspection required for specific hardware is determined
on a part number and operational history basis, and can be
obtained from a GE service representative.
Similarly, repair action is taken on the basis of part number, unit
operational history, and part condition. Repairs including (but not
limited to) strip, chemical clean, HIP (Hot Isostatic Processing),
heat treat, and recoat may also be necessary to ensure full parts
life. Weld repair will be recommended when necessary, typically
as determined by visual inspection and NDT. Failure to perform
the required repairs may lead to retirement of the part before
its life potential is fulfilled. In contrast, unnecessary repairs are
an unneeded expenditure of time and resources. To verify the
types of inspection and repair required, contact your GE service
representative prior to an outage.
For inspection of the hot gas path (Figure 32), all combustion
transition pieces and the first-stage turbine nozzle assemblies must
be removed. Removal of the second- and third-stage turbine nozzle
segment assemblies is optional, depending upon the results of
visual observations, clearance measurements, and other required
inspections. The buckets can usually be inspected in place. FPI of
the bucket vane sections may be required to detect any cracks.
In addition, a complete set of internal turbine radial and axial
clearances (opening and closing) must be taken during any hot
gas path inspection. Re-assembly must meet clearance diagram
requirements to prevent rubs and to maintain unit performance.
In addition to combustion inspection requirements, typical hot gas
path inspection requirements are:
• Inspect and record condition of first-, second-, and third-stage
buckets. If it is determined that the turbine buckets should
be removed, follow bucket removal and condition recording
instructions. Buckets with protective coating should be
evaluated for remaining coating life.
• Inspect and record condition of first-, second-, and
third-stage nozzles.
• Inspect seals and hook fits of turbine nozzles and diaphragms
for rubs, erosion, fretting, or thermal deterioration.
• Inspect and record condition of later-stage nozzle
diaphragm packings.
• Check discourager seals for rubs, and deterioration
of clearance.
• Record the bucket tip clearances.
• Inspect bucket shank seals for clearance, rubs, and deterioration.
• Perform inspections on cutter teeth of tip-shrouded buckets.
Consider refurbishment of buckets with worn cutter teeth,
particularly if concurrently refurbishing the honeycomb of the
corresponding stationary shrouds. Consult your GE service
representative to confirm that the bucket under consideration
is repairable.
• Check the turbine stationary shrouds for clearance, cracking,
erosion, oxidation, rubbing, and build-up of debris.
• Inspect turbine rotor for cracks, object damage, or rubs.
• Check and replace any faulty wheelspace thermocouples.
• Perform borescope inspection of the compressor.
• Visually inspect the turbine shell shroud hooks for signs
of cracking.
The first-stage turbine nozzle assembly is exposed to the direct hot
gas discharge from the combustion process and is subjected to the
highest gas temperatures in the turbine section. Such conditions
frequently cause nozzle cracking and oxidation, and in fact, this
is expected. The second- and third-stage nozzles are exposed to
high gas bending loads, which in combination with the operating
temperatures can lead to downstream deflection and closure
of critical axial clearances. To a degree, nozzle distress can be
tolerated, and criteria have been established for determining when
repair is required. More common criteria are described in the O&M
Manuals. However, as a general rule, first-stage nozzles will require

26
repair at the hot gas path inspection. The second- and third-stage
nozzles may require refurbishment to re-establish the proper axial
clearances. Normally, turbine nozzles can be repaired several
times, and it is generally repair cost versus replacement cost that
dictates the replacement decision.
Coatings play a critical role in protecting the buckets operating
at high metal temperatures. They ensure that the full capability
of the high strength superalloy is maintained and that the bucket
rupture life meets design expectations. This is particularly true
of cooled bucket designs that operate above 1985°F (1085°C)
firing temperature. Significant exposure of the base metal to
the environment will accelerate the creep rate and can lead to
premature replacement through a combination of increased
temperature and stress and a reduction in material strength,
as described in Figure 36. This degradation process is driven by
oxidation of the unprotected base alloy. On early generation
uncooled designs, surface degradation due to corrosion or
oxidation was considered to be a performance issue and not a
factor in bucket life. This is no longer the case at the higher firing
temperatures of current generation designs.
Given the importance of coatings, it must be recognized that even
the best coatings available will have a finite life, and the condition
of the coating will play a major role in determining bucket life.
Refurbishment through stripping and recoating is an option for
achieving bucket’s expected/design life, but if recoating is selected,
it should be done before the coating is breached to expose base
metal. Normally, for 7E.03 turbines, this means that recoating
will be required at the hot gas path inspection. If recoating is not
performed at the hot gas path inspection, the life of the buckets
would generally be one additional hot gas path inspection interval,
at which point the buckets would be replaced. For F-class gas
turbines, recoating of the first stage buckets is recommended at
each hot gas path inspection. Visual and borescope examination
of the hot gas path parts during the combustion inspections as
well as nozzle-deflection measurements will allow the operator
to monitor distress patterns and progression. This makes part-
life predictions more accurate and allows adequate time to plan
for replacement or refurbishment at the time of the hot gas path
inspection. It is important to recognize that to avoid extending the
hot gas path inspection, the necessary spare parts should be on
site prior to taking the unit out of service.
See the O&M Manual for additional recommendations and unit
specific guidance.
Major InspectionThe purpose of the major inspection is to examine all of the internal
rotating and stationary components from the inlet of the machine
through the exhaust. A major inspection should be scheduled in
accordance with the recommendations in the owner’s O&M Manual
or as modified by the results of previous borescope and hot gas
path inspections. The work scope shown in Figure 37 involves
Oxidation & Bucket Life
Base Metal Oxidation
Pressure Side Surface
Reduces Bucket Creep Life
Cooling Hole Surface Oxidation
Depleted Coating
Airfoil Surface OxidationTE Cooling Hole
Increases Stress• Reduced Load Carrying Cross Section
Increases Metal Temperature• Surface Roughness Effects
Decreases Alloy Creep Strength• Environmental Effects
Figure 36 . Stage 1 bucket oxidation and bucket life

GE Power & Water | GER-3620M (02/15) 27
inspection of all of the major flange-to-flange components of
the gas turbine, which are subject to deterioration during normal
turbine operation. This inspection includes previous elements of the
combustion and hot gas path inspections, and requires laying open
the complete flange-to-flange gas turbine to the horizontal joints,
as shown in Figure 32.
Removal of all of the upper casings allows access to the
compressor rotor and stationary compressor blading, as well as
to the bearing assemblies. Prior to removing casings, shells, and
frames, the unit must be properly supported. Proper centerline
support using mechanical jacks and jacking sequence procedures
are necessary to assure proper alignment of rotor to stator, obtain
accurate half shell clearances, and to prevent twisting of the
casings while on the half shell. Reference the O&M Manual for
unit-specific jacking procedures. In addition to combustion and
hot gas path inspection requirements, typical major inspection
requirements are:
• Check all radial and axial clearances against their original values
(opening and closing).
• Inspect all casings, shells, and frames/diffusers for cracks
and erosion.
• Inspect compressor inlet and compressor flow-path for fouling,
erosion, corrosion, and leakage.
• Check rotor and stator compressor blades for tip clearance,
rubs, object damage, corrosion pitting, and cracking.
• Remove turbine buckets and perform a nondestructive check
of buckets and wheel dovetails. Wheel dovetail fillets, pressure
faces, edges, and intersecting features must be closely examined
for conditions of wear, galling, cracking, or fretting.
• Inspect unit rotor for cracks, object damage, or rubs.
• Inspect bearing liners and seals for clearance and wear.
Figure 37 . Gas turbine major inspection – key elements
Criteria• O&MManual •TILs• GEFieldEngineer
Inspection Methods• Visual •LiquidPenetrant• Borescope •Ultrasonics
Major InspectionHot Gas Path Inspection Scope—Plus:
Key Hardware Inspect For Potential Action
Compressor blading Foreign object damage Repair/refurbishment/replace
Unit rotor Oxidation/corrosion/erosion •Bearings/seals
Journals and seal surfaces Cracking – Clean
Bearing seals Leaks – Assess oil condition
Exhaust system Abnormal wear – Re-babbitt
Missing hardware •Compressorblades
Clearance limits – Clean
Coating wear – Blend
Fretting •Exhaustsystem
– Weld repair
– Replace flex seals/L-seals
Compressor and compressor discharge case hooks
Wear Repair
All cases – exterior and interior Cracks Repair or monitor
Cases – Exterior Slippage Casing alignment

28
• Visually inspect compressor and compressor discharge case
hooks for signs of wear.
• Visually inspect compressor discharge case inner barrel.
• Inspect exhaust frame flex seals, L-seals, and horizontal joint
gaskets for any signs of wear or damage. Inspect steam gland
seals for wear and oxidation.
• Check torque values for steam gland bolts and re-torque
to full values.
• Check alignment – gas turbine to generator/gas turbine to
accessory gear.
• Inspect casings for signs of casing flange slippage.
Comprehensive inspection and maintenance guidelines have been
developed by GE and are provided in the O&M Manual to assist
users in performing each of the inspections previously described.
Parts PlanningPrior to a scheduled disassembly inspection, adequate spares
should be on-site. Lack of adequate on-site spares can have
a major effect on plant availability. For example, a planned
outage such as a combustion inspection, which should only
take two to five days, could take weeks if adequate spares are
not on-site. GE will provide recommendations regarding the
types and quantities of spare parts needed; however, it is up
to the owner to purchase these spare parts on a planned basis
allowing adequate lead times.
Early identification of spare parts requirements ensures their
availability at the time the planned inspections are performed.
Refer to the Reference Drawing Manual provided as part of the
comprehensive set of O&M Manuals to aid in identification and
ordering of gas turbine parts.
Additional benefits available from the renewal parts catalog
data system are the capability to prepare recommended spare
parts lists for the combustion, hot gas path and major inspections
as well as capital and operational spares.
Estimated repair and replacement intervals for some of the
major components are shown in Appendix D. These tables assume
that operation, inspections, and repairs of the unit have been
done in accordance with all of the manufacturer’s specifications
and instructions.
The actual repair and replacement intervals for any particular
gas turbine should be based on the user’s operating procedures,
experience, maintenance practices, and repair practices. The
maintenance factors previously described can have a major effect
on both the component repair interval and service life. For this
reason, the intervals given in Appendix D should only be used
as guidelines and not certainties for long range parts planning.
Owners may want to include contingencies in their parts planning.
The estimated repair and replacement interval values reflect
current production hardware (the typical case) with design
improvements such as advanced coatings and cooling technology.
With earlier production hardware, some of these lives may not be
achievable. Operating factors and experience gained during the
course of recommended inspection and maintenance procedures
will be a more accurate predictor of the actual intervals.
The estimated repair and replacement intervals are based on
the recommended inspection intervals shown in Figure 39. For
certain models, technology upgrades are available that extend the
maintenance inspection intervals. The application of inspection (or
repair) intervals other than those shown in Figure 39 can result in
different replacement intervals than those shown in Appendix D.
See your GE service representative for details on a specific system.
It should be recognized that, in some cases, the service life of a
component is reached when it is no longer economical to repair
any deterioration as opposed to replacing at a fixed interval. This
is illustrated in Figure 38 for a first stage nozzle, where repairs
continue until either the nozzle cannot be restored to minimum
acceptance standards or the repair cost exceeds or approaches
the replacement cost. In other cases, such as first-stage buckets,
repair options are limited by factors such as irreversible material
damage. In both cases, users should follow GE recommendations
regarding replacement or repair of these components.
It should also be recognized that the life consumption of any one
individual part within a parts set can have variations. This may
lead to a certain percentage of “fallout,” or scrap, of parts being
repaired. Those parts that fallout during the repair process will
need to be replaced by new parts. Parts fallout will vary based on
the unit operating environment history, the specific part design,
and the current repair technology.

GE Power & Water | GER-3620M (02/15) 29
Operating Hours
Noz
zle
Cons
truc
tion
Severe Deterioration
10,000 20,000 30,000 40,000 50,000 60,000 70,000 80,000
New NozzleAcceptance Standards
Repaired NozzleMin. Acceptance Standard
1stRepair
2ndRepair
3rdRepair
Repa
ir C
ost E
xcee
dsRe
plac
emen
t Cos
t
Without Repair
Figure 38 . First-stage nozzle repair program: natural gas fired – continuous dry – base load
Type of Inspection
Type of hours/starts
Hours/Starts
6B 7E 9E
MS3002K MS5001PA MS5002C, D 6B .03 7E .03 (6) 9E .03 (7)
Combustion (Non-DLN) Factored 12000/400 (3) 12000/800 (1)(3)(5) 12000/800 (1)(3)(5) 12000/600 (2)(5) 8000/900 (2)(5) 8000/900 (2)(5)
Combustion (DLN) Factored 8000/400 (3)(5) 8000/400 (3)(5) 12000/450 (5) 12000/450 (5) 12000/450 (5)
Hot Gas Path Factored 24000/1200 (4) 24000/1200 (4)(5) 24000/1200 (4)(5) 24000/1200 (5) 24000/1200 (5) 24000/900 (5)
Major Actual 48000/2400 48000/2400 (5) 48000/2400 (5) 48000/2400 (5) 48000/2400 (5) 48000/2400 (5)
Type of Inspection
Type of hours/starts
Hours/Starts
6F 7F 9F
6F .03 7F .03 7F .04 7FB .01 9F .03 9F .05
Combustion (Non-DLN) Factored 8000/400
Combustion (DLN) Factored 12000/450 (5) 24000/900 32000/900 (5) 12000/450 24000/900 12000/450
Hot Gas Path Factored 24000/900 24000/900 32000/1250 24000/900 24000/900 24000/900
Major Actual 48000/2400 48000/2400 64000/2400 48000/2400 48000/2400 48000/2400
Factors that can reduce maintenance intervals:
• Fuel
• Load setting
• Steam/water injection
• Peak load firingoperation
• Trips
• Start cycle
• Hardware design
• Off-frequency operation
1. Units with Lean Head End liners have a 400-starts combustion inspectioninterval.
2. Multiple Non-DLN configurations exist (Standard, MNQC, IGCC). The typicalcase is shown; however, different quoting limits may exist on a machine andhardware basis. Contact a GE service representative for further information.
3. Combustion inspection without transition piece removal. Combustioninspection with transition pieces removal to be performed every 2combustion inspection intervals.
4. Hot gas path inspection for factored hours eliminated on units that operateon natural gas fuel without steam or water injection.
5. Upgraded technology (Extendor*, PIP, DLN 2.6+, etc) may have longerinspection intervals.
6. Also applicable to 7121(EA) models.7. Applicable to non-AGP units only.*Trademark of General Electric Company
Note:
Baseline inspection intervals reflect current production hardware, unless otherwise noted, and operation in accordance with manufacturer specifications. They represent initial recommended intervals in the absence of operating and condition experience.
For Repair/Replace intervals see Appendix D.
Figure 39 . Baseline recommended inspection intervals: base load – natural gas fuel – dry

30
Inspection IntervalsIn the absence of operating experience and resulting part
conditions, Figure 39 lists the recommended combustion, hot
gas path and major inspection intervals for current production
GE turbines operating under typical conditions of natural gas fuel,
base load, and no water/steam injection. These recommended
intervals represent factored hours or starts calculated using
maintenance factors to account for application specific operating
conditions. Initially, recommended intervals are based on
the expected operation of a turbine at installation, but this
should be reviewed and adjusted as operating and maintenance
data are accumulated. While reductions in the recommended
intervals will result from the factors described previously or
unfavorable operating experience, increases in the recommended
intervals may also be considered where operating experience
has been favorable.
The condition of the combustion and hot gas path parts provides a
basis for customizing a program for inspection and maintenance.
The condition of the compressor and bearing assemblies is the
key driver in planning a major inspection. Historical operation
and machine conditions can be used to tailor maintenance
programs such as optimized repair and inspection criteria to
specific sites/machines. GE leverages these principles and
accumulated site and fleet experience in a “Condition Based
Maintenance” program as the basis for maintenance of units
under Contractual Service Agreements. This experience was
accumulated on units that operate with GE approved repairs,
field services, monitoring, and full compliance to GE’s technical
recommendations.
GE can assist operators in determining the appropriate
maintenance intervals for their particular application. Equations
have been developed that account for the factors described earlier
and can be used to determine application-specific combustion,
hot gas path, and major inspection intervals.
Borescope Inspection IntervalIn addition to the planned maintenance intervals, which
undertake scheduled inspections or component repairs or
replacements, borescope inspections should be conducted to
identify any additional actions, as discussed in the sections
“Gas Turbine Design Maintenance Features.” Such inspections
may identify additional areas to be addressed at a future
scheduled maintenance outage, assist with parts or resource
planning, or indicate the need to change the timing of a future
outage. The BI should use all the available access points to verify
the condition of the internal hardware. As much of the Major
Inspection workscope as possible should be done using this visual
inspection without dissassembly. Refer to Figure 4 for standard
recommended BI frequency. Specific concerns may warrant
subsequent BIs in order to operate the unit to the next scheduled
outage without teardown.
Combustion Inspection IntervalEquations have been developed that account for the earlier
mentioned factors affecting combustion maintenance intervals.
These equations represent a generic set of maintenance factors
that provide guidance on maintenance planning. As such, these
equations do not represent the specific capability of any given
combustion system. For combustion parts, the baseline operating
conditions that result in a maintenance factor of one are normal
fired startup and shutdown (no trip) to base load on natural gas
fuel without steam or water injection.
An hours-based combustion maintenance factor can be determined
from the equations given in Figure 40 as the ratio of factored hours
to actual operating hours. Factored hours considers the effects of
fuel type, load setting, and steam/water injection. Maintenance
factors greater than one reduce recommended combustion
inspection intervals from those shown in Figure 39 representing
baseline operating conditions. To obtain a recommended
inspection interval for a specific application, the maintenance
factor is divided into the recommended baseline inspection interval.
A starts-based combustion maintenance factor can be determined
from the equations given in Figure 41 and considers the effect of
fuel type, load setting, peaking-fast starts, trips, and steam/water
injection. An application-specific recommended inspection interval
can be determined from the baseline inspection interval in Figure 39
and the maintenance factor from Figure 41. Appendix B shows six
example maintenance factor calculations using the above hours
and starts maintenance factor equations.

GE Power & Water | GER-3620M (02/15) 31
Figure 40 . Combustion inspection hours-based maintenance factors
Syngas units require unit-specific intervals to account for unit-
specific fuel constituents and water/steam injection schedules.
As such, the combustion inspection interval equations may not
apply to those units.
Hours-Based Combustion Inspection
Where:i = Discrete Operating mode (or Operating Practice of Time Interval)
ti = Operating hours at Load in a Given Operating mode
Api = Load Severity factor
Ap = 1.0 up to Base Load
Ap = For Peak Load Factor See Figure 11
Afi = Fuel Severity Factor
Af = 1.0 for Natural Gas Fuel (1)
Af = 1.5 for Distillate Fuel, Non-DLN (2.5 for DLN)
Af = 2.5 for Crude (Non-DLN)
Af = 3.5 for Residual (Non-DLN)
Ki = Water/Steam Injection Severity Factor
(% Steam Referenced to Compressor Inlet Air Flow, w/f = Water to Fuel Ratio)
K = Max(1.0, exp(0.34(%Steam – 2.00%))) for Steam, Dry Control Curve
K = Max(1.0, exp(0.34(%Steam – 1.00%))) for Steam, Wet Control Curve
K = Max(1.0, exp(1.80(w/f – 0.80))) for Water, Dry Control Curve
K = Max(1.0, exp(1.80(w/f – 0.40))) for Water, Wet Control Curve
(1) Af = 10 for DLN 1/DLN 1+ extended lean-lean, and DLN 2.0/ DLN 2+ extended piloted premixed operating modes.
Maintenance Factor = Factored Hours
Actual Hours
Factored Hours = ∑ (Ki · Afi · Api · ti ), i = 1 to n in Operating Modes
Actual Hours = ∑ (ti ), i = 1 to n in Operating Modes
Maintenance Interval = Baseline CI (Figure 39)
Maintenance Factor
Figure 41 . Combustion inspection starts-based maintenance factors
Starts-Based Combustion Inspection
Where:i = Discrete Start/Stop Cycle (or Operating Practice)
Ni = Start/Stop Cycles in a Given Operating Mode
Asi = Start Type Severity Factor
As = 1.0 for Normal Start
As = For Peaking-Fast Start See Figure 14
Api = Load Severity Factor
Ap = 1.0 up to Base Load
Ap = exp (0.009 x Peak Firing Temp Adder in °F) for Peak Load
Ati = Trip Severity Factor
At = 0.5 + exp(0.0125*%Load) for Trip
At = 1 for No Trip
Afi = Fuel Severity Factor
Af = 1.0 for Natural Gas Fuel
Af = 1.25 for Non-DLN (or 1.5 for DLN) for Distillate Fuel
Af = 2.0 for Crude (Non-DLN)
Af = 3.0 for Residual (Non-DLN)
Ki = Water/Steam Injection Severity Factor
(% Steam Referenced to Compressor Inlet Air Flow, w/f = Water to Fuel Ratio)
K = Max(1.0, exp(0.34(%Steam – 1.00%))) for Steam, Dry Control Curve
K = Max(1.0, exp(0.34(%Steam – 0.50%))) for Steam, Wet Control Curve
K = Max(1.0, exp(1.80(w/f – 0.40))) for Water, Dry Control Curve
K = Max(1.0, exp(1.80(w/f – 0.20))) for Water, Wet Control Curve
Maintenance Factor = Factored Starts
Actual Starts
Factored Starts = ∑ (Ki · Afi · Ati · Api · Asi · Ni ), i = 1 to n Start/Stop Cycles
Actual Starts = ∑ (Ni ), i = 1 to n in Start/Stop Cycles
Maintenance Interval = Baseline CI (Figure 39)
Maintenance Factor

32
Hot Gas Path Inspection IntervalThe hours-based hot gas path criterion is determined from the
equations given in Figure 42. With these equations, a maintenance
factor is determined that is the ratio of factored operating hours
and actual operating hours. The factored hours consider the
specifics of the duty cycle relating to fuel type, load setting and
steam or water injection. Maintenance factors greater than one
reduce the hot gas path inspection interval from the baseline
(typically 24,000 hour) case. To determine the application specific
maintenance interval, the maintenance factor is divided into the
baseline hot gas path inspection interval, as shown in Figure 42.
The starts-based hot gas path criterion is determined from the
equations given in Figure 43.
As previously described, the limiting criterion (hours or starts)
determines the maintenance interval. Examples of these equations
are in Appendix A.
Rotor Inspection IntervalLike hot gas path components, the unit rotor has a maintenance
interval involving removal, disassembly, and inspection. This
interval indicates the serviceable life of the rotor and is generally
considered to be the teardown inspection and repair/replacement
interval for the rotor. The disassembly inspection is usually
concurrent with a hot gas path or major inspection; however,
it should be noted that the maintenance factors for rotor
maintenance intervals are distinct from those of combustion and
hot gas path components. As such, the calculation of consumed
life on the rotor may vary from that of combustion and hot gas
path components. Customers should contact GE when their rotor is
approaching the end of its serviceable life for technical advisement.
Hours-Based HGP Inspection
i = 1 to n discrete operating modes (or operating practices of time interval)
ti = Fired hours in a given operating mode
Api = Load severity factor for given operating mode
Ap = 1.0 up to base load
Ap = For peak load factor see Figure 11.
Afi = Fuel severity factor for given operating mode
Af = 1.0 for natural gas
Af = 1.5 for distillate (=1.0 when Ap > 1, at minimum Af ∙ Ap = 1.5)
Af = 2 to 3 for crude
Af = 3 to 4 for residual
Si = Water/steam injection severity factor = Ki + (Mi ∙ Ii)
I = Percent water/steam injection referenced to compressor inlet air flow
M&K = Water/steam injection constants
M K Control Water/Steam Inj . S2N/S3N Material
0 1 Dry <2.2% All
0 1 Dry >2.2% Non-FSX-414
0.18 0.6 Dry >2.2% FSX-414
0.18 1 Wet >0% Non-FSX-414
0.55 1 Wet >0% FSX-414
Maintenance Factor = Factored Hours
Actual Hours
Factored Hours = ∑ni=1 (Si · Afi · Api · ti )
Actual Hours = ∑ni=1 (ti )
Maintenance Interval = Baseline HGPI (Figure 39) (Hours) Maintenance Factor
Figure 42 . Hot gas path maintenance interval: hours-based criterion
Starts-Based HGP Inspection
Where:
Actual Starts = (NA + NB + NP)
S = Baseline Starts-Based Maintenance Interval (Figure 39)
NA = Annual Number of Part Load Start/Stop Cycles (<60% Load)
NB = Annual Number of Base Load Start/Stop Cycles
NP = Annual Number of Peak Load Start/Stop Cycles (>100% Load)
Ps = Peaking-Fast Start Factor (See Figure 14)
F = Annual Number of Peaking-Fast Starts
T = Annual Number of Trips
aT = Trip Severity Factor = f(Load) (See Figure 20)
n = Number of Trip Categories (i.e. Full Load, Part Load, etc.)
Maintenance Factor = Factored Starts
Actual Starts
Factored Starts = 0.5NA + NB + 1.3NP + PsF + ∑ni=1 (aTi – 1) Ti
Figure 43 . Hot gas path maintenance interval: starts-based criterion
Maintenance Interval = S (Starts) Maintenance Factor
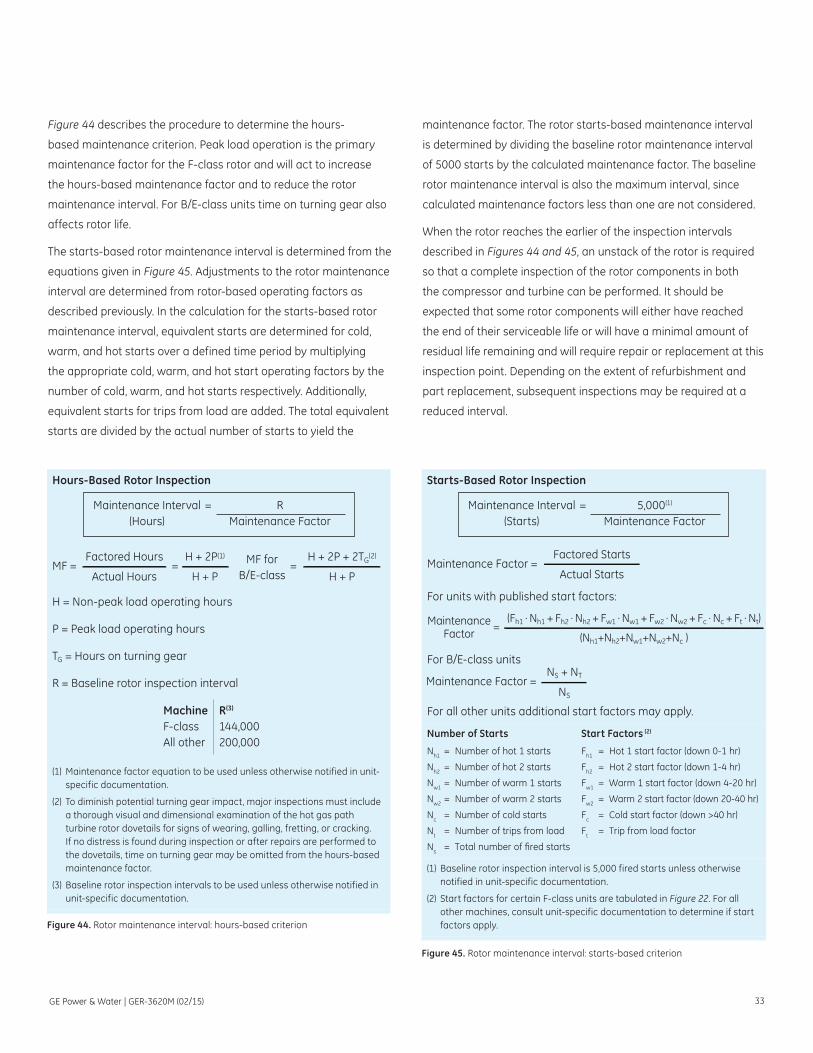
GE Power & Water | GER-3620M (02/15) 33
Figure 44 describes the procedure to determine the hours-
based maintenance criterion. Peak load operation is the primary
maintenance factor for the F-class rotor and will act to increase
the hours-based maintenance factor and to reduce the rotor
maintenance interval. For B/E-class units time on turning gear also
affects rotor life.
The starts-based rotor maintenance interval is determined from the
equations given in Figure 45. Adjustments to the rotor maintenance
interval are determined from rotor-based operating factors as
described previously. In the calculation for the starts-based rotor
maintenance interval, equivalent starts are determined for cold,
warm, and hot starts over a defined time period by multiplying
the appropriate cold, warm, and hot start operating factors by the
number of cold, warm, and hot starts respectively. Additionally,
equivalent starts for trips from load are added. The total equivalent
starts are divided by the actual number of starts to yield the
maintenance factor. The rotor starts-based maintenance interval
is determined by dividing the baseline rotor maintenance interval
of 5000 starts by the calculated maintenance factor. The baseline
rotor maintenance interval is also the maximum interval, since
calculated maintenance factors less than one are not considered.
When the rotor reaches the earlier of the inspection intervals
described in Figures 44 and 45, an unstack of the rotor is required
so that a complete inspection of the rotor components in both
the compressor and turbine can be performed. It should be
expected that some rotor components will either have reached
the end of their serviceable life or will have a minimal amount of
residual life remaining and will require repair or replacement at this
inspection point. Depending on the extent of refurbishment and
part replacement, subsequent inspections may be required at a
reduced interval.
Hours-Based Rotor Inspection
H = Non-peak load operating hours
P = Peak load operating hours
TG = Hours on turning gear
R = Baseline rotor inspection interval
MachineF-classAll other
R(3)
144,000200,000
(1) Maintenance factor equation to be used unless otherwise notified in unit-specific documentation.
(2) To diminish potential turning gear impact, major inspections must include a thorough visual and dimensional examination of the hot gas path turbine rotor dovetails for signs of wearing, galling, fretting, or cracking. If no distress is found during inspection or after repairs are performed to the dovetails, time on turning gear may be omitted from the hours-based maintenance factor.
(3) Baseline rotor inspection intervals to be used unless otherwise notified in unit-specific documentation.
MF = Factored Hours
Actual Hours
MF forB/E-class
= H + 2P(1)
H + P=
H + 2P + 2TG(2)
H + P
Figure 44 . Rotor maintenance interval: hours-based criterion
Maintenance Interval = R (Hours) Maintenance Factor
Starts-Based Rotor Inspection
For units with published start factors:
For B/E-class units
For all other units additional start factors may apply.
Number of Starts
Nh1 = Number of hot 1 starts
Nh2 = Number of hot 2 starts
Nw1 = Number of warm 1 starts
Nw2 = Number of warm 2 starts
Nc = Number of cold starts
Nt = Number of trips from load
Ns = Total number of fired starts
Start Factors (2)
Fh1 = Hot 1 start factor (down 0-1 hr)
Fh2 = Hot 2 start factor (down 1-4 hr)
Fw1 = Warm 1 start factor (down 4-20 hr)
Fw2 = Warm 2 start factor (down 20-40 hr)
Fc = Cold start factor (down >40 hr)
Ft = Trip from load factor
(1) Baseline rotor inspection interval is 5,000 fired starts unless otherwise notified in unit-specific documentation.
(2) Start factors for certain F-class units are tabulated in Figure 22. For all other machines, consult unit-specific documentation to determine if start factors apply.
Maintenance Factor = Factored Starts
Actual Starts
MaintenanceFactor
= (Fh1 · Nh1 + Fh2 · Nh2 + Fw1 · Nw1 + Fw2 · Nw2 + Fc · Nc + Ft · Nt)
(Nh1+Nh2+Nw1+Nw2+Nc )
Maintenance Factor = NS + NT
NS
Figure 45 . Rotor maintenance interval: starts-based criterion
Maintenance Interval = 5,000(1) (Starts) Maintenance Factor

34
The baseline rotor life is predicated upon sound inspection results
at the major inspections. For F-class rotors the baseline intervals
are typically 144,000 hours and 5,000 starts. For rotors other than
F-class, the baseline intervals are typically 200,000 hours and
5,000 starts. Consult unit-specific documentation to determine if
alternate baseline intervals or maintenance factors may apply.
Personnel PlanningIt is essential that personnel planning be conducted prior to an
outage. It should be understood that a wide range of experience,
productivity, and working conditions exist around the world.
However, an estimate can be made based upon maintenance
inspection labor assumptions, such as the use of a crew of
workers with trade skill (but not necessarily direct gas turbine
experience), with all needed tools and replacement parts (no
repair time) available. These estimated craft labor hours should
include controls/accessories and the generator. In addition to
the craft labor, additional resources are needed for technical
direction, specialized tooling, engineering reports, and site
mobilization/demobilization.
Inspection frequencies and the amount of downtime varies
within the gas turbine fleet due to different duty cycles and the
economic need for a unit to be in a state of operational readiness.
Contact your local GE service representative for the estimated
labor hours and recommended crew size for your specific unit.
Depending upon the extent of work to be done during each
maintenance task, a cooldown period of 4 to 24 hours may be
required before service may be performed. This time can be
utilized productively for job move-in, correct tagging and locking
equipment out-of-service, and general work preparations. At the
conclusion of the maintenance work and systems check out, a
turning gear time of two to eight hours is normally allocated prior
to starting the unit. This time can be used for job clean-up and
preparing for start.
Local GE field service representatives are available to help plan
maintenance work to reduce downtime and labor costs. This
planned approach will outline the replacement parts that may be
needed and the projected work scope, showing which tasks can
be accomplished in parallel and which tasks must be sequential.
Planning techniques can be used to reduce maintenance cost by
optimizing lifting equipment schedules and labor requirements.
Precise estimates of the outage duration, resource requirements,
critical-path scheduling, recommended replacement parts, and
costs associated with the inspection of a specific installation may
be sourced from the local GE field services office.
ConclusionGE heavy-duty gas turbines are designed to have high availability.
To achieve maximum gas turbine availability, an owner must
understand not only the equipment but also the factors affecting
it. This includes the training of operating and maintenance
personnel, following the manufacturer’s recommendations, regular
periodic inspections, and the stocking of spare parts for immediate
replacement. The recording and analysis of operating data is also
essential to preventative and planned maintenance. A key factor
in achieving this goal is a commitment by the owner to provide
effective outage management, to follow published maintenance
instructions, and to utilize the available service support facilities.
It should be recognized that, while the manufacturer provides
general maintenance recommendations, it is the equipment
user who controls the maintenance and operation of equipment.
Inspection intervals for optimum turbine service are not fixed for
every installation but rather are developed based on operation
and experience. In addition, through application of a Contractual
Service Agreement to a particular turbine, GE can work with
a user to establish a maintenance program that may differ
from general recommendations but will be consistent with
contractual responsibilities.
The level and quality of a rigorous maintenance program have a
direct effect on equipment reliability and availability. Therefore,
a rigorous maintenance program that reduces costs and outage
time while improving reliability and earning ability is the optimum
GE gas turbine user solution.

GE Power & Water | GER-3620M (02/15) 35
ReferencesJarvis, G., “Maintenance of Industrial Gas Turbines,” GE Gas Turbine
State of the Art Engineering Seminar, paper SOA-24-72, June 1972.
Patterson, J. R., “Heavy-Duty Gas Turbine Maintenance Practices,”
GE Gas Turbine Reference Library, GER-2498, June 1977.
Moore, W. J., Patterson, J.R, and Reeves, E.F., “Heavy-Duty Gas
Turbine Maintenance Planning and Scheduling,” GE Gas Turbine
Reference Library, GER-2498; June 1977, GER 2498A, June 1979.
Carlstrom, L. A., et al., “The Operation and Maintenance of General
Electric Gas Turbines,” numerous maintenance articles/authors
reprinted from Power Engineering magazine, General Electric
Publication, GER-3148; December 1978.
Knorr, R. H., and Reeves, E. F., “Heavy-Duty Gas Turbine
Maintenance Practices,” GE Gas Turbine Reference Library, GER-
3412; October 1983; GER- 3412A, September 1984; and GER-3412B,
December 1985.
Freeman, Alan, “Gas Turbine Advance Maintenance Planning,”
paper presented at Frontiers of Power, conference, Oklahoma State
University, October 1987.
Hopkins, J. P, and Osswald, R. F., “Evolution of the Design,
Maintenance and Availability of a Large Heavy-Duty Gas Turbine,”
GE Gas Turbine Reference Library, GER-3544, February 1988 (never
printed).
Freeman, M. A., and Walsh, E. J., “Heavy-Duty Gas Turbine
Operating and Maintenance Considerations,” GE Gas Turbine
Reference Library, GER-3620A.
GEI-41040, “Fuel Gases for Combustion in Heavy-Duty Gas
Turbines.”
GEI-41047, “Gas Turbine Liquid Fuel Specifications.”
GEK-101944, “Requirements for Water/Steam Purity in Gas
Turbines.”
GER-3419A, “Gas Turbine Inlet Air Treatment.”
GER-3569F, “Advanced Gas Turbine Materials and Coatings.”
GEK-32568, “Lubricating Oil Recommendations for Gas Turbines
with Bearing Ambients Above 500°F (260°C).”
GEK-110483, “Cleanliness Requirements for Power Plant Installation,
Commissioning and Maintenance.”

36
AppendixA .1) Example 1 – Hot Gas Path Maintenance Interval CalculationA 7E.03 user has accumulated operating data since the last hot
gas path inspection and would like to estimate when the next
one should be scheduled. The user is aware from GE publications
that the baseline HGP interval is 24,000 hours if operating on
natural gas, with no water or steam injection, and at base load.
It is also understood that the baseline starts interval is 1200,
based on normal startups, no trips, no peaking-fast starts. The
actual operation of the unit since the last hot gas path inspection
is much different from the baseline case. The unit operates in four
different operating modes:
1. The unit runs 3200 hrs/yr in its first operating mode, which is
natural gas at base or part load with no steam/water injection.
2. The unit runs 350 hrs/yr in its second operating mode, which is
distillate fuel at base or part load with no steam/water injection.
3. The unit runs 120 hrs/yr in its third operating mode, which is
natural gas at peak load (+100°F) with no steam/water injection.
4. The unit runs 20 hrs/yr in its fourth operating mode, which is
natural gas at base load with 2.4% steam injection on a wet
control curve.
The hours-based hot gas path maintenance interval parameters
for these four operating modes are summarized below:
Operating Mode (i)
1 2 3 4
Fired hours (hrs/yr) t 3200 350 120 20
Fuel severity factor Af 1 1.5 1 1
Load severity factor Ap 1 1 [e (0.018*100)] = 6 1
Steam/water injection rate (%) I 0 0 0 2.4
For this particular unit, the second- and third-stage nozzles are
FSX-414 material. From Figure 42, at a steam injection rate of 2.4%
on a wet control curve,
M4 = 0.55, K4 = 1
The steam severity factor for mode 4 is therefore,
= S4 = K4 + (M4 ∙ I4) = 1 + (0.55 ∙ 2.4) = 2.3
At a steam injection rate of 0%,
M = 0, K = 1
Therefore, the steam severity factor for modes 1, 2, and 3 are
= S1 = S2 = S3 = K + (M ∙ I) = 1
From the hours-based criteria, the maintenance factor is
determined from Figure 42.
MF = 1.22
The hours-based adjusted inspection interval is therefore,
Adjusted Inspection Interval = 24,000/1.22 = 19,700 hours
[Note, since total annual operating hours is 3690, the estimated
time to reach 19,700 hours is 19,700/3690 = 5.3 years.]
Also, since the last hot gas path inspection the unit has averaged
145 normal start-stop cycles per year, 5 peaking-fast start cycles
per year, and 20 base load cycles ending in trips (aT = 8) per year.
The starts-based hot gas path maintenance interval parameters
for this unit are summarized below:
Normal cycles
Peaking starts, °F
Cycles ending in trip, T
Total
Part load cycles, NA 40 0 0 40
Base load cycles, NB 100 5 20 125
Peak load cycles, NP 5 0 0 5
From the starts-based criteria, the maintenance factor is
determined from Figure 43.
MF = 1.8
The adjusted inspection interval based on starts is
Adjusted Inspection Interval = 1200/1.8 = 667 starts
[Note, since the total annual number of starts is 170, the estimated
time to reach 667 starts is 667/170 = 3.9 years.]
In this case the unit would reach the starts-based hot gas path
interval prior to reaching the hours-based hot gas path interval.
The hot gas path inspection interval for this unit is therefore 667
starts (or 3.9 years).
MF = ∑n
i=1 (Si · Afi · Api · ti )
∑ni=1) (ti )
= (1 · 1 · 1 · 3200) + (1 · 1.5 · 1 · 350) + (1 · 1 · 6 · 120) + (2.3 · 1 · 1 · 20)
(3200 + 350 + 120 + 20)
MF = 0.5NA + NB + 1.3NP + PsF + ∑n
i=1 (aTi - 1) Ti
NA + NB + NP
MF = 0.5 (40) + 125 + 1.3 (5) + 3.5 (5) + (8 - 1 )20
40 + 125 + 5

GE Power & Water | GER-3620M (02/15) 37
A .2) Example 2 – Hot Gas Path Factored Starts CalculationA 7E.03 user has accumulated operating data for the past year of
operation. This data shows number of trips from part, base, and
peak load, as well as peaking-fast starts. The user would like to
calculate the total number of factored starts in order to plan the
next HGP outage. Figure 43 is used to calculate the total number of
factored starts as shown below.
Operational history:
Normal cycles
Peaking starts with
normal shutdowns
Peaking starts with
trips
Normal starts with
tripsTotal
Part load cycles, NA
35 0 1 5 41
Base load cycles, NB
25 4 2 35 66
Peak load cycles, NP
40 0 0 10 50
Total Trips
5. 50% load (aT1 = 6.5), T1 = 5 + 1 = 6
6. Base load (aT2 = 8), T2 = 35 + 2 = 37
7. Peak load (aT3 = 10), T3 = 10
Additional Cycles
Peaking-fast starts, F = 7
From the starts-based criteria, the total number of factored starts
(FS) and actual starts (AS) is determined from Figure 43.
Maintenance Factor = =FS
AS= 3.6
558
157
= 0.5 · 41 + 66 + 1.3 · 50 + 3.5 · 7 + (6.5 - 1) 6 + (8 - 1) 37 + (10 - 1) 10 = 558
AS = NA + NB + NP = 41 + 66 + 50 = 157
FS = 0.5NA + NB + 1.3NP + PsF + ∑ni=1 (aTi - 1) Ti

38
B) Examples – Combustion MaintenanceInterval Calculations (reference Figures 40 and 41)
DLN 1 Peak Load with Power Augmentation
+50F Tfire Increase
Factored Hours = Ki * Afi * Api * ti = 34.5 HoursHours Maintenance Factor = (34.5/6) 5 .8
Where Ki = 2.34 Max(1.0, exp(0.34(3.50-1.00))) WetAfi = 1.00 Natural Gas FuelApi = 2.46 exp(0.018(50)) Peak Loadti = 6.0 Hours/Start
Factored Starts = Ki * Afi * Ati * Api * Asi * Ni = 17.4 StartsStarts Maintenance Factor = (17.4/1) 17 .4
Where Ki = 2.77 Max(1.0, exp(0.34(3.50-0.50))) WetAfi = 1.00 Natural Gas FuelAti = 1.00 No Trip at LoadApi = 1.57 exp(0.009(50)) Peak LoadAsi = 4.0 Peaking StartNi = 1.0 Considering Each Start
3.5% Steam AugmentationPeaking Start
Natural Gas Fuel6 Hours/StartWet Control Curve
Normal Shutdown (No Trip)
Standard Combustor Base Load on Crude Oil
No Tfire Increase
Factored Hours = Ki * Afi * Api * ti = 788.3 HoursHours Maintenance Factor = (788.3/220) 3 .6
Where Ki = 1.43 Max(1.0, exp(1.80(1.00-0.80))) DryAfi = 2.50 Crude Oil, Std (Non-DLN)Api = 1.00 Base Loadti = 220.0 Hours/Start
Factored Starts = Ki * Afi * Ati * Api * Asi * Ni = 5.9 StartsStarts Maintenance Factor = (5.9/1) 5 .9
Where Ki = 2.94 Max(1.0, exp(1.80(1.00-0.40))) DryAfi = 2.00 Crude Oil, Std (Non-DLN)Ati = 1.00 No Trip at LoadApi = 1.00 Base LoadAsi = 1.00 Normal StartNi = 1.0 Considering Each Start
1.0 Water/Fuel RatioNormal Start
Crude Oil Fuel220 Hours/StartDry Control Curve
Normal Shutdown (No Trip)
DLN 2 .6 Base Load on Natural Gas with Trip @ Load
No Tfire Increase
Factored Hours = Ki * Afi * Api * ti = 168.0 HoursHours Maintenance Factor = (168.0/168) 1 .0
Where Ki = 1.00 No InjectionAfi = 1.00 Natural Gas FuelApi = 1.00 Base Loadti = 168.0 Hours/Start
Factored Starts = Ki * Afi * Ati * Api * Asi * Ni = 2.6 StartsStarts Maintenance Factor = (2.6/1) 2 .6
Where Ki = 1.00 No InjectionAfi = 1.00 Natural Gas FuelAti = 2.62 0.5+exp(0.0125*60) for TripApi = 1.00 Base LoadAsi = 1.00 Normal StartNi = 1.0 Considering Each Start
No Steam/Water InjectionNormal Start
Natural Gas Fuel168 Hours/StartDry Control Curve
Trip @ 60% Load
DLN 2 .6 Base Load on Distillate
No Tfire Increase
Factored Hours = Ki * Afi * Api * ti = 943.8 HoursHours Maintenance Factor = (943.8/220) 4 .3
Where Ki = 1.72 Max(1.0, exp(1.80(1.10-0.80))) DryAfi = 2.50 Distillate Fuel, DLNApi = 1.00 Base Loadti = 220.0 Hours/Start
Factored Starts = Ki * Afi * Ati * Api * Asi * Ni = 5.3 StartsStarts Maintenance Factor = (5.3/1) 5 .3
Where Ki = 3.53 Max(1.0, exp(1.80(1.10-0.40))) DryAfi = 1.50 Distillate Fuel, DLNAti = 1.00 No Trip at LoadApi = 1.00 Base LoadAsi = 1.00 Normal StartNi = 1.0 Considering Each Start
1.1 Water/Fuel RatioNormal Start
Distillate Fuel220 Hours/StartDry Control Curve
Normal Shutdown (No Trip)
DLN 2 .6 Peak Load on Natural Gas with Peaking Start
+35F Tfire Increase
Factored Hours = Ki * Afi * Api * ti = 12.5HoursHours Maintenance Factor = (12.5/4) 3 .1
Where Ki = 1.67 Max(1.0, exp(0.34(3.50-2.00)))Afi = 1.00 Natural Gas FuelApi = 1.88 exp(0.018(35)) Peak Loadti = 4.0 Hours/Start
Factored Starts = Ki * Afi * Ati * Api * Asi * Ni = 12.8 StartsStarts Maintenance Factor = (12.8/1) 12 .8
Where Ki = 2.34 Max(1.0, exp(0.34(3.50-1.00))) DryAfi = 1.00 Natural Gas FuelAti = 1.00 No Trip at LoadApi = 1.37 exp(0.009(35)) Peak LoadAsi = 4.0 Peaking StartNi = 1.0 Considering Each Start
3.5% Steam AugmentationPeaking Start
Natural Gas Fuel4 Hours/StartDry Control Curve
Normal Shutdown (No Trip)
DLN 1 Combustor Base Load on Distillate
No Tfire Increase
Factored Hours = Ki * Afi * Api * ti = 1496.5 HoursHours Maintenance Factor = (1496.5/500) 3 .0
Where Ki = 1.20 Max(1.0, exp(1.80(0.90-0.80))) DryAfi = 2.50 Distillate Fuel, DLN 1Api = 1.00 Part Loadti = 500.0 Hours/Start
Factored Starts = Ki * Afi * Ati * Api * Asi * Ni = 3.7 StartsStarts Maintenance Factor = (3.7/1) 3 .7
Where Ki = 2.46 Max(1.0, exp(1.80(0.90-0.40))) DryAfi = 1.50 Distillate Fuel, DLNAti = 1.00 No Trip at LoadApi = 1.00 Part LoadAsi = 1.00 Normal StartNi = 1.0 Considering Each Start
0.9 Water/Fuel RatioNormal Start
Distillate Fuel500 Hours/StartDry Control Curve
Normal Shutdown (No Trip)
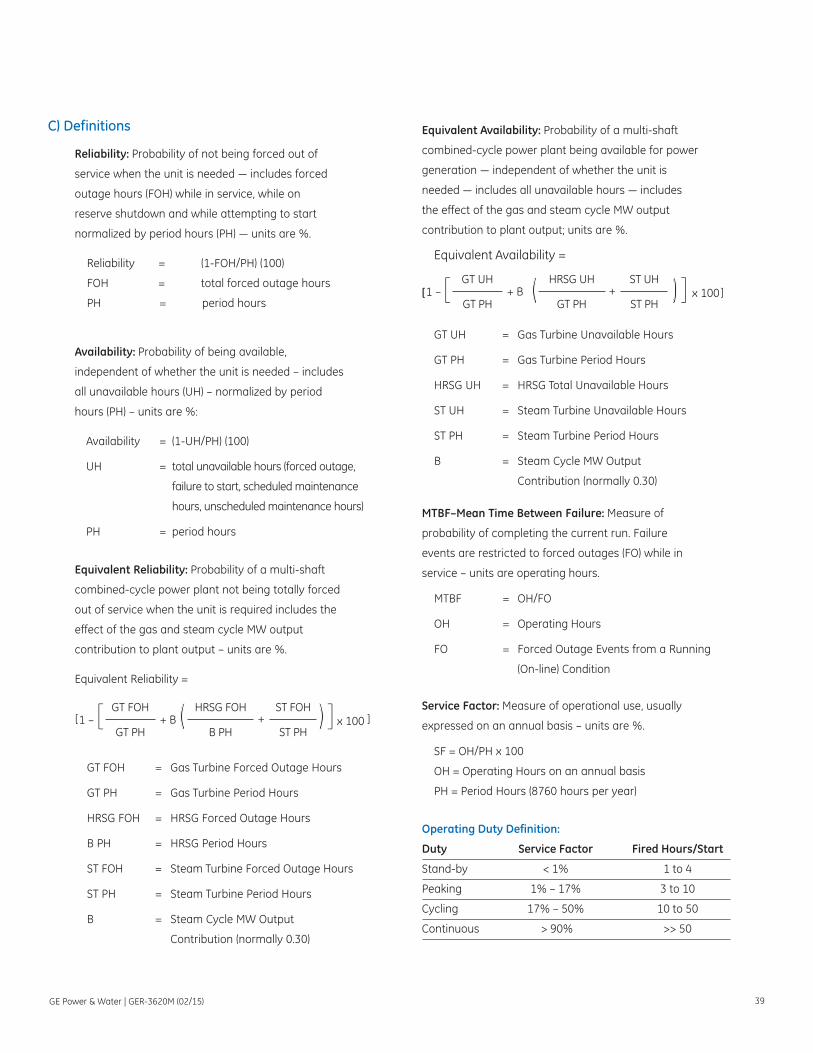
GE Power & Water | GER-3620M (02/15) 39
Reliability: Probability of not being forced out of
service when the unit is needed — includes forced
outage hours (FOH) while in service, while on
reserve shutdown and while attempting to start
normalized by period hours (PH) — units are %.
Reliability = (1-FOH/PH) (100)
FOH = total forced outage hours
PH = period hours
Availability: Probability of being available,
independent of whether the unit is needed – includes
all unavailable hours (UH) – normalized by period
hours (PH) – units are %:
Availability = (1-UH/PH) (100)
UH = total unavailable hours (forced outage,
failure to start, scheduled maintenance
hours, unscheduled maintenance hours)
PH = period hours
Equivalent Reliability: Probability of a multi-shaft
combined-cycle power plant not being totally forced
out of service when the unit is required includes the
effect of the gas and steam cycle MW output
contribution to plant output – units are %.
Equivalent Reliability =
GT FOH = Gas Turbine Forced Outage Hours
GT PH = Gas Turbine Period Hours
HRSG FOH = HRSG Forced Outage Hours
B PH = HRSG Period Hours
ST FOH = Steam Turbine Forced Outage Hours
ST PH = Steam Turbine Period Hours
B = Steam Cycle MW Output
Contribution (normally 0.30)
Equivalent Availability: Probability of a multi-shaft
combined-cycle power plant being available for power
generation — independent of whether the unit is
needed — includes all unavailable hours — includes
the effect of the gas and steam cycle MW output
contribution to plant output; units are %.
Equivalent Availability =
GT UH = Gas Turbine Unavailable Hours
GT PH = Gas Turbine Period Hours
HRSG UH = HRSG Total Unavailable Hours
ST UH = Steam Turbine Unavailable Hours
ST PH = Steam Turbine Period Hours
B = Steam Cycle MW Output
Contribution (normally 0.30)
Operating Duty Definition:
Duty Service Factor Fired Hours/Start
Stand-by < 1% 1 to 4
Peaking 1% – 17% 3 to 10
Cycling 17% – 50% 10 to 50
Continuous > 90% >> 50
MTBF–Mean Time Between Failure: Measure of
probability of completing the current run. Failure
events are restricted to forced outages (FO) while in
service – units are operating hours.
MTBF = OH/FO
OH = Operating Hours
FO = Forced Outage Events from a Running
(On-line) Condition
Service Factor: Measure of operational use, usually
expressed on an annual basis – units are %.
SF = OH/PH x 100
OH = Operating Hours on an annual basis
PH = Period Hours (8760 hours per year)
ST FOHHRSG FOHGT FOH
ST PHB PHGT PH+ B + x 1001 –
GT UH ST UHHRSG UH
ST PHGT PH GT PH+ B + x 100[[ ]1 –
[ ]
C) Definitions

40
D) Estimated Repair and Replacement Intervals(Natural Gas Only)Repair/replace intervals reflect current production hardware, unless
otherwise noted, and operation in accordance with manufacturer
specifications. Consult previous revisions of GER 3620 or other unit-
specific documentation for estimated repair/replacement intervals
of previous generation gas turbine models and hardware. Consult
your GE service representative for further information.
MS3002K PartsRepair Interval Replace Interval (Hours) Replace Interval (Starts)
Combustion Liners CI 4 (CI) 4 (CI)
Transition Pieces CI(1) 4 (CI) 4 (CI)
Stage 1 Nozzles (HGPI)(2) 4 (HGPI) 2 (HGPI)
Stage 2 Nozzles (HGPI)(2) 4 (HGPI) 4 (HGPI)
Stage 1 Shrouds (HGPI)(2) 4 (HGPI) 4 (HGPI)
Stage 2 Shrouds (HGPI)(2) 4 (HGPI) 4 (HGPI)
Stage 1 Buckets – (3) 2 (HGPI)(3) 2 (HGPI)
Stage 2 Buckets (HGPI)(2) 4 (HGPI) 4 (HGPI)
Note: Repair/replace intervals reflect current production hardware, unless otherwise noted, and operation in
accordance with manufacturer specifications. They represent initial recommended intervals in the absence of
operating and condition experience. For factored hours and starts of the repair intervals, refer to Figure 39.
CI = Combustion Inspection Interval
HGPI = Hot Gas Path Inspection Interval
(1) Repair interval is every 2 combustion inspection intervals.
(2) Repair interval is every 2 hot gas path inspection intervals with the exception of 1st stage nozzle
start-based repair interval where repair interval is one inspection interval.
(3) No repair required. GE approved repair at 24,000 factored hours may extend replace interval to
72000 factored hours.
Figure D-1 . Estimated repair and replacement intervals
MS5001PA / MS5002C,D PartsRepair Interval Replace Interval (Hours) Replace Interval (Starts)
Combustion Liners CI 4 (CI) 3 (CI)
Transition Pieces CI(1) 4 (CI) 4 (CI)(5)
Stage 1 Nozzles HGPI(2) 4 (HGPI) 2 (HGPI)
Stage 2 Nozzles HGPI(2) 4 (HGPI) 4 (HGPI)
Stage 1 Shrouds HGPI(2) 4 (HGPI) 4 (HGPI)
Stage 2 Shrouds – (3) 4 (HGPI) 4 (HGPI)
Stage 1 Buckets – (4) 2 (HGPI)(4) 2 (HGPI)
Stage 2 Buckets HGPI(2) 4 (HGPI) 4 (HGPI)
Note: Repair/replace cycles reflect current production hardware, unless otherwise noted, and operation in
accordance with manufacturer specifications. They represent initial recommended intervals in the absence of
operating and condition experience. For factored hours and starts of the repair intervals, refer to Figure 39.
CI = Combustion Inspection Interval
HGPI = Hot Gas Path Inspection Interval
(1) Repair interval is every 2 combustion inspection intervals.
(2) Repair interval is every 2 hot gas path inspection intervals with the exception of 1st stage nozzle start-
based repair interval where repair interval is one inspection interval.
(3) No repair required
(4) No repair required. GE approved repair at 24,000 factored hours may extend replace interval to 72000
factored hours
(5) 6 replace intervals (starts-based) for DLN and lean head end (LHE) units.
Figure D-2 . Estimated repair and replacement intervals
6B .03Repair Interval Replace Interval (Hours) Replace Interval (Starts)
Combustion Liners Cl 4 (Cl) 4 (Cl) / 5 (Cl)(1)
Caps Cl 4 (Cl) 5 (Cl)
Transition Pieces Cl 4 (Cl) 4 (Cl) / 5 (Cl)(1)
Fuel Nozzles Cl 2 (Cl) 2 (Cl) / 3 (Cl)(4)
Crossfire Tubes Cl 1 (CI) 1 (CI)
Crossfire Tube Retaining Clips
CI 1 (CI) 1 (CI)
Flow Divider (Distillate)
Cl 3 (Cl) 3 (Cl)
Fuel Pump (Distillate)
Cl 3 (Cl) 3 (Cl)
Stage 1 Nozzles HGPI 3 (HGPI) 3 (HGPI)
Stage 2 Nozzles HGPI 3 (HGPI) 3 (HGPI)
Stage 3 Nozzles HGPI 3 (HGPI) 3 (HGPI)
Stage 1 Shrouds HGPI 3 (HGPI) 2 (HGPI)
Stage 2 Shrouds HGPI 3 (HGPI) 4 (HGPI)
Stage 3 Shrouds HGPI 3 (HGPI) 4 (HGPI)
Stage 1 Buckets HGPI 3 (HGPI)(2) 3 (HGPI)
Stage 2 Buckets HGPI 3 (HGPI)(3) 4 (HGPI)
Stage 3 Buckets HGPI 3 (HGPI) 4 (HGPI)
Note: Repair/replace cycles reflect current production (6B.03) hardware, unless otherwise noted, and operation
in accordance with manufacturer specifications. They represent initial recommended intervals in the absence
of operating and condition experience. For factored hours and starts of the repair intervals, refer to Figure 39.
Cl = Combustion Inspection Interval
HGPI = Hot Gas Path Inspection Interval
(1) 4 (CI) for non-DLN / 5 (CI) for DLN
(2) 3 (HGPI) with strip and recoat at first HGPI
(3) 3 (HGPI) for current design only. Consult your GE Energy representative for replace intervals by part number.
(4) 2 (CI) for non-DLN / 3 (CI) for DLN
Figure D-3 . Estimated repair and replacement intervals

GE Power & Water | GER-3620M (02/15) 41
7E .03 (7)
Repair Interval Replace Interval (Hours) Replace Interval (Starts)
Combustion Liners Cl 3 (Cl) / 5 (Cl)(1) 5 (Cl)
Caps Cl 3 (Cl) 5 (Cl)
Transition Pieces Cl 4 (Cl) / 6 (Cl)(5) 6 (Cl)
Fuel Nozzles Cl 2 (Cl) / 3 (Cl)(6) 3 (Cl)
Crossfire Tubes Cl 1 (Cl) 1 (Cl)
Crossfire Tube Retaining Clips
CI 1 (CI) 1 (CI)
Flow Divider (Distillate)
Cl 3 (Cl) 3 (Cl)
Fuel Pump (Distillate)
Cl 3 (Cl) 3 (Cl)
Stage 1 Nozzles HGPI 3 (HGPI) 3 (HGPI)
Stage 2 Nozzles HGPI 3 (HGPI) 3 (HGPI)
Stage 3 Nozzles HGPI 3 (HGPI) 3 (HGPI)
Stage 1 Shrouds HGPI 2 (HGPI) 2 (HGPI)
Stage 2 Shrouds HGPI 3 (HGPI) 4 (HGPI)
Stage 3 Shrouds HGPI 3 (HGPI) 4 (HGPI)
Stage 1 Buckets HGPI 3 (HGPl)(2)(3) 3 (HGPI)
Stage 2 Buckets HGPI 3 (HGPl)(4) 4 (HGPI)
Stage 3 Buckets HGPI 3 (HGPl) 4 (HGPI)
Note: Repair/replace intervals reflect current production (7121(EA) or 7E.03) hardware, unless otherwise noted,
and operation in accordance with manufacturer specifications. They represent initial recommended intervals
in the absence of operating and condition experience. For factored hours and starts of the repair intervals,
refer to Figure 39.
Cl = Combustion Inspection Interval
HGPI = Hot Gas Path Inspection Interval
(1) 3 (CI) for DLN / 5 (CI) for non-DLN
(2) Strip and Recoat is required at first HGPI to achieve 3 HGPI replace interval.
(3) Uprated 7E machines (2055 Tfire) require HIP rejuvenation at first HGPI to achieve 3 HGPI replace interval.
(4) 3 (HGPI) interval requires meeting tip shroud engagement criteria at prior HGP repair intervals.
Consult your GE service representative for details.
(5) 4 (CI) for DLN / 6 (CI) for non-DLN
(6) 2 (CI) for DLN / 3 (CI) for non-DLN
(7) Also applicable to 7121(EA) models.
Figure D-4 . Estimated repair and replacement intervals
9E .03 (6)
Repair Interval Replace Interval (Hours) Replace Interval (Starts)
Combustion Liners Cl 3 (Cl) / 5 (Cl)(1) 5 (Cl)
Caps Cl 3 (Cl) 5 (Cl)
Transition Pieces Cl 4 (Cl) / 6 (Cl)(4) 6 (Cl)
Fuel Nozzles Cl 2 (Cl) / 3 (Cl)(5) 3 (Cl)
Crossfire Tubes Cl 1 (Cl) 1 (Cl)
Crossfire Tube Retaining Clips
CI 1 (CI) 1 (CI)
Flow Divider (Distillate)
Cl 3 (Cl) 3 (Cl)
Fuel Pump (Distillate)
Cl 3 (Cl) 3 (Cl)
Stage 1 Nozzles HGPI 3 (HGPI) 3 (HGPI)
Stage 2 Nozzles HGPI 3 (HGPI) 3 (HGPI)
Stage 3 Nozzles HGPI 3 (HGPI) 3 (HGPI)
Stage 1 Shrouds HGPI 3 (HGPI) 3 (HGPI)
Stage 2 Shrouds HGPI 3 (HGPI) 4 (HGPI)
Stage 3 Shrouds HGPI 3 (HGPI) 4 (HGPI)
Stage 1 Buckets HGPI 3 (HGPl)(2) 3 (HGPI)
Stage 2 Buckets HGPI 3 (HGPl)(3) 4 (HGPI)
Stage 3 Buckets HGPI 3 (HGPl) 4 (HGPI)
Note: Repair/replace intervals reflect current production (9171(E)) hardware, unless otherwise noted, and
operation in accordance with manufacturer specifications. They represent initial recommended intervals in
the absence of operating and condition experience. For factored hours and starts of the repair intervals, refer
to Figure 39.
Cl = Combustion Inspection Interval
HGPI = Hot Gas Path Inspection Interval
(1) 3 (CI) for DLN / 5 (CI) for non-DLN
(2) Strip and Recoat is required at first HGPI to achieve 3 HGPI replace interval.
(3) 3 (HGPI) interval requires meeting tip shroud engagement criteria at prior HGP repair intervals.
Consult your GE service representative for details.
(4) 4 (CI) for DLN / 6 (CI) for non-DLN
(5) 2 (CI) for DLN / 3 (CI) for non-DLN
(6) Applicable to non-AGP units only
Figure D-5 . Estimated repair and replacement intervals

42
6F .03Repair Interval Replace Interval (Hours) Replace Interval (Starts)
Combustion Liners CI 2 (CI) 2 (CI)
Caps CI 3 (CI) 2 (CI)
Transition Pieces CI 3 (CI) 2 (CI)
Fuel Nozzles CI 2 (CI) 2 (CI)
Crossfire Tubes CI 1 (CI) 1 (CI)
Crossfire Tube Retaining Clips
CI 1 (CI) 1 (CI)
End Covers CI 4 (CI) 2 (CI)
Stage 1 Nozzles HGPI 2 (HGPI) 2 (HGPI)
Stage 2 Nozzles HGPI 2 (HGPI) 2 (HGPI)
Stage 3 Nozzles HGPI 3 (HGPI) 3 (HGPI)
Stage 1 Shrouds HGPI 2 (HGPI) 2 (HGPI)
Stage 2 Shrouds HGPI 2 (HGPI) 2 (HGPI)
Stage 3 Shrouds HGPI 3 (HGPI) 3 (HGPI)
Stage 1 Buckets HGPI 3 (HGPI) 2 (HGPI)
Stage 2 Buckets HGPI 3 (HGPI) 2 (HGPI)
Stage 3 Buckets HGPI 2 (HGPI) 3 (HGPI)
Note: Repair/replace intervals reflect current production (6F.03 DLN 2.6) hardware, unless otherwise noted,
and operation in accordance with manufacturer specifications. They represent initial recommended intervals
in the absence of operating and condition experience. For factored hours and starts of the repair intervals,
refer to Figure 39.
CI = Combustion Inspection Interval
HGPI = Hot Gas Path Inspection Interval
Figure D-6 . Estimated repair and replacement intervals
7F .03Repair Interval Replace Interval (Hours) Replace Interval (Starts)
Combustion Liners Cl 2 (Cl) 2 (Cl)
Caps Cl 2 (Cl) 2 (Cl)
Transition Pieces Cl 2 (Cl) 2 (Cl)
Fuel Nozzles Cl 2 (Cl) 2 (Cl)
Crossfire Tubes Cl 1 (Cl) 1 (Cl)
Crossfire Tube Retaining Clips
CI 1 (CI) 1 (CI)
End Covers CI 2 (Cl) 2 (Cl)
Stage 1 Nozzles HGPI 2 (HGPI) 2 (HGPI)
Stage 2 Nozzles HGPI 2 (HGPI) 2 (HGPI)
Stage 3 Nozzles HGPI 3 (HGPI) 3 (HGPI)
Stage 1 Shrouds HGPI 2 (HGPI) 2 (HGPI)
Stage 2 Shrouds HGPI 2 (HGPI) 2 (HGPI)
Stage 3 Shrouds HGPI 3 (HGPI) 3 (HGPI)
Stage 1 Buckets HGPI 3 (HGPI)(2) 2 (HGPI)(4)
Stage 2 Buckets HGPI 3 (HGPI)(1) 3 (HGPI)(1)
Stage 3 Buckets HGPI 3 (HGPI)(3) 3 (HGPI)
Note: Repair/replace intervals reflect current production (7F.03 DLN 2.6 24k Super B and non-AGP) hardware,
unless otherwise noted, and operation in accordance with manufacturer specifications. They represent initial
recommended intervals in the absence of operating and condition experience. For factored hours and starts
of the repair intervals, refer to Figure 39.
Cl = Combustion Inspection Interval
HGPI = Hot Gas Path Inspection Interval
(1) 3 (HGPI) for current design. Consult your GE service representative for replacement intervals by part
number.
(2) GE approved repair procedure required at first HGPI for designs without platform cooling.
(3) GE approved repair procedure at 2nd HGPI is required to meet 3 (HGPI) replacement life.
(4) 2 (HGPI) for current design with GE approved repair at first HGPI. 3 (HGPI) is possible for redesigned bucket
with platform undercut and cooling modifications.
Figure D-7 . Estimated repair and replacement intervals
7F .04Repair Interval Replace Interval (Hours) Replace Interval (Starts)
Combustion Liners Cl 2 (Cl) 2 (Cl)
Caps Cl 2 (Cl) 2 (Cl)
Transition Pieces Cl 2 (Cl) 2 (Cl)
Fuel Nozzles Cl 2 (Cl) 2 (Cl)
Crossfire Tubes Cl 1 (Cl) 1 (Cl)
Crossfire Tube Retaining Clips
CI 1 (CI) 1 (CI)
End Covers CI 2 (Cl) 2 (Cl)
Stage 1 Nozzles HGPI 3 (HGPI) 3 (HGPI)
Stage 2 Nozzles HGPI 3 (HGPI) 3 (HGPI)
Stage 3 Nozzles HGPI 4 (HGPI) 4 (HGPI)
Stage 1 Shrouds HGPI 3 (HGPI) 3 (HGPI)
Stage 2 Shrouds HGPI 3 (HGPI) 3 (HGPI)
Stage 3 Shrouds HGPI 3 (HGPI) 3 (HGP)
Stage 1 Buckets HGPI 3 (HGPI) 3 (HGPI)
Stage 2 Buckets HGPI 3 (HGPI) 3 (HGPI)
Stage 3 Buckets HGPI 3 (HGPI) 3 (HGPI)
Note: Repair/replacement intervals reflect current production (7F.04 DLN 2.6) hardware, unless otherwise
noted, and operation in accordance with manufacturer specifications. They represent initial recommended
intervals in the absence of operating and condition experience. For factored hours and starts of the repair
intervals, refer to Figure 39.
Cl = Combustion Inspection Interval
HGPI = Hot Gas Path Inspection Interval
Figure D-8 . Estimated repair and replacement intervals
7FB .01Repair Interval Replace Interval (Hours) Replace Interval (Starts)
Combustion Liners Cl 2 (Cl) 3 (Cl)
Caps Cl 2 (Cl) 3 (Cl)
Transition Pieces Cl 2 (Cl) 3 (Cl)
Fuel Nozzles Cl 2 (Cl)(1) 3 (Cl)(1)
Crossfire Tubes Cl 1 (Cl) 1 (Cl)
Crossfire Tube Retaining Clips
CI 1 (CI) 1 (CI)
End Covers CI 3 (Cl) 3 (Cl)
Stage 1 Nozzles HGPI 2 (HGPI) 2 (HGPI)
Stage 2 Nozzles HGPI 1 (HGPI) 1 (HGPI)
Stage 3 Nozzles HGPI 3 (HGPI) 3 (HGPI)
Stage 1 Shrouds HGPI 2 (HGPI) 2 (HGPI)
Stage 2 Shrouds HGPI 2 (HGPI) 2 (HGPI)
Stage 3 Shrouds HGPI 3 (HGPI) 3 (HGP)
Stage 1 Buckets HGPI 1 (HGPI) 1 (HGPI)
Stage 2 Buckets HGPI 3 (HGPI) 3 (HGPI)
Stage 3 Buckets HGPI 3 (HGPI) 3 (HGPI)
Note: Repair/replace cycles reflect current production (7251(FB) DLN 2.0+ extended interval) hardware,
unless otherwise noted, and operation in accordance with manufacturer specifications. They represent initial
recommended intervals in the absence of operating and condition experience. For factored hours and starts
of the repair intervals, refer to Figure 39.
Cl = Combustion Inspection Interval
HGPI = Hot Gas Path Inspection Interval
(1) Blank and liquid fuel cartridges to be replaced at each CI
Figure D-9 . Estimated repair and replacement intervals

GE Power & Water | GER-3620M (02/15) 43
9F .03Repair Interval Replace Interval (Hours) Replace Interval (Starts)
Combustion Liners Cl 2 (Cl) 3 (Cl)
Caps Cl 2 (Cl) 3 (Cl)
Transition Pieces Cl 2 (Cl) 3 (Cl)
Fuel Nozzles Cl 2 (Cl)(1) 3 (Cl)(1)
Crossfire Tubes Cl 1 (Cl) 1 (Cl)
Crossfire Tube Retaining Clips
CI 1 (CI) 1 (CI)
End Covers CI 2 (Cl) 3 (Cl)
Stage 1 Nozzles HGPI 2 (HGPI) 2 (HGPI)
Stage 2 Nozzles HGPI 2 (HGPI) 2 (HGPI)
Stage 3 Nozzles HGPI 3 (HGPI) 3 (HGPI)
Stage 1 Shrouds HGPI 2 (HGPI) 2 (HGPI)
Stage 2 Shrouds HGPI 2 (HGPI) 2 (HGPI)
Stage 3 Shrouds HGPI 3 (HGPI) 3 (HGPI)
Stage 1 Buckets HGPI 2 (HGPI)(2) 2 (HGPI)(4)
Stage 2 Buckets HGPI 3 (HGPI)(5) 3 (HGPI)(3)
Stage 3 Buckets HGPI 3 (HGPI)(5) 3 (HGPI)
Note: Repair/replace intervals reflect current production (9F.03 DLN 2.6+) hardware, unless otherwise noted,
and operation in accordance with manufacturer specifications. They represent initial recommended intervals
in the absence of operating and condition experience. For factored hours and starts of the repair intervals,
refer to Figure 39.
Cl = Combustion Inspection Interval
HGPI = Hot Gas Path Inspection Interval
(1) Blank and liquid fuel cartridges to be replaced at each CI
(2) 2 (HGPI) for current design with GE approved repair at first HGPI. 3 (HGPI) is possible for redesigned bucket
with platform undercut and cooling modifications.
(3) Recoating at 1st HGPI may be required to achieve 3 HGPI replacement life.
(4) GE approved repair procedure at 1 (HGPI) is required to meet 2 (HGPI) replacement life.
(5) GE approved repair procedure is required to meet 3 (HGPI) replacement life.
Figure D-10 . Estimated repair and replacement intervals
9F .05Repair Interval Replace Interval (Hours) Replace Interval (Starts)
Combustion Liners CI 4 (CI) 4 (CI)
Caps CI 4 (CI) 4 (CI)
Transition Pieces CI 4 (CI) 4 (CI)
Fuel Nozzles CI 2 (Cl)(1) 2 (CI)(1)
Crossfire Tubes CI 1 (Cl) 1 (Cl)
Crossfire Tube Retaining Clips
CI 1 (CI) 1 (CI)
End Covers CI 4 (CI) 4 (CI)
Stage 1 Nozzles HGPI 1 (HGPI) 1 (HGPI)
Stage 2 Nozzles HGPI 2 (HGPI) 2 (HGPI)
Stage 3 Nozzles HGPI 3 (HGPI) 3 (HGPI)
Stage 1 Shrouds HGPI 2 (HGPI) 2 (HGPI)
Stage 2 Shrouds HGPI 2 (HGPI) 2 (HGPI)
Stage 3 Shrouds HGPI 3 (HGPI) 3 (HGPI)
Stage 1 Buckets HGPI 1 (HGPI)(2) 1 (HGPI)(2)
Stage 2 Buckets HGPI 1 (HGPI)(2) 1 (HGPI)(2)
Stage 3 Buckets HGPI 1 (HGPI)(2) 1 (HGPI)(2)
Note: Repair/replace intervals reflect current production (9F.05) hardware, unless otherwise noted, and
operation in accordance with manufacturer specifications. They represent initial recommended intervals in
the absence of operating and condition experience. For factored hours and starts of the repair intervals, refer
to Figure 39.
CI = Combustion Inspection Interval
HGPI = Hot Gas Path Inspection Interval
(1) Blank and liquid fuel cartridges to be replaced at each CI
Figure D-11 . Estimated repair and replacement intervals
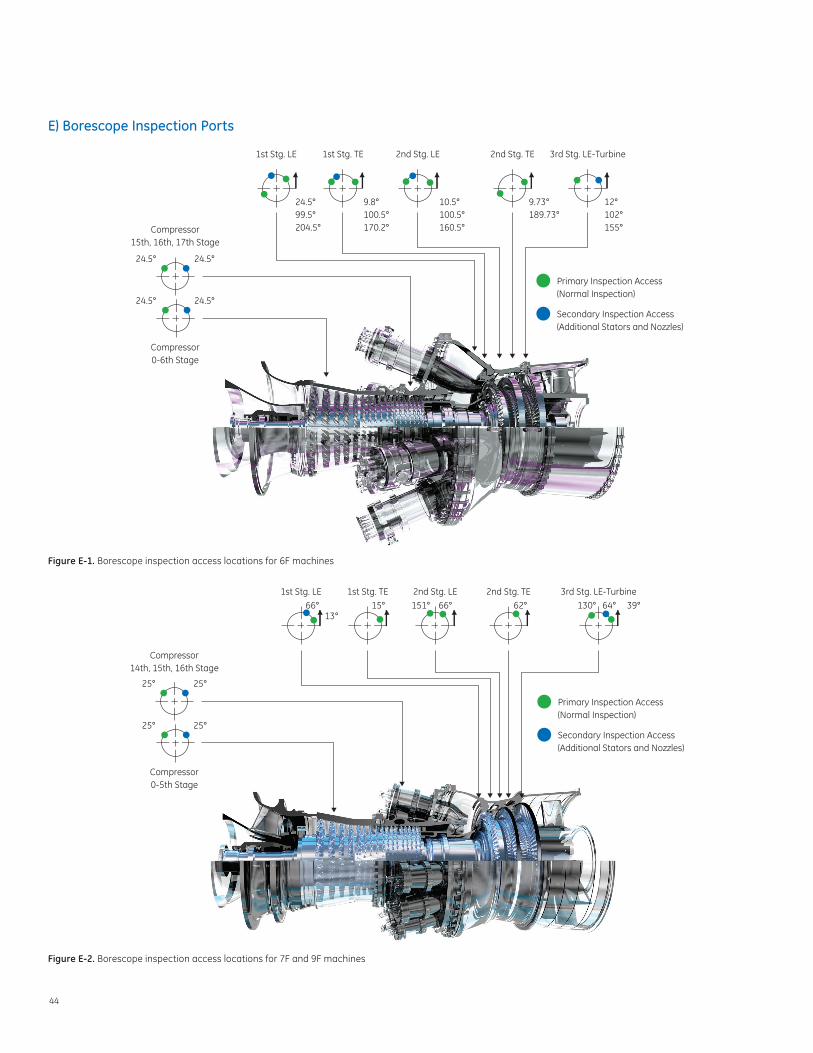
44
Compressor15th, 16th, 17th Stage
Compressor0-6th Stage
24.5°
24.5°
24.5°
24.5°99.5°204.5°
9.8°100.5°170.2°
10.5°100.5°160.5°
9.73°189.73°
12°102°155°
24.5°
1st Stg. LE 1st Stg. TE 2nd Stg. LE 2nd Stg. TE 3rd Stg. LE-Turbine
Primary Inspection Access (Normal Inspection)
Secondary Inspection Access (Additional Stators and Nozzles)
Figure E-1 . Borescope inspection access locations for 6F machines
Compressor14th, 15th, 16th Stage
Compressor0-5th Stage
25°
25°
25°
66°13°
15° 151° 66° 62° 130° 64° 39°
25°
1st Stg. LE 1st Stg. TE 2nd Stg. LE 2nd Stg. TE 3rd Stg. LE-Turbine
Primary Inspection Access (Normal Inspection)
Secondary Inspection Access (Additional Stators and Nozzles)
Figure E-2 . Borescope inspection access locations for 7F and 9F machines
E) Borescope Inspection Ports

GE Power & Water | GER-3620M (02/15) 45
F) Turning Gear/Ratchet Running Guidelines
Scenario Turning Gear (or Ratchet) Duration
Following Shutdown:
Case A.1 – Normal. Restart anticipated for >48 hours
Until wheelspace temperatures <150°F.(1) Rotor classified as unbowed. Minimum 24 hours.(2)
Case A.2 – Normal. Restart anticipated for <48 hours
Continuously until restart. Rotor unbowed.
Case B – Immediate rotor stop necessary. (Stop >20 minutes) Suspected rotating hardware damage or unit malfunction
None. Classified as bowed.
Before Startup:
Case C – Hot rotor, <20 minutes after rotor stop
0–1 hour(3)
Case D – Warm rotor, >20 minutes & <6 hours after rotor stop
4 hours
Case E.1 – Cold rotor, unbowed, off TG <48 hours
4 hours
Case E.2 – Cold rotor, unbowed, off TG >48 hours
6 hours
Case F – Cold rotor, bowed 8 hours(4)
During Extended Outage:
Case G – When idle 1 hour daily
Case H – Alternative No TG; 1 hour/week at full speed (no load).(5)
(1) Time depends on frame size and ambient environment.
(2) Cooldown cycle may be accelerated using starting device for forced cooldown. Turning gear, however,
is recommended method.
(3) 1 hour on turning gear is recommended following a trip, before restarting. For normal shutdowns, use
discretion.
(4) Follow bowed rotor startup procedure, which may be found in the unit O&M Manual.
(5) Avoids high cycling of lube oil pump during long outages.
Figure F-1 . Turning gear guidelines

46
G) B/E- and F-class Gas Turbine Naming
Class PlatformModel Designation
Prior model series
Prior model number
Prior names
F-class
6F
-MS6001(FA)
6101(FA) 6FA.01 6FA
6F.03 6111(FA) 6FA.03 6FA+e
- - - 6F Syngas -
7F
-
MS7001(FA)
7221(FA) 7FA.01 7FA
- 7231(FA) 7FA.02 7FA+
7F.03 7241(FA) 7FA.03 7FA+e
7F.04 - 7FA.04 -
- MS7001(FB) 7251(FB) 7FB.01 -
- - - 7F Syngas -
9F
-
MS9001(FA)
9311(FA) 9FA.01 9FA
- 9331(FA) 9FA.02 9FA+
9F.03 9351(FA) 9FA.03 9FA+e
-
MS9001(FB)
9371(FB) 9FB.01 -
- - 9FB.02 -
9F.05 - 9FB.03 -
Figure G-1 . F-class gas turbine naming
Class PlatformModel Designation
Prior model series
Prior model number
Prior names
B/E-class
6B
-
MS6001(B)
6521(B) -
- 6531(B) -
- 6541(B) -
- 6551(B) -
- 6561(B) -
- 6571(B) -
6B.03 6581(B) -
- - 6B PIP
7E
-
MS7001(EA)
7111(EA) -
- 7121(EA) -
7E.03 - 7EA PIP
9E
-
MS9001(E)
9151(E) -
- 9161(E) -
9E.03 9171(E) -
9E.03 - 9E PIP
9E.03 - 9E AGP
- - 9E Syngas
Figure G-2 . B/E-class gas turbine naming

GE Power & Water | GER-3620M (02/15) 47
List of FiguresFigure 1. Key factors affecting maintenance planning
Figure 2. Key technical reference documents to include in maintenance planning
Figure 3. 7E.03 gas turbine borescope inspection access locations
Figure 4. Borescope inspection planning
Figure 5. Causes of wear – hot gas path components
Figure 6. GE bases gas turbine maintenance requirements on independent counts of starts and hours
Figure 7. Hot gas path maintenance interval comparisons. GE method vs. EOH method
Figure 8. Maintenance factors
Figure 9. GE maintenance intervals
Figure 10. Estimated effect of fuel type on maintenance
Figure 11. Peak fire severity factors - natural gas and light distillates
Figure 12. Firing temperature and load relationship – heat recovery vs. simple cycle operation
Figure 13. Exhaust temperature control curve – dry vs. wet control 7E.03
Figure 14. Peaking-fast start factors
Figure 15. 7F.03 fast start factors
Figure 16. Turbine start/stop cycle – firing temperature changes
Figure 17. Second stage bucket transient temperature distribution
Figure 18. Bucket low cycle fatigue (LCF)
Figure 19. Low cycle fatigue life sensitivities – first stage bucket
Figure 20. Maintenance factor – trips from load
Figure 21. Maintenance factor – effect of start cycle maximum load level
Figure 22. Operation-related maintenance factors
Figure 23. 7F gas turbine typical operational profile
Figure 24. Baseline for starts-based maintenance factor definition
Figure 25. DLN combustion mode effect on combustion hardware life
Figure 26. F-class axial diffuser
Figure 27. E-class radial diffuser
Figure 28. Maintenance factor for overspeed operation ~constant TF
Figure 29. Deterioration of gas turbine performance due to compressor blade fouling
Figure 30. Long-term material property degradation in a wet environment
Figure 31. Susceptibility of compressor blade materials and coatings
Figure 32. 7E.03 heavy-duty gas turbine – disassembly inspections
Figure 33. Operating inspection data parameters
Figure 34. Combustion inspection – key elements
Figure 35. Hot gas path inspection – key elements
Figure 36. Stage 1 bucket oxidation and bucket life
Figure 37. Gas turbine major inspection – key elements
Figure 38. First-stage nozzle repair program: natural gas fired – continuous dry – base load
Figure 39. Baseline recommended inspection intervals: base load – natural gas fuel – dry
Figure 40. Combustion inspection hours-based maintenance factors
Figure 41. Combustion inspection starts-based maintenance factors
Figure 42. Hot gas path maintenance interval: hours-based criterion
Figure 43. Hot gas path maintenance interval: starts-based criterion
Figure 44. Rotor maintenance interval: hours-based criterion
Figure 45. Rotor maintenance interval: starts-based criterion
Figure D-1. Estimated repair and replacement intervals
Figure D-2. Estimated repair and replacement intervals
Figure D-3. Estimated repair and replacement intervals
Figure D-4. Estimated repair and replacement intervals
Figure D-5. Estimated repair and replacement intervals
Figure D-6. Estimated repair and replacement intervals
Figure D-7. Estimated repair and replacement intervals
Figure D-8. Estimated repair and replacement intervals
Figure D-9. Estimated repair and replacement intervals
Figure D-10. Estimated repair and replacement intervals
Figure D-11. Estimated repair and replacement intervals
Figure E-1. Borescope inspection access locations for 6F machines
Figure E-2. Borescope inspection access locations for 7F and 9F machines
Figure F-1. Turning gear guidelines
Figure G-1. F-class gas turbine naming
Figure G-2. B/E-class gas turbine naming

48
Revision History9/89 Original
8/91 Rev A
9/93 Rev B
3/95 Rev C
• Nozzle Clearances section removed
• Steam/Water Injection section added
• Cyclic Effects section added
5/96 Rev D
• Estimated Repair and Replacement Cycles added for F/FA
11/96 Rev E
11/98 Rev F
• Rotor Parts section added
• Estimated Repair and Replace Cycles added for FA+E
• Starts and hours-based rotor maintenance interval
equations added
9/00 Rev G
11/02 Rev H
• Estimated Repair and Replace Cycles updated and moved to
Appendix D
• Combustion Parts section added
• Inlet Fogging section added
1/03 Rev J
• Off Frequency Operation section added
10/04 Rev K
• GE design intent and predication upon proper components
and use added
• Added recommendation for coalescing filters installation
upstream of gas heaters
• Added recommendations for shutdown on gas fuel, dual fuel
transfers, and FSDS maintenance
• Trip from peak load maintenance factor added
• Lube Oil Cleanliness section added
• Inlet Fogging section updated to Moisture Intake
• Best practices for turning gear operation added
• Rapid Cool-down section added
• Procedural clarifications for HGP inspection added
• Added inspections for galling/fretting in turbine dovetails to
major inspection scope
• HGP factored starts calculation updated for application of
trip factors
• Turning gear maintenance factor removed for F-class hours-
based rotor life
• Removed reference to turning gear effects on cyclic
customers’ rotor lives
• HGP factored starts example added
• F-class borescope inspection access locations added
• Various HGP parts replacement cycles updated and
additional 6B table added
• Revision History added
11/09 Rev L
• Updated text throughout
• Casing section added
• Exhaust Diffuser section added
• Added new Fig. 26: F-class axial diffuser
• Added new Fig. 27: E-class radial diffuser
• Revised Fig. 3, 5, 7, 8, 11, 19, 20, 23, 35, 37, 38, 40, 41, 42, 43,
44, E-1, and E-2
• Appendix D – updated repair and replacement cycles
• Added PG6111 (FA) Estimated repair and replacement cycles
• Added PG9371 (FB) Estimated repair and replacement cycles
10/10 Correction L.1
• Corrected Fig. D-4, D-5, and D-11 combustion hardware
repair and replacement cycles
2/15 Rev M
• Updated text throughout
• Added Fig. 14, 15, 25
• Revised Fig. 8, 10, 12, 22, 29, 34, 35, 37, 39, 41, 42, 43, 44, 45
• Updated Appendix A
• Updated Appendix D
• Added 7F.04 Estimated repair and replacement intervals
• Added Appendix G

GE Power & Water | GER-3620M (02/15) 49

4
GTD-222, GTD-241, GTD-450, GECC-1, and Extendor are trademarks of the General Electric Company.
©2015, General Electric Company. All rights reserved.
GER-3620M (02/15)

POWER ENGINEERS, INC. Plan Approval Application – Renovo Energy Center, LLC
APPENDIX K SCR AND OXIDATION CATALYST OPERATING AND MAINTENANCE DETAILS

SCR Control Philosophy (Preliminary)
Client: GE Gas Power Systems
EKI Job#: 186216
Doc No: XXXXXX-XXX
101 Milliken Ave
Ontario, CA 91761
Phone: (909) 621-7599
Fax: (909) 621-7899
DESCRIPTIONREV DATECHECKED
BY
APPROVED
BYMADE BY

1
INTRODUCTION This manual presents general information on the function, construction, control, operation, and
maintenance of the EnviroKinetics SCR systems at the xxx Combined Power Plant in xxx. This is not a
comprehensive manual and should be used in conjunction with other equipment manuals. When
interfacing with existing equipment, those respective manuals should be consulted as well.
BACKGROUND With the increased use of fossil fuels to generate electricity, Federal and Local Governments have
imposed regulations to limit nitrogen oxide (NOx) emissions from combustion equipment. The nitrogen
contained in fossil fuels combines with oxygen during combustion to create NOx. If released to the
atmosphere, the NOx (NO, NO2) combine with available oxygen and water to form nitric acid (HNO3). The
nitric acid returns to the earth in the form of acid rain, which is harmful to our environment. The xxx SCR
utilizes an EnviroKinetics Selective Catalytic Reduction (SCR) system to reduce NOx in the flue gas.
OPERATING THEORY The flue gas contains nitrogen oxides (NOx) that form during fuel combustion. These nitrogen oxides can
be converted to nitrogen gas and water vapor using ammonia and a catalyst. Ammonia (NH3) is injected
into the flue gas upstream of the catalyst through a special injection grid designed to promote even
ammonia distribution and mixing with the flue gas. The ammonia acts as a reducing agent as the flue gas
passes through the catalyst. The NOx (NO, NO2) contained in the flue gas is converted into N2 and H2O.
The fundamental chemical reactions are:
4 NO + 4 NH3 + O2 4 N2 + 6 H2O
6 NO2 + 8 NH3 7 N2 + 12 H2O
NO + NO2 + 2 NH3 2 N2 + 3 H2O

2
The catalyst is specifically selected for each unit’s flue gas composition and promotes the chemical
reaction.
Ammonia (NH3) is introduced into the flue gas upstream of the reactor through an injection grid. The grid
is designed to control the flow of ammonia to each region of the reactor to ensure that the ratio of NH3
and NOx is uniform at the catalyst inlet.

3
EQUIPMENT DESCRIPTION
DESIGN CONDITIONS Item Units Design Conditions
Unit Type HRSG
Number of Units xxx
Unit Fuel Type xxx
Flue Gas
Flue Gas Flow Rate lb/hr xxx
Flue Gas Temperature °F xxx
Composition
O2 % vol xxx
H2O % vol xxx
CO2 % vol xxx
N2 % vol xxx
SOx ppmv @15% O2 dry xxx
Flue Gas Emissions
Inlet NOx ppmv @ 15% O2 dry xxx
Performance Requirements
Outlet NOx ppmv @ 15% O2 dry xxx
Outlet NH3 ppmv @ 15% O2 dry xxx
Pressure Drop Through SCR System
inwc xxx
Ammonia Supply
Ammonia Type xx% Aqueous
Supply Condition Liquid
Maximum Ammonia Flow Rate lb/hr xxx
Ammonia Supply Pressure psig xxx
FLUE GAS FLOW PATH Flue gas enters the reactor over a range of temperatures from xxx °F to xxx °F. The flue gas travels
through the AIG and static mixers that are designed to provide optimal distribution of ammonia
throughout the reactor cross section. The ammonia-laden flue gas arrives at the catalyst where the NOx
reacts with ammonia as it passes through the catalyst. Additional heat is recovered from the flue gas
before being discharged to the stack. Instruments used for monitoring flue gas conditions include a
differential pressure transmitter for monitoring pressure drop across the catalyst and thermocouples at
the SCR inlet for monitoring flue gas temperature.
AMMONIA FLOW CONTROL SYSTEM The reaction chemistry of the SCR requires flow control of the ammonia reagent. This is achieved by the
Ammonia Flow Control Unit (AFCU) skid. The AFCU supplies a mixture of ammonia vapor and circulated
hot flue gas to the ammonia injection grid (AIG). The AFCU skid is shop-assembled, pre-piped, and pre-
wired. The skid is operated and controlled by the plant control system.

4
The AFCU has particular features that need to be noted.
Block and drain valves on the aqueous ammonia line to allow for isolation of the ammonia from
the HRSG during shutdown periods for maintenance of the NFPA 85 Purge Credit condition.
An electric heater for rapid starting of the SCR system is provided on the recirculated flue gas.
This locally-operated heater raises the temperature of the recirculated gas during start-up so that
the vaporizer can begin to operate as soon as the SCR catalyst flue gas temperature reaches
350°F. As the temperature of the recirculated flue gas increases during HRSG start-up, the output
of the electric heater will modulate down until the temperature of the incoming recirculated flue
gas exceeds the minimum normal catalyst operating temperature, at which point the heater will
shut off
A vaporizer tower, packed with heat and mass transfer media, provides for efficient vaporization
of the aqueous ammonia into vapor. Flue gas flows vertically up through the media with the
aqueous ammonia sprayed down into the media. The flow and temperature of the circulated flue
gas is enough to vaporize all of the ammonia required for the SCR operation.
Two 100% hot-gas recirculation fans have been provided on the skid that siphon hot flue gas
from the HRSG ducting for use in vaporizing the aqueous ammonia. These fans are provided with
manual, 98% shut-off dampers on their suction and discharge connections. The manual dampers
are for maintenance purposes only and need to remain open during operation to keep the stand-
by fan in a “ready-to-start” condition as automatic and remote fan switch over can occur during
unit operations. A 98% shut-off backdraft damper is provided on each fan discharge. This
intentionally allows some hot-gas to leak back into the fan housing to keep the stand-by fan
warm and ready for operation. Depending on plant operating practices, it may be preferable to
alternate which fan is in operation, but at a minimum each fan shaft needs to be rotated 180°
once per month if left idle.
Variable Frequency Drives (VFDs) for each of the dilution fans allow for fan speed to be
modulated to avoid excess velocity in the vaporizer (flooding) and to prevent the offline fan’s
impeller from remaining idle after a trip.
Ammonia is delivered to the AFCU, filtered, and metered by a flow meter that provides a feedback signal
to the ammonia flow control valve. The amount of ammonia required is determined by feedback from a
NOx analyzer on the stack.
Hot flue gas is circulated from the HRSG duct via the ammonia dilution fans. The fans discharge the flue
gas through the start-up heater and the vaporizer tower, and return it, with ammonia, to the AIG. The
fans are operated with constant output from the Variable Frequency Drive. As previously described, the
start-up heater is only intended to operate during the start-up period so that ammonia vapor can be
delivered when the temperature of the flue gas entering the SCR catalyst is at least 350 °F.
Ammonia is injected into the hot flue gas stream in the vaporizer where it is completely vaporized.
Instrumentation monitors the vaporizer for differential pressure and level. High differential pressure

5
indicates flooding (flue gas velocity too high). Liquid accumulation in the bottom of the tower, as
indicated by the level switch, indicates incomplete vaporization from over-injection or inadequate gas
circulation.
AMMONIA SUPPLY The aqueous ammonia liquid is fed to the AFCU via the ammonia supply line.
Reagent-grade 19% by weight aqueous ammonia of the following specification is required for this system:
Property Requirement
Ammonia Assay 19%
Appearance Colorless and free of suspended matter or sediment
Residue After Ignition < 0.002% weight
Total Non-Volatile Matter < 0.05% weight
Halides < 0.5 ppmw
Alkali Metals < 1.0 ppmw
Total Sulfur < 2.0 ppmw
Phosphates < 2.0 ppmw
Iron < 0.2 ppmw
Heavy Metals < 0.5 ppmw
Makeup Solution Demineralized or deionized water
MAJOR COMPONENTS The system can be divided into three major components:
1. Catalytic Reactor and Ductwork
2. Ammonia Supply System
3. Aqueous Ammonia Vaporization System
SCR REACTOR The SCR reactor utilizes one fixed catalyst bed, horizontal flow reactor with provision for a future 50%
catalyst bed.
The reactor assembly consists of a reinforced casing with structural supports designed for internal
pressure, seismic loading, wind loading, catalyst loading, and thermal stress (design by others). The
reactor housing has inside dimensions of approximately xxx ft tall x xxx ft wide and is constructed of
carbon steel plate. The reactor is insulated internally. An access opening for catalyst loading and removal
is located at the roof.
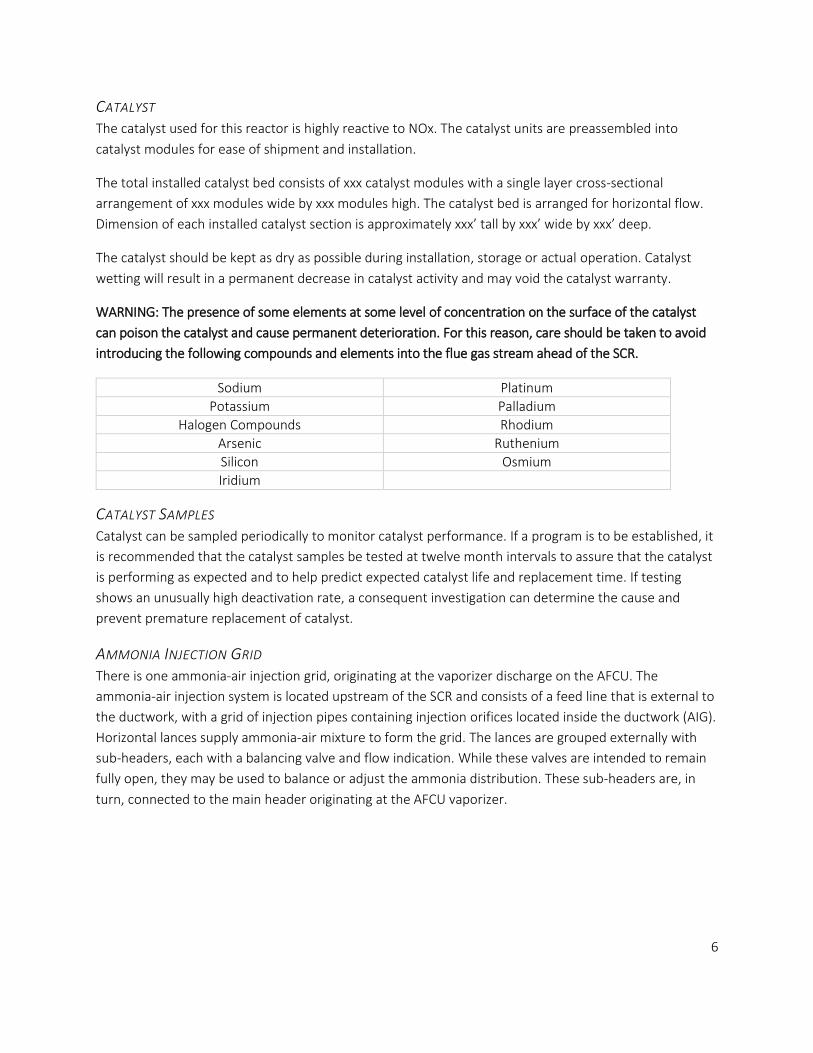
6
CATALYST The catalyst used for this reactor is highly reactive to NOx. The catalyst units are preassembled into
catalyst modules for ease of shipment and installation.
The total installed catalyst bed consists of xxx catalyst modules with a single layer cross-sectional
arrangement of xxx modules wide by xxx modules high. The catalyst bed is arranged for horizontal flow.
Dimension of each installed catalyst section is approximately xxx’ tall by xxx’ wide by xxx’ deep.
The catalyst should be kept as dry as possible during installation, storage or actual operation. Catalyst
wetting will result in a permanent decrease in catalyst activity and may void the catalyst warranty.
WARNING: The presence of some elements at some level of concentration on the surface of the catalyst
can poison the catalyst and cause permanent deterioration. For this reason, care should be taken to avoid
introducing the following compounds and elements into the flue gas stream ahead of the SCR.
Sodium Platinum
Potassium Palladium
Halogen Compounds Rhodium
Arsenic Ruthenium
Silicon Osmium
Iridium
CATALYST SAMPLES Catalyst can be sampled periodically to monitor catalyst performance. If a program is to be established, it
is recommended that the catalyst samples be tested at twelve month intervals to assure that the catalyst
is performing as expected and to help predict expected catalyst life and replacement time. If testing
shows an unusually high deactivation rate, a consequent investigation can determine the cause and
prevent premature replacement of catalyst.
AMMONIA INJECTION GRID There is one ammonia-air injection grid, originating at the vaporizer discharge on the AFCU. The
ammonia-air injection system is located upstream of the SCR and consists of a feed line that is external to
the ductwork, with a grid of injection pipes containing injection orifices located inside the ductwork (AIG).
Horizontal lances supply ammonia-air mixture to form the grid. The lances are grouped externally with
sub-headers, each with a balancing valve and flow indication. While these valves are intended to remain
fully open, they may be used to balance or adjust the ammonia distribution. These sub-headers are, in
turn, connected to the main header originating at the AFCU vaporizer.

7
MAINTENANCE The system shall be operated and maintained under a planned program of periodic inspection with the
accompanying repair and replacement of parts needed to achieve the maximum availability and reliability
of the system.
The inspection results and maintenance records should be compiled and be accessible at all times.
Results of these inspections are used to determine the necessity for equipment repair or replacement.
CATALYST MAINTENANCE Catalyst protection must be practiced constantly by maintenance personnel when inspecting or
servicing the reactor. Do not physically the catalyst directly during work inside the reactor as
catalyst damage may occur. Temporary scaffolding and footplates are required to avoid the
contact of any direct acting loads onto the catalyst modules or elements. As a precaution, a shield
shall be installed over the catalyst layer to protect the catalyst during maintenance work.
The catalyst must not be exposed to water or other moisture throughout all operating and
storage conditions to prevent catalyst deterioration. This problem can be easily prevented by
careful work and a daily check of the SCR system. All open inspection ports are to be shielded
from the rain.
Should rain enter through a cracked duct or open access door, dry the catalyst as soon as
possible. Flue gas water vapor during startup, shutdown and normal operations is not a concern.
Never wash the catalyst with water.
EQUIPMENT MAINTENANCE Periodic maintenance of the equipment will keep the equipment in excellent condition and in service for
its intended use. All equipment shall be inspected and maintained in accordance with the manufacturer's
instructions. Development of the practical maintenance program is to be based on the site and plant
conditions.

8
RECOMMENDED MAINTENANCE SCHEDULE The following table is a recommended maintenance schedule based on typical operation. Detailed
maintenance procedures for each piece of equipment are available in the manufacturer's data books.
WARNING: Review all recommended safety practices before performing maintenance on any piece of
equipment.
# Equipment Check Points
Du
rin
g O
per
atio
n
Wh
ile O
fflin
e
Interval
Ever
y Sh
ift
Dai
ly
Wee
kly
Mo
nth
ly
Year
ly
Oth
er
1
Ductwork
Inspection for gas leakage X X
2 Check for abnormal vibration X X
3 Check for signs of color change X X
4 Ammonia
Injection Grid
Check for plugging due to foreign matter inside of nozzles
X X
5 Check for deformation or corrosion X X
6
SCR Reactor
Inspect for gas leakage X X
7 Check for catalyst layer shifting X X
8 Check for corrosion X X
9 Check for dust adhesion to catalyst and clean (if necessary)
X X
10 Check for deformation or movement of sealing device
X X
11 Check total sealing system X X
12 Check for deformation or distortion of structures
X X
13
Catalyst (Visual Check)
Check for deformation of module and catalyst elements
X X
14 Check for dust accumulation and blockage
X X
15 Check catalyst for dust erosion X X
16 Ammonia
Header Confirmation of correct flow at header by pressure drop
X X
17 Vaporizer Check for gas leakage X X

9
# Equipment Check Points
Du
rin
g O
per
atio
n
Wh
ile O
fflin
e
Interval
Ever
y Sh
ift
Dai
ly
Wee
kly
Mo
nth
ly
Year
ly
Oth
er
18 Check for blockage X X X
19
Dilution Air Fans
Check for sound or vibration at blower and motor
X X
20 Application of grease X X
21 Overhaul fan
X X
22
Control Valve, Shut-Off Valve
Confirm valves are function properly X X
23 Check pressure and temperature settings
X X
24 Check for leakage X X
25 Check or replace gland packings X X
27
Pressure Switches
Visual check for electrical sparking X X
28 Check electrical terminals torque and tightness
X X
29 Measure insulation X X
30 Verify set-point X X
31
Control Panels
Confirmation of annunciator and indicator lamps
X X
32 Check electrical wires for wear X X
33 Check and clean panel internals X X
34 Check electrical terminals torque and tightness
X X
35 Logic sequence test X X
36
Manual Process Controllers
Check electrical terminals torque and tightness
X X
37 Check and clean instruments X X
38 Confirm behavior of control loops X X
39 Thermocouples Remove adhered material X X X

10
# Equipment Check Points
Du
rin
g O
per
atio
n
Wh
ile O
fflin
e
Interval
Ever
y Sh
ift
Dai
ly
Wee
kly
Mo
nth
ly
Year
ly
Oth
er
40 Calibration test X X
41
Pressure Gauges
Confirmation of indicated values X X X
42 Calibration test X X X
43 Check for damage X X
44
Piping
Check for leakage X X
45 Check for fouling X X
46 Check for vibration X X
WARNING: Before entering into and working inside the SCR reactor or ductwork, verify the following
conditions in addition to any plant-specific requirements:
Inside temperature must be lower than 104 °F.
Oxygen concentration in flue duct must be higher than 20%.
Plant is shut down and locked out to prevent restart.
The valves on the lines for ammonia, nitrogen, combustible gases and other hazardous fluids are to be
closed and locked out.
The ammonia line must be completely purged.
Depressurize all equipment and piping to atmospheric pressure before opening them.
During maintenance work, FRESH AIR shall be continuously ventilated by a fan or other suitable
equipment.
Before starting any repair work and especially when using open flames, use a combustible gas detector
to confirm that no combustible gases are present in the work area.
Always work in pairs with one remaining as an observer outside of the work/inspection area(s).
When performing work on electrical equipment, follow the instructions below to prevent electric shock
and/or damage to the equipment.
OPEN the circuit breaker for electrical equipment completely and place a safety tag in a safe,
noticeable location.
CONFIRM that the electrical power supply is absolutely isolated by using a circuit tester.
CONNECT the earth wire firmly to the ground to prevent electric shocks.

11
NOTICE: Do not perform maintenance on instruments such as transmitters, analyzers or controllers without
reading and understanding the instruction manuals. Otherwise, personal injury or damage to the
instruments may result.
Prior to starting the maintenance work on the ammonia injection system, DEPRESSURIZE and PURGE the
system using nitrogen or fresh air to secure safe conditions.
If any repairs are necessary on the pressurized section and/or high temperature service section, ISOLATE
the system or STOP OPERATION to reduce the internal pressure to an ATMOSPHERIC level and to bring
the plant temperature down to a SAFE level (120°F) before initiating repairs.
For fire explosion prevention, fire-fighting equipment shall be readily available near the equipment being
repaired. The equipment shall be properly grounded to release static electricity before starting work.

12
PERFORMANCE EVALUATION Although catalyst deterioration has been taken into account in the design, it has been found that catalyst
activity deteriorates gradually with operation time. Initial deterioration that occurs within the first few
thousand operating hours after the first start-up is somewhat more rapid.
The cause of deterioration cannot be quantitatively determined due to several causes, such as:
Decrease of catalyst specific surface area due to sintering in elevated temperatures
Effects of catalyst poisons which are usually contained in flue gas
The impact of each factor is very small. Regardless, the deterioration rate will not change abruptly as long
as the operating conditions are constant.
The expected efficiency of the SCR system should be evaluated based upon the daily operating data,
periodic performance tests, and examination of the catalyst samples.
The following methods can be used to evaluate catalyst performance and estimate remaining catalyst life:
Evaluation of operating data
Periodic system efficiency tests
Analysis of catalyst samples
EVALUATION OF OPERATION DATA Evaluation of system performance is to be done by tracking key operating data on a regular basis. The
operating data at the design conditions are preferable for calculation of system efficiency. Any abnormal
occurrences (ex. process upsets or unit trips) should be recorded.
The following key operating data should be recorded on half-hourly (minimum) intervals. This data should
be stored and readily accessible throughout the warranty period.
Parameter Metric Units Imperial Units
Fuel Flow Rate kg/hr or NM3/hr lb/hr or ft3/min
Gas Flow Rate Entering the SCR kg/hr or NM3/hr lb/hr or ft3/min
O2 Concentration at Reactor Inlet % volume, dry % volume, dry
NOx Mass Flow at Reactor Inlet kg/hr lb/hr
Outlet NOx Setpoint mg/NM3 or ppmvdc ppmvdc
Calculated NOx Reduction % %
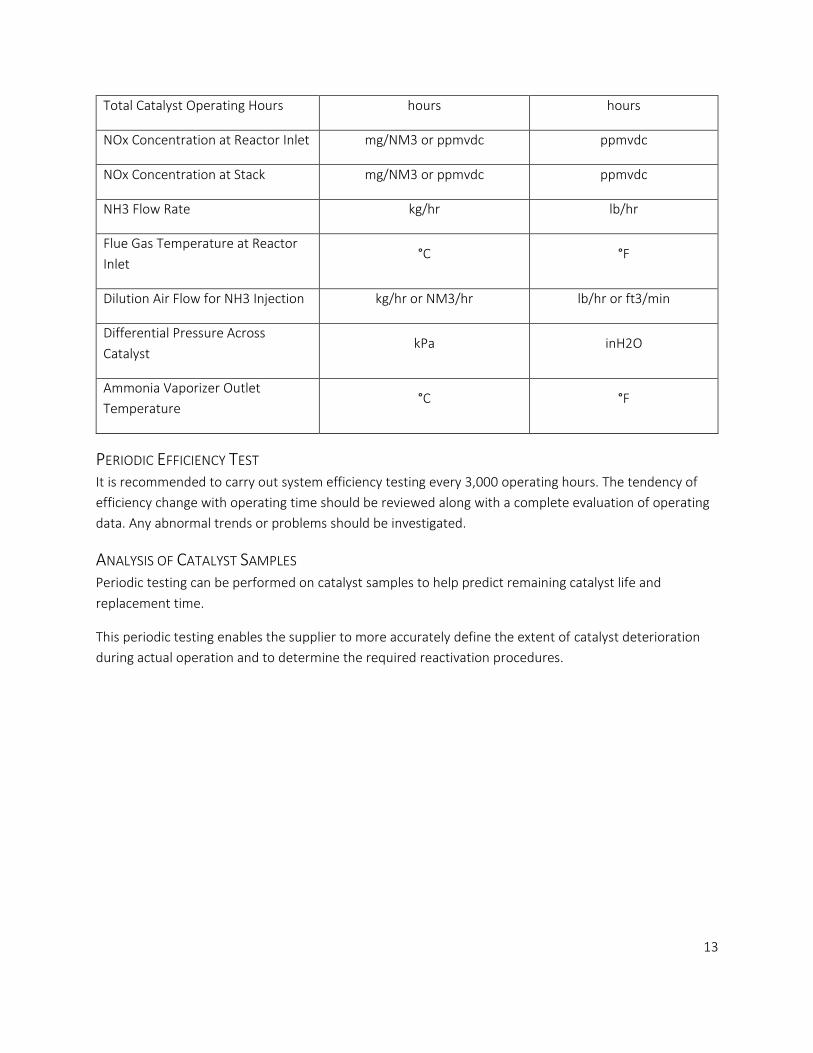
13
Total Catalyst Operating Hours hours hours
NOx Concentration at Reactor Inlet mg/NM3 or ppmvdc ppmvdc
NOx Concentration at Stack mg/NM3 or ppmvdc ppmvdc
NH3 Flow Rate kg/hr lb/hr
Flue Gas Temperature at Reactor
Inlet °C °F
Dilution Air Flow for NH3 Injection kg/hr or NM3/hr lb/hr or ft3/min
Differential Pressure Across
Catalyst kPa inH2O
Ammonia Vaporizer Outlet
Temperature °C °F
PERIODIC EFFICIENCY TEST It is recommended to carry out system efficiency testing every 3,000 operating hours. The tendency of
efficiency change with operating time should be reviewed along with a complete evaluation of operating
data. Any abnormal trends or problems should be investigated.
ANALYSIS OF CATALYST SAMPLES Periodic testing can be performed on catalyst samples to help predict remaining catalyst life and
replacement time.
This periodic testing enables the supplier to more accurately define the extent of catalyst deterioration
during actual operation and to determine the required reactivation procedures.

Johnson Matthey
Temperature (Degrees Farenheit)
A p p l i c a t i o n s :
>> Combined Cycle Gas Turbines>> Simple Cycle Gas Turbines
PerformanceJohnson Matthey pioneered Oxidation Catalyst for gas turbines in the 1970’s. Since then, Oxidation Catalysts have been installed in some of the most environmentally challenging applications, consistently providing greater than 90% destruc-tion of CO, VOCs, formaldehyde and other toxic compounds. Our core expertise in catalysis has allowed Johnson Matthey to stay at the cutting edge of new catalyst development meeting the chal-lenges of ever increasing regulatory requirements.
Our Oxidation Catalysts are formulated with Platinum Group Metals (PGM’s) to achieve maximum conversion of pollutants at gas turbine temperatures, whether it is a simple cycle or combined cycle gas turbine. Our high activity catalyst plus flow through metal monolith design delivers the smallest catalyst package and the lowest back pressure in the industry. The chart to the right illustrates the level of conversion achievable. Side reactions such as NO to NO2 are minimized.
RegenerationJohnson Matthey gas turbine Oxidation Catalysts have an established durability of 10 or more years of continuous operation. Catalytic performance can be easily maintained and restored, if necessary, through washing. And at the end of the effective life of the catalyst, Johnson Matthey closes the loop at its West Deptford, NJ facility where spent catalyst can be recycled and precious metal value is credited to you. Johnson Matthey also provides field support during catalyst inspections, bed rotations, and partial bed replacements.
DependabilityYou can count on Johnson Matthey. Founded in 1817, we are the global leader in environmental catalyst technology with more than 40 years of experience in environmental emissions control catalysts for mobile and stationary sources. We are committed to developing and supplying the highest quality product available.
For the Control of CO, VOCs & HAPs
Gas Turbine Oxidation Catalyst
100
95
90
85
80
75
CO C
onve
rsio
n
200 300 400 500 600 700 800 900 1000
OXIDATION CATALYST PERFORMANCE
• 900 Forge Avenue, Suite 100, Audubon, PA 19403-2305, (484) 320-2125• 31 Journey, Suite 250, Aliso Viejo, CA 92656, (949) 297-5200
• 1121 Alderman Drive, Suite 204, Alpharetta, GA 30005, (678) 341-7522
©2013 Johnson Matthey
www.jmsec.com

1.3 Oxidation Catalyst
1.2.1 CO AND HC CATALYST REACTIONS
Carbon monoxide and unburned hydrocarbons, in the presence of sufficient oxygen, are
oxidized over the catalyst to produce carbon dioxide and water vapor:
2CO + O2 ----> 2CO2
CH4 + 2O2 ----> CO2 + 2H2O
H2 + 2O2 ---->2H2O
1.4 Catalyst De Activation
A catalyst participates in and accelerates a chemical reaction, but remains unchanged when
the reaction is complete. In theory, a catalyst can have an infinite life, but in practice,
various factors contribute to eventual deactivation.
Johnson Matthey catalysts are formulated to provide maximum operating life for the fuel
compositions and containment levels expected.
Catalyst deactivation is caused by the physical and chemical interaction of the catalyst with
the gas stream.
1.4.1 Physical Deactivation
Physical deactivation can occur by thermal degradation of the catalyst or by fouling.
a. Catalyst Thermal Degradation
Thermal degradation of the catalyst is caused by sintering, i.e., the loss of active
catalyst surface area due to exposure to excessively high temperatures. Sintering
occurs when the heat of the gas stream causes the catalyst crystals to diffuse and
agglomerate within the wash-coat. This agglomeration reduces the active surface area.
b. Catalyst Fouling
Catalyst fouling or masking occurs when solid particulates from the gas stream adhere
to the catalyst surface, preventing the reactants from reaching the catalyst. The
severity of the fouling is dependent on both the nature and concentration of the
particulates in the individual gas stream. The loss of catalyst activity due to fouling
can usually be recovered by physically removing the fouling agent from the catalyst.
This is normally accomplished by cleaning procedures such as vacuuming or sweeping
the catalyst clean with compressed air. The optimum cleaning procedure and required
cleaning frequency will depend on the exact nature and concentration of the

particulates in the installation. Please consult with JM before attempting to clean the
catalyst.
NOTE: Every effort should be made to avoid silica contamination of the catalyst.
Silica is not volatile, and once deposited on the catalyst surface it may be
impossible to remove. If sufficient silica builds up, it will form a layer
which will prevent the gas stream from contacting active catalyst sites,
reducing catalyst performance.
1.4.2 CHEMICAL DEACTIVATION
Chemical deactivation is caused by poisoning.
a. When elements in the gas stream react with the catalyst causing a reduction in
catalytic activity, the catalyst is said to be poisoned.
It is usually not possible to recover lost activity from a catalyst which has
been poisoned. See Section 1.4 for a listing of materials which can cause
poisoning for oxidation catalyst.
The loss of catalytic activity due to poisoning occurs gradually over time as
poisons accumulate in the catalyst. The rate at which catalyst activity is lost
depends upon the concentration of the poison in the gas stream. Increasing
the inlet gas temperature during the life of the catalyst can compensate for
some loss of activity.
It is possible for catalyst poisons to form complexes with other elements in
the gas stream, thus reducing their tendency to poison the catalyst. For
example, lead and phosphorus in combination have much less effect on the
catalyst than either element separately. The presence of alkali metals and
alkaline earths is also very effective in reducing phosphorous poisoning.
The maximum permissible concentrations of contaminants are presented in
the Section 1.4 of this manual. To maintain catalyst warranties, these levels
must never be exceeded.
b. Catalyst Inhibition
Catalyst inhibition occurs when contaminant elements in the gas stream
chemically adhere to the catalyst causing a reduction in catalytic activity.
Sulfur dioxide and concentrations of halogenated compounds - such as fluoro-
hydrocarbons, chloro-hydrocarbons and brominated hydrocarbons - are all
catalyst inhibitors. Their molecules are relatively large, and when they adhere
to the catalyst molecules, they block the pollutants from reacting with the
catalyst. Catalyst inhibition can then be regarded as a chemical form of
masking.

Catalyst activity can usually be restored by eliminating the inhibitor from the
gas stream, by cycling the system at a higher temperature, or by a
combination of the two. Activity loss will occur rapidly when the catalyst is
exposed to a contaminated gas stream. This loss can be recovered by running
the system at an elevated temperature (typically 100oF/38°C above normal
operating temperature) for several hours. Please contact Johnson Matthey for
assistance with this procedure.
If SO2 and SO
3 are allowed to condense within the catalyst honeycomb
structure, sulfuric acid mist can form and corrode the catalyst support and
permanently lower activity.
1.5 Catalyst Operating Limits
1.5.1 OXIDATION CATALYST
Maximum continuous operating temperature: 750°F
Maximum intermittent operating temperature: (15 min/24 hrs) 850°F
Catalyst poisons:
Lead Arsenic Sodium Iron Silicon
Bismuth Antimony Potassium Chromium Sulfur
Mercury Phosphorus Copper Zinc
Calcium Magnesium Nickel Tin
The cumulative concentration of these poisons must not exceed 10 g/ft3.
Chlorinated compounds must not exceed 10 ppm. Silicon compounds must not be
present.

1.6 Catalyst Regeneration
The maintenance for typical catalyst installation will consist of:
1. Physical inspection every 3-6 months of operation.
2. Vacuuming as needed to remove ash build up and debris associated with increased
backpressure. Fouling, especially by particulates trapped from the gas stream, can
often be remedied by vacuuming the channels clear. This can be done with the
catalyst in place if there is sufficient access room. The air jet should be in the
direction opposite the normal flow through the catalyst.
Note: Johnson Matthey does not recommend blowing the catalyst clear with
compressed air as excessive pressure or contaminated air can cause irrevocable
damage to the catalyst.
3 Approved washing procedure as needed to maintain performance. See Appendix A.
Note: The maximum allowable number of washings is four (4) during the warranty
period of the catalyst.
1.7 Catalyst Testing
1.7.1 TEST CORES
Test cores enable Johnson Matthey to accurately monitor catalyst condition for
boiler operating fuels and operating temperature/flow conditions. This will allow
Johnson Matthey to accurately assess catalyst durability and performance, and to
report results to the customer.
The test samples are a 1" diameter cylinder cores of the catalyst taken in field from
the panel.
The test core location in the catalyst panel should be recorded along with the date
of the installation and site operating hours at the time of removal.
1.7.2. CORE REMOVAL SCHEDULE
It is recommended to test a core sample for catalyst activity after every 8,000 hours
of operation (during boiler shutdown periods):

1.8 Johnson Matthey Facilities
Johnson Matthey maintains complete physical facilities and has personnel experienced in
the analysis and evaluation of catalyst in all phases of catalyst technology. This ensures:
The selection of an optimum catalyst formulation for specific customer requirements.
Proper production control.
Catalyst operating performance analysis.
To completely assist our customers and to ensure optimum catalyst performance, Technical
Service personnel are on call to help solve problems that may develop with an on-stream
situation. The technical service engineer can usually be on the way to your plant within
hours of a request for assistance.
1.8.1 CATALYST TESTING
Analytical Capability
- Atomic Absorption
- X-ray Fluorescence
- GYP Emission Spectrograph
- Wet Chemical Analysis
These tests are used to determine the concentration of active catalyst elements,
impurity levels, and poison accumulation levels in the catalysts.
Electron Microscope with Energy Dispersive XRF
This test is used to examine catalyst at high magnification and discovers
changes in physical properties of the catalyst, determining the composition and
distribution of fouling particulates and inhibitors, and their effects.
Optical Microscope
This test is used to examine catalyst integrity and adhesion to the substrate as
well as physical changes due to excessive operating temperatures and thermal
degradation.
BET Surface Area
This test is used to determine the total surface area which retains catalyst.
Changes can be used to determine the maximum temperature to which the
catalyst has been exposed. Loss of surface area with a known operating on-
stream time can be used to determine remaining catalyst life.
X-Ray Diffraction

This test is used to determine the crystallographic phase of catalysts and
catalyst components, and to determine maximum catalyst exposure temperature
and mechanisms of poisoning.
Mercury Porosimeter
This test is used to determine pore size distribution of the catalyst support
structure.
Simulated Catalyst Activity Test (SCAT)
This test measures catalyst activity under precise conditions, including
controlled flow rate, inlet temperature, and gas composition, over laboratory
scale catalyst samples. Inlet and outlet gas streams are analyzed for O2, CO,
SOx , CO2
, hydrocarbons, oxides of nitrogen, H2, H
2O, and temperature. This
permits measurement of all characteristics of catalyst performance under
simulated operating conditions.
1.9 Catalyst Storage Requirements
If the catalyst will remain in storage for along periods of time, some precautions should be
taken to ensure that the catalyst will retain its activity.
1.9.1 OXIDATION CATALYST
The oxidation catalyst is not soluble in water so no special wrapping is required.
However, the catalyst surface should be protected by crating the panels in plywood.
1.10 Performance Testing
Measurement of carbon monoxide should be conducted according to EPA Method 10.

POWER ENGINEERS, INC. Plan Approval Application – Renovo Energy Center, LLC
APPENDIX L AUXILIARY EQUIPMENT MANUFACTURER SPECIFICATION SHEETS

Nebraska D seriesTechNical DaTa iNformaTioN PackeT

Table of Contents
Cleaver-Brooks Nebraska D Boiler Series Technical Data Sheets 100D Series ................................................................. 3-4 200D Series ................................................................. 5-6 300D Series ................................................................. 7-8 400D Series ............................................................... 9-10 500D Series ............................................................. 11-12 600D Series ............................................................. 13-14
ProFire Burner Series Technical Data Sheets ProFire D126, LND145 .................................................. 15 ProFire D252, LND300 .................................................. 16 ProFire D Series Dimension Tables ............................... 17 ProFire LND Series Dimension Tables .......................... 18 ProFire XL Burner General Data ................................... 19 ProFire XL378, LNXL378 ............................................... 20 ProFire XL504, LNXL504 ............................................... 21 ProFire XL630, LNXL630 ............................................... 22 ProFire XL Series Dimension Tables ............................. 23 ProFire LNXL Series Dimension Tables ........................ 24
NXT Burner Series Technical Data Sheets NXT Burner General Data ............................................. 25 NXT-048 ......................................................................... 26 NXT-060 ......................................................................... 27 NXT-072 ......................................................................... 28 NXT-085 ......................................................................... 29 NXT-097 ......................................................................... 30 NXT-109 ......................................................................... 31 NXT-120 ......................................................................... 32 NXT-132 ......................................................................... 33 NXT-144 ......................................................................... 34 NXT-162 ......................................................................... 35 NXT-180 ......................................................................... 36 NXT-210 ......................................................................... 37 NXT-240 ......................................................................... 38 NXT-271 ......................................................................... 39 NXT-048 to NXT-109 Dimension Tables ........................ 40 NXT-120 to NXT-271 Dimension Tables .................. 41–42

Boiler Dimensions CBND-10P-100D-25 CBND-20P-100D-35 CBND-30P-100D-40
Capacity 10,000 lb/h 20,000 lb/h 30,000 lb/h
Upper Drum 36 in 36 in 36 in
Lower Drum 24 in 24 in 24 in
Length Over Casing 10 ft 13 ft 4 in 15 ft
Width, Gas Outlet 12 3/4 in 16 3/4 in 28 3/4 in
Height, Gas Outlet 67 in 67 in 67 in
Front to CL Gas Outlet 12 5/8 in 14 5/8 in 20 5/8 in
Shipping Height 11 ft 5 in 11 ft 5 in 11 ft 5 in
Overall Width 9 ft 8 1/2 in 9 ft 8 1/2 in 9 ft 8 1/2 in
Min Operating Pressure 100 psig 100 psig 100 psig
Cleaver-Brooks Nebraska DSteam-Ready 100D Series
Capacities and Specifications
3
* Shown with NATCOM NXT Burner. For 100D Series, ProFire Burner is standard feature.

Economizer
Pressure Vessel
Design Pressure up to 375 psig • • •
Hinged Manways • • •
Lower Drum Heating Coil (LDHC) • • •
Tubes 2 in 178-A.120 Wall–PV • • •
Tubes 2 in 178-A.135 Wall–PV • • •
Operating Pressure - 200–325 psig • • •
Auxiliary Equipment
Platforms & Ladders - Boiler • • •
Platforms & Ladders - Stack ◊ ◊ ◊
Platform & Ladder - Economizer ◊ ◊ ◊
Sootblowers • • •
Variable Frequency Drive • • •
Selective Catalytic Reduction ◊ ◊ ◊
Controls
Parallel Positioning (PP) • • •
Fully Metered (FM) ◊ ◊ ◊
Eye-Hye® Remote Drum Level Transmitter
• • •
Feedwater 2- or 3-Element • • •
O2 Trim • • •
O2 Analyzer • • •
Pressure Vessel
Design Pressure 250 • • •
Tubes 2 in 178-A.105 Wall • • •
Steam Quality 0.5% Moist • • •
RH - Right Hand • • •
LH - Left Hand • • •
AL - Aluminum Casing • • •
Operating Pressure - 100–200 psig • • •
Auxiliary Equipment
Steam Trim • • •
Feedwater Trim • • •
Boiler Platform Clips • • •
Economizer • • •
Stack - 40 ft, 50 ft, 60 ft ◊ ◊ ◊
Controls
Hawk 5000 Control • • •
Single Point (SP) • • •
Feedwater - Single Element • • •
Burner
ProFire D • •
ProFire XL (See ProFire Burner technical data sheet for detailed information)
•
Standard Features Optional FeaturesCB
ND
-10P
-100
D-2
5
(Cap
acity
10,
000
lb/h
)
CB
ND
-10P
-100
D-2
5
(Cap
acity
10,
000
lb/h
)
CB
ND
-20P
-100
D-3
5
(Cap
acity
20,
000
lb/h
)
CB
ND
-20P
-100
D-3
5
(Cap
acity
20,
000
lb/h
)
CB
ND
-30P
-100
D-4
0
(Cap
acity
30,
000
lb/h
)
CB
ND
-30P
-100
D-4
0
(Cap
acity
30,
000
lb/h
)
◊ Contact us for details.
E1 Economizers CBND-10P-100D-25 CBND-20P-100D-35 CBND-30P-100D-40
Fin Height 0.75 in 0.75 in 0.75 in
Transverse Pitch 4.5 in 4.5 in 4.5 in
Longitudinal Pitch 4.5 in 4.5 in 4.5 in
Segment 0.172 in 0.172 in 0.172 in
Fin Thickness 0.05 in 0.05 in 0.05 in
Effective Length 7 ft 7 ft 7 ft
Material Carbon Steel Carbon Steel Carbon Steel
Fins Serrated Serrated Serrated
Bends Cold Bent Cold Bent Cold Bent
Fuel NG & #2 oil NG & #2 oil NG & #2 oil
Economizer Trim
Economizer feedwater bypass 1.25 in 1.5 in 2 in
Header vent valve 1 in 1 in 1 in
Header drain valve 1 in 1 in 1 in
STANDARD EQUIPMENT ALSO INCLUDED
Temperature gauges – feedwater inlet/outlet
Temperature thermowell – feedwater inlet/outlet
Temperature gauges – flue gas inlet/outlet
Temperature thermowell – flue gas inlet/outlet
4

Boiler Dimensions CBND-40E-200D-40CBND-40P-200D-40
CBND-50E-200D-45CBND-50P-200D-45
CBND-60E-200D-50
Capacity 40,000 lb/h 50,000 lb/h 60,000 lb/h
Upper Drum 36 in 36 in 36 in
Lower Drum 24 in 24 in 24 in
Length Over Casing 15 ft 16 ft 8 in 18 ft 4 in
Width, Gas Outlet 24 3/4 in 28 3/4 in 32 3/4 in
Height, Gas Outlet 79 3/4 in 79 3/4 in 79 3/4 in
Front to CL Gas Outlet 18 5/8 in 20 5/8 in 22 5/8 in
Shipping Height 13 ft 7 5/16 in 13 ft 7 5/16 in 13 ft 7 5/16 in
Overall Width 10 ft 10 1/4 in 10 ft 10 1/4 in 10 ft 10 1/4 in
Min Operating Pressure 100 psig 100 psig 100 psig
Cleaver-Brooks Nebraska DSteam-Ready 200D Series
Capacities and Specifications
5
* Shown with NATCOM NXT Burner.

Economizer
Pressure Vessel
Design Pressure up to 375 psig • • •
Hinged Manways • • •
Lower Drum Heating Coil (LDHC) • • •
Tubes 2 in 178-A.120 Wall–PV • • •
Tubes 2 in 178-A.135 Wall–PV • • •
Operating Pressure - 200–325 psig • • •
Auxiliary Equipment
Platforms & Ladders - Boiler • • •
Platforms & Ladders - Stack ◊ ◊ ◊
Platform & Ladder - Economizer ◊ ◊ ◊
Sootblowers • • •
Variable Frequency Drive • • •
Selective Catalytic Reduction ◊ ◊ ◊
Controls
Parallel Positioning (PP) • • •
Fully Metered (FM) - NXT • • •
Eye-Hye® Remote Drum Level Transmitter
• • •
Feedwater 2- or 3-Element • • •
O2 Trim • • •
O2 Analyzer • • •
Pressure Vessel
Design Pressure 250 • • •
Tubes 2 in 178-A.105 Wall • • •
Steam Quality 0.5% Moist • • •
RH - Right Hand • • •
LH - Left Hand • • •
AL - Aluminum Casing • • •
Operating Pressure - 100–200 psig • • •
Auxiliary Equipment
Steam Trim • • •
Feedwater Trim • • •
Boiler Platform Clips • • •
Economizer • • •
Stack - 40 ft, 50 ft, 60 ft ◊ ◊ ◊
Controls
Hawk 5000 Control • • •
Single Point (SP) - NXT • • •
Parallel Positioning (PP) - PF • • •
Feedwater - Single Element • • •
Burner
NATCOM NXT for E Series (See NXT Burner technical data sheet for detailed information)
• • •
ProFire XL for P Series (See ProFire Burner technical data sheet for detailed information)
• •
Standard Features Optional FeaturesCB
ND
-40E
-200
D-4
0
CB
ND
-40P
-200
D-4
0
CB
ND
-40E
-200
D-4
0
CB
ND
-40P
-200
D-4
0
CB
ND
-50E
-200
D-4
5
CB
ND
-50P
-200
D-4
5
CB
ND
-50E
-200
D-4
5
CB
ND
-50P
-200
D-4
5
CB
ND
-60E
-200
D-5
0
CB
ND
-60E
-200
D-5
0
◊ Contact us for details.
E2 Economizers CBND-40E-200D-40CBND-40P-200D-40
CBND-50E-200D-45CBND-50P-200D-45
CBND-60E-200D-50
Fin Height 0.75 in 0.75 in 0.75 in
Transverse Pitch 4.5 in 4.5 in 4.5 in
Longitudinal Pitch 4.5 in 4.5 in 4.5 in
Segment 0.172 in 0.172 in 0.172 in
Fin Thickness 0.05 in 0.05 in 0.05 in
Effective Length 9 ft 9 ft 9 ft
Material Carbon Steel Carbon Steel Carbon Steel
Fins Serrated Serrated Serrated
Bends Cold Bent Cold Bent Cold Bent
Fuel NG & #2 oil NG & #2 oil NG & #2 oil
Economizer Trim
Economizer feedwater bypass 2 in 2.5 in 2.5 in
Header vent valve 1 in 1 in 1 in
Header drain valve 1 in 1 in 1 in
STANDARD EQUIPMENT ALSO INCLUDED
Temperature gauges – feedwater inlet/outlet
Temperature thermowell – feedwater inlet/outlet
Temperature gauges – flue gas inlet/outlet
Temperature thermowell – flue gas inlet/outlet
6

Boiler Dimensions CBND-70E-300D-55 CBND-80E-300D-65 CBND-90E-300D-70
Capacity 70,000 lb/h 80,000 lb/h 90,000 lb/h
Upper Drum 42 in 42 in 42 in
Lower Drum 24 in 24 in 24 in
Length Over Casing 20 ft 23 ft 4 in 25 ft
Width, Gas Outlet 36 3/4 in 40 1/2 in 44 3/4 in
Height, Gas Outlet 88 1/2 in 88 1/2 in 88 1/2 in
Front to CL Gas Outlet 24 5/8 in 26 5/8 in 28 5/8 in
Shipping Height 14 ft 6 in 14 ft 6 in 14 ft 6 in
Overall Width 11 ft 5 in 11 ft 5 in 11 ft 5 in
Min Operating Pressure 100 psig 100 psig 100 psig
Cleaver-Brooks Nebraska DSteam-Ready 300D Series
Capacities and Specifications
7

Economizer
Pressure Vessel
Design Pressure up to 375 psig • • •
Hinged Manways • • •
Lower Drum Heating Coil (LDHC) • • •
Tubes 2 in 178-A.120 Wall–PV • • •
Tubes 2 in 178-A.135 Wall–PV • • •
Operating Pressure - 200–325 psig • • •
Auxiliary Equipment
Platforms & Ladders - Boiler • • •
Platforms & Ladders - Stack ◊ ◊ ◊
Platform & Ladder - Economizer ◊ ◊ ◊
Sootblowers • • •
Variable Frequency Drive • • •
Selective Catalytic Reduction ◊ ◊ ◊
Controls
Parallel Positioning (PP) • • •
Fully Metered (FM) • • •
Eye-Hye® Remote Drum Level Transmitter
• • •
Feedwater 2- or 3-Element • • •
O2 Trim • • •
O2 Analyzer • • •
Pressure Vessel
Design Pressure 250 • • •
Tubes 2 in 178-A.105 Wall • • •
Steam Quality 0.5% Moist • • •
RH - Right Hand • • •
LH - Left Hand • • •
AL - Aluminum Casing • • •
Operating Pressure - 100–200 psig • • •
Auxiliary Equipment
Steam Trim • • •
Feedwater Trim • • •
Boiler Platform Clips • • •
Economizer • • •
Stack - 40 ft, 50 ft, 60 ft ◊ ◊ ◊
Controls
Hawk 5000 Control • • •
Single Point (SP) • • •
Feedwater - Single Element • • •
Burner
NATCOM NXT (See NXT Burner technical data sheet for detailed information)
• • •
Standard Features Optional FeaturesCB
ND
-70E
-300
D-5
5
(Cap
acity
70,
000
lb/h
)
CB
ND
-70E
-300
D-5
5
(Cap
acity
70,
000
lb/h
)
CB
ND
-80E
-300
D-6
5
(Cap
acity
80,
000
lb/h
)
CB
ND
-80E
-300
D-6
5
(Cap
acity
80,
000
lb/h
)
CB
ND
-90E
-300
D-7
0
(Cap
acity
90,
000
lb/h
)
CB
ND
-90E
-300
D-7
0
(Cap
acity
90,
000
lb/h
)
◊ Contact us for details.
E3 Economizers CBND-70E-300D-55 CBND-80E-300D-65 CBND-90E-300D-70
Fin Height 0.75 in 0.75 in 0.75 in
Transverse Pitch 4.5 in 4.5 in 4.5 in
Longitudinal Pitch 4.5 in 4.5 in 4.5 in
Segment 0.172 in 0.172 in 0.172 in
Fin Thickness 0.05 in 0.05 in 0.05 in
Effective Length 12 ft 12 ft 12 ft
Material Carbon Steel Carbon Steel Carbon Steel
Fins Serrated Serrated Serrated
Bends Cold Bent Cold Bent Cold Bent
Fuel NG & #2 oil NG & #2 oil NG & #2 oil
Economizer Trim
Economizer feedwater bypass 2.5 in 3 in 3 in
Header vent valve 1 in 1 in 1 in
Header drain valve 1 in 1 in 1 in
STANDARD EQUIPMENT ALSO INCLUDED
Temperature gauges – feedwater inlet/outlet
Temperature thermowell – feedwater inlet/outlet
Temperature gauges – flue gas inlet/outlet
Temperature thermowell – flue gas inlet/outlet
8

Boiler Dimensions CBND-100E-400D-75 CBND-110E-400D-85 CBND-120E-400D-90
Capacity 100,000 lb/h 110,000 lb/h 120,000 lb/h
Upper Drum 48 in 48 in 48 in
Lower Drum 24 in 24 in 24 in
Length Over Casing 26 ft 8 in 30 ft 31 ft 8 in
Width, Gas Outlet 52 3/4 in 56 3/4 in 60 3/4 in
Height, Gas Outlet 88 1/2 in 88 1/2 in 88 1/2 in
Front to CL Gas Outlet 32 5/8 in 34 5/8 in 36 5/8 in
Shipping Height 15 ft 1/2 in 15 ft 1/2 in 15 ft 1/2 in
Overall Width 11 ft 7 3/4 in 11 ft 7 3/4 in 11 ft 7 3/4 in
Min Operating Pressure 100 psig 100 psig 100 psig
Cleaver-Brooks Nebraska DSteam-Ready 400D Series
Capacities and Specifications
9
* CBND-90E-300D-70 shown. 400D to 600D CBND units are available with grade mounted fan, fuel train and controls. See corresponding burner dimension table for details.
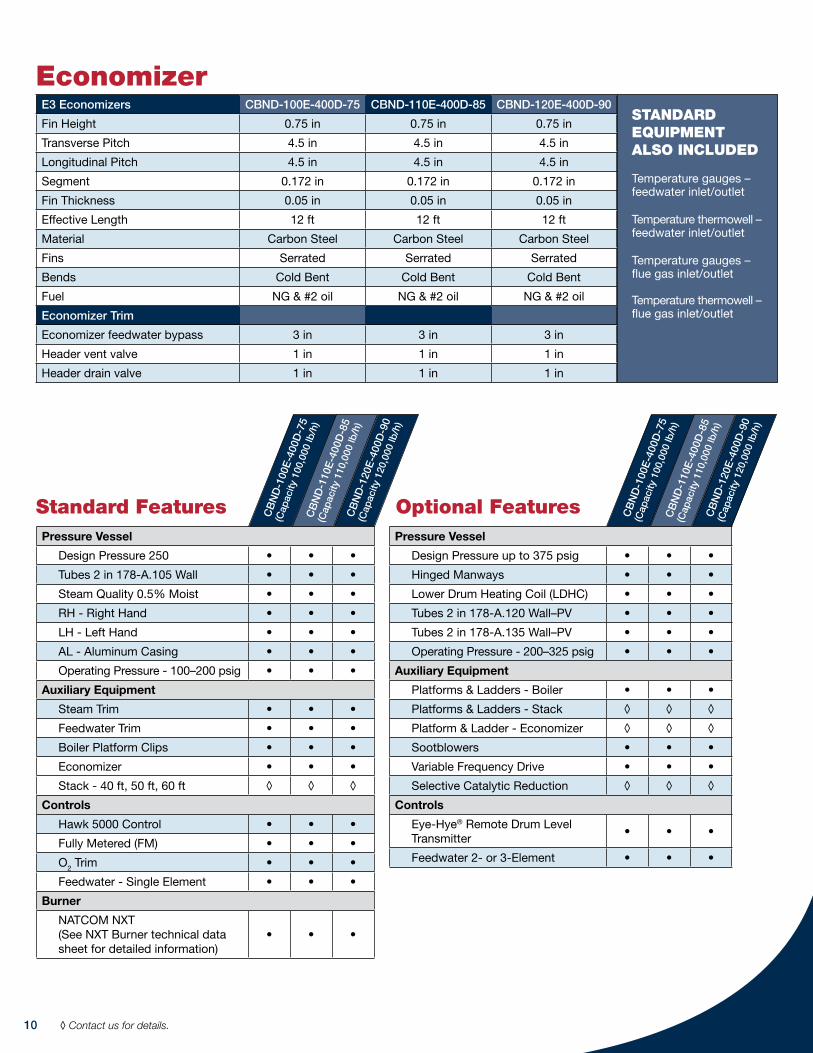
Economizer
Pressure Vessel
Design Pressure up to 375 psig • • •
Hinged Manways • • •
Lower Drum Heating Coil (LDHC) • • •
Tubes 2 in 178-A.120 Wall–PV • • •
Tubes 2 in 178-A.135 Wall–PV • • •
Operating Pressure - 200–325 psig • • •
Auxiliary Equipment
Platforms & Ladders - Boiler • • •
Platforms & Ladders - Stack ◊ ◊ ◊
Platform & Ladder - Economizer ◊ ◊ ◊
Sootblowers • • •
Variable Frequency Drive • • •
Selective Catalytic Reduction ◊ ◊ ◊
Controls
Eye-Hye® Remote Drum Level Transmitter
• • •
Feedwater 2- or 3-Element • • •
Pressure Vessel
Design Pressure 250 • • •
Tubes 2 in 178-A.105 Wall • • •
Steam Quality 0.5% Moist • • •
RH - Right Hand • • •
LH - Left Hand • • •
AL - Aluminum Casing • • •
Operating Pressure - 100–200 psig • • •
Auxiliary Equipment
Steam Trim • • •
Feedwater Trim • • •
Boiler Platform Clips • • •
Economizer • • •
Stack - 40 ft, 50 ft, 60 ft ◊ ◊ ◊
Controls
Hawk 5000 Control • • •
Fully Metered (FM) • • •
O2 Trim • • •
Feedwater - Single Element • • •
Burner
NATCOM NXT (See NXT Burner technical data sheet for detailed information)
• • •
Standard Features Optional FeaturesCB
ND
-100
E-4
00D
-75
(Cap
acity
100
,000
lb/h
)
CB
ND
-100
E-4
00D
-75
(Cap
acity
100
,000
lb/h
)
CB
ND
-110
E-4
00D
-85
(Cap
acity
110
,000
lb/h
)
CB
ND
-110
E-4
00D
-85
(Cap
acity
110
,000
lb/h
)
CB
ND
-120
E-4
00D
-90
(Cap
acity
120
,000
lb/h
)
CB
ND
-120
E-4
00D
-90
(Cap
acity
120
,000
lb/h
)
◊ Contact us for details.
E3 Economizers CBND-100E-400D-75 CBND-110E-400D-85 CBND-120E-400D-90
Fin Height 0.75 in 0.75 in 0.75 in
Transverse Pitch 4.5 in 4.5 in 4.5 in
Longitudinal Pitch 4.5 in 4.5 in 4.5 in
Segment 0.172 in 0.172 in 0.172 in
Fin Thickness 0.05 in 0.05 in 0.05 in
Effective Length 12 ft 12 ft 12 ft
Material Carbon Steel Carbon Steel Carbon Steel
Fins Serrated Serrated Serrated
Bends Cold Bent Cold Bent Cold Bent
Fuel NG & #2 oil NG & #2 oil NG & #2 oil
Economizer Trim
Economizer feedwater bypass 3 in 3 in 3 in
Header vent valve 1 in 1 in 1 in
Header drain valve 1 in 1 in 1 in
STANDARD EQUIPMENT ALSO INCLUDED
Temperature gauges – feedwater inlet/outlet
Temperature thermowell – feedwater inlet/outlet
Temperature gauges – flue gas inlet/outlet
Temperature thermowell – flue gas inlet/outlet
10

Boiler Dimensions CBND-135E-500D-95 CBND-150E-500D-100 CBND-175E-500D-115
Capacity 135,000 lb/h 150,000 lb/h 175,000 lb/h
Upper Drum 54 in 54 in 54 in
Lower Drum 24 in 24 in 24 in
Length Over Casing 30 ft 35 ft 40 ft
Width, Gas Outlet 68 3/4 in 72 3/4 in 80 3/4 in
Height, Gas Outlet 90 1/2 in 91 1/2 in 91 1/2 in
Front to CL Gas Outlet 40 5/8 in 42 5/8 in 46 5/8 in
Shipping Height 15 ft 10 1/2 in 15 ft 10 1/2 in 15 ft 10 1/2 in
Overall Width 12 ft 7 3/4 in 12 ft 7 3/4 in 12 ft 7 3/4 in
Min Operating Pressure 100 psig 100 psig 100 psig
Cleaver-Brooks Nebraska DSteam-Ready 500D Series
Capacities and Specifications
11
* CBND-90E-300D-70 shown. 400D to 600D CBND units are available with grade mounted fan, fuel train and controls. See corresponding burner dimension table for details.

Economizer
Pressure Vessel
Design Pressure up to 375 psig • • •
Hinged Manways • • •
Lower Drum Heating Coil (LDHC) • • •
Tubes 2 in 178-A.120 Wall–PV • • •
Tubes 2 in 178-A.135 Wall–PV • • •
Operating Pressure - 200–325 psig • • •
Auxiliary Equipment
Platforms & Ladders - Boiler • • •
Platforms & Ladders - Stack ◊ ◊ ◊
Platform & Ladder - Economizer ◊ ◊ ◊
Sootblowers • • •
Variable Frequency Drive • • •
Selective Catalytic Reduction ◊ ◊ ◊
Controls
Eye-Hye® Remote Drum Level Transmitter
• • •
Feedwater 2- or 3-Element • • •
Pressure Vessel
Design Pressure 250 • • •
Tubes 2 in 178-A.105 Wall • • •
Steam Quality 0.5% Moist • • •
RH - Right Hand • • •
LH - Left Hand • • •
AL - Aluminum Casing • • •
Operating Pressure - 100–200 psig • • •
Auxiliary Equipment
Steam Trim • • •
Feedwater Trim • • •
Boiler Platform Clips • • •
Economizer • • •
Stack - 40 ft, 50 ft, 60 ft ◊ ◊ ◊
Controls
Hawk 5000 Control • • •
Fully Metered (FM) • • •
O2 Trim • • •
Feedwater - Single Element • • •
Burner
NATCOM NXT (See NXT Burner technical data sheet for detailed information)
• • •
Standard Features Optional FeaturesCB
ND
-135
E-50
0D-9
5
(Cap
acity
135
,000
lb/h
)
CB
ND
-135
E-50
0D-9
5
(Cap
acity
135
,000
lb/h
)
CB
ND
-150
E-50
0D-1
00
(Cap
acity
150
,000
lb/h
)
CB
ND
-150
E-50
0D-1
00
(Cap
acity
150
,000
lb/h
)
CB
ND
-175
E-50
0D-1
15
(Cap
acity
175
,000
lb/h
)
CB
ND
-175
E-50
0D-1
15
(Cap
acity
175
,000
lb/h
)
◊ Contact us for details.
E4 Economizers CBND-135E-500D-95 CBND-150E-500D-100 CBND-175E-500D-115
Fin Height 0.75 in 0.75 in 0.75 in
Transverse Pitch 4.5 in 4.5 in 4.5 in
Longitudinal Pitch 4.5 in 4.5 in 4.5 in
Segment 0.172 in 0.172 in 0.172 in
Fin Thickness 0.05 in 0.05 in 0.05 in
Effective Length 16 ft 16 ft 16 ft
Material Carbon Steel Carbon Steel Carbon Steel
Fins Serrated Serrated Serrated
Bends Cold Bent Cold Bent Cold Bent
Fuel NG & #2 oil NG & #2 oil NG & #2 oil
Economizer Trim
Economizer feedwater bypass 3 in 4 in 4 in
Header vent valve 1 in 1 in 1 in
Header drain valve 1 in 1 in 1 in
STANDARD EQUIPMENT ALSO INCLUDED
Temperature gauges – feedwater inlet/outlet
Temperature thermowell – feedwater inlet/outlet
Temperature gauges – flue gas inlet/outlet
Temperature thermowell – flue gas inlet/outlet
12

Boiler Dimensions CBND-200E-600D-120 CBND-225E-600D-125
Capacity 200,000 lb/h 225,000 lb/h
Upper Drum 54 in 54 in
Lower Drum 24 in 24 in
Length Over Casing 41 ft 8 in 43 ft 4 in
Width, Gas Outlet 92 3/4 in 104 3/4 in
Height, Gas Outlet 91 1/2 in 91 1/2 in
Front to CL Gas Outlet 52 5/8 in 58 5/8 in
Shipping Height 15 ft 10 1/2 in 15 ft 10 1/2 in
Overall Width 12 ft 9 1/8 in 12 ft 9 1/8 in
Min Operating Pressure 100 psig 100 psig
Cleaver-Brooks Nebraska DSteam-Ready 600D Series
Capacities and Specifications
13
* CBND-90E-300D-70 shown. 400D to 600D CBND units are available with grade mounted fan, fuel train and controls. See corresponding burner dimension table for details.
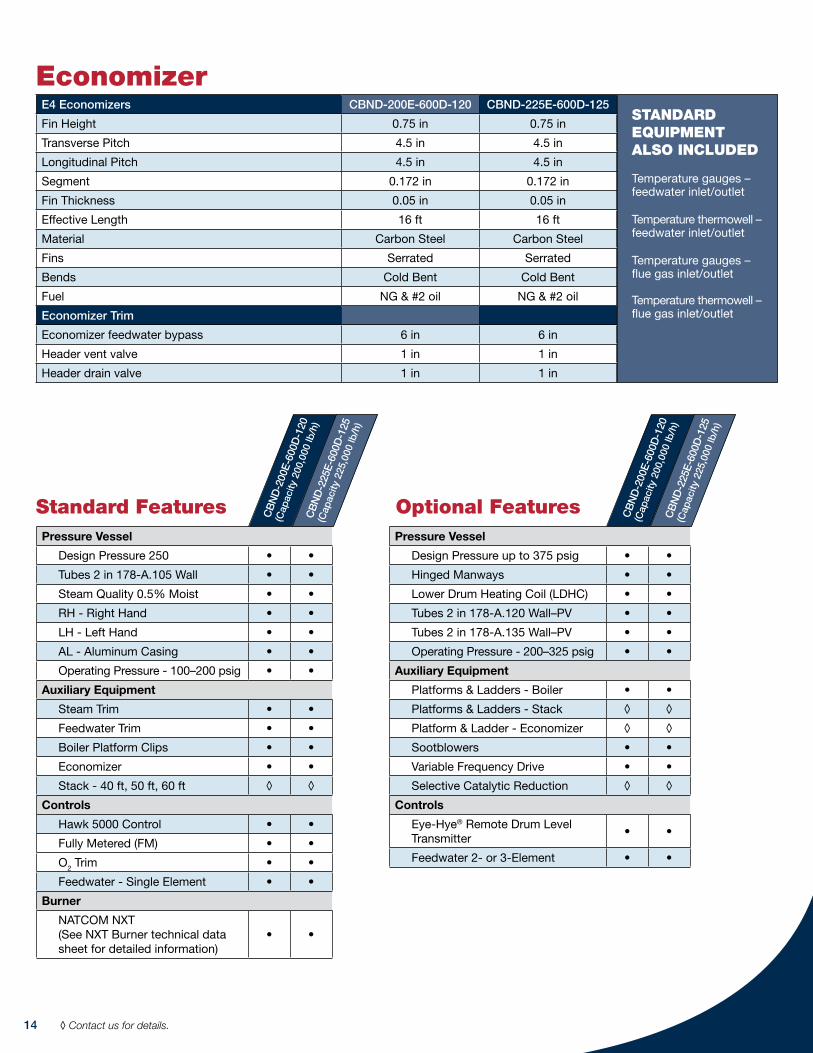
Economizer
Pressure Vessel
Design Pressure up to 375 psig • •
Hinged Manways • •
Lower Drum Heating Coil (LDHC) • •
Tubes 2 in 178-A.120 Wall–PV • •
Tubes 2 in 178-A.135 Wall–PV • •
Operating Pressure - 200–325 psig • •
Auxiliary Equipment
Platforms & Ladders - Boiler • •
Platforms & Ladders - Stack ◊ ◊
Platform & Ladder - Economizer ◊ ◊
Sootblowers • •
Variable Frequency Drive • •
Selective Catalytic Reduction ◊ ◊
Controls
Eye-Hye® Remote Drum Level Transmitter
• •
Feedwater 2- or 3-Element • •
Pressure Vessel
Design Pressure 250 • •
Tubes 2 in 178-A.105 Wall • •
Steam Quality 0.5% Moist • •
RH - Right Hand • •
LH - Left Hand • •
AL - Aluminum Casing • •
Operating Pressure - 100–200 psig • •
Auxiliary Equipment
Steam Trim • •
Feedwater Trim • •
Boiler Platform Clips • •
Economizer • •
Stack - 40 ft, 50 ft, 60 ft ◊ ◊
Controls
Hawk 5000 Control • •
Fully Metered (FM) • •
O2 Trim • •
Feedwater - Single Element • •
Burner
NATCOM NXT (See NXT Burner technical data sheet for detailed information)
• •
Standard Features Optional FeaturesCB
ND
-200
E-60
0D-1
20
(Cap
acity
200
,000
lb/h
)
CB
ND
-200
E-60
0D-1
20
(Cap
acity
200
,000
lb/h
)
CB
ND
-225
E-60
0D-1
25
(Cap
acity
225
,000
lb/h
)
CB
ND
-225
E-60
0D-1
25
(Cap
acity
225
,000
lb/h
)
◊ Contact us for details.
E4 Economizers CBND-200E-600D-120 CBND-225E-600D-125
Fin Height 0.75 in 0.75 in
Transverse Pitch 4.5 in 4.5 in
Longitudinal Pitch 4.5 in 4.5 in
Segment 0.172 in 0.172 in
Fin Thickness 0.05 in 0.05 in
Effective Length 16 ft 16 ft
Material Carbon Steel Carbon Steel
Fins Serrated Serrated
Bends Cold Bent Cold Bent
Fuel NG & #2 oil NG & #2 oil
Economizer Trim
Economizer feedwater bypass 6 in 6 in
Header vent valve 1 in 1 in
Header drain valve 1 in 1 in
STANDARD EQUIPMENT ALSO INCLUDED
Temperature gauges – feedwater inlet/outlet
Temperature thermowell – feedwater inlet/outlet
Temperature gauges – flue gas inlet/outlet
Temperature thermowell – flue gas inlet/outlet
14

ProFire BurnersD126, LND145Technical Data Sheet
Physicalarrangement:
Combustion Control System (CCS) compatibility options:
Fuel Options:Choice of NFPA or CSA compliance for U.S. or Canadian units, respectively (contact us for TSSA compliance).
Designed integral FD fan, packaged fuel train and remote control panel. Choice of right- or left-hand fuel rack.
Single Point or Parallel Positioning Combustion Control System (CCS) with O2 trim.
Main Fuel: Natural gas and/or #2 oil.
Igniter fuel: Natural gas and/or propane.
NG, no FGR #2 Oil, no FGR NG, 18% FGR #2 Oil, 18% FGR
Excess Air %* 20 20 20 20
NOx emissions ppmvd @3%O2 95 135 30 100
CO emissions ppmvd @3%O2 100 75 100 100
VOC lb/MM BTU (HHV) 0.006 0.004 0.006 0.004
Total PM lb/MM BTU (HHV) 0.01 0.05 0.01 0.05
Turndown 10 8 8 6
Performance guarantees
Performance guarantees are based on normal operating conditions and valid from 25% to 100% MCR, boiler with gas tight furnace division wall and to nominal operating pressure and temperature. Igniter emissions are not guaranteed. For application where CB does not provide the controls, emissions are guaranteed in manual mode only. SOx emissions are not burner dependent and depend solely on the sulfur content of the fuel. Burner/boiler systems are not intended for automatic recycling use. Please contact your local representative for more details.
*Excess air given for 100% MCR only.
Regulated pressure at train inlet (psig) Atomizing
Steam flow (pph)
Atomizing air for cold start
NG #2 OilAtomizing
Steam(psig) (SCFM)
10 30 30 65 30 32
Specific operating conditions
Pressure control valve not included. See piping spec for design ratings. See also general design data for additional details.
Reference documents Please reference the below documents for additional information on the content outlined in this data sheet. All documents are available in the Cleaver-Brooks Boiler Book.
Guide specificationsGeneral design dataProduct dimension tables
Piping specificationsInspection and test planPaint specification
Scope detailJob document listCommissioning plan
For 50ºF to 100ºF combustion air applications, uncontrolled or 30 ppm NOx emissions
Designed for CBND-10P-100D-25
12.2 MM BTU/H NG; 12.1 MM BTU/H #2 OIL
15

ProFire BurnersD252, LND300Technical Data Sheet
Physicalarrangement:
Combustion Control System (CCS) compatibility options:
Fuel Options:Choice of NFPA or CSA compliance for U.S. or Canadian units, respectively (contact us for TSSA compliance).
Designed integral FD fan, packaged fuel train and remote control panel. Choice of right- or left-hand fuel rack.
Single Point or Parallel Positioning Combustion Control System (CCS) with O2 trim.
Main Fuel: Natural gas and/or #2 oil.
Igniter fuel: Natural gas and/or propane.
NG, no FGR #2 Oil, no FGR NG, 18% FGR #2 Oil, 18% FGR
Excess Air %* 20 20 20 20
NOx emissions ppmvd @3%O2 95 135 30 100
CO emissions ppmvd @3%O2 100 75 100 100
VOC lb/MM BTU (HHV) 0.006 0.006 0.006 0.004
Total PM lb/MM BTU (HHV) 0.01 0.05 0.01 0.05
Turndown 10 8 8 6
Performance guarantees
Performance guarantees are based on normal operating conditions and valid from 25% to 100% MCR, boiler with gas tight furnace division wall and to nominal operating pressure and temperature. Igniter emissions are not guaranteed. For application where CB does not provide the controls, emissions are guaranteed in manual mode only. SOx emissions are not burner dependent and depend solely on the sulfur content of the fuel. Burner/boiler systems are not intended for automatic recycling use. Please contact your local representative for more details.
*Excess air given for 100% MCR only.
Regulated pressure at train inlet (psig) Atomizing
Steam flow (pph)
Atomizing air for cold start
NG #2 OilAtomizing
Steam(psig) (SCFM)
10 30 30 130 30 65
Specific operating conditions
Pressure control valve not included. See piping spec for design ratings. See also general design data for additional details.
Reference documents Please reference the below documents for additional information on the content outlined in this data sheet. All documents are available in the Cleaver-Brooks Boiler Book.
Guide specificationsGeneral design dataProduct dimension tables
Piping specificationsInspection and test planPaint specification
Scope detailJob document listCommissioning plan
For 50ºF to 100ºF combustion air applications, uncontrolled or 30 ppm NOx emissions
Designed for CBND-20P-100D-35
24.3 MM BTU/H NG; 24.2 MM BTU/H #2 OIL
16

Gas input based on natural gas at 1,000 Btu/cu. ft. and 0.60 gravity. Oil input based on No. 2 oil at 140,000 Btu/gal. PPH overall efficiency of 84% estimated. Blower wheel and motor HP is based on altitude up to 2,500 ft. above sea level. For higher altitude or 50 Hz. applications, consult factory. Firing at higher furnace pressures de-rates the burner by approximately 5% per 1/2 in. of additional pressure; consult factory.
Boiler Size Burner Model
Gas Input (MBH)
#2 Oil Input (GPH)
PPH @ 84% Eff.
Motor HP
Metering System Motor
HP 3 PH.
Blower Motor Volt/PH 60 Hz.
Gas Pressure Required
(PSI)
CBND-10P-100D-25 D-126 12,600 90 10,000 15 1/2 460/3 2.5
CBND-20P-100D-35 D-252 25,200 180 20,000 30 3/4 460/3 4.3
17
Boiler Size Burner Model A B C D E F G H I J K L M N P Q R
CBND-10P-100D-25 D-126 22 27 12 21 1/2 56 7/8 15 30 1/8 4 1/8 24 3/4 21 12 25 45 37 3/8 30 1/2 1 1/4 3
CBND-20P-100D-35 D-252 31 1/2 37 15 22 66 3/8 21 37 3/8 4 5/8 32 3/8 23 3/4 12 35 56 7/8 47 1/2 31 1 1/4 4
ProFire D Series BurnersD-126, D-252Dimension Tables
Designed for 10P-100D-25 and 20P-100D-35 CBND Boilers
12.6–25.2 MM BTU/H NG; 12.6–25.2 MM BTU/H #2 OIL

18
ProFire LND Series BurnersLND-145, LND-300Dimension Tables
Designed for 10P-100D-25 and 20P-100D-35 CBND Boilers
12.6–25.2 MM BTU/H NG; 12.6–25.2 MM BTU/H #2 OIL
Gas input based on natural gas at 1,000 Btu/cu. ft. and 0.60 gravity. Oil input based on No. 2 oil at 140,000 Btu/gal. PPH overall efficiency of 84% estimated. Blower wheel and motor HP is based on altitude up to 2,500 ft. above sea level. For higher altitude or 50 Hz. applications, consult factory. Firing at higher furnace pressures de-rates the burner by approximately 5% per 1/2 in. of additional pressure; consult factory.
Boiler Size Burner Model
Gas Input (MBH)
#2 Oil Input (GPH)
PPH @ 84% Eff.
Motor HP
Metering System Motor
HP 3 PH.
Blower Motor Volt/PH 60 Hz.
Gas Pressure Required
(PSI)
F.G.R. Line Piping
Size
CBND-10P-100D-25 LND-145 12,600 90 10,000 15 1/2 460/3 2.5 8
CBND-20P-100D-35 LND-300 25,200 180 20,000 40 3/4 460/3 4.3 10
Boiler Size Burner Model A B C D E F G H I J K L M N
CBND-10P-100D-25 LND-145 22 27 12 21 1/2 56 7/8 15 30 1/8 4 1/8 24 3/4 20 5/8 12 25 45 47 3/8
CBND-20P-100D-35 LND-300 31 1/2 37 15 22 66 3/8 21 37 3/8 4 5/8 32 3/8 23 3/4 12 35 56 7/8 58
Boiler Size Burner Model P Q R S T U V
CBND-10P-100D-25 LND-145 30 1/2 1 1/4 3 47 7/8 16 7/8 9 1/2
CBND-20P-100D-35 LND-300 31 1 1/4 4 51 5/8 16 7/8 11 3/4

* The noise level emission guarantee applies for each individual system component provided (not combined) and does not consider the overall plant floor level noise. Noise emission guarantee is based on free field sound, hemispherical radiation at the stated distance and does not include combination of sound effect radiated from other sources or noise reflected from the interior building walls and other surfaces. Also, it does not take into consideration factors which may contribute to overall installed noise levels such as existing noise from motors, casings, ducts, flowmeters, dampers, VIVs and other power house equipment.
Packaged burner general design conditions
Each pre-engineered burner system shall be designed for the following general conditions:
Codes & Regulations
System Compliant to: Component listing: Piping standard: Enclosure rating: Area classification:
NFPA 85 or CSA B149.3
UL B31.3 NEMA 4 Non hazardous
Plant General Data
Altitude Equipment LocationFD
Fan MotorVoltage
Control Voltage
Instrument Air Pressure
NoiseLimitation*
Ambient Temperature
Combustion Air Temperature
MaximumRelativeHumidity
0–2500 ft ASL
Indoors orOutdoors
480V/3/60HZor
600V/3/60HZ(Canada)
120V 80 psigRegulated
92dBA @ 3ft15ºF to100ºF
50ºF to 100ºF must be tempered to
the specified temperature
60%
Fuel
Main Burner Fuel option
Igniter Fueloption
Natural Gas Temperature at Train Inlet
Natural Gas #2 Oil
Natural Gas and/or #2 Oil
Natural Gas and/or
Propane Gas
60ºF–80ºF
Composition % Volume
High Heating Value (HHV) Composition
% MassHigh Heating Value (HHV)
Fuel Bound Nitrogen
(FBN) % Mass
Asphaltene% Mass
Viscocity SSU@60ºF
95% CH4
2% C2H6
2% N2
1% CO2
994 BTU/SCF
87.27 C12.5 H0.2 S
0.01 ash
19,300 BTU/lb
≤0.02 ≤3 42
ProFire XL BurnerGeneral Data Sheet
For 100D to 200D CBND Boilers
12.6 to 63 MM BTU/H Burners
19

ProFire BurnersXL378, LNXL378Technical Data Sheet
Physicalarrangement:
Combustion Control System (CCS) compatibility options:
Fuel Options:Choice of NFPA or CSA compliance for U.S. or Canadian units, respectively (contact us for TSSA compliance).
Designed integral FD fan, parallel positioning, packaged fuel train and remote control panel. Choice of right- or left-hand fuel rack.
O2 trim and Variable Speed Drive (VSD).
Main Fuel: Natural gas and/or #2 oil.
Igniter fuel: Natural gas and/or propane.
NG, no FGR #2 Oil, no FGR NG, 18% FGR #2 Oil, 18% FGR
Excess Air %* 20 20 20 20
NOx emissions ppmvd @3%O2 95 135 30 100
CO emissions ppmvd @3%O2 100 75 100 100
VOC lb/MM BTU (HHV) 0.006 0.004 0.006 0.004
Total PM lb/MM BTU (HHV) 0.01 0.05 0.01 0.05
Turndown 10 8 8 6
Performance guarantees
Performance guarantees are based on normal operating conditions and valid from 25% to 100% MCR, boiler with gas tight furnace division wall and to nominal operating pressure and temperature. Igniter emissions are not guaranteed. For application where CB does not provide the controls, emissions are guaranteed in manual mode only. SOx emissions are not burner dependent and depend solely on the sulfur content of the fuel. Burner/boiler systems are not intended for automatic recycling use. Please contact your local representative for more details.
*Excess air given for 100% MCR only.
Regulated pressure at train inlet (psig) Atomizing
Steam flow (pph)
Atomizing air for cold start
NG #2 OilAtomizing
Steam(psig) (SCFM)
10 30 30 170 30 95
Specific operating conditions
Pressure control valve not included. See piping spec for design ratings. See also general design data for additional details.
Reference documents Please reference the below documents for additional information on the content outlined in this data sheet. All documents are available in the Cleaver-Brooks Boiler Book.
Guide specificationsGeneral design dataProduct dimension tables
Piping specificationsInspection and test planPaint specification
Scope detailJob document listCommissioning plan
For 50ºF to 100ºF combustion air applications, uncontrolled or 30 ppm NOx emissions
Designed for CBND-30P-100D-40
36.4 MM BTU/H NG; 36.4 MM BTU/H #2 OIL
20

ProFire BurnersXL504, LNXL504Technical Data Sheet
Physicalarrangement:
Combustion Control System (CCS) compatibility options:
Fuel Options:Choice of NFPA or CSA compliance for U.S. or Canadian units, respectively (contact us for TSSA compliance).
Designed integral FD fan, parallel positioning, packaged fuel train and remote control panel. Choice of right- or left-hand fuel rack.
O2 trim and Variable Speed Drive (VSD).
Main Fuel: Natural gas and/or #2 oil.
Igniter fuel: Natural gas and/or propane.
NG, no FGR #2 Oil, no FGR NG, 18% FGR #2 Oil, 18% FGR
Excess Air %* 20 20 20 20
NOx emissions ppmvd @3%O2 95 135 30 100
CO emissions ppmvd @3%O2 50 75 75 100
VOC lb/MM BTU (HHV) 0.006 0.004 0.006 0.004
Total PM lb/MM BTU (HHV) 0.01 0.05 0.01 0.05
Turndown 10 8 8 6
Performance guarantees
Performance guarantees are based on normal operating conditions and valid from 25% to 100% MCR, boiler with gas tight furnace division wall and to nominal operating pressure and temperature. Igniter emissions are not guaranteed. For application where CB does not provide the controls, emissions are guaranteed in manual mode only. SOx emissions are not burner dependent and depend solely on the sulfur content of the fuel. Burner/boiler systems are not intended for automatic recycling use. Please contact your local representative for more details.
*Excess air given for 100% MCR only.
Regulated pressure at train inlet (psig) Atomizing
Steam flow (pph)
Atomizing air for cold start
NG #2 OilAtomizing
Steam(psig) (SCFM)
10 30 30 255 30 125
Specific operating conditions
Pressure control valve not included. See piping spec for design ratings. See also general design data for additional details.
Reference documents Please reference the below documents for additional information on the content outlined in this data sheet. All documents are available in the Cleaver-Brooks Boiler Book.
Guide specificationsGeneral design dataProduct dimension tables
Piping specificationsInspection and test planPaint specification
Scope detailJob document listCommissioning plan
For 50ºF to 100ºF combustion air applications, uncontrolled or 30 ppm NOx emissions
Designed for CBND-40P-200D-40
48.6 MM BTU/H NG; 48.5 MM BTU/H #2 OIL
21

ProFire BurnersXL630, LNXL630Technical Data Sheet
Physicalarrangement:
Combustion Control System (CCS) compatibility options:
Fuel Options:Choice of NFPA or CSA compliance for U.S. or Canadian units, respectively (contact us for TSSA compliance).
Designed integral FD fan, parallel positioning, packaged fuel train and remote control panel. Choice of right- or left-hand fuel rack.
O2 trim and Variable Speed Drive (VSD).
Main Fuel: Natural gas and/or #2 oil.
Igniter fuel: Natural gas and/or propane.
NG, no FGR #2 Oil, no FGR NG, 18% FGR #2 Oil, 18% FGR
Excess Air %* 20 20 20 20
NOx emissions ppmvd @3%O2 95 135 30 100
CO emissions ppmvd @3%O2 100 75 100 100
VOC lb/MM BTU (HHV) 0.006 0.004 0.006 0.004
Total PM lb/MM BTU (HHV) 0.01 0.05 0.01 0.05
Turndown 10 8 8 6
Performance guarantees
Performance guarantees are based on normal operating conditions and valid from 25% to 100% MCR, boiler with gas tight furnace division wall and to nominal operating pressure and temperature. Igniter emissions are not guaranteed. For application where CB does not provide the controls, emissions are guaranteed in manual mode only. SOx emissions are not burner dependent and depend solely on the sulfur content of the fuel. Burner/boiler systems are not intended for automatic recycling use. Please contact your local representative for more details.
*Excess air given for 100% MCR only.
Regulated pressure at train inlet (psig) Atomizing
Steam flow (pph)
Atomizing air for cold start
NG #2 OilAtomizing
Steam(psig) (SCFM)
10 30 30 315 30 155
Specific operating conditions
Pressure control valve not included. See piping spec for design ratings. See also general design data for additional details.
Reference documents Please reference the below documents for additional information on the content outlined in this data sheet. All documents are available in the Cleaver-Brooks Boiler Book.
Guide specificationsGeneral design dataProduct dimension tables
Piping specificationsInspection and test planPaint specification
Scope detailJob document listCommissioning plan
For 50ºF to 100ºF combustion air applications, uncontrolled or 30 ppm NOx emissions
Designed for CBND-50P-200D-45
60.7 MM BTU/H NG; 60.5 MM BTU/H #2 OIL
22

23
VIEW B-B BURNER MTNG. FLANGE
A A
B
B
W
V
S
F
E
J
K
G
H
L
M
N
P
R
VIEW A-A
GAS PILOTPIPING
ØDD
ØEEB.C.
FFX ØHH
FFX GG°
ELECTICALJ-BOX
AIR INLET
D
MAIN GAS INLET 4" NPT
GAS PILOT INLET 1/2" NPT
OIL INLET 1/2" NPT
STEAM INLET 1" NPT
Q
T
U
ProFire XL Series BurnersXL-378, XL-504, XL-630Dimension Tables
Designed for 30P-100D-40, 40P-200D-40 and 50P-200D-45 CBND Boilers
37.8–63.0 MM BTU/H NG; 37.8–63.0 MM BTU/H #2 OIL
Boiler Size Burner Model D E F G H J K L M N P Q
CBND-30P-100D-40 XL-378 137 3/10 83 3/10 26 3/5 24 31 7/10 17 3/5 33 6 1/2 28 36 2/5 38 3/10 23 3/10
CBND-40P-200D-40 XL-504 144 1/2 90 1/2 28 25 2/5 33 3/10 17 3/5 33 7 30 1/2 36 9/10 38 4/5 27
CBND-50P-200D-45 XL-630 144 1/2 90 1/2 28 25 2/5 33 3/10 17 3/5 33 7 30 1/2 36 9/10 38 4/5 27
Boiler Size Burner Model R S T U V W DD EE FF GG HH
CBND-30P-100D-40 XL-378 110 4/5 72 3/10 38 1/2 3 3/5 98 9/10 16 1/10 30 28 3/10 12 30˚ 47/50
CBND-40P-200D-40 XL-504 116 1/2 74 1/5 40 1/2 4 1/2 108 4/5 19 2/5 41 39 12 30˚ 47/50
CBND-50P-200D-45 XL-630 116 1/2 74 1/5 40 1/2 4 1/2 108 4/5 19 2/5 41 39 12 30˚ 47/50
Gas input based on natural gas at 1,000 Btu/cu. ft. and 0.60 gravity. Oil input based on No. 2 oil at 140,000 Btu/gal. PPH overall efficiency of 84% estimated. Blower wheel and motor HP is based on altitude up to 2,500 ft. above sea level. For higher altitude or 50 Hz. applications, consult factory. Firing at higher furnace pressures de-rates the burner by approximately 5% per 1/2 in. of additional pressure; consult factory.
Boiler Size Burner Model
Gas Input (MBH)
#2 Oil Input (GPH)
PPH @ 84% Eff.
Motor HP
Blower Motor Volt/3 PH
60 Hz.
Furnace Pressure
("w.c.)
Gas Pressure Required
(PSI)
CBND-30P-100D-40 XL-378 37,800 270 30,000 30 460/3 5.0 10
CBND-40P-200D-40 XL-504 50,400 360 40,000 50 460/3 3.5 10
CBND-50P-200D-45 XL-630 63,000 450 50,000 75 460/3 5.0 10
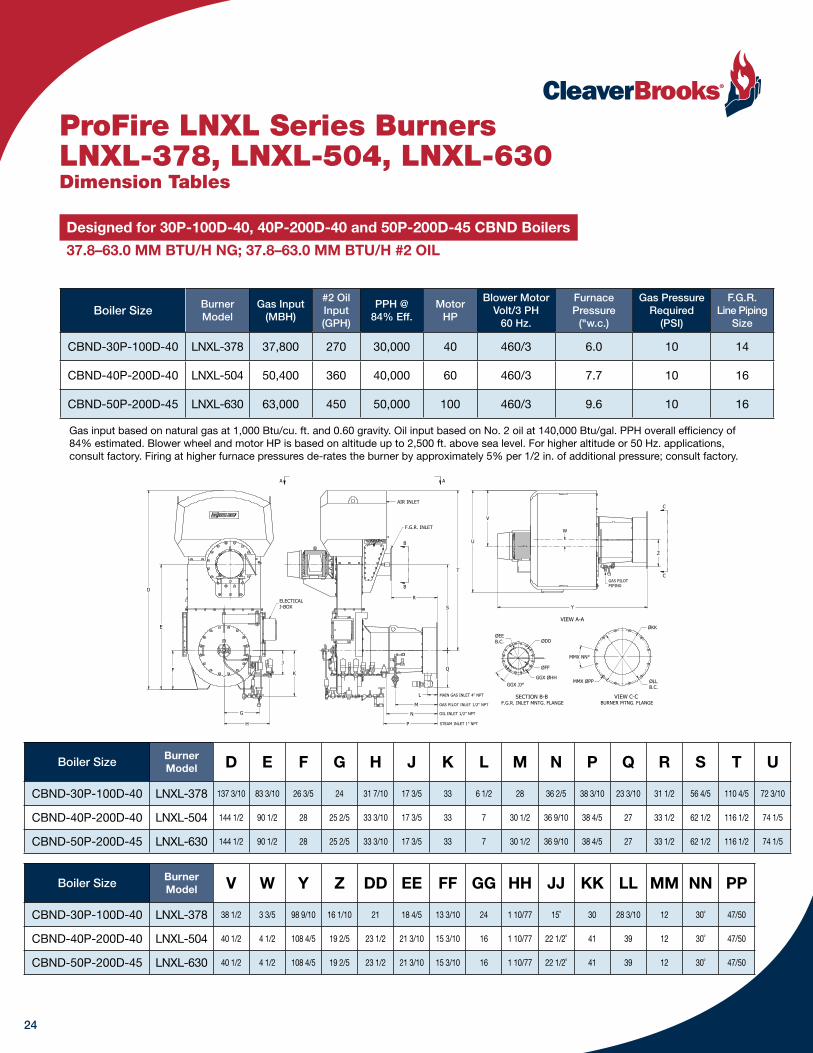
24
SECTION B-B F.G.R. INLET MNTG. FLANGE
VIEW C-C BURNER MTNG. FLANGE
A A
B
B
C
C
Z
Y
V
U
W
F
E
J
K
G
H
L
M
N
P
R
S
T
VIEW A-A
GAS PILOTPIPING
ØKK
ØLLB.C.
MMX ØPP
MMX NN°
ELECTICALJ-BOX
AIR INLET
F.G.R. INLET
D
ØDDØEEB.C.
GGX ØHHGGX JJ°
ØFF
MAIN GAS INLET 4" NPT
GAS PILOT INLET 1/2" NPT
OIL INLET 1/2" NPT
STEAM INLET 1" NPT
Q
ProFire LNXL Series BurnersLNXL-378, LNXL-504, LNXL-630Dimension Tables
Designed for 30P-100D-40, 40P-200D-40 and 50P-200D-45 CBND Boilers
37.8–63.0 MM BTU/H NG; 37.8–63.0 MM BTU/H #2 OIL
Boiler Size Burner Model D E F G H J K L M N P Q R S T U
CBND-30P-100D-40 LNXL-378 137 3/10 83 3/10 26 3/5 24 31 7/10 17 3/5 33 6 1/2 28 36 2/5 38 3/10 23 3/10 31 1/2 56 4/5 110 4/5 72 3/10
CBND-40P-200D-40 LNXL-504 144 1/2 90 1/2 28 25 2/5 33 3/10 17 3/5 33 7 30 1/2 36 9/10 38 4/5 27 33 1/2 62 1/2 116 1/2 74 1/5
CBND-50P-200D-45 LNXL-630 144 1/2 90 1/2 28 25 2/5 33 3/10 17 3/5 33 7 30 1/2 36 9/10 38 4/5 27 33 1/2 62 1/2 116 1/2 74 1/5
Boiler Size Burner Model V W Y Z DD EE FF GG HH JJ KK LL MM NN PP
CBND-30P-100D-40 LNXL-378 38 1/2 3 3/5 98 9/10 16 1/10 21 18 4/5 13 3/10 24 1 10/77 15˚ 30 28 3/10 12 30˚ 47/50
CBND-40P-200D-40 LNXL-504 40 1/2 4 1/2 108 4/5 19 2/5 23 1/2 21 3/10 15 3/10 16 1 10/77 22 1/2˚ 41 39 12 30˚ 47/50
CBND-50P-200D-45 LNXL-630 40 1/2 4 1/2 108 4/5 19 2/5 23 1/2 21 3/10 15 3/10 16 1 10/77 22 1/2˚ 41 39 12 30˚ 47/50
Gas input based on natural gas at 1,000 Btu/cu. ft. and 0.60 gravity. Oil input based on No. 2 oil at 140,000 Btu/gal. PPH overall efficiency of 84% estimated. Blower wheel and motor HP is based on altitude up to 2,500 ft. above sea level. For higher altitude or 50 Hz. applications, consult factory. Firing at higher furnace pressures de-rates the burner by approximately 5% per 1/2 in. of additional pressure; consult factory.
Boiler Size Burner Model
Gas Input (MBH)
#2 Oil Input (GPH)
PPH @ 84% Eff.
Motor HP
Blower Motor Volt/3 PH
60 Hz.
Furnace Pressure
("w.c.)
Gas Pressure Required
(PSI)
F.G.R. Line Piping
Size
CBND-30P-100D-40 LNXL-378 37,800 270 30,000 40 460/3 6.0 10 14
CBND-40P-200D-40 LNXL-504 50,400 360 40,000 60 460/3 7.7 10 16
CBND-50P-200D-45 LNXL-630 63,000 450 50,000 100 460/3 9.6 10 16

* The noise level emission guarantee applies for each individual system component provided by NATCOM (not combined) and does not consider the overall plant floor level noise. Noise emission guarantee is based on free field sound, hemispherical radiation at the stated distance and does not include combination of sound effect radiated from other sources or noise reflected from the interior building walls and other surfaces. Also, it does not take into consideration factors which may contribute to overall installed noise levels such as existing noise from motors, casings, ducts, flowmeters, dampers, VIVs and other power house equipment.
Packaged burner general design conditions
Each NXT burner system shall be designed for the following general conditions:
Codes & Regulations
System Compliant to: Component listing: Piping standard: Enclosure rating: Area classification:
NFPA 85 or CSA B149.3
UL B31.3 NEMA 4 Non hazardous
Plant General Data
Altitude Equipment LocationFD
Fan MotorVoltage
Control Voltage
Instrument Air Pressure
NoiseLimitation*
Ambient Temperature
Combustion Air Temperature
MaximumRelativeHumidity
0–2500 ft ASL
48 to 109 MM BTU/H200D–300D
120 to 271 MM BTU/H400D–600D
480V/3/60HZor
600V/3/60HZ(Canada)
120V 70 psigRegulated
85dBA @ 3ft15ºF to125ºF
48 to 109 MM BTU/H200D–300D
120 to 271MM BTU/H400D–600D
60%50ºF to 100ºF must be tempered to
the specified temperature
IndoorsIndoors orOutdoors
Fuel
Main Burner Fuel option
Igniter Fueloption
Natural Gas Temperature at Train Inlet
Natural Gas #2 Oil
Natural Gas and/or #2 Oil
Natural Gas and/or
Propane Gas
40ºF–80ºF
Composition % Volume
High Heating Value (HHV) Composition
% MassHigh Heating Value (HHV)
Fuel Bound Nitrogen
(FBN) % Mass
Asphaltene% Mass
Viscocity SSU@60ºF
95% CH4
2% C2H6
2% N2
1% CO2
994 BTU/SCF
87.27 C12.5 H0.2 S
0.01 ash
19,300 BTU/lb
≤0.02 ≤3 42
NXT BurnerGeneral Data Sheet
For 200D to 600D CBND Boilers
48 to 271 MM BTU/H Burners
25

NG, no FGR #2 Oil, no FGR NG, 9% FGR #2 Oil, 9% FGR
Excess Air %* 15 15 15 15
NOx emissions ppmvd @3%O2 60 105 30 75
CO emissions ppmvd @3%O2 50 75 50 75
VOC lb/MM BTU (HHV) 0.004 0.004 0.004 0.004
Total PM lb/MM BTU (HHV) 0.01 0.05 0.01 0.05
Turndown 10 8 10 8
Regulated pressure at train inlet (psig) Atomizing
steam flow (pph)
Atomizing air for cold start
Fan test block
No FGR/FGR(HP)
Allowed furnace pressure @ MCR
(inwc)
NG #2 OilAtomizing
Steam(psig) (SCFM)
No FGRNG
9% FGR NG
FM 20 100 95 240 70 45 40/40 Oil40/50 NG 3.5 3.9
SP, PP 18 95 95 240 70 45
NXT-048 BurnerTechnical Data Sheet
Performance guarantees
Specific operating conditions
Reference documents Please reference the below documents for additional information on the content outlined in this data sheet. All documents are available in the Cleaver-Brooks Boiler Book.
Designed for furnace dimensions of at least:
Physicalarrangement:
Combustion Control System (CCS) compatibility options:
Fuel Options: Choice of NFPA or CSA compliance for U.S. or Canadian units, respectively (contact us for TSSA compliance).
H=8.34'W=6.69' Lturn=11.33' Ltot=13.00'
FD fan, fuel train and control panel are windbox mounted. Right- or left-hand drum arrangements available.
Fully Metered (FM), Parallel Positioning (PP) and Single Point Positioning (SP). All systems use 4-20mA and pneumatic actuators.
Main Fuel: Natural gas and/or #2 oil.
Igniter fuel: Natural gas and/or propane.
Performance guarantees are based on normal operating conditions and valid from 12.5% to 100% MCR, boiler with gas tight furnace division wall and to nominal operating pressure and temperature. Igniter emissions are not guaranteed. For application where CB does not provide the controls, emissions are guaranteed in manual mode only. SOx emissions are not burner dependent and depend solely on the sulfur content of the fuel. Burner/boiler systems are not intended for automatic recycling use. Fan motors of 100 HP and above are only offered with manual start/stop control. Please contact your local representative for more details.
*Excess air given for MCR only.
Allowed furnace pressure given for NG fuel including 0.75 inwc margin. Oil-only application will result in slightly reduced furnace pressure. Pressure control valves not included. See piping spec for design ratings. See also general operating conditions for additional details.
Guide specificationsGeneral design dataProduct dimension tablesPiping specifications
Inspection and test planPaint specificationScope detailJob document list
Fan & motor specificationCommissioning plan
For indoor applications, uncontrolled or 30 ppm NOx emissions
Designed for CBND-40E-200D-40, 40 K PPH sat.
48 MM BTU/H NG; 46 MM BTU/H #2 OIL
26

NG, no FGR #2 Oil, no FGR NG, 10% FGR #2 Oil, 10% FGR
Excess Air %* 15 15 15 15
NOx emissions ppmvd @3%O2 65 105 30 75
CO emissions ppmvd @3%O2 50 75 50 75
VOC lb/MM BTU (HHV) 0.004 0.004 0.004 0.004
Total PM lb/MM BTU (HHV) 0.01 0.05 0.01 0.05
Turndown 10 8 10 8
Regulated pressure at train inlet (psig) Atomizing
steam flow (pph)
Atomizing air for cold start
Fan test block
No FGR/FGR(HP)
Allowed furnace pressure @ MCR
(inwc)
NG #2 OilAtomizing
Steam(psig) (SCFM)
No FGRNG
10% FGR NG
FM 20 100 95 300 70 60 50/60 Oil60/60 NG 5.1 5.7
SP, PP 18 95 95 300 70 60
NXT-060 BurnerTechnical Data Sheet
Performance guarantees
Specific operating conditions
Reference documents Please reference the below documents for additional information on the content outlined in this data sheet. All documents are available in the Cleaver-Brooks Boiler Book.
Designed for furnace dimensions of at least:
Physicalarrangement:
Combustion Control System (CCS) compatibility options:
Fuel Options: Choice of NFPA or CSA compliance for U.S. or Canadian units, respectively (contact us for TSSA compliance).
H=8.34'W=6.69' Lturn=12.67' Ltot=14.67'
FD fan, fuel train and control panel are windbox mounted. Right- or left-hand drum arrangements available.
Fully Metered (FM), Parallel Positioning (PP) and Single Point Positioning (SP). All systems use 4-20mA and pneumatic actuators.
Main Fuel: Natural gas and/or #2 oil.
Igniter fuel: Natural gas and/or propane.
Performance guarantees are based on normal operating conditions and valid from 12.5% to 100% MCR, boiler with gas tight furnace division wall and to nominal operating pressure and temperature. Igniter emissions are not guaranteed. For application where CB does not provide the controls, emissions are guaranteed in manual mode only. SOx emissions are not burner dependent and depend solely on the sulfur content of the fuel. Burner/boiler systems are not intended for automatic recycling use. Fan motors of 100 HP and above are only offered with manual start/stop control. Please contact your local representative for more details.
*Excess air given for MCR only.
Allowed furnace pressure given for NG fuel including 0.75 inwc margin. Oil-only application will result in slightly reduced furnace pressure. Pressure control valves not included. See piping spec for design ratings. See also general operating conditions for additional details.
Guide specificationsGeneral design dataProduct dimension tablesPiping specifications
Inspection and test planPaint specificationScope detailJob document list
Fan & motor specificationCommissioning plan
For indoor applications, uncontrolled or 30 ppm NOx emissions
Designed for CBND-50E-200D-45, 50 K PPH sat.
60 MM BTU/H NG; 58 MM BTU/H #2 OIL
27

NG, no FGR #2 Oil, no FGR NG, 11% FGR #2 Oil, 11% FGR
Excess Air %* 15 15 15 15
NOx emissions ppmvd @3%O2 70 110 30 75
CO emissions ppmvd @3%O2 50 75 50 75
VOC lb/MM BTU (HHV) 0.004 0.004 0.004 0.004
Total PM lb/MM BTU (HHV) 0.01 0.05 0.01 0.05
Turndown 10 8 10 8
Regulated pressure at train inlet (psig) Atomizing
steam flow (pph)
Atomizing air for cold start
Fan test block
No FGR/FGR(HP)
Allowed furnace pressure @ MCR
(inwc)
NG #2 OilAtomizing
Steam(psig) (SCFM)
No FGRNG
11% FGR NG
FM 20 100 95 360 70 70 75/100 Oil75/100 NG 7.1 8.2
SP, PP 18 95 95 360 70 70
NXT-072 BurnerTechnical Data Sheet
Performance guarantees
Specific operating conditions
Reference documents Please reference the below documents for additional information on the content outlined in this data sheet. All documents are available in the Cleaver-Brooks Boiler Book.
Designed for furnace dimensions of at least:
Physicalarrangement:
Combustion Control System (CCS) compatibility options:
Fuel Options: Choice of NFPA or CSA compliance for U.S. or Canadian units, respectively (contact us for TSSA compliance).
H=8.34'W=6.69' Lturn=14.00' Ltot=16.33'
FD fan, fuel train and control panel are windbox mounted. Right- or left-hand drum arrangements available.
Fully Metered (FM), Parallel Positioning (PP) and Single Point Positioning (SP). All systems use 4-20mA and pneumatic actuators.
Main Fuel: Natural gas and/or #2 oil.
Igniter fuel: Natural gas and/or propane.
Performance guarantees are based on normal operating conditions and valid from 12.5% to 100% MCR, boiler with gas tight furnace division wall and to nominal operating pressure and temperature. Igniter emissions are not guaranteed. For application where CB does not provide the controls, emissions are guaranteed in manual mode only. SOx emissions are not burner dependent and depend solely on the sulfur content of the fuel. Burner/boiler systems are not intended for automatic recycling use. Fan motors of 100 HP and above are only offered with manual start/stop control. Please contact your local representative for more details.
*Excess air given for MCR only.
Allowed furnace pressure given for NG fuel including 0.75 inwc margin. Oil-only application will result in slightly reduced furnace pressure. Pressure control valves not included. See piping spec for design ratings. See also general operating conditions for additional details.
Guide specificationsGeneral design dataProduct dimension tablesPiping specifications
Inspection and test planPaint specificationScope detailJob document list
Fan & motor specificationCommissioning plan
For indoor applications, uncontrolled or 30 ppm NOx emissions
Designed for CBND-60E-200D-50, 60 K PPH sat.
72 MM BTU/H NG; 69 MM BTU/H #2 OIL
28

NG, no FGR #2 Oil, no FGR NG, 12% FGR #2 Oil, 12% FGR
Excess Air %* 15 15 15 15
NOx emissions ppmvd @3%O2 70 110 30 75
CO emissions ppmvd @3%O2 50 75 50 75
VOC lb/MM BTU (HHV) 0.004 0.004 0.004 0.004
Total PM lb/MM BTU (HHV) 0.01 0.05 0.01 0.05
Turndown 10 8 10 8
Regulated pressure at train inlet (psig) Atomizing
steam flow (pph)
Atomizing air for cold start
Fan test block
No FGR/FGR(HP)
Allowed furnace pressure @ MCR
(inwc)
NG #2 OilAtomizing
Steam(psig) (SCFM)
No FGRNG
12% FGR NG
FM 22 125 120 420 70 80 75/100 Oil75/100 NG 5.3 6.1
SP, PP 20 120 120 420 70 80
NXT-085 BurnerTechnical Data Sheet
Performance guarantees
Specific operating conditions
Reference documents Please reference the below documents for additional information on the content outlined in this data sheet. All documents are available in the Cleaver-Brooks Boiler Book.
Designed for furnace dimensions of at least:
Physicalarrangement:
Combustion Control System (CCS) compatibility options:
Fuel Options: Choice of NFPA or CSA compliance for U.S. or Canadian units, respectively (contact us for TSSA compliance).
H=8.97'W=6.69' Lturn=15.33' Ltot=18.00'
FD fan, fuel train and control panel are windbox mounted. Right- or left-hand drum arrangements available.
Fully Metered (FM), Parallel Positioning (PP) and Single Point Positioning (SP). All systems use 4-20mA and pneumatic actuators.
Main Fuel: Natural gas and/or #2 oil.
Igniter fuel: Natural gas and/or propane.
Performance guarantees are based on normal operating conditions and valid from 12.5% to 100% MCR, boiler with gas tight furnace division wall and to nominal operating pressure and temperature. Igniter emissions are not guaranteed. For application where CB does not provide the controls, emissions are guaranteed in manual mode only. SOx emissions are not burner dependent and depend solely on the sulfur content of the fuel. Burner/boiler systems are not intended for automatic recycling use. Fan motors of 100 HP and above are only offered with manual start/stop control. Please contact your local representative for more details.
*Excess air given for MCR only.
Allowed furnace pressure given for NG fuel including 0.75 inwc margin. Oil-only application will result in slightly reduced furnace pressure. Pressure control valves not included. See piping spec for design ratings. See also general operating conditions for additional details.
Guide specificationsGeneral design dataProduct dimension tablesPiping specifications
Inspection and test planPaint specificationScope detailJob document list
Fan & motor specificationCommissioning plan
For indoor applications, uncontrolled or 30 ppm NOx emissions
Designed for CBND-70E-300D-55, 70 K PPH sat.
85 MM BTU/H NG; 81 MM BTU/H #2 OIL
29

NG, no FGR #2 Oil, no FGR NG, 13% FGR #2 Oil, 13% FGR
Excess Air %* 15 15 15 15
NOx emissions ppmvd @3%O2 75 115 30 80
CO emissions ppmvd @3%O2 50 75 50 75
VOC lb/MM BTU (HHV) 0.004 0.004 0.004 0.004
Total PM lb/MM BTU (HHV) 0.01 0.05 0.01 0.05
Turndown 10 8 10 8
Regulated pressure at train inlet (psig) Atomizing
steam flow (pph)
Atomizing air for cold start
Fan test block
No FGR/FGR(HP)
Allowed furnace pressure @ MCR
(inwc)
NG #2 OilAtomizing
Steam(psig) (SCFM)
No FGRNG
13% FGR NG
FM 22 125 120 475 70 90 100/125 Oil100/150 NG 7.1 8.4
SP, PP 20 120 120 475 70 90
NXT-097 BurnerTechnical Data Sheet
Performance guarantees
Specific operating conditions
Reference documents Please reference the below documents for additional information on the content outlined in this data sheet. All documents are available in the Cleaver-Brooks Boiler Book.
Designed for furnace dimensions of at least:
Physicalarrangement:
Combustion Control System (CCS) compatibility options:
Fuel Options: Choice of NFPA or CSA compliance for U.S. or Canadian units, respectively (contact us for TSSA compliance).
H=8.97'W=6.69' Lturn=18.33' Ltot=21.33'
FD fan, fuel train and control panel are windbox mounted. Right- or left-hand drum arrangements available.
Fully Metered (FM), Parallel Positioning (PP) and Single Point Positioning (SP). All systems use 4-20mA and pneumatic actuators.
Main Fuel: Natural gas and/or #2 oil.
Igniter fuel: Natural gas and/or propane.
Performance guarantees are based on normal operating conditions and valid from 12.5% to 100% MCR, boiler with gas tight furnace division wall and to nominal operating pressure and temperature. Igniter emissions are not guaranteed. For application where CB does not provide the controls, emissions are guaranteed in manual mode only. SOx emissions are not burner dependent and depend solely on the sulfur content of the fuel. Burner/boiler systems are not intended for automatic recycling use. Fan motors of 100 HP and above are only offered with manual start/stop control. Please contact your local representative for more details.
*Excess air given for MCR only.
Allowed furnace pressure given for NG fuel including 0.75 inwc margin. Oil-only application will result in slightly reduced furnace pressure. Pressure control valves not included. See piping spec for design ratings. See also general operating conditions for additional details.
Guide specificationsGeneral design dataProduct dimension tablesPiping specifications
Inspection and test planPaint specificationScope detailJob document list
Fan & motor specificationCommissioning plan
For indoor applications, uncontrolled or 30 ppm NOx emissions
Designed for CBND-80E-300D-65, 80 K PPH sat.
97 MM BTU/H NG; 93 MM BTU/H #2 OIL
30

NG, no FGR #2 Oil, no FGR NG, 13% FGR #2 Oil, 13% FGR
Excess Air %* 15 15 15 15
NOx emissions ppmvd @3%O2 80 120 30 80
CO emissions ppmvd @3%O2 50 75 50 75
VOC lb/MM BTU (HHV) 0.004 0.004 0.004 0.004
Total PM lb/MM BTU (HHV) 0.01 0.05 0.01 0.05
Turndown 10 8 10 8
Regulated pressure at train inlet (psig) Atomizing
steam flow (pph)
Atomizing air for cold start
Fan test block
No FGR/FGR(HP)
Allowed furnace pressure @ MCR
(inwc)
NG #2 OilAtomizing
Steam(psig) (SCFM)
No FGRNG
13% FGR NG
FM 22 125 120 540 70 100 125/150 Oil125/150 NG 9.1 10.8
SP, PP 20 120 120 540 70 100
NXT-109 BurnerTechnical Data Sheet
Performance guarantees
Specific operating conditions
Reference documents Please reference the below documents for additional information on the content outlined in this data sheet. All documents are available in the Cleaver-Brooks Boiler Book.
Designed for furnace dimensions of at least:
Physicalarrangement:
Combustion Control System (CCS) compatibility options:
Fuel Options: Choice of NFPA or CSA compliance for U.S. or Canadian units, respectively (contact us for TSSA compliance).
H=8.97'W=6.69' Lturn=19.67' Ltot=23.00'
FD fan, fuel train and control panel are windbox mounted. Right- or left-hand drum arrangements available.
Fully Metered (FM), Parallel Positioning (PP) and Single Point Positioning (SP). All systems use 4-20mA and pneumatic actuators.
Main Fuel: Natural gas and/or #2 oil.
Igniter fuel: Natural gas and/or propane.
Performance guarantees are based on normal operating conditions and valid from 12.5% to 100% MCR, boiler with gas tight furnace division wall and to nominal operating pressure and temperature. Igniter emissions are not guaranteed. For application where CB does not provide the controls, emissions are guaranteed in manual mode only. SOx emissions are not burner dependent and depend solely on the sulfur content of the fuel. Burner/boiler systems are not intended for automatic recycling use. Fan motors of 100 HP and above are only offered with manual start/stop control. Please contact your local representative for more details.
*Excess air given for MCR only.
Allowed furnace pressure given for NG fuel including 0.75 inwc margin. Oil-only application will result in slightly reduced furnace pressure. Pressure control valves not included. See piping spec for design ratings. See also general operating conditions for additional details.
Guide specificationsGeneral design dataProduct dimension tablesPiping specifications
Inspection and test planPaint specificationScope detailJob document list
Fan & motor specificationCommissioning plan
For indoor applications, uncontrolled or 30 ppm NOx emissions
Designed for CBND-90E-300D-70, 90 K PPH sat.
109 MM BTU/H NG; 104 MM BTU/H #2 OIL
31

NG, no FGR #2 Oil, no FGR NG, 13% FGR #2 Oil, 13% FGR
Excess Air %* 15 15 15 15
NOx emissions ppmvd @3%O2 80 120 30 85
CO emissions ppmvd @3%O2 50 75 50 75
VOC lb/MM BTU (HHV) 0.004 0.004 0.004 0.004
Total PM lb/MM BTU (HHV) 0.01 0.05 0.01 0.05
Turndown 10 8 10 8
Regulated pressure at train inlet (psig) Atomizing
steam flow (pph)
Atomizing air for cold start
Burner + Windbox DP No FGR/FGR
AHG DP No FGR/FGR
NG #2 OilAtomizing
Steam(psig) (SCFM) (in wc) (in wc)
22 125 120 600 70 1158.1/8.4 Oil8.1/8.4 NG
2.1/2.3 Oil3.3/3.6 NG
NXT-120 BurnerTechnical Data Sheet
Performance guarantees
Specific operating conditions
Reference documents Please reference the below documents for additional information on the content outlined in this data sheet. All documents are available in the Cleaver-Brooks Boiler Book.
Designed for furnace dimensions of at least:
Physicalarrangement:
Combustion Control System (CCS) compatibility options:
Fuel Options:Choice of NFPA or CSA compliance for U.S. or Canadian units, respectively (contact us for TSSA compliance).
H=9.04'W=6.69' Lturn=21.00' Ltot=24.67'
Designed for remote installation of FD fan, fuel train and control panel. Choice of right- or left-hand fuel rack. Choice of right, left, top, or bottom combustion air inlet flanged connection.
Fully Metered (FM) Combustion Control System (CCS) with O2 trim. All systems use 4-20mA and pneumatic actuators.
Main Fuel: Natural gas and/or #2 oil.
Igniter fuel: Natural gas and/or propane.
Performance guarantees are based on normal operating conditions and valid from 12.5% to 100% MCR, boiler with gas tight furnace division wall and to nominal operating pressure and temperature. Igniter emissions are not guaranteed. For application where CB does not provide the controls, emissions are guaranteed in manual mode only. SOx emissions are not burner dependent and depend solely on the sulfur content of the fuel. Burner/boiler systems are not intended for automatic recycling use. Please contact your local representative for more details.
*Excess air given for MCR only.
Pressure control valves not included. See piping spec for design ratings. See also general design data for additional details. All pressure drops are given at worst case conditions specified in the general design data. Burner + Windbox DP includes a windbox mounted opposed blade damper. Actual site DP may vary. DP shown does not include any design margin.
Guide specificationsGeneral design dataProduct dimension tables
Piping specificationsInspection and test planPaint specification
Scope detailJob document listCommissioning plan
For 50ºF to 100ºF combustion air applications, uncontrolled or 30 ppm NOx emissions
Designed for CBND-100E-400D-75, 100 K PPH sat.
120 MM BTU/H NG; 115 MM BTU/H #2 OIL
32

NG, no FGR #2 Oil, no FGR NG, 14% FGR #2 Oil, 14% FGR
Excess Air %* 15 15 15 15
NOx emissions ppmvd @3%O2 80 120 30 85
CO emissions ppmvd @3%O2 50 75 50 75
VOC lb/MM BTU (HHV) 0.004 0.004 0.004 0.004
Total PM lb/MM BTU (HHV) 0.01 0.05 0.01 0.05
Turndown 10 8 10 8
Regulated pressure at train inlet (psig) Atomizing
steam flow (pph)
Atomizing air for cold start
Burner + Windbox DP No FGR/FGR
AHG DP No FGR/FGR
NG #2 OilAtomizing
Steam(psig) (SCFM) (in wc) (in wc)
22 125 120 660 70 1258.4/9.0 Oil8.4/8.7 NG
2.2/2.6 Oil3.4/3.1 NG
NXT-132 BurnerTechnical Data Sheet
Performance guarantees
Specific operating conditions
Reference documents Please reference the below documents for additional information on the content outlined in this data sheet. All documents are available in the Cleaver-Brooks Boiler Book.
Designed for furnace dimensions of at least:
Physicalarrangement:
Combustion Control System (CCS) compatibility options:
Fuel Options:Choice of NFPA or CSA compliance for U.S. or Canadian units, respectively (contact us for TSSA compliance).
H=9.04'W=6.69' Lturn=24.00' Ltot=28.00'
Designed for remote installation of FD fan, fuel train and control panel. Choice of right- or left-hand fuel rack. Choice of right, left, top, or bottom combustion air inlet flanged connection.
Fully Metered (FM) Combustion Control System (CCS) with O2 trim. All systems use 4-20mA and pneumatic actuators.
Main Fuel: Natural gas and/or #2 oil.
Igniter fuel: Natural gas and/or propane.
Performance guarantees are based on normal operating conditions and valid from 12.5% to 100% MCR, boiler with gas tight furnace division wall and to nominal operating pressure and temperature. Igniter emissions are not guaranteed. For application where CB does not provide the controls, emissions are guaranteed in manual mode only. SOx emissions are not burner dependent and depend solely on the sulfur content of the fuel. Burner/boiler systems are not intended for automatic recycling use. Please contact your local representative for more details.
*Excess air given for MCR only.
Pressure control valves not included. See piping spec for design ratings. See also general design data for additional details. All pressure drops are given at worst case conditions specified in the general design data. Burner + Windbox DP includes a windbox mounted opposed blade damper. Actual site DP may vary. DP shown does not include any design margin.
Guide specificationsGeneral design dataProduct dimension tables
Piping specificationsInspection and test planPaint specification
Scope detailJob document listCommissioning plan
For 50ºF to 100ºF combustion air applications, uncontrolled or 30 ppm NOx emissions
Designed for CBND-110E-400D-85, 110 K PPH sat.
132 MM BTU/H NG; 127 MM BTU/H #2 OIL
33

NG, no FGR #2 Oil, no FGR NG, 15% FGR #2 Oil, 15% FGR
Excess Air %* 15 15 15 15
NOx emissions ppmvd @3%O2 85 125 30 90
CO emissions ppmvd @3%O2 50 75 75 100
VOC lb/MM BTU (HHV) 0.004 0.004 0.004 0.004
Total PM lb/MM BTU (HHV) 0.01 0.05 0.01 0.05
Turndown 10 8 10 8
Regulated pressure at train inlet (psig) Atomizing
steam flow (pph)
Atomizing air for cold start
Burner + Windbox DP No FGR/FGR
AHG DP No FGR/FGR
NG #2 OilAtomizing
Steam(psig) (SCFM) (in wc) (in wc)
22 125 120 720 70 1358.7/9.4 Oil8.6/9.0 NG
2.2/2.3 Oil3.0/3.2 NG
NXT-144 BurnerTechnical Data Sheet
Performance guarantees
Specific operating conditions
Reference documents Please reference the below documents for additional information on the content outlined in this data sheet. All documents are available in the Cleaver-Brooks Boiler Book.
Designed for furnace dimensions of at least:
Physicalarrangement:
Combustion Control System (CCS) compatibility options:
Fuel Options:Choice of NFPA or CSA compliance for U.S. or Canadian units, respectively (contact us for TSSA compliance).
H=9.04'W=6.69' Lturn=25.00' Ltot=29.67'
Designed for remote installation of FD fan, fuel train and control panel. Choice of right- or left-hand fuel rack. Choice of right, left, top, or bottom combustion air inlet flanged connection.
Fully Metered (FM) Combustion Control System (CCS) with O2 trim. All systems use 4-20mA and pneumatic actuators.
Main Fuel: Natural gas and/or #2 oil.
Igniter fuel: Natural gas and/or propane.
Performance guarantees are based on normal operating conditions and valid from 12.5% to 100% MCR, boiler with gas tight furnace division wall and to nominal operating pressure and temperature. Igniter emissions are not guaranteed. For application where CB does not provide the controls, emissions are guaranteed in manual mode only. SOx emissions are not burner dependent and depend solely on the sulfur content of the fuel. Burner/boiler systems are not intended for automatic recycling use. Please contact your local representative for more details.
*Excess air given for MCR only.
Pressure control valves not included. See piping spec for design ratings. See also general design data for additional details. All pressure drops are given at worst case conditions specified in the general design data. Burner + Windbox DP includes a windbox mounted opposed blade damper. Actual site DP may vary. DP shown does not include any design margin.
Guide specificationsGeneral design dataProduct dimension tables
Piping specificationsInspection and test planPaint specification
Scope detailJob document listCommissioning plan
For 50ºF to 100ºF combustion air applications, uncontrolled or 30 ppm NOx emissions
Designed for CBND-120E-400D-90, 120 K PPH sat.
144 MM BTU/H NG; 138 MM BTU/H #2 OIL
34

NG, no FGR #2 Oil, no FGR NG, 16% FGR #2 Oil, 16% FGR
Excess Air %* 15 15 15 15
NOx emissions ppmvd @3%O2 85 130 30 90
CO emissions ppmvd @3%O2 50 75 75 100
VOC lb/MM BTU (HHV) 0.004 0.004 0.004 0.004
Total PM lb/MM BTU (HHV) 0.01 0.05 0.01 0.05
Turndown 10 8 10 8
Regulated pressure at train inlet (psig) Atomizing
steam flow (pph)
Atomizing air for cold start
Burner + Windbox DP No FGR/FGR
AHG DP No FGR/FGR
NG #2 OilAtomizing
Steam(psig) (SCFM) (in wc) (in wc)
24 150 145 820 70 1459.5/9.8 Oil9.2/9.7 NG
2.3/2.4 Oil2.8/3.4 NG
NXT-162 BurnerTechnical Data Sheet
Performance guarantees
Specific operating conditions
Reference documents Please reference the below documents for additional information on the content outlined in this data sheet. All documents are available in the Cleaver-Brooks Boiler Book.
Designed for furnace dimensions of at least:
Physicalarrangement:
Combustion Control System (CCS) compatibility options:
Fuel Options:Choice of NFPA or CSA compliance for U.S. or Canadian units, respectively (contact us for TSSA compliance).
H=10.11'W=6.69' Lturn=26.33' Ltot=31.33'
Designed for remote installation of FD fan, fuel train and control panel. Choice of right- or left-hand fuel rack. Choice of right, left, top, or bottom combustion air inlet flanged connection.
Fully Metered (FM) Combustion Control System (CCS) with O2 trim. All systems use 4-20mA and pneumatic actuators.
Main Fuel: Natural gas and/or #2 oil.
Igniter fuel: Natural gas and/or propane.
Performance guarantees are based on normal operating conditions and valid from 12.5% to 100% MCR, boiler with gas tight furnace division wall and to nominal operating pressure and temperature. Igniter emissions are not guaranteed. For application where CB does not provide the controls, emissions are guaranteed in manual mode only. SOx emissions are not burner dependent and depend solely on the sulfur content of the fuel. Burner/boiler systems are not intended for automatic recycling use. Please contact your local representative for more details.
*Excess air given for MCR only.
Pressure control valves not included. See piping spec for design ratings. See also general design data for additional details. All pressure drops are given at worst case conditions specified in the general design data. Burner + Windbox DP includes a windbox mounted opposed blade damper. Actual site DP may vary. DP shown does not include any design margin.
Guide specificationsGeneral design dataProduct dimension tables
Piping specificationsInspection and test planPaint specification
Scope detailJob document listCommissioning plan
For 50ºF to 100ºF combustion air applications, uncontrolled or 30 ppm NOx emissions
Designed for CBND-135E-500D-95, 135 K PPH sat.
162 MM BTU/H NG; 155 MM BTU/H #2 OIL
35
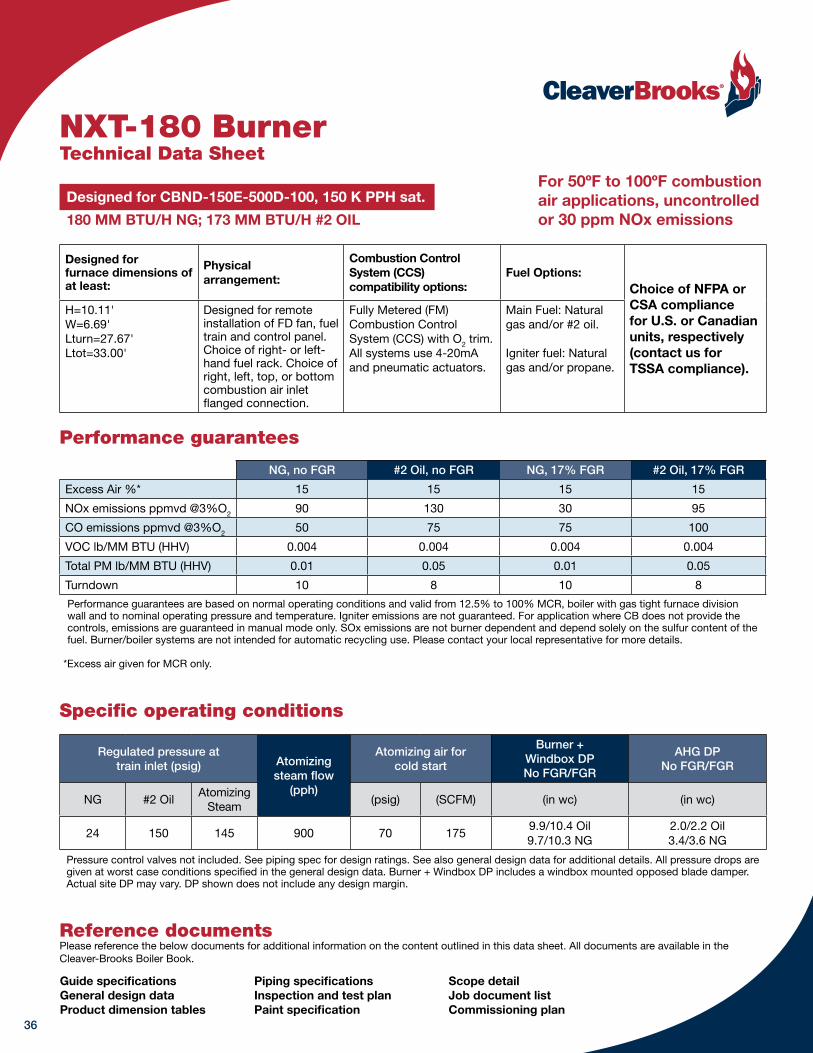
NG, no FGR #2 Oil, no FGR NG, 17% FGR #2 Oil, 17% FGR
Excess Air %* 15 15 15 15
NOx emissions ppmvd @3%O2 90 130 30 95
CO emissions ppmvd @3%O2 50 75 75 100
VOC lb/MM BTU (HHV) 0.004 0.004 0.004 0.004
Total PM lb/MM BTU (HHV) 0.01 0.05 0.01 0.05
Turndown 10 8 10 8
Regulated pressure at train inlet (psig) Atomizing
steam flow (pph)
Atomizing air for cold start
Burner + Windbox DP No FGR/FGR
AHG DP No FGR/FGR
NG #2 OilAtomizing
Steam(psig) (SCFM) (in wc) (in wc)
24 150 145 900 70 1759.9/10.4 Oil9.7/10.3 NG
2.0/2.2 Oil3.4/3.6 NG
NXT-180 BurnerTechnical Data Sheet
Performance guarantees
Specific operating conditions
Reference documents Please reference the below documents for additional information on the content outlined in this data sheet. All documents are available in the Cleaver-Brooks Boiler Book.
Designed for furnace dimensions of at least:
Physicalarrangement:
Combustion Control System (CCS) compatibility options:
Fuel Options:Choice of NFPA or CSA compliance for U.S. or Canadian units, respectively (contact us for TSSA compliance).
H=10.11'W=6.69' Lturn=27.67' Ltot=33.00'
Designed for remote installation of FD fan, fuel train and control panel. Choice of right- or left-hand fuel rack. Choice of right, left, top, or bottom combustion air inlet flanged connection.
Fully Metered (FM) Combustion Control System (CCS) with O2 trim. All systems use 4-20mA and pneumatic actuators.
Main Fuel: Natural gas and/or #2 oil.
Igniter fuel: Natural gas and/or propane.
Performance guarantees are based on normal operating conditions and valid from 12.5% to 100% MCR, boiler with gas tight furnace division wall and to nominal operating pressure and temperature. Igniter emissions are not guaranteed. For application where CB does not provide the controls, emissions are guaranteed in manual mode only. SOx emissions are not burner dependent and depend solely on the sulfur content of the fuel. Burner/boiler systems are not intended for automatic recycling use. Please contact your local representative for more details.
*Excess air given for MCR only.
Pressure control valves not included. See piping spec for design ratings. See also general design data for additional details. All pressure drops are given at worst case conditions specified in the general design data. Burner + Windbox DP includes a windbox mounted opposed blade damper. Actual site DP may vary. DP shown does not include any design margin.
Guide specificationsGeneral design dataProduct dimension tables
Piping specificationsInspection and test planPaint specification
Scope detailJob document listCommissioning plan
For 50ºF to 100ºF combustion air applications, uncontrolled or 30 ppm NOx emissions
Designed for CBND-150E-500D-100, 150 K PPH sat.
180 MM BTU/H NG; 173 MM BTU/H #2 OIL
36

NG, no FGR #2 Oil, no FGR NG, 17% FGR #2 Oil, 17% FGR
Excess Air %* 15 15 15 15
NOx emissions ppmvd @3%O2 95 130 30 95
CO emissions ppmvd @3%O2 50 75 75 100
VOC lb/MM BTU (HHV) 0.004 0.004 0.004 0.004
Total PM lb/MM BTU (HHV) 0.01 0.05 0.01 0.05
Turndown 10 8 10 8
Regulated pressure at train inlet (psig) Atomizing
steam flow (pph)
Atomizing air for cold start
Burner + Windbox DP No FGR/FGR
AHG DP No FGR/FGR
NG #2 OilAtomizing
Steam(psig) (SCFM) (in wc) (in wc)
24 150 145 1040 70 2009.4/10.3 Oil9.3/10.2 NG
2.8/3.0 Oil3.5/3.7 NG
NXT-210 BurnerTechnical Data Sheet
Performance guarantees
Specific operating conditions
Reference documents Please reference the below documents for additional information on the content outlined in this data sheet. All documents are available in the Cleaver-Brooks Boiler Book.
Designed for furnace dimensions of at least:
Physicalarrangement:
Combustion Control System (CCS) compatibility options:
Fuel Options:Choice of NFPA or CSA compliance for U.S. or Canadian units, respectively (contact us for TSSA compliance).
H=10.11'W=6.69' Lturn=32.00' Ltot=38.00'
Designed for remote installation of FD fan, fuel train and control panel. Choice of right- or left-hand fuel rack. Choice of right, left, top, or bottom combustion air inlet flanged connection.
Fully Metered (FM) Combustion Control System (CCS) with O2 trim. All systems use 4-20mA and pneumatic actuators.
Main Fuel: Natural gas and/or #2 oil.
Igniter fuel: Natural gas and/or propane.
Performance guarantees are based on normal operating conditions and valid from 12.5% to 100% MCR, boiler with gas tight furnace division wall and to nominal operating pressure and temperature. Igniter emissions are not guaranteed. For application where CB does not provide the controls, emissions are guaranteed in manual mode only. SOx emissions are not burner dependent and depend solely on the sulfur content of the fuel. Burner/boiler systems are not intended for automatic recycling use. Please contact your local representative for more details.
*Excess air given for MCR only.
Pressure control valves not included. See piping spec for design ratings. See also general design data for additional details. All pressure drops are given at worst case conditions specified in the general design data. Burner + Windbox DP includes a windbox mounted opposed blade damper. Actual site DP may vary. DP shown does not include any design margin.
Guide specificationsGeneral design dataProduct dimension tables
Piping specificationsInspection and test planPaint specification
Scope detailJob document listCommissioning plan
For 50ºF to 100ºF combustion air applications, uncontrolled or 30 ppm NOx emissions
Designed for CBND-175E-500D-115, 175 K PPH sat.
210 MM BTU/H NG; 201 MM BTU/H #2 OIL
37

NG, no FGR #2 Oil, no FGR NG, 17.5% FGR #2 Oil, 17.5% FGR
Excess Air %* 15 17.5 15 17.5
NOx emissions ppmvd @3%O2 100 130 30 95
CO emissions ppmvd @3%O2 50 75 75 100
VOC lb/MM BTU (HHV) 0.004 0.004 0.004 0.004
Total PM lb/MM BTU (HHV) 0.01 0.05 0.01 0.05
Turndown 10 8 10 8
Regulated pressure at train inlet (psig) Atomizing
steam flow (pph)
Atomizing air for cold start
Burner + Windbox DP No FGR/FGR
AHG DP No FGR/FGR
NG #2 OilAtomizing
Steam(psig) (SCFM) (in wc) (in wc)
26 150 145 1200 70 2309.5/10.2 Oil
10.4/10.5 NG2.9/3.0 Oil3.5/3.7 NG
NXT-240 BurnerTechnical Data Sheet
Performance guarantees
Specific operating conditions
Reference documents Please reference the below documents for additional information on the content outlined in this data sheet. All documents are available in the Cleaver-Brooks Boiler Book.
Designed for furnace dimensions of at least:
Physicalarrangement:
Combustion Control System (CCS) compatibility options:
Fuel Options:Choice of NFPA or CSA compliance for U.S. or Canadian units, respectively (contact us for TSSA compliance).
H=10.09'W=6.69' Lturn=32.67' Ltot=39.67'
Designed for remote installation of FD fan, fuel train and control panel. Choice of right- or left-hand fuel rack. Choice of right, left, top, or bottom combustion air inlet flanged connection.
Fully Metered (FM) Combustion Control System (CCS) with O2 trim. All systems use 4-20mA and pneumatic actuators.
Main Fuel: Natural gas and/or #2 oil.
Igniter fuel: Natural gas and/or propane.
Performance guarantees are based on normal operating conditions and valid from 12.5% to 100% MCR, boiler with gas tight furnace division wall and to nominal operating pressure and temperature. Igniter emissions are not guaranteed. For application where CB does not provide the controls, emissions are guaranteed in manual mode only. SOx emissions are not burner dependent and depend solely on the sulfur content of the fuel. Burner/boiler systems are not intended for automatic recycling use. Please contact your local representative for more details.
*Excess air given for MCR only.
Pressure control valves not included. See piping spec for design ratings. See also general design data for additional details. All pressure drops are given at worst case conditions specified in the general design data. Burner + Windbox DP includes a windbox mounted opposed blade damper. Actual site DP may vary. DP shown does not include any design margin.
Guide specificationsGeneral design dataProduct dimension tables
Piping specificationsInspection and test planPaint specification
Scope detailJob document listCommissioning plan
For 50ºF to 100ºF combustion air applications, uncontrolled or 30 ppm NOx emissions
Designed for CBND-200E-600D-120, 200 K PPH sat.
240 MM BTU/H NG; 230 MM BTU/H #2 OIL
38

NG, no FGR #2 Oil, no FGR NG, 18% FGR #2 Oil, 18% FGR
Excess Air %* 17.5 17.5 17.5 17.5
NOx emissions ppmvd @3%O2 105 135 30 100
CO emissions ppmvd @3%O2 50 75 75 100
VOC lb/MM BTU (HHV) 0.004 0.004 0.004 0.004
Total PM lb/MM BTU (HHV) 0.01 0.05 0.01 0.05
Turndown 10 8 10 8
Regulated pressure at train inlet (psig) Atomizing
steam flow (pph)
Atomizing air for cold start
Burner + Windbox DP No FGR/FGR
AHG DP No FGR/FGR
NG #2 OilAtomizing
Steam(psig) (SCFM) (in wc) (in wc)
26 150 145 1350 70 26010.2/10.8 Oil10.2/10.8 NG
2.7/2.9 Oil3.7/3.9 NG
NXT-271 BurnerTechnical Data Sheet
Performance guarantees
Specific operating conditions
Reference documents Please reference the below documents for additional information on the content outlined in this data sheet. All documents are available in the Cleaver-Brooks Boiler Book.
Designed for furnace dimensions of at least:
Physicalarrangement:
Combustion Control System (CCS) compatibility options:
Fuel Options:Choice of NFPA or CSA compliance for U.S. or Canadian units, respectively (contact us for TSSA compliance).
H=10.11'W=6.69' Lturn=33.67' Ltot=41.33'
Designed for remote installation of FD fan, fuel train and control panel. Choice of right- or left-hand fuel rack. Choice of right, left, top, or bottom combustion air inlet flanged connection.
Fully Metered (FM) Combustion Control System (CCS) with O2 trim. All systems use 4-20mA and pneumatic actuators.
Main Fuel: Natural gas and/or #2 oil.
Igniter fuel: Natural gas and/or propane.
Performance guarantees are based on normal operating conditions and valid from 12.5% to 100% MCR, boiler with gas tight furnace division wall and to nominal operating pressure and temperature. Igniter emissions are not guaranteed. For application where CB does not provide the controls, emissions are guaranteed in manual mode only. SOx emissions are not burner dependent and depend solely on the sulfur content of the fuel. Burner/boiler systems are not intended for automatic recycling use. Please contact your local representative for more details.
*Excess air given for MCR only.
Pressure control valves not included. See piping spec for design ratings. See also general design data for additional details. All pressure drops are given at worst case conditions specified in the general design data. Burner + Windbox DP includes a windbox mounted opposed blade damper. Actual site DP may vary. DP shown does not include any design margin.
Guide specificationsGeneral design dataProduct dimension tables
Piping specificationsInspection and test planPaint specification
Scope detailJob document listCommissioning plan
For 50ºF to 100ºF combustion air applications, uncontrolled or 30 ppm NOx emissions
Designed for CBND-225E-600D-125, 225 K PPH sat.
271 MM BTU/H NG; 260 MM BTU/H #2 OIL
39

All dimensions are in inches. Dimensions may differ depending on the options chosen and are given for general reference only. Refer to final project specific general arrangement drawing for exact dimensions to be used for construction purposes. Refer to the “E” dimension for shipping width. Control panel, if supplied, is being folded towards the burner when units are shipped. (Control panel is mounted on hinged supporting brackets). For retrofit application, oil gun and ignitor removal length could be larger by up to 12 inches.
A B C D E F G H J K L M N P
98.5 81 48 52 37 37 25 98 23 100 66 37 137 99
105 90 54 52 40 37 28 108 26 106 72 38 149 111
Boiler Size Burner Model
CBND-40E-200D-40CBND-50E-200D-45CBND-60E-200D-50
NXT-048NXT-060NXT-072
CBND-70E-300D-55CBND-80E-300D-65CBND-90E-300D-70
NXT-085NXT-097NXT-109
NXT-048 to NXT-109 BurnersDimension Tables
Designed for 200D to 300D CBND Boilers
48 to 109 MM BTU/H Burners
40

NXT-120 to NXT-271 BurnersDimension Tables
Boiler Size Burner Model A B C D E F G H
CBND-100E-400D-75CBND-110E-400D-85CBND-120E-400D-90
NXT-120NXT-132NXT-144
88 78 84 63 39 128 162 117
CBND-135E-500D-95CBND-150E-500D-100CBND-175E-500D-115
NXT-162NXT-180NXT-210
92 82 90 65 41 134 169 124
CBND-200E-600D-120CBND-225E-600D-125
NXT-240NXT-271
100 90 96 69 45 141 176 131
Boiler Size Burner Model Fuel A B C D E F
CBND-100E-400D-75CBND-110E-400D-85CBND-120E-400D-90CBND-135E-500D-95CBND-150E-500D-100CBND-175E-500D-115CBND-200E-600D-120CBND-225E-600D-125
NXT-120NXT-132NXT-144NXT-162NXT-180NXT-210NXT-240NXT-271
Natural Gas 108 72 48 96 66 32
Natural Gas + Oil 124 68 60 108 84 60
All dimensions shown in inches. Dimensions may differ depending on options chosen and are given for general reference only. Refer to final project specific general arrangement drawing for exact dimensions to be used for construction purposes. For retrofit application - oil gun (G) and igniter (H) removal length may expand by up to 12 inches.
General Dimensions
Fuel Rack Dimensions
Designed for 400D to 600D CBND Boilers
120 to 271 MM BTU/H Burners
41

Boiler Size Burner Model A B C* D E F G
CBND-100E-400D-75 NXT-120 70 28 142 78 116 40 32
CBND-110E-400D-85 NXT-132 78 30 154 78 126 44 32
CBND-120E-400D-90 NXT-144 78 30 154 84 132 48 34
CBND-135E-500D-95 NXT-162 84 32 158 94 136 52 38
CBND-150E-500D-100 NXT-180 84 32 168 94 140 56 38
CBND-175E-500D-115 NXT-210 94 34 190 102 154 60 40
CBND-200E-600D-120 NXT-240 102 38 202 114 170 68 44
CBND-225E-600D-125 NXT-271 102 38 218 114 184 72 44
All dimensions shown in inches. Dimensions may differ depending on options chosen and are given for general reference only. Refer to final project specific general arrangement drawing for exact dimensions to be used for construction purposes. To obtain the total length without FGR, subtract dimension “F” from dimension “C.” *Subtract 3 inches from dimension “C” when the silencer is ducted.
Air Handling Components Dimensions
42

Printed in the USA©2011 Cleaver-Brooks, Inc
CB-83911/11
Engineered Boiler Systems 6940 Cornhusker Hwy, Lincoln, NE 68507 USA
402.434.2000 · [email protected] cleaverbrooks.com/engineered

BOILER PREDICTED PERFORMANCE*Version: NB-Size-2014.0.1 Customer: Bechtel (Renovo PA) Engineer: JMJ
Proposal: TBD Fuel:
Model: NB-200D-50 Design Pressure: 350 PSIG
Boiler load - % 100% 75% 50% 25%
Steam Flow - Gross Production 54,000 40,500 27,000 13,500 Lb/Hr
Net Steam Flow - Gross less Pegging Steam 45,000 33,750 22,500 11,250 Lb/Hr
Pegging Steam 9,000 6,750 4,500 2,250 Lb/Hr
Steam Pressure - Operating 300 300 300 300 PSIG
Steam Temperature 421 421 421 421 °F
Fuel Input (HHV) 65.6 49.0 32.6 16.5 MMBTU/Hr
Ambient Air Temperature 80 80 80 80 °F
Relative Humidity 60 60 60 60 %
Excess Air 20 20 20 25 %
Flue Gas Recirculation 25 25 25 25 %
Steam Output Duty 54.7 41.0 27.3 13.7 MMBTU/hr
Heat Release Rate - Volumetric 71,774 53,638 35,716 18,028 BTU/FT3-Hr
Heat Release Rate - Area 112,551 84,111 56,008 28,270 BTU/FT2-Hr
Heat Flux 17,242 BTU/FT2-Hr
Feed Water Temperature 228 228 228 228 °F
Water Temperature Leaving Economizer 334 322 307 296 ±10°F
Blow Down 3.0 3.0 3.0 3.0 %
Boiler Gas Exit Temperature 633 576 515 456 ±10°F
Economizer Gas Exit Temperature 301 282 264 249 ±10°F
Air Flow 57,514 42,981 28,620 15,048 Lb/Hr
Flue Gas to Stack 60,293 45,058 30,003 15,746 Lb/Hr
Flue Gas Including FGR 75,366 56,322 37,504 19,682 Lb/Hr
Fuel Flow 2,778 2,076 1,382 697 Lb/Hr
Flue Gas Analysis,Losses,Efficiency - %
Dry Gas Loss 4.3 3.9 3.6 3.5 %
Air Moisture Loss 0.1 0.1 0.1 0.1 %
Fuel Moisture Loss 10.7 10.6 10.6 10.5 %
Casing Loss 0.5 0.7 1.0 2.0 %
Margin 1.0 1.0 1.0 1.0 %
Efficiency - LHV 92.4 92.7 92.9 92.0 %
Efficiency - HHV 83.3 83.6 83.7 83.0 %
Total Pressure Drop Including Economizer 7.95 4.44 1.96 0.51 IN WC
Products of Combustion - CO2 7.96 7.96 7.96 7.66 % vol.
- H2O 17.59 17.59 17.59 17.02 % vol.
-N2 71.29 71.29 71.29 71.52 % vol.
-O2 3.16 3.16 3.16 3.80 % vol.
- - - - #/mmbtu
Fuel Composition - Gas BOILER SURFACE AREAS-ft2
methane 96.943 % vol. Furnace Volume: 913 ft3
ethane 2.5240 % vol. Furnace Projected Area: 583 ft2
propane 0.1240 % vol. Evaporator: 2,591 ft2
butane 0.0007 % vol. Total Area: 3,173 ft2
carbon dioxide 0.1400 % vol. Economizer: 7,904 ft2
nitrogen 0.2700 % vol. Superheater: - ft2
LHV-Btu/lb 21285
HHV-Btu/lb 23601
NOTE: Emissions rates are estimated to be at or below as follows: CO (.036), VOC (.005) , NOx (.011) #/mmbtu
*Above data is predicted only, see proposal for guaranteed numbers.
Natural Gas
June 27, 2016
Cleaver-Brooks, Inc.
Engineered Boiler Systems
Renovo PA Boiler Performance rev1
LoadsCase1 12/19/2016
aaustin
Highlight

DIESEL GENERATOR SET
STANDBY1500 ekW 1875 kVA60 Hz 1800 rpm 480 VoltsCaterpillar is leading the power generationmarketplace with Power Solutions engineeredto deliver unmatched flexibility, expandability,reliability, and cost-effectiveness.
Image shown may notreflect actual package.
FEATURES
FUEL/EMISSIONS STRATEGY• EPA Certified for Stationary
Emergency Application(EPA Tier 2 emissions levels)
DESIGN CRITERIA• The generator set accepts 100% rated load in one
step per NFPA 110 and meets ISO 8528-5 transientresponse.
UL 2200 / CSA - Optional• UL 2200 listed packages• CSA Certified
Certain restrictions may apply.Consult with your Cat® Dealer.
FULL RANGE OF ATTACHMENTS• Wide range of bolt-on system expansion
attachments, factory designed and tested• Flexible packaging options for easy and cost
effective installation
SINGLE-SOURCE SUPPLIER• Fully prototype tested with certified torsional
vibration analysis available
WORLDWIDE PRODUCT SUPPORT• Cat dealers provide extensive post sale support
including maintenance and repair agreements• Cat dealers have over 1,800 dealer branch stores
operating in 200 countries• The Cat® S•O•SSM program cost effectively detects
internal engine component condition, even thepresence of unwanted fluids and combustionby-products
CAT® 3512C DIESEL ENGINE• Reliable, rugged, durable design• Four-stroke-cycle diesel engine combines
consistent performance and excellent fueleconomy with minimum weight
CAT GENERATOR• Designed to match the performance and output
characteristics of Cat diesel engines• Single point access to accessory connections• UL 1446 recognized Class H insulation
CAT EMCP 4 CONTROL PANELS• Simple user friendly interface and navigation• Scalable system to meet a wide range of
customer needs• Integrated Control System and Communications
Gateway
SEISMIC CERTIFICATION• Seismic Certification available• Anchoring details are site specific, and are
dependent on many factors such as generator setsize, weight, and concrete strength.IBC Certification requires that the anchoringsystem used is reviewed and approved by aProfessional Engineer
• Seismic Certification per Applicable BuildingCodes: IBC 2000, IBC 2003, IBC 2006, IBC 2009,CBC 2007
• Pre-approved by OSHP and carries anOPA#(OSP-0084-01) for use in healthcare projectsin California

STANDBY 1500 ekW 1875 kVA60 Hz 1800 rpm 480 Volts
FACTORY INSTALLED STANDARD & OPTIONAL EQUIPMENT
System Standard OptionalAir Inlet • Single element canister type air cleaner
• Service indicator[ ] Dual element & heavy duty air cleaners (with
pre-cleaners)[ ] Air inlet adapters & shut-off
Cooling • Radiator fan and fan drive• Fan and belt guards• Coolant level sensors*• Cat Extended Life Coolant*
[ ] Coolant level switch gauge[ ] Heat exchanger and expansion tank
Exhaust • Exhaust manifold - dry - dual - 8 in• 203 mm (8 in) ID round flanged outlet
[ ] Mufflers[ ] Stainless steel exhaust flex fittings[ ] Elbows, flanges, expanders & Y adapters
Fuel • Secondary fuel filters• Fuel cooler*• Fuel priming pump• Flexible fuel lines (shipped loose)
[ ] Duplex secondary fuel filter[ ] Primary fuel filter with fuel water separator
Generator • Class H insulation• Cat digital voltage regulator (CDVR) with kVAR/PF
control, 3-phase sensing• Winding temperature detectors• Anti-condensation heaters• Reactive Droop
[ ] Oversize & premium generators [ ] Bearingtemperature detectors
Power Termination • Bus bar (NEMA or IEC mechanical lug holes)- rightside standard
• Top and bottom cable entry
[ ] Circuit breakers, UL listed, 3 pole with shunttrip,100% rated, manual or electrically operated [ ]Circuit breakers, IEC compliant, 3 or 4 pole with shunttrip, manual or electrically operated
[ ] Bottom cable entry[ ] Power terminations can be located on the right, left
and/or rear as an optionGovernor • ADEM™ 3 [ ] Load share module
Control Panel • EMCP 4.2• User Interface panel (UIP) - rear mount• AC & DC customer wiring area (right side)• Emergency stop pushbutton
[ ] Option for right or left mount UIP[ ] Local & remote annunciator modules[ ] Digital I/O Module[ ] Generator temperature monitoring & protection[ ] Remote monitoring software
Lube • Lubricating oil and filter• Oil drain line with valves• Fumes disposal• Gear type lube oil pump
[ ] Oil level regulator[ ] Deep sump oil pan[ ] Electric & air prelube pumps [ ] Manual prelube with
sump pump [ ] Duplex oil filterMounting • Rails - engine / generator / radiator mounting
• Anti-vibration mounts (shipped loose)[ ] Spring-type vibration isolator [ ] IBC Isolators
Starting/Charging • 24 volt starting motor(s)• Batteries with rack and cables• Battery disconnect switch
[ ] Battery chargers (10 or 20 Amp)[ ] 45 amp charging alternator[ ] Oversize batteries[ ] Ether starting aid[ ] Heavy duty starting motors[ ] Barring device (manual)[ ] Air starting motor with control & silencer
Note Standard and optional equipment may vary for UL2200 Listed Packages. UL 2200 Listed packages mayhave oversized generators with a differenttemperature rise and motor starting characteristics.
General • Right hand service• Paint - Caterpillar Yellow(with high gloss black rails & radiator)• SAE standard rotation• Flywheel and flywheel housing - SAE No. 00
[ ] CSA certification[ ] CE Certificate of Conformance[ ] Seismic Certification per Applicable Building Codes:
IBC 2000, IBC 2003, IBC 2006, IBC 2009, CBC 2007* Not included with packages without radiators
February 13 2012 16:44 PM2

STANDBY 1500 ekW 1875 kVA60 Hz 1800 rpm 480 Volts
SPECIFICATIONS
CAT GENERATOR
Cat GeneratorFrame size......................................................................... 697Excitation................................................ Permanent MagnetPitch.............................................................................. 0.7333Number of poles...................................................................4Number of bearings...................................... Single bearingNumber of Leads.............................................................. 006Insulation....................... UL 1446 Recognized Class H withtropicalization and antiabrasion- Consult your Caterpillar dealer for available voltagesIP Rating........................................................................... IP23Alignment.............................................................. Pilot ShaftOverspeed capability........................................................150Wave form Deviation (Line to Line)........................... 003.00Voltage regulator.............. 3 Phase sensing with selectiblevolts/HzVoltage regulation............Less than +/- 1/2% (steady state)Less than +/- 1/2% (w/3% speed change)
CAT DIESEL ENGINE
3512C ATAAC, V-12, 4-Stroke Water-cooled DieselBore........................................................ 170.00 mm (6.69 in)Stroke..................................................... 190.00 mm (7.48 in)Displacement.........................................51.80 L (3161.03 in3)Compression Ratio....................................................... 14.7:1Aspiration........................................................................... TAFuel System.................................... Electronic unit injectionGovernor Type........................................................... ADEM3
CAT EMCP 4 SERIES CONTROLS
EMCP 4 controls including:- Run / Auto / Stop Control- Speed and Voltage Adjust- Engine Cycle Crank- 24-volt DC operation- Environmental sealed front face- Text alarm/event descriptions
Digital indication for:- RPM- DC volts- Operating hours- Oil pressure (psi, kPa or bar)- Coolant temperature- Volts (L-L & L-N), frequency (Hz)- Amps (per phase & average)- ekW, kVA, kVAR, kW-hr, %kW, PF
Warning/shutdown with common LED indication of:- Low oil pressure- High coolant temperature- Overspeed- Emergency stop- Failure to start (overcrank)- Low coolant temperature- Low coolant level
Programmable protective relaying functions:- Generator phase sequence- Over/Under voltage (27/59)- Over/Under Frequency (81 o/u)- Reverse Power (kW) (32)- Reverse reactive power (kVAr) (32RV)- Overcurrent (50/51)
Communications:- Six digital inputs (4.2 only)- Four relay outputs (Form A)- Two relay outputs (Form C)- Two digital outputs- Customer data link (Modbus RTU)- Accessory module data link- Serial annunciator module data link- Emergency stop pushbutton
Compatible with the following:- Digital I/O module- Local Annunciator- Remote CAN annunciator- Remote serial annunciator
February 13 2012 16:44 PM3

STANDBY 1500 ekW 1875 kVA60 Hz 1800 rpm 480 Volts
TECHNICAL DATA
Open Generator Set - - 1800 rpm/60 Hz/480 Volts DM8260EPA Certified for Stationary Emergency Application(EPA Tier 2 emissions levels)
Generator Set Package PerformanceGenset Power rating @ 0.8 pfGenset Power rating with fan
1875 kVA1500 ekW
Fuel Consumption100% load with fan75% load with fan50% load with fan
396.0 L/hr 104.6 Gal/hr310.5 L/hr 82.0 Gal/hr219.8 L/hr 58.1 Gal/hr
Cooling System1
Air flow restriction (system)Air flow (max @ rated speed for radiator arrangement)Engine Coolant capacity with radiator/exp. tankEngine coolant capacityRadiator coolant capacity
0.12 kPa 0.48 in. water2075 m³/min 73278 cfm390.8 L 103.2 gal156.8 L 41.4 gal234.0 L 61.8 gal
Inlet AirCombustion air inlet flow rate 129.4 m³/min 4569.7 cfm
Exhaust SystemExhaust stack gas temperatureExhaust gas flow rateExhaust flange size (internal diameter)Exhaust system backpressure (maximum allowable)
403.9 º C 759.0 º F308.9 m³/min 10908.7 cfm203.2 mm 8.0 in6.7 kPa 26.9 in. water
Heat RejectionHeat rejection to coolant (total)Heat rejection to exhaust (total)Heat rejection to aftercoolerHeat rejection to atmosphere from engineHeat rejection to atmosphere from generator
616 kW 35032 Btu/min1322 kW 75182 Btu/min481 kW 27354 Btu/min124 kW 7052 Btu/min94.0 kW 5345.8 Btu/min
Alternator2
Motor starting capability @ 30% voltage dipFrameTemperature Rise
2670 skVA697130 º C 234 º F
Lube SystemSump refill with filter 310.4 L 82.0 gal
Emissions (Nominal)3
NOx g/hp-hrCO g/hp-hrHC g/hp-hrPM g/hp-hr
5.08 g/hp-hr.44 g/hp-hr.11 g/hp-hr.03 g/hp-hr
1 For ambient and altitude capabilities consult your Cat dealer. Air flow restriction (system) is added to existing restriction from factory.2 UL 2200 Listed packages may have oversized generators with a different temperature rise and motor starting characteristics. Generatortemperature rise is based on a 40 degree C ambient per NEMA MG1-32.3 Emissions data measurement procedures are consistent with those described in EPA CFR 40 Part 89, Subpart D & E and ISO8178-1 formeasuring HC, CO, PM, NOx. Data shown is based on steady state operating conditions of 77ºF, 28.42 in HG and number 2 diesel fuelwith 35º API and LHV of 18,390 btu/lb. The nominal emissions data shown is subject to instrumentation, measurement, facility and engineto engine variations. Emissions data is based on 100% load and thus cannot be used to compare to EPA regulations which use valuesbased on a weighted cycle.
February 13 2012 16:44 PM4

STANDBY 1500 ekW 1875 kVA60 Hz 1800 rpm 480 Volts
RATING DEFINITIONS AND CONDITIONS
Meets or Exceeds International Specifications: AS1359,CSA, IEC60034-1, ISO3046, ISO8528, NEMA MG 1-22,NEMA MG 1-33, UL508A, 72/23/EEC, 98/37/EC,2004/108/ECStandby - Output available with varying load for theduration of the interruption of the normal source power.Average power output is 70% of the standby powerrating. Typical operation is 200 hours per year, withmaximum expected usage of 500 hours per year.Standby power in accordance with ISO8528. Fuel stoppower in accordance with ISO3046. Standby ambientsshown indicate ambient temperature at 100% load whichresults in a coolant top tank temperature just below theshutdown temperature.
Ratings are based on SAE J1349 standard conditions.These ratings also apply at ISO3046 standard conditions.Fuel rates are based on fuel oil of 35º API [16º C (60º F)]gravity having an LHV of 42 780 kJ/kg (18,390 Btu/lb)when used at 29º C (85º F) and weighing 838.9 g/liter(7.001 lbs/U.S. gal.). Additional ratings may be availablefor specific customer requirements, contact your Catrepresentative for details. For information regarding LowSulfur fuel and Biodiesel capability, please consult yourCat dealer.
February 13 2012 16:44 PM5

STANDBY 1500 ekW 1875 kVA60 Hz 1800 rpm 480 Volts
DIMENSIONS
Package DimensionsLength 5895.0 mm 232.09 inWidth 2537.5 mm 99.9 inHeight 2749.5 mm 108.25 in
NOTE: For reference only - do not use forinstallation design. Please contactyour local dealer for exact weightand dimensions. (GeneralDimension Drawing #2846048).
www.Cat-ElectricPower.com
2012 CaterpillarAll rights reserved.
Materials and specifications are subject to change without notice.The International System of Units (SI) is used in this publication.
CAT, CATERPILLAR, their respective logos, "Caterpillar Yellow," the"Power Edge" trade dress, as well as corporate and product identity used
herein, are trademarks of Caterpillar and may not be used withoutpermission.
19498305
Performance No.: DM8260
Feature Code: 512DE6C
Gen. Arr. Number: 2628100
Source: U.S. Sourced
February 13 2012
6


FIRE PUMP ENGINES
MODELSJU6H-UFADMG JU6H-UFADP0 JU6H-UFADR0 JU6H-UFADT0JU6H-UFAD58 JU6H-UFADP8 JU6H-UFADR8 JU6H-UFADW8
JU6H-UFADNG JU6H-UFADQ0 JU6H-UFADS8 JU6H-UFADX8JU6H-UFADN0 JU6H-UFAD88 JU6H-UFADS0 JU6H-UFAD98
JU6H
MODEL
RATED SPEED US-EPA
(NSPS)
Available
Until
1760 2100 2350 2400
UFADMG 175 131 175 131 No Expiration
UFAD58 183 137 No Expiration
UFADNG 190 142 181 135 183 137 183 137 No Expiration
UFADN0 197 147 197 147 200 149 200 149 No Expiration
UFADP0 209 156 211 157 211 157 No Expiration
UFADP8 220 164 No Expiration
UFADQ0 224 167 226 169 226 169 No Expiration
UFAD88 237 177 No Expiration
UFADR0 238 177.5 240 179 240 179 No Expiration
UFADR8 250 187 No Expiration
UFADS8 260 194 No Expiration
UFADS0 260 194 268 200 268 200 No Expiration
UFADT0 274 204 275 205 275 205 No Expiration
UFADW8 282 211 No Expiration
UFADX8 305 227.5 No Expiration
UFAD98 315 235 No Expiration
ITEM
JU6H MODELS
MG 58 NG N0 P8 88 P0 Q0 R0 S0 T0 R8 S8 W8 X8 98Number of Cylinders 6
Aspiration TRWA
Rotation* CW
Overall Dimensions – in. (mm) 59.8 (1519) H x 56.7 (1414) L x 36.7 (933) W 60.9 (1547) H x 58.6 (1488) L x 40.0 (1015) W
Crankshaft Centerline Height – in. (mm) 14 (356)
Weight – lb (kg) 1747 (791)
Compression Ratio 19.0:1 17.0:1
Displacement – cu. in. (L) 415 (6.8)
Engine Type 4 Stroke Cycle – Inline Construction
Bore & Stroke – in. (mm) 4.19 x 5.00 (106 x 127)
Installation Drawing D628
Wiring Diagram AC C07651
Wiring Diagram DC C071367, C072146, C071361 C071368, C072146, C071761
Engine Series John Deere 6068 Series Power Tech E John Deere 6068 Series Power Tech Plus
Speed Interpolation N/A
SPECIFICATIONS
Abbreviations: CW – Clockwise TRWA – Turbocharged with Raw Water Aftercooling N/A - Not Available L – Length W – Width H - Height
*Rotation viewed from Heat Exchanger / Front of engine
FM
®
FM-UL-cUL APPROVED RATINGS BHP/KW
CERTIFIED POWER RATING
• Each engine is factory tested to verify power and performance.
• FM-UL power ratings are shown at specific speeds, Clarke engines can be applied at a single rated RPM setting ± 50 RPM.
Picture represents JU6H-TRWA Power Tech Plus Engine Series
USA EPA (NSPS) Tier 3 Emissions Certified Off-Road (40 CFR Part 89) and NSPS Stationary (40 CFR Part 60 Sub Part llll). Meet EU Stage IIIA emission levels.
All Models available for Export
ENGINE RATINGS BASELINES
• Engines are to be used for stationary emergency standby fire pump service only. Engines are to be tested in accordance with NFPA 25.
• Engines are rated at standard SAE conditions of 29.61 in. (752.1 mm) Hg barometer and 77°F (25°C) inlet air temperature [approximates 300 ft. (91.4 m) above sea level] by the testing laboratory (see SAE Standard J 1349).
• A deduction of 3 percent from engine horsepower rating at standard SAE conditions shall be made for diesel engines for each 1000 ft. (305 m) altitude above 300 ft. (91.4 m)
• A deduction of 1 percent from engine horsepower rating as corrected to standard SAE conditions shall be made for diesel engines for every 10°F (5.6°C) above 77°F (25°C) ambient temperature.
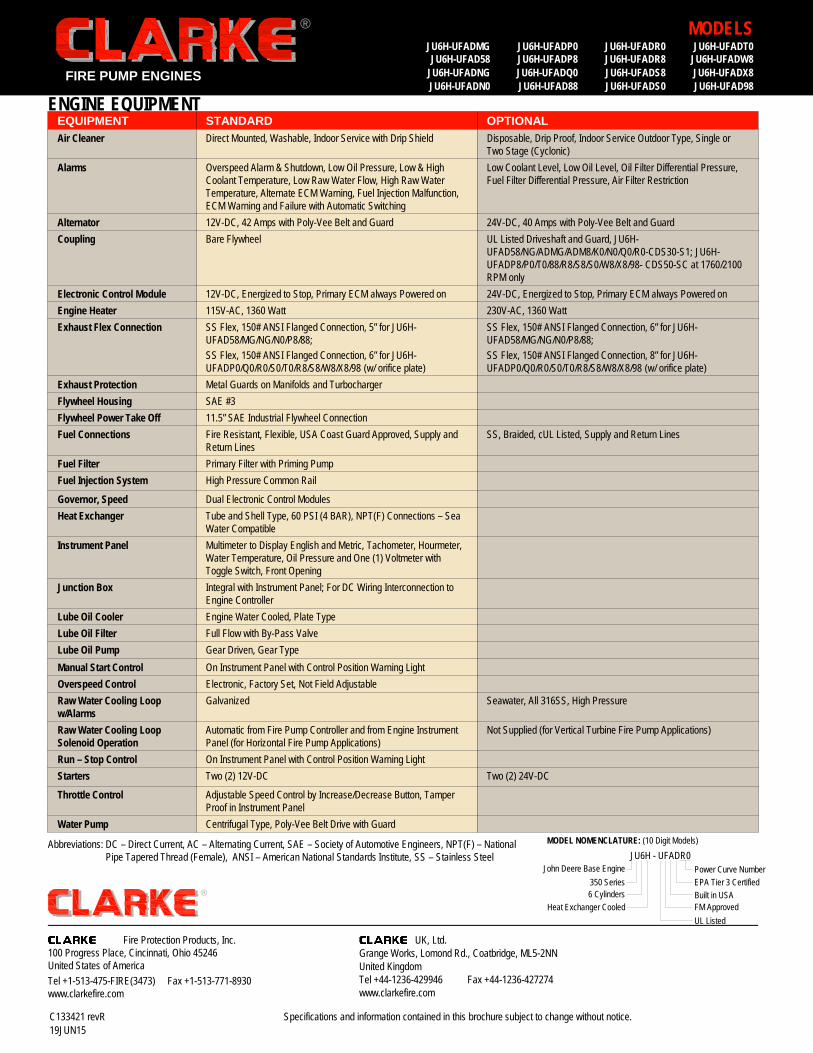
ENGINE EQUIPMENTEQUIPMENT STANDARD OPTIONAL
Air Cleaner Direct Mounted, Washable, Indoor Service with Drip Shield Disposable, Drip Proof, Indoor Service Outdoor Type, Single or Two Stage (Cyclonic)
Alarms Overspeed Alarm & Shutdown, Low Oil Pressure, Low & High Coolant Temperature, Low Raw Water Flow, High Raw Water Temperature, Alternate ECM Warning, Fuel Injection Malfunction, ECM Warning and Failure with Automatic Switching
Low Coolant Level, Low Oil Level, Oil Filter Differential Pressure, Fuel Filter Differential Pressure, Air Filter Restriction
Alternator 12V-DC, 42 Amps with Poly-Vee Belt and Guard 24V-DC, 40 Amps with Poly-Vee Belt and GuardCoupling Bare Flywheel UL Listed Driveshaft and Guard, JU6H-
UFAD58/NG/ADMG/ADM8/K0/N0/Q0/R0-CDS30-S1; JU6H-UFADP8/P0/T0/88/R8/S8/S0/W8/X8/98- CDS50-SC at 1760/2100 RPM only
Electronic Control Module 12V-DC, Energized to Stop, Primary ECM always Powered on 24V-DC, Energized to Stop, Primary ECM always Powered onEngine Heater 115V-AC, 1360 Watt 230V-AC, 1360 WattExhaust Flex Connection SS Flex, 150# ANSI Flanged Connection, 5” for JU6H-
UFAD58/MG/NG/N0/P8/88;SS Flex, 150# ANSI Flanged Connection, 6” for JU6H-UFADP0/Q0/R0/S0/T0/R8/S8/W8/X8/98 (w/ orifice plate)
SS Flex, 150# ANSI Flanged Connection, 6” for JU6H-UFAD58/MG/NG/N0/P8/88;SS Flex, 150# ANSI Flanged Connection, 8” for JU6H-UFADP0/Q0/R0/S0/T0/R8/S8/W8/X8/98 (w/ orifice plate)
Exhaust Protection Metal Guards on Manifolds and TurbochargerFlywheel Housing SAE #3Flywheel Power Take Off 11.5” SAE Industrial Flywheel ConnectionFuel Connections Fire Resistant, Flexible, USA Coast Guard Approved, Supply and
Return LinesSS, Braided, cUL Listed, Supply and Return Lines
Fuel Filter Primary Filter with Priming Pump Fuel Injection System High Pressure Common Rail
Governor, Speed Dual Electronic Control ModulesHeat Exchanger Tube and Shell Type, 60 PSI (4 BAR), NPT(F) Connections – Sea
Water CompatibleInstrument Panel Multimeter to Display English and Metric, Tachometer, Hourmeter,
Water Temperature, Oil Pressure and One (1) Voltmeter with Toggle Switch, Front Opening
Junction Box Integral with Instrument Panel; For DC Wiring Interconnection to Engine Controller
Lube Oil Cooler Engine Water Cooled, Plate TypeLube Oil Filter Full Flow with By-Pass ValveLube Oil Pump Gear Driven, Gear TypeManual Start Control On Instrument Panel with Control Position Warning LightOverspeed Control Electronic, Factory Set, Not Field AdjustableRaw Water Cooling Loop w/Alarms
Galvanized Seawater, All 316SS, High Pressure
Raw Water Cooling Loop Solenoid Operation
Automatic from Fire Pump Controller and from Engine Instrument Panel (for Horizontal Fire Pump Applications)
Not Supplied (for Vertical Turbine Fire Pump Applications)
Run – Stop Control On Instrument Panel with Control Position Warning LightStarters Two (2) 12V-DC Two (2) 24V-DC
Throttle Control Adjustable Speed Control by Increase/Decrease Button, Tamper Proof in Instrument Panel
Water Pump Centrifugal Type, Poly-Vee Belt Drive with Guard
C133421 revR19JUN15
Specifications and information contained in this brochure subject to change without notice.
FIRE PUMP ENGINES
Fire Protection Products, Inc.100 Progress Place, Cincinnati, Ohio 45246United States of AmericaTel +1-513-475-FIRE(3473) Fax +1-513-771-8930www.clarkefire.com
UK, Ltd.Grange Works, Lomond Rd., Coatbridge, ML5-2NNUnited KingdomTel +44-1236-429946 Fax +44-1236-427274www.clarkefire.com
®
®
Abbreviations: DC – Direct Current, AC – Alternating Current, SAE – Society of Automotive Engineers, NPT(F) – National Pipe Tapered Thread (Female), ANSI – American National Standards Institute, SS – Stainless Steel
MODELSJU6H-UFADMG JU6H-UFADP0 JU6H-UFADR0 JU6H-UFADT0JU6H-UFAD58 JU6H-UFADP8 JU6H-UFADR8 JU6H-UFADW8
JU6H-UFADNG JU6H-UFADQ0 JU6H-UFADS8 JU6H-UFADX8JU6H-UFADN0 JU6H-UFAD88 JU6H-UFADS0 JU6H-UFAD98
JU6H - UFADR0John Deere Base Engine
350 Series6 Cylinders
Heat Exchanger Cooled
Power Curve NumberEPA Tier 3 CertifiedBuilt in USAFM ApprovedUL Listed
MODEL NOMENCLATURE: (10 Digit Models)
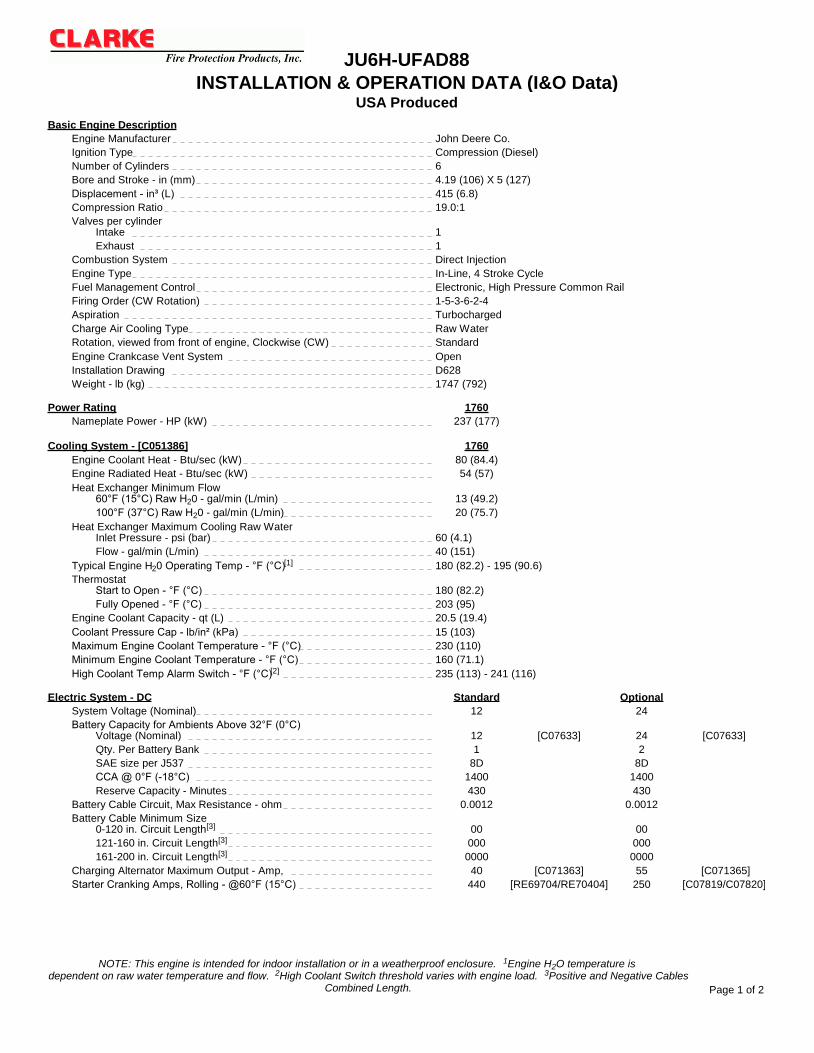
JU6H-UFAD88
USA ProducedINSTALLATION & OPERATION DATA (I&O Data)
Basic Engine Description Engine Manufacturer John Deere Co. Ignition Type Compression (Diesel) Number of Cylinders 6 Bore and Stroke - in (mm) 4.19 (106) X 5 (127) Displacement - in³ (L) 415 (6.8) Compression Ratio 19.0:1 Valves per cylinder
Intake 1
Exhaust 1 Combustion System Direct Injection Engine Type In-Line, 4 Stroke Cycle Fuel Management Control Electronic, High Pressure Common Rail Firing Order (CW Rotation) 1-5-3-6-2-4 Aspiration Turbocharged Charge Air Cooling Type Raw Water Rotation, viewed from front of engine, Clockwise (CW) Standard Engine Crankcase Vent System Open Installation Drawing D628 Weight - lb (kg) 1747 (792)
Power Rating 1760 Nameplate Power - HP (kW) 237 (177)
Cooling System - [C051386] 1760 Engine Coolant Heat - Btu/sec (kW) 80 (84.4) Engine Radiated Heat - Btu/sec (kW) 54 (57) Heat Exchanger Minimum Flow
60°F (15°C) Raw H20 - gal/min (L/min) 13 (49.2)
100°F (37°C) Raw H20 - gal/min (L/min) 20 (75.7) Heat Exchanger Maximum Cooling Raw Water
Inlet Pressure - psi (bar) 60 (4.1)
Flow - gal/min (L/min) 40 (151) Typical Engine H20 Operating Temp - °F (°C)[1] 180 (82.2) - 195 (90.6) Thermostat
Start to Open - °F (°C) 180 (82.2)
Fully Opened - °F (°C) 203 (95) Engine Coolant Capacity - qt (L) 20.5 (19.4) Coolant Pressure Cap - lb/in² (kPa) 15 (103) Maximum Engine Coolant Temperature - °F (°C) 230 (110) Minimum Engine Coolant Temperature - °F (°C) 160 (71.1) High Coolant Temp Alarm Switch - °F (°C)[2] 235 (113) - 241 (116)
Electric System - DC Standard Optional System Voltage (Nominal) 12 24 Battery Capacity for Ambients Above 32°F (0°C)
Voltage (Nominal) 12 [C07633] 24 [C07633]
Qty. Per Battery Bank 1 2 SAE size per J537 8D 8D CCA @ 0°F (-18°C) 1400 1400 Reserve Capacity - Minutes 430 430
Battery Cable Circuit, Max Resistance - ohm 0.0012 0.0012 Battery Cable Minimum Size
0-120 in. Circuit Length[3] 00 00
121-160 in. Circuit Length[3] 000 000 161-200 in. Circuit Length[3] 0000 0000
Charging Alternator Maximum Output - Amp, 40 [C071363] 55 [C071365] Starter Cranking Amps, Rolling - @60°F (15°C) 440 [RE69704/RE70404] 250 [C07819/C07820]
NOTE: This engine is intended for indoor installation or in a weatherproof enclosure. 1Engine H2O temperature is dependent on raw water temperature and flow. 2High Coolant Switch threshold varies with engine load. 3Positive and Negative Cables
Combined Length.
Page 1 of 2

JU6H-UFAD88
USA ProducedINSTALLATION & OPERATION DATA (I&O Data)
Exhaust System 1760 Exhaust Flow - ft.³/min (m³/min) 1189 (33.7) Exhaust Temperature - °F (°C) 986 (530) Maximum Allowable Back Pressure - in H20 (kPa) 30 (7.5) Minimum Exhaust Pipe Dia. - in (mm)[4] 5 (127)
Fuel System 1760 Fuel Consumption - gal/hr (L/hr) 12 (45.4) Fuel Return - gal/hr (L/hr) 16.6 (62.8) Fuel Supply - gal/hr (L/hr) 28.6 (108) Fuel Pressure - lb/in² (kPa) 3 (20.7) - 6 (41.4) Minimum Line Size - Supply - in. .50 Schedule 40 Steel Pipe
Pipe Outer Diameter - in (mm) 0.848 (21.5) Minimum Line Size - Return - in. .375 Schedule 40 Steel Pipe
Pipe Outer Diameter - in (mm) 0.675 (17.1) Maximum Allowable Fuel Pump Suction Lift
with clean Filter - in H20 (mH20) 80 (2)
Maximum Allowable Fuel Head above Fuel pump, Supply or Return - ft (m) 6.6 (2) Fuel Filter Micron Size 2 (Secondary)
Heater System Standard Optional Engine Coolant Heater
Wattage (Nominal) 1360 1360 Voltage - AC, 1 Phase 115 (+5% -10%) 230 (+5%, -10%) Part Number [C123640] [C123644]
Air System 1760 Combustion Air Flow - ft.³/min (m³/min) 457 (12.9) Air Cleaner Standard Optional
Part Number [C03396] [C03327] Type Indoor Service Only, Canister,
with Shield Single-Stage Cleaning method Washable Disposable
Air Intake Restriction Maximum LimitDirty Air Cleaner - in H20 (kPa) 10 (2.5) 10 (2.5)
Clean Air Cleaner - in H20 (kPa) 6 (1.5) 5 (1.2) Maximum Allowable Temperature (Air To Engine Inlet) - °F (°C)[5] 130 (54.4)
Lubrication System Oil Pressure - normal - lb/in² (kPa) 40 (276) - 60 (414) Low Oil Pressure Alarm Switch - lb/in² (kPa)[6] 30 (207) to 35 (241) In Pan Oil Temperature - °F (°C) 220 (104) - 245 (118) Total Oil Capacity with Filter - qt (L) 21.1 (20)
Lube Oil Heater Optional Optional Wattage (Nominal) 150 150 Voltage 120V (+5%, -10%) 240V (+5%, -10%) Part Number C04430 C04431
Performance 1760 BMEP - lb/in² (kPa) 257 (1770) Piston Speed - ft/min (m/min) 1467 (447) Mechanical Noise - dB(A) @ 1m C133373 Power Curve C132682 4Based on Nominal System. Back pressure flow analysis must be done to assure maximum allowable back pressure is not exceeded. (Note:
minimum exhaust Pipe diameter is based on: 15 feet of pipe, one 90° elbow, and a silencer pressure drop no greater than one half of the maximum allowable back pressure.) 5Review for horsepower derate if ambient air entering engine exceeds 77°F (25°C). 6Low Oil Pressure Switch threshold
varies w/engine speed. [ ] indicates component reference part number.
Page 2 of 2C132910 Rev F
KJK 09JAN15


HEATER SPECIFICATION SHEET
CUSTOMER Mulcare Pipeline Solutions DATE 15-Jul-16
ADDRESS 9 Mars Court CUSTOMER REFERENCE Hanover Engineering - Line Heater
CITY/STATE/ZIP Boonton Twp, NJ 07005 CUSTOMER PROJECT NO.
LOCATION Pennsylvania QUOTATION ITEM NUMBER
STATION OPERATING DATA 1450 psig 45°F / 1442 psig 96°F
ENGINEER Brian Shomper
PURCHASING AGENT
REMARKS
DIAMETER (inches) 120 BATH MEDIA VOLUME (Gal) 11,680 ETHYLENE GLYCOL 50/50
LENGTH (ft) 36' - 0" HEATER WEIGHT (DRY lbs) 78,360 HORIZONTAL -
WIDTH (ft) 10' - 6" HEATER WEIGHT (WET lbs) 183,780
HEIGHT (ft) (Shipping / Top of Stack) 10' - 6" / 16' - 6" POWER INPUT 480 VAC / 60 hz / 3 PH
NOMINAL RATING (MMBtu/hr) 10.9351
REMARKS
INLET OUTLET Forced Draft Burner
TYPE OF FLUID Natural Gas Natural Gas Blower Motor (HP) 5
TOTAL FLUID ENTERING SCFH 6,675,000 6,675,000 Sparging System NO
VAPOR lb/hr 305,768 305,768 Sparging System Motor (HP) NA
LIQUID lb/hr ------ ------ Safety include:
STEAM lb/hr ------ ------ Low Water Level
NON-CONDENSABLE lb/hr ------ ------ High Water Temp
FLUID VAPORIZED OR COND lb/hr ------ ------ Pilot Flame Failure
LIQUID DENSITY lbs/ft3 ------ ------ Controls Include:
LIQUID VISCOSITY cP ------ ------ Water Temp Control
LIQUID SPECIFIC HEAT Btu/lb-F ------ ------ Nat Gas Disch Temp Control
LIQUID THERMAL COND Btu/hr-ft-F ------ ------
VAPOR MOLECULAR WT lbs/lbs Mol 17.343 ------
VAPOR DENSITY lbs/ft3 5.9032 4.9277 Fluid Specific Gravity 0.600
VAPOR VISCOSITY cP 0.0143 0.0145 After Regulation (psig) 675
VAPOR SPECIFIC HEAT Btu/lb-F 0.7446 0.6695 After Regulation (F) 60
VAPOR THERMAL COND Btu/hr-ft-F 2.44E-02 2.48E-02 MINIMUM SUPPLY PRESSURE (MSP)
TEMPERATURE (IN/OUT) F 45 96 Outlet Temp at MSP (F) NA
OPERATING PRESSURE psig 1450 1442 Min Supply Press (psig) NA
VELOCITY ft/sec ------ 32 VEL @ Min Oper Press (ft/sec) NA
PRESSURE DROP (ALLOW/EST) psid 10 8 Press Drop at MPS (psid) NA
FOULING RESISTANCE hr-ft2-f/Btu ------ ------
HEAT TRANSFERRED Btu/hr 10,935,096 Operating Bath Temperature 180.0 F
BURNER'S HEAT RELEASE (LHV) Btu/hr 13,668,869 Minimum Ambient Tempeature -20 F
TRANSFER RATE (FOULED/CLEAN) Btu/hr-ft2-F 61.34 Maximum Ambient Temperature 100 F
TEMPERATURE DIFF (LMTD) 107
MAWP psig 1480 Fabrication Code ASME Section VIII Div 1
TEST PRESSURE psig 2220 Radiographic (Percentage) 100%
DESIGN TEMPERATURE F -20F to 250F National Board Stamped Yes
NUMBER OF PASS / PATH 12 Coil Material SA-106 Grade B Smls
NUMBER OF PATHS 6 Coil Hydrotest Note: 1.5 x MAWP for 4 hours Charted
TOTAL NUMBER OF TUBES 72
STRAIGHT TUBE LENGTH ft 1620 Inlet 10 inch ANSI 900# RF
TYPE Serpentine Outlet 10 inch ANSI 900# RF
REMOVABLE Yes Inlet Header thk 0.594 in
HEAT FLUX Btu/hr-ft2 5,734 Inlet Header Velocity 29 ft/sec
TUBE SIZE inches OD 4.5 Outlet Header thk 0.594 in
TUBE WALL THICKNESS inches 0.237 Outlet Header Velocity 35 ft/sec
CORROSION ALLOWANCE inches ------ Surface Area Actual 1909 ft2
REMARKS
DESIGN CODE ASME CSD-1
SHELL DIAMETER inches 120 Shell Pressure Test: 5 psig for 1 hour
SHELL LENGTH ft 26
SHELL (THICK) inches 3/8
FIRETUBE DIAMETER inches OD 30 / 4
NUMBER OF FIRETUBES 2 / 32
EACH FIRE / RETURN TUBE LENGTH ft 22 / 22
FIRE TUBE MATERIAL/THICKNESS inches 0.25 / 0.109
FIRE TUBE HEAT DENSITY Btu/hr-in2 10,000
FIRE TUBE FLUX RATE Btu/hr-ft2 10,173
REMOVABLE No
STACK DIAMETER (NO OF STACK/OD) inches 2 / 24 STACK MATERIAL SS304
STACK HEIGHT (ACT / OF GRADE) ft 6 WALL THICKNESS Gauge 10 (0.1406" Thick)
EXPANSION TANK DIAMETER inches 36 EXPANSION TANK MATERIAL Carbon Steel
EXPANSION TANK LENGTH ft 14 WALL THICKNESS 1/4 inches
PERCENT OF NET SHELL VOL % 6
Forced Draft Line Heater
HEATER DATA
BASIC HEATER DATA
REMARKS
PROCESS CONDITIONS
THERMAL DATA
PROCESS COIL

Power Flame Incorporated 9/28/2006Rev. 02/28/2012
Typical Flue Product Emissions Data for Power Flame Burners
Natural Gas L.P. Gas # 2 Fuel Oil (1)
Carbon Monoxide - CO .037 lb CO 106 BTU input .037 lb CO 106 BTU input .037 lb per 106 BTU INPUT(50 PPM) (50 PPM) (50 PPM)
Sulfur Dioxide - SO2 (1.05) x (% Sulfur by weight in fuel) = lb SO2 per 106 BTU Input
Particulate Matter .0048 lb PM per 106 BTU input .0048 lb PM per 106 BTU input .0143 lb PM per 106 BTU input
Hydrocarbons .025 lb HC's per 106 BTU input .025 lb HC's per 106 BTU input .038 lb HC's per 106 BTU input
CO2 9 % to 10% 10% to 12% 10% to 13%
Nitrogen Oxides - NOx
.088 lb NOx per 106 BTU input .092 lb NOx per 106 BTU input N/A(75 PPM) (75 PPM) N/A
Standard C(R) Burners .088 lb NOx per 106 BTU input .092 lb NOx per 106 BTU input .12 lb NOx per 106 BTU Input
(75 PPM) (75 PPM) (90) PPM(2)
LNIC(R) Burners .029 lb NOx per 106 BTU input .031 lb NOx per 106 BTU input .12 lb NOx per 106 BTU Input
Fire box/Cast Iron boilers (25 PPM) (25 PPM) (90) PPM(2)
LNIC(R) Burners .024 lb NOx per 106 BTU input .031 lb NOx per 106 BTU input .12 lb NOx per 106 BTU Input
Water tube boilers (20 PPM) (25 PPM) (90) PPM(2)
LNIAC Burners .029 lb NOx per 106 BTU input .031 lb NOx per 106 BTU input .12 lb NOx per 106 BTU Input(25 PPM) (25 PPM) (90) PPM
CM Burners .070 lb NOx per 106 BTU input .074 lb NOx per 106 BTU input .146 lb NOx per 106 BTU Input(60 PPM)(4) (60 PPM)(4) (110) PPM
LNICM Burners .033 lb NOx per 106 BTU input .033 lb NOx per 106 BTU input .12 lb NOx per 106 BTU InputScotch Boiler (30) PPM (30) PPM (90) PPMLNICM Burners .029 lb NOx per 106 BTU input .031 lb NOx per 106 BTU input .12 lb NOx per 106 BTU InputFire box/Cast Iron boilers (25) PPM (25) PPM (90) PPMLNICM Burners .029 lb NOx per 106 BTU input .031 lb NOx per 106 BTU input .12 lb NOx per 106 BTU InputWater tube boilers (20) PPM (20) PPM (90) PPMNPM Premix Burners .029 lb NOx per 106 BTU input .031 lb NOx per 106 BTU input N/A
(25) PPM (25) PPM N/ANova Plus Burners .010 lb NOx per 106 BTU input .015 lb NOx per 106 BTU input N/ANVC AND NP2 ( 9) PPM (12) PPM N/A
(1)
(2) 90 PPM NOx on cast iron sectional, fire box and water tube boiler, 120 PPM on fire tube boilers. (.159 lb NOx per 106 BTU Input)(3) Burning natural gas the VOC are estimated at 0.003 # per million BTU and SOX are 0.0005 # per million BTU.(4) In some applications the CMAX will achieve less than 60 PPM without flue gas recirculation - consult factory.
These emission rates are general estimates and do not constitute guarantees by Power Flame Inc. In instances where guarantees are required, please consult the factory with the specific application information. All NOx numbers stated are corrected to 3% O2
NOx emissions at 3 % 02 will vary based on the percent of fuel bound nitrogen (these are based on .02%) and boiler or heat exchanger configurations
Standard J, FDM & X4 Gas Burners
ksridharan
Rectangle
ksridharan
Rectangle
ksridharan
Callout
Ultra Low NOx Burners
gmartin
Rectangle
gmartin
Rectangle
gmartin
Callout
LOW NOx

POWER ENGINEERS, INC. Plan Approval Application – Renovo Energy Center, LLC
APPENDIX M RBLC CLEARINGHOUSE DETERMINATION SUMMARIES

Renovo Energy CenterPowerblocksRBLC Search ResultsNitrogen Oxides (NOx)
RBLC ID Facility Name State Permit Date Process Name/Description Fuel Size Units Control Description Limit Units Averaging Period BasisMI-0406 RENAISSANCE POWER LLC MI 11/01/2013 &Natural gas fueled combined cycle combustion turbine generators Natura 2807 MMBTU/H SCR and DLN 2 PPMVOL 3-H ROLL AVG., EXC BACT-PSDNJ-0074 WEST DEPTFORD ENERGY NJ 5/6/2009 TURBINE, COMBINED CYCLE NG 17298 MMFT3/YR SCR and water injection 2 ppmvd @ 15% O2 3 HR ROLLING AVERLAERNJ-0080 HESS NEWARK ENERGY CENTER NJ 11/1/2012 Combined Cycle Combustion Turbine NG 39463 MMCF/year SCR 2 PPMVD AVERAGE OF THREE LAER*PA-0319 RENAISSANCE ENERGY CENTER PA 8/27/2018 COMBUSTION TURBINE UNIT w/o DUCT BURNERS UNIT NG 2665.9 MMBtu/hr SCR 2 PPMDV @15% O2 LAER*IL-0130 JACKSON ENERGY CENTER IL 12/31/2018 Combined-Cycle Combustion Turbine NG 3864 mmBtu/hr SCR and DLN 2 PPMV 3-UNIT OPERATING LAERVA-0321 BRUNSWICK COUNTY POWER STATION VA 3/12/2012 COMBUSTION TURBINE GENERATORS, (3) NG 3442 MMBtu/hr SCR and DLN 2 ppmvd @ 15% O2 1 H AVG BACT-PSDVA-0328 C4GT, LLC VA 4/26/2018 GE Combustion Turbine - Option 1 - Normal Operation NG 34000 MMCF/YR SCR and DLN 2 ppmvd @ 15% O2 1 H AV BACT-PSDVA-0328 C4GT, LLC VA 4/26/2018 Siemens Combusion Turbine - Option 2 - Normal Operation NG 35000 MMCF/YR SCR and DLN 2 ppmvd @ 15% O2 1 H AV BACT-PSDVA-0325 GREENSVILLE POWER STATION VA 6/17/2016 COMBUSTION TURBINE GENERATOR WITH DUCT-FIRED HEAT RECO NG 3227 MMBtu/hr SCR 2 PPMVD 1 HR AVG N/A*PA-0316 RENOVO ENERGY CENTER, LLC PA 1/26/2018 Combustion Turbine Firing NG NG 0 SCR 2 PPMDV CORRECTED TO 15% LAER*PA-0315 HILLTOP ENERGY CENTER, LLC PA 4/12/2017 Combustion Turbine without Duct Burner NG 3509 MMBtu/hr 2 PPMDV CORRECTED TO 15% LAER*TN-0164 TVA - JOHNSONVILLE COGENERATION TN 2/1/2018 Dual-fuel CT and HRSG with duct burner NG 1020 MMBtu/hr SCR, good combustion design & practices 2 ppmvd @ 15% O2 30-DAY AVG WHEN BACT-PSD*FL-0367 SHADY HILLS COMBINED CYCLE FACILITY FL 7/27/2018 1-on-1 combined cycle unit (GE 7HA) NG 3266.9 MMBtu/hr SCR and DLN 2 ppmvd @ 15% O2 24-HOUR BLOCK AV BACT-PSDTX-0641 PINECREST ENERGY CENTER TX 11/12/2013 combined cycle turbine NG 700 MW SCR 2 PPMVD 24-HR ROLLING AVG BACT-PSDTX-0834 MONTGOMERY COUNTY POWER STATIOIN TX 3/30/2018 Combined Cycle Turbine NG 2635 MMBtu/hr SCR and DLN 2 PPMVD 15% O2 1-HOUR AVLAERMI-0431 INDECK NILES LLC MI 6/26/2018 FGCTGHRSG (2 Combined Cycle CTG with HRSGs) NG 3421 MMBtu/hr SCR with DLN 2 PPM AT 15%O2; 24-HR R BACT-PSDMI-0433 MEC NORTH, LLC AND MEC SOUTH LLC MI 6/29/2018 EUCTGHRSG (South Plant): A combined cycle natural gas-fired com NG 500 MW SCR with DLN 2 PPMV AT 15%O2; 24-HR R BACT-PSDMI-0433 MEC NORTH, LLC AND MEC SOUTH LLC MI 6/29/2018 EUCTGHRSG (North Plant): A combined-cycle natural gas-fired com NG 500 MW SCR with DLN 2 PPMVD AT 15%O2; 24-H RO BACT-PSDIL-0129 CPV THREE RIVERS ENERGY CENTER IL 7/30/2018 Combined Cycle Combustion Turbines NG 3474 mmBtu/hr SCR with DLN; water injection (ULSD) 2 ppmvd @ 15% O2 3-UNIT OPERATING LAERMI-0432 NEW COVERT GENERATING FACILITY MI 7/30/2018 FG-TURB/DB1-3 (3 combined cycle combustion turbine and heat re NG 1230 MW Good combustion practices, DLN burners, SCR 2 PPMVD AT 15%O2; EACH IN BACT-PSDPA-0306 TENASKA PA PARTNERS/WESTMORELAND GE PA 2/12/2016 Large combustion turbine NG 0 SCR, DLN, and good combustion practice 2 ppmvd @ 15% O2 LAERPA-0307 YORK ENERGY CENTER BLOCK 2 ELECTRICITY G PA 6/15/2015 Two Combine Cycle Combustion Turbine with Duct Burner NG 3001.57 MCF/hr SCR, DLN, good combustion practices 2 ppmvd @ 15% O2 LAERPA-0311 MOXIE FREEDOM GENERATION PLANT PA 9/1/2015 Combustion Turbine With Duct Burner NG 3727 MMBtu/hr DLN burner, SCR, good engineering practice 2 ppmvd @ 15% O2 LAERPA-0310 CPV FAIRVIEW ENERGY CENTER PA 9/2/2016 Combustion turbine and HRSG with duct burner NG only NG 3338 MMBtu/hr DLN, SCR, good combustion & operating practice 2 ppmvd @ 15% O2 LAERPA-0309 LACKAWANNA ENERGY CTR/JESSUP PA 12/23/2015 Combustion turbine with duct burner NG 3304.3 MMBtu/hr DLN, SCR, exclusive natural gas 2 ppmvd @ 15% O2 LAERTN-0162 JOHNSONVILLE COGENERATION TN 4/19/2016 Natural Gas-Fired Combustion Turbine with HRSG NG 1339 MMBtu/hr Good combustion design and practices, SCR 2 ppmvd @ 15% O2 30 UNIT-OPERATING BACT-PSDCT-0161 KILLINGLY ENERGY CENTER CT 6/30/2017 Natural Gas w/Duct Firing NG 2639 MMBtu/hr SCR 2 ppmvd @ 15% O2 1 HOUR BLOCK LAERMD-0041 CPV ST. CHARLES MD 4/23/2014 2 COMBINED-CYCLE COMBUSTION TURBINES NG 725 MW SCR and DLN 2 ppmvd @ 15% O2 3-HOUR BLOCK AVE LAERNJ-0079 WOODBRIDGE ENERGY CENTER NJ 7/25/2012 Combined Cycle Combustion Turbine w/o duct burner NG 40297.6 MMCF/year SCR and DLN 2 PPMVD 3-HR ROLLING AVE LAERNJ-0080 HESS NEWARK ENERGY CENTER NJ 11/1/2012 Combined cylce turbine with duct burner NG 39463 MMCF/year SCR 2 PPMVD 3-HR ROLLING AVER LAERCT-0157 CPV TOWANTIC, LLC CT 11/30/2015 Combined Cycle Power Plant NG 21200000 MMBtu/12 SCR 2 ppmvd @ 15% O2 1 HR BLOCK LAER*MD-0042 WILDCAT POINT GENERATION FACILITY MD 4/8/2014 2 COMBINED CYCLE COMBUSTION TURBINES, WITH DUCT FIRING NG 1000 MW SCR and DLN 2 ppmvd @ 15% O2 3-HOUR BLOCK AVE LAER*TX-0660 FGE TEXAS POWER I AND FGE TEXAS POWER I TX 3/24/2014 Alstom Turbine NG 230.7 MW SCR 2 PPMVD CORRECTED TO 15% BACT-PSDNY-0104 CPV VALLEY ENERGY CENTER NY 8/1/2013 Turbines and duct burners - NG NG 0 SCR and DLN 2 ppmvd @ 15% O2 1 H LAERTX-0819 GAINES COUNTY POWER PLANT TX 4/28/2017 Combined Cycle Turbine with Heat Recovery Steam Generator, fire NG 426 MW SCR and DLN 2 PPMVD 15% O2 3-H AVG BACT-PSDNJ-0085 MIDDLESEX ENERGY CENTER, LLC NJ 7/19/2016 Combined Cycle Combustion Turbine firing Natural Gas with Duct NG 4000 h/yr SCR and DLN 2 ppmvd @ 15% O2 3 H ROLLING AV BA LAERNJ-0085 MIDDLESEX ENERGY CENTER, LLC NJ 7/19/2016 Combined Cycle Combustion Turbine firing Natural Gas without Du NG 8040 H/YR SCR and DLN 2 ppmvd @ 15% O2 3 H ROLLING AV BA LAERTX-0788 NECHES STATION TX 3/24/2016 Combined Cycle & Cogeneration NG 231 MW SCR 2 PPM BACT-PSDOK-0154 MOORELAND GENERATING STA OK 7/2/2013 Combustion Turbine NG 360 MW SCR and DLN 2 ppmvd @ 15% O2 ONE-HR BACT-PSDOK-0154 MOORELAND GENERATING STA OK 7/2/2013 COMBUSTION TURBINE NG 360 MW SCR and DLN 2 ppmvd @ 15% O2 ONE-HR BACT-PSDTop 40 sources with lowest emission rates from RBLC search. December 2019*Draft determination

Renovo Energy CenterPowerblocksRBLC Search ResultsCarbon Monoxide (CO)
RBLC ID Facility Name State Permit Date Process Name/Description Fuel Size Units Control Description Limit Units Averaging Period BasisCT-0161 KILLINGLY ENERGY CENTER CT 6/30/2017 Natural Gas w/o Duct Firing NG 2969 MMBtu/hr Oxidation Catalyst 0.9 ppmvd @ 15% O2 1 HOUR BLOCK BACT-PSDNJ-0082 WEST DEPTFORD ENERGY STATIONNJ 7/18/2014 Combined Cycle Combustion Turbine without Duct Burner NG 20282 MMCF/YR Oxidation Catalyst and use of natural gas 0.9 ppmvd @ 15% O2 3-HR ROLLING AVE BAS BACT-PSDCT-0157 CPV TOWANTIC, LLC CT 11/30/2015 Combined Cycle Power Plant NG 21200000 MMBtu/12 Oxidation Catalyst 0.9 ppmvd @ 15% O2 1 HR BLOCK BACT-PSDVA-0328 C4GT, LLC VA 4/26/2018 GE Combustion Turbine - Option 1 - Normal Operation NG 34000 MMCF/YR Oxidation catalyst, good combustion practices 1 ppmvd @ 15% O2 3 HR AV/WITHOUT DB BACT-PSDVA-0321 BRUNSWICK COUNTY POWER STATVA 3/12/2013 Three Mitsubishi M501 GAC Turbines (3,442 mmBtu/hr each) NG 3342 MMBtu/hr Oxidation catalyst and good combustion practices inc 1.5 PPMVD 3-HOUR ROLLING AVG W BACT-PSD*MD-0042 WILDCAT POINT GENERATION FAC MD 4/8/2014 2 COMBINED CYCLE COMBUSTION TURBINES, WITHOUT DUCT FIRING NG 270 MW EXCLUSIVE USE OF PIPELINE QUALITY NATURAL GAS, 1.5 ppmvd @ 15% O2 3-HOUR BLOCK AVERAG BACT-PSDNJ-0082 WEST DEPTFORD ENERGY STATIONNJ 7/18/2014 Combined Cycle Combustion Turbine with Duct Burner NG 20282 MMCF/YR Oxidation catalyst and use of natural gas a clean burn 1.5 ppmvd @ 15% O2 3-HR ROLLING AVE BAS BACT-PSDVA-0315 WARREN COUNTY POWER PLANT - VA 12/17/2010 COMBINED CYCLE TURBINE & DUCT BURNER, 3 NG 2996 MMBtu/hr Oxidation catalyst and good combustion practices. 1.5 PPMVD ONE HR AVERAGE (W/O BACT-PSDCA-1212 PALMDALE HYBRID POWER PROJECCA 10/18/2011 COMBUSTION TURBINES (NORMAL OPERATION) NG 154 MW Oxidation Catalyst 1.5 PPMVD @15% O2, 1-HR AVG (N BACT-PSDVA-0325 GREENSVILLE POWER STATION VA 6/17/2016 COMBUSTION TURBINE GENERATOR WITH DUCT-FIRED HEAT RECOVERY STEAM NG 3227 MMBtu/hr Oxidation Catalyst 1.6 PPMVD 3 HR AVG N/ACT-0161 KILLINGLY ENERGY CENTER CT 6/30/2017 Natural Gas w/Duct Firing NG 2639 MMBtu/hr Oxidation Catalyst 1.7 LB/MMBTU 1 HOUR BLOCK BACT-PSDVA-0328 C4GT, LLC VA 4/26/2018 Siemens Combusion Turbine - Option 2 - Normal Operation NG 35000 MMCF/YR Oxidation catalyst & good combustion practice 1.8 ppmvd @ 15% O2 3 H AV/WITH OR WITHO BACT-PSDVA-0322 GREEN ENERGY PARTNERS/ STONE VA 4/30/2013 Large combustion turbines (>25MW) CCT1 and CCT2 NG 2.23 MMBtu/hr Catalytic Oxidizer 2 PPMVD BACT-PSDNJ-0074 WEST DEPTFORD ENERGY NJ 5/6/2009 TURBINE, COMBINED CYCLE NG 17298 MMFT3/YR Oxidation Catalyst 2 ppmvd @ 15% O2 3 HR ROLLING AVERAGEBACT-PSD*PA-0319 RENAISSANCE ENERGY CENTER PA 8/27/2018 COMBUSTION TURBINE UNIT w/o DUCT BURNERS UNIT NG 2665.9 MMBtu/hr Oxidation Catalyst 2 PPPDV @15% O2 BACT-PSD*IL-0130 JACKSON ENERGY CENTER IL 12/31/2018 Combined-Cycle Combustion Turbine NG 3864 mmBtu/hr Oxidation catalyst 2 PPMV 3 OPERATING HOUR AV BACT-PSD*PA-0315 HILLTOP ENERGY CENTER, LLC PA 4/12/2017 Combustion Turbine without Duct Burner NG 3509 MMBtu/hr Oxidation Catalyst 2 PPMDV CORRECTED TO 15% O2 BACT-PSD*TN-0164 TVA - JOHNSONVILLE COGENERAT TN 2/1/2018 Dual-fuel CT and HRSG with duct burner NG 1020 MMBtu/hr Oxidation catalyst, good combustion design & practic 2 ppmvd @ 15% O2 30-DAY AVG WHEN BUR BACT-PSDTX-0641 PINECREST ENERGY CENTER TX 11/12/2013 combined cycle turbine NG 700 MW oxidation catalyst 2 PPMVD 3-HR ROLL AVG, 15% OX BACT-PSDTX-0834 MONTGOMERY COUNTY POWER S TX 3/30/2018 Combined Cycle Turbine NG 2635 MMBtu/hr Oxidation Catalyst 2 PPMVD 15% O2 3 HOUR AVERA BACT-PSDIL-0129 CPV THREE RIVERS ENERGY CENTE IL 7/30/2018 Combined Cycle Combustion Turbines NG 3474 mmBtu/hr Oxidation catalyst 2 ppmvd @ 15% O2 3 OPERATING-HOUR, RO BACT-PSDMI-0432 NEW COVERT GENERATING FACILITMI 7/30/2018 FG-TURB/DB1-3 (3 combined cycle combustion turbine and heat recovery steam NG 1230 MW Oxidation catalyst technology and good combustion 2 PPMVD EACH CT/HRSG TRAIN; 2 BACT-PSDPA-0307 YORK ENERGY CENTER BLOCK 2 EL PA 6/15/2015 Two Combine Cycle Combustion Turbine with Duct Burner NG 3001.57 MCF/hr Oxidation catalyst and good combustion practices 2 ppmvd @ 15% O2 BACT-PSDPA-0311 MOXIE FREEDOM GENERATION PL PA 9/1/2015 Combustion Turbine With Duct Burner NG 3727 MMBtu/hr Oxidation catalyst and good combustion practices 2 ppmvd @ 15% O2 BACT-PSDPA-0311 MOXIE FREEDOM GENERATION PL PA 9/1/2015 Combustion Turbine without Duct Burner NG 0 Oxidation catalyst, good engineering practice 2 ppmvd @ 15% O2 BACT-PSDPA-0310 CPV FAIRVIEW ENERGY CENTER PA 9/2/2016 Combustion turbine and HRSG with duct burner NG only NG 3338 MMBtu/hr Oxidation catalyst operated at all steady state operat 2 ppmvd @ 15% O2 BACT-PSDPA-0309 LACKAWANNA ENERGY CTR/JESSU PA 12/23/2015 Combustion turbine with duct burner NG 3304.3 MMBtu/hr Oxidation catalyst, combustion controls, exclusive na 2 ppmvd @ 15% O2 BACT-PSDTN-0162 JOHNSONVILLE COGENERATION TN 4/19/2016 Natural Gas-Fired Combustion Turbine with HRSG NG 1339 MMBtu/hr Good combustion design and practices, oxidation cat 2 ppmvd @ 15% O2 30 UNIT-OPERATING-DA BACT-PSDMD-0041 CPV ST. CHARLES MD 4/23/2014 2 COMBINED-CYCLE COMBUSTION TURBINES NG 725 MW Oxidation catalyst and good combustion practices 2 ppmvd @ 15% O2 3-HOUR BLOCK AVERAG BACT-PSDNJ-0079 WOODBRIDGE ENERGY CENTER NJ 7/25/2012 Combined Cycle Combustion Turbine w/o duct burner NG 40297.6 MMcf/yr Oxidation Catalyst, good combustion practices and u 2 PPMVD 3-HR ROLLING AVE BAS BACT-PSDNJ-0080 HESS NEWARK ENERGY CENTER NJ 11/1/2012 Combined cylce turbine with duct burner NG 39463 MMcf/yr Oxidation catalyst 2 PPMVD 3-HR ROLLING AVERAGE BACT-PSDPA-0286 MOXIE ENERGY LLC/PATRIOT GENE PA 1/31/2013 Combined Cycle Power Blocks 472 MW - (2) NG 0 CO Catalyst 2 PPMDV BACT-PSDMD-0045 MATTAWOMAN ENERGY CENTER MD 11/13/2015 2 COMBINED-CYCLE COMBUSTION TURBINES NG 286 MW Good combustion practice and oxidation catalyst. 2 ppmvd @ 15% O2 3-HOUR BLOCK AVERAG BACT-PSDPA-0278 MOXIE LIBERTY LLC/ASYLUM POW PA 10/10/2012 Combined-cycle Turbines (2) - Natural gas fired NG 3277 MMBtu/hr Oxidation Catalyst 2 PPMVD @15% O2 BACT-PSD*TX-0660 FGE TEXAS POWER I AND FGE TEXA TX 3/24/2014 Alstom Turbine NG 230.7 MW Oxidation catalyst 2 PPMVD CORRECTED TO 15% O2 BACT-PSDNY-0104 CPV VALLEY ENERGY CENTER NY 8/1/2013 Turbines and duct burners - NG NG 0 Good combustion practice and oxidation catalyst. 2 ppmvd @ 15% O2 1 H BACT-PSDTX-0819 GAINES COUNTY POWER PLANT TX 4/28/2017 Combined Cycle Turbine with Heat Recovery Steam Generator, fired Duct Burne NG 426 MW SCR and dry low NOx burners 2 PPMVD 15% O2 3-H AVG BACT-PSDNJ-0085 MIDDLESEX ENERGY CENTER, LLC NJ 7/19/2016 Combined Cycle Combustion Turbine firing Natural Gas with Duct Burner NG 4000 h/yr Oxidation Catalyst and good combustion practices 2 ppmvd @ 15% O2 3 H ROLLING AV BASED BACT-PSDMD-0046 KEYS ENERGY CENTER MD 10/31/2014 2 COMBINED-CYCLE COMBUSTION TURBINES NG 235 MW Good combustion practice and oxidation catalyst. 2 ppmvd @ 15% O2 3-HOUR BLOCK AVERAGBACT-PSDOK-0154 MOORELAND GENERATING STA OK 7/2/2013 Combustion Turbine NG 360 MW Oxidation catalyst and good combustion practice. 2 ppmvd @ 15% O2 3-HR BACT-PSDTop 40 sources with lowest emission rates from RBLC search. December 2019*Draft determination

Renovo Energy CenterPowerblocksRBLC Search ResultsParticulate Matter (PM/PM10/PM2.5)
RBLC ID Facility Name StatePermit Date Process Name/Description
Fuel Type Size Units Control Description
Emission Limit Units Averaging Period Basis
MI-0427 FILER CITY STATION MI 11/17/2017 EUCCT (Combined cycle CTG with unfired HRSG) NG 1934.7 MMBtu/hr Good combustion practices and the use of pipel 0.0025 lb/MMBtu BACT-PSD*IL-0130 JACKSON ENERGY CENTER IL 12/31/2018 Combined-Cycle Combustion Turbine NG 3864 MMBtu/hr Good combustion practices 0.0026 lb/MMBtu 3-HR BLOCK AVERAGE BACT-PSDPA-0309 LACKAWANNA ENERGY CTR/JESSUP PA 12/23/2015 Combustion turbine with duct burner NG 3304.3 MMBtu/hr Exclusive natural gas, high-efficiency inlet air filt 0.003 lb/MMBtu BACT-PSDVA-0321 BRUNSWICK COUNTY POWER STATIONVA 3/12/2013 COMBUSTION TURBINE GENERATORS, (3) NG 3442 MMBtu/hr Low sulfur/carbon fuel and good combustion pr 0.0033 lb/MMBtu 3 H AVG/WITHOUT DUCT BURNING BACT-PSDMI-0410 THETFORD GENERATING STATION MI 7/25/2013 FGCCA or FGCCB--4 nat. gas fired CTG w/ DB for HRSG NG 2587 MMBtu/hr Combustion air filters; efficient combustion con 0.0033 lb/MMBtu TEST PROTOCOL; (3 1-H TESTS IF PO BACT-PSDOH-0375 LONG RIDGE ENERGY GENERATION LLC OH 11/7/2017 General Electric Combustion Turbine (P004) NG 3544 MMBtu/hr natural gas or a natural gas and ethane mixture 0.0036 lb/MMBtu BACT-PSDIL-0129 CPV THREE RIVERS ENERGY CENTER IL 7/30/2018 Combined Cycle Combustion Turbines NG 3474 MMBtu/hr Good combustion practices 0.0037 lb/MMBtu 3-HOUR BLOCK AVERAGE BACT-PSDVA-0325 GREENSVILLE POWER STATION VA 6/17/2016 COMBUSTION TURBINE GENERATOR WITH DUCT-FIRED HEAT REC NG 3227 MMBtu/hr Pipeline Quality Natural Gas 0.0039 lb/MMBtu AVG OF 3 TEST RUNS N/APA-0306 TENASKA PA PARTNERS/WESTMORELA PA 2/12/2016 Large combustion turbine NG 0 Good combustion practices with the use of low 0.0039 lb/MMBtu BACT-PSDMI-0405 MIDLAND COGENERATION VENTURE MI 4/23/2013 Natural gas fueled combined cycle combustion turbine generator NG 2486 MMBtu/hr Good combustion practices 0.004 lb/MMBtu TEST PROTOCOL BACT-PSDOH-0375 LONG RIDGE ENERGY GENERATION LLC OH 11/7/2017 Mitsubishi Combustion Turbine (P005) NG 3320 MMBtu/hr natural gas or a natural gas and ethane mixture 0.004 lb/MMBtu WITH DUCT BURNER. SEE NOTES. BACT-PSDPA-0278 MOXIE LIBERTY LLC/ASYLUM POWER P PA 10/10/2012 Combined-cycle Turbines (2) - Natural gas fired NG 3277 MMBtu/hr Using fuel with little or no ash and sulfur conten 0.004 lb/MMBtu FOR 468 MW POWERBLOCK BACT-PSDMI-0406 RENAISSANCE POWER LLC MI 11/1/2013 Natural gas fueled combined cycle combustion turbine generator NG 2147 MMBtu/hr Good combustion practices 0.0042 lb/MMBtu TEST PROTOCOL BACT-PSDVA-0315 WARREN COUNTY POWER PLANT - DO VA 6/17/2014 COMBINED CYCLE TURBINE & DUCT BURNER, 3 NG 2996 MMBTU/H Natural Gas only, fuel has maximum sulfur cont 0.004 lb/MMBtu 3 HR AVG. (WITHOUT DUCT BURNER BACT-PSD*PA-0319 RENAISSANCE ENERGY CENTER PA 8/27/2018 COMBUSTION TURBINE UNIT w/o DUCT BURNERS UNIT NG 2665.9 MMBtu/hr 0.0043 lb/MMBtu BACT-PSDCT-0161 KILLINGLY ENERGY CENTER CT 6/30/2017 Natural Gas w/o Duct Firing NG 2969 MMBtu/hr Good Combustion 0.0044 lb/MMBtu BACT-PSDCA-1212 PALMDALE HYBRID POWER PROJECT CA 10/18/2011 COMBUSTION TURBINES (NORMAL OPERATION) NG 154 MW USE PUC QUALITY NATURAL GAS 0.0048 lb/MMBtu 9-HR AVG (NO DUCT BURNING) BACT-PSDOH-0377 HARRISON POWER OH 4/19/2018 Mitsubishi Hitachi Power Systems (MHPS) Combustion Turbines NG 3231 MMBtu/hr Good combustion practices and pipeline quality 0.005 lb/MMBtu WITH DUCT BURNER. SEE NOTES. BACT-PSD*TN-0164 TVA - JOHNSONVILLE COGENERATION TN 2/1/2018 Dual-fuel CT and HRSG with duct burner NG 1020 MMBtu/hr Good combustion design & practice 0.005 lb/MMBtu WHEN BURNING NATURAL GAS BACT-PSDPA-0310 CPV FAIRVIEW ENERGY CENTER PA 9/2/2016 Combustion turbine and HRSG with duct burner NG only NG 3338 MMBtu/hr Low sulfur fuel, good combustion practicies 0.005 lb/MMBtu BACT-PSDTN-0162 JOHNSONVILLE COGENERATION TN 4/19/2016 Natural Gas-Fired Combustion Turbine with HRSG NG 1339 MMBtu/hr Good combustion design and practices 0.005 lb/MMBtu BACT-PSDCT-0161 KILLINGLY ENERGY CENTER CT 6/30/2017 Natural Gas w/Duct Firing NG 2639 MMBtu/hr Good Combustion 0.005 lb/MMBtu BACT-PSDMD-0041 CPV ST. CHARLES MD 4/23/2014 2 COMBINED-CYCLE COMBUSTION TURBINES NG 725 MW USE OF PIPELINE-QUALITY NATURAL GAS EXCLU 0.005 lb/MMBtu 3-HOUR BLOCK AVERAGE BACT-PSDOH-0377 HARRISON POWER OH 4/19/2018 General Electric (GE) Combustion Turbines (P005 & P006) NG 3459.6 MMBtu/hr Good combustion practices and pipeline quality 0.0052 lb/MMBtu WITH DUCT BURNER. SEE NOTES. BACT-PSDOH-0375 LONG RIDGE ENERGY GENERATION LLC OH 11/7/2017 Siemens Combustion Turbine (P006) NG 3602 MMBtu/hr natural gas or a natural gas and ethane mixture 0.0057 lb/MMBtu WITH DUCT BURNER. SEE NOTES. BACT-PSDPA-0286 MOXIE ENERGY LLC/PATRIOT GENERAT PA 1/31/2013 Combined Cycle Power Blocks 472 MW - (2) NG 0 0.0057 lb/MMBtu OTHER CASEPA-0309 LACKAWANNA ENERGY CTR/JESSUP PA 12/23/2015 Combustion turbine with duct burner NG 3304.3 MMBtu/hr Exclusive natural gas, high-efficiency inlet air filt 0.0059 lb/MMBtu BACT-PSD*IL-0112 NELSON ENERGY CENTER IL 12/28/2010 Electric Generation Facility NG 220 MW each 0.006 lb/MMBtu HOURLY AVERAGE BACT-PSDMI-0405 MIDLAND COGENERATION VENTURE MI 4/23/2013 Natural gas fueled combined cycle combustion turbine generator NG 2237 MMBTU/H Good combustion practices 0.006 lb/MMBtu EACH CTG; TEST PROTOCOL BACT-PSDMA-0039 SALEM HARBOR STATION REDEVELOPMMA 1/30/2014 Combustion Turbine with Duct Burner NG 2449 MMBTU/H 0.0062 lb/MMBtu 1 HR AVG/DO NOT APPLY DURING S BACT-PSDPA-0311 MOXIE FREEDOM GENERATION PLANT PA 9/1/2015 Combustion Turbine With Duct Burner NG 3727 MMBtu/hr 0.0063 lb/MMBtu BACT-PSDVA-0328 C4GT, LLC VA 4/26/2018 Siemens Combusion Turbine - Option 2 - Normal Operation NG 35000 MMCF/YR good combustion practices and the use of pipel 0.0065 lb/MMBtu AV OF 3 TEST RUNS/WITHOUT DUCT BACT-PSDPA-0307 YORK ENERGY CENTER BLOCK 2 ELECTR PA 6/15/2015 Two Combine Cycle Combustion Turbine with Duct Burner NG 3001.6 MCF/hr Good combustion practices and low sulfur fuels 0.0066 lb/MMBtu BACT-PSDMI-0427 FILER CITY STATION MI 11/17/2017 EUCCT (Combined cycle CTG with unfired HRSG) NG 1934.7 MMBTU/H Good combustion practices and the use of pipel 0.0066 lb/MMBtu BACT-PSDMI-0410 THETFORD GENERATING STATION MI 07/25/2013 FGCCA or FGCCB--4 nat. gas fired CTG w/ DB for HRSG NG 2587 MMBTU/H h Combustion air filters; efficient combustion con 0.0066 lb/MMBtu TEST PROTOCOL (3 1-H TESTS IF POSBACT-PSDMI-0402 SUMPTER POWER PLANT MI 11/17/2011 Combined cycle combustion turbine w/ HRSG NG 130 MW electrical output 0.0066 lb/MMBtu TEST BACT-PSDAK-0071 INTERNATIONAL STATION POWER PLA AK 12/20/2010 GE LM6000PF-25 Turbines (4) NG 59900 hp ISO Good Combustion Practices 0.0066 lb/MMBtu 3-HOUR AVERAGE BACT-PSDOH-0365 ROLLING HILLS GENERATING, LLC OH 05/20/2015 Combustion Turbines, Scenario 1 (4, identical) (P001, P002, P004, NG 2022 MMBTU/H good combustion practices along with clean fue 0.0068 lb/MMBtu HHV, 3 HR AVG. SEE NOTES. BACT-PSDPA-0307 YORK ENERGY CENTER BLOCK 2 ELECTR PA 06/15/2015 Two combined cycle turbines with out duct burner NG 2291.6 MCF/hr Good combustion practices and low sulfur fuels 0.0068 lb/MMBtu BACT-PSDPA-0310 CPV FAIRVIEW ENERGY CENTER PA 09/02/2016 Combustion turbine and HRSG without duct burner NG only NG 0 Low sulfur fuels and good combustion practices 0.0068 lb/MMBtu BACT-PSDTop 40 sources with lowest emission rates from RBLC search. December 2019*Draft determination

Renovo Energy CenterPowerblocksRBLC Search ResultsVolative Organic Compounds (VOC)
RBLC ID Facility Name State Permit Date Process Name/Description Fuel Size Units Control Description Limit Units Averaging Period BasisVA-0321 BRUNSWICK COUNTY POWER STATVA 3/12/2013 New, combined-cycle, natural gas-fired, electrical power generating facility. NG 3442 MMBTU/H Oxidation catalyst; good combustion practices. 0.7 PPMVD 3 H AVG/WITHOUT BACT-PSDVA-0328 C4GT, LLC VA 4/26/2018 Natural gas-fired combined cycle power plant NG 34000 MMCF/YR Oxidation catalyst and good combustion practices 0.7 ppmvd @ 15% O2 3 HR AV/WITHOUT BACT-PSDCT-0161 KILLINGLY ENERGY CENTER CT 6/30/2017 550 MW Combined Cycle Plant NG 2969 MMBtu/hr Oxidation Catalyst 0.7 ppmvd @ 15% O2 BACT-PSDNY-0104 CPV VALLEY ENERGY CENTER NY 8/1/2013
facility located in Middletown, NY. The combustion turbines are rated at NG 0 Good combustion practice and oxidation catalyst. 0.7 ppmvd @ 15% O2 1 H LAER
NJ-0082 WEST DEPTFORD ENERGY STATIONNJ 7/18/2014
consisting of a 427 MW Siemens Combined Cycle combustion turbine unit is NG 20282 MMCF/YR Oxidation catalysts and use of Natural gas 0.7 ppmvd @ 15% O2 AVERAGE OF THREE LAEROH-0365 ROLLING HILLS GENERATING, LLC OH 5/20/2015 Electrical services NG 2144 MMBtu/hr good combustion practices along with clean fuels 0.84 PPMVD 3-hr avg; without D BACT-PSD*PA-0319 RENAISSANCE ENERGY CENTER PA 8/27/2018 This Plan Approval is to allow the construction and temporary operation of a NG 2665.9 MMBtu/hr Oxidation Catalyst 1 PPMDV @15% O2 LAERVA-0328 C4GT, LLC VA 4/26/2018 Natural gas-fired combined cycle power plant NG 35000 MMCF/YR Oxidation catalyst and good combustion practice 1 ppmvd @ 15% O2 3 H AV/WITHOUT DBACT-PSD*PA-0316 RENOVO ENERGY CENTER, LLC PA 1/26/2018 A natural-gas-fired combined-cycle power plant consisting of two (2) identica NG 0 1 PPMDV CORRTECTED TO 15 LAER*PA-0315 HILLTOP ENERGY CENTER, LLC PA 4/12/2017
combined cycle, single shaft configuration, including a combustion turbine NG 3509 MMBtu/hr 1 PPMDV CORRECTED TO 15% LAER
MI-0432 NEW COVERT GENERATING FACILI MI 7/30/2018 Power plant NG 1230 MW An oxidation catalyst and good combustion practices. 1 PPMVD HOURLY; EACH CT/ BACT-PSDPA-0310 CPV FAIRVIEW ENERGY CENTER PA 9/2/2016
temporarily operate the Fairview Energy Center. NG 0 1 ppmvd @ 15% O2 BACT-PSD
PA-0309 LACKAWANNA ENERGY CTR/JESSUPA 12/23/2015
(3) identical General Electric Model 7HA.02 natural gas fired combustion NG 0 Oxidation catalyst, combustion controls, natural gas 1 ppmvd @ 15% O2 LAERFL-0364 SEMINOLE GENERATING STATION FL 3/21/2018 Existing fossil-fueled power plant. Two coal-fired units each rated at 736 MW NG 3514 MMBtu/hr Oxidation catalyst 1 ppmvd @ 15% O2 WITHOUT DUCT BU BACT-PSDMD-0041 CPV ST. CHARLES MD 4/23/2014
WIDE PM10 EMISSION LIMIT = 96.6 TONS/YR NG 725 MW Oxidation catalyst and good combustion practices 1 ppmvd @ 15% O2 3-HOUR BLOCK AVE LAER
NJ-0080 HESS NEWARK ENERGY CENTER NJ 11/1/2012
HESS Newark Energy Center (Hess-NEC), proposed at City of Newark (Essex NG 39463 mmcf/year Oxidation catalyst 1 PPMVD 3-HR ROLLING AVER LAER*FL-0363 DANIA BEACH ENERGY CENTER FL 12/4/2017 1200 megawatt 2-on-1 combined cycle facility, natural gas-fired, with limited NG 4000 MMBtu/hr Clean fuels 1 ppmvd @ 15% O2 FOR NATURAL GAS BACT-PSDTX-0817 CHOCOLATE BAYOU STEAM GENER TX 2/17/2017 support facility providing steam and electricity NG 50 MW OXIDATION CATALYST 1 PPMDV BACT-PSDNJ-0085 MIDDLESEX ENERGY CENTER, LLC NJ 7/19/2016
1.ONE GENERAL ELECTRIC (GE) 7HA.02 CCCT NOMINALLY RATED AT 380 NG 8040 H/YR Oxidation catalyst and good combustion practices 1 ppmvd @ 15% O2 AV OF THREE ONE H LAER
FL-0356 OKEECHOBEE CLEAN ENERGY CENTFL 3/9/2016 Fossil-fueled power plant, consisting of a 3-on-1 combined cycle unit and aux NG 3096 MMBtu/hr p Complete combustion minimizes VOC 1 ppmvd @ 15% O2 GAS OPERATION BACT-PSDPA-0286 MOXIE ENERGY LLC/PATRIOT GEN PA 1/31/2013 This plan approval is for the construction of two natural-gas-fired combined NG 0 CO Catalyst 1 PPMDV WITHOUT DUCT BUBACT-PSDPA-0288 SUNBURY GENERATION LP/SUNBU PA 4/1/2013 This plan approval is for the repowering of the Sunbury Generation facility. T NG 2538000 MMBtu/hr Oxidation Catalyst 1 PPM 3 LB/HR, DUCT BUR OTHER CASEMD-0046 KEYS ENERGY CENTER MD 10/31/2014
NOTE: PARTICULATE MATTER FACILITYWIDE EMISSIONS ARE PARTICULATE NG 235 MW Oxidation catalyst and good combustion practices 1 ppmvd @ 15% O2 W/OUT DUCT FIRIN LAER
MD-0045 MATTAWOMAN ENERGY CENTER MD 11/13/2015 990 MW COMBINED-CYCLE NATURAL GAS-FIRED POWER PLANTNOTE: PARTI NG 286 MW Oxidation catalyst and good combustion practices 1 ppmvd @ 15% O2 3-HR BLOCK AVG. W LAERTX-0714 S R BERTRON ELECTRIC GENERATIN TX 12/19/2014 NRG Texas is proposing to construct an additional electric power generation NG 240 MW oxidation catalyst 1 PPMVD @15% O2 BACT-PSDMA-0039 SALEM HARBOR STATION REDEVELMA 1/30/2014 Footprint Power Salem Harbor Development LP (the Permittee) proposes to NG 2449 MMBtu/hr Oxidation catalyst 1 ppmvd @ 15% O2 1 HR AVG EXCLUDIN OTHER CASEIA-0107 MARSHALLTOWN GENERATING ST IA 4/14/2014 Utility electric generating station NG 2258 mmBtu/hr catalytic oxidizer 1 PPM AVG. OF 3 ONE HOU BACT-PSDIA-0107 MARSHALLTOWN GENERATING ST IA 4/14/2014 Utility electric generating station NG 2258 mmBtu/hr 1 PPM AVERAGE 0F 3 ONE BACT-PSDIN-0158 ST. JOSEPH ENEGRY CENTER, LLC IN 12/3/2012 STATIONARY ELECTRIC UTILITY GENERATING STATION NG 2300 MMBtu/hr OXIDIZED CATALYST 1 PPMVD 3 HOURS BACT-PSDNJ-0081 PSEG FOSSIL LLC SEWAREN GENER NJ 3/7/2014
project will comprise of two combustion turbines, EITHER GE7FA.05 OR NG 33691 MMCF/YR Good Combustion Practices and use of Natural gas 1 ppmvd @ 15% O2 AVERAGE OF THREE LAER
NJ-0081 PSEG FOSSIL LLC SEWAREN GENER NJ 3/7/2014
project will comprise of two combustion turbines, EITHER GE7FA.05 OR NG 33691 MMCF/YR Oxidation Catalyst and use of natural gas 1 ppmvd @ 15% O2 AVERAGE OF THREE LAERNJ-0082 WEST DEPTFORD ENERGY STATIONNJ 7/18/2014 An existing Electric Generating Facility with a PSD permit. A new project con NG 20282 MMCF/YR Oxidation Catalyst and use of natural gas 1 ppmvd @ 15% O2 AVERAGE OF THREE LAERCT-0157 CPV TOWANTIC, LLC CT 11/30/2015 805 MW Combined Cycle Power Plant NG 21200000 MMBtu/12 Oxidation Catalyst 1 ppmvd @ 15% O2 BACT-PSDCT-0158 CPV TOWANTIC, LLC CT 11/30/2015 805 MW Combined Cycle Plant NG 21200000 MMBtu/yr Oxidation Catalyst 1 ppmvd @ 15% O2 BACT-PSDPA-0278 MOXIE LIBERTY LLC/ASYLUM POW PA 10/10/2012 NG 3277 MMBtu/hr Oxidation Catalyst 1 PPMVD WITHOUT DUCT BULAERLA-0331 CALCASIEU PASS LNG PROJECT LA 9/21/2018 New Liquefied Natural Gas (LNG) production, storage, and export terminal. NG 921 MMBtu/hr Catalytic Oxidation, Proper Equipment Design and Good C 1.1 PPMV 3 HOUR AVERAGE BACT-PSD*PA-0319 RENAISSANCE ENERGY CENTER PA 8/27/2018
a natural gas-fired combined cycle power plant to be located in NG 0 1.4 PPMDV @15% O2 LAER
VA-0325 GREENSVILLE POWER STATION VA 6/17/2016
electrical power generating facility utilizing three combustion turbines each NG 3227 MMBtu/hr Oxidation Catalyst and good combustion practices 1.4 PPMVD N/AFL-0337 POLK POWER STATION FL 10/14/2012 The Polk Power Station consists of: a nominal 250 MW (net) solid fuel-based NG 1160 MW fuel Sulfur limits 1.4 ppmvd @ 15% O2 BACT-PSD

Renovo Energy CenterPowerblocksRBLC Search ResultsVolative Organic Compounds (VOC)
RBLC ID Facility Name State Permit Date Process Name/Description Fuel Size Units Control Description Limit Units Averaging Period BasisLA-0254 NINEMILE POINT ELECTRIC GENER LA 8/16/2011
NO. 2 & NO. 4 FUEL OIL ARE SECONDARY FUELS. NG 7146 MMBtu/hr GOOD COMBUSTION PRACTICES 1.4 ppmvd @ 15% O2 HOURLY AVERAGE W BACT-PSD
PA-0307 YORK ENERGY CENTER BLOCK 2 EL PA 6/15/2015 Calpine Mid-Merit, LLC. currently operates Block 1 of the York Energy Center NG 2291.64 MCF/hr Oxidation catalyst, good combustion practices 1.5 ppmvd @ 15% O2 LAERPA-0311 MOXIE FREEDOM GENERATION PL PA 9/1/2015
power blocks, each consisting of a combustion gas turbine (CGT or CT) and NG 3727 MMBtu/hr Oxidation catalyst and good engineering practice 1.5 ppmvd @ 15% O2 LAER
PA-0311 MOXIE FREEDOM GENERATION PL PA 9/1/2015
power blocks, each consisting of a combustion gas turbine (CGT or CT) and NG 0 Oxidation catalyst, and good engineering practice 1.5 LB/MMBTU LAERPA-0310 CPV FAIRVIEW ENERGY CENTER PA 9/2/2016
temporarily operate the Fairview Energy Center. NG 3338 MMBtu/hr Oxidation catalyst and good combustion practices 1.5 ppmvd @ 15% O2 LAER
PA-0309 LACKAWANNA ENERGY CTR/JESSUPA 12/23/2015
(3) identical General Electric Model 7HA.02 natural gas fired combustion NG 3304.3 MMBtu/hr Oxidation catalyst, combustion controls, natural gas 1.5 ppmvd @ 15% O2 LAERPA-0291 HICKORY RUN ENERGY STATION PA 4/23/2013 Natural gas-fired combined-cycle electric generation facility that is designed NG 3.4 MMCF/HR Oxidation Catalyst 1.5 ppmvd @ 15% O2 WITH OR WITHOUT OTHER CASECT-0161 KILLINGLY ENERGY CENTER CT 6/30/2017 550 MW Combined Cycle Plant NG 2639 MMBtu/hr Oxidation Catalyst 1.6 ppmvd @ 15% O2 BACT-PSD*MD-0042 WILDCAT POINT GENERATION FACMD 4/8/2014
PLANTFACILITY-WIDE PM10 EMISSION LIMIT = 278 TONS/YR NG 1000 MW Oxidation catalyst, good combustion practices and nat ga 1.6 ppmvd @ 15% O2 3-HOUR BLOCK AVE LAER
TX-0590 KING POWER STATION TX 8/5/2010 Four combined-cycle natural gas-fired combustion turbines NG 1350 MW DLN burners in combination with an oxidation catalyst 1.8 ppmvd @ 15% O2 THREE-HOUR ROLL LAERPA-0307 YORK ENERGY CENTER BLOCK 2 EL PA 6/15/2015 Calpine Mid-Merit, LLC. currently operates Block 1 of the York Energy Center NG 3001.57 MCF/hr Oxidation catalyst, good combustion practices 1.9 ppmvd @ 15% O2 LAERNJ-0074 WEST DEPTFORD ENERGY NJ 5/6/2009 A NEW POWER GENERATING FACILITY TO BE BUILT IN WEST DEPTFORD. IT IS NG 17298 MMFT3/YR Oxidation catalyst, good combustion practices 1.9 ppmvd @ 15% O2 AVERAGE OF 3 TEST LAERTop 51 sources with lowest emission rates from RBLC search. December 2019*Draft determination

Renovo Energy StationPowerblocksRBLC Search ResultsSulfur Dioxide (SO2)
RBLC ID Facility Name State Permit Date Facility Description Fuel Size Units Control DescriptionEmission
Limit UnitsAveraging
Period Basis*FL-0367 SHADY HILLS COMBINED CYCLE FAC FL 7/27/2018 A 573-megawatt (MW) (winter) 1-on-1 combined cycle plant which includes a NG 3266.9 MMBtu/hr Clean Fuels 0 BACT-PSD*FL-0363 DANIA BEACH ENERGY CENTER FL 12/4/2017 1200 megawatt 2-on-1 combined cycle facility, natural gas-fired, with limited NG 4000 MMBtu/hr Clean fuels 0 BACT-PSDVA-0321 BRUNSWICK COUNTY POWER STATI VA 3/12/2013 New, combined-cycle, natural gas-fired, electrical power generating facility. NG 3442 MMBtu/hr Low sulfur fuel 0.0011 lb/MMBtu BACT-PSDVA-0328 C4GT, LLC VA 4/26/2018 Natural gas-fired combined cycle power plant NG 34000 MMCF/YR natural gas with a maximum sulfur content of 0.4 gr/100 scf o 0.0011 lb/MMBtu 3 HR AVG OTHER CASEVA-0328 C4GT, LLC VA 4/26/2018 Natural gas-fired combined cycle power plant NG 35000 MMCF/YR natural gas with a maximum sulfur content of 0.4 gr/100 scf o 0.0011 lb/MMBtu 3 H AV OTHER CASEVA-0325 GREENSVILLE POWER STATION VA 6/17/2016
electrical power generating facility utilizing three combustion turbines each NG 3227 MMBtu/hr Low Sulfur fuel 0.4 gr/100 scf DURING NORMA N/A
PA-0286 MOXIE ENERGY LLC/PATRIOT GENER PA 1/31/2013 This plan approval is for the construction of two natural-gas-fired combined c NG 0 0.0011 lb/MMBtu EXPRESSED AS SOBACT-PSDPA-0278 MOXIE LIBERTY LLC/ASYLUM POWE PA 10/10/2012 NG 3277 MMBtu/hr low sulfur fuel with a sulfur content of 0.4 grains per 100 scf. 0.0011 lb/MMBtu OTHER CASEOH-0352 OREGON CLEAN ENERGY CENTER OH 6/18/2013 799 Megawatt Combined Cycle Combustion Turbine Power Plant NG 515600 MMSCF/roll low sulfur fuel, only burning natrual gas with GR/100 SCF 0.0014 lb/MMBtu N/AOH-0352 OREGON CLEAN ENERGY CENTER OH 6/18/2013 799 Megawatt Combined Cycle Combustion Turbine Power Plant NG 51560 MMSCF/roll low sulfur fuel, only burning natural gas with 0.5 GR/100 SCF 0.0014 lb/MMBtu N/AOH-0352 OREGON CLEAN ENERGY CENTER OH 6/18/2013 799 Megawatt Combined Cycle Combustion Turbine Power Plant NG 47917 MMSCF/roll low sulfur fuel, only burning natural gas with 0.5 GR/100 SCF 0.0014 lb/MMBtu N/AOH-0352 OREGON CLEAN ENERGY CENTER OH 6/18/2013 799 Megawatt Combined Cycle Combustion Turbine Power Plant NG 47917 MMSCF/roll low sulfur fuel, only burning natural gas with 0.5 GR/100 SCF 0.0014 lb/MMBtu N/AOH-0374 GUERNSEY POWER STATION LLC OH 10/23/2017 1,650 MW combined cycle combustion turbine electrical generating facility NG 3516 MMBtu/hr natural gas with max sulfur content not exceed 0.50 gr/100 sc 0.0015 lb/MMBtu SEE NOTES. BACT-PSDCT-0161 KILLINGLY ENERGY CENTER CT 6/30/2017 550 MW Combined Cycle Plant NG 2969 MMBtu/hr Low Sulfur fuel 0.0015 lb/MMBtu OTHER CASECT-0161 KILLINGLY ENERGY CENTER CT 6/30/2017 550 MW Combined Cycle Plant NG 2639 MMBtu/hr Low Sulfur Fuel 0.0015 lb/MMBtu OTHER CASECT-0161 KILLINGLY ENERGY CENTER CT 6/30/2017 550 MW Combined Cycle Plant ULSD 2639 MMBtu/hr Low sulfur fuel 0.0015 lb/MMBtu OTHER CASENY-0104 CPV VALLEY ENERGY CENTER NY 8/1/2013 CPV Valley Energy Center is a 680 MW combined cycle electric generating fac ULSD 0 Ultra low sulfur diesel with maximum sulfur content 0.0015 pe 0.0015 lb/MMBtu 1 H BACT-PSDOH-0377 HARRISON POWER OH 4/19/2018 1000 MW natural gas-fired combined cycle combustion turbine plant NG 3459.6 MMBtu/hr Good combustion practices and pipeline quality natural gas 0.0017 lb/MMBtu SEE NOTES. BACT-PSDOH-0377 HARRISON POWER OH 4/19/2018 1000 MW natural gas-fired combined cycle combustion turbine plant NG 3231 MMBtu/hr Good combustion practices and pipeline quality natural gas 0.0021 lb/MMBtu BACT-PSDNY-0104 CPV VALLEY ENERGY CENTER NY 8/1/2013 CPV Valley Energy Center is a 680 MW combined cycle electric generating fac NG 0 Natural gas 0.0022 lb/MMBtu 1 H BACT-PSDPA-0288 SUNBURY GENERATION LP/SUNBUR PA 4/1/2013 This plan approval is for the repowering of the Sunbury Generation facility. Th NG 3E+06 MMBtu/hr 0.0024 lb/MMBtu OTHER CASE*IL-0112 NELSON ENERGY CENTER IL 12/28/2010 Natural gas-fired electic power generation facility with two "combined NG 220 MW each 0.0062 lb/MMBtu HOURLY AVERAGBACT-PSDCA-1211 COLUSA GENERATING STATION CA 3/11/2011 660 MW NATURAL GAS FIRED POWER PLANT NG 172 MW 0.2 LB/H TURBINE SHUTDO BACT-PSDMA-0039 SALEM HARBOR STATION REDEVELOMA 1/30/2014 Footprint Power Salem Harbor Development LP (the Permittee) proposes to c NG 2449 MMBtu/hr 0.3 ppmvd@15 1 HR AVG, DOES OTHER CASETX-0672 CORPUS CHRISTI LIQUEFACTION PLATX 9/12/2014
natural gas liquefaction and export plant and import facilities with NG 40000 hp 0.31 LB/H 1 HOUR BACT-PSD
TX-0672 CORPUS CHRISTI LIQUEFACTION PLATX 9/12/2014
natural gas liquefaction and export plant and import facilities with NG 40000 hp 0.31 LB/H 1 HOUR BACT-PSDCA-1211 COLUSA GENERATING STATION CA 3/11/2011 660 MW NATURAL GAS FIRED POWER PLANT NG 172 MW 0.4 LB/H WARM STARTUP BACT-PSDCA-1211 COLUSA GENERATING STATION CA 3/11/2011 660 MW NATURAL GAS FIRED POWER PLANT NG 172 MW 0.4 LB/H HOT STARTUP PEBACT-PSDDE-0023 NRG ENERGY CENTER DOVER DE 10/31/2012 The facility operates two electric generation units and an auxilliliary steam boNG 655 MMBtu/hr 0.51 LB/H 1 HOUR AVERAG N/AIN-0158 ST. JOSEPH ENEGRY CENTER, LLC IN 12/3/2012 STATIONARY ELECTRIC UTILITY GENERATING STATION NG 2300 MMBtu/hr FUEL SPECIFICATION 0.75 gr/100 dscf BACT-PSDMI-0432 NEW COVERT GENERATING FACILITYMI 7/30/2018 Power plant NG 1230 MW Use of clean fuel (natural gas) with a fuel sulfur limit of 0.8 gra 0.8 gr/100 dscf NAT.GAS BURNE BACT-PSDVA-0315 WARREN COUNTY POWER PLANT - DVA 12/17/2010 Virginia Electric and Power Company (Dominion) has proposed to construct a NG 2996 MMBtu/hr Natural Gas only, fuel has maximum sulfur content of 0.0003% 0.98 LB/H 3 HR AVG. OTHER CASETX-0834 MONTGOMERY COUNTY POWER ST TX 3/30/2018 NG 2635 MMBtu/hr PIPELINE QUALITY NATURAL GAS 1 gr/100 scf BACT-PSD*TX-0660 FGE TEXAS POWER I AND FGE TEXAS TX 3/24/2014 Electric Generating Utility NG 230.7 MW Low sulfur fuel, good combustion practices 1 gr/100 dscf HOURLY BACT-PSDTX-0788 NECHES STATION TX 3/24/2016 either 4 simple cycle combustion turbine generators (CTGs) or two CTGs oper NG 232 MW good combustion practices, low sulfur fuel 1 gr/100 scf HOURLY BACT-PSDTX-0788 NECHES STATION TX 3/24/2016 either 4 simple cycle combustion turbine generators (CTGs) or two CTGs oper NG 231 MW GOOD COMBUSTION PRACTICES, LOW SULFUR FUEL 1 gr/100 scf HOURLY BACT-PSDOH-0356 DUKE ENERGY HANGING ROCK ENEROH 12/18/2012 Four Natural Gas Fired Combustion Turbines, with Duct Burners; Combined C NG 172 MW Burning natural gas in an efficient combustion turbine burning 1.2 LB/H BACT-PSDOH-0356 DUKE ENERGY HANGING ROCK ENEROH 12/18/2012 Four Natural Gas Fired Combustion Turbines, with Duct Burners; Combined C NG 172 MW Burning natural gas in an efficient combustion turbine burning 1.52 LB/H BACT-PSDTX-0819 GAINES COUNTY POWER PLANT TX 4/28/2017 constructed in phases, with natural gas-fired simple cycle combustion turbine NG 227.5 MW Pipeline quality natural gas; limited hours; good combustion p 1.54 gr/100 dscf BACT-PSDTX-0819 GAINES COUNTY POWER PLANT TX 4/28/2017 constructed in phases, with natural gas-fired simple cycle combustion turbine NG 426 MW Pipeline quality natural gas 1.54 gr/100 dscf BACT-PSDTop 40 sources with lowest emission rates from RBLC search. December 2019*Draft determination
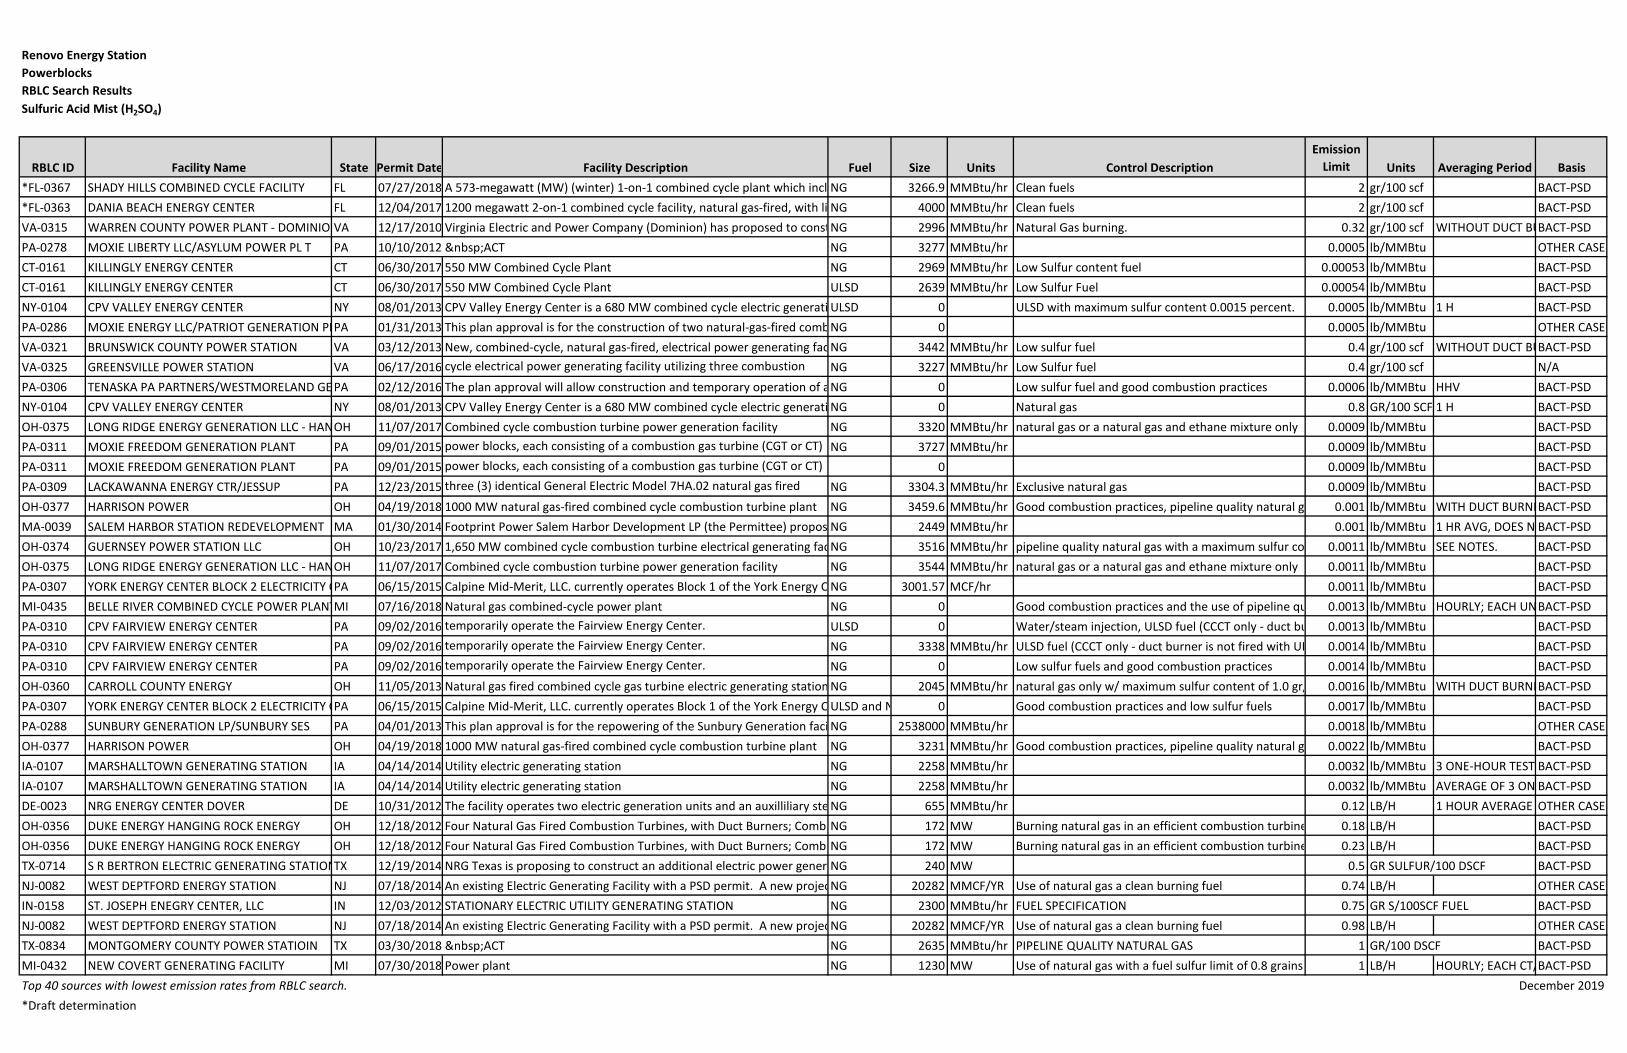
Renovo Energy StationPowerblocksRBLC Search ResultsSulfuric Acid Mist (H2SO4)
RBLC ID Facility Name State Permit Date Facility Description Fuel Size Units Control DescriptionEmission
Limit Units Averaging Period Basis*FL-0367 SHADY HILLS COMBINED CYCLE FACILITY FL 07/27/2018 A 573-megawatt (MW) (winter) 1-on-1 combined cycle plant which incl NG 3266.9 MMBtu/hr Clean fuels 2 gr/100 scf BACT-PSD*FL-0363 DANIA BEACH ENERGY CENTER FL 12/04/2017 1200 megawatt 2-on-1 combined cycle facility, natural gas-fired, with li NG 4000 MMBtu/hr Clean fuels 2 gr/100 scf BACT-PSDVA-0315 WARREN COUNTY POWER PLANT - DOMINIO VA 12/17/2010 Virginia Electric and Power Company (Dominion) has proposed to const NG 2996 MMBtu/hr Natural Gas burning. 0.32 gr/100 scf WITHOUT DUCT BU BACT-PSDPA-0278 MOXIE LIBERTY LLC/ASYLUM POWER PL T PA 10/10/2012 ACT NG 3277 MMBtu/hr 0.0005 lb/MMBtu OTHER CASE-CT-0161 KILLINGLY ENERGY CENTER CT 06/30/2017 550 MW Combined Cycle Plant NG 2969 MMBtu/hr Low Sulfur content fuel 0.00053 lb/MMBtu BACT-PSDCT-0161 KILLINGLY ENERGY CENTER CT 06/30/2017 550 MW Combined Cycle Plant ULSD 2639 MMBtu/hr Low Sulfur Fuel 0.00054 lb/MMBtu BACT-PSDNY-0104 CPV VALLEY ENERGY CENTER NY 08/01/2013 CPV Valley Energy Center is a 680 MW combined cycle electric generati ULSD 0 ULSD with maximum sulfur content 0.0015 percent. 0.0005 lb/MMBtu 1 H BACT-PSDPA-0286 MOXIE ENERGY LLC/PATRIOT GENERATION PLPA 01/31/2013 This plan approval is for the construction of two natural-gas-fired comb NG 0 0.0005 lb/MMBtu OTHER CASE-VA-0321 BRUNSWICK COUNTY POWER STATION VA 03/12/2013 New, combined-cycle, natural gas-fired, electrical power generating fac NG 3442 MMBtu/hr Low sulfur fuel 0.4 gr/100 scf WITHOUT DUCT BUBACT-PSDVA-0325 GREENSVILLE POWER STATION VA 06/17/2016
cycle electrical power generating facility utilizing three combustion NG 3227 MMBtu/hr Low Sulfur fuel 0.4 gr/100 scf N/A
PA-0306 TENASKA PA PARTNERS/WESTMORELAND GE PA 02/12/2016 The plan approval will allow construction and temporary operation of a NG 0 Low sulfur fuel and good combustion practices 0.0006 lb/MMBtu HHV BACT-PSDNY-0104 CPV VALLEY ENERGY CENTER NY 08/01/2013 CPV Valley Energy Center is a 680 MW combined cycle electric generati NG 0 Natural gas 0.8 GR/100 SCF 1 H BACT-PSDOH-0375 LONG RIDGE ENERGY GENERATION LLC - HAN OH 11/07/2017 Combined cycle combustion turbine power generation facility NG 3320 MMBtu/hr natural gas or a natural gas and ethane mixture only 0.0009 lb/MMBtu BACT-PSDPA-0311 MOXIE FREEDOM GENERATION PLANT PA 09/01/2015
power blocks, each consisting of a combustion gas turbine (CGT or CT) NG 3727 MMBtu/hr 0.0009 lb/MMBtu BACT-PSD
PA-0311 MOXIE FREEDOM GENERATION PLANT PA 09/01/2015
power blocks, each consisting of a combustion gas turbine (CGT or CT) 0 0.0009 lb/MMBtu BACT-PSDPA-0309 LACKAWANNA ENERGY CTR/JESSUP PA 12/23/2015
three (3) identical General Electric Model 7HA.02 natural gas fired NG 3304.3 MMBtu/hr Exclusive natural gas 0.0009 lb/MMBtu BACT-PSD
OH-0377 HARRISON POWER OH 04/19/2018 1000 MW natural gas-fired combined cycle combustion turbine plant NG 3459.6 MMBtu/hr Good combustion practices, pipeline quality natural g 0.001 lb/MMBtu WITH DUCT BURNE BACT-PSDMA-0039 SALEM HARBOR STATION REDEVELOPMENT MA 01/30/2014 Footprint Power Salem Harbor Development LP (the Permittee) propos NG 2449 MMBtu/hr 0.001 lb/MMBtu 1 HR AVG, DOES N BACT-PSDOH-0374 GUERNSEY POWER STATION LLC OH 10/23/2017 1,650 MW combined cycle combustion turbine electrical generating facNG 3516 MMBtu/hr pipeline quality natural gas with a maximum sulfur co 0.0011 lb/MMBtu SEE NOTES. BACT-PSDOH-0375 LONG RIDGE ENERGY GENERATION LLC - HAN OH 11/07/2017 Combined cycle combustion turbine power generation facility NG 3544 MMBtu/hr natural gas or a natural gas and ethane mixture only 0.0011 lb/MMBtu BACT-PSDPA-0307 YORK ENERGY CENTER BLOCK 2 ELECTRICITY G PA 06/15/2015 Calpine Mid-Merit, LLC. currently operates Block 1 of the York Energy C NG 3001.57 MCF/hr 0.0011 lb/MMBtu BACT-PSDMI-0435 BELLE RIVER COMBINED CYCLE POWER PLANTMI 07/16/2018 Natural gas combined-cycle power plant NG 0 Good combustion practices and the use of pipeline qu 0.0013 lb/MMBtu HOURLY; EACH UNBACT-PSDPA-0310 CPV FAIRVIEW ENERGY CENTER PA 09/02/2016
temporarily operate the Fairview Energy Center. ULSD 0 Water/steam injection, ULSD fuel (CCCT only - duct bu 0.0013 lb/MMBtu BACT-PSD
PA-0310 CPV FAIRVIEW ENERGY CENTER PA 09/02/2016
temporarily operate the Fairview Energy Center. NG 3338 MMBtu/hr ULSD fuel (CCCT only - duct burner is not fired with UL 0.0014 lb/MMBtu BACT-PSDPA-0310 CPV FAIRVIEW ENERGY CENTER PA 09/02/2016
temporarily operate the Fairview Energy Center. NG 0 Low sulfur fuels and good combustion practices 0.0014 lb/MMBtu BACT-PSD
OH-0360 CARROLL COUNTY ENERGY OH 11/05/2013 Natural gas fired combined cycle gas turbine electric generating station NG 2045 MMBtu/hr natural gas only w/ maximum sulfur content of 1.0 gr/ 0.0016 lb/MMBtu WITH DUCT BURNE BACT-PSDPA-0307 YORK ENERGY CENTER BLOCK 2 ELECTRICITY G PA 06/15/2015 Calpine Mid-Merit, LLC. currently operates Block 1 of the York Energy C ULSD and N 0 Good combustion practices and low sulfur fuels 0.0017 lb/MMBtu BACT-PSDPA-0288 SUNBURY GENERATION LP/SUNBURY SES PA 04/01/2013 This plan approval is for the repowering of the Sunbury Generation faci NG 2538000 MMBtu/hr 0.0018 lb/MMBtu OTHER CASE-OH-0377 HARRISON POWER OH 04/19/2018 1000 MW natural gas-fired combined cycle combustion turbine plant NG 3231 MMBtu/hr Good combustion practices, pipeline quality natural g 0.0022 lb/MMBtu BACT-PSDIA-0107 MARSHALLTOWN GENERATING STATION IA 04/14/2014 Utility electric generating station NG 2258 MMBtu/hr 0.0032 lb/MMBtu 3 ONE-HOUR TEST BACT-PSDIA-0107 MARSHALLTOWN GENERATING STATION IA 04/14/2014 Utility electric generating station NG 2258 MMBtu/hr 0.0032 lb/MMBtu AVERAGE OF 3 ON BACT-PSDDE-0023 NRG ENERGY CENTER DOVER DE 10/31/2012 The facility operates two electric generation units and an auxilliliary ste NG 655 MMBtu/hr 0.12 LB/H 1 HOUR AVERAGE OTHER CASE-OH-0356 DUKE ENERGY HANGING ROCK ENERGY OH 12/18/2012 Four Natural Gas Fired Combustion Turbines, with Duct Burners; Combi NG 172 MW Burning natural gas in an efficient combustion turbine 0.18 LB/H BACT-PSDOH-0356 DUKE ENERGY HANGING ROCK ENERGY OH 12/18/2012 Four Natural Gas Fired Combustion Turbines, with Duct Burners; Combi NG 172 MW Burning natural gas in an efficient combustion turbine 0.23 LB/H BACT-PSDTX-0714 S R BERTRON ELECTRIC GENERATING STATIONTX 12/19/2014 NRG Texas is proposing to construct an additional electric power gener NG 240 MW 0.5 GR SULFUR/100 DSCF BACT-PSDNJ-0082 WEST DEPTFORD ENERGY STATION NJ 07/18/2014 An existing Electric Generating Facility with a PSD permit. A new projec NG 20282 MMCF/YR Use of natural gas a clean burning fuel 0.74 LB/H OTHER CASE-IN-0158 ST. JOSEPH ENEGRY CENTER, LLC IN 12/03/2012 STATIONARY ELECTRIC UTILITY GENERATING STATION NG 2300 MMBtu/hr FUEL SPECIFICATION 0.75 GR S/100SCF FUEL BACT-PSDNJ-0082 WEST DEPTFORD ENERGY STATION NJ 07/18/2014 An existing Electric Generating Facility with a PSD permit. A new projec NG 20282 MMCF/YR Use of natural gas a clean burning fuel 0.98 LB/H OTHER CASE-TX-0834 MONTGOMERY COUNTY POWER STATIOIN TX 03/30/2018 ACT NG 2635 MMBtu/hr PIPELINE QUALITY NATURAL GAS 1 GR/100 DSCF BACT-PSDMI-0432 NEW COVERT GENERATING FACILITY MI 07/30/2018 Power plant NG 1230 MW Use of natural gas with a fuel sulfur limit of 0.8 grains 1 LB/H HOURLY; EACH CT/ BACT-PSDTop 40 sources with lowest emission rates from RBLC search. December 2019*Draft determination

Renovo Energy CenterPowerblocksRBLC Search ResultsAmmonia (NH3)
RBLC ID Facility Name State Permit Date Facility Description Fuel Size Units Control DescriptionEmission
Limit Units Averaging Period BasisCT-0161 KILLINGLY ENERGY CENTER CT 6/30/2017 550 MW Combined Cycle Plant NG 2969 MMBtu/hr Good Combustion, Optimization of SCR 2 ppmvd @ 15% O2 1 HR BLOCK OTHER CASE-CT-0161 KILLINGLY ENERGY CENTER CT 6/30/2017 550 MW Combined Cycle Plant NG 2639 MMBtu/hr Optimization of SCR 2 ppmvd @ 15% O2 1 HR BLOCK OTHER CASE-MA-0039 SALEM HARBOR STATION REDEVELOPMENT MA 1/30/2014 Footprint Power Salem Harbor Development LP (the Permit NG 2449 MMBtu/hr 2 ppmvd @ 15% O2 1 HR BLOCK AVG, DOES OTHER CASE-CT-0157 CPV TOWANTIC, LLC CT 11/30/2015 805 MW Combined Cycle Power Plant NG 21200000 MMBtu/12 mo 2 ppmvd @ 15% O2 BACT-PSDCT-0158 CPV TOWANTIC, LLC CT 11/30/2015 805 MW Combined Cycle Plant NG 21200000 MMBtu/yr 2 ppmvd @ 15% O2 1 HR BLOCK OTHER CASE-*PA-0319 RENAISSANCE ENERGY CENTER PA 8/27/2018
temporary operation of a natural gas-fired combined cycle NG 2665.9 MMBtu/hr 5 PPMDV
PA-0309 LACKAWANNA ENERGY CTR/JESSUP PA 12/23/2015
operation of three (3) identical General Electric Model NG 13.31 MMBtu/hr 5 ppmvd @ 15% O2 12-MONTH ROLLING B BACT-PSDCT-0161 KILLINGLY ENERGY CENTER CT 6/30/2017 550 MW Combined Cycle Plant ULSD 2639 MMBtu/hr Optimization of SCR 5 ppmvd @ 15% O2 1 HOUR BLOCK OTHER CASE-NJ-0085 MIDDLESEX ENERGY CENTER, LLC NJ 7/19/2016
OF NG 8040 H/YR USE OF NATURAL GAS A CLEAN BURNING FUEL 5 ppmvd @ 15% O2 3 H ROLLING AV BASED BACT-PSD
PA-0288 SUNBURY GENERATION LP/SUNBURY SES PA 4/1/2013 This plan approval is for the repowering of the Sunbury Gen NG 2538000 MMBtu/hr 5 PPMVD OTHER CASE-MD-0046 KEYS ENERGY CENTER MD 10/31/2014
PLANT NG 235 MW INITIAL STACK TEST USING EPA METHOD CTM-027 OR E 5 ppmvd @ 15% O2 AVG OF 3 TEST RUNS O OTHER CASE-
MD-0045 MATTAWOMAN ENERGY CENTER MD 11/13/2015 990 MW COMBINED-CYCLE NATURAL GAS-FIRED POWER PL NG 286 MW INITIAL STACK TEST USING EPA METHOD CTM-027 OR E 5 ppmvd @ 15% O2 AVERAGE OF 3 TEST RU OTHER CASE-PA-0296 BERKS HOLLOW ENERGY ASSOC LLC/ONTELAUPA 12/17/2013 This application is for the construction of a natural gas-fired NG 3046 MMBtu/hr 5 PPMVD BACT-PSDCT-0157 CPV TOWANTIC, LLC CT 11/30/2015 805 MW Combined Cycle Power Plant ULSD 1720000 gal/12 mo 5 ppmvd @ 15% O2 1 HR BLOCK BACT-PSDCT-0158 CPV TOWANTIC, LLC CT 11/30/2015 805 MW Combined Cycle Plant ULSD 1720000 gal/12 mo 5 ppmvd @ 15% O2 1 HR BLOCK OTHER CASE-PA-0278 MOXIE LIBERTY LLC/ASYLUM POWER PL T PA 10/10/2012 NG 3277 MMBtu/hr 5 PPMVD OTHER CASE-DE-0023 NRG ENERGY CENTER DOVER DE 10/31/2012 The facility operates two electric generation units and an au NG 655 MMBtu/hr 5.29 LB/H 1 HOUR AVERAGE OTHER CASE-*TX-0660 FGE TEXAS POWER I AND FGE TEXAS POWER TX 3/24/2014 Electric Generating Utility NG 230.7 MW AVO, good combustion practices 7 PPMVD CORRECTED TO 15% O BACT-PSDTX-0600 THOMAS C. FERGUSON POWER PLANT TX 9/1/2011 Power Plant. Two natural gas-fired combined cycle turbine NG 390 MW best management practices 7 PPMVD ROLLING 24-HR AT 15% BACT-PSDWY-0070 CHEYENNE PRAIRIE GENERATING STATION WY 8/28/2012 A nominal 220 megawatt (MW) gross electrical facility. The NG 40 MW 10 ppmvd @ 15% O2 3-HOUR AVERAGE OTHER CASE-WY-0070 CHEYENNE PRAIRIE GENERATING STATION WY 8/28/2012 A nominal 220 megawatt (MW) gross electrical facility. The NG 40 MW 10 PPM AT 15% O2 3-HOUR AVERAGE OTHER CASE-WY-0070 CHEYENNE PRAIRIE GENERATING STATION WY 8/28/2012 A nominal 220 megawatt (MW) gross electrical facility. The NG 40 MW 10 ppmvd @ 15% O2 3-HOUR AVERAGE OTHER CASE-WY-0070 CHEYENNE PRAIRIE GENERATING STATION WY 8/28/2012 A nominal 220 megawatt (MW) gross electrical facility. The NG 40 MW 10 ppmvd @ 15% O2 3-HOUR AVERAGE OTHER CASE-WY-0070 CHEYENNE PRAIRIE GENERATING STATION WY 8/28/2012 A nominal 220 megawatt (MW) gross electrical facility. The NG 40 MW 10 ppmvd @ 15% O2 3-HOUR AVERAGE OTHER CASE-NJ-0085 MIDDLESEX ENERGY CENTER, LLC NJ 7/19/2016
OF ULSD 720 H/YR USE OF ULSD OIL A CLEAN BURNING FUEL 25.9 LB/H 3 H ROLLING AV BASED OTHER CASE-
NJ-0085 MIDDLESEX ENERGY CENTER, LLC NJ 7/19/2016
OF NG 4000 h/yr USE OF NATURAL GAS A CLEAN BURNING FUEL 27.4 LB/H AV OF THREE ONE H ST OTHER CASE-OH-0356 DUKE ENERGY HANGING ROCK ENERGY OH 12/18/2012 Four Natural Gas Fired Combustion Turbines, with Duct Bur NG 172 MW 28 LB/H N/AOH-0356 DUKE ENERGY HANGING ROCK ENERGY OH 12/18/2012 Four Natural Gas Fired Combustion Turbines, with Duct Bur NG 172 MW 31.7 LB/H N/A*PA-0298 FUTURE POWER PA/GOOD SPRINGS NGCC FA PA 3/4/2014 Natural gas-fired combined-cycle electric generation facility NG 2267 MMBtu/hr 72.5 TPY BASED ON A 12-MONT BACT-PSDPA-0291 HICKORY RUN ENERGY STATION PA 4/23/2013 Natural gas-fired combined-cycle electric generation facility NG 3.4 MMCF/HR 110.2 TPY 12-MONTH ROLLING T OTHER CASE-*Draft determination December 2019

Renovo Energy CenterAuxiliary Boiler - Natural GasRBLC Search ResultsNitrogen Oxides (NOx)
RBLC ID Facility Name State Permit Date Facility Description Fuel Size Units Control DescriptionEmission
Limit Units Averaging Period BasisLA-0254 NINEMILE POINT ELECTRIC GENERATING PLANT LA 8/16/2011
FUEL; NO. 2 & NO. 4 FUEL OIL ARE SECONDARY FUELS. NG 338 MMBtu/hr PROPER OPERATION AND GOOD COMBUSTION PRACTICES 0.0002 lb/MMBtu BACT-PSD
PA-0309 LACKAWANNA ENERGY CTR/JESSUP PA #########
three (3) identical General Electric Model 7HA.02 natural gas fired NG 184.4 MMBtu/hr SCR and ultra low NOx burners, Fired only on natural gas s 0.006 lb/MMBtu 30-DAY ROLLING AV LAER*IL-0130 JACKSON ENERGY CENTER IL ######### The proposed facility is designed to generate baseload power. It will co NG 96 MMBtu/hr Ultra low-NOx burners and flue gas recirculation air prehe 0.01 lb/MMBtu 3-HOUR AVERAGE LAERMD-0046 KEYS ENERGY CENTER MD #########
NOTE: PARTICULATE MATTER FACILITYWIDE EMISSIONS ARE NG 93 MMBtu/hr EFFICIENT BOILER DESIGN WITH ULTRA LOW NOX BURNER 0.01 lb/MMBtu 3-HOUR BLOCK AVE BACT-PSD
TX-0698 BAYPORT COMPLEX TX 9/5/2013 Air Liquid currently operates a cogeneration facility in Pasadena, Texas NG 550 MMBtu/hr Selective Catalytic Reduction (SCR) 0.01 lb/MMBtu 3 HOUR ROLLING AVBACT-PSDPA-0311 MOXIE FREEDOM GENERATION PLANT PA 9/1/2015
power blocks, each consisting of a combustion gas turbine (CGT or CT) NG 55.4 MMBtu/hr 0.006 lb/MMBtu LAER
PA-0307 YORK ENERGY CENTER BLOCK 2 ELECTRICITY GE PA 6/15/2015 Calpine Mid-Merit, LLC. currently operates Block 1 of the York Energy C NG 62.04 MCF/hr Good combustion practices, Ultra-Low NOx burners, FGR 0.0086 lb/MMBtu LAERNJ-0080 HESS NEWARK ENERGY CENTER NJ 11/1/2012
HESS Newark Energy Center (Hess-NEC), proposed at City of Newark NG 51.9 mmcf/yr Low NOx burners and flue gas recirculation 0.01 lb/MMBtu AVERAGE OF THREE LAER
*MD-0042 WILDCAT POINT GENERATION FACILITY MD 4/8/2014
PLANTFACILITY-WIDE PM10 EMISSION LIMIT = 278 TONS/YR NG 45 MMBtu/hr EXCLUSIVE USE OF PIPELINE QUALITY NATURAL GAS AND 0.01 lb/MMBtu 3-HOUR BLOCK AVE LAERMD-0045 MATTAWOMAN ENERGY CENTER MD ######### 990 MW COMBINED-CYCLE NATURAL GAS-FIRED POWER PLANTNOTE: NG 42 MMBtu/hr EXCLUSIVE USE OF PIPELINE QUALITY NATURAL GAS, ULTR 0.01 lb/MMBtu 3-HOUR BLOCK AVE BACT-PSDVA-0328 C4GT, LLC VA 4/26/2018 Natural gas-fired combined cycle power plant NG 902 mmcf/y Low NOx burners 0.011 lb/MMBtu CORRECTED TO 3% OBACT-PSDVA-0325 GREENSVILLE POWER STATION VA 6/17/2016
cycle electrical power generating facility utilizing three combustion NG 185 MMBtu/hr ultra low-NOx burners 0.011 lb/MMBtu N/A
*PA-0316 RENOVO ENERGY CENTER, LLC PA 1/26/2018
two (2) identical 1 x 1 powerblocks where each powerblock consists of NG 118800 MMBtu/12 ultra-low NOx burners and flue gas re-circulation 0.011 lb/MMBtu MMBTU LAER*PA-0315 HILLTOP ENERGY CENTER, LLC PA 4/12/2017
combined cycle, single shaft configuration, including a combustion NG 42 MMBtu/hr 0.011 lb/MMBtu MMBTU
IL-0129 CPV THREE RIVERS ENERGY CENTER IL 7/30/2018 The proposed facility is designed to generate baseload power. It will co NG 96 mmBtu/hr Ultra-low NOx burners and flue gas recirculation, air prehe 0.011 lb/MMBtu 3-HOUR AVERAGE LAERPA-0306 TENASKA PA PARTNERS/WESTMORELAND GEN PA 2/12/2016 The plan approval will allow construction and temporary operation of a NG 1052 MMscf/yr Good combustion practices and ULNOx burners 0.011 lb/MMBtu LAERPA-0310 CPV FAIRVIEW ENERGY CENTER PA 9/2/2016
temporarily operate the Fairview Energy Center. NG 92.4 MMBtu/hr Ultra low NOx burners, FGR, good combustion practices 0.011 lb/MMBtu AVG OF 3 1-HR TEST LAER
MD-0041 CPV ST. CHARLES MD 4/23/2014
PLANTFACILITY-WIDE PM10 EMISSION LIMIT = 96.6 TONS/YR NG 93 MMBtu/hr Ultra low NOx burners, FGR, good combustion practices 0.011 lb/MMBtu 3-HOUR AVERAGE LAERPA-0291 HICKORY RUN ENERGY STATION PA 4/23/2013 Natural gas-fired combined-cycle electric generation facility that is desi NG 40 MMBtu/hr 0.011 lb/MMBtu OTHER CASEMA-0039 SALEM HARBOR STATION REDEVELOPMENT MA 1/30/2014 Footprint Power Salem Harbor Development LP (the Permittee) propos NG 80 MMBtu/hr ultra low NOx burners 0.011 lb/MMBtu 1 HR BLOCK AVG, DO LAERIA-0107 MARSHALLTOWN GENERATING STATION IA 4/14/2014 Utility electric generating station NG 60.1 mmBtu/hr 0.013 lb/MMBtu AVERAGE OF 3 ONE- BACT-PSDTX-0708 LA PALOMA ENERGY CENTER TX 2/7/2013 The proposed project is a new electric power plant, fueled by pipeline q NG 150 MMBtu/hr low-NOx burners, limited use 0.02 lb/MMBtu 3-HR ROLLING AVER BACT-PSDMI-0406 RENAISSANCE POWER LLC MI 11/1/2013 For technical questions regarding this permit, please contact the permi NG 40 MMBtu/hr Good combustion practices. 0.035 lb/MMBtu TEST PROTOCOL; EA BACT-PSDOR-0050 TROUTDALE ENERGY CENTER, LLC OR 3/5/2014 Troutdale Energy Center (TEC) proposes to construct and operate a 653 NG 39.8 MMBtu/hr Utilize Low-NOx burners and FGR. 0.035 lb/MMBtu 3-HR BLOCK AVERAGBACT-PSDMI-0435 BELLE RIVER COMBINED CYCLE POWER PLANT MI 7/16/2018 Natural gas combined-cycle power plant NG 99.9 MMBtu/hr Low NOx burners/Flue gas recirculation. 0.036 lb/MMBtu HOURLY BACT-PSDPA-0288 SUNBURY GENERATION LP/SUNBURY SES PA 4/1/2013 This plan approval is for the repowering of the Sunbury Generation faci NG 106000 MMBTU 0.036 lb/MMBtu OTHER CASETX-0714 S R BERTRON ELECTRIC GENERATING STATION TX ######### NRG Texas is proposing to construct an additional electric power gener NG 80 MMBtu/hr low-NOx burners 0.036 lb/MMBtu 3-HR ROLLING BACT-PSDMI-0433 MEC NORTH, LLC AND MEC SOUTH LLC MI 6/29/2018 Natural gas combined cycle power plant (two plants: north and south) NG 61.5 MMBtu/hr Ultra low NOx burners, FGR, good combustion practices 0.04 lb/MMBtu 30-DAY ROLLING AV BACT-PSDMI-0433 MEC NORTH, LLC AND MEC SOUTH LLC MI 6/29/2018 Natural gas combined cycle power plant (two plants: north and south) NG 61.5 MMBtu/hr Ultra low NOx burners, FGR, good combustion practices 0.04 lb/MMBtu 30 DAY ROLLING AV BACT-PSDMI-0423 INDECK NILES, LLC MI 1/4/2017 Natural gas combined cycle power plant. NG 182 MMBtu/hr Ultra low NOx burners, FGR, good combustion practices 0.04 lb/MMBtu 30 DAY ROLLING AV BACT-PSDMI-0427 FILER CITY STATION MI ######### New natural gas combined heat and power plant proposed at existing c NG 182 MMBtu/hr LNB that incorporate internal (within the burner) FGR and 0.04 lb/MMBtu 30 DAY ROLLING AV BACT-PSDNY-0104 CPV VALLEY ENERGY CENTER NY 8/1/2013 CPV Valley Energy Center is a 680 MW combined cycle electric generati NG 0 Flue gas recirculation with low NOx burners. 0.045 lb/MMBtu 1 H LAER*FL-0367 SHADY HILLS COMBINED CYCLE FACILITY FL 7/27/2018 A 573-megawatt (MW) (winter) 1-on-1 combined cycle plant which incl NG 60 MMBtu/hr low-NOx burners 0.05 lb/MMBtu BACT-PSDMI-0424 HOLLAND BOARD OF PUBLIC WORKS - EAST 5TH MI 12/5/2016 Natural gas combined heat and power plant. NG 83.5 MMBtu/hr Low NOx burners/Internal flue gas recirculation and good 0.05 lb/MMBtu TEST PROTOCOL WIL BACT-PSDFL-0356 OKEECHOBEE CLEAN ENERGY CENTER FL 3/9/2016 Fossil-fueled power plant, consisting of a 3-on-1 combined cycle unit an NG 99.8 MMBtu/hr Low-NOx burners 0.05 lb/MMBtu BACT-PSDMI-0412 HOLLAND BOARD OF PUBLIC WORKS - EAST 5TH MI 12/4/2013 Natural gas combined heat and power plant. NG 95 MMBtu/hr Dry low NOx burners, flue gas recirculation and good com 0.05 lb/MMBtu TEST PROTOCOL BACT-PSDMI-0412 HOLLAND BOARD OF PUBLIC WORKS - EAST 5TH MI 12/4/2013 Natural gas combined heat and power plant. NG 55 MMBtu/hr Low NOx burners and good combustion practices 0.05 lb/MMBtu TEST PROTOCOL BACT-PSDMI-0410 THETFORD GENERATING STATION MI 7/25/2013 Four (4) natural gas fired combined cycle combustion turbine generato NG 100 MMBtu/hr Low NOx burners and flue gas recirculation. 0.05 lb/MMBtu TEST PROTOCOL BACT-PSDOH-0375 LONG RIDGE ENERGY GENERATION LLC - HANNI OH 11/7/2017 Combined cycle combustion turbine power generation facility NG 26.8 MMBtu/hr Flue gas recirculation and low NOX burner 0.29 LB/H BACT-PSDOH-0366 CLEAN ENERGY FUTURE - LORDSTOWN, LLC OH 8/25/2015 962 MW (gross winter output) combined cycle gas turbine (CCGT) facilitNG 34 MMBtu/hr Flue gas recirculation (FGR) and low NOx burner 0.68 LB/H BACT-PSDTop 40 sources with lowest emission rates from RBLC search. December 2019*Draft determination

Renovo Energy CenterAuxiliary Boiler - Natural GasRBLC Search ResultsCarbon Monoxide (CO)
RBLS CD Facility Name State Permit Date Facility Description Fuel Size Units Control DescriptionEmission
Limit Units Averaging Period BasisIA-0107 MARSHALLTOWN GENERATING STATION IA 4/14/2014 Utility electric generating station NG 60.1 mmBtu/hr CO catalytic oxidizer 0.0164 lb/MMBtu AVERAGE OF 3 ON-HOUR TEST BACT-PSDMD-0041 CPV ST. CHARLES MD 4/23/2014
PLANTFACILITY-WIDE PM10 EMISSION LIMIT = 96.6 TONS/YR NG 93 mmBtu/hr GOOD COMBUSTION PRACTICES 0.02 lb/MMBtu 3-HOUR AVERAGE BLOCK BACT-PSD
VA-0325 GREENSVILLE POWER STATION VA 6/17/2016
cycle electrical power generating facility utilizing three combustion NG 185 MMBtu/hr Clean fuel and good combustion practices 0.035 lb/MMBtu N/A*PA-0316 RENOVO ENERGY CENTER, LLC PA 1/26/2018
two (2) identical 1 x 1 powerblocks where each powerblock consists NG 118800 MMBtu/12 month period 0.036 LB MMBTU BACT-PSD
*MD-0042 WILDCAT POINT GENERATION FACILITY MD 4/8/2014
PLANTFACILITY-WIDE PM10 EMISSION LIMIT = 278 TONS/YR NG 45 mmBtu/hr good combustion practices and pipeline NG 0.036 lb/MMBtu 3-HOUR BLOCK AVERAGE BACT-PSDMI-0406 RENAISSANCE POWER LLC MI 11/1/2013 For technical questions regarding this permit, please contact the perm NG 40 mmBtu/hr Good combustion practices 0.036 lb/MMBtu TEST PROTOCOL; EACH UNIT. BACT-PSDPA-0291 HICKORY RUN ENERGY STATION PA 4/23/2013 Natural gas-fired combined-cycle electric generation facility that is de NG 40 mmBtu/hr 0.036 lb/MMBtu OTHER CASE-*IL-0130 JACKSON ENERGY CENTER IL 12/31/2018 The proposed facility is designed to generate baseload power. It will NG 96 mmBtu/hr Good combustion practice 0.037 lb/MMBtu 3-HOUR BACT-PSDVA-0328 C4GT, LLC VA 4/26/2018 Natural gas-fired combined cycle power plant NG 902 mmcf/y good combustion practices and clean fuel 0.037 lb/MMBtu BACT-PSD*PA-0315 HILLTOP ENERGY CENTER, LLC PA 4/12/2017
combined cycle, single shaft configuration, including a combustion NG 42 MMBtu/hr 0.037 LB MMBTU
IL-0129 CPV THREE RIVERS ENERGY CENTER IL 7/30/2018 The proposed facility is designed to generate baseload power. It will NG 96 mmBtu/hr Good combustion practices 0.037 lb/MMBtu 3-HOUR AVERAGE BACT-PSDPA-0306 TENASKA PA PARTNERS/WESTMORELAND GEN PA 2/12/2016 The plan approval will allow construction and temporary operation o NG 1052 MMscf/yr Good combustion practices 0.037 lb/MMBtu BACT-PSDPA-0311 MOXIE FREEDOM GENERATION PLANT PA 9/1/2015
1 power blocks, each consisting of a combustion gas turbine (CGT or NG 55.4 MMBtu/hr 0.037 lb/MMBtu BACT-PSD
PA-0310 CPV FAIRVIEW ENERGY CENTER PA 9/2/2016
temporarily operate the Fairview Energy Center. NG 92.4 MMBtu/hr ULSD and good combustion practices 0.037 lb/MMBtu AVG OF 3 1-HR TEST RUNS BACT-PSDPA-0309 LACKAWANNA ENERGY CTR/JESSUP PA 12/23/2015
of three (3) identical General Electric Model 7HA.02 natural gas NG 184.4 MMBtu/hr 0.037 lb/MMBtu BACT-PSD
MD-0045 MATTAWOMAN ENERGY CENTER MD 11/13/2015 990 MW COMBINED-CYCLE NATURAL GAS-FIRED POWER PLANTNOTE NG 42 MMBtu/hr GOOD COMBUSTION PRACTICES 0.037 lb/MMBtu 3-HOUR BLOCK AVERAGE BACT-PSDTX-0714 S R BERTRON ELECTRIC GENERATING STATION TX 12/19/2014 NRG Texas is proposing to construct an additional electric power gen NG 80 MMBtu/hr low-NOx burners 0.037 lb/MMBtu 3-HR ROLLING AVERAGE BACT-PSDMI-0423 INDECK NILES, LLC MI 1/4/2017 Natural gas combined cycle power plant. NG 182 MMBtu/hr Good combustion practices. 0.04 lb/MMBtu TEST PROTOCOL WILL SPECIFY BACT-PSDMI-0427 FILER CITY STATION MI 11/17/2017 New natural gas combined heat and power plant proposed at existing NG 182 MMBtu/hr Good combustion practices 0.04 lb/MMBtu BACT-PSDOR-0050 TROUTDALE ENERGY CENTER, LLC OR 3/5/2014 Troutdale Energy Center (TEC) proposes to construct and operate a 6 NG 39.8 MMBtu/hr Utilize Low-NOx burners and FGR. 0.04 lb/MMBtu 3-HR BLOCK AVERAGE BACT-PSDPA-0307 YORK ENERGY CENTER BLOCK 2 ELECTRICITY G PA 6/15/2015 Calpine Mid-Merit, LLC. currently operates Block 1 of the York Energy NG 62.04 MCF/hr Good combustion practices 0.06 lb/MMBtu BACT-PSDNY-0104 CPV VALLEY ENERGY CENTER NY 8/1/2013 CPV Valley Energy Center is a 680 MW combined cycle electric genera NG 0 Good combustion practice. 0.0721 lb/MMBtu 1 H BACT-PSDPA-0288 SUNBURY GENERATION LP/SUNBURY SES PA 4/1/2013 This plan approval is for the repowering of the Sunbury Generation fa NG 106000 MMBTU 0.074 lb/MMBtu OTHER CASE-MI-0435 BELLE RIVER COMBINED CYCLE POWER PLANT MI 7/16/2018 Natural gas combined-cycle power plant NG 99.9 MMBtu/hr Good combustion practices 0.075 lb/MMBtu HOURLY BACT-PSDMI-0410 THETFORD GENERATING STATION MI 7/25/2013 Four (4) natural gas fired combined cycle combustion turbine generat NG 100 MMBtu/hr Efficient combustion. 0.075 lb/MMBtu HEAT INPUT. TEST PROTOCOL BACT-PSDMI-0424 HOLLAND BOARD OF PUBLIC WORKS - EAST 5T MI 12/5/2016 Natural gas combined heat and power plant. NG 83.5 MMBtu/hr Good combustion practices. 0.077 lb/MMBtu TEST PROTOCOL WILL SPECIFY BACT-PSDMI-0412 HOLLAND BOARD OF PUBLIC WORKS - EAST 5T MI 12/4/2013 Natural gas combined heat and power plant. NG 95 MMBtu/hr Good combustion practices. 0.077 lb/MMBtu TEST PROTOCOL BACT-PSDMI-0412 HOLLAND BOARD OF PUBLIC WORKS - EAST 5T MI 12/4/2013 Natural gas combined heat and power plant. NG 55 MMBtu/hr Good combustion practices 0.077 lb/MMBtu TEST PROTOCOL BACT-PSD*FL-0367 SHADY HILLS COMBINED CYCLE FACILITY FL 7/27/2018 A 573-megawatt (MW) (winter) 1-on-1 combined cycle plant which in NG 60 MMBtu/hr Good combustion practices and low-NOx bu 0.08 lb/MMBtu BACT-PSDMI-0433 MEC NORTH, LLC AND MEC SOUTH LLC MI 6/29/2018 Natural gas combined cycle power plant (two plants: north and sout NG 61.5 MMBtu/hr Good combustion practices. 0.08 lb/MMBtu HOURLY BACT-PSDMI-0433 MEC NORTH, LLC AND MEC SOUTH LLC MI 6/29/2018 Natural gas combined cycle power plant (two plants: north and sout NG 61.5 MMBtu/hr Good combustion practices. 0.08 lb/MMBtu HOURLY BACT-PSD*FL-0363 DANIA BEACH ENERGY CENTER FL 12/4/2017 1200 megawatt 2-on-1 combined cycle facility, natural gas-fired, with NG 99.8 MMBtu/hr Clean fuel 0.08 lb/MMBtu BACT-PSDFL-0356 OKEECHOBEE CLEAN ENERGY CENTER FL 3/9/2016 Fossil-fueled power plant, consisting of a 3-on-1 combined cycle unit NG 99.8 MMBtu/hr Proper combustion prevents CO 0.08 lb/MMBtu BACT-PSDMD-0046 KEYS ENERGY CENTER MD 10/31/2014
NOTE: PARTICULATE MATTER FACILITYWIDE EMISSIONS ARE NG 93 MMBtu/hr good combustion practice, effic design 0.08 lb/MMBtu 3-HOUR BLOCK AVERAGE BACT-PSD
OH-0375 LONG RIDGE ENERGY GENERATION LLC - HANN OH 11/7/2017 Combined cycle combustion turbine power generation facility NG 26.8 MMBtu/hr Good combustion controls 0.99 LB/H BACT-PSDOH-0377 HARRISON POWER OH 4/19/2018 1000 MW natural gas-fired combined cycle combustion turbine plantNG 44.55 MMBtu/hr Good combustion practices 1.67 LB/H BACT-PSDOH-0366 CLEAN ENERGY FUTURE - LORDSTOWN, LLC OH 8/25/2015 962 MW (gross winter output) combined cycle gas turbine (CCGT) facNG 34 MMBtu/hr Good combustion controls 1.87 LB/H BACT-PSDOH-0370 TRUMBULL ENERGY CENTER OH 9/7/2017 940 MW combined cycle gas turbine (CCGT) facility NG 37.8 MMBtu/hr Good combustion controls 2.08 LB/H BACT-PSDOH-0372 OREGON ENERGY CENTER OH 9/27/2017 Combined cycle gas turbine (CCGT) facility NG 37.8 MMBtu/hr good combustion controls 2.08 LB/H BACT-PSDNJ-0080 HESS NEWARK ENERGY CENTER NJ 11/1/2012
HESS Newark Energy Center (Hess-NEC), proposed at City of Newark NG 51.9 mmcubic ft/use of natural gas a clean fuel 2.45 LB/H AVERAGE OF THREE TESTS BACT-PSD
Top 40 sources with lowest emission rates from RBLC search. December 2019*Draft determination

Renovo Energy CenterAuxiliary Boiler - Natural GasRBLC Search ResultsParticulate Matter (PM/PM10/PM2.5)
RBLC ID Facility Name State Permit Date Facility Description Fuel Size Units Control DescriptionEmission
Limit Units Averaging Period Basis*FL-0367 SHADY HILLS COMBINED CYCLE FACILITY FL 7/27/2018 A 573-megawatt (MW) (winter) 1-on-1 combined cycle plant w NG 60 MMBtu/hr Clean fuels 0 BACT-PSD*FL-0367 SHADY HILLS COMBINED CYCLE FACILITY FL 7/27/2018 A 573-megawatt (MW) (winter) 1-on-1 combined cycle plant w NG 60 MMBtu/hr Clean fuels 0 BACT-PSD*FL-0363 DANIA BEACH ENERGY CENTER FL 12/4/2017 1200 megawatt 2-on-1 combined cycle facility, natural gas-fire NG 99.8 MMBtu/hr Clean fuels 0 BACT-PSDMI-0424 HOLLAND BOARD OF PUBLIC WORKS - EAST 5T MI 12/5/2016 Natural gas combined heat and power plant. NG 83.5 MMBtu/hr Good combustion practices. 0.0018 lb/MMBtu TEST PROTOCOL WI BACT-PSDMI-0412 HOLLAND BOARD OF PUBLIC WORKS - EAST 5T MI 12/4/2013 Natural gas combined heat and power plant. NG 95 MMBtu/hr Good combustion practices 0.0018 lb/MMBtu TEST PROTOCOL BACT-PSDMI-0412 HOLLAND BOARD OF PUBLIC WORKS - EAST 5T MI 12/4/2013 Natural gas combined heat and power plant. NG 55 MMBtu/hr Good combustion practices 0.0018 lb/MMBtu TEST PROTOCOL BACT-PSDMI-0410 THETFORD GENERATING STATION MI 7/25/2013 Four (4) natural gas fired combined cycle combustion turbine g NG 100 MMBtu/hr Efficient combustion; natural gas fuel. 0.0018 lb/MMBtu HEAT INPUT; TEST P BACT-PSD*PA-0316 RENOVO ENERGY CENTER, LLC PA 1/26/2018
consisting of two (2) identical 1 x 1 powerblocks where each NG 1E+05 MMBtu/12 mo 0.0019 LB MMBTU BACT-PSD
MD-0045 MATTAWOMAN ENERGY CENTER MD 11/13/2015 990 MW COMBINED-CYCLE NATURAL GAS-FIRED POWER PLAN NG 42 MMBtu/hr good combustion practices and natural gas 0.0019 lb/MMBtu 3-HOUR BLOCK AVEBACT-PSDPA-0309 LACKAWANNA ENERGY CTR/JESSUP PA 12/23/2015
operation of three (3) identical General Electric Model 7HA.02 NG 184.4 MMBtu/hr Natural gas fired exclusively 0.002 lb/MMBtu BACT-PSD
MI-0433 MEC NORTH, LLC AND MEC SOUTH LLC MI 6/29/2018 Natural gas combined cycle power plant (two plants: north and NG 61.5 MMBtu/hr Good combustion practices. 0.005 lb/MMBtu HOURLY BACT-PSDMI-0433 MEC NORTH, LLC AND MEC SOUTH LLC MI 6/29/2018 Natural gas combined cycle power plant (two plants: north and NG 61.5 MMBtu/hr Good combustion practices. 0.005 lb/MMBtu HOURLY BACT-PSDMD-0041 CPV ST. CHARLES MD 4/23/2014
PLANTFACILITY-WIDE PM10 EMISSION LIMIT = 96.6 TONS/YR NG 93 MMBtu/hr good combustion practices and natural gas 0.005 lb/MMBtu 3-HOUR AVERAGE BACT-PSD
MI-0423 INDECK NILES, LLC MI 1/4/2017 Natural gas combined cycle power plant. NG 182 MMBtu/hr Good combustion practices. 0.005 lb/MMBtu TEST PROTOCOL WI BACT-PSDMI-0427 FILER CITY STATION MI 11/17/2017 New natural gas combined heat and power plant proposed at e NG 182 MMBtu/hr Good combustion practices 0.005 lb/MMBtu BACT-PSDMI-0406 RENAISSANCE POWER LLC MI 11/1/2013 For technical questions regarding this permit, please contact th NG 40 MMBtu/hr Good combustion practices. 0.005 lb/MMBtu TEST PROTOCOL; EA BACT-PSDMI-0406 RENAISSANCE POWER LLC MI 11/1/2013 For technical questions regarding this permit, please contact th NG 40 MMBtu/hr Good combustion practices. 0.005 lb/MMBtu TEST PROTOCOL; EA BACT-PSDNY-0104 CPV VALLEY ENERGY CENTER NY 8/1/2013 CPV Valley Energy Center is a 680 MW combined cycle electric NG 0 Natural gas. 0.0063 lb/MMBtu 1 H BACT-PSDVA-0325 GREENSVILLE POWER STATION VA 6/17/2016
combined-cycle electrical power generating facility utilizing NG 185 MMBtu/hr Low sulfur /carbon fuel and good combust 0.007 lb/MMBtu N/A
MI-0435 BELLE RIVER COMBINED CYCLE POWER PLANTMI 7/16/2018 Natural gas combined-cycle power plant NG 99.9 MMBtu/hr Good combustion practices, low sulfur fue 0.007 lb/MMBtu HOURLY BACT-PSD*MD-0042 WILDCAT POINT GENERATION FACILITY MD 4/8/2014
POWER PLANTFACILITY-WIDE PM10 EMISSION LIMIT = 278 NG 45 MMBtu/hr good combustion practices and natural gas 0.0075 lb/MMBtu 3-HOUR BLOCK AVEBACT-PSD
MD-0046 KEYS ENERGY CENTER MD 10/31/2014
PLANT NG 93 MMBtu/hr good combustion practices, natural gas, ef 0.0075 lb/MMBtu 3-HOUR BLOCK AVEBACT-PSDNJ-0085 MIDDLESEX ENERGY CENTER, LLC NJ 7/19/2016
1.ONE GENERAL ELECTRIC (GE) 7HA.02 CCCT NOMINALLY NG 4000 H/YR use of natural gas a clean fuel 0.181 LB/H AV OF THREE ONE H BACT-PSD
NJ-0080 HESS NEWARK ENERGY CENTER NJ 11/1/2012
HESS Newark Energy Center (Hess-NEC), proposed at City of NG 51.9 mmcf/yr use of natural gas a clean fuel 0.22 LB/H AVERAGE OF THREE N/ANJ-0080 HESS NEWARK ENERGY CENTER NJ 11/1/2012
HESS Newark Energy Center (Hess-NEC), proposed at City of NG 51.9 mmcf/yr use of natural gas a clean fuel 0.33 LB/H AVERAGE OF THREE BACT-PSD
NJ-0080 HESS NEWARK ENERGY CENTER NJ 11/1/2012
HESS Newark Energy Center (Hess-NEC), proposed at City of NG 51.9 mmcf/yr use of natural gas a clean fuel 0.33 LB/H AVERAGE OF THREE N/APA-0296 BERKS HOLLOW ENERGY ASSOC LLC/ONTELAUPA 12/17/2013 This application is for the construction of a natural gas-fired co NG 40 MMBTU/H 0.46 T/YR OTHER CAS*Draft determination December 2019

Renovo Energy CenterAuxiliary Boiler - Natural GasRBLC Search ResultsVolatile Organic Compounds (VOC)
RBLC ID Facility Name State Permit Date Facility Description Fuel Size Units Control DescriptionEmission
Limit Units Averaging Period BasisTX-0708 LA PALOMA ENERGY CENTER TX 2/7/2013 The proposed project is a new electric power plant, fueled by pipeline qu NG 150 MMBtu/hr good combustion practices 0 BACT-PSDPA-0291 HICKORY RUN ENERGY STATION PA 4/23/2013 Natural gas-fired combined-cycle electric generation facility that is design NG 40 MMBtu/hr 0.0015 lb/MMBtu OTHER CASEMD-0041 CPV ST. CHARLES MD 4/23/2014
PLANTFACILITY-WIDE PM10 EMISSION LIMIT = 96.6 TONS/YR NG 93 MMBtu/hr Good combustion practices and natural gas 0.002 lb/MMBtu 3-HOUR AVERAGE BLAER
MD-0046 KEYS ENERGY CENTER MD 10/31/2014
NOTE: PARTICULATE MATTER FACILITYWIDE EMISSIONS ARE NG 93 MMBtu/hr EFFICIENT BOILER DESIGN, EXCLUSIVE USE OF PIPELINE 0.002 lb/MMBtu 3-HOUR BLOCK AVE LAERMD-0045 MATTAWOMAN ENERGY CENTER MD 11/13/2015 990 MW COMBINED-CYCLE NATURAL GAS-FIRED POWER PLANTNOTE: PA NG 42 MMBtu/hr Good combustion practices and natural gas 0.003 lb/MMBtu 3-HOUR BLOCK AVE LAER*MD-0042 WILDCAT POINT GENERATION FACILITY MD 4/8/2014
PLANTFACILITY-WIDE PM10 EMISSION LIMIT = 278 TONS/YR NG 45 MMBtu/hr Good combustion practices, natural gas and limited hou 0.0033 lb/MMBtu 3-HOUR BLOCK AVE LAER
NY-0104 CPV VALLEY ENERGY CENTER NY 8/1/2013 CPV Valley Energy Center is a 680 MW combined cycle electric generatin NG 0 Good combustion practice. 0.0038 lb/MMBtu 1 H LAERMI-0433 MEC NORTH, LLC AND MEC SOUTH LLC MI 6/29/2018 Natural gas combined cycle power plant (two plants: north and south) NG 61.5 MMBtu/hr Good combustion practices. 0.004 lb/MMBtu HOURLY BACT-PSDPA-0307 YORK ENERGY CENTER BLOCK 2 ELECTRICIT PA 6/15/2015 Calpine Mid-Merit, LLC. currently operates Block 1 of the York Energy Ce NG 62.04 MCF/hr Good combustion practices and FGR 0.004 lb/MMBtu LAERPA-0310 CPV FAIRVIEW ENERGY CENTER PA 9/2/2016
temporarily operate the Fairview Energy Center. NG 92.4 MMBtu/hr ULSD and good combustion practices 0.004 lb/MMBtu AVG OF 3 1-HR TEST LAER
MI-0423 INDECK NILES, LLC MI 1/4/2017 Natural gas combined cycle power plant. NG 182 MMBtu/hr Good combustion practices. 0.004 lb/MMBtu TEST PROTOCOL WI BACT-PSDVA-0321 BRUNSWICK COUNTY POWER STATION VA 3/12/2013 New, combined-cycle, natural gas-fired, electrical power generating facil NG 66.7 MMBtu/hr Clean fuel and good combustion practices 0.005 lb/MMBtu BACT-PSDVA-0328 C4GT, LLC VA 4/26/2018 Natural gas-fired combined cycle power plant NG 902 mmcf/y good combustion practices. 0.005 lb/MMBtu BACT-PSD*PA-0316 RENOVO ENERGY CENTER, LLC PA 1/26/2018
two (2) identical 1 x 1 powerblocks where each powerblock consists of a NG 118800 MMBtu/12 mo 0.005 LB MMBTU N/A
PA-0311 MOXIE FREEDOM GENERATION PLANT PA 9/1/2015
power blocks, each consisting of a combustion gas turbine (CGT or CT) NG 55.4 MMBtu/hr 0.005 lb/MMBtu LAERPA-0309 LACKAWANNA ENERGY CTR/JESSUP PA 12/23/2015
three (3) identical General Electric Model 7HA.02 natural gas fired NG 184.4 MMBtu/hr 0.005 lb/MMBtu 30-DAY ROLLING BALAER
MI-0406 RENAISSANCE POWER LLC MI 11/1/2013 For technical questions regarding this permit, please contact the permit e NG 40 MMBtu/hr Good combustion practices. 0.005 lb/MMBtu TEST PROTOCOL; EA BACT-PSDTX-0756 CCI CORPUS CHRISTI CONDENSATE SPLITTE TX 6/19/2015 Two identical condensate splitter trains each capable of processing 50,00 NG 37 MMBtu/hr (Good combustion practices will limit VOC emissions to 0 0.005 LB/100 SCF EACH BOILER BACT-PSDPA-0288 SUNBURY GENERATION LP/SUNBURY SES PA 4/1/2013 This plan approval is for the repowering of the Sunbury Generation facilit NG 106000 MMBTU 0.005 lb/MMBtu OTHER CASEOR-0050 TROUTDALE ENERGY CENTER, LLC OR 3/5/2014 Troutdale Energy Center (TEC) proposes to construct and operate a 653 m NG 39.8 MMBtu/hr Utilize Low-NOx burners and FGR. 0.005 lb/MMBtu 3-HR BLOCK AVERAGBACT-PSDIA-0107 MARSHALLTOWN GENERATING STATION IA 4/14/2014 Utility electric generating station NG 60.1 mmBtu/hr 0.005 lb/MMBtu AVERAGE OF 3 ONE BACT-PSDPA-0306 TENASKA PA PARTNERS/WESTMORELAND PA 2/12/2016 The plan approval will allow construction and temporary operation of a p NG 1052 MMscf/yr Good combustion practice 0.0054 lb/MMBtu LAERMI-0435 BELLE RIVER COMBINED CYCLE POWER PLAMI 7/16/2018 Natural gas combined-cycle power plant NG 99.9 MMBtu/hr Good combustion practices 0.008 lb/MMBtu HOURLY BACT-PSDMI-0424 HOLLAND BOARD OF PUBLIC WORKS - EAS MI 12/5/2016 Natural gas combined heat and power plant. NG 83.5 MMBtu/hr Good combustion practices. 0.008 lb/MMBtu TEST PROTOCOL WI BACT-PSDMI-0412 HOLLAND BOARD OF PUBLIC WORKS - EAS MI 12/4/2013 Natural gas combined heat and power plant. NG 95 MMBtu/hr Good combustion practices 0.008 lb/MMBtu TEST PROTOCOL BACT-PSDMI-0412 HOLLAND BOARD OF PUBLIC WORKS - EAS MI 12/4/2013 Natural gas combined heat and power plant. NG 55 MMBtu/hr Good combustion control 0.008 lb/MMBtu TEST PROTOCOL BACT-PSDMI-0410 THETFORD GENERATING STATION MI 7/25/2013 Four (4) natural gas fired combined cycle combustion turbine generators NG 100 MMBtu/hr Efficient combustion; natural gas fuel. 0.008 lb/MMBtu HEAT INPUT; TEST P BACT-PSDOH-0375 LONG RIDGE ENERGY GENERATION LLC - H OH 11/7/2017 Combined cycle combustion turbine power generation facility NG 26.8 MMBtu/hr Good combustion controls 0.13 LB/H BACT-PSDPA-0296 BERKS HOLLOW ENERGY ASSOC LLC/ONTE PA 12/17/2013 This application is for the construction of a natural gas-fired combined-cy NG 40 MMBtu/hr 0.14 T/YR BASED ON 12-MONT N/AOH-0377 HARRISON POWER OH 4/19/2018 1000 MW natural gas-fired combined cycle combustion turbine plant NG 44.55 MMBtu/hr Good combustion practices 0.16 LB/H BACT-PSDOH-0366 CLEAN ENERGY FUTURE - LORDSTOWN, LL OH 8/25/2015 962 MW (gross winter output) combined cycle gas turbine (CCGT) facilityNG 34 MMBtu/hr Good combustion controls 0.2 LB/H BACT-PSDOH-0370 TRUMBULL ENERGY CENTER OH 9/7/2017 940 MW combined cycle gas turbine (CCGT) facility NG 37.8 MMBtu/hr Good combustion controls 0.23 LB/H BACT-PSDOH-0372 OREGON ENERGY CENTER OH 9/17/2017 Combined cycle gas turbine (CCGT) facility NG 37.8 MMBtu/hr good combustion controls 0.23 LB/H BACT-PSDOH-0377 HARRISON POWER OH 4/19/2018 1000 MW natural gas-fired combined cycle combustion turbine plant NG 80 MMBtu/hr Good combustion practices 0.248 LB/H BACT-PSDNJ-0080 HESS NEWARK ENERGY CENTER NJ 11/1/2012
HESS Newark Energy Center (Hess-NEC), proposed at City of Newark NG 51.9 mmcf/yr use of natural gas a clean fuel 0.27 LB/H AVERAGE OF THREE LAER
NJ-0085 MIDDLESEX ENERGY CENTER, LLC NJ 7/19/2016
1.ONE GENERAL ELECTRIC (GE) 7HA.02 CCCT NOMINALLY RATED AT NG 4000 H/YR Good combustion practices and natural gas 0.488 LB/H AV OF THREE ONE H LAERVA-0325 GREENSVILLE POWER STATION VA 6/17/2016
electrical power generating facility utilizing three combustion turbines NG 185 MMBtu/hr Good combustion pratices 0.5 T/12 MO RO 12 MONTH ROLLING N/A
TX-0817 CHOCOLATE BAYOU STEAM GENERATING TX 2/17/2017 support facility providing steam and electricity NG 0 GOOD COMBUSTION PRACTICES 0.54 LB/H BACT-PSDOH-0367 SOUTH FIELD ENERGY LLC OH 9/23/2016 1150 MW combined-cycle gas turbine (CCGT) facility NG 99 MMBtu/hr Good combustion controls and natural gas/ultra low su 0.59 LB/H BACT-PSDOH-0360 CARROLL COUNTY ENERGY OH 11/5/2013 Natural gas fired combined cycle gas turbine electric generating station o NG 99 MMBtu/hr Good combustion practices and using combustion optim 0.59 LB/H BACT-PSDTop 40 sources with lowest emission rates from RBLC search. December 2019*Draft determination

Renovo Energy CenterAuxiliary Boiler - Natural GasRBLC Search ResultsSulfur Dioxide (SO2)
RBLC ID Facility Name State Permit Date Facility Description Fuel Size Units Control DescriptinEmission
Limit Units Averaging Period Basis*FL-0367 SHADY HILLS COMBINED CYCLE FACILITY FL 7/27/2018 A 573-megawatt (MW) (winter) 1-on-1 combined cycle plant whic NG 60 MMBtu/hr Limited sulfur content in natural gas 0 BACT-PSD*FL-0363 DANIA BEACH ENERGY CENTER FL 12/4/2017 1200 megawatt 2-on-1 combined cycle facility, natural gas-fired, w NG 99.8 MMBtu/hr Clean fuels 0 BACT-PSD*MD-0042 WILDCAT POINT GENERATION FACILITY MD 4/8/2014
POWER PLANTFACILITY-WIDE PM10 EMISSION LIMIT = 278 NG 45 MMBtu/hr EXCLUSIVE USE OF PIPELINE QUALITY NATURAL GAS 0.0006 lb/MMBtu 3-HOUR BLOCK AVERAGEBACT-PSD
VA-0321 BRUNSWICK COUNTY POWER STATION VA 3/12/2013 New, combined-cycle, natural gas-fired, electrical power generati NG 66.7 MMBtu/hr Low sulfur fuel. 0.0011 lb/MMBtu BACT-PSDVA-0325 GREENSVILLE POWER STATION VA 6/17/2016
combined-cycle electrical power generating facility utilizing three NG 185 MMBtu/hr Low sulfur fuel 0.0011 lb/MMBtu N/A
VA-0328 C4GT, LLC VA 4/26/2018 Natural gas-fired combined cycle power plant NG 105 MMBtu/hr The use of pipeline quality natural gas with a max sul 0.0012 lb/MMBtu BACT-PSDPA-0291 HICKORY RUN ENERGY STATION PA 4/23/2013 Natural gas-fired combined-cycle electric generation facility that i NG 40 MMBtu/hr 0.0021 lb/MMBtu OTHER CASENY-0104 CPV VALLEY ENERGY CENTER NY 8/1/2013 CPV Valley Energy Center is a 680 MW combined cycle electric gen NG 0 Natural gas. 0.0022 lb/MMBtu 1 H BACT-PSDPA-0288 SUNBURY GENERATION LP/SUNBURY SES PA 4/1/2013 This plan approval is for the repowering of the Sunbury Generatio NG 106000 MMBTU 0.003 lb/MMBtu OTHER CASEOH-0377 HARRISON POWER OH 4/19/2018 1000 MW natural gas-fired combined cycle combustion turbine plNG 44.55 MMBtu/hr Pipeline quality natural gas 0.022 LB/H BACT-PSDOH-0370 TRUMBULL ENERGY CENTER OH 9/7/2017 940 MW combined cycle gas turbine (CCGT) facility NG 37.8 MMBtu/hr Low sulfur fuel 0.06 LB/H BACT-PSDOH-0372 OREGON ENERGY CENTER OH 9/27/2017 Combined cycle gas turbine (CCGT) facility NG 37.8 MMBtu/hr low sulfur fuel 0.06 LB/H BACT-PSDNJ-0080 HESS NEWARK ENERGY CENTER NJ 11/1/2012
HESS Newark Energy Center (Hess-NEC), proposed at City of NG 51.9 mmcf/yr use of natural gas a clean fuel and a low sulfur fuel 0.08 LB/H N/A
OH-0377 HARRISON POWER OH 4/19/2018 1000 MW natural gas-fired combined cycle combustion turbine plNG 80 MMBtu/hr Pipeline quality natural gas 0.12 LB/H BACT-PSDNJ-0085 MIDDLESEX ENERGY CENTER, LLC NJ 7/19/2016
1.ONE GENERAL ELECTRIC (GE) 7HA.02 CCCT NOMINALLY NG 4000 H/YR USE OF NATURAL GAS A CLEAN BURNING LOW SULFU 0.128 LB/H OTHER CASE
OH-0367 SOUTH FIELD ENERGY LLC OH 9/23/2016 1150 MW combined-cycle gas turbine (CCGT) facility NG 99 MMBtu/hr natural gas/ultra low sulfur diesel 0.15 LB/H BACT-PSDPA-0296 BERKS HOLLOW ENERGY ASSOC LLC/ONTELAUNPA 12/17/2013 This application is for the construction of a natural gas-fired comb NG 40 MMBtu/hr 0.19 T/YR BASED ON 12-MONTH RO N/AOH-0374 GUERNSEY POWER STATION LLC OH 10/23/2017 1,650 MW combined cycle combustion turbine electrical generati NG 185 MMBtu/hr Pipeline natural gas fuel 0.28 LB/H BACT-PSDMI-0423 INDECK NILES, LLC MI 1/4/2017 Natural gas combined cycle power plant. NG 182 MMBtu/hr Good combustion practices and the use of pipeline q 0.6 LB/MMSCF BASED ON FUEL RECEIPT BACT-PSDMA-0039 SALEM HARBOR STATION REDEVELOPMENT MA 1/30/2014 Footprint Power Salem Harbor Development LP (the Permittee) p NG 80 MMBtu/hr 0.9 PPMVD@3% 1 HR BLOCK AVG, DOES N OTHER CASEMI-0433 MEC NORTH, LLC AND MEC SOUTH LLC MI 6/29/2018 Natural gas combined cycle power plant (two plants: north and soNG 61.5 MMBtu/hr Good combustion practices and the use of pipeline q 1.8 LB/MMSCF MONTHLY BACT-PSDMI-0433 MEC NORTH, LLC AND MEC SOUTH LLC MI 6/29/2018 Natural gas combined cycle power plant (two plants: north and soNG 61.5 MMBtu/hr Good combustion practices and the use of pipeline q 1.8 LB/MMSCF MONTHLY BACT-PSDFL-0356 OKEECHOBEE CLEAN ENERGY CENTER FL 3/9/2016 Fossil-fueled power plant, consisting of a 3-on-1 combined cycle u NG 99.8 MMBtu/hr Use of low-sulfur gas 2 GR. S/100 SCF GAS BACT-PSD*Draft determination December 2019

Renovo Energy CenterAuxiliary Boiler - Natural GasRBLC Search ResultsSulfuric Acid Mist (H2SO4)
RBLC ID Facility Name State Permit Date Facility Description Fuel Size Units Control DescriptionEmission
Limit Units Averaging Time BasisVA-0328 C4GT, LLC VA 4/26/2018 Natural gas-fired combined cycle power plant NG 902 mmcf/y The use of pipeline quality natural gas with a max sulfur conte 0 BACT-PSD*FL-0367 SHADY HILLS COMBINED CYCLE FACILITY FL 7/27/2018 A 573-megawatt (MW) (winter) 1-on-1 combined cycle plant which NG 60 MMBtu/houClean fuels 0 BACT-PSDPA-0307 YORK ENERGY CENTER BLOCK 2 ELECTRICITY PA 6/15/2015 Calpine Mid-Merit, LLC. currently operates Block 1 of the York Ener NG 62.04 MCF/hr Good combustion practices and low sulfur fuels 0 LB/MMBTU BACT-PSD*FL-0363 DANIA BEACH ENERGY CENTER FL 12/4/2017 1200 megawatt 2-on-1 combined cycle facility, natural gas-fired, wi NG 99.8 MMBtu/hr Clean fuels 0 BACT-PSDOR-0050 TROUTDALE ENERGY CENTER, LLC OR 3/5/2014 Troutdale Energy Center (TEC) proposes to construct and operate a NG 39.8 MMBTU/H
Utilize only natural gas. 0 BACT-PSD
VA-0325 GREENSVILLE POWER STATION VA 6/17/2016
cycle electrical power generating facility utilizing three NG 185 MMBTU/HRPipeline quality natural gas 0.0001 LB/MMBTU N/APA-0311 MOXIE FREEDOM GENERATION PLANT PA 9/1/2015
1 x 1 power blocks, each consisting of a combustion gas turbine NG 55.4 MMBtu/hr 0.0001 LB/MMBTU BACT-PSD
PA-0309 LACKAWANNA ENERGY CTR/JESSUP PA 12/23/2015
operation of three (3) identical General Electric Model 7HA.02 NG 184.4 MMBtu/hr 0.0001 LB/MMBTU BACT-PSDNY-0104 CPV VALLEY ENERGY CENTER NY 8/1/2013 CPV Valley Energy Center is a 680 MW combined cycle electric gene NG 48.1 Natural gas. 0.0002 LB/MMBTU 1 H BACT-PSDPA-0291 HICKORY RUN ENERGY STATION PA 4/23/2013 Natural gas-fired combined-cycle electric generation facility that is NG 40 MMBTU/H 0.0005 LB/MMBTU OTHER CASEMA-0039 SALEM HARBOR STATION REDEVELOPMENT MA 1/30/2014 Footprint Power Salem Harbor Development LP (the Permittee) pro NG 80 MMBTU/H 0.0009 LB/MMBTU 1 HR BLOCK AVG, D BACT-PSDPA-0310 CPV FAIRVIEW ENERGY CENTER PA 9/2/2016
temporarily operate the Fairview Energy Center. NG 92.4 MMBtu/hr ULSD and good combustion practices 0.0011 LB/MMBTU AVG OF 3 1-HR TES BACT-PSD
OH-0375 LONG RIDGE ENERGY GENERATION LLC - HAN OH 11/7/2017 Combined cycle combustion turbine power generation facility NG 26.8 MMBTU/H Low sulfur fuel 0.003 LB/H BACT-PSDOH-0377 HARRISON POWER OH 4/19/2018 1000 MW natural gas-fired combined cycle combustion turbine pla NG 44.55 MMBTU/H Pipeline quality natural gas 0.004 LB/H 9e-5 lb/MMBtu BACT-PSDOH-0366 CLEAN ENERGY FUTURE - LORDSTOWN, LLC OH 8/25/2015 962 MW (gross winter output) combined cycle gas turbine (CCGT) f NG 34 MMBTU/H Low sulfur fuel 0.004 LB/H BACT-PSDOH-0372 OREGON ENERGY CENTER OH 9/27/2017 Combined cycle gas turbine (CCGT) facility NG 37.8 MMBTU/H low sulfur fuel 0.004 LB/H BACT-PSD*MD-0042 WILDCAT POINT GENERATION FACILITY MD 4/8/2014
PLANTFACILITY-WIDE PM10 EMISSION LIMIT = 278 TONS/YR NG 45 MMBTU/H EXCLUSIVE USE OF PIPELINE QUALITY NATURAL GAS 0.004 LB/MMBTU 3-HOUR BLOCK AV BACT-PSD
MD-0045 MATTAWOMAN ENERGY CENTER MD 11/13/2015 990 MW COMBINED-CYCLE NATURAL GAS-FIRED POWER PLANTNO NG 42 MMBTU/H EXCLUSIVE USE OF NATURAL GAS, AND GOOD COMBUSTION P 0.004 LB/MMBTU 3-HOUR BLOCK AV BACT-PSDPA-0306 TENASKA PA PARTNERS/WESTMORELAND GE PA 2/12/2016 The plan approval will allow construction and temporary operation NG 1052 MMscf/yr Good combustion practices 0.0049 TPY BACT-PSDIA-0107 MARSHALLTOWN GENERATING STATION IA 4/14/2014 Utility electric generating station NG 60.1 mmBtu/hr 0.0055 LB/H AVERAGE OF 3 ONE BACT-PSDVA-0321 BRUNSWICK COUNTY POWER STATION VA 3/12/2013 New, combined-cycle, natural gas-fired, electrical power generating NG 66.7 MMBTU/H
H2SO4 0.0086 LB/MMBTU BACT-PSD
OH-0370 TRUMBULL ENERGY CENTER OH 9/7/2017 940 MW combined cycle gas turbine (CCGT) facility NG 37.8 MMBTU/H Low sulfur fuel 0.0087 LB/H BACT-PSDNJ-0085 MIDDLESEX ENERGY CENTER, LLC NJ 7/19/2016
1.ONE GENERAL ELECTRIC (GE) 7HA.02 CCCT NOMINALLY NG 4000 H/YR USE OF NATURAL GAS A CLEAN BURNING AND LOW SULFUR F 0.01 LB/H BACT-PSD
OH-0367 SOUTH FIELD ENERGY LLC OH 9/23/2016 1150 MW combined-cycle gas turbine (CCGT) facility NG 99 MMBTU/H natural gas/ultra low sulfur diesel 0.011 LB/H BACT-PSDOH-0352 OREGON CLEAN ENERGY CENTER OH 6/18/2013 799 Megawatt Combined Cycle Combustion Turbine Power Plant NG 99 MMBtu/H only burning natural gas 0.5 GR/100 SCF 0.011 LB/H BACT-PSD*WV-0029 HARRISON COUNTY POWER PLANT WV 3/27/2018
NG 77.8 mmBtu/hr Use of Natural Gas 0.0132 LB/HR BACT-PSD
OH-0377 HARRISON POWER OH 4/19/2018 1000 MW natural gas-fired combined cycle combustion turbine pla NG 80 MMBTU/H Pipeline quality natural gas 0.018 LB/H BACT-PSDOH-0360 CARROLL COUNTY ENERGY OH 11/5/2013 Natural gas fired combined cycle gas turbine electric generating sta NG 99 MMBtu/H only burning natural gas 0.02 LB/H BACT-PSD*WV-0032 BROOKE COUNTY POWER PLANT WV 9/18/2018 Nominal 925 mWe natural gas-fired combined-cycle power plant. S NG 111.9 mmBtu/hr Use of Natural Gas 0.02 LB/HR BACT-PSDOH-0363 NTE OHIO, LLC OH 11/5/2014 Combined-cycle, natural gas-fired power plant NG 150 MMBTU/H Exclusive Natural Gas 0.03 LB/H BACT-PSDPA-0296 BERKS HOLLOW ENERGY ASSOC LLC/ONTELA PA 12/17/2013 This application is for the construction of a natural gas-fired combin NG 40 MMBTU/H 0.04 T/YR BASED ON 12-MON N/AOH-0374 GUERNSEY POWER STATION LLC OH 10/23/2017 1,650 MW combined cycle combustion turbine electrical generating NG 185 MMBTU/H Pipeline natural gas fuel 0.043 LB/H BACT-PSD*IL-0130 JACKSON ENERGY CENTER IL 12/31/2018 The proposed facility is designed to generate baseload power. It w NG 96 mmBtu/hr Good combustion practice 0.1 POUNDS/HOUR BACT-PSDIL-0129 CPV THREE RIVERS ENERGY CENTER IL 7/30/2018 The proposed facility is designed to generate baseload power. It w NG 96 mmBtu/hr Good combustion practice 0.1 LB/HR BACT-PSDMI-0435 BELLE RIVER COMBINED CYCLE POWER PLAN MI 7/16/2018 Natural gas combined-cycle power plant NG 99.9 MMBTU/H Good combustion practices, low sulfur fuel 0.34 GR S/100 SC FUEL SUPPLIER RECBACT-PSD*Draft determination December 2019

Renovo Energy CenterDiesel Emergency Generator EngineRBLC Search ResultsNitrogen Oxides (NOx)
RBLC ID Facility Name State Permit Date Process Name Size Units Process Notes Control DescriptionEmission
Limit UnitsAveraging
Period BasisIL-0129 CPV THREE RIVERS ENERGY CENTER IL 07/30/2018 Emergency Engines 0
One large emergency engine-generator, 1500 kW 0 LAER
WY-0070 CHEYENNE PRAIRIE GENERATING STATION WY 08/28/2012 Diesel Emergency Generator (EP15) 839 hp EPA Tier 2 rated 0 BACT-PSDWV-0025 MOUNDSVILLE COMBINED CYCLE POWER PWV 11/21/2014 Emergency Generator 2015.7 HP Nominal 1,500 kW. Limited to 100 hours/year. 0 BACT-PSDOK-0154 MOORELAND GENERATING STA OK 07/02/2013 DIESEL-FIRED EMERGENCY GENERATOR EN 1341 HP <100 HR/YR OPERATION. COMBUSTION CONTROL 0.011 LB/HP-HR =4.99 g/hp- BACT-PSDPA-0296 BERKS HOLLOW ENERGY ASSOC LLC/ONTELPA 12/17/2013 Emergency Generator 60 Gal/hr 0.53 T/YR BASED ON 1 OTHER CASECA-1212 PALMDALE HYBRID POWER PROJECT CA 10/18/2011 EMERGENCY IC ENGINE 182 HP UNIT IS 135 KW. 4 G/KW-H 3-HR AVG BACT-PSDVA-0328 C4GT, LLC VA 04/26/2018 Emergency Diesel GEN 500 H/YR 2500 KW good combustion practices and the use of ultra low sulfur d 4.8 G/HP H BACT-PSDPA-0310 CPV FAIRVIEW ENERGY CENTER PA 09/02/2016 Emergency Generator Engines 0 (2) 1500 kW emergency diesel genset. Emission limitations are for each genset and fuel is restricted to ULSD (1 4.8 G/BHP-HR LAERMD-0041 CPV ST. CHARLES MD 04/23/2014 EMERGENCY GENERATOR 1500 KW 40 CFR 60 SUBPART IIII, ULTRA LOW-SULFUR DIESEL EXCLUSIVE USE OF ULSD FUEL, GOOD COMBUSTION PRACT 4.8 G/HP-H N/A LAER*MD-0042 WILDCAT POINT GENERATION FACILITY MD 04/08/2014 EMERGENCY GENERATOR 1 2250 KW 40 CFR 60 SUBPART IIII, ULTRA LOW-SULFUR DIESEL LIMITED OPERATING HOURS, USE OF ULTRA- LOW SULFUR 4.8 G/HP-H LAERMA-0039 SALEM HARBOR STATION REDEVELOPMEN MA 01/30/2014 Emergency Engine/Generator 7.4 MMBTU/H
period 4.8 GM/BHP-H 1 HR BLOCK LAER
IN-0158 ST. JOSEPH ENEGRY CENTER, LLC IN 12/03/2012 TWO (2) EMERGENCY DIESEL GENERATOR 1006 HP EACH THE TWO INTERNAL COMBUSTION ENGINES, IDENT COMBUSTION DESIGN CONTROLS AND USAGE LIMITS 4.8 G/HP-H 3 HOURS BACT-PSDIN-0158 ST. JOSEPH ENEGRY CENTER, LLC IN 12/03/2012 EMERGENCY DIESEL GENERATOR 2012 HP THIS ONE (1) INTERNAL COMBUSTION ENGINE, IDEN COMBUSTION DESIGN CONTROLS AND USAGE LIMITS 4.8 G/HP-H 3 HOURS BACT-PSDMI-0402 SUMPTER POWER PLANT MI 11/17/2011 Diesel fuel-fired combustion engine (RICE) 732 HP Diesel fuel-fired engine for emergency. Good combustion practices 4.85 G/HP-H TEST BACT-PSDPA-0311 MOXIE FREEDOM GENERATION PLANT PA 09/01/2015 Emergency Generator 0
emergency diesel generator shall not exceed 15 4.93 G/HP-HR LAER
PA-0286 MOXIE ENERGY LLC/PATRIOT GENERATION PA 01/31/2013 EMERGENCY GENERATOR-ENGINE 0 the permittee shall only use diesel fuel that is classified as ULTRA-LOW SULFUR NON-HIGHWAY DIESEL FUEL (1 4.93 GM/B-HP-H OTHER CASEPA-0278 MOXIE LIBERTY LLC/ASYLUM POWER PL T PA 10/10/2012 Emergency Generator 0 The emergency generator will be restricted to operate not more than 100 hr/yr. 4.93 G/B-HP-H OTHER CASEPA-0309 LACKAWANNA ENERGY CTR/JESSUP PA 12/23/2015 2000 kW Emergency Generator 0 To allow maintenance of vital plant loads during power outages or maintenance of the switchyard. 5.45 GM/HP-HR LAERCA-1191 VICTORVILLE 2 HYBRID POWER PROJECT CA 03/11/2010 EMERGENCY ENGINE 2000 KW 2000 KW (2,683 hp) engine OPERATIONAL RESTRICTION OF 50 HR/YR 6 G/KW-H BACT-PSD*IL-0130 JACKSON ENERGY CENTER IL 12/31/2018 Emergency Engine 1500 kW One large emergency engine-generator at the plant; one small emergency engine-generator at the switchyard. 6.4 G/KW-HR LAERVA-0325 GREENSVILLE POWER STATION VA 06/17/2016 DIESEL-FIRED EMERGENCY GENERATOR 30 0 Good Combustion Practices/Maintenance 6.4 G/KW PER HR N/A*FL-0367 SHADY HILLS COMBINED CYCLE FACILITY FL 07/27/2018 1,500 kW Emergency Diesel Generator 14.82 MMBtu/h
total of 100 hr/yr for maintenance checks, Operate and maintain the engine according to the manufa 6.4 G/KW-HOUR BACT-PSD
MI-0433 MEC NORTH, LLC AND MEC SOUTH LLC MI 06/29/2018 EUEMENGINE (North Plant): Emergency E 1341 HP A 1,341 HP (1,000 kilowatts (KW)) diesel-fired emer Good combustion practices and meeting NSPS Subpart IIII 6.4 G/KW-H HOURLY BACT-PSDMI-0433 MEC NORTH, LLC AND MEC SOUTH LLC MI 06/29/2018 EUEMENGINE (South Plant): Emergency E 1341 HP A 1,341 HP (1,000 kilowatts (kW)) diesel-fired emer Good combustion practices and meeting NSPS IIII requirem 6.4 G/KW-H HOURLY BACT-PSDMI-0435 BELLE RIVER COMBINED CYCLE POWER PLAMI 07/16/2018 EUEMENGINE: Emergency engine 2 MW A nominal 2 MW diesel-fueled emergency engine w State of the art combustion design. 6.4 G/KW-H HOURLY BACT-PSDMI-0423 INDECK NILES, LLC MI 01/04/2017 EUEMENGINE (Diesel fuel emergency engi 22.68 MMBTU/Ha 2,922 horsepower (HP) (2,179 kilowatts (kW)) die Good combustion practices and meeting NSPS IIII requirem 6.4 G/KW-H TEST PROTO BACT-PSDMD-0046 KEYS ENERGY CENTER MD 10/31/2014 DIESEL-FIRED AUXILIARY (EMERGENCY) EN 1500 KW TWO DIESEL-FIRED AUXILIARY GENERATORS (EMER EXCLUSIVE USE OF ULTRA LOW SULFUR FUEL AND GOOD C 6.4 G/KW-H BACT-PSDMD-0045 MATTAWOMAN ENERGY CENTER MD 11/13/2015 EMERGENCY GENERATOR 1490 HP 40 CFR 60 SUBPART IIII, 40 CFR 63 SUBPART ZZZZ UL EXCLUSIVE USE OF ULTRA LOW SULFUR FUEL AND GOOD C 6.4 G/KW-H BACT-PSDCA-1212 PALMDALE HYBRID POWER PROJECT CA 10/18/2011 EMERGENCY IC ENGINE 2683 HP UNIT IS 2000 KW. 6.4 G/KW-H 3-HR AVG BACT-PSDAK-0071 INTERNATIONAL STATION POWER PLANT AK 12/20/2010 Caterpillar 3215C Black Start Generator (1 1500 KW-e Turbocharger and Aftercooler 6.4 G/KW-H INSTANTAN BACT-PSDID-0018 LANGLEY GULCH POWER PLANT ID 06/25/2010 EMERGENCY GENERATOR ENGINE 750 KW COMPRESSION IGNITION INTERNAL COMBUSTION (
GOOD COMBUSTION PRACTICES (GCP) 6.4 G/KW-H NOX+NMHCBACT-PSD
*Draft Determination December 2019

Renovo Energy CenterDiesel Fire Pump EngineRBLC Search ResultsNitrogen Oxides (NOx)
RBLC ID Facility Name State Permit Date Process Name Size Units Process Notes Control DescriptionEmission
Limit UnitsAveraging
Period BasisPA-0286 MOXIE ENERGY LLC/PATRIOT GENERATION PPA 01/31/2013 Fire Pump Engine - 460 BHP 0 2.6 G/HP-H EXPRESSED OTHER CASEPA-0278 MOXIE LIBERTY LLC/ASYLUM POWER PL T PA 10/10/2012 Fire Pump 0 The fire pump will be restricted to operate not more than 100 hr/yr. 2.6 G/B-HP-H OTHER CASEVA-0328 C4GT, LLC VA 04/26/2018 Emergency Fire Water Pump 500 HR/YR 315 BHP Good combustion practices and the use of ultra 3 G/HP-HR BACT-PSDMI-0433 MEC NORTH, LLC AND MEC SOUTH LLC MI 06/29/2018 EUFPENGINE (South Plant): Fire pump engine 300 HP A 300 HP diesel-fired emergency f Good combustion practices and meeting NSPS Su 3 G/BHP-H HOURLY BACT-PSDMI-0433 MEC NORTH, LLC AND MEC SOUTH LLC MI 06/29/2018 EUFPENGINE (North Plant): Fire pump engine 300 HP A 300 HP diesel-fired emergency f Good combustion practices and meeting NSPS Su 3 G/BHP-H HOURLY BACT-PSDPA-0311 MOXIE FREEDOM GENERATION PLANT PA 09/01/2015 Fire Pump Engine 0
combusted by the fire engine 3 G/HP-HR LAER
PA-0310 CPV FAIRVIEW ENERGY CENTER PA 09/02/2016 Emergency Fire Pump Engine 0 Sulfur content of diesel fuel shall not exceed 15 ppm, operation of engine shall not 3 G/BHP-HR LAERPA-0309 LACKAWANNA ENERGY CTR/JESSUP PA 12/23/2015 Fire pump engine 15 gal/hr 3 GM/HP-HR LAERMD-0041 CPV ST. CHARLES MD 04/23/2014 EMERGENCY DIESEL ENGINE FOR FIRE WATER PUM 300 HP 40 CFR 60, SUBPART IIII, ULTRA LO EXCLUSIVE USE OF ULSD FUEL, GOOD COMBUST 3 G/HP-H N/A LAER*MD-0042 WILDCAT POINT GENERATION FACILITY MD 04/08/2014 EMERGENCY DIESEL ENGINE FOR FIRE WATER PUM 477 HP 40 CFR 60, SUBPART IIII, ULTRA LO LIMITED OPERATING HOURS, USE OF ULTRA- LOW 3 G/HP-H LAERMI-0423 INDECK NILES, LLC MI 01/04/2017 EUFPENGINE (Emergency engine--diesel fire pump) 1.66 MMBTU/H A 260 brake horsepower (bhp) die Good combustion practices and meeting NSPS Su 3 G/BHP-H TEST PROTO BACT-PSDMI-0424 HOLLAND BOARD OF PUBLIC WORKS - EAST MI 12/05/2016 EUFPENGINE (Emergency engine--diesel fire pump) 500 H/YR A 165 horsepower (hp) diesel-fue Good combustion practices. 3 G/HP-H TEST PROTO BACT-PSDMA-0039 SALEM HARBOR STATION REDEVELOPMENT MA 01/30/2014 Fire Pump Engine 2.7 MMBTU/H
12-month rolling period 3 GM/BHP-H1 HR BLOCK LAER
MI-0412 HOLLAND BOARD OF PUBLIC WORKS - EAST MI 12/04/2013 Emergency Engine --Diesel Fire Pump (EUFPENGINE 165 HP A 165 hoursepower (hp) diesel-fu Good combustion practices 3 G/HP-H TEST PROTOBACT-PSDMI-0410 THETFORD GENERATING STATION MI 07/25/2013 EU-FPENGINE: Diesel fuel fired emergency backup 315 hp namepla
emergency backup fire mump. Proper combustion design and ultra low sulfur d 3 G/HP-H TEST PROTO BACT-PSD
IN-0158 ST. JOSEPH ENEGRY CENTER, LLC IN 12/03/2012 TWO (2) FIREWATER PUMP DIESEL ENGINES 371 BHP, EACH THE TWO FIREWATER PUMP ENG COMBUSTION DESIGN CONTROLS AND USAGE LI 3 G/HP-H 3 HOURS BACT-PSDLA-0331 CALCASIEU PASS LNG PROJECT LA 09/21/2018 Firewater Pumps 634 kW Good Combustion and Operating Practices. 3.1 G/HP-H BACT-PSDCA-1192 AVENAL ENERGY PROJECT CA 06/21/2011 EMERGENCY FIREWATER PUMP ENGINE 288 HP EQUIPPED W/ A TURBOCHARGER AND AN INTER 3.4 G/HP-H BACT-PSDCA-1191 VICTORVILLE 2 HYBRID POWER PROJECT CA 03/11/2010 EMERGENCY FIREWATER PUMP ENGINE 135 KW 135 KW (182 hp) IC Diesel-fired Em OPERATIONAL RESTRICTION OF 50 HR/YR, OPERA 3.8 G/KW-H BACT-PSD*IL-0130 JACKSON ENERGY CENTER IL 12/31/2018 Firewater Pump Engine 420 horsepowerOne engine will power the pump in the firewater system. The fuel must meet the 4 G/KW-HR LAER*FL-0367 SHADY HILLS COMBINED CYCLE FACILITY FL 07/27/2018 Emergency Fire Pump Engine (347 HP) 8700 gal/year Limits equal Subpart IIII limits Operate and maintain the engine according to th 4 G/KW-HR BACT-PSDMI-0435 BELLE RIVER COMBINED CYCLE POWER PLANMI 07/16/2018 EUFPENGINE: Fire pump engine 399 BHP A 399 brake HP diesel-fueled eme State of the art combustion design. 4 G/KW-H HOURLY BACT-PSDMD-0046 KEYS ENERGY CENTER MD 10/31/2014 DIESEL-FIRED FIRE PUMP ENGINE 300 HP ONE DIESEL-FIRED FIRE PUMP EN EXCLUSIVE USE OF ULTRA LOW SULFUR DIESEL F 4 G/KW-H BACT-PSDMD-0045 MATTAWOMAN ENERGY CENTER MD 11/13/2015 EMERGENCY DIESEL ENGINE FOR FIRE WATER PUM 305 HP 40 CFR 60, SUBPART IIII, 40 CFR 63 EXCLUSIVE USE OF ULTRA LOW SULFUR FUEL AN 4 G/KW-H LAERCA-1212 PALMDALE HYBRID POWER PROJECT CA 10/18/2011 EMERGENCY IC ENGINE 182 HP UNIT IS 135 KW. 4 G/KW-H 3-HR AVG BACT-PSDID-0018 LANGLEY GULCH POWER PLANT ID 06/25/2010 FIRE PUMP ENGINE 235 KW COMPRESSION IGNITION INTERNA
GOOD COMBUSTION PRACTICES (GCP) 4 G/KW-H NOX+NMHCBACT-PSD
VA-0328 C4GT, LLC VA 04/26/2018 Emergency Diesel GEN 500 H/YR good combustion practices and the use of ultra l 4.8 G/HP H BACT-PSDPA-0310 CPV FAIRVIEW ENERGY CENTER PA 09/02/2016 Emergency Generator Engines 0 (2) 1500 kW emergency diesel genset. Emission limitations are for each genset and 4.8 G/BHP-HR LAERMD-0041 CPV ST. CHARLES MD 04/23/2014 EMERGENCY GENERATOR 1500 KW 40 CFR 60 SUBPART IIII, ULTRA LO EXCLUSIVE USE OF ULSD FUEL, GOOD COMBUST 4.8 G/HP-H N/A LAER*MD-0042 WILDCAT POINT GENERATION FACILITY MD 04/08/2014 EMERGENCY GENERATOR 1 2250 KW 40 CFR 60 SUBPART IIII, ULTRA LO LIMITED OPERATING HOURS, USE OF ULTRA- LOW 4.8 G/HP-H LAERMA-0039 SALEM HARBOR STATION REDEVELOPMENT MA 01/30/2014 Emergency Engine/Generator 7.4 MMBTU/H
12-month rolling period 4.8 GM/BHP-H1 HR BLOCK LAER
IN-0158 ST. JOSEPH ENEGRY CENTER, LLC IN 12/03/2012 TWO (2) EMERGENCY DIESEL GENERATORS 1006 HP EACH THE TWO INTERNAL COMBUSTIO COMBUSTION DESIGN CONTROLS AND USAGE LI 4.8 G/HP-H 3 HOURS BACT-PSDIN-0158 ST. JOSEPH ENEGRY CENTER, LLC IN 12/03/2012 EMERGENCY DIESEL GENERATOR 2012 HP THIS ONE (1) INTERNAL COMBUST COMBUSTION DESIGN CONTROLS AND USAGE LI 4.8 G/HP-H 3 HOURS BACT-PSDMI-0402 SUMPTER POWER PLANT MI 11/17/2011 Diesel fuel-fired combustion engine (RICE) 732 HP Diesel fuel-fired engine for emergGood combustion practices 4.85 G/HP-H TEST BACT-PSDPA-0311 MOXIE FREEDOM GENERATION PLANT PA 09/01/2015 Emergency Generator 0
combusted by the emergency 4.93 G/HP-HR LAER
PA-0286 MOXIE ENERGY LLC/PATRIOT GENERATION PPA 01/31/2013 EMERGENCY GENERATOR-ENGINE 0 the permittee shall only use diesel fuel that is classified as ULTRA-LOW SULFUR NO 4.93 GM/B-HP-H OTHER CASEPA-0278 MOXIE LIBERTY LLC/ASYLUM POWER PL T PA 10/10/2012 Emergency Generator 0 The emergency generator will be restricted to operate not more than 100 hr/yr. 4.93 G/B-HP-H OTHER CASEOH-0375 LONG RIDGE ENERGY GENERATION LLC - HAN OH 11/07/2017 Emergency Diesel Fire Pump Engine (P002) 700 HP 700 hp emergency diesel-fired fire Good combustion design 4.97 LB/H NMHC+NOX BACT-PSDOH-0374 GUERNSEY POWER STATION LLC OH 10/23/2017 Emergency Fire Pump (P006) 410 HP 410 HP emergency diesel-fired fir Certified to the meet the emissions standards in 2.7 LB/H NMHC+NOX BACT-PSDLA-0308 MORGAN CITY POWER PLANT LA 09/26/2013 380 HP Diesel Fired Pump Engine 2.3 MMBTU/hr Good combustion and maintenance practices, an 2.92 LB/H HOURLY MABACT-PSD
Top 50 sources with lowest emission rates from RBLC search.*Draft Determination December 2019

Renovo Energy CenterDiesel Generator and Fire Pump EngineRBLC Search ResultsCarbon Monoxide (CO)
RBLC ID Facility Name State Permit Date Equipment Type Size Units Control DescriptionEmission
Limit Limit Averaging Period BasisPA-0286 MOXIE ENERGY LLC/PATRIOT GENERATION PLT PA 01/31/2013 Emergency Generator 0 0.13 GM/B-HP-H OTHER CASEPA-0278 MOXIE LIBERTY LLC/ASYLUM POWER PL T PA 10/10/2012 Emergency Generator 0 0.13 G/B-HP-H OTHER CASEPA-0311 MOXIE FREEDOM GENERATION PLANT PA 09/01/2015 Emergency Generator 0 0.26 G/HP-HR BACT-PSDMI-0402 SUMPTER POWER PLANT MI 11/17/2011 Diesel fuel-fired combustion engine (RICE) 732 HP Good combustion practices 0.31 G/HP-H TEST BACT-PSDNY-0104 CPV VALLEY ENERGY CENTER NY 08/01/2013 Emergency generator 0 Good combustion practice. 0.45 G/BHP-H 1 H BACT-PSDPA-0309 LACKAWANNA ENERGY CTR/JESSUP PA 12/23/2015 Fire pump engine 15 gal/hr 0.5 GM/HP-HR BACT-PSDPA-0286 MOXIE ENERGY LLC/PATRIOT GENERATION PLT PA 01/31/2013 Fire Pump Engine - 460 BHP 0 0.5 G/HP-H OTHER CASEPA-0278 MOXIE LIBERTY LLC/ASYLUM POWER PL T PA 10/10/2012 Fire Pump 0 0.5 G/B-HP-H OTHER CASEPA-0309 LACKAWANNA ENERGY CTR/JESSUP PA 12/23/2015 2000 kW Emergency Generator 0 0.6 GM/HP-HR BACT-PSDPA-0311 MOXIE FREEDOM GENERATION PLANT PA 09/01/2015 Fire Pump Engine 0 1 G/HP-HR BACT-PSDVA-0321 BRUNSWICK COUNTY POWER STATION VA 03/12/2013 Diesel Fire water pump 376 bhp 500 h/yr good combustion practices 3.5 G/KW-HR BACT-PSDVA-0328 C4GT, LLC VA 04/26/2018 Emergency Diesel GEN 500 H/YR good combustion practices and the use of ultra low sulfur diesel (S15 ULSD 2.6 G/HP H BACT-PSDVA-0328 C4GT, LLC VA 04/26/2018 Emergency Fire Water Pump 500 HR/YR good combustion practices and the use of ultra low sulfur diesel (S15 ULSD 2.6 G/HP HR BACT-PSDVA-0325 GREENSVILLE POWER STATION VA 06/17/2016 DIESEL-FIRED WATER PUMP 376 bph (1) 0 Good Combustion Practices/Maintenance 2.6 G/HP-H HR N/AMI-0433 MEC NORTH, LLC AND MEC SOUTH LLC MI 06/29/2018 EUFPENGINE (South Plant): Fire pump engine 300 HP Good combustion practices and meeting NSPS Subpart IIII requirements. 2.6 G/BPH-H HOURLY BACT-PSDMI-0433 MEC NORTH, LLC AND MEC SOUTH LLC MI 06/29/2018 EUFPENGINE (North Plant): Fire pump engine 300 HP Good combustion practices and meeting NSPS Subpart IIII requirements. 2.6 G/BHP-H HOURLY BACT-PSDMD-0041 CPV ST. CHARLES MD 04/23/2014 Emergency Generator 1500 KW USE OF ULTRA LOW SULFUR DIESEL AND GOOD COMBUSTION PRACTICES 2.6 G/HP-H N/A BACT-PSDMD-0041 CPV ST. CHARLES MD 04/23/2014 EMERGENCY DIESEL ENGINE FOR FIRE WATER PUMP 300 HP USE OF ULTRA LOW SULFUR DIESEL AND GOOD COMBUSTION PRACTICES 2.6 G/HP-H N/A BACT-PSD*MD-0042 WILDCAT POINT GENERATION FACILITY MD 04/08/2014 EMERGENCY GENERATOR 1 2250 KW USE OF ULSD FUEL, GOOD COMBUSTION PRACTICES AND HOURS OF OPERA 2.6 G/HP-H BACT-PSD*MD-0042 WILDCAT POINT GENERATION FACILITY MD 04/08/2014 EMERGENCY DIESEL ENGINE FOR FIRE WATER PUMP 477 HP USE OF ULSD FUEL, GOOD COMBUSTION PRACTICES AND HOURS OF OPERA 2.6 G/HP-H BACT-PSDMI-0423 INDECK NILES, LLC MI 01/04/2017 Fire Pump Engine 1.66 MMBTU/H Good combustion practices and meeting NSPS Subpart IIII requirements. 2.6 G/BHP-H TEST PROTOCOL W BACT-PSDMA-0039 SALEM HARBOR STATION REDEVELOPMENT MA 01/30/2014 Emergency Engine/Generator 7.4 MMBTU/H 2.6 GM/BHP-H 1 HR BLOCK AVG IN OTHER CASEMA-0039 SALEM HARBOR STATION REDEVELOPMENT MA 01/30/2014 Fire Pump Engine 2.7 MMBTU/H 2.6 GM/BHP-H 1 HR BLOCK AVG OTHER CASEMI-0410 THETFORD GENERATING STATION MI 07/25/2013 Fire pump Engine 315 hp nameplaProper combustion design and ultra low sulfur diesel fuel. 2.6 G/HP-H TEST PROTOCOL W BACT-PSDIN-0158 ST. JOSEPH ENEGRY CENTER, LLC IN 12/03/2012 Fire pump Engines 371 BHP, EACH COMBUSTION DESIGN CONTROLS AND USAGE LIMITS 2.6 G/HP-H BACT-PSDIN-0158 ST. JOSEPH ENEGRY CENTER, LLC IN 12/03/2012 TWO (2) EMERGENCY DIESEL GENERATORS 1006 HP EACH COMBUSTION DESIGN CONTROLS AND USAGE LIMITS 2.6 G/HP-H BACT-PSDIN-0158 ST. JOSEPH ENEGRY CENTER, LLC IN 12/03/2012 EMERGENCY DIESEL GENERATOR 2012 HP COMBUSTION DESIGN CONTROLS AND USAGE LIMITS 2.6 G/HP-H 3 HOURS BACT-PSDLA-0254 NINEMILE POINT ELECTRIC GENERATING PLANT LA 08/16/2011 EMERGENCY DIESEL GENERATOR 1250 HP ULTRA LOW SULFUR DIESEL AND GOOD COMBUSTION PRACTICES 2.6 G/HP-H ANNUAL AVERAGE BACT-PSDLA-0254 NINEMILE POINT ELECTRIC GENERATING PLANT LA 08/16/2011 EMERGENCY FIRE PUMP 350 HP ULTRA LOW SULFUR DIESEL AND GOOD COMBUSTION PRACTICES 2.6 G/HP-H LB/MM BTU BACT-PSDPA-0310 CPV FAIRVIEW ENERGY CENTER PA 09/02/2016 Emergency Generator Engines 0 2.61 G/BHP-HR BACT-PSDPA-0310 CPV FAIRVIEW ENERGY CENTER PA 09/02/2016 Emergency Fire Pump Engine 0 2.61 G/BHP-HR BACT-PSD*IL-0130 JACKSON ENERGY CENTER IL 12/31/2018 Firewater Pump Engine 420 horsepower 3.5 G/KW-HR BACT-PSDVA-0321 BRUNSWICK COUNTY POWER STATION VA 03/12/2013 Emergency diesel generator- 2200 kW 500 hrs/yr good combustion practices 3.5 G/KW-HR BACT-PSDVA-0325 GREENSVILLE POWER STATION VA 06/17/2016 DIESEL-FIRED EMERGENCY GENERATOR 3000 kW (1) 0 Good Combustion Practices/Maintenance 3.5 G/KW PER HR N/A*FL-0367 SHADY HILLS COMBINED CYCLE FACILITY FL 07/27/2018 1,500 kW Emergency Diesel Generator 14.82 MMBtu/ho Operate and maintain the engine according to the manufacturer's written i 3.5 G/KW-HOUR BACT-PSD*FL-0367 SHADY HILLS COMBINED CYCLE FACILITY FL 07/27/2018 Emergency Fire Pump Engine (347 HP) 8700 gal/year Operate and maintain the engine according to the manufacturer's written i 3.5 G/KW-HOUR BACT-PSDMI-0433 MEC NORTH, LLC AND MEC SOUTH LLC MI 06/29/2018 EUEMENGINE (North Plant): Emergency Engine 1341 HP Good combustion practices and meeting NSPS Subpart IIII requirements. 3.5 G/KW-H HOURLY BACT-PSDMI-0433 MEC NORTH, LLC AND MEC SOUTH LLC MI 06/29/2018 EUEMENGINE (South Plant): Emergency Engine 1341 HP Good combustion practices and meeting NSPS IIII requirements. 3.5 G/KW-H HOURLY BACT-PSDMI-0435 BELLE RIVER COMBINED CYCLE POWER PLANT MI 07/16/2018 EUEMENGINE: Emergency engine 2 MW State of the art combustion design. 3.5 G/KW-H HOURLY BACT-PSDMI-0435 BELLE RIVER COMBINED CYCLE POWER PLANT MI 07/16/2018 EUFPENGINE: Fire pump engine 399 BHP State of the art combustion design. 3.5 G/KW-H HOURLY BACT-PSD
Top 50 sources with lowest emission rates from RBLC search.*Draft Determination
December 2019Page 3 of 2

Renovo Energy CenterDiesel Generator and Fire Pump EngineRBLC Search ResultsCarbon Monoxide (CO)
RBLC ID Facility Name State Permit Date Equipment Type Size Units Control DescriptionEmission
Limit Limit Averaging Period Basis*FL-0363 DANIA BEACH ENERGY CENTER FL 12/04/2017 Two 3300 kW emergency generators 0 Certified engine 3.5 GRAMS PER KWH BACT-PSD*FL-0363 DANIA BEACH ENERGY CENTER FL 12/04/2017 Emergency Fire Pump Engine (422 hp) 0 Certified engine 3.5 G / KWH BACT-PSDMI-0423 INDECK NILES, LLC MI 01/04/2017 EUEMENGINE (Diesel fuel emergency engine) 22.68 MMBTU/H Good combustion practices and meeting NSPS Subpart IIII requirements. 3.5 G/KW-H TEST PROTOCOL SH BACT-PSDCA-1191 VICTORVILLE 2 HYBRID POWER PROJECT CA 03/11/2010 EMERGENCY ENGINE 2000 KW OPERATIONAL RESTRICTION OF 50 HR/YR 3.5 G/KW-H BACT-PSDCA-1191 VICTORVILLE 2 HYBRID POWER PROJECT CA 03/11/2010 EMERGENCY FIREWATER PUMP ENGINE 135 KW OPERATIONAL RESTRICTION OF 50 HR/YR, OPERATE AS REQUIRED FOR FIRE 3.5 G/KW-H BACT-PSDFL-0356 OKEECHOBEE CLEAN ENERGY CENTER FL 03/09/2016 One 422-hp emergency fire pump engine 0 Use of clean engine technology 3.5 G / KW-HR BACT-PSDMD-0046 KEYS ENERGY CENTER MD 10/31/2014 DIESEL-FIRED AUXILIARY (EMERGENCY) ENGINES (TW 1500 KW EXCLUSIVE USE OF ULTRA LOW SULFUR FUEL AND GOOD COMBUSTION PRA 3.5 G/KW-H BACT-PSDMD-0046 KEYS ENERGY CENTER MD 10/31/2014 DIESEL-FIRED FIRE PUMP ENGINE 300 HP EXCLUSIVE USE OF ULTRA LOW SULFUR DIESEL FUEL AND GOOD COMBUST 3.5 G/KW-H BACT-PSDMD-0045 MATTAWOMAN ENERGY CENTER MD 11/13/2015 EMERGENCY GENERATOR 1490 HP EXCLUSIVE USE OF ULTRA LOW SULFUR FUEL AND GOOD COMBUSTION PRA 3.5 G/KW-H BACT-PSDMD-0045 MATTAWOMAN ENERGY CENTER MD 11/13/2015 EMERGENCY DIESEL ENGINE FOR FIRE WATER PUMP 305 HP USE OF ULTRA LOW SULFUR DIESEL AND GOOD COMBUSTION PRACTICES 3.5 G/KW-H BACT-PSD
Top 50 sources with lowest emission rates from RBLC search.*Draft Determination
December 2019Page 4 of 2

Renovo Energy CenterDiesel Generator and Fire Pump EngineRBLC Search ResultsParticulate Matter (PM/PM10/PM2.5)
RBLC ID Facility Name State Permit Date Process Name Size Units Control DescriptionEmission
Limit UnitsAveraging
Period BasisPA-0309 LACKAWANNA ENERGY CTR/JESSUP PA 12/23/2015 2000 kW Emergency Generator 0 0.025 GM/HP-HR BACT-PSDNY-0104 CPV VALLEY ENERGY CENTER NY 08/01/2013 Emergency generator 0 Ultra low sulfur diesel with maximum sulfur content 0.0015 percent. 0.03 G/BHP-H 1 H BACT-PSDNY-0104 CPV VALLEY ENERGY CENTER NY 08/01/2013 Fire pump 0 Ultra low sulfur diesel with maximum sulfur content 0.0015 percent. 0.043 LB/MMBTU 1 H BACT-PSDMI-0402 SUMPTER POWER PLANT MI 11/17/2011 Diesel fuel-fired combustion engine (RICE) 732 HP Good combustion practices 0.05 G/HP-H TEST BACT-PSDNJ-0085 MIDDLESEX ENERGY CENTER, LLC NJ 07/19/2016 EMERGENCY DIESEL FIRE PUMP 100 H/YR Use of Ultra Low Sulfur Diesel (ULSD) Oil a clean burning fuel and limited hours of ope 0.108 LB/H BACT-PSDPA-0309 LACKAWANNA ENERGY CTR/JESSUP PA 12/23/2015 Fire pump engine 15 gal/hr 0.11 GM/HP-HR BACT-PSDVA-0328 C4GT, LLC VA 04/26/2018 Emergency Diesel GEN 500 H/YR good combustion practices and the use of ultra low sulfur diesel (S15 ULSD) fuel oil wi 0.15 G/HP H BACT-PSDMI-0433 MEC NORTH, LLC AND MEC SOUTH LLC MI 06/29/2018 (South Plant): Fire pump engine 300 HP Diesel particulate filter, good combustion practices and meeting NSPS Subpart IIII req 0.15 G/BHP-H HOURLY BACT-PSDMI-0433 MEC NORTH, LLC AND MEC SOUTH LLC MI 06/29/2018 (North Plant): Fire pump engine 300 HP Diesel particulate filter, good combustion practices and meeting NSPS Subpart IIII req 0.15 G/BHP-H HOURLY BACT-PSDMD-0041 CPV ST. CHARLES MD 04/23/2014 EMERGENCY GENERATOR 1500 KW EXCLUSIVE USE OF ULTRA LOW SULFUR FUEL AND GOOD COMBUSTION PRACTICES 0.15 G/HP-H N/A BACT-PSDMD-0041 CPV ST. CHARLES MD 04/23/2014 Emergency Diesel Engine Fire Water Pump 300 HP EXCLUSIVE USE OF ULTRA LOW SULFUR FUEL AND GOOD COMBUSTION PRACTICES 0.15 G/HP-H N/A BACT-PSD*MD-0042 WILDCAT POINT GENERATION FACILITY MD 04/08/2014 EMERGENCY GENERATOR 1 2250 KW EXCLUSIVE USE OF ULSD FUEL, GOOD COMBUSTION PRACTICES, LIMITED HOURS OF O 0.15 G/HP-H BACT-PSD*MD-0042 WILDCAT POINT GENERATION FACILITY MD 04/08/2014 Emergency Diesel Engine Fire Water Pump 477 HP EXCLUSIVE USE OF ULSD FUEL, GOOD COMBUSTION PRACTICES, LIMITED HOURS OF O 0.15 G/HP-H BACT-PSDMI-0423 INDECK NILES, LLC MI 01/04/2017 Emergency engine--diesel fire pump 1.66 MMBTU/H Good combustion practices and meeting NSPS Subpart IIII requirements. 0.15 G/BHP-H TEST PROTOCOL W BACT-PSDLA-0308 MORGAN CITY POWER PLANT LA 09/26/2013 380 HP Diesel Fired Pump Engine 2.3 MMBTU/hr Good combustion and maintenance practices, and compliance with NSPS 40 CFR 60 S 0.15 LB/H HOURLY MAXIMU BACT-PSDMI-0410 THETFORD GENERATING STATION MI 07/25/2013 Diesel fuel fired emergency backup fire pump 315 hp namepla Proper combustion design and ultra low sulfur diesel fuel. 0.15 G/HP-H TEST PROTOCOL W BACT-PSDIN-0158 ST. JOSEPH ENEGRY CENTER, LLC IN 12/03/2012 TWO (2) FIREWATER PUMP DIESEL ENGINES 371 BHP, EACH COMBUSTION DESIGN CONTROLS AND USAGE LIMITS 0.15 G/HP-H BACT-PSDIN-0158 ST. JOSEPH ENEGRY CENTER, LLC IN 12/03/2012 TWO (2) FIREWATER PUMP DIESEL ENGINES 371 BHP, EACH COMBUSTION DESIGN CONTROLS AND USAGE LIMITS 0.15 G/HP-H BACT-PSDIN-0158 ST. JOSEPH ENEGRY CENTER, LLC IN 12/03/2012 TWO (2) FIREWATER PUMP DIESEL ENGINES 371 BHP, EACH COMBUSTION DESIGN CONTROLS AND USAGE LIMITS 0.15 G/HP-H 3 HOURS BACT-PSDIN-0158 ST. JOSEPH ENEGRY CENTER, LLC IN 12/03/2012 TWO (2) EMERGENCY DIESEL GENERATORS 1006 HP EACH COMBUSTION DESIGN CONTROLS AND USAGE LIMITS 0.15 G/HP-H BACT-PSDIN-0158 ST. JOSEPH ENEGRY CENTER, LLC IN 12/03/2012 TWO (2) EMERGENCY DIESEL GENERATORS 1006 HP EACH COMBUSTION DESIGN CONTROLS AND USAGE LIMITS 0.15 G/HP-H 3 HOURS BACT-PSDIN-0158 ST. JOSEPH ENEGRY CENTER, LLC IN 12/03/2012 TWO (2) EMERGENCY DIESEL GENERATORS 1006 HP EACH COMBUSTION DESIGN CONTROLS AND USAGE LIMITS 0.15 G/HP-H 3 HOURS BACT-PSDIN-0158 ST. JOSEPH ENEGRY CENTER, LLC IN 12/03/2012 EMERGENCY DIESEL GENERATOR 2012 HP COMBUSTION DESIGN CONTROLS AND USAGE LIMITS 0.15 G/HP-H 3 HOURS BACT-PSDIN-0158 ST. JOSEPH ENEGRY CENTER, LLC IN 12/03/2012 EMERGENCY DIESEL GENERATOR 2012 HP COMBUSTION DESIGN CONTROLS AND USAGE LIMITS 0.15 G/HP-H 3 HOURS BACT-PSDIN-0158 ST. JOSEPH ENEGRY CENTER, LLC IN 12/03/2012 EMERGENCY DIESEL GENERATOR 2012 HP COMBUSTION DESIGN CONTROLS AND USAGE LIMITS 0.15 G/HP-H 3 HOURS BACT-PSDNJ-0081 PSEG FOSSIL LLC SEWAREN GENERATING SNJ 03/07/2014 Emergency diesel fire pump 0 Use of Ultra low sulfur distillate oil 0.15 G/B-HP-H BACT-PSD*FL-0367 SHADY HILLS COMBINED CYCLE FACILITY FL 07/27/2018 1,500 kW Emergency Diesel Generator 14.82 MMBtu/houOperate and maintain the engine according to the manufacturer's written instruction 0.2 G/KW-HOUR BACT-PSD*FL-0367 SHADY HILLS COMBINED CYCLE FACILITY FL 07/27/2018 Emergency Fire Pump Engine (347 HP) 8700 gal/year Operate and maintain the engine according to the manufacturer's written instruction 0.2 G/KW-HOUR BACT-PSDMI-0433 MEC NORTH, LLC AND MEC SOUTH LLC MI 06/29/2018 (North Plant): Emergency Engine 1341 HP Diesel particulate filter, good combustion practices and meeting NSPS Subpart IIII req 0.2 G/KW-H HOURLY BACT-PSDMI-0433 MEC NORTH, LLC AND MEC SOUTH LLC MI 06/29/2018 (South Plant): Emergency Engine 1341 HP Diesel particulate filter, good combustion practices and meeting NSPS IIII requirement 0.2 G/KW-H HOURLY BACT-PSDMI-0435 BELLE RIVER COMBINED CYCLE POWER PLAMI 07/16/2018 EUEMENGINE: Emergency engine 2 MW State of the art combustion design 0.2 G/KW-H HOURLY BACT-PSDMI-0435 BELLE RIVER COMBINED CYCLE POWER PLAMI 07/16/2018 EUFPENGINE: Fire pump engine 399 BHP State of the art combustion design 0.2 G/KW-H HOURLY BACT-PSD*FL-0363 DANIA BEACH ENERGY CENTER FL 12/04/2017 Two 3300 kW emergency generators 0 Clean fuel 0.2 GRAMS PER KWH BACT-PSD*FL-0363 DANIA BEACH ENERGY CENTER FL 12/04/2017 Emergency Fire Pump Engine (422 hp) 0 Certified engine 0.2 G / KWH BACT-PSDMI-0423 INDECK NILES, LLC MI 01/04/2017 Diesel fuel emergency engine 22.68 MMBTU/H Good combustion practices and meeting NSPS Subpart IIII requirements. 0.2 G/KW-H TEST PROTOCOL W BACT-PSDMD-0046 KEYS ENERGY CENTER MD 10/31/2014 Diesel Fired Auxiliary Emergency Engines 1500 KW USE OF ULTRA LOW SULFUR DIESEL AND GOOD COMBUSTION PRACTICES 0.2 G/KW-H BACT-PSDMD-0046 KEYS ENERGY CENTER MD 10/31/2014 DIESEL-FIRED FIRE PUMP ENGINE 300 HP EXCLUSIVE USE OF ULTRA LOW SULFUR DIESEL FUEL AND GOOD COMBUSTION PRACT 0.2 G/KW-H BACT-PSDMD-0045 MATTAWOMAN ENERGY CENTER MD 11/13/2015 EMERGENCY GENERATOR 1490 HP EXCLUSIVE USE OF ULTRA LOW SULFUR FUEL AND GOOD COMBUSTION PRACTICES 0.2 G/KW-H BACT-PSDMD-0045 MATTAWOMAN ENERGY CENTER MD 11/13/2015 Emergency Diesel Engine Fire Water Pump 305 HP EXCLUSIVE USE OF ULTRA LOW SULFUR FUEL AND GOOD COMBUSTION PRACTICES 0.2 G/KW-H BACT-PSDMI-0424 HOLLAND BOARD OF PUBLIC WORKS - EAS MI 12/05/2016 Emergency engine--diesel fire pump 500 H/YR Good combustion practices. 0.22 G/HP-H TEST PROTOCOL W BACT-PSD
*Draft Determination December 2019

Renovo Energy CenterDiesel Generator and Fire Pump EngineRBLC Search ResultsParticulate Matter (PM/PM10/PM2.5)
RBLC ID Facility Name State Permit Date Process Name Size Units Control DescriptionEmission
Limit UnitsAveraging
Period BasisMI-0412 HOLLAND BOARD OF PUBLIC WORKS - EAS MI 12/04/2013 Emergency Engine --Diesel Fire Pump 165 HP Good combustion practices 0.22 G/HP-H TEST PROTOCOL BACT-PSDNJ-0080 HESS NEWARK ENERGY CENTER NJ 11/01/2012 Emergency Generator 200 H/YR use of ULSD, a low sulfur clean fuel 0.59 LB/H N/ANJ-0080 HESS NEWARK ENERGY CENTER NJ 11/01/2012 Emergency Generator 200 H/YR 0.66 LB/H BACT-PSDNJ-0085 MIDDLESEX ENERGY CENTER, LLC NJ 07/19/2016 EMERGENCY GENERATOR DIESEL 0 100 H/YR Use of Ultra Low Sulfur Diesel (ULSD) Oil a clean burning fuel and limited hours of ope 0.661 LB/H BACT-PSDLA-0308 MORGAN CITY POWER PLANT LA 09/26/2013 2000 KW Diesel Fired Emergency Generator En 20.4 MMBTU/hr Good combustion and maintenance practices, and compliance with NSPS 40 CFR 60 S 1.06 LB/H HOURLY MAXIMU BACT-PSDLA-0308 MORGAN CITY POWER PLANT LA 09/26/2013 2000 KW Diesel Fired Emergency Generator En 20.4 MMBTU/hr Good combustion and maintenance practices, and compliance with NSPS 40 CFR 60 S 1.06 LB/H HOURLY MAXIMU BACT-PSDVA-0328 C4GT, LLC VA 04/26/2018 Emergency Fire Water Pump 500 HR/YR good combustion practices and the use of ultra low sulfur diesel (S15 ULSD) fuel oil wi 15 G/HP/HR BACT-PSDWV-0025 MOUNDSVILLE COMBINED CYCLE POWER WV 11/21/2014 Emergency Generator 2015.7 HP 0 BACT-PSDWV-0025 MOUNDSVILLE COMBINED CYCLE POWER WV 11/21/2014 Fire Pump Engine 251 HP 0 BACT-PSDNJ-0080 HESS NEWARK ENERGY CENTER NJ 11/01/2012 Emergency Generator 200 H/YR use of ULSD, a low sulfur clean fuel 0 BACT-PSDPA-0296 BERKS HOLLOW ENERGY ASSOC LLC/ONTE PA 12/17/2013 Emergency Generator 60 Gal/hr 0.005 T/YR BASED ON 12-MO CASE-BY-CASEPA-0296 BERKS HOLLOW ENERGY ASSOC LLC/ONTE PA 12/17/2013 Emergency Firewater Pump 16 Gal/hr 0.005 T/YR BASED ON 12-MO N/A
*Draft Determination December 2019

Renovo Energy CenterDiesel Generator and Fire Pump EngineRBLC Search ResultsVolatile Organic Compounds (VOC)
RBLC ID Facility Name State Permit Date Process Name Size Units Process Notes Control DescriptionEmission
Limit UnitsAveraging
Period BasisPA-0286 MOXIE ENERGY LLC/PATRIOT GENERATION PLTPA 01/31/2013 EMERGENCY GENERATOR-ENGINE 0 the permittee shall only use diesel fuel that is classified as ULTRA-LOW SULFUR NON-H 0.01 GM/B-HP-H EXPRESSED CASE-BY-CASEPA-0278 MOXIE LIBERTY LLC/ASYLUM POWER PL T PA 10/10/2012 Emergency Generator 0 The emergency generator will be restricted to operate not more than 100 hr/yr. 0.01 G/B-HP-H CASE-BY-CASEPA-0311 MOXIE FREEDOM GENERATION PLANT PA 09/01/2015 Emergency Generator 0
combusted by the emergency diesel 0.02 G/HP-HR LAER
PA-0309 LACKAWANNA ENERGY CTR/JESSUP PA 12/23/2015 2000 kW Emergency Generator 0 To allow maintenance of vital plant loads during power outages or maintenance of th 0.22 GM/HP-HR LAEROK-0154 MOORELAND GENERATING STA OK 07/02/2013 Diesel fired Emergency Generator Engine 1341 HP <100 HR/YR OPERATION. COMBUSTION CONTROL. 0.318 G/HP-HR BACT-PSDLA-0254 NINEMILE POINT ELECTRIC GENERATING PLANTLA 08/16/2011 EMERGENCY DIESEL GENERATOR 1250 HP ULTRA LOW SULFUR DIESEL AND GOOD CO 1 G/HP-H ANNUAL AVBACT-PSDMD-0041 CPV ST. CHARLES MD 04/23/2014 EMERGENCY GENERATOR 1500 KW 40 CFR 60 SUBPART IIII, ULTRA LOW-SULF EXCLUSIVE USE OF ULSD FUEL, GOOD COM 4.8 LB/MMBTU N/A LAERVA-0325 GREENSVILLE POWER STATION VA 06/17/2016 Diesel fire Emergency Generator 3000 kW 0 Good Combustion Practices/Maintenance 6.4 G/KW PER HR N/AID-0018 LANGLEY GULCH POWER PLANT ID 06/25/2010 EMERGENCY GENERATOR ENGINE 750 KW COMPRESSION IGNITION INTERNAL COMB
GOOD COMBUSTION PRACTICES (GCP) 6.4 G/KW-H NOX+NMHCBACT-PSD
OH-0377 HARRISON POWER OH 04/19/2018 Emergency Diesel Generator (P003) 1860 HP 1,387 KW (1,860 HP) emergency diesel-fir Good combustion practices (ULSD) and com 19.68 LB/H NMHC+NOX BACT-PSDOH-0374 GUERNSEY POWER STATION LLC OH 10/23/2017 Emergency Generators (2 identical) 2206 HP Two identical Emergency Generators; 1,64
standards in 40 CFR 89.112 and 89.113 23.21 LB/H NMHC+NOX BACT-PSD
OH-0375 LONG RIDGE ENERGY GENERATION LLC - HANN OH 11/07/2017 Emergency Diesel Generator Engine (P001) 2206 HP 1,645 kW (2,206 HP) emergency diesel-fire Good combustion design 24.71 LB/H NMHC+NOX BACT-PSDPA-0286 MOXIE ENERGY LLC/PATRIOT GENERATION PLTPA 01/31/2013 Fire Pump Engine - 460 BHP 0 0.1 G/HP-H CASE-BY-CASEPA-0278 MOXIE LIBERTY LLC/ASYLUM POWER PL T PA 10/10/2012 Fire Pump 0 The fire pump will be restricted to operate not more than 100 hr/yr. 0.1 G/B-HP-H CASE-BY-CASEOH-0366 CLEAN ENERGY FUTURE - LORDSTOWN, LLC OH 08/25/2015 Emergency fire pump engine (P004) 140 HP 140 hp (104.5 kW) emergency diesel-fired State-of-the-art combustion design 0.11 LB/H BACT-PSDNJ-0085 MIDDLESEX ENERGY CENTER, LLC NJ 07/19/2016 EMERGENCY DIESEL FIRE PUMP 100 H/YR ULSD: Ultra low sulfur diesel Use of Ultra Low Sulfur Diesel (ULSD) Oil a 0.117 LB/H LAERNJ-0081 PSEG FOSSIL LLC SEWAREN GENERATING STATINJ 03/07/2014 Emergency diesel fire pump 0 The fire pump has a maximum heat input rate of 2.63 MMBtu/hr (approximately 250 0.119 LB/H LAERPA-0309 LACKAWANNA ENERGY CTR/JESSUP PA 12/23/2015 Fire pump engine 15 gal/hr 0.12 GM/HP-HR LAERMI-0435 BELLE RIVER COMBINED CYCLE POWER PLANT MI 07/16/2018 EUFPENGINE: Fire pump engine 399 BHP A 399 brake HP diesel-fueled emergency f State of the art combustion design. 0.13 LB/H HOURLY BACT-PSDIN-0158 ST. JOSEPH ENEGRY CENTER, LLC IN 12/03/2012 TWO (2) FIREWATER PUMP DIESEL ENGINES 371 BHP, EACH THE TWO FIREWATER PUMP ENGINES, IDE COMBUSTION DESIGN CONTROLS AND USA 0.16 LB/H BACT-PSDWV-0025 MOUNDSVILLE COMBINED CYCLE POWER PLANWV 11/21/2014 Fire Pump Engine 251 HP Limited to 100 Hours/year. 0.17 LB/H BACT-PSDPA-0311 MOXIE FREEDOM GENERATION PLANT PA 09/01/2015 Fire Pump Engine 0
combusted by the fire engine pump shall 0.2 G/HP-HR LAER
OH-0370 TRUMBULL ENERGY CENTER OH 09/07/2017 Emergency fire pump engine (P004) 300 HP Emergency Fire Pump 300 hp (224 kW meState-of-the-art combustion design 0.24 LB/H BACT-PSDOH-0372 OREGON ENERGY CENTER OH 09/27/2017 Emergency fire pump engine (P004) 300 HP 300 hp emergency diesel-fired fire pump State-of-the-art combustion design 0.24 LB/H BACT-PSDOH-0367 SOUTH FIELD ENERGY LLC OH 09/23/2016 Emergency fire pump engine (P004) 311 HP 311 hp (232.1 kW mechanical) emergency State-of-the-art combustion design 0.25 LB/H BACT-PSDOH-0352 OREGON CLEAN ENERGY CENTER OH 06/18/2013 Emergency fire pump engine 300 HP 223.8 kW. Emergency fire pump engine re Purchased certified to the standards in NSP 0.25 LB/H BACT-PSDOH-0360 CARROLL COUNTY ENERGY OH 11/05/2013 Emergency fire pump engine (P004) 400 HP 400 hp (298 kW) emergency diesel-fired fi Purchased certified to the standards in NSP 0.325 LB/H BACT-PSDNY-0104 CPV VALLEY ENERGY CENTER NY 08/01/2013 Fire pump 0 Good combustion practice. 0.3612 lb/MMBtu 1 H LAERLA-0331 CALCASIEU PASS LNG PROJECT LA 09/21/2018 Firewater Pumps 634 kW Good combustion and operating practices. 0.44 G/HP-H BACT-PSDMI-0424 HOLLAND BOARD OF PUBLIC WORKS - EAST 5T MI 12/05/2016 Emergency engine--diesel fire pump 500 H/YR A 165 horsepower (hp) diesel-fueled emer Good combustion practices 0.47 LB/H TEST PROTO BACT-PSDMI-0423 INDECK NILES, LLC MI 01/04/2017 Emergency engine--diesel fire pump 1.66 MMBtu/hr A 260 brake horsepower (bhp) diesel-fuele Good combustion practices 0.64 LB/H TEST PROTO BACT-PSDMI-0433 MEC NORTH, LLC AND MEC SOUTH LLC MI 06/29/2018 (South Plant): Fire pump engine 300 HP A 300 HP diesel-fired emergency fire pum Good combustion practices. 0.75 LB/H HOURLY BACT-PSDMI-0433 MEC NORTH, LLC AND MEC SOUTH LLC MI 06/29/2018 (North Plant): Fire pump engine 300 HP A 300 HP diesel-fired emergency fire pum Good combustion practices 0.75 LB/H HOURLY BACT-PSDLA-0254 NINEMILE POINT ELECTRIC GENERATING PLANTLA 08/16/2011 EMERGENCY FIRE PUMP 350 HP ULTRA LOW SULFUR DIESEL AND GOOD CO 1 G/HP-H ANNUAL AVBACT-PSDPA-0291 HICKORY RUN ENERGY STATION PA 04/23/2013 EMERGENCY FIREWATER PUMP 3.25 MMBtu/hr EMERGENCY FIREWATER PUMP (450 BHP) 1.11 LB/H CASE-BY-CASEOH-0377 HARRISON POWER OH 04/19/2018 Emergency Fire Pump (P004) 320 HP 238.6 KW (320 HP) emergency diesel-fired Good combustion practices (ULSD) and com 2.12 LB/H NMHC+NOX BACT-PSDOH-0374 GUERNSEY POWER STATION LLC OH 10/23/2017 Emergency Fire Pump (P006) 410 HP 410 HP emergency diesel-fired fire pump t Certified to the meet the emissions standar 2.7 LB/H NMHC+NOX BACT-PSDVA-0325 GREENSVILLE POWER STATION VA 06/17/2016 DIESEL-FIRED WATER PUMP 376 bph (1) 0 FWP-1: 104.0 tons/year (12-month rolling Good Combustion Practices/Maintenance 3 G/HP-H PER HR N/AID-0018 LANGLEY GULCH POWER PLANT ID 06/25/2010 FIRE PUMP ENGINE 235 KW COMPRESSION IGNITION INTERNAL COMB
GOOD COMBUSTION PRACTICES (GCP) 4 G/KW-H NOX+NMHCBACT-PSD
OH-0375 LONG RIDGE ENERGY GENERATION LLC - HANN OH 11/07/2017 Emergency Diesel Fire Pump Engine (P002) 700 HP 700 hp emergency diesel-fired fire pump t Good combustion design 4.97 LB/H NMHC+NOX BACT-PSD
*Draft Determination December 2019

Renovo Energy CenterDiesel Generator and Fire Pump EngineRBLC Search ResultsVolatile Organic Compounds (VOC)
RBLC ID Facility Name State Permit Date Process Name Size Units Process Notes Control DescriptionEmission
Limit UnitsAveraging
Period BasisVA-0328 C4GT, LLC VA 04/26/2018 Emergency Fire Water Pump 500 HR/YR 315 BHP good combustion practices and the use of u 0 BACT-PSDMI-0412 HOLLAND BOARD OF PUBLIC WORKS - EAST 5T MI 12/04/2013 Emergency Engine --Diesel Fire Pump 165 HP A 165 hoursepower (hp) diesel-fueled eme Good combustion practices 0.001 LB/H TEST PROTOBACT-PSDPA-0296 BERKS HOLLOW ENERGY ASSOC LLC/ONTELAUNPA 12/17/2013 Emergency Firewater Pump 16 Gal/hr 0.013 T/YR BASED ON 1 N/AMI-0410 THETFORD GENERATING STATION MI 07/25/2013 Diesel fuel fired emergency backup fire pump 315 hp nameplat
backup fire mump. It has a capacity of Proper combustion design and ultra low su 0 BACT-PSD
PA-0296 BERKS HOLLOW ENERGY ASSOC LLC/ONTELAUNPA 12/17/2013 Emergency Generator 60 Gal/hr 0.03 T/YR BASED ON 1 CASE-BY-CASENY-0104 CPV VALLEY ENERGY CENTER NY 08/01/2013 Emergency generator 0 Good combustion practice. 0.0331 lb/MMBtu 1 H LAERNJ-0079 WOODBRIDGE ENERGY CENTER NJ 07/25/2012 Emergency Generator 100 H/YR The Emergency Generator will use Ultra Lo Use of ULSD oil 0.49 LB/H LAERNJ-0085 MIDDLESEX ENERGY CENTER, LLC NJ 07/19/2016 EMERGENCY GENERATOR DIESEL 0 100 H/YR Use of Ultra Low Sulfur Diesel (ULSD) Oil a 0.557 LB/H LAERPA-0291 HICKORY RUN ENERGY STATION PA 04/23/2013 EMERGENCY GENERATOR 7.8 MMBTU/H EMERGENCY GENERATOR (1,135 BHP - 750 KW) 0.7 LB/H CASE-BY-CASEMI-0433 MEC NORTH, LLC AND MEC SOUTH LLC MI 06/29/2018 (North Plant): Emergency Engine 1341 HP A 1,341 HP (1,000 kilowatts (KW)) diesel-f Good combustion practices. 0.86 LB/H HOURLY BACT-PSDMI-0433 MEC NORTH, LLC AND MEC SOUTH LLC MI 06/29/2018 (South Plant): Emergency Engine 1341 HP A 1,341 HP (1,000 kilowatts (kW)) diesel-fi Good combustion practices 0.86 LB/H HOURLY BACT-PSDOH-0352 OREGON CLEAN ENERGY CENTER OH 06/18/2013 Emergency generator 2250 KW Emergency diesel fired generator restricte Purchased certified to the standards in NSP 3.93 LB/H BACT-PSDOH-0372 OREGON ENERGY CENTER OH 09/27/2017 Emergency generator (P003) 1529 HP 1,000 kWe (1,140 kW mechanical) emerge State-of-the-art combustion design 2 LB/H BACT-PSDNJ-0080 HESS NEWARK ENERGY CENTER NJ 11/01/2012 Emergency Generator 200 H/YR use of ULSD, a low sulfur clean fuel 2.62 LB/H LAEROH-0366 CLEAN ENERGY FUTURE - LORDSTOWN, LLC OH 08/25/2015 Emergency generator (P003) 2346 HP 1,750 kW (2,346 hp) emergency generator 3.1 LB/H BACT-PSDOH-0367 SOUTH FIELD ENERGY LLC OH 09/23/2016 Emergency generator (P003) 2947 HP 2,000 kW electric, 2,198 kW mechanical (2 State-of-the-art combustion design 3.84 LB/H BACT-PSDIN-0158 ST. JOSEPH ENEGRY CENTER, LLC IN 12/03/2012 TWO (2) EMERGENCY DIESEL GENERATORS 1006 HP EACH THE TWO INTERNAL COMBUSTION ENGIN COMBUSTION DESIGN CONTROLS AND USA 1.04 LB/H BACT-PSDIN-0158 ST. JOSEPH ENEGRY CENTER, LLC IN 12/03/2012 EMERGENCY DIESEL GENERATOR 2012 HP THIS ONE (1) INTERNAL COMBUSTION ENG COMBUSTION DESIGN CONTROLS AND USA 1.04 LB/H 3 HOURS BACT-PSDWV-0025 MOUNDSVILLE COMBINED CYCLE POWER PLANWV 11/21/2014 Emergency Generator 2015.7 HP Nominal 1,500 kW. Limited to 100 hours/year. 1.24 LB/H BACT-PSDMI-0423 INDECK NILES, LLC MI 01/04/2017 EUEMENGINE (Diesel fuel emergency engine) 22.68 MMBTU/H a 2,922 horsepower (HP) (2,179 kilowatts Good combustion practices. 1.87 LB/H TEST PROTO BACT-PSDMI-0435 BELLE RIVER COMBINED CYCLE POWER PLANT MI 07/16/2018 EUEMENGINE: Emergency engine 2 MW A nominal 2 MW diesel-fueled emergency State of the art combustion design. 1.89 LB/H HOURLY BACT-PSDOH-0360 CARROLL COUNTY ENERGY OH 11/05/2013 Emergency generator (P003) 1112 KW 1,112 kW emergency diesel fired generatoPurchased certified to the standards in NSP 1.93 LB/H BACT-PSDOH-0370 TRUMBULL ENERGY CENTER OH 09/07/2017 Emergency generator (P003) 1529 HP Emergency Generator 1000 kW (electrical State-of-the-art combustion design 2 LB/H BACT-PSD
*Draft Determination December 2019

Renovo Energy CenterDiesel Generator and Fire Pump EngineRBLC Search ResultsSulfur Dioxide (SO2)
RBLC ID Facility Name State Permit Date PROCESS_NAME Size Units Control DescriptionEmission
Limit UnitsAveraging
Period BasisOH-0377 HARRISON POWER OH 04/19/2018 Emergency Diesel Generator (P003) 1860 HP ultra-low sulfur diesel (ULSD) fuel with a sulfur content of less than 15 ppm (0.0015 pe 0.0015 LB/MMBTU BACT-PSDOH-0377 HARRISON POWER OH 04/19/2018 Emergency Fire Pump (P004) 320 HP ultra-low sulfur diesel (ULSD) fuel with a sulfur content of less than 15 ppm (0.0015 pe 0.0015 LB/MMBTU BACT-PSDVA-0328 C4GT, LLC VA 04/26/2018 Emergency Diesel GEN 500 H/YR good combustion practices and the use of ultra low sulfur diesel (S15 ULSD) fuel oil wit 0 BACT-PSDVA-0328 C4GT, LLC VA 04/26/2018 Emergency Fire Water Pump 500 HR/YR good combustion practices and the use of ultra low sulfur diesel (S15 ULSD) fuel oil wit 0 BACT-PSDVA-0325 GREENSVILLE POWER STATION VA 06/17/2016 DIESEL-FIRED EMERGENCY GENERATOR 3000 kW (1) 0 Ultra Low Sulfur Diesel/Fuel (15 ppm max) 0.0015 LB/MMBTU N/AVA-0325 GREENSVILLE POWER STATION VA 06/17/2016 DIESEL-FIRED WATER PUMP 376 bph (1) 0 Ultra Low Sulfur Diesel/Fuel (15 ppm max) 0.0015 LB/MMBTU N/AOH-0370 TRUMBULL ENERGY CENTER OH 09/07/2017 Emergency generator (P003) 1529 HP Ultra low sulfur diesel fuel 0.016 LB/H BACT-PSDOH-0370 TRUMBULL ENERGY CENTER OH 09/07/2017 Emergency fire pump engine (P004) 300 HP Ultra low sulfur diesel fuel 3.2 X10⁻³ LB/H BACT-PSDLA-0331 CALCASIEU PASS LNG PROJECT LA 09/21/2018 Firewater Pumps 634 kW Ultra-Low Sulfur Diesel Fuel with Sulfur Content of 15 ppmv. 0.04 LB/GAL BACT-PSDOH-0367 SOUTH FIELD ENERGY LLC OH 09/23/2016 Emergency fire pump engine (P004) 311 HP Ultra low sulfur diesel fuel 0.004 LB/H BACT-PSDOH-0367 SOUTH FIELD ENERGY LLC OH 09/23/2016 Emergency generator (P003) 2947 HP Ultra low sulfur diesel fuel 0.03 LB/H BACT-PSDOH-0372 OREGON ENERGY CENTER OH 09/27/2017 Emergency generator (P003) 1529 HP Ultra low sulfur diesel fuel 0.016 LB/H BACT-PSDOH-0372 OREGON ENERGY CENTER OH 09/27/2017 Emergency fire pump engine (P004) 300 HP Ultra low sulfur diesel fuel 3.2 X10⁻³ LB/H BACT-PSDOH-0374 GUERNSEY POWER STATION LLC OH 10/23/2017 Emergency Generators (2 identical, P004 and P005) 2206 HP ultra-low sulfur diesel (ULSD) fuel with a sulfur content of less than 15 ppm (0.0015 pe 0.0015 LB/MMBTU BACT-PSDOH-0374 GUERNSEY POWER STATION LLC OH 10/23/2017 Emergency Fire Pump (P006) 410 HP Certified to the meet the emissions standards in Table 4 of 40 CFR Part 60, Subpart IIII. 0.0015 LB/MMBTU BACT-PSD*FL-0367 SHADY HILLS COMBINED CYCLE FACILFL 07/27/2018 1,500 kW Emergency Diesel Generator 14.82 MMBtu/hr Clean fuel 15 PPM S IN FUEL BACT-PSD*FL-0367 SHADY HILLS COMBINED CYCLE FACILFL 07/27/2018 Emergency Fire Pump Engine (347 HP) 8700 gal/year Clean fuel 15 PPM S IN FUEL BACT-PSDMI-0433 MEC NORTH, LLC AND MEC SOUTH L MI 06/29/2018 EUFPENGINE (South Plant): Fire pump engine 300 HP Good combustion practices and meeting NSPS Subpart IIII requirements. 15 PPM FUEL SUPPL BACT-PSDMI-0433 MEC NORTH, LLC AND MEC SOUTH L MI 06/29/2018 EUEMENGINE (North Plant): Emergency Engine 1341 HP Good combustion practices and meeting NSPS Subpart IIII requirements. 15 PPM FUEL SUPPL BACT-PSDMI-0433 MEC NORTH, LLC AND MEC SOUTH L MI 06/29/2018 EUFPENGINE (North Plant): Fire pump engine 300 HP Good combustion practices and meeting NSPS Subpart IIII requirements. 15 PPM FUEL SUPPL BACT-PSDMI-0433 MEC NORTH, LLC AND MEC SOUTH L MI 06/29/2018 EUEMENGINE (South Plant): Emergency Engine 1341 HP Good combustion practices and meeting NSPS Subpart IIII requirements. 15 PPM FUEL SUPPL BACT-PSDWY-0070 CHEYENNE PRAIRIE GENERATING STAWY 08/28/2012 Diesel Emergency Generator (EP15) 839 hp Ultra Low Sulfur Diesel 0 CASE-BY-CASEWY-0070 CHEYENNE PRAIRIE GENERATING STAWY 08/28/2012 Diesel Fire Pump Engine (EP16) 327 hp Ultra Low Sulfur Diesel 0 BACT-PSD*FL-0363 DANIA BEACH ENERGY CENTER FL 12/04/2017 Two 3300 kW emergency generators 0 Clean fuel 15 PPM S IN FUEL BACT-PSD*FL-0363 DANIA BEACH ENERGY CENTER FL 12/04/2017 Emergency Fire Pump Engine (422 hp) 0 Clean fuel 15 PPM S IN FUEL BACT-PSD*MD-0042 WILDCAT POINT GENERATION FACILIMD 04/08/2014 EMERGENCY GENERATOR 1 2250 KW USE OF ULTRA-LOW DIESEL SULFUR FUEL, LIMITED HOURS OF OPERATION AND DESIGN 0.006 G/B-HP-H 3-HOUR BLO BACT-PSD*MD-0042 WILDCAT POINT GENERATION FACILIMD 04/08/2014 EMERGENCY DIESEL ENGINE FOR FIRE WATER PUMP 477 HP USE OF ULTRA-LOW DIESEL SULFUR FUEL, LIMITED HOURS OF OPERATION AND DESIGN 0.0049 G/B-HP-H 3-HOUR BLO BACT-PSDMI-0423 INDECK NILES, LLC MI 01/04/2017 EUEMENGINE (Diesel fuel emergency engine) 22.68 MMBtu/hr Good combustion practices and meeting NSPS Subpart IIII requirements. 15 PPM FUEL SUPPL BACT-PSDMI-0423 INDECK NILES, LLC MI 01/04/2017 EUFPENGINE (Emergency engine--diesel fire pump) 1.66 MMBtu/hr Good combustion practices and meeting NSPS Subpart IIII requirements. 15 PPM FUEL SUP. C BACT-PSDNY-0104 CPV VALLEY ENERGY CENTER NY 08/01/2013 Emergency generator 0 Ultra low sulfur diesel with maximum sulfur content 0.0015 percent. 0.0014 LB/MMBTU 1 H BACT-PSDNY-0104 CPV VALLEY ENERGY CENTER NY 08/01/2013 Fire pump 0 Ultra low sulfur diesel with maximum sulfur content 0.0015 percent. 0.0014 LB/MMBTU 1 H BACT-PSDFL-0356 OKEECHOBEE CLEAN ENERGY CENTE FL 03/09/2016 One 422-hp emergency fire pump engine 0 Use of ULSD 0.0015 % S IN ULSD BACT-PSDPA-0286 MOXIE ENERGY LLC/PATRIOT GENER PA 01/31/2013 Fire Pump Engine - 460 BHP 0 0.005 G/HP-H EXPRESSED CASE-BY-CASEPA-0286 MOXIE ENERGY LLC/PATRIOT GENER PA 01/31/2013 EMERGENCY GENERATOR-ENGINE 0 The permittee shall only use diesel fuel that is classified as ULTRA-LOW SULFUR NON-H 0.005 GM/B-HP-H EXPRESSED BACT-PSDPA-0291 HICKORY RUN ENERGY STATION PA 04/23/2013 EMERGENCY FIREWATER PUMP 3.25 MMBtu/hr 0.0055 LB/H CASE-BY-CASEPA-0291 HICKORY RUN ENERGY STATION PA 04/23/2013 EMERGENCY GENERATOR 7.8 MMBtu/hr 0.01 LB/H CASE-BY-CASEMA-0039 SALEM HARBOR STATION REDEVELO MA 01/30/2014 Emergency Engine/Generator 7.4 MMBtu/hr 0.011 LB/H 1 HR BLOCK CASE-BY-CASEMA-0039 SALEM HARBOR STATION REDEVELO MA 01/30/2014 Fire Pump Engine 2.7 MMBtu/hr 0.004 LB/H 1 HR BLOCK CASE-BY-CASEOH-0352 OREGON CLEAN ENERGY CENTER OH 06/18/2013 Emergency fire pump engine 300 HP 0.003 LB/H N/A
*Draft Determination December 2019

Renovo Energy CenterDiesel Generator and Fire Pump EngineRBLC Search ResultsSulfur Dioxide (SO2)
RBLC ID Facility Name State Permit Date PROCESS_NAME Size Units Control DescriptionEmission
Limit UnitsAveraging
Period BasisOH-0352 OREGON CLEAN ENERGY CENTER OH 06/18/2013 Emergency generator 2250 KW 0.03 LB/H N/AIN-0158 ST. JOSEPH ENEGRY CENTER, LLC IN 12/03/2012 TWO (2) FIREWATER PUMP DIESEL ENGINES 371 BHP, EACH ULTRA LOW SULFUR DISTILLATE AND USAGE LIMITS 0.0015 % SUFLUR DIESEL FUEL BACT-PSDIN-0158 ST. JOSEPH ENEGRY CENTER, LLC IN 12/03/2012 TWO (2) EMERGENCY DIESEL GENERATORS 1006 HP EACH ULTRA LOW SULFUR DISTILLATE AND USAGE LIMITS 0.012 LB/H BACT-PSDIN-0158 ST. JOSEPH ENEGRY CENTER, LLC IN 12/03/2012 EMERGENCY DIESEL GENERATOR 2012 HP ULTRA LOW SULFUR DISTILLATE AND UASGE LIMITS 0.024 LB/H 3 HOURS BACT-PSDPA-0296 BERKS HOLLOW ENERGY ASSOC LLC/ PA 12/17/2013 Emergency Generator 60 Gal/hr 0.0001 T/YR CASE-BY-CASEPA-0296 BERKS HOLLOW ENERGY ASSOC LLC/ PA 12/17/2013 Emergency Firewater Pump 16 Gal/hr 0.0001 T/YR N/ANJ-0081 PSEG FOSSIL LLC SEWAREN GENERAT NJ 03/07/2014 Emergency diesel fire pump 0 Use of Ultra low sulfur fuel oil 0.002 LB/MMBTU BACT-PSDPA-0278 MOXIE LIBERTY LLC/ASYLUM POWER PA 10/10/2012 Emergency Generator 0 0.005 G/B-HP-H CASE-BY-CASEPA-0278 MOXIE LIBERTY LLC/ASYLUM POWER PA 10/10/2012 Fire Pump 0 0.005 G/B-HP-H CASE-BY-CASE
*Draft Determination December 2019

Renovo Energy CenterHeater - Natural GasRBLC Search ResultsNitrogen Oxides (NOx)
RBLC ID Facility Name State Permit Date Facility Descriptin Fuel Size Units Control DescriptionEmission
Limit Units Averaging Period Basis*PA-0316 RENOVO ENERGY CENTER, LLC PA 1/26/2018
two (2) identical 1 x 1 powerblocks where each powerblock consists of NG 15 mmBtu/hr 0.01 LB MMBTU LAER
*IL-0130 JACKSON ENERGY CENTER IL 12/31/2018 The proposed facility is designed to generate baseload power. It will co NG 13 mmBtu/hr Low-NOx combustion technology 0.011 lb/MMBtu LAER*PA-0315 HILLTOP ENERGY CENTER, LLC PA 4/12/2017
combined cycle, single shaft configuration, including a combustion NG 6.4 MMBtu/hr good combustion and operating practices 0.011 LB MMBTU
IL-0129 CPV THREE RIVERS ENERGY CENTER IL 7/30/2018 The proposed facility is designed to generate baseload power. It will co NG 12.8 mmBtu/hr Low-NOx burners 0.011 lb/MMBtu LAERPA-0311 MOXIE FREEDOM GENERATION PLANT PA 9/1/2015
power blocks, each consisting of a combustion gas turbine (CGT or CT) NG 14.6 mmBtu/hr 0.011 lb/MMBtu LAER
PA-0310 CPV FAIRVIEW ENERGY CENTER PA 6/2/2016
temporarily operate the Fairview Energy Center. NG 13.8 mmBtu/hr 0.011 lb/MMBtu LAERWY-0070 CHEYENNE PRAIRIE GENERATING STATIONWY 8/28/2012 A nominal 220 megawatt (MW) gross electrical facility. The station is to NG 16.1 mmBtu/hr Ultra Low NOx Burners 0.012 lb/MMBtu 3-HOUR AVERAGE BACT-PSDIA-0107 MARSHALLTOWN GENERATING STATION IA 4/14/2014 Utility electric generating station NG 13.32 mmBtu/hr 0.013 lb/MMBtu 3-HOUR AVERAGE BACT-PSDPA-0310 CPV FAIRVIEW ENERGY CENTER PA 9/2/2016
temporarily operate the Fairview Energy Center. NG 3.2 MMBtu/hr 0.035 lb/MMBtu LAER
MD-0041 CPV ST. CHARLES MD 4/23/2014
PLANTFACILITY-WIDE PM10 EMISSION LIMIT = 96.6 TONS/YR NG 9.5 mmBtu/hr USE OF PIPELINE QUALITY NATURAL GAS AND GOOD CO 0.035 lb/MMBtu LAERMD-0045 MATTAWOMAN ENERGY CENTER MD 11/13/2015 990 MW COMBINED-CYCLE NATURAL GAS-FIRED POWER PLANTNOTE: P NG 13.8 mmBtu/hr USE OF PIPELINE QUALITY NATURAL GAS AND GOOD CO 0.035 lb/MMBtu 3-HOUR BLOCK AVERAGBACT-PSDPA-0296 BERKS HOLLOW ENERGY ASSOC LLC/ONTEPA 12/17/2013 This application is for the construction of a natural gas-fired combined-c NG 8.5 mmBtu/hr 0.035 lb/MMBtu OTHER CASE*MD-0042 WILDCAT POINT GENERATION FACILITY MD 4/8/2014
PLANTFACILITY-WIDE PM10 EMISSION LIMIT = 278 TONS/YR NG 5 mmBtu/hr USE OF EFFICIENT DESIGN OF THE HEATER, EXCLUSIVE U 0.049 lb/MMBtu 3-HOUR BLOCK AVERAGLAER
NY-0104 CPV VALLEY ENERGY CENTER NY 8/1/2013 CPV Valley Energy Center is a 680 MW combined cycle electric generatin NG 0 Forced draft low NOx burner. 0.058 lb/MMBtu 1 H LAERMI-0410 THETFORD GENERATING STATION MI 7/25/2013 Four (4) natural gas fired combined cycle combustion turbine generator NG 12 mmBtu/hr Low NOx burners 0.06 lb/MMBtu 30-D ROLL AVG EACH D BACT-PSDPA-0288 SUNBURY GENERATION LP/SUNBURY SES PA 4/1/2013 This plan approval is for the repowering of the Sunbury Generation facil NG 15 mmBtu/hr 0.085 lb/MMBtu OTHER CASE*FL-0363 DANIA BEACH ENERGY CENTER FL 12/4/2017 1200 megawatt 2-on-1 combined cycle facility, natural gas-fired, with lim NG 9.9 MMBtu/hr Manufacturer certification 0.1 lb/MMBtu DESIGN VALUE BACT-PSDFL-0356 OKEECHOBEE CLEAN ENERGY CENTER FL 3/9/2016 Fossil-fueled power plant, consisting of a 3-on-1 combined cycle unit an NG 10 MMBtu/hr Must have NOx emission design value less than 0.1 lb/M 0.1 lb/MMBtu BACT-PSDMI-0435 BELLE RIVER COMBINED CYCLE POWER PLMI 7/16/2018 Natural gas combined-cycle power plant NG 3.8 mmBtu/hr Low NOx burner 0.14 LB/H HOURLY BACT-PSDMI-0406 RENAISSANCE POWER LLC MI 11/1/2013 For technical questions regarding this permit, please contact the permit NG 20 mmBtu/hr Good combustion practices 0.15 lb/MMBtu TEST PROTOCOL BACT-PSDOH-0374 GUERNSEY POWER STATION LLC OH 10/23/2017 1,650 MW combined cycle combustion turbine electrical generating faciNG 15 mmBtu/hr Low-NOx gas burner 0.3 LB/H BACT-PSDMI-0424 HOLLAND BOARD OF PUBLIC WORKS - EAS MI 12/5/2016 Natural gas combined heat and power plant. NG 3.7 mmBtu/hr Good combustion practices. 0.55 LB/H TEST PROTOCOL WILL S BACT-PSDMI-0412 HOLLAND BOARD OF PUBLIC WORKS - EAS MI 12/4/2013 Natural gas combined heat and power plant. NG 3.7 mmBtu/hr Good combustion practices. 0.55 LB/H TEST PROTOCOL BACT-PSDMI-0435 BELLE RIVER COMBINED CYCLE POWER PLMI 7/16/2018 Natural gas combined-cycle power plant NG 20.8 mmBtu/hr Low NOx burner 0.75 LB/H HOURLY BACT-PSDVA-0328 C4GT, LLC VA 4/26/2018 Natural gas-fired combined cycle power plant NG 140 MMCF/YR Ultra Low NOx burners 0.8 T/YR BACT-PSDMI-0423 INDECK NILES, LLC MI 1/4/2017 Natural gas combined cycle power plant. NG 13.5 mmBtu/hr Good combustion practices. 2.65 LB/H HOURLY; EACH UNIT BACT-PSDCA-1191 VICTORVILLE 2 HYBRID POWER PROJECT CA 3/11/2010 563 MW power plant comprised of a hybrid of natural gas-fired combine NG 40 mmBtu/hr OPERATIONAL RESTRICTION OF 1000 HR/YR 9 PPMVD 1-HR AVG, @3% O2 BACT-PSDCA-1212 PALMDALE HYBRID POWER PROJECT CA 10/18/2011 570 MW NATURAL GAS FIRED COMBINED CYCLE POWER PLANT WITH A NG 40 mmBtu/hr 9 PPMVD @3% O2, 3-HR AVG BACT-PSDCA-1211 COLUSA GENERATING STATION CA 3/11/2011 660 MW NATURAL GAS FIRED POWER PLANT NG 10 mmBtu/hr 30 PPMVD @3% O2, 3-HR AVG BACT-PSDAK-0071 INTERNATIONAL STATION POWER PLANT AK 12/20/2010 Combined Cycle Power Power Plant NG 12.5 mmBtu/hr Low NOx Burners and Flue Gas Recirculation 32 LB/MMSCF 3-HOUR AVERAGE BACT-PSD*Draft determination December 2019

Renovo Energy CenterHeater - Natural GasRBLC Search ResultsCarbon Monoxide (CO)
RBLC ID Facility Name State Permit Date Facility Description Fuel Size Units Control Description mission Lim Units Averaging Period BasisMD-0045 MATTAWOMAN ENERGY CENTER MD 11/13/2015 990 MW COMBINED-CYCLE NATURAL GAS-FIRED POWER PLANT NG 13.8 MMBtu/hr good combustion practices 0.021 lb/MMBtu 3-HOUR BLOCK AVERAGE BACT-PSD*PA-0315 HILLTOP ENERGY CENTER, LLC PA 4/12/2017
(1x1), combined cycle, single shaft configuration, including a NG 6.4 mmBtu/hr 0.037 LB MMBTU
PA-0311 MOXIE FREEDOM GENERATION PLANT PA 9/1/2015
identical 1 x 1 power blocks, each consisting of a combustion NG 14.6 mmBtu/hr 0.037 lb/MMBtu BACT-PSDPA-0288 SUNBURY GENERATION LP/SUNBURY SES PA 4/1/2013 This plan approval is for the repowering of the Sunbury Generat NG 15 MMBtu/hr 0.037 lb/MMBtu OTHER CASEIA-0107 MARSHALLTOWN GENERATING STATION IA 4/14/2004 Utility electric generating station NG 13.32 mmBtu/hr 0.041 lb/MMBtu 3-HOUR AVERAGE BACT-PSDPA-0296 BERKS HOLLOW ENERGY ASSOC LLC/ONTELAUNEE PA 12/17/2013 This application is for the construction of a natural gas-fired com NG 8.5 MMBtu/hr 0.05 lb/MMBtu N/A*IL-0130 JACKSON ENERGY CENTER IL 12/31/2018 The proposed facility is designed to generate baseload power. It NG 13 MMBtu/hr Good combustion practice 0.08 lb/MMBtu BACT-PSDIL-0129 CPV THREE RIVERS ENERGY CENTER IL 7/30/2018 The proposed facility is designed to generate baseload power. It NG 12.8 mmBtu/hr Good combustion practice 0.08 LB/HR BACT-PSDPA-0310 CPV FAIRVIEW ENERGY CENTER PA 9/2/2016
and temporarily operate the Fairview Energy Center. NG 3.2 MMBtu/hr 0.08 lb/MMBtu BACT-PSD
WY-0070 CHEYENNE PRAIRIE GENERATING STATION WY 8/28/2012 A nominal 220 megawatt (MW) gross electrical facility. The stat NG 16.1 MMBtu/hr good combustion practices 0.08 lb/MMBtu 3-HOUR AVERAGE BACT-PSDMD-0041 CPV ST. CHARLES MD 4/23/2014
PLANTFACILITY-WIDE PM10 EMISSION LIMIT = 96.6 TONS/YR NG 9.5 MMBtu/hr good combustion practices 0.08 lb/MMBtu BACT-PSD
*MD-0042 WILDCAT POINT GENERATION FACILITY MD 4/8/2014
POWER PLANTFACILITY-WIDE PM10 EMISSION LIMIT = 278 NG 5 MMBtu/hr good combustion practices, na 0.083 lb/MMBtu 3-HOUR BLOCK AVERAGE BACT-PSDNY-0104 CPV VALLEY ENERGY CENTER NY 8/1/2013 CPV Valley Energy Center is a 680 MW combined cycle electric g NG 0 Good combustion practice. 0.084 lb/MMBtu 1 H BACT-PSDMI-0406 RENAISSANCE POWER LLC MI 11/1/2013 For technical questions regarding this permit, please contact the NG 20 MMBtu/hr Good combustion practices 0.09 lb/MMBtu TEST PROTOCOL BACT-PSDMI-0410 THETFORD GENERATING STATION MI 7/25/2013 Four (4) natural gas fired combined cycle combustion turbine ge NG 12 MMBtu/hr Efficient combustion 0.11 lb/MMBtu TEST PROTOCOL WILL SPECIF BACT-PSDMI-0435 BELLE RIVER COMBINED CYCLE POWER PLANT MI 7/16/2018 Natural gas combined-cycle power plant NG 3.8 MMBtu/hr Good combustion controls 0.14 LB/H HOURLY BACT-PSDMI-0424 HOLLAND BOARD OF PUBLIC WORKS - EAST 5TH ST MI 12/5/2016 Natural gas combined heat and power plant. NG 3.7 MMBtu/hr Good combustion practices. 0.41 LB/H TEST PROTOCOL WILL SPECIF BACT-PSDMI-0412 HOLLAND BOARD OF PUBLIC WORKS - EAST 5TH ST MI 12/4/2013 Natural gas combined heat and power plant. NG 3.7 MMBtu/hr Good combustion practices 0.41 LB/H TEST PROTOCOL BACT-PSDMI-0435 BELLE RIVER COMBINED CYCLE POWER PLANT MI 7/16/2018 Natural gas combined-cycle power plant NG 20.8 MMBtu/hr Good combustion controls. 0.77 LB/H HOURLY BACT-PSDOH-0374 GUERNSEY POWER STATION LLC OH 10/23/2017 1,650 MW combined cycle combustion turbine electrical genera NG 15 MMBtu/hr Combustion control 0.83 LB/H BACT-PSDMI-0423 INDECK NILES, LLC MI 1/4/2017 Natural gas combined cycle power plant. NG 13.5 MMBtu/hr Good combustion practices. 2.22 LB/H HOURLY; EACH UNIT BACT-PSDVA-0328 C4GT, LLC VA 4/26/2018 Natural gas-fired combined cycle power plant NG 140 MMBtu/hr good combustion practices 2.6 T/YR BACT-PSDCA-1191 VICTORVILLE 2 HYBRID POWER PROJECT CA 3/11/2010 563 MW power plant comprised of a hybrid of natural gas-fired NG 40 MMBtu/hr 1000 hr/yr 50 PPMVD 1-HR AVG, @3% O2 BACT-PSDCA-1212 PALMDALE HYBRID POWER PROJECT CA 10/18/2011 570 MW NATURAL GAS FIRED COMBINED CYCLE POWER PLANT NG 40 MMBtu/hr 50 PPMVD @3% O2, 3-HR AVG BACT-PSDCA-1211 COLUSA GENERATING STATION CA 3/11/2011 660 MW NATURAL GAS FIRED POWER PLANT NG 10 MMBtu/hr 100 PPMVD @3% O2, 3-HR AVG BACT-PSD*Draft determination December 2019

Renovo Energy CenterHeater - Natural GasRBLC Search ResultsParticulate Matter (PM/PM10/PM2.5)
RBLC ID Facility Name State Permit Date Facility Description Fuel Size Units Control DescriptionEmission
Limit Units Averaging Period BasisMI-0410 THETFORD GENERATING STATION MI 7/25/2013 Four (4) natural gas fired combined cycle combustion turbine generato NG 12 MMBtu/hr Efficient combustion; natural gas fuel. 0.0018 LB/MMBTU TEST PROTOCOL WILL SP BACT-PSDMD-0045 MATTAWOMAN ENERGY CENTER MD 11/13/2015 990 MW COMBINED-CYCLE NATURAL GAS-FIRED POWER PLANTNOTE: NG 13.8 MMBtu/hr Good combustion practices and natural gas 0.0019 LB/MMBTU BACT-PSDMI-0423 INDECK NILES, LLC MI 1/4/2017 Natural gas combined cycle power plant. NG 13.5 MMBtu/hr Good combustion practices. 0.002 LB/MMBTU TEST PROTOCOL WILL SP BACT-PSDMD-0041 CPV ST. CHARLES MD 4/23/2014
PLANTFACILITY-WIDE PM10 EMISSION LIMIT = 96.6 TONS/YR NG 9.5 MMBtu/hr Good combustion practices and natural gas 0.007 LB/MMBTU BACT-PSD
MI-0424 HOLLAND BOARD OF PUBLIC WORKS - EAST 5TH STMI 12/5/2016 Natural gas combined heat and power plant. NG 3.7 MMBtu/hr Good combustion practices. 0.007 LB/MMBTU TEST PROTOCOL WILL SP BACT-PSDMI-0412 HOLLAND BOARD OF PUBLIC WORKS - EAST 5TH STMI 12/4/2013 Natural gas combined heat and power plant. NG 3.7 MMBtu/hr Good combustion practices. 0.007 LB/MMBTU TEST PROTOCOL BACT-PSDPA-0296 BERKS HOLLOW ENERGY ASSOC LLC/ONTELAUNEE PA 12/17/2013 This application is for the construction of a natural gas-fired combined NG 8.5 MMBtu/hr 0.007 LB/MMBTU OTHER CASE*MD-0042 WILDCAT POINT GENERATION FACILITY MD 4/8/2014
PLANTFACILITY-WIDE PM10 EMISSION LIMIT = 278 TONS/YR NG 5 MMBtu/hr Good combustion practices and natural gas 0.0075 LB/MMBTU 3-HOUR AVERAGE BASIS BACT-PSD
NY-0104 CPV VALLEY ENERGY CENTER NY 8/1/2013 CPV Valley Energy Center is a 680 MW combined cycle electric genera NG 0 MMBtu/hr Natural gas. 0.0076 LB/MMBTU 1 H BACT-PSDMI-0406 RENAISSANCE POWER LLC MI 11/1/2013 For technical questions regarding this permit, please contact the perm NG 20 MMBtu/hr Good combustion practices 0.009 LB/MMBTU TEST PROTOCOL BACT-PSDMI-0435 BELLE RIVER COMBINED CYCLE POWER PLANT MI 7/16/2018 Natural gas combined-cycle power plant NG 3.8 MMBtu/hr Low sulfur fuel 0.03 LB/H HOURLY BACT-PSDMI-0435 BELLE RIVER COMBINED CYCLE POWER PLANT MI 7/16/2018 Natural gas combined-cycle power plant NG 20.8 MMBtu/hr Low sulfur fuel 0.15 LB/H HOURLY BACT-PSD*Draft determination December 2019

Renovo Energy CenterHeater - Natural GasRBLC Search ResultsVolatile Organic Compounds (VOC)
RBLC ID Facility Name State Permit Date Facility Description Fuel Size Units Control DescriptionEmission
Limit Units Averaging Period Basis*PA-0316 RENOVO ENERGY CENTER, LLC PA 1/26/2018
two (2) identical 1 x 1 powerblocks where each powerblock consists of NG 15 MMBtu 0.005 LB MMBTU LAER
TX-0756 CCI CORPUS CHRISTI CONDENSATE SPLITTER FACIL TX 6/19/2015 Two identical condensate splitter trains each capable of processing 50,0 NG 153 MMBtu/hr (Good combustion practices 0.005 LB/ 100 SCF EACH HEATER BACT-PSDOH-0374 GUERNSEY POWER STATION LLC OH 10/23/2017 1,650 MW combined cycle combustion turbine electrical generating fac NG 15 MMBtu/hr (Combustion control 0.075 LB/H 0.005 lb/MMBtu BACT-PSDMI-0435 BELLE RIVER COMBINED CYCLE POWER PLANT MI 7/16/2018 Natural gas combined-cycle power plant NG 20.8 MMBtu/hr (Good combustion controls 0.17 LB/H HOURLY BACT-PSDMI-0435 BELLE RIVER COMBINED CYCLE POWER PLANT MI 7/16/2018 Natural gas combined-cycle power plant NG 3.8 MMBtu/hr (Good combustion controls. 0.03 LB/H HOURLY BACT-PSDMI-0423 INDECK NILES, LLC MI 1/4/2017 Natural gas combined cycle power plant. NG 13.5 MMBtu/hr (Good combustion practices. 0.15 LB/H HOURLY; EACH FUEL HEATBACT-PSDMI-0424 HOLLAND BOARD OF PUBLIC WORKS - EAST 5TH STMI 12/5/2016 Natural gas combined heat and power plant. NG 3.7 MMBtu/hr (Good combustion practices. 0.03 LB/H TEST PROTOCOL WILL SPE BACT-PSDMI-0412 HOLLAND BOARD OF PUBLIC WORKS - EAST 5TH STMI 12/4/2013 Natural gas combined heat and power plant. NG 3.7 MMBtu/hr (Good combustion practices 0.03 LB/H TEST PROTOCOL BACT-PSDPA-0311 MOXIE FREEDOM GENERATION PLANT PA 9/1/2015
power blocks, each consisting of a combustion gas turbine (CGT or CT) NG 0 0.005 lb/MMBtu LAER
FL-0364 SEMINOLE GENERATING STATION FL 3/21/2018 Existing fossil-fueled power plant. Two coal-fired units each rated at 736 NG 9.9 MMBtu/hr 0.005 lb/MMBtu BACT-PSDMD-0041 CPV ST. CHARLES MD 4/23/2014
PLANTFACILITY-WIDE PM10 EMISSION LIMIT = 96.6 TONS/YR NG 9.5 MMBtu/hr (Good combustion practices and natural gas 0.005 lb/MMBtu LAER
*MD-0042 WILDCAT POINT GENERATION FACILITY MD 4/8/2014
PLANTFACILITY-WIDE PM10 EMISSION LIMIT = 278 TONS/YR NG 5 MMBtu/hr (good combustion, natural gas, effic design 0.005 lb/MMBtu 3-HOUR BLOCK AVERAGE LAERMI-0406 RENAISSANCE POWER LLC MI 11/1/2013 For technical questions regarding this permit, please contact the permit NG 20 MMBtu/hr (Good combustion practices 0.05 lb/MMBtu TEST PROTOCOL BACT-PSDPA-0288 SUNBURY GENERATION LP/SUNBURY SES PA 4/1/2013 This plan approval is for the repowering of the Sunbury Generation faci NG 15 MMBtu/hr (max) 0.006 lb/MMBtu OTHER CASEMD-0045 MATTAWOMAN ENERGY CENTER MD 11/13/2015 990 MW COMBINED-CYCLE NATURAL GAS-FIRED POWER PLANTNOTE: P NG 13.8 MMBtu/hr (Good combustion practices and natural gas 0.0054 lb/MMBtu 3-HOUR BLOCK AVERAGE LAERMI-0410 THETFORD GENERATING STATION MI 7/25/2013 Four (4) natural gas fired combined cycle combustion turbine generator NG 12 MMBtu/hr (Efficient combustion; natural gas fuel. 0.008 lb/MMBtu TEST PROTOCOL WILL SPE BACT-PSDPA-0296 BERKS HOLLOW ENERGY ASSOC LLC/ONTELAUNEE PA 12/17/2013 This application is for the construction of a natural gas-fired combined-c NG 8.5 MMBtu/hr (max) 0.05 lb/MMBtu OTHER CASECA-1211 COLUSA GENERATING STATION CA 3/11/2011 660 MW NATURAL GAS FIRED POWER PLANT NG 10 MMBtu/hr (max) 7 PPMVD @3% O2, 3-HR AVG BACT-PSDVA-0328 C4GT, LLC VA 4/26/2018 Natural gas-fired combined cycle power plant NG 140 MMCF/YR good combustion practices 0 BACT-PSDNY-0104 CPV VALLEY ENERGY CENTER NY 8/1/2013 CPV Valley Energy Center is a 680 MW combined cycle electric generati NG 0 Good combustion practice. 0 LAER*Draft determination December 2019

Renovo Energy CenterHeater - Natural GasRBLC Search ResultsSulfur Dioxide (SO2)
RBLC ID Facility Name State Permit Date FACILITY_DESCRIPTION Fuel Size Units Control DescriptionEmission
Limit Units Averaging Period BasisVA-0328 C4GT, LLC VA 4/26/2018 Natural gas-fired combined cycle power plant NG 140 MMCF/YR natural gas with a max sulfur content of 0.4 gr/100 scf 0.4 GR S /100 SCF OTHER CASE*MD-0042 WILDCAT POINT GENERATION FACILITY MD 4/8/2014
PLANTFACILITY-WIDE PM10 EMISSION LIMIT = 278 TONS/YR NG 5 MMBtu/hr USE OF EFFICIENT DESIGN OF THE HEATER, EXCLUSIVE U 0.0006 lb/MMBtu 3-HOUR BLOCK AVERABACT-PSD
PA-0296 BERKS HOLLOW ENERGY ASSOC LLC/ONTELAUNE PA 12/17/2013 This application is for the construction of a natural gas-fired combined- NG 8.5 MMBtu/hr 0.002 lb/MMBtu OTHER CASENY-0104 CPV VALLEY ENERGY CENTER NY 8/1/2013 CPV Valley Energy Center is a 680 MW combined cycle electric generat NG 9 MMBtu/hr Natural gas. 0.0022 lb/MMBtu 1 H BACT-PSDPA-0288 SUNBURY GENERATION LP/SUNBURY SES PA 4/1/2013 This plan approval is for the repowering of the Sunbury Generation fac NG 15 MMBtu/hr 0.003 lb/MMBtu OTHER CASEOH-0374 GUERNSEY POWER STATION LLC OH 10/23/2017 1,650 MW combined cycle combustion turbine electrical generating facNG 15 MMBtu/hr Pipeline natural gas fuel 0.023 LB/H BACT-PSD*FL-0363 DANIA BEACH ENERGY CENTER FL 12/4/2017 1200 megawatt 2-on-1 combined cycle facility, natural gas-fired, with l NG 9.9 MMBtu/hr Clean fuel 2 GR S /100 SCF BACT-PSDFL-0356 OKEECHOBEE CLEAN ENERGY CENTER FL 3/9/2016 Fossil-fueled power plant, consisting of a 3-on-1 combined cycle unit an NG 10 MMBtu/hr Use of low-sulfur fuel 2 GR S /100 SCF BACT-PSDMI-0423 INDECK NILES, LLC MI 1/4/2017 Natural gas combined cycle power plant. NG 13.5 MMBtu/hr Good combustion practices and the use of pipeline qual 2000 GR/MMSCF BASED UPON FUEL RE BACT-PSD*Draft determination December 2019

Renovo Energy CenterHeater - Natural GasRBLC Search ResultsSulfuric Acid Mist (H2SO4)
RBLC ID Facility Name State Permit Date Facility Description Fuel Size Units Control DescriptionEmission
Limit UnitsAveraging
PeriodEquivalent lb/MMBtu Basis
*IL-0130 JACKSON ENERGY CENTER IL 12/31/2018 The proposed facility is designed to generate bas NG 13 MMBtu/hr Good combustion practice 0.014 lb/hr 0.0011 BACT-PSDVA-0328 C4GT, LLC VA 4/26/2018 Natural gas-fired combined cycle power plant NG 140 MMCF/YR Pipeline quality natural gas with a maximum 0.4 GR S/100 SCF BACT-PSDOH-0374 GUERNSEY POWER STATION LLC OH 10/23/2017 1,650 MW combined cycle combustion turbine e NG 15 MMBtu/hr Pipeline natural gas fuel 0.0035 lb/hr 0.0002 BACT-PSDMI-0435 BELLE RIVER COMBINED CYCLE POWER PMI 7/16/2018 Natural gas combined-cycle power plant NG 20.8 MMBtu/hr Low sulfur fuel 0.34 GR S/100 SCF FUEL SUPPLIER RECORDS BACT-PSDMI-0435 BELLE RIVER COMBINED CYCLE POWER PMI 7/16/2018 Natural gas combined-cycle power plant NG 3.8 MMBtu/hr Low sulfur fuel 0.34 GR S/100 SCF FUEL SUPPLIER RECORDS BACT-PSDIL-0129 CPV THREE RIVERS ENERGY CENTER IL 7/30/2018 The proposed facility is designed to generate bas NG 12.8 MMBtu/hr Good combustion practice 0.014 lb/hr 0.001 BACT-PSDPA-0311 MOXIE FREEDOM GENERATION PLANT PA 9/1/2015
operation of two identical 1 x 1 power blocks, NG 14.6 MMBtu/hr 0.0001 lb/MMBtu BACT-PSD
*MD-0042 WILDCAT POINT GENERATION FACILITY MD 4/8/2014
GAS-FIRED POWER PLANTFACILITY-WIDE PM10 NG 5 MMBtu/hr good combustion, natural gas, effic design 0.0005 lb/MMBtu 3-HOUR BLOCK AVERAGE BACT-PSDNY-0104 CPV VALLEY ENERGY CENTER NY 8/1/2013 CPV Valley Energy Center is a 680 MW combined NG 0 Natural gas. 0.0002 lb/MMBtu 1 H BACT-PSDMD-0045 MATTAWOMAN ENERGY CENTER MD 11/13/2015 990 MW COMBINED-CYCLE NATURAL GAS-FIRED NG 13.8 MMBtu/hr good combustion practices and natural gas 0.004 lb/MMBtu 3-HOUR BLOCK AVERAGE BACT-PSDPA-0296 BERKS HOLLOW ENERGY ASSOC LLC/ONTPA 12/17/2013 This application is for the construction of a natu NG 8.5 MMBtu/hr 0.001 lb/MMBtu OTHER CASE*Draft determination December 2019

POWER ENGINEERS, INC. Plan Approval Application – Renovo Energy Center, LLC
APPENDIX N SCR PID

12345678
C
D
E
F
G
H
78 6 5 24 3 1
B
A
C
D
G
E
F
H
REV DESCRIPTION DATE APPROVED
E
SIZE
REVISIONS
DWG NO SH REV
COPYRIGHT 2014 GENERAL ELECTRIC COMPANYC
SIGNATURES
TOLERANCES ON:
MADE FOR
3 PL DECIMALS
2 PL DECIMALS
FRACTIONS
PROJECT
ANGLES
±
±
±
±
ELECTRICAL
MECHANICAL
CONTROLS
ISSUED
CIVIL
PROJ ENG
CHECKED
DIMENSIONS ARE IN INCHES
UNLESS OTHERWISE SPECIFIED
DRAWN
DWG NO
GE Power & Water
SIZE CAGE CODE
SCALE
E
DATE
SHEET
1
GENERAL ELECTRIC COMPANY
GENERAL ELECTRIC INTERNATIONAL, INC.
PROPRIETARY INFORMATION-THIS DOCUMENT CONTAINS
PROPRIETARY INFORMATION OF GENERAL ELECTRIC
COMPANY AND MAY NOT BE USED BY OR DISCLOSED TO
OTHERS, EXCEPT WITH THE WRITTEN PERMISSION OF
GENERAL ELECTRIC COMPANY.
DT-7N
THIRD ANGLE PROJECTION
YYYEZZZZ
A
V. B.
XXXXXXX
XXXXXXX
XXXXXXX
XXXXXXX
XXXXXXX
PRELIMINARY
FLOW DIAGRAM
YY-MM-DD
YY-MM-DD
YY-MM-DD
YY-MM-DD
YY-MM-DD
NONE
14-04-17
TYPICAL HRSG SCR SYSTEM
08-11-25
AY
YY
EZ
ZZ
Z
XXXA
XXX
E. B.
14/04/17

POWER ENGINEERS, INC. Plan Approval Application – Renovo Energy Center, LLC
APPENDIX O COST ANALYSIS INFORMATION (SCR FOR CTGS AND OXIDATION CATALYST FOR AUXILIARY BOILERS)

Cost Analysis for SCR/Oxidation Catalyst
on Combustion Turbines
SCR and Oxidation Catalyst - NOx, CO, VOC
Equipment Costs
SCR/OxCat Unit $1,250,000
frame and housing $15,000
total system (A) $1,265,000
freight (0.05A) $63,250 Page 2-27 Control Cost Manual
taxes (0.05A) $63,250
$1,391,500
Direct Installation Costs direct installation cost factors provided by Control Cost Manual for thermal and
Foundations and supports (0.08B) $111,320 catalytic incinerators and carbon adsorbers.
Handling and Erection (0.14B) $194,810
Electrical (0.01B) $13,915
$320,045
Total direct cost: $1,711,545
standard factors for most control equipment contained in Control Cost Manual
Engineering and Supervision (0.10B) $139,150
Construction and Field Expenses (0.05B) $69,575
Contractor fees (0.10B) $139,150
Startup (0.02B) $27,830
Performance Test (0.01B) $13,915
Contingencies (0.03B) $41,745
Total indirect cost: $431,365
Total Capital investment (TCI): $2,142,910
Operating Labor ---
Supervisory Labor ---
Maint. Labor and Materials $27,000 $45/hr; 600 hr/yr
Total purchased equipment cost (B):
Total direct installation cost:
Indirect Costs (installation)
Direct Annual Cost

Cost Analysis for SCR/Oxidation Catalyst
on Combustion Turbines
Catalyst replacement (3 year life, 2% interest) $432,500 1734
Spent catalyst handling ----
performance loss not accounted for
Total direct annual cost: $459,500
Overhead (60% total labor and materials) $16,200 Page 2-34 Control Cost Manual
Administrative charges (0.02 TCI) $42,858 Page 2-34 Control Cost Manual
Insurance (0.01 TCI) $21,429 Page 2-34 Control Cost Manual
Capital recovery (10 year at 2% interest) $99,408
(TCI - 1,250,000 = 892,910)
(892,910*0.11133)
Total indirect annual cost: $179,895
Total Annual Costs $639,395
In accordance with equation 2.11 of the Control Cost Manual, the annual cost of the
catalyst is calculated by annualizing a $5,000 replacement cost over 3 years at 2%
(0.3468 x 5,000 = $1,734). As a conservative measure the labor cost for catalyst
replacement is not factored in. The capital recovery factor is calculated using the
equation identified below. (CRF (3 yr at 2%) = 0.3468
Spent catalyst removal/disposal cost was not estimated as a conservative measure.
The spent catalyst is returned to the vendor for metal recovery and the cost for
removal/disposal is indirectly factored in the cost of a new catalyst.
At 2% interest rate over 10 years, using capital recovery factor (CRF) equation: CRF = (I (1+i)n) / (1+i)n -1) (used online calculator at http://www.ajdesigner.com/phpdiscountfactors/capital_recovery_equation.php). CRF = 0.11133 (10 years at 2%)
Indirect Annual Costs

Cost Analysis for a CO Oxidation Catalyst
for one Auxiliary Boiler
Oxidation Catalyst - CO
Per Boiler
Equipment Costs
oxidation catalyst $15,144 as provided by EmeraChem on 2/8/17 for a 66 MMBtu/hr boiler
frame and housing $20,000
total system (A) $35,144
freight (0.05A) $1,757
taxes (0.05A) $1,757
instrumentation (0.10A) $3,514
$42,173
Direct Installation Costs direct installation cost factors provided by Control Cost Manual for thermal and
Foundations and supports (0.08B) $3,374 catalytic incinerators and carbon adsorbers.
Handling and Erection (0.14B) $5,904
Electrical (0.01B) $422
$9,700
Total direct cost: $51,873
standard factors for most control equipment contained in Control Cost Manual
Engineering and Supervision (0.10B) $4,217
Construction and Field Expenses (0.05B) $2,109
Contractor fees (0.10B) $4,217
Startup (0.02B) $843
Performance Test (0.01B) $422
Contingencies (0.03B) $1,265
Total indirect cost: $13,074
Total Capital investment (TCI): $64,946
Operating Labor $160 $40/hr; 4 hours per year for operations
Supervisory Labor ---
Maint. Labor and Materials $2,250 $45/hr; 50 hr/yr approximately 1 hour per week for testing and maintenance
Page 2-27 of EPA's Office of Air Quality Planning and Standards (OAQPS) Control Cost
Manual, sixth edition (January 2002)
Total purchased equipment cost (B):
Total direct installation cost:
Indirect Costs (installation)
Direct Annual Cost

Cost Analysis for a CO Oxidation Catalyst
for one Auxiliary Boiler
Catalyst replacement (3 year life, 3% interest) $5,353 $5,353.40
Spent catalyst handling ----
performance loss $636 0.0671$/kWhr
Total direct annual cost: $8,399
Overhead (60% total labor and materials) $1,350 Page 2-34 Control Cost Manual
Administrative charges (0.02 TCI) $1,299 Page 2-34 Control Cost Manual
Insurance (0.01 TCI) $649 Page 2-34 Control Cost Manual
Capital recovery (10 year at 3% interest) $5,838
(TCI - 15,144 = 49,802)
(49,802*0.11723)
Total indirect annual cost: $9,137
Total Annual Costs $17,536
CO emissions removed (tons/year) 1.93
Cost effectiveness (dollars/ton CO removed) $9,110 maximum per boiler
CO emission reduction is from 0.036 lb/MMBtu to 0.0036 lb/MMBtu
which is equivalent to a reduction of 1.925 tpy (2.138 tpy to 0.2138 tpy) for one boiler
0.036-0.0036/0.036*100 = 90%
Indirect Annual Costs
In accordance with equation 2.11 of the Control Cost Manual, the annual cost of the
catalyst is calculated by annualizing a $15,144 replacement cost over 3 years at 3%
(0.3535 x 15,144 = $5,353). As a conservative measure the labor cost for catalyst
replacement is not factored in. The capital recovery factor is calculated using the
equation identified below. (CRF (3 yr at 3%) = 0.3535
Spent catalyst removal/disposal cost was not estimated as a conservative measure.
The spent catalyst is returned to the vendor for metal recovery and the cost for
removal/disposal is indirectly factored in the cost of a new catalyst.
energy cost obtained from US Energy Information Administration, online interactive
Electricity Data Browser: http://www.eia.gov/electricity/data.cfm. Value provided is
the rolling 12-month cost ending in February 2013 for the industrial sector.
Average Cost Effectiveness
At 3% interest rate over 10 years, using capital recovery factor (CRF) equation: CRF = (I (1+i)n) / (1+i)n -1) (used online calculator at http://www.ajdesigner.com/phpdiscountfactors/capital_recovery_equation.php). CRF = 0.11723 (10 years at 3%)

POWER ENGINEERS, INC. Plan Approval Application – Renovo Energy Center, LLC
APPENDIX P STORAGE TANK INFORMATION

Appendix P
Storage Tank Information
Supplement to Plan Approval Application Form Section B.4
Tanks 2,000 gallons or greater containing VOC
installation max pressure type of relief vent vapor pressure type of
Tank ID Tank description Manf. date of tank relief device set pressure
at storage temp
(psia) roof
Tank #1
storage of backup fuel
for turbines ULSD TBD TBD ambient 3.5 MM
emergency
vent TBD 0.0048
fixed roof
with
internal
floating 35 MM
Tank #2
turbine/generator #1
lube oil tank luricating oil TBD TBD ambient 20,000 breather vent NA <0.0048 fixed nil
Tank #3
turbine/generator #2
lube oil tank lubricating oil TBD TBD ambient 20,000 breather vent NA <0.0048 fixed nil
Tank #4
Emergency Generator
Tank ULSD TBD TBD ambient 2,500 breather vent NA <0.0048 fixed nil
Tanks identified above are not subject to 129.56 and 129.57 because the vapor pressures do not exceed 1.5 psia.
Tank associated with the fire pump engine is not included because it is less than 2,000 gallons.
material
stored capacity (gal)
throughput
per year (gal)
Project will also include two 26,000 gallon above ground aqueous ammonia storage tanks to provide ammonia for the SCR systems. The ammonia tanks are not listed in the table above
since ammonia is not a VOC.

POWER ENGINEERS, INC. Plan Approval Application – Renovo Energy Center, LLC
APPENDIX Q REGISTRY OF AVAILABLE NOX AND VOC OFFSETS

November 26, 2019 Page 1
DEPARTMENT OF ENVIRONMENTAL PROTECTION COMMONWEALTH OF PENNSYLVANIA
CERTIFIED EMISSION REDUCTION CREDITS IN PENNSYLVANIA’S ERC REGISTRY
Emission reduction credits (ERCs) are surplus, permanent, quantified and federally enforceable emission reductions used to offset emission increases of oxides of nitrogen (NOx), volatile organic compounds (VOCs) and the following criteria pollutants: carbon monoxide (CO), lead (Pb), oxides of sulfur (SOx), particulate matter (PM), particulate matter with an aerodynamic diameter of 10 micrometers or less (PM-10), and particulate matter with an aerodynamic diameter of 2.5 micrometers or less (PM-2.5). The Pennsylvania Department of Environmental Protection (PADEP) maintains an ERC registry in accordance with the requirements of 25 Pa. Code § 127.209. The ERC registry system provides for the tracking of the creation, transfer and use of ERCs. Prior to registration of the credits, ERC Registry Applications are reviewed and approved by the Department to confirm that the ERCs meet the requirements of 25 Pa. Code §§ 127.206-208. Registration of the credits in the ERC registry system constitutes certification that the ERCs satisfy applicable requirements and that the credits are available for use. The following registered and certified ERCs in the ERC Registry are currently available for use as follows: (1) To satisfy non-attainment new source review (NNSR) emission offset ratio requirements; (2) To “net-out" of NSR at ERC-generating facilities; (3) To sell or trade the ERCs for use as emission offsets at new or modified facilities. The certified ERCs shown below, expressed in tons per year (tpy), satisfy the applicable ERC requirements contained in 25 Pa. Code §§ 127.206-208. ERCs created from the curtailment or shutdown of a source or facility expires for use as offsets 10 years after the emission reduction occurs. ERCs generated by the over control of emissions by an existing facility do not expire for use as offsets. However, credits in the registry that are not used in a plan approval will be discounted if new air quality requirements are adopted by the Department or U.S. Environmental Protection Agency (EPA). For additional information concerning this listing of certified ERCs, contact the Bureau of Air Quality, Division of Permits, Department of Environmental Protection, 12th Floor, Rachel Carson State Office Building, P. O. Box 8468, Harrisburg, PA 17105-8468, (717) 787-4325. This Pennsylvania ERC registry report, ERC Registry application and instructions are located at www.dep.pa.gov, select Businesses, Air, Bureau of Air Quality, Permits, Emission Reduction Credits.
Facility information Criteria
Pollutant Certified
ERCs Available
(tpy)
Expiration date
Intended use of ERCs
LSC Communications Inc. (f.k.a. R.R. Donnelley & Sons) County: Lancaster Contact Person: Stacey Haefner Telephone Number: (712)-293-2056
VOCs
16.00
None
Internal Trading

November 26, 2019 Page 2
Facility information Criteria Pollutant
Certified ERCs
Available (tpy)
Expiration date
Intended use of ERCs
PPG Industries, Inc. Source Location: Springdale Complex County: Allegheny Contact Person: Joe Frank Telephone Number: (412) 274-3884
VOCs 171.82 None Trading
The Procter & Gamble Paper Products Company Source Location: Mehoopany Plant County: Wyoming Contact Person: Amy Jacoby Telephone Number: (570) 833-6396
NOx
91.10
None
Internal Use
INDSPEC Chemical Corp. Source: Boiler # 8 Source Location: Petrolia County: Butler Contact Person: John Kane Telephone Number: (724) 756-2370 Ext. 108
NOx SOx
158.68 717.95
None Trading
Sunoco Partners Marketing & Terminals, LP Source: Wastewater Conveyance System Source Location: Marcus Hook Borough County: Delaware Contact Person: Kevin Smith Telephone Number: (610) 859-1279
VOCs 142.62 None Trading/ Internal
Use
World Kitchen Inc. Source Location: Charleroi Plant County: Washington Contact Person: Tony Pane Telephone Number: (724) 489-2255
NOx 131.43 None Trading
Highway Materials, Inc.
Source: 1011
Source: 1011
Source: 1011
Source: 1012
Source: 1012
Source: 1012
Source location: Whitemarsh Township
County: Montgomery
Contact Person: Greg Mullen
Telephone Number: (610) 832-8000
VOCs
NOx
SOx
VOCs
NOx
SOx
0.435
1.655
4.888
0.383
1.436
4.346
9/27/2021
9/27/2021
9/27/2021
10/7/2021
10/7/2021
10/7/2021
Trading

November 26, 2019 Page 3
Facility information Criteria Pollutant
Certified ERCs
Available (tpy)
Expiration date
Intended use of ERCs
GenOn Emissions, LLC Source Location: Titus Station Township: Cumru County: Berks Contact Person: Randall Lack Telephone Number: (281) 207-7213
NOx VOCs CO SOx PM-10 PM-2.5 Pb
1453.26 11.32 94.79
9100.08 223.38 96.57 0.06
8/30/2023 8/30/2023 8/30/2023 8/30/2023 8/30/2023 8/30/2023 8/30/2023
Trading
P.H. Glatfelter Company Source Location: 228 South Main St, Spring Grove County: York Contact Person: Jonathan E. Moores Telephone Number: (717) 225-4711 X 2395
SOx
428.00 None Trading
Bellefield Boiler Plant Source Location: 4400 Forbes Ave, Pittsburgh County: Allegheny Contact Person: Anthony J. Young Telephone Number: (412) 578-2495
PM-10 PM-2.5 SOx
61.81 52.68
578.89
None None None
Trading/ Internal
Use
University of Pittsburgh Medical Center (UPMC) Source Location: 600 Grant Street, Pittsburgh County: Allegheny Contact Person: Eric Cartwright Telephone Number: (412) 647-0896
PM-10 PM-2.5 SOx
16.69 14.22
156.31
None None None
Trading/ Internal
Use
Philadelphia Energy Solutions (PES)
ERC Generating Source: Sunoco, Inc. (R&M)
Source Location: Marcus Hook Borough
County: Delaware
Contact Person: Chuck Barksdale
Telephone Number: (215) 339-2074
NOx
SO2
VOCs
CO
PM-10
PM-2.5
295.23
0.36
32.98
199.11
28.33
28.33
12/31/2021
12/31/2021
12/31/2021
12/31/2021
12/31/2021
12/31/2021
Trading/ Internal
Use
Philadelphia Energy Solutions (PES)
ERC Generating Source: Sunoco, Inc. (R&M)
Source Location: Marcus Hook Borough
County: Delaware
Contact Person: Chuck Barksdale
Telephone Number: (215) 339-2074
NOx
SO2
VOCs
CO
PM-10
PM-2.5
111.37
128.42
2.21
365.60
317.94
317.94
12/31/2021
12/31/2021
12/31/2021
12/31/2021
12/31/2021
12/31/2021
Internal Use Only

November 26, 2019 Page 4
Facility information Criteria Pollutant
Certified ERCs
Available (tpy)
Expiration date
Intended use of ERCs
Pactiv, LLC
ERC Generating Source: Dopaco, Inc.
Sources: Presses 101 to 104
Source Location: Downingtown, Chester
Contact Person: Phoebe C. Robb
Telephone Number: (484) 875-3814
VOCs 60.30
None Trading/ Internal
Use
Exelon Power
Sources: Boiler #1
Source: Eddystone Generating Station
Source Location: Eddystone Borough
County: Delaware
Contact person: Albert Hatton
Telephone Number: (610) 765-5316
NOx
VOCs
SO2
PM-10
PM-2.5
CO
Pb
2547.85
5.97
2988.50
130.53
54.84
127.77
0.38
2/17/2021
2/17/2021
2/17/2021
2/17/2021
2/17/2021
2/17/2021
2/17/2021
Trading
Exelon Power
Sources: Boiler #2, centrifuge dryers &
coal handling fugitives
Source: Eddystone Generating Station
Source Location: Eddystone Borough
County: Delaware
Contact person: Albert Hatton
Telephone Number: (610) 765-5316
NOx
VOCs
SO2
PM-10
PM-2.5
CO
Pb
2016.85
5.81
2720.10
302.43
178.38
135.40
0.40
4/27/2021
4/27/2021
4/27/2021
4/27/2021
4/27/2021
4/27/2021
4/27/2021
Trading
Texas Eastern Transmission, L.P.
Sources: I.C. Engines 031 thru 039
Source Location: Bedford Compression Station
Township: Bedford
County: Bedford
Contact Person: Matthew Myers
Telephone Number: (412) 375-3064
NOx
CO
VOCs
PM-10
PM-2.5
SO2
164.46
32.45
34.30
4.37
4.37
0.054
4/15/2023
4/15/2023
4/15/2023
4/15/2023
4/15/2023
4/15/2023
Trading
International Paper
Source: Bleach Plant, Erie Mill
County: Erie
Contact Person: Allyson Bristow
Telephone Number: (901) 419-4852
VOCs 0.60 None Trading
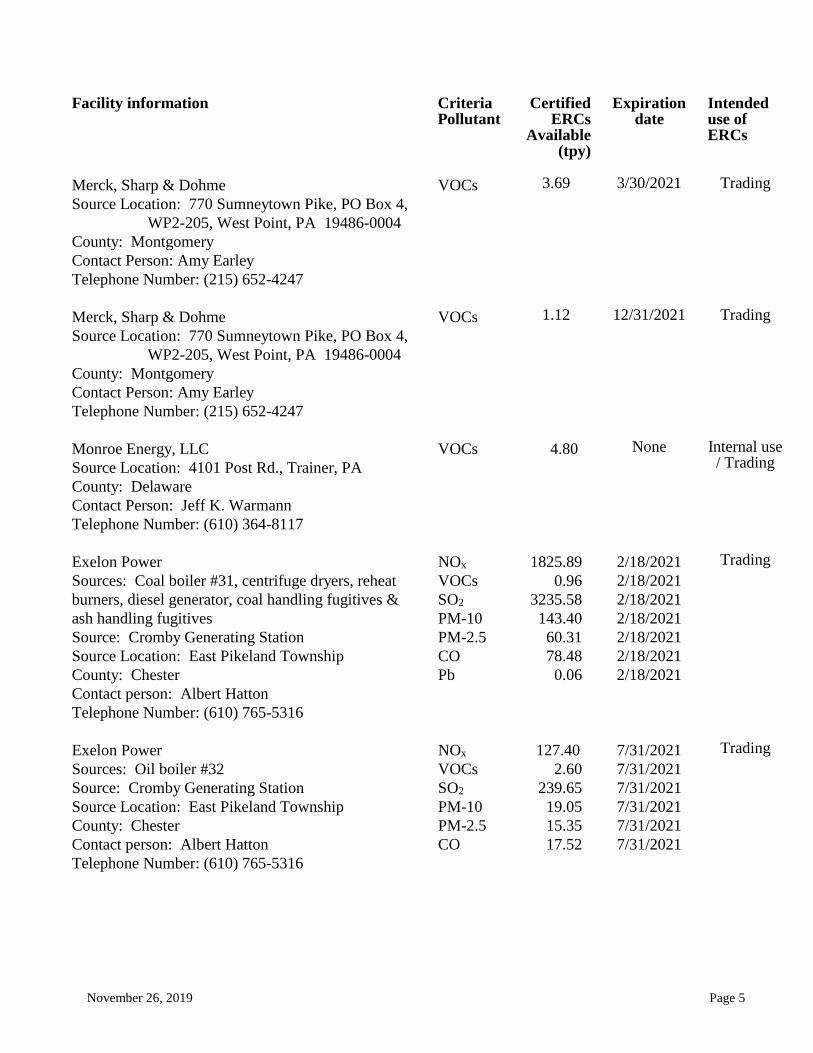
November 26, 2019 Page 5
Facility information Criteria Pollutant
Certified ERCs
Available (tpy)
Expiration date
Intended use of ERCs
Merck, Sharp & Dohme
Source Location: 770 Sumneytown Pike, PO Box 4,
WP2-205, West Point, PA 19486-0004
County: Montgomery
Contact Person: Amy Earley
Telephone Number: (215) 652-4247
VOCs 3.69 3/30/2021 Trading
Merck, Sharp & Dohme
Source Location: 770 Sumneytown Pike, PO Box 4,
WP2-205, West Point, PA 19486-0004
County: Montgomery
Contact Person: Amy Earley
Telephone Number: (215) 652-4247
VOCs 1.12 12/31/2021 Trading
Monroe Energy, LLC
Source Location: 4101 Post Rd., Trainer, PA
County: Delaware
Contact Person: Jeff K. Warmann
Telephone Number: (610) 364-8117
VOCs 4.80 None Internal use / Trading
Exelon Power
Sources: Coal boiler #31, centrifuge dryers, reheat
burners, diesel generator, coal handling fugitives &
ash handling fugitives
Source: Cromby Generating Station
Source Location: East Pikeland Township
County: Chester
Contact person: Albert Hatton
Telephone Number: (610) 765-5316
NOx
VOCs
SO2
PM-10
PM-2.5
CO
Pb
1825.89
0.96
3235.58
143.40
60.31
78.48
0.06
2/18/2021
2/18/2021
2/18/2021
2/18/2021
2/18/2021
2/18/2021
2/18/2021
Trading
Exelon Power
Sources: Oil boiler #32
Source: Cromby Generating Station
Source Location: East Pikeland Township
County: Chester
Contact person: Albert Hatton
Telephone Number: (610) 765-5316
NOx
VOCs
SO2
PM-10
PM-2.5
CO
127.40
2.60
239.65
19.05
15.35
17.52
7/31/2021
7/31/2021
7/31/2021
7/31/2021
7/31/2021
7/31/2021
Trading

November 26, 2019 Page 6
Facility information Criteria Pollutant
Certified ERCs
Available (tpy)
Expiration date
Intended use of ERCs
Exelon Power
Sources: Oil boiler #33
Source: Cromby Generating Station
Source Location: East Pikeland Township
County: Chester
Contact person: Albert Hatton
Telephone Number: (610) 765-5316
NOx
SO2
PM-10
PM-2.5
CO
1.68
2.32
0.25
0.17
0.55
6/29/2022
6/29/2022
6/29/2022
6/29/2022
6/29/2022
Trading
Exelon Power
Sources: Oil delivery fugitives
Source: Cromby Generating Station
Source Location: East Pikeland Township
County: Chester
Contact person: Albert Hatton
Telephone Number: (610) 765-5316
PM-10
PM-2.5
0.48
0.07
6/30/2022
6/30/2022
Trading
Exelon Power
Sources: Natural gas preheater
Source: Cromby Generating Station
Source Location: East Pikeland Township
County: Chester
Contact person: Albert Hatton
Telephone Number: (610) 765-5316
NOx
SO2
PM-10
PM-2.5
CO
0.06
0.02
0.01
0.01
0.05
10/16/2022
10/16/2022
10/16/2022
10/16/2022
10/16/2022
Trading
UGI Development Company
Source: Hunlock Creek Energy Center
Source Location: Hunlock Township
County: Luzerne
Contact Person: Jeff Steeber
Telephone Number: (570) 542-5369 ext. 232
SO2
PM-10
3263.16
54.45
5/22/2020
5/22/2020
Trading/
Internal
Shell Chemical Appalachia LLC
Source: G.F. Wheaton Power Plant / Units 034 & 035
Source Location: Potter Township / Monaca
County: Beaver
Contact Person: Jim Sewell
Telephone Number: (281) 731-3287
SOx
PM-10
CO
1898.73
44.26
64.20
9/11/2021
9/11/2021
9/11/2021
Trading

November 26, 2019 Page 7
Facility information Criteria Pollutant
Certified ERCs
Available (tpy)
Expiration date
Intended use of ERCs
Armstrong World Industries, Inc.
Source: Beaver Falls Ceiling Plant
Source Location: Beaver Falls Township
County: Beaver
Contact Person: John Ackiewicz
Telephone Number: 717-396-5373
NOx
VOCs
PM-2.5
CO
14
27
21
46
3/31/2021
3/31/2021
3/31/2021
3/31/2021
Trading
Exelon Power
Sources: Boiler #1
Source: Schuylkill Generating Station
Source Location: 2800 Christian St., Phila.
County: Philadelphia
Contact person: Albert Hatton
Telephone Number: (610) 765-5316
NOx
VOCs
SO2
PM-10
PM-2.5
CO
Pb
40.02
0.68
68.06
6.10
4.81
4.50
0.0014
6/21/2022
6/21/2022
6/21/2022
6/21/2022
6/21/2022
6/21/2022
6/21/2022
Trading
Volvo Construction Equipment, N.A.
Source: Paint Booth / ID 101
Source: Clean & Prime Paint Booth / ID 102
Source: Big Paint Booth / ID 103
Source Location: Shippensburg Borough
County: Franklin
Contact Person: Richard Halter
Telephone Number: (717) 530-6526
VOCs
VOCs
VOCs
4.61
5.81
2.17
12/31/2023
9/26/2022
12/31/2023
Internal
Letterkenny Army Depot
Source: Coating Booth / ID 102 (2009 & 2010)
Source: Coating Booth / ID 103 (2009 & 2010)
Source: Coating Booth / ID 109
Source Location: Letterkenny Township
County: Franklin
Contact Person: Samuel J. Pelesky
Telephone Number: (717) 267-5591
Hurst Jaws of Life, Inc.
(f.k.a. Hale Products, Inc.)
Source: Test Engines (IDs 111, 732 & 733), paint
booths (IDs 900 & 902) & misc. combustion sources
(ID 901)
Source Location: Conshohocken Borough
County: Montgomery
VOCs
VOCs
VOCs
NOx
6.07
6.21
0.12
6.3552
9/19/2023
9/19/2023
9/18/2022
2/26/2023
Internal
Trading

November 26, 2019 Page 8
Facility information Criteria Pollutant
Certified ERCs
Available (tpy)
Expiration date
Intended use of ERCs
Contact Person: Michael Laskaris
Telephone Number: 1-800-533-3569
Carmeuse Lime, Inc
Source: Kiln 3
Source Location: Millard Lime Plant
Township: North Londonderry
County: Lebanon
Contact Person: Mark Reider
Telephone Number: (717) 867-5851
NOx
VOCs
SOx
PM-10
PM-2.5
PM
CO
79.87
0.24
33.49
0.80
0.39
1.46
256.50
4/08/2023
4/08/2023
4/08/2023
4/08/2023
4/08/2023
4/08/2023
4/08/2023
Trading
Allegheny Energy Supply Company, LLC
Source: Unit 1
Source Location: Armstrong Power Plant
Township: Washington
County: Armstrong
Contact Person: Tonia A. Downs
Telephone Number: (724) 837-3000
NOx
VOCs
SOx
PM-10
PM-2.5
Pb
CO
760.40
0.04
12552.65
203.16
56.66
0.0369
85.39
8/31/2022
8/31/2022
8/31/2022
8/31/2022
8/31/2022
8/31/2022
8/31/2022
Trading
Allegheny Energy Supply Company, LLC
Source: Unit 2
Source Location: Armstrong Power Plant
Township: Washington
County: Armstrong
Contact Person: Tonia A. Downs
Telephone Number: (724) 837-3000
* Reduction needed in accordance with 25 Pa. Code §
127.206(c) for compliance with Pennsylvania’s RACT
II requirements of 1.4 tpy NOx ERCs.
NOx
SOx
PM-10
PM-2.5
Pb
CO
1557.50
13334.05
160.50
90.49
0.0247
90.36
7/21/2022
7/21/2022
7/21/2022
7/21/2022
7/21/2022
7/21/2022
Trading

November 26, 2019 Page 9
Facility information Criteria Pollutant
Certified ERCs
Available (tpy)
Expiration date
Intended use of ERCs
GenOn Emissions, LLC Source Location: Brunot Island Station, Pittsburgh County: Allegheny Contact Person: Randall Lack Telephone Number: (281) 207-7213
NOx 4.91 9/26/2023 Trading
Shell Chemical Appalachia LLC
Source: Monaca Zinc Smelter / 24 emission sources
Source Location: Potter Township / Monaca
County: Beaver
Contact Person: Jim Sewell
Telephone Number: (281) 731-3287
NOx
SOx
PM-10
PM-2.5
CO
197.60
877.90
308.84
30.32
21705.20
4/26/2024
4/26/2024
4/26/2024
4/26/2024
4/26/2024
Trading
GenOn Emissions, LLC Source Location: Elrama Station, Union Township Source: Unit 1 County: Washington Contact Person: Randall Lack
Telephone Number: (281) 207-7213
VOCs
NOx
SOx
PM-10
PM-2.5
CO
Pb
2.93
784.99
555.14
76.73
20.85
30.41
0.03
6/23/2022
6/23/2022
6/23/2022
6/23/2022
6/23/2022
6/23/2022
6/23/2022
Trading
GenOn Emissions, LLC Source Location: Elrama Station, Union Township Sources: Units 2 & 3 County: Washington Contact Person: Randall Lack Telephone Number: (281) 207-7213
VOCs
NOx
SOx
PM-10
PM-2.5
CO
Pb
7.39
1925.11
1377.46
183.53
50.56
76.63
0.06
5/30/2022
5/30/2022
5/30/2022
5/30/2022
5/30/2022
5/30/2022
5/30/2022
Trading
GenOn Emissions, LLC Source Location: Elrama Station, Union Township Source: Unit 4 County: Washington Contact Person: Randall Lack Telephone Number: (281) 207-7213
VOCs
NOx
SOx
PM-10
PM-2.5
CO
Pb
7.25
2065.25
1487.09
182.06
49.57
74.81
0.07
9/03/2022
9/03/2022
9/03/2022
9/03/2022
9/03/2022
9/03/2022
9/03/2022
Trading

November 26, 2019 Page 10
Facility information Criteria Pollutant
Certified ERCs
Available (tpy)
Expiration date
Intended use of ERCs
Bemis Company, Inc
Source: #711
Source Location: Hazle Township
County: Luzerne
Contact Person: Rob Harmon
Telephone Number: (920) 527-7695
VOCs
9.17
9/15/2024
Trading
First Energy Solutions Corporation
(f.k.a. Allegheny Energy Supply Company, LLC)
Source: Unit 3
Source Location: Mitchell Power Plant
Township: Union
County: Washington
Contact Person: Eric R. Foster
Telephone Number: (330) 436-1530
NOx
SOx
PM-10
1636
1215
141
10/04/2023
10/04/2023
10/04/2023
Trading
Republic Services of PA, LLC
Modern Landfill
Source: #104
Engine 2
Source Location: Lower Windsor Township
County: York
Contact Person: Karl Schmit
Telephone Number: (610) 223-0922
VOCs
NOx
SOx
PM-2.5
CO
1.07
7.98
0.60
0.25
39.32
12/16/2023
12/16/2023
12/16/2023
12/16/2023
12/16/2023
Trading
Republic Services of PA, LLC
Modern Landfill
Source: #105
Engine 3
Source Location: Lower Windsor Township
County: York
Contact Person: Karl Schmit
Telephone Number: (610) 223-0922
VOCs
NOx
SOx
PM-2.5
CO
1.41
12.54
0.82
0.34
56.62
11/11/2023
11/11/2023
11/11/2023
11/11/2023
11/11/2023
Trading

November 26, 2019 Page 11
Facility information Criteria Pollutant
Certified ERCs
Available (tpy)
Expiration date
Intended use of ERCs
Republic Services of PA, LLC
Modern Landfill
Source: #106
Engine 4
Source Location: Lower Windsor Township
County: York
Contact Person: Karl Schmit
Telephone Number: (610) 223-0922
VOCs
NOx
SOx
PM-2.5
CO
1.88
9.04
0.70
0.29
45.76
11/04/2023
11/04/2023
11/04/2023
11/04/2023
11/04/2023
Trading
Environmental Strategy Consultants, Inc.
(f.k.a. G-Seven LTD)
Sources: Various
Source Location: Hatfield, PA
Township: Hatfield
County: Montgomery
Contact Person: Lorna Velardi
Telephone Number: (215) 391-4690
NOx
0.08
12/02/2023 Trading
Transcontinental Gas Pipeline Co., LLC
Sources: 033, 034, 035
Source Location: Station 195, Delta, PA
Township: Peach Bottom
County: York
Contact Person: Jim Powel
Telephone Number: (717) 456-5315
VOCs
NOx
SOx
PM-2.5
CO
39.0
301.4
0.2
6.7
223.6
5/01/2024
5/01/2024
5/01/2024
5/01/2024
5/01/2024
Trading
Sunoco Partners Marketing & Terminals, LP
Sources: 104, 105
Source Location: Marcus Hook Borough
County: Delaware
Contact Person: Kevin Smith
Telephone Number: (610) 859-1279
NOx
VOCs
SO2
PM-2.5
PM-10
CO
38.00
26.46
2.54
64.32
64.32
199.78
12/30/2021
12/30/2021
12/30/2021
12/30/2021
12/30/2021
12/30/2021
Trading
AES Beaver Valley, LLC
Sources: 032, 033, 034, 035
Source Location: Cogen Plant
Borough: Potter
County: Beaver
Contact Person: Eric Holtvogt
Telephone Number: (937) 259-7224
NOx
CO
SOx
PM-10
PM-2.5
2067.7
1665.0
3187.0
198.0
89.0
6/30/2025
6/30/2025
6/30/2025
6/30/2025
6/30/2025
Trading

November 26, 2019 Page 12
Facility information Criteria Pollutant
Certified ERCs
Available (tpy)
Expiration date
Intended use of ERCs
Recipient/Holder of ERC: Elements Markets, LLC Contact Person: Randall Lack Telephone Number: (281) 207-7200
ERC Generating Facility: Allegheny Energy
Supply Company, LLC
Source Municipality: Washington Township County: Armstrong
Source: Unit 1
NOx 27.58 8/31/2022 Trading
Recipient/Holder of ERC: Elements Markets, LLC Contact Person: Randall Lack Telephone Number: (281) 207-7200
ERC Generating Facility: Quad Graphics Inc.
Source Municipality: Village of Depew County: Erie State: New York
VOCs 26.51 12/16/2020 Trading
Recipient/Holder of ERC: Elements Markets, LLC Contact Person: Randall Lack Telephone Number: (281) 207-7200
ERC Generating Facility: Team Ten, LLC
Source: 033A
Source Location: Tyrone Paper Mill
Township: Tyrone Borough
County: Blair
VOCs
NOx
SOx
2.48
182.70
2638.21
07/16/2026
07/16/2026
07/16/2026
Trading
Viking Energy, LLC
Source: 031
Source Location: 909 Cannery Road,
Northumberland, PA 18757
Township: Point
County: Northumberland
Contact Person: Robert Maggiani
Telephone Number: (774) 265-0227
NOx
184.25
4/01/2022
Trading
Recipient/Holder of ERC: Elements Markets, LLC
Contact Person: Randall Lack Telephone Number: (281) 207-7200
ERC Generating Facility: Quad Graphics, Inc.
Source Location: Atglen Plant
Township: West Sadsbury
County: Chester
VOCs
44.80
03/04/2026
Trading

November 26, 2019 Page 13
Facility information Criteria Pollutant
Certified ERCs
Available (tpy)
Expiration date
Intended use of ERCs
LSC Communications Inc. (f.k.a. R.R. Donnelley & Sons) Sources: 200 & 210 (Printing Presses) Source Location: City of Lancaster County: Lancaster Contact Person: Stacey Haefner
Telephone Number: (712)-293-2056
VOCs
5.43 03/31/2025 Trading
Recipient/Holder of ERC: Elements Markets, LLC Contact Person: Randall Lack Telephone Number: (281) 207-7200 ERC Generating Facility: LEDVANCE, LLC (f.k.a. Osram Sylvania, Inc.) Source: P109 (Glass Melting Furnace) Source Location: Wellsboro Borough County: Tioga
SOx
NOx
PM-10
VOCs
47.45
146.31
26.23
12.04
9/28/2026
9/28/2026
9/28/2026
9/28/2026
Trading
Recipient/Holder of ERC: Elements Markets, LLC
Contact Person: Randall Lack
Telephone Number: (281) 207-7200
ERC Generating Facility: Osram Sylvania, Inc.
Sources: 101 Degreaser
102 Stamping Lubrication
104 Glassing Furnace
199 Solvent Source Location: West Manchester Township County: York Contact Person: Kelley Reynolds Telephone Number: (978) 753-6602
VOCs
VOCs
VOCs
NOx
SOx
PM-10
PM-2.5
VOCs
3.91
4.29
0.57
16.14
10.63
1.80
0.63
2.43
12/19/2024
12/19/2024
9/30/2024
9/30/2024
9/30/2024
9/30/2024
9/30/2024
12/19/2024
Trading
PaperWorks Industries Inc.
Sources: Boilers #1, #3, #4
Source Location: City of Philadelphia
County: Philadelphia
Contact Person: Frank Delgrego
Telephone Number: (215) 984-7057
VOCs
NOx
14.356
110.055
4/12/2027
4/12/2027
Trading

November 26, 2019 Page 14
Facility information Criteria Pollutant
Certified ERCs
Available (tpy)
Expiration date
Intended use of ERCs
Lindy Paving, Inc – West Pittsburg
Source Location: Taylor Township Facility
County: Lawrence
Contact Person: Paul J. Reiner, Jr
Telephone Number: 412-281-4389
VOCs
NOx
SOx
PM-10
CO
1.64
4.05
1.34
7.19
9.47
4/04/2022
4/04/2022
4/04/2022
4/04/2022
4/04/2022
Trading
Piney Creek Power Plant
Source Location: Clarion Township Facility
County: Clarion
Contact Person: Kendall Reed
Telephone Number: 814-226-8001
NOx
SOx
PM-10
PM-2.5
CO
267.00
256.28
34.81
8.65
115.00
4/12/2023
4/12/2023
4/12/2023
4/12/2023
4/12/2023
Trading
Allegheny Energy Supply Company, LLC
Source: Unit 1
Source Location: Hatfield’s Ferry Power Station
Township: Monongahela
County: Greene
Contact Person: Eric R. Foster
Telephone Number: (330) 436-1530
NOx
VOCs
SOx
PM-10
PM-2.5
6983.6
20.5
840.2
352.3
252.9
9/26/2023
Trading
Allegheny Energy Supply Company, LLC
Source: Unit 2
Source Location: Hatfield’s Ferry Power Station
Township: Monongahela
County: Greene
Contact Person: Eric R. Foster
Telephone Number: (330) 436-1530
NOx
VOCs
SOx
PM-10
PM-2.5
6864.4
20.3
840.1
731.3
525.2
10/06/2023
Trading
Allegheny Energy Supply Company, LLC
Source: Unit 3
Source Location: Hatfield’s Ferry Power Station
Township: Monongahela
County: Greene
Contact Person: Eric R. Foster
Telephone Number: (330) 436-1530
NOx
VOCs
SOx
PM-10
PM-2.5
6811.8
21.9
1180.6
920.7
661.2
9/28/2023
Trading

November 26, 2019 Page 15
Facility information Criteria Pollutant
Certified ERCs
Available (tpy)
Expiration date
Intended use of ERCs
Mack Trucks, Inc.
Source: 003
003
103
104
118A
119A Township: Lower Macungie County: Lehigh Contact Name: Robert Peterson Telephone Number: (610) 966-8810
VOCs
NOx
VOCs
VOCs
VOCs
VOCs
0.008
0.142
59.151
6.577
4.921
0.547
8/01/2027
8/01/2027
12/08/2026
12/08/2026
12/08/2026
12/08/2026
Trading
GenOn Emissions, LLC Township: Upper Mount Bethel Source Location: Portland Generating Station County: Northampton Contact Person: Randall Lack Telephone Number: (281) 207-7213
VOCs
NOx
16.84
2331.40
12/01/2025
12/01/2025
Trading
Merck, Sharp & Dohme
Source Location: 770 Sumneytown Pike, PO Box 4,
WP2-205, West Point, PA 19486-0004
Source: Rotary Kiln Incinerator (005)
County: Montgomery
Contact Person: Amy Earley
Telephone Number: (215) 652-4247
NOx
PM-10
10.43
1.36
2/19/2027
2/19/2027
Trading
Mack Trucks, Inc.
Sources: 106
107 Township: Lower Macungie County: Lehigh Contact Name: Robert Peterson Telephone Number: (610) 966-8810
VOCs
VOCs
39.06
4.34
12/04/2027
12/04/2027
Trading

November 26, 2019 Page 16
Facility information Criteria Pollutant
Certified ERCs
Available (tpy)
Expiration date
Intended use of ERCs
Hill Top Energy Center, LLC (Subsidiary) AEIF Hill Top, LLC (Parent Company) Township: Cumberland County: Greene Contact Name: Jason Kahan Telephone Number: (212) 564-4287
NOx 197.0 7/16/2026 Internal

Maryland Department of Environment
Available Emission Reduction Credits (ERC)
As of May 1, 2019Owner Amount (Tons) ERC Expiration Date ERC Source ERC Contact Information
VOC: 0 Permit #: 021-00003 Gary A. Molchan
NOx: 0 Company Name: 610-837-3329
SO2: 1,137 Essroc Cement Corp. Mailing Address:
PM2.5: 56 Jurisdictions: 3251 Bath Pike
Frederick County Nazareth, PA 18064
VOC: Permit #: 025-0212 Mr. Chris Skaggs
NOx: 167 Company Name: 410-333-2730
SO2: 33Harford County Resource
Recovery FacilityMailing Address:
PM2.5: Jurisdictions: 100 S. Charles Street, Tower II,
Suite 403
Harford Baltimore MD 21201-2705
VOC: 0 Permit #: 021-00005 Michael A. Palazzolo
NOx: 0 Company Name: 412-553-4832
SO2: 3,014 Alcoa Inc. Mailing Address:
PM2.5: 312 Jurisdictions: 201 Isabella Street
Frederick County Pittsburgh, PA 15212
VOC: 0 Permit #: 005-01956 Donald Gerard
NOx: 0 Company Name: Phone:
SO2: 0Polystyrene Products
Company, Inc.410-574-0680
PM2.5: 0 Jurisdictions: Mailing Address:
Baltimore County 8845 Kelso Drive
Baltimore, MD 21221
VOC: 0 Permit #: 005-0147 Roberto Perez
NOx: 2,404 Company Name: 847-418-2071 cell:847-815-
8488
SO2: 3,519 HRE Sparrows Point
PM2.5: 1,355 Jurisdictions: Mailing Address:
Baltimore County
VOC: 93 Permit #: 11-0006 Tom Johnson
NOx: Company Name: 410-742-5540
SO2: Eastern Shore Forest
ProductsMailing Address:
PM2.5: Jurisdictions:
Caroline County Eastern Shore Forest Products
3667 St. Luke's Road
Salisbury, MD 21804
Alcoa Inc. 3/31/2020
Essroc Cement
Corporation12/31/2018
Harford County
Resource Recovery
Facility
3/17/2026
Polystyrene Products
Company, Inc.10/27/2020
HRE Sparrows Point
LLC9/14/2022
Eastern Shore Forest
Products2/16/2027

ContaminantRegion
Available (TPY)*Nonattainment Area
Facility NameDEC ID
ContactTelephone #
Comments Reduction Date
VOC 0.00 Alcan Packaging Mr. Coil1 Severe Ozone 1-2820-00185 773-399-8599
VOC 15.29 Alcan Packaging Mr. Coil1 Severe Ozone 1-2820-00185 773-399-8599
VOC**** 43.73 Northville E. Setauket Terminal Mr. Ripp
Severe Ozone 1-4722-01658 631-753-42200.00 Mr. Lack
Severe Ozone 281-207-7213
VOC 8.40 FiberMark/Arcon Coating Mr. Kraft Emission point(s) shutdown
1 Severe Ozone 1-2820-01862 215-536-4000 2.8 tpy DEC retainedVOC 5.325 Marglo Pack. Corp. Mr. Glassman Emission point(s) shutdown
1 Severe Ozone 1-2824-00898 718-649-2800 1.775tpy DEC retain
VOC 0.00 Northrop Grumman Corp. Mr. Cofman
1 Severe Ozone 1-2824-00112 516-575-4680
VOC 0.00 TRW INC., Steering Wheel Systems Mr. Ferrentino
Severe Ozone 1-4722-00898 518-465-10100.00 Mr. Marchmont
Severe Ozone 508-786-7214
VOC 0.00 TRW INC., Steering Wheel Systems Mr. Ferrentino
Severe Ozone 1-4722-00898 518-465-10100.00 Mr. Marchmont
Severe Ozone 508-786-7214
VOC 3.34 Adchem Industries, Inc. Mr. Pufahl Facility shutdown
1 Severe Ozone 1-2822-00620 631-727-6000 1.11 tpy DEC retain
VOC 0.00 Arkay Packaging Corp. Ms. Triglia
Severe Ozone 1-4734-00016 631-297-33459.86 Mr. Lack
Severe Ozone 281-207-7213
1
New York State Department of Environmental Conservation Emission Reduction Credits (ERCs) Registry
Pursuant to the New York State Clean Air Compliance Act and 6NYCRR Subparts 231-2 and 231-10, Notice is hereby given of the following listing of ERCs, registered by the NYSDEC, which are available for offsets as of November 6, 2019.Contact: ERC Unit, NYS DEC, 625 Broadway, 11th Floor, Albany NY 12233-3254, 518-402-8403
1
Ramapo Energy 7 tpy committed to Calpine # 1-4722-02441
1 tpy transferred to Ramapo Energy & re-transferred to Calpine # 1-4722-02441
42.55 tpy transferred to Caithness LI Energy #1-4722-04426
7 tpy transferred to Ramapo Energy & re-transferred to Calpine # 1-4722-02441
1
1
24.03 transferred to Element Markets
Element Markets, LLC 24.03 transferred to Philadelphia Energy Solutions (PA)
Ramapo Energy 1 tpy committed to Calpine # 1-4722-02441
8.80 tpy transferred to Alcan Packaging #1-4728-04190
69.20 tpy transferred to Alcan Packaging #1-4728-04190
Elements Markets, LLC
9.86 tpy transferred to Elements Markets

ContaminantRegion
Available (TPY)*Nonattainment Area
Facility NameDEC ID
ContactTelephone #
Comments Reduction Date
VOC 0.00 Sprague Energy Corp. Mr. Johnson
Severe Ozone 1-2820-01104 516-622-71100.00 Carbo industries, Inc. Mr. Wieting
Severe Ozone 1-2820-01085 516-229-3600VOC 0.00 Uniflex Holdings, Inc. Mr. Remillard
1 Severe Ozone 1-2822-00367 781-817-8970
VOC 1.70 Freeport Power Plant#2 Mr. Bianco Emission Points Shutdown
1 Severe Ozone 1-2820-00358 516-377-2200 0.60 tpy DEC retainVOC 0.00 Printpack, Seal-it Mr. Wiederhold Facility shutdown
Severe Ozone 1-4720-01685 404-691-5830 19.77 tpy transferred to Koch Supply0.00 Mr. Porter
Severe Ozone 316-828-6250VOC 0.00 PE Bay Shore LLC Mr. Murphy Facility Shutdown
Severe Ozone 1-4728-00141 315-448-2266 4.07 transferred to Element Markets0.00 Mr. Lack
Severe Ozone 281-207-7213
VOC 0.00 Aladdin Packaging, LLC Mr. Endzweig Facility shutdown
1 Severe Ozone 1-4728-00618 631-273-4747 81.30 used as offsets
VOC 0.00 Montauk Generating Fac. Mr. Flannery Facility shutdown
Severe Ozone 1-4724-00036 516-545-4875 1.16 tpy transferred To Element Markets0.00 Mr. Lack
Severe Ozone 281-207-72131.16 Mr. Torell
Severe Ozone 610-364-8399
VOC 0.00Glenwood Combustion Turbine Fac., Mr. Flannery
Emission Points shutdown
Severe Ozone 1-2822-00481 516-545-4875 9.42 tpy transferred To Element Markets0.00 Mr. Lack
Severe Ozone 281-207-72139.42 Mr. Torell
Severe Ozone 610-364-8399
VOC 0.072National Grid – EF Barrett Power Station, Mr. Flannery
1 Severe Ozone 1-2820-00553 516-545-4875VOC 0.00 Con Ed. – 59th St. Mr. Cartagena
2 Severe Ozone 2-6202-00032 212-460-6275VOC 0.00 Con Ed. – Astoria Mr. Cartagena
2 Severe Ozone 2-6301-00006 212-460-6275VOC 0.00 P&G Port Ivory Plant Ms. Clancy
2 Severe Ozone 2-6401-00004 973-690-3487
October 13, 2011***
Emission Points shutdown
Element Markets, LLC 4.07 tpy transferred to Monroe Energy, LLC (PA)
7.42 tpy committed to ConEd East River #2-6206-00012
11.87 tpy committed to ConEd East River #2-6206-00012
0.60 tpy transferred to Port Auth. Of NY & NJ
Koch Supply & Trading, LP
19.77 tpy transferred to Tenaska, Inc. (PA)1
Element Markets, LLC 9.42 tpy transferred to Monroe Energy (Broker) LLC
1
Element Markets, LLC 1.16 tpy transferred to Monroe Energy (Broker) LLC
Monroe Energy (Broker), LLC
1
Monroe Energy (Broker), LLC
July 1, 2012***
11.81(6.00 and 5.81) tpy transferred to Carbo industries, Inc.
11.81 retired, OOC # R1-20130603-74
1
1
58 tpy committed To CPV Energy Center #3-3356-00136

ContaminantRegion
Available (TPY)*Nonattainment Area
Facility NameDEC ID
ContactTelephone #
Comments Reduction Date
VOC 69.22 Betts Ave. Municipal
Incinerator Mr. Bekowies
2 Severe Ozone 2-6304-00093 212-837-8383
VOC 47.14 Green point Municipal Incinerator Mr. Bekowies
2 Severe Ozone 2-6101-00022 212-837-8383
VOC 149.00 SW Brooklyn Municipal Incinerator Mr. Bekowies
2 Severe Ozone 2-6106-00002 212-837-8383VOC 0.00 Con Ed.- Waterside Mr. Cartagena
2 Severe Ozone 2-6206-00038 212-460-3968VOC 0.00 Con Ed.- Waterside Mr. Cartagena Future Facility Shutdown
2 Severe Ozone 2-6206-00038 212-460-4858 35.34 tpy committed To # 2-6206-00012 (East River)
VOC 0.00 Con Ed.- Hudson Ave. Mr. Guastafeste
Severe Ozone 2-6101-00042 212-460-485812.86 Mr. Karalus
Severe Ozone 612-373-5307
VOC 7.83 Con Ed.- Hudson Ave. Mr. Ogunsola
2 Severe Ozone 2-6101-00042 212-460-1223
VOC 0.00 Astoria Generating Station – Orion Mr. Webb
Severe Ozone 2-6301-00185 410-234-0994
85.22 Astoria Generating Station – Orion Mr. Webb
Severe Ozone 2-6301-00185 410-234-0994
VOC 132.00 Newtown Creek WPCP Mr. Lopez
2 Severe Ozone 2-6101-00025 718-595-5049
VOC 0.10 East River Housing Corp. Mr. Jacob
2 Severe Ozone 2-6206-00096 212-677-5858VOC 0.00 GATX SI, Inc. Mr. Dahl
Severe Ozone 2-6401-00042 312-621-845216.84 Mr. Lack
19.85 tpy transferred To National Grid Generation LLC19.85 Mr. Flannery
Severe Ozone 516-545-4875VOC 6.90 Arrow Lock Mfg. Co. Mr. Shah Facility shutdown
2 Severe Ozone 2-6105-00250 718-927-2772 x240 2.3 tpy DEC retainVOC 0.00 Tanagraphics Ms. Jurist
2 Severe Ozone 2-6205-00088 212-255-6876
VOC 0.00 Seybert-Nichol's Printing Mr. Steinberg
Facility shutdown
Facility shutdown
Emission point(s) shutdown
2Elements Markets, LLCSevere Ozone 281-207-7213
National Grid Generation LLC
NRG Power Marketing Inc.
2
2
10.53 tpy committed to Tanaseybert 2-6202-01677
14.49 tpy committed to Tanaseybert 2-6202-01677
2.43 tpy committed to ConEd East River #2-6206-00012
12.86 tpy transferred to NRG Power Marketing Inc.
85.22 tpy of PA ( Leonard Acd.) ERCs were transferred
Emission Point(s) Shutdown
93.69 tpy transferred to Element Markets, Inc.
Emission point(s) shutdown
57 tpy transferred to PSEG Energy resources & trading (CT)

ContaminantRegion
Available (TPY)*Nonattainment Area
Facility NameDEC ID
ContactTelephone #
Comments Reduction Date
2 Severe Ozone 2-6205-00087 212-548-7836
VOC 0.00 Kenner Printing Co. Inc. Mr. Steinberg
2 Severe Ozone 2-6205-00119 212-548-7836VOC 0.00 Digital Now Ms. Kahanec
2 Severe Ozone 2-6205-01660 212-453-9266
VOC 3.20 American Sugar Refining, Inc. Mr. Demone Facility shutdown
2 Severe Ozone 2-6101-00152 732-590-1177 1.01 tpy DEC retainVOC 48.60 Poletti Power Project Mr. Ramos
2 Severe Ozone 2-6301-00084 914-681-6682
VOC 0.00 NYOFCO Sludge Pellet. Facility Mr. Lambalot Facility shutdown
Severe Ozone 2-6007-00140 203-509-2577 11.18 tpy transferred to Element Markets, Inc.0.00 Mr. Lack
Severe Ozone 281-207-7213
VOC 0.01 Astoria Gas Turbine Power Mr. Cartagena
2 Severe Ozone 2-6301-00191 917-612-5224
VOC 0.00National Grid Far Rockaway Power Station
Mr. FlanneryFacility shutdown
Severe Ozone 2-6308-00040 516-545-4875 9.27 tpy transferred To Element Markets0.00 Mr. Lack
Severe Ozone 281-207-72139.27 Mr. Torell
Severe Ozone 610-364-8399
VOC 0.00 Interstate Brands Corporation Mr. Davis Facility shutdown
Severe Ozone 2-6307-00276 816-502-4023 22.78 tpy transferred to Koch Supply & Trading, LP0.00 Ms. Barnthouse
Severe Ozone 316-828-7270
VOC 15.50N. Shores Towers Appt. total energy plant
Mr. Castro
2 Severe Ozone 2-6206-00096 718-423-3335
VOC 0.30Tallman Island Wastewater Treatment Plant
Ms. Elardo
2 Severe Ozone 2-6302-00012 718-595-6924
VOC 0.00 Genpak Corp.-Middletown Mr. Postulka
3 Moderate Ozone 3-3309-00064 518-798-9511
VOC 5.60 Harlem Valley Psychiatric Center Mr. Bard
3 Moderate Ozone 3-1326-00023 518-473-5823
Emission Sources Shutdown
69.00 tpy temporarily unavailable for use
Source Reduction
Emission sources shutdown September 19, 2013***
2
2
Emission Source shutdown
2Element Markets, LLC 9.27 tpy transferred to Monroe Energy (Broker) LLC
Monroe Energy (Broker), LLC
Koch Supply & Trading, LP
22.78 tpy transferred to Tenaska, Inc. (PA)
Elements Markets, LLC
11.18 tpy transferred to Monroe Energy, LLC (PA)
Emission Source shutdown
8.28 tpy committed to Tanaseybert 2-6202-01677
0.85 tpy committed to Tanaseybert 2-6202-01677

ContaminantRegion
Available (TPY)*Nonattainment Area
Facility NameDEC ID
ContactTelephone #
Comments Reduction Date
VOC 0.00 General Motors Corp. Mr. Pordon 178.58 tpy DEC retained100 tpy committed to Vulcraft of NY, INC170 tpy committed to ConEd East River #2-6206-00012258.76 tpy transferred to PG & E Energy trading145 tpy committed to Astoria Energy, LLC, #2-6301-00647 from PG & E45 tpy committed to GenOn, Bowline LLC from PG &E68.76 transferred to FPL Energy (PA) from PG &E
0.00 145 tpy committed to Astoria Energy, LLC, #2-6301-00647
45 tpy committed to GenOn, Bowline LLC68.76 transferred to FPL Energy (PA)
0.00 Mr. Konary Name Change 12/03/10Severe Ozone 617-529-3874 Name change to GenOn Emissions, LLC
45.00 Mr. LackSevere Ozone 281-207-7213
28.76 Mr. BusaSevere Ozone 561-691-7171
VOC 2.44 IBM-Poughkeepsie Fac. Mr. Brannen
3 Moderate Ozone 3-1346-00035 914-433-1509
VOC 0.78 Wyeth-Ayerst/Lederle Mr. Kontaxis
3 Severe Ozone 3-3924-00025 914-732-2500VOC 0.00 Tesa tape Inc. Mr. Rigano 35.95 DEC retained
Severe Ozone 3-3352-00111 704-553-4664 107.85 Transferred to Element Markets, LLC
8.75 Mr. Lack 4.50 tpy transferred to Philadelphia Ship Repair LLC., PA
40.00 tpy transferred to Monroe Energy LLC., PA54.60 tpy transferred to Philadelphia Ship Repair LLC., PA
VOC 1.27 St. John’s Riverside Hospital Mr. Doerr Emission point shutdown
3 Severe Ozone 3-5518-00222 914-964-4211 00.42 DEC retained
VOC 0.10 A.G. Properties of Kingston, LLC Mr. Ginsberg
3 Ozone Transport Region 3-5154-00153 845-383-0400
VOC 1.55 Wyeth Ayerst Pharmaceutical Mr. Alexandro Emission point shutdown
3 Severe Ozone 3-3924-00025 914-732-2160 00.51 DEC retained
VOC 0.00 Lovett Generating Station Mr. Konary Facility shutdown
Severe Ozone 3-3928-00010 617-529-3874 Name change to GenOn Emissions, LLC27.20 Mr. Lack
Severe Ozone 281-207-7213
3GenOn Emissions, LLC
Facility shutdown
Emission point shutdown
3
3
Severe Ozone
Severe Ozone
Severe Ozone 281-207-7213
PG & E Energy trading
GenOn Bowline LLC
Element Markets, LLC
GenOn Emissions, LLC
3-5534-00104 313-556-0791
FPL Energy 40 tpy committed to Caithness LI Energy, # 1-4722-04426
Emission points shutdown

ContaminantRegion
Available (TPY)*Nonattainment Area
Facility NameDEC ID
ContactTelephone #
Comments Reduction Date
VOC 14.72 Metal Container Corp. Mr. Kimutis 107.9 used for internal offsets
4.53 used for internal offsets67.85 used for internal offsets
VOC 1.161 Schenectady Int. Inc. Mr. Windish4 Marginal Ozone 4-4228-00056 518-370-4200
VOC 0.00 Mr. Arcone4 Marginal Ozone 301-280-6607
VOC 107.00 Glens Falls Lehigh Portland Cement Co Mr. Matz
4 Marginal Ozone 4-1926-00001 610-366-4752
VOC 0.07 Knolls Atomic Power Lab. Mr. Seepo
4 Marginal Ozone 4-4224-00024 518-395-6366VOC 4.60 BASF Corporation Ms. Roque
4 Marginal Ozone 4-3814-00006 973-426-2662
VOC 45.74 General Electric Power System Mr. Oldi
4 Marginal Ozone 4-4215-00015 518-385-3505
VOC 7.45 Von Roll Isola USA, Inc. Ms. Mellon
4 Marginal Ozone 4-4215-00099 518-344-7140
VOC 0.00 Bennington Paperboard Co. Mr. Doerr
4 Marginal Ozone 4-3828-00006 740-862-3594VOC 0.00 Norbord Industries Mr. Towles Facility shutdown
Ozone Transport Region 4-1230-00019 864-697-1250 15.56 tpy transferred to Element Markets, Inc.0.00 Mr. Lack
Ozone Transport Region 281-207-7213
15.56 BEMIS company, Inc. Mr. Kubicek
Ozone Transport Region 927-527-7695VOC 0.00 Holcim (US) Inc. Mr. Graves Facility shutdown
Ozone Transport Region 4-1926-00021 518-943-4040 20 tpy transferred to Element Markets, LLC20.00 Mr. Lack
Ozone Transport Region 281-207-7200VOC 0.00 Karg Brothers Mr. Wood
5 Ozone Transport Region 5-1708-00012 607-762-7016
VOC 0.00 Graphic Packaging Corp. Mr. Hollod 106 tpy committed to Besicorp-Recycling # 4-3814-00061
82 tpy committed to Besicorp-Power # 4-3814-00052308.97 tpy transferred to Evolution Markets
116.00 Mr. Ammirato 90 tpy transferred to Moxie Freedom, PA
Marginal Ozone 914-323-0255 102.97 tpy transferred to Lackawanna Energy Center (PA)
VOC 0.35 Pactiv LLC. Mr. Pettit
Moderate Ozone3
42.20 transferred to Panda Liberty/ Patriot Plant., PA
Elements Markets, LLC
15.56 tpy transferred To BEMIS company, Inc.
5 Marginal Ozone 5-4115-00004 770-644-3223
4
30.68 tpy committed to Vulcraft of NY, INC
Evolution Markets, LLC
Facility shutdown
Facility shutdown
Facility shutdown
Emission points shutdown
Source reduction
Emission points shutdown
PG&E Energy Trading 41.10 tpy committed to Athens Gen. Fac.
845-567-56373-3348-00084
Emission point shutdown
Element Markets, LLC4

ContaminantRegion
Available (TPY)*Nonattainment Area
Facility NameDEC ID
ContactTelephone #
Comments Reduction Date
5 Ozone Transport Region 5-0942-00014 518-562-6110
VOC 0.34 Mohawk Paper Mills, Inc. Mr. Milner
5 Marginal Ozone 5-4154-00003 518-237-1740
VOC 13.40 Mallinckrodt Anesthesiology Ms. Zeigler
5 Ozone Transport Region 5-5320-00006 314-654-6347
VOC 0.00 General Elect.- Ft. Edward Mr. West
5 Ozone Transport Region 5-5330-00009 518-746-5560
VOC 35.30 Pliant Solutions Corp. Mr. Shuder
5 Ozone Transport Region 5-5330-00016 757-820-0114
VOC 0.00 International Paper-Corinth Mr. Lienert Facility shutdown
Ozone Transport Region 5-4126-00007 901-419-3895 32.10 tpy transferred to Element Markets, LLC
32.10 Mr. Lack
Ozone Transport Region 281-207-7200VOC 0.00 F.E. Hale Mfg. Co. Mr. Benson Facility shutdown
Ozone Transport Region 6-2130-00004 315-894-5490 43 tpy transferred to Element Markets, LLC0 Mr. Lack
Ozone Transport Region 281-207-7200
43.00 American Packaging Corp Mr. Foerster
Ozone Transport Region 8-2622-00202 920-623-1008VOC 0.337 Anitec Image Corp. Mr. Markle
7 Ozone Transport Region 7-0302-00064 607-774-3375
VOC 3.02 Lockheed Martin Corp. Mr. Maciel
7 Ozone Transport Region 7-3132-00010 315-456-1714
VOC 0.00 Binghamton Cogen. Plant Mr. Potts
7 Ozone Transport Region 7-0302-00079 609-625-7699VOC 6.32 Syracuse Power Co. Mr. Ingalls
7 Ozone Transport Region 7-3132-00049 315-471-4420
VOC 20.56 Syracuse Terminal (Hess) Mr. Haid
7 Ozone Transport Region 7-3115-00014 732-750-6555
VOC 0.00 Intelicoat Technologies Mr. Stratton
7 Ozone Transport Region 7-0346-00003 413-539-5318
VOC 75.00 Marsellus Casket Co. Mr. Vredenburg
7 Ozone Transport Region 7-3126-00093 713-525-9054
5Element Markets, LLC
Element Markets, LLC 43 tpy transferred to American Packaging Corporation6
31.48 tpy committed to Vulcraft of NY, INC
Facility shutdown
Emission point(s) shutdown
Facility shutdown
19.00 tpy committed to Athens Gen. Fac.
Facility shutdown
Emission point(s) shutdown
Emission point shutdown
114.02 tpy committed To Athens Gen. Fac.
Facility shutdown
45.21 tpy committed to Flexo Trans. Inc., # 9140200574

ContaminantRegion
Available (TPY)*Nonattainment Area
Facility NameDEC ID
ContactTelephone #
Comments Reduction Date
VOC 1.00 St. Joseph=s Hospital Mr. Scicchitamo
7 Ozone Transport Region 7-2626-00047 315-448-5737
VOC 31.08 Sunoco, Inc. Syracuse Term. Mr. McGill
7 Ozone Transport Region 7-3115-00150 215-246-8267
VOC 0.80 Owens-Brockway Glass Cont. Inc. Mr. Tussing
7 Ozone Transport Region 7-3558-00014 419-247-8682
VOC 0.00 Westover Generating Station, Mr. Irwin Facility shutdown
Ozone Transport Region 7-0346-00045 315-536-2359 x3423 7.92 tpy transferred to Greenidge Generation LLC
0.00 Greenidge Generation LLC Mr. Irwin
Ozone Transport Region 8-5736-00004 315-536-2359 x34230.00 Mr. Lack
Ozone Transport Region 281-207-72137.92 Mr. Kwok
Ozone Transport Region 917-589-0012VOC 3.50 Erdle Perforating Co. Mr. Rick
8 Ozone Transport Region 8-2626-00047 716-247-4700VOC 0.00 Eastman Kodak Co. Ms. Karatas
8 Ozone Transport Region 8-2614-00205 716-477-5992
VOC 1.60 NYSOMH -Rochester Psychiatric Center Mr. Bard
8 Ozone Transport Region 8-2614-00341 518-473-5823VOC 0.00 ITT Automotive Inc. Mr. Johnson
8 Ozone Transport Region 8-2614-00192 716-277-3534VOC 0.00 Eastman Kodak Co. Mr. Spiegel
8 Ozone Transport Region 8-2626-00017 716-726-2038VOC 0.00 Eastman Kodak Co. Ms. Karatas
8 Ozone Transport Region 8-2626-00017 716-477-5992
VOC 1.58 E I DuPont Co.-Driving Pk. Mr. Olson
8 Ozone Transport Region 8-2614-00197 716-879-4662
VOC 0.00 Imation Enterprises Corp. Mr. Metzger
8 Ozone Transport Region 8-2614-00057 612-704-5461VOC 0.00 Eastman Kodak Co. Ms. Karatas
8 Ozone Transport Region 8-2614-00205 716-477-5992
VOC 4.40 RG&E, Beebee Station Ms. Selbig
8 Ozone Transport Region 8-2614-00448 716-771-2145
VOC 3.48 Monroe-Livingston Landfill Mr. Moriera
8 Ozone Transport Region 8-2656-00008 603-929-3443
7
56.71 tpy committed to Athens Gen. Fac.
1.90 retired, CAA-02-2011-1209
Emission Unit shutdown
Emission point(s) Shutdown
Emission point(s) shutdown
Element Markets, LLC 7.92 tpy transferred to Hill Top Energy Center, LLC
Emission point(s) shutdown
Facility shutdown
7.92 tpy transferred to Element Markets, LLC
Facility shutdown
Emission point(s) shutdown
18.89 tpy committed to Vulcraft of NY, INC
39.60 retired, CAA-02-2011-1209
Hill Top Energy Center, LLC
9.40 retired, CAA-02-2011-1209
Emission point(s) shutdown
60.20 retired, CAA-02-2011-1209

ContaminantRegion
Available (TPY)*Nonattainment Area
Facility NameDEC ID
ContactTelephone #
Comments Reduction Date
VOC 16.10 RG&E, Russell Station Ms. Sahler
8 Ozone Transport Region 8-2628-00068 585-724-8684
VOC 3.50 Monroe-Livingston Landfill Mr. Chraston
8 Ozone Transport Region 8-2656-00008 585-889-9460
VOC 15.21 Greenidge Generation LLC Mr. Irwin
8 Ozone Transport Region 8-5736-00004 315-536-2359VOC 16.00 Weber Knapp Co. Mr. Monsen
9 Ozone Transport Region 9-0608-00087 716-484-9135VOC 0.00 Dowcraft Corp. Gene Sadowski
9 Ozone Transport Region 9-0638-00018 716-665-6210
VOC 0.40 Delphi Harrison Th. Sys. Ms. Harper Emission point(s) shutdown
Marginal Ozone 9-2909-00018 716-439-2955 29.53 tpy transferred to Element Markets, LLC0.03 Mr. Lack
Marginal Ozone 281-207-7200
29.50 American Packaging Corp Mr. Foerster
Marginal Ozone 8-2622-00202 920-623-1008
VOC 0.00 Delphi Harrison Th. Sys. Ms. Harper Source Reduction
Marginal Ozone 9-2909-00018 716-439-2955 47.6 tpy transferred to Elements Markets, LLC0.00 Mr. Lack 38.88 tpy transferred to BEMIS company, Inc.
Marginal Ozone 281-207-7213 8.72 tpy transferred to Hill Top Energy Center, LLC38.88 Mr. Kubicek
Marginal Ozone 927-527-76958.72 Mr. Kwok
Marginal Ozone 917-589-0012VOC 0.00 Bush Industries Inc. Mr. Newman Source Reduction
Ozone Transport Region 9-0454-00001 716-665-2000 175.7 transferred to Element Markets, LLC0.00 Mr. Lack 174 tpy transferred to Perdue AgriBusiness (PA)
Ozone Transport Region 281-207-7213 1.7 tpy transferred to Perdue AgriBusiness (PA)
VOC 74.12 CWM Chemical serv. Inc. Mr. Hino
9 Ozone Transport Region 9-2934-00022 716-754-0278
VOC 0.00 TitanX Engine Cooling, Inc. Mr. Anderson Emission Point(s) shutdown
Ozone Transport Region 9-0699-00056 716-665-2620 41.4 tpy transferred to Element Markets, LLC41.40 Mr. Lack
Ozone Transport Region 281-207-7200
VOC 0.00 Occidental Chemical Corp. Ms. Desmukh Facility shutdown
Marginal Ozone 9-2912-00041 972-404-3217 88.3 tpy transferred to American Packaging Corp. #8-2622-00202
9
Facility shutdown
Emission point(s) Shutdown
Emission point(s) shutdown
9.05 tpy committed to Athens Gen. Fac.
BEMIS company, Inc.
9Element Markets, LLC 29.5 tpy transferred to American Packaging Corporation
9Element Markets, LLC
Element Markets, LLC9
9
Element Markets, LLC
Emission Point(s) shutdown
Hill Top Energy Center, LLC
Emission sources shutdown March 18, 2011***

ContaminantRegion
Available (TPY)*Nonattainment Area
Facility NameDEC ID
ContactTelephone #
Comments Reduction Date
7.80 American Packaging
Corp Mr. Foerster
Marginal Ozone 8-2622-00202 920-623-1008
VOC 7.50 The Colad Group, Inc. Mr. Pelz
9 Marginal Ozone 9-1402-00009 716-849-1776
VOC 19.07 Dunlop Tire Corporation Mr. Pyanowski Emission point(s) shutdown
9 Marginal Ozone 9-1464-00030 716-879-8274 137.93 tpy used as offsets
VOC 0.00 Bethlehem Steel Corp. Mr. Ossman Facility shutdown
200 tpy transferred to St. Lawrence Cement (Holcim) and committed to Greenport Project DEC ID #4-1040-00011
105 tpy transferred to Tecumseh Redevelop. Inc.0.00 Holcim (US) Inc. Ms. Garakani
Marginal Ozone 4-1040-00011 734-529-4233137.61 Mr. Lack 62.39 tpy transferred to Crown Cork & Seal
Marginal Ozone 281-207-7200105.00 Mr. Nagel
Marginal Ozone 716-856-06350.00 Crown Cork & Seal Mr. Antry
Marginal Ozone 7-4928-00064 215-698-5308
VOC 1.10 Limestone Compressor Fac. Mr. Young
9 Ozone Transport Region 9-0942-40027 814-871-8657
VOC 1.80 UCAR Carbon company Ms. Bolton
9 Marginal Ozone 9-2911-00185 931-380-4215VOC 34.75 Dinaire, LLC Mr. Schmitt
9 Marginal Ozone 9-1402-00218 716-894-1201
VOC 13.83 United Refining Company Mr. Roy
9 Marginal Ozone 9-1464-00007 814-726-4859
VOC 0.00 Prestolite Electric Inc. Mr. Koch
9 Ozone Transport Region 9-5620-00027 716-492-1700
VOC 22.70 Medina Power Company Mr. Pecnik
9 Ozone Transport Region 9-0484-00017 716-532-3371
VOC 4.22 Saint-Gobain Abrasives Mr. Fogarty
9 Marginal Ozone 9-2940-00048 508-795-5860VOC 0.00 SGL Carbon LLC Mr. Higgs Facility shutdown
Marginal Ozone 9-2911-00038 704-593-5165 127.52 tpy transferred to Element Markets, LLC0.02 Mr. Lack
9Element Markets, LLC 127.5 tpy transferred to American Packaging Corporation
Facility shutdown
Facility shutdown
Emission Point(s) shutdown
Element Markets, LLC
9
62.39 tpy used as offsets
4.5 tpy committed to Prestolite (P00001)
Facility shutdown
Tecumseh Redevelop Inc.
Emission Point(s) shutdown
Facility shutdown
35.00 tpy committed to Athens Gen. Fac.
Marginal Ozone 9-1409-00003 610-694-2060
200 tpy transferred to Element Markets, LLC
80.5 tpy used as offsets

ContaminantRegion
Available (TPY)*Nonattainment Area
Facility NameDEC ID
ContactTelephone #
Comments Reduction Date
Marginal Ozone 281-207-7200
127.5 American Packaging Corp Mr. Foerster
Marginal Ozone 8-2622-00202 920-623-1008
VOC 29.53 The Goodyear Tire and Rubber Co. Mr. Jones
9 Marginal Ozone 9-2911-00036 716-236-2635
VOC 1.77 Caraustar Mill/Buffalo Paperboard Mr. Cohen
9 Marginal Ozone 9-2909-00062 770-799-3844
VOC 13.45 Arcelormittal Lackawanna LLC Mr. Nagel
9 Marginal Ozone 9-1499-00067 330-659-9102
VOC 0.00 QG Printing Corporation Mr. Estock Facility shutdown
400 tpy transferred to Mid-Atlantic Develop(PA)55 tpy transferred to American Craft Brewing, PA106.10 transferred to LI Land Dev., LLC, PA
VOC 0.00 SGK Ventures Frewsburg Fac. Mr. Stalkamp Facility shutdown
Ozone Transport Region 9-1499-00067 312-683-9454 21.56 tpy transferred Element Markets0.00 Mr. Lack
Ozone Transport Region 281-207-721321.56 Mr. Kubicek
Ozone Transport Region 927-527-7695VOC 0.00 Mr. Marchmont
Severe Ozone 508-786-72140.00 Mr. Mussleman Ramapo changed name to ANP
Severe Ozone 508-382-9356 31.50 tpy transferred to Element Markets0.50 Mr. Lack
Severe Ozone 281-207-721331.00 Mr. Kubicek
Severe Ozone 927-527-7695VOC 0.00 Mr. Slade
PA Severe Ozone 914-681-6387VOC 0.00 Mr. Svendsen
PA Severe Ozone 410-230-3500VOC 0.00 Mr. Hribar
Severe Ozone 440-358-48320.00 Mr. Konary Name Change 12/3/10
Severe Ozone 617-529-3874 Name change to GenOn Emissions, LLC73.02 Mr. Lack
Severe Ozone 281-207-7213VOC 0.00 Mr. Marchmont
Severe Ozone 508-786-72140.00 Mr. Mussleman 5 tpy transferred to Calpine # 1-4722-02441
PA
GenOn Emissions, LLC
Marginal Ozone 9-1430-002139 414-566-7617
GenOn Bowline LLC
21.56 tpy transferred To BEMIS company, Inc.
PA
American National
3M Company, Bristol, PA
31 tpy transferred to Ramapo Energy(ANP)
Avery Dennison Corp., PA
73.02 tpy committed to GenOn Bowline
3M Company, Bristol, PA
41 tpy committed to NYPA Poletti site
Leonardo Academy Inc., PA
85.22 tpy committed to Astoria Generating, #2-6301-00185
Element Markets, LLC
American National Power
9
BEMIS company, Inc.
March 31, 2015***
PA
BEMIS company, Inc.
Progress Lighting Inc., Philadelphia, PA
31.5 tpy transferred to Ramapo Energy
Element Markets, LLC 31.00 tpy transferred To BEMIS company, Inc.
Emission Point(s) shutdown
Facility shutdown
Facility shutdown

ContaminantRegion
Available (TPY)*Nonattainment Area
Facility NameDEC ID
ContactTelephone #
Comments Reduction Date
Severe Ozone 508-382-9356 26 tpy transferred to Element Markets, LLC0.00 Mr. Lack
Severe Ozone 281-207-721326.00 Mr. Kubicek
Severe Ozone 927-527-7695VOC 0.00 Mr. Kane
PA Moderate Ozone 607-974-6568VOC 0.00 Mr. Proia
PA Moderate Ozone 607-529-9000VOC 0.00
Moderate Ozone0.00 Mr. Alexander
Moderate Ozone (518) 452-70000.00 Holcim (US) Inc. Ms. Garakani
Moderate Ozone 4-1040-00011 734-529-42330.00 Mr. Lack 31.61 tpy transferred to Crown Cork & Seal
Moderate Ozone 281-207-72000.00 Crown Cork & Seal Mr. Antry 31.61 tpy used as offsets
Moderate Ozone 7-4928-00064 215-698-5308VOC 0.00 Ms. Frazier
PA Severe Ozone 617-456-2200VOC 0.00 Mr. Remillard
PA Severe Ozone 781-817-8970
NOx 20.50National Grid (Formerly KeySpan Gen. LLC.)
Mr. Teetz
1 Severe Ozone 1-4722-00107 516-391-6133
NOx 253.80National Grid (Formerly KeySpan Gen. LLC.)
Mr. TeetzName change (2007)
Severe Ozone 1-2822-00481 516-391-6133 225 tpy transferred to Morgan Stanley0.00 Mr. Woods 78.36 tpy transferred to Bronx Zoo, # 2-6005- 00125
Severe Ozone 212-761-8895 146.64 transferred to Caithness LI II, LLC #1-4722-04426146.64 Mr. Grace
Severe Ozone 917-472-4593
NOx 0.00Zapco Energy Tactics Corp. - Oceanside LGRF
Mr. AntignanoEmission point(s) shutdown
7.35 tpy DEC retained15.86 tpy transferred to Morgan Stanley6.24 tpy transferred to KeySpan
0.00 Mr. WoodsSevere Ozone 212-761-8895
1
Newcomer Products Inc., PA
Air Resources Group (ARG)
31.61 transferred to Holcim (US) Inc. 4-1040-00011
31.61 tpy transferred to Element Markets, LLC
Morgan Stanley 15.86 tpy transferred to Bronx Zoo, # 2-6005- 00125
1 Severe Ozone 1-2820-02479 516-563-6336
Name change (2007)
Morgan Stanley
3M Company, Bristol, PA
136 tpy transferred to CVEC#3-1326-00275
Arbill Industries Inc., PA
17 tpy committed to CPV Energy Center #3-3356-00136
Caithness Long Island II, LLC
19.00 tpy committed to Vulcraft of NY, #8-0728-00033
Cogentrix of PA., PA 31.61 transferred to Air Resources Group (ARG)
Element Markets, LLC 26.00 tpy transferred To BEMIS company, Inc.
LTV Steel Company, PA
140 tpy committed to Corning Inc.
BEMIS company, Inc.
Power
PA
Element Markets, LLC

ContaminantRegion
Available (TPY)*Nonattainment Area
Facility NameDEC ID
ContactTelephone #
Comments Reduction Date
6.24
National Grid (Formerly KeySpan Gen. LLC.)
Mr. Teetz
Severe Ozone 1-2820-02479 516-391-6133
NOx 0.00Zapco Energy Tactics Corp. - Old Bethpage LGRF
Mr. Smith (Spagnoli Road Energy)
Severe Ozone 1-2824-00077 516-512-7415
0.00National Grid (Formerly KeySpan Gen. LLC.)
Mr. Teetz
Severe Ozone 1-2824-00077 516-391-6133
64.80National Grid (Spagnoli Rd. Energy Centre)
Mr. Teetz
Severe Ozone 1-2824-00077 516-391-6133
NOx 0.00Zapco Energy Tactics Corp. -Old Bethpage LGRF
Facility shutdown
8.35 tpy DEC retained25.06 tpy transferred to Morgan Stanley
0.00 Mr. Woods 10.00 tpy transferred to Bristol-Myers (CT)Severe Ozone 212-761-8895 15.06 tpy transferred to Bronx Zoo, # 2-6005-00125
NOx 10.30 Central Islip Psychiatric Center Mr. Bard
1 Severe Ozone 1-4728-00244 518-473-5823
NOx 0.00 Zapco Energy Tactics Corp. Mr. Antignano 4.01 tpy retained by DEC
10.2 tpy committed to Spagnoli Rd. Energy center # 1-4726-015001.82 tpy transferred to KeySpan
1.82National Grid (Formerly KeySpan Gen. LLC.)
Mr. Teetz
Severe Ozone 1-2820-00951 516-391-6133
10.20National Grid (Spagnoli Rd. Energy Centre)
Mr. Teetz
Severe Ozone 1-2820-00951 516-391-6133
NOx 0.00 Environmental Waste Incineration, Inc. Mr. Walker Facility shutdown
1 Severe Ozone 1-2809-00088 215-766-7230 38.25 tpy retained by DEC
NOx 0.00 TRW INC, Steering Wheel Systems Mr. Ferrentino Facility shutdown
1.9 tpy DEC retained5.7 tpy committed to GenOn Bowline LLC
1
64.8 tpy committed to Spagnoli Rd. Energy center # 1-4726-01500 through KeySpan
Name change (2007)1
Morgan Stanley
Name change (2007)
Severe Ozone 1-4722-00898 518-465-1010
1 Severe Ozone 1-2824-00077
Source Reduction
Name change (2007)
1 Severe Ozone 1-2820-00951 516-563-6336

ContaminantRegion
Available (TPY)*Nonattainment Area
Facility NameDEC ID
ContactTelephone #
Comments Reduction Date
0.00 Mr. Konary Name Change 12/3/10Severe Ozone 617-529-3874 Name change to GenOn Emissions, LLC
5.70 Mr. LackSevere Ozone 281-207-7213
NOx 59.10NYSOMH - Kings Park Psychiatric Center Mr. Bard
1 Severe Ozone 1-4734-00103 518-473-5823
NOx 0.00 Smithtown West Energy Generating Mr. Woods Emission point(s) shutdown
4.28 tpy DEC retained12.82 tpy transferred to Morgan Stanley
0.00Severe Ozone
NOx 0.00
Brookhaven Landfill Gas Recovery (Wehran Energy Corp.)
Mr. Wehran, Jr.
23 tpy transferred to Kleen Energy System(CT)
Severe Ozone 1-4722-00799 201-327-0215 56.15 tpy transferred to Shell energy (US)0.00 Mr. Martin
Severe Ozone 713-767-5419NOx 0.00 Covanta Babylon Inc. Mr. Volpe Source Reduction
Severe Ozone 1-4720-00777 631-491-1976 141 tpy transferred to Shell energy (US)0.00 Mr. Martin 37.95 tpy transferred to Plainfield Renew. Energy, CT
Severe Ozone 713-767-5419 103.05 tpy transferred to CPV Shore, LLC0.00 Mr. Freeman
Severe Ozone 240-723-2312
NOx 54.40 Freeport Power Plant#2 Mr. Bianco Emission Points Shutdown
1 Severe Ozone 1-2820-00358 516-377-2200 18.10 tpy DEC retain
NOx 14.60 Suffolk County Dev. Ctr. Mr. Bard
1 Severe Ozone 1-4726-00428 518-473-5823NOx 0.00 PE Bay Shore LLC Mr. Murphy Facility Shutdown
Severe Ozone 1-4728-00141 315-448-2266 29.55 & 13.66 tpy transferred to CPV Shore, LLC2.94 Mr. Freeman
Severe Ozone 240-723-2328
NOx 8.54 Montauk Generating Fac. Mr. Flannery
1 Severe Ozone 1-4724-00036 516-545-4875
NOx 0.00 Glenwood Combustion Turbine Mr. Flannery Emission Points shutdown
Severe Ozone Fac., 1-2822-00481 516-545-4875 112.64 tpy transferred To Element Markets LLC0.00 Mr. Lack
Severe Ozone 281-207-7213112.64 Mr. Mirabito
GenOn Emissions, LLC
1
Shell Energy North America (US) L.P.CPV Shore, LLC
1
103.05 tpy transferred to Wood bridge Energy Center, NJ
Morgan Stanley 12.82 tpy transferred to Bronx Zoo, # 2-6005-00125
CPV Shore, LLC 29.55 & 10.72 tpy transferred to Wood bridge Energy Center, NJFacility shutdown
Elements Markets, LLC
19.7 tpy DEC retained
1 Severe Ozone 1-4734-00169 212-761-8895
Shell Energy North America (US) L.P.
56.15 tpy transferred to Plainfield Renew. Energy, CT1
GenOn, Bowline LLC
1July 1, 2012***112.64 tpy transferred To NTE Connecticut, LLC
NTE Connecticut, LLC
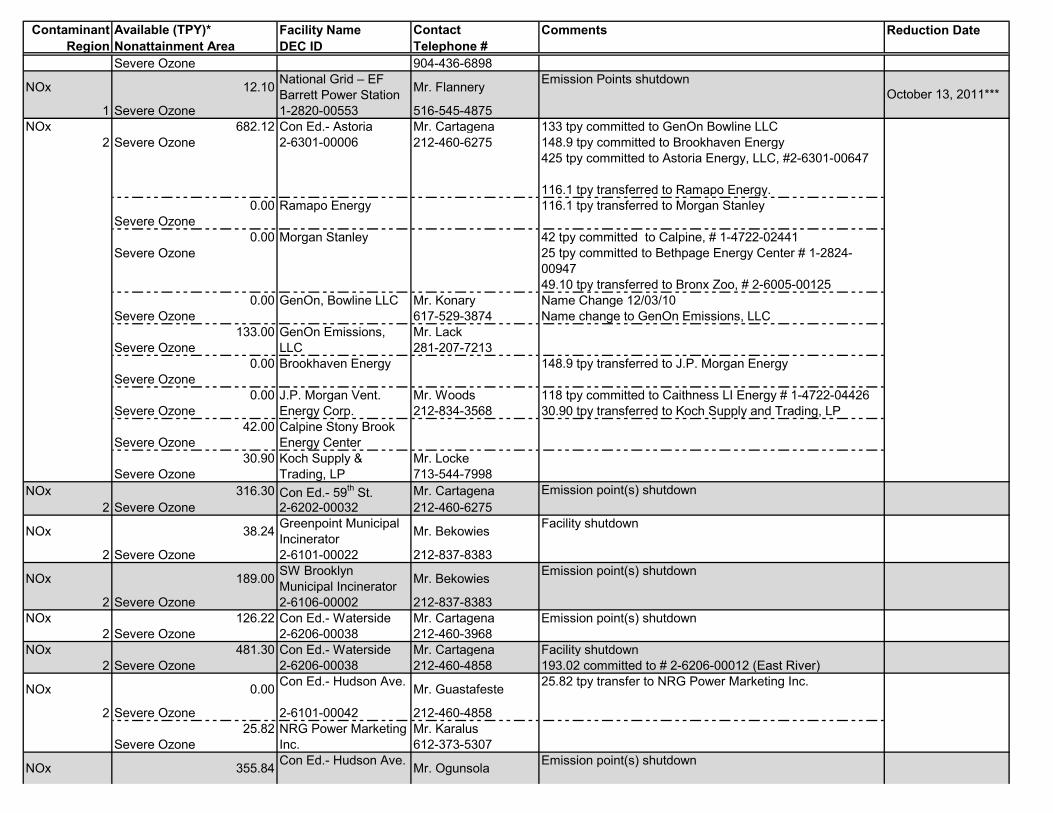
ContaminantRegion
Available (TPY)*Nonattainment Area
Facility NameDEC ID
ContactTelephone #
Comments Reduction Date
Severe Ozone 904-436-6898
NOx 12.10 National Grid – EF Barrett Power Station Mr. Flannery
1 Severe Ozone 1-2820-00553 516-545-4875NOx 682.12 Con Ed.- Astoria Mr. Cartagena 133 tpy committed to GenOn Bowline LLC
148.9 tpy committed to Brookhaven Energy425 tpy committed to Astoria Energy, LLC, #2-6301-00647
116.1 tpy transferred to Ramapo Energy.0.00
Severe Ozone0.00 42 tpy committed to Calpine, # 1-4722-02441
25 tpy committed to Bethpage Energy Center # 1-2824-0094749.10 tpy transferred to Bronx Zoo, # 2-6005-00125
0.00 Mr. Konary Name Change 12/03/10Severe Ozone 617-529-3874 Name change to GenOn Emissions, LLC
133.00 Mr. LackSevere Ozone 281-207-7213
0.00Severe Ozone
0.00 Mr. Woods 118 tpy committed to Caithness LI Energy # 1-4722-04426Severe Ozone 212-834-3568 30.90 tpy transferred to Koch Supply and Trading, LP
42.00Severe Ozone
30.90 Mr. LockeSevere Ozone 713-544-7998
NOx 316.30 Con Ed.- 59th St. Mr. Cartagena2 Severe Ozone 2-6202-00032 212-460-6275
NOx 38.24 Greenpoint Municipal Incinerator Mr. Bekowies
2 Severe Ozone 2-6101-00022 212-837-8383
NOx 189.00 SW Brooklyn Municipal Incinerator Mr. Bekowies
2 Severe Ozone 2-6106-00002 212-837-8383NOx 126.22 Con Ed.- Waterside Mr. Cartagena
2 Severe Ozone 2-6206-00038 212-460-3968NOx 481.30 Con Ed.- Waterside Mr. Cartagena Facility shutdown
2 Severe Ozone 2-6206-00038 212-460-4858 193.02 committed to # 2-6206-00012 (East River)
NOx 0.00 Con Ed.- Hudson Ave. Mr. Guastafeste
Severe Ozone 2-6101-00042 212-460-485825.82 Mr. Karalus
Severe Ozone 612-373-5307
NOx 355.84 Con Ed.- Hudson Ave. Mr. Ogunsola
GenOn Emissions, LLC
2
Koch Supply & Trading, LP
2
Calpine Stony Brook Energy Center
NRG Power Marketing Inc.
Severe Ozone
Severe Ozone 2-6301-00006 212-460-6275
Brookhaven Energy
Emission point(s) shutdown
148.9 tpy transferred to J.P. Morgan Energy
Emission point(s) shutdown
Emission point(s) shutdown
J.P. Morgan Vent. Energy Corp.
Ramapo Energy 116.1 tpy transferred to Morgan Stanley
October 13, 2011***
Morgan Stanley
GenOn, Bowline LLC
Emission point(s) shutdown
Facility shutdown
Emission Points shutdown
25.82 tpy transfer to NRG Power Marketing Inc.

ContaminantRegion
Available (TPY)*Nonattainment Area
Facility NameDEC ID
ContactTelephone #
Comments Reduction Date
2 Severe Ozone 2-6101-00042 212-460-1223NOx 11.03 St. John=s University Mr. Zweifler Source Reduction
2 Severe Ozone 2-6306-00067 718-990-2520 17.44 used for netting
NOx 294.40 Newtown Creek WPCP Mr. Lopez 115.5 DEC retained
2 Severe Ozone 2-6101-00025 718-595-5049 50.7 tpy committed to Fountain Ave. Landfill #2-6105-00687
NOx 80.00 Visy Paper Mr. Davey2 Severe Ozone 2-6403-00107 718-370-1114
NOx 21.4 East River Housing Corp. Mr. Jacob
2 Severe Ozone 2-6206-00096 212-677-5858
NOx 220.00 Betts Ave. Municipal Incinerator Mr. Nabavi
2 Severe Ozone 2-6304-00093 917-237-5958NOx 2.80 Arrow Lock Mfg. Co. Mr. Shah Facility shutdown
2 Severe Ozone 2-6105-00250 718-927-2772 x240 1.0 tpy DEC retain
NOx 0.00 Kings Plaza Total Energy Mr. Williams
2 Severe Ozone 2-6105-00301 609-654-6166
NOx 0.00 Warbasse Houses & Power Plant Mr. Sellitti
Severe Ozone 2-6107-00141 718-372-87640.00 Mr. Lack 1.0 tpy transferred to Kleen Energy, CT
21.38 tpy transferred to Merck, Sharpe & Dohme Corp., PA
4.82 tpy transferred to CPV Shore, LLC4.82 Mr. Freeman
Severe Ozone 240-723-2312
NOx 15.64 Long Island Jewish Med. Center Mr. LaBonne 26.8 used for netting
2 Severe Ozone 2-6307-00290 516-734-3030 5.21 tpy DEC retain
NOx 59.30 American Sugar Refining, Inc., Mr. Demone Facility shutdown
2 Severe Ozone 2-6101-00152 732-590-1177 19.7 tpy DEC retainNOx 0.00 Simsmetal East LLC. Mr. Witte
2 Severe Ozone 2-6304-00268 908-964-8812NOx 1239.72 Poletti Power Project Mr. Ramos Emission Source shutdown
125 tpy transferred to PSEG Energy resources & trading (CT)
41.78 tpy transferred to Lotus Danbury LMS100, LLC (CT)147.5 tpy transferred to North Bergen Liberty Generating Station (NJ)
NOx 0.00 NYOFCO Sludge Pellet. Facility Mr. Witte
2
Severe Ozone 2-6301-00084 914-681-6682
186 tpy transferred to Kleen Energy System (CT)
27.2 tpy transferred To Elements Markets
2
Severe Ozone 281-207-7213Elements Markets, LLC
CPV Shore, LLC
34.12 tpy committed to Northeast Dredging Equipment Co.
Facility shutdown
Emission point(s) shutdown
33.44 tpy committed to Northeast Dredging Equipment Co.
1 tpy transferred to CVEC#3-1326-00275

ContaminantRegion
Available (TPY)*Nonattainment Area
Facility NameDEC ID
ContactTelephone #
Comments Reduction Date
2 Severe Ozone 2-6007-00140 908-964-8812
NOx 11.18 Astoria Gas Turbine Power Mr. Cartagena
2 Severe Ozone 2-6301-00191 917-612-5224
NOx 49.84National Grid Far Rockaway Power Station
Mr. FlanneryFacility shutdown
Severe Ozone 2-6308-00040 516-545-4875 87.36 tpy transferred To Element Markets50.36 tpy transferred To NTE Connecticut, LLC7 tpy transferred to Monroe Energy (Broker), LLC1 tpy transferred to Monroe Energy, LLC (PA)
Severe Ozone 281-207-7213 29 tpy transferred to Cogen Technologies Linden Venture, LP (NJ)
50.36 Mr. MirabitoSevere Ozone 904-436-6898
0.00 Mr. TorellSevere Ozone 610-364-8399
7.00 Mr. LackSevere Ozone 281-207-7213
NOx 0.00 Terranext Eastchester Hts. Mr. Woodruff Source Reduction
Severe Ozone 2-6002-00465 347-221-0070 12.10 tpy transferred to CPV Shore, LLC0.00 Mr. Freeman
Severe Ozone 240-723-2328
NOx 0.00 Interstate Brands Corporation Mr. Davis Facility shutdown
Severe Ozone 2-6307-00276 816-502-4023 2.16 tpy transferred to Koch Supply & Trading, LP2.16 Ms. Barnthouse
Severe Ozone 316-828-7270
NOx 18.63N. Shores Towers Appt. total energy plant
Mr. CastroEmission Sources Shutdown
2 Severe Ozone 2-6206-00096 718-423-3335 40.87 used for netting
NOx 0.00 St. Barnabas Hospital Mr. DiGirolomo Emission Sources Shutdown
2 Severe Ozone 2-6005-00232 718-690-6556 18.08 tpy transferred to North Bergen Liberty Generating Station (NJ)
NOx 42.40Tallman Island Wastewater Treatment Plant
Ms. Elardo
2 Severe Ozone 2-6302-00012 718-595-6924
NOx 42.00 Harlem Valley Psychiatric Center Mr. Bard
3 Moderate Ozone 3-1326-00023 518-473-5823
NOx 2.93 Wyeth-Ayerst/Lederle Mr. Kontaxis
0.00 Mr. Lack
Source Reduction /Facility shutdown
Emission point shutdown
CPV Shore, LLC 12.10 tpy transferred to Wood bridge Energy Center, NJ2
2Koch Supply & Trading, LP
Emission Source shutdown
Element Markets, LLC
Element Markets, LLC
NTE Connecticut, LLC
Monroe Energy (Broker), LLC
7 tpy transferred to Element Markets, LLC
2
Emission sources shutdown September 18, 2013***

ContaminantRegion
Available (TPY)*Nonattainment Area
Facility NameDEC ID
ContactTelephone #
Comments Reduction Date
3 Severe Ozone 3-3924-00025 914-732-2500
NOx 0.052 IBM-Poughkeepsie Fac. Mr. Brannen
3 Moderate Ozone 3-1346-00035 914-433-1509
NOx 13.10 Hudson River Psychiatric Center Mr. Bard
3 Moderate Ozone 3-1346-00030 518-473-5823
NOx 0.00 BICC Cable Corporation Mr. Sniffen 1.95 DEC retained
Severe Ozone 3-5518-00067 281-207-7213 5.90 transferred to Elements Markets0.00 Mr. Lack
Severe Ozone 281-207-72135.90 Mr. Freeman
Severe Ozone 240-723-2312NOx 0.00 Tesa Tape Inc. Mr. Rigano 1.48 DEC retained
Severe Ozone 3-3352-00111 704-553-4664 4.42 Transferred to Element Markets, LLC0.00 Mr. Lack
Severe Ozone 281-207-7213
NOx 0.00 Algonquin Gas Stony Pt. Mr. Wooden Future Emission units shutdown
3 Severe Ozone 3-3928-00001 617-560-1345 14.08 tpy committed for netting
NOx 6.52 St. John’s Riverside Hospital, Mr. Doerr Emission point shutdown
3 Severe Ozone 3-5518-00025 914-964-4211 2.17 DEC retained
NOx 17.00 A.G. Properties of Kingston, LLC, Mr. Ginsberg
3 Ozone Transport Region 3-5154-00153 845-383-0400
NOx 1.04 Wyeth Ayerst Pharmaceutical, Mr. Alexandro Emission point shutdown
3 Severe Ozone 3-3924-00025 914-732-2160 00.35 DEC retained
NOx 0.00 Lovett Generating Station, Mr. Konary Facility shutdown
643 tpy transferred to Element Markets, LLCName change to GenOn Emissions, LLC
643.00 Element Markets, LLC Mr. Lack
Severe Ozone 281-207-72133566.20 Mr. Lack
Severe Ozone 281-207-7213NOx 0.59 Cibro Pet. Prod. Inc. Mr. Harvey
4 Marginal Ozone 4-0101-00070 518-761-0750NOx 2.10 Schenectady Int. Inc. Mr. Windish
4 Marginal Ozone 4-4228-00056 518-370-4200
NOx 2003.00 Glens Falls Lehigh Portland Cement Co Mr. Matz
4 Marginal Ozone 4-1926-00001 610-366-4752
Severe Ozone 3-3928-00010 617-529-38743
GenOn Emissions, LLC
Facility shutdown
Emission points shutdown
Emission points shutdown
3
Element Markets, LLC 4.42 tpy transferred to Merck, Sharpe & Dohme Corp., PA
CPV Shore, LLC
3
Source Reduction
Element Markets, LLC 5.90 tpy transferred to CPV Shore, LLC
Emission points shutdown
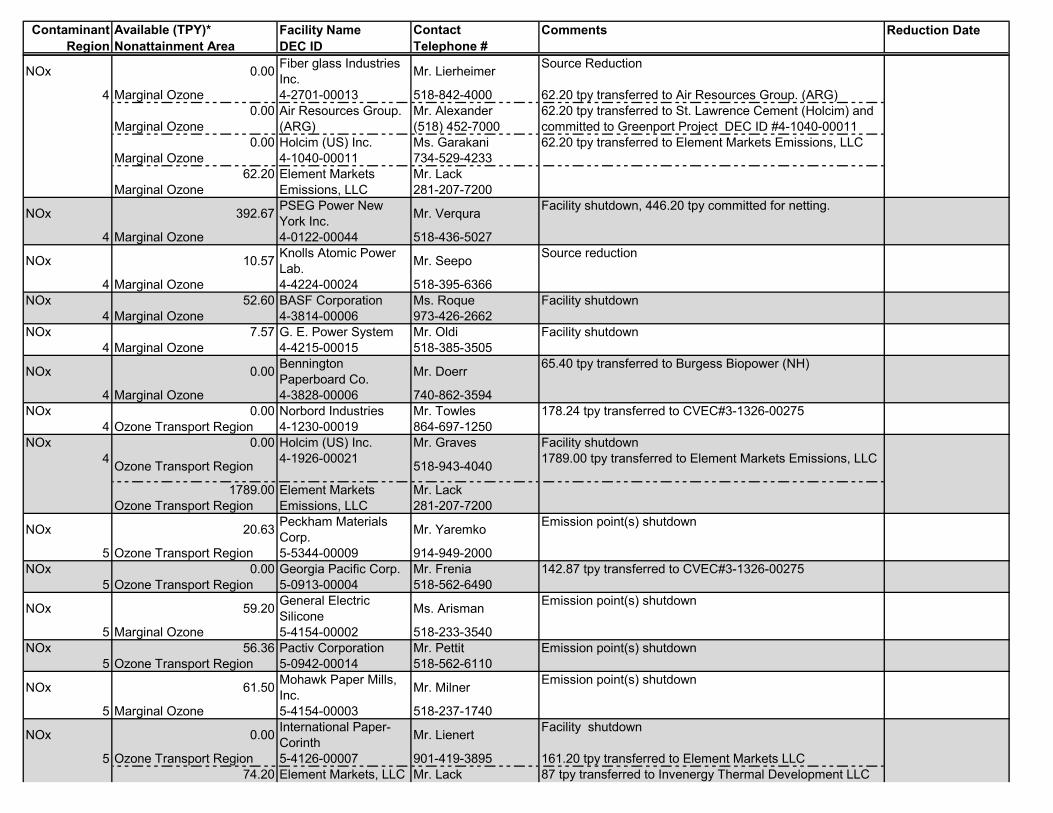
ContaminantRegion
Available (TPY)*Nonattainment Area
Facility NameDEC ID
ContactTelephone #
Comments Reduction Date
NOx 0.00 Fiber glass Industries
Inc. Mr. Lierheimer Source Reduction
Marginal Ozone 4-2701-00013 518-842-4000 62.20 tpy transferred to Air Resources Group. (ARG)0.00 Mr. Alexander
Marginal Ozone (518) 452-70000.00 Holcim (US) Inc. Ms. Garakani
Marginal Ozone 4-1040-00011 734-529-423362.20 Mr. Lack
Marginal Ozone 281-207-7200
NOx 392.67 PSEG Power New York Inc. Mr. Verqura
4 Marginal Ozone 4-0122-00044 518-436-5027
NOx 10.57 Knolls Atomic Power Lab. Mr. Seepo
4 Marginal Ozone 4-4224-00024 518-395-6366NOx 52.60 BASF Corporation Ms. Roque
4 Marginal Ozone 4-3814-00006 973-426-2662NOx 7.57 G. E. Power System Mr. Oldi
4 Marginal Ozone 4-4215-00015 518-385-3505
NOx 0.00 Bennington Paperboard Co. Mr. Doerr
4 Marginal Ozone 4-3828-00006 740-862-3594NOx 0.00 Norbord Industries Mr. Towles
4 Ozone Transport Region 4-1230-00019 864-697-1250NOx 0.00 Holcim (US) Inc. Mr. Graves Facility shutdown
Ozone Transport Region 4-1926-00021 518-943-4040 1789.00 tpy transferred to Element Markets Emissions, LLC
1789.00 Mr. LackOzone Transport Region 281-207-7200
NOx 20.63 Peckham Materials Corp. Mr. Yaremko
5 Ozone Transport Region 5-5344-00009 914-949-2000NOx 0.00 Georgia Pacific Corp. Mr. Frenia
5 Ozone Transport Region 5-0913-00004 518-562-6490
NOx 59.20 General Electric Silicone Ms. Arisman
5 Marginal Ozone 5-4154-00002 518-233-3540NOx 56.36 Pactiv Corporation Mr. Pettit
5 Ozone Transport Region 5-0942-00014 518-562-6110
NOx 61.50 Mohawk Paper Mills, Inc. Mr. Milner
5 Marginal Ozone 5-4154-00003 518-237-1740
NOx 0.00 International Paper-Corinth Mr. Lienert Facility shutdown
Ozone Transport Region 5-4126-00007 901-419-3895 161.20 tpy transferred to Element Markets LLC74.20 Mr. Lack
4
Element Markets Emissions, LLC
5
Emission point(s) shutdown
Element Markets, LLC 87 tpy transferred to Invenergy Thermal Development LLC
178.24 tpy transferred to CVEC#3-1326-00275
Facility shutdown
142.87 tpy transferred to CVEC#3-1326-00275
Emission point(s) shutdown
Emission point(s) shutdown
Emission point(s) shutdown
Facility shutdown
65.40 tpy transferred to Burgess Biopower (NH)
Source reduction
62.20 tpy transferred to Element Markets Emissions, LLC
Air Resources Group. (ARG)
62.20 tpy transferred to St. Lawrence Cement (Holcim) and committed to Greenport Project DEC ID #4-1040-00011
Facility shutdown, 446.20 tpy committed for netting.
4
Element Markets Emissions, LLC

ContaminantRegion
Available (TPY)*Nonattainment Area
Facility NameDEC ID
ContactTelephone #
Comments Reduction Date
Ozone Transport Region 281-207-720087.00 Mr. King
Ozone Transport Region 312-582-1419
NOx 59.70NYSOMH - Mohawk Valley Psychiatric Center
Mr. Bard
6 Ozone Transport Region 6-3016-00138 518-473-5823
NOx 226.10 Magan-Racine Facility Mr. Megan
6 Ozone Transport Region 6-4022-00021 352-793-6565
NOx 22.20NYSOMH - St. Lawrence Psychiatric Center
Mr. Bard
6 Ozone Transport Region 6-4012-00016 518-473-5823
NOx 35.80GLDC/Former Griffiss Air Force Base Steam Plant
Ms. Lemaire
6 Marginal Ozone 6-3013-00229 315-330-4092NOx 134.00 Anitec Image Corp. Mr. Markle
7 Ozone Transport Region 7-0302-00064 607-774-3375NOx 297.00 NiMo Power Corp. Mr. Russo
7 Ozone Transport Region 7-3512-00030 315-428-6798NOx 0.00 Fibertek Energy Fac. Mr. Schintzius
7 Ozone Transport Region 7-3132-00052 315-487-4346NOx 233.00 Heritage Power LLC Mr. Dreisbach
7 Ozone Transport Region 7-3556-00097 518-385-9122NOx 55.53 Syracuse Power Co. Mr. Ingalls
7 Ozone Transport Region 7-3132-00049 315-471-4420
NOx 496.00 Owens-Brockway Glass Container Inc. Mr. Tussing
7 Ozone Transport Region 7-3558-00014 419-247-8682
NOx 85.30 Cornell Uni. Cent. Energy Plant Ms. Brown
7 Ozone Transport Region 7-5007-00030 607-254-8687
NOx 0.00 Westover Generating Station Mr. Irwin Facility shutdown
Ozone Transport Region 7-0346-00045 315-536-2359 x3423 1046.40 tpy transferred to Greenidge Generation LLC
346.10 Greenidge Generation LLC Mr. Irwin 69 tpy transferred to High Acres Landfill
47.30 tpy transferred to Riga/Mill Seat Landfill91 tpy transferred to Invenergy Thermal Development( PA)
177 tpy used as offsets by Greenidge316 tpy transferred to NRG Canal 3 Development LLC (MA)
47.30 Riga/Mill Seat Landfill Mr. Garland
Invenergy Thermal Development LLC
Facility shutdown
Emission point(s) shutdown
7
315-536-2359 x34238-5736-00004Ozone Transport Region
560 tpy committed to Athens Gen. Fac.
From Bethlehem Steel Corp., PA
Facility shutdown
Emission point(s) shutdown
Emission point(s) shutdown
233 tpy used by Corning Inc.
Facility shutdown

ContaminantRegion
Available (TPY)*Nonattainment Area
Facility NameDEC ID
ContactTelephone #
Comments Reduction Date
Ozone Transport Region 8-2648-00014 585-753-751169.00 High Acres Landfill Ms. Zayatz
Ozone Transport Region 8-9908-00162 716-286-03554NOx 0.00 SUNY - Brockport Ms. Boyle
8 Ozone Transport Region 8-2652-00024 518-443-5146
NOx 64.00 NYSEG-Hickling Generating Station Mr. Malecki
8 Ozone Transport Region 8-4638-00011 607-762-7763
NOx 14.70 E I DuPont Co.-Driving Pk. Mr. Olson
8 Ozone Transport Region 8-2614-00197 716-879-4662
NOx 159.20 University of Rochester Mr. Stillman
8 Ozone Transport Region 8-2699-00059 716-275-2056
NOx 41.50 NYSOMH-Rochester Psychiatric Center Mr. Bard
8 Ozone Transport Region 8-2614-00341 518-473-5823
NOx 783.00 RG&E, Beebee Station Ms. Selbig 18 tpy committed to Besicorp-Recycling # 4-3814-00061
8 Ozone Transport Region 8-2614-00448 716-771-2145 242 tpy committed to Besicorp-Power # 4-3814-00052
NOx 187.03 Corning Inc.- Fall brook plant Mr. Ritter
8 Ozone Transport Region 8-4603-00008 607-974-7247
NOx 0.00 Monroe-Livingston Landfill Mr. Moriera 10.60 tpy transferred to High Acres Landfill
Ozone Transport Region 8-2656-00008 603-929-3443 00.40 tpy transferred to Riga/Mill Seat Landfill
0.40 Riga/Mill Seat Landfill Mr. Garland
Ozone Transport Region 8-2648-00014 585-753-751110.60 High Acres Landfill Ms. Zayatz
Ozone Transport Region 8-9908-00162 716-286-03554
NOx 2026.30 RG&E, Russell Station Ms. Sahler
8 Ozone Transport Region 8-2628-00068 585-724-8684
NOx 0.00 Monroe-Livingston Landfill Mr. Chraston Emission point(s)
Ozone Transport Region 8-2656-00008 585-889-9460 Shutdown, 15 tpy transferred to Riga/Mill Seat Landfill
15.00 Riga/Mill Seat Landfill Mr. Garland
Ozone Transport Region 8-2648-00014 585-753-7511NOx 438.02 Greenidge Generation
LLC Mr. Irwin
8 Ozone Transport Region 8-5736-00004 315-536-2359
NOx 5.00 Delphi Harrison Th. Sys. Ms. Harper
9 Marginal Ozone 9-1402-00286 716-439-2955
Emission point(s) shutdown
8
8
Facility shutdown
Emission sources shutdown March 18, 2011***
source reduction
Facility Shutdown
24.00 tpy committed to Guardian Glass
Emission point(s) shutdown
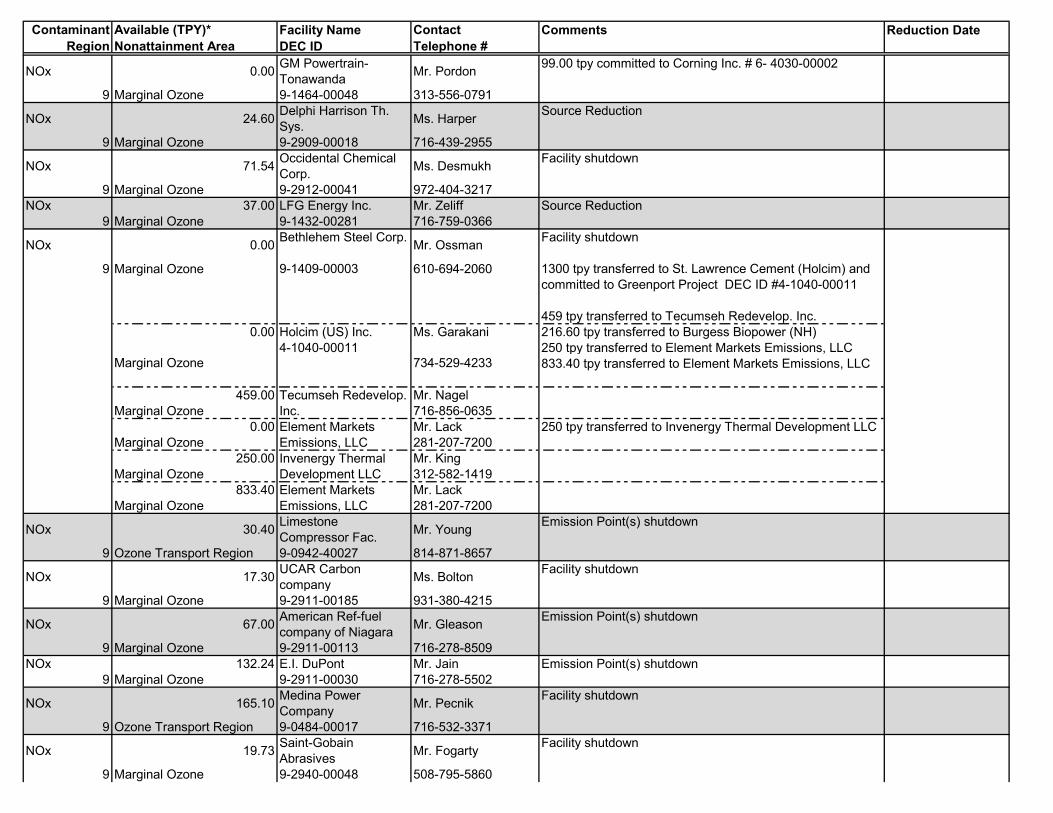
ContaminantRegion
Available (TPY)*Nonattainment Area
Facility NameDEC ID
ContactTelephone #
Comments Reduction Date
NOx 0.00 GM Powertrain-
Tonawanda Mr. Pordon
9 Marginal Ozone 9-1464-00048 313-556-0791
NOx 24.60 Delphi Harrison Th. Sys. Ms. Harper
9 Marginal Ozone 9-2909-00018 716-439-2955
NOx 71.54 Occidental Chemical Corp. Ms. Desmukh
9 Marginal Ozone 9-2912-00041 972-404-3217NOx 37.00 LFG Energy Inc. Mr. Zeliff
9 Marginal Ozone 9-1432-00281 716-759-0366
NOx 0.00 Bethlehem Steel Corp. Mr. Ossman Facility shutdown
1300 tpy transferred to St. Lawrence Cement (Holcim) and committed to Greenport Project DEC ID #4-1040-00011
459 tpy transferred to Tecumseh Redevelop. Inc.0.00 Holcim (US) Inc. Ms. Garakani 216.60 tpy transferred to Burgess Biopower (NH)
250 tpy transferred to Element Markets Emissions, LLC833.40 tpy transferred to Element Markets Emissions, LLC
459.00 Mr. NagelMarginal Ozone 716-856-0635
0.00 Mr. LackMarginal Ozone 281-207-7200
250.00 Mr. KingMarginal Ozone 312-582-1419
833.40 Mr. LackMarginal Ozone 281-207-7200
NOx 30.40 Limestone Compressor Fac. Mr. Young
9 Ozone Transport Region 9-0942-40027 814-871-8657
NOx 17.30 UCAR Carbon company Ms. Bolton
9 Marginal Ozone 9-2911-00185 931-380-4215
NOx 67.00 American Ref-fuel company of Niagara Mr. Gleason
9 Marginal Ozone 9-2911-00113 716-278-8509NOx 132.24 E.I. DuPont Mr. Jain
9 Marginal Ozone 9-2911-00030 716-278-5502
NOx 165.10 Medina Power Company Mr. Pecnik
9 Ozone Transport Region 9-0484-00017 716-532-3371
NOx 19.73 Saint-Gobain Abrasives Mr. Fogarty
9 Marginal Ozone 9-2940-00048 508-795-5860
9
Element Markets Emissions, LLC
Marginal Ozone4-1040-00011
734-529-4233
Source Reduction
99.00 tpy committed to Corning Inc. # 6- 4030-00002
Source Reduction
Facility shutdown
Facility shutdown
Marginal Ozone 9-1409-00003 610-694-2060
Facility shutdown
Emission Point(s) shutdown
Emission Point(s) shutdown
Tecumseh Redevelop. Inc.
Emission Point(s) shutdown
Element Markets Emissions, LLC
250 tpy transferred to Invenergy Thermal Development LLC
Invenergy Thermal Development LLC
Facility shutdown
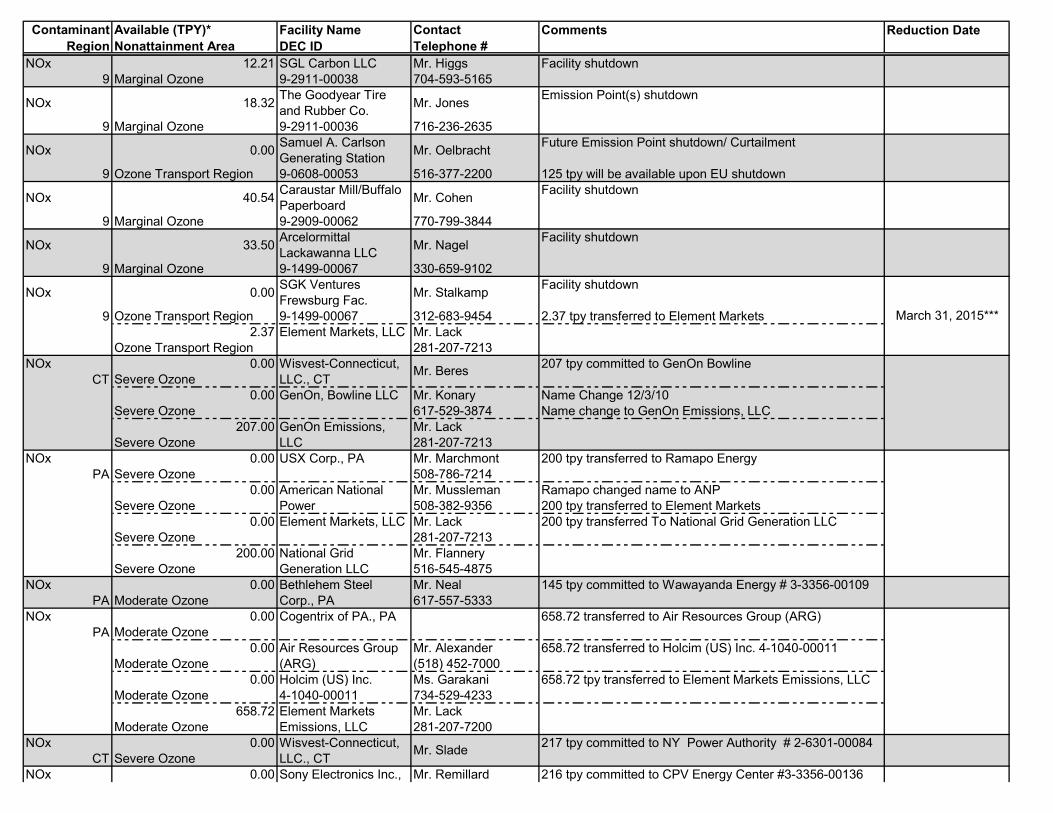
ContaminantRegion
Available (TPY)*Nonattainment Area
Facility NameDEC ID
ContactTelephone #
Comments Reduction Date
NOx 12.21 SGL Carbon LLC Mr. Higgs9 Marginal Ozone 9-2911-00038 704-593-5165
NOx 18.32 The Goodyear Tire and Rubber Co. Mr. Jones
9 Marginal Ozone 9-2911-00036 716-236-2635
NOx 0.00 Samuel A. Carlson Generating Station Mr. Oelbracht Future Emission Point shutdown/ Curtailment
9 Ozone Transport Region 9-0608-00053 516-377-2200 125 tpy will be available upon EU shutdown
NOx 40.54 Caraustar Mill/Buffalo Paperboard Mr. Cohen
9 Marginal Ozone 9-2909-00062 770-799-3844
NOx 33.50 Arcelormittal Lackawanna LLC Mr. Nagel
9 Marginal Ozone 9-1499-00067 330-659-9102
NOx 0.00 SGK Ventures Frewsburg Fac. Mr. Stalkamp Facility shutdown
Ozone Transport Region 9-1499-00067 312-683-9454 2.37 tpy transferred to Element Markets2.37 Mr. Lack
Ozone Transport Region 281-207-7213NOx 0.00
Severe Ozone0.00 Mr. Konary Name Change 12/3/10
Severe Ozone 617-529-3874 Name change to GenOn Emissions, LLC207.00 Mr. Lack
Severe Ozone 281-207-7213NOx 0.00 Mr. Marchmont
Severe Ozone 508-786-72140.00 Mr. Mussleman Ramapo changed name to ANP
Severe Ozone 508-382-9356 200 tpy transferred to Element Markets0.00 Mr. Lack
Severe Ozone 281-207-7213200.00 Mr. Flannery
Severe Ozone 516-545-4875NOx 0.00 Mr. Neal
PA Moderate Ozone 617-557-5333NOx 0.00
Moderate Ozone0.00 Mr. Alexander
Moderate Ozone (518) 452-70000.00 Holcim (US) Inc. Ms. Garakani
Moderate Ozone 4-1040-00011 734-529-4233658.72 Mr. Lack
Moderate Ozone 281-207-7200NOx 0.00
CT Severe OzoneNOx 0.00 Mr. Remillard
Element Markets, LLC
CT
GenOn Emissions, LLC
PA
Element Markets Emissions, LLC
9 March 31, 2015***
Sony Electronics Inc., 216 tpy committed to CPV Energy Center #3-3356-00136
658.72 tpy transferred to Element Markets Emissions, LLC
Wisvest-Connecticut, LLC., CT Mr. Slade 217 tpy committed to NY Power Authority # 2-6301-00084
Facility shutdown
Cogentrix of PA., PA 658.72 transferred to Air Resources Group (ARG)
Air Resources Group (ARG)
658.72 transferred to Holcim (US) Inc. 4-1040-00011
Element Markets, LLC 200 tpy transferred To National Grid Generation LLC
Bethlehem Steel Corp., PA
145 tpy committed to Wawayanda Energy # 3-3356-00109
Wisvest-Connecticut, LLC., CT Mr. Beres 207 tpy committed to GenOn Bowline
USX Corp., PA 200 tpy transferred to Ramapo Energy
American National Power
GenOn, Bowline LLC
Facility shutdown
Facility shutdown
Emission Point(s) shutdown
PA
National Grid Generation LLC

ContaminantRegion
Available (TPY)*Nonattainment Area
Facility NameDEC ID
ContactTelephone #
Comments Reduction Date
PA Severe Ozone 781-817-8970NOx 0.00 Mr. Ritter
PA Severe Ozone 607-974-7247
PM-10 0.86 Con Ed.- 59th St. Mr. Cartagena2 Moderate 2-6202-00032 212-460-6275
PM-10 0.00 Con Ed.- Waterside Mr. Cartagena2 Moderate 2-6206-00038 212-460-3968
PM-10 0.00 Con Ed.- Waterside Mr. Cartagena Future Facility Shutdown2 Moderate 2-6206-00038 212-460-4858 70.40 committed to # 2-6206-00012 (East River)
PM-10 1.40 East River Housing Corp. Mr. Jacob
2 Moderate 2-6206-00096 212-677-5858 PM-2.5 Poletti Power Project Mr. Ramos
2 2-6301-00084 914-681-6682
PM-2.5 Con Ed.- Hudson Ave. Mr. Ogunsola
2 2-6101-00042 212-460-1223
PM-2.5 NYOFCO Sludge Pellet. Facility Mr. Lambalot
2-6007-00140 203-509-2577Ms. Evensen316-828-7496
PM-2.5National Grid Far Rockaway Power Station
Mr. Flannery
2 2-6308-00040 516-545-4875
PM-2.5 Lovett Generating Station, Mr. Konary Facility shutdown
3-3928-00010 617-529-3874 Name change to GenOn Emissions, LLCMr. Lack281-207-7213
CO 8.32 Zapco Energy Tactics Corp. Mr. Jansen
1 Moderate 1-2820-02479 516-924-5300
CO 34.52 Zapco Energy Tactics Corp. Mr. Antignano
1 Moderate 1-2824-00077 516-563-6336
CO 16.03 Zapco Energy Tactics Corp. Mr. Antignano
1 Moderate 1-2820-00951 516-563-6336
CO 6.35 Environmental Waste Incineration, Inc. Mr. Walker
1 Moderate 1-2809-00088 215-766-7230
Facility shutdown
Emission point(s) shutdown
Emission point(s) shutdown
Emission point(s) shutdown
2
12.81 Facility shutdown
0.00 25.76 tpy transferred to Koch Supply & Trading
25.76 Koch Supply & Trading, LP
0.00
3336.30 GenOn Emissions,
LLC
Emission point(s) Shutdown
93.60 Emission Source shutdown
44.71 Emission point(s) shutdown
25.04 committed to ConEd East River #2-6206-00012
13.92 committed to ConEd East River #2-6206-00012
PA
Corning Asahi Video Inc., PA
173 tpy committed to Corning Diesel Mfg. Fac. #8-4642-00108

ContaminantRegion
Available (TPY)*Nonattainment Area
Facility NameDEC ID
ContactTelephone #
Comments Reduction Date
CO 125.62 Con Ed.- Astoria Mr. Cartagena2 Moderate 2-6301-00006 212-460-6275
CO 48.00 Con Ed.- 59th St. Mr. Cartagena2 Moderate 2-6202-00032 212-460-6275
CO 4.00 Hershey Choc. & Conf. Corp. Mr. Simmons
2 Moderate 2-6304-00481 717-534-7540CO 0.00 P&G Port Ivory Plant Ms. Clancy
2 Moderate 2-6401-00004 973-690-3487
CO 40.84 SW Brooklyn Municipal Incinerator Mr. Bekowies
2 Moderate 2-6106-00002 212-837-8383CO 81.70 Con Ed.- Waterside Mr. Cartagena
2 Moderate 2-6206-00038 212-460-3968CO 86.63 Con Ed.- Waterside Mr. Cartagena Facility shutdown
2 Moderate 2-6206-00038 212-460-4858 120.27 committed to # 2-6206-00012 (East River)
CO 0.00 Con Ed.- Hudson Ave. Mr. Guastafeste
Moderate 2-6101-00042 212-460-485812.79 Mr. Karalus
Moderate 612-373-5307
SO2**Glenwood Combustion Turbine Fac. Mr. Flannery
1 1-2822-00481 516-545-4875
SO2** Con Ed.- Hudson Ave. Mr. Ogunsola
2 2-6101-00042 212-460-1223
SO2** NYOFCO Sludge Pellet. Facility Mr. Lambalot
2 2-6007-00140 203-509-2577
SO2**National Grid Far Rockaway Power Station
Mr. Flannery
2 2-6308-00040 516-545-4875
SO2** Lovett Generating Station Mr. Konary Facility shutdown
3-3928-00010 617-529-3874 Name change to GenOn Emissions, LLCMr. Lack281-207-7213
GenOn Emissions, LLC
12.79 tpy transfer to NRG Power Marketing Inc.
Emission point(s) shutdown
15.90 tpy transferred to Port Auth. of NY & NJ
2
15.10 Facility shutdown
1.00 Facility shutdown
1.04
July 1, 2012***
Emission Points. Shutdown
460.34 Emission point(s) shutdown
NRG Power Marketing Inc.
* (TPY) - tons per year
** SO2 ERCs can only be available for use as precursors for PM2.5 non-attainment
3
0.00
10178.00
Emission point(s) shutdown
18.16 tpy used by Freshkill Landfill
145 tpy committed to Astoria Energy, LLC, #2-6301-00647
Emission point(s) shutdown

ContaminantRegion
Available (TPY)*Nonattainment Area
Facility NameDEC ID
ContactTelephone #
Comments Reduction Date
Total ERCs TPY
Bold entries - additions this week VOC 2384.565NOx 23444.422PM-10 2.26PM-2.5 513.18SO2** 10655.48CO 464.80
NOTE: THIS REGISTRY IS FOR INFORMATIONAL PURPOSES ONLY. THE DEPARTMENT IS NOT RESPONSIBLE FOR ANY ERRORS AND OMISSIONS. PARTIES USING THE INFORMATION CONTAINED HEREIN ARE SOLELY RESPONSIBLE FOR VERIFYING LEGAL OWNERSHIP AND THE VALIDITY OF ERCs. REPORTED TRANSFERS OF ERCs ARE NOTED AS A COURTESY AND NO ATTEMPT HAS BEEN MADE TO VERIFY THAT REPORTED ERCs TRANSFERS ARE VALID OR EFFECTIVE AS A MATTER OF LAW.
*** As of January 29, 2016, Reduction Date for the creation of the newly approved ERCs will be listed for all the ERCs placed in the registry.**** Original ERCs of 84.94 tpy was changed to 67.76 tpy, to be consistent with the facility’s Air Permit dated 1/5/2016.

POWER ENGINEERS, INC. Plan Approval Application – Renovo Energy Center, LLC
APPENDIX R MUNICIPAL NOTIFICATIONS
FRE 361-2786 (PER-02-02-09) RENOVO 137575 (2019-12-27) TD
POWER ENGINEERS, INC.
303 U.S. ROUTE ONE FREEPORT, ME 04032 USA
PHONE
FAX
207-869-1200
207-869-1299
December 27, 2019
Clinton County Commissioners
Clinton County Government
232 East Main Street
Lock Haven, PA 07745
Subject: Renovo Energy Center, LLC Plan Approval Application
Dear Commissioners:
On behalf of Renovo Energy Center, LLC (REC), POWER Engineers, Inc. is providing this notice
that REC is submitting a Plan Approval Application to the Pennsylvania Department of
Environmental Protection (PaDEP) for the construction and operation of a nominally rated 1,240
MW (net) dual fuel fired (natural gas and ultra-low sulfur diesel) combined-cycle electric generating
plant to be located in Renovo, Clinton County, Pennsylvania.
The proposed REC facility will consist of two 1-on-1 power blocks that include a Combustion
Turbine Generator (CTG), Heat Recovery Steam Generator (HRSG), and a Steam Turbine (STG)
in line to produce electricity for distribution into the transmission grid system. Each combined
cycle system is intended to be fired on natural gas unless there is an interruption in supply.
Additionally, each HRSG is equipped with a natural gas-fired Duct Burner (DB) for supplemental
steam production, and the steam from the HRSGs is routed through the condensing STG.
The facility will be equipped with state-of-the-art air pollution control equipment. REC will utilize
air cooled condensers for condensing the exhaust steam, which is an environmentally preferred
method as compared to a traditional wet cooling tower. The proposed REC facility will also include
two auxiliary boilers, an emergency generator, an emergency firewater pump, and a natural gas
heater. The HRSG DBs, the auxiliary boilers, and fuel gas heater will only combust pipeline quality
natural gas. The emergency firewater pump and emergency generator will utilize ultra-low sulfur
diesel fuel oil.
This notice is being provided in accordance with the Municipal Notification requirements in 25 Pa
Code Section 127.43a. The Plan Approval Application may be reviewed by making arrangements
with:
Pennsylvania Department of Environmental Protection
Northcentral Regional Office (Air Quality)
208 West Third Street Suite 101
Williamsport, PA 17701-6448
(570) 327-3637
Renovo Energy Center, LLC
December 27, 2019
FRE 361-2786 (PER-02-02-09) RENOVO 137575 (2019-12-27) TD
PAGE 2 OF 2
A 30-day comment period begins when the municipality and county receive the notice. Those
wishing to comment to the PaDEP on this application must do so within 30 days from the date of
receipt of this notice.
If you have any comments or concerns regarding the Plan Approval Application, please contact
Muhammad Zaman, Environmental Program Manager at the address above or he can be reached at
570-327-3648.
Sincerely,
Tim Donnelly
Senior Project Manager
Enclosure(s): Correspondence letter to DEP
c: Rick Franzese, Bechtel Development Company
Bill Bousquet, Innovative Power Solutions, LLC
DMS 137575/PER-02-02-09

FRE 361-2785 (PER-02-02-09) RENOVO 137575 (2019-12-27) TD
POWER ENGINEERS, INC.
303 U.S. ROUTE ONE FREEPORT, ME 04032 USA
PHONE
FAX
207-869-1200
207-869-1299
December 27, 2019
Renovo Borough
140 3rd Street, Apt 11
Renovo, PA 17764
Subject: Renovo Energy Center, LLC Plan Approval Application
To Whom It May Concern:
On behalf of Renovo Energy Center, LLC (REC), POWER Engineers, Inc. is providing this notice
that REC is submitting a Plan Approval Application to the Pennsylvania Department of
Environmental Protection (PaDEP) for the construction and operation of a nominally rated 1,240
MW (net) dual fuel fired (natural gas and ultra-low sulfur diesel) combined-cycle electric generating
plant to be located in Renovo, Clinton County, Pennsylvania.
The proposed REC facility will consist of two 1-on-1 power blocks that include a Combustion
Turbine Generator (CTG), Heat Recovery Steam Generator (HRSG), and a Steam Turbine (STG)
in line to produce electricity for distribution into the transmission grid system. Each combined
cycle system is intended to be fired on natural gas unless there is an interruption in supply.
Additionally, each HRSG is equipped with a natural gas-fired Duct Burner (DB) for supplemental
steam production, and the steam from the HRSGs is routed through the condensing STG.
The facility will be equipped with state-of-the-art air pollution control equipment. REC will utilize
air cooled condensers for condensing the exhaust steam, which is an environmentally preferred
method as compared to a traditional wet cooling tower. The proposed REC facility will also include
two auxiliary boilers, an emergency generator, an emergency firewater pump, and a natural gas
heater. The HRSG DBs, the auxiliary boilers, and fuel gas heater will only combust pipeline quality
natural gas. The emergency firewater pump and emergency generator will utilize ultra-low sulfur
diesel fuel oil.
This notice is being provided in accordance with the Municipal Notification requirements in 25 Pa
Code Section 127.43a. The Plan Approval Application may be reviewed by making arrangements
with:
Pennsylvania Department of Environmental Protection
Northcentral Regional Office (Air Quality)
208 West Third Street Suite 101
Williamsport, PA 17701-6448
(570) 327-3637

Renovo Energy Center, LLC
December 27, 2019
FRE 361-2785 (PER-02-02-09) RENOVO 137575 (2019-12-27) TD
PAGE 2 OF 2
A 30-day comment period begins when the municipality and county receive the notice. Those
wishing to comment to the PaDEP on this application must do so within 30 days from the date of
receipt of this notice.
If you have any comments or concerns regarding the Plan Approval Application, please contact
Muhammad Zaman, Environmental Program Manager at the address above or he can be reached at
570-327-3648.
Sincerely,
Tim Donnelly
Senior Project Manager
Enclosure(s): Correspondence letter to DEP
c: Rick Franzese, Bechtel Development Company
Bill Bousquet, Innovative Power Solutions, LLC
DMS 137575/PER-02-02-09

POWER ENGINEERS, INC. Plan Approval Application – Renovo Energy Center, LLC
APPENDIX S CLINTON COUNTY SALDO LETTER, WATER SUPPLY LETTER OF APPROVAL, PHMC PROJECT REVIEW INFORMATION


Renovo Energy Center LLC 5275 Westview Drive Frederick, MD 21703
July 27, 2015
Pennsylvania Historical and Museum Commission Bureau for Historic Preservation Attn: Steven McDougal 400 North Street, 2th Floor Harrisburg, PA 17120
Steven:
It was a pleasure speaking with you the other day. Enclosed are the documents which I
described over the phone. They are several views of the same piece of property. When you
have had a chance to familiarize yourself with these documents, let's spend 15 minutes on the
phone and I can help explain them to you.
Also enclosed is a revised document titled "Project Narrative - PHMC Review Renovo Energy
Center Proposed Location." Please replace the previously filed document of the same name
with this one.
With regard to the contamination- while it is found throughout the industrial park, it appears
heaviest in the areas where the power plant will be located and we will have to pay particular
attention to these areas during construction.
Thank you very much for your effort in this matter and I look forward to talking with you
soon. Also, I will be at the site in the next few weeks and we could always plan a site visit
together.
Very truly yours,
~-Thomas D. Emero, Director
Innovative Power Solutions LLC
Consultant to Renovo Energy Center LLC

1
Project Narrative – PHMC Review
Renovo Energy Center Proposed Location
Renovo Energy Center LLC is proposing to use an approximately 20-acre portion of the Renovo
Industrial Park to site a natural gas electrical plant. The property is located in Renovo Borough,
Clinton County. The site is shown on the Quadrangle map included with this submission. This
site has a long history of heavy industrial use. Beginning in 1862, the site was used for over 100
years for the construction, modification and repair of rail cars. Over 3,000 people worked on
the site at its height in the 1920s and 30s. The site has changed hands several times since the
1960s. The power plant is proposed to be located directly over that portion of the site which
has been most heavily used over the past 100 to 150 years.
In 1995, Clinton County Economic Partnership completed Phase II and Expanded Phase II ESA
Investigation Reports of the site to facilitate and encourage its redevelopment. In 2011,
additional environmental investigation of the site revealed contamination throughout the site,
with higher levels of contamination identified at several locations. A Remedial Investigation
Report was prepared, along with Site Specific Remediation and ecological and human health
risk assessments. Restrictive covenants have been placed on the property with regard to the
disturbance of soils in certain areas.
In 2001, a road was added to the site to facilitate the use of the site as an industrial park. Over
the last 30 years or so numerous buildings have been demolished including: former machine
shop, tool room, foundry, paint shop, store depot, lumber shed, and tank shop. These
demolitions left only the chimney to the foundry, a former machine shop, the former erecting
shop, and the former boiler shop. The existing buildings are labeled with their previous usage in
the included site plan.
In order to prepare the land for development of the power plant, the road that was constructed
to facilitate industrial park development will be partially demolished and a turnaround area will
be constructed near the intersection of Industrial Park Road and Mt. Glen Road. The remaining
buildings and the chimney will be removed. A cell tower located on the site will be relocated to
a parcel shown on the map off of Renovo Road. The power plant will be located in the center
of the site where the current buildings are and where the demolished buildings were situated.
We are submitting this project site for review to determine whether there are any structures on
the site that would require additional investigation prior to starting construction on the power
plant. Such construction would include demolition and clearing of the remaining structures
within the project area. The placement of utilities, fences, additional buildings, etc. has not

2
plant. Such construction would include demolition and clearing of the remaining structures
within the project area. The placement of utilities, fences, additional buildings, etc. has not
been proposed at this time. For this reason, the project boundary is assumed to be coincident
with the area of potential effect.
In addition to the aforementioned 7.5’ USGS Quadrangle, the following materials are included:
a) a basic site plan consisting of annotated Google Earth imagery copy written 2015, b)
annotated images of the site including aerial imagery from 1938, 1959, and 1968 from Penn
Pilot and c) images taken by Sweetland Engineering and Associates survey crews, which are
labeled individually below the images. This project will require Pennsylvania DEP permitting for
an NPDES permit for Earth Disturbances. Because this permit has not yet been acquired, it was
not listed in section C of the request for consultation form.