Using Life Cycle Assessment to Evaluate Green and Grey Combined Sewer Overflow Control Strategies
13
RESEARCH AND ANALYSIS Using Life Cycle Assessment to Evaluate Green and Grey Combined Sewer Overflow Control Strategies Maria R. C. De Sousa, Franco A. Montalto, and Sabrina Spatari Keywords: environmental impact green infrastructure greenhouse gas (GHG) emissions industrial ecology stormwater management urban hydrology Summary Decentralized approaches to managing urban stormwater are gaining increased attention within the contexts of urban sustainability, climate change adaptation, and as a means of reducing combined sewer overflows (CSOs). This study applied a life cycle assessment (LCA) to comparing the environmental efficiency of three means of equivalently reducing CSOs to the Bronx River (Bronx, NY, USA). Strategy 1 featured decentralized green infras- tructure technologies, while “grey” strategies 2 and 3 detained, and detained and treated, respectively, excess flows at the end of pipe. We estimated greenhouse gas emissions (in metric tons of carbon dioxide equivalents [t CO 2 -eq]) over the construction, operation, and maintenance phases, including energy consumed at the wastewater treatment plant (WWTP), carbon sequestered, and shading provided by vegetation (in the case of the green approach) over a 50-year analysis period. The study area comprised the entire drainage area contributing to New York State permitted CSO discharge points associated with the Hunts Point WWTP . The analysis was performed using a hybrid of process and economic input-output (EIO) LCA methods. The decentralized green strategy outperformed the two grey strategies in terms of this set of environmental metrics. The net emissions of the green strategy over 50 years was 19,000 t CO 2 -eq, whereas the grey strategies emitted 85,000 t CO 2 -eq (detention) and 400,000 t CO 2 -eq (detention and treatment). These results were significantly influenced by the emissions associated with the operation and maintenance activities required for strategies 2 and 3, and the carbon sequestered and shading provided by the vegetation in strategy 1, and suggest that watershed managers who seek to reduce CSOs and reduce carbon footprints would opt for the green approach. Introduction Combined sewer overflows (CSOs) are caused during wet weather events, when stormwater generated on impervious surfaces causes urban collection systems to exceed their con- veyance capacity. Because combined sewage contains untreated domestic and industrial wastewaters, as well as urban runoff, CSOs are both a public health and environmental liability. In Address correspondence to: Franco A. Montalto, 3141 Chestnut Street, Curtis Hall 251, Philadelphia, PA USA 19104. Email: [email protected] c 2012 by Yale University DOI: 10.1111/j.1530-9290.2012.00534.x Volume 16, Number 6 their attempt to curb such events, urban watershed managers are currently comparing a variety of end-of-pipe and source con- trol measures. While end-of-pipe (or “grey”) strategies typically detain and/or treat would-be overflow volumes in large concrete tanks or tunnels, source control strategies seek to minimize the rate and volume of stormwater that enters the collection system in the first place. www.wileyonlinelibrary.com/journal/jie Journal of Industrial Ecology 901
-
Upload
independent -
Category
Documents
-
view
1 -
download
0
Transcript of Using Life Cycle Assessment to Evaluate Green and Grey Combined Sewer Overflow Control Strategies

R E S E A R C H A N D A N A LYS I S
Using Life Cycle Assessment to EvaluateGreen and Grey Combined SewerOverflow Control StrategiesMaria R C De Sousa Franco A Montalto and Sabrina Spatari
Keywords
environmental impactgreen infrastructuregreenhouse gas (GHG) emissionsindustrial ecologystormwater managementurban hydrology
Summary
Decentralized approaches to managing urban stormwater are gaining increased attentionwithin the contexts of urban sustainability climate change adaptation and as a means ofreducing combined sewer overflows (CSOs) This study applied a life cycle assessment(LCA) to comparing the environmental efficiency of three means of equivalently reducingCSOs to the Bronx River (Bronx NY USA) Strategy 1 featured decentralized green infras-tructure technologies while ldquogreyrdquo strategies 2 and 3 detained and detained and treatedrespectively excess flows at the end of pipe We estimated greenhouse gas emissions (inmetric tons of carbon dioxide equivalents [t CO2-eq]) over the construction operationand maintenance phases including energy consumed at the wastewater treatment plant(WWTP) carbon sequestered and shading provided by vegetation (in the case of the greenapproach) over a 50-year analysis period The study area comprised the entire drainagearea contributing to New York State permitted CSO discharge points associated with theHunts Point WWTP The analysis was performed using a hybrid of process and economicinput-output (EIO) LCA methods The decentralized green strategy outperformed the twogrey strategies in terms of this set of environmental metrics The net emissions of the greenstrategy over 50 years was 19000 t CO2-eq whereas the grey strategies emitted 85000 tCO2-eq (detention) and 400000 t CO2-eq (detention and treatment) These results weresignificantly influenced by the emissions associated with the operation and maintenanceactivities required for strategies 2 and 3 and the carbon sequestered and shading providedby the vegetation in strategy 1 and suggest that watershed managers who seek to reduceCSOs and reduce carbon footprints would opt for the green approach
Introduction
Combined sewer overflows (CSOs) are caused during wetweather events when stormwater generated on impervioussurfaces causes urban collection systems to exceed their con-veyance capacity Because combined sewage contains untreateddomestic and industrial wastewaters as well as urban runoffCSOs are both a public health and environmental liability In
Address correspondence to Franco A Montalto 3141 Chestnut Street Curtis Hall 251 Philadelphia PA USA 19104 Email fmontaltocoedrexeledu
ccopy 2012 by Yale UniversityDOI 101111j1530-9290201200534x
Volume 16 Number 6
their attempt to curb such events urban watershed managersare currently comparing a variety of end-of-pipe and source con-trol measures While end-of-pipe (or ldquogreyrdquo) strategies typicallydetain andor treat would-be overflow volumes in large concretetanks or tunnels source control strategies seek to minimize therate and volume of stormwater that enters the collection systemin the first place
wwwwileyonlinelibrarycomjournaljie Journal of Industrial Ecology 901
R E S E A R C H A N D A N A LYS I S
Green infrastructure (GI) is the term currently applied toa family of source control measures that reduce stormwater bypromoting infiltration evapotranspiration and the capture and(re)use of stormwater on individual lots distributed throughoutthe urban watershed (US EPA 2011) By enhancing these hy-drologic processes within the urban watershed GI technologiessuch as bioretention facilities green roofs porous pavementsand stormwater planters can reduce the volume of runoff gen-erated thus enabling changes in sewer hydraulics overflowfrequencies and durations and ultimately the fraction of wetweather flow that arrives at the treatment plant At least twostudies suggest that under certain conditions widespread im-plementation of GI could be more cost effective at reducingCSOs than an end-of-pipe detention tank (MacMullan andReich 2007 Montalto et al 2007) Although GI has only beenshown to reduce CSOs using hydrologic and hydraulic mod-els many US cities have initiated extensive GI programs Asof this date five major US cities (Syracuse NY MilwaukeeWI Kansas City MO Portland OR and Chicago IL) havecommitted to using GI as part of their long-term plans to re-duce CSOs and have begun implementation Another three(Cleveland OH St Louis MO and Philadelphia PA) havecommitted to a green strategy but have not yet begun imple-mentation while New York NY Washington DC SeattleWA Cincinnati OH and Louisville KY are either activelyexploring or have proposed a green strategy (Kloss 2012) Thereliability with which GI can actually reduce CSOs will only beknown with certainty after a sufficient density of GI facilitieshas been implemented and a real watershed response detectedby monitoring Because of its perceived ancillary benefits GI ishowever also increasingly ldquocross-listedrdquo as an urban sustainabil-ity and climate change adaptation initiative A seminal ldquotriplebottom linerdquo study commissioned recently by the PhiladelphiaWater Department (PWD 2009) compared the environmen-tal public health and social benefits of ldquogreenrdquo and ldquogreyrdquoapproaches to controlling CSOs concluding that the overallbenefits of the green approach far exceed those of the grey oneSome benefits attributed to GI included improved real estatevalue community aesthetics livability and quality of life aswell as enhanced ecosystem function Despite the excitementsurrounding this study published research in this field is lim-ited and the extent to which GI can reduce municipal carbonfootprints has not been comprehensively explored Spatari andcolleagues (2011) used life cycle assessment (LCA) techniquesto compute the energy and carbon payback periods associatedwith the construction of a block-scale GI strategy Other re-searchers have attempted to compare the energy required toinstall specific GI measures such as green roofs (Kosareo andReis 2007 Saiz et al 2006) with the savings accrued fromtheir use and their cost-effectiveness for individual investment(Blackhurst et al 2010) To date no researchers have system-atically compared watershed-scale green and grey approachesusing LCA techniques
This study compares watershed-scale green and grey ap-proaches to CSO control by quantifying the greenhouse gas(GHG) emissions associated with their construction operation
and maintenance The study area includes the entire drainagearea contributing to two CSOs on the Bronx River known asHP-007 and HP-009 in the Bronx New York City (NYC)The performance of the three different CSO control strate-gies is compared over a 50-year period We use hydrologic andhydraulic modeling results to consider associated changes inenergy consumption at the Hunts Point wastewater treatmentplant (WWTP) with a maximum capacity of 200 million gal-lons per day (Mgalday) (NYC DEP 2011)1 and consider theenergy requirements associated with physical components ofeach strategy The latter analysis includes required and avoidedcement production which globally accounts for more than 5of all carbon dioxide (CO2) emissions (Adam 2007 Brehm2007 Hendriks et al 2004) The analysis of the green approachalso considers carbon sequestered and shading provided byvegetation
MethodsOverview
Although LCA has traditionally been applied to consumergoods and services its field of application has expanded overthe last decade to include infrastructure (eg Herstein et al2009 Racoviceanu et al 2007) In the present application thefunctional unit considered is the 784 hectare (ha) drainage area2
contributing to the two CSO discharge points HP-007 and HP-009 Three alternative CSO control measures are compared
Scenario 1 includes a combination of GI technologies(eg 2712 ha porous pavements 118 ha street-end bioreten-tion bump-out facilities 280 ha curbside infiltration planters106 ha backyard rain gardens and 854 ha subgrade cisterns)which are collectively sized to capture the first 25 cm of runoffgenerated from approximately one-third of the total drainagearea The GI features themselves occupy about 5 of the totalarea The procedure used to select this particular portfolio anddensity of GI is described elsewhere (Goldstein 2011) but in-cluded detailed consideration of social acceptability costs andphysical constraints To simplify the analysis several assump-tions were made regarding the new canopy area associated withthe vegetated GI At the end of the first year of the analy-sis period it is assumed that all of the vegetated GI has beeninstalled and further that 36 new trees are added per 100square meters (m2) of each vegetated GI system This relation-ship was derived from inspection of other bioretention facilitiesinstalled in NYC by the NYC Department of Parks and Recre-ation (Martin 2011) For computing carbon sequestration andshading these trees are assumed to be Quercus palustris (pinoak) trees Benefits derived from other vegetation (eg in theunderstory) are neglected
To assess the reliability with which the GI in scenario 1can reduce runoff alter flow to the WWTP and modify thevolume and frequency of CSOs compared to a base ldquodo noth-ingrdquo case the entire study area was modeled using the USEnvironmental Protection Agencyrsquos (US EPArsquos) Stormwa-ter Management Model (SWMM) version 50021 The morethan 784 ha drainage area was represented with subcatchments
902 Journal of Industrial Ecology
R E S E A R C H A N D A N A LYS I S
Table 1 Flows and facilities assumed for each of the three scenarios
Scenario 1 Scenario 2 Scenario 3Do nothing Mm3 Mm3 Mm3
Mm3
Annual Annual Change from Annual Change from Annual Change fromScenarios value value do nothing value do nothing value do nothing
Runoff per year 468 454 minus014 468 0 468 0Total number of CSO events
per year35 30 minus5 30 minus5 30 minus5
Total CSO volume per year 123 091 minus032 091 minus032 091 minus032Total flow to WWTP from
study area per year2719 2748 029 2748 029 2719 0
Notes Mm3 = million cubic meters CSO = combined sewer overflow WWTP = wastewater treatment plant
ranging in size from 2023 to 24281 ha The imperviousnessand other model parameters were adapted from a previously de-veloped hydrologic and hydraulic model of the entire drainagearea associated with the Hunts Point WWTP and developedby the NYC Department of Environmental Protection Thismodel was calibrated and validated previously using flow datacollected during a 2004ndash2005 CSO facility planning study (Liand Rangarajan 2011)
Although further details of this modeling effort are pro-vided in a companion article (Goldstein and Montalto 2012)the model results are summarized in Table 1 When drivenusing 1988 hourly rainfall recorded at John F Kennedy In-ternational Airport in Jamaica NY (the average precip-itation conditions used in many of the NYC and NewYorkndashNew Jersey harbor watershedwater quality assessments)the GI approach decreased the volume of runoff by 3712million gallons per year (Mgalyr)3 reduced the numberof CSO events from 12 to 7 and reduced the volumeof combined sewage discharged to the Bronx River by859 Mgalyr (0352 million cubic meters per year [Mm3yr])However despite the reductions in runoff and CSO vol-ume scenario 1 actually increased the volume of combinedsewage flowing to the Hunts Point WWTP by 7652 Mgalyr(029 Mm3yr) The increase in flow to the treatment plant isattributed to the role that the GI technologies play in reducingthe rate of runoff and extending the time over which it is dis-charged These two alterations to the local hydrology serve tomore efficiently use the conveyance capacity of the collectionsystem resulting in fewer overflows and greater flow conveyedto the WWTP during and after wet weather
Scenario 2 features an end-of-pipe detention facility sizedto achieve a similar reduction of CSO events and volumes aswould be accomplished by scenario 1 The detention facilitytemporarily stores the would-be overflow volume for pumpingback into the collection system after the wet weather eventScenario 2 avoids construction of the GI facilities but re-quires construction of a reinforced concrete detention tankAs described below this tank is assumed to be approximately32 Mgal (0012 Mm3) in volume No changes in vegetationcanopy area are assumed over the base ldquodo nothingrdquo case for thisscenario
Scenario 3 is identical to scenario 2 except that the detainedflow is assumed to be treated (physically and chemically) at thetank location and discharged directly to the Bronx River (notpumped to the WWTP)
Table 1 summarizes the flows and facilities assumed for eachof the three scenarios over a 50-year analysis period A diagramdepicting the system boundary is presented in Figure 1
The focus of this analysis is on the GHG emissions of eachof the three scenarios The boundaries encompass the materialextraction manufacturing and transport activities necessary toinstall operate and manage the infrastructure included in eachscenario In addition the carbon sequestration and energy bene-fits provided by the new vegetation (conservatively consideringonly trees and no understory) are computed for scenario 1
Detailed Methodology
A hybrid of process and economic input-output (EIO) LCAmethodologies were employed in this analysis taking advan-tage of the specific data that were available (Bilec et al 2010Sharrard 2007 Stokes and Horvath 2010 Suh et al 2004)Process-based steps were used for the modules that could bebest characterized through data sets in SimaPro and EIO LCAwas used for specific price-based components of the life cycleinventory (LCI) for which we had specific cost data for specificcommodities
The hybrid methodology consisted of six unique steps
1 Process-based LCI analysis2 Estimation of the construction costs for scenarios 2
and 33 Estimation of the infrastructure operation and mainte-
nance (OampM) costs for all three scenarios4 Estimation of the energy variation at the WWTP in
scenarios 1 and 25 Estimation of the carbon sequestration and CO2 reduc-
tions due to shading and induced energy savings in thebuildings brought about by the trees in scenario 1
6 Life cycle impact assessment computation of energy andGHG life cycle impacts
Sousa et al Evaluating Watershed-Scale CSO Strategies with LCA 903
R E S E A R C H A N D A N A LYS I S
Figure 1 Life cycle flow diagram and system boundary
Each of these steps is described below with specific assump-tions summarized in Table 2
Step 1 Life Cycle Inventory AnalysisFollowing International Organization for Standardization
(ISO) process LCA methods described in the ISO 14044 re-quirements and guidelines (ISO 2006 Baumann and Tillman2004) we define the life cycle system boundary that guides thelife cycle inventory (LCI) analysis (Figure 1) A list of the con-struction materials (Table 3) required to build scenario 1rsquos GIswas developed based on the design details specified by Gold-stein (2011) with the exception of those materials required forthe subgrade cisterns which were estimated based on typicalmanufacturer specifications (Stormchamber 2011) The trans-portation costs were estimated based on data provided by theNYC Department of Parks and Recreation Greenstreets Pro-gram (Shetty 2011) A 32-ton capacity truck was assumed fortransportation distances of less than 400 kilometers (km) whilerail transportation was assumed for longer distances due to typ-ical cost considerations described in the literature (Wakeleyet al 2009)
The GHG emissions associated with scenario 1 were com-puted using SimaPro 71 (PRe Consultants 2007) a softwaredatabase and process flow modeling program designed to per-form LCA under the ISO (2006) guidelines The databases in-cluded in SimaPro that were used in this study were Ecoinventv2 and US Input Output
To estimate the full supply chain GHG emissions associatedwith the construction of grey infrastructure assumed in scenarios2 and 3 we used aggregate-level cost data with the EconomicInput-Output Life Cycle Assessment (EIO-LCA) tool devel-oped at Carnegie Mellon University (Green Design Institute2011) We used the 1997 consumer price EIO-LCA model dueto its coverage of the watersewer construction projects sectorand adjusted to 1997 US dollar ($) costs using the ConsumerPrice Index (CPI) As noted by Hendrickson and colleagues(2006) the EIO-LCA model identifies the economic and en-vironmental impacts of a purchase from a particular economicsector representing the entire supply chain for producing thereferred purchase In addition to its use in estimating GHGemissions associated with the implementation costs for scenar-ios 2 and 3 the EIO-LCA tool was also used to study the en-vironmental loads associated with operation and maintenance(OampM) activities (described below) for all three scenarios
Step 2 Estimation of the Construction Costs for Scenarios2 and 3According to Wise and colleagues (2011) a significant ben-
efit of GI is avoided construction of end-of-pipe grey infras-tructure systems like those considered in scenarios 2 and 3Without GI the latter would be required for water utilitiesto avoid fines due to noncompliance with regulations requir-ing control andor abatement of CSOs In this analysis thecost of a detention tank that would reduce CSOs equivalent
904 Journal of Industrial Ecology
R E S E A R C H A N D A N A LYS I S
Table 2 Employed methods and respective assumptions
Step Methodtool Data source Assumptions
Inventory analysis of the GIs SimaPro Hydrologic StormchamberManual calculations basedon Goldstein (2011) design
32-ton capacity truck was used forthe transportation distancesunder 400 km and railtransportation for greaterdistances (Wakeley et al 2009)
Estimation of the changes instormwater flow to the WWTPand CSO volume incurred bythe adopted GI scheme
EPA-SWMM version 50021 Goldstein (2011) 1988 JFK Airport station rainfalldata
Estimation of the change in energyconsumption at the WWTPassociated with the differencesin the amount of runoff treated
1188 kWhMgal treated EPRI (2002) 100 Mgalday WWTPconsidering advancedtreatment
Estimation of the carbonsequestration by the trees andother vegetation implied by theGI (SC1)
Center for Urban Forest ResearchTree Carbon Calculator (CTCC)
Center for Urban ForestResearch(wwwfsfedusccrctopicsurban-forests)
US climate zone northeast treelife span 50 years buildingvintage 1950ndash1980 treedistance from the buildings20ndash40 ft building airconditioning equipmentwallwindow building heatingequipment natural gaselectricity emissions factors(kgMWh) for Queens NYUSA 4672 (CO2) 00030heating emissions factor(kgMBTU) for natural gas531 (CO2) 00059 (CH4)00001 (N2O) (CCRC 2011)
Impact assessment of the GIs(SC1)
SimaPro (IPCC 2007GWP 100 years)
Product Ecology Consultant(wwwprenlcontentsimapro-lca-software)
Databases used Ecoinvent v2and US Input Output
Impact assessment of the energynecessary at the WWTP to treatthe variation of runoff accruedby the GI schemes (SC1 andSC2)
SimaPro (IPCC 2007GWP 100 years)
Product Ecology Consultant(wwwprenlcontentsimapro-lca-software)
Databases used Ecoinvent v2and US Input Output
Impact assessment of theadditional grey infrastructureinstallation needed in case of noadoption of GI (SC2 and SC3)
EIO-LCA US 1997 (483) NationalPurchase Price Model consideringWater Sewer and PipelineConstruction Industry Sector
Carnegie Mellon University US 1997 (483) National PurchasePrice Model considering WaterSewer and PipelineConstruction Industry Sector
Impact assessment of the annualOampM activities of the GI (SC1)
EIO-LCA US 1997 (483) NationalPurchase Price Model consideringConstruction IndustryMaintenance and Repair ofNonresidential Buildings
Carnegie Mellon University US 1997 (483) National PurchasePrice Model consideringConstruction IndustryMaintenance and Repair ofNonresidential Buildings
Impact assessment of the annualOampM activities of the greyinfrastructure (SC2 and SC3)
EIO-LCA US 1997 (483) NationalPurchase Price Model consideringMining and Utilities IndustryWater Sewage and Other SystemsSector
Carnegie Mellon University US 1997 (483) National PurchasePrice Model consideringMining and UtilitiesIndustryWater Sewage andOther Systems Sector
Notes GI = green infrastructure WWTP = wastewater treatment plant SC = scenario CSO = combined sewer overflow kWhMgal =kilowatt-hours per million gallons Mgalday = million gallons per day ft = feet kgMWh = kilograms per megawatt-hour CO2 = carbondioxide kgMBTU = kilograms per million British thermal units CH4 = methane N2O = nitrous oxide OampM = operation and maintenance
to the green approach was estimated based on a review ofgovernment data and reports (City of New York 2010 NYCDEP 2007) Detention-based CSO control facilities (withouttreatment facilities) built or in planning across NYC cost onaverage $052 per gallon (gal) of reduced annual CSO vol-
ume with an upper bound of $070gal and a lower bound of$037gal At $052gal of reduced CSO approximately $447million would be required to construct a detention tank that canreduce annual CSOs by approximately 859 Mgal as requiredin scenario 2 Although it was not used directly in the analysis
Sousa et al Evaluating Watershed-Scale CSO Strategies with LCA 905
R E S E A R C H A N D A N A LYS I S
Table 3 Emissions (in t CO2-eq) from the three scenarios the wastewater treatment plant and the trees
Emissions (t CO2-eq)
Installation
Source Material Unit Quantity t CO2-eq kg CO2-equnit Annual andor OampM Over 50 years
Scenario 1 Concrete m3 32000 8400 260Excavation m3 180000 97 054Bark mulch t 500 300 600Geotextile m2 420000 2700 64HDPE kg 200000 490 25PVC kg 16000 50 31Transport truck t-km 80000000 8500 011Transport rail t-km 82000 4 005Total 20000 300 19000
Scenario 2 31500 1050 85000Scenario 3 100000 5840 400000WWTP 70 3500Trees Variable minus25643
Notes t CO2-eq = metric tons of carbon dioxide equivalent kg CO2-equnit = kilograms of carbon dioxide equivalent per unit m3 = cubic meterst = metric ton m2 = square meters t-km = metric ton kilometers HDPE = high-density polyethylene PVC = polyvinyl chloride WWTP = wastewatertreatment plant
the actual volume of this tank can be estimated using a recentreport citing the construction costs of CSO tanks of differentvolumes (NY Newsday 2004) Assuming that it costs on aver-age $1305gal of tank storage the detention tank assumed inscenario 2 would have the capacity to store approximately 32Mgal (0012 Mm3)
The cost to construct scenario 3 includes the cost of a deten-tion tank accompanied by a physical and chemical treatmentfacility Also per the NYC DEP (2007) and City of New York(2010) CSO control facilities with detention and treatmentbuilt or in planning across NYC cost on average $175gal ofreduced annual CSO volume with an upper bound of $245galand a lower bound of $105gal Using the average value thecost of this facility would be $150 million Again although thevolume of this facility is not utilized in the analysis presented inthis article it could be assumed that the detention tanks wouldhave a similar storage capacity to the one considered in scenario2 with the residual extra cost associated with its physical andchemical treatment operations
Step 3 Estimation of the Infrastructure Operation andMaintenance CostsThe OampM costs of the infrastructure considered in each
of the three scenarios were also estimated from the literatureFor scenario 1 OampM costs were defined separately for eachGI typology based on average literature costs converted into2011 US dollars (Table 4) The annual OampM cost assumedfor porous concrete was $013 per square foot (ft2)4 and assumesbiannual sweeping high-pressure jet washing and replacementof 1 of the area (Tackett 2011 US EPA 2005) The OampMcosts of bioretention bump-outs curbside infiltration plantersand backyard rain gardens were assumed to be identical A totalof $114ft2 (US EPA 2005) would cover repair of eroded areasremoval and replacement of all dead and diseased vegetation
mulching of void areas irrigation of vegetated areas (biannualor as needed) and removal of mulch and application of a newlayer (annual) The annual OampM costs of the subgrade cisternwere derived from studies on Stormchambers (Stormchamber2011 UNHSC 2009) For $002ft2 of Stormchamber bottomthese facilities could be vacuum cleaned twice a year (or asneeded)
The OampM costs associated with the detention tank in sce-nario 2 were assumed to be on average 14 of the constructioncosts or the average of all literature values excluding the ex-treme highest and lowest values The upper end of possibleOampM costs was 2 of the construction costs and the lower endwas 08 (City of Akron 1999 Montalto et al 2007)
Specific OampM activities related to large detention tanksinclude odor control and ventilation removal and disposal ofaccumulated residual sludge and solids (Zukovs and Marsalek2004) and inlet andor outlet pumping (US EPA 2007)
According to the US EPA (1999a) and the Detroit Waterand Sewerage Department (DWSD 2003) the OampM costs ofdetention tanks that include physical and chemical treatmentoperations are 104 to 36 of the construction costs TheOampM costs for scenario 3 were thus estimated at 23 (averageof the literature values excluding the extreme highest and lowestvalues) of the construction costs According to the DWSD(2003) OampM activities for this type of facility include chemicalacquisition costs preventative maintenance costs energy costsand sludge disposal
Step 4 Estimation of the Energy Variation at the Waste-water Treatment Plant in Scenarios 1 and 2Because scenarios 1 and 2 alter the volume of water that is
conveyed to the Hunts Point WWTP the difference in energyat the WWTP over the ldquodo nothingrdquo case had to be com-puted (As stated earlier scenario 3 does not alter the volume
906 Journal of Industrial Ecology
R E S E A R C H A N D A N A LYS I S
Table 4 Installation and OampM costs for green-infrastructures summary
GI element Construction costs Data source OampM cost (annual) Data source
Porous pavement $250ndash$830ft2 (2006) Montalto et al (2007) 1ndash2 of construction costs CRI (2005) NCGBT(2003) US EPA(1999b)
$109ndash$218ft2 EPA (2005) $016ft2 EPA (2005)$2ndash$3ft2 EPA (2003)$26ft2 Tackett (2011) $006ft2 Tackett (2011)$4ndash$5ft2 UNHSC (2009) $0008ft2 UNHSC (2009)$710ft2 CNT (2009)
Subgrade cistern $078ft2 of mitigatedimpervious area($34000acre)
UNHSC (2009) $0008ft2 (twice a year)$0016ft2
UNHSC (2009)
Backyard raingarden
$13ndash$14ft2 Bannerman (2003) 2ndash8 EPA (2005) Flinker(2005) CRWA (2008)
$540ft2 of the mitigatedimpervious area
Tackett (2011) $011ft2 of the mitigatedimpervious area
Tackett (2011)
$041ft2 $18000acre ofmitigated impervious area
UNHSC (2009)
$9ndash3200ft2 CNT (2009)
of flow conveyed to the WWTP over the baseline conditions)For scenarios 1 and 2 the energy consumed was estimated bymultiplying the annual volume of flow to the plant by an esti-mate of the unit electricity consumption for wastewater treat-ment plants with the capacity to treat more than 100 Mgalday(eg 1188 kilowatt-hours per millions gallons [kWhMgal])published by the Electric Power Research Institute (EPRI2002)
Step 5 Estimation of the Carbon Sequestration and Car-bon Dioxide Reductions Due the Energy Savings in theBuildings by the TreesThe new trees sequester carbon and their canopies reduce
building energy consumption These benefits were estimated us-ing the Tree Carbon Calculator (CTCC) a ldquoproof of conceptrdquotool developed by the Center for Urban Forest Research at theUS Forest Service and approved by the Climate Action Re-serversquos Urban Forest Project Protocol for tree planting projects(CCRC 2011) The CTCC provides carbon-related informa-tion for individual trees located in any of the United Statesrsquo 16different climate zones The tool was developed based on sizeand growth data derived from a database of 650 to 1000 streettrees representative of about 20 predominant species in each ofthe 16 different reference cities (CCRC 2011) Among otheroutputs CTCC quantifies annual CO2 sequestered as well asreductions in CO2 emissions due to building energy savings
Trees reduce building energy consumption by providingshade (reducing air conditioning needs) but also by blockingwind Reduced wind speeds result in less infiltration of cold airinto buildings during the winter months limiting conductiveheat loss and reducing the need for heating (Heisler 1986 Peperet al 2007 Simpson and McPherson 1998) Heisler (1986) re-
ported that trees can reduce wind speed and resulting air infil-tration by up to 50 translating into potential annual heatingsavings of 25 Simpson and McPherson (1998) simulated thetree impacts in wind speed reduction on residential energy useand found an annual energy decrease of 25 per tree in Sacra-mento CA USA
CTCC uses a biomass equation derived from measurementsmade on trees planted in urban areas to estimate the total CO2
stored and sequestrated by different species The shading andwind-blocking benefits of trees on building energy consumptionconsidered in the CTCC are derived from computer simula-tions that were conducted in reference cities located in eachof the US climate zones using distinct combinations of treesizes building types building ages and types of heatingcoolingequipment and locations following methods defined by McPher-son and Simpson (1999) These simulations estimated the an-nual building energy use per residential unit and on a per treebasis by comparing results before and after adding the trees(CCRC 2011) The results in terms of reduced building energyconsumption are sensitive to the position of the trees relativeto the building
Although an exhaustive study of the spatial orientation ofthe future canopy in this study area was not within the scopeof this study a sensitivity analysis was performed to test theimportance of tree orientation on the results This analysis al-ternatively placed all the trees to the south (yielding the leastenergy savings) to the north (yielding the most energy savings)and to the west and the southwest (yielding average energy sav-ings) of the buildings
It was assumed that 2065 pin oak trees were installed duringthe first year of the GI program in equal proportions in eachof the vegetated GI facilities (eg the street-end bioretention
Sousa et al Evaluating Watershed-Scale CSO Strategies with LCA 907
R E S E A R C H A N D A N A LYS I S
bump-out facilities curbside infiltration planters and backyardrain gardens)
The base analysis assumes all of the trees were planted onthe southwest side of a building (with the other orientationsconsidered only in the sensitivity analysis) Other assumptionsadopted for this coarse analysis were
bull US climate zone northeastbull Tree life span 50 yearsbull Building vintage 1950ndash1980bull Tree distance from the buildings 20 to 40 feet (ft)bull Buildings air conditioning equipment wallwindowbull Buildings heating equipment natural gasbull Electricity emissions factors (kilograms per megawatt hour
[kgMWh]) for Queens NY USA 4672 (CO2) 00030(methane [CH4]) and 00001 (nitrous oxide [N2O])(CCRC 2011)
bull Heating emissions factors (kilograms per million Britishthermal units [kgMBTU]) for natural gas 531 (CO2)00059 (CH4) and 00001 (N2O) (CCRC 2011)
Step 6 Energy and Greenhouse Gas Life Cycle ImpactsIn order to compare the environmental performance of the
three different scenarios three different sets of impacts were as-sembled Scenario 1 includes the impacts associated with con-structing operating and maintaining the GI as well as treatingthe increase in flow to the WWTP As described earlier theseemissions are mitigated partially by CO2 sequestration by thevegetation and the reduced building energy loads associatedwith shading and wind blocking For scenario 2 there are im-pacts associated with constructing operating and maintainingthe detention tank and also treating the increase in flow tothe treatment plant over the ldquodo nothingrdquo case (ie the totalvolume of overflows in the base condition is assumed to be de-tained for later conveyance to the WWTP increasing annualtreated flow) The impacts associated with scenario 3 includeconstruction and OampM of the new detention tanktreatmentoperations and no change in flow to the treatment plant (iethe total volume of existing overflows is assumed to be treatedin the new end-of-pipe facility and discharged directly to theriver at that location)
From the LCI we estimated global warming potential(GWP) using characterization factors from the Intergovern-mental Panel on Climate Change (IPCC 2007) that convertair emissions to carbon dioxide equivalents (CO2-eq)
The EIO-LCA model was used to estimate the GWP associ-ated with the construction activities for scenarios 2 and 3 andOampM activities for all three scenarios The US 1997 (483)National Purchase Price Model was selected using ldquoConstruc-tion IndustryWater Sewer and Pipeline Construction Sectorrdquoto represent construction activities in scenarios 2 and 3 ldquoMin-ing and Utilities IndustryWater Sewage and Other SystemsSectorrdquo was used to represent the OampM activities of scenarios 2and 3 and ldquoConstruction IndustryMaintenance and Repair ofNonresidential Buildings Sectorrdquo was used to represent OampMactivities associated with scenario 1
The annual net GWP emissions of the three scenarios iscomputed as follows
GWPSC1 = I1 + OampM1 + WWTP minus Trees (1)
GWPSC2 = I2 + OampM2 + WWTP (2)
GWPSC3 = I3 + OampM3 (3)
where I1 I2 and I3 represent the emissions associated with ini-tial construction activities for scenarios 1 2 and 3 respectivelyand are incurred only during year 1 OampM1 OampM2 and OampM3
are the cumulative OampM emissions associated with each of thethree different scenarios WWTP is the cumulative new emis-sions associated with energy consumption at the WWTP andTrees refers to the reduced GWP achieved through carbon se-questration and building energy savings due to shading andwind blockage by the trees
Results and Discussion
Installation of the GI in scenario 1 emitted 20000 t CO2-eq compared with 31500 t CO2-eq for the detention tank inscenario 2 and 100000 t CO2-eq for the tank and treatmentfacilities in scenario 3 (Figure 2) These results indicate that interms of initial emissions scenario 1 yielded superior environ-mental performance when compared with the grey infrastruc-ture options Of the total emissions associated with constructionof the GI the greatest contributions came from transportation(8500 t CO2-eq) followed by cement manufacturing and con-crete (8400 t CO2-eq) (Figure 2)
The annual net emissions for OampM for scenario 1 werealso significantly lower than those incurred in scenarios 2 and3 with significant cumulative effects over the 50-year studyperiod Cumulatively scenario 1 is expected to release 19000t CO2-eq compared with 85000 t CO2-eq for scenario 2 and400000 t CO2-eq for scenario 3 (Figure 3) The cumulativeOampM emissions associated with scenarios 2 and 3 amountedto 170 (scenario 2) and 300 (scenario 3) of their year 1construction emissions after 50 years of operation comparedwith the cumulative OampM emissions of scenario 1 which onlyincreased by 75 over its initial emissions
It is noteworthy that the carbon sequestration and savingsin energy accrued by the trees were a key part of the net annualemissions associated with the GI in scenario 1 By year 25 thetrees had grown sufficiently to completely mitigate the emissionsassociated with the total annual OampM emissions for all of theGI facilities After year 25 the reduction in emissions associatedwith the trees exceeds the annual emissions associated with allscenario 1 OampM activities providing negative loads
Another significant finding was the significant difference inemissions between the two grey scenarios (2 and 3) Over 50years scenario 2 releases 100000 t CO2-eq whereas scenario3 generates this quantity of emissions during initial construc-tion activities alone arriving at almost 400000 t CO2-eq incumulative emissions after 50 years
908 Journal of Industrial Ecology
R E S E A R C H A N D A N A LYS I S
Figure 2 Cradle-to-green infrastructure (GI) installation global warming potential (GWP) for three infrastructure scenarios Note Thefigure shows the dominant input contributions toward GWP from the process and economic input-output (EIO) models The ldquootherrdquocategory includes aggregated EIO sector inputs including primary aluminum production and lime production
Sensitivity Analyses
Two sensitivity analyses were performed to examine whetherthe findings hold up if the uncertain data sets used in the analysiswere allowed to vary within the full range of possible values Thefirst sensitivity analysis varied the emissions associated with theconstruction and OampM activities for each of the three scenariosThe second sensitivity analysis focused on the position of thetrees relative to buildings Each of these analyses is describedbelow
Sensitivity Analysis 1To consider the full range of possible emissions associated
with construction and OampM activities implied by each sce-
nario first the upper and lower bound on the emissions asso-ciated with initial construction needed to be computed Forscenarios 2 and 3 the original analysis used the average cost pergallon of annual CSO reduction as gleaned from the literatureIn the sensitivity analysis the upper and lower bounds of thedetention tank costs in scenario 2 were set at $070 and $037respectively For scenario 3 the upper and lower bounds of thedetentiontreatment facility costs were $245 and $105 respec-tively The same procedure could not be applied for scenario1 because the emissions were computed based on unit materialand transportation costs Instead the upper and lower boundsof emissions associated with GI installation were assumed to bethe average of the variance of the literature values for scenarios
Figure 3 Emissions over 50 years according to the different scenarios
Sousa et al Evaluating Watershed-Scale CSO Strategies with LCA 909
R E S E A R C H A N D A N A LYS I S
2 and 3 expressed as a percentage of the average value used inthe initial analysis
The next step was to compute the upper and lower boundsof the annual OampM costs The upper and lower bounds forscenario 1 were based on the values found in the literatureSince the OampM costs for scenarios 2 and 3 were expressed asranges of percentages of the installation costs these percentageswere applied to the upper and lower bounds of the installationcosts as computed per the above For example the lower boundwas found by multiplying the lower bound of the OampM costpercentages (08 for scenario 2 104 for scenario 3) by the
lower bound of the installation costs ($037gal for scenario2 $105gal for scenario 3) These products were used in theEIO-LCA model to derive the corresponding extreme emissionspossibilities The same approach was used to calculate the upperbounds
The results of the first sensitivity analysis are shown inFigure 4a There was very little overlap between the emis-sions envelopes associated with the range of possible emis-sions associated with the three different scenarios Hence thefirst sensitivity analysis reinforces the original findings namelythat the GI approach featured in scenario 1 is environmentally
Figure 4 Sensitivity analyses (a) Sensitivity analysis of the emissions over 50 years from the installation and operation and maintenance(OampM) activities of scenarios 1 2 and 3 Note The dashed line represents the base case results of the scenarios emissions (b) Sensitivityanalysis of the tree benefits considering the treesrsquo location north southwest west or south face of the building Note The dashed linerepresents just the carbon dioxide (CO2) sequestration provided by the trees over 50 years
910 Journal of Industrial Ecology
R E S E A R C H A N D A N A LYS I S
preferable to the grey approaches included in scenarios 2 and 3for the metrics studied
Sensitivity Analysis 2Regarding the avoided CO2 emissions associated with the
impact of trees on building energy consumption a second sen-sitive analysis was conducted to consider the effect of differ-ent positions of the trees relative to the buildings The entire50-year analysis was repeated four times with the trees alterna-tively positioned to the south (least expected energy savings)the north (most expected energy savings) the west and thesouthwest (average expected energy savings) of the buildings
It is noteworthy that the carbon sequestered by the treesdoes not vary with the position and represents 11227 t CO2-eq over 50 years The avoided CO2 emissions through buildingenergy savings provided by the trees ranged from 1614 t CO2-eq(south) to 14416 t CO2-eq (north) which when added to theCO2 sequestered (11227 t CO2-eq) resulted in from 12841 tCO2-eq (south) to 25643 t CO2-eq (north) of mitigated GWPemissions The results of this sensitivity analysis are shown inFigure 4b and indicate that the energy benefits provided by thetrees are a significant fraction of the total of CO2 emissionsdecrease provided by the trees but only when the trees are notplanted to the south
Conclusion
This research used LCA methods to compare the environ-mental performance of three different approaches to reducingCSOs to the Bronx River NYC To our knowledge this studywas the first attempt to apply LCA methods at this scale andin this application While all three scenarios were scaled toreduce CSOs equivalently they required different construc-tion and OampM activities and in the cases of scenarios 1 and2 would also engender changes in the volume of annual flowto the regional WWTP When the GHG emissions associatedwith construction operation and maintenance are accountedfor the CSO abatement strategy represented by scenario 1which treats runoff from approximately one-third of the to-tal drainage area in decentralized green infrastructure facilitiesthat collectively amount to an area that is approximately 5of the total drainage area results in significantly better envi-ronmental performance than the end-of-pipe detention or thecombined detention and treatment strategies Both in terms ofthe emissions during initial construction and the cumulativenet emissions released over the first 50 years of operation thegreen infrastructure approach results in fewer emissions thaneither of the two grey approaches
This kind of analysis is limited by the availability of the req-uisite data sets Two sensitivity analyses varied the emissionsassociated with construction operation and maintenance ac-tivities and also the placement of the trees These analysesfurther reinforce the original conclusion that is that the fullrange of possible emissions associated with the green approach
will be significantly lower than those associated with the twogrey strategies
By conservatively assuming that the new GI would includeonly about 2000 new pin oak trees and no understory thecarbon sequestered and shading provided by the trees is firstable to fully offset the annual OampM emissions during year 25Further tree growth after year 25 exceeds the annual emissionsand begins to ldquopay backrdquo the emissions associated with initialconstruction of the GI network However this portion of theanalysis should be validated with actual studies documentingthe growth rates canopy configurations carbon sequestrationshading and wind protection provided by urban trees as wellas similar studies on other types of vegetation (shrubs grassesflowers etc) commonly planted in urban GI systems Very fewsuch studies have been performed to date
It should also be noted that this study did not quantifythe GHG emissions associated with other potential services(eg reduced pavement temperatures improved air qualityenhanced habitat etc) and disservices (eg increased street-sweeping requirements enhanced flooding potential etc) thatcould be brought about by watershed-scale implementation ofGI Additional research is needed to establish the relative im-portance of such factors in determining environmental perfor-mance Additional work is also needed to inventory the con-struction and OampM activities and costs associated with greenand grey CSO abatement strategies for which published datasets are currently quite limited Finally given all of the spatialinfrastructural economic social and other constraints presentin twenty-first-century cities the level of penetration that greeninfrastructure technologies will actually have in urban water-sheds still remains to be seen Nonetheless this study suggeststhat watershed managers who seek to reduce CSOs and reducemunicipal carbon footprints should opt for a green approachover a grey one
Acknowledgements
The authors are grateful to Nandan Shetty from the NewYork City Department of Parks and Recreation Sri Rangarajanand Chenchen Li from HDR Tracy Tackett from Seattle PublicUtilities Alan Cohn from the New York City Department ofEnvironmental Protection and Alisha Goldstein all of whomassisted in identifying different data sets used in this project
Notes
1 One gallon (gal) asymp 379 liters (L) so 200 million gallons per day(Mgalday) asymp 758 million liters per day (MLday)
2 One hectare (ha) = 001 square kilometers (km2 SI) asymp 000386square miles (mi2) asymp 247 acres
3 One gallon asymp 0003785 cubic meters (m3) so 3712 million gallonsper year (Mgalyr) is equivalent to 014 million cubic meters peryear (Mm3yr)
4 One square foot (ft2) = 0093 square meters (m2)
Sousa et al Evaluating Watershed-Scale CSO Strategies with LCA 911
R E S E A R C H A N D A N A LYS I S
References
Adam D 2007 The unheralded polluter Cement industry comes cleanon its impact The Guardian [Brussels] 12 October
Bannerman R 2003 Rain gardens A how-to manual for homeownersPUB-WT-776 Madison WI USA Wisconsin Department ofNatural Resources
Baumann H and A M Tillman 2004 The hitch hikerrsquos guide to LCALund Sweden Studentlitteratur AB
Bilec M M R J Ries and H S Matthews 2010 Life-cycle assess-ment modeling of construction processes for buildings Journal ofInfrastructure Systems 16(3) 199ndash205 httpascelibraryorgisoresource1jitse4v16i3p199_s1 Accessed 6 December 2011
Blackhurst M C T Hendrickson and H S Matthews 2010 Cost-effectiveness of green roofs Journal of Architectural Engineering16(4) 136ndash143
Brehm D 2007 Nanoengineered concrete could cut carbon diox-ide emissions MITNEWS 14 February 2007 httpwebmitedunewsoffice2007concretehtml Accessed 1 December 2011
CCRC (Center for Urban Forest Research) 2011 The Center forUrban Forest Research tree carbon calculator wwwfsfedusccrctopicsurban-forestsctcc Accessed 7 August 2011
City of Akron 1999 Facilities plan rsquo98 Akron OH USA wwwciakronohusCSOFP98FI1PDF Accessed 5 August 2011
City of New York 2010 NYC green infrastructure plan A sustainablestrategy for clean waterways City of New York NY USAwwwnycgovhtmldeppdfgreen_infrastructureNYCGreenIn-frastructurePlan_HighRespdf Accessed 15 April 2011
CNT (Center for Neighborhood Technology) 2009 Greenvalues calculator benefit details httpgreenvaluescntorgnationalbenefits detailphpreduced-treatment Accessed 12June 2011
CRI (Conservation Research Institute) 2005 Changing cost percep-tions An analysis of conservation development wwwcdfinccomCDF_ResourcesCost20Analysis20-20Part20120-20Report20-20with20Exec20Summarypdf Accessed5 August 2011
CRWA (Charles River Watershed Association) 2008 Blackstonetown hall demonstration project Evaluation of low impact de-velopment (LID) best management practices (BMPs) opportu-nities wwwcrwaorgprojectsblackstonelid evaluationpdf Ac-cessed 10 June 2011
DWSD (Detroit Water and Sewerage Department) 2003 Wastewatermaster plan DWSD project no CS-1314 Technical feasibility ofa wet weather flow treatment facility Detroit MI USA DWSD
EPRI (Electric Power Research Institute) 2002 Water and sus-tainability (Volume 4) US electricity consumption for watersupply and treatmentmdashThe next half century wwwcircleofblueorgwaternewswp-contentuploads201008EPRI-Volume-4pdfAccessed 19 April 2011
Flinker P 2005 Green rooftop systems In Urban environmentaldesign manual Providence RI USA Rhode Island Depart-ment of Environmental Management wwwdemrigovprogramsbpoladmsuswshedpubshtm Accessed 5 June 2011
Goldstein A 2011 Comparison of a high and low spatial resolutionmodel for an urban block and implications for depicting low im-pact development Masterrsquos thesis Drexel University Philadel-phia PA USA
Goldstein A and F A Montalto 2012 Comparison of a high and lowspatial resolution model for an urban block Journal of HydrologicEngineering Submitted for publication
Green Design Institute 2011 Economic input-output life cycle assess-ment wwweiolcanet Accessed 20 May 2011
Heisler G M 1986 Energy savings with trees Journal of Arboriculture12(5) 113ndash125
Hendrickson C T L B Lave and H S Matthews 2006 Environ-mental life cycle assessment of goods and services Washington DCUSA Resources for the Future
Hendriks C A E Worrell D de Jager K Blok and P Rieme 2004Emission reduction of greenhouse gases from the cement industryPaper presented at the Greenhouse Gas Control TechnologiesConference 5 September Vancouver BC Canada
Herstein Y R Filion and K R Hall 2009 Evaluating environmentalimpact in water distribution system design Journal of InfrastructureSystems 15(3) 241ndash250
IPCC 2007 Intergovernmental panel on climate change In Climatechange 2007 The physical science basis Contribution of workinggroup I to the fourth assessment report of the intergovernmentalpanel on climate change edited by S Solomon et al CambridgeCambridge University Press
ISO (International Organization for Standardization) 2006 ISO14044 Environmental management mdash Life cycle assessment mdash Re-quirements and guidelines Geneva Switzerland ISO
Kloss C Personal communication with Christopher Kloss GreenInfrastructure Coordinator US Environmental ProtectionAgency Office of Water 12 January 2012
Kosareo L and R Reis 2007 Comparative environmental life cycleassessment of green roofs Building and Environment 42(11) 2606ndash2613
Li C and S Rangarajan 2011 Technical Memorandum on Up-scalingof Drexel Universityrsquos Pilot Project to HP-009 Drainage AreaMahwah NJ HDR|HydroQual
MacMullan E and S Reich 2007 The economics of low-impact devel-opment A literature review Eugene OR USA ECONorthwest
Martin J 2011 Personal communication with Jeff Martin landscapearchitect New York City Department of Parks and Recreation14 April 2011
McPherson E G and J R Simpson 1999 Carbon dioxide reductionsthrough urban forestry Guidelines for professional and volun-teer tree planters General Technical Report PSW-171 AlbanyCA USDA Forest Service Pacific Southwest Research Station237 wwwfsfeduspswprogramsuesduepproductscufr_43pdfAccessed 6 December 2011
Montalto F C Behr K Alfredo M Wolf M Arye and M Walsh2007 Rapid assessment of the cost-effectiveness of low impact de-velopment for CSO control Landscape and Urban Planning 82(3)117ndash131
NCGBT (North Carolina Green Building Technology Database)2003 Pervious paving details for Chadbourn Street Townof Wrightsville Beach January 2 2006 httpwwwncgreenbuildingorgsitencgpublictechsearchresultscfmprojectid=93ampcategory=6ampparameter=98ampclicked=true Accessed August 102011
NYNewsday 2004 wwwnewsdaycomnewsnew-pact-stirs-up-old-stink-1650186 Accessed 10 July 2011
NYC DEP (New York City Department of Environmen-tal Protection) 2007 Flushing Bay waterbodywatershedfacility plan wwwhydroqualcomProjectsltcpwbwsflushing_bayflushing_bay_section_7pdf Accessed 20 July 2011
NYC DEP (New York City Department of Environmental Protec-tion) 2011 New York Cityrsquos wastewater treatment systemwwwnycgovhtmldeppdfwwsystempdf Accessed 21 July 2011
912 Journal of Industrial Ecology
R E S E A R C H A N D A N A LYS I S
Peper P J E G McPherson J R Simpson S L Gardner K E Vargasand Q Xiao 2007 New York City New York municipal forestresource analysis Technical Report Davis CA USA Center forUrban Forest Research
PRe Consultants 2007 SimaPro 71 LCA software Amersfoort theNetherlands
PWD (Philadelphia Water Department) 2009 Philadelphia com-bined sewer overflow long term control plan update wwwphillywatershedsorgltcpuVol02_TBLpdf Accessed 20 August 2011
Racoviceanu A I B W Karney C A Kennedy and A F Colombo2007 Life-cycle energy use and greenhouse gas emissions inven-tory for water treatment systems Journal of Infrastructure Systems13(4) 261ndash270
Saiz S C Kennedy B Bass and K Pressnail 2006 Comparativelife cycle assessment of standard and green roofs EnvironmentalScience and Technology 40(13) 4312ndash4316
Sharrard A L 2007 Greening construction processes using an input-output-based hybrid life cycle assessment model PhD thesisCarnegie Mellon University Pittsburgh PA USA
Shetty N 2011 Personal communication with N Shetty New YorkCity Department of Parks and Recreation 10 April 2011
Simpson J R and E G McPherson 1998 Simulation of tree shadeimpacts on residential energy use for space conditioning in Sacra-mento Atmospheric Environment Urban Atmospheres 32(1) 69ndash74
Spatari S Z Yu and F A Montalto 2011 Life cycle implicationsof urban green infrastructure Environmental Pollution 159(8ndash9)2174ndash2179
Stokes J R and A Horvath 2010 Supply-chain environ-mental effects of wastewater utilities Environmental ResearchLetters 5(2010) 014015 DOI 1010881748-932651014015httpiopscienceioporg1748-932651014015 Accessed 5 De-cember 2011
Stormchamber 2011 Stormchamber design manual wwwstormchamberscompdfStormChamberDesignManualpdf Accessed 7July 2011
Suh S M Lenzen G J Treloar H Hondo A Horvath G Huppes OJolliet U Klann W Krewitt Y Moriguchi J Munksgaard andG Norris 2004 System boundary selection in life-cycle invento-ries using hybrid approaches Environmental Science amp Technology38(3) 657ndash664
Tackett T 2011 Personal communication with Tracy Tackett LID
Program Manager Urban Watersheds Division Seattle PublicUtilities Seattle WA USA 10 August 2011
UNHSC (University of New Hampshire Stormwater Center) 2009Biannual report Durham NH USA
US EPA (US Environmental Protection Agency) 1999a Combinedsewer overflow management fact sheet Retention basins EPA832-F99-042 US EPA Office of Water Washington DC USA
US EPA (US Environmental Protection Agency) 1999b Stormwa-ter technology fact sheet Porous pavement httpwwwepagovowmmtbporouspapdf Accessed 1 August 2011
US EPA (US Environmental Protection Agency) 2005 Nationalmanagement measures to control nonpoint source pollution from urbanareas Washington DC USA US EPA
US EPA (US Environmental Protection Agency) 2007 Re-ducing stormwater costs through low impact development(LID) strategies and practices December 2007 wwwepagovowowNPSlidcosts07documentsreducingstormwatercostspdfAccessed 19 June 2011
US EPA (US Environmental Protection Agency) 2011 Storm wa-ter management model (SWMM) httpwwwepagovathenswwqtschtmlswmmhtml Accessed 18 May 2011
Wakeley H L C T Hendrickson W M Griffin and H SMatthews 2009 Economic and environmental transportation ef-fects of large-scale ethanol production and distribution in theUnited States Environmental Science amp Technology 43(7) 2228ndash2233
Wise S J Braden D Ghalayini J Grant C Kloss E MacMullan SMorse F Montalto D Nees D Nowak S Peck S Shaikh andC Yu Integrating valuation methods to recognize green infras-tructurersquos multiple benefits wwwcntorgrepositoryCNT-LID-paperpdf Accessed 20 May 2011
Zukovs G and J Marsalek 2004 Planning and design combined seweroverflow treatment Water Quality Research Journal of Canada39(4)439ndash448
About the Authors
Maria R C De Sousa is a PhD student and Franco Mon-talto and Sabrina Spatari are assistant professors in the Depart-ment of Civil Architectural and Environmental Engineeringat Drexel University Philadelphia PA USA
Sousa et al Evaluating Watershed-Scale CSO Strategies with LCA 913
R E S E A R C H A N D A N A LYS I S
Green infrastructure (GI) is the term currently applied toa family of source control measures that reduce stormwater bypromoting infiltration evapotranspiration and the capture and(re)use of stormwater on individual lots distributed throughoutthe urban watershed (US EPA 2011) By enhancing these hy-drologic processes within the urban watershed GI technologiessuch as bioretention facilities green roofs porous pavementsand stormwater planters can reduce the volume of runoff gen-erated thus enabling changes in sewer hydraulics overflowfrequencies and durations and ultimately the fraction of wetweather flow that arrives at the treatment plant At least twostudies suggest that under certain conditions widespread im-plementation of GI could be more cost effective at reducingCSOs than an end-of-pipe detention tank (MacMullan andReich 2007 Montalto et al 2007) Although GI has only beenshown to reduce CSOs using hydrologic and hydraulic mod-els many US cities have initiated extensive GI programs Asof this date five major US cities (Syracuse NY MilwaukeeWI Kansas City MO Portland OR and Chicago IL) havecommitted to using GI as part of their long-term plans to re-duce CSOs and have begun implementation Another three(Cleveland OH St Louis MO and Philadelphia PA) havecommitted to a green strategy but have not yet begun imple-mentation while New York NY Washington DC SeattleWA Cincinnati OH and Louisville KY are either activelyexploring or have proposed a green strategy (Kloss 2012) Thereliability with which GI can actually reduce CSOs will only beknown with certainty after a sufficient density of GI facilitieshas been implemented and a real watershed response detectedby monitoring Because of its perceived ancillary benefits GI ishowever also increasingly ldquocross-listedrdquo as an urban sustainabil-ity and climate change adaptation initiative A seminal ldquotriplebottom linerdquo study commissioned recently by the PhiladelphiaWater Department (PWD 2009) compared the environmen-tal public health and social benefits of ldquogreenrdquo and ldquogreyrdquoapproaches to controlling CSOs concluding that the overallbenefits of the green approach far exceed those of the grey oneSome benefits attributed to GI included improved real estatevalue community aesthetics livability and quality of life aswell as enhanced ecosystem function Despite the excitementsurrounding this study published research in this field is lim-ited and the extent to which GI can reduce municipal carbonfootprints has not been comprehensively explored Spatari andcolleagues (2011) used life cycle assessment (LCA) techniquesto compute the energy and carbon payback periods associatedwith the construction of a block-scale GI strategy Other re-searchers have attempted to compare the energy required toinstall specific GI measures such as green roofs (Kosareo andReis 2007 Saiz et al 2006) with the savings accrued fromtheir use and their cost-effectiveness for individual investment(Blackhurst et al 2010) To date no researchers have system-atically compared watershed-scale green and grey approachesusing LCA techniques
This study compares watershed-scale green and grey ap-proaches to CSO control by quantifying the greenhouse gas(GHG) emissions associated with their construction operation
and maintenance The study area includes the entire drainagearea contributing to two CSOs on the Bronx River known asHP-007 and HP-009 in the Bronx New York City (NYC)The performance of the three different CSO control strate-gies is compared over a 50-year period We use hydrologic andhydraulic modeling results to consider associated changes inenergy consumption at the Hunts Point wastewater treatmentplant (WWTP) with a maximum capacity of 200 million gal-lons per day (Mgalday) (NYC DEP 2011)1 and consider theenergy requirements associated with physical components ofeach strategy The latter analysis includes required and avoidedcement production which globally accounts for more than 5of all carbon dioxide (CO2) emissions (Adam 2007 Brehm2007 Hendriks et al 2004) The analysis of the green approachalso considers carbon sequestered and shading provided byvegetation
MethodsOverview
Although LCA has traditionally been applied to consumergoods and services its field of application has expanded overthe last decade to include infrastructure (eg Herstein et al2009 Racoviceanu et al 2007) In the present application thefunctional unit considered is the 784 hectare (ha) drainage area2
contributing to the two CSO discharge points HP-007 and HP-009 Three alternative CSO control measures are compared
Scenario 1 includes a combination of GI technologies(eg 2712 ha porous pavements 118 ha street-end bioreten-tion bump-out facilities 280 ha curbside infiltration planters106 ha backyard rain gardens and 854 ha subgrade cisterns)which are collectively sized to capture the first 25 cm of runoffgenerated from approximately one-third of the total drainagearea The GI features themselves occupy about 5 of the totalarea The procedure used to select this particular portfolio anddensity of GI is described elsewhere (Goldstein 2011) but in-cluded detailed consideration of social acceptability costs andphysical constraints To simplify the analysis several assump-tions were made regarding the new canopy area associated withthe vegetated GI At the end of the first year of the analy-sis period it is assumed that all of the vegetated GI has beeninstalled and further that 36 new trees are added per 100square meters (m2) of each vegetated GI system This relation-ship was derived from inspection of other bioretention facilitiesinstalled in NYC by the NYC Department of Parks and Recre-ation (Martin 2011) For computing carbon sequestration andshading these trees are assumed to be Quercus palustris (pinoak) trees Benefits derived from other vegetation (eg in theunderstory) are neglected
To assess the reliability with which the GI in scenario 1can reduce runoff alter flow to the WWTP and modify thevolume and frequency of CSOs compared to a base ldquodo noth-ingrdquo case the entire study area was modeled using the USEnvironmental Protection Agencyrsquos (US EPArsquos) Stormwa-ter Management Model (SWMM) version 50021 The morethan 784 ha drainage area was represented with subcatchments
902 Journal of Industrial Ecology
R E S E A R C H A N D A N A LYS I S
Table 1 Flows and facilities assumed for each of the three scenarios
Scenario 1 Scenario 2 Scenario 3Do nothing Mm3 Mm3 Mm3
Mm3
Annual Annual Change from Annual Change from Annual Change fromScenarios value value do nothing value do nothing value do nothing
Runoff per year 468 454 minus014 468 0 468 0Total number of CSO events
per year35 30 minus5 30 minus5 30 minus5
Total CSO volume per year 123 091 minus032 091 minus032 091 minus032Total flow to WWTP from
study area per year2719 2748 029 2748 029 2719 0
Notes Mm3 = million cubic meters CSO = combined sewer overflow WWTP = wastewater treatment plant
ranging in size from 2023 to 24281 ha The imperviousnessand other model parameters were adapted from a previously de-veloped hydrologic and hydraulic model of the entire drainagearea associated with the Hunts Point WWTP and developedby the NYC Department of Environmental Protection Thismodel was calibrated and validated previously using flow datacollected during a 2004ndash2005 CSO facility planning study (Liand Rangarajan 2011)
Although further details of this modeling effort are pro-vided in a companion article (Goldstein and Montalto 2012)the model results are summarized in Table 1 When drivenusing 1988 hourly rainfall recorded at John F Kennedy In-ternational Airport in Jamaica NY (the average precip-itation conditions used in many of the NYC and NewYorkndashNew Jersey harbor watershedwater quality assessments)the GI approach decreased the volume of runoff by 3712million gallons per year (Mgalyr)3 reduced the numberof CSO events from 12 to 7 and reduced the volumeof combined sewage discharged to the Bronx River by859 Mgalyr (0352 million cubic meters per year [Mm3yr])However despite the reductions in runoff and CSO vol-ume scenario 1 actually increased the volume of combinedsewage flowing to the Hunts Point WWTP by 7652 Mgalyr(029 Mm3yr) The increase in flow to the treatment plant isattributed to the role that the GI technologies play in reducingthe rate of runoff and extending the time over which it is dis-charged These two alterations to the local hydrology serve tomore efficiently use the conveyance capacity of the collectionsystem resulting in fewer overflows and greater flow conveyedto the WWTP during and after wet weather
Scenario 2 features an end-of-pipe detention facility sizedto achieve a similar reduction of CSO events and volumes aswould be accomplished by scenario 1 The detention facilitytemporarily stores the would-be overflow volume for pumpingback into the collection system after the wet weather eventScenario 2 avoids construction of the GI facilities but re-quires construction of a reinforced concrete detention tankAs described below this tank is assumed to be approximately32 Mgal (0012 Mm3) in volume No changes in vegetationcanopy area are assumed over the base ldquodo nothingrdquo case for thisscenario
Scenario 3 is identical to scenario 2 except that the detainedflow is assumed to be treated (physically and chemically) at thetank location and discharged directly to the Bronx River (notpumped to the WWTP)
Table 1 summarizes the flows and facilities assumed for eachof the three scenarios over a 50-year analysis period A diagramdepicting the system boundary is presented in Figure 1
The focus of this analysis is on the GHG emissions of eachof the three scenarios The boundaries encompass the materialextraction manufacturing and transport activities necessary toinstall operate and manage the infrastructure included in eachscenario In addition the carbon sequestration and energy bene-fits provided by the new vegetation (conservatively consideringonly trees and no understory) are computed for scenario 1
Detailed Methodology
A hybrid of process and economic input-output (EIO) LCAmethodologies were employed in this analysis taking advan-tage of the specific data that were available (Bilec et al 2010Sharrard 2007 Stokes and Horvath 2010 Suh et al 2004)Process-based steps were used for the modules that could bebest characterized through data sets in SimaPro and EIO LCAwas used for specific price-based components of the life cycleinventory (LCI) for which we had specific cost data for specificcommodities
The hybrid methodology consisted of six unique steps
1 Process-based LCI analysis2 Estimation of the construction costs for scenarios 2
and 33 Estimation of the infrastructure operation and mainte-
nance (OampM) costs for all three scenarios4 Estimation of the energy variation at the WWTP in
scenarios 1 and 25 Estimation of the carbon sequestration and CO2 reduc-
tions due to shading and induced energy savings in thebuildings brought about by the trees in scenario 1
6 Life cycle impact assessment computation of energy andGHG life cycle impacts
Sousa et al Evaluating Watershed-Scale CSO Strategies with LCA 903
R E S E A R C H A N D A N A LYS I S
Figure 1 Life cycle flow diagram and system boundary
Each of these steps is described below with specific assump-tions summarized in Table 2
Step 1 Life Cycle Inventory AnalysisFollowing International Organization for Standardization
(ISO) process LCA methods described in the ISO 14044 re-quirements and guidelines (ISO 2006 Baumann and Tillman2004) we define the life cycle system boundary that guides thelife cycle inventory (LCI) analysis (Figure 1) A list of the con-struction materials (Table 3) required to build scenario 1rsquos GIswas developed based on the design details specified by Gold-stein (2011) with the exception of those materials required forthe subgrade cisterns which were estimated based on typicalmanufacturer specifications (Stormchamber 2011) The trans-portation costs were estimated based on data provided by theNYC Department of Parks and Recreation Greenstreets Pro-gram (Shetty 2011) A 32-ton capacity truck was assumed fortransportation distances of less than 400 kilometers (km) whilerail transportation was assumed for longer distances due to typ-ical cost considerations described in the literature (Wakeleyet al 2009)
The GHG emissions associated with scenario 1 were com-puted using SimaPro 71 (PRe Consultants 2007) a softwaredatabase and process flow modeling program designed to per-form LCA under the ISO (2006) guidelines The databases in-cluded in SimaPro that were used in this study were Ecoinventv2 and US Input Output
To estimate the full supply chain GHG emissions associatedwith the construction of grey infrastructure assumed in scenarios2 and 3 we used aggregate-level cost data with the EconomicInput-Output Life Cycle Assessment (EIO-LCA) tool devel-oped at Carnegie Mellon University (Green Design Institute2011) We used the 1997 consumer price EIO-LCA model dueto its coverage of the watersewer construction projects sectorand adjusted to 1997 US dollar ($) costs using the ConsumerPrice Index (CPI) As noted by Hendrickson and colleagues(2006) the EIO-LCA model identifies the economic and en-vironmental impacts of a purchase from a particular economicsector representing the entire supply chain for producing thereferred purchase In addition to its use in estimating GHGemissions associated with the implementation costs for scenar-ios 2 and 3 the EIO-LCA tool was also used to study the en-vironmental loads associated with operation and maintenance(OampM) activities (described below) for all three scenarios
Step 2 Estimation of the Construction Costs for Scenarios2 and 3According to Wise and colleagues (2011) a significant ben-
efit of GI is avoided construction of end-of-pipe grey infras-tructure systems like those considered in scenarios 2 and 3Without GI the latter would be required for water utilitiesto avoid fines due to noncompliance with regulations requir-ing control andor abatement of CSOs In this analysis thecost of a detention tank that would reduce CSOs equivalent
904 Journal of Industrial Ecology
R E S E A R C H A N D A N A LYS I S
Table 2 Employed methods and respective assumptions
Step Methodtool Data source Assumptions
Inventory analysis of the GIs SimaPro Hydrologic StormchamberManual calculations basedon Goldstein (2011) design
32-ton capacity truck was used forthe transportation distancesunder 400 km and railtransportation for greaterdistances (Wakeley et al 2009)
Estimation of the changes instormwater flow to the WWTPand CSO volume incurred bythe adopted GI scheme
EPA-SWMM version 50021 Goldstein (2011) 1988 JFK Airport station rainfalldata
Estimation of the change in energyconsumption at the WWTPassociated with the differencesin the amount of runoff treated
1188 kWhMgal treated EPRI (2002) 100 Mgalday WWTPconsidering advancedtreatment
Estimation of the carbonsequestration by the trees andother vegetation implied by theGI (SC1)
Center for Urban Forest ResearchTree Carbon Calculator (CTCC)
Center for Urban ForestResearch(wwwfsfedusccrctopicsurban-forests)
US climate zone northeast treelife span 50 years buildingvintage 1950ndash1980 treedistance from the buildings20ndash40 ft building airconditioning equipmentwallwindow building heatingequipment natural gaselectricity emissions factors(kgMWh) for Queens NYUSA 4672 (CO2) 00030heating emissions factor(kgMBTU) for natural gas531 (CO2) 00059 (CH4)00001 (N2O) (CCRC 2011)
Impact assessment of the GIs(SC1)
SimaPro (IPCC 2007GWP 100 years)
Product Ecology Consultant(wwwprenlcontentsimapro-lca-software)
Databases used Ecoinvent v2and US Input Output
Impact assessment of the energynecessary at the WWTP to treatthe variation of runoff accruedby the GI schemes (SC1 andSC2)
SimaPro (IPCC 2007GWP 100 years)
Product Ecology Consultant(wwwprenlcontentsimapro-lca-software)
Databases used Ecoinvent v2and US Input Output
Impact assessment of theadditional grey infrastructureinstallation needed in case of noadoption of GI (SC2 and SC3)
EIO-LCA US 1997 (483) NationalPurchase Price Model consideringWater Sewer and PipelineConstruction Industry Sector
Carnegie Mellon University US 1997 (483) National PurchasePrice Model considering WaterSewer and PipelineConstruction Industry Sector
Impact assessment of the annualOampM activities of the GI (SC1)
EIO-LCA US 1997 (483) NationalPurchase Price Model consideringConstruction IndustryMaintenance and Repair ofNonresidential Buildings
Carnegie Mellon University US 1997 (483) National PurchasePrice Model consideringConstruction IndustryMaintenance and Repair ofNonresidential Buildings
Impact assessment of the annualOampM activities of the greyinfrastructure (SC2 and SC3)
EIO-LCA US 1997 (483) NationalPurchase Price Model consideringMining and Utilities IndustryWater Sewage and Other SystemsSector
Carnegie Mellon University US 1997 (483) National PurchasePrice Model consideringMining and UtilitiesIndustryWater Sewage andOther Systems Sector
Notes GI = green infrastructure WWTP = wastewater treatment plant SC = scenario CSO = combined sewer overflow kWhMgal =kilowatt-hours per million gallons Mgalday = million gallons per day ft = feet kgMWh = kilograms per megawatt-hour CO2 = carbondioxide kgMBTU = kilograms per million British thermal units CH4 = methane N2O = nitrous oxide OampM = operation and maintenance
to the green approach was estimated based on a review ofgovernment data and reports (City of New York 2010 NYCDEP 2007) Detention-based CSO control facilities (withouttreatment facilities) built or in planning across NYC cost onaverage $052 per gallon (gal) of reduced annual CSO vol-
ume with an upper bound of $070gal and a lower bound of$037gal At $052gal of reduced CSO approximately $447million would be required to construct a detention tank that canreduce annual CSOs by approximately 859 Mgal as requiredin scenario 2 Although it was not used directly in the analysis
Sousa et al Evaluating Watershed-Scale CSO Strategies with LCA 905
R E S E A R C H A N D A N A LYS I S
Table 3 Emissions (in t CO2-eq) from the three scenarios the wastewater treatment plant and the trees
Emissions (t CO2-eq)
Installation
Source Material Unit Quantity t CO2-eq kg CO2-equnit Annual andor OampM Over 50 years
Scenario 1 Concrete m3 32000 8400 260Excavation m3 180000 97 054Bark mulch t 500 300 600Geotextile m2 420000 2700 64HDPE kg 200000 490 25PVC kg 16000 50 31Transport truck t-km 80000000 8500 011Transport rail t-km 82000 4 005Total 20000 300 19000
Scenario 2 31500 1050 85000Scenario 3 100000 5840 400000WWTP 70 3500Trees Variable minus25643
Notes t CO2-eq = metric tons of carbon dioxide equivalent kg CO2-equnit = kilograms of carbon dioxide equivalent per unit m3 = cubic meterst = metric ton m2 = square meters t-km = metric ton kilometers HDPE = high-density polyethylene PVC = polyvinyl chloride WWTP = wastewatertreatment plant
the actual volume of this tank can be estimated using a recentreport citing the construction costs of CSO tanks of differentvolumes (NY Newsday 2004) Assuming that it costs on aver-age $1305gal of tank storage the detention tank assumed inscenario 2 would have the capacity to store approximately 32Mgal (0012 Mm3)
The cost to construct scenario 3 includes the cost of a deten-tion tank accompanied by a physical and chemical treatmentfacility Also per the NYC DEP (2007) and City of New York(2010) CSO control facilities with detention and treatmentbuilt or in planning across NYC cost on average $175gal ofreduced annual CSO volume with an upper bound of $245galand a lower bound of $105gal Using the average value thecost of this facility would be $150 million Again although thevolume of this facility is not utilized in the analysis presented inthis article it could be assumed that the detention tanks wouldhave a similar storage capacity to the one considered in scenario2 with the residual extra cost associated with its physical andchemical treatment operations
Step 3 Estimation of the Infrastructure Operation andMaintenance CostsThe OampM costs of the infrastructure considered in each
of the three scenarios were also estimated from the literatureFor scenario 1 OampM costs were defined separately for eachGI typology based on average literature costs converted into2011 US dollars (Table 4) The annual OampM cost assumedfor porous concrete was $013 per square foot (ft2)4 and assumesbiannual sweeping high-pressure jet washing and replacementof 1 of the area (Tackett 2011 US EPA 2005) The OampMcosts of bioretention bump-outs curbside infiltration plantersand backyard rain gardens were assumed to be identical A totalof $114ft2 (US EPA 2005) would cover repair of eroded areasremoval and replacement of all dead and diseased vegetation
mulching of void areas irrigation of vegetated areas (biannualor as needed) and removal of mulch and application of a newlayer (annual) The annual OampM costs of the subgrade cisternwere derived from studies on Stormchambers (Stormchamber2011 UNHSC 2009) For $002ft2 of Stormchamber bottomthese facilities could be vacuum cleaned twice a year (or asneeded)
The OampM costs associated with the detention tank in sce-nario 2 were assumed to be on average 14 of the constructioncosts or the average of all literature values excluding the ex-treme highest and lowest values The upper end of possibleOampM costs was 2 of the construction costs and the lower endwas 08 (City of Akron 1999 Montalto et al 2007)
Specific OampM activities related to large detention tanksinclude odor control and ventilation removal and disposal ofaccumulated residual sludge and solids (Zukovs and Marsalek2004) and inlet andor outlet pumping (US EPA 2007)
According to the US EPA (1999a) and the Detroit Waterand Sewerage Department (DWSD 2003) the OampM costs ofdetention tanks that include physical and chemical treatmentoperations are 104 to 36 of the construction costs TheOampM costs for scenario 3 were thus estimated at 23 (averageof the literature values excluding the extreme highest and lowestvalues) of the construction costs According to the DWSD(2003) OampM activities for this type of facility include chemicalacquisition costs preventative maintenance costs energy costsand sludge disposal
Step 4 Estimation of the Energy Variation at the Waste-water Treatment Plant in Scenarios 1 and 2Because scenarios 1 and 2 alter the volume of water that is
conveyed to the Hunts Point WWTP the difference in energyat the WWTP over the ldquodo nothingrdquo case had to be com-puted (As stated earlier scenario 3 does not alter the volume
906 Journal of Industrial Ecology
R E S E A R C H A N D A N A LYS I S
Table 4 Installation and OampM costs for green-infrastructures summary
GI element Construction costs Data source OampM cost (annual) Data source
Porous pavement $250ndash$830ft2 (2006) Montalto et al (2007) 1ndash2 of construction costs CRI (2005) NCGBT(2003) US EPA(1999b)
$109ndash$218ft2 EPA (2005) $016ft2 EPA (2005)$2ndash$3ft2 EPA (2003)$26ft2 Tackett (2011) $006ft2 Tackett (2011)$4ndash$5ft2 UNHSC (2009) $0008ft2 UNHSC (2009)$710ft2 CNT (2009)
Subgrade cistern $078ft2 of mitigatedimpervious area($34000acre)
UNHSC (2009) $0008ft2 (twice a year)$0016ft2
UNHSC (2009)
Backyard raingarden
$13ndash$14ft2 Bannerman (2003) 2ndash8 EPA (2005) Flinker(2005) CRWA (2008)
$540ft2 of the mitigatedimpervious area
Tackett (2011) $011ft2 of the mitigatedimpervious area
Tackett (2011)
$041ft2 $18000acre ofmitigated impervious area
UNHSC (2009)
$9ndash3200ft2 CNT (2009)
of flow conveyed to the WWTP over the baseline conditions)For scenarios 1 and 2 the energy consumed was estimated bymultiplying the annual volume of flow to the plant by an esti-mate of the unit electricity consumption for wastewater treat-ment plants with the capacity to treat more than 100 Mgalday(eg 1188 kilowatt-hours per millions gallons [kWhMgal])published by the Electric Power Research Institute (EPRI2002)
Step 5 Estimation of the Carbon Sequestration and Car-bon Dioxide Reductions Due the Energy Savings in theBuildings by the TreesThe new trees sequester carbon and their canopies reduce
building energy consumption These benefits were estimated us-ing the Tree Carbon Calculator (CTCC) a ldquoproof of conceptrdquotool developed by the Center for Urban Forest Research at theUS Forest Service and approved by the Climate Action Re-serversquos Urban Forest Project Protocol for tree planting projects(CCRC 2011) The CTCC provides carbon-related informa-tion for individual trees located in any of the United Statesrsquo 16different climate zones The tool was developed based on sizeand growth data derived from a database of 650 to 1000 streettrees representative of about 20 predominant species in each ofthe 16 different reference cities (CCRC 2011) Among otheroutputs CTCC quantifies annual CO2 sequestered as well asreductions in CO2 emissions due to building energy savings
Trees reduce building energy consumption by providingshade (reducing air conditioning needs) but also by blockingwind Reduced wind speeds result in less infiltration of cold airinto buildings during the winter months limiting conductiveheat loss and reducing the need for heating (Heisler 1986 Peperet al 2007 Simpson and McPherson 1998) Heisler (1986) re-
ported that trees can reduce wind speed and resulting air infil-tration by up to 50 translating into potential annual heatingsavings of 25 Simpson and McPherson (1998) simulated thetree impacts in wind speed reduction on residential energy useand found an annual energy decrease of 25 per tree in Sacra-mento CA USA
CTCC uses a biomass equation derived from measurementsmade on trees planted in urban areas to estimate the total CO2
stored and sequestrated by different species The shading andwind-blocking benefits of trees on building energy consumptionconsidered in the CTCC are derived from computer simula-tions that were conducted in reference cities located in eachof the US climate zones using distinct combinations of treesizes building types building ages and types of heatingcoolingequipment and locations following methods defined by McPher-son and Simpson (1999) These simulations estimated the an-nual building energy use per residential unit and on a per treebasis by comparing results before and after adding the trees(CCRC 2011) The results in terms of reduced building energyconsumption are sensitive to the position of the trees relativeto the building
Although an exhaustive study of the spatial orientation ofthe future canopy in this study area was not within the scopeof this study a sensitivity analysis was performed to test theimportance of tree orientation on the results This analysis al-ternatively placed all the trees to the south (yielding the leastenergy savings) to the north (yielding the most energy savings)and to the west and the southwest (yielding average energy sav-ings) of the buildings
It was assumed that 2065 pin oak trees were installed duringthe first year of the GI program in equal proportions in eachof the vegetated GI facilities (eg the street-end bioretention
Sousa et al Evaluating Watershed-Scale CSO Strategies with LCA 907
R E S E A R C H A N D A N A LYS I S
bump-out facilities curbside infiltration planters and backyardrain gardens)
The base analysis assumes all of the trees were planted onthe southwest side of a building (with the other orientationsconsidered only in the sensitivity analysis) Other assumptionsadopted for this coarse analysis were
bull US climate zone northeastbull Tree life span 50 yearsbull Building vintage 1950ndash1980bull Tree distance from the buildings 20 to 40 feet (ft)bull Buildings air conditioning equipment wallwindowbull Buildings heating equipment natural gasbull Electricity emissions factors (kilograms per megawatt hour
[kgMWh]) for Queens NY USA 4672 (CO2) 00030(methane [CH4]) and 00001 (nitrous oxide [N2O])(CCRC 2011)
bull Heating emissions factors (kilograms per million Britishthermal units [kgMBTU]) for natural gas 531 (CO2)00059 (CH4) and 00001 (N2O) (CCRC 2011)
Step 6 Energy and Greenhouse Gas Life Cycle ImpactsIn order to compare the environmental performance of the
three different scenarios three different sets of impacts were as-sembled Scenario 1 includes the impacts associated with con-structing operating and maintaining the GI as well as treatingthe increase in flow to the WWTP As described earlier theseemissions are mitigated partially by CO2 sequestration by thevegetation and the reduced building energy loads associatedwith shading and wind blocking For scenario 2 there are im-pacts associated with constructing operating and maintainingthe detention tank and also treating the increase in flow tothe treatment plant over the ldquodo nothingrdquo case (ie the totalvolume of overflows in the base condition is assumed to be de-tained for later conveyance to the WWTP increasing annualtreated flow) The impacts associated with scenario 3 includeconstruction and OampM of the new detention tanktreatmentoperations and no change in flow to the treatment plant (iethe total volume of existing overflows is assumed to be treatedin the new end-of-pipe facility and discharged directly to theriver at that location)
From the LCI we estimated global warming potential(GWP) using characterization factors from the Intergovern-mental Panel on Climate Change (IPCC 2007) that convertair emissions to carbon dioxide equivalents (CO2-eq)
The EIO-LCA model was used to estimate the GWP associ-ated with the construction activities for scenarios 2 and 3 andOampM activities for all three scenarios The US 1997 (483)National Purchase Price Model was selected using ldquoConstruc-tion IndustryWater Sewer and Pipeline Construction Sectorrdquoto represent construction activities in scenarios 2 and 3 ldquoMin-ing and Utilities IndustryWater Sewage and Other SystemsSectorrdquo was used to represent the OampM activities of scenarios 2and 3 and ldquoConstruction IndustryMaintenance and Repair ofNonresidential Buildings Sectorrdquo was used to represent OampMactivities associated with scenario 1
The annual net GWP emissions of the three scenarios iscomputed as follows
GWPSC1 = I1 + OampM1 + WWTP minus Trees (1)
GWPSC2 = I2 + OampM2 + WWTP (2)
GWPSC3 = I3 + OampM3 (3)
where I1 I2 and I3 represent the emissions associated with ini-tial construction activities for scenarios 1 2 and 3 respectivelyand are incurred only during year 1 OampM1 OampM2 and OampM3
are the cumulative OampM emissions associated with each of thethree different scenarios WWTP is the cumulative new emis-sions associated with energy consumption at the WWTP andTrees refers to the reduced GWP achieved through carbon se-questration and building energy savings due to shading andwind blockage by the trees
Results and Discussion
Installation of the GI in scenario 1 emitted 20000 t CO2-eq compared with 31500 t CO2-eq for the detention tank inscenario 2 and 100000 t CO2-eq for the tank and treatmentfacilities in scenario 3 (Figure 2) These results indicate that interms of initial emissions scenario 1 yielded superior environ-mental performance when compared with the grey infrastruc-ture options Of the total emissions associated with constructionof the GI the greatest contributions came from transportation(8500 t CO2-eq) followed by cement manufacturing and con-crete (8400 t CO2-eq) (Figure 2)
The annual net emissions for OampM for scenario 1 werealso significantly lower than those incurred in scenarios 2 and3 with significant cumulative effects over the 50-year studyperiod Cumulatively scenario 1 is expected to release 19000t CO2-eq compared with 85000 t CO2-eq for scenario 2 and400000 t CO2-eq for scenario 3 (Figure 3) The cumulativeOampM emissions associated with scenarios 2 and 3 amountedto 170 (scenario 2) and 300 (scenario 3) of their year 1construction emissions after 50 years of operation comparedwith the cumulative OampM emissions of scenario 1 which onlyincreased by 75 over its initial emissions
It is noteworthy that the carbon sequestration and savingsin energy accrued by the trees were a key part of the net annualemissions associated with the GI in scenario 1 By year 25 thetrees had grown sufficiently to completely mitigate the emissionsassociated with the total annual OampM emissions for all of theGI facilities After year 25 the reduction in emissions associatedwith the trees exceeds the annual emissions associated with allscenario 1 OampM activities providing negative loads
Another significant finding was the significant difference inemissions between the two grey scenarios (2 and 3) Over 50years scenario 2 releases 100000 t CO2-eq whereas scenario3 generates this quantity of emissions during initial construc-tion activities alone arriving at almost 400000 t CO2-eq incumulative emissions after 50 years
908 Journal of Industrial Ecology
R E S E A R C H A N D A N A LYS I S
Figure 2 Cradle-to-green infrastructure (GI) installation global warming potential (GWP) for three infrastructure scenarios Note Thefigure shows the dominant input contributions toward GWP from the process and economic input-output (EIO) models The ldquootherrdquocategory includes aggregated EIO sector inputs including primary aluminum production and lime production
Sensitivity Analyses
Two sensitivity analyses were performed to examine whetherthe findings hold up if the uncertain data sets used in the analysiswere allowed to vary within the full range of possible values Thefirst sensitivity analysis varied the emissions associated with theconstruction and OampM activities for each of the three scenariosThe second sensitivity analysis focused on the position of thetrees relative to buildings Each of these analyses is describedbelow
Sensitivity Analysis 1To consider the full range of possible emissions associated
with construction and OampM activities implied by each sce-
nario first the upper and lower bound on the emissions asso-ciated with initial construction needed to be computed Forscenarios 2 and 3 the original analysis used the average cost pergallon of annual CSO reduction as gleaned from the literatureIn the sensitivity analysis the upper and lower bounds of thedetention tank costs in scenario 2 were set at $070 and $037respectively For scenario 3 the upper and lower bounds of thedetentiontreatment facility costs were $245 and $105 respec-tively The same procedure could not be applied for scenario1 because the emissions were computed based on unit materialand transportation costs Instead the upper and lower boundsof emissions associated with GI installation were assumed to bethe average of the variance of the literature values for scenarios
Figure 3 Emissions over 50 years according to the different scenarios
Sousa et al Evaluating Watershed-Scale CSO Strategies with LCA 909
R E S E A R C H A N D A N A LYS I S
2 and 3 expressed as a percentage of the average value used inthe initial analysis
The next step was to compute the upper and lower boundsof the annual OampM costs The upper and lower bounds forscenario 1 were based on the values found in the literatureSince the OampM costs for scenarios 2 and 3 were expressed asranges of percentages of the installation costs these percentageswere applied to the upper and lower bounds of the installationcosts as computed per the above For example the lower boundwas found by multiplying the lower bound of the OampM costpercentages (08 for scenario 2 104 for scenario 3) by the
lower bound of the installation costs ($037gal for scenario2 $105gal for scenario 3) These products were used in theEIO-LCA model to derive the corresponding extreme emissionspossibilities The same approach was used to calculate the upperbounds
The results of the first sensitivity analysis are shown inFigure 4a There was very little overlap between the emis-sions envelopes associated with the range of possible emis-sions associated with the three different scenarios Hence thefirst sensitivity analysis reinforces the original findings namelythat the GI approach featured in scenario 1 is environmentally
Figure 4 Sensitivity analyses (a) Sensitivity analysis of the emissions over 50 years from the installation and operation and maintenance(OampM) activities of scenarios 1 2 and 3 Note The dashed line represents the base case results of the scenarios emissions (b) Sensitivityanalysis of the tree benefits considering the treesrsquo location north southwest west or south face of the building Note The dashed linerepresents just the carbon dioxide (CO2) sequestration provided by the trees over 50 years
910 Journal of Industrial Ecology
R E S E A R C H A N D A N A LYS I S
preferable to the grey approaches included in scenarios 2 and 3for the metrics studied
Sensitivity Analysis 2Regarding the avoided CO2 emissions associated with the
impact of trees on building energy consumption a second sen-sitive analysis was conducted to consider the effect of differ-ent positions of the trees relative to the buildings The entire50-year analysis was repeated four times with the trees alterna-tively positioned to the south (least expected energy savings)the north (most expected energy savings) the west and thesouthwest (average expected energy savings) of the buildings
It is noteworthy that the carbon sequestered by the treesdoes not vary with the position and represents 11227 t CO2-eq over 50 years The avoided CO2 emissions through buildingenergy savings provided by the trees ranged from 1614 t CO2-eq(south) to 14416 t CO2-eq (north) which when added to theCO2 sequestered (11227 t CO2-eq) resulted in from 12841 tCO2-eq (south) to 25643 t CO2-eq (north) of mitigated GWPemissions The results of this sensitivity analysis are shown inFigure 4b and indicate that the energy benefits provided by thetrees are a significant fraction of the total of CO2 emissionsdecrease provided by the trees but only when the trees are notplanted to the south
Conclusion
This research used LCA methods to compare the environ-mental performance of three different approaches to reducingCSOs to the Bronx River NYC To our knowledge this studywas the first attempt to apply LCA methods at this scale andin this application While all three scenarios were scaled toreduce CSOs equivalently they required different construc-tion and OampM activities and in the cases of scenarios 1 and2 would also engender changes in the volume of annual flowto the regional WWTP When the GHG emissions associatedwith construction operation and maintenance are accountedfor the CSO abatement strategy represented by scenario 1which treats runoff from approximately one-third of the to-tal drainage area in decentralized green infrastructure facilitiesthat collectively amount to an area that is approximately 5of the total drainage area results in significantly better envi-ronmental performance than the end-of-pipe detention or thecombined detention and treatment strategies Both in terms ofthe emissions during initial construction and the cumulativenet emissions released over the first 50 years of operation thegreen infrastructure approach results in fewer emissions thaneither of the two grey approaches
This kind of analysis is limited by the availability of the req-uisite data sets Two sensitivity analyses varied the emissionsassociated with construction operation and maintenance ac-tivities and also the placement of the trees These analysesfurther reinforce the original conclusion that is that the fullrange of possible emissions associated with the green approach
will be significantly lower than those associated with the twogrey strategies
By conservatively assuming that the new GI would includeonly about 2000 new pin oak trees and no understory thecarbon sequestered and shading provided by the trees is firstable to fully offset the annual OampM emissions during year 25Further tree growth after year 25 exceeds the annual emissionsand begins to ldquopay backrdquo the emissions associated with initialconstruction of the GI network However this portion of theanalysis should be validated with actual studies documentingthe growth rates canopy configurations carbon sequestrationshading and wind protection provided by urban trees as wellas similar studies on other types of vegetation (shrubs grassesflowers etc) commonly planted in urban GI systems Very fewsuch studies have been performed to date
It should also be noted that this study did not quantifythe GHG emissions associated with other potential services(eg reduced pavement temperatures improved air qualityenhanced habitat etc) and disservices (eg increased street-sweeping requirements enhanced flooding potential etc) thatcould be brought about by watershed-scale implementation ofGI Additional research is needed to establish the relative im-portance of such factors in determining environmental perfor-mance Additional work is also needed to inventory the con-struction and OampM activities and costs associated with greenand grey CSO abatement strategies for which published datasets are currently quite limited Finally given all of the spatialinfrastructural economic social and other constraints presentin twenty-first-century cities the level of penetration that greeninfrastructure technologies will actually have in urban water-sheds still remains to be seen Nonetheless this study suggeststhat watershed managers who seek to reduce CSOs and reducemunicipal carbon footprints should opt for a green approachover a grey one
Acknowledgements
The authors are grateful to Nandan Shetty from the NewYork City Department of Parks and Recreation Sri Rangarajanand Chenchen Li from HDR Tracy Tackett from Seattle PublicUtilities Alan Cohn from the New York City Department ofEnvironmental Protection and Alisha Goldstein all of whomassisted in identifying different data sets used in this project
Notes
1 One gallon (gal) asymp 379 liters (L) so 200 million gallons per day(Mgalday) asymp 758 million liters per day (MLday)
2 One hectare (ha) = 001 square kilometers (km2 SI) asymp 000386square miles (mi2) asymp 247 acres
3 One gallon asymp 0003785 cubic meters (m3) so 3712 million gallonsper year (Mgalyr) is equivalent to 014 million cubic meters peryear (Mm3yr)
4 One square foot (ft2) = 0093 square meters (m2)
Sousa et al Evaluating Watershed-Scale CSO Strategies with LCA 911
R E S E A R C H A N D A N A LYS I S
References
Adam D 2007 The unheralded polluter Cement industry comes cleanon its impact The Guardian [Brussels] 12 October
Bannerman R 2003 Rain gardens A how-to manual for homeownersPUB-WT-776 Madison WI USA Wisconsin Department ofNatural Resources
Baumann H and A M Tillman 2004 The hitch hikerrsquos guide to LCALund Sweden Studentlitteratur AB
Bilec M M R J Ries and H S Matthews 2010 Life-cycle assess-ment modeling of construction processes for buildings Journal ofInfrastructure Systems 16(3) 199ndash205 httpascelibraryorgisoresource1jitse4v16i3p199_s1 Accessed 6 December 2011
Blackhurst M C T Hendrickson and H S Matthews 2010 Cost-effectiveness of green roofs Journal of Architectural Engineering16(4) 136ndash143
Brehm D 2007 Nanoengineered concrete could cut carbon diox-ide emissions MITNEWS 14 February 2007 httpwebmitedunewsoffice2007concretehtml Accessed 1 December 2011
CCRC (Center for Urban Forest Research) 2011 The Center forUrban Forest Research tree carbon calculator wwwfsfedusccrctopicsurban-forestsctcc Accessed 7 August 2011
City of Akron 1999 Facilities plan rsquo98 Akron OH USA wwwciakronohusCSOFP98FI1PDF Accessed 5 August 2011
City of New York 2010 NYC green infrastructure plan A sustainablestrategy for clean waterways City of New York NY USAwwwnycgovhtmldeppdfgreen_infrastructureNYCGreenIn-frastructurePlan_HighRespdf Accessed 15 April 2011
CNT (Center for Neighborhood Technology) 2009 Greenvalues calculator benefit details httpgreenvaluescntorgnationalbenefits detailphpreduced-treatment Accessed 12June 2011
CRI (Conservation Research Institute) 2005 Changing cost percep-tions An analysis of conservation development wwwcdfinccomCDF_ResourcesCost20Analysis20-20Part20120-20Report20-20with20Exec20Summarypdf Accessed5 August 2011
CRWA (Charles River Watershed Association) 2008 Blackstonetown hall demonstration project Evaluation of low impact de-velopment (LID) best management practices (BMPs) opportu-nities wwwcrwaorgprojectsblackstonelid evaluationpdf Ac-cessed 10 June 2011
DWSD (Detroit Water and Sewerage Department) 2003 Wastewatermaster plan DWSD project no CS-1314 Technical feasibility ofa wet weather flow treatment facility Detroit MI USA DWSD
EPRI (Electric Power Research Institute) 2002 Water and sus-tainability (Volume 4) US electricity consumption for watersupply and treatmentmdashThe next half century wwwcircleofblueorgwaternewswp-contentuploads201008EPRI-Volume-4pdfAccessed 19 April 2011
Flinker P 2005 Green rooftop systems In Urban environmentaldesign manual Providence RI USA Rhode Island Depart-ment of Environmental Management wwwdemrigovprogramsbpoladmsuswshedpubshtm Accessed 5 June 2011
Goldstein A 2011 Comparison of a high and low spatial resolutionmodel for an urban block and implications for depicting low im-pact development Masterrsquos thesis Drexel University Philadel-phia PA USA
Goldstein A and F A Montalto 2012 Comparison of a high and lowspatial resolution model for an urban block Journal of HydrologicEngineering Submitted for publication
Green Design Institute 2011 Economic input-output life cycle assess-ment wwweiolcanet Accessed 20 May 2011
Heisler G M 1986 Energy savings with trees Journal of Arboriculture12(5) 113ndash125
Hendrickson C T L B Lave and H S Matthews 2006 Environ-mental life cycle assessment of goods and services Washington DCUSA Resources for the Future
Hendriks C A E Worrell D de Jager K Blok and P Rieme 2004Emission reduction of greenhouse gases from the cement industryPaper presented at the Greenhouse Gas Control TechnologiesConference 5 September Vancouver BC Canada
Herstein Y R Filion and K R Hall 2009 Evaluating environmentalimpact in water distribution system design Journal of InfrastructureSystems 15(3) 241ndash250
IPCC 2007 Intergovernmental panel on climate change In Climatechange 2007 The physical science basis Contribution of workinggroup I to the fourth assessment report of the intergovernmentalpanel on climate change edited by S Solomon et al CambridgeCambridge University Press
ISO (International Organization for Standardization) 2006 ISO14044 Environmental management mdash Life cycle assessment mdash Re-quirements and guidelines Geneva Switzerland ISO
Kloss C Personal communication with Christopher Kloss GreenInfrastructure Coordinator US Environmental ProtectionAgency Office of Water 12 January 2012
Kosareo L and R Reis 2007 Comparative environmental life cycleassessment of green roofs Building and Environment 42(11) 2606ndash2613
Li C and S Rangarajan 2011 Technical Memorandum on Up-scalingof Drexel Universityrsquos Pilot Project to HP-009 Drainage AreaMahwah NJ HDR|HydroQual
MacMullan E and S Reich 2007 The economics of low-impact devel-opment A literature review Eugene OR USA ECONorthwest
Martin J 2011 Personal communication with Jeff Martin landscapearchitect New York City Department of Parks and Recreation14 April 2011
McPherson E G and J R Simpson 1999 Carbon dioxide reductionsthrough urban forestry Guidelines for professional and volun-teer tree planters General Technical Report PSW-171 AlbanyCA USDA Forest Service Pacific Southwest Research Station237 wwwfsfeduspswprogramsuesduepproductscufr_43pdfAccessed 6 December 2011
Montalto F C Behr K Alfredo M Wolf M Arye and M Walsh2007 Rapid assessment of the cost-effectiveness of low impact de-velopment for CSO control Landscape and Urban Planning 82(3)117ndash131
NCGBT (North Carolina Green Building Technology Database)2003 Pervious paving details for Chadbourn Street Townof Wrightsville Beach January 2 2006 httpwwwncgreenbuildingorgsitencgpublictechsearchresultscfmprojectid=93ampcategory=6ampparameter=98ampclicked=true Accessed August 102011
NYNewsday 2004 wwwnewsdaycomnewsnew-pact-stirs-up-old-stink-1650186 Accessed 10 July 2011
NYC DEP (New York City Department of Environmen-tal Protection) 2007 Flushing Bay waterbodywatershedfacility plan wwwhydroqualcomProjectsltcpwbwsflushing_bayflushing_bay_section_7pdf Accessed 20 July 2011
NYC DEP (New York City Department of Environmental Protec-tion) 2011 New York Cityrsquos wastewater treatment systemwwwnycgovhtmldeppdfwwsystempdf Accessed 21 July 2011
912 Journal of Industrial Ecology
R E S E A R C H A N D A N A LYS I S
Peper P J E G McPherson J R Simpson S L Gardner K E Vargasand Q Xiao 2007 New York City New York municipal forestresource analysis Technical Report Davis CA USA Center forUrban Forest Research
PRe Consultants 2007 SimaPro 71 LCA software Amersfoort theNetherlands
PWD (Philadelphia Water Department) 2009 Philadelphia com-bined sewer overflow long term control plan update wwwphillywatershedsorgltcpuVol02_TBLpdf Accessed 20 August 2011
Racoviceanu A I B W Karney C A Kennedy and A F Colombo2007 Life-cycle energy use and greenhouse gas emissions inven-tory for water treatment systems Journal of Infrastructure Systems13(4) 261ndash270
Saiz S C Kennedy B Bass and K Pressnail 2006 Comparativelife cycle assessment of standard and green roofs EnvironmentalScience and Technology 40(13) 4312ndash4316
Sharrard A L 2007 Greening construction processes using an input-output-based hybrid life cycle assessment model PhD thesisCarnegie Mellon University Pittsburgh PA USA
Shetty N 2011 Personal communication with N Shetty New YorkCity Department of Parks and Recreation 10 April 2011
Simpson J R and E G McPherson 1998 Simulation of tree shadeimpacts on residential energy use for space conditioning in Sacra-mento Atmospheric Environment Urban Atmospheres 32(1) 69ndash74
Spatari S Z Yu and F A Montalto 2011 Life cycle implicationsof urban green infrastructure Environmental Pollution 159(8ndash9)2174ndash2179
Stokes J R and A Horvath 2010 Supply-chain environ-mental effects of wastewater utilities Environmental ResearchLetters 5(2010) 014015 DOI 1010881748-932651014015httpiopscienceioporg1748-932651014015 Accessed 5 De-cember 2011
Stormchamber 2011 Stormchamber design manual wwwstormchamberscompdfStormChamberDesignManualpdf Accessed 7July 2011
Suh S M Lenzen G J Treloar H Hondo A Horvath G Huppes OJolliet U Klann W Krewitt Y Moriguchi J Munksgaard andG Norris 2004 System boundary selection in life-cycle invento-ries using hybrid approaches Environmental Science amp Technology38(3) 657ndash664
Tackett T 2011 Personal communication with Tracy Tackett LID
Program Manager Urban Watersheds Division Seattle PublicUtilities Seattle WA USA 10 August 2011
UNHSC (University of New Hampshire Stormwater Center) 2009Biannual report Durham NH USA
US EPA (US Environmental Protection Agency) 1999a Combinedsewer overflow management fact sheet Retention basins EPA832-F99-042 US EPA Office of Water Washington DC USA
US EPA (US Environmental Protection Agency) 1999b Stormwa-ter technology fact sheet Porous pavement httpwwwepagovowmmtbporouspapdf Accessed 1 August 2011
US EPA (US Environmental Protection Agency) 2005 Nationalmanagement measures to control nonpoint source pollution from urbanareas Washington DC USA US EPA
US EPA (US Environmental Protection Agency) 2007 Re-ducing stormwater costs through low impact development(LID) strategies and practices December 2007 wwwepagovowowNPSlidcosts07documentsreducingstormwatercostspdfAccessed 19 June 2011
US EPA (US Environmental Protection Agency) 2011 Storm wa-ter management model (SWMM) httpwwwepagovathenswwqtschtmlswmmhtml Accessed 18 May 2011
Wakeley H L C T Hendrickson W M Griffin and H SMatthews 2009 Economic and environmental transportation ef-fects of large-scale ethanol production and distribution in theUnited States Environmental Science amp Technology 43(7) 2228ndash2233
Wise S J Braden D Ghalayini J Grant C Kloss E MacMullan SMorse F Montalto D Nees D Nowak S Peck S Shaikh andC Yu Integrating valuation methods to recognize green infras-tructurersquos multiple benefits wwwcntorgrepositoryCNT-LID-paperpdf Accessed 20 May 2011
Zukovs G and J Marsalek 2004 Planning and design combined seweroverflow treatment Water Quality Research Journal of Canada39(4)439ndash448
About the Authors
Maria R C De Sousa is a PhD student and Franco Mon-talto and Sabrina Spatari are assistant professors in the Depart-ment of Civil Architectural and Environmental Engineeringat Drexel University Philadelphia PA USA
Sousa et al Evaluating Watershed-Scale CSO Strategies with LCA 913

R E S E A R C H A N D A N A LYS I S
Table 1 Flows and facilities assumed for each of the three scenarios
Scenario 1 Scenario 2 Scenario 3Do nothing Mm3 Mm3 Mm3
Mm3
Annual Annual Change from Annual Change from Annual Change fromScenarios value value do nothing value do nothing value do nothing
Runoff per year 468 454 minus014 468 0 468 0Total number of CSO events
per year35 30 minus5 30 minus5 30 minus5
Total CSO volume per year 123 091 minus032 091 minus032 091 minus032Total flow to WWTP from
study area per year2719 2748 029 2748 029 2719 0
Notes Mm3 = million cubic meters CSO = combined sewer overflow WWTP = wastewater treatment plant
ranging in size from 2023 to 24281 ha The imperviousnessand other model parameters were adapted from a previously de-veloped hydrologic and hydraulic model of the entire drainagearea associated with the Hunts Point WWTP and developedby the NYC Department of Environmental Protection Thismodel was calibrated and validated previously using flow datacollected during a 2004ndash2005 CSO facility planning study (Liand Rangarajan 2011)
Although further details of this modeling effort are pro-vided in a companion article (Goldstein and Montalto 2012)the model results are summarized in Table 1 When drivenusing 1988 hourly rainfall recorded at John F Kennedy In-ternational Airport in Jamaica NY (the average precip-itation conditions used in many of the NYC and NewYorkndashNew Jersey harbor watershedwater quality assessments)the GI approach decreased the volume of runoff by 3712million gallons per year (Mgalyr)3 reduced the numberof CSO events from 12 to 7 and reduced the volumeof combined sewage discharged to the Bronx River by859 Mgalyr (0352 million cubic meters per year [Mm3yr])However despite the reductions in runoff and CSO vol-ume scenario 1 actually increased the volume of combinedsewage flowing to the Hunts Point WWTP by 7652 Mgalyr(029 Mm3yr) The increase in flow to the treatment plant isattributed to the role that the GI technologies play in reducingthe rate of runoff and extending the time over which it is dis-charged These two alterations to the local hydrology serve tomore efficiently use the conveyance capacity of the collectionsystem resulting in fewer overflows and greater flow conveyedto the WWTP during and after wet weather
Scenario 2 features an end-of-pipe detention facility sizedto achieve a similar reduction of CSO events and volumes aswould be accomplished by scenario 1 The detention facilitytemporarily stores the would-be overflow volume for pumpingback into the collection system after the wet weather eventScenario 2 avoids construction of the GI facilities but re-quires construction of a reinforced concrete detention tankAs described below this tank is assumed to be approximately32 Mgal (0012 Mm3) in volume No changes in vegetationcanopy area are assumed over the base ldquodo nothingrdquo case for thisscenario
Scenario 3 is identical to scenario 2 except that the detainedflow is assumed to be treated (physically and chemically) at thetank location and discharged directly to the Bronx River (notpumped to the WWTP)
Table 1 summarizes the flows and facilities assumed for eachof the three scenarios over a 50-year analysis period A diagramdepicting the system boundary is presented in Figure 1
The focus of this analysis is on the GHG emissions of eachof the three scenarios The boundaries encompass the materialextraction manufacturing and transport activities necessary toinstall operate and manage the infrastructure included in eachscenario In addition the carbon sequestration and energy bene-fits provided by the new vegetation (conservatively consideringonly trees and no understory) are computed for scenario 1
Detailed Methodology
A hybrid of process and economic input-output (EIO) LCAmethodologies were employed in this analysis taking advan-tage of the specific data that were available (Bilec et al 2010Sharrard 2007 Stokes and Horvath 2010 Suh et al 2004)Process-based steps were used for the modules that could bebest characterized through data sets in SimaPro and EIO LCAwas used for specific price-based components of the life cycleinventory (LCI) for which we had specific cost data for specificcommodities
The hybrid methodology consisted of six unique steps
1 Process-based LCI analysis2 Estimation of the construction costs for scenarios 2
and 33 Estimation of the infrastructure operation and mainte-
nance (OampM) costs for all three scenarios4 Estimation of the energy variation at the WWTP in
scenarios 1 and 25 Estimation of the carbon sequestration and CO2 reduc-
tions due to shading and induced energy savings in thebuildings brought about by the trees in scenario 1
6 Life cycle impact assessment computation of energy andGHG life cycle impacts
Sousa et al Evaluating Watershed-Scale CSO Strategies with LCA 903
R E S E A R C H A N D A N A LYS I S
Figure 1 Life cycle flow diagram and system boundary
Each of these steps is described below with specific assump-tions summarized in Table 2
Step 1 Life Cycle Inventory AnalysisFollowing International Organization for Standardization
(ISO) process LCA methods described in the ISO 14044 re-quirements and guidelines (ISO 2006 Baumann and Tillman2004) we define the life cycle system boundary that guides thelife cycle inventory (LCI) analysis (Figure 1) A list of the con-struction materials (Table 3) required to build scenario 1rsquos GIswas developed based on the design details specified by Gold-stein (2011) with the exception of those materials required forthe subgrade cisterns which were estimated based on typicalmanufacturer specifications (Stormchamber 2011) The trans-portation costs were estimated based on data provided by theNYC Department of Parks and Recreation Greenstreets Pro-gram (Shetty 2011) A 32-ton capacity truck was assumed fortransportation distances of less than 400 kilometers (km) whilerail transportation was assumed for longer distances due to typ-ical cost considerations described in the literature (Wakeleyet al 2009)
The GHG emissions associated with scenario 1 were com-puted using SimaPro 71 (PRe Consultants 2007) a softwaredatabase and process flow modeling program designed to per-form LCA under the ISO (2006) guidelines The databases in-cluded in SimaPro that were used in this study were Ecoinventv2 and US Input Output
To estimate the full supply chain GHG emissions associatedwith the construction of grey infrastructure assumed in scenarios2 and 3 we used aggregate-level cost data with the EconomicInput-Output Life Cycle Assessment (EIO-LCA) tool devel-oped at Carnegie Mellon University (Green Design Institute2011) We used the 1997 consumer price EIO-LCA model dueto its coverage of the watersewer construction projects sectorand adjusted to 1997 US dollar ($) costs using the ConsumerPrice Index (CPI) As noted by Hendrickson and colleagues(2006) the EIO-LCA model identifies the economic and en-vironmental impacts of a purchase from a particular economicsector representing the entire supply chain for producing thereferred purchase In addition to its use in estimating GHGemissions associated with the implementation costs for scenar-ios 2 and 3 the EIO-LCA tool was also used to study the en-vironmental loads associated with operation and maintenance(OampM) activities (described below) for all three scenarios
Step 2 Estimation of the Construction Costs for Scenarios2 and 3According to Wise and colleagues (2011) a significant ben-
efit of GI is avoided construction of end-of-pipe grey infras-tructure systems like those considered in scenarios 2 and 3Without GI the latter would be required for water utilitiesto avoid fines due to noncompliance with regulations requir-ing control andor abatement of CSOs In this analysis thecost of a detention tank that would reduce CSOs equivalent
904 Journal of Industrial Ecology
R E S E A R C H A N D A N A LYS I S
Table 2 Employed methods and respective assumptions
Step Methodtool Data source Assumptions
Inventory analysis of the GIs SimaPro Hydrologic StormchamberManual calculations basedon Goldstein (2011) design
32-ton capacity truck was used forthe transportation distancesunder 400 km and railtransportation for greaterdistances (Wakeley et al 2009)
Estimation of the changes instormwater flow to the WWTPand CSO volume incurred bythe adopted GI scheme
EPA-SWMM version 50021 Goldstein (2011) 1988 JFK Airport station rainfalldata
Estimation of the change in energyconsumption at the WWTPassociated with the differencesin the amount of runoff treated
1188 kWhMgal treated EPRI (2002) 100 Mgalday WWTPconsidering advancedtreatment
Estimation of the carbonsequestration by the trees andother vegetation implied by theGI (SC1)
Center for Urban Forest ResearchTree Carbon Calculator (CTCC)
Center for Urban ForestResearch(wwwfsfedusccrctopicsurban-forests)
US climate zone northeast treelife span 50 years buildingvintage 1950ndash1980 treedistance from the buildings20ndash40 ft building airconditioning equipmentwallwindow building heatingequipment natural gaselectricity emissions factors(kgMWh) for Queens NYUSA 4672 (CO2) 00030heating emissions factor(kgMBTU) for natural gas531 (CO2) 00059 (CH4)00001 (N2O) (CCRC 2011)
Impact assessment of the GIs(SC1)
SimaPro (IPCC 2007GWP 100 years)
Product Ecology Consultant(wwwprenlcontentsimapro-lca-software)
Databases used Ecoinvent v2and US Input Output
Impact assessment of the energynecessary at the WWTP to treatthe variation of runoff accruedby the GI schemes (SC1 andSC2)
SimaPro (IPCC 2007GWP 100 years)
Product Ecology Consultant(wwwprenlcontentsimapro-lca-software)
Databases used Ecoinvent v2and US Input Output
Impact assessment of theadditional grey infrastructureinstallation needed in case of noadoption of GI (SC2 and SC3)
EIO-LCA US 1997 (483) NationalPurchase Price Model consideringWater Sewer and PipelineConstruction Industry Sector
Carnegie Mellon University US 1997 (483) National PurchasePrice Model considering WaterSewer and PipelineConstruction Industry Sector
Impact assessment of the annualOampM activities of the GI (SC1)
EIO-LCA US 1997 (483) NationalPurchase Price Model consideringConstruction IndustryMaintenance and Repair ofNonresidential Buildings
Carnegie Mellon University US 1997 (483) National PurchasePrice Model consideringConstruction IndustryMaintenance and Repair ofNonresidential Buildings
Impact assessment of the annualOampM activities of the greyinfrastructure (SC2 and SC3)
EIO-LCA US 1997 (483) NationalPurchase Price Model consideringMining and Utilities IndustryWater Sewage and Other SystemsSector
Carnegie Mellon University US 1997 (483) National PurchasePrice Model consideringMining and UtilitiesIndustryWater Sewage andOther Systems Sector
Notes GI = green infrastructure WWTP = wastewater treatment plant SC = scenario CSO = combined sewer overflow kWhMgal =kilowatt-hours per million gallons Mgalday = million gallons per day ft = feet kgMWh = kilograms per megawatt-hour CO2 = carbondioxide kgMBTU = kilograms per million British thermal units CH4 = methane N2O = nitrous oxide OampM = operation and maintenance
to the green approach was estimated based on a review ofgovernment data and reports (City of New York 2010 NYCDEP 2007) Detention-based CSO control facilities (withouttreatment facilities) built or in planning across NYC cost onaverage $052 per gallon (gal) of reduced annual CSO vol-
ume with an upper bound of $070gal and a lower bound of$037gal At $052gal of reduced CSO approximately $447million would be required to construct a detention tank that canreduce annual CSOs by approximately 859 Mgal as requiredin scenario 2 Although it was not used directly in the analysis
Sousa et al Evaluating Watershed-Scale CSO Strategies with LCA 905
R E S E A R C H A N D A N A LYS I S
Table 3 Emissions (in t CO2-eq) from the three scenarios the wastewater treatment plant and the trees
Emissions (t CO2-eq)
Installation
Source Material Unit Quantity t CO2-eq kg CO2-equnit Annual andor OampM Over 50 years
Scenario 1 Concrete m3 32000 8400 260Excavation m3 180000 97 054Bark mulch t 500 300 600Geotextile m2 420000 2700 64HDPE kg 200000 490 25PVC kg 16000 50 31Transport truck t-km 80000000 8500 011Transport rail t-km 82000 4 005Total 20000 300 19000
Scenario 2 31500 1050 85000Scenario 3 100000 5840 400000WWTP 70 3500Trees Variable minus25643
Notes t CO2-eq = metric tons of carbon dioxide equivalent kg CO2-equnit = kilograms of carbon dioxide equivalent per unit m3 = cubic meterst = metric ton m2 = square meters t-km = metric ton kilometers HDPE = high-density polyethylene PVC = polyvinyl chloride WWTP = wastewatertreatment plant
the actual volume of this tank can be estimated using a recentreport citing the construction costs of CSO tanks of differentvolumes (NY Newsday 2004) Assuming that it costs on aver-age $1305gal of tank storage the detention tank assumed inscenario 2 would have the capacity to store approximately 32Mgal (0012 Mm3)
The cost to construct scenario 3 includes the cost of a deten-tion tank accompanied by a physical and chemical treatmentfacility Also per the NYC DEP (2007) and City of New York(2010) CSO control facilities with detention and treatmentbuilt or in planning across NYC cost on average $175gal ofreduced annual CSO volume with an upper bound of $245galand a lower bound of $105gal Using the average value thecost of this facility would be $150 million Again although thevolume of this facility is not utilized in the analysis presented inthis article it could be assumed that the detention tanks wouldhave a similar storage capacity to the one considered in scenario2 with the residual extra cost associated with its physical andchemical treatment operations
Step 3 Estimation of the Infrastructure Operation andMaintenance CostsThe OampM costs of the infrastructure considered in each
of the three scenarios were also estimated from the literatureFor scenario 1 OampM costs were defined separately for eachGI typology based on average literature costs converted into2011 US dollars (Table 4) The annual OampM cost assumedfor porous concrete was $013 per square foot (ft2)4 and assumesbiannual sweeping high-pressure jet washing and replacementof 1 of the area (Tackett 2011 US EPA 2005) The OampMcosts of bioretention bump-outs curbside infiltration plantersand backyard rain gardens were assumed to be identical A totalof $114ft2 (US EPA 2005) would cover repair of eroded areasremoval and replacement of all dead and diseased vegetation
mulching of void areas irrigation of vegetated areas (biannualor as needed) and removal of mulch and application of a newlayer (annual) The annual OampM costs of the subgrade cisternwere derived from studies on Stormchambers (Stormchamber2011 UNHSC 2009) For $002ft2 of Stormchamber bottomthese facilities could be vacuum cleaned twice a year (or asneeded)
The OampM costs associated with the detention tank in sce-nario 2 were assumed to be on average 14 of the constructioncosts or the average of all literature values excluding the ex-treme highest and lowest values The upper end of possibleOampM costs was 2 of the construction costs and the lower endwas 08 (City of Akron 1999 Montalto et al 2007)
Specific OampM activities related to large detention tanksinclude odor control and ventilation removal and disposal ofaccumulated residual sludge and solids (Zukovs and Marsalek2004) and inlet andor outlet pumping (US EPA 2007)
According to the US EPA (1999a) and the Detroit Waterand Sewerage Department (DWSD 2003) the OampM costs ofdetention tanks that include physical and chemical treatmentoperations are 104 to 36 of the construction costs TheOampM costs for scenario 3 were thus estimated at 23 (averageof the literature values excluding the extreme highest and lowestvalues) of the construction costs According to the DWSD(2003) OampM activities for this type of facility include chemicalacquisition costs preventative maintenance costs energy costsand sludge disposal
Step 4 Estimation of the Energy Variation at the Waste-water Treatment Plant in Scenarios 1 and 2Because scenarios 1 and 2 alter the volume of water that is
conveyed to the Hunts Point WWTP the difference in energyat the WWTP over the ldquodo nothingrdquo case had to be com-puted (As stated earlier scenario 3 does not alter the volume
906 Journal of Industrial Ecology
R E S E A R C H A N D A N A LYS I S
Table 4 Installation and OampM costs for green-infrastructures summary
GI element Construction costs Data source OampM cost (annual) Data source
Porous pavement $250ndash$830ft2 (2006) Montalto et al (2007) 1ndash2 of construction costs CRI (2005) NCGBT(2003) US EPA(1999b)
$109ndash$218ft2 EPA (2005) $016ft2 EPA (2005)$2ndash$3ft2 EPA (2003)$26ft2 Tackett (2011) $006ft2 Tackett (2011)$4ndash$5ft2 UNHSC (2009) $0008ft2 UNHSC (2009)$710ft2 CNT (2009)
Subgrade cistern $078ft2 of mitigatedimpervious area($34000acre)
UNHSC (2009) $0008ft2 (twice a year)$0016ft2
UNHSC (2009)
Backyard raingarden
$13ndash$14ft2 Bannerman (2003) 2ndash8 EPA (2005) Flinker(2005) CRWA (2008)
$540ft2 of the mitigatedimpervious area
Tackett (2011) $011ft2 of the mitigatedimpervious area
Tackett (2011)
$041ft2 $18000acre ofmitigated impervious area
UNHSC (2009)
$9ndash3200ft2 CNT (2009)
of flow conveyed to the WWTP over the baseline conditions)For scenarios 1 and 2 the energy consumed was estimated bymultiplying the annual volume of flow to the plant by an esti-mate of the unit electricity consumption for wastewater treat-ment plants with the capacity to treat more than 100 Mgalday(eg 1188 kilowatt-hours per millions gallons [kWhMgal])published by the Electric Power Research Institute (EPRI2002)
Step 5 Estimation of the Carbon Sequestration and Car-bon Dioxide Reductions Due the Energy Savings in theBuildings by the TreesThe new trees sequester carbon and their canopies reduce
building energy consumption These benefits were estimated us-ing the Tree Carbon Calculator (CTCC) a ldquoproof of conceptrdquotool developed by the Center for Urban Forest Research at theUS Forest Service and approved by the Climate Action Re-serversquos Urban Forest Project Protocol for tree planting projects(CCRC 2011) The CTCC provides carbon-related informa-tion for individual trees located in any of the United Statesrsquo 16different climate zones The tool was developed based on sizeand growth data derived from a database of 650 to 1000 streettrees representative of about 20 predominant species in each ofthe 16 different reference cities (CCRC 2011) Among otheroutputs CTCC quantifies annual CO2 sequestered as well asreductions in CO2 emissions due to building energy savings
Trees reduce building energy consumption by providingshade (reducing air conditioning needs) but also by blockingwind Reduced wind speeds result in less infiltration of cold airinto buildings during the winter months limiting conductiveheat loss and reducing the need for heating (Heisler 1986 Peperet al 2007 Simpson and McPherson 1998) Heisler (1986) re-
ported that trees can reduce wind speed and resulting air infil-tration by up to 50 translating into potential annual heatingsavings of 25 Simpson and McPherson (1998) simulated thetree impacts in wind speed reduction on residential energy useand found an annual energy decrease of 25 per tree in Sacra-mento CA USA
CTCC uses a biomass equation derived from measurementsmade on trees planted in urban areas to estimate the total CO2
stored and sequestrated by different species The shading andwind-blocking benefits of trees on building energy consumptionconsidered in the CTCC are derived from computer simula-tions that were conducted in reference cities located in eachof the US climate zones using distinct combinations of treesizes building types building ages and types of heatingcoolingequipment and locations following methods defined by McPher-son and Simpson (1999) These simulations estimated the an-nual building energy use per residential unit and on a per treebasis by comparing results before and after adding the trees(CCRC 2011) The results in terms of reduced building energyconsumption are sensitive to the position of the trees relativeto the building
Although an exhaustive study of the spatial orientation ofthe future canopy in this study area was not within the scopeof this study a sensitivity analysis was performed to test theimportance of tree orientation on the results This analysis al-ternatively placed all the trees to the south (yielding the leastenergy savings) to the north (yielding the most energy savings)and to the west and the southwest (yielding average energy sav-ings) of the buildings
It was assumed that 2065 pin oak trees were installed duringthe first year of the GI program in equal proportions in eachof the vegetated GI facilities (eg the street-end bioretention
Sousa et al Evaluating Watershed-Scale CSO Strategies with LCA 907
R E S E A R C H A N D A N A LYS I S
bump-out facilities curbside infiltration planters and backyardrain gardens)
The base analysis assumes all of the trees were planted onthe southwest side of a building (with the other orientationsconsidered only in the sensitivity analysis) Other assumptionsadopted for this coarse analysis were
bull US climate zone northeastbull Tree life span 50 yearsbull Building vintage 1950ndash1980bull Tree distance from the buildings 20 to 40 feet (ft)bull Buildings air conditioning equipment wallwindowbull Buildings heating equipment natural gasbull Electricity emissions factors (kilograms per megawatt hour
[kgMWh]) for Queens NY USA 4672 (CO2) 00030(methane [CH4]) and 00001 (nitrous oxide [N2O])(CCRC 2011)
bull Heating emissions factors (kilograms per million Britishthermal units [kgMBTU]) for natural gas 531 (CO2)00059 (CH4) and 00001 (N2O) (CCRC 2011)
Step 6 Energy and Greenhouse Gas Life Cycle ImpactsIn order to compare the environmental performance of the
three different scenarios three different sets of impacts were as-sembled Scenario 1 includes the impacts associated with con-structing operating and maintaining the GI as well as treatingthe increase in flow to the WWTP As described earlier theseemissions are mitigated partially by CO2 sequestration by thevegetation and the reduced building energy loads associatedwith shading and wind blocking For scenario 2 there are im-pacts associated with constructing operating and maintainingthe detention tank and also treating the increase in flow tothe treatment plant over the ldquodo nothingrdquo case (ie the totalvolume of overflows in the base condition is assumed to be de-tained for later conveyance to the WWTP increasing annualtreated flow) The impacts associated with scenario 3 includeconstruction and OampM of the new detention tanktreatmentoperations and no change in flow to the treatment plant (iethe total volume of existing overflows is assumed to be treatedin the new end-of-pipe facility and discharged directly to theriver at that location)
From the LCI we estimated global warming potential(GWP) using characterization factors from the Intergovern-mental Panel on Climate Change (IPCC 2007) that convertair emissions to carbon dioxide equivalents (CO2-eq)
The EIO-LCA model was used to estimate the GWP associ-ated with the construction activities for scenarios 2 and 3 andOampM activities for all three scenarios The US 1997 (483)National Purchase Price Model was selected using ldquoConstruc-tion IndustryWater Sewer and Pipeline Construction Sectorrdquoto represent construction activities in scenarios 2 and 3 ldquoMin-ing and Utilities IndustryWater Sewage and Other SystemsSectorrdquo was used to represent the OampM activities of scenarios 2and 3 and ldquoConstruction IndustryMaintenance and Repair ofNonresidential Buildings Sectorrdquo was used to represent OampMactivities associated with scenario 1
The annual net GWP emissions of the three scenarios iscomputed as follows
GWPSC1 = I1 + OampM1 + WWTP minus Trees (1)
GWPSC2 = I2 + OampM2 + WWTP (2)
GWPSC3 = I3 + OampM3 (3)
where I1 I2 and I3 represent the emissions associated with ini-tial construction activities for scenarios 1 2 and 3 respectivelyand are incurred only during year 1 OampM1 OampM2 and OampM3
are the cumulative OampM emissions associated with each of thethree different scenarios WWTP is the cumulative new emis-sions associated with energy consumption at the WWTP andTrees refers to the reduced GWP achieved through carbon se-questration and building energy savings due to shading andwind blockage by the trees
Results and Discussion
Installation of the GI in scenario 1 emitted 20000 t CO2-eq compared with 31500 t CO2-eq for the detention tank inscenario 2 and 100000 t CO2-eq for the tank and treatmentfacilities in scenario 3 (Figure 2) These results indicate that interms of initial emissions scenario 1 yielded superior environ-mental performance when compared with the grey infrastruc-ture options Of the total emissions associated with constructionof the GI the greatest contributions came from transportation(8500 t CO2-eq) followed by cement manufacturing and con-crete (8400 t CO2-eq) (Figure 2)
The annual net emissions for OampM for scenario 1 werealso significantly lower than those incurred in scenarios 2 and3 with significant cumulative effects over the 50-year studyperiod Cumulatively scenario 1 is expected to release 19000t CO2-eq compared with 85000 t CO2-eq for scenario 2 and400000 t CO2-eq for scenario 3 (Figure 3) The cumulativeOampM emissions associated with scenarios 2 and 3 amountedto 170 (scenario 2) and 300 (scenario 3) of their year 1construction emissions after 50 years of operation comparedwith the cumulative OampM emissions of scenario 1 which onlyincreased by 75 over its initial emissions
It is noteworthy that the carbon sequestration and savingsin energy accrued by the trees were a key part of the net annualemissions associated with the GI in scenario 1 By year 25 thetrees had grown sufficiently to completely mitigate the emissionsassociated with the total annual OampM emissions for all of theGI facilities After year 25 the reduction in emissions associatedwith the trees exceeds the annual emissions associated with allscenario 1 OampM activities providing negative loads
Another significant finding was the significant difference inemissions between the two grey scenarios (2 and 3) Over 50years scenario 2 releases 100000 t CO2-eq whereas scenario3 generates this quantity of emissions during initial construc-tion activities alone arriving at almost 400000 t CO2-eq incumulative emissions after 50 years
908 Journal of Industrial Ecology
R E S E A R C H A N D A N A LYS I S
Figure 2 Cradle-to-green infrastructure (GI) installation global warming potential (GWP) for three infrastructure scenarios Note Thefigure shows the dominant input contributions toward GWP from the process and economic input-output (EIO) models The ldquootherrdquocategory includes aggregated EIO sector inputs including primary aluminum production and lime production
Sensitivity Analyses
Two sensitivity analyses were performed to examine whetherthe findings hold up if the uncertain data sets used in the analysiswere allowed to vary within the full range of possible values Thefirst sensitivity analysis varied the emissions associated with theconstruction and OampM activities for each of the three scenariosThe second sensitivity analysis focused on the position of thetrees relative to buildings Each of these analyses is describedbelow
Sensitivity Analysis 1To consider the full range of possible emissions associated
with construction and OampM activities implied by each sce-
nario first the upper and lower bound on the emissions asso-ciated with initial construction needed to be computed Forscenarios 2 and 3 the original analysis used the average cost pergallon of annual CSO reduction as gleaned from the literatureIn the sensitivity analysis the upper and lower bounds of thedetention tank costs in scenario 2 were set at $070 and $037respectively For scenario 3 the upper and lower bounds of thedetentiontreatment facility costs were $245 and $105 respec-tively The same procedure could not be applied for scenario1 because the emissions were computed based on unit materialand transportation costs Instead the upper and lower boundsof emissions associated with GI installation were assumed to bethe average of the variance of the literature values for scenarios
Figure 3 Emissions over 50 years according to the different scenarios
Sousa et al Evaluating Watershed-Scale CSO Strategies with LCA 909
R E S E A R C H A N D A N A LYS I S
2 and 3 expressed as a percentage of the average value used inthe initial analysis
The next step was to compute the upper and lower boundsof the annual OampM costs The upper and lower bounds forscenario 1 were based on the values found in the literatureSince the OampM costs for scenarios 2 and 3 were expressed asranges of percentages of the installation costs these percentageswere applied to the upper and lower bounds of the installationcosts as computed per the above For example the lower boundwas found by multiplying the lower bound of the OampM costpercentages (08 for scenario 2 104 for scenario 3) by the
lower bound of the installation costs ($037gal for scenario2 $105gal for scenario 3) These products were used in theEIO-LCA model to derive the corresponding extreme emissionspossibilities The same approach was used to calculate the upperbounds
The results of the first sensitivity analysis are shown inFigure 4a There was very little overlap between the emis-sions envelopes associated with the range of possible emis-sions associated with the three different scenarios Hence thefirst sensitivity analysis reinforces the original findings namelythat the GI approach featured in scenario 1 is environmentally
Figure 4 Sensitivity analyses (a) Sensitivity analysis of the emissions over 50 years from the installation and operation and maintenance(OampM) activities of scenarios 1 2 and 3 Note The dashed line represents the base case results of the scenarios emissions (b) Sensitivityanalysis of the tree benefits considering the treesrsquo location north southwest west or south face of the building Note The dashed linerepresents just the carbon dioxide (CO2) sequestration provided by the trees over 50 years
910 Journal of Industrial Ecology
R E S E A R C H A N D A N A LYS I S
preferable to the grey approaches included in scenarios 2 and 3for the metrics studied
Sensitivity Analysis 2Regarding the avoided CO2 emissions associated with the
impact of trees on building energy consumption a second sen-sitive analysis was conducted to consider the effect of differ-ent positions of the trees relative to the buildings The entire50-year analysis was repeated four times with the trees alterna-tively positioned to the south (least expected energy savings)the north (most expected energy savings) the west and thesouthwest (average expected energy savings) of the buildings
It is noteworthy that the carbon sequestered by the treesdoes not vary with the position and represents 11227 t CO2-eq over 50 years The avoided CO2 emissions through buildingenergy savings provided by the trees ranged from 1614 t CO2-eq(south) to 14416 t CO2-eq (north) which when added to theCO2 sequestered (11227 t CO2-eq) resulted in from 12841 tCO2-eq (south) to 25643 t CO2-eq (north) of mitigated GWPemissions The results of this sensitivity analysis are shown inFigure 4b and indicate that the energy benefits provided by thetrees are a significant fraction of the total of CO2 emissionsdecrease provided by the trees but only when the trees are notplanted to the south
Conclusion
This research used LCA methods to compare the environ-mental performance of three different approaches to reducingCSOs to the Bronx River NYC To our knowledge this studywas the first attempt to apply LCA methods at this scale andin this application While all three scenarios were scaled toreduce CSOs equivalently they required different construc-tion and OampM activities and in the cases of scenarios 1 and2 would also engender changes in the volume of annual flowto the regional WWTP When the GHG emissions associatedwith construction operation and maintenance are accountedfor the CSO abatement strategy represented by scenario 1which treats runoff from approximately one-third of the to-tal drainage area in decentralized green infrastructure facilitiesthat collectively amount to an area that is approximately 5of the total drainage area results in significantly better envi-ronmental performance than the end-of-pipe detention or thecombined detention and treatment strategies Both in terms ofthe emissions during initial construction and the cumulativenet emissions released over the first 50 years of operation thegreen infrastructure approach results in fewer emissions thaneither of the two grey approaches
This kind of analysis is limited by the availability of the req-uisite data sets Two sensitivity analyses varied the emissionsassociated with construction operation and maintenance ac-tivities and also the placement of the trees These analysesfurther reinforce the original conclusion that is that the fullrange of possible emissions associated with the green approach
will be significantly lower than those associated with the twogrey strategies
By conservatively assuming that the new GI would includeonly about 2000 new pin oak trees and no understory thecarbon sequestered and shading provided by the trees is firstable to fully offset the annual OampM emissions during year 25Further tree growth after year 25 exceeds the annual emissionsand begins to ldquopay backrdquo the emissions associated with initialconstruction of the GI network However this portion of theanalysis should be validated with actual studies documentingthe growth rates canopy configurations carbon sequestrationshading and wind protection provided by urban trees as wellas similar studies on other types of vegetation (shrubs grassesflowers etc) commonly planted in urban GI systems Very fewsuch studies have been performed to date
It should also be noted that this study did not quantifythe GHG emissions associated with other potential services(eg reduced pavement temperatures improved air qualityenhanced habitat etc) and disservices (eg increased street-sweeping requirements enhanced flooding potential etc) thatcould be brought about by watershed-scale implementation ofGI Additional research is needed to establish the relative im-portance of such factors in determining environmental perfor-mance Additional work is also needed to inventory the con-struction and OampM activities and costs associated with greenand grey CSO abatement strategies for which published datasets are currently quite limited Finally given all of the spatialinfrastructural economic social and other constraints presentin twenty-first-century cities the level of penetration that greeninfrastructure technologies will actually have in urban water-sheds still remains to be seen Nonetheless this study suggeststhat watershed managers who seek to reduce CSOs and reducemunicipal carbon footprints should opt for a green approachover a grey one
Acknowledgements
The authors are grateful to Nandan Shetty from the NewYork City Department of Parks and Recreation Sri Rangarajanand Chenchen Li from HDR Tracy Tackett from Seattle PublicUtilities Alan Cohn from the New York City Department ofEnvironmental Protection and Alisha Goldstein all of whomassisted in identifying different data sets used in this project
Notes
1 One gallon (gal) asymp 379 liters (L) so 200 million gallons per day(Mgalday) asymp 758 million liters per day (MLday)
2 One hectare (ha) = 001 square kilometers (km2 SI) asymp 000386square miles (mi2) asymp 247 acres
3 One gallon asymp 0003785 cubic meters (m3) so 3712 million gallonsper year (Mgalyr) is equivalent to 014 million cubic meters peryear (Mm3yr)
4 One square foot (ft2) = 0093 square meters (m2)
Sousa et al Evaluating Watershed-Scale CSO Strategies with LCA 911
R E S E A R C H A N D A N A LYS I S
References
Adam D 2007 The unheralded polluter Cement industry comes cleanon its impact The Guardian [Brussels] 12 October
Bannerman R 2003 Rain gardens A how-to manual for homeownersPUB-WT-776 Madison WI USA Wisconsin Department ofNatural Resources
Baumann H and A M Tillman 2004 The hitch hikerrsquos guide to LCALund Sweden Studentlitteratur AB
Bilec M M R J Ries and H S Matthews 2010 Life-cycle assess-ment modeling of construction processes for buildings Journal ofInfrastructure Systems 16(3) 199ndash205 httpascelibraryorgisoresource1jitse4v16i3p199_s1 Accessed 6 December 2011
Blackhurst M C T Hendrickson and H S Matthews 2010 Cost-effectiveness of green roofs Journal of Architectural Engineering16(4) 136ndash143
Brehm D 2007 Nanoengineered concrete could cut carbon diox-ide emissions MITNEWS 14 February 2007 httpwebmitedunewsoffice2007concretehtml Accessed 1 December 2011
CCRC (Center for Urban Forest Research) 2011 The Center forUrban Forest Research tree carbon calculator wwwfsfedusccrctopicsurban-forestsctcc Accessed 7 August 2011
City of Akron 1999 Facilities plan rsquo98 Akron OH USA wwwciakronohusCSOFP98FI1PDF Accessed 5 August 2011
City of New York 2010 NYC green infrastructure plan A sustainablestrategy for clean waterways City of New York NY USAwwwnycgovhtmldeppdfgreen_infrastructureNYCGreenIn-frastructurePlan_HighRespdf Accessed 15 April 2011
CNT (Center for Neighborhood Technology) 2009 Greenvalues calculator benefit details httpgreenvaluescntorgnationalbenefits detailphpreduced-treatment Accessed 12June 2011
CRI (Conservation Research Institute) 2005 Changing cost percep-tions An analysis of conservation development wwwcdfinccomCDF_ResourcesCost20Analysis20-20Part20120-20Report20-20with20Exec20Summarypdf Accessed5 August 2011
CRWA (Charles River Watershed Association) 2008 Blackstonetown hall demonstration project Evaluation of low impact de-velopment (LID) best management practices (BMPs) opportu-nities wwwcrwaorgprojectsblackstonelid evaluationpdf Ac-cessed 10 June 2011
DWSD (Detroit Water and Sewerage Department) 2003 Wastewatermaster plan DWSD project no CS-1314 Technical feasibility ofa wet weather flow treatment facility Detroit MI USA DWSD
EPRI (Electric Power Research Institute) 2002 Water and sus-tainability (Volume 4) US electricity consumption for watersupply and treatmentmdashThe next half century wwwcircleofblueorgwaternewswp-contentuploads201008EPRI-Volume-4pdfAccessed 19 April 2011
Flinker P 2005 Green rooftop systems In Urban environmentaldesign manual Providence RI USA Rhode Island Depart-ment of Environmental Management wwwdemrigovprogramsbpoladmsuswshedpubshtm Accessed 5 June 2011
Goldstein A 2011 Comparison of a high and low spatial resolutionmodel for an urban block and implications for depicting low im-pact development Masterrsquos thesis Drexel University Philadel-phia PA USA
Goldstein A and F A Montalto 2012 Comparison of a high and lowspatial resolution model for an urban block Journal of HydrologicEngineering Submitted for publication
Green Design Institute 2011 Economic input-output life cycle assess-ment wwweiolcanet Accessed 20 May 2011
Heisler G M 1986 Energy savings with trees Journal of Arboriculture12(5) 113ndash125
Hendrickson C T L B Lave and H S Matthews 2006 Environ-mental life cycle assessment of goods and services Washington DCUSA Resources for the Future
Hendriks C A E Worrell D de Jager K Blok and P Rieme 2004Emission reduction of greenhouse gases from the cement industryPaper presented at the Greenhouse Gas Control TechnologiesConference 5 September Vancouver BC Canada
Herstein Y R Filion and K R Hall 2009 Evaluating environmentalimpact in water distribution system design Journal of InfrastructureSystems 15(3) 241ndash250
IPCC 2007 Intergovernmental panel on climate change In Climatechange 2007 The physical science basis Contribution of workinggroup I to the fourth assessment report of the intergovernmentalpanel on climate change edited by S Solomon et al CambridgeCambridge University Press
ISO (International Organization for Standardization) 2006 ISO14044 Environmental management mdash Life cycle assessment mdash Re-quirements and guidelines Geneva Switzerland ISO
Kloss C Personal communication with Christopher Kloss GreenInfrastructure Coordinator US Environmental ProtectionAgency Office of Water 12 January 2012
Kosareo L and R Reis 2007 Comparative environmental life cycleassessment of green roofs Building and Environment 42(11) 2606ndash2613
Li C and S Rangarajan 2011 Technical Memorandum on Up-scalingof Drexel Universityrsquos Pilot Project to HP-009 Drainage AreaMahwah NJ HDR|HydroQual
MacMullan E and S Reich 2007 The economics of low-impact devel-opment A literature review Eugene OR USA ECONorthwest
Martin J 2011 Personal communication with Jeff Martin landscapearchitect New York City Department of Parks and Recreation14 April 2011
McPherson E G and J R Simpson 1999 Carbon dioxide reductionsthrough urban forestry Guidelines for professional and volun-teer tree planters General Technical Report PSW-171 AlbanyCA USDA Forest Service Pacific Southwest Research Station237 wwwfsfeduspswprogramsuesduepproductscufr_43pdfAccessed 6 December 2011
Montalto F C Behr K Alfredo M Wolf M Arye and M Walsh2007 Rapid assessment of the cost-effectiveness of low impact de-velopment for CSO control Landscape and Urban Planning 82(3)117ndash131
NCGBT (North Carolina Green Building Technology Database)2003 Pervious paving details for Chadbourn Street Townof Wrightsville Beach January 2 2006 httpwwwncgreenbuildingorgsitencgpublictechsearchresultscfmprojectid=93ampcategory=6ampparameter=98ampclicked=true Accessed August 102011
NYNewsday 2004 wwwnewsdaycomnewsnew-pact-stirs-up-old-stink-1650186 Accessed 10 July 2011
NYC DEP (New York City Department of Environmen-tal Protection) 2007 Flushing Bay waterbodywatershedfacility plan wwwhydroqualcomProjectsltcpwbwsflushing_bayflushing_bay_section_7pdf Accessed 20 July 2011
NYC DEP (New York City Department of Environmental Protec-tion) 2011 New York Cityrsquos wastewater treatment systemwwwnycgovhtmldeppdfwwsystempdf Accessed 21 July 2011
912 Journal of Industrial Ecology
R E S E A R C H A N D A N A LYS I S
Peper P J E G McPherson J R Simpson S L Gardner K E Vargasand Q Xiao 2007 New York City New York municipal forestresource analysis Technical Report Davis CA USA Center forUrban Forest Research
PRe Consultants 2007 SimaPro 71 LCA software Amersfoort theNetherlands
PWD (Philadelphia Water Department) 2009 Philadelphia com-bined sewer overflow long term control plan update wwwphillywatershedsorgltcpuVol02_TBLpdf Accessed 20 August 2011
Racoviceanu A I B W Karney C A Kennedy and A F Colombo2007 Life-cycle energy use and greenhouse gas emissions inven-tory for water treatment systems Journal of Infrastructure Systems13(4) 261ndash270
Saiz S C Kennedy B Bass and K Pressnail 2006 Comparativelife cycle assessment of standard and green roofs EnvironmentalScience and Technology 40(13) 4312ndash4316
Sharrard A L 2007 Greening construction processes using an input-output-based hybrid life cycle assessment model PhD thesisCarnegie Mellon University Pittsburgh PA USA
Shetty N 2011 Personal communication with N Shetty New YorkCity Department of Parks and Recreation 10 April 2011
Simpson J R and E G McPherson 1998 Simulation of tree shadeimpacts on residential energy use for space conditioning in Sacra-mento Atmospheric Environment Urban Atmospheres 32(1) 69ndash74
Spatari S Z Yu and F A Montalto 2011 Life cycle implicationsof urban green infrastructure Environmental Pollution 159(8ndash9)2174ndash2179
Stokes J R and A Horvath 2010 Supply-chain environ-mental effects of wastewater utilities Environmental ResearchLetters 5(2010) 014015 DOI 1010881748-932651014015httpiopscienceioporg1748-932651014015 Accessed 5 De-cember 2011
Stormchamber 2011 Stormchamber design manual wwwstormchamberscompdfStormChamberDesignManualpdf Accessed 7July 2011
Suh S M Lenzen G J Treloar H Hondo A Horvath G Huppes OJolliet U Klann W Krewitt Y Moriguchi J Munksgaard andG Norris 2004 System boundary selection in life-cycle invento-ries using hybrid approaches Environmental Science amp Technology38(3) 657ndash664
Tackett T 2011 Personal communication with Tracy Tackett LID
Program Manager Urban Watersheds Division Seattle PublicUtilities Seattle WA USA 10 August 2011
UNHSC (University of New Hampshire Stormwater Center) 2009Biannual report Durham NH USA
US EPA (US Environmental Protection Agency) 1999a Combinedsewer overflow management fact sheet Retention basins EPA832-F99-042 US EPA Office of Water Washington DC USA
US EPA (US Environmental Protection Agency) 1999b Stormwa-ter technology fact sheet Porous pavement httpwwwepagovowmmtbporouspapdf Accessed 1 August 2011
US EPA (US Environmental Protection Agency) 2005 Nationalmanagement measures to control nonpoint source pollution from urbanareas Washington DC USA US EPA
US EPA (US Environmental Protection Agency) 2007 Re-ducing stormwater costs through low impact development(LID) strategies and practices December 2007 wwwepagovowowNPSlidcosts07documentsreducingstormwatercostspdfAccessed 19 June 2011
US EPA (US Environmental Protection Agency) 2011 Storm wa-ter management model (SWMM) httpwwwepagovathenswwqtschtmlswmmhtml Accessed 18 May 2011
Wakeley H L C T Hendrickson W M Griffin and H SMatthews 2009 Economic and environmental transportation ef-fects of large-scale ethanol production and distribution in theUnited States Environmental Science amp Technology 43(7) 2228ndash2233
Wise S J Braden D Ghalayini J Grant C Kloss E MacMullan SMorse F Montalto D Nees D Nowak S Peck S Shaikh andC Yu Integrating valuation methods to recognize green infras-tructurersquos multiple benefits wwwcntorgrepositoryCNT-LID-paperpdf Accessed 20 May 2011
Zukovs G and J Marsalek 2004 Planning and design combined seweroverflow treatment Water Quality Research Journal of Canada39(4)439ndash448
About the Authors
Maria R C De Sousa is a PhD student and Franco Mon-talto and Sabrina Spatari are assistant professors in the Depart-ment of Civil Architectural and Environmental Engineeringat Drexel University Philadelphia PA USA
Sousa et al Evaluating Watershed-Scale CSO Strategies with LCA 913
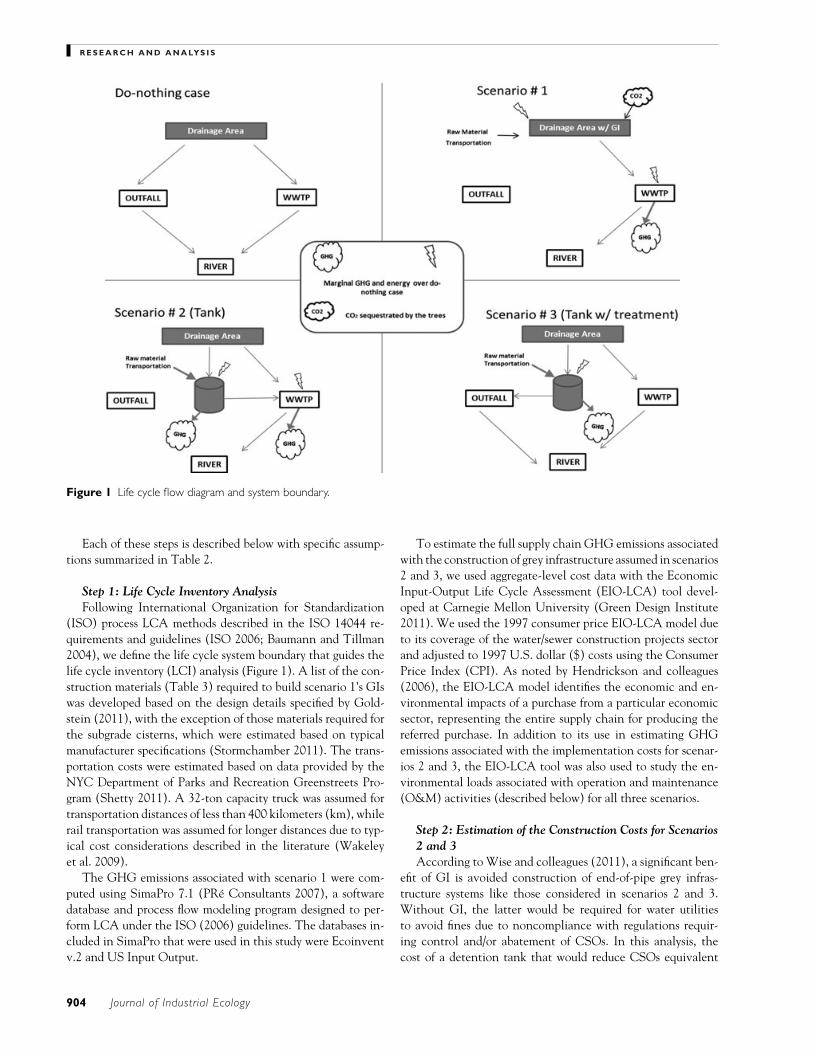
R E S E A R C H A N D A N A LYS I S
Figure 1 Life cycle flow diagram and system boundary
Each of these steps is described below with specific assump-tions summarized in Table 2
Step 1 Life Cycle Inventory AnalysisFollowing International Organization for Standardization
(ISO) process LCA methods described in the ISO 14044 re-quirements and guidelines (ISO 2006 Baumann and Tillman2004) we define the life cycle system boundary that guides thelife cycle inventory (LCI) analysis (Figure 1) A list of the con-struction materials (Table 3) required to build scenario 1rsquos GIswas developed based on the design details specified by Gold-stein (2011) with the exception of those materials required forthe subgrade cisterns which were estimated based on typicalmanufacturer specifications (Stormchamber 2011) The trans-portation costs were estimated based on data provided by theNYC Department of Parks and Recreation Greenstreets Pro-gram (Shetty 2011) A 32-ton capacity truck was assumed fortransportation distances of less than 400 kilometers (km) whilerail transportation was assumed for longer distances due to typ-ical cost considerations described in the literature (Wakeleyet al 2009)
The GHG emissions associated with scenario 1 were com-puted using SimaPro 71 (PRe Consultants 2007) a softwaredatabase and process flow modeling program designed to per-form LCA under the ISO (2006) guidelines The databases in-cluded in SimaPro that were used in this study were Ecoinventv2 and US Input Output
To estimate the full supply chain GHG emissions associatedwith the construction of grey infrastructure assumed in scenarios2 and 3 we used aggregate-level cost data with the EconomicInput-Output Life Cycle Assessment (EIO-LCA) tool devel-oped at Carnegie Mellon University (Green Design Institute2011) We used the 1997 consumer price EIO-LCA model dueto its coverage of the watersewer construction projects sectorand adjusted to 1997 US dollar ($) costs using the ConsumerPrice Index (CPI) As noted by Hendrickson and colleagues(2006) the EIO-LCA model identifies the economic and en-vironmental impacts of a purchase from a particular economicsector representing the entire supply chain for producing thereferred purchase In addition to its use in estimating GHGemissions associated with the implementation costs for scenar-ios 2 and 3 the EIO-LCA tool was also used to study the en-vironmental loads associated with operation and maintenance(OampM) activities (described below) for all three scenarios
Step 2 Estimation of the Construction Costs for Scenarios2 and 3According to Wise and colleagues (2011) a significant ben-
efit of GI is avoided construction of end-of-pipe grey infras-tructure systems like those considered in scenarios 2 and 3Without GI the latter would be required for water utilitiesto avoid fines due to noncompliance with regulations requir-ing control andor abatement of CSOs In this analysis thecost of a detention tank that would reduce CSOs equivalent
904 Journal of Industrial Ecology
R E S E A R C H A N D A N A LYS I S
Table 2 Employed methods and respective assumptions
Step Methodtool Data source Assumptions
Inventory analysis of the GIs SimaPro Hydrologic StormchamberManual calculations basedon Goldstein (2011) design
32-ton capacity truck was used forthe transportation distancesunder 400 km and railtransportation for greaterdistances (Wakeley et al 2009)
Estimation of the changes instormwater flow to the WWTPand CSO volume incurred bythe adopted GI scheme
EPA-SWMM version 50021 Goldstein (2011) 1988 JFK Airport station rainfalldata
Estimation of the change in energyconsumption at the WWTPassociated with the differencesin the amount of runoff treated
1188 kWhMgal treated EPRI (2002) 100 Mgalday WWTPconsidering advancedtreatment
Estimation of the carbonsequestration by the trees andother vegetation implied by theGI (SC1)
Center for Urban Forest ResearchTree Carbon Calculator (CTCC)
Center for Urban ForestResearch(wwwfsfedusccrctopicsurban-forests)
US climate zone northeast treelife span 50 years buildingvintage 1950ndash1980 treedistance from the buildings20ndash40 ft building airconditioning equipmentwallwindow building heatingequipment natural gaselectricity emissions factors(kgMWh) for Queens NYUSA 4672 (CO2) 00030heating emissions factor(kgMBTU) for natural gas531 (CO2) 00059 (CH4)00001 (N2O) (CCRC 2011)
Impact assessment of the GIs(SC1)
SimaPro (IPCC 2007GWP 100 years)
Product Ecology Consultant(wwwprenlcontentsimapro-lca-software)
Databases used Ecoinvent v2and US Input Output
Impact assessment of the energynecessary at the WWTP to treatthe variation of runoff accruedby the GI schemes (SC1 andSC2)
SimaPro (IPCC 2007GWP 100 years)
Product Ecology Consultant(wwwprenlcontentsimapro-lca-software)
Databases used Ecoinvent v2and US Input Output
Impact assessment of theadditional grey infrastructureinstallation needed in case of noadoption of GI (SC2 and SC3)
EIO-LCA US 1997 (483) NationalPurchase Price Model consideringWater Sewer and PipelineConstruction Industry Sector
Carnegie Mellon University US 1997 (483) National PurchasePrice Model considering WaterSewer and PipelineConstruction Industry Sector
Impact assessment of the annualOampM activities of the GI (SC1)
EIO-LCA US 1997 (483) NationalPurchase Price Model consideringConstruction IndustryMaintenance and Repair ofNonresidential Buildings
Carnegie Mellon University US 1997 (483) National PurchasePrice Model consideringConstruction IndustryMaintenance and Repair ofNonresidential Buildings
Impact assessment of the annualOampM activities of the greyinfrastructure (SC2 and SC3)
EIO-LCA US 1997 (483) NationalPurchase Price Model consideringMining and Utilities IndustryWater Sewage and Other SystemsSector
Carnegie Mellon University US 1997 (483) National PurchasePrice Model consideringMining and UtilitiesIndustryWater Sewage andOther Systems Sector
Notes GI = green infrastructure WWTP = wastewater treatment plant SC = scenario CSO = combined sewer overflow kWhMgal =kilowatt-hours per million gallons Mgalday = million gallons per day ft = feet kgMWh = kilograms per megawatt-hour CO2 = carbondioxide kgMBTU = kilograms per million British thermal units CH4 = methane N2O = nitrous oxide OampM = operation and maintenance
to the green approach was estimated based on a review ofgovernment data and reports (City of New York 2010 NYCDEP 2007) Detention-based CSO control facilities (withouttreatment facilities) built or in planning across NYC cost onaverage $052 per gallon (gal) of reduced annual CSO vol-
ume with an upper bound of $070gal and a lower bound of$037gal At $052gal of reduced CSO approximately $447million would be required to construct a detention tank that canreduce annual CSOs by approximately 859 Mgal as requiredin scenario 2 Although it was not used directly in the analysis
Sousa et al Evaluating Watershed-Scale CSO Strategies with LCA 905
R E S E A R C H A N D A N A LYS I S
Table 3 Emissions (in t CO2-eq) from the three scenarios the wastewater treatment plant and the trees
Emissions (t CO2-eq)
Installation
Source Material Unit Quantity t CO2-eq kg CO2-equnit Annual andor OampM Over 50 years
Scenario 1 Concrete m3 32000 8400 260Excavation m3 180000 97 054Bark mulch t 500 300 600Geotextile m2 420000 2700 64HDPE kg 200000 490 25PVC kg 16000 50 31Transport truck t-km 80000000 8500 011Transport rail t-km 82000 4 005Total 20000 300 19000
Scenario 2 31500 1050 85000Scenario 3 100000 5840 400000WWTP 70 3500Trees Variable minus25643
Notes t CO2-eq = metric tons of carbon dioxide equivalent kg CO2-equnit = kilograms of carbon dioxide equivalent per unit m3 = cubic meterst = metric ton m2 = square meters t-km = metric ton kilometers HDPE = high-density polyethylene PVC = polyvinyl chloride WWTP = wastewatertreatment plant
the actual volume of this tank can be estimated using a recentreport citing the construction costs of CSO tanks of differentvolumes (NY Newsday 2004) Assuming that it costs on aver-age $1305gal of tank storage the detention tank assumed inscenario 2 would have the capacity to store approximately 32Mgal (0012 Mm3)
The cost to construct scenario 3 includes the cost of a deten-tion tank accompanied by a physical and chemical treatmentfacility Also per the NYC DEP (2007) and City of New York(2010) CSO control facilities with detention and treatmentbuilt or in planning across NYC cost on average $175gal ofreduced annual CSO volume with an upper bound of $245galand a lower bound of $105gal Using the average value thecost of this facility would be $150 million Again although thevolume of this facility is not utilized in the analysis presented inthis article it could be assumed that the detention tanks wouldhave a similar storage capacity to the one considered in scenario2 with the residual extra cost associated with its physical andchemical treatment operations
Step 3 Estimation of the Infrastructure Operation andMaintenance CostsThe OampM costs of the infrastructure considered in each
of the three scenarios were also estimated from the literatureFor scenario 1 OampM costs were defined separately for eachGI typology based on average literature costs converted into2011 US dollars (Table 4) The annual OampM cost assumedfor porous concrete was $013 per square foot (ft2)4 and assumesbiannual sweeping high-pressure jet washing and replacementof 1 of the area (Tackett 2011 US EPA 2005) The OampMcosts of bioretention bump-outs curbside infiltration plantersand backyard rain gardens were assumed to be identical A totalof $114ft2 (US EPA 2005) would cover repair of eroded areasremoval and replacement of all dead and diseased vegetation
mulching of void areas irrigation of vegetated areas (biannualor as needed) and removal of mulch and application of a newlayer (annual) The annual OampM costs of the subgrade cisternwere derived from studies on Stormchambers (Stormchamber2011 UNHSC 2009) For $002ft2 of Stormchamber bottomthese facilities could be vacuum cleaned twice a year (or asneeded)
The OampM costs associated with the detention tank in sce-nario 2 were assumed to be on average 14 of the constructioncosts or the average of all literature values excluding the ex-treme highest and lowest values The upper end of possibleOampM costs was 2 of the construction costs and the lower endwas 08 (City of Akron 1999 Montalto et al 2007)
Specific OampM activities related to large detention tanksinclude odor control and ventilation removal and disposal ofaccumulated residual sludge and solids (Zukovs and Marsalek2004) and inlet andor outlet pumping (US EPA 2007)
According to the US EPA (1999a) and the Detroit Waterand Sewerage Department (DWSD 2003) the OampM costs ofdetention tanks that include physical and chemical treatmentoperations are 104 to 36 of the construction costs TheOampM costs for scenario 3 were thus estimated at 23 (averageof the literature values excluding the extreme highest and lowestvalues) of the construction costs According to the DWSD(2003) OampM activities for this type of facility include chemicalacquisition costs preventative maintenance costs energy costsand sludge disposal
Step 4 Estimation of the Energy Variation at the Waste-water Treatment Plant in Scenarios 1 and 2Because scenarios 1 and 2 alter the volume of water that is
conveyed to the Hunts Point WWTP the difference in energyat the WWTP over the ldquodo nothingrdquo case had to be com-puted (As stated earlier scenario 3 does not alter the volume
906 Journal of Industrial Ecology
R E S E A R C H A N D A N A LYS I S
Table 4 Installation and OampM costs for green-infrastructures summary
GI element Construction costs Data source OampM cost (annual) Data source
Porous pavement $250ndash$830ft2 (2006) Montalto et al (2007) 1ndash2 of construction costs CRI (2005) NCGBT(2003) US EPA(1999b)
$109ndash$218ft2 EPA (2005) $016ft2 EPA (2005)$2ndash$3ft2 EPA (2003)$26ft2 Tackett (2011) $006ft2 Tackett (2011)$4ndash$5ft2 UNHSC (2009) $0008ft2 UNHSC (2009)$710ft2 CNT (2009)
Subgrade cistern $078ft2 of mitigatedimpervious area($34000acre)
UNHSC (2009) $0008ft2 (twice a year)$0016ft2
UNHSC (2009)
Backyard raingarden
$13ndash$14ft2 Bannerman (2003) 2ndash8 EPA (2005) Flinker(2005) CRWA (2008)
$540ft2 of the mitigatedimpervious area
Tackett (2011) $011ft2 of the mitigatedimpervious area
Tackett (2011)
$041ft2 $18000acre ofmitigated impervious area
UNHSC (2009)
$9ndash3200ft2 CNT (2009)
of flow conveyed to the WWTP over the baseline conditions)For scenarios 1 and 2 the energy consumed was estimated bymultiplying the annual volume of flow to the plant by an esti-mate of the unit electricity consumption for wastewater treat-ment plants with the capacity to treat more than 100 Mgalday(eg 1188 kilowatt-hours per millions gallons [kWhMgal])published by the Electric Power Research Institute (EPRI2002)
Step 5 Estimation of the Carbon Sequestration and Car-bon Dioxide Reductions Due the Energy Savings in theBuildings by the TreesThe new trees sequester carbon and their canopies reduce
building energy consumption These benefits were estimated us-ing the Tree Carbon Calculator (CTCC) a ldquoproof of conceptrdquotool developed by the Center for Urban Forest Research at theUS Forest Service and approved by the Climate Action Re-serversquos Urban Forest Project Protocol for tree planting projects(CCRC 2011) The CTCC provides carbon-related informa-tion for individual trees located in any of the United Statesrsquo 16different climate zones The tool was developed based on sizeand growth data derived from a database of 650 to 1000 streettrees representative of about 20 predominant species in each ofthe 16 different reference cities (CCRC 2011) Among otheroutputs CTCC quantifies annual CO2 sequestered as well asreductions in CO2 emissions due to building energy savings
Trees reduce building energy consumption by providingshade (reducing air conditioning needs) but also by blockingwind Reduced wind speeds result in less infiltration of cold airinto buildings during the winter months limiting conductiveheat loss and reducing the need for heating (Heisler 1986 Peperet al 2007 Simpson and McPherson 1998) Heisler (1986) re-
ported that trees can reduce wind speed and resulting air infil-tration by up to 50 translating into potential annual heatingsavings of 25 Simpson and McPherson (1998) simulated thetree impacts in wind speed reduction on residential energy useand found an annual energy decrease of 25 per tree in Sacra-mento CA USA
CTCC uses a biomass equation derived from measurementsmade on trees planted in urban areas to estimate the total CO2
stored and sequestrated by different species The shading andwind-blocking benefits of trees on building energy consumptionconsidered in the CTCC are derived from computer simula-tions that were conducted in reference cities located in eachof the US climate zones using distinct combinations of treesizes building types building ages and types of heatingcoolingequipment and locations following methods defined by McPher-son and Simpson (1999) These simulations estimated the an-nual building energy use per residential unit and on a per treebasis by comparing results before and after adding the trees(CCRC 2011) The results in terms of reduced building energyconsumption are sensitive to the position of the trees relativeto the building
Although an exhaustive study of the spatial orientation ofthe future canopy in this study area was not within the scopeof this study a sensitivity analysis was performed to test theimportance of tree orientation on the results This analysis al-ternatively placed all the trees to the south (yielding the leastenergy savings) to the north (yielding the most energy savings)and to the west and the southwest (yielding average energy sav-ings) of the buildings
It was assumed that 2065 pin oak trees were installed duringthe first year of the GI program in equal proportions in eachof the vegetated GI facilities (eg the street-end bioretention
Sousa et al Evaluating Watershed-Scale CSO Strategies with LCA 907
R E S E A R C H A N D A N A LYS I S
bump-out facilities curbside infiltration planters and backyardrain gardens)
The base analysis assumes all of the trees were planted onthe southwest side of a building (with the other orientationsconsidered only in the sensitivity analysis) Other assumptionsadopted for this coarse analysis were
bull US climate zone northeastbull Tree life span 50 yearsbull Building vintage 1950ndash1980bull Tree distance from the buildings 20 to 40 feet (ft)bull Buildings air conditioning equipment wallwindowbull Buildings heating equipment natural gasbull Electricity emissions factors (kilograms per megawatt hour
[kgMWh]) for Queens NY USA 4672 (CO2) 00030(methane [CH4]) and 00001 (nitrous oxide [N2O])(CCRC 2011)
bull Heating emissions factors (kilograms per million Britishthermal units [kgMBTU]) for natural gas 531 (CO2)00059 (CH4) and 00001 (N2O) (CCRC 2011)
Step 6 Energy and Greenhouse Gas Life Cycle ImpactsIn order to compare the environmental performance of the
three different scenarios three different sets of impacts were as-sembled Scenario 1 includes the impacts associated with con-structing operating and maintaining the GI as well as treatingthe increase in flow to the WWTP As described earlier theseemissions are mitigated partially by CO2 sequestration by thevegetation and the reduced building energy loads associatedwith shading and wind blocking For scenario 2 there are im-pacts associated with constructing operating and maintainingthe detention tank and also treating the increase in flow tothe treatment plant over the ldquodo nothingrdquo case (ie the totalvolume of overflows in the base condition is assumed to be de-tained for later conveyance to the WWTP increasing annualtreated flow) The impacts associated with scenario 3 includeconstruction and OampM of the new detention tanktreatmentoperations and no change in flow to the treatment plant (iethe total volume of existing overflows is assumed to be treatedin the new end-of-pipe facility and discharged directly to theriver at that location)
From the LCI we estimated global warming potential(GWP) using characterization factors from the Intergovern-mental Panel on Climate Change (IPCC 2007) that convertair emissions to carbon dioxide equivalents (CO2-eq)
The EIO-LCA model was used to estimate the GWP associ-ated with the construction activities for scenarios 2 and 3 andOampM activities for all three scenarios The US 1997 (483)National Purchase Price Model was selected using ldquoConstruc-tion IndustryWater Sewer and Pipeline Construction Sectorrdquoto represent construction activities in scenarios 2 and 3 ldquoMin-ing and Utilities IndustryWater Sewage and Other SystemsSectorrdquo was used to represent the OampM activities of scenarios 2and 3 and ldquoConstruction IndustryMaintenance and Repair ofNonresidential Buildings Sectorrdquo was used to represent OampMactivities associated with scenario 1
The annual net GWP emissions of the three scenarios iscomputed as follows
GWPSC1 = I1 + OampM1 + WWTP minus Trees (1)
GWPSC2 = I2 + OampM2 + WWTP (2)
GWPSC3 = I3 + OampM3 (3)
where I1 I2 and I3 represent the emissions associated with ini-tial construction activities for scenarios 1 2 and 3 respectivelyand are incurred only during year 1 OampM1 OampM2 and OampM3
are the cumulative OampM emissions associated with each of thethree different scenarios WWTP is the cumulative new emis-sions associated with energy consumption at the WWTP andTrees refers to the reduced GWP achieved through carbon se-questration and building energy savings due to shading andwind blockage by the trees
Results and Discussion
Installation of the GI in scenario 1 emitted 20000 t CO2-eq compared with 31500 t CO2-eq for the detention tank inscenario 2 and 100000 t CO2-eq for the tank and treatmentfacilities in scenario 3 (Figure 2) These results indicate that interms of initial emissions scenario 1 yielded superior environ-mental performance when compared with the grey infrastruc-ture options Of the total emissions associated with constructionof the GI the greatest contributions came from transportation(8500 t CO2-eq) followed by cement manufacturing and con-crete (8400 t CO2-eq) (Figure 2)
The annual net emissions for OampM for scenario 1 werealso significantly lower than those incurred in scenarios 2 and3 with significant cumulative effects over the 50-year studyperiod Cumulatively scenario 1 is expected to release 19000t CO2-eq compared with 85000 t CO2-eq for scenario 2 and400000 t CO2-eq for scenario 3 (Figure 3) The cumulativeOampM emissions associated with scenarios 2 and 3 amountedto 170 (scenario 2) and 300 (scenario 3) of their year 1construction emissions after 50 years of operation comparedwith the cumulative OampM emissions of scenario 1 which onlyincreased by 75 over its initial emissions
It is noteworthy that the carbon sequestration and savingsin energy accrued by the trees were a key part of the net annualemissions associated with the GI in scenario 1 By year 25 thetrees had grown sufficiently to completely mitigate the emissionsassociated with the total annual OampM emissions for all of theGI facilities After year 25 the reduction in emissions associatedwith the trees exceeds the annual emissions associated with allscenario 1 OampM activities providing negative loads
Another significant finding was the significant difference inemissions between the two grey scenarios (2 and 3) Over 50years scenario 2 releases 100000 t CO2-eq whereas scenario3 generates this quantity of emissions during initial construc-tion activities alone arriving at almost 400000 t CO2-eq incumulative emissions after 50 years
908 Journal of Industrial Ecology
R E S E A R C H A N D A N A LYS I S
Figure 2 Cradle-to-green infrastructure (GI) installation global warming potential (GWP) for three infrastructure scenarios Note Thefigure shows the dominant input contributions toward GWP from the process and economic input-output (EIO) models The ldquootherrdquocategory includes aggregated EIO sector inputs including primary aluminum production and lime production
Sensitivity Analyses
Two sensitivity analyses were performed to examine whetherthe findings hold up if the uncertain data sets used in the analysiswere allowed to vary within the full range of possible values Thefirst sensitivity analysis varied the emissions associated with theconstruction and OampM activities for each of the three scenariosThe second sensitivity analysis focused on the position of thetrees relative to buildings Each of these analyses is describedbelow
Sensitivity Analysis 1To consider the full range of possible emissions associated
with construction and OampM activities implied by each sce-
nario first the upper and lower bound on the emissions asso-ciated with initial construction needed to be computed Forscenarios 2 and 3 the original analysis used the average cost pergallon of annual CSO reduction as gleaned from the literatureIn the sensitivity analysis the upper and lower bounds of thedetention tank costs in scenario 2 were set at $070 and $037respectively For scenario 3 the upper and lower bounds of thedetentiontreatment facility costs were $245 and $105 respec-tively The same procedure could not be applied for scenario1 because the emissions were computed based on unit materialand transportation costs Instead the upper and lower boundsof emissions associated with GI installation were assumed to bethe average of the variance of the literature values for scenarios
Figure 3 Emissions over 50 years according to the different scenarios
Sousa et al Evaluating Watershed-Scale CSO Strategies with LCA 909
R E S E A R C H A N D A N A LYS I S
2 and 3 expressed as a percentage of the average value used inthe initial analysis
The next step was to compute the upper and lower boundsof the annual OampM costs The upper and lower bounds forscenario 1 were based on the values found in the literatureSince the OampM costs for scenarios 2 and 3 were expressed asranges of percentages of the installation costs these percentageswere applied to the upper and lower bounds of the installationcosts as computed per the above For example the lower boundwas found by multiplying the lower bound of the OampM costpercentages (08 for scenario 2 104 for scenario 3) by the
lower bound of the installation costs ($037gal for scenario2 $105gal for scenario 3) These products were used in theEIO-LCA model to derive the corresponding extreme emissionspossibilities The same approach was used to calculate the upperbounds
The results of the first sensitivity analysis are shown inFigure 4a There was very little overlap between the emis-sions envelopes associated with the range of possible emis-sions associated with the three different scenarios Hence thefirst sensitivity analysis reinforces the original findings namelythat the GI approach featured in scenario 1 is environmentally
Figure 4 Sensitivity analyses (a) Sensitivity analysis of the emissions over 50 years from the installation and operation and maintenance(OampM) activities of scenarios 1 2 and 3 Note The dashed line represents the base case results of the scenarios emissions (b) Sensitivityanalysis of the tree benefits considering the treesrsquo location north southwest west or south face of the building Note The dashed linerepresents just the carbon dioxide (CO2) sequestration provided by the trees over 50 years
910 Journal of Industrial Ecology
R E S E A R C H A N D A N A LYS I S
preferable to the grey approaches included in scenarios 2 and 3for the metrics studied
Sensitivity Analysis 2Regarding the avoided CO2 emissions associated with the
impact of trees on building energy consumption a second sen-sitive analysis was conducted to consider the effect of differ-ent positions of the trees relative to the buildings The entire50-year analysis was repeated four times with the trees alterna-tively positioned to the south (least expected energy savings)the north (most expected energy savings) the west and thesouthwest (average expected energy savings) of the buildings
It is noteworthy that the carbon sequestered by the treesdoes not vary with the position and represents 11227 t CO2-eq over 50 years The avoided CO2 emissions through buildingenergy savings provided by the trees ranged from 1614 t CO2-eq(south) to 14416 t CO2-eq (north) which when added to theCO2 sequestered (11227 t CO2-eq) resulted in from 12841 tCO2-eq (south) to 25643 t CO2-eq (north) of mitigated GWPemissions The results of this sensitivity analysis are shown inFigure 4b and indicate that the energy benefits provided by thetrees are a significant fraction of the total of CO2 emissionsdecrease provided by the trees but only when the trees are notplanted to the south
Conclusion
This research used LCA methods to compare the environ-mental performance of three different approaches to reducingCSOs to the Bronx River NYC To our knowledge this studywas the first attempt to apply LCA methods at this scale andin this application While all three scenarios were scaled toreduce CSOs equivalently they required different construc-tion and OampM activities and in the cases of scenarios 1 and2 would also engender changes in the volume of annual flowto the regional WWTP When the GHG emissions associatedwith construction operation and maintenance are accountedfor the CSO abatement strategy represented by scenario 1which treats runoff from approximately one-third of the to-tal drainage area in decentralized green infrastructure facilitiesthat collectively amount to an area that is approximately 5of the total drainage area results in significantly better envi-ronmental performance than the end-of-pipe detention or thecombined detention and treatment strategies Both in terms ofthe emissions during initial construction and the cumulativenet emissions released over the first 50 years of operation thegreen infrastructure approach results in fewer emissions thaneither of the two grey approaches
This kind of analysis is limited by the availability of the req-uisite data sets Two sensitivity analyses varied the emissionsassociated with construction operation and maintenance ac-tivities and also the placement of the trees These analysesfurther reinforce the original conclusion that is that the fullrange of possible emissions associated with the green approach
will be significantly lower than those associated with the twogrey strategies
By conservatively assuming that the new GI would includeonly about 2000 new pin oak trees and no understory thecarbon sequestered and shading provided by the trees is firstable to fully offset the annual OampM emissions during year 25Further tree growth after year 25 exceeds the annual emissionsand begins to ldquopay backrdquo the emissions associated with initialconstruction of the GI network However this portion of theanalysis should be validated with actual studies documentingthe growth rates canopy configurations carbon sequestrationshading and wind protection provided by urban trees as wellas similar studies on other types of vegetation (shrubs grassesflowers etc) commonly planted in urban GI systems Very fewsuch studies have been performed to date
It should also be noted that this study did not quantifythe GHG emissions associated with other potential services(eg reduced pavement temperatures improved air qualityenhanced habitat etc) and disservices (eg increased street-sweeping requirements enhanced flooding potential etc) thatcould be brought about by watershed-scale implementation ofGI Additional research is needed to establish the relative im-portance of such factors in determining environmental perfor-mance Additional work is also needed to inventory the con-struction and OampM activities and costs associated with greenand grey CSO abatement strategies for which published datasets are currently quite limited Finally given all of the spatialinfrastructural economic social and other constraints presentin twenty-first-century cities the level of penetration that greeninfrastructure technologies will actually have in urban water-sheds still remains to be seen Nonetheless this study suggeststhat watershed managers who seek to reduce CSOs and reducemunicipal carbon footprints should opt for a green approachover a grey one
Acknowledgements
The authors are grateful to Nandan Shetty from the NewYork City Department of Parks and Recreation Sri Rangarajanand Chenchen Li from HDR Tracy Tackett from Seattle PublicUtilities Alan Cohn from the New York City Department ofEnvironmental Protection and Alisha Goldstein all of whomassisted in identifying different data sets used in this project
Notes
1 One gallon (gal) asymp 379 liters (L) so 200 million gallons per day(Mgalday) asymp 758 million liters per day (MLday)
2 One hectare (ha) = 001 square kilometers (km2 SI) asymp 000386square miles (mi2) asymp 247 acres
3 One gallon asymp 0003785 cubic meters (m3) so 3712 million gallonsper year (Mgalyr) is equivalent to 014 million cubic meters peryear (Mm3yr)
4 One square foot (ft2) = 0093 square meters (m2)
Sousa et al Evaluating Watershed-Scale CSO Strategies with LCA 911
R E S E A R C H A N D A N A LYS I S
References
Adam D 2007 The unheralded polluter Cement industry comes cleanon its impact The Guardian [Brussels] 12 October
Bannerman R 2003 Rain gardens A how-to manual for homeownersPUB-WT-776 Madison WI USA Wisconsin Department ofNatural Resources
Baumann H and A M Tillman 2004 The hitch hikerrsquos guide to LCALund Sweden Studentlitteratur AB
Bilec M M R J Ries and H S Matthews 2010 Life-cycle assess-ment modeling of construction processes for buildings Journal ofInfrastructure Systems 16(3) 199ndash205 httpascelibraryorgisoresource1jitse4v16i3p199_s1 Accessed 6 December 2011
Blackhurst M C T Hendrickson and H S Matthews 2010 Cost-effectiveness of green roofs Journal of Architectural Engineering16(4) 136ndash143
Brehm D 2007 Nanoengineered concrete could cut carbon diox-ide emissions MITNEWS 14 February 2007 httpwebmitedunewsoffice2007concretehtml Accessed 1 December 2011
CCRC (Center for Urban Forest Research) 2011 The Center forUrban Forest Research tree carbon calculator wwwfsfedusccrctopicsurban-forestsctcc Accessed 7 August 2011
City of Akron 1999 Facilities plan rsquo98 Akron OH USA wwwciakronohusCSOFP98FI1PDF Accessed 5 August 2011
City of New York 2010 NYC green infrastructure plan A sustainablestrategy for clean waterways City of New York NY USAwwwnycgovhtmldeppdfgreen_infrastructureNYCGreenIn-frastructurePlan_HighRespdf Accessed 15 April 2011
CNT (Center for Neighborhood Technology) 2009 Greenvalues calculator benefit details httpgreenvaluescntorgnationalbenefits detailphpreduced-treatment Accessed 12June 2011
CRI (Conservation Research Institute) 2005 Changing cost percep-tions An analysis of conservation development wwwcdfinccomCDF_ResourcesCost20Analysis20-20Part20120-20Report20-20with20Exec20Summarypdf Accessed5 August 2011
CRWA (Charles River Watershed Association) 2008 Blackstonetown hall demonstration project Evaluation of low impact de-velopment (LID) best management practices (BMPs) opportu-nities wwwcrwaorgprojectsblackstonelid evaluationpdf Ac-cessed 10 June 2011
DWSD (Detroit Water and Sewerage Department) 2003 Wastewatermaster plan DWSD project no CS-1314 Technical feasibility ofa wet weather flow treatment facility Detroit MI USA DWSD
EPRI (Electric Power Research Institute) 2002 Water and sus-tainability (Volume 4) US electricity consumption for watersupply and treatmentmdashThe next half century wwwcircleofblueorgwaternewswp-contentuploads201008EPRI-Volume-4pdfAccessed 19 April 2011
Flinker P 2005 Green rooftop systems In Urban environmentaldesign manual Providence RI USA Rhode Island Depart-ment of Environmental Management wwwdemrigovprogramsbpoladmsuswshedpubshtm Accessed 5 June 2011
Goldstein A 2011 Comparison of a high and low spatial resolutionmodel for an urban block and implications for depicting low im-pact development Masterrsquos thesis Drexel University Philadel-phia PA USA
Goldstein A and F A Montalto 2012 Comparison of a high and lowspatial resolution model for an urban block Journal of HydrologicEngineering Submitted for publication
Green Design Institute 2011 Economic input-output life cycle assess-ment wwweiolcanet Accessed 20 May 2011
Heisler G M 1986 Energy savings with trees Journal of Arboriculture12(5) 113ndash125
Hendrickson C T L B Lave and H S Matthews 2006 Environ-mental life cycle assessment of goods and services Washington DCUSA Resources for the Future
Hendriks C A E Worrell D de Jager K Blok and P Rieme 2004Emission reduction of greenhouse gases from the cement industryPaper presented at the Greenhouse Gas Control TechnologiesConference 5 September Vancouver BC Canada
Herstein Y R Filion and K R Hall 2009 Evaluating environmentalimpact in water distribution system design Journal of InfrastructureSystems 15(3) 241ndash250
IPCC 2007 Intergovernmental panel on climate change In Climatechange 2007 The physical science basis Contribution of workinggroup I to the fourth assessment report of the intergovernmentalpanel on climate change edited by S Solomon et al CambridgeCambridge University Press
ISO (International Organization for Standardization) 2006 ISO14044 Environmental management mdash Life cycle assessment mdash Re-quirements and guidelines Geneva Switzerland ISO
Kloss C Personal communication with Christopher Kloss GreenInfrastructure Coordinator US Environmental ProtectionAgency Office of Water 12 January 2012
Kosareo L and R Reis 2007 Comparative environmental life cycleassessment of green roofs Building and Environment 42(11) 2606ndash2613
Li C and S Rangarajan 2011 Technical Memorandum on Up-scalingof Drexel Universityrsquos Pilot Project to HP-009 Drainage AreaMahwah NJ HDR|HydroQual
MacMullan E and S Reich 2007 The economics of low-impact devel-opment A literature review Eugene OR USA ECONorthwest
Martin J 2011 Personal communication with Jeff Martin landscapearchitect New York City Department of Parks and Recreation14 April 2011
McPherson E G and J R Simpson 1999 Carbon dioxide reductionsthrough urban forestry Guidelines for professional and volun-teer tree planters General Technical Report PSW-171 AlbanyCA USDA Forest Service Pacific Southwest Research Station237 wwwfsfeduspswprogramsuesduepproductscufr_43pdfAccessed 6 December 2011
Montalto F C Behr K Alfredo M Wolf M Arye and M Walsh2007 Rapid assessment of the cost-effectiveness of low impact de-velopment for CSO control Landscape and Urban Planning 82(3)117ndash131
NCGBT (North Carolina Green Building Technology Database)2003 Pervious paving details for Chadbourn Street Townof Wrightsville Beach January 2 2006 httpwwwncgreenbuildingorgsitencgpublictechsearchresultscfmprojectid=93ampcategory=6ampparameter=98ampclicked=true Accessed August 102011
NYNewsday 2004 wwwnewsdaycomnewsnew-pact-stirs-up-old-stink-1650186 Accessed 10 July 2011
NYC DEP (New York City Department of Environmen-tal Protection) 2007 Flushing Bay waterbodywatershedfacility plan wwwhydroqualcomProjectsltcpwbwsflushing_bayflushing_bay_section_7pdf Accessed 20 July 2011
NYC DEP (New York City Department of Environmental Protec-tion) 2011 New York Cityrsquos wastewater treatment systemwwwnycgovhtmldeppdfwwsystempdf Accessed 21 July 2011
912 Journal of Industrial Ecology
R E S E A R C H A N D A N A LYS I S
Peper P J E G McPherson J R Simpson S L Gardner K E Vargasand Q Xiao 2007 New York City New York municipal forestresource analysis Technical Report Davis CA USA Center forUrban Forest Research
PRe Consultants 2007 SimaPro 71 LCA software Amersfoort theNetherlands
PWD (Philadelphia Water Department) 2009 Philadelphia com-bined sewer overflow long term control plan update wwwphillywatershedsorgltcpuVol02_TBLpdf Accessed 20 August 2011
Racoviceanu A I B W Karney C A Kennedy and A F Colombo2007 Life-cycle energy use and greenhouse gas emissions inven-tory for water treatment systems Journal of Infrastructure Systems13(4) 261ndash270
Saiz S C Kennedy B Bass and K Pressnail 2006 Comparativelife cycle assessment of standard and green roofs EnvironmentalScience and Technology 40(13) 4312ndash4316
Sharrard A L 2007 Greening construction processes using an input-output-based hybrid life cycle assessment model PhD thesisCarnegie Mellon University Pittsburgh PA USA
Shetty N 2011 Personal communication with N Shetty New YorkCity Department of Parks and Recreation 10 April 2011
Simpson J R and E G McPherson 1998 Simulation of tree shadeimpacts on residential energy use for space conditioning in Sacra-mento Atmospheric Environment Urban Atmospheres 32(1) 69ndash74
Spatari S Z Yu and F A Montalto 2011 Life cycle implicationsof urban green infrastructure Environmental Pollution 159(8ndash9)2174ndash2179
Stokes J R and A Horvath 2010 Supply-chain environ-mental effects of wastewater utilities Environmental ResearchLetters 5(2010) 014015 DOI 1010881748-932651014015httpiopscienceioporg1748-932651014015 Accessed 5 De-cember 2011
Stormchamber 2011 Stormchamber design manual wwwstormchamberscompdfStormChamberDesignManualpdf Accessed 7July 2011
Suh S M Lenzen G J Treloar H Hondo A Horvath G Huppes OJolliet U Klann W Krewitt Y Moriguchi J Munksgaard andG Norris 2004 System boundary selection in life-cycle invento-ries using hybrid approaches Environmental Science amp Technology38(3) 657ndash664
Tackett T 2011 Personal communication with Tracy Tackett LID
Program Manager Urban Watersheds Division Seattle PublicUtilities Seattle WA USA 10 August 2011
UNHSC (University of New Hampshire Stormwater Center) 2009Biannual report Durham NH USA
US EPA (US Environmental Protection Agency) 1999a Combinedsewer overflow management fact sheet Retention basins EPA832-F99-042 US EPA Office of Water Washington DC USA
US EPA (US Environmental Protection Agency) 1999b Stormwa-ter technology fact sheet Porous pavement httpwwwepagovowmmtbporouspapdf Accessed 1 August 2011
US EPA (US Environmental Protection Agency) 2005 Nationalmanagement measures to control nonpoint source pollution from urbanareas Washington DC USA US EPA
US EPA (US Environmental Protection Agency) 2007 Re-ducing stormwater costs through low impact development(LID) strategies and practices December 2007 wwwepagovowowNPSlidcosts07documentsreducingstormwatercostspdfAccessed 19 June 2011
US EPA (US Environmental Protection Agency) 2011 Storm wa-ter management model (SWMM) httpwwwepagovathenswwqtschtmlswmmhtml Accessed 18 May 2011
Wakeley H L C T Hendrickson W M Griffin and H SMatthews 2009 Economic and environmental transportation ef-fects of large-scale ethanol production and distribution in theUnited States Environmental Science amp Technology 43(7) 2228ndash2233
Wise S J Braden D Ghalayini J Grant C Kloss E MacMullan SMorse F Montalto D Nees D Nowak S Peck S Shaikh andC Yu Integrating valuation methods to recognize green infras-tructurersquos multiple benefits wwwcntorgrepositoryCNT-LID-paperpdf Accessed 20 May 2011
Zukovs G and J Marsalek 2004 Planning and design combined seweroverflow treatment Water Quality Research Journal of Canada39(4)439ndash448
About the Authors
Maria R C De Sousa is a PhD student and Franco Mon-talto and Sabrina Spatari are assistant professors in the Depart-ment of Civil Architectural and Environmental Engineeringat Drexel University Philadelphia PA USA
Sousa et al Evaluating Watershed-Scale CSO Strategies with LCA 913
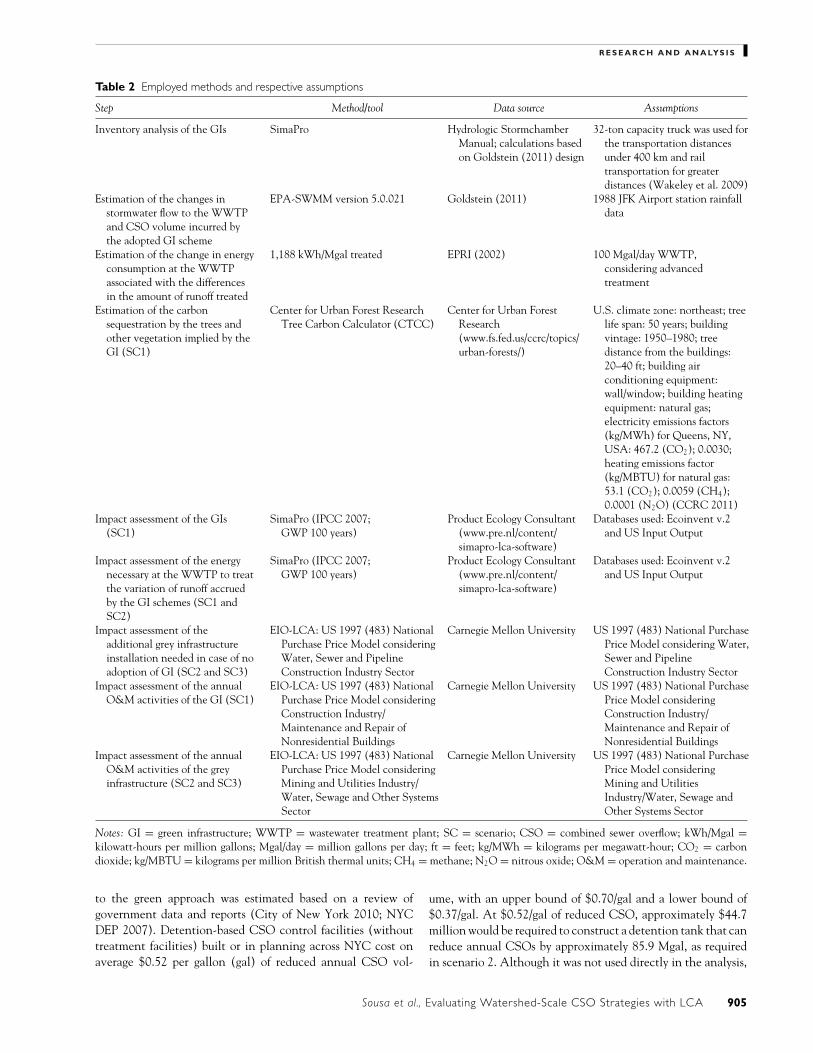
R E S E A R C H A N D A N A LYS I S
Table 3 Emissions (in t CO2-eq) from the three scenarios the wastewater treatment plant and the trees
Emissions (t CO2-eq)
Installation
Source Material Unit Quantity t CO2-eq kg CO2-equnit Annual andor OampM Over 50 years
Scenario 1 Concrete m3 32000 8400 260Excavation m3 180000 97 054Bark mulch t 500 300 600Geotextile m2 420000 2700 64HDPE kg 200000 490 25PVC kg 16000 50 31Transport truck t-km 80000000 8500 011Transport rail t-km 82000 4 005Total 20000 300 19000
Scenario 2 31500 1050 85000Scenario 3 100000 5840 400000WWTP 70 3500Trees Variable minus25643
Notes t CO2-eq = metric tons of carbon dioxide equivalent kg CO2-equnit = kilograms of carbon dioxide equivalent per unit m3 = cubic meterst = metric ton m2 = square meters t-km = metric ton kilometers HDPE = high-density polyethylene PVC = polyvinyl chloride WWTP = wastewatertreatment plant
the actual volume of this tank can be estimated using a recentreport citing the construction costs of CSO tanks of differentvolumes (NY Newsday 2004) Assuming that it costs on aver-age $1305gal of tank storage the detention tank assumed inscenario 2 would have the capacity to store approximately 32Mgal (0012 Mm3)
The cost to construct scenario 3 includes the cost of a deten-tion tank accompanied by a physical and chemical treatmentfacility Also per the NYC DEP (2007) and City of New York(2010) CSO control facilities with detention and treatmentbuilt or in planning across NYC cost on average $175gal ofreduced annual CSO volume with an upper bound of $245galand a lower bound of $105gal Using the average value thecost of this facility would be $150 million Again although thevolume of this facility is not utilized in the analysis presented inthis article it could be assumed that the detention tanks wouldhave a similar storage capacity to the one considered in scenario2 with the residual extra cost associated with its physical andchemical treatment operations
Step 3 Estimation of the Infrastructure Operation andMaintenance CostsThe OampM costs of the infrastructure considered in each
of the three scenarios were also estimated from the literatureFor scenario 1 OampM costs were defined separately for eachGI typology based on average literature costs converted into2011 US dollars (Table 4) The annual OampM cost assumedfor porous concrete was $013 per square foot (ft2)4 and assumesbiannual sweeping high-pressure jet washing and replacementof 1 of the area (Tackett 2011 US EPA 2005) The OampMcosts of bioretention bump-outs curbside infiltration plantersand backyard rain gardens were assumed to be identical A totalof $114ft2 (US EPA 2005) would cover repair of eroded areasremoval and replacement of all dead and diseased vegetation
mulching of void areas irrigation of vegetated areas (biannualor as needed) and removal of mulch and application of a newlayer (annual) The annual OampM costs of the subgrade cisternwere derived from studies on Stormchambers (Stormchamber2011 UNHSC 2009) For $002ft2 of Stormchamber bottomthese facilities could be vacuum cleaned twice a year (or asneeded)
The OampM costs associated with the detention tank in sce-nario 2 were assumed to be on average 14 of the constructioncosts or the average of all literature values excluding the ex-treme highest and lowest values The upper end of possibleOampM costs was 2 of the construction costs and the lower endwas 08 (City of Akron 1999 Montalto et al 2007)
Specific OampM activities related to large detention tanksinclude odor control and ventilation removal and disposal ofaccumulated residual sludge and solids (Zukovs and Marsalek2004) and inlet andor outlet pumping (US EPA 2007)
According to the US EPA (1999a) and the Detroit Waterand Sewerage Department (DWSD 2003) the OampM costs ofdetention tanks that include physical and chemical treatmentoperations are 104 to 36 of the construction costs TheOampM costs for scenario 3 were thus estimated at 23 (averageof the literature values excluding the extreme highest and lowestvalues) of the construction costs According to the DWSD(2003) OampM activities for this type of facility include chemicalacquisition costs preventative maintenance costs energy costsand sludge disposal
Step 4 Estimation of the Energy Variation at the Waste-water Treatment Plant in Scenarios 1 and 2Because scenarios 1 and 2 alter the volume of water that is
conveyed to the Hunts Point WWTP the difference in energyat the WWTP over the ldquodo nothingrdquo case had to be com-puted (As stated earlier scenario 3 does not alter the volume
906 Journal of Industrial Ecology
R E S E A R C H A N D A N A LYS I S
Table 4 Installation and OampM costs for green-infrastructures summary
GI element Construction costs Data source OampM cost (annual) Data source
Porous pavement $250ndash$830ft2 (2006) Montalto et al (2007) 1ndash2 of construction costs CRI (2005) NCGBT(2003) US EPA(1999b)
$109ndash$218ft2 EPA (2005) $016ft2 EPA (2005)$2ndash$3ft2 EPA (2003)$26ft2 Tackett (2011) $006ft2 Tackett (2011)$4ndash$5ft2 UNHSC (2009) $0008ft2 UNHSC (2009)$710ft2 CNT (2009)
Subgrade cistern $078ft2 of mitigatedimpervious area($34000acre)
UNHSC (2009) $0008ft2 (twice a year)$0016ft2
UNHSC (2009)
Backyard raingarden
$13ndash$14ft2 Bannerman (2003) 2ndash8 EPA (2005) Flinker(2005) CRWA (2008)
$540ft2 of the mitigatedimpervious area
Tackett (2011) $011ft2 of the mitigatedimpervious area
Tackett (2011)
$041ft2 $18000acre ofmitigated impervious area
UNHSC (2009)
$9ndash3200ft2 CNT (2009)
of flow conveyed to the WWTP over the baseline conditions)For scenarios 1 and 2 the energy consumed was estimated bymultiplying the annual volume of flow to the plant by an esti-mate of the unit electricity consumption for wastewater treat-ment plants with the capacity to treat more than 100 Mgalday(eg 1188 kilowatt-hours per millions gallons [kWhMgal])published by the Electric Power Research Institute (EPRI2002)
Step 5 Estimation of the Carbon Sequestration and Car-bon Dioxide Reductions Due the Energy Savings in theBuildings by the TreesThe new trees sequester carbon and their canopies reduce
building energy consumption These benefits were estimated us-ing the Tree Carbon Calculator (CTCC) a ldquoproof of conceptrdquotool developed by the Center for Urban Forest Research at theUS Forest Service and approved by the Climate Action Re-serversquos Urban Forest Project Protocol for tree planting projects(CCRC 2011) The CTCC provides carbon-related informa-tion for individual trees located in any of the United Statesrsquo 16different climate zones The tool was developed based on sizeand growth data derived from a database of 650 to 1000 streettrees representative of about 20 predominant species in each ofthe 16 different reference cities (CCRC 2011) Among otheroutputs CTCC quantifies annual CO2 sequestered as well asreductions in CO2 emissions due to building energy savings
Trees reduce building energy consumption by providingshade (reducing air conditioning needs) but also by blockingwind Reduced wind speeds result in less infiltration of cold airinto buildings during the winter months limiting conductiveheat loss and reducing the need for heating (Heisler 1986 Peperet al 2007 Simpson and McPherson 1998) Heisler (1986) re-
ported that trees can reduce wind speed and resulting air infil-tration by up to 50 translating into potential annual heatingsavings of 25 Simpson and McPherson (1998) simulated thetree impacts in wind speed reduction on residential energy useand found an annual energy decrease of 25 per tree in Sacra-mento CA USA
CTCC uses a biomass equation derived from measurementsmade on trees planted in urban areas to estimate the total CO2
stored and sequestrated by different species The shading andwind-blocking benefits of trees on building energy consumptionconsidered in the CTCC are derived from computer simula-tions that were conducted in reference cities located in eachof the US climate zones using distinct combinations of treesizes building types building ages and types of heatingcoolingequipment and locations following methods defined by McPher-son and Simpson (1999) These simulations estimated the an-nual building energy use per residential unit and on a per treebasis by comparing results before and after adding the trees(CCRC 2011) The results in terms of reduced building energyconsumption are sensitive to the position of the trees relativeto the building
Although an exhaustive study of the spatial orientation ofthe future canopy in this study area was not within the scopeof this study a sensitivity analysis was performed to test theimportance of tree orientation on the results This analysis al-ternatively placed all the trees to the south (yielding the leastenergy savings) to the north (yielding the most energy savings)and to the west and the southwest (yielding average energy sav-ings) of the buildings
It was assumed that 2065 pin oak trees were installed duringthe first year of the GI program in equal proportions in eachof the vegetated GI facilities (eg the street-end bioretention
Sousa et al Evaluating Watershed-Scale CSO Strategies with LCA 907
R E S E A R C H A N D A N A LYS I S
bump-out facilities curbside infiltration planters and backyardrain gardens)
The base analysis assumes all of the trees were planted onthe southwest side of a building (with the other orientationsconsidered only in the sensitivity analysis) Other assumptionsadopted for this coarse analysis were
bull US climate zone northeastbull Tree life span 50 yearsbull Building vintage 1950ndash1980bull Tree distance from the buildings 20 to 40 feet (ft)bull Buildings air conditioning equipment wallwindowbull Buildings heating equipment natural gasbull Electricity emissions factors (kilograms per megawatt hour
[kgMWh]) for Queens NY USA 4672 (CO2) 00030(methane [CH4]) and 00001 (nitrous oxide [N2O])(CCRC 2011)
bull Heating emissions factors (kilograms per million Britishthermal units [kgMBTU]) for natural gas 531 (CO2)00059 (CH4) and 00001 (N2O) (CCRC 2011)
Step 6 Energy and Greenhouse Gas Life Cycle ImpactsIn order to compare the environmental performance of the
three different scenarios three different sets of impacts were as-sembled Scenario 1 includes the impacts associated with con-structing operating and maintaining the GI as well as treatingthe increase in flow to the WWTP As described earlier theseemissions are mitigated partially by CO2 sequestration by thevegetation and the reduced building energy loads associatedwith shading and wind blocking For scenario 2 there are im-pacts associated with constructing operating and maintainingthe detention tank and also treating the increase in flow tothe treatment plant over the ldquodo nothingrdquo case (ie the totalvolume of overflows in the base condition is assumed to be de-tained for later conveyance to the WWTP increasing annualtreated flow) The impacts associated with scenario 3 includeconstruction and OampM of the new detention tanktreatmentoperations and no change in flow to the treatment plant (iethe total volume of existing overflows is assumed to be treatedin the new end-of-pipe facility and discharged directly to theriver at that location)
From the LCI we estimated global warming potential(GWP) using characterization factors from the Intergovern-mental Panel on Climate Change (IPCC 2007) that convertair emissions to carbon dioxide equivalents (CO2-eq)
The EIO-LCA model was used to estimate the GWP associ-ated with the construction activities for scenarios 2 and 3 andOampM activities for all three scenarios The US 1997 (483)National Purchase Price Model was selected using ldquoConstruc-tion IndustryWater Sewer and Pipeline Construction Sectorrdquoto represent construction activities in scenarios 2 and 3 ldquoMin-ing and Utilities IndustryWater Sewage and Other SystemsSectorrdquo was used to represent the OampM activities of scenarios 2and 3 and ldquoConstruction IndustryMaintenance and Repair ofNonresidential Buildings Sectorrdquo was used to represent OampMactivities associated with scenario 1
The annual net GWP emissions of the three scenarios iscomputed as follows
GWPSC1 = I1 + OampM1 + WWTP minus Trees (1)
GWPSC2 = I2 + OampM2 + WWTP (2)
GWPSC3 = I3 + OampM3 (3)
where I1 I2 and I3 represent the emissions associated with ini-tial construction activities for scenarios 1 2 and 3 respectivelyand are incurred only during year 1 OampM1 OampM2 and OampM3
are the cumulative OampM emissions associated with each of thethree different scenarios WWTP is the cumulative new emis-sions associated with energy consumption at the WWTP andTrees refers to the reduced GWP achieved through carbon se-questration and building energy savings due to shading andwind blockage by the trees
Results and Discussion
Installation of the GI in scenario 1 emitted 20000 t CO2-eq compared with 31500 t CO2-eq for the detention tank inscenario 2 and 100000 t CO2-eq for the tank and treatmentfacilities in scenario 3 (Figure 2) These results indicate that interms of initial emissions scenario 1 yielded superior environ-mental performance when compared with the grey infrastruc-ture options Of the total emissions associated with constructionof the GI the greatest contributions came from transportation(8500 t CO2-eq) followed by cement manufacturing and con-crete (8400 t CO2-eq) (Figure 2)
The annual net emissions for OampM for scenario 1 werealso significantly lower than those incurred in scenarios 2 and3 with significant cumulative effects over the 50-year studyperiod Cumulatively scenario 1 is expected to release 19000t CO2-eq compared with 85000 t CO2-eq for scenario 2 and400000 t CO2-eq for scenario 3 (Figure 3) The cumulativeOampM emissions associated with scenarios 2 and 3 amountedto 170 (scenario 2) and 300 (scenario 3) of their year 1construction emissions after 50 years of operation comparedwith the cumulative OampM emissions of scenario 1 which onlyincreased by 75 over its initial emissions
It is noteworthy that the carbon sequestration and savingsin energy accrued by the trees were a key part of the net annualemissions associated with the GI in scenario 1 By year 25 thetrees had grown sufficiently to completely mitigate the emissionsassociated with the total annual OampM emissions for all of theGI facilities After year 25 the reduction in emissions associatedwith the trees exceeds the annual emissions associated with allscenario 1 OampM activities providing negative loads
Another significant finding was the significant difference inemissions between the two grey scenarios (2 and 3) Over 50years scenario 2 releases 100000 t CO2-eq whereas scenario3 generates this quantity of emissions during initial construc-tion activities alone arriving at almost 400000 t CO2-eq incumulative emissions after 50 years
908 Journal of Industrial Ecology
R E S E A R C H A N D A N A LYS I S
Figure 2 Cradle-to-green infrastructure (GI) installation global warming potential (GWP) for three infrastructure scenarios Note Thefigure shows the dominant input contributions toward GWP from the process and economic input-output (EIO) models The ldquootherrdquocategory includes aggregated EIO sector inputs including primary aluminum production and lime production
Sensitivity Analyses
Two sensitivity analyses were performed to examine whetherthe findings hold up if the uncertain data sets used in the analysiswere allowed to vary within the full range of possible values Thefirst sensitivity analysis varied the emissions associated with theconstruction and OampM activities for each of the three scenariosThe second sensitivity analysis focused on the position of thetrees relative to buildings Each of these analyses is describedbelow
Sensitivity Analysis 1To consider the full range of possible emissions associated
with construction and OampM activities implied by each sce-
nario first the upper and lower bound on the emissions asso-ciated with initial construction needed to be computed Forscenarios 2 and 3 the original analysis used the average cost pergallon of annual CSO reduction as gleaned from the literatureIn the sensitivity analysis the upper and lower bounds of thedetention tank costs in scenario 2 were set at $070 and $037respectively For scenario 3 the upper and lower bounds of thedetentiontreatment facility costs were $245 and $105 respec-tively The same procedure could not be applied for scenario1 because the emissions were computed based on unit materialand transportation costs Instead the upper and lower boundsof emissions associated with GI installation were assumed to bethe average of the variance of the literature values for scenarios
Figure 3 Emissions over 50 years according to the different scenarios
Sousa et al Evaluating Watershed-Scale CSO Strategies with LCA 909
R E S E A R C H A N D A N A LYS I S
2 and 3 expressed as a percentage of the average value used inthe initial analysis
The next step was to compute the upper and lower boundsof the annual OampM costs The upper and lower bounds forscenario 1 were based on the values found in the literatureSince the OampM costs for scenarios 2 and 3 were expressed asranges of percentages of the installation costs these percentageswere applied to the upper and lower bounds of the installationcosts as computed per the above For example the lower boundwas found by multiplying the lower bound of the OampM costpercentages (08 for scenario 2 104 for scenario 3) by the
lower bound of the installation costs ($037gal for scenario2 $105gal for scenario 3) These products were used in theEIO-LCA model to derive the corresponding extreme emissionspossibilities The same approach was used to calculate the upperbounds
The results of the first sensitivity analysis are shown inFigure 4a There was very little overlap between the emis-sions envelopes associated with the range of possible emis-sions associated with the three different scenarios Hence thefirst sensitivity analysis reinforces the original findings namelythat the GI approach featured in scenario 1 is environmentally
Figure 4 Sensitivity analyses (a) Sensitivity analysis of the emissions over 50 years from the installation and operation and maintenance(OampM) activities of scenarios 1 2 and 3 Note The dashed line represents the base case results of the scenarios emissions (b) Sensitivityanalysis of the tree benefits considering the treesrsquo location north southwest west or south face of the building Note The dashed linerepresents just the carbon dioxide (CO2) sequestration provided by the trees over 50 years
910 Journal of Industrial Ecology
R E S E A R C H A N D A N A LYS I S
preferable to the grey approaches included in scenarios 2 and 3for the metrics studied
Sensitivity Analysis 2Regarding the avoided CO2 emissions associated with the
impact of trees on building energy consumption a second sen-sitive analysis was conducted to consider the effect of differ-ent positions of the trees relative to the buildings The entire50-year analysis was repeated four times with the trees alterna-tively positioned to the south (least expected energy savings)the north (most expected energy savings) the west and thesouthwest (average expected energy savings) of the buildings
It is noteworthy that the carbon sequestered by the treesdoes not vary with the position and represents 11227 t CO2-eq over 50 years The avoided CO2 emissions through buildingenergy savings provided by the trees ranged from 1614 t CO2-eq(south) to 14416 t CO2-eq (north) which when added to theCO2 sequestered (11227 t CO2-eq) resulted in from 12841 tCO2-eq (south) to 25643 t CO2-eq (north) of mitigated GWPemissions The results of this sensitivity analysis are shown inFigure 4b and indicate that the energy benefits provided by thetrees are a significant fraction of the total of CO2 emissionsdecrease provided by the trees but only when the trees are notplanted to the south
Conclusion
This research used LCA methods to compare the environ-mental performance of three different approaches to reducingCSOs to the Bronx River NYC To our knowledge this studywas the first attempt to apply LCA methods at this scale andin this application While all three scenarios were scaled toreduce CSOs equivalently they required different construc-tion and OampM activities and in the cases of scenarios 1 and2 would also engender changes in the volume of annual flowto the regional WWTP When the GHG emissions associatedwith construction operation and maintenance are accountedfor the CSO abatement strategy represented by scenario 1which treats runoff from approximately one-third of the to-tal drainage area in decentralized green infrastructure facilitiesthat collectively amount to an area that is approximately 5of the total drainage area results in significantly better envi-ronmental performance than the end-of-pipe detention or thecombined detention and treatment strategies Both in terms ofthe emissions during initial construction and the cumulativenet emissions released over the first 50 years of operation thegreen infrastructure approach results in fewer emissions thaneither of the two grey approaches
This kind of analysis is limited by the availability of the req-uisite data sets Two sensitivity analyses varied the emissionsassociated with construction operation and maintenance ac-tivities and also the placement of the trees These analysesfurther reinforce the original conclusion that is that the fullrange of possible emissions associated with the green approach
will be significantly lower than those associated with the twogrey strategies
By conservatively assuming that the new GI would includeonly about 2000 new pin oak trees and no understory thecarbon sequestered and shading provided by the trees is firstable to fully offset the annual OampM emissions during year 25Further tree growth after year 25 exceeds the annual emissionsand begins to ldquopay backrdquo the emissions associated with initialconstruction of the GI network However this portion of theanalysis should be validated with actual studies documentingthe growth rates canopy configurations carbon sequestrationshading and wind protection provided by urban trees as wellas similar studies on other types of vegetation (shrubs grassesflowers etc) commonly planted in urban GI systems Very fewsuch studies have been performed to date
It should also be noted that this study did not quantifythe GHG emissions associated with other potential services(eg reduced pavement temperatures improved air qualityenhanced habitat etc) and disservices (eg increased street-sweeping requirements enhanced flooding potential etc) thatcould be brought about by watershed-scale implementation ofGI Additional research is needed to establish the relative im-portance of such factors in determining environmental perfor-mance Additional work is also needed to inventory the con-struction and OampM activities and costs associated with greenand grey CSO abatement strategies for which published datasets are currently quite limited Finally given all of the spatialinfrastructural economic social and other constraints presentin twenty-first-century cities the level of penetration that greeninfrastructure technologies will actually have in urban water-sheds still remains to be seen Nonetheless this study suggeststhat watershed managers who seek to reduce CSOs and reducemunicipal carbon footprints should opt for a green approachover a grey one
Acknowledgements
The authors are grateful to Nandan Shetty from the NewYork City Department of Parks and Recreation Sri Rangarajanand Chenchen Li from HDR Tracy Tackett from Seattle PublicUtilities Alan Cohn from the New York City Department ofEnvironmental Protection and Alisha Goldstein all of whomassisted in identifying different data sets used in this project
Notes
1 One gallon (gal) asymp 379 liters (L) so 200 million gallons per day(Mgalday) asymp 758 million liters per day (MLday)
2 One hectare (ha) = 001 square kilometers (km2 SI) asymp 000386square miles (mi2) asymp 247 acres
3 One gallon asymp 0003785 cubic meters (m3) so 3712 million gallonsper year (Mgalyr) is equivalent to 014 million cubic meters peryear (Mm3yr)
4 One square foot (ft2) = 0093 square meters (m2)
Sousa et al Evaluating Watershed-Scale CSO Strategies with LCA 911
R E S E A R C H A N D A N A LYS I S
References
Adam D 2007 The unheralded polluter Cement industry comes cleanon its impact The Guardian [Brussels] 12 October
Bannerman R 2003 Rain gardens A how-to manual for homeownersPUB-WT-776 Madison WI USA Wisconsin Department ofNatural Resources
Baumann H and A M Tillman 2004 The hitch hikerrsquos guide to LCALund Sweden Studentlitteratur AB
Bilec M M R J Ries and H S Matthews 2010 Life-cycle assess-ment modeling of construction processes for buildings Journal ofInfrastructure Systems 16(3) 199ndash205 httpascelibraryorgisoresource1jitse4v16i3p199_s1 Accessed 6 December 2011
Blackhurst M C T Hendrickson and H S Matthews 2010 Cost-effectiveness of green roofs Journal of Architectural Engineering16(4) 136ndash143
Brehm D 2007 Nanoengineered concrete could cut carbon diox-ide emissions MITNEWS 14 February 2007 httpwebmitedunewsoffice2007concretehtml Accessed 1 December 2011
CCRC (Center for Urban Forest Research) 2011 The Center forUrban Forest Research tree carbon calculator wwwfsfedusccrctopicsurban-forestsctcc Accessed 7 August 2011
City of Akron 1999 Facilities plan rsquo98 Akron OH USA wwwciakronohusCSOFP98FI1PDF Accessed 5 August 2011
City of New York 2010 NYC green infrastructure plan A sustainablestrategy for clean waterways City of New York NY USAwwwnycgovhtmldeppdfgreen_infrastructureNYCGreenIn-frastructurePlan_HighRespdf Accessed 15 April 2011
CNT (Center for Neighborhood Technology) 2009 Greenvalues calculator benefit details httpgreenvaluescntorgnationalbenefits detailphpreduced-treatment Accessed 12June 2011
CRI (Conservation Research Institute) 2005 Changing cost percep-tions An analysis of conservation development wwwcdfinccomCDF_ResourcesCost20Analysis20-20Part20120-20Report20-20with20Exec20Summarypdf Accessed5 August 2011
CRWA (Charles River Watershed Association) 2008 Blackstonetown hall demonstration project Evaluation of low impact de-velopment (LID) best management practices (BMPs) opportu-nities wwwcrwaorgprojectsblackstonelid evaluationpdf Ac-cessed 10 June 2011
DWSD (Detroit Water and Sewerage Department) 2003 Wastewatermaster plan DWSD project no CS-1314 Technical feasibility ofa wet weather flow treatment facility Detroit MI USA DWSD
EPRI (Electric Power Research Institute) 2002 Water and sus-tainability (Volume 4) US electricity consumption for watersupply and treatmentmdashThe next half century wwwcircleofblueorgwaternewswp-contentuploads201008EPRI-Volume-4pdfAccessed 19 April 2011
Flinker P 2005 Green rooftop systems In Urban environmentaldesign manual Providence RI USA Rhode Island Depart-ment of Environmental Management wwwdemrigovprogramsbpoladmsuswshedpubshtm Accessed 5 June 2011
Goldstein A 2011 Comparison of a high and low spatial resolutionmodel for an urban block and implications for depicting low im-pact development Masterrsquos thesis Drexel University Philadel-phia PA USA
Goldstein A and F A Montalto 2012 Comparison of a high and lowspatial resolution model for an urban block Journal of HydrologicEngineering Submitted for publication
Green Design Institute 2011 Economic input-output life cycle assess-ment wwweiolcanet Accessed 20 May 2011
Heisler G M 1986 Energy savings with trees Journal of Arboriculture12(5) 113ndash125
Hendrickson C T L B Lave and H S Matthews 2006 Environ-mental life cycle assessment of goods and services Washington DCUSA Resources for the Future
Hendriks C A E Worrell D de Jager K Blok and P Rieme 2004Emission reduction of greenhouse gases from the cement industryPaper presented at the Greenhouse Gas Control TechnologiesConference 5 September Vancouver BC Canada
Herstein Y R Filion and K R Hall 2009 Evaluating environmentalimpact in water distribution system design Journal of InfrastructureSystems 15(3) 241ndash250
IPCC 2007 Intergovernmental panel on climate change In Climatechange 2007 The physical science basis Contribution of workinggroup I to the fourth assessment report of the intergovernmentalpanel on climate change edited by S Solomon et al CambridgeCambridge University Press
ISO (International Organization for Standardization) 2006 ISO14044 Environmental management mdash Life cycle assessment mdash Re-quirements and guidelines Geneva Switzerland ISO
Kloss C Personal communication with Christopher Kloss GreenInfrastructure Coordinator US Environmental ProtectionAgency Office of Water 12 January 2012
Kosareo L and R Reis 2007 Comparative environmental life cycleassessment of green roofs Building and Environment 42(11) 2606ndash2613
Li C and S Rangarajan 2011 Technical Memorandum on Up-scalingof Drexel Universityrsquos Pilot Project to HP-009 Drainage AreaMahwah NJ HDR|HydroQual
MacMullan E and S Reich 2007 The economics of low-impact devel-opment A literature review Eugene OR USA ECONorthwest
Martin J 2011 Personal communication with Jeff Martin landscapearchitect New York City Department of Parks and Recreation14 April 2011
McPherson E G and J R Simpson 1999 Carbon dioxide reductionsthrough urban forestry Guidelines for professional and volun-teer tree planters General Technical Report PSW-171 AlbanyCA USDA Forest Service Pacific Southwest Research Station237 wwwfsfeduspswprogramsuesduepproductscufr_43pdfAccessed 6 December 2011
Montalto F C Behr K Alfredo M Wolf M Arye and M Walsh2007 Rapid assessment of the cost-effectiveness of low impact de-velopment for CSO control Landscape and Urban Planning 82(3)117ndash131
NCGBT (North Carolina Green Building Technology Database)2003 Pervious paving details for Chadbourn Street Townof Wrightsville Beach January 2 2006 httpwwwncgreenbuildingorgsitencgpublictechsearchresultscfmprojectid=93ampcategory=6ampparameter=98ampclicked=true Accessed August 102011
NYNewsday 2004 wwwnewsdaycomnewsnew-pact-stirs-up-old-stink-1650186 Accessed 10 July 2011
NYC DEP (New York City Department of Environmen-tal Protection) 2007 Flushing Bay waterbodywatershedfacility plan wwwhydroqualcomProjectsltcpwbwsflushing_bayflushing_bay_section_7pdf Accessed 20 July 2011
NYC DEP (New York City Department of Environmental Protec-tion) 2011 New York Cityrsquos wastewater treatment systemwwwnycgovhtmldeppdfwwsystempdf Accessed 21 July 2011
912 Journal of Industrial Ecology
R E S E A R C H A N D A N A LYS I S
Peper P J E G McPherson J R Simpson S L Gardner K E Vargasand Q Xiao 2007 New York City New York municipal forestresource analysis Technical Report Davis CA USA Center forUrban Forest Research
PRe Consultants 2007 SimaPro 71 LCA software Amersfoort theNetherlands
PWD (Philadelphia Water Department) 2009 Philadelphia com-bined sewer overflow long term control plan update wwwphillywatershedsorgltcpuVol02_TBLpdf Accessed 20 August 2011
Racoviceanu A I B W Karney C A Kennedy and A F Colombo2007 Life-cycle energy use and greenhouse gas emissions inven-tory for water treatment systems Journal of Infrastructure Systems13(4) 261ndash270
Saiz S C Kennedy B Bass and K Pressnail 2006 Comparativelife cycle assessment of standard and green roofs EnvironmentalScience and Technology 40(13) 4312ndash4316
Sharrard A L 2007 Greening construction processes using an input-output-based hybrid life cycle assessment model PhD thesisCarnegie Mellon University Pittsburgh PA USA
Shetty N 2011 Personal communication with N Shetty New YorkCity Department of Parks and Recreation 10 April 2011
Simpson J R and E G McPherson 1998 Simulation of tree shadeimpacts on residential energy use for space conditioning in Sacra-mento Atmospheric Environment Urban Atmospheres 32(1) 69ndash74
Spatari S Z Yu and F A Montalto 2011 Life cycle implicationsof urban green infrastructure Environmental Pollution 159(8ndash9)2174ndash2179
Stokes J R and A Horvath 2010 Supply-chain environ-mental effects of wastewater utilities Environmental ResearchLetters 5(2010) 014015 DOI 1010881748-932651014015httpiopscienceioporg1748-932651014015 Accessed 5 De-cember 2011
Stormchamber 2011 Stormchamber design manual wwwstormchamberscompdfStormChamberDesignManualpdf Accessed 7July 2011
Suh S M Lenzen G J Treloar H Hondo A Horvath G Huppes OJolliet U Klann W Krewitt Y Moriguchi J Munksgaard andG Norris 2004 System boundary selection in life-cycle invento-ries using hybrid approaches Environmental Science amp Technology38(3) 657ndash664
Tackett T 2011 Personal communication with Tracy Tackett LID
Program Manager Urban Watersheds Division Seattle PublicUtilities Seattle WA USA 10 August 2011
UNHSC (University of New Hampshire Stormwater Center) 2009Biannual report Durham NH USA
US EPA (US Environmental Protection Agency) 1999a Combinedsewer overflow management fact sheet Retention basins EPA832-F99-042 US EPA Office of Water Washington DC USA
US EPA (US Environmental Protection Agency) 1999b Stormwa-ter technology fact sheet Porous pavement httpwwwepagovowmmtbporouspapdf Accessed 1 August 2011
US EPA (US Environmental Protection Agency) 2005 Nationalmanagement measures to control nonpoint source pollution from urbanareas Washington DC USA US EPA
US EPA (US Environmental Protection Agency) 2007 Re-ducing stormwater costs through low impact development(LID) strategies and practices December 2007 wwwepagovowowNPSlidcosts07documentsreducingstormwatercostspdfAccessed 19 June 2011
US EPA (US Environmental Protection Agency) 2011 Storm wa-ter management model (SWMM) httpwwwepagovathenswwqtschtmlswmmhtml Accessed 18 May 2011
Wakeley H L C T Hendrickson W M Griffin and H SMatthews 2009 Economic and environmental transportation ef-fects of large-scale ethanol production and distribution in theUnited States Environmental Science amp Technology 43(7) 2228ndash2233
Wise S J Braden D Ghalayini J Grant C Kloss E MacMullan SMorse F Montalto D Nees D Nowak S Peck S Shaikh andC Yu Integrating valuation methods to recognize green infras-tructurersquos multiple benefits wwwcntorgrepositoryCNT-LID-paperpdf Accessed 20 May 2011
Zukovs G and J Marsalek 2004 Planning and design combined seweroverflow treatment Water Quality Research Journal of Canada39(4)439ndash448
About the Authors
Maria R C De Sousa is a PhD student and Franco Mon-talto and Sabrina Spatari are assistant professors in the Depart-ment of Civil Architectural and Environmental Engineeringat Drexel University Philadelphia PA USA
Sousa et al Evaluating Watershed-Scale CSO Strategies with LCA 913
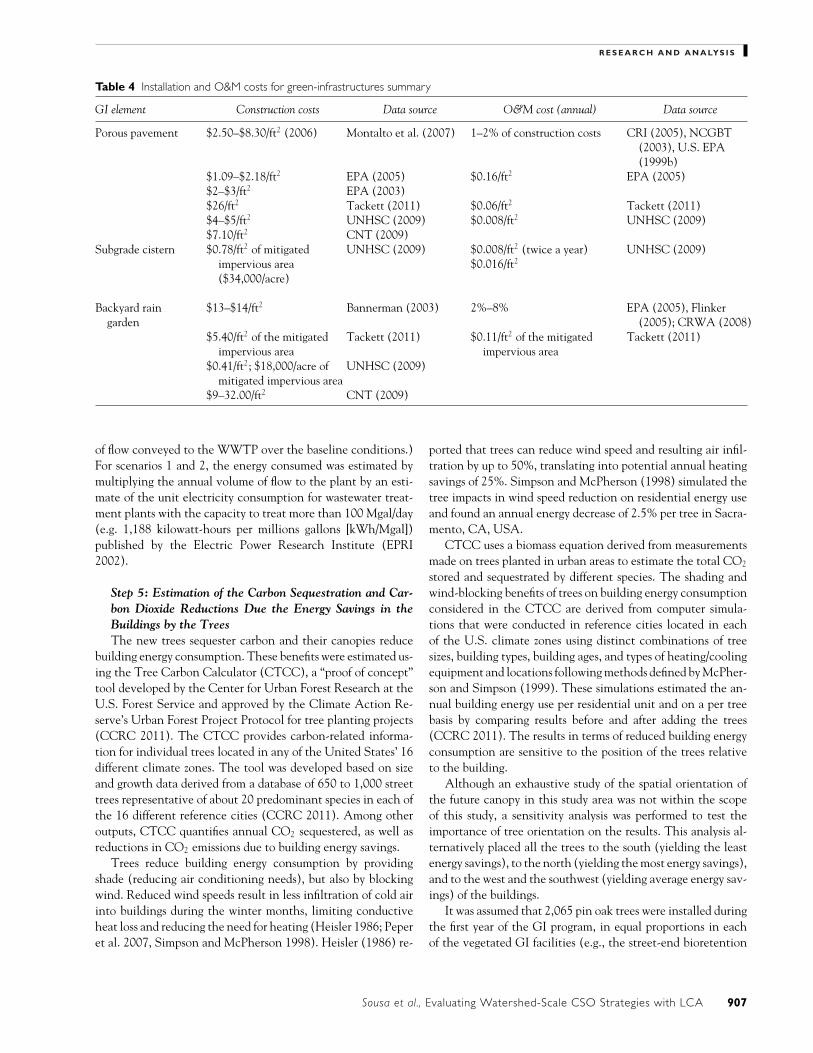
R E S E A R C H A N D A N A LYS I S
Table 4 Installation and OampM costs for green-infrastructures summary
GI element Construction costs Data source OampM cost (annual) Data source
Porous pavement $250ndash$830ft2 (2006) Montalto et al (2007) 1ndash2 of construction costs CRI (2005) NCGBT(2003) US EPA(1999b)
$109ndash$218ft2 EPA (2005) $016ft2 EPA (2005)$2ndash$3ft2 EPA (2003)$26ft2 Tackett (2011) $006ft2 Tackett (2011)$4ndash$5ft2 UNHSC (2009) $0008ft2 UNHSC (2009)$710ft2 CNT (2009)
Subgrade cistern $078ft2 of mitigatedimpervious area($34000acre)
UNHSC (2009) $0008ft2 (twice a year)$0016ft2
UNHSC (2009)
Backyard raingarden
$13ndash$14ft2 Bannerman (2003) 2ndash8 EPA (2005) Flinker(2005) CRWA (2008)
$540ft2 of the mitigatedimpervious area
Tackett (2011) $011ft2 of the mitigatedimpervious area
Tackett (2011)
$041ft2 $18000acre ofmitigated impervious area
UNHSC (2009)
$9ndash3200ft2 CNT (2009)
of flow conveyed to the WWTP over the baseline conditions)For scenarios 1 and 2 the energy consumed was estimated bymultiplying the annual volume of flow to the plant by an esti-mate of the unit electricity consumption for wastewater treat-ment plants with the capacity to treat more than 100 Mgalday(eg 1188 kilowatt-hours per millions gallons [kWhMgal])published by the Electric Power Research Institute (EPRI2002)
Step 5 Estimation of the Carbon Sequestration and Car-bon Dioxide Reductions Due the Energy Savings in theBuildings by the TreesThe new trees sequester carbon and their canopies reduce
building energy consumption These benefits were estimated us-ing the Tree Carbon Calculator (CTCC) a ldquoproof of conceptrdquotool developed by the Center for Urban Forest Research at theUS Forest Service and approved by the Climate Action Re-serversquos Urban Forest Project Protocol for tree planting projects(CCRC 2011) The CTCC provides carbon-related informa-tion for individual trees located in any of the United Statesrsquo 16different climate zones The tool was developed based on sizeand growth data derived from a database of 650 to 1000 streettrees representative of about 20 predominant species in each ofthe 16 different reference cities (CCRC 2011) Among otheroutputs CTCC quantifies annual CO2 sequestered as well asreductions in CO2 emissions due to building energy savings
Trees reduce building energy consumption by providingshade (reducing air conditioning needs) but also by blockingwind Reduced wind speeds result in less infiltration of cold airinto buildings during the winter months limiting conductiveheat loss and reducing the need for heating (Heisler 1986 Peperet al 2007 Simpson and McPherson 1998) Heisler (1986) re-
ported that trees can reduce wind speed and resulting air infil-tration by up to 50 translating into potential annual heatingsavings of 25 Simpson and McPherson (1998) simulated thetree impacts in wind speed reduction on residential energy useand found an annual energy decrease of 25 per tree in Sacra-mento CA USA
CTCC uses a biomass equation derived from measurementsmade on trees planted in urban areas to estimate the total CO2
stored and sequestrated by different species The shading andwind-blocking benefits of trees on building energy consumptionconsidered in the CTCC are derived from computer simula-tions that were conducted in reference cities located in eachof the US climate zones using distinct combinations of treesizes building types building ages and types of heatingcoolingequipment and locations following methods defined by McPher-son and Simpson (1999) These simulations estimated the an-nual building energy use per residential unit and on a per treebasis by comparing results before and after adding the trees(CCRC 2011) The results in terms of reduced building energyconsumption are sensitive to the position of the trees relativeto the building
Although an exhaustive study of the spatial orientation ofthe future canopy in this study area was not within the scopeof this study a sensitivity analysis was performed to test theimportance of tree orientation on the results This analysis al-ternatively placed all the trees to the south (yielding the leastenergy savings) to the north (yielding the most energy savings)and to the west and the southwest (yielding average energy sav-ings) of the buildings
It was assumed that 2065 pin oak trees were installed duringthe first year of the GI program in equal proportions in eachof the vegetated GI facilities (eg the street-end bioretention
Sousa et al Evaluating Watershed-Scale CSO Strategies with LCA 907
R E S E A R C H A N D A N A LYS I S
bump-out facilities curbside infiltration planters and backyardrain gardens)
The base analysis assumes all of the trees were planted onthe southwest side of a building (with the other orientationsconsidered only in the sensitivity analysis) Other assumptionsadopted for this coarse analysis were
bull US climate zone northeastbull Tree life span 50 yearsbull Building vintage 1950ndash1980bull Tree distance from the buildings 20 to 40 feet (ft)bull Buildings air conditioning equipment wallwindowbull Buildings heating equipment natural gasbull Electricity emissions factors (kilograms per megawatt hour
[kgMWh]) for Queens NY USA 4672 (CO2) 00030(methane [CH4]) and 00001 (nitrous oxide [N2O])(CCRC 2011)
bull Heating emissions factors (kilograms per million Britishthermal units [kgMBTU]) for natural gas 531 (CO2)00059 (CH4) and 00001 (N2O) (CCRC 2011)
Step 6 Energy and Greenhouse Gas Life Cycle ImpactsIn order to compare the environmental performance of the
three different scenarios three different sets of impacts were as-sembled Scenario 1 includes the impacts associated with con-structing operating and maintaining the GI as well as treatingthe increase in flow to the WWTP As described earlier theseemissions are mitigated partially by CO2 sequestration by thevegetation and the reduced building energy loads associatedwith shading and wind blocking For scenario 2 there are im-pacts associated with constructing operating and maintainingthe detention tank and also treating the increase in flow tothe treatment plant over the ldquodo nothingrdquo case (ie the totalvolume of overflows in the base condition is assumed to be de-tained for later conveyance to the WWTP increasing annualtreated flow) The impacts associated with scenario 3 includeconstruction and OampM of the new detention tanktreatmentoperations and no change in flow to the treatment plant (iethe total volume of existing overflows is assumed to be treatedin the new end-of-pipe facility and discharged directly to theriver at that location)
From the LCI we estimated global warming potential(GWP) using characterization factors from the Intergovern-mental Panel on Climate Change (IPCC 2007) that convertair emissions to carbon dioxide equivalents (CO2-eq)
The EIO-LCA model was used to estimate the GWP associ-ated with the construction activities for scenarios 2 and 3 andOampM activities for all three scenarios The US 1997 (483)National Purchase Price Model was selected using ldquoConstruc-tion IndustryWater Sewer and Pipeline Construction Sectorrdquoto represent construction activities in scenarios 2 and 3 ldquoMin-ing and Utilities IndustryWater Sewage and Other SystemsSectorrdquo was used to represent the OampM activities of scenarios 2and 3 and ldquoConstruction IndustryMaintenance and Repair ofNonresidential Buildings Sectorrdquo was used to represent OampMactivities associated with scenario 1
The annual net GWP emissions of the three scenarios iscomputed as follows
GWPSC1 = I1 + OampM1 + WWTP minus Trees (1)
GWPSC2 = I2 + OampM2 + WWTP (2)
GWPSC3 = I3 + OampM3 (3)
where I1 I2 and I3 represent the emissions associated with ini-tial construction activities for scenarios 1 2 and 3 respectivelyand are incurred only during year 1 OampM1 OampM2 and OampM3
are the cumulative OampM emissions associated with each of thethree different scenarios WWTP is the cumulative new emis-sions associated with energy consumption at the WWTP andTrees refers to the reduced GWP achieved through carbon se-questration and building energy savings due to shading andwind blockage by the trees
Results and Discussion
Installation of the GI in scenario 1 emitted 20000 t CO2-eq compared with 31500 t CO2-eq for the detention tank inscenario 2 and 100000 t CO2-eq for the tank and treatmentfacilities in scenario 3 (Figure 2) These results indicate that interms of initial emissions scenario 1 yielded superior environ-mental performance when compared with the grey infrastruc-ture options Of the total emissions associated with constructionof the GI the greatest contributions came from transportation(8500 t CO2-eq) followed by cement manufacturing and con-crete (8400 t CO2-eq) (Figure 2)
The annual net emissions for OampM for scenario 1 werealso significantly lower than those incurred in scenarios 2 and3 with significant cumulative effects over the 50-year studyperiod Cumulatively scenario 1 is expected to release 19000t CO2-eq compared with 85000 t CO2-eq for scenario 2 and400000 t CO2-eq for scenario 3 (Figure 3) The cumulativeOampM emissions associated with scenarios 2 and 3 amountedto 170 (scenario 2) and 300 (scenario 3) of their year 1construction emissions after 50 years of operation comparedwith the cumulative OampM emissions of scenario 1 which onlyincreased by 75 over its initial emissions
It is noteworthy that the carbon sequestration and savingsin energy accrued by the trees were a key part of the net annualemissions associated with the GI in scenario 1 By year 25 thetrees had grown sufficiently to completely mitigate the emissionsassociated with the total annual OampM emissions for all of theGI facilities After year 25 the reduction in emissions associatedwith the trees exceeds the annual emissions associated with allscenario 1 OampM activities providing negative loads
Another significant finding was the significant difference inemissions between the two grey scenarios (2 and 3) Over 50years scenario 2 releases 100000 t CO2-eq whereas scenario3 generates this quantity of emissions during initial construc-tion activities alone arriving at almost 400000 t CO2-eq incumulative emissions after 50 years
908 Journal of Industrial Ecology
R E S E A R C H A N D A N A LYS I S
Figure 2 Cradle-to-green infrastructure (GI) installation global warming potential (GWP) for three infrastructure scenarios Note Thefigure shows the dominant input contributions toward GWP from the process and economic input-output (EIO) models The ldquootherrdquocategory includes aggregated EIO sector inputs including primary aluminum production and lime production
Sensitivity Analyses
Two sensitivity analyses were performed to examine whetherthe findings hold up if the uncertain data sets used in the analysiswere allowed to vary within the full range of possible values Thefirst sensitivity analysis varied the emissions associated with theconstruction and OampM activities for each of the three scenariosThe second sensitivity analysis focused on the position of thetrees relative to buildings Each of these analyses is describedbelow
Sensitivity Analysis 1To consider the full range of possible emissions associated
with construction and OampM activities implied by each sce-
nario first the upper and lower bound on the emissions asso-ciated with initial construction needed to be computed Forscenarios 2 and 3 the original analysis used the average cost pergallon of annual CSO reduction as gleaned from the literatureIn the sensitivity analysis the upper and lower bounds of thedetention tank costs in scenario 2 were set at $070 and $037respectively For scenario 3 the upper and lower bounds of thedetentiontreatment facility costs were $245 and $105 respec-tively The same procedure could not be applied for scenario1 because the emissions were computed based on unit materialand transportation costs Instead the upper and lower boundsof emissions associated with GI installation were assumed to bethe average of the variance of the literature values for scenarios
Figure 3 Emissions over 50 years according to the different scenarios
Sousa et al Evaluating Watershed-Scale CSO Strategies with LCA 909
R E S E A R C H A N D A N A LYS I S
2 and 3 expressed as a percentage of the average value used inthe initial analysis
The next step was to compute the upper and lower boundsof the annual OampM costs The upper and lower bounds forscenario 1 were based on the values found in the literatureSince the OampM costs for scenarios 2 and 3 were expressed asranges of percentages of the installation costs these percentageswere applied to the upper and lower bounds of the installationcosts as computed per the above For example the lower boundwas found by multiplying the lower bound of the OampM costpercentages (08 for scenario 2 104 for scenario 3) by the
lower bound of the installation costs ($037gal for scenario2 $105gal for scenario 3) These products were used in theEIO-LCA model to derive the corresponding extreme emissionspossibilities The same approach was used to calculate the upperbounds
The results of the first sensitivity analysis are shown inFigure 4a There was very little overlap between the emis-sions envelopes associated with the range of possible emis-sions associated with the three different scenarios Hence thefirst sensitivity analysis reinforces the original findings namelythat the GI approach featured in scenario 1 is environmentally
Figure 4 Sensitivity analyses (a) Sensitivity analysis of the emissions over 50 years from the installation and operation and maintenance(OampM) activities of scenarios 1 2 and 3 Note The dashed line represents the base case results of the scenarios emissions (b) Sensitivityanalysis of the tree benefits considering the treesrsquo location north southwest west or south face of the building Note The dashed linerepresents just the carbon dioxide (CO2) sequestration provided by the trees over 50 years
910 Journal of Industrial Ecology
R E S E A R C H A N D A N A LYS I S
preferable to the grey approaches included in scenarios 2 and 3for the metrics studied
Sensitivity Analysis 2Regarding the avoided CO2 emissions associated with the
impact of trees on building energy consumption a second sen-sitive analysis was conducted to consider the effect of differ-ent positions of the trees relative to the buildings The entire50-year analysis was repeated four times with the trees alterna-tively positioned to the south (least expected energy savings)the north (most expected energy savings) the west and thesouthwest (average expected energy savings) of the buildings
It is noteworthy that the carbon sequestered by the treesdoes not vary with the position and represents 11227 t CO2-eq over 50 years The avoided CO2 emissions through buildingenergy savings provided by the trees ranged from 1614 t CO2-eq(south) to 14416 t CO2-eq (north) which when added to theCO2 sequestered (11227 t CO2-eq) resulted in from 12841 tCO2-eq (south) to 25643 t CO2-eq (north) of mitigated GWPemissions The results of this sensitivity analysis are shown inFigure 4b and indicate that the energy benefits provided by thetrees are a significant fraction of the total of CO2 emissionsdecrease provided by the trees but only when the trees are notplanted to the south
Conclusion
This research used LCA methods to compare the environ-mental performance of three different approaches to reducingCSOs to the Bronx River NYC To our knowledge this studywas the first attempt to apply LCA methods at this scale andin this application While all three scenarios were scaled toreduce CSOs equivalently they required different construc-tion and OampM activities and in the cases of scenarios 1 and2 would also engender changes in the volume of annual flowto the regional WWTP When the GHG emissions associatedwith construction operation and maintenance are accountedfor the CSO abatement strategy represented by scenario 1which treats runoff from approximately one-third of the to-tal drainage area in decentralized green infrastructure facilitiesthat collectively amount to an area that is approximately 5of the total drainage area results in significantly better envi-ronmental performance than the end-of-pipe detention or thecombined detention and treatment strategies Both in terms ofthe emissions during initial construction and the cumulativenet emissions released over the first 50 years of operation thegreen infrastructure approach results in fewer emissions thaneither of the two grey approaches
This kind of analysis is limited by the availability of the req-uisite data sets Two sensitivity analyses varied the emissionsassociated with construction operation and maintenance ac-tivities and also the placement of the trees These analysesfurther reinforce the original conclusion that is that the fullrange of possible emissions associated with the green approach
will be significantly lower than those associated with the twogrey strategies
By conservatively assuming that the new GI would includeonly about 2000 new pin oak trees and no understory thecarbon sequestered and shading provided by the trees is firstable to fully offset the annual OampM emissions during year 25Further tree growth after year 25 exceeds the annual emissionsand begins to ldquopay backrdquo the emissions associated with initialconstruction of the GI network However this portion of theanalysis should be validated with actual studies documentingthe growth rates canopy configurations carbon sequestrationshading and wind protection provided by urban trees as wellas similar studies on other types of vegetation (shrubs grassesflowers etc) commonly planted in urban GI systems Very fewsuch studies have been performed to date
It should also be noted that this study did not quantifythe GHG emissions associated with other potential services(eg reduced pavement temperatures improved air qualityenhanced habitat etc) and disservices (eg increased street-sweeping requirements enhanced flooding potential etc) thatcould be brought about by watershed-scale implementation ofGI Additional research is needed to establish the relative im-portance of such factors in determining environmental perfor-mance Additional work is also needed to inventory the con-struction and OampM activities and costs associated with greenand grey CSO abatement strategies for which published datasets are currently quite limited Finally given all of the spatialinfrastructural economic social and other constraints presentin twenty-first-century cities the level of penetration that greeninfrastructure technologies will actually have in urban water-sheds still remains to be seen Nonetheless this study suggeststhat watershed managers who seek to reduce CSOs and reducemunicipal carbon footprints should opt for a green approachover a grey one
Acknowledgements
The authors are grateful to Nandan Shetty from the NewYork City Department of Parks and Recreation Sri Rangarajanand Chenchen Li from HDR Tracy Tackett from Seattle PublicUtilities Alan Cohn from the New York City Department ofEnvironmental Protection and Alisha Goldstein all of whomassisted in identifying different data sets used in this project
Notes
1 One gallon (gal) asymp 379 liters (L) so 200 million gallons per day(Mgalday) asymp 758 million liters per day (MLday)
2 One hectare (ha) = 001 square kilometers (km2 SI) asymp 000386square miles (mi2) asymp 247 acres
3 One gallon asymp 0003785 cubic meters (m3) so 3712 million gallonsper year (Mgalyr) is equivalent to 014 million cubic meters peryear (Mm3yr)
4 One square foot (ft2) = 0093 square meters (m2)
Sousa et al Evaluating Watershed-Scale CSO Strategies with LCA 911
R E S E A R C H A N D A N A LYS I S
References
Adam D 2007 The unheralded polluter Cement industry comes cleanon its impact The Guardian [Brussels] 12 October
Bannerman R 2003 Rain gardens A how-to manual for homeownersPUB-WT-776 Madison WI USA Wisconsin Department ofNatural Resources
Baumann H and A M Tillman 2004 The hitch hikerrsquos guide to LCALund Sweden Studentlitteratur AB
Bilec M M R J Ries and H S Matthews 2010 Life-cycle assess-ment modeling of construction processes for buildings Journal ofInfrastructure Systems 16(3) 199ndash205 httpascelibraryorgisoresource1jitse4v16i3p199_s1 Accessed 6 December 2011
Blackhurst M C T Hendrickson and H S Matthews 2010 Cost-effectiveness of green roofs Journal of Architectural Engineering16(4) 136ndash143
Brehm D 2007 Nanoengineered concrete could cut carbon diox-ide emissions MITNEWS 14 February 2007 httpwebmitedunewsoffice2007concretehtml Accessed 1 December 2011
CCRC (Center for Urban Forest Research) 2011 The Center forUrban Forest Research tree carbon calculator wwwfsfedusccrctopicsurban-forestsctcc Accessed 7 August 2011
City of Akron 1999 Facilities plan rsquo98 Akron OH USA wwwciakronohusCSOFP98FI1PDF Accessed 5 August 2011
City of New York 2010 NYC green infrastructure plan A sustainablestrategy for clean waterways City of New York NY USAwwwnycgovhtmldeppdfgreen_infrastructureNYCGreenIn-frastructurePlan_HighRespdf Accessed 15 April 2011
CNT (Center for Neighborhood Technology) 2009 Greenvalues calculator benefit details httpgreenvaluescntorgnationalbenefits detailphpreduced-treatment Accessed 12June 2011
CRI (Conservation Research Institute) 2005 Changing cost percep-tions An analysis of conservation development wwwcdfinccomCDF_ResourcesCost20Analysis20-20Part20120-20Report20-20with20Exec20Summarypdf Accessed5 August 2011
CRWA (Charles River Watershed Association) 2008 Blackstonetown hall demonstration project Evaluation of low impact de-velopment (LID) best management practices (BMPs) opportu-nities wwwcrwaorgprojectsblackstonelid evaluationpdf Ac-cessed 10 June 2011
DWSD (Detroit Water and Sewerage Department) 2003 Wastewatermaster plan DWSD project no CS-1314 Technical feasibility ofa wet weather flow treatment facility Detroit MI USA DWSD
EPRI (Electric Power Research Institute) 2002 Water and sus-tainability (Volume 4) US electricity consumption for watersupply and treatmentmdashThe next half century wwwcircleofblueorgwaternewswp-contentuploads201008EPRI-Volume-4pdfAccessed 19 April 2011
Flinker P 2005 Green rooftop systems In Urban environmentaldesign manual Providence RI USA Rhode Island Depart-ment of Environmental Management wwwdemrigovprogramsbpoladmsuswshedpubshtm Accessed 5 June 2011
Goldstein A 2011 Comparison of a high and low spatial resolutionmodel for an urban block and implications for depicting low im-pact development Masterrsquos thesis Drexel University Philadel-phia PA USA
Goldstein A and F A Montalto 2012 Comparison of a high and lowspatial resolution model for an urban block Journal of HydrologicEngineering Submitted for publication
Green Design Institute 2011 Economic input-output life cycle assess-ment wwweiolcanet Accessed 20 May 2011
Heisler G M 1986 Energy savings with trees Journal of Arboriculture12(5) 113ndash125
Hendrickson C T L B Lave and H S Matthews 2006 Environ-mental life cycle assessment of goods and services Washington DCUSA Resources for the Future
Hendriks C A E Worrell D de Jager K Blok and P Rieme 2004Emission reduction of greenhouse gases from the cement industryPaper presented at the Greenhouse Gas Control TechnologiesConference 5 September Vancouver BC Canada
Herstein Y R Filion and K R Hall 2009 Evaluating environmentalimpact in water distribution system design Journal of InfrastructureSystems 15(3) 241ndash250
IPCC 2007 Intergovernmental panel on climate change In Climatechange 2007 The physical science basis Contribution of workinggroup I to the fourth assessment report of the intergovernmentalpanel on climate change edited by S Solomon et al CambridgeCambridge University Press
ISO (International Organization for Standardization) 2006 ISO14044 Environmental management mdash Life cycle assessment mdash Re-quirements and guidelines Geneva Switzerland ISO
Kloss C Personal communication with Christopher Kloss GreenInfrastructure Coordinator US Environmental ProtectionAgency Office of Water 12 January 2012
Kosareo L and R Reis 2007 Comparative environmental life cycleassessment of green roofs Building and Environment 42(11) 2606ndash2613
Li C and S Rangarajan 2011 Technical Memorandum on Up-scalingof Drexel Universityrsquos Pilot Project to HP-009 Drainage AreaMahwah NJ HDR|HydroQual
MacMullan E and S Reich 2007 The economics of low-impact devel-opment A literature review Eugene OR USA ECONorthwest
Martin J 2011 Personal communication with Jeff Martin landscapearchitect New York City Department of Parks and Recreation14 April 2011
McPherson E G and J R Simpson 1999 Carbon dioxide reductionsthrough urban forestry Guidelines for professional and volun-teer tree planters General Technical Report PSW-171 AlbanyCA USDA Forest Service Pacific Southwest Research Station237 wwwfsfeduspswprogramsuesduepproductscufr_43pdfAccessed 6 December 2011
Montalto F C Behr K Alfredo M Wolf M Arye and M Walsh2007 Rapid assessment of the cost-effectiveness of low impact de-velopment for CSO control Landscape and Urban Planning 82(3)117ndash131
NCGBT (North Carolina Green Building Technology Database)2003 Pervious paving details for Chadbourn Street Townof Wrightsville Beach January 2 2006 httpwwwncgreenbuildingorgsitencgpublictechsearchresultscfmprojectid=93ampcategory=6ampparameter=98ampclicked=true Accessed August 102011
NYNewsday 2004 wwwnewsdaycomnewsnew-pact-stirs-up-old-stink-1650186 Accessed 10 July 2011
NYC DEP (New York City Department of Environmen-tal Protection) 2007 Flushing Bay waterbodywatershedfacility plan wwwhydroqualcomProjectsltcpwbwsflushing_bayflushing_bay_section_7pdf Accessed 20 July 2011
NYC DEP (New York City Department of Environmental Protec-tion) 2011 New York Cityrsquos wastewater treatment systemwwwnycgovhtmldeppdfwwsystempdf Accessed 21 July 2011
912 Journal of Industrial Ecology
R E S E A R C H A N D A N A LYS I S
Peper P J E G McPherson J R Simpson S L Gardner K E Vargasand Q Xiao 2007 New York City New York municipal forestresource analysis Technical Report Davis CA USA Center forUrban Forest Research
PRe Consultants 2007 SimaPro 71 LCA software Amersfoort theNetherlands
PWD (Philadelphia Water Department) 2009 Philadelphia com-bined sewer overflow long term control plan update wwwphillywatershedsorgltcpuVol02_TBLpdf Accessed 20 August 2011
Racoviceanu A I B W Karney C A Kennedy and A F Colombo2007 Life-cycle energy use and greenhouse gas emissions inven-tory for water treatment systems Journal of Infrastructure Systems13(4) 261ndash270
Saiz S C Kennedy B Bass and K Pressnail 2006 Comparativelife cycle assessment of standard and green roofs EnvironmentalScience and Technology 40(13) 4312ndash4316
Sharrard A L 2007 Greening construction processes using an input-output-based hybrid life cycle assessment model PhD thesisCarnegie Mellon University Pittsburgh PA USA
Shetty N 2011 Personal communication with N Shetty New YorkCity Department of Parks and Recreation 10 April 2011
Simpson J R and E G McPherson 1998 Simulation of tree shadeimpacts on residential energy use for space conditioning in Sacra-mento Atmospheric Environment Urban Atmospheres 32(1) 69ndash74
Spatari S Z Yu and F A Montalto 2011 Life cycle implicationsof urban green infrastructure Environmental Pollution 159(8ndash9)2174ndash2179
Stokes J R and A Horvath 2010 Supply-chain environ-mental effects of wastewater utilities Environmental ResearchLetters 5(2010) 014015 DOI 1010881748-932651014015httpiopscienceioporg1748-932651014015 Accessed 5 De-cember 2011
Stormchamber 2011 Stormchamber design manual wwwstormchamberscompdfStormChamberDesignManualpdf Accessed 7July 2011
Suh S M Lenzen G J Treloar H Hondo A Horvath G Huppes OJolliet U Klann W Krewitt Y Moriguchi J Munksgaard andG Norris 2004 System boundary selection in life-cycle invento-ries using hybrid approaches Environmental Science amp Technology38(3) 657ndash664
Tackett T 2011 Personal communication with Tracy Tackett LID
Program Manager Urban Watersheds Division Seattle PublicUtilities Seattle WA USA 10 August 2011
UNHSC (University of New Hampshire Stormwater Center) 2009Biannual report Durham NH USA
US EPA (US Environmental Protection Agency) 1999a Combinedsewer overflow management fact sheet Retention basins EPA832-F99-042 US EPA Office of Water Washington DC USA
US EPA (US Environmental Protection Agency) 1999b Stormwa-ter technology fact sheet Porous pavement httpwwwepagovowmmtbporouspapdf Accessed 1 August 2011
US EPA (US Environmental Protection Agency) 2005 Nationalmanagement measures to control nonpoint source pollution from urbanareas Washington DC USA US EPA
US EPA (US Environmental Protection Agency) 2007 Re-ducing stormwater costs through low impact development(LID) strategies and practices December 2007 wwwepagovowowNPSlidcosts07documentsreducingstormwatercostspdfAccessed 19 June 2011
US EPA (US Environmental Protection Agency) 2011 Storm wa-ter management model (SWMM) httpwwwepagovathenswwqtschtmlswmmhtml Accessed 18 May 2011
Wakeley H L C T Hendrickson W M Griffin and H SMatthews 2009 Economic and environmental transportation ef-fects of large-scale ethanol production and distribution in theUnited States Environmental Science amp Technology 43(7) 2228ndash2233
Wise S J Braden D Ghalayini J Grant C Kloss E MacMullan SMorse F Montalto D Nees D Nowak S Peck S Shaikh andC Yu Integrating valuation methods to recognize green infras-tructurersquos multiple benefits wwwcntorgrepositoryCNT-LID-paperpdf Accessed 20 May 2011
Zukovs G and J Marsalek 2004 Planning and design combined seweroverflow treatment Water Quality Research Journal of Canada39(4)439ndash448
About the Authors
Maria R C De Sousa is a PhD student and Franco Mon-talto and Sabrina Spatari are assistant professors in the Depart-ment of Civil Architectural and Environmental Engineeringat Drexel University Philadelphia PA USA
Sousa et al Evaluating Watershed-Scale CSO Strategies with LCA 913
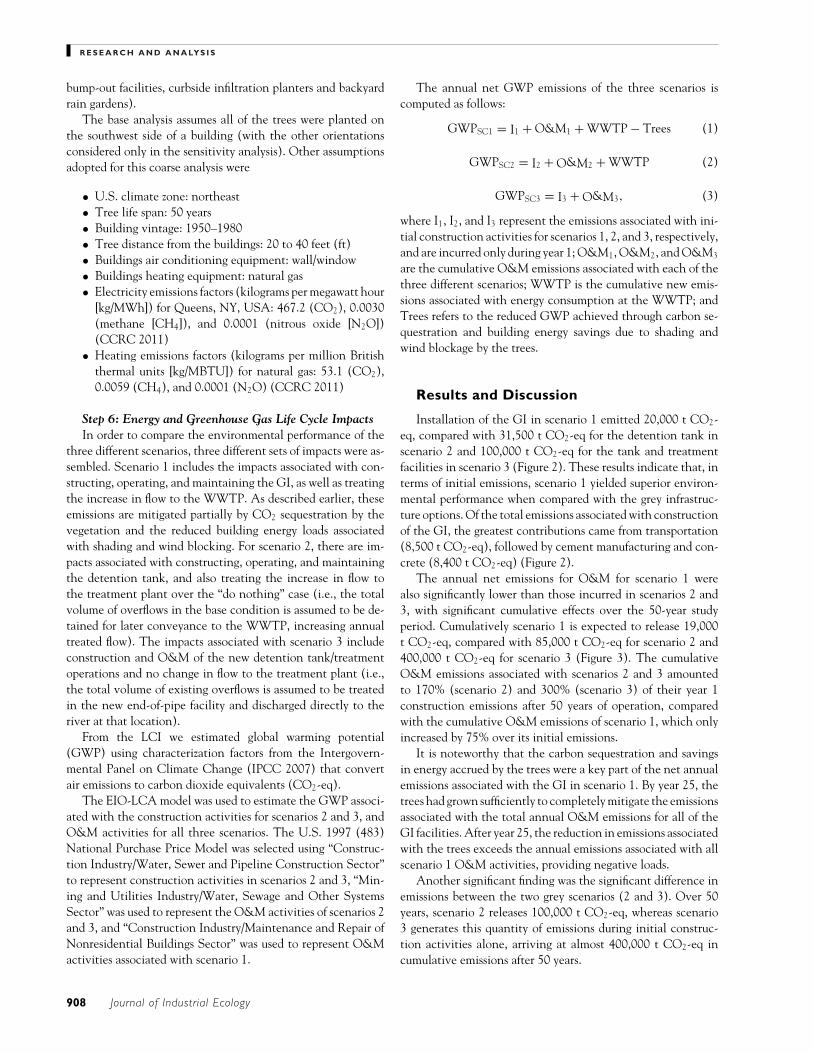
R E S E A R C H A N D A N A LYS I S
bump-out facilities curbside infiltration planters and backyardrain gardens)
The base analysis assumes all of the trees were planted onthe southwest side of a building (with the other orientationsconsidered only in the sensitivity analysis) Other assumptionsadopted for this coarse analysis were
bull US climate zone northeastbull Tree life span 50 yearsbull Building vintage 1950ndash1980bull Tree distance from the buildings 20 to 40 feet (ft)bull Buildings air conditioning equipment wallwindowbull Buildings heating equipment natural gasbull Electricity emissions factors (kilograms per megawatt hour
[kgMWh]) for Queens NY USA 4672 (CO2) 00030(methane [CH4]) and 00001 (nitrous oxide [N2O])(CCRC 2011)
bull Heating emissions factors (kilograms per million Britishthermal units [kgMBTU]) for natural gas 531 (CO2)00059 (CH4) and 00001 (N2O) (CCRC 2011)
Step 6 Energy and Greenhouse Gas Life Cycle ImpactsIn order to compare the environmental performance of the
three different scenarios three different sets of impacts were as-sembled Scenario 1 includes the impacts associated with con-structing operating and maintaining the GI as well as treatingthe increase in flow to the WWTP As described earlier theseemissions are mitigated partially by CO2 sequestration by thevegetation and the reduced building energy loads associatedwith shading and wind blocking For scenario 2 there are im-pacts associated with constructing operating and maintainingthe detention tank and also treating the increase in flow tothe treatment plant over the ldquodo nothingrdquo case (ie the totalvolume of overflows in the base condition is assumed to be de-tained for later conveyance to the WWTP increasing annualtreated flow) The impacts associated with scenario 3 includeconstruction and OampM of the new detention tanktreatmentoperations and no change in flow to the treatment plant (iethe total volume of existing overflows is assumed to be treatedin the new end-of-pipe facility and discharged directly to theriver at that location)
From the LCI we estimated global warming potential(GWP) using characterization factors from the Intergovern-mental Panel on Climate Change (IPCC 2007) that convertair emissions to carbon dioxide equivalents (CO2-eq)
The EIO-LCA model was used to estimate the GWP associ-ated with the construction activities for scenarios 2 and 3 andOampM activities for all three scenarios The US 1997 (483)National Purchase Price Model was selected using ldquoConstruc-tion IndustryWater Sewer and Pipeline Construction Sectorrdquoto represent construction activities in scenarios 2 and 3 ldquoMin-ing and Utilities IndustryWater Sewage and Other SystemsSectorrdquo was used to represent the OampM activities of scenarios 2and 3 and ldquoConstruction IndustryMaintenance and Repair ofNonresidential Buildings Sectorrdquo was used to represent OampMactivities associated with scenario 1
The annual net GWP emissions of the three scenarios iscomputed as follows
GWPSC1 = I1 + OampM1 + WWTP minus Trees (1)
GWPSC2 = I2 + OampM2 + WWTP (2)
GWPSC3 = I3 + OampM3 (3)
where I1 I2 and I3 represent the emissions associated with ini-tial construction activities for scenarios 1 2 and 3 respectivelyand are incurred only during year 1 OampM1 OampM2 and OampM3
are the cumulative OampM emissions associated with each of thethree different scenarios WWTP is the cumulative new emis-sions associated with energy consumption at the WWTP andTrees refers to the reduced GWP achieved through carbon se-questration and building energy savings due to shading andwind blockage by the trees
Results and Discussion
Installation of the GI in scenario 1 emitted 20000 t CO2-eq compared with 31500 t CO2-eq for the detention tank inscenario 2 and 100000 t CO2-eq for the tank and treatmentfacilities in scenario 3 (Figure 2) These results indicate that interms of initial emissions scenario 1 yielded superior environ-mental performance when compared with the grey infrastruc-ture options Of the total emissions associated with constructionof the GI the greatest contributions came from transportation(8500 t CO2-eq) followed by cement manufacturing and con-crete (8400 t CO2-eq) (Figure 2)
The annual net emissions for OampM for scenario 1 werealso significantly lower than those incurred in scenarios 2 and3 with significant cumulative effects over the 50-year studyperiod Cumulatively scenario 1 is expected to release 19000t CO2-eq compared with 85000 t CO2-eq for scenario 2 and400000 t CO2-eq for scenario 3 (Figure 3) The cumulativeOampM emissions associated with scenarios 2 and 3 amountedto 170 (scenario 2) and 300 (scenario 3) of their year 1construction emissions after 50 years of operation comparedwith the cumulative OampM emissions of scenario 1 which onlyincreased by 75 over its initial emissions
It is noteworthy that the carbon sequestration and savingsin energy accrued by the trees were a key part of the net annualemissions associated with the GI in scenario 1 By year 25 thetrees had grown sufficiently to completely mitigate the emissionsassociated with the total annual OampM emissions for all of theGI facilities After year 25 the reduction in emissions associatedwith the trees exceeds the annual emissions associated with allscenario 1 OampM activities providing negative loads
Another significant finding was the significant difference inemissions between the two grey scenarios (2 and 3) Over 50years scenario 2 releases 100000 t CO2-eq whereas scenario3 generates this quantity of emissions during initial construc-tion activities alone arriving at almost 400000 t CO2-eq incumulative emissions after 50 years
908 Journal of Industrial Ecology
R E S E A R C H A N D A N A LYS I S
Figure 2 Cradle-to-green infrastructure (GI) installation global warming potential (GWP) for three infrastructure scenarios Note Thefigure shows the dominant input contributions toward GWP from the process and economic input-output (EIO) models The ldquootherrdquocategory includes aggregated EIO sector inputs including primary aluminum production and lime production
Sensitivity Analyses
Two sensitivity analyses were performed to examine whetherthe findings hold up if the uncertain data sets used in the analysiswere allowed to vary within the full range of possible values Thefirst sensitivity analysis varied the emissions associated with theconstruction and OampM activities for each of the three scenariosThe second sensitivity analysis focused on the position of thetrees relative to buildings Each of these analyses is describedbelow
Sensitivity Analysis 1To consider the full range of possible emissions associated
with construction and OampM activities implied by each sce-
nario first the upper and lower bound on the emissions asso-ciated with initial construction needed to be computed Forscenarios 2 and 3 the original analysis used the average cost pergallon of annual CSO reduction as gleaned from the literatureIn the sensitivity analysis the upper and lower bounds of thedetention tank costs in scenario 2 were set at $070 and $037respectively For scenario 3 the upper and lower bounds of thedetentiontreatment facility costs were $245 and $105 respec-tively The same procedure could not be applied for scenario1 because the emissions were computed based on unit materialand transportation costs Instead the upper and lower boundsof emissions associated with GI installation were assumed to bethe average of the variance of the literature values for scenarios
Figure 3 Emissions over 50 years according to the different scenarios
Sousa et al Evaluating Watershed-Scale CSO Strategies with LCA 909
R E S E A R C H A N D A N A LYS I S
2 and 3 expressed as a percentage of the average value used inthe initial analysis
The next step was to compute the upper and lower boundsof the annual OampM costs The upper and lower bounds forscenario 1 were based on the values found in the literatureSince the OampM costs for scenarios 2 and 3 were expressed asranges of percentages of the installation costs these percentageswere applied to the upper and lower bounds of the installationcosts as computed per the above For example the lower boundwas found by multiplying the lower bound of the OampM costpercentages (08 for scenario 2 104 for scenario 3) by the
lower bound of the installation costs ($037gal for scenario2 $105gal for scenario 3) These products were used in theEIO-LCA model to derive the corresponding extreme emissionspossibilities The same approach was used to calculate the upperbounds
The results of the first sensitivity analysis are shown inFigure 4a There was very little overlap between the emis-sions envelopes associated with the range of possible emis-sions associated with the three different scenarios Hence thefirst sensitivity analysis reinforces the original findings namelythat the GI approach featured in scenario 1 is environmentally
Figure 4 Sensitivity analyses (a) Sensitivity analysis of the emissions over 50 years from the installation and operation and maintenance(OampM) activities of scenarios 1 2 and 3 Note The dashed line represents the base case results of the scenarios emissions (b) Sensitivityanalysis of the tree benefits considering the treesrsquo location north southwest west or south face of the building Note The dashed linerepresents just the carbon dioxide (CO2) sequestration provided by the trees over 50 years
910 Journal of Industrial Ecology
R E S E A R C H A N D A N A LYS I S
preferable to the grey approaches included in scenarios 2 and 3for the metrics studied
Sensitivity Analysis 2Regarding the avoided CO2 emissions associated with the
impact of trees on building energy consumption a second sen-sitive analysis was conducted to consider the effect of differ-ent positions of the trees relative to the buildings The entire50-year analysis was repeated four times with the trees alterna-tively positioned to the south (least expected energy savings)the north (most expected energy savings) the west and thesouthwest (average expected energy savings) of the buildings
It is noteworthy that the carbon sequestered by the treesdoes not vary with the position and represents 11227 t CO2-eq over 50 years The avoided CO2 emissions through buildingenergy savings provided by the trees ranged from 1614 t CO2-eq(south) to 14416 t CO2-eq (north) which when added to theCO2 sequestered (11227 t CO2-eq) resulted in from 12841 tCO2-eq (south) to 25643 t CO2-eq (north) of mitigated GWPemissions The results of this sensitivity analysis are shown inFigure 4b and indicate that the energy benefits provided by thetrees are a significant fraction of the total of CO2 emissionsdecrease provided by the trees but only when the trees are notplanted to the south
Conclusion
This research used LCA methods to compare the environ-mental performance of three different approaches to reducingCSOs to the Bronx River NYC To our knowledge this studywas the first attempt to apply LCA methods at this scale andin this application While all three scenarios were scaled toreduce CSOs equivalently they required different construc-tion and OampM activities and in the cases of scenarios 1 and2 would also engender changes in the volume of annual flowto the regional WWTP When the GHG emissions associatedwith construction operation and maintenance are accountedfor the CSO abatement strategy represented by scenario 1which treats runoff from approximately one-third of the to-tal drainage area in decentralized green infrastructure facilitiesthat collectively amount to an area that is approximately 5of the total drainage area results in significantly better envi-ronmental performance than the end-of-pipe detention or thecombined detention and treatment strategies Both in terms ofthe emissions during initial construction and the cumulativenet emissions released over the first 50 years of operation thegreen infrastructure approach results in fewer emissions thaneither of the two grey approaches
This kind of analysis is limited by the availability of the req-uisite data sets Two sensitivity analyses varied the emissionsassociated with construction operation and maintenance ac-tivities and also the placement of the trees These analysesfurther reinforce the original conclusion that is that the fullrange of possible emissions associated with the green approach
will be significantly lower than those associated with the twogrey strategies
By conservatively assuming that the new GI would includeonly about 2000 new pin oak trees and no understory thecarbon sequestered and shading provided by the trees is firstable to fully offset the annual OampM emissions during year 25Further tree growth after year 25 exceeds the annual emissionsand begins to ldquopay backrdquo the emissions associated with initialconstruction of the GI network However this portion of theanalysis should be validated with actual studies documentingthe growth rates canopy configurations carbon sequestrationshading and wind protection provided by urban trees as wellas similar studies on other types of vegetation (shrubs grassesflowers etc) commonly planted in urban GI systems Very fewsuch studies have been performed to date
It should also be noted that this study did not quantifythe GHG emissions associated with other potential services(eg reduced pavement temperatures improved air qualityenhanced habitat etc) and disservices (eg increased street-sweeping requirements enhanced flooding potential etc) thatcould be brought about by watershed-scale implementation ofGI Additional research is needed to establish the relative im-portance of such factors in determining environmental perfor-mance Additional work is also needed to inventory the con-struction and OampM activities and costs associated with greenand grey CSO abatement strategies for which published datasets are currently quite limited Finally given all of the spatialinfrastructural economic social and other constraints presentin twenty-first-century cities the level of penetration that greeninfrastructure technologies will actually have in urban water-sheds still remains to be seen Nonetheless this study suggeststhat watershed managers who seek to reduce CSOs and reducemunicipal carbon footprints should opt for a green approachover a grey one
Acknowledgements
The authors are grateful to Nandan Shetty from the NewYork City Department of Parks and Recreation Sri Rangarajanand Chenchen Li from HDR Tracy Tackett from Seattle PublicUtilities Alan Cohn from the New York City Department ofEnvironmental Protection and Alisha Goldstein all of whomassisted in identifying different data sets used in this project
Notes
1 One gallon (gal) asymp 379 liters (L) so 200 million gallons per day(Mgalday) asymp 758 million liters per day (MLday)
2 One hectare (ha) = 001 square kilometers (km2 SI) asymp 000386square miles (mi2) asymp 247 acres
3 One gallon asymp 0003785 cubic meters (m3) so 3712 million gallonsper year (Mgalyr) is equivalent to 014 million cubic meters peryear (Mm3yr)
4 One square foot (ft2) = 0093 square meters (m2)
Sousa et al Evaluating Watershed-Scale CSO Strategies with LCA 911
R E S E A R C H A N D A N A LYS I S
References
Adam D 2007 The unheralded polluter Cement industry comes cleanon its impact The Guardian [Brussels] 12 October
Bannerman R 2003 Rain gardens A how-to manual for homeownersPUB-WT-776 Madison WI USA Wisconsin Department ofNatural Resources
Baumann H and A M Tillman 2004 The hitch hikerrsquos guide to LCALund Sweden Studentlitteratur AB
Bilec M M R J Ries and H S Matthews 2010 Life-cycle assess-ment modeling of construction processes for buildings Journal ofInfrastructure Systems 16(3) 199ndash205 httpascelibraryorgisoresource1jitse4v16i3p199_s1 Accessed 6 December 2011
Blackhurst M C T Hendrickson and H S Matthews 2010 Cost-effectiveness of green roofs Journal of Architectural Engineering16(4) 136ndash143
Brehm D 2007 Nanoengineered concrete could cut carbon diox-ide emissions MITNEWS 14 February 2007 httpwebmitedunewsoffice2007concretehtml Accessed 1 December 2011
CCRC (Center for Urban Forest Research) 2011 The Center forUrban Forest Research tree carbon calculator wwwfsfedusccrctopicsurban-forestsctcc Accessed 7 August 2011
City of Akron 1999 Facilities plan rsquo98 Akron OH USA wwwciakronohusCSOFP98FI1PDF Accessed 5 August 2011
City of New York 2010 NYC green infrastructure plan A sustainablestrategy for clean waterways City of New York NY USAwwwnycgovhtmldeppdfgreen_infrastructureNYCGreenIn-frastructurePlan_HighRespdf Accessed 15 April 2011
CNT (Center for Neighborhood Technology) 2009 Greenvalues calculator benefit details httpgreenvaluescntorgnationalbenefits detailphpreduced-treatment Accessed 12June 2011
CRI (Conservation Research Institute) 2005 Changing cost percep-tions An analysis of conservation development wwwcdfinccomCDF_ResourcesCost20Analysis20-20Part20120-20Report20-20with20Exec20Summarypdf Accessed5 August 2011
CRWA (Charles River Watershed Association) 2008 Blackstonetown hall demonstration project Evaluation of low impact de-velopment (LID) best management practices (BMPs) opportu-nities wwwcrwaorgprojectsblackstonelid evaluationpdf Ac-cessed 10 June 2011
DWSD (Detroit Water and Sewerage Department) 2003 Wastewatermaster plan DWSD project no CS-1314 Technical feasibility ofa wet weather flow treatment facility Detroit MI USA DWSD
EPRI (Electric Power Research Institute) 2002 Water and sus-tainability (Volume 4) US electricity consumption for watersupply and treatmentmdashThe next half century wwwcircleofblueorgwaternewswp-contentuploads201008EPRI-Volume-4pdfAccessed 19 April 2011
Flinker P 2005 Green rooftop systems In Urban environmentaldesign manual Providence RI USA Rhode Island Depart-ment of Environmental Management wwwdemrigovprogramsbpoladmsuswshedpubshtm Accessed 5 June 2011
Goldstein A 2011 Comparison of a high and low spatial resolutionmodel for an urban block and implications for depicting low im-pact development Masterrsquos thesis Drexel University Philadel-phia PA USA
Goldstein A and F A Montalto 2012 Comparison of a high and lowspatial resolution model for an urban block Journal of HydrologicEngineering Submitted for publication
Green Design Institute 2011 Economic input-output life cycle assess-ment wwweiolcanet Accessed 20 May 2011
Heisler G M 1986 Energy savings with trees Journal of Arboriculture12(5) 113ndash125
Hendrickson C T L B Lave and H S Matthews 2006 Environ-mental life cycle assessment of goods and services Washington DCUSA Resources for the Future
Hendriks C A E Worrell D de Jager K Blok and P Rieme 2004Emission reduction of greenhouse gases from the cement industryPaper presented at the Greenhouse Gas Control TechnologiesConference 5 September Vancouver BC Canada
Herstein Y R Filion and K R Hall 2009 Evaluating environmentalimpact in water distribution system design Journal of InfrastructureSystems 15(3) 241ndash250
IPCC 2007 Intergovernmental panel on climate change In Climatechange 2007 The physical science basis Contribution of workinggroup I to the fourth assessment report of the intergovernmentalpanel on climate change edited by S Solomon et al CambridgeCambridge University Press
ISO (International Organization for Standardization) 2006 ISO14044 Environmental management mdash Life cycle assessment mdash Re-quirements and guidelines Geneva Switzerland ISO
Kloss C Personal communication with Christopher Kloss GreenInfrastructure Coordinator US Environmental ProtectionAgency Office of Water 12 January 2012
Kosareo L and R Reis 2007 Comparative environmental life cycleassessment of green roofs Building and Environment 42(11) 2606ndash2613
Li C and S Rangarajan 2011 Technical Memorandum on Up-scalingof Drexel Universityrsquos Pilot Project to HP-009 Drainage AreaMahwah NJ HDR|HydroQual
MacMullan E and S Reich 2007 The economics of low-impact devel-opment A literature review Eugene OR USA ECONorthwest
Martin J 2011 Personal communication with Jeff Martin landscapearchitect New York City Department of Parks and Recreation14 April 2011
McPherson E G and J R Simpson 1999 Carbon dioxide reductionsthrough urban forestry Guidelines for professional and volun-teer tree planters General Technical Report PSW-171 AlbanyCA USDA Forest Service Pacific Southwest Research Station237 wwwfsfeduspswprogramsuesduepproductscufr_43pdfAccessed 6 December 2011
Montalto F C Behr K Alfredo M Wolf M Arye and M Walsh2007 Rapid assessment of the cost-effectiveness of low impact de-velopment for CSO control Landscape and Urban Planning 82(3)117ndash131
NCGBT (North Carolina Green Building Technology Database)2003 Pervious paving details for Chadbourn Street Townof Wrightsville Beach January 2 2006 httpwwwncgreenbuildingorgsitencgpublictechsearchresultscfmprojectid=93ampcategory=6ampparameter=98ampclicked=true Accessed August 102011
NYNewsday 2004 wwwnewsdaycomnewsnew-pact-stirs-up-old-stink-1650186 Accessed 10 July 2011
NYC DEP (New York City Department of Environmen-tal Protection) 2007 Flushing Bay waterbodywatershedfacility plan wwwhydroqualcomProjectsltcpwbwsflushing_bayflushing_bay_section_7pdf Accessed 20 July 2011
NYC DEP (New York City Department of Environmental Protec-tion) 2011 New York Cityrsquos wastewater treatment systemwwwnycgovhtmldeppdfwwsystempdf Accessed 21 July 2011
912 Journal of Industrial Ecology
R E S E A R C H A N D A N A LYS I S
Peper P J E G McPherson J R Simpson S L Gardner K E Vargasand Q Xiao 2007 New York City New York municipal forestresource analysis Technical Report Davis CA USA Center forUrban Forest Research
PRe Consultants 2007 SimaPro 71 LCA software Amersfoort theNetherlands
PWD (Philadelphia Water Department) 2009 Philadelphia com-bined sewer overflow long term control plan update wwwphillywatershedsorgltcpuVol02_TBLpdf Accessed 20 August 2011
Racoviceanu A I B W Karney C A Kennedy and A F Colombo2007 Life-cycle energy use and greenhouse gas emissions inven-tory for water treatment systems Journal of Infrastructure Systems13(4) 261ndash270
Saiz S C Kennedy B Bass and K Pressnail 2006 Comparativelife cycle assessment of standard and green roofs EnvironmentalScience and Technology 40(13) 4312ndash4316
Sharrard A L 2007 Greening construction processes using an input-output-based hybrid life cycle assessment model PhD thesisCarnegie Mellon University Pittsburgh PA USA
Shetty N 2011 Personal communication with N Shetty New YorkCity Department of Parks and Recreation 10 April 2011
Simpson J R and E G McPherson 1998 Simulation of tree shadeimpacts on residential energy use for space conditioning in Sacra-mento Atmospheric Environment Urban Atmospheres 32(1) 69ndash74
Spatari S Z Yu and F A Montalto 2011 Life cycle implicationsof urban green infrastructure Environmental Pollution 159(8ndash9)2174ndash2179
Stokes J R and A Horvath 2010 Supply-chain environ-mental effects of wastewater utilities Environmental ResearchLetters 5(2010) 014015 DOI 1010881748-932651014015httpiopscienceioporg1748-932651014015 Accessed 5 De-cember 2011
Stormchamber 2011 Stormchamber design manual wwwstormchamberscompdfStormChamberDesignManualpdf Accessed 7July 2011
Suh S M Lenzen G J Treloar H Hondo A Horvath G Huppes OJolliet U Klann W Krewitt Y Moriguchi J Munksgaard andG Norris 2004 System boundary selection in life-cycle invento-ries using hybrid approaches Environmental Science amp Technology38(3) 657ndash664
Tackett T 2011 Personal communication with Tracy Tackett LID
Program Manager Urban Watersheds Division Seattle PublicUtilities Seattle WA USA 10 August 2011
UNHSC (University of New Hampshire Stormwater Center) 2009Biannual report Durham NH USA
US EPA (US Environmental Protection Agency) 1999a Combinedsewer overflow management fact sheet Retention basins EPA832-F99-042 US EPA Office of Water Washington DC USA
US EPA (US Environmental Protection Agency) 1999b Stormwa-ter technology fact sheet Porous pavement httpwwwepagovowmmtbporouspapdf Accessed 1 August 2011
US EPA (US Environmental Protection Agency) 2005 Nationalmanagement measures to control nonpoint source pollution from urbanareas Washington DC USA US EPA
US EPA (US Environmental Protection Agency) 2007 Re-ducing stormwater costs through low impact development(LID) strategies and practices December 2007 wwwepagovowowNPSlidcosts07documentsreducingstormwatercostspdfAccessed 19 June 2011
US EPA (US Environmental Protection Agency) 2011 Storm wa-ter management model (SWMM) httpwwwepagovathenswwqtschtmlswmmhtml Accessed 18 May 2011
Wakeley H L C T Hendrickson W M Griffin and H SMatthews 2009 Economic and environmental transportation ef-fects of large-scale ethanol production and distribution in theUnited States Environmental Science amp Technology 43(7) 2228ndash2233
Wise S J Braden D Ghalayini J Grant C Kloss E MacMullan SMorse F Montalto D Nees D Nowak S Peck S Shaikh andC Yu Integrating valuation methods to recognize green infras-tructurersquos multiple benefits wwwcntorgrepositoryCNT-LID-paperpdf Accessed 20 May 2011
Zukovs G and J Marsalek 2004 Planning and design combined seweroverflow treatment Water Quality Research Journal of Canada39(4)439ndash448
About the Authors
Maria R C De Sousa is a PhD student and Franco Mon-talto and Sabrina Spatari are assistant professors in the Depart-ment of Civil Architectural and Environmental Engineeringat Drexel University Philadelphia PA USA
Sousa et al Evaluating Watershed-Scale CSO Strategies with LCA 913
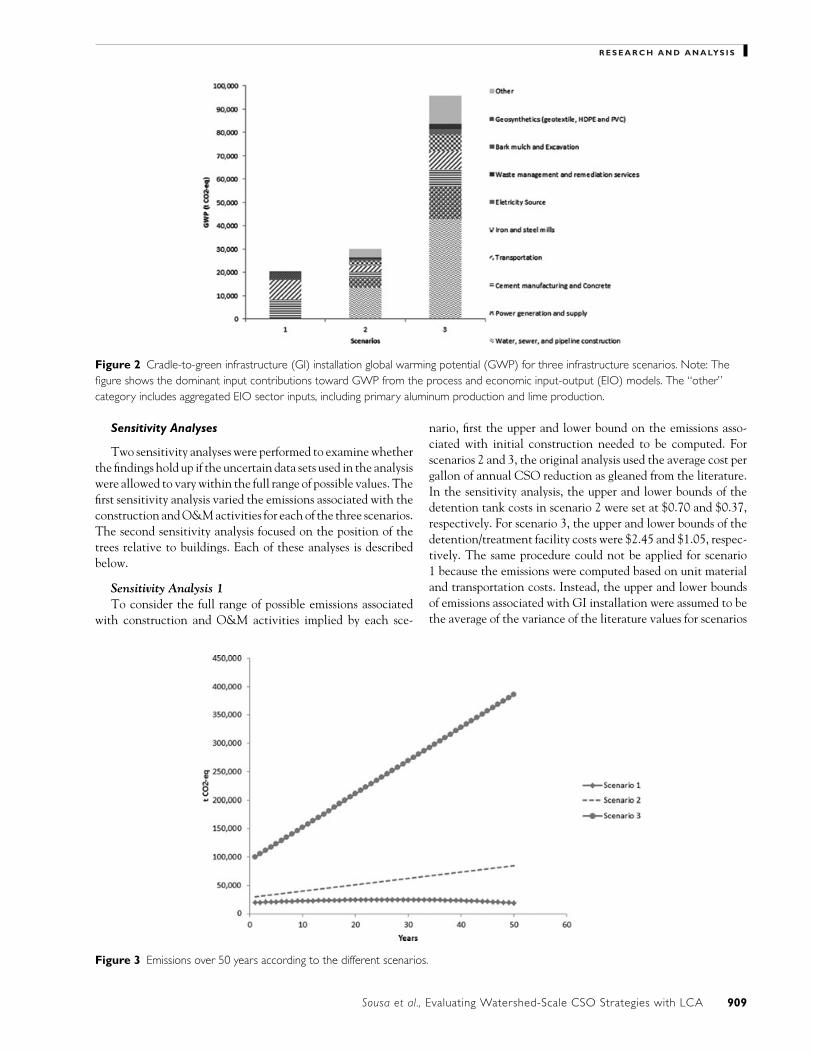
R E S E A R C H A N D A N A LYS I S
Figure 2 Cradle-to-green infrastructure (GI) installation global warming potential (GWP) for three infrastructure scenarios Note Thefigure shows the dominant input contributions toward GWP from the process and economic input-output (EIO) models The ldquootherrdquocategory includes aggregated EIO sector inputs including primary aluminum production and lime production
Sensitivity Analyses
Two sensitivity analyses were performed to examine whetherthe findings hold up if the uncertain data sets used in the analysiswere allowed to vary within the full range of possible values Thefirst sensitivity analysis varied the emissions associated with theconstruction and OampM activities for each of the three scenariosThe second sensitivity analysis focused on the position of thetrees relative to buildings Each of these analyses is describedbelow
Sensitivity Analysis 1To consider the full range of possible emissions associated
with construction and OampM activities implied by each sce-
nario first the upper and lower bound on the emissions asso-ciated with initial construction needed to be computed Forscenarios 2 and 3 the original analysis used the average cost pergallon of annual CSO reduction as gleaned from the literatureIn the sensitivity analysis the upper and lower bounds of thedetention tank costs in scenario 2 were set at $070 and $037respectively For scenario 3 the upper and lower bounds of thedetentiontreatment facility costs were $245 and $105 respec-tively The same procedure could not be applied for scenario1 because the emissions were computed based on unit materialand transportation costs Instead the upper and lower boundsof emissions associated with GI installation were assumed to bethe average of the variance of the literature values for scenarios
Figure 3 Emissions over 50 years according to the different scenarios
Sousa et al Evaluating Watershed-Scale CSO Strategies with LCA 909
R E S E A R C H A N D A N A LYS I S
2 and 3 expressed as a percentage of the average value used inthe initial analysis
The next step was to compute the upper and lower boundsof the annual OampM costs The upper and lower bounds forscenario 1 were based on the values found in the literatureSince the OampM costs for scenarios 2 and 3 were expressed asranges of percentages of the installation costs these percentageswere applied to the upper and lower bounds of the installationcosts as computed per the above For example the lower boundwas found by multiplying the lower bound of the OampM costpercentages (08 for scenario 2 104 for scenario 3) by the
lower bound of the installation costs ($037gal for scenario2 $105gal for scenario 3) These products were used in theEIO-LCA model to derive the corresponding extreme emissionspossibilities The same approach was used to calculate the upperbounds
The results of the first sensitivity analysis are shown inFigure 4a There was very little overlap between the emis-sions envelopes associated with the range of possible emis-sions associated with the three different scenarios Hence thefirst sensitivity analysis reinforces the original findings namelythat the GI approach featured in scenario 1 is environmentally
Figure 4 Sensitivity analyses (a) Sensitivity analysis of the emissions over 50 years from the installation and operation and maintenance(OampM) activities of scenarios 1 2 and 3 Note The dashed line represents the base case results of the scenarios emissions (b) Sensitivityanalysis of the tree benefits considering the treesrsquo location north southwest west or south face of the building Note The dashed linerepresents just the carbon dioxide (CO2) sequestration provided by the trees over 50 years
910 Journal of Industrial Ecology
R E S E A R C H A N D A N A LYS I S
preferable to the grey approaches included in scenarios 2 and 3for the metrics studied
Sensitivity Analysis 2Regarding the avoided CO2 emissions associated with the
impact of trees on building energy consumption a second sen-sitive analysis was conducted to consider the effect of differ-ent positions of the trees relative to the buildings The entire50-year analysis was repeated four times with the trees alterna-tively positioned to the south (least expected energy savings)the north (most expected energy savings) the west and thesouthwest (average expected energy savings) of the buildings
It is noteworthy that the carbon sequestered by the treesdoes not vary with the position and represents 11227 t CO2-eq over 50 years The avoided CO2 emissions through buildingenergy savings provided by the trees ranged from 1614 t CO2-eq(south) to 14416 t CO2-eq (north) which when added to theCO2 sequestered (11227 t CO2-eq) resulted in from 12841 tCO2-eq (south) to 25643 t CO2-eq (north) of mitigated GWPemissions The results of this sensitivity analysis are shown inFigure 4b and indicate that the energy benefits provided by thetrees are a significant fraction of the total of CO2 emissionsdecrease provided by the trees but only when the trees are notplanted to the south
Conclusion
This research used LCA methods to compare the environ-mental performance of three different approaches to reducingCSOs to the Bronx River NYC To our knowledge this studywas the first attempt to apply LCA methods at this scale andin this application While all three scenarios were scaled toreduce CSOs equivalently they required different construc-tion and OampM activities and in the cases of scenarios 1 and2 would also engender changes in the volume of annual flowto the regional WWTP When the GHG emissions associatedwith construction operation and maintenance are accountedfor the CSO abatement strategy represented by scenario 1which treats runoff from approximately one-third of the to-tal drainage area in decentralized green infrastructure facilitiesthat collectively amount to an area that is approximately 5of the total drainage area results in significantly better envi-ronmental performance than the end-of-pipe detention or thecombined detention and treatment strategies Both in terms ofthe emissions during initial construction and the cumulativenet emissions released over the first 50 years of operation thegreen infrastructure approach results in fewer emissions thaneither of the two grey approaches
This kind of analysis is limited by the availability of the req-uisite data sets Two sensitivity analyses varied the emissionsassociated with construction operation and maintenance ac-tivities and also the placement of the trees These analysesfurther reinforce the original conclusion that is that the fullrange of possible emissions associated with the green approach
will be significantly lower than those associated with the twogrey strategies
By conservatively assuming that the new GI would includeonly about 2000 new pin oak trees and no understory thecarbon sequestered and shading provided by the trees is firstable to fully offset the annual OampM emissions during year 25Further tree growth after year 25 exceeds the annual emissionsand begins to ldquopay backrdquo the emissions associated with initialconstruction of the GI network However this portion of theanalysis should be validated with actual studies documentingthe growth rates canopy configurations carbon sequestrationshading and wind protection provided by urban trees as wellas similar studies on other types of vegetation (shrubs grassesflowers etc) commonly planted in urban GI systems Very fewsuch studies have been performed to date
It should also be noted that this study did not quantifythe GHG emissions associated with other potential services(eg reduced pavement temperatures improved air qualityenhanced habitat etc) and disservices (eg increased street-sweeping requirements enhanced flooding potential etc) thatcould be brought about by watershed-scale implementation ofGI Additional research is needed to establish the relative im-portance of such factors in determining environmental perfor-mance Additional work is also needed to inventory the con-struction and OampM activities and costs associated with greenand grey CSO abatement strategies for which published datasets are currently quite limited Finally given all of the spatialinfrastructural economic social and other constraints presentin twenty-first-century cities the level of penetration that greeninfrastructure technologies will actually have in urban water-sheds still remains to be seen Nonetheless this study suggeststhat watershed managers who seek to reduce CSOs and reducemunicipal carbon footprints should opt for a green approachover a grey one
Acknowledgements
The authors are grateful to Nandan Shetty from the NewYork City Department of Parks and Recreation Sri Rangarajanand Chenchen Li from HDR Tracy Tackett from Seattle PublicUtilities Alan Cohn from the New York City Department ofEnvironmental Protection and Alisha Goldstein all of whomassisted in identifying different data sets used in this project
Notes
1 One gallon (gal) asymp 379 liters (L) so 200 million gallons per day(Mgalday) asymp 758 million liters per day (MLday)
2 One hectare (ha) = 001 square kilometers (km2 SI) asymp 000386square miles (mi2) asymp 247 acres
3 One gallon asymp 0003785 cubic meters (m3) so 3712 million gallonsper year (Mgalyr) is equivalent to 014 million cubic meters peryear (Mm3yr)
4 One square foot (ft2) = 0093 square meters (m2)
Sousa et al Evaluating Watershed-Scale CSO Strategies with LCA 911
R E S E A R C H A N D A N A LYS I S
References
Adam D 2007 The unheralded polluter Cement industry comes cleanon its impact The Guardian [Brussels] 12 October
Bannerman R 2003 Rain gardens A how-to manual for homeownersPUB-WT-776 Madison WI USA Wisconsin Department ofNatural Resources
Baumann H and A M Tillman 2004 The hitch hikerrsquos guide to LCALund Sweden Studentlitteratur AB
Bilec M M R J Ries and H S Matthews 2010 Life-cycle assess-ment modeling of construction processes for buildings Journal ofInfrastructure Systems 16(3) 199ndash205 httpascelibraryorgisoresource1jitse4v16i3p199_s1 Accessed 6 December 2011
Blackhurst M C T Hendrickson and H S Matthews 2010 Cost-effectiveness of green roofs Journal of Architectural Engineering16(4) 136ndash143
Brehm D 2007 Nanoengineered concrete could cut carbon diox-ide emissions MITNEWS 14 February 2007 httpwebmitedunewsoffice2007concretehtml Accessed 1 December 2011
CCRC (Center for Urban Forest Research) 2011 The Center forUrban Forest Research tree carbon calculator wwwfsfedusccrctopicsurban-forestsctcc Accessed 7 August 2011
City of Akron 1999 Facilities plan rsquo98 Akron OH USA wwwciakronohusCSOFP98FI1PDF Accessed 5 August 2011
City of New York 2010 NYC green infrastructure plan A sustainablestrategy for clean waterways City of New York NY USAwwwnycgovhtmldeppdfgreen_infrastructureNYCGreenIn-frastructurePlan_HighRespdf Accessed 15 April 2011
CNT (Center for Neighborhood Technology) 2009 Greenvalues calculator benefit details httpgreenvaluescntorgnationalbenefits detailphpreduced-treatment Accessed 12June 2011
CRI (Conservation Research Institute) 2005 Changing cost percep-tions An analysis of conservation development wwwcdfinccomCDF_ResourcesCost20Analysis20-20Part20120-20Report20-20with20Exec20Summarypdf Accessed5 August 2011
CRWA (Charles River Watershed Association) 2008 Blackstonetown hall demonstration project Evaluation of low impact de-velopment (LID) best management practices (BMPs) opportu-nities wwwcrwaorgprojectsblackstonelid evaluationpdf Ac-cessed 10 June 2011
DWSD (Detroit Water and Sewerage Department) 2003 Wastewatermaster plan DWSD project no CS-1314 Technical feasibility ofa wet weather flow treatment facility Detroit MI USA DWSD
EPRI (Electric Power Research Institute) 2002 Water and sus-tainability (Volume 4) US electricity consumption for watersupply and treatmentmdashThe next half century wwwcircleofblueorgwaternewswp-contentuploads201008EPRI-Volume-4pdfAccessed 19 April 2011
Flinker P 2005 Green rooftop systems In Urban environmentaldesign manual Providence RI USA Rhode Island Depart-ment of Environmental Management wwwdemrigovprogramsbpoladmsuswshedpubshtm Accessed 5 June 2011
Goldstein A 2011 Comparison of a high and low spatial resolutionmodel for an urban block and implications for depicting low im-pact development Masterrsquos thesis Drexel University Philadel-phia PA USA
Goldstein A and F A Montalto 2012 Comparison of a high and lowspatial resolution model for an urban block Journal of HydrologicEngineering Submitted for publication
Green Design Institute 2011 Economic input-output life cycle assess-ment wwweiolcanet Accessed 20 May 2011
Heisler G M 1986 Energy savings with trees Journal of Arboriculture12(5) 113ndash125
Hendrickson C T L B Lave and H S Matthews 2006 Environ-mental life cycle assessment of goods and services Washington DCUSA Resources for the Future
Hendriks C A E Worrell D de Jager K Blok and P Rieme 2004Emission reduction of greenhouse gases from the cement industryPaper presented at the Greenhouse Gas Control TechnologiesConference 5 September Vancouver BC Canada
Herstein Y R Filion and K R Hall 2009 Evaluating environmentalimpact in water distribution system design Journal of InfrastructureSystems 15(3) 241ndash250
IPCC 2007 Intergovernmental panel on climate change In Climatechange 2007 The physical science basis Contribution of workinggroup I to the fourth assessment report of the intergovernmentalpanel on climate change edited by S Solomon et al CambridgeCambridge University Press
ISO (International Organization for Standardization) 2006 ISO14044 Environmental management mdash Life cycle assessment mdash Re-quirements and guidelines Geneva Switzerland ISO
Kloss C Personal communication with Christopher Kloss GreenInfrastructure Coordinator US Environmental ProtectionAgency Office of Water 12 January 2012
Kosareo L and R Reis 2007 Comparative environmental life cycleassessment of green roofs Building and Environment 42(11) 2606ndash2613
Li C and S Rangarajan 2011 Technical Memorandum on Up-scalingof Drexel Universityrsquos Pilot Project to HP-009 Drainage AreaMahwah NJ HDR|HydroQual
MacMullan E and S Reich 2007 The economics of low-impact devel-opment A literature review Eugene OR USA ECONorthwest
Martin J 2011 Personal communication with Jeff Martin landscapearchitect New York City Department of Parks and Recreation14 April 2011
McPherson E G and J R Simpson 1999 Carbon dioxide reductionsthrough urban forestry Guidelines for professional and volun-teer tree planters General Technical Report PSW-171 AlbanyCA USDA Forest Service Pacific Southwest Research Station237 wwwfsfeduspswprogramsuesduepproductscufr_43pdfAccessed 6 December 2011
Montalto F C Behr K Alfredo M Wolf M Arye and M Walsh2007 Rapid assessment of the cost-effectiveness of low impact de-velopment for CSO control Landscape and Urban Planning 82(3)117ndash131
NCGBT (North Carolina Green Building Technology Database)2003 Pervious paving details for Chadbourn Street Townof Wrightsville Beach January 2 2006 httpwwwncgreenbuildingorgsitencgpublictechsearchresultscfmprojectid=93ampcategory=6ampparameter=98ampclicked=true Accessed August 102011
NYNewsday 2004 wwwnewsdaycomnewsnew-pact-stirs-up-old-stink-1650186 Accessed 10 July 2011
NYC DEP (New York City Department of Environmen-tal Protection) 2007 Flushing Bay waterbodywatershedfacility plan wwwhydroqualcomProjectsltcpwbwsflushing_bayflushing_bay_section_7pdf Accessed 20 July 2011
NYC DEP (New York City Department of Environmental Protec-tion) 2011 New York Cityrsquos wastewater treatment systemwwwnycgovhtmldeppdfwwsystempdf Accessed 21 July 2011
912 Journal of Industrial Ecology
R E S E A R C H A N D A N A LYS I S
Peper P J E G McPherson J R Simpson S L Gardner K E Vargasand Q Xiao 2007 New York City New York municipal forestresource analysis Technical Report Davis CA USA Center forUrban Forest Research
PRe Consultants 2007 SimaPro 71 LCA software Amersfoort theNetherlands
PWD (Philadelphia Water Department) 2009 Philadelphia com-bined sewer overflow long term control plan update wwwphillywatershedsorgltcpuVol02_TBLpdf Accessed 20 August 2011
Racoviceanu A I B W Karney C A Kennedy and A F Colombo2007 Life-cycle energy use and greenhouse gas emissions inven-tory for water treatment systems Journal of Infrastructure Systems13(4) 261ndash270
Saiz S C Kennedy B Bass and K Pressnail 2006 Comparativelife cycle assessment of standard and green roofs EnvironmentalScience and Technology 40(13) 4312ndash4316
Sharrard A L 2007 Greening construction processes using an input-output-based hybrid life cycle assessment model PhD thesisCarnegie Mellon University Pittsburgh PA USA
Shetty N 2011 Personal communication with N Shetty New YorkCity Department of Parks and Recreation 10 April 2011
Simpson J R and E G McPherson 1998 Simulation of tree shadeimpacts on residential energy use for space conditioning in Sacra-mento Atmospheric Environment Urban Atmospheres 32(1) 69ndash74
Spatari S Z Yu and F A Montalto 2011 Life cycle implicationsof urban green infrastructure Environmental Pollution 159(8ndash9)2174ndash2179
Stokes J R and A Horvath 2010 Supply-chain environ-mental effects of wastewater utilities Environmental ResearchLetters 5(2010) 014015 DOI 1010881748-932651014015httpiopscienceioporg1748-932651014015 Accessed 5 De-cember 2011
Stormchamber 2011 Stormchamber design manual wwwstormchamberscompdfStormChamberDesignManualpdf Accessed 7July 2011
Suh S M Lenzen G J Treloar H Hondo A Horvath G Huppes OJolliet U Klann W Krewitt Y Moriguchi J Munksgaard andG Norris 2004 System boundary selection in life-cycle invento-ries using hybrid approaches Environmental Science amp Technology38(3) 657ndash664
Tackett T 2011 Personal communication with Tracy Tackett LID
Program Manager Urban Watersheds Division Seattle PublicUtilities Seattle WA USA 10 August 2011
UNHSC (University of New Hampshire Stormwater Center) 2009Biannual report Durham NH USA
US EPA (US Environmental Protection Agency) 1999a Combinedsewer overflow management fact sheet Retention basins EPA832-F99-042 US EPA Office of Water Washington DC USA
US EPA (US Environmental Protection Agency) 1999b Stormwa-ter technology fact sheet Porous pavement httpwwwepagovowmmtbporouspapdf Accessed 1 August 2011
US EPA (US Environmental Protection Agency) 2005 Nationalmanagement measures to control nonpoint source pollution from urbanareas Washington DC USA US EPA
US EPA (US Environmental Protection Agency) 2007 Re-ducing stormwater costs through low impact development(LID) strategies and practices December 2007 wwwepagovowowNPSlidcosts07documentsreducingstormwatercostspdfAccessed 19 June 2011
US EPA (US Environmental Protection Agency) 2011 Storm wa-ter management model (SWMM) httpwwwepagovathenswwqtschtmlswmmhtml Accessed 18 May 2011
Wakeley H L C T Hendrickson W M Griffin and H SMatthews 2009 Economic and environmental transportation ef-fects of large-scale ethanol production and distribution in theUnited States Environmental Science amp Technology 43(7) 2228ndash2233
Wise S J Braden D Ghalayini J Grant C Kloss E MacMullan SMorse F Montalto D Nees D Nowak S Peck S Shaikh andC Yu Integrating valuation methods to recognize green infras-tructurersquos multiple benefits wwwcntorgrepositoryCNT-LID-paperpdf Accessed 20 May 2011
Zukovs G and J Marsalek 2004 Planning and design combined seweroverflow treatment Water Quality Research Journal of Canada39(4)439ndash448
About the Authors
Maria R C De Sousa is a PhD student and Franco Mon-talto and Sabrina Spatari are assistant professors in the Depart-ment of Civil Architectural and Environmental Engineeringat Drexel University Philadelphia PA USA
Sousa et al Evaluating Watershed-Scale CSO Strategies with LCA 913
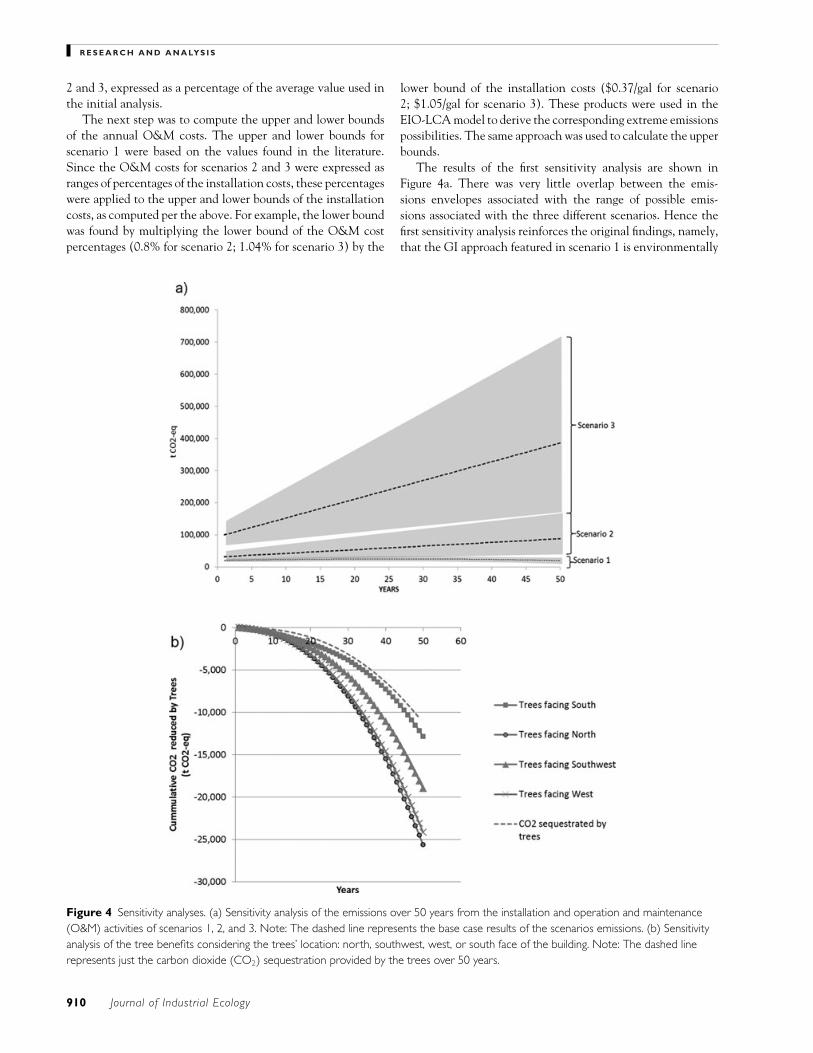
R E S E A R C H A N D A N A LYS I S
References
Adam D 2007 The unheralded polluter Cement industry comes cleanon its impact The Guardian [Brussels] 12 October
Bannerman R 2003 Rain gardens A how-to manual for homeownersPUB-WT-776 Madison WI USA Wisconsin Department ofNatural Resources
Baumann H and A M Tillman 2004 The hitch hikerrsquos guide to LCALund Sweden Studentlitteratur AB
Bilec M M R J Ries and H S Matthews 2010 Life-cycle assess-ment modeling of construction processes for buildings Journal ofInfrastructure Systems 16(3) 199ndash205 httpascelibraryorgisoresource1jitse4v16i3p199_s1 Accessed 6 December 2011
Blackhurst M C T Hendrickson and H S Matthews 2010 Cost-effectiveness of green roofs Journal of Architectural Engineering16(4) 136ndash143
Brehm D 2007 Nanoengineered concrete could cut carbon diox-ide emissions MITNEWS 14 February 2007 httpwebmitedunewsoffice2007concretehtml Accessed 1 December 2011
CCRC (Center for Urban Forest Research) 2011 The Center forUrban Forest Research tree carbon calculator wwwfsfedusccrctopicsurban-forestsctcc Accessed 7 August 2011
City of Akron 1999 Facilities plan rsquo98 Akron OH USA wwwciakronohusCSOFP98FI1PDF Accessed 5 August 2011
City of New York 2010 NYC green infrastructure plan A sustainablestrategy for clean waterways City of New York NY USAwwwnycgovhtmldeppdfgreen_infrastructureNYCGreenIn-frastructurePlan_HighRespdf Accessed 15 April 2011
CNT (Center for Neighborhood Technology) 2009 Greenvalues calculator benefit details httpgreenvaluescntorgnationalbenefits detailphpreduced-treatment Accessed 12June 2011
CRI (Conservation Research Institute) 2005 Changing cost percep-tions An analysis of conservation development wwwcdfinccomCDF_ResourcesCost20Analysis20-20Part20120-20Report20-20with20Exec20Summarypdf Accessed5 August 2011
CRWA (Charles River Watershed Association) 2008 Blackstonetown hall demonstration project Evaluation of low impact de-velopment (LID) best management practices (BMPs) opportu-nities wwwcrwaorgprojectsblackstonelid evaluationpdf Ac-cessed 10 June 2011
DWSD (Detroit Water and Sewerage Department) 2003 Wastewatermaster plan DWSD project no CS-1314 Technical feasibility ofa wet weather flow treatment facility Detroit MI USA DWSD
EPRI (Electric Power Research Institute) 2002 Water and sus-tainability (Volume 4) US electricity consumption for watersupply and treatmentmdashThe next half century wwwcircleofblueorgwaternewswp-contentuploads201008EPRI-Volume-4pdfAccessed 19 April 2011
Flinker P 2005 Green rooftop systems In Urban environmentaldesign manual Providence RI USA Rhode Island Depart-ment of Environmental Management wwwdemrigovprogramsbpoladmsuswshedpubshtm Accessed 5 June 2011
Goldstein A 2011 Comparison of a high and low spatial resolutionmodel for an urban block and implications for depicting low im-pact development Masterrsquos thesis Drexel University Philadel-phia PA USA
Goldstein A and F A Montalto 2012 Comparison of a high and lowspatial resolution model for an urban block Journal of HydrologicEngineering Submitted for publication
Green Design Institute 2011 Economic input-output life cycle assess-ment wwweiolcanet Accessed 20 May 2011
Heisler G M 1986 Energy savings with trees Journal of Arboriculture12(5) 113ndash125
Hendrickson C T L B Lave and H S Matthews 2006 Environ-mental life cycle assessment of goods and services Washington DCUSA Resources for the Future
Hendriks C A E Worrell D de Jager K Blok and P Rieme 2004Emission reduction of greenhouse gases from the cement industryPaper presented at the Greenhouse Gas Control TechnologiesConference 5 September Vancouver BC Canada
Herstein Y R Filion and K R Hall 2009 Evaluating environmentalimpact in water distribution system design Journal of InfrastructureSystems 15(3) 241ndash250
IPCC 2007 Intergovernmental panel on climate change In Climatechange 2007 The physical science basis Contribution of workinggroup I to the fourth assessment report of the intergovernmentalpanel on climate change edited by S Solomon et al CambridgeCambridge University Press
ISO (International Organization for Standardization) 2006 ISO14044 Environmental management mdash Life cycle assessment mdash Re-quirements and guidelines Geneva Switzerland ISO
Kloss C Personal communication with Christopher Kloss GreenInfrastructure Coordinator US Environmental ProtectionAgency Office of Water 12 January 2012
Kosareo L and R Reis 2007 Comparative environmental life cycleassessment of green roofs Building and Environment 42(11) 2606ndash2613
Li C and S Rangarajan 2011 Technical Memorandum on Up-scalingof Drexel Universityrsquos Pilot Project to HP-009 Drainage AreaMahwah NJ HDR|HydroQual
MacMullan E and S Reich 2007 The economics of low-impact devel-opment A literature review Eugene OR USA ECONorthwest
Martin J 2011 Personal communication with Jeff Martin landscapearchitect New York City Department of Parks and Recreation14 April 2011
McPherson E G and J R Simpson 1999 Carbon dioxide reductionsthrough urban forestry Guidelines for professional and volun-teer tree planters General Technical Report PSW-171 AlbanyCA USDA Forest Service Pacific Southwest Research Station237 wwwfsfeduspswprogramsuesduepproductscufr_43pdfAccessed 6 December 2011
Montalto F C Behr K Alfredo M Wolf M Arye and M Walsh2007 Rapid assessment of the cost-effectiveness of low impact de-velopment for CSO control Landscape and Urban Planning 82(3)117ndash131
NCGBT (North Carolina Green Building Technology Database)2003 Pervious paving details for Chadbourn Street Townof Wrightsville Beach January 2 2006 httpwwwncgreenbuildingorgsitencgpublictechsearchresultscfmprojectid=93ampcategory=6ampparameter=98ampclicked=true Accessed August 102011
NYNewsday 2004 wwwnewsdaycomnewsnew-pact-stirs-up-old-stink-1650186 Accessed 10 July 2011
NYC DEP (New York City Department of Environmen-tal Protection) 2007 Flushing Bay waterbodywatershedfacility plan wwwhydroqualcomProjectsltcpwbwsflushing_bayflushing_bay_section_7pdf Accessed 20 July 2011
NYC DEP (New York City Department of Environmental Protec-tion) 2011 New York Cityrsquos wastewater treatment systemwwwnycgovhtmldeppdfwwsystempdf Accessed 21 July 2011
912 Journal of Industrial Ecology
R E S E A R C H A N D A N A LYS I S
Peper P J E G McPherson J R Simpson S L Gardner K E Vargasand Q Xiao 2007 New York City New York municipal forestresource analysis Technical Report Davis CA USA Center forUrban Forest Research
PRe Consultants 2007 SimaPro 71 LCA software Amersfoort theNetherlands
PWD (Philadelphia Water Department) 2009 Philadelphia com-bined sewer overflow long term control plan update wwwphillywatershedsorgltcpuVol02_TBLpdf Accessed 20 August 2011
Racoviceanu A I B W Karney C A Kennedy and A F Colombo2007 Life-cycle energy use and greenhouse gas emissions inven-tory for water treatment systems Journal of Infrastructure Systems13(4) 261ndash270
Saiz S C Kennedy B Bass and K Pressnail 2006 Comparativelife cycle assessment of standard and green roofs EnvironmentalScience and Technology 40(13) 4312ndash4316
Sharrard A L 2007 Greening construction processes using an input-output-based hybrid life cycle assessment model PhD thesisCarnegie Mellon University Pittsburgh PA USA
Shetty N 2011 Personal communication with N Shetty New YorkCity Department of Parks and Recreation 10 April 2011
Simpson J R and E G McPherson 1998 Simulation of tree shadeimpacts on residential energy use for space conditioning in Sacra-mento Atmospheric Environment Urban Atmospheres 32(1) 69ndash74
Spatari S Z Yu and F A Montalto 2011 Life cycle implicationsof urban green infrastructure Environmental Pollution 159(8ndash9)2174ndash2179
Stokes J R and A Horvath 2010 Supply-chain environ-mental effects of wastewater utilities Environmental ResearchLetters 5(2010) 014015 DOI 1010881748-932651014015httpiopscienceioporg1748-932651014015 Accessed 5 De-cember 2011
Stormchamber 2011 Stormchamber design manual wwwstormchamberscompdfStormChamberDesignManualpdf Accessed 7July 2011
Suh S M Lenzen G J Treloar H Hondo A Horvath G Huppes OJolliet U Klann W Krewitt Y Moriguchi J Munksgaard andG Norris 2004 System boundary selection in life-cycle invento-ries using hybrid approaches Environmental Science amp Technology38(3) 657ndash664
Tackett T 2011 Personal communication with Tracy Tackett LID
Program Manager Urban Watersheds Division Seattle PublicUtilities Seattle WA USA 10 August 2011
UNHSC (University of New Hampshire Stormwater Center) 2009Biannual report Durham NH USA
US EPA (US Environmental Protection Agency) 1999a Combinedsewer overflow management fact sheet Retention basins EPA832-F99-042 US EPA Office of Water Washington DC USA
US EPA (US Environmental Protection Agency) 1999b Stormwa-ter technology fact sheet Porous pavement httpwwwepagovowmmtbporouspapdf Accessed 1 August 2011
US EPA (US Environmental Protection Agency) 2005 Nationalmanagement measures to control nonpoint source pollution from urbanareas Washington DC USA US EPA
US EPA (US Environmental Protection Agency) 2007 Re-ducing stormwater costs through low impact development(LID) strategies and practices December 2007 wwwepagovowowNPSlidcosts07documentsreducingstormwatercostspdfAccessed 19 June 2011
US EPA (US Environmental Protection Agency) 2011 Storm wa-ter management model (SWMM) httpwwwepagovathenswwqtschtmlswmmhtml Accessed 18 May 2011
Wakeley H L C T Hendrickson W M Griffin and H SMatthews 2009 Economic and environmental transportation ef-fects of large-scale ethanol production and distribution in theUnited States Environmental Science amp Technology 43(7) 2228ndash2233
Wise S J Braden D Ghalayini J Grant C Kloss E MacMullan SMorse F Montalto D Nees D Nowak S Peck S Shaikh andC Yu Integrating valuation methods to recognize green infras-tructurersquos multiple benefits wwwcntorgrepositoryCNT-LID-paperpdf Accessed 20 May 2011
Zukovs G and J Marsalek 2004 Planning and design combined seweroverflow treatment Water Quality Research Journal of Canada39(4)439ndash448
About the Authors
Maria R C De Sousa is a PhD student and Franco Mon-talto and Sabrina Spatari are assistant professors in the Depart-ment of Civil Architectural and Environmental Engineeringat Drexel University Philadelphia PA USA
Sousa et al Evaluating Watershed-Scale CSO Strategies with LCA 913