
Influence of characteristics on combined sewer performance
9
Influence of characteristics on combined sewer performance M. Möderl, M. Kleidorfer and W. Rauch ABSTRACT Elements of combined sewer systems are among others sub-catchments, junctions, conduits and weirs with or without storage units. The spatial distribution and attributes of all these elements influence both system characteristics and sewer performance. Until today, little work has been done to analyse the influence of such characteristics in a case unspecific approach. In this study, 250 virtual combined sewer systems are analysed by defining groups of systems, which are representative for their different characteristics. The set was created with a further development of the case study generator (CSG), a tool for automatic generation of branched sewer systems. Combined sewer overflow and flooding is evaluated using performance indicators based on hydrodynamic simulations. The analysis of system characteristics, like those presented in this paper, helps researchers to understand coherences and aids practitioners in designing combined sewers. For instance, it was found that characteristics that have a positive influence on emission reduction frequently have a negative influence on flooding avoidance and vice versa. M. Möderl (corresponding author) M. Kleidorfer W. Rauch Unit of Environmental Engineering, University of Innsbruck, Technikerstr. 13, 6020 Innsbruck, Austria E-mail: [email protected] Key words | case study generator, characteristic, combined sewer overflow, combined sewer system, flooding INTRODUCTION Urban drainage management aims at the disposition of wastewater under dry weather conditions and the avoidance of sewer flooding and receiving water pollution under wet weather conditions. Storm water and municipal wastewater is drained with either separate or combined sewer systems, or a combination thereof. The characteristics of these two sewer types are described in e.g. De Toffol et al.() and Defilipp & Shih (). In this study, we focus on com- bined sewer systems only. The characteristics of sewer networks have already been investigated by e.g. MacArthur & Sanchez-Garcia () with regard to the spectral characteristics of network redun- dancy and Shirazi et al.() towards sediment removal efficiency of flushing devices. Therein, the characteristics of a sewer network (composed of a series of connected pipes) are expressed as e.g. function of pipe diameters, pipe slopes and dry weather flow (DWF). Following these ideas, the aim of this paper is to investigate the influence of combined sewer system characteristics on its performance. A combined sewer system consists of e.g. sub-catch- ments, junctions, conduits, weirs and storage units. The spatial distribution and attributes of all these elements influence both system characteristics and performance. Thus, in this study hydraulic performance of combined sewer systems are analysed by defining groups, which are representative for their characteristics. Another issue in the analysis of system characteristics and hydraulic performance is the available number of hydro- dynamic sewer system models. In an analysis, usually one or two case studies are investigated. Only sometimes more than three case studies are used, but it is not common to use sev- eral hundred case studies including small and large models. Even if the use of single case studies is common for building theories and the analysis of systems (Eisenhardt ) they still are individual investigations. To generalise conclusions from individual investigations of systems onto an unspecific basis is questionable. Thus, this paper uses a novel method for the construction of hydrodynamic sewer models with different characteristics for case study analysis, namely the case study generator (CSG, Möderl et al. ). Urban drainage systems (UDS) have been found to resemble tree graphs. Ghosh et al.() use the dendritic 1052 © IWA Publishing 2012 Water Science & Technology | 66.5 | 2012 doi: 10.2166/wst.2012.280
Transcript of Influence of characteristics on combined sewer performance

1052 © IWA Publishing 2012 Water Science & Technology | 66.5 | 2012
Influence of characteristics on combined sewer
performance
M. Möderl, M. Kleidorfer and W. Rauch
ABSTRACT
Elements of combined sewer systems are among others sub-catchments, junctions, conduits and
weirs with or without storage units. The spatial distribution and attributes of all these elements
influence both system characteristics and sewer performance. Until today, little work has been done
to analyse the influence of such characteristics in a case unspecific approach. In this study, 250
virtual combined sewer systems are analysed by defining groups of systems, which are
representative for their different characteristics. The set was created with a further development of
the case study generator (CSG), a tool for automatic generation of branched sewer systems.
Combined sewer overflow and flooding is evaluated using performance indicators based on
hydrodynamic simulations. The analysis of system characteristics, like those presented in this paper,
helps researchers to understand coherences and aids practitioners in designing combined sewers.
For instance, it was found that characteristics that have a positive influence on emission reduction
frequently have a negative influence on flooding avoidance and vice versa.
doi: 10.2166/wst.2012.280
M. Möderl (corresponding author)M. KleidorferW. RauchUnit of Environmental Engineering,University of Innsbruck,Technikerstr. 13,6020 Innsbruck,AustriaE-mail: [email protected]
Key words | case study generator, characteristic, combined sewer overflow, combined sewer
system, flooding
INTRODUCTION
Urban drainage management aims at the disposition of
wastewater under dry weather conditions and the avoidanceof sewer flooding and receiving water pollution under wetweather conditions. Storm water and municipal wastewater
is drained with either separate or combined sewer systems,or a combination thereof. The characteristics of these twosewer types are described in e.g. De Toffol et al. ()
and Defilipp & Shih (). In this study, we focus on com-bined sewer systems only.
The characteristics of sewer networks have already been
investigated by e.g. MacArthur & Sanchez-Garcia ()with regard to the spectral characteristics of network redun-dancy and Shirazi et al. () towards sediment removalefficiency of flushing devices. Therein, the characteristics of
a sewer network (composed of a series of connected pipes)are expressed as e.g. function of pipe diameters, pipe slopesand dry weather flow (DWF). Following these ideas, the
aim of this paper is to investigate the influence of combinedsewer system characteristics on its performance.
A combined sewer system consists of e.g. sub-catch-
ments, junctions, conduits, weirs and storage units. The
spatial distribution and attributes of all these elements
influence both system characteristics and performance.Thus, in this study hydraulic performance of combinedsewer systems are analysed by defining groups, which are
representative for their characteristics.Another issue in the analysis of system characteristics
and hydraulic performance is the available number of hydro-
dynamic sewer system models. In an analysis, usually one ortwo case studies are investigated. Only sometimes more thanthree case studies are used, but it is not common to use sev-
eral hundred case studies including small and large models.Even if the use of single case studies is common for buildingtheories and the analysis of systems (Eisenhardt ) theystill are individual investigations. To generalise conclusions
from individual investigations of systems onto an unspecificbasis is questionable. Thus, this paper uses a novel methodfor the construction of hydrodynamic sewer models with
different characteristics for case study analysis, namely thecase study generator (CSG, Möderl et al. ).
Urban drainage systems (UDS) have been found to
resemble tree graphs. Ghosh et al. () use the dendritic

1053 M. Möderl et al. | Characteristics of sewer performance Water Science & Technology | 66.5 | 2012
and space-filling ‘Tokunaga’ fractal tree geometry to generate
artificial UDS. Urich et al. () investigate the generationof virtual sewer systems using an agent-based modellingapproach. In contrast, the CSG applies a Galton–Watson
branching process to generate tree structured combinedsewers. Parameters, e.g. conduit diameters, weir crests andstorage volumes, are designed according to state-of-the-artrules, but a stochastic influence is added to resemble reality.
In Möderl et al. (), it is shown that the algorithm is ableto generate networks with realistic hydrodynamic behaviour.
For this investigation, a set of 250 virtual combined
sewer systems is generated. The CSG and the set are avail-able to download (http://www.hydro-it.com/extern/IUT/csg). This set of virtual case studies (VCSs) enables a more
case unspecific analysis, taking into account the character-istics of network structure.
MATERIALS AND METHODS
CSG and 250 virtual combined sewer systems
The first step of this study is the generation of data for a gen-eric approach. Therefore, 250 virtual combined sewersystems are generated using the CSG. The models and
input parameters of the CSG are shown in Figure 1. Therein,the arrows between modules describe the data flow. TheCSG is coded in Matlab language as script. By using thisscript, it is possible to generate different UDS using a tree
layout algorithm based on predefined boundary conditions.In the following a brief description of the modules is given.
Figure 1 | Modules of the case study generator and input parameters.
Layout module
The algorithm for layout design is based on the Galton–Watson branching process (Pitman ) and defines the
structure of a rooted tree by the probability of children ineach generation and the maximum number of generations.Thereby, the term child means a node, which is connectedto a downstream parental node. Note that the algorithm
starts at the root. Thus, the algorithm is constructed inupstream flow direction. A probability matrix of children(PMC) defines all parameters for the branching process. In
this matrix, the rows represent the number of children andthe columns represent the individual generation. This situ-ation is different to the classical process, because usually
the nodes are sampled using equal probabilities for eachgeneration. This modification is necessary to reproduce thelayout of a combined sewer system in a realistic way. Inthe presented approach, the number of children is between
zero and three. Only in the first generation, the number ofchildren is reduced to the options one or two using anequal probability of 0.5. After the creation of the layout
graph, the network is uniformly scaled, relative to the long-est path through the UDS (L). Note that L is an inputparameter. The width of the urban drainage catchment is
assumed as L/2.
Digital terrain model module (DTM)
The elevation of each node is given by the average elevationgradient of the network but is also subject to a random
deviation. Based on these node elevations, a Delaunay tri-angulation is applied to construct a DTM. The DTM is

1054 M. Möderl et al. | Characteristics of sewer performance Water Science & Technology | 66.5 | 2012
subsequently used for the allocation of sub-catchments,
which are connected to the nodes of the sewer network.
Other modules
The areas of the sub-catchments and the generations ofthe nodes are used to define the location of the weirs
and the storage units in the system. The diameters of theconduits are computed by means of a time area design pro-cedure. DWF is determined by assuming a randomised
population density for the allocated areas. A more detaileddescription of the modules is given in Möderl et al. ().
Input parameters for the CSG are chosen according to
real world systems located in alpine valleys. The input par-ameters are sampled from uniform distributions within thefollowing intervals:
• mean slopes of conduits¼ [0.5 1.5]
• possible diameters¼ [0.2 2.4] m
• elevation of the wastewater treatment plant (WWTP)¼500 m
• longest flowpath through the system (L)¼ [5,000 13,000] m
• population density¼ [150 250] inhabitants/ha
• wastewater per population equivalent¼ [250 300] l/dy
• design rainfall intensities¼ 41.4 mm/hr or 1,15 l/s/ha
For the performance evaluation EPA SWMM5 (Rossman) is chosen as hydrodynamic flow simulator. Theabsolute values of the system performance vary according
to the influence of the rainfall used as model input. How-ever, the relative performance, expressing the differences
Figure 2 | Five examples of VCSs.
of UDS, is assumed independent of rainfall characteristics.
Thus, in this study, the performance is calculated by usinga rainfall time series of a gauge in Innsbruck (Austria)measured in 1996. For the simulations with SWMM5 the
dynamic wave option for flow routing (variable routingtime step< 60 s) and the Horton method (maximumand minimum infiltration rate¼ 60 and 6.12 mm/hr, decayconstant¼ 3.0 1/hr) for infiltration is applied. Surface
characteristics are defined with the following assumptions:
• The slope of a catchment area is calculated based on theDTM.
• The width of the catchment area is calculated based on
the size of the area.
• Imperviousness is sampled from a uniform distribution[0.25% 0.75%].
• Manning’s roughness coefficient is set to 0.015 for imper-vious and 0.2 for pervious areas.
• Depression storage is assumed to be 1.8 mm for imper-vious and 5 mm for pervious areas.
According to design standards, the volume of storage
units is assumed to vary between 1 and 5 mm in relationto the impervious area connected. Other input parameters(in total more than 20) are assumed according to standard
values and can be found in the program source code andthe generated input files (both are available online). InFigure 2, the layouts of five of the 250 VCSs are shown
including the longest flow path through the system (L).Graphs of all layouts are also online and freely available.

1055 M. Möderl et al. | Characteristics of sewer performance Water Science & Technology | 66.5 | 2012
Performance indicators
Performance indicators in relation to sewer flooding andcombined sewer overflow (CSO) emission are computed
as follows. The indicator for CSO emission performance isrelated to the CSO volume and reflects the Austrian guide-line ÖWAV-RB 19 (). According to Kleidorfer &Rauch () the sum of overflow volume spilled into the
receiving water body (VCSO) is divided by the sum of surfacerunoff volume (VR) of each sub-catchment (c) treated at theWWTP:
Emission efficiency ¼ 1�PNCSO
cso¼1 VCSO,cso
� �
PCc¼1 VR,c
(1)
Flooding performance is computed by dividing the sumof the maximum ponded volume (VP) of N nodes (n) by thetotal surface runoff volume VR:
Flooding efficiency ¼ 1�PN
n¼1 max (VP,n)PCc¼1 VR,c
(2)
Grouping according to characteristics
As a second step, sensitive and meaningful characteristicsof the sewer systems need to be defined based on theparameters of the hydrodynamic model. Characteristics,
which are considered in the investigation, are summarisedin Table 1. In the round brackets the notations and theunits are given.
According to the characteristics in Table 1, the systems
of the set of 250 VCSs are separated into two groups foreach characteristic. Separators chosen are the 30 (low mag-nitude of characteristic) and 70 (high magnitude of
characteristic) percentile of the cumulative distribution
Table 1 | Characteristics of combined sewer systems
Category Characteristics
Catchment Number of catchments (NoC, –), sum of imperviousarea (SoAi, ha), percentage of impervious area(PoAi, %), sum of dry weather flow (SoDWF, l/s)
Node Number of nodes (NoN, –), number of storage units(NoSU, –), percentage of combined sewer overflows(PoCSO, %), percentage of storage units (PoSU, %),sum of storage volume in units (SoVn, qm)
Link Median of diameters of conduits (MoD, m)
function (CDF) of the aggregated values taking into account
all VCSs (see Figure 3). The validity of this approach hasbeen tested also with lower number of VCSs, resulting innearly similar results.
As the impervious catchment size is decisive for theanalysis, the separation has here been chosen as low(lower than median) and high (lower than median) SoAi.This different definition is needed to maintain a sufficient
sample size in the comparison. In the following, smaller sys-tems are those with an impervious area lower than themedian value and larger systems are all other systems.
Kruskal–Wallis test
The variance of performance indicators for flooding andemissions are analysed with respect to the impact of differ-ent characteristics using the Kruskal–Wallis test (Kruskal
& Wallis ). The Kruskal–Wallis test is chosen as it is anon-parametric test, which does not require Gaussian dis-tributed samples. This test returns probabilities (P values)
for the null hypothesis that all samples are drawn from thesame population. Small values of p (P� 0.05) indicate thatthere is significant proof that samples are not drawn fromthe same population, i.e. that this characteristic has a signifi-
cant impact on the performance indicators.
RESULTS AND DISCUSSION
In the following, the influence of the characteristic groups
is compared with highlight the impact on performanceindicators for emission and flooding. Table 2 presents theP-values of the Kruskal–Wallis test for the different
groups: distinguished between (1) characteristics (all) andsystems with (2) low and (3) high impervious area (SoAi).Highly significant characteristics with P-values smaller
than 0.05 are printed in bold. Non-relevant characteristicswith P-values above 0.8 are printed in italics. NoSU andNoC are sensitive characteristics for emission performance
and SoVn, MoD and characteristics, which correlate withinflow, affect the flooding performance.
It becomes clear from the analysis that the specific sto-rage volume (SoVn/SoAi) of VCSs has no significant
influence on the performance. The analysis of the CSO emis-sion leads to the assumption that smaller systems with highspecific storage volume reduce the stress of the receiving
water body, similar to larger systems with low specific sto-rage. Because of such inconsistencies, only characteristic

Table 2 | P-values of the Kruskal–Wallis test
Emission performance Flooding performanceSoAi low all SoAi high SoAi low all SoAi high
SoDWF/SoAi
0.69 0.61 0.42 0.29 0.29 0.11
NoSU 0.16 0.00 0.01 0.01 0.60 0.39
PoSU 0.23 0.32 0.12 0.53 0.00 0.04
SoVn 0.91 0.84 0.30 0.00 0.00 0.00
SoVn/SoAi 0.39 0.92 0.32 0.15 0.85 0.66
MoD 0.01 0.12 0.52 0.00 0.00 0.17
PoAi 0.83 0.97 0.58 0.52 0.55 0.53
SoAi 0.30 0.98 0.62 0.00 0.00 0.00
SoDWF 0.75 0.76 0.13 0.00 0.00 0.00
NoC 0.11 0.02 0.04 0.31 0.08 0.70
NoN 0.09 0.04 0.17 0.14 0.36 0.84
Highly significant characteristics with P-values smaller than 0.05 are in bold. Non-relevant
characteristics with P-values above 0.8 are in italics.
Figure 3 | Separation into groups according to characteristics.
1056 M. Möderl et al. | Characteristics of sewer performance Water Science & Technology | 66.5 | 2012
groups with significant impact of at least one group are here
analysed further.The next figures show the performance of VCSs
distinguished between the chosen characteristics and
the sum of the impervious area (SoAi). The influence ofcharacteristics is analysed by comparing differences in theshape of the CDFs. In the diagrams, the performance (x-axis) is plotted against the cumulative percentage (y-axis).The grey CDFs represent systems with high imperviousarea. The dash–dotted lines represent systems with low mag-nitude of the chosen characteristic. The empirical hysteresis
is a measure for the influence. The diagrams titled (a) and(b) show emission and flooding performance, respectively.In the diagram (c) the specific characteristic is plotted
against the impervious area to investigate correlations withsystem size. In diagram (c), only VCSs with low (dots) andhigh (diamantes) magnitude of the characteristic are
considered.
1057 M. Möderl et al. | Characteristics of sewer performance Water Science & Technology | 66.5 | 2012
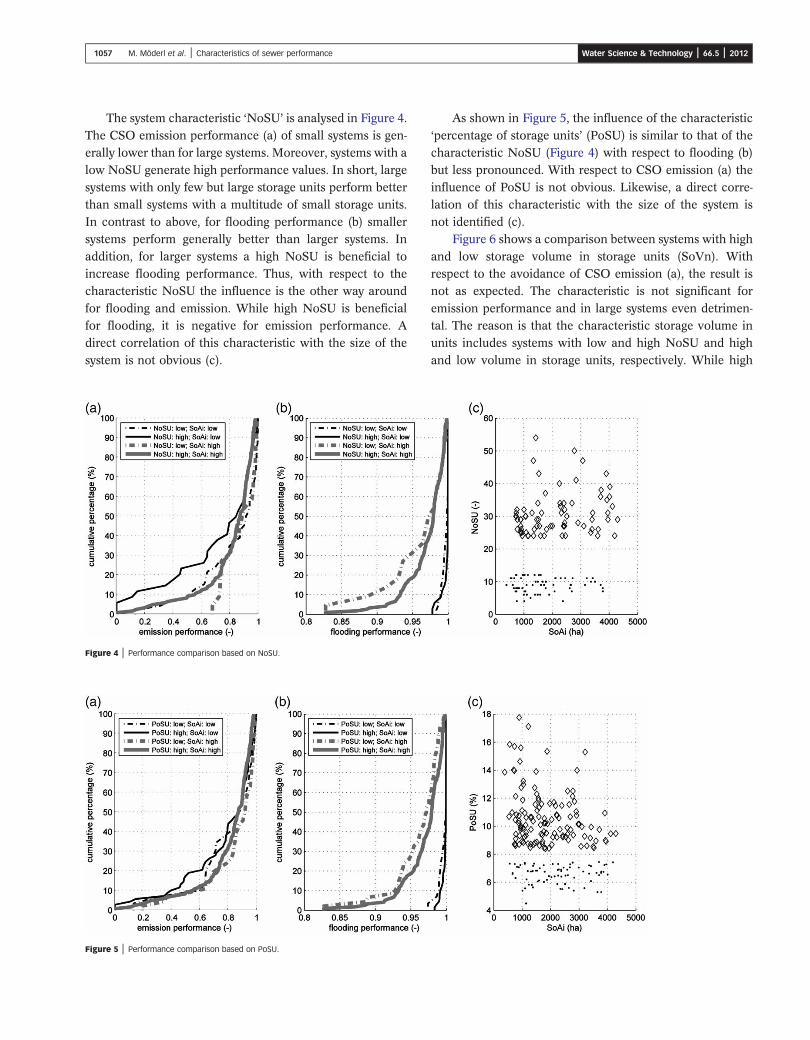
The system characteristic ‘NoSU’ is analysed in Figure 4.
The CSO emission performance (a) of small systems is gen-erally lower than for large systems. Moreover, systems with alow NoSU generate high performance values. In short, large
systems with only few but large storage units perform betterthan small systems with a multitude of small storage units.In contrast to above, for flooding performance (b) smallersystems perform generally better than larger systems. In
addition, for larger systems a high NoSU is beneficial toincrease flooding performance. Thus, with respect to thecharacteristic NoSU the influence is the other way around
for flooding and emission. While high NoSU is beneficialfor flooding, it is negative for emission performance. Adirect correlation of this characteristic with the size of the
system is not obvious (c).
Figure 4 | Performance comparison based on NoSU.
Figure 5 | Performance comparison based on PoSU.
As shown in Figure 5, the influence of the characteristic
‘percentage of storage units’ (PoSU) is similar to that of thecharacteristic NoSU (Figure 4) with respect to flooding (b)but less pronounced. With respect to CSO emission (a) the
influence of PoSU is not obvious. Likewise, a direct corre-lation of this characteristic with the size of the system isnot identified (c).
Figure 6 shows a comparison between systems with high
and low storage volume in storage units (SoVn). Withrespect to the avoidance of CSO emission (a), the result isnot as expected. The characteristic is not significant for
emission performance and in large systems even detrimen-tal. The reason is that the characteristic storage volume inunits includes systems with low and high NoSU and high
and low volume in storage units, respectively. While high

Figure 7 | Performance comparison based on MoD.
Figure 6 | Performance comparison based on SoVn in units.
Figure 8 | Emission plotted against flooding performance.
1058 M. Möderl et al. | Characteristics of sewer performance Water Science & Technology | 66.5 | 2012
specific storage volume is in general positive, a high numberof units is negative for emission performance (see Figure 4).Therefore, this characteristic is inclusive for emission per-
formance. With respect to flooding performance, it is clearthat a lower total storage volume in the system results inbetter performance. This situation is because CSO is notinfluencing flooding performance. The reduced interceptor
capacity to use the storage volume in units leads to a sur-charge of upstream conduits. The more storage is availablein the system, the higher this effect has an advantage and
the longer the upstream section is influenced.The influence of the diameter distribution is shown
in Figure 7. A high MoD indicates systems with higher
diameters, thus higher flow capacity and more inline sto-rage volume, but a low NoSU. Therefore, a high MoDresults in a better emission performance, irrespective of

1059 M. Möderl et al. | Characteristics of sewer performance Water Science & Technology | 66.5 | 2012
the size of the system. With regard to flooding performance,
the effect of MoD is reversed. A lower MoD results in betterperformance. This seems to be opposite to common sense.The reason is that systems with small MoD are representa-
tive of systems with many flow restrictions in connectionwith CSO devices. As outlined already in Figure 4, ahigher NoSU with CSOs has a positive effect on floodingperformance.
An interesting fact is noticed analysing different charac-teristics. In many instances, characteristics with positiveinfluence on emission performance have a negative influ-
ence on flooding performance and vice versa. This factbecomes evident when plotting emission against floodingperformance (Figure 8).
CONCLUSIONS
Using the technology of the case study generator, a sampleof 250 virtual combined sewer system models is generatedfor further analysis. This set is grouped according to a
number of characteristics and the performance of the setis analysed for both, CSO emission and flooding. The analy-sis is done using a statistical test (Kruskal–Wallis test) and
on a case-by-case basis.As a general result, it is evident that characteristics that
have a positive impact on emission performance often have
a negative impact on flooding performance and vice versa.Further, NoSU and NoC are sensitive characteristics foremission performance and SoVn, MoD and characteristics,which correlate with inflow, affect the flooding perform-
ance, but the Kruskal–Wallis test made it clear that not allcharacteristics are significant with respect to the perform-ance of the sewer system.
In a detailed analysis the characteristics ‘median of con-duit diameter’ and ‘sum of total storage volume’, especially,proved different results to those expected. For instance, it
was found that the total storage volume in a system is incon-clusive for the assessment of CSO emission. In this case, afurther differentiation would be needed to identify the deci-
sive system characteristic. In the case of ‘median of conduitdiameter’ it was found that systems with statistical smallerconduits reveal a better flooding performance than thosewith larger diameters. While this scenario is opposite to
common sense, the reason is that statistical smaller diam-eters represent systems with a higher NoSU with CSOdevices, which again is positive for flooding performance.
Concluding, the analysis of a large set of combinedsewer systems revealed valuable insight with regard to the
influence of system characteristics. The relation between
system characteristics and system performance is lessobvious than commonly assumed and sometimes evenopposite to common assumptions. Future work must focus
on widening of the database and introducing a more rigor-ous definition of system characteristics.
ACKNOWLEDGEMENTS
This study is part of the project ‘KIRAS PL 3: Achilles’, projectno. 824682 under the ‘Sicherheitsforschungs-Förderpro-gramm KIRAS’ and was funded by the Austrian Federal
Ministry for Transport, Innovation and Technology (BMVIT)and the Austrian Research Promotion Agency (FFG).
REFERENCES
De Toffol, S., Engelhard, C. & Rauch, W. Combined sewersystem versus separate system – a comparison of ecologicaland economical performance indicators. Water Science andTechnology 55 (4), 255–264.
DeFilippi, J. A. & Shih, C. S. Characteristics of separatedstorm and combined sewer flows. Journal Water PollutionControl Federation 43 (10), 2033–2058.
Eisenhardt, K. M. Building theories from case-study research.Academy of Management Review 14 (4), 532–550.
Ghosh, I., Hellweger, F. L. & Fritch, T. G. Fractal generationof artificial sewer networks for hydrologic simulations. In:Proceedings of the ESRI International User Conference, SanDiego, California, August 7–11.
Kleidorfer, M. & Rauch, W. An application of Austrian legalrequirements for CSO emissions. Water Science andTechnology 64 (5), 1081–1088.
Kruskal, W. H. & Wallis, W. A. Use of ranks in one-criterionvariance analysis. Journal of the American StatisticalAssociation 47 (260), 583–621.
MacArthur, B. & Sanchez-Garcia, R. J. Spectralcharacteristics of network redundancy. Physical Review E80 (2), 026117 (10pp).
Möderl, M., Butler, D. & Rauch, W. A stochastic approachfor automatic generation of urban drainage systems. WaterScience and Technology 59 (6), 1137–1143.
ÖWAV-RB 19. Richtlinie für die Bemessung vonMischwasserentlastungen. Österreichischer Wasser- undAbfallwirtschaftsverband, Wien.
Pitman, J. Enumerations Of Trees And Forests Related ToBranching Processes and Random Walks. Department ofStatistics, University of California, Berkeley, CA.
Rossman, L. A. Storm Water Management Model - User’sManual Version 5.0. National Risk Management ResearchLaboratory – U.S. Environmental Protection Agency,Cincinnati, OH.

1060 M. Möderl et al. | Characteristics of sewer performance Water Science & Technology | 66.5 | 2012
Shirazi, R. H. S. M., Bouteligier, R. & Berlamont, J. Evaluation of sediment removal efficiency of flushing devicesregarding sewer system characteristics. In: Proceedings ofthe 8th International Conference on Hydro-science andEngineering, Nagoya, Japan, 9–12 Sept.
Urich, C., Sitzenfrei, R., Möderl, M. & Rauch, W. An agentbased approach for generating virtual sewer systems in thesoftware VIBe. In: Proceedings of the 8th InternationalConference on Urban Drainage Modelling, Tokyo, Japan,7–11 Sept.
First received 1 July 2011; accepted in revised form 16 April 2012