Miami-Dade Water and Sewer Sludge Thickening and ...
21
30 June 2018 • Florida Water Resources Journal M iami-Dade County embarked on a biosolids planning effort in 2006 and produced a final biosolids master plan in 2008. The goal of the plan was to determine a path forward for Miami-Dade Water and Sewer Dept. (MDWASD) to process biosolids in an efficient and effective manner that would meet future growth and upcoming regulatory requirements in the state of Florida. Several capital programs and a decade later, MDWASD is in the mist of constructing, design, and planning aspects of that biosolids master plan that so fundamentally showed that, through better technology, new philosophies in biosolids treatment, better appreciation for the environment, and purpose of the end product, there was a more sustainable way. One of the early key observations of that biosolids master planning effort was that sludge gravity thickening in the constantly hot and humid conditions of south Florida is very prone to septic conditions. These conditions manifest in poor sludge thickening (lower thickened sludge concentrations), a high solids rejection rate (poor solids capture), and frequent process upsets, resulting in the bulking of the sludge blanket. In essence, gravity thickeners are pri- marily designed for primary, lime, and com- bined sludges, but poorly suited for waste activated sludge (WAS), producing lower sludge underflow concentration and lower solids re- covery (WEF MOP No. 8, fifth edition, 2008). Miami-Dade County’s experience with normal operation of sludge gravity concentra- tors has been a constant battle to fight process failure, rather than an opportunity of optimiz- ing a process for better performance. The solu- tion and design consideration proposed was the basis of a multiplant design-build project with mechanical thickening of sludge to 5 to 6 per- cent total solids (TS) from the current 2 to 4 percent TS thickened sludge concentrations. As a part of the MDWASD consent decree with the U.S. Environmental Protection Agency (EPA), the utility agreed to rehabilitate its exist- ing gravity thickening process at its South Dis- trict Wastewater Treatment Plant (SDWWTP) and Central District Wastewater Treatment Plant (CDWWTP). In the progression of initial planning efforts at the behest of the utility’s op- erations staff, process engineers, and local regu- lators, the plan changed from rehabilitation of the existing thickening process to something proven to work in hot and humid climates, be easier to properly operate and maintain, and produce much higher thickened sludge concen- trations in a stable process. The debate concerning rotary drum thick- eners, gravity belt thickeners. and thickening centrifuges went on throughout the basis of the design period. Due to their high throughput, space considerations, and the utility’s familiar- ity with dewatering centrifuges to allow for sim- ilar operations and maintenance, centrifuges were selected as the technology to design around for thickening (WEF MOP No. 11, sixth edition, 2008). This in turn deemed that careful study of centrifuges was merited based on con- cerns over the specific sludge conditions and downstream process impacts at both plants. In tandem with changes to sludge thicken- ing, the anaerobic digestion process at each plant is being modified from two-stage mesophilic anaerobic digestion (with heated and mixed primary digesters and unheated, minimally mixed secondary digesters) to single- stage mesophilic anaerobic digestion at CDWWTP and acid-gas mesophilic anaerobic digestion at SDWWTP, with all rehabilitated di- gesters having the capacity for heating and mix- ing. As the thickened sludge concentration would be higher, the study incorporated mesophilic anaerobic digestion at steady state under these high-feed solids condition at a 20- day detention time, as these would be the pro- posed future design condition. Due to the equipment age and the vast im- provements in energy efficiency of newer, lighter machines, the dewatering centrifuges were slated for replacement as part of the consent de- cree. The ripple effect of the aforementioned process changes impact-digested sludge con- centrations, and potentially, sludge dewater- ability. The pilot study included the testing of the future dewatering feed sludge conditions on both the dewatering centrifuge design consid- erations and final dewatered sludge quality and quantity to achieve a 24 percent cake solids con- centration, with 95 percent solids capture rate. Facility Background The SDWWTP is located in the southeast- ern portion of Miami-Dade County and serves its southern and southwestern portions. The plant is a high-purity-activated sludge second- ary treatment facility, with a permitted capacity of 112.5 mil gal per day (mgd). The SDWWTP produces only WAS, and wasting is controlled using a modulating valve and flow meter that is tapped off at the return activated sludge pumps. The WAS is mixed with polymer in the piping and sent to four 55-ft-di- ameter gravity thickeners with 13-ft side water depth. The gravity thickeners thicken the solids to 2 to 3 percent total solids (TS) before being stabilized in twelve 105-ft-diameter anaerobic digesters, each with a nominal operating volume of 1.5 mil gal. The digesters are arranged in three clusters of four digesters per cluster, where two digesters per cluster operate as primary digesters and two Miami-Dade Water and Sewer Sludge Thickening and Dewatering Centrifuge Pilot Studies at Two of the Southeast’s Largest Wastewater Treatment Plants Manuel Moncholi, Terry Goss, Brian Stitt, and Ismael Diaz Manuel Moncholi is chief of the operations program management division at Miami- Dade Water and Sewer Dept. and a Ph.D. candidate at Florida International University in Miami. Terry Goss is biosolids practice leader at AECOM Water in Raleigh, N.C., and Brian Stitt is senior project manager at AECOM Water in Miami. Ismael Diaz is project manager at Gannett Fleming in Miami. FWRJ
-
Upload
khangminh22 -
Category
Documents
-
view
0 -
download
0
Transcript of Miami-Dade Water and Sewer Sludge Thickening and ...

30 June 2018 • Florida Water Resources Journal
Miami-Dade County embarked on abiosolids planning effort in 2006 andproduced a final biosolids master plan
in 2008. The goal of the plan was to determinea path forward for Miami-Dade Water andSewer Dept. (MDWASD) to process biosolids inan efficient and effective manner that wouldmeet future growth and upcoming regulatoryrequirements in the state of Florida.
Several capital programs and a decade later,MDWASD is in the mist of constructing, design,and planning aspects of that biosolids masterplan that so fundamentally showed that,through better technology, new philosophies inbiosolids treatment, better appreciation for theenvironment, and purpose of the end product,there was a more sustainable way.
One of the early key observations of thatbiosolids master planning effort was that sludgegravity thickening in the constantly hot andhumid conditions of south Florida is very proneto septic conditions. These conditions manifestin poor sludge thickening (lower thickenedsludge concentrations), a high solids rejectionrate (poor solids capture), and frequent processupsets, resulting in the bulking of the sludgeblanket. In essence, gravity thickeners are pri-marily designed for primary, lime, and com-bined sludges, but poorly suited for wasteactivated sludge (WAS), producing lower sludgeunderflow concentration and lower solids re-covery (WEF MOP No. 8, fifth edition, 2008).
Miami-Dade County’s experience withnormal operation of sludge gravity concentra-tors has been a constant battle to fight processfailure, rather than an opportunity of optimiz-ing a process for better performance. The solu-tion and design consideration proposed was thebasis of a multiplant design-build project withmechanical thickening of sludge to 5 to 6 per-cent total solids (TS) from the current 2 to 4percent TS thickened sludge concentrations.
As a part of the MDWASD consent decreewith the U.S. Environmental Protection Agency(EPA), the utility agreed to rehabilitate its exist-
ing gravity thickening process at its South Dis-trict Wastewater Treatment Plant (SDWWTP)and Central District Wastewater TreatmentPlant (CDWWTP). In the progression of initialplanning efforts at the behest of the utility’s op-erations staff, process engineers, and local regu-lators, the plan changed from rehabilitation ofthe existing thickening process to somethingproven to work in hot and humid climates, beeasier to properly operate and maintain, andproduce much higher thickened sludge concen-trations in a stable process.
The debate concerning rotary drum thick-eners, gravity belt thickeners. and thickeningcentrifuges went on throughout the basis of thedesign period. Due to their high throughput,space considerations, and the utility’s familiar-ity with dewatering centrifuges to allow for sim-ilar operations and maintenance, centrifugeswere selected as the technology to designaround for thickening (WEF MOP No. 11, sixthedition, 2008). This in turn deemed that carefulstudy of centrifuges was merited based on con-cerns over the specific sludge conditions anddownstream process impacts at both plants.
In tandem with changes to sludge thicken-ing, the anaerobic digestion process at eachplant is being modified from two-stagemesophilic anaerobic digestion (with heatedand mixed primary digesters and unheated,minimally mixed secondary digesters) to single-stage mesophilic anaerobic digestion at CDWWTP and acid-gas mesophilic anaerobicdigestion at SDWWTP, with all rehabilitated di-gesters having the capacity for heating and mix-ing. As the thickened sludge concentrationwould be higher, the study incorporatedmesophilic anaerobic digestion at steady stateunder these high-feed solids condition at a 20-day detention time, as these would be the pro-posed future design condition.
Due to the equipment age and the vast im-provements in energy efficiency of newer, lightermachines, the dewatering centrifuges wereslated for replacement as part of the consent de-
cree. The ripple effect of the aforementionedprocess changes impact-digested sludge con-centrations, and potentially, sludge dewater-ability. The pilot study included the testing ofthe future dewatering feed sludge conditions onboth the dewatering centrifuge design consid-erations and final dewatered sludge quality andquantity to achieve a 24 percent cake solids con-centration, with 95 percent solids capture rate.
Facility Background
The SDWWTP is located in the southeast-ern portion of Miami-Dade County and servesits southern and southwestern portions. Theplant is a high-purity-activated sludge second-ary treatment facility, with a permitted capacityof 112.5 mil gal per day (mgd).
The SDWWTP produces only WAS, andwasting is controlled using a modulating valveand flow meter that is tapped off at the returnactivated sludge pumps. The WAS is mixed withpolymer in the piping and sent to four 55-ft-di-ameter gravity thickeners with 13-ft side waterdepth. The gravity thickeners thicken the solidsto 2 to 3 percent total solids (TS) before beingstabilized in twelve 105-ft-diameter anaerobicdigesters, each with a nominal operating volumeof 1.5 mil gal.
The digesters are arranged in three clustersof four digesters per cluster, where two digestersper cluster operate as primary digesters and two
Miami-Dade Water and Sewer Sludge Thickening and Dewatering CentrifugePilot Studies at Two of the Southeast’sLargest Wastewater Treatment Plants
Manuel Moncholi, Terry Goss, Brian Stitt, and Ismael Diaz
Manuel Moncholi is chief of the operationsprogram management division at Miami-Dade Water and Sewer Dept. and a Ph.D.candidate at Florida International Universityin Miami. Terry Goss is biosolids practiceleader at AECOM Water in Raleigh, N.C.,and Brian Stitt is senior project manager atAECOM Water in Miami. Ismael Diaz isproject manager at Gannett Fleming inMiami.
F W R J
Florida Water Resources Journal • June 2018 31
operate as secondary digesters. Digester Clus-ter 3 normally operates with two of the digestersacting as sludge storage tanks before dewater-ing. Digester 9 is located in Cluster 3 and acts asa primary digester that discharges to Digester10, which acts as a secondary digester. The di-gested biosolids are further dewatered usingfour Alfa Laval PM 75000 centrifuges, whichachieve 18 to 22 percent TS. The sludge fed tothe centrifuges is currently conditioned using adry polymer-type system.
The CDWWTP, located on Virginia Key, isthe oldest existing sewer treatment plant oper-ated by MDWASD and was originally con-structed in 1956. The CDWWTP is ahigh-purity oxygen-activated sludge secondarytreatment facility, with a permitted capacity of143 mgd. The plant has two separate liquid pro-cessing streams: Plant 1 is rated at 60 mgd aver-age daily flow (ADF) and Plant 2 is rated at 83mgd ADF.
The CDWWTP produces only WAS, whichis mixed with polymer in the piping and sent toeight 55-ft-diameter gravity thickeners with a13-ft side water depth. Both Plant 1 and Plant 2contain four gravity thickeners each. The grav-ity thickeners thicken the solids to 2 to 4 percentTS before being stabilized in twenty-four 105-ft-diameter anaerobic digesters, each with anominal operating volume of 1.5 mil gal, oper-ated under two-stage mesophilic conditions.Plant 1 consists of two digester clusters, eachwith four digesters, and Plant 2 consists of fourdigester clusters, each with four digesters. Thedigested biosolids are further dewatered usingAlfa Laval DS 706 centrifuges, which achievegreater than 25 percent TS. The sludge fed to thecentrifuges is currently conditioned using a drypolymer-type system. Ferric sulfate is also addedto the dewatering feed primarily for struvitecontrol.
The CDWWTP also receives primarysludge and WAS from the North District Waste-water Treatment Plant (NDWWTP). The sludgetransfer building at NDWWTP houses foursludge transfer pumps with variable speeddrives. The pumps are used to pump sludgethrough two 16-in. force mains. The force mainsare parallel for about 10 mi before they join atan interconnection. From the interconnection,sludge can be directed to the sewage collectionsystem of CDWWTP (Force Main #2) or to anextension of one 16-in. force main that contin-ues another 6 mi, where it discharges to thegravity sludge thickeners located at Plant 2 ofCDWWTP (Force Main #1). The sludge fromNDWWTP contains an exorbitant amount ofrags, plastics, and grit, which have historicallybeen problematic for CDWWTP sludge thick-ening operations. Screening of NDWWTP
sludges will be implemented to remedy this op-erational challenge.
Design Considerations for Sludge Thicken-ing and Dewatering Centrifuges
In general principle, a centrifuge behavessimilarly to clarifiers and gravity thickeners inthat physical separation of solid from liquid is aresult of gravity and can be aided by metal co-agulants and organic polymers, which increaseparticle density and promote flocculation. Theadvantages of centrifuges to enhance the rate orsettling, sludge concentration, and solids recov-ery is a result of centripetal forces being thou-sands of times greater than the gravitationalforce experienced in a clarifier. The hydrauliccapacity of a centrifuge can be expressed as afunction of the centrifuges dimensions and theacceleration force experienced within the cen-trifuge due to the speed of rotation of the cen-trifuge, as shown in Equation 1 (WEF MOP No.8, fifth edition, 2008).
Equation 1
S =2pl (w2/100g)(0.75r22+0.25r1
2)
Where:S = theoretical hydraulic capacity (cm2);l = centrifuge bowl’s effective clarifying length
(cm);w = centrifuge bowl’s angular velocity (rad/s);
g = acceleration from gravity (m/s2);r1 = radius from centrifuge centerline to the
liquid surface in the centrifuge bowl (cm);r2 = radius from centrifuge centerline to the
inside wall of the centrifuge bowl (cm).
The equation helps in determining themaximum hydraulic capacity for a size of a ma-chine and operational settings. Sizing a facilityassists in calculating a minimum number ofunits to achieve a hydraulic throughput. Un-fortunately for design and operations, cen-trifuge performance is additionally dependenton the input sludge conditions, polymer dose,metal salt dosing, pumping considerations, andother factors. Due to the variability of sludgesbetween treatment plants, even those with thesame treatment processes and influent waste-water characteristics that determine the real-world number of centrifuges to successfullyprocess a plant’s sludge to both a certain sludgeconcentration and solids recovery, while man-aging chemical and power costs pilot testing, isessential (WEF MOP No. 8, fifth edition, 2008).
Pilot Study Overview and Objectives
To better establish performance criteria forthe new thickening and dewatering centrifuges,a nearly year-long centrifuge thickening, diges-
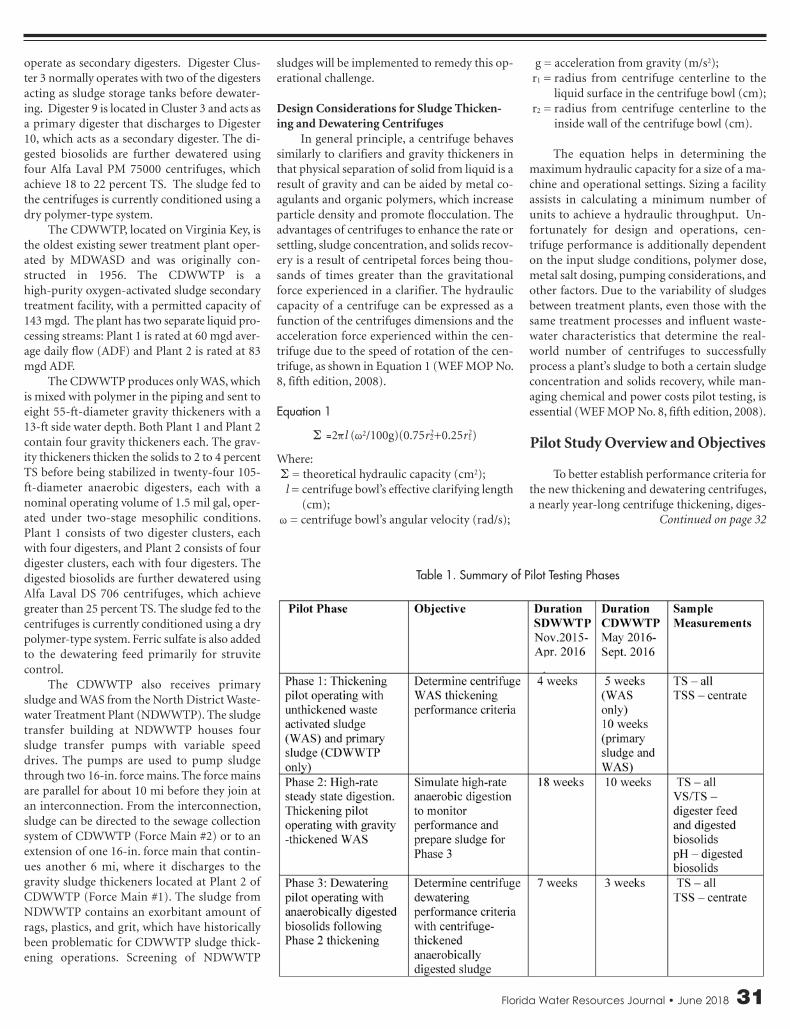
Table 1. Summary of Pilot Testing Phases
Continued on page 32

32 June 2018 • Florida Water Resources Journal
tion, and centrifuge dewatering pilot study wasconducted at SDWWTP and CDWWTP. Thepilot study was set up to simulate future thick-ening, digestion, and dewatering operating con-ditions to establish thickening and dewateringperformance criteria. The pilot operation wasconducted in three distinct phases at each plant,as outlined in Table 1, with critical samplestaken throughout each phase pertinent to un-derstanding equipment performance and set-ting design criteria.
Figures 1 and 2 show a plan view layout ofthe sites and identify the locations for the cen-trifuge thickening and dewatering pilot trailers.Figure 3 provides photos of the pilot testingtrailers, which were selected after a competitivebidding process. The program management andconstruction management (PMCM) team over-saw the piloting effort, with outstanding sup-port from SDWWTP staff.
Periodic samples collected throughout thepilot operation were all analyzed for TS. DuringPhases 2 and 3, the PMCM team regularly mon-itored the volatile solids (VS) content of thethickened sludge fed to the digester and digestedbiosolids samples. Digested biosolids pH wasmeasured and the centrate samples were ana-lyzed for total suspended solids (TSS). Collegeinterns were trained to perform the samplingand laboratory analysis throughout the dura-tion of the pilot testing period.
South District Wastewater Treatment Plant Phase 1: Thickening Pilot Testing
The Phase 1 piloting operation was basedon feeding unthickened WAS to the pilotthickening centrifuge. The purpose of thePhase 1 operation was to determine the opti-mum polymer design conditions and per-formance of the centrifuge thickening. The
Figure 1. Central District Wastewater Treatment Plant Pilot Site Plan Showing Centrifuge Installation
Figure 2. South District Wastewater Treatment Plant Pilot Site Plan Showing Centrifuge Installation
Figure 3. Photos of Pilot Equipment: Thickening (left) and Dewatering (right) (courtesy of Centrisys)
Continued from page 31

Florida Water Resources Journal • June 2018 33
overall target for the centrifuge thickeningperformance, as stated in the basis of designand specifications, was to thicken the WAS to5.5 percent TS while maintaining greater than95 percent solids recovery; determining thenecessary polymer dose to achieve this per-formance is also important. Parameters thatwere adjusted for the centrifuge thickening in-cluded the pool depth, bowl speed, and differ-ential scroll speed (Goss, et al.).
Thickening Pilot Testing: No-Polymer Operation
The system initially started up on lowersludge flows, with no polymer injection. Figure4 summarizes the operation, without polymer,for a medium bowl speed equal to 2,590 revolu-tions per minute (rpm) and differential speedof 12 rpm, with flow rates ranging from 40 to100 gal per minute (gpm).
This operation showed that it was possibleto thicken the sludge up to 6 percent TS withoutthe use of polymer, but at higher throughputs(above 60 gpm), the solids recovery was sacri-ficed. The tests were conducted at a deep pooldepth, a medium pool depth, and a shallow pooldepth. The trend shows that, at the shallowestpool depth, solids recovery improved, but totalthickened solids were sacrificed. The thickenedsolids concentration at the deep and mediumpool depths were nearly the same, but it shouldbe noted that the feed solid content was lowerwhen testing the deepest pool depth (0.9 per-cent TS),while the feed solids were closer to 1.4percent solids when testing the medium pooldepth. If testing was done on the same feedsolids concentration, it would be expected thatthe solids would be thicker at the deepest pooldepth.
Results of the testing without polymer in-dicated that it’s possible to maintain the desiredthickened TS concentrations without the use ofpolymer. Although the operation without poly-mer may sacrifice solids recovery, future opera-tion at this condition may be desired whensludge production is below design capacity, as itcould reduce operation and maintenance costsassociated with polymer consumption.
Thickening Pilot Testing: Emulsion PolymerSetup and Initial Testing
The pilot unit was set up to allow injectionof polymer at two locations, as illustrated in Fig-ure 5, either directly into the bowl of the unit(internal injection) or in the sludge feed line up-stream of the centrifuge inlet (external injec-tion). Polymer flow was measured during eachsampling event using a calibration column lo-cated on the pilot trailer.
The initial polymer used was PRAESTOL®
K144-L, which is a cationic, high-molecular-weight emulsion polymer. Polymer dosage,using internal injection, was slowly increased ata constant throughput of 100 gpm, while visu-ally monitoring the clarity of the centrate. Thetesting was conducted at the shallowest pooldepth and a differential speed of 12 rpm. Once
polymer was added, the bowl speeds were re-duced from 2,590 rpm to between 1,900 to2,100 rpm to keep the thickened solids frombeing too thick. The results showed that, withthe increased polymer dosages and reduction inbowl speed, the thickened solid content re-
Figure 4. No-Polymer Operation, Medium Bowl Speed (2,590 rpm)
Figure 5. Thickening
Polymer Injection Point
Continued on page 34

34 June 2018 • Florida Water Resources Journal
mained steady, but the solids recovery im-proved.
Once relatively clear centrate wasachieved, the flow rate to the machine was in-creased to maximize throughput, while opti-mizing solids recovery (based on visualobservations of centrate quality). In addition,other cationic, high-molecular-weight emul-sion polymers were tested in the machine and
optimization testing showed that the polymerworked the best.
Thickening Pilot Testing: Dry Polymer SetupThe Centrisys thickening unit contains an
emulsion polymer system and is not set up withthe provisions to operate on dry polymer, so acreative solution was required to facilitate test-ing dry polymer in the pilot centrifuge. In orderto allow the testing, one of the SDWWTP poly-
mer makeup systems (not currently in use), wasused to make up the dry polymer solution,which was pumped to a tote that was connectedto a dedicated portable pump to meter the drypolymer solution into the centrifuge. Photos ofthe setup are provided in Figure 6. The pumpon the trailer used for emulsion polymer wastoo small to pump the dry polymer solution.
A calibration curve was developed for thepolymer pump by a series of bucket tests con-ducted at different pump speeds and the curvewas compared to the theoretical zero poundsper sq in. (psi) pump curve, which showed goodconvergence. The dry polymer used for testingwas Polydyne C-3283, which is the polymer theplant currently uses in its dewatering cen-trifuges.
Thickening Pilot Testing: ResultsPilot tests were run to further determine
results for the centrifuge thickening operation.The results from the optimization trials showedthat good performance could be achieved withmedium bowl speeds of 2,400 to 2,600 rpm. Ata lower flow rate of 100 gpm, an emulsion poly-mer dose of 1 pound per dry ton (lb/DT)showed good results, but as the flow was in-creased to 150 gpm, at least 2 lb/DT wereneeded. The higher polymer dose requirementsat higher flows also correlated to the pointwhere external polymer injection provided bet-ter results than internal polymer injection.
The polymer curves and flow curves con-ducted during the performance testing periodwere to further test the limits for the operationalparameters. Additional performance testing wasconducted in March 2016 using the plants drypolymer (Polydyne C-3283). The purpose wasto repeat the November 2015 testing, but withdry polymer that more closely represents futureoperation.
Thickening Pilot Testing: Polymer CurveResults
Polymer curve tests were conducted bymaintaining a constant volumetric throughputof sludge feed to the centrifuge, but changingthe polymer dose to measure the impact. Withthe exception of changing polymer dose, allother parameters on the centrifuge remainedthe same for each polymer curve test. In No-vember 2015, three different polymer curveswere generated for the 144-L emulsion polymerat 100, 150, and 170 gpm WAS flow ratesthrough the pilot centrifuge. In March 2016, anadditional 144-L emulsion polymer curve wasconducted at 130 gpm and several dry polymercurves were conducted at 130, 150, and 170gpm.
Figure 7. Emulsion Polymer: 130 and 150 gpm WAS Feed, Medium Bowl Speed
Figure 6. Temporary Dry Polymer Setup
Continued on page 36
Continued from page 33

36 June 2018 • Florida Water Resources Journal
Figure 7 also shows the data for emulsionpolymer curves at the 130 and 150 gpm WASfeed, conducted at medium bowl speed (2,400to 2,600 rpm). At 130 gpm WAS feed, the curvewas conducted with internal polymer injection,and at 150 gpm WAS feed, the curve was con-ducted with external polymer injection. Theconcentration of the WAS during this testingranged from 1.1 to 1.5 percent TS.
As shown in Figure 7, at 130 gpm WAS feedwith internal emulsion polymer injection and adeep pool depth, good performance is obtainedfor polymer doses greater than 1 lb/DT activeachieving close to 6 percent TS. At polymerdoses greater than 1 lb/DT active, close to 100percent solids recovery was also achieved. Ex-ceeding 1 lb/DT or up to 1.6 lb/DT active didnot have much of an impact on the solids con-centration or the solids recovery.
At 150 gpm WAS feed, with external emul-sion polymer injection and a shallow pool depthgreater than 5 percent, TS was achieved for allpolymer doses tested. The solids recovery ex-ceeded 95 percent for the two highest dosingpoints when active dosing was greater than 2.3lb/DT.
The dry polymer curve for the WAS flowrate of 130 gpm, with both internal and externaldry polymer injection, is shown in Figure 8 fora medium bowl speed of 2,586 rpm and deeppool depth. The polymer concentration duringthese tests was approximately 0.8 percent TS. Anadditional 130 gpm WAS polymer curve, alsoshown in Figure 8, used a 0.4 percent TS poly-mer solution (with internal dry polymer injec-tion) at a bowl speed of 2,408 rpm and deeppool depth. For all tests, the feed averaged 1.2 to1.4 percent TS.
For internal dry polymer injection witha 0.8 percent TS polymer solution, greaterthan 5.5 percent TS was achieved for all poly-mer doses tested; however, only greater than95 percent recovery was achieved at polymerdoses greater than 5 lb/DT. For external drypolymer injection with a 0.8 percent TS poly-mer solution, the active polymer dose rang-ing from 4.3 to 6.7 lb/DT did not showsignificant differences in centrifuge perform-ance in terms of solids content. The thickenedsolids content ranged from 6.5 to 6.6 percentTS and the solids recoveries were greater than95 percent for all samples. The TSS sampleanalyzed for 4.3 lb/DT may also have had anerror and it was noted that the centrate wasvisually dirtier than the samples with highpolymer dosages.
For internal dry polymer injection with a0.4 percent polymer solution, greater than 5.5percent TS was achieved for all polymer doses
Figure 8. Dry Polymer: 130 gpm WAS Feed, Internal and External Injection, Medium Bowl Speed
Figure 9. Dry Polymer: 150 gpm, Internal and External Injection, Medium Bowl Speed
Continued from page 34

Florida Water Resources Journal • June 2018 37
tested, and at polymer doses greater than 3.8lb/DT, the solids recovery was near the 95 per-cent target. The thickening pilot results showthat at 130 gpm WAS feed, approximately 5lb/DT of the dry polymer is required to main-tain greater than 95 percent recovery, but at thesettings tested, the thickened sludge exceeds theneeded solids content and approaches 7 percentTS. Further optimization would be required tomaintain the target of 5.5 percent TS, such aslowering the pool depth.
The dry polymer curves for the WAS flowrate of 150 gpm with both internal and externaldry polymer injection is shown in Figure 9 for amedium bowl speed of approximately 2,585rpm and deep pool depth. The polymer con-centration during these tests ranged between 0.7to 0.8 percent TS. For all tests, the feed averaged1.2 to 1.3 percent TS.
For internal dry polymer injection, greaterthan 5 percent TS was achieved for all polymerdoses tested; however, none of the pointsachieved greater than 95 percent recovery. Flocswere observed in the centrate for the externalpolymer injection testing, so it was evident thatthis flow was too high for the internal polymerinjection to work efficiently. For external injec-tion, greater than 6 percent TS was achieved forall polymer doses tested. The solids recovery,however, was only greater than 95 percent forthe highest active polymer dose, which was 5.3lb/DT. It may have been possible to get more op-timal performance (closer to 5.5 percent TSwith greater than 95 percent solids recovery)with a shallower pool depth.
Thickening Pilot Testing: Extended Opera-tion Results
After generating the polymer, flow, andbowl speed curves, the unit was operated severaldays at a constant flow rate with optimized set-tings to test the stability of the operationthroughout the course of a day. During Novem-ber 2015, these tests were conducted using the144-L emulsion polymer at a WAS flow rate of135, 165, and 200 gpm. In March 2016, the ex-tended operation testing with dry polymer wasrepeated twice at 135 gpm. Samples were col-lected during these trials approximately onceevery hour.
The results with emulsion polymer werestable throughout the course of a run, but theresults with the dry polymer showed more fluc-tuation with solid recovery degradation overtime. It was planned to again repeat the 135 gpmextended operation testing using the dry poly-mer; however, the gearbox on the progressingcavity-thickened sludge pump failed before thistesting was completed. Due to the lead time torepair it, it was not possible to conduct the ad-
ditional testing in the schedule for the project. Itis believed that limitations in the setup and lackof mixing on the polymer tote contributed tothe poor performance for the extended opera-tion testing with dry polymer. The concentra-tion of polymer samples collected throughoutthe extended run varied between 20 to 40 per-cent on both days tested.
A comparison of the extended operation at135 gpm with emulsion and dry polymer is de-picted in Figure 10. The runs with dry polymerat 4 to 7 lb/DT active polymer dosages were con-ducted with a deeper pool depth than the runwith emulsion polymer conducted at 2 to 3lb/DT active polymer dosages. The deeper pooldepth is likely the reason the solid content washigher with the dry polymer testing than theemulsion polymer testing. The feed WAS con-centration during all three runs ranged from 1.1to 1.5 percent TS.
The thickening pilot testing showed thatthe centrifuge could reliably produce solids at 5to 6 percent TS and achieve greater than 95 per-cent solids recovery. Testing was conductedusing both dry and emulsion polymers. The drypolymer required 5 to 7 lb/DT active dosingcompared to 1 to 3 lb/DT active based on theemulsion. It was also possible to thicken thesludge to 5 to 6 percent TS without the use ofpolymer, but this reduced hydraulic throughput
by about 50 percent to allow solids recoveries toremain above 90 percent.
South District Wastewater Treatment Plant Phase 2: Continuous Thickening
Pilot Operation
During Phase 2 operation, mechanicallythickened sludge was fed to Digester 9 to simu-late future high-rate digestion conditions and toincrease the solids content of the digestedbiosolids for the Phase 3 dewatering pilot oper-ations. The feed to the thickening pilot wasswitched to gravity-thickened sludge to increasesolids loading through the thickener to increasethe turnover rate in Digester 9. This mode ofoperation started in December 2015, continuedthrough March 2016, and remained running inparallel with the dewatering piloting conductedin Phase 3. During Phase 2 operation, the thick-ening centrifuge was fed approximately 100 to150 gpm of sludge from the gravity concentra-tor and operated continuously. Figure 11 sum-marizes the centrifuge performance during thePhase 2 operation. On March 21, 2016, the feedwas switched back to the unthickened WASwhen the additional thickening testing using drypolymer was conducted.
Figure 10. Extended Thickening Operation at 135 gpm
Continued on page 38

38 June 2018 • Florida Water Resources Journal
During Phase 2 operation, the feed fromthe gravity concentrators averaged 2.2 percentTS, but ranged between 1.5 to 3 percent TS. Theconcentration in the gravity concentrator meas-ured by the pilot staff compared closely with theconcentration based on the plant records. Thethickened solids content averaged 6.2 percent TSbut fluctuated between 5 to 7 percent TS. Dur-ing the Phase 1 operation, it was found that thehydraulic pressures inside the machine wouldincrease over time, likely due to grit building upin the machine, and would shut down on analarm if pressures reached too high of a level. Inorder to mitigate this, the machine was operatedat a lower speed, with higher polymer doses formost of the Phase 2 operation, which allowedfor the unit to operate continuously. Weeklycleaning and routine maintenance was con-ducted throughout the operation.
Throughout the Phase 2 operation, thesolids content in Digester 9 was increased to ap-proximately 3.5 percent TS. In comparison dur-ing this period, the other operational digestersoperated at 1.5 to 2 percent TS, as shown in Fig-ure 12.
During the Phase 2 operation period, Di-gester 9 averaged approximately 46 percentvolatile solids reduction (VSR) with rawundigested sludge averaging 87 percent VS/TSand digested biosolids averaging 77 percentVS/TS. Gas production averaged 16 cu ft(ft3)/lb VSR throughout the four months ofoperation. The solids retention time (SRT) inthe digesters averaged a little more than 30days and the solids loading rate (SLR) aver-aged 0.11 lb VS/ft3/day.
When comparing the pilot data to theplant’s other digesters, the VS feed matched theplant records, but the digester SRT was shorterat approximately 20 days and the digestedbiosolids VS content was slightly lower with theplants VSR during this period, averaging ap-proximately 42 percent. Thus, it appears thatoperating digestion with longer SRT and higherthickened sludge increased the VSR by about 4percent, reducing the biosolids for downstreamdewatering and beneficial use.
It was desired to have Digester 9 at a newsteady state before starting the dewatering pi-loting, so dewatering was targeted to start afterapproximately three digester SRTs had beenachieved. Figure 13 confirms that the dewater-ing performance testing was conducted afterthree digester turnovers were achieved in Di-gester 9. The data in Figure 12 showed that theconcentration in Digester 9 reached a consistentvalue of approximately 3.5 percent TS by March2016.
Figure 11. Phase 2 Continuous Thickening Operation
Figure 12. Digester Concentration Comparison, Digester 9 Versus Plant Records
Continued from page 37

Florida Water Resources Journal • June 2018 39
South District Wastewater Treatment Plant Phase 3: Dewatering Pilot Testing
The purpose of the Phase 3 operation wasto determine the optimal design conditions andperformance of the dewatering centrifuge usingthe thickened biosolids fed from Digester 9. Theoverall target for the centrifuge dewatering per-formance as stated in the basis of design andspecifications was to dewater the thickened di-gested biosolids to 20 percent TS, while main-taining greater than 95 percent solids recovery.The necessary polymer dose to achieve this per-formance is also important to determine. Thedraft specifications indicate that the active poly-mer dose should be less than 25 lb/DT. Textbookvalues for anaerobically digested WAS-onlybiosolids are not readily available, as mostanaerobic digesters in the industry digest WASblended with primary sludge. The Metcalf andEddy (M&E) fifth edition (2014) lists 16 to 25percent TS expected for untreated WAS and lists22 to 25 percent TS expected for anaerobicallydigested combined WAS and primary. For bothuntreated WAS and anaerobically digested WASand primary, the polymer consumption is ex-pected to be 15 to 30 lb/DT active, and solids re-coveries are expected to be 95 percent or greater.
Dewatering Pilot Testing: Emulsion PolymerInitial Testing
The initial testing started with emulsionpolymers on March 2, 2016. Five cationic, high-molecular-weight emulsion polymers weretested in order to select the most effective two-polymer types for further testing. The emulsionpolymers were able to achieve 22 to 25 percentTS. Based on visual observation of cake drynessand centrate quality, Centrisys proceeded withpurchasing more of the two-candidate emulsionpolymers (PRAESTOL 274 FLX and 290 FLX).
Dewatering Pilot Testing: Dry Polymer SetupThe centrifuge trailer has a dry polymer
feeding system that was rarely used and re-quired some effort to make it functional. Thepolymer blending system did not provide ade-quate mixing of the dry polymer and left un-mixed and residual portions of polymer in thetank; the dry polymer feed pump, however,provided suitable control to deliver a dry poly-mer solution to the centrifuge. The SDWWTPalso had a dry polymer makeup system that wasno longer used, but was functional. Initially, drypolymer solution was metered from the plant’smakeup system directly to the dewatering cen-trifuge; however, the plant’s polymer pumps
Figure 13. Digester 9 Turnover Progress During Phase 2 Operation
Figure 14. Compiled Dry Polymer Curves from Digester 9 Continued on page 40

40 June 2018 • Florida Water Resources Journal
could not adequately control the polymer feedfor testing.
In order to conduct the testing, a hybrid ofboth systems was used. A polymer solution thatwas made up using the plant’s system waspumped into the dry polymer solution hopperon the Centrisys pilot dewatering centrifuge.The Centrisys pump was then used to meter thepolymer to the centrifuge. The dry polymerused for the dewatering testing was Polydyne C-3283, which is currently used for SDWWTP de-watering centrifuges.
Dewatering Pilot Testing: Polymer InjectionLocation Optimization
Polymer injection location in the biosolidsis important in getting proper biosolids floccu-lation for the desired dewatering. Several injec-tion locations were tested using the plant’s drypolymer. A mixed injection system, which in-cluded dosing a portion of the polymer in astatic mixer in the interconnecting hose and therest of the polymer injected at the grinder onthe pilot trailer, was initially found to be the bestmethod for polymer injection based on visualobservations of the centrate clarity. Later test-ing found that injecting polymer directly intothe feed tube of the centrifuge provided bettercentrate quality. The first few weeks of testingwere based primarily on the mixed polymer in-jection and the later testing was conducted usingprimarily the feed tube injection point.
Dewatering Pilot Testing: Polymer Curve Results
Polymer curve tests were conducted bymaintaining a constant volumetric throughputof digested biosolids feed to the centrifuge bychanging the polymer dose to measure the im-pact. With the exception of changing polymerdose, most of the other parameters on the cen-trifuge remained the same for each polymercurve test. During some of the tests, however,the differential speed was adjusted to increasecake solids, while still trying to maintain good-quality centrate based on visual observations.Testing showed that reducing the differentialspeed would increase cake solids, but could sac-rifice centrate quality and solids recovery.
Polymer curve tests were conducted usingboth emulsion and dry polymer with bothmixed and feed tube polymer injection. All ofthe dry polymer curves conducted on thickenedbiosolids from Digester 9 are presented in Fig-ure 14 and the data depict the injection pointand polymer concentration.
For the majority of the dry polymer test-ing, the targeted polymer concentration was 0.8
Figure 15. Compiled Emulsion Polymer Curves from Digester 9
Figure 16. Extended Operation Using Dry Polymer
Continued on page 42
Continued from page 39

42 June 2018 • Florida Water Resources Journal
percent, but actual concentrations were meas-ured daily throughout testing, and solution con-centration appeared to vary from day to day. Inaddition, the team conducted testing with amore dilute dry polymer concentration. Thered circle in Figure 14 denotes the area targetedfor optimization with dry polymer. All of theemulsion polymer curves conducted on thick-ened biosolids from Digester 9 are presented inFigure 15.
The polymer testing curves showed thatSDWWTP digested biosolids did not dewater tothe level anticipated in the preliminary design(>20percent TS) at active polymer doses of 25lb/DT. Using the plant’s dry polymer (PolydyneC-3283), it was difficult to dewater to greaterthan 18 percent TS unless the active polymerdose was above 50 lb/DT. Dryer cake could beproduced using emulsion polymer, but highpolymer doses were also required. For the drypolymer, using feed tube injection versus the ex-ternal or mixed injection allowed for lowerpolymer doses, while still maintaining recover-ies above 95 percent.
Dewatering Pilot Testing: Extended Opera-tion Results
In addition to polymer curve tests, the de-watering centrifuge was operated several days ata constant flow rate to test the stability of oper-ation throughout the course of a day. Three testswere conducted at 50 gpm: two with dry poly-mer and one with 274-FLX emulsion polymer.Two tests were conducted at 75 gpm: one withdry polymer and one with 274-FLX emulsionpolymer.
The extended runs using dry polymer areshown in Figure 16. The data showed stable per-formance with high recoveries (>98 percent) forlower active polymer doses of 19 to 23 lb/DT, ascompared to results from the polymer curvetesting. The dewatered cake solids during the ex-
tended operation tests averaged 17 to 17.5 per-cent TS at 50 gpm feed flow, with 19 to 22 lb/DTactive polymer dose. At 75 gpm, with an activepolymer dose of 23 lb/DT, the dewatered cakesolids averaged 16 to 16.5 percent TS.
The extended runs using emulsion 274FLX polymer are shown in Figure 17. The datashowed stable performance with high recoveries(>96 percent) for active polymer doses of 37 to44 lb/DT. The dewatered cake solids duringthese tests averages 20.5 to 21 percent TS at 50gpm feed flow, with 44 lb/DT active polymerdose. At 75 gpm, with an active polymer dose of37 lb/DT, the dewatered cake solids averaged19.3 to 19.6 percent TS.
The Phase 3 dewatering testing showedthat 16 to 18 percent TS cake could be achievedwith 20 to 30 lb/DT active dosing of dry poly-mer. The pilot testing showed that the dewa-tered cake solids were lower than thepreliminary design value of 20 percent TS, witha presumed 25 lb/DT active polymer whenusing dry polymer. Dryer cake at 20 to 22 per-cent TS could be produced using emulsion poly-mer, but required higher dosages above 40lb/DT active.
The Struvite Complex
Struvite accumulation and fouling has his-torically been one of the major maintenance is-sues for SDWWTP operations, consumingresources for continuous pipe cleaning to main-tain steady, uninterrupted operation of the ex-isting digestion and dewatering process. Struviteis magnesium ammonium phosphate(MgNH4PO4(s) or MAP) and results from high-soluble orthophosphate concentrations in thedigested biosolids when adequate ammonia andmagnesium are present.
The potential for struvite formation is ex-pected to increase in the future, with improvedthickening prior to anaerobic digestion; more-
over, increasing the orthophosphate concentra-tion in the biosolids has been reported to reducedewatering performance in terms of lower cakesolids and higher polymer dosing requirements(Kopp et al., 2016).
Goss et al. (2017) presented the results fromthe centrifuge thickening piloting, digestionhigh-rate piloting, and centrifuge dewatering pi-loting at SDWWTP. The SDWWTP Digester 9was isolated to receive mechanically thickenedsludge (from a pilot-thickening centrifuge) tosimulate future high-rate anaerobic digestion.The digester was operated in this manner toallow it to reach a steady state with mechanicallythickened sludge. The solids content in Digester9 was increased from 2 to 2.5 percent TS to ap-proximately 3.4 to 3.5 percent TS.
Once three digester SRT turnovers wereachieved in Digester 9, pilot centrifuge dewater-ing testing was conducted, but the resultsshowed that only 18 percent TS could beachieved, with active dry polymer dosages of 20to 30 lb/DT. The initial goal was to achievegreater than 20 percent TS, with greater than 95percent solids recovery, using an active dry poly-mer dose of less than 25 lb/DT.
Since it was desired to improve dewateringand mitigate the maintenance issues associatedwith struvite fouling, SDWWTP staff evaluatedmethods for struvite control, which could alsoenhance dewatering. In the AirPrex® process,struvite is crystallized directly from thebiosolids stream from an anaerobic digesterprior to dewatering. The precipitation of stru-vite prior to dewatering is one potentialmethod to achieve both improved dewateringand reduced maintenance costs. The objectiveof the pilot study presented here was to demon-strate the technology at SDWWTP and docu-ment the struvite precipitation and centrifugedewatering performance results. The AirPrexpilot testing was conducted after a series ofthickening, digestion, and dewatering pilot test-ing was completed at SDWWTP (Goss et al.,2017).
Background on Struvite FormationPrecipitation from MAP is a common
problem in wastewater treatment plants, whichcan foul piping and equipment. Struvite typi-cally forms in plants that contain anaerobic di-gesters with upstream biological phosphorousremoval. Struvite precipitation occurs when therelease of orthophosphate and ammonia fromcell hydrolysis during anaerobic digestion reactswith magnesium ions at pH conditions that areconducive for struvite formation (pH of 7.5 to10). Struvite accumulation tends to occur at lo-cations where pressure is low and carbon diox-ide (CO2) is released from the solution, thusFigure 17. Extended Operation Using Emulsion Polymer
Continued from page 40

Florida Water Resources Journal • June 2018 43
increasing the pH. Unwanted struvite foulinghas traditionally been solved by manual clean-ing, dilution, and dosing an iron salt to precip-itate the phosphorous, or using an antiscalingagent to lower the pH.
The following chemical equation dictatesstruvite formation (Snoeyink et al.):
Equation 2
MgNH4PO4*6H2O1 Mg2+ + NH4
+ + PO43- +
6H2O pKSO = 12.6
Under these conditions, the activities{Mg2
+}{NH4+}{PO4
3-} can increase above thesolubility product or solubility equilibrium, de-fined at KSO, causing struvite precipitation. Thecommon places for struvite accumulation arelocations where pressure is low and CO2 is re-leased from the solution, thus increasing the pH(Snoeyink et al.).
For every kilogram of phosphorus recov-ered, 7.9 kilograms of dry struvite are produced.Typically, magnesium concentration in thewastewater or in the anaerobic digester is at alower molar ratio than the phosphorous, somagnesium is generally the limiting reagent forunintended struvite formation; therefore, theaddition of a magnesium salt is required and acommon feature of most controlled struviteprecipitation and removal processes.
AirPrex ProcessThe AirPrex process was developed and
patented by Berliner Wasserbetriebe (Germany)in collaboration with the Berlin Institute ofTechnology. In this process, struvite is crystal-lized directly from the biosolids stream out ofan anaerobic digester, rather than from centrate,as is the case with more-developed struvite crys-tallization processes, such as the Ostara Pearlprocess. A general process flow diagram for theAirPrex process is provided in Figure 18.
AirPrex Piloting at South District WastewaterTreatment Plant
The AirPrex piloting was conducted inApril 2016 and the AirPrex-treated biosolidswere dewatered using a pilot dewatering cen-trifuge. The reactor was equipped with aeratorsthat strip out CO2 to increase the pH to between7.9 and 8.2. The aeration also provides circula-tion of the struvite crystals inside the reactor,which grow until they reach a sedimentationpoint and settle to the bottom of the cone-shaped reactor. Magnesium chloride was alsodosed to the reactor as a 30 percent liquid solu-tion and the dosing was set to be proportional tothe orthophosphate concentrations andbiosolids flow. For the pilot operation, the mag-
Figure 18. Typical AirPrex Process Flow Diagram (Courtesy of CNP Corp.)
Figure 19. AirPrex Pilot and Frac Tank
Figure 20. Digester 9 Solids ConcentrationContinued on page 44

44 June 2018 • Florida Water Resources Journal
nesium chloride dosing rate was set at 1.8 galper 1,000 gal of digested biosolids (Stitt et al.,2017).
During the pilot period, the AirPrex unitoperated continuously, with a digested biosolidsflow that ranged from 8 to 12 gpm, and thetreated sludge was stored in a mobile frac tankequipped with mechanical mixers that provideda buffer and storage between the AirPrex systemand pilot centrifuge. The frac tank was filledcontinuously during operation, but since thedewatering pilot throughput was up to four to10 times the flow rate of the AirPrex pilot, thepilot dewatering unit needed about two to fourhours of operation time to empty the frac tank.Photos of the pilot unit reactor and frac tank areprovided in Figure 19.
The feed to the dewatering pilot was set upto allow testing of both the AirPrex and non-AirPrex-treated digested biosolids in the sameday, which allowed for consecutive testing to beconducted to determine the impact of the tech-nology on the dewaterability of the digestedbiosolids. The objective of the demonstrationwas to verify the performance of the technologyin terms of:S Percent of orthophosphate removal from the
digested biosolids S Change in dry cake solids against the base-
lineS Change in polymer consumption compared
to the baselineS Ability to generate MAP (struvite) that can
be recovered
Specified dewatering requirements were toachieve greater than 20 percent TS, with greaterthan 95 percent solids recovery at an active poly-mer dose of 25 lb/DT or less (MWH, January2016).
The AirPrex reactor was first fed digestedbiosolids from Digester 9 on April 4, 2016, andthe dewatering centrifuge first started process-ing AirPrex-treated biosolids on April 5, 2016.Digester 9 was chosen since it was being oper-ated as a pilot digester, which was receiving me-chanically thickened sludge for four monthsprior to the start of testing. The first week of de-watering operation was performed to optimizethe dewatering centrifuge for the AirPrex-treated biosolids. After a few days of operation,however, it was noted that the feed solids to thecentrifuge from Digester 9 were decreasing rap-idly. It was found that a flush valve was left openfor several days that allowed water to fill Di-gester 9, diluting the digester.
Based on the trend shown in Figure 20, itappears that dilution started at the end of March2016, reducing the concentration in Digester 9
Table 2. Summary of AirPrex Performance Data
Figure 21. AirPrex Nutrient and pH Monitoring
Continued from page 43

Florida Water Resources Journal • June 2018 45
from 3.3 to 3.5 percent TS down to 2 percent TS.Because of the dilution, the feed to the AirPrexreactor was switched from Digester 9 to Digester10 on April 12, 2016. Digester 10 was acting as asecondary digester that was receiving only me-chanically thickened digested sludge from Di-gester 9 and the concentration in the digesterwas steady at approximately 2.5 percent TS.
AirPrex Performance DataDaily sampling was conducted from the
AirPrex reactors to monitor the orthophosphateand ammonia concentrations, as well as the pHof the inflow feeding the AirPrex unit and theoutflow, which fed the frac tank (and was thefeed for the AirPrex-treated biosolids dewater-ing testing). Centrate samples from the dewa-tering unit were also collected for a period oftime to monitor both ammonia and or-thophosphate concentrations, as well as pH. Fig-ure 21 summarizes the data monitored duringthe AirPrex testing, and a vertical red line wasadded to the figures to depict the point wherethe feed to the AirPrex unit was switched fromDigester 9 to Digester 10.
The data did not show a large difference inthe orthophosphate concentrations whenswitched from Digester 9 to Digester 10; how-ever, the ammonia concentration in Digester 9decreased over time, as the digester was diluted.When switching to Digester 10, both the am-monia concentration and the pH of the inflowbiosolids increased. When operating with feedbiosolids from Digester 9, the pH averaged 7.6,but when switched to Digester 10, the pH aver-aged 7.8. The results from Figure 21 also showthat the centrate orthophosphate and ammoniaconcentrations, as well as the pH, measuredsimilar values and followed the trends of theAirPrex outflow biosolids.
After the first day of AirPrex operation, theprocess was optimized and approximately 91percent orthophosphate reduction was main-tained throughout the pilot reactor (rangingfrom 89 to 93 percent), reducing the concentra-tion from approximately 200 mg/L down to lessthan 20 mg/L. In addition, the AirPrex processalso provided a 14 to 16 percent reduction inammonia concentration. Table 2 provides theaverage orthophosphate and ammonia concen-trations in and out of the AirPrex pilot reactorthroughout the test. The data broken down forthe period when testing was conducted fromDigester 9 and Digester 10 are also presented inTable 2.
From the reactor, the struvite collected inthe cone was sent to a grit washer, but limita-tions in the pilot setup showed that the struviterecovered was in a crude form and present withsludge and other debris. Pictures of the struvite
product are provided in Figure 22. Further-more, the grit washer was located in the testtrailer beside the reactor and the struvite had atendency to accumulate in the interconnectinghose. The grit washer was also oversized for theapplication, so some seed sand had to be addedto provide enough pressure for the auger’s pres-sure sensor to be activated. For a full-scale ap-plication, the grit washer would be placeddirectly underneath the reactor and more timewould be available to seed the system with stru-vite.
Dewatering ResultsThe majority of the dewatering testing with
Airprex was conducted with the same dry poly-mer used in the plant’s existing dewatering cen-trifuges and previously used in the dewateringtests (Polydyne C-3283) at a targeted concen-tration of 0.4 percent TS. Some additional test-ing was also conducted with Polydyne emulsionpolymer based on recommendations from on-site jar testing.
The first week of dewatering operation,using sludge from Digester 9, was performed tooptimize the machine for the AirPrex treatedbiosolids, but because of the dilution issue, theresults could not be directly compared to theprevious pilot dewatering testing conductedwithout AirPrex pretreatment. Optimization in-cluded adjusting pool depths, bowl speeds, dif-ferential speed, and polymer dosing. The initialdewatering results were, however, promisingand results of greater than 21 percent TS werebeing achieved, compared to 18 percent TSprior to starting the AirPrex pilot.
Because of the dilution in Digester 9, it wasdecided to conduct sequential testing with andwithout AirPrex-treated digested biosolids togauge the impact of the technology on dewat-erability of SDWWTP digested biosolids. Sincethe concentration in Digester 9 was diluted, thefeed to the AirPrex unit and to the pilot cen-trifuge was switched from Digester 9 to Digester10 on April 12, 2016, and the remainder of the
Figure 22. Recovered Struvite Product
Table 3. Summary of Dry Polymer Curve Tests from Digester 10
Table 4. Optimal Settings for Flow Based on the Polymer Curves from Digester 10
Continued on page 46

46 June 2018 • Florida Water Resources Journal
AirPrex and centrifuge pilot dewatering testswere conducted using the digested biosolidsfrom Digester 10.
Dry Polymer Curve TestingIn order to better gauge the impact that the
AirPrex treatment had on the dewaterability ofthe digested biosolids from Digester 10, severaldry polymer curve tests were conducted at 45,60, and 80 gpm, with and without AirPrex pre-treatment. The flow rate, feed concentrations,dry polymer concentration, and dates for thesetests are summarized in Table 3. For all of thetests the bowl speed was maintained at 93 per-cent, which is equal to 3,100 rpm.
All of the dry polymer curves conductedwith and without AirPrex on the digestedbiosolids from Digester 10 are summarized inFigure 23. The data for all three polymer curvesshow that, with AirPrex pretreatment, the sludgedewatering was improved, allowing close to a 3percent increase in the dry solids content at thesame polymer dosing rate. The data also showthat the driest cake achievable without AirPrexpretreatment can be achieved with AirPrex pre-treatment at a lower polymer dose. When com-paring the trends with and without AirPrex,however, it can be seen that, without AirPrex,the optimal polymer dose, meaning the pointwhere additional polymer dose does not im-prove cake solids, is lower. Table 4 summarizes
Figure 23. Summary of All Digester 10 Dry Polymer Curves With and Without AirPrex
Figure 24. Centrifuge Operation With Dry Polymerat 60 gpm, April 14, 2016 (right), and at 80 gpm, April 15, 2016 (left)
Continued on page 48
Continued from page 45

48 June 2018 • Florida Water Resources Journal
the optimal point based on the polymer curveswith and without AirPrex treatment.
The data show that, with lower through-puts, lower differential speeds can be main-tained and dryer cake can be produced withAirPrex treatment, compared to operation with-out AirPrex treatment. The results also indicatedthat, with AirPrex treatment, up to 21 to 23 per-cent TS cake could be achieved, with recoveriesat or above 93 percent when a 30 to 32 lb/DTactive polymer dosage rate was used. This iscompared to operation without AirPrex, show-ing that 18 to 20 percent TS cake can beachieved with recoveries at or above 95 percentwhen a 29 to 30 lb/DT active polymer dosagerate was used.
Extended Operation TestingIn order to test the stability of dewatering
operation for the AirPrex-treated digestedbiosolids, several extended operation tests wereconducted at 45, 60, and 80 gpm using digestedbiosolids from Digester 10. For all of the tests,the bowl speed was maintained at 93 percent(3,100 rpm) and polymer concentrations were
approximately 0.4 percent TS. With the testsconducted at 60 and 80 gpm, the testing startedwith an extended run on non-AirPrex-treatedbiosolids based on the optimal settings and thenswitched to AirPrex-treated biosolids to see theimpact over the course of the run.
On April 14, 2016, an extended operationtest was conducted at 60 gpm, targeting the op-timal setting from Table 4, and the results aresummarized in Figure 24. When running on thenon-AirPrex-treated biosolids, with a differen-tial speed of 3.3 rpm and a polymer dose of 27.6lb/DT active, the centrifuge dewatered thebiosolids from approximately 2.4 to 18.9 per-cent TS, with a solids recovery of 97.7 percent.When the centrifuge feed was switched to Air-Prex-treated biosolids at the same polymer dose(27.6 lb/DT active), but with a lower differen-tial speed of 2.5 rpm, the dewatered cake solidsincreased to 20.1 percent TS (starting with a 2.5percent TS feed) and recoveries were main-tained at 98.2 percent. Further increasing thepolymer dose to 31 lb/DT active improved thedewatered cake solids to 21.3 percent TS, and re-coveries were near 100 percent. Because of thehigh recovery, the differential was further re-
duced to 2.3 rpm, but this did not show im-provement in dewatering, and recoveries werestill at 98.5 percent. During the run on April 14,2016, the non-AirPrex-treated feed averaged 2.4percent TS and the AirPrex-treated feed aver-aged 2.5 percent TS; the polymer concentrationaveraged 0.42 percent TS. The results, based onthe optimal setting, matched the results indi-cated by the previously conducted polymercurve, shown in Figure 23.
On April 15, 2016, an extended operationtest was conducted at 80 gpm, and the results aresummarized in Figure 24. The test again targetedthe optimized setting outlined in Table 4, but thetesting was further expanded to gauge the im-pacts on the differential speed and polymer doseon dewaterability. The test started with non-Air-Prex-treated biosolids using the optimized dif-ferential speed settings (3.1 rpm) and polymerdose settings (31.4 lb/DT) for the AirPrex-treated biosolids. At these settings, up to 19.3percent TS cake was produced, but recovery wasonly 83.6 percent. When the differential was in-creased to 4.2 rpm and the polymer dose was re-duced to 28.4 lb/DT, the dewatering was reducedto 18.3 percent TS, but recoveries improved to
Figure 25. Dry Polymer Curve and Extended Operation Data, Central District Wastewater Treatment Plant, Waste Activated Sludge Only
Continued from page 46

Florida Water Resources Journal • June 2018 49
93 percent. When switching to the AirPrex-treated biosolids, without adjusting any of thecentrifuge parameters, the dewatered cake solidsimproved to 19.9 percent TS and recoveries im-proved to 98.1 percent. Lowering the differentialto 3.2 rpm with the same polymer dose increasedthe dewatered cake solids to 20.7 percent TS, andrecoveries were still high at 97.1 percent.
Finally, when adjusting the differentialspeed and polymer to the optimized AirPrexsetting outlined in Table 4 (3.1 rpm and 31.2lb/DT active), the dewatered cake solids im-proved to 21.3 percent TS, with recoveries of97.3 percent, showing slightly better results thanindicated by the previously conducted polymercurve (Figure 23). Throughout the testing, thefeed biosolids concentration (both with andwithout AirPrex treatment) averaged 2.5 per-cent TS and the polymer concentration aver-aged 0.43 percent TS.
On April 16, 2016, an extended operationtest was conducted at 45 gpm right after con-ducting the 45-gpm polymer dose test with Air-Prex-treated sludge. The testing showed that,when operating at a 1.5 rpm differential speedand an active polymer dose of 31.1 lb/DT, de-watering up to 23 percent TS, with recoveries at95 percent, were possible. The marginal increasein differential speed allowed the recoveries toimprove to 95 percent, compared to operationat 1.4 rpm differential speed. The feed solidsconcentration during this run averaged 2.4 per-cent TS and the polymer concentration aver-aged 0.44 percent TS.
Central District Wastewater Treatment Plant Phase 1: Thickening Pilot Testing
Thickening Pilot SetupThickening in the pilot unit was tested
without polymer, with emulsion polymer, andwith dry polymer. The pilot unit was set up toallow injection of polymer at two locations, asillustrated in Figure 5, either directly into thebowl of the unit (internal injection) or in thesludge feed line upstream of the centrifuge inlet(external injection). Polymer flow was measuredduring each sampling event using a calibrationcolumn located on the pilot trailer.
The emulsion polymer used for testing wasPRAESTOL K144-L, a cationic, high-molecular-weight emulsion polymer. Two different drypolymers were also tested, including the drypolymer currently used in the CDWWTP grav-ity concentrators (SNF Polydyne Clarifloc SE-1138) and dry polymer currently used in theCDWWTP dewatering centrifuges (SNF Poly-dyne Clarifloc SE-1141).Thickening Pilot Testing: Central District
Wastewater Treatment Plant Waste ActivatedSludge
For the CDWWTP WAS-only thickeningoperation, the system was set up and operatedwith emulsion polymer, dry polymer, and with-out polymer. Polymer curve tests were con-ducted by maintaining a constant volumetricthroughput of sludge feed to the centrifuge,while changing the polymer dose. With the ex-ception of changing the polymer dose, all otherparameters on the centrifuge remained the samefor each polymer curve test. After generating thepolymer curves, the unit was operated severaldays at a constant flow rate, with optimized set-tings to test the stability of operation through-out the course of a day.
The testing showed that the centrifuge, op-erating on CDWWTP WAS only, could reliablythicken the WAS from 0.9 to 1.3 percent TS to 5to 6 percent TS, and achieve greater than 95 per-cent solids recovery. Testing was conductedusing both dry and emulsion polymers. The drypolymer required 3 to 4 lb/DT active dosingcompared to 0.6 to 3 lb/DT based on the emul-sion. It was also possible to thicken the sludgeto 5 to 6 percent TS without the use of polymer,but this reduced hydraulic throughput by about25 percent to allow solids recoveries to remainabove 95 percent. Examples of polymer curvedata and extended operation data collected areprovided in Figure 25 (Stitt et al., 2018).
Thickening Pilot Testing: North DistrictWastewater Treatment Plant Primary andWaste Activated Sludge
When the pilot operation initially began inMay 2016, the 6-mi, 16-in. line from the inter-ceptor that allowed NDWWTP sludge to be fedto CDWWTP gravity thickeners was out ofservice, so pilot testing of NDWWTP sludgecould not begin until this was brought back inservice. In addition, the amount of debris and
grit in the sludge from NDWWTP, which havehistorically been problematic for CDWWTP op-erations, was exacerbated during the pilotingperiod, since the primary sludge degritters atNDWWTP were out of service for a replace-ment.
In order to provide a solution to minimizethe impact of rags and grit for an interim pe-riod before the consent decree projects were tobe implemented, MDWASD operations in-stalled two Lakeside Raptor® screens, shown inFigure 26 on the receiving pipe for NDWWTPsludge. The unit contains a screening systemand an aerated grit chamber that provides re-moval of both rags and grit to a dumpster.
The NDWWTP sludge from the screenswas directed to one of the CDWWTP gravityconcentrators.
Testing of the NDWWTP sludge started atthe end of June 2016 and testing ultimately con-tinued through mid-September 2016. Duringthe testing period, daily plant records for NDWWTP sludge production and transfer op-erations were provided to the PMCM team,which included information of flow to ForceMain #1 and the solids concentration. The pre-liminary design for NDWWTP sludge concen-tration was 0.75 percent TS average, with arange from 0.5 to 1 percent TS, but data col-lected showed that the NDWWTP concentra-tion was typically less than 0.5 percent TS.
Initial testing was conducted mostly onNDWWTP primary sludge since a large pro-portion of the WAS was directed to Force Main#2 to the influent of CDWWTP due to limita-tion in the piping. On Aug. 29, 2016, after somepiping modifications were made, all NDWWTPsludge began going through Force Main #1, andthis mode of operation remained throughoutthe duration of the pilot, which concluded onSept. 15, 2016. The combination of thin sludge
Figure 26. Central District Wastewater Treatment Plant Lakeside Raptor Screens for North DistrictWastewater Treatment Plant Sludge
Continued on page 50

50 June 2018 • Florida Water Resources Journal
and the high proportion of primary sludgemade thickening in the pilot centrifuge very dif-ficult.
Although the CDWWTP WAS-only sludgewas easily able to thicken in the pilot centrifuge,NDWWTP primary sludge and WAS, which wasmore dilute, was difficult to handle and thickenreliably. After testing NDWWTP primary sludgeand WAS alone, using multiple parameters, astable operation could not be maintained. Ini-tial attempts to blend NDWWTP primary andWAS with CDWWTP WAS, using an in-pipeblending system, were also unsuccessful.
Because of the difficulties with NDWWTPprimary and WAS operation, a separate fractank and recirculation pump were rented toallow a buffer for NDWWTP primary and WASand for better control of blending CDWWTPWAS and also NDWWTP primary and WAS.When NDWWTP sludge was blended with CDWWTP sludge in the blend tank, shown inFigure 27, stable operation could be maintainedin the centrifuge, and greater than 5.5 percentTS-thickened sludge with greater than 95 per-cent solids recovery could be achieved. The drypolymer required 1.5 to 3 lb/DT active dosingcompared to 2 to 3 lb/DT, based on the emul-sion. The testing showed that including a blendtank to mix CDWWTP and NDWWTP sludgewould be important for future operation to besuccessful. Example data collected for thicken-ing CDWWTP and NDWWTP sludge blend areprovided in Figure 28.
The setup used during the pilot, however,had several limitations with regard to capacity,tank mixing, and flow metering that should notbe issues in a full-scale system. Because of thelimitations, there were some variations notedfor day-to-day operation. In addition, duringthe time of testing, the feed pump on the pilotcentrifuge was wearing out and close to failuredue to excessive wear on the stator from grit. Be-cause of these issues, it was not possible to con-
Figure 28. Central District Wastewater Treatment Plant
and North District WastewaterTreatment Plant Polymer
Curve and Extended Operating Testing Data
Figure 27. Central District Wastewater Treatment Plant and North District Wastewater Treatment Plant Blend Tank
Figure 29. Continuous Thickening Operation
Continued from page 49

Florida Water Resources Journal • June 2018 51
duct an extended operation run for more thantwo to three hours at a time.
Central District Wastewater Treatment Plant Phase 2: Continuous Thickening
Pilot Operation
Centrifuge-thickened sludge was fed toPlant 2, Cluster 1, and Digester 3 (the test di-gester) to simulate future high-rate single-stagemesophilic anaerobic digestion conditions andto increase the solids content of the digestedbiosolids for the dewatering pilot operations.Near-continuous operation began in mid-Juneand the team maintained continuous operationthrough mid-August, but performance testingon CDWWTP and/or NDWWTP sludge con-tinued to be conducted during normal workdayhours, with operation switching to CDWWTPWAS only for overnight and weekend opera-tions. A manifold was set up to allow switchingbetween NDWWTP and CDWWTP sludgesand was also used initially to blend the sludges.Mechanical problems with the unit, specificallythe thickened cake pump, limited the through-put and the operation time. The stator in thethickened sludge pump had to be replaced sev-eral times throughout the duration of the pilot.
For the stable period (shown in Figure 29),the thickened solids content to the digester av-eraged 6.3 percent TS (with a 2.3 lb/DT activepolymer dose) and the VS content of the rawsludge being fed to the digester averaged 86 per-cent VS/TS. The solids content in the test di-gester was increased to approximately 2.8 to 3percent TS. For comparison, the rest of the di-gesters operating at CDWWTP were being fedgravity-thickened sludge at approximately 3.8percent TS with a VS content of 83 percentVS/TS, and the other operational digesters op-erated at an average of 2.2 percent TS. The VSRestimations during this period ranged from 50to greater than 70 percent, while the digester wasapproaching a steady state.
Central District Wastewater Treatment Plant Phase 3: Dewatering Pilot Testing
The purpose of the dewatering pilot oper-ation was to determine the optimal design con-ditions and performance of the dewateringcentrifuge using the thickened biosolids fedfrom the test digester. The overall target for thecentrifuge dewatering performance, as stated inthe basis of design and specifications, was to de-water the thickened digested biosolids to greaterthan 24 percent TS, while maintaining greaterthan 95 percent solids recovery. The necessary
polymer dose to achieve this performance is alsoimportant to determine.
The draft specifications indicate that theactive polymer dose should be less than 25lb/DT. The M&E fifth edition (2013) lists 22 to25 percent TS expected for anaerobically di-gested WAS and primary sludge, with the poly-mer consumption expected to be 15 to 30 lb/DTactive polymer dose and solids recoveries ex-pected to be 95 percent or greater. The CDWWTP currently doses ferric sulfate at a rateof 1.9 gal per 1000 gal of sludge ahead of thecentrifuges for struvite control. This practice isplanned to continue in the future, so a tempo-rary ferric dosing system was also included withthe pilot.
Dewatering Pilot Testing: SetupFor the dewatering pilot, the system was set
up and tested with emulsion and dry polymer,as well as ferric sulfate conditioning, similar tothe current CDWWTP dewatering operation.The majority of the testing was conducted usingthe plant’s dry polymer, which is more repre-sentative of the future design; however, somelimited testing was also conducted using emul-sion polymer to provide a comparison.
The initial dewatering operation was dedi-cated to optimizing the machine for the site-specific operation. Adjustable parametersincluded the pool depth, bowl speed, and dif-ferential scroll speed. The pool depth was ad-justed manually through adjustment of theoutlet weir plate and throughout all of the de-watering operation, and the system was oper-ated with the B weir plate, which corresponds tothe second deepest pool depth. For most of thedewatering operation, the centrifuge also oper-
ated at the highest bowl speed of 3,350 rpm. Itwas also found that injecting polymer directlyinto the feed tube was the best injection point,compared to other polymer injection locationstested.
Initial testing started with emulation poly-mers on Aug. 11, 2016. Three cationic, high-molecular-weight emulsion polymers weretested in order to determine the top polymertype for further testing. The emulsion polymerswere able to achieve 21 to 26 percent TS withgreater than 95 percent solids recovery, but re-quired higher polymer doses than listed in thespecifications (>30 lb/DT). Since the emulsionpolymer dosing requirements were high com-pared to the specification requirements and thebasis of design is for a dry polymer, only limitedfurther testing was conducted using emulsionpolymer.
The dry polymer used for all of the dewa-tering testing was Polydyne Clarifloc C-SE-1141,which is currently used for CDWWTP dewater-ing centrifuges. This dry polymer testing usedfor the duration of the pilot was optimized tostart performance testing on Aug. 17, 2016.
Dewatering Pilot Testing: Polymer CurveTesting
Polymer curve tests were conducted bymaintaining a constant volumetric throughputof digested biosolids feed to the centrifuge,while changing the polymer dose to measure theimpact. With the exception of changing poly-mer dose, most of the other parameters on thecentrifuge remained the same for each polymercurve test.
Polymer curve tests were conducted pri-
Figure 30. Central District Wastewater Treatment Plant Dewatering Polymer Curve Testing With and Without Ferric (data, left; photo of cake, right)
Continued on page 52

52 June 2018 • Florida Water Resources Journal
marily on dry polymer with feed tube polymerinjection. Testing was mostly done with ferricsulfate dosing, but testing without dosing ferricsulfate was also done as a comparison. The datafor this comparison are shown in Figure 30. Thecake solids ranged from 23.5 to 26.3 percent TS,with the addition of ferric sulfate. Without theaddition of ferric sulfate, the cake solids were 3to 4 percentage points lower, ranging from 21 to24 percent TS. The difference in solid contentwas visibly noticeable, as can be seen in Figure30. Without the addition of ferric sulfate, thesolids recovery was also noticeably worse thanoperating with ferric sulfate.
Dewatering Pilot Testing: Extended Opera-tion Results
In addition to polymer curve tests, the de-watering centrifuge was operated for two daysat a constant flow rate to test the stability of op-eration throughout the course of a day. Twotests were conducted at 80 gpm using dry poly-mer. Throughout the course of the test, it wasdesired to maintain constant settings; however,periodic adjustments were made based on vi-sual observations of both the dewatered solidsconcentration and the centrate quality. The pilotfield staff collected samples during these trialsapproximately once every 30 minutes to onehour, depending on the total duration of theparticular test.
One extended run using dry polymer isshown in Figure 31. Performance during thisrun was stable, with dewatered cake solids av-eraging 25 percent TS and solids recoveries av-eraging over 98 percent for all samplescollected. The feed during this run was consis-tent, averaging 3 percent TS. The differentialspeed was held at 3 rpm during the five hoursof operation. The power consumption averagedabout 0.19 kilowatt (kW)/gpm. The polymerconcentration during this run averaged 0.8 per-cent and the active polymer dose averaged 25.8lb/DT.
The results of the dewatering piloting indi-cate that the centrifuge dewatering unit will beable to achieve a total cake solids of >24 percentTS and solids recovery requirements of >95 per-cent. The testing showed that >24 percent TScake could be achieved with 25 lb/DT activedosing of dry polymer and a ferric sulfate doseequal to 1.9 gal ferric sulfate per 1,000 gal ofsludge. Testing conducted without the use offerric sulfate conditioning showed that dewa-tering performance was reduced by 2 to 4 per-cent TS in cake solids and that the solidsrecovery percentages were lower. The centrifugecould achieve 26 to 28 percent TS with emul-sion polymer, but the polymer dosages are
higher and almost double that of the desiredmaximum of 25 lb/DT active.
Conclusions
Throughout the pilot studies at SDWWTPand CDWWTP, two plants with identical treat-ment processes, the results clearly show howsite-specific sludge conditions drive the thick-ening and dewatering process performance, andpilot testing for the design of sludge thickeningand dewater is a crucial step in properly design-ing and setting plant expectations.
The SDWWTP Phase 1 thickening testingshowed that the centrifuge could reliably pro-duce solids at 5 to 6 percent TS and achievegreater than 95 percent solids recovery. Testingwas conducted using both dry and emulsionpolymers. The dry polymer required 5 to 7lb/DT active dosing compared to 1 to 3 lb/DT,based on the emulsion. It was also possible tothicken the sludge to 5 to 6 percent TS withoutthe use of polymer, but this reduced hydraulicthroughput by about 50 percent to allow thesolids recovery to remain above 90 percent.
During SDWWTP Phase 2, the solids con-tent in Digester 9 was increased from approxi-mately 2 percent to approximately 3.4 to 3.5percent TS, and the VSR in Digester 9 averaged46 percent with a digester SRT of approximately30 days. During the same period of time, theother digesters at the plant received gravity-con-centrated sludge at 1.5 to 3 percent TS, and av-eraged approximately 42 percent VSR, with adigester SRT of approximately 20 days. The in-crease in VSR was likely due to the longer SRTand higher solids concentration.
The SDWWTP Phase 3 dewatering testingshowed that 16 to 18 percent TS cake could beachieved with 20 to 30 lb/DT active dosing ofdry polymer. The pilot testing showed that thedewatered cake solids were lower than the pre-liminary design value of 20 percent TS, with apresumed 25 lb/DT active polymer when usingdry polymer without sludge pretreatment.Dryer cake at 20 to 22 percent TS could be pro-duced using emulsion polymer, but requiredhigher dosages above 40 lb/DT active.
It was found that removal of orthophos-phate through struvite recovery within the di-gestion process resulted in a two- to four-pointincrease in the cake solids in the downstreamdewatering process, compared to operationwithout struvite recovery and similar activepolymer dosages. The conclusion of the pilotdetermined that, to achieve a greater than 20percent cake solids (up to 22 percent cake solids,in fact) was achieved with AirPrex pretreatment,as compared to 19 percent without pretreat-ment, using 25 to 35 lb/DT active polymer
dosages.The CDWWTP Phase 1 WAS-only thick-
ening testing showed that the centrifuge, op-erating on CDWWTP WAS only, couldreliably produce solids at 5 to 6 percent TS andachieve greater than 95 percent solids recov-ery. Testing was conducted using both dry andemulsion polymers. The dry polymer required3 to 4 lb/DT active dosing compared to 0.6 to3 lb/DT, based on the emulsion. It was alsopossible to thicken the sludge to 5 to 6 percentTS without the use of polymer, but this re-duced hydraulic throughput by about 25 per-cent to allow solids recoveries to remain above95 percent.
Although the CDWWTP WAS-onlysludge was easily able to thicken in the pilotcentrifuge, NDWWTP primary sludge andWAS, which was more dilute, was difficult tohandle. After testing the NDWWTP primarysludge and WAS alone, stable operation couldnot be maintained. Initial attempts to blendNDWWTP primary and WAS with CDWWTPWAS using an in-pipe blending system werealso unsuccessful.
Because of the difficulties with NDWWTP primary and WAS operation, aseparate tank was rented to allow a buffer forNDWWTP primary and WAS, and for bettercontrol of blending CDWWTP WAS, and NDWWTP primary and WAS. When NDWWTP sludge was blended with CDWWTP sludge in the blend tank, stable op-eration could be maintained in the centrifugeand greater than 95 percent solids recoverywas achieved. The dry polymer required 1.5 to3 lb/DT active dosing compared to 2 to 3lb/DT, based on the emulsion. The testingshowed that including a blend tank to mixCDWWTP and NDWWTP sludge is impor-tant for future operations to be successful.
The near-continuous operation of CDWWTP Phase 2 began in mid-June and theteam maintained continuous operationthrough mid-August, but mechanical problemswith the unit, specifically the thickened cakepump, limited the throughput and the opera-tion time. For the stable period, the thickenedsolids content to the digester averaged 6.3 per-cent TS (with a 2.3 lb/DT active polymer dose)and the VS content of the raw sludge being fedto the digester averaged 86 percent VS/TS. Thesolids content in the test digester was increasedto approximately 2.8 to 3 percent TS. For com-parison, the rest of the digesters operating atCDWWTP were being fed gravity-thickenedsludge at about 3.8 percent TS, with a VS con-tent of 83 percent VS/TS, and the other opera-tional digesters operated at an average of 2.2percent TS. The VSR estimations during this
Continued from page 51

Florida Water Resources Journal • June 2018 53
period ranged from 50 to greater than 70 per-cent, while the digester was approaching asteady state.
The results of the CDWWTP Phase 3 de-watering piloting indicate that the centrifugedewatering unit will be able to achieve totalcake solids of >24 percent TS and solids re-covery requirements of >95 percent. The test-ing showed that >24 percent TS cake could beachieved, with 25 lb/DT active dosing of drypolymer and a ferric sulfate dose equal to 1.9gal ferric sulfate per 1,000 gal of sludge. Test-ing conducted without the use of ferric sulfateconditioning showed that the dewatering per-formance was reduced by 2 to 4 percent TS incake solids and that solids recovery percent-ages were lower. The centrifuge could achieve26 to 28 percent TS with emulsion polymer,but the polymer dosages are higher and almostdouble that of the desired maximum of 25lb/DT active.
Overall, the pilot testing was used to set thenecessary performance criteria for a design-build package. The CDWWTP testing alsoshowed the importance of including a blendtank to be able to successfully manage andthicken the highly variable sludge quality fromthe primary, and WAS from NDWWTP. The de-watering portion of this pilot at SDWWTP ac-centuated the importance of properlyidentifying possible dewatering challenges,namely the impact of high struvite potential,and that to achieve the performance goals, extraconsiderations may need to be added to the de-sign. The pilot results as a whole highlight theimportance of piloting to determine operationaldifficulties and to refine design performance cri-teria.
Acknowledgments
The team would like to thank all of theplant staff at SDWWTP and CDWWTP, espe-cially Leo Pou, Francois Saint-Phard, Mike Gar-cia, and David Hall for their outstandingsupport during this pilot testing. The teamwould also like to thank the staff from Centrisysand CNP Corp. for their commitment to mak-ing the testing a success. We also thank the in-terns Gabriela Aramayo, Alejandro Cepero,Andres McEwen, and Yareliz Negron, fromFlorida International University, and Kate Ire-land, from University of Miami, who helpedmake this project possible by monitoring pilotoperations, collecting samples, and running nu-merous laboratory tests.
References
• American Public Health Association, Ameri-can Water Works Association, Water Environ-ment Federation. “Standard Methods for theExamination of Water and Wastewater.” 20thedition, 1999.
• Goss C., Stitt B., Moncholi M., Abu-Orf, M.,Diaz I. (2017). “Piloting to Establish Perform-ance Conditions at Miami’s South DistrictWWTP.” Proceedings of the 2017 WEF Residu-als and Biosolids Management Conference,Water Environment Federation, Alexandria,Va.
• Kopp, J., Yoshida, H., Forstner, G. (2016). “Im-pact of Hydrolysis and Bio-P RemovalProcesses on Biosolids Dewaterability andPolymer Consumption in the DewateringProcess.” Proceedings of the 2016 WEF Techni-
cal Exhibition and Conference, Water Environ-ment Federation, Alexandria, Va.
• S-884 - SDWWTP SLUDGE THICKENING& DEWATERING BLDG CD 1.06, 1.08, Spec-ification Section 46 71 36 – CENTRIFUGES.MWH, Jan. 20, 2016.
• Snoeyink, V., Jenkins, D. (1980). Water Chem-istry. John Wiley and Sons Inc., New York,N.Y.
• Stitt B., Goss T., Moncholi M., Abu-Orf M.,Diaz I. (2018). “Enhanced Dewatering withStruvite Recovery: Pilot Testing of AirPrex®Technology at Miami’s South District Waste-water Treatment Plant.” Proceedings of the2017 WEF Residuals and Biosolids Manage-ment Conference, Water Environment Federa-tion, Alexandria, Va.
• Stitt B., Goss T., Diaz I., Moncholi M. (2018).“Overcoming Obstacles with a Difficult toHandle Sludge: Centrifuge Piloting at Miami’sCentral District Wastewater Treatment Plant.”Proceedings of the 2018 Florida Water ResourceConference, Daytona Beach, Fla.
• S-888 - CDWWTP SLUDGE THICKENING& DEWATERING BLDG CD 2.12, 2.13, 2.16,Specification Section 46 71 36 – CEN-TRIFUGES. MWH, Jan, 20, 2016.
• Metcalf & Eddy (2013). Wastewater Engineer-ing Treatment and Reuse. 5th edition.
• Water Environment Federation Press (2010).Manual of Practice No. 8: Design of MunicipalWastewater Treatment Plants. 5th edition.
• Water Environment Federation Press (2008).Manual of Practice No. 11: Operation of Mu-nicipal Wastewater Treatment Plants. 6th edi-tion. SS
Figure 31. Extended Operation Using Dry Polymer