
Isolation and Optimization of Culture Conditions of a ... - MDPI
Upload
khangminh22Category
view
0download
0
processes
Article
Modeling and Multi-Criteria Optimization of a Process forH2O2 Electrosynthesis
Martin von Kurnatowski * and Michael Bortz
�����������������
Citation: von Kurnatowski, M.;
Bortz, M. Modeling and
Multi-Criteria Optimization of a
Process for H2O2 Electrosynthesis.
Processes 2021, 9, 399. https://
doi.org/10.3390/pr9020399
Academic Editor: Bor-Yih Yu
Received: 25 January 2021
Accepted: 14 February 2021
Published: 23 February 2021
Publisher’s Note: MDPI stays neutral
with regard to jurisdictional claims in
published maps and institutional affil-
iations.
Copyright: © 2021 by the authors.
Licensee MDPI, Basel, Switzerland.
This article is an open access article
distributed under the terms and
conditions of the Creative Commons
Attribution (CC BY) license (https://
creativecommons.org/licenses/by/
4.0/).
Fraunhofer Institute for Industrial Mathematics ITWM, Fraunhofer-Platz 1, 67663 Kaiserslautern, Germany;[email protected]* Correspondence: [email protected]
Abstract: This article introduces a novel laboratory-scale process for the electrochemical synthesisof hydrogen peroxide (H2O2). The process aims at an energy-efficient, decentralized production,and a mathematical optimization of it is presented. A dynamic, zero-dimensional mathematicalmodel of the reactor is set up in Aspen custom modeler®. The proposed model constitutes areasonable compromise between complexity and convergence. After thoroughly determining thereaction kinetics by adjustment to experimental data, the reactor unit is embedded in an AspenPlus® flowsheet in order to investigate its interaction with other unit operations. The downstreamcontains another custom module for membrane distillation. Electricity appears as a resource in theprocess, and optimization shows that it reaches product purities of up to 3 wt.-%. Both the processoptimization and the adjustment of the reaction kinetics are treated as multi-criteria optimization(MCO) problems.
Keywords: process engineering; electrolysis; parameter estimation; Aspen custom models;process optimization
1. Introduction
Electrochemical applications have undergone a remarkable increase in importanceduring the last decades due to the need for efficient modern technologies, e.g., in syn-theses of substances or mobility, but also due to the rapidly evolving availability of newexperimental and numerical tools for precise study and characterization of electrochemicalsystems [1]. One example of such an electrochemical device is the fuel cell (FC) for genera-tion of electrical energy from oxidation of hydrogen or short-chained hydrocarbons likeethanol or methanol [2,3]. The most promising candidate for the large-scale production ofhydrogen for use in fuel cells is the electrolyzer for water electrolysis [4], which is itselfbased on electrochemistry. Moreover, batteries are currently facing strong interest fromresearchers, since they are an essential component, e.g., in modern microelectronic de-vices, in electromobility and in energy storage. Latz and Zausch gave thermodynamicallyconsistent theoretical descriptions of transport phenomena [5], reaction kinetics [6] andthermal aspects [7] in these devices. Another application of electrolysis is the conversionof carbon dioxide (CO2) [8] to valuable products such as organic acids or short- and long-chained alcohols in order to reduce the global carbon footprint. A work realizing such asynthesis route experimentally to produce ethylene using copper(I) oxide catalysts can befound in [9].
The process introduced in this work comprises the oxygen reduction reaction (ORR)mechanism, with hydrogen peroxide (H2O2) as the desired product. This important com-modity chemical has a wide range of applicability in decentralized or industrial processes.In the chemical industry, it is synthesized via the anthraquinone process, delivering productpurities of 1–2 wt%, which can be enhanced up to 70 wt% by downstream processing [10].Due to its high oxidation potential, it is commonly used for treatment of waste water orbleaching of paper pulp or textiles [11,12]. Furthermore, it is employed extensively in the
Processes 2021, 9, 399. https://doi.org/10.3390/pr9020399 https://www.mdpi.com/journal/processes

Processes 2021, 9, 399 2 of 24
production of fine chemicals [13]. In the encymatic halogenation of the phenolic monoter-penes thymol and carvacrol to different products for anti-inflammatory, anti-microbialand anti-cancer applications, H2O2 accompanied by the enzyme chloroperoxidase is usedas a bio-catalyst [14]. Getrey et al. showed that the highest conversion rates are reachedwith electrochemical in-situ synthesis of H2O2 directly in the active zone for the followingreaction [15]. Thus, there are no transport problems for the catalyst as in the case of externalinjection of hydrogen peroxide. Since oxygen is used here as a reactant to produce H2O2,maximum efficiencies are achieved using gas diffusion electrodes [16] to avoid the problemof limited solubility of O2 in the electrolyte.
Decentralized electrochemical production of H2O2 has received growing interest fromresearchers in recent years. Yang et al. perceive this as part of a general trend [17]. Theypredict that the increased availability and decreased cost of renewable electricity willtransform the chemical industry towards on-site production. This could lead to logisticchallenges, e.g., if larger amounts of product have to be gathered. On the other hand, the de-centralized approach has the potential advantages of more efficient energy conversion,easier product storage and lower capital expenditure according to Sehrish et al. [18]. In thisrespect, Li et al. recently stated that gas diffusion electrodes, such as the one used in thecurrent work (see Section 2.3), are crucial to exploit the advantages of an electrochemicalproduction of H2O2 [19]. They quantitatively assessed their reactor with respect to energyconsumption, production capacity, cost and long-term stability. They conclude that thetechnology is already feasible for on-site abatement of pharmaceutical residues in groundwater. As for long-term stability, they report a life time of their electrode limited to about46 days due to flooding of pores. In a real-world application, the electrodes need to bereplaced before expiration to ensure a site-independent product quality.
Inspiration for modeling electrochemical reactors can be obtained from theoreticalworks on fuel cell research, the quantity of which is higher than that for electrolyzers. SinceFCs convert substances into electric power, they can be considered as the inverse operationof electrosynthesis. Schultz et al. set up a rigorous, one-dimensional model of a directmethanol fuel cell using a Flory-Huggins activity model [20]. Later, the same group investi-gated the dynamic response of the system with respect to reaction kinetics [21]. The basicfeatures to be covered by a model in any case are mass balances, material conversion,potential drops and membrane flows. In the case of spatial resolution (dim. > 0), local trans-port effects need to be described, too. They may be Knudsen diffusion or Maxwell–Stefandiffusion, the latter being governed by molecular friction in porous media [22], which istaken into account in [20]. Furthermore, Weinzierl and Krewer used numerical simula-tions to analyze the water management in direct methanol fuel cells [23,24]. For a moresophisticated approach, see e.g., [25], where a version of the 2D Navier–Stokes equations issolved for a mixture in order to investigate its coupling to chemical surface reactions viaboundary conditions.
A mathematical model of an electrochemical cell for copper electrolysis, composed of0D and 2D submodels, was given by Pohjoranta et al. [26], who validated their theoreticalpredictions by comparison to cyclic voltammetry measurements. However, this work isconcerned with the overall process. Details about unit operations are secondary as longas their main dependencies are captured with reasonable accuracy. Hence, we stick to a0D reactor model such as the one of Görgün et al. [27], who published a balance-basedmathematical description of an electrolyzer with a proton exchange membrane (PEM),or the one of Argyropoulos et al. [28], who set up a semi-empirical 0D model of a directmethanol FC in a similar fashion. The aspired philosophy of the model equations is to aimfor fast convergence while realistically reproducing measured data for the most importantoutput quantities, i.e., the product weight fraction and the Faraday efficiency. This isadditionally beneficial, because it does not imply a high number of transport coefficientsas in the case of spatial resolution. Such coefficients (e.g., the binary Maxwell–Stefandiffusional coefficients) are often unknown in praxi due to the limited availability of

Processes 2021, 9, 399 3 of 24
experimental data for parameter estimation. However, it will be necessary to thoroughlydetermine the kinetics of the reaction mechanism under consideration.
A means of studying electrochemical reaction kinetics, which relies on experimentaldata, is the rotating ring-disk electrode (RRDE) system [29,30]. The method is based onthe rotation of circular electrodes, inducing a forced flow to drag reactants to the electrode.Then, the detected electric currents at the disk and at the ring, with the latter being locatedat higher radii, contain information about the reaction kinetics. Yet, a micro-scale simulationis required in order to extract this information from experimental results. An applicationto determine electro-kinetic rate constants of the ORR mechanism at gold catalysts can befound in [31]. Recent reviews about catalysts for electrosynthesis of H2O2 by oxidation ofwater can be found in [32,33]. Recently, two-dimensional RRDE simulations based on afinite-difference discretization were successfully adapted to corresponding measurementsin a detailed and quantitative electro-kinetic study [34]. Such a way of determiningparameters of a unit operation by simulations on a smaller scale can be considered as apart of a bottom-up modeling approach, as sketched in Figure 1. Alternatively, the kineticparameters can be calculated by direct adjustment of the unit model to experimental data,as in this work.
Figure 1. Bottom-up approach to process modeling. The parameters of unit models are derived fromsimulations on a smaller scale. Then, the unit models are embedded in a process flowsheet.
The process model proposed in this article is set up in Aspen Plus V10®. However,this commercial flowsheet simulator does not provide a model of an electrochemical reactoras a unit operation and hence, an electrolysis cell model was implemented in Aspencustom modeler V10® (ACM) here. Note that this has been done before by Redissi andBouallou [35], who performed an economic evaluation of a high-temperature co-electrolysisprocess for conversion of CO2/H2O to synthesis gas, based on simulations in Aspen Plus®.Apart from that, the process comprises a membrane distillation module [36] for separationof acidic components from the product solution in the downstream processing, whichis neither available in Aspen Plus®. Implementations of such unit operations in AspenPlus® can be found in [37,38]. A critical review on the modeling of membrane distillationtechnologies was given by Hitsov et al. [39]. A species-selective flow through a membraneis forced by the thermal gradient between a heated feed side and a cooler permeate side.The pores are hydrophobic and therefore the liquid phases from each side only partiallypenetrate the membrane. Material transport through the gas-filled segments of the pores is
Processes 2021, 9, 399 4 of 24
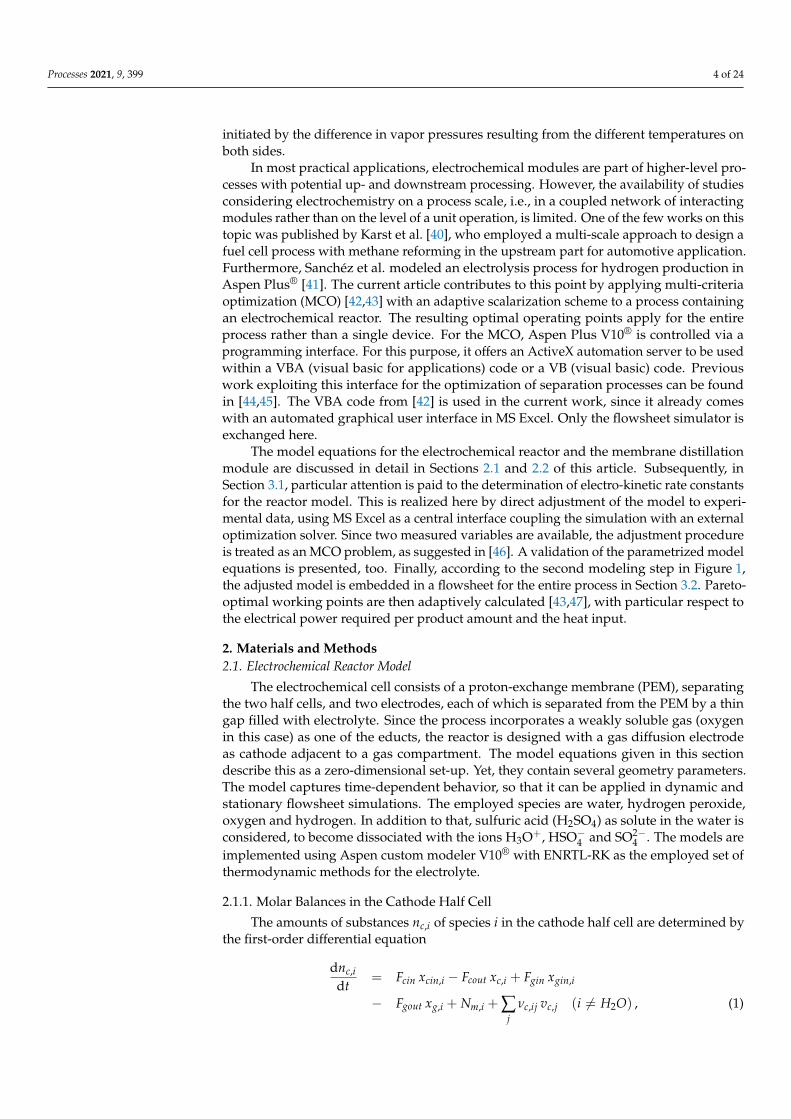
initiated by the difference in vapor pressures resulting from the different temperatures onboth sides.
In most practical applications, electrochemical modules are part of higher-level pro-cesses with potential up- and downstream processing. However, the availability of studiesconsidering electrochemistry on a process scale, i.e., in a coupled network of interactingmodules rather than on the level of a unit operation, is limited. One of the few works on thistopic was published by Karst et al. [40], who employed a multi-scale approach to design afuel cell process with methane reforming in the upstream part for automotive application.Furthermore, Sanchéz et al. modeled an electrolysis process for hydrogen production inAspen Plus® [41]. The current article contributes to this point by applying multi-criteriaoptimization (MCO) [42,43] with an adaptive scalarization scheme to a process containingan electrochemical reactor. The resulting optimal operating points apply for the entireprocess rather than a single device. For the MCO, Aspen Plus V10® is controlled via aprogramming interface. For this purpose, it offers an ActiveX automation server to be usedwithin a VBA (visual basic for applications) code or a VB (visual basic) code. Previouswork exploiting this interface for the optimization of separation processes can be foundin [44,45]. The VBA code from [42] is used in the current work, since it already comeswith an automated graphical user interface in MS Excel. Only the flowsheet simulator isexchanged here.
The model equations for the electrochemical reactor and the membrane distillationmodule are discussed in detail in Sections 2.1 and 2.2 of this article. Subsequently, inSection 3.1, particular attention is paid to the determination of electro-kinetic rate constantsfor the reactor model. This is realized here by direct adjustment of the model to experi-mental data, using MS Excel as a central interface coupling the simulation with an externaloptimization solver. Since two measured variables are available, the adjustment procedureis treated as an MCO problem, as suggested in [46]. A validation of the parametrized modelequations is presented, too. Finally, according to the second modeling step in Figure 1,the adjusted model is embedded in a flowsheet for the entire process in Section 3.2. Pareto-optimal working points are then adaptively calculated [43,47], with particular respect tothe electrical power required per product amount and the heat input.
2. Materials and Methods2.1. Electrochemical Reactor Model
The electrochemical cell consists of a proton-exchange membrane (PEM), separatingthe two half cells, and two electrodes, each of which is separated from the PEM by a thingap filled with electrolyte. Since the process incorporates a weakly soluble gas (oxygenin this case) as one of the educts, the reactor is designed with a gas diffusion electrodeas cathode adjacent to a gas compartment. The model equations given in this sectiondescribe this as a zero-dimensional set-up. Yet, they contain several geometry parameters.The model captures time-dependent behavior, so that it can be applied in dynamic andstationary flowsheet simulations. The employed species are water, hydrogen peroxide,oxygen and hydrogen. In addition to that, sulfuric acid (H2SO4) as solute in the water isconsidered, to become dissociated with the ions H3O+, HSO−4 and SO2−
4 . The models areimplemented using Aspen custom modeler V10® with ENRTL-RK as the employed set ofthermodynamic methods for the electrolyte.
2.1.1. Molar Balances in the Cathode Half Cell
The amounts of substances nc,i of species i in the cathode half cell are determined bythe first-order differential equation
dnc,i
dt= Fcin xcin,i − Fcout xc,i + Fgin xgin,i
− Fgout xg,i + Nm,i + ∑j
νc,ij vc,j (i 6= H2O) , (1)

Processes 2021, 9, 399 5 of 24
where the last term corresponds to reactive conversions of substances. For an explanationof each quantity, refer to the list of symbols in Appendix A. The mole fractions in thecathode half cell and the gas compartment are related to the amounts of substances by
xc,i = nc,i
/ N
∑i=1
nc,i , xg,i = 0 (i ∈ liq) , (2)
xg,i = ng,i
/ N
∑i=1
ng,i , xc,i = 0 (i ∈ gas) . (3)
From Equation (1), it can be seen that the balance is drawn around the cathode half celland the gas compartment together. We neglect the solution of oxygen from the gas compart-ment in the bulk of the electrolyte in the cathode compartment, because the solubility of O2in water is only about 9 mg/L. Thus, at a moderate flow rate of 10 mL/min, there wouldbe only 0.09 mg/min of dissolved oxygen leaving the cathode compartment. This can beneglected in the component balance because the system will be fed with about 5.3 g/minO2 (�0.09 mg/min). Evaporation of liquids into the gas compartment is neglected forsimilar reasons. Both effects would require a sub-model for mass transport through thegas diffusion electrode, which would be very difficult to parametrize realistically. So, thecost-benefit relation is insufficient for the type of overall process model that is set up here.
The concentrations in the bulk of the cathode half cell cc,i and at the cathode surfaceare given by the equations
cc,i =nc,i
Vc, (4)
Diδc,i
A(cs
c,i − cc,i)= ∑
jνc,ij vc,j (i /∈ gas) , (5)
csc,i = Hg,i pg,i (i ∈ gas) , (6)
respectively. The concentrations csc,i of the non-gaseous components at the surface are
calculated from the linear relation (5), which is a local material conservation conditionat the surface with a simplified version of Fick’s law in its differential form describingthe molar flow rate through the boundary layer. It includes the assumption of spatiallyconstant concentration gradients for the species diffusing towards the surface or awayfrom it. Furthermore, it implies that the concentration profile adapts instantaneously tolocal concentration changes. The distinction between bulk and surface concentration in0D is used as a feature to make the model more versatile by applying different valuesfor the thickness of the boundary layer δc,i. For water as the solvent, the limit δc,H2O → 0is reasonably used (i.e., cc,H2O = cs
c,H2O). The concentrations of the gaseous componentsin the reactive zone (only O2 in the process) follow from Henry’s law (Equation (6)) forsolution of gases in liquids, since those species are fed to the reaction zone from the gascompartment side.
In order to match the number of equations and the number of calculated variables,another equation for the determination of Fcout is required. For a realistic description of thereactor, it is necessary to consider the Equation
Vc = ∑i∈liq
Vcm,i nc,i , (7)
requiring the gap in the half cell to be steadily brimfull with liquid. However, with thisequation used to calculate Fcout, the model converged poorly in our tests. Instead, the equa-tion is used to determine nc,H2O, and hence, the dynamic Equation (1) is not used for water.To obtain an equation for Fcout, Equation (7) is differentiated with respect to time, and theresulting expression for nc,H2O is set equal to its analogue arising from the unused molarbalance (1) for water. This yields the incompressibility condition

Processes 2021, 9, 399 6 of 24
0 = Fcin xcin,H2O − Fcout xc,H2O + Nm,H2O
+ ∑j
νc,H2O,j vc,j +1
Vcm,H2O∑
i ∈ liqi 6=H2O
Vcm,i nc,i (8)
(with nc,i in the last sum from Equation (1)) for calculation of Fcout. Thus, the molar balancefor water is contained implicitly in the equations. Fgout follows from the phenomenological relation
Fgout =KvVgm
√ρ0
ρg
(pg
p0− 1.0
)(9)
with a slight pressure drop being assumed across the outlet valve of the gas compartment.
2.1.2. Molar Balances in the Anode Half Cell
The balance equations on the anode side are analogue to the cathode balances, exceptfor the gas compartment, which does not exist for the anode half cell. The molar componentbalance for the anode reads:
dna,i
dt= Fain xain,i − Faout xa,i − Nm,i + ∑
jνa,ij va,j (i 6= H2O) , (10)
with the mole fractions given by
xa,i = na,i
/ N
∑i=1
na,i . (11)
Again, the bulk and surface concentrations are obtained from
ca,i =na,i
Va, (12)
Diδa,i
A(cs
a,i − ca,i)= ∑
jνa,ij va,j , (13)
with ca,H2O = csa,H2O. In contrast to the cathode side, dissolved oxygen emerging from
oxidation of water occurs on the anode side in the process. The anode half cell is supposedto be entirely filled with liquid, too:
Va = ∑i∈liq
Vam,i na,i , (14)
meaning that oxygen bubble formation is not considered here. Such bubbles increase theoverpotential by blocking active surface sites. Nouri-Khorasani et al. report changes inthe overpotential of 28. . . 43 mV in this respect [48]. Neglecting this effect is reasonablebecause the cell in this article works at about 1.6 V (�43 mV) under moderate operatingconditions. The molar balance (10) for water is used only implicitly during the derivationof the incompressibility condition
0 = Fain xain,H2O − Faout xa,H2O − Nm,H2O
+ ∑j
νa,H2O,j va,j +1
Vam,H2O∑
i ∈ liqi 6=H2O
Vam,i na,i (15)
for calculation of Faout.

Processes 2021, 9, 399 7 of 24
There are two contributions to Nm. The oxonium ions H3O+ are the only chargedparticles traversing the PEM. Moreover, water is the only non-charged component beingconducted through the membrane by electro-osmotic drag. Then, we have
Nm,H3O+ =IF
, (16)
Nm,H2O =IF
λ , (17)
Nm,i = 0 (i 6= H3O+ , H2O) (18)
with the drag coefficient λ.
2.1.3. Reaction Kinetics and Voltage
The electric current Ij across the electrode surface resulting from reaction j is calculatedusing the Butler–Volmer equation [6,49]:
Ij = AFljk j
(cs
ox,j e−ljαFRT (E−E0
j ) − csred,j e
lj(1−α)FRT (E−E0
j )
). (19)
The sum of this equation over all electrochemical reactions for one electrode yieldsthe condition
I = ∑j
Ij , (20)
which determines the electrode potential E for the case of galvanostatic operation. Equa-tion (20) only holds if all occurring electrochemical reactions are known. Equation (19)enables us to give the Faraday efficiencies
ηj =Ij
I(21)
explicitly. Note that these Faraday efficiencies are not identical to the η usually resultingfrom experiments, where the molar flow rate of the product species is measured anddivided by its theoretical maximum according to the electric current. These experimentalvalues correspond to a species rather than a reaction. They are averaged over all reactionsinvolving the species, and they become equal to ηj in case of only one reaction, or moreprecisely, in the case where the respective component occurs only in reaction j. Apart fromthat, the electric reaction currents Ij are used to calculate the reaction rates from Faraday’slaw of electrolysis:
vj =Ij
ljF. (22)
The formal potential E0j is calculated from the Nernst equation, and the equilibrium
potential Eeqj , i.e., the electrode potential in case of only reaction j and zero electric current,
is derived from E0j accordingly:
E0j = Eo
j −RTljF
∑i
ln(γs
ij)νij , (23)
Eeqj = E0
j −RTljF
∑i
ln
(cs
ij
c0
)νij
. (24)
Values for potentials are given with reference to the standard hydrogen electrode (SHE)in this work. Equations (19)–(24) are evaluated separately for each electrode. However,they are only written down here once, because they are the same in both cases.

Processes 2021, 9, 399 8 of 24
To determine the overall voltage drop over the cell, we require the Ohmic voltage drop
UOhm = I(Rliq + Rm) (25)
with the resistance of the electrolyte in the gaps and the resistance of the membrane:
Rliq =da + dc
σliq A, (26)
Rm =dm
σm A. (27)
Furthermore, the overpotential associated with reaction j is defined as
Eoverj = E− Eeq
j , (28)
which is, just like the Faraday efficiencies from (21), a measure of efficiency for the cell.In the literature, the overall cell voltage U is usually composed of the open circuit
voltage U0, the overpotentials and the Ohmic losses. However, in the case of multipleactive reactions, it is not straightforward to calculate U0 and the total overpotentials at eachelectrode. Using Equations (23) and (26) from [20] instead, U can be written in terms of Eaand Ec:
U = UOhm + Ec − Ea , (29)
where the potential difference Ec − Ea consists of the open circuit voltage and the totaloverpotentials. This form can be evaluated because Ea and Ec, which are not reaction-specific, are calculated from (19) together with (20).
Finally, the electric power consumption of the cell is
Pel = UI . (30)
In this convention, the electric current I has a positive algebraic sign. The applied electricalpower enables the necessary increase in the Gibbs free energy and thus, the conversion ofchemicals. However, it partly gets lost due to Joule heating and overpotentials, which arecaused by polarization effects at the electrodes [28,49].
2.1.4. Reactions
The model equations given so far are generic in the sense that they do not correspondto a particular electrochemical reaction mechanism. In order to refer to the process of H2O2production, the following reactions were implemented together with the model.
Cathode:
O2 + 2 H3O+ + 2 e−k1−→ 2 H2O + H2O2 (31)
O2 + 4 H3O+ + 4 e−k2−→ 6 H2O (32)
H2O2 + 2 H3O+ + 2 e−k3−→ 4 H2O (33)
Anode:
6 H2O ka−→ 4 H3O+ + 4 e− + O2 (34)
The desired reaction (31) is the oxygen 2-electron reduction to hydrogen peroxide,which is often accompanied by the oxygen 4-electron reduction to water (Equation (32)) anda subsequent reduction of H2O2 (Equation (33)). Together, (31)–(33) constitute the oxygenreduction reaction (ORR) mechanism [30,31,50]. At the counter electrode, the anodicreaction of water electrolysis (Equation (34)) is used for the production of H3O+. These arethe four active reaction channels for the process.
Processes 2021, 9, 399 9 of 24
2.2. Membrane Distillation Model
The process includes downstream processing employing a module for membranedistillation to remove the added acid from the product solution. This separation process isprincipally based on differences in the chemical potential of species i on both sides of themembrane. Assuming the trans-membrane flux Nm,i to be proportional to this difference, itcan be expressed as [51]
Nm,i = Bi
(p0
i, f γi, f xi, f − p0i,p γi,p xi,p
), (35)
neglecting any non-ideal behavior of the gas phases on each side. The transport coefficientsBi depend on the membrane thickness and on how efficiently species i is transferredthrough the membrane. The flux (35) is forced by a thermal gradient across the membrane.The feed stream to the feed side of the module is heated to a temperature Tf well above thefeed temperature Tp on the permeate side. Consequently, the saturation vapor pressurep0
i, f of species i in the feed side of the pores is higher than the saturation vapor pressure
p0i,p of species i in the permeate side of the pores. The solutions on each side penetrate the
membrane only to a certain extent but never reach the liquid coming from the other sidedue to the hydrophobic design of the pores. The difference in vapor pressures on each sidecauses a material flux through the gas-filled section of the pores. Again, the vapor pressuresof the liquid components and the activity coefficients γi, f , γi,p at compositions xi, f , xi,p areobtained using the corresponding methods from Aspen’s ENRTL-RK set. The pressures ofgaseous species are calculated using Henry’s law.
The outlet compositions xout,i, f , xout,i,p are determined by the component balances
Fout, f xout,i, f = Fin, f xi, f − Nm,i , (36)
Fout,p xout,i,p = Fin,p xi,p + Nm,i (37)
on the feed and the permeate side, respectively, and the outlet flow rates Fout, f , Fout,p followfrom the sum of Equation (36) and (37) over all components, exploiting the summation conditions:
Fout, f = Fin, f −∑i
Nm,i , (38)
Fout,p = Fin,p + ∑i
Nm,i . (39)
2.3. Experimental Details
Experimental data were generated in order to adjust and validate the model. The mea-surements were conducted with the real electrochemical cell, which had a cross-sectionalarea of A = 100 cm2. The thicknesses of the anode and cathode compartment are da = 7 mmand dc = 1.2 mm, respectively, and the corresponding compartment volumes are calculatedaccordingly as Va = da A = 70 cm3 and Vc = dc A = 12 cm3. The half cells are separated bya fumasep® F-10120-PK proton exchange membrane (PEM). The cathode was made of ahydrophobized commercial Freudenberg H23C8 gas diffusion layer, which was sputteredwith platinum as catalyst in order to obtain a gas diffusion electrode. The gas compartmentis fed with 175 Nml/min synthetic air. For the anode half cell, an electrolyte solution of2 mol/L H2SO4 in water is used, which is fed with a rate of 70 ml/min and which is recy-cled after it passed the cell. The experiments were conducted at room temperature (about22.5 ◦C in the laboratory), and no temperature control or external cooling was applied tothe cell. Furthermore, the measurements were executed using galvanostatic operation withan electric current of I = 2.37 A. Due to the low values of the product purity x (below 1 %),the corresponding relative measurement error is rather large (up to 50 %). Thus, values ofmodel parameters derived from the measured data are considered as estimates.

Processes 2021, 9, 399 10 of 24
3. Results and Discussion3.1. Model Adjustment
In this subsection, the reactor model is adjusted to the experimental data. Sensi-tivity analyses of the model performed in Aspen Plus® showed that the electro-kineticparameters from the Butler–Volmer Equation (19) have the highest impact on the outputquantities of the model and hence, they are chosen as free variables in an optimizationproblem designed to adjust the model to the measurements. The applicability of thedetermined reaction kinetics after a potential upscaling of the process then depends onhow realistically the other model parameters are chosen. Some of the remaining inputparameters can be determined from literature, e.g., the standard potentials under standardconditions Eo
j . Table 1 summarizes the parameter values used in the model adjustmentof the electrochemical reactor. At the cathode, reactions (31)–(33) are active and they areenumerated consecutively, i.e., the reaction index j (used e.g., for αj and Eo
j ) is 1 for the reactionfrom (31), 2 for (32) and 3 for (33). At the anode, the water electrolysis reaction (34) is active.The parameters dm, σm concerning the membrane are taken from the data sheet providedby the manufacturer (see Table 1). The reference quantities are set to p0 = 1.01325 bar,c0 = 1 mol/L and ρ0 = 1 g/cm3. The true component approach is used to specify the acidconcentration, i.e., only the mole fraction of H2SO4 is entered and the employed propertymethods provided by Aspen calculate the corresponding ionic concentations. All feedtemperatures and pressures to the reactor are set to 22.5 ◦C and 1.01325 bar, except for thefeed pressure to the gas compartment, which is set to 1.02 bar. The gas compartment isfed with pure oxygen in the simulation, and the associated feed rate is set to 20 % of theexperimental value, which is the percentage of oxygen in synthetic air. Still, there are somemodel parameters to be estimated, e.g., the electro-osmotic drag coefficient is chosen asλ = 6 from experimental experience. In previous work for the ORR mechanism at PdAu3surfaces, the charge transfer coefficients were calculated [34]. Here, they must be in thesame order of magnitude since the Eo
j do not differ.The model parameters obtained from model adjustments here result from the solution
of a least squares problem. For the electrochemical reactor, the product purity x and theFaraday efficiency η were measured as functions of the feed rate to the cathode half cell.The objective function f to be minimized is the weighted sum over all normalized andsquared differences between the measured values and the values predicted by the modelat given cathode feed rate Fcin:
f = wxSx + wηSη , (40)
with Sx, Sη given by
Sx =Nx
∑l=1
( xsim,l − xexp,l
xexp
)2, (41)
Sη =Nη
∑l=1
(ηsim,l − ηexp,l
ηexp
)2. (42)
The terms are normalized to their mean experimental value. Here, the simulatedFaraday efficiency is calculated as in the experiments, i.e., the product purity x is recorded,multiplied by the set point for the flow rate Fcin and finally divided by the theoreticalmaximum I/(2F) for the case without side reactions:
ηsim =x Fcin
I/(2F). (43)

Processes 2021, 9, 399 11 of 24
Table 1. Parameter values used in the model adjustment calculations of the electrochemical reactorfor determination of the electro-kinetic rate constants k1, k2 and k3.
Parameter Value Unit Type/Source
A 100 cm2
geometryda 7 mmdc 1.2 mmVa 70 cm3
Vc 12 cm3
ca,H2SO4 2 mol/L
experimental design
cc,H2SO4 2 mol/LFain 70 mL/minFgin 35 mL/minI 2.37 Ap 1.01325 barT 22.5 ◦C
Eo1 0.685 V vs. SHE [31]
Eo2 1.229 V vs. SHE [30,50]
Eo3 1.76 V vs. SHE [50]
Eoa 0 V vs. SHE
Hg,O2 1.3 mol/(bar·m3) [52] (H2O as solvent)
dm 127.5 µm from data sheetσm 5.44 S/m for 0.5 M H2SO4
α1 0.2
estimate
α2 0.01α3 0.01αa 0.5Di/δa,i (i 6=H2O) 0.05 cm/sDi/δc,i (i 6=H2O, O2) 0.05 cm/ska 0.001 cm/sKv 0.1 m3/hλ 6σliq 1.5 S/m
NLPQLP tolerance 0.001
convergencegradient accuracy 0.0001simulation accuracy 10−8
sandwiching quality 1.05
The solver NLPQLP from the Schittkowski suite [53] is used to minimize f by varyingthe optimization variables k1, k2 and k3.
Since electro-kinetic rate constants may vary by many orders of magnitude [49], theyare replaced using the nonlinear transformation
k j = 10−bj (44)
and the bj are used as optimization variables instead. This way, the optimization solvercalculates steps in a logarithmically scaled design space and it does not need to distinguishbetween steps of different orders of magnitude. Without this transformation, no meaningfulresults could be found. Table 2 shows the employed starting values and boundaries for theoptimization variables.

Processes 2021, 9, 399 12 of 24
Table 2. Starting values and boundaries for the optimization variables bj estimated by adapting theelectrochemical reactor model to measured data.
Variable Starting Value Lower Boundary Upper Boundary
b1 7.0 3.0 8.0b2 7.0 6.7 8.0b3 7.0 5.0 8.0
Particular attention needs to be paid to the different convergence parameters whenworking in the framework of flowsheet optimization. The error tolerance of the optimiza-tion solver and the accuracy of gradient calculations must be less strict than the accuracyof the simulation. Otherwise, the information the solver is looking for in the functionevaluations will simply disappear in numerical noise. Here, the tolerance of NLPQLP is setto 10−3, the relative accuracy of the gradients is 10−4 and the flowsheet tolerance is 10−8.The latter is used as accuracy requirement for mass balances, flash calculations and for thesystem of equations itself, which is solved in equation-oriented mode.
A common choice for wx, wη is the reciprocal variance of the corresponding exper-imental data [54], ensuring that more precisely measured quantities are granted moreimpact on the objective function. However, the variances are often unknown, as is thecase here, too. Hence, the weighting factors can be chosen out of a continuum betweenthe extreme compromises wx = 0, wη > 0 and wx > 0, wη = 0, where the optimizationvariables are adapted to only one quantity, respectively. We use the sandwiching algo-rithm [43] to adaptively determine distinct sets of weighting factors, for each of which theoptimization problem described above is solved. The result is a finite number of solutions,each corresponding to a different estimate for the k j. These points represent a Pareto set [47]with well-defined sandwiching quality in the objective space spanned by the criteria Sx andSη . A similar procedure has also been presented in [46] for solving reconciliation problems.
Aspen Plus V10® is coupled to the NLPQLP solver and the sandwiching subroutinesvia MS Excel. A VBA code is used to manage the data transfer, and a self-designed (Excel-based) graphical interface is used for problem specification and automated formatting ofresults. The framework is similar to the one published in [42], except for CHEMCAD as aflowsheet simulator being replaced by Aspen here. The applied HappLS class from theAspen Plus GUI 36.0 Type Library exposes all required properties and methods to accessflowsheet data from within VBA.
Figure 2 shows the Pareto frontier of the MCO problem for adjustment of the elec-trochemical reactor model to measured data displayed in the objective space spanned bythe sums Sx and Sη . Within the given approximation quality (see bottom of Table 1), thisfrontier is represented by the calculated Pareto points and the straight lines connectingthem. It is the set separating the feasible and infeasible parts in the objective space. In theplot, the extreme compromises are marked corresponding to wx = 0 (bottom right) andwη = 0 (top left). For all six calculated points, the results including the respective weightingfactors wx, wη determined by the sandwiching algorithm are listed in Table 3.
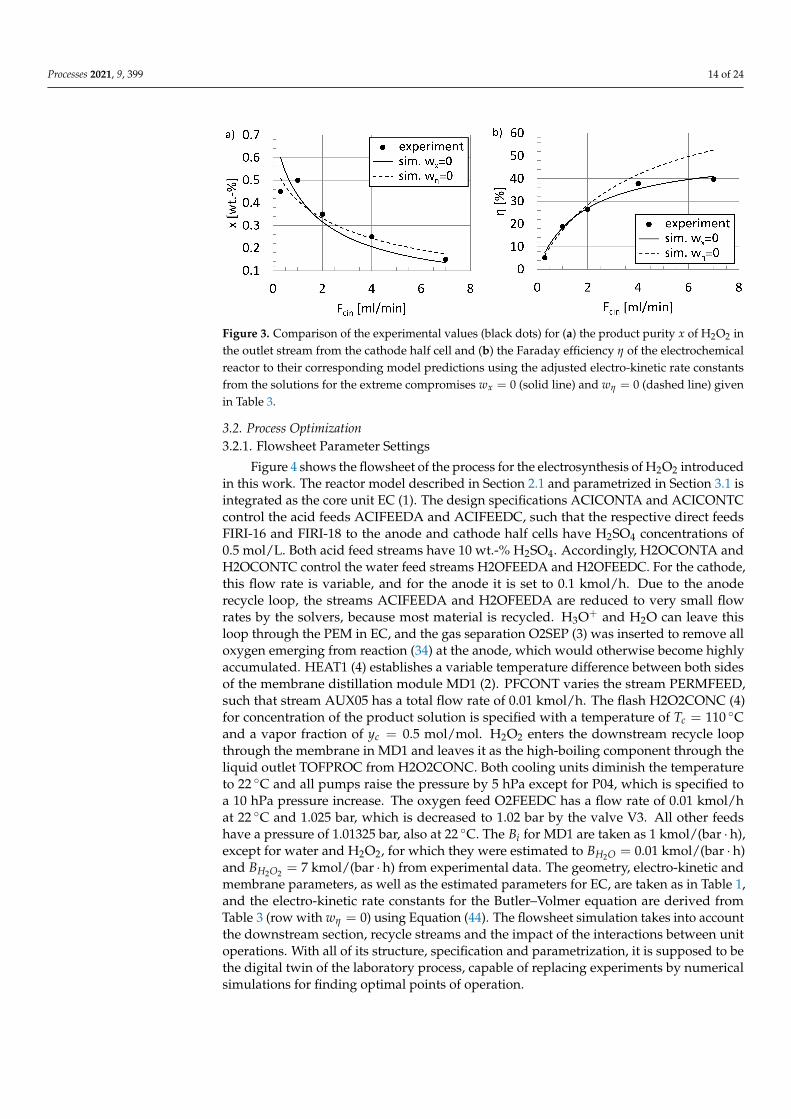
A comparison of the experimental data to the predictions of the adapted models isexhibited in Figure 3. The measured data represented by black dots are displayed as afunction of the feed rate to the cathode half cell Fcin. The extreme compromises wx = 0,wη = 0 corresponding to solutions 1 and 2 in Table 3 were chosen for the plot. I.e., thebj for the two solutions were inserted into Equation (44) to obtain the respective electro-kinetic rate constants k j for utilization in the cell model. Subsequently, the models weresolved for 40 equidistant values of Fcin in the interval 0.3. . . 7 ml/min, in order to reacha quasi-continuous representation for the lines in Figure 3. For both parametrizations,the model from Section 2.1 achieves a reasonable approximation of the experimental data.The simulation results for wx = 0 (solid line) deviate more strongly from the measurementsfor x, especially at low feed rates, and the simulation results for wη = 0 agree less wellwith the measurements for η, particularly at larger feed rates. This is the expected result

Processes 2021, 9, 399 13 of 24
because e.g., for wx = 0, the deviations accumulated in Sx from (41) are not taken intoaccount in the objective function f from (40). Hence, the corresponding measurementpoints cannot force the curve to pass them by more closely in the optimization procedure.For Fcin between 0.3. . . 2 ml/min, the model reproduces the experimental values for ηalmost exactly for both parametrizations. The results of solution 1 (wη = 0) are chosenfor the model used in the subsequent section about process optimization, because there,a more accurate prediction of the product purity is desired, since the considered criteriapartly depend on x, but not on η. Using j0 = F k (cb
O)1−α(cb
R)α [49], an exchange current
density of j0 ≈ 5 µA/cm2 can be found for the corresponding kinetic parameters. This iscomparable to the lowest values found in [55] for the Pt/Nafion interface.
Figure 2. Pareto frontier of the multi-criteria optimization problem for adjustment of the electrochem-ical reactor model to measured data displayed in the objective space spanned by the sums Sx and Sη
over all normalized and squared differences between the measured values and the values predictedby the model for the product purity x and the Faraday efficiency η. The plotted points correspond tothe data in Table 3.
Table 3. Results including the respective weighting factors wx, wη for the Pareto points from themulti-criteria optimization problem for adjustment of the electrochemical reactor model to measureddata. The points are plotted in the objective space in Figure 2.
Solution no. wx wη Sx Sη b1 b2 b3
1 0.2253 0.0000 0.1079 0.2894 7.274 7.546 6.0122 0.0000 3.8629 0.2671 0.0198 7.270 7.130 6.3233 0.2252 0.1329 0.1595 0.0376 7.326 7.223 6.1724 0.2253 0.0461 0.1334 0.0909 7.341 7.314 6.1105 0.2125 1.2819 0.1958 0.0225 7.330 7.163 6.2526 0.2253 0.0289 0.1244 0.1299 7.237 7.351 6.081
Processes 2021, 9, 399 14 of 24
Figure 3. Comparison of the experimental values (black dots) for (a) the product purity x of H2O2 inthe outlet stream from the cathode half cell and (b) the Faraday efficiency η of the electrochemicalreactor to their corresponding model predictions using the adjusted electro-kinetic rate constantsfrom the solutions for the extreme compromises wx = 0 (solid line) and wη = 0 (dashed line) givenin Table 3.
3.2. Process Optimization3.2.1. Flowsheet Parameter Settings
Figure 4 shows the flowsheet of the process for the electrosynthesis of H2O2 introducedin this work. The reactor model described in Section 2.1 and parametrized in Section 3.1 isintegrated as the core unit EC (1). The design specifications ACICONTA and ACICONTCcontrol the acid feeds ACIFEEDA and ACIFEEDC, such that the respective direct feedsFIRI-16 and FIRI-18 to the anode and cathode half cells have H2SO4 concentrations of0.5 mol/L. Both acid feed streams have 10 wt.-% H2SO4. Accordingly, H2OCONTA andH2OCONTC control the water feed streams H2OFEEDA and H2OFEEDC. For the cathode,this flow rate is variable, and for the anode it is set to 0.1 kmol/h. Due to the anoderecycle loop, the streams ACIFEEDA and H2OFEEDA are reduced to very small flowrates by the solvers, because most material is recycled. H3O+ and H2O can leave thisloop through the PEM in EC, and the gas separation O2SEP (3) was inserted to remove alloxygen emerging from reaction (34) at the anode, which would otherwise become highlyaccumulated. HEAT1 (4) establishes a variable temperature difference between both sidesof the membrane distillation module MD1 (2). PFCONT varies the stream PERMFEED,such that stream AUX05 has a total flow rate of 0.01 kmol/h. The flash H2O2CONC (4)for concentration of the product solution is specified with a temperature of Tc = 110 ◦Cand a vapor fraction of yc = 0.5 mol/mol. H2O2 enters the downstream recycle loopthrough the membrane in MD1 and leaves it as the high-boiling component through theliquid outlet TOFPROC from H2O2CONC. Both cooling units diminish the temperatureto 22 ◦C and all pumps raise the pressure by 5 hPa except for P04, which is specified toa 10 hPa pressure increase. The oxygen feed O2FEEDC has a flow rate of 0.01 kmol/hat 22 ◦C and 1.025 bar, which is decreased to 1.02 bar by the valve V3. All other feedshave a pressure of 1.01325 bar, also at 22 ◦C. The Bi for MD1 are taken as 1 kmol/(bar · h),except for water and H2O2, for which they were estimated to BH2O = 0.01 kmol/(bar · h)and BH2O2 = 7 kmol/(bar · h) from experimental data. The geometry, electro-kinetic andmembrane parameters, as well as the estimated parameters for EC, are taken as in Table 1,and the electro-kinetic rate constants for the Butler–Volmer equation are derived fromTable 3 (row with wη = 0) using Equation (44). The flowsheet simulation takes into accountthe downstream section, recycle streams and the impact of the interactions between unitoperations. With all of its structure, specification and parametrization, it is supposed to bethe digital twin of the laboratory process, capable of replacing experiments by numericalsimulations for finding optimal points of operation.

Processes 2021, 9, 399 15 of 24
Figure 4. Flowsheet of the process for H2O2 production with two recycle loops (one for the anodehalf cell and one in the downstream processing) and five design specifications as taken from AspenPlus®. The most important unit operations are marked with bold numbers: 1. Electrochemical reactorEC for H2O2 production, 2. Membrane distillation module MD1 for acid separation, 3. Oxygenseparation O2SEP for removal of O2 from the anode recycle loop, 4. Flash H2O2CONC for productconcentration, 5. Heater HEAT1 for thermal gradient across the membrane unit. The product isdrained from the process in the main outlet TOFPROC.
3.2.2. Flowsheet Convergence
The flowsheet is solved in sequential-modular mode. Two steps turned out to be cru-cial in order to obtain convergence. First, O2SEP had to be inserted for the above-mentionedreason. Second, the design specifications were nested inside the loops converging the tearstreams FBA1 and AUX04. Otherwise, the tear streams cannot converge, because, e.g., theanode recycle loop would have to be closed with the initial flow rate of H2OFEEDA, whichis far too large for the amount of substance in the loop to remain finite. Tear streams aswell as design specifications are converged with Broyden solvers. The relative tolerance forAUX04 is 10−4, while it could be reduced to 10−8 for FBA1. The accuracies of the designspecifications in the upstream processing are 10−5, and for PFCONT it is 10−3. The errortolerances for flash convergence, entropy balance and for fugacity calculations are set to10−8, and the accuracy of mass balances is 10−4.

Processes 2021, 9, 399 16 of 24
3.2.3. Multi-Criteria Optimization Problem
For the optimization problem, the solver accuracy was set to 10−3, numerical deriva-tives were evaluated using a relative perturbation of 3 % and the quality of the sandwichingapproximation was 1.05. Table 4 provides an overview over the MCO problem designed toanalyze the process and to calculate Pareto-optimal working points for it. The optimizationvariables are I, Fcin and the temperature TMD of the stream to the feed side of the membranedistillation unit MD1. The latter quantity is a specification for HEAT1. I is varied in theinterval 0.5. . . 10 A. At I = 0.5 A there is almost only 0.05 wt.-% H2O2 left in the main outletTOFPROC, and we do not wish to go below that. Apart from that, it should be noted thatfor I as high as 10 A, a notable production of H2, which is not considered here, sets in in thereal system. Furthermore, at such high electric currents, external cooling of the reactor isrequired, which is not considered here, either. The boundaries for Fcin are 0.01. . . 1 kmol/haccording to a reasonable interval of ≈ 3 . . . 300 ml/min. TMD is kept between 23. . . 98 ◦C,so that the feed temperature for MD1 is always higher than the permeate temperature butwithout evaporating the solution. The optimization solver works with TMD measured inunits of 10 ◦C because then the actual optimization variable is O(1) within its boundaries,which turned out to be more stable. Among the five objectives, three quantities have notbeen introduced yet: the overall electric power consumption Pel,tot is taken as the sum of thecell power Pel and the powers of all pumps, and the ratio of this quantity to the componentflow rate Nout of H2O2 in TOFPROC is a measure for the electrical energy dissipated per kgperoxide output. Pel takes its lowest value of 0.4 W for I = 0.5 A, Fcin = 0.01 kmol/h. xoutis the overall product purity, i.e., the mass fraction of H2O2 in the main outlet. The heatconsumption is the sum of the net duties of HEAT1 and COOL1 for separation of acidiccomponents and the net duties of the flash H2O2CONC and COOL2 in the recycle loop forproduct concentration. The O2 consumption is taken as the mass flow rates of O2FEEDCminus O2OUTA and O2OUTC, since the two latter streams are considered as recycled.
Table 4. Configuration of the MCO problem for optimization of working points for the processproducing H2O2 represented by the flowsheet displayed in Figure 4.
Variable Type Unit Init. Value
I var. A 2.37Fcin var. kmol/h 0.025TMD var. 10 ◦C 70xout max. wt.-% 0.7164Fcout max. g/min 7.9769
Pel,tot/Nout min. kWh/kg 4.618Heat consumption min. kW 0.2099O2 consumption min. mg/min 6.955
3.2.4. Multi-Criteria Optimization Results and Discussion
The highest H2O2 purities in TOFPROC were found at about 3 wt.-%. The outcome ofthe Pareto approximation shall be discussed here within the context of two-dimensionalprojections in the objective space. Figure 5a shows such projections for the heat consump-tion and the O2 consumption of the entire process with Pel,tot/Nout on the horizontal axis.The data sets for Figure 5 are given in Table 5. Within the given approximation quality,the plotted lines represent the boundary between feasible and infeasible regions. Resultingpoints appearing as dominated in the projections (i.e., points where an improvement inboth objectives is possible without becoming infeasible) in the corresponding projectionhave been removed from the plots. In Figure 5a, the transition from high to low heat and O2consumptions while simultaneously worsening the ratio Pel,tot/Nout along the Pareto setsin this diagram is achieved by reducing the feed rate to the cathode half cell from 0.09 to0.01 kmol/h and by lowering TMD. Of course, this will lead to smaller heat consumptions,

Processes 2021, 9, 399 17 of 24
but it also results in less H2O2 crossing the membrane in MD1 and hence in lower valuesof Nout.
Figure 5. Two-dimensional projections of the Pareto approximation. The different objectives on thevertical axes are displayed in relation to (a) Pel,tot/Nout and (b) Fcout on the respective horizontal axes.In each sub-figure, the black dots belong to the left vertical axis and the O2 consumption marked byred squares is allocated to the right vertical axis, as exemplarily indicated by the arrows in (a).
Table 5. Objectives and optimization variables selected from the Pareto set resulting from MCO forthe process. Only non-dominated points, plotted in Figure 5, are given here.
Projection of Heat Consumption on Pel,tot/Nout (Figure 5a, Left Vertical axis):
Pel,tot/NoutHeat
Consumption I Fcin TMD
[kWh/kg] [kW] [A] [kmol/h] [◦C]
3.778 0.444 0.5 0.09 97.9435.028 0.200 0.5 0.019 70.0805.420 0.194 0.5 0.015 70.00017.168 0.158 10.0 0.012 55.22465.408 0.137 0.5 0.01 23
Projection of O2 Consumption on Pel,tot/Nout (Figure 5a, Right Vertical axis):
Pel,tot/NoutO2
Consumption I Fcin TMD
[kWh/kg] [mg/min] [A] [kmol/h] [◦C]
3.778 0.750 0.5 0.09 97.9435.028 0.600 0.5 0.019 70.0805.420 0.558 0.5 0.015 70.0006.210 0.505 0.5 0.011 70.72765.408 0.469 0.5 0.01 23
Projection of Pel,tot/Nout on Fcout (Figure 5b, Left Vertical axis):Fcout Pel,tot/Nout I Fcin TMD
[g/min] [MWh/kg] [A] [kmol/h] [◦C]
28.123 0.004 0.5 0.09 97.943311.043 0.138 2.381 1 70311.043 3.232 2.38 1 23
Projection of O2 Consumption on Fcout (Figure 5b, Right Vertical axis):
FcoutO2
Consumption I Fcin TMD
[g/min] [mg/min] [A] [kmol/h] [◦C]
3.151 0.469 0.5 0.01 23310.876 0.903 0.5 1 40.452311.043 9.766 2.38 1 23

Processes 2021, 9, 399 18 of 24
Very sharp bends in the Pareto frontiers are found in Figure 5b. For the O2 consump-tion, the bending point in the bottom right can be reached from the point in the top right,mainly by decreasing the electric current from 2.38 to 0.5 A. This drastically reduces theamount of oxygen converted in electrochemical reactions. In fact, both objectives on thevertical axes can be decreased by more than an order of magnitude in this range, withalmost no reduction in Fcout. Such interesting regions are sought after by and can only befound using MCO, while the sandwiching algorithm prevents an unnecessary amount ofpoints being calculated in these intervals. Mind that only two criteria are regarded in thisreflection. e.g., xout drops significantly with decreasing I. From the solution in the bottomleft of Figure 5b, the bending point is reached by increasing Fcin. This notably improvesFcout, while the other two objectives in the projection worsen only marginally.
In order to assess the relation of electrical and thermal energy consumption, the reactorand the membrane distillation module are compared. At moderate operating conditions(I = 2.37 A, Fcin = 0.025 kmol/h, TMD = 70 ◦C), the cell power Pel is 3.84 W. It mainlydepends on the electrical current and is increased to 56.87 W by increasing I to its upperboundary at 10 A. The heat for membrane distillation is injected in HEAT1. Under themoderate conditions just mentioned, this heater operates at a thermal input of 25.59 W. Thisheat input depends on TMD, and it is increased to 40.54 W by increasing TMD to its uppperboundary at 98 ◦C. Hence, depending on the operating conditions, Pel can be smaller orlarger than the energy required for membrane distillation, and its range comprises that ofthe heat input in HEAT1. The overall heat consumption (see Table 5) exceeds the electricalpower, but such a contribution also exists in the conventional anthraquinone process.
In Table 5, there are several non-identical values of TMD very close to 70 ◦C. This wasinvestigated using a sensitivity analysis in the range TMD = 69.9 . . . 70.1 ◦C with I = 0.5 Aand Fcin = 0.01 kmol/h. Fcout and the O2 consumption do not depend on TMD, the latterbecause there is no oxygen in the downstream. Pel,tot/Nout does not vary notably in thisrange. However, xout as well as the heat consumption both vary by about 0.2 % in thisrange. On the one hand, this variation is large enough so that, together with the givensolver tolerance of 0.001, our algorithm can distinguish between the respective values inthe table and they do not result from numerical noise. On the other hand, the variation issmall enough for a robust implementation of the Pareto-optimal operating points in thereal process. The challenge will then be to accurately establish the optimal temperature allover the feed side of the membrane in MD1.
4. Conclusions
This work introduces a process for electrosynthesis of H2O2 and focuses on its model-ing and multi-criteria optimization. The proposed model equations for the required customunits pursue the goal of rapid convergence and a reasonable mathematical mapping ofthe main output quantities, particularly the product purity but also the Faraday efficiency.For calculation of the outlet flow rates of the reactor, a numerically stable incompress-ibility condition is derived. The Butler–Volmer kinetics are determined from adjustmentto experimental data, which is realized by solving an MCO problem, since it is not clearin general how to weight different measured quantities against each other. The modelis implemented in Aspen custom modeler®, and its validated form is embedded in anAspen Plus® flowsheet. For the application of MCO to both, model adjustment as well aselectrosynthesis on a process level, the availability of studies is limited so far.
The Pareto set obtained from MCO can be exploited by process operators for a quickand simple selection of efficient working points without the need for further simulations,and especially without time-consuming experiments. The MCO results show that theproduct purities of the process introduced here are higher than those of the anthraquinoneprocess (before downstream). Hence, the proposed process is a promising approach tosustainable production of hydrogen peroxide. However, the product flow rates in the rangeof several mL/min cannot compete with the industrial process. However, they need not,because the process considered here is designed for decentralized applications. Neverthe-

Processes 2021, 9, 399 19 of 24
less, the product amount should be increased in future work. In this respect, upscalingcannot be the (only) solution because the process is supposed to remain decentralized.However, stacking multiple electrochemical cells can be one way to achieve higher productflow rates (at the cost of more energy input of course).
Author Contributions: Conceptualization, M.v.K. and M.B.; methodology, M.v.K.; software, M.v.K.;validation, M.v.K.; writing—original draft preparation, M.v.K.; writing—review and editing, M.v.K.and M.B.; visualization, M.v.K.; supervision, M.B.; project administration, M.v.K. and M.B.; fundingacquisition, M.B. All authors have read and agreed to the published version of the manuscript.
Funding: This research was funded by the Fraunhofer Society within the Lighthouse Project “Elec-tricity as a Resource”. The APC was funded by the Fraunhofer Society.
Institutional Review Board Statement: Not applicable.
Informed Consent Statement: Not applicable.
Data Availability Statement: All data required to reproduce the results presented in this study canbe found in the article.
Acknowledgments: Our gratitude goes to Carsten Cremers and Jan Meier from the fuel cell groupat Fraunhofer ICT for the measured data and a lot of information about electrochemical systems.Stimulating discussion about the basic principles of membrane distillation with Dusan Boskovicfrom the “Chemical process development and flow chemistry” group at Fraunhofer ICT is gratefullyappreciated. In addition to that, we are much obliged to Johannes Neuhaus from BASF SE for helpingwith the convergence properties of the flowsheet simulation for the process. Useful support in theMCO procedure by Jens Babutzka from SAP SE Germany is thankfully acknowledged.
Conflicts of Interest: The authors declare no conflict of interest.
AbbreviationsThe following abbreviations are used in this article:
ACM Aspen custom modeler®
FC Fuel cellMCO Multi-criteria optimizationMS MicrosoftORR Oxygen reduction reactionPEM Proton exchange membraneRRDE Rotating ring-disc electrodeVB Visual basicVBA Visual basic for applications
Appendix A. List of Symbols
A cross-sectional area of the reactorbj absolute value of the exponent in the electro-kinetic rate constant for reaction jBi transport coefficient of species i through the membrane in the membrane distillation
modulec0 reference concentration (1 mol/L)ca,i bulk concentration of species i in the anode half cellcs
a,i concentration of species i at the anode surfacecc,i bulk concentration of species i in the cathode half cellcs
c,i concentration of species i at the cathode surfacecb
O bulk concentration of the species to be reducedcs
ox,j concentration of the species to be reduced in reaction j at the electrode surfacecb
R bulk concentration of the species to be oxidizedcs
red,j concentration of the species to be oxidized in reaction j at the electrode surfaceda thickness of the gap between membrane and anodedc thickness of the gap between membrane and cathodedm membrane thickness

Processes 2021, 9, 399 20 of 24
Di Fickian diffusional coefficient of species i in the electrolyteE electrode potentialEo
1 standard potential under standard conditions for the two-electron reduction (31) ofoxygen to H2O2
Eo2 standard potential under standard conditions for the four-electron reduction (32) of
oxygen to H2OEo
3 standard potential under standard conditions for the reduction (33) of H2O2Ea anode potentialEo
a standard potential under standard conditions for the water electrolysis reaction (34)at the anode
Eeqa,j equilibrium potential of reaction j at the anode
Eovera,j overpotential associated with reaction j at the anode
E0j formal potential of reaction j
Eeqj equilibrium potential of reaction j
Eoj standard potential under standard conditions for reaction j
Eoverj overpotential associated with reaction j
Ec cathode potentialEeq
c,j equilibrium potential of reaction j at the cathodeEover
c,j overpotential associated with reaction j at the cathodef least squares objective function for model adjustmentF Faraday constantFain molar flow rate of the anode feedFaout molar flow rate of the anode outletFcin molar flow rate of the cathode feedFcout molar flow rate of the cathode outletFgin molar flow rate of the feed to the gas compartmentFgout molar flow rate of the outlet from the gas compartmentFin, f molar feed flow rate to the feed side of the membrane distillation moduleFin,p molar feed flow rate to the permeate side of the membrane distillation moduleFout, f molar outlet flow rate from the feed side of the membrane distillation moduleFout,p molar outlet flow rate from the permeate side of the membrane distillation module∆Gj molar change in Gibbs free energy corresponding to reaction jHg,i Henry constant of species iI electric current through the electrochemical reactorIj electric current across the electrode surface caused be reaction jj0 exchange current densityk1 electro-kinetic rate constant of the two-electron reduction (31) of oxygen to H2O2k2 electro-kinetic rate constant of the four-electron reduction (32) of oxygen to H2Ok3 electro-kinetic rate constant of the reduction (33) of H2O2ka electro-kinetic rate constant of the water electrolysis reaction (34) at the anodekdisp rate constant of the disproportionation of H2O2k j electro-kinetic rate constant of reaction jKv Kv value for the outlet valve of the gas compartmentlj number of electrons transferred per mole in reaction jna,i amount of substance of species i in the anode half cellnc,i amount of substance of species i in the cathode half cellN number of considered speciesNm,i mole-based component flow rate of species i through the membraneNout component flow rate of H2O2 in the main outlet from the processNx number of measured values for the product purityNη number of measured values for the Faraday efficiencyp pressurep0 reference pressure beyond the outlet valve of the gas compartment (1 atm)pg pressure in the gas compartment

Processes 2021, 9, 399 21 of 24
pg,i partial pressure of species i in the gas compartmentp0
i, f vapor pressure of species i on the feed side of the membrane distillation modulep0
i,p vapor pressure of species i on the permeate side of the membrane distillation modulePel electric power consumed by the cellPel,tot overall electric power consumption of the processqa,j enthalpy of electrochemical reaction j in the anode half cellqc,j enthalpy of electrochemical reaction j in the cathode half cellR gas constantRliq electric resistance of the electrolyteRm electric resistance of the membraneSx sum over all normalized and squared differences between the measured values and
the values predicted by the cell model for the product puritySη sum over all normalized and squared differences between the measured values and
the values predicted by the cell model for the Faraday efficiencyt timeT temperatureTc specified temperature of the flash H2O2CONC for product concentrationU cell voltageU0 open circuit voltageUOhm Ohmic voltage drop across the cellva,j reaction rate of anode reaction jvc,j reaction rate of cathode reaction jvdisp reaction rate of the disproportionation of H2O2Va gap volume of the anode half cellVam,i molar Volume of species i in the anode half cellVc gap volume of the cathode half cellVcm,i molar Volume of species i in the cathode half cellVgm mean molar volume of the gas in the gas compartmentwη weighting factor of Sη
wx weighting factor of Sxx product purity, mass fraction of H2O2 in outlet stream from the cathode half cellxa,i mole fraction of species i in the anode half cellxain,i mole fraction of species i in the feed stream to the anode half cellxc,i mole fraction of species i in the cathode half cellxcin,i mole fraction of species i in the feed stream to the cathode half cellxexp,l l-th measured value for xxg,i mole fraction of species i in the gas compartmentxgin,i mole fraction of species i in the feed stream to the gas compartmentxi, f mole fraction of species i on the feed side of the membrane distillation modulexi,p mole fraction of species i on the permeate side of the membrane distillation modulexout overall product purity, mass fraction of H2O2 in main outlet from the processxout,i, f outlet mole fraction of species i from the feed side of the membrane distillation
modulexout,i,p outlet mole fraction of species i from the permeate side of the membrane distillation
modulexsim,l simulated product purity for measured point lxexp experimental product purity averaged over all measured valuesyc specified vapor fraction of the flash H2O2CONC for product concentration
Appendix A.1. Greekα1 charge transfer coefficient of the two-electron reduction (31) of oxygen to H2O2α2 charge transfer coefficient of the four-electron reduction (32) of oxygen to H2Oα3 charge transfer coefficient of the reduction (33) of H2O2αa charge transfer coefficient of the water electrolysis reaction (34) at the anodeαj charge transfer coefficient of reaction j

Processes 2021, 9, 399 22 of 24
γi, f activity coefficient of species i on the feed side of the membrane distillation moduleγi,p activity coefficient of species i on the permeate side of the membrane distillation
moduleγs
ij activity coefficient of species i in reaction j at the electrode surfaceδa,i thickness of the diffusional boundary layer for species i in front of the anodeδc,i thickness of the diffusional boundary layer for species i in front of the cathodeη species-based Faraday efficiency as usually determined in experimentsηa,j Faraday efficiency associated with reaction j at the anodeηc,j Faraday efficiency associated with reaction j at the cathodeηexp,l l-th measured value for ηηj Faraday efficiency of reaction jηsim simulated Faraday efficiency to be compared to the measured analogue ηηsim,l simulated Faraday efficiency for measured point lηexp experimental Faraday efficiency averaged over all measured valuesλ electro-osmotic drag coefficientνa,ij stoichiometric coefficient of species i in anode reaction jνc,ij stoichiometric coefficient of species i in cathode reaction jρ0 reference mass density (1 g/cm3)ρg mean mass density of the gas in the gas compartmentσliq electric conductivity of the electrolyteσm proton conductivity of the membrane
References1. Alkire, R.C.; Braatz, R.D. Electrochemical engineering in an age of discovery and innovation. AIChE J. 2004, 50, 2000–2007.
[CrossRef]2. Niroumand, A.M.; Homayouni, H.; DeVaal, J.; Golnaraghi, F.; Kjeang, E. In-Situ Diagnostic Tools for Hydrogen Transfer Leak
Characterization in PEM Fuel Cell Stacks Part II: Operational Applications. J. Power Sources 2016, 322, 147–154. [CrossRef]3. Zhou, S.; Schultz, T.; Peglow, M.; Sundmacher, K. Analysis of the nonlinear dynamics of a direct methanol fuel cell. Phys. Chem.
Chem. Phys. 2001, 3, 347–355. [CrossRef]4. Kim, H.; Park, M.; Lee, K.S. One-dimensional dynamic modeling of a high-pressure water electrolysis system for hydrogen
production. Int. J. Hydrog. Energy 2013, 38, 2596–2609. [CrossRef]5. Latz, A.; Zausch, J. Thermodynamic consistent transport theory of Li-ion batteries. J. Power Sources 2011, 196, 3296–3302.
[CrossRef]6. Latz, A.; Zausch, J. Thermodynamic derivation of a Butler–Volmer model for intercalation in Li-ion batteries. Electrochim. Acta
2013, 110, 358–362. [CrossRef]7. Latz, A.; Zausch, J. Multiscale modeling of lithium ion batteries: Thermal aspects. Beilstein J. Nanotechnol. 2015, 6, 987–1007.
[CrossRef]8. Montoya, J.H.; Shi, C.; Chan, K.; Nørskov, J.K. Theoretical Insights into a CO Dimerization Mechanism in CO2 Electroreduction.
J. Phys. Chem. Lett. 2015, 6, 2032–2037. [CrossRef] [PubMed]9. Ren, D.; Deng, Y.; Handoko, A.D.; Chen, C.S.; Malkhandi, S.; Yeo, B.S. Selective Electrochemical Reduction of Carbon Dioxide to
Ethylene and Ethanol on Copper(I) Oxide Catalysts. ACS Catal. 2015, 5, 2814–2821. [CrossRef]10. Edwards, J.K.; Freakley, S.J.; Lewis, R.J.; Pritchard, J.C.; Hutchings, G.J. Advances in the direct synthesis of hydrogen peroxide
from hydrogen and oxygen. Catal. Today 2015, 248, 3–9. [CrossRef]11. Li, J.; Staykov, A.; Ishihara, T.; Yoshizawa, K. Theoretical Study of the Decomposition and Hydrogenation of H2O2 on Pd and
Au@Pd Surfaces: Understanding toward High Selectivity of H2O2 Synthesis. J. Phys. Chem. C 2011, 115, 7392–7398. [CrossRef]12. Qiang, Z.; Chang, J.H.; Huang, C.P. Electrochemical generation of hydrogen peroxide from dissolved oxygen in acidic solutions.
Water Res. 2002, 36, 85–94. [CrossRef]13. Edwards, J.K.; Thomas, A.; Solsona, B.E.; Landon, P.; Carley, A.F.; Hutchings, G.J. Comparison of supports for the direct synthesis
of hydrogen peroxide from H2 and O2 using Au–Pd catalysts. Catal. Today 2007, 122, 397–402. [CrossRef]14. Horst, A.; Bormann, S.; Meyer, J.; Steinhagen, M.; Ludwig, R.; Drews, A.; Ansorge-Schumacher, M.; Holtmann, D. Electro-
enzymatic hydroxylation of ethylbenzene by the evolved unspecific peroxygenase of Agrocybe aegerita. J. Mol. Catal. B: Enzym.2016, 133, S137–S142. [CrossRef]
15. Getrey, L.; Krieg, T.; Hollmann, F.; Schrader, J.; Holtmann, D. Enzymatic halogenation of the phenolic monoterpenes thymol andcarvacrol with chloroperoxidase. Green Chem. 2014, 16, 1104–1108. [CrossRef]
16. Krieg, T.; Hüttmann, S.; Mangold, K.M.; Schrader, J.; Holtmann, D. Gas diffusion electrode as novel reaction system for anelectro-enzymatic process with chloroperoxidase. Green Chem. 2011, 13, 2686. [CrossRef]

Processes 2021, 9, 399 23 of 24
17. Yang, S.; Verdaguer-Casadevall, A.; Arnarson, L.; Silvioli, L.; Colic, V.; Frydendal, R.; Rossmeisl, J.; Chorkendorff, I.; Stephens,I.E.L. Toward the Decentralized Electrochemical Production of H2O2: A Focus on the Catalysis. ACS Catal. 2018, 8, 4064–4081.[CrossRef]
18. Sehrish, A.; Manzoor, R.; Dong, K.; Jiang, Y.; Lu, Y. Recent progress on electrochemical production of hydrogen peroxide. Chem.Rep. 2019, 1, 81–101. [CrossRef]
19. Li, Y.; Zhang, Y.; Xia, G.; Zhan, J.; Yu, G.; Wang, Y. Evaluation of the technoeconomic feasibility of electrochemical hydrogenperoxide production for decentralized water treatment. Front. Environ. Sci. Eng. 2020, 15, 2021. [CrossRef]
20. Schultz, T.; Sundmacher, K. Rigorous dynamic model of a direct methanol fuel cell based on Maxwell–Stefan mass transportequations and a Flory–Huggins activity model: Formulation and experimental validation. J. Power Sources 2005, 145, 435–462.[CrossRef]
21. Schultz, T.; Krewer, U.; Sundmacher, K. Impact of electrode kinetics on the dynamic response of a DMFC to change of methanolfeed concentration. J. Power Sources 2007, 165, 138–151. [CrossRef]
22. Krishna, R.; Wesselingh, J. The Maxwell-Stefan approach to mass transfer. Chem. Eng. Sci. 1997, 52, 861–911. [CrossRef]23. Weinzierl, C.; Krewer, U. Model-based analysis of water management in alkaline direct methanol fuel cells. J. Power Sources 2014,
268, 911–921. [CrossRef]24. Weinzierl, C.; Krewer, U. Model-based analysis of water management at anode of alkaline direct methanol fuel cells. Chem. Eng.
Sci. 2016, 143, 181–193. [CrossRef]25. Amano, R.S.; Abou-Ellail, M.M.; Elhaw, S.; Saeed Ibrahim, M. Numerical simulation of hydrogen–air reacting flows in rectangular
channels with catalytic surface reactions. Heat Mass Transf. 2013, 49, 1243–1260. [CrossRef]26. Pohjoranta, A.; Mendelson, A.; Tenno, R. A copper electrolysis cell model including effects of the ohmic potential loss in the cell.
Electrochim. Acta 2010, 55, 1001–1012. [CrossRef]27. Görgün, H. Dynamic modelling of a proton exchange membrane (PEM) electrolyzer. Int. J. Hydrog. Energy 2006, 31, 29–38.
[CrossRef]28. Argyropoulos, P.; Scott, K.; Shukla, A.K.; Jackson, C. A semi-empirical model of the direct methanol fuel cell performance, Part I.
Model development and verification. J. Power Sources 2003, 123, 190–199. [CrossRef]29. Guha, S. Simulation studies on a rotating ring disk electrode system: Role of supporting electrolyte in determination of relevance
of ionic migration. AIChE J. 2013, 59, 1390–1399. [CrossRef]30. Dong, Q.; Santhanagopalan, S.; White, R.E. Simulation of Polarization Curves for Oxygen Reduction Reaction in 0.5 M H2SO4 at
a Rotating Ring Disk Electrode. J. Electrochem. Soc. 2007, 154, A816–A825. [CrossRef]31. Staszak-Jirkovský, J.; Halasa, M.; Schiffrin, D.J. Kinetics of electrocatalytic reduction of oxygen and hydrogen peroxide on
dispersed gold nanoparticles. Phys. Chem. Chem. Phys. 2010, 12, 8042. [CrossRef]32. Perry, S.C.; Pangotra, D.; Vieira, L.; Csepei, L.I.; Sieber, V.; Wang, L.; Ponce de Léon, C.; Walsh, F.C. Electrochemical synthesis of
hydrogen peroxide from water and oxygen. Nat. Rev. Chem. 2019, 3, 442–458. [CrossRef]33. Shi, X.; Back, S.; Gill, T.M.; Siahrostami, S.; Zheng, X. Electrochemical Synthesis of H2O2 by Two-Electron Water Oxidation
Reaction. Chem 2020, 7, 38–63. [CrossRef]34. von Kurnatowski, M.; Bortz, M.; Klein, P.; Kintzel, B.; Cremers, C. Quantitative Kinetic Analysis of a PdAu3 Alloy Catalyst for
Oxygen Electro-Reduction. J. Electrochem. Soc. 2017, 164, H1072–H1080. [CrossRef]35. Redissi, Y.; Bouallou, C. Valorization of Carbon Dioxide by Co-Electrolysis of CO2/H2O at High Temperature for Syngas
Production. Energy Procedia 2013, 37, 6667–6678. [CrossRef]36. Bahmanyar, A.; Asghari, M.; Khoobi, N. Numerical simulation and theoretical study on simultaneously effects of operating
parameters in direct contact membrane distillation. Chem. Eng. Process. Process Intensif. 2012, 61, 42–50. [CrossRef]37. Chang, H.; Liau, J.S.; Ho, C.D.; Wang, W.H. Simulation of membrane distillation modules for desalination by developing user’s
model on Aspen Plus platform. Desalination 2009, 249, 380–387. [CrossRef]38. Zuo, G.; Wang, R.; Field, R.; Fane, A.G. Energy efficiency evaluation and economic analyses of direct contact membrane
distillation system using Aspen Plus. Desalination 2011, 283, 237–244. [CrossRef]39. Hitsov, I.; Maere, T.; De Sitter, K.; Dotremont, C.; Nopens, I. Modelling approaches in membrane distillation: A critical review.
Sep. Purif. Technol. 2015, 142, 48–64. [CrossRef]40. Karst, F.; Freund, H.; Maestri, M.; Sundmacher, K. Multiscale Chemical Process Design Exemplified for a PEM Fuel Cell Process.
Chem. Ing. Tech. 2014, 86, 2075–2088. [CrossRef]41. Sánchez, M.; Amores, E.; Abad, D.; Rodríguez, L.; Clemente-Jul, C. Aspen Plus model of an alkaline electrolysis system for
hydrogen production. Int. J. Hydrog. Energy 2020, 45, 3916–3929. [CrossRef]42. Von Kurnatowski, M.; Bortz, M.; Scherrer, A.; Hoffmann, A.; Lorenz, H.M.; Caraucan, M.; Grützner, T.; Künzle, N.; Küfer, K.H.
Multi-criteria Optimization of an Industrial World-Scale Process. Chem. Ing. Tech. 2017, 89, 1471–1478. [CrossRef]43. Bortz, M.; Burger, J.; Asprion, N.; Blagov, S.; Böttcher, R.; Nowak, U.; Scheithauer, A.; Welke, R.; Küfer, K.H.; Hasse, H. Multi-
criteria optimization in chemical process design and decision support by navigation on Pareto sets. Comput. Chem. Eng. 2014,60, 354–363. [CrossRef]
44. Sangal, V.K.; Kumar, V.; Mishra, I.M. Optimization of structural and operational variables for the energy efficiency of a dividedwall distillation column. Comput. Chem. Eng. 2012, 40, 33–40. [CrossRef]

Processes 2021, 9, 399 24 of 24
45. Vazquez-Castillo, J.A.; Venegas-Sánchez, J.A.; Segovia-Hernández, J.G.; Hernández-Escoto, H.; Hernández, S.; Gutiérrez-Antonio,C.; Briones-Ramírez, A. Design and optimization, using genetic algorithms, of intensified distillation systems for a class ofquaternary mixtures. Comput. Chem. Eng. 2009, 33, 1841–1850. [CrossRef]
46. Höller, J.; Bickert, P.; Schwartz, P.; von Kurnatowski, M.; Kerber, J.; Künzle, N.; Lorenz, H.M.; Asprion, N.; Blagov, S.; Bortz, M.Parameter Estimation Strategies in Thermodynamics. ChemEngineering 2019, 2019, 56. [CrossRef]
47. Geoffrion, A.M. Proper efficiency and the theory of vector maximization. J. Math. Anal. Appl. 1968, 22, 618–630. [CrossRef]48. Nouri-Khorasani, A.; Ojong, E.T.; Smolinka, T.; Wilkinson, D.P. Model of oxygen bubbles and performance impact in the porous
transport layer of PEM water electrolysis cells. Int. J. Hydrog. Energy 2017, 42, 28665–28680. [CrossRef]49. Bard, A.J.; Faulkner, L.R. Electrochemical Methods: Fundamentals and Applications, 2nd ed.; Wiley: New York, NY, USA, 2001.50. Song, C.; Zhang, J. Electrocatalytic Oxygen Reduction Reaction. In PEM Fuel Cell Electrocatalysts and Catalyst Layers, Fundamentals
and Applications, 2nd ed.; Zhang, J., Ed.; Springer: London, UK, 2008; Chapter 2, pp. 89–134.51. Khayet, M. Membranes and theoretical modeling of membrane distillation: A review. Adv. Colloid Interface Sci. 2011, 164, 56–88.
[CrossRef] [PubMed]52. Sander, R. Compilation of Henry’s law constants (version 4.0) for water as solvent. Atmos. Chem. Phys. 2015, 15, 4399–4981.
[CrossRef]53. Schittkowski, K. A robust implementation of a sequential quadratic programming algorithm with successive error restoration.
Optim. Lett. 2011, 5, 283–296. [CrossRef]54. Narasimhan, S.; Jordache, C. Data Reconciliation & Gross Error Detecion, an Intelligent Use of Process Data, 1st ed.; Gulf Publishing
Company: Houston, TX, USA, 2000.55. Parthasarathy, A.; Srinivasan, S.; Appleby, A.J.; Martin, C.R. Pressure Dependence of the Oxygen Reduction Reaction at the
Platinum Microelectrode/Nafion Interface: Electrode Kinetics and Mass Transport. J. Electrochem. Soc. 1992, 39, 2856–2862.[CrossRef]
Copyright © 2022 FDOKUMEN