Experimental Optimization of Process Parameters in ... - MDPI
19
micromachines Article Experimental Optimization of Process Parameters in CuNi18Zn20 Micromachining Andrea Abeni 1 , Alessandro Metelli 1 , Cristian Cappellini 2 and Aldo Attanasio 1, * Citation: Abeni, A.; Metelli, A.; Cappellini, C.; Attanasio, A. Experimental Optimization of Process Parameters in CuNi18Zn20 Micromachining. Micromachines 2021, 12, 1293. https://doi.org/10.3390/ mi12111293 Academic Editor: Mehmet Remzi Dokmeci Received: 1 October 2021 Accepted: 21 October 2021 Published: 21 October 2021 Publisher’s Note: MDPI stays neutral with regard to jurisdictional claims in published maps and institutional affil- iations. Copyright: © 2021 by the authors. Licensee MDPI, Basel, Switzerland. This article is an open access article distributed under the terms and conditions of the Creative Commons Attribution (CC BY) license (https:// creativecommons.org/licenses/by/ 4.0/). 1 Department of Mechanical and Industrial Engineering, University of Brescia, Via Branze 38, 25123 Brescia, Italy; [email protected] (A.A.); [email protected] (A.M.) 2 Faculty of Science and Technology, Free University of Bolzano, Piazza Università 1, 39100 Bolzano, Italy; [email protected] * Correspondence: [email protected]; Tel.: +39-331-613-3181 Abstract: Ultraprecision micromachining is a technology suitable to fabricate miniaturized and complicated 3-dimensional microstructures and micromechanisms. High geometrical precision and elevated surface finishing are both key requirements in several manufacturing sectors. Electronics, biomedicals, optics and watchmaking industries are some of the fields where micromachining finds applications. In the last years, the integration between product functions, the miniaturization of the features and the increasing of geometrical complexity are trends which are shared by all the cited industrial sectors. These tendencies implicate higher requirements and stricter geometrical and dimensional tolerances in machining. From this perspective, the optimization of the micromachining process parameters assumes a crucial role in order to increase the efficiency and effectiveness of the process. An interesting example is offered by the high-end horology field. The optimization of micro machining is indispensable to achieve excellent surface finishing combined with high precision. The cost-saving objective can be pursued by limiting manual post-finishing and by complying the very strict quality standards directly in micromachining. A micro-machining optimization technique is presented in this a paper. The procedure was applied to manufacturing of main-plates and bridges of a wristwatch movement. Cutting speed, feed rate and depth of cut were varied in an experimental factorial plan in order to investigate their correlation with some fundamental properties of the machined features. The dimensions, the geometry and the surface finishing of holes, pins and pockets were evaluated as results of the micromachining optimization. The identified correlations allow to manufacture a wristwatch movement in conformity with the required technical characteristics and by considering the cost and time constraints. Keywords: micromilling; process optimization; ANOVA; surface finishing 1. Introduction The horology industry represents one of the major manufacturing sectors for mi- cromachining. In particular, micromilling and microdrilling finds several applications in the manufacturing of the mechanical watches. Although quartz watches based dominate the watch market, the business turnover related to mechanical watches is meaningfully higher [1]. The standard size of a wristwatch movement is very limited, with a diameter ranging from 17 mm to 36 mm and a thickness lower than 4 mm. In the low volume of the caliber are assembled some hundreds of miniaturized components, such as wheels, shafts, levers, screws, springs and bushing. The components are mounted inside the case of the mechanical movement, which is composed by a main plate and the bridges. All the parts have pockets, micro-holes and micro-pins to mechanically constrain the miniaturized components. The micromachining of these features must comply with tight dimensional and geometrical tolerances. Furthermore, the surface finishing assumes a crucial role in order to reduce the frictional effects and to guarantee adequate visual appearance. Micromachines 2021, 12, 1293. https://doi.org/10.3390/mi12111293 https://www.mdpi.com/journal/micromachines
-
Upload
khangminh22 -
Category
Documents
-
view
3 -
download
0
Transcript of Experimental Optimization of Process Parameters in ... - MDPI
micromachines
Article
Experimental Optimization of Process Parameters inCuNi18Zn20 Micromachining
Andrea Abeni 1, Alessandro Metelli 1, Cristian Cappellini 2 and Aldo Attanasio 1,*
�����������������
Citation: Abeni, A.; Metelli, A.;
Cappellini, C.; Attanasio, A.
Experimental Optimization of Process
Parameters in CuNi18Zn20
Micromachining. Micromachines 2021,
12, 1293. https://doi.org/10.3390/
mi12111293
Academic Editor: Mehmet
Remzi Dokmeci
Received: 1 October 2021
Accepted: 21 October 2021
Published: 21 October 2021
Publisher’s Note: MDPI stays neutral
with regard to jurisdictional claims in
published maps and institutional affil-
iations.
Copyright: © 2021 by the authors.
Licensee MDPI, Basel, Switzerland.
This article is an open access article
distributed under the terms and
conditions of the Creative Commons
Attribution (CC BY) license (https://
creativecommons.org/licenses/by/
4.0/).
1 Department of Mechanical and Industrial Engineering, University of Brescia, Via Branze 38,25123 Brescia, Italy; [email protected] (A.A.); [email protected] (A.M.)
2 Faculty of Science and Technology, Free University of Bolzano, Piazza Università 1, 39100 Bolzano, Italy;[email protected]
* Correspondence: [email protected]; Tel.: +39-331-613-3181
Abstract: Ultraprecision micromachining is a technology suitable to fabricate miniaturized andcomplicated 3-dimensional microstructures and micromechanisms. High geometrical precision andelevated surface finishing are both key requirements in several manufacturing sectors. Electronics,biomedicals, optics and watchmaking industries are some of the fields where micromachining findsapplications. In the last years, the integration between product functions, the miniaturization ofthe features and the increasing of geometrical complexity are trends which are shared by all thecited industrial sectors. These tendencies implicate higher requirements and stricter geometrical anddimensional tolerances in machining. From this perspective, the optimization of the micromachiningprocess parameters assumes a crucial role in order to increase the efficiency and effectiveness of theprocess. An interesting example is offered by the high-end horology field. The optimization of micromachining is indispensable to achieve excellent surface finishing combined with high precision. Thecost-saving objective can be pursued by limiting manual post-finishing and by complying the verystrict quality standards directly in micromachining. A micro-machining optimization technique ispresented in this a paper. The procedure was applied to manufacturing of main-plates and bridges ofa wristwatch movement. Cutting speed, feed rate and depth of cut were varied in an experimentalfactorial plan in order to investigate their correlation with some fundamental properties of themachined features. The dimensions, the geometry and the surface finishing of holes, pins and pocketswere evaluated as results of the micromachining optimization. The identified correlations allow tomanufacture a wristwatch movement in conformity with the required technical characteristics andby considering the cost and time constraints.
Keywords: micromilling; process optimization; ANOVA; surface finishing
1. Introduction
The horology industry represents one of the major manufacturing sectors for mi-cromachining. In particular, micromilling and microdrilling finds several applications inthe manufacturing of the mechanical watches. Although quartz watches based dominatethe watch market, the business turnover related to mechanical watches is meaningfullyhigher [1]. The standard size of a wristwatch movement is very limited, with a diameterranging from 17 mm to 36 mm and a thickness lower than 4 mm. In the low volume ofthe caliber are assembled some hundreds of miniaturized components, such as wheels,shafts, levers, screws, springs and bushing. The components are mounted inside the caseof the mechanical movement, which is composed by a main plate and the bridges. All theparts have pockets, micro-holes and micro-pins to mechanically constrain the miniaturizedcomponents. The micromachining of these features must comply with tight dimensionaland geometrical tolerances. Furthermore, the surface finishing assumes a crucial role inorder to reduce the frictional effects and to guarantee adequate visual appearance.
Micromachines 2021, 12, 1293. https://doi.org/10.3390/mi12111293 https://www.mdpi.com/journal/micromachines
Micromachines 2021, 12, 1293 2 of 19
Among the manufacturing processes, micromilling is one of the most flexible andfastest way to produce complex tridimensional microfeatures with high dimensional accu-racy [2]. It can be successfully applied to a wide variety of materials by using micro-scaledmill with diameters in a sub-millimeter range with different coatings [3]. Micromillingis a subtractive process characterized by a contact between the tool cutting edge and theworkpiece along a defined path. As in conventional-size milling, the cutting speed, thefeed rate, and the depth of cut are the most meaningful process parameters. The research ofthe best combinations of these parameters is crucial to guarantee high precision, flexibility,excellent surface finishing, tight geometrical and dimensional tolerances with a low mate-rial scrap in the micrometric magnitude scale [4,5]. The selection of the process parametersmust also consider the tool deflection effect, defined also as tool run-out effect [6]. Thehigh ratio between the tool length and its diameter results in a drastic reduction of the toolshank section modulus. Form and feature geometric errors on the machined componentand distortion of cutting forces are the most undesired effects of tool deflection [7,8]. Thecomponent assembly and the product functioning are strongly correlated to the machiningoptimization. Surface roughness, holes and pins geometrical accuracy (dimension andcircularity), burrs extension and their distribution must be controlled by optimizing theprocess parameters [9].
In contrast with conventional scale milling, when performing a micromilling operation,particular attention must be paid to size and surface effects, since they strongly affect thechip formation and the related surface quality. In micromilling, in fact, the dimensionsof uncut chip thickness and work material grain size are comparable. Grain-size effectsinfluence the chip typology, leading to a quasi-shear extrusion chip and cutting forceincrease, when the grain size decreases [10,11]. Moreover, this process is characterized by arelatively small ratio between the depth of cut (DOC) and the cutting-edge radius (r0) [12].It results in negative rake angles, increasing the compressive stresses on the work materialthat reduces the chip brittle fracture, by enhancing the material plasticity. An incrementof the negative rake angle favorites the contact between the back cutting surface and thework-piece surface, altering the shearing cutting mode into extrusion cutting, ploughing, orroughing in which the workpiece material undergoes to scraping, squeezing, and groovinginstead of been correctly cut [13–15]. Additionally, indentation effects can take place,consistently rising the surface hardness and cracks propagation [16,17]. The amount ofresidual chips at the bottom and side of the micro-slot may affect the surface quality. Theseeffects may result in higher size and number of burrs and rapid wear of the micro-millingtool [18]. The burrs can be defined as the residual material that overhangs outside theworkpiece edge after machining. Several deburring processes are currently employed inthe industrial processes, but the removal may require several minutes and damage themachined features. Therefore, the burr minimization on microparts during micromilling ismore desirable and advisable compared with the deburring [19]. Several investigationswere published about the thematic of the burr reduction [20–22]. The effect of the processparameters was quantitively or qualitatively computed by considering different work-piecematerials, such as Inconel 718 [23], stainless steel AISI 316L [24] and Ti-6Al-4V [25]. Theexperimental researches revealed different behaviors for different materials.
On the other hand, there is a lack of information on machinability at microscale of thematerials commonly employed in watch movements. Nickel silver, brass and gold are someof the materials used to produce main plate and bridges, but the CuNi18Zn20 is probablythe most common alloy in the horology field due to its grey appearance, higher mechanicalproperties, and better corrosion resistance than other brass alloys [26]. CuNi18Zn20 isa free lead brass alloy characterized by a single α-phase microstructure. Several studieswere performed on the machinability of lead free brasses, revealing their difficult to bemachined due to the high ductility of α-phase, leading to extended burrs formation andlow surface quality, when conventional cutting processes are performed [27,28]. Amongstthese, the results related to the analysis of CuZn38As brass alloy are of great interest, sinceit is mainly composed by an α-phase microstructure (98%) and shows a machinability
Micromachines 2021, 12, 1293 3 of 19
comparable with CuNi18Zn20 [29]. This study underlined that to reduce the machinedsurface roughness and to achieve better dimensional tolerances, low feed rate must beemployed. However, although a wide documentation can be found on their machinability,in literature there are not papers which deals with the issues which afflicts the watchmaking industry, where micromachining conditions are employed. In this case, low feedrate and depth of cut, combined with high cutting speed are suggested [30–32], but nobibliographic references concerning the processing of CuNi18Zn20 can be found. This paperdeals with the optimization of finishing operations in micromachining of microfeatureson CuNi18Zn20 samples. The optimization process was performed using a microtoolwith a standard geometry, therefore the obtained results can aid the manufacturers in thechoice of the process parameters; An experimental approach was adopted by designing aprototype which included some ad hoc features in a limited volume. The selected featuresconsist in microholes, micropins and pockets. In watchmaking industry, microholes arenecessary to couple the bridges and the main plate with the jewels that binds the shaftsof the wheels. The diameters usually are equal to few hundreds of micrometers whilethe required tolerances are reduced to few tens of micrometers to ensure the correctmechanical coupling. Pins ensure the fixing between the main plate and the bridges, andtheir dimension is comparable with the diameter of the holes. The cylindricity of pins isan imperative requirement to avoid an uncorrected interference with the holes into thebridges. Finally, pockets are fabricated to house the wheels in the caliber structure andtheir depth is crucial for a corrected wheels positioning.
The micromachining of the listed features was repeated several times by varyingthe process parameters on three levels and testing all the possible combinations. Theoutputs were evaluated in terms of diameter, circularity and cylindricity of pins and holes.Moreover, Sa, Ssk, and Sku roughness parameters of the pocket surfaces were measuredin order to examine the surface quality [33]. The correlation between process parametersand outputs was analyzed by means of Analysis of Variance (ANOVA) technique. Theburrs extension was checked by using a multifocal 3D microscope. Finally, an optimalparameters set was selected by considering also the time production necessary to fabricateeach prototype.
2. Materials and Methods
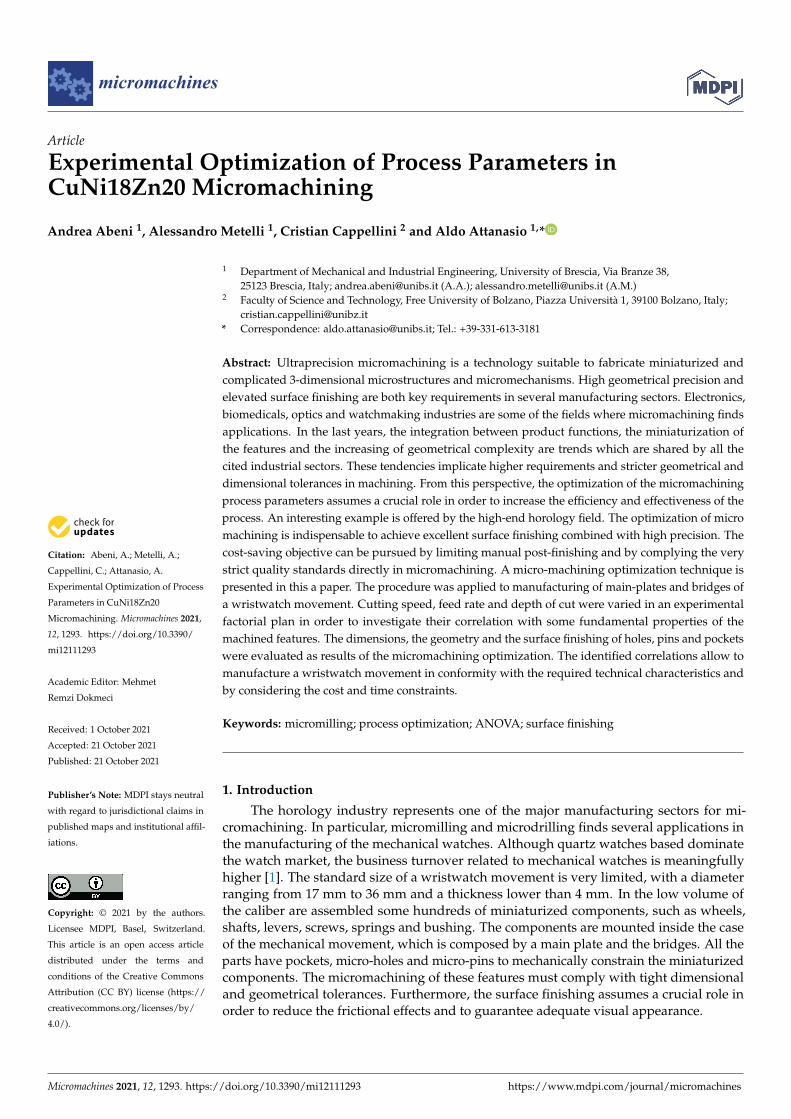
Micromachining tests were executed by using a five axis Nano Precision MachiningCentre KERN Pyramid Nano equipped with a Heidenhain iTCN 530 numeric control. It isvisible in Figure 1a. The spindle reaches a maximum rotational speed of 50 krpm with amaximum torque of 1.5 Nm. The machining center operates in a controlled environmentwith a temperature of 20± 0.5 ◦C and humidity of 35% to guarantee the maximum accuracyand precision [34]. The micromill features are summarized in Table 1.
Micromachines 2021, 12, x FOR PEER REVIEW 3 of 18
great interest, since it is mainly composed by an α-phase microstructure (98%) and shows a machinability comparable with CuNi18Zn20 [29]. This study underlined that to reduce the machined surface roughness and to achieve better dimensional tolerances, low feed rate must be employed. However, although a wide documentation can be found on their machinability, in literature there are not papers which deals with the issues which afflicts the watch making industry, where micromachining conditions are employed. In this case, low feed rate and depth of cut, combined with high cutting speed are suggested [30–32], but no bibliographic references concerning the processing of CuNi18Zn20 can be found. This paper deals with the optimization of finishing operations in micromachining of microfeatures on CuNi18Zn20 samples. The optimization process was performed using a microtool with a standard geometry, therefore the obtained results can aid the manufacturers in the choice of the process parameters; An experimental approach was adopted by designing a prototype which included some ad hoc features in a limited volume. The selected features consist in microholes, micropins and pockets. In watchmaking industry, microholes are necessary to couple the bridges and the main plate with the jewels that binds the shafts of the wheels. The diameters usually are equal to few hundreds of micrometers while the required tolerances are reduced to few tens of micrometers to ensure the correct mechanical coupling. Pins ensure the fixing between the main plate and the bridges, and their dimension is comparable with the diameter of the holes. The cylindricity of pins is an imperative requirement to avoid an uncorrected interference with the holes into the bridges. Finally, pockets are fabricated to house the wheels in the caliber structure and their depth is crucial for a corrected wheels positioning.
The micromachining of the listed features was repeated several times by varying the process parameters on three levels and testing all the possible combinations. The outputs were evaluated in terms of diameter, circularity and cylindricity of pins and holes. Moreover, Sa, Ssk, and Sku roughness parameters of the pocket surfaces were measured in order to examine the surface quality [33]. The correlation between process parameters and outputs was analyzed by means of Analysis of Variance (ANOVA) technique. The burrs extension was checked by using a multifocal 3D microscope. Finally, an optimal parameters set was selected by considering also the time production necessary to fabricate each prototype.
2. Materials and Methods Micromachining tests were executed by using a five axis Nano Precision Machining
Centre KERN Pyramid Nano equipped with a Heidenhain iTCN 530 numeric control. It is visible in Figure 1a. The spindle reaches a maximum rotational speed of 50 krpm with a maximum torque of 1.5 Nm. The machining center operates in a controlled environment with a temperature of 20 ± 0.5 °C and humidity of 35% to guarantee the maximum accuracy and precision [34]. The micromill features are summarized in Table 1.
(a) (b)
Figure 1. The KERN Pyramid Nano Ultraprecision machining center (a); the SECO 905L008-MEGA-Tmicromill (b).
Micromachines 2021, 12, 1293 4 of 19
Table 1. Features of micromill SECO 905L008-MEGA-T.
Propriety Value
Manufacturer SECOCode 905L008-MEGA-TNominal diameter [µm] 800Number of flutes 2Measured diameter [µm] 795 ± 1Measured cutting-edge radius [µm] 6 ± 0.8Helix angle [◦] 20Rake angle [◦] 4Material Tungsten CarbideMaterial coating Titanium Nitride
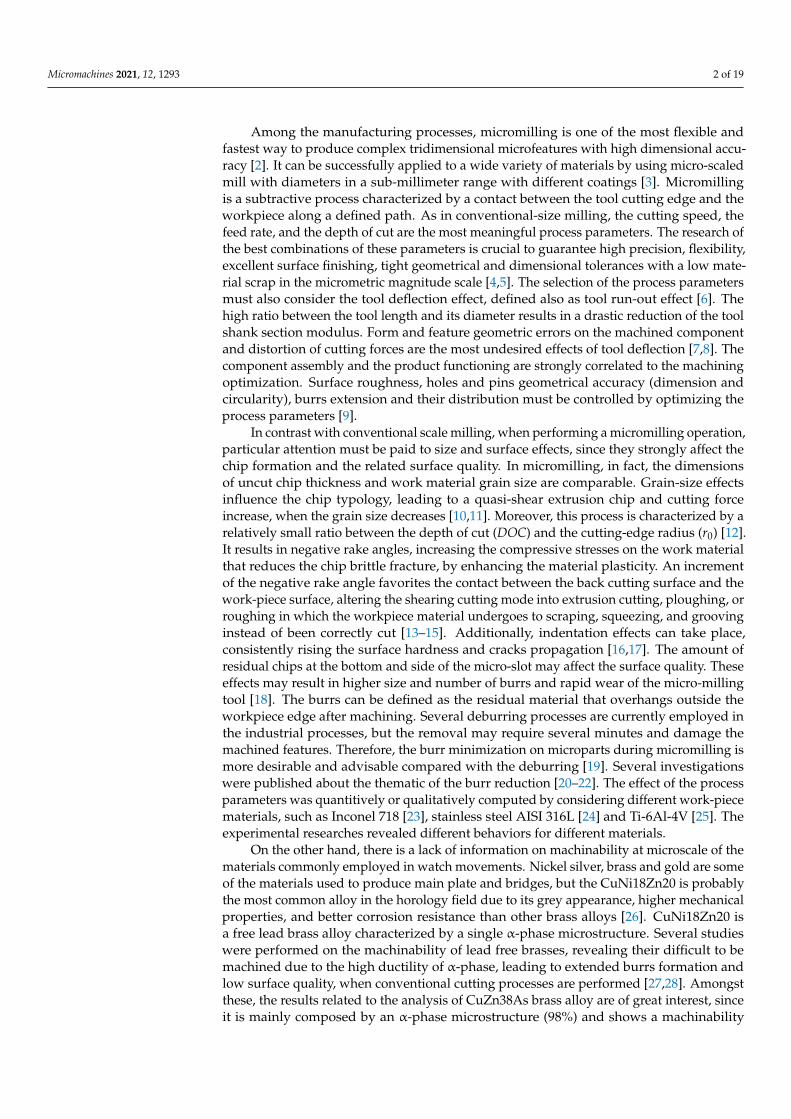
A SECO 905L008-MEGA-T sample is visible in Figure 1b. The actual diameters andthe actual cutting-edge radius were measured by using a 3D multifocal microscope HiroxRH-2000 which guarantees an accuracy of 0.8 µm. The micromachining was performedon CuNi18Zn20 samples. The alloy is characterized by brightness (i.e., the intensity oflight emanating from the machined surface which depends on the final roughness), goodelasticity, excellent mechanical resistance and good machinability and it finds wide applica-tions in watchmaking industry. The experimental tests consist in the micromachining of aself-designed prototypal geometry. It is shown in Figure 2. The prototype dimension is9 mm × 6 mm × 0.9 mm and it was manufactured in two steps:
• A rough machining to cut a block from a sheet with a thickness of 1.2 mm. A 3 mmdiameter end-mill was utilized to machine the blank.
• The two-flutes 0.8 mm diameter micromill was employed to machine a 0.5 mm thick-ness pocket by leaving three pins. The diameters of the pins are Φ 0.6 mm, Φ 1 mmand Φ 2 mm. The same micromill was employed to machine a through-hole with adiameter equal to Φ 1 mm on the Φ 2 mm pin. The CAM set allowed to perform anormal attack to the surface of the workpiece.
Micromachines 2021, 12, x FOR PEER REVIEW 4 of 18
Figure 1. The KERN Pyramid Nano Ultraprecision machining center (a); the SECO 905L008-MEGA-T micromill (b).
Table 1. Features of micromill SECO 905L008-MEGA-T
Propriety Value Manufacturer SECO Code 905L008-MEGA-T Nominal diameter [μm] 800 Number of flutes 2 Measured diameter [μm] 795 ± 1 Measured cutting-edge radius [μm] 6 ± 0.8 Helix angle [°] 20 Rake angle [°] 4 Material Tungsten Carbide Material coating Titanium Nitride
A SECO 905L008-MEGA-T sample is visible in Figure 1b. The actual diameters and the actual cutting-edge radius were measured by using a 3D multifocal microscope Hirox RH-2000 which guarantees an accuracy of 0.8 μm. The micromachining was performed on CuNi18Zn20 samples. The alloy is characterized by brightness (i.e., the intensity of light emanating from the machined surface which depends on the final roughness), good elasticity, excellent mechanical resistance and good machinability and it finds wide appli-cations in watchmaking industry. The experimental tests consist in the micromachining of a self-designed prototypal geometry. It is shown in Figure 2. The prototype dimension is 9 mm × 6 mm × 0.9 mm and it was manufactured in two steps: • A rough machining to cut a block from a sheet with a thickness of 1.2 mm. A 3 mm
diameter end-mill was utilized to machine the blank. • The two-flutes 0.8 mm diameter micromill was employed to machine a 0.5 mm thick-
ness pocket by leaving three pins. The diameters of the pins are Φ 0.6 mm, Φ 1 mm and Φ 2 mm. The same micromill was employed to machine a through-hole with a diameter equal to Φ 1 mm on the Φ 2 mm pin. The CAM set allowed to perform a normal attack to the surface of the workpiece. The listed features were identified as critical parts commonly micromachined on a
wristwatch caliber. The prototypes were machined 27 times by changing the depth of cut (DOC), the feed per tooth (fZ) and the cutting speed (VC) on three levels (Table 2) in a 33 complete factorial plan. Table 3 summarizes the values of the process parameters. Ma-chining was performed in lubricated condition by using emulsified oil and monitoring the tool wear to ensure that is neglectable.
(a) (b)
Figure 2. The micromachined prototype: (a) a 3D render; (b) the 2D dimensioned drawing.
The listed features were identified as critical parts commonly micromachined on awristwatch caliber. The prototypes were machined 27 times by changing the depth ofcut (DOC), the feed per tooth (fZ) and the cutting speed (VC) on three levels (Table 2) ina 33 complete factorial plan. Table 3 summarizes the values of the process parameters.Machining was performed in lubricated condition by using emulsified oil and monitoringthe tool wear to ensure that is neglectable.
Micromachines 2021, 12, 1293 5 of 19
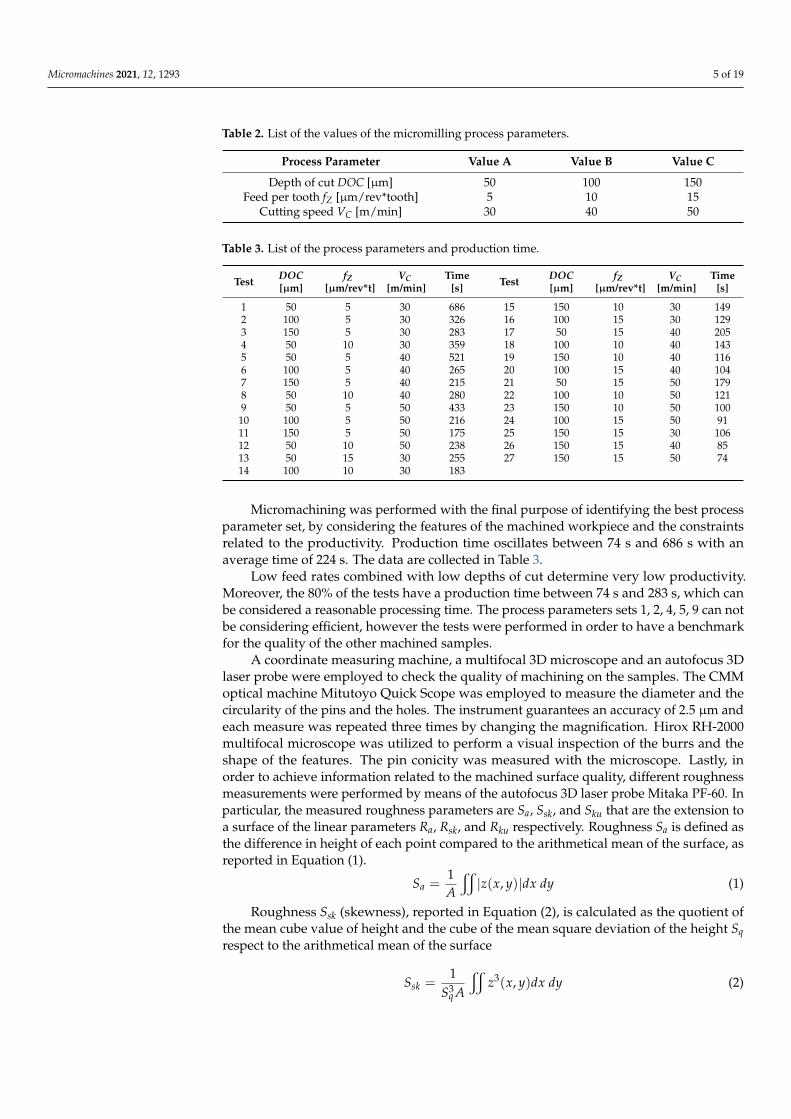
Table 2. List of the values of the micromilling process parameters.
Process Parameter Value A Value B Value C
Depth of cut DOC [µm] 50 100 150Feed per tooth fZ [µm/rev*tooth] 5 10 15
Cutting speed VC [m/min] 30 40 50
Table 3. List of the process parameters and production time.
Test DOC[µm]
fZ[µm/rev*t]
VC[m/min]
Time[s] Test DOC
[µm]fZ
[µm/rev*t]VC
[m/min]Time
[s]
1 50 5 30 686 15 150 10 30 1492 100 5 30 326 16 100 15 30 1293 150 5 30 283 17 50 15 40 2054 50 10 30 359 18 100 10 40 1435 50 5 40 521 19 150 10 40 1166 100 5 40 265 20 100 15 40 1047 150 5 40 215 21 50 15 50 1798 50 10 40 280 22 100 10 50 1219 50 5 50 433 23 150 10 50 10010 100 5 50 216 24 100 15 50 9111 150 5 50 175 25 150 15 30 10612 50 10 50 238 26 150 15 40 8513 50 15 30 255 27 150 15 50 7414 100 10 30 183
Micromachining was performed with the final purpose of identifying the best processparameter set, by considering the features of the machined workpiece and the constraintsrelated to the productivity. Production time oscillates between 74 s and 686 s with anaverage time of 224 s. The data are collected in Table 3.
Low feed rates combined with low depths of cut determine very low productivity.Moreover, the 80% of the tests have a production time between 74 s and 283 s, which canbe considered a reasonable processing time. The process parameters sets 1, 2, 4, 5, 9 can notbe considering efficient, however the tests were performed in order to have a benchmarkfor the quality of the other machined samples.
A coordinate measuring machine, a multifocal 3D microscope and an autofocus 3Dlaser probe were employed to check the quality of machining on the samples. The CMMoptical machine Mitutoyo Quick Scope was employed to measure the diameter and thecircularity of the pins and the holes. The instrument guarantees an accuracy of 2.5 µm andeach measure was repeated three times by changing the magnification. Hirox RH-2000multifocal microscope was utilized to perform a visual inspection of the burrs and theshape of the features. The pin conicity was measured with the microscope. Lastly, inorder to achieve information related to the machined surface quality, different roughnessmeasurements were performed by means of the autofocus 3D laser probe Mitaka PF-60. Inparticular, the measured roughness parameters are Sa, Ssk, and Sku that are the extension toa surface of the linear parameters Ra, Rsk, and Rku respectively. Roughness Sa is defined asthe difference in height of each point compared to the arithmetical mean of the surface, asreported in Equation (1).
Sa =1A
x|z(x, y)|dx dy (1)
Roughness Ssk (skewness), reported in Equation (2), is calculated as the quotient ofthe mean cube value of height and the cube of the mean square deviation of the height Sqrespect to the arithmetical mean of the surface
Ssk =1
S3q A
xz3(x, y)dx dy (2)
Micromachines 2021, 12, 1293 6 of 19
where Sq is (Equation (3))
Sq =
√1A
x|z2(x, y)|dx dy (3)
Roughness Sku (kurtosis), reported in Equation (4), is defined as the ratio between themean fourth power of height and the fourth power of Sq within the sampling area.
Sku =1
S4q A
xz4(x, y)dx dy (4)
Even if the measurements of these roughness parameters are time consuming, theyrepresent more detailed data about the whole surface finishing. Sa furnish a global overviewof the surface quality since, considering its definition, it is not significantly affected byscratches, contamination, and measurement noise. On the other hand, Ssk and Sku valuespermit the assessment of the shape of valleys and peaks on the surface. In particular,Ssk leads to the estimation of the asymmetry of height discrepancies respect to the meanplane, being it suitable for abrasion evaluation in case of sliding surfaces. Negative valuesof Ssk suggest the surface is mainly constitute of valleys, that are useful for lubricationpurposes, while positive Ssk values indicate that primarily peaks and asperities characterizethe surface. A more detailed measure of peaks and valleys sharpness is provided by Skuwhere, a smooth surface is individuated by a value lower than 3, while above this valuethe surface shows sharp asperities. The high precision along the surfaces requested toguarantee accurate contact between the component faces in horology, makes the evaluationof roughness parameters an attractive technique for quality assessment in watchmakingindustry [35]. The sampling area A employed in these measurements was selected on thebase of the pocket and it was equal to 1 mm × 1 mm.
3. Results3.1. Qualitative Analysis
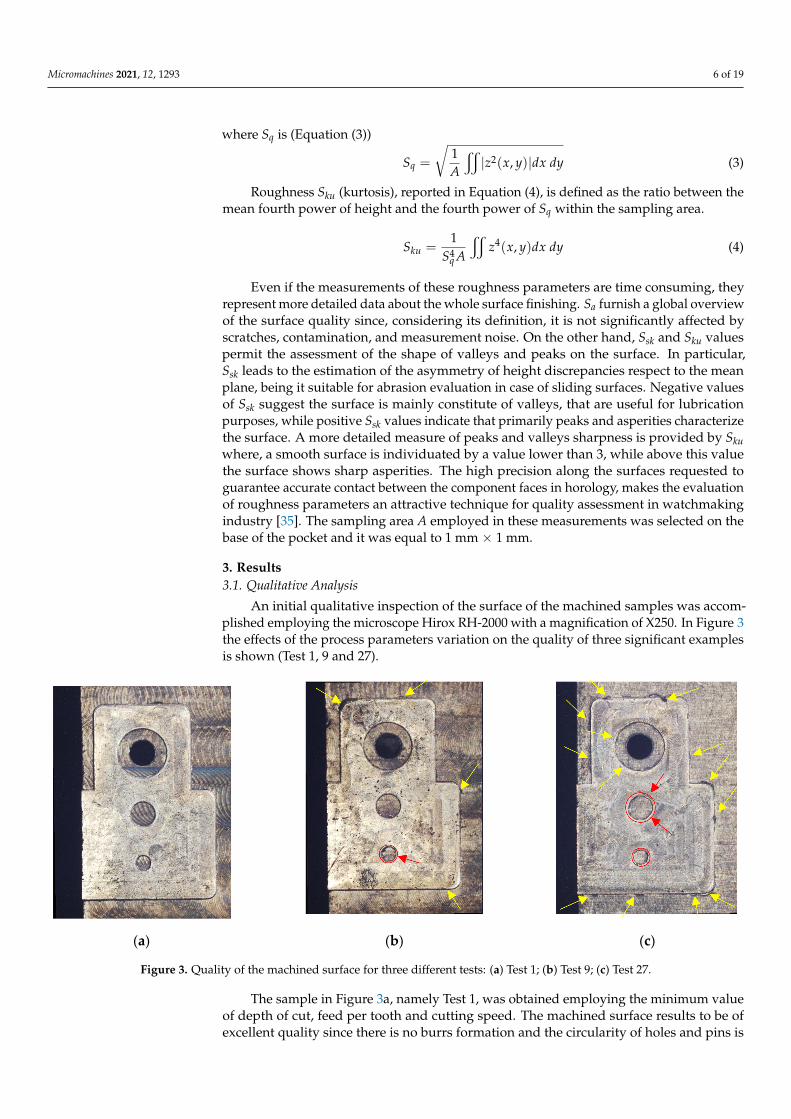
An initial qualitative inspection of the surface of the machined samples was accom-plished employing the microscope Hirox RH-2000 with a magnification of X250. In Figure 3the effects of the process parameters variation on the quality of three significant examplesis shown (Test 1, 9 and 27).
Micromachines 2021, 12, x FOR PEER REVIEW 7 of 18
(a) (b) (c)
Figure 3. Quality of the machined surface for three different tests: (a) Test 1; (b) Test 9; (c) Test 27.
The last sample in Figure 3c is related to Test 27 in which the maximum values of depth of cut, feed per tooth and cutting speed were applied. In this case, a wide diffusion of burrs with dimensions that are not negligible is present. Similar distributions of the burrs were detected in the samples of Test 25, and Test 26. The totality of these three tests were performed by employing a value of the depth of cut of 150 μm and a value of the feed per tooth of 15 μm, hence the application of the maximum value of depth of cut in conjunction with the maximum value of the feed per tooth is not suitable to answer to surface quality requirements. Moreover, the dimensions and the shape of pins and holes for Test 27 are not acceptable. In particular, the shape of the machined pin with a diameter of 0.6 mm is irregular, as marked by the red colored circles and arrows. Analogous defects were observed in the samples processed with a feed per tooth of 10 μm in conjunction with a cutting speed of 40 m/min and 50 m/min, and in the samples machined with a feed per tooth of 15 μm irrespective to the cutting speed.
Following this preliminary qualitative examination, a quantitative evaluation of the quality of the machined feature results was conducted. In order to correlate the machining parameters with the experimental measurements, analyses of variance of these latter were performed as well.
3.2. Quantitative Analysis, ANOVA and Optimization Quantitative measurements of diameters of the three pins and of the hole, and their
circularities were achieved by means of the CMM machine Mitutoyo Quick Scope, while Hirox RH-2000 microscope was employed for estimating the conicity of the pins. Amongst the realized features, the pins with a nominal diameter of 1 mm and 2 mm presented low variability and high precision, whereas the manufacture of the hole and of the smaller pin exhibited the most important criticalities.
With the aim of evaluating how the employed process parameters affect the speci-men quality, an analysis of variance (ANOVA), for each measured machined feature, namely hole diameter, the smaller pin diameter, circularity, and conicity, and roughness parameters, was performed. This technique allows to understand the influence of the var-iation of the process parameters on material machinability as well, and it is mandatory to optimize the micromilling operation.
The hole diameter values for each test are visible in Figure 4. In this graph, the nom-inal and the average values of the diameter are also plotted. The average diameter is equal to 1.014 mm and, around it, considering the accuracy of ±2.5 μm of the CMM machine, upper and lower bounds were constructed. For this reason, the points that are contained in the band can be approximated with the mean value. The offset between nominal and
Figure 3. Quality of the machined surface for three different tests: (a) Test 1; (b) Test 9; (c) Test 27.
The sample in Figure 3a, namely Test 1, was obtained employing the minimum valueof depth of cut, feed per tooth and cutting speed. The machined surface results to be ofexcellent quality since there is no burrs formation and the circularity of holes and pins is
Micromachines 2021, 12, 1293 7 of 19
optimal. The values of these latter, in fact, have a deviation from the nominal value that islower than 2 µm.
In Figure 3b, the surface aspect of Test 9 is observable. This sample was milled utilizingthe same depth of cut and feed per tooth, but the cutting speed was raised from 30 m/minto 50 m/min. As a consequence, more burrs are present respect to Test 1 (marked by theyellow colored arrows), but in any case, their reduced dimensions do not prejudice themechanical coupling between parts.
The last sample in Figure 3c is related to Test 27 in which the maximum values ofdepth of cut, feed per tooth and cutting speed were applied. In this case, a wide diffusionof burrs with dimensions that are not negligible is present. Similar distributions of theburrs were detected in the samples of Test 25, and Test 26. The totality of these three testswere performed by employing a value of the depth of cut of 150 µm and a value of thefeed per tooth of 15 µm, hence the application of the maximum value of depth of cut inconjunction with the maximum value of the feed per tooth is not suitable to answer tosurface quality requirements. Moreover, the dimensions and the shape of pins and holesfor Test 27 are not acceptable. In particular, the shape of the machined pin with a diameterof 0.6 mm is irregular, as marked by the red colored circles and arrows. Analogous defectswere observed in the samples processed with a feed per tooth of 10 µm in conjunction witha cutting speed of 40 m/min and 50 m/min, and in the samples machined with a feed pertooth of 15 µm irrespective to the cutting speed.
Following this preliminary qualitative examination, a quantitative evaluation of thequality of the machined feature results was conducted. In order to correlate the machiningparameters with the experimental measurements, analyses of variance of these latter wereperformed as well.
3.2. Quantitative Analysis, ANOVA and Optimization
Quantitative measurements of diameters of the three pins and of the hole, and theircircularities were achieved by means of the CMM machine Mitutoyo Quick Scope, whileHirox RH-2000 microscope was employed for estimating the conicity of the pins. Amongstthe realized features, the pins with a nominal diameter of 1 mm and 2 mm presented lowvariability and high precision, whereas the manufacture of the hole and of the smaller pinexhibited the most important criticalities.
With the aim of evaluating how the employed process parameters affect the specimenquality, an analysis of variance (ANOVA), for each measured machined feature, namelyhole diameter, the smaller pin diameter, circularity, and conicity, and roughness parameters,was performed. This technique allows to understand the influence of the variation of theprocess parameters on material machinability as well, and it is mandatory to optimize themicromilling operation.
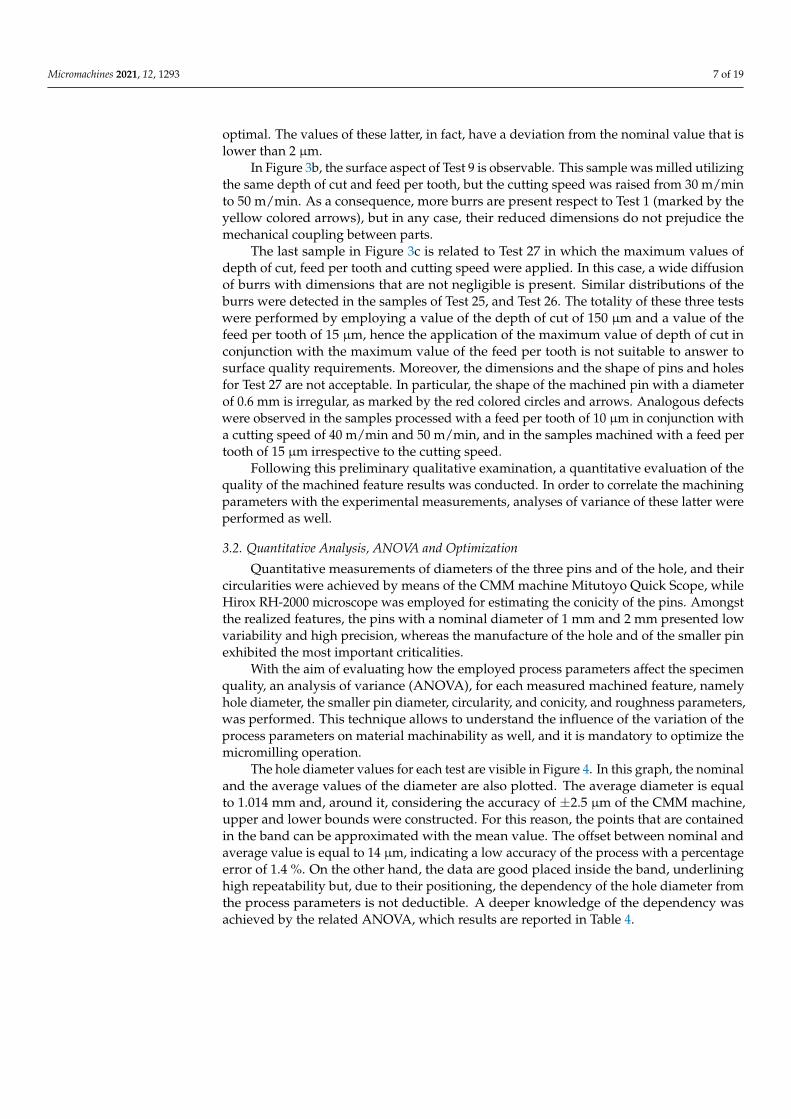
The hole diameter values for each test are visible in Figure 4. In this graph, the nominaland the average values of the diameter are also plotted. The average diameter is equalto 1.014 mm and, around it, considering the accuracy of ±2.5 µm of the CMM machine,upper and lower bounds were constructed. For this reason, the points that are containedin the band can be approximated with the mean value. The offset between nominal andaverage value is equal to 14 µm, indicating a low accuracy of the process with a percentageerror of 1.4 %. On the other hand, the data are good placed inside the band, underlininghigh repeatability but, due to their positioning, the dependency of the hole diameter fromthe process parameters is not deductible. A deeper knowledge of the dependency wasachieved by the related ANOVA, which results are reported in Table 4.
Micromachines 2021, 12, 1293 8 of 19
Micromachines 2021, 12, x FOR PEER REVIEW 8 of 18
average value is equal to 14 μm, indicating a low accuracy of the process with a percentage error of 1.4 %. On the other hand, the data are good placed inside the band, underlining high repeatability but, due to their positioning, the dependency of the hole diameter from the process parameters is not deductible. A deeper knowledge of the dependency was achieved by the related ANOVA, which results are reported in Table 4.
Figure 4. Hole diameters as a function of the performed tests.
Table 4. Analysis of variance of hole diameter φH = 1.000 mm.
Source DoF Seq SS Adj SS Adj MS F P DOC 2 0.0002108 0.0002108 0.0001054 5.20 0.036
fz 2 0.0001415 0.0001415 0.0000707 3.49 0.081 VC 2 0.0000077 0.0000077 0.0000039 0.19 0.830
DOC*fz 4 0.0003732 0.0003732 0.0000933 4.60 0.032 DOC*VC 4 0.0001228 0.0001228 0.0000307 1.51 0.286
fz*VC 4 0.0000782 0.0000782 0.0000196 0.96 0.477 Error 8 0.0001622 0.0001622 0.0000203 Total 26 0.0010965
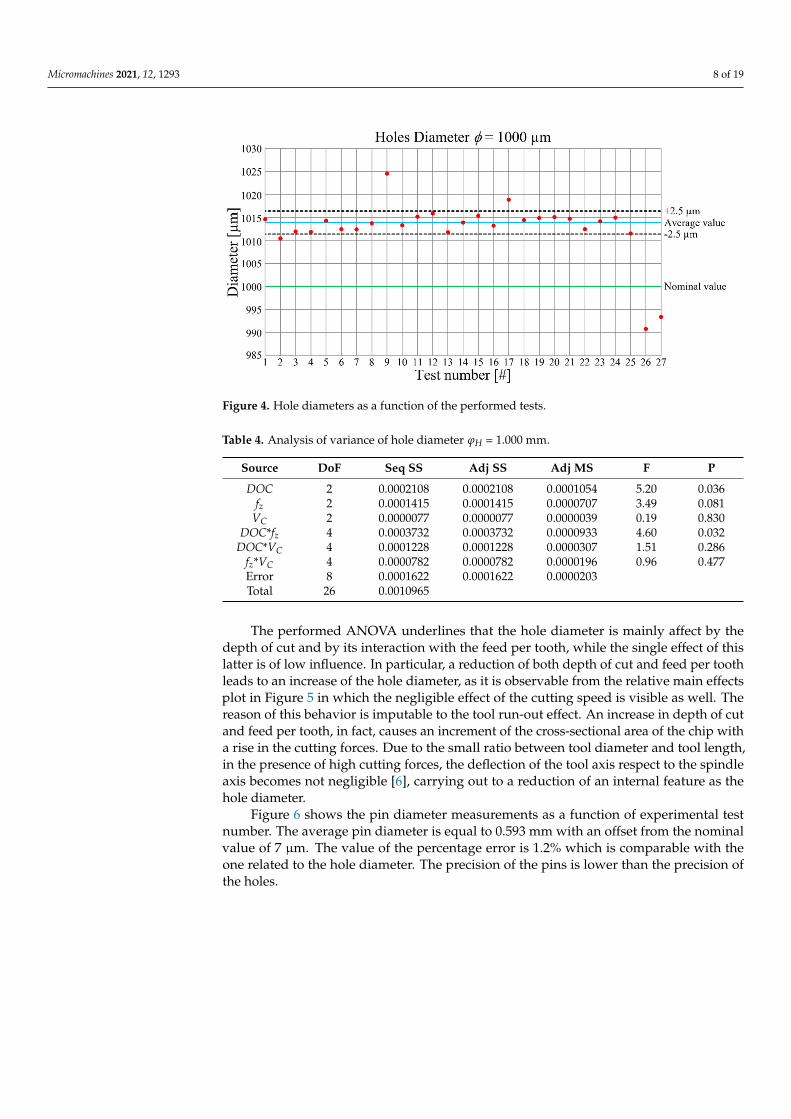
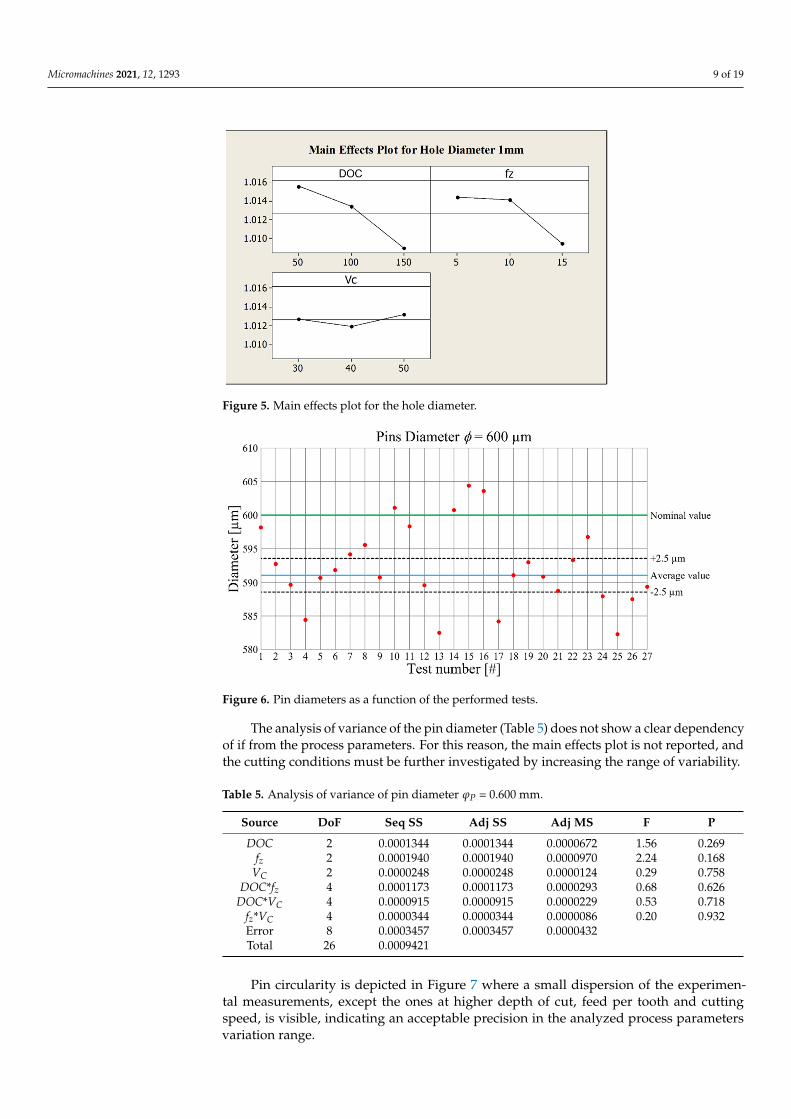
The performed ANOVA underlines that the hole diameter is mainly affect by the depth of cut and by its interaction with the feed per tooth, while the single effect of this latter is of low influence. In particular, a reduction of both depth of cut and feed per tooth leads to an increase of the hole diameter, as it is observable from the relative main effects plot in Figure 5 in which the negligible effect of the cutting speed is visible as well. The reason of this behavior is imputable to the tool run-out effect. An increase in depth of cut and feed per tooth, in fact, causes an increment of the cross-sectional area of the chip with a rise in the cutting forces. Due to the small ratio between tool diameter and tool length, in the presence of high cutting forces, the deflection of the tool axis respect to the spindle axis becomes not negligible [6], carrying out to a reduction of an internal feature as the hole diameter.
Figure 4. Hole diameters as a function of the performed tests.
Table 4. Analysis of variance of hole diameter ϕH = 1.000 mm.
Source DoF Seq SS Adj SS Adj MS F P
DOC 2 0.0002108 0.0002108 0.0001054 5.20 0.036fz 2 0.0001415 0.0001415 0.0000707 3.49 0.081
VC 2 0.0000077 0.0000077 0.0000039 0.19 0.830DOC*fz 4 0.0003732 0.0003732 0.0000933 4.60 0.032
DOC*VC 4 0.0001228 0.0001228 0.0000307 1.51 0.286fz*VC 4 0.0000782 0.0000782 0.0000196 0.96 0.477Error 8 0.0001622 0.0001622 0.0000203Total 26 0.0010965
The performed ANOVA underlines that the hole diameter is mainly affect by thedepth of cut and by its interaction with the feed per tooth, while the single effect of thislatter is of low influence. In particular, a reduction of both depth of cut and feed per toothleads to an increase of the hole diameter, as it is observable from the relative main effectsplot in Figure 5 in which the negligible effect of the cutting speed is visible as well. Thereason of this behavior is imputable to the tool run-out effect. An increase in depth of cutand feed per tooth, in fact, causes an increment of the cross-sectional area of the chip witha rise in the cutting forces. Due to the small ratio between tool diameter and tool length,in the presence of high cutting forces, the deflection of the tool axis respect to the spindleaxis becomes not negligible [6], carrying out to a reduction of an internal feature as thehole diameter.
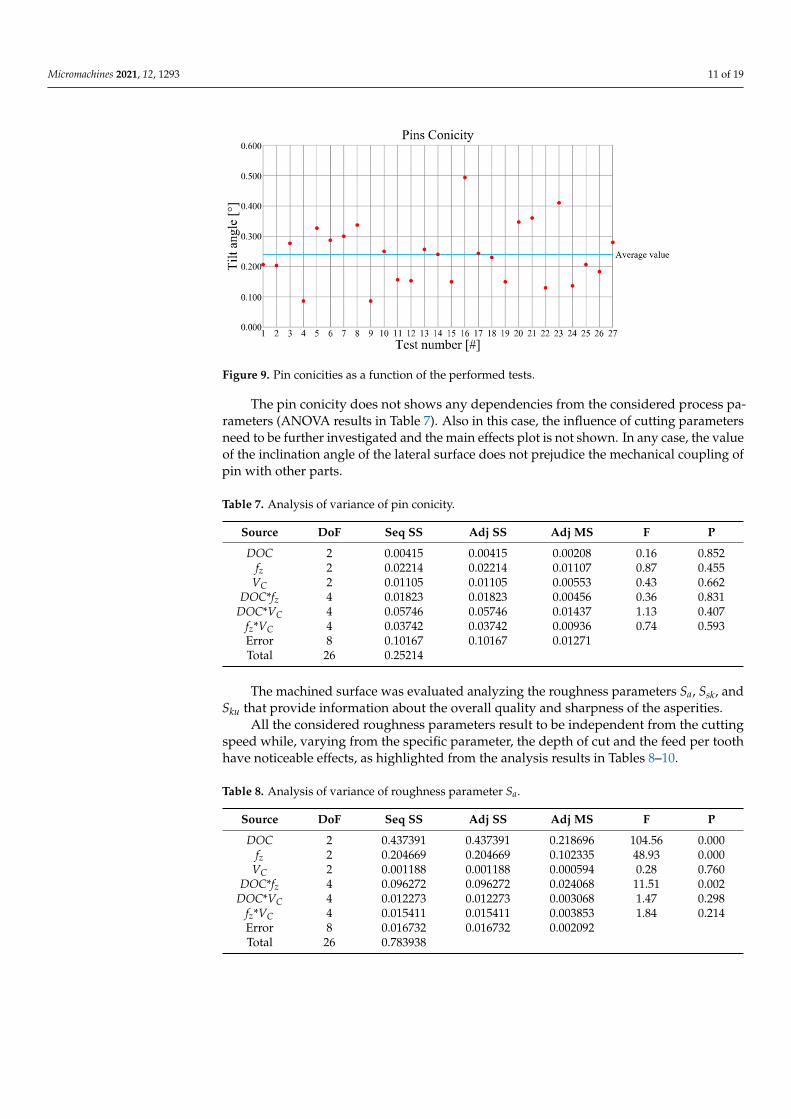
Figure 6 shows the pin diameter measurements as a function of experimental testnumber. The average pin diameter is equal to 0.593 mm with an offset from the nominalvalue of 7 µm. The value of the percentage error is 1.2% which is comparable with theone related to the hole diameter. The precision of the pins is lower than the precision ofthe holes.
Micromachines 2021, 12, 1293 9 of 19Micromachines 2021, 12, x FOR PEER REVIEW 9 of 18
Figure 5. Main effects plot for the hole diameter.
Figure 6 shows the pin diameter measurements as a function of experimental test num-ber. The average pin diameter is equal to 0.593 mm with an offset from the nominal value of 7 μm. The value of the percentage error is 1.2% which is comparable with the one related to the hole diameter. The precision of the pins is lower than the precision of the holes.
Figure 6. Pin diameters as a function of the performed tests.
The analysis of variance of the pin diameter (Table 5) does not show a clear depend-ency of if from the process parameters. For this reason, the main effects plot is not re-ported, and the cutting conditions must be further investigated by increasing the range of variability.
Table 5. Analysis of variance of pin diameter φP = 0.600 mm.
Source DoF Seq SS Adj SS Adj MS F P DOC 2 0.0001344 0.0001344 0.0000672 1.56 0.269
fz 2 0.0001940 0.0001940 0.0000970 2.24 0.168 VC 2 0.0000248 0.0000248 0.0000124 0.29 0.758
DOC*fz 4 0.0001173 0.0001173 0.0000293 0.68 0.626 DOC*VC 4 0.0000915 0.0000915 0.0000229 0.53 0.718
fz*VC 4 0.0000344 0.0000344 0.0000086 0.20 0.932 Error 8 0.0003457 0.0003457 0.0000432 Total 26 0.0009421
Figure 5. Main effects plot for the hole diameter.
Micromachines 2021, 12, x FOR PEER REVIEW 9 of 18
Figure 5. Main effects plot for the hole diameter.
Figure 6 shows the pin diameter measurements as a function of experimental test num-ber. The average pin diameter is equal to 0.593 mm with an offset from the nominal value of 7 μm. The value of the percentage error is 1.2% which is comparable with the one related to the hole diameter. The precision of the pins is lower than the precision of the holes.
Figure 6. Pin diameters as a function of the performed tests.
The analysis of variance of the pin diameter (Table 5) does not show a clear depend-ency of if from the process parameters. For this reason, the main effects plot is not re-ported, and the cutting conditions must be further investigated by increasing the range of variability.
Table 5. Analysis of variance of pin diameter φP = 0.600 mm.
Source DoF Seq SS Adj SS Adj MS F P DOC 2 0.0001344 0.0001344 0.0000672 1.56 0.269
fz 2 0.0001940 0.0001940 0.0000970 2.24 0.168 VC 2 0.0000248 0.0000248 0.0000124 0.29 0.758
DOC*fz 4 0.0001173 0.0001173 0.0000293 0.68 0.626 DOC*VC 4 0.0000915 0.0000915 0.0000229 0.53 0.718
fz*VC 4 0.0000344 0.0000344 0.0000086 0.20 0.932 Error 8 0.0003457 0.0003457 0.0000432 Total 26 0.0009421
Figure 6. Pin diameters as a function of the performed tests.
The analysis of variance of the pin diameter (Table 5) does not show a clear dependencyof if from the process parameters. For this reason, the main effects plot is not reported, andthe cutting conditions must be further investigated by increasing the range of variability.
Table 5. Analysis of variance of pin diameter ϕP = 0.600 mm.
Source DoF Seq SS Adj SS Adj MS F P
DOC 2 0.0001344 0.0001344 0.0000672 1.56 0.269fz 2 0.0001940 0.0001940 0.0000970 2.24 0.168
VC 2 0.0000248 0.0000248 0.0000124 0.29 0.758DOC*fz 4 0.0001173 0.0001173 0.0000293 0.68 0.626
DOC*VC 4 0.0000915 0.0000915 0.0000229 0.53 0.718fz*VC 4 0.0000344 0.0000344 0.0000086 0.20 0.932Error 8 0.0003457 0.0003457 0.0000432Total 26 0.0009421
Pin circularity is depicted in Figure 7 where a small dispersion of the experimen-tal measurements, except the ones at higher depth of cut, feed per tooth and cuttingspeed, is visible, indicating an acceptable precision in the analyzed process parametersvariation range.

Micromachines 2021, 12, 1293 10 of 19
Micromachines 2021, 12, x FOR PEER REVIEW 10 of 18
Pin circularity is depicted in Figure 7 where a small dispersion of the experimental measurements, except the ones at higher depth of cut, feed per tooth and cutting speed, is visible, indicating an acceptable precision in the analyzed process parameters variation range.
Figure 7. Pin circularities as a function of the performed tests.
As underlined by the ANOVA results in Table 6, the pin circularity is heavily affected by the feed per tooth and its interaction with the depth of cut. In particular, the main effects plot in Figure 8 shows that pin circularity increases when feed per tooth and depth of cut grow.
Table 6. Analysis of variance of pin circularity.
Source DoF Seq SS Adj SS Adj MS F P DOC 2 0.0001792 0.0001792 0.0000896 2.84 0.117
fz 2 0.0003530 0.0003530 0.0001765 5.59 0.030 VC 2 0.0001263 0.0001263 0.0000631 2.00 0.198
DOC*fz 4 0.0005390 0.0005390 0.0001347 4.26 0.039 DOC*VC 4 0.0001299 0.0001299 0.0000325 1.03 0.449
fz*VC 4 0.0000988 0.0000988 0.0000247 0.78 0.568 Error 8 0.0002528 0.0002528 0.0000316 Total 26 0.0016789
Figure 8. Main effects plot for pin circularity.
Figure 7. Pin circularities as a function of the performed tests.
As underlined by the ANOVA results in Table 6, the pin circularity is heavily affectedby the feed per tooth and its interaction with the depth of cut. In particular, the main effectsplot in Figure 8 shows that pin circularity increases when feed per tooth and depth of cutgrow.
Table 6. Analysis of variance of pin circularity.
Source DoF Seq SS Adj SS Adj MS F P
DOC 2 0.0001792 0.0001792 0.0000896 2.84 0.117fz 2 0.0003530 0.0003530 0.0001765 5.59 0.030
VC 2 0.0001263 0.0001263 0.0000631 2.00 0.198DOC*fz 4 0.0005390 0.0005390 0.0001347 4.26 0.039
DOC*VC 4 0.0001299 0.0001299 0.0000325 1.03 0.449fz*VC 4 0.0000988 0.0000988 0.0000247 0.78 0.568Error 8 0.0002528 0.0002528 0.0000316Total 26 0.0016789
Micromachines 2021, 12, x FOR PEER REVIEW 10 of 18
Pin circularity is depicted in Figure 7 where a small dispersion of the experimental measurements, except the ones at higher depth of cut, feed per tooth and cutting speed, is visible, indicating an acceptable precision in the analyzed process parameters variation range.
Figure 7. Pin circularities as a function of the performed tests.
As underlined by the ANOVA results in Table 6, the pin circularity is heavily affected by the feed per tooth and its interaction with the depth of cut. In particular, the main effects plot in Figure 8 shows that pin circularity increases when feed per tooth and depth of cut grow.
Table 6. Analysis of variance of pin circularity.
Source DoF Seq SS Adj SS Adj MS F P DOC 2 0.0001792 0.0001792 0.0000896 2.84 0.117
fz 2 0.0003530 0.0003530 0.0001765 5.59 0.030 VC 2 0.0001263 0.0001263 0.0000631 2.00 0.198
DOC*fz 4 0.0005390 0.0005390 0.0001347 4.26 0.039 DOC*VC 4 0.0001299 0.0001299 0.0000325 1.03 0.449
fz*VC 4 0.0000988 0.0000988 0.0000247 0.78 0.568 Error 8 0.0002528 0.0002528 0.0000316 Total 26 0.0016789
Figure 8. Main effects plot for pin circularity. Figure 8. Main effects plot for pin circularity.
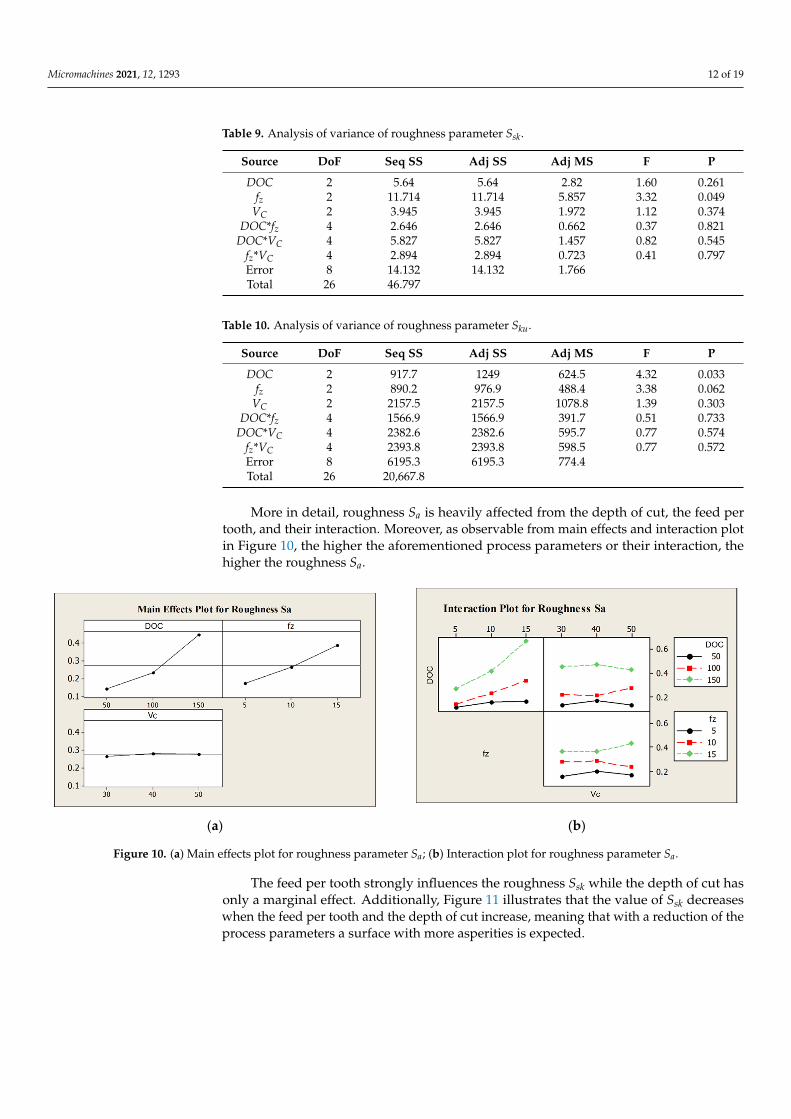
The conicity of the pins was assessed by the evaluation of the tilt of the lateral surfacein comparison to the normal direction respect to the pocket surface. The related tilt angleranges between 0◦ and 0.5◦ for all the tests, as shown in Figure 9.
Micromachines 2021, 12, 1293 11 of 19
Micromachines 2021, 12, x FOR PEER REVIEW 11 of 18
The conicity of the pins was assessed by the evaluation of the tilt of the lateral surface in comparison to the normal direction respect to the pocket surface. The related tilt angle ranges between 0° and 0.5° for all the tests, as shown in Figure 9.
Figure 9. Pin conicities as a function of the performed tests.
The pin conicity does not shows any dependencies from the considered process pa-rameters (ANOVA results in Table 7). Also in this case, the influence of cutting parameters need to be further investigated and the main effects plot is not shown. In any case, the value of the inclination angle of the lateral surface does not prejudice the mechanical cou-pling of pin with other parts.
Table 7. Analysis of variance of pin conicity.
Source DoF Seq SS Adj SS Adj MS F P DOC 2 0.00415 0.00415 0.00208 0.16 0.852
fz 2 0.02214 0.02214 0.01107 0.87 0.455 VC 2 0.01105 0.01105 0.00553 0.43 0.662
DOC*fz 4 0.01823 0.01823 0.00456 0.36 0.831 DOC*VC 4 0.05746 0.05746 0.01437 1.13 0.407
fz*VC 4 0.03742 0.03742 0.00936 0.74 0.593 Error 8 0.10167 0.10167 0.01271 Total 26 0.25214
The machined surface was evaluated analyzing the roughness parameters Sa, Ssk, and Sku that provide information about the overall quality and sharpness of the asperities.
All the considered roughness parameters result to be independent from the cutting speed while, varying from the specific parameter, the depth of cut and the feed per tooth have noticeable effects, as highlighted from the analysis results in Tables 8–10.
Table 8. Analysis of variance of roughness parameter Sa.
Source DoF Seq SS Adj SS Adj MS F P DOC 2 0.437391 0.437391 0.218696 104.56 0.000
fz 2 0.204669 0.204669 0.102335 48.93 0.000 VC 2 0.001188 0.001188 0.000594 0.28 0.760
DOC*fz 4 0.096272 0.096272 0.024068 11.51 0.002 DOC*VC 4 0.012273 0.012273 0.003068 1.47 0.298
fz*VC 4 0.015411 0.015411 0.003853 1.84 0.214 Error 8 0.016732 0.016732 0.002092 Total 26 0.783938
Figure 9. Pin conicities as a function of the performed tests.
The pin conicity does not shows any dependencies from the considered process pa-rameters (ANOVA results in Table 7). Also in this case, the influence of cutting parametersneed to be further investigated and the main effects plot is not shown. In any case, the valueof the inclination angle of the lateral surface does not prejudice the mechanical coupling ofpin with other parts.
Table 7. Analysis of variance of pin conicity.
Source DoF Seq SS Adj SS Adj MS F P
DOC 2 0.00415 0.00415 0.00208 0.16 0.852fz 2 0.02214 0.02214 0.01107 0.87 0.455
VC 2 0.01105 0.01105 0.00553 0.43 0.662DOC*fz 4 0.01823 0.01823 0.00456 0.36 0.831
DOC*VC 4 0.05746 0.05746 0.01437 1.13 0.407fz*VC 4 0.03742 0.03742 0.00936 0.74 0.593Error 8 0.10167 0.10167 0.01271Total 26 0.25214
The machined surface was evaluated analyzing the roughness parameters Sa, Ssk, andSku that provide information about the overall quality and sharpness of the asperities.
All the considered roughness parameters result to be independent from the cuttingspeed while, varying from the specific parameter, the depth of cut and the feed per toothhave noticeable effects, as highlighted from the analysis results in Tables 8–10.
Table 8. Analysis of variance of roughness parameter Sa.
Source DoF Seq SS Adj SS Adj MS F P
DOC 2 0.437391 0.437391 0.218696 104.56 0.000fz 2 0.204669 0.204669 0.102335 48.93 0.000
VC 2 0.001188 0.001188 0.000594 0.28 0.760DOC*fz 4 0.096272 0.096272 0.024068 11.51 0.002
DOC*VC 4 0.012273 0.012273 0.003068 1.47 0.298fz*VC 4 0.015411 0.015411 0.003853 1.84 0.214Error 8 0.016732 0.016732 0.002092Total 26 0.783938
Micromachines 2021, 12, 1293 12 of 19
Table 9. Analysis of variance of roughness parameter Ssk.
Source DoF Seq SS Adj SS Adj MS F P
DOC 2 5.64 5.64 2.82 1.60 0.261fz 2 11.714 11.714 5.857 3.32 0.049
VC 2 3.945 3.945 1.972 1.12 0.374DOC*fz 4 2.646 2.646 0.662 0.37 0.821
DOC*VC 4 5.827 5.827 1.457 0.82 0.545fz*VC 4 2.894 2.894 0.723 0.41 0.797Error 8 14.132 14.132 1.766Total 26 46.797
Table 10. Analysis of variance of roughness parameter Sku.
Source DoF Seq SS Adj SS Adj MS F P
DOC 2 917.7 1249 624.5 4.32 0.033fz 2 890.2 976.9 488.4 3.38 0.062
VC 2 2157.5 2157.5 1078.8 1.39 0.303DOC*fz 4 1566.9 1566.9 391.7 0.51 0.733
DOC*VC 4 2382.6 2382.6 595.7 0.77 0.574fz*VC 4 2393.8 2393.8 598.5 0.77 0.572Error 8 6195.3 6195.3 774.4Total 26 20,667.8
More in detail, roughness Sa is heavily affected from the depth of cut, the feed pertooth, and their interaction. Moreover, as observable from main effects and interaction plotin Figure 10, the higher the aforementioned process parameters or their interaction, thehigher the roughness Sa.
Micromachines 2021, 12, x FOR PEER REVIEW 12 of 18
Table 9. Analysis of variance of roughness parameter Ssk.
Source DoF Seq SS Adj SS Adj MS F P DOC 2 5.64 5.64 2.82 1.60 0.261
fz 2 11.714 11.714 5.857 3.32 0.049 VC 2 3.945 3.945 1.972 1.12 0.374
DOC*fz 4 2.646 2.646 0.662 0.37 0.821 DOC*VC 4 5.827 5.827 1.457 0.82 0.545
fz*VC 4 2.894 2.894 0.723 0.41 0.797 Error 8 14.132 14.132 1.766 Total 26 46.797
Table 10. Analysis of variance of roughness parameter Sku.
Source DoF Seq SS Adj SS Adj MS F P DOC 2 917.7 1249 624.5 4.32 0.033 fz 2 890.2 976.9 488.4 3.38 0.062 VC 2 2157.5 2157.5 1078.8 1.39 0.303 DOC*fz 4 1566.9 1566.9 391.7 0.51 0.733 DOC*VC 4 2382.6 2382.6 595.7 0.77 0.574 fz*VC 4 2393.8 2393.8 598.5 0.77 0.572 Error 8 6195.3 6195.3 774.4 Total 26 20667.8
More in detail, roughness Sa is heavily affected from the depth of cut, the feed per tooth, and their interaction. Moreover, as observable from main effects and interaction plot in Figure 10, the higher the aforementioned process parameters or their interaction, the higher the roughness Sa.
(a) (b)
Figure 10. (a) Main effects plot for roughness parameter Sa; (b) Interaction plot for roughness parameter Sa.
The feed per tooth strongly influences the roughness Ssk while the depth of cut has only a marginal effect. Additionally, Figure 11 illustrates that the value of Ssk decreases when the feed per tooth and the depth of cut increase, meaning that with a reduction of the process parameters a surface with more asperities is expected.
Figure 10. (a) Main effects plot for roughness parameter Sa; (b) Interaction plot for roughness parameter Sa.
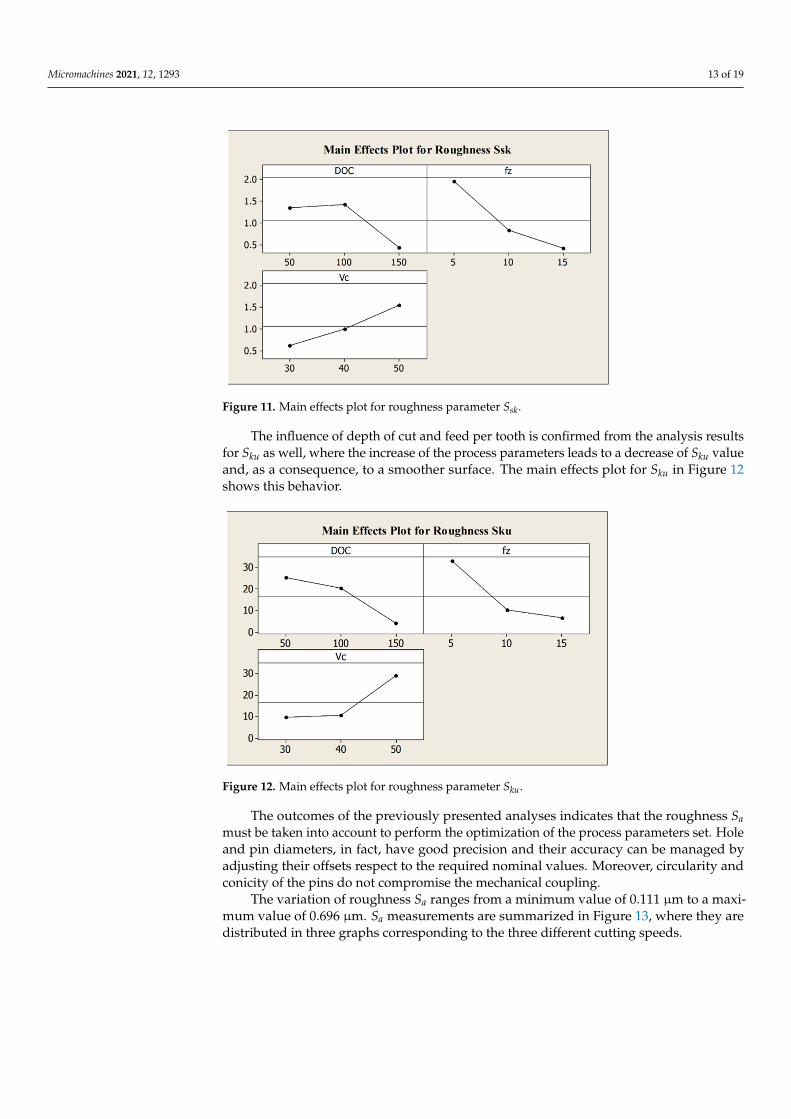
The feed per tooth strongly influences the roughness Ssk while the depth of cut hasonly a marginal effect. Additionally, Figure 11 illustrates that the value of Ssk decreaseswhen the feed per tooth and the depth of cut increase, meaning that with a reduction of theprocess parameters a surface with more asperities is expected.
Micromachines 2021, 12, 1293 13 of 19Micromachines 2021, 12, x FOR PEER REVIEW 13 of 18
Figure 11. Main effects plot for roughness parameter Ssk.
The influence of depth of cut and feed per tooth is confirmed from the analysis results for Sku as well, where the increase of the process parameters leads to a decrease of Sku value and, as a consequence, to a smoother surface. The main effects plot for Sku in Figure 12 shows this behavior.
Figure 12. Main effects plot for roughness parameter Sku.
The outcomes of the previously presented analyses indicates that the roughness Sa must be taken into account to perform the optimization of the process parameters set. Hole and pin diameters, in fact, have good precision and their accuracy can be managed by adjusting their offsets respect to the required nominal values. Moreover, circularity and conicity of the pins do not compromise the mechanical coupling.
The variation of roughness Sa ranges from a minimum value of 0.111 μm to a maxi-mum value of 0.696 μm. Sa measurements are summarized in Figure 13, where they are distributed in three graphs corresponding to the three different cutting speeds.
As already underlined, low values of depth of cut and feed per tooth, that have the greatest influence on Sa, lead to the best surface quality, thus the lowest process parame-ters values should be employed to achieve high levels of finishing. On the other hand, the process optimization must warrant an acceptable production time (TP). In Figure 14 the correlation between roughness Sa and production time for the performed tests is showed.
Figure 11. Main effects plot for roughness parameter Ssk.
The influence of depth of cut and feed per tooth is confirmed from the analysis resultsfor Sku as well, where the increase of the process parameters leads to a decrease of Sku valueand, as a consequence, to a smoother surface. The main effects plot for Sku in Figure 12shows this behavior.
Micromachines 2021, 12, x FOR PEER REVIEW 13 of 18
Figure 11. Main effects plot for roughness parameter Ssk.
The influence of depth of cut and feed per tooth is confirmed from the analysis results for Sku as well, where the increase of the process parameters leads to a decrease of Sku value and, as a consequence, to a smoother surface. The main effects plot for Sku in Figure 12 shows this behavior.
Figure 12. Main effects plot for roughness parameter Sku.
The outcomes of the previously presented analyses indicates that the roughness Sa must be taken into account to perform the optimization of the process parameters set. Hole and pin diameters, in fact, have good precision and their accuracy can be managed by adjusting their offsets respect to the required nominal values. Moreover, circularity and conicity of the pins do not compromise the mechanical coupling.
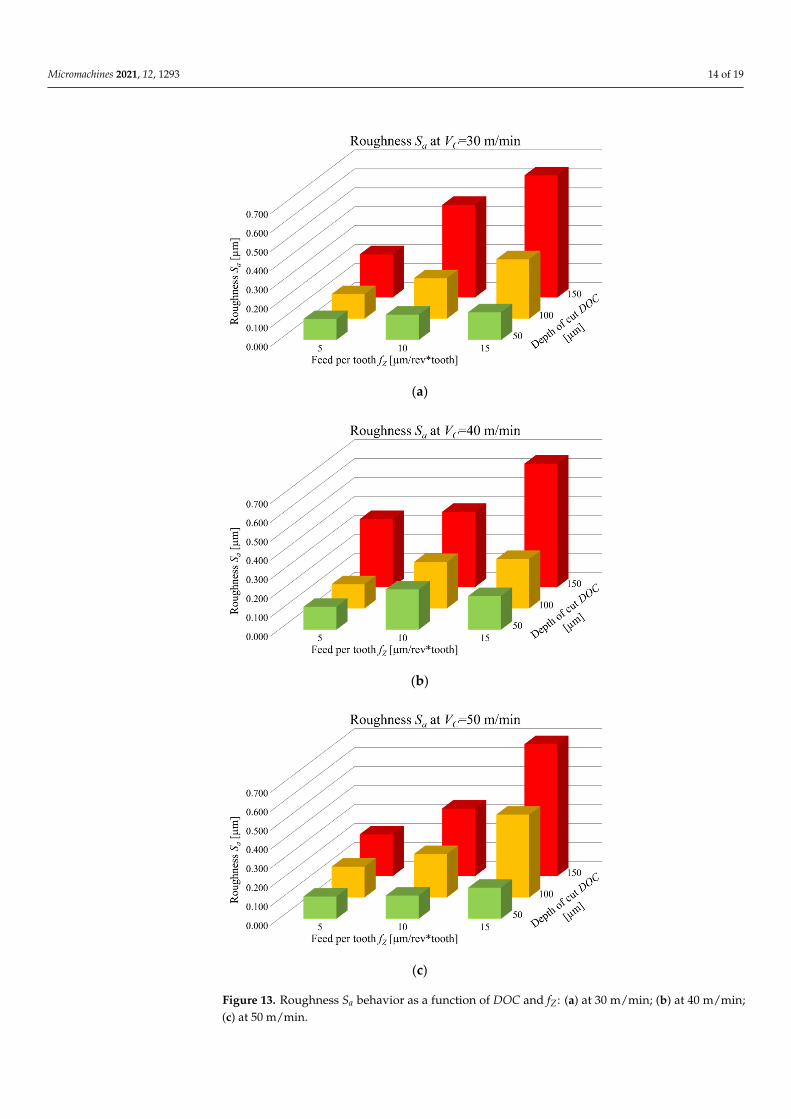
The variation of roughness Sa ranges from a minimum value of 0.111 μm to a maxi-mum value of 0.696 μm. Sa measurements are summarized in Figure 13, where they are distributed in three graphs corresponding to the three different cutting speeds.
As already underlined, low values of depth of cut and feed per tooth, that have the greatest influence on Sa, lead to the best surface quality, thus the lowest process parame-ters values should be employed to achieve high levels of finishing. On the other hand, the process optimization must warrant an acceptable production time (TP). In Figure 14 the correlation between roughness Sa and production time for the performed tests is showed.
Figure 12. Main effects plot for roughness parameter Sku.
The outcomes of the previously presented analyses indicates that the roughness Samust be taken into account to perform the optimization of the process parameters set. Holeand pin diameters, in fact, have good precision and their accuracy can be managed byadjusting their offsets respect to the required nominal values. Moreover, circularity andconicity of the pins do not compromise the mechanical coupling.
The variation of roughness Sa ranges from a minimum value of 0.111 µm to a maxi-mum value of 0.696 µm. Sa measurements are summarized in Figure 13, where they aredistributed in three graphs corresponding to the three different cutting speeds.
Micromachines 2021, 12, 1293 14 of 19Micromachines 2021, 12, x FOR PEER REVIEW 14 of 18
(a)
(b)
(c)
Figure 13. Roughness Sa behavior as a function of DOC and fZ: (a) at 30 m/min; (b) at 40 m/min; (c) at 50 m/min.
Figure 13. Roughness Sa behavior as a function of DOC and fZ: (a) at 30 m/min; (b) at 40 m/min;(c) at 50 m/min.

Micromachines 2021, 12, 1293 15 of 19
As already underlined, low values of depth of cut and feed per tooth, that have thegreatest influence on Sa, lead to the best surface quality, thus the lowest process parametersvalues should be employed to achieve high levels of finishing. On the other hand, theprocess optimization must warrant an acceptable production time (TP). In Figure 14 thecorrelation between roughness Sa and production time for the performed tests is showed.
Micromachines 2021, 12, x FOR PEER REVIEW 15 of 18
Figure 14. Production time (TP) and roughness Sa as a function of the experimental tests.
For a better interpretation of the graph in Figure 14, the order of the experimental tests is rearranged from the one requesting the highest production time to the one requir-ing the lowest. The trend underlined by the graph is that reducing the production time a grow of the roughness is detected. Hence, a compromise between them is necessary, in order to optimize the process parameters selection. Tests 17, 14, and 21 individuate the best deal. Related to these tests, the roughness Sa varies between 0.164 and 0.214 μm while the production time ranges amongst 179 s and 205 s. Tests 17 and 21 were both accom-plished employing the minimum value of the depth of cut (DOC = 50 μm) and the maxi-mum value of the feed per tooth (fZ = 15 μm) leading to a pin diameter that is far from the nominal value of 0.600 mm with, in addiction, an irregular shape. Moreover, the hole di-ameter for the Test 17 is outside the band of the measurement accuracy (Figure 4), mean-ing a loss of precision for this combination of parameters. Finally, considering the good compromise between production time and final surface roughness, and the compliance of dimensional and geometrical tolerances, the outcomes of this optimization reveals that the optimized process parameters are those of Test 14. This test is characterized by the application of central level values of both feed per tooth (fZ = 10 μm) and depth of cut (DOC = 100 μm) at the lowest cutting speed (VC = 30 m/min), providing a pin diameter of 600.8 + 2.5 μm, with low values of circularity (19.1 μm) and conicity (24%), a roughness Sa equal to 0.214 μm and a production time equal to 183 s. A reduction of feed per tooth and depth of cut, maintaining the lowest cutting speed, shows a better value of surface rough-ness than the one of Test 14, but the production times are higher than the acceptable value of 283 s. On the other hand, keeping at low cutting speed value and using the highest ones for the other parameters, leads to quick production times, but to a compromised rough-ness. This can be explained considering the elevated chip cross-sectional area and the re-lated high cutting energy required. The increase of this latter, generates higher cutting temperatures, favoring a ductile chip formation, rather than a brittle one, that decreases the surface quality.
In order to validate the entire procedure of optimization, a functioning wristwatch movement was fabricated in the laboratories of the University of Brescia. A first set of main plate and bridges were machined by using the process parameters suggested by a catalogue. The result is not considerable acceptable due to several issues: • The workpieces profiles show large burrs that compromises the mechanical coupling between the bridges and the main plates and between the machined parts and the jewels; • Pins show bulging distortion and the cylindricity tolerance is not respected; • Micro-holes circularity is not adequate; • The surface roughness is elevated, and it affects the movement functionality.
Figure 14. Production time (TP) and roughness Sa as a function of the experimental tests.
For a better interpretation of the graph in Figure 14, the order of the experimental testsis rearranged from the one requesting the highest production time to the one requiring thelowest. The trend underlined by the graph is that reducing the production time a growof the roughness is detected. Hence, a compromise between them is necessary, in orderto optimize the process parameters selection. Tests 17, 14, and 21 individuate the bestdeal. Related to these tests, the roughness Sa varies between 0.164 and 0.214 µm while theproduction time ranges amongst 179 s and 205 s. Tests 17 and 21 were both accomplishedemploying the minimum value of the depth of cut (DOC = 50 µm) and the maximum valueof the feed per tooth (fZ = 15 µm) leading to a pin diameter that is far from the nominalvalue of 0.600 mm with, in addiction, an irregular shape. Moreover, the hole diameter forthe Test 17 is outside the band of the measurement accuracy (Figure 4), meaning a loss ofprecision for this combination of parameters. Finally, considering the good compromisebetween production time and final surface roughness, and the compliance of dimensionaland geometrical tolerances, the outcomes of this optimization reveals that the optimizedprocess parameters are those of Test 14. This test is characterized by the application ofcentral level values of both feed per tooth (fZ = 10 µm) and depth of cut (DOC = 100 µm) atthe lowest cutting speed (VC = 30 m/min), providing a pin diameter of 600.8 + 2.5 µm, withlow values of circularity (19.1 µm) and conicity (24%), a roughness Sa equal to 0.214 µmand a production time equal to 183 s. A reduction of feed per tooth and depth of cut,maintaining the lowest cutting speed, shows a better value of surface roughness than theone of Test 14, but the production times are higher than the acceptable value of 283 s. Onthe other hand, keeping at low cutting speed value and using the highest ones for the otherparameters, leads to quick production times, but to a compromised roughness. This can beexplained considering the elevated chip cross-sectional area and the related high cuttingenergy required. The increase of this latter, generates higher cutting temperatures, favoringa ductile chip formation, rather than a brittle one, that decreases the surface quality.
In order to validate the entire procedure of optimization, a functioning wristwatchmovement was fabricated in the laboratories of the University of Brescia. A first set ofmain plate and bridges were machined by using the process parameters suggested by acatalogue. The result is not considerable acceptable due to several issues:
Micromachines 2021, 12, 1293 16 of 19
• The workpieces profiles show large burrs that compromises the mechanical cou-pling between the bridges and the main plates and between the machined parts andthe jewels;
• Pins show bulging distortion and the cylindricity tolerance is not respected;• Micro-holes circularity is not adequate;• The surface roughness is elevated, and it affects the movement functionality.
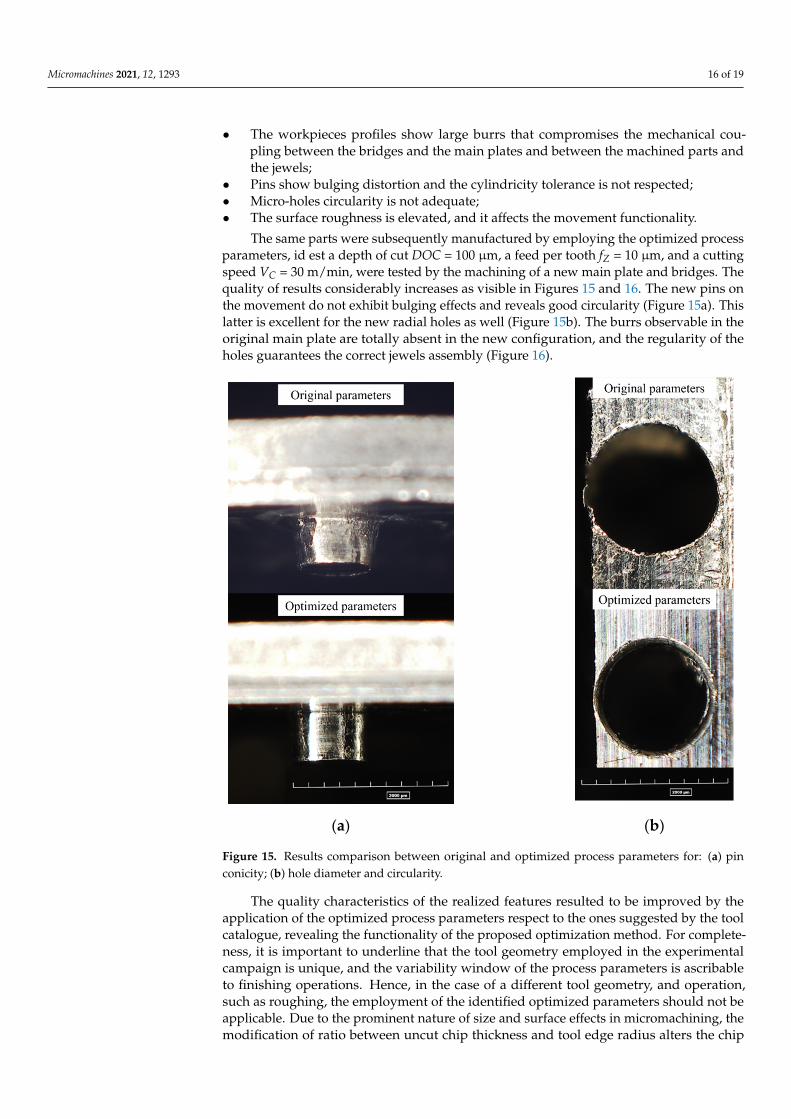
The same parts were subsequently manufactured by employing the optimized processparameters, id est a depth of cut DOC = 100 µm, a feed per tooth fZ = 10 µm, and a cuttingspeed VC = 30 m/min, were tested by the machining of a new main plate and bridges. Thequality of results considerably increases as visible in Figures 15 and 16. The new pins onthe movement do not exhibit bulging effects and reveals good circularity (Figure 15a). Thislatter is excellent for the new radial holes as well (Figure 15b). The burrs observable in theoriginal main plate are totally absent in the new configuration, and the regularity of theholes guarantees the correct jewels assembly (Figure 16).
Micromachines 2021, 12, x FOR PEER REVIEW 16 of 18
The same parts were subsequently manufactured by employing the optimized pro-cess parameters, id est a depth of cut DOC = 100 μm, a feed per tooth fZ = 10 μm, and a cutting speed VC = 30 m/min, were tested by the machining of a new main plate and bridges. The quality of results considerably increases as visible in Figures 15 and 16. The new pins on the movement do not exhibit bulging effects and reveals good circularity (Figure 15a). This latter is excellent for the new radial holes as well (Figure 15b). The burrs observable in the original main plate are totally absent in the new configuration, and the regularity of the holes guarantees the correct jewels assembly (Figure 16).
(a) (b)
Figure 15. Results comparison between original and optimized process parameters for: (a) pin conic-ity; (b) hole diameter and circularity.
(a) (b)
Figure 16. Comparison between the features machined with: (a) original process parameters; (b) optimized process parameters.
The quality characteristics of the realized features resulted to be improved by the application of the optimized process parameters respect to the ones suggested by the tool catalogue, revealing the functionality of the proposed optimization method. For complete-ness, it is important to underline that the tool geometry employed in the experimental campaign is unique, and the variability window of the process parameters is ascribable to
Figure 15. Results comparison between original and optimized process parameters for: (a) pinconicity; (b) hole diameter and circularity.
The quality characteristics of the realized features resulted to be improved by theapplication of the optimized process parameters respect to the ones suggested by the toolcatalogue, revealing the functionality of the proposed optimization method. For complete-ness, it is important to underline that the tool geometry employed in the experimentalcampaign is unique, and the variability window of the process parameters is ascribableto finishing operations. Hence, in the case of a different tool geometry, and operation,such as roughing, the employment of the identified optimized parameters should not beapplicable. Due to the prominent nature of size and surface effects in micromachining, themodification of ratio between uncut chip thickness and tool edge radius alters the chip

Micromachines 2021, 12, 1293 17 of 19
formation mechanism, varying CuNi18Zn20 machinability. In order to select the mostsuitable process parameters, when machining setup differs from the one employed in thiswork, this behavior must be considered.
Micromachines 2021, 12, x FOR PEER REVIEW 16 of 18
The same parts were subsequently manufactured by employing the optimized pro-cess parameters, id est a depth of cut DOC = 100 μm, a feed per tooth fZ = 10 μm, and a cutting speed VC = 30 m/min, were tested by the machining of a new main plate and bridges. The quality of results considerably increases as visible in Figures 15 and 16. The new pins on the movement do not exhibit bulging effects and reveals good circularity (Figure 15a). This latter is excellent for the new radial holes as well (Figure 15b). The burrs observable in the original main plate are totally absent in the new configuration, and the regularity of the holes guarantees the correct jewels assembly (Figure 16).
(a) (b)
Figure 15. Results comparison between original and optimized process parameters for: (a) pin conic-ity; (b) hole diameter and circularity.
(a) (b)
Figure 16. Comparison between the features machined with: (a) original process parameters; (b) optimized process parameters.
The quality characteristics of the realized features resulted to be improved by the application of the optimized process parameters respect to the ones suggested by the tool catalogue, revealing the functionality of the proposed optimization method. For complete-ness, it is important to underline that the tool geometry employed in the experimental campaign is unique, and the variability window of the process parameters is ascribable to
Figure 16. Comparison between the features machined with: (a) original process parameters;(b) optimized process parameters.
4. Conclusions
The paper described an experimental approach to a problem of optimization of cuttingprocess parameters in a complex micro-machining case. As results of the experimentalcampaign of 27 prototypes machining, it was evidenced that the employment of thehighest depth of cut and feed per tooth induced to excessive burrs distribution. Moreover,the final geometry showed irregularities in the tests with fZ = 10 µm combined withVC = 40–50 m/min, and fZ = 15 µm unrelatedly the cutting speed. A critical size for themachining of microfeatures was individuated as 1 mm. The features in submillimeterdimensional scale requires machining with low feed rates and low cutting speeds.
The conicity of pins does not result a critical tolerance while a lack of accuracy emergedabout the offset between the nominal and the effective diameters of pins and holes. The sizeof the deviation does not depend on the process parameters and it is equal to the 1.5% of thenominal diameter. A possible cause is the micro mill run-out due to the evidence that theholes show higher then expected diameters. Vice versa, the pins have lower then expecteddiameters due to tool eccentricity. A strong correlation between roughness and depth ofcut emerged by the data analysis. The trend is not commonly reported in conventionalscale machining. The chatter vibrations were identified as a possible explanation of thisscale effect. The depth of cut increasement implicates higher cutting forces which candetermines the vibrations of the workpiece. The roughness resulted directly correlated alsoto the feed rate.
Author Contributions: Conceptualization, A.A. (Andrea Abeni) and A.A. (Aldo Attanasio); For-mal analysis, A.A. (Andrea Abeni), A.M., C.C. and A.A. (Aldo Attanasio); Investigation, A.A.(Andrea Abeni) and A.A. (Aldo Attanasio); Methodology, A.A. (Andrea Abeni) and A.M.; Super-vision, A.A. (Aldo Attanasio); Validation, C.C. All authors have read and agreed to the publishedversion of the manuscript.
Funding: This research received no external funding.
Institutional Review Board Statement: Not applicable.
Informed Consent Statement: Not applicable.
Conflicts of Interest: The authors declare no conflict of interest.
Micromachines 2021, 12, 1293 18 of 19
References1. Su, S.; Du, R. Signature analysis of mechanical watch movements. Mech. Syst. Signal Process. 2007, 21, 3189–3200. [CrossRef]2. Gherman, L.; Gleadall, A.; Bakker, O.; Ratchev, S. Manufacturing Technology: Micro-machining. In Micro-Manufacturing
Technologies and Their Applications; Fassi, I., Shipley, D., Eds.; Springer Tracts in Mechanical Engineering; Springer: Cham,Switzerland, 2017; pp. 97–127.
3. Mijuškovic, G.; Cica, D. Investigation, modeling, and optimization of surface roughness in micro-milling of graphite electrodes.Int. J. Adv. Manuf. Technol. 2021, 117, 579–590. [CrossRef]
4. Schorderet, A.; Herzog, R.; Jacquod, N.; Marchand, Y.; Prongué, C. Productivity Increase of High Precision Micro-Milling byTrajectory Optimization. In Proceedings of the HSM 15th International Conference on High Speed Machining, Prague, CzechRepublic, 8–9 October 2019.
5. Zhang, X.; Yu, T.; Dai, Y.; Qu, S.; Zhao, J. Energy consumption considering tool wear and optimization of cutting parameters inmicro milling process. Int. J. Mech. Sci. 2020, 178, 105628. [CrossRef]
6. Attanasio, A. Tool Run-Out Measurement in Micro Milling. Micromachines 2017, 8, 221. [CrossRef] [PubMed]7. O’Toole, L.; Kang, C.W.; Fang, F.Z. Precision micro-milling process: State of the art. Adv. Manuf. 2021, 9, 173–205. [CrossRef]8. Huo, D.; Chen, W.; Teng, X.; Lin, C.; Yang, K. Modeling the Influence of Tool Deflection on Cutting Force and Surface Generation
in Micro-Milling. Micromachines 2017, 8, 188. [CrossRef]9. Zhou, M.; Chen, Y.; Zhang, G. Force prediction and cutting-parameter optimization in micro-milling Al7075-T6 based on response
surface method. Micromachines 2020, 11, 766. [CrossRef]10. Simoneau, A.; Ng, E.; Elbestawi, M.A. Grain Size and Orientation Effects When Microcutting AISI 1045 Steel. CIRP Ann. 2007, 56, 57–60.
[CrossRef]11. Wu, X.; Li, L.; He, N.; Yao, C.; Zhao, M. Influence of the cutting edge radius and the material grain size on the cutting force in
micro cutting. Precis. Eng. 2016, 45, 359–364. [CrossRef]12. Abeni, A.; Loda, D.; Özel, T.; Attanasio, A. Analytical force modelling for micro milling additively fabricated Inconel 625. Prod.
Eng. 2020, 14, 613–627. [CrossRef]13. Shi, Z.; Li, Y.; Liu, Z.; Yang, Q. Determination of minimum uncut chip thickness during micro-end milling Inconel 718 with
acoustic emission signals and FEM simulation. Int. J. Adv. Manuf. Technol. 2018, 98, 37–45. [CrossRef]14. Przestacki, D.; Chwalczuk, T.; Wojciechowski, S. The study on minimum uncut chip thickness and cutting forces during
laser-assisted turning of WC/NiCr clad layers. Int. J. Adv. Manuf. Technol. 2017, 91, 3887–3898. [CrossRef]15. Lee, Y.J.; Wang, H. Current understanding of surface effects in microcutting. Mater. Des. 2020, 192, 108688. [CrossRef]16. Nix, W.D.; Gao, H. Indentation size effects in crystalline materials: A law for strain gradient plasticity. J. Mech. Phys. Solids 1998,
46, 411–425. [CrossRef]17. Durst, K.; Backes, B.; Göken, M. Indentation size effect in metallic materials: Correcting for the size of the plastic zone. Scr. Mater.
2005, 52, 1093–1097. [CrossRef]18. Chen, Y.; Wang, T.; Zhang, G. Research on parameter optimization of micro-milling Al7075 based on edge-size-effect.
Micromachines 2020, 11, 197. [CrossRef] [PubMed]19. Wu, X.; Du, M.; Shen, J.; Jiang, F.; Li, Y.; Liu, L. Experimental research on the top burr formation in micro milling. Int. J. Adv.
Manuf. Technol. 2021, 1–10. [CrossRef]20. Aurich, J.C.; Bohley, M.; Reichenbach, I.G.; Kirsch, B. Surface quality in micro milling: Influences of spindle and cutting
parameters. CIRP Ann. 2017, 66, 101–104. [CrossRef]21. Chen, N.; Zhang, X.; Wu, J.; Wu, Y.; Li, L.; He, N. Suppressing the burr of high aspect ratio structure by optimizing the cutting
parameters in the micro-milling process. Int. J. Adv. Manuf. Technol. 2020, 111, 985–997. [CrossRef]22. Abeni, A.; Ginestra, P.S.; Attanasio, A. Micro-milling of Selective Laser Melted Stainless Steel. In Selected Topics in Manufacturing;
Ceretti, E., Tolio, T., Eds.; Lectures Notes in Mechanical Engineering; Springer: Cham, Switzerland, 2021; pp. 1–12.23. Lu, X.H.; Jia, Z.Y.; Wang, H.; Feng, Y.X.; Liang, S.Y. The effect of cutting parameters on micro-hardness and the prediction
of Vickers hardness based on a response surface methodology for micro-milling Inconel 718. Measurement 2019, 140, 56–62.[CrossRef]
24. Hajiahmadi, S. Burr size investigation in micro milling of stainless steel 316L. Int. J. Light. Mater. Manuf. 2019, 2, 296–304.[CrossRef]
25. Aslantas, K.; Ekici, E.; Çiçek, A. Optimization of process parameters for micro milling of Ti-6Al-4V alloy using Taguchi-basedgray relational analysis. Measurement 2018, 128, 419–427. [CrossRef]
26. Isler, P. Watches: Mechanical materials. In Encyclopedia of Materials: Science and Technology, 2nd ed.; Buschow, K.H.J., Cahn, R.W.,Flemings, M.C., Ilschner, B., Kramer, E.J., Mahajan, S., Veyssière, P., Eds.; Elsevier: Amsterdam, The Netherlands, 2003; pp. 1–17.
27. Johansson, J.; Persson, H.; Ståhl, J.E.; Zhou, J.M.; Bushlya, V.; Schultheiss, F. Machinability Evaluation of Low-Lead Brass Alloys.Procedia Manuf. 2019, 38, 1723–1730. [CrossRef]
28. Nobel, C.; Klocke, F.; Lung, D.; Wolf, S. Machinability Enhancement of Lead-Free Brass Alloys. Procedia CIRP 2014, 14, 95–100.[CrossRef]
29. Zoghipour, N.; Tascioglu, E.; Atay, G.; Kaynak, Y. Machining-induced surface integrity of holes drilled in lead-free brass alloy.Procedia CIRP 2020, 87, 148–152. [CrossRef]

Micromachines 2021, 12, 1293 19 of 19
30. Sun, Z.; To, S. Effect of Machining Parameters and Tool Wear on Surface Uniformity in Micro-Milling. Micromachines 2018, 9, 268.[CrossRef] [PubMed]
31. Muhammad, A.; Gupta, M.K.; Mikołajczyk, T.; Pimenov, D.Y.; Giasin, K. Effect of Tool Coating and Cutting Parameters on SurfaceRoughness and Burr Formation during Micromilling of Inconel 718. Metals 2021, 11, 167. [CrossRef]
32. Chen, Z.; Wu, X.; Zeng, K.; Shen, J.; Jiang, F.; Liu, Z.; Luo, W. Investigation on the Exit Burr Formation in Micro Milling.Micromachines 2021, 12, 952. [CrossRef]
33. D’Urso, G.; Giardini, C.; Quarto, M. Characterization of surfaces obtained by micro-EDM milling on steel and ceramic components.Int. J. Adv. Manuf. Technol. 2018, 97, 2077–2085. [CrossRef]
34. Abeni, A.; Lancini, M.; Attanasio, A. Characterization of machine tools and measurement system for micromilling. Nanotechnol.Precis. Eng. 2019, 2, 23–28. [CrossRef]
35. Serje, D.; Pacheco, J.; Diez, E. Micromilling research: Current trends and future prospects. Int. J. Adv. Manuf. Technol. 2020, 111, 1889–1916.[CrossRef]