optimization of process parameters for natural gas sweetening ...
11
Arinola A. O. et al/LAUTECH Journal of Engineering and Technology 10(2) 2016: 19-29 19 OPTIMIZATION OF PROCESS PARAMETERS FOR NATURAL GAS SWEETENING USING ASPEN HYSYS AND RESPONSE SURFACE METHODOLOGY Arinkoola A. Olatunde 1, 2, *, Salam K. Kazeem 1 , Jimoh M. Omolola 1 and Oghafua O. Nosa 1 1 Petroleum Engineering Unit, Department of Chemical Engineering, Ladoke Akintola University of Technology, Ogbomoso, Nigeria 2 Petroleum Engineering Stream, African University of Science and Technology (AUST) Abuja, Nigeria * Corresponding Author Email: [email protected] Abstract Amines process remains the most economic and efficient technology available today for the removal of acid gases. However, the costs associated with pumping higher flow rates and cost of increased energy needs for the regeneration of solution can undermine the economic feasibility of the project portfolio.Theabsorber pressure, the composition and temperature at which the sour gas is availabledictates sour gas and amine flow rates needed to meet the sweet gas specifications. To improve absorber capacity for a given sweet gas specification, optimization are commonly carried out using spread sheet with an adjust function to manipulate sour gas flow rate for fixed amine flow rate. Thisstudy performed optimization using response surface methodology on a simulated and calibrated amine plant. The result shows that the optimum operating conditions for 96% CO 2 removal were temperature of 30 o C, mass flow rate of 868.75 kg/hr and 20 numbers of plates. In conclusion, using experimental design and response surface methodology the parameter manipulation for attainment of optimal conditions is overcome. 1. Introduction Hydrogen sulfide, carbon dioxide, water vapor and other sulfur containing compounds constitute major impurities in natural gas and pose serious operational challenges. The unique size of H 2 S and CO 2 permits a perfect fitting into cavities formed by water molecules that result in gas hydrate formation under high pressures and relatively low temperatures (Paez et al. 2001). Natural gas that contains more than 5.7 milligrams of H 2 S per one cubic meter of natural gas is “sour”. That containing only CO 2 and no sulfur compounds is termed “sweet” gas. However, it is a good practice to remove both impurities to prevent corrosion problems and increase the heating value of the gas by removing the CO 2 . In this regard, sweetening of natural gas is an important step to minimize the risks of health hazards, meeting the sales contract, minimizing the corrosion and preventing the gas hydrate formation. The utilization of natural gas as domestic fuel necessitates H 2 S removal due to associated health hazards. The prolonged exposure to H 2 S beyond the threshold limit of 10 ppm portends serious health danger. At 0.13 ppm, H 2 S can be sensed by smell. At 4.6 ppm, the smell is quite noticeable. As the concentration increases beyond 200 ppm, the sense of smell fatigues, and the gas can no longer be detected by odor. At 500 ppm, breathing problems have observed and death can be expected in minutes. At 1000 ppm, death occurs immediately (Arnold and Stewart, 1999). Produced gases from reservoirs usually contain H 2 S and CO 2 in varying concentrations ranging from barely detectable quantities to more than 3000 to 4000 ppm for H 2 S and CO 2 respectively. From economic side, most contracts for the sale of natural gas require less than 4 ppm of these gases and heating value ranging from 920 to 980 Btu/scf (Mokhatab, 1999). Therefore, these impurities are treated so that the gas can be transported without restrictions. There exists several gas sweetening processes for the removal of CO 2 from natural gas. These include Chemisorption, Physical absorption, Adsorption, Hybrid solvents and Membrane separation (Kohl and Riesenfeld, 1997). Notwithstanding, the design of the sweetening plant and the amount of solvent requirement are determined by the absorption behavior of the least soluble compound to be removed (Douglas et al., 1987). Process selection depends upon the pressure LAUTECH Journal of Engineering and Technology 10 (2) 2016: 19-29
-
Upload
khangminh22 -
Category
Documents
-
view
0 -
download
0
Transcript of optimization of process parameters for natural gas sweetening ...
Arinola A. O. et al/LAUTECH Journal of Engineering and Technology 10(2) 2016: 19-29
19
OPTIMIZATION OF PROCESS PARAMETERS FOR NATURAL GAS SWEETENING USING ASPEN HYSYS AND RESPONSE SURFACE METHODOLOGY
Arinkoola A. Olatunde1, 2,*, Salam K. Kazeem1, Jimoh M. Omolola1and Oghafua O. Nosa1 1Petroleum Engineering Unit, Department of Chemical Engineering, Ladoke Akintola University of Technology,
Ogbomoso, Nigeria 2Petroleum Engineering Stream, African University of Science and Technology (AUST) Abuja, Nigeria *Corresponding Author Email: [email protected]
Abstract Amines process remains the most economic and efficient technology available today for the removal of acid gases. However, the costs associated with pumping higher flow rates and cost of increased energy needs for the regeneration of solution can undermine the economic feasibility of the project portfolio.Theabsorber pressure, the composition and temperature at which the sour gas is availabledictates sour gas and amine flow rates needed to meet the sweet gas specifications. To improve absorber capacity for a given sweet gas specification, optimization are commonly carried out using spread sheet with an adjust function to manipulate sour gas flow rate for fixed amine flow rate. Thisstudy performed optimization using response surface methodology on a simulated and calibrated amine plant. The result shows that the optimum operating conditions for 96% CO2 removal were temperature of 30 oC, mass flow rate of 868.75 kg/hr and 20 numbers of plates. In conclusion, using experimental design and response surface methodology the parameter manipulation for attainment of optimal conditions is overcome. 1. Introduction Hydrogen sulfide, carbon dioxide, water vapor and other sulfur containing compounds constitute major impurities in natural gas and pose serious operational challenges. The unique size of H2S and CO2 permits a perfect fitting into cavities formed by water molecules that result in gas hydrate formation under high pressures and relatively low temperatures (Paez et al. 2001). Natural gas that contains more than 5.7 milligrams of H2S per one cubic meter of natural gas is “sour”. That containing only CO2 and no sulfur compounds is termed “sweet” gas. However, it is a good practice to remove both impurities to prevent corrosion problems and increase the heating value of the gas by removing the CO2. In this regard, sweetening of natural gas is an important step to minimize the risks of health hazards, meeting the sales contract, minimizing the corrosion and preventing the gas hydrate formation. The utilization of natural gas as domestic fuel necessitates H2S removal due to associated health hazards. The prolonged exposure to H2S beyond the threshold limit of 10 ppm portends serious health danger. At 0.13 ppm, H2S can be sensed by smell. At 4.6 ppm, the smell is quite noticeable. As the
concentration increases beyond 200 ppm, the sense of smell fatigues, and the gas can no longer be detected by odor. At 500 ppm, breathing problems have observed and death can be expected in minutes. At 1000 ppm, death occurs immediately (Arnold and Stewart, 1999). Produced gases from reservoirs usually contain H2S and CO2 in varying concentrations ranging from barely detectable quantities to more than 3000 to 4000 ppm for H2S and CO2 respectively. From economic side, most contracts for the sale of natural gas require less than 4 ppm of these gases and heating value ranging from 920 to 980 Btu/scf (Mokhatab, 1999). Therefore, these impurities are treated so that the gas can be transported without restrictions. There exists several gas sweetening processes for the removal of CO2 from natural gas. These include Chemisorption, Physical absorption, Adsorption, Hybrid solvents and Membrane separation (Kohl and Riesenfeld, 1997). Notwithstanding, the design of the sweetening plant and the amount of solvent requirement are determined by the absorption behavior of the least soluble compound to be removed (Douglas et al., 1987). Process selection depends upon the pressure
LAUTECH Journal of Engineering and Technology 10 (2) 2016: 19-29
Arinola A. O. et al/LAUTECH Journal of Engineering and Technology 10(2) 2016: 19
and composition of the raw natural gas, the trace components and their composition, and the desired quality of marketable natural gas (pipeline specification of LNG). The chemisorption and physical absorption or combination of these two has been used extensively in existing LNG(Jaswar Koto, 2014).
Figure 1: Typical LNG plant’s block diagram For optimum efficiency and effective impurity removal, the operating parameters of the sweetening unit must be maintained at optimum. Technicallywhen the gas reservoir pressure declines,contracted gas flow rate decreases.Nusually drilled to maintain production rate and front end compression may become necessary in the later stages of field life. But after a while when front end compression is also unable to supply gas with enough pressure, the pressure of the sweetening unit starts declining. Consequently, the efficiency of the unit keeps reducing with time. In this paper the effect of declining pressure, number of plates and flow rate on the chemisorption processes are simulated using HYSYSoptimization are carried out using spread sheet with an adjust function to manipulate sour gas flow rate for fixed amine flow rate.Experimentaldesign and response surface methodology were integrated with the numerical simulation for process optimization 2 Theory 2.1 Chemisorption Many solvent systems have been proposed and studied for removing CO2by chemical absorption. Mono Ethanol Amine (MEA) has beenwidely studied system (Alie et al., 2005, Abuet al., 2007). The use of aqueousMEA for the removal of CO2 from flue gases is technology which has been described in detailnumber of sources (Reddy et al., 2003, 2008)amines include tertiary amines such as
Arinola A. O. et al/LAUTECH Journal of Engineering and Technology 10(2) 2016: 19-29
20
raw natural gas, the trace components and their composition, and the desired quality of marketable natural gas (pipeline specification of LNG). The chemisorption and physical absorption or combination of these two has been used extensively in existing LNG facilities
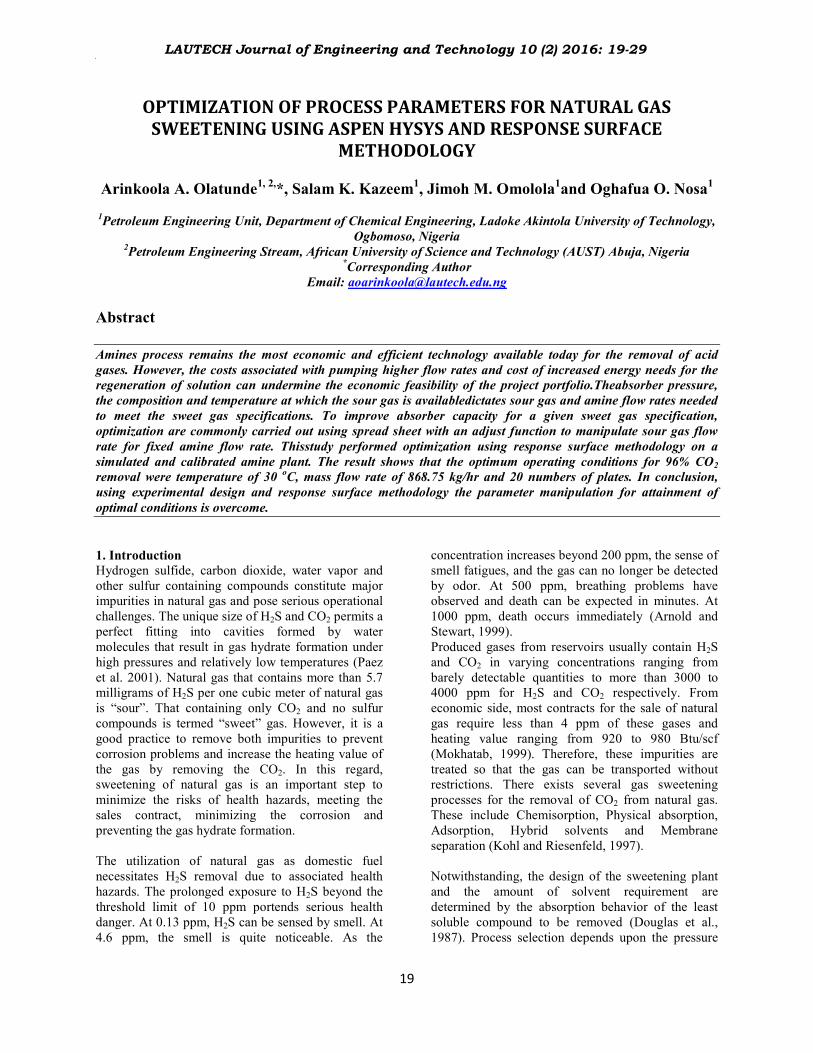
A typical LNG plant's overall flow diagram, and the main process units, is shown in Fig. 1. In this scheme, the feed gas is delivered at high pressure (up to 1,300 psi and 90 bar) from upstream gas fields via trunk lines and any associated condensate is removed. The gas is metered and pressureto the plant's design operating pressure.
Figure 1: Typical LNG plant’s block diagram optimum efficiency and effective impurity
, the operating parameters of the sweetening optimum. Technically,
when the gas reservoir pressure declines, the contracted gas flow rate decreases.Newwells are usually drilled to maintain production rate and front
n may become necessary in the later stages of field life. But after a while when front end compression is also unable to supply gas with enough pressure, the pressure of the sweetening unit starts declining. Consequently, the efficiency of the unit
In this paper the effect of declining pressure, number of plates and flow rate on the chemisorption processes are simulated using HYSYS. Usually, optimization are carried out using spread sheet with
r gas flow rate xperimentaldesign and
were integrated with the numerical simulation for process optimization.
solvent systems have been proposed and chemical absorption.
has been the most Alie et al., 2005, Abu-Zahra
The use of aqueousMEA for the from flue gases is a popular
in detailed in a et al., 2003, 2008). Other
amines include tertiary amines such as Methyl Di
Ethanol Amine (MDEA)(Lu et al., 2005hindered amines have also been investigated Shen, 2002, Xu et al., 2002). The phindered amines was found to be better suited to absorption in higher CO2 atmospheres (8-15% CO2). Mixed amine blends are designed to take advantage of the desirable properties in primary and tertiary amines. It is desired that these have the high capacity and low heat of absorption characteristic of tertiary amines and the fast rate of reaction characteristic of primary amines. This will lead to reduced circulation rates of the solvent and yield a lower heat duty in the stripper (Idem et al., 2006). Irrespective of amine type, process selection depends upon the pressure and composition of the raw natural gas, the trace components and their composition, and the desired quality of marketable natural gas (pipeline specification of LNG specification). The design of the absorber and the amount of solvent required are determined by the absorption behavior of the least soluble compound to be removed 2007).In general, two reagents are available for chemisorption: the hot potassium carbonate solutionand amines. The hot potassium carbonate process is used to remove both CO2 and H2S in the gas stream. It works best on a gas with CO2 partial presof 30-90 psi (Kumar et al., 2003suited for applications where the acid gas partial pressures are low and low levels of acid gas are
A typical LNG plant's overall flow diagram, and the main process units, is shown in Fig. 1. In this scheme, the feed gas is delivered at high pressure (up to 1,300 psi and 90 bar) from upstream gas fields via
and any associated condensate is removed. The gas is metered and pressure-controlled to the plant's design operating pressure.
Lu et al., 2005). Sterically hindered amines have also been investigated (Yih and
The performance of hindered amines was found to be better suited to
partial pressure
Mixed amine blends are designed to take advantage of the desirable properties in primary and tertiary
that these have the high capacity and low heat of absorption characteristic of tertiary amines and the fast rate of reaction characteristic of primary amines. This will lead to reduced circulation rates of the solvent and yield a lower heat duty in the
rocess selection depends upon the pressure and composition of the raw natural gas, the trace components and their composition, and the desired quality of marketable natural gas (pipeline
of LNG specification). The design of the absorber and the amount of solvent required are determined by the absorption behavior of the least soluble compound to be removed (Wiley & Sons,
wo reagents are available for ot potassium carbonate solution
The hot potassium carbonate process is used to S in the gas stream. It works
partial pressures in the range Kumar et al., 2003). Amines are well
suited for applications where the acid gas partial pressures are low and low levels of acid gas are
Arinola A. O. et al/LAUTECH Journal of Engineering and Technology 10(2) 2016: 19
desired in the residue gas. MEA,DEA and MDEA are extensively used in industry for CO2 removal. The flow scheme for all amine sweetening units is generally similar. MEA reacts with COfollow (Kumar et al., 2003):
The fundamental underlying principle is the exothermic, reversible reaction between a weak acid (e.g., CO2) and a weak base (e.g., amine) to form a
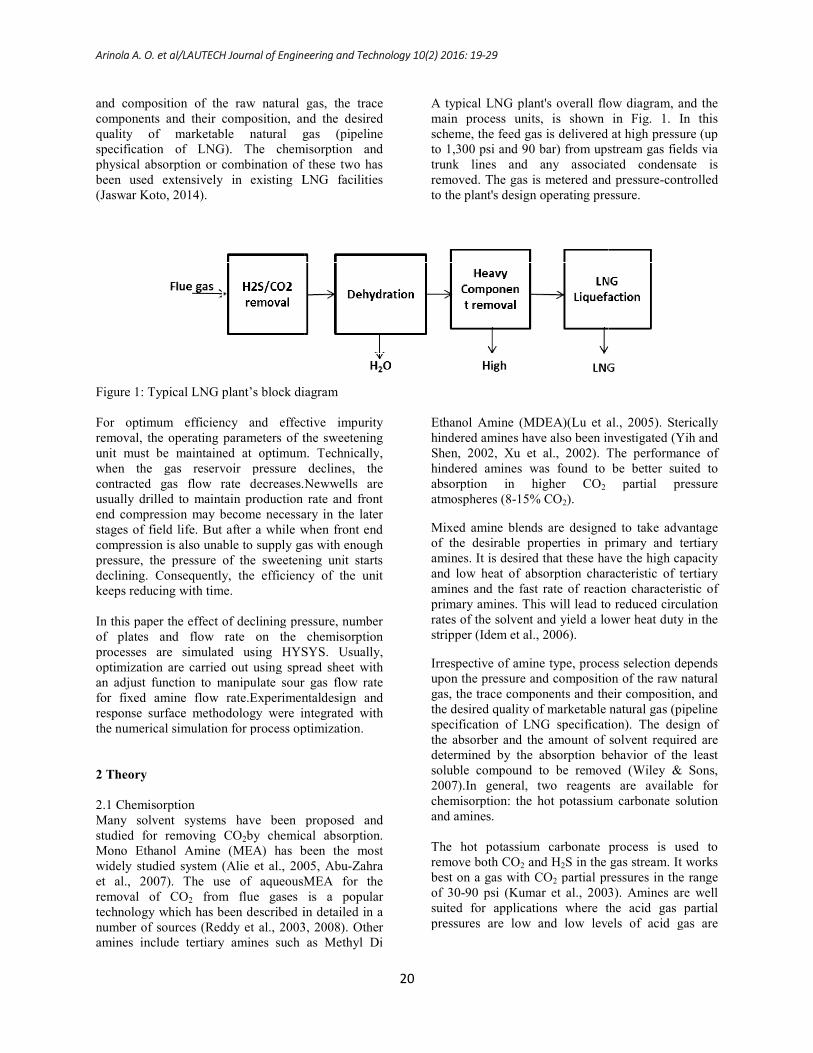
Figure 2: General flow diagram of a CO The natural gas enters the plant through avesselthat removes any free liquid or entrainment solids. The gas leaves the top of the scrubber and enters the bottom of the absorber in countercurrent contact with aqueous lean amine solution. Sweet gas leaves the top of the absorber and flow to a dehydration unit before liquefaction. Lean amine flows downward to the sour gas and absorbs the COconstituent and becomes rich solution. The rich solvent from the bottom of the absorber is flashed in a separator to recover some absorbed hydrocarbon in the rich solvent and then passed through amineheat exchanger to the stripper where the acid gas
Arinola A. O. et al/LAUTECH Journal of Engineering and Technology 10(2) 2016: 19-29
21
desired in the residue gas. MEA,DEA and MDEA are removal.
The flow scheme for all amine sweetening units is enerally similar. MEA reacts with CO2 and H2S as
The fundamental underlying principle is the exothermic, reversible reaction between a weak acid
) and a weak base (e.g., amine) to form a
soluble salt. The choice of amineoften arbitrary and made on basis of experiencegeneral, corrosion inhibitors are effective in sweetening processes which allows the use of high concentration of amine. DEA con30-40 wt. % but HYSYS can be applicable up to 50 %. 3 Methodology 3.1 Model specification and description The flowsheet model from Abu-was adopted for simulation and optimization of removal (Figure 2).
flow diagram of a CO2 removal process plant (Abu-Zahra et al., 2007)
enters the plant through a knock-out any free liquid or entrainment
solids. The gas leaves the top of the scrubber and enters the bottom of the absorber in countercurrent contact with aqueous lean amine solution. Sweet gas leaves the top of the absorber and flow to a
liquefaction. Lean amine flows downward to the sour gas and absorbs the CO2 constituent and becomes rich solution. The rich solvent from the bottom of the absorber is flashed in a separator to recover some absorbed hydrocarbon in
passed through amine-amine heat exchanger to the stripper where the acid gas
absorbed is stripped off at a very high temperature and low pressure. The acid gas then leaves the top of the stripper column. The lean amine from the bottom of the reboiler attached to the stripper flows through amine-amine heat exchanger and through a water air cooler before being introduced back to the top of the absorber. These processes were modelled in the HYSYS simulation environment. Simulation was done using the in-built amine package with Kent Eisenberg’s thermodynamic model for aqueous amine solutions and non-ideal vapor phase model. The components
of amine-concentration is and made on basis of experience. In
general, corrosion inhibitors are effective in sweetening processes which allows the use of high concentration of amine. DEA concentration range is
but HYSYS can be applicable up to 50
Model specification and description -Zahra et al., (2007), optimization of CO2
absorbed is stripped off at a very high temperature and low pressure. The acid gas then leaves the top of the stripper column. The lean amine from the bottom
hed to the stripper flows through amine heat exchanger and through a water air
cooler before being introduced back to the top of the
These processes were modelled in the HYSYS simulation environment. Simulation was done using
amine package with Kent Eisenberg’s thermodynamic model for aqueous amine solutions
ideal vapor phase model. The components

Arinola A. O. et al/LAUTECH Journal of Engineering and Technology 10(2) 2016: 19
and the fluid package are added. The unprocess flow diagram (PFD) developed is shown in
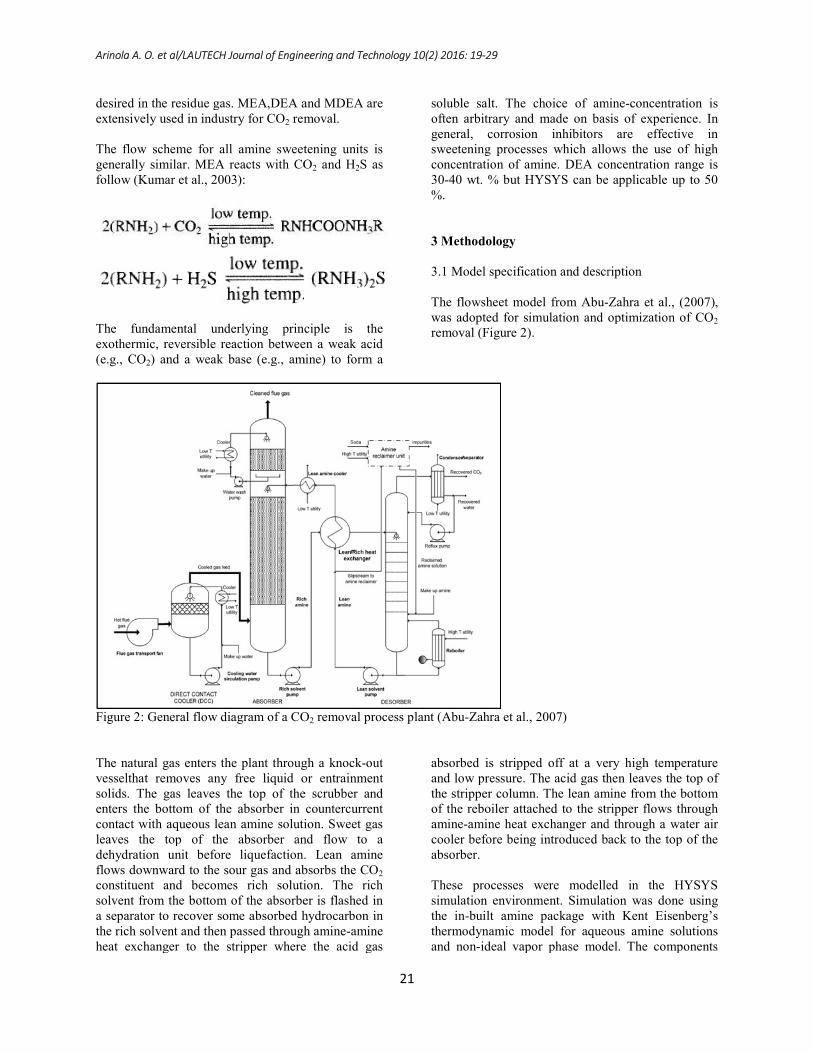
Figure 3: Un-simulated process flow diagram3.2Process Simulation Table 1 shows the stream compositionsimulation. The simulation of the process begins with the simulation of the feed sour gas stream by specifying the gas temperature, pressure and flow rate.The natural gas enters the gas sweetening plant at temperature of 20 ̊C, pressure of 6895 kPa and with mass flow rate of 1100 kg mole/h.The remaining process parameters were estimatedusing EOS and the result is shown in Figure 4.Other streams specifications made are, the regenerated feed out of the amine-amine heat exchanger temperature to control the exchanger factor, DEA to Contactor temperature pressure and flow rate, make up water Table 1 Sour gas composition
Component Nitrogen Carbon Dioxide Hydrogen Sulphide Methane Ethane Propane i-Butane n-Butane i-Pentane n-Pentane n-Hexane n-Heptane Water
Arinola A. O. et al/LAUTECH Journal of Engineering and Technology 10(2) 2016: 19-29
22
and the fluid package are added. The un-simulated process flow diagram (PFD) developed is shown in
Figure 3.
simulated process flow diagram
he stream composition for HYSYS The simulation of the process begins with
the simulation of the feed sour gas stream by specifying the gas temperature, pressure and flow
The natural gas enters the gas sweetening plant at pressure of 6895 kPa and with
rate of 1100 kg mole/h.The remaining using EOS and the
.Other streams specifications made are, the regenerated feed out of
amine heat exchanger temperature to or, DEA to Contactor
temperature pressure and flow rate, make up water
temperature and DEA to recycle temperature. material and energy balance is shown in Figures5and6. Specification of sweet gas is around 50 ppm CO2. In order to ensure convergence on the absorber, the absorber top and bottom temperature and pressure was specified and simulated. Similarly, the regenerator convergence was attained by specifying the condenser and re-boiler pressure, the reflux ratio and the vent rate, the column was then simulated.
Molar Composition 0.0016 0.0480 0.0171 0.8631 0.0390 0.0092 0.0026 0.0029 0.0014 0.0012 0.0018 0.0071 0.0050
temperature and DEA to recycle temperature. The material and energy balance is shown in
. Specification of sweet gas is around
In order to ensure convergence on the absorber, the absorber top and bottom temperature and pressure was specified and simulated. Similarly, the regenerator convergence was attained by specifying
boiler pressure, the reflux ratio he vent rate, the column was then simulated.
Arinola A. O. et al/LAUTECH Journal of Engineering and Technology 10(2) 2016: 19-29
23
Figure 4: Natural gas property estimated at inlet conditions
Figure 5: Converged absorber
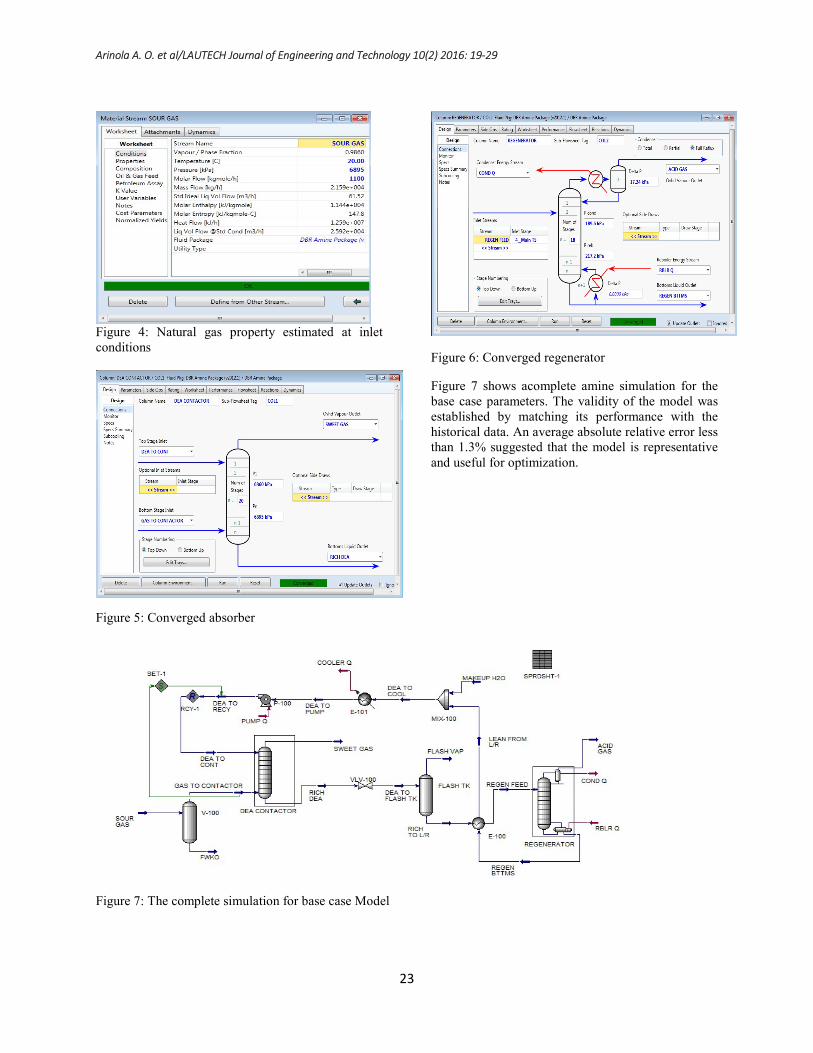
Figure 6: Converged regenerator Figure 7 shows acomplete amine simulation for the base case parameters. The validity of the model was established by matching its performance with the historical data. An average absolute relative error less than 1.3% suggested that the model is representative and useful for optimization.
Figure 7: The complete simulation for base case Model

Arinola A. O. et al/LAUTECH Journal of Engineering and Technology 10(2) 2016: 19-29
24
3.3Sensitivity Analysis Sensitivity analysis shows that the molar flow rate, temperature and number of plates are key process parameters. As shown in Figure 8 and 9, the temperature, number of plates and molar flow rate has a tremendous effect on amount of CO2 removal. From Figure 8, it is observed that at constant molar
flow rate the removal efficiency increases with decreasing number of plates. For example, at 850 kg/h, maximum CO2 remaining was recorded with minimum numbers of plates. The CO2 removal decreases as the number of plate decreases until 15 plates. Similar observation was made for different temperature.
Figure 8 Sensitivity of CO2 removals to molar flow rate for different number of plates at 20oC and 6898 kpa
Figure 9 Sensitivity of CO2 removals to molar flow rate for different number of plates at Molar flow rate of 1150 kg/h at different temperatures 3.4 Process Optimization For optimization study, the parameters were sampled using Box-Behnken Design (BBD) algorithm. BBD belongs to the family of 3 level experimental design algorithms in which each numeric factor can be
varied over 3 levels. Table 2 shows the factors setting for experimentation. An overall of 17 experiments were performed as shown in Table 3. The result was analyzed by analysisof variance using response surface methodology (RSM).
00.00020.00040.00060.0008
0.0010.00120.00140.00160.0018
0.002
0 500 1000 1500
Residu
al CO2
Molar Flow
15 plates20 plates23 plates25 plates
00.00020.00040.00060.0008
0.0010.00120.00140.00160.0018
0.002
0 10 20 30 40
Residu
al CO2
Temperature, oC
15 plates20 plates23 plates25 plates

Arinola A. O. et al/LAUTECH Journal of Engineering and Technology 10(2) 2016: 19-29
25
Table 2 Parameter settings for optimization case Name Units Low Actual High Actual Low Coded High Coded Temperature oC 10 30 -1 1 Flow rate kg/hr 850 1350 -1 1 Number of plate 15 25 -1 1
Table 3 Design Matrix for Box-Behnken Design Std Run A:Temperature B:q C:NP CO2 removal
5 1 -1 0 -1 0.046415 10 2 0 1 -1 0.046075 1 3 -1 -1 0 0.047474 8 4 1 0 1 0.047812 2 5 1 -1 0 0.047503
11 6 0 -1 1 0.047825 12 7 0 1 1 0.04769 14 8 0 0 0 0.04747 13 9 0 0 0 0.04747 3 10 -1 1 0 0.047326
17 11 0 0 0 0.04747 9 12 0 -1 -1 0.046492 4 13 1 1 0 0.047219 7 14 -1 0 1 0.047813
15 15 0 0 0 0.04747 16 16 0 0 0 0.04747 6 17 1 0 -1 0.038734
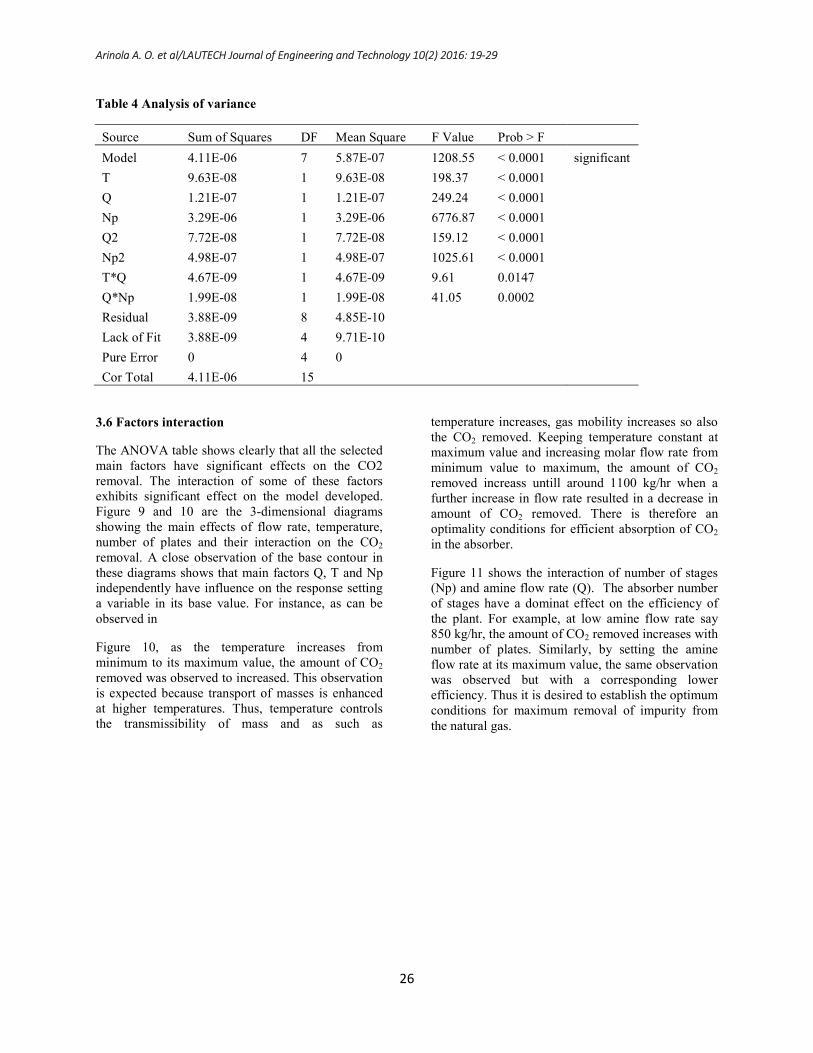
3.5 Response Surface Modelling The development of valid response surface was based on careful analysis of variance for selection of model regressor and parameter interactions using value of "Prob > F" statistics. The F-statistics can be viewed as the ratio of signal (desirable) to noise (undesirable). The result obtained from the ANOVA is presented in Table 4. TheModel F-value of
1208.55 implies the model is significant with high desirebility. There is only a 0.01% chance that a "Model F-Value" this large could occur due to noise. It was observed that the probability coefficients (p-value) for T, Q, Np, Q2, Np2, T*Q, and Q*Np were less than 0.05, given a certainty level of 95%. This validate the choice of quadratic model consisted of main, quadratic terms for Q and Np as well as the interaction terms (T*Q and Q*Np).
Arinola A. O. et al/LAUTECH Journal of Engineering and Technology 10(2) 2016: 19-29
26
Table 4 Analysis of variance Source Sum of Squares DF Mean Square F Value Prob > F Model 4.11E-06 7 5.87E-07 1208.55 < 0.0001 significant T 9.63E-08 1 9.63E-08 198.37 < 0.0001 Q 1.21E-07 1 1.21E-07 249.24 < 0.0001 Np 3.29E-06 1 3.29E-06 6776.87 < 0.0001 Q2 7.72E-08 1 7.72E-08 159.12 < 0.0001 Np2 4.98E-07 1 4.98E-07 1025.61 < 0.0001 T*Q 4.67E-09 1 4.67E-09 9.61 0.0147 Q*Np 1.99E-08 1 1.99E-08 41.05 0.0002 Residual 3.88E-09 8 4.85E-10 Lack of Fit 3.88E-09 4 9.71E-10 Pure Error 0 4 0 Cor Total 4.11E-06 15
3.6 Factors interaction The ANOVA table shows clearly that all the selected main factors have significant effects on the CO2 removal. The interaction of some of these factors exhibits significant effect on the model developed. Figure 9 and 10 are the 3-dimensional diagrams showing the main effects of flow rate, temperature, number of plates and their interaction on the CO2 removal. A close observation of the base contour in these diagrams shows that main factors Q, T and Np independently have influence on the response setting a variable in its base value. For instance, as can be observed in Figure 10, as the temperature increases from minimum to its maximum value, the amount of CO2 removed was observed to increased. This observation is expected because transport of masses is enhanced at higher temperatures. Thus, temperature controls the transmissibility of mass and as such as
temperature increases, gas mobility increases so also the CO2 removed. Keeping temperature constant at maximum value and increasing molar flow rate from minimum value to maximum, the amount of CO2 removed increass untill around 1100 kg/hr when a further increase in flow rate resulted in a decrease in amount of CO2 removed. There is therefore an optimality conditions for efficient absorption of CO2 in the absorber. Figure 11 shows the interaction of number of stages (Np) and amine flow rate (Q). The absorber number of stages have a dominat effect on the efficiency of the plant. For example, at low amine flow rate say 850 kg/hr, the amount of CO2 removed increases with number of plates. Similarly, by setting the amine flow rate at its maximum value, the same observation was observed but with a corresponding lower efficiency. Thus it is desired to establish the optimum conditions for maximum removal of impurity from the natural gas.

Arinola A. O. et al/LAUTECH Journal of Engineering and Technology 10(2) 2016: 19
Figure 10 3-Dimensional diagram for the effect of mass flow rate (Q), temperature (T) and and their interaction on CO2 removal.
Figure 11 3-Dimensional diagram for the effect of mass flow rate (Q), number of plate (Np) and and their interaction on CO2 removal.
Arinola A. O. et al/LAUTECH Journal of Engineering and Technology 10(2) 2016: 19-29
27
Dimensional diagram for the effect of mass flow rate (Q), temperature (T) and and their interaction on
Dimensional diagram for the effect of mass flow rate (Q), number of plate (Np) and and their interaction
Dimensional diagram for the effect of mass flow rate (Q), temperature (T) and and their interaction on
Dimensional diagram for the effect of mass flow rate (Q), number of plate (Np) and and their interaction

Arinola A. O. et al/LAUTECH Journal of Engineering and Technology 10(2) 2016: 19-29
28
To find the optimum process parameters that favor removal of CO2 from the gas stream, an optimization problem was set up thus: Maximize the objective function: = 0.038604 + 1.33647 − 05 ∗+ 1.64146 − 06 ∗+ 6.66542 − 04 ∗
− 1.35878 − 09 ∗ − 1.4594− 05 ∗ − 1.366 − 08 ∗ ∗+ 5.646 − 08 ∗ ∗
Subject to 10 ≤ ≤ 30, 850 ≤ ≤ 1350 15 ≤ ≤ 25 The standard deviation, multiple regression correlation coefficient, and predicted R-square values for the response surface model representing the objective function are 0.00002203, 0.9982 and 0.9911 respectively.The problem was solved numerically with the target criteria (CO2 removed) set at maximum leaving the constraints at their ranges. Figure 12 shows the ramp of numerical optimization in response surface methodology for temperature, mass flow rate and number of plate with CO2 removedof 0.0475238 moles. Thus, the optimum operating conditions for column CO2removal weretemperature of 30 oC, mass flow rate of 868.75 kg/hr and 20 numbers of plates.
Figure 12 Ramp of numerical optimization in response surface methodology for Temperature, mass
flow rate and numbers of plates for CO2 removal from a natural gas. 4 Conclusions and Recommendations 4.1 Conclusions An optimization approach for CO2 removal by integrating process simulator with the response surface methodologies is presented. Theimpacts of the amine flow rate, sour gas inlet temperature and absorber number of plates were analyzed. The results show that the number of absorber plates has a significant impact on the CO2 removal. The efficiency was optimum as the number of plates reduces from 25 to around 20 for the selected solvent. The increase in amine circulation rate led to corresponding increase in amount of CO2 removed. This could however increase the cost of the operation. The inlet temperature of the sour gas slightly affects the CO2 removal. Thus, as the temperature decreases it is expected that the amount of energy requirement will tend to decrease. 4.2 Recommendations Based on the experiment conducted, analyses and conclusions of this work, the following are recommended: (i). Detailed optimization framework for integrated equipment and process design parameters is recommended. (ii). The definition of the objective function in terms of cost is desirable. The use of Net Present Value (NPV) for example could give a more realistic analysis taking into account all the CAPEX and OPEX. 5.0 References Paez, J.E., Blok, R., Vaziri, H. and Islam, M.R. (2001) ‘Problems in gas hydrates: practical guidelines for field remediation’, SPE paper No. 69424, SPE Latin American and Caribbean fPetroleum Engineering Conference, 25–28 March, Buenos ires, Argentina Arnold, K. & Stewart M.; Surface Production Operations, Vol. 2; Ed. 2; Gulf Publishing Company; Houston TX; 1999; pp 151-153, 164-167,190.
Arinola A. O. et al/LAUTECH Journal of Engineering and Technology 10(2) 2016: 19-29
29
Mokhatab R.Design Considerations for Acid Gas Injection. Laurence Reid Gas Conditioning Conference, 1999. Douglas H. Mackenzie, Francis Chiraka Prambil, Christina A. Daniels, Jerry A. Bullin, (1987) “Design & Operation of a Selective Sweetening Plant Using MDEA,” Energy Progress: 31-36 Kohl, A.L. and F.C. Riesenfeld, Gas Purification. 5th edition ed, ed. A.L. Kohl and F.C. Riesenfeld. 1997, New York: Elsevier. 1439. Jaswar Koto (2014) “Absorption Acid Gas Removal in Liquefied Natural Gas Process,” Journal of Ocean, Mechanical and Aerospace -Science and Engineering, Vol.7, pp24-28 Reddy, S., J. Scherffius, S. Freguia, and R. C., Fluor's Econamine FG PlusSM Technology: An Enhanced Amine-Based CO2 Capture Process, in Second National Conference on Carbon Sequestration. 2003: Alexandria, VA. Reddy, S., D. Johnson, and J. Gilmartin, Fluor's Econamine FG PlusSM Technology for CO2 Capture at Coal-fired Power Plants, in Power Plant Air Pollutant Control "Mega" Symposium. 2008: Baltimore, MD. Lu, J.G., L.J. Wang, X.Y. Sun, J.S. Li, and X.D. Liu, Absorption of CO2 into aqueous solutions of methyldiethanolamine and activated methyldiethanolamine from a gas mixture in a hollow fiber contactor. Industrial & Engineering Chemistry Research, 2005. 44(24): p. 9230-9238. Yih, S.M. and K.P. Shen, Kinetics of carbon dioxide reaction with sterically hindered 2-amino-2-methyl-1-propanol aqueous solutions. Industrial & Engineering Chemistry Research, 2002. 27(12): p. 2237-2241. Xu, S., Y.-W. Wang, F.D. Otto, and A.E. Mather, Kinetics of the reaction of carbon dioxide with 2-amino-2-methyl-1-propanol solutions. Chemical Engineering Science, 1996. 51(6): p. 841-850. Idem, R., M. Wilson, P. Tontiwachwuthikul, A. Chakma, A. Veawab, A. Aroonwilas, and D. Gelowitz, Pilot plant studies of the CO2 capture performance of aqueous MEA and mixed MEA/MDEA solvents,” Industrial & Engineering Chemistry Research, 2006. 45(8): p. 2414-2420
Wiley Critical Content-Petroleum Technology; Vol.1; John Wiley & Sons; 2007; pp-378 Kumar, P.S., J.A. Hogendoorn, G.F. Versteeg, and P.H.M. Feron, Kinetics of the reaction of CO2 with aqueous potassium salt of taurine and glycine. Aiche Journal, 2003. 49(1): p. 203-213. Abu-Zahra, M.R.M., L.H.J. Schneiders, J.P.M. Niederer, P.H.M. Feron, and G.F. Versteeg, CO2 capture from power plants: Part I. A parametric study of the technical performance based on monoethanolamine. International Journal of Greenhouse Gas Control, 2007. 1(1): p. 37-46. Alie, C., L. Backham, E. Croiset, and P.L. Douglas, Simulation of CO2 capture using MEA scrubbing: a flowsheet decomposition method. Energy Conversion and Management, 2005. 46(3): p. 475-487. .