
OPTIMIZATION OF PROCESS PARAMETERS FOR DOCOSAHEXAENOIC ACID PRODUCTION BY SCHIZOCHYTRIUM SPECIES...
12
www.wjpps.com Vol 3, Issue 5, 2014. 1546 Umesh et al. World Journal of Pharmacy and Pharmaceutical Sciences OPTIMIZATION OF PROCESS PARAMETERS FOR DOCOSAHEXAENOIC ACID PRODUCTION BY SCHIZOCHYTRIUM SPECIES USING STATISTICAL TECHNIQUE Umesh Luthra*, Archana Tripathi, Sneha Khadpekar, Nishtha K.Singh, Aditi Trivedi and Harish Kumar Ipca Laboratories Ltd., Biotech R&D, Kandivali (W), Mumbai- 400067, Maharashtra, India ABSTRACT A marine microalgae Schizochytrium sp. was used for DHA production. The aim of this study was to optimize the shake flask process parameters for maximizing DHA production via statistical technique. The process parameters play a significant role in DHA production. The effect of four factors – Temperature, RPM, Inoculum% and pH was determined. The significant factors i.e. temperature, pH and rpm were screened using the first-order model based on Plackett-Burman design which was further optimized by central composite design. Central composite design was based on second degree polynomial used to identify optimal culture conditions for the production of DHA. A maximum DHA production was achieved 5.29 mg/g with the combination of optimized factors: temperature 26.93 o C, rpm 152.31 and pH 5.71. Validation experiments were also performed to verify the adequacy and accuracy of the model. The predicted optimum levels were in agreement with the verification experimental results. Key words: Schizochytrium sp., Docosahexaenoic acid, Plackett-Burman design, Central composite design. INTRODUCTION Docosahexaenoic acid (DHA) is long chain polyunsaturated fatty acid. It is commonly referred as omega – 3 fatty acid. It plays an important role in human health. Omega – 3 fatty acids are good for heart and brain. In infants, it is required for the development of brains, eyes and nervous systems during the first six months. DHA is a primary structural component WORLD JOURNAL OF PHARMACY AND PHARMACEUTICAL SCIENCES Volume 3, Issue 5, 1546-1557. Research Article ISSN 2278 – 4357 Article Received on 20 March 2014, Revised on 12 April 2014, Accepted on 05 May 2014 *Correspondence for Author Dr. Umesh Luthra Ipca Laboratories Ltd., Biotech R&D, Kandivali (W), Mumbai- 400067, Maharashtra, India.
-
Upload
independent -
Category
Documents
-
view
0 -
download
0
Transcript of OPTIMIZATION OF PROCESS PARAMETERS FOR DOCOSAHEXAENOIC ACID PRODUCTION BY SCHIZOCHYTRIUM SPECIES...
www.wjpps.com Vol 3, Issue 5, 2014.
1546
Umesh et al. World Journal of Pharmacy and Pharmaceutical Sciences
OPTIMIZATION OF PROCESS PARAMETERS FOR
DOCOSAHEXAENOIC ACID PRODUCTION BY SCHIZOCHYTRIUM
SPECIES USING STATISTICAL TECHNIQUE
Umesh Luthra*, Archana Tripathi, Sneha Khadpekar, Nishtha K.Singh, Aditi Trivedi
and Harish Kumar
Ipca Laboratories Ltd., Biotech R&D, Kandivali (W), Mumbai- 400067, Maharashtra, India
ABSTRACT
A marine microalgae Schizochytrium sp. was used for DHA production.
The aim of this study was to optimize the shake flask process
parameters for maximizing DHA production via statistical technique.
The process parameters play a significant role in DHA production. The
effect of four factors – Temperature, RPM, Inoculum% and pH was
determined. The significant factors i.e. temperature, pH and rpm were
screened using the first-order model based on Plackett-Burman design
which was further optimized by central composite design. Central
composite design was based on second degree polynomial used to
identify optimal culture conditions for the production of DHA. A maximum DHA production
was achieved 5.29 mg/g with the combination of optimized factors: temperature 26.93oC,
rpm 152.31 and pH 5.71. Validation experiments were also performed to verify the adequacy
and accuracy of the model. The predicted optimum levels were in agreement with the
verification experimental results.
Key words: Schizochytrium sp., Docosahexaenoic acid, Plackett-Burman design, Central
composite design.
INTRODUCTION
Docosahexaenoic acid (DHA) is long chain polyunsaturated fatty acid. It is commonly
referred as omega – 3 fatty acid. It plays an important role in human health. Omega – 3 fatty
acids are good for heart and brain. In infants, it is required for the development of brains,
eyes and nervous systems during the first six months. DHA is a primary structural component
WWOORRLLDD JJOOUURRNNAALL OOFF PPHHAARRMMAACCYY AANNDD PPHHAARRMMAACCEEUUTTIICCAALL SSCCIIEENNCCEESS
VVoolluummee 33,, IIssssuuee 55,, 11554466--11555577.. RReesseeaarrcchh AArrttiiccllee IISSSSNN 2278 – 4357
Article Received on 20 March 2014, Revised on 12 April 2014, Accepted on 05 May 2014
*Correspondence for Author
Dr. Umesh Luthra
Ipca Laboratories Ltd., Biotech
R&D, Kandivali (W), Mumbai-
400067, Maharashtra, India.
www.wjpps.com Vol 3, Issue 5, 2014.
1547
Umesh et al. World Journal of Pharmacy and Pharmaceutical Sciences
of human brain, cerebral cortex, skin, sperm, testicles and retina. It can be obtained directly
from maternal milk and fish oil (Guesnet, 2011). Mammals can not synthesize omega-3 fatty
acids and therefore they need to obtain through diet (Cetrik and Shimizu, 1999). Cold water
marine fish are the rich source of DHA.
DHA is commercially produced from microalgae (Martek, 2007). Some marine microalgae
such as dinoflagellates and species in the heterokonta phylum contain high DHA (Barclay et
al., 1994; Apt and Behrens, 1999; De Swaaf et al., 2003; Wu & Lin, 2003; Wu et al., 2005).
One of the heterotrophic microalgae, Schizochytrium sp. is able to produce DHA and can be
used due to its fast growth rate.
DHA is necessary to prevent human diseases such as cancer (Roynette et al., 2004),
cardiovascular disease (Lee and Lip, 2003), schizophrenia and Alzheimer’s disease (Ursin,
2003) and generalized peroxisomal disorders (Kim, 2008). Omega–3 fatty acids play an
important role to control the expression of specific genes in human body (Sessler and Ntambi,
1998). Low level of DHA can affect the metabolism of dopamine and serotonin in brain
(Innis, 2007).
The higher productivity has been achieved by optimizing the process parameters and culture
conditions. It is necessary to study the factors influencing the production of secondary
metabolites. The “one factor at a time” is a classical technique of optimization which
involves sequential experiments where one factor is varied and others are held at constant
level. This technique is not only requires work and time but also unable to explain factor
interactions. Statistical experimental designs have been involved to eliminate the drawback of
single factor optimization process and utilized for the optimization of process parameters for
secondary metabolite production. Response surface methodology is widely employed for
optimization of shake flask process. The first order model based on Plackett-Burman design.
Plackett-Burman design experiments have been widely used for screening and selection of
efficient factors. The screened significant variables were further optimized by CCD and
response surface methodology.
The goal of this study was to use Plackett-Burman design followed by central composite
design and response surface methodology for the optimization of process parameters to
enhance the productivity of DHA by Schizochytrium sp.

www.wjpps.com Vol 3, Issue 5, 2014.
1548
Umesh et al. World Journal of Pharmacy and Pharmaceutical Sciences
MATERIAL AND METHODS
MICROORGANISM
Schizochytrium sp. was used in this study for the production of DHA by submerged
fermentation. The culture was acquired from the American Type Culture Collection
(ATCC), P.O. Box 1549, Manassas, VA 20108, USA. The medium components were
procured from Merck, Mumbai, India. All chemicals were analytical grade. A stock culture
was maintained on agar media containing 40 g/l dextrose, 10 g/l yeast extract, 10 g/l tryptone,
35 g/l NaCl, 0.5 g/l MgSO4, 0.5 g/l CaCl2, 0.25 g/l KH2PO4, 0.1 g/l KCl and 20 g/l Agar.
CULTURE CONDITION
Inoculum was prepared by cultivating 48 h grown culture in 250 ml Erlenmeyer flasks
containing 35 ml seed medium and incubated at 28oC and 120 rpm in orbital shaker for 60 h.
Seed culture was used to inoculate production media.
ANALYTICAL METHOD
DHA productivity in the culture broth was analyzed by HPLC method. The extraction of
culture broth was done in ethanol. The extracted solution was injected into the HPLC.
Hypersil BDS C-18, 100X4.6mm, 5µ column was used for the estimation of DHA. 0.1%
ortho-phosphoric acid and acetonitrile was used as a mobile phase. The flow rate was set at
1.3 ml/min. Concentration of DHA was calculated by comparing the obtained peak area with
standard area.
EXPERIMENTAL DESIGN AND DATA ANALYSIS
PLACKETT-BURMAN DESIGN
The Plackett-Burman design was used to identify the most important variables with respect to
their main effects in the system, which is then optimized in the further studies. It is an
efficient method to determine the significant factors using a few experimental runs. Four
variables were selected in this study which can significantly affect the product yield. The
name of the factors was temperature, rpm, inoculum % and pH. Eight experiments were
generated with four variables and three dummy variables. The experimental design for the
selection of significant factors is shown in Table 1. Any factor that was not assigned as
variables is designated as dummy variables. Dummy variables are used to estimate
experimental errors in data analysis (Soliman et al., 2005). The factors were examined at two
levels, –1 for low level and +1 for high level (Rajendran et al., 2007). Plackett-Burman is a
fraction of two level of factorial design and allows the investigation of ‘n-1’ variables
www.wjpps.com Vol 3, Issue 5, 2014.
1549
Umesh et al. World Journal of Pharmacy and Pharmaceutical Sciences
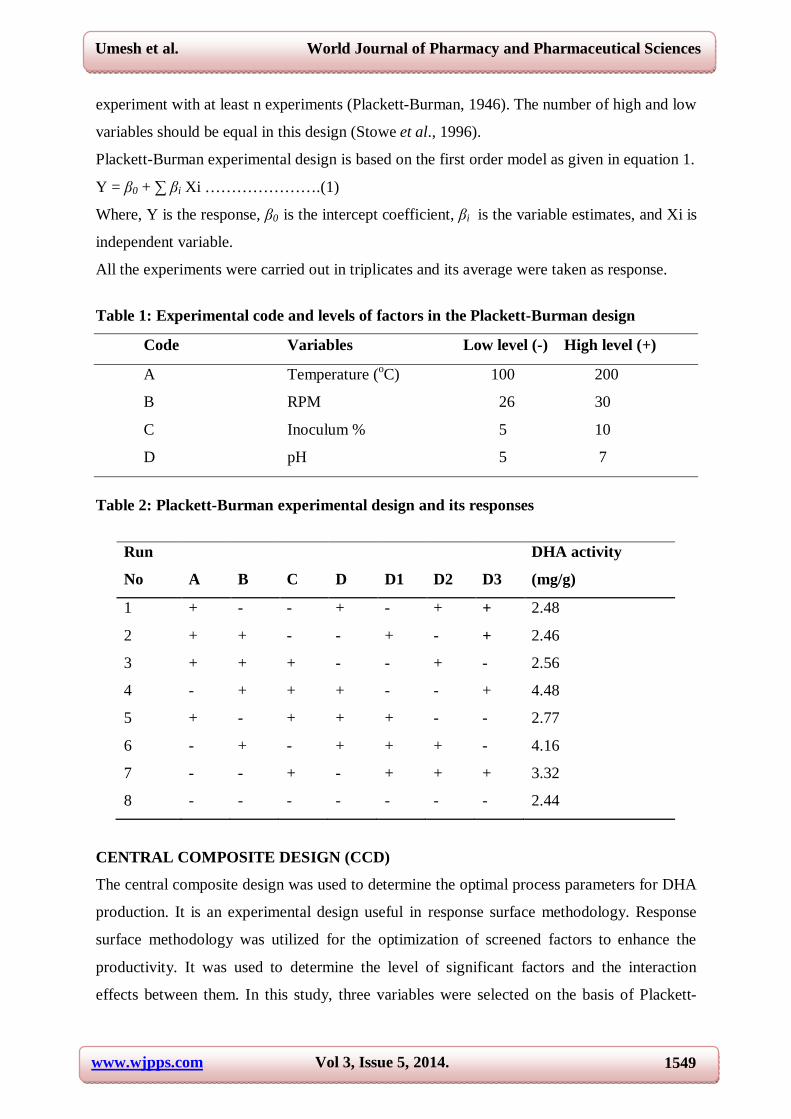
experiment with at least n experiments (Plackett-Burman, 1946). The number of high and low
variables should be equal in this design (Stowe et al., 1996).
Plackett-Burman experimental design is based on the first order model as given in equation 1.
Y = β0 + ∑ βi Xi ………………….(1)
Where, Y is the response, β0 is the intercept coefficient, βi is the variable estimates, and Xi is
independent variable.
All the experiments were carried out in triplicates and its average were taken as response.
Table 1: Experimental code and levels of factors in the Plackett-Burman design
Code Variables Low level (-) High level (+)
A Temperature (oC) 100 200
B RPM 26 30
C Inoculum % 5 10
D pH 5 7
Table 2: Plackett-Burman experimental design and its responses
Run
No A B C D D1 D2 D3
DHA activity
(mg/g)
1 + - - + - + + 2.48
2 + + - - + - + 2.46
3 + + + - - + - 2.56
4 - + + + - - + 4.48
5 + - + + + - - 2.77
6 - + - + + + - 4.16
7 - - + - + + + 3.32
8 - - - - - - - 2.44
CENTRAL COMPOSITE DESIGN (CCD)
The central composite design was used to determine the optimal process parameters for DHA
production. It is an experimental design useful in response surface methodology. Response
surface methodology was utilized for the optimization of screened factors to enhance the
productivity. It was used to determine the level of significant factors and the interaction
effects between them. In this study, three variables were selected on the basis of Plackett-
www.wjpps.com Vol 3, Issue 5, 2014.
1550
Umesh et al. World Journal of Pharmacy and Pharmaceutical Sciences
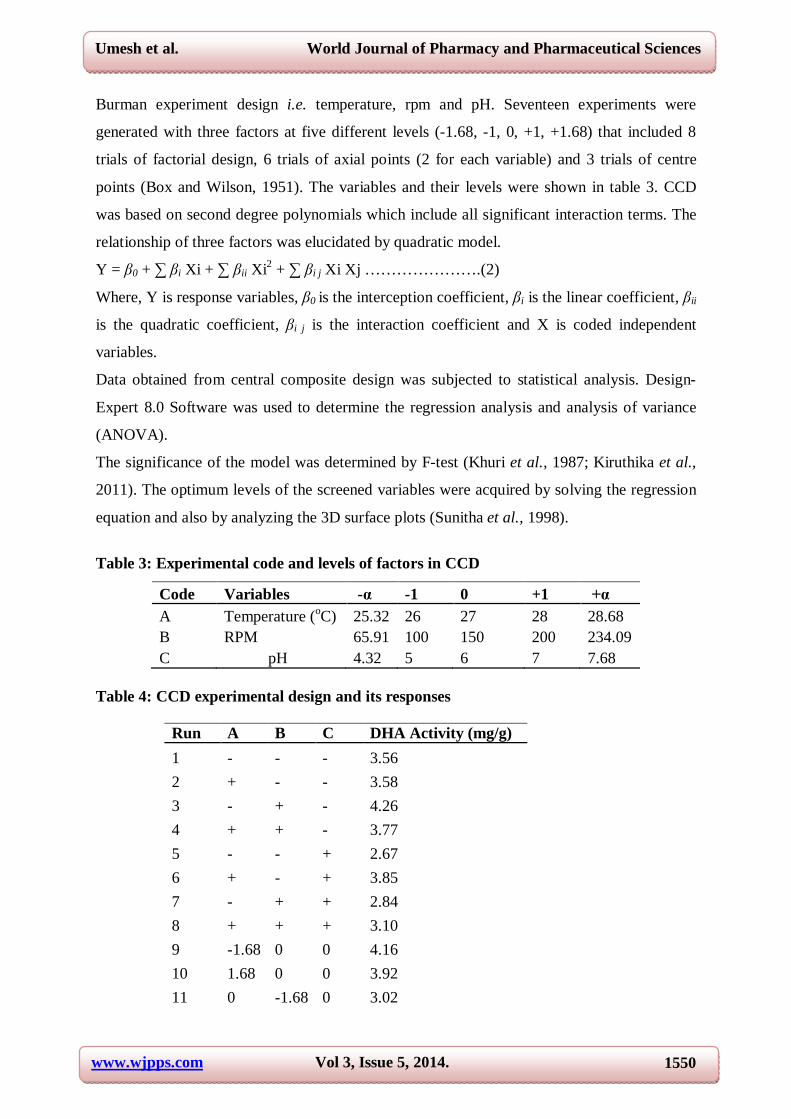
Burman experiment design i.e. temperature, rpm and pH. Seventeen experiments were
generated with three factors at five different levels (-1.68, -1, 0, +1, +1.68) that included 8
trials of factorial design, 6 trials of axial points (2 for each variable) and 3 trials of centre
points (Box and Wilson, 1951). The variables and their levels were shown in table 3. CCD
was based on second degree polynomials which include all significant interaction terms. The
relationship of three factors was elucidated by quadratic model.
Y = β0 + ∑ βi Xi + ∑ βii Xi2 + ∑ βi j Xi Xj ………………….(2)
Where, Y is response variables, β0 is the interception coefficient, βi is the linear coefficient, βii
is the quadratic coefficient, βi j is the interaction coefficient and X is coded independent
variables.
Data obtained from central composite design was subjected to statistical analysis. Design-
Expert 8.0 Software was used to determine the regression analysis and analysis of variance
(ANOVA).
The significance of the model was determined by F-test (Khuri et al., 1987; Kiruthika et al.,
2011). The optimum levels of the screened variables were acquired by solving the regression
equation and also by analyzing the 3D surface plots (Sunitha et al., 1998).
Table 3: Experimental code and levels of factors in CCD
Code Variables -α -1 0 +1 +α A Temperature (oC) 25.32 26 27 28 28.68 B RPM 65.91 100 150 200 234.09 C pH 4.32 5 6 7 7.68
Table 4: CCD experimental design and its responses
Run A B C DHA Activity (mg/g) 1 - - - 3.56 2 + - - 3.58 3 - + - 4.26 4 + + - 3.77 5 - - + 2.67 6 + - + 3.85 7 - + + 2.84 8 + + + 3.10 9 -1.68 0 0 4.16 10 1.68 0 0 3.92 11 0 -1.68 0 3.02
www.wjpps.com Vol 3, Issue 5, 2014.
1551
Umesh et al. World Journal of Pharmacy and Pharmaceutical Sciences
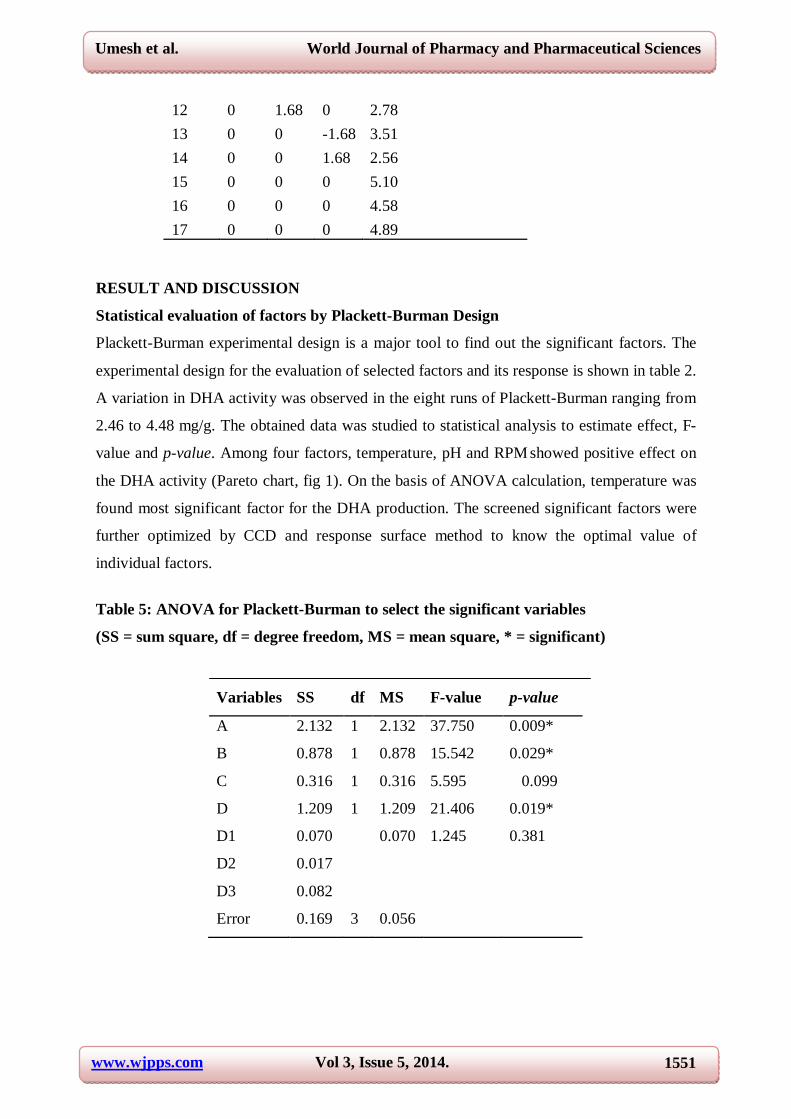
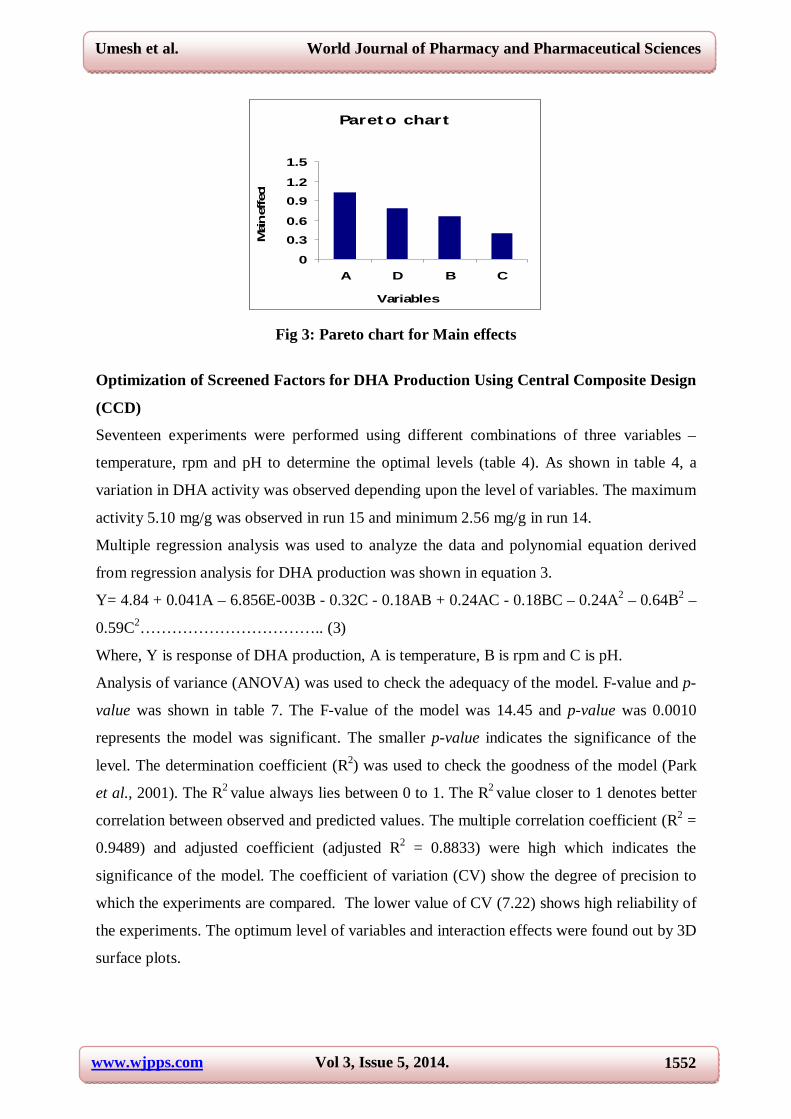
RESULT AND DISCUSSION
Statistical evaluation of factors by Plackett-Burman Design
Plackett-Burman experimental design is a major tool to find out the significant factors. The
experimental design for the evaluation of selected factors and its response is shown in table 2.
A variation in DHA activity was observed in the eight runs of Plackett-Burman ranging from
2.46 to 4.48 mg/g. The obtained data was studied to statistical analysis to estimate effect, F-
value and p-value. Among four factors, temperature, pH and RPM showed positive effect on
the DHA activity (Pareto chart, fig 1). On the basis of ANOVA calculation, temperature was
found most significant factor for the DHA production. The screened significant factors were
further optimized by CCD and response surface method to know the optimal value of
individual factors.
Table 5: ANOVA for Plackett-Burman to select the significant variables
(SS = sum square, df = degree freedom, MS = mean square, * = significant)
Variables SS df MS F-value p-value
A 2.132 1 2.132 37.750 0.009*
B 0.878 1 0.878 15.542 0.029*
C 0.316 1 0.316 5.595 0.099
D 1.209 1 1.209 21.406 0.019*
D1 0.070 0.070 1.245 0.381
D2 0.017
D3 0.082
Error 0.169 3 0.056
12 0 1.68 0 2.78 13 0 0 -1.68 3.51 14 0 0 1.68 2.56 15 0 0 0 5.10 16 0 0 0 4.58 17 0 0 0 4.89
www.wjpps.com Vol 3, Issue 5, 2014.
1552
Umesh et al. World Journal of Pharmacy and Pharmaceutical Sciences
Pareto chart
0
0.3
0.6
0.9
1.2
1.5
A D B C
Variables
Mai
n ef
fect
Fig 3: Pareto chart for Main effects
Optimization of Screened Factors for DHA Production Using Central Composite Design
(CCD)
Seventeen experiments were performed using different combinations of three variables –
temperature, rpm and pH to determine the optimal levels (table 4). As shown in table 4, a
variation in DHA activity was observed depending upon the level of variables. The maximum
activity 5.10 mg/g was observed in run 15 and minimum 2.56 mg/g in run 14.
Multiple regression analysis was used to analyze the data and polynomial equation derived
from regression analysis for DHA production was shown in equation 3.
Y= 4.84 + 0.041A – 6.856E-003B - 0.32C - 0.18AB + 0.24AC - 0.18BC – 0.24A2 – 0.64B2 –
0.59C2…………………………….. (3)
Where, Y is response of DHA production, A is temperature, B is rpm and C is pH.
Analysis of variance (ANOVA) was used to check the adequacy of the model. F-value and p-
value was shown in table 7. The F-value of the model was 14.45 and p-value was 0.0010
represents the model was significant. The smaller p-value indicates the significance of the
level. The determination coefficient (R2) was used to check the goodness of the model (Park
et al., 2001). The R2 value always lies between 0 to 1. The R2 value closer to 1 denotes better
correlation between observed and predicted values. The multiple correlation coefficient (R2 =
0.9489) and adjusted coefficient (adjusted R2 = 0.8833) were high which indicates the
significance of the model. The coefficient of variation (CV) show the degree of precision to
which the experiments are compared. The lower value of CV (7.22) shows high reliability of
the experiments. The optimum level of variables and interaction effects were found out by 3D
surface plots.
www.wjpps.com Vol 3, Issue 5, 2014.
1553
Umesh et al. World Journal of Pharmacy and Pharmaceutical Sciences
Table 6: Analysis of variance (ANOVA) for quadratic polynomial model
Variables SS df MS F-value p-value
Model 9.07 9 1.01 14.45 0.0010*
A 0.023 1 0.023 0.34 0.5798
B 6.419E-004 1 6.419E-004 9.206E-003 0.9263
C 1.36 1 1.36 19.49 0.0031*
AB 0.26 1 0.26 3.67 0.0971
AC 0.46 1 0.46 6.54 0.0377*
BC 0.27 1 0.27 3.87 0.0897
A2 0.65 1 0.65 9.28 0.0187*
B2 4.65 1 4.65 66.76 <0.0001*
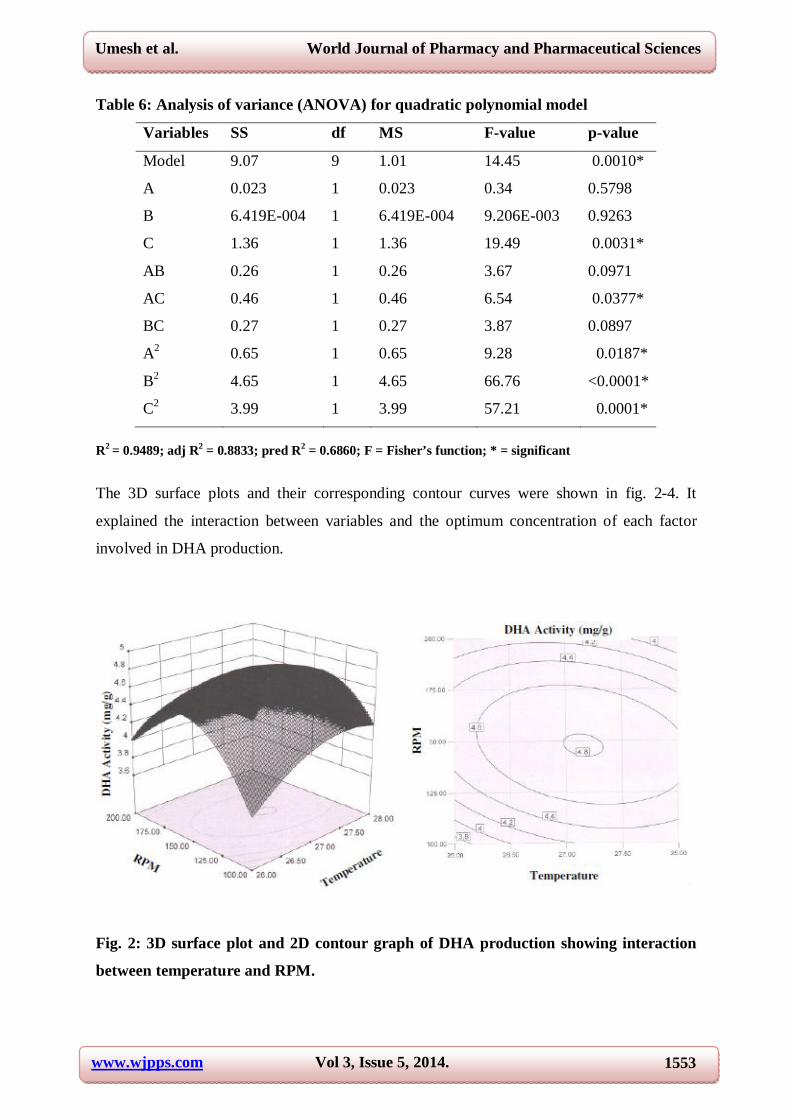
C2 3.99 1 3.99 57.21 0.0001* R2 = 0.9489; adj R2 = 0.8833; pred R2 = 0.6860; F = Fisher’s function; * = significant The 3D surface plots and their corresponding contour curves were shown in fig. 2-4. It
explained the interaction between variables and the optimum concentration of each factor
involved in DHA production.
Fig. 2: 3D surface plot and 2D contour graph of DHA production showing interaction
between temperature and RPM.
www.wjpps.com Vol 3, Issue 5, 2014.
1554
Umesh et al. World Journal of Pharmacy and Pharmaceutical Sciences
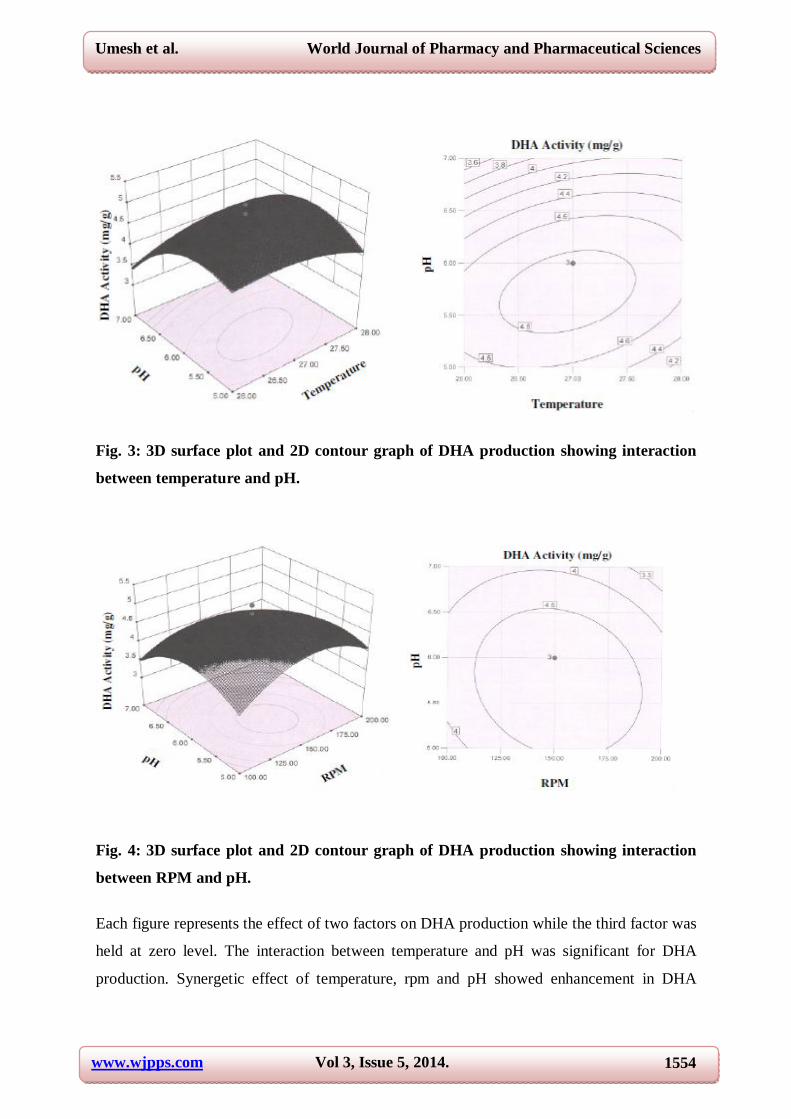
Fig. 3: 3D surface plot and 2D contour graph of DHA production showing interaction
between temperature and pH.
Fig. 4: 3D surface plot and 2D contour graph of DHA production showing interaction
between RPM and pH.
Each figure represents the effect of two factors on DHA production while the third factor was
held at zero level. The interaction between temperature and pH was significant for DHA
production. Synergetic effect of temperature, rpm and pH showed enhancement in DHA
www.wjpps.com Vol 3, Issue 5, 2014.
1555
Umesh et al. World Journal of Pharmacy and Pharmaceutical Sciences
production. The optimal level of each variable obtained from polynomial model was 26.93oC
temperature, 152.31 rpm and 5.71 pH.
Validation of Model
To verify the adequacy of the model obtained from CCD for DHA production, three sets of
experiments were performed with the obtained optimal conditions. The mean value for DHA
production by Schizochytrium sp. was 5.29 mg/g, which was in agreement with the predicted
value.
CONCLUSION
Statistical technique is a major tool for the enhancement of secondary metabolite production.
In this study, Plackett-Burman and central composite design with response surface
methodology were employed for optimization of process parameters for production of DHA
by Schizochytrium sp.. In Plackett-Burman design, temperature, rpm and pH were selected as
a critical factor for DHA productivity. The favorable conditions for the individual variables
were further optimized by central composite design. The obtained optimum levels for
maximum DHA production were 26.93oC temperature, 152.31 rpm and 5.71 pH. Under such
conditions, the highest DHA production was 5.29 mg/g. Thus it is proposed that this
optimization approach would be effective for improving the microbial technology.
REFERENCES
1. Apt, K.E., and Behrens, P.W. (1999) Commercial developments in microalgal
biotechnology. J. Phycology. 35: 215-226.
2. Barclay W. R., Meager K.M., and Abril J. R. (1994). Hetrotrophic production of long
chain omega-3 fatty acids utilizing algae and algae-like microorganisms. J. Phycology. 6:
123-129.
3. Box G.E.P., Wilson K.B. (1951). On the experimental attainment of optimum conditions.
Journal of the Royal Statistical Society. 13(1): 1-45.
4. Certik, M and S. Shimizu. 1999. Biosynthesis and regulation of microbial
polyunsaturated fatty acid production. Journal of Bioscience and Bioengineering. 87(1):
1-14.
5. De Swaaf M. E., Sijtsma L. and Pronk J. T. (2003) High cell density fed batch cultivation
of the docosahexaenoic acid producing marine alga Crypthecodinium cohnii. Biotechnol
Bioeng. 81: 666-672.
www.wjpps.com Vol 3, Issue 5, 2014.
1556
Umesh et al. World Journal of Pharmacy and Pharmaceutical Sciences
6. Guesnet P, Alessandri JM (2011). "Docosahexaenoic acid (DHA) and the developing
central nervous system (CNS) - Implications for dietary recommendations". Biochimie 93
(1): 7–12.
7. Innis, S. M. (2007) Fatty acids and early human development Early Human Development
83 (12): 761-766.
8. Khuri A. I., Cornell J. A., (1987). Response Surfaces: designs and Analyses. Marcel
Dekker, Inc., New York.
9. Kiruthika P., Nisshanthini S. D., Saraswathi A., Angayarkanni J. and Rajendran R. (2011).
Application of statistical design to the optimization of culture medium for biomass
production by Exiguoabacterium sp. HM 119395. International Journal of Advanced
Biotechnology and Research. 2 (4): 422-430.
10. Lee K.W. and. Lip G.Y.H. (2003). The role of omega-3 fatty acids in the secondary
prevention of cardiovascular disease. QJM-INT. J. MED. 96: 465-480.
11. Martek Biosciences Corporation (5 April 2007). “The History of Martek”. Archived from
the original on February 5, 2007. Retrieved March 10, 2007.
12. Park Y. S., Kang S.W., Lee J.S., et. al. (2005) Xylanase production in solid state
fermentation by Aspergillus niger mutant using statistical experimental designs. Appl
Microbiol Biotechnol 58: 761-766.
13. Plackett RL, Burman JP. (1946) The Design of Optimization Multifactorial Experiments.
Biometrika 33(4): 305-325.
14. Rajendran A., Thirngnanam M., Thangavelu V. (2007). Statistical evolution of medium
components by Plackett-Burman statistical design and kinetic modeling of lipase
production by Pseudomonas fluorescence. Ind J Biotech 6:469-478.
15. Roynette C.E., Calder P.C., Dupertuis Y.M. and Pichard C. (2004) n-3 Polysaturated fatty
acids and colon cancer prevention. Clinical Nutrition. 23: 139-151.
16. Sessler, A. M. and Ntambi J. M. (1998) Polyunsaturated Fatty Acid Regulation of Gene
Expression. The Journal of Nutrition. 128(6): 923-926.
17. Soliman NA, Bereka M, Abdel-Fattah YR. (2005) Polyglutamic Acid (PGA) production
by Bacillus sp. SAB-26: Application of Plackett-Burman experimental design to evaluate
culture requirements. Applied Microbiol. Biotechnol. 69; 259-267.
18. Stowe RA, Mayer RP. Efficient screening of process variables. Industrial and
Engineering Chemistry Research, 1996, 56: 36−40.
www.wjpps.com Vol 3, Issue 5, 2014.
1557
Umesh et al. World Journal of Pharmacy and Pharmaceutical Sciences
19. Sunitha I., Rao SMV., Ayyanna C. (1998). Optimization of medium constituents and
fermentation conditions for the production of L-glutamic acid by the co-immobilized
whole cells of Micrococcus and Pseudomonas reptilivora. Biopro Eng. 18:353-359.
20. Wu, S. T., and lin, L.P., (2003) Application of response surface methodology to optimize
docosahexaenoic acid production by Schizochytrium sp. S31. J. Food Biochem. 27: 127–
139.
21. Wu, S. T. S.T.Yu., and L.P, Lin. (2005) Effect of culture conditions on docosahexaenoic
acid production by Schizochytrium sp. S31. J. Process Biochemistry. 40: 3103–3108.