statistical pocket book - MoSPI
323
-
Upload
khangminh22 -
Category
Documents
-
view
1 -
download
0
Transcript of statistical pocket book - MoSPI


India(Combined Issue 2006 & 2007)
STATISTICAL
POCKET BOOK
CENTRAL STATISTICAL ORGANISATION
MINISTRY OF STATISTICS AND PROGRAMME
IMPLEMENTATION
GOVERNMENT OF INDIA, NEW DELHI
www.mospi.gov.in
4 5 t h E d i t i o n
Sta t i s t i ca l Pocke t Book Ind ia 2006 & 2007

Sta t i s t i ca l Pocke t Book Ind ia 2006 & 2007
1
Not for Scale

FOREWORD
Central Statistical Organisation (CSO) in the Ministry of Statistics& Programme Implementation (MOS&PI) is the nodal agency for theintegrated development of official statistical system of the Country, has beencompiling and disseminating statistical data on various aspects toGovernment, Semi-government, international bodies and private datausers/agencies. The statistics collected by CSO on various socio economicindicators are useful to planners and researchers and other national andinternational agencies. The data thus collected are disseminated throughvarious reports/publications brought out by the Ministry and also by itswebsite (www.mospi.gov.in). The “Statistical Pocket Book, India” is onesuch publications. It is being brought out since 1960.
2. The present issue of the publication viz. Statistical Pocket Book,
India (Combined issue 2006 & 2007), which is the 45 edition in the seriesgives data on various socio economic trends prevailing in the country on anAll India basis. The publication contains data for the latest 3 years besidesthe data for the base year as 1990-91 for comparative purposes. The entiredatasets have been abridged in 27 chapters each chapter containing no. oftables.
3. As in the past, the data for the publication have been provided byvarious Ministries/Departments of the Central Government besides otheragencies. Wherever necessary, these have been supplemented by culling outinformation from official publications and reports including those from theUN and other International agencies. The CSO is thankful for thecontinuous and generous cooperation extended by them in providing thedesired data to enable the organisation to bring out this publication in thepresent form.
4. Data collection, its validation, compilation and updation,presentation of charts/graphs and generation of the manuscript have beencarried out in the Research and Publication Unit. The officers and staff of theUnit have done a commendable job in bringing out this publication under theover all guidance of Shri P.K. Ray, Additional Director General, Dr. V.K.Malhotra, Deputy Director General, Smt. Pravin Horo Singh, Director, Dr.Praveen Shukla, Joint Director assisted by Shri R.P. Srivastava, AssistantDirector (Graphics).
th
Sta t i s t i ca l Pocke t Book Ind ia 2006 & 2007
1

5. This is a combined issue for 2006 & 2007. I hope the publicationwould be useful inter alia to Planners, Policy makers, Research workers andacademicians. Comments/suggestions for further improvement in the contentand quality of the publication would be highly appreciated. The same mayplease be sent to the Deputy Director General (RPU), Research & PublicationUnit, West Block-8, Wing-6 (Ground floor), New Delhi-110 066 (Telephoneno and fax no. are 011-26183425 and 011-26171985).
October, 2007New Delhi Dr. S.K. Nath
Director GeneralCentral Statistical Organisation
Sta t i s t i ca l Pocke t Book Ind ia 2006 & 2007
1

OFFICERS AND STAFF OF RESEARCH AND PUBLICATION UNITASSOCIATED WITH THE PUBLICATION
Additional Director General
Deputy Director General
Director
Joint Director
Senior Statistical Officer
Statistical Officers
Investigators
Assistant Director(Graphics)
Senior Artist
Junior Artist
Shri P. K. Ray
Dr. V.K. Malhotra
Smt. Pravin Horo Singh,
Dr. Praveen Shukla
Shri Raj Lal
Shri J.N. Ram, Shri Abhimanyu Lenka
Shri Vipin Kumar, Shri K.K. Meena, Shri Nawalesh Kumar Sinha
Shri Rajendra Prasad Srivastava
Shri Jaini Prakash
Shri Radhakrishna Rao
Research and Publication UnitMinistry of Statistics & Programme Implementation
West Block-8, Wing-6, R.K.Puram, New Delhi-110066.Telephone: 011-26183425 , Telefax: 011-26171985
E-mail: [email protected] Web site: http://mospi.gov.in
Sta t i s t i ca l Pocke t Book Ind ia 2006 & 2007
(I)
CONTENTS
Section/Table I. AREA AND POPULATION
1.1 Some demographic facts 1.2 Area and population by States : 2001 Census 1.3 Population characteristics 1.4 Percentage distribution of workers by industrial categories 1.5 Distribution of population by age-group and sex : 2001 Census 1.6 Estimated mid-year population 1.7 Population of cities/urban agglomeration : 2001 census
II. LABOUR 2.1 Employment in public and private sector establishments 2.2 Industry-wise employment in public and private sector establishments 2.3 Employment in Railways 2.4 Estimates employment in insurance 2.5 Factory employment 2.6 (A) Average per capita annual earnings of workers in manufacturing Industries covered under the payment of wages act, 1936 2.6 (B) Average per capita annual earnings of workers in manufacturing Industries covered under the payment of wages act, 1936 2.7 Average daily employment in mines 2.8 Average daily employment in plantations 2.9 Estimated employment in banking 2.10 Employment exchanges 2.11 Industrial disputes 2.12 Absenteeism in selected industries 2.13 Trade unions
III. EDUCATION AND MASS MEDIA 3.1 Number of educational institutions 3.2 Number of scholars by stage of education 3.3 Students on roll at the school/university stage 3.4 Literacy in India 3.5 Number of cinemas 3.6 Number of newspapers
IV. MEDICAL CARE AND VITAL STATISTICS
4.1 Number of hospitals, dispensaries, beds(all types)and medical Practitioners 4.2 Birth, death and infant mortality rates
4.3 Progress of family welfare programme
Page
1-23-4
567
8-910-21
2223-25
2626
27-3132-35
36
37383839394040
41-4243-44
4546-47
4848
49
5051

(II)
V. NATIONAL PRODUCT AND RELATED AGGREGATES
5.1 National product, consumption, saving and capital formation 5.2(A) Gross domestic product by economic activity (at current prices) 5.2(B) Net domestic product by economic activity (at current prices) 5.3(A) Gross domestic product by economic activity (at 1999-2000 prices) 5.3(B) Net domestic product by economic activity (at 1999-2000 prices) 5.4 Private final consumption expenditure by object (at current prices) 5.5 Private final consumption expenditure by object (at 1999-2000 prices) 5.6 Domestic saving by type of institution (at current prices)
5.7 Capital formation by type of assets and by type of institutions (at current prices) 5.8 Capital formation by type of assets and by type of institutions (at 1999-2000 prices)
5.9 Performance of public sector (at current prices) 5.10 Performance of public sector (at 1999-2000 prices) 5.11 Per capita net state domestic product(at current prices) 5.12 Per capita net state domestic product (at 1993-94 prices)
VI. AGRICULTURE
6.1 Land utilisation statistics 6.2 Estimated number of operational holdings and area operated by size of holdings: 2000-01 6.3 Area under principal crops
6.4 Production of principal crops 6.5 Average yield of principal crops 6.6 Index number of area under crops (Base: Triennium ending 1981-82=100) 6.7 Index number of agricultural production (Base: Triennium ending 1981-82=100) 6.8 Index number of agricultural yield (Base: Triennium ending 1981-82=100) 6.9 Availability of food grains 6.10 Per capita net availability of food grains 6.11 Per capita availability of certain important articles of consumption 6.12 Net and gross area irrigated 6.13 Co-operative societies
VII. LIVESTOCK, POULTRY AND FISHERY 7.1 Census of livestock and poultry 7.2 Fish-catch and disposal
VIII. MINING 8.1 Production of principal minerals 8.2 Value of Production of principal minerals 8.3 Index number of mineral production (Base : 1993-94=100)
IX. INDUSTRY
5253545556
57-5859-60
6162
63
64656667
6869
70-7172-7374-7576-7778-7980-81
82828384
85-86
8788
899091

(III)
9.1 Production of selected items of major manufacturing industries 9.2 Index number of industrial production (Base:1993-94=100) 9.3 Annual survey of industries- Factory sector Summary results 9.4 Annual survey of industries: Capital and output factory sector-2003-04 & 2004-05 9.5 Annual survey of industries: Employment and value added -Statewise : Factory sector – 2003-04 & 2004-05
9.6 Performance of Small Scale Industries Sector
X. FUEL AND POWER
10.1 Primary source of energy (production) 10.2 Production and distribution of raw coal & lignite
10.3 Electricity: Installed generating capacity - All India 10.4 Electricity: Installed generating capacity - by States 10.5 Electricity: Generated and sold 10.6 Electricity: Purchased as per classification NIC-98-4 digit industries 10.7 Rural electrification in India
XI. FOREIGN TRADE
11.1 Value of foreign trade in merchandise and treasure 11.2 Imports of foreign merchandise by principal commodities 11.3 Value of principal imports (percentage distribution) 11.4 Value of imports of foreign merchandise by principal countries 11.5 Quantum index of imports 11.6 Unit value index of imports 11.7 Exports of Indian merchandise by principal commodities 11.8 Value of principal exports (percentage distribution) 11.9 Value of exports of Indian merchandise by principal countries 11.10 Quantum index of exports 11.11 Unit value index of exports
XII. TRANSPORT, COMMUNICATIONS AND TOURISM 12.1 Railways- General statistics 12.2 Railways - Wagon loadings by commodities (broad gauge) 12.3 Railways - Wagon loadings by commodities(metre gauge) 12.4 Total road length by surface 12.5 Number of registered motor vehicles 12.6 Number of persons killed and injured by motor vehicle accidents 12.7 Civil Aviation- Domestic services 12.8 Civil Aviation- International services 12.9 Shipping- Strength of Indian shipping fleet 12.10 Shipping- Number and tonnage of vessels entered (all major ports) 12.11 Shipping- Cargo handled at major ports 12.12 Posts, telegraphs & telephones- Traffic and earnings 12.13 Number of foreign tourists to India by country of nationality
XIII. BANKING AND CURRENCY
92-9394-95
9697-100
101-104
105
106107108109110
111-115116
117118-119
120121-122
123124
125-127128
129-131132133
134135136
137-138139139140141142143
144-146147
148-151

(IV)
13.1 Reserve Bank of India - Issue department 13.2 Reserve Bank of India - Banking department 13.3 Scheduled commercial banks - Business in India 13.4 Ownership of banks deposits (Indian and foreign) by Economic sector 13.5 Number of offices and aggregate deposits of commercial banking companies 13.6 Distribution of commercial bank offices (scheduled and non-scheduled banks) 13.7 Distribution of outstanding credit of scheduled commercial banks according to occupation 13.8 Outstanding advances of public sector banks to agriculture, small scale industries etc. 13.9 State Co-operative Banks 13.10 Money stock measures (new series) 13.11 Sources of money stock (M3) 13.12 Money rates in India
XIV. PUBLIC FINANCE 14.1 Overall budgetary position of Government of India
14.2 Central government receipts-Major component 14.3 Major heads of capital receipts of the central government. 14.4 a) Major heads of expenditure of the central government. 14.4 b) Major heads of Developmental and Non-Developmental Expenditure of the Central Govt.
14.5 Overall consolidated budgetary position of State Governments 14.6 Revenue and capital budgets of the States 14.7 Revenue and expenditure of States (revenue account) 14.8 Capital budget of State governments 14.9 Tax revenue of the Centre, States and Union Territories as percentage of National Product at factor cost 14.10 Debt position of Central and State Governments 14.11 Small savings
XV. INCOME-TAX 15.1 Revenue collection from Direct and Indirect Taxes 15.2 Revenue collection from Total Tax Revenue 15.3 Direct Taxes(IT&OT) collection-Pre Assessment and Post Assessment Scenario 15.4 Cost of Collection of Taxes 15.5 Number of Effective Assessees
XVI. BALANCE OF PAYMENTS 16.1 Overall balance of payments - Current account. 16.2 Overall balance of payments - Capital account. 16.3 Financing of payment deficits by plan periods 16.4 Foreign exchange reserves 16.5 External assistance - authorization and utilization classified by source
152153154155156
157
158-160
161
162163164165
166167168169169
170171-173
174175-176
177
178179-180
181181182182183
184185186187
188-194

(V)
XVII. STATUTORY FINANCIAL CORPORATIONS
17.1 Industrial Finance Corporation of India Ltd.-Financial assistance to industries 17.2 Industrial Finance Corporation of India Ltd.- (Liabilities and assets) 17.3 (A) State Financial corporations (Liabilities and assets)-2002-03 17.3 (B) State Financial corporations (Liabilities and assets)-2003-04 17.3 (C) State Financial corporations (Liabilities and assets)-2004-05 17.3 (D) State Financial corporations (Liabilities and assets)-2005-06
XVIII. JOINT STOCK COMPANIES
18.1 Companies (limited by shares) at work, liquidated & struck off and newly registered companies 18.2 Capital raised from Public by non-government, non-financial
Companies by issue of prospectuses 18.3 Foreign Direct Investment - Country-wise 18.4 Foreign Direct Investment stocks - Industry-wise
XIX. INSURANCE 19.1 Gross direct premium on business in India of Indian insurers in Public Sector 19.2 Progress of life insurance -Public Sector 19.3 Investment of life insurance funds 19.4 (A) Progress of general insurance –Public Sector 19.4 (B) Assets of Indian general insurance – Public Sector
XX. PRICES 20.1 Index number of wholesale prices (By major groups and sub-groups) (Base: 1993-94=100) 20.2 Index number of consumer prices - Industrial workers (Base: 1982=100) 20.3 Index number of consumer prices - Agricultural labourers (Base: 1986-87=100) 20.4 Index number of consumer prices - Urban non-manual employees (Base: 1984-85=100)
XXI. FIVE YEAR PLANS 21.1 Plan outplay and actual expenditure by heads of development-public sector
21.2 Financial resources for the Plans 21.3 Plan resources realised of centre and state 21.4 Financing pattern of Tenth plan of public sector outlay.
195-197
198199-200201-202203-204
2005-206
207-208
209
210211
212213214215215
216
217
218
219
220-221
222-225226227

(VI)
XXII. ACCIDENTAL DEATHS AND SUICIDES
22.1 Number of accidental deaths by causes 22.2 Number of suicides
XXIII. CLIMATE
23.1 Mean maximum and mean minimum temperature(at selected centres) 23.2 Annual rainfall
XXIV. ELECTORAL STATISTICS
24.1 General elections to Lok Sabha : 2004 24.2 Number of persons contested and elected in various
General Elections-Lok Sabha 24.3 Composition/Allocation of seats in the Rajya Sabha
XXV. LOCAL BODIES
25.1 Current income and expenditure of local authorities 25.2 Number of Districts, DRDAs, Zilla Parishads, Blocks and villages Inhabited & un-Inhabited in the country 25.3 Number of Panchayats and elected representatives in the three levels of Panchayats, States/UTs as on Ist December, 2006.
XXVI. MISCELLANEOUS 26.1 State level differentials of selected characteristics
XXVII. INTERNATIONAL COMPARISONS 27.1 Area and population : 2003 27.2 Estimates of per capita gross national product at current prices 27.3 Area and production of selected crops 27.4 Production of selected industries 27.5 World trade 27.6 Strength of merchant shipping fleet. 27.7 Gross national product, per capita GNP and agriculture's share in GDP
Explanatory Notes
228229
230-231232-233
234-235236
237-238
239240
241
242-244
245246
247-252253-254255-257
258259
260-270
List of prices Publications of Central Statistical Organisation (CSO)……Inner side of back cover page
The following symbols have been used .. Not available
- Nil, negligible or not applicable P Provisional NA Not Applicable

(VII)
LIST OF CHARTS / MAP
Sl.No. Chart
Facing Page
Map of India
1. 2. 3. 4. 5. 6. 7. 8. 9. 10. 11. 12. 13. 14. 15. 16. 17. 18. 19. 20. 21. 22. 23. 24. 25. 26. 27.
Estimated mid-year population Employment in public and private sector establishments Students on roll at school/university stage Number of Newspapers Medical Care and Vital Statistics Per Capita Net National Product Net domestic product by economic activity Land Utilisation Operational holdings and area operated 1995-96 Index of area under crops Index number of agricultural production Index number of mineral production Index number of industrial production Annual Survey of Industries-factory sector Electricity-installed capacity, generation and sale Rural Electrification of India Foreign trade Foreign trade by countries Railways Shipping - strength of Indian shipping fleet Shipping cargo handled at major ports Money stock measures Joint stock companies at work Index number of wholesale prices-All Commodities Index of Whole sale prices : manufactured products etc. Index number of consumer prices Incidence of accidental deaths and suicides.

(VIII)
CONVERSION FACTORS
I. STANDARDS OF WEIGHTS
1 gram 1 Kilogram 1 metric ton 1 quintal
15.432 grains2.204623 lb. avdp.0.984207 long ton
220.4623 lb. avdp.
II. STANDARDS OF LENGTH AND CAPACITY
1 centimetre 1 metre 1 kilometre 1 sq. centimetre 1 sq. metre 1 hectare 1 sq. kilometre 1 litre
0.393701 inch1.093613 yards 0.621371 mile
0.155000 sq. inch 1.195990 sq. yards
2.471054 acres 0.386102 sq. mile
0.879877 imp. quart or 1.056688 US quarts
III. RAILWAYS AND AIR TRAFFIC STANDARDS
1 passenger kilometre 1 metric ton kilometre
0.621371 passenger mile 0.611558 long ton mile

Item Unit 1971 1981 1991 2001
Population of India Million 548 683+ 846++ 1029*Female Population Percent 48.2 48.3+ 48.1++ 49.7*Rural Population Percent 80.1 76.7+ 74.3++ 74.3*Birth rate Per 1000 36.9 33.9 29.5 25.4Death rate Per 1000 14.9 12.5 9.8 8.4Working force (2) Percent 32.9 36.7 37.5 39.1**Density of PersonsPopulation (3) per sq.km. 177 216 267 325*Literacy rate (4) Percent 29.5 43.7 52.2 64.8**Annual exponential rateof growth (5) Percent 2.22 2.20+++ 2.14++ 1.95Expectation of life at birth (6) Year 45.6 55.4 57.7 62.5***
For footnotes, please see next page.
1
I. AREA AND POPULATION
TABLE 1.1 SOME DEMOGRAPHIC FACTS (1)
Source: Office of the Registrar General,India

Assam and Jammu & Kashmir respectively.
for 1971 refer to the period 1961-71.
2
(1) Relates to Census data.
Population Projections(Oct.1989).
the Sample Registration System.
out while in 1991 interpolated population of the State has been considered, as Census was not carried out there. (4) Excludes 0-4 age group for 1971 and 0-6 age group for 1981,1991 and 2001. Data for 1981and 1991 exclude Assam and Jammu and Kashmir respectively. (5) Relates to the decades preceding the year of the Census,e.g. the figures
(2) Figures for 1971 show 'workers' as classified by 'main activity'only,without taking into account the work formed as'secondary activity'.Data for 1981 and 1991 excludes
I. AREA AND POPULATION
TABLE 1.1 SOME DEMOGRAPHIC FACTS -Concld.
Footnotes to Table 1.1
+ Includes projected population of Assam as projected by the Standing Committee of Experts on
(3) Density has been worked out on the basis of comparable data. For this, entire area of Jammu and Kashmir under illegal occupation of Pakistan and China have been left out. In addition to this, in 1971 entire Jammu & Kashmir have been left
(6) Figure for 1971 relate to the period 1961-71 and are based on the respective life tables. The figures shown against 1981 & 1991 relate to the periods 1981-85 and 1986-90 respectively and have been estimated by using Age Specific Mortality Rates as revealed by
++ Includes interpolated population of Jammu and Kashmir. +++ Includes interpolated population of Assam for 1981. *** Data relates to year 1998-2002. * Includes estimated population o Paomata, Mao Maram and Purul sub-divisions of Senapati district of Manipur for 2001 Census. ** Excludes figures of Paomata, Mao Maram and Purul sub-divisions of Senapati district of Manipur for 2001 Census.

Area Population Density Sex %ge
State/Union as on ('000) per ratio ofTerritory 1/3/2001 Total sq.km. (females/ Main
('000 000 workers sq.km.) males)
States: Andhra Pradesh++ 275 76210 277 978 38.05 Arunachal Pradesh 84 1098 13 893 37.66 Assam 78 26656 340 935 26.57 Bihar 94 82999 881 919 25.37 Chhattishgarh+ 135 20834 154 989 33.89 Goa 4 1348 364 961 31.59 Gujarat 196 50671 258 920 31.15 Haryana 44 21145 478 861 29.54 Himachal Pradesh 56 6078 109 968 32.32 Jammu & Kashmir +++ 222*** 10144 100 892 25.01 Jharkhand 80 26946 338 941 23.98 Karnataka 192 52851 276 965 36.63 Kerala 39 31841 819 1058 25.87 Madhya Pradesh+ 308 60348 196 919 31.61 Maharashtra 308 96879 315 922 36.82 Manipur 22 2294* 103* 974* 31.67** Meghalaya 22 2319 103 972 32.03 Mizoram 21 888 42 935 40.95 Nagaland 17 1990 120 900 35.38 Orissa 156 36804 236 972 26.01 Punjab 50 24359 484 876 32.18 Rajasthan 342 56507 165 921 30.85 Sikkim 7 541 76 875 39.29 Tamil Nadu 130 62406 480 987 37.95 Tripura 10 3199 305 948 28.33 Uttar Pradesh 241 166198 690 898 23.74 Uttaranchal Pradesh 53 8489 159 962 27.37 West Bengal 89 80176 903 934 28.77
For footnotes, please see next page.
Contd…………..
3
I. AREA AND POPULATION
TABLE 1.2 AREA AND POPULATION BY STATES : 2001 CENSUS

Area Population Density Sex %ge
State/Union as on ('000) per ratio ofTerritory 1/3/2001 Total sq.km. (females/ Main
('000 000 worker sq.km.) males)
Union Territories: A.& N.Islands 8 356 43 846 31.99 Chandigarh 0.1 901 7900 777 36.52 D. & Nagar Haveli 0.5 220 449 812 43.69 Daman & Diu 0.1 158 1413 710 42.73 Delhi 1.5 13851 9340 821 31.07 Lakshadweep 0.03 61 1895 948 19.36 Pondicherry++ 0.5 974 2030 1001 32.52
All India +++ 3287*** 1028737* 325* 933* 30.44**
* Population , Density and Sex ratio includes estimated population of Paomata, Mao Maram and Purual sub-divisions of Senapati district of Manipur for 2001. ** Excludes figures of Paomata, Mao Maram and Purual sub-divisions of Senapati district of Manipur for 2001+++ Population excludes area under unlawful occupation of Pakistan and China.
4
+ Disputed area of 10 sq. km. is neither included in Madhya Pradesh nor in Chattisgarh state. ++ Disputed area of 13 sq.km. between Pondicherry and Andhra Pradesh is neither included in Pondicherry nor in Andhra Pradesh.
I. AREA AND POPULATION
TABLE 1.2 AREA AND POPULATION BY STATES : 2001 CENSUS-concld.
China and 37,555 sq. km. under illegal occupation of China in Leh (Ladakh) district.
While calculating density of India and Jammu & Kashmir, the area under lawful occupation of Pakistan and China have been excluded.
Source: Office of the Registrar General, India
The area figures are provided by the Surveyor General of India. The area figures for India is 3287,263 Sq.Km.
Note:*** Area figures include the area under unlawful occupation of Pakistan and China. The area includes 78114 sq. km. under illegal occupation of Pakistan ; 5180 sq.km. illegally handed over by Pakistan to

Item Unit 1971 1981 1991 2001
1.Population Million 548 683+ 846 1029*2.Percentage variation over the preceding census 24.80 24.66 23.86 21.54*3.Sex ratio Females/
000 males 930 934 927 933*4.Percentage distribution (i) Rural population 80.1 76.7+ 74.3++ 74.3* (ii) Urban population 19.9 23.7 25.7 27.815.Total (2) Million 548 665 838 1028** (i) Workers (3) 18.05++ 24.46 31.41 40.22 (ii) Non-workers 36.77 42.07 52.44 62.66.Percentage distribution (i) Workers (4) 32.9++ 36.7 37.5 39.10** (ii) Non-workers 67.1 63.3 62.5 60.00**
(1) Relates to Census data.
respectively.
and 2001 respectively.
Population Projections(Oct.1989).
with the earlier Censuses.
5
economic activity at the time of 1971 Census;the figure is not strictly comparable
Note: The items relating to workers (Item Nos. 5 & 6) exclude the figures for Assam and Jammu & Kashmir in 1981 & 1991 respectively. Other items include interpolated data for Assam in 1981 and for Jammu & Kashmir in 1991.
* Includes estimated population of Paomata, Mao Maram and Purul sub-divisions of Senapati district of Manipur for 2001 Census. ** Excludes figures of Paomata, Mao Maram and Purul sub-divisions of Senapati district of Manipur for 2001 Census.
(2) The population totals shown here differ from the actuals shown against item 1as the classification of workers and non workers is not available for all the areas. (3) Includes 2.21 crore , 2.82 and 8.9 crore as 'marginal workers' in 1981, 1991 and 2001
(4) Includes 3.3 percent, 3.4 percent and 8.6 percent as `marginal workers' in 1981, 1991
++ Due to the exclusion of work performed as 'secondary activity' from the criterion of
+ Includes projected population of Assam as projected by the Standing Committee of Experts on
I. AREA AND POPULATION
Source: Office of the Registrar General, India
TABLE 1.3 POPULATION CHARACTERISTICS (1)

Industrial categories 1971+ 1981++ 1991* 2001
Agriculture and Allied Activities 72.1 68.8 66.9 .. I.Cultivators 43.4 41.6 39.7 31.7** II.Agricultural labourers 26.3 24.9 26.1 26.5** III.Livestock,forestry,fishing hunting, plantations, orchards etc. 2.4 2.3 2.1 ..
..Non-Agricultural Activities 27.9 31.2 33.1 37.6 ** IV.Mining & Quarrying 0.5 0.6 0.6 .. V.Manufacturing 9.4 11.3 10.0 .. (i) Household Industry (2) 3.5 3.5 2.4 4.2** (ii) Other than Household Industry 5.9 7.8 7.6 .. VI.Construction 1.2 1.7 1.9 .. VII.Trade and Commerce 5.6 6.3 7.5 ..VIII.Transport,Storage and Communication 2.5 2.7 2.8 .. IX. Other Services 8.7 8.6 10.3 ..
Total 100.0 100.0 100.0 100.0
(1) Relates to Census data.
++ Excludes Assam. * Excludes Jammu & Kashmir.
6
activity at the time of 1971 Census;the figures are not strictly comparable with the
I. AREA AND POPULATION
Source: Office of the Registrar General,India
(2) Includes persons engaged in household activities under categories III & IV also. + Due to exclusion of work performed as'secondary activity' from the criterion of economic
TABLE 1.4 PERCENTAGE DISTRIBUTION OF WORKERS BY INDUSTRIAL CATEGORIES (1)
the earlier Censuses.
** Excludes figures of Paomata, Mao Maram and Purul sub-divisions of Senapati district of Manipur for 2001 Census.

('000s)
Age-group Male Female Total %age
0-4 57120 53327 110447 10.7 5-9 66735 61582 128317 12.5 10-14 65633 59214 124847 12.1 15-19 53940 46276 100216 9.7 20-24 46321 43443 89764 8.7 25-29 41557 41865 83422 8.1 30-34 37362 36912 74274 7.2 35-39 36039 34535 70574 6.9 40-44 29879 25859 55738 5.4 45-49 24868 22541 47409 4.6 50-54 19852 16736 36588 3.6 55-59 13583 14070 27653 2.7 60-64 13586 13931 27517 2.7 65-69 9472 10335 19807 1.9 70+ 14710 14589 29299 2.8 Age not stated 1500 1238 2738 0.3 All ages 532157 496453 1028610 100.00
Notes:
7
TABLE 1.5 DISTRIBUTION OF POPULATION BY AGE-GROUP AND SEX : 2001 CENSUS
of Manipur.
I. AREA AND POPULATION
Source: Office of the Registrar General,India
1. 2001 figures excludes Paomata, Mao Maram and Purul sub-divisions of Senapati district

('000 No.)
State/UnionTerritory 1991 2005 2006 2007
States: Andhra Pradesh 66942 80147 81001 81836 Arunachal Pradesh 873 1160 1174 1188 Assam 22569 28406 28797 29183 Bihar 65007 89776 91253 92699Chhatisgarh 17744 22367 22710 23048 Goa 1175 1463 1506 1556 Gujarat 41568 54426 55262 56088 Haryana 16597 23029 23460 23888 Himachal Pradesh 5202 6408 6479 6550 Jammu & Kashmir 7907 10837 10995 11152Jharkand 22000 29000 29452 29895 Karnataka 45241 55822 56480 57128 Kerala 29210 33083 33357 33626 Madhya Pradesh 48947 65605 66791 67967 Maharashtra 79528 103755 105338 106919 Manipur 1851 2289 2317 2346 Meghalaya 1791 2450 2480 2510 Mizoram 697 939 950 962 Nagaland 1229 2102 2128 2154 Orissa 31843 38626 39021 39407 Punjab 20406 25839 26172 26503 Rajasthan 44366 61525 62661 63789 Sikkim 410 571 578 586 Tamil Nadu 56103 64800 65306 65795 Tripura 2781 3380 3421 3463 Uttar Pradesh 133073 180990 184449 187928Uttaranachal 7097 9123 9268 9414 West Bengal 68549 84599 85531 86430
Contd………
8
I. AREA AND POPULATION
TABLE 1.6 ESTIMATED MID-YEAR POPULATION -State-wise & All India
as on Ist July
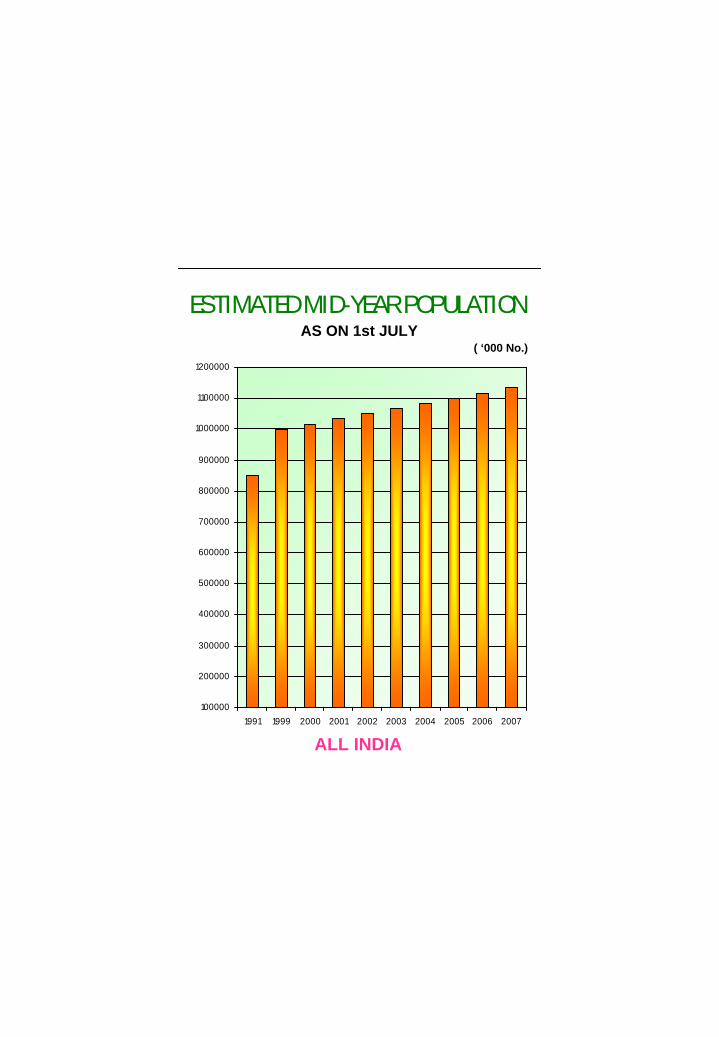
100000
200000
300000
400000
500000
600000
700000
800000
900000
1000000
1100000
1200000
1991 1999 2000 2001 2002 2003 2004 2005 2006 2007
ALL INDIA
ESTIMATED MID-YEAR POPULATIONAS ON 1st JULY
( ‘000 No.)

('000 No.)
State/UnionTerritory 1991 2005 2006 2007
Union Territories: A. & N. Islands 284 410 424 438 Chandigarh 649 1067 1121 1182 D. & N. Haveli 140 257 271 286 Daman & Diu 103 209 220 231 Delhi 9549 15718 16175 16641 Lakshadweep 52 71 73 74 Pondicherry 815 1070 1112 1162
All India 852297 1101318 1117734 1134023
9
as on Ist July
I. AREA AND POPULATION
Note 2 : Includes interpolated Population of J & K for 1991.
Source: Projected Population based on the Final Population Totals,
Senapati district of Manipur for 2001.
TABLE 1.6 ESTIMATED MID-YEAR POPULATION -State-wise & All India-Concld.
Note 1: Excluding estimated Population of Mao Maram, Paomata and Purul sub-divisions of
Primary Census Abstract, Census Abstract, Census of India 2001

State/City Population State/City Population
Andhra Pradesh Andhra Pradesh-contd.1 Hyderabad(M Corp.) 3637483 20 Malkagiri (M) 1938632 Visakhapatnam(M. Corp.) 982904 21 Eluru(M) 1900623 Vijayawada(M. Corp.) 851282 22 Machilipatnam(M) 1793534 Warangal(M Corp. ) 530636 23 Vizianagaram(M) 1746515 Guntur(M Corp.) 514461 24 Khammam(M) 1595446 Nellore (M) 378428 25 Kapra (M) 1590027 Rajahmundry(M Corp.) 315251 26 Adoni(M) 1573058 Kakinada(M) 296329 27 Tenali(M) 1537569 Kukatpally (M) 292289 28 Serilingampally (M) 153364
10 Nizamabad(M) 288722 29 Nandyal(M) 15267611 Kurnool(M Corp.) 269122 30 Chittoor(M) 15265412 Lal Bahudur Nagar (M) 268689 31 Ongole(M) 15047113 Gajuwaka (M) 259180 32 Proddatur(M) 15030914 Ramagundam(M) 236600 33 Rajendranagar (M) 14324015 Qutubullarpur(M) 231108 34 Bhimavaram(M) 13740916 Tirupati(M) 228202 35 Mahbubnagar(M) 13098617 Anantapur(M) 218808 36 Cuddapah(M) 12650518 Secunderabad Cantonment 37 Hindupur(M) 125074
Board (CB) 206102 38 Uppal Kalan (M) 11721719 Karimnagar(M) 205653 39 Guntakal(M) 117103
Contd………
10
I. AREA AND POPULATION
TABLE 1.7 POPULATION OF CITIES/URBAN AGGLOMORATION : 2001 CENSUS(100,000 and above)

State/City Population State/City Population
Andhra Pradesh-contd. Bihar-contd.40 Gudivada(M) 113054 9 Chapra(M) 17919041 Nalgonda (M) 110286 10 Katihar(M) 17519942 Srikakulam(M) 109905 11 Purnia(M) 17168743 Adilabad (M) 109529 12 Dinapur Nizamat (M) 13117644 Dharmavaram (M) 103357 13 Sasaram (M) 13117245 Tadepalligudem (M) 102622 14 Saharsa (M) 125167
15 Hajipur (M) 119412Assam 16 Dehri(M) 119057
1 Guwahati ( M.Corp.) 809895 17 Bettiah (M) 116670 2 Silchar(MB) 142199 18 Siwan (M) 109919 3 Dibrugarh(MB) 121893 19 Motihari (M) 100683 4 Nagaon(MB) 107667
Bihar Chhattisgarh1 Patna(M Corp.) 13664442 Gaya(M Corp.) 385432 1 Raipur (M Corp.) 6057473 Bhagalpur(M Corp.) 340767 2 Bhilai Nagar (M Corp.) 5563664 Muzaffarpur( M.Corp.) 305525 3 Korba ( M Corp.) 3156905 Darbhanga( M.Corp.) 267348 4 Bilaspur ( M Corp.) 2756946 Bihar (M) 232071 5 Durg ( M Corp.) 2325177 Arrah(M) 203380 6 Rajnandgaon (M Corp.) 1437708 Munger(M) 188050 7 Raigarh ( M) 111154
11
TABLE 1.7 POPULATION OF CITIES/URBAN AGGLOMORATION : 2001 CENSUS-contd.(100,000 and above)
I. AREA AND POPULATION

State/City Population State/City Population
Gujarat Gujarat-contd.1 Ahmedabad(M Corp.) 3520085 21 Palanpur (M) 1104192 Surat(M Corp.) 2433835 22 Ghatlodiya(M) 1066843 Vadodara(M Corp.) 1306227 23 Jetpur Navagadh (M) 1043124 Rajkot(M Corp.) 967476 24 Botad (M) 1001945 Bhavnagar(M Corp.) 511085 25 Kalol (M) 1000086 Jamnagar(M Corp. ) 4435187 Gandhinagar(NAC) 195985 Haryana 8 Nadiad(M) 192913 1 Faridabad (M Corp.) 10559389 Junagadh(M) 168515 2 Rohtak(M CI) 286807
10 Surendranagar Dudhrej (M) 156161 3 Panipat(M CI) 26174011 Gandhidham(M) 151693 4 Hisar(M CI) 25668912 Bharuch(M) 148140 5 Sonipat(M CI) 21497413 Morvi(M) 145719 6 Karnal(M CI) 20764014 Veraval (M) 141357 7 Yamunanagar(M CI) 18969615 Navsari(M) 134017 8 Gurgaon(M CI) 17295516 Porbandar(M) 133051 9 Bhiwani(M CI) 16953117 Anand(M) 130685 10 Sirsa(M CI) 16073518 Godhra(M) 121879 11 Panchkula Urban Estate(EO) 14092519 Vejalpur (M) 113445 12 Ambala (M CI) 13927920 Patan(M) 112219 13 Jind (M CI) 135855
12
I. AREA AND POPULATION
TABLE 1.7 POPULATION OF CITIES/URBAN AGGLOMORATION :2001 CENSUS-contd.(100,000 and above)

State/City Population State/City Population
Haryana-contd. Jharkhand-contd.14 Bahadurgarh (M CI) 119846 5 Mango (NA) 16612515 Thanesar (M CI) 119687 6 Hazaribagh (M) 12726916 Kaithal (M CI) 117285 7 Adityapur (NA) 11923317 Ambala Sadar ( M CI) 10656818 Jagadhari ( M CI) 101290 Karnataka 19 Palwal (M CI) 10072220 Rewari ( M CI) 100684 1 Bangalore(M Corp.) 4301326
2 Hubli-Dharwad(M Corp.) 786195Himachal Pradesh 3 Mysore(M Corp.) 755379
1 Shimla (M Corp.) 142555 4 Gulbarga(M Corp.) 4225695 Belgaum(M Corp.) 399653
Jammu & Kashmir 6 Mangalore(M Corp.) 3995657 Davangere(CMC) 364523
1 Srinagar(MC) 898440 8 Bellary(CMC) 3167662 Jammu(MC) 369959 9 Shimoga(CMC) 274352
10 Dasarahalli (CMC) 264940Jharkhand 11 Tumkur(CMC) 248929
12 Bijapur(CMC) 2281751 Ranchi (M Corp.) 847093 13 Raichur(CMC) 2074212 Jamshedpur (NA) 573096 14 Bommanahalli ( CMC) 2016523 Bokaro Steel city (CT) 393805 15 Krishnarajapura (CMC) 1862104 Dhanbad (M) 199258 16 Byatarayanapura (CMC) 181744
13
I. AREA AND POPULATION
TABLE 1.7 POPULATION OF CITIES/URBAN AGGLOMORATION : 2001 CENSUS-contd.(100,000 and above)

State/City Population State/City Population
Madhya Pradesh17 Bidar (CMC) 17287718 Hospet (CMC) 164240 1 Indore(M Corp.) 147496819 Bhadravati(CMC) 160662 2 Bhopal(M Corp.) 143735420 Gadag-Betigeri (CMC) 154982 3 Jabalpur(M Corp.) 93248421 Robertson Pet (CMC) 141424 4 Gwalior(M Corp.) 82702622 Mahadevapura (CMC) 135794 5 Ujjain(M Corp.) 43042723 Mandya(CMC) 131179 6 Sagar(M Corp.) 23213324 Chitradurga (CMC) 122702 7 Dewas(M Corp.) 23167225 Hassan (CMC) 116574 8 Satna(M Corp.) 22546426 Kolar (CMC) 113907 9 Ratlam(M Corp.) 22220227 Udupi(CMC) 113112 10 Burhanpur(M Corp.) 19372528 Chikmagalur (CMC) 101251 11 Murwara(Katni)(M Corp.) 187029
12 Singrauli (M Corp.) 185190Kerala 13 Rewa(M Corp.) 183274
14 Khandwa(M Corp.) 1722421 Thiruvananthapuram(M Corp.) 744983 15 Bhind(M) 1537522 Kochi (M Corp.) 595575 16 Morena(M) 1509593 Kozhikode(M Corp.) 436556 17 Shivpuri(M) 1468924 Kollam(M Corp.) 361560 18 Guna(M) 1371755 Thrissur (M Corp.) 317526 19 Vidisha (M) 1254536 Alappuzha(M) 177029 20 Chhindwara (M) 1222477 Palakkad(M) 130767 21 Mandsaur (M) 116505
14
(100,000 and above)
Karnataka Contd-
I. AREA AND POPULATION
TABLE 1.7 POPULATION OF CITIES/URBAN AGGLOMORATION : 2001 CENSUS-contd.

State/City Population State/City Population
Madhya Pradesh-contd. Maharashtra-contd.22 Damoh(M) 112185 18 Malegaon(M CI) 40940323 Neemuch (M) 107663 19 Akola(M CI) 400520
20 Jalgaon(M CI) 368618Maharashtra 21 Dhule(M CI) 341755
1 Greater Mumbai(M Corp.) 11978450 22 Ahmadnagar(M CI) 3076152 Pune(M Corp. 2538473 23 Latur(M CI) 2999853 Nagpur(M Corp.) 2052066 24 Chandrapur(M CI) 2894504 Thane (M Corp) 1262551 25 Parbhani(M CI) 2593295 Kalyan-Dombivli (M Corp.) 1193512 26 Ichalkaranji(M CI) 2576106 Nashik(M Corp.) 1077236 27 Jalna(M CI) 2357957 Pimpri Chinchwad (M Corp.) 1012472 28 Ambarnath (M CI) 2038048 Aurangabad(M Corp.) 873311 29 Nalasopara ( M CI) 1845389 Solapur(M Corp.) 872478 30 Bhusawal(M CI) 172372
10 Navi Mumbai (M Corp.) 704002 31 Bid(M CI) 13819611 Bhiwandi(M CI) 598741 32 Gondiya(M CI) 12090212 Amravati (M.Corp.) 549510 33 Yavatmal (M CI) 12067613 Mira-Bhayandar ( M CI) 520388 34 Virar ( M CI) 11892814 Kolhapur(M Corp.) 493167 35 Navghar-Manikpur ( M CI) 11672315 Ulhasnagar ( M Corp.) 473731 36 Wardha(M CI) 11111816 Sangli-Miraj Kupwad (M Corp.) 436781 37 Satara ( M CI) 10804817 Nanded-Waghala (M Corp.) 430733 38 Achalpur ( M CI) 107316
15
(100,000 and above)
I. AREA AND POPULATION
TABLE 1.7 POPULATION OF CITIES/URBAN AGGLOMORATION : 2001 CENSUS-contd.

State/City Population State/City Population
Maharashtra-contd. Punjab39 Barshi ( M CI) 104785 1 Ludhiana (M.Corp.) 139846740 Panvel ( M CI) 104058 2 Amritsar (M.Corp.) 966862
3 Jalandhar (M.Corp.) 706043Manipur 4 Patiala(M Corp.) 303151
1 Imphal(M CI) 221492 5 Bathinda(M CI) 2172566 Pathankot(M CI) 157925
Meghalaya 7 Hoshiarpur(M CI) 1496681 Shillong(M) 132867 8 Batala(M CI) 125677
9 Moga(M CI) 125573Mizoram 10 Abohar(M CI) 124339
1 Aizawl (NT) 228280 11 S.A.S. Nagar (Mohali) (M CI) 12348412 Malerkotla ( M CI) 107009
Orissa 13 Khanna ( M CI) 1030991 Bhubaneswar(M Corp.) 6480322 Cuttack(M Corp.) 534654 Rajasthan 3 Brahmapur(M) 307792 1 Jaipur(M Corp.) 23225754 Raurkela(M) 224987 2 Jodhpur(M Corp.) 8510515 Raurkela Indust. Township(ITS) 206693 3 Kota(M Corp.) 6943166 Puri(M) 157837 4 Bikaner(M Cl) 5296907 Sambalpur(M) 153643 5 Ajmer(M Cl) 4855758 Baleshwar (M) 106082 6 Udaipur(M Cl) 389438
16
I. AREA AND POPULATION
TABLE 1.7 POPULATION OF CITIES/URBAN AGGLOMORATION : 2001 CENSUS-contd.(100,000 and above)

State/City Population State/City Population
Rajasthan-contd. Tamil Nadu-contd.7 Bhilwara(M Cl) 280128 14 Dindigul(M) 1969558 Alwar(M CI) 260593 15 Vellore(M) 1772309 Ganganagar(MCl) 210713 16 Cuddalore(M) 158634
10 Bharatpur(M CI) 204587 17 Kancheepuram(M) 15314011 Pali(MCl) 187641 18 Erode(M) 15054112 Sikar(MCl) 185323 19 Alandur (M) 14628713 Tonk (M CI) 135689 20 Pallavaram (M) 14462314 Hanumangarh ( M) 129556 21 Kumbakonam(M) 13995415 Beawar(M CI) 123759 22 Tambaram (M) 13793316 Kishangarh ( M) 116222 23 Tiruvannamalai(M) 13056717 Jhunjhunun ( M) 100485 24 Neyveli (TS) 127552
25 Rajapalayam(M) 122307Tamil Nadu 26 Pudukkottai (M) 109217
1 Chennai ( M Corp.) 4343645 Tripura 2 Coimbatore(M Corp.) 930882 1 Agartala(M CI) 1899983 Madurai(M Corp.) 9288694 Tiruchirappalli(M Corp.) 752066 Uttar Pradesh 5 Salem(M Corp.) 696760 1 Kanpur(M Corp.) 25513376 Tirunelveli(M Corp.) 411831 2 Lucknow(M Corp.) 21859277 Tiruppur(M) 344543 3 Agra(M Corp.) 12751348 Ambattur ( M) 310967 4 Varanasi(M Corp.) 10919189 Avadi ( M) 229403 5 Meerut(M Corp.) 1068772
10 Thoothukkudi ( M) 216054 6 Allahabad(M Corp.) 97539311 Thanjavur ( M) 215314 7 Ghaziabad(M Corp.) 96825612 Tiruvottiyur ( M) 212281 8 Bareilly(M Corp.) 71839513 Nagercoil (M) 208179 9 Aligarh(M Corp.) 669087
17
TABLE 1.7 POPULATION OF CITIES/URBAN AGGLOMORATION : 2001 CENSUS-contd.(100,000 and above)
I. AREA AND POPULATION

State/City Population State/City Population
Uttar Pradesh-contd. Uttar Pradesh-contd.10 Moradabad(M Corp.) 641583 35 Unnao (MB) 14466211 Gorakhpur ( M Corp.) 622701 36 Orai (MB) 13931812 Saharanpur(MB) 455754 37 Banda (MB) 13483913 Jhansi(MB) 383644 38 Pilibhit (MB) 12424514 Muzaffarnagar(MB) 316729 39 Hathras (MB) 12324415 Noida (CT) 305058 40 Lakhimpur (MB) 12148616 Mathura(MB) 302770 41 Loni ( NP) 12094517 Shahajahanpur(MB) 296662 42 Gonda (MB) 12030118 Rampur(MB) 281494 43 Modinagar (MB) 11321819 Firozabad(MB) 279102 44 Hardoi (MB) 11248620 Farrukhabad-cum- 45 Lalitpur (MB) 111892
Fatehgarh(MB) 228333 46 Basti (MB) 10760121 Maunath Bhanjan(MB) 212657 47 Etah (MB) 10711022 Hapur(MB) 211983 48 Deoria (MB) 10422723 Etawah(MB) 210453 49 Chandausi (MB) 10374924 Mirzapur-cum- 50 Ballia (MB) 101465
Vindhyachal(MB) 205053 51 Kanpur(CB) 10079625 Sambhal(MB) 182478 52 Sultanpur (MB) 10006526 Bulandshahr(MB) 17642527 Rae Bareli(MB) 169333 West Bengal28 Bahraich(MB) 16832329 Amroha(MB) 165129 1 Kolkata (M Corp.) 457287630 Jaunpur(MB) 160055 2 Haora (M. Corp.) 100753231 Fatehpur (MB) 152078 3 Durgapur(M Corp.) 49340532 Sitapur(MB) 151908 4 Asansol(M Corp.) 47543933 Budaun (MB) 148029 5 Siliguri(M Corp.) 47237434 Faizabad(MB) 144705 6 Bhatpara (M) 442385
18
TABLE 1.7 POPULATION OF CITIES/URBAN AGGLOMORATION : 2001 CENSUS-contd.(100,000 and above)
I. AREA AND POPULATION

State/City Population State/City Population
West Bengal-contd. West Bengal-contd.7 South Dum Dum (M) 392444 34 Krishnanagar(M) 1391108 Maheshtala (M) 385266 35 Santipur(M) 1382359 Panihati (M) 348438 36 Balurghat(M) 135737
10 Rajpur Sonarpur (M) 336707 37 Jamuria (M) 12948411 Kamarhati (M) 314507 38 Bankura(M) 12878112 Kulti (M) 289903 39 Habra(M) 12760213 Barddhaman(M) 285602 40 Kanchrapara (M) 12619114 Rajarhat Gopalpur (M) 271811 41 Halisahar (M) 12451015 Bally (M) 260906 42 Titagarh (M) 12421316 Baranagar (M) 250768 43 North Barrackpur (M) 12366817 Barasat (M) 231521 44 Khardaha (M) 11647018 North Dum Dum (M) 220042 45 Nabadwip(M) 11501619 Naihati (M) 215303 46 Puruliya (M) 11380620 Uluberia (M) 202135 47 Rishra (M) 11330521 Serampore (M) 197857 48 Basirhat(M) 11315922 Kharagpur (M) 188761 49 Ashoknagar Kalyan-23 Haldia(M) 170673 garh (M) 11160724 Hugli-Chinsurah (M) 170206 50 Raniganj(M) 11111625 Raiganj(M) 165212 51 Baidyabati (M) 10822926 Bidhan Nagar (M) 164221 52 Darjiling (M) 10719727 Chandannagar (M Corp.) 162187 53 Bhadreswar (M) 10607128 English Bazar(M) 161456 54 Bansberia (M) 10441229 Baharampur(M) 160143 55 Champdani (M) 10324630 Madhyamgram (M) 155451 56 Bangaon (M) 10216331 Uttarpara Kotrung (M) 150363 57 Dum Dum (M) 10129632 Medinipur(M) 149769 58 Jalpaiguri (M) 10034833 Barrackpur (M) 144391
19
I. AREA AND POPULATION
TABLE 1.7 POPULATION OF CITIES/URBAN AGGLOMORATION : 2001 CENSUS-contd.(100,000 and above)

State/City Population
Uttaranchal
1 Dehradun (M.Corp.) 4266742 Haldwani-Cum_Kathgodam(MB) 1290153 Hardwar (M B) 175340
Union Territories:Delhi
1 DMC (U) (M. Corp.) 98791722 N.D.M.C. (M CL) 3023633 Sultan Pur Majra (CT) 1644264 Kirari Suleman Nagar (CT) 1546335 Bhalswa Jahangir Pur (CT) 1523396 Nangloi Jat (CT) 1509487 Karawal Nagar (CT) 1486248 Dallo Pura (CT) 1326219 Delhi Cantt. (CB) 12491710 Deoli (CT) 119468
Chandigarh1 Chandigarh (M Corp.) 808515
Pondicherry 1 Pondicherry (M) 2208652 Ozukarai (M) 217707
20
I. AREA AND POPULATION
(100,000 and above) TABLE 1.7 POPULATION OF CITIES/URBAN AGGLOMORATION :2001 CENSUS.

CMC -City Municipal Council CT -Census Town FCA -Faridabad Complex Administration M -Municipality MB -Municipal Board MC -Municipal Committee M.Corp. -Muncipal Corporation. MCl -Municipal Council NA -Notified Area. NAC -Notified Area Committee NM -Non-Municipal PTS -Panchayat Township UA -Urban AgglomorationEO - Estate OfficeU - UrbanCB - Cantoment BoardNP - Nagar PanchayatITS - Industrial Township N T - Notified Town
21
(ii) Primary Census Abstract Total Population: Table A-5 Source: Office of the Registrar General, India
I. AREA AND POPULATION
(100,000 and above)TABLE 1.7 POPULATION OF CITIES/URBAN AGGLOMORATION : 2001 CENSUS-Concld.
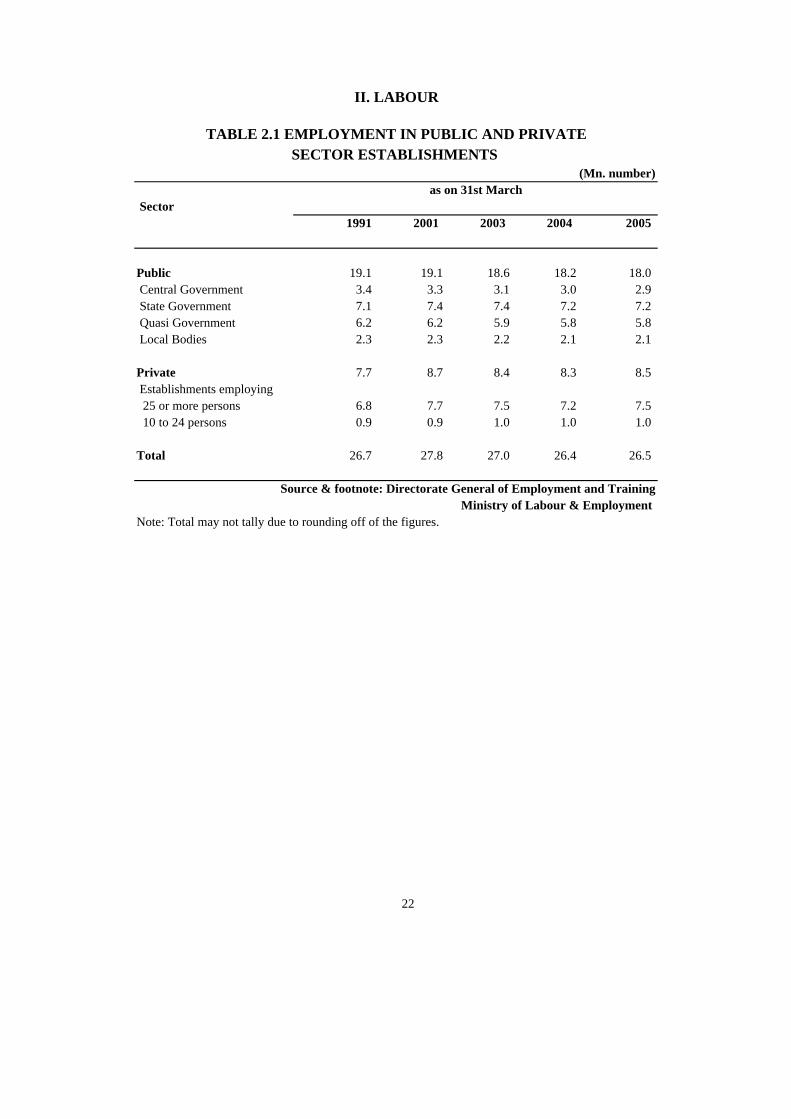
(Mn. number)
Sector 1991 2001 2003 2004 2005
Public 19.1 19.1 18.6 18.2 18.0 Central Government 3.4 3.3 3.1 3.0 2.9 State Government 7.1 7.4 7.4 7.2 7.2 Quasi Government 6.2 6.2 5.9 5.8 5.8 Local Bodies 2.3 2.3 2.2 2.1 2.1
Private 7.7 8.7 8.4 8.3 8.5 Establishments employing 25 or more persons 6.8 7.7 7.5 7.2 7.5 10 to 24 persons 0.9 0.9 1.0 1.0 1.0
Total 26.7 27.8 27.0 26.4 26.5
Note: Total may not tally due to rounding off of the figures.
22
II. LABOUR
TABLE 2.1 EMPLOYMENT IN PUBLIC AND PRIVATE SECTOR ESTABLISHMENTS
Source & footnote: Directorate General of Employment and Training
as on 31st March
Ministry of Labour & Employment

EMPLOYMENT IN PUBLIC AND PRIVATE
SECTOR ESTABLISHMENTS(As on 31st March)
Mn. Nos.
0
5
10
15
20
25
30
1991 2001 2003 2004 2005
Estts. Employing 10 to 24 personsEstts. Employing 25 or more personsLocal BodiesQuasi GovernmentState GovernmentCentral Government
PrivateSector
PublicSector

(Mn. number)
Division
Public Private Public Privatesector sector sector sector
Agriculture,hunting, forestry & fishing 0.6 0.9 0.5 0.9Mining and quarrying 1.0 0.1 0.9 0.1Manufacturing 1.9 4.5 1.4 5.0Electricity,gas and water 0.9 0.0 0.9 0.1Construction 1.2 0.1 1.1 0.1Wholesale, retail trade,restaurent & hotels 0.2 0.3 0.2 0.3Transport,storage and communications 3.0 0.1 3.0 0.1Financing,insurance,real estate & business services 1.2 0.3 1.3 0.4Community,social and personal services 9.2 1.5 9.8 1.7
Total 19.1 7.7 19.1 8.7
For footnote (1), please see next page.Contd.
23
1991
TABLE 2.2 INDUSTRY-WISE EMPLOYMENT IN PUBLIC AND PRIVATE SECTOR ESTABLISHMENTS (1)
2001
II. LABOUR
as on 31st March

(Mn. number)
Division
Public Private Public Privatesector sector sector sector
Agriculture,hunting, forestry & fishing 0.5 0.9 0.5 0.9Mining and quarrying 0.9 0.1 0.9 0.1Manufacturing 1.4 4.9 1.3 4.7Electricity,gas and water 0.9 0.0 0.9 0.1Construction 1.0 0.1 1.0 0.0Wholesale, retail trade, restaurents & hotels 0.2 0.3 0.2 0.4Transport,storage and communications 3.0 0.1 2.9 0.1Financing,insurance, real estate and business services 1.2 0.4 1.4 0.4Community,social and personal services 9.7 1.7 9.6 1.8
Total 18.8 8.4 18.6 8.4
For footnote (1), please see next page.
24
as on 31st March
20032002
II. LABOUR
TABLE 2.2 INDUSTRY-WISE EMPLOYMENT IN PUBLIC AND PRIVATE SECTOR ESTABLISHMENTS (1)-contd.
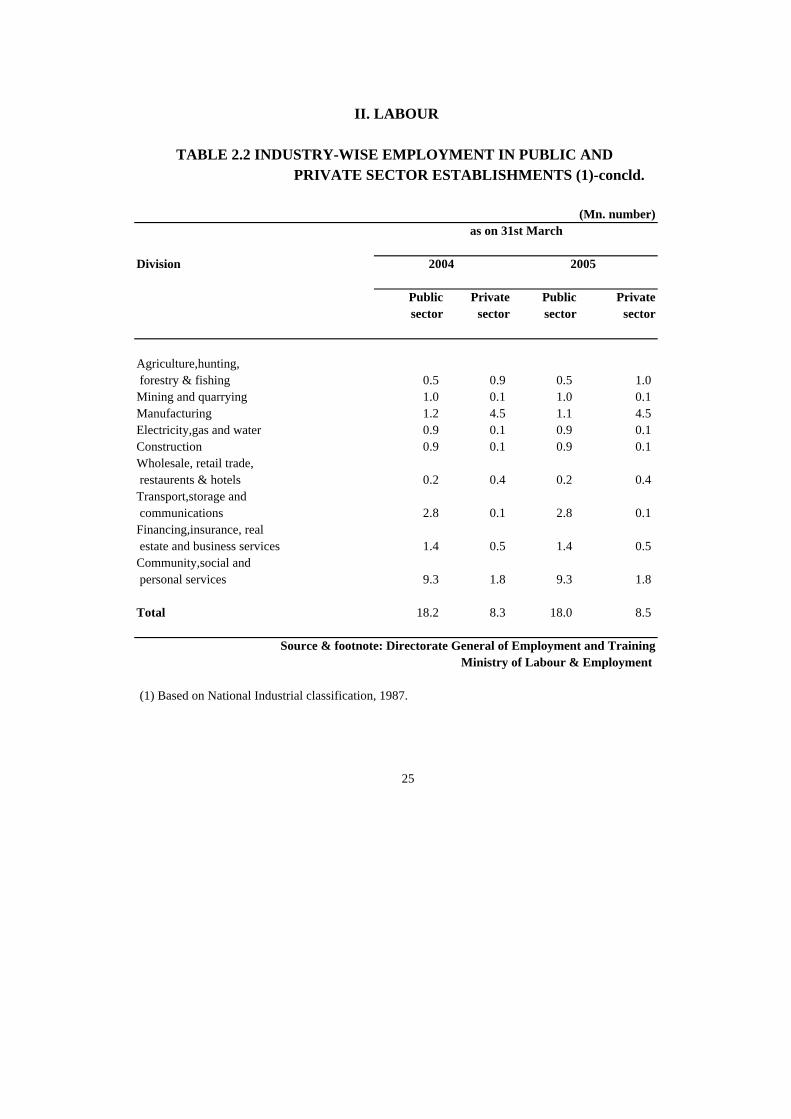
(Mn. number)
Division
Public Private Public Privatesector sector sector sector
Agriculture,hunting, forestry & fishing 0.5 0.9 0.5 1.0Mining and quarrying 1.0 0.1 1.0 0.1Manufacturing 1.2 4.5 1.1 4.5Electricity,gas and water 0.9 0.1 0.9 0.1Construction 0.9 0.1 0.9 0.1Wholesale, retail trade, restaurents & hotels 0.2 0.4 0.2 0.4Transport,storage and communications 2.8 0.1 2.8 0.1Financing,insurance, real estate and business services 1.4 0.5 1.4 0.5Community,social and personal services 9.3 1.8 9.3 1.8
Total 18.2 8.3 18.0 8.5
(1) Based on National Industrial classification, 1987.
25
II. LABOUR
TABLE 2.2 INDUSTRY-WISE EMPLOYMENT IN PUBLIC AND PRIVATE SECTOR ESTABLISHMENTS (1)-concld.
as on 31st March
2004 2005
Source & footnote: Directorate General of Employment and Training Ministry of Labour & Employment

('000 number)
Item1990-91 2000-01 2003-04 2004-05 2005-06
Government Railways(*) 1636 1528 1427 1410 1397Railway Board & other Railway offices including M.T.Ps. (Railways) 19 21 19 15 15
Total 1655 1549 1446 1425 1412
(*) Includes production units.
('000 number)
Item1990-91 2000-01 2003-04 2004-05 2005-06
Life Insurance 96.3 120.4 115.7 114.6 113.2GIPSA Companies 80.2 83.0 73.4 72.2 71.8
Total 176.5 203.4 189.1 186.8 185.0
26
TABLE 2.4 ESTIMATED EMPLOYMENT IN INSURANCE
2.General Insurers's (Public Sector) Association of India (GIPSA) Sources & footnote: 1.Life Insurance Corporation of India
Source & footnote: Railway Board, Ministry of Railways
TABLE 2.3 EMPLOYMENT IN RAILWAYS
GIPSA : General Insurers's (Public Sector) Association of India (GIPSA)
as on 31st March
as on 31st March
II. LABOUR

('000 number)
Industry 1991 1996 1997 1998
Food Products 1222 1322 1315 1383 (a) Grain mill products 295 337 338 363 (b) Vacuum pan sugar factories 196 252 148 155 (c) Other sugar factories including gur 104 117 31 32 (d) Hydrogenated oils, vanaspati ghee,etc. 12 11 10 10 (e) Vegetable oils and fats 123 157 123 123 (f) Tea processing 110 72 76 79 (g) Processing of edible nuts 144 85 211 210 (h) Others 238 291 378 411Beverages,tobacco and related products 139 144 90 96 (a) Beverages 48 63 44 52 (b) Bidi 1 @ @ @ (c) Tobacco(excluding bidi) and related products 91 81 46 44Cotton textiles 1075 967 918 953Wool,silk and man made fibre textiles 253 252 254 292Jute, hemp and mesta textiles 262 37 38 42Textile products (including wearing apparel other than foot-wear) 265 427 380 498Wood and wood products, furniture and fixtures 189 161 173 187
For footnotes, please see last page of this table.Contd.
27
II. LABOUR
TABLE 2.5 FACTORY EMPLOYMENT (*)

('000 number)
Industry 1991 1996 1997 1998
Paper and paper products and printing,publishing and allied industries 313 327 298 333 (a) paper and paper products 141 171 146 166 (b) printing and publishing 172 156 152 167Leather and leather & Fur products (except repair) 109 135 104 103 (a) Footwear (except repair) 41 44 31 32 (b) Others 69 91 73 71Chemicals and chemical products except products of petroleum and coal 617 735 652 730 (a) Fertilizers and pesti- cides 77 99 71 89 (b) Drugs and medicines 119 169 150 145 (c) Matches 58 62 66 67 (d) Others 363 405 356 429Rubber,plastic,petroleum and coal products 307 340 336 370 (a) Rubber and plastic products 226 260 256 285 (b) Petroleum and coal products 81 80 80 85Non-metallic mineral products 614 655 603 648 (a) Structural clay products 241 250 274 296 (b) Glass and glass products 70 83 35 37 (c) Cement,lime and plaster 117 129 120 125 (d) Mica products 12 12 12 9 (e) Others 174 181 162 181
For footnotes, please see last page of this table.
28
II. LABOUR
TABLE 2.5 FACTORY EMPLOYMENT (*)-contd.

('000 number)
Industry 1991 1996 1997 1998
Basic metal and alloys industries 692 619 539 605 (a) Iron and steel 262 200 189 195 (b) Foundries 206 211 172 191 (c) Others 223 208 178 219Metal products and parts except machinery and transport equipments 363 361 332 392Machinery and equipments (other than transport equipment) 993 1015 805 951Transport equipment and parts 491 515 412 434Other manufacturing industries 122 136 124 134Electricity 149 158 144 132Gas and steam 11 12 11 10Water works and supply 14 14 13 21Restaurants,cafes and other eating and drinking places @ @ @ @Sanitary services 3 4 6 7Recreational and cultural services 2 2 2 2 (a) Motion picture production 2 2 2 2Other industries not specified above 549 543 469 493 Total 8754 8881 8018 8816
For footnotes, please see last page of this table.
29
II. LABOUR
TABLE 2.5 FACTORY EMPLOYMENT (*)-contd.

('000 number)
NIC-98 Industry(**) 2000 2001 2002(P) 2003(P)
15 Food Products 775 819 906 779151 (a) Production,Processing and Preservation
of meat fish fruit vegetables,oilsw and fats 107 129 119 113152 (b) Manufacture of Dairy prodct 38 55 58 51153 (c) Manufacture of Grain mill products,starches and
starch products and prepared animal feeds 196 258 284 250154 (d)Manufacture of food products 394 329 386 315155 (e) Manufacture of Beverages 41 48 58 5016 Manufacture of tobacco products 36 34 44 3717 Manufacture of Textiles 595 933 871 61718 Manufacture of Wearing Apparel
Dressing and dyeing of Fur. 105 208 314 200181 (a) Manufacturing of wearing apperel,except
for apparel. 103 205 312 198182 (b) Dressing and dyeing of fur and pelts. 2 3 1 119 Tanning and Dressing of Leather,Manufacture
Luggage, Handbags,Saddlery, Harness and Footwear 30 91 106 37191 (a) Tanning and dressing of leather 8 45 49 10192 (b) Manufacture of footwear. 22 45 57 2620 Manufacture of Wood & products of Wood
and Cork,Except furniture,Manufactures of articles of Straw and Plating Material. 111 97 119 104
21 Manufacture of paper and paper products 78 116 122 10422 Publishing Printing and Reproduction of Recorded
Media 96 115 122 9523 Manufacture of Coke,Refined Petroleum Products
and Nuclear Fuel. 21 54 40 37
For footnotes, please see last page of this table.
30
II. LABOUR
TABLE 2.5 FACTORY EMPLOYMENT (*)-contd.

('000 number)
NIC-98 Industry(**) 2000 2001 2002(P) 2003(P)
24 Manufacture of chemical and chemical products 324 618 539 378241 (a)Manufacturing of Basic Chemicals 116 182 134 119242 ( b) Manufacture of other chemical products 197 412 392 250243 (c) Manufacture of man-made fibres 10 24 12 1026 Manufacture of other non-metallic mineral products 278 345 367 319
261 (a) Manufacture of glass and glass products 16 45 30 22269 (b)Manufacture of non-metallic mineral
products N.E.C. 262 300 338 29727 Manufacture of Basic metal 248 313 387 345
271 (a) Manufacture of Basic Iron and Steel 154 196 229 225272 (b)Manufacture of of Basic precious and non-ferrous
metals 45 62 76 68273 ( c) Casting of metals 49 55 82 5228 Manufacture of Fabricated metal products except
machinery and eqipment 187 273 356 28429 Manufacture of machinery and equipment NEC 214 325 422 28733 Manufacture of Medical Precision and Optical
Instruments watches & clocks 19 33 70 4034 Manufacture of Motor Vehicles,Trailers
and Semi trailers 107 156 172 13035 Manufacture of other transport equipments 159 201 215 17136 Manufacture of furniture; Manufactureing NEC 59 72 74 7240 Electricity, Gas and Steam and Hot Water Supply 76 86 95 8655 Hotels and Restaurants @ @ @ @
551 ( a)Hotels, camping sites and other provision of short-stay accomodation @ @ @ @
552 ( b)Restaurants,bars and canteens @ @ - -90 Sewage and Refuge Disposal, Sanitation and
Similar Activities 2 3 2 192 Recreational Culture and Sporting Activities. 1 2 2 1
Others 705 839 993 803
All Industries 4926 5733 6330 4927
@ Less than 500. Note: Totals may not tally due to rounding off of the figures.
31
(**) Data are based on National Industrial Classification, 1998.
TABLE 2.5 FACTORY EMPLOYMENT (*)-concld.
II. LABOUR
Source & footnotes: Labour Bureau, Chandigarh (*) Figures are estimated average daily employment in working factories.
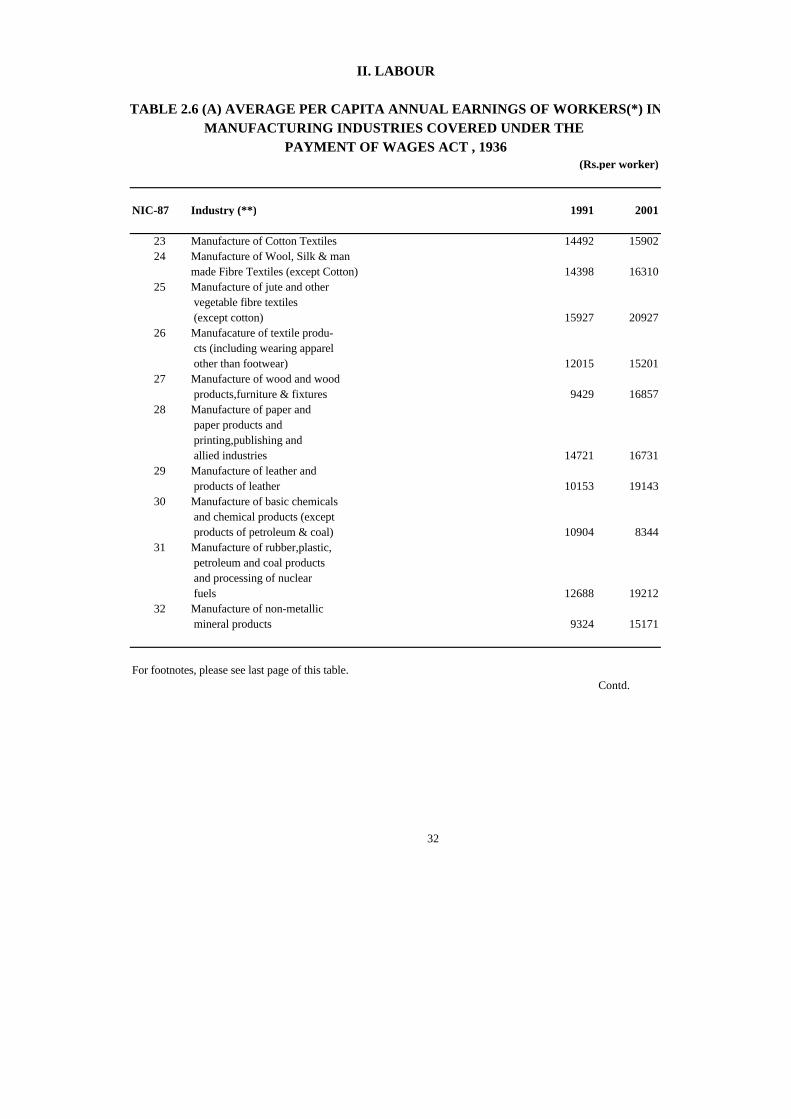
(Rs.per worker)
NIC-87 Industry (**) 1991 2001
23 Manufacture of Cotton Textiles 14492 1590224 Manufacture of Wool, Silk & man
made Fibre Textiles (except Cotton) 14398 1631025 Manufacture of jute and other
vegetable fibre textiles (except cotton) 15927 20927
26 Manufacature of textile produ- cts (including wearing apparel other than footwear) 12015 15201
27 Manufacture of wood and wood products,furniture & fixtures 9429 16857
28 Manufacture of paper and paper products and printing,publishing and allied industries 14721 16731
29 Manufacture of leather and products of leather 10153 19143
30 Manufacture of basic chemicals and chemical products (except products of petroleum & coal) 10904 8344
31 Manufacture of rubber,plastic, petroleum and coal products and processing of nuclear fuels 12688 19212
32 Manufacture of non-metallic mineral products 9324 15171
Contd.
32
II. LABOUR
TABLE 2.6 (A) AVERAGE PER CAPITA ANNUAL EARNINGS OF WORKERS(*) IN
For footnotes, please see last page of this table.
PAYMENT OF WAGES ACT , 1936MANUFACTURING INDUSTRIES COVERED UNDER THE

(Rs.per worker)
NIC-87 Industry (**) 1991 2001
33 Basic metal and alloys industries 14494 19999
34 Manufacture of metal products and parts except machinery and transport equipment 12096 19993
35 Manufacture of machinery, machine tools & parts,except electrical machinery 11011 21669+
36 Manufacture of electrical/ electronic machinery, apparatus, appliances and supplies and parts 13038 -
37 Manufacture of transport equipments and parts 10177 18030
38 Other manufacturing industries 12756 -39 Repair of capital goods 13396 -40 Electricity generation,
transmission and distribution 9490 1308241 Gas and steam generation and
distribution through pipes 14216 1602542 Water works and supply 11632 -61 Wholesale trade in wood,paper,
skin, leather and fur, fuel, petroleum,chemicals,perfumery, ceramics,glass and ores 15401 -
33
II. LABOUR
TABLE 2.6 (A) AVERAGE PER CAPITA ANNUAL EARNINGS OF WORKERS(*) IN MANUFACTURING INDUSTRIES COVERED UNDER THE
For footnotes, please see last page of this table.
PAYMENT OF WAGES ACT , 1936-Contd.

(Rs.per worker)
NIC-87 Industry (**) 1991 2001
62 Wholesale trade in all types of machinery,equipment including transport equipments 17940 -
63 Wholesale trade not else- - where classified 7040 -
64 Commission agents - -65 Retail Trade in food &
food Products etc. - 1703667 Retail trade in fuel and
other household utilities and durables 8541 15484
68 Retail trade not elsewhere classified 6854 -
69 Restaurants and hotels 10797 -70 Land transport 12314 -71 Water transport 7483 -72 Air transport 10194 2601973 Services incidental to
transport 7109 -74 Storage and ware housing
services 10583 1732175 Communication services 10583 -80 Banking and similar type of
financial institutions - -82 Real estate and business
services 12009 -89 Business services not else-
where classified 9772 -
34
II. LABOUR
TABLE 2.6 (A) AVERAGE PER CAPITA ANNUAL EARNINGS OF WORKERS(*) IN MANUFACTURING INDUSTRIES COVERED UNDER THE
For footnotes, please see last page of this table.
PAYMENT OF WAGES ACT , 1936-Contd.

(Rs.per worker)
NIC-87 Industry (**) 1991 2001
90 Public administration and defence services 6910 16599
91 Sanitary services 11386 -92 Education,scientific and
research services 13186 1500093 Health and medical services 8226 1298394 Community services - -95 Recreational and cultural
services 12133 -96 Personal services 13392 -97 Repair services 10978 -98 International and other extra
territorial bodies services 18669 -99 Services not elsewhere
classified above 9378 -XI Activities not adequately
calssified 2822 -OY Repair services if not included
under 97 - -
All Industries 12208 16751
35
(*) Data relates to workers earning less than Rs.1600/= per month. (**) Data are based on National Industrial Classification 1987.
II. LABOUR
TABLE 2.6 (A) AVERAGE PER CAPITA ANNUAL EARNINGS OF WORKERS(*) IN
PAYMENT OF WAGES ACT , 1936-Concld.
Source and footnotes : Labour Bureau,Chandigarh
MANUFACTURING INDUSTRIES COVERED UNDER THE
(ii) The coverage of data varies from year to year as returns have not been received from
(+) Relates to Industry Code 35 & 36.
all the factories coming within the purview of the Act.
Notes :(i) Data excludes employees in Railway workshops.

(Rs.per worker)
NIC-98 2002 2003
15 15351 1164816 14113 533017 10007 1672018 8346 1591319
12195 1221920
9756 1499121 15969 1238622 11968 1470723 9009 1550824 11732 1540925 14657 1356526 14182 1097627 9817 1430028
12357 1443329 27734 1660030 - 1380031 8355 1325332
16946 1561633
15094 3845234 13723 1761135 23350 1311436 12864 1311137 - 15975
13912 12969
36
II. LABOUR
Manufacture of Coke, Refined Petroleum Products and Nuclear Fuel
Notes :(i) Data excludes employees in Railway workshops. (ii) The coverage of data varies from year to year as returns have not been received from
TABLE 2.6 (B) AVERAGE PER CAPITA ANNUAL EARNINGS OF WORKERS(*) IN MANUFACTURING INDUSTRIES COVERED UNDER THE
PAYMENT OF WAGES ACT , 1936
Source and footnotes : Labour Bureau,Chandigarh
Industry (**)
Recycling
Tanning and Dressing of Leather; Manufacture of Luggage, Handbags, Saddlery, Harness and Footwear
Manufacture of Wood and Products fo Wood and Cork,Except Furniture; Manufacture of Articles of Straw and Plaiting Material
Manufacture lof Paper and Paper Products
Publishing, Printing and Reproduction of Recorded Media
Manufacture of Food Products and Beverages
Manufacture of Tobacco Products
Manufacture of Textiles
Manufacture of Wearing Apparel; Dressing and Dyeing of Fur
Manufacture of Checmials and Chemical Products
Manufacture of Rubber, Plastic Products
Manufacture of Other Non-Mettallic Mineral Products
Manufacture of Basic Metals
Manufacture of Furniture; Manufacturing of N.E.C.
Manufacture of Fabricated Metal Products except Machinery and Equipment
Manufacture of Machinery and Equipment N.E.C.*
Manufacture of Office, Accounting and Computing Machinery
Manufacture of Electrical Machinery and Apparatus N.E.C.
Manufacture of Radio, Television and Communication Equpment and Apparatus
Manufacture of Medical, Precision and Optical Instruments, Watches and Clocks
Manufacture of Motor Vehicles, Trailers and Semi-Trailers
Manufacture of Other Transport Equipment
all the factories coming within the purview of the Act.
All Manufacturing Industries
(*) Data relates to workers earning less than Rs.1600/= per month. (**) Data are based on National Industrial Classification 1998.
('000 number)
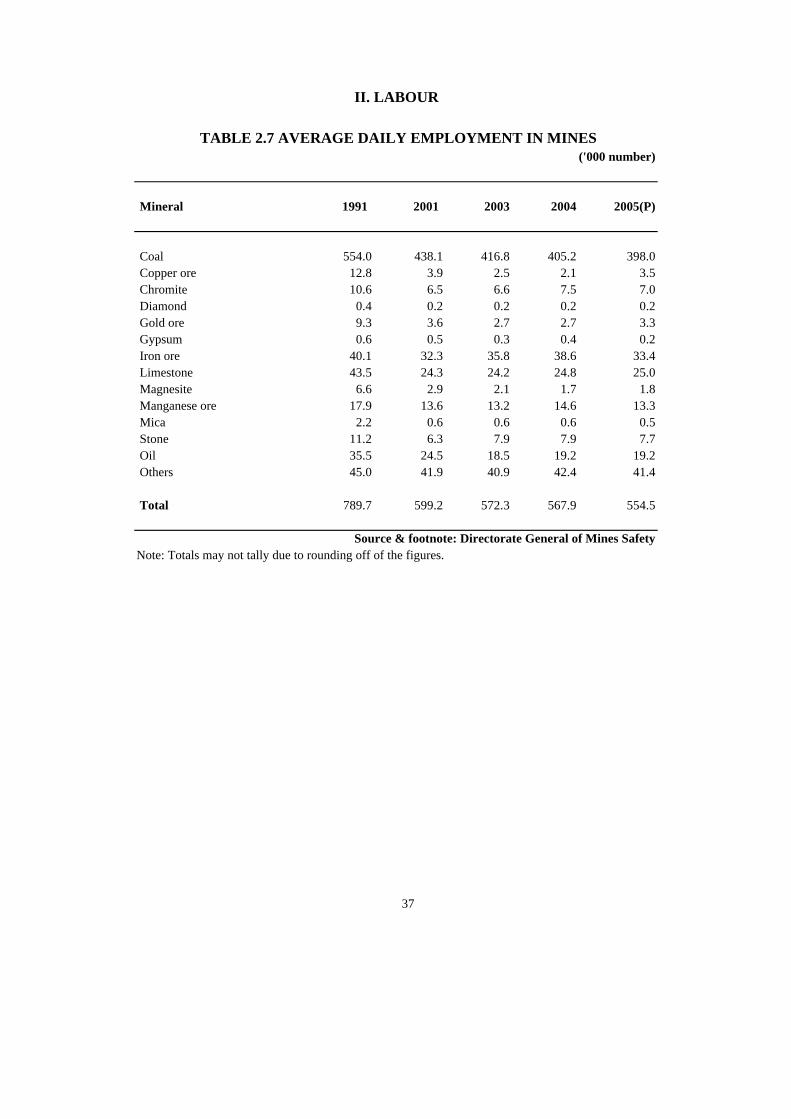
Mineral 1991 2001 2003 2004 2005(P)
Coal 554.0 438.1 416.8 405.2 398.0 Copper ore 12.8 3.9 2.5 2.1 3.5 Chromite 10.6 6.5 6.6 7.5 7.0 Diamond 0.4 0.2 0.2 0.2 0.2 Gold ore 9.3 3.6 2.7 2.7 3.3 Gypsum 0.6 0.5 0.3 0.4 0.2 Iron ore 40.1 32.3 35.8 38.6 33.4 Limestone 43.5 24.3 24.2 24.8 25.0 Magnesite 6.6 2.9 2.1 1.7 1.8 Manganese ore 17.9 13.6 13.2 14.6 13.3 Mica 2.2 0.6 0.6 0.6 0.5 Stone 11.2 6.3 7.9 7.9 7.7 Oil 35.5 24.5 18.5 19.2 19.2 Others 45.0 41.9 40.9 42.4 41.4
Total 789.7 599.2 572.3 567.9 554.5
Note: Totals may not tally due to rounding off of the figures.
37
Source & footnote: Directorate General of Mines Safety
II. LABOUR
TABLE 2.7 AVERAGE DAILY EMPLOYMENT IN MINES

('000 number)
Item 1991 2001 2003 2004 2005
Tea* 997 1232 1256 1258(E) 1259(E) Coffee 367 552 497 527 543 Rubber 293 349 372 378 385
Total 1657 2133 2125 2163 2187
E- Estimated
Item1990-91 2000-01 2003-04 2004-05 2005-06(P)
Number ('000) 1008.8 957.8 906.7 923.2 922.3 Index (1961=100) 758.5 720.2 681.7 694.1 693.5
Notes:
38
respective financial year and, for others, it is as on March 31 of the corresponding financial year.
2. Number of employees in the Reserve Bank of India are as on December 31 of the
Source & footnotes: Reserve Bank of India
1. Figures relate to all Scheduled Commercial Banks (Indian and Foreign),Regional Rural Banks and the Reserve Bank of India.
II. LABOUR
Sources & footnote: Tea Board, Coffee Board and Rubber Board
TABLE 2.9 ESTIMATED EMPLOYMENT IN BANKING
TABLE 2.8 AVERAGE DAILY EMPLOYMENT IN PLANTATIONS
as on 31st March
* Since 1998 figures are inclusive of small growers operating in different tea producing districts/states.

Item 1991 2001 2004 2005 2006
Number of Exchanges (at year end) (No.) 854 938 947 947 947Registrations ('000) 6236 5553 5373 5437 7290Placements ('000) 253 169 138 173 177Applicants on live register (at year end) ('000) 36300 41996 40458 39348 41466
Item 1991 2001 2003 2004 2005
No.of work Stoppages 1810 674 552 477 456No.of workers involved ('000) 1342 688 1816 2072 2914No.of man-days lost ('000) 26428 23767 30256 23866 29665Time-loss per 1000 workers employed (man-days) Manufacturing 2725 3666 3954P 3294P 3688(P) Mining and quarrying 1473 1366 8360 2388P 2585(P) Coal mining 2572 2304 15305 760P 1194(P) Plantations 177 2207 4380 3602P 8201(P) Posts & Telegraphs - - 30 7 17(P) Transport Storage & Communication 31 146 17 18 32(P)
39
TABLE 2.11 INDUSTRIAL DISPUTES
Source & footnote: Labour Bureau, Shimla
II. LABOUR
TABLE 2.10 EMPLOYMENT EXCHANGES
Source & footnote: Directorate General of Employment and Training Ministry of Labour & Employment

(percent)
Industry 1991 2001 2003 2004 2005
Coal mining 23.1 21.2 21.1 21.0 21.0Iron and steel industry 16.4 10.8 9.7 11.5 11.2Ordnance factories 13.6 12.8 14.0 13.3 13.7Cement factories 11.7 13.2 11.3 11.5 11.2Match factories 18.2 .. 27.5 .. 10.5Telegraph workshops 23.0 13.8 25.2 23.2 24.3
Item 1991 2001 2003 2004
Registered trade unions 53535 66624 74649 74403Unions furnishing returns 8418 6531 7258 5242Percentage response 16 10 10 7Membership of unions furnishing returns ('000) 6100 5873 6277 3397Average membership of unions furnishing returns 725 899 865 648
40
2. Directorate General of Mines Safety
II. LABOUR
TABLE 2.12 ABSENTEEISM IN SELECTED INDUSTRIES
Sources: 1. Labour Bureau, Shimla
Note:Returns were not submitted by all the unions. In case of a State not submitting the the returns, the figures for the last year was repeated.
TABLE 2.13 TRADE UNIONS
Source & footnote: Labour Bureau,Chandigarh

Type of Institution 1990-91 2002-03(P) 2003-04(P) 2004-05(P)
Universities (1) 184 304 304 407Research Institutions .. 81 85 136Boards of education 35 39 39 41Arts, science and commerce colleges 4862 9166 9427 10377Professional Degree College Medicine(2) 130 759 783 817 Teachers' training Colleges 474 873 900 1082 Engineering,technology and architecture 282 978 1068 1302Other professional colleges (3) 876 .. 1991 2431Schools for general education Pre-primary/Pre-basic 15877 64712 63167 63596 Primary/Junior basic 560935 651382 712239 767520 Middle/Senior basic 151456 245274 262286 274731 High/Higher secondary(4) 79803 137207 145962 152049
Contd.
41
As on 30th September
III. EDUCATION AND MASS MEDIA
TABLE 3.1 NUMBER OF EDUCATIONAL INSTITUTIONS

|::
As on 30th September
Type of Institution 1990-91 2002-03(P) 2003-04(P) 2004-05(P)
Teachers' training schools 1167 1202 1303 1465Technical & industrial and arts & crafts schools 3693 4647 4877 5114 Polytechnic insitutes 879 1173 1105 1171
(3) Includes law colleges, agriculture colleges, Veterinary science colleges etc.
42
(1) Include institutions deemed to be Universities and the institutions of national
(4) Includes pre-degree jr.colleges/higher sec. schools, high/post basic schools
TABLE 3.1 NUMBER OF EDUCATIONAL INSTITUTIONS - Concld.
Source & footnotes: Ministry of H.R.D.Deptt of Sec.&Higher Education &U.G.C.
(2) Includes M.B.B.S., Dentistry, Nursing, Pharmacy, Ayurvedic & Unani/Homeopathy etc. and Management, MCA/IT colleges.
III. EDUCATION AND MASS MEDIA

100000
200000
300000
400000
500000
600000
700000
800000
1990-91 2002-03 2003-04 2004-05
Primary/Junior Middle/Senior High/Higher secondary
NUMBER OF EDUCATIONAL INSTITUITIONSGROWTH OF SCHOOLS
('000)
As on 30th September
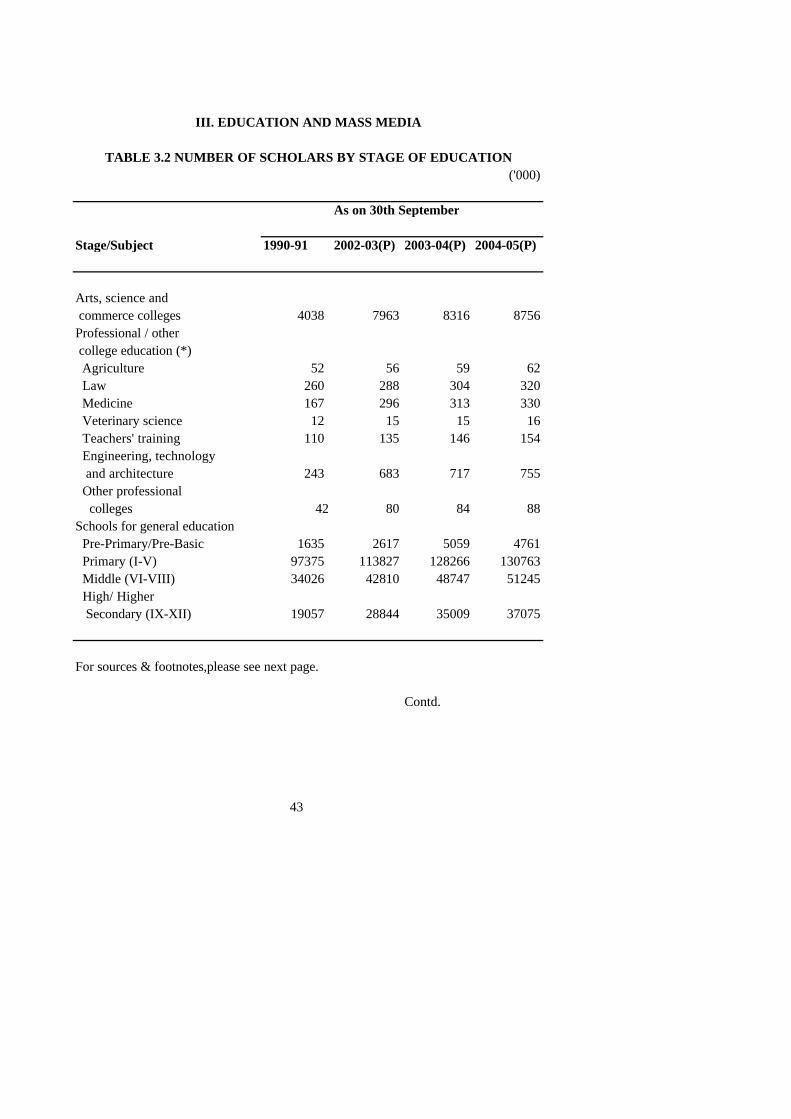
Stage/Subject 1990-91 2002-03(P) 2003-04(P) 2004-05(P)
Arts, science and commerce colleges 4038 7963 8316 8756Professional / other college education (*) Agriculture 52 56 59 62 Law 260 288 304 320 Medicine 167 296 313 330 Veterinary science 12 15 15 16 Teachers' training 110 135 146 154 Engineering, technology and architecture 243 683 717 755 Other professional colleges 42 80 84 88Schools for general education Pre-Primary/Pre-Basic 1635 2617 5059 4761 Primary (I-V) 97375 113827 128266 130763 Middle (VI-VIII) 34026 42810 48747 51245 High/ Higher Secondary (IX-XII) 19057 28844 35009 37075
Contd.
43
TABLE 3.2 NUMBER OF SCHOLARS BY STAGE OF EDUCATION
For sources & footnotes,please see next page.
III. EDUCATION AND MASS MEDIA

0
50
100
150
200
250
1990-91 2002-03 2003-04 2004-05
Class I-V Class VI-VIII Class IX-XI/XII University/ Colleges
STUDENTS ON ROLL AT SCHOOL / UNIVERSITY STAGE
(Million No. )

('000)
As on 30th September
Stage/Subject 1990-91 2002-03(P) 2003-04(P) 2004-05(P)
Teachers' training schools 118 93 108 124Technical & industrial and arts & crafts schools 406 678 711 742 Polytechnic institutes 273 428 373 389
44
|::
Source & footnotes: Department of Secondary & Higher Education.& U .G.C.
(1) The data includes data from universites/colleges/institutionsand exclude enrolment for Diploma/Certificate Courses below Degree level (Post-matric).
III. EDUCATION AND MASS MEDIA
TABLE 3.2 NUMBER OF SCHOLARS BY STAGE OF EDUCATION - Concld.

STUDENT IN SCHOOLSas on 30th September
0
10000
20000
30000
40000
50000
60000
1990-91 2002-03 2003-04 2004-05
Middle (VI-VIII) High/ Higher Secondary (IX-XII)
( ‘000 No.)

As on 30th September
Stage 1990-91 2002-03(P) 2003-04(P) 2004-05(P)
Class I-V 97.4 122.4 128.3 130.8 Boys 57.0 65.1 68.4 69.7 Girls 40.4 57.3 59.9 61.1
Class VI-VIII 34.0 46.8 48.8 51.2 Boys 21.5 26.3 27.3 28.5 Girls 12.5 20.6 21.5 22.7
Class IX-XI/XII 19.1 33.2 35.0 37.1 Boys 12.8 19.5 20.6 21.7 Girls 6.3 13.7 14.4 15.4
University/College* 3.7 9.5 10.0 11.8 Boys 2.4 5.7 6.0 7.1 Girls 1.3 3.8 4.0 4.6
Note : Totals may not tally because of rounding off of figures.
45
(*) Enrolment in general education Excluding Diploma/Certificate Courses of below degree level includes Ph.D/D.Sc./D.Phill., M.A., M.Sc.,M.Com, B.A./B.A.(Hons)/B.Sc./B.Sc.(Hons)/B.Com/B.Com(Hons)/B.E./B.Sc.(Engg)/B.Arch., B.Ed./B.T., Medicine/Dentistry/Nursing/Pharmacy/Ayurvedic & Unani/Homeopathy etc.
Source & Footnotes: Department of Secondary & Higher Education.&
(Million no.)
III. EDUCATION AND MASS MEDIA
TABLE 3.3 STUDENTS ON ROLL AT THE SCHOOL/UNIVERSITY STAGE

State/UnionTerritory
Total Male Female Total Male Female
States: Andhra Pradesh 61 70 50 53 61 45 Arunachal Pradesh 54 64 44 60 65 54 Assam 63 71 55 71 76 65 Bihar 47 60 33 46 56 35 Chhatisgarh 65 77 52 57 68 47 Goa 82 88 75 75 81 70 Gujarat 69 80 58 66 75 56 Haryana 68 79 56 62 71 52 Himachal Pradesh 77 85 67 72 79 65 Jammu & Kashmir 56 67 43 61 70 51 JharKhand 54 67 39 52 64 40 Karnataka 67 76 57 61 68 54 Kerala 91 94 88 83 86 81 Madhya Pradesh 64 76 50 54 64 43 Maharashtra 77 86 67 70 77 63 Manipur (1) 71 80 61 76 82 69 Meghalaya 63 65 60 78 79 76 Mizoram 89 91 87 90 90 90 Nagaland 67 71 62 78 82 75 Orissa 63 75 51 57 65 49 Punjab 70 75 63 68 72 63 Rajasthan 60 76 44 50 62 37 Sikkim 69 76 60 75 80 70
Contd…….
46
III. EDUCATION AND MASS MEDIA
TABLE 3.4 LITERACY IN INDIA
Percentage of Literates
______________________________ ____________________________2001 Census 2004-05

State/UnionTerritory
Total Male Female Total Male Female
Tamil Nadu 74 82 64 70 78 63 Tripura 73 81 65 74 79 69 Uttarakhand 72 83 60 64 74 55 Uttar Pradesh 56 69 42 51 61 41 West Bengal 69 77 60 66 72 59
Union Territories: A. & N. Islands 81 86 75 77 83 71 Chandigarh 82 86 77 84 87 79 D. & N.Haveli 58 71 40 58 71 42 Daman & Diu 78 87 66 76 78 74 Delhi 82 87 75 80 85 74 Lakshadweep 87 93 81 78 82 73 Pondicherry 81 89 74 74 82 67
INDIA (1) 65 75 54 60 68 51
(1) Excludes Figures of Paomata,Mao Maram and Puru sub-divisions of Senapati distt.of Manipur for 2001Census.
47
Source: 1. Office of the Registrar General, India2. NSS Report no. 517 (61st Round), National Sample Survey Organisation
III. EDUCATION AND MASS MEDIA
______________________________ ____________________________
TABLE 3.4 LITERACY IN INDIA-Concld.
Percentage of Literates
2001 Census 2004-05

0
10000
20000
30000
40000
50000
60000
1991 2001 2003-04 2004-05 2005-06
ENGLISH INDIAN LANGUAGES
NUMBER OF NEWSPAPERSAS ON 31st MARCH

Type1990-91 2001-01 2003-04 2004-05 2005-06
Permanent 8820 9017 8479 8233 6349 Touring 4361 3266 2665 2496 2061
Total(1) 13199 12290 11144 10729 8410
Type1991* 2001* 2003-04 2004-05 2005-06
English Daily # 243 441 504 518 535 Others (Periodicity) 4719 7155 7988 8250 8529
Indian Languages Daily # 3243 5545 6144 6376 6633 Others (Periodicity) 22009 38819 43833 45269 46786
48
As on 31st March
As on 31st March
TABLE 3.6 NUMBER OF REGISTRED NEWSPAPERS
# Including Tri/By weeklies also
Source & footnote : Office of the Registrar of Newspapers for India Ministry of Information & Broadcasting
* As on 31st December.
III. EDUCATION AND MASS MEDIA
TABLE 3.5 NUMBER OF CINEMAS
Source & footnote: Film Division,
(1) Include 18 military cinemas in the year 1990-91 and 7 Military cinemas in the year 2000-01.
Ministry of Information and Broadcasting.

Item Unit1991 2001 2005 2006
Hospitals (000) 11.2 17.9 7.0# 7.7#Dispensaries (000) 27.4 22.3 0.3## 0.3##No.of beds (all types) (000) 811+ 904+ 470** 493**Beds per lakh population (000) 95 88 2@@ 2@@Registered medical practitioners (000) 393.6@ 577.1P 767.5P N.A.Registered medical practitioners per lakh population (no.) 46.5@ 55.1P 70.0P N.A,Registered nurses (000) 340.2 776.4 1481 N.A.Registered nurses per lakh population (no.) 40 78 135 N.A.Medical college(++) (no.) 146* .. 242 262Annual admissions (no.) 12199 .. 26449 28928
(++) Academic year (e.g. 1991 will relate to 1991-92 and so on.) * Total number of medical colleges Include unrecognised medical colleges.
49
IV. MEDICAL CARE AND VITAL STATISTICS
TABLE 4.1 NUMBER OF HOSPITALS, DISPENSARIES,BEDS(ALL TYPES) AND MEDICAL PRACTITIONERS
as on 1st January
(#) Relates to Government Allopathic Hospitals-Health Information of India, 2005 & 2006. (##) Relates to C.G.H.S. Dispensaries-Health Information of India, 2005 & 2006.
** Relates to Beds in Government Allopathic Hospitals-Health Information of India, 2005 & 2006.
@@ Data pertains to Population served per government hospital bed-Health Information of India, 2004 & 2005. Health Information of India, 2005 & 2006.
Source: Central Bureau of Health Intelligence
(+) Includes all types of beds i.e. in hospitals, dispensaries, primary health centres and voluntary organisations etc.
@ Include projected population of Jammu & Kashmir, where 1991 census could not be held.
Directorate General of Health Services

05
1015
20253035
1990 2001 2002 2003 2004
Crude B irt h Rate Crude Death Rate
VITAL STATISTICS(Per 1000 Population)
0
20
40
60
80
100
1990 2001 2002 2003 2004
INFANT MORTALITY RATE(Per 1000 Live Births)
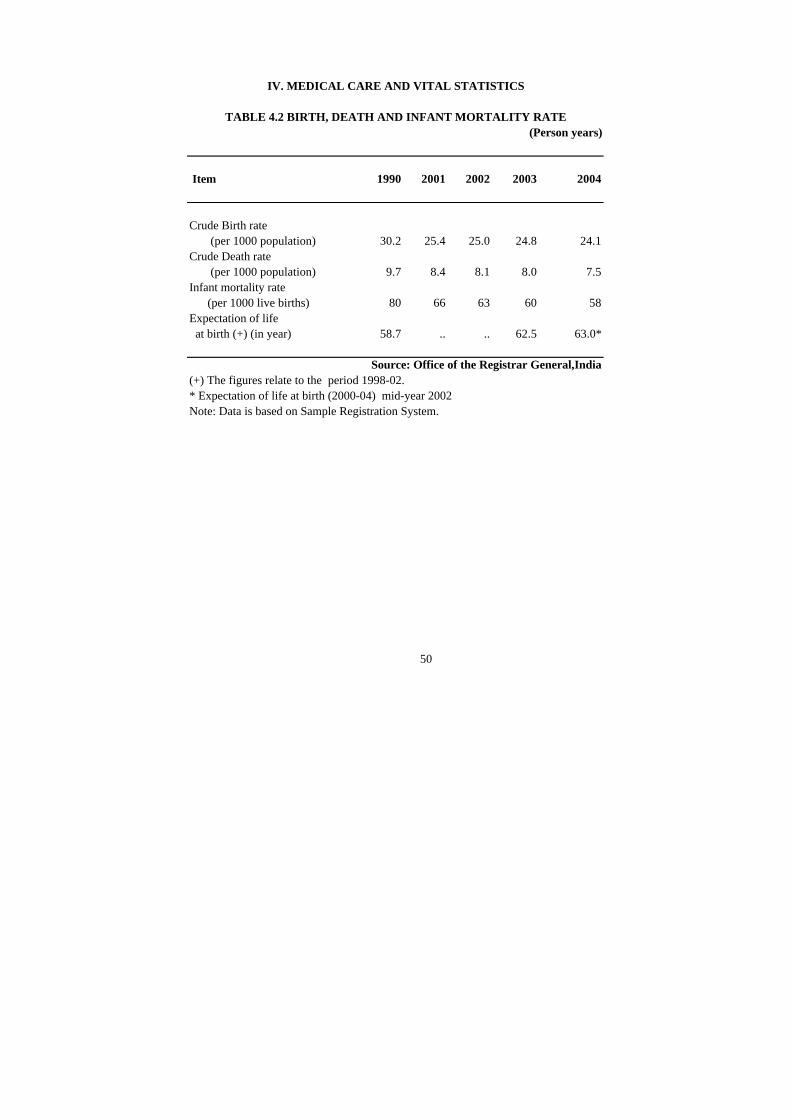
Item 1990 2001 2002 2003 2004
Crude Birth rate (per 1000 population) 30.2 25.4 25.0 24.8 24.1Crude Death rate (per 1000 population) 9.7 8.4 8.1 8.0 7.5Infant mortality rate (per 1000 live births) 80 66 63 60 58Expectation of life at birth (+) (in year) 58.7 .. .. 62.5 63.0*
* Expectation of life at birth (2000-04) mid-year 2002Note: Data is based on Sample Registration System.
50
TABLE 4.2 BIRTH, DEATH AND INFANT MORTALITY RATE
Source: Office of the Registrar General,India(+) The figures relate to the period 1998-02.
IV. MEDICAL CARE AND VITAL STATISTICS
(Person years)

Item Unit 1990-91 2000-01 2003-04 2004-05
Family welfare centres(+) 000 no. 137.4 .. .. ..Sterilisation Mn. no. 4.13 4.74 4.93 4.92IUD acceptors Mn. no. 5.37 6.05 6.11 6.17Contraceptive acceptors [equivalent users(++)] Mn. no. 17.86 25.84 33.75 33.46
`
51
IV. MEDICAL CARE AND VITAL STATISTICS
TABLE 4.3 PROGRESS OF FAMILY WELFARE PROGRAMME
Source: Ministry of Health and Family Welfare (+) Include 192 urban family welfare centres in the year 1990-91which have been
(++) Including equivalent oral pill users as well. urban health postsor merged with pilot project centres.

5000
10000
15000
20000
25000
30000
1999-00 2003-04 2004-05 2005-06
Current Prices Constant Prices
PER CAPITA NET NATIONAL PRODUCT( RUPEES )
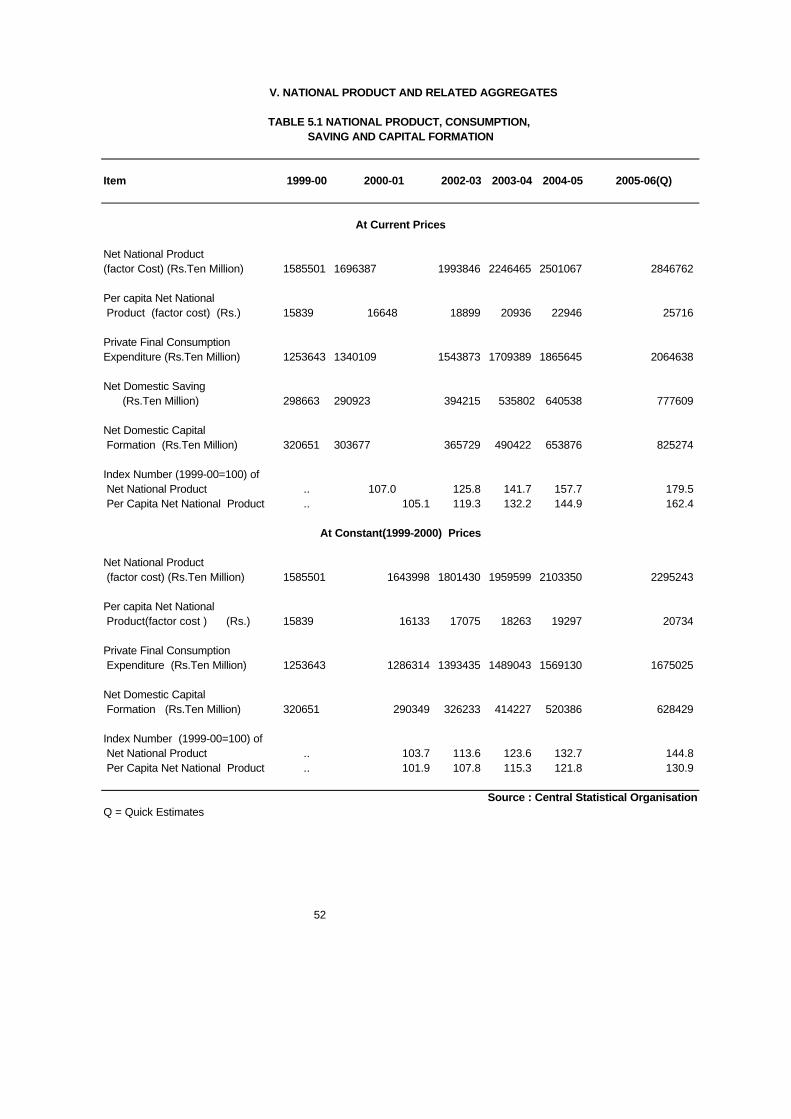
Item 1999-00 2000-01 2002-03 2003-04 2004-05 2005-06(Q)
Net National Product (factor Cost) (Rs.Ten Million) 1585501 1696387 1993846 2246465 2501067 2846762
Per capita Net National Product (factor cost) (Rs.) 15839 16648 18899 20936 22946 25716
Private Final ConsumptionExpenditure (Rs.Ten Million) 1253643 1340109 1543873 1709389 1865645 2064638
Net Domestic Saving (Rs.Ten Million) 298663 290923 394215 535802 640538 777609
Net Domestic Capital Formation (Rs.Ten Million) 320651 303677 365729 490422 653876 825274
Index Number (1999-00=100) of Net National Product .. 107.0 125.8 141.7 157.7 179.5 Per Capita Net National Product .. 105.1 119.3 132.2 144.9 162.4
Net National Product (factor cost) (Rs.Ten Million) 1585501 1643998 1801430 1959599 2103350 2295243
Per capita Net National Product(factor cost ) (Rs.) 15839 16133 17075 18263 19297 20734
Private Final Consumption Expenditure (Rs.Ten Million) 1253643 1286314 1393435 1489043 1569130 1675025
Net Domestic Capital Formation (Rs.Ten Million) 320651 290349 326233 414227 520386 628429
Index Number (1999-00=100) of Net National Product .. 103.7 113.6 123.6 132.7 144.8 Per Capita Net National Product .. 101.9 107.8 115.3 121.8 130.9
Q = Quick Estimates
52
At Current Prices
V. NATIONAL PRODUCT AND RELATED AGGREGATES
TABLE 5.1 NATIONAL PRODUCT, CONSUMPTION, SAVING AND CAPITAL FORMATION
At Constant(1999-2000) Prices
Source : Central Statistical Organisation

(Rs.Ten Million)
Industry 1999-00 2000-01 2002-03 2003-04 2004-05 2005-06
1.Agriculture,forestry and fishing 446515 449746 472679 533642 536629 595058 1.1 Agriculture 409660 409113 426141 484330 484999 536196 1.2 Forestry & logging 17916 19298 21048 22374 22855 24104 1.3 Fishing 18939 21336 25491 26938 28775 347582.Mining & quarrying 41594 45706 62742 63882 84464 904823.Manufacturing 264113 300392 346029 388549 453603 519746 3.1 Registered 173003 199262 235734 265303 312622 360386 3.2 Unregistered 91110 101130 110295 123246 140981 1593604.Elect. gas & water supply 44526 46040 54531 56675 60607 659795.Construction 102007 111999 135172 156806 185669 2221106.Trade, hotels & restaurants 254143 280934 347255 398983 464333 540415 6.1 Trade 231878 256100 317021 365118 424552 493755 6.2 Hotels & restaurants 22265 24834 30233 33864 39781 466607.Transport,storage and communication 133371 147921 180314 211256 250214 284521 7.1 Railways 21122 21443 26277 28800 32102 32995 7.2 Transport by other means 82376 93123 114732 135662 161102 182206 7.3 Storage 1427 1577 1697 1825 2160 2307 7.4 Communication 28446 31778 37608 44969 54850 670138.Financing,insurance,real estate & business services 233550 254772 332115 375606 413129 464493 8.1 Banking & insurance 105662 105715 144801 161985 167831 180205 8.2 Real estate,ownership of dwellings and business services 127888 149057 187314 213621 245298 2842889.Community, social and personal services 266707 287905 334466 364019 407285 468128 9.1 Public administration & defence 122384 129363 146867 156157 177496 208343 9.2 Other services 144323 158543 187599 207862 229789 25978510.Total gross domestic product at factor cost [1 to 9] 1786525 1925415 2265304 2549418 2855933 3250932
53
TABLE 5.2 (A) GROSS DOMESTIC PRODUCT BY ECONOMIC ACTIVITY (at current prices)
Source : Central Statistical Organisation

0
400000
800000
1200000
1600000
2000000
2400000
2800000
1999-00 2003-04 2004-05 2005-06
NET DOMESTIC PRODUCT BY ECONOMIC ACTIVITY( RS. Ten Million )
( at Current Prices )
( at 1993-94 Prices )
0
500000
1000000
1500000
2000000
2500000
1990-00 2003-04 2004-05 2005-06Community, social & personal servicesFinancing, insurance, real estate & business servicesTrade, hotels & restaurants Manufacturing, electricity gas & water supply Mining & quarryingAgriculture, forestry & fishing
( at 1999-2000 Prices )

(Rs.Ten Million)
Industry 1999-00 2000-01 2002-03 2003-04 2004-05 2005-06
1.Agriculture,forestry and fishing 424559 426122 443690 502038 500784 555242 1.1 Agriculture 390286 388513 401443 457648 454986 502972 1.2 Forestry & logging 17228 18582 20233 21495 21881 23056 1.3 Fishing 17044 19026 22015 22895 23917 292142.Mining & quarrying 32975 36631 52439 52803 71979 766943.Manufacturing 206126 234529 266333 299289 348527 396169 3.1 Registered 128653 148863 174824 197921 234164 268048 3.2 Unregistered 77473 85666 91510 101368 114363 1281214.Elect. gas & water supply 24204 23957 28255 28020 28201 301885.Construction 99312 108882 130882 151774 179709 2152026.Trade, hotels & restaurants 248196 274243 339204 389727 453600 528321 6.1 Trade 227633 251362 311319 358493 416918 485108 6.2 Hotels & restaurants 20564 22881 27885 31234 36682 432137.Transport,storage and communication 105793 117479 143053 169311 200755 229332 7.1 Railways 14627 14710 18980 20155 21498 21463 7.2 Transport by other means 67861 75950 93361 111575 132762 150266 7.3 Storage 1336 1475 1571 1684 2000 2129 7.4 Communication 21969 25343 29141 35898 44494 554748.Financing,insurance,real estate & business services 213030 230901 298554 336801 366623 411540 8.1 Banking & insurance 102611 102243 140670 157487 162793 174589 8.2 Real estate,ownership of dwellings and business services 110419 128658 157883 179314 203830 2369519.Community, social and personal services 246738 266378 308126 334953 373264 429043 9.1 Public administration & defence 107036 113188 127819 135688 153978 181916 9.2 Other services 139702 153190 180307 199265 219286 24712710.Total net domestic product at factor cost [1 to 9] 1600932 1719120 2010536 2264715 2523442 2871731
54
V. NATIONAL PRODUCT AND RELATED AGGREGATES
TABLE 5.2 (B) NET DOMESTIC PRODUCT BY ECONOMIC ACTIVITY
Source : Central Statistical Organisation
(at current prices)

(Rs.Ten Million)
Industry 1999-00 2000-01 2002-03 2003-04 2004-05 2005-06
1.Agriculture,forestry and fishing 446515 445595 439321 483274 483080 512147 1.1 Agriculture 409660 407368 398560 441958 441124 468953 1.2 Forestry & logging 17916 18399 19090 18872 19169 19482 1.3 Fishing 18939 19828 21671 22444 22787 237132.Mining & quarrying 41594 42589 47168 48626 52250 541283.Manufacturing 264113 284571 311685 332363 361115 393956 3.1 Registered 173003 186570 209909 224919 245343 268194 3.2 Unregistered 91110 98001 101776 107444 115772 1257624.Elect. gas & water supply 44526 45439 48423 50735 54531 574015.Construction 102007 108362 121650 136225 155431 1775436.Trade, hotels & restaurants 254143 267326 313221 345424 374313 404919 6.1 Trade 231878 243505 286060 315966 342297 369885 6.2 Hotels & restaurants 22265 23821 27161 29458 32016 350347.Transport, storage and communication 133371 148339 182273 209879 241711 275318 7.1 Railways 21122 21996 24863 26486 27998 30154 7.2 Transport by other means 82376 88735 101777 113907 128496 139890 7.3 Storage 1427 1514 1421 1494 1705 1775 7.4 Communication 28446 36094 54212 67992 83512 1034998.Financing,insurance,real estate & business services 233550 243087 281611 297326 323187 358535 8.1 Banking & insurance 105662 103571 125845 128659 139940 159499 8.2 Real estate,ownership of dwellings & business services 127888 139516 155766 168667 183247 1990369.Community, social and personal services 266707 279465 302381 318739 344042 370585 9.1 Public administration & defence 122384 124926 130637 134019 146031 153874 9.2 Other services 144323 154539 171744 184720 198011 21671110.Total gross domestic product at factor cost (1 to 9) 1786525 1864773 2047733 2222591 2389660 2604532
55
(at 1999-2000 prices)
Source : Central Statistical Organisation
V. NATIONAL PRODUCT AND RELATED AGGREGATES
TABLE 5.3(A) GROSS DOMESTIC PRODUCT BY ECONOMIC ACTIVITY

(Rs.Ten Million)
Industry 1999-00 2000-01 2002-03 2003-04 2004-05 2005-06
1.Agriculture,forestry and fishing 424559 422365 412900 455407 453728 481136 1.1 Agriculture 390286 387063 376032 418429 416572 443242 1.2 Forestry & logging 17228 17692 18343 18090 18370 18662 1.3 Fishing 17044 17610 18525 18888 18786 192322.Mining & quarrying 32975 33792 38011 39089 42324 438023.Manufacturing 206126 221986 240848 255772 277237 300680 3.1 Registered 128653 138771 155583 166493 181617 196975 3.2 Unregistered 77473 83215 85266 89279 95620 1037054.Elect. gas & water supply 24204 24084 25053 26078 28727 305245.Construction 99312 105408 117798 131799 150510 1721086.Trade, hotels & restaurants 248196 260992 306010 337457 365739 395759 6.1 Trade 227633 239020 280951 310262 336196 363330 6.2 Hotels & restaurants 20564 21972 25058 27195 29543 324297.Transport, storage and communication 105793 119181 148430 173333 202097 233170 7.1 Railways 14627 15462 18141 19636 21023 23028 7.2 Transport by other means 67861 72466 82295 92134 104196 113600 7.3 Storage 1336 1417 1311 1376 1581 1645 7.4 Communication 21969 29835 46684 60187 75297 948988.Financing,insurance,real estate & business services 213030 220171 252424 264919 288084 320778 8.1 Banking & insurance 102611 100276 122165 124782 135890 155230 8.2 Real estate,ownership of dwellings & business services 110419 119895 130259 140137 152195 1655489.Community, social and personal services 246738 258564 278761 293589 316853 341056 9.1 Public administration & defence 107036 109150 113516 116171 127044 133663 9.2 Other services 139702 149414 165245 177418 189809 20739310.Total net domestic product at factor cost (1 to 9) 1600932 1666543 1820235 1977444 2125299 2319014
56
TABLE 5.3(B) NET DOMESTIC PRODUCT BY ECONOMIC ACTIVITY
V. NATIONAL PRODUCT AND RELATED AGGREGATES
(at 1999-2000 prices)
Source : Central Statistical Organisation

(Rs.Ten Million)
Item 1999-00 2000-01 2002-03 2003-04 2004-05 2005-06
1. Food,beverages & tobacco 647011 632810 668333 720807 742609 816855 1.1 Food 570005 556538 581693 629492 640888 694480 1.1.1 Cereals & bread 169986 142456 130904 143638 120570 122833 1.1.2 Pulses 18845 16858 17341 21600 19399 21155 1.1.3 Sugar & gur 36986 38384 34371 31336 33547 47494 1.1.4 Oils & oilseeds 30518 27468 30255 45454 54367 48834 1.1.5 Fruits & vegetables 113535 126520 138508 147609 150652 164737 1.1.6 Potato & other tubers 10536 10264 13783 12411 16590 19256 1.1.7 Milk & milk products 103681 102926 113960 120220 127114 136137 1.1.8 Meat,egg & fish 50649 55177 63327 65656 68999 79230 1.1.9 Coffee,tea & cocoa 9214 8921 9638 9350 13516 15472 1.1.10 Spices. 17715 16870 18301 20570 20080 19977 1.1.11 Other food 8340 10694 11305 11648 16054 19355 1.2 Beverages,pan and intoxicants 19676 20664 30351 33098 41011 495841.2.1 beverages 9667 11139 20420 22667 29904 375171.2.2 pan&other intoxicants 10009 9525 9931 10431 11107 12067 1.3 Tobacco & its products 34395 30065 25153 23397 19946 25167 1.4 Hotels & restaurants 22935 25543 31136 34820 40764 476242. Clothing & footwear 66292 80045 79857 86430 100164 104406 2.1 Clothing 57936 70914 71766 77643 90052 93945 2.2 Footwear 8356 9131 8091 8787 10112 104613. Gross rent,fuel & power 143558 167794 197896 213526 228816 244258 3.1 Gross rent & water charges 99270 110242 131674 141774 152612 164371 3.2 Fuel & power 44288 57552 66222 71752 76204 798873.2.1electricity 9859 11680 15088 17192 18666 197463.2.2 liquified petroleum gas 5971 9195 12160 13612 16288 176813.2.3 kerosene oil 4036 10171 9744 9524 8738 86963.2.4 other fuel 24422 26506 29230 31424 32512 337644. Furniture, furnishing appliances and services 40939 45317 51846 57390 64897 75120 4.1 Furniture, furnishing &repair 1648 1726 1427 1572 1615 16214.2 relrigerator,cooking washing , appliances etc. 6257 7032 7486 8560 10587 122034.3 glassware tableware &utensils 15284 15923 17637 19566 21076 248524.4 other goods 9510 11614 14227 15401 17991 213224.5 services 8240 9022 11069 12291 13628 15122
Contd……
57
V. NATIONAL PRODUCT AND RELATED AGGREGATES
TABLE 5.4 PRIVATE FINAL CONSUMPTION EXPENDITURE BY OBJECT (at current prices)

(Rs.Ten Million)
Item 1999-00 2000-01 2002-03 2003-04 2004-05 2005-06
5. Medical care & health services 54825 64777 88305 101855 117438 1354836. Transport & communication 164524 193635 244750 289659 344961 396393 6.1 Personal transport eqpmts. 9178 9672 11708 13340 14597 16856 6.2 Operation of personal transport equipment 47081 56877 74370 91747 117270 131537 6.3 Purchase of transport services 93727 110313 137524 157951 181455 207816 6.4 Communication 14538 16773 21148 26621 31639 401847. Recreation,education & cultural services 42779 49278 57641 65771 76375 86058 7.1 Equipment, paper &stationery 17147 19940 21962 25629 31264 35315 7.2 recreation&cultural sevices 1851 2455 1665 1868 2071 22977.3 education 23781 26883 34014 38274 43040 484468. Misc. goods & services 97613 112762 156498 178012 198469 2135068.1 personal care &effects 37588 40053 46202 50237 54463 593678.2 personal goods n.e.c 26001 29509 32621 36742 43954 518838.3 other miscellaneous services 34024 43200 77675 91033 100052 1022569. Private final consumption expenditure in domestic market 1257541 1346418 1545126 1713450 1873729 2072079
58
V. NATIONAL PRODUCT AND RELATED AGGREGATES
TABLE 5.4 PRIVATE FINAL CONSUMPTION EXPENDITURE BY OBJECT-Concld. (at current prices)
Source : Central Statistical Organisation

Item 1999-00 2000-01 2002-03 2003-04 2004-05 2005-06
1. Food,beverages & tobacco 647011 618316 626269 657626 652864 684665 1.1 Food 570005 543894 545349 570900 562447 581293 1.1.1 Cereals & bread 169986 144355 139306 149778 126040 122263 1.1.2 Pulses 18845 15583 15862 20286 18116 17652 1.1.3 Sugar & gur 36986 37860 35552 32713 29679 37486 1.1.4 Oils & oilseeds 30518 30361 27792 36188 45623 42023 1.1.5 Fruits & vegetables 113535 120369 114886 114122 113381 117285 1.1.6 Potato & other tubers 10536 10060 10221 10302 10421 10474 1.1.7 Milk & milk products 103681 93088 97965 100821 102182 108997 1.1.8 Meat,egg & fish 50649 51810 58421 60017 60932 63348 1.1.9 Coffee,tea & cocoa 9214 10928 12701 12671 16529 18231 1.1.10 Spices. 17715 18861 21357 22718 24135 25612 1.1.11 Other food 8340 10619 11286 11284 15409 17922 1.2 Beverages,pan and intoxicants 19676 21716 32493 37764 43909 507911.2.1 beverages 9667 10856 19991 24861 30487 370551.2.2 pan&other intoxicants 10009 10860 12502 12903 13422 13736 1.3Tobacco & its products 34395 28213 20532 18723 13645 16648 1.4 Hotels & restaurants 22935 24493 27895 30239 32863 359332. Clothing & footwear 66292 77403 78581 76682 86961 95908 2.1 Clothing 57936 67974 69015 67462 76936 86223 2.2 Footwear 8356 9429 9566 9220 10025 96853. Gross rent,fuel & power 143558 147642 155900 161109 165973 170225 3.1 Gross rent & water charges 99270 101896 107358 110200 113119 116119 3.2 Fuel & power 44288 45746 48542 50909 52854 541063.2.1electricity 9859 10270 11319 12185 12990 138473.2.2 liquified petroleum gas 5971 6524 7766 8654 9527 95823.2.3 kerosene oil 4036 3836 3530 3470 3187 31753.2.4 other fuel 24422 25116 25927 26600 27150 275024. Furniture, furnishing appliances and services 40939 43899 47274 51094 55975 628304.1 Furniture, furnishing &repair 1648 1710 1411 1496 1464 14744.2 relrigerator,cooking washing , appliances etc. 6257 6965 7304 8203 9962 115084.3 glassware tableware &utensils 15284 15110 15742 17105 17522 193234.4 other goods 9510 11295 12720 13484 15459 181614.5 services 8240 8819 10097 10806 11568 12364
Contd…….
59
(Rs.Ten Million)
V. NATIONAL PRODUCT AND RELATED AGGREGATES
TABLE 5.5 PRIVATE FINAL CONSUMPTION EXPENDITURE BY OBJECT (at 1999-00 prices)

(Rs.Ten Million)
Item 1999-00 2000-01 2002-03 2003-04 2004-05 2005-06
5. Medical care & health services 54825 61199 80053 90038 101327 1124346. Transport & communication 164524 186224 220423 249494 280567 304252 6.1 Personal transport eqpmt. 9178 9109 10783 12246 12759 14261 6.2 Operation of personal transport equipment 47081 54781 67458 77055 88149 88679 6.3 Purchase of transport services 93727 104793 119408 131859 146329 160128 6.4 communications 14538 17541 22774 28334 33330 411847. Recreation,education & cultural services 42779 47812 53581 60036 69879 780617.1 equipment paper & stationery 17147 19240 20686 23895 29860 340267.2 recreation & cultural services 1851 2382 1497 1619 2071 22977.3 Education 23781 26190 31398 34522 37948 417388. Misc. goods & services 97613 110491 134988 147792 165709 1814868.1 personal care &effects 37588 39355 42571 44607 46771 491518.2 personal goods n.e.c. 26001 28864 30316 32873 38545 443358.3 others miscellaneous services 34024 42272 62101 70312 80393 880009. Private final consumption expenditure in domestic market 1257541 1292986 1397069 1493871 1579255 1689861
60
(at 1999-2000 prices)TABLE 5.5 PRIVATE FINAL CONSUMPTION EXPENDITURE BY OBJECT-Concld.
Source : Central Statistical Organisation
V. NATIONAL PRODUCT AND RELATED AGGREGATES

(Rs.Ten Million)
Item 1999-00 2000-01 2002-03 2003-04 2004-05 2005-06
1. Household sector 412516 442136 559074 657327 674834 797117 1.1 Financial saving 206602 215219 253255 313260 318791 416462 1.1.1 Currency 20845 15632 28632 42675 36977 51954 1.1.2 Net deposits 51732 72369 73455 77675 42846 98937 1.1.3 Shares and debentures 24550 8847 5929 3973 8841 33419 1.1.4 Net claims on Govt. 27859 37778 55878 87618 106927 87024 1.1.5 Life insurance funds 27684 32679 41351 49775 66437 83212 1.1.6 Prov. & pension funds 53932 47914 48010 51544 56763 61916 1.2 Saving in physical assets 205914 226917 305819 344067 356043 3806552. Private corporate sector 87234 90143 103965 131355 223512 288430 2.1 Joint stock companies 78114 76643 86845 111807 201327 263776 2.1.1 Non-financial 74495 83128 91298 113925 193764 249243 2.1.2 Financial 6777 -308 4413 6153 16118 21953 2.1.3 less: Reinvested Earnings of Foreign Companies 3158 6177 8866 8271 8555 7420 2.2 Coop. banks & societies 9120 13500 17120 19548 22185 246543. Public sector -15494 -35061 -14056 31822 74682 71262 3.1 Public authorities -73967 -96209 -113394 -83233 -60904 -68270 3.1.1 Govt. administration -99507 -115755 -128929 -100369 -80493 -90493 3.1.2 Departmental (commer- cial) enterprises 25540 19546 15535 17136 19589 222223 3.2 Non-deptt. enterprises 58473 61148 99338 115056 135586 139532 3.2.1 Government companies 29960 33483 52394 67702 82350 .. 3.2.2 Statutory corporations 28513 27665 46944 47354 53236 .. (including port trusts) -4.Gross domestic savings(1+2+3) 484256 497218 648982 820504 973028 11568095. Less consumption of fixed capital** 185593 206295 254767 284702 332490 379200 5.1 Household sector 64899 73543 94732 108048 128129 145845 5.2 Private corporate sector 44540 52658 67594 76740 91309 109120 5.3 Public sector 76154 80094 92441 99914 113052 1242356. Net domestic saving(4-5) 298663 290923 394215 535802 640538 777609 6.1 Household sector 347617 368593 464342 549279 546705 651272 6.2 Private corporate sector 42694 37485 36371 54615 132203 179310 6.3 Public sector -91648 -115155 -106498 -68092 -38370 -52973
61
V. NATIONAL PRODUCT AND RELATED AGGREGATES
Source : Central Statistical Organisation
TABLE 5.6 DOMESTIC SAVING BY TYPE OF INSTITUTIONS (at current prices)

(Rs. Ten Million)
Item 1999-00 2000-01 2002-03 2003-04 2004-05 2005-06
1.Gross capital formation(gcf) 509518 506181 614679 734585 927629 1147253 1.1 Public sector 144610 144639 149324 174597 220487 264426 1.2 Private corporate sector 143475 119901 145579 191349 310045 459715 1.3 Household sector 205914 226917 305819 344067 356043 380655 1.4 Valuables+ 15519 14724 13957 24572 41054 424572.Gross fixed capital formation 456416 478317 584366 687150 822786 1000760 2.1 Public sector 129286 135699 154213 177736 204638 245898 2.1.1 Construction 80658 86848 106492 120046 134563 167367 2.1.2 Machinery & eqpmts. 48628 48851 47721 57690 70075 78531 2.2 Private corporate sector 127412 120012 133739 173215 269012 383708 2.2.1 Construction 19907 20568 29496 40905 45865 92399 2.2.2 Machinery & equip. 107505 99444 104243 132310 223147 291309 2.3 Household sector 199718 222606 296414 336199 349136 371154 2.3.1 Construction 126443 137842 171706 200292 248130 264621 2.3.2 Machinery & equip. 73275 84764 124708 135907 101006 1065333.Change in stocks 37583 13140 16356 22863 63789 104036 3.1 Public sector 15325 8940 -4889 -3139 15849 18528 3.2 Private corporate sector 16063 -111 11840 18134 41033 76007 3.3 Household sector 6196 4311 9405 7868 6907 95014.Valuables+ 15519 14724 13957 24572 41054 424575.Less consumption of fixed capital 185593 206295 254767 284702 332490 379200 5.1 Public sector 76154 80094 92441 99914 113052 124235 5.2 Private corporate sector 44540 52658 67594 76740 91309 109120 5.3 Household sector 64899 73543 94732 108048 128129 1458456.Net capital formation (ncf) 323925 299886 359912 449883 595139 768053 6.1 Public sector 68456 64545 56883 74683 107435 140191 6.2 Private corporate sector 98935 67243 77985 114609 218736 350595 6.3 Household sector 141015 153374 211087 236019 227914 234810 6.4 Valuables+ 15519 14724 13957 24572 41054 424577.Errors & omissions -3274 3791 5816 40538 58737 572208.Net capital formation adjusted for errors and omissions 320651 303677 365728 490421 653876 8252739.Gross capital formation adjusted for errors and omissions 506244 509972 620495 775123 986366 1204473
+ Excluding work of art & antiques.
62
(at current prices)
Source : Central Statistical Organisation
V. NATIONAL PRODUCT AND RELATED AGGREGATES
BY TYPE OF INSTITUTIONSTABLE 5.7 CAPITAL FORMATION BY TYPE OF ASSETS AND

(Rs.Ten Million)
Item 1999-00 2000-01 2002-03 2003-04 2004-05 2005-06
1.Gross capital formation(gcf) 509518 484951 548554 624680 737823 870619 1.1 Public sector 144610 140239 134108 145240 169134 195484 1.2 Private corporate sector 143475 114481 128669 160778 246348 347698 1.3 Household sector 205914 215975 272847 297121 288468 293445 1.4 Valuables + 15519 14256 12930 21541 33873 339922.Gross fixed capital formation 456416 457888 520164 588088 657317 757806 2.1 Public sector 129286 131730 137967 152835 162613 184836 2.1.1 Construction 80658 84308 95273 103227 106929 125806 2.1.2 Machinery & eqpmts 48628 47422 42694 49608 55684 59030 2.2 Private corporate sector 127412 114659 117812 145015 212749 287544 2.2.1 Construction 19907 19591 26169 35557 37349 71627 2.2.2 Machinery & eqpmts. 107505 95068 91643 109458 175400 215917 2.3 Household sector 199718 211499 264385 290238 281955 285426 2.3.1 Construction 126443 131540 152247 169753 197061 199857 2.3.2 Machinery & eqpmts. 73275 79959 112138 120485 84894 855693.Change in stocks 37583 12807 15460 15051 46633 78821 3.1 Public sector 15324 8509 -3859 -7595 6521 10648 3.2 Private corporate sector 16063 -178 10857 15763 33599 60154 3.3 Household sector 6196 4476 8462 6883 6513 80194.Valuables + 15519 14256 12930 21541 33873 339925.Less consumption of fixed capital 185593 198230 227498 245148 264361 285519 5.1 Public sector 76154 77717 82600 85697 88895 92175 5.2 Private corporate sector 44540 49758 60538 67143 75154 85396 5.3 Household sector 64899 70755 84360 92308 100312 1079486.Net capital formation(ncf) 323925 286721 321056 379532 473462 585100 6.1 Public sector 68456 62522 51508 59543 80239 103309 6.2 Private corporate sector 98935 64723 68131 93635 171194 262302 6.3 Household sector 141015 145220 188487 204813 188156 185497 6.4 Valuables + 15519 14256 12930 21541 33873 339927.Errors & omissions -3274 3629 5177 34695 46924 433298.Net capital formation adjusted for errors and omissions 320651 290350 326233 414227 520386 6284299.Gross capital formation adjusted for errors and omissions 506244 488580 553731 659375 784747 913948
+ Excluding work of art & antiques.
63
(at 1999-2000 prices)
Source : Central Statistical Organisation
V. NATIONAL PRODUCT AND RELATED AGGREGATES
TABLE 5.8 CAPITAL FORMATION BY TYPE OF ASSETS AND BY TYPE OF INSTITUTIONS

( Rs.Ten Million)
Item 1999-00 2000-01 2002-03 2003-04 2004-05 2005-06
1. Gross domestic product 1786525 1925415 2265304 2549418 2855933 3250932 1.1 Public 457006 481861 578851 626219 686333 748528 1.2 Private 1329519 1443554 1686453 1923199 2169600 25024042. Gross domestic saving 484256 497218 648982 820504 973028 1156809 2.1 Public -15494 -35061 -14057 31822 74682 71262 2.2 Private 499750 532279 663039 788682 898346 10855473. Gross domestic capital formation unadjusted * 493999 491457 600723 710014 886575 1104797 3.1 Public 144610 144639 149324 174597 220487 264426 3.2 Private 349389 346818 451399 535417 666088 8403714. Final consumption expenditure 1510285 1611819 1836446 2024085 2216271 2476590 4.1 Public 252744 265401 291320 310635 342542 404511 4.2 Private 1257541 1346418 1545126 1713450 1873729 2072079
1. Gross domestic product 25.6 25.0 25.6 24.6 24.0 23.02. Gross domestic saving -3.2 -7.1 -2.2 3.9 7.7 6.23. Gross domestic capital formation (unadjusted) 29.3 29.4 24.9 24.6 24.9 23.94. Final consumption expenditure 16.7 16.5 15.9 15.3 15.5 16.3
* Excluding valuables64
V. NATIONAL PRODUCT AND RELATED AGGREGATES
TABLE 5.9 PERFORMANCE OF PUBLIC SECTOR
Source : Central Statistical Organisation
Percentage share of public sector
(at current prices)

(Rs.Ten Million)
Item 1999-00 2000-01 2002-03 2003-04 2004-05 2005-06
1. Gross domestic product 1786525 1864773 2047733 2222591 2389660 2604532 1.1 Public 457006 465149 518787 544425 566788 605381 1.2 Private 1329519 1399624 1528946 1678166 1822872 19991512. Gross domestic capital formation unadjusted* 493999 470694 535624 603139 703950 836627 2.1 Public 144610 140239 134108 145240 169134 195484 2.2 Private 349389 330455 401516 457899 534816 6411433. Final consumption expenditure 1510285 1546938 1655099 1758335 1858012 1995948 3.1 Public 252744 253952 258030 264464 278757 306087 3.2 Private 1257541 1292986 1397069 1493871 1579255 1689861
1. Gross domestic product 25.6 24.9 25.3 24.5 23.7 23.22. Gross domestic capital formation (unadjusted) 29.3 29.8 25.0 24.1 24.0 23.43. Final consumption expenditure 16.7 16.4 15.6 15.0 15.0 15.3
* Excluding valuables
65
V. NATIONAL PRODUCT AND RELATED AGGREGATES
TABLE 5.10 PERFORMANCE OF PUBLIC SECTOR (at 1999-2000 prices)
Percentage share of public sector
Source : Central Statistical Organisation

State/Union Territory 1990-00 2000-01 2001-02 2002-03 2003-04 2004-05
Andhra Pradesh 15049 16708 17932 19087 21372 23153 Arunachal Pradesh 13669 14699 15577 16916 19029 19724 Assam 10080 10718 11423 12247 12821 13633 Bihar 4794 5161 5004 5606 5362 5772Jharkhand 10362 8749 10129 11139 11999 13013 Goa 44349 49693 51073 60787 57369 58184 Gujarat 18831 17938 19713 22624 26672 28355 Haryana 21105 23213 24883 26818 29504 32712 Himachal Pradesh 18160 19925 21570 22902 25059 27486 Jammu & Kashmir 12373 12781 13444 14507 15318 16190 Karnataka 16345 17816 18091 19576 21238 23945 Kerala 18117 20107 20287 22776 24492 27048 Madhya Pradesh 11764 10777 12209 11500 13722 14069Chattisgarh 10405 9922 12032 12369 14963 15073 Maharashtra 22978 21891 24044 26858 28848 32170 Manipur 11070 11066 12683 12878 13732 14901 Meghalaya 13088 14632 15813 16803 18135 19572Mizoram 14909 18491 19704 22207 .. .. Nagaland 12594 17629 18911 20746 .. .. Orissa 9507 9245 9879 10164 12645 13601 Punjab 22745 24206 25868 26395 28607 30701 Rajasthan 12765 12514 13621 12641 15738 16212 Sikkim 14761 16503 17644 20013 22062 24115 Tamil Nadu 18337 20346 20326 21740 23358 25965 Tripura 13195 15253 17383 18550 20357 .. Uttar Pradesh 8970 9162 9320 9963 10637 11477Uttranchal 11443 12863 13466 14947 16982 19652 West Bengal 14817 16146 17499 18494 20548 22497 A. & N.Islands 22262 24418 25999 28340 .. ..Chandigarh 42942 44516 47734 53886 60105 67370 Delhi 37065 42509 44286 45579 49494 53976 Pondicherry 29383 35190 37296 45431 50936 56034 All India (Per Capita NNP at factor cost) 15839 16648 17800 18899 20936 22946
66
V. NATIONAL PRODUCT AND RELATED AGGREGATES
TABLE 5.11 PER CAPITA NET STATE DOMESTIC PRODUCT (at current prices)As on 31.01.2007
Source: Central Statistical Organisation
(Rs.)
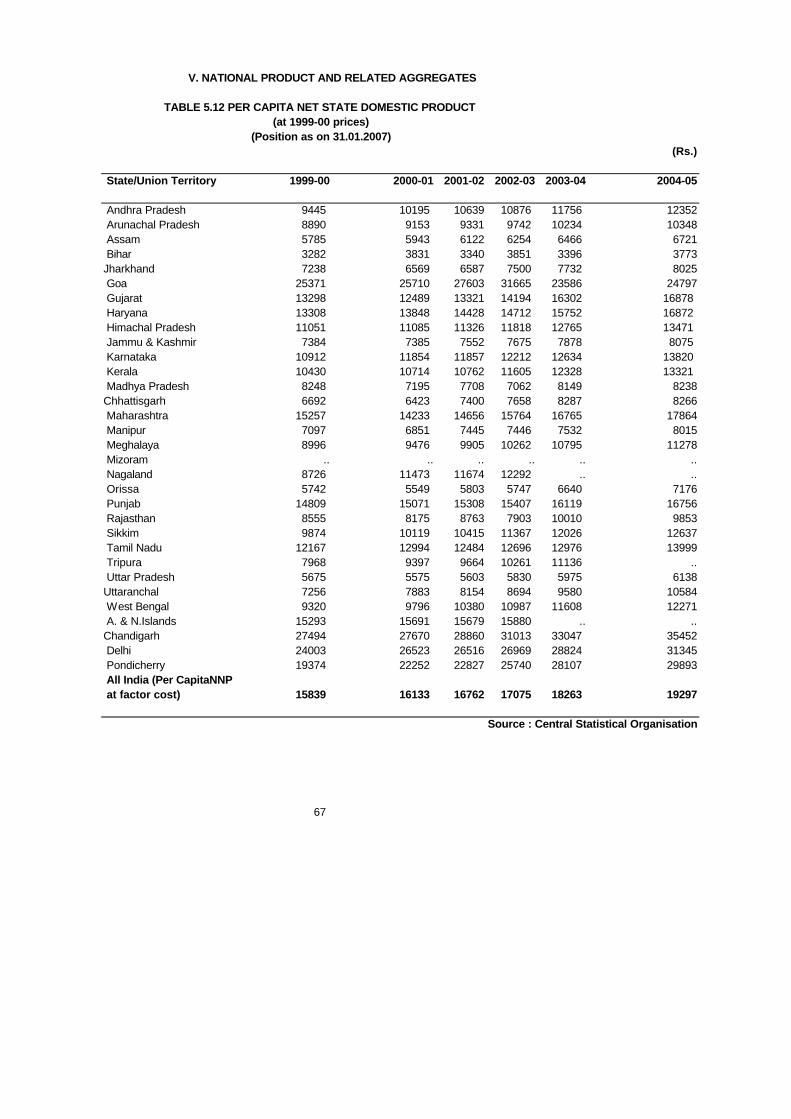
State/Union Territory 1999-00 2000-01 2001-02 2002-03 2003-04 2004-05
Andhra Pradesh 9445 10195 10639 10876 11756 12352 Arunachal Pradesh 8890 9153 9331 9742 10234 10348 Assam 5785 5943 6122 6254 6466 6721 Bihar 3282 3831 3340 3851 3396 3773Jharkhand 7238 6569 6587 7500 7732 8025 Goa 25371 25710 27603 31665 23586 24797 Gujarat 13298 12489 13321 14194 16302 16878 Haryana 13308 13848 14428 14712 15752 16872 Himachal Pradesh 11051 11085 11326 11818 12765 13471 Jammu & Kashmir 7384 7385 7552 7675 7878 8075 Karnataka 10912 11854 11857 12212 12634 13820 Kerala 10430 10714 10762 11605 12328 13321 Madhya Pradesh 8248 7195 7708 7062 8149 8238Chhattisgarh 6692 6423 7400 7658 8287 8266 Maharashtra 15257 14233 14656 15764 16765 17864 Manipur 7097 6851 7445 7446 7532 8015 Meghalaya 8996 9476 9905 10262 10795 11278 Mizoram .. .. .. .. .. .. Nagaland 8726 11473 11674 12292 .. .. Orissa 5742 5549 5803 5747 6640 7176 Punjab 14809 15071 15308 15407 16119 16756 Rajasthan 8555 8175 8763 7903 10010 9853 Sikkim 9874 10119 10415 11367 12026 12637 Tamil Nadu 12167 12994 12484 12696 12976 13999 Tripura 7968 9397 9664 10261 11136 .. Uttar Pradesh 5675 5575 5603 5830 5975 6138Uttaranchal 7256 7883 8154 8694 9580 10584 West Bengal 9320 9796 10380 10987 11608 12271 A. & N.Islands 15293 15691 15679 15880 .. ..Chandigarh 27494 27670 28860 31013 33047 35452 Delhi 24003 26523 26516 26969 28824 31345 Pondicherry 19374 22252 22827 25740 28107 29893 All India (Per CapitaNNP at factor cost) 15839 16133 16762 17075 18263 19297
67
TABLE 5.12 PER CAPITA NET STATE DOMESTIC PRODUCT (at 1999-00 prices)
(Rs.)
Source : Central Statistical Organisation
(Position as on 31.01.2007)
V. NATIONAL PRODUCT AND RELATED AGGREGATES

FORESTS20%
AREA SOWN MORE THAN
ONCE15%
AREA SOWN (NET)41%
FALLOWS LAND OTHER
THAN CURRENT FALLOW
3%
OTHER UNCULTIVATE
D LAND EXCLUDING
FALLOW LAND8%
NOT AVAILABLE
FOR CULTIVATION
12%
LAND UTILISATIONMILLION HECTARE
2004-05

FORESTS20%
AREA SOWN MORE THAN
ONCE15%
AREA SOWN (NET)41%
FALLOWS LAND OTHER
THAN CURRENT FALLOW
3%
OTHER UNCULTIVATE
D LAND EXCLUDING
FALLOW LAND8%
NOT AVAILABLE
FOR CULTIVATION
12%
LAND UTILISATIONMILLION HECTARE
2003-04

Item 1990-91 2000-01 2003-04(P) 2004-05(P)
Reporting area (2) for land utilisation statistics 304.9 305.1 305.3 305.2 Forests 67.8 69.6 69.7 69.7 Not available for cultivation 40.5 41.5 42.2 42.3 Other uncultivated land excluding fallow land 30.2 27.7 27.0 27.0 Current fallow 13.7 14.8 14.3 14.2 Fallow lands other than current fallows 9.7 10.1 11.2 10.7
Area sown (net) 143.0 141.1 141.0 141.3 Area sown more than once 42.7 44.5 49.4 49.6 Total cropped area 185.7 185.7 190.4 190.9
(1) Relates to agriculture year : July to June.
68
VI. AGRICULTURE
TABLE 6.1 LAND UTILISATION STATISTICS (1) (Million hectare)
Source: Directorate of Economics & Statistics, Ministry of Agriculture
(2) Excludes data in respect of Jammu and Kashmir under unlawful occupation of China & Pakistan.Note:Totals may not tally due to rounding off of the figures.

Size class (hectare) Lakh %age Lakh %age
hectare
Marginal (Below 1) 761 61.6 301 17.2 Small (1 - 2) 228 18.8 323 20.1 Semi-Medium (2 - 4) 141 12.4 383 23.9 Medium (4 - 10) 66 5.5 381 23.8 Large (10 and above) 12 1.2 211 14.8
Total 1208 100.0 1599 100.0
* Excluding Jharkhand
69
TABLE 6.2 ESTIMATED NUMBER OF OPERATIONAL HOLDINGS ANDAREA OPERATED BY SIZE OF HOLDINGS: 2000-01 *
____________________Area operatedNumber
(Rs.)
Source: Ministry of Agriculture
VI. AGRICULTURE

SEMI-MEDIUM 12%
MEDIUM5%
LARGE1%
MARGINAL63%
SMALL 19%
Number Lakh
SEMI-MEDIUM
22%
MARGINAL
13%
LARGE
20%
MEDIUM
29%SMALL
16%
Area Operated Lakh Hectare
ESTIMATED NUMBER OF OPERATIONAL ESTIMATED NUMBER OF OPERATIONAL HOLDINGS AND AREA OPERATED HOLDINGS AND AREA OPERATED
BY SIZE OF HOLDINGS : 2000BY SIZE OF HOLDINGS : 2000--0101

Crop 1990-91 2000-01 2003-04 2004-05 2005-06
Foodgrains 127835 121048 123446 120078 121599 Cereals 103173 100700 99988 97315 99208 Rice 42687 44712 42593 41907 43660 Jowar 14358 9856 9331 9092 8667 Bajra 10477 9829 10612 9233 9581 Maize 5904 6611 7343 7430 7588 Ragi 2171 1759 1666 1553 1534 Small millets 2447 1424 1191 1101 1064 Wheat 24167 25731 26595 26383 26484 Barley 962 778 657 617 630
Pulses 24662 20348 23458 22763 22391 Gram 7521 5185 7048 6715 6926 Tur 3593 3632 3516 3519 3581 Other pulses 13548 11531 12894 12529 11884
Non-foodgrains Oilseeds (1) 24148 22770 23663 27523 27863 Groundnut 8309 6559 5987 6640 6736 Sesamum 2516 1720 1700 1844 1723 Rapeseed and mustard 5782 4477 5428 7316 7277 Linseed 1099 580 477 449 437 Castorseed 810 1080 717 743 864
For footnotes, please see next page.Contd…..
70
VI. AGRICULTURE
TABLE 6.3 AREA UNDER PRINCIPAL CROPS (' 000 hectare)

Crop 1990-91 2000-01 2003-04 2004-05 2005-06
Non-foodgrains-Concld. Coconut 1475 1840 1934 1935 1947( P) Fibres Cotton (Lint) 7440 8535 7598 8787 8677 Jute 778 828 849 774 760 Mesta 239 190 153 142 138
Plantation crops Tea(2) 416 504 520 521 523(E) Coffee(3) 271 347 355 363 380 Rubber (4) 306 400 428 440 447(P)
Fruits and vegetables Potato 936 1222 1289 1319 1401( P) Banana 365 459 391 404 424( P)
Condiments and spices Pepper (black) 173 211 233 228 260( P) Chillies (dry) 816 837 774 738 655( P) Ginger (dry) 54 86 85 95 109( P) Turmeric 119 192 150 159 172( P)
Miscellaneous Sugarcane 3686 4316 3938 3662 4201( P) Tobacco 411 286 370 367 373( P)
soyabean.
E: Estimated P: Provisional Note:Totals may not tally due to rounding off of the figures.
71
VI. AGRICULTURE
TABLE 6.3 AREA UNDER PRINCIPAL CROPS-Concld. ('000 hectare)
Source: 1. Directorate of Economics & Statistics, Ministry of Agriculture
relate to total area and not plucked area.
(2 ) Rubber Board M/o Commerce (3) Coffee Board M/o Industry (4) Tea Board M/o Commerce
(1) Relate to nine major oil seeds including nigerseed, safflower, sunflower and
(2) Figures supplied by the Tea Board. These are as on 31st December of the year and
(3) Figures supplied by the Coffee Board and relate to bearing planted area. (4) Figures supplied by the Rubber Board & relate to tapped area only.

Crop 1990-91 2000--01 2003-04 2004-05 2005-06
Foodgrains 176390 196814 213189 198363 208603 Cereals 162125 185739 198284 185233 195219 Rice 74291 84977 88526 83132 91793 Jowar 11681 7529 6681 7244 7630 Bajra 6894 6759 12109 7931 7684 Maize 8962 12043 14984 14172 14710 Ragi 2340 2732 1966 2432 2354 Small millets 1190 587 564 478 472 Wheat 55135 69681 72156 68637 69355 Barley 1632 1431 1298 1207 1221
Pulses 14265 11076 14905 13130 13384 Gram 5356 3855 5718 5469 5600 Tur 2417 2247 2356 2347 2738 Other pulses 6492 4974 6831 5313 5047
Non-foodgrains Oilseeds (1) 18609 18437 25186 24354 27978 Groundnut 7515 6408 8127 6774 7993 Sesamum 835 518 782 674 641 Rapeseed & mustard 5229 4187 6291 7593 8131 Linseed 332 204 197 170 173 Castorseed 716 883 797 793 991
For footnotes, please see next page.
72
Contd….
('000 tonnes)
VI. AGRICULTURE
TABLE 6.4 PRODUCTION OF PRINCIPAL CROPS

Crop 1990-91 2000-01 2003-04 2004-05 2005-06
Non-foodgrains-Concld. Coconut(2) 973 1260 1218 1283 1481 Fibres Cotton(lint) (3) 9842 9524 13729 16429 18499 Jute (4) 7917 9317 10252 9399 9970 Mesta (4) 1311 1239 921 873 870 Plantation crops Tea(5) 720 847 879 907 931(E) Coffee(6) 170 301 271 276 274 Rubber(7) 330 630 712 750 803(P) Fruits and vegetables Potato 15206 22488 23060 23631 23905 Banana 7153 11771 11388 11710 12105 Condiments and spices Pepper (black) 48 50 73 73 93 Chillies (dry) 719 908 1236 1186 1015 Ginger (dry) 154 288 310 359 390 Turmeric 342 654 565 718 852 Miscellaneous Sugarcane 241046 295956 233862 237088 281172 Tobacco 556 488 550 549 552
soyabean. (2) In crore nuts. (3) In '000 bales of 170 kgs each. (4) In '000 bales of 180 kgs each.
(6) Figures supplied by the Coffee Board.
tapped area. E : Estimated P : Provisional
73
VI. AGRICULTURE
TABLE 6.4 PRODUCTION OF PRINCIPAL CROPS-concld.('000 tonnes)
Source: Directorate of Economics & Statistics, Ministry of Agriculture (1) Relates to nine major oil seeds including nigerseed, safflower, sunflower and
(5) Figures supplied by the Tea Board and are as on 31st Dec.of the year.
Note:Totals may not tally due to rounding off of the figures.
(7) Figures supplied by the Rubber Board and relate to natural rubber (dry) from

Crop 1990-91 2000-01 2003-04 2004-05 2005-06
Foodgrains 13.8 16.3 17.3 16.5 17.2 Cereals 15.7 18.4 19.8 19.0 19.7 Rice 17.4 19.0 20.8 19.8 21.0 Jowar 8.1 7.6 7.2 8.0 8.8 Bajra 6.6 6.9 11.4 8.6 8.0 Maize 15.2 18.2 20.4 19.1 19.4 Ragi 10.8 15.5 11.8 15.7 15.3 Small millets 4.9 4.1 4.7 4.3 4.4 Wheat 22.8 27.1 27.1 26.0 26.2 Barley 17.0 18.4 19.8 19.6 19.4
Pulses 5.8 5.4 6.4 5.8 6.0 Gram 7.1 7.4 8.1 8.2 8.1 Tur 6.7 6.2 6.7 6.7 7.7 Other pulses 4.8 4.6 5.5 4.6 4.6
Non-foodgrains
Oilseeds (1) 7.7 8.1 10.6 8.9 10.0 Groundnut 9.0 9.8 13.6 10.2 11.9 Sesamum 3.3 3.0 4.6 3.7 3.7 Rapeseed and mustard 9.0 9.4 11.6 10.4 11.2 Linseed 3.0 3.5 4.1 3.8 4.0 Castorseed 8.8 8.2 11.1 10.7 11.5
For footnotes, please see next page.
74
VI. AGRICULTURE
Contd….
TABLE 6.5 AVERAGE YIELD OF PRINCIPAL CROPS (quintals per hectare)

Crop 1990-91 2000-01 2003-04 2004-05 2005-06
Non-foodgrains-Concld. Coconut (nuts/hect.) 6595 6848 6298 6632 7608(P) Fibres Cotton 2.2 1.9 3.1 3.2 3.6 Jute 18.3 20.3 21.7 21.9 23.6 Mesta 9.9 11.8 10.9 11.1 11.4
Plantation crops Tea(2) 17.3 16.8 16.9 17.4 17.8(E) Coffee(3) 8.0 9.6 8.2 8.2 8.0 Rubber(4) 10.8 15.8 16.6 17.1(P) 18.0(P)
Fruits and vegetables Potato 162.5 184.0 178.9 179.2 170.6(P) Banana 196.0 257.6 291.6 289.7 285.8(P)
Condiments and spices Pepper (black) 2.8 2.4 3.1 3.2 3.6(P) Chillies (dry) 8.8 10.1 16.0 16.1 15.5(P) Ginger (dry) 28.4 33.4 36.5 37.7 35.7(P) Turmeric 28.8 41.3 37.6 45.2 49.5(P)
Miscellaneous Sugarcane 653.9 685.8 593.8 647.5 669.3(P) Tobacco 13.5 17.0 14.9 15.0 14.8(P)
soyabean.
Coffee Board.
E : Estimated P : Provisional
75
(3) Based on the estimated bearing area for 1980-81 onwards supplied by the
(4) Figures supplied by the Rubber Board; yield relates to production of natural
Source: Directorate of Economics & Statistics, Ministry of Agriculture
rubber (dry) per hectare of tapped area.
(quintals per hectare)TABLE 6.5 AVERAGE YIELD OF PRINCIPAL CROPS-concld.
VI. AGRICULTURE
and relate to total area and not plucked area.
(1) Relate to nine major oil seeds including nigerseed, safflower, sunflower and
(2) Figures supplied by the Tea Board. These are as on 31st December of the year

80
100
120
140
160
1990-91 2000-01 2003-04 2004-05 2005-06
Foodgrains Non-foodgrains All Crops
INDEX NUMBER OF AREA UNDER CROPS
( BASE : Triennium ending 1981-82=100 )
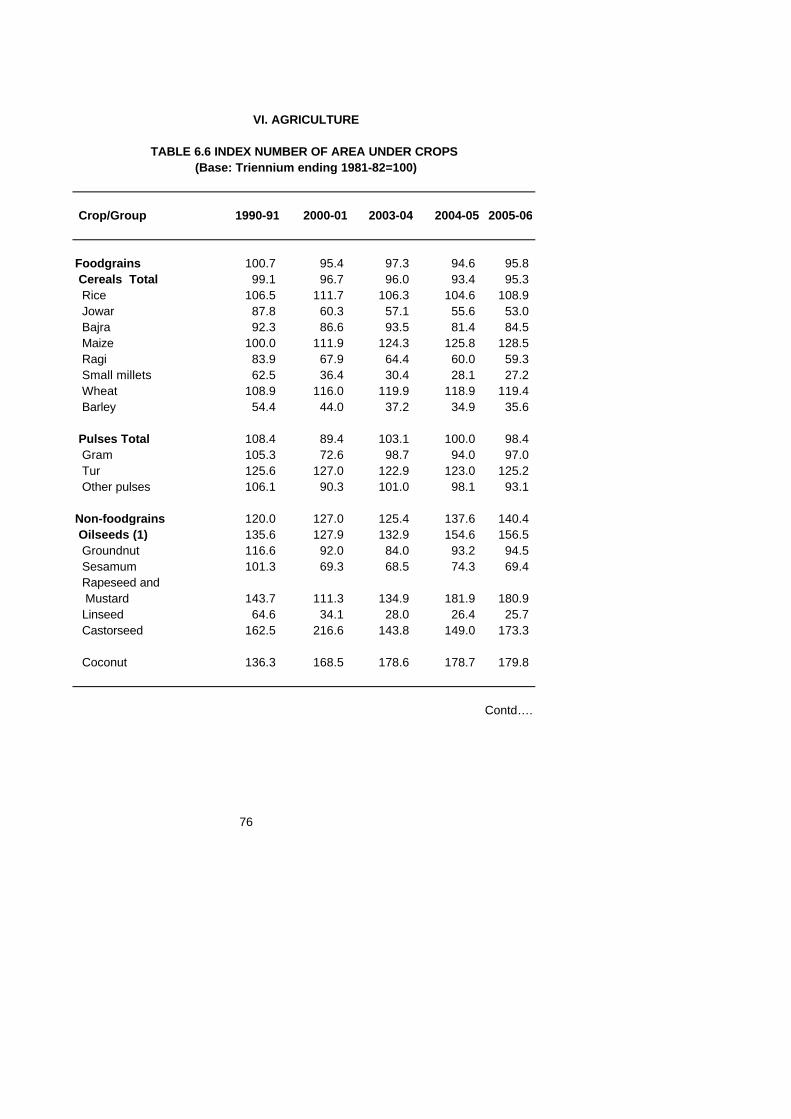
Crop/Group 1990-91 2000-01 2003-04 2004-05 2005-06
Foodgrains 100.7 95.4 97.3 94.6 95.8 Cereals Total 99.1 96.7 96.0 93.4 95.3 Rice 106.5 111.7 106.3 104.6 108.9 Jowar 87.8 60.3 57.1 55.6 53.0 Bajra 92.3 86.6 93.5 81.4 84.5 Maize 100.0 111.9 124.3 125.8 128.5 Ragi 83.9 67.9 64.4 60.0 59.3 Small millets 62.5 36.4 30.4 28.1 27.2 Wheat 108.9 116.0 119.9 118.9 119.4 Barley 54.4 44.0 37.2 34.9 35.6
Pulses Total 108.4 89.4 103.1 100.0 98.4 Gram 105.3 72.6 98.7 94.0 97.0 Tur 125.6 127.0 122.9 123.0 125.2 Other pulses 106.1 90.3 101.0 98.1 93.1
Non-foodgrains 120.0 127.0 125.4 137.6 140.4 Oilseeds (1) 135.6 127.9 132.9 154.6 156.5 Groundnut 116.6 92.0 84.0 93.2 94.5 Sesamum 101.3 69.3 68.5 74.3 69.4 Rapeseed and Mustard 143.7 111.3 134.9 181.9 180.9 Linseed 64.6 34.1 28.0 26.4 25.7 Castorseed 162.5 216.6 143.8 149.0 173.3
Coconut 136.3 168.5 178.6 178.7 179.8
76
Contd….
TABLE 6.6 INDEX NUMBER OF AREA UNDER CROPS (Base: Triennium ending 1981-82=100)
VI. AGRICULTURE

Crop/Group 1990-91 2000-01 2003-04 2004-05 2005-06
Non-foodgrains-Concld. Fibres 91.1 102.7 92.3 104.0 102.7 Cotton(lint) 92.9 106.6 94.9 109.7 108.4 Jute 89.7 95.5 97.9 89.3 87.7 Mesta 67.1 53.3 42.9 39.9 38.8
Plantation Crops 122.5 160.4 163.2 164.9 164.9 Tea 110.3 133.5 136.8 137.3 137.3 Coffee 111.1 165.9 157.0 157.0 157.0 Rubber 158.2 198.3 221.0 227.1 227.1
Fruits and Vegetables 111.6 135.8 140.6 145.7 155.7 Potato 128.6 168.0 177.2 181.2 192.6 Banana 129.0 162.1 138.1 142.9 149.8
Condiments and Spices: 113.8 126.1 134.7 125.8 124.4 Pepper (black) 157.1 193.8 211.4 206.8 235.7 Chillies (dry) 98.1 100.5 93.0 88.6 78.7 Ginger (dry) 126.5 202.4 199.8 223.7 256.6 Turmeric 120.3 142.7 111.7 118.2 128.1
Miscellaneous Sugarcane 130.4 152.7 139.4 129.6 148.7 Tobacco 93.3 59.4 84.0 83.3 84.7
All Crops 105.2 102.7 103.8 104.6 106.1
and soyabean.
77
Source: Directorate of Economics & Statistics, Ministry of Agriculture (1) Relate to nine major oil seeds including nigerseed, safflower, sunflower and
TABLE 6.6 INDEX NUMBER OF AREA UNDER CROPS-Concld. (Base: Triennium ending 1981-82=100)
VI. AGRICULTURE

100
120
140
160
180
200
220
240
1990-91 2000-01 2003-04 2004-05 2005-06
Foodgrains Non-foodgrains All Crops
INDEX NUMBER OF AGRICULTURAL PRODUCTION
( BASE : Triennium ending 1981-82=100 )

Crop/Group 1990-91 2000-01 2003-04 2004-05 2005-06
Foodgrains 143.7 158.4 172.0 159.9 169.3 Cereals 144.2 165.1 175.7 164.4 174.7 Rice 149.4 170.9 178.0 167.2 184.6 Jowar 102.7 66.2 58.7 63.7 67.0 Bajra 139.6 136.8 245.1 160.6 155.6 Maize 137.6 184.9 230.0 217.6 225.8 Ragi 86.6 101.1 72.7 90.0 87.1 Small millets 76.9 37.9 36.4 30.9 30.5 Wheat 156.6 198.0 205.0 195.0 197.0 Barley 82.8 72.5 65.8 61.2 61.9
Pulses 140.5 109.3 146.8 128.9 131.4 Gram 130.2 93.7 139.0 133.0 136.1 Tur 121.9 113.3 118.9 118.4 138.1 Other pulses 159.1 121.9 167.4 130.2 123.6
Non-foodgrains 156.3 178.2 201.5 206.8 229.0 Oilseeds (1) 184.2 176.5 234.9 232.6 264.3 Groundnut 125.3 106.8 135.5 112.9 133.3 Sesamum 181.0 112.2 169.4 146.0 138.9 Rapeseed & Mustard 256.3 205.2 308.3 372.1 398.5 Linseed 84.7 51.9 50.2 43.3 44.0 Castorseed 289.7 357.1 322.3 320.9 400.8
Coconut 172.4 224.7 215.8 227.4 262.5
Fibers 128.2 126.6 175.6 204.9 229.5 Cotton(lint) 130.9 126.6 182.5 218.4 246.0 Jute 122.6 144.2 158.7 145.5 154.3 Mesta 76.7 72.5 53.9 51.1 50.9
78
Contd…..
(Base: Triennium ending 1981-82=100)TABLE 6.7 INDEX NUMBER OF AGRICULTURAL PRODUCTION
VI. AGRICULTURE

Crop/Group 1990-91 2000-01 2003-04 2004-05 2005-06
Plantation Crops 144.9 209.0 217.2 226.2 226.2 Tea 132.3 151.3 156.6 159.2 159.2 Coffee 122.3 216.8 194.7 210.4 210.4 Rubber 217.2 416.1 469.8 494.8 494.8
Fruits and Vegetables 145.1 218.3 221.1 227.5 244.6 Potato 163.3 241.5 247.7 253.8 256.7 Banana 163.6 294.9 260.4 267.8 276.8
Condiments and Spices 143.9 203.3 254.7 252.5 248.9 Pepper (black) 166.7 221.2 254.2 253.5 322.6 Chillies(dry) 140.9 192.8 242.2 232.4 198.9 Ginger(dry) 181.5 340.5 356.9 424.4 461.1 Turmeric 159.6 332.9 263.3 334.7 396.9
Miscellaneous Crops Sugarcane 154.3 189.4 149.7 151.7 179.9 Tobacco 115.8 71.8 114.5 114.4 115.0
All Crops 148.4 165.8 183.0 177.3 191.4
.
..
79
TABLE 6.7 INDEX NUMBER OF AGRICULTURAL PRODUCTION-concld. (Base: Triennium ending 1981-82=100)
VI. AGRICULTURE
Source: Directorate of Economics & Statistics, Ministry of Agriculture (1) Relate to nine major oil seeds including nigerseed,safflower,sunflower & soyabean

Crop/Group 1990-91 2000-01 2003-04 2004-05 2005-06
Foodgrains 137.8 152.8 165.3 156.5 162.3 Cereals 139.3 156.8 168.9 160.7 166.8 Rice 140.2 153.2 167.5 159.9 169.4 Jowar 116.9 109.7 102.9 114.5 126.5 Bajra 151.1 157.9 262.1 197.3 184.2 Maize 137.6 165.2 185.0 172.9 175.8 Ragi 103.2 148.7 113.0 150.0 147.0 Small millets 123.0 104.3 119.8 109.8 112.1 Wheat 143.8 170.7 171.0 164.0 165.1 Barley 152.1 164.9 177.0 175.5 173.7
Pulses 128.1 120.4 140.5 127.0 130.1 Gram 123.6 129.1 140.8 141.4 140.3 Tur 97.0 89.2 96.7 96.2 110.3 Other pulses 149.9 134.9 165.7 132.6 132.8
Non-foodgrains 128.0 133.2 151.2 147.6 157.6 Oilseeds (1) 132.7 133.4 176.1 149.2 167.0 Groundnut 107.4 116.1 161.2 121.2 141.0 Sesamum 178.6 161.9 247.4 196.6 200.1 Rapeseed & Mustard 178.3 184.4 228.5 204.6 220.3 Linseed 131.2 152.4 179.1 164.3 171.5 Castorseed 178.2 164.9 224.0 215.4 231.2
Coconut 126.5 133.4 120.8 127.2 146.0
& soyabean.
80
VI. AGRICULTURE
(1) Relate to nine major oilseeds including nigerseed,safflower,sunflower
Contd…..
TABLE 6.8 INDEX NUMBER OF AGRICULTURAL YIELD (Base: Triennium ending 1981-82=100)

Crop/Group 1990-91 2000-01 2003-04 2004-05 2005-06
Non-foodgrains-Concld. Fibres 139.9 122.2 188.0 195.0 221.3 Cotton(lint) 140.8 118.8 192.4 199.0 226.9 Jute 136.6 151.0 162.0 163.0 176.1 Mesta 114.3 136.0 125.7 128.1 131.3
Plantation Crops 122.2 137.3 140.1 144.7 144.7 Tea 119.9 113.3 114.5 116.0 116.0 Coffee 110.3 130.7 124.0 134.0 134.0 Rubber 137.5 201.5 212.6 217.9 217.9
Fruits & Vegetables 124.8 150.4 149.6 148.5 148.2 Potato 127.0 143.8 139.8 140.0 133.3 Banana 126.8 182.0 188.6 187.4 184.8
Condiments & Spices 124.2 154.5 178.5 179.9 177.7 Pepper (black) 106.1 114.2 120.2 122.6 136.9 Chillies (dry) 143.7 191.9 260.4 262.3 252.8 Ginger (dry) 143.4 168.3 178.7 189.7 179.7 Turmeric 132.7 233.3 235.6 283.3 310.0
Miscellaneous Sugarcane 118.3 124.0 107.4 117.1 121.0 Tobacco 124.0 120.8 136.3 137.3 135.8
All Crops 133.8 114.3 159.7 153.1 160.2
81
Source: Directorate of Economics & Statistics, Ministry of Agriculture
VI. AGRICULTURE
TABLE 6.8 INDEX NUMBER OF AGRICULTURAL YIELD-concld. (Base: Triennium ending 1981-82=100)

(Million tonne)
Commodity Group 1991 2000 2005 2006(P)
I. Cereals 1. Production (1) (i) Gross 162.1 196.4 185.2 195.2 (ii) Net 141.9 171.8 162.1 170.8 2. Net imports -0.6 -1.4 -7.2 -3.8 3. Change in Govt.stocks
-4.4 13.9 -2.4 -1.5 4. Net availability [1(ii)+2-3] 145.7 156.6 157.4 168.4II. Pulses Net availability 12.9 11.8 12.6 13.3
accounts only.
(grams per day)
Commodity Group 1991 2000 2005 2006(P)
Cereals 469 423 390.9 412.1 Pulses 42 32 31.5 32.5 Foodgrains 510 454 422.4 444.5
P : Provisional Note:Totals may not tally due to rounding off of the figures.
82
Note: Net imports are based on imports and exports on Government of India
TABLE 6.10 PER CAPITA NET AVAILABILITY OF FOODGRAINS
Source: Directorate of Economics & Statistics, Ministry of Agriculture
VI. AGRICULTURE
TABLE 6.9 AVAILABILITY OF FOODGRAINS
Source: Directorate of Economics & Statistics, Ministry of Agriculture
(1) Figures relate to the agricultural year July to June

Item 1990-91 2000-2001 2002-20032003-2004(P)
Edible oils (1) (kg.) 5.5 8.2 7.2 NAVanaspati (kg.) 1.0 1.3 1.4 NASugar (2) (kg.) 12.7 15.8 16.3 NACotton cloth (3) (metre) 15.1 14.2 14.4 13.4Man-made fibrefabrics (3) (metre) 9.0 16.5 17.0 17.6Tea (3) (gram) 612.0 631.0 596.0 NACoffee (3) (gram) 59.0 58.0 67.0 70.0Electricity (Domestic) (kwh.) 38.2 75.0 79.0 83.6
manufacture of vanaspati.
sugar year (Nov.-Oct.).
1990-91 and so on.
83
seed oil,sunflower oil, and soyabean oil but exclude oils for
(2) Figures refer to actual releases for domestic consumption during
(3) Data relate to calendar year. Figures for 1990 are shown against
TABLE 6.11 PER CAPITA AVAILABILITY OF CERTAIN IMPORTANT ARTICLES OF CONSUMPTION
Source: Economic Survey, Ministry of Finance
(1) Include groundnut oil,rapeseed & mustard oil,sesamum oil,niger-
VI. AGRICULTURE

('000 hectare)
Item 1990-91 2000-01 2003-04P 2004-05P
Net area irrigated 48023 54836 55996 58537 By sources- Canals 17453 16169 15599 15909 Government 16973 15966 15394 15703 Private 480 203 205 206 Tanks 2944 2476 2017 1830 Wells (1) 24694 33457 35768 35038 Other sources 2932 2735 2613 5761
Gross area irrigated 63204 75820 77106 79506 Cropwise distribution Foodcrops 52134 63361 63396 64096 Foodgrains 44866 53782 52949 53857 Cereals and millets 42258 51172 49639 50560 Rice 19469 24709 22578 23269 Wheat 19511 22681 23634 23642 Barley 530 531 432 402 Jowar 794 838 746 827 Bajra 548 781 687 764 Maize 1162 1486 1437 1542 Other cereals and millets (2) 244 146 126 114 Pulses 2608 2609 3310 3297 Sugarcane 3398 4206 4000 3714 Condiments and spices 1100 1510 1905 1793 Fruits and vegetables 2575 3847 4523 4712 Other food crops 195 16 19 19 Non-foodcrops 11070 12460 13710 15410 Oilseeds 5761 5400 6508 8040 Cotton 2487 2793 2626 3076 Other non-foodcrops(3) 2822 4267 4577 4295
(1) Include tube wells. (2) Include ragi. (3) Include tobacco and fodder crops also. P : ProvisionalNote:Totals may not tally due to rounding off of figures.
84
TABLE 6.12 NET AND GROSS AREA IRRIGATED
Source: Ministry of Agriculture
VI. AGRICULTURE

Member- Working Type of society Number ship capital
('000) (Rs.Billion)
(1) (2) (3) (4)_____________________________________________________________________________I. All Credit Societies(A+B) 146206 158488 3552.31 A.Short-term structure 145416 145508 3267.56 1.State Co-op. Banks 30 114 540.42 2.Dist. Central Co-op. Banks 368 1839 1016.59 3.Industrial Co-op. Banks 8 130 10.05 4.Primary Agriculture Credit societies (1) 94825 105871 464.55 5.Grain Banks 153 30 0.03 6.Primary Co-op Banks 1997 19862 998.52 7.Primay Non-Ag. Societies 48035 17662 237.40 B.Long-term structure 790 12980 284.75 1.State Co-op. Agriculture & Rural Development Banks 20 5726 186.59 2.Primary Co-op.Agriculture and Rural Development Banks 770 7254 98.16II.All non-credit societies 243874 50634 425.18 1.Marketing 5911 6814 83.68 2.Agricultural Processing 1887 1051 10.17 3.Suger factories 117 2078 46.98 4.Farming 2387 120 0.34 5.Others (2) 184302 33390 234.00
For footnotes, please see next page. Contd.
85
VI. AGRICULTURE
TABLE 6.13 CO-OPERATIVE SOCIETIES (as on 31st March 2002)

Type of society AdvancedOutstanding Overdue
(1) (5) (6) (7)
I. All Credit Societies 1928.23 2028.57 380.24 A.Short-term structure 1887.12 1815.28 352.55 1.State Co-op. Banks 262.99 314.77 33.64 2.Dist. Central Co-op. Banks 577.93 576.15 142.70 3.Industrial Co-op. Banks 2.20 5.54 0.92 4.Primary Agriculture Credit societies (1) 264.58 307.81 101.94 5.Grain Banks 0.01 0.01 0.00 6.Primary Co-op Banks 634.76 460.14 55.60 7.Primay Non-Ag. Societies 144.65 150.86 17.75 B.Long-term structure 41.11 213.29 27.69 1.State Co-op. Agriculture & Rural Development Banks 25.39 137.49 15.71 2.Primary Co-op.Agriculture and Rural Development Banks 15.72 75.80 11.98II.All Non-credit Societies 33.25 84.36 8.16 1.Marketing 3.13 4.92 0.00 2.Agricultural Processing 0.87 0.79 0.10 3.Suger factories 0.88 1.14 0.03 4.Farming 0.01 0.04 0.02 5.Others (2) 26.50 75.20 7.53
(1) Includes FSS and LAMPS.
86
Source : National Banks for Agriculture and Rural Development (NABARD)
(2) Include weaver societies, other industrial societies, consumer stores & all other non-credit societies.
VI. AGRICULTURE
TABLE 6.13 CO-OPERATIVE SOCIETIES-concld. (as on 31st March 2002)
Loans (Rs.Billion)

(Million number)
Item 1977 1987 1997 2003
Livestock 369.5 445.3 485.4 485.0 Cattle 180.0 199.7 198.9 185.2 Males over 3 yrs. (1) 74.9 74.7 68.7 57.6 Females over 3 yrs. (1) 57.6 62.1 64.4 64.5 Young stocks 47.6 63.0 65.7 63.1 Buffaloes 62.0 76.0 89.9 97.9 Males over 3 years 8.4 7.5 7.9 6.7 Females over 3 years 31.9 39.1 46.8 51.0 Young stocks 21.8 29.4 35.2 40.3 Sheep 40.9 45.7 57.5 61.5 Goats 75.6 110.2 122.7 124.4 Horses and ponies 0.9 0.8 0.8 0.8 Other livestock 9.9 12.9 15.5 15.3
Poultry 160.9 275.3 347.6 489.0 Fowls 149.3 251.0 315.4 457.4 Ducks 10.1 23.5 30.9 30.0 Others 1.3 0.8 1.3 1.7
(1) In case of cross bred cattle, figures relate to over two and half years. Note:Totals may not tally due to rounding off of the figures.
87
VII. LIVESTOCK,POULTRY AND FISHERY
Source and Footnote : Department of Animal Husbandry & Dairying Ministry of Agriculture
TABLE 7.1 CENSUS OF LIVESTOCK AND POULTRY

('000 tonne)
Item1991 2003 2004 2005(P)
Catch 4044 6399 6305 6572 Fresh water 1655 3458 3526 3756 Marines 2389 2941 2779 2816
Disposal 4044 6265 6391 6607 Marketing fresh 2706 4889 5284 5469 Curring 614 352 331 348 Reduction (1) 381 483 330 345 Others (2) 343 541 448 445
(P) : Provisional (1) Includes offal reduction, unspecified and Misc. purpose (2) Include frozen and canned.
88
Source & Footnotes: Fishries Division,Ministry of Agriculture
TABLE 7.2 FISH-CATCH AND DISPOSAL
VII. LIVESTOCK,POULTRY AND FISHERY

0
1000
2000
3000
4000
5000
6000
7000
1991 2003 2004 2005
FISH CATCH AND DISPOSAL
(‘000 Tonne)

Mineral Unit of 1990-91 2000-01 2004-05 2005-06(P)quantity
Fuel minerals Coal Mn. tonne 212 314 383 407 Lignite Mn. tonne 14 24 30 30 Natural Gas (Utilised) m.c.m. 12869 27860 30820 31223 Petroleum (crude) Mn. tonne 33 32 34 32Metallic minerals Bauxite Mn. tonne 5 8 12 12 Chromite '000 tonne 940 1972 3621 3423 Copper Conc*. '000 tonne 5255 164 137 124 Gold Kg 2200 2600 3526 3050 Iron ore Mn. tonne 56 81 146 154 Lead Conc. 000 tonne 44 54 82 98 Manganese ore Mn. tonne 2 2 2 2 Zinc Conc. 000 tonne 137 366 666 893Non-metallic minerals Apatite & Phosphorite 000 tonne 683 1362 1731 1382 Dolomite Mn. tonne 3 3 4 4 Gypsum Mn. tonne 2 3 4 3 Limestone Mn. tonne 70 127 166 170 Magnesite 000 tonne 500 300 384 351 Mica (crude) 000 Kg 4000 1000 1276 1259
89
VIII. MINING
TABLE 8.1 PRODUCTION OF PRINCIPAL MINERALS
Source : Indian Bureau of Mines, Minstry of Mines* Relates to Copper Ore for 1990-91.

Mineral 1990-91 2000-01 2004-05 2005-06(P)
Fuel minerals 161436 479010 605116 614848 Coal 60211 203520 304335 323543 Lignite 3589 14175 21916 21521 Natural Gas(Utilised) 18320 80702 89401 90407 Petroleum (crude) 79316 180613 189464 179376
Metallic minerals 12970 37286 99404 114861 Bauxite 607 1787 2517 2860 Chromite 1558 3650 8496 9779 Copper Conc.* 1700 3243 2131 2246 Gold 853 1235 1943 2082 Iron ore 5873 21180 74029 86905 Lead Conc. 373 798 653 708 Manganese ore 752 1978 5549 5082 Zinc Conc. 1004 3055 3999 4956 Others 250 360 87 243Non-metallic minerals 6663 20344 26845 27284 Apatite & Phosphorite 541 2359 2944 1390 Dolomite 279 744 916 1076 Gypsum 145 441 502 390 Limestone 4159 13474 17942 19020 Magnesite 298 380 364 489 Mica (crude) 32 26 26 32 Others 1209 2920 4151 4887
Miner Minerals 10161 51012 82390 82390
All Minerals value 191230 587653 813755 839383
90
VIII. MINING
TABLE 8.2 VALUE OF PRODUCTION OF PRINCIPAL MINERALS
(Rs.Mn.)
Source: Indian Bureau of Mines, Ministry of Mines * Relates to Copper Ore for 1990-91.

Mineral Weight 2000-01 2003-04 2004-05 2005-06(P)
Fuel Minerals Coal mining 324.628 127 146 155 164Petroleum and natural gas 532.552 133 140 142 137
Metallic Minerals (1) 80.765 130 187 221 228 Iron ore 38.428 135 206 245 259 Chromite 11.017 185 273 340 321 Copper ore 8.352 70 58 58 53 Manganese ore 6.122 94 105 141 118
Non-metallic Minerals(2) 42.327 142 167 185 181 Limestone 25.010 153 184 199 205 Phosphorite 4.488 130 139 166 133 Dolomite 3.082 88 118 126 129
Minor minerals 19.728 144 144 144 144 All Minerals 1000.000 131 147 154 155
(1) Includes all metallic minerals other than those declared as prescribed substances under the Atomic Energy Act,1962. (2) Includes other non-metallic minerals.
91
VIII. MINING
TABLE 8.3 INDEX NUMBER OF MINERAL PRODUCTION
( Base: 1993-94=100 )
Source: Indian Bureau of Mines, Ministry of Mines

INDEX NUMBER 0FMINERAL PRODUCTION
(BASE : 1993-94=100)
100
110
120
130
140
150
160
170
180
190
200
210
220
230
240
2000-01 2003-04 2004-05 2005-06
COAL MINING
PETROLEUM AND NATURAL GAS
M ETALLIC MINERALS
NON-METALIC M INERALS
M INOR MINERALS
ALL MINERALS

Item Unit 2002-03 2003-04 2004-05 2005-06
Sugar Million tonnes 18.9 16.3 13.3 18.5
Vanaspati oil (1) 000 Tonne 4028 4546 5381 4341
Tea 000 Tonne 838 851 831 893
Coffee 000 Tonne 285 257 296 262
Cigarettes Million Nos 54991 49769 54748 75711
Cotton yarn $ Mn.Kg 2174 2121 2271 2451
Cotton cloth $$ M.Sq.Mtrs 19278 18063 20566 23405
Blended cloth $$ M.Sq.Mtrs 5910 6067 6030 6148
Jute Manufactures 000 M. tonnes 1328 1283 1303 1328Footwear (leather and rubber)$ Mn.pairs 179 186 192 197
Plywood commercial 000 Sq.Mtrs 8914 8480 5371 5817
Paper & paper board $ 000 Tonnes 5239 5556 5793 5885
Rubber tyres and tubes (2) Mill.Nos 113 136 189 250
Sulphuric acid 000 Tonnes 5988 6076 6666 6974
Caustic soda 000 Tonnes 1539 1601 1771 1881
Soda ash 000 Tonnes 1610 1705 2027 2327
Filament yarn Mn.Kg 1096 1146 1112 1179
Viscose staple fibre 000 Tonnes 167 144 187 198
Storage batteries 000 Nos 3893 18969 38330 35670
Dry cells batteries Mill.Nos 2520 2322 2683 2679
G.L.S. lamps Mill.Nos 461 975 464 482
Electric fans $ 000 Nos 9194 10000 9713 10736
Locomotives all types Numbers 181 202 211 277
Automobiles (3) 000 Nos. 935 1283 1565 1702
Motor cycles 000 Nos. 3893 4355 5122 6201
Scooter and mopeds 000 Nos. 1195 1270 1333 1401
Bicycles all kinds 000 Nos. 11595 12341 8030 8268
For source & footnotes please see next page.
92
Contd…
IX. INDUSTRY
TABLE 9.1 PRODUCTION OF SELECTED ITEMS OF MAJOR MANUFACTURING INDUSTRIES
Production

Item Unit 2002-03 2003-04 2004-05 2005-06
Phosphatic fertilizers 000 Tonne 3885 3568 3986 4162
Nitrogenous fertilizers 000 Tonne 10560 10633 11340 11402
Paints, enamels & varnishes $ 000 Tonne 637 667 720 728
Soap $ 000 Tonne 4086 4194 4142 4150
Matches $ Mil.boxes 94598 95237 95648 94425
Cement Mn.Tonne 112 117 125 141
Asbestos (cement sheets and accessories) 000 Tonne 1248 1347 1594 1900
Pig iron 000 Tonne 5059 5197 3982 3697
Stainless/ alloy steel 000 Tonne 1786 1791 1795 2120
Aluminium ingots 000 Tonne 467 601 516 561
Tractors 000 Nos. 192 179 242 254
Diesel engines 000 Nos. 2943 2972 2975 3021
Textile machinery Rs.Mn. 12558 12559 14260 21429
Printing machinery Rs.Mn. 2278 2654 2786 3084
Power driven pumps 000 Nos 584 663 649 718
Machine tools $ Rs.Bn. 24 25 26 29
Sewing machines 000 Nos 83 74 41 0
Air conditioners window type 000 Nos 207 276 387 515
Refrigerators (domestic) 000 Nos 2735 3715 4360 5159Power & dist. transformers (IPP)
Mill.K.V.A 75 63 59 68
Electric motors Mn. H.P. 5 9 11 10
PVC/PICL K.Metre 42602 54558 34476 62823
Telecommunication cables Mill.Mtr 20803 20406 16488 14027
(2) Include bicycle tyres & tubes, giant tyres and tubes, Tractors/a.d.v. tyres and two-wheelers tyres.
(3) Include commercial vehicles, zeep type vehicles and passanger cars.
$ Include production of small scale sector also.
$$: Includes production of decentralised sector also.
93
(1) Includes edible hydrogenated oil, soyabeen oil,sunflower oil,coconut oil,cotton seed oil,
groundnut oil, mustard/ rape seed oil, rice bran oil and till seed oil.
Sources: 1.Central Statistical Organisation
IX. INDUSTRY
TABLE 9.1 PRODUCTION OF SELECTED ITEMS OF MAJOR MANUFACTURING INDUSTRIES-Concld.
Production
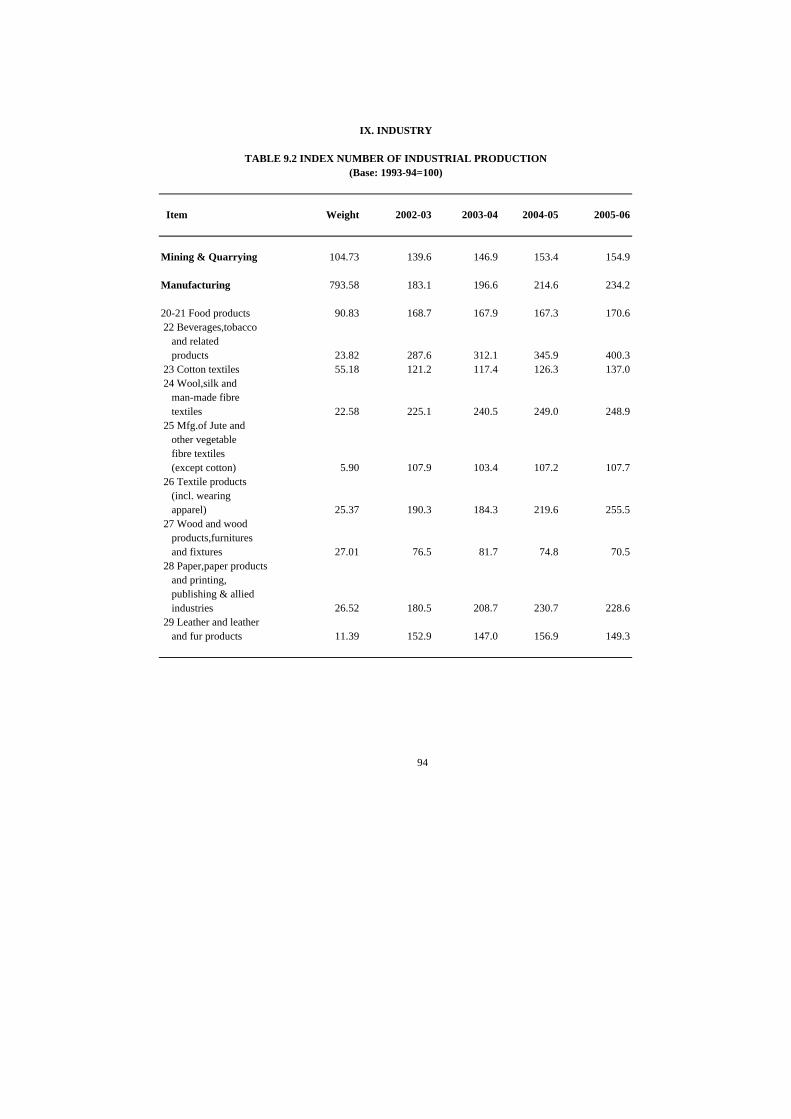
Item Weight 2002-03 2003-04 2004-05 2005-06
Mining & Quarrying 104.73 139.6 146.9 153.4 154.9
Manufacturing 793.58 183.1 196.6 214.6 234.2
20-21 Food products 90.83 168.7 167.9 167.3 170.6 22 Beverages,tobacco and related products 23.82 287.6 312.1 345.9 400.3 23 Cotton textiles 55.18 121.2 117.4 126.3 137.0 24 Wool,silk and man-made fibre textiles 22.58 225.1 240.5 249.0 248.9 25 Mfg.of Jute and other vegetable fibre textiles (except cotton) 5.90 107.9 103.4 107.2 107.7 26 Textile products (incl. wearing apparel) 25.37 190.3 184.3 219.6 255.5 27 Wood and wood products,furnitures and fixtures 27.01 76.5 81.7 74.8 70.5 28 Paper,paper products and printing, publishing & allied industries 26.52 180.5 208.7 230.7 228.6 29 Leather and leather and fur products 11.39 152.9 147.0 156.9 149.3
94
TABLE 9.2 INDEX NUMBER OF INDUSTRIAL PRODUCTION(Base: 1993-94=100)
IX. INDUSTRY

Item Weight 2002-03 2003-04 2004-05 2005-06
30 Basic chemical and chemical products (except products of petroleum & coal) 140.02 191.8 208.4 238.6 258.5 31 Rubber, plastic, petroleum and coal products 57.28 179.7 187.7 192.2 200.5 32 Non-metallic mineral products 43.97 232.0 240.6 244.3 271.1 33 Basic metal and alloy industries 74.53 170.4 186.0 196.1 227.0 34 Metal products and parts except machinery & tran- sport equipment 28.10 151.7 157.3 166.3 164.4 35-36 Machinery and equipments other than transport equipment 95.65 201.4 233.3 279.4 312.8 37 Transport equipments and parts 39.84 232.9 272.6 283.7 319.7 38 Other manufacturing industries 25.59 173.3 186.6 221.2 276.9
Electricity 101.69 164.3 172.6 181.5 190.9
General Index(crude) 1000.00 176.6 189.0 204.8 221.5
95
(Base: 1993-94=100)
Source: Central Statistical Organisation
IX. INDUSTRY
TABLE 9.2 INDEX NUMBER OF INDUSTRIAL PRODUCTION-concld.

130
140
150
160
170
180
190
200
210
220
230
240
250
2002-03 2003-04 2004-05 2005-06
MINING & QUARRYINGMANUFACTURINGELECTRICITYGENERAL INDEX (CRUDE)
INDEX NO.OFINDUSTRIAL PRODUCTION
(Base : 1993-94=100)

Item/Unit 1990-91 2002-03 2003-04 2004-05
Number of factories (No.) 110179 127957 129074 136353Productive capital (Rs Million) 1761679 5448805 5925624 6731232Fixed capital (Rs.Million) 1336476 4447594 4733314 5130693Working capital (Rs.Million) 425204 1001211 1192310 1600540Workers employed ('000) 6307 6161 6087 6599Other persons engaged ('000) 1855 1709 1716 1784Wages to workers (Rs Million) 131920 296890 304778 336351Total inputs (RsMillion) 2089860 9161855 10396238 13629413Fuels consumed (Rs.Million) 208998 665758 737127 858538Materials consumed (Rs Million) 1669432 7007724 7932852 10243475Depreciation (Rs.Million) 100629 420356 448235 497132Total output (Rs Million) 2705635 11305611 12873800 16725614Net value added (Rs.Million) 515146 1723400 2029328 2599069
96
IX. INDUSTRY
TABLE 9.3 ANNUAL SURVEY OF INDUSTRIES-FACTORY SECTOR SUMMARY RESULTS
Source: Central Statistical Organisation
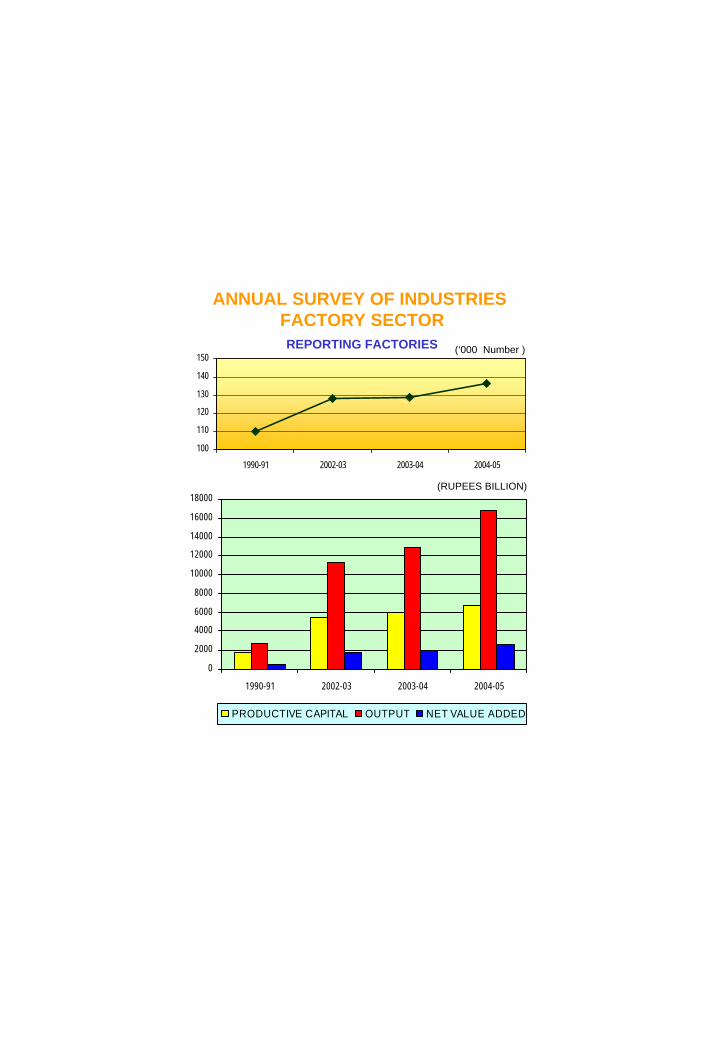
0
2000
4000
6000
8000
10000
12000
14000
16000
18000
1990-91 2002-03 2003-04 2004-05
PRODUCTIVE CAPITAL OUTPUT NET VALUE ADDED
100
110
120
130
140
150
1990-91 2002-03 2003-04 2004-05
(‘000 Number )
ANNUAL SURVEY OF INDUSTRIESFACTORY SECTOR
(RUPEES BILLION)
REPORTING FACTORIES

(Rs.Mn.)
Industry No. of Productive Total Net ValueCode/group (NIC-98) factories capital output added
01 Agriculture, hunting and related service activities 2868 14269 96343 329214 Mining and quarrying,n.e.c. 116 1308 1149 41515 Manufacture of food products and beverages 23839 546511 1803254 15933916 Manufactore of tobacco products 3078 31484 120752 4811517 Manufacture of textiles 13035 509178 971028 12659218 Manufacture of wearing apparel,dressing and dyeing of fur 3190 67049 172067 3310419 Tanning and dressing of leather, manufacture of luggage, handbags, saddlery, harness and footwear 2336 37959 114301 1372520. Manufacture of wood and wood products and cork,except furniture 3042 15411 36160 414221 Manufacture of paper and paper products 3579 143635 205340 3321122 Publishing, printing and reproduction of recorded media 3007 57309 110443 3008823 Manufacture of coke, refined petroleum products and nuclear fuel 918 670731 1784670 24330724 Manufacture of chemicals and chemical products 10226 1030335 1800308 35811925 Manufacture of rubber and plastics products 6999 209404 412984 6372126 Manufacture of other non- metallic mineral products 11838 376637 403064 8067427 Manufacture of basic metals 6523 936385 1590320 28109528 Manufacture of fabricated metal products, except machinery and equipment 8051 114497 304161 50439
97
OUTPUT FACTORY SECTOR - 2003-04
Contd…
IX. INDUSTRY
TABLE 9.4 ANNUAL SURVEY OF INDUSTRIES : CAPITAL AND

(Rs.Mn.)
Industry No. of Productive Total Net ValueCode/group (NIC-98) factories capital output added
29 Manufacture of mechinery and equipment N.E.C. 8850 224370 547158 10865230. Manufacture of Office,Accounting and Computing Machinery 180 55722 68248 1612031 Manufacture of electrical machinery and apparatus N.E.C. 3868 141771 351911 6538232 Manufacture of radio, television and communication equipment and apparatus 997 141552 283902 3662933 Manufacture of medical, precision and optical instrument, watches and clocks 1009 38453 87380 2083834 Manufacture of motore vehicles, trailers and semi- trailers 2757 234138 702439 12001735 Manufacture of other transport equipment 1723 83325 323604 6334636 Manufacture of furniture, manufacturing N.E.C. 2198 76212 245666 2722937.Recycling 48 447 3580 22640 Others 4797 167533 333570 41513
Total(all industries) 129074 5925624 12873800 2029328
98
IX. INDUSTRY
TABLE 9.4 ANNUAL SURVEY OF INDUSTRIES : CAPITAL AND OUTPUT FACTORY SECTOR - 2003-04-Contd.

(Rs.Mn.)
Industry No. of Productive Total Net ValueCode/group (NIC-04) factories capital output added
01 Agriculture, hunting and related service activities 2960 14963 101565 684514 Mining and quarrying,n.e.c. 150 1592 2456 71715 Manufacture of food products and beverages 25363 583807 2042552 18059616 Manufactore of tobacco products 3201 33722 123360 4986617 Manufacture of textiles 13521 576613 1110833 14486718 Manufacture of wearing apparel,dressing and dyeing of fur 3397 80316 237479 4469919 Tanning and dressing of leather, manufacture of luggage, handbags, saddlery, harness and footwear 2293 37021 123237 1350120. Manufacture of wood and wood products and cork,except furniture 3053 17118 41874 390221 Manufacture of paper and paper products 3763 154818 226968 3387722 Publishing, printing and reproduction of recorded media 3135 65359 129424 2972323 Manufacture of coke, refined petroleum products and nuclear fuel 990 696642 2363444 30200724 Manufacture of chemicals and chemical products 10747 1058386 2109147 42735825 Manufacture of rubber and plastics products 7225 261651 521976 6994026 Manufacture of other non- metallic mineral products 13223 443026 514755 11912527 Manufacture of basic metals 6736 1211527 2448011 49250728 Manufacture of fabricated metal products, except machinery and equipment 8138 132551 388199 60333
Contd.
99
OUTPUT FACTORY SECTOR - 2004-05
IX. INDUSTRY
TABLE 9.4 ANNUAL SURVEY OF INDUSTRIES : CAPITAL AND

(Rs.Mn.)
Industry No. of Productive Total Net ValueCode/group (NIC-04) factories capital output added
29 Manufacture of mechinery and equipment N.E.C. 9387 264709 721834 13523630. Manufacture of Office,Accounting and Computing Machinery 200 57258 65347 1090931 Manufacture of electrical machinery and apparatus N.E.C. 3923 151362 431324 7839932 Manufacture of radio, television and communication equipment and apparatus 1001 136587 309611 3724133 Manufacture of medical, precision and optical instrument, watches and clocks 991 40733 96220 2419734 Manufacture of motore vehicles, trailers and semi- trailers 3093 265308 1434588 16790035 Manufacture of other transport equipment 1987 99044 440056 7906836 Manufacture of furniture, manufacturing N.E.C. 2686 91055 322621 3817137.Recycling 70 863 3226 37640 Others 5121 255204 415508 47709
Total(all industries) 136353 6731232 16725614 2599069
N.E.C.- Not Elsewhere Classified Note: Totals may not tally due to rounding off of the figures.
100
OUTPUT FACTORY SECTOR - 2004-05-Concld.
Source: Central Statistical Organisation
IX. INDUSTRY
TABLE 9.4 ANNUAL SURVEY OF INDUSTRIES : CAPITAL AND

State/Union Territory Nos. % to Rs. % to Rank
total Mn. total States: Andhra Pradesh 864112 10.98 133753 6.59 5 Assam 113993 1.45 37409 1.84 15 Bihar 57404 0.73 6143 0.30 24 Chattisgarh 99764 1.27 53459 2.63 10 Goa 34457 0.44 22880 1.13 19 Gujarat 729310 9.27 288655 14.22 2 Haryana 318266 4.04 91433 4.51 7 Himachal Pradesh 36753 0.47 17499 0.86 22Jammu & Kashmir 26952 0.34 1877 0.09 25Jharkhand 144529 1.84 81589 4.02 8 Karnataka 507410 6.45 138438 6.82 4 Kerala 316611 4.02 40911 2.02 14 Madhya Pradesh 214140 2.72 52869 2.61 12 Maharashtra 1114070 14.16 419098 20.65 1Manipur 1231 0.02 31 0.00 31Meghalaya 2228 0.03 515 0.03 28Nagaland 2802 0.04 180 0.01 29 Orissa 124983 1.59 32149 1.58 16 Punjab 336397 4.27 53141 2.62 11
Rajasthan 245274 3.12 51732 2.55 13 Tamil Nadu 1162594 14.77 191005 9.41 3Tripura 14508 0.18 681 0.03 27 Uttarakhand 41561 0.53 15144 0.75 23 Uttar Pradesh 569603 7.24 126490 6.23 6 West Bengal 515267 6.55 79026 3.89 9
Contd…101
Net Value added byFactory Sector
Total Personsemployed
________________________ ____________________________
IX. INDUSTRY
TABLE 9.5 ANNUAL SURVEY OF INDUSTRIES: EMPLOYMENT AND VALUE ADDED-STATEWISE:FACTORY SECTOR
2003-04

State/Union Territory Nos. % to Rs. % to Rank
total Mn. total
Union Territories:
Andaman & Nicobar 271 0.00 84 0.00 30Chandigarh 8938 0.11 1638 0.08 26Delhi 115478 1.47 20245 1.00 20Dadra & N Haveli 51861 0.66 28014 1.38 17Daman & Diu 59877 0.76 23350 1.15 18Pondicherry 39438 0.50 19889 0.98 21
Total 7870081 100.00 2029328 100.00 -
102
For source & footnotes please see page no.
IX. INDUSTRY
2003-04
TABLE 9.5 ANNUAL SURVEY OF INDUSTRIES: EMPLOYMENT AND
engaged________________________ ____________________________
Factory Sector
VALUE ADDED-STATEWISE:FACTORY SECTOR -Contd.
Total Persons Net Value added by

State/Union Territory Nos. % to Rs. % to Rank
total Mn. total States: Andhra Pradesh 933473 11.04 159378 6.13 6 Assam 119548 1.41 37208 1.43 17 Bihar 61775 0.73 9102 0.35 24 Chattisgarh 106409 1.26 87054 3.35 10 Goa 37581 0.44 29709 1.14 18 Gujarat 808618 9.57 360156 13.86 2 Haryana 354861 4.20 116956 4.50 8 Himachal Pradesh 44287 0.52 21852 0.84 21Jammu & Kashmir 31090 0.37 5760 0.22 25Jharkhand 152530 1.80 167780 6.46 5 Karnataka 553457 6.55 205318 7.90 4 Kerala 317834 3.76 40660 1.56 16 Madhya Pradesh 216563 2.56 55535 2.14 14 Maharashtra 1162346 13.75 513092 19.74 1Manipur 1835 0.02 58 0.00 30Meghalaya 3037 0.04 921 0.04 28Nagaland 2821 0.03 200 0.01 29 Orissa 145747 1.72 60454 2.33 12 Punjab 391081 4.63 58074 2.23 13 Rajasthan 268437 3.18 65826 2.53 11 Tamil Nadu 1268335 15.00 215674 8.30 3Tripura 15392 0.18 2312 0.09 26 Uttarakhand 51762 0.61 19480 0.75 22 Uttar Pradesh 587702 6.95 142978 5.50 7 West Bengal 517939 6.13 105489 4.06 9
103
________________________ ____________________________
Total Persons Net Value added byemployed Factory Sector
IX. INDUSTRY
TABLE 9.5 ANNUAL SURVEY OF INDUSTRIES: EMPLOYMENT AND VALUE ADDED-STATEWISE:FACTORY SECTOR - Contd.
2004-05

State/Union Territory Nos. % to Rs. % to Rank
total Mn. total
Union Territories:
Andaman & Nicobar 251 0.00 45 0.00 31Chandigarh 9972 0.12 2080 0.08 27Delhi 121128 1.43 24308 0.94 20Dadra & N Haveli 58306 0.69 48971 1.88 15Daman & Diu 68812 0.81 27462 1.06 19Pondicherry 40695 0.48 15178 0.58 23
Total 8453624 100.00 2599069 100.00
of Lakshadweep.
104
Source: Central Statistical Organisation
Notes: 1. ASI excludes the States of Arunachal Pradesh,Mizoram,Sikkim and Union Territory
2. Totals may not tally due to rounding off of the figures.
engaged Factory Sector________________________ ____________________________
VALUE ADDED-STATEWISE:FACTORY SECTOR -Concld. 2004-05
Total Persons Net Value added by
IX. INDUSTRY
TABLE 9.5 ANNUAL SURVEY OF INDUSTRIES: EMPLOYMENT AND

SI.No/Item 2002-03 2003-04 2004-05 2005-06
1. No.of units('000 persons.) 10949 11395 11859 12342
2.Production at constant prices (at 2001-02 Prices) (Rs.Ten million)#
a)Target 316143 354079 396570 444157 b)Achievement 306771 336344 372938 418884
3. Production at current prices (Rs. Ten million) a)Target 324906 373710 429548 493405 b)Achievement 314850 364547 429796 497842
4. Employment('000 persons) a)Target 25813 26693 27573 28453 b)Achievement 26021 27142 28257 29491
5. Export(Rs.Ten million) a)Target 73600 .. .. .. b)Achievement 86013 97644 124417 ..
105
IX INDUSTRY
Table 9.6 PERFORMANCE OF SMALL SCALE INDUSTRIES SECTOR
Source: Office of the Development Commissioner (MSME) Ministry of Micro, Small & Medium Enterprises
# Figures based on the growth rate compiled the IIP(SSI) with new base year 2001-02.

0
2000
4000
6000
8000
10000
12000
14000
16000
18000
1990-91 2002-03 2003-04 2004-05
PRODUCTIVE CAPITAL OUTPUT NET VALUE ADDED
100
110
120
130
140
150
1990-91 2002-03 2003-04 2004-05
(‘000 Number )
ANNUAL SURVEY OF INDUSTRIESFACTORY SECTOR
(RUPEES BILLION)
REPORTING FACTORIES

130
140
150
160
170
180
190
200
210
220
230
240
250
2002-03 2003-04 2004-05 2005-06
MINING & QUARRYINGMANUFACTURINGELECTRICITYGENERAL INDEX (CRUDE)
INDEX NO.OFINDUSTRIAL PRODUCTION
(Base : 1993-94=100)

(Production) ( 000 tonne)
Source 1990-91 2000-01 2004-05 2005-06
Coal 214057 313696 382615 407039Lignite 14074 24247 30337 30066Natural Gas(MCM) 17998 29477 31763 32202Crude Petroleum (TMT) 32160 32426 33981 32190Petroleum Products (TMT)# 48562 95614 118579 119750
MCM:-Million Cubic Metres
106
X. FUEL AND POWER
Source: 1.Office of the Coal Controler, Ministry of Coal2.Ministry of Petroleum & Natural Gas
TABLE 10.1 PRIMARY SOURCES OF ENERGY
# Excludes LPG production from fractionators. TMT : Thousand Metric Tonnes

( `000 Tonne )
COAL PRODUCTION IN INDIA
050000
100000150000200000
250000300000350000400000450000
1990-91 2000-01 2004-05 2005-06

(Million tonne)
Item/Industry 1990-91 2000-01 2004-05 2005-06
I. Raisings of coal 228 337 383 407
II. Total despatch of coal 215 341 379 396 1. Despatch by rail of coal 121 168 184 189 2. Despatch of Coal by Road 38 68 84 92 3. Despatch of Coal by other means 56 106 111 115
III. Distribution of Coal to Principal Industries 1. Steel & Washery 18 20 18 20 2. Railways 5 - - - 3. Electricity 117 269 301 306 4. Cement 10 10 15 15 5. Paper 2 3 3 3 6. Fertilizer 3 4 2 2 7. Textile 2 2 - - 8. Soft Coke 1 .. .. .. 9. Brick 2 4 2 1 10. Others 57 29 38 48
107
TABLE 10.2 PRODUCTION AND DISTRIBUTION OF RAW COAL & LIGNITE
X. FUEL AND POWER
Source: Office of the Coal Controller, Ministry of Coal

ALL INDIA(MW)
Type1991 2004 2005 2006
Utilities 66086 112684 118426 124287 Steam 43004 64956 67791 68519 Hydro 18753 29507 30942 32326 Gas 2552 11840 11910 12690 Diesel & wind 212 3661 5013 7393 Nuclear 1565 2720 2770 3360
Non-Utilities 8613* 18740 19103 21468
Total 74699 131424 137528 145755
*The data for the year 1991 includes 111mw relates to Railways coverd under non-utilities.
108
X. FUEL AND POWER
TABLE 10.3 ELECTRICITY: INSTALLED GENERATING CAPACITY-
Note: Capacity figures relate to the total existing at the end of the financial year.
as on 31st March
Source: Central Electricity Authority

0
20000
40000
60000
80000
100000
120000
140000
1991 2004 2005 2006
0100200300400500600700800
1990-91 2000-01 2004-05 2005-06
Generation Sale
ELECTRICITYINSTALLED GENERATING CAPACITY
( UTILITIES ONLY )
GENERATED AND SOLD
(Mw)
( Bn.Kwh)

BY STATES(MW)
States/ Union Territories1991 2001 2005 2006
Andhra Pradesh 4130 6756 8072 8860 Assam 537 622 622 622 Bihar 1549 2108 598 629 Chhatisgarh .. .. 1412 1439 Gujarat 4395 7223 7679 8047 Haryana 1780 1990 2546 2560 Himachal Pradesh 272 326 709 758 Jammu & Kashmir 262 417 493 504 Jharkhand .. .. 1630 1754 Karnataka 2970 4465 5935 6529 Kerala 1477 2218 2242 2287 Madhya Pradesh 3297 4373 3324 3795 Maharashtra 8705 12911 13369 13838 Manipur 12 13 47 51 Meghalaya 134 189 188 189 Nagaland 6 6 28 31 Orissa 1612 2298 2320 2345 Punjab 3049 4529 4629 4750 Rajasthan 1722 2489 3814 3866 Sikkim 21 38 37 46 Tamil Nadu 4089 6521 8315 9419 Tripura 53 85 128 149 Uttar Pradesh 5527 5613 4706 4924 Uttaranchal .. .. 987 1020 West Bengal 3072 4783 4788 4727 Delhi 552 602 932 932 D.V.C. 2032 2872 3082 3007 Central Govt.Projects 14740 27969 35547 36917 Others 91 209 249 291
India 66086 101627 118426 124287
Notes:- (1) D.V.C. stand for Damodar Vally Corporation. (2) Installed capcity of jointly owned projects have been shown divided between the partner states. (*) Relates to public utilities only.
109
TABLE 10.4 ELECTRICITY: INSTALLED GENERATING CAPACITY- (*)
X. FUEL AND POWER
as on 31st March
Source: Central Electricity Authority

(Bn. kwh)
Item 1990-91 2000-01 2004-05 2005-06
Generation 289.44 560.84 665.87 697.46 Utilities (UT) 264.33 501.20 594.46 623.82 Steam 178.32 357.18 424.24 435.49 Hydro 71.64 74.36 84.61 101.49 Oil and gas & wind 8.23 52.76 68.59 69.51 Nuclear 6.14 16.90 17.01 17.32 Non-utilities(NU) 25.11 59.64 71.42 73.64
Sales 190.36 309.73 386.13 411.89 Domestic light and small power 31.98 75.63 95.66 100.09 Commercial light and small power 11.18 22.54 31.38 35.96 Industrial power 84.21 107.62 137.59 151.56 Public lighting 1.65 3.42 4.97 5.18 Railways/Tramways 4.11 8.21 9.50 9.94 Agriculture 50.32 84.73 88.56 90.29 Public water and sewage pumping 3.65 7.04 9.62 10.26 Miscellaneous 3.26 7.40 8.87 8.60
Per capita generation (1) (kwh) 346 557 611 630
(1) Both public utilities and non-utilities.Note:Totals may not tally due to rounding off of the figures.
110
Source: Central Electricity Authority
X. FUEL AND POWER
TABLE 10.5 ELECTRICITY: GENERATED AND SOLD

X. FUEL AND POWERTable 10.6 ELECTRICITY : PURCHASED AS PER CLASSIFICATION
NIC 98 4-DIGIT INDUSTRIES (ASI 2003-2004)
Industry (thousand kwh)Code Industry Description Quantity0140 Agricultural and animal husbandry service ativities, except veterinary activities 2625921422 Extraction of salt 145211511 Production, processing and preserving of meat and meat products 811421512 Processing and preserving of fish and fish products 250381
1513 Processing and preserving of fruit and vegetables 1408861514 Manufature of vegetable and animal oils and fats 9938841520 Manufacture of dairy product 7643461531 Manufacture of grain mill products 17218891532 Manufacture of starches and starch products 1789931533 Manufacture of prepared animal feeds 1736311541 Manufacture of bakery products 1754331542 Manufacture of sugar 3869881543 Manufacture of coaoa, chocolate and sugar confectionery 741311544 Manufcture of macaroni, noodles, conscious and similar farinaceous products 65511549 Manufacture of other food products n.e.c. 7344351551 Distilling, rectifying and blending of spirits; ethyl alcohol production from fermented materials 1479261552 Manufacture of wines 407991553 Manufacture of malt liquors and malt 2392081554 Manufacture of soft drinks; production of mineral waters 2753161600 Manufacture of tobaco products 1343461711 Preparation and spinning of textile fiber including weaving of textiles 106684401712 Finishing of textile 18090101721 Manufacture of made-up textile articles, except apparel 691071722 Manufacture of carpet and rugs 917671723 Manufacture of cordage, rope, twine and netting 1239071729 Manufacture of other textiles n.e.c. 1058691730 Manufacture of knitted and crocheted fabrics and articles 347656
111
Contd….

Industry Industry Description Quantity code
1810 Manufcture of wearing apparel, except fur apparel 4856711820 Dressing and dyeing of fur; manufacture of articles of fur 10131911 Tanning and dressing of leather 1713991912 Manufcture of luggage, handbags, and the like, saddlery and harness 249171920 Manufacture of footwear 2853992010 Saw milling and planing of wood 210712020 Manufacture of products of wood, cork, straw and plaiting materials ..2021 Manufacture of veneer sheets; manufacture of ply wood, laminboard, particle board and 212368
other panels and boards2022 Manufacture of builders' carpentry and joinery 160952023 Manufacturing of wooden containers 46072029 Manufacture of other products of wood, manufacture of articles of cork, straw and 8657
plaiting materials2101 Manufacture of pulp, paper and paper board 23706542102 Manufacture of corrugated paper and paperboard and of containers of paper and paperboard 1883842109 Manufacture of other articles and paper and paperboard 806982211 Publishing of books, brochures, musical books and other publications. 180412212 Publishing of newspapers, journals and periodicals 1871182219 Other publishing 84982221 Printing 1751442222 Service activities related to printing 45192230 Reproduction of recorded media 120202310 Manufacture of coke oven products 3440392320 Manufacture of refined petroleum products 2617422411 Manufacture of basic chemicals except fertilizers and itrogen compounds 47350872412 Manufacture of fertilizers and nitrogen compounds 16196042413 Manufacture of plastics in primary forms and of synthetic rubber 4688452421 Manufacture of pesticides and other agro chemical products 391453
112
X. FUEL AND POWER
TABLE 10.6 ELECTRICITY: PURCHASED AS PER CLASSIFICATION NIC 98 4-DIGIT INDUSTRIES (ASI-2003-2004)-contd.
(thousand kwh)
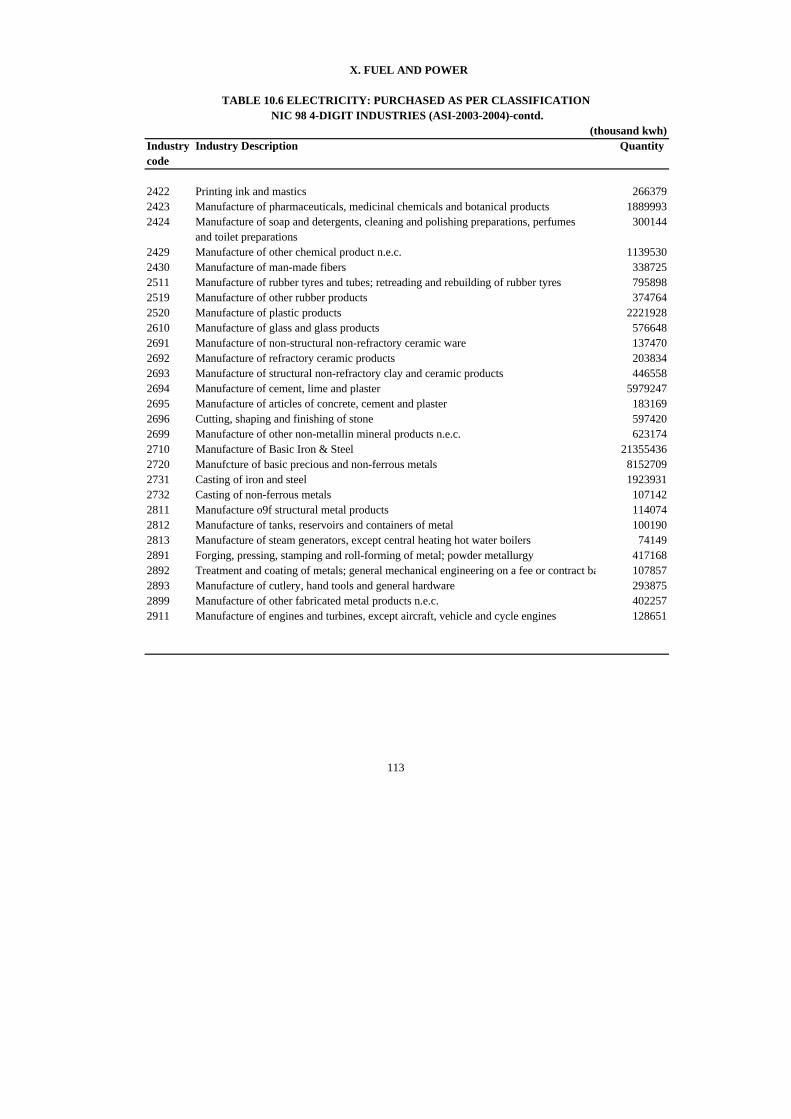
Industry Industry Description Quantity code
2422 Printing ink and mastics 2663792423 Manufacture of pharmaceuticals, medicinal chemicals and botanical products 18899932424 Manufacture of soap and detergents, cleaning and polishing preparations, perfumes 300144
and toilet preparations2429 Manufacture of other chemical product n.e.c. 11395302430 Manufacture of man-made fibers 3387252511 Manufacture of rubber tyres and tubes; retreading and rebuilding of rubber tyres 7958982519 Manufacture of other rubber products 3747642520 Manufacture of plastic products 22219282610 Manufacture of glass and glass products 5766482691 Manufacture of non-structural non-refractory ceramic ware 1374702692 Manufacture of refractory ceramic products 2038342693 Manufacture of structural non-refractory clay and ceramic products 4465582694 Manufacture of cement, lime and plaster 59792472695 Manufacture of articles of concrete, cement and plaster 1831692696 Cutting, shaping and finishing of stone 5974202699 Manufacture of other non-metallin mineral products n.e.c. 6231742710 Manufacture of Basic Iron & Steel 213554362720 Manufcture of basic precious and non-ferrous metals 81527092731 Casting of iron and steel 19239312732 Casting of non-ferrous metals 1071422811 Manufacture o9f structural metal products 1140742812 Manufacture of tanks, reservoirs and containers of metal 1001902813 Manufacture of steam generators, except central heating hot water boilers 741492891 Forging, pressing, stamping and roll-forming of metal; powder metallurgy 4171682892 Treatment and coating of metals; general mechanical engineering on a fee or contract basis 1078572893 Manufacture of cutlery, hand tools and general hardware 2938752899 Manufacture of other fabricated metal products n.e.c. 4022572911 Manufacture of engines and turbines, except aircraft, vehicle and cycle engines 128651
113
(thousand kwh)
X. FUEL AND POWER
TABLE 10.6 ELECTRICITY: PURCHASED AS PER CLASSIFICATION NIC 98 4-DIGIT INDUSTRIES (ASI-2003-2004)-contd.

Industry Industry Description Quantity code
2912 Manufacture of pumps, compressors, taps and valves 2213012913 Manufacture of bearings, gears, gearing and driving elements 3352672914 Manufacture of ovens, furnaces and furnace burners 148842915 Manufacture of lifting and handling equipment 372592919 Manufacture of other general purpose machinery 1944662921 Manufacture of agricultural and forestry machinery 2278282922 Manufactrure of machine-tools 707942923 Manufcture of machinery for metallurgy; converters, ingot moulds, ladles and casting 22171
machines; metal rolling mills and rolls for such mills.2924 Manufacture of machinery for minng, quarrying and construction 1130172925 Manufacture of machinery for food, beverage and tobacco processing 507852926 Manufacture of machinery for textile, apparel and leather production 1273802927 Manfacture of weapons and ammunition 88982929 Manufacture of other special purpose machinery 1355872930 Manufacture of domestic appliances, n.e.c. 1293243000 Manufacture of office, accounting and computing machinery 532243110 Manufacture of electric motors, generators and transformers 2722103120 Manufacture of electricity distribution and control apparatus for a voltage exceeding 1000 volts1647343130 Manufacture of insulated wire and cable 3060263140 Manufacture of accumulators, primary cells and primary batteries 2260813150 Manufacture of electric lamps and lighting equipment 942263190 Manufacture of other electrical equipment n.e.c. 1060783210 Manufacture of electronic valves and tubes and other electronic components 278403
114
X. FUEL AND POWER
TABLE 10.6 ELECTRICITY: PURCHASED AS PER CLASSIFICATION NIC 98 4-DIGIT INDUSTRIES (ASI-2003-2004)-contd.
(thousand kwh)

Industry Industry Description Quantity code
3220 Manufacture of television and radio transmitters and apparatus for line telephonny 89773and line telegraphy
3230 Manufacture of television and radio receivers, sound or video recording apparatus, 171637and associated goods
3311 Manufacture of medical and surgical equipment and orthopedic appliances 781123312 Manufacture of instruments and appliances for measuring, checking, testing, navigating and 41753
other purposes except industrial process control equipment3313 Manufacture of industrial process control equipment 277013320 Manufacture of optical instruments and photographic equipment 235723330 Manufacture of watches and clocks 353213410 Manufacture of motor vehicles 5287373420 Manufacture of bodies (coach work) for motor vehicles; manufacture of trailers and semi-trailers569893430 Manufacture of parts and accessories for motor vehicles and their engines 13271443511 Building and repairing of ships 455053512 Building and repairing of pleasure and sporting boats 5743520 Manufacture of railway and tramway locomotives and rolling stock 833173530 Manufacture of aircraft and spacecraft 121163591 Manufacture of motorcycles 5041443592 Manufacture of bicycles and invalid carriages 1930553599 Manufacture fo toher transport equipment n.e.c. 260213610 Manufacture of furniture 1061133691 Manufacture of jewellery and related articles 1249893692 Manufacture of musical instruments 7283693 Manufacture of sports goods 166153694 Manufacture of games and toys 141383699 Other manufacturing n.e.c. 1103673710 Recycling of metal waste and scrap 743293720 Electricity, gas and water supply 5058
others 884756Total 89235023
115
TABLE 10.6 ELECTRICITY: PURCHASED AS PER CLASSIFICATION NIC 98 4-DIGIT INDUSTRIES (ASI-2003-2004)-concld.
(thousand kwh)
X. FUEL AND POWER
Source: Central Statistical Organisation

1991 2004 2005 2006
Number of Villages 587258 638588* 638588# 639445@
Villages Electrified 481124 495031 498990 459486
% of Villages Electrified 81.93 77.52 78.14 71.86
# As on 1st November, 2005. @ As on 31st December, 2005.
116
X. FUEL AND POWER
TABLE 10.7 RURAL ELECTRIFICATION IN INDIA (thousand kwh)
Source: Central Electricity Authority * As on 1st April, 2004.

(Rs. Ten Million)
Item 1990-91 2000-01 2004-05 2005-06
Exports Merchandise including re-export 32557.63 207571.01 375339.53 456471.86
Imports Merchandise 43192.86 230872.76 501064.54 660408.90 Treasure 46.20 19.76 19.93 13.71Balance of Trade Merchandise -10635.23 -27301.75 -125725.01 -203991.04 Treasure -46.20 -19.76 -19.92 -13.71 Total (Merchandise & Treasure) -10635.23 -27301.75 -125725.01 -203991.04
* Treasure figures relate to gold bullion, coins, etc. However in Case of exports and re-exports, treasure figures are not available
117
XI. FOREIGN TRADE
TABLE 11.1 VALUE OF FOREIGN TRADE INMERCHANDISE AND TREASURE
Source: Directorate General of Commercial Intelligence & Statistics

-250000
-200000
-150000
-100000
-50000
0
1990-91 2000-01 2004-05 2005-06
BALANCE OF TRADE(RS.TEN MILLION)
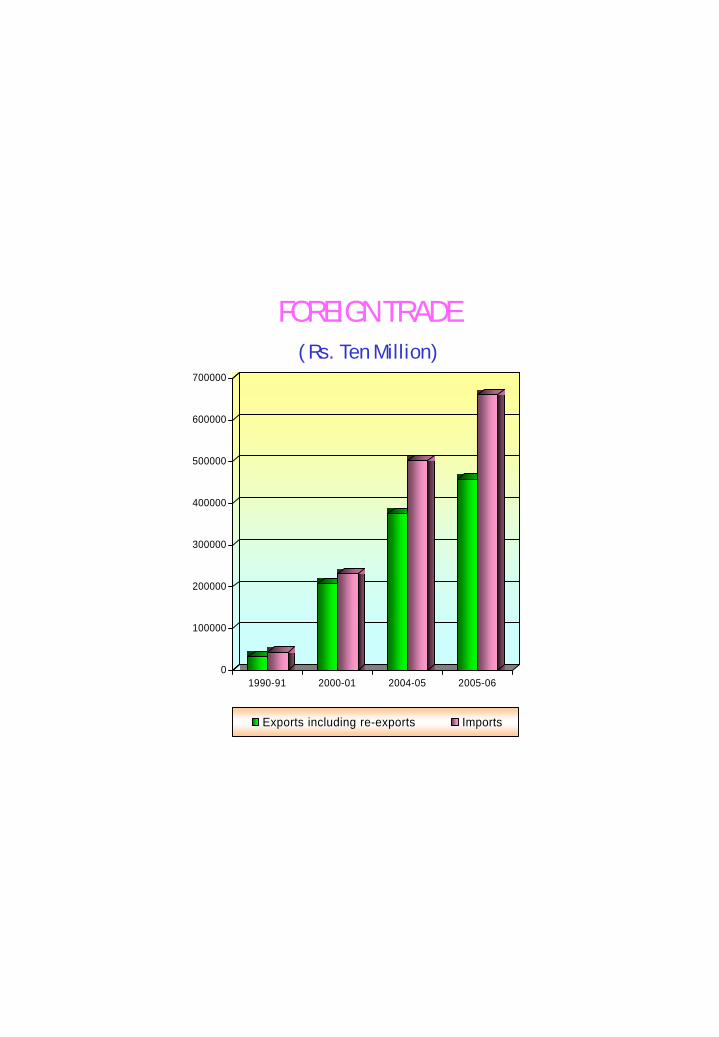
FOREIGN TRADE( Rs. Ten Million)
0
100000
200000
300000
400000
500000
600000
700000
1990-91 2000-01 2004-05 2005-06
Exports including re-exports Imports

Commodity Unit 1990-91 2000-01 2004-05 2005-06
Milk and cream '000 tonne 1.1 1.3 2.2 1.6Wheat Rs.Ten Milliion 22.3 2.9 0.1 ..Fruit fresh & nut Rs.Ten Milliion 106.1 800.3 1070.2 1392.4Rice Rs.Ten Milliion 39.2 17.8 .. 0.3Wool raw '000 tonne 29.4 53.8 80.6 90.2Cotton raw '000 tonne 0.2 118.5 187.0 98.8Jute raw '000 tonne 32.1 67.3 20.7 61.3Petroleum, petroleum products and related materials Rs.Ten Milliion 10816.1 71496.5 34094.0 94640.0Organic chemicals Rs.Ten Milliion 1442.0 6364.3 17110.4 20987.0Medicinal and pharmaceutical products Rs.Ten Milliion 468.4 1722.6 3057.5 4551.4Fertilizers manu factured Rs.Ten Milliion 1141.1 2015.1 4147.5 7408.1Artificial resin & plastic materials Rs.Ten Milliion 1094.6 2551.1 6293.6 10042.9Ingots,blooms,slabs, billets etc. '000 tonnes 156.0 361.3 440.3 744.5Textile yarn and thread Rs.Ten Milliion 254.6 1211.3 2478.8 3668.6Joists,girders,angles,shapes, sections etc. '000 tonnes 29.0 34.7 108.9 178.1Universal plates and sheets excl. tinned and galvanised sheets Rs.Ten Milliion 569.0 1404.6 2876.7 4192.6Wire rods and wire coated or not Rs.Ten Milliion 7.0 79.4 200.1 315.5
Tubes,pipes and fittings of iron Rs.Ten Milliion 230.0 509.8 1611.2 2963.0
Contd.
118
XI. FOREIGN TRADE
TABLE 11.2 IMPORTS OF FOREIGN MERCHANDISE BY PRINCIPAL COMMODITIES

BY PRINCIPAL COMMODITIES-Concld.
Commodity 1990-91 2000-01 2004-05 2005-06
Steam generating boilers 7.7 12.9 72.1 132.0Internal combustion diesel engines 7.8 137.6 622.3 925.6Metal working machinery 297.7 1335.0 2825.2 5558.0Textile & leather machinery and accessories 465.7 1515.6 3715.8 7513.3Mining & construction machinery 37.1 767.4 1678.5 2315.5Mechanical handling equipment 334.7 949.4 3928.2 5034.4Electric generators, motors etc. 192.9 608.8 2239.3 3312.0Insulated cables and wires for electricity 69.2 433.5 1363.1 1551.4Telecommunication equipments 178.6 1712.5 14279.4 20983.7Railway vehicles 22.5 78.6 115.6 47.3Road motor vehicles 21.4 113.8 487.7 738.4Aircrafts 336.5 680.7 5182.4 19068.5Scientific,medical,optical,measuring and controlling equipments 1030.6 .. .. .. Others .. .. .. ..
Grand Total .. .. 113919.0 223033.9
119
TABLE 11.2 IMPORTS OF FOREIGN MERCHANDISE
Source: Directorate General of Commercial Intelligence & Statistics
XI. FOREIGN TRADE
(Value in Rs. Ten Million)

Item/Group 1990-91 2000-01 2004-05 2005-06
Mineral fuels and lubricants 26.9 31.0 26.3 29.5Machinery 12.6 6.4 26.8 7.7 i.Electrical 3.9 1.0 4.0 1.0 ii.Other than electrical 8.7 5.4 22.8 6.7Iron and steel 4.4 1.4 8.8 2.9Fertilizers crude and manufactured 3.4 1.3 4.0 1.3Transport equipment 3.9 1.9 14.8 5.9Non-ferrous metals 2.6 1.1 4.4 1.2Paper, paper board and manufactures thereof 1.1 0.4 1.1 0.3Professional,scientific and controlling instruments 2.4 1.7 5.8 1.3Cereals and cereal preparation 0.4 0.1 0.1 0.0Medicinal and pharmaceutical products 1.1 0.8 2.4 0.7Fruits and vegetables 1.8 0.4 1.0 0.3Dyeing,tanning and colouring materials 0.4 0.4 1.4 0.3Chemical elements and compounds 6.0 0.7 2.7 0.7Cotton (raw) - 0.5 0.9 0.1Others 33.0 55.2 .. 47.6 Total 100.0 100.0 100.0 100.0
120
XI. FOREIGN TRADE
TABLE 11.3 VALUE OF PRINCIPAL IMPORTS (Percentage distribution)
Source: Directorate General of Commercial Intelligence & Statistics

(Rs. Ten Million)
Country 1990-91 2000-01 2004-05 2005-06
Commonwealth Countries Australia 1463.6 4774.9 16097.9 21906.1 Bangladesh 31.3 357.5 266.2 562.4 Canada 559.2 1764.1 3416.3 4072.6 Kenya 39.1 85.5 201.4 214.8 Kuwait 363.0 532.3 1334.8 2044.8 Malaysia 955.4 5175.9 10093.5 10694.7 New Zealand 117.6 354.3 481.9 959.1 Singapore 1427.6 6551.7 11613.1 14848.3 Sri Lanka 36.8 211.7 1637.3 2557.7 Tanzania Republic 61.9 271.5 576.1 530.2 United Kingdom 2893.9 14198.0 15717.7 17400.8
Others Austria 157.9 312.6 1156.5 1523.1 Belgium 2717.7 13068.2 20518.6 20919.8 Myanmar 166.2 931.4 1790.7 2328.6 Congo People's Republic .. 36.4 94.4 194.5 Denmark 133.2 505.9 1170.0 2284.2Czech Republic .. .. .. 1152.8Serbia Montngro .. .. .. 8.6
Contd.
121
XI. FOREIGN TRADE
TABLE 11.4 VALUE OF IMPORTS OF FOREIGN MERCHANDISE BY PRINCIPAL COUNTRIES

(Rs. Ten Million)
Country 1990-91 2000-01 2004-05 2005-06
Egypt Arab Republic 78.8 176.7 616.8 976.0 Germany 3473.1 7928.4 17485.9 26668.7 Finland 175.6 946.6 1695.4 2583.3 France 1304.4 2871.5 8349.2 18211.0 Iran 1017.6 973.9 1783.3 3110.0 Iraq 495.5 31.5 4.9 9.0 Italy 1091.2 3261.3 5954.7 8215.5 Japan 3244.5 8318.2 14117.6 17980.0 Mozambique 1.0 90.6 183.3 224.1 Norway 16.2 208.7 1030.2 1281.0 Pakistan 84.5 299.4 416.7 795.0 Poland 146.0 196.0 395.6 477.3 Saudi Arabia 2899.2 2848.2 5680.2 7226.9 Sudan 2.9 33.8 100.7 144.4 Sweden 349.7 1082.0 4122.8 5189.7 Switzerland 480.1 1703.1 26143.6 29024.8 U.S.A 5244.7 12812.1 30702.6 41859.5 U.S.S.R. 2548.1 2344.5 5755.2 8952.9
Total Imports 43192.9 95424.6 390531.7 277132.6
(#) Figures relate to Russia.
122
TABLE 11.4 VALUE OF IMPORTS OF FOREIGN MERCHANDISE
XI. FOREIGN TRADE
BY PRINCIPAL COUNTRIES - Concld.
Source: Directorate General of Commercial Intelligence & Statistics
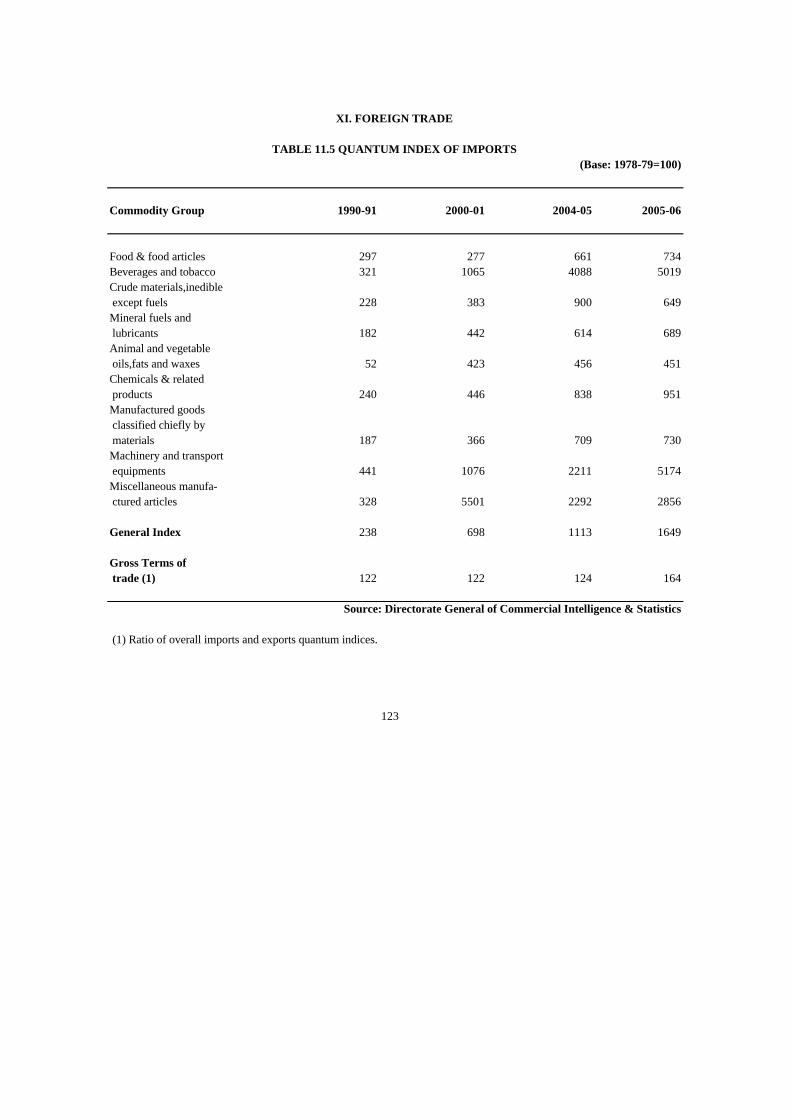
(Base: 1978-79=100)
Commodity Group 1990-91 2000-01 2004-05 2005-06
Food & food articles 297 277 661 734Beverages and tobacco 321 1065 4088 5019Crude materials,inedible except fuels 228 383 900 649Mineral fuels and lubricants 182 442 614 689Animal and vegetable oils,fats and waxes 52 423 456 451Chemicals & related products 240 446 838 951Manufactured goods classified chiefly by materials 187 366 709 730Machinery and transport equipments 441 1076 2211 5174Miscellaneous manufa- ctured articles 328 5501 2292 2856
General Index 238 698 1113 1649
Gross Terms of trade (1) 122 122 124 164
(1) Ratio of overall imports and exports quantum indices.
123
XI. FOREIGN TRADE
TABLE 11.5 QUANTUM INDEX OF IMPORTS
Source: Directorate General of Commercial Intelligence & Statistics

(Base: 1978-79=100)
Commodity Group 1990-91 2000-01 2004-05 2005-06
Food & food articles 141 483 480 502Beverages & tobacco 536 1007 1206 1207Crude materials, inedible except fuels 308 588 497 870Mineral fuels and lubricants 383 1077 1512 2110Animal and vegetable oils,fats and waxes 121 276 450 404Chemicals and related products 280 560 661 769Manufactured goods classified chiefly by materials 311 727 775 875Machinery and trans- port equipments 188 289 378 242Miscellaneous manufa- ctured articles 294 111 519 530
General Index 268 487 663 592
Net terms of trade (1) 109 122 110 135
(1) Ratio of overall exports unit value index to similar imports index.
124
XI. FOREIGN TRADE
TABLE 11.6 UNIT VALUE INDEX OF IMPORTS
Source: Directorate General of Commercial Intelligence & Statistics
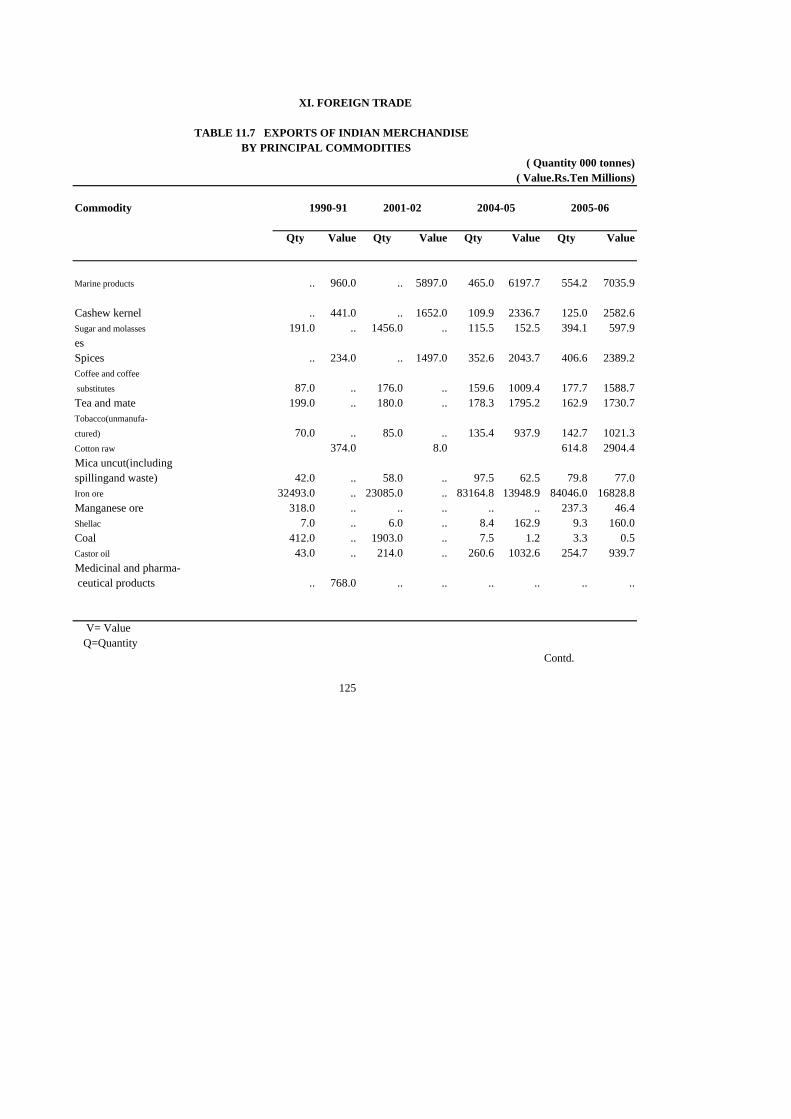
BY PRINCIPAL COMMODITIES
Commodity
Qty Value Qty Value Qty Value Qty Value
Marine products .. 960.0 .. 5897.0 465.0 6197.7 554.2 7035.9
Cashew kernel .. 441.0 .. 1652.0 109.9 2336.7 125.0 2582.6Sugar and molasses 191.0 .. 1456.0 .. 115.5 152.5 394.1 597.9esSpices .. 234.0 .. 1497.0 352.6 2043.7 406.6 2389.2Coffee and coffee
substitutes 87.0 .. 176.0 .. 159.6 1009.4 177.7 1588.7Tea and mate 199.0 .. 180.0 .. 178.3 1795.2 162.9 1730.7Tobacco(unmanufa-
ctured) 70.0 .. 85.0 .. 135.4 937.9 142.7 1021.3Cotton raw 374.0 8.0 614.8 2904.4Mica uncut(including spillingand waste) 42.0 .. 58.0 .. 97.5 62.5 79.8 77.0Iron ore 32493.0 .. 23085.0 .. 83164.8 13948.9 84046.0 16828.8Manganese ore 318.0 .. .. .. .. .. 237.3 46.4Shellac 7.0 .. 6.0 .. 8.4 162.9 9.3 160.0Coal 412.0 .. 1903.0 .. 7.5 1.2 3.3 0.5Castor oil 43.0 .. 214.0 .. 260.6 1032.6 254.7 939.7Medicinal and pharma- ceutical products .. 768.0 .. .. .. .. .. ..
Contd.
125
XI. FOREIGN TRADE
TABLE 11.7 EXPORTS OF INDIAN MERCHANDISE
( Value.Rs.Ten Millions)
1990-91 2001-02 2004-05 2005-06
( Quantity 000 tonnes)
V= Value Q=Quantity

Commodity Unit
Qty Value Qty Value Qty Value Qty Value
Artificial resins and plastic materialsand cellulose easters & other articles .. 142.6 .. .. .. .. .. ..Leather .. 20 .. .. .. 2641.6 .. 2817.0Cotton fabrics, Ten Millions sq. grey unbleached metre 22.5 .. .. .. .. 1374.1 .. 1233.0Mill made cotton Ten Millions sq. fabrics bleached metre 11.3 .. .. .. .. 2297.6 .. 2301.6Handloom cotton fabrics grey Ten Millions sq. unbleached metre 3.8 .. .. .. .. .. .. ..Jute fabrics 000 tonnes 104 .. .. .. .. 318.9 .. 340.7Made up articles wholly or chiefly of jute (incl.jute floor covering) .. 2.1 .. 125.0 .. 405.9 .. 596.3Jutebagsand sacks 000 tonnes 88.0 .. .. .. .. 237.8 .. 292.5Woollen carpets, Ten Millions sq. rugs etc. metre 0.9 .. .. .. .. 1993.2 .. 2665.8Pig-iron,spiegeleisen,sponge ironore and steel powders and shots ferro-alloys 000 tonnes 86.0 .. .. .. .. 1783.3 .. 1697.2
Q=Quantity
126
XI. FOREIGN TRADE
TABLE 11.7 EXPORTS OF INDIAN MERCHANDISE BY PRINCIPAL COMMODITIES-Contd.
1990-91 2004-05 2005-06
( Value.Rs.Ten Millions)
2001-02
V= Value .

Commodity Unit
Qty Value Qty Value Qty Value Qty Value
Iron & steel bars,rods,angles,shapes & sections(incl. sheet pilling) 000 tonnes 120.0 .. .. .. .. 1963.4 .. 2272.8Rails (railway- and tramway) 000 tonnes 0.1 .. .. .. .. 2.9 .. 1.8Tubes, pipes & fittings of iron and steel 000 tonnes 65.0 .. .. .. .. 3310.6 .. 4936.2Internal combustion diesel enginesother than aircraft engines .. 55.9 .. 146.6 .. 508.3 .. 518.7Metal working- machinery .. 55.5 .. 170.1 .. 234.8 .. 302.1Sewing machine 000 no. 52.0 .. .. .. .. 15.6 .. 15.1Fans 000 no. 244.0 .. .. .. .. 113.9 .. 115.6Railway and tram-way goods vans, wagons and tracks no. 11.0 .. .. .. .. 0.02 .. 11.6Motor vehicles no. 8355.0 .. .. .. .. 3918.7 .. 4935.8Bicycles 000 no. 186.0 .. .. .. .. 162.5 .. 107.1Clothing (except fur clothing) .. 4012.0 .. .. .. .. .. ..Leather footwear 190.0 .. .. .. .. 2776.8 .. 3576.5
127
XI. FOREIGN TRADE
TABLE 11.7 EXPORTS OF INDIAN MERCHANDISE BY PRINCIPAL COMMODITIES-Concld.
Source: Directorate General of Commercial Intelligence & Statistics V= Value. Q=Quantity
( Value.Rs.Ten Millions)
1990-91 2001-02 2004-05 2005-06
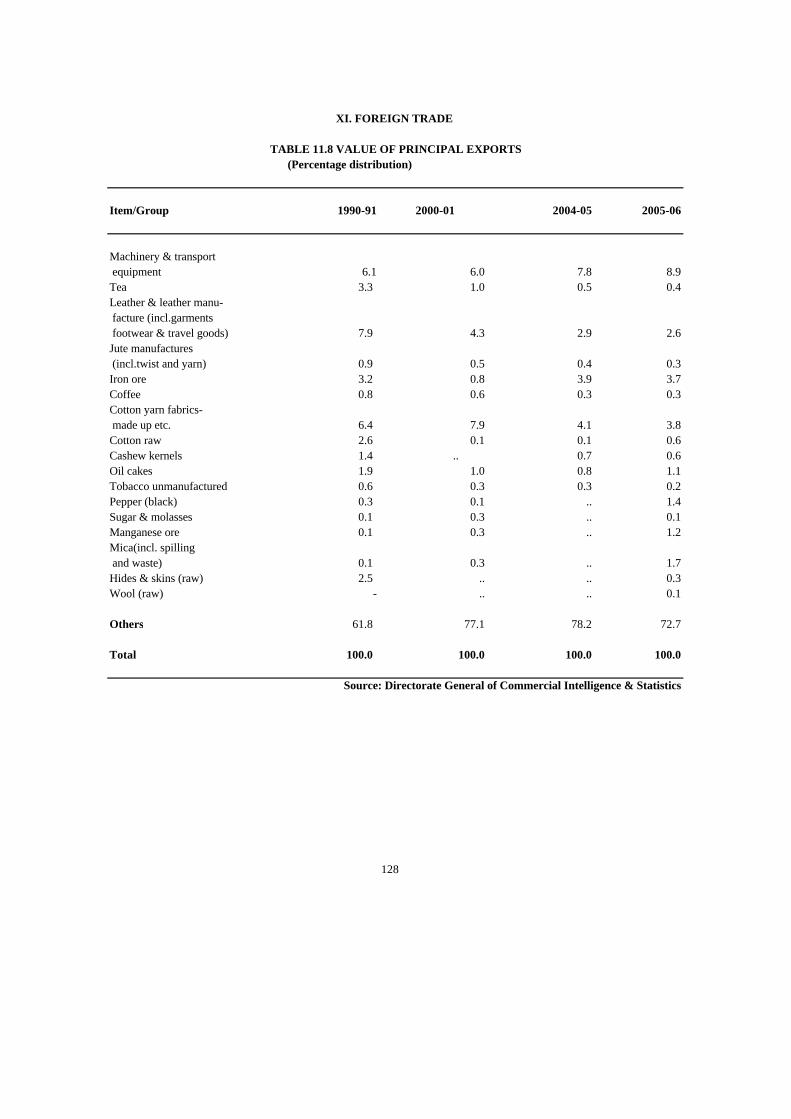
Item/Group 1990-91 2000-01 2004-05 2005-06
Machinery & transport equipment 6.1 6.0 7.8 8.9Tea 3.3 1.0 0.5 0.4Leather & leather manu- facture (incl.garments footwear & travel goods) 7.9 4.3 2.9 2.6Jute manufactures (incl.twist and yarn) 0.9 0.5 0.4 0.3Iron ore 3.2 0.8 3.9 3.7Coffee 0.8 0.6 0.3 0.3Cotton yarn fabrics- made up etc. 6.4 7.9 4.1 3.8Cotton raw 2.6 0.1 0.1 0.6Cashew kernels 1.4 .. 0.7 0.6Oil cakes 1.9 1.0 0.8 1.1Tobacco unmanufactured 0.6 0.3 0.3 0.2Pepper (black) 0.3 0.1 .. 1.4Sugar & molasses 0.1 0.3 .. 0.1Manganese ore 0.1 0.3 .. 1.2Mica(incl. spilling and waste) 0.1 0.3 .. 1.7Hides & skins (raw) 2.5 .. .. 0.3Wool (raw) - .. .. 0.1
Others 61.8 77.1 78.2 72.7
Total 100.0 100.0 100.0 100.0
128
XI. FOREIGN TRADE
TABLE 11.8 VALUE OF PRINCIPAL EXPORTS (Percentage distribution)
Source: Directorate General of Commercial Intelligence & Statistics

(Rs. Ten Million)
Country 1990-91 2000-01 2004-05 2005-06
Commonwealth Countries Australia 321.2 1847.7 3101.1 3635.9 Bahrein 62.8 358.2 676.2 851.1 Bangladesh 547.4 4277.3 7218.5 7368.7 Canada 279.9 2974.6 3676.5 4522.9 Ghana 15.6 267.6 781.5 889.1 Hong Kong 1069.6 12020.9 16446.3 19796.1 Kenya 64.6 636.2 1867.4 2552.5 Kuwait 73.7 909.4 1829.7 2274.5 Malaysia 270.8 2764.6 4687.1 5144.0 Mauritius 91.6 910.4 1116.5 883.0 New Zealand 40.3 288.9 398.8 628.2 Nigeria 112.8 1734.9 2765.3 3869.6 Qatar 30.9 289.4 911.6 1148.2 Singapore 680.7 3964.3 17186.0 24019.7 Sri Lanka 234.8 2896.4 6089.2 8963.9 Tanzania Republic 53.1 463.8 757.7 1077.8 United Kingdom 2121.0 10438.6 15790.3 22399.2 Yemen Arab Republic 54.7 20.0 1071.6 1234.4
Contd.
129
XI. FOREIGN TRADE
TABLE 11.9 VALUE OF EXPORTS OF INDIAN MERCHANDISE BY PRINCIPAL COUNTRIES

(Rs. Ten Million)
Country 1990-91 2000-01 2004-05 2005-06
Others Afghanistan 91.5 117.9 708.7 631.6 Argentina 8.6 447.2 812.3 883.3 Belgium 1258.4 6680.7 11020.6 12712.0 Bulgaria 5.5 52.7 108.0 106.6 Denmark 152.3 796.4 1295.4 1816.5 Egypt Arab Republic 177.4 1620.5 1903.6 2977.1 Ethiopia 24.4 299.3 242.3 330.9 France 762.6 4652.9 7228.9 9207.1 Germany 2535.8 8658.2 12017.8 15877.0 Hungary 83.4 194.6 470.1 372.6 Indonesia 196.2 1824.0 5821.2 6110.6 Iran 140.8 1036.2 5453.3 5261.2 Iraq 43.4 381.7 577.3 690.4 Ireland 35.7 470.5 915.5 1238.6 Italy 1000.4 5947.9 9797.5 11152.7 Japan 3038.9 8187.3 9073.0 10985.4Czech Republic .. .. .. 428.9Serbia Montngro .. .. .. 37.0
130
XI. FOREIGN TRADE
TABLE 11.9 VALUE OF EXPORTS OF INDIAN MERCHANDISE BY PRINCIPAL COUNTRIES-Contd.

(Rs. Ten Million)
Country 1990-91 2000-01 2004-05 2005-06
Others - Contd. Myanmar 3.4 241.2 493.0 490.1 Nepal 86.6 643.0 3338.6 3807.4 Netherlands 641.6 4016.1 6891.0 10956.7 Norway 56.8 274.6 447.5 576.5 Pakistan 73.6 848.4 2288.2 3051.7 Poland 165.4 388.7 754.5 1004.8 Romania 95.5 53.9 464.0 373.6 Saudi Arabia 418.0 3694.7 6196.8 8012.5 Socialist Republic of Vietnam 30.8 1030.0 2390.0 3057.9 Sudan 38.5 445.9 1367.4 1304.5 Sweden 155.2 804.1 1021.4 1445.1 Switzarland 400.2 2002.1 2356.5 2123.0 Syrian Arab Republic 17.6 340.9 1113.2 1224.9 Thailand 443.2 2416.2 3952.0 4760.8 U.S.A. 4789.6 42403.7 59630.7 76828.1 U.S.S.R. 5250.3 4054.6 2720.1 3245.9
Total Exports 32405.6 152294.0 361879.2 314341.4
(#) Figures relate to Russia.
131
XI. FOREIGN TRADE
BY PRINCIPAL COUNTRIES-Concld.
Source: Directorate General of Commercial Intelligence & Statistics
TABLE 11.9 VALUE OF EXPORTS OF INDIAN MERCHANDISE

0 8000 16000 24000 32000 40000 48000 56000 64000 72000 80000
U.S.S.R.
U.S.A .
United Kingdom
Germany
Japan
Belgium
Italy
Kenya
Czech Republic
Bangladesh
Singapore
France
Malaysia
Sri Lanka
Australia
Canada
Denmark
Kuw ait
Iran
Imports Exports
FOREIGN TRADE BY COUNTRIES2005-06
( Rs. Ten Million)

(Base: 1978-79=100)
Commodity Group 1990-91 2000-01 2004-05 2005-06
Food and food articles 138 304 457 486Beverages & tobacco 103 176 209 233Crude materials,inedible except fuels 236 229 368 456Mineral fuels and lubricants 1988 4277 10920 13982Animal & vegetable oils fats and waxes 213 1009 1374 1215Chemicals and related products 681 2608 5442 6788Manufactured goods classified chiefly by materials 138 484 617 709Machinery and transport equipments 311 960 1707 2003Misc. manufactured articles 262 934 1377 1245
General Index 194 571 899 1005
132
XI. FOREIGN TRADE
TABLE 11.10 QUANTUM INDEX OF EXPORTS
Source: Directorate General of Commercial Intelligence & Statistics
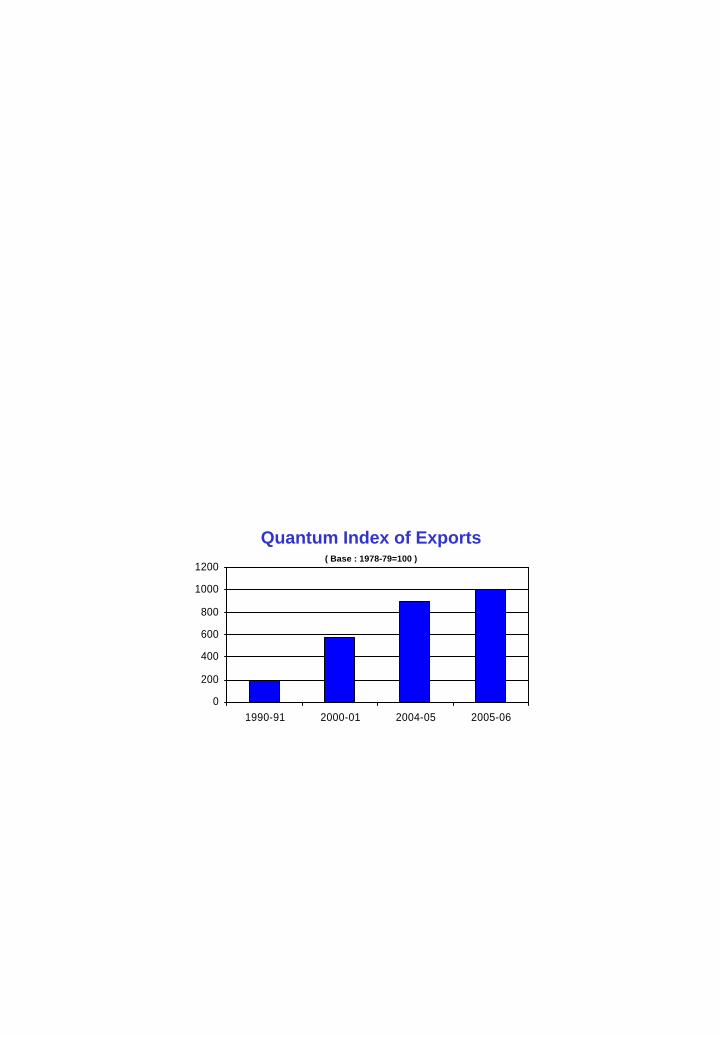
0
200
400
600
800
1000
1200
1990-91 2000-01 2004-05 2005-06
Quantum Index of Exports( Base : 1978-79=100 )

(Base: 1978-79=100)
Commodity Group 1990-91 2000-01 2004-05 2005-06
Food and food articles 226 524 483 512Beverages and tobacco 228 467 569 551Crude materials,inedible except fuels 261 642 1390 1407Mineral fuels and lubricants 246 1063 1513 1935Animal & vegetable oils fats and waxes 223 571 621 563Chemicals and related products 232 534 518 506Manufactured goods classified chiefly by materials 378 700 919 886Machinery & transport equipment 201 425 544 642Misc. manufactured articles 348 680 648 849
General Index 293 624 732 798
133
TABLE 11.11 UNIT VALUE INDEX OF EXPORTS
Source: Directorate General of Commercial Intelligence & Statistics
XI. FOREIGN TRADE

0102030405060708090
1990-91 2000-01 2004-05 2005-06
Per Passenger Per Tonne
Average Earning Per Km.(Paise)
RAILWAYSEarning in Rs.Billion and
Passenger Km. In Billion Nos.
0
100
200
300
400
500
600
700
1990-91 2000-01 2004-05 2005-06
Working Expenses Net Earnings Passenger Kilometers
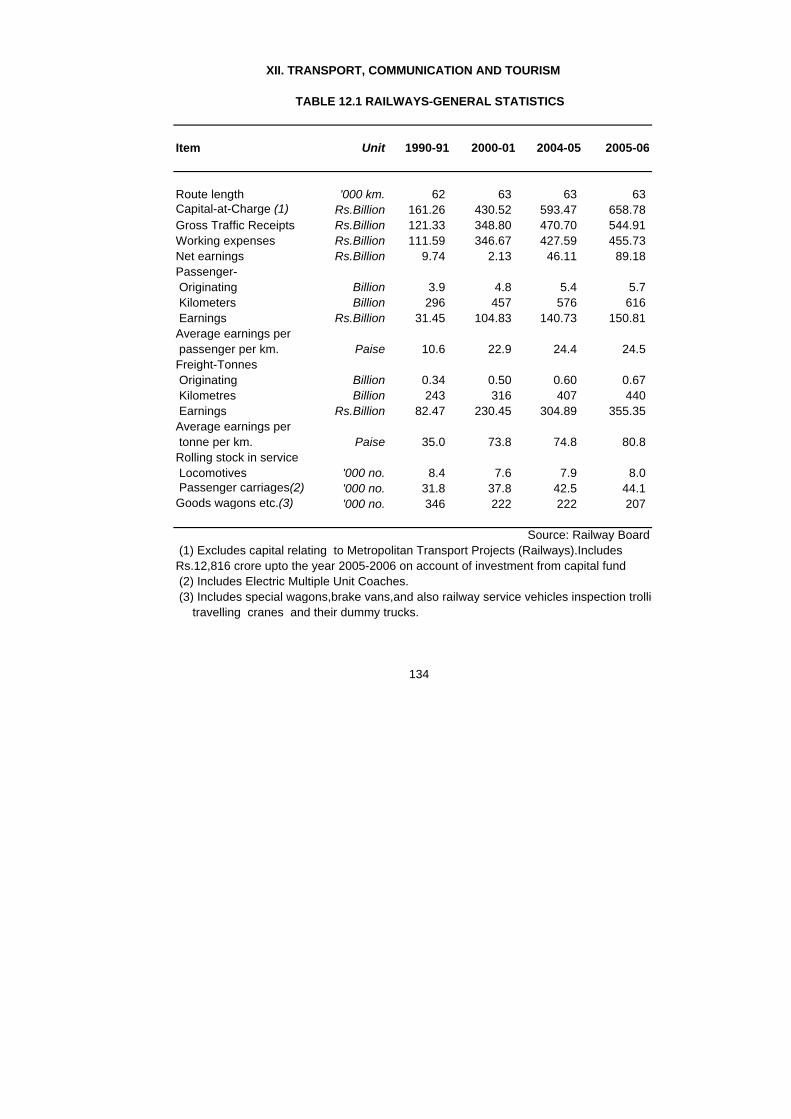
Item Unit 1990-91 2000-01 2004-05 2005-06
Route length '000 km. 62 63 63 63Capital-at-Charge (1) Rs.Billion 161.26 430.52 593.47 658.78Gross Traffic Receipts Rs.Billion 121.33 348.80 470.70 544.91Working expenses Rs.Billion 111.59 346.67 427.59 455.73Net earnings Rs.Billion 9.74 2.13 46.11 89.18Passenger- Originating Billion 3.9 4.8 5.4 5.7 Kilometers Billion 296 457 576 616 Earnings Rs.Billion 31.45 104.83 140.73 150.81Average earnings per passenger per km. Paise 10.6 22.9 24.4 24.5Freight-Tonnes Originating Billion 0.34 0.50 0.60 0.67 Kilometres Billion 243 316 407 440 Earnings Rs.Billion 82.47 230.45 304.89 355.35Average earnings per tonne per km. Paise 35.0 73.8 74.8 80.8Rolling stock in service Locomotives '000 no. 8.4 7.6 7.9 8.0 Passenger carriages(2) '000 no. 31.8 37.8 42.5 44.1Goods wagons etc.(3) '000 no. 346 222 222 207
(2) Includes Electric Multiple Unit Coaches.
134
(1) Excludes capital relating to Metropolitan Transport Projects (Railways).IncludesRs.12,816 crore upto the year 2005-2006 on account of investment from capital fund
(3) Includes special wagons,brake vans,and also railway service vehicles inspection trollies, travelling cranes and their dummy trucks.
XII. TRANSPORT, COMMUNICATION AND TOURISM
TABLE 12.1 RAILWAYS-GENERAL STATISTICS
Source: Railway Board

(Broad Gauge) ('000 wagons loaded)
Commodity 1990-91 2000-01 2004-05 2005-06
Revenue earning traffic 13323 20231 22085 23528 Coal and coke 5732 9129 8884 9441 Grains and pulses 874 1066 1781 1562 Oilseeds 12 8 4 10 Cotton raw 9 .. .. .. Jute raw 4 - 31 43 Jute manufactures 12 11 16 17 Sugar 66 107 76 84 Sugarcane 5 1 .. .. Cement 1057 1662 1658 1783 Iron and steel 458 555 680 742 Tea 4 3 3 3 Manganese ore 44 34 32 41 Iron ore 1545 2470 3880 4329 Other metallic ores 74 76 60 73 Limestone and dolomite 357 404 313 344 Miscellaneous 3070 4705 4667 5056Non-revenue traffic 559 358 339 241
Grand Total 13882 20589 22425 23769
(1) Government Railways only (in terms of four-wheelers).
135
TABLE 12.2 RAILWAYS (1) - WAGON LOADINGS BY COMMODITIES
Source: Railway Board
XII. TRANSPORT, COMMUNICATION AND TOURISM

(Metre Gauge) ('000 wagons loaded)
Commodity 1990-91 2000-01 2004-05 2005-06
Revenue earning traffic 1808 559 422 326 Coal and coke 202 .. .. .. Grains and pulses 297 93 44 35 Oilseeds 12 .. .. .. Cotton raw 6 .. .. .. Jute raw 1 1 1 .. Jute manufactures 5 .. .. .. Sugar 25 5 9 14 Sugarcane 69 24 19 17 Cement 265 149 97 76 Iron and steel 8 .. .. .. Manganese ore 9 .. .. .. Iron ore 40 .. .. .. Other metallic ores 3 .. .. .. Limestone and dolomite 54 .. .. .. Miscellaneous 812 287 252 184Non-revenue traffic 229 75 43 33
Grand Total 2037 634 465 359
(1) Government Railways only (in terms of four wheelers).
136
Source: Railway Board
XII. TRANSPORT, COMMUNICATION AND TOURISM
TABLE 12.3 RAILWAYS (1) - WAGON LOADINGS BY COMMODITIES

(kilometre) Year/State/UT Surfaced Unsurfaced Total length
Per 100 Per Lakh Sq.Kms of Popu-
of Area lation++
1991 61.3 238.5* 1091043 1240043 23310862000 73.5 238.0 1390598 1025480 24160782001 74.3 236.5 1414547 1028124 24426712002 74.7 233.7 1420489 1036158 2456647
2002 Andhra Pradesh 71.3 255.0 119857 76315 196172 Arunachal Pradesh 21.9 1669.5 5689 12676 18365 Assam 114.7 328.9 12882 76604 89486 Bihar 80.9 89.3 32858 43207 76065 Goa 241.8 690.8 6830 2842 9672 Gujarat 70.2 265.7 124295 13322 137617 Haryana 64.1 130.6 26311 1892 28203 Himachal Pradesh 52.9 477.7 16754 12863 29617 Jammu & Kashmir 10.6 225.3 9943 13486 23429 Karnataka 79.5 284.2 104241 104241 152599 Kerala 386.8 467.0 50164 100687 150851 Madyha Pradesh 52.3 259.2 78191 82777 160968 Maharashtra 86.8 270.7 209559 57893 267452 Manipur 52.0 476.4 3863 7571 11434 Meghalaya 43.5 398.4 6560 3005 9565 Mizoram 24.2 563.9 2877 2198 5075 Nagaland 123.7 1051.0 6451 14570 21021 Orissa 151.9 635.5 52245 184789 237034 Punjab 123.1 248.1 52747 8783 61530 Rajasthan 38.7 228.0 82456 50026 132482 Sikkim 28.8 336.5 1546 473 2019 Tamil Nadu 127.7 264.0 125887 40174 166061 Tripura 163.0 509.0 4393 11903 16296 Uttar Pradesh 103.1 145.5 166659 81822 248481 West Bengal 103.4 112.6 49517 42505 92023
for footnotes please see next page. Contd.
137
XII. TRANSPORT, COMMUNICATION AND TOURISM
TABLE 12.4 TOTAL ROAD LENGTH BY SURFACE (As on 31st March)
Road Length(Kms.)+

(kilometre)
Year/State/UT Surfaced Unsurfaced Total __________ __________ length
Per 100 Per Lakh Sq.Kms of Popu-
of Area lation++
Union Territories: A & N Islands 14.7 295.0 1180 0 1180 Chandigarh 2045.0 227.2 2045 0 2045 Dadra & Nagar Haveli 116.0 290.0 580 0 580 Daman & Diu 414.0 207.0 324 90 414 Delhi 1719.0 179.1 23274 2511 25785 Lakshadweep 500.0 241.9 150 0 150 Pondicherry 514.2 257.1 2115 456 2571
+ Excluding Jawahar Rojgar Yojna (JRY) Roads except for 1991. ++ Estimated mid year population by Registrar General of India, Ministry of Home Affairs. (As on 1st July, ). * Calculated on the basis of the population of 1991 Census.
138
Source: Transport Research Wing, Ministry of Road Transport & Highways
XII. TRANSPORT, COMMUNICATION AND TOURISM
TABLE 12.4 TOTAL ROAD LENGTH BY SURFACE-Concld. (As on 31st March)
Road Length(Kms.)+

('000 number)
Type of vehicle
1991 2001 2003 2004(P)
Two wheelers 14200 38556 47519 51922 Cars,Jeeps and Taxis 2954 7058 8599 9451 Buses @ 331 634 721 768 Goods vehicles 1356 2948 3492 3748 Others (1) 2533 5795 6676 6829
Total 21374 54991 67007 72718
(1) Include tractors,trailers, three wheelers (passengers ) and other miscellaneous vehicles which are not separately classified. @ Include omni-buses.(P)-Provisional
('000 no.)
Item 1991 2001 2004 2005(P)
Road accidents 293.4 405.6 429.9 439.3 Persons killed 56.4 80.9 92.6 95.0 Persons injured 255.0 405.2 464.5 465.3
(P)- Provisional.
139
as on 31st March
Source: Transport Research Wing,
XII. TRANSPORT, COMMUNICATION AND TOURISM
TABLE 12.5 NUMBER OF REGISTERED MOTOR VEHICLES
Ministry of Road Transport& Highways
Ministry of Road Transport & Highways
TABLE 12.6 NUMBER OF PERSONS KILLED AND INJURED BY MOTOR VEHICLE ACCIDENTS
Source: Motor Transport Statistics of India,

Item Unit 1990-91 2000-01 2004-05 2005-06
Aircraft Hours flown ('000) 124 250 399 475 Kilometres flown (Billion) 0.06 0.14 0.21 0.25Passenger Number carried ('000) 7912 13712 19445 25205 Kilometres performed (Billion) 7.03 12.28 18.03 23.71 Seat kilometres available (Billion) 8.85 19.90 27.79 35.08 Load factor % 79.4 61.7 64.9 67.6Cargo carried ('000 tonne) 97 167 245 256 Freight ('000 tonne) 82 144 218 225 Mail ('000 tonne) 15 23 27 32Tonne kilometres performed (Billion) 0.68 1.22 1.82 2.34 Passenger (Billion) 0.58 1.05 1.56 2.07 Freight (Billion) 0.09 0.15 0.23 0.24 Mail (Billion) 0.02 0.02 0.03 0.03Capacity Tonne kilometres available (Billion) 0.90 2.13 2.84 3.49Weight load factor % 75.8 57.5 63.9 67.10
140
XII. TRANSPORT, COMMUNICATION AND TOURISM
TABLE 12.7 : CIVIL AVIATION-DOMESTIC SERVICES
Source: Office of the Director General of Civil Aviation
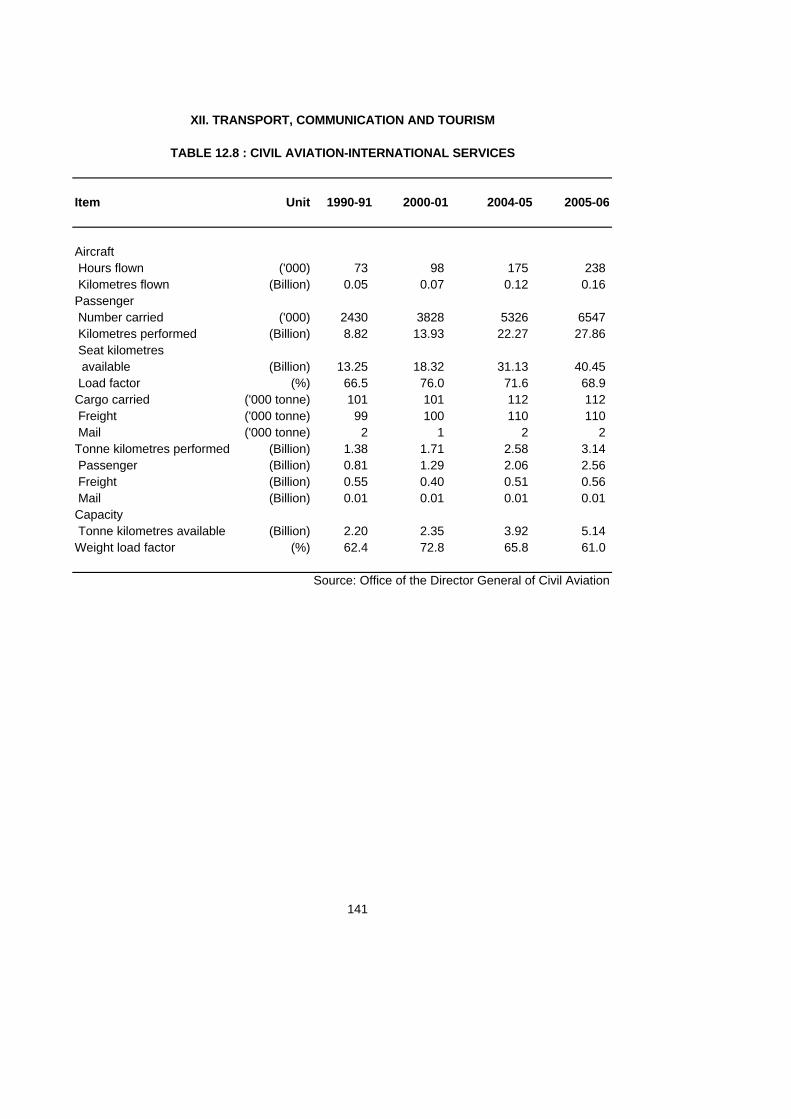
Item Unit 1990-91 2000-01 2004-05 2005-06
Aircraft Hours flown ('000) 73 98 175 238 Kilometres flown (Billion) 0.05 0.07 0.12 0.16Passenger Number carried ('000) 2430 3828 5326 6547 Kilometres performed (Billion) 8.82 13.93 22.27 27.86 Seat kilometres available (Billion) 13.25 18.32 31.13 40.45 Load factor (%) 66.5 76.0 71.6 68.9Cargo carried ('000 tonne) 101 101 112 112 Freight ('000 tonne) 99 100 110 110 Mail ('000 tonne) 2 1 2 2Tonne kilometres performed (Billion) 1.38 1.71 2.58 3.14 Passenger (Billion) 0.81 1.29 2.06 2.56 Freight (Billion) 0.55 0.40 0.51 0.56 Mail (Billion) 0.01 0.01 0.01 0.01Capacity Tonne kilometres available (Billion) 2.20 2.35 3.92 5.14Weight load factor (%) 62.4 72.8 65.8 61.0
141
XII. TRANSPORT, COMMUNICATION AND TOURISM
TABLE 12.8 : CIVIL AVIATION-INTERNATIONAL SERVICES
Source: Office of the Director General of Civil Aviation

0
200
400
600
1991 2001 2004 2005
0
2000
4000
6000
8000
1991 2001 2004 2005
Coastal Trade Overseas Trade
NUMBER OF VESSELS
TONNAGE(‘000 GRT)
(As on 31st December)

Category1991 2001 2004 2005
Vessels engaged in coastal trade Number 169 329 454 485 Tonnage ('000 GRT) 561 731 808 816Vessels engagedin overseas trade Number 246 228 215 236 Tonnage ('000 GRT) 5378 6237 6893 7427
Total Number 415 557 669 721 Tonnage ('000 GRT) 5939 6968 7701 8243
GRT Gross Registered Tonnage.
142
XII. TRANSPORT, COMMUNICATION AND TOURISM
TABLE 12.9 SHIPPING - STRENGTH OF INDIAN SHIPPING FLEET
As on 31st December
Source: Transport Research Wing, Ministry of Shipping,Road Transport & Highways

Item 1990-91 2000-01 2004-05 2005-06(P)
Overseas Number 6793 5365 5533 6761 Tonnage('000 NRT) 46307 55466 68111 83562Coastal Number 8616 3329 3559 3722 Tonnage('000 NRT) 21692 23995 29711 26120
Total Number 15409 8694 9092 10483 Tonnage('000 NRT) 67999 79461 97822 109682
NRT Net Registered Tonnage.
143
(all major ports)
Source: Directorate General of Commercial Intelligence and Statistics
TABLE 12.10 SHIPPING-NUMBER AND TONNAGE OF VESSELS ENTERED
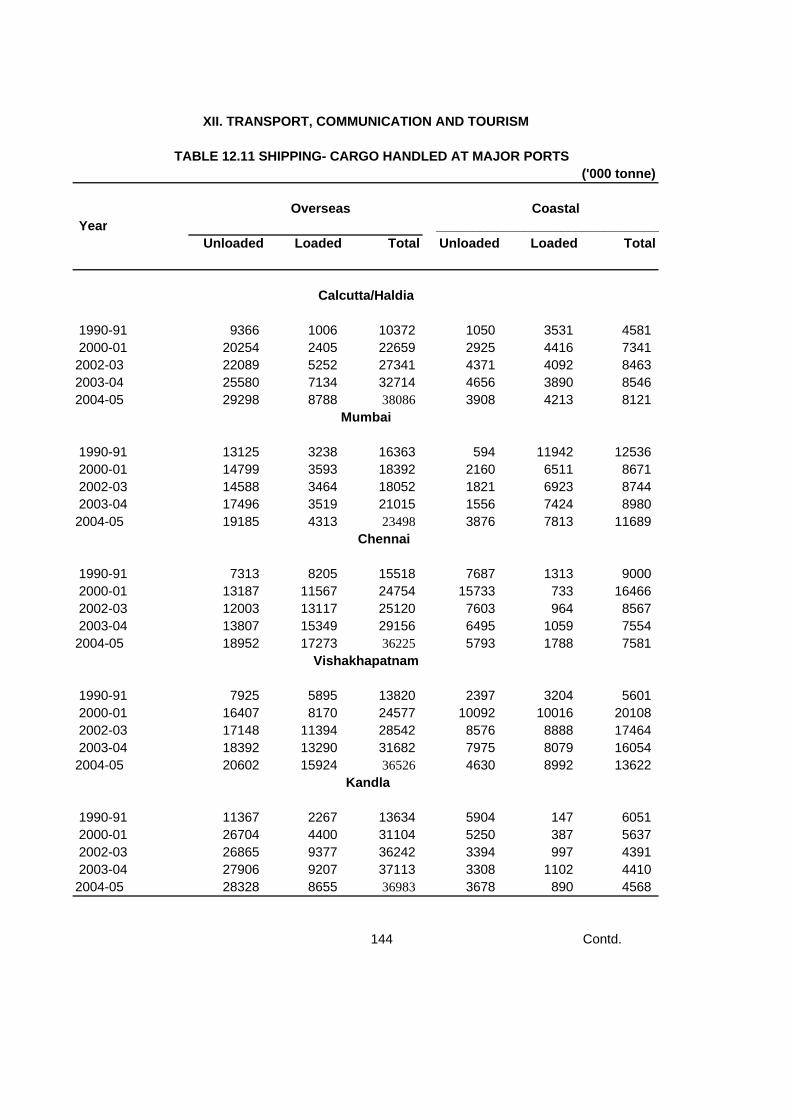
('000 tonne)
Year ___________________________________Unloaded Loaded Total Unloaded Loaded Total
1990-91 9366 1006 10372 1050 3531 4581 2000-01 20254 2405 22659 2925 4416 73412002-03 22089 5252 27341 4371 4092 84632003-04 25580 7134 32714 4656 3890 85462004-05 29298 8788 38086 3908 4213 8121
1990-91 13125 3238 16363 594 11942 12536 2000-01 14799 3593 18392 2160 6511 8671 2002-03 14588 3464 18052 1821 6923 8744 2003-04 17496 3519 21015 1556 7424 89802004-05 19185 4313 23498 3876 7813 11689
Chennai
1990-91 7313 8205 15518 7687 1313 9000 2000-01 13187 11567 24754 15733 733 16466 2002-03 12003 13117 25120 7603 964 8567 2003-04 13807 15349 29156 6495 1059 75542004-05 18952 17273 36225 5793 1788 7581
1990-91 7925 5895 13820 2397 3204 5601 2000-01 16407 8170 24577 10092 10016 20108 2002-03 17148 11394 28542 8576 8888 17464 2003-04 18392 13290 31682 7975 8079 160542004-05 20602 15924 36526 4630 8992 13622
1990-91 11367 2267 13634 5904 147 6051 2000-01 26704 4400 31104 5250 387 5637 2002-03 26865 9377 36242 3394 997 4391 2003-04 27906 9207 37113 3308 1102 44102004-05 28328 8655 36983 3678 890 4568
144 Contd.
XII. TRANSPORT, COMMUNICATION AND TOURISM
TABLE 12.11 SHIPPING- CARGO HANDLED AT MAJOR PORTS
Overseas Coastal
Calcutta/Haldia
Mumbai
Vishakhapatnam
Kandla

('000 tonne)
Year ___________________________________Unloaded Loaded Total Unloaded Loaded Total
1990-91 1058 13154 14212 663 36 699 2000-01 2558 15813 18371 1132 125 1257 2002-03 3379 19076 22455 1001 193 1194 2003-04 3241 23326 26567 1227 80 1307 2004-05 4784 24741 29525 847 287 1134
1990-91 2839 2101 4940 - 1944 1944 2000-01 6015 3793 9808 833 9259 10092 2002-03 5914 5786 11700 1077 11124 12201 2003-04 5896 7254 13150 809 11352 12161 2004-05 7931 10649 18580 507 11017 11524
1990-91 2138 380 2518 4113 644 4757 2000-01 6278 1072 7350 4783 1011 5794 2002-03 7230 1108 8338 3669 1017 4686 2003-04 8174 1656 9830 2844 898 3742 2004-05 8324 2027 10351 2626 1126 3752
1990-91 1654 368 2022 - - - 2000-01 9120 7644 16764 1491 320 1811 2002-03 11237 13415 24652 1431 761 2192 2003-04 12964 15487 28451 1830 909 2739 2004-05 14591 15437 30028 2042 738 2780
1990-91 799 6485 7284 564 174 738 2000-01 8227 5349 13576 963 3352 4315 2002-03 9426 7843 17269 1166 2995 4161 2003-04 10393 11026 21419 2654 2600 5254 2004-05 11277 14207 25484 4235 4172 8407
145 Contd.
XII. TRANSPORT, COMMUNICATION AND TOURISM
TABLE 12.11 SHIPPING- CARGO HANDLED AT MAJOR PORTS-Contd.
Overseas Coastal
Mormugao
Paradip
Cochin
Jawaharlal Nehru
New Mangalore

('000 tonne)
Year ___________________________________Unloaded Loaded Total Unloaded Loaded Total
1990-91 1448 521 1969 3093 13 3106 2000-01 3654 2396 6050 6185 49 6234 2002-03 3950 3690 7640 5614 40 5654 2003-04 4281 3410 7691 5903 84 5987 2004-05 6024 3665 9689 6036 86 6122
2001-02 _ _ _ 3401 _ 3401 2002-03 _ _ _ 8485 _ 8485 2003-04 _ _ _ 9277 _ 9277 2004-05 122 520 642 8838 _ 8838
1990-91 59032 43620 102652 26065 22948 49013 2000-01 127203 66202 193405 51547 36179 87726 2002-03 133829 93522 227351 48208 37994 86202 2003-04 148130 110658 258788 48534 37477 86011 2004-05 169418 126199 295617 47016 41122 88138
146
XII. TRANSPORT, COMMUNICATION AND TOURISM
TABLE 12.11 SHIPPING- CARGO HANDLED AT MAJOR PORTS-Concld.
Overseas Coastal
Ministry of Shipping,Road Transport & Highways.
Tuticorin
Ennore
Total- All Major Ports
Source: Transport Research Wing,

0
50000
100000
150000
200000
250000
300000
350000
1990-91 2000-01 2002-03 2003-04 2004-05
Overseas Coastal
SHIPPINGCARGO HANDLED AT MAJOR PORTS
(‘000 TONNES)

Item Unit 1990-91 2000-01 2004-05 2005-06
Number of units (1)Post offices (2) '000 149 155 156 155Telegraph offices (3) '000 43 43 26 23Number of Telephones (4) '000 6021 36279 98373 142092Traffic handledPostal articles (5)(including M.Os.) Ten million 1475.9 1431.2 746.2 679.7Regd.articles (6) Ten million 31.1 24.5 21.4 20.9Money orders (7) Ten million 10.6 10.9 10.2 9.6Value of M.Os. Rs. Ten million 2937.2 5851.8 7052.2 7183.4Telegrams booked (8) Ten million 6.4 3.4 1.5 1.1Trunk calls (9)(effective) Ten million 22.4 3.3 - -EarningsPostal revenues Rs. Ten million 840.9 3297.8 4432.0 5023.0Telecom revenue (10) Rs. Ten million 4447.0 10175.5 - -
(1) As at the end of the financial year. (2) Include permanent and experimental post offices. (3) Include licensed offices. (4) Including WLL and cellular mobile phones. (5) Include service and registered articles. (6) Include foreign traffic of Posts and Telegraphs. (7) Include foreign money orders issued. (8) Include foreign telegrams. (9) As per records of Bharat Sanchar Nigam Ltd.(BSNL).
147
Revenue. It does not include MTNL, Mumbai and Delhi however excludes network charges received from MTNL.
TRAFFIC AND EARNINGS
XII. TRANSPORT, COMMUNICATION AND TOURISM
TABLE 12.12 POSTS,TELEGRAPHS AND TELEPHONES -
Sources & footnotes: : 1. Department of Posts 2. Department of Telecommunications
(10) Includes advance rental in the "Own Your Telephone"Scheme, Telegraph Revenue and Wireless

(No.)
Nationality 1991 2001 2004 2005
North America 153502 417747 662004 768808 Canada 36142 88600 135884 157643 U.S.A. 117322 329147 526120 611165 Others 38 0 0 0
Central and South America 11819 21925 28165 35586 Argentina 1428 2906 2799 3313 Brazil 2488 3819 7397 7005 Mexico 1110 3473 4570 5398 Others 6793 11727 13399 19870
Western Europe 514541 819973 1128297 1282119 Austria 9945 17787 21093 27187 Belgium 12549 18851 24007 25596 Denmark 5645 14531 15805 20170 Finland 5524 8186 12525 16258 France 69346 102434 131824 152258 Germany 72019 80011 116679 120243 Greece 2212 3996 4468 4793 Ireland 2400 6136 8996 10052 Italy 41129 41351 65561 67642 Netherlands 19845 42368 51211 52755 Norway 3543 7667 10631 11194 Portugal 3819 7028 10648 11457 Spain 13644 23073 42895 45247 Sweeden 10591 14446 26154 28799 Switzerland 29247 25308 28260 34311 U.K. 212052 405472 555907 651083 Others 1031 1328 1633 3074
Contd…
148
TABLE 12.13 NUMBER OF FOREIGN TOURISTS TO INDIA
XII. TRANSPORT, COMMUNICATION AND TOURISM
BY COUNTRY OF NATIONALITY

(No.)
Nationality 1991 2001 2004 2005
Eastern Europe 46073 38863 82426 101445 Czechoslovakia 3200 3197 4114 4783 Hungry 1760 1939 3527 3704 Poland 6160 5181 8445 10983 C.I.S.(USSR)(*) 30896 24831 61187 75242 Others 4057 3715 5153 6733
Africa 62087 90962 114593 134801 Egypt 2346 2479 3781 4048 Ethiopia 6100 2897 2661 3248 Kenya 13831 15973 17538 19816 Mali 32 85 2541 114 Mauritius 6385 16039 19823 19760 Nigeria 2342 7539 6659 10049 South Africa 8087 21162 32148 39229 Sudan 5063 2323 2487 3660 Tanzania 6103 6579 9953 11193 Zambia 3970 1290 1468 1848 Others 7828 14596 15534 21836
West Asia 116857 96424 122808 133821 Bahrain 11386 3945 4414 4923 Israel 6882 28774 39083 42866 Jorden 2213 1428 2400 3333
(*) Data for the year 1991 relates to former U.S.S.R.
149
TABLE 12.13 NUMBER OF FOREIGN TOURISTS TO INDIA BY COUNTRY OF NATIONALITY-Contd.
XII. TRANSPORT, COMMUNICATION AND TOURISM

(No.)
Nationality 1991 2001 2004 2005
Kuwait 5884 1850 2965 3103 Oman 17035 13114 14927 14979 Qatar 6734 1361 1788 2176 Saudi Arabia 21114 9851 11929 12444 Syria 2709 1501 2289 2385 Turkey 2117 2432 7008 7906 U.A.E. 25806 21483 22668 24560 Yemen Arab Rep. 11944 7773 8826 9423 Others 3033 2912 4511 5723
South Asia 589705 672133 790698 841969 Afghanistan 25328 1248 12705 14025 Iran 19959 11728 24733 28691 Maldives 8722 17564 21099 33915 Nepal 21834 41135 51534 77024 Pakistan 190128 52762 67416 88609 Bangladesh 251260 431312 477446 456371 Srilanka 70088 112813 128711 136400 Bhutan 2386 3571 7054 6934 Others - - - -
South East Asia 78850 139975 209110 241408 Indonesia 4209 7767 11408 12640 Malaysia 30617 57869 84390 96276 Maynnar 558 3417 4932 5652 Philippines 3207 7199 10492 11422
150
XII. TRANSPORT, COMMUNICATION AND TOURISM
TABLE 12.13 NUMBER OF FOREIGN TOURISTS TO INDIA BY COUNTRY OF NATIONALITY-Contd.

(No.)
Nationality 1991 2001 2004 2005
Singapore 28363 42824 60710 68666 Thailand 11354 18623 33442 41978 Others 542 2276 3736 4774
East Asia 68794 130464 201627 223567 China 4975 18657 52279 63791 Hong Kong 10128 918 1965 1908 Japan 46655 80634 96851 103082 Korea 5769 29685 49314 53585 Others 1267 570 1218 1201
Autralasia 30535 66104 100944 119778 Australia 22700 52691 81608 96258 Newzeland 5968 11700 16762 20463 Fiji 1223 1422 2003 2326 Others 644 291 571 731
Stateless 3001 9393 1434 13490Others - 33319 14471 21818
Grand Total 1675764 2537282 3456577 3918610
151
BY COUNTRY OF NATIONALITY-Concld.
Source: Ministry of Tourism
TABLE 12.13 NUMBER OF FOREIGN TOURISTS TO INDIA
XII. TRANSPORT, COMMUNICATION AND TOURISM
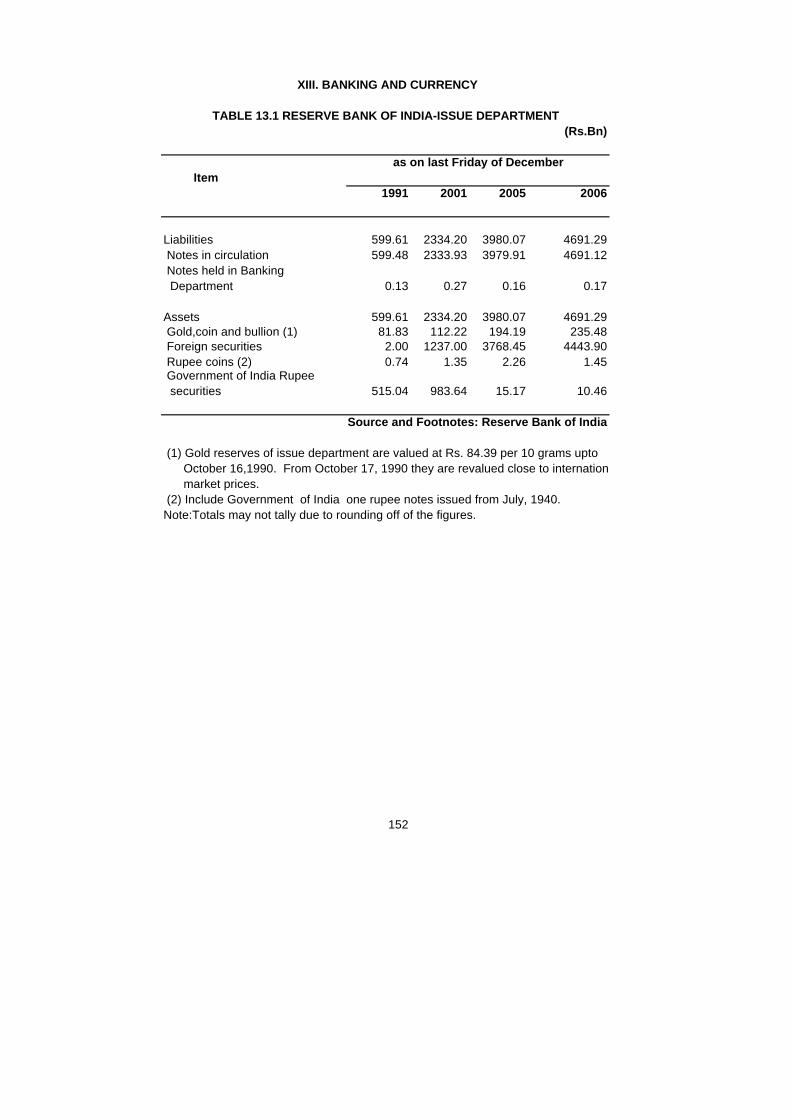
(Rs.Bn)
Item 1991 2001 2005 2006
Liabilities 599.61 2334.20 3980.07 4691.29 Notes in circulation 599.48 2333.93 3979.91 4691.12 Notes held in Banking Department 0.13 0.27 0.16 0.17
Assets 599.61 2334.20 3980.07 4691.29 Gold,coin and bullion (1) 81.83 112.22 194.19 235.48 Foreign securities 2.00 1237.00 3768.45 4443.90 Rupee coins (2) 0.74 1.35 2.26 1.45 Government of India Rupee securities 515.04 983.64 15.17 10.46
Note:Totals may not tally due to rounding off of the figures.
152
XIII. BANKING AND CURRENCY
TABLE 13.1 RESERVE BANK OF INDIA-ISSUE DEPARTMENT
as on last Friday of December
Source and Footnotes: Reserve Bank of India
(1) Gold reserves of issue department are valued at Rs. 84.39 per 10 grams upto October 16,1990. From October 17, 1990 they are revalued close to international market prices. (2) Include Government of India one rupee notes issued from July, 1940.

(Rs.Bn.)
Item 1991 2001 2005 2006
Liabilities 675.26 1763.27 3284.69 4191.65 Govt. deposits 1.12 1.41 812.65 * 924.24 * Other deposits 396.14 780.66 1200.28 1478.44 Other liabilities 278.00 981.20 1271.76 1788.98
Assets 675.26 1763.27 3284.69 4191.65 Notes and coins 0.13 0.28 0.18 0.19 Balances held abroad (1) 92.72 945.51 2446.01 3094.84 Loans and advances (2) 97.00 289.83 35.78 67.53 Bills purchased and discounted 9.81 - - - Capital investments 450.45 473.56 695.44 936.02 Other assets 25.15 54.09 107.29 93.07
(12.56) (25.15) (41.42) (53.21)
(1) Include cash, short-term securities and fixed deposits.
NABARD; (vi) Exim bank; and (vii) others.
153
*:- Includes balances under Market Stablisation Scheme and depositsof the Central and State Governments with the Reserve Bank of India.
TABLE 13.2 RESERVE BANK OF INDIA - BANKING DEPARTMENT
as on last reporting Friday of December
Source and Footnotes: Reserve Bank of India
(2) Include loans and advances to (i) State Governments (including temporary overdrafts); (ii) Scheduled commercial banks; (iii) State cooperative banks; (iv) I.D.B.I;(v) ARDC/
Note:1.Figures in bracket indicate the value of gold held under other assets. 2.Totals may not tally due to rounding off of the figures.
XIII. BANKING AND CURRENCY

(Rs.Bn.)
Item 1991 2001 2005 2006
Number of reporting banks (Indian & Foreign) 273 296 285 218 Demand deposits (1) 426.53 1425.52 2480.28 3646.40 Time deposits (1) 1781.14 8200.66 14521.71 17444.09 Total deposits [A] 2207.57 9626.18 17001.98 21090.49Cash in hand and balances with Reserve Bank [B] 348.27 652.02 965.77 1401.06Investment in Government securities (2) 605.16 3400.35 7189.82 7007.42Advances (3) 1198.04 5114.34 11004.29 15070.77 Of which Bills (inland) 52.27 234.82 327.86 437.30Percentage of[B] w.r.t.[A] 15.8 6.8 5.7 6.6Cheque clearances (4) Number in Mn. 352 527 739 794 Amount 18394.60 91896.83 81551.42 81949.77
(1) Exclude inter-bank deposits.
Note:1:-Totals may not tally due to rounding off of the figures. 2:-Data include the impact of mergers in the banking system during May ,2002. and conversion of a non-banking entity into a banking entity in October,2004.
154
(4) Data relate to the clearing houses managed by RBI only, and inclusive of inter-bank and high-value clearings.These data pertain to financial year and are at the end of
Source and Footnotes: Reserve Bank of India
(2) At book value: include treasury bills & treasury deposit receipts. (3) Figures relate to loans,cash credits overdrafts and bills purchased discounted.
March of the respective years.
TABLE 13.3 SCHEDULED COMMERCIAL BANKS-BUSINESS IN INDIA
as on last reporting Friday of March
XIII. BANKING AND CURRENCY

(Rs.Bn.)
Economic Sector2001 2002 2004 2005
I.Government Sector 971.92 1187.16 2285.66 2608.64
II.Private Corporate Sector: ( Non-Financial ) 452.55 639.75 1236.46 1546.68III. Financial Sector 711.09 771.26 1331.69 1385.26
IV.Household Sector 6558.73 7504.02 9190.08 10832.24V.Foreign Sector 1070.30 1141.54 1698.67 1481.71
Total(I+II+III+IV+V) 9764.60 11243.72 15742.57 17854.52
Note: Totals may not tally due to rounding off of the figures.
155
Source: Reserve Bank of India
TABLE 13.4 OWNERSHIP OF BANK DEPOSITS (INDIAN AND FOREIGN) BY ECONOMIC SECTOR
as on March 31
XIII. BANKING AND CURRENCY

FOREIGN SECTOR
8% GOVERNM ENT SECTOR
15%
OTHER INSTITUTIONS
2%
CORPORATE SECTOR
14%
HOUSE HOLD SECTOR
60%
OWNERSHIP OF BANK DEPOSITS (2005)Rs. Billion

(Deposits in Rs.Bn.)
Item1991 2001 2005 2006
A.Number of reporting banks 276 300 289 222 Scheduled Commercial banks 273 296 285 218 Indian 250 254 254 189 Foreign 23 42 31 29 Non-Scheduled Commercial banks 3 4 4 4
B.Number of offices 62740 67937 70373 71117 Scheduled commercial banks 62704 67923 70348 71149 Indian 62553 67718 70103 70888 Foreign 151 205 245 261 Non-Scheduledcommercial banks 36 14 25 28
C.Aggregate deposits 2012.74 9891.41 17328.58 21090.48 Scheduled commercial banks 2011.99 9891.41 17328.58 21090.48 Indian 1899.58 9384.00 16558.83 19971.44 Foreign 112.41 507.41 769.75 1119.04 Non-Scheduled Commercial banks 0.75 .. .. ..
156
Source and Footnotes: Reserve Bank of India
XIII. BANKING AND CURRENCY
TABLE 13.5 NUMBER OF OFFICES AND AGGREGATE DEPOSITS OF COMMERCIAL BANKS
as on last Friday of March

Centre1991 2001 2005 2006 (P)
Rural 33119 32585 30790 30769Semi-urban 13045 14843 15325 15503Urban 9013 11193 12419 12747Metropolitan 7563 9316 11839 12158
Total 62740 67937 70373 71177
Note:-1. No of Offices include Administrative Offices. 2.Classification of population groups up to March 2004 is based on 1991 census. For March 2005 and 2006,classification of bank offices was based on 2001 census.
157
Source: Reserve Bank of India
as on 31st March
TABLE 13.6 DISTRIBUTION OF COMMERCIAL BANK OFFICES (Scheduled & Non-Scheduled Banks)
XIII. BANKING AND CURRENCY
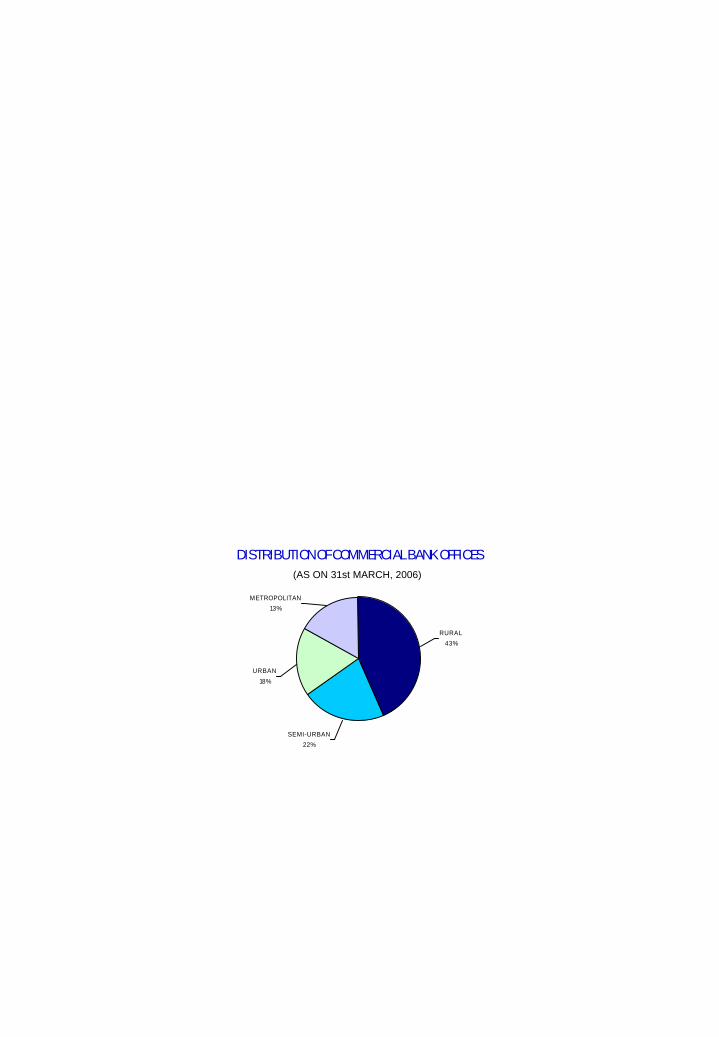
DISTRIBUTION OF COMMERCIAL BANK OFFICES(AS ON 31st MARCH, 2006)
SEMI-URBAN
22%
RURAL
43%
URBAN
18%
METROPOLITAN
13%

Occupation Number of CreditAmount out-accounts limit standing
('00) (Rs.Bn.) (Rs.Bn.)
I. Agriculture 266563 1491.43 1243.85 1.Direct finance 260104 1121.11 946.35 2.Indirect finance 6459 370.32 297.50II. Industry 37167 7140.05 4468.25 1.Mining and quarrying 181 317.60 158.17 2.Food manufacturing and processing 2324 664.90 310.50 (a) Rice, flour and dal mills 1074 127.75 77.07 (b) Sugar 13 94.95 59.61 (c) Edible oils and vanaspati 154 57.79 39.72 (d) Tea processing 22 151.49 24.91 (e) Processing of Fruits & vegetables 18 11.41 8.79 (f) Others 1043 221.52 100.39 3.Beverages and tobacco 44 62.65 42.86 4.Textiles 2258 912.65 524.07 (a) Cotton textiles 712 418.06 253.53 (b) Jute textiles 170 14.08 8.40 ( c) Handloom Textiles & Khadi) 296 32.46 23.48 (d) Other Textiles 1080 448.04 238.67 5.Paper,paper products and printing 474 159.48 106.15 6.Leather and leather products 260 62.21 41.48 7.Rubber and Plastic products 458 152.72 89.86
Contd:
158
XIII. BANKING AND CURRENCY
TABLE 13.7 DISTRIBUTION OF OUTSTANDING CREDIT OF SCHEDULED COMMERCIAL BANKS ACCORDING TO OCCUPATION
as at the end of March 2005

Occupation Number of CreditAmount out-accounts limit standing
('00) (Rs.Bn.) (Rs.Bn.) 8.Chemical and chemical products 971 705.65 392.33 (a) Heavy industrial chemicals 63 170.02 102.33 (b) Fertilisers 13 118.24 77.94 (c) Drugs and pharmaceuticals 176 222.81 103.16 (d) Non-Edible Oils 7 8.20 5.05 (e) Others Chemicals & Chemical Products 712 186.38 103.86 9.Petroleum,coal products and nuclear fuels 33 188.76 120.98 10.Manufacture of cement and cement products 115 102.62 76.32 11.Basic metal and metal products 1337 855.90 538.55 (a) Iron and steel 201 614.95 387.89 (b) Non-Ferrous Metals 58 108.83 55.62 (c) Metal products 1078 132.12 95.04 12.Engineering 2293 604.10 404.15 (a) Heavy engineering 129 114.36 85.32 (b) Light engineering 859 197.38 121.57 (c) Electrical & electronic machinery and goods 1305 292.36 197.27 13.Vehicles,vehicle parts and transport equipments 409 294.20 188.97 14.Other industries 23132 784.74 526.91 15.Electricity,gas & water 51 507.44 363.17 16.Construction 2827 764.42 583.76
159
COMMERCIAL BANKS ACCORDING TO OCCUPATION-Contd.
as at the end of March 2005
XIII. BANKING AND CURRENCY
TABLE 13.7 DISTRIBUTION OF OUTSTANDING CREDIT OF SCHEDULED

Occupation Number of CreditAmount out-accounts limit standing
('00) (Rs.Bn.) (Rs.Bn.)
III.Transport operators 5775 177.62 137.21
IV.Professional and other services 14697 800.93 552.66
V.Personal Loans 328353 3475.98 2559.81 1.Loans for purchase of consumer durables 15102 80.57 63.49 2.Loans for housing 36665 1450.34 1267.97 3.Rest of personal loans 276586 1945.07 1228.36
VI.Trade 60911 1733.57 1296.46 Wholesale trade 4993 948.63 735.18 Retail trade 55918 784.94 561.27
VII.Finance 1080 914.40 732.77
VIII.All others 56962 728.67 533.68
Total bank credit 771508 16462.66 11524.68Of Which:- 1.Artisans & village & Tiny industries 12883 79.04 61.49 2.Other small scale industries 9392 628.53 470.76
160
Source: Reserve Bank of India
XIII. BANKING AND CURRENCY
TABLE 13.7 DISTRIBUTION OF OUTSTANDING CREDIT OF SCHEDULED COMMERCIAL BANKS ACCORDING TO OCCUPATION-Concld.
as at the end of March 2005

(Rs.Bn.)
Item September March March March 1991 2001 2005 2006
1.Agriculture 172.99 535.71 1099.17 1552.20 (i)Direct finance (1) 159.54 381.37 830.38 1121.26 (ii)Indirect finance 13.45 154.34 268.79 430.942.Small scale industries 166.20 484.00 680.00 824.343.Setting up of industrial estates 0.51 0.52 0.83 2.334.Other priority sectors(2) 86.99 403.81 1250.95 1636.61 (i) Road & water transport operators 24.64 36.93 38.77 58.85 (ii) Retail trade & small business 43.61 141.97 287.17 519.30(iii) Professional and self employed persons 14.01 33.02 46.45 66.36 (iv) Education 0.91 10.28 63.98 108.03 (v) Consumption loans 0.29 6.86 8.98 13.02 (vi) State sponsored corporation organisation for on lending to other priority sectors mentioned in (i) to (v) above 0.15 4.46 17.68 12.73(vii) Housing loans 3.38 170.29 787.92 858.32 Total [1 to 4] 426.69 1424.04 3030.95 4015.48
Total Advances 1060.61 3412.91 7174.19 10176.56
(1) Excludes advances to plantations other than development. (2) Exclude advances in state sponsored organisation forSC/ST, advances to self help groups,advances to software Industries having credit unit upto 1 crore, Food & Agro based processing sector not satisfyig SSI norms & Investment in venture capital.
161
XIII. BANKING AND CURRENCY
TABLE 13.8 OUTSTANDING ADVANCES OF PUBLIC SECTOR BANKS TO AGRICULTURE, SMALL SCALE INDUSTRIES ETC.
as on last Friday of
Source and Footnote: Reserve Bank of India

(Rs.Bn.)
Item 1991 2001 2005 2006
Liabilities (2) Demand 16.81 38.49 47.31 56.01 Time 39.46 275.74 363.11 384.52 Borrowings (3) 35.74 97.56 132.58 150.06
Assets Cash in hand and balances with RBI 2.77 10.91 19.32 24.99 Govt. securities (4) 10.62 76.25 166.79 164.72 Advances 26.21 125.94 144.81 155.68 Due from banks (5) 54.95 165.60 219.40 241.67 Bills purchased and discounted 0.14 0.24 0.21 0.21
(1) Relate to the banks maintaining accounts with RBI. (2) Exclude borrowings from banks, and inter-bank deposits.
Governments.
162
XIII. BANKING AND CURRENCY
TABLE 13.9 STATE CO-OPERATIVE BANKS (1)
as on last Friday of March
Source & Footnotes: Reserve Bank of India
(4) At book value: include treasury bills & treasury deposit receipts. (5) Include advances of Scheduled State Co-operative Banks to Central Co-operative Banks and Primary Co-operative Banks.
(3) Include borrowings from the Reserve Bank of India, State Bank of India, Industrial Development Bank of India, National Bank for Agriculture and Rural Development, Notified banks, National Co-operative Development Corporation and the State

(Rs.Bn.)
Component 1990-91 2000-01 2004-05 2005-06
Currency with the public 530.48 2095.50 3558.63 4131.43 i.Notes in circulation 536.61 2128.51 3612.13 4219.22 ii.Circulation of Rupee coins(1) 16.21 53.54 74.48 87.54iii.Cash on hand with banks 22.34 86.54 127.98 175.33 iv.Deposit money of the public 398.44 1698.99 2916.32 4121.02
A. M1 [i+ii+iv-iii] 928.92 3794.50 6474.95 8252.45B. Post Office savings bank deposits 42.05 50.41 50.41 50.41C. M2 [A+B] 970.97 3844.91 6513.04 8302.86D. Time deposits with banks 1729.36 9337.71 16039.54 19042.90
M3 [A+D] 2658.28 13132.20 22514.49 27295.35
Note:1:- Totals may not tally due to rounding off of the figures. 2:- Data include the impact of mergers in the banking during May ,2002. and conversion of a non-banking entity into a banking entity in October, 2004.
163
XIII. BANKING AND CURRENCY
TABLE 13.10 MONEY STOCK MEASURES
Source and Footnotes: Reserve Bank of India
(1) Rupee coins include small coins, ten Rupee commemorative coins issued since October, 1969,two Rupee coins issued since November, 1982 and five Rupee coins issued since November,1985.

010002000
3000400050006000
700080009000
1990-91 2000-01 2004-05 2005-06
M 1 POST OFFICE SAVING BANK DEPOSITS
(Rs.BILLION)M1
0300060009000
12000150001800021000240002700030000
1990-91 2000-01 2004-05 2005-06
M 2 TIME DEPOSITS WITH BANKS
M2
MONEY STOCK MEASURES(New series)

(Rs.Bn.)
Source 1990-91 2000-01 2004-05 2005-06
1. Net bank credit to Govt. 1401.93 5119.55 7567.66 7690.932. Bank credit to commercial sector 1717.69 6792.18 12802.49 16909.613. Net Foreign exchange assets of banking sector(1) 105.81 2498.20 6492.55 7261.944. Government's currency liabilities to the public 16.21 53.54 74.48 87.545. Banking sector's net non- monetary liabilities other than time deposits(1) 583.36 1331.26 4422.69 4654.66
M3 [1+2+3+4-5] 2658.28 13132.20 22514.49 27295.35
Note:- Data include the impact of mergers in the banking system during May,2002 and conversion of a non-banking entity into a banking entity in October, 2004
164
Source and Footnotes: Reserve Bank of India
(1) Inclusive of appreciation in the value of gold following its revaluation close to international market price effective October 17, 1990. Such appreciation has a corresponding effect on Reserve Bank's net non-monetary liabilities.
XIII. BANKING AND CURRENCY
TABLE 13.11 SOURCES OF MONEY STOCK (M3)

Category 1991-92 2001-02 2004-05 2005-06
Bank Rate (1) 11-12. 6.5-7.0 6.0 6.0State Bank of India Advance rate (2) 16.5 11.0-11.5 10.25-11.25 10.25-11.25Lending rate of (3): Scheduled commercial banks .. 13.66 12.57 11.97Call/Notice Money Rate 19.57 7.16 4.65 5.6
effective Oct 9,1991, It decreased to 11% w.e.f April 16,1997,to 10% w.e.f.June 26,1997,to 9% w.e.f
to 6.25% w.e.f. October 30,2002 and to 6.00 % w. e. f. April 30,2003
2001 Monetary and Credit Policy,PLR was converted in to a reference or benchmark rate for banks.From 1995-96 onwards the data relate to Five major public sector banks and from 2003-04, relate to Benchmark PLR (3) Lending rates of Scheduled Commercial Banks are weighted average interest rates of bank credit based on accounts with credit limit of over Rs. 2 lakhs and are exclusive of inland and foreign bills purchased and discounted.
165
XIII. BANKING AND CURRENCY
TABLE 13.12 MONEY RATES IN INDIA
Source and Footnotes: Reserve Bank of India
October 22,1997, raised to 11% w.e.f January 17,1998,decresed to 10.5% March 19,1998,
(percent per annum)
(1) The Reserve Bank of India discount rate was raised to 11% effective July 4,1991,to 12%
to 10 % w.e.f April 03,1998 to 9% w.e.f April 29,1998, to 8% w.e.f March 02,1999, to 7%
borrowers for credit limits over Rs.2 lakh.The rate charged on loans up to Rs.2 lakh should not exceed the PLR.Banks declare their Prime Lending rates as approved by their Boards.In April
w.e.f April 02,2000,raised to 8% w.e.f , July 22,2000, decreased to 7.5% w.e.f Februray 17,2001,to 7% w.e.f March 02,2001 to 6.5 % w.e.f October 23,2001.
(2) Prime Lending Rate(PLR) is the rate generally charged by the banks for lending to prime

(Rs.Ten Mn.)
Item 1990-91 2004-05 2005-06 2006-07(Accounts) (Accounts) (R.E) (BE)
I.Revenue account* A.Receipts 54954 306013 348474 403465 B.Expenditure 73516 384351 440295 488192 C.Surplus (+)/Deficit(-) -18562 -78338 -91821 -84727
II.Capital account A.Receipts $ 38997 191669 160231 160526 B.Disbursements 31782 113331 68410 75799 C.Surplus (+)/Deficit(-) 7215 78338 91821 84727
III.Overall surplus(+)/deficit(-) -11347 - - -
* Inclusive of Commercial departments.
166
1997-98 onwards budgetary deficit represents draw-down in cash balances.
RE : Revised Estimates. BE : Budget Estimates.
$ Does not include receipts in respect of Market stabilisation Scheme,which will remain in the cash balance of the Central Government and will not be used for expenditure.Note: With discontiuation of the ad-hoc treaury bills and 91-day tap treasury bills, the concept of conventional budget deficit has lost its relevance since April 1, 1997. Therefore, from
XIV. PUBLIC FINANCE
TABLE 14.1 OVERALL BUDGETARY POSITION OF GOVERNMENT OF INDIA
Source: Budget documents of the Government of India.

(Rs.Ten Mn.)
Items 1990-91 2004-05 2005-06 2006-07(Accounts) (Accounts) (R.E) (B.E)
1.Tax revenue (net)# 42978 224798 274139 3272052.Direct Tax (net)# 6903 95935 125550 155253 of which: A.Personal income tax 1250 34867 47848 55810 B.Corporation Tax 5335 60289 77483 992213.Indirect Tax (net)# 36075 128863 148589 171952 of which: A.Excise Duties(net) 14100 77241 87416 93667 B. Customs Duties 20644 41811 45793 546914.Non-tax Revenue 11976 81215 74335 76260 of which: Interest Receipts 8730 32364 21245 192635.Revenue Receipts (1+4) 54954 306013 348474 4034656.Capital Receipts 38997 199799 145194 1605267.Total Receipts (5+6) 93951 505812 493668 563991
167
RE : Revised Estimates. BE : Budget Estimates.
XIV. PUBLIC FINANCE
TABLE 14.2: CENTRAL GOVERNMENT RECEIPTS-MAJOR COMPONENTS
Source: Budget documents of the Government of India.
# Net of State Governments' Share and amount assigned to National Calamity Contingency Fund(NCCF).Note: The taxes and duties referred to in the Union list are now distributed in the same manner as laid down by the Constitution (Eighteenth Amendment) Act, 2000 read along with the recommendations of the Twelfth Finance Commission.
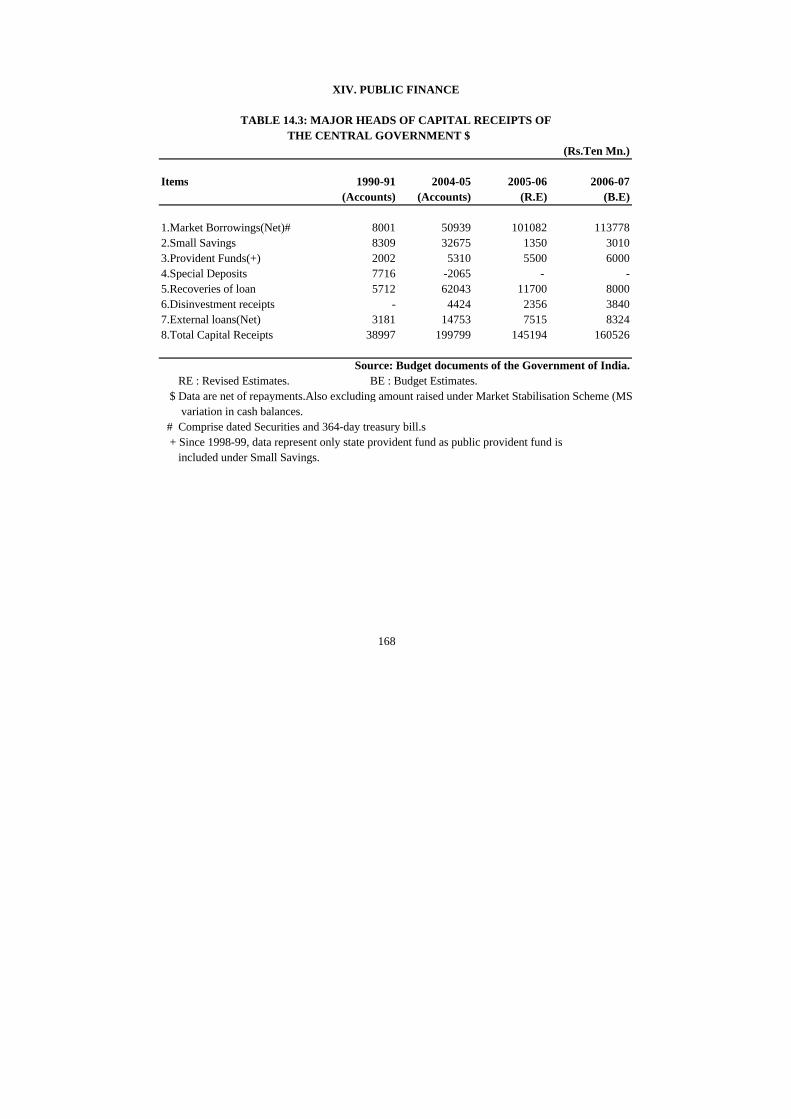
(Rs.Ten Mn.)
Items 1990-91 2004-05 2005-06 2006-07(Accounts) (Accounts) (R.E) (B.E)
1.Market Borrowings(Net)# 8001 50939 101082 1137782.Small Savings 8309 32675 1350 30103.Provident Funds(+) 2002 5310 5500 60004.Special Deposits 7716 -2065 - -5.Recoveries of loan 5712 62043 11700 80006.Disinvestment receipts - 4424 2356 38407.External loans(Net) 3181 14753 7515 83248.Total Capital Receipts 38997 199799 145194 160526
variation in cash balances.
168
XIV. PUBLIC FINANCE
RE : Revised Estimates. BE : Budget Estimates.
THE CENTRAL GOVERNMENT $ TABLE 14.3: MAJOR HEADS OF CAPITAL RECEIPTS OF
Source: Budget documents of the Government of India.
$ Data are net of repayments.Also excluding amount raised under Market Stabilisation Scheme (MSS)and
# Comprise dated Securities and 364-day treasury bill.s + Since 1998-99, data represent only state provident fund as public provident fund is included under Small Savings.

(Rs.Ten Mn.)
Items 1990-91 2004-05 2005-06 2006-07(Accounts) (Accounts) (R.E) (BE)
1.Revenue expenditure 73516 384351 440295 488192 of which : A. Defence expenditure 10874 43862 48625 51542 B. Interest payments 21498 126934 130032 139823 C. Subsidies 12158 43653 46874 462132.Capital Expenditure 31782 113331# 68410 75799 A. Loans and Advances 19652 28910 11417 8861 B. Capital outlay 12130 51746 56993 66938 of which : a. Defence expenditure 4552 31994 33075 374583.Total expenditure (1+2) 105298 497682 508705 563991
(Rs.Ten Mn.)
Items 1990-91 2004-05 2005-06 2006-07(Accounts) (Accounts) (R.E) (B.E)
1.Developmental Expenditure 58645 214955 232698 262515 of which : A. Economic services 24588 115030 139254 156629 B. Social services 3274 29906 36967 418972.Non-developmental Expenditure 49349 262904 290264 3160813.Total expenditure (1+2) 107994 477860 522962 578595
169
MENTAL EXPENDITURE OF THE CENTRAL GOVERNMENT $
RE : Revised Estimates. BE : Budget Estimates. $ Data include gross expenditure of other commercial and Postal depaerments..
GOVERNMENT
RE : Revised Estimates. BE : Budget Estimates.
and capital outlay.
Source: Budget documents of the Government of India.
# Includes National Samll Saving Fund (NSSF) repayments apart from loan and advances
TABLE 14.4b:MAJOR HEADS OF DEVELOPMENTAL AND NON-DEVELOP-
Source: Budget documents of the Government of India.
TABLE 14.4a:MAJOR HEADS OF EXPENDITURE OF THE CENTRAL
XIV. PUBLIC FINANCE

(Rs.Ten Mn.)
Item 1990-91 2004-05 2005-06 2006-07(Accounts) (Accounts) (R.E) (BE)
I. Revenue account (A) Receipts 66467 372075 454243 520147
(519874) (B) Expenditure 71776 408497 471421 524658 (C) Surplus(+) or Deficit(-) -5309 -36423 -17178 -4511
(-4785)
II. Capital account (A) Receipts 24693 204687 159136 151969 (B) Disbursements 19312 157805 136332 143471 (C) Surplus(+) or Deficit(-) 5381 46882 22803 8498
III. Overall Surplus(+) or Deficit (-) 72 10459 5625 3986(3713)
170
XIV. PUBLIC FINANCE
TABLE 14.5 OVERALL CONSOLIDATED BUDGETARYPOSITION OF STATE GOVERNMENTS
Source: State Finances : A study of Budgets of 2006-07, Reserve Bank of India RE : Revised Estimates. BE : Budget Estimates.
2. Figures outside brackets under 2006-07 (Budget Estimates) include the estimated net yield of Rs.273 crore from Additional Resource Mobilisation measures introduced in the State budgets.
Notes: 1. Figures for 2004-05 in respect of Jammu & Kashmir and Jharkhand relate to Revised Estimate.

(Rs.Ten Mn.)Revenue Revenue Capital Capital Overall
State receipt expen- receipt Expen- surplusditure diture (+) or
deficit(-)Andhra Pradesh 28750 31307 152910 149895 458Arunachal Pradesh 1502 1510 4087 4174 -95Assam 9937 10229 15111 15108 -289Bihar 15714 14638 49203 50955 -676Chattisgarh 7249 7103 29630 29765 11Goa 1820 1943 4872 4749 0Gujarat 20265 24302 78965 74859 69Haryana 11149 11407 42151 41718 175Himachal Pradesh 4635 5793 12482 11117 207Jammu & Kashmir 9765 8188 2374 3950 1Jharkhand 7307 8419 6853 6446 -705Karnataka 26570 24932 66263 67891 10Kerala 13500 17169 50379 46576 134Madhya Pradesh 19743 18026 44619 46376 -40Maharashtra 41013 51047 77556 67400 122Manipur 1743 1651 5320 5131 281Meghalaya 1546 1596 3690 3707 -67Mizoram 1502 1394 2481 2632 -43Nagaland 1840 1685 3319 3473 1Orissa 11850 12372 22596 21950 124Punjab 13807 17198 26437 22871 175Rajasthan 17764 19906 66806 64789 -125Sikkim 1892 1723 2112 2258 23Tamil Nadu 28452 29155 86890 85973 214Tripura 2577 2183 4597 4937 54Uttarakhand 4086 5036 27788 26776 62Uttar Pradesh 37617 44610 175150 167625 532West Bengal 19918 28146 109530 101491 -189NCT Delhi 8563 5827 4539 7048 227All States 372075 408497 1178712 1141639 651
171
Contd..
XIV. PUBLIC FINANCE
TABLE 14.6 REVENUE AND CAPITAL BUDGETS OF THE STATES 2004-05 (ACCOUNTS)

(Rs.Ten Mn.)Revenue Revenue Capital Capital Overall
State receipt expen- receipt Expen- surplusditure diture (+) or
deficit(-)Andhra Pradesh 36271 37389 27428 26660 -350Arunachal Pradesh 1925 1702 2381 2412 192Assam 14285 14617 22626 22203 91Bihar 19116 19269 11157 11801 -797Chhattisgarh 9384 8603 20259 21186 -146Goa 2189 2259 2829 2759 0Gujarat 25129 25463 104415 103515 566Haryana 12646 13249 101278 100681 -6Himachal Pradesh 6333 6427 4524 4284 146Jammu & Kashmir 11540 9724 3678 5494 0Jharkhand 8203 9756 5521 6849 -2881Karnataka 29685 28498 21958 23116 29Kerala 16596 21090 51921 47673 -246Madhya Pradesh 21344 21370 55154 55422 -294Maharashtra 52198 53617 140304 135010 3875Manipur 2545 2063 4546 4877 151Meghalaya 2007 1876 13052 13105 78Mizoram 1886 1705 2385 2582 -16Nagaland 2579 2118 1249 1758 -48Orissa 14122 14638 13858 13341 1Punjab 17891 19604 70049 66732 1604Rajasthan 20746 21611 90638 89726 47Sikkim 2012 1813 1776 2113 -138Tamil Nadu 32904 33264 103926 103876 -310Tripura 3077 2561 7016 7742 -210Uttarakhand 6397 6820 9702 9370 -91Uttar Pradesh 46740 49872 66300 63645 -477West Bengal 24654 33252 95298 86473 227NCT Delhi 9838 7190 4771 6810 609All States 454243 471421 1059997 1041216 1603
172
2005-06 (R.E.)-contd.
XIV. PUBLIC FINANCE
TABLE 14.6 REVENUE AND CAPITAL BUDGETS OF THE STATES

(Rs.Ten Mn.)Revenue Revenue Capital Capital Overall
State receipt* expen- receipt Expen- surplusditure diture (+) or
deficit(-)Andhra Pradesh 44331 45327 34198 33233 -31Arunachal Pradesh 2000 1810 2195 2375 10Assam 15661 16096 20933 22333 -1835Bihar 22391 21780 12442 13704 -651Chhattisgarh 10797 9597 20763 22048 -85Goa 3142 3176 2900 2873 -7Gujarat 26282 26276 69762 69741 27Haryana 13747 14067 100358 100049 -11Himachal Pradesh 6521 6775 4139 3898 -13Jammu & Kashmir 12565 9630 2813 5845 -97Jharkhand 10144 10857 8288 7826 -251Karnataka 35875 34341 22722 24229 27Kerala 19140 24555 50835 45532 -112Madhya Pradesh 23480 22510 51700 52450 220Maharashtra 59146 58840 66149 59605 6850Manipur 2792 1995 4693 5624 -134Meghalaya 2458 2118 12956 13242 54Mizoram 1695 1558 518 524 131Nagaland 2716 2190 1224 1651 99Orissa 15465 15940 15787 15312 0Punjab 20040 21446 69266 67479 381Rajasthan 23991 24034 63259 63155 61Sikkim 2170 1923 1945 2256 -64Tamil Nadu 38732 39861 81262 80127 6Tripura 3204 2763 6693 7355 -221Uttarankhand 7441 7596 13251 13527 -431Uttar Pradesh 56144 55021 66729 67713 139West Bengal 26703 35042 94369 85532 498NCT Delhi 11099 7536 187 5810 -2060All States 520147 524658 902333 895048 2774
173
* Includes the estimated yield of Rs.273 crore from Additional Resource measures proposed by the State Governments for 2006-07 (BE).Note: 1. Figures for Jammu & Kashmir and Jharkhand for the year 2004-05 relate to Revised Estimates.2. Totals may not tally due to rounding off of figures.
TABLE 14.6 REVENUE AND CAPITAL BUDGETS OF THE STATES
RE : Revised Estimates. BE : Budget Estimates.
Source: State Finances : A Study of Budgets of 2006-07, Resere Bank of India
XIV. PUBLIC FINANCE
2006-07 (B.E.)-concld.

(Rs.Ten Mn.)
Item 1990-91 2004-05 2005-06 2006-07(Accounts) (Accounts) (R.E) (BE)
I. Tax revenue (A+B) 44586 267683 317539 366622(366383)
A.Revenue from States' Taxes [ i + ii + iii ] 30345 189133 224817 257203
(256964) i).Tax on income 634 2349 2565 2721 ii).Taxes on property and -2721 capital transactions 2742 22307 27340 31679 iii).Taxes on commodities (31631) and services 26970 164478 194911 222804
(222612) B.Share in Central taxes 14242 78550 92723 109419
II.Non-tax revenue[C+D] 21881 104392 136704 153525(153491)
C.Grants from the centre 12643 56857 90002 100188 D.States' own non-tax revenue 9237 47535 46702 53337
(53303)
Total revenue [I+II] 66467 372075 454243 520147(519874)
E.Developmental expenditure[i+ii] 48855 216474 262818 286765 i. Social services 27962 132053 163984 181306 ii. Economic services 20892 84421 98834 105459 F.Non-developmental expenditure 22137 183961 198501 224775 G.Grants in aid & contribution - 8063 10101 13119 H.Others 784.1(#) - - -
Total expenditure of State Govternments [E+F+G+H] 71776 408498 471420 524659
Surplus (+)or deficit(-)on revenue Account -5309 -36423 -17177 -4512
174
:2. Figures outside brackets under the year 2006-07(BE) are adjusted for Rs.273 crore towards additional resources mobilisation measures proposed by the States.
and reserve with Finance Department. Notes 1.Figures for 2004-05 (Accounts) in respect of Jammu & Kashmir and Jharkhand States relate to Revised Estimates.
XIV. PUBLIC FINANCE
TABLE 14.7 REVENUE AND EXPENDITURE OF STATES(Revenue account)
Source: State Finances : A study of Budgets of 2006-07, Reserve Bank of India RE : Revised Estimates. BE : Budget Estimates. (#) Includes compensation and assignments to local bodies and panchayati raj institutions

(Rs.Ten Mn.)
Item of Receipts 1990-91 2004-05 2005-06 2006-07(Accounts) (Accounts) (R.E) (BE)
1.Internal debt* 3264 147122 122473 110700 of which : Market loans (Gross) 2561 40447 23806 28268 Special Securities issued to NSSF+ .. 87431 84263 648152.Loans from Centre+ 13974 26157 10911 135253.Recovery of loans & advances 1501 8567 7459 55134.Small savings, provident funds etc.(net) 3069 8883 10423 103365.Contingency funds (net) 40 208 -51 576.Reserve funds (net)** 1120 7127 3250 43657.Deposits and advances (net)*** 1670 8074 -702 -11548.Appropriation to contingency fund (net) -168 -75 -1 -9.Remmitances (net) -154 1240 957 197510.Others # 530 -2617 4415 6652
Total receipts[1 to 10] 24847 204687 159136 151969
Bank of India .
2. Capital receipts include Public Accounts on a net basis.Contd…
175
Central Government.Note : Figures for 2004-05 (Accounts) in respect of Jammu & Kashmir and Jharkhand relate to Revised Estimates.
Co-operative Development Corporation,, Life Insurance Corporation of India, Khadi and Village Industries Commission etc but excludes Ways and Means Advances and overdrafts from the Reserve.
TABLE 14.8 CAPITAL BUDGET OF STATE GOVERNMENTSA.TOTAL CAPITAL RECEIPTS
Receipts. . (+) With the change in the system of accounting with effect from 1999-2000, States' share in small savings which was included earlier under loans from the centre is included under internal debt and shown as special securities issued to National Small Saving Fund of the
famine relief funds and roads & bridges funds).
(*) Includes market loans, special securities issued to National Small Savings Fund (NSSF), Land compensation bonds,, cash credits and loans from State Bank of India and other banks (net
XIV. PUBLIC FINANCE
(#) Include Suspense and Miscellaneous (net) and inter- State Settlement (net) and Miscellaneous Capital
as also loans from National Rural Credit (Long-term operations) fund of NABARD, National
Government Commercial Undertakings) as well as those not bearing interest (like sinking funds,
(***) Deposits and Advances (net)includes deposits bearing interest (like deposits of local funds) as well as those not bearing interest (like Defence and Postal Deposits and Civil Advances).
(**) Reserve Fund (net) include reserve funds bearing interest (like the depreeciation reserve funds of

(Rs.Ten Mn.)
Item of Disbursements 1990-91 2004-05 2005-06 2006-07(Accounts) (Accounts) (R.E) (BE)
1.Total capital outlay (I+II) 9223 61559 85350 96506 I. Developmental outlay (A+B) 8961 58889 81704 92111 A.Social services 1257 12079 16574 18724 B.Economic services 7703 46810 65130 73387 II.Non-developmental outlay (*) 263 2670 3646 43952.Discharge of internal debt (**) 337 38442 23457 23162 of which : Market loans 5 5888 5176 55063. Repayment of loans to the centre 3997 37961 8706 86984. Loans and advances by the State Governments 5755 19843 18819 15106
Total disbursements [1 to 4] 19312 157805 136332 143471
Surplus(+) or Deficit (-)on Capital Account 5535 46882 22804 8498
loans from the State Bank of India and other banks and Ways and Means Advances and Overdraft from the Reserve Bank of India.
176
RE : Revised Estimates. BE : Budget Estimates.
XIV. PUBLIC FINANCE
TABLE 14.8 CAPITAL BUDGET OF STATE GOVERNMENTS-Concld.B.TOTAL CAPITAL DISBURSEMENTS
Source: State Finances : A study of Budgets of 2006-07, Reserve Bank of India
Corporation, Life Insurance Corporation of India etc.but excludes repayments of cash credits and
Note : Figures for 2004-05 (Accounts) in respect of Jammu & Kashmir and Jharkhand relate to Revised Estimates. 2. Capital expenditure are given exclusive of Public Accounts.
National Rural Credit (Long-term operations) fund of the NABARD, National Co-operative Development
(*) Comprises expenditure on general services. (**) Includes repayment of market loans, land compensation bonds, as also repayment of loans from

Net national Tax Tax revenue Year Product at revenue as %age of
current prices (Rs.Ten Mn.) national(Rs.Ten Mn.) product
1990-91 418074 87564 20.9 1993-94 685912 124111 18.1 1994-95 805981 151273 18.8 1995-96 941861 174852 18.6 1996-97 1093962 199840 18.3 1997-98 1224946 217313 17.7 1998-99 1415093 233069 16.5 1999-00 1585501 274974 17.3 2000-01 1696387 305374# 18.0 2001-02 1847667 313844# 17.0 2002-03 1993846 357342# 17.9 2003-04 2246465 413981# 18.4 2004-05 2501067 492481# 19.72005-06 * 2846762 591641# RE 20.82006-07 A 3296639 688103 #BE 20.9
* Quick Estimates A Advance estimates
177
# Excluding the amount transferred to National Calamity Contingency Fund.
2. Central Statistical Organisation
XIV. PUBLIC FINANCE
TABLE 14.9 TAX REVENUE OF THE CENTRE,STATES AND UNION TERRITORIESAS PERCENTAGE OF NATIONAL PRODUCT AT FACTOR COST
Sources: 1. Reserve Bank of India
(AT CURRENT PRICES)

(Rs.Ten Mn.)
Item 1991 2001 2005 2006( R. E.)
A.Liabilities Central Government 314558 1168541 1994422 21953871.Public debt 185529 869643 1336849 1424335 1.Internal debt 154004 803698 1275971 1355943 11.External debt * 31525 65945 60877 683922.National Small Saving Fund (NSSF) and State Provident funds @ 61771 96343 390477 4843273. Reserve funds and deposits 21922 58535 92989 101170B.Total debt of state Governments 128155 602072 1042305 1152652C.Loans from the Centre to State Governments 73889 218380 160045 157003D.Investment in special Sec- urities of states under National Small Saving Fund (NSSF) 0 60202 301536 389986Total debt of the Central andState Governments(A+B-C-D) 368824 1492031 2575146 2801050
* At book Value. @National Small Savings Fund is represented through Small Savings for year 1991.
178
TABLE 14.10 DEBT POSITION OF CENTRAL AND STATE GOVERNMENTS
XIV. PUBLIC FINANCE
2.Government Of India,Budget Documents
(R. E.) Revised Estimates.
(amount oustanding at the end of March)
Source: State Finances : A study of the State Budgets of 2006-07, Reserve Bank of India
Note: Totals may not tally due to rounding off of figures.

(Rs. Ten Mn.)
Item 1990-91 2003-04 2004-05 2005-06
I.Total deposits R 9455 94272 122616 130447 O 17022 188907 251665 306968 A.Post Office Savings R 4253 21720 24824 31432 Bank Deposits (1) O 4205 13367 14870 16790 B.Post Office Cumulative Time R .. .. .. .. Deposits (2) (4) O 274 -29 -26 41
C.Post Office Time R 746 16339 20253 20526 Deposits O 2973 24067 31994 38879 D.Post Office Recu- R 1428 16645 19979 23488 rring Deposits O 2638 33963 41102 50188 E.Post Office Monthly Income R 873 38851 48457 47273 Scheme O 2340 113386 151026 183077 F.National Savings R 2085 509 329 292 Scheme O 4592 4143 3952 4057 G.Other deposits R - - - -
O - 20 11 20 II.Total Certificates R 8214 39170 33369 39812
O 33257@ 174563 191794 203771III.Public Provident R - 2528 2534 3024 Fund (3) O - 12267 14273 16872 Total Savings R 17700$ 135970 158519 173283 (I+II+III) O 50279$ 375737 457732 527611
For footnotes, please see next page.
Contd…
179
XIV. PUBLIC FINANCE
TABLE 14.11 SMALL SAVINGS
Source : Reserve Bank of India

180
XIV. PUBLIC FINANCE
TABLE 14.11 SMALL SAVINGS-Concld.
(1) Receipts and oustandings include interest credited to depositors'account from time to time. Outstandings include the balances under Dead Savings Bank accounts. (2) Includes cumulative time deposits with duration of 5 years,10 years & 15 years. (3) Data on Public Provident Fund (PPF) relate to Post Office transactions and do not
(4) Negative figures are due to rectification of misclassification.
R : Receipts. O : Outstandings.
include PPF mobilised by banks.
(@) Relate to Social Securities Certificates only. ($) Excluding Public Provident Fund.
Notes:1. Outstanding relate to end of period and include Indian Union's share of the pre- Partition liabilities and repayments include those from the pre-partition holding of Indian Investors. 2. Totals may not tally due to rounding off of figures.

(Rs.Ten Million)
2000-01 2001-02 2002-03 2003-04 2004-05 2005-06
Revenue collection from Direct Taxes
68305 69198 83088 105088 132771 165208
Corporation Tax 35696 36609 46172 63562 82680 101277 Income Tax 31764 32004 36866 41386 49268 63630 Other Direct Taxes 845 585 50 140 823 301
Revenue collection from Indirect Taxes 119814 117318 132608 148608 170398(P) 200065(P) Customs 47542 40268 44852 48629 57566 65248 Excise 68526 72555 82310 90774 98636 110778 Service Tax 2613 3302 4122 7891 14196 24039 Foreign Travel Tax (FTT)/Inland Air Travel Tax (IATT)
1133 1193 1324 1314 # #
(Rs.Ten Million)
Financial year Direct Tax (DT)
Indirect Taxes
(IT)
Total Direct Tax (DT) as % of
Total
2000-01 68305 119814 188119 36.31 2001-02 69198 117318 186516 37.10 2002-03 83088 132608 215696 38.52 2003-04 105088 148608 253696 41.42 2004-05 132771 170398 303169 43.79 2005-06 165208 200065 365273 45.23
181
TABLE 15.2 REVENUE COLLECTION FROM TOTAL TAX REVENUE
Source : Directorate General of Income Tax.
XV INCOME TAX
TABLE 15.1 REVENUE COLLECTION FROM DIRECT AND INDIRECT TAXES
Source : Directorate General of Income Tax. (#) Foreign Travel Tax (FTT)/Inland Air Travel Tax (IATT) abolished since 09.01.2004.

(Rs.Ten Million)
2000-01 2001-02 2002-03 2003-04 2004-05
Pre-assessment collectionTax deductable at source (TDS) 28213 32672 36568 42955 43973Advance tax 32614 34094 49158 58713 90034Self assessment 5841 5479 6414 9852 10044
Post-assessment collectionRegular assessment 8121 9492 10745 16015 6006other receipt 5420 4094 2184 3150 10405
Total collection 80209 85831 105069 130685 160462Refunds 12751 17220 22031 25736 28514Net collection 67458 68611 83038 104949 131948
(Rs.Ten Million)
Financial year
2000-01 2001-02 2002-03 2003-04 2004-05 2005-06 165208 1227
182
XV INCOME TAX
TABLE 15.3 DIRECT TAXES (IT&OT) COLLECTIONS-PRE ASSESSMENT AND POST-ASSESSMENT SCENARIO
Source : C&AG Report No.8 March, 2005
TABLE 15.4 COST OF COLLECTION OF TAXES
Source : Directorate General of Income Tax.
929993984
10501138
Total Direct Tax Collection
Total Cost of Collection
683056919883088
105088131918

2000-01 2001-02 2002-03 2003-04 2004-05 2005-06
Company 334261 349185 365124 372483 373165 382003Individual 20662926 23734413 25935556 26624224 24792990 26977218H.U.F. 553194 607519 644489 654848 620468 637716Firms 1336861 1378706 1345232 1338613 1235373 1213890Trusts 63999 97272 117304 154276 71375 71616Others 51035 58784 57224 57952 65190 56232
Total 23002276 26225879 28464929 29202396 27158561 29338675
183
XV INCOME TAX
TABLE 15.5 NUMBER OF EFFECTIVE ASSESSEES
Source : Directorate General of Income Tax.

(Rs.Ten Million)
Item 1990-91 2000-01 2004-05 2005-06
Merchandise (a) Credit 33153 207852 381785 465705 Debit 50086 264589 533550 695131 Net -16933 -56737 -151765 -229426Services (1) (b) Credit 8169 74555 193711 272220 Debit 6408 66650 124880 166601 Net 1761 7905 68831 105619Transfer Payments ( c) Credit 4567 60948 97201 111856 Debit 28 981 4066 4183 Net 4539 59967 93135 107673
Income (d) Credit 660 12275 20638 25124 Debit 7393 35008 43013 49712Net -6733 -22733 -22375 -24588Total (a+b+c+d) Credit 46549 355630 693335 874905 Debit 63915 367228 705509 915627 Net -17366 -11598 -12174 -40722
(1) Includes foreign travel,transportation, insurance,investment income, Government not included elsewhere and miscellaneous. Note:Interest payments forming part of gross withdrawal under FCNRA depostis have been segregated under invisible payments since April-June 1990.Merchandise credit relates to export of goods while merchandise debit represent imports of goods.
184
XVI. BALANCE OF PAYMENTS
TABLE 16.1 OVERALL BALANCE OF PAYMENTS-CURRENT ACCOUNT
Source: Reserve Bank of India

(Rs.Ten Million)
Item 1990-91 2000-01 2004-05 2005-06(PR)
Foreign Investment (a) Credit 202 80824 210205 337301 Debit 19 54080 152148 260982 Net 183 26744 58057 76319Loans (b) Credit 16924 109271 135685 166208 Debit 6995 84812 87090 139650 Net 9929 24459 48595 26558Banking Capital ( c) Credit 18133 44448 65278 95988 Debit 16908 53592 48238 90193 Net 1225 -9144 17040 5795Rupee Debt Service (d) Credit - - - - Debit 2140 2760 1858 2557 Net -2140 -2760 -1858 -2557Other Capital (e) Credit 5593 12948 30507 28979 Debit 2129 11637 26974 32125 Net 3464 1311 3533 -3146Capital Account(a+b+c+d+e) Credit 40852 247491 441675 628476 Debit 28191 206881 316308 525507 Net 12661 40610 125367 102969
IMF Credit 3334 - - - Debit 1156 115 - - Net 2178 115 - -Reserves Increase(+)/Decrease(-) 2293 -27528 -115907 -65892
185
XVI. BALANCE OF PAYMENTS
TABLE 16.2 OVERALL BALANCE OF PAYMENTS- CAPITAL ACCOUNT
Source: Reserve Bank of India

(Rs.Ten Million)
Averages of Annual Plans Item
1990-91 2000-01 2004-05 2005-06(PR)
1.Imports(c.i.f) 50086 264589 533550 6951312.Exports(f.o.b) 33153 207852 381785 4657053.Trade balance [2-1] -16933 -56737 -151765 -2294264.Invisibles(net) -433 45139 139591 1887045.Current Account(net) [3+4] -17366 -11598 -12174 -407226.Capital Transactions 12661 40610 125367 103969 (a) Foreign Invest- ment(net) 183 26744 58057 76319 (b) Loans(net) 9929 24459 48595 26558 (c) Banking Capital (net) 1225 -9144 17040 5795 (d) Rupee Debt Service(net) -2140 -2760 -1858 -2557 (e) Other capital (net) 3464 1311 3533 -31467.Errors and Omissions 234 -1369 2714 36498.Overall Balance [5 to 7] -4471 27643 115907 658969.Monetary Movements 4471 -27643 -115907 -65896 (a) IMF Transactions (net) 2178 -115 - - (c) Increase(+/decrease(-) in reserves 2293 -27528 -115907 -65896
186
XVI. BALANCE OF PAYMENTS
TABLE 16.3 FINANCING OF PAYMENT DEFICITS BY PLAN PERIOD
Source: Reserve Bank of India

(Rs.Ten Million)
SDRS Gold RTP Foreign Total End of Period Currency
Assets
1990-91 200 6828 0 4388 11416 1996-97 7 14557 0 80368 94932 1997-98 4 13394 0 102507 115905 1998-99 34 12559 0 125412 138005 1999-00 16 12973 0 152924 165913 2000-01 11 12711 0 184482 197204 2001-02 50 14868 0 249118 264036 2002-03 19 16785 3190 341476 361470 2003-04 10 18216 5688 466215 490129 2004-05 20 19686 6289 593121 6191162005-06 12 25674 3374 647327 676387
Note: Gold was valued at Rs 84.39 per 10 grams till Oct. 16,1990. It has been revalued at close to international market price of Gold with effect from October 17, 1990. RTP:- Reserve Tranche Position in IMF.RTP was included in Reserves from 2002-03 onwards.
187
XVI. BALANCE OF PAYMENTS
TABLE 16.4 FOREIGN EXCHANGE RESERVES
Source: Reserve Bank of India
SDRs : Special Drawings Rights

0
100000
200000
300000
400000
500000
600000
700000
800000
90-91 96-97 97-98 98-99 99-00 00-01 01-02 02-03 03-04 04-05 05-06
Foreign Currency Reserves( Rs. Ten Million)
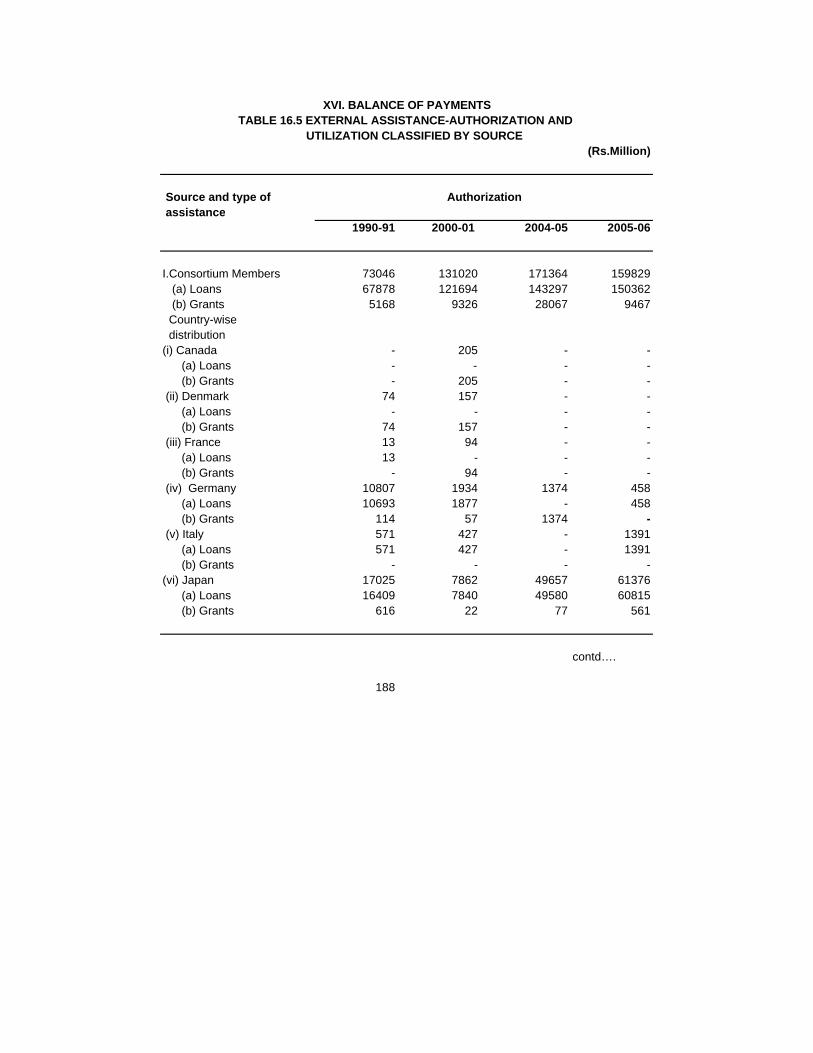
(Rs.Million)
Source and type of assistance
1990-91 2000-01 2004-05 2005-06
I.Consortium Members 73046 131020 171364 159829 (a) Loans 67878 121694 143297 150362 (b) Grants 5168 9326 28067 9467 Country-wise distribution(i) Canada - 205 - - (a) Loans - - - - (b) Grants - 205 - - (ii) Denmark 74 157 - - (a) Loans - - - - (b) Grants 74 157 - - (iii) France 13 94 - - (a) Loans 13 - - - (b) Grants - 94 - - (iv) Germany 10807 1934 1374 458 (a) Loans 10693 1877 - 458 (b) Grants 114 57 1374 - (v) Italy 571 427 - 1391 (a) Loans 571 427 - 1391 (b) Grants - - - -(vi) Japan 17025 7862 49657 61376 (a) Loans 16409 7840 49580 60815 (b) Grants 616 22 77 561
contd….
188
XVI. BALANCE OF PAYMENTSTABLE 16.5 EXTERNAL ASSISTANCE-AUTHORIZATION AND
UTILIZATION CLASSIFIED BY SOURCE
Authorization

(Rs.Million)
Source and type of assistance
1990-91 2000-01 2004-05 2005-06
(vii) Netherlands 2272 67 34 - (a) Loans 1010 - - - (b) Grants 1262 67 34 - (viii)Sweden 194 - - - (a) Loans - - - - (b) Grants 194 - - - (ix) U.K. 2532 4747 25819 8728 (a) Loans - - - - (b) Grants 2532 4747 25819 8728 (x) U.S.A. 376 8 426 - (a) Loans - - - - (b) Grants 376 8 426 -(xi) I.B.R.D. 22190 72085 33485 60075 (a) Loans 22190 68169 33283 59974 (b) Grants - 3917 201 101 (xii) I.D.A. 16984 43436 60570 27802 (a) Loans 43382 60434 27725 (b) Grants 54 136 77II.Russian Federation
(a) Loans - - - - Country-wise distribution (i) Russian Fed. (a) Loans - - - -
189
XVI. BALANCE OF PAYMENTSTABLE 16.5 EXTERNAL ASSISTANCE-AUTHORIZATION AND
UTILIZATION CLASSIFIED BY SOURCE-Contd.
Authorization-Contd.

(Rs.Million)
Source and type of assistance
1990-91 2000-01 2004-05 2005-06
III.Others 8188 52683 86892 49484 (a) Loans 8135 52656 84164 42501 (b) Grants 53 27 2727 6983 Country-wise distribution (i) Switzerland 53 - - - (a) Loans - - - - (b) Grants 53 - - -III.Others-Contd. (ii) European Economic Community - - 1865 - (a) Loans - - - - (b) Grants - - 1865 -(III) I.F. A. D. - - - 642 (a) Loans - - - 642 (b) Grants - - - - (iv) O.P.E.C. Fund Loans 116 - - -( iv) ADB 52683 84164 46284 (a) Loans 8019 52656 84164 41859 (b) Grants 27 - 4424(v) U.N.D.P - 454 266 (a) Grants - - 454 266(vi) U.N..F.P.A. - - 364 - (a) Grants - - 364 -(vii)Global Fund - - - 2293 (a) Grants - - - 2293(viiI)IDF (WB) - - 39 - (a) Grants - - 39 -( IX) Development GatewayFoundation - - 5 - (a) Grants - - 5 -Grand Total 81234 183703 258255 209313 (a) Loans 76013 174350 227461 192863 (b) Grants 5221 9353 30794 16450
190
XVI. BALANCE OF PAYMENTSTABLE 16.5 EXTERNAL ASSISTANCE-AUTHORIZATION AND
UTILIZATION CLASSIFIED BY SOURCE-Contd.
Authorization-Contd.

(Rs.Million)
Source and type of assistance
1990-91 2000-01 2004-05 2005-06
I.Consortium Members 57965 120016 131775 150836 (a) Loans 53835 111807 112708 133673 (b) Grants 4130 8209 19067 17162 Country-wise distribution (i) Austria 187 - - - (a) Loans 187 - - - (b) Grants - - - - (ii) Norway - - - - (a) Loans - - - - (b) Grants - - - -(iii) Canada 158 29 20 2 (a) Loans - - - - (b) Grants 158 29 20 2 (iv) Denmark 572 495 156 - (a) Loans 1 - -1 - (b) Grants 571 495 157 - (v) France 1642 649 513 232 (a) Loans 1642 645 513 232 (b) Grants - 4 - - (vi) Germany 4227 4483 1270 1914 (a) Loans 4223 3189 180 344 (b) Grants 4 1294 1089 1570 (vii) Italy 106 - - - (a) Loans 106 - - - (b) Grants - - - -(viii) Japan 8949 27304 29713 27451 (a) Loans 8613 27146 29079 26887 (b) Grants 336 158 634 564
191
XVI. BALANCE OF PAYMENTSTABLE 16.5 EXTERNAL ASSISTANCE-AUTHORIZATION AND
UTILIZATION CLASSIFIED BY SOURCE-Contd.
Utilization

(Rs.Million)
Source and type of assistance
1990-91 2000-01 2004-05 2005-06
(ix) Netherlands 1931 703 492 356 (a) Loans 1253 - - - (b) Grants 678 703 492 356 (x) Sweden 1990 - - - (a) Loans 1648 - - - (b) Grants 342 - - - (xi) U.K. 1817 3073 15069 13715 (a) Loans - - - - (b) Grants 1817 3073 15069 13715 (xii) U.S.A. 569 811 996 527 (a) Loans 345 - - - (b) Grants 224 811 996 527 (xiii) I.B.R.D. 21846 33758 37251 42006 (a) Loans 21846 32346 36906 41680 (b) Grants - 1413 345 326 (xiv) I.D.A. 13886 48710 46296 53556 Loans 48481 46030 53453 Grants 229 266 104 (xv) EEC (Special action credit) - - - - (xvi) IFAD Loan 85 401 320 495 (a) Loans 85 401 320 495 (b) Grants - - - - (xvii) IMF Trust fund - - - - II. Russian Fed. and East Europen Countries (a) Loans 3128 1301 11952 11078 Country-wise distribution (i) Russian Fed. (a) Loans 2953 1301 11952 11078(ii) Reps. of Czech & slovak (a) Loans 175 - - -
192
XVI. BALANCE OF PAYMENTSTABLE 16.5 EXTERNAL ASSISTANCE-AUTHORIZATION AND
UTILIZATION CLASSIFIED BY SOURCE-Contd.
Utilization-Contd.

(Rs.Million)
Source and type of assistance
1990-91 2000-01 2004-05 2005-06
III.Others 5950 22367 39738 380181 (a) Loans 4737 21852 33900 273104 (b) Grants 1213 515 5837 10708 Country-wise distribution (i) Abu Dhabi fund (a) Loans - - - - (ii) Switzerland 197 - 264 0.3 (a) Loans 186 - 143 0.3 (b) Grants 11 - 121 -(iii) Other International Institutions (1) Grants 489 - 967 1643 (iv) European Economic 8205 Community - Grants 512 446 4263 8205 (v) Oil Producing and Exporting Countries (a) Loans 98 415 - - (vi) Saudi Arab fund for Development (a) Loans 297 - - - (vii)Norway Grants 201 69 12 -(viii)Spain (a) Loans 332 - - -
(1) Other International Institutions includes UNICEF,UNDP,ILO,WHO,UNFPA and UNESCO.
193
XVI. BALANCE OF PAYMENTS
TABLE 16.5 EXTERNAL ASSISTANCE-AUTHORIZATION AND UTILIZATION CLASSIFIED BY SOURCE-Contd.
Utilization-Contd.

(Rs.Million)
Source and type of assistance
1990-91 2000-01 2004-05 2005-06
(ix) Kuwait Fund for Arab Economic Development 13 - - - (a) Loans 13 - - - (b) Grants - - - -(x) ADB - 21451 21486 26824 (a) Loans 21451 21486 26813 (b) Grants 3811 - - 11(xi)Australia (a) Loans - - - -(xii)U.PU (a) Grants - - - -(xiii) Global Fund - - 467 84 (a) Grants - - 467 84(xiv)U.N.Dev.Fund for Women (a) Grants - - - -(xV)IDF (WB) - - 9 (a) Grants - - 6 9
Grand Total 67043 142383 171513 188854 (a) Loans 61700 133659 146608 160984 (b) Grants 5343 8724 24905 27870
Notes : 1.Constituent items may not add up to total because of rounding. 2.Utilization figures are exclusive of suppliers' credit and commerical borrowings. 3.Utilization of assistance is on Government and Non-Govt.accounts. 4.Authorization figures include agreement signed on Government and non-Govt. accounts.
194
UTILIZATION CLASSIFIED BY SOURCE-Concld.
Utilization-Concld.
Source: Department of Economic Affairs, Ministry of Finance
XVI. BALANCE OF PAYMENTS
TABLE 16.5 EXTERNAL ASSISTANCE-AUTHORIZATION AND

(Rs.Mn.)
Industry 2004-05 2005-06 31st 31st
March,2005 March,2006
Food Products: Sugar - - 13425.2 13425.2
Misc. Food Products & Beverages - - 8150.6 8150.6
Textiles - - 47127.5 47127.5
Jute manufactures - - 607.5 607.5
Wood products - - 1088.7 1088.7
Paper and paper products - - 10293.0 10293.0
Leather products - - 2313.6 2313.6
Rubber products - - 3409.0 3409.0
Chemicals and Chemical Products: Petroleum products - - 24224.6 24224.6
Basic chemicals - - 17808.5 17808.5
Fertilisers and pesticides - - 17472.7 17472.7
Synthetic and other manmade fibres - - 21265.1 21265.1
Synthetic resins and plastics - - 16599.1 16599.1
Other chemicals and chemical products - - 6406.2 6406.2
Contd…
195
XVII. STATUTORY FINANCIAL CORPORATIONS
TABLE 17.1 INDUSTRIAL FINANCE CORPORATION OF INDIA LTD.FINANCIAL ASSISTANCE TO INDUSTRIES
Sanction for the period
Cumulative sanc- tions as on
____________________________ ____________________________

(Rs.Mn.)
Industry 2004-05 2005-06 31st 31st
March,2005 March,2006
Non-metallic Mineral Products: Glass and glass products - - 3056.2 3056.2
Cement - - 21362.9 21362.9
Other non-metallic mineral products - - 5387.0 5387.0
Basic Metal and Alloy Industries: Iron & steel and ferro alloy - - 63792.6 63792.6
Non-ferrous metal industry - - 3894.4 3894.4
Metal products except machinery and transport equipment - - 15785.8 15785.8
Machinery & accessories - - 8936.7 8936.7
Electronics and electrical machinery, apparatus, appliances and parts - - 25082.1 25082.1
Transport equipment and parts - - 10709.7 10709.7
Power Generation - - 46200.8 46200.8
Mining, Oil Exploration & Crude petroleum - - 3272.1 3272.1
Hotel & Tourism - - 8723.7 8723.7
XVII. STATUTORY FINANCIAL CORPORATIONS
TABLE 17.1 INDUSTRIAL FINANCE CORPORATION OF INDIA LTD.FINANCIAL ASSISTANCE TO INDUSTRIES-contd.
Sanction for Cumulative sanc- the period tions as on
____________________________ ____________________________
196

(Rs.Mn.)
Industry 2004-05 2005-06 31st 31st
March,2005 March,2006
Shipping Industry - - 1495.5 1495.5
Medical & Health Services - - 8333.2 8333.2
Constructions - - 2373.3 2373.3
Leasing - - 6997.3 6997.3
Fishing - - 713.6 713.6
Telecom Services - - 6418.8 6418.8
Ports & Port Services 3768.50 - 9437.4 9437.4
Bridge Construction - - 145.5 145.5
Steam generation - - - -
Aviation - - 250.0 250.0
Other Industries - - 4405.0 4405.0
Other Services - - 9931.3 9931.3
Miscellaneous manufa- cturing industries - - 3726.7 3726.7
Total 3768.5 - 460622.9 460622.9
197
TABLE 17.1 INDUSTRIAL FINANCE CORPORATION OF INDIA LTD.FINANCIAL ASSISTANCE TO INDUSTRIES-concld.
Sanction for Cumulative sanc-
XVII. STATUTORY FINANCIAL CORPORATIONS
Note: The foreign currency component of assistance sanctioned was converted into FEDA (Foreign Exchange Dealer's Association of India) rates prevailing at the end of the respective periods.
the period tions as on____________________________ ____________________________
Source: Industrial Finance Corporation of India Ltd.

(Rs.Bn.)
Item1991 2001 2005 2006
Paid up capital 1.35 10.88 10.68 10.68
Total liabilities or assets 64.91 227.79 177.36 162.07
Loans outstanding 56.82 161.58 81.00 65.22
Assistance sanctioned (cumulative) 114.23 424.70 460.62 460.62
Assistance disbursed (cumulative) 70.45 411.32 444.02 445.89
198
XVII. STATUTORY FINANCIAL CORPORATION
TABLE 17.2 INDUSTRIAL FINANCE CORPORATION OF INDIA LTD. (LIABILITIES AND ASSETS)
Source: Industrial Finance Corporation of India Ltd.
as on 31st March

0
100
200
300
400
500
1991 2001 2005 2006
Assistance Sanctioned Assistance Disbursed
IFCI Cumulative Assistance Sanctioned & Disbursed(AS ON 31ST MARCH)
(Rs.Billion)

(as on 31st March)
Year/State/ No. of Capital Bonds Other Total Union Territory corpor- and and liabi- liabi-
ations reser- deben- lities lities/ ves tures (*) Assests
1990-91 18 9935.8 22052.7 33297.1 65285.6 1999-00 18 20202.7 52122.0 79703.1 152027.8 2000-01 18 17929.7 58497.7 89795.2 166222.6 2001-02 18 18127.4 59024.1 100204.0 177355.5 2002-03 18 18588.1 58484.7 100041.4 177114.2
2002-03 Andhra Pradesh 1 1040.9 5236.2 7766.1 14043.2 Assam 1 166.2 534.3 715.4 1415.9 Bihar 1 878.9 996.4 7972.5 9847.8 Delhi 1 535.8 71.0 1254.9 1861.7 Gujarat 1 2009.6 5895.2 9342.8 17247.6 Haryana 1 482.9 2613.4 3864.4 6960.7 Himachal Pradesh 1 331.4 965.2 1066.5 2363.1 Jammu & Kashmir 1 707.9 830.5 2254.4 3792.8 Kerala 1 1381.1 3756.4 17722.7 10427.3 Karnataka 1 1665.0 7438.5 5005.9 26542.3 Madhya Pradesh 1 952.1 2825.9 2716.6 6494.6 Maharashtra 1 1084.8 3855.8 7100.1 12040.7 Orissa 1 1013.9 3346.6 6315.7 10676.2 Punjab 1 511.0 2385.8 3923.8 6820.6 Rajasthan 1 1362.2 3000.5 5304.7 9667.4 Tamil Nadu 1 1496.8 4361.7 8003.7 13862.2 Uttar Pradesh 1 1995.3 7993.3 7595.3 17583.9 West Bengal 1 972.3 2378.0 2115.9 5466.2
Contd… For footnotes, please see page no.206
199
XVII. STATUTORY FINANCIAL CORPORATION
TABLE 17.3 (A) STATE FINANCIAL CORPORATIONS (LIABILITIES AND ASSETS)
Liabilities (Rs. Mn.)

(as on 31st March)
Year/State/ No. of Cash in Invest- Loans Other Union Territory corpor- hand and ments and Assests
ations balances advances (**)with
banks
1990-91 18 3028.2 95.4 59609.5 2552.5 1999-00 18 7281.4 1000.5 109339.5 34405.9 2000-01 18 7950.2 1480.5 115433.9 41358.0 2001-02 18 6604.8 1599.5 115614.3 53536.9 2002-03 18 5725.7 527.3 111287.5 59573.7
2002-03 Andhra Pradesh 1 731.2 0.4 11099.1 2212.5 Assam 1 51.4 0.1 624.3 740.1 Bihar 1 262.6 0.6 2893.5 6691.1 Delhi 1 37.2 0.1 1728.7 95.7 Gujarat 1 254.1 156.4 10631.5 6205.6 Haryana 1 318.1 95.4 4639.7 1907.5 Himachal Pradesh 1 43.8 - 1488.6 830.7 Jammu & Kashmir 1 61.0 - 1329.0 2402.8 Kerala 1 663.4 10.3 8372.5 1381.1 Karnataka 1 313.1 79.3 17866.9 8283.0 Madhya Pradesh 1 53.6 32.5 3939.2 2469.3 Maharashtra 1 519.6 39.8 6174.7 5306.6 Orissa 1 227.4 3.4 6176.0 4269.4 Punjab 1 146.6 8.1 4294.2 2371.7 Rajasthan 1 491.3 0.6 7561.6 1613.9 Tamil Nadu 1 371.9 93.9 9072.6 4323.8 Uttar Pradesh 1 1023.6 3.2 9126.8 7430.3 West Bengal 1 155.8 3.2 4268.6 1038.6
Source & Footnotes : Small Industrial Development Bank of India For footnotes, please see page no.206
200
XVII. STATUTORY FINANCIAL CORPORATION
TABLE 17.3 (A) STATE FINANCIAL CORPORATIONS (LIABILITIES AND ASSETS)-concld.
Assests (Rs. Mn.)

0100200300400500600
1991 1997 1998 1999 2000 2001 2002 2003 2004 2005 2006
0
100
200
300
400
500
1990-91 1997-98 1998-99 1999-00 2000-01 2001-02 2002-03 2003-04 2004-05 2005-06
INDUSTRIAL WORKERS(BASE: 1982=100)/(BASE : 2001=100 FOR 2006)
URBAN NON-MANUAL EMPLOYEES(BASE:1984-85=100)
0
100
200
300
400
1991 1997 1998 1999 2000 2001 2002 2003 2004 2005 2006
AGRICULTURAL WORKERS(BASE:1986-87=100)

(as on 31st March)
Year/State/ No. of Capital Bonds Other Total Union Territory corpor- and and liabi- liabi-
ations reser- deben- lities lities/ ves tures (*) Assests
1990-91 18 9935.8 22052.7 33297.1 65285.6 1999-00 18 20202.7 52122.0 79703.1 152027.8 2000-01 18 17929.7 58497.7 89795.2 166222.6 2001-02 18 18127.4 59024.1 100204.0 177355.5 2002-03 18 18588.1 58484.7 100041.4 177114.2 2003-04 18 18524.3 54762.2 96207.9 169494.4
2003-04 Andhra Pradesh 1 1060.9 4933.2 7479.6 13473.7 Assam 1 166.2 522.1 743.6 1431.9 Bihar 1 878.9 875.3 5884.8 7639.0 Delhi 1 553.5 71.0 995.0 1619.5 Gujarat 1 1902.4 5302.6 10517.7 17722.7 Haryana 1 482.9 2368.6 3462.1 6313.6 Himachal Pradesh 1 331.4 914.7 1157.7 2403.8 Jammu & Kashmir 1 713.9 804.5 2271.6 3790.0 Kerala 1 1802.0 3531.4 4468.1 9801.5 Karnataka 1 1381.1 7138.5 16022.3 24541.9 Madhya Pradesh 1 796.4 2286.2 2383.8 5466.4 Maharashtra 1 1084.8 3603.3 7165.4 11853.5 Orissa 1 1013.9 3172.0 6200.5 10386.4 Punjab 1 511.0 2199.8 3649.2 6360.0 Rajasthan 1 1362.2 2830.5 5649.7 9842.4 Tamil Nadu 1 1496.8 4361.7 7952.4 13810.9 Uttar Pradesh 1 1994.0 7558.2 7995.2 17547.4 West Bengal 1 992.0 2288.6 2209.2 5489.8
Contd… For footnotes, please see page no.206
201
XVII. STATUTORY FINANCIAL CORPORATION
TABLE 17.3(B) STATE FINANCIAL CORPORATIONS (LIABILITIES AND ASSETS)
Liabilities (Rs. Mn.)

(as on 31st March)
Year/State/ No. of Cash in Invest- Loans Other Union Territory corpor- hand and ments and Assests
ations balances advances (**)with
banks
1990-91 18 3028.2 95.4 59609.5 2552.5 1999-00 18 7281.4 1000.5 109339.5 34405.9 2000-01 18 7950.2 1480.5 115433.9 41358.0 2001-02 18 6604.8 1599.5 115614.3 53536.9 2002-03 18 5048.7 1204.3 111287.5 59573.7 2003-04 18 6191.8 359.0 102718.7 60224.9
2003-04 Andhra Pradesh 1 713.4 0.4 10740.4 2019.5 Assam 1 65.3 0.1 603.8 762.7 Bihar 1 159.9 0.5 2852.3 4626.3 Delhi 1 46.1 0.1 1469.1 104.2 Gujarat 1 104.5 54.2 9494.4 8069.6 Haryana 1 358.4 93.4 3880.8 1981.0 Himachal Pradesh 1 41.2 0.1 1509.2 853.3 Jammu & Kashmir 1 40.7 0.0 1266.4 2482.9 Kerala 1 566.3 10.3 7842.1 1382.8 Karnataka 1 465.6 51.5 16662.9 7361.9 Madhya Pradesh 1 155.9 26.7 3060.3 2223.5 Maharashtra 1 479.7 12.8 5181.8 6179.2 Orissa 1 199.8 0.0 5865.6 4321.0 Punjab 1 209.8 8.1 3663.8 2478.3 Rajasthan 1 572.0 0.6 7736.5 1533.3 Tamil Nadu 1 1253.3 93.9 8144.2 4319.5 Uttar Pradesh 1 644.5 3.3 8474.6 8425.0 West Bengal 1 115.4 3.0 4270.5 1100.9
202
XVII. STATUTORY FINANCIAL CORPORATION
TABLE 17.3 (B) STATE FINANCIAL CORPORATIONS (LIABILITIES AND ASSETS)-concld.
Assests (Rs. Mn.)
Source & Footnotes: Small Industrial Development Bank of India For footnotes, please see page no.206

(as on 31st March)
Year/State/ No. of Capital Bonds Other Total Union Territory corpor- and and liabi- liabi-
ations reser- deben- lities lities/ ves tures (*) Assests
1990-91 18 9935.8 22052.7 33297.1 65285.6 1999-00 18 20202.7 52122.0 79703.1 152027.8 2000-01 18 17929.7 58497.7 89795.2 166222.6 2001-02 18 18127.4 59024.1 100204.0 177355.5 2002-03 18 18588.1 58484.7 100041.4 177114.2 2003-04 18 18524.3 54762.2 96207.9 169494.4 2004-05 18 20010.5 43449.5 104361.7 167821.7
2004-05 Andhra Pradesh 1 1085.9 2691.9 9565.9 13343.7 Assam 1 166.2 522.1 624.8 1313.1 Bihar 1 878.9 875 5866 7620 Delhi 1 591.9 68.0 1275.5 1935.4 Gujarat 1 1902.4 3592.7 12491.0 17986.1 Haryana (P) 1 482.9 1986.1 3249.2 5718.2 Himachal Pradesh 1 331.4 931.0 1444.2 2706.6 Jammu & Kashmir (P) 1 721.9 577.5 2409.0 3708.4 Kerala 1 1823.9 2180.4 .4854.9 8859.2 Karnataka 1 1381.1 6584.5 16600.5 24566.1 Madhya Pradesh 1 872.7 2204.0 2558.6 5635.3 Maharashtra 1 1085.2 3353.3 7081.5 11520.0 Orissa 1 1013.9 2136.0 7001.3 10151.2 Punjab (P) 1 511.0 1957.3 3353.1 5821.4 Rajasthan 1 1522.2 2640.5 6568.1 10730.8 Tamil Nadu 1 2633.5 2599.2 8331.8 13564.5 Uttar Pradesh 1 1992.8 6460.5 8725.8 17179.1 West Bengal 1 1012.7 2089.2 2360.3 5462.2
For footnotes, please see page no.206
203
Liabilities (Rs. Mn.)
XVII. STATUTORY FINANCIAL CORPORATION
TABLE 17.3 (C) STATE FINANCIAL CORPORATIONS (LIABILITIES AND ASSETS)

(as on 31st March)
Year/State/ No. of Cash in Invest- Loans Other Union Territory corpor- hand and ments and Assests
ations balances advances (**)with
banks
1990-91 18 3028.2 95.4 59609.5 2552.5 1999-00 18 7281.4 1000.5 109339.5 34405.9 2000-01 18 7950.2 1480.5 115433.9 41358.0 2001-02 18 6604.8 1599.5 115614.3 53536.9 2002-03 18 5048.7 1204.3 111287.5 59573.7 2003-04 18 5824.8 726.0 102718.7 60224.9 2004-05 18 7413.3 360.0 97305.3 62743.1
2004-05 Andhra Pradesh 1 548.5 5.4 10910.2 1879.6 Assam 1 68.6 0.1 523.9 720.5 Bihar 1 134 1 2854.9 4631.0 Delhi 1 113.4 0.1 1695.8 126.1 Gujarat 1 210.6 60.6 8665.1 9049.8 Haryana (P) 1 243.3 86.2 3254.7 2134.0 Himachal Pradesh 1 78.1 0.1 1729.5 898.9 Jammu & Kashmir (P) 1 41.8 - 1194.9 2471.7 Kerala 1 451.9 15.3 7063.9 1328.1 Karnataka 1 1240.2 44.4 15601.4 7680.1 Madhya Pradesh 1 177.0 22.7 3095.2 2340.4 Maharashtra 1 477.1 12.6 4551.2 6479.1 Orissa 1 223.0 - 5539.2 4389.0 Punjab (P) 1 108.0 8.2 3162.1 2543.1 Rajasthan 1 958.5 0.6 8259.1 1512.6 Tamil Nadu 1 1580.8 93.9 7730.7 4159.1 Uttar Pradesh 1 596.1 6.7 7295.1 9281.2 West Bengal 1 162.4 2.6 4178.4 1118.8
Note: The jurisdiction of the following SFCs have been extended to the State/UTs mentioned against the names: Assam : Manipur & Tripura; Gujarat : Dadra & Nagar Haveli; Maharastra : Goa, Daman & Diu.
(**) Other Assests include fixed assests, provision for taxation accumulated losses,etc.
204
Assests (Rs. Mn.)
Source & Footnotes : Small Industrial Development Bank of India(*) Other liabilities includes Refinance from IDBI and SIDBI, fixed deposit, borrowings from RBI, & Banks, NPA provisions etc.
XVII. STATUTORY FINANCIAL CORPORATION
TABLE 17.3(C) STATE FINANCIAL CORPORATIONS (LIABILITIES AND ASSETS)-concld.

(as on 31st March)
Year/State/ No. of Capital Bonds Other Total Union Territory corpor- and and liabi- liabi-
ations reser- deben- lities lities/ ves tures (*) Assests
1990-91 18 9935.8 22052.7 33297.1 65285.6 1999-00 18 20202.7 52122.0 79703.1 152027.8 2000-01 18 17929.7 58497.7 89795.2 166222.6 2001-02 18 18127.4 59024.1 100204.0 177355.5 2002-03 18 18588.1 58484.7 100041.4 177114.2 2003-04 18 18524.3 54762.2 96207.9 169494.4 2004-05 18 19123.6 42574.2 98722.0 160419.8 2005-06 17 17764.1 35062.9 94365.9 147192.9
2005-06 Andhra Pradesh 1 1585.9 1874.2 10522.2 13982.3 Assam 1 166.2 125.1 1190.8 1482.1 Bihar 1 878.9 875 5609 7363 Delhi 1 696.7 26.5 1039.2 1762.4 Gujarat .. .. .. .. .. Haryana (P) 1 504.5 1199.5 3317.2 5021.2 Himachal Pradesh 1 335.4 897.5 1633.4 2866.3 Jammu & Kashmir (P) 1 721.9 565.0 2406.2 3693.1 Kerala 1 1881.0 1869.3 4993.0 8743.3 Karnataka 1 1381.1 6935.7 15599.9 23916.7 Madhya Pradesh 1 911.6 1434.5 4124.2 6470.3 Maharashtra 1 1084.9 2989.8 6865.1 10939.8 Orissa 1 1013.9 1782.1 6890.3 9686.3 Punjab (P) 1 511.0 1891.4 3054.8 5457.2 Rajasthan 1 1562.2 2105.3 7285.5 10953.0 Tamil Nadu 1 1496.8 2243.5 9059.5 12799.8 Uttar Pradesh 1 1991.5 5587.3 8526.4 16105.2 West Bengal 1 1040.6 2660.9 2249.1 5950.6
For footnotes, please see page no.206
205
XVII. STATUTORY FINANCIAL CORPORATION
TABLE 17.3 (D) STATE FINANCIAL CORPORATIONS (LIABILITIES AND ASSETS)
Liabilities (Rs. Mn.)

(as on 31st March)
Year/State/ No. of Cash in Invest- Loans Other Union Territory corpor- hand and ments and Assests
ations balances advances (**)with
banks
1990-91 18 3028.2 95.4 59609.5 2552.5 1999-00 18 7281.4 1000.5 109339.5 34405.9 2000-01 18 7950.2 1480.5 115433.9 41358.0 2001-02 18 6604.8 1599.5 115614.3 53536.9 2002-03 18 5048.7 1204.3 111287.5 59573.7 2003-04 18 5824.8 726.0 102718.7 60224.9 2004-05 18 6933.7 704.5 94435.7 58345.9 2005-06 17 7268.8 274.5 84541.2 55108.4
2005-06 Andhra Pradesh 1 901.2 5.4 11435.4 1640.3 Assam 1 97.5 0.1 490.1 894.4 Bihar .. 135.8 0.5 2775 4452.1 Delhi 1 153.7 0.1 1491.9 116.7 Gujarat 1 .. .. .. .. Haryana (P) 1 70.2 72.3 2884.8 1993.9 Himachal Pradesh 1 78.6 0.1 1850.4 937.2 Jammu & Kashmir (P) 1 24.9 - 1213.3 2454.9 Kerala 1 811.4 20.3 6517.3 1394.3 Karnataka 1 1156.4 33.2 13264.7 9462.4 Madhya Pradesh 1 319.7 22.2 3589.1 2539.3 Maharashtra 1 463.6 13.0 3962.8 6500.4 Orissa 1 202.7 - 5115.3 4368.3 Punjab (P) 1 107.3 8.2 2798.6 2543.1 Rajasthan 1 473.5 0.6 9065.0 1413.9 Tamil Nadu 1 1170.7 93.9 7612.7 3922.5 Uttar Pradesh 1 799.5 2.0 5951.6 9352.1 West Bengal 1 302.1 2.6 4523.3 1122.6
Note: The jurisdiction of the following SFCs have been extended to the State/UTs mentioned against the names: Assam : Manipur & Tripura; Gujarat : Dadra & Nagar Haveli; Maharastra : Goa, Daman & Diu.
206
Source & Footnotes : Small Industrial Development Bank of India(*) Other liabilities includes Refinance from IDBI and SIDBI, fixed deposit, borrowings from RBI, & Banks, NPA provisions etc.(**) Other Assests include fixed assests, provision for taxation accumulated losses,etc.
XVII. STATUTORY FINANCIAL CORPORATION
TABLE 17.3(D) STATE FINANCIAL CORPORATIONS (LIABILITIES AND ASSETS)-concld.
Assests (Rs. Mn.)

(Rs.Ten Million)
Companies No. Paid-up No. Paid-up
capital capital
Companies at work (1) 224452 74798 569100 357247 Public 27358 38567 76270 246570 Private 197094 36231 492830 110677 Non-Government Companies 223285 20313 567834 247501 Public 26813 16597 75615 184466 Private 196472 3716 492219 63035 Government Companies 1167 54484 1266 109746 Public 545 21970 655 62104 Private 622 32514 611 47642Liquidated and struck off Companies 173 12 427 206 Public 39 8 111 204 Private 134 4 316 2Newly registered Companies(2) 22342 6310 27187 32857 Public 1597 3382 2179 24086 Private 20745 2928 25008 8771 Non-Government Companies 22323 5342 27167 17957 Public 1589 2907 2162 9241 Private 20734 2435 25005 8716 Government Companies 19 968 20 14900 Public 8 475 17 14845 Private 11 493 3 55
For footnotes, please see next page.
Contd.
207
XVIII. JOINT STOCK COMPANIES
TABLE 18.1 COMPANIES (LIMITED BY SHARES) AT WORK, LIQUIDATED & STRUCK OFF AND NEWLY REGISTERED COMPANIES
1990-91 2000-01
(As on 31st March)

(Rs. Ten Million)
Companies No. Paid-up No. Paid-up
capital capital
Companies at work (1) 641512 498791 679649 654022 Public 77380 349494 78328 468668 Private 564132 149297 601321 185353 Non-Government Companies 640203 352432 678321 498208 Public 76678 257764 77609 367519 Private 563525 94669 600712 130688 Government Companies 1309 146358 1328 155814 Public 702 91730 719 101149 Private 607 54628 609 54665Liquidated and struck off Companies 498 19 1777 7331 Public 111 19 335 5043 Private 387 1 1442 2288Newly registered Companies(2) 30076 17143 40059 11477 Public 1233 11078 1393 5229 Private 28843 6066 38666 6248 Non-Government Companies 30050 8085 40040 9069 Public 1208 2024 1376 2826 Private 28842 6061 38664 6242 Government Companies 26 9059 19 2408 Public 25 9054 17 2402 Private 1 5 2 6
208
2003-04 2004-05
Notes : (1) Figures of Paid up Capital is estimated, worked out on the basis of a sample of companies. (2) Capital figures of newly registered companies relate to authorised capital.
(As on 31st March)
Source & footnotes: Ministry of Company Affairs,
XVIII. JOINT STOCK COMPANIES
TABLE 18.1 COMPANIES (LIMITED BY SHARES) AT WORK, LIQUIDATED & STRUCK OFF AND NEWLY REGISTERED COMPANIES (Concld.)

COMPANIES AT WORK
0100000200000300000400000500000600000700000800000
1990-91 200-01 2003-04 2004-05
( NUMBER)
0100000200000300000400000500000600000700000800000
1990-91 2000-01 2003-04 2004-05
PAID UP CAPITAL
JOINT STOCK COMPANIES AT WORK(LIMITED BY SHARES)
(RS. TEN MILLION)

(Amount in Rs.Ten Million)
Classification 1990-91 2000-01 2001-02 2002-03(P)
Number of companies 130 91 4 3Capital raised 1836.91 2027.71 1032.17 207.00 Equity 814.00 2027.71 862.17 207.00 Debentures 1022.91 - 170.00 -Amount offered to public 827.30 1751.40 913.77 207.00Amount earmarked for firm allotment 1009.61 276.31 118.40 -Amount under-written 772.49 1419.11 878.50 255.00
209
TABLE 18.2 CAPITAL RAISED FROM PUBLIC BY NON-GOVERNMENT, NON-FINANCIAL COMPANIES BY ISSUE OF PROSPECTUSES
Source: Ministry of Company Affairs,
XVIII. JOINT STOCK COMPANIES

(Rs.Ten Million)
Country 2002-03 2003-04 2004-05 2005-06
France 252 153 192 53Germany 491 311 625 200Japan 314 302 533 383Mauritius 2544 1715 3583 6063Netherlands 448 887 856 222Singapore 186 68 280 738South Korea 71 99 61 271Switzerland 167 23 280 302United Kingdom 1067 707 367 1161U.S.A. 1277 1337 2049 1539Others 1082 980 1310 4005
Total 7899 6582 10136 14937
210
(1) Data exclude the Foreign Direct Investment inflows under the NRI direct investment
section 6 of FEMA 1999.
XVIII. JOINT STOCK COMPANIES
TABLE 18.3 FOREIGN DIRECT INVESTMENT INFLOW DATA(1) -COUNTRY-WISE
route through the Researve Bank of India and inflow due to acquisition of shares under
Source: Reserve Bank of India

(Rs.Ten Million)
Industry 2002-03 2003-04 2004-05 2005-06
Fisheries 43 9 44 125Mining 43 81 48 27Manufacturing 2287 1918 4037 5591Food and dairy product 186 288 800 658Electricity 229 405 61 369Construction 1129 774 913 850Trade, hotel & restaurants 186 302 96 423Transport 57 90 306 294Financing, insurance, real estate & business services1062 927 1586 2011Computer services 1415 747 1625 3425Educational services 5 - 9 18Research & scientific services - 5 22 22Health & medical services 133 68 109 271Other services 86 9 44 218Others 1039 959 437 636
Total 7899 6582 10136 14937
Source: Reserve Bank of India
211
section 6 of FEMA 1999.
(1) Data exclude the Foreign Direct Investment inflows under the NRI direct investment route through the Researve Bank of India and inflow due to acquisition of shares under
Source: Reserve Bank of India
TABLE 18.4 FOREIGN DIRECT INVESTMENT INFLOW DATA (1)-INDUSTRY-WISE
XVIII. JOINT STOCK COMPANIES

(Rs.Ten Million)
Type of business 1990-91 2003-04 2004-05 2005-06
Life 5578.8 63050.6 74998.9 90659.4 Fire 659.0 2446.0 2411.4 2515.9 Marine 503.0 965.0 983.0 1002.3 Miscellaneous 1628.0 9925.0 10578.6 11478.8
Capital Redemption (including annuity certain insurance business) 0.8 13.1 12.3 12.7
Total 8369.6 76399.7 88984.2 105669.1
212
XIX. INSURANCE
TABLE 19.1 GROSS DIRECT PREMIUM ON BUSINESS IN INDIA OF INDIAN INSURERS IN PUBLIC SECTOR
Sources : 1. Life Insurance Corporation of India2. General Insurance (Public Sector) Association of India.

Item 1990-91 2003-04 2004-05 2005-06
I.Business in force excluding annuity contract at the end of the period (Sum assured with bonus in Rs.Ten Million) In India 149153 1111687 1285528 1532142 Outside India (1) 528 2512 2677 2674 II.New Business during the period-individual Insurance (Sum assured in RsTen Million) In India 28139 199698 182860 287530 Outside India (1) 100 341 405 416 Group Insurances (Sum assured in Rs.Ten Million) In India 25912 128048 117663 177317 Outside India (1) - - - - Average sum assured per individual policy (Rs.'000) In India 33 75 81 97 Outside India (1) 116 295 294 311
III.Premium Income during the period (Rs.Ten Million) 5601 54070* 63030* 83043*
213
(1) At post devaluation rate of exchange.
XIX. INSURANCE
Source: Life Insurance Corporation of India
TABLE 19.2 PROGRESS OF LIFE INSURANCE (PUBLIC SECTOR)
* Excluding premium in respect of group assurances and annuities.

(Rs.Ten Million)
Item 1990-91 2003-04 2004-05 2005-06
Govt. of India securities 9439.4 166939.4 199785.3 236958.6Special deposits with Central Govt. 1483.4 1282.0 0 0Indian State Government securities 1071.4 34521.4 48830.8 56650.6Govt. guaranteed & other approved securities 2297.3 2900.4 2472.0 2277.6Shares & debentures of Indian companies 2829.9 75845.3 87706.8 139631.3Loans on mortgages 3620.9 33510.7 39277.0 38897.8Land & house property 222.4 2468.6 2844.6 2844.8Other Social Sector Investment 12724.4 16840.7 26719.4Others 5390.4 12171.0 15254.0 19243.3
Foreign Government, municipal securities, etc. 117.3 668.5 727.2 733.4Debentures & shares of Joint Stock Companies 0.4 97.1 62.4 60.4
Total 26472.8 343128.8 413800.8 524017.2
214
Source: Life Insurance Corporation of India
XIX. INSURANCE
TABLE 19.3 INVESTMENT OF LIFE INSURANCE FUNDS

(RsTen Million)
Type of Business 1990-91 2003-04 2004-05 2005-06
Gross direct premium on business written in India 2790.0 13336.0 13973.0 14997.1 Fire 659.0 2446.0 2411.4 2515.9 Marine 503.0 965.0 983.0 1002.3 Miscellaneous 1628.0 9925.0 10578.6 11478.8
Net premium income in India 2419.0 10328.0 10226.9 10814.6 Fire 528.0 1858.0 1644.55 1522.66 Marine 416.0 523.0 484.04 497.2 Miscellaneous 1475.0 7947.0 8098.28 8794.73
Assets of Indian Insurers 6680.8 - 16225.8 17417.4 Government and local authorities securities 1219.1 - 6543.12 7517.6 Foreign Govt.securities 9.2 - 0.04 0.04 Debentures 843.5 - 3512.09 3723.87 Shares 785.5 - 4281.96 4713.87 Deposits,cash & stamps 1375.5 - 1888.59 1461.99 Agents balance etc. 463.2 - - - Others 1984.8 - - -
(Rs.Ten MIllion)
Assets of Indian General Insurers 2002-03 2005-06
Govermment Securities 5594 5907Foreign government securities .. ..State Government Securities and Other Approved Securties 2489 2943Loan to HUDCO,State Govt.Housing ,Fire Fighting Equlpments Infrastructure .. ..Socio Economic Sector 1284 4770Market Sector 10875 13672Other than approved investments .. ..Total Investment 20242 27292
215
XIX. INSURANCE
TABLE 19.4(b) ASSETS OF INDIAN GENERAL INSURANCE (PUBLIC SECTOR)
Sources: General Insurance (Public Sector) Association of India.
Sources: General Insurance (Public Sector) Association of India.
XIX. INSURANCE
TABLE 19.4(a) PROGRESS OF GENERAL INSURANCE (PUBLIC SECTOR)

(Base: 1993-94=100)
Major Groups/Sub-Group 1994-95 2001-02 2004-05 2005-06
I.Primary article 115.8 168.4 188.1 193.6 1.Food articles 112.8 176.1 186.3 195.3 2.Non-food articles 124.2 152.9 187.6 179.1 3.Minerals 104.9 119.3 255.1 322.8
II.Fuel,power,light and lubricants 108.9 226.7 280.2 306.8
III.Manufactured products 112.3 144.3 166.3 171.4 1.Food products 114.1 145.4 174.9 176.8 2.Beverages,tobacco & tobacco products 118.3 193.8 216.2 226.8 3.Textiles 118.2 119.3 135.7 129.5 4.Wood & wood products 110.9 174.4 179.5 194.6 5.Paper and paper products 106.1 172.8 174.6 178.5 6.Leather and leather products 109.7 141.0 155.7 166.8 7.Rubber and plastic products 106.4 126.0 134.5 139.1 8.Chemicals and Chemical products 116.6 169.0 181.7 188.2 9.Non-metallic mineral products 110.9 144.0 157.7 170.0 10.Basic metals,alloys & metal products 108.4 140.7 203.3 218.4 11.Machinery & machine tools 106.0 129.1 140.2 147.4 12.Transport equipments and parts 107.4 146.8 154.3 159.9
All Commodities 112.6 161.3 187.3 195.6
216
XX. PRICES
TABLE 20.1 INDEX NUMBER OF WHOLESALE PRICES (By major Groups and Sub-Groups)
Source: Office of the Economic Adviser, Ministry of Commerce & Industry

100
125
150
175
200
1994-95 2001-02 2004-05 2005-06
All-Commodities
INDEX NO. OF WHOLESALE PRICES(BASE: 1993-94 =100)
100
150
200
250
300
350
1994-95 2001-02 2004-05 2005-06
Fuel,Power,Light AndLubricants

50100150200250300350
1994-95 2001-02 2004-05 2005-06
PRIMARY ARTICLES FOOD ARTICLES
NON - FOOD ARTICLES MINERALS
100120140160180200220240
1994-95 2001-02 2004-05 2005-06
MANUFACTURED PRODUCTS
TEXTILES
CHEMICALS AND CHEMICAL PRODUCTS
BASIC METALS, ALLOYS & METAL PRODUCTS
MACHINERY & MACHINE TOOLS
(BASE : 1993- 94 = 100)

Centre 1991 2001 2005 2006 *
Ahmedabad 218 460 519 120 Ajmer 217 452 537 122 Alwaye 195 458 542 125 Amritsar 204 403 492 130 Balaghat 213 409 473 @ Bangalore 204 438 533 125 Barbil 207 420 479 @ Bhilai 196 407 480 121 Chennai 208 487 565 118 Coimbatore 197 441 508 119 Delhi 218 529 648 122 Guwahati 208 471 531 115 Hyderabad 203 438 532 116 Indore 222 470 537 122 Jamshedpur 204 419 508 126 Jharia 198 365 442 126 Kanpur 222 447 520 125 Kolkata 218 492 587 121 Mumbai 226 528 611 126 Nagpur 223 483 554 130 Nasik 228 498 576 124 Pune 217 516 589 127 Raniganj 201 399 471 124 Rourkela 194 407 473 124 Srinagar 202 520 632 118 Yamunanagar 201 428 521 127
All India (1) 212 458 536 123
(1) All India Index covers 70 centres including the above. * The Labour Bureau has released the new series of CPI (IW) on base 2001=100 w.e.f. January, 2006 index. The new All-India Index is based on the CPI-(IW) for 78 centres. @ Centre not featuring in the new seies of CPI(IW) on base 2001=100.
217
TABLE 20.2 INDEX NUMBER OF CONSUMER PRICES -
INDUSTRIAL WORKERS (Selected Centres) (Base: 1982=100)
Source: Labour Bureau
XX. PRICES

State 2000 2003 2005 2006
Andhra Pradesh 321 347 363 383 Assam 324 337 352 373 Bihar 292 305 334 365 Gujarat 312 337 359 383 Haryana 311 332 366 389 Himachal Pradesh 295 315 332 355 Jammu & Kashmir 325 347 353 374 Karnataka 311 334 338 350 Kerala 318 337 352 365 Madhya Pradesh 311 318 341 370 Maharashtra 306 328 358 383 Manipur 317 305 316 331 Meghalaya 343 346 368 397 Orissa 310 308 327 347 Punjab 316 335 364 399 Rajasthan 311 324 361 395 Tamil Nadu 301 355 348 362 Tripura 335 322 340 368 Uttar Pradesh 302 326 352 391 West Bengal 293 312 338 352
All India 307 328 348 372
Note: Agriculture year is July - June.
TABLE 20.3 INDEX NUMBER OF CONSUMER PRICES -
Source: Labour Bureau
AGRICULTURAL LABOURERS
XX. PRICES
(Base:1986-87=100)

Centre Weight 1990-91 2000-01 2004-05 2005-06
Ahmedabad 1.68 153 337 385 400 Bangalore 2.75 161 389 456 480 Bhopal 1.64 166 361 394 417 Chandigarh 0.78 176 445 561 605 Chennai 3.86 168 420 520 543 Cuttack (1) 0.92 154 365 428 447 Delhi (2) 6.56 156 381 446 472 Hyderabad (3) 1.99 164 383 459 488 Jaipur 1.39 165 371 427 443 Kolkata 6.92 164 344 398 416 Lucknow 1.53 158 342 421 438 Mumbai 8.40 154 375 434 450 Patna 1.28 167 344 396 418 Shillong 0.22 179 382 445 466 Shimla 0.40 163 377 444 462 Srinagar 0.32 150 393 430 449 Thiruvanan- thapuram 1.36 152 362 449 479
All India (4) 100.00 161 371 436 456
(1) Includes Bhubaneshwar. (2) Includes New Delhi. (3) Includes Secunderabad.
219
NON MANUAL EMPLOYEES (Base: 1984-85=100)
XX. PRICES
(4) All India Index covers 59 centres including the selected centres listed above.
Source: Central Statistical Organisation
TABLE 20.4 CONSUMER PRICE INDEX FOR URBAN

Ninth Plan Annual Plan(1997-2002) (2001-02)
Heads of outlay ______________Development (at 1996-97 Revised Actual Revised Actual Revised Actual
prices) Estimate Expn. Estimate Expn. Estimate Expn.
Agriculture and allied activities 42462 7693 7577 8541 8248 8890 7655Rural development 74686 10452 9852 13867 14235 19875 19753Special area programme 3649 882 1045 810 919 1055 1066Irrigation and flood contro 55420 13952 13529 14589 14552 16104 11965Energy 222375 40315 40893 43323 37145 53604 44710Industry & minerals 65148 8995 6866 9572 7942 9476 8776Transport 119373 30866 25734 41696 29918 38868 35244Communications,information and broadcasting 47280 20322 31881 18916 18083 14226 13057Science, technology and environment 18458 3543 3249 3908 3670 4358 4160Social services 183273 45711 40920 54803 46474 60070 56954Others 27076 5200 4191 6325 5129 7207 6863
Total 859200 187931 185737 216349 186315 233733 210203
220
________________
XXI. FIVE YEAR PLANS
TABLE 21.1 PLAN OUTLAY AND ACTUAL EXPENDITURE BY HEADS OF DEVELOPMENT - PUBLIC SECTOR
Annual Plan Annual Plan(2002-03)(2000-01)
1 2 3 4 5 6 7
(Rs.Ten Million)

Tenth Plan(2002-2007) Revised Plan
Heads of outlay ________________ Estimates OutlayDevelopment (at 2001- Revised Actual Revised Actual (2005-06) 2006-07
2002 prices) Estimate Expn. Estimate Expn.
Agriculture and allied activities 58933 9436 8146 10875 10963 13440 16163Rural development 121928 21649 24747 19917 18585 27214 30711Special area programmes 20879 2190 5545 4176 2385 4904 5522Irrigation and flood contro 103315 15817 12270 20505 19024 25007 33189Energy 403927 57926 49462 60144 60729 71306 90499Industry & minerals 58939 7698 7477 10196 10113 13512 18213Transport 225977 38145 30415 38986 38772 58915 72055Communications,information and broadcasting 98968 12876 12875 9173 9281 17773 20366Science, technology and environment 30424 4507 4425 5623 5521 6411 8395Social services 347391 66510 46618 81757 79734 103308 131989Others 54958 6796 7807 7914 8557 9841 14185
Total 1525639 243550 209787 269267 263665 351629 441285
Notes :1. Totals may not tally due to rounding off of the figures
221
2. Others include General Economic Services and General Services3. The figures for Annual Plan are at current prices
Source: Planning Commission
1 9 10 11 12 13 14
XXI. FIVE YEAR PLANS
TABLE 21.1 PLAN OUTLAY AND ACTUAL EXPENDITURE BY HEADS OF DEVELOPMENT - PUBLIC SECTOR-Concld.
_______________
Annual Plan(2003-04)
Annual Plan(2004-05)
(Rs.Ten Million)

(Rs. Ten Million) Item First Second Third Annual Fourth
Plan Plan Plan Plans Plan(Est- (Accts.) (Accts.) (Accts.) (Accts.) imates)
1951-56 1956-61 1961-66 1966-69 1969-74
I. Domestic Budgetary Resources 1438 2562 5021 3539 12013 1.Balance from current revenues at pre-plan rates of taxation(BCR ) 382 -50 -419 346 -236 2.Additional taxation incld. measures to increase the surplus of public enterprise (ARM) 255a 1052a 2892 908 4280 3.Surplus of public sector undertakings, exclusive of yield from measures adopted for raising additional resources for the plan (A) Railways 115b 00150 62 -115 -165 (B) Others c c 373 513 1300d 4.Retained profits of Reserve Bank .. .. .. .. 296e 5.Loans from public (net)(1) 204 780f 823 725 3145g 6.Small savings 243 00400 682h 419h 1064h 7.State provident fund 92i 170i 336 303 874 8.Misc. capital receipts (net) 147 00060 272 440 1455II.External assistance (3) 189 01090 2423 2410 2087III.Deficit financing (2) 333 00948 1133 676 2060Aggregate Resources 1960 04600 8577 6625 16160
For footnotes, please see next page.
222
XXI. FIVE YEAR PLANS
TABLE 21.2 FINANCIAL RESOURCES FOR THE PLANS
Source: Planning Commission

(3) At the current rate of exchange.
(c) Included under items 1 and 2.
(i) Includes unfunded debt other than State Provident funds.
223
TABLE 21.2 FINANCIAL RESOURCES FOR THE PLANS-Contd.
XXI. FIVE YEAR PLANS
(1) Inclusive of the borrowings of State enterprises from the wings while those for the subsequent plan periods represent net absorption of loans by the public i.e. investors other than the Reserve Bank of India. (2) Figures of deficit financing shown for the Third Plan period and the subsequent three
respectively.
(a) Excluding yield from changes in railways and fares and freight charges. The yield is included under item 3(A).
annual plans refer to changes in Govt.indebtedness(both long term and short-term) to the R.B.I. These are, therefore, not comparable with those for the first two plans which relate to budget deficits. On a comparable basis, deficit financing during the first and second plan periods works out to Rs.260 crores and Rs.1177 crores
(b) Inclusive of yield from changes in railway fares and freight charges.
(d) For the Fourth Plan period, repayments by the enterprises in respect of loans from the market and the Life Insurance Corporation have been netted under this item where as such repayments in the earlier plan periods were netted under item 5. (e) In the earlier Plans, the retained profit of R.B.I. as well as the outlays financed from these profits were kept outside plan resources and outlay. (f) Includes investments by the State Bank of India out of PL 480- Funds. (g) Inclusive of borrowings by Financial Institutions and the Food Corporation of India, State Governments gross borrowings from the L.I.C. for water supply and housing.In the earlier Plans,the LIC loans for water supply were included under miscellaneous capital receipts whereas the LIC loans for housing and the outlay financed from such loans were kept outside plan resources and outlays.Besides the figures included for the Fourth plan in respect of the State enterprises'borrowings from the market and the LIC are on gross basis, the repayments having been netted,as stated in footenote (e) under item 3(B) in the table. (h) Includes gold bonds, prize bonds,compulsory deposits and annuity deposits.
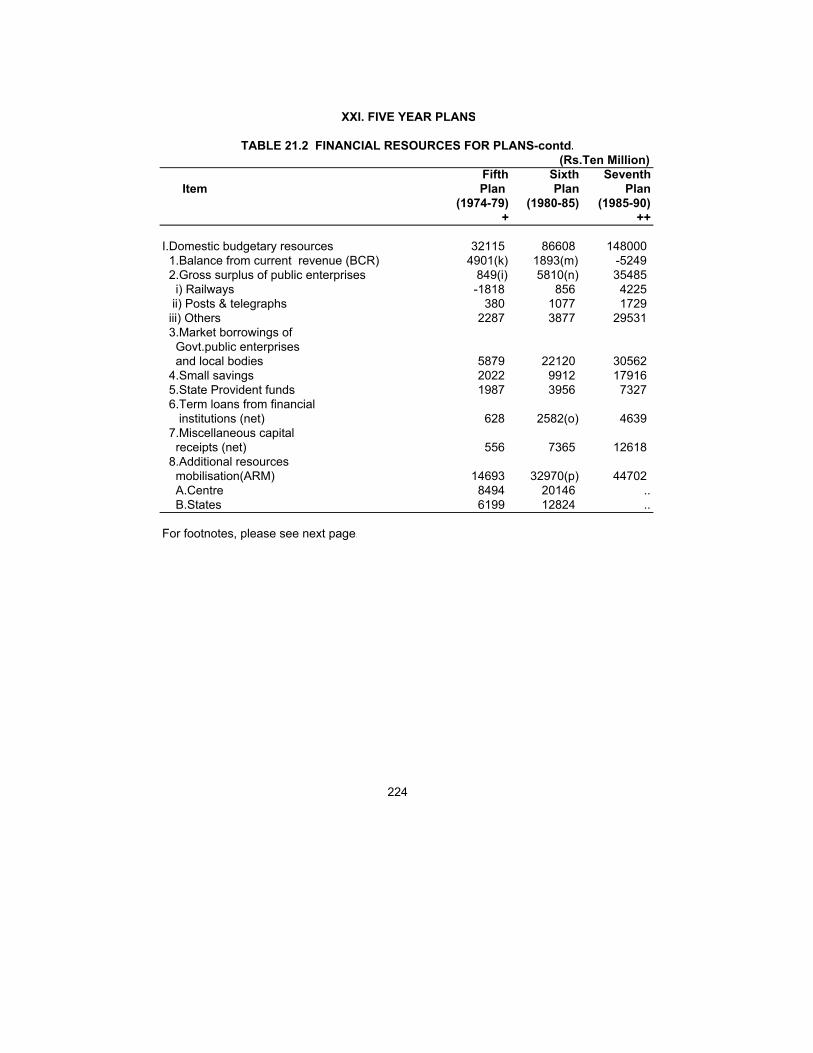
(Rs.Ten Million)Fifth Sixth Seventh
Item Plan Plan Plan(1974-79) (1980-85) (1985-90)
+ ++
I.Domestic budgetary resources 32115 86608 148000 1.Balance from current revenue (BCR) 4901(k) 1893(m) -5249 2.Gross surplus of public enterprises 849(i) 5810(n) 35485 i) Railways -1818 856 4225 ii) Posts & telegraphs 380 1077 1729 iii) Others 2287 3877 29531 3.Market borrowings of Govt.public enterprises and local bodies 5879 22120 30562 4.Small savings 2022 9912 17916 5.State Provident funds 1987 3956 7327 6.Term loans from financial institutions (net) 628 2582(o) 4639 7.Miscellaneous capital receipts (net) 556 7365 12618 8.Additional resources mobilisation(ARM) 14693 32970(p) 44702 A.Centre 8494 20146 .. B.States 6199 12824 .. For footnotes, please see next page.
224
XXI. FIVE YEAR PLANS
TABLE 21.2 FINANCIAL RESOURCES FOR PLANS-contd.

(Rs. Ten Million)Fifth Sixth Seventh
Item Plan Plan Plan(1974-79) (1980-85) (1985-90)
+ ++
9.Borrowings against utilisation foreign exchange reserves 600 - - II.External assistance (net) 5834 8529 18000III.Deficit financing 1354 15684 14000
Aggregate resources [I+II+III] 39303 110821 180000
++ Estimates at 1984-85 Prices. (k) At 1973-74 rates of taxation. (i) At 1973-74 fares, freights and tariffs. (m) At 1979-80 rates of taxation.
(o) Relates to gross term loans. (p) At 1980-85 measures.
225
TABLE 21.2 FINANCIAL RESOURCES FOR PLANS-concld.
XXI. FIVE YEAR PLANS
Source : Planning Commission
+ Based on projection. Estimates for 1974-75 are at current prices while those for the subsequent years are at 1975-76 prices.
(n) Relates to contribution of public enterprises at 1979-80 rates, fares and tariffs.

(Rs. Ten Million)
ItemCentre States Total Centre States Total
I. BCR -37554 -2009 -39563 -156790 -106962 -263752II. Resources of PSEs 1,34,172 -2723 1,31,449 2,28,795 52107 2,80,902III. Borrowings including net MCR 1,65,148 75067 2,40,215 455624 2,15,592 6,71,216IV. Net flow from abroad 19234 .. 19234 17452 .. 17452V. Deficit Financing 33037 .. 33037 .. ..VI. Aggregates Resources 3,14,037 70335 3,84,372 5,45,081 1,60,737 7,05,818VII. Assistance for States Plan -75750 75750 0 -138394 1,38,394 -VIII.Resources for Public Sector Plan (V+VI) 2,38,287 1,46,085 3,84,372 4,06,687 2,99,131 7,05,818
226
XXI. FIVE YEAR PLANS
Eighth Plan (1992-97) Ninth Plan (1997-2002) _____________________ __________________________
At 1991-92 prices At 1996-97 prices
1. In Eighth Plan, centre figures include UTs figures but in Ninth Plan centre
states figures includes other UTs (those without legislatures).
TABLE 21.3 PLAN RESOURCES REALISED OF CENTRE AND STATE
Note : The figures of realisation are provisional as actual are not availlable.
figures include UTs with legilatures(not those without legislatures) whereas
Source : Planning Commission

(Rs. Ten Million)
Item Centre States & TotalUTs
I. BCR (-)6,385 26578 20193III. Borrowings including net MCR 6,85,185 2,61,482 9,46,667III. Net inflow from abroad 27200 - 27200IV. Resources of PSEs 5,15,556 82684 5,98,240V. Assistance for Plans of States & UTs (-)3,00,265 3,00,265 -VI. Resources for Public Sector Plan 9,21,291 6,71,009 15,92,300
227
OF PUBLIC SECTOR OUTLAY
Source : Planning Commission
At 2001-02 prices
TABLE 21.4 FINANCING PATTERN OF TENTH PLAN
XXI. FIVE YEAR PLANS

Causes of accidents 1991 2001 2004 P 2005
A. Natural Causes 4447 36651 18937 22415 Cold and Exposure 593 641 570 646 Cyclone/Tornado 138 93 1512 1438 Starvation/Thirst - 338 134 163 Earthquake/Landslide 589 13956 401 1314 Epidemic - 103 69 103 Flood 735 399 754 785 Heat Stroke 679 505 756 1075 Lightning 1713 1507 1842 2064 Torrential rains - 114 133 557 Other Natural Causes including Avalan - 18995 12766 14270 B. Un-natural Causes 183556 234368 258326 271760 Air Crash 15 30 23 6 Collapse of structure 2006 3119 2169 2718 Drowning 23693 20739 21190 23571 Electrocution 2933 5641 6224 6987 Explosion 606 575 601 643 Falls 3650 7446 8448 9132 Factory/Machine Accidents 539 641 715 671 Fire 22306 22449 18445 19093 Fire-arms 3169 2688 2283 2254 Sudden deaths - 15065 17413 18519 Killed by animals 1108 770 788 847 Mines or quarry disaster 519 499 456 456 Poisoning 19738 24077 22035 20800 Stampede - 30 31 346 Suffocation 296 892 1218 1549 Traffic accidents 61010 99516 111794 118265 Other causes 118 14266 30409 31389 Causes not known 41850 15925 14084 14514 Total(A+B) 188003 271019 277263 294175
228
XXII. ACCIDENTAL DEATHS AND SUICIDES
TABLE 22.1 NUMBER OF ACCIDENTAL DEATHS BY CAUSES
Source:National Crime Records Bureau, Ministry of Home Affairs

050000
100000150000200000250000300000350000
1991 2001 2004 2005
Accidental Deaths Suicides
2.24%
35.32%
33.52%
20.74%
8.18%
Upto 14 Years 15-29 Years 30-44 Years 45-59 Years 60 Years & above
SUICIDES BY AGE GROUP-2005
ACCIDENTALDEATHS AND SUICIDES
(NUMBER)

Item 1991 2001 2004 P 2005
A. By Sex 78450 108506 113697 113914 Male 46324 66314 72651 72916 Female 32126 42192 41046 40998B. By Age-group(1) 78450 108506 113697 113914 Upto 14 years 9638 3007 2913 2555 15-29 years 34440 38910 40136 40234 30-44 years 24075 36448 38296 38183 45-59 years 10297 21579 23139 23625 60 years & above .. 8562 9213 9317
C. By Causes of Suicides 78450 108506 113697 113914 Bankruptcy or sudden change in Eco. status 907 2918 3063 3095 Illness (2) 11371 24098 25452 25061 Death of dear person 1784 871 749 820 Dowry dispute 1360 2414 2638 2351 Drug abuse/addiction - 1414 1927 2032 Failure in Examination 1380 2062 2496 2283 Fall in social reputation 419 1209 710 1572 Family problems 9909 24162 25531 25441 Love affairs 3242 3114 3799 3496 Poverty 1947 2549 3403 2548 Property dispute 1474 1599 1689 1559 Unemployment 1299 2734 2571 2172 Causes not known 13104 20585 18812 17445 Other Causes 30254 18777 20857 24039
229
(1) Data for the year 1991 relate to Age-group below 18, 18-29, 30-50 and 50 years & above respectively. (2) It includes Aids/STD, Cancer, Paralysis, Insanity/Mental Illness , Other Prolonged Illness.
XXII. ACCIDENTAL DEATHS AND SUICIDES
TABLE 22.2 NUMBER OF SUICIDES
Source:National Crime Records Bureau, Ministry of Home Affairs

CentreMonth Tempera- Month Tempera-
ture ture
Ahmedabad May 41.5 January 11.9Ajmer May 41.5 January 11.3Allahabad(Bamrauli) May 39.7 December 8.7Bangalore April 33.8 December 15.8Bhopal(Bairagarh) May 40.3 January 10.9Bhubaneshwar April 38.4 January 16.5Chandigarh (Airport) May/June 37.5 January 6.5Chennai(Nunganbakam) June 37.4 January 21.2Chennai(Meenambakkam) May 38.0 January/Februrary 21.0Cuttack April 37.2 January 13.0Darjeeling .. .. .. ..Dibrugarh August 33.3 January 10.1Guwahati May 32.4 January 11.1Gwalior May 42.8 January 7.4Hyderabad (Begumpet) May 38.4 January 14.0Indore May 40.6 January 10.2Jaipur May 42.0 January 7.9
Contd…..For footnote, please see page no.
230
XXIII. CLIMATE
Mean Maximum Mean Minimum
TABLE 23.1 MEAN MAXIMUM AND MEAN MINIMUM TEMPERATURE(*)
Temperature Temperature
(in selected centres in 2006)(Degree centigrade)

CentreMonth Tempera- Month Tempera-
ture ture
Jodhpur May 41.2 January 8.4Kodaikanal April 21.1 January 9.3Kolkata May 35.3 January 14.0Lucknow April 38.6 January 7.6Mumbai May 33.7 January 19.3Mysore April 34.6 February 14.1Nagpur April 42.3 January 12.0New Delhi(Safdarjung) May 39.8 January 7.1Patiala May 39.2 January 6.1Patna .. .. .. ..Pune April 37.3 January 9.7Port Blair April 32.1 January 23.0Rajkot May 41.4 January 12.4Shillong August 24.9 January 6.8Shimla May 25.3 January 5.0Srinagar May 28.2 January -1.3Thiruvananthapuram March/April 33.9 December 21.7Vishakhapatnam May 32.7 January 20.0
231
XXIII. CLIMATE
TABLE 23.1 MEAN MAXIMUM AND MEAN MINIMUM TEMPERATURE(*)-Concld.
(in selected centres in 2006)(Degree centigrade)
Mean Maximum Mean Minimum
(*) Relates to mean maximum temperature for the hottest month and mean minimum temperature for the coldest month.
Temperature Temperature
Source: India Meteorological Department

Normal (**) Sub-divisions (*)
2003 2004 2005 2006
Andaman and Nicobar Islands 3001 2447 2508 2763 2448Arunachal Pradesh 2935 2761 2892 2542 2108Assam & Meghalaya 2801 2835 2891 2315 1777Nagaland,Manipur, Mizoram& Tripura 1926 2029 1999 1612 1562Sub-Himalayan, West Bengal& Sikkim 2617 3289 2768 2671 2305Gangetic West Bengal 1495 1458 1488 1585 1587Orissa 1471 1751 1338 1551 1810Jharkhand 1335 1299 1153 859 1356Bihar 1236 1455 1077 914 1001East Uttar Pradesh 1041 1177 902 828 772 West Uttar Pradesh 888 1130 647 753 510Uttaranchal 1586 1904 1584 1469 1265Haryana, Delhi and Chandigarh 567 721 524 587 377Punjab 649 645 445 604 545Himachal Pradesh 1324 1269 766 996 896Jammu & Kashmir 1245 1106 916 1310 1477West Rajasthan 296 387 190 260 362East Rajasthan 677 630 627 617 712West Madhya Pradesh 989 1011 840 784 1141East Madhya Pradesh 1230 1533 947 1408 1008Gujarat Region 970 1259 1004 1385 1458
Contd….For footnotes, please see the next page.
232
Actual
XXIII. CLIMATE
TABLE 23.2 ANNUAL RAINFALL (In Full Millimetre)
_________________________________________

Normal (**) Sub-division (*)
2003 2004 2005 2006
Saurashtra and Kutch 517 733 498 639 703Konkan & Goa 2977 2829 2912 3558 3379Madhya Maharashtra 847 740 883 1102 1181Marathwada 840 645 677 864 819Vidarbha 1104 1033 796 1258 1277Chhattisgarh 1364 1703 1174 1305 1232Coastal Andhra Pradesh 1012 1119 934 1239 1067Telangana 942 1007 762 1231 1045Rayalaseema 678 654 656 999 609Tamil Nadu and Pondicherry 912 925 1105 1314 912Coastal Karnataka 3613 3087 3062 3275 3866North Interior Karnataka 720 474 645 856 628South Interior Karantaka 1030 818 1028 1357 951Kerala 3097 2276 2911 3151 3298Lakshadweep 1585 1533 2097 1579 1695
233
(**) Sub-divisional normal rainfall values are based on 1941-90 period (Revised since 01.06.2004).
Source & Footnotes: India Meteorological Department
_______________________________________
(*) Refer to the set up of 36 Metrological Sub-divisions.
(In Full Millimetre)
Actual
TABLE 23.2 ANNUAL RAINFALL-concld.
XXIII. CLIMATE

State/ No. of Total Total Valid Percen- Union Territory seats electors votes votes tage
polled polled (1)
('000 number)
Andhra Pradesh 42 51146 35776 35763 69.95 Arunachal Pradesh 2 684 385 385 56.35 Assam 14 15015 10377 10372 69.11 Bihar 40 50560 29332 29329 58.02Chattisgarh 11 13719 7146 7145 52.09 Goa 2 941 553 552 58.77 Gujarat 26 33675 15214 15211 45.18 Haryana 10 12321 8097 8093 65.72 Himachal Pradesh 4 4182 2497 2495 59.71 Jammu & Kashmir 6 6368 2242 2239 35.20Jharkhand 14 16812 9363 9361 55.69 Karnataka 28 38592 25139 25115 65.14 Kerala 20 21125 15094 15086 71.45 Madhya Pradesh 29 38390 18463 18459 48.09 Maharashtra 48 63012 34263 34253 54.38 Manipur 2 1537 1036 1035 67.41 Meghalaya 2 1289 679 679 52.69 Mizoram 1 550 350 348 63.60 Nagaland 1 1041 956 955 91.77 Orissa 21 25652 16945 16934 66.06 Punjab 13 16615 10233 10229 61.59 Rajasthan 25 34712 17347 17332 49.97 Sikkim 1 282 220 220 77.95 Tamil Nadu 39 47252 28733 28715 60.81 Tripura 2 1978 1327 1324 67.08 Uttar Pradesh 80 110624 53278 53270 48.16Uttaranchal 5 5563 2674 2673 48.07 West Bengal 42 47437 37021 37000 78.04
For footnotes, please see next page.
234
XXIV. ELECTORAL STATISTICS
TABLE 24.1 GENERAL ELECTIONS TO LOK SABHA : 2004

State/ No. of Total Total Valid Percen- Union Territory seats electors votes votes tage
polled polled (1) ___________________________
('000 number)
A. & N.Islands 1 242 154 154 63.66 Chandigarh 1 528 270 269 51.14 D & N.Haveli 1 123 85 85 69.04 Daman & Diu 1 79 56 55 70.16 Delhi 7 8763 4126 4126 47.09 Lakshadweep 1 39 32 32 81.52 Pondicherry 1 637 484 484 76.07
Total 543 671488 389948 389780 58.07
(1) Percentage of votes polled to total number of electors in contested constituencies is based on absolute number of votes/electors.Note: Total may not tally due to rounding off of the figures.
235
Source: Election Commission of India
XXIV. ELECTORAL STATISTICS
TABLE 24.1 GENERAL ELECTIONS TO LOK SABHA : 2004-Concld.

Number of Persons Contested/ElectedGeneral Year Number Election of seats
Contested Elected Contested Elected
First 1952 489 .. .. .. ..Second 1957 494 45 27 1473 467Third 1962 494 70 35 1915 459Fourth 1967 520 67 30 2302 490Fifth 1971 518 86 21 2698 497Sixth 1977 542 70 19 2369 523Seventh 1980 542 142 28 4478 514Eighth 1984 542 164 42 5406 500Ninth 1989 529 198 27 5962 502Tenth * 1991 534 329 38 8451 496Eleventh 1996 543 599 40 13353 503Twelveth 1998 543 274 43 4476 500Thirteenth 1999 543 284 49 4364 494Fourteenth 2004 543 355 45 5080 498
Note : Total number of contestants include the number of candidates elected unopposed, if any. * The Figures include figures for Punjab also in which Lok Sabha election were held in 1992-not in 1991
236
Source : Election Commission of India
XXIV. ELECTORAL STATISTICS
TABLE 24.2 NUMBER OF PERSONS CONTESTED AND ELECTED IN VARIOUS GENERAL ELECTIONS - LOK SABHA
Female Male

Year/State/Union Territory
All members(1) Women members
1990 245 24 1994 245 20 1996 245 18 1998 245 19 2000 245 22 2002 245 25 2004 245 28 2005 245 252006 245 25
2006States: Andhra Pradesh 18 1 Arunachal Pradesh 1 - Assam 7 1 Bihar 16 - Chhattisgarh 5 1 Goa 1 - Gujarat 11 1 Haryana 5 1 Himachal Pradesh 3 1 Jammu & Kashmir 4 - Jharkhand 6 1 Karnataka 12 1 Kerala 9 - Madhya Pradesh 11 3 Maharashtra 19 1 Manipur 1 - Meghalaya 1 - Mizoram 1 - Nagaland 1 - Orissa 10 3 Punjab 7 1 Rajasthan 10 2 Sikkim 1 - Tamil Nadu 18 1 Tripura 1 - Uttaranchal 3 - Uttar Pradesh 31 2 West Bengal 16 1
For footnote, please see next page.237
Table 24.3 COMPOSITION/ALLOCATION OF SEATS IN RAJYA SABHA
XXIV. ELECTORAL STATISTICS
Number of

Year/State/Union Territory
All members(1) Women members
Union Territories: Delhi 3 - Pondicherry 1 -
Nominated by the President 12 3
(1) Figures include 12 members nominated by the President of India.
238
Source: Rajya Sabha Secretariat
XXIV. ELECTORAL STATISTICS
Table 24.3 COMPOSITION/ALLOCATION OF SEATS IN RAJYA SABHA-Concld.
Number of

(Rs.Bn.)
Source 2000-01 2003-04 2004-05(P) 2005-06*
A.Current Income 1.Tax revenue 86.26 101.73 116.05 137.52 1.1 Direct taxes 35.85 42.28 48.23 57.15 1.2 Indirect taxes 50.41 59.45 67.82 80.37 2.Fees and other miscellaneous receipts 13.64 14.90 16.99 20.13 3.Income from enterpreneurship & property 13.51 19.50 22.36 26.41 3.1 Profits 0.16 3.76 5.10 6.14 3.2 Net interest 3.36 3.96 3.81 4.51 3.3 Other property receipts 9.99 11.78 13.45 15.76
4.Current grants from(+) 358.72 481.67 583.22 759.43 4.1 Central govt. 79.15 158.03 91.13 173.02 4.2 State governments 279.57 323.64 492.09 586.41
Total Income [1+2+3+4] 472.13 617.80 738.62 943.49
B.Current Expenditure 1.Salaries & Wages 221.14 260.42 285.56 335.53 1.1 Public works 6.12 7.64 8.38 9.85 1.2 Water supply 8.37 7.53 8.26 9.71 1.3 Education 86.81 107.58 117.97 138.61 1.4 Medical & public health 25.07 25.15 27.58 32.41 1.5 Sanitation 25.41 32.35 35.47 41.68 1.6 Public admn. 69.36 80.17 87.90 103.27 2.Commodities & Services 69.01 91.95 100.73 119.46 3.Net interest paid 5.83 11.33 12.13 14.41 4.Subsidies 11.03 5.08 6.13 7.27 5.Current grants 10.74 12.45 13.07 13.85
Total Expenditure [1+2+3+4+5] 317.75 381.23 417.62 490.52
(+) Current grants relating to NCT of Delhi are included in State Governments i.e. item 4.2
XXV. LOCAL BODIES
25.1 CURRENT INCOME AND EXPENDITURE OF LOCAL AUTHORITIES
Source & Footnotes : Central Statistical Organisation
239
(P) Provisional estimates * Quick estimates
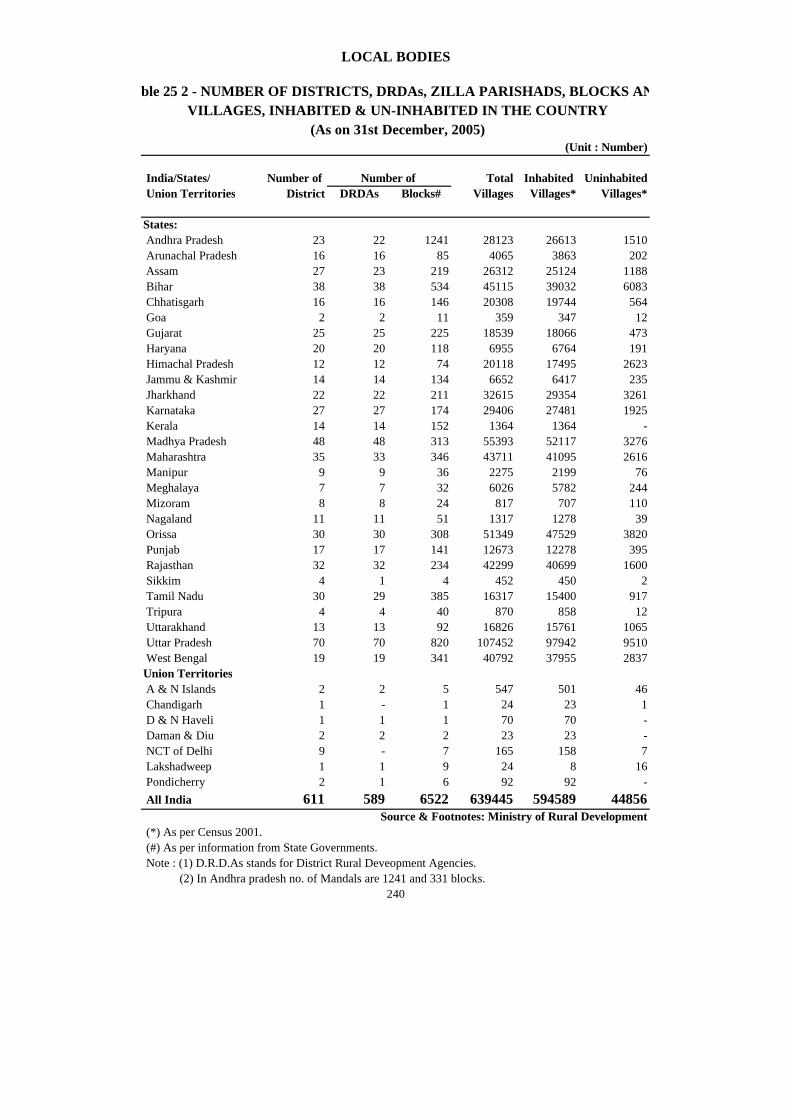
India/States/ Number of Total Inhabited Uninhabited Union Territories District DRDAs Blocks# Villages Villages* Villages*
States: Andhra Pradesh 23 22 1241 28123 26613 1510 Arunachal Pradesh 16 16 85 4065 3863 202 Assam 27 23 219 26312 25124 1188 Bihar 38 38 534 45115 39032 6083 Chhatisgarh 16 16 146 20308 19744 564 Goa 2 2 11 359 347 12 Gujarat 25 25 225 18539 18066 473 Haryana 20 20 118 6955 6764 191 Himachal Pradesh 12 12 74 20118 17495 2623 Jammu & Kashmir 14 14 134 6652 6417 235 Jharkhand 22 22 211 32615 29354 3261 Karnataka 27 27 174 29406 27481 1925 Kerala 14 14 152 1364 1364 - Madhya Pradesh 48 48 313 55393 52117 3276 Maharashtra 35 33 346 43711 41095 2616 Manipur 9 9 36 2275 2199 76 Meghalaya 7 7 32 6026 5782 244 Mizoram 8 8 24 817 707 110 Nagaland 11 11 51 1317 1278 39 Orissa 30 30 308 51349 47529 3820 Punjab 17 17 141 12673 12278 395 Rajasthan 32 32 234 42299 40699 1600 Sikkim 4 1 4 452 450 2 Tamil Nadu 30 29 385 16317 15400 917 Tripura 4 4 40 870 858 12 Uttarakhand 13 13 92 16826 15761 1065 Uttar Pradesh 70 70 820 107452 97942 9510 West Bengal 19 19 341 40792 37955 2837Union Territories A & N Islands 2 2 5 547 501 46 Chandigarh 1 - 1 24 23 1 D & N Haveli 1 1 1 70 70 - Daman & Diu 2 2 2 23 23 - NCT of Delhi 9 - 7 165 158 7 Lakshadweep 1 1 9 24 8 16 Pondicherry 2 1 6 92 92 - All India 611 589 6522 639445 594589 44856
Table 25 2 - NUMBER OF DISTRICTS, DRDAs, ZILLA PARISHADS, BLOCKS AND
LOCAL BODIES
Source & Footnotes: Ministry of Rural Development
Number of
(Unit : Number) (As on 31st December, 2005)
VILLAGES, INHABITED & UN-INHABITED IN THE COUNTRY
240
Note : (1) D.R.D.As stands for District Rural Deveopment Agencies.
(*) As per Census 2001. (#) As per information from State Governments.
(2) In Andhra pradesh no. of Mandals are 1241 and 331 blocks.

States/ Number Elected Number Elected Number Elected Union Territories Represe- Represe- Represe-
ntatives ntatives ntativesStates: Andhra Pradesh 21913 208291 1095 14617 22 1095 Arunachal Pradesh # 1639 6485 136 1639 14 136 Assam 2487 23453 203 2148 21 390 Bihar 8463 117397 531 11537 38 1157 Chhattisgarh 9820 157250 146 2977 16 321 Goa 189 1439 £ £ 2 50 Gujarat 13819 109209 224 4161 25 817 Haryana 6187 66256 119 2833 19 384 Himachal Pradesh 3243 25352 75 1667 12 251 Jharkhand 3746 .. 211 .. 22 .. Jammu & Kashmir .. .. .. .. .. .. Karnataka 5652 91402 176 3683 27 1005 Kerala 999 16139 152 2004 14 339 Madhya Pradesh 23051 388829 313 7164 48 884 Maharashtra 27918 223857 351 3902 33 1951 Manipur 165 1707 £ £ 4 61 Meghalaya Mizoram Nagaland Orissa 6234 93781 314 6227 30 854 Punjab 12443 88132 140 2760 17 315 Rajasthan 9188 113637 237 5494 32 1040 Sikkim 166 905 £ £ 4 100 Tamil Nadu 12618 109308 385 6570 29 656 Tripura 513 5352 23 299 4 82 Uttarakhand 7227 53988 95 3152 13 360 Uttar Pradesh 52000 703294 820 65668 70 2698 West Bengal 3354 49545 341 8483 18 720Union Territories A & N Islands 67 759 7 67 1 30 Chandigarh 17 162 1 15 1 10 D & N Haveli 11 114 £ £ 1 11 Daman & Diu 14 77 £ £ 1 20 NCT of Delhi Lakshadweep 10 79 £ £ 1 22 Pondicherry 98 913 10 108 .. ..
Total 233251 2657112 6105 157175 539 15759
@ These states have Traditional Councils of villages Elders. $ NCT of Delhi-Panchayati Raj System is yet to be revived. # The figures do not include Tirap District.
241
Source & Footnotes : Ministry of Panchayati Raj
---------------------------------(@)---------------------------------- ---------------------------------(@)---------------------------------- ---------------------------------(@)----------------------------------
£ Two tier Panchayat.
---------------------------------($)----------------------------------
LOCAL BODIES
Table 25.3 - NUMBER OF PANCHAYATS AND ELECTED REPRESENTATIVES IN THE THREE LEVELS OF PANCHAYATS, STATES/UTs AS ON 1st DECEMBER, 2006
Village Panchayats District PanchayatsIntermediate Panchayats

Enrolment of school
Per 100 Per Lakh going Sq.Kms of Popu- Children £ 31-03-2005 31-03-2006 31-03-2004 31-03-2005
of Area lation++ in class State/Union I-V as onTerritory 30-09-2004
('000 no.)
(1) (2) (3) (4) (5) (6) (7) (8)
Andhra Pradesh 71.3 255.0 7692 100.0 99.8 2374365 2440823Arunachal Pradesh 21.9 1669.5 185 71.1 56.8 .. ..Assam 114.7 328.9 3511 78.4 78.3 3675 3675Bihar 80.9 89.3 10042 71.5 ($) 52.8 ($) 270392($) 271169($)Chattisgarh .. .. 3406 94.3 83.3 106749 130259Goa 241.8 690.8 107 100.0 100.0 7485 7485Gujarat 70.2 265.7 6553 100.0 99.1 807681 825262Haryana 64.1 130.6 2074 100.0 100.0 462635 467973Himachal Pradesh 52.9 477.7 671 99.4 96.7 9196 10259Jammu & Kashmir 10.6 225.3 969 97.3 98.2 9714 9714Jharkand .. .. 3447 .. 30.4(@) 8735@ 9453@Karnataka 79.5 284.2 5884 98.9 98.7 1434060 1509025Kerala 386.8 467.0 2543 100.0 100.0 446366 460470Madhya Pradesh 52.3 259.2 10351 97.4 96.3 1329388 1340123Maharashtra 86.8 270.7 11385 100.0 86.5 2572815 2623272Manipur 52.0 476.4 349 92.6 83.4 45 45Meghalaya 43.5 398.4 468 68.8 59.3 65 65Mizoram 24.2 563.9 124 99.6 80.6 .. ..Nagaland 123.7 1051.0 224 100.0@ 64.3@ 194@ 194@Orissa 151.9 635.5 5219 79.8 55.2 74625 74625Punjab 132.1 248.1 1901 100.0 100.0 912889 930311Rajasthan 38.7 228.0 9330 98.8 65.0 741124 783703Sikkim 28.8 336.5 86 100.0 94.4 .. ..Tamil Nadu 127.7 264.0 6403 100.0 100.0 1854471 1886147Tripura 163.0 509.0 461 96.0 57.2 3095 3273Uttarakhand .. .. 1192 58.7 68.3 844964 844964Uttar Pradesh 103.1 145.5 24580 87.9 93.5 17719 18408West Bengal 103.4 112.6 9881 85.4 86.6 113563 113888Union Territories 304.9 191.1 1725 100.0 100.0 39004 39063
ALL INDIA 74.8 233.8 130763 85.0 77.4 14445014 14803648 (+) Excluding Jawahar Rojgar Yojna (JRY) Roads.(++) Estimated mid year population by Registrar General of India, Ministry of Home Affairs (£) Relates to age group 6-11 years.($) Achievment corresponding to list of inhabited village as per 1991 census.(@) Jharkhand and Nagaland States have revised the achievement of village electrified as on 31.03.2006.
Contd……
242
XXVI. MISCELLANEOUS
TABLE 26.1 STATE LEVEL DIFFERENTIALS OF SELECTED CHARACTERISTICS
Road Length(Kms.)+ %age of villages electrified as on
Number of pumpsets energised as on2002
(As on 31st March)

Per capita Population served Popula- net state per government tion of domestic allopathic hospital ScheduledState/Union product beds (including) Tribes Territory at current 2003-04 2004-05 2003-04 2004-05community heath census
prices centres) 2001+2003-04 (no.) (¢) (Mn.no.)
(Rs.) 2005 (1) (9) (10) (11) (12) (13) (14) (15)
Andhra Pradesh 23153 864 933 13375 15938 2297 5.0Arunachal Pradesh 19724 .. .. .. .. 562 0.7Assam 13633 114 120 3741 3721 9350¢ 3.3Bihar 5772 57 62 614 910 28980¢ 0.8Chattisgarh 15073 100 106 5346 8705 3955¢ 6.6Goa 58184 34 38 2288 2971 566 ..Gujarat 28355 729 809 28865 36016 1564 7.5Haryana 32712 318 355 9143 11696 3185 ..Himachal Pradesh 27486 37 44 1750 2185 817 0.2Jammu & Kashmir 16190 27 31 188 576 - 1.1Jharkhand 13013 145 153 8159 16778 20073 7.1Karnataka 23945 507 553 13844 20532 1343 3.5Kerala 27048 317 318 4091 4066 1299 0.4Madhya Pradesh 14069 214 217 5287 5554 3411 12.2Maharashtra 32170 1114 1162 41910 51309 1325 8.6Manipur 14901 1 2 3 6 3822 0.7+Meghalaya 19572 2 3 52 92 1118 2.0Mizoram .. .. .. .. .. 807 0.8Nagaland .. 3 3 18 20 1024 1.8Orissa 13601 125 146 3215 6045 2971 8.1Punjab 30701 336 391 5314 5807 2824 ..Rajasthan 16212 245 268 5173 6583 1910 7.1Sikkim 24115 .. .. .. .. 793 0.1
For footnotes, please see next page.
243
_____________________ _____________________
Net Value added by manu-facture : Factory Sector^
(Rs.Ten Million)
XXVI. MISCELLANEOUS
TABLE 26.1 STATE LEVEL DIFFERENTIALS OFSELECTED CHARACTERISTICS-Contd.
Factory employment^
('000 no.)

Per capita Population served Popula- net state per government tion of domestic allopathic hospital ScheduledState/Union product beds (including) Tribes Territory at current 2003-04 2004-05 2003-04 2004-05community heath census
prices centres) 2001+2003-04 (no.) (¢) (Mn.no.)
(Rs.) 2005 (1) (9) (10) (11) (12) (13) (14) (15)
Tamil Nadu 25965 1163 1268 19101 21567 0.7 0.7Tripura .. 15 15 68 231 0.1 0.1Uttarakhand 19652 42 588 1514 1948 0.3 0.3Uttar Pradesh 11477 570 52 12649 14298 0.1 0.1West Bengal 22497 515 518 7903 10549 0.4 0.4
Union Territories 177380 276 299 9322 11804 0.2 0.2A & N Island .. 0 0 8 4 .. ..Chandigarh .. 9 10 164 208 .. ..D & N Haveli .. 52 58 2801 4897 .. ..Daman & Diu .. 60 69 2335 2746 .. ..Delhi .. 115 121 2024 2431 .. ..Lakshadweep .. .. .. .. .. .. ..Pondicherry .. 39 41 1989 1518 .. ..
ALL INDIA 23222 7870 8454 202933 259907 84.3 84.3
(^) Annual Survey of Industry excludes the states of Arunachal Pradesh, Mizoram, Sikkim and UT of Lakhadweep.
Note: Totals may not tally due to rounding off of the figures.
244
4. Central Electricity Authority 5. Ministry of Human Resource Development,Department of Secondary
Factory employment
('000 no.)
Net Value added by manu-facture : Factory Sector
(Rs.Ten Million) _____________________
3. Primary Census Abstract, Census of India 2001
(+) Excludes population of Paomata, Mao Maram and Purul sub division of Senapati district of Manipur for 2001 Census. (¢) Data relates to beds in Government Allopathic Hospitals (Including CHCs)- Health Information of India, 2005.
_____________________
and Higher Education.
Sources:1. Central Statistical Organisation 2. Central Bureau of Health Intelligence, Directorate General of Health Services, Ministry of Heath & Family Welfare
SELECTED CHARACTERISTICS-Concld.TABLE 26.1 STATE LEVEL DIFFERENTIALS OF
XXVI. MISCELLANEOUS

Population Annual Area Density(mid year Rate of (sq.km.) per sq.
Country estimates) increase % km. ('000) (2000-03)
1.Australia 19873 1.2 7741220 3 2.Bangladesh .. .. 143998 .. 3.Bhutan .. .. 47000 .. 4.Brazil 178985 2.2 8514877 21 5.Canada 31660 1.0 9970610 3
6.China 1288400 0.7 9596961 134 7.Egypt 67976 2.0 1001449 68 8.France 59768 0.5 551500 108 9.Germany 82534 0.1 357022 231 10.India 1068214 1.7 3287263 325
11.Indonesia 214251 .. 1904569 11212.Malaysia 25048 2.1 329847 7613.Maldives 285 1.6 298 95714.Mexico 104214 1.2 1958201 5315.Myanmar .. .. 676578 ..
16.Nepal .. .. 147181 ..17.Nigeria 126153 3.0 923768 13718.Pakistan 147662 2.4 796095 18519.Philippines 81081 2.0 300000 27020.Russian Federation 144566 -0.5 17098242 8
21.Sri Lanka .. .. 65610 ..22.U.K. 59554 0.4 242900 24523.U.S.A. 290811 1.8 9629091 30
245
XXVII. INTERNATIONAL COMPARISONS
TABLE 27.1 POPULATION, AREA AND DENSITY : 2003
Source: U.N.Statistical Yearbook(50th issue)
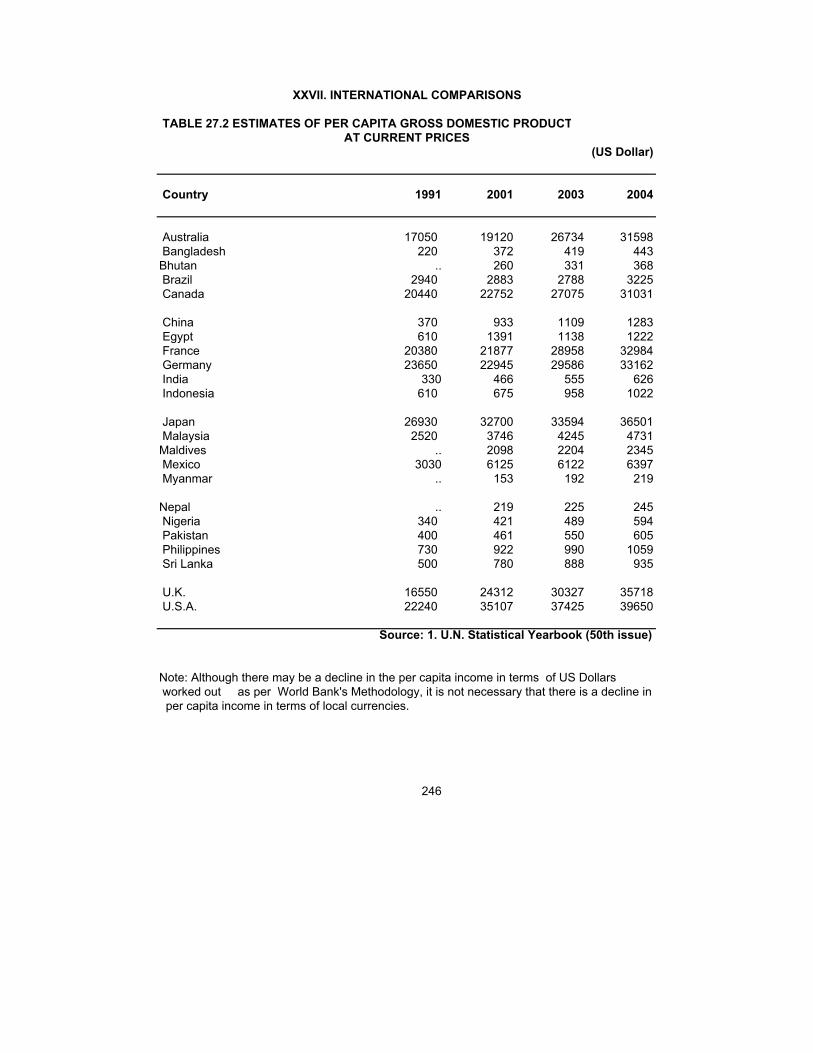
TABLE 27.2 ESTIMATES OF PER CAPITA GROSS DOMESTIC PRODUCT
Country 1991 2001 2003 2004
Australia 17050 19120 26734 31598 Bangladesh 220 372 419 443Bhutan .. 260 331 368 Brazil 2940 2883 2788 3225 Canada 20440 22752 27075 31031
China 370 933 1109 1283 Egypt 610 1391 1138 1222 France 20380 21877 28958 32984 Germany 23650 22945 29586 33162 India 330 466 555 626 Indonesia 610 675 958 1022
Japan 26930 32700 33594 36501 Malaysia 2520 3746 4245 4731Maldives .. 2098 2204 2345 Mexico 3030 6125 6122 6397 Myanmar .. 153 192 219
Nepal .. 219 225 245 Nigeria 340 421 489 594 Pakistan 400 461 550 605 Philippines 730 922 990 1059 Sri Lanka 500 780 888 935
U.K. 16550 24312 30327 35718 U.S.A. 22240 35107 37425 39650
Note: Although there may be a decline in the per capita income in terms of US Dollars worked out as per World Bank's Methodology, it is not necessary that there is a decline in per capita income in terms of local currencies.
246
Source: 1. U.N. Statistical Yearbook (50th issue)
XXVII. INTERNATIONAL COMPARISONS
AT CURRENT PRICES (US Dollar)

Country2002 2003 2002 2003 2004 @
1.Australia 150 38 1291 391 553 2.Bangladesh 11059* 11100* 37851* 38060* 39754 3.Bhutan 19 18F 44 38 45 4.Brazil 3146 3150 10457 10199 13277 5.Canada .. .. .. .. ..
6.China 28509 27398* 176342 166417* 180523 7.Egypt 613 615* 5600* 5800F 6352 8.France 18 19 105 105 115 9.Germany .. .. .. .. .. 10.India 40102 44000* 107600 132013 128000
11.Indonesia 11521 11477 51490 52079 5408812.Malaysia 677 675* 2091 2145 219613.Maldives .. .. .. .. ..14.Mexico 50 50F 227 192 19215.Myanmar 6200* 6650* 22780* 24640* 23700
16 Nepal 1545* 1550F 4133* 4155* 429017.Nigeria 3116 4900F 3192 4952 354218.Pakistan 2226 2210* 6718 6751* 753719.Philippines 4046 4094 13271 14031 1449720.Russian Fed. 130 142 490 450 471
21.Sri Lanka 820 911 2859 3071 262822.U.K. .. .. .. .. ..23.U.S.A. 1298 1213 9569 9034 10470
World 147552 153522 569527 589126 608368
* Unofficial figure F FAO estimate
247
Area_____________________
Production ____________________________
Contd..
XXVII. INTERNATIONAL COMPARISONS
TABLE 27.3 AREA AND PRODUCTION OF SELECTED CROPS Area: '000 hectare
Prod.: '000 Metric Tonne
Rice (paddy)_____________________ _________________________

Country
2002 2003 2002 2003 2004 @
1.Australia 11045 12456 10059 24900 20376 2.Bangladesh 742 778* 1606 1550* 1253 3.Bhutan 5 4 4 5 5 4.Brazil 2105 2488 3106 5900 5726 5.Canada 8836 10467 16198 23552 25860
6.China 23908 22040* 90290 86100 91952 7.Egypt 1030 1000* 6183 6150* 7178 8.France 5230 4905 38934 30582 39705 9.Germany 3015 2967 20818 19296 25427 10.India 26345 24886 72766 65129 72060
11.Indonesia .. .. .. .. ..12.Malaysia .. .. .. .. ..13.Maldives .. .. .. .. ..14.Mexico 635 627 3236 3000* 290015.Myanmar 90* 90* 100* 100* 140
16 Nepal 667 680F 1258 1344* 138717.Nigeria 67 67F 77 73 7118.Pakistan 8058 8069 18227 19210 1950019.Philippines .. .. .. .. ..20.Russian Fed. 24478 19960 50609 34062 45413
21.Sri Lanka .. .. .. .. ..22.U.K. 1996 1837 15973 14288 1547323.U.S.A. 18582 21383 44063 63590 58738
World 213716 208765 573513 556349 629873
* Unofficial figure F FAO estimate
248
Area: '000 hectareProd.: '000 Metric Tonne
XXVII. INTERNATIONAL COMPARISONS
TABLE 27.3 AREA AND PRODUCTION OF SELECTED CROPS-contd.
Wheat_____________________ ____________________________
Production_______________________ _________________________
Area

Country
2002 2003 2002 2003 2004 @
1.Australia 83 60 457 316 395 2.Bangladesh 5F 5F 10F 10F 10 3.Bhutan 31 26 48 42* 70 4.Brazil 11751 12935 35933 47809 41806 5.Canada 1283 1226 8999 9587 8836
6.China 24661 23520* 121499 114175 130434 7.Egypt 850F 830F 6500F 6400F 6728 8.France 1831 1667 16440 11898 16391 9.Germany 399 473 3738 3415 420010.India 6662 7000* 11167 14800* 14000
11.Indonesia 3127 3355 9654 10910 1122512.Malaysia 23* 24* 70* 72* 7213.Maldives .. .. .. .. ..14.Mexico 7120 7781 19299 19652 2200015.Myanmar 309* 300* 660* 750* 810
16 Nepal 826 833* 1511 1441* 159017.Nigeria 4490 4700F 4934 5150* 477918.Pakistan 970 875* 1737 1275* 279719.Philippines 2395 2485* 4319 4478 541320.Russian Fed. 547 648 1563 2113 3516
21.Sri Lanka 23 27 26 30 3522.U.K. .. .. .. .. ..23.U.S.A. 28050 28789 228805 256905 299917
World 138271 142685 604162 638043 724515
* Unofficial figure F FAO estimate
249
XXVII. INTERNATIONAL COMPARISONS
TABLE 27.3 AREA AND PRODUCTION OF SELECTED CROPS-contd.Area: '000 hectare
Prod.: '000 Metric Tonne
Maize_____________________ ____________________________
Area Production____________________ _____________________________

Country
2002 2003 2002 2003 2004 @
1.Australia 417 423 32260 36012* 36993 2.Bangladesh 163 166 6502 6838 6484 3.Bhutan .. .. 13F 13F 13 4.Brazil 5100 5343 363721 386232 416256 5.Canada .. .. .. .. ..
6.China 1422 1328F 92203 92370 90979 7.Egypt 132F 132F 15000F 12000F 16230 8.France .. .. .. .. .. 9.Germany .. .. .. .. .. 10.India 4412 4608 297208 289630 236180
11.Indonesia 350* 350 25530* 25600* 2560012.Malaysia 21 17* 1600F 1600f 120013. Maldives .. .. .. .. ..14.Mexico 632 639 45635 45126 4512715.Myanmar 158 165F 7116 7500f 6368
16.Nepal 59 60F 2248 2250F 230517.Nigeria 40 35F 747 548 77618.Pakistan 1000 1086 48042 52056 5341919.Philippines 385* 385* 27203 25835* 3250020.Russian Fed. .. .. .. .. ..
21.Sri Lanka 18 17 963 956 99022.U.K. .. .. .. .. ..23.U.S.A. 414 404 32253 31301 26320
World 20180 20420 1338169 1333253 1328217
* Unofficial figure F FAO estimate
250
Area: '000 hectareProd.: '000 Metric Tonne
Sugarcane___________________
XXVII. INTERNATIONAL COMPARISONS
TABLE 27.3 AREA AND PRODUCTION OF SELECTED CROPS-contd.
Production____________________ ______________________________
Area

Country
2002 2003 2002 2003 2004 @
1.Australia .. .. .. .. .. 2.Bangladesh 50F 54F 55* 60* 56 3.Bhutan .. .. .. .. .. 4.Brazil 4 4F 9 9 8 5.Canada .. .. .. .. ..
6.China 913 898F 766 800 855 7.Egypt .. .. .. .. .. 8.France .. .. .. .. .. 9.Germany .. .. .. .. .. 10.India 430F 443F 847 885* 851
11.Indonesia 116 116 157 159 16512.Malaysia 3F 3F 5F 5F 413. Maldives .. .. .. .. ..14.Mexico .. .. .. .. ..15.Myanmar 69 72F 23* 24F 25
16.Nepal 12 13F 8 8F 1217.Nigeria .. .. .. .. ..18.Pakistan .. .. .. .. ..19.Philippines .. .. .. .. ..20.Russian Fed. 2 2 1 1 1
21.Sri Lanka 211 211 310 303 30822.U.K. .. .. .. .. ..23.U.S.A. .. .. .. .. ..
WORLD 2406 2410 3125 3207 3342
* Unofficial figure F FAO estimate
251
XXVII. INTERNATIONAL COMPARISONS
TABLE 27.3 AREA AND PRODUCTION OF SELECTED CROPS-contd.Area: '000 hectare
Prod.: '000 Metric Tonne
Tea_______________________ _________________________
Area Production______________________ ____________________________

Country
2002 2003 2002 2003 2004 @
1.Australia 22 22F 22F 37 40 2.Bangladesh 27 27F 34 34F 343. Bhutan .. .. .. .. .. 4.Brazil 97 85 195 177 226 5.Canada .. .. .. .. ..
6.China 4946 5125F 14895 13447 14410 7.Egypt 64F 64F 207F 207F 1928.France .. .. .. .. .. 9.Germany .. .. .. .. ..10.India 5954 8000* 4363 7500* 7000
11.Indonesia 647 683 1267 1377 146912.Malaysia 2F 2F 6F 6F 213.Maldives .. .. .. .. ..14.Mexico 62 62F 75 75F 7515.Myanmar 567 575* 723 730* 715
16.Nepal .. .. .. .. ..17.Nigeria 2782 2800F 2699 2700F 293718.Pakistan 100* 100F 106* 106F 7719.Philippines 27* 27* 26 28* 2720.Russian Fed. .. .. .. .. ..
21.Sri Lanka 9 11 6 7 822.U.K. .. .. .. .. ..23.U.S.A. 525 531 1506 1880 1945
World 24105 26463 33303 35658 36421
* Unofficial figure F FAO estimate@ Area figures for the year 2004 were not available.
252
XXVII. INTERNATIONAL COMPARISONS
TABLE 27.3 AREA AND PRODUCTION OF SELECTED CROPS-concld.Area: '000 hectare
Prod.: '000 Metric Tonne
Groundnut (in shell)_____________________ _____________________________
Source: F.A.O. Production Year Book,2003@ FAO Statistical Yearbook 2004
Area Production_____________________ _____________________________

(000 metric tonne)
Aluminium Nitrogenous Paper & Cement Country 2003 fertilizers paper board 2003
2002 2004
Australia 1855 .. 3090 7517 Bangladesh .. 1071 46 2565 Brazil 1635 752 8221 34010 Canada .. 3836 20578 14063 China 5866 23644 37929 862081 Egypt .. 1548 460 29100 France 685 .. 10249 20544 Germany 1341 .. 20392 .. India .. 4145 4145 117035 Indonesia .. 2868 7223 35000 Japan 44 670 30457 68766 Malaysia .. 585 968 17243 Mexico 34 379 4060 33729 Myanmar .. .. 45 581 Nigeria .. .. 19 2100 Pakistan .. 2183 700 10845 Philippines .. 201 1056 10000 Russian Fed. .. .. 6789 40998 Sri Lanka .. .. 25 1163 U.K. 548 .. 6503 12000 U.S.A. 5523 9442 83612 92843
WORLD .. 87206 336765 ..
Contd….
253
XXVII. INTERNATIONAL COMPARISONS
TABLE 27.4 PRODUCTION OF SELECTED INDUSTRIES

(000 metric tonne) Crude- Pig Iron Coal Radio
steel 2003 2003 receivers Country 2003 (000 no.)
2003
Australia 7544 6116 188150 .. Bangladesh .. .. .. 140 Brazil 31147 32039 2064 5603 Canada 15927 8554 30374 .. China 223990 213667 832667 75302 Egypt 4400 1080 28 .. France 19758 12744 1454 5657 Germany 44809 29481 56034 621 India 32219 31747 215929 3572 Indonesia 2042 .. 76525 .. Japan 110510 82091 .. 3051 Malaysia 3960 .. 107 9915 Mexico 15179 10930 2948 .. Myanmar 25 .. 609 .. Nigeria .. .. 16 .. Pakistan .. 1140 1566 765 Philippines 500 .. 869 .. Russian Fed. 62839 48707 107591 2383 Sri Lanka 30 .. .. .. U.K. 13268 10228 17026 .. U.S.A. 93702 40600 546386 8221
World .. .. 2568362 ..
254
Source: U.N. Statistical Yearbook - Fiftieth issue)
XXVII. INTERNATIONAL COMPARISONS
TABLE 27.4 PRODUCTION OF SELECTED INDUSTRIES-Concld.
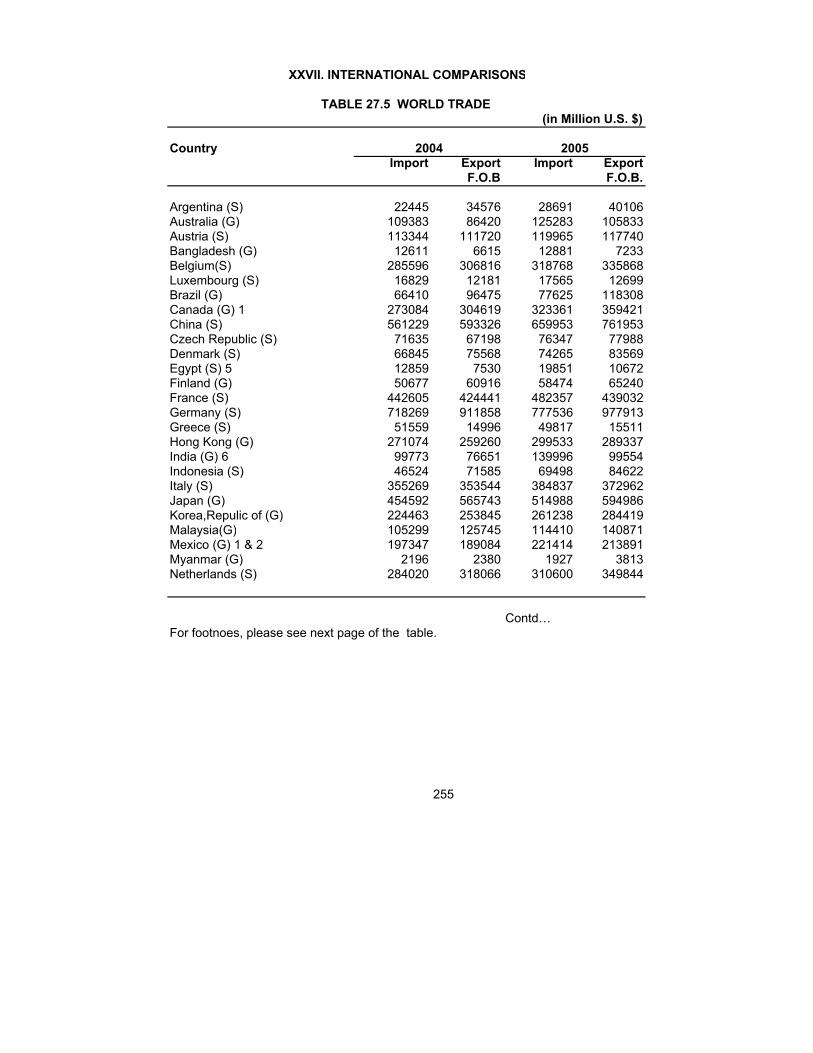
(in Million U.S. $)
CountryImport Export Import Export
F.O.B F.O.B.
Argentina (S) 22445 34576 28691 40106Australia (G) 109383 86420 125283 105833Austria (S) 113344 111720 119965 117740Bangladesh (G) 12611 6615 12881 7233Belgium(S) 285596 306816 318768 335868Luxembourg (S) 16829 12181 17565 12699Brazil (G) 66410 96475 77625 118308Canada (G) 1 273084 304619 323361 359421China (S) 561229 593326 659953 761953Czech Republic (S) 71635 67198 76347 77988Denmark (S) 66845 75568 74265 83569Egypt (S) 5 12859 7530 19851 10672Finland (G) 50677 60916 58474 65240France (S) 442605 424441 482357 439032Germany (S) 718269 911858 777536 977913Greece (S) 51559 14996 49817 15511Hong Kong (G) 271074 259260 299533 289337India (G) 6 99773 76651 139996 99554Indonesia (S) 46524 71585 69498 84622Italy (S) 355269 353544 384837 372962Japan (G) 454592 565743 514988 594986Korea,Repulic of (G) 224463 253845 261238 284419Malaysia(G) 105299 125745 114410 140871Mexico (G) 1 & 2 197347 189084 221414 213891Myanmar (G) 2196 2380 1927 3813Netherlands (S) 284020 318066 310600 349844
Contd…For footnoes, please see next page of the table.
255
XXVII. INTERNATIONAL COMPARISONS
TABLE 27.5 WORLD TRADE
2004 2005

(in Million U.S. $)
CountryImport Export Import Export
F.O.B F.O.B.
Nigeria (G) 14164 31148 15200 42277Norway (G) 48062 81709 54786 101917Pakistan (G) 17949 13379 25356 16050Panama (S) 3 3594 944 4180 1018Philippines (G) 42345 39680 46963 39879Poland (S) 89094 74831 100759 89214Singapore (G) 173582 198633 200050 229652Spain (S) 257672 182156 287610 191021Sri Lanka (G) 7973 5757 8833 6347Sweden (G) 100792 123306 111326 130210Switzerland (S) 110324 117820 119784 126099United Kingdom (G) 451715 341621 483064 371406United States (G) 4 1525680 818520 1732350 907158Russian Fed. (G) 75569 181663 98688 241118
World 8742072 8516117 9887447 9664036
G Relates to general trade. S Relates to special trade.
bonded warehouses. Total export include revaluation and export
3. Export include re-exports and petroleum products.
its other possessions (Guam and American Samoa). Data includes Import and export of non-monetry gold. 5. Imports exclude petroleum imported without stated value. Exports cover domestic exports.6. Excluding military goods, fissionable materials, bunkers, ships and aircrafts.
256
1. Imports F.O.B.
Source: U.N.Monthly Bulletin of Statistics, January, 2007
XXVII. INTERNATIONAL COMPARISONS
TABLE 27.5 WORLD TRADE-contd.
2004 2005
2. Trade data include maquiladoras and exclude goods from customs-
4. Including the trade of the U.S. Virgin Island and Puerto Rico but
of silver.
excluding shipments of merchandise between the United States and

Notes:
257
1. Under the general trade system, both goods entering directly for domestic consumption and goods entered into customs storage are recorded, at the time
XXVII. INTERNATIONAL COMPARISONS
TABLE 27.5 WORLD TRADE-concld.
(c) nationalized goods ie. foreign goods declared from domestic consumption
of their first arrival,as imports; under the special trade system,goods are recorded
2. Outward moving goods consist of: (a) national goods ie. those wholly or partly produced in the country; (b) foreign goods, neither transformed nor declared for domestic consumption in the country, which move outward from custom storage;
as imports when declared for domestic consumption whether at the time of entry or on withdrawal from custom storage.
which move outwards without having been transformed. General exports comprise all three categories and in the general trade system, the sum of (b) and (c) may be tabulated as re-export.Special exports comprise categories (a) & (c). Direct transit trade, consisting of goods entering or leaving for transport
Germany w.e.f. 3rd October 1990, the two German states have united to form one sovereign state. As from the date of unification, the Federal Republic of Germany acts in the United Nations under the designation of `Germany'.
purpose only, is excluded from both import and export statistics. (3) Through accession of the German Democratic Republic to the Federal Republic of
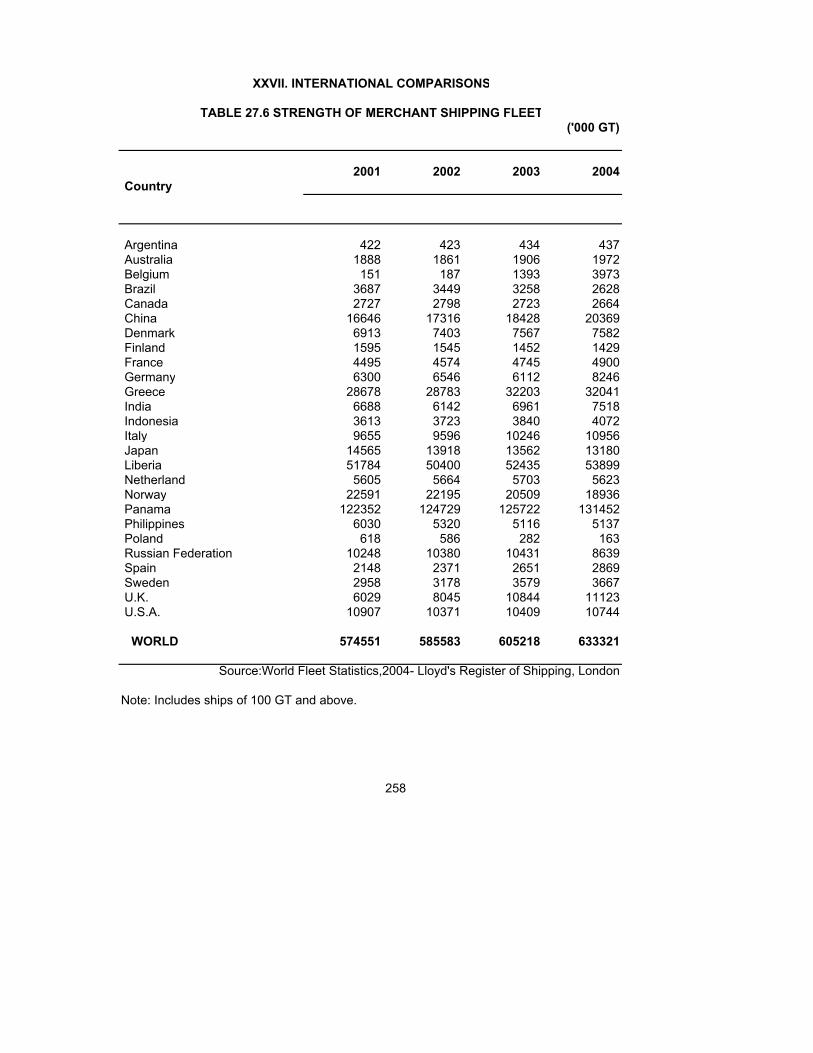
('000 GT)
2001 2002 2003 2004 Country
Argentina 422 423 434 437 Australia 1888 1861 1906 1972 Belgium 151 187 1393 3973 Brazil 3687 3449 3258 2628 Canada 2727 2798 2723 2664 China 16646 17316 18428 20369 Denmark 6913 7403 7567 7582 Finland 1595 1545 1452 1429 France 4495 4574 4745 4900 Germany 6300 6546 6112 8246 Greece 28678 28783 32203 32041 India 6688 6142 6961 7518 Indonesia 3613 3723 3840 4072 Italy 9655 9596 10246 10956 Japan 14565 13918 13562 13180 Liberia 51784 50400 52435 53899 Netherland 5605 5664 5703 5623 Norway 22591 22195 20509 18936 Panama 122352 124729 125722 131452 Philippines 6030 5320 5116 5137 Poland 618 586 282 163 Russian Federation 10248 10380 10431 8639 Spain 2148 2371 2651 2869 Sweden 2958 3178 3579 3667 U.K. 6029 8045 10844 11123 U.S.A. 10907 10371 10409 10744
WORLD 574551 585583 605218 633321
Note: Includes ships of 100 GT and above.
258
Source:World Fleet Statistics,2004- Lloyd's Register of Shipping, London
XXVII. INTERNATIONAL COMPARISONS
TABLE 27.6 STRENGTH OF MERCHANT SHIPPING FLEET

Country2004 2005 2004 2005 2004 2005
Australia 541.2 673.2 26900 33120 3 3 Bangladesh 61.2 66.7 440 470 21 20 Bhutan .. .. .. .. Brazil 552.1 662 3090 3550 10 8 Canada 905600 1052600 28390 32590 .. ..
China 1676800 2269700 1290 174000 13 13 Denmark 219400 261800 40650 48330 2 2 Egypt,Arab Rep. 90100 93000 1310 1260 15 15 France 1858700 2169200 30090 34600 3 2 Germany (2) 2489000 2875600 30120 34870 1 1
India 674600 804100 620 730 21 18 Indonesia 248000 282200 1140 1280 15 13 Italy 1503600 17729 26120 30250 3 2 Japan 4749900 49765 37180 38950 1 2 Malaysia 117100 125900 4650 4970 10 9
Maldives .. .. .. .. .. .. Mexico 703100 7534 6770 7310 4 4 Myanmar .. .. .. ..b .. .. Nepal 6500 7300 260 270 40 38 Nigeria 54000 74000 390 560 17 23
Pakistan 90700 107300 600 690 22 22 Philippines 96900 109700 1170 1320 14 14 Russian Fed.(3) 487300 638100 3410 4460 5 6 Singapore 105000 119800 24220 27580 - - Sri Lanka 19600 22800 1010 1160 18 17
U.K. 2016400 2272700 33940 37740 1 1 U.S.A. 12150900 12912900 41400 43560 1 1
(1) Atlas method
Republic of Germany.
259
(US $ million) capita(1) share (US $) in GDP (%)
XXVII. INTERNATIONAL COMPARISONS
TABLE 27.7 GROSS NATIONAL PRODUCT,PER CAPITA GNP ANDAGRICULTURE'S SHARE IN GDP
GNP (1) GNP per Agriculture's
Source:World Development Indicators 2007
(2) PPP Estimate of GNP per capita and data on shares in GDP refer to the former Federal
(3) Estimates for the economies of the former 'Soviet Union' are preliminery and their classification is kept under review.

EXPLANATORY NOTES
SECTION II. LABOUR Tables 2.1 and 2.2 - The data in these tables include estimated employment in respect of non-responding establishments also. Employment in Public Sector includes employment in Railways but excludes employment in Indian missions abroad. In the private sector, the data relate to employment in the non-agricultural establishments normally employing 25 or more workers i.e. those falling within the purview of Employment Exchanges(Compulsory Notification of the Vacancies) Act, 1959. Since March 1966 they also include employment in establishments employing 10 to 24 workers. Table 2.3 - The staff statistics of Indian Railways fall within the scope of "Administrative Statistics". These data are compiled annually by the Zonal Railways, manufacturing/ production units, or the Railway Offices, Units and Projects as well as attached and subordinate offices and furnished to the Railway Board. These are consolidated into a single statement and printed in the Indian Railways Annual Statistical Statements. Table 2.5 - The statistics of factory employment are collected under the Factories Act, 1948 and relate to all factories employing 10 workers or more with the aid of power and 20 workers or more without the aid of power and the establishments declared as factories by the State Governments under Section 85 of the Act. Table 2.6 - Statistics of earnings are collected under the Payment of Wages Act, 1936 and relate to factories registered under section 2(m) of the Factories Act, 1948 upto the year 1982. However, from the year 1983 onwards these figures include data in respect of factories under Section 85 of the Factories Act, 1948 also. The figures exclude railway workshops. Table 2.7 - The statistics are based on annual returns collected by the Director General of Mines Safety under the Mines Act, 1952. Table 2.9 - Statistics of the Employment in Banking are based on the data supplied by Reserve Bank of India. Table 2.11 - The figures refer to industrial disputes resulting in work stoppages and involving 10 workers or more and are exclusive of political and sympathetic strikes. Table 2.12 - Statistics on absenteeism give percentages of man-shifts lost to man-shifts scheduled to work. Table 2.13 - The data refer to trade unions submitting returns and registered under the Indian Trade Unions Act, 1926. The registration under the Act is not compulsory.
260
SECTION III. EDUCATION AND MASS MEDIA
Recognised institutions are those which are recognised by the Government or University or a Board of Secondary and Intermediate Education constituted by law, offer the prescribed courses of studies and are open to inspection and direction by the Education Department. A person aged 7 years and above who can both read and write with understanding in any language has been taken as literate. It is not necessary for a person to have received any formal education or passed any minimum educational standard for being treated as literate. People who were blind and could read in Braille are treated to be literates.
SECTION V. NATIONAL PRODUCT AND RELATED AGGREGATES The estimates of gross/net national product at factor cost have been worked out by adopting the production approach for the commodity producing sectors like agriculture, forestry, fishing, mining and manufacturing. For rest of the sectors income and/or expenditure approach is followed. The estimates of gross/net national product at market prices have been derived by adding indirect taxes and subtracting subsidies at the aggregate level. The estimates of expenditure on gross domestic product are also worked out by expenditure approach separately for the government final consumption expenditure, private final consumption expenditure and capital formation. The estimates of per capita national income are arrived at by dividing the net national product at factor cost by the corresponding mid financial year estimates of population as released by the Registrar General, India. The methodology of estimation and source material used are given in the publication entitled "National Accounts Statistics - Sources and Methods, 2007". Table 5.7 & 5.8 - The tables show the estimates of domestic capital formation at current and 1999-2000 prices respectively. These estimates are prepared by the commodity flow approach separately for construction, machinery and equipment and changes in stocks.
SECTION VI. AGRICULTURE Table 6.1 - Reported area according to village papers is worked out from the returns of the area prepared by the village staff for revenue purposes. Table 6.2 - The estimates of number of operational holdings and area operated by size of holdings are based on the results of Agricultural Census, 2000-01. Tables 6.3 and 6.4 - Figures are given for area and production of principal crops in tables 6.3 and 6.4 respectively. Regular all India forecasts are issued for most of these crops, Viz. all food-grains, oil seeds, fibres, potatoes, sugarcane, ginger, black pepper, chillies and tobacco etc. The figures in respect of tea, coffee and rubber have been obtained from the respective source agencies. Variation in coverage and refinements in methods of estimating the area and production of crops effected during the last decade have introduced an element of non- comparability over time.
261

Table 6.5 - The table presents data regarding average yield of principal crops in quintals per hectare. Average yield per hectare has been obtained by dividing the total production by the corresponding total area under each crop but in the case of rubber total production divided by tapped area . Tables 6.6 to 6.8 - The index numbers are based on gross area sown and cover 42 crops under two main groups and eight sub-groups. For calculating the group index of area, the coverage under different crops has been pooled together and no special weightage has been allotted to different crops. The production/yield per hectare index has been computed by the chain base method to allow for changes in coverage and estimation. The group index of production/yield per hectare has been computed by weighted average method. Tables 6.9 and 6.10 - Production figures relate to the agricultural year ending 30th June. 1991 figures correspond to 1990-91 and so on for the subsequent years. Net production has been taken as 87.5% of the gross production and the remaining 12.5% has been provided for feed, seed requirements and wastage. Per capita net availability has been calculated taking into account the figures of production, net imports and change in stocks. Figures in respect of change in stocks with traders and producers are not known. The estimates of net availability shown above should not therefore, be taken to be strictly equivalent to consumption. Table 6.12 - This table presents net area irrigated by sources of irrigation and gross area irrigated by crops. Net area irrigated is equal to gross area irrigated minus area irrigated more than once. Table 6.13 - Data under other non-credit societies relate to milk supply societies, poultry societies, forest labourers societies, labour contract and construction societies, women co-operative societies, co-operative spinning mills, fisheries societies, consumer co-operative societies, Weavers societies, other industrial societies etc. It excludes data in respect of non-reporting States.
SECTION VII. LIVESTOCK, POULTRY AND FISHERHY
Data are collected quinquennilly through a census known as Livestock Census. The 17th Livestock Census was conducted with 15th October 2003 as the reference date. It was for the first time that all the States/ UTs participated and the census work was completed in 15 months. The 17th Livestock Census was conducted by the Department of Animal Husbandry, Dairying and Fisheries, Ministry of Agriculture. The census collects data of livestock, poultry, agricultural implements and machinery and fishery statistics. As per the 17th Livestock Census, out of total livestock in the country, around 38.2% are cattle,20.2 are buffaloes,12.7% are sheep and 25.6% are goats. Out of total poultry, around 93.5% are fowls and rest 6.5% are ducks, drakes, ducklings, turkeys and other poultry birds in the country.
262

SECTION VIII. MINING Tables 8.1 and 8.2 - These tables present consolidated data on production and value of minerals other than 'atomic minerals' covered under Atomic Energy Act, 1962 and are based on the basic data received through the statutory returns submitted by the mine owners to the Indian Bureau of Mines under Mineral Conservation and Development Rules (MCDR), 1988 framed under Mines and Minerals Regulation and Development (MMRD) Act, 1957 excepting for coal, lignite, petroleum and natural gas and minor minerals. As regards coal and lignite, Office of Coal Controller, Kolkata provides all the basic information for all the States. Data on petroleum (crude) and natural gas (utilized) are received from the Ministry of Petroleum and Natural Gas, New Delhi and minor minerals from the various State Governments. Atomic minerals do not fall under the purview of MCDR, 1988 and no data are released for public use on these minerals. Table 8.3 - The Index of Mineral Production (Base: 1993-94=100) covers all the minerals in the mining and quarrying sector excepting, atomic minerals. Minor minerals are also represented in the Index of Mineral production. The index includes 67 items and these have been classified according to the National Industrial Classification (NIC). In preparing the weighing diagram for the index in question the gross value added has been taken into account instead of the net value added which was employed for the index released earlier.
SECTION IX. INDUSTRY Table 9.1 - The table presents data on production of selected items included in the item basket for preparation of all-India Index of Industrial Production (base 1993-94). The data given in the table are based on the frame of factories monitored by respective source agencies located in various Ministries/Departments and it may not necessarily be the total production of the respective item in the country. The production data are collected on a statutory basis from the producing units through 15 source agencies located in various Ministries/Departments/Subordinate offices like the Department of Industrial Policy & Promotion, Directorate of Sugar and Vanaspati, Office of the Textile Commissioner, Office of the Jute Commissioner, Iron & Steel (Joint Plant Committee). Table 9.2 - The base year of the Index of Industrial Production (IIP) has been revised from 1980-81 to 1993-94 and a revised pattern of weights has been adopted to make the IIP more representative of the industrial sector. The item basket for the 1993-94 series contains 543 items as compared to 352 in the earlier series, the addition being 3 items for mining sector and 188 for the manufacturing sector. To retain the distinctive character and enable the collection of data, the source agencies proposed clubbing of 478 items of the manufacturing sector into 285 (now reduced to 281) items groups. The revised series also include production figures relating to 18 items from the small scale sector. The index is a simple weighted arithmetic mean of production relatives, weights being proportional to Gross value Added (at item level Gross Value of Output) of base year for the sake of continuity, consistency, the international practices and the UN recommendations on the subject.
263

Tables 9.3, 9.4 and 9.5 - The Annual Survey of Industries (ASI), conducted annually since 1959, covers all factories registered under Sections 2m(i) and 2m(ii) of the Factories Act,1948 employing 10 or more workers and using power and those employing 20 or more workers but not using power. The survey also covers bidi and cigar manufacturing establishments registered under the Bidi and Cigar Workers (Condition of Employment) Act, 1966 employing 10 or more workers using power and 20 or more workers without using power. All the electricity undertakings engaged in the generation, transmission and distribution of electricity registered with the Central Electricity Authority covered earlier under ASI irrespective of their employment size have now been excluded from the purview of ASI from 1998-99 and onwards. Since ASI 2000-01, Factories employing 100 or more workers, are being again completely surveyed and constitute the ASI census sector. Besides, all industrial units as per the Industry Frame of five (5) less industrially developed States/UTs viz Manipur, Meghalay; Nagaland; Tripura and A & N Islands are also completely surveyed. The remaining registered factories in the frame constitute sample sector for the purpose of sampling and are arranged in each state by NIC 98 (4 digit level) X district X no. of workers for selecting such samples. Factories or units marked as NOP (Non-operating units) by FOD, NSSO in the ASI frame 2000-01 and onwards are being excluded from purview of selection. The concepts and definitions used for the parameters to be estimated are the same for both the sectors i.e. census or sample. Census and non-census sectors together constitute Factory sector or Registered sector.
SECTION X. FUEL AND POWER
Table 10.1 - The production and despatch data relate to all-India including Jammu & Kashmir for raw coal as well as lignite. Industry-wise despatch data relate to coal and coke despatched by railways including duplicate movement. The production data are obtained from the collieries directly and also from companies controlling the collieries. The rail despatch data are compiled from the daily statements of loading of wagons at the different Railway Allotment Zones to various industries/States. Tables 10.2 to 10.4 - Data on generation and sale of electricity relate to public utilities and non-utilities, however military power stations have been excluded. Data on installed generating capacity relate to utilities only.
SECTION XI. FOREIGN TRADE The sources of foreign trade statistics are the Customs and Central Excise Authorities. These are compiled by the Directorate General of Commercial Intelligence and Statistics, Kolkata from the copies of the bills of entry and shipping. The statistics are recorded on the basis of the General System of Recording under which the goods arriving from abroad are first included under imports and when they are shipped again they are included under re exports. Trade of other countries passing in transit through India is excluded. The figures of quantity of exports and imports, where specified by weight, are net i.e. exclusive of packing. In practice, imports are valued at c.i.f. and exports at f.o.b., although theoretically, recorded values are supposed to be real values.
264

Tables 11.5, 11.6, 11.10 and 11.11 - The present indices of imports and exports cover 89% and 92% of the total values of imports and exports respectively made during the base year. The unit value indices reflect the changes in the unit value of articles imported or exported whereas the quantum indices are designed to show the movements in the aggregate value of imports & exports after elimination of the effect of price changes. The unit value indices are calculated according to Paasche formula. The quantum indices which are calculated by the Laspeyres formula are not computed separately but are derived from the former indices. "Net terms of trade" represents the value indices of exports as percent of value indices of imports. The "Gross Terms of Trade" represents the quantum indices of imports as percent of quantum indices of exports.
SECTION XII. TRANSPORT, COMMUNICATION AND TOURISM Table 12.1 - Data relate to Government Railways only. In calculating route length, double or triple lines are counted only once. Gross earnings and expenses represent total earnings and expenses of railways during the accounting period irrespective of whether or not the earnings have been realised or expenses paid. Passenger kilometres and net ton kilometres have been arrived at by multiplying the total number of passengers carried and the total tons of goods handled by the respective number of kilometres covered. Tables 12.7 and 12.8 - In order to ensure international comparability, the data furnished are in accordance with the standards laid down by the International Civil Aviation Organisation. Statistics relate to capacity available by total payload and revenue traffic of (a) passengers, (b) freight and (c) mail carried on scheduled services by Indian carriers (Air India and Indian Airlines). Flights are classified as either "International" or "Domestic". International means a flight stage with one or both terminals in the territory of State, other than the State in which the airline is registered. Domestic means a flight stage not classifiable as international. Statistics of hours flown represent the total number of hours flown by individual aeroplanes and that of kilometres flown represent the total kilometres flown by individual aeroplanes. Capacity (tonne kilometres) available : Capacity that is available or carriage of revenue load (passenger, baggage, freight and mail). Capacity figures are obtained by multiplying the tonnage offered to the public for air transportation of passenger, freight and mail by the kilometres flown. Table 12.9 - The Strength of Indian Merchant Shipping Fleet plying on the coastal and overseas trades have been shown in this table and covers ships registered under Merchant Shipping Act, 1958.
265

Table 12.10 - The table provides data regarding Net Registered Tonnage of vessels which entered with cargo by vessels steam and sailing in foreign and coastal trade. The data are based on the monthly returns received from Customs authorities. Table 12.11 - The table provides data relating to gross tonnage of cargo (imports and exports) handled at major ports in coastal and foreign trade. The data are based on annual returns received from the Port Trust Authorities. Table 12.13 - Data relate to visitors coming to India for a period of not less than 24 hours for the purposes of business, holiday/pleasure or study tours, reasons of health, religion, sports, visiting families/friends attending meetings or in a representative capacity of any kind. These data exclude nationals of Nepal entering India through land routes along Indo-Nepal border and all foreigners entering India from Bhutan by land.
SECTION XIII. BANKING AND CURRENCY Table 13.1 - Notes in circulation comprise of notes issued by the Govt. of India upto April, 1935 and by the banks since then, less notes held in the Banking Department. The Government of India one rupee notes issued since July,1940 are treated as rupee coins and hence are not included under this head. Assets - Under Section 33(1) of the Reserve Bank of India Act 1934, the assets of the Issue Department consist of (i) gold coins and gold bullions, (ii) foreign securities, (iii) Rupee coins and (iv) Government of India Rupee securities. Table 13.2 - Liabilities consist of (i) deposits and (ii) other liabilities. Deposits include the deposits of (i) the Central and State Governments, (ii) Commercial and Cooperative banks and (iii) Others. Other liabilities consists of (i) paid up capital of Rs.5 crore,(ii) Reserve fund of Rs.6,500 crore (iii) National Industrial credit (long term operations) fund of Rs. 5,677 crore and (iv) National Housing Credit(long term operations) of fund Rs.177 crore from the week ended July 1,1994. Assets of the Banking Department consist of (i) notes and coins, (ii) balances held abroad, (iii) loans and advances, (iv) bills purchased and discounted, (v) investments and (vi) other assets. Table 13.3 - Scheduled Commercial Banks- The banks, which carry on business of banking in India and which are included in the second schedule to the Reserve Bank of India Act,1934, are known as Scheduled Banks. These include the State Bank of India, its subsidiaries, nationalised banks, regional rural banks, other Indian banks and foreign banks. The banks credit consists of (i) term loans, cash credits and overdrafts, (ii) inland bills purchased and discounted, and (iii) foreign bills purchased and discounted. Table 13.9 - The data are compiled on the basis of returns in Form 'B' submitted under section 42 of the Reserve Bank of India Act 1934.
266

Table 13.10 - The table gives data on sources of Money stock. These sources are net bank credit to Government, bank credit to commercial sector, net foreign exchange assets of banking sector and Government's currency liabilities to the public (these are netted by figures of changes in the non- monetary liabilities of the banking system). Table 13.11 – The table gives data on sources of Money stock. These sources are net bank credit to Government, bank credit to commercial sector, net foreign exchange assets of banking sector and Government’s currency liabilities to the public.( these are netted by figures of changes in the non- monetary liabilities of the banking system.. General Notes: (i) Aggregate deposits represent the total of demand and time deposits. (ii) Bank credit is the total of "loans, cash credits and overdrafts", "Inland bills purchased and discounted" and "Foreign bills purchased and discounted". (iii) With the establishment of National Bank for Agriculture and Rural Development (NABARD) on July 12, 1982 certain assets and liabilities of the RBI were transferred to NABARD necessitating some reclassification of aggregates in the sources of money stock from that date. Table 13.12 - Data presented in this table relate to the rates at which the various categories of banks and financial institutions are prepared to (i) discount/rediscount bills of exchange, (ii) give loans and advances, (iii) accept deposits on "call" basis, and (iv) provide refinance facilities.
SECTION XIV. PUBLIC FINANCE The tables contained in this section show the budgetary position of Central Government, State Governments and other related financial institutions.
SECTION XV. INCOME TAX
Statistics presented in this Section relate to Revenue collection from Direct Taxes, Indirect Taxes, Cost of Collections and Number of Effective Assesses received by the Directorate General of Income Tax for the relevant assessment years.
Taxes in India are of two types, Direct Tax and Indirect Tax. Direct Tax, like income tax, wealth tax, etc. are those whose burden falls directly on the taxpayer. The burden of indirect taxes, like service tax, VAT, etc. can be passed on to a third party.
Income Tax is chargeable with total income of the previous year of every person. The term ‘person’ includes an individual, an Hindu Undivided Family (HUF), a company, a firm, an association of persons (AOP), a body of individual (BOI), a local authority and an artificial juridical person. Income Tax paid by companies is categorized as Corporate Tax.
• Income tax is levied on the 'total income' of the assessee.
• Income of the 'previous year' is taxed in the 'assessment year.'
• Income is classified into and computed under five categories called 'heads of income.' 267

The overall control for administration of Direct Taxes lies with the Department of Revenue which functions through Income Tax Department with the Central Board of Direct Taxes (CBDT) at its apex. The CBDT is a statutory authority functioning under the Central Board of Revenue Act, 1963. It also functions as a division of the Ministry dealing with matters relating to levy and collection of Direct Taxes. This Chapter contains tables giving data from 2000-01 onwards upto 2005-06. Earlier data on Gross Income, Returned Income, Tax payable etc. was presented but due to discontinued of Directorate’s of Income Tax publication ‘All India Income Tax Statistics (AIITS) after the year 1999-2000. However, for earlier data please refer to 2005 issue of Statistical Pocket Book, India.
SECTION XVI. BALANCE OF PAYMENTS Data for India’s balance of payments are obtained primarily as a by-product of ITRS i.e. the system of reporting of foreign exchange transactions undertaken by the banks to RBI and supplemented by other official sources of information. Foreign currency transactions have been converted into rupees at par/ Central Exchange Rate upto June,1972 and on the basis of average of the Bank’s spot buying and selling rates for sterling and the monthly average of cross rates of non-sterling currencies based on London Market thereafter . Effective March 1993 conversion is made by crossing average spot buying and selling rate for U.S. dollar in the forex market and then the monthly averages of cross rates- non dollar currencies bases on the London market. Table 16.2 - The format of presentation of Balance of Payments data has been revised by Reserve Bank of India from July 1996. Data contained in this table is as per the revised format. Table 16.5 - Loan amounts are net of surrenders, de-obligations and cancellations etc. Figures for utilisations are exclusive of suppliers' credits, but inclusive of non- government loans.
SECTION XIX. INSURANCE Table 19.1 - The figures of gross premium written direct in India pertaining to Life and Capital Redemption (including Annuity Certain Insurance Business) has been obtained from the Corporation's and Company’s Audited Revenue Accounts. The figures arrived at do not take into account adjustment on account of reinsurance accepted and ceded. Table 19.2 - The premium income is the total accumulation of the Life Insurance Corporation's first year premium, renewal premium, single premium and consideration for annuities granted less reinsurance.
SECTION XX. PRICES Table 20.1 - With effect from April, 2000 a revised wholesale price index series with base 1993-94=100 has been introduced to replace the earlier operated series with base 1981-82=100. The current WPI series includes as many as 435 individual commodities classified under three major groups viz. Primary Articles; Fuel, Power, Light & Lubricants; and Manufactured Products. The number of commodities included under these three major groups are 98, 19 and 318 respectively. These major groups have been further divided into groups and subgroups.
268

The weights to the selected items have been assigned on the basis of the value of transactions consisting of (a) the average value of marketed/marketable surplus in the case of agricultural commodities and the value of products for sale in the case of non-agricultural goods; (b) total value of imports, including import duty; and (c) total value of excise duty if applicable. The weighting diagram has been prepared on the basis of the entire volume of transactions in the economy. The All Commodities index as also the indices of subgroups, groups and major groups are all derived by the method of weighted arithmetic mean. Table 20.2 - The Consumer Price Index for Industrial Workers is designed to represent changes in the cost of a given basket of goods and services consumed by an average Working class family, in the base period. The old series with base 1982=100 which covered 70 centres has been replaced by the new series with base 2001=100 with effect from the index for the month of January 2006. The new series is based on the Consumer Price Index Numbers for 78 centres and is being maintained by Labour Bureau. For individual series, the indices have been worked out with the year 1982 = 100 as the base upto December, 2005. The indices represent weighted arithmetic mean of price relatives. Weights are based on the average consumption expenditure pattern of the surveyed families excluding non-consumption items derived from the Working Class Family Income and Expenditure Surveys conducted in 1981-82 series for 1982 series and 1999-2000 for 2001 series in selected industrial centres. Table 20.3 - The Labour Bureau has new series of Consumer Price Index Numbers for Agricultural Labourers on base 1986-87=100 with effect from November,1995 replacing the old series on base 1960-61=100 with improved methodology and wide coverage. The new series are being compiled separately for agricultural and rural labourers with enlarged coverage of States from 15 to 20 and enhanced number of sample price villages from 422 to 600. The weighing diagram for the new series base(1986-87=100) for all the 20 States and All India have been derived from the consumer expenditure data based on Central Samples collected by the National Sample Survey Organisation during 38th round conducted in 1983. For details regarding scope and method of construction, reference may be made to the note published in February,1996issue of the Indian Labour Journal, a monthly publication of the Labour Bureau. Table 20.4 - A family budget survey of the non-manual employees population was conducted during 1982-83 at 59 selected urban centres of the country. A non-manual employee family for the purpose of the survey was defined as one "which derived 50% or more of its income during the reference month from the earnings of its members who are gainfully occupied as employees in non-manual work in the non-agricultural sector". The expenditure data derived from all the sample families canvassed in the survey provides basis for building up the weighting diagram for the consumer price index for each centre. The indices measure the average change in the consumer price over a period of time at a particular centre and can not be used for the comparison of costliness of different centres. For scope, methodology etc. reference may be made to the April 1989 issue of the Monthly Abstract of Statistics published by the Central Statistical Organisation.
269

SECTION XXI. FIVE YEAR PLANS Plan Outlay is the allocation of funds to the programmes/projects/schemes included in different Annual/Five year plans.
SECTION XXII. ACCIDENTAL DEATHS AND SUICIDES The source for these data is the National Crime Records Bureau,(NCRB) Ministry of Home Affairs which obtains the requisite information from Police authorities in different States. For the year 1995 onwards data was collected in modified input form by the NCRB and therefore the format of presentation of data have been slightly changed as per the format of statistical compilation by the NCRB.
SECTION XXIII. CLIMATE Meteorological data such as temperature and rainfall are recorded at the observatories of the India Meteorological Department. In addition to observatory stations there are about 7,941 rain recording stations maintained by different State Governments. Observations of temperature of air in shade are taken at most of the observatories twice a day i.e. at 0830 and 1730 hours, I.S.T. Rainfall is recorded at 0830 hours I.S.T. daily throughout the country. The amounts measured give the rainfall of the previous 24 hours ending at 0830 hours of the date of measurement.
SECTION XXIV. ELECTORAL STATISTICS Under the Indian Constitution and the law, general elections are held for the purpose of constituting a new Lok Sabha (House of People) on the expiry of the duration of the existing House or on its dissolution. The elections are held on the basis of adult suffrage.
SECTION XXV. LOCAL BODIES Local authorities include urban and rural civic bodies like municipal corporations, municipalities, municipal boards, notified area committees, township councils, district boards/ zila parishads, town panchayats, panchayat unions and panchayats. All India annual estimates of income and expenditure of local authorities have been worked out from the analysed data received from State Directorates of Economics and Statistics. In the case of non-responding States the income and expenditure have been estimated.
270