Pocket Guide - World Nuclear Association
44
Pocket Guide 2018/19 Environment • Radiation • Reactors • Uranium
-
Upload
khangminh22 -
Category
Documents
-
view
6 -
download
0
Transcript of Pocket Guide - World Nuclear Association

Pocket Guide
2018/19
Environment • Radiation • Reactors • Uranium


Nuclear Power, Energy and the Environment

Energy and emissions, selected countries (2015)
Location Population(million)
GDP(billion US$)
CO2 emissions (milliontonnes)
Energy use per capita(toe*)
Australia 24 1485 381 5.2
Austria 9 411 62 3.8
Bangladesh 161 157 71 0.2
Belgium 11 508 93 4.8
Brazil 208 2330 451 1.4
Bulgaria 7 55 44 2.6
Canada 36 1796 549 7.5
China 1371 8910 9041 2.2
Colombia 48 359 72 0.7
Congo (DR) 77 30 3 0.4
Croatia 4 58 16 2.0
Czech Republic 11 224 100 4.0
Denmark 6 341 32 2.8
Egypt 92 248 199 0.9
Ethiopia 99 48 10 0.5
Finland 6 248 42 5.9
France 67 2778 291 3.7
Germany 82 3697 730 3.8
Hungary 10 143 43 2.6
Iceland 0 15 2 16.9
India 1311 2297 2066 0.7
Indonesia 258 988 442 0.9
Iran 79 464 552 3.0
Ireland 5 303 35 2.9
Italy 61 2060 331 2.5
Japan 127 5986 1142 3.4

Location Population(million)
GDP(billion US$)
CO2 emissions (milliontonnes)
Energy use per capita(toe*)
Lithuania 3 45 11 2.5
Mexico 121 1208 442 1.6
Myanmar 54 89 24 0.4
Netherlands 17 868 156 4.4
New Zealand 5 167 31 4.5
Nigeria 182 462 64 0.8
North Korea 25 27 23 0.3
Norway 5 465 37 5.7
Pakistan 189 216 146 0.5
Philippines 101 266 104 0.5
Romania 20 189 70 1.6
Russia 144 1724 1469 4.9
Saudi Arabia 32 672 532 7.0
Slovakia 5 101 29 3.0
Slovenia 2 49 13 3.2
South Africa 55 417 428 2.6
South Korea 51 1267 586 5.4
Spain 46 1415 247 2.6
Sweden 10 541 37 4.6
Switzerland 8 626 37 3.0
Thailand 68 393 248 2.0
Turkey 78 1088 317 1.7
UAE 9 360 180 8.0
UK 65 2682 390 2.8
Ukraine 45 121 189 2.0
USA 322 16,597 4998 6.8
Vietnam 92 155 168 0.8
World 7334 75,489 32,294 1.9
*Tonnes of oil equivalent Source: IEA

Location tonnes /capita Location tonnes
/capita Location tonnes /capita
Saudi Arabia 16.9 New Zealand 6.7 Thailand 3.6
Australia 15.8 China 6.6 Lithuania 3.6
USA 15.5 Slovenia 6.2 Romania 3.5
Canada 15.3 Iceland 6.2 Brazil 2.2
South Korea 11.6 Bulgaria 6.1 Egypt 2.2
Taiwan 10.7 UK 6.0 Vietnam 1.8
Russia 10.2 Denmark 5.6 Indonesia 1.7
Czech Republic 9.4 Italy 5.5 India 1.6
Netherlands 9.2 Slovakia 5.4 Colombia 1.5
Japan 9.0 Spain 5.3 Philippines 1.0
Germany 8.9 Switzerland 4.5 North Korea 0.9
Belgium 8.3 France 4.4 Pakistan 0.8
South Africa 7.8 Hungary 4.3 Myanmar 0.5
Finland 7.7 Ukraine 4.2 Bangladesh 0.4
Ireland 7.6 Turkey 4.1 Cote d'Ivoire 0.4
Austria 7.2 Sweden 3.8 Nigeria 0.4
Norway 7.1 Croatia 3.7 Ethiopia 0.1
Iran 7.0 Mexico 3.7 Congo (DR) 0.0
World 4.4
Source: IEA
CO2 emissions per capita (2015)

Location kg/ US$ Location kg/
US$ Location kg/ US$
Switzerland 0.06 New Zealand 0.19 Czech
Republic 0.44
Sweden 0.07 Colombia 0.20 Bangladesh 0.45
Norway 0.08 Germany 0.20 Indonesia 0.45
Congo (DR) 0.09 Ethiopia 0.21 South Korea 0.46
Denmark 0.09 Lithuania 0.24 Taiwan 0.49
France 0.10 Australia 0.26 Thailand 0.63
Ireland 0.12 Slovenia 0.26 Pakistan 0.68
Iceland 0.14 Croatia 0.27 Saudi Arabia 0.79
Nigeria 0.14 Cote d'Ivoire 0.28 Bulgaria 0.80
Austria 0.15 Myanmar 0.28 Egypt 0.80
UK 0.15 Slovakia 0.29 North Korea 0.84
Italy 0.16 Turkey 0.29 Russia 0.85
Finland 0.17 Hungary 0.30 India 0.90
Spain 0.17 USA 0.30 China 1.01
Belgium 0.18 Canada 0.31 South Africa 1.06
Netherlands 0.18 Mexico 0.37 Vietnam 1.09
Brazil 0.19 Romania 0.37 Iran 1.19
Japan 0.19 Philippines 0.39 Ukraine 1.56
World 0.43
Source: IEA
CO2 emissions per GDP (2015)

Source: IEA
Source: IPCC
Global CO2 emissions (2015)
Emissions intensity by energy source
44.9% Coal
34.6% Oil
19.9% Gas
0.6% Other
Total emissions32 billion tonnes per year
1200
1000
800
600
400
200
0
Coal
g/kW
h
OilGas
Solar
Nuclea
rW
indHyd
ro

Countries with nuclear electricity
Location Nuclear capacity MWe
% share of electricity, 2017
USA 99,829 20
France 63,130 72
Japan 39,952 4
China 40,733 4
Russia 28,961 18
South Korea 22,505 27
Canada 13,553 15
Ukraine 13,107 55
Germany 9444 12
UK 8883 19
Sweden 8376 40
Spain 7121 21
India 6219 3
Belgium 5943 50
Czech Republic 3932 33
Switzerland 3333 33
Finland 2764 33
Bulgaria 1926 34
Brazil 1896 3
Hungary 1889 50
South Africa 1830 7
Slovakia 1816 54
Argentina 1627 5
Mexico 1600 6
Pakistan 1355 6
Romania 1310 18
Iran 915 2
Slovenia 696 39
Netherlands 485 3
Armenia 376 33
Total* 400,433 10.5
* Includes six reactors on Taiwan with total of 4927 MWe.Sources: World Nuclear Association, IAEAas of 28.08.18

39.3% Coal
22.9% Gas
16.0% Hydro
10.6% Nuclear
7.1% Other
4.1% Oil
Total generation24,255 TWh
Source: IEA
Nuclear and climate change
Electricity from nuclear power plants generates significantly lower emissions of carbon dioxide (CO2) compared with fossil fuel plants.
A study by the International Atomic Energy Agency (IAEA) puts greenhouse gas emissions from nuclear generation at between 9 and 21 tonnes CO2-equivalent per GWh of electricity produced. This compares with between 385 and 1343 tonnes for fossil fuel and between 9 and 279 tonnes for renewable energy sources.
Nuclear power accounted for about 10.5% of global electricity production in 2017. The current use of nuclear energy avoids the emission of about 2.1 billion tonnes of CO2-equivalent every year.
According to the International Energy Agency (IEA), nuclear energy has avoided the emission of some 56
Electricity generation by fuel (2015)

gigatonnes of CO2, the equivalent of two years’ global emissions at today’s rate. It is estimated that, at current nuclear usage and CO2 emission levels, almost four years’ worth of CO2 emissions will be avoided by 2040.
The IEA predicts that global electricity demand will increase by between 80% and 130% by 2050. Studies show that significant reductions in carbon emissions, while also meeting this growing demand, cannot happen without nuclear as a major component of the energy mix.
At least 80% of the world’s electricity must be low-carbon by 2050 if the world is to keep global warming within 2°C, according to the Intergovernmental Panel on Climate Change (IPPC).
Harmony
The nuclear industry believes a diverse mix of low carbon generating technologies in order for the 2°C goal to be met. Its target for nuclear energy is to provide 25% of electricity in 2050, requiring some 1000 GWe of new nuclear capacity to be constructed. The build rate required to meet this goal is: 10 GWe per year between 2018 and 2020; 25 GWe per year between 2021 and 2025; and 33 GWe per year between 2026 and 2050.
To realise the Harmony goal, the global nuclear industry should seek to create: a level playing field for all low carbon technologies; harmonised regulatory processes; and an effective safety paradigm.
Achieving 1000 GWe of new nuclear build by 2050 will require a cooperative effort by the whole nuclear community - from industry to research, governments and regulators - to focus on removing the real barriers to growth. Harmony provides the framework for the nuclear industry to deliver its potential.


Radiation

Alpha (α) particles
• Particles (helium nuclei) consisting of two protons and two neutrons.
• Emitted from naturally-occurring heavy elements such as uranium and radium, as well as from some man-made unstable elements (formed artificially by neutron capture and possibly subsequent beta decay).
• Densely ionizing but can be readily stopped by a few centimetres of air, a sheet of paper, or human skin.
• Only dangerous if alpha-emitter is inhaled or ingested and released inside the body at high exposures.
• Alpha-emitters can be safely stored in a sealed container.
• Measurement of exposures from alpha particles requires special detector systems.
What is radiation?
Radiation is energy being transmitted through space. Visible light, ultra-violet light and transmission signals for TV and radio communications are all forms of radiation that are common in our daily lives. There are two types of radiation: ‘ionizing’ and ‘non-ionizing’. Ionizing radiation is electromagnetic radiation with sufficient energy to remove tightly bound electrons from atoms, thereby creating ions capable of breaking chemical bonds, and thus causing ionization of the matter through which it passes. Non-ionizing radiation has sufficient energy to move atoms but not create ions.
Types of ionizing radiation

Beta (β) particles
• Either electrons or positrons emitted by many radioactive elements.
• Can be stopped by wood, aluminium or glass a few millimetres thick.
• Can penetrate into human skin but generally less so than gamma radiation.
• High exposure produces an effect like sunburn, but which is slower to heal.
• Can be safely stored in appropriate sealed containers.
• Measurement of exposures from beta particles requires special detector systems.
Gamma (γ) rays
• High-energy beams similar to X-rays.
• A form of electromagnetic radiation.
• Emitted during radioactive alpha and beta decays.
• Very penetrating so need dense materials such as water, glass, lead, steel or concrete to shield them.
• Poses the main hazard to people when a container holding radioactive materials becomes unsealed.
• Gamma activity can be measured with a scintillation detector or Geiger counter.
• Doses can be assessed by the small badges worn by workers handling radioactive materials.
X-rays • Similar to gamma rays, but originate from the electron cloud.
• A form of electromagnetic radiation.
• X-ray photons carry enough energy to ionize atoms and disrupt molecular bonds.
• Higher energy X-rays can traverse relatively thick objects without being absorbed or scattered much.

Neutrons • A free neutron usually emitted as a result of spontaneous or induced nuclear fission.
• Can be shielded by light atoms, particularly those containing hydrogen.
• Indirectly ionizing and hence can be destructive to human tissue.
• Can be slowed down (or ‘moderated’) by graphite or water.
• Measurement of exposures from neutrons requires special detector systems.
Types of radiation and penetration
Thin plates made of glass,wood, aluminium, etc.
Lead, iron, other thick metal platesand water.
Water, concrete, etc.
αAlpha
βBeta
xX-ray
γGamma
nNeutron
Paper
Measuring radiation
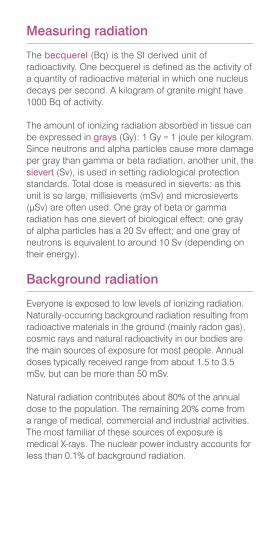
The becquerel (Bq) is the SI derived unit of radioactivity. One becquerel is defined as the activity of a quantity of radioactive material in which one nucleus decays per second. A kilogram of granite might have 1000 Bq of activity.
The amount of ionizing radiation absorbed in tissue can be expressed in grays (Gy): 1 Gy = 1 joule per kilogram. Since neutrons and alpha particles cause more damage per gray than gamma or beta radiation, another unit, the sievert (Sv), is used in setting radiological protection standards. Total dose is measured in sieverts: as this unit is so large, millisieverts (mSv) and microsieverts (μSv) are often used. One gray of beta or gamma radiation has one sievert of biological effect; one gray of alpha particles has a 20 Sv effect; and one gray of neutrons is equivalent to around 10 Sv (depending on their energy).
Background radiation
Everyone is exposed to low levels of ionizing radiation. Naturally-occurring background radiation resulting from radioactive materials in the ground (mainly radon gas), cosmic rays and natural radioactivity in our bodies are the main sources of exposure for most people. Annual doses typically received range from about 1.5 to 3.5 mSv, but can be more than 50 mSv.
Natural radiation contributes about 80% of the annual dose to the population. The remaining 20% come from a range of medical, commercial and industrial activities. The most familiar of these sources of exposure is medical X-rays. The nuclear power industry accounts for less than 0.1% of background radiation.

Sources of exposure to radiation
13% Cosmic
9% Food and
Drinking Water
80% Natural Radiation
20% Medicine
<0.1% Nuclear Industry
42% Radon
16% Soil
Source: UNSCEAR
Key points
• Radiation exists naturally everywhere at widely varying levels. In some places, due to radioactive materials in the ground, natural background radiation is 10 times higher-than-average.
• Mankind has evolved in a world with strongly differing background radiation without developing a sense to detect it.
• Radiation has always been around and is now well understood. It has been used and studied for more than 100 years.
• Radiation resulting from the use of nuclear energy accounts for only a minute fraction of background radiation.


Protection against radiation
Radiation has always been present in the environment and in our bodies. However, we can and should minimise unnecessary exposure to significant levels of man-made radiation. Radiation can be very easily detected. There are a range of simple, sensitive instruments capable of detecting minute amounts of radiation from natural and anthropogenic sources. There are three ways in which people can be protected from identified radiation sources:
Time: Dose is reduced by limiting exposure time.
Distance: The intensity of radiation decreases with distance from its source.
Shielding: Barriers of lead, concrete or water give good protection from penetrating radiation such as gamma rays.

The International Commission for Radiological Protection has developed a system for protection with three basic principles:
Justification: No practice involving exposure to radiation should be adopted unless it produces a net benefit to those exposed or to society generally.
Optimization: Radiation doses and risks should be kept “as low as reasonably achievable” (ALARA), whilst taking into account economic and social factors.
Limitation: The exposure of individuals should be subject to dose or risk limits, above which the radiation risk would be deemed unacceptable.
These principles apply to normal exposures. A similar system applies for accidental exposures but where it is not possible to limit doses, a target ‘reference’ level is suggested instead.
Underlying these principles is the application of the ‘linear hypothesis’ based on the idea that any level of radiation dose, no matter how low, involves the possibility of risk to human health. However, the weight of scientific evidence has never established any cancer risk or other health effects at doses below 50 mSv over a short period or at about 100 mSv/yr.
Nuclear accidents and radiation release
The exposure levels during normal operation of civil nuclear facilities are very low. However, there have been some serious accidents, which received extensive public attention and whose consequences have been reviewed by the United Nations Scientific Committee on the Effects of Atomic Radiation (UNSCEAR).
• A 2008 report from UNSCEAR concluded that apart from increased thyroid cancers in children affected in the region, “there is no evidence of a major public health impact attributable to radiation exposure” from the April 1986 Chernobyl accident in Ukraine. Thyroid cancer is usually not fatal if diagnosed and treated early.
• In May 2013, UNSCEAR reported that radiation exposure following the March 2011 accident at Fukushima Daiichi plant in Japan “did not cause any immediate health effects” and “it is unlikely to be able to attribute any health effects in the future among the general public and the vast majority of workers.”

Some comparative whole-body radiation doses
Can cause symptoms of radiation sickness (1000 mSv)
Average annual exposure to astronauts working on the
International Space Station (150 mSv)
Typical dose from living within a few kilometres of an operating nuclear
power plant for one year (0.001 mSv)
Typical chest X-ray (0.1 mSv)
Typical annual dose received by worker in a nuclear power plant
(1 mSv)
Typical annual dose to a worker in a uranium mine (<5 mSv)
Maximum annual dose limit for nuclear energy worker (50 mSv)

Recommended maximum dose for persons carrying out emergency work (500 mSv)
Recommended five-year dose limit for nuclear energy workers (100 mSv)
Typical chest CT scan (7 mSv)
Average total global dose from natural background radiation (2.4 mSv)
Annual public dose limit (1 mSv)
Typical dose received during flight from New York to Tokyo (0.1 mSv)
1,000
500
100
50
10
1
0

IMAGE

Nuclear Power Reactor Characteristics

Location
Nuclearelectricitygeneration, 2017(billion kWh)
Share oftotal electricityproduction,2017 (%)
Number ofoperable reactors*
Nucleargeneratingcapacity*
(MWe)
Argentina 5.7 4.5 3 1627
Armenia 2.4 32.5 1 376
Belgium 40.2 49.9 7 5943
Brazil 14.9 2.7 2 1896
Bulgaria 14.9 34.3 2 1926
Canada 95.1 14.6 19 13,553
China 232.6 3.9 43 40,733
Czech Rep 26.8 33.1 6 3932
Finland 21.6 33.2 4 2764
France 381.8 71.6 58 63,130
Germany 72.2 11.6 7 9444
Hungary 15.2 50.0 4 1889
India 34.9 3.2 22 6219
Iran 6.4 2.2 1 915
Japan 29.3 3.6 42 39,952
Mexico 10.6 6.0 2 1600
Netherlands 3.3 2.9 1 485
Pakistan 6.1 6.2 5 1355
Romania 10.6 17.7 2 1310
Russia 190.1 17.8 37 28,961
Slovakia 14.0 54.0 4 1816
Slovenia 6.0 39.1 1 696
South Africa 15.1 6.7 2 1830
South Korea 141.3 27.1 24 22,505
Spain 55.6 21.2 7 7121
Sweden 63.1 39.6 8 8376
Switzerland 19.6 33.4 5 3333
Ukraine 80.4 55.1 15 13,107
UK 63.9 19.3 15 8883
USA 805.6 20.0 99 99,829
Total** 2502.9 10.5 454 400,433
Nuclear power & reactors worldwide
*as of 28.08.18 Sources: World Nuclear Association, IAEA
**The world total includes six reactors on Taiwan with a combined capacity of 4927 MWe, which generated a total of 21.6 billion kWh in 2017, accounting for 9.3% of its electricity generation.

Fuelelements
Steel pressurevessel
Steam
Water
Controlrods
Pump
Steamgenerator
Steelpressurevessel
Fuel elements
Water
Control rodsPressurizer
Reinforced concretecontainment and shield
Steam
Pressurized water reactor (PWR)
Boiling water reactor (BWR)

Concretepressurevessel
Carbondioxide
Steamgenerator
Fuel elements
Graphite moderator
Control rods
Steamgenerator
Fuel elements
Pressure tubes
Heavywater
Control rods
Steam
Calandria
Pressurized heavy water reactor (PHWR/Candu)
Advanced gas-cooled reactor (AGR)

Steamgenerators
Graphitemoderator
Pressure tubes
Fuel elements
Concrete shield
Control rods
Water
Steamgenerator
Helium
Reactorvessel
Steam
Fuel pebbles
Graphite
Control rods
Light water graphite-moderated reactor (LWGR/RBMK)
High-temperature reactor (HTR)

Nuclear fission and types of nuclear reactor
• Like all other thermal power plants, nuclear reactors work by generating heat, which boils water to produce steam to drive the turbogenerators. In a nuclear reactor, the heat is the product of nuclear fission.
• Uranium and plutonium nuclei in the fuel are bombarded by neutrons and split usually into two smaller fragments, releasing energy in the form of heat, as well as more neutrons. Some of these released neutrons then cause further fissions, thereby setting up a chain reaction.
• The neutrons released are ‘fast’ neutrons, with high energy. These neutrons need to be slowed down by a moderator for the chain reaction to occur.
• In BWRs (boiling water reactors) and PWRs (pressurized water reactors), collectively known as LWRs (light water reactors), the light water (H2O) coolant is also the moderator.
• PHWRs (pressurized heavy water reactors) use heavy water (deuterium oxide, D2O) as moderator. Unlike LWRs, they have separate coolant and moderator circuits. Coolant may be light or heavy water.
• The chain reaction is controlled by the use of control rods, which are inserted into the reactor core either to slow or stop the reaction by absorbing neutrons.
• In the Candu PHWR, fuel bundles are arranged in pressure tubes, which are individually cooled. These pressure tubes are situated within a large tank called a calandria containing the heavy water moderator. Unlike LWRs, which use low enriched uranium, PHWRs use natural uranium fuel, or it may be slightly enriched. Candu reactors can be refuelled whilst on-line.
• A PWR generates steam indirectly: heat is transferred from the primary reactor coolant, which is kept liquid at high pressure, into a secondary circuit where steam is produced for the turbine.

• A BWR produces steam directly by boiling the water coolant. The steam is separated from the remaining water in steam separators positioned above the core, and passed to the turbines, then condensed and recycled.
• In GCRs (gas-cooled reactors) and AGRs (advanced gas-cooled reactors) carbon dioxide is used as the coolant and graphite as the moderator. Like heavy water, a graphite moderator allows natural uranium (in GCRs) or very low-enriched uranium (in AGRs) fuel to be used.
• The LWGR (light water graphite reactor) has enriched fuel in pressure tubes with the light water coolant. These are surrounded by the graphite moderator. More often referred to as the RBMK.
• In FBR (fast breeder reactor) types, the fuel is a mix of oxides of plutonium and uranium; no moderator is used. The core is usually surrounded by a ‘fertile blanket’ of uranium-238. Neutrons escaping the core are absorbed by the blanket, producing further plutonium, which is separated out during subsequent reprocessing for use as fuel. FBRs normally use liquid metal, such as sodium, as the coolant at low pressure.
• High temperature gas-cooled reactors (HTGRs), not yet in commercial operation, offer an alternative to conventional designs. They use graphite as the moderator and helium as the coolant. HTGRs have ceramic-coated fuel capable of handling temperatures exceeding 1600ºC and gain their efficiency by operating at temperatures of 700-950ºC. The helium can drive a gas turbine directly or be used to make steam.
• While the size of individual reactors is increasing to well over 1200 MWe, there is growing interest in small units down to about 10 MWe.
Reactor facts and performance
• Electricity was first generated by a nuclear reactor on 20 December 1951 when the EBR-I test reactor in the USA lit up four light bulbs.
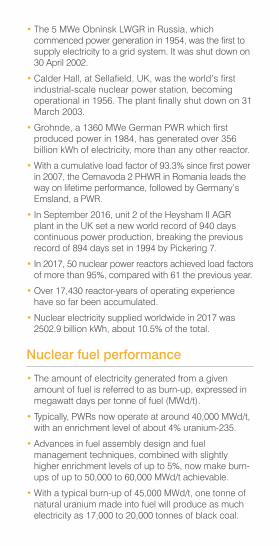
• The 5 MWe Obninsk LWGR in Russia, which commenced power generation in 1954, was the first to supply electricity to a grid system. It was shut down on 30 April 2002.
• Calder Hall, at Sellafield, UK, was the world’s first industrial-scale nuclear power station, becoming operational in 1956. The plant finally shut down on 31 March 2003.
• Grohnde, a 1360 MWe German PWR which first produced power in 1984, has generated over 356 billion kWh of electricity, more than any other reactor.
• With a cumulative load factor of 93.3% since first power in 2007, the Cernavoda 2 PHWR in Romania leads the way on lifetime performance, followed by Germany’s Emsland, a PWR.
• In September 2016, unit 2 of the Heysham II AGR plant in the UK set a new world record of 940 days continuous power production, breaking the previous record of 894 days set in 1994 by Pickering 7.
• In 2017, 50 nuclear power reactors achieved load factors of more than 95%, compared with 61 the previous year.
• Over 17,430 reactor-years of operating experience have so far been accumulated.
• Nuclear electricity supplied worldwide in 2017 was 2502.9 billion kWh, about 10.5% of the total.
Nuclear fuel performance
• The amount of electricity generated from a given amount of fuel is referred to as burn-up, expressed in megawatt days per tonne of fuel (MWd/t).
• Typically, PWRs now operate at around 40,000 MWd/t, with an enrichment level of about 4% uranium-235.
• Advances in fuel assembly design and fuel management techniques, combined with slightly higher enrichment levels of up to 5%, now make burn-ups of up to 50,000 to 60,000 MWd/t achievable.
• With a typical burn-up of 45,000 MWd/t, one tonne of natural uranium made into fuel will produce as much electricity as 17,000 to 20,000 tonnes of black coal.
Cha
ract
eris
ticP
WR
BW
RP
HW
R (
Can
du)
LWG
R (
RB
MK
)A
GR
FBR
Act
ive
core
hei
ght,
m4.
23.
75.
97.
08.
31.
0
Act
ive
core
dia
met
er, m
3.4
4.7
6.0
11.8
9.3
3.7
Fuel
inve
ntor
y, to
nnes
104
134
9019
211
032
Vess
el ty
peC
ylin
der
Cyl
inde
rTu
bes
Tube
sC
ylin
der
Cyl
inde
r
Fuel
UO
2U
O2
UO
2U
O2
UO
2Pu
O2/U
O2
Form
Enric
hed
Enric
hed
Nat
ural
Enric
hed
Enric
hed
-
Coo
lant
H2O
H2O
D2O
H2O
CO
2So
dium
Stea
m g
ener
atio
nIn
dire
ctD
irect
Indi
rect
Dire
ctIn
dire
ctIn
dire
ct
Mod
erat
orH
2OH
2OD
2OG
raph
iteG
raph
iteN
one
Num
ber o
pera
ble*
290
7549
1514
3
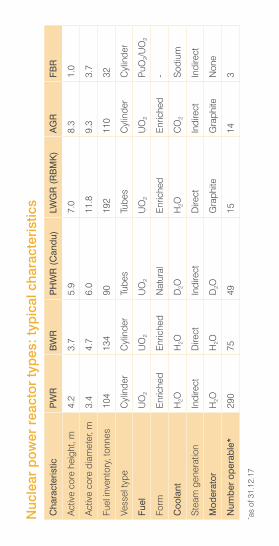
Nuc
lear
pow
er r
eact
or ty
pes:
typi
cal c
hara
cter
istic
s
* as
of 3
1.12
.17


Uranium, from Mine to Mill

Mineralogy and ore grade
• Uraninite is the most common primary uranium mineral; others of economic interest include coffinite and brannerite. The most common form of uraninite is pitchblende, which is sometimes associated with colourful secondary uranium minerals derived from weathering.
• The average abundance of uranium in the Earth’s crust is 2.7 parts per million, making it more common than tin.
• The concentration of uranium needed to form an economic mineral deposit varies widely depending on its geological setting and physical location. Average ore grades at operating uranium mines range from 0.03% U to as high as 24% U, but are most frequently less than 1% U. Lower uranium grades are viable as by-product.
Mining methods
• Open pit: used to mine relatively shallow deposits. Economics depend on the ratio of ore to waste, higher grade ores having lower ratios.
• Underground: used to mine deposits too deep for open pit mining. For mining to be viable, these deposits must be comparatively high grade.
• In-situ leach: this method is applicable only to sandstone-hosted uranium deposits located below the water table in a confined aquifer. The uranium is dissolved in acid or alkali injected into and recovered from the aquifer by means of wells. The geology remains undisturbed.
• By-product: uranium often occurs in association with other minerals such as gold (South Africa), phosphates (USA and elsewhere) and copper (Australia).

Min
eC
ount
ryM
ain
owne
rM
ine
type
Prod
uctio
n (tU
)%
of w
orld
pr
oduc
tion
2016
2017
2016
2017
Cig
ar L
ake
Can
ada
Cam
eco
Con
vent
iona
l66
6669
2411
12
McA
rthur
Riv
erC
anad
aC
amec
oC
onve
ntio
nal
6945
6193
1110
Tortk
uduk
/ M
uyun
kum
Kaz
akhs
tan
Ora
noIS
L40
1735
196
6
Oly
mpi
c D
amA
ustra
liaB
HP
Bill
iton
By-
prod
uct
(cop
per)
3233
2381
54
Bud
enov
skoy
e 2
Kaz
akhs
tan
Ura
nium
One
/Kaz
atom
prom
ISL
2081
2352
34
Inka
iK
azak
hsta
nC
amec
oIS
L22
9121
164
4
Som
air
Nig
erO
rano
Con
vent
iona
l21
6421
163
4
Sout
h In
kai
Kaz
akhs
tan
Ura
nium
One
/Kaz
atom
prom
ISL
2056
1982
33
Ran
ger
Aus
tralia
Rio
Tin
toC
onve
ntio
nal
1994
1945
33
Bud
enov
skoy
e 1,
3 &
4K
azak
hsta
nU
rani
um O
ne/K
azat
ompr
omIS
L17
4319
313
3
Tota
l fro
m to
p m
ines
33,1
9031
,458
5353
Top
uran
ium
min
es in
201
6-20
17
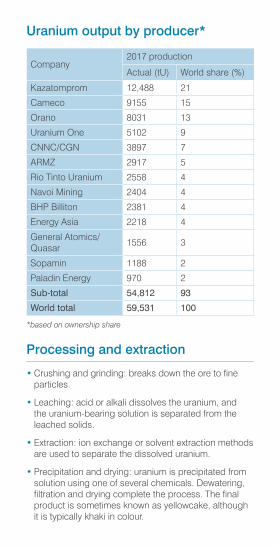
Company2017 production
Actual (tU) World share (%)
Kazatomprom 12,488 21
Cameco 9155 15
Orano 8031 13
Uranium One 5102 9
CNNC/CGN 3897 7
ARMZ 2917 5
Rio Tinto Uranium 2558 4
Navoi Mining 2404 4
BHP Billiton 2381 4
Energy Asia 2218 4
General Atomics/Quasar 1556 3
Sopamin 1188 2
Paladin Energy 970 2
Sub-total 54,812 93
World total 59,531 100
Uranium output by producer*
*based on ownership share
Processing and extraction
• Crushing and grinding: breaks down the ore to fine particles.
• Leaching: acid or alkali dissolves the uranium, and the uranium-bearing solution is separated from the leached solids.
• Extraction: ion exchange or solvent extraction methods are used to separate the dissolved uranium.
• Precipitation and drying: uranium is precipitated from solution using one of several chemicals. Dewatering, filtration and drying complete the process. The final product is sometimes known as yellowcake, although it is typically khaki in colour.

World uranium production (2017)
Mining method (2017)
5% Others
5% Russia
4% Uzbekistan
2% USA
39% Kazakhstan
22% Canada
13% All Africa
10% Australia
0 10 20 30 40 50
In-situ leach50%
By-product4%
Conventional46%

Milling
Simplified flow chart of uranium ore processing from mining to the production of concentrate. These processes are commonly known as milling and the product – uranium oxide concentrate – is the raw material for making nuclear fuel.
Crushing & grinding
Leaching
Precipitate uranium
Separate solids
Drying
Uranium oxide concentrate, U3O8 (yellowcake) contains approximately 85%
uranium by weight
Open pitmining
Underground mining
Separate solidsTailings disposal
In-situleach mining
Extract Uin liquor
Recyclebarren liquor
Recyclebarren liquor

Country 2017production (tU)
Uraniumresources (tU)*<US$130/kg
Australia 5882 1,688,000
Canada 13,116 486,000
China 1885 173,300
India 421 Not available
Kazakhstan 23,391 309,100
Namibia 4224 251,700
Niger 3449 285,800
Pakistan 45 Not available
Russia 2917 285,500
South Africa 308 338,100
Ukraine 550 95,100
USA 940 86,400
Uzbekistan 2404 78,000
Other 0 606,900
Total 59,531 4,683,900
Uranium production and resources
*OECD/NEA Reasonably Assured Resources categorySources: World Nuclear Association & OECD/NEA

Uranium history
• In 1789, Martin Klaproth, a German chemist, isolated an oxide of uranium while analyzing pitchblende samples from silver mines in Bohemia.
• For over 100 years uranium was mainly used as a colorant for ceramic glazes and for tinting in early photography. Uranium was produced in Bohemia, Cornwall (UK), Portugal and Colorado and total production amounted to about 300-400 tonnes.
• The discovery of radium in 1898 by Marie Curie led to the construction of a number of radium extraction plants processing uranium ore (radium is a decay product of uranium).
• Prized for its use in cancer therapy, radium reached a price of 750,000 gold francs per gram in 1906 (US$10 million). It is estimated that 754 grams were produced worldwide between 1898 and 1928. Uranium itself was treated simply as a waste material.
• With the discovery of nuclear fission in 1939, the uranium industry entered a new era. On 2 December 1942, the first controlled nuclear chain reaction was achieved in Chicago. Although nuclear fission was first used for military purposes, the emergence of civil nuclear power reactors in the 1950s demonstrated the enormous potential of nuclear fission for supplying electricity.
• From a small beginning in 1951, when four lightbulbs were lit with nuclear electricity, the nuclear power industry now supplies about 10.5% of world electricity.
• Between the mid-1940s and the late-1980s, uranium supply exceeded reactor requirements. However, the gap between requirements and production since 1990 has been filled by secondary supplies, mostly from stockpiles including military inventory. Going forward, the gap will increasingly be filled by higher primary production, as secondary supplies diminish.

Fron
t cov
er im
age:
ED
F En
ergy

World Nuclear AssociationTower House10 Southampton StreetLondon WC2E 7HA UK
+44 (0)20 7451 [email protected]
Nuclear Power, Energy and the EnvironmentHow much carbon dioxide does each energy source emit? Which countries have the highest and lowest emissions of CO2? How can nuclear energy help combat climate change?
RadiationWhat is radiation? Where does it come from? How can it be measured? What steps can be taken to protect against high doses of radiation?
Nuclear Power Reactor CharacteristicsHow do nuclear power plants work? What are the different types of reactors in use? Which countries have chosen nuclear to meet their electricity needs?
Uranium, Mine to MillWhere does uranium come from? Which countries are the largest producers? How is uranium extracted and processed to produce nuclear fuel?
Pocket Guide 2018/19 Edition© World Nuclear Association 2018 Registered in England and Wales, company number 01215741
This pocket guide covers: