Report of the Committee on Financial Sector Statistics - MoSPI
165
-
Upload
khangminh22 -
Category
Documents
-
view
2 -
download
0
Transcript of Report of the Committee on Financial Sector Statistics - MoSPI


Request for comments and suggestions on the Reports of Committees constituted by NSC
NSCs vide letter No.8(64)/2010-NSC dated 05.10.2016 constituted 5 professional
committees to examine potential improvement in methodology and database related issues pertaining to estimation of GDP within the broad framework of SNA 2008. These committees are 1) Committee on Real Sector Statistics, 2) Committee on Financial Sector Statistics, 3) Committee on Fiscal Statistics, 4) Committee on Online Reporting System and 5) Committee on Analytics.
Four of the above committees submitted their reports in the 102nd Meeting of the National Statistical Commission held on 16-17th July, 2018 under the Chairmanship of Dr R B Barman, Chairperson, NSC at Sardar Patel Bhawan.
The draft reports of these committees are placed in the public domain to facilitate wider public consultation. The NSC welcomes comments and suggestions on the reports at the following address by 30th September, 2018:
National Statistical Commission NSC Secretariat, Room No-305, 3rd Floor, C-Wing, Pushpa Bhawan, New Delhi – 110062 Email: [email protected]
It may be noted that the NSC does not necessarily agree with the views, data and other contents of the reports.


Index
Chapter No Chapter Name/ Section/ Sub-Section/ Annex Page No.
Preface vi - ix
List of Abbreviations x - xiii
Chapter 1 Background 1 - 28
Section I : Introduction 1
Section II : Sectors and Instruments Covered in India’s
Flow of Funds Accounts 4
II.1 Institutional Sectors 4
II.1.1 Financial Corporations 5
II.1.2 Non-Financial Corporations 6
II.1.3 General Government (GG) 6
II.1.4 Rest of the World (RoW) 6
II.1.5 Household and Non-profit institutions
Serving Households (NPISH) 7
II.2 Instruments Covered 7
Section III : Approach of the Committee and Brief
Proceedings 7
Section IV : International Position on Compilation of FoF
Accounts 9
Section V : Organisation of the Report 11
Annex 1.1 : Committee on Financial Sector Statistics - List
of Members 12
Annex 1.2 : Target and Encouraged Sectors for
Dissemination of Financial Accounts Data 13
Annex 1.3 : Target and Encouraged Instruments for
Dissemination of Financial Accounts 15
Annex 1.4 : Availability of Data on Major Instruments for
all Major Sectors of the Economy 16
Annex 1.5 : Sectors and Instruments for Collecting
FWTW Information – Quarterly and Annual 17
Annex 1.6 : Detailed Template for Collecting FWTW
Information – Quarterly and Annual 18

Report of the Committee on Financial Sector Statistics, 2018
Index
Chapter No Chapter Name/ Section/ Sub-Section/ Annex Page No.
Chapter 2 Recommendations of Earlier Committees - Implementation 29 - 50
Status
Section I : Introduction 29
Section II : High Level Committee on Estimation of Savings
and Investment (2009) – Relevant
Recommendations and Implementation Status 30
Section III : Recommendations of the Working Group (WG) on
Compilation of FoF Accounts of the Indian
Economy (2015) - Implementation Status 39
Section IV : Role of the Committee 50
Chapter 3 Current Status of the Compilation of the Flow of Funds 51 - 89
Accounts of the Indian Economy
Section I : Introduction 51
Section II : Sources of Data 52
Section III : Issues in FoF Compilation and Suggestions 52
Section IV : Compilation of FoF for Private Corporate
Business Sector – An Exploratory Analysis 60
IV.1 Framework of the Analysis 60
IV.2 Estimates of Select Variables for 2014-15 and
2015-16 61
IV.3 Scope of Further Work 63
Section V : Statistical Discrepancies in the RBI and the CSO
Estimates of Financial Accounts 64
Section VI : Quarterly Compilation of FoF 68
VI.1 Methodology 69
VI.2 Data Issues 69
VI.3 Discrepancy in Quarterly and Annual Data 71
Section VII: Strengthening of Data Collection System (for
Macro-micro Linkages) and Data Dissemination 71
VII.1 Additional Fields in the Existing Databases 72
VII.2 Integrated Data Warehouse Networks 73
VII.3 Strengthening of Statistics on Institutional
Sectors with Higher Frequency 73
VII.4 Other Recommendations 75
Annex 3.1 : Flow of Fund Accounts of the Indian Economy:
Sources of Data 77
Annex 3.2 A: Model Equation 80
Annex 3.2 B: Regression Results for the Year 2014-15 82
[iii]

Report of the Committee on Financial Sector Statistics, 2018
Index
Chapter No Chapter Name/ Section/ Sub-Section/ Annex Page No.
Annex 3.2 C: Regression Results for the Year 2015-16 86
Chapter 4 Flow of Funds compilation for Local Governments 90 - 121
Section I : Introduction 90
I.1 SNA 2008 on Local Government 90
I.2 Efforts of the RBI in Compiling Local Bodies
Data 90
I.3 Structure and Accounting Systems of Local
Bodies in India 91
I.3.1 Rural Local Bodies 91
I.3.2 Urban Local Bodies 92
I.4 Approach of the Committee on Capturing
Local bodies Data 93
Section II : Issues in Data Collection from Local Bodies in India 93
II.1 Availability of Rural Local Bodies’ Data 93
II.2 Discussions with Government Officials 96
II.2.1 Issues in Fund Flow Mechanism 96
II.2.2 Issues Relating to Technical Support
and Multiple Software 96
II.2.3 Other Issues 97
Section III : Status of Data Collection by the CSO 97
III.1 Scope for Improvement 98
Section IV : Format for Capturing Local Bodies’ Data for FoF 99
Section V : Discussions with the Representatives of
AIILSG and DMA Maharashtra 99
Section VI : Way Ahead 100
Annex 4.1 : Major Items Covered under the RBI Survey on
“Finances of Local Authorities” 103
Annex 4.2 : Common template for Combined Requirement of
Compilation of National Accounts (Sequence of
Accounts) and FoF from Local Bodies 107
Annex 4.3 : Flow of Funds Data for Local Bodies in
[iv]

Report of the Committee on Financial Sector Statistics, 2018
Index
Chapter No Chapter Name/ Section/ Sub-Section/ Annex Page No.
Himachal Pradesh 121
Chapter 5 Estimating Flow of Funds at State Level: An Approach and 122 - 138
Some Issues
Section I : Introduction 122
Section II : Conceptual Challenges for Measuring FoF at State
Level 123
Section III : Data Availability and Gaps 130
Section IV : Recommendations and Future Directions 136
Chapter 6 Recommendations 139 - 147
[v]

Report of the Committee on Financial Sector Statistics, 2018
PREFACE
In early 2000, the Government of India appointed the National Statistical
Commission, first of its kind, to critically examine the deficiencies of the present
statistical system and suggest remedial actions with an aim to bringing out adequate
data of high quality with the desired timeliness. The Commission made wide ranging
recommendations covering all the sectors of the Indian economy. Subsequently, based
on the recommendation of Dr. C. Rangarajan, the then Chairman of the Economic
Advisory Council, the GoI made a permanent National Statistical Commission (NSC), an
autonomous body that would reduce the problems faced by the statistical agencies in
the country in relation to collection and dissemination of data.
The present NSC (Chairman: Dr. R.B. Barman) in 2016 appointed five
professional Committees covering real sector statistics, financial sector statistics, fiscal
statistics, online reporting system and analytics. I have the privilege of chairing the
Committee on Financial Sector Statistics (CFSS).
In a mature advanced economy, the financial sector statistics provide the counter
part of the real sector transactions and thereby a better understanding of the actual
working of the economy. In a developing economy like India, where the structure keeps
changing significantly over time and where several segments are not operating in a
formal environment, the financial and real sector flows are not likely to match
satisfactorily. Statistics in both the sectors are inevitably evolving and maturing over
time. We have, therefore, to keep revising and updating concepts, methodologies and
data sources to remain relevant and sensitive to the information needs of policy making
and academic research. The present Committee is an effort in this direction.
The economy is conceptualized as consisting of four broad sectors, viz. the business
sector, government sector, foreign sector and the household sector. The first three sectors
are independently defined with clear scope and content. The household sector is the
residual sector incorporating everything other than the first three sectors defined as
comprehensively as possible. The interactions and interrelations among these four sectors
provide extremely useful framework for the policy and academic research.
[vi]
Report of the Committee on Financial Sector Statistics, 2018
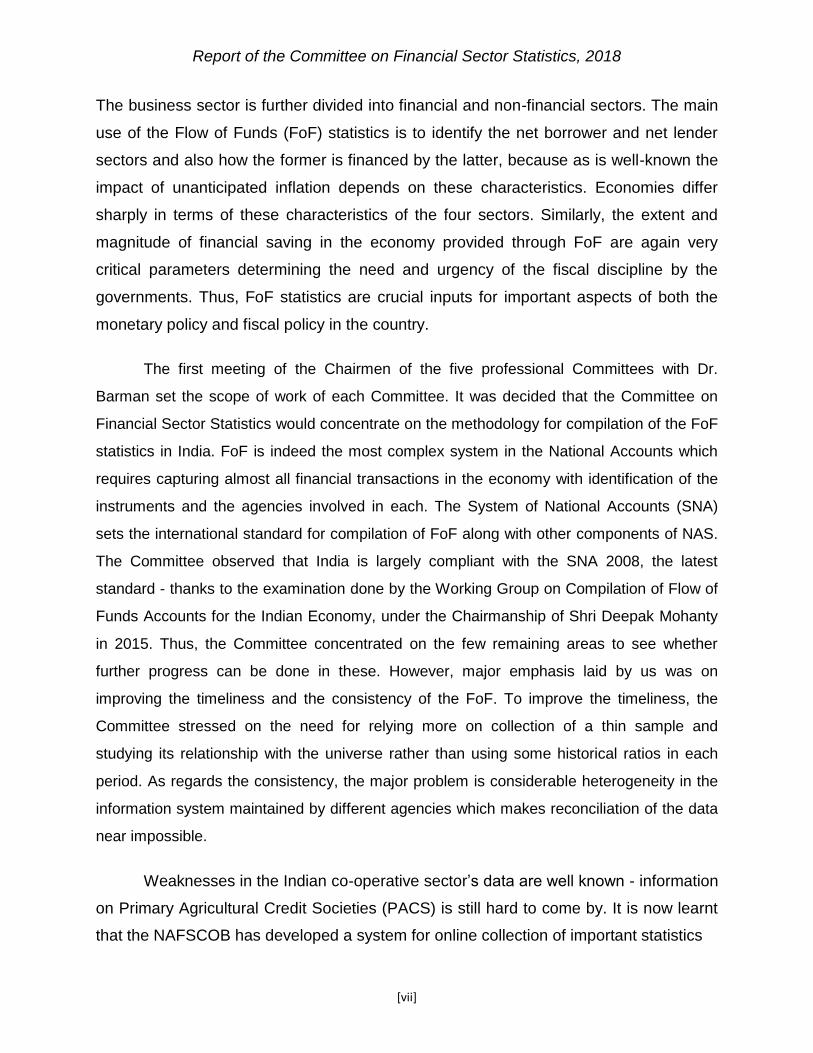
The business sector is further divided into financial and non-financial sectors. The main
use of the Flow of Funds (FoF) statistics is to identify the net borrower and net lender
sectors and also how the former is financed by the latter, because as is well-known the
impact of unanticipated inflation depends on these characteristics. Economies differ
sharply in terms of these characteristics of the four sectors. Similarly, the extent and
magnitude of financial saving in the economy provided through FoF are again very
critical parameters determining the need and urgency of the fiscal discipline by the
governments. Thus, FoF statistics are crucial inputs for important aspects of both the
monetary policy and fiscal policy in the country.
The first meeting of the Chairmen of the five professional Committees with Dr.
Barman set the scope of work of each Committee. It was decided that the Committee on
Financial Sector Statistics would concentrate on the methodology for compilation of the FoF
statistics in India. FoF is indeed the most complex system in the National Accounts which
requires capturing almost all financial transactions in the economy with identification of the
instruments and the agencies involved in each. The System of National Accounts (SNA)
sets the international standard for compilation of FoF along with other components of NAS.
The Committee observed that India is largely compliant with the SNA 2008, the latest
standard - thanks to the examination done by the Working Group on Compilation of Flow of
Funds Accounts for the Indian Economy, under the Chairmanship of Shri Deepak Mohanty
in 2015. Thus, the Committee concentrated on the few remaining areas to see whether
further progress can be done in these. However, major emphasis laid by us was on
improving the timeliness and the consistency of the FoF. To improve the timeliness, the
Committee stressed on the need for relying more on collection of a thin sample and
studying its relationship with the universe rather than using some historical ratios in each
period. As regards the consistency, the major problem is considerable heterogeneity in the
information system maintained by different agencies which makes reconciliation of the data
near impossible.
Weaknesses in the Indian co-operative sector’s data are well known - information
on Primary Agricultural Credit Societies (PACS) is still hard to come by. It is now learnt
that the NAFSCOB has developed a system for online collection of important statistics
[vii]

Report of the Committee on Financial Sector Statistics, 2018
related to PACS. Besides the co-operative sector, another weak area is the local
government sector comprising of large number of rural panchayats. Despite the
emphasis given by successive Finance Commissions, not much progress has been
made in development of a uniform system of double entry book-keeping at the
panchayat level. The Committee has devised a format for collection of data from the
local bodies that would serve the requirement of the CSO for compilation of the GDP
and the RBI for compilation of the FoF. The Committee also looked at two other
refinements. One is the compilation of the FoF at the state level; and the other is
release of FoF at quarterly frequency covering the financial sector to start with.
While all members of this Committee have substantially enriched the
deliberations to their best abilities, I must acknowledge significant contribution made by
the non-official members – Dr. K.G.K. Subba Rao, Dr. Deepak Sethia, Dr. N.R.
Bhanumurthy, and Dr. J.R. Varma. Their inputs have enhanced the quality of our
recommendations. Shri V.K. Srivastava, Director, DEPR, Shri A. Shukla, Assistant
Adviser, DEPR and Dr. Tarun Saxena, Assistant Adviser, DSIM at RBI also contributed
immensely to the discussions and content of the report of the Committee. Shri T.
Rajeshwar Singh, Assistant Adviser, DSIM helped the Committee for the exploratory
econometric exercise with the corporate sector data.
The Committee benefitted from the insights provided by the members of AIl India
Institute of Local Self-Government (AIISLG), specially invited for one of the meetings,
regarding the working of the urban local bodies. Similarly, an official from the PFRDA invited
for one of the meetings of the Committee shared the information base on NPS and other
Pension accounts maintained by them. The Secretariat at the DSIM, RBI arranged for all
the logistics during the tenure of the Committee and has played a commendable role in
bringing out the proceedings of the Committee at regular intervals as also in finalisation of
the Report of the Committee under the able and effective guidance of Dr. Goutam
Chatterjee, the Member Secretary of the Committee. Contributions made by Shri Haridwar
Yadav, Shri Vivek Kumar, Assistant Advisers and Shri T.B. Sreejith, Research Officer in
DSIM during finalisation of the Report are acknowledged.
[viii]

Report of the Committee on Financial Sector Statistics, 2018
It is hoped that the recommendations of the Committee will be useful for improving
the quality of the FoF for India in line with International prescriptions. RBI may work along
the lines suggested herein while compiling the next release of the FoF to the extent possible
and that is why we have not attempted such an exercise as a part of this Report.
Ravindra H. Dholakia Date: May 15, 2018
[ix]

Report of the Committee on Financial Sector Statistics, 2018
Abbreviations
ADB Asian Development Bank
ADC Autonomous District Council
AG Accountant General
AIDIS All-India Debt and Investment Survey
AIF Alternative Investment Fund
AIFI All India Financial Institutions
AIILSG All India Institute of Local Self Government
ASI Annual Survey of Industries
BoP Balance of Payments
CAG Comptroller and Auditor General
CCIL Clearing Corporation of India Ltd
CDS Credit Default Swaps
CDSL Central Depository Services (India) Ltd
CFC Central Finance Commission
CFSS Committee on Financial Sector Statistics
CGD Centre for Good Governance
CIN Corporate Identification Number
CSO Central Statistics Office
DCBR Department of Co-operative Banking Regulation
DCCB District Central Co-operative Banks
DEPR Department of Economic and Policy Research
DES Directorate of Economics and Statistics
DGI Data Gap Initiatives
DMA Directorate of Municipal Administration
DNBR Department of Non-Banking Regulation
DNBS Department of Non-Banking supervision
DSIM Department of Statistics and Information Management
EPFO Employees’ Provident Fund Organisation
FC Finance Commission
FCA Foreign Currency Assets
FETERS Foreign Exchange Transactions Electronic Reporting System
[x]
Report of the Committee on Financial Sector Statistics, 2018
Abbreviations
FIDD Financial Inclusion and Development Department
FoF Flow of Funds
FPO Farmer Producer Organisation
FRA Forward Rate Agreement
FSS Financial Sector Statistics
GG General Government
GIS Geographic information system
GoI Government of India
GP Gram Panchayat
GPMS Gram Panchayat Management System
GSDP Gross State Domestic product
GVA Gross Value Added
HFC Housing Finance Company
HFCs-D Deposit-taking Housing Finance Companies
HFCs-ND Non Deposit-taking Housing Finance Companies
HLC High Level Committee (HLC) on Estimation of Savings and Investment (2009)
IBRD International Bank for Reconstruction and Development
IDA International Development Association
IFC International Finance Corporation
IIP International Investment Position
IMF International Monetary Fund
IRDA Insurance Regulatory and Development Authority
IRS Interest Rate Swap
LAB Local Area Banks
LB Local Bodies
LEI Legal Entity Identifier
MCA Ministry Of Corporate Affairs
MFI Micro-Finance Institutions
MGNREGS Mahatma Gandhi National Rural Employment Guarantee Scheme
MMFSC Manual of Monetary and Financial Statistics Compilation
MMMF Money Market Mutual Funds
[xi]

Report of the Committee on Financial Sector Statistics, 2018
Abbreviations
MoPR Ministry of Panchayati Raj
MOSPI Ministry of Statistics and Programme Implementation
MP Mandal Parishad
MSME Micro, Small and Medium Enterprises
NAAD National Accounts Analysis Division
NABARD National Bank For Agriculture And Rural Development
NAFSCOB National Federation of State Cooperative Banks
NB Net Borrowing
NBFCs Non-Banking Financial Companies
NBFCs-D Deposit-taking Non-Banking Financial Companies
NBFCs-ND Non Deposit-taking Non-banking Financial Companies
NBFCs-ND-SI Systemically Important Non Deposit-taking Non-banking Financial Companies
NBS National Balance Sheet
NFI Net Financial Investment
NHB National Housing Bank
NIC National Industrial Classification
NL Net Lending
NMMMF Non-Money Market Mutual Funds
NPISHs Non-Profit Institutions serving Households
NPS National Pension System
NSC National Statistical Commission
NSDL National Securities Depository Ltd.
NVA Net Value Added
OCVA Other Changes in the Volume of Assets
ODC Other Depository Corporations
OECD Organization for Economic Cooperation and Development
OTC Over-the-Counter
PACS Primary Agricultural Credit Society
PCARDB Primary Cooperative Agriculture and Rural Development Banks
PCB Primary Co-operative Banks
PFRDA Pension Fund Regulatory and Development Authority
[xii]

Report of the Committee on Financial Sector Statistics, 2018
Abbreviations
PMAY Prime Minister Awas Yojana
PRI Panchayati Raj Institutions
PRIASoft Panchayati Raj Institutions Accounting Software
PS Panchayat Samiti
PUC Paid-up Capital
RBI Reserve Bank of India
RCS Registrar of Cooperative Societies
RLB Rural Local Body
RoI Rest of India
RoW Rest of the World
RTA Registrars and Transfer Agents
SCARDB State Cooperative Agriculture and Rural Development Bank
SCB Scheduled Commercial Banks
SDDS Special Data Dissemination Standard
SDR Special Drawing Rights
SEBI Securities and Exchange Board of India
SFC State Finance Commission
SNA System of National Accounts
SOA Sequence of Accounts
StCB State Co-operative Banks
UCB Urban Co-operative banks
ULB Urban Local Body
ULIP Unit Linked Insurance Plan
WG Working Group on Compilation of FoF Accounts of the Indian Economy (2015)
WUA Water Users Association
ZP Zilla Parishad
[xiii]

Report of the Committee on Financial Sector Statistics, 2018
Chapter 1
Background
Section I: Introduction
1.1 The Sequence of Accounts (SOA) in the System of National Accounts (SNA)
provides an integrated framework connecting production, capital accumulation and
financial accounts, each of which present not only a summary of the respective
accounts, but also linkages from one account to another. The saving-investment gap,
the balancing entry in the capital accumulation account, is the connecting link to the
financial accounts. The financial accounts permit identification of net borrowers and
lenders, along with the size of the surplus or deficit at the sectoral level. The financial
accounts further explain how net lending (NL) or net borrowing (NB) is effected by
means of changes in holding of various credit instruments. However, details on who
is financing whom and through which credit instrument cannot be identified at this
level. Flow of Funds (FoF) accounts answer these questions by providing structure of
the sources and the uses of funds of different sectors of the economy and the credit
instruments by means of which inter-sectoral transfer of funds (from-whom-to-whom
- --FWTW) takes place. When credit instruments are arranged according to the order
of liquidity, and for each credit instrument, the suppliers and the receivers are
identified, the net financial deficit of the deficit sectors as also their reliance on other
sectors can be analysed. Similarly, the net surplus of the surplus sectors and their
role in financing other sectors can also be studied. Thus, FoF accounts supplement
financial counterpart in the SOA, and are compiled separately from the accounts of
the institutions covered in each of the sectors.
1.2 FoF accounts serve many useful purposes. As FoF accounts track the flow of money
to and from various sectors, they present a better view of the interconnectedness of
various sectors and the extent of shock that may propagate from one sector of the
economy to another. Transactions in various sub-sectors of the financial sector help in
assessing the nature and pace of financial developments in the economy. These
accounts show how the government finances its deficit or manages its surplus and
acquires financial assets. Given the matrix of inter sectoral disposition of funds, it would
be possible to work out the resources to be mobilised from various
Report of the Committee on Financial Sector Statistics, 2018
sectors for a targeted level of investment. Alternatively, the feasible level of investment
can be worked out for a given structure of saving and the matrix under reference. These
exercises are expected to be useful in financial planning. The transactions of domestic
sectors with the Rest of the World (RoW) sector as compiled in FoF accounts can be
used to check consistency with corresponding parameters derived independently from
the national accounts and the balance of payments (BoP). They also help in analysing
the differential impact of monetary policies (e.g. rate change) on various sectors in the
economy due to their choice of financial instruments.
1.3 The recent financial crisis (2008) highlighted several data gaps that needed to be
filled-in for better assessing the evolution of the economy, one among them being
sectoral coverage of national balance sheet and FoF data with data on non-bank
financial institutions of particular importance. Also, it is envisaged under the G-20 Data
Gap Initiatives (DGI) that maturity wise breakdown of instruments in FoF accounts would
help in assessing maturity risk, sector specific issues in asset liability management,
liquidity management and leverages being enjoyed by the institutional sectors. Further,
information on nominal/ market values of debt securities with details on nonperforming
loans would be useful in identifying the credit risk transfer among various sectors. While
FoF accounts involve the aggregation of a large number of sectors with their detailed
financial transactions, there remains issues of correct valuation of assets; and exclusion
of non-reproducible real assets and human wealth.
1.4 In view of the numerous benefits from FoF accounts, most of the economies
compile these accounts at quarterly/ annual frequencies. The FoF accounts for India
owe their origin to a suggestion of Sir C.D. Deshmukh, the then Union Finance
Minister, in 1955. In 1956, the Central Statistics Office (CSO) initiated preparatory
work along with the Reserve Bank of India (RBI). Based on the pilot exercise
undertaken by Professor H. W. Arndt of the University of Australia in 1959 in a
memorandum entitled ''Financial Flows in the Indian Economy 1951-52 – 1957-58'',
the CSO and the RBI appointed a Working Group on Flow of Funds (Chairman: Shri
P. C. Mathew) to formulate proposals for further work in this direction. The Mathew
Working Group suggested a model set of accounts to be adopted and presented a
consolidated FoF accounts of India for the year 1957-58. Subsequently, the RBI
developed the work further and published the detailed FoF accounts in December
1964 starting covering data from 1951-52 onwards.
[2]

Report of the Committee on Financial Sector Statistics, 2018
1.5 Over the period, significant improvements have been brought about in the
methodology and coverage in line with international standards, particularly the SNA.
These revisions are well chronicled in the Report of the Working Group (WG) on the
compilation of FoF accounts for the Indian Economy (2015). The latest article on FoF
accounts for the Indian Economy for 2015-16 was released in August 2017 along
with detailed statements. The data in the present series (incorporating realignments
in economic sectors as per recommendations of the WG) starts from the year 2011-
12, and as such, it will not be strictly comparable with the data prior to 2011-12.
1.6 With recent emphasis on linking macro data with the underlying micro statistics to
improve its quality, there was a need to review the system for generating
disaggregate data to the extent possible and building the aggregates consistent with
the same. With this background, the National Statistical Commission (NSC), Ministry
of Statistics and Programme Implementation (MOSPI), Government of India vide
order dated October 5, 2016 constituted a professional Committee1 on Financial
Sector Statistics (CFSS), under the Chairmanship of Prof. Ravindra H. Dholakia,
Indian Institute of Management, Ahmedabad with membership of renowned
academicians/ researchers in the field and the institutions involved in supplying data
(List of members in Annex 1.1). The Department of Statistics and Information
Management (DSIM), RBI provided secretarial support to the Committee.
1.7 The terms of reference of the Committee were:
i) To review the existing system for collection, processing of FoF statistics
with a view to suggest measures for an integrated system capturing
granular data;
ii) To explore possibility and suggest appropriate method and mechanism for
providing the estimates at the State level;
1 In all, five professional Committees were constituted to cover the requirement of statistics for estimation of National Accounts Statistics as per SNA 2008 and look into issues of data governance, data integrity and audit trails of a National Statistical System.
[3]

Report of the Committee on Financial Sector Statistics, 2018
iii) To recommend suitable measures to strengthen system and process for
collection, collation and dissemination of these statistics with possibility for
improving timelines;
iv) To take stock of the existing Information Technology deployment for
collection of granular data from primary sources and recommend suitable
measures to establish/revamp system for (1) processing and (2) periodic
audit through deep drive for integrated system;
v) To examine present system for dissemination of data and recommend
measures for improvement consistent with international standard.
1.8 The chapter is organised into five sections. The next section discusses the sectors
and instruments covered under the FoF accounts of India. Approach of the Committee
along with briefs on the proceedings of the Committee are given in Section
III. Section IV delineates the present position of compilation of FoF accounts in other
countries, with special reference to the G-20 DGI. Section V gives an outline of the
Report.
Section II: Sectors and Instruments Covered in India’s Flow of Funds Accounts
1.9 At present (the latest revision effective from 2011-12), the major sectors and
instrument-wise classification; and the associated nomenclature in compilation and
dissemination of India’s FoF accounts are broadly in alignment with SNA 2008.
II.1 Institutional Sectors
1.10 India’s FoF accounts comprises five broad institutional sectors, namely (i)
financial corporations; (ii) non-financial corporations both in public2 and private3
sectors; (iii) general government (GG) - the Central as well as State governments;
(iv) household (HH) sector; and (v) RoW. The household sector includes Non-Profit
Institutions serving Households (NPISHs) as separating the data is problematic.
Constituents of each of these sectors are detailed below.
2 Public non-financial corporations cover central public sector non-departmental non-financial enterprises, state power utilities and port trusts. Other State PSUs are not included.
3 Private non-financial corporations refer to both public and private limited non-financial companies.
[4]

Report of the Committee on Financial Sector Statistics, 2018
II.1.1 Financial Corporations
1.11 Financial corporations have been split into following institutional units:
a) Central Bank – the Reserve Bank of India (RBI),
b) Other depository corporations (ODC) which comprises: (i) scheduled
commercial banks (SCBs), (ii) non-scheduled commercial banks [e.g., the Local Area
Banks (LAB)], (iii) co-operative banks and other co-operative institutions - this sub-
sector includes State Co-operative Banks (StCBs), District Central Co-operative
Banks (DCCBs), Primary / Urban Co-operative banks (PCBs/UCBs), Primary
Agriculture Credit Societies (PACS), State Co-operative Agriculture and Rural
Development Banks (SCARDBs), Primary Co-operative Agriculture and Rural
Development Banks (PCARDBS) and Industrial Co-operative Banks (state / central), (iv) deposit-taking non-banking financial companies (NBFCs-D); this sub-sector
includes all deposit-taking NBFCs registered with the Department of Non-banking
Regulation (DNBR) in the RBI and (v) deposit-taking housing finance companies
(HFCs-D); this sub-sector includes all deposit taking HFCs registered with the
National Housing Bank (NHB).
c) Mutual Funds - this sub-sector includes the mutual funds registered with the
Securities and Exchange Board of India (SEBI).
d) Other financial intermediaries, except insurance corporations and pension &
provident funds – this comprises non-deposit taking NBFCs (NBFC-ND) and non-
deposit taking HFCs (HFCs-ND)
e) All India Financial Institutions (AIFIs) – National Bank for Agriculture and
Rural Development (NABARD), NHB, EXIM Bank and Small Industries Development
Bank of India (SIDBI).
f) Insurance corporations – both life and non-life insurance companies
g) Provident / Pension funds - this sub-sector covers (i) the employees’ provident
fund of the non-government and certain semi-government organisations whose
accounts are not reflected in the budgets of central and state governments, (ii) the
[5]

Report of the Committee on Financial Sector Statistics, 2018
contributory pension funds; (iii) the National Pension System (NPS), and (iv) the
deposit-linked insurance funds maintained by certain trusts of provident funds.
II.1.2 Non-Financial Corporations
1.12 Non-financial corporations have been split into five broad institutional units; i) Non-
Government non-financial companies - this sub-sector comprises all public and private
limited companies registered in India under the Indian Companies Act, 2013 (and the
erstwhile Indian Companies Act, 1956) and branches of foreign companies operating in
India, ii) State Power Utilities and State Electricity Boards; iii) Co-operative non-credit
societies, iv) Government owned Port Trusts, and v) Government Non-departmental
non-financial undertakings (Public non-financial corporations).
II.1.3 General Government (GG)
1.13 General government has been bifurcated into flowing institutional units;
a) Central government b) State Governments and Union Territories
At present, Local Governments’ (rural and urban Local Bodies (LBs)) data are not
separately included in India’s FoF accounts.
II.1.4 Rest of the World (RoW)
1.14 The domestic sectors have transactions with foreign governments, foreign
central banks, foreign commercial banks, non-bank financial institutions, various
international agencies and institutions like International Monetary Fund (IMF),
International Bank for Reconstruction and Development (IBRD), International
Development Association (IDA), Asian Development Bank (ADB), International
Finance Corporation (IFC), foreign non-financial corporations and non-resident
individuals. All transactions of the domestic sectors with foreign units that are
effected through the medium of money and credit are recorded in the accounts of the
RoW. The FoF accounts of the RoW are derived from the BoP statistics, external
debt statistics and international investment position of the Indian economy.
[6]

Report of the Committee on Financial Sector Statistics, 2018
II.1.5 Household and Non-profit Institutions Serving Households (NPISH)
1.15 The household sector comprises all individuals, non-government non-corporate
enterprises of farm business and non-farm business, like, sole proprietorships and
partnerships, and non-profit institutions. Household sector is conceptually a residual
sector. However, during compilation, information on various instruments for this sector
are collated separately, and not derived as residual. In FoF accounts being compiled by
RBI, the household sector figures are obtained either from counterparty’s accounts, or
are estimated from results of surveys conducted by various statistical agencies. While
preparing FWTW tables, an additional ‘other sector’ is introduced to account for the
residuals (which cannot be allocated to any of the five institutional sectors).
II.2 Instruments Covered
1.16 Financial instruments covered in the Indian FoF accounts follows the framework
of SNA 2008 and include (i) monetary gold and special drawing rights (SDRs), (ii)
currency and deposits, (iii) debt securities, (iv) loans and borrowings, (v) equity and
investment funds (such as mutual funds), (vi) insurance, pension and provident
funds, (vii) other accounts (including trade debt) and (viii) other liabilities/ assets and
items not elsewhere classified (NEC), if any. Further disaggregates are shown
wherever required.
Section III: Approach of the Committee and Brief Proceedings
1.17 The Committee held periodic meetings to carry out the task assigned to it. The
Committee noted that the High Level Committee (HLC) on Estimation of Savings and
Investment, 2009 (Chairman: Dr. C. Rangarajan) and more recently, the WG suggested
numerous changes in light of the developments in the financial sector and international
best practices. Thus, in the first meeting of the Committee held on February 15, 2017
at RBI, Ahmedabad, the Chairman suggested that the Committee may look into the
reasons for incomplete implementation of recommendations of the above reports and
suggest a way forward. Dr. R.B. Barman, Chairman, NSC who attended the first meeting
as a special invitee mentioned that the main distinguishing feature of the present
Committees would be to build a bottom-up system of consistent macro aggregates and
suggest use of integrated Data Warehouse Networks to
[7]

Report of the Committee on Financial Sector Statistics, 2018
facilitate the process of collection, collation and dissemination of data. Thereafter,
members from the RBI and the CSO briefed to the Committee members about:
a) existing methodology for compilation of Flow of Funds Accounts of the Indian
Economy,
b) SOA as envisaged in the SNA 2008 and
c) methodology for computing estimates of output and GVA of the financial
corporations in the National Accounts Statistics (NAS).
1.18 Finally, in that meeting three sub-groups were formed by the Chairman:
a. Sub-group on Compilation of Regional Accounts - The group was
entrusted with the task of identifying data gaps in preparation of state-wise
FoF accounts and suggest measures to resolve the issues. The members of
the sub-group included Prof. Deepak Sethia (Co-ordinator), Prof. N.R.
Bhanumurthy and representative from RBI.
b. Sub-group on Existing Issues in Compilation of FoF and Possible
Solutions for Fixing these Problems - The sub-group was required to
identify weaknesses in the current compilation methodology and recommend
steps to overcome them. The sub-group was also advised to study cross-
country practices regarding compilation of quarterly FoF and suggest ways to
implement the same in India. This sub-group consisted of members from the
Department of Economic and Policy Research (DEPR) of RBI (co-ordinator),
CSO, NABARD, Insurance Regulatory and Development Authority (IRDA) of
India, Ministry of Corporate Affairs (MCA) and SEBI.
c. Sub-group on Government sector – Data on Local Governments -
This sub-group had the remit to focus on filling data gaps in the Government
sector, with special reference to local Governments. The sub-group was
expected to sort out the issues in collecting required data from this sub-sector.
The members of this subgroup included Prof. N.R. Bhanumurthy (co-
ordinator), Prof. Deepak Sethia, representatives of the CSO and the Ministry
of Finance (MoF).
1.19 The second meeting of the Committee was held on May 20, 2017 at the RBI,
Mumbai. In the meeting, co-ordinators of the respective sub-groups made
[8]

Report of the Committee on Financial Sector Statistics, 2018
presentations on some aspects relating to their work area. An approach for estimating
FoF at the State level was presented highlighting limitations in the existing data.
Implementation status of recommendations of the WG was discussed for possible way
ahead. As regards the data of rural local bodies (RLBs), it was brought out that there is
no uniform system in maintaining their accounts and availability of staff is the biggest
constraint. Also, the Committee was apprised of internationally agreed template for
compilation and dissemination of FoF data as part of the G20 DGI. The Committee
considered the issue of mismatches in FoF estimates of the RBI and stock positions as
reflected from sequence of accounts compiled by the CSO.
1.20 The third meeting of the Committee was held on September 29, 2017 at RBI,
Mumbai. Officials from the All India Institute of Local Self Government (AIILSG),
Pension Fund Regulatory and Development Authority (PFRDA) and Mutual Funds
Division of SEBI attended the meeting as special invitees. AIILSG officials pointed
out that annual accounts data of the urban local bodies (ULBs) are not available
uniformly but they may be submitting select key accounting data to the respective
central authority in the State. Further, the Committee considered the status of data
collection on LBs and suggested that the CSO and the RBI may prepare a common
template for data collection for their combined requirement of compilation of National
Accounts and the FoF. The Committee also discussed ways of improving the
availability and timeliness of data for compilation of FoF accounts of India. The sub-
group on formation of regional accounts presented finer details of their approach
paper on estimation of FoF at the State level.
1.21 The final meeting of the Committee held on March 26, 2018 discussed the
draft report thoroughly and finalised its recommendations.
Section IV: International Position on Compilation of FoF Accounts
1.22 While the framework of the SNA has been largely implemented in most of the
advanced economies, its adoption has remained partial in the emerging economies (see
the Report of the WG for more details). Financial crisis of 2008 underscored the need to
focus on the inter-linkages among various sectors of an economy and between them and
their counterparts in the rest of the world. In this regard, preparation of FoF from one
economic sector to another through each of the suggested instruments
[9]

Report of the Committee on Financial Sector Statistics, 2018
gained importance. Recognising this, the G-20 DGI suggested preparation of
financial stocks and flows, sector-wise and instrument-wise, at quarterly and annual
frequencies. It has also prescribed the coverage of the sectors and the instruments
in FoF accounts in two parts, namely, target and encouraged (see details of sectors
in Annex 1.2 and instruments in Annex 1.3). G-20 member countries are required to
provide data for all target sectors on all target instruments.
1.23 A survey conducted by the Organisation for Economic Co-operation and
Development (OECD) for G-20 countries and its key accession partners on
availability of data on major instruments for all major sectors in the economy
revealed that majority of the countries have at least partial annual and quarterly
FWTW data (Annex 1.4). Data on loans and ‘currency and deposits’ are available for
most of the economies and compilation of FoF at annual frequency is most common.
The survey revealed that 13 European Economic Area countries (viz., Austria, Czech
Republic, Estonia, Finland, Greece, Hungary, Ireland, Italy, Lithuania, Norway,
Slovak Republic, Slovenia, Spain and Sweden) have FWTW data in respect of all the
major eight instruments at quarterly as well as at annual frequencies. Australia was
the only non-European country, which was having information on all the major
instruments at quarterly as well as at annual frequencies. Costa Rica and Israel were
having the information at annual frequency, but not at quarterly frequency. Countries
ranging from Belgium, Canada, New Zealand, Switzerland and UK to Colombia,
Brazil and Indonesia reported complete absence of FWTW information. Other
countries (such as France and USA) were having annual/ quarterly FWTW
information only for some instruments. In short, FWTW data availability varies
substantially across countries - even among the group of mature developed
economies – and much progress needs to be made.
1.24 Based on the availability of information, the OECD prepared a number of formats
and discussed these with G-20 participating countries to arrive at a consensus. As per
the present status of discussions, a common format arrived at is given in Annex 1.5. It is
decided that to start with FWTW information may be captured only for major economic
sectors [viz.: (a) Total economy (S1), (b) non-financial corporations (S11), (c) financial
corporations (S12), (d) General Government (S13),
(e) Households and NPISHs (S14_S15), and (f) Rest of the World (S2)]. The
[10]

Report of the Committee on Financial Sector Statistics, 2018
instruments on which information is to be collected for these sectors are grouped into
Tier 1 (targeted/ minimum - included in the template) and Tier 2 (encouraged -
inclusion in the template under consideration). The G-20 countries are required to
submit these information by 2021.
1.25 A comparison of target (Tier 1) instruments being recommended by the G-20
DGI with the present data disseminated by India indicates that it is not disseminating
information on (a) bifurcation of loans as well as debt securities into long- and short-
term, (b) listed shares and (c) financial derivatives. Further, the prescribed template
also aims to have information on eligible instruments separately in domestic and
foreign currencies. The Committee felt that the above shortcoming may be bridged
quickly so that India can comply with the international standard.
Section V. Organisation of the Report
1.26 The report is organised into six chapters. Chapter II reviews the implementation
status of the recommendations made by HLC and the WG. Chapter III on ‘Current
Issues in Compilation of the FoF Accounts of the Indian Economy’ lists out the data
sources, issues in the FoF compilation, important data/ methodological gaps,
reasons for differences in the CSO and the RBI data and their possible reconciliation.
Chapter IV discusses availability of data on local self-government and provides the
Committee’s suggestions regarding collection of data from rural/ urban LBs for
inclusion in the national accounts and the FoF. Feasibility of compiling the FoF
accounts at the State level is explored in Chapter-V. Finally, the recommendations of
the Committee are summarised and consolidated in Chapter VI.
[11]
Report of the Committee on Financial Sector Statistics, 2018
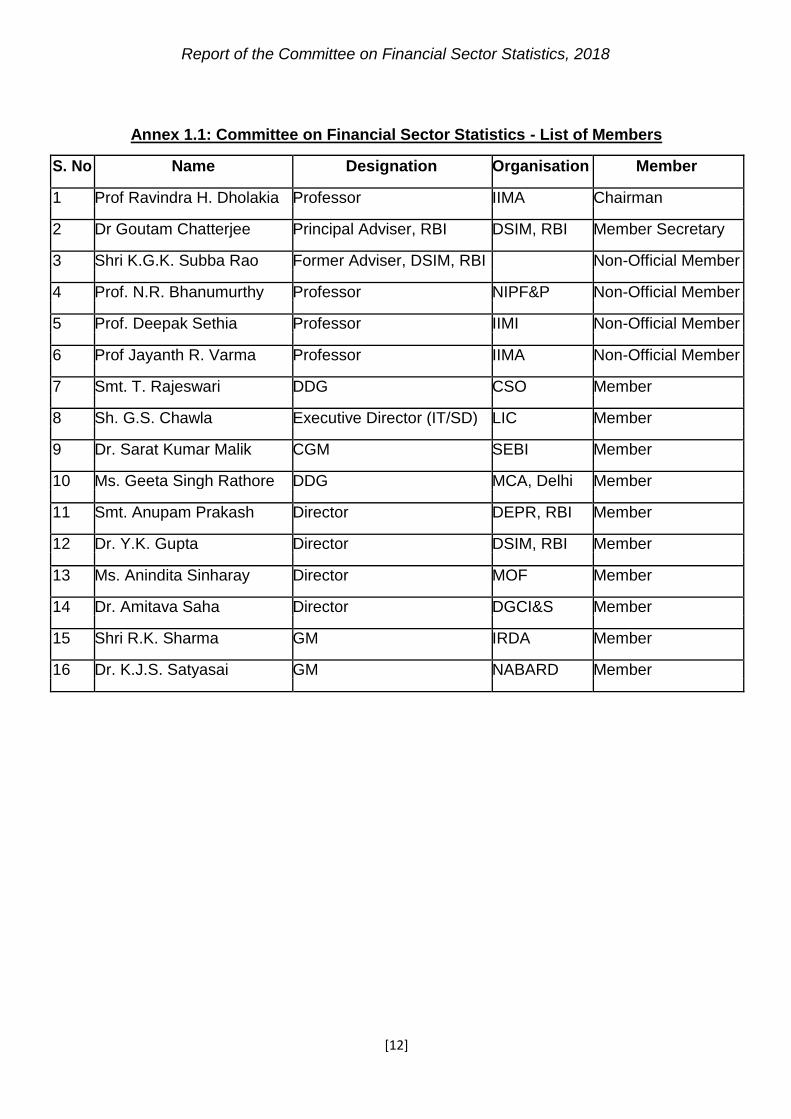
Annex 1.1: Committee on Financial Sector Statistics - List of Members
S. No Name Designation Organisation Member
1 Prof Ravindra H. Dholakia Professor IIMA Chairman
2 Dr Goutam Chatterjee Principal Adviser, RBI DSIM, RBI Member Secretary
3 Shri K.G.K. Subba Rao Former Adviser, DSIM, RBI Non-Official Member
4 Prof. N.R. Bhanumurthy Professor NIPF&P Non-Official Member
5 Prof. Deepak Sethia Professor IIMI Non-Official Member
6 Prof Jayanth R. Varma Professor IIMA Non-Official Member
7 Smt. T. Rajeswari DDG CSO Member
8 Sh. G.S. Chawla Executive Director (IT/SD) LIC Member
9 Dr. Sarat Kumar Malik CGM SEBI Member
10 Ms. Geeta Singh Rathore DDG MCA, Delhi Member
11 Smt. Anupam Prakash Director DEPR, RBI Member
12 Dr. Y.K. Gupta Director DSIM, RBI Member
13 Ms. Anindita Sinharay Director MOF Member
14 Dr. Amitava Saha Director DGCI&S Member
15 Shri R.K. Sharma GM IRDA Member
16 Dr. K.J.S. Satyasai GM NABARD Member
[12]

Report of the Committee on Financial Sector Statistics, 2018
Annex 1.2: Target and Encouraged Sectors for Dissemination of Financial Accounts Data
= Target
= Encouraged
Measure: Current prices; Quarterly data non-seasonally adjusted.
Consolidation: non-consolidated data for all sectors + consolidated data as a target for S13 only (and on an encouraged basis for all other sectors)
Sectors Sector Code Quarterly Annual
Timeliness T+ 4 T+ 9
Total
Total
S1
Economy
Total S11
Total S1100
Total S11001
Of which:
Public non-
Public non-
financial
financial
corporations,
S110011
Domestically corporations
which are part of
controlled domestic
Non-
non- multinationals
financial
Total
S11002
financial corporations
Private,
Of which:
corporations
National private
national
non-financial
non-
corporations,
S110021
financial
which are part of
corporations
domestic
multinationals
Foreign-
controlled
non- Total S11003
financial
corporations
Total S12
Monetary
Total
S121+S122+S123
financial
Central bank
S121
institutions Other deposit-taking S122
corporations
Money market funds
S123
Total S124+S125+S126+S127
Financial
Non-MMF investment funds S124 Other financial Intermediaries
corporations
Other
except Insurance corporations S125
financial
and pension funds
corporations
Financial Auxiliaries
S126
Captive financial institutions and
S127
money lenders
Insurance Total S128+S129 corp. and
Insurance corporations
S128
pension
funds Pension funds S129
Continued…
[13]

Report of the Committee on Financial Sector Statistics, 2018
Annex 1.2: Target and Encouraged Sectors for Dissemination of Financial Accounts Data
= Target
= Encouraged
Measure: Current prices; Quarterly data non-seasonally adjusted.
Consolidation: non-consolidated data for all sectors + consolidated data as a target for S13 only (and on an encouraged basis for all other sectors)
Sectors Sector Code Quarterly Annual
Timeliness T+ 4 T+ 9
Total S12DO
Total S12001
Public Of which:
Public financial
financial
corporations
Domestically
corporations which are part of S120011
domestic
controlled multinationals
financial
Total
S12002
corporations
Of which:
Private National private
national financial
financial
corporations S120021
corporations
which are part of
domestic
multinationals
Foreign- controlled
Total
S12003
financial
corporations
General Total S13 government Of which: Social Security Funds S1314
Total S14+S15
Households
Households
S14
and NPISHs
NPISH s S15
Rest of the
Total
S2
World
[14]

Report of the Committee on Financial Sector Statistics, 2018
Annex 1.3: Target and Encouraged Instruments for Dissemination of Financial Accounts
Targets Encouraged
Instruments Quarterly Annual
F1 Monetary gold and SDRs
F11 Monetary gold
F12 SDRs
F2 Currency and deposits
Of which: Domestic currency
F21 Currency
F22 Transferable deposits
F221 Interbank positions
F229 Other transferable deposits
F29 Other deposits
F3 Debt securities
Of which: Domestic currency
F31 Short-term
F32 Long-term
With remaining maturity of one year and less
With remaining maturity of more than a year
F4 Loans
Of which: Domestic currency
F41 Short-term
F42 Long-term
With remaining maturity of one year and less
With remaining maturity of more than a year
F5 Equity and investment fund shares
F51 Equity
F511 Listed shares
F512 Unlisted shares
F519 Other equity
F52 Investment fund shares/units
F521 Money market fund shares/units
F522 Non MMF investment fund shares/units
F6 Insurance, pension and standardized guarantee schemes
F61 Non-life insurance technical reserves
F62 Life insurance and annuity entitlements
F63+F64+F65 Retirement entitlements
F63 Pension entitlements
F64 Claim of pension fund on pension managers
F65 Entitlements to non-pension benefits
F66 Provisions for calls under standardized
guarantees
F7 Financial derivatives and employee stock options
F71 Financial derivatives
F711 Options
F712 Forwards
F72 Employee stock options
F8 Other accounts receivable/payable
Of which: Domestic currency
F81 Trade credits and advances
F89 Other accounts receivable/payable
[15]

Report of the Committee on Financial Sector Statistics, 2018
Annex 1.4: Availability of Data on Major Instruments for all Major Sectors of the Economy
Country Annual Quarterly
Developed Countries/ Advances Economies
Australia F1 to F8 F1 to F8
Austria F1 to F8 F1 to F8
Belgium No No
Canada No No
Chile F2 & F4 F2 & F4
Czech Republic F1 to F8 F1 to F8
Denmark F1 to F8 F1 to F8
Estonia F1 to F8 F1 to F8
Finland F1 to F8 F1 to F8
France F1; F2; F4 & F8 F1; F2; F4 & F8
Germany F2; F3; F4; F511; F52 F2; F3; F4; F511; F52
Greece F1 to F8 F1 to F8
Hungary F1 to F8 F1 to F8
Iceland F2; F3; F4; F51; F52; F7; F8 No
Ireland F1 to F8 F1 to F8
Israel F1 to F8 No
Italy F1 to F8 F1 to F8
Japan F3; F4 F3; F4
Netherlands F2; F3; F4:F51; F52; F6 F2; F3; F4:F51; F52; F6
New Zealand No No
Norway F1 to F8 F1 to F8
Poland F1; F2; F4; F6 F1; F2; F4; F6
Portugal F3 F3
Slovak Republic F1 to F8 F1 to F8
Slovenia F1 to F8 F1 to F8
Spain F1 to F8 F1 to F8
Sweden F1 to F8 F1 to F8
Switzerland NO NO
United Kingdom NO NO
United State F2; F4; F52; F6 F2; F4; F52; F6
Latvia F2; F3; F4; F51; F52; F6 F2; F3; F4; F511; F52
Lithuania F1 to F8 F1 to F8
Colombia NO NO
Costa Rica F1 to F8 NO
Developing Countries/ Emerging Market Economies
Russia F2; F3; F4; F5; F6; F8 NO
Brazil No No
Indonesia No No
Mexico F2; F3; F4; F51; F52; F6 No
Turkey F2; F4 F2; F4
[16]

Report of the Committee on Financial Sector Statistics, 2018
Annex 1.5: Sectors and Instruments for Collecting FWTW Information – Quarterly and Annual (Stocks and Flows) (Measure: Current Prices)
(Consolidation: Non-consolidated data for all sectors) (Liabilities: In columns; Assets: In rows)
Target (or, Minimum) (Or Tier 1)
Encouraged (Or Tier 2)
Sectors Instruments
Total Economy (S1) F Total Assets/ Liabilities
Non-financial corporations (S11) F1 Monetary gold and SDRs
Financial corporations (S12) F2 Currency and deposits
General government (S13) F21 Currency
Households and NPISHs
(S14+S15) F22_29 Deposits
Rest of the World (S2) F3 Debt securities
F31 Short-term
F32 Long-term
F4 Loans
F41 Short-term
F42 Long-term
F5 Equity and investment fund shares
F51 Equity
F511 Listed shares
F512+F519 Unlisted shares and Other
equity
F52 Investment fund shares/units F6 Insurance, pension and standardized guarantee
schemes
F61 Non-life insurance technical reserves
F62 Life insurance and annuity entitlements
F63 Pension entitlements
F64 Claim of pension fund on pension managers
F65 Entitlements to non-pension benefits F66 Provisions for calls under standardized
guarantees
F7 Financial derivatives and employee stock options
F71 Financial derivatives
F72 Employee stock options
F8 Other accounts receivable/payable
F81 Trade credits and advances
F89 Other accounts receivable/payable Note: 1) Information is required for each of the above sectors/ instruments as per target (or minimum)/ encouraged. 2) As of now, data on red inked instruments is not being shown separately in India’s FoF accounts due to unavailability of information at desired granularity.
[17]

Report of the Committee on Financial Sector Statistics, 2018
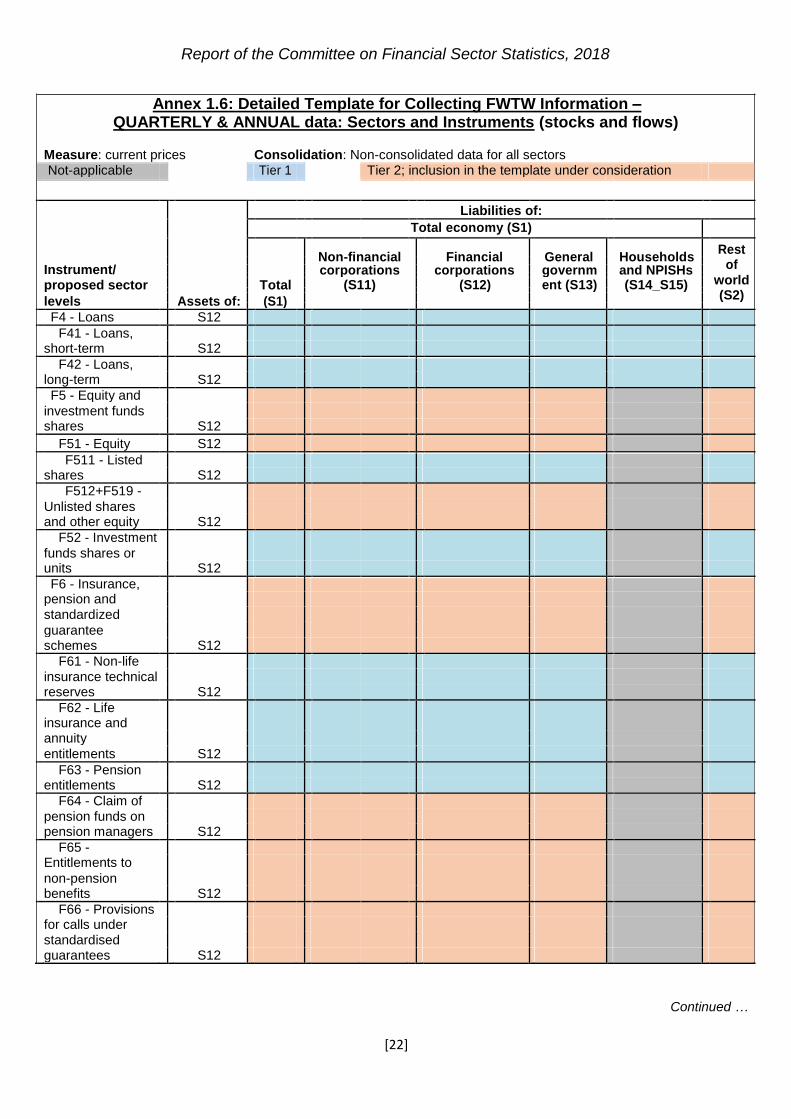
Annex 1.6: Detailed Template for Collecting FWTW Information – QUARTERLY & ANNUAL data: Sectors and Instruments (stocks and flows)
Measure: current prices Consolidation: Non-consolidated data for all sectors Not-applicable Tier 1 Tier 2; inclusion in the template under consideration
Liabilities of:
Total economy (S1)
Non-financial
Financial
General
Households
Rest
Instrument/
of
corporations corporations governm and NPISHs
world
proposed sector Total (S11) (S12) ent (S13) (S14_S15)
(S2)
levels Assets of: (S1)
F - Total
assets/liabilities S1
F1 - Monetary
gold and SDRs S1
F2 - Currency and
deposits S1
F21 - Currency
S1
F22_F29 -
Deposits S1
F3 - Debt
securities S1
F31 - Debt
securities, short-
term S1
F32 - Debt
securities, long-
term S1
F4 - Loans S1
F41 - Loans,
short-term S1
F42 - Loans,
long-term S1
F5 - Equity and
investment funds
shares S1
F51 - Equity
S1
F511 - Listed
shares S1
F512+F519 -
Unlisted shares
and other equity S1
F52 - Investment
funds shares or
units S1
F6 - Insurance,
pension and
standardized
guarantee
schemes S1
F61 - Non-life
insurance technical
reserves S1
Continued …
[18]

Report of the Committee on Financial Sector Statistics, 2018
Annex 1.6: Detailed Template for Collecting FWTW Information – QUARTERLY & ANNUAL data: Sectors and Instruments (stocks and flows)
Measure: current prices Consolidation: Non-consolidated data for all sectors Not-applicable Tier 1 Tier 2; inclusion in the template under consideration
Liabilities of:
Total economy (S1)
Non-financial
Financial
General
Households
Rest
Instrument/
of
corporations corporations governm and NPISHs
world
proposed sector Total (S11) (S12) ent (S13) (S14_S15)
(S2)
levels Assets of: (S1)
F62 - Life
insurance and
annuity
entitlements S1
F63 - Pension
entitlements S1
F64 - Claim of
pension funds on
pension managers S1
F65 -
Entitlements to
non-pension
benefits S1
F66 - Provisions
for calls under
standardised
guarantees S1
F7 - Financial
derivatives and
employee stock
options S1
F71 - Financial
derivatives S1
F72 - Employee
stock options S1
F8 - Other
accounts
receivable/payable S1
F81 - Trade
credits S1
F89 - Other
accounts
receivable/payable
excluding trade
credits S1
F - Total
assets/liabilities S11
F1 - Monetary gold and SDRs S11
F2 - Currency and
deposits S11
F21 - Currency
S11
F22_F29 -
Deposits S11 Continued …
[19]

Report of the Committee on Financial Sector Statistics, 2018
Annex 1.6: Detailed Template for Collecting FWTW Information – QUARTERLY & ANNUAL data: Sectors and Instruments (stocks and flows)
Measure: current prices Consolidation: Non-consolidated data for all sectors Not-applicable Tier 1 Tier 2; inclusion in the template under consideration
Liabilities of:
Total economy (S1)
Non-financial
Financial
General
Households
Rest
Instrument/
of
corporations corporations governm and NPISHs
world
proposed sector Total (S11) (S12) ent (S13) (S14_S15)
(S2)
levels Assets of: (S1)
F3 - Debt
securities S11
F31 - Debt
securities, short-
term S11
F32 - Debt
securities, long-
term S11
F4 - Loans S11
F41 - Loans,
short-term S11
F42 - Loans,
long-term S11
F5 - Equity and
investment funds
shares S11
F51 - Equity
S11
F511 - Listed
shares S11
F512+F519 -
Unlisted shares
and other equity S11
F52 - Investment
funds shares or
units S11
F6 - Insurance,
pension and
standardized
guarantee
schemes S11
F61 - Non-life
insurance technical
reserves S11
F62 - Life
insurance and
annuity
entitlements S11
F63 - Pension
entitlements S11
F64 - Claim of
pension funds on
pension managers S11
Continued …
[20]

Report of the Committee on Financial Sector Statistics, 2018
Annex 1.6: Detailed Template for Collecting FWTW Information – QUARTERLY & ANNUAL data: Sectors and Instruments (stocks and flows)
Measure: current prices Consolidation: Non-consolidated data for all sectors Not-applicable Tier 1 Tier 2; inclusion in the template under consideration
Liabilities of:
Total economy (S1)
Non-financial
Financial
General
Households
Rest
Instrument/
of
corporations corporations governm and NPISHs
world
proposed sector Total (S11) (S12) ent (S13) (S14_S15)
(S2)
levels Assets of: (S1)
F65 -
Entitlements to
non-pension
benefits S11
F66 - Provisions
for calls under
standardised
guarantees S11
F7 - Financial
derivatives and
employee stock
options S11
F71 - Financial
derivatives S11
F72 - Employee
stock options S11
F8 - Other
accounts
receivable/payable S11
F81 - Trade
credits S11
F89 - Other
accounts
receivable/payable
excluding trade
credits S11
F - Total
assets/liabilities S12
F1 - Monetary
gold and SDRs S12
F2 - Currency and
deposits S12
F21 - Currency
S12
F22_F29 -
Deposits S12
F3 - Debt
securities S12
F31 - Debt
securities, short-
term S12
F32 - Debt
securities, long-
term
S12
Continued …
[21]
Report of the Committee on Financial Sector Statistics, 2018
Annex 1.6: Detailed Template for Collecting FWTW Information – QUARTERLY & ANNUAL data: Sectors and Instruments (stocks and flows)
Measure: current prices Consolidation: Non-consolidated data for all sectors Not-applicable Tier 1 Tier 2; inclusion in the template under consideration
Liabilities of:
Total economy (S1)
Non-financial
Financial
General
Households
Rest
Instrument/
of
corporations corporations governm and NPISHs
world
proposed sector Total (S11) (S12) ent (S13) (S14_S15)
(S2)
levels Assets of: (S1)
F4 - Loans S12
F41 - Loans,
short-term S12
F42 - Loans,
long-term S12
F5 - Equity and
investment funds
shares S12
F51 - Equity
S12
F511 - Listed
shares S12
F512+F519 -
Unlisted shares
and other equity S12
F52 - Investment
funds shares or
units S12
F6 - Insurance,
pension and
standardized
guarantee
schemes S12
F61 - Non-life
insurance technical
reserves S12
F62 - Life
insurance and
annuity
entitlements
S12
F63 - Pension
entitlements S12
F64 - Claim of
pension funds on
pension managers S12
F65 -
Entitlements to
non-pension
benefits S12
F66 - Provisions
for calls under
standardised
guarantees S12
Continued …
[22]

Report of the Committee on Financial Sector Statistics, 2018
Annex 1.6: Detailed Template for Collecting FWTW Information – QUARTERLY & ANNUAL data: Sectors and Instruments (stocks and flows)
Measure: current prices Consolidation: Non-consolidated data for all sectors Not-applicable Tier 1 Tier 2; inclusion in the template under consideration
Liabilities of:
Total economy (S1)
Non-financial
Financial
General
Households
Rest
Instrument/
of
corporations corporations governm and NPISHs
world
proposed sector Total (S11) (S12) ent (S13) (S14_S15)
(S2)
levels Assets of: (S1)
F7 - Financial
derivatives and
employee stock
options S12
F71 - Financial
derivatives S12
F72 - Employee
stock options S12
F8 - Other
accounts
receivable/payable S12
F81 - Trade
credits S12
F89 - Other
accounts
receivable/payable
excluding trade
credits S12
F - Total
assets/liabilities S13
F1 - Monetary gold and SDRs S13
F2 - Currency and
deposits S13
F21 - Currency
S13
F22_F29 -
Deposits S13
F3 - Debt
securities
S13
F31 - Debt
securities, short-
term S13
F32 - Debt
securities, long-
term S13
F4 - Loans S13
F41 - Loans,
short-term S13
F42 - Loans,
long-term S13
F5 - Equity and
investment funds
shares
S13
Continued …
[23]

Report of the Committee on Financial Sector Statistics, 2018
Annex 1.6: Detailed Template for Collecting FWTW Information – QUARTERLY & ANNUAL data: Sectors and Instruments (stocks and flows)
Measure: current prices Consolidation: Non-consolidated data for all sectors Not-applicable Tier 1 Tier 2; inclusion in the template under consideration
Liabilities of:
Total economy (S1)
Non-financial
Financial
General
Households
Rest
Instrument/
of
corporations corporations governm and NPISHs
world
proposed sector Total (S11) (S12) ent (S13) (S14_S15)
(S2)
levels Assets of: (S1)
F51 - Equity S13
F511 - Listed
shares S13
F512+F519 -
Unlisted shares
and other equity S13
F52 - Investment
funds shares or
units S13
F6 - Insurance,
pension and
standardized
guarantee
schemes S13
F61 - Non-life
insurance technical
reserves S13
F62 - Life
insurance and
annuity
entitlements S13
F63 - Pension
entitlements S13
F64 - Claim of
pension funds on
pension managers S13
F65 -
Entitlements to
non-pension
benefits S13
F66 - Provisions
for calls under
standardised
guarantees S13
F7 - Financial
derivatives and
employee stock
options S13
F71 - Financial
derivatives S13
F72 - Employee stock options S13
Continued …
[24]

Report of the Committee on Financial Sector Statistics, 2018
Annex 1.6: Detailed Template for Collecting FWTW Information – QUARTERLY & ANNUAL data: Sectors and Instruments (stocks and flows)
Measure: current prices Consolidation: Non-consolidated data for all sectors Not-applicable Tier 1 Tier 2; inclusion in the template under consideration
Liabilities of:
Total economy (S1)
Non-financial
Financial
General
Households
Rest
Instrument/
of
corporations corporations governm and NPISHs
world
proposed sector Total (S11) (S12) ent (S13) (S14_S15)
(S2)
levels Assets of: (S1)
F8 - Other
accounts
receivable/payable S13
F81 - Trade
credits S13
F89 - Other
accounts
receivable/payable
excluding trade
credits S13
F - Total
assets/liabilities S14_S15
F1 - Monetary
gold and SDRs S14_S15
F2 - Currency and
deposits S14_S15
F21 - Currency
S14_S15
F22_F29 -
Deposits S14_S15
F3 - Debt
securities S14_S15
F31 - Debt
securities, short-
term S14_S15
F32 - Debt
securities, long-
term S14_S15
F4 - Loans S14_S15
F41 - Loans,
short-term S14_S15
F42 - Loans,
long-term S14_S15
F5 - Equity and
investment funds
shares S14_S15
F51 - Equity
S14_S15
F511 - Listed
shares S14_S15
F512+F519 -
Unlisted shares
and other equity S14_S15
Continued …
[25]

Report of the Committee on Financial Sector Statistics, 2018
Annex 1.6: Detailed Template for Collecting FWTW Information – QUARTERLY & ANNUAL data: Sectors and Instruments (stocks and flows)
Measure: current prices Consolidation: Non-consolidated data for all sectors Not-applicable Tier 1 Tier 2; inclusion in the template under consideration
Liabilities of:
Total economy (S1)
Non-financial
Financial
General
Households
Rest
Instrument/
of
corporations corporations governm and NPISHs
world
proposed sector Total (S11) (S12) ent (S13) (S14_S15)
(S2)
levels Assets of: (S1)
F52 - Investment
funds shares or
units S14_S15
F6 - Insurance,
pension and
standardized
guarantee
schemes S14_S15
F61 - Non-life
insurance technical
reserves S14_S15
F62 - Life
insurance and
annuity
entitlements S14_S15
F63 - Pension
entitlements S14_S15
F64 - Claim of
pension funds on
pension managers S14_S15
F65 -
Entitlements to
non-pension
benefits S14_S15
F66 - Provisions
for calls under
standardised
guarantees S14_S15
F7 - Financial
derivatives and
employee stock
options S14_S15
F71 - Financial
derivatives S14_S15
F72 - Employee stock options S14_S15
F8 - Other
accounts
receivable/payable S14_S15
F81 - Trade
credits S14_S15
Continued …
[26]

Report of the Committee on Financial Sector Statistics, 2018
Annex 1.6: Detailed Template for Collecting FWTW Information – QUARTERLY & ANNUAL data: Sectors and Instruments (stocks and flows)
Measure: current prices Consolidation: Non-consolidated data for all sectors Not-applicable Tier 1 Tier 2; inclusion in the template under consideration
Liabilities of:
Total economy (S1)
Non-financial
Financial
General
Households
Rest
Instrument/
of
corporations corporations governm and NPISHs
world
proposed sector Total (S11) (S12) ent (S13) (S14_S15)
(S2)
levels Assets of: (S1)
F89 - Other
accounts
receivable/payable
excluding trade
credits S14_S15
F - Total
assets/liabilities S2
F1 - Monetary gold and SDRs S2
F2 - Currency and
deposits S2
F21 - Currency
S2
F22_F29 -
Deposits S2
F3 - Debt
securities S2
F31 - Debt
securities, short-
term S2
F32 - Debt
securities, long-
term S2
F4 - Loans S2
F41 - Loans,
short-term S2
F42 - Loans,
long-term S2
F5 - Equity and
investment funds
shares S2
F51 - Equity
S2
F511 - Listed
shares S2
F512+F519 -
Unlisted shares
and other equity S2
F52 - Investment
funds shares or
units S2
F6 - Insurance,
pension and
standardized
guarantee
schemes S2 Continued …
[27]

Report of the Committee on Financial Sector Statistics, 2018
Annex 1.6: Detailed Template for Collecting FWTW Information – QUARTERLY & ANNUAL data: Sectors and Instruments (stocks and flows)
Measure: current prices Consolidation: Non-consolidated data for all sectors Not-applicable Tier 1 Tier 2; inclusion in the template under consideration
Liabilities of:
Total economy (S1)
Non-financial
Financial
General
Households
Rest
Instrument/
of
corporations corporations governm and NPISHs
world
proposed sector Total (S11) (S12) ent (S13) (S14_S15)
(S2)
levels Assets of: (S1)
F61 - Non-life
insurance technical
reserves S2
F62 - Life
insurance and
annuity
entitlements S2
F63 - Pension
entitlements S2
F64 - Claim of
pension funds on
pension managers S2
F65 -
Entitlements to
non-pension
benefits S2
F66 - Provisions
for calls under
standardised
guarantees S2
F7 - Financial
derivatives and
employee stock
options S2
F71 - Financial
derivatives S2
F72 - Employee stock options S2
F8 - Other
accounts
receivable/payable S2
F81 - Trade
credits S2
F89 - Other
accounts
receivable/payable
excluding trade
credits S2
[28]

Report of the Committee on Financial Sector Statistics, 2018
Chapter 2
Recommendations of Earlier Committees - Implementation Status
Section I: Introduction
2.1 The Government of India appointed the HLC in December 2007 to critically
review the existing methodologies used to estimate saving and investment
aggregates for the Indian economy and suggest measures for improvement. The
major expectations from the Committee were (a) to assess whether the structural
changes in income levels and saving behaviour of the Indian economy are reflected
in the existing estimates, (b) to examine the empirical methods and procedures used
in the estimates based on commodity-flow-method and FoF method, (c) to improve
data quality, minimise data gaps, and revalidate the data bases in organised and
unorganised sectors, and (d) to review the existing methodology and suggest
improvements in the estimation of capital formation at the regional level. The HLC
submitted its Report in 2009.
2.2 In 2015, the RBI constituted the Working Group (WG) on the Compilation of FoF
Accounts for the Indian Economy under the Chairmanship of Dr. Deepak Mohanty,
the Executive Director, to review the existing methodology for compilation of FoF
accounts in India and to suggest changes required in the coverage of institutions,
instruments and sources of data in the compilation procedure. The WG was also
asked to suggest improvements in administrative, methodological and technological
aspects to enhance the efficacy of the compilation process and prepare a manual on
the compilation of the FoF accounts in India.
2.3 As there are some overlaps in the terms of reference assigned to this Committee
with the HLC and the WG, it took note of the major recommendations made by them
and examined the status of their implementation. These are discussed in Sections II
and III, respectively. Section IV summarises the Committee’s observations.
[29]

Report of the Committee on Financial Sector Statistics, 2018
Section II: High Level Committee on Estimation of Savings and Investment (2009) – Relevant Recommendations and Implementation Status
2.4 The HLC identified a number of issues and gave its recommendations on saving
estimates of households, private corporate and public sectors; estimates of capital
formation at all-India level as well as at regional levels; FoF estimates; and separate
saving estimates for pure households, household enterprises and unincorporated
bodies.
2.5 The HLC also felt the need for (a) periodic revisions in the ‘rates and ratios’, (b)
improving existing databases, (c) creating new databases to bridge data gaps and
cross validations of estimates, and (d) moving from sample based estimation to the
census based estimation, wherever possible, which are used in the NAS and the FoF
accounts for both organised and unorganised sectors.
2.6 Out of 94 recommendations of the HLC, 11 recommendations were classified
under the major head on compilation of FoF. In addition, there were 9
recommendations classified under various other heads, which have bearing on
compilation of FoF. These 20 recommendations along with their implementation
status are discussed below (Table 1).
2.7 Some of the major recommendations of the HLC were as follows:
Increasing coverage of financial and non-financial companies used for compiling FoF and national accounts;
Streamlining data on co-operative sector and bridging the data gaps;
Providing combined balance sheet data of all insurance institutions (public and private; life and non-life) by IRDA as per the suggested FoF format;
Incorporating data for the local self-government in the FoFs accounts.
[30]

Report of the Committee on Financial Sector Statistics, 2018
Table 1: Recommendations of the HLC Relating to FoF Accounts: Action Taken Report
S. Recommendation (with No.) of HLC Implementation Status No.
Recommendations on FoFs Compilation
1. Data on Co-operative Sector: To resolve the issue of delay in receipt of information from the Recommendation XII.a: All efforts should be State level reporting agencies viz., co-operative banks and undertaken to improve the time gap in the publication Registrar of Cooperative Societies (RCS), and discussing ‘Statistical Statements Relating to the Co-operative modalities towards modification and simplification of the Movement in India (Credit and Non-credit societies)’, publication formats, CSO had made efforts in the past for holding brought out by NABARD. (Action: NABARD) a meeting of RCS of States. However, no meeting took place on
2. Recommendation XII.b: In the light of genuine the issue. difficulties expressed by NABARD in regularly
compiling the comprehensive data, NABARD may NABARD suggested that all the States/ UTs Governments and endeavour undertaking “projections” of household RCS may be made responsible (nodal) for the data publication deposits in co-operative banks and credit societies, and sharing with all the stakeholders (CSO and the RBI) for which could be revised when firm data become compilation of national accounts, saving estimates and FoF available. (Action: NABARD) account in view of the 97th Constitutional Amendment. The 3. Recommendation XII.c: NABARD should continue in amendment empowers State Governments to obtain periodic
its role as the nodal agency for the co-operative sector reports of activities and accounts of co-operatives. and provide data for the compilation of national
NABARD further suggested that MOSPI may be involved in the accounts, savings estimates and FoF accounts in so far as the co-operative sector is concerned. In this whole process to guide all concerned to collect and publish the regard, NABARD may collaborate with National required data. Federation of State Co-operative Banks (NAFSCOB),
National Cooperative Union of India (NCUI) as these
agencies are publishing some basic data on credit and non-credit societies. (Action: NABARD)
4. Data on Financial Companies: Implemented. RBI has made all out efforts to increase the Recommendation XII.d: Since there exists large data
gap in the estimation of non-banking companies, coverage of Financial and Investment companies. RBI has started
[31]

Report of the Committee on Financial Sector Statistics, 2018
S. Recommendation (with No.) of HLC Implementation Status No.
because of non-inclusion of a wide array of using data of Non-banking Financial and Investment companies unregistered companies, the HLC recommended that as received from MCA in their study from 2013-14 onwards which a census should collect data on assets, liabilities, has led to significant increase in the Paid-up Capital (PUC) income and expenditure of NBFCs including the coverage (91 percent in 2013-14, 78 percent for 2014-15, and 75 unregistered/ exempted category of NBFCs. The per cent in 2015-16). Companies reporting data to MCA by a cut- census should be conducted by DSIM, RBI in off date, are included in the RBI studies after due validation. collaboration with the Department of Company Affairs,
Government of India. (Action: MCA and RBI)
5. Recommendation XII.e: The HLC recommended that
the data emerging from the census on the assets/
liabilities position of the NBFCs should be
appropriately incorporated in the FoFs accounts also.
(Action: RBI)
6. Recommendation XII.f: In respect of companies For the purpose of compilation of FoF accounts, the RBI registered with the RBI, data for registered companies Department of Non-Banking Supervision (DNBS) has have to be firmed up with appropriate consolidation commenced providing data relating to all deposit-taking NBFCs and follow up if response is weak. For the unregistered and all non-deposit taking systemically important NBFCs. The companies, sample studies will have to be undertaken coverage of other non-deposit taking NBFCs is being expanded and their results will have to be used after establishing in a phased manner. proper blow-up factors. (Action: RBI)
7. Consolidated data on the Insurance Sector: IRDA’s response on the format suggested by the HLC under Recommendation XII.g: The RBI may approach the various heads was as follows: IRDA to provide combined balance sheet for all Sources- insurance institutions – public and private - as per the a) Most of the private insurers have foreign joint venture. suggested FoFs format. This will go a long way in the However, there is no column in the format in which the capital IRDA providing an alternative database not only for ‘life contributed by their foreign partner can be stated. fund’ but also for FoFs compilation at the RBI from time b) It does not capture information about the “reserve and to time. (Action: IRDA) surplus”. c) It only captures information about the “Life Funds”. Does it mean that the fund for pension, annuity and Unit Linked
[32]

Report of the Committee on Financial Sector Statistics, 2018
S. Recommendation (with No.) of HLC Implementation Status No.
Insurance Plan (ULIP) will not be part of the same? This needs clarity. d) It is not comprehensive as substantial part of the sources of fund in case of life insurance will be of policyholders’ funds. The same has not been disclosed separately. Uses: a) Deposits- Information in the desired format is not available. Only the information about the deposits with scheduled and non-scheduled banks is available. b) Loans and Advances- At present the information about the loans to central/state Governments, banks and financial institutions, companies, etc., is only captured. However, information for the other categories as specified in the format is not captured. c) Investment: The details of investments in the format specified by the RBI is not captured at present. In view of the above, IRDA proposed that the format compiled for their Annual Report may be adopted. This will bring consistency and uniformity in the reporting.”
8. Consolidated data for Capital Market Institutions: Implemented. SEBI informed that as most of the capital market Recommendation XII.h: The SEBI may collect the entities/institutions registered with the MCA, records like balance consolidated balance sheet position for all registrars sheet as at the end of the each accounting period, profit and loss and broker houses and provide the data as per the account are available with them. Therefore, SEBI requested RBI format suggested by the Committee to be forwarded to extract the relevant information from MCA portal directly. by the RBI, so that the same can be incorporated in the However, RBI (DEPR) felt that these capital market institutions, FoF accounts. (Action: SEBI) are involved in non-fund based activities and thus may not be
9. Recommendation XII.i: The HLC recommended that included in the FoF accounts. the consolidated Statements of assets/liabilities of all Further, it may also be noted that RBI studies on non-government capital market institutions (namely, merchant bankers financial and investment companies already covers all financial and registered brokers) should be compiled by the
[33]

Report of the Committee on Financial Sector Statistics, 2018
S. Recommendation (with No.) of HLC Implementation Status No.
SEBI or have them compiled and forwarded to RBI for companies for which data is available with the MCA and which compilation of FoFs account of the Indian economy. pass data integrity checks. (Action: SEBI)
10. Ownership of Government securities: Implemented. RBI informed that the data in Table 122 of the Recommendation XII.j: The HLC recommended that
an appropriate format as prescribed in this Report on
Handbook of Statistics of the Indian Economy 2015-16 viz., Ownership of Central and State Government securities, shows
the ownership pattern of Government securities holdings of government securities as per eleven categories, viz.,
(consolidated for all levels of Government), comprising (i) RBI (own account) (ii) Scheduled Commercial Banks (iii) co-
six categories, viz., 1) Government , 2) Banks, 3) operative banks (iv) Primary Dealers (v) Insurance Companies
Financial Sector other than Banks, 4) Non-Service (vi) Financial Institutions (vii) Mutual Funds (viii) Provident Funds
Sector (Corporates, Firms and Societies), 5) External (ix) Corporates (x) Foreign institutional investors and (xi) Others.
Sector and 6) Household Sector, may be prepared by
the RBI as at end-March every year, so that the residual status can be accorded to household (as
defined in national accounts and FoF framework) in
this instrument. The concerned Department within the
RBI should ensure the providing of such information for estimation of household financial savings estimates.
(Action: RBI)
11. Data on Local Self-Governments: On-going process. Recommendation XII.k: In respect of the accounts of
local authorities, only the data for port trusts are
available. In this regard, the data for the local self-
Government may also be provided to enhance the
coverage of FoFs accounts. (Action: CSO)
[34]

Report of the Committee on Financial Sector Statistics, 2018
S. Recommendation (with No.) of HLC Implementation Status No.
Other Recommendations Relevant to Flow of Funds 12. Recommendation VI.c: The HLC recommended that
On-going process: RBI informed that attempts are being made the FoFs
accounts of the Indian economy need to be to compile the FoF on a regular basis as well as to close the data
compiled regularly and in a more up -to-date manner. gaps/constraints in the compilation process. Further, the lag of
There is a need to closely examine the
current data publication of FoF accounts has also been reduced from 21 gaps and constraints coming in the way of compiling months to 17 months.
the FoFs accounts regularly. (Action: RBI) Over the years, some improvements in the data compilation processes have been progressively made by inter-alia, collating consolidated information from data repositories/regulators,
instead of consolidating the same from individual entities. For instance, the consolidated data for the insurance sector were sourced from IRDA. The coverage of HFC and Mutual Funds has been improved significantly. Consolidated data on NBFCs are being obtained from DNBS of the RBI, instead of the earlier practice of estimating from the survey results of ‘Financial and Investment Companies’. In the co-operative sector, consolidated balance sheet data of State Cooperative Banks and District Central Cooperative Banks are being obtained from NABARD.
13. Recommendation VI.bb: Till a reliable flow of data Implemented. The global paid-up capital series is provided by from the SEBI on various parameters is available on a the MCA to the RBI as and when required. regular basis, the need for a blow-up factor for
RBI informed that at present, households’ investments in shares computing household investment in the shares,
and mutual funds are compiled as follows: i) Data on total capital debentures, mutual funds and bonds of all companies
raised by public and private limited companies and mutual funds is there. Accordingly, global paid-up capital series
are obtained from SEBI (through Division of Financial Markets, needs to be provided to the RBI by the Ministry of
DEPR, RBI). (ii) Households’ share in the total capital raised is Corporate Affairs. (Action: MCA and RBI)
based on past ratios and for mutual funds, it is based on data
available with SEBI.

[35]

Report of the Committee on Financial Sector Statistics, 2018
S. Recommendation (with No.) of HLC Implementation Status No.
14. Recommendation VI.dd: Till the MCA 21 data is Implemented. available and can be used for the purpose of financial
savings estimation under trade debt, the existing
methodology of computing trade debt may be
continued. For estimating trade debt figure for all
companies from the sample studies of the RBI, there
is a need to have an appropriate blow-up factor. As
recommended earlier, global paid-up capital series
needs to be provided to the RBI by the Ministry of
Corporate Affairs. (Action: MCA and RBI)
15. Recommendation VII.i: In order to capture the data at Implemented. MCA informed that appropriate rights have been the RBI-end, the MCA needs to provide appropriate provided to RBI officials to access records available in MCA 21 access rights, specifically computable format database. electronically, to the MCA21 database so that dataflow RBI confirmed that a suitable mechanism has already been put in is ensured. (Action: MCA and RBI) place in consultation with MCA for regular supply of data. However, at present there might be some technical issues in accessing these databases at the RBI end.
16. Recommendation VI.w: The HLC recommended the Implemented. SEBI informed that the Data Warehousing and involvement of the SEBI in providing information on a Business Intelligence System (DWBIS) database provides the regular basis to the RBI on areas like annual ownership details as per the following categories – corporate, subscription to public issues of shares, debentures, FI/FII, HUF individuals and others. However, the categories which mutual funds and commercial bonds (each separately FoF mandates are much wider and includes NRIs, trusts and and consolidated for all depositories) as per the others. Attempts are being made to include all the parameters in ownership categories (categories of subscribers are the database. Qualified Institutional Investors, FIIs, NRIs, corporate,
RBI confirmed that the information relating to public issues of
trusts and other categories) from which the RBI will shares, debentures, mutual funds and commercial bonds is being
extract household investment in shares, debentures, received from SEBI and is being used for FoF compilation.
mutual funds and commercial bonds for household
financial savings estimation (Annex A6.5.1).
Registrars/Depositories/AMFI need to be involved for
[36]

Report of the Committee on Financial Sector Statistics, 2018
S. Recommendation (with No.) of HLC Implementation Status No.
regular data support. Henceforth, the SEBI would
arrange to collect the required data from these entities, which are the primary sources of those data, by
sensitising them and explaining the requirement of
their data for estimation of household financial savings. (Action: SEBI and RBI)
17. Recommendations VI.hh and VI.p: The HLC Implemented. IRDA has sent following comments to the RBI: recommended that the IRDA should be involved in the “Data on (i) Life Fund and (ii) Bonus to policy holders are not household financial savings estimation by way of captured in the format suggested by the HLC. They informed that providing regular information on ‘life funds’, bonus to generally life insurance funds will not be participated by trust, policy holders and loans and advances, consolidated unincorporated enterprises of farm business or unincorporated for all insurance institutions – both in the public and enterprises of non-farm business. They suggested that instead private sector in the format prescribed in this Report. of having break-up of life fund into individuals, trusts etc., it will be (Action: IRDA) better to have the following two break-up: (a) Individuals – (i) Micro, and (ii) Other than Micro (b) Group – (i) Micro, (ii) Other than Micro Apart from above, they also suggested to include pension/ annuity funds and ULIP funds. RBI confirmed that the data on life funds for both public and private sector have been provided by IRDA since 2012-13. These data have been taken into account for compilation of FoF accounts.
18. Recommendation VI.t: Since there is a need to Implemented. PFRDA informed that they are collecting data on capture household savings in the form of pension number of subscribers and corpus of each category of funds, the relevant apex body, namely, the PFRDA subscribers (i.e. Central Government employees, state should collect and disseminate such information on a Government employees, Private Sector and NPS-Lite) under regular basis. (Action: PFRDA) NPS on monthly intervals which is uploaded by the Department of Financial Services, Ministry of Finance, Government of India, on their website.
[37]

Report of the Committee on Financial Sector Statistics, 2018
S. Recommendation (with No.) of HLC Implementation Status No.
RBI confirmed that data on households’ savings in NPS are collected by RBI from PFRDA on a regular basis.
19. Recommendation VIIl.b: The CSO should make CSO informed that as per the recommendations of the Thirteenth separate estimates of GDP, consumption expenditure, Finance Commission (TFC) for preparing the LBs’ accounts as savings and capital formation for the LBs. These could one of its milestones, CSO devised a simple schedule consisting best be prepared based on census of ULBs and on of sections regarding the current and capital receipts as well as sample basis in the case of RLBs. For this purpose, current and capital expenditure at aggregate level for each local States may be provided financial assistance to body and a separate section to enter the information of funds undertake analysis of LBs’ accounts. (Action: CSO) available with the local body. State DES have taken initiative in this regard and collected data based on the available resources. As a result, in the 2011-12 series, the accounts of both small and large LBs have been compiled on the basis of a larger sample covering about 60 percent of the transfers given. As per the design for collecting data from LBs for preparing accounts, ULBs are covered on census basis and RLBs on sample basis. The CSO at present are compiling separate estimates of GDP, consumption expenditure, savings and capital formation for the LBs and including them in the national level estimates.
20. Recommendation VII.n: The HLC emphasises the Consultations are held as and when required. need for an ongoing consultative approach and
strengthening of the statistical system at concerned
organisations namely, CSO, NABARD, MCA and RBI.
(Action: CSO, NABARD, MCA and RBI)
[38]

Report of the Committee on Financial Sector Statistics, 2018
Section III: Recommendations of the Working Group (WG) on Compilation of FoF Accounts of the Indian Economy (2015) – Implementation Status
2.8 The major emphasis of the WG was to align India’s FoF accounts with the SNA
2008 to the extent possible. The WG reviewed the existing FoF methodology and
identified the data gaps. It made extensive recommendations to bridge the data gaps
and broadly align compilation of India’s FoF with SNA 2008 in terms of classification of
sectors and instruments. Based on availability of data and ease of implementation,
recommendations were grouped into ‘short term’ and ‘medium to long term’. It was
envisaged that the medium to long-term recommendations would be implemented as
and when new data become available and it is feasible to compile them.
2.9 Some of the major recommendations of the WG are:
i) Standardisation of institutional sectors/ sub-sectors/ categories and instruments
broadly in alignment with the SNA 2008 for compilation and presentation of FoF accounts.
ii) Incorporation of local self-governments (rural and urban LBs), and State public
sector enterprises (SPSEs)’ data in the FoF accounts.
iii) Bifurcation of ‘debt securities’ and ‘loans’ into short-term and long-term; reporting
of equity in three categories - ‘listed shares’, ‘unlisted shares’ and ‘other equity’;
categorisation of deposits into ‘transferable (interbank and non-bank separately)’ and
‘others’.
iv) Assessing the feasibility of compiling and publishing the ‘valuation account’ and
the ‘other changes in volume account’ separately in consultation with the CSO; and
recording of the discrepancy between the stocks and flows in a separate “Reconciliation
Table”.
v) Vetting of FoF data with the concerned data suppliers and other stakeholders of
the respective sectors.
vi) Examining possibility of compiling and publishing FoF accounts on quarterly
basis beginning with the financial sector.
[39]

Report of the Committee on Financial Sector Statistics, 2018
2.10 Overall, 37 recommendations for implementation in the short-term and 18
recommendations for the long-term were made by the WG. Of these, 22 short-term and
1 long-term recommendations are already implemented. Implementation status of other
recommendations is given in Table 2 below.
Table 2: Recommendations of the Working-Group on Compilation of FoF
Accounts of the Indian Economy - Implementation Status
S. Recommendation Status No.
I. Recommendations for the Short-Term
I.1 Sectors
1 The compilation of the FoF accounts for the Indian Implemented. The economy may be restructured with the adoption of the FoF accounts under following five mutually exclusive institutional sectors: the new series are (i) Non-Financial Corporations, (ii) Financial available from Corporations, (iii) General Government, (iv) 2011-12 onwards. Households and NPISHs, and (v) the Rest of the
World, which is largely in line with the SNA 2008
framework except that the NPISHs would not be
reported separately due to non-availability of data.
2 Non-Financial Corporations sector would include: (a) Implemented ‘Non-Government Non-Financial Public and Private except that data of Limited Companies’, (b) Government Non-Financial the SPSEs are yet Departmental/Non-Departmental Commercial to be incorporated. Undertakings (NDCUs), (c) Port Trusts (both public
and private) and (d) the Cooperative Non-Credit
Societies. The NDCUs would comprise the non-
financial Central and State Public Sector Enterprises
(CPSEs and SPSEs) and the Power Generation/
Transmission/ Distribution Companies/ SEBs. The
State level enterprises, would however, be covered in
the medium to long term. Accordingly, the CPSEs,
SEBs/SPUs and Port Trusts will not be included under the Government Sector as per the current practice.
3 While compiling the FoF accounts for the CPSEs Implemented. based on data from the Survey done by the Department of Public Enterprises (DPE), Ministry of the Heavy Industries and Public Enterprises, data pertaining to financial enterprises (such as Export Credit Guarantee Corporation of India Ltd.(ECGC), Housing and Urban Development Corporation
[40]

Report of the Committee on Financial Sector Statistics, 2018
S. Recommendation Status No.
Ltd.(HUDCO), Indian Infrastructure Finance Company
(IIFC), Indian Railway Financial Corporation Ltd
(IRFC), Indian Renewable Energy Development
Agency (IREDA) and Power Finance Corporation
(PFC)) must be excluded to avoid double-counting.
4 As regards compilation of the FoF accounts for the Implemented. non-financial companies, MCA’s/ DSIM’s database
may be considered. Simultaneously, the possibility of
collecting data relating to listed companies from the
SEBI/ exchanges may also be examined. The use of
data from two different sources could lead to the
possibility of double counting which may be corrected
by the compilers.
5 Keeping in view the non-standard balance sheet To be implemented. formats adopted by non-financial and financial
corporations, the possibility of collecting information
regarding ownership pattern of financial claims and
assets from the Custodians and SEBI may be
explored.
6 Recognising that the Co-operative non-credit societies On receipt of data are too marginal/small to have much impact on the from NABARD, the overall co-operatives scenario, the estimation process procedure will be based on the earlier method may continue to be used changed. for the Co-operative non-credit societies wherever
data is not available in time.
7 The Financial Corporations sector would constitute Partially seven sub-sectors, namely, (a) the Central Bank, (b) Implemented. ‘deposit-taking corporations except the Central Bank’,
(c) Money Market funds (MMFs), (d) Non-MMFs, (e)
other financial intermediaries except insurance
corporations and pension funds, (f) insurance
corporations, and (g) pension funds and non-
government provident funds. The Central and State
Government Employees Provident Fund would,
however, be included under the Central and State
Governments sectors, respectively.
8 The financial flows of the RBI may be compiled as is To be implemented. being done currently. The source of data for the
compilation of the FoF accounts for the RBI is the
Statement of Affairs of the RBI provided by the
[41]
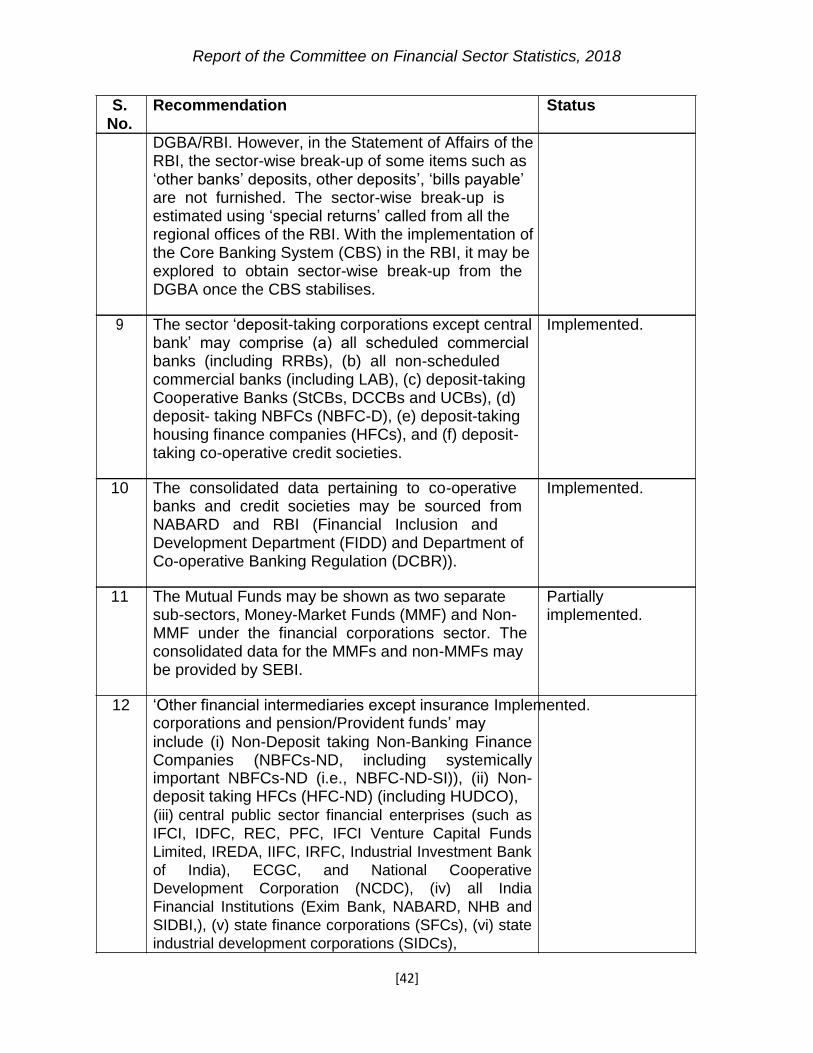
Report of the Committee on Financial Sector Statistics, 2018
S. Recommendation Status No.
DGBA/RBI. However, in the Statement of Affairs of the RBI, the sector-wise break-up of some items such as
‘other banks’ deposits, other deposits’, ‘bills payable’
are not furnished. The sector-wise break-up is
estimated using ‘special returns’ called from all the
regional offices of the RBI. With the implementation of the Core Banking System (CBS) in the RBI, it may be
explored to obtain sector-wise break-up from the
DGBA once the CBS stabilises.
9 The sector ‘deposit-taking corporations except central Implemented. bank’ may comprise (a) all scheduled commercial
banks (including RRBs), (b) all non-scheduled
commercial banks (including LAB), (c) deposit-taking
Cooperative Banks (StCBs, DCCBs and UCBs), (d)
deposit- taking NBFCs (NBFC-D), (e) deposit-taking
housing finance companies (HFCs), and (f) deposit-
taking co-operative credit societies.
10 The consolidated data pertaining to co-operative Implemented. banks and credit societies may be sourced from
NABARD and RBI (Financial Inclusion and
Development Department (FIDD) and Department of
Co-operative Banking Regulation (DCBR)).
11 The Mutual Funds may be shown as two separate Partially sub-sectors, Money-Market Funds (MMF) and Non- implemented. MMF under the financial corporations sector. The
consolidated data for the MMFs and non-MMFs may
be provided by SEBI.
12 ‘Other financial intermediaries except insurance Implemented. corporations and pension/Provident funds’ may include (i) Non-Deposit taking Non-Banking Finance Companies (NBFCs-ND, including systemically important NBFCs-ND (i.e., NBFC-ND-SI)), (ii) Non-deposit taking HFCs (HFC-ND) (including HUDCO), (iii) central public sector financial enterprises (such as
IFCI, IDFC, REC, PFC, IFCI Venture Capital Funds
Limited, IREDA, IIFC, IRFC, Industrial Investment Bank
of India), ECGC, and National Cooperative
Development Corporation (NCDC), (iv) all India
Financial Institutions (Exim Bank, NABARD, NHB and
SIDBI,), (v) state finance corporations (SFCs), (vi) state
industrial development corporations (SIDCs),
[42]

Report of the Committee on Financial Sector Statistics, 2018
S. Recommendation Status No.
and (vii) Other financial corporations (such as SBI
DFHI and SBI Capital).
13 The data provided by the DNBR on the NBFC-ND-SIs Implemented. and NBFC-ND together with DSIM data may be used
for the compilation of the FoF accounts of financial and investment companies’ sub-sector. The compilers
should take into account the possibility of double
counting.
14 The consolidated data pertaining to Housing Finance Implemented. Companies may be provided by the NHB.
15 The financial flows of the insurance sector (including Implemented. both life insurance and non-life insurance) may
continue to be presented as a separate sub-sector
under the ‘financial corporations’ sector. The consolidated data pertaining to insurance corporations may be sourced from IRDA.
16 The FoF accounts of the provident/pension funds may Implemented. be compiled separately and comprise non-
Government provident/pension funds (such as Public
Provident Fund (PPF), Employees (non-Government)
Provident Fund Scheme (EPFO), Seamen's P.F.
Scheme, Coal Mines P.F., Assam Tea plantation
scheme, Local Authority Provident Fund, Dock Labour Board, as well as the Employees Provident Funds of
RBI, Commercial Banks, L.I.C., ECGC, Employees
State Insurance Corporation (ESIC), Port Trusts, Air
India, International Airport Authority and Other
StatutoryCorporations).However,as the investment/asset pattern of the Central and State
Government Employees Provident Funds are not
available separately, these two funds would continue
to be included in the respective Government sectors
as is the current practice. The Pension Funds may
include the NPS and the pension funds of the EPF
scheme, Coal Mines, Assam Tea Plantation, Port
Trusts and Dock Labour Board.
17 The consolidated FoF data pertaining to Cooperative Implemented. Banks and Societies, Mutual Funds [Money Market Funds (MMF) and Non-MMFs], Insurance Companies,
Housing Finance Companies could be provided by the
[43]

Report of the Committee on Financial Sector Statistics, 2018
S. Recommendation Status No.
respective regulators to RBI, namely NABARD, SEBI,
IRDA, and NHB.
18 The extant method of sub-sectoring of the general No action required. government may be continued.
19 The current practice of obtaining the data for the ROW No action required. sector, which is derived from the BOP statistics from
RBI (DEPR) may be continued.
20 The current practice of obtaining the households No action required. sector as a residual may be continued.
I.2 Financial Instruments
21 In the short term, the following seven main financial Implemented. instruments may be covered in the FoF accounts: (a) Financial Monetary gold and SDRs, (b) Currency and deposits, instruments in the (c) Debt securities, (d) Loans, (e) Equity and FoF accounts have investment fund shares and (f) Insurance, pension and been standardised standardized guarantee schemes, and (g) ‘Other from the year 2011- accounts receivable or payable’. 12 onwards.
22 The compilation and reporting of the ‘monetary gold’ Implemented. and ‘SDRs’ may be aligned with that in SNA 2008. The transaction in ‘gold coin and bullion’ presently taken
for the FoF accounts may be classified under the
instrument ‘monetary gold’.
23 The allocation of SDRs may be captured and recorded Implemented. under the Sources side of the Central Government
sector as an additional item in the FoF accounts. For
the ROW sector, the SDR allocation may be classified on the ‘Uses’ side under the head, increase in assets
and under the sub-head, ‘investments - Government’.
24 The extant practice of compiling and reporting the No action required. transactions in currency and deposits may be
continued.
25 The present classification of deposits as per standard To be implemented. Indian convention into saving deposits, current
deposits and term (fixed) deposits in the India’s FoF
accounts may be continued (deviating from SNA 2008 classification of transferable deposits, etc.) with
appropriate explanatory notes that would aid a better
understanding of these instruments to international
[44]

Report of the Committee on Financial Sector Statistics, 2018
S. Recommendation Status No.
users. The sub-group further suggests the bifurcation
of term deposits into short-term and long-term
deposits on the basis of original maturity, as
suggested in SNA 2008.
26 “Investments” may continue to be a separate head Partially under Indian FoF. The extant instrument of Implemented. The ‘investments’ may be sub-categorised into (i) Equity, categorisation of (ii) Preference shares and (iii) Debt Securities. The debt securities into Debt Securities may be further classified into (a) short-term and Central Government Securities, (b) State Government long-term Securities, (c) Other Government Securities, (d) depending on the Corporate Securities (Bonds and Commercial Paper), original term of (e) Bank Securities, (f) Other Financial Institutions’ maturity is not yet Securities (of which mutual funds), (g) Foreign implemented as the Securities and (h) Other Securities. The categorisation tenor-wise reporting of debt securities into short-term and long-term is not being done at depending on the original term of maturity may be present. It will be examined. adopted in due course.
27 Appropriateness of reporting of CDs as a separate To be implemented. sub-classification under the sub-head ‘term deposits’
of the major head ‘Deposits’, with a caveat that these
are strictly not comparable to deposits as per SNA
2008, may be examined.
28 The issue of debentures by the SCARDBs is going to Implemented. be discontinued though the debentures issued till now
are likely to be held in the same form till maturity. The
NABARD has already issued circular to SCARDBs for
switch over from debentures to loan system. In view of this, the necessary changes be made in the FoF
accounts of the SCARDBs.
29 Classification of loans into two categories, i.e. ‘in To be implemented. domestic currency’ and ‘in foreign currency’, and their
further classification into short-term and long-term
depending on the original term of maturity may be
examined. While short-term loans comprise loans that
have an original maturity of one year or less, long-term loans have an original maturity of more than one year.
30 Though banks are classifying the RIDF under To be implemented. investments in their balance sheets, these could be
shown separately on the liability side of the sub-sector ‘other financial intermediaries except insurance and
[45]

Report of the Committee on Financial Sector Statistics, 2018
S. Recommendation Status No.
pension funds’ on the basis of information gathered from the concerned institutions in this regard.
31 The borrowing of the StCBs and DCCBs from To be implemented. NABARD may be shown separately in the FoF accounts format. The data on borrowing of the StCBs and DCCBs from NABARD are available with DCBR.
32 With a view to provide greater disaggregation, the data To be implemented. on Banking Capital may be classified into deposits, loans, investments and others based on ‘International Banking Statistics’ published by the RBI.
33 The trade credit data available with Division of To be implemented. International Trade and Finance (DITF) of DEPR may be taken for data on trade credit given by ROW to India. Similarly, the possibility of inclusion of data on trade credit given by India to RoW from the item ‘export receipts’ shown as ‘other capital’ in BoP may be explored.
34 Capturing of transactions under the Liberalized To be implemented.
Remittance Scheme (LRS) for resident individuals under a separate head may be examined.
I.3 Other Recommendations
35 Separate Reporting of total sources/uses for the To be implemented. domestic economy and the rest of the World: In the extant FoF sector Statements, the last column reports
an amount denominated as TOTAL which is the sum of
all the amounts recorded in each domestic institutional
sector and also the rest of the world for a certain asset
(uses)/liability (sources) category. However, the SNA
2008 reports total for S1 (Domestic economy) and for
S2 (Rest of the World) separately. The WG
recommended adoption of this terminology.
36 Once the sectoral FoF accounts are compiled, joint To be implemented. meetings could be held with the concerned data suppliers and other stakeholders to get the FoF accounts data of the respective sectors vetted and validated.
37 A review mechanism be put in place wherein the To be implemented. methodology, data gaps, and other issues are
[46]

Report of the Committee on Financial Sector Statistics, 2018
S. Recommendation Status No.
reviewed at periodic intervals (preferably once in three years).
II. Recommendations for the Medium to Long-Term
II.1 Sectors
38 In the Non-Financial Corporations sector, the inclusion To be implemented. of State Public Sector Enterprises (SPSEs), Producer Data on SPSEs Companies, ‘Micro, Small and Medium Enterprises have been (MSMEs) and Water Users’ Association (WUA) may requested from be examined. CSO. Data on other entities are not available.
39 Data on SPSEs may be resorted from the Report of To be implemented. the State Level Public Enterprises Survey (or, SPSEs) Data on SPSEs are released by the DPE up to 2007-08, and some being provided estimations may be made while compiling the FoF regularly by CSO. accounts for recent years. However, exclusion of
financial enterprises from this data may be ensured to
avoid double counting.
40 The data on CPSEs, SLPEs (or SPSEs), SEBs and Implemented publicly owned port trusts may be shown separately except for SPSEs. underthesub-sectorPublicNon-Financial
Corporations, within the Non-Financial Corporation
sector.
41 Examining the inclusion of the Micro Finance To be implemented. Institutions (MFIs) established under the Society
Registration Act, 1860, Indian Trusts Act, 1882, Self
Help Co-operative Act, and Multi State Co-operative
Societies Act, in the FoF accounts under the sector
‘other financial intermediaries except insurance
corporations and pension funds’.
42 In the Financial Corporations sector, the incorporation To be implemented. of the sub-sectors ‘financial auxiliaries’ and ‘captive
financial institutions and money lenders’ may be
examined.
43 The incorporation of Venture Capital Funds (VCFs), To be implemented. Portfolio Managers and MFIs in the sub-sector ‘Other
[47]

Report of the Committee on Financial Sector Statistics, 2018
S. Recommendation Status No.
financial intermediaries except insurance
corporations and pension funds’ may be assessed.
44 The SNA 2008 classifies the following institutional To be implemented. units as financial auxiliaries: (i) Insurance brokers, (ii)
loan brokers, (iii) share brokers, (iv) floatation
corporations, (v) asset management companies, (vi)
pension fund managers, (vii) companies engaged in
foreign exchange activities, (vii) deposit account
management services, (viii) credit-related services,
(ix) financial leasing services, (x) trade finance related
services, (xi) payment and money transmission
services, (xii) fund management services, (xiii)
financial consultancy and advisory services, (xiv)
underwriting services, (xv) clearing and settlement
services, (xvi) derivative, stock, securities and foreign
exchange trading services, (xvii) Portfolio Managers,
(xviii) Venture Capital Funds and (xix) other financial
services. The WG recommended that the availability
of data for these institutional units with MCA, SEBI and Stock Exchanges may be examined.
45 The CSO and the Directorate of Economics and To be implemented. Statistics (DES) in each State Government may be
contacted for obtaining data regarding urban and rural LBs for inclusion in the General Government sector.
46 The data availability and the feasibility of classifying To be implemented. each of the sub-sectors in the non-financial and
financial corporations sectors into public, national
private and foreign controlled corporations may be
examined.
II.2 Instruments
47 The methodology of and data availability for compiling To be implemented. the following financial instruments may be examined:
(a) categorisation of ‘deposits’ into ‘transferable deposits’ and ‘other deposits’ and the further classification of ‘transferable deposits’ into ‘inter-bank positions’ and ‘other transferable deposits,
(b) bifurcation of the financial instruments ‘debt securities’ and loans’ into short-term and long-term,
[48]

Report of the Committee on Financial Sector Statistics, 2018
S. Recommendation Status No.
(c) reporting of ‘equity’ in three categories, ‘listed
shares, unlisted shares, and ‘other equity’.
48 The WG recommended that the classification of To be implemented. deposits with the RBI into ‘transferable’ (‘inter-bank’
positions and ‘other transferable deposits’) and ‘other
deposits’ may be examined.
49 An additional instrument “Financial Derivatives and To be implemented. Employee Stock Options” in line with SNA 2008 may
be introduced. Explore FETERS data (available with
DSIM) for capturing ‘financial derivatives and
employee stock option’ transactions between
residents and non-residents, through Foreign
Exchange Transactions Electronic Reporting System
(FETERS) data (available with DSIM).
50 The nature of data available with Clearing Corporation To be implemented. of India Ltd (CCIL) (on transactions in over-the-
counter (OTC) foreign exchange derivatives, Rupee
Interest Rate Swap (IRS), Forward Rate Agreement
(FRA) and Credit Default Swaps (CDS)) and SEBI (on exchange-traded derivative transactions such as
equity futures, currency futures and interest rate
futures) may be examined from the view point of
incorporating the same in the FoF Accounts.
II.3 Other Recommendations
51 The feasibility of compiling and publishing separately To be implemented. the ‘valuation account’ and the ‘other changes in
volume account’ could be assessed once the
methodology to be adopted is finalised in consultation
with the CSO.
52 The discrepancy between the stocks and flows could To be implemented. be recorded in a “Reconciliation Table”.
53 The RBI may examine the possibility of compiling and To be implemented. publishing the FoF accounts on quarterly basis
beginning with the financial sector.
54 National Balance Sheet (NBS) may be compiled by To be implemented. the RBI on an annual basis using the same
sectorisation as followed for the FoF accounts in the
revised framework as per the WG Report and using
[49]

Report of the Committee on Financial Sector Statistics, 2018
S. Recommendation Status No.
the sectoral balance sheet data as received for the
FoF accounts. Provisional NBS may be released with
one year lag and final NBS data with a lag of two
years.
55 The data flow into the FoF database to be automated To be implemented. to the extent possible. Institution of a database system (such as Oracle) at the back-end may be examined.
Section IV. Role of the Committee
2.11 The Committee observed that the HLC and the WG covered almost the entire
gamut of FoF compilation. Many of the recommendations made by them have already
been implemented. However, implementation of some of the recommendations are
pending for long probably due to poor information system in those sectors. Important
among them are the co-operative sector and the local self-Government (rural and urban
LBs) sector. There is clearly a need to create new databases for including these sectors
in India’s FoF. Further, there are incompleteness in databases being used for FoF
compilation in respect of other sectors. For example, the regulatory MCA data for non-
financial as well as financial corporation sector is incomplete on account of non-
reporting. Therefore, there is a need to explore alternative approach. Similarly, data on
ownership category is available only for new issues while it is required for the entire
sector. Further, coverage of the schemes under insurance and the provident /pension
funds may not be complete.
2.12 The Committee, therefore, decided to look into the reasons for non-compliance or
incomplete compliance and make relevant suggestions, wherever possible. Next few
Chapter will deal with the same.
[50]

Report of the Committee on Financial Sector Statistics, 2018
Chapter 3
Current Status of the Compilation of the Flow of Funds Accounts of the Indian Economy
Section I: Introduction
3.1 RBI has been compiling the annual FoF accounts on FWTW basis for the Indian
economy starting from the year 1951-52. The methodology for compilation of the FoF is
reviewed regularly, which is well chronicled in the Report of the WG. The sector and
instrument-wise classification and the associated nomenclature of the FoF accounts
have been broadly aligned with SNA 2008 with effect from the year 2011-12. Also, as
per the template prescribed by the G20 DGI group, intra-sector transactions are
presently included under sources and uses of funds of the different sectors. This is a
conceptual departure from the earlier prescription, which inflates the aggregate flows
from each sector. Some of the prescriptions of SNA 2008 that have not yet been
implemented were highlighted by the WG and its implementation status are mentioned
in chapter 2. Timeliness in release of FoF Accounts for the Indian Economy has also
been reduced from 21 months to 17 months (data for 2015-16 was released in August
20174 along with detailed statements5). However, the present system still suffers from
lack of timely and relevant data for some of the sectors.
3.2 In this backdrop, the present chapter lists out the data sources and the time lag in
receipt of data from each source in Section II. Section III highlights some of the
improvements brought about in the recent past and suggests ways to overcome some of
the outstanding issues. To deal with incompleteness and timely receipt of data relating to
the important segment of private non-financial corporations, the Committee has done some
exploratory exercise which is described separately in Section IV. Section V suggests the
remedial measures, which could be undertaken to bridge the gap between the CSO and the
RBI data. Section VI discusses the issues in compilation of FoF at
4 https://www.rbi.org.in/Scripts/BS_ViewBulletin.aspx?Id=17042 5 The detailed statements 1 to 9 relating to FoF were released separately on www.rbi.org.in; the hyperlinks
to these statements are provided in the Press Release for the August 2017 issue of the RBI Bulletin in which this article appeared.
[51]

Report of the Committee on Financial Sector Statistics, 2018
quarterly frequency. Strengthening of existing database systems and other
recommendations are discussed in Section VII.
Section II: Sources of Data
3.3 In the RBI, the National Accounts Analysis Division (NAAD) in the DEPR is
entrusted with compilation of the FoF accounts sourcing data from various agencies.
Data sources for each sector are provided in Annex 3.1. In its present format, almost
entire flows are calculated as changes in the stock position at the end of the periods. In
some cases, where stock data are not available, actual flows are used.
Section III. Issues in FoF Compilation and Suggestions
3.4 With availability of MCA 21 data, some improvement in the coverage of private non-
financial sector (in terms of the PUC) has been made. Also, sourcing of data from the
DNBS (RBI) resulted in significant enhancement in the coverage of NBFCs. Regulators
of the Insurance and the Pension and Provident Fund sectors, viz., the IRDA and the
PFRDA have also contributed by providing the consolidated position of the respective
sectors. As against this, data from the co-operative sector and LBs remain the weakest
link. Besides the timeliness, there are also issues regarding the adequacy of available
data. In this regard, the Committee made the following suggestions for improvement:
a) Co-operative Sector
i) While the balance sheet data of the StCBs and the DCCBs are made
available by the NABARD and the DCBR (RBI) in reasonable time, NABARD
has discontinued publishing data for other constituents of the rural co-
operative sector. NABARD suggested that all the State/ UT Governments
may be made responsible for collection of co-operative sector data, as the
97th Constitutional amendment empowers them to do so. RCS may be made
the nodal agency for the same and MOSPI may be involved in guiding them.
The Committee agreed with the above suggestion.
[52]

Report of the Committee on Financial Sector Statistics, 2018
However, the Committee maintained that considering NABARD’s vast
experience in this area, it may coordinate a meeting of representatives
from some select RCS, the RBI and the CSO to kick start the process.
ii) Also, NABARD may provide projections on co-operative sector data as
required in preparation of the FoF accounts and to start with, estimation of
household sector’s deposits with the co-operatives at the State level may
be attempted.
iii) Data on PACS are released by NAFSCOB with a lag of 15-18 months. It
may be used for compilation of FoF.
b) Micro-Finance Institutions
Another limitation in the present set up is non-availability of data in respect of the
MFIs. The Committee suggests that the matter may be pursued with their apex
bodies like Sa-Dhan which has 180 members, for submission of the required data.
c) Non-Financial and Financial Corporations
i) SNA recommends reporting of ‘equity’ as, ‘listed shares’, ‘unlisted shares’, and
‘other equity’. Presently, information on listed shares is available with the
SEBI. As such, unlisted shares information may be obtained by deducting
the amount of listed shares from total shares (as provided by the MCA). As
the share of ‘other equity’ is expected to be negligible at present, it may be
ignored.
ii) Another issue in FoF compilation is that it requires institutional (economic
sectors) classification of equity holdings. This is estimated using data on
subscription to the new issues as maintained by the SEBI. As a large part of
corporate sector is privately6 owned, the ratio based on data of only public
issues probably underestimates investment of the household sector in equity
instruments. In fact, this ratio may not be correct even for all listed equities, as
it does not take into account change of ownership on account of secondary 6 Some commonly used ownership structures other than public ownership are private limited, partnership and proprietorship, etc.
[53]

Report of the Committee on Financial Sector Statistics, 2018
market trading. Similarly, it becomes difficult to estimate net acquisition of debt
assets by households as the data on gross issuance of public debt securities
by corporates are captured by SEBI, but the information pertaining to
redemptions is not available. As most of the debt as well as equity are
nowadays being held in demat form, the Committee suggests that SEBI may
explore collecting holdings data in respect of corporate debt as well as listed/
unlisted equity through the depositories/ custodians (National Securities
Depository Ltd. (NSDL)/ Central Depository Services (India) Ltd (CDSL)); and
also from the Registrars and Transfer Agents (RTA). If necessary, depositories/
custodians/ RTAs may be advised (by the SEBI/ the MCA) to maintain broad
economic sector classification of security holders.
iii) However, from the long-term perspective, to overcome the issues discussed
in the preceding two paras, the MCA should capture economic sector-wise
equity/ debentures holdings for each company (both financial and non-
financial); and also a separate system for capturing details of ‘other equity’
(equity in the form other than shares). As regards the former, MCA is already
collecting information on select parameters (listing status, principal business
activity, equity shares and debentures issued/ redeemed during the year,
institutional ownership of shareholding) from companies, each financial year, in
Form MGT-7. However, ownership information is not available for debt
instruments (debentures/ loans, etc.). Also, the ownership classification is not
as per FoF requirement and the information is available only in respect of the
reporting companies. Minor changes in the format of this return viz., bifurcation
of ownership of the ‘Government companies’ and ‘body corporate’ into financial
and non-financial categories, will make it the most useful database for FoF
compilation. Further, ownership information may be obtained for debt
instruments, such as loans/ debentures/ bonds also.
iv) At present, for classification of a company into financial and non-financial, RBI
(DSIM) relies mainly on the economic activity code as reflected in the
Corporate Identification Number (CIN) allotted to it. However, the CIN is
assigned to a company at the time of incorporation of the company. As Form
[54]

Report of the Committee on Financial Sector Statistics, 2018
MGT-7 captures current business activity of a company, the Committee
recommends that the MCA may provide company-wise detailed MGT-7
data each year to the RBI for classification of companies into financial and
non-financial.
v) Another issue relates to classifying each of the sub-sectors in the financial
and the non-financial corporate sectors into public, national private and
foreign controlled corporations. In this regard, as already mentioned, Form
MGT-7 provides ownership pattern of shareholding by promoters and
others, which may be used for identification of public/ national private sector
companies. Further, Form AOC-4 submitted by each company to the MCA
contains information on percentage shares held by foreign holding
companies, which may be used for identification of foreign controlled
companies. The Committee recommends that the information contained in
Form MGT-7 and Form AOC-4 combined may be used for classifying
companies as public, private and foreign controlled. As regards the banks,
this information is readily available. The identification of foreign controlled
MFs /Insurance /Pension Funds can be done by the respective regulator
and they may furnish data for each segment separately. Use of private
databases may also be considered.
vi) Information on employees’ stock options issued during a year are collected
by the MCA from companies in Form AOC-4/ MGT-7. The Committee
recommends that the same may be used for FoF compilation.
vii) As can be seen in the Annex 1.5, financial derivatives are included in the list
of target instruments by the G20 DGI. In this regard, the WG recommended
that nature of data available with CCIL and SEBI with regard to OTC and
exchange-traded derivative transactions, respectively, may be examined
from the view point of incorporating the same in the FoF Accounts (Ref.
S.No.50, Table 2 in Chapter 2). The matter may be pursued vigorously.
viii) While submission of Forms AOC-4 and MGT-7 is mandatory, still there is gross
non-reporting. It is understood that MCA has also introduced a penalty scheme
for non-filing. The Committee recommends that the MCA may
[55]
Report of the Committee on Financial Sector Statistics, 2018
consider introducing further deterrent so that timely submission of these
Forms by all active companies are ensured.
ix) SNA 2008 prescribes bifurcation of loans, debt securities and investments
into short-term (up to one year) and long-term. It is understood that it may
be possible for banks and also the NBFCs to furnish this information, if
called for. As regards the non-financial/ financial corporations, the balance
sheet structure presently prescribed by the MCA provides these details and
they are being published in the Company Finances Studies of the RBI
(DSIM). This may be used in FoF compilation of these sectors. Further,
implementation of Ind-AS7 norms will ensure disclosure of short-term and
long-term borrowings even for banks and other financial institutions.
x) As regards the data in respect of WUAs, Farmer Producer Organisations
(FPOs) and MSMEs, to the extent, these organisations are registered under
the Companies Act, MCA may have information. However, identification of
such institutions in the MCA database is a challenge, as there is no NIC
code to identify these organisations. The Committee suggests that till such
time, wherever NABARD or its subsidiaries have promoted or financed such
institutions, the information can be obtained for making estimations and
projections.
xi) Presently, the FoF accounts in India do not capture data from financial
auxiliaries (like loan/insurance brokers and portfolio managers) and ‘captive
financial institutions and money lenders’. As regards the loan/ insurance
brokers and portfolio managers, they mainly offer fee-based services, and
as such, their exclusion may not cause any serious problem. Further, the
captive financial institutions may be included in the financial sector (mostly
NBFCs), though their separate identification is not possible at present. As
majority of the money lenders belong to the unorganised sector, capturing
data from them may not be feasible.
7 Indian Accounting Standard (abbreviated as Ind-AS) are issued by the Ministry of Corporate Affairs (MCA), as per the recommendations of National Advisory Committee on Accounting Standards (NACAS) and under the supervision of Accounting Standards Board (ASB), for adoption by companies in India.
[56]

Report of the Committee on Financial Sector Statistics, 2018
xii) The Committee also suggested that data on alternative investment funds
(AIFs) may be included in the sub-sector ‘other financial corporations’. AIF
is a privately pooled investment vehicle which collects funds from
sophisticated investors, whether domestic or foreign, for investing it in
accordance with a defined investment policy for the benefit of its investors.
The broad ambit of AIF includes different sub-categories like venture capital
funds, SME funds, social venture funds, infrastructure funds, etc. SEBI may
collect data on these entities and provide to the FoF data compilers.
xiii) Notwithstanding the improved coverage of non-financial corporations,
especially the private limited companies in recent years, the aggregate
picture is obtained using the blow-up method based on PUC. However,
there are severe limitations to this exercise as: (a) the sample is small and
not random (based on available companies’ data) and (b) all variables may
not be equally related to the size of the PUC. Further, timely availability of
data is another issue. Considering the above, the Committee suggests an
alternative approach for compiling data in respect of the private corporate
business sector (described separately in section IV below). For exploratory
purpose, the exercise was restricted to companies in the manufacturing
sector. However, it may easily be extended to the entire financial/ non-
financial sector.
xiv) SNA 2008 recommends bifurcation of deposits into transferrable and other
deposits. While the definition of transferrable deposits may not strictly apply,
bifurcation of bank deposits into ‘current and savings’ and ‘term’ may be
shown.
xv) The WG recommended preparation of FoF account for money market
mutual funds (MMMFs) and non-money market MFs (NMMMFs) separately.
This has been attempted in a limited way while releasing data for 2015-16.
Going forward, investment of all the economic sectors in MMMFs and
NMMMFs may be captured respectively.
[57]

Report of the Committee on Financial Sector Statistics, 2018
d) Insurance Sector Data
The HLC suggested that the RBI may approach the IRDA to provide combined
balance sheet for all insurance institutions – public and private - as per the FoF
format. In response, the IRDA pointed out a few issues with the FoF format and
also mentioned that many of the details required in this regard are not captured
by them. IRDA suggested that the format used in their Annual Report may be
adopted by the RBI. This will bring consistency and uniformity in the reporting.
The Committee recommends that IRDA should provide the data on life and non-
life insurance (both – public and private) to the RBI in a mutually agreed format.
In respect of data gaps, if any, required for compilation of FoF, the same may be
captured by the IRDA. In particular, IRDA should provide an estimate of loans
and advances to households from the insurance sector (both public and private)
regularly to the RBI. Further, the RBI should use the actual data on non-life
insurance as received from the IRDA, instead of using the ratio derived from life
insurance sector data.
e) Data on Pension and Provident Funds
Retirement funds are a prominent financial asset of households. Data on these
funds are sourced from the budget documents of the central and state
governments, annual reports of the EPFO8, returns received from pension and
provident funds set up by some statutory organisations, and the PFRDA. The
PFRDA is collecting data on number of subscribers and corpus for each category
of subscribers under the NPS at monthly intervals and households’ saving in the
NPS is collected by the RBI from the PFRDA on a regular basis.
f) Government Sector Data
i) HLC recommended that the ownership pattern of Government securities
(consolidated for all levels of Government), comprising six categories, viz., 1)
government , 2) banks, 3) financial sector other than banks, 4) non-service
sector (corporates, firms and societies), 5) external sector and 6) households
8 Data from EPFO comes with significant lags, latest available annual report of EPFO pertains to FY 2015-16.
[58]

Report of the Committee on Financial Sector Statistics, 2018
sector, may be prepared by the concerned Department of RBI. Table 122
(Ownership of Central and State Government Securities) of the Handbook of
Statistics of the Indian Economy, 2016-17 shows holdings of government
securities as per eleven categories, viz., (i) RBI (own account) (ii) scheduled
commercial banks (iii) cooperative banks (iv) primary dealers (v) insurance
companies (vi) financial institutions (vii) mutual funds (viii) provident funds (ix)
corporates (x) foreign institutional investors and (xi) others. The Committee
noted that ‘others’ also include sectors other than the households, such as
state/ local/ quasi governments holding securities of central governments and
trusts. The Committee recommends that the data on various components of
‘others’ should be clubbed along with the respective sectors and data on
households sector be separately carved out, for FoF compilation.
ii) Inclusion of LBs under the GG can strengthen the FoF accounts. Chapter 4
discusses issues relating to local government finances in detail.
g) Data on Rest of the World
The FoF with the RoW sector is compiled on the basis of BoP data, which is
mainly based on transaction level data for a given period. It does not match with
difference in stock data captured in the International Investment Position (IIP),
which also incorporates valuation changes. The difference in the two figures is
quite large. The Committee suggests that while BoP data may continue to be
used for FoF purpose, both sets of data (IIP and BoP) may be presented
separately for reference purpose.
h) Others
i) Feasibility of compiling and publishing separately the ‘valuation account’
and the ‘other changes in volume account’ may be explored. Further,
generation of “Reconciliation Table” to record discrepancy between the
stocks and the flows may also be examined.
ii) Priority may be accorded to fulfil these requirements which are included in
Tier-1 (i.e. targeted/ minimum) in the template prepared by the G20 DGI.
[59]

Report of the Committee on Financial Sector Statistics, 2018
Section IV: Compilation of FoF for Private Corporate Business Sector – An Exploratory Analysis
3.5 A major issue considered by the Committee was improvement in timeliness in
release of FoF statistics. Currently, India’s FoF (annual) data are released with a lag of
around 17 months, as against the recommended time lag of 9 months. In this regard, a
major handicap is the timeline prescribed under the Companies Act for finalisation of
audited annual accounts. Corporates are allowed to take 6 months for preparation of
audited annual accounts, and in cases of genuine difficulties, they may seek further
extensions. Thus, reasonable amount of data are received only after a lag of 9 months.
Thereafter, checking of data consistencies and aggregation take some more time. The
Committee explored the possibility of estimating the required data based on audited
annual accounts of early reporting companies.
3.6 Another issue considered by the Committee is the present methodology for
compilation of national accounts. Aggregated data on audited annual accounts of
available (i.e. sample) non-Government (financial/ non-financial) companies are blown
up using a factor based on the PUC. The same methodology is used for compilation of
FoF accounts also. As the method has serious limitations9, the Committee explored two
alternative methods, namely, (a) growth rate method, and (b) regression method, for
estimation of various variables. For an exploratory exercise, data on manufacturing
sector were only considered.
IV.1 Framework of the Analysis
3.7 Identification of Early Reporting Companies: Based on date of submission of
audited annual accounts data to the MCA in the last few years, the Committee felt that
the accounts received up to October (T+7 months) may be considered as early
reporting companies. Data of these companies may be used as sample data for
estimating the required variables for FoF and financial accounts. 9 See Sapre, Amey and Sinha, Pramod (2016) “Some areas of concern about Indian manufacturing sector GDP estimation”, NIPFP Working Paper, No. 172, August, 2016.
[60]

Report of the Committee on Financial Sector Statistics, 2018
3.8 Estimation of Variables: As discussed above, estimation of the required variables
for preparation of FoF for manufacturing companies was based on two alternative
methods. For each method, aggregates published in the company finances studies of
the RBI for the year (for which estimation is required) were considered as the final
estimate. The exercise was repeated for two years, namely, 2014-15 and 2015-16.
3.9 Growth Rate Method: For obtaining growth rates, two years’ data are required.
Therefore, availability of previous year’s data of the early reporting companies (as per
date of submission in the current year) was checked from the company finances
studies. Companies for which data in respect of both the years were available,
constituted the sample for estimation. Growth rate for each item, required for estimation,
was obtained for the sample companies and the same growth rate was applied to the
previous year’s final estimate. The figure so obtained is considered as an early estimate
for the current year.
3.10 Regression Method: In this method, a panel regression was run using all companies’
data available till date (from 2011-12 onwards) including the early reporting companies for
the current year. For each dependent variable (required for estimation), same set of
explanatory variables, namely, type of the company (public/ private limited), its listed/
unlisted status, industry of operation (based on 2 digit NIC-code) and geography (location of
the regd. office) as available from the unique CIN; the paid-up capital and age of the
company were considered along with an index of macro-economic parameter (growth in the
index of industrial production for the manufacturing sector) (details are in Annex 3.2 A).
Based on this regression model, required data for all the non-reporting companies (those
reported data in any of the previous years) was estimated.
IV.2 Estimates of Select Variables for 2014-15 and 2015-16
3.11 Using the above methods, select balance sheet variables (deposits; bonds/
debentures; short-term and long-term borrowings on the liabilities side; cash and cash
equivalent; investment in Government and trust securities, in bonds/ debentures, in
equity instruments and in mutual funds; and loans and advances on the assets side)
were estimated for the years 2014-15 and 2015-16 (Annex 3.2 B and Annex 3.2 C).
[61]

Report of the Committee on Financial Sector Statistics, 2018
3.12 Differences (in percentage terms) in the estimates for both the years are given in
Tables 1 and 2 below. It may be observed that, the range of errors based on panel
regression method was the lowest followed by the growth rate method. Estimates based
on PUC blow-up method had maximum range of errors. So, the Committee found merit
in using the regression technique for estimating the population figures from the available
information.
Table1: Estimation of select balance sheet variables of 64,506 companies in
manufacturing sector for 2014-15 using 19,361 early reporting companies data
(Amount in Rs. Million; Errors in %)
Actual
Estimates Estimates
Estimates Using PUC Using Panel
Using Growth
Variables CFD Study Blow-up Regression
Rates Method
Population Method Method
Figures
Estimate
Error Estimate
Error Estimate
Error
(%) (%)
(%)
Liability
Deposits 49,837 16,901 -66.1 22,981 -53.9 43,745 -12.2
Bond/ Debenture 5,62,556 2,63,570 -53.1 3,31,854 -41.0 5,79,176 3.0
Long Term Loans 38,82,435 20,47,226 -47.3 41,51,791 6.9 36,12,381 -7.0
Short Term Loans 23,90,453 11,86,011 -50.4 29,28,905 22.5 18,22,376 -23.8
Assets
Cash and cash 17,02,927 10,76,396 -36.8 18,40,255 8.1 14,88,743
-12.6
equivalent
Investment in
Govt./ Trust 35,612 2,072 -94.2 58,686 64.8 39,578 11.1
Securities
Investment in 2,48,847 4,81,955 93.7 2,36,541 -4.9 2,18,446
-12.2
Bond/ Debenture
Investment in
Equity 25,83,147 79,65,206 208.4 18,27,190 -29.3 18,30,743 -29.1
Instrument/Shares
Investment in 14,44,772 16,72,378 15.8 14,38,385 -0.4 17,70,904
22.6
Mutual funds
Loans and 29,23,560 33,15,495 13.4 27,75,360 -5.1 26,77,979
-8.4
Advances
Range of Errors -94.2 to 208.4 -53.9 to 64.8 -29.1 to 22.6
(Spread) (302.5) (118.7) (51.7)
[62]

Report of the Committee on Financial Sector Statistics, 2018
Table2: Estimation of select balance sheet variables of 80,374 companies in
manufacturing sector for 2015-16 using 24,359 early reporting companies data
(Amount in Rs. Million; Errors in %)
Actual
Estimates Estimates
Estimates Using PUC Using Panel
Using Growth Variables
CFD Study Blow-up Regression Rates Method Population Method Method
Figures
Estimate
Error Estimate
Error Estimate
Error
(%) (%) (%)
Liability
Deposits 98,816 51,553 -47.8 1,41,159 42.9 94,344 -4.5
Bond/ Debenture 8,05,201 5,81,076 -27.8 10,58,766 31.5 7,30,811 -9.2
Long Term Loans 41,44,892 34,08,545 -17.8 43,56,943 5.1 39,71,663 -4.2
Short Term Loans 32,37,505 22,20,127 -31.4 32,40,753 0.1 30,06,518 -7.1
Assets
Cash and cash
14,56,267 21,22,218 45.7 13,62,928 -6.4 13,38,641 -8.1 equivalent
Investment in
Govt./ Trust 2,62,350 51,592 -80.3 2,06,597 -21.3 50,123 -80.9
Securities
Investment in
1,98,860 6,24,519 214.0 1,63,952 -17.6 1,58,750 -20.2 Bond/ Debenture
Investment in
Equity 9,66,902 73,29,380 658.0 1,48,279 -84.7 9,44,852 -2.3
Instrument/Shares
Investment in
11,05,936 25,11,474 127.1 12,09,285 9.3 8,13,444 -26.4 Mutual funds
Loans and
30,93,785 42,81,592 38.4 30,74,999 -0.6 27,43,563 -11.3 Advances
Range of Errors -80.3 to 658.0 -84.7 to 42.9 -80.9 to -2.3 (Spread) (738.4) (127.5) (78.6)
IV.3 Scope of Further Work
3.13 The regression exercise conducted by the Committee is very preliminary and there is
enough scope to extend the work. For example, industry of operation (2-digit level NIC) was
considered as a regressor but most of the industry dummies were insignificant10
. Also, in
addition to the growth parameter, other business variables, such as, interest rates and
capital market condition can also be considered as regressors. Further, for estimating
10 The present exercise used random effect model but reducing the dimension of data will enable fixed effect estimation.

[63]

Report of the Committee on Financial Sector Statistics, 2018
required parameters for the entire private corporate sector, apart from manufacturing
sector companies, the modelling exercise needs to be repeated for other companies
[operating under primary (agriculture and mining) and tertiary sector (services
companies including financial sector)]. For these other companies, IIP may not be a
suitable macroeconomic variable. Even for the manufacturing sector, for some of the
variables, IIP growth was not significant. Thus, an alternative can be to use GDP growth
in place of the IIP.
3.14 It is also observed that for variables, which assumes large values, growth rate
estimates are quite stable. Further, in case of variables which assumes medium to small
values, regression estimates are more stable. In such cases, a judgement may be used
regarding appropriate method of estimation for each line item (i.e. variable of interest).
Alternatively, model averaging may be resorted to either with equal weights to both the
estimates, or with the weights inversely proportional to the errors of estimates.
3.15 The above framework can be extended to estimate all the balance sheet variables.
In such a case, an additional problem may arise as total assets and liabilities may not
match. However, keeping estimates of total liabilities/ assets intact, other variables’
estimates may be considered proportionately to force the accounting identities in these
estimates.
3.16 The Committee recommends that the data compilers (both of national accounts as
well as FoF) may further explore appropriate statistical methods, such as, growth rates
or regression models to estimate the balance sheet variables, in order to reduce the
shortcoming/ errors in present PUC based blow-up method.
Section V: Statistical Discrepancies in the RBI and the CSO Estimates of Financial Accounts
3.17 As the FoF accounts and the financial accounts are prepared by the RBI and the
CSO independently some discrepancies in the two data sets are unavoidable. Statistical
discrepancies are recognised by the SNA 2008 and Manual of Monetary and Financial
[64]
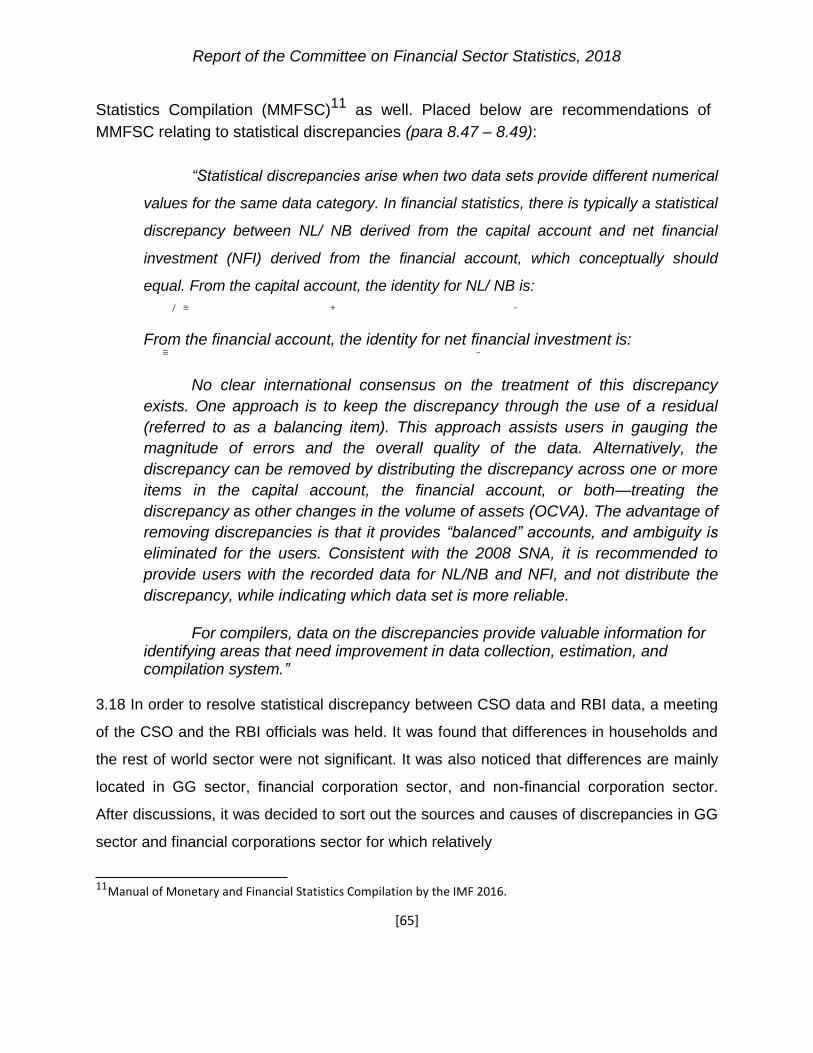
Report of the Committee on Financial Sector Statistics, 2018
Statistics Compilation (MMFSC)11 as well. Placed below are recommendations of
MMFSC relating to statistical discrepancies (para 8.47 – 8.49):
“Statistical discrepancies arise when two data sets provide different numerical
values for the same data category. In financial statistics, there is typically a statistical
discrepancy between NL/ NB derived from the capital account and net financial
investment (NFI) derived from the financial account, which conceptually should
equal. From the capital account, the identity for NL/ NB is:
/ ≡ + –
From the financial account, the identity for net financial investment is: ≡ –
No clear international consensus on the treatment of this discrepancy
exists. One approach is to keep the discrepancy through the use of a residual
(referred to as a balancing item). This approach assists users in gauging the
magnitude of errors and the overall quality of the data. Alternatively, the
discrepancy can be removed by distributing the discrepancy across one or more
items in the capital account, the financial account, or both—treating the
discrepancy as other changes in the volume of assets (OCVA). The advantage of
removing discrepancies is that it provides “balanced” accounts, and ambiguity is
eliminated for the users. Consistent with the 2008 SNA, it is recommended to
provide users with the recorded data for NL/NB and NFI, and not distribute the
discrepancy, while indicating which data set is more reliable.
For compilers, data on the discrepancies provide valuable information for identifying areas that need improvement in data collection, estimation, and compilation system.”
3.18 In order to resolve statistical discrepancy between CSO data and RBI data, a meeting
of the CSO and the RBI officials was held. It was found that differences in households and
the rest of world sector were not significant. It was also noticed that differences are mainly
located in GG sector, financial corporation sector, and non-financial corporation sector.
After discussions, it was decided to sort out the sources and causes of discrepancies in GG
sector and financial corporations sector for which relatively 11 Manual of Monetary and Financial Statistics Compilation by the IMF 2016.
[65]

Report of the Committee on Financial Sector Statistics, 2018
firmer data are available as compared with the private non-financial corporate sector. This
was to be done by using the same source of data for compilation as detailed below:
(i) Financial Corporation Sector: It was observed that there is a sizable mismatch
between FoF and Financial Accounts in ‘currency and deposits’, primarily on
account of mismatch in Non-Banking Financial Institutions (NBFIs) data. Data for
NBFIs in FoF are sourced from the Department of Non-banking Supervision, RBI
while in financial account, it is prepared from MCA database. As this was a major
difference, it was decided that the RBI would supply the list of NBFCs to the CSO
after entering CIN numbers against each NBFC and then CSO would compare it
with their list and supply that to RBI so that the sample set is made identical with
mutual consultations. Another reason for a significant difference might be on
account of inclusion of unorganised financial entities like private money lenders
and Insurance agents under financial corporations by the CSO, while the RBI
excludes this sector for the FoF.
(ii) General Government Sector: The GG sector comprises of the central
government, state governments and LBs. However differences arise on account
of the following:
Data Sources: The CSO compiles data for GG sector accounts from the
detailed analysis of Demand for grants (budget documents), Finance
accounts and Annual Financial Statements of central and state
governments. CSO follows economic and purpose classification of
transactions as recommended by SNA which is called COFOG
(Classification of Functions of Government). On the other hand, RBI
compiles data for this sector on the basis of receipt budgets of the Union
Government and RBI’s report on ‘State Finances: A Study of Budgets’. It
was decided that RBI would supply instrument-wise source of information
to the CSO.
Classification: There are two differences in the classification of
instruments, a) treatment of external debt: while it was shown as debt
[66]

Report of the Committee on Financial Sector Statistics, 2018
securities by the CSO, the RBI classifies it as ‘loans and borrowings’12
, and
b) treatment of provident funds: RBI accounts it under ‘insurance, pension
and provident funds’ on liability side of the GG sector account while CSO
accounts it under ‘debt securities’. It was decided that the CSO may
consider allocating government employees provident fund under the head
‘insurance, pension and provident funds’ in the liability statement of the
GG sector. Regarding external debt, the Committee recommends that it
should be treated as ‘Loans and Advances’.
Use of Current vs. Historical Exchange Rate for Valuation of External
Liabilities: In FoF accounts, the RBI estimates external liabilities at
current exchange rate, while in financial accounts, CSO uses historical
exchange rate. In the sequence of accounts compiled by CSO, balancing
items are derived as a flow from previous account. Accordingly, in the
capital account the NL and NB are derived from savings estimates which
is a balancing item in the use of income accounts which is based on
detailed budget analysis. The net balance of the financial account is equal
in magnitude but with opposite sign, to the balancing item of the capital
account. Therefore, to maintain consistency, the NL and NB in the finance
accounts are also valued as in the other accounts.
Data of Local Governments: Another reason for the difference is non-
inclusion of LBs and autonomous institutions by the RBI in the FoF
account. The CSO informed that they collect data on LBs from 14 states
for estimation of GVA and use a blow up factor based on grants received
by the LBs from the States. It was informed by CSO that at present
information collected is only for compiling GVA and GFCF estimates and
information pertaining to finances of LBs is not collected. 3.19 It was discussed that CSO is using the data on quasi corporations for compilation of
the national accounts statistics. However, in the absence of sectoral break-down, these
12 The RBI accounts it as ‘loans and borrowings’ as they are non-negotiable in nature.
[67]

Report of the Committee on Financial Sector Statistics, 2018
could not be included in the FoF accounts. As such, the difference on account of this
sector may not be reconciled.
3.20 In the external transaction account of CSO though DGCIS figure is taken for
merchandise trade, difference between RBI and DGCIS figure is shown as ‘adjustment
of merchandise exports/ imports to change of ownership basis’ to maintain the overall
CAD as published by RBI.
3.21 From the above discussions, it can be inferred that due to several practical
problems, the two estimates will not be fully reconciled. However, the Committee
suggests that the differences on account of data sources and their cut-off dates or
otherwise may be reconciled to the extent possible. For this purpose, the CSO and the
RBI may exchange their notes before release of these data. Further, wherever, it is not
possible to reconcile the differences (say, on account of valuation requirements for
matching identities in the sequence of accounts), it may be stated upfront in the
publications with complete transparency. It was also suggested that methodological
documents for preparation of the FoF and the national accounts may also cover these
aspects.
Section VI: Quarterly Compilation of FoF
3.22 Annual FoF Accounts are important for analysing structural issues in an economy.
However, in its present format, it provides little guidance for framing of monetary policy,
or strengthening the financial stability framework. Sectoral data on a quarterly basis
help in better assessment of macroeconomic conditions by identifying the sectoral
linkages, spill-overs, and vulnerabilities, as also tracing the transmission of potential
shocks of one sector/region to others in timely manner and support monetary and
macro-prudential policies provided they are available with a reasonable lag.
3.23 The DGI launched by the G-20 countries post the 2008 crisis, endorsed the proposal to
“develop a strategy to promote the compilation and dissemination of the balance sheet
approach (BSA), FoF, and sectoral data more generally” (Recommendation #15). In the
second phase of the DGI (DGI-II) launched in 2016, it was
[68]

Report of the Committee on Financial Sector Statistics, 2018
emphasised to “...compile and disseminate, on a quarterly basis ..., sectoral accounts
flows and balance sheet data, based on the internationally agreed template, including
data for the other (non-bank) financial corporations sector, and develop from-whom to-
whom matrices for both transactions and stocks to support balance sheet analysis”
(Recommendation #8).
3.24 Furthermore, countries adhering to the Special Data Dissemination Standard
(SDDS) Plus13 are expected to disseminate on a quarterly basis, a minimum set of
internationally comparable data on sectoral balance sheets, with a focus on the sub-
sector details of the financial corporations.
3.25 Most G-20 economies have quite concrete plans to compile, on a regular basis,
data according to the template, and/or fill remaining data gaps. Since India is a member
of the G-20, the WG had also suggested that the “RBI may examine the possibility of
compiling and publishing the FoF accounts on a quarterly basis beginning with the
financial sector”.
VI.1 Methodology
3.26 The Committee recommends that quarterly FoF accounts may be prepared
following the same methodology used in compilation of annual FoF Accounts to the
extent feasible. The Committee also looked into the data issues which are described in
next sub-section.
VI.2 Data Issues
3.27 Data for FoF accounts – mostly, the balance sheets - are available on yearly basis
with long time lag. The committee looked at alternative sources of data for quarterly FoF
accounts. It observed that data on majority of items in financial sector and some data on
General Government and RoW are available at quarterly frequency as detailed below.
13 The Special Data Dissemination Standard Plus (SDDS Plus) was established in 2012 and goes beyond the focus of the SDDS by putting an emphasis on countries that have systematically important financial sectors that are integral to the working of the international monetary system. All SDDS subscribers can also, and are encouraged to, adhere to the SDDS Plus.
[69]

Report of the Committee on Financial Sector Statistics, 2018
a) Data on Financial Sector: In respect of the financial sector, quarterly consolidated
data should available with the respective regulator/ supervisor. For example, data
for commercial banks with RBI (DBS); co-operative banks with RBI (DCBS); deposit
taking NBFCs and NBFC-ND-SI (covering large NBFCs) with RBI(DNBS); life and
non-life insurance sector with the IRDA; NPS and some other select pension
schemes with the PFRDA. Quarterly data on mutual funds can be explored with the
SEBI. While the EPFO releases monthly data on PF subscriptions, details of
investments at quarterly frequency as required for FoF may also be obtained from
them. b) For any other sub-sector, the Committee recommends that quarterly data may be
estimated/ projected/ extrapolated from the annual data using appropriate
benchmarks. c) Quarterly Data of the General Government Sector: Main source of information for
compilation of annual FoF is budget documents of the Union and State
governments, which are available on an annual frequency only. The Committee
desires that data compilers may look at the monthly budget reviews of the Central
Government to find out availability of data required for FoF estimates. Further, data
on central government securities/ state development loan as available with RBI
(IDMD) may provide the quantum of Government borrowings. d) Household Sector: The RBI has released quarterly estimates of financial assets
and liabilities of the household sector, based on information available in the financial
statements of counterparty sector in March 2018 issue of the RBI Bulletin. e) Non-financial Private/ Public Corporations: At present, we do not have any
quarterly balance sheet data of non-financial corporations. However, as per the
SEBI guidelines, the listed companies are required to submit to the recognised
stock exchanges a half yearly statement of assets and liabilities within 45 days from
the end of the half year. The Committee recommends that the SEBI may prescribe
submission of this data on a quarterly frequency. f) Rest of the World: For the RoW, major data source is the BoP statistics and the
international investment position, which are available on quarterly basis.
[70]

Report of the Committee on Financial Sector Statistics, 2018
3.28 From the above, it may be observed that balance sheet data for most of the sub-
sectors of the financial sector are available on a quarterly basis and using the same as
a mirror image, major portion of the financial flows of other sectors/ sub-sectors can be
estimated. The Committee further observed that as per latest FoF accounts for 2015-16,
the financial sector contributes the most (36.0 per cent) in total source of funds, followed
by non-financial corporations (34.2 per cent), general government (19.4 per cent),
households (7.3 per cent) and RoW (3.1 per cent). The Committee, therefore,
recommended that Quarterly FoF accounts may be attempted immediately for the
financial sector. Further, though the study on household sector as mentioned above has
some limitations, it serves as a precursor towards compilation of quarterly FoF for the
household sector. The remaining sectors (Government and non-financial corporations)
may be put under the residual sector till the time actual data are made available.
Wherever required, missing data on sectors/ instruments may be estimated/ projected/
benchmarked. The quarterly FoF may be compiled in abridged form and called
provisional estimates. Subsequently, once quarterly data becomes available from
respective regulators/ data sources, the compilation methodologies may be revised.
VI.3 Discrepancy in Quarterly and Annual Data:
3.29 Due to various reasons, viz., differences in reporting dates and quarter-end dates,
incomplete coverage, estimation technique etc., quarterly data may not add up to
annual data, which is sourced from the annual reports. The Committee recommends
that the statistical discrepancy arising on account of the quarterly and annual accounts
may be adjusted at the time of compilation of annual FoF accounts.
Section VII: Strengthening of Data Collection System (for Macro-micro Linkages) and Data Dissemination
3.30 The mandate of the Committee extends beyond suggesting measures to implement
the remaining provisions of SNA 2008 framework for compilation of the FoF accounts of
India. It is required to look into the quality of the collected data and the derived estimates
and suggest measures to establish the data integrity with necessary audit trails. The
Committee is also expected to suggest ways to make the FoF estimates available at
[71]

Report of the Committee on Financial Sector Statistics, 2018
disaggregated level which can provide better insight to the policy makers. Deliberations
of the Committee in this regard are reported below.
VII.1 Additional Fields in the Existing Databases
3.31 As per the recommendations of the HLC, most of the regulators are providing
consolidated data for the entities regulated by them for compilation of the FoF accounts.
These data are primarily based on the audited annual accounts prepared by the
respective entities. While the aggregate position of items of assets and liabilities
published therein are matched with the books of accounts maintained by them, further
disaggregates, say details of the instrument holders as required for the FoF are culled
out separately. In the absence of a well developed system, veracity of such data can
always be questioned.
3.32 In this context, the Committee noted that with significant improvement in Information
Technology, most of the institutional agencies have moved from manual record keeping
system to a digitised one. The Committee envisaged creation of a system where all
transaction level data can be stored with proper identifiers so that the aggregates as per
required dimensions can be directly built-up from the same. This will ensure complete
consistency between the macro and the micro data. To start with unique identification of the
instrument holder along with the location details are sought to be captured. The Committee
noted that in respect of SCBs, the Basic Statistical Returns (BSR) system prescribed by the
RBI captures locational details of the borrowers and the depositors up to the village/ town
level and has recently created a framework for capturing the identification details of the
borrowers. The Committee suggests that all the regulators should incorporate these fields in
their databases, wherever relevant. As regards the unique identifiers, Aadhar and PAN for
Individuals, CIN for Corporates registered with MCA, legal entity identifier (LEI) for foreign
institutions and Udyog Aadhar for enterprises registered with the Ministry of MSME may be
used across databases, or similar codes as given by the regulators/ authorised agencies.
While capturing locational details, all database should have separate fields for 4 levels
(Country, State, District, Taluka and Village/ Town) consistent with the Census structure. It
will enable GIS based analysis, which will enable policy makers to discover the region
specific linkages among various
[72]

Report of the Committee on Financial Sector Statistics, 2018
sectors (viz., real sector, financial sector, fiscal sector, etc.) and will ensure optimal
productive allocation of resources at desired level of geographies.
VII.2 Integrated Data Warehouse Networks
3.33 The Committee was of the view that all data compilers/ regulators may follow
dimensional data model in their own data warehouse and maintain required dimensions
for classification of statistics into economic (institutional) sector, and locational details
up to village/ town level as mentioned above. In addition, if the instrument holder is
engaged in some economic activity, the economic activity classification code as per NIC
2008 may also be captured. Use of dimensional data model would enable generating
aggregated data at the desired combinations of dimensions with in-built consistency. 3.34 The above data warehouses may also follow good data governance architecture,
maintain appropriate masters and should be capable of generating well defined audit
trails with proper explanations in the metadata. The above data warehouses may then
be integrated/ linked with each other. However, it would require aligning of data
definitions (e.g., rural, etc.) across the information systems.
VII.3 Strengthening of Statistics on Institutional Sectors with Higher Frequency
3.35 In view of the above, the Committee suggests specific mandate for each of the
sectors as follows:
Corporate Sector: Ministry of Corporate Affairs (MCA) through their MCA21
system should maintain and be able to provide balance sheet items, compulsory
disclosures and also the ‘sources and uses of funds’ for each company being
reported to them. The balance sheets generally describe instruments on
liabilities and assets sides. However, details of instrument holders is available
only for some instruments, such as borrowings and investments. Similar details
in respect of other financial instruments, such as equity, deposits (on assets as
well as on liabilities side), accounts receivable/ payable, etc. are also required. In
respect of the companies which do not come under the purview of MCA, MOSPI
may do surveys for collecting the required data.
[73]

Report of the Committee on Financial Sector Statistics, 2018
Government Sector: Committee on Fiscal Sector Statistics is expected to
suggest ways of compiling data pertaining to Central/ State/ Local Governments’
expenses including the various schemes launched by these Governments with
the granularity at the district level. However, details of economic sector holding
the Government securities, or contributing in financial instruments of the
Government’s balance sheet are equally important.
Data collection on RLBs through Panchayati Raj System needs to be
strengthened. If required, it may be re-looked from scratch, so that it fulfil all
administrative, fiscal, regulatory/ supervisory (audit) and statistical requirements.
It should also be integrated with data requirements from ULBs.
Financial Sector: Being the most important segment for FoF compilation, each
financial sector regulator should maintain homogeneous set of data.
o Mutual Funds: Security and Exchange Board of India (SEBI) may devise
a system which would enable them to provide details of holdings by
institutional categories (individuals, corporate, Government, etc.), in
various types of mutual funds scheme (money market/ investment funds)
and geographical location of investors.
o Equity Capital and Bond Holdings: Similar system may be developed
by the SEBI to provide data on stock (shares) holdings and corporate
bonds with the above dimensions for listed agencies. Such data may be
captured by the SEBI through stock exchanges, depository corporations,
share registrars and transfer agents (RTAs), etc.
o Insurance Corporations: LIC, which have a substantial market share in life
insurance products, also maintains policy holders’ details in their data
warehouse environment. They need to geo-code the location of policy
holders/ service agents as described above (if not done already) so as to
generate data on subscriptions received from policy holders and payments
made to the agencies for their services, scheme-wise (pension, ULIP,
general, etc.) and geography-wise with desired granularities. Similarly, other
public sector general insurance companies should also be able to
[74]

Report of the Committee on Financial Sector Statistics, 2018
provide such data from their system. IRDA may have a data warehouse
for collecting and maintaining the unit level data with details on scheme-
type, institutional category and geographical location of policy holders in
respect of public/ private insurance companies.
o Data on Scheduled Commercial Banks, Urban Cooperative Banks
and Deposit Taking NBFCs: RBI, through BSR Surveys, collects stock
figures (as on date) of deposits/ credit with scheduled commercial banks,
which provide details at granularities of institutional/ economic sectors
and geographies up to district level. However, in case of urban
cooperative banks and NBFCs, it collects only aggregated information. In
case of rural co-operatives as well, sectoral details of assets and liabilities
are not available. Therefore, possibilities to conduct annual surveys in line
with BSR surveys for collecting data from NBFCs and cooperative
institutions may be explored by the RBI (DNBS) and the NABARD.
o Data on RRBs, Rural Cooperative Banks, PACS, PACARDBs, and
SACARDBs: NABARD may create a data warehouse for maintaining
granular data on financial operations of the entities being supervised/
regulated by them. Similarly, each state Government may create new
database for cooperative credit societies as highlighted in one of the
previous section.
o Household sector: Some of the micro level data for this sector may be
available from financial sector regulators, e.g., deposits/ credit of SCBs
from the RBI; mutual funds, stocks and debentures holdings data from
SEBI, investments in insurance products from LIC/ IRDA, etc. These data
may be used to calculate net changes in liabilities and assets of the
households.
VII.4 Other Recommendations
3.36 i) In India, the audited accounts are generally available with a lag of 6-9 months
and scrutiny of the same can take up to another 3 months. Thus, 12 months
can be considered as reasonable time for release of annual FoF data.
[75]

Report of the Committee on Financial Sector Statistics, 2018
However, some of the institutions/ regulators make available unaudited data
early, which can be used in preparing provisional estimates. Provisional
annual FoF accounts may be released within 9 months from the reference
date.
ii) As availability of data from some sectors is an issue, the Committee
recommends releasing provisional/ revised estimates of FoF along with the
methodologies (including use of estimations/ projections) for compiling such
estimates from the primary sources of data.
iii) Provisional quarterly FoF may be released within 4 months from the reference
dates (in line with ECB14
), using estimations in case of non-availability of data.
iv) Improvement in the format for release of FoF data can be thought of in line
with international best practices - while the annual data could be more
detailed, the quarterly data could be abridged.
v) Considering the significant international attention being paid to the
implementation of agreed data templates through outreach, technical
assistance, and training, the compilers from the National Account Analysis
Division of DEPR, RBI and CSO, MoSPI may be given adequate training and
exposure.
3.37 To address the issue of periodic audit, the Committee opined that as the FoF is
derived from primary accounts of concerned institutions, audit of the primary accounts
should be a priority.
14 ECB Monthly Bulletin – Euro Area Statistics Methodological Notes http://sdw.ecb.europa.eu/browse.do?node=9691132#tabs-5
[76]

Report of the Committee on Financial Sector Statistics, 2018
Annex 3.1: Flow of Fund Accounts of the Indian Economy: Sources of Data
Sector and sub- Source agency
Source Time-line of
sector
document (s)
data availability
1. Non-Financial Corporations
1.a Public Non-
financial Corporations Ministry of Heavy Survey of Public Sector 12 months (i) Government
Non- Industries and Enterprises (PSEs)
departmental Public
commercial Enterprises
undertakings Respective
Performance of State Power
(NDCUs)
(ii) Power power utility Utilities-Annual Publication of
Companies Power Finance Corporation 12 months
1.b Other Non-financial RBI (DSIM) Annual data furnished by MCA 12 months Corporations to RBI (DSIM)
(i) Public
Limited
Companies
(ii) Private RBI (DSIM), Annual data furnished by 12 months Limited SEBI and MCA Ministry of Corporate Affairs
Companies (MCA) to RBI (DSIM)
2. Financial Corporations
2.a Central Bank RBI (DGBA, 1. RBI Statement of Affairs No lag various regional 2. Real Time Handbook of offices) Statistics on the Indian Economy
(www.dbie.rbi.org.in)
2.b Deposit-taking 12 months corporations, except
the central bank
(i) Commercial Banks RBI (DSIM) Statistical Tables relating to 9 months Banks in India (from DSIM)
Section 42 returns (from DBR/DSIM)
Form X returns for RRBs (from
DBR)
(ii) LAB RBI (DBS) 9 months
(iii) State Cooperative NABARD/RBI 1. Form IX return 9 months Banks (DCBR) 2. Statistical Tables relating to
(iv)District Central NABARD/ RBI Banks in India 9 months Cooperative Banks (DCBR) 3. Statistical Statements relating
to the Cooperative Movement in
India, which is available with a
time lag.
[77]
Continued …

Report of the Committee on Financial Sector Statistics, 2018
Sector and sub- Source agency
Source Time-line of sector document (s)
data availability
(v) Urban Cooperative DCBR, RBI 9 months Banks
(vi) NBFC- D RBI (DNBR and 9 months DSIM)
(vii) HFCs-D National Housing 9 months Bank (NHB)
(viii) Central Public Ministry of Heavy Surveyof Public Sector 9 months Sector Financial Industries and Enterprises
Corporations Public
Enterprises
(ix) Mutual Funds Securities and No lag Exchange Board
of India (SEBI)
(x) Other financial Annual Reports 3 months intermediaries, except of the respective
insurance corporations institutions
and pension funds
(xi) Non-deposit taking RBI (DNBR) 3 months Non-Banking Financial
Companies
(xii) Non-deposit taking NHB 3 months Housing Finance
Companies
(xiii) Insurance IRDA IRDA Annual Report, LIC Annual 3 months Corporations Report
(xiv) Pension Funds PFRDA/MOSPI Respective Provident and 3 months (CSO) Pension Funds
3.General Government
3.a Central RBI, DEPR 1. Economic and Functional Revised Government (FAD) Classification of the Union estimate figures Budget (EFC) are available 2. Union Budget documents with a lag of 12 3. Union Finance Accounts months. (http://cga.nic.in/) However, they 4. Combined Finance and are subject to Revenue Accounts (CFRA) change. (http://cag.gov.in/)
3.b State Governments RBI, DEPR 1. A Study of State Budgets Revised (FAD) and 2. Combined Finance and estimate figures Comptroller and Revenue Accounts are available Auditor General 3. Finance Accounts of with a lag of 12 (CAG) State Governments months. However, they
Continued …
[78]

Report of the Committee on Financial Sector Statistics, 2018
Sector and sub- Source agency
Source Time-line of sector
document (s) data availability
are subject to change.
4.Households and Non-profit
institutions serving households
5. Rest of the World RBI, DEPR BoP Statistics, External Debt 3 months (DITF) & DSIM Statisticsand International Investment Position of India
[79]

Report of the Committee on Financial Sector Statistics, 2018
Annex 3.2 A: Model Equation = + 1( ) + 2( ℎ) + 3( ) + 4( ) + 3( )
31 6
+ ∑ ( ) + ∑ ( ) +
=10 =2
Where,
is the dependent variable (as per below table) of interest for ith company at time t
Liability Assets
Deposits Cash and cash equivalent
Bond/Debenture Investment in Govt./Trust Securities
Long Term Loans Investment in Bond/Debenture
Short Term Loans Investment in Equity Instrument/Shares
Investment in Mutual funds
Loans and Advances
is the residual, is the intercept and ′ , ′ ′ are the regression coefficients for the set of regressors described below.
Description of Explanatory Variables (1) ( ) = Paid-up capital of the ith company at time t
(2) ( ℎ) : IIP growth of kth industry at time t to which ith company belong (3) ( ) : Age of ith company at time t
(4) ( ) = kth Indgroup in the
manufacturing sector Industry Group Name
9 MANUFACTURE OF FOOD PRODUCTS AND BEVERAGES
10 MANUFACTURE OF TOBACCO PRODUCTS
11 MANUFACTURE OF TEXTILES
MANUFACTURE OF WEARING APPAREL; DRESSING 12 AND DYEING OF FUR
TANNING AND DRESSING OF LEATHER; MANUFACTURE OF LUGGAGE,HANDBAGS SADDLERY, HARNESS AND
13 FOOTWEAR
MANUFACTURE OF WOOD AND OF PRODUCTS OF WOOD AND CORK,EXCEPT FURNITURE;MANUFACTURE
14 OF ARTICLES OF STRAW AND PLATING MATERIALS
15 MANUFACTURE OF PAPER AND PAPER PRODUCTS
Continued … [80]

Report of the Committee on Financial Sector Statistics, 2018
(4) ( ) = kth Indgroup in the
manufacturing sector Industry Group Name
PUBLISHING, PRINTING AND REPRODUCTION OF 16 RECORDED MEDIA
MANUFACTURE OF COKE, REFINED PETROLEUM 17 PRODUCTS AND NUCLEAR FUEL
MANUFACTURE OF CHEMICALS AND CHEMICAL 18 PRODUCTS
19 MANUFACTURE OF RUBBER AND PLASTIC PRODUCTS
MANUFACTURE OF OTHER NON-METALLIC MINERAL 20 PRODUCTS
21 MANUFACTURE OF BASIC METALS
MANUFACTURE OF FABRICATED METAL PRODUCTS, 22 EXCEPT MACHINERY AND EQUIPMENTS
MANUFACTURE OF MACHINERY AND EQUIPMENT 23 N.E.C.
MANUFACTURE OF OFFICE, ACCOUNTING AND 24 COMPUTING MACHINERY
MANUFACTURE OF ELECTRICAL MACHINERY AND 25 APPARATUS N.E.C.
MANUFACTURE OF RADIO, TELEVISION AND 26 COMMUNICATION EQUIPMENT AND APPARATUS
MANUFACTURE OF MEDICAL, PRECISION AND OPTICAL 27 INSTRUMENTS,WATCHES AND CLOCKS
MANUFACTURE OF MOTOR VEHICLES, TRAILERS AND 28 SEMI-TRAILERS
29 MANUFACTURE OF OTHER TRANSPORT EQUIPMENT
MANUFACTURE OF FURNITURE; MANUFACTURING 30 N.E.C.
31 RECYCLING
(5) ( ) = Region to which
the company
belong Region Name
1 North
2 East
3 West
4 South
5 Central
6 North East
(6) ( ) = 1 if the ith company is Listed, otherwise 0
(7) ( ) = 1 if the ith company is Public Limited, Otherwise 0
[81]

Report of the Committee on Financial Sector Statistics, 2018
Annex 3.2 B: Regression Results for the Year 2014-15
Dependent (A) Liability Items (B) Asset Items
Variables ->
Deposits Bonds & Long Short Cash and Investmen Investment Investment Investmen Loans & Debentures Term Term Cash t in Govt/ in Bond/ in Equity t in Mutual Advances
Independent Loans Loans Equivalents Trust Debenture Instrument Funds
Securities
/ Shares
Variables ↓
PUC 0.65*** 1.65*** 2.65*** 3.65*** 4.65*** 5.65*** 6.65*** 7.65*** 8.65*** 9.65***
(0) (0) (0.19) (0.01) (0.01) (0) (0) (0.01) (0.01) (0.01)
For independent variables "IIPGrowth" and "Age" - Coefficients and (Standard Errors) are in thousands of data unit.
IIPGrowth 4.29 156.36 65.64 -161.62 -780.81** 3.40 1.84 -61.83 200.37 -53.79
(17.02) (196.08) (875.48) (230.81) (361.9) (14.56) (76.03) (611.33) (635.71) (583.41)
859.65**
Age 18.90** 69.00 * 205.11** 500.09*** 21.65*** 121.44*** 912.65*** 1011.37*** 942.84***
(7.8) (65.67) (297.81) (83.65) (121.2) (4.88) (25.46) (204.73) (212.9) (195.38) For independent variables "Indgroup", "List", "Type", Region and "Constant" - Coefficients and (Standard Errors) are in millions of data
unit. Industry Groups
10 -0.62 -7.88 -48.70 17.30 109.00*** 0.91 2.69 7.96 46.80 1.24
(1.53) (12.9) (58.3) (16.4) (23.7) (0.96) (4.99) (40.1) (41.7) (38.3)
11 0.58 5.89* 46.40*** 5.33 2.86 0.65** 3.37** 32.40*** 25.70** 24.80**
(0.42) (3.58) (16.2) (-4.56) (6.61) (0.27) (1.39) (11.2) (11.6) (10.7)
12 0.20 3.72 21.70 -0.33 4.52 0.35 1.54 15.30 14.60 15.50
(0.52) (4.38) (19.9) (5.58) (8.09) (0.33) (1.7) (13.7) (14.2) (13)
13 -0.18 -0.33 -6.44 -5.59 0.10 -0.04 -0.43 4.77 -2.75 -2.16
(0.9) (7.59) (34.4) (9.66) (14) (0.56) (2.94) (23.7) (24.6) (22.6)
14 0.28 5.63 23.10 -3.01 -2.02 0.39 1.49 12.70 16.10 11.40
(0.92) (7.71) (35) (9.82) (14.2) (0.57) (2.99) (24) (25) (22.9)
15 -0.05 -0.08 -1.11 -7.52 -3.44 -0.04 -0.53 -1.42 -3.03 -4.84
(0.68) (5.75) (26.1) (7.33) (10.6) (0.43) (2.23) (17.9) (18.6) (17.1)
16 0.23 5.79 22.70 -1.36 35.50*** 0.38 1.72 22.10 15.50 32.70**
Continued … [82]

Report of the Committee on Financial Sector Statistics, 2018
Dependent (A) Liability Items (B) Asset Items
Variables ->
Deposits Bonds & Long Short Cash and Investmen Investment Investment Investmen Loans & Debentures Term Term Cash t in Govt/ in Bond/ in Equity t in Mutual Advances
Independent Loans Loans Equivalents Trust Debenture Instrument Funds
Securities
/ Shares
Variables ↓
(0.58) (4.89) (22.2) (6.23) (9.03) (0.36) (1.9) (15.3) (15.9) (14.6)
17 -0.57 -8.62 -53.90 0.86 -1.99 -0.83 -4.17 -19.90 -37.80 -31.00
(0.95) (7.96) (36.1) (10.1) (14.7) (0.59) (3.08) (24.8) (25.8) (23.7)
18 0.06 0.16 -0.61 -3.15 -0.46 -0.01 -0.13 4.37 -0.60 -0.78
(0.4) (3.34) (15.2) (4.26) (6.17) (0.25) (1.3) (10.4) (10.8) (9.95)
19 0.16 2.20 11.80 -4.11 0.08 0.16 0.53 7.70 5.66 4.49
(0.49) (4.12) (18.7) (5.25) (7.61) (0.31) (1.6) (12.9) (13.4) (12.3)
20 0.07 0.77 0.09 -2.85 -4.40 -0.07 -0.78 0.75 -4.02 3.63
(0.62) (5.24) (23.8) (6.68) (9.68) (0.39) (2.03) (16.3) (17) (15.6)
21 -0.04 4.16 -0.12 6.66 -0.39 -0.14 -1.35 -6.78 -5.49 3.20
(0.44) (3.73) (16.9) (4.74) (6.89) (0.28) (1.45) (11.6) (12.1) (11.1)
22 0.13 0.36 0.03 -4.80 -4.24 -0.02 -0.41 -0.18 -2.32 -0.14
(0.54) (4.52) (20.5) (5.76) (8.35) (0.34) (1.75) (14.1) (14.7) (13.5)
23 0.00 0.13 -1.74 -6.83 -1.93 0.03 -0.26 1.99 0.49 -0.85
(0.43) (3.65) (16.6) (4.65) (6.74) (0.27) (1.42) (11.4) (11.8) (10.9)
24 0.08 2.13 86.68 -6.87 11.60 0.18 0.64 9.07 11.20 12.50
(0.92) (7.8) (35.4) (9.93) (14.4) (0.58) (3.02) (24.3) (25.3) (23.2)
25 1.50*** 0.64 -20.60 -3.46 -3.00 -0.39 -1.96 -9.48 -18.90 -13.10
(0.52) (4.44) (20.1) (5.64) (8.19) (0.33) (1.72) (13.8) (14.4) (13.2)
26 -0.43 -6.32 -29.90 -18.90** -4.50 -0.46 -3.49 -31.90* -18.50 -14.30
(0.74) (6.22) (28.2) (7.92) (11.5) (0.46) (2.41) (19.4) (20.2) (18.5)
27 0.24 4.95 19.20 -3.17 8.05 0.37 1.60 16.00 16.00 15.70
(0.81) (6.84) (31) (8.71) (12.6) (0.51) (2.65) (21.3) (22.2) (20.3)
28 -2.04*** -28.70*** -162.00*** -22.80*** -22.60** -2.47*** -11.60*** -73.80*** -114.00*** -74.40***
(0.73) (6.16) (27.9) (7.84) (11.4) (0.46) (2.39) (19.2) (20) (18.3)
[83] Continued …

Report of the Committee on Financial Sector Statistics, 2018
Dependent (A) Liability Items (B) Asset Items
Variables ->
Deposits Bonds & Long Short Cash and Investmen Investment Investment Investmen Loans & Debentures Term Term Cash t in Govt/ in Bond/ in Equity t in Mutual Advances
Independent Loans Loans Equivalents Trust Debenture Instrument Funds
Securities
/ Shares
Variables ↓
29 -1.16 -12.00 -77.80** -9.05 -21.10 -1.80*** -8.47*** -58.40** -78.10*** -55.90**
(0.94) (7.91) (35.9) (10.1) (14.6) (0.59) (3.07) (24.7) (25.7) (23.5)
30 0.65 2.86 11.70 26.10*** 27.90*** 0.19 0.85 10.70 6.62 12.70
(0.57) (4.82) (21.9) (6.13) (8.9) (0.36) (1.87) (15) (15.6) (14.3)
31 0.30 2.56 16.70 -7.19 1.12 0.39 1.73 14.90 16.60 13.90
(2.02) (17.1) (77.3) (21.7) (31.5) (1.27) (6.61) (53.2) (55.3) (50.7)
104.00**
Listing 3.54*** 61.20*** 29.70*** * 192.00*** 5.25*** 27.60*** 211.00*** 222.00*** 271.00***
(1.12) (9.68) (43.8) (12.2) (17.9) (0.72) (3.75) (30.2) (31.4) (28.8)
-
173.00** -
Type -2.47*** -34.50*** * -17.10* -50.50*** -3.57*** -17.80*** -129.00*** -155.00*** 127.00***
(0.94) (8.18) (37) (10.3) (15.1) (0.61) (3.17) (25.5) (26.5) (24.3)
Region
2 -0.53* -1.56 -11.80 -7.39** -0.43 -0.08 -0.33 -1.54 -2.71 -5.89
(0.3) (2.49) (11.3) (3.18) (4.6) (0.18) (0.97) (7.77) (8.08) (7.41)
3 -0.46** -0.49 14.70*** -1.41 1.19 -0.21 -1.09 -8.27 -7.63 -4.97
(0.24) (1.98) (8.98) (2.52) (3.65) (0.15) (0.77) (6.17) (6.42) (5.89)
4 -1.30*** -13.40*** -76.40*** -4.66 -5.69 -1.29*** -6.47*** -47.60*** -56.10*** -46.20***
(0.33) (2.82) (12.8) (3.59) (5.21) (0.21) (1.09) (8.8) (9.15) (8.4)
5 -0.22 1.29 8.60 5.48 3.43 0.19 1.02 10.10 7.29 4.61
(0.56) (4.72) (21.4) (6.02) (8.71) (0.35) (1.83) (14.7) (15.3) (14)
6 -0.43 -0.93 -8.10 -6.69 -4.68 -0.10 -0.52 -0.60 -5.05 2.80
(1.07) (8.97) (40.7) (11.4) (16.5) (0.67) (3.48) (28) (29.1) (26.7) Continued …
[84]

Report of the Committee on Financial Sector Statistics, 2018
Dependent (A) Liability Items (B) Asset Items
Variables ->
Deposits Bonds & Long Short Cash and Investmen Investment Investment Investmen Loans & Debentures Term Term Cash t in Govt/ in Bond/ in Equity t in Mutual Advances
Independent Loans Loans Equivalents Trust Debenture Instrument Funds
Securities
/ Shares
Variables ↓
_Constant -0.31 -7.79** -30.90*** 3.28 -10.70* -0.85*** -3.96*** -31.00*** -37.70*** -29.90***
(0.36) (3.05) (13.8) (3.87) (5.62) (0.23) (1.18) (9.5) (9.87) (9.06)
R-square: 0.12 0.22 0.32 0.19 0.13 0.28 0.26 0.23 0.29 0.31
Note: Figures in first row are estimates of coefficients; and figures in parentheses in next row representing standard errors.
*** Significant at 1% level of significance; ** Significant at 5% level of significance; * Significant at 10% level of significance.
[85]

Report of the Committee on Financial Sector Statistics, 2018
Annex 3.2 C: Regression Results for the Year 2015-16
Dependent Variables -> (A) Liability Items (B) Asset Items
Deposits Bonds & Long Term Short Term Cash and Investment Investment Investment Investment Loans & Debentures Loans Loans Cash in Govt/ in Bond/ in Equity in Mutual Advances
Independent Equivalents Trust Debenture Instrument/ Funds
Variables ↓ Securities Shares
PUC 0.37*** 1.35*** 5.27*** 1.22*** 1.06*** 0.15*** 0.38*** 2.14*** 2.81*** 3.1***
(0) (0.01) (0.02) (0) (0.01) (0) (0) (0.01) (0.01) (0.01)
For independent variables "IIPGrowth" and "Age" - Coefficients and (Standard Errors) are in thousands of data unit.
IIPGrowth 2.38 26.46 343.57 -374.39* -646.24** 0.38 12.71 222.84 214.33 -113.04
(11.67) (243.69) (673.02) (193.85) (281.17) (32.33) (66.92) (557.5) (441.62) (405.66)
Age 28.46*** 350.62*** 1951.52*** 507.21*** 927.96*** 51.55*** 304.1*** 2166.73*** 1201.46*** 1507.39***
(7.44) (101.63) (347.88) (101.58) (115.78) (13.31) (30.16) (229.56) (209.59) (205.42) For independent variables "Indgroup", "List", "Type", Region and "Constant" - Coefficients and (Standard Errors) are in millions of data
unit. Industry Groups
10 -0.78 -17.9 -73.5 -23.3 147*** -0.77 30.4*** 62.8 51.1 10.3
(1.47) (19.8) (68.1) (19.9) (22.5) (2.59) (5.88) (44.6) (40.9) (40.2)
11 0.2 14.7*** 54.7*** 10.1* 4.31 2.05*** 3.71** 17 27** 26.9**
(0.41) (5.58) (19.1) (5.58) (6.35) (0.73) (1.65) (12.6) (11.5) (11.3)
12 -0.05 5.43 18.9 1.97 7.03 0.57 1.47 9.44 9.25 14.1
(0.51) (6.95) (23.8) (6.94) (7.93) (0.91) (2.06) (15.7) (14.3) (14)
13 -0.17 2.2 -4.44 -4.25 2.58 0.21 0 5.13 0.67 1.59
(0.88) (12) (40.9) (12) (13.6) (1.57) (3.55) (27) (24.7) (24.2)
14 0.04 7.73 24.7 0.11 1.44 0.83 1.74 9.89 14.3 13
(0.88) (11.9) (40.8) (11.9) (13.6) (1.56) (3.53) (26.9) (24.6) (24.1)
15 -0.14 -0.18 -5.25 -9.45 -4.19 0.05 -0.98 -8.85 -2.7 -8.11
(0.67) (9.01) (30.9) (9.04) (10.3) (1.18) (2.68) (20.3) (18.6) (18.3)
16 -0.03 7.25 22.7 0.26 31.1*** 0.72 2.11 17.9 15.1 30.4*
(0.57) (7.66) (26.3) (7.7) (8.73) (1) (2.28) (17.3) (15.8) (15.5) Continued …
[86]

Report of the Committee on Financial Sector Statistics, 2018
Dependent Variables -> (A) Liability Items (B) Asset Items
Deposits Bonds & Long Term Short Term Cash and Investment Investment Investment Investment Loans & Debentures Loans Loans Cash in Govt/ in Bond/ in Equity in Mutual Advances
Independent Equivalents Trust Debenture Instrument/ Funds
Variables ↓ Securities Shares
17 -0.4 -8.56 -40.1 8.26 10.2 -1.11 -3.74 -15.4 -24 -21.7
(0.91) (12.4) (42.4) (12.4) (14.1) (1.62) (3.67) (27.9) (25.5) (25)
18 0.09 -0.38 -5.08 1.93 4 0.01 -0.02 4.88 -1.55 4.51
(0.39) (5.25) (18) (5.25) (5.99) (0.69) (1.56) (11.9) (10.8) (10.6)
19 -0.03 3.44 8.39 -4.02 1.04 0.37 0.33 1.29 5.29 3.58
(0.48) (6.45) (22.1) (6.46) (7.34) (0.84) (1.91) (14.6) (13.3) (13.1)
20 -0.13 -0.14 -5.84 -4.19 -1.3 -0.32 -1.84 -8.38 -1.33 1.64
(0.6) (8.17) (28.1) (8.2) (9.31) (1.07) (2.43) (18.5) (16.9) (16.6)
21 0.04 6.38 14.9 6.61 -0.73 -0.43 -0.25 11.6 -3.17 6.19
(0.42) (5.77) (19.7) (5.74) (6.57) (0.76) (1.71) (13) (11.9) (11.6)
22 -0.11 -2.18 -8.83 -5.38 -5.71 -0.24 -1.02 -2.41 -7.98 -4.59
(0.52) (7.06) (24.3) (7.09) (8.04) (0.92) (2.1) (15.9) (14.6) (14.3)
23 -0.22 -0.35 -6.78 -6.65 2.19 0.04 -0.38 -0.63 0.84 -0.26
(0.42) (5.68) (19.5) (5.69) (6.47) (0.74) (1.69) (12.8) (11.7) (11.5)
24 -0.24 3.17 2.62 -7.26 13.4 0.51 0.76 3.3 12.4 14
(0.9) (12.2) (41.9) (12.2) (13.9) (1.6) (3.63) (27.7) (25.2) (24.7)
25 1.01** -5.66 -43.8* -7.94 -3.1 -1.34 -3.78* -18.3 -28.6** -25.2*
(0.51) (6.93) (23.6) (6.9) (7.9) (0.91) (2.05) (15.7) (14.3) (14)
26 -0.89 -30.7*** -116*** -24.8** 27.6** -3.24** -8.05*** -37.6* -46.3** -29.3
(0.71) (9.73) (33.3) (9.72) (11.1) (1.27) (2.89) (22) (20.1) (19.7)
27 -0.19 5.33 3.2 -5.69 6.77 0.53 0.85 5.19 7.39 7.58
(0.79) (10.7) (36.7) (10.7) (12.2) (1.4) (3.18) (24.2) (22.1) (21.6)
28 -1.23* -46.2*** -172*** -35.2*** -19.5* -5.08*** -12.6*** -59.8*** -90.8*** -69.2***
(0.71) (9.6) (33) (9.63) (10.9) (1.26) (2.85) (21.7) (19.8) (19.5)
Continued … [87]

Report of the Committee on Financial Sector Statistics, 2018
Dependent Variables -> (A) Liability Items (B) Asset Items
Deposits Bonds & Long Term Short Term Cash and Investment Investment Investment Investment Loans & Debentures Loans Loans Cash in Govt/ in Bond/ in Equity in Mutual Advances
Independent Equivalents Trust Debenture Instrument/ Funds
Variables ↓ Securities Shares
29 -0.87 -17.5 -75.9* -17.5 -0.07 -3.34** -7.82** -39.7 -41.6 -44.8*
(0.91) (12.3) (42.2) (12.3) (14) (1.61) (3.65) (27.8) (25.4) (24.9)
30 0.38 4.52 8.42 28.4*** 29.8*** 0.51 1.22 6.72 5.03 14.8
(0.57) (7.97) (26.8) (7.81) (9.1) (1.05) (2.35) (18) (16.2) (15.8)
31 0.36 5.38 21.2 12.7 8.04 0.76 3.15 20.7 14 27.6
(1.95) (26.9) (91.4) (26.7) (30.6) (3.52) (7.95) (60.8) (55.2) (54)
Listing 3.95*** 94.5*** 386*** 201*** 252*** 6.28*** 40.3*** 342*** 209*** 358***
(0.76) (11.5) (37.2) (10.8) (13.2) (1.51) (3.34) (26.1) (22.9) (22)
Type -0.58 -71.2*** -217*** -16.6** -51.7*** -8.82*** -22.7*** -120*** -156*** -138***
(0.48) (7.92) (24.5) (7.11) (9.08) (1.04) (2.26) (18) (15.3) (14.6)
Region
2 -0.47 -1.39 -11.4 -5.68 -0.86 0.02 0.03 -4.31 1.07 -4.24
(0.29) (3.9) (13.4) (3.93) (4.45) (0.51) (1.16) (8.81) (8.08) (7.93)
3 -0.14 0.09 -5.65 0.59 -0.16 -0.03 -0.83 -2.06 -4.25 -0.4
(0.23) (3.11) (10.7) (3.12) (3.54) (0.41) (0.92) (7.02) (6.42) (6.3)
4 -0.76** -19.6*** -68.7*** -5.72 -0.09 -2.15*** -6.48*** -39*** -41.4*** -37.3***
(0.31) (4.35) (14.8) (4.31) (4.95) (0.57) (1.29) (9.82) (8.92) (8.73)
5 -0.23 5.12 18.9 7.88 5.12 0.66 1.26 7 10.5 7.87
(0.54) (7.35) (25.3) (7.39) (8.37) (0.96) (2.19) (16.6) (15.2) (14.9)
6 -0.4 0.6 -1.56 -5.11 -5.93 0.18 -0.99 -2.74 -0.13 8.96
(1.04) (14) (48.2) (14.1) (16) (1.84) (4.17) (31.7) (29) (28.4)
Continued …
[88]

Report of the Committee on Financial Sector Statistics, 2018
Dependent Variables -> (A) Liability Items (B) Asset Items
Deposits Bonds & Long Term Short Term Cash and Investment Investment Investment Investment Loans & Debentures Loans Loans Cash in Govt/ in Bond/ in Equity in Mutual Advances
Independent Equivalents Trust Debenture Instrument/ Funds
Variables ↓ Securities Shares
Constant -0.26 -15.6*** -59.2*** -4.11 -19.5*** -1.89*** -7.03*** -46.5*** -38.6*** -40.4***
(0.34) (4.67) (16) (4.68) (5.32) (0.61) (1.39) (10.6) (9.64) (9.46)
R-square: 0.0694 0.2242 0.311 0.2313 0.1227 0.1718 0.2228 0.1242 0.2484 0.3092
Note: Figures in first row are estimates of coefficients with figures in parentheses in next row representing standard errors.
*** Significant at 1% level of significance; ** Significant at 5% level of significance; * Significant at 10% level of significance.
[89]

Report of the Committee on Financial Sector Statistics, 2018
Chapter 4
Flow of Funds Compilation for Local Governments
Section I: Introduction
I.1 SNA 2008 on Local Government
4.1. SNA 2008 recognises the local Government15 as a separate sub-sector of the GG
sector along with the Central and the State Governments. Under SNA 2008, the local
Government sub-sector consists of local Governments plus those non-market Non-
Profit Institutions (NPI) controlled by the local Governments. In principle, fiscal,
legislative and executive authority of the local Government extends over the smallest
geographical areas distinguished for administrative and political purposes. The scope of
their authority is generally much less than that of Central or State (regional)
governments, and they may, or may not, be entitled to levy taxes on institutional units
and/ or resident in their areas. They are often heavily dependent on grants or transfers
from higher levels of Government, and they may act as agents of Central or regional
governments to some extent.
I.2 Efforts of the RBI in Compiling Local Bodies Data
4.2. The RBI used to compile data on LBs through the “Survey on Borrowings and
Investments of Local Authorities” (subsequently renamed as the “Finances of Local
Authorities”). First such survey was undertaken in 195716
with a view to gather detailed
information from select Local Authorities (LAs) on their borrowings and investments as on
reference date. However, it also covered revenue/ capital receipts and disbursements
during the reference year. Data collected through this survey were used for FoF
compilation. The survey covered the Port trusts, city corporations and municipalities in
towns with a population of 1 lakh and more as per the latest available census data. A 15 The terminology local Government/ local bodies/ local authorities refers to the same institution. However, the term used in respective literature has been retained.
16 Covering data for the period from 1951-52 to 1956-57 and results were published in April 1958 issue of the RBI Bulletin.
[90]

Report of the Committee on Financial Sector Statistics, 2018
detailed list of variables compiled under the said survey is given in Annex 4.1.
Subsequently, on account of poor response, the survey was discontinued. At present,
following SNA 2008, port trusts are classified under non-financial sector. In the absence
of any reliable data on other LBs, separate classification is not made17.
I.3 Structure and Accounting System of Local Bodies in India
4.3. In India, jurisdiction of the LBs extends over villages, towns or cities. The LBs
constituted for rural areas – RLBs, popularly known as the Panchayati Raj Institutions
(PRIs) – consists of three layers, namely, Gram Panchayats (GP), Panchayat Samiti (PS)
and Zilla Parishad (ZP); and those constituted for urban areas – ULBs - are known by
names such as Nagar Parishad, Nagar Palika, Municipality, Municipal Corporation etc.
I.3.1 Rural Local Bodies
4.4. The 73rd Constitutional Amendment Act of 1992 contains provisions for devolution
of powers and responsibilities to the panchayats both for (a) preparation of plans for
economic development and social justice and (b) implementation in relation to twenty-
nine subjects listed in the eleventh schedule of the constitution. The Ministry of
Panchayati Raj (MoPR) was set up to institutionalise the PRIs at village, Taluka, and
district levels, as the third tier of the Government. These panchayats receive funds from
three main sources, namely, local body grants as recommended by the Central Finance
Commission (CFC), funds for implementation of Central Government sponsored
schemes, and funds released by the State governments on the recommendations of the
SFC. They may also raise own resources through local taxes and service charges.
I.3.1.1 Maintenance of Panchayats’ Accounts
4.5. Article 243J of the Constitution states that the legislature of a State may, by law, make
provisions with respect to the maintenance of accounts by the Panchayats and auditing of
such accounts. To keep an account of income and expenditure of PRIs, at the
17 However, based on data from the counterparties, financing of the local bodies may be included in GG or ‘other’
(unclassified) sector.
[91]

Report of the Committee on Financial Sector Statistics, 2018
district and State levels, formats suggested by the CAG were accepted by the MoPR
and National Informatics Centre was entrusted to develop input screens on the
Ministry’s portal and link this to all States for uploading of State-wise data.
I.3.2 Urban Local Bodies
4.6. Similarly, the mandate of the ULBs is to undertake planning for ‘economic
development and social justice’ and implement city/town development plans. The major
sources of revenue for ULBs are local taxes (property tax, municipal tax, water charges,
etc.) and grants from Central/ State Governments. For some large ULBs, development
charges levied on real estate is also one of the major non-tax revenues. Big municipal
corporations may also raise funds by issuing bonds in financial markets or by raising
loans from international agencies. There may be cases, though rare, where LBs may
finance the projects of Central/ State Government or international agencies.
I.3.2.1 Accounting System of ULBs in India
4.7. Most ULBs in India follow a cash based instead of accrual based accounting
system and no distinction is made between revenue and capital items. While cash
based accounts serve the purpose of legislative control over public finances, it provides
room for fiscal opportunism. As such, financial statements of ULBs following cash based
accounting do not reflect their complete and comprehensive financial position with
relation to fixed assets/ depreciation, capital work-in-progress, current/ contingent
assets/ liabilities, etc.
4.8. Therefore, there is a strong need to move towards a double entry accrual-based
system, wherein transactions reflect in the books of accounts of the period in which they
accrue and arise, irrespective of actual receipt or payment taking place during the
period. Accrual based accounting makes a distinction between capital and revenue
items and present the financial status of the ULBs in more comprehensive and
consolidated manner. As such, an accrual system is helpful in expanding the efficacy of
fiscal management.
[92]

Report of the Committee on Financial Sector Statistics, 2018
I.4 Approach of the Committee on Capturing Local bodies Data
4.9. Following the recommendations of the SNA 2008, the CSO attempted to cover the
local Government sub-sector in the revised system of National Accounts since 2011-12.
However, the RBI has not so far included this sub-sector in the FoF accounts.
Recognising the fact that collection of statistics from the LBs may be a challenge, the
Committee formed a sub-group to specifically look into the issues. The sub-group
studied availability of data in respect of LBs with special focus on rural bodies, which is
described in Section II. Considering the difficulties in collecting data from large number
of rural bodies with disparate systems, the Committee decided to prioritise collection of
data from the ULBs, in particular, the big municipal corporations. Also, the CSO
prepared a note on present status of collection of data on LBs for national accounts
purpose, which is presented in Section III. RBI (DEPR) in consultation with the CSO
finalised a format for capturing the data on LBs as required for FoF (Section IV).
Further, consultations with representatives from the AIILSG, involved in research and
training of staff in municipal administration and officials of the Directorate of Municipal
Administration (DMA) were held to check the feasibility of collecting data as per the
devised format (Section V). The last section discusses the Way Ahead.
Section II: Issues in Data Collection from Local Bodies in India
II.1 Availability of Rural Local Bodies’ Data
4.10. Eleventh FC addressed the issue of non-availability of LBs accounts for the first time,
especially for devolution. To bring uniformity in data compilation, CAG prepared eight
different forms in 2002. However, their adoption by PRIs was very poor. Subsequently, the
Technical Committee on Budget and Accounting Standards for PRIs (2008) designed and
developed a simple and robust accounting system with the help of the National Informatics
Centre, namely, Panchayati Raj Institutions Accounting Software (PRIASoft). This web-
enabled software having role based authentication included a centralised database for all
the inflows (receipts) and outflows (expenditures) of the PRIs’ accounts. This software was
intended to be of use to all the stakeholders, namely, three
[93]

Report of the Committee on Financial Sector Statistics, 2018
levels of Panchayati Raj (District Panchayat, Panchayat Union and Village Panchayat),
the CAG, State Accountant Generals (AGs) and the citizens. The software facilitated
proactive disclosure of accounts of the Panchayats, up to voucher level in public domain
for viewing by all stakeholders including citizens. The software followed cash based
double-entry system of book-keeping done in an intuitive and user-friendly manner
without unduly burdening the end-user with the knowledge of accounting. The software
also facilitated adopting of eight accounting formats prescribed by the CAG. Despite
being simple and providing on-site support, implementation of the software remained
only partial. Also, some of the states have developed their own software (AP/ Kerala -
Saankhya, Karnataka - Panchamitra, MP – Panchayat Darpan, and WB - Gram
Panchayat Management System (GPMS)).
4.11. Subsequent FCs continued to focus on improving the PRI accounts. In this regard,
the Thirteenth FC conditioned adoption of the CAG format by the LBs and placing their
audit report in the legislative assembly for release of performance grants. At present, 13
states are placing audited reports of their LBs in legislative assembly. Fourteenth FC
suggested 10 per cent performance grants for LBs on producing last three years of
audited statements. However, the information flow, even for deciding on devolution, is
still scanty. Fourteenth FC had undertaken a large survey of LBs with regard to their
core functions and finances. Responses revealed that only nine states claimed full
implementation of adoption of CAG formats, 10 states claimed partial implementation,
and six states reported either implementation at an early stage or no implementation
(Table 1). Three states did not respond to the survey. However, as per CAG reports,
only four states have fully implemented adoption of their formats. This is despite
National Informatics Centre deploying three staff in each state for technical support on
the software developed by them.
[94]

Report of the Committee on Financial Sector Statistics, 2018
Table 1: Implementation Status of Software for Adoption of CAG Formats Based on the Survey Conducted by the 14th Finance
Commission
Fully implemented Partially Not implemented No implemented or implementation response at early stage
Maharastra, Andhra Pradesh, Arunachal Pradesh, Jharkhand, Himachal Pradesh, Assam, Bihar, Mizoram, Goa, Nagaland, Tripura, Karnataka, Haryana, Gujarat, Jammu & Kashmir, Odisha Kerala, Madhya Rajasthan, Sikkim, Meghalaya,
Pradesh, Punjab, Chhattisgarh, Uttarakhand
Uttar Pradesh, West Manipur, Tamil Nadu
Bengal
Source: Report No. 38, Centre for Policy Research.
4.12. The sub-group on LBs’ data tried to find out the status of online availability of LBs’
accounts for the states of Andhra Pradesh, Karnataka and Rajasthan, and also had
discussions with some of the officials. LBs in these three states are using different
software. Findings of the sub-group are delineated below:
In Rajasthan, PRIAsoft (managed by the National Informatics Centre) is used
only for updating receipts from the CFC and the SFC as well as expenditures.
The software provides only the cashbook (monthly as well as annual). Recently,
Rajasthan has started using integrated e-Panchayat Raj software. One needs to
see how this initiative would help in generating online data.
Karnataka uses Panchamitra software, which is managed by the National
Informatics Centre and provides micro level data on household especially for own
tax revenues.
Andhra Pradesh (AP) has a software managed by the Centre for Good
Governance (CGD) and the DES. AP software provides an integrated and macro
level statistics. The consolidated data for GPs, Mandal Parishads (MPs), ZPs,
Municipal Bodies as well as municipal corporations are available for AP.
The pace of reporting data through the adopted accounting software varied in
these states. Data updating process was the fastest in Karnataka where data for
2016-17 are available for most of the GPs. For Andhra Pradesh, data for 2015-16
[95]

Report of the Committee on Financial Sector Statistics, 2018
were available for almost all the LBs and data entry for 2016-17 was in progress.
In Rajasthan, only 80% of GPs updated their data in PRIAsoft for 2015-16,
consisting of CFC and SFC funds only. The updating for 2016-17 was yet to start
(until mid-2017). Balance sheets data were not uploaded in the PRIASoft.
On the other hand, all the States had completed compilation of the accounts for
Mahatma Gandhi National Rural Employment Guarantee Scheme (MGNREGS)
for 2016-17 by the end of April 2017 but none of the above accounting software
captures the MGNREGS funds, as the same is done outside the treasury system.
(Under MGNREGS, the money is transferred to the beneficiary directly and does
not enter the LBs’ books.)
II.2 Discussions with Government Officials
4.13. The sub-group visited Umrena Block Panchayat in Alwar district of Rajasthan,
which was identified for implementation of Integrated Raj e-Panchayat software. The
sub-group also had discussions with Sangam Mandal Praja Parishad (SMPP) of Nellore
district in Andhra Pradesh and the officials who are handling Panchamitra in Karnataka.
The issues highlighted during discussions are broadly categorised in three sub-sections
as below:-
II.2.1 Issues in Fund Flow Mechanism
4.14. In many cases, funds are received from Central/ State Governments and other
LBs directly. In direct benefit transfer and MGNREGS schemes, the money is
transferred directly to the beneficiary and does not enter the LBs books. Funds relating
to Swatch Bharat Mission, Prime Minister Awas Yojana (PMAY), etc. are getting
transferred from Blocks directly to GPs. Service provisions through parastatals (both in
rural and urban LBs) also takes place outside the government system.
II.2.2 Issues Relating to Technical Support and Multiple Software
4.15. In some of the States, technical support is available at the Block level, while in
other States the support is available only at district level. Further, training and technical
[96]

Report of the Committee on Financial Sector Statistics, 2018
skills appear to be the major issue at GP level. GP officials also complain about
electricity, IT, as well as internet facilities at the GP level. In some cases, software do
not capture Own Revenues. Integration of data captured through multiple software,
such as, NREGAsoft, PRIAsoft, AWASsoft. Planplus, etc.; remains a challenge in
bringing such data to a uniform platform.
II.2.3 Other Issues
4.16. Weak co-ordination among PRIs, Finance (Local Fund Organisations) and
Planning/ Statistics Departments; weak co-ordination among the LB officials itself; and
delay in auditing as well as submitting the same to the State legislature are some other
issues in compilation and timely availability of LBs’ data. Very few States are having
granular level information of the finances at GP level. 4.17. Further, the absence of robust systems and staff constraints among others make it
very difficult to obtain such information from LBs. Hindrances, like non-maintenance of
proper accounts at local body level, lack of monetary resources and skilled manpower
to collect & consolidate the huge database from large number of GPs, etc.; pose
problems in data compilation for LBs.
Section III: Status of Data Collection by the CSO
4.18. CSO has been collecting LBs’ data and after projections/ estimations, using it to
compile the GG figures in the National Accounts Statistics. With an objective to derive
district level GDP figures, 13th FC recommended to collate receipts and payments data
for LBs. The CSO devised a simple schedule (Part I of Annex 4.2) consisting of sections
regarding the current and capital receipts as well as current and capital expenditure at
aggregate level for each LB and a separate section to enter the information of funds
available with the LB. The schedule was designed keeping in view the activities of LBs
as listed in the Article 243G and 243W of the Constitution. Responsibility of collecting
such data was entrusted to the DES of respective states. The CSO scheme to be
followed by all the States for capturing LBs’ data was as follows:
i) All the States had to prepare a list of LBs up to ‘GP’ level. The list included the
information on population, total annual receipts and expenditure of local body. The
[97]

Report of the Committee on Financial Sector Statistics, 2018
information on total annual receipts and expenditure was to validate the collected
data.
ii) All RLBs in each taluk/ block/ mandal had to be covered in three phases: 30% in
phase-I, 30% in phase-II and the remaining in the third phase while the ULBs were
to be covered on census basis each year. Phasing was proposed due to the
difficulties faced by the DES in mobilizing the resources in a short span of time.
iii) Panchayats selected in each phase were to be divided into two groups to have a
check on non-sampling errors. Information was to be collected by separate
investigators for these two groups of Panchayats.
iv) Information in respect of LBs was to be collected for at least three years in each
phase. If the collection year is t, information is required to be collected for year t-3,
t-2 and t-1. In this manner, it was ensured that data for base year 2011-12 was
available on census basis.
v) These data were converted into the main accounts as per the national accounts
methodology.
vi) Block level estimates were arrived at by compiling all the Panchayat level estimates
available for that at block and using an appropriate multiplier. The block level
estimates were summed up further to have aggregation at district, State or country. 4.19. Following the above scheme, the coverage of LBs’ data has increased
considerably and the revised 2011-12 series of national accounts now covers LBs’ data
in respect of 21 States/UTs. The Committee suggests that CSO may rigorously follow-
up with the non-responding States to further improve the coverage.
III.1 Scope for Improvement:
4.20. There is a scope for improvement in the data received from the States. The main
focus of the States has been to prepare the net value added (NVA) and capital formation
estimates. Data on purpose accounts, income outlay accounts and borrowing accounts are
not being compiled by all the States. Further, complete information regarding the types of
taxes levied, loans, transfers etc. are also not being provided by all the States.
[98]

Report of the Committee on Financial Sector Statistics, 2018
Hence, approximations are being done while compiling the saving estimates at all-India
level and in segregation of taxes into product and production taxes.
Section IV: Format for Capturing Local Bodies’ Data for FoF
4.21. To compile the FoF data pertaining to LBs, a simple data template was devised by
the Sub-group (Part II of Annex 4.2) on balance sheets items. The template covers
loans and borrowings with sectoral breakup; other accounts receivables/ payables and
other liabilities (including unused grants) on the liabilities side and currency (cash in
hand); deposits with the sectoral breakup under short and long term deposits; other
accounts receivables/ payables and other assets on the assets side. This format was
provided to DES of various states to explore the possibility of submitting this data on a
regular basis. So far, response is received only from one state (Himachal Pradesh)
(Data given in Annex 4.3).
Section V: Discussions with the Representatives of AIILSG and DMA Maharashtra
4.22. Discussions with the representatives from AIILSG revealed that most of the ULBs
prepare their balance sheets but with a substantial time lag and a few large ULBs
(mainly municipal corporations) post annual accounts on their own websites. However,
all the municipalities/ nagar panchayats report select key accounting data to the
respective central authority in the State, namely, DMA or Commissioner and Director of
Municipal Administration (CDMA). This reporting is required for getting Central/ State
Governments’ finances. However, such data are not always placed in public domain.
Further, there is no systematic way/ common format to report these data to DMAs/
CDMAs. A number of LBs in various States are using PRIAsoft for preparing their
balance sheets. However, some of the LBs are still preparing their accounts based on
single entry accounting systems. AIILSG is, however, providing consultancy services to
these ULBs to prepare their accounts based on double entry accounting system. The
format of balance sheets of LBs also varies from State to State.
4.23. As suggested by the representatives of the AIILSG, a meeting was held with Shri.
Virendra Singh, IAS, Commissioner and Director, DMA, Maharashtra. From the
[99]

Report of the Committee on Financial Sector Statistics, 2018
discussions with the DMA, it is understood that at present there are 27 Municipal
Corporations, 237 Municipal Councils and 127 Nagar Panchayats in Maharashtra.
Municipal Corporations prepare their annual accounts and report the same to the
Principal Secretary, Urban Development Department of the Maharashtra Government.
Most of them also publish the same on their respective websites. Further, Municipal
Councils and Nagar Panchayats in Maharashtra prepare their accounts and submit the
same to DMA. RLBs come under the purview of Rural Development Department of
Maharashtra Government.
4.24. ULBs in Maharashtra prepare their accounts on accrual basis and required to get
the same audited internally by June 30th to report the same to the DMA. DMA publishes
local body-wise data on their website www.mahaulb.maharashtra.gov.in. However, the
data compiled presently on LBs mainly cover major heads of receipts and expenditure.
4.25. The data desired in the templates for compilation of FoF are assets and liabilities
data, which are not being reported by LBs to the DMA. Further, the receipt and
expenditure data as per CSO format required for compilation of National Accounts are
also not presently available with such granularity with the DMA. However, the DMA may
help in collecting such data in required formats (CSO as well as the RBI) from the LBs
under its purview, after receiving an official request from the competent authority along
with the required software for capturing such data.
4.26. DMA also indicated that similar administrative setup might be followed in all the
States in respect of LBs. Financial data on LBs at the national level is not available at a
single place. Therefore, to have a holistic picture of the LBs’ accounts in India, the said
three departments in each state are to be contacted to explore the data availability.
Section VI: Way Ahead
4.27. The availability of required data on LBs in an uniform computer extractable format in
timely manner, which is crucial for its use in preparation of National Accounts and FoF
accounts, has remained a challenge over the period due to various reasons. Even the CSO,
with the help of the DES in the States, is not able to capture data from all the States
[100]

Report of the Committee on Financial Sector Statistics, 2018
and UTs on a regular basis. Some of the reasons are hand written accounts,
inaccessibility/non-maintenance of proper accounts at local body level, lack of IT skilled
manpower/infrastructure, large number of LBs, and insufficient monetary resources.
While the system of data compilation of LBs’ accounts across the country has improved
to some extent, due to the steps taken by the Government from time to time, there is
still a large scope for further improvement. Still the accounting practices, followed by the
various LBs across the country, vary significantly. Some of the LBs in India are quite big
in terms of their budget and in some cases, they financed the central/ state government
projects. Therefore, such an important segment of the economy cannot be left out while
compiling the National Accounts and the FoF. Based on the observations made by the
sub-group, the Committee recommends the following -
i) CSO/ MoSPI may collect data on LBs as per the proforma devised by the
Committee from the DES in each state and share the same with the RBI.
They should rigorously follow-up with the DES in case of non-response.
ii) The Government may form a High Level Committee (comprising members
from Urban Development Department, Ministry of Panchayati Raj, Ministry of
Statistics and Programme Implementation, RBI, and representatives from
select states’ Directorate of Economic and Statistics, DMAs, representatives
from select large municipal corporations) to fine tune the format, if required for
meeting the data requirements of all stakeholders.
iii) All the States may use a uniform software for capturing data of RLBs/ ULBs.
In case of any issue, they may take up the matter with the CAG or the
National Informatics Centre. It will enable easy compilation of national level
aggregates. Necessary software may also be developed for capturing this
data from LBs and it may be made mandatory to all LBs (rural as well as
urban) to report the data in the prescribed format. Necessary administrative/
financial support may be provided to the LBs for this purpose. Once, the
system is developed, the responsibility of continuous monitoring of data may
be assigned to the respective DES. CSO and RBI may access the system to
get desired data as required for National Accounts and FoF Accounts.
[101]

Report of the Committee on Financial Sector Statistics, 2018
iv) Looking to the large number of RLBs, there is a need to have National e-
Panchayat system that will link/integrate the information pertaining to RLBs
available in all the states (including Autonomous District Council (ADC)
states). National Informatics Centre may undertake this job in coordination
with the Ministry of Panchayti Raj (MoPR).
v) For better accessibility and uniformity, MoPR may provide such data on their
website.
vi) While National Informatics Centre is providing technical support at the district
level for updating the accounts, as in the MGNREGS, some provision for
‘Administrative Cost’ may be made either in the CFC or the SFC or in both to
help the GPs to maintain their financial accounts as per the prescribed system.
vii) Necessary trainings may be arranged at periodic intervals for manpower
responsible for creating, reporting data and maintaining data at LBs as well as
those involved in operating the software.
viii) The Committee learnt that with the Fifteenth Finance Commission may be
undertaking a survey with regard to RLB's capacity in generating own
revenues. The Commission may be approached to involve CSO/RBI in
structuring the survey so that the results of the survey may be used at a later
stage in compilation of national accounts and FoF.
[102]

Report of the Committee on Financial Sector Statistics, 2018
Annex 4.1: Major Items Covered under the RBI Survey on “Finances of
Local Authorities”
1. Revenue and Capital Receipts of Local Authorities 1.1 Revenue Receipts
1.1.1 Rates and Taxes 1.1.1.1Rates 1.1.1.2Taxes
1.1.1.2.1 Of which, Property Tax
A. on Residential Property B. on Non-Residential Property
1.1.2 Non Tax Revenues 1.1.2.1 Receipts from Remunerative Enterprises 1.1.2.2 Gross Receipts from property 1.1.2.3 Fees, Fines, etc. 1.1.2.4 Grants
1.1.2.4.1 Of which, Grants from Governments
1.1.3 Other Revenue receipts
1.2 Capital Receipts 1.2.1 Loans
1.2.1.1 From Market
A. Amount Received i. Below 5 Years ii. 5 yrs. And above but less than 10 yrs. iii. 10 yrs. And above but below 15 yrs. iv. 15 yrs. And above
B. Amount Repaid C. Net Amount
i. Amount Received ii. Amount Repaid iii. Net Borrowings
B. State Government i. Amount Received ii. Amount Repaid iii. Net Borrowings
A. Of which, From Banks i. Amount Received
Continued …
[103]

Report of the Committee on Financial Sector Statistics, 2018
ii. Amount Repaid iii. Net Loans
1.2.2 Other Capital Receipts 1.2.2.1 Withdrawal from Deposits 1.2.2.2 Appropriation from reserve funds 1.2.2.3 Sale proceeds of Securities 1.2.2.4 Others
2 Disbursements by Local Authorities
2.1 For General Administration 2.1.1 Of Which, Wage and Salaries
2.2 To Remunerative Enterprise 2.2.1 Of Which, Wage and Salaries
2.3 For public services 2.3.1 Public Safety 2.3.2 Public Health and Governances 2.3.3 Public Works 2.3.4 Public Instructions
2.4 Plant and Machinery 2.5 Depreciation 2.6 Maintenance and Repairs 2.7 Amortization Payments
2.8 Interest Payment 2.9 Provision for Sinking Funds 2.10 Transfers to Reserve Funds 2.11 Other Disbursements 2.12 Revenue Account 2.13 Capital Account
2.13.1 Repayment of Loans and Advances 2.13.2 Deposits with Banks and Others 2.13.3 Others
3. Outstanding Debt/ Borrowings of Local Authorities
3.1 From market
3.1.1 Loans Floated 3.1.2 Issued Amount 3.1.3 Amount subscribed
Continued …
[104]

Report of the Committee on Financial Sector Statistics, 2018
3.2 From Government 3.2.1 Central Government 3.2.2 State Government 3.2.3 Other Local Bodies
3.3 From Others 3.3.1 Of which, from banks
4. Investments of Local Authorities – Own Accounts
4.1 Central Government securities 4.1.1 Treasury Bills 4.1.2 Other Securities
4.2 State Government securities 4.3 Local Authorities securities 4.4 Small Savings Schemes 4.5 Cash on Hand
4.6 Demand Deposits with Banks 4.7 Time Deposits with Banks 4.8 Shares and Debentures of
4.8.1 Joint Stock Companies 4.8.2 Cooperative Institutions 4.8.3 Other Investments
5. Investments of Local Authorities – Other Accounts
5.1 Central Government securities 5.1.1 Treasury Bills 5.1.2 Other Securities
5.2 State Government securities 5.3 Local Authorities securities 5.4 Small Savings Schemes 5.5 Cash on Hand 5.6 Demand Deposits with Banks 5.7 Time Deposits with Banks
5.8 Shares and Debentures of 5.8.1 Joint Stock Companies 5.8.2 Cooperative Institutions 5.8.3 Other Investments
Continued …
[105]

Report of the Committee on Financial Sector Statistics, 2018
6. Investment of Provident Funds Collected (Local Authorities)
6.1 Central Government 6.1.1 Treasury Bills 6.1.2 Other Securities
6.2 State Government
6.3 Local Authorities 6.4 Small Savings 6.5 Others
7. Investment of Amount Deposited by Contractors to Local Authorities
8. Information on Gross Fixed Capital Formation
8.1 Gross Value of Buildings 8.2 Gross Value of Plant and Machinery 8.3 Gross Value of Vehicles 8.4 Gross Value of Other Fixed Assets 8.5 Accumulated Depreciation on Buildings 8.6 Accumulated Depreciation on Plant and Machinery 8.7 Accumulated Depreciation on Vehicles 8.8 Accumulated Depreciation on Other Fixed Assets
[106]

Report of the Committee on Financial Sector Statistics, 2018
Annex 4.2: Common Template for Combined Requirement of Compilation of National Accounts (Sequence of Accounts) and FoF from Local Bodies
PART-I
Schedule for Local Bodies to Collect Receipt and Payment Data
Government of India
Central Statistics Office
Schedule for Preparation of Local Bodies Accounts
Rural * Phase-I * Group-I *
Urban Phase-II Group-II
Phase-III
Block 0: Identification Particulars
1. Name of State/UT
2. Name of District
3. Name of Tehsil/Taluk/Block
4. Type/Level of Local Body Zila Parishad/ Panchayat Samiti/ Gram
4.1 In case of Rural (Please tick the relevant entry) Panchayat
Municipal Corporation/ Municipality / Nagar 4.2 In case of Urban (Please tick the relevant entry) Panchayat 5. Name of Local Body
6. Code of Local body (code/SI. no maintained by State, if any)
7. Number of villages/wards in Local Body
8. (In case of rural)Name(s) of villages covered under the Local Body
9. Total Population covered under the local body (In 2011 census)
10. Area covered under Local Bodies (In Square km.)
11. Whether Panchayat is maintaining proper Accounts (Yes or No )
12. Accounting Year
13. Name and Designation of Informant
14. Name of Investigator
15. Date of Collection of Data
Annex 4.2 Continued [107]

Report of the Committee on Financial Sector Statistics, 2018
Block 1: Receipts
I. Current Receipts
Estimate
S. No Description of Item (In Rs. Thousands)
1 2 3
1 Direct Taxes
1.1 Land revenue
1.2 Property tax
1.3 Other direct taxes
2 Indirect Taxes
2.1 Tax on vehicles
2.2 Entertainment tax
2.3 Stamp duty
2.4 Other indirect taxes
3 Commercial Receipts
4 Sale of goods & services
4.0 TOTAL
4.1 General Public Services
4.2 Education Services
4.3 Health Services
4.4 Social Security and Welfare Services
4.5 Housing and Community Amenity Services
4.6 Cultural Recreational and Religious Services
4.7 Agriculture, Forestry, Fishing and Hunting
4.8 Manufacturing
4.9 Electricity & Gas
4.10 Water Supply
4.11 Transport
4.12 Construction
4.13 Environment Protection
4.14 Relief on calamities
4.15 Sanitation
4.16 Others
5 Fees, fines & misc. services
6 Property Income
6.1 Interest receipts
6.2 Rent and Royalty
7 Current Grants From
7.1 Centre
7.2 State
Annex 4.2 Continued
[108]
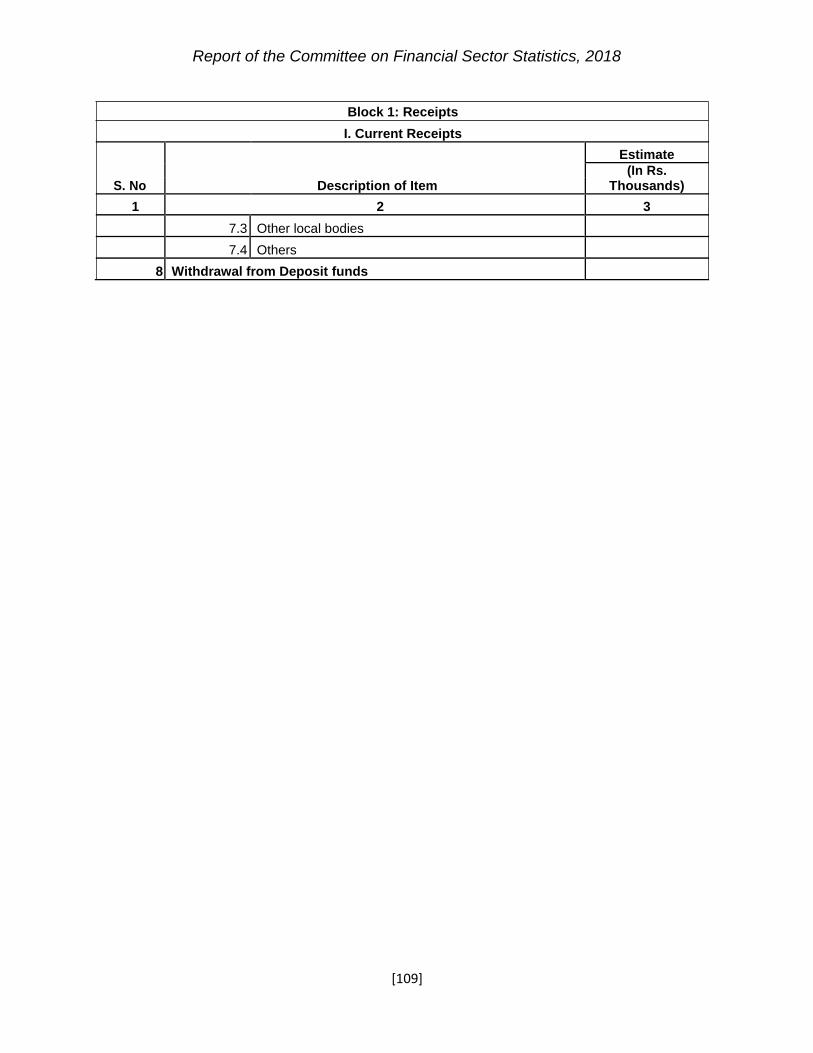
Report of the Committee on Financial Sector Statistics, 2018
Block 1: Receipts
I. Current Receipts
Estimate
(In Rs. S. No Description of Item Thousands)
1 2 3
7.3 Other local bodies
7.4 Others
8 Withdrawal from Deposit funds
[109]

Report of the Committee on Financial Sector Statistics, 2018
II. Capital Receipts
Estimate
S. No Description of Item (In Rs. Thousands)
1 2 3
1 Grants
1.1 From centre
1.1.1 MGNREGS
1.1.2 Sarva Shiksha Abhiyan
1.1.3 Indira Awas Yojna
1.1.4 National Rural Health Mission
1.1.5 PM Gram Sadak Yojna
1.1.6 Other Central Grant
1.2 From state
1.2.1 MGNREGS
1.1.2 Sarva Shiksha Abhiyan
1.2.3 Indira Awas Yojna
1.2.4 National Rural Health Mission
1.2.5 PM Gram Sadak Yojna
1.2.6 Other State Grant
1.3 Grants from other local bodies
1.4 Grants from others
2 Sale of Financial Assets
3 Sale of Land
3.1 Administration
3.2 DCU
4 Sale of Second hand Assets
4.1 Sale of Building
4.1.1 Administration
4.1.2 DCU
4.2 Sale of Other Assets
4.2.1 Administration
4.2.2 DCU
Continued …
[110]

S. Items No.
Purpose General Public
1 Services
Education
2 Services
3 Health Services Social Security
and Welfare
4 Services Housing and
Community
5 Amenity Services Cultural Recreational and Religious
6 Services Agriculture,
Forestry, Fishing
7 and Hunting
8 Manufacturing
9 Electricity & Gas
10 Water Supply
11 Transport
Report of the Committee on Financial Sector Statistics, 2018
Block 2: Expenditures
I. CURRENT EXPENDITURE (In Rs. Thousands)
Sa
lary
Wa
ge
s
Be
ne
fits
Pen
sio
n
Pur
chas
eofG
oods
andS
ervi
c
es
Current
Maintenance Transfers
Bu
ildin
g
Road
Oth
erC
onst
ru
ctio
n
Cash In Kind
1 2 3 4 5 6.1 6.2 6.3 7.1 7.2
[111]
Su
bsid
ies
Interest
Payments
Ce
ntr
e
Sta
te
Oth
ers
8 9.1 9.2 9.3
Continued …

S. Items No.
Purpose
12 Construction Environment
13 Protection
Relief on
14 calamities
15 Sanitation
16 Others
17 Total
Report of the Committee on Financial Sector Statistics, 2018
Block 2: Expenditures
I. CURRENT EXPENDITURE (In Rs. Thousands)
Sa
lary
Wa
ge
s
Be
ne
fits
Pen
sio
n
Pur
chas
eofG
oods
andS
ervi
c
es
Current Su
bsid
ies
Interest
Maintenance Transfers Payments
Bu
ildin
g
Road
Oth
erC
onst
ru
ctio
n
Cash In Kind Ce
ntr
e
Sta
te
Oth
ers
1 2 3 4 5 6.1 6.2 6.3 7.1 7.2 8 9.1 9.2 9.3
Continued …
[112]

Report of the Committee on Financial Sector Statistics, 2018
Items
S. N
o.
Purpose General Public
1 Services
Education
2 Services
Health
3 Services Social
Security
and
Welfare
4 Services Housing
and
Commu-
5 nity
II. CAPITAL EXPENDITURE (In Rs. Thousands )
C o r r e s p o n d i n g H e a d u s e d i n B u d g e t A n a l y s i s a t C e n t r a l L e v e l
P u r c h a s e o f F i n a n c i a l a s s e t s
P u r c h a s e o f L a n d
P u r c h a s e o f B u i l d i n g
P u r c h a s e o f O t h e r a s s e t s
B u il d i n g
Ro
ad
O t h e r C o n s t r u c t i o n
C a p i t a l i z e d W a g e s
Tr
an
sp ort
Ma
chin
ery
So
ftw
are
A ni m al St oc k
C u l t i v a t e d A s s e t s
C a p i t a l T r a n s f e r s
C h a n g e i n S t o c k
S ec
o n d
han
d a
ss
ets
Capital Expenditure on assets
Pu
rch
a
se
of
1 2 3.1 3.2 4.1 4.2 4.3 4.4 4.5 4.6 4.7 4.8 4.9 5 6
1
3
4
5
6
Continued …
[113]

Report of the Committee on Financial Sector Statistics, 2018
Items
S. N
o.
Purpose Amenity Services
Cultural
Recrea-
tional and
Religious
6 Services Agri-
culture,
Forestry,
Fishing
and 7 Hunting
Manu-
8 facturing
Electricity
9 & Gas
II. CAPITAL EXPENDITURE (In Rs. Thousands )
C o r r e s p o n d i n g H e a d u s e d i n B u d g e t A n a l y s i s a t C e n t r a l L e v e l
P u r c h a s e o f F i n a n c i a l a s s e t s
P u r c h a s e o f L a n d
P u r c h a s e o f B u i l d i n g
P u r c h a s e o f O t h e r a s s e t s
B u il d i n g
Ro
ad
O t h e r C o n s t r u c t i o n
C a p i t a l i z e d W a g e s
Tr
an
sp ort
Ma
chin
ery
So
ftw
are
A ni m al St oc k
C u l t i v a t e d A s s e t s
C a p i t a l T r a n s f e r s
C h a n g e i n S t o c k
S ec
o n d
han
d a
ss
ets
Capital Expenditure on assets
Pu
rch
a
se
of
1 2 3.1 3.2 4.1 4.2 4.3 4.4 4.5 4.6 4.7 4.8 4.9 5 6
7
8.2
8.3
8.4
Continued … [114]

Report of the Committee on Financial Sector Statistics, 2018
Items
S. N
o.
Purpose
Water
10 Supply
11 Transport Cons-
12 truction Environ-
ment 13 Protection
Relief on
14 calamities
15 Sanitation
16 Others
17 Total
II. CAPITAL EXPENDITURE (In Rs. Thousands )
Co
rr
es
po
nd
in
gH
ea
du
se
din
Bu
dg
e
tAn
al
ys
isa
tCe
nt
ralL
e
ve
l
Pu
rch
as
eo
fFin
an
cia
las
se
t
s
Pur
chas
eofL
an
d
P u r c h a s e o f B u il d i n g
Pur
chas
eof
Oth
eras
set
s
Build
ing
Road
Oth
erC
o
nstru
ctio
n
Cap
italiz
edW
ag
es
Tran
spor
t
Mac
hi
nery
Softw
a
re
Ani
mal
Sto
ck
Cul
tivat
edA
sset
s Cap
italT
rans
fer
s Ch
ange
inS
toc
k
Se
co
nd
han
d a
ss
ets
Capital Expenditure on assets
Pu
rch
a
se
of
1 2 3.1 3.2 4.1 4.2 4.3 4.4 4.5 4.6 4.7 4.8 4.9 5 6
8.5
8.6
8.3
9
10.1
6.2
10.2
Continued …
[115]

Report of the Committee on Financial Sector Statistics, 2018
(in
`)
Re
ce
ipts
Cu
rre
nt
Sa
les
S
.
No
.
1
1
2
3
4
5
BLOCK-3: Items of Expenditure of Departmental Commercial Undertakings (If any) in the Local Body
I. Current Expenditure (In Rs. Thousands)
Items Sa
lary
Wa
ge
s
Be
ne
fits
Pen
sio
n
Pur
chas
eofG
oods
and
Se
rvic
es
Ma
inte
na
nc
e In
tere
stP
aym
ents
Re
nt
De
pre
cia
tio
n
Bu
ild
ing
Ro
ad
Oth
er C
ons-
truc
tion
Industry 1 2 3 4 5 6.1 6.2 6.3 7 8 9
Agriculture (Irrigation)
Transport
Electricity
Forestry
Manu- facturing
Continued …
[116]

Report of the Committee on Financial Sector Statistics, 2018
S. N
o.
1
2
3
4
5
Items
Industry
Agri-culture
(Irri-gation)
Trans-
port Electri-
city Forestry
Manu- facturing
II. Capital Expenditure (In Rs. Thousands)
Capital expenditure on assets
Pur
chas
e of
Land
Bu
ildin
g
Ro
ad
Oth
erC
onst
ruct
ion
Tra
nsp
ort
Ma
ch
ine
ry
So
ft W
are
Anim
alSt
ock
Cul
tivat
edA
sset
s
1.1 1.2 1.3 1.4 1.5 1.6 1.7 1.8 2
Purchase of Change in Second hand Stock
assets
Bu
ildin
g
Asse
ts
3.1 3.2 4
Continued …
[117]

Report of the Committee on Financial Sector Statistics, 2018
BLOCK-4
Funds (In Rs. Thousands)
S. No. Items Receipts Expenditure
1 Loans
1.1 Centre
1.2 State
1.3 Other Local Bodies
1.4 Financial Institution
1.5 Others
2 Remittance
3 Internal Debt
4 Small savings, Provident fund etc.
5 Reserve Funds
6 Deposits and Advances
7 Suspense and Miscellaneous
8 Other Funds
9 Opening Balance
10 Closing Balance
Continued …
[118]

Report of the Committee on Financial Sector Statistics, 2018
PART II
Statement: Flow of Funds
(Rs. Thousands) 2015-16 2016-17
Liabilities
I. Deposits
Nonfinancial corporations
Households and NPISHs II. Debt securities
Banks
Insurance
Pension and Provident Funds III. Loans and borrowing
Financial corporations
Other depository
corporations Banks
of which
Scheduled commercial banks (including regional rural banks) Urban co-operative Banks Rural co-operative Banks Deposit taking primary agriculture co-operative credit
societies Others (please specify)
Other financial corporations Insurance Others (please specify)
General Government Central Government State Government Other local bodies
Others (please specify) Of which, Small Savings
IV. Provident and Pension Funds V. Reserves and Surplus
Municipal/ Panchayat Fund Earmarked Funds Reserves
VI. Other account payable VII. Other Liabilities Gross Financial Liabilities
[119] Continued …
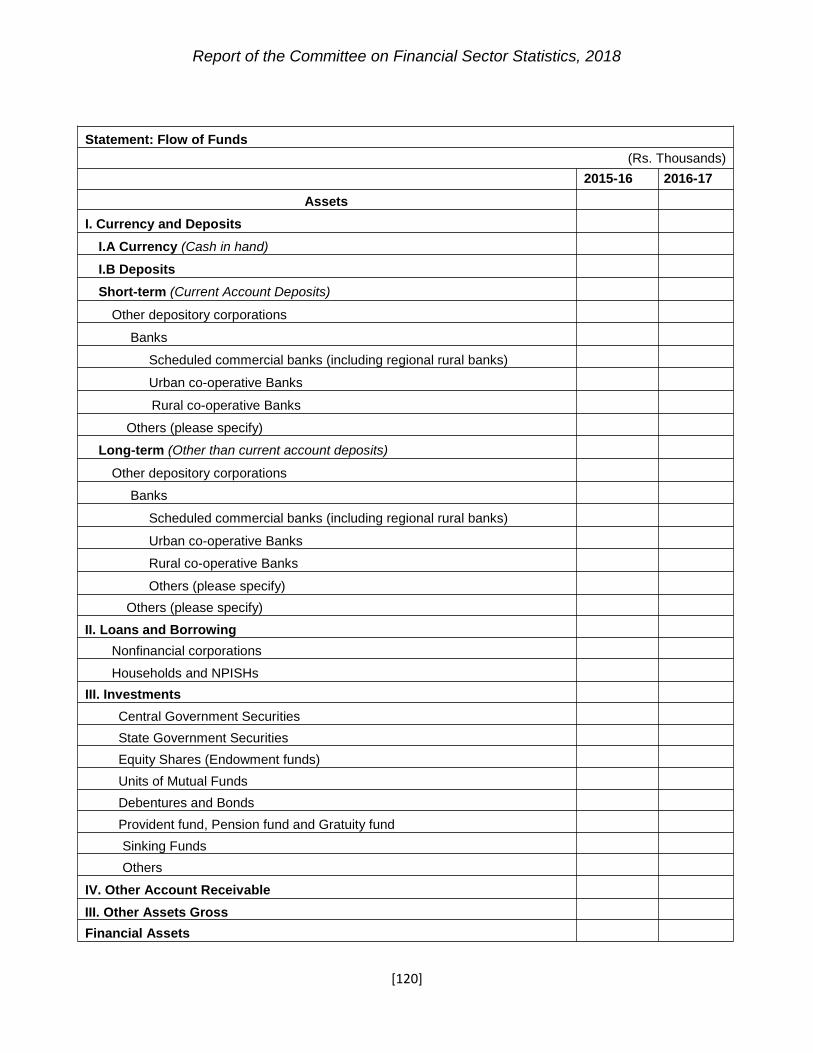
Report of the Committee on Financial Sector Statistics, 2018
Statement: Flow of Funds (Rs. Thousands)
2015-16 2016-17
Assets I. Currency and Deposits
I.A Currency (Cash in hand)
I.B Deposits
Short-term (Current Account Deposits)
Other depository corporations
Banks Scheduled commercial banks (including regional rural banks) Urban co-operative Banks Rural co-operative Banks
Others (please specify) Long-term (Other than current account deposits)
Other depository corporations Banks
Scheduled commercial banks (including regional rural banks) Urban co-operative Banks Rural co-operative Banks Others (please specify)
Others (please specify) II. Loans and Borrowing
Nonfinancial corporations
Households and NPISHs III. Investments
Central Government Securities State Government Securities Equity Shares (Endowment funds) Units of Mutual Funds Debentures and Bonds Provident fund, Pension fund and Gratuity fund Sinking Funds Others
IV. Other Account Receivable III. Other Assets Gross
Financial Assets
[120]

Report of the Committee on Financial Sector Statistics, 2018
Annex 4.3: Flow of Funds Data for Local Bodies in Himachal Pradesh
Liabilities 2015-16 2016-17
I. Deposits 0.00 0.00
Nonfinancial Corporations 0.00 0.00
Household and NPISHs 0.00 0.00
II.Debt Securities 13.71 15.71
Banks 0.00 0.00
Insurance 0.00 0.00
Pension and Provident funds 13.71 15.71
III. Loan and Borrowing 1.43 6.65
Financial Corporations 0.00 0.00
Banks 0.07 1.88
Insurance 0.00 0.00
Other(please specify) 0.68 1.18
General Government 0.68 3.59
Central Government 0.37 1.83
State Government 0.30 1.76
IV. Reserves and Surplus 935.78 1044.52
Municipal Funds 23.30 50.38
Earmarked Funds 877.63 968.30
Reserves/surplus 34.85 25.84
V. Other account payable 6.58 66.39
Vi. Other Liabilities 270.50 378.99
Gross Financial Liabilities 1227.99 1512.27
(Rs. Crore)
Assets 2015-16 2016-17
I. Currency and Deposits 40.49 30.57
I.A Currency(Cash in hand) 0.00 0.00
I.B Deposits 40.49 30.57
Banks 40.49 30.57
Other (specify) 0.00 0.00
II. Loans and Borrowing 3.36 4.38
Nonfinancial Corporations 3.20 4.06
Household and NPISHs 0.16 0.31
III. Investments 1051.98 1470.01
IV. Other account receivable 191.89 179.60
V. Other Assets -59.73 -172.29
Gross Financial Assets 1227.99 1512.27
[121]

Report of the Committee on Financial Sector Statistics, 2018
Chapter 5
Estimating Flow of Funds at State Level: An Approach and Some Issues
Section I: Introduction
5.1 Regional Accounts in India are largely limited to measurement of the Gross and Net
Domestic Product based on income originating approach. Further breakdown of the
macroeconomic aggregates in terms of consumption, saving, and investment at the
state level is challenging because of the lack of data on inter-state trade transactions
and factor income flows. Recognizing this, the Committee on Regional Accounts (CRA,
1976) recommended the use of direct data at the state level for preparing
macroeconomic aggregates of income and expenditure which could further be used to
obtain estimates of saving and inter-state trade as residuals. Though some of the states
are preparing estimates of capital formation through expenditure side approach,
estimates of saving are not prepared at the state level. Independent efforts for preparing
saving and investment estimates have been made in the past largely following the
expenditure side approach (Lakhchaura, 2004; Dholakia, 2006; Rajeswari et al., 2009;
Sethia, 2016). Measurement of inter-state trade and financial flows are important for
examining the extent of integration of regional economies. Sethia (2016) and the recent
Economic Survey (2017-18) suggest substantial integration of state economies through
inter-state trade, with the estimates for net inter-state trade balance at around 20-25
percent of the Gross State Domestic Product (GSDP) for many states.18 Applying the
international trade theories in a regional context, such large trade balances should be
accompanied by combined inter-state flows of factor income payments, net unilateral
transfers (through redistributive central fiscal policy or other mechanism), and financial
(capital account) transfers, equal in magnitude but opposite in the direction. For an
economy of sub-continental size, consisting of states at different stages of development,
tracking of inter-regional flows of funds assumes great importance.
18 Sethia (2016) uses expenditure approach where trade balance is measured as the saving investment gap. On the other hand, the Economic Survey’s trade balance estimates are based on the data collected from returns filed under the recently introduced Goods and Service Tax (GST).
[122]

Report of the Committee on Financial Sector Statistics, 2018
5.2 The use of expenditure side approach in the Indian context is well known for the
underestimates generated from the survey results. For example, household
consumption surveys conducted by the National Sample Survey Office (NSSO)
measure only half of the consumption expenditure as reported in the NAS. This
underestimation could be attributed apart from differences in the scope and coverage,
to sampling design, recall bias, deliberate underreporting, particularly for the items
consumed at higher income level. Hence, any estimates of saving prepared based on
the NSS consumption expenditure surveys are also likely to suffer from such limitations.
5.3 The FoF at the state level can provide an alternative approach for estimating
savings and inter-state financial flows at the state level, with details at sectoral and
instrument level. As the FoF accounts are compiled from the accounts of the institutions
of the respective sectors, these are more credible. Since there are two parties to each
transaction, households sector accounts derived as a residual based on the accounts of
other institutions, are also reliable. Thus, the residual based approach, followed at the
national level, can be followed at the regional level as well.
5.4 Though attractive in terms of avoiding measurement issues related to household
sample surveys, the compilation of the FoF at state level faces its own conceptual
challenges and data gaps. Section 2 examines conceptual challenges involved in
defining the FoF at the state level. Section 3 discusses the availability of data and gaps
thereof for measuring FoF at the state level. Section 4 concludes the chapter and
outlines the recommendations and future course of action.
Section II: Conceptual Challenges for Measuring FoF at State Level
5.5 FoF accounts at the national level are prepared for five institutional sectors, namely,
i) Financial Corporations, ii) Non-Financial Corporations, iii) General Government, iv)
Households and NPISH, and v) RoW. When similar accounts are to be compiled at the
state level, these should encompass transactions of all the sectors in a state with
reference to other domestic sectors and the external sector. Here, the domestic sector
would refer to sectors within the state, while external sector can be decomposed into
Rest of India (RoI) comprising all other states and Rest of the World (foreign
[123]

Report of the Committee on Financial Sector Statistics, 2018
transactions). Under this approach, the first stage of the exercise hinges on the
measurement of the sources and uses of funds of the various sectors within a state. At
the next stage, one needs to map transactions of the domestic (within state) sector with
other states (RoI). Finally, transactions with the foreign sector (RoW) need to be
compiled. These three stages can be termed as intra-state (domestic), inter-state (with
RoI), and international (with RoW) financial transactions.
5.6 Before examining the availability of data for the state-level FoF, it is imperative to
understand the nature of transactions likely to happen at these three stages. Among the
institutional sectors, the household sector is likely to have transactions with other
sectors within physical boundaries of the same state. Even for the institutional sector of
state government, one party to the financial transactions, namely, state government
itself, clearly belongs to its own state. However, with the state as the unit of analysis,
financial institutions, non-financial corporations, and central government sector pose
challenges, given their operations extend beyond boundaries of individual states. In this
sense, they are comparable to supra-regional sectors in the parlance of the GSDP
compilation. Some illustrative examples can explain nature of the intra-state and inter-
state transactions, and provide possible guidance on the approach to be followed for
their measurement in FoF context at the state level:
5.7 Example 1: Household savings in Rajasthan channelled to single-state non-
financial corporation for investing in Gujarat through ODC;s branches in both the states.
At the national level, this example involves three sectors and two transactions, where ODC
is party to both the transactions. ODC also acts as an agency that engages in an inter-state
transfer of funds through its branches in two states. From the state’s perspective,
transactions between ODCs’ branches need to be captured separately. It is quite difficult to
capture, also probably of little interest as well, to know if this project in Gujarat was funded
by the saving made in Rajasthan. However, it is possible to know if the ODC sector of a
particular state had a deficit or surplus against Rest of India, which requires details on
sources and uses on a net basis. Hence, the transaction between two branches of the ODC
in different states can be considered as two separate transactions with Rest of India. Thus,
the two transactions within the ODC sector along with one
[124]

Report of the Committee on Financial Sector Statistics, 2018
transaction of ODC sector with household and firm each will allow us to capture the
entire resource flow through four transactions:
a) Household deposits money in ODC in Rajasthan.
b) ODC transfers money from its branch in Rajasthan to-Rest of India (RoI) pool.
c) ODC branch in Gujarat borrows money from ODC-RoI pool.
d) ODC lends money to the firm in Gujarat
Of the above three transactions, first and fourth are intra-state transactions, while
the middle two are inter-state transactions. The FoF entries for the above
transactions can be prepared as follows:
FoF Entries for Example
1 Rajasthan
Intra-state Transaction
Sources Uses
Household Deposits
ODC Deposits
Gujarat
Inter-State Transaction
Sources Uses
ODC-RoI Intra-Bank
Transfer
ODC- Intra-Bank
Gujarat Transfer
Inter-state Transaction
Sources Uses
ODC- Intra-bank
Rajasthan Transfer
ODC-RoI Intra-bank
Transfer
Gujarat
SourcesUses
ODC Loan
Firm Loan
5.8 Database on the banking sector, captured through the BSR system, permits us to
capture all the four transactions separately (Inter-state transactions of ODCs to be compiled
on a net basis). A similar structure would allow us to capture the flow of resources from
households to state governments through the banking system. The more
[125]

Report of the Committee on Financial Sector Statistics, 2018
challenging task would be to analyse transactions of the banking sector with firms that
have operations across states or transactions of the ODCs with the central government.
We explore these cases below:
5.9 Example 2: Household savings in Rajasthan channelled to multi-state non-financial
corporations for investing in Gujarat through ODC’s. The firm’s headquarter and branch
of the ODC making the loan transaction are located in Maharashtra.
Multi-state firms may raise resources in the financial centres (Mumbai, Gurgaon) and
invest in their projects located in another state. The household savings, deposited in
Rajasthan, can be transferred to Gujarat through Maharashtra. Hence, this entire
transaction can be divided into five parts:
a) Household deposits money in ODC in Rajasthan.
b) ODC transfers money from its branch in Rajasthan to ODC-RoI pool
c) ODC in Maharashtra raise resources from ODC-RoI pool
d) ODC lends money to the firm in Maharashtra
e) Firm transfers money to its unit in Gujarat
5.10 Existing database from the BSR system enables us to capture only the first four
steps of these transactions. The FoF entries for these four transactions would be similar
to those shown under example 1. It may be noted that role of Maharashtra is limited to
bring resources (source) from Rajasthan to be transferred to Gujarat (Use) through
ODCs. In this sense, it is similar to the role of financial intermediary institutions which
incurs huge liabilities and acquire comparable assets, with little net transactions on their
part.
5.11 Details on intra-firm transfers that take place in inter-state context are not available
currently. Tracing this node of the transaction is crucial not only from the FoF perspective
but also from the saving–investment identity at the state level. Key lies in linking the
headquarter/ establishment borrowing in Maharashtra to the establishment making physical
investment in Gujarat, where both the establishments belong to the same enterprise. Multi-
state firms are unlikely to be part of the household sector, and should be
[126]

Report of the Committee on Financial Sector Statistics, 2018
covered under MCA database (non-financial corporations). For single state firms, it will
be sufficient to have a state registration code in the MCA filing to enable state-wise
mapping of financial transactions. However, for firms having establishments in multiple
states, the registration code will not allow linkages between establishment and state.
5.12 Multi-state non-financial corporations may be engaged in manufacturing, services,
and to an extent in agriculture sector as well. In case of the manufacturing sector, the
Annual Survey of Industries (ASI) captures details of the profit, loss, and investment at
the establishment level. However, the details on financial transactions, other than one
carried out by the establishment, would be available only from MCA database. Demand
for financial resources at the establishment level arise for making physical investment
and financing losses. Profit and net financial liabilities by the firm (which is an aggregate
of all establishments of the firm) supply funds to meet these requirements.
Establishments of a multi-state firm can be categorized into lender and borrower.
Establishments where profits exceed their investment requirement would belong to the
former category, who need to lend their surplus (profit minus investment) to other
establishments. Borrower establishments are either loss making or their profits are
lower than their investment, requiring them to borrow the difference. Surplus generated
by the lender establishment plus financial borrowings of the firm should be first lent
(uses) to non-financial corporate RoI sector (sources), which will further lend (uses)
these funds to the borrowing establishments of the firm (sources) pro-rata on the basis
of demand for funds at the establishment level. The concept of constructing non-
financial corporate RoI sector is similar to ODC-RoI pool in the Example 1. The idea of
borrowing and lending establishments within the firm can also be applied if the firm is a
net lender at an aggregate level. In this case, there could be some establishments
which are borrower while others which are lender. Lender establishments will channel
their funds (uses) to non-financial corporate RoI sector (sources) which will first meet
the requirements (uses) of the borrowing establishment of the firm. The leftover surplus
can then be used to acquire (uses) financial assets.
5.13 The latest Annual Survey of Industries (ASI) Schedule (2016-17) contains an item,
namely CIN. With CIN details furnished by the establishments in the ASI schedule, it may
[127]

Report of the Committee on Financial Sector Statistics, 2018
be possible to map the MCA firm with its establishments in the ASI. Subsequently, all
the intra-firm transfers can be taken as transactions within the non-financial sector of
the state with the same sector at RoI level. It may be noted that intra-firm transfers,
particularly of profits, may be considered of current nature since they do not create
corresponding assets and liabilities. However, it is desirable to measure these flows
from the perspective of savings and investment at the state level. Linking ASI data with
MCA database has an additional advantage of improving the quality of both the
database through cross-validation.
5.14 For non-financial corporate sector in the service sector, it may not be feasible to
establish linkage between enterprise and establishment under the current scenario. A
survey on the service sector, similar on lines with the ASI may help in bridging this
missing link. Such standalone service sector survey is desirable even otherwise given
the rising contribution of the service sector in the Indian economy, and its utility for the
measurement of state domestic product.
5.15 Example 3: Households savings in Maharashtra is channelled to the central
government through banking sector for financing fiscal deficit
This example can be divided into two transactions.
a) Household deposits money in ODC’s in Maharashtra.
b) ODC acquires the central government securities.
5.16 The first transaction does not pose a challenge, as the BSR database allows
tracing of banking transactions with the household sector at the state level. The second
part, where ODC provides resources to the central government, needs to be examined
for its conceptual position in the FoF accounts. There are three alternative choices for
allocating the central government’s liabilities on regional basis a) to the states that
benefit from the expenditure financed by the central government’s fiscal deficit, b) to the
states that are likely to pay taxes in future to repay the central government’s liabilities,
and c) to consider central government’s liabilities as super-regional sector which need
not be allocated to any state.
[128]

Report of the Committee on Financial Sector Statistics, 2018
5.17 For the first alternative, one needs to identify the quantum of benefits that each
state derives from the expenditure financed by the central government’s fiscal deficit.
Central government’s operations extend across the nation, and it is difficult (though not
impossible) to attempt inter-state distribution of central fiscal transfers and
expenditures.19 However, as per the second alternative and in sync with the concept of
liability, one should be concerned about which state would be paying the central debt in
future rather than which state is receiving the central funds today. Central expenditures
are akin to current transfers to the recipient state, with no corresponding liability to pay it
back. Hence, if the central government incurs fiscal deficit, then taxpayers implicitly owe
the responsibility to pay it back in future. Accordingly, central government’s financial
liabilities can be allocated among states in proportion to their contribution in central
taxes rather than the inter-state pattern of central spending.20
5.18 The third alternative is to keep central government as a separate sector and not to
allocate it to any state. In the context of GSDP estimation, the sectors for which the national
aggregates are not allocated to any state are termed as super-regional sectors; e.g.,
national defence, foreign embassies, etc. It should be noted that in the context of FoF, the
tax payment is considered as a current transfer rather than a financial transaction. From this
perspective, taxpayers' liabilities to pay additional taxes in future due to current fiscal deficit
need not be considered for the FoF accounts. Resorting to fiscal deficit rather than raising
more taxes today can be considered as a choice exercised by the government. Taxpayers
must pay their taxes today or tomorrow. Hence, it becomes an intra-sectoral transaction
within the taxpayer group. While important from the fiscal perspective, the fiscal deficit can
be considered as a super-regional sector for the FoF purposes, requiring no allocation at
the state level. Considering the current transfer nature of taxation, we also prefer to follow
the third approach. The approach of treating the central government as a super-regional
sector should also be applied to the financial assets of the central government. The central
government may provide equity/loan funds to public sector undertakings (PSUs) or loans to
state governments. These resources
19 In many federal economies in the developed world, e.g., Canada, Germany, Spain and Italy, central government's transactions are measured at the state level.
20Vaillancourt and Bird (2007) have used this approach to allocate federal fiscal deficit across provinces in Canada.
[129]

Report of the Committee on Financial Sector Statistics, 2018
ultimately belong to the taxpayers who can expect benefits in future in terms of lower
taxation (due to non-tax revenues from the financial assets owned by the central
government). Similar to the taxes to be paid in future to repay the central government’s
fiscal deficit, taxpayer’s future benefits from the central government’s financial assets in
terms of lower taxes can be considered as a current transaction, requiring no allocation
at the state level for FoF purposes. In the accounts of the counterparty, transaction with
the central government will be shown as a transaction with the super-regional sector.
On similar lines, RBI can also be shown as super-regional sector in the accounts of the
counter-party, and need not be linked to any state.
Section III: Data Availability and Gaps
5.19 With the above conceptual context in the background, we may examine to what
extent transactions can be identified at within state, RoI, and RoW levels. This exercise
will provide an overview of the data availability, the gaps thereof, and possible ways to
address them. This is attempted for each sub-sector, following the sectoral classification
of the RBI’s FoF accounts.
Table: 1 Status of Data Availability for Measuring Financial Transactions at the State Level
(Numbers in parenthesis contain the average21 share of the sector in sources and uses at the national level)
S. No. Institution Comment
1 Financial Corporations (42.4, 46.9)
Sources: Currency, Deposits, Other liabilities
At the national level, based on previous surveys, nearly 90 percent of the currency issued is presumed to be retained by the household sector for financial savings.
1.1 RBI (5.6, 5.8) From the theoretical perspective, both transaction and asset demand for currency can be linked to income.
Hence, GSDP can be considered as an indicator for cash holding across states. However, state-wise allocation of cash-holding pro-rata on the basis of GSDP assumes uniform cash/GSDP ratio. To address this concern, state-wise data on cash deposits made during 21 Average derived from FoF account for the period from 2011-12 to 2014-15.
[130]

Report of the Committee on Financial Sector Statistics, 2018
S. No. Institution Comment
demonetisation may provide a benchmark on state- specific currency/GSDP ratio. For subsequent years, state-wise cash deposits under demonetisation can be carried forward using the growth rate of GSDP or bank deposits (whichever better correlates with the cash deposits during demonetisation), with all-India currency figures as the controlling total.
The state Governments keep deposits with the RBI. Detailed state-wise data may be available from records of the RBI.
Similarly, ODCs keep deposits with the RBI. ODCs may
be identified by the state-wise deposits22 taken by the individual ODIs.
Other liabilities may remain unallocated.
Uses: Debt securities: Debt securities acquired by RBI are largely issued by central government/ foreign govt. or foreign central bank. As discussed in example 3, the former can be considered as a super-regional sector, and the latter is transaction with the RoW which need not be allocated to any state.
Ways and Means Advances can be linked to the respective states, for which data can be obtained from the RBI records or Study of State Finances.
Loans to ODCs may be allocated based on the state-
wise deposits23 taken by the individual ODIs.
22 Presuming that these deposits are for CRR requirements or OMO operations where surplus liquidity is parked with RBI, state-wise deposits can be taken as an indicator rather than location of headquarter.
23 In case these loans are under OMO operations then may be linked with state-wise deposits: Banks may be taking these loans to meet their CRR requirements.
[131]

Report of the Committee on Financial Sector Statistics, 2018
S. No. Institution Comment
1.2 Other Depository Corporations (26, 28.4)
Sources: Deposits, Loans and borrowings from the central bank:
The RBI survey of ownership of deposits provides two- way classification by State X Ownership of deposits.
Uses: Loans to households and non-financial corporations: State-wise loans by type of organization are also available from BSR-1 tabulations. Example 2 suggests that transactions with multi-state firms can be Scheduled allocated to the state where the establishment of multi-
1.2.1 Commercial Banks state firm carrying out transaction with ODI is located. (22.1, 24.8) Subsequent flow of fund from the one establishment of multi-state firm (e.g. headquarter taking loan) to another establishment (e.g. factory where funds are to be used for investment) are to be mapped as transaction between non-financial corporate sector of the state with non-financial corporate sector RoI.
Debt securities of central and state governments: Debt securities of the state governments can directly be attributed to the particular state. Central government debt securities: Same as mentioned for 1.1
Sources: Deposits, Loans
Deposits: As far as rural co-operatives are concerned their network is generally restricted to one state. For a few multi state Urban Co-operative banks, their deposits may be considered as originated from the state of their headquarters. In the absence of other details, it may be assumed that the depositors are households.
Co-operative Banks Uses: Loans
1.2.2 and Credit The Apex (State) cooperative bank accounts will give
Societies (2.6, 1.9) some idea of the funds flowing from the cooperative
banks. The Households will get loans primarily from Primary credit societies. Though these data may not be available, the loans obtained by households from cooperative societies for a benchmark year will be available from the decennial All-India Debt and Investment Survey (AIDIS) surveys of the NSSO. For subsequent years, they may be estimated by extrapolating the data for other years.
[132]

Report of the Committee on Financial Sector Statistics, 2018
S. No. Institution Comment
Sources: Deposits, Debt securities, Loans
Non-Banking Uses: Loan, Deposits.
Finance In the absence of any other information, it may be
1.2.3 Companies – assumed that the operations of the NBFCs are restricted
Deposit Taking in the state where their registered office is located - (0.5, 0.5) information on this may be available with the RBI. The
required details may be compiled accordingly.
Sources: Deposits, Debt securities, Loan Uses: Loan, Deposits.
Housing Finance In the absence of any other information, it may be
1.2.4 Companies – assumed that the operations of the HFCs are restricted Deposit Taking in the state where their registered office is located -
(0.8, 1.3) information on this may be available with the National Housing Bank. The required details may be compiled accordingly. HDFC may be requested to provide this information state-wise.
1.3 Other Financial Corporations (10.9, 12.7)
All India Financial Sources: Deposits, Debt securities, Loan Institutions (AFI), Uses: Loan, Deposits State Finance
1.3.1 Corporations, State For AFIs, the data on state-wise operation may be called Industrial for. Operation of State level organisations may be
Development assumed to be within the State of its location. Corporations (0.9,
1.1)
Non-Banking Sources: Debt securities, Loan, Equity Uses: Loan Finance
1.3.2 Companies – Non- Same as 1.2.3. Deposit Taking
(2.5, 3.4)
Housing Finance Sources: Debt securities, Loan Uses: Loan
1.3.3 Companies – Non-
Deposit Taking Same as 1.2.4
(0.3, 0.4)
[133]
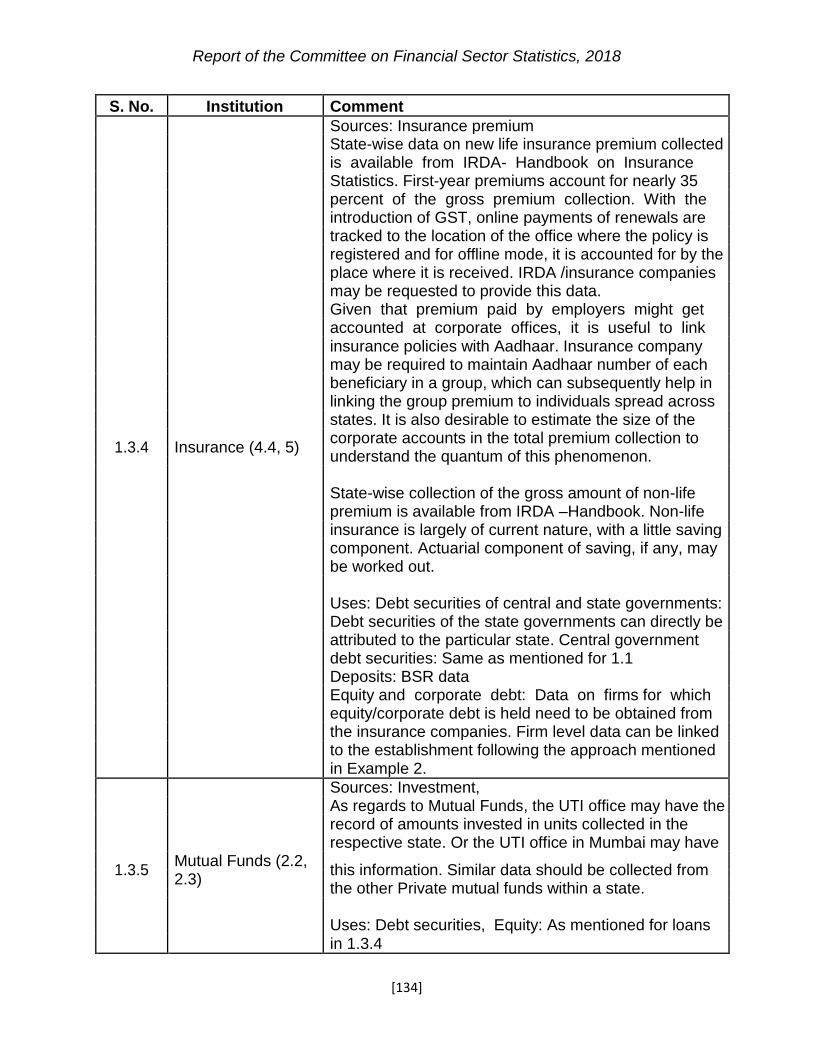
Report of the Committee on Financial Sector Statistics, 2018
S. No. Institution Comment
Sources: Insurance premium State-wise data on new life insurance premium collected is available from IRDA- Handbook on Insurance Statistics. First-year premiums account for nearly 35 percent of the gross premium collection. With the introduction of GST, online payments of renewals are tracked to the location of the office where the policy is registered and for offline mode, it is accounted for by the place where it is received. IRDA /insurance companies may be requested to provide this data. Given that premium paid by employers might get accounted at corporate offices, it is useful to link insurance policies with Aadhaar. Insurance company may be required to maintain Aadhaar number of each beneficiary in a group, which can subsequently help in linking the group premium to individuals spread across states. It is also desirable to estimate the size of the
1.3.4 Insurance (4.4, 5) corporate accounts in the total premium collection to understand the quantum of this phenomenon.
State-wise collection of the gross amount of non-life premium is available from IRDA –Handbook. Non-life insurance is largely of current nature, with a little saving component. Actuarial component of saving, if any, may be worked out.
Uses: Debt securities of central and state governments: Debt securities of the state governments can directly be attributed to the particular state. Central government debt securities: Same as mentioned for 1.1 Deposits: BSR data Equity and corporate debt: Data on firms for which equity/corporate debt is held need to be obtained from the insurance companies. Firm level data can be linked to the establishment following the approach mentioned in Example 2.
Sources: Investment, As regards to Mutual Funds, the UTI office may have the record of amounts invested in units collected in the
Mutual Funds (2.2, respective state. Or the UTI office in Mumbai may have
1.3.5 this information. Similar data should be collected from 2.3) the other Private mutual funds within a state.
Uses: Debt securities, Equity: As mentioned for loans in 1.3.4
[134]

Report of the Committee on Financial Sector Statistics, 2018
S. No. Institution Comment
Sources: Pension entitlement, Contribution towards Provident Funds
Provident Funds The regulatory authorities of Pension and Provident
1.3.6 and Pension (Non- Funds may be approached to obtain the state-wise data. government) Funds EPFO has data on circle wise contribution. PFRDA may
(0.5, 0.5) segregate contributors to the NPS system state-wise.
Uses: Debt securities, Equity. As in 1.3.4
2 Non-financial Corporations (31.8, 20.2)
Sources: Loan, Equity
As explained in Example 2, linkages between ASI and MCA database through CIN number can be used for
Public Non- manufacturing sector. For the service sector, it may not
be feasible to establish linkage between enterprise and
financial 2.1 establishment under the current scenario. A survey on
Corporations (3.5, the service sector, similar on lines with the ASI may help 1.5) in bridging this missing link.
Uses: Investments (financial), Trade Credit, Other Assets. Same as for Sources
Private Non- Sources: Loan, Equity, Other Liabilities.
financial 2.2 Uses: Loan, Equity, Other Assets.
Corporations (28.3, Same as 2.1
18.6)
3 General Government (16.5, 1.1)
Central Sources: Debt securities, Loan 3.1 Government (11.5, Uses: Deposits, Equity, Currency – Super Regional
0.3) sector, not to be allocated to any state
RBI study on state budgets may provide the requisite information. The ownership pattern of central and state government securities is available from the RBI studies.
3.2 State Governments Ownership pattern of securities on individual states will (5, 0.7) be required rather than all state together as currently
available in public domain. City corporations may be included, for which the data from the concerned corporation may be available.
[135]
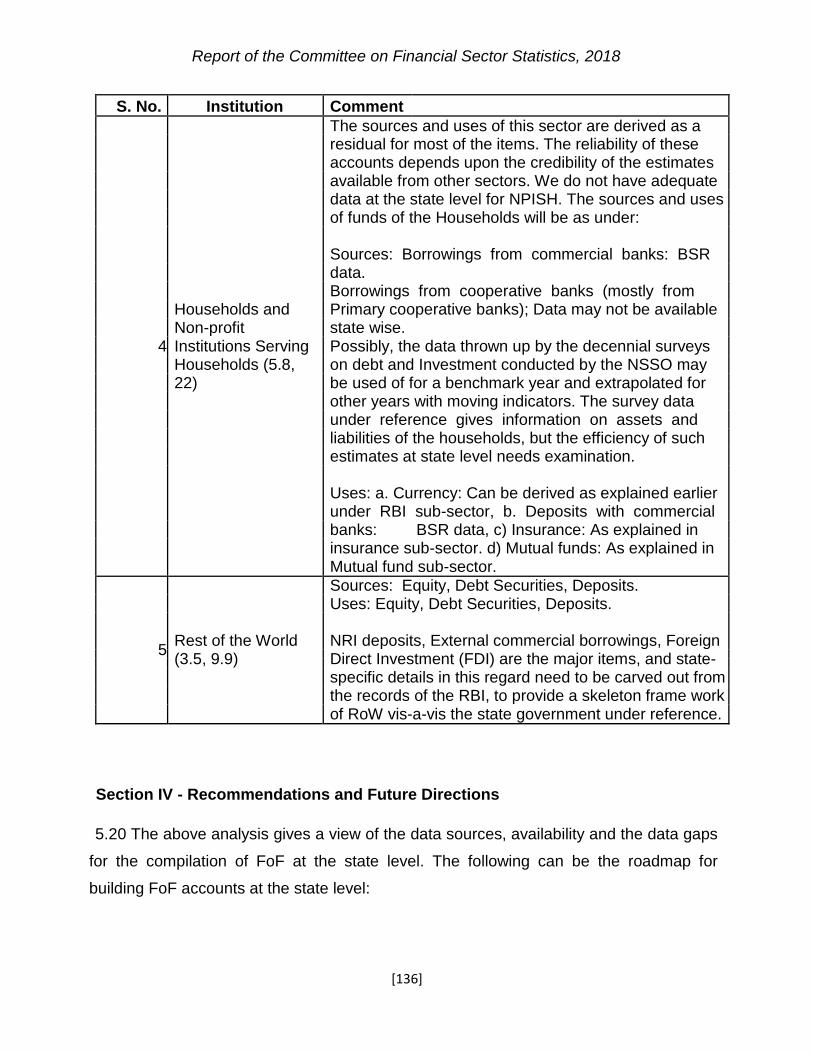
Report of the Committee on Financial Sector Statistics, 2018
S. No. Institution Comment
The sources and uses of this sector are derived as a residual for most of the items. The reliability of these accounts depends upon the credibility of the estimates available from other sectors. We do not have adequate data at the state level for NPISH. The sources and uses of funds of the Households will be as under:
Sources: Borrowings from commercial banks: BSR data.
Borrowings from cooperative banks (mostly from Households and Primary cooperative banks); Data may not be available Non-profit state wise.
4 Institutions Serving Possibly, the data thrown up by the decennial surveys Households (5.8, on debt and Investment conducted by the NSSO may 22) be used of for a benchmark year and extrapolated for other years with moving indicators. The survey data under reference gives information on assets and liabilities of the households, but the efficiency of such estimates at state level needs examination.
Uses: a. Currency: Can be derived as explained earlier under RBI sub-sector, b. Deposits with commercial banks: BSR data, c) Insurance: As explained in insurance sub-sector. d) Mutual funds: As explained in Mutual fund sub-sector.
Sources: Equity, Debt Securities, Deposits. Uses: Equity, Debt Securities, Deposits.
5 Rest of the World NRI deposits, External commercial borrowings, Foreign (3.5, 9.9) Direct Investment (FDI) are the major items, and state-
specific details in this regard need to be carved out from the records of the RBI, to provide a skeleton frame work of RoW vis-a-vis the state government under reference.
Section IV - Recommendations and Future Directions
5.20 The above analysis gives a view of the data sources, availability and the data gaps
for the compilation of FoF at the state level. The following can be the roadmap for
building FoF accounts at the state level:
[136]

Report of the Committee on Financial Sector Statistics, 2018
i) The Financial Institutions account for over 40 per cent of the total sources of
funds. Hence, the feasibility of building up other sector accounts at least
partially from this information could be attempted. It is desirable to begin with
the accounts for Scheduled Commercial Banks. BSR data provides details on
the deposits and credit for this sector. Survey on ownership of central and
state government securities can provide details on another major use of the
funds by the financial sector. The RBI should be treated as a super-regional
sector, which need not be allocated to any state. The transactions by other
institutional sectors with the RBI should be treated as transactions with a
super-regional sector.
ii) At next stage, accounts for state government, insurance sector, and other
financial institutions can be prepared. This, along with counterpart
transactions with household sector, will cover more than half of the FoF
transactions at the national level. This exercise will provide details on net
financial resources position at the state level, excluding non-financial
corporate sector. The Central Government should be treated as a super-
regional sector, which need not be allocated to any state. The transactions by
other institutional sectors with the Central Government should be treated as
transactions with a super-regional sector.
iii) At the current stage, transactions with non-financial corporate sector can be
kept separately without linking it to a particular state. Missing link of the non-
financial corporations in the manufacturing sector can be mapped as and
when linking of MCA and ASI databases become feasible. For Non-financial
corporations in the service sector, a survey on the service sector, similar on
lines with the ASI may help in bridging this missing link. Such standalone
service sector survey is desirable even otherwise given the rising contribution
of the service sector in the Indian economy, and its utility for the
measurement of state domestic product.
iv) The approach recommended for preparing the FoF at state level relies on
sectoral data sources which contain information for all states together, e.g., BSR,
ASI, AIDIS, etc. There will be economies of scale if the FoF for all states
[137]

Report of the Committee on Financial Sector Statistics, 2018
are prepared together rather than done individually at the state level. Given its
expertise in preparing the FoF accounts of at the national level, the RBI would
be best placed to carry out this exercise at the state level. To begin with, the
state level FoF accounts should be prepared on an annual basis for the next
five years. The frequency can be increased later depending upon the
statistical developments. Time lag required to prepare the state level FoF
accounts would depend upon the time-lag with which the input data are
released. While the input data for the financial sector and government sector
can be gathered within a time-gap of 12 months, the ASI data are released 2
years after the reference year. Hence, the time-lag for state level FoF
accounts can be kept at ASI (24 months) plus 6 months. The time lag can be
reduced later depending upon the statistical developments.
References
CRA (1976). Final Report of the Committee on Regional Accounts, Government of India.
Dholakia, R.H. (2006). Preliminary Estimates of Regional Accounts for Gujarat”, The Journal of Income & Wealth, 28(2), 3-14.
Economic Survey (2018). A New, Exciting Bird’s-Eye View of the Indian Economy Through the GST, in Economic Survey 2017-18, Ministry of Finance, Government of India.
Lakhchaura, P. (2004). Capital Formation at State Level, Ministry of Statistics & Programme Implementation Official Statistics Seminar Series, Volume I, 38-64.
Rajeswari, T., A. S. Ray, and H. Sahoo, (2009). Estimation of Capital Formation at State Level, The Journal of Income & Wealth 31(1), 27-33.
Sethia, D. (2016). Regional Accounts of India: Methods, New Estimates, and their Uses, Review of Income and Wealth, 62(1), 92-119.
Vaillancourt, F. and Bird. R. M. (2007). The Interregional Incidence of Central Budgets in Federations: Some Evidence from Canada, Public Budgeting & Finance, 27(1), 1-19.
[138]

Report of the Committee on Financial Sector Statistics, 2018
Chapter 6
Recommendations
6.1 This Chapter summarises the recommendations of the Committee. The Committee
recommends that RBI should prepare and publish the Flow of Funds (FoF) estimates at
the national and state levels. The national level estimates should be on an annual and
quarterly basis, whereas the state level estimates may be on an annual basis for the
next five years. The Central Statistics Office (CSO) may continue to prepare the
national level estimates of saving and capital formation as part of the national accounts.
However, the CSO and the RBI should work closely with each other to reduce if not
eliminate the discrepancies in the estimates in the NAS and the FoF respectively and
provide clear explanations, as transparently as possible, wherever the discrepancies
cannot be avoided. Priority may be accorded to strengthen the source systems so that
the prescribed standards for FoF compilation by the G20 group by 2021 can be met.
The following are the specific recommendations for improvements.
Co-operative Sector
6.2 All the State/ UT Governments may be made responsible for collection of co-operative
sector data, as the 97th Constitutional amendment empowers them to do so. The Registrars
of Co-operative Societies may be made the nodal agency for the same and MOSPI may be
involved in guiding them. Considering NABARD’s vast experience in this area, it may
coordinate a meeting of representatives from some select Registrars of Co-operative
Societies, the RBI, and the CSO to kick start the process. [Para 3.4 (a) (i)]
6.3 NABARD may provide projections on co-operative sector data items as required
in preparation of the FoF accounts; to start with, estimation of household sector’s deposits
with the co-operatives at the State level may be attempted. [Para 3.4 (a) (ii)]
6.4 PACS data may be sourced from NAFSCOB through NABARD. [Para 3.4 (a) (iii)]
[139]

Report of the Committee on Financial Sector Statistics, 2018
Micro-Finance Institutions
6.5 For FoF data on Micro-Finance Institutions (MFIs), their apex bodies like Sa-Dhan,
which has around 180 members, may be approached. [Para 3.4 (b)]
Non-Financial and Financial Corporations
6.6 SNA recommends reporting of ‘equity’ as, ‘listed shares’, ‘unlisted shares’, and ‘other
equity’. Presently, information on listed shares is available with the SEBI. As such, unlisted
shares information may be obtained by deducting the amount of listed shares from total
shares (as provided by the MCA). As the share of ‘other equity’ is expected to
be negligible at present, it may be ignored. [Para 3.4 (c) (i)]
6.7 SEBI may explore collecting ownership details of holdings in respect of corporate debt
as well as equity through the depositories/ custodians (NSDL/CDSL); and also from
Registrars and Transfer Agents (RTA). If necessary, depositories/ custodians/ RTAs may be
asked to maintain broad economic sector classification of security holders.
[Para 3.4 (c) (ii)]
6.8 However, from the long-term perspective, the MCA should capture ownership
details (economic sector-wise) of equity/ debt instruments holdings for each company
(both financial and non-financial) through Form MGT-7 with necessary changes. Details of ‘other equity’ may also be captured. [Para 3.4 (c) (iii)]
6.9 MCA may provide information on economic activity and equity ownership as
available in Forms AOC-4 and MGT-7 to the RBI, which may be used for classification
of companies into financial and non-financial; and also public, private and foreign
controlled. [Para 3.4 (c) (iv) and (v)]
6.10 Information on employees’ stock options as collected by the MCA from companies
in Form AOC-4 and MGT-7 may be provided to the RBI, who may explore using the same
for FoF compilation. [Para 3.4 (c) (vi)]
6.11 As recommended by the WG, nature of data available with CCIL and SEBI with
regard to OTC and exchange-traded derivative transactions, respectively, may be
[140]

Report of the Committee on Financial Sector Statistics, 2018
examined from the view point of incorporating the same in the FoF Accounts. The matter
may be pursued vigorously. [Para 3.4 (c) (vii)]
6.12 Rigorous monitoring may be done by the MCA for submission of Forms AOC-4
and MGT-7 by all active companies. [Para 3.4 (c) (viii)]
6.13 The present balance sheet structure prescribed by MCA provide details of short/
long-term loans, debt securities and investments, and these are being published in
Company Finances Studies on non-financial/ financial corporations conducted by the RBI
(DSIM). These details may be included in FoF accounts as prescribed in SNA 2008.
[Para 3.4 (c) (ix)]
6.14 Till the time required identifier for Water Users’ Associations, Farmer Producer
Organisations and ‘Micro, Small and Medium Enterprises' be made in the MCA database,
the NABARD may provide required information from such institutions promoted or
financed by them. [Para 3.4 (c) (x)]
6.15 Alternative investment funds (AIFs) may be included in the sector “Other financial
intermediaries”. SEBI should collect data on AIFs and provide the same to the FoF data compilers. [Para 3.4 (c) (xii)]
6.16 Coverage of non-Government non-financial/ financial corporations in MCA
database is still incomplete. Based on the exploratory exercise carried out by the
Committee, the data compilers (both of national accounts as well as FoF) may use
appropriate statistical methods, such as, growth rates or regression models to estimate
the balance sheet variables, in order to reduce the shortcoming/ errors in present PUC based blow-up method. [Para 3.16]
6.17 SNA 2008 recommended bifurcation of deposits into transferrable and other
deposits. While the definition of transferrable deposits does not strictly apply, bifurcation
of bank deposits into ‘current and savings’ and ‘term’ may be shown. [Para 3.4 (c) (xiv)]
6.18 As prescribed in the SNA 2008, preparation of FoF accounts for Money Market
MFs and non-Money Market MFs may be prepared separately. [Para 3.4 (c) (xv)]
[141]

Report of the Committee on Financial Sector Statistics, 2018
Insurance Sector
6.19 IRDA should provide the data on life and non-life insurance (both – public and
private) to the RBI (DEPR) in mutually agreed format. In respect of data gaps, if any,
required for compilation of FoF, the same may be captured by the IRDA. [Para 3.4 (d)]
6.20 The RBI (DEPR) should use the actual data on non-life insurance companies as
received from the IRDA, instead of using the ratio derived from life insurance sector
data. [Para 3.4 (d)] Government Sector
6.21 RBI (IDMD) may provide ownership of Central and State Government Securities
as per the institutional categories required for compilation of the FoF. [Para 3.4 (f) (i)]
6.22 CSO/ MoSPI may collect data on local bodies as per the proforma devised by the
Committee from the DES in each state and share the same with the RBI for FoF
compilation. They should rigorously follow-up with non-responding States for further improving the coverage. [Para 4.27 (i)]
6.23 The Government may set-up a High Level Committee (comprising members from
Urban Development Department, Ministry of Panchayati Raj, Ministry of Statistics and
Programme Implementation, RBI, Directorate of Economic and Statistics of select states,
DMAs, select large municipal corporations) to fine tune the format, if required for meeting
the data requirements of all stakeholders. [Para 4.27 (ii)]
6.24 Necessary software may also be developed for capturing this data from LBs and it
may be made mandatory to all LBs (rural as well as urban) to report the data in the
prescribed forms. Once, the system is developed, the responsibility of continuous
monitoring of data may be assigned to the respective DES. CSO and RBI may access
the system to get desired data as required for national accounts and Flow of Funds accounts. [Para 4.27 (iii)]
6.25 The National Informatics Centre may, in coordination with the Ministry of Panchayti
Raj (MoPR), may device National e-Panchayat system that will link/ integrate the
information pertaining to RLBs available in all the states (including Autonomous District
Council (ADC) States).
[142]
[Para 4.27 (iv)]

Report of the Committee on Financial Sector Statistics, 2018
6.26 For better accessibility and uniformity, MoPR may host the National e-Panchayat
system on their website. [Para 4.27 (v)]
6.27 As is done for MGNREGS, some provision for ‘Administrative Cost’ may be made
either in the Central Finance Commission (CFC) or the State Finance Commission (SFC) or
in both to help Gram Panchayats (GPs) to maintain their financial accounts as per the
prescribed system. [Para 4.27 (vi)]
6.28 Necessary trainings may be arranged at periodic intervals for manpower in local
bodies for preparing and maintaining accounts on double entry book-keeping basis.
Necessary training may also be arranged for those responsible for reporting and maintaining of data in software. [Para 4.27 (vii)]
6.29 The Fifteenth Finance Commission may be approached to involve CSO/ RBI in
structuring any survey of rural local bodies undertaken by them so that the results of the
survey may be used at a later stage in compilation of NAS/ FoF accounts.
[Para 4.27 (viii)]
Rest of the World
6.30 While BoP data may continue to be used for FoF purpose, both sets of data (IIP
and BoP) may be presented separately for reference purpose. [Para 3.4 (g)]
Statistical Discrepancies in the RBI and the CSO Estimates
6.31 As regards statistical discrepancies in data released by the CSO (in NAS) and the RBI
(in FoF), differences on account of data sources and their cut-off dates or otherwise may be
reconciled to the extent possible. Further, wherever, it is not possible to reconcile the
differences, it may be stated upfront in the publications with complete transparency. The
methodological documents for preparation of flow of funds and national accounts may also
cover reasons for differences in two data sources. The CSO and the RBI may exchange
notes before release of the national accounts and the FoF, to reconcile
inconsistencies between the two sets of data. [Para 3.21]
[143]

Report of the Committee on Financial Sector Statistics, 2018
Compilation of Quarterly FoFs Accounts
6.32 Quarterly FoF accounts may follow the methodology used in compilation of annual
FoF Accounts. [Para 3.26]
6.33 Monthly budget reviews of the Central Government along with data on government
securities/ state development loans from the RBI (IDMD) may be used to prepare FoF
estimates on general government sector. [Para 3.27 (c)]
6.34 SEBI may prescribe submission of quarterly statement of assets and liabilities by
the listed companies (half-yearly, as of now). [Para 3.27 (e)]
6.35 RBI (DEPR) may prepare quarterly FoF accounts for household sector on a regular
basis with gradually increasing the data coverage. [Para 3.28]
6.36 While availability of data may be an issue, estimations/ projections from the annual
data may be made using appropriate benchmarks for instruments/ sectors. [Para 3.28]
6.37 The statistical discrepancies arising on account of the quarterly and the annual
accounts may be adjusted at the time of compilation of annual FoF accounts. [Para 3.29]
Others
6.38 The feasibility of compiling and publishing separately the ‘valuation account’ and
the ‘other changes in volume account’ may be explored. Further, generation of
“Reconciliation Table” to record discrepancy between the stocks and the flows may also be examined. [Para 3.4 (h) (i)]
6.39 As per the recommendation of G20 DGI, data for all the target sectors on all the
target instruments need to be provided by the G20 countries by 2021. Priority may be accorded to strengthen the source systems required for the same. [Para 3.4 (h) (ii)]
6.40 Considering the significant international attention being paid to the implementation
of agreed data templates through outreach, technical assistance, and training, the
compilers from the National Account Analysis Division of DEPR, RBI and CSO, MoSPI may be given adequate training and exposure. [Para 3.36 (v)]
[144]
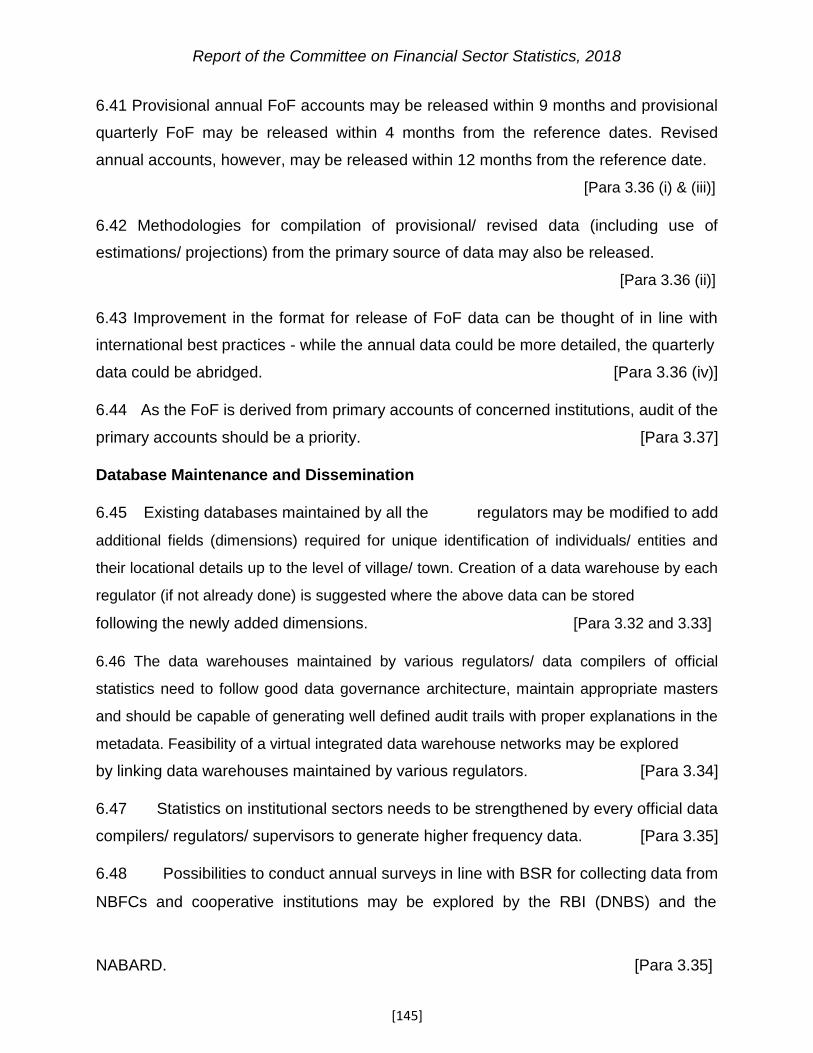
Report of the Committee on Financial Sector Statistics, 2018
6.41 Provisional annual FoF accounts may be released within 9 months and provisional
quarterly FoF may be released within 4 months from the reference dates. Revised
annual accounts, however, may be released within 12 months from the reference date.
[Para 3.36 (i) & (iii)]
6.42 Methodologies for compilation of provisional/ revised data (including use of
estimations/ projections) from the primary source of data may also be released.
[Para 3.36 (ii)]
6.43 Improvement in the format for release of FoF data can be thought of in line with
international best practices - while the annual data could be more detailed, the quarterly data could be abridged. [Para 3.36 (iv)]
6.44 As the FoF is derived from primary accounts of concerned institutions, audit of the
primary accounts should be a priority. [Para 3.37]
Database Maintenance and Dissemination
6.45 Existing databases maintained by all the regulators may be modified to add
additional fields (dimensions) required for unique identification of individuals/ entities and
their locational details up to the level of village/ town. Creation of a data warehouse by each
regulator (if not already done) is suggested where the above data can be stored
following the newly added dimensions. [Para 3.32 and 3.33]
6.46 The data warehouses maintained by various regulators/ data compilers of official
statistics need to follow good data governance architecture, maintain appropriate masters
and should be capable of generating well defined audit trails with proper explanations in the
metadata. Feasibility of a virtual integrated data warehouse networks may be explored
by linking data warehouses maintained by various regulators. [Para 3.34]
6.47 Statistics on institutional sectors needs to be strengthened by every official data
compilers/ regulators/ supervisors to generate higher frequency data. [Para 3.35]
6.48 Possibilities to conduct annual surveys in line with BSR for collecting data from
NBFCs and cooperative institutions may be explored by the RBI (DNBS) and the
NABARD. [Para 3.35]
[145]

Report of the Committee on Financial Sector Statistics, 2018
Flow of Funds at State Level
6.49 As the financial corporation sector account for over 40 per cent of the total sources
of funds, feasibility of building up other sector accounts at state level at least partially
from this information may be attempted. BSR system for the scheduled commercial
banks which provides state-wise/ institutional sector-wise details on the deposits and
credit together with the survey on ownership of central and state government securities
conducted by the RBI (IDMD) can provide details of major use of funds by the financial
sector. The transactions by other institutional sectors with the RBI should be treated as transactions with a super-regional sector. [Para 5.20 (i)]
6.50 At next stage, accounts for state government, insurance sector, and other financial
institutions can be prepared. This, along with counterpart transactions with household
sector, will cover more than half of the FoF transactions at the national level.
[Para 5.20 (ii)]
6.51 The Central Government should also be treated as a super-regional sector, which
need not be allocated to any state. The transactions by other institutional sectors with the
Central Government should be treated as transactions with a super-regional sector.
[Para 5.20 (ii)]
6.52 At the current stage, transactions with non-financial corporate sector can be kept
separately without linking it to a particular state. Missing link of the non-financial
corporations in the manufacturing sector can be mapped as and when linking of MCA and
Annual Survey of Industries (ASI) databases become feasible. [Para 5.20 (iii)]
6.53 For Non-financial corporations in the service sector, a survey on the service sector,
similar on lines with the ASI may be conducted. Such standalone service sector survey
may serve other purposes as well like the measurement of state domestic product.
[Para 5.20 (iii)]
6.54 Given its expertise in preparing the FoF accounts of at the national level, the RBI
would be best placed to carry out this exercise at the state level. To begin with, the state
level FoF accounts should be prepared on an annual basis for the next five years. The
frequency can be increased later depending upon the statistical developments.
[Para 5.20 (iv)]
[146]

Report of the Committee on Financial Sector Statistics, 2018
6.55 Time lag required to prepare the state level FoF accounts would depend upon the
time-lag with which the input data are released. While the input data for the financial
sector and government sector can be gathered within a time-gap of 12 months, the ASI
data are released 2 years after the reference year. Hence, the time-lag for state level
FoF accounts can be kept at ASI (24 months) plus 6 months. The time lag can be
reduced later depending upon the statistical developments.
[147]
[Para 5.20 (iv)]