sarvekshana - MOSPI
216
SARVEKSHANA National Sample Survey Organisation Ministry of Statistics & Programme Implementation Government of India New Delhi Journal of National Sample Survey Organisation losZ{k.k losZ{k.k losZ{k.k losZ{k.k losZ{k.k 88 th Issue Vol. XXV No. 4 & Vol. XXVI No. 1 (October 2005) Vol. XXV No. 4 & Vol. XXVI No. 1 88 th ssue los Z {k.k los Z {k.k los Z {k.k los Z {k.k los Z {k.k SARVEKSHANA
-
Upload
khangminh22 -
Category
Documents
-
view
2 -
download
0
Transcript of sarvekshana - MOSPI

SARVEKSHANA
National Sample Survey OrganisationMinistry of Statistics & Programme Implementation
Government of IndiaNew Delhi
Journal of
National Sample Survey Organisation
losZ{k.klosZ{k.klosZ{k.klosZ{k.klosZ{k.k
88th IssueVol. XXV No. 4 & Vol. XXVI No. 1
(October 2005)
Vol.XXVNo. 4
&Vol.
XXVINo. 1
88th
ssue
losZ{k.klosZ{k.klosZ{k.klosZ{k.klosZ{k.k S
AR
VE
KS
HA
NA

SARVEKSHANA
National Sample Survey OrganisationMinistry of Statistics & Programme Implementation
Government of IndiaNew Delhi
Journal ofNational Sample Survey Organisation
Vol. XXV No. 4 & Vol. XXVI No. 188th Issue


SARVEKSHANA
Journal of National Sample Survey OrganizationEditorial Advisory BoardProf. K.L. Krishna, Indian Council for Research on International Economic Relations,New Delhi (Chairman)Prof. T.J. Rao, Indian Statistical Institute, KolkataProf. K. Sundaram, Delhi School of Economics, University of Delhi, DelhiProf. C.P. Chandrasekhar, Jawahar Lal Nehru University, New DelhiDr. S. Ray, Director General & CEO, NSSOShri N.V. Tolani, Deputy Director General, SDRD, NSSOShri P.C. Tangri, Deputy Director General, CPD, NSSO (Managing Editor)
Editorial Secretariat - Coordination and Publication Division, National Sample SurveyOrganisation, Sardar Patel Bhawan, Sansad Marg, New Delhi-110001.Mr. Ram Kripal, DirectorMr. P.K. Dhamija, Joint DirectorMr. Bhupinder Kumar, S.O.Mr. S. A. Beg, J.I.
Frequency and Subscription‘Sarvekshana’ is published twice a yearThe subscription rate is Rs. 200 per issue.Mail subscription to: Controller of Publications, Department of Publication, Civil Lines, Delhi-110054.Ph. 23819689, 23813302, 23817823
Manuscript Submission‘Sarvekshana’ is aimed at encouraging research and analysis of NSS data to bring about a deeperunderstanding of socio-economic development of the country. For details about manuscriptsubmission refer to back of cover page.Opinions expressed in ‘Sravekshana’ are those of the authors and not necessarily reflect the viewsor policies of the NSSO or the Government of India. NSSO is not responsible for the accuracy ofthe data and information included in the technical papers nor does it accept any consequence fortheir use. Material in ‘Sarvekshana’ may be freely quoted with appropriate acknowledgement and acopy of the publication sent to the Managing Editor.
Suggestions for improvement of the Journal may be addressed to:
The Managing Editor, Sarvekshana,Coordination and Publication DivisionNational Sample Survey OrganisationSardar Patel Bhawan, Sansad Marg, New Delhi.
SarvekshanaVol. XXV No. 4 & Vol. XXVI No. 1Issue No. 88


An Expert Group under the chairmanship of Prof. Nikhilesh Bhattacharya was consti-tuted by the Ministry of Statistics and Programme Implementation, Government ofIndia, to study some of the aspects of non-sampling errors in the survey of householdconsumer expenditure and informal non-agricultural enterprises (manufacturing andtrade). The other members of the Expert Group included Prof. T.J. Rao and Prof. A.K.Adhikari, Indian Statistical Institute and the heads of all the four Divisions of Na-tional Sample Survey Organisation.
As part of the work of the Expert Group, the Cross-Validation Study of Estimates ofPrivate Consumption Expenditure Available from Household Survey and NationalAccounts was prepared during 2001 by the National Sample Survey Organisation andthe Central Statistical Organisation with contributions mainly from S/Shri Aloke Kar,D.P. Mondal and P.D. Gupta under the technical direction of Dr. A.C. Kulshreshtha.Comments on the report were obtained from Prof. B.S. Minhas, Prof. S.D. Tendulkar,Mrs. Uma Dutta Roychoudhury and Dr. Vaskar Saha. Most of these comments havebeen incorporated in the report. However, the discussion and comments of the expertsare also presented as part of the report. Prof. Nikhilesh Bhattacharya has not beenable to go through the present version of the report due to his health condition.
About the Expert Group on Non-sampling Errors and the Study


CONTENTS
PART – I : TECHNICAL PAPERSPage No.
1. Report on Cross-Validation Study of Estimates of Private 1Consumption Expenditure Available from Household Surveyand National AccountsExpert Group on Non-sampling Errors
PART – II : SUMMARY AND MAJOR FINDINGSOF SURVEYS
2. An Integrated Summary of NSS Fifty-Fifth Round 71(July1999-June 2000) Survey Results on InformalSector Employment in India.Asis Roy and Salil Mukhopadhyay
1. Introduction 732. Summary of findings 77
Annex-I : Tables ( With Subject-wise List) 97
Annex-II : Sample Design and Estimation procedure 121
Annex-III : Concepts, Definitions and Procedures 133
Annex-IV : National Industrial Classification (NIC) – 1998 141
Annex-V : Activity Coverage for informal non- agricultral 147Survey in NSS 55th Round
Annex -VI : Facsimile of Informal Non Agricultural Enterprises 153Schedule (Sch. 2.0) and Household Employment andUnemployment Schedule (Sch. 10)
PART – III : HINDI SECTION
Hindi Section fg-1&fg- 13

TECHNICAL PAPERS
Report on Cross-Validation Study of Estimates of PrivateConsumption Expenditure Available from Household Survey
and National Accountsby
Expert Group on Non-sampling Errors
PART - I

SARVEKSHANA

SARVEKSHANA
Report onCross- Validation Study of Estimates of Private Consumption Ex-
penditure Available from Household Survey andNational Accounts*
1. Introduction
Estimates of private final consumption ex-penditure in India are generated as a part ofthe National Accounts Statistics (NAS) com-piled annually by the Central StatisticalOrganisation (CSO). A different set of esti-mates of household consumption expendi-ture is also available from the HouseholdConsumer Expenditure Surveys (HCES) ofthe National Sample Survey Organisation(NSSO). As one would expect, the estimatesfrom the two sources fail to agree closely.More importantly, a recent study bySundaram and Tendulkar (2001) and simi-lar studies undertaken in the past reveal thatthe gap between the two sets of estimates iswidening over time. The present study is anattempt to (a) understand the magnitude andnature of the divergence between the two setsof estimates, (b) identify the underlying rea-sons for the divergence and (c) suggest mea-sures for improvements in compilation ofNAS and conduct of HCES in the light ofthe identified sources for the difference.
The CSO’s estimate of private final con-sumption expenditure is derived followingwhat is called the “commodity flow” ap-proach. This approach consists of obtainingthe quantum and value of different commodi-ties flowing finally into the consumptionprocess of the households and the privatenon-profit institutions serving households(NPISH), from the quantum and value of thecommodities produced and available during
the accounting year, which is generally a fi-nancial year, extending from beginning ofApril of one calendar year to end of Marchof the next. For the commodities obtainedfrom agriculture proper (i.e. excluding ani-mal husbandry), however, the output of theagricultural year is taken as such to repre-sent the production of the accounting year.Generally speaking, in this approach, thefollowing are netted out from the quantumand value of the total output of a commod-ity or a commodity-group to arrive at theestimate of its net availability in the domes-tic economy:
(i) The part used up in the process of fur-ther production (intermediate consump-tion),
(ii) Change in stocks and
(iii) Exports, net of imports.
An amount is also discounted for the wast-age of agricultural produce.
Having thus arrived at the estimate of netavailability, the part used for capital forma-tion and that used by the general governmentadministration for current consumption arededucted from it to arrive at the commod-ity-wise estimates of the quantum and valueof private final consumption expenditure(PFCE) at current market prices. The sumof all the commodity-wise estimates of valuegives the aggregate estimate of PFCE, whichin fact represents the value of goods and ser-
* Prepared by NAD of the CSO and SDRD of the NSSO for the Expert Group on Non-sampling Errors, with contributions mainly
from S/Shri Aloke Kar, D.P.Mondal, and Sh. P.D.Gupta, under the technical direction of Dr. A.C. Kulshreshtha.
1

SARVEKSHANA
1 For example, the definition of household consumption expenditure followed in by the NSS does not include the imputed compo-
nents of PFCE as defined in the System of National Accounts.2 The CSO revises its estimates periodically - generally once every ten years. This enables it to use more recent and representative
benchmark estimates of productivity and workforce for estimation of macro-economic aggregates. Each revision results in adifferent series of estimates of PFCE, among other macro-economic aggregates, which is referred to by the corresponding baseyear. The revision exercise is usually taken up a few years after the base year. As a result, two (sometimes more than two) sets ofestimates of the macro-economic aggregates - pre-revised and revised - become available for the years common to two consecu-tive series.
vices consumed by the households andNPISHs.
The NSSO, on the other hand, employs thetechnique of survey sampling, in which theconsumption expenditure of a randomsample of households is ascertained directlyby canvassing a well-designed schedule ofenquiry whose coverage is broad enough toinclude every item of household consump-tion expenditure. But the surveys conductedfor this purpose, called Household Con-sumption Expenditure Surveys (HCES), arerequired to cover only the households andnot the NPISHs. Moreover, these surveys areusually carried out over a period of one yearthat generally corresponds to an agriculturalyear, i.e. beginning of July of one calendaryear to end of June of the next.
Evidently, the two data sets are not strictlycomparable. Apart from the differences inthe coverage and reference time-frames thatare apparent, comparability of the two setsof estimates are constrained by the differ-ences in the concepts1 and methods of esti-mation inherent in the very approaches em-ployed by the two agencies. Nevertheless, anumber of studies comparing the two setsof estimates conducted in the past reveal thatthe estimates for the individual years of1950s, 1960s and 1970s were in fairly closeagreement, in spite of the entirely differentapproaches and the databases used for esti-mation by the two agencies. Most of thesestudies pertain to the estimates for the indi-vidual years of 1950s and 1960s and con-tain comparisons at broad levels of aggre-
gation. Only two of the latest studies (Minhaset. al., 1986, and Minhas, 1988) deal withthe estimates for two years of the 1970s andone (Minhas et. al., 1989) with the estimatesof 1983. These contain comprehensive dis-aggregated level comparison of the two setsof estimates.
The estimates given in Table 1 are partlyquoted from the studies mentioned aboveand partly worked out for the present study.The NSS estimates given in the table are ar-rived at as the product of the estimates ofannual per capita consumption expenditureobtained from the HCES and the populationprojections based on the Population Census(RGI, 1996). The product is obtained sepa-rately for the rural and urban populations andthe sum is taken as the estimate for totalhousehold consumption expenditure of thedomestic economy. The NAS estimates fordifferent years quoted in the table are thecurrent-price estimates taken from the latestseries of NAS estimates with base year pro-ceeding the current year.2 The present studyuses the NAS estimates for 1993-94 releasedin 2000 (CSO, 2000).
It is seen from Table 1 that till the 1970s thedifference between the two estimates of to-tal consumption expenditure was of the or-der of 13 per cent or less. Considering thedifferences in approach, coverage, conceptand data sources used, the order of differ-ence of about 10 per cent is indeed not sur-prising. But, what appears to be a matter ofserious concern is that the gap between thetwo sets of estimates has been widening pro-
2

SARVEKSHANA
1957-58 NSS 6626 3241 9867NAS 6920 3461 10381% difference -4.25 -6.36 -4.95
1960-61 NSS 8118 4130 12247NAS 8594 4302 12896% difference - 5.54 - 4.00 - 5.03
1967-68 NSS 16373 5537 22695NAS 17238 9017 26255% difference - 5.02 - 16.55 -13.56
1972-73 NSS 23420 9790 33210NAS 22214 12946 35160% difference 5.43 -24.38 -5.55
1977-78 NSS 36500 20030 56530NAS 38157 24923 63080% difference -4.34 -19.63 -10.38
1983-84 NSS 69739 38934 108668NAS 85613 60471 146084% difference -18.55 -35.62 -25.61
1987-88 NSS 106205 67560 173765NAS 122805 101256 224061% difference -13.52 -33.28 -22.45
1993-94 NSS 224066 131704 355770NAS 315243 259529 574772% difference -28.92 -49.25 -38.10
Notes: 1. % difference stands for (NSS – NAS) / NAS expressed in percentage.2. The estimates for 1957-58 and 1960-61 are quoted from Srinivasan et. al. (1974), who in turn have
used the estimates for 1957-58 compiled by Kansal and Saluja (1961) for the NAS estimates.3. The estimates for 1972-73 and 1977-78 are based on Minhas et. al. (1986), appropriately adjusting the
food-nonfood composition for comparability.4. Sources for NAS estimates for 1983-84, 1987-88 and 1993-94 are the National Accounts Statistics of
1990, 1992 and 2000 respectively.5. The NSS estimates for 1983-84, 1987-88 and 1993-94 are obtained by simply as the product of popu-
lation and per capita consumption based on HCES of 1983, 1987-88 and 1993-94 respectively.
Year Source Food Non-food Total
Table 1: Divergence between the NSS and NAS estimates of consumption expenditurefor selected years (Rs. Crore)*
* 1 Crore = 10 million
gressively since the 1980s, in spite of theexposition of shortcomings of both the esti-mates contained in the studies mentioned
above and the measures taken to overcomethem.
3
SARVEKSHANA
Table 1 shows that the divergence betweenthe estimates of total consumption, whichwas about 10 per cent in 1977-78, had soaredto a level of about 25 per cent by 1983-84,remained at almost the same level in 1987-88, and then mounted to as high as 38 percent in 1993-94. So far as the expenditureon food consumption is concerned, the esti-mates from the two sources varied by onlyabout 5 per cent, that too either way, till the1970s. But during the following period theincrement in the NAS estimate has been at amuch faster rate than that in the NSS esti-mate. So much so, the difference betweenthe NSS and NAS estimates rose to a levelof 19 per cent by the 1980s and by 1993-94the difference was about 29 per cent. Muchin the same way, the divergence between theestimates of non-food consumption, whichwas of the order of 5 per cent till 1960-61,has grown manifold to a shade below 50 percent in 1993-94. A divergence as wide as thisis indeed surprising. It is necessary to men-tion here that the NSS estimates of all theyears of 1970s, 1980s and 1990s given inthe table are based on quinquennial surveys,which were conducted on a larger second-stage sample than the other years for whichthe estimates are available.
The present study is an attempt to investi-gate the underlying sources for the widen-ing gap between the two sets of estimates.For this purpose, it utilises the unpublisheddisaggregated item-level estimates from theConsumption Expenditure Survey of NSSO(50th Round) 1993-94, and the disaggregateditem-level data used for compiling the Pri-vate Final Consumption Expenditure (PFCE)for the National Accounts Statistics. It is es-
sentially an extension of the study under-taken by Minhas et. al. (1986) for the years1972-73 and 1977-78. The present studycontains a disaggregated comparison of theestimates of food and non-food consump-tion in 1993-94 and attempts a comprehen-sive analysis for understanding the underly-ing reasons for divergence.3 To begin with,it deals with the known causes of divergencebetween the two sets of estimates in the nextsection. Much of these causes are inherentin the different approaches adopted by thetwo agencies and have been discussed ex-tensively in the earlier studies. Next, in thetwo following sections, detailed item-wisecomparison of the estimates on food andnon-food consumption is taken up to iden-tify the components principally responsiblefor the high order of difference between theaggregate estimates and the underlying rea-sons for the divergence. The report ends withsummary findings of the analysis and a fewsuggestions for improvement.
2. Comparability of the Estimates
The comparison of the two sets of estimatesis constrained by certain differences inher-ent in the approaches adopted by the twoagencies. A number of studies taken up inthe past have dealt with these causes. Par-ticularly, Minhas (1988) provides a compre-hensive account of the limitations of com-paring the two sets of estimates. The follow-ing is a brief discussion on the identified pos-sible reasons for differences that are inher-ent in the methods of estimation used by thetwo agencies.
Coverage: As observed in the earlier studieslike those by Mukherjee and Chaterjee
3 The present study is confined to comparison of only the revised (for 1993-94 series) NAS estimates and NSS estimates. Minhas
and Kansal (1990) have attempted appraisal of the margins of uncertainty in the NAS estimates by comparing the pre-revised andrevised estimates of PFCE for the early years of 1980. More recently, Sundaram and Tendulkar (2001) have compared the NASand NSS estimates, using the pre-revised and revised estimates of PFCE for 1993-94. The present study makes no such attempt.
4

SARVEKSHANA
4 Exceptions being the first (Oct.72 – Sept.73) and the third (Jan. – Dec. 1983) NSS quinquennial surveys.
(1974) and Minhas (1988), the HouseholdConsumer Expenditure Surveys (HCES) ofthe NSSO excludes the houseless and theinstitutional population like the inhabitantsof orphanages, prison and hospitals, whilethe consumption of these persons areincluded in NAS estimate. Also included inthe NAS estimate is the consumptionexpenditure of NPISHs, which are notcovered by the HCES. Nevertheless, the NSSestimates of average per capita consumptionexpenditure, in conjunction with theestimated total population of the country,provides a valid aggregate estimate of theconsumption expenditure of the households,despite being subject to the limitation ofnon-coverage of the houseless and the
institutional population in the HCES. So faras the comparability between the two sets ofestimates is concerned, this limitation isvirtually of no consequence, as the propor-tion of the houseless and the institutionalpopulation in the total population is negligi-bly small. As for the consumption expendi-ture of NPISHs, though it is not possible toderive any reasonable estimate of its sharein the NAS estimate of PFCE owing to ab-sence of data, there are reasons to believethat it is rather small. In some recent studieslike those by Ravallion (2000) and Bhalla(2000), the share of NPISHs in the estimateof PFCE has been assumed to be 10 per cent.This, it appears, is distinctly on the higherside.
Reference Time-frame: The NAS estimatesof final consumption expenditure are workedout from the production data of various goodsand services, which are compiled primarilyfor estimation of gross domestic product forthe current (financial: April-March) account-ing year. Since, the data on agricultural pro-duction used for national accounting pertainto agricultural (July–June) year, the NAS es-timates of consumption expenditure on agri-cultural produce essentially represent the
consumption out of the current agriculturalyear’s production rather than the actual con-sumption during the financial year, notwith-standing the adjustments made for produc-tion flow into non-consumption uses in thecommodity-flow approach. For the HCES,on the other hand, the NSSO normally usesan agricultural year4 as the survey period,and thus the NSS estimates represent theactual consumption during the agriculturalyear. But, since the production and consump
Rice 72.86 80.30Wheat 57.21 59.84Coarse cereals 36.59 30.81Pulses 12.82 13.31Food Grains 179.48 184.26Nine major oilseeds 20.11 21.50Sugarcane 228.03 229.66
Table 2: Production of Food Grains, Oilseeds and Sugarcane during Agricultural Years1992-93 and 1993-94 (in million tonnes)
Source: Agricultural Statistics at a Glance, 1999, Directorate of Economics and Statistics, Ministry of Agriculture.
Crop 1992-93 1993-94
5

SARVEKSHANA
tion of goods, particularly of agricultural pro-duce, are events usually separated in timeby considerable gaps, whatever is producedduring the agricultural year is not necessar-ily consumed during the same period, nor isthe current year’s consumption drawn en-tirely from the current year’s production. Forreasons such as these, the NAS estimates arestrictly not comparable with the NSS esti-mates. The comparability, however, shouldnot be seriously affected if the output of foodcrops in two successive years differs little.Since that was not so, Minhas et. al. (1986)made an attempt to assess the magnitude ofdiscrepancy accounted for by the differentreference time-frames of the NAS and NSSestimates by using the crop season-wise dataof food grains production of the current andthe preceding agricultural years. For thepresent study, however, no such attempt hasbeen made, particularly because the growthin production of food grains between 1992-93 and 1993-94 was too low (Table 2), inthe aggregate, to significantly affect the com-parability in this respect. Moreover, such ad-justments for reference period involve toomany strong assumptions to render validityto their results as possible explanation forthe divergence.
Unmatched classification schemes : Theclassification schemes for grouping com-modities and services adopted by the twoagencies both at the data collection and com-pilation stages as well as those used for pre-sentation of results differ considerably inmany respects. This makes item-wise com-parison difficult. Prior to the 1980-81 seriesof the NAS, the classification schemes dif-fered in respect of expenditure on ‘hotels &restaurants’, which was classified under non-food consumer services in the NAS, while it
was included in the food group in the NSSestimate (Minhas, 1988). Since the 1980-81series, however, the consumption expendi-ture on ‘hotels & restaurants’ is classified inthe ‘food’ group in the NAS as well. Yet, theclassification schemes used by the two agen-cies at present differ in a number of otherrespects. For example:
• In the NAS, the ‘rice’ retained by thefarmers for their self-consumption isput entirely under ‘rice’ consumption,whether or not a part of it is convertedinto rice products. In contrast, riceproducts like murmure, cheera / pohaand khoi are not included in the NSSestimate of ‘rice’, even when they aremade out of ‘home-grown stock’.
• Expenditure on purchase and repairsof transport equipment is classifiedunder ‘durables’ in the NSS estimates,while it is included in the transport-group in the NAS estimates of PFCE.
• The expenditure on cooked food givento the domestic servants (whether full-time or part-time) is included in the‘food’ group in the NSS. In the NAS,on the other hand, all payments(whether in cash or kind) made to thedomestic help are, in principle, takenas expenses incurred for consumptionof ‘personal services’.
Treatment of cooked meals: In the HCES,the meals served to a domestic help who isnot a member of the employer household areincluded only in the consumption expendi-ture of the serving households and not in thatof the recipient households. In the nationalaccounting framework, the “cooked meals”consumed by the domestic help is taken as a
6

SARVEKSHANA
part of the remuneration she/he receives forthe services provided to the employer house-hold, which, in turn, is used up as final con-sumption by the latter. Thus, the value of the“cooked meals” served to a domestic helpby an employer household forms a part of‘food’ consumption of the former and thatof consumption of ‘services’ of the latter.But, in order to avoid double counting of theexpenditure on ‘food’, the value of ‘cookedmeals’ is recorded as consumption expendi-ture of only the employer household in theHCES. As a result, in the aggregate, theHCES fails to include the part of the valueof services provided by domestic helps thatis remunerated for by “cooked meals”. Thus,the NSS method of collection of data on“cooked meals” served to domestic helps aspart of their remuneration leads to underes-timation of the total value of services con-sumed by the households, and thus the totalconsumption expenditure incurred by them.
The value of “cooked meals” is notionallyincluded in the income of the domestic helpsas part of their income and thus forms partof their final consumption, according to theapproach followed for the NAS estimates.In the Enterprise Survey whose results aretaken to represent the estimates of GVA of‘personal services’ sub-sector, the payments‘in kind’ are also included in the earnings ofthe enterprises. Moreover, since the services
produced by the domestic helps, which areevaluated as the wages, in cash or kind,earned by them, are taken as final consump-tion of the employer households, the valueof the “cooked meals” gets included in con-sumption expenditure of the former.Notional components in NAS estimate ofPFCE: Only the rent on dwellings actuallypaid is included in the NSS estimate, whilethe NAS estimate includes all imputed rent-als of owner-occupied dwellings. This ac-counts for a substantial part of the divergenceobserved between the two estimates. Othersuch notional component in the NAS esti-mate is the Financial Intermediation Ser-vices Indirectly Measured (FISIM). This isbeing included in PFCE since the 1980-81series of national accounts. Thus, the NSSand NAS estimates of consumption do notsuffer from non-comparability in this respectfor the earlier years. Inclusion of these no-tional components in the NAS estimate ofprivate consumption is, however, in strictadherence to the standards set by the inter-nationally accepted system of national ac-counts. Table 3 illustrates how these notionalcomponents of the NAS estimates affect thecomparability. In the table, the figures givenin col.(2) are the unadjusted NSS estimates,while those given in col.(7), called ‘adjustedNSS estimates’, are the NSS estimates in-cluding the notional components of rent andFISIM.
Year Unadjusted % diff. Cols. Imputed Adjusted % diff. Cols.NSS NAS (2) & (3) rentals FISIM NSS (7) & (3)
(1) (2) (3) (4) (5) (6) (7) (8)1983-84 108668 146084 -25.61 10478 758 119904 -17.921987-88 173765 224061 -22.45 15416 1513 190694 -14.891993-94 355771 574772 -38.10 37297 11801 404869 -29.59
Table 3: Comparison between the NSS estimates and NAS estimates adjusted for renton dwellings and FISIM (Rs. crore)
Note : 1. % difference stands for (NSS – NAS) / NAS expressed in percentage.2. Sources same as those for Table 1.
7

SARVEKSHANA
3. Comparison of Estimates ofFood Consumption for 1993-94
As the classification schemes followed bythe two agencies differ, the individual itemshave been regrouped suitably to make theirestimates from the two sources comparable.For this purpose, the sub-groups like thoseof gram products, pulses product, cerealproducts, cereal substitutes, vegetables, veg-etable products, and confectionary itemshave been regrouped suitably taking indi-vidual item-level estimates which are avail-able from both the sources. The regroupinginvolves both the sets of estimates. For thepresent study, expenditure on pan, tobacco& beverages is included in the estimates offood consumption.
For obtaining the NAS estimate of privateconsumption of food items by commodityflow approach, data on output, seed, feed,wastage, imports and exports, changes instock, government final consumption andintermediate consumption are required. Thebasic data on output, based on crop estima-tion, are available from the Directorate ofEconomics and Statistics, Ministry of Agri-culture (DESAg). The seed and feed ratiosused are based on current cost of cultivationstudies. The wastage ratios for most of thecommodities are based on estimates avail-able from the Directorate of Market Intelli-gence (DMI), but these have not been up-dated. The estimated wastage ratios used atpresent pertain to 1968-69. The main sourceof data on intermediate consumption for a
1. Cereals & Cereal Products 72188 77655 -5467 -7.042. Bread 560 554 6 1.083. Gram (Whole) 530 265 265 100.004. Pulses & pulses product 12665 11993 672 5.605. Cereal substitute (tapioca etc.) 309 1024 -715 -69.826. Sugar and Gur 9956 19881 -9925 -49.927. Milk & milk products 33737 46594 -12857 -27.598. Edible oils & oilseeds 15674 23204 -7530 -32.459. Meat, egg & fish 11923 21737 -9814 -45.1510. Fruits, vegetables & their products 28851 68036 -39185 -57.5911. Salt 595 595 0 0.0012. Spices 8015 8015 0 0.0013. Non-alcoholic Beverages 9156 6422 2734 42.5714. Processed / Other food 5910 5436 474 8.7215. Pan 1830 2988 -1158 -38.7616. Tobacco 5877 12309 -6432 -52.2517. Alcoholic beverages and other intoxicants 2525 2393 132 5.5218. Hotel & restaurant / cooked meals 3765 6142 -2377 -38.70Food: Total 224066 315243 - 91177 - 28.92
Table 4: Comparison between the NAS and NSS estimates for different item-groupsof food consumption for 1993-94 (Rs. crore)
Item-group NSS NAS NSS %estimate estimate - NAS difference
8
SARVEKSHANA
number of commodities is again DMI reportfor the year 1968-69. The data on exportsand imports are available on a regular basisfrom the Director General of CommercialIntelligence and Statistics (DGCI&S) and theestimates of Government consumption ex-penditure are based on the rates obtainedfrom the latest Input-Output tables.
Table 4 gives the NAS and NSS estimatesfor the different food sub-groups made com-parable by suitably regrouping the fooditems. The estimates differ by over Rs. 91thousand crore, the NSS estimate beingsmaller than the NAS estimate by about 29per cent of the latter. The main contributor,it is seen, is the “fruits, vegetables and theirproducts” item-group, which alone accountsfor Rs. 39 thousand crore out of the total dif-ference of Rs. 91 thousand crore betweenthe estimates of food consumption. This isfollowed by the “milk & milk products” and“sugar & gur” item-groups, accounting forRs. 13 thousand and Rs. 10 thousand crorerespectively. The NSS estimates are higherthan the NAS estimates for only a few item-groups like ‘pulses & pulses products’, ‘non-alcoholic beverages’ and ‘gram (whole)’.The differences between the estimates forsuch groups are much smaller in compari-son. The estimates for the item-groups ‘salt’and ‘spices’, it is seen, do not vary at all.This is because the NAS estimate for boththe item-groups is directly taken from theHCES. The NAS and NSS estimates for theitem-group ‘processed / other food’, whichincludes expenditure on items like biscuits,confectionery and other processed food, donot differ much. It is interesting to note thatdespite the known reluctance of the respon-dents in reporting consumption of alcoholicbeverages and other intoxicants in the HCES,the NSS estimate for this item-group is mar-ginally higher than the NAS estimate. It ap-
pears that consumption of these items is un-der-estimated by both the CSO and NSSO.Possibly, underestimation in the NAS owesto non-reporting of illegal production in theregistered manufacturing or failure of thesurveys to capture production in theunorganised segment of the economy.
The divergence between the two sets of es-timates, at a more disaggregated level, is dis-cussed in the following paragraphs. The at-tempt here is to identify the items within anitem-group that are mainly responsible forthe divergence between the two estimates forthe item-group. The NAS and NSS estimatesof quantity consumed are compared for theitems for which quantity estimates are avail-able from both the sources. For a valid com-parison between the estimates of consump-tion expenditure (henceforth called ‘valueestimates’) for the item-groups, the NASvalue estimates have been adjusted for pricesto eliminate the effect of differential implicitprices in the divergence between the two setsof estimates. For the items for which quan-tity and value estimates are available fromboth the sources, the adjusted NAS valueestimates are arrived at by evaluating theNAS quantity estimates at NSS implicitprices. For the other items, the adjusted NASestimates are taken same as the unadjustedvalue. The item-groups ‘salt’, ‘spices’ and‘pan’, for which the NAS estimates are basedon the NSS estimates, and those like ‘bever-ages and intoxicants’ and ‘processed / otherfood’ for which the estimates differ little areexcluded from the following discussion.
Food grains
The NSS estimate of expenditure on foodgrains consumption has always been higherthan that of the NAS. The difference betweenthe two estimates, it is seen from Table 5,varied from 10 per cent to 29 per cent for
9

SARVEKSHANA
Note: (i) Sources: Same as those for Table 1. (ii) * The estimates for the years 1957-58 and 1960-61 include “cereal substitutes”.
1957-58* 3974 3436 15.66 538 -2941960-61* 4411 3942 11.90 469 -4761972-73 13418 10362 29.49 3056 12061977-78 19302 17560 9.92 1742 -16571993-94 85943 90467 - 5.00 - 4524 - 91177
Table 5: Difference Between the NSS and NAS Estimates (in Rs. crore) of Consumptionof Food grains in Different Years
Year NSS NAS % Difference Difference for Difference forthe group “all food”
the years 1957-58, 1960-61, 1972-73 and1977-78. What is important to note is thatunlike the estimates for earlier years pre-sented in the table, the NAS estimate for1993-94 exceeds the corresponding NSS es-timate. Moreover, the growth rate implicitin the NAS estimates is higher than that inthe NSS estimates.
Since the sub-groups ‘cereals & cereal prod-ucts’ and ‘pulses & pulses products’ havemajor shares in total consumption expendi-ture on food, it is necessary to undertake adisaggregated-level comparison of NAS andNSS estimates of cereals and pulses con-sumption. The following paragraphs containa detailed comparison of the quantity andvalue estimates of consumption of individualconstituents of food grains in 1993-94. Be-sides the cereals and pulses, food grains com-prise cereals and pulses products and wholegrams. Breads produced in bakeries, beingprincipally a wheat product, are also includedin this group of food items.
Cereals and cereal products
Table 6 gives a comparison of the NSS andNAS estimates of consumption of cerealsand its products for 1993-94. It also providescomparable estimates for the item ‘gram
(whole grain)’ and ‘bread’. Both the NASand NSS value estimates for the items in therice and wheat groups represent the expen-diture actually incurred on the items. Thequantity available from the Public Distribu-tion System (PDS) is evaluated at the ad-ministered price in the NAS, while the costactually paid by the households for the quan-tity obtained from the PDS are recorded inthe HCES. Thus, the implicit prices that canbe worked out from the NAS and NSS esti-mates of value and quantity given in the tablerepresent the (weighted) average of the open-market and administered prices. The implicitprices derived from the NAS estimates forall the cereal-group (a type of cereal and itsproducts) of this group, except rice, are foundto be higher than the respective implicitprices derived from the NSS estimates. (Acomparison of implicit prices derived fromthe NAS and NSS estimates is given in Ap-pendix I for different items). The adjustedNAS value estimates too are given in thetable alongside the unadjusted NAS esti-mates of value.
The estimates of quantity of wheat productare not worked out separately in the NAS.To segregate the NAS estimate of quantityof wheat products, the estimates of suji andmaida have been taken directly from the ASI.
10

SARVEKSHANA
Rice: total 68840 43670 67873 41066 2605 43031 639Cheera / poha 542 419 1310* 1900 -1481 1900 -1481Khoi-Lawa 80 51 426* 572 -521 572 -521Muri 1100 1087 1479* 1705 -619 1705 -619Other Rice Products 593 357 — — 357 0 357
Rice products: total 2315 1914 3115* 4177 -2263 4177 -2263Rice & Rice products 71104 45584 71088* 45243 341 47209 -1625Wheat 1917 811 374 170 641 158 653Atta 45259 19397 42112 18522 876 18066 1331Maida 246 149 3412@ 1854 -1705 1854 -1705Suji,Rawa 577 402 624@ 339 64 339 64Sewai, Noodles 29 58 — — 58 — 58Other Wheat Products 108 51 — — 51 — 51Wheat & its products 48056 20867 46522 20885 -18 20417 450Jowar & its products 7814 2417 11369 4247 -1830 3513 -1096Bajra & its products 4198 1514 4778 1745 -231 1725 -211Maize & its products 3114 1012 9073 3588 -2576 2949 -1937Barley & its products 80 35 1213 693 -658 363 -328Small Millets &its products 159 67 868 249 -182 218 -151Ragi & its products 2171 692 2507 860 -168 800 -108
Other cereals — — — 32 -32 32 -32Change in Stock — — — 113 -113 113 -113Total Cereals 136748 72188 147418 77655 -5467 77338 -5150Bread(Bakery) — 560 — 554 5 554 5Gram (Whole Grain) 354 530 206 265 265 308 222
Table 6: Itemwise comparison between NAS and NSS estimates of quantity (000 tonnes)and value (Rs. crore) of consumption of ‘Cereals and Cereal Products’ for1993-94
NSS NAS Difference NAS AdjustedItem Quantity Value Quantity Value (NSS - adjusted by difference
NAS) NSS price
Note: 1. * The NAS quantity figures quoted for rice products (marked with asteriks) are in terms of quantity of rice used forproduction of the rice product.
2. @ The NAS quantity estimates of output for Suji and Maida are taken directly from the ASI, for the study. Thequantity and value of atta, given above, is derived from the estimates of NAS and the ASI results for suji and maida.
The estimate of quantity of atta has beenobtained by deducting the ASI quantity esti-mates of suji and maida from the NAS esti-mate of total quantity of wheat products.
The following observations emerge from theestimates presented in Table 6 :
i. The unadjusted NAS estimate of total
11

SARVEKSHANA
cereals consumption is higher than theNSS estimate by Rs.5467 crore, whichreduces by about three hundred croresonce the NAS quantity estimates areevaluated at NSS implicit prices. Theunadjusted NSS and NAS estimates forthe major cereal items like rice, wheatand atta compare closely both in termsof quantity and value. The NSS esti-mates for these items are higher thanthe corresponding estimates of NAS.
ii. The NSS estimate of quantity of riceconsumption is higher than the NASestimate, in spite of the fact that noprovision for intermediate consump-tion of rice or its products in hotels andrestaurants or other industries has beenmade while working out the NAS es-timate. The difference between thevalue estimates reduces substantiallyby adjusting the NAS estimates forprices.
iii. Unlike the estimate for rice consump-tion, the NAS estimates for the con-sumption of rice products are higherthan the corresponding NSS estimates,with the only exception of ‘other riceproducts’. In fact, the method adoptedfor the NAS estimates has no provi-sion of estimating ‘other rice prod-ucts’. As a result, the NAS estimate forrice, obtained by commodity flow ap-proach, should be on the higher sideas the rice consumed in the process ofproduction of ‘other rice products’would not have been deducted from theoutput of rice. On the other hand, NASestimate of rice products would obvi-ously be on the lower side owing toexclusion of ‘other rice products’ fromthe NAS estimate. Moreover, the NAS
value estimate for the sub-group ‘riceand rice product’ as a whole wouldhave been underestimated as the priceof rice is expected to be lower than itsproducts. However, the magnitude ofunderestimation owing to this reasonis not expected to be very significant.
iv. For the items of the wheat group,though the NAS estimates of value andquantity are lower than the NSS esti-mates in most cases. Only for maida,the NAS estimate is much higher thanthe NSS estimate. This item alone isresponsible for the NAS estimates be-ing higher than the NSS estimates forthe sub-group ‘wheat and its product’.It may be noted that the implicit priceof atta in the NAS is higher than thatof the NSS estimate, since a simpleaverage price of atta, suji and maidawas taken to represent the price of allwheat products while working out theNAS estimate. Since the prices of sujiand maida are higher than that of attaand since the share of atta in the wheatproducts is much higher than the othertwo taken together, the composite priceof wheat products thus arrived atshould certainly be higher than theprice of atta.
v. The NSS and NAS estimates also dif-fer appreciably for the minor cerealsand their products and in most of thesecases the NAS estimates are found tobe higher than the NSS estimates. Asubstantial part of the difference be-tween the two sets of value estimatesfor these items may be attributed to thedifferential implicit prices. Adjustmentfor prices brings about a considerablereduction in the discrepancy betweenthe estimates of value.
12

SARVEKSHANA
Arhar 2860 4783 2159 2626 2157 3606 1177Gram split 679 1070 1171 1752 -682 1803 -733Moong 1170 1839 853 1324 515 1329 511Masur 1243 1648 532 669 979 695 953Urd 1084 1433 1023 1339 94 1334 99Other Pulses 752 920 1547 1540 -620 1894 -973Pulses: total 7788 11694 7285 9250 2444 10660 1033Besan 383 632 619 985 -353 1021 -389Other Pulses Products — — 1105 1749 -1409 1749 -1409Pulses & Products: total — 12665 — 11993 672 13430 -764
Table 7: Itemwise comparison between NAS and NSS estimates of quantity (000 tonnes)and value (Rs. crore) of consumption of ‘Pulses and Pulses Products’ for1993-94
NSS NAS Difference NAS AdjustedItem Quantity Value Quantity Value (NSS - adjusted by difference
NAS) NSS price
The NSS estimate for ‘other pulses’ includes Khesari , Peas and Soyabeans. Both the NAS and NSS estimates for ‘Other pulsesproducts’ include gram products.
Pulses and Pulses Products
Table 7 gives a comparison of the NSS andNAS estimates of consumption of pulses andits products for 1993-94. This is the onlymajor item-group of food consumption forwhich the NSS estimates are found to behigher than the NAS estimates. In fact, it isseen that except for the items like ‘otherpulses products’, ‘other pulses’ and ‘splitgram’, the NSS estimates are higher than theNAS estimates.
Much of the difference between the two setsof estimates owes to higher implicit price in
NSS estimates. Adjustment for prices of theNAS estimates of value substantially reducesthe gap between the estimates for ‘pulses:total’. In fact, the adjusted NAS estimatefor ‘pulses and pulses products’ exceeds theNSS estimate.
There is another reason for which the NASvalue estimates for pulses are affected by adownward bias. The mark-ups applied on exfarm prices of grains retained by the pro-ducers, particularly for arhar, moong, uradand masur, to arrive at the value of dal ap-pear to be low. So much so, that the derivedvalues of dals obtained from the retained
grains are found to be less than the respec-tive values of the grains themselves, if evalu-ated at ex farm prices. On the other hand,both the NAS quantity and value estimates
without doubt suffer from an upward bias,as the present method makes no provisionfor intermediate consumption of the dals inhotels and restaurants or in other industries.
13

SARVEKSHANA
Sugar and Gur
This item-group has always been a majorcontributor towards the difference betweenthe two sets of estimates of consumption ex-penditure on food. For 1993-94, the NSSestimate of consumption of sugar and gur isonly about a half of that of the NAS esti-mate. The difference was as much more pro-nounced in the earlier years for which theestimates are given in Table 8. Further, theestimates for 1972-73 and 1977-78 indicate,that the divergence between the two sets ofestimates has been more pronounced for gurthan for sugar. Yet, for 1993-94, the gap be-tween the estimates of gur consumption ismuch higher as compared to earlier years.
The NSS and NAS estimates of differentcomparable components of this group for
1993-94 are given in Table 9. The NSS esti-mate of ‘Sugar & khandsari’ includes sugarcandy (Misri) and other sugars, which arenot covered specifically in the NAS. Thecontribution of sugar candy (Misri) and othersugars in the difference between the valueestimates for the item-group is, however,virtually negligible. In spite of the largercoverage and the higher implicit price, theNSS estimate for ‘Sugar & khandsari’ is sub-stantially lower than the NAS estimate, bothin terms of value and quantity. The gap be-tween the value estimates of ‘Sugar &khandsari’ consumption, therefore, widenswhen the NAS estimate of production isevaluated at NSS implicit prices. However,for the item-group as a whole, adjustmentfor price reduces the gap, though only mar-ginally.
Year Item NSS NAS % Difference DifferenceDifference for the group for “all food”
1957-58 Sugar & gur: total 222 378 -41.27 -156 -2941960-61 Sugar & gur: total 325 524 -37.98 -199 -476
1972-73 Sugar 705 943 - 25.24 - 238 —gur 529 1316 - 59.80 - 787 —Sugar & gur: total 1234 2259 -45.37 -1025 1206
1977-78 Sugar 935 1066 -12.29 - 131 —Gur 593 1411 - 57.97 - 818 —Sugar & gur: total 1528 2477 -38.31 - 949 -1657
1993-94 Sugar 8545 11282 - 32.03 - 2737 —Gur 1411 7995 - 82.35 - 6584 —Sugar & gur: total 9956 19881 - 49.92 - 9925 - 91177
Table 8: Difference Between the NSS and NAS Estimates of Consumption of “Sugar,Gur etc.” in Different Years ( Rs. Crore)
Source: Same as those for Table 5.Note: The NAS estimate for 1993-94 excludes sugarcane, but includes changes in stock.
14

SARVEKSHANA
The major factor responsible for the inter-agency difference in the estimate for thegroup as a whole, as it appears from thepresent as well as the earlier studies, is thedivergence between the estimates of gur con-sumption. In 1972-73 and 1977-78 the NASestimate for gur consumption was about 2.5times of NSS estimate. By 1993-94, the dif-ference between the two estimates is foundto have widened further - the NAS estimateis more than five times of the NSS estimate.The NAS estimates for this group are pre-pared separately for gur , refined sugar andpalm gur. From the production estimates ofsugarcane, available from the DESAg, theestimated amount (i) retained as seed, (ii)used for chewing, (iii) used in production ofBurra and Khandsari and (iv) going as in-put to sugar factories are deducted to arriveat an estimate of sugarcane available for gurmaking. The estimates of quantity used forchewing and that used for Burra andKhandsari are obtained by applying certainnorms, which vary from State to State. Thequantity of sugarcane consumed by the sugarfactories and production of sugar are avail-able from the Directorate of Vanaspati andSugar, M/o Agriculture. The conversion rateof sugarcane to sugar implicit in the figures
available from the Directorate works out toabout 10.3 per cent, which is fairly consis-tent with the conversion rate of 11 per centimplicit in the estimates available from theASI (CSO, 1998).
On the derived estimates of sugarcane avail-able for gur making in different States, vary-ing State-specific conversion rates are ap-plied to arrive at an estimate of gur produc-tion. Though the conversion rates, varyingfrom 9 to 11 per cent over the States, used atpresent are based on old DMI Report of1961, they cannot be said to be unreason-ably high, considering that a sugarcane-to-sugar conversion rate of about 11 per cent isalso implicit in the ASI estimates. As it ap-pears, the production estimates of gur andsugar used in the NAS are quite consistentwith the estimate of sugarcane productionand the concerned technological ratios. Theonly possible reasons for high differencebetween NAS and NSS estimates of sugarand gur consumption can therefore be (i) lowratio (5%) of intermediate consumption ofgur and sugar used for deriving the NAS es-timates, (ii) under-reporting of consumptionof sugar and gur in the HCES and(iii) overestimation of sugarcane production.
Sugar & khandsari 7525 8501 10293 11282 -2780 11629 -3127Gur: Cane 1339 1293 8567 7867 -6574 8273 -6980Gur Others 108 119 — 128 -9 128 -9Sugar Candy(Misri) — 11 — — 11 — 11Sugar (Others) — 33 — — 33 — 33Change in stock — — 604 604 — — 604Sugar & Gur: Total — 9956 — 19881 -9924 19748 -9792
Table 9: Itemwise comparison between NAS and NSS estimates of quantity and value(Rs. crore) of consumption of ‘Sugar, Gur etc.’ for 1993-94
NSS NAS Difference NAS AdjustedItem Quantity Value Quantity Value (NSS - adjusted by difference
(000 ton) (000 ton) NAS) NSS price
15

SARVEKSHANA
1957-58 543 1123 -51.65 -580 -2941960-61 978 1247 -21.57 -269 -4761972-73 2606 2765 -5.75 -159 12061977-78 4749 5227 -9.14 -478 -16571993-94 33737 46594 -27.59 -12857 -91177
Table 10:Difference Between the NSS and NAS Estimates of Consumption of “Milk& Milk Products” in Different Years (Rs. crore)
Sources : Same as those for Table 1.
Year NSS NAS % Difference DifferenceDifference for the group for “all food”
The last two reasons appear to be less likely.It is hard to find a definite reason for under-reporting of sugar or gur consumption in theHCES. Likewise, the regular crop reportingsystem, which covers sugarcane as a princi-pal crop, is not expected to produce overes-timates of sugarcane production consistentlyover the years. Thus, it appears that taking 5
per cent of gur and sugar production as in-termediate consumption is unrealistic.
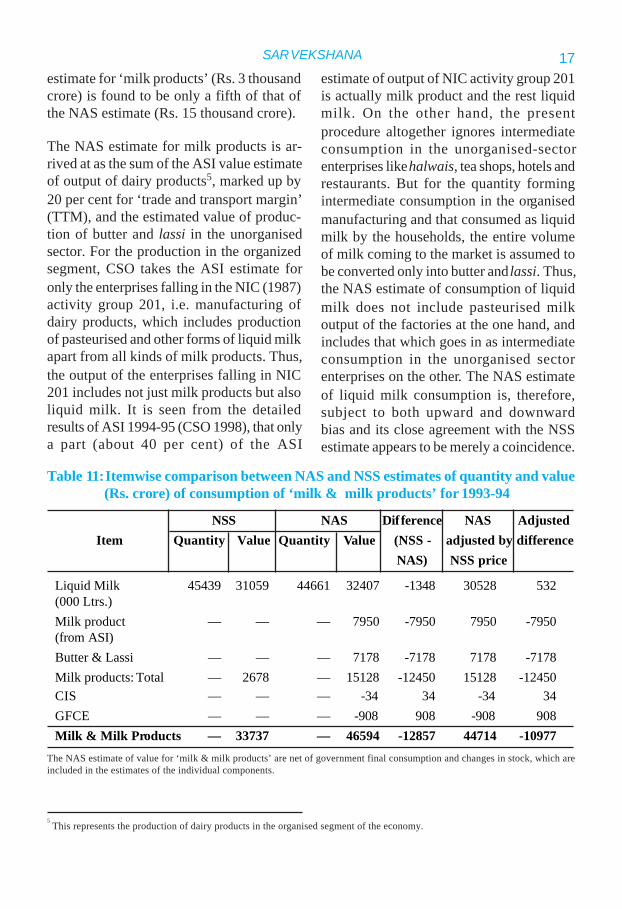
Milk and Milk products
This item-group is only next to ‘fruits andvegetable’ group in its contribution towardsthe discrepancy between the estimates offood consumption. It is seen from Table 10
that the NAS estimate is higher by aboutRs. 12 thousand crore than the NSS estimate– a difference of about 28 per cent. Thedifference between the estimates for thisitem-group was much smaller (6% and9% respectively) in both 1972-73 and1977-78, though it was high in the earlieryears.
Table 11 gives the comparable item-wise es-timates for 1993-94, as available from thetwo sources. The NAS and NSS estimatesof consumption of liquid milk, both in termsof quantity and value, compare closely witheach other. However, while the NSS estimateof quantity is higher by about 2 per cent, thatfor value is less by about 5 per cent than therespective NAS estimates. The implicit priceof liquid milk worked out from the NAS es-timates (Rs. 7.26 per lt.) is higher than thatfrom the NSS estimates (Rs. 6.84 per lt.).For evaluating the quantity of liquid milk
consumed by the households, the NAS hadused an ex farm price of Rs. 7.17 and a retailprice of Rs. 8.30 per litre, both of which arehigher than the implicit price derived fromthe NSS estimates. Thus, after adjustmentfor prices, the NSS estimate turns out to behigher than NAS estimate. It may be notedhere that, unlike the years for which the ear-lier comparative studies were conducted, theNSS and NAS estimates of consumption ofmilk, both in liquid form and otherwise, arein principle comparable for 1993-94, so faras the method of data collection in the HCESand that of compilation of NAS are con-cerned.
Estimation of value of consumption of milkproducts poses a more serious problem. Infact, this sub-group alone contributes Rs. 12thousand crore in an overall discrepancy ofRs. 91 thousand crore between the estimatesfor the ‘food’ group as a whole. The NSS
16
SARVEKSHANA
5 This represents the production of dairy products in the organised segment of the economy.
estimate for ‘milk products’ (Rs. 3 thousandcrore) is found to be only a fifth of that ofthe NAS estimate (Rs. 15 thousand crore).
The NAS estimate for milk products is ar-rived at as the sum of the ASI value estimateof output of dairy products5, marked up by20 per cent for ‘trade and transport margin’(TTM), and the estimated value of produc-tion of butter and lassi in the unorganisedsector. For the production in the organizedsegment, CSO takes the ASI estimate foronly the enterprises falling in the NIC (1987)activity group 201, i.e. manufacturing ofdairy products, which includes productionof pasteurised and other forms of liquid milkapart from all kinds of milk products. Thus,the output of the enterprises falling in NIC201 includes not just milk products but alsoliquid milk. It is seen from the detailedresults of ASI 1994-95 (CSO 1998), that onlya part (about 40 per cent) of the ASI
estimate of output of NIC activity group 201is actually milk product and the rest liquidmilk. On the other hand, the presentprocedure altogether ignores intermediateconsumption in the unorganised-sectorenterprises like halwais, tea shops, hotels andrestaurants. But for the quantity formingintermediate consumption in the organisedmanufacturing and that consumed as liquidmilk by the households, the entire volumeof milk coming to the market is assumed tobe converted only into butter and lassi. Thus,the NAS estimate of consumption of liquidmilk does not include pasteurised milkoutput of the factories at the one hand, andincludes that which goes in as intermediateconsumption in the unorganised sectorenterprises on the other. The NAS estimateof liquid milk consumption is, therefore,subject to both upward and downwardbias and its close agreement with the NSSestimate appears to be merely a coincidence.
Liquid Milk 45439 31059 44661 32407 -1348 30528 532(000 Ltrs.)Milk product — — — 7950 -7950 7950 -7950(from ASI)Butter & Lassi — — — 7178 -7178 7178 -7178Milk products: Total — 2678 — 15128 -12450 15128 -12450CIS — — — -34 34 -34 34GFCE — — — -908 908 -908 908Milk & Milk Products — 33737 — 46594 -12857 44714 -10977
Table 11:Itemwise comparison between NAS and NSS estimates of quantity and value(Rs. crore) of consumption of ‘milk & milk products’ for 1993-94
The NAS estimate of value for ‘milk & milk products’ are net of government final consumption and changes in stock, which areincluded in the estimates of the individual components.
NSS NAS Difference NAS AdjustedItem Quantity Value Quantity Value (NSS - adjusted by difference
NAS) NSS price
17

SARVEKSHANA
What appears likely from the above discus-sion is that the consumption of milk prod-ucts is overestimated by the CSO. A part ofthe volume of milk assumed to be used forbutter and lassi production may in fact beused as intermediate consumption in enter-prises producing other commodities likesweetmeat, tea and coffee, hotel and restau-rant services, consumption of which are es-timated separately in the NAS. In addition,the entire output of ASI (NIC 201) is not milkproduct – a large part of it is in factpasteurised milk or other forms of processedmilk.
Edible oil and Oilseeds
The NSS estimate of consumption expendi-ture of ‘edible oils and oilseeds’ for 1993-94 is lower than the NAS estimate by 32 percent. For 1977-78 too, the NSS estimate islower than the NAS estimates by almost asimilar margin of 27 per cent, and its sharein the overall divergence between the esti-mates of food consumption is found to besubstantial. But, in the years prior to that,as seen from Table 12, the gap between thetwo estimates was much narrower - of theorder of about 10 per cent.
1957-58 274 322 -14.91 -48 -2941960-61 364 406 -10.34 -42 -4761972-73 1286 1465 -12.22 -179 12061977-78 2243 3077 -27.10 -834 -16571993-94 15674 23204 - 32.45 - 7530 - 91177
Table 12:Difference Between the NSS and NAS Estimates of Consumption of EdibleOil and oilseeds in different years (Rs. crore)
Year NSS NAS % Difference DifferenceDifference for the group for “all food”
For the present study, the estimates of ed-ible oils for 1993-94 available from the twosources have been re-grouped to make theestimates comparable. For this purpose, theoils used less commonly have been clubbedtogether in the ‘others’ category for the NSSestimates. The comparable estimates thusarrived at from the two sources are presentedin Table 13. The estimates of oilseeds con-sumption are also given in the table. For the two most commonly used edibleoils, mustard oil and groundnut oil, the esti-mates from the two sources are fairly closeto each other. The major part of the big dif-ference between the estimates for the groupas a whole is caused by vanaspati and oil-seeds. In the earlier study (Minhas et. al.,1986) too it was found that the estimates for
the edible oils other than vanaspati differedlittle in the year 1972-73, though for the year1977-78 the difference was substantial.
For the NAS estimates, the CSO uses theestimates of oilseeds production availablefrom the DESAg and those of edible oils pro-duction from Ministry of Food and CivilSupplies. These estimates of edible oils arein fact derived on the basis of certain assump-tions on utilisation of oilseeds for differentpurposes like seed, feed, waste etc. and oilextraction rates.
For deriving the NAS estimates, varying ra-tios of intermediate consumption are usedfor the edible oils, but for vanaspati no ad-justment is made for its use in other indus-tries. This appears to be an important rea-
18

SARVEKSHANA
The difference in the estimates of consump-tion is most pronounced for the oilseeds. TheNSS estimate is found to be less than 1 percent of that of the NAS. It may be notedthat groundnuts used as such are not includedhere. Notwithstanding the possibility ofunderreporting in the NSS, the NAS estimatefor oilseeds appears to be on the higher side,particularly because the latter is based on theassumption that the entire amount of oilseedsretained by the producers is consumed asoilseeds.
Meat, fish and eggs
This is another item-group of food items forwhich the estimates for 1993-94 from thetwo sources vary widely. The value estimatesfor this item-group differ by about Rs. 10thousand crores, the NSS estimate beinglower than the NAS estimate by as much as45 per cent. The difference between the es-timates for this item-group has never beenas high in the earlier years. Of the earlieryears for which the comparable estimates aregiven
Vanaspati 411 1533 919 3526 -1994 3322 -1790Mustard Oil 1785 5558 1584 5249 308 4882 676Groundnut Oil 1645 6125 1445 5420 705 5303 822Coconut Oil 108 462 347 1948 -1486 1275 -812Gingili (Til) Oil 108 363 101 482 -119 326 36Linseed Oil: total 80 173 22 98 75 45 127Edible Oil (Others) 411 1429 497 2091 -662 1339 90Edible Oils: Total — 15642 — 18814 -3173 16493 -851Oilseeds — 33 — 3508 -3475 3508 -3475Edible oil and oilseeds — 15674 — 23204 -7530 20001 -4327
Table 13:Itemwise comparison between NAS and NSS estimates of quantity (000 tonnes)and value (Rs. Crore) of consumption of ‘Edible Oils and Oilseeds’ for1993-94
Note: 1. The NSS estimate for the group ‘other edible oils’ includes those for Margarine, ‘Refined oil’, Palm oil and RapeseedOil.
2. NAS estimate for the entire group “Edible oils and oilseeds” include imports and change in stock which are not shownseparately in the table.
NSS NAS Difference NAS AdjustedItem Quantity Value Quantity Value (NSS - adjusted by difference
NAS) NSS price
son for the difference between the estimatesof vanaspati consumption, since it is usedextensively in commercial establishmentslike halwais , hotels and restaurants. As forthe edible oils other than vanaspati, thoughthe estimates for the entire sub-group com-pare closely, the estimates for individual oilsare found to differ substantially in somecases. The difference is most pronounced
for coconut oil. The estimates of both quan-tity and value differ widely. In particular, theNSS estimate of value is only a fourth ofthat of the NAS estimate. This is mainlydue to the varying prices implicit in the twosets of estimates. The gap between the twoestimates of ‘edible oils: total’ reduces sub-stantially by adjusting the NAS estimates forprices.
19

SARVEKSHANA
in Table 14, the estimates differ by more than10 per cent only for the year 1960-61. In fact,the difference observed for 1993-94 is insharp contrast to the findings of the earlierstudy (Minhas et. al. , 1986) for the years1972-73 and 1977-78, for which thedifference between the two estimates werefound to be of order of 3 and 1 per centrespectively.
Table 15 gives the comparable NSS and NASestimates of consumption of individual itemsof the item-group for 1993-94. For the meatsub-group, the table shows, the estimatesfrom the two sources are fairly close to eachother. The NAS estimate exceeds the NSSestimates by only about four hundred crore,even as the NSS estimate is higher than theNAS estimate for ‘goat meat and mutton’.The quantity estimates and the implicit pricesof goat meat and mutton indicate presenceof classification error - the NSS estimatesare more likely to be affected in this case.Taking the two together, it is seen that theNSS estimates both in terms of value andquantity are higher than the NAS estimates,though the combined implicit price is higherin the NAS. Thus, the gap between the twovalue estimates widens when the NAS valueestimate is adjusted for prices.
The problem evidently is in the rest of the
items of this item-group. The NSS estimatefor ‘chicken’ is only about a fourth of that ofthe NAS estimate, that for eggs & egg prod-ucts is only about half and for fish about 60per cent. The NSS estimates of egg consump-tion were also found to be lower than theNAS estimates by similar proportions for1972-73 and 1977-78. For ‘fish’, however,the estimates were much closer in 1972-73and 1973-74.
The sub-group ‘other meat products’ com-prises glands, other poultry killed and othermeat product in the NAS. In the NSS sur-vey no data is collected separately for theseitems. The expenditure on these items isembodied in the expenditure on meat. Inthe NAS, this sub-group contributes aboutRs.1422 crore and is a major factor for thediscrepancy between the two sets of esti-mates.
The other reason for the discrepancy maybe that the intermediate consumption formost of the items of this group is taken asnil in the NAS. This appears to be the mainreason for the wide divergence between thetwo sets of estimates, particularly for eggsand chicken since a large volume of these isactually used as input in the food process-ing industries, hotels and restaurants.
Table 14:Difference Between the NSS and NAS Estimates of Consumption of “Meat,Fish and Egg” in Different Years (Rs. crore)
1957-58 280 311 -9.97 -31 -2941960-61 330 385 -14.29 -55 -4761972-73 891 915 -2.62 -24 12061977-78 1677 1690 -0.77 -13 -16571993-94 11923 21737 -45.15 -9814 - 91177
Sources: Same as those for Table 1.
Year NSS NAS % Difference DifferenceDifference for the group for “all food”
20

SARVEKSHANA
Fruits and Vegetables
In terms of magnitude, the divergence be-tween the NAS and NSS estimates of con-sumption expenditure is the widest for “fruitsand vegetables and their products” amongthe item-groups of food consumption. Of theinter-agency difference of about Rs. 91 thou-sand crore in the estimates of consumptionof all food items in 1993-94, about Rs. 39thousand crore owes to the difference be-tween the estimates for this item-group. Con-sistent with the observations made in the ear-lier studies (Minhas et. al., 1988; Srinivasanet. al. , 1974) on the estimates for 1957-58,1972-73 and 1977-78, the NSS estimate forthis sub-group is found to be considerablylower than the corresponding NAS estimatefor 1993-94. But, it can be seen from Table16 that the difference between the estimates
for this group has widened substantially, par-ticularly after 1977-78. The gap betweenthe estimates from the two sources was ofthe order of 40 per cent of the NAS estimatetill the 1970s. For 1993-94, the NSS esti-mate for this group is less than the NAS es-timate by about 58 per cent of the latter.
The different classification schemes used bythe two agencies render the NAS and NSSestimates of expenditure on fruits and veg-etables directly non-comparable. In order tomake them comparable, the item-wise esti-mates for 1993-94 available from both thesources have been suitably re-grouped. Theitems of fruits and vegetables for which sepa-rate estimates are available from the twoagencies have been reclassified into compa-rable groups. The redefined group consistsof “fruits & vegetables (including their prod
Table 15: Itemwise comparison between NAS and NSS estimates of quantity (000 tonnes)and value (Rs. crore) of consumption of ‘Meat, Egg And Fish’ item-group for1993-94
Goat Meat 657 3315 538 2932 383 2714 601Mutton 137 886 165 871 15 1067 -181Goat meat plus mutton 794 4201 703 3803 398 3781 420Beef 246 503 286 633 -130 585 -82Pork 80 208 150 546 -338 389 -182Buffalo Meat 246 302 331 643 -341 407 -104Other Meat — 51 — — 51 — 51Meat: total — 5265 — 5625 - 360 5162 103Other Meat (by product) — — — 1422 -1422 1422 -1422Chicken — 994 — 4133 -3139 4133 -3139Other Birds (No.) — 48 — 499 -450 499 -450Eggs & egg products — 1146 — 2487 -1341 2487 -1341Fish — 4437 — 7450 -3013 7450 -3013Meat Egg Fish : total — 11923 21737 -9814 21153 -9229
NSS NAS Difference NAS AdjustedItem Quantity Value Quantity Value (NSS - adjusted by difference
NAS) NSS price
21

SARVEKSHANA
1957-58 359 592 - 39.36 - 233 - 2941972-73 1835 3097 - 40.75 - 1262 12061977-78 3228 5517 - 41.49 - 2289 - 16571993-94 28851 68036 - 57.59 - 39185 - 91177
Table 16:Difference between the NSS and NAS Value Estimates of Consumption of‘fruits & vegetables’ in different years (Rs. crore)
i. The estimates for 1957-58 are quoted from Srinivasan et. al. (1974), who in turn have used the estimatescompiled by Kansal and Saluja (1961) for the NAS estimates.
ii. The estimates for 1972-73 and 1977-78 are quoted from Minhas et. al. (1988)
Year NSS NAS % Difference Difference Difference(NSS-NAS)/ (fruits & “ all food”
NAS vegetables)
Note: The category ‘other fruits and vegetables’, other than horticulture, classified in the NAS has been distributed to ‘othervegetables’ and ‘other fruits’ of the table in proportion to the value of their gross value of output. The NAS estimate for theitem-group “other fruits” includes that for the “horticulture crops not elsewhere covered”.
Potato 12983 4290 11840 4698 -408 3907 383Onion 5274 2588 3555 2132 456 1746 843sweet potato 188 48 — 487 -439 487 -439other vegetables — 13823 — 8044 5779 8044 5779Flowers — 286 — 1093 -807 1093 -807Kitchen garden — — — 1396 -1396 1396 -1396Total vegetables — 21035 — 17850 3185 16673 4362Banana — 1720 — 4067 -2347 4067 -2347Coconut (mill.) 3871 1523 8118 3299 -1776 3190 -1667Mango 823 692 3638 3115 -2423 3060 -2368Grapes 195 327 482 689 -362 809 -482Copra 108 296 — 660 -364 660 -364Groundnut 354 609 1892 3232 -2623 3256 -2647Cashew nut — 101 57 1343 -1242 1343 -1242Other fruits — 2191 — 31673 -29482 31673 -29482Total fruits (dry & fresh) — 7459 — 48078 -40619 48057 -40598Total fruits & vegetables — 28494 — 65928 - 37434 64731 - 36237Fruits & vegetable products — 357 — 2108 -1751 2108 -1751Fruits & vegetables — 28851 — 68037 - 39186 66839 - 37988and their products
Table 17:Itemwise comparison between NAS and NSS estimates of quantity (000 tonnes)and value (Rs. crore) of consumption of ‘fruits & vegetables and their products’for 1993-94
NSS NAS Difference NAS AdjustedItem Quantity Value Quantity Value (NSS - adjusted by difference
NAS) NSS price
22

SARVEKSHANA
ucts)” group, and the items potato, sweetpotato and sugarcane for chewing appear-ing in the classification scheme of the NAS.The NAS estimate for this group includesfruit products like pickles, sauce, jam andjelly. The estimates for these items are usu-ally put in the ‘miscellaneous food products’by the NSSO. The NSS estimates for theseitems have been added to its estimates offruits(fresh), fruits(dry), and vegetables toarrive at a comparable estimate. Further, theestimated consumption of green coconut,which is classified under ‘non-alcoholic bev-erages’ by the NSSO, has also been includedin the NSS estimate, as it is included in theNAS estimate of fruit consumption. It mayalso be noted that, to make the NSS estimatecomparable with the NAS estimate for the‘vegetable’ group, which includes consump-tion of floriculture produce, the NSS esti-mate for consumption of flowers has beenincluded in this group. The NAS estimatealso includes consumption of the produce ofthe kitchen gardens, since kitchen gardensare used mostly for growing of vegetables.Table 17 presents an item-by-item compari-son between the estimates of quantities andvalues of consumption, to the extent the clas-sification schemes adopted by the two agen-cies permit.
The item-specific estimates from the twosources reveal that the big difference be-tween the estimates for this group oweschiefly to the diverging estimates of fruitconsumption. For the ‘fruit’ sub-group, as awhole, the NSS estimate falls shorter thanthe NAS estimate by a long way. In sharpcontrast, for the ‘vegetable’ group, not onlyis the difference between the NSS and NASestimates smaller but also the former ishigher than the latter.
Item-wise comparison within the vegetable
group shows that the NSS estimate of quan-tity of potato consumed, though higher, com-pare closely with that of the NAS, even asthe implicit prices in the NAS estimates arehigher than that in NSS estimates by about20 per cent. In case of onion consumption,the NSS estimates of both quantity and valueare substantially higher than those of theNAS.
Clearly, the ‘fruits’ sub-group is principallyresponsible for the major part of the big in-ter-agency difference between the estimatesof quantity and value of consumption of‘fruits and vegetables and their products’.The relative standard errors (RSEs) for thissub-group, based on 28th Round data, werefound to be rather high by Minhas (1988),but the divergence between the estimatesfrom the two sources cannot be attributed tosampling error. The NSS estimates formango, banana and cashew nut are by farless than the NAS estimates. For the NASestimates, however, it is assumed that only30 per cent of the market supplies for mangoand none at all for the other two fruits areused in other industries as intermediate con-sumption.
For the NAS, the National HorticultureBoard (NHB) is the main source for the pro-duction and price data for the fruits not cov-ered in area and production statistics of theDESAg. The NHB compiles data on area,production and productivity through theState Horticulture Boards (SHB). It has,however, been noticed that there is a size-able divergence between the figures theSHBs supply to the DES and those to theNHB. The primary data on prices of thesefruits are collected by the NHB through 33Market Information Centres spread over thewholesale markets of the country. But theprice data the NBH thus collects relate to
23

SARVEKSHANA
1957-58 202 237 -14.77 -35 -2941972-73 612 1117 -45.21 -505 12061977-78 1000 1533 -34.77 -533 -16571993-94 5877 12309 -52.25 -6432 - 97254
Table 18:Difference Between the NSS and NAS Estimates of Consumption of Tobaccoin Different Years (Rs. Crore)
Year NSS NAS % Difference DifferenceDifference for the group for “all food”
wholesale prices rather than the prices rep-resenting the first point of sale. However, itis seen from the table in Appendix I that theimplicit prices worked out from the NSS andNAS estimates of value and quantity do notvary significantly for mango.
The NAS estimates of ‘fruits’ consumptioncertainly deserves a closer scrutiny, particu-larly because it appears to be rather high ascompared to estimates of cereals and pulsesconsumption, or, for that matter, those ofvegetables and ‘meat, fish and eggs’ group.While the cereal and pulses consumption isestimated to be Rs. 78 thousand crore andRs. 12 thousand crore respectively in theNAS, that for ‘fruits’ alone is Rs. 48 thou-sand crore. Moreover, the estimated con-sumption of fruits alone is found to exceedthe consumption of vegetables and ‘meat,fish and eggs’ taken together.On the other hand, apart from that the after-purchase wastages are not recorded in theHCES, there is a possibility that the report-ing of fruits suffers severely from recall lapsein the HCES. Fruits consumed outside home,whether purchased or collected free, are mostlikely not captured in the HCES. As evi-dence one can take the example of banana,for which the production estimate used forderiving the NAS estimate is based on thedata available from regular crop reporting
scheme and thus is expected to be fairly re-liable. But even for this fruit crop, the NSSconsumption estimate is less than half of theNAS estimate. Apprehending the possibil-ity of non-reporting of fruits consumption,a set of probing question: ‘whether some spe-cific fruits were consumed by any memberof household’ was introduced in the sched-ule of enquiry of the HCES, 43rd round. Thiswas included in the HCES of the 50th roundas well. There was, however, hardly anyimprovement in the NSS estimate of fruitsconsumption owing to introduction of thesequestions. Thus, on the one hand the NASestimate of fruits consumption appears to beon the higher side, while on the other theNSS estimate seems to suffer from under-estimation.
Tobacco
This is another item-group for which theNAS consumption estimates has alwaysbeen substantially higher than the NSS esti-mates (Table 18). In fact, for 1993-94, theNSS estimate is only about a half of the NSSestimate for this item-group. The compara-tive study taken up earlier for the years 1972-73 and 1977-78 had also produced a similarobservation. Table 18, however, reveals thatthe gap between the estimates for the year1957-58 is a good deal narrower.
24

SARVEKSHANA
Bidi 3750 6195Cigarettes 1062 5350Leaf Tobacco 508 1449Snuff 33 456Cheroot 140 139Other Tobacco Products 385 572(incld. that for hookah and zarda)Change in stocks — - 1852Tobacco : total 5877 12309
Table 19:Itemwise comparison between NAS and NSS estimates of value of tobaccoconsumption (Rs. crore)
Item NSS NAS
Table 19 gives the item-wise estimates of to-bacco consumption from the two sources forthe year 1993-94. Clearly, ‘bidi’ and ‘ciga-rettes’ have major shares in the divergencebetween the estimates for this item-group.Of the total difference of about Rs. 6.5 croreowing to this sub-group, ‘bidi’ and ‘ciga-rettes’ together account for Rs. 5.5 crore.Needless to say, the NSS estimates are likely
to be on the lower side, as the data collectedthrough interviews are expected to be ad-versely affected by under-reporting result-ing from the inhibitions against consump-tion of tobacco. Moreover, in the HCES, in-formation is usually collected from a mem-ber of the household, who is often unawareof tobacco consumption habits of the othermembers of the household.
Hotels and Restaurants
Till the 1970-71 series of the NAS, the item-group was classified in the category of ser-vices. Since the 1980-81 series this is takenas a part of the food consumption, as the re-ceipts from sale of food constitutes a majorshare of the total receipts by the hotel andrestaurant industry.
The NAS estimate for hotel and restaurantis obtained from the estimate of gross valueadded (GVA), which is based on the resultsof Enterprise Survey on hotel and restau-rants. For estimating private consumption forthis item, first, an estimate of output of ho-tel and restaurants is derived from the esti-mate of GVA. Out of the estimate of outputthus arrived at, 33 per cent is assumed toform part of private consumption. Thus, the
NAS estimate obviously includes the accom-modation charges in addition to the value offood served by the hotels and restaurants.Moreover, hotels and restaurants not onlyserve meals to the consumers but also a va-riety other food items like tea, snacks andbeverages. The NSSO, on the other hand,does not provide any estimate of consump-tion for this item-group as such. Instead itprovides separate estimates of value of“cooked meals”, snacks, beverages and“other processed food” purchased by thehouseholds. But, the entire value of thesnacks, beverages and “other processedfood” consumed by the households cannotbe attributed to the restaurants. Thus thecomparison here is restricted to the NAS es-timate for ‘hotels and restaurants’ and theNSS estimate of purchased ‘cooked meals’,
25

SARVEKSHANA
1972-73 839 444 88.96 395 12061977-78 1125 757 48.61 368 - 16571993-94 3765 6142 -38.70 -2377 - 91177
Table 20: Difference Between the NSS estimate for purchased ‘cooked meals’ and NASestimates for Hotel and Restaurant in Different Years (Rs. Crore)
Year NSS NAS % Difference DifferenceDifference for the group for “all food”
bearing in mind that comparability of thesetwo estimates is severely constrained by thedifference in coverage. These estimates fordifferent years are placed alongside in Table20 to illustrate how the two estimates differfrom each other.
It is seen that NSS estimate for this groupwas higher than the NAS estimate in both1972-73 and 1977-78. But, for 1993-94 it isto the contrary. It is true that, owing to thelarger coverage, the NAS estimate is ex-pected to be higher. But difference of theorder of 39 per cent cannot be explained bythe receipts from accommodation charges.The results of the Enterprise Survey on ho-tel and restaurants, 1993-94, published bythe CSO (1999) reveal that only about 9 percent of the total receipts of hotels and res-taurants were for accommodation chargesand the rest largely for food served. How-ever, the food served includes snacks andbeverages that are not counted as “cookedmeals” in the HCES. Thus, it is difficult tointerpret the difference between the two es-timates.
According to the general instructions for theHCES, all expenses incurred by the house-holds are required to be recorded against oneor the other item of the schedule of enquiry.Thus, it appears that the expenditure incurredby the households on accommodation inhotels and snacks and beverages served in
restaurants as well as hotels are supposed tobe captured respectively under the heads of‘other consumer services’ and ‘other pro-cessed food’. The ‘Instructions for FieldStaff’ for the HCES of the 50th Round, how-ever, do not contain any specific instructionsabout recording charges paid for accommo-dation in hotels.
4. Comparison of Estimates ofNon-Food Consumption for1993-94
Private final consumption expenditure otherthan that on ‘food, pan, tobacco and intoxi-cants’ constitutes consumption on fuel,‘clothing and footwear’, ‘other manufac-tured goods’ and services. This is referredto as ‘non-food consumption’ through outthe present study. Services and manufacturedgoods, in national accounting, are furtherclassified according to their nature and use.In the HCES, household non-food consumergoods and services, other than fuel and‘clothing and footwear’ are, by convention,classified into ‘durable goods’ and ‘miscel-laneous goods and services’. Using the de-tailed and disaggregated item-level NAS andNSS estimates for 1993-94, the individualitems have been appropriately regrouped intocomparable item-groups. The NSS estimatesused for this purpose are based on the datacollected in the HCES with 30 days refer-ence period.Table 21 presents the item-group
26

SARVEKSHANA
1. Clothing & footwear 21382 34999 -13617 -38.912. Gross (house) rent & water charges 8179 46854 -38675 -82.543. Fuel & power 24527 21385 3142 14.694. Furniture, furnishings, appliances
& services 6007 17610 -11603 -65.895. Medical care & health services 18221 19543 -1322 -6.766. Transport equipment & operational cost 7178 24592 -17414 -70.317. Transport services 8450 36143 -27693 -76.628. Communication 1048 4258 -3210 -75.399. Recreation, Education &
Cultural services 11811 17626 -5815 -32.9910.Misc. goods & services 24901 36519 -11618 -31.81
Total non-food 131704 259529 -127825 -49.25Total consumption expenditure 355771 574772 -219001 -38.10
Table 21:Comparison of NAS and NSS estimates of consumption expenditure ondifferent non-food item-groups for 1993-94 (Rs. Crore)
Item-group NSS NAS NSS - NAS % difference
level magnitude of divergence in terms ofthe extent by which the NSS estimate ex-ceeds the NAS estimate and the differenceexpressed as percentage of the latter.
Apparently, the NSS estimate for non-foodconsumption is only about a half of the NASestimate. But, as discussed in Section 2, theNAS estimate includes two important com-ponents of consumption that cannot be ob-tained directly from the reported consump-tion of the households, and are thus called‘notional’ in the present study. The NAS es-timate of ‘gross rent’ includes the notionalelement of imputed rent of owner-occupieddwellings, that of ‘furniture, furnishings,appliances and services’ includes the no-tional element of non-life insurance servicesand the residual category ‘miscellaneousgoods and services’ includes the notionalelement of FISIM embodied in the bankingand insurance services. Evidently, a validcomparison between the two sets of esti-
mates requires adjustment of the NSS esti-mate for the notional elements that are notincluded in the NSS-based estimate of ag-gregate consumption.
Having adjusted the NSS estimates for theitems house rent, banking services and in-surance services by replacing them by theNAS estimates (Table 22), it is seen that theNSS estimate for non-food adjusted for thenotional elements is less than the NAS esti-mate by only Rs. 79 thousand crore, whichis 30.33 per cent of the latter. The differencebetween the estimates for total consumptionexpenditure reduces from Rs. 219 thousandcrore to Rs.170 thousand crore, i.e. from38.10 per cent to 29.56 per cent, as a resultof the adjustment. The difference betweenNAS and NSS estimates for the item-group‘Gross rent & water charges’ comes downfrom 83 per cent to just 3 per cent and thatfor the item-group ‘Miscellaneous goods andservices’ gets virtually wiped out.
27

SARVEKSHANA
Table 22:Comparison of NAS and NSS estimates of different items of non-foodconsumption for 1993-94 adjusted for the notional elements (Rs. Crore)
1. Clothing & footwear 21382 34999 -13617 -38.912. Gross (house) rent & water charges 45476 46854 -1378 -2.943. Fuel & power 24527 21385 3142 14.694. Furniture, furnishings, appliances
& services 6055 17610 -11555 -65.625. Medical care & health services 18221 19543 - 1322 - 6.766. Transport equipment & operational cost 7178 24592 -17414 -70.817. Transport services 8450 36143 -27693 -76.628. Communication 1048 4258 -3210 -75.399. Recreation, Education
& Cultural services 11811 17626 -5815 -32.9910.Misc. goods & services 36655 36519 136 0.37
Total non-food 180803 259529 -78726 - 30.33Total consumption expenditure 404869 574772 - 169903 - 29.56
Item-group Adjusted NAS NSS - %NSS NAS difference
Comparison of individual item-groups re-veals that for all item-groups, except ‘fueland light’, the NAS estimate is much higherthan the NSS estimate. The two item-groupsthat account for the major part of the diver-gence between the NAS and the adjustedNSS estimates are the ‘transport services’and ‘transport equipment & operationalcost’. Together they account for Rs. 45 thou-sand crore out of a total difference of Rs. 79thousand crore for the non-food consump-tion, i.e. about 57 per cent of the excess ofNAS estimate over the NSS estimate. Thetwo item-groups ‘clothing and footwear’ and‘furniture, furnishings, appliances & ser-vices’ also contribute substantial amounts ofabout Rs. 14 thousand crore and Rs. 12 thou-sand crore respectively towards the diver-gence between the two estimates.
Table 22 reveals that the NAS and NSS esti-mates for the item-group ‘medical care &health services’ differ little. This is because,
the NAS estimate for this item-group is de-rived from the per capita consumption ex-penditure available from the HCES of theNSS 50th Round (1993-94). To the aggre-gate household consumption expenditurebased on NSS estimate, the receipts of Cen-tral Government on account of Central Gov-ernment Health Scheme (CGHS) are alsoadded to arrive at the NAS estimate. Theaddition of CGHS contribution, however,appears to be duplication, since the monthlyCGHS contribution of the Central Govern-ment employees is included in the NSS esti-mate, according to the ‘Instruction to FieldStaff’ for the 50th Round. The NAS estimatefor this item-group could be overestimatedin this respect. Even so, the private consump-tion expenditure on health and medical ser-vices is likely to be actually higher than theNAS estimate, as the consumption of theNPISHs is not included in it. The share ofNPISHs in the PFCE is expected to be sub-stantial in the fields of health and education.
28

SARVEKSHANA
Before turning our attention to comparisonof the estimates of individual item-groups,it is necessary to describe the general methodof deriving the NAS estimate of private con-sumption of manufactured goods. For NASestimates on non-food consumption, vary-ing approaches are adopted for differentitem-groups. The estimates for the manufac-tured goods are obtained by the commodityflow approach, while those for fuel and ser-vices are derived by varying other ap-proaches. The commodity-wise value of con-sumption of manufactured goods is derivedfrom the estimate of value of production, byapplying various ratios and norms represent-ing (i) percentage share of consumables, (ii)gross distributive margins, (iii) percentageshares used for fixed capital formation andinter-industry consumption and (iv) Govern-ment consumption. For the registered manu-
facturing, the commodity-wise shares of con-sumable items in the total output (of prod-uct and by-product) have been obtained fromthe detailed results of ASI for the year 1993-94. For the unregistered manufacturing,product and by-product ratio to value addedhave been worked out from the EnterpriseSurvey on Unorganised Manufacturing,1994-95. The percentage shares of capitalformation are based on the norms workedout on the basis of the results of All IndiaDebt and Investment Survey, 1981-82.Lastly, the data on government consumptionare available every year from the budgetdocuments.
Clothing and FootwearThe difference between the estimates for‘clothing & footwear’ group account for adifference of more than Rs. 13.5 thousand
1957-58 Clothing & Footwear 941 997 -5.62 -56 2731960-61 Clothing & Footwear 971 1064 -8.74 -93 5611967-68 Clothing 1148 1592 -27.89 -444 —
Footwear 114 168 -32.14 -54 —Clothing & Footwear 1262 1760 -28.30 -498 - 3480
1972-73 Clothing 2319 2563 -9.52 -244 —Footwear 163 192 -15.10 -29 —Clothing & Footwear 2482 2755 -9.91 -273 - 2823
1977-78 Clothing 5068 5888 -13.93 -820 —Footwear 407 353 15.30 54 —Clothing & Footwear 5475 6241 -12.27 -766 - 4645
1993-94 Clothing 18203 30937 -41.16 -12734 —Footwear 3179 4062 -21.74 -883 —Clothing & Footwear 21382 34999 -38.91 -13617 - 78726
Table 23:Difference Between the NSS and NAS Estimates (Rs. crore) of Consumptionof clothing and footwear in Different Years
Note: Sources are same as that for Table 1.
Year item NSS NAS % Difference DifferenceDifference for the for “all non-
group food”
29

SARVEKSHANA
crore, out of a difference of Rs. 79 thousandcrore for non-food consumption as a wholefor 1993-94. The NSS estimate of clothingand footwear has always been less than theNAS estimate (Table 23). Initially, in 1957-58 and 1960-61, when the NSS estimate ofnon-food consumption exceeded the corre-sponding NAS estimate, the NSS estimatefor ‘clothing and footwear’ was less than theNAS estimate by about 7 and 9 per cent re-spectively. In 1967-68, the gap between theestimates for the group as a whole widenedto 28 per cent. In the following decade, thegap closed substantially, only to grow widerto about as high as 39 per cent in 1993-94.
In national accounting, the estimates forclothing are prepared separately for cotton,silk and woollen fabrics and miscellaneoustextiles. In the 1980-81 series of NAS esti-mates, the data of the Office of the TextileCommissioner was used for estimation ofprivate consumption. In the present 1993-94 series, the estimates of private consump-tion of textile products, consistent with theGDP estimates, are based on the results ofASI, Enterprise Survey and the Second AllIndia Census of Small Scale Industrial Units,1987-88.
Fuel and Light
For this item-group the difference betweenthe NAS and NSS estimate for 1993-94 ishigher than NAS estimate by Rs. 3142 crore.The item sub-groups ‘firewood & chips’,‘electricity’, ‘kerosene’ and ‘L.P.G’ aremainly responsible for the difference be-tween the two estimates of ‘fuel & light’.The NSS estimate of consumption expendi-ture on fuel and light has always been higherthan that of the NAS. The gap between thetwo estimates, it is seen from Table 24, hasprogressively closed from 130 per cent in
1957-58 to just 15 per cent in 1993-94. In1972-73, the NSS estimate was higher thanthe NAS estimate by about 49 per cent andin 1977-78 by about 62 per cent.
Separate estimates of consumption of dif-ferent items of fuel and light in 1993-94 areavailable from both the sources. These aregiven in Table 25, in which the item ‘others’stands for ‘other fuel & light’ for the NSSestimate and ‘vegetable wastes and bagasse’for the NAS. Vegetable waste, in the NASestimate, consists of the estimated privateconsumption cotton sticks, jute sticks andarhar sticks. A detailed comparison of theestimates for the constituents of domesticfuel consumption for 1993-94 is taken up inthe following paragraphs.
It is seen from Table 25, that, as in 1972-73and 1977-78 (Minhas et al, 1986), ‘firewoodand chips’ is still the single major fuel itemthat accounts for about 40 per cent of thetotal expenditure of the group as a whole.Out of the difference of Rs. 3142 crore for‘fuel & light’, Rs. 1290 owes to the differ-ence between the estimates for this item offuel consumption. The estimates of firewoodconsumption in the NAS series earlier to1980-81 were based on the firewood pro-duction data available from the offices of theChief Conservator of Forests in variousstates, adjusted upwards for the illegal fell-ing not reported by the official sources. Sincethe 1980-81 series, however, the NAS con-sumption estimates of firewood are based onthe consumption data available from theHCES of the NSSO. In the 1993-94 series,the NAS estimate firewood production is de-rived from the NSS estimate of householdfuel wood consumption by deducting fromit the value of agricultural waste and bagasseused as fuel wood (since it is included in theagricultural production as by-products) and
30

SARVEKSHANA
1957-58* Total fuel & light 597 260 129.62 337 2731960-61* Total fuel & light 721 284 153.87 437 5611972-73 Electricity 102 82 24.39 20
L.P.G 26 17 52.94 9Kerosene 308 401 -23.19 -93Other fuel 1370 715 91.61 655Total fuel & light 1806 1215 48.64 591 - 2823
1977-78 Electricity 233 272 -14.34 -39L.P.G 64 67 -4.48 -3Kerosene 655 538 21.75 117Other fuel 2471 1238 99.60 1233Total fuel & light 3423 2115 61.84 1308 - 4645
1993-94 Electricity 4797 3926 22.19 871L.P.G 1961 1521 28.93 440Kerosene 3648 2906 25.53 742Other fuel 14121 13032 8.36 1089
Total fuel & light 24527 21385 14.69 3142 - 78726
Table 24:Difference Between the NSS and NAS Estimates (Rs. crore) of Consumptionof Fuel and light in Different Years
Year item NSS NAS % Difference DifferenceDifference for the for “all non-
group food”
adding the estimated value of firewood usedin the funerals. The difference between theestimates of firewood consumption owes tothe adjustments made for the NAS estimateunder the assumption that vegetable wastes,bagasse are included, while fire wood usedin funerals are not included in the NSS esti-mate for ‘firewood & chips’. But, it is notclear from the ‘Instructions to Field Staff’for the 50th Round, whether the value of veg-etable wastes and bagasse used as fuel fordomestic purposes is included in the NSSestimate for ‘firewood & chips’ or ‘other fueland light’. Moreover, whatever is deductedfrom the NSS estimate of ‘firewood &chips’, for arriving at the estimate of fire-wood production, ought to be added back as‘vegetable waste and bagasse’ to the estimate
of consumption of ‘fuel and light’. But, whilederiving the NAS estimate of private con-sumption of ‘vegetable waste and bagasse’,a part of the value that is deducted for esti-mating the production of firewood is takenas intermediate consumption and thus is notadded back.
The other items having large shares in thedifference between the estimates of ‘fuel andlight’ are electricity, kerosene and L.P.G. Forall these items, the NSS estimates of quan-tity consumed are substantially higher thanthe NAS estimates. Differences between theestimates of values of consumption are morepronounced for the items ‘electricity’ and‘L.P.G.’, the implicit prices in the NSS esti-mates being higher than the price at which
31

SARVEKSHANA
Coke 1594 166 175 22 144 18 148(000 tonnes)Firewood, chips — 10053 — 8763 1290 8763 1290Electricity 45856 4797 43344 3926 871 4551 246(MKwh)Dung cake — 2835 — 2797 38 2797 38Kerosene 9496 3648 7294 2906 742 2801 847(Mlt.)Coal 2809 274 2659 379 -105 261 13(mill. Tonnes)Coal gas / gas coke — 6 — 6 0 6 0L.P.G 2846 1961 2503 1521 440 1725 236(000 tonnes)Charcoal 195 28 580 294 -266 84 -56(000 tonnes)Other oils — 33 — — 33 — 33for lightingCandles — 92 — — 92 — 92Gobar gas — 43 — 412 -369 412 -369Others — 591 — 359 232 359 232Total fuel & light — 24527 — 21385 3142 21776 2751
Table 25:Comparison between NAS Estimates and NSS Adjusted and UnadjustedEstimates of Consumption of Fuel and Light in 1993-94 (Rs. Crore)
Note: ‘Others’ stands ‘other fuel & light’ for the NSS estimate and ‘vegetable wastes, bagasse, etc.’ for the NAS.
NSS NAS Difference NAS AdjustedItem Quantity Value Quantity Value (NSS - adjusted by difference
NAS) NSS price
the NAS estimates of quantity consumed areevaluated. The NAS estimates of quantityand value of private electricity consumptionare based on the data on electricity sold todomestic consumers and average electricityrates available from the Central ElectricityAuthority. For L.P.G and kerosene, the dataon quantity and retail prices are taken from“Indian Petroleum and PetrochemicalsStatistics” by Ministry of Petroleum andNatural Gas. The prices used for evaluatingthe consumption in NAS are obtained fromthe official sources and thus represent the
prices set by the regulatory authorities, ratherthan the prices actually paid by the consum-ers. The prices implicit in the NSS estimatesof quantity and value of electricity andL.P.G., on the other hand, are expected to becloser estimates of average prices actuallypaid by the customers, which vary not onlybetween States but also from one area toanother. Evaluating the NAS estimates forquantities, where ever possible, by the im-plicit prices of the NSS estimates brings thetwo sets of estimates of value a littlecloser.
32

SARVEKSHANA
Furniture, Furnishing, Appliances andServices
This item-group consists of a wide varietyof consumer goods and services. In the NAS,this is further classified into the sub-groupsof ‘furniture, furnishing & repairs’, ‘refrig-erator, cooking and washing appliances’,‘glassware, tableware and utensils’ a residual
category of ‘other goods’ and ‘services con-sumed at the household level’. For 1993-94,the NAS estimate for this group as a wholeis found to be substantially higher than theNSS estimate. In 1972-73 and 1977-78 toothe NAS estimate for this group was higherthan the NSS estimate, but the differencebetween the two was less pronounced(Table 26).
1972-73 652 1003 -35.00 -351 - 28231977-78 1480 1984 -25.40 -504 - 46451993-94 6007 17610 -65.89 -11603 - 78726
Table 26:Difference Between the NSS and NAS Estimates (Rs. Crore) of Consumptionof furniture, furnishing, appliances and services in Different Years
Year NSS NAS % Difference Difference forDifference for the group “all non-food”
From the detailed item-wise comparison ofthe estimates for 1993-94 given in Table 27,it is seen that the sub-group of ‘glassware,tableware and utensils’ is the main contribu-tor towards the group-level divergence be-tween the two sets of estimates. More than ahalf of the group-level difference of Rs. 11.6thousand crore is accounted for by this sub-group, with the item ‘other metal / house-hold utensils’ contributing about Rs. 3.7thousand crore. The residual sub-group of‘other goods’ too has a significant contribu-tion to the group-level divergence betweenthe estimates.
The sub-group ‘services’ of this group cov-ers two categories of services, viz. (i) do-mestic and laundry services and (ii) non-lifeinsurance services. The latter is not coveredin the HCES, as its worth cannot be directlyevaluated from the data collected from thecustomer households. Among the domesticservices, the value of services provided bythe domestic helps is clearly underestimatedin the NSS, owing to two distinct reasons.
First, the “cooked meals” served to the do-mestic servants are not recorded as consump-tion of services in the HCES but as expendi-ture on food in the employer household. Sec-ond, even the wages paid in cash to thewhole-time domestic servants, who in theNSS surveys are treated as household mem-bers of the employer households, were notrecorded as consumption expenditure of thelatter.6 The large difference between the es-timates for domestic services, at least par-tially, owes to the omissions in the HCESmentioned above. In the NAS, the estimatesfor domestic services are based on the re-sults of the Enterprise Survey on Services,1991-92. This survey did not provide sepa-rate estimates for the domestic services, thusthe Enterprise Survey estimate for the entiregroup of personal services was applied forobtaining the estimates of its value addedand consumption. The NAS estimate for do-mestic services may thus be on the higherside, as the domestic servants are likely toearn less than the workers engaged in pro-viding personal services.
6. The salary & wages paid in cash to the full-time domestic servent have, however, been included in the consumption expenditure
of the employer household, for the first time, in the HCES is the 55th round (1999-2000) of NSSO.
33

SARVEKSHANA
Transport
This head includes two item-groups, viz. (i)purchase and repairs of transport equipmentand (ii) consumption of transport services,and accounts for a major part of the differ-ence between the NAS and NSS estimatesof non-food consumption. Of the differenceof Rs. 77 thousand crore between the twoestimates for the non-food consumption in
1993-94, Rs. 45 thousand crore is due to thedifference between the estimates for thishead. Divergence between the estimates forthis head has been high even in the past.Table 28 shows that the divergence, whichwas of the order of 32 per cent in late 1950s,had widened to over 60 per cent by the early1970s, and then continued to grow from 71per cent in 1977-78 to a shade under 75 percent in 1993-94.
Carpet 581 14 -567 -97.59Coir product 4 54 50 1250.00Wooden & steel furniture 727 648 -79 -10.87Furniture, furnishing & repairs 1312 716 -596 -45.43Non-electrical mach. 248 235 -13 -5.24Electrical mach. 782 667 -115 -14.71Refg’tr & AC 529 336 -193 -36.48Freeze, cooking, washing appliances 1559 1238 -321 -20.59Glass & glass product 514 44 -470 -91.44Earthenware & chinaware 1864 157 -1707 -91.58Metal utensils 1543 978 -565 -36.62other metal / household utensils 3758 90 -3668 -97.61Glassware, tableware & utensils 7679 1269 -6410 -83.47Matches 1917 619 -1298 -67.71Misc. personal goods 376 594 218 57.98Plastic products 580 113 -467 -80.52Rubber products 122 14 -108 -88.52Batteries 694 100 -594 -85.59Other goods 3689 1440 -2249 -60.97Domestic services 2051 813 -1238 -60.36Laundries, dry cleaners 1272 531 -741 -58.25Insurance 48 x — —Services 3371 1344 -2027 -60.13Furniture, furnishings, 17610 6007 -11603 -65.89appliances & services
Table 27: Comparison between NAS and NSS Estimates of Consumption of Furniture,furnishings, appliances and services in 1993-94 (Rs. Crore)
Items NSS NAS difference % difference
34

SARVEKSHANA
For all the years since 1972-73 presented inthe table, the percentage difference betweenthe estimates for the two item-groups wasof similar order. But, the share of ‘transportservices’ in the estimates of non-food con-sumption as a whole being higher, its con-tribution to the divergence too is of greatersignificance. The item-group ‘transport ser-vices’ alone is responsible for over a thirdof the divergence observed between the NASand NSS estimates of total non-food con-sumption for 1993-94.
Transport ServicesTable 29 gives a detailed comparison be-
tween the NAS and NSS estimates of con-sumption of different types of transport ser-vices for 1993-94. It is seen that the NSSestimate for this group falls short of the cor-responding NAS estimate by about 77 percent. Of the nominal difference of Rs. 28thousand crore between the two estimates,expenditure on account of bus (includingtram) fare account for Rs. 12 thousand croreand that on account of taxi and auto-rick-shaw fare Rs. 11 thousand crore. In fact, theestimates of taxi and auto-rickshaw fareavailable from the sources are so differentthat the NSS estimate is only about one-twentieth of the NAS estimate.
1957-58 Transport: total 160 236 -32.20 -76 2731972-73 transport equipment 117 381 -69.29 -264 -----
transport services 489 1257 -61.10 -768 -----Transport: total 606 1638 -63.00 -1032 - 2825
1977-78 transport equipment 211 853 -75.26 -642 -----transport services 900 2971 -69.71 -2071 -----Transport: total 1111 3824 -70.95 -2713 - 4645
1993-94 transport equipment 7178 24592 -70.81 -17414 -----transport services 8450 36143 -76.62 -27693 -----Transport: total 15628 60735 -74.27 -45107 - 78726
Table28: Difference Between the NSS and NAS Estimates (Rs. Crore) of Consumptionof transport in Different Years
Year item NSS NAS % Difference DifferenceDifference for the for “all non-
group food”
Table 29:Comparison between NAS and NSS Estimates (Rs. Crore) of Consumptionof Transport Services in 1993-94
Air fare 31 170 -139 -81.76Rail fare 1030 3913 -2883 -73.68Bus (including tram) fare 6058 18296 -12238 -66.89Taxi, auto-rickshaw fare etc. 596 11447 -10851 -94.79Others with incidental services 735 2317 -1582 -68.28Transport services: Total 8450 36143 -27693 -76.62
Items NSS NAS difference % difference
35

SARVEKSHANA
In national accounting, estimates of total pas-senger earnings are worked out separatelyfor each mode and a proportion of each isattributed to private consumption. For rail,air and organised water transport the data aredirectly available from the annual reports.Of the gross passenger earnings, 80 per centfor rail, 15 per cent for air are taken as pri-vate consumption. For the other modes ofmechanised road transport, the gross passen-ger earnings are estimated as the product ofan estimated average ‘earnings per vehicle’and total number of vehicles available fromthe Ministry of Surface Transport (MoST).Of the gross passenger earnings, 50 per centfor taxi, 90 per cent each for auto rickshawsand buses are taken as private consumption.
The NSS estimate includes expenditure in-curred on account of journeys undertakenand transportation of goods made by air, rail,bus, steamer, car, taxi, and other mechanisedand non-mechanised means of conveyance.It includes all expenses on account of con-veyance for the households’ domestic pur-poses and excludes that incurred for officialand business purposes. Thus, leaving asidethe consumption of NPISHs, the NSS esti-mate are in principle exactly comparablewith the NAS estimate, but for the fact thatthe NAS does not include transportation ofgoods made by the private consumptionunits, which undeniably forms an insignifi-cant part of the whole.
Yet, the NSS estimates are by far lower thanthe corresponding NAS estimates. Clearly,the NSS estimates for air and rail appear tobe on the lower side, as the NAS estimatesare based on reliable accounting data of grossreceipts. The earlier study for the years 1972-73 and 1977-78 (Minhas, 1988) alsorecognised the possibility of underestimationof conveyance charges in the HCES. Con-
sequently, in an attempt to ensure that theexpenses under this head are not missed dur-ing the interviews, an additional set of ques-tions relating to journeys undertaken duringthe reference period by the household mem-bers was introduced in the schedule of en-quiry of the HCES of 43rd Round (1987-88),which was continued in the 50th RoundHCES as well. On the other side, the ratiosused for arriving at the NAS estimates ofprivate consumption from the gross earningswere revised to make them more realistic.Despite that, the gap between the two setsof estimates has not only persisted but alsowidened over the years. Thus, besides inves-tigating for the reasons for under-reportingin the HCES, the following issues needs tobe investigated further to validate the NASestimates:
• The estimates of number of vehiclesavailable from the MoST are based onregistration of vehicles. Do they rep-resent the actual number in operation?
• Validity of the estimates of per vehicleearnings used at present for the NASestimate?
• Validity of the assumed ratios of pri-vate consumption of these servicesused for deriving the NAS estimates.
Transport equipment and operationalcost
Table 30 gives the comparable item-wise es-timates of ‘transport equipment and opera-tional costs’, as available from the twosources for 1993-94. It is seen that the NSSestimate for this group is less than one-thirdof the corresponding NAS estimate. Of thenominal difference of Rs. 17 thousand crorebetween the two estimates, the fuel costsaccount for Rs. 12 thousand crore. The NSS
36

SARVEKSHANA
purchase 222 825 -603 -73.09repairs 87 552 -465 -84.24Motor vehicles & parts: total 309 1377 -1068 -77.56purchase 1352 1469 -117 -7.96repairs 1416 2318 -902 -38.91Mobike, scooter & cycle: total 2768 3787 -1019 -26.91Other transport equipment including repairs 29 — 29 —Repairs services 247 3489 -3242 -92.92equipment & repairs 3353 8653 - 5300 - 61.25Tyres & tubes 209 735 -526 -71.56Road tax * 663 102 561 550.00Petrol & diesel 2953 15102 -12149 -80.45Operational costs: total 3825 15939 -12114 -76.00Transport equipment & operational cost 7178 24592 - 17414 - 70.81
Table 30: Comparison between NAS and NSS Estimates of expenditure on Transportequipment & operational costs in 1993-94 (Rs. Crore)
Note *: This includes all consumer taxes and cess
Items NSS NAS difference % difference
estimate of fuel costs is only about a fifth ofthe NAS estimate.
This group includes expenses incurred forpurchase and repairs of owned transportequipment and their operational costs, viz.expenses incurred for replacement of tyresand tubes, purchase of fuel and taxes. TheNSS estimate of taxes, however, includes allconsumer taxes, besides the road tax. On theother hand, the NAS estimate does not in-clude the purchase and operation of animal-and man-driven transport equipment and ani-mals used exclusively or partially for con-veyance for non-productive domestic pur-poses, which are included in the NSS esti-mate. The NSS estimate of purchase andoperation of such transport equipment isgiven in the table against ‘other transportequipment including repairs’, which, as itcan be seen, is a relatively small amount. Asfor the mechanised transport equipment, itis seen that the estimates of purchase of two-
wheelers (including bicycle) compareclosely with each other, but those of motorcars and their parts differ by about 75 percent. From the persistent differences betweenthe NAS and NSS estimates observed in thepast, it was suspected that the householdexpenditure on durables was not fully cap-tured in the NSS estimates, as the expensivedurables were purchased more by the rela-tively affluent households, which were notadequately represented in the NSS sample.To improve the efficiency of consumer ex-penditure estimates, therefore, a samplingdesign oriented towards capturing larger pro-portion of the affluent households in samplewas adopted for the HCES both in the 43rd
Round (1987-88) and the 50th Round (1993-94). In spite of that, the difference betweenthe estimates of purchase of car continues toremain high.
In addition to repair costs of the owned ve-hicles, the NAS estimate includes “repair
37

SARVEKSHANA
Motor Cycle, Scooter 22 127 8,876 18,899Motor Car, Jeep 2 13 876 2,654
Table 31: Comparison between the Estimated number of Transport Equipment forOwn Use possessed by the Households
vehicle NSS estimate of average estimated number of vehiclesnumber of vehicles per 1000 hhs. (000) possessed
rural urban NSS MoST
services” (NIC 97). This appears to be a du-plication of repair costs of owned vehicles,since NIC 97 includes repairs of mechanisedtransport equipment as well. The PFCE forrepair services (activity division code 97 ofNIC 1987) is estimated as Rs. 3489 croreand it includes repairs of transport equip-ment. In addition, the repair costs for eachtype of mechanised transport equipment isalso included in the NAS estimate, whichtogether amounts to Rs. 2,870 crore. Hadthe entire contribution of NIC division 97 inNAS estimate not been included in thisgroup, the percentage difference betweentwo estimates for ‘Transport equipment &operational cost’ would have been 67 percent rather than 72 per cent.
Transport equipment in the NSS is coveredunder the broad group of items called‘durables’ used for household purposes.Expenditures incurred on first-handpurchase, repair, construction and construc-tion of durables used for domestic purposesare included under this head. On the otherhand, the expenditure on tyres, tubes and fuelare covered in the broad group called‘conveyance’. For the present study, theitems have been appropriately regrouped tomake the estimates comparable with theNASestimates. The NSS estimate of total valueof transport equipment (in fact, for allhousehold durables) includes the value ofraw materials, services and labour chargesspent for construction and their repairs.
There is, however, a little ambiguity in the“Instruction to Field Staff, Vol. I’ of the 50th
Round in this respect. While it clearly in-structs that all costs of repairs of vehicleshould be recorded under the head of trans-port equipment, it also states that the expen-diture incurred on account of servicing ofowned conveyance should be recorded as‘repair charges’, which is a head mainlymeant for recording the service charges paidto artisans for repairing of all items used asdomestic consumption. Thus, the ‘repaircharges’ in the NSS estimate is likely to in-clude a small part of repair charges for thetransport equipment as well.
In national accounting, the estimate ofpurchase of vehicles by the private house-holds and NPISHs are derived by commod-ity flow approach, while those of repairservices and maintenance costs pertaining toowned transport are derived as the productof per vehicle average cost per year andnumber of vehicles. The per vehicleaverage cost is estimated on the basis of theallowance prescribed for computing rebateon income tax in respect of repairs andmaintenance of different vehicles. Theaverage costs are estimated separately for repairs and fuel consumption. The estimatesof number of cars and two-wheelers otherthan bicycles are available from the MoST.The estimate of number of bicycles isderived from the production data under theassumption of an average road life of tenyears.
38
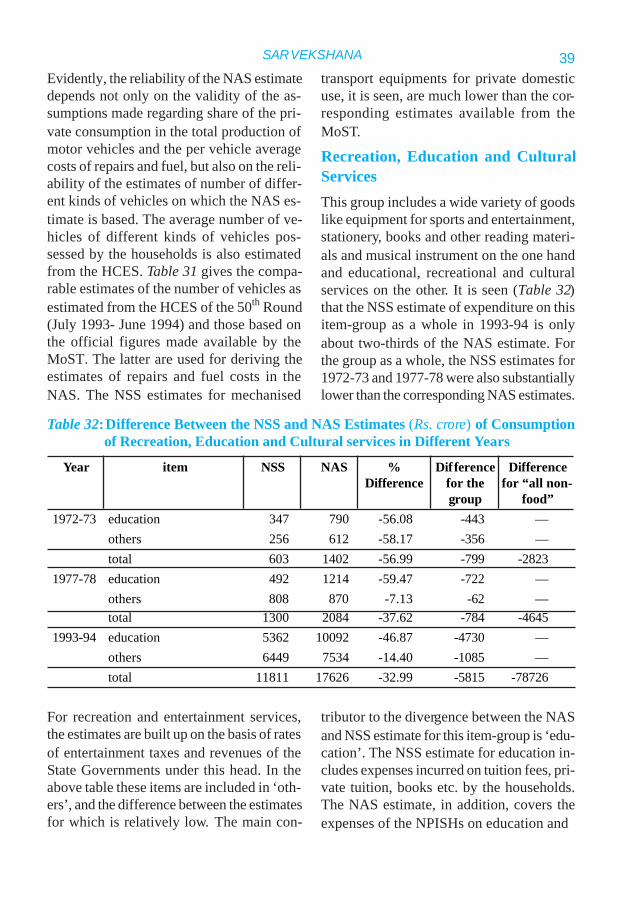
SARVEKSHANA
1972-73 education 347 790 -56.08 -443 —others 256 612 -58.17 -356 —total 603 1402 -56.99 -799 -2823
1977-78 education 492 1214 -59.47 -722 —others 808 870 -7.13 -62 —total 1300 2084 -37.62 -784 -4645
1993-94 education 5362 10092 -46.87 -4730 —others 6449 7534 -14.40 -1085 —total 11811 17626 -32.99 -5815 -78726
Table 32:Difference Between the NSS and NAS Estimates (Rs. crore) of Consumptionof Recreation, Education and Cultural services in Different Years
Year item NSS NAS % Difference DifferenceDifference for the for “all non-
group food”
Evidently, the reliability of the NAS estimatedepends not only on the validity of the as-sumptions made regarding share of the pri-vate consumption in the total production ofmotor vehicles and the per vehicle averagecosts of repairs and fuel, but also on the reli-ability of the estimates of number of differ-ent kinds of vehicles on which the NAS es-timate is based. The average number of ve-hicles of different kinds of vehicles pos-sessed by the households is also estimatedfrom the HCES. Table 31 gives the compa-rable estimates of the number of vehicles asestimated from the HCES of the 50th Round(July 1993- June 1994) and those based onthe official figures made available by theMoST. The latter are used for deriving theestimates of repairs and fuel costs in theNAS. The NSS estimates for mechanised
transport equipments for private domesticuse, it is seen, are much lower than the cor-responding estimates available from theMoST.
Recreation, Education and CulturalServicesThis group includes a wide variety of goodslike equipment for sports and entertainment,stationery, books and other reading materi-als and musical instrument on the one handand educational, recreational and culturalservices on the other. It is seen (Table 32)that the NSS estimate of expenditure on thisitem-group as a whole in 1993-94 is onlyabout two-thirds of the NAS estimate. Forthe group as a whole, the NSS estimates for1972-73 and 1977-78 were also substantiallylower than the corresponding NAS estimates.
For recreation and entertainment services,the estimates are built up on the basis of ratesof entertainment taxes and revenues of theState Governments under this head. In theabove table these items are included in ‘oth-ers’, and the difference between the estimatesfor which is relatively low. The main con-
tributor to the divergence between the NASand NSS estimate for this item-group is ‘edu-cation’. The NSS estimate for education in-cludes expenses incurred on tuition fees, pri-vate tuition, books etc. by the households.The NAS estimate, in addition, covers theexpenses of the NPISHs on education and
39

SARVEKSHANA
related activities. The difference between theestimates on education is thus expected tobe substantial, as the NPISHs have fairlylarge share in educational activities.
5. Concluding Remarks and Sug-gestions
While summing up the findings of the com-parison of NAS and NSS estimates of foodand non-food consumption, first it is worthstressing that a substantial part of the appar-ent divergence owes to the ‘notional’ ele-ments like imputed rent and FISIM in theNAS estimate. Inclusion of these elementsin the NSS estimate, it may be recalled,brings about a reduction of nearly 8.5 per-centage points out of the overall differenceof 38 per cent.
The other important factor responsible forthe divergence is the differential implicitprices. As observed by Minhas et. al. (1986),a substantial part of the difference betweenthe NAS and NSS estimates for the years1972-73 and 1977-78 could be explained bythe differences in implicit prices of variousconsumer goods. For 1993-94, however,only a small part (0.67 percentage points) ofthe difference between the estimates of totalconsumption expenditure is attributable tothe differential implicit prices of food itemsand fuel. The NSS estimates adjusted for the‘notional’ elements and the NAS estimatesadjusted for prices are given in Appendix II.It is seen that the adjustment, on the whole,closes the gap by about 9.21 percentagepoints, leaving a difference of about 29 percent unreconciled. The detailed item-by-itemcomparison of the NAS and NSS estimatesundertaken in the preceding sections revealsother underlying reason for the divergencebetween the two sets of adjusted estimates.
What emerges from the detailed comparisonof the two sets of adjusted estimates is thatthe divergence between the aggregate esti-mates of consumption expenditure owesprincipally to the divergence between theestimates for a few specific sub-groups offood and non-food items. The major con-tributors towards the divergence between theestimates of expenditure on food are the‘fruits’, ‘milk products’, ‘chicken’, ‘eggs’and ‘fish’, minor cereals and their products,‘vanaspati’, oilseeds and the sub-group ‘to-bacco’. The other significant difference be-tween the NAS and NSS estimates is in thesub-group ‘sugar and gur’. These items to-gether account for 27.16 percentage pointsout of the total difference for food items of27.58 per cent.
More significantly, the NAS and NSS esti-mates for the important sub-groups of fooditems like major cereals, more commonlyused pulses and edible oils, liquid milk andvegetables do not differ much. The gaps be-tween the NSS and NAS estimates for thesesub-groups are so narrow that they could aswell be caused by the differences in cover-age, sampling errors and those relating todifferences in reference time-frames.
As for the divergence between the estimatesfor non-food consumption, two item-groups,viz. ‘transport services’ and ‘transport equip-ment and operational cost’ account for themajor part of the divergence between theadjusted NAS and NSS estimates. Togetherthey account for Rs. 45 thousand crore outof a total difference of Rs. 164 thousand crorebetween the NAS and NSS estimates of con-sumption expenditure in 1993-94. The twoitem-groups ‘clothing and footwear’ and‘furniture, furnishings, appliances & ser-vices’ also contribute substantial amounts of
40

SARVEKSHANA
about Rs. 14 thousand crore and Rs. 12 thou-sand crore respectively towards the diver-gence between the two sets of estimates.Apart from the item-groups for which esti-mates have been adjusted or the NAS esti-mate is based on the NSS estimate, for mostof the item-groups the estimates from the twosources differ by about 70 per cent. Only for‘clothing & footwear’ and ‘recreation, edu-cation and cultural services’ the differencebetween the estimates, though still large, isnot as wide - the NSS estimate is less thanthe NAS estimate by 39 and 33 per cent re-spectively.
Comparison between the item-wise esti-mates made in the earlier sections help toidentify a multiplicity of underlying factorsresponsible for the wide divergence betweenthe two sets of estimates. It also leaves dif-ferences between estimates for some of theitem-groups unreconciled, thereby demarcat-ing the relatively weak areas of the statisti-cal system. That some items are being un-der-reported in the HCES appears to be quitea conceivable possibility, though it requiresto be substantiated by adequate evidences.Some errors are also possibly inherent in theNAS estimates as they depend on an assort-ment of direct and indirect estimates of out-put along with various rates and ratios, someof which are based on the results of studiescarried out in distant past. Needless to say,these need to be updated so that they repre-sent the changed technological / physiologi-cal conditions more appropriately. The fol-lowing are some suggestions for improve-ment in the methods of deriving NAS esti-mates and data collection in the HCES. Be-sides the suggestions for improvement, cer-tain studies on validity of the available da-tabase and exploring for alternative meth-ods are also proposed below:
1. The available estimates of averageprices, whether peak-season or whole-sale or retail, are based on the datacollected in the regular price collec-tion schemes. Commodities transactedin the market vary in quality over awide range. But, for each commodity,prices of only a fixed set of specifiedqualities are collected in the price col-lection schemes, notwithstanding thechanges in the market shares of differ-ent qualities that take place over time.The NSS implicit prices, on the otherhand, represent the average price of thecommodities appropriately weightedby the actual shares of different quali-ties in the current consumption basket.Apart from the price data availablefrom the regular price collection sys-tem, the CSO uses price data from vari-ous other sources while deriving theNAS value estimates. For example, thedata source like CEA is used for priceof electricity, Ministry of Petroleumand Natural Gas for price of L.P.G. andkerosene and the NHB for prices ofnon-forecast fruit crops. Often, just amarking-up rate (for example, for theprice of dal obtained from ‘retained’grains) is applied on the price of aproduct to estimate the price of its de-rivatives. Thus, the prices used forNAS estimates may often not be ap-propriate for evaluating the value ofconsumption. Instead, use of NSS im-plicit prices for deriving NAS valueestimates would be more appropriate.For this purpose, the NSS implicitprices can be generated from the datacollected in the HCES, separately forconsumption out of home-grown stockand that out of quantity purchased. Thefeasibility of deriving NAS value esti-
41

SARVEKSHANA
mates using NSS implicit prices re-quires a comprehensive study.
2. The accuracy of the NAS estimates,being derived by commodity flow ap-proach, depends heavily on the accu-racy of rates, ratios and norms appliedon the production estimates for nettingout the amounts used for further pro-duction in the form of seeds, feeds andinter-industry consumption. The NASestimates also depend on the estimatedratio of marketable surplus. The ratesused for allocating the production ofdurables to the households and indus-try are largely based on subjectivejudgements. For example, the ratiosassumed for estimating private con-sumption of rail and bus services isbased entirely on subjective judge-ments. These need to be replaced byproper estimates based on objectivestudies.
3. The data on change in stock used atpresent are not appropriate on twocounts. First relates to nonconformityof the reference periods. While the ref-erence period of production data forall agricultural produce is the agricul-tural year, the data on change in stockfor the public sector are based on thedata on stocks at the beginning and endof the financial year available from thebudget documents and annual reports.Second, there is hardly any data onchange in stock for the household sec-tor. So far the enterprise surveys havefailed to provide useable estimates ofchange in stock. Thus, special studiesneed to be undertaken to explore al-ternative ways of estimating thechange in stock in the household sec-tor.
4. At present, no provision is made forintermediate consumption of fooditems like cereals, pulses, gur andsugar, chickens, eggs, milk and milkproducts, vanaspati etc. in hotels, res-taurants and other food processing in-dustries. The inter-industry consump-tion rates of these food items need tobe estimated from the latest input-out-put table or appropriate studies.
5. That the NSS underestimates the con-sumption of durables has been sug-gested by a number of scholars in thepast. Minhas (1988) while comment-ing on the possibility of underestima-tion of durable consumption in theHCES, noted that non-cooperationfrom the affluent households could bethe main reason for the downward bias.Recently, Lal, Mohan and Natarajan(2001) have compared the NSS esti-mates of consumption of certaindurables with the figures of their salespublished in various newspapers andbusiness magazines. They have ob-served that the NSS estimates of pri-vate consumption are as low as one-fourth of the production of durableslike televisions, tape recorder, electricfan and two-wheelers. This calls for afurther investigation for identifying thepossible reasons for discrepancy be-tween the NAS and NSS estimates.
6. The NSS estimates of travelling ex-penses incurred by the households alsoappear to suffer from gross underesti-mation. A study is required to be un-dertaken to explore alternative meansof collecting data particularly on railand bus fares paid by the households.
7. The inclusion of ‘repair services’ (ac-tivity-group 97 according to NIC
42

SARVEKSHANA
1987) in the NAS leads to duplicationof operational cost of owned transportequipment. The procedure needs to becorrected in this respect.
8. The entire amount of output of NIC(1987) activity group of 201, i.e. manu-facturing of dairy products, is atpresent assumed to be milk products,whereas a large part (about 40%) of itis in fact liquid milk of different kinds.Though this does not affect the aggre-gate estimate for the item-group ‘milk& milk products’, it understates theconsumption of liquid milk. The esti-mates of milk products like butter andlassi are based on norms worked outin the past for the practices prevalentat that time. These too require revi-sion, as the methods of disposal of milkproduce have undergone vast changesin the recent past.
9. The NAS estimate on ‘medical andhealth care’, being based entirely onthe NSS estimate, excludes the con-sumption of the NPISHs. The con-sumption expenditure of the NPISHsis not expected to be distributed overall the food and non-food item-groupsas the household consumption expen-diture. In fact, NPISHs, being moreactive in the fields of health and edu-cation, are expected to have propor-tionately larger shares in these twoitem-groups. To estimate the magni-tude and distribution of consumptionexpenditure of the NPISHs, it is nec-essary to take up a special study to startwith, and carry out surveys on a con-tinuing basis for regular flow of data.
10. The exact definition of ‘firewood &chips’ used for the HCES is not clear
from the ‘Instructions to Field Staff,50th Round’. The CSO uses the NSSestimate of consumption of ‘firewood& chips’ under the assumption thatwhile it includes vegetable wastes likejute, cotton and arhar sticks, it ex-cludes the wood used in the funerals.The exact definition of ‘firewood &chips’ is required to be specifiedclearly in the instructions for the fu-ture CESs.
11. A mechanism is required to be devisedin the HCES for collecting the data oncooked meals received, as part ofwages, by workers engaged in provid-ing services for household consump-tion from the employer household, sothat the necessary correction for theomission in the NSS estimate may bemade.
12. The NSS estimates of fruit consump-tion fall far short of the NAS estimates.Possibly, non-cooperation of the afflu-ent is one of the reasons for underesti-mating fruit consumption in the HCES.Besides, investigating for other pos-sible reasons for underestimation in theHCES, reconciliation of the differencebetween the differences between theestimates of fruits consumption re-quires a comprehensive study of theestimation procedure followed by theSHBs for obtaining area, productionand productivity estimates of differentfruits.
13. Lastly, for quite a few item-groups be-longing mostly to the service sector,the NAS estimates of gross valueadded (GVA) and private consumptionare based on independent sources ofdata. The NAS estimate for consump-
43

SARVEKSHANA
References
Central Statistical Organisation, Ministry of Statistics & P.I., Government of India :-__ (1980) : National Accounts Statistics - Sources and Methods . April 1980.__ (1978) : National Accounts Statistics – 1970-71 to 1975-76. January 1978.__ (1989) : National Accounts Statistics - Sources and Methods. October 1989.__ (1998) : Annual Survey of Industries, 1994-95 (Factory Sector). Vols. II & III. Feb-
ruary 1998.__ (1999a): New Series on National Accounts Statistics (Base Year 1993-94), May 1999.__ (1999b): Report on Hotels and other lodging places and Restaurants, cafes and other
eating and drinking places. Enterprise Survey 1993-94. June 1999.__ (1990) : National Accounts Statistics, 1990.__ (1992) : National Accounts Statistics, 1992.__ (2000) : National Accounts Statistics, 2000.
Department of Economics and Statistics, Ministry of Agriculture, Government of India :-__ (1999) : Agricultural Statistics at a Glance.__ (1998) : Bulletin of Food Statistics 1996 and 1997 . Kansal, S. M. and Saluja, M. R.
(1961): ‘Preliminary Estimates of Total Consumption Expenditure in In-dia’, Paper presented in the Third Indian Conference on Research in Na-tional Income, 1961.
Lal, D., Mohan, R. and Natarajan, I. (2001): ‘Economic Reforms and Poverty Alleviation– A Tale of Two Surveys’, Economic and Political Weekly, Vol. XXXVI, Nos.
Minhas, B. S. (1988): ‘Validation of Large Scale Sample Survey Data – Case of NSSEstimates of Household Consumption Expenditure’, Sankhya, Series B, Vol. 50, Part3, Supplement.
tion of road transport services by bus,taxi and auto-rickshaw as well as thatof repair services of owned convey-ance is derived using the data on num-ber of vehicles available from theMoST. For the item-group ‘medicaland health services’, ‘salt’, ‘spices’ and‘pan’, the NAS estimates are derivedfrom the NSS estimates, since the lat-ter are known to represent the house-hold consumption better. Thus, for
these item-groups, the estimates ofoutput, which are required for PFCEestimates, are not expected to be nec-essarily consistent with the estimatesof GVA. In other words, it is a pos-sible source of statistical discrepancyin the NAS. It is therefore felt that thefeasibility of using a common data setfor both GVA and PFCE estimates forthese item-groups needs to be exploredfurther.
44

SARVEKSHANA
Minhas, B. S., Kansal, S. M., Jagdish Kumar and Joshi, P. D. (1986): ‘On Reliability of theAvailable Estimates of Private Consumption Expenditure in India’, The Journal of In-come and Wealth, Vol. 9, No. 2.
Minhas, B. S. and Kansal, S. M. (1989): ‘Comparison of NSS and CSO Estimates of Pri-vate Final Consumption (Some Observations Based on 1983 Data)’, The Journal ofIncome and Wealth, Vol. 11, No. 1.
Minhas, B. S. and Kansal, S. M. (1990): ‘Firmness, Fluidity and Margins of Uncertainty inthe National Accounts Estimates of Private Consumption Expenditure in the 1980s’,The Journal of Income and Wealth, Vol. 12, No. 1.
Mukherjee, M. and Chaterjee, G. S. (1974): ‘On Validity of NSS estimates of ConsumptionExpenditure’, in Bardhan, P. K. and Srinivasan, T. N. eds. Poverty and Income Distri-bution in India.
National Sample Survey Organisation, Ministry of Statistics & P.I. :-__ Government of India (1985): Report on the third quinquennial survey on consumer
expenditure. Report No. 319. June 1985.__ (1990): Fourth quinquennial survey on consumer expenditure: Pattern of consump-
tion of cereals, pulses, tobacco and some other selected items . Report No.374. September 1990.
__ (1993) : Design, concepts, definitions and procedures: Instruction to field staff. Vol.I. Fiftieth Round (July 1993 – June 1994). Mimeo. June 1993.
__ (1997a) : Consumption of some important commodities in India. Report No. 404. March1997.
__ (1997b) : Use of durable goods by Indian households: 1993-94 . Report No. 426. Sep-tember 1997.
__ (1999) : Design, concepts, definitions and procedures: Instruction to field staff. Vol.I. 55th Round (July 1999 – June 2000). Mimeo. May 1999.
Ravallion, M (2000): ‘Should Poverty Measures be Anchored to the National Ac-counts?’, Economic and Political Weekly, Vol. XXXV, Nos. 35 and 36.
Registrar General of India (1996), Government of India: Population Projection forIndia and States 1996 – 2016. Census of India 1991. Report of the TechnicalGroup on Population Projections Constituted by the Planning Commission.August 1996.
Srinivasan, T. N., Radhakrishnan, P. N. and Vaidyanathan, A. (1974): ‘Data on Distri-bution of Consumption Expenditure in India: An Evaluation’, in Bardhan,P. K. and Srinivasan, T. N. eds. Poverty and Income Distribution in India.
Sundaram, K. and Tendulkar, S. D. (2001): ‘NAS-NSS Estimates of Private Consump-tion for Poverty Estimation – A Disaggregated Comparison for 1993-94’,Economic and Political Weekly, Vol. XXXVI, No. 2.
45

SARVEKSHANA
Rice 6.34 6.05 Vanaspati 36.15 38.37Mustard Oil 30.82 33.14
Wheat 4.23 4.55 Groundnut Oil 36.70 37.51Atta 4.29 4.40 Coconut Oil 36.73 56.14Maida 6.04 5.43 Gingili (Til) Oil 32.30 47.72Suji,Rawa 6.97 5.43 Linseed Oil 20.60 44.52Wheat & its products 4.34 4.49 Edible Oil (Others) 26.95 41.97
Jowar & its products 3.09 3.74 Goat Meat 50.45 54.50Bajra & its products 3.61 3.65 Mutton 64.66 52.78Maize & its products 3.25 3.92 Goat meat plus mutton 52.90 54.09Barley & its products 2.99 5.71 Beef 20.47 22.14Small Millets & its products 2.51 2.89 Pork 25.94 36.40Ragi & its products 3.19 3.43 Buffalo Meat 12.29 19.43Gram(Whole Grain) 14.97 12.85
Potato 3.30 3.97Arhar 16.70 12.20 Onion 4.91 6.00Gram split 15.40 14.96 Coconut 3.93 4.06Moong 15.58 15.76 Mango 8.41 8.56Masur 13.06 12.58 Grapes 16.78 14.29Urd 13.04 13.09 Groundnut 17.21 17.08Other Pulses 12.24 9.96Besan 16.49 15.91 Coke 1.04 1.26
Electricity 1.05 0.91Sugar & khandsari 11.30 10.96 Kerosene 3.84 3.98Gur: Cane 9.66 9.18 Coal 0.98 1.43
L.P.G 6.89 6.08Liquid Milk (Litre) 6.84 7.26 Charcoal 1.44 5.07
Appendix I
Implicit Prices (Rs.) of food and fuel items/item-groups Derived from the NAS andNSS Estimates of Quantity and Value of Consumption
Note: 1. The prices given in the table are for one kilogram of the item / item-group, unless otherwise specified in parentheses.2. Prices for the item-groups like ‘barley and its products’ and ‘goat meat plus mutton’ given in the table represent the
weighted average of the prices of the constituent individual items.
Item / item-group NSS NAS Item / item-group NSS NAS
46

SARVEKSHANA
1. Cereals & Cereal Products 77338 72188 -6.66 -51502. Bread 554 560 1.08 63. Gram (Whole) 308 530 72.08 2224. Pulses & pulses product 13430 12665 -5.70 -7655. Cereal substitute (tapioca etc) 1024 309 -69.82 -7156. Sugar and Gur 19748 9956 -49.58 -97927. Milk & milk products 44714 33737 -24.55 -109778. Edible oils & oilseeds 20001 15674 -21.63 -43279. Meat, egg & fish 21153 11923 -43.63 -923010.Fruits, vegetables & their products 66839 28851 -56.84 -3798811. Salt 595 595 0.00 012.Spices 8015 8015 0.00 013.Non-alcoholic Beverages 6422 9156 42.57 273414.Processed / Other food 5436 5910 8.72 47415.Pan 2988 1830 -38.76 -115816.Tobacco 12309 5877 -52.25 -643217.Alcoholic beverages and
other intoxicants 2393 2525 5.52 13218.Hotel & restaurant / cooked meals 6142 3765 -38.70 -2377Food: Total 309409 224066 -27.58 -853431. Clothing & footwear 34999 21382 -38.91 -136172. Gross (house) rent & water charges 46854 45476 -2.94 -13783. Fuel & power 21776 24527 14.69 31424. Furniture, furnishings,
appliances & services 17610 6055 -65.62 -115555. Medical care & health services 19543 18221 -6.76 -13226. Transport equipment & operational cost 24592 7178 -70.81 -174147. Transport services 36143 8450 -76.62 -276938. Communication 4258 1048 -75.39 -32109. Recreation, Education & Cultural services 17626 11811 -32.99 -581510.Misc. goods & services 36519 36655 0.37 136Non-food: Total 259920 180803 -30.33 -78726Total consumption expenditure 569329 404869 -28.89 -164460
Appendix II
Comparison between Estimates of Private Consumption Expenditure - NSS EstimatesAdjusted for the ‘Notional’ Elements and NAS Estimates Adjusted for Prices
Rs. CroreItem-group NAS NSS % difference difference
47

SARVEKSHANA
Food Items1. Cereals & Cereal Products 72188 77655 -7.041.1 Rice & Rice Products 45584 45243 0.751.1.1 Rice 43670 41066 6.341.1.2 Rice products 1914 4177 -54.181.2 Wheat & wheat products 20867 20885 -0.091.2.1 Wheat 811 170 377.061.2.2 Atta 19397 18522 4.721.2.3 Maida 149 1854 -91.961.2.4 Suji, Rawa 402 339 18.581.2.5 Sewai, noodles 58 — —1.2.6 Other wheat products 50 — —1.3.1 Jowar & its products 2417 4247 -43.091.4.1 Bajra & its products 1514 1745 -13.241.5.1 Maize & its products 1012 3588 -71.791.6.1 Barley & its products 35 693 -94.951.7.1 Small millets & their products 67 249 -73.091.8.1 Ragi & its products 692 860 -19.531.9.1 Other cereals — 32 —1.10.1 Change in stock — 113 —
2. Bread 560 554 1.08
3. Gram (Whole) 530 265 100.00
4. Pulses & pulses product 12665 11993 5.604.1 Pulse: total 11693 9250 26.414.1.1 Arhar ** 4783 2626 82.144.1.2 Gram split 1070 1752 -38.934.1.3 Moong ** 1839 1324 38.904.1.4 Masur 1648 669 146.344.1.5 Urd 1433 1339 7.024.1.6 Other pulses 920 1540 -40.264.2 Pulses products 972 2734 -64.45
Appendix III
A Disaggregated-Level Comparison between Unadjusted NAS and NSS Estimates ofPrivate Consumption Expenditure Rs. Crore
Item NSS NAS % difference
48

SARVEKSHANA
Appendix III(contd.)
A Disaggregated-Level Comparison between Unadjusted NAS and NSS Estimates ofPrivate Consumption Expenditure Rs. Crore
Item NSS NAS % difference
4.2.1 Besan 632 985 -35.844.2.2 Other pulses products 340 1749 -80.564.3 CIS of pulses — 9 —
5. Cereal substitute (tapioca etc) 309 1024 -69.825.1 Tapioca & its products 290 1024 -71.685.1.1 Tapioca (green) 102 926 -88.985.1.2 Products / sago 188 98 91.845.2 Mahua 8 — —5.3 Others 11 — —
6. Sugar and Gur 9956 19881 -49.926.1 Sugar & Khandsari 8501 11282 -24.656.1.1 Sugar 8415 11282 -25.416.1.2 Khandsari 86 — —6.2.1 Gur : Cane 1293 7867 -83.566.2.2 Gur: others 118 128 -7.816.3 Sugar (candy) 11 — —6.4 Sugar: others 33 — —6.5 CIS — 604 —
7. Milk & milk products 33737 46594 -27.597.1 Milk - liquid 31059 32407 -4.167.2 Milk products 2678 15128 -82.307.3 CIS — -34 -100.007.4 GFCE — -908 -100.00
8. Edible oils & oilseeds 15674 23204 -32.458.1 Edible Oils 15641 18814 -16.878.1.1 Vanaspati 1533 3526 -56.528.1.2 Mustard oil 5558 5249 5.898.1.3 Groundnut oil 6125 5420 13.018.1.4 Coconut oil 462 1948 -76.28
49

SARVEKSHANA
Appendix III(contd.)
A Disaggregated-Level Comparison between Unadjusted NAS and NSS Estimates ofPrivate Consumption Expenditure Rs. Crore
Item NSS NAS % difference
8.1.5 Gingili (Til) Oil 363 482 -24.698.1.6 Linseed oil 173 98 76.538.1.7 Edible oils (others) 1427 2091 -31.768.2 Oilseeds 33 3508 -99.068.3 Imported oils — 210 —8.4 CIS — 672 —
9. Meat, egg & fish 11923 21737 -45.159.1 Meat: Total 6259 11180 -44.029.1.1 Goat meat 3315 2932 13.069.1.2 Mutton 886 871 1.729.1.3 Beef 503 633 -20.549.1.4 Pork 208 546 -61.909.1.5 Buffalo Meat 302 643 -53.039.1.6 Other Meat 51 — —9.1.7 Other meat - by product — 1422 -100.009.1.8 Chicken 994 4133 -75.959.2 Other birds 48 499 -90.389.3 Eggs & egg products 1146 2487 -53.929.4 Fish 4448 7450 -40.309.5 Others 22 — —9.5 CIS — 122 —
10. Fruits, vegetables & their products 28851 68036 -57.5910.1 Vegetables 21035 17850 17.8410.1.1 Potato 4290 4698 -8.6810.1.2 Onion 2588 2132 21.3910.1.3 Sweet potato 48 487 -90.1410.1.4 Other vegetables 13823 8044 71.8410.1.5 Flowers 286 1093 -73.8310.1.6 Kitchen garden — 1396 —10.2 Total fruits 7459 48078 -84.49
50
SARVEKSHANA
Appendix III(contd.)
A Disaggregated-Level Comparison between Unadjusted NAS and NSS Estimates ofPrivate Consumption Expenditure Rs. Crore
Item NSS NAS % difference
10.2.1 Banana 1720 4067 -57.7110.2.2 Coconut 1523 3299 -53.8310.2.3 Mango 692 3115 -77.7810.2.4 Grapes 327 689 -52.5410.2.5 Copra 296 660 -55.1510.2.6 Groundnut 609 3232 -81.1610.2.7 Cashew nut 101 1343 -92.4810.2.8 Other fruits 2191 31673 -93.08
10.3 Fruits & vege. Products 357 2108 -83.0610.3.1 Pickles 283 — —10.3.2 Sauce 34 — —10.3.3 Jam, Jelly 40 — —10.3.9 fruit products — 2108 —
11. Salt 595 595 0.00
12. Spices 8015 8015 0.00
13. Non-alcoholic Beverages 9156 6422 42.5713.1 Tea 8024 4445 80.5213.2 Coffee 589 747 -21.1513.3 Ice 6 — —13.4 Cold beverages 104 — —13.5 Fruit juice & shakes 93 — —13.6 Others 340 571 -40.4613.7 CIS of Tea, coffee — 659 —
14. Processed / Other food 5910 5436 8.7214.1 Biscuits & confec. 1586 3602 -55.9714.1.1 Biscuits 1586 1793 -11.5414.1.2 Sugar confectionery — 1809 —14.2 Salted refreshment 1780 — —
51

SARVEKSHANA
Appendix III(contd.)
A Disaggregated-Level Comparison between Unadjusted NAS and NSS Estimates ofPrivate Consumption Expenditure Rs. Crore
Item NSS NAS % difference
14.3 Prepared sweets 1179 — —14.4 Cake & pastry 42 — —14.5 Other/ processed food 876 1269 -30.9714.5.1 other processed 873 1269 -31.2114.5.2 Honey 3 — —14.6 baby food, powder milk, ice cream 447 — —14.6.1 Baby food 125 — —14.6.2 Powder / condensed 285 — —14.6.3 ice cream 37 — —14.7 CIS of other food — 565 -100.00
15. Pan & its ingredients 1830 2988 -38.7615.1 Pan 1070 637 67.9715.1.1 Pan leaf 433 — —15.1.2 Pan Finished 637 637 0.0015.2 Ingredients 760 2351 -67.6715.2.1 Areca nut 564 2351 -76.0115.2.2 Lime 40 — —15.2.3 Kattha 54 — —15.2.4 Others 102 — —
16. Tobacco 5877 12309 -52.2516.1 Bidi 3749 6195 -39.4816.2 Cigarettes 1062 5350 -80.1516.3 Leaf Tobacco 508 1449 -64.9416.4 Snuff 33 456 -92.7616.5 Cheroot 140 139 0.7216.6 Other Tobacco Products 385 572 -32.6916.7 Change in stocks — -1852 —
17. Alcoholic beverages and other intoxicants 2525 2393 5.5217.1 Alcoholic beverages 2389 1550 54.13
52

SARVEKSHANA
Appendix III(contd.)
A Disaggregated-Level Comparison between Unadjusted NAS and NSS Estimates ofPrivate Consumption Expenditure Rs. Crore
Item NSS NAS % difference
17.1.1 Toddy 362 — —17.1.2 Country liquor 1546 — —17.1.3 Beer 78 — —171.4 Foreign / refined liquor 403 — —17.1.9 all 1550 -100.0017.2 Opium / other drugs 136 16 750.0017.2.1 Opium / opium etc. 30 16 87.5017.2.2 Ganja 19 — —17.2.3 Other drugs & intoxicants 87 — —17.3 CIS of Beverages — 827 —
18. Hotel & restaurant / cooked meals 3765 6142 -38.70Food Total 224066 315243 -28.92Non-Food Items1. Clothing & footwear 21382 34999 -38.911.1 Clothing 18203 30937 -41.161.2 Footwear 3179 4062 -21.742. Gross (house) rent & water charges 8179 46854 -82.542.1 Gross (house) rent 6210 43507 -85.732.2 repairs & Maintenance 1641 2609 -37.102.3 Water charges 328 738 -55.56
3. Fuel & power 24527 21385 14.693.1 coke 166 22 654.553.2 Firewood, chips 10053 8763 14.723.3 Electricity 4797 3926 22.193.4 Dung cake 2835 2797 1.363.5 kerosene 3648 2906 25.533.6 coal 274 379 -27.703.7 coal gas / gas coke 6 6 0.003.8 L.P.G 1961 1521 28.933.9 Charcoal 28 294 -90.48
53

SARVEKSHANA
Appendix III(contd.)
A Disaggregated-Level Comparison between Unadjusted NAS and NSS Estimates ofPrivate Consumption Expenditure Rs. Crore
Item NSS NAS % difference
3.10 other oils 33 — —3.11 Candles 92 — —3.12 Methylated spirit 0 — —3.13 Gobar gas 43 412 -89.563.14 other fuel & light / veg. waste, bagasse 591 359 64.62
4. Furniture, furnishings, appliances & services 6007 17610 -65.894.1 furniture, furnishing & repairs 716 1312 -45.434.1.1 Carpet 14 581 -97.594.1.2 Coir product 54 4 1250.004.1.3 Wooden & steel furniture 648 727 -10.874.2 Freeze, cooking, washing appliances 1238 1559 -20.594.2.1 Non-electrical mach. 235 248 -5.244.2.2 Electrical mach. 667 782 -14.714.2.3 Refg’tr & AC 336 529 -36.484.3 Glassware, tableware & utensils 1269 7679 -83.474.3.1 Glass & glass product 44 514 -91.444.3.2 Earthenware & china 157 1864 -91.584.3.3 Metal utensils 978 1543 -36.624.3.4 other metal / hh. Utensils 90 3758 -97.614.4 Other goods 1440 3689 -60.974.4.1 Matches 619 1917 -67.714.4.2 Misc. personal goods 594 376 57.984.4.3 Plastic products 113 580 -80.524.4.4 Rubber products 14 122 -88.524.4.5 Batteries 100 694 -85.594.5 Services 1344 3371 -60.134.5.1 Domestic services 813 2051 -60.364.5.2 Laundries, dry cleaners 531 1272 -58.254.5.3 Insurance — 48 —
5. Medical care & health services 18221 19543 -6.76
54
SARVEKSHANA
Appendix III(contd.)
A Disaggregated-Level Comparison between Unadjusted NAS and NSS Estimates ofPrivate Consumption Expenditure Rs. Crore
Item NSS NAS % difference
6. Transport equipment & operational cost 7178 24592 -70.816.1 equipment & repairs 3353 8653 -61.256.1.1 Motor vehicles & parts 309 1377 -77.566.1.2 Mobike, scooter & cycle 2768 3787 -26.916.1.3 Other transport equipment 29 — —6.1.4 Repairs services 247 3489 -92.926.2 Tyres & tubes 209 735 -71.566.3 Road tax 663 102 550.006.4 Petrol & diesel 2953 15102 -80.45
7. Transport services 8450 36143 -76.627.1 Air fare 31 170 -81.767.2 Rail fare 1030 3913 -73.687.3 Bus (tram) fare 6058 18296 -66.897.4 Taxi, auto rickshaw 596 11447 -94.797.5 Others with incidental services 735 2317 -68.288. Communication 1048 4258 - 75.398.1 Postage, telegram and others 359 864 - 58.458.2 Telephone charges 689 3393 - 79.69
9. Recreation, Education & cultural services 11811 17626 -32.999.1 Equipment, paper & stationery 5093 6330 -19.549.1.1 TV & Radio 1331 1883 -29.319.1.2 Other musical Instrument 3 18 -83.339.1.3 Photographic goods 117 119 -1.689.1.4 Office machinery — 31 —9.1.5 Sports & athletic goods 173 48 260.429.1.6 Books, journals, newspaper, periodicals 2245 2670 -15.929.1.7 Stationery & fountain pen 1224 95 1188.429.1.8 Fireworks — 1466 —9.2 Recreation & Cultural services 1356 1204 12.629.2.1 Cinema, Theatre 867 — —
55

SARVEKSHANA
Appendix III(contd.)
A Disaggregated-Level Comparison between Unadjusted NAS and NSS Estimates ofPrivate Consumption Expenditure Rs. Crore
Item NSS NAS % difference
9.2.2 Mela, fare, picnic 155 — —9.2.3 club fees 22 — —9.2.4 other amusements 276 — —9.2.5 Library charges 36 — —9.2.6 all — 1204 —9.3 Education 5362 10092 - 46.879.3.1 Private tuition fees 1360 582 133.689.3.2 Others 4002 9510 -57.92
10. Misc. goods & services 24901 36519 -31.8110.1 Personal care & effects 7290 10897 -33.1010.1.1 Barber, beautician etc. 1631 1186 37.5210.1.2 Religious services 183 1359 -86.5310.1.3 other personal services /
other consumer services 2712 618 338.8310.1.4 Sanitary services 148 939 -84.2410.1.5 Services n.e.c. 1193 1691 -29.4510.1.6 Tailoring services 1423 5058 -71.8710.1.7 TV & Radio services — 46 —10.2 Personal goods n.e.c 17462 11697 49.2910.2.1 Jewellery goods 1175 3806 -69.1310.2.2 Watches, clock 185 421 -56.0610.2.3 Leather products 79 405 -80.4910.2.4 Non-metallic mineral pro. 163 140 16.4310.2.5 Toilet product 15860 6925 129.0310.3 Other misc. services 149 13925 -98.9310.3.1.Banking charges x 9081 —10.3.2 Legal services 81 1452 -94.4210.3.3 Business services 68 719 -90.5410.3.4 Life insurance x 2673 —
Total non-food 131704 259529 -49.25Total consumption expenditure 355770 574772 -38.10
56

SARVEKSHANA
S.D. Tendulkar (Delhi School of Econom-ics, Delhi University): In the 50th Round ofthe NSS (1993-94), the data were collectedfor both 30 days and 365 days reference pe-riod, for the item-groups like clothing, foot-wear, durables, transport equipment, educa-tion and health services. For such item-groups, it would be useful to undertake com-parison of NAS estimates with the corre-sponding NSS estimates based on the datacollected with 365 days reference period.Also, for the item-groups food grains and‘clothing and footwear’, a comparison of the1993-94 series of the NAS estimates withthe pre-revised 1980-81 series of the NASestimates may be included.
Regarding the observations made on the ba-sis of the validation exercise undertaken bythe authors, I have the following commentsto offer:
1. The statement that the estimate of 10per cent share of the NPISHs in NASestimate of PFCE is on the higher sidemade in the paragraph on “Coverage”is based on subjective judgement.
2. In the context of the “cooked meals”served to domestic helps as a part oftheir remuneration, contained in theparagraph on “cooked meals”, authorsclaim that the method followed in theNSS leads to underestimation. The ar-gument is not clear.
3. On the observations made in respectof ‘Hotel and Restaurant’: (a) What isthe basis for assuming that 33 per cent
of the output of hotels and restaurantsforms part of private consumption? (b)Does the NAS estimate for private con-sumption of hotel and restaurant ser-vices include a part of non-alcoholicbeverages? [Third paragraph of thesection on ‘Hotel and Restaurant’]
4. Some more detailed analysis is re-quired on the difference between theestimates for “clothing and footwear.”
5. Some more detailed analysis is re-quired on the difference between theestimates for “Glassware, tableware &utensils” and if possible also providequantity-price comparison. [Table 27]
6. What are the bases of taking 80 percent of rail fare, 15 per cent of airfare,50 per cent of taxi fare and 90 per centof auto-rickshaw and bus fare as pri-vate final consumption? [Second para-graph of the section on ‘transport Ser-vices’]
7. The estimated number of vehiclesavailable from the MoST can at bestbe underestimates and hence would notexplain the divergence between theNSS and NAS estimate of transportfares. [Table 29]
U. Dutta Roychoudhury (Retired fromCentral Statistical Organisation): My com-ments on the report are as follows:
1. The study shows it very clearly thatfor some of the items like milk andmilk products and manufactured articlesNAS estimates need looking into. In
Discussion on the Report “Cross ValidationStudy of Estimates of Private Consumption Expenditure
available from Household Survey and National Accounts”
57

SARVEKSHANA
these cases NAS estimates of quantityconsumed need looking into and per-haps need revision.
2. Unless the price problem is solvedthere is no point in undertaking a com-parison. From the revaluation by theNSSO prices the difference goes downin many of the cases. When the esti-mates are derived by the commodityflow method the prices have to be thesame as for other estimates of NationalAccounts. It is impossible to solve thisproblem except to say that the prob-lem may be pointed out to the Com-mission and give them the alternativederived estimates and its total point-ing out very specifically that it hasbeen derived independently and are notthe same as the NAS estimates. Theyshould therefore preferably use them.On the other hand, the NSS estimatesof rent and taxes must be adjusted.Also the difference in coverage be-tween NAS and NSS estimates mustdefinitely be highlighted.
3. For some of the items like hotels andrestaurants, durables, travelling ex-penses, the NSS estimates need look-ing into. This is also true of cookedmeals used as wages by workers en-gaged in providing services for em-ployers households. There are severalother items of similar nature listed inConcluding Remarks which need to beexamined.
B.S.Minhas (Retired from Indian StatisticalInstitute, Delhi): I had been looking forwardto reading this study as it promised to be anextension of some research work which mycolleagues and I had done in the late 1980s.I have quickly read the whole manuscript.
However my comments relate mostly tosome aspects of Table 1, in the first sectionof the report.
I Does the change in consumption ex-penditure between 1987-88 and 1993-94, as per NAS data, make sense? Initself? Or in relation to other aggre-gates, such as National Income of theNAS?
The NAS Consumption Expenditure in1993-94 is estimated at Rs.574,772crores, as against Rs.224,061 crores in1987-88, implying an increase of156.5% in six years. Using an inde-pendent (directly observed) index ofwholesale prices (the implicit deflatorsare suspect when the data on whichthey are based are suspect), increasein wholesale prices over the same sixyear period works out to 72.6%. Inother words, according to the NAS, ag-gregate private consumption expendi-ture of the Indian people rose by (156.5- 72.6) 83.9% in real terms (taking theprice inflation out) in just six years.This implies an average annual in-crease of about 14% in real terms. Re-member, over this period, real incomegrowth per year was around 5-6%(1987-88 to 1993-94). How can thishappen? Is it possible? Where fromdid income come to finance annual in-creases in consumption expendituresof the order of 14% per year between1987-88 & 1993-94?
These puzzles are not difficult to un-ravel. Why cross validate, when inter-se validity of the NAS over-time is cry-ing out loud for questioning. The Na-tional Statistical Commission may wishto give some thought to this problem.
58

SARVEKSHANA
Contemporary Data on Consumer Expenditure(Rs. Crores)
1982-83 1983-84 1983NSS 117750NAS 114480(a) 136400(b) 125440 ((a+b)/2)
II Let us look at the changes in aggre-gate consumer expenditure estimatedthrough Consumer Expenditure Sur-veys by the NSS.
The NSS estimate of consumer expen-diture in 1993-94 was shown to beRs.335,770 crores as againstRs.173,765 crores in 1987-88 (seeTable 1 of Report (NAD/SDRD) p.3).This shows an increase of 104.7% overthe six year period and adjusting forthe (same) price rise of 72.6%, the realincrease in aggregate national con-sumer expenditure works out to about32% over a six year period – an aver-age annual increase of around 5.3%.
III Some Comments on 1983 Data
My colleagues and I had done detailedcross validation of the 1972-73 as wellas 1977-78. However, it is not gener-ally known that Mr. Kansal and I hadalso published a paper on the 1983 data(Journal of Income and Wealth, JIW,Vol.II, No.1, January 1989, pp.7-24).We had indicated that the difference be-tween the NSS and NAS data for 1983,adjusted for differences in reference
periods, prices etc., were rather small.However this Report (NAD/SDRD)shows (Table 1, p.3) the difference tobe 24.88%; NAS NSS by 24.88%?This is wrong. First the NSS estimateof expenditure on non-food for 1983(January-December) was Rs.48710crores rather than Rs.3996 crores in-dicated in the Report.
The NSS estimate of aggregate con-sumer expenditure of 1983 (Jan-Dec)is Rs.117750 crores (See Table 1 p.16of our 1989 paper loc. Cited) Comparethis with the contemporary estimatesfor 1982-83 (Rs.114480) and 1983-84(Rs.136400) of the NAS. We have inthe above cited paper made some re-fined adjustments for comparability ofthe two data sets and found the differ-ence between the NSS and NAS wasaround six per cent
NSS food-grains consumption washigher than NAS but the non-food ex-penditure of NAS was higher thanNSS.
Let me offer a crude (but defensible)simple cross-validation exercise forNSS 1983 vs. NAS 1983-84.
Since the NSS data was for January-Decem-ber 1983 and the agricultural year is fromJuly-June i.e.82-83, it is June 1982-July 1983and for 1983-84, it is from June 1983-July
1984. The consumption of food and otherconsumption goods in 1983 would be from1983 and 1983-84 production, we can aver-age the consumption of those two years for
59

SARVEKSHANA
comparison purposes. Seen the way the dif-ference between NSS and NAS for 1983
comes to 6.3%. However if one were to takethe non-contemporary, so called revised,
estimates of NAS (as they appear onTable 1 of the Report) then the difference isabout 9.5%.
IV In our paper, “Firmness, Fluidity andMargins of Uncertainty in NationalAccounts Estimates of Private Expen-diture in the 1980s”, JIW, Vol. 12,No.1, January 1990, pp 92-102 we haddemonstrated that the NAS procedureswere subject to very large errors. Thecross-validation studies for the con-sumer expenditure data for 1972-73,1977-78 and 1983, showed that the dif-ferences between the NSS and NASestimates were well within the rangeof uncertainty which surrounds theNAS estimates (around 20% in PFCE).However there seems to be no inter-seconsistency between the NAS esti-mates of PFCE for 1987-88 and 1993-94. In fact, the increase in NAS con-sumer expenditure between 1987-88and 1993-94 has been shown to be soinconsistent with changes in other na-tional income aggregates that no pur-pose is likely to be served by attempt-ing a cross-validation study of the re-vised NAS data with the NSS data for1993-94.
In the 1990’s, there has been manywrite-ups in the popular press aboutthe fluidity and lack of objectivity in
India’s national Accounts Statistics. Itseems that the main burden of unprin-cipled revisions and arbitrary adjust-ments has been borne by the PFCE es-timates. I do have some disturbing ob-servations to make on some sectoralconsumption expenditure estimatesdiscussed in the Report under exami-nation. The revision process seemsnothing short of a fast breeder reactorfor accumulating errors. One looks invain for any methodological studies orscientific procedures for the accep-tance of new data, or sources in theNAS. The whole exercise seems to betoo fluid to accommodate any concernsfor consistency and other optimalityproperties in the estimates of aggregateconsumption expenditure.
Vaskar Saha (Central StatisticalOrganisation): The Central Statistical Orga-nization (CSO) compiles and publishes theestimates of Private Final Consumption Ex-penditure (PFCE) in its annual publicationNational Accounts Statistics (NAS). The Na-tional Sample Survey (NSS) Organization,on the other hand, conducts Household Con-sumption Expenditure Survey (HCES) forcollecting data on Household ConsumptionExpenditure (HCE) [either with thin second-stage sample (annual round) or with largersample (quinquennial round)] and releasesvarious estimates on HCE. Ideally the two
1983 1982-83 1983-84NSS 118445(corrected for error)NAS 130282(a+b/2) 11480(a) 14608(b)
100 x 130282-118445 = 9.6% 118445
NSS (1983) vs. NAS Revised Data
( )
60

SARVEKSHANA
estimates derived through PFCE and HCEshould not vary significantly as both the es-timates attempt to measure Household Con-sumption Expenditure though the approachesare different. But in reality the divergencebetween the two estimates are increasing sig-nificantly over the years. In fact quite a fewstudies have been conducted, as pointed outby the Study Group (SG) consisting of NADand SDRD, to find out the reasons for diver-gences between the NSS and NAS estimatesof consumption expenditure for some se-lected years. It was observed by the SG thatthe divergences between these two estimateswere within about 10% in the years, namely,1957-58, 1960-61, 1967-68, 1972-73 and1977-78, but the same was as high as 25%by 1982-83 and remained at almost the samelevel in 1987-88. The SG also found that thedifference between these two estimates wasabout 38% in 1993-94. If the estimates oftotal consumption are examined at food andnon-food categories, the SG observed thatthe contribution of non-food items in the di-vergence of estimates has increased in amuch faster rate than that of the food items.After identification of possible reasons forsuch high divergences between the NAS andNSS estimates, the SG suggested a numberof measures to reduce such divergences infuture. The SG has also observed that the di-vergence in the two sets of estimates is in-evitable because of differences in approach,coverage, reference period, classificationscheme, etc. Keeping all these points in view,an attempt has been made in the followingparagraphs to suggest, even at the cost ofrepetition of what had been identified by theSG, the steps required to be taken for reduc-tion of such divergences between the NASand the NSS estimates in future:
1. The cross-validation studies on the es-timates of private consumption expen-
diture from two sources, namely, NSSand NAS, have primarily been doneby the academicians and researchscholars. The recent attempt made bythe official agencies responsible for thecompilation of NAS and NSS data isdefinitely a welcome step and similarstudies should be attempted in futurealso by the concerned official agenciesat least for the reference years whenNSS quinquennial surveys on con-sumption expenditure are conducted.
2. The NAS estimates of PFCE are de-rived from the production side using“commodity flow” approach and theadjustments required for conversion ofproducer’s price to consumer price areappropriately made in this estimate.But these estimates include the finalconsumption of the Non-profit Insti-tutions Serving Households (NPISHs),as the consumption data of NPISHs arenot separately available from anysource. In order to make the estimatescomparable, there is an urgent need todevelop a mechanism for getting sepa-rate estimates for the consumption ex-penditure and other important param-eters of NPISHs. Since NPISHs is oneof the five institutional sectors as faras System of National Account (SNA)is concerned, detailed informationabout NPISHs is essential not only forcross-validation purpose but also forthe preparation of sequence of ac-counts for the five institutional sectors.Till such a mechanism for regular datacollection in respect of NPISHs is de-veloped, the contribution of NPISHsin the economy should be estimatedthrough special studies.
3. The NSS estimates are derived from
61

SARVEKSHANA
the consumption side with the help ofscientific sampling technique and cov-ers only pure households. In the NSSsurveys, therefore, police, defence per-sonnel, houseless persons, institutionalpopulation like the inhabitants of or-phanages, prison and hospitals, etc.,are not included. In the NAS, however,consumption expenditures of thesepersons are included. Therefore appro-priate adjustments should be made inthe NSS estimates to make the NSSand the NAS estimates comparable.
4. The existing consumer expenditureschedule of NSS is quite lengthy andas such may suffer from respondent’sfatigue especially towards the end ofdata collection from a household whendata are collected for non-food items.Thus, in order to reduce respondent’sfatigue, special emphasis should begiven for shortening of NSS consumerexpenditure schedule. Study based onthe past data should be done for theselection of items/ item groups for thepurpose of shortening of schedule andsuitable instructions should be givento the field investigators for the col-lection of data. The survey results ob-tained through canvassing of abridgedschedules in various rounds encourageworking in this direction. In order tohave an idea about the respondent’s fa-tigue, sequence for collection of data(non-food items first then food itemsand vice versa) should also be changedand studies in this direction should beencouraged.
5. Reduction of recall lapse in the HCESis also an area where urgent attentionis needed by the NSSO. For this pur-pose, selection of appropriate reference
periods for data collection is very im-portant. The Pilot Study on referenceperiod recently conducted by theNSSO under the guidance of Prof. N.Bhattacharya throw significant light onthis aspect. In fact this study on refer-ence period revealed that even the ‘pre-vious day’ as reference period is alsovery important for some items. Effortsshould be made to conduct similarstudy in future also and the findings ofthese innovative studies should be usedto determine the appropriate referenceperiod for future NSS surveys. Appro-priate correction factors should also beattempted through these studies toguard possible under and/or over esti-mation of certain items in the detailedHCES. At the time of cross-validationstudy on the estimates of consumptionexpenditure from NAS and NSS, find-ings of these innovative studies shouldbe used, wherever necessary, to explainthe observed divergences.
6. The NSSO should conduct focused sur-vey with appropriate sample size insome selected areas. In case of con-sumption of fruits or tobacco by house-holds, for example, it would be diffi-cult to find out reliable estimatesthrough sample surveys covering theentire country where the objective ofthe survey is primarily to collect dataon consumer expenditure for all foodand non-food items. Focused type stud-ies providing emphasis on fruits or to-bacco, as in the above example, withrelatively small sample size will comeas a rescue in such situations. Correc-tion factors could be found out throughsuch scientific type studies. In case oftobacco consumption, the NSS esti-mate based on large-scale survey is
62

SARVEKSHANA
likely to be on the lower side, as thedata collected from a senior memberof the household through enquirymethod may suffer from under-report-ing due to inhibitions against con-sumption of tobacco. Focused surveywith appropriate sample design andwith limited items should be conductedto collect reliable information in thesesituations.
7. Contributions from affluent householdsplay an important role in the estimatesof some parameters through NSS sur-veys. In the consumer expenditure sur-vey special effort is normally made forcollecting data from affluent house-holds. Non-cooperation from the afflu-ent households particularly in urbanarea could lead to under estimation insome important items like durablegoods, fruit consumption, etc. Theproblem of non-cooperation needs tobe tackled urgently through rigorouspersuasion, if necessary by senior of-ficers or by enacting appropriate Act.
8. NAS is compiled keeping in view theSNA framework. According to SNAcertain notional values like imputedrent and Financial Intermediation Ser-vices Indirectly Measured (FISIM) areincluded in the NAS. But these imputedvalues are not covered in the NSS esti-mates. The contribution of the imputedvalues is quite significant in NAS. Theimputed values should, therefore, beadjusted in NAS estimates while at-tempting cross-validation study tomake the estimates comparable.
9. Wide difference between the estimatesof private consumption expenditureavailable from NAS and NSS indicatesthe existing weakness in the statistical
system in India. In order to criticallyexamine the deficiencies of the presentstatistical system, the Government ofIndia constituted the National Statisti-cal Commission (NSC) under theChairmanship of Dr. Rangarajan, thethen Governor of Andhra Pradesh. TheNSC made a number of recommenda-tions to revamp the statistical systemto generate timely and reliable statis-tics. In fact the total number of recom-mendations made by the NSC is morethan six hundred in number. All the rec-ommendations are important for re-vamping the exiting statistical system.However, due to availability of limitedresources both human and capital, pri-ority should be assigned to a few se-lected recommendations for implemen-tations, which have direct bearing onthe improvement of the statistical sys-tem particularly relating to economicstatistics. These selected recommenda-tions should also cover the areasneeded for estimation of private con-sumption expenditure by the NSS andthe NAS.
10. The IMF has taken initiatives for en-hancing the availability of timely andcomprehensive statistics with respectto all the important sectors of theeconomy for arriving at sound macro-economic policies by the membercountries. In order to achieve this ob-jective, Special Data DisseminationStandard (SDDS) with respect of 17data categories broadly grouped under(i) real sector, (ii) fiscal sector, (iii) fi-nancial sector, and (iv) external sectorwere evolved by the IMF in 1996. Sub-sequently the IMF evolved the Gen-eral Data Dissemination System(GDDS) in 1997 for those countries,
63

SARVEKSHANA
whose statistical system is not strongenough to meet the standards of SDDS.Further work has been done by the IMFto complement SDDS and GDDSthrough the development of the DataQuality Assessment Framework(DQAF). The IMF also has taken ini-tiative to increase the number of coun-tries actively pursuing SDDS subscrip-tion. The objective for the preparationof the DQAF was to provide a com-mon structure for assessing the dataquality. Further, the DQAF has beenintegrated into the data module of Re-ports on Observance of Standards andCodes (ROSCs). India is participatingin SDDS and a mission from the IMFvisited India recently to prepare a re-port on the ROSC. The IMF missionmade an in-depth assessment of thequality of data categories of nationalaccounts, price indices, balance of pay-ments, government financial statistics,and monetary statistics. These reportswill highlight the status of the country’sstatistical system with respect to thestandard laid down by the IMF. Rank-ing in the form of three categories,namely, Observed (O), Largely Ob-served (LO) and Largely Not Observed(LNO) are being assigned to variousaspects of data collection, compilation,dissemination, etc., relating to four sec-tors, viz., (i) real sector, (ii) fiscal sec-tor, (iii) financial sector, and (iv) ex-ternal sector as compared to the bestinternational practices. If the Countryagrees, the ROSC will be displayed inthe IMF website. The study includesimplementation of 1993 SNA. As faras the private consumption expenditureis concerned, 1993 SNA envisages theclassification to follow is the COICOP.
For meeting the international require-ment, the consumer expenditure surveyconducted by the NSSO should makenecessary provision in the CES sched-ules so that PFCE data of NAS couldbe released following COICOP.
11. The goods and services produced orconsumed in an economy are ex-pressed in monetary terms for aggre-gation. Pricing of goods and servicesplays a very important role for this pur-pose. The SG felt that a substantial partof the difference between the NAS andNSS estimates could be explained bythe differences in implicit prices ofvarious consumer goods. For this pur-pose, the SG made a detailed compari-son between the NAS and NSS esti-mates for different items/ item-groupsof food and non-food consumption for1993-94 and very significant differ-ences were observed in some items/item-groups. After eliminating the ef-fect of differential implicit prices in thetwo sets of estimates, the SG reducedthe differences significantly. Removalof the effect of differential implicitprices is essential for a valid compari-son between the estimates of consump-tion expenditure. While doing thecross-validation study in future, thisaspect needs to be taken care of by ad-justing the NAS or NSS estimates interms of NSS or NAS prices or a com-bination of both.
12. The NAS estimates might suffer fromover estimation in some area. The es-timates of number of vehicles, for ex-ample, are taken from the Ministry ofSurface Transport, which are based onnumber of registration of vehicles andnot on the actual number of vehicles
64
SARVEKSHANA
in operation. So for finding out the con-tribution of transport services in NAS,the actual number of vehicles in op-eration and the estimates of per vehicleearnings are to be found out in a reli-able manner. Periodic sample surveysare to be conducted in such cases tofind out the contribution of such areasin the NAS.
13. For the compilation of NAS estimates,all the goods and services produced inthe economy during the particular ac-counting year are to be covered. Butdata for all goods and services pro-duced in the economy during that par-ticular accounting period are not gen-erally available at the time of compila-tion either because the data are not col-lected at all or the data are yet to bereleased by the source agency. In suchcases the NAS uses various rates, ra-tios, norms, results of type studies, pasttrend, etc. Though there is no alterna-tive to this practice in the compilationof NAS if the advance release calen-dar of NAS is to be maintained, the re-liability of the NAS estimates, nodoubt, depends a great deal on the ac-curacy of rates, ratios, etc., used for thecompilation of the NAS. But some ofthe rates and ratios, which are presentlybeing used by the NAS are based onthe results of studies carried out longback. Thus the various rates, ratios,norms, etc., used in the compilation ofNAS should be updated on a regularbasis in order to take care the temporaland/ or technological changes.
14. The SG has identified substantial dif-ferences between the NAS and the NSSestimates even at item/ item group levellike ‘fruit’, ‘milk products’, vanaspati’,
‘chicken’, ‘eggs and egg products’ etc.Studies should be carried out to iden-tify the reasons for such high diver-gences. For the NAS, the NationalHorticulture Board (NHB), for ex-ample, is the main source for the pro-duction and price data for the fruits notcovered in area and production statis-tics by the Directorate of Economicsand Statistics, Ministry of Agriculture.The methodology followed by theNHB for the estimation of productionand price data for these fruits requiresa relook. In fact as recommended bythe National Statistical Commission,the methodology adopted for crop es-timation survey on fruits and veg-etables should also be reviewed and analternative methodology for the esti-mation of production of horticulturecrops should be developed. In this en-deavour, special emphasis should begiven for estimating the production ofhigh valued crops like mushroom,herbs, etc.
The authors replied, in writing, as follows:
Comparison between the 1993-94 se-ries of the NAS estimates with the pre-revised 1980-81 series of the NAS:
As mentioned in a footnote (footnote 3) ofthe report, the study was confined to the com-parison of only the revised (1993-94 series)NAS estimates and NSS estimates. Compari-son of the estimates of the present series withthe pre-revised estimates, as Tendulkar sug-gests, amounts to introduction of an addi-tional dimension to the study, which calls formore detailed analysis. This kind of an analy-sis would no doubt enable one to commenton the latest revision, as was attempted byMinhas et. al. in their paper “Firmness, Flu-
65

SARVEKSHANA
Estimates PFCE (Rs. Crore) 1987 to 1993-94 annual realGrowth (%) growth rate
1987-88 1993-94 nominal real
Table 1: Annual Growth Rate of Consumption Expenditure (%) – from NAS and NSS
PFCE Quoted by Prof. Minhas 224,061 574,772 156.5 48.6 6.8CES of the NSSO 173,765 335,770 93.2 12.0 1.9Current-price PFCE(1993-94 series) 260,195 574,772 120.9 28.0 4.2PFCE at 1993-94 prices(1993-94 series) 451,215 574,772 — 27.4 4.1
idity and Margins of Uncertainty in NationalAccounts Estimates of Private Expenditurein the 1980s” for the revision of the NASseries done with 1980-81 as the base year.But, as the focus of the study was to exam-ine the validity of the NAS and NSS esti-mates, particularly the sources and methodscurrently used for national accounting (whichhave evolved over the years through a seriesof revisions), this was not attempted in thestudy. The purpose of the study was to in-vestigate the reasons of divergence betweenthe two sets of estimates, rather than on theNAS revisions. It was considered more rel-evant to identify the areas where the diver-gence was most pronounced and isolate thepossible reasons for the same. Inter-se con-sistency between the NAS estimates of PFCEdrawn from two different series was there-fore not an issue for the study.
The comparison between the estimates for1987-88 and 1993-94 attempted by Minhasuses estimates from two different series ofnational accounts statistics (NAS) and arethus not comparable. Minhas has arrived atan annual increase in PFCE of the order of14% per year between 1987-88 & 1993-94,using the estimates given in Table 1 of thereport, and an increment of 72.6 per cent inWholesale Price Index (WPI) during the pe-
riod. Apart from the inadequacies of WPI asa deflator of consumption expenditure (as ser-vices are not included in the basket used forWPI), the procedure used by Minhas employsa kind of linear growth rather than compoundgrowth. Using the same numbers but underthe assumption of compound growth, theannual growth rate works out to around 7 percent (not 14 per cent) for PFCE estimatesfrom two different series and 2 per cent forthe estimates from the household consump-tion expenditure survey (HCES) of theNSSO. Minhas has obtained an estimate of5.3 per cent annual growth rate for the esti-mate of consumption expenditure of NSSO.(See Table 1 of this note)
For a valid measure of growth rate of a macro-economic aggregate, it is essential to use theestimates drawn from the same series of theNAS. The CSO has published the estimatesof the earlier years that are comparable to theestimates of 1993-94 series of NAS. The an-nual growth rates, derived following the sameprocedure, from the comparable estimates ofthe 1993-94 series of NAS, turns out to bearound 4 per cent for both deflated current-price and constant-price estimates. The dif-ference between the growth rates obtainedfrom the two sources is indeed significant,but is not as striking as projected in Minhas’
66

SARVEKSHANA
Table 2: Aggregate estimates of food and non-food consumption in 1983-84 based onNSS 38th Round (1983)
MPCE (Rs): food 73.63 97.31 —MPCE (Rs): non-food 36.68 68.49 —population (000) as on 1st Oct. 1983 550922 172187 —Aggregate consumption (Rs. Crores)food 49,353 20,386 69,739non-food 24,586 14,348 38,934total 73,939 34,734 1,08,668
Estimates rural urban total
comments. The purpose of undertaking thestudy was essentially to explore for the rea-sons of such divergence.
To guard against misinterpretation ofTable 1 of the report, the study group whilerevising the first draft has introduced a foot-note (footnote 3), so that the study would notappear to be an attempt at temporal compari-son of the PFCE estimates.
On 1983 Data
Minhas has questioned the estimates for1983-84 cited in Table 1 of the report. Themethod of computing the NSS estimates forthe financial year 1983-84 is indicated inTable 2 of this note. The population projec-
tions are taken from the Population Projec-tion for India and States 1981 – 1985 of theRGI. These estimates differ considerablyfrom those referred to in the paper mentionedby Minhas. First, the NSS estimates of non-food expenditure (Rs. 48,000 Crores) quotedby him from his paper (1989) is in fact anadjusted estimate – the estimate based onHCES 1983 adjusted by imputed house rent.The NSS estimates presented in the Table 1of the report are based on survey-based esti-mates of actual household consumption ex-penditure and are not adjusted in any way.This is indicated clearly in the accompany-ing text of the report. Further, Table 3 andthe accompanying text of the report alsoreveal that the high order of divergence
between the estimates from the two sourcescontinues to persist even after making appro-priate adjustments for imputed house rent.
The NAS estimates quoted by Minhas per-tain to the 1970-71 series of NAS, whereasthe figures quoted in the report are taken fromNAS 1990. His comments on the estimatesfor 1983-84 have however helped us in re-viewing the first draft and make necessarycorrections in this respect.
Regarding the “refined” adjustments done by
Prof. Minhas and his colleague in their pa-per, the Study Group was of the view thatsuch refinements are too fine to help iden-tify the actual reasons for the observed di-vergence. As discussed in the report, thegrowth in production of food grains between1992-93 and 1993-94 was too low to signifi-cantly affect the comparability on this count.Moreover, such adjustments for referenceperiod involve too many strong assumptionsto render validity to their results as possibleexplanation for the divergence.
67

SARVEKSHANA
Comparing survey results based ontwo different reference periods:This was kept outside the scope of the studyfor much the same reason as mentionedabove. It may, however, be noted that NSSestimates based on data collected with 365days reference period are usually less thanthose based on data collected with 30 daysreference period. Thus, the comparison be-tween the NAS and NSS estimates for theseitem-groups, as suggested by Tendulkar,would have been poorer, had the estimatesbased on data collected with 365 days refer-ence period been used. However, as sug-gested, we have now mentioned in the firstparagraph of Section 4 that “The NSS esti-mates used for this purpose are based on thedata collected with 30 days reference pe-riod”.
Share of NPISHsThe statement made in the report that the es-timate of 10 per cent share of the NPISHs inNAS estimate of PFCE is on the higher sideis indeed subjective, but is founded on a gen-eral idea formed from the estimates of othermacro-economic aggregates and the data ofEconomic Census 1998.On cooked mealsThe claim made in the first draft that themethod followed in respect of recording“cooked meals” in the NSS leads to under-estimation was not clear to Tendulkar. DuttaRoychoudhury too was of the opinion that itneeds further examination. The relevant texthas been revised to express our view moreclearly. It is important to note in this contextthat, in the HCES, the meals served to a do-mestic help who is not a member of the em-ployer household are included only in theconsumption expenditure of the servinghouseholds and not at all in that of the re-
cipients’ households. But, the “cookedmeals” consumed by the domestic help is apart of the remuneration she/he receives forthe services provided to the employer house-hold, which, in turn, is used up as final con-sumption by the latter. Thus, the value of the“cooked meals” served to a domestic helpby an employer household forms a part of‘food’ consumption of the former and thatof consumption of ‘services’ of the latter. Inthe method followed in the HCES, the valueof “cooked meal” representing consumptionof services is not recorded.
Share of PFCE in output of Hotels andrestaurants
There is at present no objective basis for theassumption that 33 per cent of the output isconsumed by the households. The necessityof using a norm based on an objective studyhas been stressed in the recommendations.The value of tea, snacks, beverages and“other processed food” served in the hotelsand restaurants are, in principle, included inthe private consumption expenditure on ho-tels and restaurants, both in NAS and NSS.Only the part of these food items that is con-sumed at home is taken under the respectiveheads.
Disaggregated comparison of itemgroups like‘ clothing and footwear’and “glassware, tableware & utensils”
The classification schemes followed by thetwo agencies do not permit more disaggre-gated analysis, as suggested by Tendulkar.In fact, we could not identify any specificreason for the divergence between the twoestimates, so far as the methodology is con-cerned. Thus, only the facts relating to datasources used have been mentioned, withoutmentioning possible reasons. As for quan-
68

SARVEKSHANA
tity-price comparison of “glassware, table-ware & utensils”, it could not be taken upsince the only available estimates are thoseof value.
Norms used for PFCE on Transportservices
There is at present no objective basis for as-suming that 80 per cent of rail fare, 15 percent of airfare, 50 per cent of taxi fare and90 per cent of auto-rickshaw and bus fare asprivate final consumption. The necessity ofusing norms based on objective studies hasbeen stressed in the recommendations. TheMoST estimates of number of vehicles areknown to be on the higher side as the sys-tem of de-registration is not operative inmany of the States.
Estimates of PFCE on milk and milkproducts
The accuracy of the NAS estimatesdepends heavily on the accuracy ofthe rates, ratios and norms applied on theproduction estimates for arriving at theestimate of private consumption. As pointedout by Roy Choudhury, the NAS estimatesof consumption of milk, milk products andmanufactured articles suffer greatly due toabsence of up-to-date estimates of the re-quired rates, ratios and norms. This defi-ciency and the necessity of taking up stud-ies to overcome them have been stressed inthe recommendations given in Section 5 ofthe report.
On problem relating to valuation ofcommodities consumed and prices
Getting an appropriate price-base for esti-mation of NAS aggregates is indeed a for-midable problem. Roy Choudhury acknowl-edges the problem and expresses her graveconcern about use of different sets of pricedata for estimating the NAS aggregates. Asolution to this problem has been suggestedin Section 5 of the report, which entails ex-amination of implicit prices derived from theNSS estimates of value and quantity for dif-ferent commodities. Roy Choudhury en-dorses the necessity of examining the NSSestimates on the items like hotels and res-taurants, durables, travelling expenses fur-ther. These issues have been covered in therecommendations made in Section 5 of thereport. These recommendations, as sug-gested, have been further re-examined, alsotaking into consideration the Tendulkar’scomments on them, and have now been re-vised appropriately.
We thank the discussants for the commentsthat have helped us in improving the con-tents of the report. We do not have any spe-cific observation to make on the commentsoffered by Saha, which consist of a commen-tary on the findings of the WG and certainsuggestions for improvement in the presentpractices of compilation of NAS and collec-tion of household consumption expendituredata. We regret not addressing all the pointsraised.
69


SUMMARY AND MAJORFINDINGS OF SURVEYS
An Integrated Summary of NSS Fifty-Fifth Round(July 1999-June 2000) Survey Results on Informal Sector
Employment in IndiaAsis Roy and Salil Mukhopadhyay
PART - II

SARVEKSHANA
An Integrated Summary of NSS Fifty-Fifth Round(July 1999 – June 2000) Survey Results on
Informal Sector Employment in India.
Contents Page No.
1. Introduction 73
2. Summary of findings 77
Annex - I Tables 97
Annex –II Sample Design and Estimation Procedure 121
Annex - III Concepts, Definitions and Procedures 133
Annex - IV National Industrial Classification 141(NIC) – 1998
Annex - V Activity coverage for informal 147non-agricultural survey inNSS 55th Round
Annex –VI Facsimile of Informal Non Agricultural 153Enterprises Schedule (Sch. 2.0) andHousehold Employment andUnemployment Schedule (Sch. 10)
72

SARVEKSHANA
1 Introduction1.1 In 1972, the term ‘informal sector’ wasfirst used by the International LabourOrganisation (ILO) to denote a wide rangeof small and un-registered economic activi-ties. Since then, this term has been debatedmuch for want of a universally acceptabledefinition. In the Fifteenth International Con-ference held in January 1993 (ICLS-1993)at Geneva, the Labour Statisticians discussedvarious issues relating to the concept anddefinition of the informal sector and a reso-lution (Resolution-II) concerning statisticsof employment in the informal sector wastaken at the end of the conference. Later, theSystem of National Accounts (1993) recom-mended by United Nations also endorsed thisresolution with regard to the concept of in-formal sector. The concept and definition ofthe informal sector as per the resolutionadopted at the Fifteenth International Con-ference of Labour Statisticians (ICLS-1993)is briefly discussed here.
1.2 Informal Sector
1.2.1 Informal sector may be broadly char-acterized as consisting of units engaged inthe production of goods or services that typi-cally operate at low level of organisation,with little or no division between labour andcapital as factors of production and on asmall scale. Labour relations, where theyexist, are based mostly on casual employ-ment, kinship, or personal or social relations
rather than contractual arrangements withformal guarantees. The production units ininformal sector have characteristic featuresof household enterprises. The owners ofthese production units have to raise the nec-essary finance at their own risk and are per-sonally liable, without limit, for any debtsor obligation incurred in the production pro-cess. Expenditure for production is often in-distinguishable from household expenditure.The capital goods such as building or ve-hicles may be used indistinguishably for thebusiness and household purpose. The fixedand other assets used do not belong to theproduction units as such but to their owners.
1.2.2 For statistical purpose, the informalsector is regarded as a group of productionunits, which form part of the household sec-tor as household enterprises or equivalently,unincorporated enterprises owned by house-holds. Within the household sector, the in-formal sector comprises (i) ‘informal ownaccount enterprises’ that are owned and op-erated by own-account workers, either aloneor in partnership with members of the sameor other households, which may employ con-tributing family members and employees onan occasional basis but do not employ em-ployees on a continuing basis; and (ii) ‘en-terprises of informal employers’ that areowned and operated by employers, alone orin partnership with members of the same orother households, which employ one or moreemployees on a continuing basis. The infor-
An Integrated Summary ofNSS Fifty-Fifth Round (July 1999 - June 2000)
Survey Results on Informal Sector Employment in India
Asis Roy and Salil Kumar Mukhopadhyay *
* Both are working in Survey Design and Research Division, National Sample Survey Or ganisation, Kolkata.
73

SARVEKSHANA
mal sector is defined irrespective of the kindof work place where the productive activi-ties are carried out, the extent of fixed capi-tal assets used, the duration of the operationof enterprise (perennial, seasonal or casual),and its operation as a main or secondary ac-tivity of the owner.
1.2.3 According to the United NationsSystem of National Accounts (Rev. 4), house-hold enterprises (or equivalently unincorpo-rated enterprises owned by households) areunits engaged in the production of goods orservices, which are not constituted as sepa-rate legal entities independently of the house-holds or household members that own them,and for which no complete sets of accountsare available which would permit a clear dis-tinction of the production activities of the en-terprises from the other activities of theirowners. The household enterprises includeunincorporated enterprises owned and op-erated by individual household members orunincorporated partnership enterprisesformed by two or more members of the samehousehold as well as formed by members ofdifferent households.
1.3 Informal sector in the Indian con-text
1.3.1 To measure the contribution of infor-mal sector to the national economy, theUnited Nations Statistical Commission con-stituted an international “Expert Group onInformal Sector Statistics” which ispopularly referred to as the Delhi Group. Theprimary purpose of this group is tofacilitate the exchange of knowledge and ex-perience among countries, internationalorganisations and other concerned agenciesin regard to the measurement of the size ofthe informal sector and its contribution to aneconomy.
1.3.2 In India, the term ‘informal sector’has not been used in the official statistics orin the National Accounts Statistics (NAS).The terms used in the Indian NAS are‘organised’ and ‘unorganised’ sectors. Theorganised sector comprises enterprises forwhich the statistics are available regularlyfrom the budget documents or reports, an-nual reports in the case of Public Sector andthrough Annual Survey of Industries in caseof registered manufacturing. On the otherhand, the unorganised sector refers to thoseenterprises whose activities or collection ofdata is not regulated under any legal provi-sion and / or those which do not maintainany regular accounts. Non-availability ofregular information has been the main criteriafor treating the sector as unorganised. Thisdefinition helps to demarcate organised sectorfrom the unorganised sector. For example,units not registered under the Factories Act1948 constitute unorganised component ofmanufacturing on account of activity notregulated under any Act. In case of the sec-tors like trade, transport, hotels & restaurants,storage and warehousing, and services, allnon-public sector units constitute theunorganised sector. However, the enterprisescovered under Annual Survey of Industries(ASI) do not fall under the purview ofunorganised sector survey.
1.3.3 The Delhi Group felt that ‘InformalOwn Account Enterprises’ and ‘Enterprisesof the Informal Employers’ as mentioned inthe resolution adopted at the Fifteenth Inter-national Conference of Labour Statisticians(ICLS-1993) are conceptually close to thatdefined in the Indian Statistical System’, i.e.,‘Own Account Enterprises’ and ‘Establish-ments’ with at least one hired worker. Thisdefinition which is enterprise based providesa good coverage of enterprises to work outthe value added by industry groups required
74

SARVEKSHANA
for the National Accounts Statistics. Thework force in the Informal Sector can alsobe measured through the household surveysby taking into account the principal and sub-sidiary activities of each member of thehousehold.
1.4 NSS surveys to measure employ-ment in the Informal Sector
1.4.1 In the recent years, both householdand enterprise surveys were conducted byNSSO in its 55th (July 1999-June 2000), 56th
(July 2000-June 2001) and 57th (July 2001-June 2002) rounds. In the 56th round, enter-prise survey was on unorganised manufac-turing sector and in the 57th round it was onunorganised services (excluding trade andfinance). In the 56th and 57th rounds, infor-mation on employment through householdsurvey was obtained from Schedule 1.0. Inthe 55th round, information on employmentin the informal sector was available fromboth enterprise survey (Schedule 2.0) andhousehold survey (Schedule 10).
1.4.2 The National Sample SurveyOrganisation (NSSO) conducted an inte-grated survey of households and enterprisesin its 55th round during July 1999 to June2000. The subjects covered were householdconsumer expenditure (Schedule 1.0), em-ployment-unemployment (Schedule 10) andinformal non-agricultural enterprises (Sched-ule 2.0). Besides collection of usual infor-mation on employment-unemployment in-dicators, certain information on workers inthe non-agricultural sector was collected, tomeasure employment in the informal sector,from the households selected for the employ-ment-unemployment survey. The non-agri-cultural enterprises engaged in the activitiesof manufacturing, construction, trading andrepair services, hotels and restaurants, trans-port storage and communications, financial
intermediation, real estate, renting and busi-ness activities, education, health and socialwork, other community, social and personalservice activities (excluding domestic ser-vices) were covered in this survey. Informa-tion on characteristics of the enterprises,fixed assets, employment, expenses and re-ceipts, value added, employment etc. wascollected from the enterprises surveyed,which provided scope for generating alter-native estimate of jobs created in the infor-mal sector and may be approximated to thesize of employment in the informal sectorobtained through enterprise approach. In thissurvey, all unincorporated proprietary andpartnership enterprises were defined as in-formal sector enterprises. This definitiondiffers from the concept of unorganised sec-tor used in National Accounts Statistics. Inthe unorganised sector, in addition to theunincorporated proprietary or partnership en-terprises, enterprises run by cooperative so-cieties, trusts, private and public limitedcompanies (Non ASI) are also covered. Theinformal sector can therefore be consideredas a subset of the unorganised sector. Theconcepts relevant for the two surveys andalso, useful for this note are presented inAnnex-III.
1.4.3 This note presents the summary offindings, based on schedule 10, on non-ag-ricultural workers by various attributes suchas their activity status, broad industry ofwork, enterprise type, location of workplace,etc., with special emphasis on workers inthe informal sector, i.e., those working inproprietary or partnership type of enterprises.A comparison of the same with that obtainedfrom the enterprise survey has formed a partof this summary also. However, the detailedresults on the employment in the informalnon-agricultural enterprises are available inNSS Report numbers 459 and 460.
75

SARVEKSHANA
1.5 Geographical coverage
1.5.1 The survey covered the whole of theIndian Union except (i) Ladakh and Kargildistricts of Jammu & Kashmir, (ii) villagessituated beyond 5 Kms. of bus route in thestate of Nagaland and (iii) inaccessible vil-lages of Andaman and Nicobar. As in the pre-vious rounds, all the uninhabited villages ofthe country, according to 1991 census, areleft out of the coverage of NSS 55th round.
1.6 Sample Design1.6.1 A stratified sampling design wasadopted for selection of the sample first-stageunits (FSUs). The FSUs were villages(panchayat wards for Kerala) for rural areasand Urban Frame Survey (UFS) blocks forurban areas. The Ultimate stage units (USUs)were the households for canvassing con-sumer expenditure (Schedule 1.0) & employ-ment-unemployment schedules (Schedule10/10.1) and enterprises for canvassing in-formal sector enterprise schedule (Schedule2.0). USUs were selected by the method ofcircular systematic sampling from the cor-responding frame in the FSU. Large FSUswere sub-divided into hamlet groups (rural)/ sub-blocks (urban). Details of the forma-tion of hamlet–group/sub-blocks and proce-dure of selection of households are also givenin Annex-II.
1.7 Sample size – first stage units
1.7.1 A total number of 10,384 FSUs (6,208villages and 4,176 urban blocks) wereselected for survey in the central sample atthe all-India level in the 55th round for allthe schedules, of which 10,173 villages/blocks (6,048 villages and 4,125 urbanblocks) were actually surveyed. Table 1.1 ofAnnex-II gives the number of FSUs surveyedfor the different states/u.t.s. Sample size for
the whole round for each State/UT x Sector(i.e. rural/urban) was allocated equallyamong the 4 sub-rounds. Sample FSUs foreach sub-round were selected afresh in theform of 2 independent sub-samples. Thus,there were 8 such sub-samples. In addition,3894 FSUs – 1298 in each of the sub-rounds2, 3 and 4, corresponding to sub-samples 1,3 and 5 - were re-visited for canvassingSchedule 10.1 meant for collection of se-lected data on employment and unemploy-ment at the re-visit. Note that, informationfor measuring employment in the informalsector collected for workers in the non-agri-cultural sector through Schedule 10.1 in there-visit was also used for estimating the em-ployment in informal sector presented inReport number 460.
1.8 Sample size – second stage units
1.8.1 For schedule 10, a sample of 1,65,244households were surveyed – 97,986 in ruralareas and 67,258 in urban areas. As regardsthe number of persons surveyed, it was5,09,779 in the rural sector and 3,09,234 inthe urban sector. For the enterprise survey,1,97,637 units (114506 from the rural and83131 from the urban) belonging to theinformal sector were surveyed. Table 1.2 ofAnnex-II gives the number of persons andenterprises surveyed for the different states/u.t.s
1.9 Period of survey and workprogramme
1.9.1 The fieldwork of 55th round of NSSOstarted from 1st July, 1999 and continued till30th June, 2000. As usual, the survey periodof this round was divided into four sub-rounds, each with a duration of three months,the 1st sub-round period ranging from Julyto September,1999, the 2nd sub-round periodfrom October to December 1999 and so on.
76

SARVEKSHANA
Equal number of sample FSU’s was allottedfor survey in each of these four sub-rounds.
1.10 Lay-out of the paper
1.10.1As stated earlier, this paper deals withvarious estimates with regard to non-agri-cultural workers, with special emphasis onworkers in the informal sector, along withtheir correlates as obtained from the datacollected through 55th survey on Employ-ment and Unemployment (schedule 10), andInformal Non-agricultural Enterprises(Schedule 2.0). Including the present intro-ductory sub-section, Sub-section 2 gives thesummary findings of the survey. All the sum-mary results for the states and u.ts. are putin Annex-I. The details of sample design andestimation procedure including the villagesand urban blocks allotted as well as sur-veyed, allocation for each State and UnionTerritory, number of persons/enterprises sur-veyed for employment-unemployment and in-formal sector non-agricultural enterprise en-quiry are given in Annex-II. Annex–III gives,in detail, the concepts and definitions of onlythose terms used in the survey in connectionwith the various items covered in this paper.Extract of NIC 1998 giving activities coveredunder different tabulation categories (A-Q)is given at Annex-IV. Detailed activities, cov-erage and their definition used in this sur-vey for collection of data through schedule2.0 are given in Annex-V.
2. Summary of findings
2.1 This sub-section summarises the impor-tant findings of the Employment-Unemploy-ment survey based on the responses to thequestions put to the usual status non-agri-cultural workers on the various particularsof their enterprise of work and discusses thesalient features pertaining to these aspects.A comparison on number of workers in the
informal sector obtained from householdsurvey (Schedule 10) and Enterprise survey(Schedule 2.0) has also been made in thissub-section.
2.2 The usual activity status refers hereto activity status of workers taking togetherthe principal status (ps) and subsidiary eco-nomic status-I (ss) for persons categorised‘not working’ in their principal status. In thispaper, this has been referred to as ‘workers(ps+ss)’. Discussions are mainly centeredaround the all-India estimates. It may be men-tioned that while all-India summary resultsare presented along with write-up in theStatements, the corresponding results at thestate/ union territory level are given togetherin the Tables in Annex-I.
2.3 As per the survey estimates, about921 million people stayed in 189 millionhouseholds in India during 1999-2000. About73 percent of the households belonged torural India and accounted for nearly 75 per-cent of total population. The average house-hold size for the rural was 5.0 which was alittle higher than the urban average of 4.5.On an average, the sex ratio (number of fe-males per 1000 males) of an Indian house-hold was 947. For every 1000 males, thenumber of females was more in the rural(959) as compared to the urban areas (915).It may be noted in this context that comparedto the census population or the projectionsthereof, population estimates from the NSSOsurveys are, in general, on the lower side.This difference arises mainly due to the dif-ferences in methods and coverage adoptedby the NSSO in comparison to the censusoperation.
2.4 At the outset, an overview of the to-tal work-force and the share of non-agricul-tural sector in the workforce as obtained
77
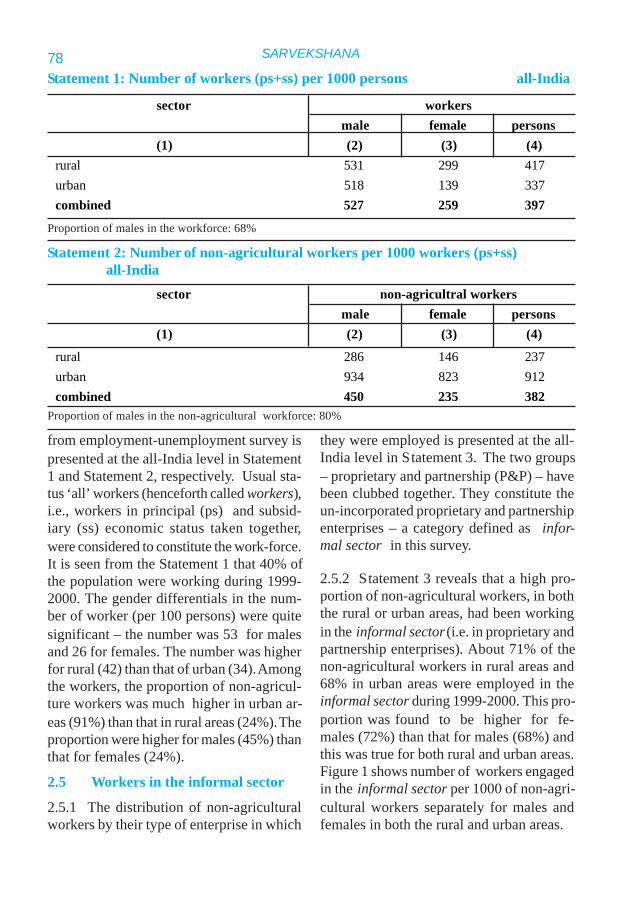
SARVEKSHANA
rural 531 299 417urban 518 139 337combined 527 259 397
Statement 1: Number of workers (ps+ss) per 1000 persons all-India
Proportion of males in the workforce: 68%
rural 286 146 237urban 934 823 912combined 450 235 382
Statement 2: Number of non-agricultural workers per 1000 workers (ps+ss)all-India
Proportion of males in the non-agricultural workforce: 80%
sector non-agricultral workersmale female persons
(1) (2) (3) (4)
from employment-unemployment survey ispresented at the all-India level in Statement1 and Statement 2, respectively. Usual sta-tus ‘all’ workers (henceforth called workers),i.e., workers in principal (ps) and subsid-iary (ss) economic status taken together,were considered to constitute the work-force.It is seen from the Statement 1 that 40% ofthe population were working during 1999-2000. The gender differentials in the num-ber of worker (per 100 persons) were quitesignificant – the number was 53 for malesand 26 for females. The number was higherfor rural (42) than that of urban (34). Amongthe workers, the proportion of non-agricul-ture workers was much higher in urban ar-eas (91%) than that in rural areas (24%). Theproportion were higher for males (45%) thanthat for females (24%).
2.5 Workers in the informal sector
2.5.1 The distribution of non-agriculturalworkers by their type of enterprise in which
they were employed is presented at the all-India level in Statement 3. The two groups– proprietary and partnership (P&P) – havebeen clubbed together. They constitute theun-incorporated proprietary and partnershipenterprises – a category defined as infor-mal sector in this survey.
2.5.2 Statement 3 reveals that a high pro-portion of non-agricultural workers, in boththe rural or urban areas, had been workingin the informal sector (i.e. in proprietary andpartnership enterprises). About 71% of thenon-agricultural workers in rural areas and68% in urban areas were employed in theinformal sector during 1999-2000. This pro-portion was found to be higher for fe-males (72%) than that for males (68%) andthis was true for both rural and urban areas.Figure 1 shows number of workers engagedin the informal sector per 1000 of non-agri-cultural workers separately for males andfemales in both the rural and urban areas.
78
sector workersmale female persons
(1) (2) (3) (4)

SARVEKSHANA
(1) (2) (3) (4) (5) (6) (7) (8) (9) (10) (11) (12)rural
male 657 10 14 13 695 98 12 56 41 98 1000 female 404 321 18 7 750 70 9 56 33 82 1000 persons 602 78 15 12 707 92 11 56 39 95 1000
urban male 623 7 25 19 674 142 15 88 37 44 1000 female 374 281 20 11 685 130 14 74 40 57 1000 persons 578 56 24 18 676 140 15 85 38 46 1000
combined male 639 9 20 16 684 121 14 73 39 69 1000 female 390 302 19 9 720 98 11 64 36 71 1000 persons 590 66 20 15 691 116 13 71 39 70 1000
Statement 3: Per 1000 distribution of non-agricultural workers (ps+ss) by enterprisetype all-India
non-agricultural workers (ps+ss) by enterprise type
categoryof
workers
proprietary partnership
male female withinsamehh
fromdifft.hhs. P&
P
publ
icse
ctor
sem
i-pub
lic
othe
rs
not k
now
n
n.r.
tota
l
Note: ‘n.r.’ stands for non response
2.6 Informal sector workers by type ofenterprise
2.6.1 Statement 4 presents the distributionof workers in the informal sector by type ofenterprise in which they were employed,separately for males and females in bothrural and urban areas. Among the workersin the informal sector, majority are engagedin the proprietary enterprises – 95 % formales and 96 % for females. About 93% ofthe male workers in the informal non-agri-cultural sector were engaged in the propri-etary male enterprises. As against this, only42% of female workers were engaged in theproprietary female enterprises. Figure 2shows, both for rural and urban areas, theshare of informal sector workers in the pro-
prietary enterprises and that in partnershipenterprises.
79

SARVEKSHANA
Figure 2: Share of informal sector workers in the proprietary enterprises and that in partnershipenterprises
Statement 4:Per 1000 distribution of workers in the informal sector ( i.e., those engagedin proprietary and partnership enterprises) by type of enterprise all-India
(1) (2) (3) (4) (5) (6) rural
male 945 14 20 19 1000female 539 428 24 9 1000persons 851 110 21 17 1000
urbanmale 924 10 37 28 1000female 546 410 29 16 1000persons 855 83 36 27 1000
combinedmale 934 13 29 23 1000female 542 419 26 13 1000persons 854 96 29 22 1000
categoryof
workers
type of enterprise
proprietary partnership proprietaryand
partnershipmale female from differenthouseholds
within samehousehold
Proprietary male 87 13 100Proprietary female 11 89 100
Statement 5: Distribution of workers by sex in each of the proprietary male andproprietary female enterprises all-India
enterprise type workersmale female all
(1) (2) (3) (4)
80

SARVEKSHANA
2.6.2 It may be noted that about 68% of thework-force in the country was shared by themales. The situation was extremely biasedtowards males in the case of work-force inthe non-agricultural sector, informal sectoras well as in the case of proprietary enter-prises. About 20% of the employment wasleft to the females in each of non-agricul-tural enterprises, informal sector enterprisesand proprietary enterprises. Further analy-sis of the work-force in the proprietary en-terprises are made in Statement 5. A cleargender bias is observed when the share ofwork-force is examined in respect of sex ofthe owner of the proprietary enterprises .About 87% of the workers in the proprietarymale enterprises were males, whereas in the
proprietary female enterprises the share offemale workers was 89%.
2.7 The state level distributions of non-agri-cultural workers by their type of enterprisein which they were employed as obtainedfrom the survey are presented in Table 1.
2.8 Informal sector workers in differ-ent usual activity status
2.8.1 It may be of interest to obtain the pro-portion of non-agricultural workers engagedin the informal sector for different usual ac-tivity statuses of workers. Statement 6 pre-sents these proportions corresponding to dif-ferent work statuses excluding those engagedas casual workers in public works.
Statement 6: Number of non-agricultural workers (ps+ss) engaged in proprietary orpartnership (P&P) enterprises per 1000 non-agricultural workers (ps+ss) foreach activity status all-India
non-agricultural workers (ps+ss) engaged in P&P enterprisesusual rural urban
activity status male female persons male female persons(1) (2) (3) (4) (5) (6) (7)
11 908 926 911 955 925 95012 934 902 932 914 518 87821 897 917 908 943 946 94411-21 907 921 911 951 928 94731 336 284 328 402 408 40351 698 637 687 740 721 73711-51 (excl. 41) 697 754 710 675 687 677
2.8.2 It is observed from Statement 6 thatproportion of workers in the informal sectoramong the non-agricultural sector is highestamong the self-employed and it was as highas 91% in rural areas and 95% in urban ar-eas during 1999-2000. Among the non-agri-cultural workers who were casual labourersengaged in other than public works too, asubstantial chunk was employed in the in-formal sector – 69% in rural areas and 74%
in urban areas. As compared to these cat-egories, a relatively less proportion of theregular salaried workers were employed inthe informal sector. The proportion rangedfrom 33% in rural areas to 40% in urban ar-eas. It may be noted that number of non-agricultural workers (ps+ss) engaged in pro-prietary or partnership (P&P) enterprises per1000 non-agricultural workers (ps+ss), pre-sented in Statement 6 is higher than the cor-
81

SARVEKSHANA
Statement 7:Per 1000 distribution of non-agricultural workers (ps+ss) by activity statusseparately for those (i) engaged in proprietary or partnership enterprises and(ii) all enterprises all-India
rural11 497 382 362 294 466 36312 9 7 2 2 7 621 92 71 400 329 163 12711-21 598 460 764 626 636 49631 129 267 65 172 114 24651 273 273 171 203 250 25811-51 (excl. 41) 1000 1000 1000 1000 1000 1000
urban11 447 316 346 257 429 30612 19 14 5 6 16 1221 101 73 245 178 127 9111-21 567 402 596 441 572 40931 264 443 238 400 259 43651 169 154 167 159 169 15511-51 (excl. 41) 1000 1000 1000 1000 1000 1000
non-agricultural workers (ps+ss)usual male female persons
activity status P&P all P&P all P&P all(1) (2) (3) (4) (5) (6) (7)
responding figures presented in Statement 3.This is because proportion of workers in pro-prietary or partnership (P&P) enterprises inStatement 6 has been obtained by excluding
those engaged as casual labourers in publicworks (activity status code 41) from the to-tal workers engaged in non-agricultural en-terprises.
2.8.3 Statement 7 shows the distributions atall-India level – separately for non-agricul-tural workers in general, and for workers inthe informal sector in particular – over dif-ferent activity statuses of such workers.
2.8.4 In rural areas: It is observed that theself-employed workers were more preponder-ant among those working in the informalsector (64%) than among all non-agriculturalworkers (50%). Within the informal sector,
of the female workers, as many as 76% wereself-employed while, among male workers,about 60% were self-employed. Among allnon-agricultural workers, proportions of self-employed were a little lower than those work-ing in the informal sector, these being 63%for females and 46% for males. The propor-tion of regular wage earners was loweramong workers in the informal sector (11%)than that among all non-agricultural work-ers (25%).
82

SARVEKSHANA
C 656 732 672 266 400 278D 787 876 819 698 859 732E 93 25 92 60 41 59F 697 519 677 753 636 739G 890 896 891 892 844 886H 867 878 870 899 896 899I 717 514 715 657 419 647J 238 291 243 218 181 212K 753 675 750 797 735 791L 57 37 55 52 69 54M 187 248 204 324 389 355N 531 183 420 452 348 412O 741 781 753 745 798 764P 522 686 625 616 826 751Q 0 0 0 588 794 636all (C- Q) 695 750 707 674 685 676
Statement 8: Number of non-agricultural workers (ps+ss) engaged in proprietary orpartnership enterprises per 1000 non-agricultural workers for each tabulationcategory. all-India
Description of Tabulation category C to Q: C: Mining and Quarrying; D: Manufacturing; E: Electricity, Gas and water supply; F:Construction; G: Wholesale and retail trades, repair of motor vehicles, motor cycles and personal and household goods;H: Hotelsand restaurants; I: Transport, storage and communications; J: Financial intermediation; K: Real estate, renting and business activi-ties; L: Public administration and defence, compulsory social security; M: Education; N: Health and social work; O: Other com-munity, social and personal service activities; P: Private households with employed persons; Q: Extra – territorial organisationsand bodies
non-agricultural workers (ps+ss) in P&P enterprisestabulation rural urbancategories male female persons male female persons
(1) (2) (3) (4) (5) (6) (7)
2.8.5 In urban areas: The proportion of self-employed workers in urban areas – whetheramong those working in the informal sectoror among all non-agricultural workers – waslower than the corresponding proportions inrural areas. These were 57% among work-ers in the informal sector and 41% amongall non-agricultural workers. In urban areas,unlike in rural areas, the proportion of regu-lar wage earners – whether among workersin the informal sector or among all non-ag-ricultural workers taken together – was much
higher than that for casual labourers. Whileamong all non-agricultural workers, propor-tion of regular wage earners and casual work-ers were estimated as 44% and 16% respec-tively, among workers in the informal sec-tor, these estimates were 26% and 17% re-spectively.
2.8.6 The state level distribution of workersin the informal sector by their activity sta-tus as obtained from the survey are presentedin Table 2.
83
SARVEKSHANA
2.9 Informal sector workers by broadindustry of work
2.9.1 It would be interesting to know thatcorresponding to each broad industry of work(referred to as tabulation category), howmany of the non-agricultural workers wereaccounted by the informal sector alone.Statement 8 presents the proportions of in-formal sector workers among all non-agri-cultural workers separately for each tabula-tion category. The descriptions correspond-ing to each tabulation category is given inAnnex-V.
2.9.2 Statement 8 shows that more than four-fifths of all non-agricultural workers engagedin wholesale or retail trade etc (i.e. tabula-tion category G) or in hotels and restaurants(i.e. tabulation category H) belonged to theinformal sector alone. This was true in ruralor urban areas and even when male or fe-male non-agricultural workers were consid-ered separately. Among the manufacturingworkers (tabulation category D) also, theproportion of non-agricultural workers em-ployed in the informal sector was quite sig-nificant – more so in rural than in urban ar-eas. This proportion was higher for femalesthan for males. The survey has estimatedthat as high as 88% and 86% of femalesworkers in the manufacturing sector were inthe informal sector in rural and urban areas,respectively. The corresponding estimatesfor males were 79% and 70% in rural andurban areas, respectively. On the other hand,among real estate, renting and businessworkers (tabulation category K), the situa-tion was just the reverse. Nearly 80% ofurban and 75% of rural male workers in thiscategory were in the informal sector whilethe corresponding proportions for femaleworkers were 73% and 68% in urban andrural areas, respectively. Number of work-
ers in the informal sector per 100 workersof different tabulation categories are shownin Figure 3 for both rural and urban areas.
2.9.3 Having formed an idea of the relativepreponderance of informal sector workersamong workers for each broad non-agricul-tural industry of work, it would be of inter-est to have a look into how informal sectorworkers in particular, and non-agriculturalworkers in general, are distributed over thevarious broad industries of work (i.e., tabu-lation category). Statement 9 presents thesedistributions at the all-India level, separatelyfor rural and urban areas.
2.9.4 In rural areas: The survey results sug-gest that manufacturing (tabulation categoryD) and wholesale and retail trade, etc. (tabu-lation category G) sectors together were themost important providers of employment. Inthe manufacturing (tabulation category D)sector alone, about 31% of the non-agricul-tural - and 36% of the informal sector– work-ers were employed. Most of the non-agricul-tural female workers (52%)- and those in theinformal sector too (61%) were engaged inmanufacturing activities. For male workers,these proportions were less - 26% for thoseengaged in all non-agricultural work and29% for those in informal sector. Wholesaleand retail trade etc. (tabulation category G)sector also plays an important role in pro-viding employment. About 19% of all non-agricultural workers and 24% of workers ininformal sector were employed in such in-dustries, the proportions being significantlyhigher for males than for females. Propor-tions of male workers engaged in wholesaleand retail trade etc, was more than the corre-sponding proportions of female workers forall non-agricultural workers as well as forthose in the informal sector.
84

SARVEKSHANA
ruralC 19 20 19 20 19 20D 289 255 605 519 362 312E 1 9 0 1 1 7F 157 156 50 72 132 138G 272 212 132 110 239 190H 31 25 31 26 31 25I 114 110 3 4 88 87J 3 8 1 3 2 7K 10 9 1 1 8 7L 5 59 1 25 4 51M 14 52 24 74 16 57N 10 12 5 21 9 14O 75 71 116 111 85 79P 1 2 11 12 4 4Q 0 0 0 0 0 0all(C – Q) 1000 1000 1000 1000 1000 1000
urbanC 4 9 3 4 3 8D 248 239 366 292 269 249E 1 9 0 2 1 7F 104 93 54 59 95 87G 372 281 220 179 345 263H 44 33 36 27 43 32I 108 111 13 21 91 95J 7 21 4 17 6 20K 32 27 15 14 29 24L 6 84 5 48 6 78M 15 32 78 137 27 50N 11 16 23 45 13 21O 41 37 107 92 53 47P 7 8 76 63 20 18Q 0 0 0 0 0 0all(C – Q) 1000 1000 1000 1000 1000 1000
Statement 9: Per 1000 distribution of non-agricultural workers (ps+ss) by tabulationcategory of NIC-98 separately for those (i) engaged in proprietary orpartnership (P&P) enterprises and (ii) all enterprises all-India
tabulation non-agricultural workers (ps+ss)categories male female Persons
P&P all P&P all P&P all(1) (2) (3) (4) (5) (6) (7)
85

SARVEKSHANA
2.9.5 In urban areas: Here, too, the sametwo broad industries of work were the mainproviders of employment in the non-agricul-tural sector - 25% by manufacturing (tabu-lation category D) and 26% by wholesaleand retail trade etc.(tabulation category G).The broad features noted in rural areas re-garding gender differentials for those en-gaged in manufacturing and wholesale andretail trade, etc. hold true here also for allnon-agricultural workers as well as for thosein the informal sector.
2.9.6 The state level distributions of work-ers in the informal sector by the broad in-dustries of work (i.e. tabulation category) asobtained from the survey are presented inTable 3.
2.10 Workers in the informal manufac-turing enterprises
2.10.1 As seen from the previous section, thecategory ‘manufacturing’ was the most im-
portant provider of employment in rural ar-eas and was one of the most important onein urban areas. So, it would be of interest totake a further look at such activities.
2.10.2 An important aspect of any manufac-turing enterprise is use of electricity for pur-poses of manufacturing. Statement 10 pre-sents the proportions of workers employedin manufacturing enterprises which usedelectricity for production purposes to all non-agricultural workers employed in such en-terprises- separately for the manufacturingenterprises belonging to the informal sectoras well as for all manufacturing enterprises.
2.10.3 In rural areas: The survey estimatesthat a little less than a quarter (24%) of allworkers in manufacturing enterprises wereemployed in those manufacturing units thatused electricity for manufacturing purpose.The proportion was much higher for maleworkers (32%) than that for female workers
Figure 3 : Number of workers in the informal sector per 100 workers of different tabulationcategories.
86

SARVEKSHANA
(9%). The proportion was little lower - about20% - for those working in informal sectorunits. However, when workers employed in
manufacturing enterprises owned on a part-nership basis are considered separately, thisproportion was much higher (51%).
proprietary 253 78 184 474 178 397partnership 586 274 506 755 577 738P&P 274 85 201 504 191 427all 320 86 236 570 222 498
Statement 10:Number of workers (ps+ss) engaged in manufacturing enterprises thoseused electricity for production purposes per 1000 non-agricultural workersin the manufacturing enterprises for broad enterprise typesall-India
workers (ps+ss) in mfg. enterprises using electricityrural urban
male female persons male female persons(1) (2) (3) (4) (5) (6) (7)
2.10.4 In urban areas: Here, the proportionof workers in manufacturing enterprises us-ing electricity to all those working in manu-facturing enterprises as a whole was almostdouble (50%) of that in rural areas. The fea-ture observed in rural areas viz. this propor-tion being a little lower for workers in infor-mal sector as a whole but being much higherfor workers in partnership owned manufac-turing units holds true in urban areas too. Inthe latter case, the proportion was estimatedto be as high as 74%. The feature of the pro-portion being much higher for male work-ers than that for female workers also holdstrue in urban areas, they being estimated as57% and 22% respectively.
2.11 Workers by location of work place
2.11.1 Information on the various types oflocation of work place/enterprise in which aperson was working has been collected foreach of the working members of the samplehousehold. Statement 11 presents the dis-tribution of usual status non-agriculturalworkers – and separately for those who wereworking in enterprises in the informal sec-
tor only – by their location of work place.The description of different locations ofworkplace are given at the bottom of State-ment 11.
2.11.2 In rural areas: Quite a significant pro-portion of non-agricultural workers, particu-larly the males, residing in rural areas hadto move to the urban for their day-to-daywork. About 8 % of the rural non-agricul-tural male workers had to move to the urbanfor work. The said proportion for femaleworkers was less by 5 % point. However,these proportions were further lower whenemployment in the informal sector alone isconsidered. For female workers employedin the informal sector, the proportion wasabout 3 %. The corresponding proportion formales being 7 %. Female workers were morefrequently found to be working in the ruralareas in own dwelling and, to a lesser ex-tent, in employer’s enterprise etc. but out-side employer’s dwelling. However, for maleworkers, apart from these two categories,there were quite a number who worked inown enterprise etc. but outside own dwell-
type ofmanufacturingentrprises
87

SARVEKSHANA
rural1 99 78 35 31 84 682 207 148 586 459 294 2153 194 141 95 76 171 1274 28 27 47 44 32 315 178 235 110 169 163 2216 28 23 14 12 25 217 115 100 34 44 96 888 65 64 31 36 57 58sub-total (2 to 8) 815 738 918 841 839 7609 5 4 4 3 5 410 16 13 2 3 13 1011 3 3 2 3 3 312 26 36 10 15 23 3113 3 3 0 0 2 214 13 13 5 7 11 1115 5 6 1 2 4 5sub-total (9 to15) 71 77 25 32 61 67n.r. 15 107 22 97 17 105all 1000 1000 1000 1000 1000 1000
urban1 51 39 25 19 47 362 17 11 43 31 21 153 43 31 19 14 39 284 6 5 17 14 8 75 26 37 17 28 24 356 5 4 4 3 5 47 10 8 8 6 10 88 8 8 5 5 7 7sub-total (2 to 8) 114 103 113 102 114 1039 107 73 357 252 152 10510 244 170 95 70 217 15211 26 27 123 104 44 4112 283 395 179 290 264 37613 36 30 26 25 34 2914 73 61 43 44 67 5815 55 53 26 32 50 50sub-total (9 to15) 824 810 849 817 829 811n.r. 10 48 12 62 10 50all 1000 1000 1000 1000 1000 1000
Statement 11:Per 1000 distribution of non-agricultural workers (ps+ss) by location ofworkplace separately for those (i) engaged in proprietary or partnership (P&P)enterprises and (ii) all enterprises all-India
non-agricultural workers (ps+ss)male female persons
P&P all P&P all P&P all(1) (2) (3) (4) (5) (6) (7)
Descriptions of the codes:1 – no fixed place; workplace in rural areas : 2 – own dwelling, 3 – own enterprise/unit /office/shop butoutside own dwelling, 4 – employer ’s dwelling, 5 – employer ’s enterprise/ unit /office/shop but outside employer ’s dwelling, 6 –street with fixed location, 7 – construction site, 8 – others; work place in urban areas: 9 – own dwelling, 10 – own enterprise/unit/office/shop but outside own dwelling, 11 – employer’s dwelling, 12 – employer’s enterprise/ unit /office/shop but outside employer ’sdwelling, 13 – street with fixed location, 14 – construction site, 15 – others.
location ofworkplace
88

SARVEKSHANA
ing. The proportion of workers with no fixedwork place was higher among males thanamong females. For all non-agriculturalworkers, these proportions were estimatedas 8% and 3% for males and females, respec-tively while for those working in the infor-mal sector alone, the estimates were 10% and4% for males and females, respectively.
2.11.3 In urban areas: Among all non-agri-cultural workers residing in urban areas,about 10% had to move to the rural areasfor their day-to-day work. This proportionwas slightly higher (11%) for those employedin the informal sector. The gender variationsin these proportions were very little. About25% of the female non-agricultural workersresiding in urban areas had worked in theirown dwelling in urban areas compared to7% for the males. The difference widenedfurther in the case of informal sector – theproportions being 36% for females and 11%for males. Other categories of work placewhere females worked with relatively higherfrequency are employer’s enterprise etc. butoutside employer’s dwelling in urban areas(29% among all enterprises and 18% amonginformal sector alone) and employer’s dwell-ing in urban areas (10% among all enter-prises and 12% among informal sectoralone). On the other hand, male workerswere most commonly found working inemployer’s enterprises etc. but outsideemployer’s dwelling in urban areas (40%among all enterprises and 28% among in-formal sector alone). They were also work-ing in relatively large numbers in own enter-prises, etc. but outside own dwelling in ur-ban areas – 17% among all enterprises and24% among enterprises within the informalsector alone. There were quite a few casesof non-reporting with respect to the locationof work place of workers in both rural andurban areas.
2.12 Workers in the informal sector andsize of the enterprises
2.12.1 The size in terms of number of work-ers of the enterprises or establishments wherethey were engaged was collected for eachnon-agricultural worker in the survey. Suchinformation have been presented in State-ment 12 in the form of distribution of non-agricultural workers (ps+ss) by number ofworkers in their enterprise separately forthose (i) engaged in proprietary or partner-ship (P&P) enterprises and (ii) all enter-prises. A large proportion of non-agriculturalworkers are found to work in the small en-terprises. The proportion of workers engagedin enterprises of size less than 6 workers was61% in rural areas and 54% in urban areas.These proportions increased considerably to80% and 76%, respectively for the informalsector, and reached the highest level forfemale workers (83% in rural and 79% inurban). Thus, the number of tiny (in termsof number of workers) enterprises are manyin the economy and absorb a large section ofwork-force of the informal sector as well asthat of the non-agricultural sector.
2.12.2 Statement 13 seeks to find the rela-tionship among the sex of the workers en-gaged in the non-agricultural proprietaryenterprises, sex of the proprietor and the sizeof the enterprises. Employment in the enter-prises engaging six or more workers, called‘big enterprises’, has been considered for thisanalysis. When male workers are engagedin the proprietary female enterprises, a rela-tively higher proportion of workers are em-ployed in the ‘big enterprises’. In the ruralareas, the proportion of male workers en-gaged in the proprietary female ‘big enter-prises’ was 29% and corresponding propor-tion for female workers was 21% when they
89

SARVEKSHANA
Statement 12:Per 1000 distribution of non-agricultural workers (ps+ss) by number ofworkers in their enterprise separately for those (i) engaged in proprietary orpartnership (P&P) enterprises and (ii) all enterprises.
all-India
ruralless than 6 787 595 826 676 796 6136 - 9 73 71 62 64 71 6910 - 19 41 51 36 41 40 4920 & above 44 91 41 64 43 86not known 41 83 24 65 37 79all (incl. n.r.) 1000 1000 1000 1000 1000 1000
urbanless than 6 749 533 785 576 756 5416 - 9 88 76 65 70 84 7510 - 19 54 61 42 61 52 6120 & above 51 174 55 137 52 167not known 45 105 36 88 43 102all (incl. n.r.) 1000 1000 1000 1000 1000 1000
non-agricultural workers (ps+ss)male female persons
P&P all P&P all P&P all(1) (2) (3) (4) (5) (6) (7)
were engaged in proprietary male enter-prises. As against this, the proportion was14% when males were engaged inproprietary male enterprises and it was 3%when females were engaged in proprietaryfemale enterprises. In the urban areas, for
the proprietary female enterprises, only 3%of the female workers were engaged in en-terprises with workers 6 or more, whereas,this proportion was about 23% when femaleswere engaged in proprietary male enter-prises.
Statement 13:Number of workers employed in non-agricultural enterprises with 6 ormore workers per 1000 workers for each sex and enterprise typeall-India
proprietary male 144 210 172 227proprietary female 288 29 192 35
enterprise type workersrural urban
male female male female (1) (2) (3) (4) (5)
no. of workersin non-agri.enterprises
90

SARVEKSHANA
2.13 Workers in enterprises maintain-ing written accounts
2.13.1 There are many who consider thatmost or all informal sector enterprises do notmaintain books of account of their expendi-ture or receipts that they make. To test sucha hypothesis, the status of account of the
enterprise for each working member of asample household was recorded in this sur-vey. Statement 14 below presents the pro-portion of workers employed in enterprisesmaintaining such written accounts amongnon-agricultural workers. It also presents theproportions separately for different types ofenterprises.
2.13.2 The survey estimated about 20% ofall non-agricultural workers in rural areas -and 36% in urban areas - were employed inenterprises that maintained written accounts.The proportion was higher for male work-ers (21% in rural and 38% in urban areas)than that for female workers (15% in ruraland 29% in urban areas).
2.13.3 The Statement also shows that whenworkers employed in the informal sectoronly was considered, these proportions weremuch lower - 11% in rural areas and 24% inurban areas. These proportions declined fur-ther to 10% in rural and 21% in urban areasfor those working solely in the proprietarytype of enterprise.
2.14 Comparison of number of work-ers in the informal sector obtainedthrough enterprise survey andhousehold survey approach
2.14.1 As mentioned earlier, survey of non-agricultural enterprises belonging to the in-formal sector was also carried out in the 55th
round. Information on number of workersengaged in those enterprises, along withother things, were also collected throughSchedule 2.0. An independent estimate of thenumber of non-agricultural workers that hasbeen obtained from such information col-lected, provides a scope for comparing withthe number of workers according to the prin-cipal (ps) and subsidiary activity statuses (ss)
proprietary 105 79 99 229 141 213partnership 401 264 373 638 578 630P&P 117 85 109 256 160 239public sector 782 742 775 840 835 839semi-public 814 462 757 816 832 819others 573 531 564 722 656 712not known 219 70 192 266 190 251all 209 152 197 379 287 363
Statement 14: Number of non-agricultural workers (ps+ss) engaged in enterprisesmaintaining written accounts per 1000 non-agricultural workers
all indianon-agri. workers (ps+ss) in enterprises maintaining accounts
rural urbanmale female persons male female persons
(1) (2) (3) (4) (5) (6) (7)
type ofentrprises
91

SARVEKSHANA
obtained from the data collected through em-ployment and unemployment schedule(Schedule 10).
2.14.2 There are certain points that are to bekept in mind while comparing the two setsof estimates. In the employment and unem-ployment survey, the number of workers isobtained from the household by head-countconsidering the participation of the house-hold members in the economic activity ei-ther in the principal status or in the subsid-iary status. In the enterprise survey, infor-mation on number of workers are obtainedfrom the enterprise by considering the num-ber of persons working in the enterprise ona fairly regular basis. A worker need notmean that the same person is working con-tinuously; it only refers to a position. Thus,if more than one person work against a po-sition in an enterprise, the number of work-ers in the enterprise survey will be one,whereas in the employment-unemploymentsurvey, the number of workers will be morethan one. On the other hand, if a personworks in more than one enterprises on a fairlyregular basis, in the employment-unemploy-ment survey the number of worker will beone but in the enterprise survey, he/she is tobe counted as worker in all those enterprises.Again, a person may be engaged in economicactivity for a month or so during a period of365 days and he/she is considered as workerin the employment and unemployment, but
he/she may not be counted as a worker inenterprise survey – not being engaged in theenterprise on a fairly regular basis during thereference period. In view of these reasons,the two sets of estimates are not strictly com-parable. However, they are expected to con-verge closely.
2.14.3 Number of enterprises surveyed: En-terprise survey of 55th round covered all in-formal enterprises in the non-agriculturalsector of the economy, excluding those en-gaged in mining and quarrying, electricity,gas and water supply. All unincorporated en-terprises which operate on either proprietaryor partnership basis were considered to con-stitute the informal sector. Enterprises en-gaged in the activities relating to tabulationcategories ‘D’ to ‘O’ (except E and L) werecovered in the enterprise survey. A total of197637 non-agricultural enterprises weresurveyed all over India. Of them, 114506(i.e., 58%) were from rural areas and 83131from urban areas. Out of the total number ofsample enterprises, 1.63 lakhs* (82%) wereOAEs and the rest were Establishments. Ofthe rural 1.14 lakhs sample enterprises, 89%were OAEs and the rest were Establish-ments. In the urban areas, 73% of the sampleenterprises were OAEs and the rest were Es-tablishments.
2.14.4 Estimated number of enterprises:At the all India level, the number of non-
Statement 15:Estimated number of workers in informal sector obtained form schedule10 and schedule 2.0 all-India
rural 39808 44121 46688urban 39975 45521 47168combined 79783 89643 93856
sector estimated number of workers (000)Schedule 2.0 Schedule 10
ps ps+ss(1) (2) (3) (4)
Note: * 100 thousand = 1 lakh
92
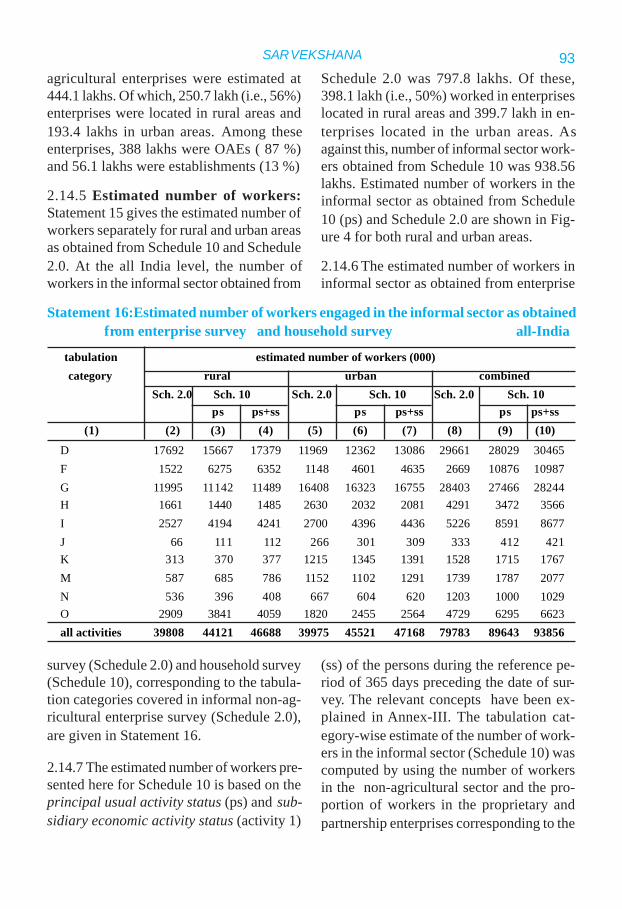
SARVEKSHANA
agricultural enterprises were estimated at444.1 lakhs. Of which, 250.7 lakh (i.e., 56%)enterprises were located in rural areas and193.4 lakhs in urban areas. Among theseenterprises, 388 lakhs were OAEs ( 87 %)and 56.1 lakhs were establishments (13 %)
2.14.5 Estimated number of workers:Statement 15 gives the estimated number ofworkers separately for rural and urban areasas obtained from Schedule 10 and Schedule2.0. At the all India level, the number ofworkers in the informal sector obtained from
Schedule 2.0 was 797.8 lakhs. Of these,398.1 lakh (i.e., 50%) worked in enterpriseslocated in rural areas and 399.7 lakh in en-terprises located in the urban areas. Asagainst this, number of informal sector work-ers obtained from Schedule 10 was 938.56lakhs. Estimated number of workers in theinformal sector as obtained from Schedule10 (ps) and Schedule 2.0 are shown in Fig-ure 4 for both rural and urban areas.
2.14.6 The estimated number of workers ininformal sector as obtained from enterprise
Statement 16:Estimated number of workers engaged in the informal sector as obtainedfrom enterprise survey and household survey all-India
D 17692 15667 17379 11969 12362 13086 29661 28029 30465F 1522 6275 6352 1148 4601 4635 2669 10876 10987G 11995 11142 11489 16408 16323 16755 28403 27466 28244H 1661 1440 1485 2630 2032 2081 4291 3472 3566I 2527 4194 4241 2700 4396 4436 5226 8591 8677J 66 111 112 266 301 309 333 412 421K 313 370 377 1215 1345 1391 1528 1715 1767M 587 685 786 1152 1102 1291 1739 1787 2077N 536 396 408 667 604 620 1203 1000 1029O 2909 3841 4059 1820 2455 2564 4729 6295 6623all activities 39808 44121 46688 39975 45521 47168 79783 89643 93856
tabulation estimated number of workers (000)category rural urban combined
Sch. 2.0 Sch. 10 Sch. 2.0 Sch. 10 Sch. 2.0 Sch. 10ps ps+ss ps ps+ss ps ps+ss
(1) (2) (3) (4) (5) (6) (7) (8) (9) (10)
survey (Schedule 2.0) and household survey(Schedule 10), corresponding to the tabula-tion categories covered in informal non-ag-ricultural enterprise survey (Schedule 2.0),are given in Statement 16.
2.14.7 The estimated number of workers pre-sented here for Schedule 10 is based on theprincipal usual activity status (ps) and sub-sidiary economic activity status (activity 1)
(ss) of the persons during the reference pe-riod of 365 days preceding the date of sur-vey. The relevant concepts have been ex-plained in Annex-III. The tabulation cat-egory-wise estimate of the number of work-ers in the informal sector (Schedule 10) wascomputed by using the number of workersin the non-agricultural sector and the pro-portion of workers in the proprietary andpartnership enterprises corresponding to the
93

SARVEKSHANA
tabulation category. The estimated numberof workers from Schedule 2.0 is based onthe number of workers usually working ona working day in the sample enterprises dur-ing the reference month, i.e., last 30 dayspreceding the date of survey. In the enter-prise survey, a worker is one who partici-pates in the activities of the enterprise on afairly regular basis during the referencemonth either on full time or on part time ba-sis. So the casual labourers are not captured
in the enterprise survey approach. Theseworkers can best be captured through thehousehold survey approach (Schedule 10).The individuals serving as housemaids,cooks, gardeners, governess, baby sitters,chowkidars, night watchmen etc. were out-side the coverage of enterprise survey, al-though they were included in the householdsurvey (Schedule 10).
2.14.8 It is seen from Statement 15 that theestimated number of workers from Sched-ule 10 is higher than those estimated fromSchedule 2.0, both in rural and urban areas.The total number of workers (ps) fromSchedule 10 is found to be about 12% higherthan that from Schedule 2.0. The extent ofdivergence is almost same both in rural andurban areas.
2.14.9 Figure 5 presents the tabulation cat-egory-wise comparison of estimated num-ber of workers as obtained from Schedule10 (ps) and Schedule 2.0. It may be seenthat the estimated number of workers fortabulation category D (manufacturing) , G
Figure 5 : Number of workers (000) in the informal sector by tabulation category
94

SARVEKSHANA
(trade), H (hotels and restaurants) and N(health and social work) is higher for Sched-ule 2.0 as compared to the respective esti-mates obtained from Schedule 10. The esti-mated number of workers is close in case oftabulation category M (education). In thecase of remaining tabulation categories, theestimates from Schedule 10 are higher thanthe estimates from Schedule 2.0. Further, thedivergence in the two sets of estimates isquite large in case of tabulation categories F(construction) and I (transport, storage andcommunication). The enterprises belonging
to construction and transport are perhaps dif-ficult to be captured through enterprise sur-vey approach. For example, a mason whoworks at different places (self employed) istreated as an enterprise in the enterprisesurvey. But the labourers accompanying himwill not be captured as workers in the enter-prise survey approach if they are not hiredby the mason. Similarly, the porters / load-ers etc. can not be captured in the enterprisesurvey approach if they are not hired on afairly regular basis by the transport enter-prises.
2.14.10 Table 4 gives estimated number ofworkers in the informal sector in the stateand u.t. level as obtained from enterprisesurvey (Schedule 2.0) and household survey(Schedule 10). Figure 6 shows the estimatednumber of workers from the two approaches
for the major states of India. In all the majorstates, the estimated number of workers fromSchedule 10 is higher than the Schedule 2.0except in the states of Bihar and Orissa,where the estimate for Schedule 2.0 is higherthan Schedule 10.
Figure 6 : Estimated number of workers (000) in the informal sector for major states
95
SARVEKSHANA
References:
1. A labour force survey module on informal employment (including employment in theinformal sector) as a tool for enhancing the international comparability of data, Septem-ber 2002: Ralf Hussmanns, Bureau of Statistics, ILO
2. Testing the conceptual framework of informal employment: A case study of India: Dr.G. Raveendran & G.C. Manna, NSSO, Ministry of Statistics and Programme Implemen-tation, Government of India.
3. NSSO Report Number 458: Employment and Unemployment Situations in India, 1999-2000.
4. NSSO Report Number 459: Informal Sector in India, 1999-2000.5. NSSO Report Number 460: Non-agricultural workers in informal sector based on Em-
ployment-Unemployemnt survey, 1999-2000.
2.14.11 Tables 5 and 6 respectively giveState/UT wise estimated number of informalsector workers in manufacturing (tabulationcategory D) and ‘trade & repair services’(tabulation category G) as obtained fromSchedule 2.0 and Schedule 10. It may be seenthat the number of workers in the informalsector for the industry ‘manufacturing andtrade’ as estimated from Schedule 2.0 ishigher than those estimated from Schedule10 for a number of States/UTs.
AcknowledgementsThe authors acknowledge the constantencouragement and active guidancereceived from Shri Jogeswar Das,Deputy Director General, SDRD, Kolkata.The technical support, guidance, helpand encouragement received fromSri Bimal Kumar Giri, Director, SDRDhelped the authors to prepare thismaterial.
96

SARVEKSHANA
TABLES
ofIntegrated Summary of
NSS Fifty-Fifth Round (July1999-June 2000) Survey ResultsOn
Informal Sector Employment in India.
ANNEX - I

SARVEKSHANA
List of Tables in Annex-I
Table no. Contents Page no.
Table 1 Per 1000 distribution of non-agricultural workers according to 99usual activity category (ps+ss) by enterprise type for each stateand u.t.
Table 2 Per 1000 distribution of non-agricultural workers according to 105usual activity category (ps+ss) engaged in proprietary or partnershipenterprises by activity status for each state and u.t.
Table 3 Per 1000 distribution of non-agricultural workers according to 111usual activity category (ps+ss) engaged in proprietary or partnershipenterprises by tabulation category of NIC 1998 for each state and u.t.
Table 4 Estimated number of workers as obtained through enterprise survey 117(Sch. 2.0) and household survey (Sch. 10) approach
Table 5 Estimated number of workers in manufacturing (tabulation 118category D) as obtained through enterprise survey (Sch. 2.0)and household survey (Sch. 10) approach
Table 6 Estimated number of workers in trading services (Tabulation 119category G) as obtained through enterprise survey (Sch. 2.0) andhousehold survey (Sch. 10) approach
98 Annex-I

SARVEKSHANA
Table (1):Per 1000 distribution of non-agricultural workers according to usual activitycategory (ps+ss) by enterprise type for each state and u.t.
rural males
Andhra Pr. 739 11 8 11 769 88 5 54 18 66 1000Ar. Pradesh 116 0 0 18 133 181 1 8 42 635 1000Assam 598 6 3 9 615 110 6 76 57 136 1000Bihar 579 9 18 4 611 52 6 34 31 266 1000Goa 621 1 6 0 629 113 34 155 48 21 1000
Gujarat 591 2 10 60 664 115 28 52 79 62 1000Haryana 553 5 16 13 587 175 16 52 62 108 1000Himachal Pradesh 531 3 0 2 537 160 14 51 53 185 1000Jammu & Kashmir 595 18 4 2 618 174 1 35 40 132 1000Karnataka 660 10 18 12 700 114 12 55 13 106 1000
Kerala 755 9 14 26 804 65 3 42 32 54 1000Madhya Pd. 596 13 6 5 620 139 15 57 70 99 1000Maharashtra 529 6 11 15 562 141 44 126 61 66 1000Manipur 417 4 23 20 465 361 11 53 20 90 1000Meghalaya 476 52 15 11 554 163 48 65 58 112 1000
Mizoram 300 8 0 39 347 381 152 30 2 88 1000Nagaland 297 0 9 4 310 378 4 26 0 282 1000Orissa 653 11 16 2 682 132 14 37 45 90 1000Punjab 662 4 18 10 695 98 6 44 69 88 1000Rajasthan 739 5 7 8 758 81 6 58 53 44 1000
Sikkim 393 16 2 1 411 488 35 15 6 45 1000Tamil Nadu 647 14 21 20 702 105 7 94 38 54 1000Tripura 504 6 10 10 531 37 4 13 16 399 1000Uttar Pradesh 701 15 15 15 746 73 10 50 35 86 1000West Bengal 761 14 12 1 788 50 12 23 23 104 1000
A&N Islands 481 0 0 4 484 469 0 44 0 3 1000Chandigarh 630 1 30 17 678 102 16 90 93 21 1000D & N Haveli 620 0 21 12 653 50 5 181 111 0 1000Daman & Diu 421 0 59 58 538 103 9 282 62 6 1000Delhi 504 13 114 0 632 303 5 24 35 1 1000
Lakshadweep 118 41 0 3 161 585 0 232 21 1 1000Pondicherry 580 0 15 44 639 174 5 134 25 23 1000All India 657 10 14 13 695 98 12 56 41 98 1000
enterprise typeproprietary partnership propr- public semi- others not
state/u.t. male female within from ietary sector public known n.r. allsame difft. or part-hhs. hhs. nership
(1) (2) (3) (4) (5) (6) (7) (8) (9) (10) (11) (12)
99Annex-I

SARVEKSHANA
Table (1):Per 1000 distribution of non-agricultural workers according to usual activitycategory (ps+ss) by enterprise type for each state and u.t.
rural females
Andhra Pr. 494 219 21 2 737 53 1 126 13 70 1000Ar. Pradesh 0 24 0 0 24 85 0 40 183 668 1000Assam 239 341 5 6 591 93 7 80 67 162 1000Bihar 506 189 19 3 718 37 0 48 8 189 1000Goa 463 219 0 0 682 160 79 42 38 0 1000
Gujarat 410 136 2 30 577 165 41 27 110 80 1000Haryana 340 342 31 0 713 54 0 52 107 74 1000Himachal Pradesh 267 119 10 0 396 354 16 29 39 166 1000Jammu & Kashmir 548 97 18 76 739 120 0 26 23 92 1000Karnataka 315 379 25 30 748 91 15 17 15 114 1000
Kerala 477 244 7 15 743 87 9 100 21 40 1000Madhya Pd. 359 227 23 0 610 115 6 102 71 96 1000Maharashtra 429 181 10 7 627 126 41 60 78 68 1000Manipur 46 641 111 0 799 97 5 29 10 60 1000Meghalaya 107 278 11 0 396 197 0 278 10 119 1000
Mizoram 169 328 76 2 575 362 13 13 15 22 1000Nagaland 124 155 0 0 278 496 18 7 0 201 1000Orissa 446 353 18 0 818 38 1 15 59 69 1000Punjab 265 335 7 9 616 119 0 61 55 149 1000Rajasthan 524 214 10 5 753 93 0 54 51 49 1000
Sikkim 228 64 1 4 297 617 0 23 3 60 1000Tamil Nadu 426 314 30 13 782 62 4 64 27 61 1000Tripura 384 177 23 3 588 83 4 25 29 271 1000Uttar Pradesh 426 374 16 5 821 46 13 22 23 75 1000West Bengal 257 610 15 0 883 25 6 5 12 69 1000
A & N Islands 218 50 0 0 268 690 0 42 0 0 1000Chandigarh 247 358 0 0 606 123 0 229 43 0 1000D & N Haveli 451 123 0 0 573 96 53 92 173 13 1000Daman & Diu 327 135 91 83 636 84 44 20 216 0 1000Delhi 417 2 0 0 419 279 61 241 0 0 1000
Lakshadweep 0 0 0 0 0 737 0 263 0 0 1000Pondicherry 365 178 0 64 607 100 0 181 36 76 1000All India 404 321 18 7 750 70 9 56 33 82 1000
enterprise typeproprietary partnership propr- public semi- others not
state/u.t. male female within from ietary sector public known n.r. allsame difft. or part-hhs. hhs. nership
(1) (2) (3) (4) (5) (6) (7) (8) (9) (10) (11) (12)
100 Annex-I

SARVEKSHANA
Table (1):Per 1000 distribution of non-agricultural workers according to usual activitycategory (ps+ss) by enterprise type for each state and u.t.
rural persons
Andhra Pr. 659 79 12 8 759 76 3 77 16 69 1000Ar. Pradesh 102 3 0 15 120 170 1 12 58 639 1000Assam 551 50 4 8 612 107 6 77 58 140 1000Bihar 566 42 18 4 631 49 5 36 27 252 1000Goa 589 46 5 0 640 123 43 131 46 17 1000
Gujarat 562 24 9 55 650 123 30 48 84 65 1000Haryana 538 28 17 12 596 166 15 52 65 106 1000Himachal Pradesh 508 13 1 2 524 178 14 49 52 183 1000Jammu & Kashmir 591 26 5 9 630 168 1 34 39 128 1000Karnataka 568 108 20 17 713 108 13 45 13 108 1000
Kerala 686 68 12 23 789 71 5 57 29 49 1000Madhya Pd. 534 69 10 4 618 133 13 68 70 98 1000Maharashtra 514 33 11 14 572 139 44 116 64 65 1000Manipur 273 252 58 12 595 258 8 44 16 79 1000Meghalaya 324 145 14 6 489 177 28 153 38 115 1000
Mizoram 251 128 28 25 433 374 100 24 7 62 1000Nagaland 268 26 7 4 305 398 6 23 0 268 1000Orissa 587 121 17 2 726 102 10 30 49 83 1000Punjab 617 42 17 10 686 100 6 46 67 95 1000Rajasthan 706 36 8 7 757 83 5 57 52 46 1000
Sikkim 356 27 2 2 386 517 27 17 5 48 1000Tamil Nadu 578 108 24 18 727 92 6 85 35 55 1000Tripura 492 24 12 9 537 42 4 15 18 384 1000Uttar Pradesh 660 69 15 13 757 69 10 46 34 84 1000West Bengal 617 185 13 0 815 43 10 18 20 94 1000
A & N Islands 446 7 0 3 455 499 0 44 0 2 1000Chandigarh 595 35 27 15 672 104 15 102 88 19 1000D & N Haveli 597 16 18 10 642 56 12 169 120 1 1000Daman & Diu 410 15 63 61 549 101 13 252 80 5 1000Delhi 502 13 111 0 626 303 6 30 34 1 1000
Lakshadweep 102 35 0 2 140 606 0 236 18 0 1000Pondicherry 535 38 12 48 632 158 4 144 28 34 1000All India 602 78 15 12 707 92 11 56 39 95 1000
enterprise typeproprietary partnership propr- public semi- others not
state/u.t. male female within from ietary sector public known n.r. allsame difft. or part-hhs. hhs. nership
(1) (2) (3) (4) (5) (6) (7) (8) (9) (10) (11) (12)
101Annex-I

SARVEKSHANA
Table (1):Per 1000 distribution of non-agricultural workers according to usual activitycategory (ps+ss) by enterprise type for each state and u.t.
urban males
Andhra Pr. 639 10 8 23 679 176 5 75 35 30 1000Ar. Pradesh 197 0 0 12 209 122 0 45 5 619 1000Assam 560 5 7 11 583 195 9 39 13 161 1000Bihar 565 5 10 7 587 119 10 71 31 182 1000Goa 419 3 40 23 486 170 5 109 227 3 1000
Gujarat 601 2 53 33 689 120 26 109 44 12 1000Haryana 573 7 28 24 631 103 14 174 52 26 1000Himachal Pradesh 414 12 21 1 449 312 34 31 50 124 1000Jammu & Kashmir 503 8 26 5 543 213 6 49 70 119 1000Karnataka 611 8 12 19 650 136 20 111 43 40 1000
Kerala 607 11 18 29 664 130 4 65 28 109 1000Madhya Pd. 589 7 19 7 621 173 19 82 46 59 1000Maharashtra 582 5 33 28 648 145 24 120 46 17 1000Manipur 441 14 43 42 540 279 13 55 22 91 1000Meghalaya 347 24 16 10 396 478 13 47 37 29 1000
Mizoram 415 31 9 6 462 372 10 27 33 96 1000Nagaland 173 8 5 0 186 485 2 69 7 251 1000Orissa 561 6 6 11 584 234 32 66 34 50 1000Punjab 683 3 42 10 738 126 5 30 62 39 1000Rajasthan 684 2 11 7 704 195 19 37 29 16 1000
Sikkim 603 12 3 2 620 342 7 8 0 23 1000Tamil Nadu 674 11 21 26 731 98 5 96 31 39 1000Tripura 418 2 2 21 444 119 4 2 23 408 1000Uttar Pradesh 698 11 32 16 757 105 12 57 26 43 1000West Bengal 607 7 29 15 659 141 18 104 40 38 1000
A & N Islands 354 1 18 36 408 403 8 172 8 1 1000Chandigarh 524 9 40 18 591 273 29 45 55 7 1000D & N Haveli 701 5 57 28 791 33 0 167 2 7 1000Daman & Diu 699 9 34 28 770 69 14 144 0 3 1000Delhi 632 4 36 10 682 167 7 115 15 14 1000
Lakshadweep 166 0 0 7 173 564 0 56 8 199 1000Pondicherry 696 3 3 19 721 127 3 77 10 62 1000All India 623 7 25 19 674 142 15 88 37 44 1000
enterprise typeproprietary partnership propr- public semi- others not
state/u.t. male female within from ietary sector public known n.r. allsame difft. or part-hhs. hhs. nership
(1) (2) (3) (4) (5) (6) (7) (8) (9) (10) (11) (12)
102 Annex-I

SARVEKSHANA
Table (1):Per 1000 distribution of non-agricultural workers according to usual activitycategory (ps+ss) by enterprise type for each state and u.t.
urban females
Andhra Pr. 448 244 8 13 713 100 4 83 56 44 1000Ar. Pradesh 29 167 0 0 196 295 0 0 32 477 1000Assam 187 262 3 8 459 248 30 99 19 145 1000Bihar 276 391 3 0 670 71 2 57 32 168 1000Goa 219 267 28 4 519 190 71 69 152 0 1000
Gujarat 368 275 14 17 674 140 38 68 58 22 1000Haryana 320 275 10 13 619 179 24 81 38 59 1000Himachal Pradesh 243 166 23 1 432 339 31 58 27 113 1000Jammu & Kashmir 190 144 7 9 351 426 8 53 107 55 1000Karnataka 371 289 4 17 681 139 12 95 34 39 1000
Kerala 282 287 8 10 587 113 10 90 32 168 1000Madhya Pd. 360 291 28 3 681 127 11 74 27 80 1000Maharashtra 357 275 33 15 679 138 23 89 44 27 1000Manipur 81 514 103 4 702 155 8 26 4 105 1000Meghalaya 47 370 2 0 419 465 12 53 11 40 1000
Mizoram 232 333 19 9 594 233 1 10 20 142 1000Nagaland 63 198 50 0 311 465 0 28 10 186 1000Orissa 384 221 4 29 639 178 34 46 69 34 1000Punjab 311 164 7 6 487 167 18 65 74 189 1000Rajasthan 376 321 8 5 709 192 5 40 43 11 1000
Sikkim 377 66 3 0 446 505 0 23 0 26 1000Tamil Nadu 449 240 16 13 718 107 10 76 36 53 1000Tripura 139 180 8 16 343 217 0 15 21 404 1000Uttar Pradesh 398 338 61 5 802 103 5 25 21 44 1000West Bengal 369 366 13 2 750 82 17 56 37 58 1000
A & N Islands 249 288 5 30 572 375 3 46 0 4 1000Chandigarh 221 223 22 8 473 416 32 16 33 30 1000D & N Haveli 644 16 0 0 660 60 79 202 0 0 1000Daman & Diu 461 232 4 5 702 88 0 198 10 2 1000Delhi 276 292 13 4 584 216 11 147 32 10 1000
Lakshadweep 9 26 0 0 35 316 0 0 12 637 1000Pondicherry 458 168 8 16 650 92 0 132 4 122 1000All India 374 281 20 11 685 130 14 74 40 57 1000
enterprise typeproprietary partnership propr- public semi- others not
state/u.t. male female within from ietary sector public known n.r. allsame difft. or part-hhs. hhs. nership
(1) (2) (3) (4) (5) (6) (7) (8) (9) (10) (11) (12)
103Annex-I

SARVEKSHANA
Table (1): Per 1000 distribution of non-agricultural workers according to usualactivity category (ps+ss) by enterprise type for each state and u.t.
urban persons
Andhra Pr. 595 64 8 21 687 159 5 77 40 32 1000Ar. Pradesh 172 24 0 10 207 147 0 38 9 599 1000Assam 502 45 6 10 563 203 12 49 14 159 1000Bihar 532 49 9 6 596 113 9 69 31 182 1000Goa 387 45 38 20 491 173 16 102 215 3 1000
Gujarat 562 48 46 30 686 123 28 102 47 14 1000Haryana 543 38 26 22 630 112 15 163 51 29 1000Himachal Pradesh 391 33 21 1 446 315 33 34 47 125 1000Jammu & Kashmir 474 21 24 6 525 233 6 50 73 113 1000Karnataka 560 69 10 19 657 137 19 107 41 39 1000
Kerala 520 85 15 24 644 125 6 72 29 124 1000Madhya Pd. 551 54 20 6 631 165 18 81 43 62 1000Maharashtra 544 50 33 26 653 144 24 114 46 19 1000Manipur 324 176 62 30 593 239 11 46 16 95 1000Meghalaya 248 138 11 7 404 474 12 49 29 32 1000
Mizoram 360 123 12 7 502 330 7 22 29 110 1000Nagaland 142 63 18 0 222 479 2 57 8 232 1000Orissa 526 49 5 14 595 223 33 62 41 46 1000Punjab 630 26 37 9 703 132 7 35 64 59 1000Rajasthan 640 47 11 7 705 195 17 38 31 14 1000
Sikkim 548 25 3 2 578 381 5 12 0 24 1000Tamil Nadu 618 68 20 22 728 100 6 91 32 43 1000Tripura 385 24 3 20 432 131 3 4 23 407 1000Uttar Pradesh 658 54 36 15 763 105 11 53 25 43 1000West Bengal 569 65 27 13 674 131 18 96 40 41 1000
A & N Islands 329 69 15 34 446 397 7 142 6 2 1000Chandigarh 468 48 36 16 569 300 30 39 51 11 1000D & N Haveli 695 6 51 25 778 36 8 171 2 5 1000Daman & Diu 641 64 27 22 753 74 11 157 3 2 1000Delhi 582 44 32 9 668 174 7 119 17 15 1000
Lakshadweep 119 8 0 5 132 489 0 39 9 331 1000Pondicherry 635 45 4 18 703 118 2 91 9 77 1000All India 578 56 24 18 676 140 15 85 38 46 1000
enterprise typeproprietary partnership propr- public semi- others not
state/u.t. male female within from ietary sector public known n.r. allsame difft. or part-hhs. hhs. nership
(1) (2) (3) (4) (5) (6) (7) (8) (9) (10) (11) (12)
104 Annex-I
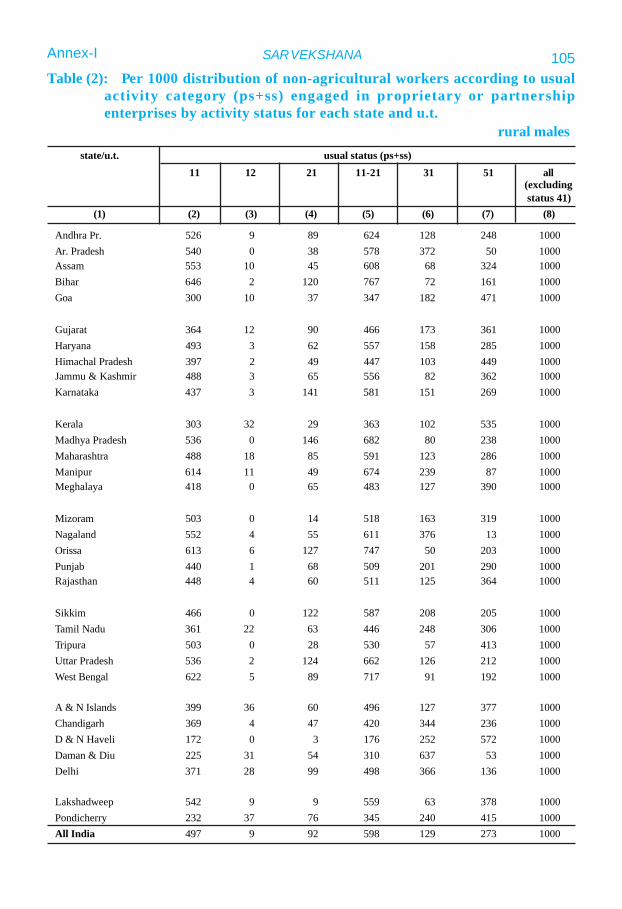
SARVEKSHANA
state/u.t. usual status (ps+ss)11 12 21 11-21 31 51 all
(excludingstatus 41)
(1) (2) (3) (4) (5) (6) (7) (8)
Table (2): Per 1000 distribution of non-agricultural workers according to usualactivity category (ps+ss) engaged in proprietary or partnershipenterprises by activity status for each state and u.t.
rural males
Andhra Pr. 526 9 89 624 128 248 1000Ar. Pradesh 540 0 38 578 372 50 1000Assam 553 10 45 608 68 324 1000Bihar 646 2 120 767 72 161 1000Goa 300 10 37 347 182 471 1000
Gujarat 364 12 90 466 173 361 1000Haryana 493 3 62 557 158 285 1000Himachal Pradesh 397 2 49 447 103 449 1000Jammu & Kashmir 488 3 65 556 82 362 1000Karnataka 437 3 141 581 151 269 1000
Kerala 303 32 29 363 102 535 1000Madhya Pradesh 536 0 146 682 80 238 1000Maharashtra 488 18 85 591 123 286 1000Manipur 614 11 49 674 239 87 1000Meghalaya 418 0 65 483 127 390 1000
Mizoram 503 0 14 518 163 319 1000Nagaland 552 4 55 611 376 13 1000Orissa 613 6 127 747 50 203 1000Punjab 440 1 68 509 201 290 1000Rajasthan 448 4 60 511 125 364 1000
Sikkim 466 0 122 587 208 205 1000Tamil Nadu 361 22 63 446 248 306 1000Tripura 503 0 28 530 57 413 1000Uttar Pradesh 536 2 124 662 126 212 1000West Bengal 622 5 89 717 91 192 1000
A & N Islands 399 36 60 496 127 377 1000Chandigarh 369 4 47 420 344 236 1000D & N Haveli 172 0 3 176 252 572 1000Daman & Diu 225 31 54 310 637 53 1000Delhi 371 28 99 498 366 136 1000
Lakshadweep 542 9 9 559 63 378 1000Pondicherry 232 37 76 345 240 415 1000All India 497 9 92 598 129 273 1000
105Annex-I

SARVEKSHANA
Table (2): Per 1000 distribution of non-agricultural workers according to usualactivity category (ps+ss) engaged in proprietary or partnershipenterprises by activity status for each state and u.t.
rural females
Andhra Pr. 257 1 535 793 70 137 1000Ar. Pradesh 787 0 0 787 213 0 1000Assam 478 14 187 679 55 266 1000Bihar 383 0 509 892 13 95 1000Goa 265 0 152 417 93 490 1000
Gujarat 244 0 366 610 13 377 1000Haryana 467 0 254 721 35 244 1000Himachal Pradesh 328 0 305 633 203 164 1000Jammu & Kashmir 217 29 576 822 129 49 1000Karnataka 414 0 401 815 41 144 1000
Kerala 247 8 134 389 178 433 1000Madhya Pradesh 309 0 381 690 18 292 1000Maharashtra 282 9 467 758 46 196 1000Manipur 704 10 260 975 14 11 1000Meghalaya 714 5 161 881 5 114 1000
Mizoram 474 0 387 861 89 50 1000Nagaland 369 0 386 755 245 0 1000Orissa 346 0 559 904 15 81 1000Punjab 383 22 91 496 194 310 1000Rajasthan 228 0 297 525 43 431 1000
Sikkim 250 0 325 575 281 144 1000Tamil Nadu 347 4 359 709 169 121 1000Tripura 279 15 57 351 228 421 1000Uttar Pradesh 340 0 527 867 26 107 1000West Bengal 559 0 324 883 19 97 1000
A & N Islands 187 0 269 456 0 544 1000Chandigarh 102 0 218 320 412 268 1000D & N Haveli 208 0 31 239 245 516 1000Daman & Diu 176 17 264 456 196 348 1000Delhi 158 0 443 601 399 0 1000
Lakshadweep 0 0 0 0 0 0 1000Pondicherry 366 0 128 494 342 164 1000All India 362 2 400 764 65 171 1000
state/u.t. usual status (ps+ss)11 12 21 11-21 31 51 all
(excludingstatus 41)
(1) (2) (3) (4) (5) (6) (7) (8)
106 Annex-I

SARVEKSHANA
Table (2): Per 1000 distribution of non-agricultural workers according to usualactivity category (ps+ss) engaged in proprietary or partnershipenterprises by activity status for each state and u.t.
rural persons
Andhra Pr. 441 6 230 678 110 213 1000Ar. Pradesh 546 0 37 583 368 49 1000Assam 544 10 63 617 67 316 1000Bihar 591 1 200 793 60 147 1000Goa 292 8 63 362 163 475 1000
Gujarat 347 11 129 487 150 363 1000Haryana 490 3 78 571 148 281 1000Himachal Pradesh 392 2 66 460 110 430 1000Jammu & Kashmir 456 6 125 587 87 325 1000Karnataka 431 2 213 646 120 234 1000
Kerala 289 27 54 370 120 511 1000Madhya Pradesh 477 0 207 685 64 252 1000Maharashtra 453 16 149 619 110 271 1000Manipur 661 11 158 830 123 48 1000Meghalaya 517 2 97 616 86 298 1000
Mizoram 489 0 201 689 126 184 1000Nagaland 524 4 106 634 356 11 1000Orissa 516 4 284 804 37 158 1000Punjab 434 3 71 508 200 292 1000Rajasthan 414 3 96 513 113 374 1000
Sikkim 428 0 157 585 221 194 1000Tamil Nadu 356 16 163 535 221 244 1000Tripura 477 2 31 510 76 414 1000Uttar Pradesh 504 2 189 695 110 195 1000West Bengal 603 4 162 768 69 163 1000
A & N Islands 382 34 77 493 117 390 1000Chandigarh 347 3 62 411 350 239 1000D & N Haveli 177 0 7 183 251 566 1000Daman & Diu 218 29 82 330 578 92 1000Delhi 367 28 105 500 366 134 1000
Lakshadweep 542 9 9 559 63 378 1000Pondicherry 259 30 86 375 261 364 1000All India 466 7 163 636 114 250 1000
state/u.t. usual status (ps+ss)11 12 21 11-21 31 51 all
(excludingstatus 41)
(1) (2) (3) (4) (5) (6) (7) (8)
107Annex-I
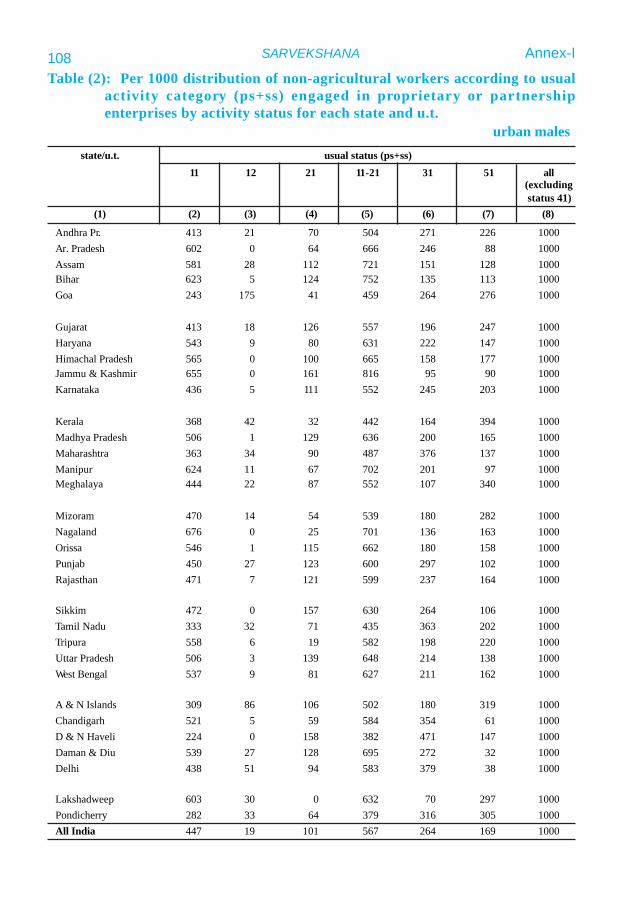
SARVEKSHANA
Table (2): Per 1000 distribution of non-agricultural workers according to usualactivity category (ps+ss) engaged in proprietary or partnershipenterprises by activity status for each state and u.t.
urban males
Andhra Pr. 413 21 70 504 271 226 1000Ar. Pradesh 602 0 64 666 246 88 1000Assam 581 28 112 721 151 128 1000Bihar 623 5 124 752 135 113 1000Goa 243 175 41 459 264 276 1000
Gujarat 413 18 126 557 196 247 1000Haryana 543 9 80 631 222 147 1000Himachal Pradesh 565 0 100 665 158 177 1000Jammu & Kashmir 655 0 161 816 95 90 1000Karnataka 436 5 111 552 245 203 1000
Kerala 368 42 32 442 164 394 1000Madhya Pradesh 506 1 129 636 200 165 1000Maharashtra 363 34 90 487 376 137 1000Manipur 624 11 67 702 201 97 1000Meghalaya 444 22 87 552 107 340 1000
Mizoram 470 14 54 539 180 282 1000Nagaland 676 0 25 701 136 163 1000Orissa 546 1 115 662 180 158 1000Punjab 450 27 123 600 297 102 1000Rajasthan 471 7 121 599 237 164 1000
Sikkim 472 0 157 630 264 106 1000Tamil Nadu 333 32 71 435 363 202 1000Tripura 558 6 19 582 198 220 1000Uttar Pradesh 506 3 139 648 214 138 1000West Bengal 537 9 81 627 211 162 1000
A & N Islands 309 86 106 502 180 319 1000Chandigarh 521 5 59 584 354 61 1000D & N Haveli 224 0 158 382 471 147 1000Daman & Diu 539 27 128 695 272 32 1000Delhi 438 51 94 583 379 38 1000
Lakshadweep 603 30 0 632 70 297 1000Pondicherry 282 33 64 379 316 305 1000All India 447 19 101 567 264 169 1000
state/u.t. usual status (ps+ss)11 12 21 11-21 31 51 all
(excludingstatus 41)
(1) (2) (3) (4) (5) (6) (7) (8)
108 Annex-I

SARVEKSHANA
Table (2): Per 1000 distribution of non-agricultural workers according to usualactivity category (ps+ss) engaged in proprietary or partnershipenterprises by activity status for each state and u.t.
urban females
Andhra Pr. 266 1 293 559 193 248 1000Ar. Pradesh 267 0 200 468 532 0 1000Assam 362 9 22 393 302 305 1000Bihar 427 0 271 698 179 123 1000Goa 548 0 141 688 126 186 1000
Gujarat 354 3 198 554 93 353 1000Haryana 496 0 123 619 195 186 1000Himachal Pradesh 376 0 268 645 270 86 1000Jammu & Kashmir 310 85 148 544 92 363 1000Karnataka 390 0 237 627 225 148 1000
Kerala 401 20 124 545 242 213 1000Madhya Pradesh 393 0 296 688 104 208 1000Maharashtra 383 6 157 545 311 144 1000Manipur 711 2 194 907 67 26 1000Meghalaya 557 0 93 650 158 192 1000
Mizoram 409 0 241 650 90 260 1000Nagaland 553 0 273 826 137 37 1000Orissa 299 0 431 730 42 228 1000Punjab 299 5 144 448 466 87 1000Rajasthan 438 1 237 675 126 198 1000
Sikkim 89 0 115 204 518 278 1000Tamil Nadu 287 6 247 539 332 129 1000Tripura 180 0 106 287 453 260 1000Uttar Pradesh 331 5 422 757 181 62 1000West Bengal 375 5 178 558 289 153 1000
A & N Islands 172 97 184 453 131 416 1000Chandigarh 365 0 14 378 545 77 1000D & N Haveli 24 0 434 458 33 508 1000Daman & Diu 623 0 235 858 60 82 1000Delhi 283 32 196 511 465 24 1000
Lakshadweep 250 469 0 719 281 0 1000Pondicherry 211 0 200 411 316 273 1000All India 346 5 245 596 238 167 1000
state/u.t. usual status (ps+ss)11 12 21 11-21 31 51 all
(excludingstatus 41)
(1) (2) (3) (4) (5) (6) (7) (8)
109Annex-I
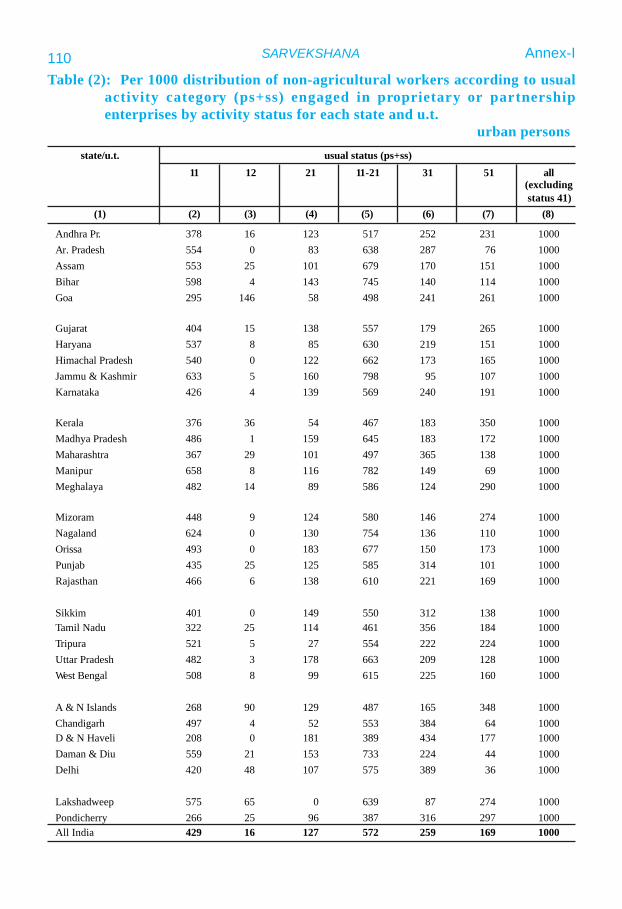
SARVEKSHANA Annex-I
Table (2): Per 1000 distribution of non-agricultural workers according to usualactivity category (ps+ss) engaged in proprietary or partnershipenterprises by activity status for each state and u.t.
urban persons
Andhra Pr. 378 16 123 517 252 231 1000Ar. Pradesh 554 0 83 638 287 76 1000Assam 553 25 101 679 170 151 1000Bihar 598 4 143 745 140 114 1000Goa 295 146 58 498 241 261 1000
Gujarat 404 15 138 557 179 265 1000Haryana 537 8 85 630 219 151 1000Himachal Pradesh 540 0 122 662 173 165 1000Jammu & Kashmir 633 5 160 798 95 107 1000Karnataka 426 4 139 569 240 191 1000
Kerala 376 36 54 467 183 350 1000Madhya Pradesh 486 1 159 645 183 172 1000Maharashtra 367 29 101 497 365 138 1000Manipur 658 8 116 782 149 69 1000Meghalaya 482 14 89 586 124 290 1000
Mizoram 448 9 124 580 146 274 1000Nagaland 624 0 130 754 136 110 1000Orissa 493 0 183 677 150 173 1000Punjab 435 25 125 585 314 101 1000Rajasthan 466 6 138 610 221 169 1000
Sikkim 401 0 149 550 312 138 1000Tamil Nadu 322 25 114 461 356 184 1000Tripura 521 5 27 554 222 224 1000Uttar Pradesh 482 3 178 663 209 128 1000West Bengal 508 8 99 615 225 160 1000
A & N Islands 268 90 129 487 165 348 1000Chandigarh 497 4 52 553 384 64 1000D & N Haveli 208 0 181 389 434 177 1000Daman & Diu 559 21 153 733 224 44 1000Delhi 420 48 107 575 389 36 1000
Lakshadweep 575 65 0 639 87 274 1000Pondicherry 266 25 96 387 316 297 1000All India 429 16 127 572 259 169 1000
state/u.t. usual status (ps+ss)11 12 21 11-21 31 51 all
(excludingstatus 41)
(1) (2) (3) (4) (5) (6) (7) (8)
110

SARVEKSHANAAnnex-I
And
hra P
r.42
230
113
922
941
110
76
215
1416
02
0A
r. Pr
ades
h0
9221
452
273
036
09
6521
031
00
Ass
am4
108
070
384
1511
50
610
92
273
50
Bih
ar13
299
110
329
229
902
106
2010
122
30
Goa
8763
024
522
889
276
00
43
04
00
Guj
arat
1040
53
110
243
1113
60
167
46
490
0H
arya
na12
270
025
725
221
126
010
28
1327
20
Him
acha
l Pra
desh
116
77
425
167
4312
51
126
313
248
0Ja
mm
u &
Kas
hmir
019
70
418
229
575
17
188
1132
00
Kar
nata
ka53
287
011
225
771
111
322
26
1167
00
Ker
ala
4216
81
233
260
5915
89
192
133
310
0M
adhy
a Pr
ades
h19
296
010
733
327
850
512
157
951
0M
ahar
asht
ra10
304
112
329
340
130
27
24
1273
00
Man
ipur
016
93
123
210
1815
50
713
923
3811
50
0M
egha
laya
133
690
228
315
2917
50
017
02
257
0M
izor
am87
104
020
931
114
330
010
363
077
00
Nag
alan
d28
700
9935
415
153
00
115
8127
056
0O
rissa
630
90
167
306
4373
07
111
1164
30
Punj
ab0
224
224
225
918
165
212
74
2143
10
Raj
asth
an70
176
236
919
419
940
125
115
402
0Si
kkim
1911
40
201
351
3017
90
322
04
2246
0Ta
mil
Nad
u18
405
315
019
644
106
75
18
153
20
Trip
ura
099
017
128
150
720
135
162
273
00
Utta
r Pra
desh
431
70
152
277
1510
81
118
2216
691
0W
est B
enga
l2
362
274
330
2612
72
71
237
360
0A
& N
Isla
nds
018
30
400
252
015
20
60
00
70
0C
hand
igar
h0
303
032
916
312
742
5011
00
531
0D
& N
Hav
eli
4236
30
5579
1838
60
00
30
550
0D
aman
& D
iu0
571
013
108
135
138
09
00
109
50
Del
hi0
406
068
417
1574
02
00
44
100
Laks
hadw
eep
00
037
850
70
800
00
00
340
0Po
ndic
herr
y0
377
1489
271
8954
230
013
051
170
All
Indi
a19
289
115
727
231
114
310
514
1075
10
Tabl
e (3
):Pe
r 10
00 d
istr
ibut
ion
of n
on-a
gric
ultu
ral w
orke
rs a
ccor
ding
to u
sual
act
ivity
cat
egor
y (p
s+ss
) eng
aged
inpr
opri
etar
y or
par
tner
ship
ent
erpr
ises
by
tabu
latio
n ca
tego
ry o
f NIC
199
8 fo
r eac
h st
ate
and
u.t.
rura
l mal
est
ate/
u.t.
tabu
latio
n ca
tego
ry (a
s per
NIC
199
8)C
DE
FG
HI
JK
LM
NO
PQ
(1)
(2)
(3)
(4)
(5)
(6)
(7)
(8)
(9)
(10)
(11)
(12)
(13)
(14)
(15)
(16)
111

SARVEKSHANA
And
hra
Pr.
5535
40
3516
773
10
00
281
271
140
Ar.
Prad
esh
00
00
787
00
00
00
021
30
0A
ssam
056
90
094
219
00
014
1424
642
0B
ihar
568
80
3112
67
14
00
114
121
20
Goa
165
630
9543
014
30
00
040
164
00
Guj
arat
2242
70
153
266
1016
00
03
010
30
0H
arya
na0
205
00
448
00
00
024
032
30
0H
imac
hal P
rade
sh0
490
019
247
647
00
013
10
600
0Ja
mm
u &
Kas
hmir
078
70
1876
034
00
084
00
10
Kar
nata
ka53
578
025
142
721
00
57
311
30
0K
eral
a19
556
082
5950
614
63
6323
8830
0M
adhy
a Pr
ades
h6
596
014
516
48
20
01
62
690
0M
ahar
asht
ra18
526
085
267
360
00
021
537
70
Man
ipur
4871
00
021
315
00
00
67
00
0M
egha
laya
1943
028
685
145
80
00
50
670
0M
izor
am0
198
050
548
430
00
2761
073
00
Nag
alan
d0
700
072
80
00
00
148
540
00
Oris
sa0
763
042
8921
00
00
160
653
0Pu
njab
030
60
1215
539
00
00
125
2527
662
0R
ajas
than
124
420
025
198
50
00
032
662
30
Sikk
im35
174
00
404
970
03
098
035
153
0Ta
mil
Nad
u8
678
039
128
446
07
124
245
190
Trip
ura
019
60
9476
00
00
134
680
361
720
Utta
r Pra
desh
057
30
2415
917
10
02
2913
178
40
Wes
t Ben
gal
084
60
751
61
00
016
160
120
A &
N Is
land
s26
045
020
128
90
011
39
00
083
00
Cha
ndig
arh
020
70
028
40
00
00
1922
226
80
0D
& N
Hav
eli
106
644
055
370
158
00
00
00
00
Dam
an &
Diu
056
00
027
238
00
00
00
130
00
Del
hi0
00
085
10
00
00
00
014
90
Laks
hadw
eep
00
00
00
00
00
00
00
0Po
ndic
herr
y0
351
030
290
117
00
370
980
5621
0A
ll In
dia
1960
50
5013
231
31
11
245
116
110
Tabl
e (3
):Pe
r 10
00 d
istr
ibut
ion
of n
on-a
gric
ultu
ral w
orke
rs a
ccor
ding
to u
sual
act
ivity
cat
egor
y (p
s+ss
) eng
aged
inpr
opri
etar
y or
par
tner
ship
ent
erpr
ises
by
tabu
latio
n ca
tego
ry o
f NIC
199
8 fo
r eac
h st
ate
and
u.t.
rura
l fem
ale
stat
e/u.
t.ta
bula
tion
cate
gory
(as p
er N
IC 1
998)
CD
EF
GH
IJ
KL
MN
OP
Q(1
)(2
)(3
)(4
)(5
)(6
)(7
)(8
)(9
)(1
0)(1
1)(1
2)(1
3)(1
4)(1
5)(1
6)
112 Annex-I

SARVEKSHANA
And
hra
Pr.
4627
01
106
210
5275
54
119
1019
56
0A
r. Pr
ades
h0
9020
441
285
035
09
6420
035
00
Ass
am3
166
061
347
1410
30
58
93
269
100
Bih
ar11
379
188
258
2572
28
518
912
23
0G
oa10
463
021
227
310
121
60
03
120
170
0G
ujar
at11
408
311
624
611
119
013
64
557
00
Har
yana
1126
50
236
268
1911
60
92
1012
512
0H
imac
hal P
rade
sh1
189
739
817
240
119
111
612
1226
70
Jam
mu
& K
ashm
ir0
264
037
221
25
701
616
169
280
0K
arna
taka
5336
80
8822
571
802
163
69
800
0K
eral
a37
260
119
721
357
122
1016
225
845
70
Mad
hya
Prad
esh
1537
40
116
289
2264
04
913
688
00
Mah
aras
htra
1134
11
117
289
3910
81
61
710
671
0M
anip
ur25
452
159
212
1674
03
6614
2255
00
Meg
hala
ya95
610
161
439
6811
90
011
22
395
0M
izor
am44
150
012
942
929
170
065
620
750
0N
agal
and
2470
084
412
1312
90
097
9131
048
0O
rissa
447
30
122
228
3547
04
113
764
30
Punj
ab0
232
221
824
920
148
210
717
2166
80
Raj
asth
an78
213
135
117
917
800
104
145
432
0Si
kkim
2212
50
166
360
4114
80
272
173
2465
0Ta
mil
Nad
u15
496
211
317
344
735
61
132
508
0Tr
ipur
a0
110
016
325
844
640
146
222
283
80
Utta
r Pra
desh
435
80
131
258
1590
19
723
1687
10
Wes
t Ben
gal
151
21
5324
320
882
51
215
434
0A
& N
Isla
nds
2017
20
384
255
014
09
60
00
130
0C
hand
igar
h0
295
030
117
311
682
4610
219
711
0D
& N
Hav
eli
4939
60
5574
1635
90
00
20
480
0D
aman
& D
iu0
570
012
130
122
120
08
00
925
50
Del
hi0
399
067
425
1473
02
00
44
130
Laks
hadw
eep
00
037
850
70
800
00
00
340
0Po
ndic
herr
y0
372
1177
275
9543
187
030
052
180
All
Indi
a19
362
113
223
931
882
84
169
854
0
Tabl
e (3
):Pe
r 10
00 d
istr
ibut
ion
of n
on-a
gric
ultu
ral w
orke
rs a
ccor
ding
to u
sual
act
ivity
cat
egor
y (p
s+ss
) eng
aged
inpr
opri
etar
y or
par
tner
ship
ent
erpr
ises
by
tabu
latio
n ca
tego
ry o
f NIC
199
8 fo
r eac
h st
ate
and
u.t.
rura
l per
sons
stat
e/u.
t.ta
bula
tion
cate
gory
(as p
er N
IC 1
998)
CD
EF
GH
IJ
KL
MN
OP
Q(1
)(2
)(3
)(4
)(5
)(6
)(7
)(8
)(9
)(1
0)(1
1)(1
2)(1
3)(1
4)(1
5)(1
6)
113Annex-I

SARVEKSHANA
And
hra
Pr.
419
60
144
341
5212
514
2910
2413
435
0A
r. Pr
ades
h0
078
158
625
400
00
540
032
130
Ass
am1
108
057
455
6471
851
447
3298
40
Bih
ar16
230
248
431
3782
242
1439
1145
20
Goa
981
025
631
470
214
040
100
51
00
Guj
arat
028
41
110
393
3510
76
261
310
231
0H
arya
na0
213
097
467
4989
913
45
1635
30
Him
acha
l Pra
desh
017
28
158
381
8281
625
2015
1437
00
Jam
mu
& K
ashm
ir0
144
018
550
536
546
298
91
230
0K
arna
taka
422
01
136
396
4410
88
355
110
320
0K
eral
a4
216
219
431
261
126
829
412
331
00
Mad
hya
Prad
esh
518
61
8443
442
116
527
1317
958
30
Mah
aras
htra
026
20
106
342
4912
38
431
614
3113
0M
anip
ur33
125
114
032
259
930
1210
536
471
00
Meg
hala
ya0
957
278
433
1011
80
44
77
306
0M
izor
am25
117
023
835
425
970
2893
116
70
0N
agal
and
022
50
194
374
4028
031
00
998
00
Oris
sa7
172
011
537
288
835
362
2224
722
0Pu
njab
027
12
8738
245
113
122
54
1449
50
Raj
asth
an37
267
114
733
718
951
334
155
363
0Si
kkim
3010
65
5450
214
642
00
86
070
310
Tam
il N
adu
129
41
9733
051
104
1228
27
1047
140
Trip
ura
044
435
403
2292
321
119
3113
212
20
Utta
r Pra
desh
027
90
8139
537
902
247
266
483
0W
est B
enga
l1
239
187
342
4714
36
362
3413
3811
0A
& N
Isla
nds
020
70
102
442
3318
40
270
20
03
0C
hand
igar
h0
192
010
143
965
604
683
1511
2121
0D
& N
Hav
eli
061
60
7414
433
950
340
00
30
0D
aman
& D
iu4
690
6952
779
115
010
36
211
53
0D
elhi
028
41
7240
126
856
3819
85
2821
4La
ksha
dwee
p0
162
039
216
262
205
016
00
00
00
Pond
iche
rry
032
10
170
296
4786
1026
12
029
120
All
Indi
a4
248
110
437
244
108
732
615
1141
70
Tabl
e (3
):Pe
r 10
00 d
istr
ibut
ion
of n
on-a
gric
ultu
ral w
orke
rs a
ccor
ding
to u
sual
act
ivity
cat
egor
y (p
s+ss
) eng
aged
inpr
opri
etar
y or
par
tner
ship
ent
erpr
ises
by
tabu
latio
n ca
tego
ry o
f NIC
199
8 fo
r eac
h st
ate
and
u.t.
urba
n m
ale
stat
e/u.
t.ta
bula
tion
cate
gory
(as p
er N
IC 1
998)
CD
EF
GH
IJ
KL
MN
OP
Q(1
)(2
)(3
)(4
)(5
)(6
)(7
)(8
)(9
)(1
0)(1
1)(1
2)(1
3)(1
4)(1
5)(1
6)
114 Annex-I

SARVEKSHANA
And
hra
Pr.
227
70
127
256
749
519
458
1111
544
0A
r. Pr
ades
h0
00
058
80
00
024
983
00
810
Ass
am0
138
00
103
108
59
014
18
329
249
0B
ihar
032
34
3126
820
04
241
4322
112
148
0G
oa0
211
018
630
584
00
00
690
144
00
Guj
arat
024
40
9727
99
297
132
3119
221
500
Har
yana
023
80
1441
91
120
190
169
2297
90
Him
acha
l Pra
desh
062
049
330
8016
416
8318
078
977
0Ja
mm
u &
Kas
hmir
2137
00
263
146
00
00
015
723
180
0K
arna
taka
546
90
5923
133
48
163
3631
6539
0K
eral
a3
461
031
214
2520
1418
1164
2665
470
Mad
hya
Prad
esh
043
00
8023
642
121
27
3818
103
290
Mah
aras
htra
021
30
3129
929
103
391
7242
138
123
0M
anip
ur0
397
06
377
6637
012
5413
238
00
Meg
hala
ya0
990
250
197
110
180
80
133
132
0M
izor
am32
820
100
571
101
200
1735
191
1011
0N
agal
and
025
30
045
311
00
930
887
2471
0O
rissa
047
10
128
143
310
00
025
1918
20
0Pu
njab
026
10
1029
313
421
2112
195
2083
500
Raj
asth
an32
489
012
814
38
243
110
807
678
0Si
kkim
883
011
715
446
00
06
474
7046
50
Tam
il N
adu
346
80
3819
948
182
52
5220
4995
1Tr
ipur
a0
764
012
248
4848
027
814
912
147
660
Utta
r Pra
desh
047
50
1413
118
136
35
204
889
340
Wes
t Ben
gal
136
60
1112
437
74
20
7417
143
212
0A
& N
Isla
nds
016
10
029
023
00
00
5358
415
00
Cha
ndig
arh
019
80
018
217
777
470
211
3714
679
0D
& N
Hav
eli
067
00
406
00
00
033
049
40
0D
aman
& D
iu0
138
013
324
90
013
033
043
733
0D
elhi
032
70
1713
334
110
2452
110
9210
010
00
Laks
hadw
eep
00
025
046
90
00
028
10
00
00
Pond
iche
rry
040
90
121
275
370
03
022
710
125
0A
ll In
dia
336
60
5422
036
134
155
7823
107
760
Tabl
e (3
):Pe
r 10
00 d
istr
ibut
ion
of n
on-a
gric
ultu
ral w
orke
rs a
ccor
ding
to u
sual
act
ivity
cat
egor
y (p
s+ss
) eng
aged
inpr
opri
etar
y or
par
tner
ship
ent
erpr
ises
by
tabu
latio
n ca
tego
ry o
f NIC
199
8 fo
r eac
h st
ate
and
u.t.
urba
n fe
mal
est
ate/
u.t.
tabu
latio
n ca
tego
ry (a
s per
NIC
199
8)C
DE
FG
HI
JK
LM
NO
PQ
(1)
(2)
(3)
(4)
(5)
(6)
(7)
(8)
(9)
(10)
(11)
(12)
(13)
(14)
(15)
(16)
115Annex-I

SARVEKSHANA
And
hra
Pr.
421
50
140
321
5797
1226
832
1260
140
Ar.
Prad
esh
00
6713
661
934
00
081
110
2822
0A
ssam
111
20
5041
057
638
4638
2429
127
360
Bih
ar14
242
346
410
3571
240
1239
1254
200
Goa
710
30
244
312
7317
70
349
124
260
0G
ujar
at0
277
110
837
431
947
231
711
569
0H
arya
na0
216
088
461
4480
814
424
1742
30
Him
acha
l Pra
desh
015
87
144
375
8273
524
2836
2245
10
Jam
mu
& K
ashm
ir1
158
019
048
234
516
278
183
220
0K
arna
taka
427
60
118
359
4185
831
59
1539
90
Ker
ala
427
62
154
288
5210
010
266
248
3911
0M
adhy
a Pr
ades
h4
230
183
398
4298
423
1220
1066
80
Mah
aras
htra
025
40
9333
545
103
742
118
1950
320
Man
ipur
2023
01
8834
361
720
1285
273
580
0M
egha
laya
096
518
445
640
810
93
75
6549
0M
izor
am28
104
018
843
253
690
2472
144
84
0N
agal
and
023
70
116
406
2817
056
036
868
290
Oris
sa5
237
011
832
375
654
282
2323
961
0Pu
njab
027
02
7937
342
106
122
623
1552
90
Raj
asth
an37
299
114
430
917
852
303
256
414
0Si
kkim
4186
466
437
128
340
08
141
7011
20
Tam
il N
adu
233
71
8229
850
8310
232
1812
4834
0Tr
ipur
a0
474
3137
624
887
1913
442
1320
68
0U
ttar P
rade
sh0
307
072
358
3579
321
751
654
80
Wes
t Ben
gal
126
21
7330
246
118
630
241
1457
470
A &
N Is
land
s0
193
071
397
3012
90
190
1718
125
20
Cha
ndig
arh
019
30
8639
958
634
652
4515
4030
0D
& N
Hav
eli
057
10
6816
630
870
310
30
440
0D
aman
& D
iu3
850
5648
063
890
112
121
188
100
Del
hi0
290
165
369
2776
536
2320
1637
304
Laks
hadw
eep
014
90
381
187
5718
90
1522
00
00
0Po
ndic
herr
y0
342
015
829
144
668
201
72
4615
0A
ll In
dia
326
91
9534
543
916
296
2713
5320
0
Tabl
e (3
):Pe
r 10
00 d
istr
ibut
ion
of n
on-a
gric
ultu
ral w
orke
rs a
ccor
ding
to u
sual
act
ivity
cat
egor
y (p
s+ss
) eng
aged
inpr
opri
etar
y or
par
tner
ship
ent
erpr
ises
by
tabu
latio
n ca
tego
ry o
f NIC
199
8 fo
r eac
h st
ate
and
u.t.
urba
n pe
rson
sst
ate/
u.t.
tabu
latio
n ca
tego
ry (a
s per
NIC
199
8)C
DE
FG
HI
JK
LM
NO
PQ
(1)
(2)
(3)
(4)
(5)
(6)
(7)
(8)
(9)
(10)
(11)
(12)
(13)
(14)
(15)
(16)
116 Annex-I

SARVEKSHANA
Andhra Pradesh 3740 4108 4261 3425 4389 4529 7164 8498 8790Arunachal Pradesh 11 5 5 8 3 3 19 7 7Assam 884 1192 1306 358 388 410 1242 1580 1716Bihar 3472 3053 3223 1498 1594 1631 4970 4647 4855Goa 45 93 95 119 90 93 163 184 188
Gujarat 1264 1884 1933 3057 2923 3012 4321 4808 4945Haryana 496 838 875 820 926 959 1316 1764 1835Himachal Pradesh 276 341 344 80 60 62 355 402 406Jammu & Kashmir 331 346 375 206 179 185 538 526 559Karnataka 2092 2005 2061 2574 2713 2784 4666 4718 4845
Kerala 1790 2899 3037 1167 1448 1506 2957 4347 4543Madhya Pradesh 2071 1982 2109 2092 2784 2864 4162 4765 4974Maharashtra 2385 2447 2585 5775 6849 7079 8160 9297 9665Manipur 78 50 62 61 46 53 139 96 115Meghalaya 73 39 39 37 31 31 110 70 70
Mizoram 10 9 9 22 23 24 31 32 33Nagaland 15 11 11 18 10 12 33 21 23Orissa 2500 1641 1924 610 851 922 3110 2492 2846Punjab 673 1071 1099 1394 1497 1538 2068 2568 2636Rajasthan 1543 2380 2438 1401 1827 1902 2944 4207 4340
Sikkim 18 21 21 9 7 7 27 28 28Tamil Nadu 2983 4246 4325 4107 5047 5179 7090 9293 9504Tripura 110 192 193 71 41 42 181 234 235Uttar Pradesh 7674 7499 7867 5640 6474 6830 13314 13973 14697West Bengal 5046 5234 5958 3043 3261 3381 8088 8495 9339
A & N. Islands 9 12 12 6 12 13 15 24 25Chandigarh 30 20 20 110 116 125 140 136 144D & Nagar Haveli 5 19 19 3 5 5 8 24 24Daman & Diu 6 11 11 10 12 12 16 23 23Delhi 153 436 436 2161 1803 1873 2314 2239 2309
Lakshadweep 1 0 0 1 1 1 2 1 1Pondicherry 29 33 34 92 106 109 121 139 143all India 39808 44121 46688 39975 45522 47168 79783 89643 93856
Table (4) : Estimated number of workers as obtained through enterprise survey(Sch. 2.0) and household survey (Sch. 10) approach
state/ut estimated number of workers (000)rural urban combined
Sch. 2.0 Sch. 10 Sch. 2.0 Sch. 10 Sch. 2.0 Sch. 10ps ps+ss ps ps+ss ps ps+ss
(1) (2) (3) (4) (5) (6) (7) (8) (9) (10)
117Annex-I

SARVEKSHANA
Andhra Pradesh 1472 1140 1215 818 949 1002 2290 2088 2217Arunachal Pradesh 1 0 0 1 0 0 1 0 0Assam 235 154 222 51 42 50 286 196 271Bihar 1383 1143 1247 279 396 415 1662 1539 1662Goa 17 7 7 14 8 10 31 15 16
Gujarat 534 790 805 1018 823 844 1553 1613 1649Haryana 123 221 235 215 191 208 338 412 444Himachal Pradesh 106 65 66 15 10 10 121 75 76Jammu & Kashmir 133 76 101 61 27 29 195 103 130Karnataka 1053 781 803 802 741 783 1855 1523 1586
Kerala 656 758 829 372 409 425 1028 1167 1254Madhya Pradesh 1035 728 808 571 646 675 1606 1374 1483Maharashtra 921 801 895 1761 1796 1860 2682 2596 2754Manipur 35 19 31 20 9 14 55 28 44Meghalaya 14 3 3 4 3 3 18 6 6
Mizoram 3 1 2 5 3 3 8 4 5Nagaland 4 1 1 3 2 3 7 3 4Orissa 1514 714 916 161 178 220 1675 892 1136Punjab 188 246 259 328 412 422 516 658 681Rajasthan 605 544 569 453 557 595 1058 1101 1164
Sikkim 4 3 3 1 1 1 5 4 4Tamil Nadu 1649 2147 2204 1497 1740 1814 3147 3887 4018Tripura 47 22 22 9 2 2 56 24 25Uttar Pradesh 2970 2654 2849 1648 1955 2124 4619 4609 4973West Bengal 2925 2434 3075 1028 878 933 3953 3312 4008
A & N. Islands 1 2 2 2 2 2 3 4 5Chandigarh 18 6 6 30 24 25 49 30 31D & Nagar Haveli 1 8 8 0 3 3 2 11 11Daman & Diu 2 6 6 2 1 1 4 7 7Delhi 32 176 176 752 523 576 784 699 752
Lakshadweep 0 0 0 0 0 0 0 0 0Pondicherry 9 13 13 46 37 38 54 49 51all India 17692 15666 17379 11969 12362 13086 29661 28029 30465
Table 5: Estimated number of workers in manufacturing (tabulation categoryD) as obtained through enterprise survey (Sch. 2.0) and household survey(Sch. 10) approach
state/ut estimated number of workers (000)rural urban combined
Sch. 2.0 Sch. 10 Sch. 2.0 Sch. 10 Sch. 2.0 Sch. 10ps ps+ss ps ps+ss ps ps+ss
(1) (2) (3) (4) (5) (6) (7) (8) (9) (10)
118 Annex-I

SARVEKSHANA
Andhra Pradesh 1004 919 944 1383 1437 1495 2387 2355 2439Arunachal Pradesh 8 2 2 5 2 2 14 3 3Assam 434 451 464 194 175 182 628 626 645Bihar 1103 814 847 706 694 703 1809 1507 1550Goa 12 29 29 57 29 30 69 58 59
Gujarat 467 458 485 1289 1102 1139 1756 1560 1624Haryana 207 218 238 362 435 446 569 653 684Himachal Pradesh 88 59 60 39 23 24 127 83 84Jammu & Kashmir 109 77 81 73 88 90 182 165 171Karnataka 620 474 491 1065 1001 1019 1685 1475 1510
Kerala 534 665 678 410 425 444 943 1089 1122Madhya Pradesh 683 601 625 909 1144 1170 1592 1746 1796Maharashtra 873 735 757 2398 2372 2454 3271 3107 3211Manipur 19 14 14 20 19 20 39 33 35Meghalaya 32 19 19 18 15 15 50 34 34
Mizoram 5 4 4 12 11 12 17 16 16Nagaland 9 6 6 10 4 5 18 10 10Orissa 554 420 441 235 288 300 789 709 741Punjab 262 270 277 682 560 584 944 830 861Rajasthan 470 464 479 574 599 614 1044 1063 1093
Sikkim 8 8 8 4 4 4 13 12 12Tamilnadu 671 767 770 1354 1570 1604 2025 2337 2373Tripura 36 53 53 32 18 18 68 71 71Uttar Pradesh 2467 1966 2052 2373 2421 2482 4840 4388 4534West Bengal 1224 1439 1460 1194 1058 1077 2418 2497 2538
A & N. Islands 5 3 3 3 5 5 8 8 8Chandigarh 6 3 3 42 49 51 48 52 55D & Nagar Haveli 2 1 1 1 1 1 3 2 2Daman & Diu 1 1 1 4 6 6 5 7 8Delhi 73 188 188 936 728 734 1008 916 922
Lakshadweep 0 0 0 1 0 0 1 0 0Pondicherry 9 10 10 24 32 32 33 42 42all India 11995 11142 11489 16408 16323 16755 28403 27466 28244
Table 6: Estimated number of workers in trading services (Tabulation categoryG) as obtained through enterprise survey (Sch. 2.0) and household survey(Sch. 10) approach
state/ut estimated number of workers (000)rural urban combined
Sch. 2.0 Sch. 10 Sch. 2.0 Sch. 10 Sch. 2.0 Sch. 10ps ps+ss ps ps+ss ps ps+ss
(1) (2) (3) (4) (5) (6) (7) (8) (9) (10)
119Annex-I

SARVEKSHANA

SARVEKSHANA
SAMPLE DESIGN ANDESTIMATION PROCEDURE
NSS Fifty Fifth Round(July 1999 – June 2000)
ANNEX - II

SARVEKSHANA
Sample Design and Estimation Procedure
1. Sample Design
1.1 General:
A stratified sampling design has beenadopted for selection of the sample first-stageunits (FSUs). The FSUs are villages(panchayat wards for Kerala) for rural areasand Urban Frame Survey (UFS) blocks forurban areas. The Ultimate stage units (USUs)are households for canvassing consumer ex-penditure (schedule 1.0) & employment-un-employment schedules (schedule 10/10.1)and enterprises for canvassing informal sec-tor enterprise schedule (schedule 2.0). USUsare selected by the method of circular sys-tematic sampling from the correspondingframe in the FSU. Large FSUs are subdi-vided into hamlet groups (rural) / sub-blocks(urban) that are grouped into two segments,and USUs are selected independently fromeach of these segments.
1.2 Sampling Frame:
List of villages (panchayat wards for Kerala)as per 1991 Census and latest lists of UFSblocks are respectively used for selection ofrural and urban sample FSUs. For selectionof sample villages from the State of Jammu& Kashmir, list of villages as per 1981 Cen-sus has been used as the sampling frame. Asalready mentioned that all the uninhabitedvillages of the country as per 1991 Census,interior villages of Nagaland situated beyond5 kms. of a bus route and inaccessible vil-lages of Andaman & Nicobar Islands are leftout of the survey coverage of the NSS 55th
round.
1.3 Sample size (FSUs):
A total number of 10,384 FSUs were selectedfor survey in the central sample at all-Indialevel (rural & urban combined) in the 55th
round. Sample size for the whole round foreach State/UT and Sector (i.e., rural/ urban)is allocated equally among the four sub-rounds. Sample FSUs for each sub-round areselected afresh in the form of two indepen-dent sub-samples. Of the 10384 FSUs se-lected for the survey, 10173 were actuallysurveyed. This comprises 6048 villages and4125 urban blocks. State/UT-wise distribu-tion of FSUs allotted and surveyed is givenTable 1.1. Similar information giving thenumber of persons surveyed for employment–unemployment surveys and enterprises sur-veyed for enterprise survey are presented inTable 1.2.
1.4 Stratification
1.4.1 Rural:
Two special strata were formed at the State/UT level, viz.
Stratum 1: all FSUs with population be-tween 1 to 100, and
Stratum 2: FSUs with population morethan 15,000.
[Note:The above two strata were spreadacross a given state and are not confined toany particular administrative division withinthe state.]
These strata of either type were formed if atleast 50 such FSUs were there in the respec-
122 Annex-II
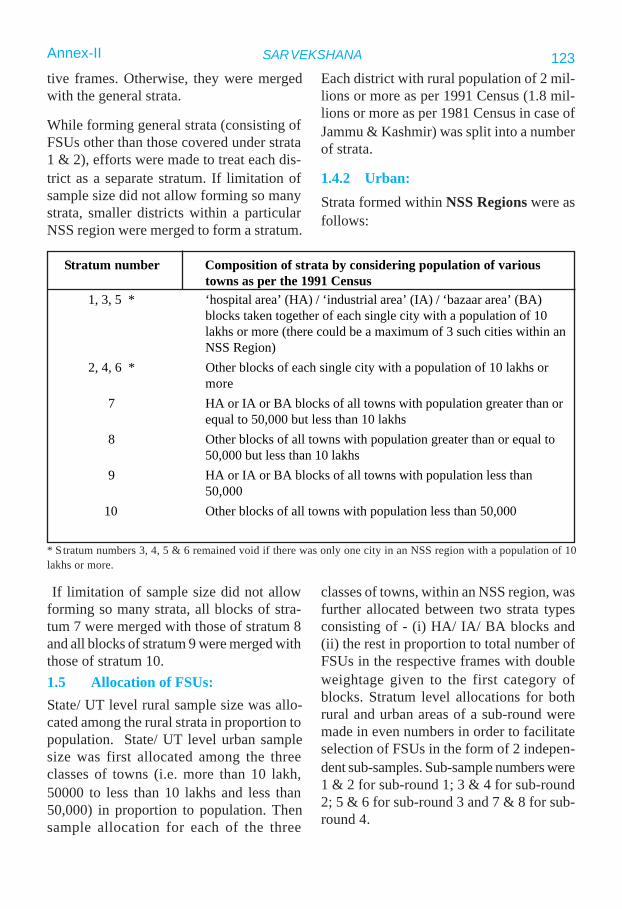
SARVEKSHANA
tive frames. Otherwise, they were mergedwith the general strata.
While forming general strata (consisting ofFSUs other than those covered under strata1 & 2), efforts were made to treat each dis-trict as a separate stratum. If limitation ofsample size did not allow forming so manystrata, smaller districts within a particularNSS region were merged to form a stratum.
Each district with rural population of 2 mil-lions or more as per 1991 Census (1.8 mil-lions or more as per 1981 Census in case ofJammu & Kashmir) was split into a numberof strata.
1.4.2 Urban:Strata formed within NSS Regions were asfollows:
Stratum number Composition of strata by considering population of varioustowns as per the 1991 Census
1, 3, 5 * ‘hospital area’ (HA) / ‘industrial area’ (IA) / ‘bazaar area’ (BA)blocks taken together of each single city with a population of 10lakhs or more (there could be a maximum of 3 such cities within anNSS Region)
2, 4, 6 * Other blocks of each single city with a population of 10 lakhs ormore
7 HA or IA or BA blocks of all towns with population greater than orequal to 50,000 but less than 10 lakhs
8 Other blocks of all towns with population greater than or equal to50,000 but less than 10 lakhs
9 HA or IA or BA blocks of all towns with population less than50,000
10 Other blocks of all towns with population less than 50,000
If limitation of sample size did not allowforming so many strata, all blocks of stra-tum 7 were merged with those of stratum 8and all blocks of stratum 9 were merged withthose of stratum 10.1.5 Allocation of FSUs:State/ UT level rural sample size was allo-cated among the rural strata in proportion topopulation. State/ UT level urban samplesize was first allocated among the threeclasses of towns (i.e. more than 10 lakh,50000 to less than 10 lakhs and less than50,000) in proportion to population. Thensample allocation for each of the three
classes of towns, within an NSS region, wasfurther allocated between two strata typesconsisting of - (i) HA/ IA/ BA blocks and(ii) the rest in proportion to total number ofFSUs in the respective frames with doubleweightage given to the first category ofblocks. Stratum level allocations for bothrural and urban areas of a sub-round weremade in even numbers in order to facilitateselection of FSUs in the form of 2 indepen-dent sub-samples. Sub-sample numbers were1 & 2 for sub-round 1; 3 & 4 for sub-round2; 5 & 6 for sub-round 3 and 7 & 8 for sub-round 4.
* S tratum numbers 3, 4, 5 & 6 remained void if there was only one city in an NSS region with a population of 10lakhs or more.
123Annex-II

SARVEKSHANA
1.6 Selection of FSUs :
For each sub-round, sample FSUs fromeach stratum were selected in the form of 2independent sub-samples by followingcircular systematic sampling with(a) probability proportional topopulation for all rural strata otherthan stratum 1, and (b) equal probabilityfor rural stratum 1 as well as all urbanstrata.
1.7 Formation of hamlet-group (hg’s) inlarge villages and sub-block (sb’s) in largeurban blocks: Depending upon the values ofapproximate present population (P) and ap-proximate total number of non-agriculturalenterprises (E), decision was taken to dividethe FSU into a fixed number of hamlet-groups (hg’s - the term applicable for ruralsamples) / sub-blocks (sb’s - the term appli-cable for urban samples) as per the rulesgiven below:
(1) (2) (3) (4)Less than 1200 1 @ Less than 100 1 @
1200 – 1999 5 100 – 249 52000 – 2399 6 250 – 299 6
2400 – 2799 7 300 – 349 72800 – 3199 8 350 – 399 8
(and so on) (and so on)@ no. of hg’s/ sb’s = ‘1’ means the whole FSU is considered for listing.[For rural areas of Himachal Pradesh, Sikkim and Poonch, Rajouri, Udhampur and Doda districts of Jammu & Kashmir,number of hg’s formed in the village as per population criterion was : 1 for P < 600, 5 for P = 600 to 999, 6 for P = 1000to 1199, 7 for P = 1200 to 1399, 8 for P = 1400 to 1599, and so on. (Procedure remains unchanged as per enterprisecriterion.)]
Population No. of hg’s/ sb’s Number of no. of hg’s/ sb’s(P) formed in the FSU as enterprises formed in the FSU as
per population criterion (E) per enterprise criterion
The number (D) of hamlet-groups (hg)/ sub-blocks (sb) formed in the FSU was such thatthe higher of the two values as per popula-tion and enterprise criteria was chosen. Ifvalue of P was less than 1200 (600 for cer-tain hilly areas specified above) as well asvalue of E was less than 100 for an FSU, hg/sb formation was not resorted to and thewhole FSU was considered for listing. Incase hg’s/ sb’s were formed in the sampleFSU, the same was done by more or lessequalizing population.
1.8 Formation of Segments withinFSU:
The hg/ sb having maximum concentrationof non-agricultural enterprises was selectedwith certainty for listing of households/ en-terprises. This hg/ sb was referred to as seg-ment 1. From the remaining (D-1) hg’s/ sb’sof the FSU, two more hg’s/ sb’s were se-lected circular systematically and these twoselected hg’s/ sb’s together were referred toas segment 2 for a combined listing of house-
124 Annex-II

SARVEKSHANA
holds/ enterprises. Thus listing of house-holds/ enterprises was done only in segments1 and 2 of the FSU. The FSU not requiringhg/ sb formation was treated as segment 1for the purpose of data collection and esti-mation.
1.9 Sampling frame of households/enterprises:
Having determined the area(s) considered forlisting, all the households (including thosefound temporarily locked) and non-agricul-tural enterprises were listed in the next step.Although all non-agricultural enterpriseswere listed, only the ‘informal non-agricul-tural enterprises’ (other than those coveredunder ASI and mining & quarrying and elec-tricity, gas & water supply) which operatedat least 30 days (15 days for seasonal enter-prises) during the last year qualified for sur-vey. Such enterprises were referred to as ‘eli-gible enterprises’. Listing of households aswell as eligible enterprises for the purposeof sample selection was independent for seg-ments 1 & 2.
1.10 Stratification of households:
All the households listed in a segment (bothrural & urban) were stratified into two sec-ond stage strata, viz. ‘affluent households’(formed second stage stratum 1) and the rest(formed second stage stratum 2). In rural sec-tor, a household was classified as ‘affluent’if the household owned certain items likemotor car/ jeep, colour TV, telephone, etc.or owns land / livestock in excess of certainlimits. In urban sector, the households hav-ing MPCE (monthly per capita consumer ex-penditure) greater than certain limit for agiven town/city were treated as ‘affluent’households for the present survey and wereincluded in the frame of second stage stra-tum 1, and rest of the urban households were
included in the frame of second stage stra-tum 2.
1.11 Stratification of enterprises:
All the eligible informal non-agricultural en-terprises other than mining & quarrying andelectricity, gas & water supply which oper-ated at least 30 days (15 days for seasonalenterprises) during the last year in a segment(both rural & urban) were stratified into 12strata by jointly considering their broad in-dustry group and enterprise class. Eligibleenterprises could belong to any of the 6 broadindustry groups, viz. manufacturing - 1, con-struction - 2, trade & repair services - 3, ho-tels & restaurants - 4, transport, storage &communication - 5 and other service sector- 6. The enterprises were classified into twoenterprise classes. Enterprise class of an en-terprise was ‘1’ for Own Account Enter-prises. Enterprise class for Establishmentswas ‘2’. Thus there were 12 possible strataof various combinations of broad industrygroups and enterprise classes.
1.12 Number of households/ enterprisesselected for survey:
The number of households/ enterprises se-lected for survey from each FSU in generalis given on the next page :-
The FSUs of sub-sample 1, sub-sample 3,and sub-sample 5 were revisited during sub-round 2, sub-round 3 and sub-round 4 re-spectively. In the FSUs of these re-visit sub-samples, all the households where Schedule10 was previously canvassed (i.e. during theprevious sub-round) were revisited for can-vassing Schedule 10.1. However, in casesuch a household could not be surveyed dur-ing revisit, it was substituted and Schedule10 was canvassed in the substituted house-hold. Further, Schedule 10 was also can-vassed for those households which were ca
125Annex-II
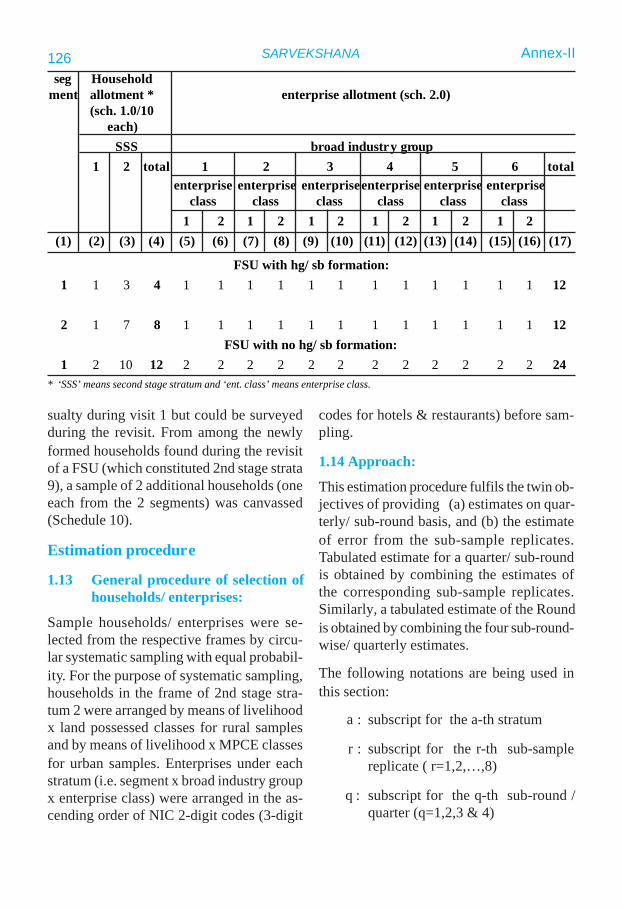
SARVEKSHANA
FSU with hg/ sb formation:1 1 3 4 1 1 1 1 1 1 1 1 1 1 1 1 12
2 1 7 8 1 1 1 1 1 1 1 1 1 1 1 1 12FSU with no hg/ sb formation:
1 2 10 12 2 2 2 2 2 2 2 2 2 2 2 2 24* ‘SSS’ means second stage stratum and ‘ent. class’ means enterprise class.
seg Householdment allotment * enterprise allotment (sch. 2.0)
(sch. 1.0/10each)
SSS broad industry group1 2 total 1 2 3 4 5 6 total
enterprise enterprise enterpriseenterprise enterprise enterpriseclass class class class class class
1 2 1 2 1 2 1 2 1 2 1 2(1) (2) (3) (4) (5) (6) (7) (8) (9) (10) (11) (12) (13) (14) (15) (16) (17)
sualty during visit 1 but could be surveyedduring the revisit. From among the newlyformed households found during the revisitof a FSU (which constituted 2nd stage strata9), a sample of 2 additional households (oneeach from the 2 segments) was canvassed(Schedule 10).
Estimation procedure
1.13 General procedure of selection ofhouseholds/ enterprises:
Sample households/ enterprises were se-lected from the respective frames by circu-lar systematic sampling with equal probabil-ity. For the purpose of systematic sampling,households in the frame of 2nd stage stra-tum 2 were arranged by means of livelihoodx land possessed classes for rural samplesand by means of livelihood x MPCE classesfor urban samples. Enterprises under eachstratum (i.e. segment x broad industry groupx enterprise class) were arranged in the as-cending order of NIC 2-digit codes (3-digit
codes for hotels & restaurants) before sam-pling.
1.14 Approach:
This estimation procedure fulfils the twin ob-jectives of providing (a) estimates on quar-terly/ sub-round basis, and (b) the estimateof error from the sub-sample replicates.Tabulated estimate for a quarter/ sub-roundis obtained by combining the estimates ofthe corresponding sub-sample replicates.Similarly, a tabulated estimate of the Roundis obtained by combining the four sub-round-wise/ quarterly estimates.
The following notations are being used inthis section:
a : subscript for the a-th stratum
r : subscript for the r-th sub-samplereplicate ( r=1,2,…,8)
q : subscript for the q-th sub-round /quarter (q=1,2,3 & 4)
126 Annex-II

SARVEKSHANA
f : subscript for the f-th sampled vil-lage/ block as First Stage Unit( FSU )
v : subscript for the v-th visit ofsampled village/ block ( v=1 & 2)
s : subscript for the s-th segment ofsampled village/ block ( s= 1 & 2)
c : subscript for the c-th 2nd stage stra-tum of households in the sampledvillage / block (c= 1,2); for new hhsduring revisit, c= 9.
g : subscript for the g-th broad groupof industry (g=1,2,3,..,6)
t : subscript for the t-th enterprise class(t= 1 & 2)
j : subscript for the j-th sampled house-hold
k : subscript for the k-th sampled en-terprise
p : subscript for pooled estimate
z: size used for selection of an FSUfrom the sampling frame
Z : total of sizes in the sampling framefor the stratum
[Note: For urban sector, z=1 and Z=N which isthe total number of UFS blocks (FSU’s) in theframe.]
n : number of sampled FSU surveyed withina stratum and a sub-sample replicate (includ-ing zero cases but excluding casualty and notreported cases) and used for tabulation
L : number of sub-sample replicatessurveyed and used for tabulation
D : number of hamlet-groups/ sub-
blocks formed in rural/ urbansampled FSU
H : total number of households listed inthe appropriate frame
h : number of sampled households sur-veyed and used for tabulation fromthe frame
E : total number of enterprises listed inthe appropriate frame
e : number of sampled enterprises sur-veyed and used for tabulation fromthe frame
y, x : value of characteristic y, x obtainedin the sample
Y , : estimated value of the total of char-acteristic y, x respectively.
1.15 Estimates of aggregates:
In the formulae given in this section, is theestimate of aggregate of any characteristic yfor a given stratum (a), and for a particularsub-round (q) and sub-sample replicate (r).These formulae [except (5) and (6)] are pro-vided for the general case of FSU’s having 2segments 1 & 2. For the FSU’s requiring nohg/ sb formation, the formula is identical tothat given for segment 1 while the contribu-tion from segment 2 is taken as zero.
1.16 Schedule 2.0
For estimating a characteristic of enterprisesfor a stratum of a sub-sample replicate fromthe selection frame based on a broad groupof industry (g) x enterprise class (t):
Rural
…(1)
127Annex-II

SARVEKSHANA
Here , for segment 1 (s=1) and
, for segment 2(s=2).
Urban
…(2)
Here , for segment 1 (s=1) and
, for segment 2(s=2).
Note: For tabulating any characteristic from
this detailed schedule, is to be
used.
1.17 Schedule 10
For estimating the total of a characteristic ofhousehold from a given 2nd stage stratum(c) in the selection frame:
Rural
…(3)
Here , for segment 1 (s=1) and
, for segment 2 (s=2).
Urban
…(4)
Here , for segment 1 (s=1) and
, for segment 2 (s=2).
Note: For tabulating any characteristic from this
detailed schedule , is to be used.
1.18 Combined estimate from sub-samples
In the previous section, the estimate of thetotal of characteristic y as obtained for a stra-tum (a), for a particular sub-round (q) and asub-sample replicate (r), actually represent
. The combined /pooled estimate for aparticular stratum and a particular sub-roundis computed as the average of sub-samplereplicate estimates and is given below:
........(5)
1.19 Estimate of aggregates for a sub-round at State/ UT/ region level
If be the State/ UT/ Region level esti-mate of the aggregate from the r-th sub-sample replicate and q-th sub-round, and ,the combined/ pooled estimate of the aggre-gate based on the whole sample, for a givensub-round/ quarter q, then:
128 Annex-II

SARVEKSHANA
…(6)based on sub-sample replicate group r,
and
…(7)
based on all sub-sample replicates.
1.20 Estimates of aggregates for theround (i.e. all the 4 sub-rounds/quarters together) at State/ UT/Region level
The estimates of aggregates for the wholeround are computed as the simple averageof the sub-round estimates derived in previ-ous section, and are given below:
…(8)
based on sub-sample replicate1 and 2*,
and
…(9)
based on whole sample.
*Note: In the Round, sub-samples 1, 3, 5 & 7 (insub-rounds 1 to 4) are combined together to form sub-sample replicate1 (annual) while sub-samples 2, 4, 6& 8 (in sub-rounds 1 to 4) combine together to form
sub-sample replicate 2 (annual). This is being fol-lowed in the remaining sections also.
Stratum level estimate for the Round is ob-tained similarly.
1.21 Estimates of ratio
If & be the State/ UT/ Region level ag-gregate estimate corresponding to variablesx and y, then the estimate of ratio is givenbelow:
…(10)
based on sub-sample group r,
and
…(11)
based on the whole sample.
(The formulae for are obtained similarly byreplacing by and y by x in the aboveformulae stated in previous sections.)
Note: Estimates for the sub-round (quarter) and
may also be obtained by replacing and , by
and respectively and and by and , respectively.
129Annex-II

SARVEKSHANA
Andhra Pradesh 432 320 432 320Ar. Pradesh 80 24 74 21Assam 296 72 291 71Bihar 624 192 611 190Goa 16 24 16 24
Gujarat 208 232 208 232Haryana 96 64 96 64Himachal Pradesh 144 80 140 80Jammu & Kashmir 208 128 131 84Karnataka 232 208 232 208
Kerala 240 168 240 168Madhya Pradesh 432 264 432 264Maharashtra 352 440 352 440Manipur 64 56 64 56Meghalaya 80 32 80 32
Mizoram 40 72 39 72Nagaland 40 24 40 24Orissa 296 88 295 88Punjab 184 160 184 160Rajasthan 272 168 272 168
Sikkim 88 24 88 24Tamil Nadu 352 360 352 360Tripura 136 48 86 48Uttar Pradesh 792 392 791 391West Bengal 384 288 384 288
A & N Islands 24 16 24 16Chandigarh 16 64 16 64D & N Haveli 16 8 16 8Daman & Diu 16 16 15 16Delhi 16 96 16 96
Lakshadweep 8 16 7 16Pondicherry 24 32 24 32All India 6208 4176 6048 4125
Table 1.1: Number of villages/ blocks allotted and surveyed, and number of personssurveyed in different states and union territories
state/u.t. villages / blocksallotted surveyed
rural urban rural urban ( 1 ) (2) (3) (4) (5)
130 Annex-II

SARVEKSHANA
Andhra Pr. 30668 22712 53380 9466 6921 16387Ar. Pradesh 5393 993 6386 293 250 543Assam 25875 4890 30765 5248 1420 6668Bihar 54810 15635 70445 12477 3734 16211Goa 1193 1634 2827 341 408 749
Gujarat 17681 17936 35617 3914 4747 8661Haryana 8858 5091 13949 1806 1370 3176Himachal Pradesh 10807 4703 15510 1875 1363 3238Jammu & Kashmir 10796 6744 17540 2395 1812 4207Karnataka 19627 15232 34859 4584 4365 8949
Kerala 16815 12642 29457 4993 3651 8644Madhya Pradesh 39359 22425 61784 6198 4699 10897Maharashtra 28027 33233 61260 6660 8677 15337Manipur 5441 4757 10198 874 1128 2002Meghalaya 6472 2282 8754 718 335 1053
Mizoram 2826 5571 8397 354 1043 1397Nagaland 3285 1559 4844 649 362 1011Orissa 23277 6209 29486 5803 1823 7626Punjab 16346 11509 27855 3415 3382 6797Rajasthan 25828 13668 39496 4541 3144 7685
Sikkim 7111 1475 8586 1048 494 1542Tamil Nadu 23523 22961 46484 7581 7872 15453Tripura 6435 3305 9740 1959 910 2869Uttar Pradesh 78391 34132 112523 16803 8454 25257West Bengal 31813 19404 51217 8238 5931 14169
A & N. Islands 2327 1061 3388 324 235 559Chandigarh 927 4387 5314 352 1091 1443D & N Haveli 1247 527 1774 289 168 457Daman & Diu 1095 1318 2413 319 370 689Delhi 1340 6768 8108 364 1746 2110
Lakshadweep 455 2314 2769 136 564 700Pondicherry 1731 2157 3888 489 662 1151all India 509779 309234 819013 114506 83131 197637
Table 1.2: Number of persons and enterprises surveyed in different states and unionterritories
state/ u.t. no. of persons surveyed no. of enterprises surveyed( Sch. 10) (Sch. 2.0)
rural urban combined rural urban combined (1) (2) (3) (4) (5) (6) (7)
131Annex-II


CONCEPTS, DEFINITIONS AND PROCEDURES
ANNEX - III
SARVEKSHANA
A: Survey on Employment andUnemployment
1.1 Household:
A group of persons who normally live to-gether and take food from a common kitchenconstitute a household. The adverb “nor-mally” means that temporary visitors are ex-cluded but temporary stay-aways are in-cluded. Thus, a child residing in a hostel forstudies is excluded from the household of his/her parents, but a resident employee or a resi-dent domestic servant or paying guest (butnot just a tenant in the house) is included inthe employer/host’s household. “Living to-gether” is given more importance than “shar-ing food from a common kitchen” in draw-ing the boundaries of a household in case thetwo criteria are in conflict. However, in thespecial case of a person taking food with hisfamily but sleeping elsewhere (say, in a shopor a different house) due to space shortage,the household formed by such a person’sfamily members is taken to include the per-son also. Each inmate of a hotel, mess, board-ing-lodging house, hostel, etc., is consideredto be a single-member household except thata family living in a hotel (say) is consideredone household only. The same principle isapplicable for the residential staff of such es-tablishments.
1.2 Economic activity:
Any activity resulting in production of goodsand services that add value to national prod-uct is considered as an economic activity.Such activities include produc-tion of allgoods and services for market, i.e., produc-tion for pay or profit, and, the production ofprimary commodities for own consumption
and own account production of fixed assets,among the non-market activities. As in ear-lier rounds, certain activities like prostitution,begging, smuggling, etc., which though fetchearnings, are, by convention, not consideredas economic activities.
1.3 Activity status:
It is the activity situation in which a personis found during a reference period with re-gard to the person’s participation in economicand non-economic activities. According tothis, a person could be in one or a combina-tion of the following three broad activity sta-tuses during a reference period:
(i) working or being engaged in economicactivity (work) as defined above,
(ii) being not engaged in economic activ-ity (work) but either making tangibleefforts to seek ‘work’ or being avail-able for ‘work’ if the ‘work’ is avail-able and
(iii) being not engaged in any economic ac-tivity (work) and also neither seekingnor available for ‘work’.
Broad activity statuses mentioned in (i) &(ii) above are associated with ‘being in labourforce’ and the last with ‘not being in thelabour force’. Within the labour force, broadactivity status (i) and (ii) are associated with‘employment’ and ‘unemployment’, respec-tively.
1.4 Categories of activity status:
Identification of each individual into a uniquesituation could pose a problem when morethan one of the three broad activity statuseslisted above are concurrently obtained for a
Concepts, Definitions and Procedures134 Annex-III

SARVEKSHANA
person. In such an eventuality, the identifi-cation uniquely under any one of the threebroad activity statuses has been done byadopting either the major time or priority cri-terion . The former is used for classificationof persons according to the ‘usual activitystatus’ approach and the latter for classifica-tion of persons according to the ‘current ac-tivity status’ approach. Each of the threebroad activity statuses are further sub-dividedinto several detailed activity categories. If a
person categorised as engaged in economic/non-economic activity by adopting one of thetwo criteria mentioned above is found to bepursuing more than one economic/non-eco-nomic activity during the reference period,the appropriate detailed activity status coderelates to the activity in which relatively moretime has been spent. The detailed activitycategories under each of the three broadactivity statuses used in the survey along withthe codes assigned to them are stated below:
situation of working or being engaged in economic activities (employed)11 worked in household enterprise (self-employed) as own account worker12 worked in household enterprise (self-employed) as employer21 worked as helper in household enterprises (unpaid family worker)31 worked as regular salaried / wage employee41 worked as casual wage labour in public works51 worked as casual wage labour in other types of work61 had work in household enterprise but did not work due to sickness62 had work in household enterprise but did not work due to other reasons71 had regular salaried/wage employment but did not work due to sickness72 had regular salaried/wage employment but did not work due to other reasonssituation of being not engaged in work but seeking or available for work (unemployed):81 sought work82 did not seek but was available for worksituation of being not available for work (not in labour force)91 attended educational institutions92 attended domestic duties only93 attended domestic duties and was also engaged in free collection of goods (vegetables,
roots, firewood, cattle-feed etc.) sewing, tailoring, weaving etc. for household use94 rentiers, pensioners, remittance recipient, etc.95 not able to work due to disability96 beggars, prostitutes97 others98 did not work due to sickness (for casual workers only)
code description
1.5 Workers (or employed):
Persons who are engaged in any economicactivity or who, despite their attachment to
economic activity, abstain from work for rea-son of illness, injury or other physical dis-ability, bad weather, festivals, social or reli-gious functions or other contingencies ne-
135Annex-III

SARVEKSHANA
cessitating temporary absence from work,constitute workers. Unpaid helpers who as-sist in the operation of an economic activityin the household farm or non-farm activitiesare also considered as workers. All the work-ers are assigned one of the detailed activitystatuses under the broad activity category‘working’ or ‘being engaged in economicactivity’ (or employed).
1.6 Seeking or available for work (orunemployed):
Persons, who could not work owing to lackof work, but either sought work through em-ployment exchanges, intermediaries, friendsor relatives or by making applications to pro-spective employers or expressed their will-ingness or availability for work under theprevailing conditions of work and remunera-tion, are considered as those ‘seeking or avail-able for work’ (or unemployed).
1.7 Self-employed:
Persons who operate their own farm or non-farm enterprises or are engaged indepen-dently in a profession or trade on own-ac-count or with one or a few partners aredeemed to be self-employed in householdenterprises. The essential feature of the self-employed is that they have autonomy (i.e.,how, where and when to produce) and eco-nomic independence (i.e., market, scale of op-eration and money) for carrying out their op-eration. The fee or remuneration received bythem comprises two parts - share of theirlabour and profit of the enterprise. In otherwords, their remuneration is determinedwholly or mainly by sales or profits of thegoods or services which are produced.
1.8 Categories of self-employed per-sons:
Self-employed persons are categorised asfollows:
(i) Own-Account workers: Those self-employed persons who operate theirenterprises on their own account orwith one or a few partners and who,during the reference period, by andlarge, run their enterprise without hir-ing any labour are categorised as OwnAccount Workers. They could, how-ever, have unpaid helpers to assist themin the activity of the enterprise.
(ii) Employers are those self-employedpersons who work on their own accountor with one or a few partners and, who,by and large, run their enterprise byhiring labour, and
(iii) Helpers in household enterprise arethose self-employed persons (mostlyfamily members) who are engaged intheir household enterprises, workingfull or part time and do not receive anyregular salary or wages in return for thework performed. They do not run thehousehold enterprise on their own butassist the related person living in thesame household in running the house-hold enterprise.
1.9 Regular salaried/wage employee:
These are persons who work in others’ farmor non-farm enterprises (both household andnon-household) and, in return, receive sal-
136 Annex-III

SARVEKSHANA
ary or wages on a regular basis (i.e. not onthe basis of daily or periodic renewal of workcontract). This category includes not onlypersons getting time wage but also personsreceiving piece wage or salary and paid ap-prentices, both full time and part-time.
1.10 Casual wage labour:
A person who is casually engaged in others’farm or non-farm enterprises (both householdand non-household) and, in return, receivewages according to the terms of the daily orperiodic work contract, is a casual wagelabour.
1.11 Usual activity status:
The usual activity status relates to the activ-ity status of a person during the referenceperiod of 365 days preceding the date of sur-vey. The activity status on which a personspends relatively longer time (i.e., major timecriterion) during the 365 days preceding thedate of survey is considered as the principalusual activity status of the person. To de-cide the principal usual activity of a person,he/she is first categorised as belonging to thelabour force or not during the reference pe-riod on the basis of major time criterion.Persons thus adjudged as not belonging tothe labour force are assigned the broad ac-tivity status ‘neither working nor availablefor work’. For persons belonging to thelabour force, the broad activity status of ei-ther ‘working’ or ‘not working but seekingand/or available for work’ is ascertainedbased on the same criterion viz. relativelylonger time spent in either of the two broadstatuses within the labour force during the365 days preceding the date of survey.Within the broad activity status so deter-mined, the detailed activity status of a per-son pursuing more than one such activity isdetermined once again on the basis of the
relatively longer time spent on such activi-ties. In terms of activity codes, codes 11-51are applicable for persons classified as work-ers, while code 81 is assigned to people ei-ther seeking or available for work (unem-ployed persons) and codes 91-97 for thosewho are out of labour force.
1.12 Subsidiary economic activity sta-tus:
A person whose principal usual status is de-termined on the basis of the major time cri-terion may be pursuing some economic ac-tivity for a relatively shorter time duringthe reference period of 365 days precedingthe date of survey. The status in which sucheconomic activity is pursued is the subsid-iary economic activity status of that person.Thus, activity status codes 11-51 only are ap-plicable for persons reporting some subsid-iary economic activity. It may be noted thatengagement in work in subsidiary capacitycould arise out of the following two situa-tions, viz.
(i) a person could be engaged for a rela-tively longer period during the last 365days in one economic/non-economicactivity and for a relatively shorter pe-riod in another economic activity, and
(ii) a person could be pursuing one eco-nomic activity/ non-economic activityalmost throughout the year in the prin-cipal usual activity status and simulta-neously pursue another economic ac-tivity for a relatively shorter period ina subsidiary capacity.
1.13 Number of subsidiary economicactivities pursued during last 365days:
For persons reporting some subsidiary ac-tivity, the number of subsidiary activities pur-
137Annex-III

SARVEKSHANA
sued by him/her during last 365 days wereascertained and recorded. However, detailsof a maximum of two such subsidiary eco-nomic activities were recorded. The activi-ties having different work status were con-sidered as different activities. Activitieswithin the same work status but with differ-ent industry and/or occupation are also con-sidered as different activities. If the personis engaged in two or more subsidiary eco-nomic activities, the details of two subsid-iary economic activities pursued for the maxi-mum time period among all the subsidiaryeconomic activities are considered, and themajor subsidiary economic activity is deemedas ‘subsidiary status number I’ and the nextmajor one as ‘subsidiary status number II’.
B: Survey on Informal Non-agri-cultural Enterprises
1.14 Enterprise:
An enterprise is an undertaking which is en-gaged in the production and / or distributionof some goods and / or services meant mainlyfor the purpose of sale, whether fully orpartly. An enterprise may be owned and op-erated by a single household or by severalhouseholds jointly, or by an institutionalbody.
1.15 Non-agricultural enterprise:
All enterprises covered under Tabulation Cat-egories ‘A’ and ‘B’ of the National Indus-trial Classification, NIC-1998 (see Annex-ure IV), are ‘agricultural enterprises’ while theothers covered under Tabulation Categories ‘C’to ‘Q’ are ‘non-agricultural enterprises’.However, in the 55th round survey, the enter-prises falling under tabulation categories Dto O (except E and L) have only been cov-ered. Therefore, the non-agricultural enter-
prises belonging to mining & quarrying(Tabulation category C), electricity, gas andwater (Tabulation category E), public admin-istration and defence, compulsory social se-curity (Tabulation category L), private house-holds with employed persons (Tabulationcategory P), and extra-territorial organisationand bodies (Tabulation category Q), have notbeen covered in this survey.
1.16 Informal Non-agricultural enter-prises:
All non-agricultural enterprises (excludingthose covered under the Annual Survey ofIndustries) with type of ownership as either‘proprietary’ or ‘partnership’ were treated asinformal non-agricultural enterprises.
1.17 Proprietary enterprises:
Proprietary enterprises are those where anindividual is the sole owner of the enterprise.
1.18 Partnership Enterprises:
Partnership is defined as the ‘relation betweenpersons who have agreed to share the prof-its of a business carried on by all or any oneof them acting for all’. Partners may be fromthe same household or they may be from dif-ferent households.
1.19 Own account enterprise (OAE):
An own account enterprise is an undertakingrun by household labour, usually without anyhired worker employed on a ‘fairly regularbasis’. ‘Fairly regular basis’ means the ma-jor part of the period of operation(s) of theenterprise during the last 365 days.
1.20 Establishment:
Those enterprises, which have got at least onehired worker on a ‘fairly regular basis’ arecalled establishments.
138 Annex-III
SARVEKSHANA
1.21 Seasonal enterprise:
Seasonal enterprises are those which are usu-ally run in a particular season or fixed monthsof a year.
1.22 Worker:
A worker is defined as one who participateseither full time or part time in the activity ofthe enterprise. The worker may serve the en-terprise in any capacity - primary or super-visory. He/she may or may not receive wages/salaries in return for his/ her work incidentalto or connected with the entrepreneurial ac-tivity.
1.23 Working owner.
In the case of proprietary enterprises, theowner himself / herself works / supervisesthe work in the enterprise and is consideredas working owner. In fact, in most of theown-account enterprises the owner himself /herself manages all activities of the enterprisewithout the help of anybody else (on a ‘fairlyregular basis’). In the case of partnershipenterprises, if only one partner or some ofthe partners or all the partners work in theenterprise on a fairly regular basis then theyare treated as working owners.
1.24 Hired worker:
A hired worker is a person employed directlyor through any agency on payment of regu-lar wage/ salary in cash or kind. Appren-tices, paid or unpaid, are treated as hiredworkers. Paid household workers, servantsand resident workers of the enterprise are alsoconsidered as hired workers.
1.25 Other worker/ helper:
This includes all persons belonging to thehousehold of the proprietor or households of
the partners who are working in or for theenterprise without regular salary or wages.Persons working as exchange labourer in theenterprise without salary or wages will alsobe covered in this category. All unpaid house-hold workers/ helpers who are associatedwith the activities of the enterprise duringthe reference month are considered againstthis category.
1.26 Reference Period:
Last month was used as the reference periodto collect most of the data on enterprises.Various receipts and expenses as well asemployment, emoluments, rent, interest andnet surplus for the enterprises was collectedfor the last month only. Last month refers tothe last 30 days (preceding the date of sur-vey) for perennial and casual enterprises ir-respective of the number of days of opera-tion. For seasonal enterprises also, lastmonth refers to the last 30 days (precedingthe date of survey), if they have worked con-tinuously for the last 30 days or more (in-cluding scheduled holidays) in the currentseason. Only for seasonal enterprises, whichhave worked for less than 30 days in the cur-rent season, last month refers to an averagemonth in the last working season. If someenterprise is unable to give information forthe last 30 days and is able to give informa-tion for the last calendar month, figures forthe same are taken. For some of the itemslike value of fixed assets, amount of loan out-standing, etc., the reference period is ‘as onthe date of survey’. For some other items likenet additions to fixed assets, number ofmonths operated, number of other economicactivities taken up, etc., the reference periodis the ‘last 365 days preceding the date ofsurvey’.
139Annex-III


NATIONAL INDUSTRIAL CLASSIFICATION
(NIC) – 1998
ANNEX - IV

SARVEKSHANA
A. AGRICULTURE, HUNTING AND FORESTRYB. FISHINGC. MINING AND QUARRYINGD. MANUFACTURINGE. ELECTRICITY, GAS AND WATER SUPPLYF. CONSTRUCTIONG. WHOLESALE AND RETAIL TRADE; REPAIR OF MOTOR VEHICLES,
MOTORCYCLES AND PERSONAL AND HOUSEHOLD GOODSH. HOTELS AND RESTAURANTSI. TRANSPORT, STORAGE AND COMMUNICATIONSJ. FINANCIAL INTERMEDIATIONK. REAL ESTATE, RENTING AND BUSINESS ACTIVITIESL. PUBLIC ADMINISTRATION AND DEFENCE; COMPULSORY SOCIAL
SECURITYM. EDUCATIONN. HEALTH AND SOCIAL WORKO. OTHER COMMUNITY, SOCIAL AND PERSONAL SERVICE ACTIVITIESP. PRIVATE HOUSEHOLDS WITH EMPLOYED PERSONSQ. EXTRA-TERRITORIAL ORGANISATIONS AND BODIES
NATIONAL INDUSTRIAL CLASSIFICATION (NIC) – 1998
TABULATION CATEGORIES: CLASSIFICATION AT ONE DIGIT LEVELTabulationCategory Description
142 Annex-IV

SARVEKSHANA
DIVISIONS: CLASSIFICATION AT TWO DIGIT LEVEL
A AGRICULTURE, HUNTING AND FORESTRY
01 AGRICULTURE, HUNTING AND RELATED SERVICEACTIVITIES
02 FORESTRY, LOGGING AND RELATED SERVICE ACTIVITIES
B FISHING
05 FISHING, OPERATION OF FISH HATCHERIES AND FISHFARMS; SERVICE ACTIVITIES INCIDENTAL TO FISHING
C MINING AND QUARRYING
10 MINING OF COAL AND LIGNITE; EXTRACTION OF PEAT
11 EXTRACTION OF CRUDE PETROLEUM AND NATURALGAS; SERVICE ACTIVITIES INCIDENTAL TO OIL AND GASEXTRACTION, EXCLUDING SURVEYING
12 MINING OF URANIUM AND THORIUM ORES
13 MINING OF METAL ORES
14 OTHER MINING AND QUARRYING
D MANUFACTURING
15 MANUFACTURE OF FOOD PRODUCTS AND BEVERAGES
16 MANUFACTURE OF TOBACCO PRODUCTS
17 MANUFACTURE OF TEXTILES
18 MANUFACTURE OF WEARING APPAREL; DRESSING ANDDYEING OF FUR
19 TANNING AND DRESSING OF LEATHER; MANUFACTUREOF LUGGAGE, HANDBAGS, SADDLERY, HARNESS ANDFOOTWEAR
20 MANUFACTURE OF WOOD AND OF PRODUCTS OF WOODAND CORK, EXCEPT FURNITURE; MANUFACTURE OFARTICLES OF STRAW AND PLAITING MATERIALS
21 MANUFACTURE OF PAPER AND PAPER PRODUCTS
22 PUBLISHING, PRINTING AND REPORODUCTION OFRECORDED MEDIA
23 MANUFACTURE OF COKE, REFINED POETROLEUMPRODUCTS AND NUCLEAR FUEL
NATIONAL INDUSTRIAL CLASSIFICATION (NIC) – 1998
TabulationCategory Division Description
143Annex-IV

SARVEKSHANA
24 MANUFACTURE OF CHEMICALS AND CHEMICALPRODUCTS
25 MANUFACTURE OF RUBBER AND PLASTICS PRODUCTS
26 MANUFACTURE OF OTHER NON-METALLIC MINERALPRODUCTS
27 MANUFACTURE OF BASIC METALS
28 MANUFACTURE OF FABRICATED METAL PRODUCTS,EXCEPT MACHINERY AND EQUIPMENT
29 MANUFACTURE OF MACHINERY AND EQUIPMENT N.E.C.*
30 MANUFACTURE OF OFFICE, ACCOUNTING ANDCOMPUTING MACHINERY
31 MANUFACTURE OF ELECTRICAL MACHINERY ANDAPPARATUS N.E.C.
32 MANUFACTURE OF RADIO, TELEVISION ANDCOMMUNICATION EQUIPMENT AND APPARATUS
33 MANUFACTURE OF MEDICAL, PRECISION AND OPTICALINSTRUMENTS, WATCHES AND CLOCKS
34 MANUFACTURE OF MOTOR VEHICLES, TRAILERS ANDSEMI-TRAILERS
35 MANUFACTURE OF OTHER TRANSPORT EQUIPMENMT
36 MANUFACTURE OF FURNITURE; MANUFACTURING N.E.C.
37 RECYCLING
E ELECTRICITY, GAS AND WATER SUPPLY
40 ELECTRICITY, GAS, STEAM AND HOT WATER SUPPLY
41 COLLECTION, PURIFICATION AND DISTRIBUTION OFWATER
F CONSTRUCTION
45 CONSTRUCTION
G WHOLESALE AND RETAIL TRADE; REPAIR OF MOTORVEHICLES, MOTORCYCLES AND PERSONAL ANDHOUSEHOLD GOODS
50 SALE, MAINTENANCE AND REPAIR OF MOTOR VEHICLESAND MOTORCYCLES; RETAIL SALE OF AUTOMOTIVEFUEL
51 WHOLESALE TRADE AND COMMISSION TRADE, EXCEPTOF MOTOR VEHICLES AND MOTORCYCLES
TabulationCategory Division Description
* N.E.C. = Not Elsewhere Classified
144 Annex-IV

SARVEKSHANA
TabulationCategory Division Description
52 RETAIL TRADE, EXCEPT OF MOTOR VEHICLES ANDMOTORCYCLES; REPAIR OF PERSONAL AND HOUSEHOLDGOODS
H HOTELS AND RESTAURANTS
55 HOTELS AND RESTAURANTS
I TRANSPORT, STORAGE AND COMMUNICATIONS
60 LAND TRANSPORT; TRANSPORT VIA PIPELINES
61 WATER TRANSPORT
62 AIR TRANSPORT
63 SUPPORTING AND AUXILIARY TRANSPORT ACTIVITIES;ACTIVITIES OF TRAVEL AGENCIES
64 POST AND TELECOMMUNICATIONS
J FINANCIAL INTERMEDIATION
65 FINANCIAL INTERMEDIATION, EXCEPT INSURANCE ANDPENSION FUNDING
66 INSURANCE AND PENSION FUNDING, EXCEPTCOMPULSORY SOCIAL SECURITY
67 ACTIVITIES AUXILIARY TO FINANCIAL INTERMEDIATION
K REAL ESTATE, RENTING AND BUSINESS ACTIVITIES
70 REAL ESTATE ACTIVITIES
71 RENTING OF MACHINERY AND EQUIPMENT WITHOUTOPERATOR AND OF PERSONAL AND HOUSEHOLD GOODS
72 COMPUTER AND RELATED ACTIVITIES
73 RESEARCH AND DEVELOPMENT
74 OTHER BUSINESS ACTIVITIES
L PUBLIC ADMINISTRATION AND DEFENCE; COMPULSORYSOCIAL SECURITY
75 PUBLIC ADMINISTRATION AND DEFENCE; COMPULSORYSOCIAL SECURITY
M EDUCATION
80 EDUCATION
N HEALTH AND SOCIAL WORK
85 HEALTH AND SOCIAL WORK
145Annex-IV

SARVEKSHANA
O OTHER COMMUNITY, SOCIAL AND PERSONAL SERVICEACTIVITIES
90 SEWAGE AND REFUSE DISPOSAL, SANITATION ANDSIMILAR ACTIVITIES
91 ACTIVITIES OF MEMBERSHIP ORGANIZATIONS N.E.C.
92 RECREATIONAL, CULTURAL AND SPORTING ACTIVITIES
93 OTHER SERVICE ACTIVITIES
P PRIVATE HOUSEHOLD WITH EMPLOYED PERSONS
95 PRIVATE HOUSEHOLDS WITH EMPLOYED PERSONS
Q EXTRA-TERRITORIAL ORGANISATIONS AND BODIES
99 EXTRA-TERRITORIAL ORGANISATIONS AND BODIES
TabulationCategory Division Description
146 Annex-IV

SARVEKSHANA
ACTIVITY COVERAGE FOR INFORMALNON- AGRICULTURAL SURVEY
inNSS 55th Round
ANNEX - V

SARVEKSHANA
Activity coverage for informal non-agriculturalsurvey in NSS 55th Round
Manufacturing Manufacturing is the process of transformation of raw materials intoNIC (15-37) final products.All units mainly engaged in manufacturing which are
registered not under Sections 2m(i) and 2m(ii) of the Factories Act1948, are covered under this activity. Enterprises engaged inmanufacturing of Bidi and Cigars, other than those covered in ASI, arealso covered.
Construction All units like contractors, sub-contractors, overseers, plumbers, masons,NIC (45) electricians, mistries for mosaic or tiles fitting, etc. connected with the
construction activity are covered. However, own-account constructionis outside the coverage. The self-employed persons engaged inconstruction activity will generally be listed in their households. Butpromoters/ contractors, who have offices of their own, are listed againsttheir main offices, if they have any such office.
Trading and repair Generally, the activity of trading (wholesale as well as retail) involvesNIC(50-52) only servicespurchase of goods and their disposal by way of sale,
without any intermediate physical transformation of goods. In wholesaletrade, goods are generally purchased from the producer and sold to theretailer. The activities of intermediaries (commission agents) who donot actually purchase or sell goods but only arrange their purchase andsale and earn remuneration by way of brokerage and commission arealso included. In retail trade, goods are generally purchased from thewholesaler and sold to the ultimate consumers.Sale of agricultural produce or manufactured goods directly by theproducer is excluded. Also excluded from trade are the agency activitiesof intermediaries in stock exchange, real estate and other financialmatters. Free collection and sale of agricultural produce is excluded.Separate and distinct trading units of manufacturing concerns (like Saleshops of DCM, Bombay Dying, Bata Shoe, etc.) are excluded. However,if private dealers or agents run these units, they are covered.
Hotels and restaurants A hotel is an enterprise, which provides lodging services with or withoutNIC (55) arrangements for meals, other prepared food and refreshments.
Dharamshala type lodging places are also covered under hotels.
Detailed coverage of various activities in theNSS 55th round, along with their two digitcodes is summarised below. The surveycovered all informal non-agriculturalenterprises other than the activities classi-fied under Tabulation categories C, E, L, Pand Q. Thus, activities such as agriculture,
fishing, mining and quarrying,electricity, gas and water supply, public ad-ministration & defence, compulsory socialsecurity, private households withemployed persons and extra territorialorganisations & bodies were excluded incoverage.
Activity / NIC 2digit code Coverage
148 Annex-V

SARVEKSHANA
A restaurant generally provides eating and drinking services whereprepared meals, food and refreshments and other snacks are sold forimmediate consumption without any provision for lodging.Suchestablishments are variously known as restaurants, cafes, cafeteria,snack bars, lunch counters, refreshment stands, milk bar canteens, etc.Bars and other drinking places are also treated as restaurants. Canteenslocated in offices, factories, etc. are treated as restaurants if private ontractors operate them. But departmental canteens run by governmentare excluded.
Transport, storage and Transport means rendering transport service to others as a businesscommunications proposition. Transport activity relates to the act of carrying passengerNIC(60-64) and/or goods from one place to another. Supporting services incidental
to transport such as packing, freighting, travel agency etc. are alsocovered under transport. Both mechanised and non-mechanisedtransport is covered. The following activities are also covered:(i) hackney carriages, carriage by bullock-carts/ ekka/tonga, etc.(ii) transport by animals like horses, elephants, mules, camels, etc.,(iii) transport by man including rickshaw-pullers, cart-operators, etc.,(iv) non-mechanized inland/ ocean/ coastal and water transport,(v) pipeline transport, (vi) supporting services to land transport likeoperation of highway bridges, toll roads, parking lots, etc. and(vii) supporting services to water transport like operation andmaintenance of piers, docks, light house, loading and dischargingvessels, etc.The operation of storage and warehouses on hire to the farm producer,dealer, trader, processor and manufacturing enterprises, as anindependent business is covered in this survey.Warehousing services may be given to the private individuals/households also. Storage and warehousing services in respect of grains,other food articles, oil seeds and other agricultural commodities likecotton, jute and tobacco, are included. Also included are the refrigeratedstorage facilities on hire to other enterprises for potato, fruits, dairyproducts, fish and other food products and also refrigerated food lockeron rental services chiefly delivered to individual household. Storageof all manufactured products including textiles, machine tools, apparatusand equipment are to be included. Spaces for lumber, waste and scrapmaterials are included. But farm produce stored by the owner of thefarm in his own godown or a dealer or a manufacturer storing hiscommodities in his own godown or warehouse are excluded from thescope of this survey. Also excluded are the establishments of CentralWarehousing corporation, State Warehousing Corporations and thewarehousing by the Central and State Governments. Lockers in
Activity / NIC 2digit code Coverage
149Annex-V

SARVEKSHANA
commercial banks and in other type of enterprises for safe storage ofprecious belongings are also excluded.All enterprises providing communication services, not owned bygovernment, Public Sector undertakings, local bodies and corporatesector, are covered.This will include courier services, ISD/STD/ PCO booths; Voice MailServices through computer networking, Video/fax services, phone plusservices, voiced and non-voiced leased circuits, telex/FAX/data servicesthrough computer network, radio paging, cellular mobile telephoneservices, and audio services etc.
Financial intermediation All financial intermediation activities like, financial leasing, activitiesNIC(65-67) of hirepurchase financing, life insurance agents, non-life insurance
agents, administration of financial markets, stock brokers, actuaries,financial advisors, etc. are covered.
Real estate, renting and Real estate activities are covered under NIC code 70. They includebusiness activities activities like: (i) purchase, sale, letting and operating of real estate i.e.NIC (70-74) residential/nonresidential buildings, (ii) developing and sub-dividing
real estate into lots, (iii) lessors of real property and (iv) real estateagents, brokers and managers engaged in renting, buying and selling,managing and appraising real estate on a contract or fee basis. Lettingout of an accommodation is not included except in case of real estateagents running such a business.Renting of machinery and equipment will be covered under NIC 71.Note that a household hiring out machinery & equipment or householddurables are also treated as an enterprise. All business activitiesclassifiable under NIC codes 72 to 74 are covered in this survey.Stamp vendors are not covered here but covered under retail trade.
Education NIC(80) Only such educational institutions are included which are underproprietary or partnership control. Research and scientific servicesrendered by institutions and laboratories are also covered provided theysatisfy the above criterion. These may be engaged in research inbiological, physical and social sciences. Meteorological institutes andmedical research organizations belonging to the informal sector arealso included. Management training institutes, computer trainingcentres, Nursing schools, schools of music, drama, dance, modelling,fashion designing, yoga and physical education and general coachingcentres (e.g. for various competitive examinations) etc. are to becovered. Private tutors are covered only when the person (tutor) isgiving tuition in his own house/coaching centre.
Health and social work All enterprises engaged in health and medical services other than thoseNIC (85) owned by government, public sector undertakings, local bodies or
corporate sector are covered, irrespective of the system of medicine.
Activity / NIC 2digit code Coverage
150 Annex-V

SARVEKSHANA
All dispensaries, clinics and consultation chambers run by doctors arealso covered. The survey also covers activities of veterinary servicesincluding bird hospitals. An employed doctor and para-medical person(such as midwife, dai, etc.) doing private practice are covered and his/her private practice alone is considered as an enterprise. Included inthis activity are all kinds of health clubs. Big hospitals like Escort,Apollo, Peerless, etc. are not covered as they belong to the corporatesector.
Other community, social This cover the activities like sewage and refuse disposal, activities ofand personal service membership organizations, recreational, cultural and sporting activitiesactivities (excluding covered under NIC 90 to 93; and other service activities like washingdomestic services) and cleaning of textile products, hair dressing, funeral and relatedNIC (90-93) activities, massage saloons, sauna baths, activities of shoe shiners,
porters, car parkers etc; activities such as tailoring, embroidery, etc.classified under NIC 93. Palmists and astrologers are also coveredhere.It may be noted that individuals serving as housemaids, cooks,gardeners, governess, baby sitters, chowkidars, night watchmen, etc.are in general outside the coverage of the present survey. However,if such activities are provided by some agencies against prescribedfees, those agencies will be treated as enterprises under NIC 93. Forexample, an agency, which supplies baby sitters, or night watchmen,with some profit margin, is covered.
Activity / NIC 2digit code Coverage
151Annex-V


FACSIMILE OF INFORMALNON-AGRICULTURAL ENTERPRISES
Schedule (Sch. 2.0) and Household Employment andUnemployment Schedule (Sch. 10)
NSS Fifty-Fifth Round(July 1999 – June 2000)
ANNEX - VI
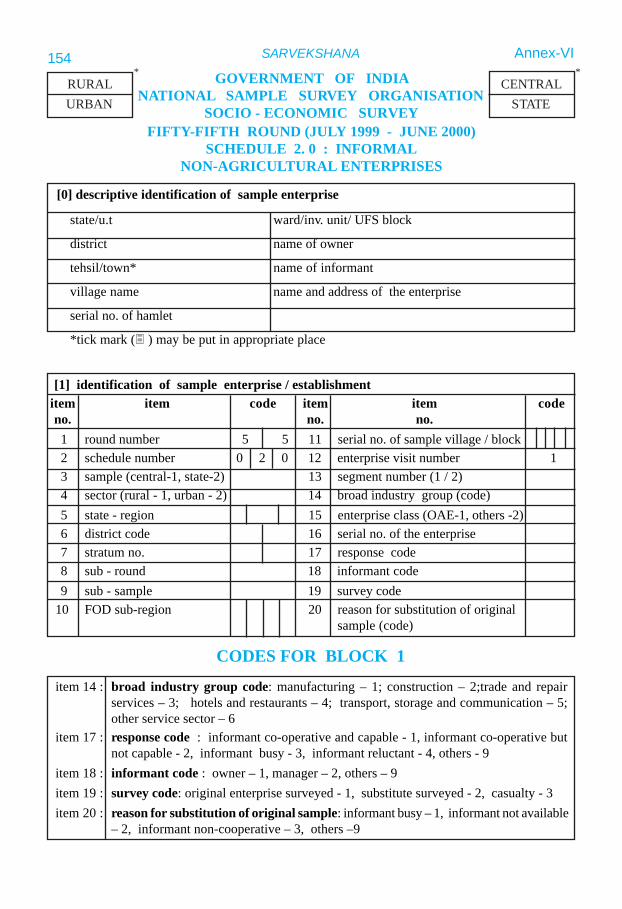
SARVEKSHANA
GOVERNMENT OF INDIANATIONAL SAMPLE SURVEY ORGANISATION
SOCIO - ECONOMIC SURVEYFIFTY-FIFTH ROUND (JULY 1999 - JUNE 2000)
SCHEDULE 2. 0 : INFORMALNON-AGRICULTURAL ENTERPRISES
RURALURBAN
*
CODES FOR BLOCK 1
item 14 : broad industry group code: manufacturing – 1; construction – 2;trade and repairservices – 3; hotels and restaurants – 4; transport, storage and communication – 5;other service sector – 6
item 17 : response code : informant co-operative and capable - 1, informant co-operative butnot capable - 2, informant busy - 3, informant reluctant - 4, others - 9
item 18 : informant code : owner – 1, manager – 2, others – 9item 19 : survey code: original enterprise surveyed - 1, substitute surveyed - 2, casualty - 3item 20 : reason for substitution of original sample: informant busy – 1, informant not available
– 2, informant non-cooperative – 3, others –9
CENTRALSTATE
*
[0] descriptive identification of sample enterprise
state/u.t ward/inv. unit/ UFS block
district name of owner
tehsil/town* name of informant
village name name and address of the enterprise
serial no. of hamlet
*tick mark ( ) may be put in appropriate place
1 round number 5 5 11 serial no. of sample village / block 2 schedule number 0 2 0 12 enterprise visit number 1 3 sample (central-1, state-2) 13 segment number (1 / 2) 4 sector (rural - 1, urban - 2) 14 broad industry group (code) 5 state - region 15 enterprise class (OAE-1, others -2) 6 district code 16 serial no. of the enterprise 7 stratum no. 17 response code 8 sub - round 18 informant code 9 sub - sample 19 survey code10 FOD sub-region 20 reason for substitution of original
sample (code)
[1] identification of sample enterprise / establishmentitem item code item item codeno. no. no.
154 Annex-VI

SARVEKSHANA
item 3 : type of ownershipproprietary (male) ………................…... 1 partnership with members of the same
household …....................………………. 3proprietary(female) ……………………. 2 partnership between members not all
from the same household ………………. 4item 5 : location of the enterprisewithin household premises ……………. 1 with fixed premises but without any
structure ………………………………... 4outside household premises: mobile market ………………………….. 5with fixed premises and with permanent without fixed premises(street vendors) … 6structure ………………………………. 2with fixed premises and with construction site ………………………... 7temporary structure/kiosk/stall ………… 3items 10, 11 & 12 : act/authority of registrationlicense issued by municipal development commissioner ofcorporation/panchayat/local body …….. 01 handicrafts/handloom ………………….. 08partnership act ………………………… 02 development commissioner of small
scale industries …………………………. 09provident fund act …………………… 03 road transport act ………………………. 10shops and establishments act …………. 04 motor vehicles act …………………….... 11sales tax act …………………………… 05 hotels and restaurants act ………………. 12state directorate of industries …………. 06 money lenders act ……………………… 13khadi & village industries others (please mention the act in thecommission/board ……………………... 07 space provided) ……………………...…. 19items 13 & 14 : source/destination agencygovernment …………………………... 1 private individual / household …………. 5co-operative/ marketing society ……….. 2 no source agency ………………… 6private enterprise ……………………… 3 others ………………………………….. 9contractor / middleman …………… 4item 15 : problems faced by the enterpriseno specific problem ……………………. 01 competition from larger units …………. 07shortage of capital ……………………... 02 non-availability of labour ……………… 08lack of lighting facilities ……………… 03 labour problems ……………………….. 09problem of power-cut …………………. 04 raw materials/fuel not available or
exorbitant price ………………………. 10lack of marketing / other infrastructural non- recovery of service charges / fees/facilities ……………………………….. 05 credit ……………………………… 11local problems ………………………… 06 others (specify in the space provided) 19item 18 : type of contractworking solely for enterprise/contractor.. 1 mainly for customers but also on contract 3mainly on contract but also for other solely for customers …………...……….. 4customers ……………………………… 2items 19 & 20 : equipment / raw materials supplied byself-procured …………………………... 1 both ……………………………………. 3supplied by the master unit/contractor … 2
CODES FOR BLOCK 2155Annex-VI

SARVEKSHANA
[2] particulars of operation and background information1 5-digited code as per NIC 1998
description of activity:2 nature of operation (perennial – 1, seasonal – 2, casual – 3)3 type of ownership (code)4 whether accounts maintained ? (yes-1, no-2)5 location of the enterprise (code)6 number of months operated during the last 365 days7 whether mixed activity? (yes – 1, no – 2)8 number of other economic activities taken up during the last 365 days9 registered under any act/authority? (yes-1, no-2)10 code 1
if ‘yes’ in item 9,11 registered under code 212 code 313 source agency for purchase of basic inputs (code)14 destination agency for sale of final product/service (code)15 problems faced in its operation (code)16 status of the enterprise over the last 3 years
(expanding – 1, stagnant – 2, contracting – 3, not applicable – 9 )17 working on contract basis? (yes-1, no-2)18 type of contract(code)19 equipment supplied by (code)20 if ‘yes’ in item 17 raw materials supplied by (code)21 design specified by contractor ? ( yes–1, no – 2 )
156 Annex-VI
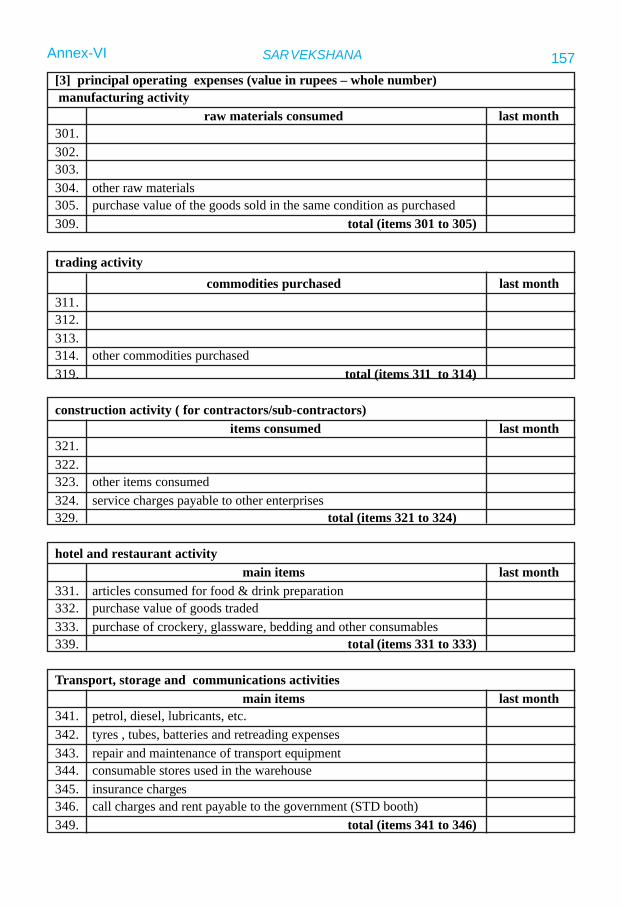
SARVEKSHANA
[3] principal operating expenses (value in rupees – whole number) manufacturing activity
raw materials consumed last month301.302.303.304. other raw materials305. purchase value of the goods sold in the same condition as purchased309. total (items 301 to 305)
trading activitycommodities purchased last month
311.312.313.314. other commodities purchased319. total (items 311 to 314)
construction activity ( for contractors/sub-contractors) items consumed last month
321.322.323. other items consumed324. service charges payable to other enterprises329. total (items 321 to 324)
hotel and restaurant activitymain items last month
331. articles consumed for food & drink preparation332. purchase value of goods traded333. purchase of crockery, glassware, bedding and other consumables339. total (items 331 to 333)
Transport, storage and communications activitiesmain items last month
341. petrol, diesel, lubricants, etc.342. tyres , tubes, batteries and retreading expenses343. repair and maintenance of transport equipment344. consumable stores used in the warehouse345. insurance charges346. call charges and rent payable to the government (STD booth)349. total (items 341 to 346)
157Annex-VI

SARVEKSHANA
educational activitymain items last month
351. recurring expenses on laboratory, newspaper, etc.352. maintenance of furniture and fixtures359. total (items 351 to 352)
medical and health activitymain items last month
361. diet of patients362. medicine, drugs and chemicals363. purchase of disposable therapeutic equipment364. machinery maintenance charges369. total (items 361 to 364)
If some of the items have already been covered under specific activities in block 3,they should not be reported again in block 3.1.
Block 3.1 records the overall expenses for all service enterprises.[3.1] other operating expenses : all activities (value in rupees - whole number)
items last month371. electricity charges372. fuel and lubricant373. raw materials consumed for own construction of building,
furniture and fixtures (including labour charges)
minor repair and maintenance of374. building375. furniture and fixtures376. machinery377. transport equipment378. other fixed assets
381. rent payable on machinery and equipment (other than land and building)382. contract, sub-contract and commission expenses383. travelling, freight and cartage (transport) expenses384. communication expenses (telephone, telegram, fax , postal, courier ,
e-mail, etc.)385. purchase of consumable stores, packing materials, etc.386. paper, printing and stationery expenses387. service charges for work done by other establishments (e.g., legal, audit,
advertising and other accounting services; warehousing expenses etc.)388. licence fees, cess charged by local bodies, other local rates
(excise duties and other indirect taxes are not to be included)391. other expenses399. total (items 371 to 391)
158 Annex-VI

SARVEKSHANA
[4] principal receipts ( value in rupees – whole number) manufacturing activity
products and by-products manufactured last month401.402.403.404. other products/ by-products405. sale value of the goods sold in the same condition as purchased409. sub-total (items 401 to 405)411. opening stock of semi-finished goods412. closing stock of semi-finished goods413. changes in stock of semi-finished goods (item 412 - item 411)
put (-) sign in case of negative value419. total (item 409+item 413)
trading activitycommodities sold last month
421.422.423.424. other commodities sold429. sub-total (items 421 to 424)431. opening stock of trading goods432. closing stock of trading goods433. changes in stock of trading goods (item 432 - item 431)
put (-) sign in case of negative value439. total (item 429 +item 433)440. overall trade margin ( in percentage - whole number)
construction activitymain items last month
441. amount receivable from master contractor / owner442. service charges including commission (plumbers, masons, etc.)449. total (items 441 and 442)
hotel and restaurant activitymain items last month
451. lodging charges and rent receivable for hiring out rooms andhalls for functions, conferences
452. receipts from sale of prepared food, refreshment and drinks453. receipts from trading of purchased food, refreshment and drinks454. receipts from catering services459. total (items 451 to 454)
159Annex-VI
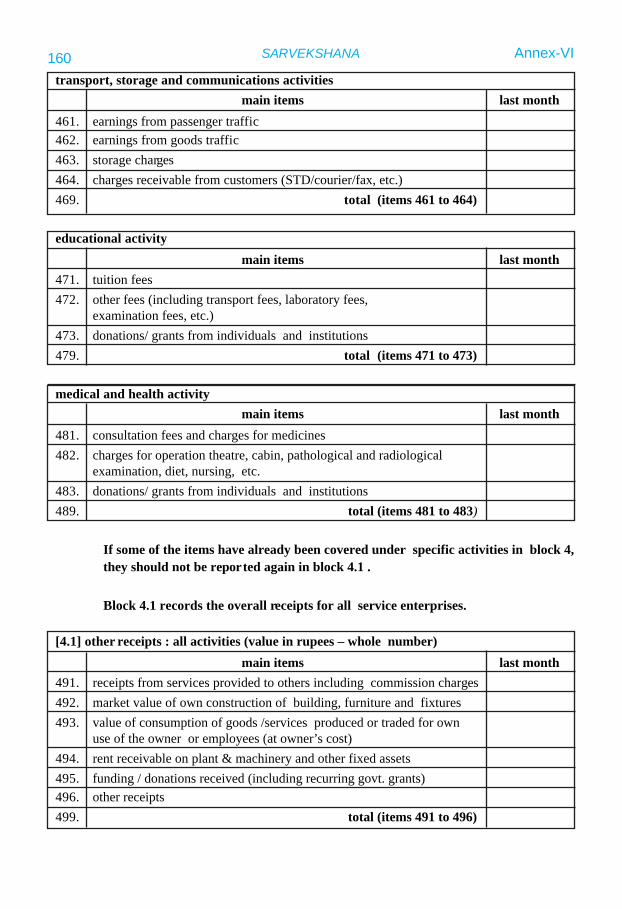
SARVEKSHANA
transport, storage and communications activitiesmain items last month
461. earnings from passenger traffic462. earnings from goods traffic463. storage charges464. charges receivable from customers (STD/courier/fax, etc.)469. total (items 461 to 464)
educational activitymain items last month
471. tuition fees472. other fees (including transport fees, laboratory fees,
examination fees, etc.)473. donations/ grants from individuals and institutions479. total (items 471 to 473)
medical and health activitymain items last month
481. consultation fees and charges for medicines482. charges for operation theatre, cabin, pathological and radiological
examination, diet, nursing, etc.483. donations/ grants from individuals and institutions489. total (items 481 to 483)
If some of the items have already been covered under specific activities in block 4,they should not be reported again in block 4.1 .
Block 4.1 records the overall receipts for all service enterprises.
[4.1] other receipts : all activities (value in rupees – whole number)main items last month
491. receipts from services provided to others including commission charges492. market value of own construction of building, furniture and fixtures493. value of consumption of goods /services produced or traded for own
use of the owner or employees (at owner’s cost)494. rent receivable on plant & machinery and other fixed assets495. funding / donations received (including recurring govt. grants)496. other receipts499. total (items 491 to 496)
160 Annex-VI

SARVEKSHANA
[7] compensation to workers during the reference monthserial type of emoluments value (Rs)no.(1) (2) (3)1 salary / wages, allowances and other individual benefits (cash & kind)*2 imputed value of group benefits for the month @3
total emoluments (items 1 and 2)*includes bonus, retirement benefits etc. apportioned for the month@ includes employer’s contribution towards canteen, sports, insurance, etc.
[5] calculation of gross value added (value in rupees - whole number)items last month
501 total operating expenses: [items(309+319+329+339+349+359+369+399)]
502 total receipts: [items( 419+439+449+459+469+479+489+499) ]509 gross value added (item 502 - item 501)
put (-) sign in case of negative value
[6] employment particulars of the enterprise during the reference monthserial type of worker average number of workersno. full time part time total
female male female male (cols. 3 to 6)(1) (2) (3) (4) (5) (6) (7)1 working owner2 hired worker3 other worker / helper4 total (1 to 3)
161Annex-VI

SARVEKSHANA
[10] factor incomes of the enterpriseserial item monthly value (Rs)no.1 emoluments (item 3, col.3 of block 7)2 rent payable (item 1, col.6 of block 8)3 interest payable (item 11, col. 4 of block 9)4 net surplus (including home consumption )5 total (1 to 4)
[9] loan outstanding as on the date of surveyserial source of loan amount interest payable duringno. (Rs) the ref. month (Rs)(1) (2) (3) (4)1 central and state level term lending institutions2 government (central, state, local bodies)3 public sector banks and other commercial banks4 co-operative banks and societies5 other institutional agencies6 money lenders7 business partner(s)8 suppliers / contractors9 friends and relatives
10 others11 total (1 to 10)
[8] fixed assets owned and hiredserial type of assets market value of assets *net additions monthlyno. (Rs) as on the date during last rent on
of survey 365 days hired assets(Rs) (Rs)
owned hired(1) (2) (3) (4) (5) (6)1 land and building2 plant and machinery3 transport equipment4 tools and other fixed assets5 total (1 to 4)
*net additions to owned assets to be reported
162 Annex-VI
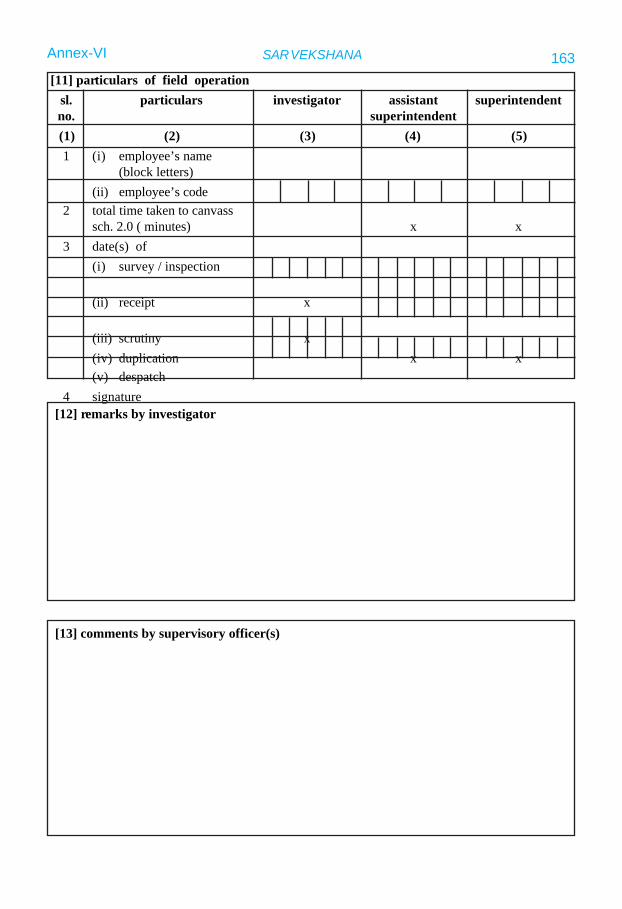
SARVEKSHANA
[11] particulars of field operationsl. particulars investigator assistant superintendentno. superintendent(1) (2) (3) (4) (5)1 (i) employee’s name
(block letters)(ii) employee’s code
2 total time taken to canvasssch. 2.0 ( minutes) x x
3 date(s) of(i) survey / inspection
(ii) receipt x
(iii) scrutiny x(iv) duplication x x(v) despatch
4 signature[12] remarks by investigator
[13] comments by supervisory officer(s)
163Annex-VI

SARVEKSHANA
GOVERNMENT OF INDIANATIONAL SAMPLE SURVEY ORGANISATION
SOCIO-ECONOMIC SURVEYFIFTY-FIFTH ROUND : JULY 1999 - JUNE 2000
HOUSEHOLD SCHEDULE 10 : EMPLOYMENTAND UNEMPLOYMENT
[0] descriptive identification of sample householdstate/u.t. : srl. no. of hamlet :district : ward/inv. unit/block :tehsil/town : name of head :village name : name of informant :
item 17: response code : informant : co-operative and capable-1, co-operative but notcapable-2; busy-3, reluctant-4, others-9.
item 18: survey code : household surveyed : original-1, substitute-2; casualty-3.item 19: reason for first substitution of original household : informant busy-1, members
away from home-2, informant non-cooperative-3, others-9.
* tick mark ( ) may be put in the appropriate place.
RURALURBAN
*CENTRAL
STATE
*
[1] identification of sample householditem item code item item codeno. no.1. round number 5 5 11. srl. no. of sample village / block2. schedule number 1 0 0 12. household visit number (1 / 2)3. sample (central-1, state-2) 13. segment (1 / 2)4. sector (rural-1, urban-2) 14. second-stage stratum5. state - region 15. sample household no.
6. district code 16. srl. no. of informant
7. stratum number (as in col. 1, block 4)
8. sub - round 17. response code9. sub - sample 18. survey code10. FOD sub - region 19. reason for first substitution
of original hh. (code)CODES FOR BLOCK 1
164 Annex-VI

SARVEKSHANA
[2] particulars of field operationsrl. particulars investigator assistant superintendentno. superintendent(1) (2) (3) (4) (5)1. i) name
ii) code2. date(s) of : DD MM YY DD MM YY DD MM YY
(i) survey/ inspection(ii) receipt(iii) scrutiny(iv) despatch
3. no. of addl. sheets attached4. total time taken to canvass
schedule 10 (minutes)5. signature
[11] comments by supervisory officer(s)[10] remarks by investigator
165Annex-VI

SARVEKSHANA
[3] household characteristics1. household size2 social group
(code)3. religion
(code)4. household type
(code)5. total expenditure last month (Rs)
(to be copied from item 19, bl. 9)6. land owned as on date of survey (in 0.00 hectares)7. land possessed as on date of survey (in 0.00 hectares)
[land possessed = land (owned + leased-in +neither owned nor leased-in) - land leased out]
8. land cultivated during July 1998 - June 1999 (in 0.00 hectares)no. of members who got work for 9. maleat least 60 days in ‘public works’ 10. femaleduring the last 365 days
item 2: social group: scheduled tribe-1, scheduled caste-2, other backward class-3, others-9.item 3: religion : Hinduism-1, Islam-2, Christianity-3, Sikhism-4, Jainism-5, Buddhism-6,
Zoroastrianism-7, others-9.item 4: household type:
for rural areas : self-employed in non-agricul-ture-1, agricultural labour-2, otherlabour-3, self-employed in agriculture-4, others-9.for urban areas: self-employed-1, regular wage/salary earning-2, casual labour-3,others-9.
Note: 1 Acre = 0.4047 Hectare
CODES FOR BLOCK 3
166 Annex-VI

SARVEKSHANA
[3.1] indebtedness of rural labour household as on date of survey (i.e. for householdswith code 2 or 3 in item 4, block 3)
serial nature of source purpose amount outstandingno. of loan loan (code) (code) (code) including interest on
date of survey (Rs)(1) (2) (3) (4) (5)
total
col. (2) : nature of loan : hereditary loan -1, loan contracted in cash -2, loan contracted inkind -3, loan contracted partly in cash and partly in kind -4.
col. (3) : source: government -1, co-operative society -2, bank -3, employer/landlord -4,agricul-tural/professional money lender -5, shop keeper/trader -6, rela-tives/friends -7, others -9.
col. (4) : purpose: household consumption: medical expenses -1, educa-tional expenses -2,legal expenses -3, other consumption expenses -4; marriage and other ceremonialexpenses -5, purchase of land/construction of building -6, productive purpose -7,repayment of debt -8, others -9.
CODES FOR BLOCK 3.1
167Annex-VI

SARVEKSHANA Annex-VI
col. (3): relation to head : self-1, spouse of head-2, married child-3, spouse of married child-4,unmarried child-5, grand child-6, father/mother/father-in-law/mother-in-law-7, brother/sister/brother-in-law/sister-in-law/other relatives-8, servants/employees/other non-relatives-9.
col. (6): marital status : never married-1, currently married-2, widowed-3, divorced/separated-4.
col. (7): educational standard-general : not literate-01, literate through attending: NFEC/AEC-02, TLC-03, others-04; literate but below primary-05, primary-06, middle-07, secondary-08, higher secondary-09, graduate and above in : agriculture-10, engineering/technology-11, medicine-12, other subjects-13.
col (8): educational standard-technical : no technical education-1, technical degree inagriculture / engineering / technology / medicine etc.- 2, diploma or certificate in:agriculture-3, engineering/technology-4, medicine-5, crafts-6, other subjects-9.
col (9): current attendance in educational institution and course of study: currently notattending any educational institution: never attended: to supplement hh. income-11,other reasons-12; ever attended but discontinued studies: to supplement hh. income-13, other reasons-14; dropped out: to supplement hh. income-15, other reasons-16;currently attending: NFEC/AEC-21, TLC-22; pre-primary-23, primary-24, middle-25,secondary and higher secondary-26, graduate & above in: agriculture-27, engineering/technology-28, medicine-29, other subjects -30; diploma or certificate course:agriculture-31, engineering/technology-32, medicine-33, crafts-34, other subjects-35.
col. (15): location of last usual residence: same district: rural-1, urban-2; same state but anotherdistrict: rural-3, urban-4; another state: rural-5, urban-6; another country-7.
col. (17): state/ u.t. : A.P.-02, Ar.P.-03, Assam-04, Bihar-05, Goa-06, Gujarat-07, Haryana-08,H.P.-09, J &K-10, Karnataka-11, Kerala-12, M.P.-13, Maharashtra-14, Manipur-15,Meghalaya-16, Mizoram-17, Nagaland-18, Orissa-19, Punjab-20, Rajasthan-21, Sikkim-22, T.N.-23, Tripura-24, U.P.-25, W.B.-26, A & N Is.-27, Chandi-garh-28, Dadra &Nagar Haveli-29, Daman & Diu-30, Delhi-31, Lakshadweep-32, Pondicherry-33.country: Bangladesh- 51, Nepal- 52, Pakistan- 53, Sri Lanka- 54, Bhutan- 55, GulfCountries (Saudi Arabia, Iran, Iraq, Kuwait, UAE and other countries of the region)-56, Other Asian Countries- 57, USA- 58, Canada- 59, Other Countries of North andSouth America- 60, UK- 61, Other Countries of Europe- 62, Countries of Africa- 63,Rest of the World- 64.
col. (18): usual status at the time of migration: worked in h.h. enterprise (self-employed) : ownaccount worker -11, employer-12, worked as helper in h.h. enterprise (unpaid familyworker)-21, worked as regular salaried/wage employee-31, worked as casual wagelabour: in public works-41, in other types of work-51; did not work but was seekingand/or available for work-81, attended educational institution-91, attended domesticduties only-92, attended domestic duties and was also engaged in free collection ofgoods (vegetables, roots, fire-wood, cattle feed, etc.), sewing, tailoring, weaving, etc.for household use-93, rentiers, pensioners, remittance recipients, etc. -94, not able towork due to disability-95, beggars, prostitutes-96, others-97.
col. (20): reason for leaving the last usual place of residence: in search of employment -01, insearch of better employment -02, to take up employment/better employment -03, transferof service/contract -04, proximity to place of work-05, studies -06, acquisition of ownhouse/flat -07, housing problems -08, social/ political problems -09, health -10, marriage-11, migration of parent/earning member of the family -12, others -19.
CODES FOR BLOCK 4168

SARVEKSHANA[4
] dem
ogra
phic
and
mig
ratio
n pa
rtic
ular
s of h
ouse
hold
mem
bers
srl.
no.
nam
e of
mem
ber
rela
-tio
nto head
(cod
e)
sex
(male
-1, fem
-al
e-2)
age
(yea
rs)m
ar-
ital
stat
us(c
ode)
gen-
eral
tech
-ni
cal
educ
atio
nal
stand
ard
(cod
e)
cur-
rent
atte
n-da
nce
ined
uca-
tiona
lin
stit-
utio
nan
dco
urse
ofstu
dy(c
ode)
curr
e-nt
lyre
gis-
tere
dw
ithem
p-lo
y-m
ent
exch
-an
ge(y
es-
1, n
o-2)
whe
-th
erst
ay-
ing
inth
esa
me
vill.
/to
wn
for
last
6m
on-
ths o
rm
ore
(yes
-1,
no-
2)
if co
de 1
inco
l. 11
whe
t-he
r sta
yed
away
from
vill.
/tow
n fo
rla
st 6
mon
ths
or m
ore
(yes
-1,
no-
2)
whe
t-he
rpl
ace
ofen
um-
eratio
ndi
ffers
from last
usua
lpl
ace
ofre
sid-
ence
( yes
-1,
no-
2)
perio
dsin
cele
av-
ing
the
last
usua
lpl
ace
of resi-
denc
e(y
rs.)
loca
-tio
n(c
ode)
nam
eco
de
If c
ode
1 in
col
. 13
parti
cula
rs o
f las
tus
ual r
esid
ence
usua
l act
ivity
at th
e tim
e of
mig
ratio
n
(1)
(2)
(3)
(4)
(5)
(6)
(7)
(8)
(9)
(10)
(11)
(12)
(13)
(14)
(15)
(16)
(17)
(18)
(19)
(20)
stat
us(c
ode)
for
code
s11
-51
in c
ol18
,in
dus-
try divi
-si
on (2 digi
tN
IC19
98)
rea-
son
for
leav
-in
gth
ela
stus
ual
plac
eof resi-
denc
e(c
ode)
Stat
e/u.
t./co
untry
169Annex-VI
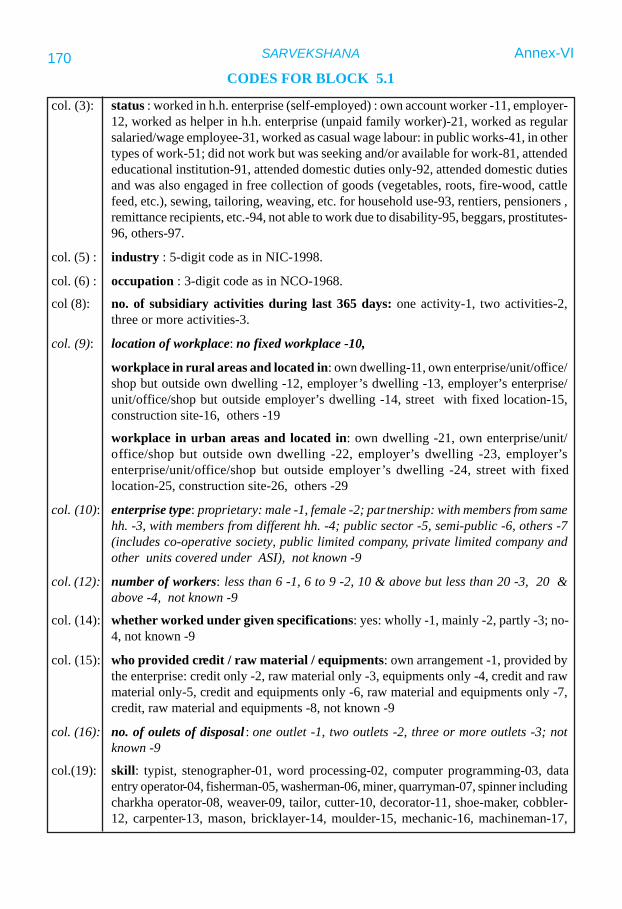
SARVEKSHANA
col. (3): status : worked in h.h. enterprise (self-employed) : own account worker -11, employer-12, worked as helper in h.h. enterprise (unpaid family worker)-21, worked as regularsalaried/wage employee-31, worked as casual wage labour: in public works-41, in othertypes of work-51; did not work but was seeking and/or available for work-81, attendededucational institution-91, attended domestic duties only-92, attended domestic dutiesand was also engaged in free collection of goods (vegetables, roots, fire-wood, cattlefeed, etc.), sewing, tailoring, weaving, etc. for household use-93, rentiers, pensioners ,remittance recipients, etc.-94, not able to work due to disability-95, beggars, prostitutes-96, others-97.
col. (5) : industry : 5-digit code as in NIC-1998.
col. (6) : occupation : 3-digit code as in NCO-1968.
col (8): no. of subsidiary activities during last 365 days: one activity-1, two activities-2,three or more activities-3.
col. (9): location of workplace: no fixed workplace -10,
workplace in rural areas and located in: own dwelling-11, own enterprise/unit/office/shop but outside own dwelling -12, employer’s dwelling -13, employer’s enterprise/unit/office/shop but outside employer’s dwelling -14, street with fixed location-15,construction site-16, others -19
workplace in urban areas and located in: own dwelling -21, own enterprise/unit/office/shop but outside own dwelling -22, employer’s dwelling -23, employer’senterprise/unit/office/shop but outside employer’s dwelling -24, street with fixedlocation-25, construction site-26, others -29
col. (10): enterprise type: proprietary: male -1, female -2; partnership: with members from samehh. -3, with members from different hh. -4; public sector -5, semi-public -6, others -7(includes co-operative society, public limited company, private limited company andother units covered under ASI), not known -9
col. (12): number of workers: less than 6 -1, 6 to 9 -2, 10 & above but less than 20 -3, 20 &above -4, not known -9
col. (14): whether worked under given specifications: yes: wholly -1, mainly -2, partly -3; no-4, not known -9
col. (15): who provided credit / raw material / equipments: own arrangement -1, provided bythe enterprise: credit only -2, raw material only -3, equipments only -4, credit and rawmaterial only-5, credit and equipments only -6, raw material and equipments only -7,credit, raw material and equipments -8, not known -9
col. (16): no. of oulets of disposal : one outlet -1, two outlets -2, three or more outlets -3; notknown -9
col.(19): skill: typist, stenographer-01, word processing-02, computer programming-03, dataentry operator-04, fisherman-05, washerman-06, miner, quarryman-07, spinner includingcharkha operator-08, weaver-09, tailor, cutter-10, decorator-11, shoe-maker, cobbler-12, carpenter-13, mason, bricklayer-14, moulder-15, mechanic-16, machineman-17,
CODES FOR BLOCK 5.1170 Annex-VI
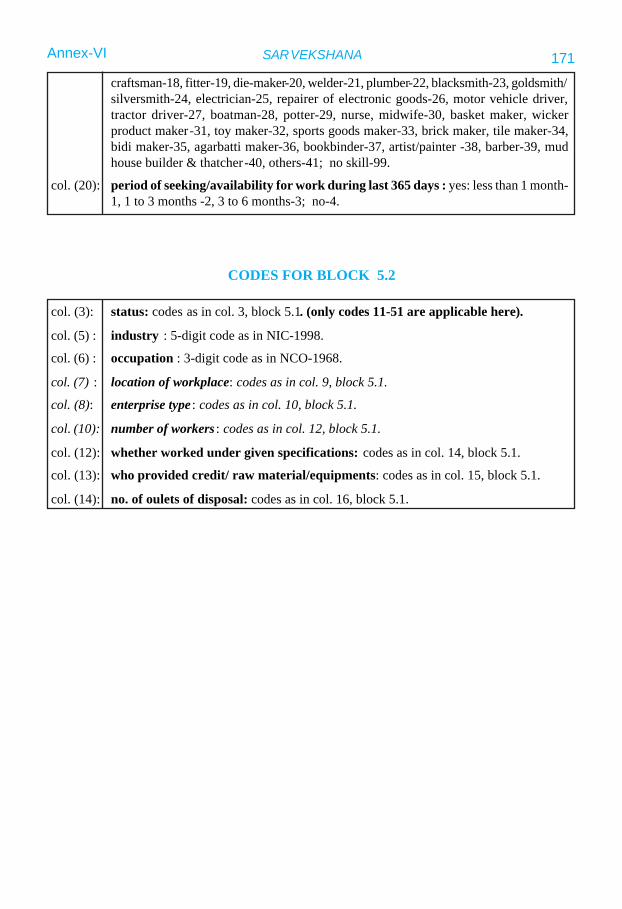
SARVEKSHANA
craftsman-18, fitter-19, die-maker-20, welder-21, plumber-22, blacksmith-23, goldsmith/silversmith-24, electrician-25, repairer of electronic goods-26, motor vehicle driver,tractor driver-27, boatman-28, potter-29, nurse, midwife-30, basket maker, wickerproduct maker-31, toy maker-32, sports goods maker-33, brick maker, tile maker-34,bidi maker-35, agarbatti maker-36, bookbinder-37, artist/painter -38, barber-39, mudhouse builder & thatcher-40, others-41; no skill-99.
col. (20): period of seeking/availability for work during last 365 days : yes: less than 1 month-1, 1 to 3 months -2, 3 to 6 months-3; no-4.
col. (3): status: codes as in col. 3, block 5.1. (only codes 11-51 are applicable here).
col. (5) : industry : 5-digit code as in NIC-1998.
col. (6) : occupation : 3-digit code as in NCO-1968.
col. (7) : location of workplace: codes as in col. 9, block 5.1.
col. (8): enterprise type : codes as in col. 10, block 5.1.
col. (10): number of workers : codes as in col. 12, block 5.1.
col. (12): whether worked under given specifications: codes as in col. 14, block 5.1.
col. (13): who provided credit/ raw material/equipments: codes as in col. 15, block 5.1.
col. (14): no. of oulets of disposal: codes as in col. 16, block 5.1.
CODES FOR BLOCK 5.2
171Annex-VI
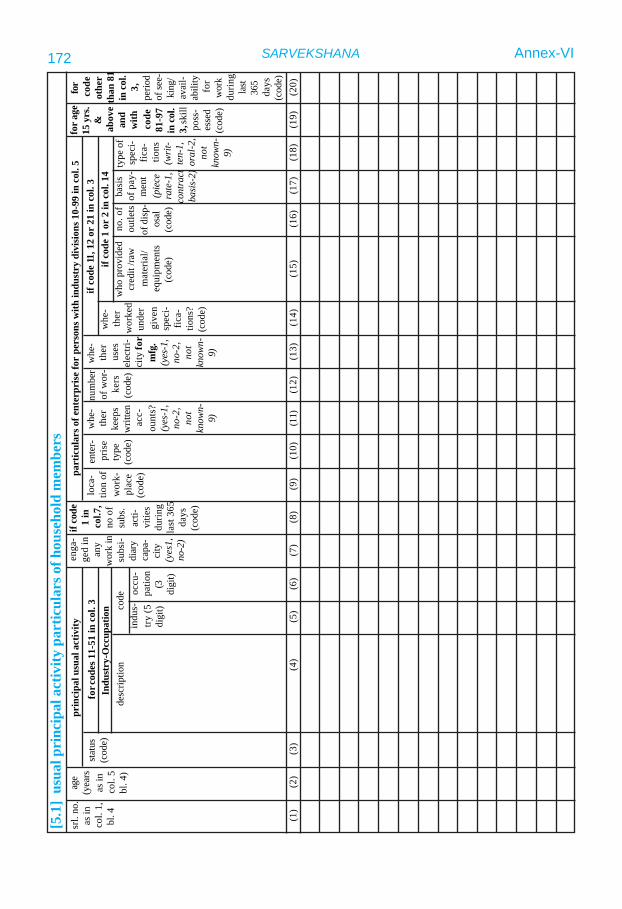
SARVEKSHANA [5
.1]
usua
l pri
ncip
al a
ctiv
ity p
artic
ular
s of h
ouse
hold
mem
bers
age
(yea
rsas
inco
l. 5
bl. 4
)
stat
us(c
ode)
desc
riptio
nco
dein
dus-
try (5
digi
t)
occu
-pa
tion
(3di
git)
enga
-ge
d in
any
wor
k in
subs
i-di
ary
capa
-ci
ty(y
es1,
no-2
)
if co
de1
inco
l.7,
no o
fsu
bs.
acti-
vitie
sdu
ring
last
365
days
(cod
e)
prin
cipa
l usu
al a
ctiv
itylo
ca-
tion
ofw
ork-
plac
e(c
ode)
ente
r-pr
ise
type
(cod
e)
whe
-th
erke
eps
writ
ten
acc-
ount
s?(y
es-1
,no
-2,
not
know
n-9)
num
ber
of w
or-
kers
(cod
e)
whe
-th
erus
esel
ectri
-ci
ty fo
rm
fg.
(yes
-1,
no-2
,no
tkn
own-
9)
whe
-th
erw
orke
dun
der
give
nsp
eci-
fica-
tions
?(c
ode)
who
pro
vide
dcr
edit
/raw
mat
eria
l/eq
uipm
ents
(cod
e)
no. o
fou
tlets
of d
isp-
osal
(cod
e)
basi
sof
pay
-m
ent
(pie
cera
te-1
,co
ntra
ctba
sis-2
)type
of
spec
i-fic
a-tio
ns(w
rit-
ten-
1,or
al-2
,no
tkn
own-
9)
for
age
15 y
rs.
&ab
ove
and
with
code
81-9
7in
col
.3,
skill
poss
-es
sed
(cod
e)
for
code
othe
rth
an 8
1in
col
.3,
perio
dof
see-
king
/av
ail-
abili
tyfo
rw
ork
durin
gla
st36
5da
ys(c
ode)
part
icul
ars o
f ent
erpr
ise
for
pers
ons w
ith in
dust
ry d
ivis
ions
10-
99 in
col
. 5if
code
11, 1
2 or
21
in c
ol. 3
if co
de 1
or
2 in
col
. 14
for c
odes
11-
51 in
col
. 3
srl.
no.
as in
col.
1,bl
. 4
(2)
(3)
(4)
(5)
(6)
(7)
(8)
(9)
(10)
(11)
(12)
(13)
(14)
(15)
(16)
(17)
(18)
(19)
(1)
(20)
Indu
stry
-Occ
upat
ion
172 Annex-VI

SARVEKSHANA[5
.2]
usua
l sub
sidia
ry e
cono
mic
act
ivity
par
ticul
ars o
f hou
seho
ld m
embe
rs (i
.e.,
thos
e w
ith c
ode
1 in
col
. 7, b
l. 5.
1)sr
l. no
.as
inco
l. 1,
bl. 4
age
(yea
rsas
inco
l. 5
bl. 4
)
stat
us(c
ode)
desc
riptio
nco
de
indu
stry
(5-d
igit)
occu
-pa
tion
(3-d
igit)
loca
-tio
n of
wor
k-pl
ace
(cod
e)
ente
r-pr
ise
type
code
whe
-th
erke
eps
writ
ten
acco
-un
ts ?
(yes
-1,
no-2
,no
tkn
own-
9)
num
-be
r of
wor
kers
(cod
e)w
he-
ther
wor
ked
unde
rgi
ven
spec
i-fic
a-tio
ns ?
(cod
e)
who
pro
vide
dcr
edit/
raw
mat
eria
l /eq
uipm
ents
(cod
e)
no. o
f out
lets
of d
ispo
sal
(cod
e)
basi
sof
pay
-m
ent
(pie
cera
te-1
,co
nt-
ract
basi
s-2)
type
of s
pcifi
-ca
tions
(wr
it-te
n-1,
ora
l-2,
not k
now
n-9)
whe
-th
erus
esel
ect-
ricity
for
mfg
.(y
es-1
,no
-2,
not
know
n-9)
usua
l sub
sidi
ary
activ
ity
for c
odes
11-
51 in
col
. 3
part
icul
ars o
f ent
erpr
ise
for
pers
ons w
ith in
dust
ry d
ivis
ions
10-
99 in
col
. 5
if co
de 11
, 12
or 2
1 in
col
. 12
if co
de 1
or
2 in
col
. 12
(2)
(3)
(4)
(5)
(6)
(7)
(8)
(9)
(10)
(11)
(12)
(13)
(14)
(15)
(16)
(17)
(1)
subs
idia
ry st
atus
num
ber-
I
subs
idia
ry st
atus
num
ber-I
I
subs
-id
iary
stat
usno
. (1/
2) 1 1 1 1 1 1 1 1 2 2 2 2 2
Indu
stry
-Occ
upat
ion
173Annex-VI

SARVEKSHANA [5
.3] t
ime
disp
ositi
on d
urin
g th
e w
eek
ende
d on
.....
......
srl.
no.
as in
col.
1,bl
. 4
age
(yrs
.)as
inco
l. 5,
bl. 4
stat
us(c
ode)
srl.
no.
of a
cti-
vity
indu
-str
ydi
vi-
sion
(cod
e)
for
rura
lar
eas
only
,op
era-
tion
(cod
e)
seve
n-th
day
sixt
hda
yfif
thda
yfo
rth day
third day
seco
ndda
yfir
stda
y
tota
lno
. of
days
inea
chac
ti-vi
ty(0
.0)
cash
kind
tota
l
mod
eof
pay
-m
ent
(cod
e)
no. o
fda
ys w
ithno
min
alw
ork
stat
us(c
ode)
indu
stry
occu
-pa
tion
whe
ther
un-
empl
oyed
on a
ll th
e7
days
of
the
wee
k(y
es-1
, n
o-2)
curr
ent w
eekl
yac
tivity
par
ticul
ars
for c
odes
11-
72 in
col.
20 (
code
)
(5 d
igit)
(3
dig
it)
curr
ent d
ay a
ctiv
ity p
artic
ular
sin
tens
ity o
f act
ivity
(ful
l-1.0
, hal
f-0.
5)w
age
and
sala
ryea
rnin
gs (r
ecei
ved
orre
ceiv
able
) for
the
wor
k do
ne d
urin
g th
ew
eek
(Rs)
(2)
(3)
(4)
(5)
(6)
(7)
(8)
(9)
(10)
(11)
(12)
(13)
(14)
(15)
(16)
(17)
(18)
(19)
(1)
(20)
(21)
(22)
(23)
tota
l
tota
l
tota
l
tota
l
tota
l
1.0
1.0
1.0
1.0
1.0
1.0
1.0
7.0
1.0
1.0
1.0
1.0
1.0
1.0
1.0
7.0
1.0
1.0
1.0
1.0
1.0
1.0
1.0
7.0
1.0
1.0
1.0
1.0
1.0
1.0
1.0
7.0
1.0
1.0
1.0
1.0
1.0
1.0
1.0
7.0
Annex-VI 174

SARVEKSHANA [5
.3] t
ime
disp
ositi
on d
urin
g th
e w
eek
ende
d on
.....
......
srl.
no.
as in
col.
1,bl
. 4
age
(yrs
.)as
inco
l. 5,
bl. 4
stat
us(c
ode)
srl.
no.
of a
cti-
vity
indu
-str
ydi
vi-
sion
(cod
e)
for
rura
lar
eas
only
,op
era-
tion
(cod
e)
seve
n-th
day
sixt
hda
yfif
thda
yfo
rth day
third day
seco
ndda
yfir
stda
y
tota
lno
. of
days
inea
chac
ti-vi
ty(0
.0)
cash
kind
tota
l
mod
eof
pay
-m
ent
(cod
e)
no. o
fda
ys w
ithno
min
alw
ork
stat
us(c
ode)
indu
stry
occu
-pa
tion
whe
ther
un-
empl
oyed
on a
ll th
e7
days
of
the
wee
k(y
es-1
, n
o-2)
curr
ent w
eekl
yac
tivity
par
ticul
ars
for c
odes
11-
72 in
col.
20 (
code
)
(5 d
igit)
(3
dig
it)
curr
ent d
ay a
ctiv
ity p
artic
ular
sin
tens
ity o
f act
ivity
(ful
l-1.0
, hal
f-0.
5)w
age
and
sala
ryea
rnin
gs (r
ecei
ved
orre
ceiv
able
) for
the
wor
k do
ne d
urin
g th
ew
eek
(Rs)
(2)
(3)
(4)
(5)
(6)
(7)
(8)
(9)
(10)
(11)
(12)
(13)
(14)
(15)
(16)
(17)
(18)
(19)
(1)
(20)
(21)
(22)
(23)
tota
l
tota
l
tota
l
tota
l
tota
l
1.0
1.0
1.0
1.0
1.0
1.0
1.0
7.0
1.0
1.0
1.0
1.0
1.0
1.0
1.0
7.0
1.0
1.0
1.0
1.0
1.0
1.0
1.0
7.0
1.0
1.0
1.0
1.0
1.0
1.0
1.0
7.0
1.0
1.0
1.0
1.0
1.0
1.0
1.0
7.0
175Annex-VI

SARVEKSHANA [5
.3] t
ime
disp
ositi
on d
urin
g th
e w
eek
ende
d on
.....
......
srl.
no.
as in
col.
1,bl
. 4
age
(yrs
.)as
inco
l. 5,
bl. 4
stat
us(c
ode)
srl.
no.
of a
cti-
vity
indu
-str
ydi
vi-
sion
(cod
e)
for
rura
lar
eas
only
,op
era-
tion
(cod
e)
seve
n-th
day
sixt
hda
yfif
thda
yfo
rth day
third day
seco
ndda
yfir
stda
y
tota
lno
. of
days
inea
chac
ti-vi
ty(0
.0)
cash
kind
tota
l
mod
eof
pay
-m
ent
(cod
e)
no. o
fda
ys w
ithno
min
alw
ork
stat
us(c
ode)
indu
stry
occu
-pa
tion
whe
ther
un-
empl
oyed
on a
ll th
e7
days
of
the
wee
k(y
es-1
, n
o-2)
curr
ent w
eekl
yac
tivity
par
ticul
ars
for c
odes
11-
72 in
col.
20 (
code
)
(5 d
igit)
(3
dig
it)
curr
ent d
ay a
ctiv
ity p
artic
ular
sin
tens
ity o
f act
ivity
(ful
l-1.0
, hal
f-0.
5)w
age
and
sala
ryea
rnin
gs (r
ecei
ved
orre
ceiv
able
) for
the
wor
k do
ne d
urin
g th
ew
eek
(Rs)
(2)
(3)
(4)
(5)
(6)
(7)
(8)
(9)
(10)
(11)
(12)
(13)
(14)
(15)
(16)
(17)
(18)
(19)
(1)
(20)
(21)
(22)
(23)
tota
l
tota
l
tota
l
tota
l
tota
l
1.0
1.0
1.0
1.0
1.0
1.0
1.0
7.0
1.0
1.0
1.0
1.0
1.0
1.0
1.0
7.0
1.0
1.0
1.0
1.0
1.0
1.0
1.0
7.0
1.0
1.0
1.0
1.0
1.0
1.0
1.0
7.0
1.0
1.0
1.0
1.0
1.0
1.0
1.0
7.0
176 Annex-VI

SARVEKSHANA
[6] follow-up questions for persons unemployed on all the 7 days of the week (i.e.,code 1 in col. 23 of bl. 5.3)
srl. no.as in
col. 1 ofbl. 5.3
age (yrs.)as in
col. 2 ofbl. 5.3
whetherever
worked(yes-1, no-
2)
duration(code)
status(code)
industry(5-digit
code as inNIC 1998
occup-ation (3-digit code
as inNCO-1968)
reason forbreak inemploy-
ment(code)
forcode 2
in col. 8reason(code)
for code 1 in col. 3,particulars of last employment
(1) (2) (3) (4) (5) (6) (7) (8) (9)
col. (4): duration : only 1 week -1, 1 to 2 weeks -2, 2 weeks to 1 month -3, 1 to 2 months -4,2 to 3 months -5, 3 to 6 months -6, 6 to 12 months -7, 12 months & above -8
col. (5): status : code structure same as in col. (3), block 5.1 (only codes 11-51 areapplicable).
col. (8): reason for break in employment : loss of earlier job-1, quit earlier job-2, lay-offwithout pay-3, unit has closed down-4, lack of work in the enterprise (for self-employed persons)-5, lack of work in the area (for casual labour)-6, others-9.
col.(9): reason for quitting job: work was not remunerative enough-1, unpleasantenvironment-2, employer harsh-3, health hazard-4, to avail benefits of voluntaryretirement-5, others-9.
CODES FOR BLOCK 6
177Annex-VI

SARVEKSHANA
cols. (4) status : codes 11, 12, 21, 31, 41, 51 and 91-97 of col. (3), block-5.1 and also thefollowing codes: had work in h.h. enterprise but did not work due to : sickness-61,other reasons-62; had regular salaried/wage employment but did not work due to :sickness-71, other reasons - 72; sought work-81, did not seek but was available forwork-82, did not work due to temporary sickness (for casual workers only)-98.
col. (5): industry division : 2 digit division codes as per NIC 1998.col. (6): operation (for rural areas only): manual work in cultivation: ploughing-01, sowing-
02, transplanting-03, weeding-04, harvesting-05, other cultivation activities-06; manualwork in other agricultural activities: forestry-07, plantation-08, animal husbandry -09,fisheries-10, other agricultural activities-11; manual work in non-agricultural activities-12, non-manual work in : cultivation-13, activities other than cultivation-14.
col. (18): mode of payment: piece rate in cash : daily-01, weekly-02, fortnightly-03,monthly-04, other-05;
piece rate in kind : daily-06, weekly-07, fortnightly-08,monthly-09, other-10;
piece rate in both cash and kind: daily-11, weekly-12, fortnightly-13,monthly-14, other-15;
other (non-piece) rate in cash: daily-16, weekly-17, fortnightly-18,monthly-19, other-20;
other (non-piece) rate in kind: daily-21, weekly-22, fortnightly-23,monthly-24, other-25;
other (non-piece) rate in both cash and kind: daily-26, weekly-27, fortnightly-28,monthly-29, other-30.
col. (21): industry : 5-digit code as in NIC-1998.col. (22): occupation : 3-digit code as in NCO-1968.
CODES FOR BLOCK 5.3
and (20):
178 Annex-VI

SARVEKSHANA[7
.1]
follo
w-u
p qu
estio
ns o
n av
aila
bilit
y fo
r w
ork
to p
erso
ns w
orki
ng i
n th
e us
ual
prin
cipa
l or
sub
sidi
ary
stat
us(a
ctiv
ity -
I) (i
.e. t
hose
with
cod
es 1
1-51
eith
er in
col
. 3
of b
l. 5.
1 or
bl.
5.2)
srl.
no. a
sin
col
. 1,
bl. 5
.1
age
(yrs
.)as
inco
l.2, o
fbl
. 5.1
prin
cipa
l(a
s in
col.
3, b
l. 5.
1)
subs
idia
ryac
tivity
- I
(as i
n co
l.3,
bl.
5.2)
whe
ther
enga
ged
mos
tly in
full
time
or p
art
time
wor
kdu
ring
last
365
days
(ful
ltim
e-1,
part
time-
2)
whe
ther
wor
ked
mor
e or
less
regu
larly
durin
g la
st36
5 da
ys(y
es-1
, no-
2)
appr
ox-
imat
e no
.of
mon
ths
with
out
wor
k(m
onth
s)
if en
try≥
1 in
col
. 7,
soug
ht /
avai
labl
efo
r wor
kdu
ring
thos
em
onth
s(y
es: o
nm
ost
days
-1,
on so
me-
days
-2;
no-3
))
if co
de 1
or 2
inco
l. 8,
mad
e an
yef
forts
toge
t wor
k(c
ode)
if co
de 1
or 2
inco
l. 10
,re
ason
(cod
e)
soug
ht /
avai
labl
efo
rad
ditio
nal
wor
kdu
ring
the
days
he/
she
had
wor
k(c
ode)
usua
l act
ivity
stat
us c
ode
soug
ht /
avai
labl
efo
ral
tern
ativ
ew
ork
durin
g th
eda
ys h
e/sh
e ha
dw
ork
(cod
e)
if co
de 1
or 2
inco
l. 12
,re
ason
(cod
e)
(1)
(2)
(3)
(4)
(5)
(6)
(7)
(8)
(9)
(10)
(11)
(12)
(13)
179Annex-VI

SARVEKSHANA[7
.2] f
ollo
w-u
p qu
estio
ns o
n ch
ange
of n
atur
e of
wor
k an
d/or
est
ablis
hmen
t to
pers
ons
wor
king
in th
e us
ual p
rinc
ipal
stat
us o
r sub
sidia
ry st
atus
(act
ivity
- I)
(i.e
. tho
se w
ith c
odes
11-5
1 in
col
. 3 o
f bl.
5.1
or b
l. 5.
2)sr
l. no
.as
inco
l. 1,
bl. 5
.1
age
(yrs
.)as
inco
l.2,
ofbl
. 5.1
prin
-ci
pal
(as i
nco
l. 3,
bl. 5
.1)
subs
i-di
ary
acti-
vity
- I
(as i
nco
l. 3,
bl. 5
.2)
is th
ere
any
unio
n /
asso
-ci
atio
nin
you
rac
tiv-
ity?
(cod
e)
if ‘y
es’
inco
l. 5,
whe
ther
am
embe
rof
uni
on/ a
sso-
ciat
ion
(yes
-1,
no-2
)
natu
reof
em
pl-
oym
ent
(per
ma-
nent
-1,
tem
po-
rary
-2
whe
ther
cove
red
unde
rPr
ovi-
dent
Fund
(cod
e)
wor
kac
tivity
stat
us(y
es-1
,no
-2)
if ‘y
es’
in c
ol.
11, l
ast
indu
stry
(cod
e)
occu
-pa
tion
(yes
-1,
no-2
)
if ‘y
es’
in c
ol.
13, l
ast
occu
patio
n(c
ode)
esta
bl-
ishm
ent
(yes
-1,
no-2
)
if ‘y
es’
in c
ol.
11 o
r 13
reas
onfo
r las
tch
ange
(cod
e)
indu
stry
(yes
-1,
no-2
)if
‘yes
’in
col.
9,la
stac
tivity
stat
us(c
ode)
usua
l sta
tus
for
code
s 11-
51in
col
. 3 o
r 4
for
code
s 11-
51 in
col
. 3w
heth
er d
urin
g la
st 2
yea
rs c
hang
ed
(1)
(2)
(3)
(4)
(5)
(6)
(7)
(8)
(9)
(10)
(11)
(12)
(13)
(14)
(15)
(16)
180 Annex-VI

SARVEKSHANA
CODES FOR BLOCK 7.2
col. (5) : union/association : yes-1, no-2, not known-9col. (8) : whether covered under Provident Fund : yes: GPF-1, CPF-2, PPF-3, combination
of GPF, CPF and PPF - 4; no-5col. (10) : status: code structure same as in col. 3, bl. 5.1 (only codes 11 -51 are applicable).col. (12) : industry: 2-digit codes as in NIC-1998.col. (14) : occupation: 2-digit codes as in NCO-1968.col. (16) : reason for last change : loss of earlier job due to : retrenchment/lay-off-1, closure of
unit-2, for better income/remuneration-3, no job satis-faction-4, lack of work in theenterprise (for self-employed) -5, lack of job security-6, work place too far-7, promotion/transfer-8, others-9.
items yes : commodities produced in own farm/free collection-1, commodities acquiredotherwise-2; no-3.
item 23: type of work acceptable: dairy -1, poultry -2, other animal husbandry -3, spinningand weaving -4, manu-facturing wood and cane products -5, tailoring -6, leathergoods manufacturing -7, others -9 .
item 25: whether assistance required: no assistance -1; yes: initial finance on easy terms -2,working finance facilities -3, easy availability of raw materials -4, assured market -5,training -6, accommodation -7, others -9.
CODES FOR BLOCK 8
10-14:
col. (9): made any efforts to get work : registered in employment exchange-1, other efforts-2, no effort-3
col. (10)/(12): sought/ available for additional/ alternative work during the days he/she hadwork : yes: on most days-1, on some days-2, no-3
col. (11): reason for seeking/available for additional work : to supplement income-1, notenough work-2, both-3, others-9.
col. (13): reason for seeking/available for alternative work : present work not remunerativeenough-1, no job satisfaction-2, lack of job security-3, work place too far-4, wantswage/salary job-5, others-9.
CODES FOR BLOCK 7.1181Annex-VI

SARVEKSHANA
1. serial number as in col. 1, bl. 42. age (years) as in col. 5, bl. 43. Were you required to spend most of your time on domestic
duties almost throughout the last 365 days? (yes-1, no-2)4. if code 1 in item 3, reason thereof (no other member to
carry out the domestic duties-1,cannot afford hired help-2, for social
and/or religious constraints-3, others-9)5. if code 2 in item 3, reason for still pursuing domestic duties
(non-availability of work-1, bypreference-2, others-9)
for items 6 to 19 alongwith your domestic duties did youmore or less regularly carry out during the last 365 days:
6. maintenance of kitchen gardens, orchards etc.? (yes-1, no-2) 7. work in household poultry, dairy, etc.? (yes-1, no-2) 8. free collection of fish, small game, wild fruits,
vegetables, etc. for household consumption? (yes-1, no-2) 9. free collection of fire-wood, cowdung, cattle
feed etc. for household consumption? (yes-1, no-2)10. husking of paddy for household consumption? (code)11. grinding of foodgrains for household consumption? (code)12. preparation of gur for household consumption? (code)13. preservation of meat and fish for household
consumption? (code)14. making baskets and mats for household use? (code)15. preparation of cow-dung cake for use as fuel
in the household? (yes-1, no-2)16. sewing, tailoring, weaving etc. for household
use? (yes-1, no-2)17. tutoring of own children or others’ children
free of charge? (yes-1, no-2)18. bringing water from outside the household
premises? (yes-1, no-2)19. bringing water from outside the village? (yes-1, no-2)20. if yes in item 19: distance in kilometers
21. inspite of your pre-occupation in domesticduties, are you willing to accept work ifwork is made available at your household? (yes-1, no-2)
22. the nature of work acceptable (regular full time-1,regular part-time-2, occasional
full time-3, occasional part-time-4)23. type of work acceptable (code)24. do you have any skill/experience to
undertake that work? (yes-1, no-2)25. what assistance do you require to
undertake that work? (code)
[8] follow-up questions for females (code 2 in col. 4, bl.4) with usual activity statuscode 92 or 93 ( in col. 3 of bl. 5.1)
for ruralonly
ifcode1 initem21
182 Annex-VI

SARVEKSHANA
1. cereals & cereal products2. pulses & pulse products3. milk & milk products4. edible oil5. vegetables6. fruits & nuts7. egg, fish & meat8. other food items (sugar, salt, spices, beverages, processed food, etc.)9. pan, tobacco & intoxicants10. fuel & light11. total (items 1 to 10)12. misc. goods & services (monthly expenditure)
12.1 cinema / theatre / video show12.2 tuition fees12.3 newspapers, magazines, fiction12.4 medical expenses (non-institutional)12.5 toilet articles including washing soap & other cleaning agents12.6 regular (commuting type) and other journeys12.7 house rent12.8 other miscellaneous goods & services12.9 sub-total (items 12.1 to 12.8)
13. misc. goods & services (annual expenditure)13.1 school books & other educational articles13.2 hospital, nursing home (institutional)13.9 sub-total (items 13.1+13.2)
14. clothing15. footwear16. durable goods
16.1 furniture16.2 utensils16.3 ornaments16.4 kitchen equipments16.5 vehicles16.6 clocks & watches16.7 cassettes & records16.8 TV, radio, etc.16.9 other household appliances16.10 repair and maintenance16.99 durable goods total (items 16.1 to 16.10)
17. total ( item 13.9+ item14 + item 15+ item 16.99)18. average monthly expenditure for items 13.9, 14, 15 and 16.99 (i.e. item 17 ¸ 12)19. monthly total consumer expenditure ( item 11 + item 12.9 + item 18)
[9] worksheet for recording household consumer expenditureitem group value of consumption (Rs)
duringlast 30 days last 365 days
(1) (2) (3)
183Annex-VI


[k.M III&fgUnh
losZ{k.klosZ{k.klosZ{k.klosZ{k.klosZ{k.k
jk"Vªh; izfrn'kZ losZ{k.k laxBujk"Vªh; izfrn'kZ losZ{k.k laxBujk"Vªh; izfrn'kZ losZ{k.k laxBujk"Vªh; izfrn'kZ losZ{k.k laxBujk"Vªh; izfrn'kZ losZ{k.k laxBu
lkaf[;dh ,oa dk;ZØe dk;kZUo;u ea=ky;lkaf[;dh ,oa dk;ZØe dk;kZUo;u ea=ky;lkaf[;dh ,oa dk;ZØe dk;kZUo;u ea=ky;lkaf[;dh ,oa dk;ZØe dk;kZUo;u ea=ky;lkaf[;dh ,oa dk;ZØe dk;kZUo;u ea=ky;
Hkkjr ljdkjHkkjr ljdkjHkkjr ljdkjHkkjr ljdkjHkkjr ljdkj
ubZ fnYyhubZ fnYyhubZ fnYyhubZ fnYyhubZ fnYyh
jk’Vªh; izfrn”kZ losZ{k.k laxBu
dh
if=dk
Hkkx XXV la[;k 4
o
Hkkx XXVI la[;k 1
vad la[;k 88

laikndh; lykgdkj cksMZlaikndh; lykgdkj cksMZlaikndh; lykgdkj cksMZlaikndh; lykgdkj cksMZlaikndh; lykgdkj cksMZ
1- izks- ds- ,y- d`".k
2- izks- Vh- ts- jko
3- izks- ds- lqUnje
4- izks- lh- ih- pUnz'ks[kj
5- MkW ,l- js
6- Jh ,u- oh- rksykuh
7- Jh ih- lh- rkaxM+h ¼izca/kdh; laiknd½
laikndh; lfpoky;laikndh; lfpoky;laikndh; lfpoky;laikndh; lfpoky;laikndh; lfpoky;
leUo; ,oa izdk'ku izHkkx] jk"Vªh; izfrn'kZ losZ{k.k
laxBu] ljnkj iVsy Hkou] laln ekxZ] ubZ
fnYyh&110001
Jh jke d`iky] funs'kd
Jh iou dqekj /kehtk] la;qDr funs'kd
Jh HkwisUnz dqekj] lkaf[;dh vf/kdkjh
Jh ,l- ,- csx] dfu"d vUos"kd
ewY; % vUrnsZ'kh; 200-00 :i;s

losZ{k.k
XXV, la[;k 4 o Hkkx XXVI la[;k 1
Hkkjr esa vukSipkfjd {ks= jkstxkj
laca/kh losZ{k.k ifj.kkeksa
ds jk- iz- losZ- 55oka nkSj
¼tqykbZ] 1999&twu] 2000½ dk ,dhd`r lkj fg- 1&13
vfll jkW; rFkk lfyy dqekj eq[kksik/;k;
fo"k;&lwphfo"k;&lwphfo"k;&lwphfo"k;&lwphfo"k;&lwph


1 |ɺiÉÉ´ÉxÉÉ
1.1 +ÉxÉÉè{ÉSÉÉÉÊ®BÉE FÉäjÉ àÉÖJªÉiÉ& =xÉ <BÉEÉ<ªÉÉåºÉä ÉÊàÉãÉBÉE® ¤ÉxÉiÉÉ cè VÉÉä ºÉÆMÉ~xÉ BÉEä ÉÊxÉàxÉ ºiÉ®{É® BÉEɪÉÇ®iÉ cÉäiÉä cé ÉÊVÉxÉàÉå =i{ÉÉnxÉ BÉEä ºÉÉvÉxÉBÉEä °ô{É àÉå {ÉÚÆVÉÉÒ +ÉÉè® gÉàÉ àÉå lÉÉä½É ºÉÉ +ÉlÉ´ÉÉxÉMÉhªÉ +ÉÆiÉ® cÉäiÉÉ cè +ÉÉè® VÉÉä UÉä]ä {ÉèàÉÉxÉä {É®´ÉºiÉÖ+ÉÉäÆ +ÉÉè® ºÉä ÉÉ+ÉÉäÆ BÉEä =i{ÉÉnxÉ àÉå ãÉMÉä cé *gÉÉÊàÉBÉE ºÉƤÉÆvÉ, VÉcÉÆ £ÉÉÒ Éä ÉÊ ÉtÉàÉÉxÉ cé, +ÉÉè{ÉSÉÉÉÊ®BÉE|ÉÉÊiÉ£ÉÚÉÊiɪÉÉå ºÉÉÊciÉ ºÉÆÉÊ ÉnÉiàÉBÉE BªÉ´ÉºlÉÉ BÉEÉÒ +É{ÉäFÉÉ+ÉÉÊvÉBÉEÉÆ¶É +ÉÉÊxɪÉiÉ ®ÉäVÉMÉÉ®, ÉÊ®¶iÉänÉ®ÉÒ +ÉlÉ´ÉÉ´ÉèªÉÉÎBÉDiÉBÉE +ÉlÉ´ÉÉ ºÉÉàÉÉÉÊVÉBÉE ºÉƤÉÆvÉÉå {É® +ÉÉvÉÉÉÊ®iÉcÉäiÉä cé * +ÉxÉÉè{ÉSÉÉÉÊ®BÉE FÉäjÉ BÉEÉÒ =i{ÉÉnxÉ <BÉEÉ<ªÉÉåàÉå PÉ®äãÉÚ =tÉàÉÉå BÉEä ÉÊ ÉÉʶÉ-] ãÉFÉhÉ cÉäiÉä cé *<xÉ =i{ÉÉnxÉ <BÉEÉ<ªÉÉå BÉEä º´ÉÉàÉÉÒ +É{ÉxÉä VÉÉäÉÊJÉàÉ{É® VÉ°ô®ÉÒ ÉÊ ÉkÉ ABÉEjÉ BÉE®iÉä cé +ÉÉè® BªÉÉÎBÉDiÉMÉiÉ°ô{É ºÉä ÉʤÉxÉÉ ÉÊBÉEºÉÉÒ ºÉÉÒàÉÉ BÉEä =i{ÉÉnxÉ |ÉÉÊμÉEªÉÉàÉå ´ÉcxÉ ÉÊBÉEA MÉA jÉ@hÉ +ÉlÉ´ÉÉ ¤ÉÉvªÉiÉÉ cäiÉÖ=kÉ®nɪÉÉÒ cÉäiÉä cé * =i{ÉÉnxÉ cäiÉÖ BªÉªÉ +ÉàÉÚàÉxÉPÉ®äãÉÚ BªÉªÉ ºÉä ÉÊ£ÉxxÉ xÉcÉÓ cÉäiÉÉ cè * £É´ÉxÉ +ÉlÉ´ÉÉ´ÉÉcxÉ VÉèºÉä {ÉÚÆVÉÉÒMÉiÉ ºÉÉàÉÉxÉ BªÉÉ{ÉÉ® +ÉlÉ´ÉÉ PÉ®äãÉÚ=qä¶ªÉ cäiÉÖ +ÉÉÊ É£ÉätÉ °ô{É ºÉä |ɪÉÉäMÉ ÉÊBÉEA VÉɺÉBÉEiÉä cé * +ÉSÉãÉ iÉlÉÉ |ɪÉÉäMÉ BÉEÉÒ MÉ<Ç +ÉxªÉ{ÉÉÊ®ºÉÆ{ÉÉÊkɪÉÉÆ ºÉÉàÉÉxªÉiÉÉ =i{ÉÉnxÉ <BÉEÉ<ǪÉÉå ºÉä
ºÉƤÉr xÉcÉÓ cÉäiÉÉÒ ÉËBÉEiÉÖ =xÉBÉEä º´ÉÉàÉÉÒ ºÉä cÉäiÉÉÒcé *
1.2 ºÉÉÆÉÎJªÉBÉEÉÒªÉ |ɪÉÉäVÉxÉ cäiÉÖ, +ÉxÉÉè{ÉSÉÉÉÊ®BÉEFÉäjÉ BÉEÉä =i{ÉÉnxÉ <BÉEÉ<ªÉÉå BÉEä ABÉE ºÉàÉÚc BÉEä°ô{É àÉå àÉÉxÉÉ VÉÉiÉÉ cè VÉÉä PÉ®äãÉÚ =tÉàÉÉå +ÉlÉ´ÉɺÉàÉBÉEFÉ,{ÉÉÊ®´ÉÉ®Éå BÉEä º´ÉÉÉÊàÉi´É ´ÉÉãÉä+ÉÉ ÊxÉMÉÉ ÊàÉiÉ=tÉàÉÉå BÉEä °ô{É àÉå PÉ®äãÉÚ FÉäjÉ BÉEä £ÉÉMÉ BÉEÉÒ ºÉÆ®SÉxÉÉBÉE®iÉÉ cè * PÉ®äãÉÚ FÉäjÉ BÉEä +ÉÆiÉMÉÇiÉ, +ÉxÉÉè{ÉSÉÉÉÊ®BÉEFÉäjÉ àÉå ¶ÉÉÉÊàÉãÉ cé : ( i) Þ+ÉxÉÉè{ÉSÉÉÉÊ®BÉE º´ÉãÉäJÉÉ=tÉàÉ Þ VÉÉä ÉÊBÉE º´É-ãÉäJÉÉ BÉEÉÌàɪÉÉå uÉ®É ªÉÉ iÉÉä+ÉBÉEäãÉä +ÉlÉ´ÉÉ =ºÉÉÒ ªÉÉ +ÉxªÉ {ÉÉÊ®´ÉÉ® BÉEä ºÉnºªÉÉåBÉEä ºÉÉlÉ ºÉc£ÉÉMÉÉÒnÉ®ÉÒ àÉå =xcÉÓ BÉEä º´ÉÉÉÊàÉi´ÉàÉå ®ciÉÉ cè +ÉÉè® |ÉSÉÉÉÊãÉiÉ ÉÊBÉEªÉÉ VÉÉiÉÉ cè +ÉÉè®VÉÉä +ÉɴɺÉÉÊ®BÉE +ÉÉvÉÉ® {É® ºÉc£ÉÉMÉÉÒnÉ®{ÉÉÉÊ®´ÉÉÉÊ®BÉE ºÉnºªÉÉå iÉlÉÉ BÉEàÉÇSÉÉÉÊ®ªÉÉå BÉEÉä ÉÊxɪÉÉäÉÊVÉiÉBÉE®iÉÉ cè ÉËBÉEiÉÖ BÉEàÉÇSÉÉÉÊ®ªÉÉå BÉEÉä ÉÊxÉ®ÆiÉ®iÉÉ BÉEä+ÉÉvÉÉ® {É® ÉÊxɪÉÉäÉÊVÉiÉ xÉcÉÓ BÉE®iÉÉ cè, +ÉÉè® (ii)Þ+ÉxÉÉè{ÉSÉÉÉÊ®BÉE ÉÊxɪÉÉäVÉBÉEÉå BÉEä =tÉàÉ Þ VÉÉä ÉÊBÉEÉÊxɪÉÉäVÉBÉEÉå uÉ®É +ÉBÉEäãÉä +ÉlÉ´ÉÉ =ºÉÉÒ ªÉÉ +ÉxªÉ{ÉÉÊ®´ÉÉ® BÉEä ºÉnºªÉÉå BÉEä ºÉÉlÉ º´ÉÉÉÊàÉi´É àÉå £ÉÉMÉÉÒnÉ®ÉÒ´ÉÉãÉä cé +ÉÉè® |ÉSÉÉÉÊãÉiÉ ÉÊBÉEA VÉÉiÉä cé, V É É äABÉE +ÉlÉ´ÉÉ +ÉÉÊvÉBÉE BÉEàÉÇSÉÉÉÊ®ªÉÉå BÉEÉä ÉÊxÉ®ÆiÉ®iÉÉ BÉEä+ÉÉvÉÉ® {É® ÉÊxɪÉÉäÉÊVÉiÉ BÉE®iÉä cé *
£ÉÉ®iÉ àÉå +ÉxÉÉè{ÉSÉÉÉÊ®BÉE FÉäjÉ ®ÉäVÉMÉÉ® ºÉƤÉÆvÉÉÒ ºÉ´ÉæFÉhÉ {ÉÉÊ®hÉÉàÉÉåBÉEä ®É.|É.ºÉ´Éæ. 55´ÉÉÆ nÉè® (VÉÖãÉÉ<Ç, 1999 - VÉÚxÉ, 2000)
BÉEÉ ABÉEÉÒBÉßEiÉ ºÉÉ®
+ÉÉÊºÉºÉ ®ÉìªÉ iÉlÉÉ ºÉÉÊãÉãÉ BÉÖEàÉÉ® àÉÖJÉÉä{ÉÉvªÉÉªÉ *
* nÉäxÉÉå ºÉ´ÉæFÉhÉ +ÉÉÊ£ÉBÉEã{É A´ÉÆ +ÉxÉÖºÉÆvÉÉxÉ |É£ÉÉMÉ, ®É-]ÅÉÒªÉ |ÉÉÊiÉn¶ÉÇ ºÉ´ÉæFÉhÉ ºÉÆMÉ~xÉ, BÉEÉäãÉBÉEÉiÉÉ àÉå BÉEɪÉÇ®iÉ cé *

2. +ÉxÉÉè{ÉSÉÉÉÊ®BÉE FÉäjÉ àÉå ®ÉäVÉMÉÉ®+ÉÉBÉEãÉxÉ cäiÉÖ ®É.|É.ºÉ´Éæ.ºÉÆ. uɮɺɴÉæFÉhÉ
2.1 ®É-]ÅÉÒªÉ |ÉÉÊiÉn¶ÉÇ ºÉ´ÉæFÉhÉ ºÉÆMÉ~xÉ xÉä VÉÖãÉÉ<Ç,1999 ºÉä VÉÚxÉ, 2000 BÉEä nÉè®ÉxÉ +É{ÉxÉä 55´ÉånÉè® àÉå {ÉÉÊ®´ÉÉ®Éå A´ÉÆ =tÉàÉÉå BÉEÉ ABÉE ABÉEÉÒBÉßEiɺɴÉæFÉhÉ +ÉɪÉÉäÉÊVÉiÉ ÉÊBÉEªÉÉ * <ºÉàÉå VÉÉä ÉÊ É-ɪɶÉÉÉÊàÉãÉ ÉÊBÉEA MÉA ´Éä lÉä - PÉ®äãÉÚ ={É£ÉÉäBÉDiÉÉ BªÉªÉ(+ÉxÉÖºÉÚSÉÉÒ 1.0), ®ÉäVÉMÉÉ®-¤Éä®ÉäVÉMÉÉ®ÉÒ (+ÉxÉÖºÉÚSÉÉÒ-10) iÉlÉÉ +ÉxÉÉè{ÉSÉÉÉÊ®BÉE MÉè®-BÉßE-ÉÉÒªÉ =tÉàÉ (+ÉxÉÖºÉÚSÉÉÒ2.0) * ®ÉäVÉMÉÉ®-¤Éä®ÉäVÉMÉÉ®ÉÒ BÉEÉÒ ºÉÉàÉÉxªÉ VÉÉxÉBÉEÉ®ÉÒBÉEä +ÉãÉÉ´ÉÉ ®ÉäVÉMÉÉ®-¤Éä®ÉäVÉMÉÉ®ÉÒ ºÉ´ÉæFÉhÉ cäiÉÖ SɪÉÉÊxÉiÉ{ÉÉÊ®´ÉÉ®Éå ºÉä, +ÉxÉÉè{ÉSÉÉÉÊ®BÉE FÉäjÉ àÉå ®ÉäVÉMÉÉ® +ÉÉBÉEãÉxÉcäiÉÖ ®ÉäVÉMÉÉ®-¤Éä®ÉäVÉMÉÉ®ÉÒ ºÉÆBÉEäiÉBÉEÉå ºÉƤÉÆvÉÉÒ ºÉÉàÉÉxªÉºÉÚSÉxÉÉ iÉlÉÉ MÉè®-BÉßEÉÊ-É FÉäjÉ àÉå BÉEÉàÉMÉÉ®Éå ºÉƤÉÆvÉÉÒäBÉÖEU ºÉÚSÉxÉÉ ABÉEjÉ BÉEÉÒ MÉ<Ç lÉÉÒ * ºÉ´ÉæÉÊFÉiÉ =tÉàÉÉåºÉä =tÉàÉÉå BÉEÉÒ ÉÊ É¶Éä-ÉiÉÉ+ÉÉäÆ, +ÉSÉãÉ {ÉÉÊ®ºÉÆ{ÉÉÊkɪÉÉå,®ÉäVÉMÉÉ®, BªÉªÉ A´ÉÆ |ÉÉÉÎ{iɪÉÉÆ, àÉÚãªÉ´ÉßÉÊr, ®ÉäVÉMÉÉ®<iªÉÉÉÊn ºÉƤÉÆvÉÉÒ ºÉÚSÉxÉÉ ABÉEjÉ BÉEÉÒ MÉ<Ç ÉÊVɺɺÉä+ÉxÉÉè{ÉSÉÉÉÊ®BÉE FÉäjÉ àÉå ºÉßÉÊVÉiÉ xÉÉèBÉEÉÊ®ªÉÉå BÉEä ÉèBÉEÉÎã{ÉBÉE+ÉxÉÖàÉÉxÉ iÉèªÉÉ® BÉE®xÉä BÉEÉ +ɴɺɮ |ÉÉ{iÉ cÖ+ÉÉ +ÉÉè®ÉÊVɺɺÉä =tÉàÉ oÉÎ-]BÉEÉähÉ BÉEä àÉÉvªÉàÉ ºÉä |ÉÉ{iÉ+ÉxÉÉè{ÉSÉÉÉÊ®BÉE FÉäjÉ àÉå ®ÉäVÉMÉÉ® BÉEä +ÉÉBÉEÉ® BÉEÉ+ÉxÉÖàÉÉxÉ ãÉMÉɪÉÉ VÉÉ ºÉBÉEiÉÉ cè *
2.2 £ÉÉèMÉÉäÉÊãÉBÉE FÉäjÉ ÉʴɺiÉÉ® &-
ºÉ´ÉæFÉhÉ àÉå ºÉàɺiÉ £ÉÉ®iÉ ºÉÆPÉ BÉEÉä ¶ÉÉÉÊàÉãÉ ÉÊBÉEªÉÉMɪÉÉ ãÉäÉÊBÉExÉ VÉÉä FÉäjÉ ¶ÉÉÉÊàÉãÉ xÉcÉÓ ÉÊBÉEA MÉA,´Éä lÉä (i) VÉààÉÚ +ÉÉè® BÉE¶àÉÉÒ® BÉEä ãÉqÉJÉ iÉlÉÉBÉEÉ®ÉÊMÉãÉ ÉÊVÉãÉä, (ii) xÉÉMÉÉãÉéb ®ÉVªÉ BÉEä MÉÉÆ É
VÉÉä ¤ÉºÉ °ô] BÉEä 5 ÉÊBÉE.àÉÉÒ. ºÉä +ÉÉÊvÉBÉE BÉEÉÒ nÚ®ÉÒ{É® ÉκlÉiÉ cé +ÉÉè® ( iii) +ÉhbàÉÉxÉ +ÉÉè® ÉÊxÉBÉEÉä¤ÉÉ®BÉEä MÉÉÆ É VÉcÉÆ {ÉcÖÆSÉxÉÉ ºÉÆ£É´É xÉcÉÓ lÉÉ * {ÉcãÉä nÉè®BÉEÉÒ £ÉÉÆÉÊiÉ, 1991 BÉEÉÒ VÉxÉMÉhÉxÉÉ BÉEä +ÉxÉÖºÉÉ®nä¶É BÉEä AäºÉä ºÉ£ÉÉÒ MÉÉÆ É, VÉcÉÆ ãÉÉäMÉ xÉcÉÓ ®ciÉä,BÉEÉä ®É.|É.ºÉ´Éæ. 55´Éå nÉè® àÉå ¶ÉÉÉÊàÉãÉ xÉcÉÓ ÉÊBÉEªÉÉMɪÉÉ *
2.3 |ÉÉÊiÉn¶ÉÇ +ÉÉÊ£ÉBÉEã{É &-
|ÉlÉàÉ SÉ®hÉ <BÉEÉ<ªÉÉå (A{ÉE AºÉ ªÉÚ) BÉEä |ÉÉÊiÉn¶ÉÇBÉEä SɪÉxÉ cäiÉÖ ABÉE ºiÉ®ÉÒBÉßEiÉ |ÉÉÊiÉSɪÉxÉ +ÉÉÊ£ÉBÉEã{É+É{ÉxÉɪÉÉ MɪÉÉ * OÉÉàÉÉÒhÉ FÉäjÉ cäiÉÖ |ÉlÉàÉ SÉ®hÉ<BÉEÉ<ªÉÉÆ MÉÉÆ É (BÉEä®ãÉ cäiÉÖ {ÉÆSÉɪÉiÉ ÉÉbÇ) lÉä +ÉÉ讶Éc®ÉÒ FÉäjÉ cäiÉÖ ¶Éc®ÉÒ ºÉÆ®SÉxÉÉ ºÉ´ÉæFÉhÉ (ªÉÚ A{ÉEAºÉ) JÉhb lÉä * +ÉÆÉÊiÉàÉ SÉ®hÉ <BÉEÉ<ªÉÉÆ (ªÉÚ AºÉªÉÚ), ={É£ÉÉäBÉDiÉÉ BªÉªÉ (+ÉxÉÖºÉÚSÉÉÒ 1.0) iÉlÉÉ ®ÉäVÉMÉÉ®-¤Éä®ÉäVÉMÉÉ®ÉÒ +ÉxÉÖºÉÚÉÊSɪÉÉÆ (+ÉxÉÖºÉÚSÉÉÒ 10/10.1) iÉèªÉÉ®BÉE®xÉä cäiÉÖ {ÉÉÊ®´ÉÉ® iÉlÉÉ +ÉxÉÉè{ÉSÉÉÉÊ®BÉE FÉäjÉ =tÉàÉ+ÉxÉÖºÉÚSÉÉÒ (+ÉxÉÖºÉÚSÉÉÒ 2.0) iÉèªÉÉ® BÉE®xÉä cäiÉÖ =tÉàÉlÉä * +ÉÆÉÊiÉàÉ SÉ®hÉ <BÉEÉ<ªÉÉå BÉEÉä iÉnxÉÖ°ô{ÉÉÒ ¶Éc®ÉÒºÉÆ®SÉxÉÉ ºÉ´ÉæFÉhÉ ºÉä ÉiÉÇÖãÉ μÉEàɤÉr |ÉÉÊiÉSɪÉxÉ BÉEÉÒ{ÉrÉÊiÉ BÉEä uÉ®É SɪÉÉÊxÉiÉ ÉÊBÉEªÉÉ MɪÉÉ lÉÉ * ¤É½ÉÒ|ÉlÉàÉ SÉ®hÉ <BÉEÉ<ªÉÉå cäàÉãÉä] ºÉàÉÚc (OÉÉàÉÉÒhÉ)/={É-JÉÆb(¶Éc®ÉÒ) àÉå ={É- ÉÊ É£ÉÉÉÊVÉiÉ lÉÉÓ *
2.4 |ÉÉÊiÉn¶ÉÇ +ÉÉBÉEÉ® &-
ºÉ£ÉÉÒ +ÉxÉÖºÉÚÉÊSɪÉÉå cäiÉÖ 55´Éå nÉè® àÉå +ÉÉÊJÉãÉ £ÉÉ®iɺiÉ® {É® BÉEäxpÉÒªÉ |ÉÉÊiÉn¶ÉÇ àÉå ºÉ´ÉæFÉhÉ cäiÉÖ BÉÖEãÉ10,384 A{ÉE AºÉ ªÉÚ ( 6208 MÉÉÆ É +ÉÉè® 4176¶Éc®ÉÒ JÉÆb) BÉEÉ SɪÉxÉ ÉÊBÉEªÉÉ MɪÉÉ lÉÉ ÉÊVÉxÉàÉå ºÉä10173 MÉÉÆ ÉÉå/JÉÆbÉå (6048 MÉÉÆ É iÉlÉÉ 4125¶Éc®ÉÒ JÉÆbÉä) BÉEÉ ´ÉɺiÉÉÊ ÉBÉE °ô{É ºÉä ºÉ´ÉæFÉhÉ
ÉÊc. - 2 ºÉ´ÉæFÉhÉ

ÉÊBÉEªÉÉ MɪÉÉ * càÉä¶ÉÉ BÉEÉÒ iÉ®c <ºÉ nÉè® BÉEÉҺɴÉæFÉhÉ +É´ÉÉÊvÉ BÉEÉä SÉÉ® ={É-nÉè®Éå àÉå ¤ÉÉÆ]É MɪÉÉ,|ÉiªÉäBÉE BÉEÉÒ +É´ÉÉÊvÉ iÉÉÒxÉ àÉÉc lÉÉÒ +ÉÉè® <xÉ |ÉiªÉäBÉESÉÉ®Éå ={É-nÉè®Éå àÉå 2 º´ÉiÉÆjÉ ={É-|ÉÉÊiÉn¶ÉÉç BÉEä°ô{É àÉå |ÉlÉàÉ SÉ®hÉ <BÉEÉ<ªÉÉå BÉEÉÒ ºÉàÉÉxÉ ºÉÆJªÉÉxÉA ÉÊºÉ®ä ºÉä SɪÉÉÊxÉiÉ BÉEÉÒ MÉ<Ç * <ºÉ |ÉBÉEÉ® AäºÉä8 ={É-|ÉÉÊiÉn¶ÉÇ lÉä * <ºÉBÉEä +ÉÉÊiÉÉÊ®BÉDiÉ, 3894A{ÉE AºÉ ªÉÚ - ÉÊVɺÉàÉå ºÉä ÉÊBÉE ={É-|ÉÉÊiÉn¶ÉÇ 1,3iÉlÉÉ 5 BÉEä iÉnxÉÖ°ô{ÉÉÒ 2,3, iÉlÉÉ 4 ={ÉnÉè®Éå BÉEä|ÉiªÉäBÉE àÉå 1298 BÉEÉ +ÉxÉÖºÉÚSÉÉÒ 10.1 iÉèªÉÉ® BÉE®xÉäcäiÉÖ {ÉÖxÉ& ÉÊxÉ®ÉÒFÉhÉ ÉÊBÉEªÉÉ MɪÉÉ <ºÉBÉEÉ iÉÉi{ɪÉÇ{ÉÖxÉ& ÉÊxÉ®ÉÒFÉhÉ {É® ®ÉäVÉMÉÉ® A´ÉÆ ¤Éä®ÉäVÉMÉÉ®ÉÒ ºÉƤÉÆvÉÉÒSɪÉÉÊxÉiÉ +ÉÉÆBÉE½ä ABÉEÉÊjÉiÉ BÉE®xÉÉ lÉÉ * +ÉxÉÖºÉÚSÉÉÒ10 cäiÉÖ 1,65,244 {ÉÉÊ®´ÉÉ®Éå BÉEä |ÉÉÊiÉn¶ÉÇ BÉEɺɴÉæFÉhÉ ÉÊBÉEªÉÉ MɪÉÉ - 97, 986 OÉÉàÉÉÒhÉ FÉäjÉ àÉåiÉlÉÉ 67,258 ¶Éc®ÉÒ FÉäjÉÉå àÉå * VÉcÉÆ iÉBÉE ºÉ´ÉæÉÊFÉiÉãÉÉäMÉÉå BÉEÉÒ ºÉÆJªÉÉ BÉEÉ ºÉƤÉÆvÉ cè iÉÉä OÉÉàÉÉÒhÉ FÉäjÉàÉå ªÉc 5,09,779 iÉlÉÉ ¶Éc®ÉÒ FÉäjÉ àÉå 3,09,234lÉÉÒ * =tÉàÉ ºÉ´ÉæFÉhÉ cäiÉÖ +ÉxÉÉè{ÉSÉÉÉÊ®BÉE FÉäjÉ ºÉäºÉƤÉÆÉÊvÉiÉ 1,97,637 <BÉEÉ<ªÉÉå (114506 OÉÉàÉÉÒhÉFÉäjÉ ºÉä iÉlÉÉ 83131 ¶Éc®ÉÒ FÉäjÉ ºÉä) BÉEÉ ºÉ´ÉæFÉhÉÉÊBÉEªÉÉ MɪÉÉ *
3. ={ÉãÉÉʤvɪÉÉå BÉEÉ ºÉÉ®
3.1 ªÉc ={ÉJÉÆb +ÉxÉÖºÉÚSÉÉÒ 10 {É® +ÉÉvÉÉÉÊ®iÉ+ÉxÉÉè{ÉSÉÉÉÊ®BÉE FÉäjÉ BÉEä AäºÉä BÉEÉàÉMÉÉ®Éå +ÉlÉÉÇiÉ VÉÉä+É{ÉxÉä º´ÉÉÉÊàÉi´É ÉÉãÉä +ÉlÉ´ÉÉ ºÉÉZÉänÉ®ÉÒ ÉÉãÉä =tÉàÉÉåàÉå BÉEɪÉÇ BÉE®iÉä cé, {É® VÉÉä® näiÉä cÖA MÉè®-BÉßEÉÊ-ÉBÉEÉàÉMÉÉ®Éå BÉEÉÒ =xÉBÉEÉÒ ÉÊ ÉÉÊ£ÉxxÉ ÉÊ É¶Éä-ÉiÉÉ+ÉÉäÆ VÉèºÉä=xÉBÉEä BÉEɪÉÇBÉEãÉÉ{É BÉEÉÒ ÉκlÉÉÊiÉ, BÉEɪÉÇ BÉEÉ ÉÊ ÉºiÉßiÉ=tÉÉäMÉ, =tÉàÉ |ÉBÉEÉ®, BÉEɪÉǺlÉãÉ BÉEÉÒ ÉκlÉÉÊiÉ,<iªÉÉÉÊn ºÉƤÉÆvÉÉÒ +ÉɴɶªÉBÉE ={ÉãÉÉΤvɪÉÉå BÉEÉ ºÉÉ®
|ɺiÉÖiÉ BÉE®iÉÉ cè * =tÉàÉ ºÉ´ÉæFÉhÉ ºÉä |ÉÉ{iÉ BÉEÉÒMÉ<Ç <ºÉÉÒ |ÉBÉEÉ® BÉEÉÒ ABÉE iÉÖãÉxÉÉ BÉEÉä £ÉÉÒ <ºÉºÉÉ® BÉEÉ ABÉE £ÉÉMÉ ¤ÉxÉɪÉÉ MɪÉÉ cè * +ÉxÉÉè{ÉSÉÉÉÊ®BÉEMÉè®-BÉßEÉÊ-É =tÉàÉÉå àÉå ®ÉäVÉMÉÉ® ºÉƤÉÆvÉÉÒ ÉÊ ÉºiÉßiÉ {ÉÉÊ®hÉÉàÉ®É.|É.ºÉ´Éæ. ÉÊ®{ÉÉä]Ç ºÉÆ. 459 iÉlÉÉ 460 àÉå ={ÉãɤvÉcè * {ÉÉÊ®hÉÉàÉÉå BÉEÉ ºÉÉ®ÉÆ¶É ¤ÉÉn BÉEä {Éè®ÉOÉÉ{ÉE àÉåÉÊnªÉÉ MɪÉÉ cè * ÉÊ ÉºiÉßiÉ iÉÉÉÊãÉBÉEÉAÆ {ÉÉÊ®ÉʶÉ-]-1àÉå nÉÒ MÉ<Ç cé *
3.2 ºÉ´ÉæFÉhÉ +ÉxÉÖàÉÉxÉÉå BÉEä +ÉxÉÖºÉÉ®, 1999-2000 BÉEä nÉè®ÉxÉ £ÉÉ®iÉ àÉå ãÉMÉ£ÉMÉ 92.10 BÉE®Éä½ãÉÉäMÉ 18.90 BÉE®Éä½ {ÉÉÊ®´ÉÉ®Éå àÉå ®ciÉä cé * ãÉMÉ£ÉMÉ73 |ÉÉÊiɶÉiÉ {ÉÉÊ®´ÉÉ® OÉÉàÉÉÒhÉ £ÉÉ®iÉ ºÉä ºÉƤÉÆÉÊvÉiÉ céVÉÉä BÉÖEãÉ VÉxɺÉÆJªÉÉ BÉEÉ ãÉMÉ£ÉMÉ 75 |ÉÉÊiɶÉiÉ cé*OÉÉàÉÉÒhÉ FÉäjÉ cäiÉÖ +ÉÉèºÉiÉ {ÉÉÊ®´ÉÉ® +ÉÉBÉEÉ® 5.0 lÉÉVÉÉä ¶Éc®ÉÒ FÉäjÉ BÉEä 4.5 +ÉÉèºÉiÉ ºÉä lÉÉä½É +ÉÉÊvÉBÉEcè * +ÉÉèºÉiÉxÉ, ABÉE £ÉÉ®iÉÉÒªÉ {ÉÉÊ®´ÉÉ® BÉEÉ ÉËãÉMÉ+ÉxÉÖ{ÉÉiÉ (|ÉÉÊiÉ 1000 {ÉÖ°ô-ÉÉå {É® àÉÉÊcãÉÉ+ÉÉäÆ BÉEÉÒºÉÆJªÉÉ) 947 lÉÉ * |ÉiªÉäBÉE 1000 {ÉÖ°ô-ÉÉå cäiÉÖ¶Éc®ÉÒ FÉäjÉÉå (915) BÉEÉÒ iÉÖãÉxÉÉ àÉå OÉÉàÉÉÒhÉ FÉäjÉ àÉå(959) àÉÉÊcãÉÉ+ÉÉäÆ BÉEÉÒ ºÉÆJªÉÉ +ÉÉÊvÉBÉE lÉÉÒ *
3.3 |ÉÉ®Æ£É àÉå, BÉÖEãÉ BÉEɪÉÇ-¤ÉãÉ +ÉÉè® MÉè®-BÉßEÉÊ-ÉFÉäjÉ BÉEä BÉEɪÉǤÉãÉ BÉEÉ £ÉÉMÉ VÉèºÉÉ ÉÊBÉE ®ÉäVÉMÉÉ®+ÉÉè® ¤Éä®ÉäVÉMÉÉ®ÉÒ ºÉ´ÉæFÉhÉ ºÉä |ÉÉ{iÉ ÉÊBÉEªÉÉ VÉÉiÉÉ cèBÉEÉ É˺ÉcÉ´ÉãÉÉäBÉExÉ ºÉàɺiÉ £ÉÉ®iÉ ºiÉ® {É® μÉEàɶÉ&ÉÊ É´É®hÉÉÒ-* +ÉÉè® ÉÊ É´É®hÉÉÒ-** àÉå |ɺiÉÖiÉ ÉÊBÉEªÉÉ VÉÉiÉÉcè * +ÉÉàÉ ºiÉ® {É® ºÉ£ÉÉÒ BÉEÉàÉMÉÉ®Éå (+É¤É ºÉäBÉEÉàÉMÉÉ® BÉEcÉ VÉÉA), +ÉlÉÉÇiÉ +ÉÉÉÌlÉBÉE ºiÉ® ºÉÉlÉãÉäxÉä {É® àÉÖJªÉ ({ÉÉÒAºÉ) +ÉÉè® ºÉcɪÉBÉE(AºÉAºÉ)BÉEÉàÉMÉÉ®Éå BÉEä BÉEɪÉǤÉãÉ MÉÉÊ~iÉ BÉE®xÉä {É® ÉÊ ÉSÉÉ®ÉÊBÉEªÉÉ lÉÉ * ÉÊ É´É®hÉÉÒ-* ºÉä ªÉc näJÉÉ MɪÉÉ cè ÉÊBÉE1999-2000 BÉEä nÉè®ÉxÉ 40± VÉxɺÉÆJªÉÉ BÉEɪÉÇ
ÉÊc. - 3ºÉ´ÉæFÉhÉ

BÉE® ®cÉÒ lÉÉÒ * BÉEÉàÉMÉÉ®Éå BÉEÉÒ ºÉÆJªÉÉ àÉå ÉËãÉMɺÉƤÉÆvÉÉÒ +ÉÆiÉ® (|ÉÉÊiÉ 100 BªÉÉÎBÉDiÉ) BÉEÉ{ÉEÉÒ =ããÉäJÉxÉÉÒªÉlÉÉ * ªÉc ºÉÆJªÉÉ {ÉÖ°ô-ÉÉå BÉEä ÉÊãÉA 53 +ÉÉè® àÉÉÊcãÉÉ+ÉÉäÆBÉEä ÉÊãÉA 26 lÉÉÒ * MÉÉÆ ÉÉå àÉå ªÉc ºÉÆJªÉÉ =SSiÉ®¶Éc®Éå àÉå (34) BÉEÉÒ iÉÖãÉxÉÉ àÉå (42) lÉÉÒ * BÉEÉàÉMÉÉ®Éå
àÉå MÉè®-BÉßEÉÊ-É BÉEÉàÉMÉÉ®Éå BÉEÉ ºÉàÉÉxÉÖ{ÉÉiÉ OÉÉàÉÉÒhÉFÉäjÉÉå àÉå (24±) BÉEÉÒ iÉÖãÉxÉÉ àÉå ¶Éc®ÉÒ FÉäjÉÉå àÉåBÉEÉ{ÉEÉÒ =SSÉiÉ® (91±) lÉÉ * ªÉc ºÉàÉÉxÉÖ{ÉÉiÉàÉÉÊcãÉÉ+ÉÉäÆ BÉEä ÉÊãÉA (24±) BÉEÉÒ iÉÖãÉxÉÉ àÉå {ÉÖ°ô-ÉÉåBÉEä ÉÊãÉA =SSÉiÉ® (45±) lÉÉ *
3.4 +ÉxÉÉè{ÉSÉÉÉÊ®BÉE FÉäjÉ àÉå BÉEÉàÉMÉÉ®
3.4.1 =tÉàÉ ÉÊVɺÉàÉå Éä BÉEɪÉÇ®iÉ lÉä BÉEä |ÉBÉEÉ® BÉEä+ÉxÉÖºÉÉ® MÉè®-BÉßEÉÊ-É BÉEÉàÉMÉÉ®Éå BÉEÉ ºÉàɺiÉ £ÉÉ®iɺiÉ® {É® ÉÊ ÉiÉ®hÉ ÉÊ É´É®hÉÉÒ-*** àÉå |ɺiÉÖiÉ ÉÊBÉEªÉÉ
MɪÉÉ cè * nÉä ºÉàÉÚcÉå - º´ÉÉÉÊàÉi´É +ÉÉè® ºÉÉZÉänÉ®ÉÒ({ÉÉÒ AÆb {ÉÉÒ) BÉEÉä ABÉE ºÉÉlÉ ®JÉÉ MɪÉÉ cè * ´Éä+ÉÉÊxÉMÉÉÊàÉiÉ º´ÉÉÉÊàÉi´É +ÉÉè® ºÉÉZÉänÉ®ÉÒ =tÉàÉ BÉEÉÒ®SÉxÉÉ BÉE®iÉä cé - <ºÉ ºÉ´ÉæFÉhÉ BÉEÉÒ +ÉxÉÉè{ÉSÉÉÉÊ®BÉEFÉäjÉ BÉEä °ô{É àÉå {ÉÉÊ®£ÉÉÉÊ-ÉiÉ ABÉE gÉähÉÉÒ *
OÉÉàÉÉÒhÉ 286 146 237
¶Éc®ÉÒ 934 823 912
ºÉƪÉÖBÉDiÉ 450 235 382
MÉè®-BÉßEÉÊ-É BÉEɪÉǤÉãÉ àÉå {ÉÖ°ô-ÉÉå BÉEÉ +ÉxÉÖ{ÉÉiÉ & 80±
ÉÊ´É´É®hÉÉÒ-2: |ÉÉÊiÉ cVÉÉ® ({ÉÉÒAºÉ+AºÉAºÉ) BÉEÉàÉMÉÉ®Éå {É® MÉè®-BÉßEÉÊ-É BÉEÉàÉMÉÉ®Éå BÉEÉÒ ºÉÆJªÉɺÉàɺiÉ £ÉÉ®iÉ
FÉäjÉ MÉè®-BÉßEÉÊ-É BÉEÉàÉMÉÉ®
{ÉÖ°ô-É àÉÉÊcãÉÉ BªÉÉÎBÉDiÉ
(1) (2) (3) (4)
ÉÊ´É´É®hÉÉÒ-1 : |ÉÉÊiÉ 1000 BªÉÉÎBÉDiɪÉÉå {É® BÉEÉàÉMÉÉ®Éå ({ÉÉÒAºÉ+AºÉAºÉ) BÉEÉÒ ºÉÆJªÉÉ
ºÉàɺiÉ £ÉÉ®iÉ
FÉäjÉ BÉEÉàÉMÉÉ®
{ÉÖ°ô-É àÉÉÊcãÉÉ BªÉÉÎBÉDiÉ
(1) (2) (3) (4)
OÉÉàÉÉÒhÉ 531 299 417
¶Éc®ÉÒ 518 139 337
ºÉƪÉÖBÉDiÉ 527 259 397
BÉEɪÉǤÉãÉ àÉå {ÉÖ°ô-ÉÉå BÉEÉ +ÉxÉÖ{ÉÉiÉ & 68±
ÉÊc. - 4 ºÉ´ÉæFÉhÉ

ÉÊ´É´É®hÉÉÒ-3:=tÉàÉ BÉEä |ÉBÉEÉ® BÉEä +ÉxÉÖºÉÉ® MÉè®-BÉßEÉÊ-É BÉEÉàÉMÉÉ®Éå ({ÉÉÒAºÉ+AºÉAºÉ) BÉEÉ |ÉÉÊiÉ 1000{É® ÉÊ´ÉiÉ®hÉ
ºÉàɺiÉ £ÉÉ®iÉ
1 2 3 4 5 6 7 8 9 10 11 12
OÉÉàÉÉÒhÉ
{ÉÖ°ô-É 657 10 14 13 695 98 12 56 41 98 1000
àÉÉÊcãÉÉ 404 321 18 7 750 70 9 56 33 82 1000
BªÉÉÎBÉDiÉ 602 78 15 12 707 92 11 56 39 95 1000
¶Éc®ÉÒ
{ÉÖ°ô-É 623 7 25 19 674 142 15 88 37 44 1000
àÉÉÊcãÉÉ 374 281 20 11 685 130 14 74 40 57 1000
BªÉÉÎBÉDiÉ 578 56 24 18 676 140 15 85 38 46 1000
ºÉƪÉÖBÉDiÉ
{ÉÖ°ô-É 639 9 20 16 684 121 14 73 39 69 1000
àÉÉÊcãÉÉ 390 302 19 9 720 98 11 64 36 71 1000
BªÉÉÎBÉDiÉ 590 66 20 15 691 116 13 71 39 70 1000
BÉEÉàÉMÉÉ®ÉåBÉEÉÒ gÉähÉÉÒ
=tÉàÉ BÉEä |ÉBÉEÉ® BÉEä +ÉxÉÖºÉÉ® MÉè®-BÉßEÉÊ-É({ÉÉÒAºÉ+AºÉAºÉ)BÉEÉàÉMÉÉ®
º´ÉÉÉÊàÉi´É ºÉÉZÉänÉ®ÉÒ
{ÉÖ°ô-É àÉÉÊcãÉÉ =ºÉÉÒ{ÉÉÊ®´ÉÉ®
àÉå
ÉÊ´ÉÉÊ£ÉxxÉ{ÉÉÊ®´ÉÉ®Éå
ºÉä
{ÉÉÒAÆb{ÉÉÒ
ºÉÉ´ÉÇ-VÉÉÊxÉBÉEFÉäjÉ
+ÉvÉǺÉÉ´ÉÇ-VÉÉÊxÉBÉE
+ÉxªÉ +ÉYÉÉiÉ MÉè®=kÉ®
BÉÖEãÉ
3.4.2 ÉÊ É´É®hÉÉÒ-3 ºÉä {ÉiÉÉ SÉãÉiÉÉ cè ÉÊBÉE OÉÉàÉÉÒhÉ+ÉÉè® ¶Éc®ÉÒ nÉäxÉÉå FÉäjÉÉå àÉå MÉè®-BÉßEÉÊ-É BÉEÉàÉMÉÉ®Éå BÉEÉABÉE =SSÉ ºÉàÉÉxÉÖ{ÉÉiÉ +ÉxÉÉè{ÉSÉÉÉÊ®BÉE FÉäjÉ (+ÉlÉÉÇiɺ´ÉÉÉÊàÉi´É +ÉÉè® ºÉÉZÉänÉ®ÉÒ ´ÉÉãÉä =tÉàÉÉå) àÉå BÉEɪÉÇBÉE® ®cä lÉä * 1999-2000 BÉEä nÉè®ÉxÉ OÉÉàÉÉÒhÉFÉäjÉÉå àÉå MÉè®-BÉßEÉÊ-É BÉEÉàÉMÉÉ®Éå BÉEÉ ãÉMÉ£ÉMÉ 71|ÉÉÊiɶÉiÉ +ÉÉè® ¶Éc®ÉÒ FÉäjÉÉå àÉå ãÉMÉ£ÉMÉ 68 |ÉÉÊiɶÉiÉ+ÉxÉÉè{ÉSÉÉÉÊ®BÉE FÉäjÉ àÉå BÉEɪÉÇ®iÉ lÉä * {ÉÖ°ô-É (68|ÉÉÊiɶÉiÉ) BÉEÉÒ iÉÖãÉxÉÉ àÉå àÉÉÊcãÉÉ+ÉÉäÆ (72 |ÉÉÊiɶÉiÉ)BÉEÉ ªÉc +ÉxÉÖ{ÉÉiÉ =SSÉiÉ® lÉÉ ªÉc OÉÉàÉÉÒhÉ +ÉÉ讶Éc®ÉÒ nÉäxÉÉå FÉäjÉÉå BÉEä ÉÊãÉA ~ÉÒBÉE lÉÉ *
3.5 =tÉàÉ BÉE ä |ÉBÉEÉ® BÉE ä +ÉxÉ ÖºÉÉ®+ÉxÉÉè{ÉSÉÉÉÊ®BÉE FÉäjÉ BÉEä BÉEÉàÉMÉÉ®
3.5.1 ÉÊ É´É®hÉÉÒ-4 OÉÉàÉÉÒhÉ +ÉÉè® ¶Éc®ÉÒ nÉäxÉÉå FÉäjÉÉåàÉå {ÉÖ°ô-É +ÉÉè® àÉÉÊcãÉÉ+ÉÉäÆ BÉEä ÉÊãÉA {ÉßlÉBÉE-{ÉßlÉBÉE=tÉàÉ ÉÊVɺÉàÉå Éä BÉEɪÉÇ®iÉ lÉä BÉEä |ÉBÉEÉ® BÉEä +ÉxÉÖºÉÉ®+ÉxÉÉè{ÉSÉÉÉÊ®BÉE FÉäjÉ àÉå BÉEÉàÉMÉÉ®Éå BÉEÉ ÉÊ ÉiÉ®hÉ |ɺiÉÖiÉBÉE®iÉÉÒ cè * +ÉxÉÉè{ÉSÉÉÉÊ®BÉE FÉäjÉ àÉå BÉEÉàÉMÉÉ®Éå àÉå ºÉä+ÉÉÊvÉBÉEÉÆ¶É 95 |ÉÉÊiɶÉiÉ {ÉÖ°ô-É +ÉÉè® 96 |ÉÉÊiɶÉiÉàÉÉÊcãÉÉAÆ º´ÉÉÉÊàÉi´É ´ÉÉãÉä =tÉàÉÉå àÉå ãÉMÉä cé *+ÉxÉÉè{ÉSÉÉÉÊ®BÉE MÉè®-BÉßEÉÊ-É FÉäjÉ àÉå {ÉÖ°ô-É BÉEÉàÉMÉÉ®Éå
ÉÊc. - 5ºÉ´ÉæFÉhÉ

BÉEÉ ãÉMÉ£ÉMÉ 93 |ÉÉÊiɶÉiÉ {ÉÖ°ô-É º´ÉÉÉÊàÉi´É ´ÉÉãÉä=tÉàÉÉå àÉå ãÉMÉä lÉä * <ºÉBÉEä ÉÊ É{É®ÉÒiÉ BÉEä ÉãÉ 42
|ÉÉÊiɶÉiÉ àÉÉÊcãÉÉ BÉEÉàÉMÉÉ® cÉÒ àÉÉÊcãÉÉ+ÉÉäÆ BÉEä º´ÉÉÉÊàÉi´É´ÉÉãÉä =tÉàÉÉå àÉå BÉEɪÉÇ®iÉ lÉÉÓ *
ÉÊ´É´É®hÉÉÒ-4:=tÉàÉÉå BÉEä |ÉBÉEÉ® BÉEä +ÉxÉÖºÉÉ® +ÉxÉÉè{ÉSÉÉÉÊ®BÉE FÉäjÉ(+ÉlÉÉÇiÉ VÉÉä º´ÉÉÉÊàÉi´É +ÉÉè® ºÉÉZÉänÉ®ÉÒ=tÉàÉÉå àÉå BÉEɪÉÇ®iÉ) àÉå BÉEÉàÉMÉÉ®Éå BÉEÉ |ÉÉÊiÉ 1000 {É® ÉÊ´ÉiÉ®hÉ
ºÉàɺiÉ £ÉÉ®iÉ
BÉEÉàÉMÉÉ®Éå =tÉàÉÉå BÉEÉ |ÉBÉEÉ®BÉEÉÒgÉähÉÉÒ º´ÉÉÉÊàÉi´É ºÉÉZÉänÉ®ÉÒ º´ÉÉÉÊàÉi´É +ÉÉè®
{ÉÖ°ô-É àÉÉÊcãÉÉ {ÉÖ°ô-É àÉÉÊcãÉÉ ºÉÉZÉänÉ®ÉÒ(1) (2) (3) (4) (5) (6)
OÉÉàÉÉÒhÉ
{ÉÖ°ô-É 945 14 20 19 1000
àÉÉÊcãÉÉ 539 428 24 9 1000
BªÉÉÎBÉDiÉ 851 110 21 17 1000
¶Éc®ÉÒ
{ÉÖ°ô-É 924 10 37 28 1000
àÉÉÊcãÉÉ 546 410 29 16 1000
BªÉÉÎBÉDiÉ 855 83 36 27 1000
ºÉƪÉÖBÉDiÉ
{ÉÖ°ô-É 934 13 29 23 1000
àÉÉÊcãÉÉ 542 419 26 13 1000
BªÉÉÎBÉDiÉ 854 96 29 22 1000
3.5.2 ªÉc =ããÉäJÉÉÊxÉªÉ cè ÉÊBÉE nä¶É àÉå BÉEɪÉǤÉãÉBÉEÉ ãÉMÉ£ÉMÉ 68 |ÉÉÊiɶÉiÉ £ÉÉMÉ {ÉÖ°ô-ÉÉå BÉEÉ lÉÉ *MÉè®-BÉßEÉÊ-É FÉäjÉ, iÉlÉÉ +ÉxÉÉè{ÉSÉÉÉÊ®BÉE FÉäjÉ BÉEäºÉÉlÉ ºÉÉlÉ º´ÉÉÉ ÊàÉi´É ´ÉÉãÉ ä =tÉàÉÉ å àÉ å,BÉEɪÉÇǤÉãÉ BÉEä àÉÉàÉãÉä àÉå ÉκlÉÉÊiÉ {ÉÖ°ô-ÉÉå BÉEä|ÉÉÊiÉ +ÉiªÉÉÉÊvÉBÉE {ÉFÉ{ÉÉiÉ{ÉÚhÉÇ lÉÉÒ * MÉè® BÉßE-ÉÉÒªÉ=tÉàÉÉå, +ÉxÉÉè{ÉSÉÉÉÊ®BÉE =tÉàÉÉå iÉlÉÉ º´ÉÉÉÊàÉi´É´ÉÉãÉä =tÉàÉÉå |ÉiªÉäBÉE àÉå àÉÉÊcãÉÉ+ÉÉäÆ BÉEä ÉÊãÉAãÉMÉ£ÉMÉ 20± ®ÉäVÉMÉÉ® BÉEä +ɴɺɮ ®JÉä MÉA *
<ºÉBÉEä {ɶSÉÉiÉ º´ÉÉÉÊàÉi´É =tÉàÉÉå àÉå BÉEɪÉǤÉãÉBÉEä ÉÊ É¶ãÉä-ÉhÉ ÉÊ É´É®hÉÉÒ-5 àÉå ÉÊBÉEA MÉA cé * º´ÉÉÉÊàÉi´É´ÉÉãÉä =tÉàÉÉå BÉEä º´ÉÉÉÊàɪÉÉå BÉEÉÒ ÉËãÉMÉ ºÉƤÉÆvÉÉÒVÉÉÆSÉ BÉE®iÉä ºÉàÉªÉ BÉEɪÉǤÉãÉ BÉEÉÒ ÉÊcººÉänÉ®ÉÒ àÉåÉËãÉMÉ {ÉÚ ÉÉÇOÉc º{É-] °ô{É ºÉä ãÉÉÊFÉiÉ cÉäiÉÉ cè *º´ÉÉÉÊàÉi´É ´ÉÉãÉä {ÉÖ°ô-É =tÉàÉÉå àÉå {ÉÖ°ô-É BÉEÉàÉMÉÉ®ÉåBÉEÉ |ÉÉÊiɶÉiÉ 87± lÉÉ VɤÉÉÊBÉE º´ÉÉÉÊàÉi´É ´ÉÉãÉäàÉÉÊcãÉÉ =tÉàÉÉå àÉå àÉÉÊcãÉÉ BÉEÉàÉMÉÉ®Éå BÉEÉ |ÉÉÊiɶÉiÉ89± lÉÉ *
ÉÊc. - 6 ºÉ´ÉæFÉhÉ

3.6 ÉÊ´ÉÉÊ£ÉxxÉ ºÉÉàÉÉxªÉ MÉÉÊiÉÉÊ´ÉÉÊvÉ ÉκlÉÉÊiÉ àÉå+ÉxÉÉè{ÉSÉÉÉÊ®BÉE FÉäjÉ BÉEÉàÉMÉÉ® &
3.6.1 ÉÊ É´É®hÉÉÒ-6 ºÉÉ´ÉÇVÉÉÊxÉBÉE BÉEɪÉÉç àÉå +ÉÉÊxɪÉiÉàÉVÉnÚ® BÉEä °ô{É àÉå ãÉMÉä BÉEÉàÉMÉÉ®Éå BÉEÉä UÉä½BÉE®BÉEÉàÉMÉÉ®Éå BÉEÉÒ ÉÊ ÉÉÊ£ÉxxÉ MÉÉÊiÉÉÊ ÉÉÊvÉ ÉκlÉÉÊiɪÉÉå BÉEäÉÊãÉA +ÉxÉÉè{ÉSÉÉÉÊ®BÉE FÉäjÉ àÉå ãÉMÉä MÉè®-BÉßE-ÉÉÒªÉ BÉEÉàÉMÉÉ®ÉåBÉEä ºÉàÉÉxÉÖ{ÉÉiÉ n¶ÉÉÇiÉÉÒ cè * ÉÊ É´É®hÉÉÒ-6 ºÉä ªÉcnäJÉÉ MɪÉÉ cè ÉÊBÉE +ÉxÉÉè{ÉSÉÉÉÊ®BÉE FÉäjÉ àÉå MÉè®-BÉßE-ÉÉÒªÉ BÉEÉàÉMÉÉ®Éå BÉEÉ ºÉàÉÉxÉÖ{ÉÉiÉ º´É-®ÉäVÉMÉÉ® àÉåºÉ´ÉÉÇÉÊvÉBÉE cè * ªÉc ºÉàÉÉxÉÖ{ÉÉiÉ ´É-ÉÇ 1999-2000
BÉEä nÉè®ÉxÉ OÉÉàÉÉÒhÉ FÉäjÉÉå àÉå 91± iÉlÉÉ ¶Éc®ÉÒFÉäjÉÉå àÉå 95± ®cÉ * MÉè®-BÉßE-ÉÉÒªÉ BÉEÉàÉMÉÉ®, VÉÉä+ÉÉÊxɪÉÉÊàÉiÉ àÉVÉnÚ®Éå BÉEä °ô{É àÉå ºÉÉ´ÉÇVÉÉÊxÉBÉE BÉEɪÉÉçBÉEä +ÉãÉÉ´ÉÉ £ÉÉÒ BÉEɪÉÇ®iÉ lÉä, =xÉàÉå ºÉä OÉÉàÉÉÒhÉ FÉäjÉàÉå 69± iÉlÉÉ ¶Éc®ÉÒ FÉäjÉ àÉå 74± +ÉlÉÉÇiÉ ABÉE¤É½É £ÉÉMÉ +ÉxÉÉè{ÉSÉÉÉÊ®BÉE FÉäjÉ àÉå BÉEɪÉÇ®iÉ lÉÉ *<xÉ gÉäÉÊhɪÉÉå BÉEÉÒ iÉÖãÉxÉÉ àÉå, +ÉxÉÉè{ÉSÉÉÉÊ®BÉE FÉäjÉ àÉåÉÊxɪÉÉÊàÉiÉ ´ÉäiÉxÉ£ÉÉäMÉÉÒ BÉEÉàÉMÉÉ® +É{ÉäFÉÉBÉßEiÉ BÉEàɺÉàÉÉxÉÖ{ÉÉiÉ àÉå ÉÊxɪÉÉäÉÊVÉiÉ lÉä * ªÉc ºÉàÉÉxÉÖ{ÉÉiÉOÉÉàÉÉÒhÉ FÉäjÉÉå àÉå 33± iÉlÉÉ ¶Éc®ÉÒ FÉäjÉÉå àÉå 40±iÉBÉE ®cÉ *
ÉÊ´É´É®hÉÉÒ-6: |ÉiªÉäBÉE MÉÉÊiÉÉÊ´ÉÉÊvÉ ºiÉ® BÉEä ÉÊãÉA |ÉÉÊiÉ 1000 MÉè®-BÉßE-ÉÉÒªÉ BÉEÉàÉMÉÉ®Éå ({ÉÉÒAºÉ+AºÉAºÉ) àÉ庴ÉÉÉÊàÉi´É ªÉÉ ºÉÉZÉänÉ®ÉÒ({ÉÉÒ AÆb {ÉÉÒ) àÉå ãÉMÉä MÉè®-BÉßE-ÉÉÒªÉ BÉEÉàÉMÉÉ®Éå BÉEÉÒ ºÉÆJªÉÉ
ºÉàɺiÉ £ÉÉ®iɺÉÉàÉÉxªÉ {ÉÉÒ AÆb {ÉÉÒ =tÉàÉÉå àÉå BÉEɪÉÇ®iÉ MÉè®-BÉßE-ÉÉÒªÉ BÉEÉàÉMÉÉ® ({ÉÉÒAºÉ+AºÉAºÉ)MÉÉÊiÉÉÊ´ÉÉÊvÉ OÉÉàÉÉÒhÉ ¶Éc®ÉÒ
{ÉÖ°ô-É àÉÉÊcãÉÉAÆ BªÉÉÎBÉDiÉ {ÉÖ°ô-É àÉÉÊcãÉÉAÆ BªÉÉÎBÉDiÉ(1) (2) (3) (4) (5) (6) (7)11 908 926 911 955 925 95012 934 902 932 914 518 87821 897 917 908 943 946 94411-21 907 921 911 951 928 94731 336 284 328 402 408 40351 698 637 687 740 721 737
11-51( 41 BÉEÉä UÉä½BÉE® ) 697 754 710 675 687 677
ÉÊ´É´É®hÉÉÒ-5 :{ÉÖ°ô-É º´ÉÉÉÊàÉi´É +ÉÉè® àÉÉÊcãÉÉ º´ÉÉÉÊàÉi´É ÉÉãÉä =tÉàÉÉå àÉå ºÉä |ÉiªÉäBÉE àÉå ÉËãÉMÉ BÉEä +ÉxÉÖºÉÉ®BÉEÉàÉMÉÉ®Éå BÉEÉ ÉÊ´ÉiÉ®hÉ *
ºÉàɺiÉ £ÉÉ®iÉ
=tÉàÉ |ÉBÉEÉ® BÉEÉàÉMÉÉ®
{ÉÖ°ô-É àÉÉÊcãÉÉ ºÉ£ÉÉÒ
(1) (2) (3) (4)
{ÉÖ°ô-É º´ÉÉÉÊàÉi´É 87 13 100
àÉÉÊcãÉÉ º´ÉÉÉÊàÉi´É 11 89 100
ÉÊc. - 7ºÉ´ÉæFÉhÉ

3.7 ´Éßcn BÉEɪÉÇ =tÉÉäMÉÉå BÉEä +ÉxÉÖºÉÉ®+ÉxÉÉè{ÉSÉÉÉÊ®BÉE FÉäjÉ BÉEÉàÉMÉÉ®
3.7.1 ªÉc VÉÉxÉxÉÉ °ôÉÊSÉBÉE® cÉäMÉÉ ÉÊBÉE |ÉiªÉäBÉE´Éßcn BÉEɪÉÇ =tÉÉäMÉ (ºÉÉ®hÉÉÒªÉxÉ gÉähÉÉÒ BÉEä ºÉÆn£ÉÇàÉå) BÉEä ºÉÆMÉiÉ ÉÊBÉEiÉxÉä MÉè®-BÉßE-ÉÉÒªÉ BÉEÉàÉMÉÉ® +ÉBÉEäãÉä+ÉxÉÉè{ÉSÉÉÉÊ®BÉE FÉäjÉ àÉå +ÉÉBÉEÉÊãÉiÉ ÉÊBÉEA MÉA cé *
ÉÊ É´É®hÉÉÒ-7 |ÉiªÉäBÉE ºÉÉ®hÉÉÒªÉxÉ gÉähÉÉÒ BÉEä ÉÊãÉA+ÉãÉMÉ-+ÉãÉMÉ ºÉ£ÉÉÒ MÉè®-BÉßE-ÉÉÒªÉ BÉEÉàÉMÉÉ®Éå àÉå+ÉxÉÉè{ÉSÉÉÉÊ®BÉE FÉäjÉ BÉEÉàÉMÉÉ®Éå BÉEÉ ºÉàÉÉxÉÖ{ÉÉiÉ n¶ÉÉÇiÉÉÒcè *
3.7.2 ÉÊ É´É®hÉÉÒ-7 ªÉc n¶ÉÉÇiÉÉÒ cè ÉÊBÉE lÉÉäBÉE ªÉÉJÉÖn®É BªÉÉ{ÉÉ® +ÉÉÉÊn (+ÉlÉÉÇiÉ ºÉÉ®hÉÉÒªÉxÉ gÉähÉÉÒ
ºÉÉ®hÉÉÒªÉxÉ gÉäÉÊhɪÉÉÆ {ÉÉÒ AÆb {ÉÉÒ =tÉàÉÉå àÉå ãÉMÉä MÉè®-BÉßE-ÉÉÒªÉ BÉEÉàÉMÉÉ® ({ÉÉÒAºÉ+AºÉAºÉ)OÉÉàÉÉÒhÉ ¶Éc®ÉÒ
{ÉÖ°ô-É àÉÉÊcãÉÉAÆ BªÉÉÎBÉDiÉ {ÉÖ°ô-É àÉÉÊcãÉÉAÆ BªÉÉÎBÉDiÉ(1) (2) (3) (4) (5) (6) (7)
ÉÊ´É´É®hÉÉÒ-7 º´ÉÉÉÊàÉi´É A´ÉÆ ºÉÉZÉänÉ®ÉÒ =tÉàÉÉå àÉå ãÉMÉä, |ÉiªÉäBÉE ºÉÉ®hÉÉÒªÉxÉ gÉähÉÉÒ cäiÉÖ |ÉÉÊiÉ 1000 MÉè®-BÉßE-ÉÉÒªÉ BÉEÉàÉMÉÉ®Éå àÉå ({ÉÉÒAºÉ+AºÉAºÉ) BÉEÉÒ ºÉÆJªÉÉ ºÉàɺiÉ £ÉÉ®iÉ
ºÉÉÒ 656 732 672 266 400 278
bÉÒ 787 876 819 698 859 732
<Ç 93 25 92 60 41 59
A{ÉE 697 519 677 753 636 739VÉÉÒ 890 896 891 892 844 886
ASÉ 867 878 870 899 896 899
+ÉÉ<Ç 717 514 715 657 419 647
VÉä 238 291 243 218 181 212
BÉEä 753 675 750 797 735 791AãÉ 57 37 55 52 69 54
AàÉ 187 248 204 324 389 355
AxÉ 531 183 420 452 348 412
+ÉÉä 741 781 753 745 798 764
{ÉÉÒ 522 686 625 616 826 751BÉDªÉÚ 0 0 0 588 974 636
ºÉ£ÉÉÒ (ºÉÉÒ-BÉDªÉÚ) 695 750 707 674 685 676
ºÉÉÒ ºÉä BÉDªÉÚ ºÉÉ®hÉÉÒªÉxÉ BÉEÉ ÉÊ´É´É®hÉ& ºÉÉÒ& JÉxÉxÉ A´ÉÆ =iJÉxÉxÉ; bÉÒ& ÉÊ´ÉÉÊxÉàÉÉÇhÉ; <Ç& ÉÊ´ÉtÉÖiÉ, MÉèºÉ A´ÉÆ VÉãÉ +ÉÉ{ÉÚÉÌiÉ; A{ÉE& ÉÊxÉàÉÉÇhÉ;VÉÉÒ& lÉÉäBÉE A´ÉÆ JÉÖn®É BªÉÉ{ÉÉ®, àÉÉä]® ÉÉcxÉ, àÉÉä]® ºÉÉ<ÇÉÊBÉEãÉ +ÉÉè® ÉèªÉÉÎBÉDiÉBÉE A´ÉÆ PÉ®äãÉÚ ºÉÉàÉÉxÉ BÉEÉÒ àÉ®ààÉiÉ; ASÉ& cÉä]ãÉ iÉlÉÉ®äºiÉ®ÉÆ; +ÉÉ<Ç& {ÉÉÊ®´ÉcxÉ, £ÉÆbÉ® A´ÉÆ ºÉÆSÉÉ®; VÉä& ÉÊ´ÉkÉÉÒªÉ àÉvªÉºlÉiÉÉ; BÉEä& £ÉÚ ºÉÆ{ÉnÉ, ÉÊBÉE®ÉAnÉ®ÉÒ iÉlÉÉ BªÉÉ{ÉÉÉÊ®BÉE ÉÊμÉEªÉÉBÉEãÉÉ{É;AãÉ& ºÉÉ´ÉÇVÉÉÊxÉBÉE |ɶÉɺÉxÉ A´ÉÆ ºÉÖ®FÉÉ, +ÉɴɶªÉBÉE ºÉÉàÉÉÉÊVÉBÉE ®FÉÉ; AàÉ& ÉʶÉFÉÉ; AxÉ& º´ÉɺlªÉ A´ÉÆ ºÉÉàÉÉÉÊVÉBÉE BÉEɪÉÇ; +ÉÉä& +ÉxªÉºÉàÉÖnÉªÉ ºÉÉàÉÉÉÊVÉBÉE A´ÉÆ ´ÉèªÉÉÎBÉDiÉBÉE ºÉä´ÉÉ BÉEɪÉÇ; {ÉÉÒ& ÉÊxɪÉÉäÉÊVÉiÉ BªÉÉÎBÉDiɪÉÉå ºÉÉÊciÉ ÉÊxÉVÉÉÒ {ÉÉÊ®´ÉÉ®; BÉDªÉÚ& +ÉÉÊiÉÉÊ®BÉDiÉ-ºÉÆPÉÉҪɺÉÆMÉ~xÉ A´ÉÆ ÉÊxÉBÉEÉªÉ *
ÉÊc. - 8 ºÉ´ÉæFÉhÉ

VÉÉÒ) ªÉÉ cÉä]ãÉÉå +ÉÉè® ®äº]Éå®å]Éå(+ÉlÉÉÇiÉ ºÉÉ®hÉÉÒªÉxÉgÉähÉÉÒ ASÉ) àÉå ãÉMÉä ºÉ£ÉÉÒ MÉè®-BÉßE-ÉÉÒªÉ BÉEÉàÉMÉÉ®ÉåBÉEÉ 4/5 ºÉä £ÉÉÒ +ÉÉÊvÉBÉE £ÉÉMÉ +ÉBÉEäãÉä +ÉxÉÉè{ÉSÉÉÉÊ®BÉEFÉäjÉ ºÉä ºÉƤÉÆÉÊvÉiÉ cè * ªÉc OÉÉàÉÉÒhÉ +ÉÉè® ¶Éc®ÉÒFÉäjÉÉå àÉå £ÉÉÒ ºÉiªÉ lÉÉ +ÉÉè® iÉ¤É £ÉÉÒ VÉ¤É {ÉÖ°ô-É +ÉÉè®àÉÉÊcãÉÉ MÉè®-BÉßE-ÉÉÒªÉ BÉEÉàÉMÉÉ®Éå BÉEÉä +ÉãÉMÉ-+ÉãÉMÉàÉÉxÉÉ VÉÉiÉÉ lÉÉ * ÉÊ ÉÉÊxÉàÉÉÇhÉ BÉEÉàÉMÉÉ®Éå (ºÉÉ®hÉÉÒªÉxÉgÉähÉÉÒ bÉÒ) àÉå £ÉÉÒ, +ÉxÉÉè{ÉSÉÉÉÊ®BÉE FÉäjÉ àÉå ÉÊxɪÉÉäÉÊVÉiÉMÉè® BÉßE-ÉÉÒªÉ BÉEÉàÉMÉÉ®Éå BÉEÉ ºÉàÉÉxÉÖ{ÉÉiÉ ¤ÉcÖiÉàÉci´É{ÉÚhÉÇ lÉÉ - VɤÉÉÊBÉE ¶Éc®ÉÒ FÉäjÉÉå BÉEÉÒ +É{ÉäFÉÉOÉÉàÉÉÒhÉ FÉäjÉÉå àÉå <ºÉºÉä £ÉÉÒ +ÉÉÊvÉBÉE lÉÉ * ªÉcºÉàÉÉxÉÖ{ÉÉiÉ {ÉÖ°ô-ÉÉå BÉEä àÉÖBÉEɤÉãÉä àÉÉÊcãÉÉ+ÉÉäÆ àÉå =SSÉiÉ®lÉÉ *
ºÉ´ÉæFÉhÉ BÉEää +ÉxÉÖºÉÉ® ªÉc +ÉxÉÖàÉÉxÉ ãÉMÉɪÉÉ MɪÉÉcè ÉÊBÉE +ÉxÉÉè{ÉSÉÉÉÊ®BÉE FÉäjÉ àÉå ÉÊ ÉÉÊxÉàÉÉÇhÉ FÉäjÉ àÉå OÉÉàÉÉÒhÉA´ÉÆ ¶Éc®ÉÒ FÉäjÉÉå àÉå μÉEàɶÉ& 88± iÉlÉÉ 86±àÉÉÊcãÉÉ BÉEÉàÉMÉÉ® lÉÉÓ* {ÉÖ°ô-ÉÉå BÉEÉ OÉÉàÉÉÒhÉ A´ÉƶÉc®ÉÒ FÉäjÉÉå àÉå iÉnxÉÖ°ô{ÉÉÒ +ÉÉBÉEãÉxÉ μÉEàɶÉ& 79±iÉlÉÉ 70± lÉÉ * nںɮÉÒ +ÉÉä®, £ÉÚ ºÉÆ{ÉnÉ, ÉÊBÉE®ÉAnÉ®ÉÒA´ÉÆ BªÉÉ{ÉÉ® BÉEÉàÉMÉÉ®Éå (ºÉÉ®hÉÉÒªÉxÉ gÉähÉÉÒ BÉEä)àÉå ÉκlÉÉÊiÉ {ÉÚhÉÇiÉ& ÉÊ É{É®ÉÒiÉ lÉÉÒ * <ºÉ gÉähÉÉÒ àÉåãÉMÉ£ÉMÉ 80± ¶Éc®ÉÒ iÉlÉÉ 75± OÉÉàÉÉÒhÉ {ÉÖ°ô-ÉBÉEÉàÉMÉÉ® +ÉxÉÉè{ÉSÉÉÉÊ®BÉE FÉäjÉ àÉå lÉÉ VɤÉÉÊBÉEàÉÉÊcãÉÉ BÉEÉàÉMÉÉ®Éå BÉEä ÉÊãÉA ¶Éc®ÉÒ A´ÉÆ OÉÉàÉÉÒhÉFÉäjÉÉå àÉå iÉnxÉÖ°ô{ÉÉÒ +ÉxÉÖ{ÉÉiÉ μÉEàɶÉ& 73± iÉlÉÉ68± lÉÉ *
3.8 +ÉxÉÉè{ÉSÉÉÉÊ®BÉE FÉäjÉ àÉå BÉEÉàÉMÉÉ® iÉlÉÉ=tÉàÉÉå BÉEÉ +ÉÉBÉEÉ®
3.8.1 ºÉ´ÉæFÉhÉ àÉå |ÉiªÉäBÉE MÉè®-BÉßE-ÉÉÒªÉ BÉEÉàÉMÉÉ®BÉEä ÉÊãÉA =tÉàÉÉå +ÉlÉ´ÉÉ |ÉÉÊiÉ-~ÉxÉÉå VÉcÉÆ Éä BÉEɪÉÇ®iÉcé, BÉEä BÉEÉàÉMÉÉ®Éå BÉEÉÒ ºÉÆJªÉÉ BÉEä °ô{É àÉå +ÉÉBÉEÉ®BÉEÉä ABÉEjÉ ÉÊBÉEªÉÉ MɪÉÉ lÉÉ * AäºÉÉÒ ºÉÚSÉxÉÉ (i)º´ÉÉÉÊàÉi´É +ÉlÉ´ÉÉ ºÉÉZÉänÉ®ÉÒ ({ÉÉÒ AÆb {ÉÉÒ) =tÉàÉÉåàÉå ãÉMÉä iÉlÉÉ (ii) ºÉ£ÉÉÒ =tÉàÉÉå BÉEä ÉÊãÉA, =xÉBÉEä=tÉàÉÉå àÉå +ÉãÉMÉ ºÉä ãÉMÉä cÖA BÉEÉàÉMÉÉ®Éå BÉEÉÒºÉÆJªÉÉ BÉEä +ÉxÉÖºÉÉ® MÉè®-BÉßE-ÉÉÒªÉ BÉEÉàÉMÉÉ®Éå({ÉÉÒAºÉ+AºÉAºÉ) BÉEä ÉÊ ÉiÉ®hÉ BÉEä °ô{É àÉå ÉÊ É´É®hÉ8 àÉå àÉå nÉÒ MÉ<Ç cè * MÉè®-BÉßE-ÉÉÒªÉ BÉEÉàÉMÉÉ®Éå BÉEÉABÉE ¤É½É ºÉàÉÉxÉÖ{ÉÉiÉ ãÉPÉÖ =tÉàÉÉå àÉå BÉEÉàÉ BÉE®®cÉ cè * 6 BÉEÉàÉMÉÉ®Éå ºÉä BÉEàÉ +ÉÉBÉEÉ® BÉEä =tÉàÉÉåàÉå ãÉMÉä BÉEÉàÉMÉÉ®Éå BÉEÉ +ÉxÉÖ{ÉÉiÉ OÉÉàÉÉÒhÉ iÉlÉɶÉc®ÉÒ FÉäjÉÉå àÉå μÉEàɶÉ& 61± iÉlÉÉ 54± lÉÉ *<ºÉ +ÉxÉÖ{ÉÉiÉ àÉå +ÉxÉÉè{ÉSÉÉÉÊ®BÉE FÉäjÉ BÉEä ÉÊãÉA ÉÊ É¶Éä-É´ÉßÉÊr cÖ<Ç VÉÉä ¤ÉfÃBÉE® 80± iÉlÉÉ 76± iÉBÉE {ÉcÖÆSÉMɪÉÉ * àÉÉÊcãÉÉ BÉEÉàÉMÉÉ®Éå BÉEä ÉÊãÉA ªÉc +ÉxÉÖ{ÉÉiÉOÉÉàÉÉÒhÉ A´ÉÆ ¶Éc®ÉÒ FÉäjÉ BÉEä ÉÊãÉA μÉEàɶÉ& 83±iÉlÉÉ 79± iÉBÉE BÉEä =SSiÉàÉ ºiÉ® iÉBÉE {ÉcÖÆSÉ MɪÉÉ* <ºÉÉÊãÉA, UÉä]ä (BÉEÉàÉMÉÉ®Éå BÉEÉÒ ºÉÆJªÉÉ BÉEä ºÉƤÉÆvÉàÉå) =tÉàÉÉå BÉEÉÒ ºÉÆJªÉÉ +ÉlÉÇBªÉ´ÉºlÉÉ àÉå ¤ÉcÖiÉ cè+ÉÉè® +ÉxÉÉè{ÉSÉÉÉÊ®BÉE FÉäjÉ +ÉÉè® MÉè®-BÉßE-ÉÉÒªÉ FÉäjÉ BÉEäBÉEɪÉǤÉãÉ BÉEÉ ABÉE ¤ÉcÖiÉ ¤É½É £ÉÉMÉ <ºÉàÉå ºÉàÉɪÉÉäÉÊVÉiÉcè *
ÉÊc. - 9ºÉ´ÉæFÉhÉ
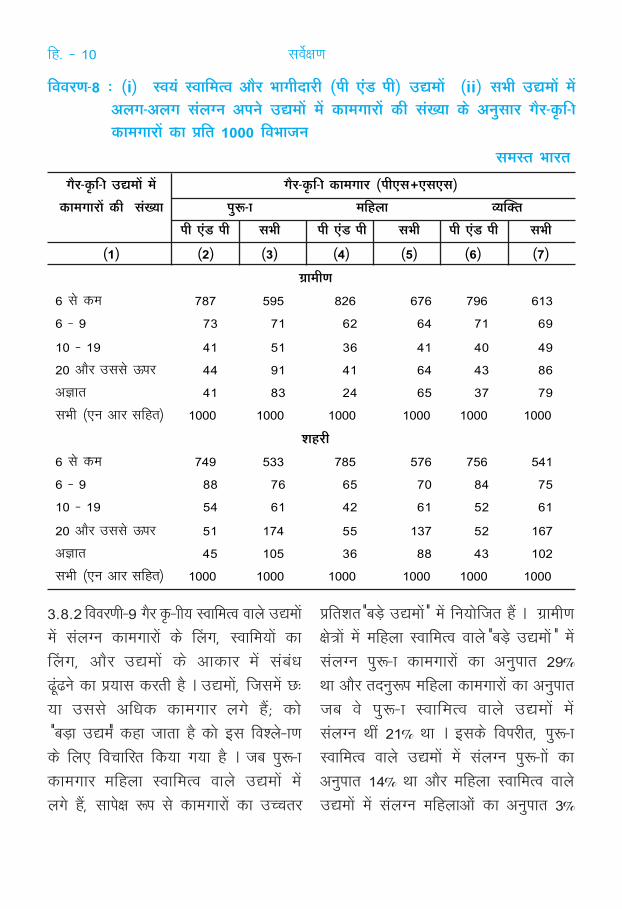
ÉÊ´É´É®hÉ-8 : (i) º´ÉªÉÆ º´ÉÉÉÊàÉi´É +ÉÉè® £ÉÉMÉÉÒnÉ®ÉÒ ({ÉÉÒ AÆb {ÉÉÒ) =tÉàÉÉå (ii) ºÉ£ÉÉÒ =tÉàÉÉå àÉå+ÉãÉMÉ-+ÉãÉMÉ ºÉÆãÉMxÉ +É{ÉxÉä =tÉàÉÉå àÉå BÉEÉàÉMÉÉ®Éå BÉEÉÒ ºÉÆJªÉÉ BÉEä +ÉxÉÖºÉÉ® MÉè®-BÉßEÉÊ-ÉBÉEÉàÉMÉÉ®Éå BÉEÉ |ÉÉÊiÉ 1000 ÉÊ É£ÉÉVÉxÉ
ºÉàɺiÉ £ÉÉ®iÉ
3.8.2 ÉÊ É´É®hÉÉÒ-9 MÉè® BÉßE-ÉÉÒªÉ º´ÉÉÉÊàÉi´É ÉÉãÉä =tÉàÉÉåàÉå ºÉÆãÉMxÉ BÉEÉàÉMÉÉ®Éå BÉEä ÉËãÉMÉ, º´ÉÉÉÊàɪÉÉå BÉEÉÉËãÉMÉ, +ÉÉè® =tÉàÉÉå BÉEä +ÉÉBÉEÉ® àÉå ºÉƤÉÆvÉfÚÆfxÉä BÉEÉ |ɪÉÉºÉ BÉE®iÉÉÒ cè * =tÉàÉÉå, ÉÊVɺÉàÉå U&ªÉÉ =ºÉºÉä +ÉÉÊvÉBÉE BÉEÉàÉMÉÉ® ãÉMÉä cé; BÉEÉä Þ¤É½É =tÉàÉÞ BÉEcÉ VÉÉiÉÉ cè BÉEÉä <ºÉ ÉÊ É¶ãÉä-ÉhÉBÉEä ÉÊãÉA ÉÊ ÉSÉÉÉÊ®iÉ ÉÊBÉEªÉÉ MɪÉÉ cè * VÉ¤É {ÉÖ°ô-ÉBÉEÉàÉMÉÉ® àÉÉÊcãÉÉ º´ÉÉÉÊàÉi´É ´ÉÉãÉä =tÉàÉÉå àÉåãÉMÉä cé, ºÉÉ{ÉäFÉ °ô{É ºÉä BÉEÉàÉMÉÉ®Éå BÉEÉ =SSÉiÉ®
|ÉÉÊiɶÉiÉ Þ¤É½ä =tÉàÉÉå Þ àÉå ÉÊxɪÉÉäÉÊVÉiÉ cé * OÉÉàÉÉÒhÉFÉäjÉÉå àÉå àÉÉÊcãÉÉ º´ÉÉÉÊàÉi´É ´ÉÉãÉä ޤɽä =tÉàÉÉå Þ àÉåºÉÆãÉMxÉ {ÉÖ°ô-É BÉEÉàÉMÉÉ®Éå BÉEÉ +ÉxÉÖ{ÉÉiÉ 29±lÉÉ +ÉÉè® iÉnxÉÖ°ô{É àÉÉÊcãÉÉ BÉEÉàÉMÉÉ®Éå BÉEÉ +ÉxÉÖ{ÉÉiÉVÉ¤É ´Éä {ÉÖ°ô-É º´ÉÉÉÊàÉi´É ´ÉÉãÉä =tÉàÉÉå àÉåºÉÆãÉMxÉ lÉÉÓ 21± lÉÉ * <ºÉBÉEä ÉÊ É{É®ÉÒiÉ, {ÉÖ°ô-ɺ´ÉÉÉÊàÉi´É ´ÉÉãÉä =tÉàÉÉå àÉå ºÉÆãÉMxÉ {ÉÖ°ô-ÉÉå BÉEÉ+ÉxÉÖ{ÉÉiÉ 14± lÉÉ +ÉÉè® àÉÉÊcãÉÉ º´ÉÉÉÊàÉi´É ´ÉÉãÉä=tÉàÉÉå àÉå ºÉÆãÉMxÉ àÉÉÊcãÉÉ+ÉÉäÆ BÉEÉ +ÉxÉÖ{ÉÉiÉ 3±
OÉÉàÉÉÒhÉ
6 ºÉä BÉEàÉ 787 595 826 676 796 613
6 - 9 73 71 62 64 71 69
10 - 19 41 51 36 41 40 49
20 +ÉÉè® =ºÉºÉä >ó{É® 44 91 41 64 43 86
+ÉYÉÉiÉ 41 83 24 65 37 79
ºÉ£ÉÉÒ (AxÉ +ÉÉ® ºÉÉÊciÉ) 1000 1000 1000 1000 1000 1000
¶Éc®ÉÒ
6 ºÉä BÉEàÉ 749 533 785 576 756 541
6 - 9 88 76 65 70 84 75
10 - 19 54 61 42 61 52 61
20 +ÉÉè® =ºÉºÉä >ó{É® 51 174 55 137 52 167
+ÉYÉÉiÉ 45 105 36 88 43 102
ºÉ£ÉÉÒ (AxÉ +ÉÉ® ºÉÉÊciÉ) 1000 1000 1000 1000 1000 1000
MÉè®-BÉßEÉÊ-É =tÉàÉÉå àÉå MÉè®-BÉßEÉÊ-É BÉEÉàÉMÉÉ® ({ÉÉÒAºÉ+AºÉAºÉ)
BÉEÉàÉMÉÉ®Éå BÉEÉÒ ºÉÆJªÉÉ {ÉÖ°ô-É àÉÉÊcãÉÉ BªÉÉÎBÉDiÉ
{ÉÉÒ AÆb {ÉÉÒ ºÉ£ÉÉÒ {ÉÉÒ AÆb {ÉÉÒ ºÉ£ÉÉÒ {ÉÉÒ AÆb {ÉÉÒ ºÉ£ÉÉÒ
(1) (2) (3) (4) (5) (6) (7)
ÉÊc. - 10 ºÉ´ÉæFÉhÉ

lÉÉ * ¶Éc®ÉÒ FÉäjÉÉå àÉå, àÉÉÊcãÉÉ º´ÉÉÉÊàÉi´É ´ÉÉãÉä=tÉàÉÉå BÉEä ÉÊãÉA BÉEä ÉãÉ 3±, 6 ªÉÉ <ºÉºÉä +ÉÉÊvÉBÉEBÉEÉàÉMÉÉ®Éå ºÉÉÊciÉ àÉÉÊcãÉÉ BÉEÉàÉMÉÉ®Éå ÉÉãÉä =tÉàÉÉå
àÉå ºÉÆãÉMxÉ lÉÉ, VɤÉÉÊBÉE ªÉc +ÉxÉÖ{ÉÉiÉ ãÉMÉ£ÉMÉ23± lÉÉ VÉ¤É àÉÉÊcãÉÉAÆ {ÉÖ°ô-É º´ÉÉÉÊàÉi´É ´ÉÉãÉä=tÉàÉÉå àÉå ºÉÆãÉMxÉ lÉÉÓ *
ÉÊ´É´É®hÉ-9: |ÉiªÉäBÉE ÉËãÉMÉ +ÉÉè® =tÉàÉ |ÉBÉEÉ® BÉEä ÉÊãÉA |ÉÉÊiÉ 1000 BÉEÉàÉMÉÉ®Éå {É® 6 ªÉÉ =ºÉºÉä+ÉÉÊvÉBÉE BÉEÉàÉMÉÉ®Éå ´ÉÉãÉä MÉè®-BÉßE-ÉÉÒªÉ =tÉàÉÉå àÉå ÉÊxɪÉÉäÉÊVÉiÉ BÉEÉàÉMÉÉ®Éå BÉEÉÒ ºÉÆJªÉÉ
ºÉàɺiÉ £ÉÉ®iÉ=tÉàÉ |ÉBÉEÉ® BÉEÉàÉMÉÉ®
OÉÉàÉÉÒhÉ ¶Éc®ÉÒ
{ÉÖ°ô-É àÉÉÊcãÉÉ {ÉÖ°ô-É àÉÉÊcãÉÉ
(1) (2) (3) (4) (5)
{ÉÖ°ô-É º´ÉÉÉÊàÉi´É 144 210 172 227
àÉÉÊcãÉÉ º´ÉÉÉÊàÉi´É 288 29 192 35
3.9 =tÉàÉ ºÉ´ÉæFÉhÉ +ÉÉè® {ÉÉÊ®´ÉÉ® ºÉ´ÉæFÉhÉ={ÉÉMÉàÉ BÉEä àÉÉvªÉàÉ ºÉä |ÉÉ{iÉ +ÉxÉÉè{É-SÉÉÉÊ®BÉE FÉäjÉ àÉå BÉEÉàÉMÉÉ®Éå BÉEÉÒ ºÉÆJªÉÉBÉEÉÒ iÉÖãÉxÉÉ
3.9.1 55´Éå nÉè® BÉEä =tÉàÉ ºÉ´ÉæFÉhÉ xÉä JÉxÉxÉ+ÉÉè® JÉnÉxÉ, ÉÊ ÉtÉÖiÉ, MÉèºÉ +ÉÉè® VÉãÉ +ÉÉ{ÉÚÉÌiÉ àÉåºÉÆãÉMxÉ =tÉàÉÉå BÉEÉä UÉä½BÉE® +ÉlÉÇBªÉ´ÉºlÉÉ BÉEä MÉè®-BÉßEÉÊ-É FÉäjÉ àÉå ºÉ£ÉÉÒ +ÉxÉÉè{ÉSÉÉÉÊ®BÉE =tÉàÉÉå BÉEÉäBÉE´É® ÉÊBÉEªÉÉ cè * ºÉ£ÉÉÒ +ÉÉÊxÉMÉÉÊàÉiÉ =tÉàÉÉå VÉÉä ªÉÉ
iÉÉä º´ÉÉÉÊàÉi´É ªÉÉ £ÉÉMÉÉÒnÉ®ÉÒ +ÉÉvÉÉ® {É® SÉãÉiÉä céBÉEÉä +ÉxÉÉè{ÉSÉÉÉÊ®BÉE FÉäjÉ BÉEä MÉ~xÉ cäiÉÖ àÉÉxÉÉ MɪÉÉlÉÉ * ºÉàɺiÉ £ÉÉ®iÉ àÉå BÉÖEãÉ 197637 MÉè®-BÉßEÉÊ-É=tÉàÉÉå BÉEÉ ºÉ´ÉæFÉhÉ ÉÊBÉEªÉÉ MɪÉÉ lÉÉ * ºÉàɺiÉ£ÉÉ®iÉ ºiÉ® {É® MÉè®-BÉßEÉÊ-É =tÉàÉÉå BÉEÉÒ ºÉJªÉÉ444.1 ãÉÉJÉ +ÉxÉÖàÉÉÉÊxÉiÉ lÉÉÒ * ÉÊVÉxÉàÉå ºÉä250.7 ãÉÉJÉ (+ÉlÉÉÇiÉ 56±) =tÉàÉ OÉÉàÉÉÒhÉ FÉäjÉÉåàÉå +ÉÉè® 193.4 ãÉÉJÉ ¶Éc®ÉÒ FÉäjÉÉå àÉå ÉκlÉiÉ lÉä *<xÉ =tÉàÉÉå àÉå, 388 ãÉÉJÉ +ÉÉä A <Ç (87±) +ÉÉè®56.1 ãÉÉJÉ |ÉÉÊiÉ-~ÉxÉ (13±) lÉä *
ÉÊ´É´É®hÉ-10:+ÉxÉÖºÉÚSÉÉÒ 10 +ÉÉè® +ÉxÉÖºÉÚSÉÉÒ 2.0 ºÉä |ÉÉ{iÉ +ÉxÉÉè{ÉSÉÉÉÊ®BÉE FÉäjÉ àÉå BÉEÉàÉMÉÉ®Éå BÉEÉÒ+ÉxÉÖàÉÉÉÊxÉiÉ ºÉÆJªÉÉ
ºÉàɺiÉ £ÉÉ®iÉ
FÉäjÉ BÉEÉàÉMÉÉ®Éå BÉEÉÒ +ÉxÉÖàÉÉÉÊxÉiÉ ºÉÆJªÉÉ (000)
+ÉxÉÖºÉÚSÉÉÒ 2.0 +ÉxÉÖºÉÚSÉÉÒ 10
{ÉÉÒAºÉ {ÉÉÒAºÉ+AºÉAºÉ
(1) (2) (3) (4)OÉÉàÉÉÒhÉ 39808 44121 46688¶Éc®ÉÒ 39975 45521 47168ºÉƪÉÖBÉDiÉ 79783 89643 93856
ÉÊc. - 11ºÉ´ÉæFÉhÉ

3.9.2BÉEÉàÉMÉÉ®Éå BÉEÉÒ +ÉxÉÖàÉÉÉÊxÉiÉ ºÉÆJªÉÉ : ÉÊ É´É®hÉ10 +ÉxÉÖºÉÚSÉÉÒ 10 +ÉÉè® +ÉxÉÖºÉÚSÉÉÒ 2.0 ºÉä |ÉÉ{iÉÉxÉÖºÉÉ®OÉÉàÉÉÒhÉ +ÉÉè® ¶Éc®ÉÒ FÉäjÉÉå BÉEä ÉÊãÉA +ÉãÉMÉ +ÉãÉMÉBÉEÉàÉMÉÉ®Éå BÉEÉÒ +ÉxÉÖàÉÉÉÊxÉiÉ ºÉÆJªÉÉ n¶ÉÉÇiÉÉÒ cè *ºÉàɺiÉ £ÉÉ®iÉ ºiÉ® {É®, +ÉxÉÖºÉÚSÉÉÒ 2.0 ºÉä |ÉÉ{iÉ+ÉxÉÉè{ÉSÉÉÉÊ®BÉE FÉäjÉ àÉå BÉEÉàÉMÉÉ®Éå BÉEÉÒ ºÉÆJªÉÉ 797.8
ãÉÉJÉ lÉÉÒ * <xÉàÉå, 398.1 ãÉÉJÉ (+ÉlÉÉÇiÉ 50±) BÉEÉàÉMÉÉ® =tÉàÉ OÉÉàÉÉÒhÉ FÉäjÉ àÉå ÉκlÉiÉ lÉä +ÉÉè®399.7 ãÉÉJÉ BÉEÉàÉMÉÉ® ¶Éc®ÉÒ FÉäjÉÉå àÉå ÉκlÉiÉ=tÉàÉÉå àÉå lÉä * <ºÉBÉEä ÉÊ É{É®ÉÒiÉ, +ÉxÉÖºÉÚSÉÉÒ 10 ºÉä|ÉÉ{iÉ +ÉxÉÉè{ÉSÉÉÉÊ®BÉE FÉäjÉ BÉEÉàÉMÉÉ®Éå BÉEÉÒ ºÉÆJªÉÉ938.56 ãÉÉJÉ lÉÉÒ *
bÉÒ 17692 15667 17379 11969 12362 13086 29661 28029 30465
A{ÉE 1522 6275 6352 1148 4601 4635 2669 10876 10987
VÉÉÒ 11995 11142 11489 16408 16323 16755 28403 27466 28244
ASÉ 1661 1440 1485 2630 2032 2081 4291 3472 3566
+ÉÉ<Ç 2527 4194 4241 2700 4396 4436 5226 8591 8677
VÉä 66 111 112 266 301 309 333 412 421
BÉEä 313 370 377 1215 1345 1391 1528 1715 1767
AàÉ 587 685 786 1152 1102 1291 1739 1787 2077
AxÉ 536 396 408 667 604 620 1203 1000 1029
+ÉÉä 2909 3841 4059 1820 2455 2564 4729 6295 6623
ºÉàɺiÉ 39808 44121 46688 39975 45521 47168 79783 89643 93856MÉÉÊiÉÉÊ´ÉÉÊvɪÉÉÆ
ÉÊ´É´É®hÉ-11:=tÉàÉ ºÉ´ÉæFÉhÉ +ÉÉè® {ÉÉÊ®´ÉÉ® ºÉ´ÉæFÉhÉ ºÉä |ÉÉ{iÉÉxÉÖºÉÉ® +ÉxÉÉè{ÉSÉÉÉÊ®BÉE FÉäjÉ àÉå ãÉMÉäBÉEÉàÉMÉÉ®Éå BÉEÉÒ +ÉxÉÖàÉÉÉÊxÉiÉ ºÉÆJªÉÉ
ºÉàɺiÉ £ÉÉ®iÉMÉhÉxÉÉ gÉähÉÉÒ BÉEÉàÉMÉÉ®Éå BÉEÉÒ +ÉxÉÖàÉÉÉÊxÉiÉ ºÉÆJªÉÉ (000)
OÉÉàÉÉÒhÉ ¶Éc®ÉÒ ºÉƪÉÖBÉDiÉ
+ÉxÉÖ.2.0 +ÉxÉÖºÉÚSÉÉÒ 10 +ÉxÉÖ.2.0 +ÉxÉÖºÉÚSÉÉÒ 10 +ÉxÉÖ.2.0 +ÉxÉÖºÉÚSÉÉÒ 10
{ÉÉÒAºÉ {ÉÉÒAºÉ+ {ÉÉÒAºÉ {ÉÉÒAºÉ+ {ÉÉÒAºÉ {ÉÉÒAºÉ+AºÉAºÉ AºÉAºÉ AºÉAºÉ
(1) (2) (3) (4) (5) (6) (7) (8) (9) (10)
3.9.3 +ÉxÉÉè{ÉSÉÉÉÊ®BÉE MÉè®-BÉßEÉÊ-É =tÉàÉ ºÉ´ÉæFÉhÉ àÉåBÉE´É® BÉEÉÒ MɪÉÉÒ MÉhÉxÉÉ gÉähÉÉÒ BÉEä iÉnxÉÖ°ô{É =tÉàɺɴÉæFÉhÉ (+ÉxÉÖºÉÚSÉÉÒ 2.0) +ÉÉè® {ÉÉÊ®´ÉÉ® ºÉ´ÉæFÉhÉ(+ÉxÉÖºÉÚSÉÉÒ 10) ºÉä |ÉÉ{iÉ +ÉxÉÉè{ÉSÉÉÉÊ®BÉE FÉäjÉ àÉåBÉEÉàÉMÉÉ®Éå BÉEÉÒ +ÉxÉÖàÉÉÉÊxÉiÉ ºÉÆJªÉÉ ÉÊ É´É®hÉÉÒ 11 àÉå
nÉÒ MɪÉÉÒ cè * ÉÊ É´É®hÉÉÒ-11 ºÉä ªÉc nÉ̶ÉiÉ cÉäiÉÉcè ÉÊBÉE +ÉxÉÖºÉÚSÉÉÒ 10 ºÉä BÉEÉàÉMÉÉ®Éå BÉEÉÒ +ÉxÉÖàÉÉÉÊxÉiɺÉÆJªÉÉ OÉÉàÉÉÒhÉ +ÉÉè® ¶Éc®ÉÒ FÉäjÉ nÉäxÉÉå àÉå +ÉxÉÖºÉÚSÉÉÒ2.0 ºÉä +ÉxÉÖàÉÉÉÊxÉiÉ ºÉÆJªÉÉ ºÉä +ÉÉÊvÉBÉE cè * +ÉxÉÖºÉÚSÉÉÒ10 ºÉä BÉEÉàÉMÉÉ®Éå ({ÉÉÒAºÉ) BÉEÉÒ BÉÖEãÉ ºÉÆJªÉÉ +ÉxÉÖºÉÚSÉÉÒ
ÉÊc. - 12 ºÉ´ÉæFÉhÉ

2.0 BÉEä BÉEÉàÉMÉÉ®Éå BÉEÉÒ ºÉÆJªÉÉ ºÉä ãÉMÉ£ÉMÉ 12±+ÉÉÊvÉBÉE cÉäxÉÉ {ÉɪÉÉÒ MɪÉÉÒ cè * ÉÊ£ÉxxÉiÉÉ BÉEÉ ÉÊ ÉºiÉÉ®OÉÉàÉÉÒhÉ +ÉÉè® ¶Éc®ÉÒ nÉäxÉÉå FÉäjÉÉå àÉå ãÉMÉ£ÉMÉ ºÉàÉÉxÉcè * ªÉc näJÉÉ VÉÉ ºÉBÉEiÉÉ cè ÉÊBÉE MÉhÉxÉÉ gÉähÉÉÒbÉÒ (ÉÊ ÉÉÊxÉàÉÉÇhÉ), VÉÉÒ(BªÉÉ{ÉÉ®), ASÉ(cÉä]ãÉ +ÉÉè®®äºiÉ®ÉÆ), +ÉÉè® AxÉ (º´ÉɺlªÉ +ÉÉè® ºÉÉàÉÉÉÊVÉBÉE BÉEɪÉÇ)cäiÉÖ +ÉxÉÖºÉÚSÉÉÒ 2.0 àÉå BÉEÉàÉMÉÉ®Éå BÉEÉÒ +ÉxÉÖàÉÉÉÊxÉiɺÉÆJªÉÉ +ÉxÉÖºÉÚSÉÉÒ 10 ºÉä |ÉÉ{iÉ ºÉƤÉÆÉÊvÉiÉ +ÉxÉÖàÉÉxÉÉåBÉEÉÒ iÉÖãÉxÉÉ àÉå +ÉÉÊvÉBÉE cè * BÉEÉàÉMÉÉ®Éå BÉEÉÒ +ÉxÉÖàÉÉÉÊxÉiɺÉÆJªÉÉ MÉhÉxÉÉ gÉähÉÉÒ AàÉ(ÉʶÉFÉÉ)BÉEä àÉÉàÉãÉä àÉå ºÉàÉÉÒ{Écè * ¶Éä-É MÉhÉxÉÉ gÉäÉÊhɪÉÉå BÉEä àÉÉàÉãÉä àÉå, +ÉxÉÖºÉÚSÉÉÒ10 BÉEä +ÉxÉÖàÉÉxÉ +ÉxÉÖºÉÚSÉÉÒ 2.0 BÉEä +ÉxÉÖàÉÉxÉÉå ºÉä=SSÉiÉ® cè * <ºÉBÉEä +ÉãÉÉ´ÉÉ, MÉhÉxÉÉ gÉähÉÉÒA{ÉE(ÉÊxÉàÉÉÇhÉ) +ÉÉè® +ÉÉ<Ç({ÉÉÊ®´ÉcxÉ, £ÉhbÉ®hÉ +ÉÉè®
ºÉÆSÉÉ®) BÉEä àÉÉàÉãÉä àÉå +ÉxÉÖàÉÉxÉÉå BÉEä nÉä ºÉä]Éå àÉåÉÊ£ÉxxÉiÉÉ ´ÉßckÉ cè * ÉÊxÉàÉÉÇhÉ +ÉÉè® {ÉÉÊ®´ÉcxÉ ºÉäºÉƤÉÆÉÊvÉiÉ =tÉàÉ BÉEÉä ºÉƣɴÉiÉ =tÉàÉ ºÉ´ÉæFÉhÉ ={ÉÉMÉàÉBÉEä àÉÉvªÉàÉ ºÉä {ÉBÉE½xÉÉ àÉÖÉζBÉEãÉ cè * =nÉc®hÉÉlÉÇ,ABÉE ®ÉVÉÉÊàɺjÉÉÒ VÉÉä ÉÊ ÉÉÊ£ÉxxÉ ºlÉÉxÉÉå(º´É-ÉÊxɪÉÉäÉÊVÉiÉ){É® BÉEɪÉÇ BÉE®iÉÉ cè BÉEÉä =tÉàÉ ºÉ´ÉæFÉhÉ àÉå ABÉE=tÉàÉ BÉEä °ô{É àÉå àÉÉxÉÉ MɪÉÉ cè * ãÉäÉÊBÉExÉ=ºÉBÉEä ºÉÉlÉ ãÉMÉä gÉÉÊàÉBÉEÉå BÉEÉä =tÉàÉ ºÉ´ÉæFÉhÉ={ÉÉMÉàÉ àÉå BÉEÉàÉMÉÉ®Éå BÉEä °ô{É àÉå xÉcÉÓ ®JÉÉ VÉÉAMÉɪÉÉÊn =xcå ®ÉVÉ-ÉÊàɺjÉÉÒ uÉ®É ÉÊBÉE®ÉªÉä {É® xÉ ®JÉÉMɪÉÉ cÉä * =ºÉÉÒ |ÉBÉEÉ®, {ÉããÉänÉ®/£ÉÉÉÊ®BÉE BÉEÉä=tÉàÉ ºÉ´ÉæFÉhÉ ={ÉÉMÉàÉ àÉå xÉcÉÓ ®JÉÉ VÉÉ ºÉBÉEiÉɪÉÉÊn =xcå {ÉÉÊ®´ÉcxÉ =tÉàÉÉå uÉ®É ÉÊxɪÉÉÊàÉiÉ +ÉÉvÉÉ®{É® ÉÊBÉE®ÉªÉä {É® xÉ ÉÊãɪÉÉ MɪÉÉ cÉä *
ÉÊc. - 13ºÉ´ÉæFÉhÉ


(A) 85TH ISSUEPart-I : Technical Papers
1. Adjusted Indian Poverty Estimates for 1999-2000Angus Deaton
2. Developing Country Nutrition Does Improve with Income : A Look ofCalorie and Protein Intakes, 1983 to 1993-94Brinda Vishwanathan and J.C. Meenakshi
3. Computing Prices and Poverty Rates in India, 1999-2000Angus Deaton
4. On some Aspects of Living Standards in India-Evidence from NSS andOther InquiriesProf. N. Bhattacharya
Part-II : Methodological Study5. Results of a Pilot Survey on Suitability of Different Reference Periods for
Measuring Household ConsumptionNSSO Expert Group on Non-Sampling Errors (January-June 2000)
(B) 86TH ISSUE
Part-I : Technical Papers1. Magnitude of the Women Work Force in India : An Appraisal of the NSS
Estimates and MethodsPaul Jacob
Part-II : Summary and Major Findings of Surveys2. An Integrated Summary of NSS Fifty-Fifth Round (July 1999-June 2000)
Consumer Expenditure Survey ResultsRattan Chand and G.C. Manna
(C) 87TH ISSUEPart-I : Summary and Major Findings of Surveys
An Integrated Summary of Employment and Unemployment Survey Results,NSS Fifty-Fifth Round (July 1999-June 2000)Rattan Chand and G.C. Manna
BROAD CONTENTS OF THE LAST THREE ISSUES OF'SARVEKSHANA'

• Authors are requested to send three typewritten copies oftheir papers / articles to the Deputy Director General,Coordination and Publication Division, National SampleSurvey Organisation, Sardar Patel Bhavan, New Delhi-110 001.
• Typescript should be double-spaced. Margins should be1½" wide on the left and 1" on the right. It is better that asoft copy of the paper/article in MS Word/Excel is alsoforwarded. The paper/articles can directly be e-mailed [email protected] also
• Mathematical formulae, symbols etc. should be neatlywritten, if typing is not possible. The graphs, charts anddiagrams, if any, should be complete with all details andbe such that direct reproduction can be obtained.
• Reference to other papers, books etc. should be given infull e.g. name of author, title of publication, name ofjournal, date of publication etc.
• A summary of the paper not exceeding 150 words shouldalso be sent.
• Subscription to Sarvekshna should be sent to the Controllerof Publications, Department of Publication, Civil Lines,Delhi-110 054
PDOS 57 XXV No. 4 & XXVI No. 1450
The objective of this journal is to present analytical articlesbased on the results published by NSSO. Sarvekshana welcomescontributions based on the NSS data and those relating to itsmethodology.
SUGGESTION FOR IMPROVEMENTARE WELCOME