COMMITTEE REF:
293
COMMITTEE REF: EX/06/17 NOTICE OF MEETING BODY : EXECUTIVE DATE : TUESDAY 27 TH JUNE 2017 TIME : 6.00 P.M. PLACE : COMMITTEE ROOM 3, TOWN HALL, LUTON COUNCILLORS: SIMMONS (CHAIR) HUSSAIN CASTLEMAN A. KHAN N. AYUB MALCOLM BURNETT SHAW HOPKINS TIMONEY QUORUM : 3 MEMBERS INFORMATION FOR THE PUBLIC PURPOSE: The Executive is the Council’s primary decision-making body dealing with a range of functions across the Council’s activities and services. This meeting is open to the public and you are welcome to attend. For further information, or to see the papers, please contact us at the Town Hall: IN PERSON, 9 am to 5 pm, Monday to Friday, or CALL Democratic and Member Services on 01582 546070 An induction loop facility is available for meetings held in Committee Room 3. Arrangements can be made for access to meetings for disabled people. If you would like us to arrange this for you, please call us on 01582 546070. Page 1 of 293
-
Upload
khangminh22 -
Category
Documents
-
view
1 -
download
0
Transcript of COMMITTEE REF:
COMMITTEE REF: EX/06/17
NOTICE OF MEETING BODY : EXECUTIVE DATE : TUESDAY 27TH JUNE 2017 TIME : 6.00 P.M. PLACE : COMMITTEE ROOM 3, TOWN HALL, LUTON COUNCILLORS: SIMMONS (CHAIR) HUSSAIN CASTLEMAN A. KHAN N. AYUB MALCOLM BURNETT SHAW HOPKINS TIMONEY QUORUM : 3 MEMBERS INFORMATION FOR THE PUBLIC PURPOSE: The Executive is the Council’s primary decision-making body dealing
with a range of functions across the Council’s activities and services. This meeting is open to the public and you are welcome to attend.
For further information, or to see the papers, please contact us at the Town Hall: IN PERSON, 9 am to 5 pm, Monday to Friday, or CALL Democratic and Member Services on 01582 546070
An induction loop facility is available for meetings held in Committee Room 3. Arrangements can be made for access to meetings for disabled people. If you would like us to arrange this for you, please call us on 01582 546070.
Page 1 of 293
AGENDA Agenda Subject Page Item No.
EMERGENCY EVACUATION PROCEDURE – COMMITTEE ROOM 3
Proceed straight ahead through two sets of double doors, follow the green emergency exit signs to the main town hall entrance and proceed to the assembly point at St. Georges Square.
1. APOLOGIES FOR ABSENCE 2. PUBLISHED RECORD OF THE MEETING
1. 24th April 2017
SECTION 106, LOCAL GOVERNMENT FINANCE ACT 1992 Those item(s) on the Agenda affected by Section 106 of the Local Government Finance Act 1992 will be identified at the
meeting. Any Members so affected is reminded that (s)he should disclose the fact and refrain from voting on those item(s).
DISCLOSURES OF INTERESTS
Members are reminded that they must disclose both the existence and nature of any disclosable pecuniary interest and any personal interest that they have in any matter to be considered at the meeting unless the interest is a sensitive interest in which event they need not disclose the nature of the interest. A member with a disclosable pecuniary interest must not further participate in any discussion of, vote on, or take any executive steps in relation to the item of business. A member with a personal interest, which a member of the public with knowledge of the relevant facts would reasonably regard as so significant that it is likely to prejudice the member’s judgment of the public interest, must similarly not participate in any discussion of, vote on, or take any executive steps in relation to the item of business. Disclosable pecuniary interests and Personal Interests are defined in the Council’s Code of Conduct for Members and Co-opted members.
Page 2 of 293
3. BUSINESS NOT COVERED BY CURRENT FORWARD PLAN: GENERAL EXCEPTION
The Executive Leader to report on any business which it is
proposed should be considered by the Executive following compliance with Regulation 15 of the Local Authorities (Executive Arrangements) (Access to Information) (England) Regulations 2000.
CUSTOMER AND COMMERCIAL (FINANCE)
1. Corporate Performance Report Q4 2016-17 6 - 83 (Report of the Service Director, Transformation & Technology)
2. Capital Funding for Improvement of the Vauxhall Way/Kimpton Road Junction 84 - 86 (Report of the Service Director, Planning & Economic Growth)
PLANNING & INFRASTRUCTURE (REGENERATION)
3. Popular Homes - (Private Report – Agenda Item 21) (Joint Report of the Service Director, Fixed Assets and Service Director, Housing)
4. Acquisition of Leasehold Interest in Accommodation for the Homeless - (Private Report – Agenda Item 22) (Joint Report of the Service Director, Fixed Assets and Service Director, Housing)
4. BUSINESS NOT COVERED BY CURRENT FORWARD PLAN: SPECIAL URGENCY The Executive Leader to report on any business which it is
proposed should be considered following compliance with Regulation 16 of the Local Authorities (Executive Arrangements) (Access to Information) (England) Regulations 2000.
5. REFERENCES FROM COMMITTEES AND OTHER
BODIES
6. RECOMMENDATIONS FROM SCRUTINY REVIEWS 7. PETITIONS BUSINESS ITEMS LEADER 8. NEXT STEP FOR HEALTH AND SOCIAL CARE IN LUTON 87 - 101 (Report of the Director of Public Health & Procurement)
Page 3 of 293
CUSTOMER AND COMMERCIAL (FINANCE) 9. DIGITAL STRATEGY 102 - 146
(Report of the Service Director Transformation & Technology) 10. PROVISIONAL REVENUE & CAPITAL OUTTURN 2016-17 147 - 203 (Report of the Service Director, Finance & Audit) PEOPLE (CHILDREN’S SERVICES) 11. DIRECT PAYMENTS (CHIDLRENS) 204 - 208 (Report of the Service Director, Prevention & Early Intervention) 12. YOUTH OFFENDING SERVICE – SHARED LUTON & BEDFORDSHIRE BOARD 209 - 230 (Report of the Service Director, Prevention & Early Intervention) 13. FAMILY SAFEGUARDING MODEL – UPDATE 231 - 243 (Report of the Service Director, Children and Families) 14. ACADEMIC CALENDAR FOR COMMUNITY SCHOOLS 244 - 250 (Report of the Service Director, Support Challenge & Intervention) PLANNING AND INFRASTRUCTURE (REGENERATION) 15. LIF BUSINESS CASES FOR FUNDING 251 - 293 (Report of the Acting Service Director, Policy
Communities and Engagement) 16. LOCAL GOVERNMENT ACT 1972, PART VA To consider whether to pass a resolution under
Regulation 21(1)(b) of the Local Authorities (Executive Arrangements) (Access to Information) (England) Regulations 2000 to exclude the public from the meeting during consideration of the item(s) listed below as it is likely, that if members of the public were present during the transaction of the item(s), exempt information within the meaning of the Paragraph(s) of Part 1 of Schedule 12A to the Local Government Act 1972 indicated next to the item, would be disclosed to them.
CUSTOMER AND COMMERCIAL (FINANCE) 17. CHALLNEY PFI RE-FINANCING 294 - 297 (Report of the Director of Customer & Commercial) 18. FINANCING MAJOR CAPITAL PROGRAMME PROJECTS 298 - 303 (Report of the Service Director, Finance and Audit) CUSTOMER AND COMMERCIAL (HOUSING & ENVIRONMENT) 19. LGO Report 304 - 322 (Report of the LGO)
Page 4 of 293
PLANNING AND INFRASTRUCTURE (REGENERATION) 20. LAND AT POWER COURT 323 - 337 (Report of the Service Director, Fixed Assets) 21. Poplar Homes 338 - 343 (Report of the Service Director, Fixed Assets & Service Director, Housing) 22. Acquisition of a Leasehold Interest in Accommodation 344 - 346 for the Homeless (Report of the Service Director, Fixed Assets & Service Director, Housing) Contact Officer: Angela Fraser Telephone No: 01582 546070
Page 5 of 293
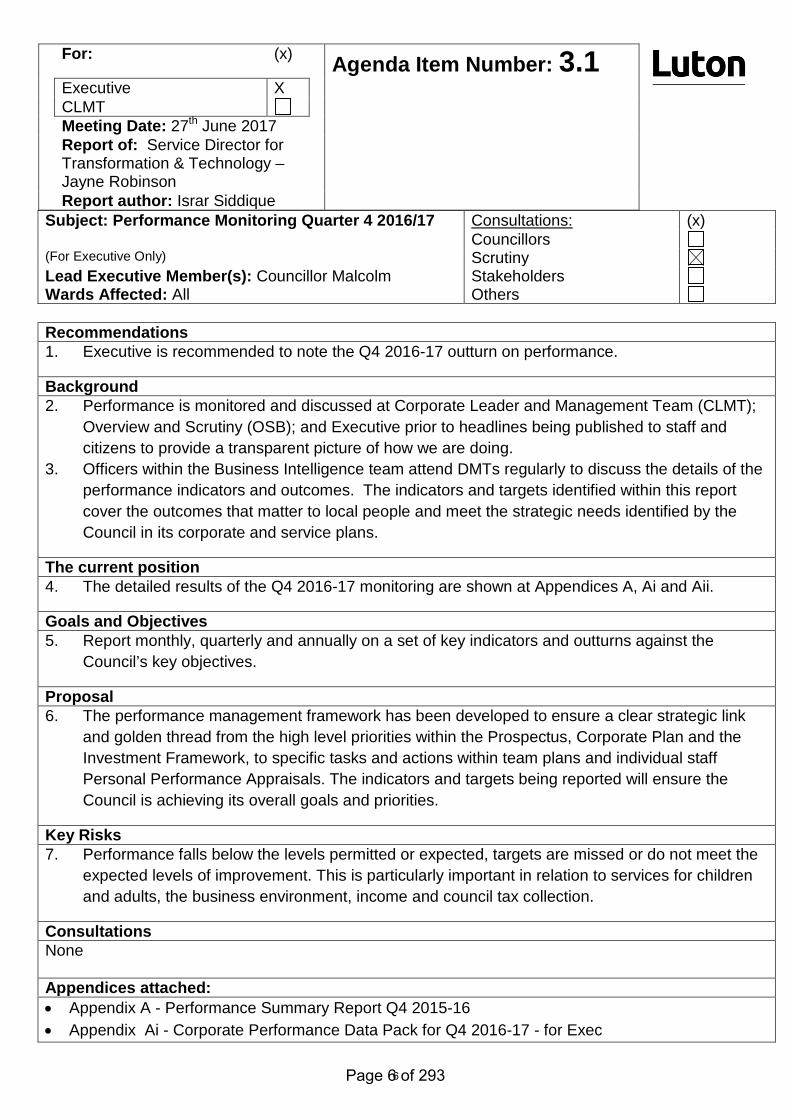
Subject: Performance Monitoring Quarter 4 2016/17
Consultations: (x) Councillors
(For Executive Only) Scrutiny Lead Executive Member(s): Councillor Malcolm Stakeholders Wards Affected: All Others Recommendations 1. Executive is recommended to note the Q4 2016-17 outturn on performance.
Background 2. Performance is monitored and discussed at Corporate Leader and Management Team (CLMT);
Overview and Scrutiny (OSB); and Executive prior to headlines being published to staff and citizens to provide a transparent picture of how we are doing.
3. Officers within the Business Intelligence team attend DMTs regularly to discuss the details of the performance indicators and outcomes. The indicators and targets identified within this report cover the outcomes that matter to local people and meet the strategic needs identified by the Council in its corporate and service plans.
The current position 4. The detailed results of the Q4 2016-17 monitoring are shown at Appendices A, Ai and Aii.
Goals and Objectives 5. Report monthly, quarterly and annually on a set of key indicators and outturns against the
Council’s key objectives.
Proposal 6. The performance management framework has been developed to ensure a clear strategic link
and golden thread from the high level priorities within the Prospectus, Corporate Plan and the Investment Framework, to specific tasks and actions within team plans and individual staff Personal Performance Appraisals. The indicators and targets being reported will ensure the Council is achieving its overall goals and priorities.
Key Risks 7. Performance falls below the levels permitted or expected, targets are missed or do not meet the
expected levels of improvement. This is particularly important in relation to services for children and adults, the business environment, income and council tax collection.
Consultations None Appendices attached: • Appendix A - Performance Summary Report Q4 2015-16 • Appendix Ai - Corporate Performance Data Pack for Q4 2016-17 - for Exec
For: (x) Agenda Item Number: 3.1 Executive X CLMT Meeting Date: 27th June 2017 Report of: Service Director for Transformation & Technology – Jayne Robinson
Report author: Israr Siddique
6Page 6 of 293
• Appendix Aii - Corporate Performance Annual Data Pack for 2016-17 - for Exec
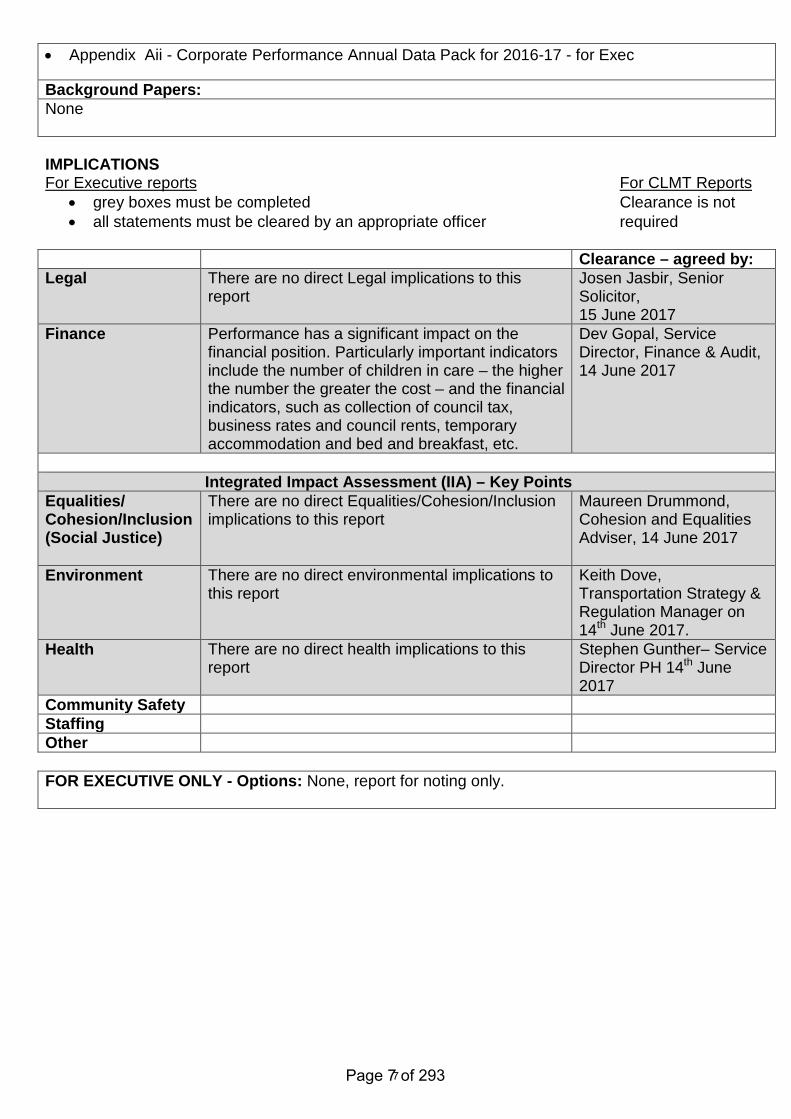
Background Papers: None IMPLICATIONS For Executive reports For CLMT Reports
• grey boxes must be completed Clearance is not • all statements must be cleared by an appropriate officer required
Clearance – agreed by: Legal There are no direct Legal implications to this
report Josen Jasbir, Senior Solicitor, 15 June 2017
Finance Performance has a significant impact on the financial position. Particularly important indicators include the number of children in care – the higher the number the greater the cost – and the financial indicators, such as collection of council tax, business rates and council rents, temporary accommodation and bed and breakfast, etc.
Dev Gopal, Service Director, Finance & Audit, 14 June 2017
Integrated Impact Assessment (IIA) – Key Points Equalities/ Cohesion/Inclusion (Social Justice)
There are no direct Equalities/Cohesion/Inclusion implications to this report
Maureen Drummond, Cohesion and Equalities Adviser, 14 June 2017
Environment
There are no direct environmental implications to this report
Keith Dove, Transportation Strategy & Regulation Manager on 14th June 2017.
Health
There are no direct health implications to this report
Stephen Gunther– Service Director PH 14th June 2017
Community Safety Staffing Other FOR EXECUTIVE ONLY - Options: None, report for noting only.
7Page 7 of 293
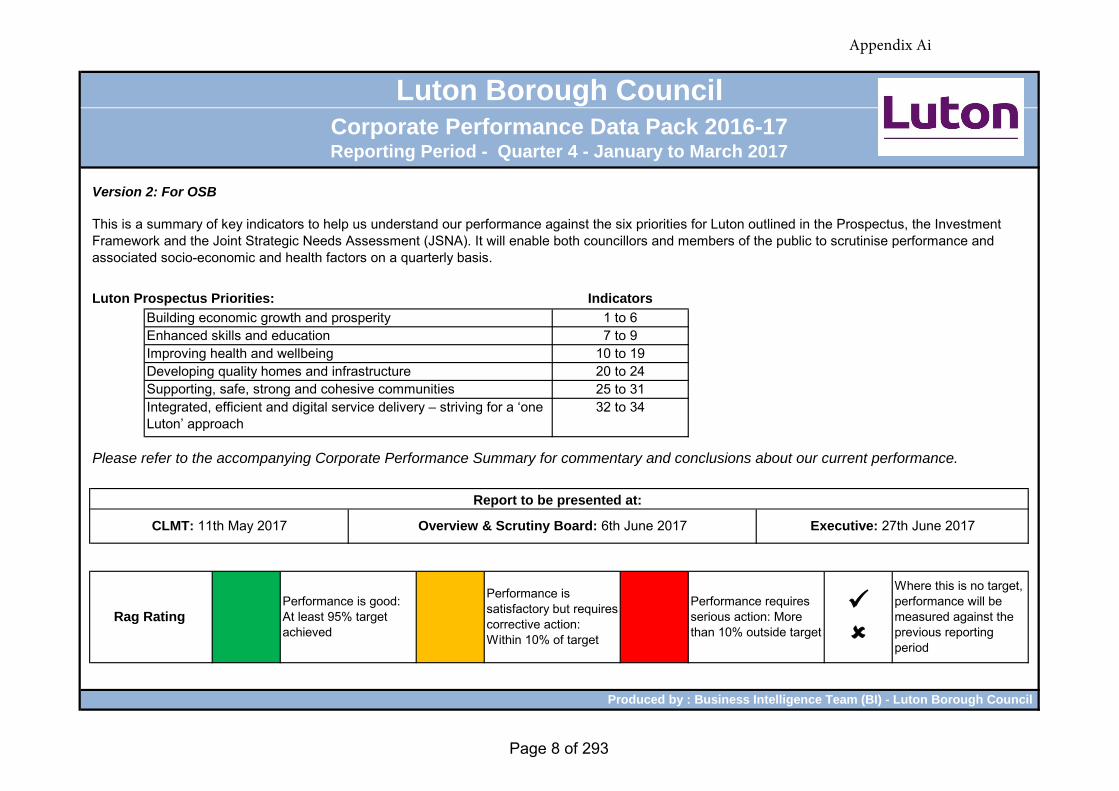
Version 2: For OSB
Luton Prospectus Priorities:
Produced by : Business Intelligence Team (BI) - Luton Borough Council
CLMT: 11th May 2017 Overview & Scrutiny Board: 6th June 2017 Executive: 27th June 2017
Rag Rating Performance is good: At least 95% target achieved
Performance is satisfactory but requires corrective action: Within 10% of target
Performance requires serious action: More than 10% outside target
Where this is no target, performance will be measured against the previous reporting period
Report to be presented at:
Enhanced skills and education 7 to 9Improving health and wellbeing 10 to 19Developing quality homes and infrastructure 20 to 24Supporting, safe, strong and cohesive communities 25 to 31Integrated, efficient and digital service delivery – striving for a ‘one Luton’ approach
32 to 34
Please refer to the accompanying Corporate Performance Summary for commentary and conclusions about our current performance.
Luton Borough CouncilCorporate Performance Data Pack 2016-17Reporting Period - Quarter 4 - January to March 2017
This is a summary of key indicators to help us understand our performance against the six priorities for Luton outlined in the Prospectus, the Investment Framework and the Joint Strategic Needs Assessment (JSNA). It will enable both councillors and members of the public to scrutinise performance and associated socio-economic and health factors on a quarterly basis.
Indicators
Building economic growth and prosperity 1 to 6
Appendix Ai
Page 8 of 293
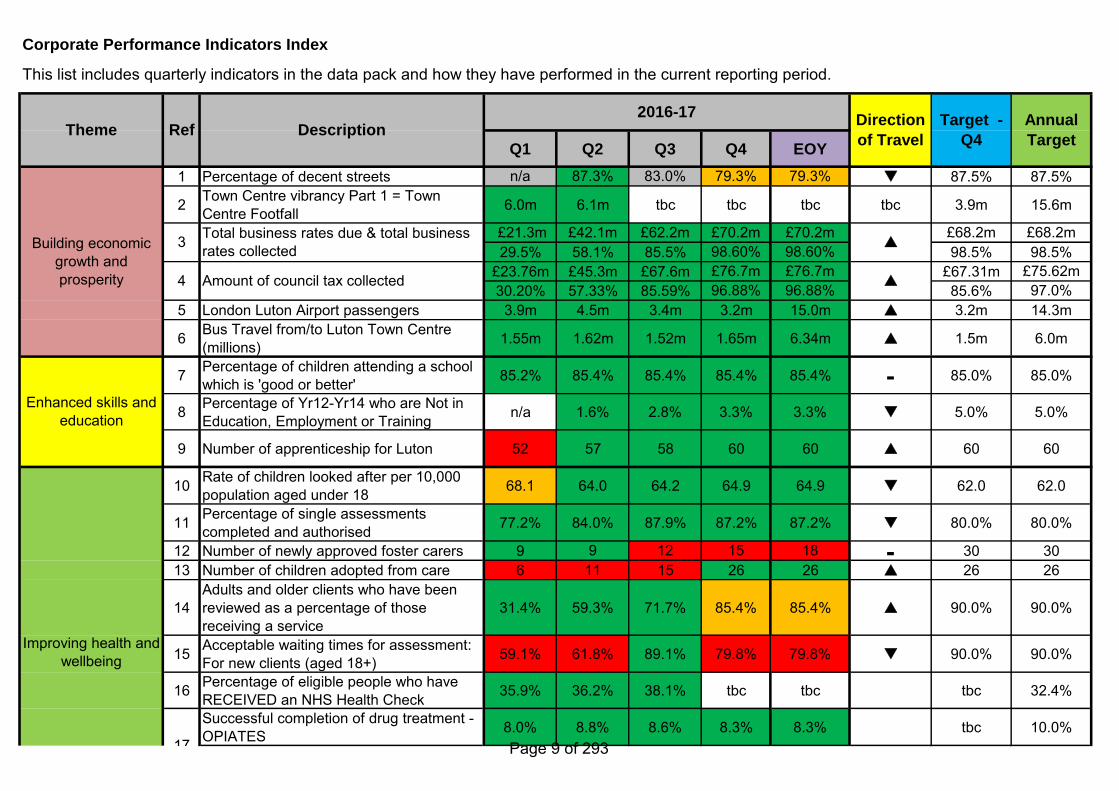
Corporate Performance Indicators Index
Q1 Q2 Q3 Q4 EOY
1 Percentage of decent streets n/a 87.3% 83.0% 79.3% 79.3% 87.5% 87.5%
2 Town Centre vibrancy Part 1 = Town Centre Footfall 6.0m 6.1m tbc tbc tbc tbc 3.9m 15.6m
£21.3m £42.1m £62.2m £70.2m £70.2m £68.2m £68.2m29.5% 58.1% 85.5% 98.60% 98.60% 98.5% 98.5%
£23.76m £45.3m £67.6m £76.7m £76.7m £67.31m £75.62m30.20% 57.33% 85.59% 96.88% 96.88% 85.6% 97.0%
5 London Luton Airport passengers 3.9m 4.5m 3.4m 3.2m 15.0m 3.2m 14.3m
6 Bus Travel from/to Luton Town Centre (millions) 1.55m 1.62m 1.52m 1.65m 6.34m 1.5m 6.0m
7 Percentage of children attending a school which is 'good or better' 85.2% 85.4% 85.4% 85.4% 85.4% - 85.0% 85.0%
8 Percentage of Yr12-Yr14 who are Not in Education, Employment or Training n/a 1.6% 2.8% 3.3% 3.3% 5.0% 5.0%
9 Number of apprenticeship for Luton 52 57 58 60 60 60 60
10 Rate of children looked after per 10,000 population aged under 18 68.1 64.0 64.2 64.9 64.9 62.0 62.0
11 Percentage of single assessments completed and authorised 77.2% 84.0% 87.9% 87.2% 87.2% 80.0% 80.0%
12 Number of newly approved foster carers 9 9 12 15 18 - 30 3013 Number of children adopted from care 6 11 15 26 26 26 26
14Adults and older clients who have been reviewed as a percentage of those receiving a service
31.4% 59.3% 71.7% 85.4% 85.4% 90.0% 90.0%
15 Acceptable waiting times for assessment: For new clients (aged 18+) 59.1% 61.8% 89.1% 79.8% 79.8% 90.0% 90.0%
16 Percentage of eligible people who have RECEIVED an NHS Health Check 35.9% 36.2% 38.1% tbc tbc tbc 32.4%
Successful completion of drug treatment - OPIATES 8.0% 8.8% 8.6% 8.3% 8.3% tbc 10.0%
Enhanced skills and education
Improving health and wellbeing
17
Target -
Q4
Annual
Target
Building economic growth and prosperity
3 Total business rates due & total business rates collected
4 Amount of council tax collected
Direction
of Travel
This list includes quarterly indicators in the data pack and how they have performed in the current reporting period.
Theme Ref Description2016-17
Page 9 of 293
Q1 Q2 Q3 Q4 EOY
Target -
Q4
Annual
Target
Building economic growth and prosperity
Direction
of TravelTheme Ref Description
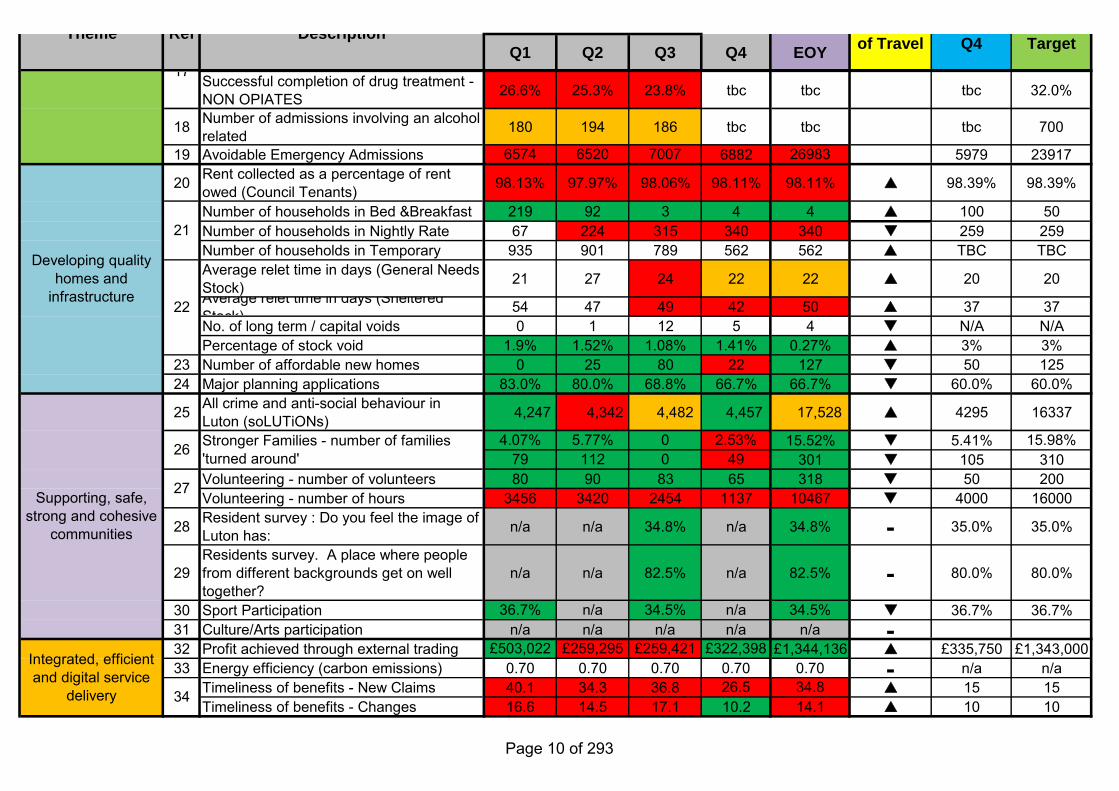
Successful completion of drug treatment - NON OPIATES 26.6% 25.3% 23.8% tbc tbc tbc 32.0%
18 Number of admissions involving an alcohol related 180 194 186 tbc tbc tbc 700
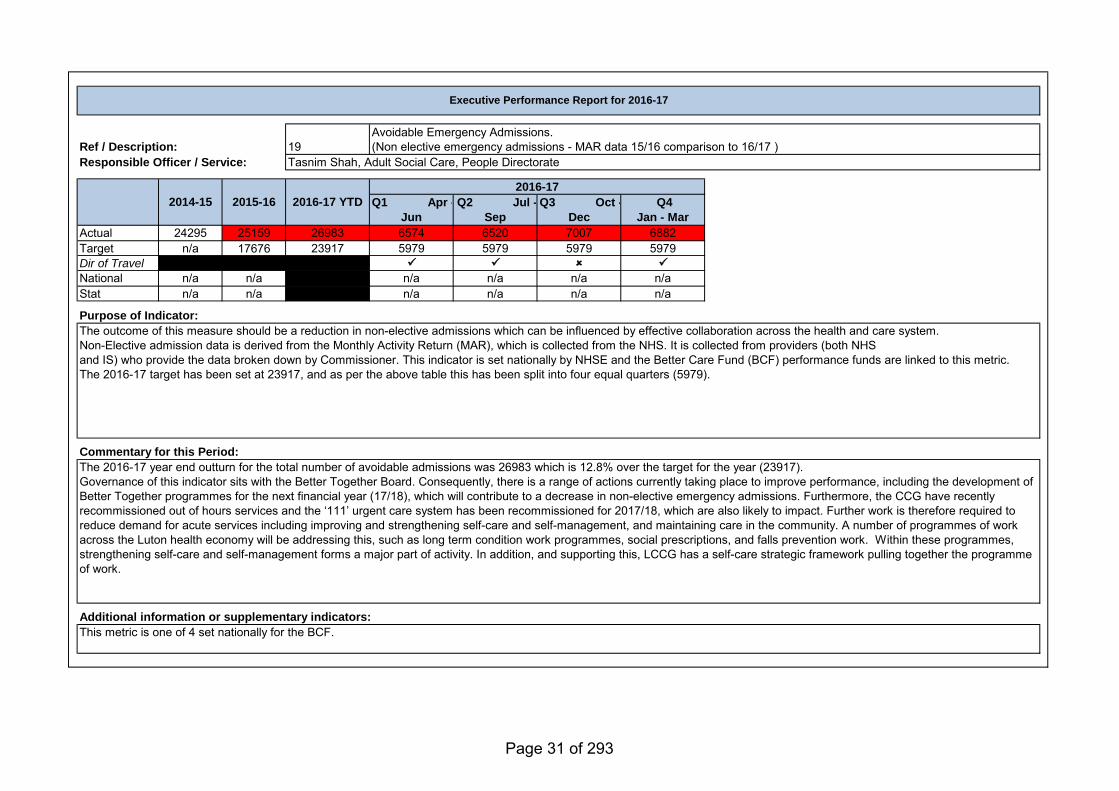
19 Avoidable Emergency Admissions 6574 6520 7007 6882 26983 5979 23917
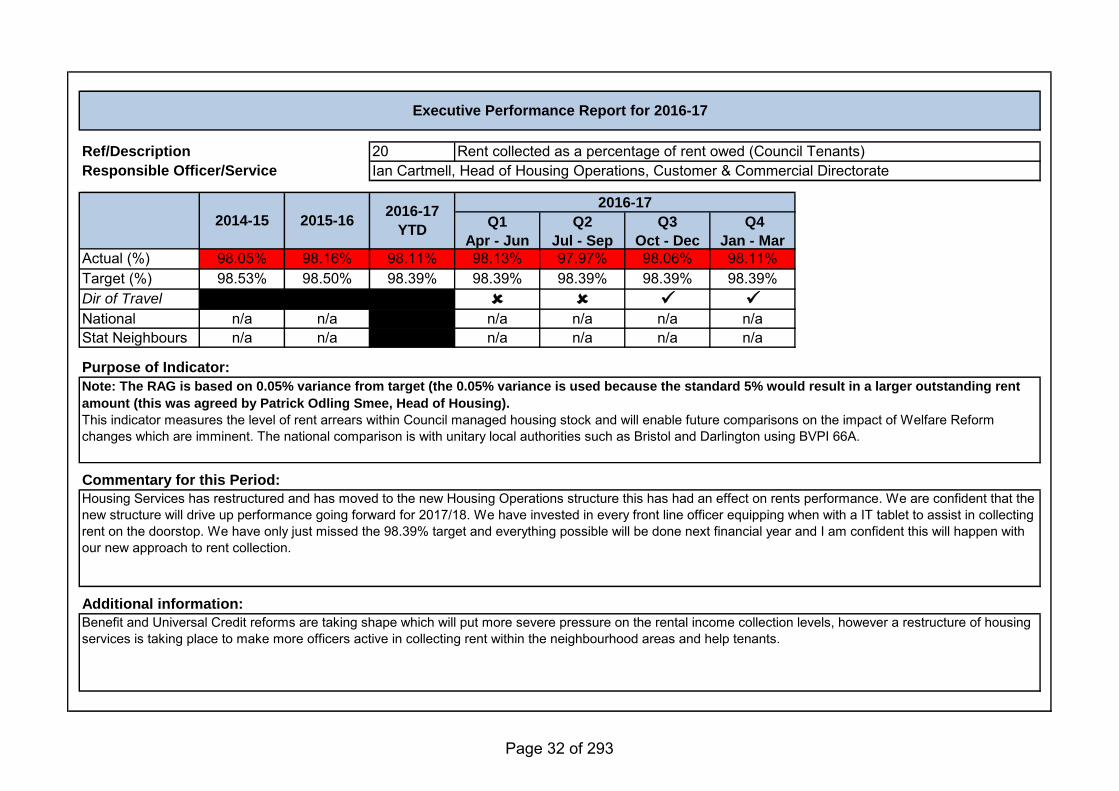
20 Rent collected as a percentage of rent owed (Council Tenants) 98.13% 97.97% 98.06% 98.11% 98.11% 98.39% 98.39%
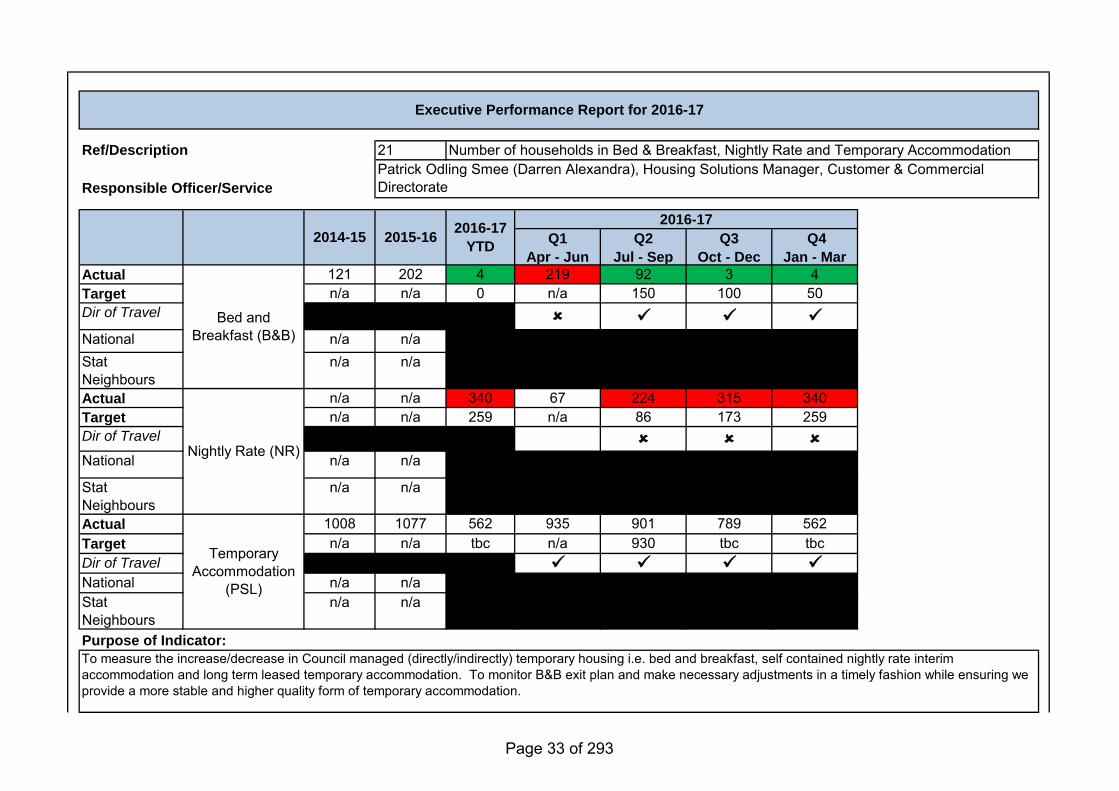
Number of households in Bed &Breakfast 219 92 3 4 4 100 50Number of households in Nightly Rate 67 224 315 340 340 259 259Number of households in Temporary 935 901 789 562 562 TBC TBCAverage relet time in days (General Needs Stock) 21 27 24 22 22 20 20Average relet time in days (Sheltered Stock) 54 47 49 42 50 37 37No. of long term / capital voids 0 1 12 5 4 N/A N/APercentage of stock void 1.9% 1.52% 1.08% 1.41% 0.27% 3% 3%
23 Number of affordable new homes 0 25 80 22 127 50 12524 Major planning applications 83.0% 80.0% 68.8% 66.7% 66.7% 60.0% 60.0%
25 All crime and anti-social behaviour in Luton (soLUTiONs) 4,247 4,342 4,482 4,457 17,528 4295 16337
4.07% 5.77% 0 2.53% 15.52% 5.41% 15.98%79 112 0 49 301 105 310
Volunteering - number of volunteers 80 90 83 65 318 50 200Volunteering - number of hours 3456 3420 2454 1137 10467 4000 16000
28 Resident survey : Do you feel the image of Luton has: n/a n/a 34.8% n/a 34.8% - 35.0% 35.0%
29Residents survey. A place where people from different backgrounds get on well together?
n/a n/a 82.5% n/a 82.5% - 80.0% 80.0%
30 Sport Participation 36.7% n/a 34.5% n/a 34.5% 36.7% 36.7%31 Culture/Arts participation n/a n/a n/a n/a n/a -32 Profit achieved through external trading £503,022 £259,295 £259,421 £322,398 £1,344,136 £335,750 £1,343,00033 Energy efficiency (carbon emissions) 0.70 0.70 0.70 0.70 0.70 - n/a n/a
Timeliness of benefits - New Claims 40.1 34.3 36.8 26.5 34.8 15 15Timeliness of benefits - Changes 16.6 14.5 17.1 10.2 14.1 10 10
Supporting, safe, strong and cohesive
communities
26 Stronger Families - number of families 'turned around'
27
Integrated, efficient and digital service
delivery 34
Improving health and wellbeing
17
Developing quality homes and
infrastructure
21
22
Page 10 of 293
Ref / Description: 1Responsible Officer / Service:
Q1
Apr - Jun
Q2 Q3
Oct - Dec
Q4
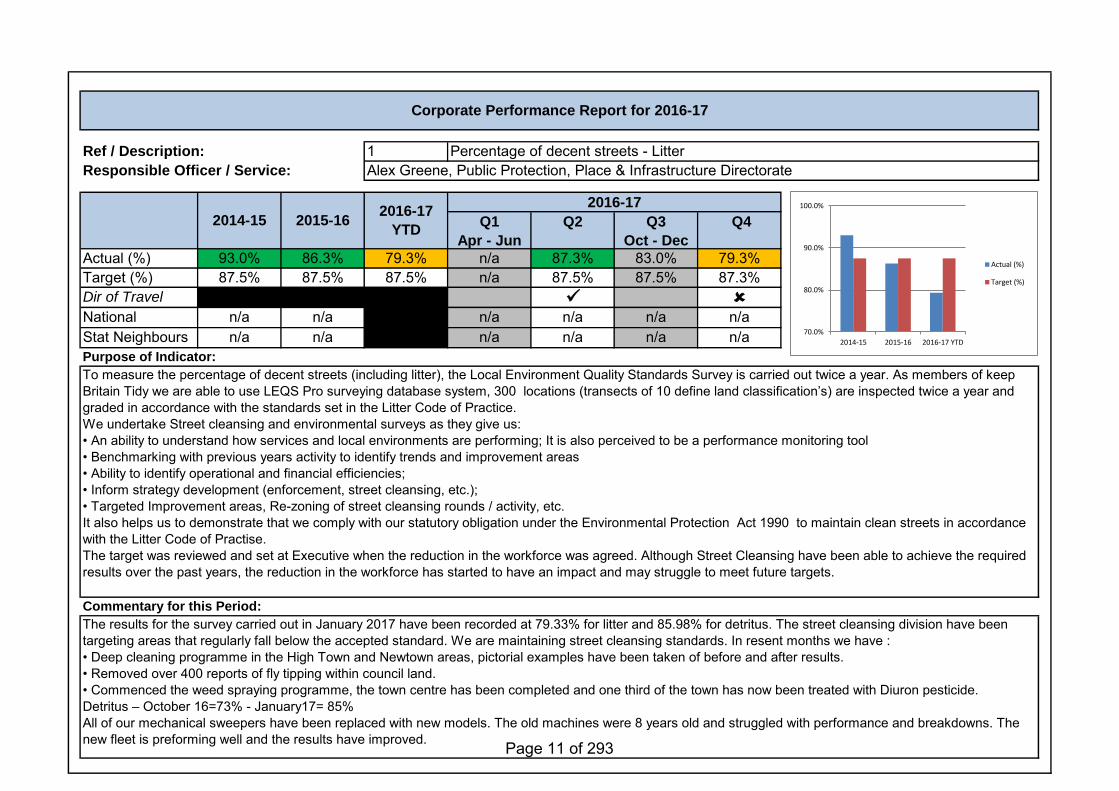
Actual (%) 93.0% 86.3% 79.3% n/a 87.3% 83.0% 79.3%Target (%) 87.5% 87.5% 87.5% n/a 87.5% 87.5% 87.3%Dir of Travel
National n/a n/a n/a n/a n/a n/aStat Neighbours n/a n/a n/a n/a n/a n/aPurpose of Indicator:
Commentary for this Period:
To measure the percentage of decent streets (including litter), the Local Environment Quality Standards Survey is carried out twice a year. As members of keep Britain Tidy we are able to use LEQS Pro surveying database system, 300 locations (transects of 10 define land classification’s) are inspected twice a year and graded in accordance with the standards set in the Litter Code of Practice.We undertake Street cleansing and environmental surveys as they give us:• An ability to understand how services and local environments are performing; It is also perceived to be a performance monitoring tool• Benchmarking with previous years activity to identify trends and improvement areas• Ability to identify operational and financial efficiencies;• Inform strategy development (enforcement, street cleansing, etc.);• Targeted Improvement areas, Re-zoning of street cleansing rounds / activity, etc.It also helps us to demonstrate that we comply with our statutory obligation under the Environmental Protection Act 1990 to maintain clean streets in accordance with the Litter Code of Practise.The target was reviewed and set at Executive when the reduction in the workforce was agreed. Although Street Cleansing have been able to achieve the required results over the past years, the reduction in the workforce has started to have an impact and may struggle to meet future targets.
The results for the survey carried out in January 2017 have been recorded at 79.33% for litter and 85.98% for detritus. The street cleansing division have been targeting areas that regularly fall below the accepted standard. We are maintaining street cleansing standards. In resent months we have :• Deep cleaning programme in the High Town and Newtown areas, pictorial examples have been taken of before and after results.• Removed over 400 reports of fly tipping within council land.• Commenced the weed spraying programme, the town centre has been completed and one third of the town has now been treated with Diuron pesticide.Detritus – October 16=73% - January17= 85% All of our mechanical sweepers have been replaced with new models. The old machines were 8 years old and struggled with performance and breakdowns. The new fleet is preforming well and the results have improved.
Corporate Performance Report for 2016-17
Percentage of decent streets - LitterAlex Greene, Public Protection, Place & Infrastructure Directorate
2014-15 2015-162016-17
YTD
2016-17
70.0%
80.0%
90.0%
100.0%
2014-15 2015-16 2016-17 YTD
Actual (%)
Target (%)
Page 11 of 293
Ref / Description: 2Responsible Officer / Service:
Q1
Apr - Jun
Q2
Jul - Sep
Q3
Oct - Dec
Q4
Jan - Mar
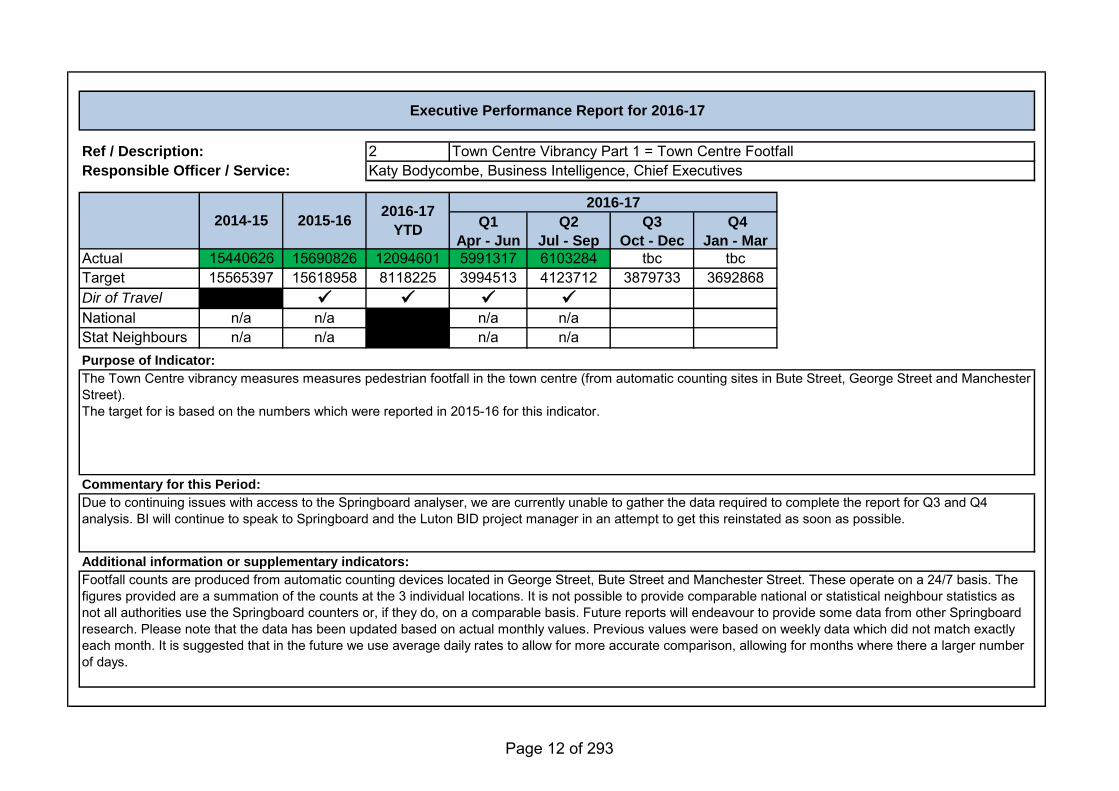
Actual 15440626 15690826 12094601 5991317 6103284 tbc tbcTarget 15565397 15618958 8118225 3994513 4123712 3879733 3692868Dir of Travel
National n/a n/a n/a n/aStat Neighbours n/a n/a n/a n/aPurpose of Indicator:
Commentary for this Period:
Additional information or supplementary indicators:
The Town Centre vibrancy measures measures pedestrian footfall in the town centre (from automatic counting sites in Bute Street, George Street and Manchester Street).The target for is based on the numbers which were reported in 2015-16 for this indicator.
Due to continuing issues with access to the Springboard analyser, we are currently unable to gather the data required to complete the report for Q3 and Q4 analysis. BI will continue to speak to Springboard and the Luton BID project manager in an attempt to get this reinstated as soon as possible.
Footfall counts are produced from automatic counting devices located in George Street, Bute Street and Manchester Street. These operate on a 24/7 basis. The figures provided are a summation of the counts at the 3 individual locations. It is not possible to provide comparable national or statistical neighbour statistics as not all authorities use the Springboard counters or, if they do, on a comparable basis. Future reports will endeavour to provide some data from other Springboard research. Please note that the data has been updated based on actual monthly values. Previous values were based on weekly data which did not match exactly each month. It is suggested that in the future we use average daily rates to allow for more accurate comparison, allowing for months where there a larger number of days.
Executive Performance Report for 2016-17
Town Centre Vibrancy Part 1 = Town Centre Footfall Katy Bodycombe, Business Intelligence, Chief Executives
2014-15 2015-162016-17
YTD
2016-17
Page 12 of 293
3 Total business rates due & total business rates collected
Q1
Jul - Sep
Q2
Jul - Sep
Q3
Oct - Dec
Q4
Jan - Mar
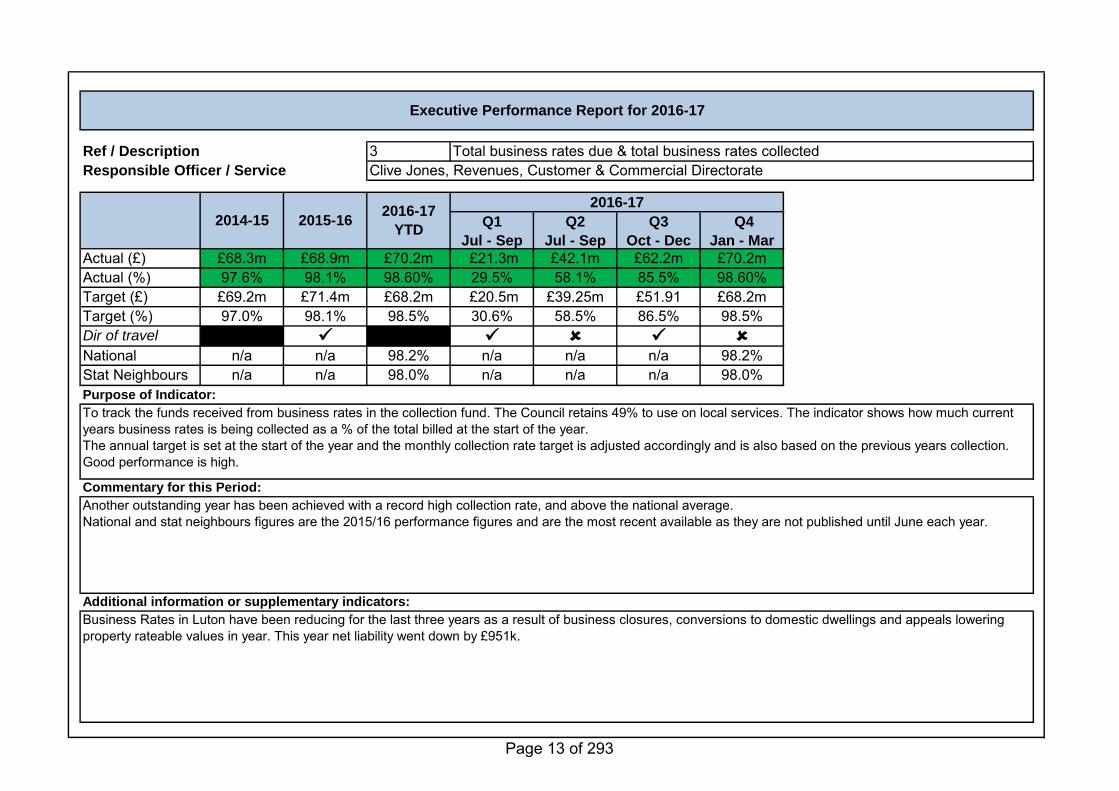
Actual (£) £68.3m £68.9m £70.2m £21.3m £42.1m £62.2m £70.2mActual (%) 97.6% 98.1% 98.60% 29.5% 58.1% 85.5% 98.60%Target (£) £69.2m £71.4m £68.2m £20.5m £39.25m £51.91 £68.2mTarget (%) 97.0% 98.1% 98.5% 30.6% 58.5% 86.5% 98.5%Dir of travel
National n/a n/a 98.2% n/a n/a n/a 98.2%Stat Neighbours n/a n/a 98.0% n/a n/a n/a 98.0%Purpose of Indicator:
Commentary for this Period:
Additional information or supplementary indicators:
To track the funds received from business rates in the collection fund. The Council retains 49% to use on local services. The indicator shows how much current years business rates is being collected as a % of the total billed at the start of the year.The annual target is set at the start of the year and the monthly collection rate target is adjusted accordingly and is also based on the previous years collection. Good performance is high.
Another outstanding year has been achieved with a record high collection rate, and above the national average.National and stat neighbours figures are the 2015/16 performance figures and are the most recent available as they are not published until June each year.
Business Rates in Luton have been reducing for the last three years as a result of business closures, conversions to domestic dwellings and appeals lowering property rateable values in year. This year net liability went down by £951k.
Executive Performance Report for 2016-17
Ref / Description
Responsible Officer / Service Clive Jones, Revenues, Customer & Commercial Directorate
2014-15 2015-162016-17
YTD
2016-17
Page 13 of 293
4
Q1
Apr - Jun
Q2
Jul - Sep
Q3
Oct - Dec
Q4
Jan - Mar
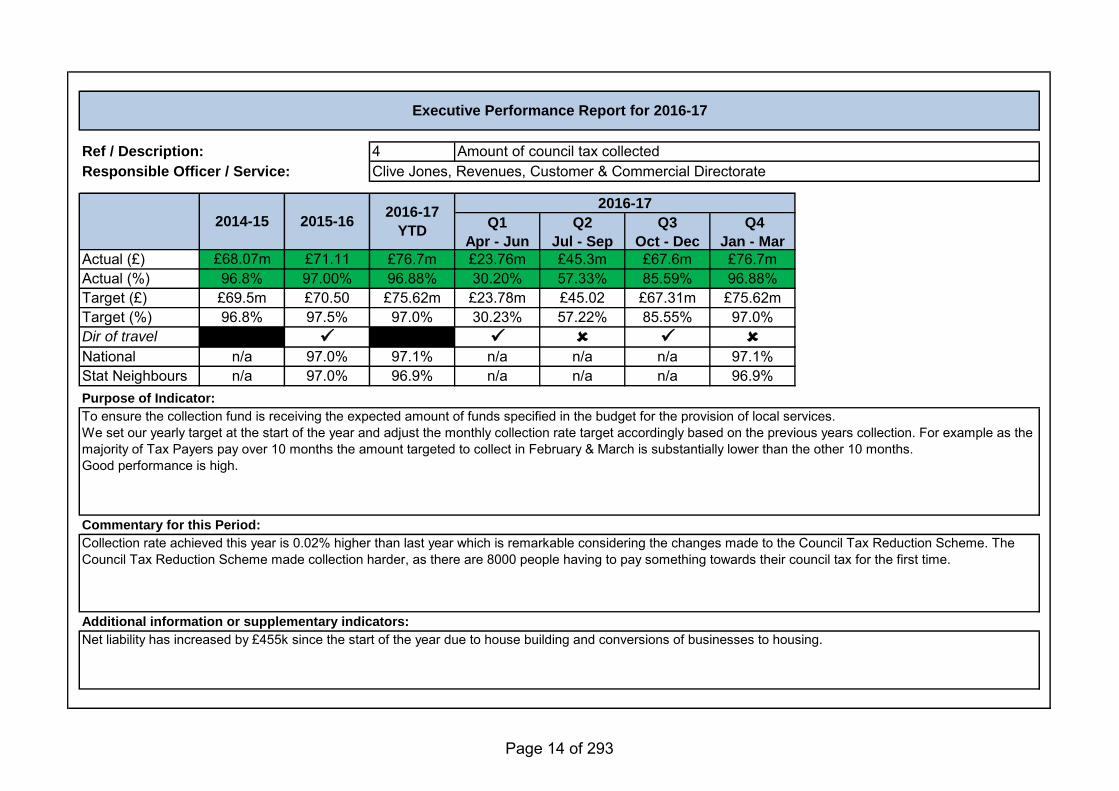
Actual (£) £68.07m £71.11 £76.7m £23.76m £45.3m £67.6m £76.7mActual (%) 96.8% 97.00% 96.88% 30.20% 57.33% 85.59% 96.88%Target (£) £69.5m £70.50 £75.62m £23.78m £45.02 £67.31m £75.62mTarget (%) 96.8% 97.5% 97.0% 30.23% 57.22% 85.55% 97.0%Dir of travel
National n/a 97.0% 97.1% n/a n/a n/a 97.1%Stat Neighbours n/a 97.0% 96.9% n/a n/a n/a 96.9%Purpose of Indicator:
Commentary for this Period:
Additional information or supplementary indicators:
To ensure the collection fund is receiving the expected amount of funds specified in the budget for the provision of local services.We set our yearly target at the start of the year and adjust the monthly collection rate target accordingly based on the previous years collection. For example as the majority of Tax Payers pay over 10 months the amount targeted to collect in February & March is substantially lower than the other 10 months. Good performance is high.
Collection rate achieved this year is 0.02% higher than last year which is remarkable considering the changes made to the Council Tax Reduction Scheme. The Council Tax Reduction Scheme made collection harder, as there are 8000 people having to pay something towards their council tax for the first time.
Net liability has increased by £455k since the start of the year due to house building and conversions of businesses to housing.
Executive Performance Report for 2016-17
Ref / Description: Amount of council tax collectedResponsible Officer / Service: Clive Jones, Revenues, Customer & Commercial Directorate
2014-15 2015-162016-17
YTD
2016-17
Page 14 of 293
Ref / Description: 5Responsible Officer / Service:
Q1
Apr - Jun
Q2
Jul - Sep
Q3
Oct - Dec
Q4
Jan - Mar
Actual 10,785,774 12,839,013 15,052,648 3,907,286 4,499,639 3,399,560 3,246,163Target 10,601,000 12,054,000 14,300,000 3,706,000 4,343,000 3,187,000 3,064,000Dir of Travel
National n/a n/a n/a n/a n/a n/a n/aStat Neighbours n/a n/a n/a n/a n/a n/a n/a
Purpose of Indicator:
Commentary for this Period:
Additional information or supplementary indicators:
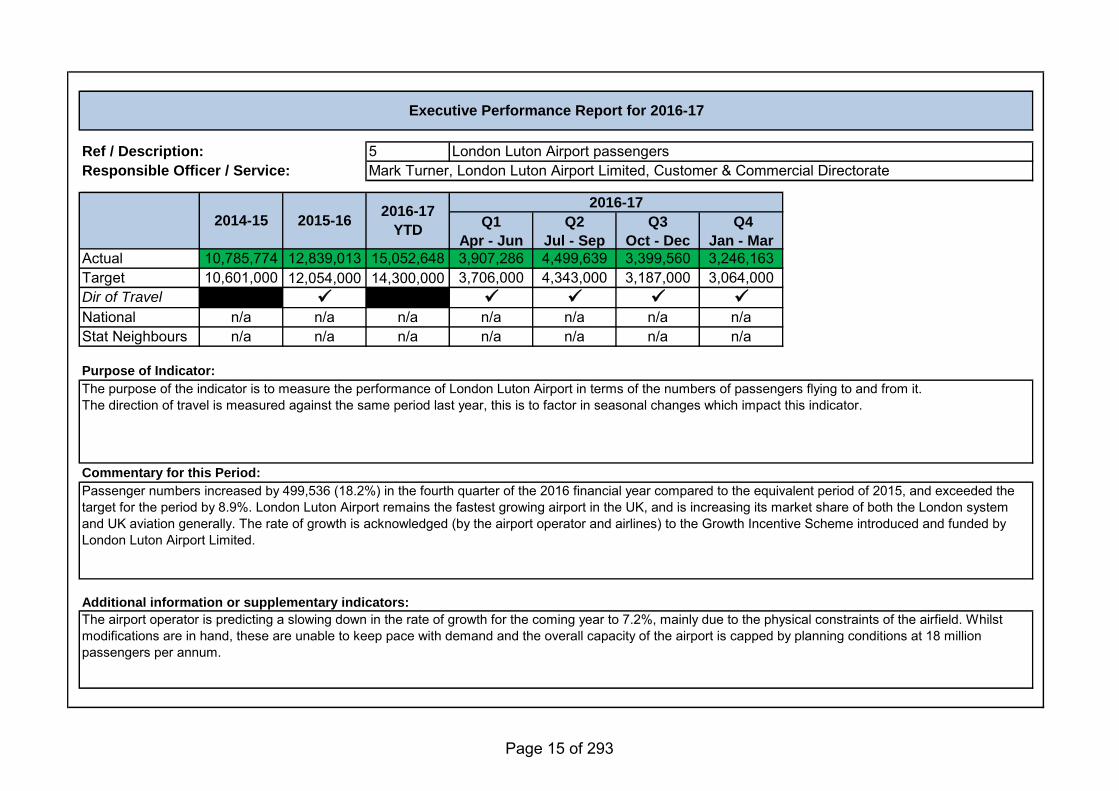
The purpose of the indicator is to measure the performance of London Luton Airport in terms of the numbers of passengers flying to and from it.The direction of travel is measured against the same period last year, this is to factor in seasonal changes which impact this indicator.
Passenger numbers increased by 499,536 (18.2%) in the fourth quarter of the 2016 financial year compared to the equivalent period of 2015, and exceeded the target for the period by 8.9%. London Luton Airport remains the fastest growing airport in the UK, and is increasing its market share of both the London system and UK aviation generally. The rate of growth is acknowledged (by the airport operator and airlines) to the Growth Incentive Scheme introduced and funded by London Luton Airport Limited.
The airport operator is predicting a slowing down in the rate of growth for the coming year to 7.2%, mainly due to the physical constraints of the airfield. Whilst modifications are in hand, these are unable to keep pace with demand and the overall capacity of the airport is capped by planning conditions at 18 million passengers per annum.
Executive Performance Report for 2016-17
London Luton Airport passengersMark Turner, London Luton Airport Limited, Customer & Commercial Directorate
2014-15 2015-162016-17
YTD
2016-17
Page 15 of 293
Ref / Description: 6Responsible Officer / Service:
Q1
Apr - Jun
Q2
Jul - Sep
Q3
Oct - Dec
Q4
Jan - Mar
Actual 5.5m 5.46m 6.34m 1.55m 1.62m 1.52m 1.65mTarget n/a 5.5m 6.0m 1.5m 1.5m 1.5m 1.5mDir of Travel
National n/a n/a n/a n/a n/a n/a n/aStat n/a n/a n/a n/a n/a n/a n/a
Purpose of Indicator:
Commentary for this Period:
Additional information or supplementary indicators:
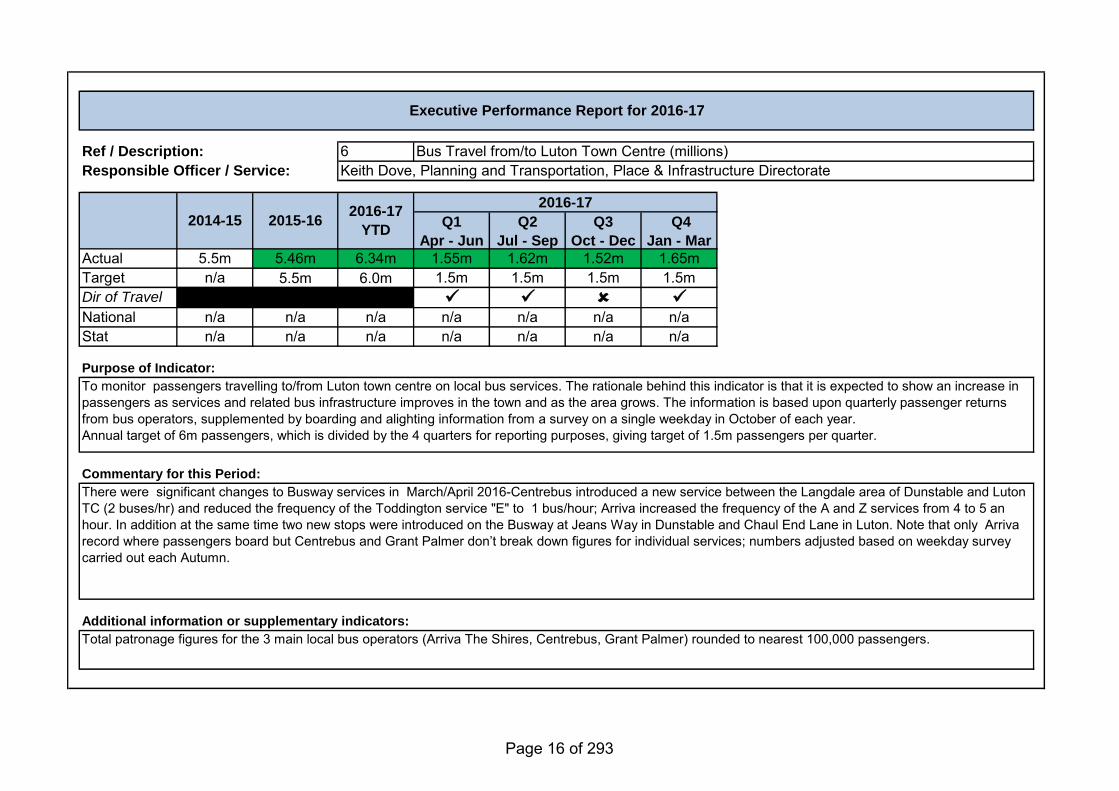
Total patronage figures for the 3 main local bus operators (Arriva The Shires, Centrebus, Grant Palmer) rounded to nearest 100,000 passengers.
To monitor passengers travelling to/from Luton town centre on local bus services. The rationale behind this indicator is that it is expected to show an increase in passengers as services and related bus infrastructure improves in the town and as the area grows. The information is based upon quarterly passenger returns from bus operators, supplemented by boarding and alighting information from a survey on a single weekday in October of each year.Annual target of 6m passengers, which is divided by the 4 quarters for reporting purposes, giving target of 1.5m passengers per quarter.
There were significant changes to Busway services in March/April 2016-Centrebus introduced a new service between the Langdale area of Dunstable and Luton TC (2 buses/hr) and reduced the frequency of the Toddington service "E" to 1 bus/hour; Arriva increased the frequency of the A and Z services from 4 to 5 an hour. In addition at the same time two new stops were introduced on the Busway at Jeans Way in Dunstable and Chaul End Lane in Luton. Note that only Arriva record where passengers board but Centrebus and Grant Palmer don’t break down figures for individual services; numbers adjusted based on weekday survey carried out each Autumn.
2016-17
Executive Performance Report for 2016-17
2014-15 2015-162016-17
YTD
Bus Travel from/to Luton Town Centre (millions)Keith Dove, Planning and Transportation, Place & Infrastructure Directorate
Page 16 of 293
Ref / Description: 7Responsible Officer / Service:
2013/14 2014/15 2015-16Q1
Apr - Jun
Q2
Jul - Sep
Q3
Oct - Dec
Q4
Jan - Mar
Actual 79.0% 84.0% 83.5% 85.4% 85.2% 85.4% 85.4% 85.4%Target 83.0% 85.0% 85.0% 85.0% 85.0% 85.0% 85.0% 85.0%Dir of Travel
National 78.0% 81.0% 84.9%Stat Neighbours 75.0% 74.3% tbc
Purpose of Indicator:
Commentary for this Period:
Additional information or supplementary indicators:
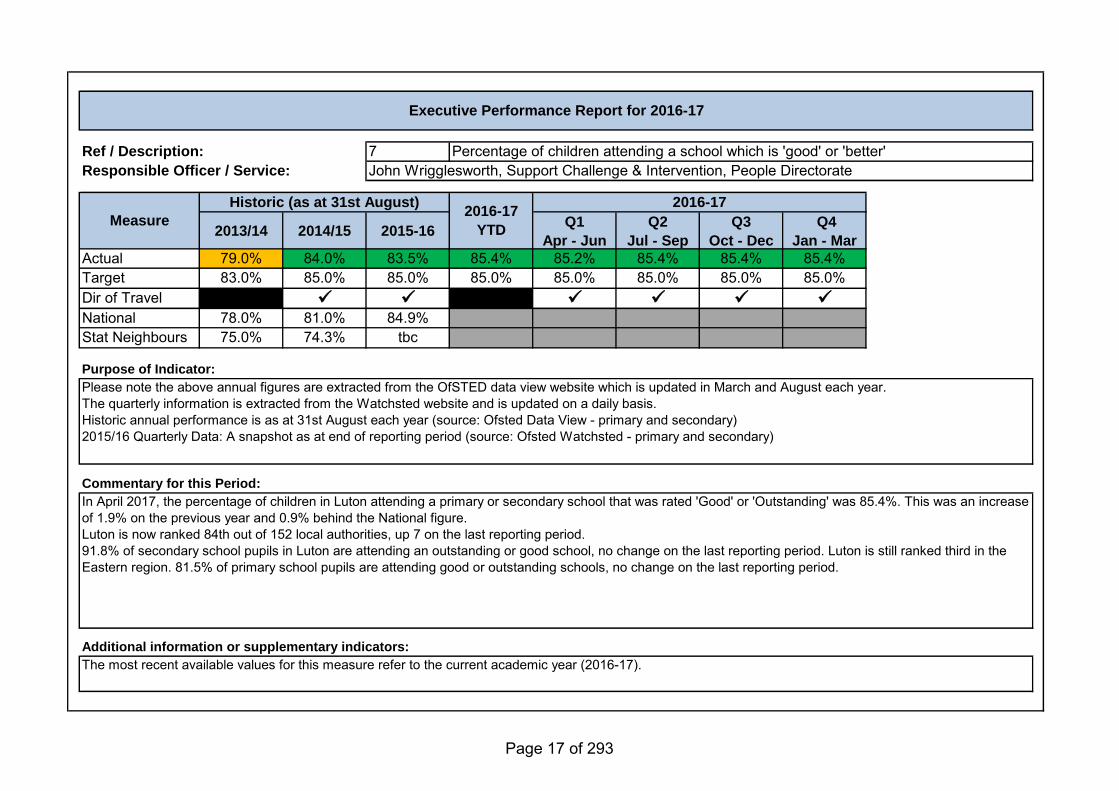
Please note the above annual figures are extracted from the OfSTED data view website which is updated in March and August each year. The quarterly information is extracted from the Watchsted website and is updated on a daily basis. Historic annual performance is as at 31st August each year (source: Ofsted Data View - primary and secondary)2015/16 Quarterly Data: A snapshot as at end of reporting period (source: Ofsted Watchsted - primary and secondary)
In April 2017, the percentage of children in Luton attending a primary or secondary school that was rated 'Good' or 'Outstanding' was 85.4%. This was an increase of 1.9% on the previous year and 0.9% behind the National figure. Luton is now ranked 84th out of 152 local authorities, up 7 on the last reporting period.91.8% of secondary school pupils in Luton are attending an outstanding or good school, no change on the last reporting period. Luton is still ranked third in the Eastern region. 81.5% of primary school pupils are attending good or outstanding schools, no change on the last reporting period.
The most recent available values for this measure refer to the current academic year (2016-17).
Executive Performance Report for 2016-17
Percentage of children attending a school which is 'good' or 'better'John Wrigglesworth, Support Challenge & Intervention, People Directorate
Measure
Historic (as at 31st August)2016-17
YTD
2016-17
Page 17 of 293
Ref / Description: 8Responsible Officer / Service:
Q1
Apr - Jun
Q2
Jul - Sep
Q3
Oct - Dec
Q4
Jan - Mar
Actual 3.4% 1.6% 2.8% 3.4%Numbers 180 84 150 180Target None Set None Set None Set None SetDir of Travel
National 3.0 2.0% 2.7% 3.0Stat Neighbours 2.8 1.9% 2.7% 2.8Purpose of Indicator:
Commentary for this Period:
Additional information or supplementary indicators:
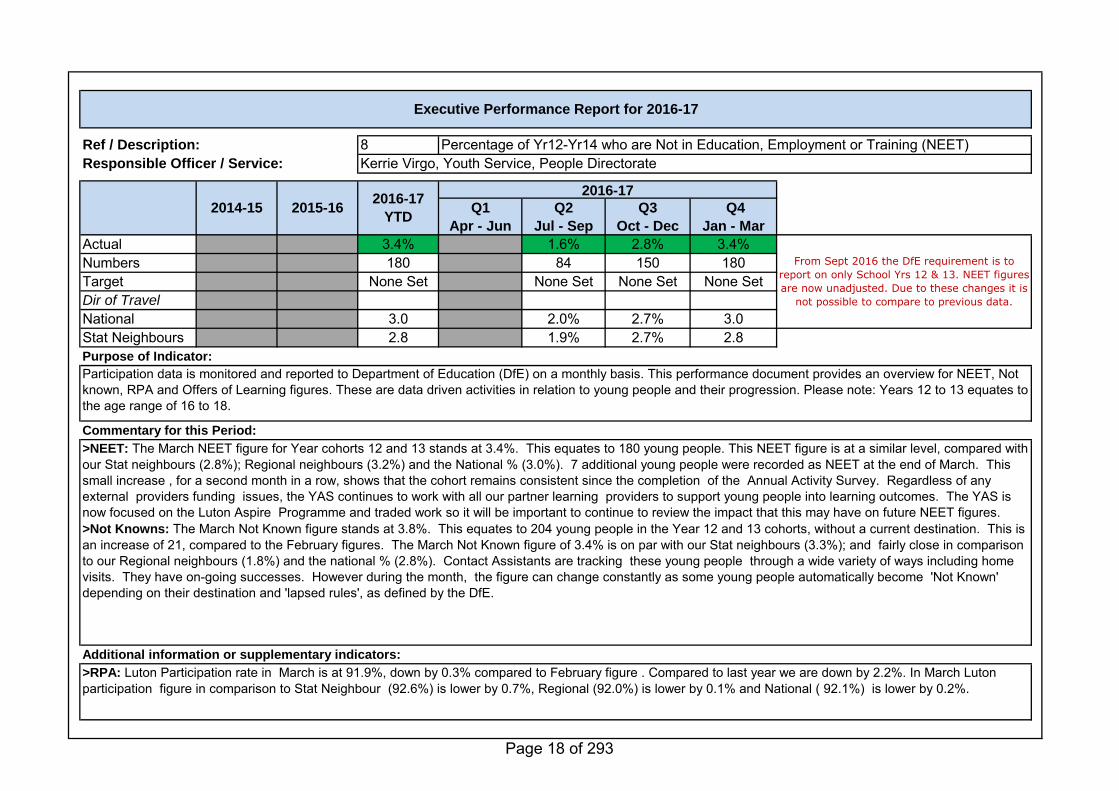
Participation data is monitored and reported to Department of Education (DfE) on a monthly basis. This performance document provides an overview for NEET, Not known, RPA and Offers of Learning figures. These are data driven activities in relation to young people and their progression. Please note: Years 12 to 13 equates to the age range of 16 to 18.
>NEET: The March NEET figure for Year cohorts 12 and 13 stands at 3.4%. This equates to 180 young people. This NEET figure is at a similar level, compared with our Stat neighbours (2.8%); Regional neighbours (3.2%) and the National % (3.0%). 7 additional young people were recorded as NEET at the end of March. This small increase , for a second month in a row, shows that the cohort remains consistent since the completion of the Annual Activity Survey. Regardless of any external providers funding issues, the YAS continues to work with all our partner learning providers to support young people into learning outcomes. The YAS is now focused on the Luton Aspire Programme and traded work so it will be important to continue to review the impact that this may have on future NEET figures. >Not Knowns: The March Not Known figure stands at 3.8%. This equates to 204 young people in the Year 12 and 13 cohorts, without a current destination. This is an increase of 21, compared to the February figures. The March Not Known figure of 3.4% is on par with our Stat neighbours (3.3%); and fairly close in comparison to our Regional neighbours (1.8%) and the national % (2.8%). Contact Assistants are tracking these young people through a wide variety of ways including home visits. They have on-going successes. However during the month, the figure can change constantly as some young people automatically become 'Not Known' depending on their destination and 'lapsed rules', as defined by the DfE.
>RPA: Luton Participation rate in March is at 91.9%, down by 0.3% compared to February figure . Compared to last year we are down by 2.2%. In March Luton participation figure in comparison to Stat Neighbour (92.6%) is lower by 0.7%, Regional (92.0%) is lower by 0.1% and National ( 92.1%) is lower by 0.2%.
Executive Performance Report for 2016-17
Percentage of Yr12-Yr14 who are Not in Education, Employment or Training (NEET)Kerrie Virgo, Youth Service, People Directorate
2014-15 2015-162016-17
YTD
2016-17
From Sept 2016 the DfE requirement is to
report on only School Yrs 12 & 13. NEET figures
are now unadjusted. Due to these changes it is
not possible to compare to previous data.
Page 18 of 293
9
Q1
Apr - Jun
Q2
Jul - Sep
Q3
Oct - Dec
Q4
Jan - Mar
Actual 55 42 60 52 57 58 60Target 50 60 60 60 60 60 60Dir of Travel
National n/a n/a n/a n/a n/a n/aStat Neighbours n/a n/a n/a n/a n/a n/aPurpose of Indicator:
Commentary for this Period:
Additional information or supplementary indicators:
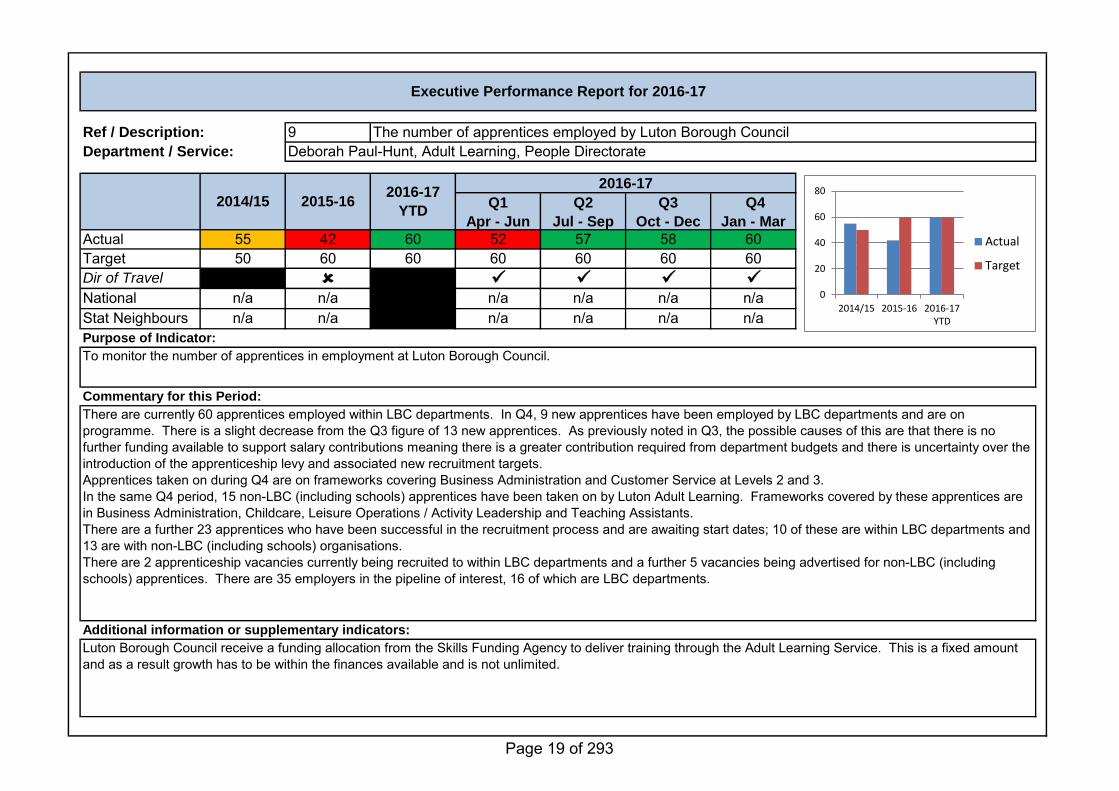
To monitor the number of apprentices in employment at Luton Borough Council.
There are currently 60 apprentices employed within LBC departments. In Q4, 9 new apprentices have been employed by LBC departments and are on programme. There is a slight decrease from the Q3 figure of 13 new apprentices. As previously noted in Q3, the possible causes of this are that there is no further funding available to support salary contributions meaning there is a greater contribution required from department budgets and there is uncertainty over the introduction of the apprenticeship levy and associated new recruitment targets. Apprentices taken on during Q4 are on frameworks covering Business Administration and Customer Service at Levels 2 and 3. In the same Q4 period, 15 non-LBC (including schools) apprentices have been taken on by Luton Adult Learning. Frameworks covered by these apprentices are in Business Administration, Childcare, Leisure Operations / Activity Leadership and Teaching Assistants. There are a further 23 apprentices who have been successful in the recruitment process and are awaiting start dates; 10 of these are within LBC departments and 13 are with non-LBC (including schools) organisations.There are 2 apprenticeship vacancies currently being recruited to within LBC departments and a further 5 vacancies being advertised for non-LBC (including schools) apprentices. There are 35 employers in the pipeline of interest, 16 of which are LBC departments.
Luton Borough Council receive a funding allocation from the Skills Funding Agency to deliver training through the Adult Learning Service. This is a fixed amount and as a result growth has to be within the finances available and is not unlimited.
Executive Performance Report for 2016-17
Ref / Description: The number of apprentices employed by Luton Borough CouncilDepartment / Service: Deborah Paul-Hunt, Adult Learning, People Directorate
2014/15 2015-162016-17
YTD
2016-17
0
20
40
60
80
2014/15 2015-16 2016-17YTD
Actual
Target
Page 19 of 293
10
Including
UASC
Excluding
UASC
Actual 74.9 69.1 64.9 68.1 64.0 64.2 64.9 58.8Target n/a n/a 62.0 62.0 62.0 62.0 62.0 55.0No of children 399 378 364 382 359 360 364 330Dir of Travel
National 60.0 60.0Stat Neighbours 72.1 68.6Purpose of Indicator:
Commentary for this Period:
Additional information or supplementary indicators:
Q4
Mar
PROV
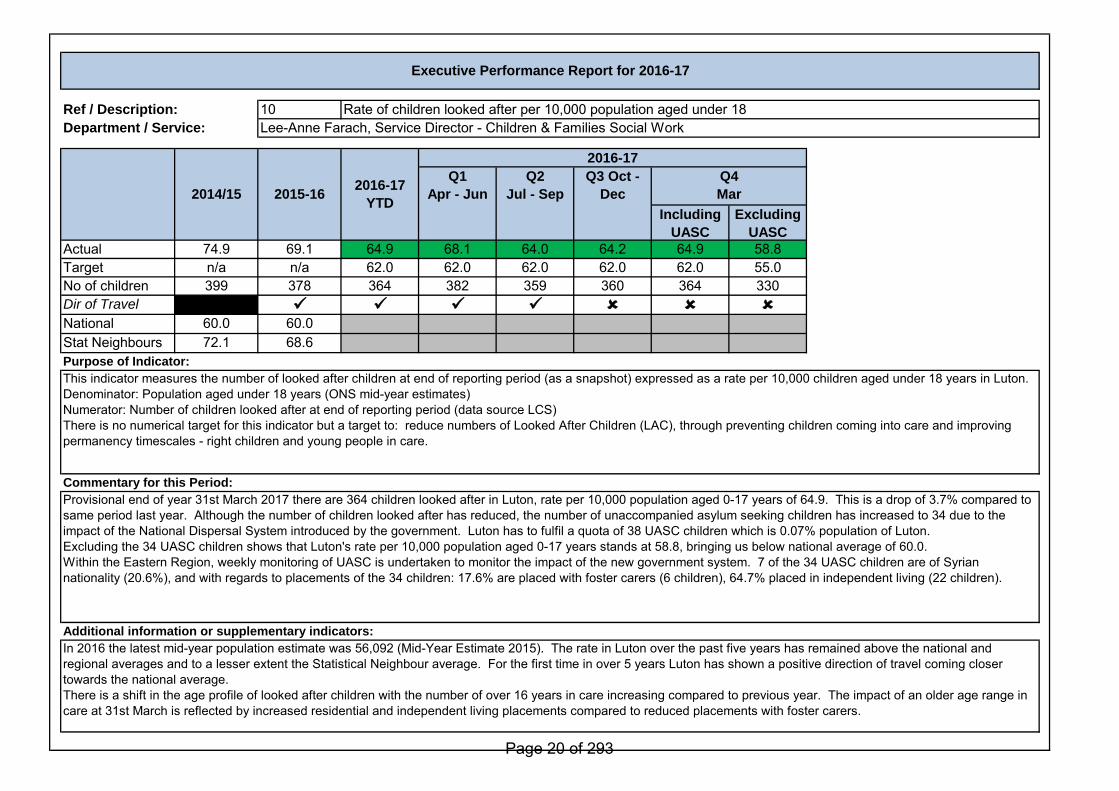
This indicator measures the number of looked after children at end of reporting period (as a snapshot) expressed as a rate per 10,000 children aged under 18 years in Luton.Denominator: Population aged under 18 years (ONS mid-year estimates) Numerator: Number of children looked after at end of reporting period (data source LCS)There is no numerical target for this indicator but a target to: reduce numbers of Looked After Children (LAC), through preventing children coming into care and improving permanency timescales - right children and young people in care.
Provisional end of year 31st March 2017 there are 364 children looked after in Luton, rate per 10,000 population aged 0-17 years of 64.9. This is a drop of 3.7% compared to same period last year. Although the number of children looked after has reduced, the number of unaccompanied asylum seeking children has increased to 34 due to the impact of the National Dispersal System introduced by the government. Luton has to fulfil a quota of 38 UASC children which is 0.07% population of Luton.Excluding the 34 UASC children shows that Luton's rate per 10,000 population aged 0-17 years stands at 58.8, bringing us below national average of 60.0.Within the Eastern Region, weekly monitoring of UASC is undertaken to monitor the impact of the new government system. 7 of the 34 UASC children are of Syrian nationality (20.6%), and with regards to placements of the 34 children: 17.6% are placed with foster carers (6 children), 64.7% placed in independent living (22 children).
In 2016 the latest mid-year population estimate was 56,092 (Mid-Year Estimate 2015). The rate in Luton over the past five years has remained above the national and regional averages and to a lesser extent the Statistical Neighbour average. For the first time in over 5 years Luton has shown a positive direction of travel coming closer towards the national average.There is a shift in the age profile of looked after children with the number of over 16 years in care increasing compared to previous year. The impact of an older age range in care at 31st March is reflected by increased residential and independent living placements compared to reduced placements with foster carers.
2014/15 2015-162016-17
YTD
2016-17
Q1
Apr - Jun
Q2
Jul - Sep
Q3 Oct -
Dec
Executive Performance Report for 2016-17
Ref / Description: Rate of children looked after per 10,000 population aged under 18Department / Service: Lee-Anne Farach, Service Director - Children & Families Social Work
Page 20 of 293
11
Q1
Apr - Jun
Q2
Apr-Sep
Q3
Oct - Dec
Q4
Jan - Mar
Actual 74.3% 73.7% 87.2% 77.2% 84.0% 87.9% 87.2%Target 80.0% 80.0% 80.0% 80.0% 80.0% 80.0% 80.0%Dir of Travel O O O O
National 81.5% 83.4%Stat Neighbours 83.4% 84.9%Purpose of Indicator:
Commentary for this Period:
Additional information or supplementary indicators:
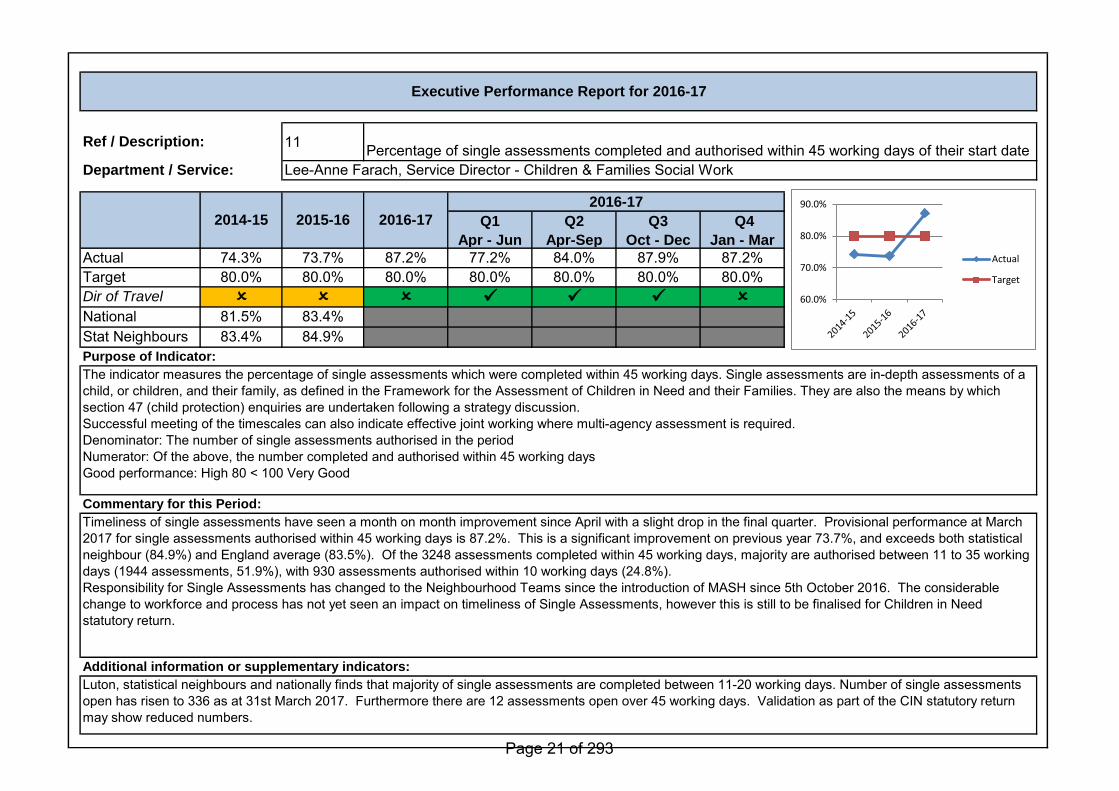
The indicator measures the percentage of single assessments which were completed within 45 working days. Single assessments are in-depth assessments of a child, or children, and their family, as defined in the Framework for the Assessment of Children in Need and their Families. They are also the means by which section 47 (child protection) enquiries are undertaken following a strategy discussion.Successful meeting of the timescales can also indicate effective joint working where multi-agency assessment is required.Denominator: The number of single assessments authorised in the periodNumerator: Of the above, the number completed and authorised within 45 working daysGood performance: High 80 < 100 Very Good
Timeliness of single assessments have seen a month on month improvement since April with a slight drop in the final quarter. Provisional performance at March 2017 for single assessments authorised within 45 working days is 87.2%. This is a significant improvement on previous year 73.7%, and exceeds both statistical neighbour (84.9%) and England average (83.5%). Of the 3248 assessments completed within 45 working days, majority are authorised between 11 to 35 working days (1944 assessments, 51.9%), with 930 assessments authorised within 10 working days (24.8%).Responsibility for Single Assessments has changed to the Neighbourhood Teams since the introduction of MASH since 5th October 2016. The considerable change to workforce and process has not yet seen an impact on timeliness of Single Assessments, however this is still to be finalised for Children in Need statutory return.
Luton, statistical neighbours and nationally finds that majority of single assessments are completed between 11-20 working days. Number of single assessments open has risen to 336 as at 31st March 2017. Furthermore there are 12 assessments open over 45 working days. Validation as part of the CIN statutory return may show reduced numbers.
Executive Performance Report for 2016-17
Ref / Description: Percentage of single assessments completed and authorised within 45 working days of their start dateDepartment / Service: Lee-Anne Farach, Service Director - Children & Families Social Work
2014-15 2015-16 2016-17
2016-17
60.0%
70.0%
80.0%
90.0%
Actual
Target
Page 21 of 293
12
Q1
Apr - Jun
Q2
Jul - Sep
Q3
Oct - Dec
Q4
Jan - Mar
Actual 47 23 18 9 12 15 18Target 30 30 30 8 15 23 30Dir of Travel O O O O O
NationalStat NeighboursPurpose of Indicator:
Commentary for this Period:
Additional information or supplementary indicators:
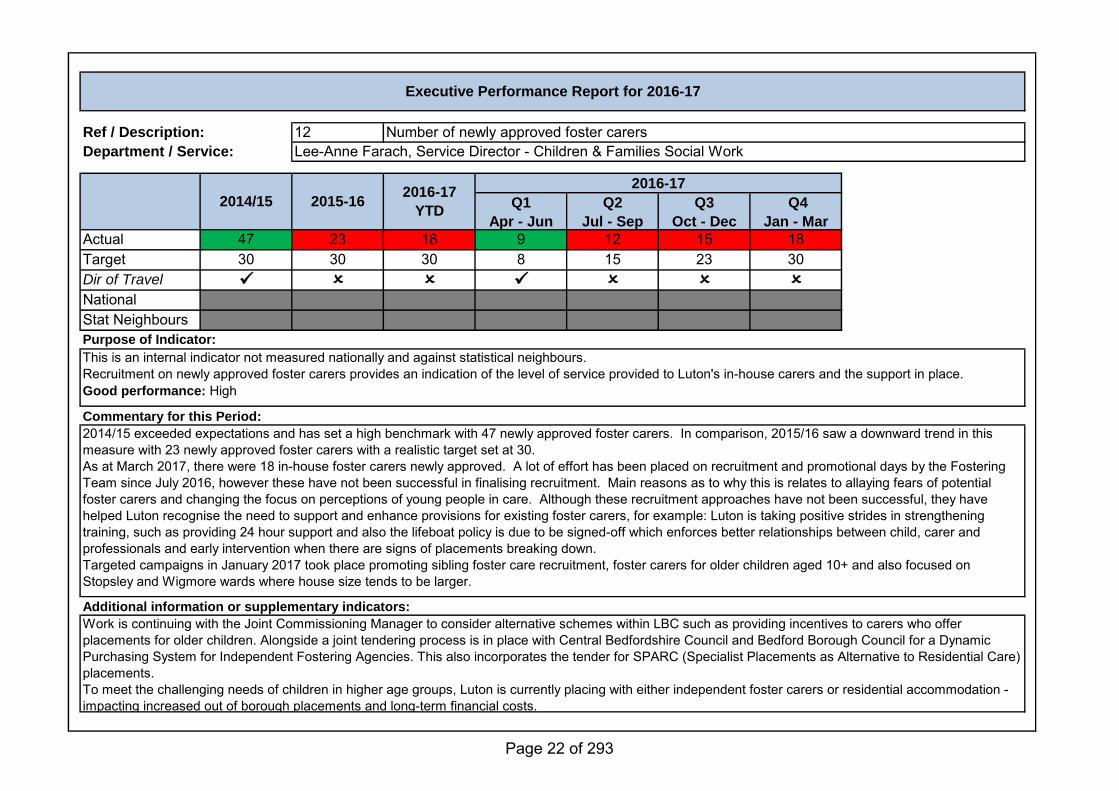
This is an internal indicator not measured nationally and against statistical neighbours.Recruitment on newly approved foster carers provides an indication of the level of service provided to Luton's in-house carers and the support in place.Good performance: High
2014/15 exceeded expectations and has set a high benchmark with 47 newly approved foster carers. In comparison, 2015/16 saw a downward trend in this measure with 23 newly approved foster carers with a realistic target set at 30. As at March 2017, there were 18 in-house foster carers newly approved. A lot of effort has been placed on recruitment and promotional days by the Fostering Team since July 2016, however these have not been successful in finalising recruitment. Main reasons as to why this is relates to allaying fears of potential foster carers and changing the focus on perceptions of young people in care. Although these recruitment approaches have not been successful, they have helped Luton recognise the need to support and enhance provisions for existing foster carers, for example: Luton is taking positive strides in strengthening training, such as providing 24 hour support and also the lifeboat policy is due to be signed-off which enforces better relationships between child, carer and professionals and early intervention when there are signs of placements breaking down.Targeted campaigns in January 2017 took place promoting sibling foster care recruitment, foster carers for older children aged 10+ and also focused on Stopsley and Wigmore wards where house size tends to be larger.
Work is continuing with the Joint Commissioning Manager to consider alternative schemes within LBC such as providing incentives to carers who offer placements for older children. Alongside a joint tendering process is in place with Central Bedfordshire Council and Bedford Borough Council for a Dynamic Purchasing System for Independent Fostering Agencies. This also incorporates the tender for SPARC (Specialist Placements as Alternative to Residential Care) placements.To meet the challenging needs of children in higher age groups, Luton is currently placing with either independent foster carers or residential accommodation - impacting increased out of borough placements and long-term financial costs.
Executive Performance Report for 2016-17
Ref / Description: Number of newly approved foster carersDepartment / Service: Lee-Anne Farach, Service Director - Children & Families Social Work
2014/15 2015-162016-17
YTD
2016-17
Page 22 of 293
13
Q1
Apr - Jun
Q2
Jul - Sep
Q3
Oct - Dec
Q4
Jan - Mar
Actual 25 18 26 6 11 15 26Target 20 20 26 7 14 21 26Dir of Travel O O O
NationalStat NeighboursPurpose of Indicator:
Commentary for this Period:
Additional information or supplementary indicators:
Adoption is one of the main options for permanence for children in care, who cannot return to live with their birth parents . One of the main aims of the Adoption and Children Act 2002, which came into force on 30 December 2005, is to improve the process of adoption. This indicator will provide an indication of whether number of adoptions granted are improving on a yearly basis.Denominator: Number of children who ceased to be looked after as a result of the granting of an adoption order (SSDA903 reason episode ceased codes E11 and E12).Good performance: High number
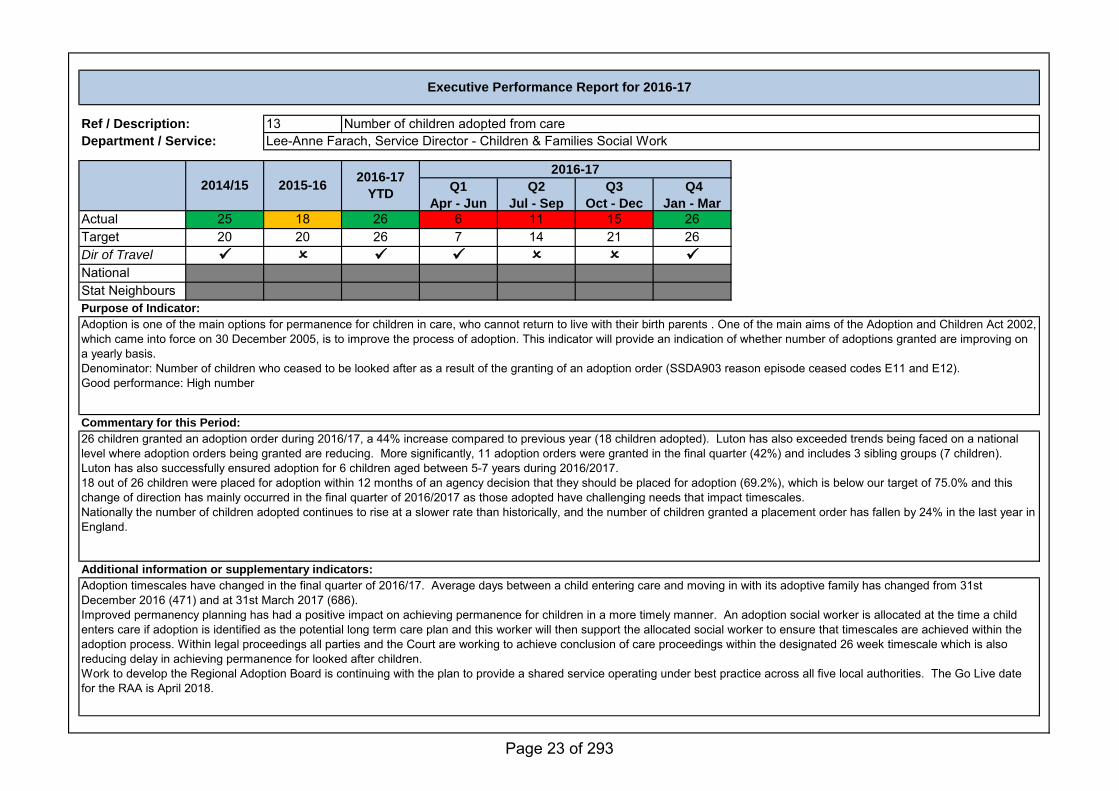
26 children granted an adoption order during 2016/17, a 44% increase compared to previous year (18 children adopted). Luton has also exceeded trends being faced on a national level where adoption orders being granted are reducing. More significantly, 11 adoption orders were granted in the final quarter (42%) and includes 3 sibling groups (7 children). Luton has also successfully ensured adoption for 6 children aged between 5-7 years during 2016/2017.18 out of 26 children were placed for adoption within 12 months of an agency decision that they should be placed for adoption (69.2%), which is below our target of 75.0% and this change of direction has mainly occurred in the final quarter of 2016/2017 as those adopted have challenging needs that impact timescales.Nationally the number of children adopted continues to rise at a slower rate than historically, and the number of children granted a placement order has fallen by 24% in the last year in England.
Adoption timescales have changed in the final quarter of 2016/17. Average days between a child entering care and moving in with its adoptive family has changed from 31st December 2016 (471) and at 31st March 2017 (686).Improved permanency planning has had a positive impact on achieving permanence for children in a more timely manner. An adoption social worker is allocated at the time a child enters care if adoption is identified as the potential long term care plan and this worker will then support the allocated social worker to ensure that timescales are achieved within the adoption process. Within legal proceedings all parties and the Court are working to achieve conclusion of care proceedings within the designated 26 week timescale which is also reducing delay in achieving permanence for looked after children.Work to develop the Regional Adoption Board is continuing with the plan to provide a shared service operating under best practice across all five local authorities. The Go Live date for the RAA is April 2018.
Executive Performance Report for 2016-17
Ref / Description: Number of children adopted from careDepartment / Service: Lee-Anne Farach, Service Director - Children & Families Social Work
2014/15 2015-162016-17
YTD
2016-17
Page 23 of 293
Ref / Description: 14Responsible Officer / Service:
Q1
Apr - Jun
Q2
Jul - Sep
Q3
Oct - Dec
Q4
Jan - Mar
Actual 61.1% 67.2% 85.4% 31.4% 59.3% 71.7% 85.4%Target 90.0% 90.0% 90.0% 22.5% 45.0% 67.5% 90.0%Actual (Numbers) 3001 3269 3179 992 2141 2795 3179Dir of Travel
National n/a n/a n/a n/a n/a n/aStat Neighbours n/a n/a n/a n/a n/a n/aPurpose of Indicator:
Commentary for this Period:
Additional information or supplementary indicators:
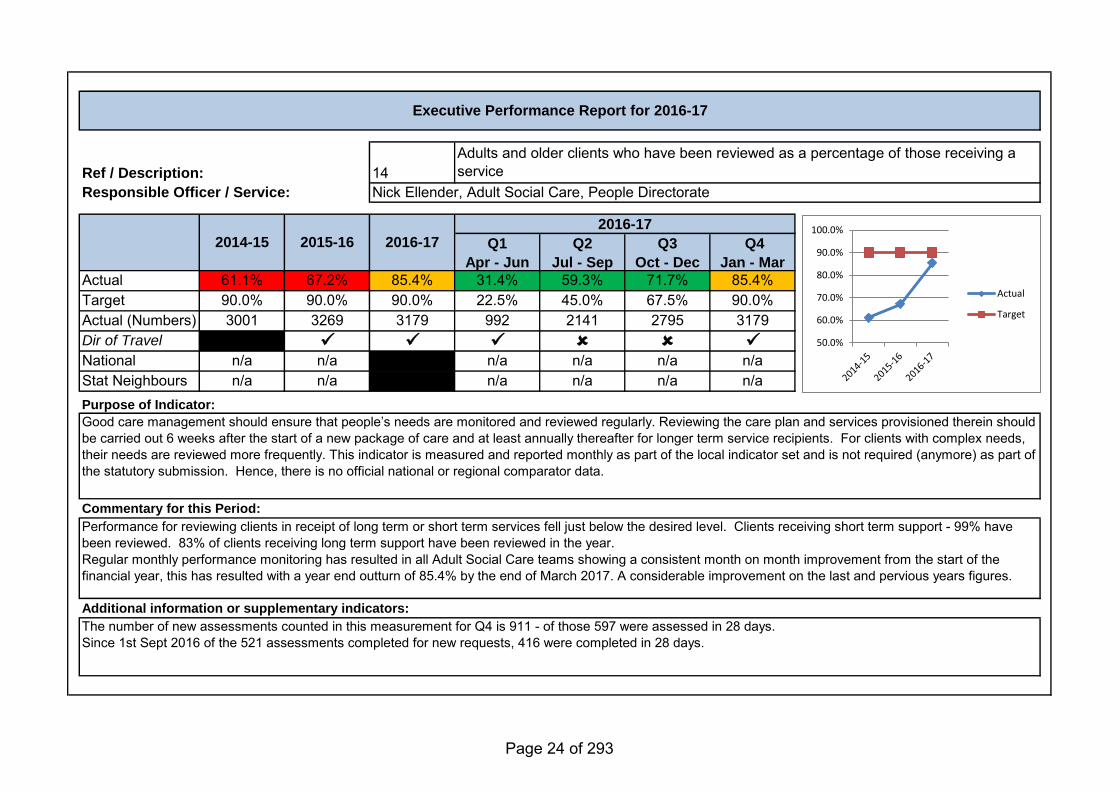
Good care management should ensure that people’s needs are monitored and reviewed regularly. Reviewing the care plan and services provisioned therein should be carried out 6 weeks after the start of a new package of care and at least annually thereafter for longer term service recipients. For clients with complex needs, their needs are reviewed more frequently. This indicator is measured and reported monthly as part of the local indicator set and is not required (anymore) as part of the statutory submission. Hence, there is no official national or regional comparator data.
Performance for reviewing clients in receipt of long term or short term services fell just below the desired level. Clients receiving short term support - 99% have been reviewed. 83% of clients receiving long term support have been reviewed in the year. Regular monthly performance monitoring has resulted in all Adult Social Care teams showing a consistent month on month improvement from the start of the financial year, this has resulted with a year end outturn of 85.4% by the end of March 2017. A considerable improvement on the last and pervious years figures.
The number of new assessments counted in this measurement for Q4 is 911 - of those 597 were assessed in 28 days.Since 1st Sept 2016 of the 521 assessments completed for new requests, 416 were completed in 28 days.
Executive Performance Report for 2016-17
Adults and older clients who have been reviewed as a percentage of those receiving a service
Nick Ellender, Adult Social Care, People Directorate
2014-15 2015-16 2016-17
2016-17
50.0%
60.0%
70.0%
80.0%
90.0%
100.0%
Actual
Target
Page 24 of 293
Ref / Description: 15Responsible Officer / Service:
Q1
Apr - Jun
Q2
Jul - Sep
Q3
Oct - Dec
Q4
Jan - Mar
Actual 52.6% 65.1% 79.8% 59.1% 61.8% 89.1% 79.8%Target 90.0% 90.0% 90.0% 90.0% 90.0% 90.0% 90.0%Actual (Numbers)
N/A 473 597 188 341 454 597Dir of Travel
National n/a n/a n/a n/a n/a n/aStat Neighbours n/a n/a n/a n/a n/a n/aPurpose of Indicator:
Commentary for this Period:
Additional information or supplementary indicators:
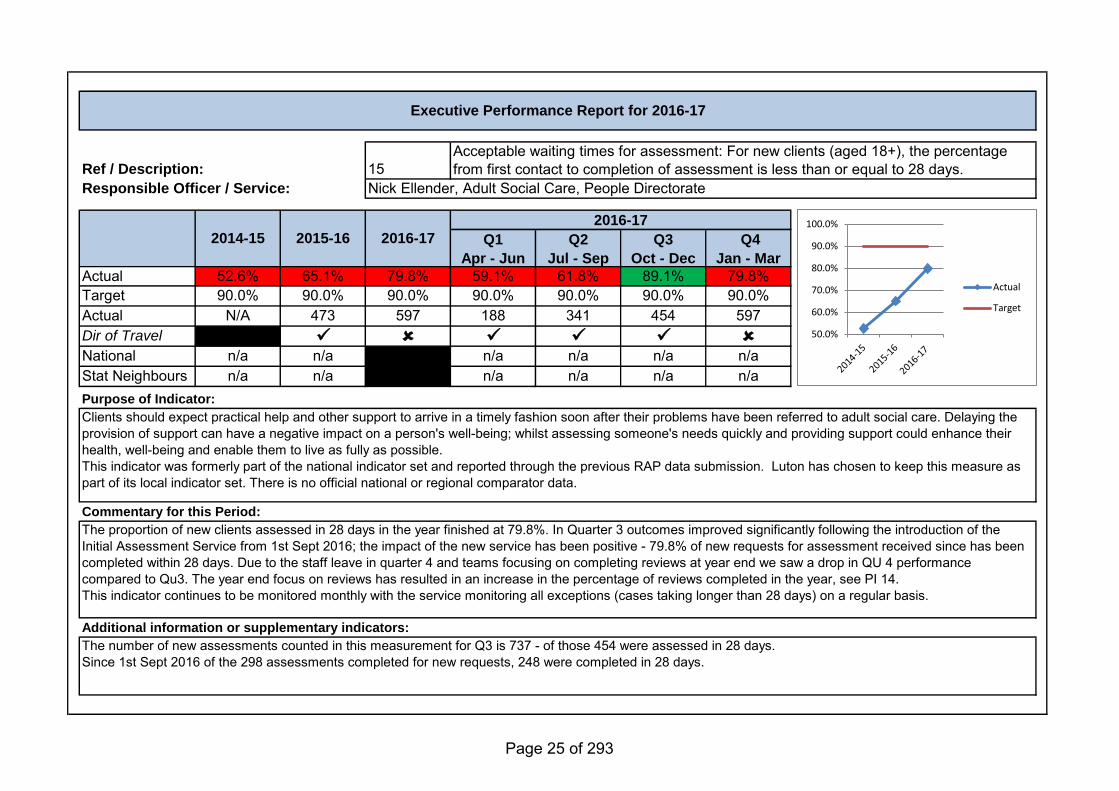
Clients should expect practical help and other support to arrive in a timely fashion soon after their problems have been referred to adult social care. Delaying the provision of support can have a negative impact on a person's well-being; whilst assessing someone's needs quickly and providing support could enhance their health, well-being and enable them to live as fully as possible.This indicator was formerly part of the national indicator set and reported through the previous RAP data submission. Luton has chosen to keep this measure as part of its local indicator set. There is no official national or regional comparator data.
The proportion of new clients assessed in 28 days in the year finished at 79.8%. In Quarter 3 outcomes improved significantly following the introduction of the Initial Assessment Service from 1st Sept 2016; the impact of the new service has been positive - 79.8% of new requests for assessment received since has been completed within 28 days. Due to the staff leave in quarter 4 and teams focusing on completing reviews at year end we saw a drop in QU 4 performance compared to Qu3. The year end focus on reviews has resulted in an increase in the percentage of reviews completed in the year, see PI 14.This indicator continues to be monitored monthly with the service monitoring all exceptions (cases taking longer than 28 days) on a regular basis.
The number of new assessments counted in this measurement for Q3 is 737 - of those 454 were assessed in 28 days.Since 1st Sept 2016 of the 298 assessments completed for new requests, 248 were completed in 28 days.
Executive Performance Report for 2016-17
Acceptable waiting times for assessment: For new clients (aged 18+), the percentage from first contact to completion of assessment is less than or equal to 28 days.
Nick Ellender, Adult Social Care, People Directorate
2014-15 2015-16 2016-17
2016-17
50.0%
60.0%
70.0%
80.0%
90.0%
100.0%
Actual
Target
Page 25 of 293
Ref / Description: 16Responsible Officer / Service:
Q1
Apr - Jun
Q2
Jul - Sep
Q3
Oct - Dec
Q4
Jan - Mar
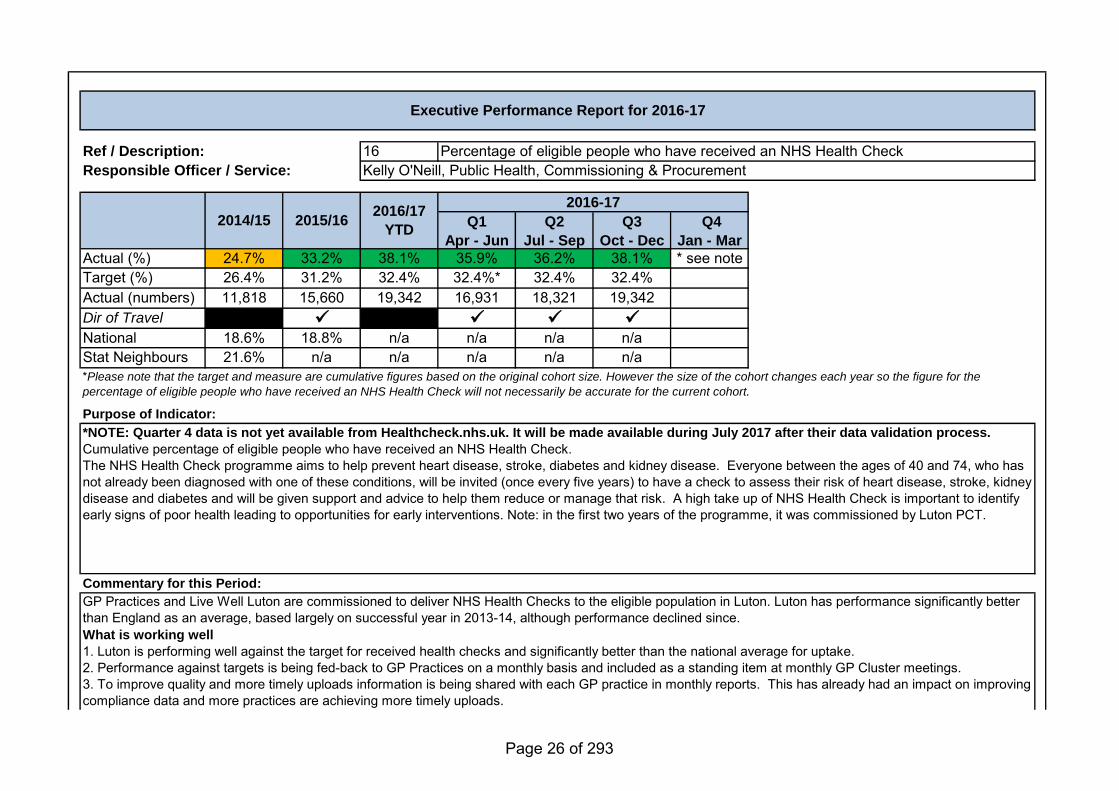
Actual (%) 24.7% 33.2% 38.1% 35.9% 36.2% 38.1% * see noteTarget (%) 26.4% 31.2% 32.4% 32.4%* 32.4% 32.4%Actual (numbers) 11,818 15,660 19,342 16,931 18,321 19,342Dir of Travel
National 18.6% 18.8% n/a n/a n/a n/aStat Neighbours 21.6% n/a n/a n/a n/a n/a
Purpose of Indicator:
Commentary for this Period:
*Please note that the target and measure are cumulative figures based on the original cohort size. However the size of the cohort changes each year so the figure for the
percentage of eligible people who have received an NHS Health Check will not necessarily be accurate for the current cohort.
*NOTE: Quarter 4 data is not yet available from Healthcheck.nhs.uk. It will be made available during July 2017 after their data validation process.
Cumulative percentage of eligible people who have received an NHS Health Check.The NHS Health Check programme aims to help prevent heart disease, stroke, diabetes and kidney disease. Everyone between the ages of 40 and 74, who has not already been diagnosed with one of these conditions, will be invited (once every five years) to have a check to assess their risk of heart disease, stroke, kidney disease and diabetes and will be given support and advice to help them reduce or manage that risk. A high take up of NHS Health Check is important to identify early signs of poor health leading to opportunities for early interventions. Note: in the first two years of the programme, it was commissioned by Luton PCT.
GP Practices and Live Well Luton are commissioned to deliver NHS Health Checks to the eligible population in Luton. Luton has performance significantly better than England as an average, based largely on successful year in 2013-14, although performance declined since.What is working well
1. Luton is performing well against the target for received health checks and significantly better than the national average for uptake.2. Performance against targets is being fed-back to GP Practices on a monthly basis and included as a standing item at monthly GP Cluster meetings.3. To improve quality and more timely uploads information is being shared with each GP practice in monthly reports. This has already had an impact on improving compliance data and more practices are achieving more timely uploads. 4. Monitoring and support meetings are being made with GPs gaining insight into the barriers and challenges. Shared tips based on latest evidence have been sharedCurrent work streams
1. Latest evidence and tips are shared with GPs to support their conversion and uptake of a health check. Some GP practices are more successfully inventive. For example one GP sends all 40 year olds a birthday card and invitation to a health check. Text message is known to have a greater impact on uptake and this has been shared with practices. 2. Online training for all delivery staff and a face to face training held in Autumn 20174. Working closely with National Diabetes Prevention Programme which launches in Luton in June.What is not working well
1. Compliance data in the area of audit C [alcohol] question and Qrisk are poor for some practices – efforts mentioned above are being implemented to improve this situation. Problems with Audit C question are being experienced national and has been raised with regional network colleagues.2. Further work is needed to provide assurances of quality of Health Checks and further steps to ensure quality meets best practice standards. 3. There is a disparity in GP practice performance; the above are some of the areas being implemented to resolve issues.
Executive Performance Report for 2016-17
Percentage of eligible people who have received an NHS Health CheckKelly O'Neill, Public Health, Commissioning & Procurement
2014/15 2015/162016/17
YTD
2016-17
Page 26 of 293
Additional information or supplementary indicators:
GP Practices and Live Well Luton are commissioned to deliver NHS Health Checks to the eligible population in Luton. Luton has performance significantly better than England as an average, based largely on successful year in 2013-14, although performance declined since.What is working well
1. Luton is performing well against the target for received health checks and significantly better than the national average for uptake.2. Performance against targets is being fed-back to GP Practices on a monthly basis and included as a standing item at monthly GP Cluster meetings.3. To improve quality and more timely uploads information is being shared with each GP practice in monthly reports. This has already had an impact on improving compliance data and more practices are achieving more timely uploads. 4. Monitoring and support meetings are being made with GPs gaining insight into the barriers and challenges. Shared tips based on latest evidence have been sharedCurrent work streams
1. Latest evidence and tips are shared with GPs to support their conversion and uptake of a health check. Some GP practices are more successfully inventive. For example one GP sends all 40 year olds a birthday card and invitation to a health check. Text message is known to have a greater impact on uptake and this has been shared with practices. 2. Online training for all delivery staff and a face to face training held in Autumn 20174. Working closely with National Diabetes Prevention Programme which launches in Luton in June.What is not working well
1. Compliance data in the area of audit C [alcohol] question and Qrisk are poor for some practices – efforts mentioned above are being implemented to improve this situation. Problems with Audit C question are being experienced national and has been raised with regional network colleagues.2. Further work is needed to provide assurances of quality of Health Checks and further steps to ensure quality meets best practice standards. 3. There is a disparity in GP practice performance; the above are some of the areas being implemented to resolve issues.
Percentage of the eligible population, aged 40 – 74 years, receiving an NHS Health Check since 1 April 2013.Data available from: http://www.healthcheck.nhs.uk/interactive_map/Target = 66% of the annual 20% of eligible cohort (cumulative).
Page 27 of 293
Ref / Description: 17Responsible Officer / Service:
Q1 Apr -
Jun
Q2 Jul -
Sep
Q3 Oct -
Dec
Q4 Jan
- Mar
Actual (%) 7.0% 8.9% 8.3% 8.0% 8.8% 8.6% 8.3%Target (%) n/a 8.0% 8.0% 8.0% 8.0% 8.0% 8.0%Dir of Travel
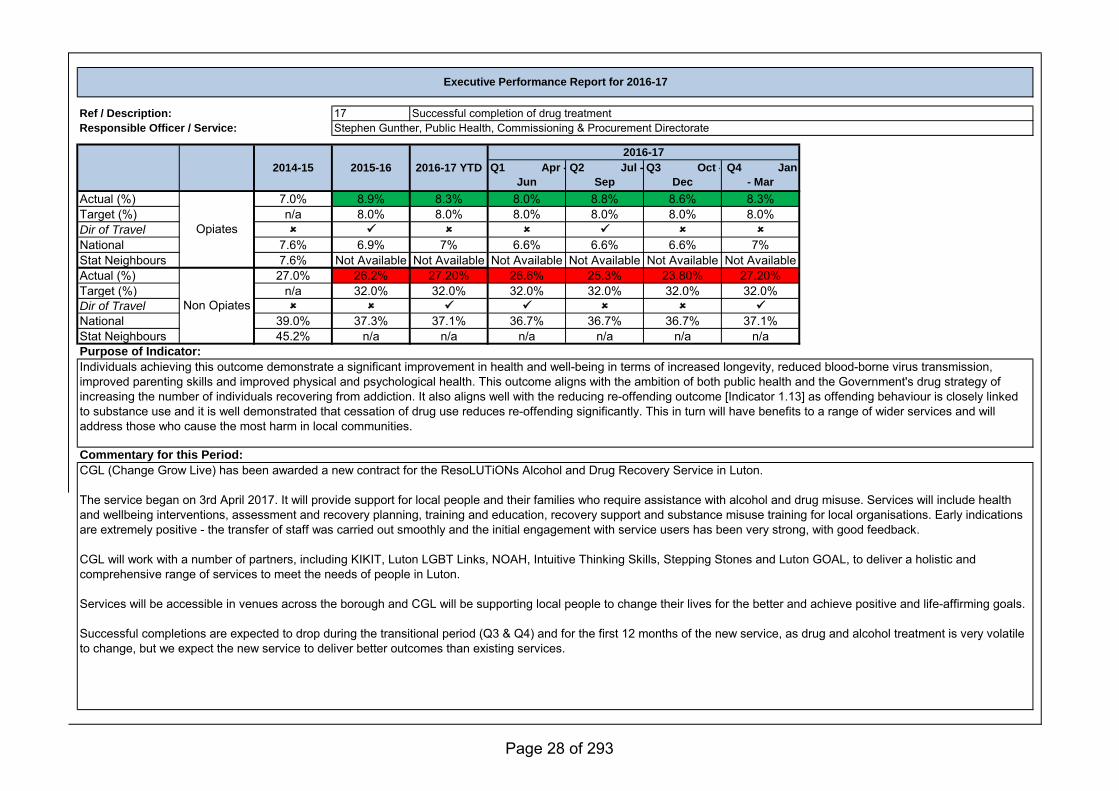
National 7.6% 6.9% 7% 6.6% 6.6% 6.6% 7%Stat Neighbours 7.6% Not Available Not Available Not Available Not Available Not Available Not AvailableActual (%) 27.0% 26.2% 27.20% 26.6% 25.3% 23.80% 27.20%Target (%) n/a 32.0% 32.0% 32.0% 32.0% 32.0% 32.0%Dir of Travel
National 39.0% 37.3% 37.1% 36.7% 36.7% 36.7% 37.1%Stat Neighbours 45.2% n/a n/a n/a n/a n/a n/aPurpose of Indicator:
Commentary for this Period:
Executive Performance Report for 2016-17
Successful completion of drug treatmentStephen Gunther, Public Health, Commissioning & Procurement Directorate
Opiates
Non Opiates
2014-15 2015-16 2016-17 YTD
2016-17
Individuals achieving this outcome demonstrate a significant improvement in health and well-being in terms of increased longevity, reduced blood-borne virus transmission, improved parenting skills and improved physical and psychological health. This outcome aligns with the ambition of both public health and the Government's drug strategy of increasing the number of individuals recovering from addiction. It also aligns well with the reducing re-offending outcome [Indicator 1.13] as offending behaviour is closely linked to substance use and it is well demonstrated that cessation of drug use reduces re-offending significantly. This in turn will have benefits to a range of wider services and will address those who cause the most harm in local communities.
CGL (Change Grow Live) has been awarded a new contract for the ResoLUTiONs Alcohol and Drug Recovery Service in Luton.
The service began on 3rd April 2017. It will provide support for local people and their families who require assistance with alcohol and drug misuse. Services will include health and wellbeing interventions, assessment and recovery planning, training and education, recovery support and substance misuse training for local organisations. Early indications are extremely positive - the transfer of staff was carried out smoothly and the initial engagement with service users has been very strong, with good feedback.
CGL will work with a number of partners, including KIKIT, Luton LGBT Links, NOAH, Intuitive Thinking Skills, Stepping Stones and Luton GOAL, to deliver a holistic and comprehensive range of services to meet the needs of people in Luton.
Services will be accessible in venues across the borough and CGL will be supporting local people to change their lives for the better and achieve positive and life-affirming goals.
Successful completions are expected to drop during the transitional period (Q3 & Q4) and for the first 12 months of the new service, as drug and alcohol treatment is very volatile to change, but we expect the new service to deliver better outcomes than existing services.
Page 28 of 293
Ref / Description: 18Responsible Officer / Service:
Q1
Apr - Jun
Q2
Jul - Sep
Q3
Oct - Dec
Q4
Jan - Mar
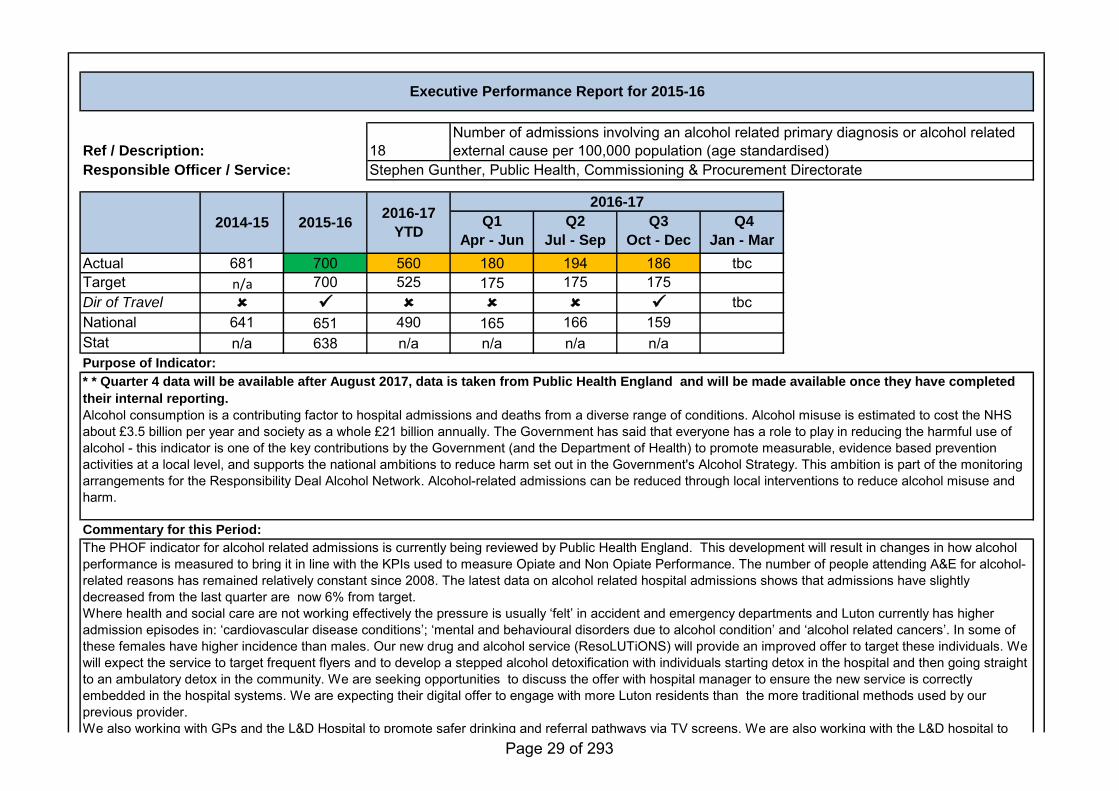
Actual 681 700 560 180 194 186 tbcTarget n/a 700 525 175 175 175Dir of Travel tbcNational 641 651 490 165 166 159Stat n/a 638 n/a n/a n/a n/aPurpose of Indicator:
Commentary for this Period:
The PHOF indicator for alcohol related admissions is currently being reviewed by Public Health England. This development will result in changes in how alcohol performance is measured to bring it in line with the KPIs used to measure Opiate and Non Opiate Performance. The number of people attending A&E for alcohol-related reasons has remained relatively constant since 2008. The latest data on alcohol related hospital admissions shows that admissions have slightly decreased from the last quarter are now 6% from target.Where health and social care are not working effectively the pressure is usually ‘felt’ in accident and emergency departments and Luton currently has higher admission episodes in: ‘cardiovascular disease conditions’; ‘mental and behavioural disorders due to alcohol condition’ and ‘alcohol related cancers’. In some of these females have higher incidence than males. Our new drug and alcohol service (ResoLUTiONS) will provide an improved offer to target these individuals. We will expect the service to target frequent flyers and to develop a stepped alcohol detoxification with individuals starting detox in the hospital and then going straight to an ambulatory detox in the community. We are seeking opportunities to discuss the offer with hospital manager to ensure the new service is correctly embedded in the hospital systems. We are expecting their digital offer to engage with more Luton residents than the more traditional methods used by our previous provider. We also working with GPs and the L&D Hospital to promote safer drinking and referral pathways via TV screens. We are also working with the L&D hospital to increase the in-reach of ResoLUTiONS alcohol treatment offer and to develop alcohol detox pathways.The downturn in performance this year is to be expected with the re-commissioning of our treatment services, but we will be looking for an improvement once ResoLUTiONs becomes established.
Executive Performance Report for 2015-16
2014-15 2015-16
Number of admissions involving an alcohol related primary diagnosis or alcohol related external cause per 100,000 population (age standardised)
Stephen Gunther, Public Health, Commissioning & Procurement Directorate
* * Quarter 4 data will be available after August 2017, data is taken from Public Health England and will be made available once they have completed
their internal reporting.
Alcohol consumption is a contributing factor to hospital admissions and deaths from a diverse range of conditions. Alcohol misuse is estimated to cost the NHS about £3.5 billion per year and society as a whole £21 billion annually. The Government has said that everyone has a role to play in reducing the harmful use of alcohol - this indicator is one of the key contributions by the Government (and the Department of Health) to promote measurable, evidence based prevention activities at a local level, and supports the national ambitions to reduce harm set out in the Government's Alcohol Strategy. This ambition is part of the monitoring arrangements for the Responsibility Deal Alcohol Network. Alcohol-related admissions can be reduced through local interventions to reduce alcohol misuse and harm.
2016-17
YTD
2016-17
Page 29 of 293
The PHOF indicator for alcohol related admissions is currently being reviewed by Public Health England. This development will result in changes in how alcohol performance is measured to bring it in line with the KPIs used to measure Opiate and Non Opiate Performance. The number of people attending A&E for alcohol-related reasons has remained relatively constant since 2008. The latest data on alcohol related hospital admissions shows that admissions have slightly decreased from the last quarter are now 6% from target.Where health and social care are not working effectively the pressure is usually ‘felt’ in accident and emergency departments and Luton currently has higher admission episodes in: ‘cardiovascular disease conditions’; ‘mental and behavioural disorders due to alcohol condition’ and ‘alcohol related cancers’. In some of these females have higher incidence than males. Our new drug and alcohol service (ResoLUTiONS) will provide an improved offer to target these individuals. We will expect the service to target frequent flyers and to develop a stepped alcohol detoxification with individuals starting detox in the hospital and then going straight to an ambulatory detox in the community. We are seeking opportunities to discuss the offer with hospital manager to ensure the new service is correctly embedded in the hospital systems. We are expecting their digital offer to engage with more Luton residents than the more traditional methods used by our previous provider. We also working with GPs and the L&D Hospital to promote safer drinking and referral pathways via TV screens. We are also working with the L&D hospital to increase the in-reach of ResoLUTiONS alcohol treatment offer and to develop alcohol detox pathways.The downturn in performance this year is to be expected with the re-commissioning of our treatment services, but we will be looking for an improvement once ResoLUTiONs becomes established.
Page 30 of 293
Ref / Description: 19Responsible Officer / Service:
Q1 Apr -
Jun
Q2 Jul -
Sep
Q3 Oct -
Dec
Q4
Jan - Mar
Actual 24295 25159 26983 6574 6520 7007 6882Target n/a 17676 23917 5979 5979 5979 5979Dir of Travel
National n/a n/a n/a n/a n/a n/aStat Neighbours
n/a n/a n/a n/a n/a n/a
Purpose of Indicator:
Commentary for this Period:
Additional information or supplementary indicators:
The outcome of this measure should be a reduction in non-elective admissions which can be influenced by effective collaboration across the health and care system.Non-Elective admission data is derived from the Monthly Activity Return (MAR), which is collected from the NHS. It is collected from providers (both NHSand IS) who provide the data broken down by Commissioner. This indicator is set nationally by NHSE and the Better Care Fund (BCF) performance funds are linked to this metric. The 2016-17 target has been set at 23917, and as per the above table this has been split into four equal quarters (5979).
The 2016-17 year end outturn for the total number of avoidable admissions was 26983 which is 12.8% over the target for the year (23917).Governance of this indicator sits with the Better Together Board. Consequently, there is a range of actions currently taking place to improve performance, including the development of Better Together programmes for the next financial year (17/18), which will contribute to a decrease in non-elective emergency admissions. Furthermore, the CCG have recently recommissioned out of hours services and the ‘111’ urgent care system has been recommissioned for 2017/18, which are also likely to impact. Further work is therefore required to reduce demand for acute services including improving and strengthening self-care and self-management, and maintaining care in the community. A number of programmes of work across the Luton health economy will be addressing this, such as long term condition work programmes, social prescriptions, and falls prevention work. Within these programmes, strengthening self-care and self-management forms a major part of activity. In addition, and supporting this, LCCG has a self-care strategic framework pulling together the programme of work.
This metric is one of 4 set nationally for the BCF.
Executive Performance Report for 2016-17
Avoidable Emergency Admissions.(Non elective emergency admissions - MAR data 15/16 comparison to 16/17 )
Tasnim Shah, Adult Social Care, People Directorate
2014-15 2015-16 2016-17 YTD
2016-17
Page 31 of 293
20
Q1
Apr - Jun
Q2
Jul - Sep
Q3
Oct - Dec
Q4
Jan - Mar
Actual (%) 98.05% 98.16% 98.11% 98.13% 97.97% 98.06% 98.11%Target (%) 98.53% 98.50% 98.39% 98.39% 98.39% 98.39% 98.39%Dir of Travel
National n/a n/a n/a n/a n/a n/aStat Neighbours n/a n/a n/a n/a n/a n/a
Purpose of Indicator:
Commentary for this Period:
Additional information:
Benefit and Universal Credit reforms are taking shape which will put more severe pressure on the rental income collection levels, however a restructure of housing services is taking place to make more officers active in collecting rent within the neighbourhood areas and help tenants.
Executive Performance Report for 2016-17
Ref/Description Rent collected as a percentage of rent owed (Council Tenants)Responsible Officer/Service Ian Cartmell, Head of Housing Operations, Customer & Commercial Directorate
2014-15 2015-162016-17
YTD
2016-17
Note: The RAG is based on 0.05% variance from target (the 0.05% variance is used because the standard 5% would result in a larger outstanding rent
amount (this was agreed by Patrick Odling Smee, Head of Housing).
This indicator measures the level of rent arrears within Council managed housing stock and will enable future comparisons on the impact of Welfare Reform changes which are imminent. The national comparison is with unitary local authorities such as Bristol and Darlington using BVPI 66A.
Housing Services has restructured and has moved to the new Housing Operations structure this has had an effect on rents performance. We are confident that the new structure will drive up performance going forward for 2017/18. We have invested in every front line officer equipping when with a IT tablet to assist in collecting rent on the doorstop. We have only just missed the 98.39% target and everything possible will be done next financial year and I am confident this will happen with our new approach to rent collection.
Page 32 of 293
Ref/Description 21
Responsible Officer/Service
Q1
Apr - Jun
Q2
Jul - Sep
Q3
Oct - Dec
Q4
Jan - Mar
Actual 121 202 4 219 92 3 4Target n/a n/a 0 n/a 150 100 50Dir of Travel
National n/a n/aStat Neighbours
n/a n/a
Actual n/a n/a 340 67 224 315 340Target n/a n/a 259 n/a 86 173 259Dir of Travel
National n/a n/a
Stat Neighbours
n/a n/a
Actual 1008 1077 562 935 901 789 562Target n/a n/a tbc n/a 930 tbc tbcDir of Travel
National n/a n/aStat Neighbours
n/a n/a
Purpose of Indicator:
Executive Performance Report for 2016-17
Number of households in Bed & Breakfast, Nightly Rate and Temporary AccommodationPatrick Odling Smee (Darren Alexandra), Housing Solutions Manager, Customer & Commercial Directorate
2014-15 2015-162016-17
YTD
2016-17
Bed and Breakfast (B&B)
Nightly Rate (NR)
Temporary Accommodation
(PSL)
To measure the increase/decrease in Council managed (directly/indirectly) temporary housing i.e. bed and breakfast, self contained nightly rate interim accommodation and long term leased temporary accommodation. To monitor B&B exit plan and make necessary adjustments in a timely fashion while ensuring we provide a more stable and higher quality form of temporary accommodation.
Page 33 of 293
Commentary for this Period:
Additional information:
1) Bed and Breakfast B&B - Corporate hotels providing a single room for the night (no kitchen/cooking facilities)2) Nightly Rate Accommodation - Self contained properties with nightly letting (licence) arrangements between tenant and provider3) Temporary Accommodation (PSL) - leased (long term) arrangements between Council and provider4) Assured shorthold tenancies (ASTs) Agreement between landlord and tenant in the private sector 5) Temporary Accommodation Hostel (Supported HB Element)
In Q4 we have successfully managed to exit B&B as planned with the only 4 households remain all of which require specially adapted accommodation. We have procured over 300 nightly rate properties to sufficiently accommodate households moving out of B&B and new households entering temporary accommodation. Focus will now be given to reduce this number of households in nightly rate accommodation as well as reduce the number of new placements however the number did increase in Q4. We have established Rutland House a 54 unit temporary accommodation hostel with third sector support for families, this is a cheaper model of TA and one we intend to explore going forward. Purley Centre is now empty and ready for demolition.
Page 34 of 293
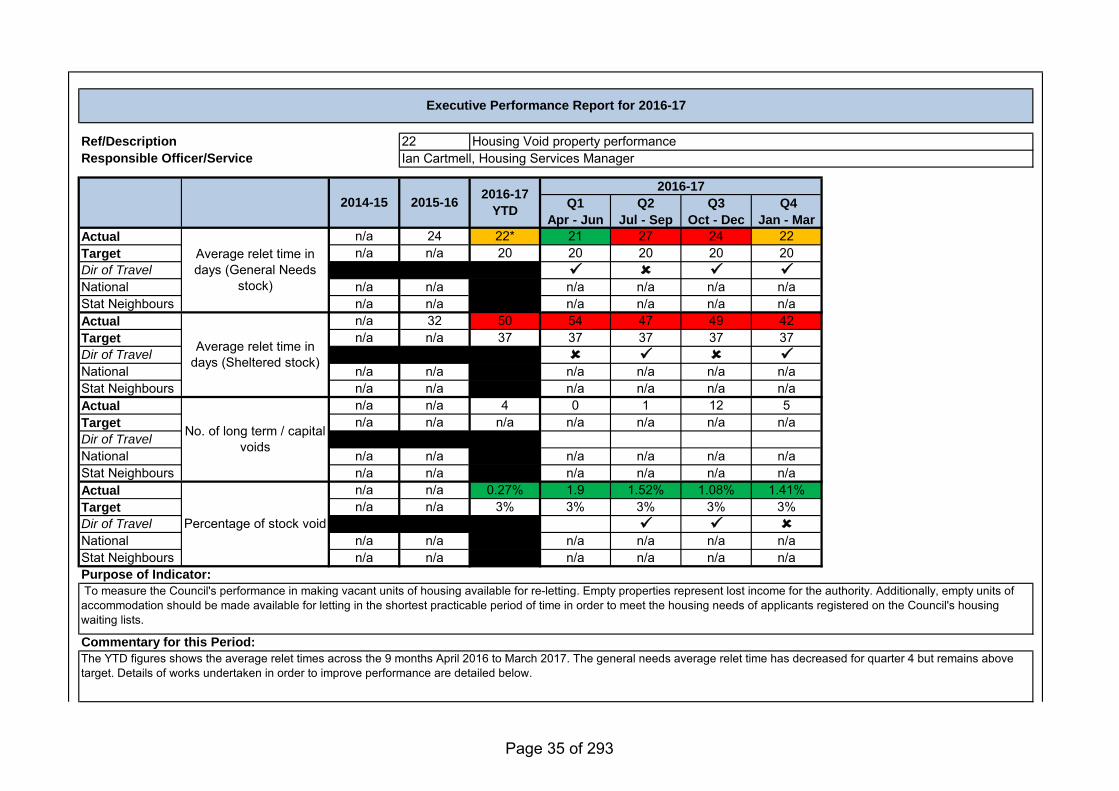
Ref/Description 22Responsible Officer/Service
Q1
Apr - Jun
Q2
Jul - Sep
Q3
Oct - Dec
Q4
Jan - Mar
Actual n/a 24 22* 21 27 24 22Target n/a n/a 20 20 20 20 20Dir of Travel
National n/a n/a n/a n/a n/a n/aStat Neighbours n/a n/a n/a n/a n/a n/aActual n/a 32 50 54 47 49 42Target n/a n/a 37 37 37 37 37Dir of Travel
National n/a n/a n/a n/a n/a n/aStat Neighbours n/a n/a n/a n/a n/a n/aActual n/a n/a 4 0 1 12 5Target n/a n/a n/a n/a n/a n/a n/aDir of Travel
National n/a n/a n/a n/a n/a n/aStat Neighbours n/a n/a n/a n/a n/a n/aActual n/a n/a 0.27% 1.9 1.52% 1.08% 1.41%Target n/a n/a 3% 3% 3% 3% 3%Dir of Travel
National n/a n/a n/a n/a n/a n/aStat Neighbours n/a n/a n/a n/a n/a n/aPurpose of Indicator:
Commentary for this Period:
Executive Performance Report for 2016-17
Housing Void property performanceIan Cartmell, Housing Services Manager
2014-15 2015-162016-17
YTD
2016-17
Average relet time in days (General Needs
stock)
Average relet time in days (Sheltered stock)
No. of long term / capital voids
Percentage of stock void
To measure the Council's performance in making vacant units of housing available for re-letting. Empty properties represent lost income for the authority. Additionally, empty units of accommodation should be made available for letting in the shortest practicable period of time in order to meet the housing needs of applicants registered on the Council's housing waiting lists.
The YTD figures shows the average relet times across the 9 months April 2016 to March 2017. The general needs average relet time has decreased for quarter 4 but remains above target. Details of works undertaken in order to improve performance are detailed below.
Page 35 of 293
Additional information or supplementary indicators:
The service has formulated an Action Plan detailing measures to be undertaken in order to drive continued performance improvement and to achieve performance targets. Measures include:• Benchmarking with sub-regional partner landlords and through a national bench-marking platform (Housemark) which will be utilised to compare performance, and good practice, with top-performing landlords;• Through the introduction of an “Exit Standard”, Rechargeable Repair procedure and by introducing Incentives to vacating tenants, reduce the level of remedial works required on empty dwellings by improving the condition of properties when they are vacated;• Change from fortnightly to weekly advertising on our Choice Based Lettings service;• Increase the number of remedial works that are undertaken within the pre and post void periods;• Computer-based technology will be reviewed with a view to changing systems in order to drive efficiencies;• Encouraging closer working between teams participating in the end-to-end void process.
1) General needs housing - number of calendar days from the termination of the tenancy held by the previous occupier to the commencement of a new tenancy;2) Sheltered Accommodation - As per (1) above but relating to sheltered housing. 3) Long Term/Capital voids - properties that require major capital works or where the property has been identified for conversion or disposal;4) Percentage of stock void - this is an indicator of tenancy sustainability and will be benchmarked with other housing providers. To avoid double counting the figure quoted is based on completed “end to end” void periods for the quarter. This will serve to provide a true end of year figure.
Page 36 of 293
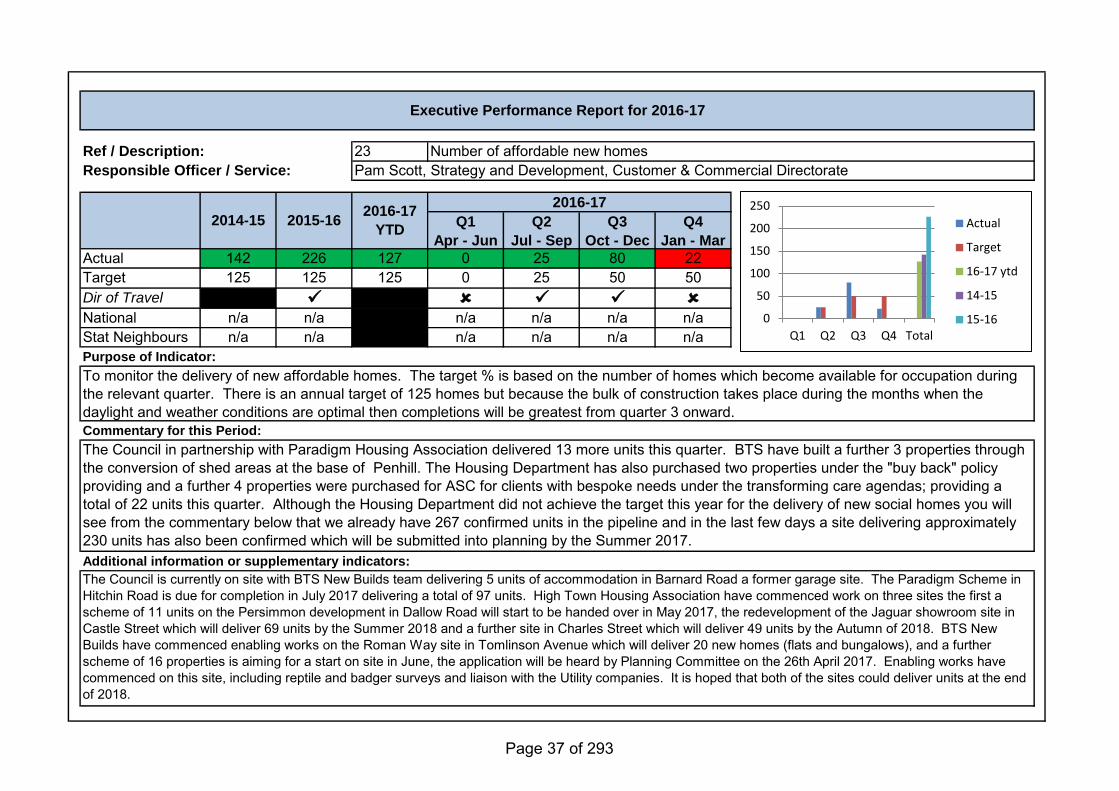
Ref / Description: 23Responsible Officer / Service:
Q1
Apr - Jun
Q2
Jul - Sep
Q3
Oct - Dec
Q4
Jan - Mar
Actual 142 226 127 0 25 80 22Target 125 125 125 0 25 50 50Dir of Travel
National n/a n/a n/a n/a n/a n/aStat Neighbours n/a n/a n/a n/a n/a n/aPurpose of Indicator:
Commentary for this Period:
Additional information or supplementary indicators:
To monitor the delivery of new affordable homes. The target % is based on the number of homes which become available for occupation during the relevant quarter. There is an annual target of 125 homes but because the bulk of construction takes place during the months when the daylight and weather conditions are optimal then completions will be greatest from quarter 3 onward.
The Council in partnership with Paradigm Housing Association delivered 13 more units this quarter. BTS have built a further 3 properties through the conversion of shed areas at the base of Penhill. The Housing Department has also purchased two properties under the "buy back" policy providing and a further 4 properties were purchased for ASC for clients with bespoke needs under the transforming care agendas; providing a total of 22 units this quarter. Although the Housing Department did not achieve the target this year for the delivery of new social homes you will see from the commentary below that we already have 267 confirmed units in the pipeline and in the last few days a site delivering approximately 230 units has also been confirmed which will be submitted into planning by the Summer 2017.
The Council is currently on site with BTS New Builds team delivering 5 units of accommodation in Barnard Road a former garage site. The Paradigm Scheme in Hitchin Road is due for completion in July 2017 delivering a total of 97 units. High Town Housing Association have commenced work on three sites the first a scheme of 11 units on the Persimmon development in Dallow Road will start to be handed over in May 2017, the redevelopment of the Jaguar showroom site in Castle Street which will deliver 69 units by the Summer 2018 and a further site in Charles Street which will deliver 49 units by the Autumn of 2018. BTS New Builds have commenced enabling works on the Roman Way site in Tomlinson Avenue which will deliver 20 new homes (flats and bungalows), and a further scheme of 16 properties is aiming for a start on site in June, the application will be heard by Planning Committee on the 26th April 2017. Enabling works have commenced on this site, including reptile and badger surveys and liaison with the Utility companies. It is hoped that both of the sites could deliver units at the end of 2018.
Executive Performance Report for 2016-17
Number of affordable new homesPam Scott, Strategy and Development, Customer & Commercial Directorate
2014-15 2015-162016-17
YTD
2016-17
0
50
100
150
200
250
Q1 Q2 Q3 Q4 Total
Actual
Target
16-17 ytd
14-15
15-16
Page 37 of 293
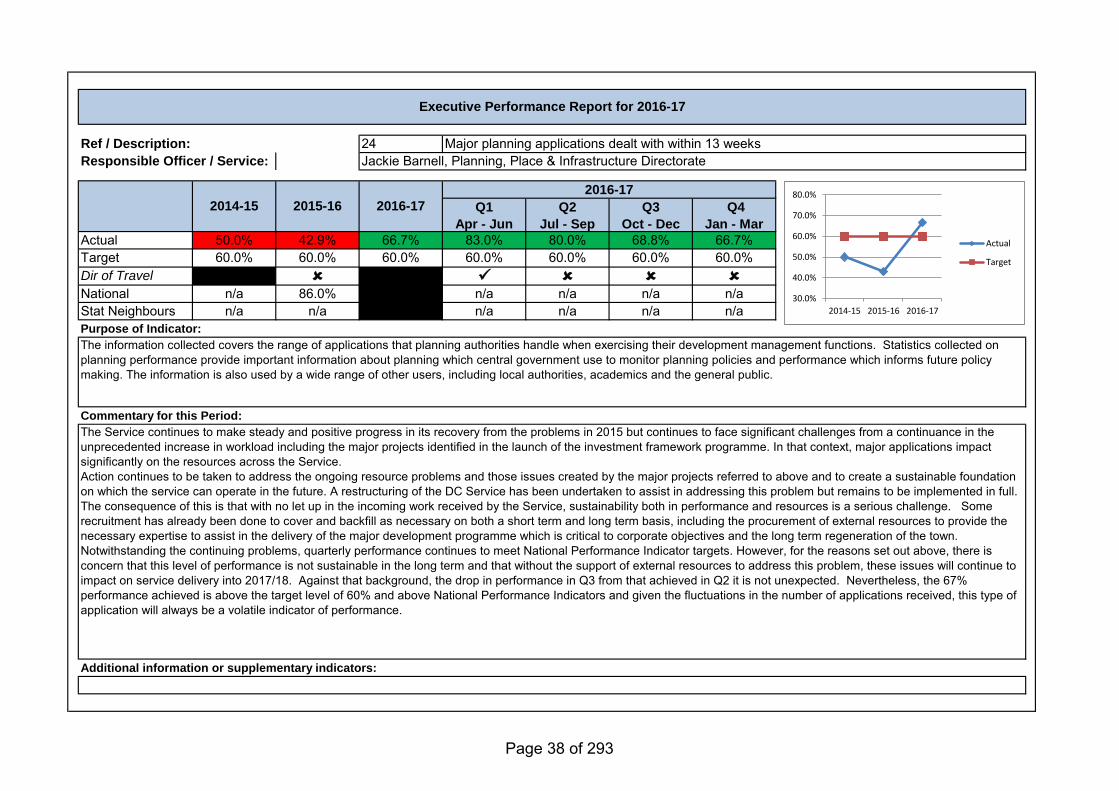
Ref / Description: 24Responsible Officer / Service:
Q1
Apr - Jun
Q2
Jul - Sep
Q3
Oct - Dec
Q4
Jan - Mar
Actual 50.0% 42.9% 66.7% 83.0% 80.0% 68.8% 66.7%Target 60.0% 60.0% 60.0% 60.0% 60.0% 60.0% 60.0%Dir of Travel
National n/a 86.0% n/a n/a n/a n/aStat Neighbours n/a n/a n/a n/a n/a n/aPurpose of Indicator:
Commentary for this Period:
Additional information or supplementary indicators:
The information collected covers the range of applications that planning authorities handle when exercising their development management functions. Statistics collected on planning performance provide important information about planning which central government use to monitor planning policies and performance which informs future policy making. The information is also used by a wide range of other users, including local authorities, academics and the general public.
The Service continues to make steady and positive progress in its recovery from the problems in 2015 but continues to face significant challenges from a continuance in the unprecedented increase in workload including the major projects identified in the launch of the investment framework programme. In that context, major applications impact significantly on the resources across the Service. Action continues to be taken to address the ongoing resource problems and those issues created by the major projects referred to above and to create a sustainable foundation on which the service can operate in the future. A restructuring of the DC Service has been undertaken to assist in addressing this problem but remains to be implemented in full. The consequence of this is that with no let up in the incoming work received by the Service, sustainability both in performance and resources is a serious challenge. Some recruitment has already been done to cover and backfill as necessary on both a short term and long term basis, including the procurement of external resources to provide the necessary expertise to assist in the delivery of the major development programme which is critical to corporate objectives and the long term regeneration of the town.Notwithstanding the continuing problems, quarterly performance continues to meet National Performance Indicator targets. However, for the reasons set out above, there is concern that this level of performance is not sustainable in the long term and that without the support of external resources to address this problem, these issues will continue to impact on service delivery into 2017/18. Against that background, the drop in performance in Q3 from that achieved in Q2 it is not unexpected. Nevertheless, the 67% performance achieved is above the target level of 60% and above National Performance Indicators and given the fluctuations in the number of applications received, this type of application will always be a volatile indicator of performance.
Executive Performance Report for 2016-17
Major planning applications dealt with within 13 weeksJackie Barnell, Planning, Place & Infrastructure Directorate
2014-15 2015-16 2016-17
2016-17
30.0%
40.0%
50.0%
60.0%
70.0%
80.0%
2014-15 2015-16 2016-17
Actual
Target
Page 38 of 293
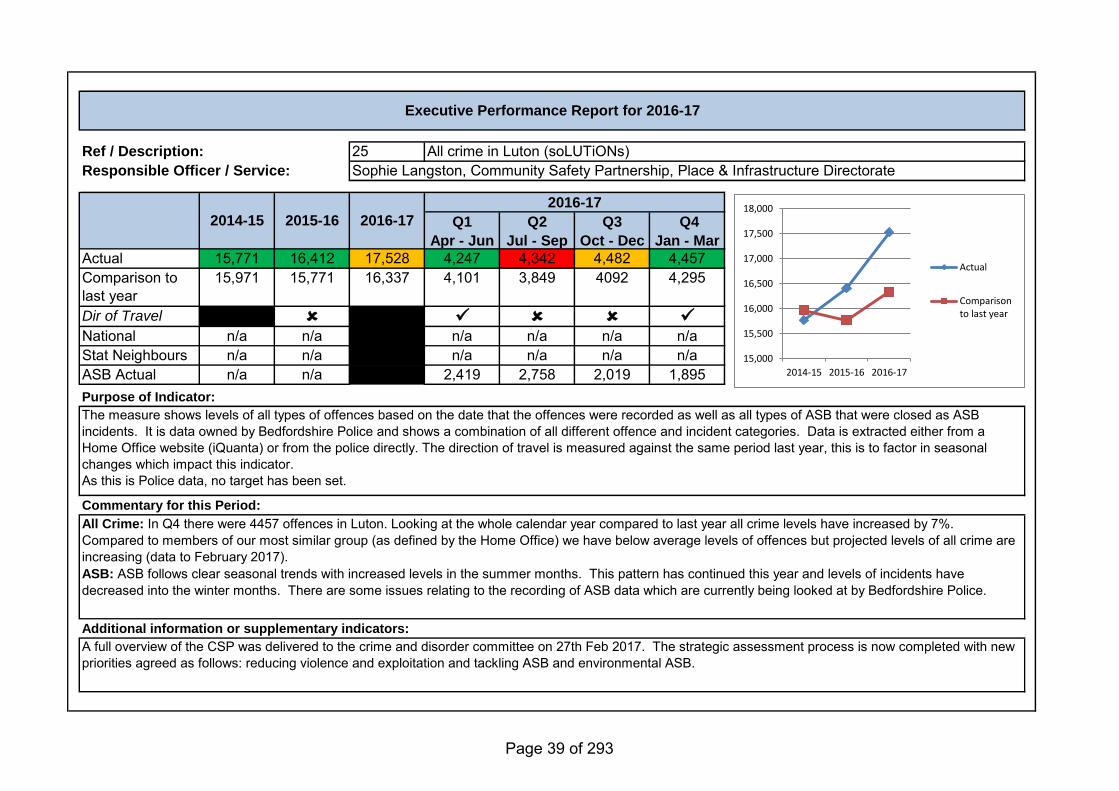
Ref / Description: 25Responsible Officer / Service:
Q1
Apr - Jun
Q2
Jul - Sep
Q3
Oct - Dec
Q4
Jan - Mar
Actual 15,771 16,412 17,528 4,247 4,342 4,482 4,457Comparison to last year
15,971 15,771 16,337 4,101 3,849 4092 4,295
Dir of Travel
National n/a n/a n/a n/a n/a n/aStat Neighbours n/a n/a n/a n/a n/a n/aASB Actual n/a n/a 2,419 2,758 2,019 1,895Purpose of Indicator:
Commentary for this Period:
Additional information or supplementary indicators:
The measure shows levels of all types of offences based on the date that the offences were recorded as well as all types of ASB that were closed as ASB incidents. It is data owned by Bedfordshire Police and shows a combination of all different offence and incident categories. Data is extracted either from a Home Office website (iQuanta) or from the police directly. The direction of travel is measured against the same period last year, this is to factor in seasonal changes which impact this indicator.As this is Police data, no target has been set.
All Crime: In Q4 there were 4457 offences in Luton. Looking at the whole calendar year compared to last year all crime levels have increased by 7%. Compared to members of our most similar group (as defined by the Home Office) we have below average levels of offences but projected levels of all crime are increasing (data to February 2017). ASB: ASB follows clear seasonal trends with increased levels in the summer months. This pattern has continued this year and levels of incidents have decreased into the winter months. There are some issues relating to the recording of ASB data which are currently being looked at by Bedfordshire Police.
A full overview of the CSP was delivered to the crime and disorder committee on 27th Feb 2017. The strategic assessment process is now completed with new priorities agreed as follows: reducing violence and exploitation and tackling ASB and environmental ASB.
Executive Performance Report for 2016-17
All crime in Luton (soLUTiONs)Sophie Langston, Community Safety Partnership, Place & Infrastructure Directorate
2014-15 2015-16 2016-17
2016-17
15,000
15,500
16,000
16,500
17,000
17,500
18,000
2014-15 2015-16 2016-17
Actual
Comparisonto last year
Page 39 of 293
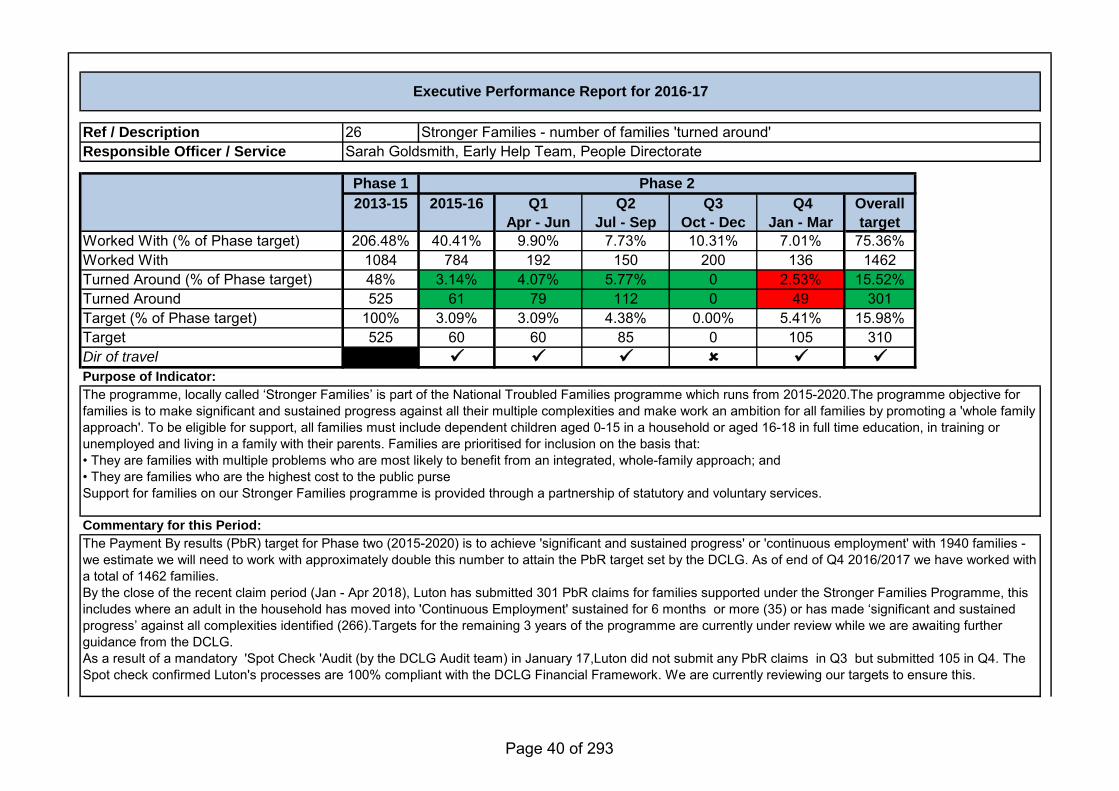
Ref / Description 26Responsible Officer / Service
Phase 1
2013-15 2015-16 Q1
Apr - Jun
Q2
Jul - Sep
Q3
Oct - Dec
Q4
Jan - Mar
Overall
target
Worked With (% of Phase target) 206.48% 40.41% 9.90% 7.73% 10.31% 7.01% 75.36%Worked With 1084 784 192 150 200 136 1462Turned Around (% of Phase target) 48% 3.14% 4.07% 5.77% 0 2.53% 15.52%Turned Around 525 61 79 112 0 49 301Target (% of Phase target) 100% 3.09% 3.09% 4.38% 0.00% 5.41% 15.98%Target 525 60 60 85 0 105 310Dir of travel
Purpose of Indicator:
Commentary for this Period:
The Payment By results (PbR) target for Phase two (2015-2020) is to achieve 'significant and sustained progress' or 'continuous employment' with 1940 families - we estimate we will need to work with approximately double this number to attain the PbR target set by the DCLG. As of end of Q4 2016/2017 we have worked with a total of 1462 families. By the close of the recent claim period (Jan - Apr 2018), Luton has submitted 301 PbR claims for families supported under the Stronger Families Programme, this includes where an adult in the household has moved into 'Continuous Employment' sustained for 6 months or more (35) or has made ‘significant and sustained progress’ against all complexities identified (266).Targets for the remaining 3 years of the programme are currently under review while we are awaiting further guidance from the DCLG.As a result of a mandatory 'Spot Check 'Audit (by the DCLG Audit team) in January 17,Luton did not submit any PbR claims in Q3 but submitted 105 in Q4. The Spot check confirmed Luton's processes are 100% compliant with the DCLG Financial Framework. We are currently reviewing our targets to ensure this.
Executive Performance Report for 2016-17
Stronger Families - number of families 'turned around'Sarah Goldsmith, Early Help Team, People Directorate
Phase 2
The programme, locally called ‘Stronger Families’ is part of the National Troubled Families programme which runs from 2015-2020.The programme objective for families is to make significant and sustained progress against all their multiple complexities and make work an ambition for all families by promoting a 'whole family approach'. To be eligible for support, all families must include dependent children aged 0-15 in a household or aged 16-18 in full time education, in training or unemployed and living in a family with their parents. Families are prioritised for inclusion on the basis that: • They are families with multiple problems who are most likely to benefit from an integrated, whole-family approach; and • They are families who are the highest cost to the public purseSupport for families on our Stronger Families programme is provided through a partnership of statutory and voluntary services.
Page 40 of 293
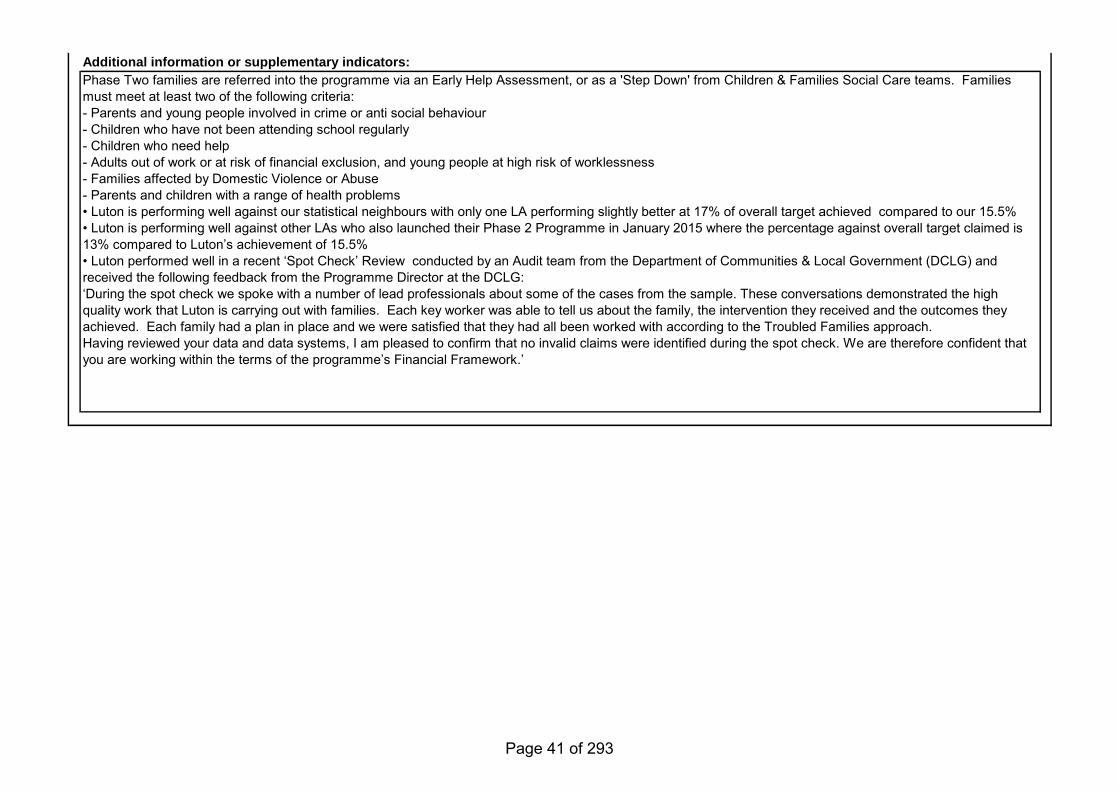
Additional information or supplementary indicators:
Phase Two families are referred into the programme via an Early Help Assessment, or as a 'Step Down' from Children & Families Social Care teams. Families must meet at least two of the following criteria:- Parents and young people involved in crime or anti social behaviour- Children who have not been attending school regularly- Children who need help- Adults out of work or at risk of financial exclusion, and young people at high risk of worklessness- Families affected by Domestic Violence or Abuse- Parents and children with a range of health problems • Luton is performing well against our statistical neighbours with only one LA performing slightly better at 17% of overall target achieved compared to our 15.5%• Luton is performing well against other LAs who also launched their Phase 2 Programme in January 2015 where the percentage against overall target claimed is 13% compared to Luton’s achievement of 15.5%• Luton performed well in a recent ‘Spot Check’ Review conducted by an Audit team from the Department of Communities & Local Government (DCLG) and received the following feedback from the Programme Director at the DCLG:‘During the spot check we spoke with a number of lead professionals about some of the cases from the sample. These conversations demonstrated the high quality work that Luton is carrying out with families. Each key worker was able to tell us about the family, the intervention they received and the outcomes they achieved. Each family had a plan in place and we were satisfied that they had all been worked with according to the Troubled Families approach. Having reviewed your data and data systems, I am pleased to confirm that no invalid claims were identified during the spot check. We are therefore confident that you are working within the terms of the programme’s Financial Framework.’
Page 41 of 293
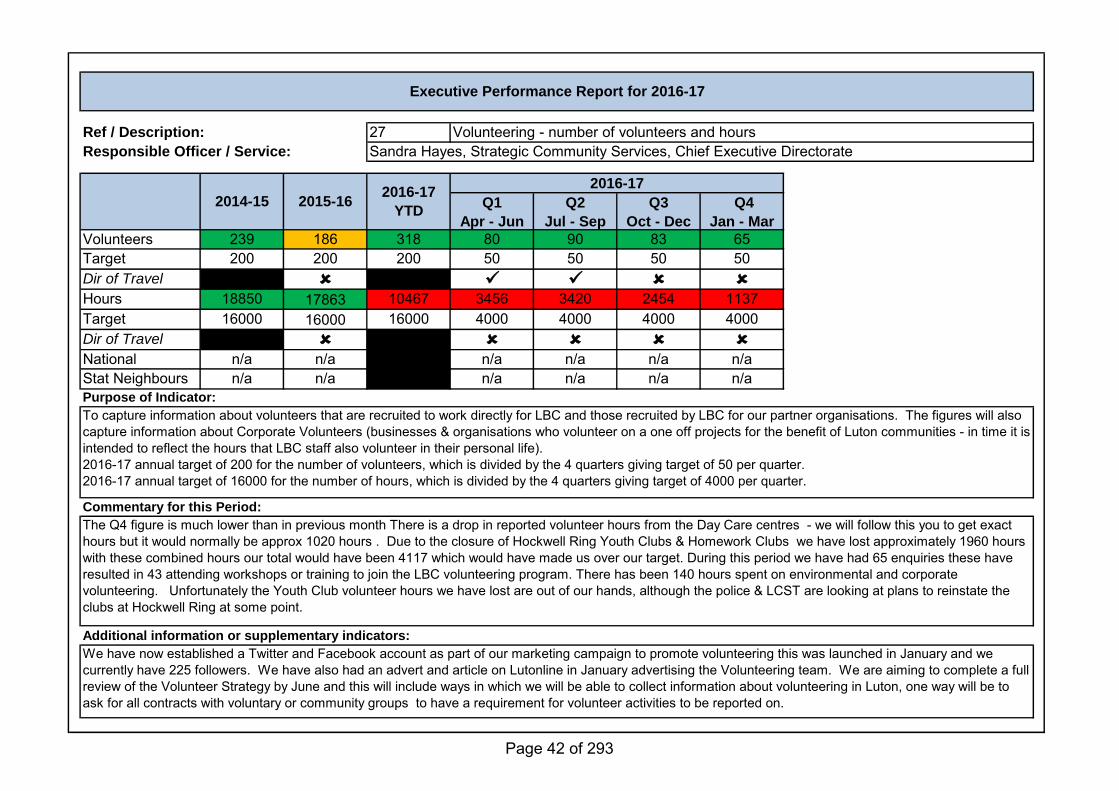
Ref / Description: 27Responsible Officer / Service:
Q1
Apr - Jun
Q2
Jul - Sep
Q3
Oct - Dec
Q4
Jan - Mar
Volunteers 239 186 318 80 90 83 65Target 200 200 200 50 50 50 50Dir of Travel
Hours 18850 17863 10467 3456 3420 2454 1137Target 16000 16000 16000 4000 4000 4000 4000Dir of Travel
National n/a n/a n/a n/a n/a n/aStat Neighbours n/a n/a n/a n/a n/a n/aPurpose of Indicator:
Commentary for this Period:
Additional information or supplementary indicators:
To capture information about volunteers that are recruited to work directly for LBC and those recruited by LBC for our partner organisations. The figures will also capture information about Corporate Volunteers (businesses & organisations who volunteer on a one off projects for the benefit of Luton communities - in time it is intended to reflect the hours that LBC staff also volunteer in their personal life).2016-17 annual target of 200 for the number of volunteers, which is divided by the 4 quarters giving target of 50 per quarter.2016-17 annual target of 16000 for the number of hours, which is divided by the 4 quarters giving target of 4000 per quarter.
The Q4 figure is much lower than in previous month There is a drop in reported volunteer hours from the Day Care centres - we will follow this you to get exact hours but it would normally be approx 1020 hours . Due to the closure of Hockwell Ring Youth Clubs & Homework Clubs we have lost approximately 1960 hours with these combined hours our total would have been 4117 which would have made us over our target. During this period we have had 65 enquiries these have resulted in 43 attending workshops or training to join the LBC volunteering program. There has been 140 hours spent on environmental and corporate volunteering. Unfortunately the Youth Club volunteer hours we have lost are out of our hands, although the police & LCST are looking at plans to reinstate the clubs at Hockwell Ring at some point.
We have now established a Twitter and Facebook account as part of our marketing campaign to promote volunteering this was launched in January and we currently have 225 followers. We have also had an advert and article on Lutonline in January advertising the Volunteering team. We are aiming to complete a full review of the Volunteer Strategy by June and this will include ways in which we will be able to collect information about volunteering in Luton, one way will be to ask for all contracts with voluntary or community groups to have a requirement for volunteer activities to be reported on.
Executive Performance Report for 2016-17
Volunteering - number of volunteers and hours Sandra Hayes, Strategic Community Services, Chief Executive Directorate
2014-15 2015-162016-17
YTD
2016-17
Page 42 of 293
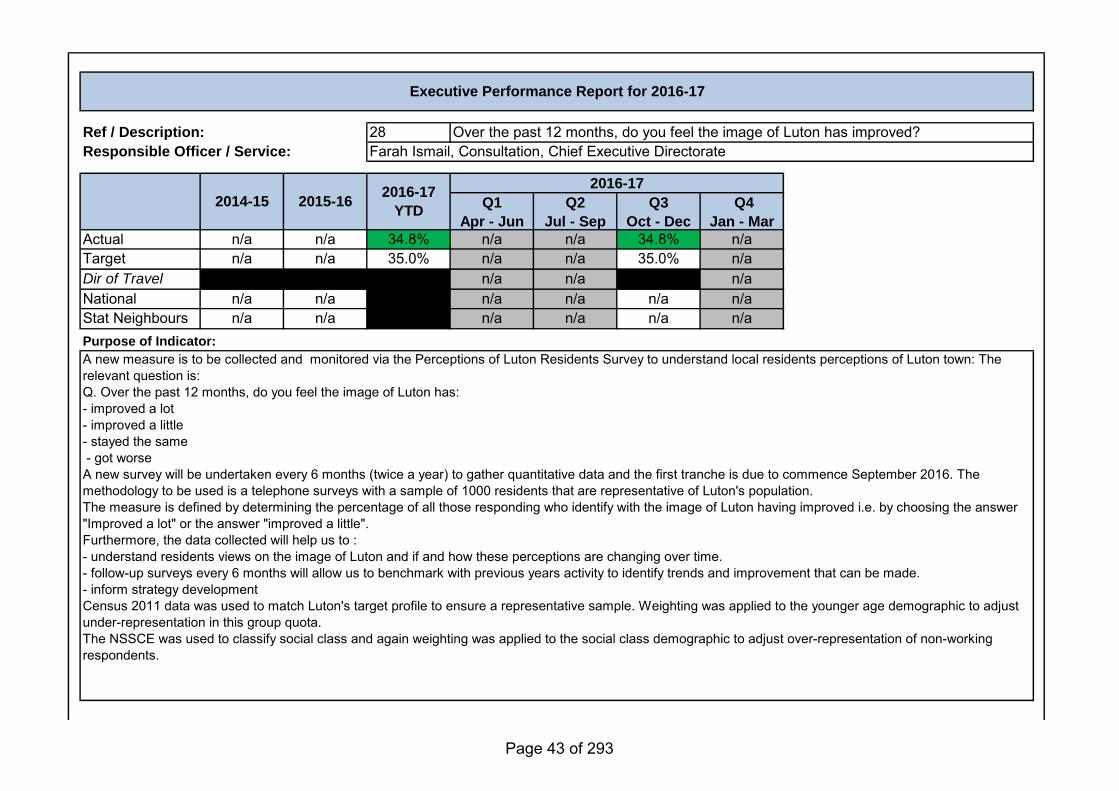
Ref / Description: 28Responsible Officer / Service:
Q1
Apr - Jun
Q2
Jul - Sep
Q3
Oct - Dec
Q4
Jan - Mar
Actual n/a n/a 34.8% n/a n/a 34.8% n/aTarget n/a n/a 35.0% n/a n/a 35.0% n/aDir of Travel n/a n/a n/aNational n/a n/a n/a n/a n/a n/aStat Neighbours n/a n/a n/a n/a n/a n/aPurpose of Indicator:
A new measure is to be collected and monitored via the Perceptions of Luton Residents Survey to understand local residents perceptions of Luton town: The relevant question is: Q. Over the past 12 months, do you feel the image of Luton has:- improved a lot- improved a little- stayed the same - got worse A new survey will be undertaken every 6 months (twice a year) to gather quantitative data and the first tranche is due to commence September 2016. The methodology to be used is a telephone surveys with a sample of 1000 residents that are representative of Luton's population. The measure is defined by determining the percentage of all those responding who identify with the image of Luton having improved i.e. by choosing the answer "Improved a lot" or the answer "improved a little". Furthermore, the data collected will help us to :- understand residents views on the image of Luton and if and how these perceptions are changing over time. - follow-up surveys every 6 months will allow us to benchmark with previous years activity to identify trends and improvement that can be made. - inform strategy developmentCensus 2011 data was used to match Luton's target profile to ensure a representative sample. Weighting was applied to the younger age demographic to adjust under-representation in this group quota.The NSSCE was used to classify social class and again weighting was applied to the social class demographic to adjust over-representation of non-working respondents.
Executive Performance Report for 2016-17
Over the past 12 months, do you feel the image of Luton has improved?Farah Ismail, Consultation, Chief Executive Directorate
2014-15 2015-162016-17
YTD
2016-17
Page 43 of 293
Commentary for this Period:
Additional information or supplementary indicators:
A telephone survey was carried out in September 2016, with a sample of 1000 Luton residents to capture their views on the image of Luton and their perceptions on various aspects of the town. Quotas were set for each of Luton’s 19 wards to allow data extraction at ward level. The fieldwork was undertaken by an independent research company to ensure impartiality and minimise the risk of skewing the findings due to factors such as social desirability. The survey findings are statistically robust.A new performance indicator has been set and information collected from October 2016 to measure local residents’ perceptions on the image of Luton and how it’s improving. Respondents were asked to indicate whether they feel the image of Luton has improved, stayed the same or worsened over the last 12 months. 35% of respondents feel the image has improved, 33% remain neutral by indicating stayed the same and 30% feel it’s worsened. 2% indicated don't know.A member briefing on the results is planned to take place in Feb / March 2017.
Overall, mixed views were expressed on this.Wards indicating high level of ‘improved’ response are Northwell (51%), Wigmore (49%) and Round Green (46%).Wards indicating high level of ‘worsened’ response are South (46%), Sundon Park (38%) Leagrave (37%) and Crawley (37%) wards.Wards indicating high level of ‘stayed the same’ response are Bramingham (43%), Limbury (42%), Farley (40%) and Challney (40%).
Notably, the younger residents (aged 16-29 years) most feel the image of Luton has improved over the last 12 months (43%) compared to the older age categories – 30-59 years (32%) and 60+ years (30%).A significantly higher ‘improved’ response from working / employed residents and students compared to non-working residents that indicate a higher ‘worsened’ response.
The findings of this survey have been presented to Luton Investment Framework Board and Senior Stakeholders, Senior Management Leadership Group and Leaders Brief. The next wave of this benchmarking tracker survey is planned to commence in April 2017. The methodology will be replicated - a telephone survey will be undertaken with a sample of 1000 local residents using the set of questions and sample quotas as the previous survey to minimise the risk of bias.The data captured from these surveys will continue to inform the Investment Framework Strategy and other relevant strategies
Page 44 of 293
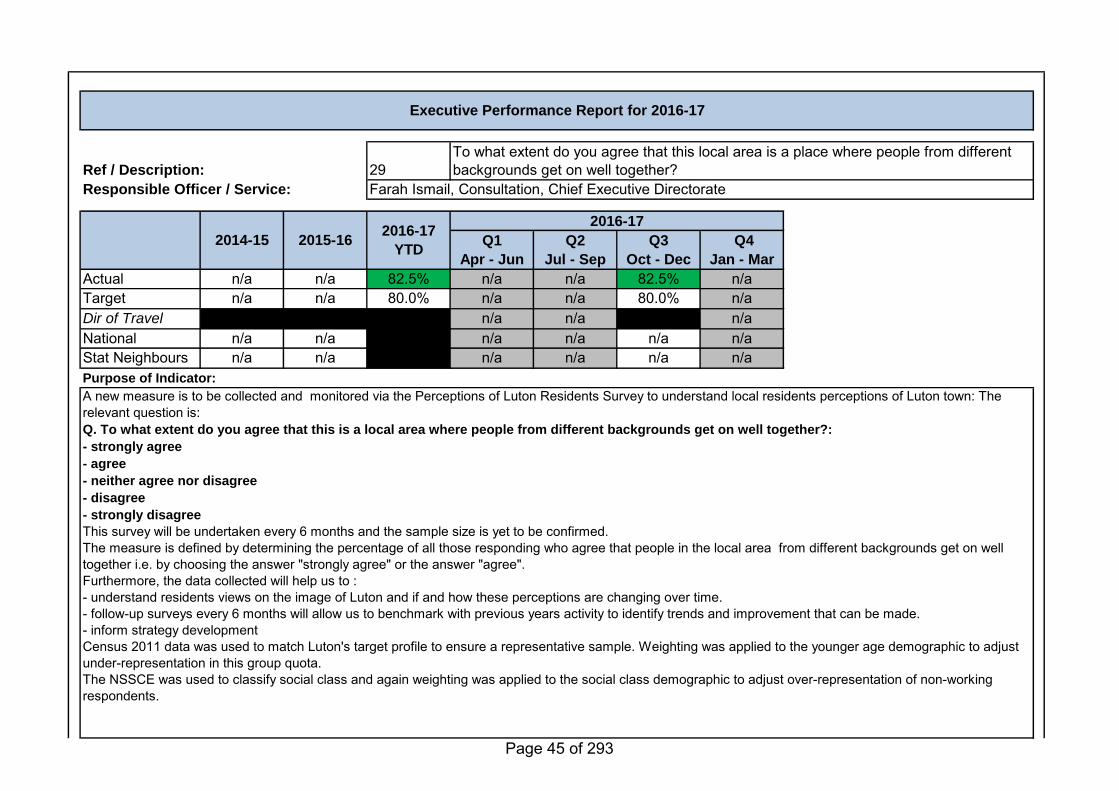
Ref / Description: 29Responsible Officer / Service:
Q1
Apr - Jun
Q2
Jul - Sep
Q3
Oct - Dec
Q4
Jan - Mar
Actual n/a n/a 82.5% n/a n/a 82.5% n/aTarget n/a n/a 80.0% n/a n/a 80.0% n/aDir of Travel n/a n/a n/aNational n/a n/a n/a n/a n/a n/aStat Neighbours n/a n/a n/a n/a n/a n/aPurpose of Indicator:
A new measure is to be collected and monitored via the Perceptions of Luton Residents Survey to understand local residents perceptions of Luton town: The relevant question is: Q. To what extent do you agree that this is a local area where people from different backgrounds get on well together?:
- strongly agree
- agree
- neither agree nor disagree
- disagree
- strongly disagree
This survey will be undertaken every 6 months and the sample size is yet to be confirmed. The measure is defined by determining the percentage of all those responding who agree that people in the local area from different backgrounds get on well together i.e. by choosing the answer "strongly agree" or the answer "agree". Furthermore, the data collected will help us to :- understand residents views on the image of Luton and if and how these perceptions are changing over time. - follow-up surveys every 6 months will allow us to benchmark with previous years activity to identify trends and improvement that can be made. - inform strategy developmentCensus 2011 data was used to match Luton's target profile to ensure a representative sample. Weighting was applied to the younger age demographic to adjust under-representation in this group quota.The NSSCE was used to classify social class and again weighting was applied to the social class demographic to adjust over-representation of non-working respondents.
Executive Performance Report for 2016-17
To what extent do you agree that this local area is a place where people from different backgrounds get on well together?
Farah Ismail, Consultation, Chief Executive Directorate
2014-15 2015-162016-17
YTD
2016-17
Page 45 of 293
Commentary for this Period:
Additional information or supplementary indicators:
Overall, agreement is very high across all wards.Wards that most agree their local area is a place where people from different backgrounds get on well together are Biscot (96%), Wigmore (93%), Round Green 89%) and Limbury (88%).Levels of disagreement are highest in South (29%), Northwell (23%) Icknield (22%) and Saints (22%) wards. Residents living in the area for less than 6 years are notably less likely to agree with this statement (65%) compared to residents living in the area for 6 years or more (84%).A significantly high number of residents indicating ‘Other’ as their ethnicity agree that their local area is a place where people from different backgrounds get on well together whilst Black residents most disagree (20%) followed by White residents (17%).The findings of this survey have been presented to Luton Investment Framework Board and Senior Stakeholders, Senior Management Leadership Group and Leaders Brief. The next wave of this benchmarking tracker survey is planned to commence in April 2017. The methodology will be replicated - a telephone survey will be undertaken with a sample of 1000 local residents using the set of questions and sample quotas as the previous survey to minimise the risk of bias.The data captured from these surveys will continue to inform the Investment Framework Strategy and other relevant strategies.
A telephone survey was carried out in September 2016, with a sample of 1000 Luton residents to capture their views on the image of Luton and perceptions on various aspects of the town. Quotas were set for each of Luton’s 19 wards to allow data extraction at ward level. The fieldwork was undertaken by an independent research company to ensure impartiality and minimise the risk of skewing the findings due to factors such as social desirability. The survey findings are statistically robust.When respondents were asked to rate to what extent they agreed/disagreed that their local area is a place where people from different backgrounds get on well together, 82.5% of respondents agreed the local area is a place where people from different backgrounds get on well together. This is slightly above the target of 80.0%. 14.9% disagreed with this statement and 2.5% indicated don't know.A member briefing on the results is planned to take place in Feb / March 2017.
Page 46 of 293
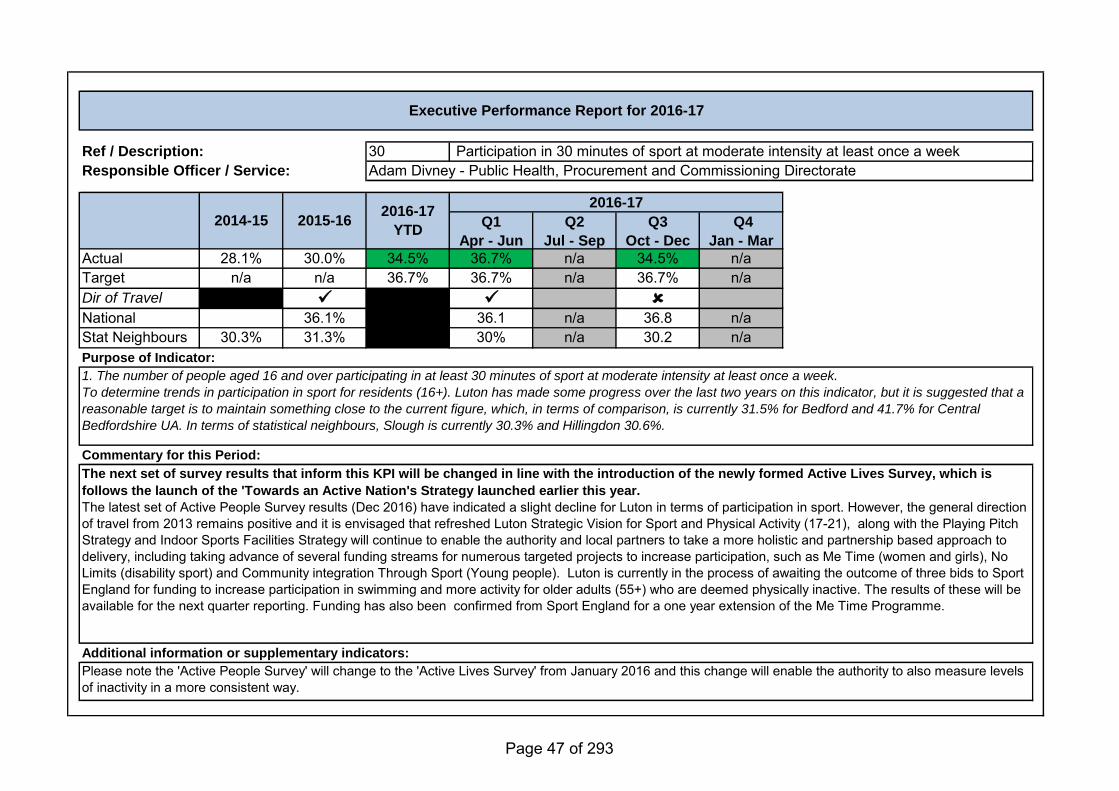
Ref / Description: 30Responsible Officer / Service:
Q1
Apr - Jun
Q2
Jul - Sep
Q3
Oct - Dec
Q4
Jan - Mar
Actual 28.1% 30.0% 34.5% 36.7% n/a 34.5% n/aTarget n/a n/a 36.7% 36.7% n/a 36.7% n/aDir of Travel
National 36.1% 36.1 n/a 36.8 n/aStat Neighbours 30.3% 31.3% 30% n/a 30.2 n/aPurpose of Indicator:
Commentary for this Period:
Additional information or supplementary indicators:
1. The number of people aged 16 and over participating in at least 30 minutes of sport at moderate intensity at least once a week.
To determine trends in participation in sport for residents (16+). Luton has made some progress over the last two years on this indicator, but it is suggested that a
reasonable target is to maintain something close to the current figure, which, in terms of comparison, is currently 31.5% for Bedford and 41.7% for Central
Bedfordshire UA. In terms of statistical neighbours, Slough is currently 30.3% and Hillingdon 30.6%.
The next set of survey results that inform this KPI will be changed in line with the introduction of the newly formed Active Lives Survey, which is
follows the launch of the 'Towards an Active Nation's Strategy launched earlier this year.
The latest set of Active People Survey results (Dec 2016) have indicated a slight decline for Luton in terms of participation in sport. However, the general direction of travel from 2013 remains positive and it is envisaged that refreshed Luton Strategic Vision for Sport and Physical Activity (17-21), along with the Playing Pitch Strategy and Indoor Sports Facilities Strategy will continue to enable the authority and local partners to take a more holistic and partnership based approach to delivery, including taking advance of several funding streams for numerous targeted projects to increase participation, such as Me Time (women and girls), No Limits (disability sport) and Community integration Through Sport (Young people). Luton is currently in the process of awaiting the outcome of three bids to Sport England for funding to increase participation in swimming and more activity for older adults (55+) who are deemed physically inactive. The results of these will be available for the next quarter reporting. Funding has also been confirmed from Sport England for a one year extension of the Me Time Programme.
Please note the 'Active People Survey' will change to the 'Active Lives Survey' from January 2016 and this change will enable the authority to also measure levels of inactivity in a more consistent way.
Executive Performance Report for 2016-17
Participation in 30 minutes of sport at moderate intensity at least once a week Adam Divney - Public Health, Procurement and Commissioning Directorate
2014-15 2015-162016-17
YTD
2016-17
Page 47 of 293
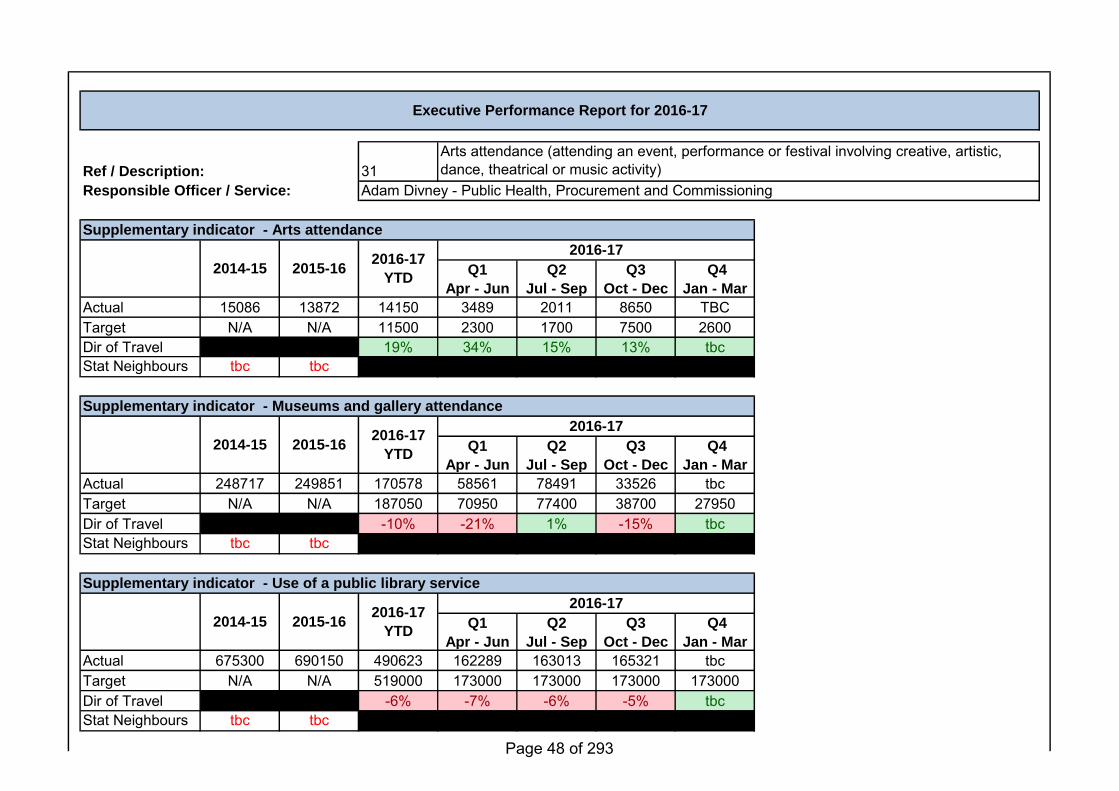
Ref / Description: 31Responsible Officer / Service:
Q1
Apr - Jun
Q2
Jul - Sep
Q3
Oct - Dec
Q4
Jan - Mar
Actual 15086 13872 14150 3489 2011 8650 TBCTarget N/A N/A 11500 2300 1700 7500 2600Dir of Travel 19% 34% 15% 13% tbcStat Neighbours tbc tbc
Q1
Apr - Jun
Q2
Jul - Sep
Q3
Oct - Dec
Q4
Jan - Mar
Actual 248717 249851 170578 58561 78491 33526 tbcTarget N/A N/A 187050 70950 77400 38700 27950Dir of Travel -10% -21% 1% -15% tbcStat Neighbours tbc tbc
Q1
Apr - Jun
Q2
Jul - Sep
Q3
Oct - Dec
Q4
Jan - Mar
Actual 675300 690150 490623 162289 163013 165321 tbcTarget N/A N/A 519000 173000 173000 173000 173000Dir of Travel -6% -7% -6% -5% tbcStat Neighbours tbc tbc
Supplementary indicator - Use of a public library service
2014-15 2015-162016-17
YTD
2016-17
Supplementary indicator - Museums and gallery attendance
2014-15 2015-162016-17
YTD
2016-17
Executive Performance Report for 2016-17
Arts attendance (attending an event, performance or festival involving creative, artistic, dance, theatrical or music activity)
Adam Divney - Public Health, Procurement and Commissioning
Supplementary indicator - Arts attendance
2014-15 2015-162016-17
YTD
2016-17
Page 48 of 293
Purpose of Indicator:
Commentary for this Period:
Additional information or supplementary indicators:
DATA NOT AVAILABLE UNTIL NOW UNTIL Spring 2017*. *The principle measure for participation in sports and arts is the Active People Survey (APS) which is to be renamed the Active Lives Survey (ALS) from 2017. This is the participation national survey for sport and arts, with the results released annually and always include a full year’s worth of data. The Active Lives Survey explores participation in leisure and recreational activities, including sport, physical activity and culture. The survey is led by Sport England in partnership with the Arts Council, Public Health England and Department for Transport. The Active Lives Survey is a Sport England-led survey about English adults (aged 16+) participation in leisure and recreational activities, including sport, physical activity and culture. The survey will involve a mixed postal and online methodology and the overall number of respondents for Luton will be 1000 people each year. The survey will collect representative data from the adult population in England and in each local authority area in England.
The next set of survey results that inform this KPI will be published (for arts and culture) in Autumn 2017 - there have been some delays in receiving
this data. These results will enable a baseline to be established regarding ongoing performance monitoring. In the meantime local data from Luton
Culture has been provided. Luton is seeing a significant amount of investment currently from Arts Council England (ACE), including 1.5M PA for the five stands of the Luton Investment Programme including a creative producer, a new cultural celebration, a public realm arts plan and a professional development programme. LIP will also see a 10-year vision and strategic arts and cultural plan for Luton incorporating a fundraising and resource development strategy and a social return on investment evaluation framework. The other significant investment by ACE is 680K for the Creative People and Places programme - named Revolution, which will see a host of arts and culture activities taking place from April 16-April 18. The final complimentary element is the launch of the Cultural Quarter. All of the above are expected to raise participation levels within the town. In terms of the headline KPI 'Arts attendance (attending an event, performance or festival involving creative, artistic, dance, theatrical or music activity)' their have been several largescale events held within the town over the last two quarters including the Fireworks Spectacular, Xmas Light Switch, St Georges Day. Luton Culture's commentary for this period is as follows - Luton Culture Arts - We are continuing to see a 70% return on our programme investment and will have delivered 196 events at the end of the year compared to around 50 in 2015-16. Some of the successes of the programme included Christmas at Stockwood, which was delivered over nine days to 7,000 visitor and the children’s Christmas show 'Twas the Night before Christmas' which was at 85% capacity. Overall children’s theatre was very successful following this significant investment. The Punk 1976 season featuring gigs, spoken word, talks and film screenings in November and co-curated by Steve Abbott achieved an average 67% capacity and we are now working on 2017 Lutonia, building on the success of 2016, when we had an audience of 3,198. We have also worked with young local talent and have given out three arts bursaries and secured anchor tenancies including for NGYT to deliver targeted arts programmes at the Hat Factory.
Museums - Wardown remains closed and Stockwood target was set quite high. We are slightly down on last year's visitors overall but we will adjust the targets to be more realistic for this year. The focus has been on the redevelopment of Wardown House Museum and Gallery due to open on 8 April 2017 to the public. The Museum Makers continues to grow engagement and has been showcased nationally as an exemplary piece of work. We have 1,216 signed up Museum Makers and of which over 120 are active volunteers. The summer exhibition 'Brick Kingdom' reached 10,026 visitors which was 1/5 of overall site visitors. Detailed
feedback on the opening of the newly refurbished museum will be available for the next quarters reporting, however, initial figures demonstrate a
strong launch over the Easter period with 8390 visits between 8th and 17th April. Libraries - Number of visitors are declining nationally. However our IT usage and use of online resources are increasing. As part of the restructure we have a Supervisor Librarian responsible for each individual library with an aim to making the service relevant to the local needs of the community while delivering our national offers. They will be promoting services and undertaking outreach in the community to encourage increased footfall.
Page 49 of 293
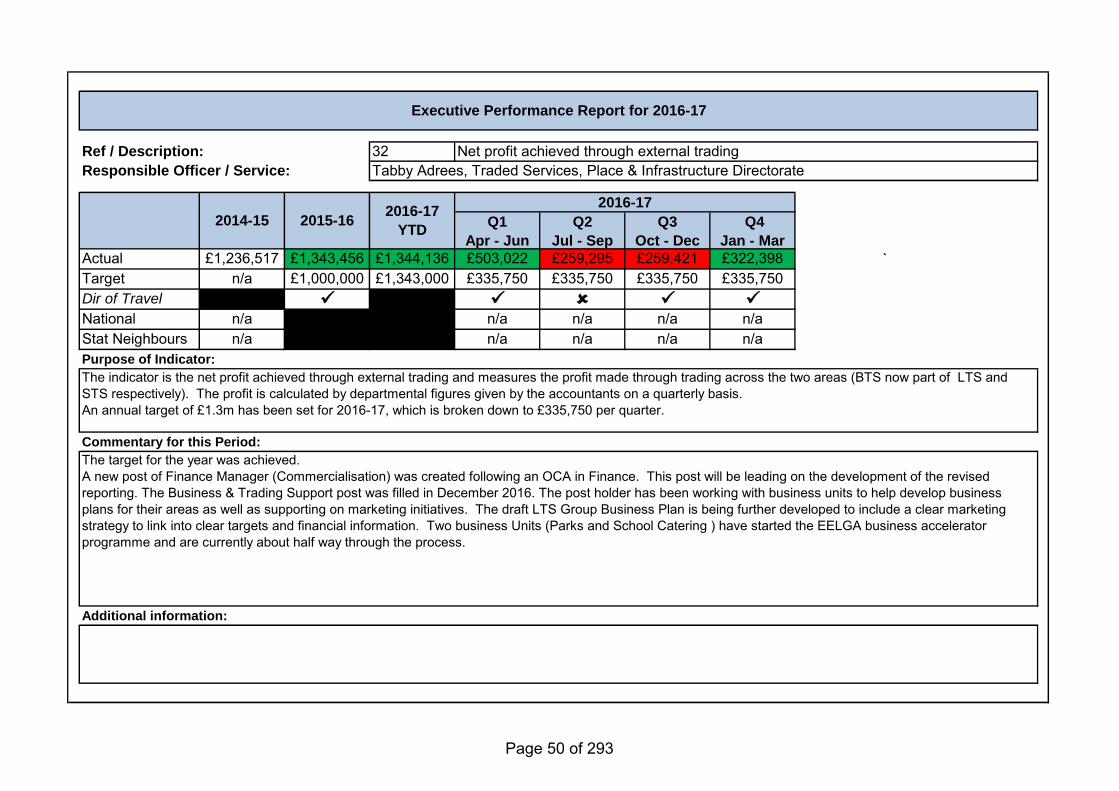
Ref / Description: 32Responsible Officer / Service:
Q1
Apr - Jun
Q2
Jul - Sep
Q3
Oct - Dec
Q4
Jan - Mar
Actual £1,236,517 £1,343,456 £1,344,136 £503,022 £259,295 £259,421 £322,398 `Target n/a £1,000,000 £1,343,000 £335,750 £335,750 £335,750 £335,750Dir of Travel
National n/a n/a n/a n/a n/aStat Neighbours n/a n/a n/a n/a n/aPurpose of Indicator:
Commentary for this Period:
Additional information:
The indicator is the net profit achieved through external trading and measures the profit made through trading across the two areas (BTS now part of LTS and STS respectively). The profit is calculated by departmental figures given by the accountants on a quarterly basis.An annual target of £1.3m has been set for 2016-17, which is broken down to £335,750 per quarter.
The target for the year was achieved.A new post of Finance Manager (Commercialisation) was created following an OCA in Finance. This post will be leading on the development of the revised reporting. The Business & Trading Support post was filled in December 2016. The post holder has been working with business units to help develop business plans for their areas as well as supporting on marketing initiatives. The draft LTS Group Business Plan is being further developed to include a clear marketing strategy to link into clear targets and financial information. Two business Units (Parks and School Catering ) have started the EELGA business accelerator programme and are currently about half way through the process.
Executive Performance Report for 2016-17
Net profit achieved through external trading Tabby Adrees, Traded Services, Place & Infrastructure Directorate
2014-15 2015-162016-17
YTD
2016-17
Page 50 of 293
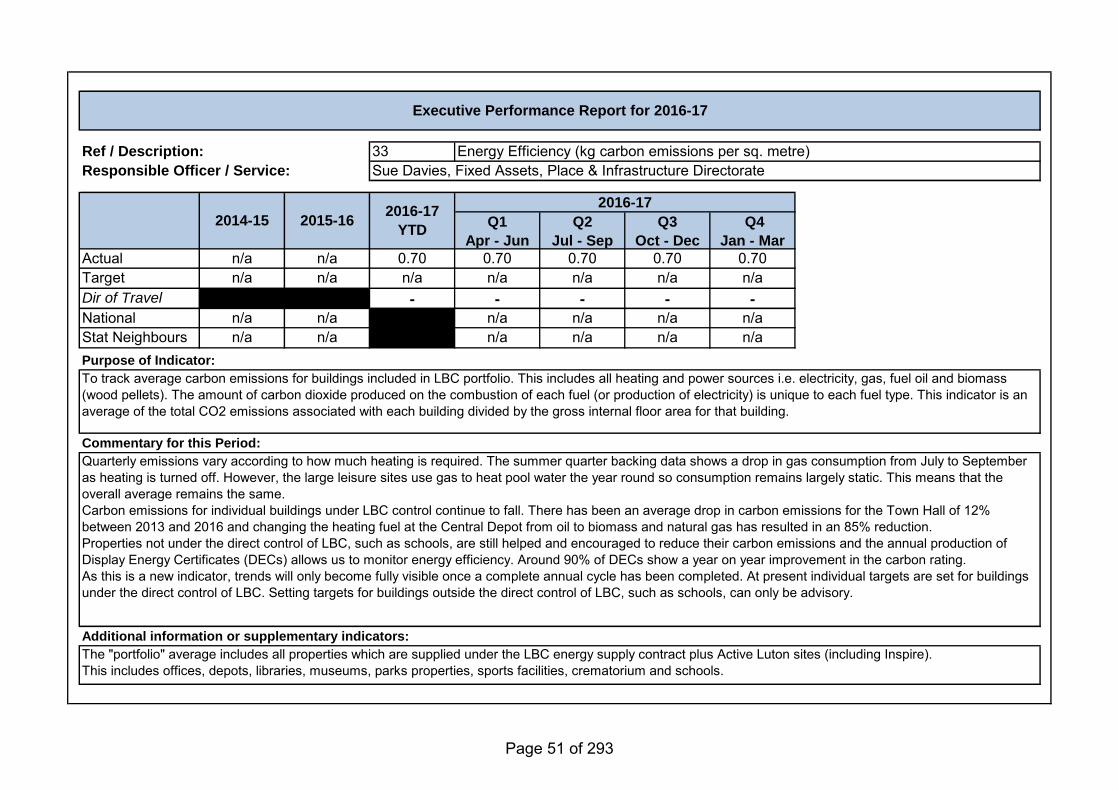
Ref / Description: 33Responsible Officer / Service:
Q1
Apr - Jun
Q2
Jul - Sep
Q3
Oct - Dec
Q4
Jan - Mar
Actual n/a n/a 0.70 0.70 0.70 0.70 0.70Target n/a n/a n/a n/a n/a n/a n/aDir of Travel - - - - -National n/a n/a n/a n/a n/a n/aStat Neighbours n/a n/a n/a n/a n/a n/aPurpose of Indicator:
Commentary for this Period:
Additional information or supplementary indicators:
To track average carbon emissions for buildings included in LBC portfolio. This includes all heating and power sources i.e. electricity, gas, fuel oil and biomass (wood pellets). The amount of carbon dioxide produced on the combustion of each fuel (or production of electricity) is unique to each fuel type. This indicator is an average of the total CO2 emissions associated with each building divided by the gross internal floor area for that building.
Quarterly emissions vary according to how much heating is required. The summer quarter backing data shows a drop in gas consumption from July to September as heating is turned off. However, the large leisure sites use gas to heat pool water the year round so consumption remains largely static. This means that the overall average remains the same.Carbon emissions for individual buildings under LBC control continue to fall. There has been an average drop in carbon emissions for the Town Hall of 12% between 2013 and 2016 and changing the heating fuel at the Central Depot from oil to biomass and natural gas has resulted in an 85% reduction.Properties not under the direct control of LBC, such as schools, are still helped and encouraged to reduce their carbon emissions and the annual production of Display Energy Certificates (DECs) allows us to monitor energy efficiency. Around 90% of DECs show a year on year improvement in the carbon rating.As this is a new indicator, trends will only become fully visible once a complete annual cycle has been completed. At present individual targets are set for buildings under the direct control of LBC. Setting targets for buildings outside the direct control of LBC, such as schools, can only be advisory.
The "portfolio" average includes all properties which are supplied under the LBC energy supply contract plus Active Luton sites (including Inspire).This includes offices, depots, libraries, museums, parks properties, sports facilities, crematorium and schools.
Executive Performance Report for 2016-17
Energy Efficiency (kg carbon emissions per sq. metre)Sue Davies, Fixed Assets, Place & Infrastructure Directorate
2014-15 2015-162016-17
YTD
2016-17
Page 51 of 293
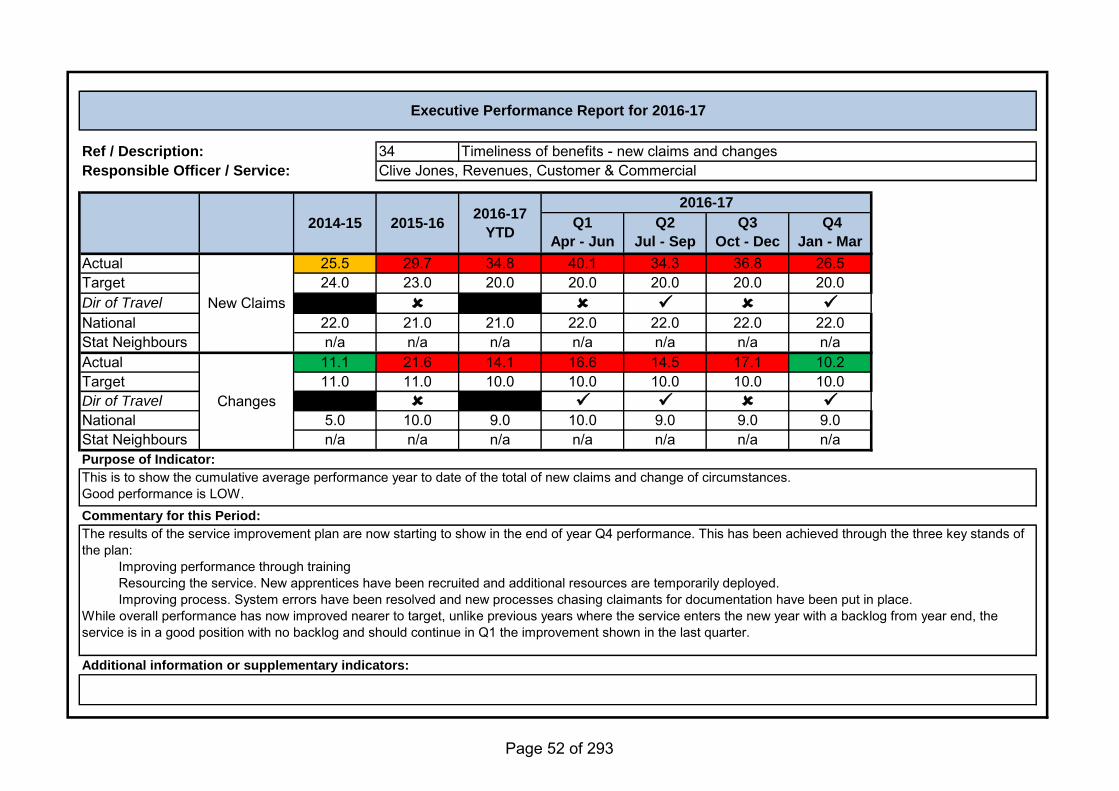
Ref / Description: 34Responsible Officer / Service:
Q1
Apr - Jun
Q2
Jul - Sep
Q3
Oct - Dec
Q4
Jan - Mar
Actual 25.5 29.7 34.8 40.1 34.3 36.8 26.5Target 24.0 23.0 20.0 20.0 20.0 20.0 20.0Dir of Travel
National 22.0 21.0 21.0 22.0 22.0 22.0 22.0Stat Neighbours n/a n/a n/a n/a n/a n/a n/aActual 11.1 21.6 14.1 16.6 14.5 17.1 10.2Target 11.0 11.0 10.0 10.0 10.0 10.0 10.0Dir of Travel
National 5.0 10.0 9.0 10.0 9.0 9.0 9.0Stat Neighbours n/a n/a n/a n/a n/a n/a n/aPurpose of Indicator:
Commentary for this Period:
Additional information or supplementary indicators:
Executive Performance Report for 2016-17
Timeliness of benefits - new claims and changesClive Jones, Revenues, Customer & Commercial
2014-15 2015-162016-17
YTD
2016-17
New Claims
Changes
This is to show the cumulative average performance year to date of the total of new claims and change of circumstances. Good performance is LOW.
The results of the service improvement plan are now starting to show in the end of year Q4 performance. This has been achieved through the three key stands of the plan: Improving performance through training Resourcing the service. New apprentices have been recruited and additional resources are temporarily deployed. Improving process. System errors have been resolved and new processes chasing claimants for documentation have been put in place.While overall performance has now improved nearer to target, unlike previous years where the service enters the new year with a backlog from year end, the service is in a good position with no backlog and should continue in Q1 the improvement shown in the last quarter.
Page 52 of 293
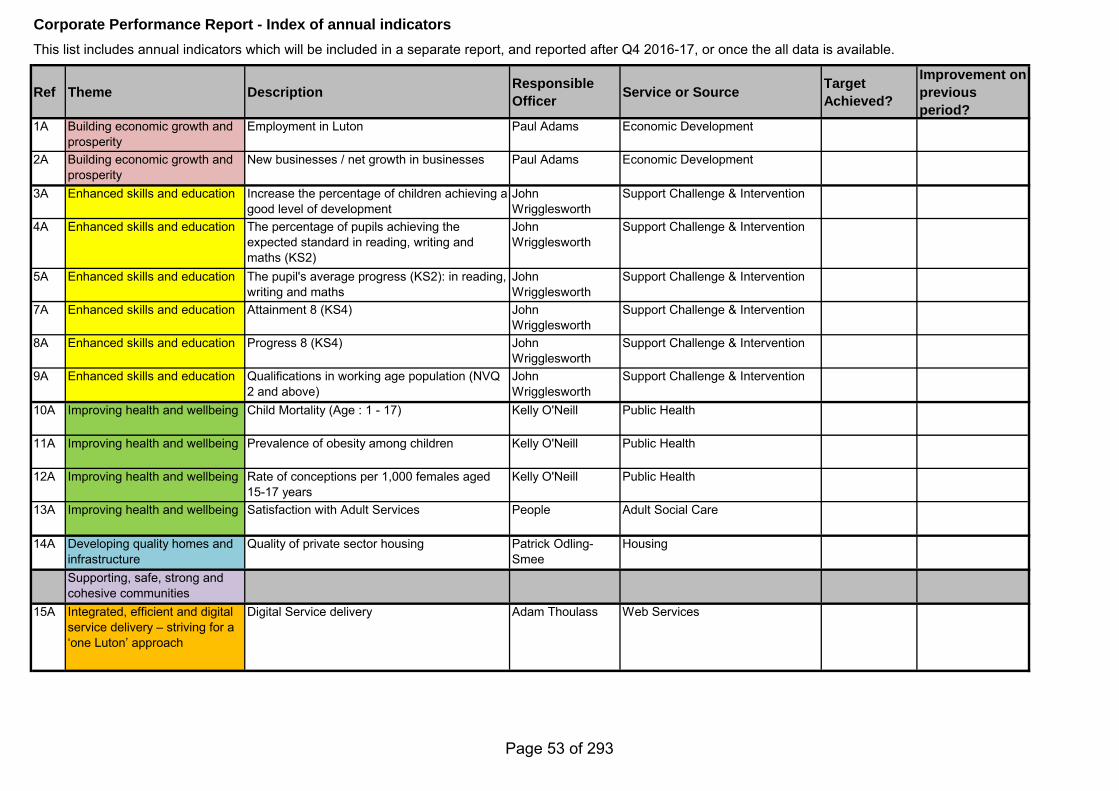
Ref Theme DescriptionResponsible
OfficerService or Source
Target
Achieved?
Improvement on
previous
period?1A Building economic growth and
prosperityEmployment in Luton Paul Adams Economic Development
2A Building economic growth and prosperity
New businesses / net growth in businesses Paul Adams Economic Development
3A Enhanced skills and education Increase the percentage of children achieving a good level of development
John Wrigglesworth
Support Challenge & Intervention
4A Enhanced skills and education The percentage of pupils achieving the expected standard in reading, writing and maths (KS2)
John Wrigglesworth
Support Challenge & Intervention
5A Enhanced skills and education The pupil's average progress (KS2): in reading, writing and maths
John Wrigglesworth
Support Challenge & Intervention
7A Enhanced skills and education Attainment 8 (KS4) John Wrigglesworth
Support Challenge & Intervention
8A Enhanced skills and education Progress 8 (KS4) John Wrigglesworth
Support Challenge & Intervention
9A Enhanced skills and education Qualifications in working age population (NVQ 2 and above)
John Wrigglesworth
Support Challenge & Intervention
10A Improving health and wellbeing Child Mortality (Age : 1 - 17) Kelly O'Neill Public Health
11A Improving health and wellbeing Prevalence of obesity among children Kelly O'Neill Public Health
12A Improving health and wellbeing Rate of conceptions per 1,000 females aged 15-17 years
Kelly O'Neill Public Health
13A Improving health and wellbeing Satisfaction with Adult Services People Adult Social Care
14A Developing quality homes and infrastructure
Quality of private sector housing Patrick Odling-Smee
Housing
Supporting, safe, strong and cohesive communities
15A Integrated, efficient and digital service delivery – striving for a ‘one Luton’ approach
Digital Service delivery Adam Thoulass Web Services
Corporate Performance Report - Index of annual indicators
This list includes annual indicators which will be included in a separate report, and reported after Q4 2016-17, or once the all data is available.
Page 53 of 293
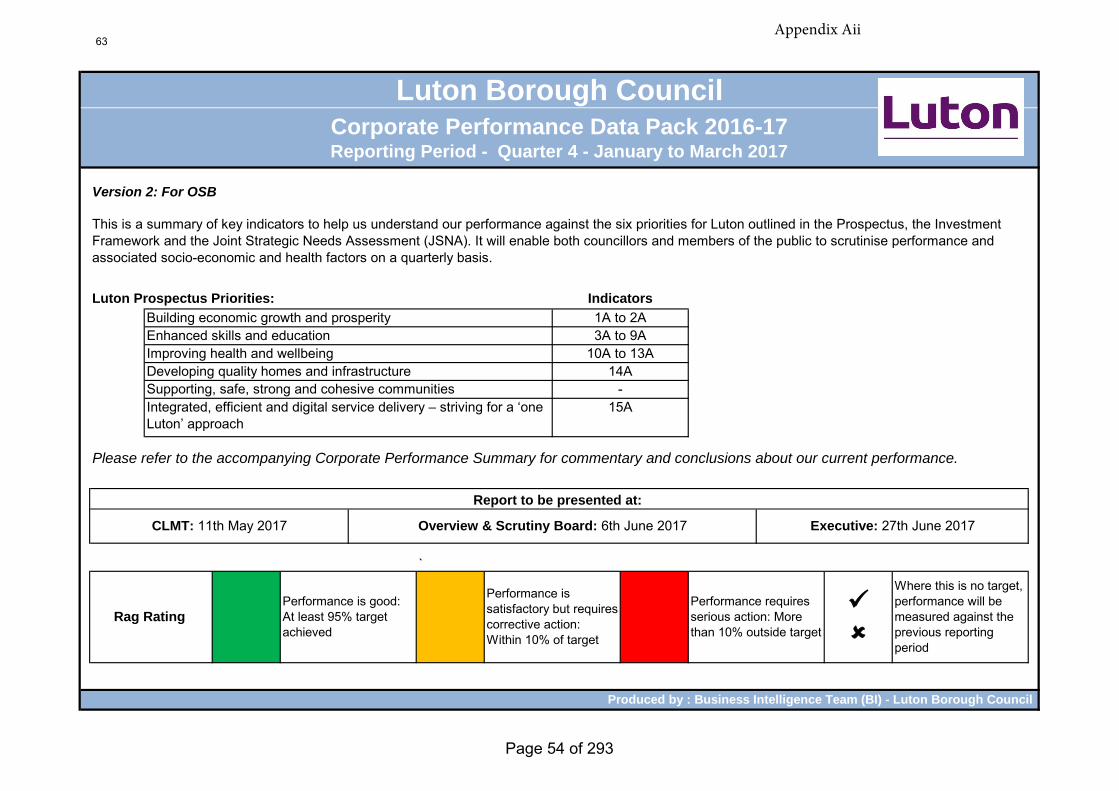
Version 2: For OSB
Luton Prospectus Priorities:
`
Luton Borough CouncilCorporate Performance Data Pack 2016-17Reporting Period - Quarter 4 - January to March 2017
This is a summary of key indicators to help us understand our performance against the six priorities for Luton outlined in the Prospectus, the Investment Framework and the Joint Strategic Needs Assessment (JSNA). It will enable both councillors and members of the public to scrutinise performance and associated socio-economic and health factors on a quarterly basis.
Indicators
Building economic growth and prosperity 1A to 2AEnhanced skills and education 3A to 9AImproving health and wellbeing 10A to 13A
Where this is no target, performance will be measured against the previous reporting period
Report to be presented at:
15A
Please refer to the accompanying Corporate Performance Summary for commentary and conclusions about our current performance.
Integrated, efficient and digital service delivery – striving for a ‘one Luton’ approach
Developing quality homes and infrastructureSupporting, safe, strong and cohesive communities
14A-
Produced by : Business Intelligence Team (BI) - Luton Borough Council
CLMT: 11th May 2017 Overview & Scrutiny Board: 6th June 2017 Executive: 27th June 2017
Rag Rating Performance is good: At least 95% target achieved
Performance is satisfactory but requires corrective action: Within 10% of target
Performance requires serious action: More than 10% outside target
Appendix Aii63
Page 54 of 293
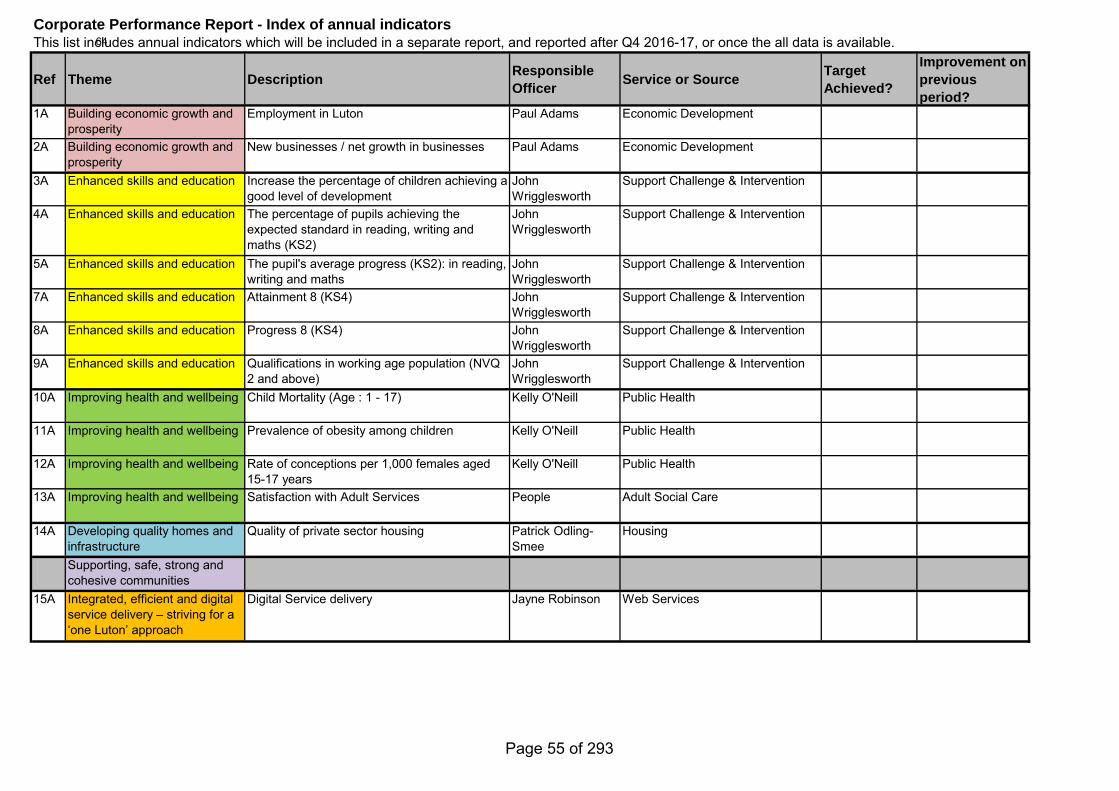
Ref Theme DescriptionResponsible
OfficerService or Source
Target
Achieved?
Improvement on
previous
period?1A Building economic growth and
prosperityEmployment in Luton Paul Adams Economic Development
2A Building economic growth and prosperity
New businesses / net growth in businesses Paul Adams Economic Development
3A Enhanced skills and education Increase the percentage of children achieving a good level of development
John Wrigglesworth
Support Challenge & Intervention
4A Enhanced skills and education The percentage of pupils achieving the expected standard in reading, writing and maths (KS2)
John Wrigglesworth
Support Challenge & Intervention
5A Enhanced skills and education The pupil's average progress (KS2): in reading, writing and maths
John Wrigglesworth
Support Challenge & Intervention
7A Enhanced skills and education Attainment 8 (KS4) John Wrigglesworth
Support Challenge & Intervention
8A Enhanced skills and education Progress 8 (KS4) John Wrigglesworth
Support Challenge & Intervention
9A Enhanced skills and education Qualifications in working age population (NVQ 2 and above)
John Wrigglesworth
Support Challenge & Intervention
10A Improving health and wellbeing Child Mortality (Age : 1 - 17) Kelly O'Neill Public Health
11A Improving health and wellbeing Prevalence of obesity among children Kelly O'Neill Public Health
12A Improving health and wellbeing Rate of conceptions per 1,000 females aged 15-17 years
Kelly O'Neill Public Health
13A Improving health and wellbeing Satisfaction with Adult Services People Adult Social Care
14A Developing quality homes and infrastructure
Quality of private sector housing Patrick Odling-Smee
Housing
Supporting, safe, strong and cohesive communities
15A Integrated, efficient and digital service delivery – striving for a ‘one Luton’ approach
Digital Service delivery Jayne Robinson Web Services
Corporate Performance Report - Index of annual indicatorsThis list includes annual indicators which will be included in a separate report, and reported after Q4 2016-17, or once the all data is available.64
Page 55 of 293
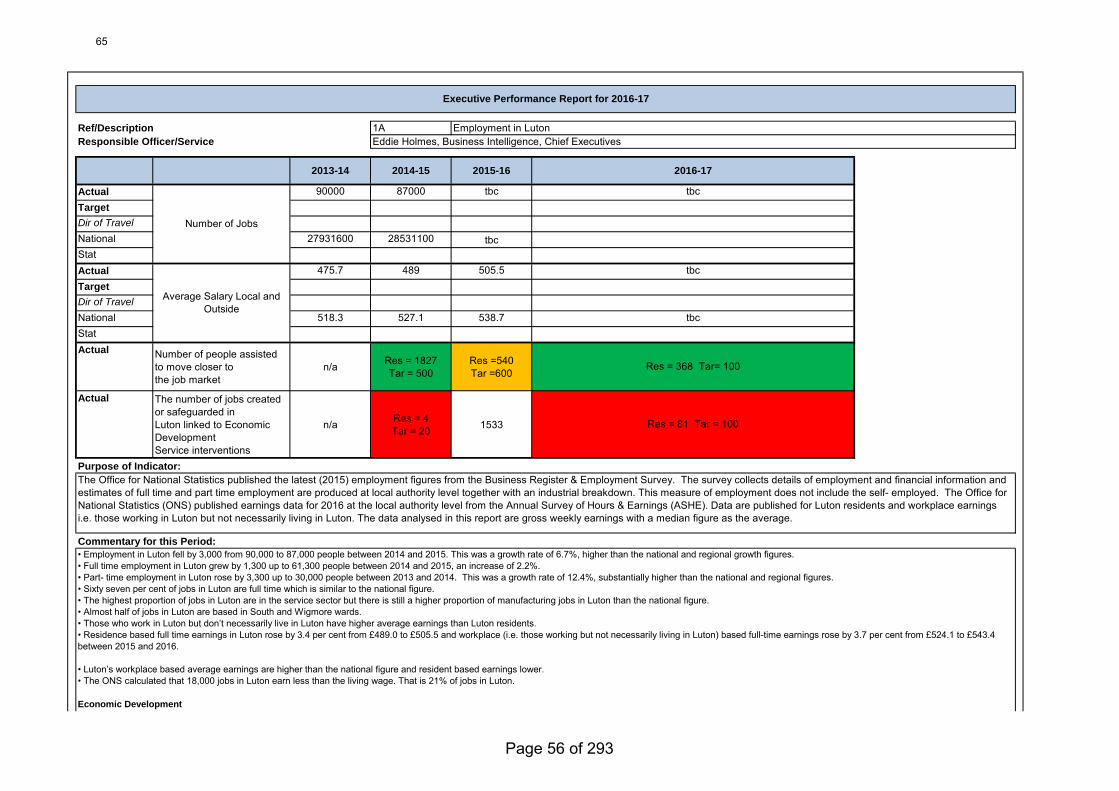
Ref/Description 1AResponsible Officer/Service
Actual 90000 87000 tbcTarget
Dir of Travel
National 27931600 28531100 tbcStat NeighboursActual 475.7 489 505.5Target
Dir of Travel
National 518.3 527.1 538.7Stat NeighboursActual Number of people assisted
to move closer tothe job market
n/a Res = 1827 Tar = 500
Res =540 Tar =600
Actual The number of jobs created or safeguarded inLuton linked to Economic DevelopmentService interventions
n/a Res = 4 Tar = 20 1533
Purpose of Indicator:
Commentary for this Period:
Executive Performance Report for 2016-17
Employment in LutonEddie Holmes, Business Intelligence, Chief Executives
2013-14 2014-15 2015-16 2016-17
Number of Jobs
tbc
Average Salary Local and Outside
tbc
tbc
Res = 368 Tar= 100
Res = 81 Tar = 100
The Office for National Statistics published the latest (2015) employment figures from the Business Register & Employment Survey. The survey collects details of employment and financial information and estimates of full time and part time employment are produced at local authority level together with an industrial breakdown. This measure of employment does not include the self- employed. The Office for National Statistics (ONS) published earnings data for 2016 at the local authority level from the Annual Survey of Hours & Earnings (ASHE). Data are published for Luton residents and workplace earnings i.e. those working in Luton but not necessarily living in Luton. The data analysed in this report are gross weekly earnings with a median figure as the average.
• Employment in Luton fell by 3,000 from 90,000 to 87,000 people between 2014 and 2015. This was a growth rate of 6.7%, higher than the national and regional growth figures.• Full time employment in Luton grew by 1,300 up to 61,300 people between 2014 and 2015, an increase of 2.2%.• Part- time employment in Luton rose by 3,300 up to 30,000 people between 2013 and 2014. This was a growth rate of 12.4%, substantially higher than the national and regional figures.• Sixty seven per cent of jobs in Luton are full time which is similar to the national figure.• The highest proportion of jobs in Luton are in the service sector but there is still a higher proportion of manufacturing jobs in Luton than the national figure.• Almost half of jobs in Luton are based in South and Wigmore wards.• Those who work in Luton but don’t necessarily live in Luton have higher average earnings than Luton residents. • Residence based full time earnings in Luton rose by 3.4 per cent from £489.0 to £505.5 and workplace (i.e. those working but not necessarily living in Luton) based full-time earnings rose by 3.7 per cent from £524.1 to £543.4 between 2015 and 2016.
• Luton’s workplace based average earnings are higher than the national figure and resident based earnings lower.• The ONS calculated that 18,000 jobs in Luton earn less than the living wage. That is 21% of jobs in Luton.
Economic Development
- A total 476 people were assisted to move closer to the job market (against a quarterly target of 125 (annual target = 500)). This indicator is important as it tracks activity to move people into employment or closer to the job market. Individuals often have multiple barriers to employment requiring specialist provision to provide employability skills. Activities are driven by the Skills and Employability Strategy 2016-2020. The target is lower than in previous years because European funded projects had come to an end. New ESF projects have now commenced and the impact of those have been recorded below. As it is, the target has already been exceeded through the success of a rangeof projects undertaken during the year.- This indicator measures the effectiveness of Economic Development Service interventions in terms of jobs created or safeguarded, as a result of engagement with businesses. It does not include figures from other sections of the Council.
65
Page 56 of 293
Additional information:
• Employment in Luton fell by 3,000 from 90,000 to 87,000 people between 2014 and 2015. This was a growth rate of 6.7%, higher than the national and regional growth figures.• Full time employment in Luton grew by 1,300 up to 61,300 people between 2014 and 2015, an increase of 2.2%.• Part- time employment in Luton rose by 3,300 up to 30,000 people between 2013 and 2014. This was a growth rate of 12.4%, substantially higher than the national and regional figures.• Sixty seven per cent of jobs in Luton are full time which is similar to the national figure.• The highest proportion of jobs in Luton are in the service sector but there is still a higher proportion of manufacturing jobs in Luton than the national figure.• Almost half of jobs in Luton are based in South and Wigmore wards.• Those who work in Luton but don’t necessarily live in Luton have higher average earnings than Luton residents.• Residence based full time earnings in Luton rose by 3.4 per cent from £489.0 to £505.5 and workplace (i.e. those working but not necessarily living in Luton) based full-time earnings rose by 3.7 per cent from £524.1 to £543.4between 2015 and 2016.
• Luton’s workplace based average earnings are higher than the national figure and resident based earnings lower.• The ONS calculated that 18,000 jobs in Luton earn less than the living wage. That is 21% of jobs in Luton.
Economic Development
- A total 476 people were assisted to move closer to the job market (against a quarterly target of 125 (annual target = 500)). This indicator is important as it tracks activity to move people into employment or closer to the job market. Individuals often have multiple barriers to employment requiring specialist provision to provide employability skills. Activities are driven by the Skills and Employability Strategy 2016-2020. The target is lower than in previous years because European funded projects had come to an end. New ESF projects have now commenced and the impact of those have been recorded below. As it is, the target has already been exceeded through the success of a range of projects undertaken during the year.- This indicator measures the effectiveness of Economic Development Service interventions in terms of jobs created or safeguarded, as a result of engagement with businesses. It does not include figures from other sections of the Council.
These data are from Office for National Statistics, 2016 employment data has not yet been published
66
Page 57 of 293
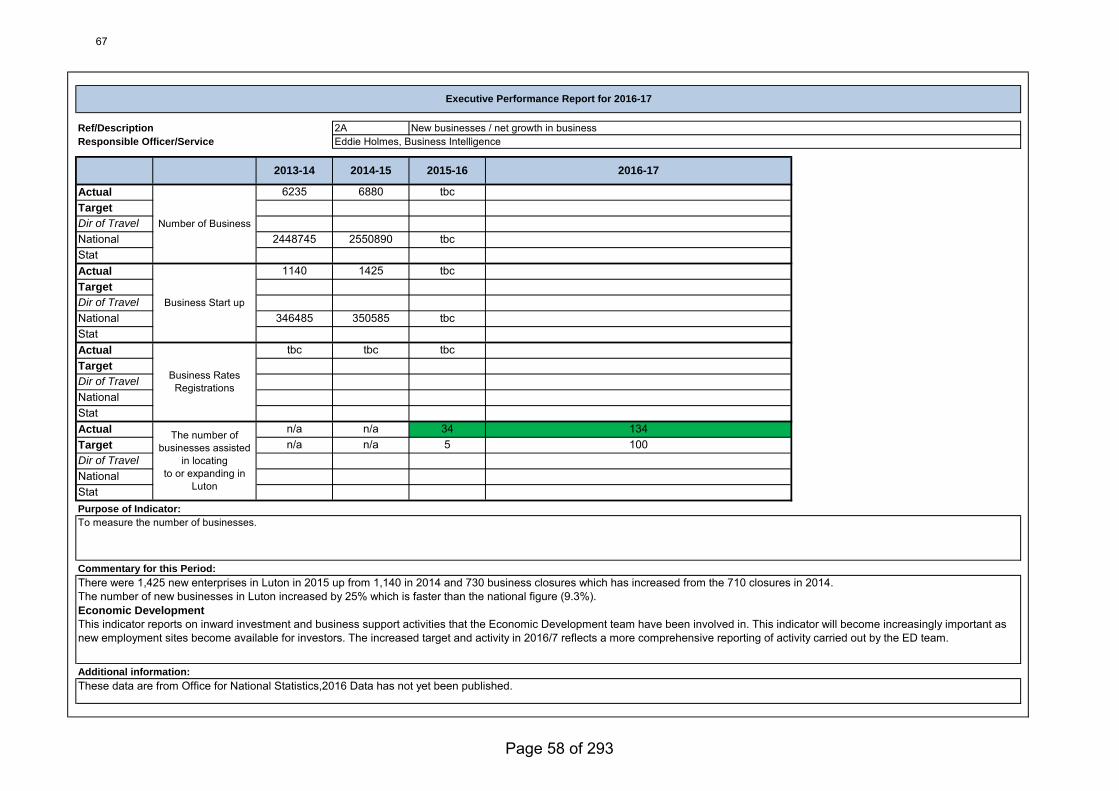
Ref/Description 2AResponsible Officer/Service
Actual 6235 6880 tbcTarget
Dir of Travel
National 2448745 2550890 tbcStat NeighboursActual 1140 1425 tbcTarget
Dir of Travel
National 346485 350585 tbcStat NeighboursActual tbc tbc tbcTarget
Dir of Travel
NationalStat NeighboursActual n/a n/a 34Target n/a n/a 5Dir of Travel
NationalStat NeighboursPurpose of Indicator:
Commentary for this Period:
Additional information:
Executive Performance Report for 2016-17
New businesses / net growth in businessEddie Holmes, Business Intelligence
2013-14 2014-15 2015-16 2016-17
Number of Business
Business Start up
Business Rates Registrations
To measure the number of businesses.
There were 1,425 new enterprises in Luton in 2015 up from 1,140 in 2014 and 730 business closures which has increased from the 710 closures in 2014.The number of new businesses in Luton increased by 25% which is faster than the national figure (9.3%).Economic Development
This indicator reports on inward investment and business support activities that the Economic Development team have been involved in. This indicator will become increasingly important as new employment sites become available for investors. The increased target and activity in 2016/7 reflects a more comprehensive reporting of activity carried out by the ED team.
These data are from Office for National Statistics,2016 Data has not yet been published.
The number of businesses assisted
in locatingto or expanding in
Luton
134100
67
Page 58 of 293
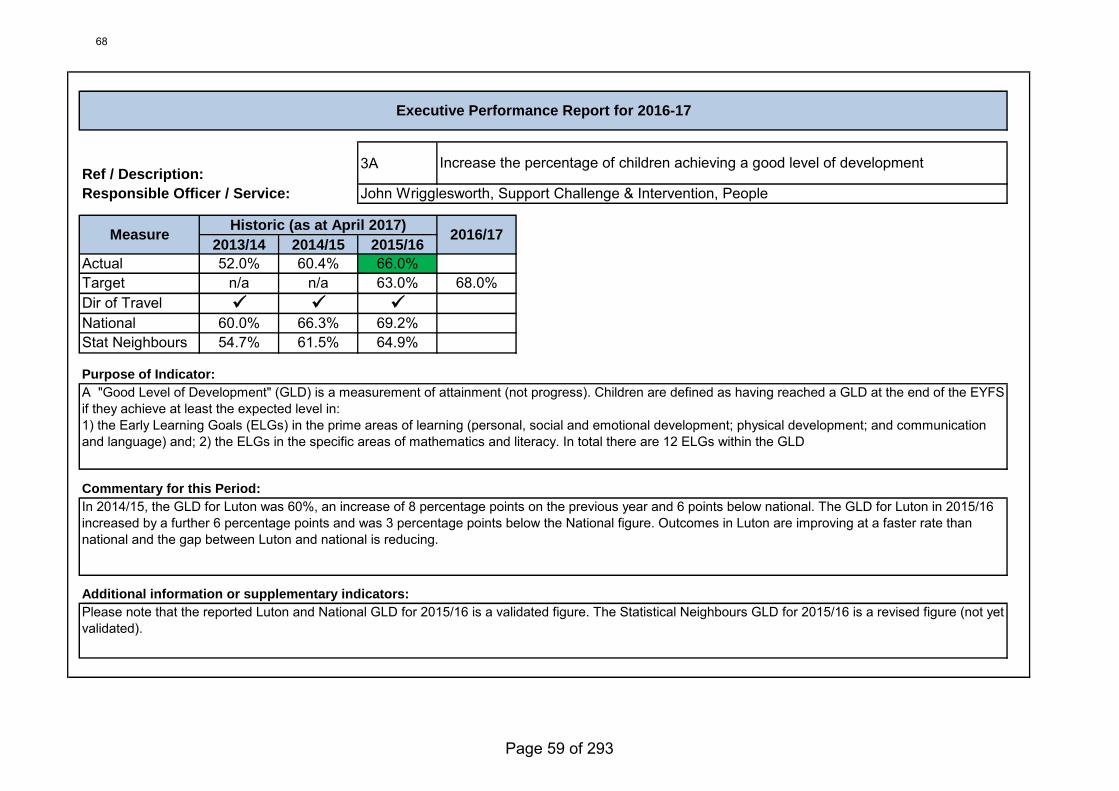
Ref / Description: 3A
Responsible Officer / Service:
2013/14 2014/15 2015/16
Actual 52.0% 60.4% 66.0%Target n/a n/a 63.0% 68.0%Dir of Travel
National 60.0% 66.3% 69.2%Stat Neighbours 54.7% 61.5% 64.9%
Purpose of Indicator:
Commentary for this Period:
Additional information or supplementary indicators:
A "Good Level of Development" (GLD) is a measurement of attainment (not progress). Children are defined as having reached a GLD at the end of the EYFS if they achieve at least the expected level in:1) the Early Learning Goals (ELGs) in the prime areas of learning (personal, social and emotional development; physical development; and communicationand language) and; 2) the ELGs in the specific areas of mathematics and literacy. In total there are 12 ELGs within the GLD
In 2014/15, the GLD for Luton was 60%, an increase of 8 percentage points on the previous year and 6 points below national. The GLD for Luton in 2015/16 increased by a further 6 percentage points and was 3 percentage points below the National figure. Outcomes in Luton are improving at a faster rate than national and the gap between Luton and national is reducing.
Please note that the reported Luton and National GLD for 2015/16 is a validated figure. The Statistical Neighbours GLD for 2015/16 is a revised figure (not yet validated).
Executive Performance Report for 2016-17
Increase the percentage of children achieving a good level of development
John Wrigglesworth, Support Challenge & Intervention, People
MeasureHistoric (as at April 2017)
2016/17
68
Page 59 of 293
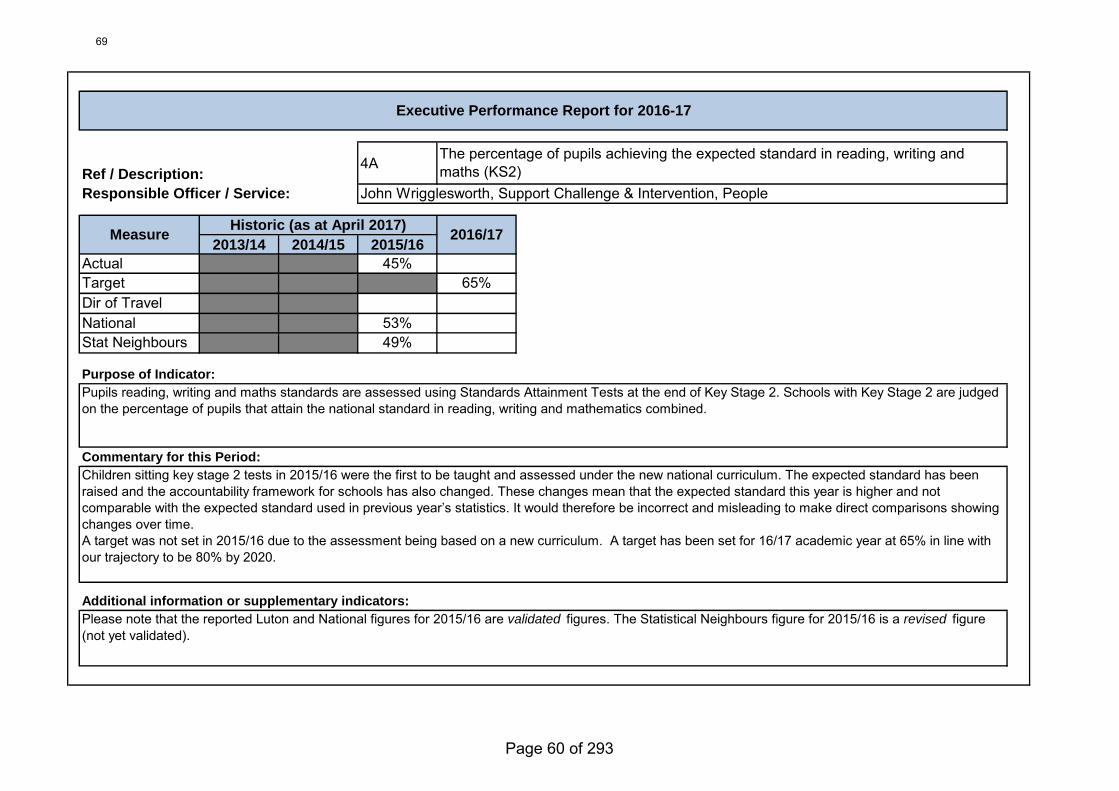
Ref / Description: 4A
Responsible Officer / Service:
2013/14 2014/15 2015/16
Actual 45%Target 65%Dir of TravelNational 53%Stat Neighbours 49%
Purpose of Indicator:
Commentary for this Period:
Additional information or supplementary indicators:
Pupils reading, writing and maths standards are assessed using Standards Attainment Tests at the end of Key Stage 2. Schools with Key Stage 2 are judged on the percentage of pupils that attain the national standard in reading, writing and mathematics combined.
Children sitting key stage 2 tests in 2015/16 were the first to be taught and assessed under the new national curriculum. The expected standard has been raised and the accountability framework for schools has also changed. These changes mean that the expected standard this year is higher and not comparable with the expected standard used in previous year’s statistics. It would therefore be incorrect and misleading to make direct comparisons showing changes over time. A target was not set in 2015/16 due to the assessment being based on a new curriculum. A target has been set for 16/17 academic year at 65% in line with our trajectory to be 80% by 2020.
Please note that the reported Luton and National figures for 2015/16 are validated figures. The Statistical Neighbours figure for 2015/16 is a revised figure (not yet validated).
Executive Performance Report for 2016-17
The percentage of pupils achieving the expected standard in reading, writing and maths (KS2)
John Wrigglesworth, Support Challenge & Intervention, People
MeasureHistoric (as at April 2017)
2016/17
69
Page 60 of 293
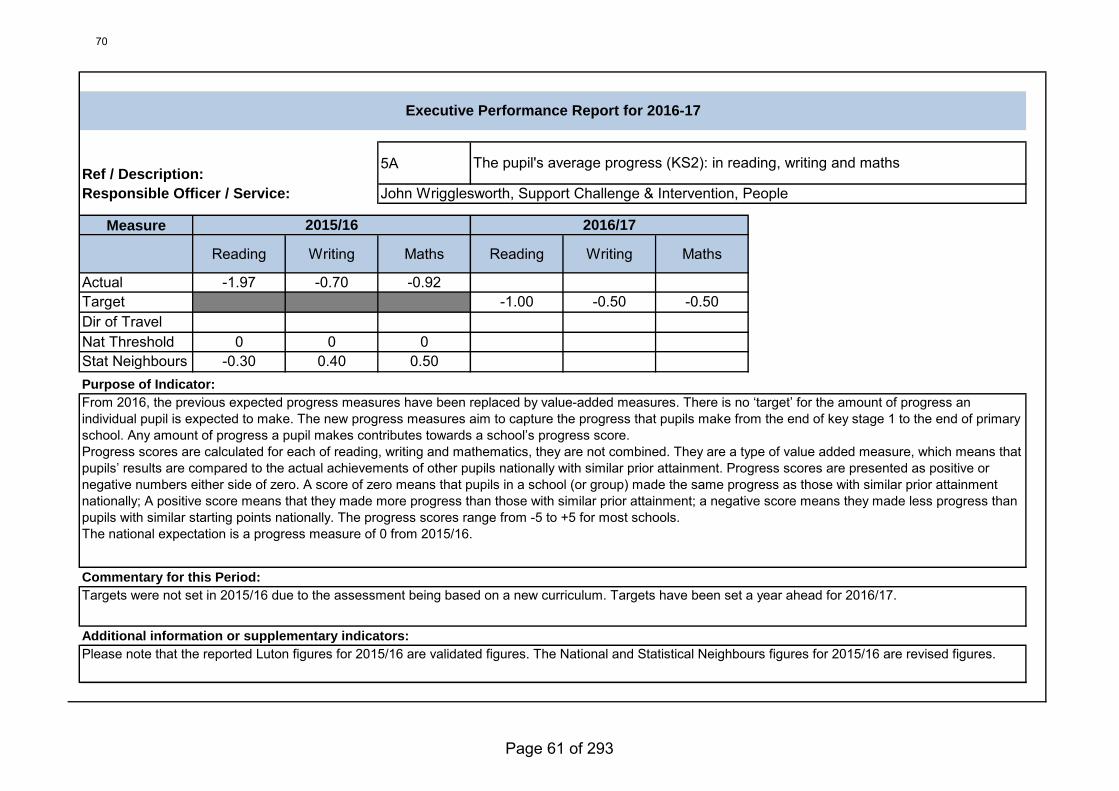
Ref / Description: 5A
Responsible Officer / Service:
Measure
Reading Writing Maths Reading Writing Maths
Actual -1.97 -0.70 -0.92Target -1.00 -0.50 -0.50Dir of TravelNat Threshold 0 0 0Stat Neighbours -0.30 0.40 0.50Purpose of Indicator:
Commentary for this Period:
Additional information or supplementary indicators:
From 2016, the previous expected progress measures have been replaced by value-added measures. There is no ‘target’ for the amount of progress an individual pupil is expected to make. The new progress measures aim to capture the progress that pupils make from the end of key stage 1 to the end of primary school. Any amount of progress a pupil makes contributes towards a school’s progress score.Progress scores are calculated for each of reading, writing and mathematics, they are not combined. They are a type of value added measure, which means that pupils’ results are compared to the actual achievements of other pupils nationally with similar prior attainment. Progress scores are presented as positive or negative numbers either side of zero. A score of zero means that pupils in a school (or group) made the same progress as those with similar prior attainment nationally; A positive score means that they made more progress than those with similar prior attainment; a negative score means they made less progress than pupils with similar starting points nationally. The progress scores range from -5 to +5 for most schools.The national expectation is a progress measure of 0 from 2015/16.
Targets were not set in 2015/16 due to the assessment being based on a new curriculum. Targets have been set a year ahead for 2016/17.
Please note that the reported Luton figures for 2015/16 are validated figures. The National and Statistical Neighbours figures for 2015/16 are revised figures.
Executive Performance Report for 2016-17
The pupil's average progress (KS2): in reading, writing and maths
John Wrigglesworth, Support Challenge & Intervention, People
2015/16 2016/17
70
Page 61 of 293
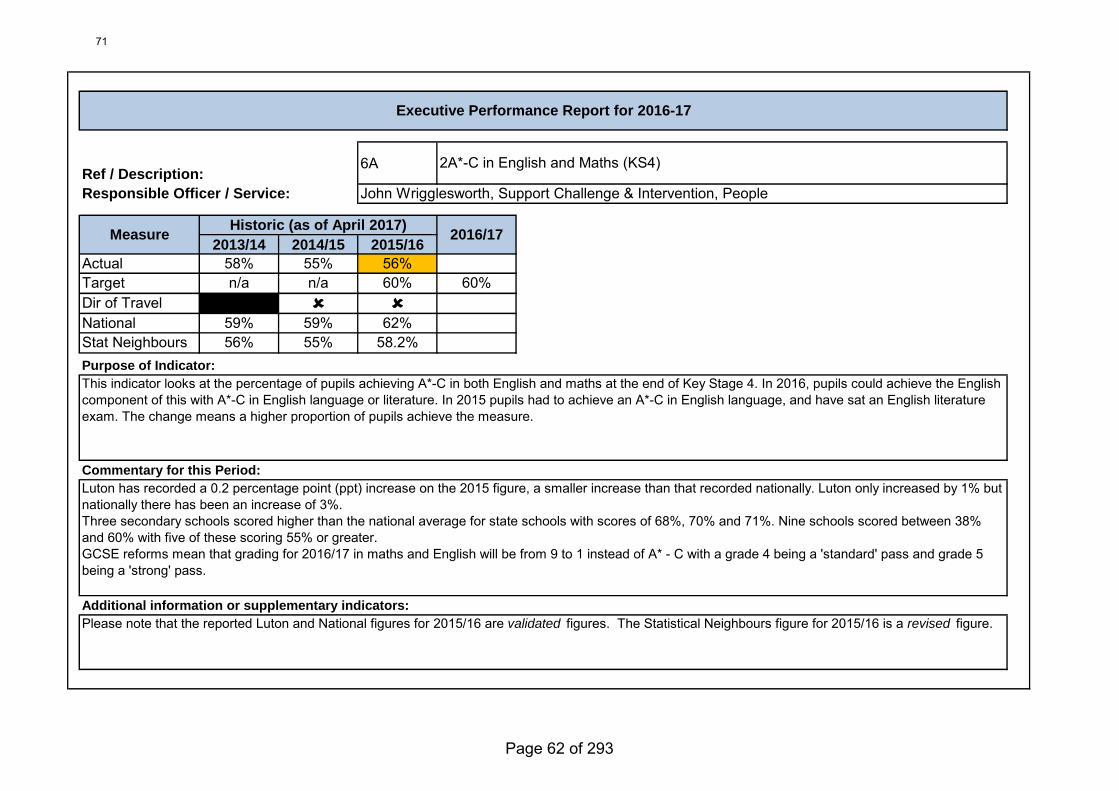
Ref / Description: 6A
Responsible Officer / Service:
2013/14 2014/15 2015/16
Actual 58% 55% 56%Target n/a n/a 60% 60%Dir of Travel
National 59% 59% 62%Stat Neighbours 56% 55% 58.2%Purpose of Indicator:
Commentary for this Period:
Additional information or supplementary indicators:
This indicator looks at the percentage of pupils achieving A*-C in both English and maths at the end of Key Stage 4. In 2016, pupils could achieve the English component of this with A*-C in English language or literature. In 2015 pupils had to achieve an A*-C in English language, and have sat an English literature exam. The change means a higher proportion of pupils achieve the measure.
Luton has recorded a 0.2 percentage point (ppt) increase on the 2015 figure, a smaller increase than that recorded nationally. Luton only increased by 1% but nationally there has been an increase of 3%.Three secondary schools scored higher than the national average for state schools with scores of 68%, 70% and 71%. Nine schools scored between 38% and 60% with five of these scoring 55% or greater.GCSE reforms mean that grading for 2016/17 in maths and English will be from 9 to 1 instead of A* - C with a grade 4 being a 'standard' pass and grade 5 being a 'strong' pass.
Please note that the reported Luton and National figures for 2015/16 are validated figures. The Statistical Neighbours figure for 2015/16 is a revised figure.
Executive Performance Report for 2016-17
2A*-C in English and Maths (KS4)
John Wrigglesworth, Support Challenge & Intervention, People
MeasureHistoric (as of April 2017)
2016/17
71
Page 62 of 293
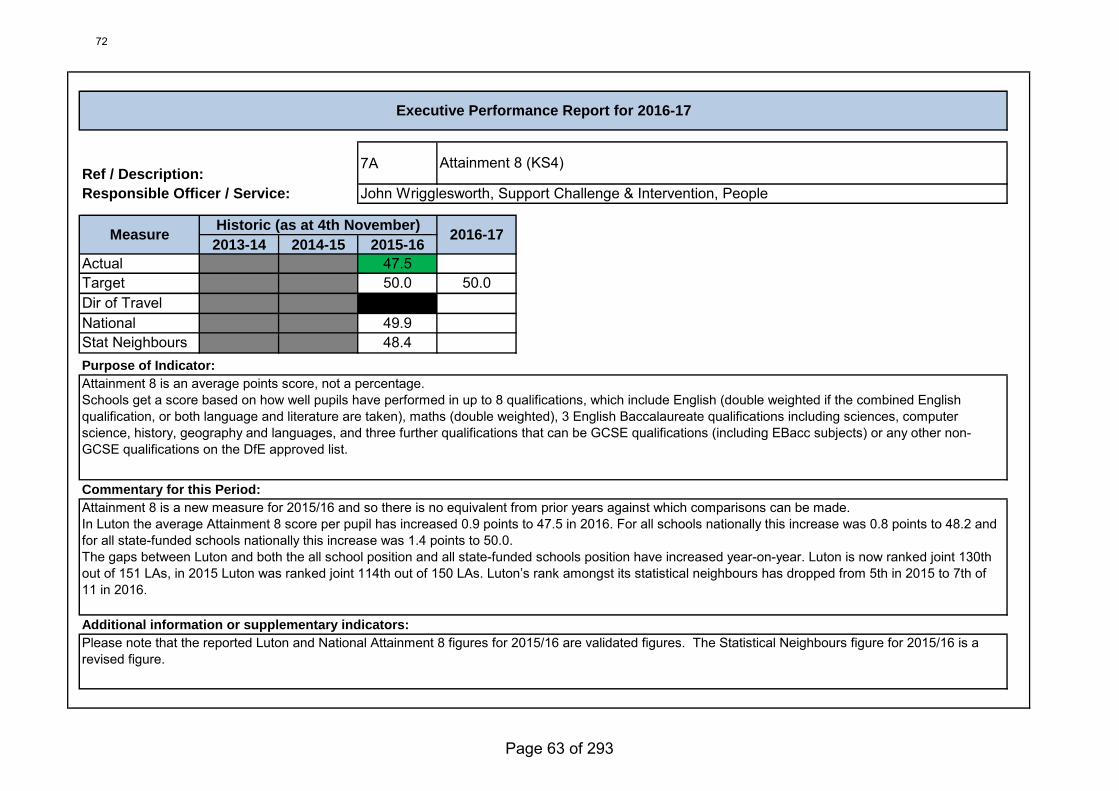
Ref / Description: 7A
Responsible Officer / Service:
2013-14 2014-15 2015-16
Actual 47.5Target 50.0 50.0Dir of TravelNational 49.9Stat Neighbours 48.4Purpose of Indicator:
Commentary for this Period:
Additional information or supplementary indicators:
Attainment 8 is an average points score, not a percentage.Schools get a score based on how well pupils have performed in up to 8 qualifications, which include English (double weighted if the combined English qualification, or both language and literature are taken), maths (double weighted), 3 English Baccalaureate qualifications including sciences, computer science, history, geography and languages, and three further qualifications that can be GCSE qualifications (including EBacc subjects) or any other non-GCSE qualifications on the DfE approved list.
Attainment 8 is a new measure for 2015/16 and so there is no equivalent from prior years against which comparisons can be made.In Luton the average Attainment 8 score per pupil has increased 0.9 points to 47.5 in 2016. For all schools nationally this increase was 0.8 points to 48.2 and for all state-funded schools nationally this increase was 1.4 points to 50.0.The gaps between Luton and both the all school position and all state-funded schools position have increased year-on-year. Luton is now ranked joint 130th out of 151 LAs, in 2015 Luton was ranked joint 114th out of 150 LAs. Luton’s rank amongst its statistical neighbours has dropped from 5th in 2015 to 7th of 11 in 2016.
Please note that the reported Luton and National Attainment 8 figures for 2015/16 are validated figures. The Statistical Neighbours figure for 2015/16 is a revised figure.
Executive Performance Report for 2016-17
Attainment 8 (KS4)
John Wrigglesworth, Support Challenge & Intervention, People
MeasureHistoric (as at 4th November)
2016-17
72
Page 63 of 293
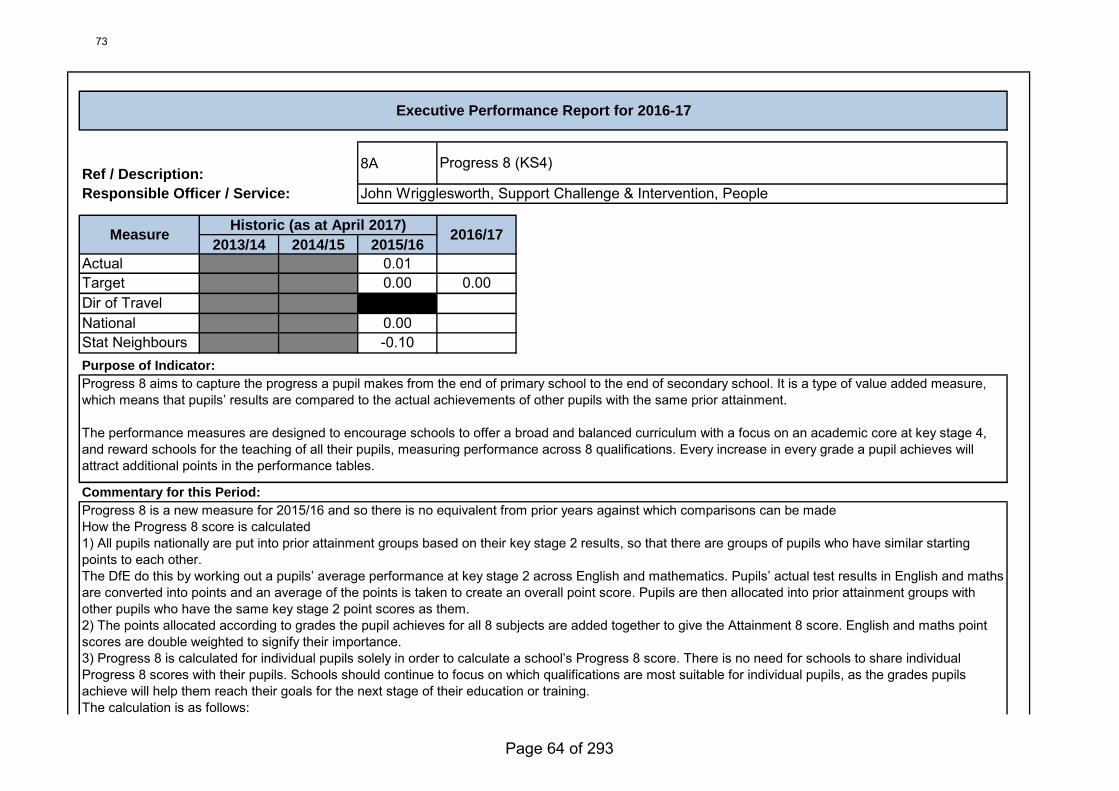
Ref / Description: 8A
Responsible Officer / Service:
2013/14 2014/15 2015/16
Actual 0.01Target 0.00 0.00Dir of TravelNational 0.00Stat Neighbours -0.10Purpose of Indicator:
Commentary for this Period:
Progress 8 aims to capture the progress a pupil makes from the end of primary school to the end of secondary school. It is a type of value added measure, which means that pupils’ results are compared to the actual achievements of other pupils with the same prior attainment.
The performance measures are designed to encourage schools to offer a broad and balanced curriculum with a focus on an academic core at key stage 4, and reward schools for the teaching of all their pupils, measuring performance across 8 qualifications. Every increase in every grade a pupil achieves will attract additional points in the performance tables.
Progress 8 is a new measure for 2015/16 and so there is no equivalent from prior years against which comparisons can be madeHow the Progress 8 score is calculated1) All pupils nationally are put into prior attainment groups based on their key stage 2 results, so that there are groups of pupils who have similar startingpoints to each other.The DfE do this by working out a pupils’ average performance at key stage 2 across English and mathematics. Pupils’ actual test results in English and maths are converted into points and an average of the points is taken to create an overall point score. Pupils are then allocated into prior attainment groups with other pupils who have the same key stage 2 point scores as them.2) The points allocated according to grades the pupil achieves for all 8 subjects are added together to give the Attainment 8 score. English and maths pointscores are double weighted to signify their importance.3) Progress 8 is calculated for individual pupils solely in order to calculate a school’s Progress 8 score. There is no need for schools to share individualProgress 8 scores with their pupils. Schools should continue to focus on which qualifications are most suitable for individual pupils, as the grades pupils achieve will help them reach their goals for the next stage of their education or training.The calculation is as follows:• The individual pupil’s Attainment 8 score (for example 56).• Compare this to the national average Attainment 8 score for pupils in the same prior attainment group.• A pupil’s progress score is the difference between their actual Attainment 8 result and the average result of those in their prior attainment group.• If David, for example, achieved an Attainment 8 score of 56 and the average Attainment 8 score for his prior attainment group was 55 - his progress score would be +1.• We divide +1 by 10 to give an individual pupil’s Progress 8 score, which is in this example is 0.1.4) Add together the Progress 8 scores of all the pupils in year 11 and divide by the number of pupils in the school to give a school level progress score.Progress 8 scores will be centred around 0, with most schools within the range of -1 to +1.A negative score does not mean that pupils did not make any progress; rather it means they made less progress than other pupils nationally with similar starting points.For example, if a school has a Progress 8 score of -0.25 this would mean that, on average, pupils in this school achieved a quarter of a grade less than otherpupils nationally with similar starting points.Luton’s Progress 8 score in 2015/16 was in line with the overall National Average Overall (+0.0), in line for the English element (-0.0), significantly above for the Mathematics element (+0.1), in line for the EBacc element (-0.0), and in line for the Open element (+0.0).
Executive Performance Report for 2016-17
Progress 8 (KS4)
John Wrigglesworth, Support Challenge & Intervention, People
MeasureHistoric (as at April 2017)
2016/17
73
Page 64 of 293
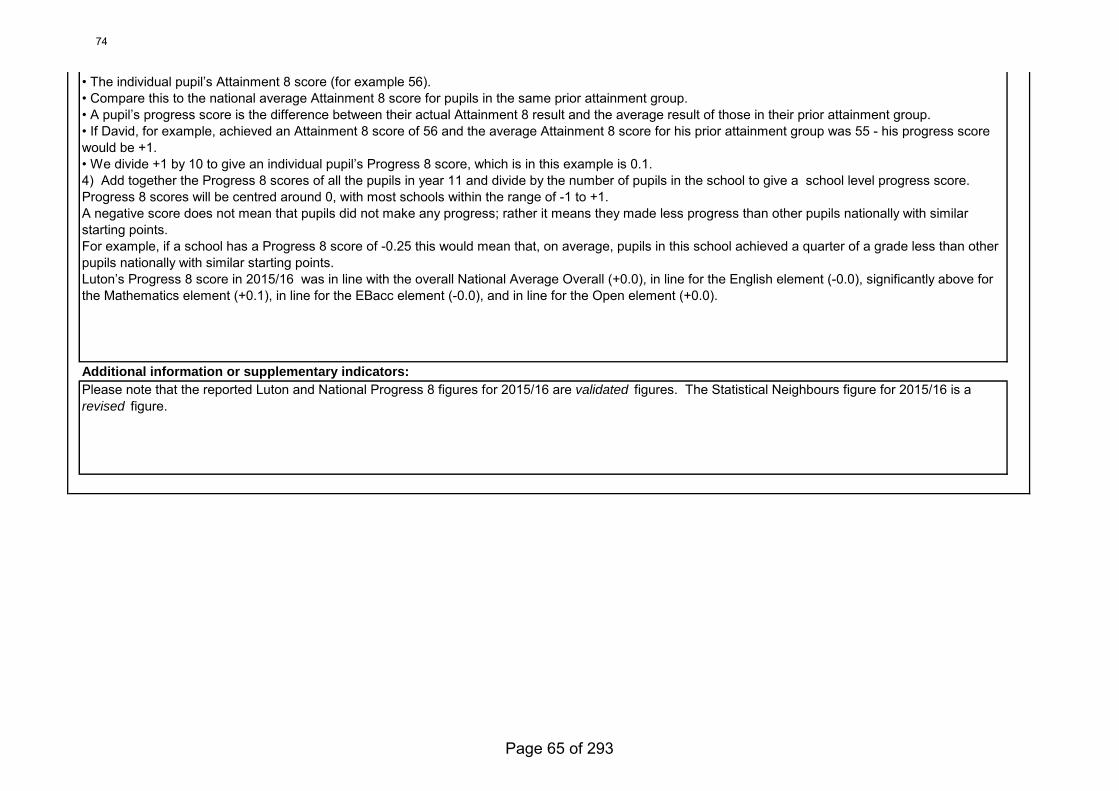
Additional information or supplementary indicators:
Progress 8 is a new measure for 2015/16 and so there is no equivalent from prior years against which comparisons can be madeHow the Progress 8 score is calculated1) All pupils nationally are put into prior attainment groups based on their key stage 2 results, so that there are groups of pupils who have similar startingpoints to each other.The DfE do this by working out a pupils’ average performance at key stage 2 across English and mathematics. Pupils’ actual test results in English and mathsare converted into points and an average of the points is taken to create an overall point score. Pupils are then allocated into prior attainment groups with other pupils who have the same key stage 2 point scores as them.2) The points allocated according to grades the pupil achieves for all 8 subjects are added together to give the Attainment 8 score. English and maths point scores are double weighted to signify their importance.3) Progress 8 is calculated for individual pupils solely in order to calculate a school’s Progress 8 score. There is no need for schools to share individualProgress 8 scores with their pupils. Schools should continue to focus on which qualifications are most suitable for individual pupils, as the grades pupilsachieve will help them reach their goals for the next stage of their education or training.
he calculation is as follows:• The individual pupil’s Attainment 8 score (for example 56).• Compare this to the national average Attainment 8 score for pupils in the same prior attainment group.• A pupil’s progress score is the difference between their actual Attainment 8 result and the average result of those in their prior attainment group.• If David, for example, achieved an Attainment 8 score of 56 and the average Attainment 8 score for his prior attainment group was 55 - his progress scorewould be +1.• We divide +1 by 10 to give an individual pupil’s Progress 8 score, which is in this example is 0.1.4) Add together the Progress 8 scores of all the pupils in year 11 and divide by the number of pupils in the school to give a school level progress score.Progress 8 scores will be centred around 0, with most schools within the range of -1 to +1.A negative score does not mean that pupils did not make any progress; rather it means they made less progress than other pupils nationally with similar starting points.For example, if a school has a Progress 8 score of -0.25 this would mean that, on average, pupils in this school achieved a quarter of a grade less than other pupils nationally with similar starting points.Luton’s Progress 8 score in 2015/16 was in line with the overall National Average Overall (+0.0), in line for the English element (-0.0), significantly above for the Mathematics element (+0.1), in line for the EBacc element (-0.0), and in line for the Open element (+0.0).
Please note that the reported Luton and National Progress 8 figures for 2015/16 are validated figures. The Statistical Neighbours figure for 2015/16 is a revised figure.
74
Page 65 of 293
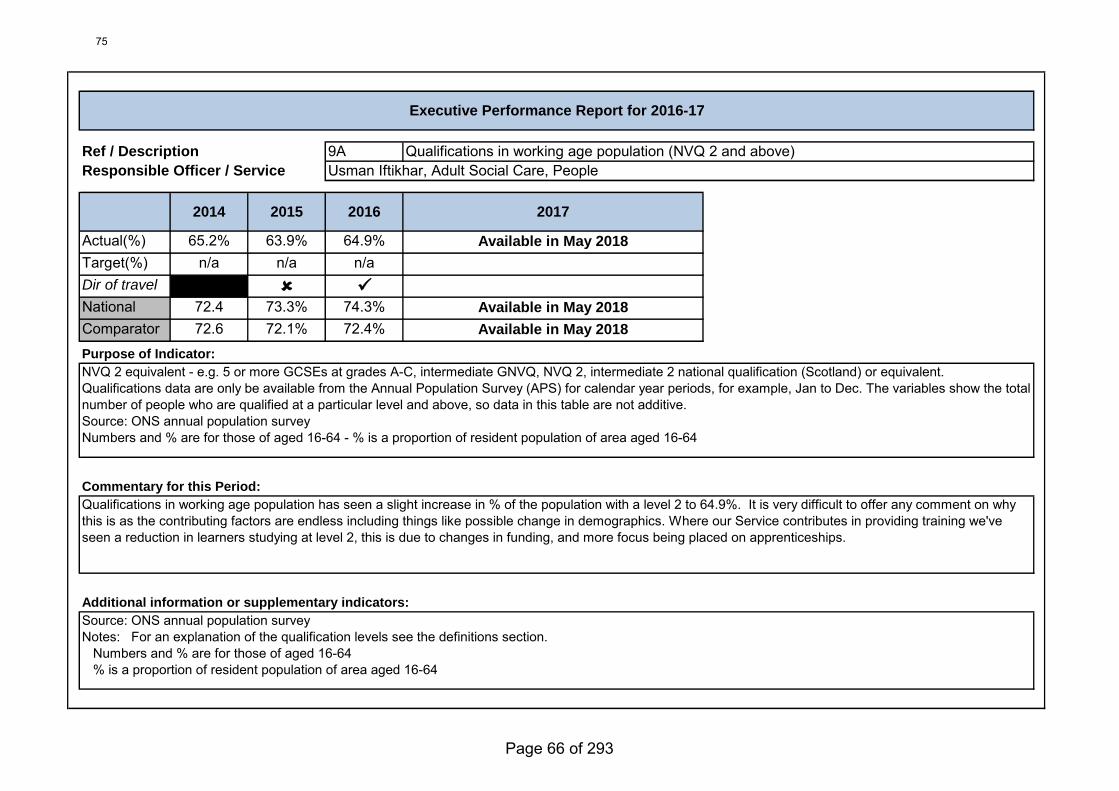
9A
Actual(%) 65.2% 63.9% 64.9%Target(%) n/a n/a n/aDir of travel
National 72.4 73.3% 74.3%Comparator 72.6 72.1% 72.4%
Purpose of Indicator:
Commentary for this Period:
Additional information or supplementary indicators:
2014 2015 2016 2017
Executive Performance Report for 2016-17
Ref / Description Qualifications in working age population (NVQ 2 and above)Responsible Officer / Service Usman Iftikhar, Adult Social Care, People
Available in May 2018
NVQ 2 equivalent - e.g. 5 or more GCSEs at grades A-C, intermediate GNVQ, NVQ 2, intermediate 2 national qualification (Scotland) or equivalent.Qualifications data are only be available from the Annual Population Survey (APS) for calendar year periods, for example, Jan to Dec. The variables show the total number of people who are qualified at a particular level and above, so data in this table are not additive. Source: ONS annual population surveyNumbers and % are for those of aged 16-64 - % is a proportion of resident population of area aged 16-64
Qualifications in working age population has seen a slight increase in % of the population with a level 2 to 64.9%. It is very difficult to offer any comment on why this is as the contributing factors are endless including things like possible change in demographics. Where our Service contributes in providing training we've seen a reduction in learners studying at level 2, this is due to changes in funding, and more focus being placed on apprenticeships.
Source: ONS annual population surveyNotes: For an explanation of the qualification levels see the definitions section. Numbers and % are for those of aged 16-64 % is a proportion of resident population of area aged 16-64
Available in May 2018
Available in May 2018
75
Page 66 of 293
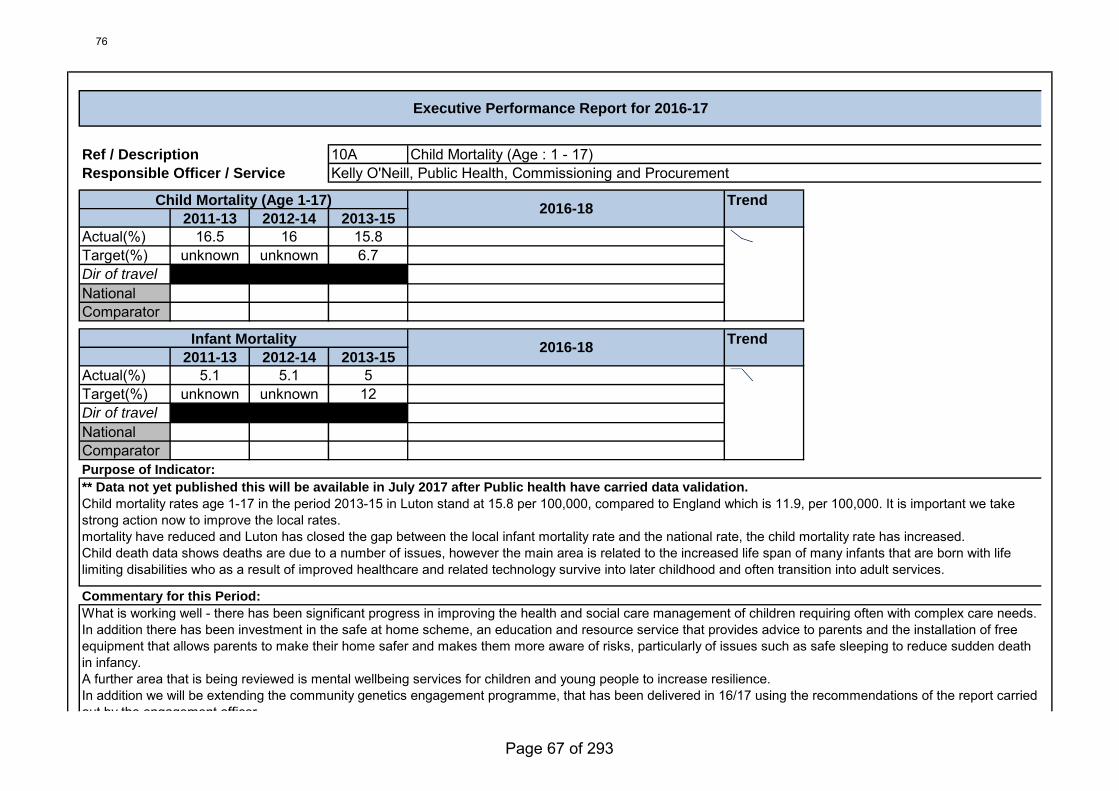
10A
Trend
2011-13 2012-14 2013-15
Actual(%) 16.5 16 15.8Target(%) unknown unknown 6.7Dir of travel
NationalComparator
Trend
2011-13 2012-14 2013-15
Actual(%) 5.1 5.1 5Target(%) unknown unknown 12Dir of travel
NationalComparatorPurpose of Indicator:
Commentary for this Period:
Child Mortality (Age 1-17)2016-18
Executive Performance Report for 2016-17
Ref / Description Child Mortality (Age : 1 - 17)Responsible Officer / Service Kelly O'Neill, Public Health, Commissioning and Procurement
** Data not yet published this will be available in July 2017 after Public health have carried data validation.
Child mortality rates age 1-17 in the period 2013-15 in Luton stand at 15.8 per 100,000, compared to England which is 11.9, per 100,000. It is important we take strong action now to improve the local rates.mortality have reduced and Luton has closed the gap between the local infant mortality rate and the national rate, the child mortality rate has increased. Child death data shows deaths are due to a number of issues, however the main area is related to the increased life span of many infants that are born with life limiting disabilities who as a result of improved healthcare and related technology survive into later childhood and often transition into adult services.
What is working well - there has been significant progress in improving the health and social care management of children requiring often with complex care needs. In addition there has been investment in the safe at home scheme, an education and resource service that provides advice to parents and the installation of free equipment that allows parents to make their home safer and makes them more aware of risks, particularly of issues such as safe sleeping to reduce sudden death in infancy.A further area that is being reviewed is mental wellbeing services for children and young people to increase resilience. In addition we will be extending the community genetics engagement programme, that has been delivered in 16/17 using the recommendations of the report carried out by the engagement officer.There will also be the first year of the integrated 0-19 healthy child programme where there well be a greater resource of frontline health and children centre professionals working more closely with families who require additional support. Premature births – SiP (LWL and L&D have been commissioned to deliver a Smoking in pregnancy service , targeting those pregnant women with no desire to quit. This is a pilot program which has already seen some positive outcomes achieving quits from this cohort.Maternal weight - Pregnancy plus, is a program delivered in partnership with Beeze bodies to reduce the levels of obesity in pregnant women.Child injuries –, public health are developing and commissioning services that contribute toward the reduction of childhood hospital emergency attendances and admissions ie safe at home services being delivered by Flying Start in Luton.Genetics community work, Public health are developing a community engagement programme to reduce the number of children dying in infancy as a result ofgenetic anomalies and the associated impact of child disabilities.Delivery of Flying Start nutrition evidence based outcome to reduce child obesity with fewer children identified as overweight and obese at NCMP Year R surveillance.
2016-18Infant Mortality
76
Page 67 of 293
Additional information or supplementary indicators:
What is working well - there has been significant progress in improving the health and social care management of children requiring often with complex care needs. In addition there has been investment in the safe at home scheme, an education and resource service that provides advice to parents and the installation of freeequipment that allows parents to make their home safer and makes them more aware of risks, particularly of issues such as safe sleeping to reduce sudden death in infancy.A further area that is being reviewed is mental wellbeing services for children and young people to increase resilience. In addition we will be extending the community genetics engagement programme, that has been delivered in 16/17 using the recommendations of the report carriedout by the engagement officer.There will also be the first year of the integrated 0-19 healthy child programme where there well be a greater resource of frontline health and children centre professionals working more closely with families who require additional support. Premature births – SiP (LWL and L&D have been commissioned to deliver a Smoking in pregnancy service , targeting those pregnant women with no desire to quit. This is a pilot program which has already seen some positive outcomes achieving quits from this cohort.Maternal weight - Pregnancy plus, is a program delivered in partnership with Beeze bodies to reduce the levels of obesity in pregnant women.Child injuries –, public health are developing and commissioning services that contribute toward the reduction of childhood hospital emergency attendances and admissions ie safe at home services being delivered by Flying Start in Luton.Genetics community work, Public health are developing a community engagement programme to reduce the number of children dying in infancy as a result of genetic anomalies and the associated impact of child disabilities.Delivery of Flying Start nutrition evidence based outcome to reduce child obesity with fewer children identified as overweight and obese at NCMP Year R surveillance.
While the focus has been on infant mortality there does need to be a full review of the aggregated picture for child mortality to understand what further action needs to be taken.
77
Page 68 of 293
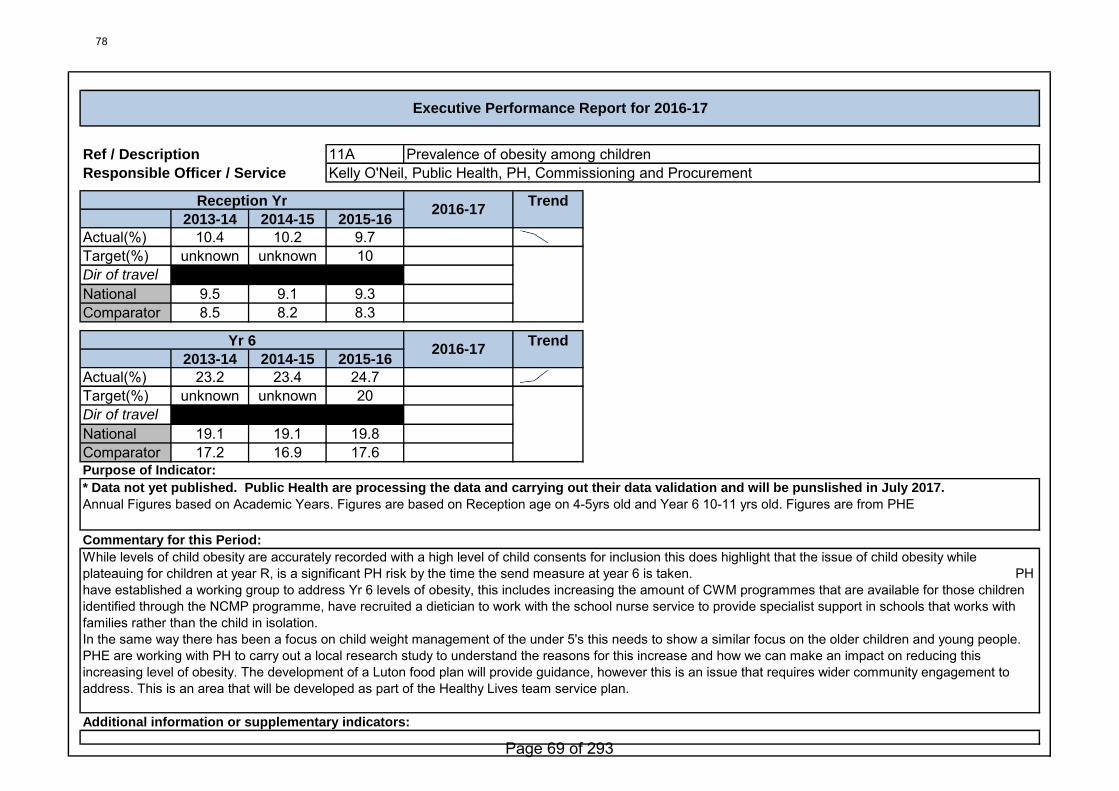
11A
2013-14 2014-15 2015-16
Actual(%) 10.4 10.2 9.7Target(%) unknown unknown 10Dir of travel
National 9.5 9.1 9.3Comparator 8.5 8.2 8.3
2013-14 2014-15 2015-16
Actual(%) 23.2 23.4 24.7Target(%) unknown unknown 20Dir of travel
National 19.1 19.1 19.8Comparator 17.2 16.9 17.6Purpose of Indicator:
Commentary for this Period:
Additional information or supplementary indicators:
Reception Yr2016-17
Trend
Executive Performance Report for 2016-17
Ref / Description Prevalence of obesity among childrenResponsible Officer / Service Kelly O'Neil, Public Health, PH, Commissioning and Procurement
Yr 6 2016-17
Trend
While levels of child obesity are accurately recorded with a high level of child consents for inclusion this does highlight that the issue of child obesity while plateauing for children at year R, is a significant PH risk by the time the send measure at year 6 is taken. PH have established a working group to address Yr 6 levels of obesity, this includes increasing the amount of CWM programmes that are available for those children identified through the NCMP programme, have recruited a dietician to work with the school nurse service to provide specialist support in schools that works with families rather than the child in isolation. In the same way there has been a focus on child weight management of the under 5's this needs to show a similar focus on the older children and young people. PHE are working with PH to carry out a local research study to understand the reasons for this increase and how we can make an impact on reducing this increasing level of obesity. The development of a Luton food plan will provide guidance, however this is an issue that requires wider community engagement to address. This is an area that will be developed as part of the Healthy Lives team service plan.
* Data not yet published. Public Health are processing the data and carrying out their data validation and will be punslished in July 2017.
Annual Figures based on Academic Years. Figures are based on Reception age on 4-5yrs old and Year 6 10-11 yrs old. Figures are from PHE
78
Page 69 of 293
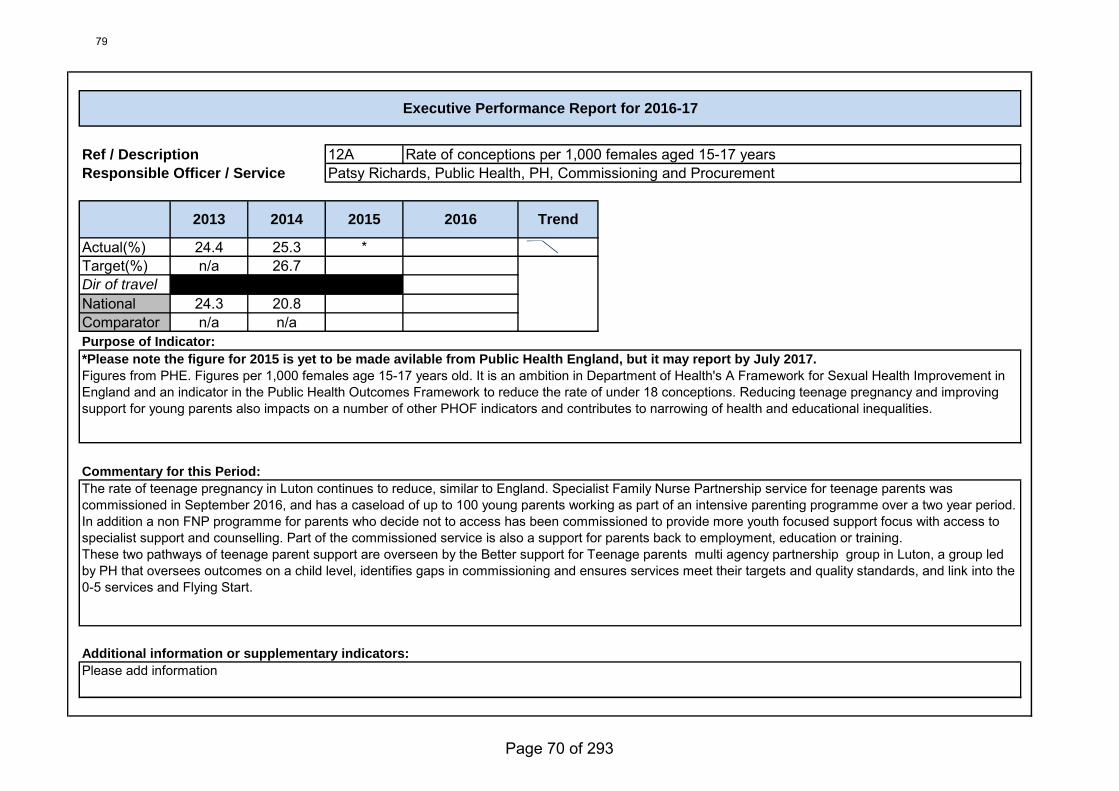
12A
Actual(%) 24.4 25.3 *Target(%) n/a 26.7Dir of travel
National 24.3 20.8Comparator n/a n/aPurpose of Indicator:
Commentary for this Period:
Additional information or supplementary indicators:
Executive Performance Report for 2016-17
Ref / Description Rate of conceptions per 1,000 females aged 15-17 yearsResponsible Officer / Service Patsy Richards, Public Health, PH, Commissioning and Procurement
2013 2014 2015 2016 Trend
*Please note the figure for 2015 is yet to be made avilable from Public Health England, but it may report by July 2017.
Figures from PHE. Figures per 1,000 females age 15-17 years old. It is an ambition in Department of Health's A Framework for Sexual Health Improvement in England and an indicator in the Public Health Outcomes Framework to reduce the rate of under 18 conceptions. Reducing teenage pregnancy and improving support for young parents also impacts on a number of other PHOF indicators and contributes to narrowing of health and educational inequalities.
The rate of teenage pregnancy in Luton continues to reduce, similar to England. Specialist Family Nurse Partnership service for teenage parents was commissioned in September 2016, and has a caseload of up to 100 young parents working as part of an intensive parenting programme over a two year period. In addition a non FNP programme for parents who decide not to access has been commissioned to provide more youth focused support focus with access to specialist support and counselling. Part of the commissioned service is also a support for parents back to employment, education or training. These two pathways of teenage parent support are overseen by the Better support for Teenage parents multi agency partnership group in Luton, a group led by PH that oversees outcomes on a child level, identifies gaps in commissioning and ensures services meet their targets and quality standards, and link into the 0-5 services and Flying Start.
Please add information
79
Page 70 of 293
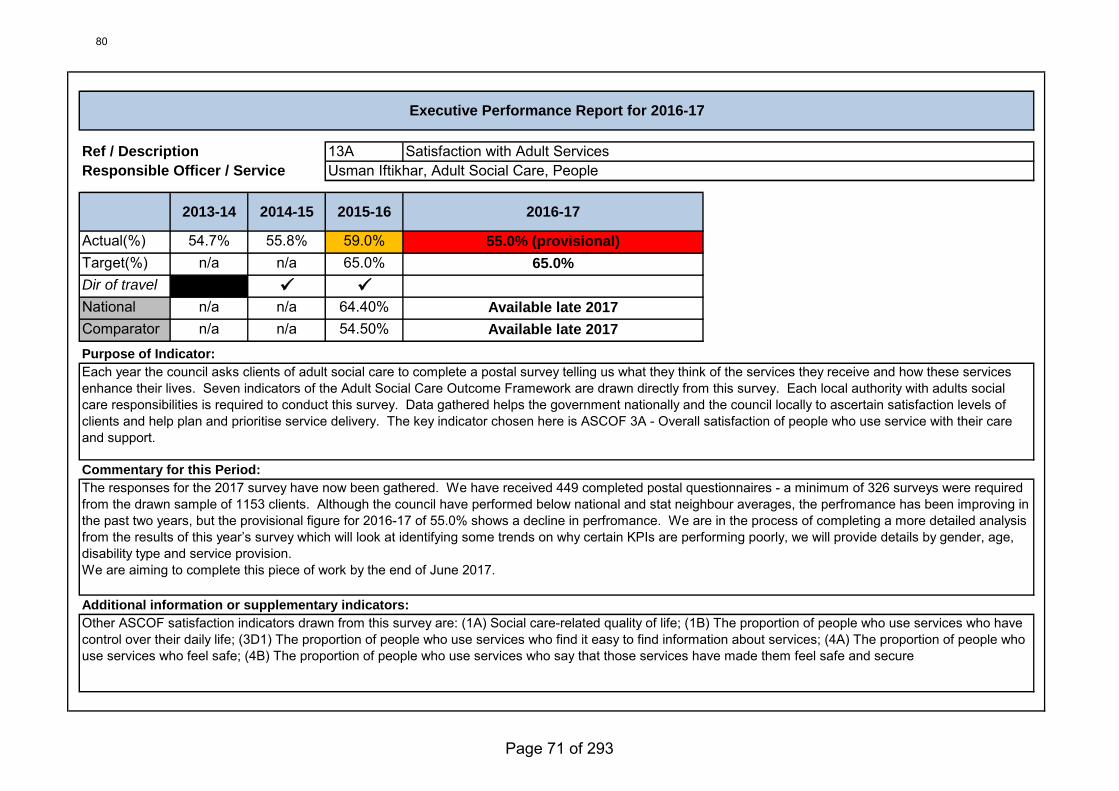
13A
Actual(%) 54.7% 55.8% 59.0%Target(%) n/a n/a 65.0%Dir of travel
National n/a n/a 64.40%Comparator n/a n/a 54.50%
Purpose of Indicator:
Commentary for this Period:
Additional information or supplementary indicators:
2013-14 2014-15 2015-16 2016-17
Executive Performance Report for 2016-17
Usman Iftikhar, Adult Social Care, PeopleSatisfaction with Adult ServicesRef / Description
Responsible Officer / Service
Other ASCOF satisfaction indicators drawn from this survey are: (1A) Social care-related quality of life; (1B) The proportion of people who use services who have control over their daily life; (3D1) The proportion of people who use services who find it easy to find information about services; (4A) The proportion of people who use services who feel safe; (4B) The proportion of people who use services who say that those services have made them feel safe and secure
Each year the council asks clients of adult social care to complete a postal survey telling us what they think of the services they receive and how these services enhance their lives. Seven indicators of the Adult Social Care Outcome Framework are drawn directly from this survey. Each local authority with adults social care responsibilities is required to conduct this survey. Data gathered helps the government nationally and the council locally to ascertain satisfaction levels of clients and help plan and prioritise service delivery. The key indicator chosen here is ASCOF 3A - Overall satisfaction of people who use service with their care and support.
The responses for the 2017 survey have now been gathered. We have received 449 completed postal questionnaires - a minimum of 326 surveys were required from the drawn sample of 1153 clients. Although the council have performed below national and stat neighbour averages, the perfromance has been improving in the past two years, but the provisional figure for 2016-17 of 55.0% shows a decline in perfromance. We are in the process of completing a more detailed analysis from the results of this year’s survey which will look at identifying some trends on why certain KPIs are performing poorly, we will provide details by gender, age, disability type and service provision.We are aiming to complete this piece of work by the end of June 2017.
Available late 2017
55.0% (provisional)
65.0%
Available late 2017
80
Page 71 of 293
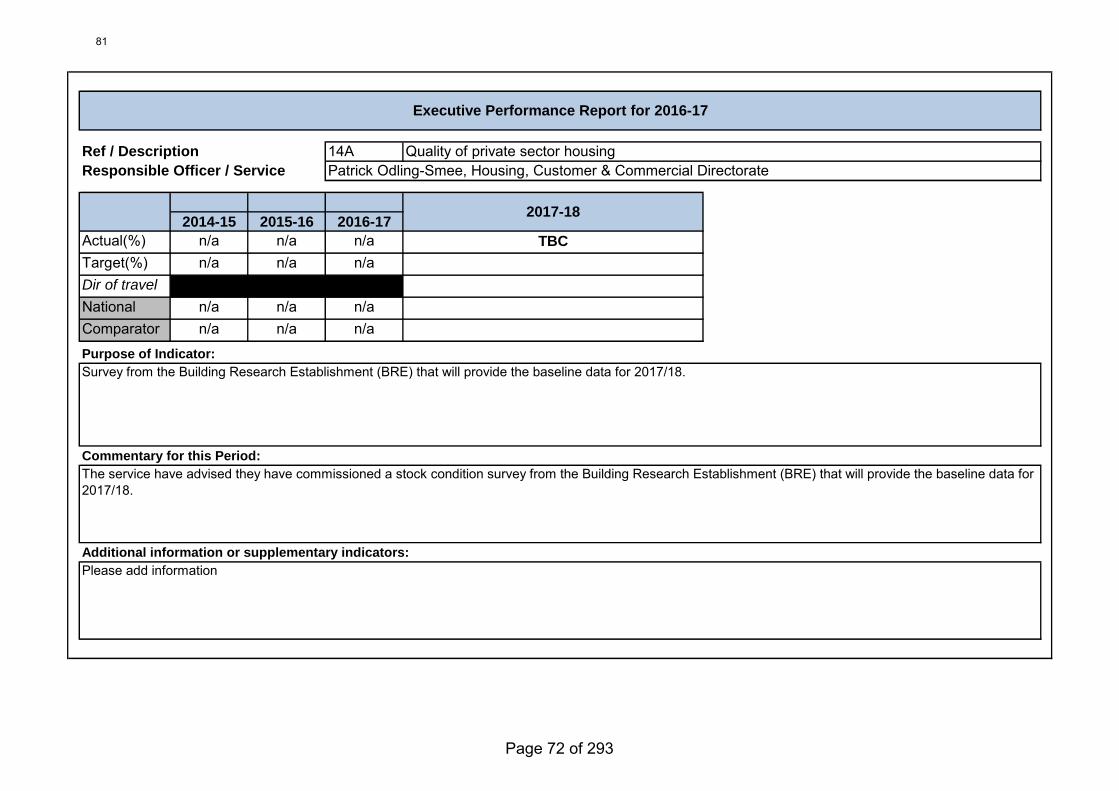
14A
2014-15 2015-16 2016-17
Actual(%) n/a n/a n/aTarget(%) n/a n/a n/aDir of travel
National n/a n/a n/aComparator n/a n/a n/a
Purpose of Indicator:
Commentary for this Period:
Additional information or supplementary indicators:
2017-18
Please add information
Survey from the Building Research Establishment (BRE) that will provide the baseline data for 2017/18.
The service have advised they have commissioned a stock condition survey from the Building Research Establishment (BRE) that will provide the baseline data for 2017/18.
TBC
Ref / Description
Responsible Officer / Service
Executive Performance Report for 2016-17
Patrick Odling-Smee, Housing, Customer & Commercial DirectorateQuality of private sector housing
81
Page 72 of 293
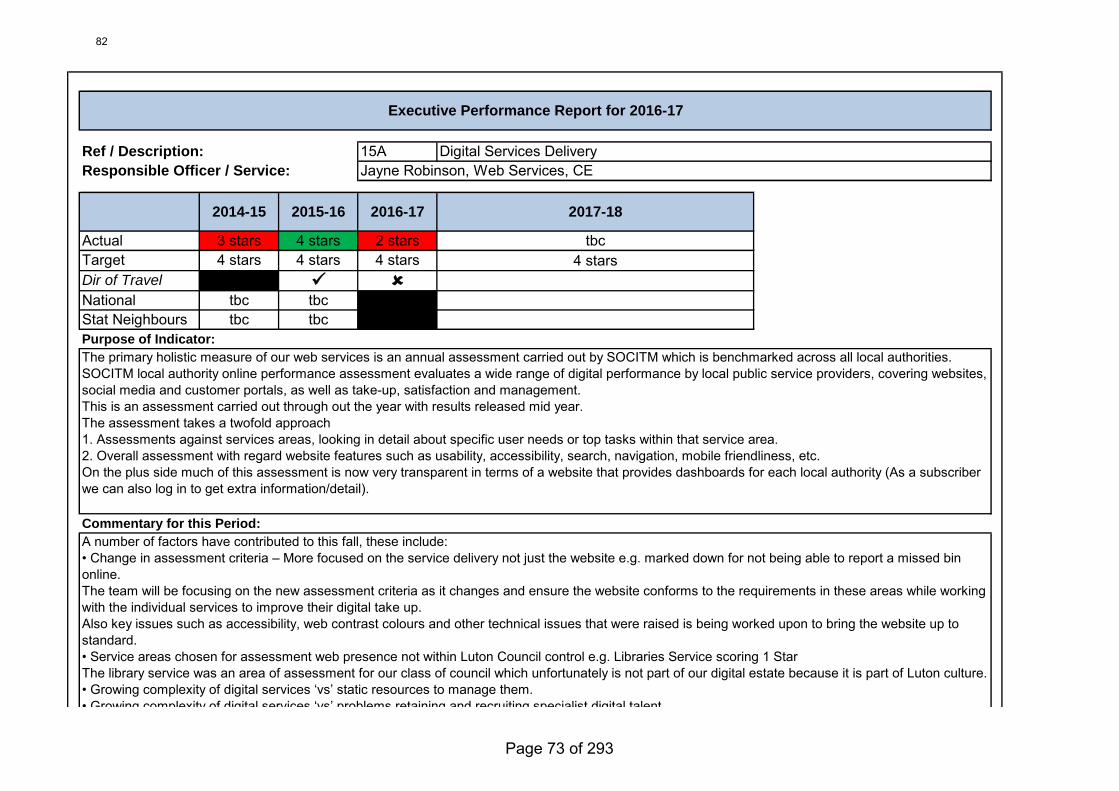
Ref / Description: 15AResponsible Officer / Service:
Actual 3 stars 4 stars 2 starsTarget 4 stars 4 stars 4 starsDir of Travel
National tbc tbcStat Neighbours tbc tbcPurpose of Indicator:
Commentary for this Period:
The primary holistic measure of our web services is an annual assessment carried out by SOCITM which is benchmarked across all local authorities. SOCITM local authority online performance assessment evaluates a wide range of digital performance by local public service providers, covering websites, social media and customer portals, as well as take-up, satisfaction and management.This is an assessment carried out through out the year with results released mid year.The assessment takes a twofold approach 1. Assessments against services areas, looking in detail about specific user needs or top tasks within that service area.2. Overall assessment with regard website features such as usability, accessibility, search, navigation, mobile friendliness, etc.On the plus side much of this assessment is now very transparent in terms of a website that provides dashboards for each local authority (As a subscriber we can also log in to get extra information/detail).
A number of factors have contributed to this fall, these include:• Change in assessment criteria – More focused on the service delivery not just the website e.g. marked down for not being able to report a missed binonline. The team will be focusing on the new assessment criteria as it changes and ensure the website conforms to the requirements in these areas while working with the individual services to improve their digital take up.Also key issues such as accessibility, web contrast colours and other technical issues that were raised is being worked upon to bring the website up to standard.• Service areas chosen for assessment web presence not within Luton Council control e.g. Libraries Service scoring 1 StarThe library service was an area of assessment for our class of council which unfortunately is not part of our digital estate because it is part of Luton culture.• Growing complexity of digital services ‘vs’ static resources to manage them.• Growing complexity of digital services ‘vs’ problems retaining and recruiting specialist digital talentThe newly forming digital team will bring in new team members which will improve the resource level needed to manage the complex digital service• Focus on challenging big ticket digital projects pulling limited resource away from continuous improvement and development of existing assets.The newly forming digital team will bring in resources to help in focusing on continuous improvement and development of the existing assets.• Outdated core digital platform infrastructure e.g. Content Management System, SharePoint 2010• Lack of fully ‘responsive’ core digital platform infrastructure. Responsive means Web services that automatically display well on whichever device (Laptop, desktop, mobile, tablet) you are viewing it on.• Organisational change including restructures and ICT contract refresh impacting operational delivery and continuous improvement.
Executive Performance Report for 2016-17
2014-15 2015-16 2016-17
Digital Services DeliveryJayne Robinson, Web Services, CE
tbc
2017-18
4 stars
82
Page 73 of 293
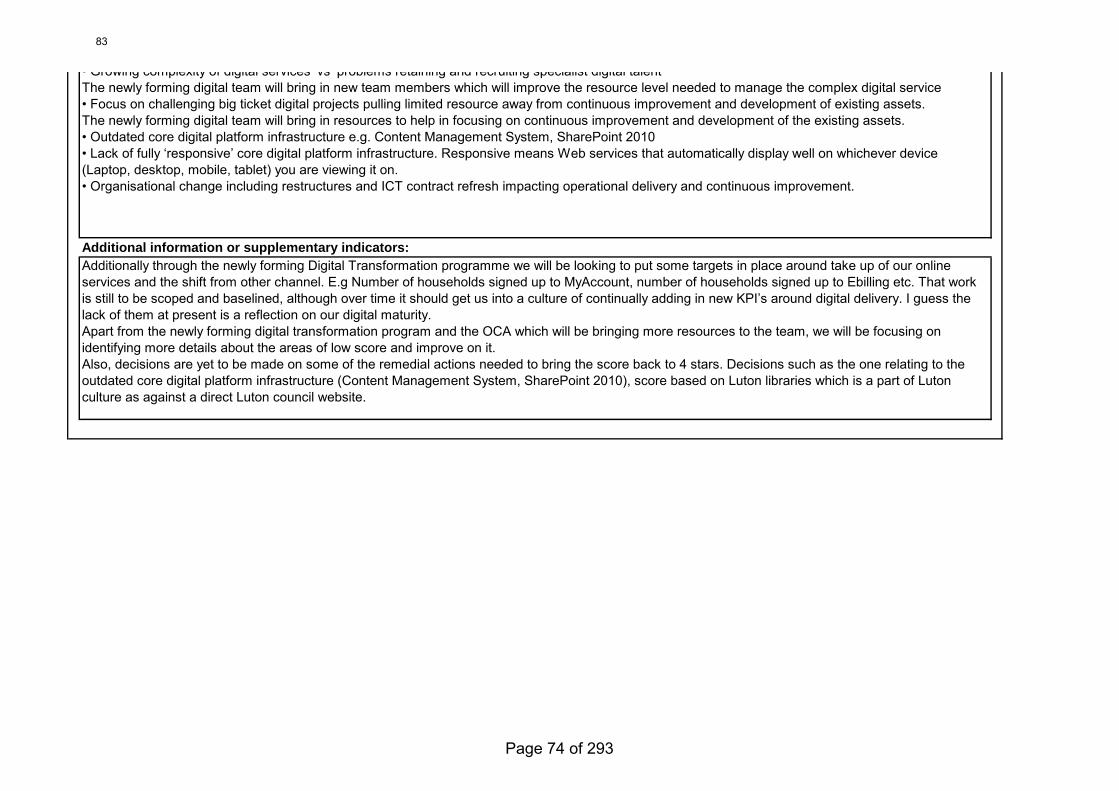
Additional information or supplementary indicators:
Additionally through the newly forming Digital Transformation programme we will be looking to put some targets in place around take up of our online services and the shift from other channel. E.g Number of households signed up to MyAccount, number of households signed up to Ebilling etc. That work is still to be scoped and baselined, although over time it should get us into a culture of continually adding in new KPI’s around digital delivery. I guess the lack of them at present is a reflection on our digital maturity.Apart from the newly forming digital transformation program and the OCA which will be bringing more resources to the team, we will be focusing on identifying more details about the areas of low score and improve on it.Also, decisions are yet to be made on some of the remedial actions needed to bring the score back to 4 stars. Decisions such as the one relating to the outdated core digital platform infrastructure (Content Management System, SharePoint 2010), score based on Luton libraries which is a part of Luton culture as against a direct Luton council website.
A number of factors have contributed to this fall, these include:• Change in assessment criteria – More focused on the service delivery not just the website e.g. marked down for not being able to report a missed bin online. The team will be focusing on the new assessment criteria as it changes and ensure the website conforms to the requirements in these areas while workingwith the individual services to improve their digital take up.Also key issues such as accessibility, web contrast colours and other technical issues that were raised is being worked upon to bring the website up tostandard.• Service areas chosen for assessment web presence not within Luton Council control e.g. Libraries Service scoring 1 StarThe library service was an area of assessment for our class of council which unfortunately is not part of our digital estate because it is part of Luton culture.• Growing complexity of digital services ‘vs’ static resources to manage them.• Growing complexity of digital services ‘vs’ problems retaining and recruiting specialist digital talentThe newly forming digital team will bring in new team members which will improve the resource level needed to manage the complex digital service• Focus on challenging big ticket digital projects pulling limited resource away from continuous improvement and development of existing assets.The newly forming digital team will bring in resources to help in focusing on continuous improvement and development of the existing assets.• Outdated core digital platform infrastructure e.g. Content Management System, SharePoint 2010• Lack of fully ‘responsive’ core digital platform infrastructure. Responsive means Web services that automatically display well on whichever device(Laptop, desktop, mobile, tablet) you are viewing it on.• Organisational change including restructures and ICT contract refresh impacting operational delivery and continuous improvement.
83
Page 74 of 293
Subject: Corporate Performance Report – Q4 2016-17 Consultations: (x) Councillors
(For Executive Only) Scrutiny Lead Executive Member(s): Stakeholders Wards Affected: Others Recommendations Background The purpose of this report is to provide CLMT, Overview and Scrutiny Board and the Executive with the current performance against LBC’s key priorities, measured by a selection of performance indicators. From 2016-17 there will be a quarterly and a separate annual report, as part of a new reporting process in line with the Corporate Performance Management Framework. The performance report consists of two elements:
1) Corporate Performance Summary (this document): providing headline commentary for the council’s six new priorities (where information is available in this reporting period).
2) Corporate Performance Data pack, which includes an index of all performance indicators and a detailed page for each indicator where new information is available this period, providing current performance, benchmark information, and commentary.
The current position Priority 1: Building economic growth and prosperity PI 1: The Local Environment Quality Standards Survey is completed twice a year to measure the percentage of decent streets (including litter) in Luton. The latest survey was carried out in January 2017, and the results show a decline in performance to 79.3% from 87.3(July 2017). The street cleansing division have been targeting areas that regularly fall below accepted standards. This includes:
• Deep cleaning programme in the High Town and Newtown areas, pictorial examples have been taken of before and after results. • Removed over 400 reports of fly tipping on council land. • Commenced a weed spraying programme, the town centre has been completed and one third of the town has now been treated with Diuron pesticide. • All mechanical sweepers have been replaced by new models leading to a higher quality and more reliable service
As highlighted previously, at the start of October 2016 the Enforcement Team commissioned an independent street cleansing inspection by Keep Britain Tidy, which reported similar figures (this result is included in the template for Q3). PI 1A - Employment in Luton • Total employment in Luton fell by 3,000 from 90,000 to 87,000 people between 2014 and 2015. • Full time employment in Luton grew by 1,300 up to 61,300 people between 2014 and 2015, an increase of 2.2%. • Part- time employment in Luton fell by 4,200 people to 25,800 between 2014 and 2015.
For: (x) Agenda Item Number: Executive For Executive – private: delete if not appropriate CLMT NOT FOR PUBLICATION Meeting Date:11th May 2017 Exempt information falling within
paragraph(s)..... Of part 1 of schedule 12a to the local government act 1972 Report of: Jayne Robinson
Report author: Israr Siddique
Page 75 of 293
• Sixty seven per cent of jobs in Luton are full time which is similar to the national figure. • The highest proportion of jobs in Luton are in the service sector but there is still a higher proportion of manufacturing jobs in Luton than the national figure. • Almost half of jobs in Luton are based in South and Wigmore wards. • Those that work in Luton but don’t necessarily live in Luton have higher average earnings than Luton residents. • Residence based full time earnings in Luton rose by 3.4 per cent from £489.0 to £505.5 and workplace (i.e. those working but not necessarily living in Luton) based full-time earnings rose by 3.7 per cent from £524.1 to £543.4 between 2015 and 2016. • Luton’s workplace based average earnings are higher than the national figure and resident based earnings lower. • The ONS calculated that 18,000 jobs in Luton earn less than the living wage. That is 21% of jobs in Luton. PI 2: There is currently no Footfall data available for Q4. The third party supplier has not provided this. We have been trying to re-establish the correct level of access for producing quarterly performance reports. The measure will updated as soon as the information is available. PI 2A - New businesses / net growth in business: There were 1,425 new enterprises in Luton in 2015 up from 1,140 in 2014 and 730 business closures which have increased from the 710 closures in 2014. The number of new businesses in Luton increased by 25% which is faster than the national figure (9.3%). PI 3: By end of Q4, £70.2m in Total Business Rates had been collected against the target of £68.2m. Total collection had exceeded the annual target and seen a year on year increase. This is a particular achievement given that Business Rates in Luton have been reducing for the last three years as a result of business closures, conversions to domestic dwellings and appeals lowering property rateable values in year. PI 4: Council Tax collection achieved a record £76.7M in Q4, against a target of £75.6m. Compared with last year, an additional £5.5m has been collected and almost £8.5m more than 2014-15. This is a remarkable achievement considering the changes made to the Council Tax Reduction Scheme, with 8000 people having to pay something towards their council tax for the first time. PI 5: There were 3.2m London Luton Airport passengers between January and March against a target of 3.0m, taking the end of year result to over 15.0m. Passenger numbers increased by 499,536 (18.2%) in the final quarter of the 2016-17 financial year compared to the equivalent period of 2015-16, and exceeded the target for the period by 8.9%. The airport operator is predicting a slowing down in the rate of growth for the coming year to 7.2%, mainly due to the physical constraints of the airfield. PI 6: The number of passengers using Bus Travel from/to Luton Town Centre (millions) has increased this quarter to 1.65m from 1.52m in the last quarter (Q3). The increase in Q4 is likely to be due to services being back to full capacity after the festive period during which time some services run a limited service. Priority 2: Enhanced skills and education The 2016 key stage 2 assessments are the first which assess the new, more challenging national curriculum which was introduced in 2014. Because of the changes to the curriculum, figures for 2016 are not directly comparable to those for earlier years. 45% of Luton’s pupils achieved the expected standard and 3% achieved a high standard in reading, writing and mathematics. Nationally, these proportions were 53% at the expected standard and 5% at the higher standard. Luton’s pupils scored highest in achieving the expected standard in grammar, punctuation and spelling (71%), nationally it was writing (74%). The worst performing subject was
Page 76 of 293
reading for both Luton (56%) and England (66%). Luton’s rankings have improved in some subjects, particularly writing (up 14 places), mathematics (up 8 places) and GPS (up 6 places). Luton’s position for reading, writing and mathematics combined remained the same and the position for reading deteriorated. The gap between Luton and both the ‘all school’ and ‘state-funded schools’ position has declined. Luton is now ranked joint 130th out of 151 LAs. In 2015 Luton was ranked joint 114th out of 150 LAs. Luton’s rank amongst its statistical neighbours has dropped from 5th in 2015 to 7th of 11 in 2016. Attainment in 2016 was below both national and our statistical neighbours. Raising attainment in Key Stage 2 is a key strategic priority. Luton schools are being supported by the locally developed Spotlight on Standards programme. In Luton the average Attainment 8 score per pupil at Key Stage 4 has increased 0.9 points to 47.5 in 2016. For all schools nationally this increase was 0.8 points to 48.2 and for all state-funded schools nationally this increase was 1.4 points to 50.0. Qualifications in working age population has seen a slight increase in % of the population with a level 2 to 64.9%. PI 8: The Luton NEET percentage for all Y12 to Y14's result for Math was 3.4%. From September the NEET measurer was changed by the Department of Education (DfE). The new measure will be calculated by adding the proportion of young people NEET in each area to the proportion whose activity is recorded as not known. It will replace the previous ‘adjusted’ NEET figure and indicate how well an LA is performing at both tracking young people and managing the proportion who are NEET. Authorities will no longer be required to track young people of academic age 18, although we are expecting that most LAs will decide to continue tracking the most vulnerable. Young people in the final year of compulsory education (academic age 15) are unaffected by the change. Young adults with a current education, health and care plan should still be included in the XML up to academic age 25. Alongside this change in requirement, DfE are also introducing a new performance measure to focus on reducing the proportion of young people whose activity is recorded as ‘not known’ as well as those who are NEET. PI 9: Since the lifting of the moratorium, the number of LBC employed apprentices has been steadily increasing. From 52 in Q1, we have reached 60 in Q4. In Q4, 9 new apprentices have been employed by LBC departments and are on programme. There is a slight decrease from the Q3 figure of 13 new apprentices. As previously noted in Q3, the possible causes of this are that there is no further funding available to support salary contributions meaning there is a greater contribution required from department budgets and there is uncertainty over the introduction of the apprenticeship levy and associated new recruitment targets. Priority 3: Improving health and wellbeing PI 10: The provisional end of year figures for 31st March 2017 are 364 children looked after in Luton, a rate of 64.9 per 10,000 population aged 0-17 years. This is a drop of 3.7% compared to the same period last year. Although the number of children looked after has reduced, the number of unaccompanied asylum seeking children has increased to 34 due to the impact of the National Dispersal System introduced by the government. Luton has to fulfil a quota of 38 UASC children which is 0.07% population of Luton. PI 11: This indicator measures the percentage of single assessments which were completed within 45 working days. Performance has seen a month on month improvement since April with a slight drop in the final quarter with provisional figure at March 2017 of 87.2%. This is a significant improvement on the previous year figure of 73.7%, and exceeds both statistical neighbour (84.9%) and the England average (83.4%).
Page 77 of 293
PI 12: The Fostering Team focused on recruitment and promotional days to attract new foster carers in July 2016, to help increase the number of approvals, however the service have fallen short of the target (30). As at March 2017, there were 18 in-house foster carers newly approved. A lot of effort has been placed on recruitment and promotional days by the Fostering Team since July 2016, however these have not been successful in finalising recruitment. Recruiting new foster carers is challenging and the reasons for not meeting the targets are complex, including allaying fears of potential foster carers and changing the focus on perceptions of young people in care. PI 13: 26 children were granted an adoption order during 2016/17, a 44% increase compared to last year when 18 children were adopted. Luton has also exceeded national trends where adoption orders being granted are reducing. More significantly, 11 adoption orders were granted in the final quarter (42%) including 3 sibling groups (7 children). Luton has also successfully ensured adoption for 6 children aged between 5-7 years during 2016/2017. PI 12A: Child Mortality (Age: 1 - 17): Significant progress has been made in the health and social care management of children. With investment in the safe at home scheme providing advice, guidance and equipment to parents for a safer home. A further area that is being reviewed is mental wellbeing services for children and young people to increase resilience. In addition we will be extending the community genetics engagement programme, that has been delivered in 16/17 using the recommendations of the report carried out by the engagement officer. There will also be the first year of the integrated 0-19 healthy child programme where there will be a greater resource of frontline health and children centre professionals working more closely with families who require additional support. PI 13A: Prevalence of obesity among children: With high level of child consents for inclusion it has highlighted that the issue of child obesity children at Reception year which will have an effect by the time the measure at year 6 is taken. Measures taken to address Yr 6 levels of obesity includes increasing the amount of CWM programmes available for those children, recruitment of a dietician to work with the school nurse service to provide specialist support in schools that works with families rather than the child in isolation, with focus needed to be also in Year 6 weight management. Study to understand reasons for increase will be looked into with aim at reducing current levels. Healthy Lives Team service plan will look into further work with guidance to be made available from the Luton food plan. PI 14A: Rate of conceptions per 1,000 females aged 15-17 years: Teenage pregnancy rates in Luton show a gradual decease compared to last year and this trend is seen nationally. A new specialist Family Nurse Partnership service was introduced in September 2016. In addition a non FNP programme for parents who decide not to access has been commissioned to provide more youth focused support. PI 14: Adults and older clients who have been reviewed, has seen performance substantially improve this year. Regular monthly performance monitoring has resulted in all Adult Social Care teams showing consistent month on month improvement from the start of the financial year, this has resulted in a year end outturn of 85.4%. This is a considerable improvement on the last (67.2%) and previous year’s (61.1%) performance. PI 15: Acceptable waiting times for assessment: End of year performance was 79.8%, and since the new Initial Assessment Service was introduced on September 1st 2016 there has been a significant improvement in dealing with new requests for assessments and completed within 28 days. Compared with previous years (52.6% in 2014-15 and 65.1% in 2015-16) the end of year result is very positive despite the target (90.0%) not being achieved. PI 15A: Satisfaction with Adult Services: The council asks clients of adult social care to complete a postal survey telling us what they think of the services they receive and how these services enhanced their lives. Final result for 2016-17 is yet to be determined but draft result will be made available in June 2017. Although the council have performed below national and stat neighbour averages, it has
Page 78 of 293
improved in the area in the past two years. PI 16: For the NHS Health Check, Q4 data is not yet available from Healthcheck.nhs.uk, but should be made available during May 2017. In Q3 19,342 eligible people received an NHS Health Check, giving a quarterly result of 38.1% against a target of 32.4%. Luton is currently performing very well, not only exceeding its local target by almost 6%, but also performing substantially better then National statistical averages, and the service is expected to end the year in similar fashion. PI 17: For the Successful completion of drug treatment, Q4 data is not yet available from Healthcheck.nhs.uk, but should be made available during May 2017. The Q3 result of 8.6% remains above the 8.0% target, but dropped from the previous quarter (8.8%). ResoLUTiONs Alcohol and Drug Recovery Service in Luton have been awarded to CGL (Change Grow Live). They took over the service from the 3rd April 2017. Services will include health and wellbeing interventions, assessment and recovery planning, training and education, recovery support and substance misuse training for local organisations. Early indications are extremely positive - the transfer of staff was carried out smoothly and the initial engagement with service users has been very strong, with good feedback. PI 18: Quarter 4 data will be available after August 2017 from Healthcheck.nhs.uk. For the Number of admissions involving alcohol, in Q3 the cumulative result stood at 560 against a target of 525. Luton currently has higher admission episodes in: ‘cardiovascular disease conditions’; ‘mental and behavioural disorders due to alcohol condition’ and ‘alcohol related cancers’. Our new drug and alcohol service (ResoLUTiONS) will provide an improved offer to target these individuals. We expect the service to target frequent flyers and to develop a stepped alcohol detoxification with individuals starting detox in the hospital and then going straight to an ambulatory detox in the community. PI 19: For Avoidable Admissions, the quarter 4 figure of 4533 only includes data for January and February, but even without the March figure the annual target (23917) has already been exceeded, with the current figure standing at 24634. Feb data was released by the NHS on 13th April 2017 and March data will be available in May 2017. A range of actions are currently taking place to improve performance, including the development of Better Together programmes. Additionally, the CCG have recently recommissioned out of hours services and the ‘111’ urgent care system has been recommissioned for 2017/18, which are also likely to impact. Further work is therefore required to reduce demand for acute services including improving and strengthening self-care and self-management, and maintaining care in the community. Priority 4: Developing quality homes and infrastructure PI 16A: Quality of private sector housing: The service has advised they have commissioned a stock condition survey from the Building Research Establishment (BRE) that will provide the baseline data for 2017/18. PI 20: The percentage of rent collected as a proportion of rent owed was 98.11% at the end of Q4, this is slightly above the Q3 result of 98.06%. Housing Services has restructured and has moved to the new Housing Operations structure, which has had a short term impact on rents performance. The service is confident that the new structure will drive up performance going forward for 2017/18. PI 21: For Bed and Breakfast, Temporary Accommodation, and Nightly Rate, there have been significant improvements in the number of households in B&B, with only 4 remaining at the end of March 2017. There has been a corresponding rise in Nightly Rate accommodation, which is a much cheaper form of accommodation and is more stable for homeless families. Focus will now be on reducing the number of households in nightly rate accommodation. PI 22: For Housing Voids, the time taken to let a property for general needs has decreased to 22 days from 24 days but still remains above the target of 20 days. Performance for sheltered properties reduced from 49 to 42 days. The service has an action in place to help drive performance
Page 79 of 293
improvement. There are number of measure in place to ensure future performance improvement and to achieve performance targets, including, the introduction of an “Exit Standard”, Rechargeable Repair procedure , new incentives to vacating tenants reducing the level of remedial works required on empty dwellings by improving the condition of properties when they are vacated, increase the number of remedial works that are undertaken within the pre and post void periods and encouraging closer working between teams participating in the end-to-end void process. PI 23: 22 affordable new homes were delivered in Q4, taking the end of year figure to 127, exceeding the annual target of 125. The Council and its partners delivered 13 more units this quarter. BTS have built a further 3 properties through the conversion of shed areas at the base of Penhill. The Housing Department has also purchased two properties under the "buy back" policy and a further 4 properties were purchased for ASC for clients with bespoke needs under the transforming care agenda; providing a total of 22 units this quarter. PI 24: In Q4, 66.7% of Major planning applications were dealt with within 13 week, remaining above the quarterly target of 60%, but showing a significant decline compared with performance in Q1 at 83.0%. With the difficulties and poor performance report in 2014-5 and 2015-16, the Service continue to make steady and positive progress but continues to face significant challenges from an unprecedented increase in workload including the major projects identified in the launch of the Luton investment framework programme. Priority 5: Supporting, safe, strong and cohesive communities PI 25: In Q4 there were 4457 offences in Luton. Looking at the whole calendar year compared to last year all crime levels have increased by 7%. Compared to members of our most similar group (as defined by the Home Office) we have below average levels of offences but projected levels of all crime are increasing (data to February 2017). PI 26: Stronger Families - number of families 'turned around': As of the end of Q4 2016-17, the service had worked with a total of 1463 families. Currently, 301 have been families turned around during phase 2 of the troubled families programme, slightly behind the target of 310 families. Luton is performing well against our statistical neighbours with only one LA performing slightly better at 17% of overall target achieved compared to our 15.5%. Luton performed well in a recent ‘Spot Check’ Review conducted by an Audit team from the Department of Communities & Local Government (DCLG) and received positive feedback from the Programme Director at the DCLG. PI 27: Volunteering - number of volunteers and hours: Q4 performance is currently provisional but the figures show a reduction in the number of volunteers recruited to 65 from 83 in Q3, but remains above the quarterly target of 50. However the number of hours has dropped significantly to 1137 from 2454 in Q3. This has been due to the closure of the Hockwell Ring Youth Clubs & Homework Clubs which have lost approximately 1960 hours. During this period we have had 65 enquiries, which have resulted in 43 attending workshops or training to join the LBC volunteering program. Since April, there have been a number of changes to the process of recruitment, training and development of volunteering opportunities, which have also had an impact on performance. PI 28: Perceptions of Luton - Core question: Over the past 12 months, do you feel the image of Luton has improved. Most recent survey was completed Q3 and the next survey will be reported in Q1 2017-18. This is a new measure for this year and is defined by determining the percentage of all those responding who identify with the image of Luton having improved i.e. by choosing the answer "Improved a lot" or the answer "improved a little". 34.8% of respondents felt the image of Luton has improved over the last 12 months. This is in line with the current target of 35%. For the next survey a target of 40% has been set to improve on current performance. The survey will be undertaken every 6 months (twice a year).
Page 80 of 293
PI 29: To what extent do you agree that this local area is a place where people from different backgrounds get on well together? Most recent survey was completed Q3 and the next survey will be reported in in Q1 2017-18. This is a new measure for this year and is defined by determining the percentage of all those responding who agree that people in the local area from different backgrounds get on well together i.e. by choosing the answer "strongly agree" or the answer "agree". 82.5% of respondents agreed the local area is a place where people from different backgrounds get on well together. This is slightly above the target of 80%. This survey will be undertaken every 6 months (twice a year). PI 30: Participation in 30 minutes of sport at moderate intensity at least once a week. Taken from the latest Active People Survey (Dec 2016), results indicate a slight decrease for Luton in participation in sport, down 2% from the previous survey. However, the general direction of travel from 2013 remains positive since the approval of Luton's Strategic Vision for Sport and Physical Activity, including the Playing Pitch Strategy and Indoor Sports Facilities Strategy. For the start of 2017/18, the new Active Lives data has been circulated for sport and physical activity (but the data is yet to be interrogated) this will be used to define new measures relating to physical inactivity. PI 31: The next set of survey results that inform this KPI will be published (for arts and culture) in Spring 2017 - there have been delays in receiving this data with date for release being put back by Sport England. These results will enable a baseline to be established regarding ongoing performance monitoring. Luton is seeing a significant amount of investment currently from Arts Council England (ACE), including £1.5m PA for the five stands of the Luton Investment Programme including a creative producer, a new cultural celebration, a public realm arts plan and a professional development programme. Active Live Survey data for Arts/Culture is not available until Spring 2017. The service has shifted the cultural KPI over to one which can be measured locally. There are issues with reporting this quarter, but we have been working in parallel with Luton Culture to ensure their own business plan and KPI’s reflect what we require them to report to us. In its place the service have included a local measure around Arts attendance, which is based on the attendance of cultural and arts facilities in Luton, in the year. Priority 5: Integrated, efficient and digital service delivery – striving for a ‘one Luton’ approach PI 18A: Digital Services Delivery: Luton’s web based service is measured on an annual basis. SOCITM local authority online performance assessment evaluates a wide range of digital performance by local public service providers, covering websites, social media and customer portals, as well as take up, satisfaction and management. Luton Performance has dropped considerably from 4 stars in 2015-16 to 2 stars this year. Reason for the decline include: Change in assessment criteria, growing complexity of digital services, Outdated core digital platform infrastructure. The Digital Transformation programme will look resolve these issues and develop targets for online services. PI 32: Net profit achieved through external trading Currently there is no financial information for Q4 2016-17. A Senior Finance Manager and Business & Trading Support post have recently been filled (in December) and tasked with supporting business units and in developing an overall business plan for Trading. A Business Plan for the LTS Group has been drafted and submitted to Joint Board for agreement. PI 33: Energy Efficiency (kg carbon emissions per sq. metre): To track average carbon emissions for buildings included in LBC portfolio. Overall performance has remained consistent throughout the year at 0.70 kg/sqm, partially due to large leisure sites using gas to heat pool water all year round so consumption remains largely static. It has also been highlighted, due to the portfolio being large and varied; savings at some properties are effectively “wiped out” by changes in occupancy levels at others. Review of the current measure will be carried out and going forward reporting by building types will be in place to get a more accurate and robust set of data for next year.
Page 81 of 293
PI 34: Timeliness of benefits – End of Q4 showed significant improvement in times taken to process New Claims and Changes. New claims reported 26.5 days, still above the 20 day target but considerably better compared to the 40 days reported in Q1. New claims end of year performance was 10.2 days against a target of 10 days. Actions from the improvement plan are now beginning to take effect in Q4 with the overall performance, and unlike previous years where the service entered the new year with a backlog from year end, the service is in a good position with no backlog and should continue the improvement shown in the last quarter. Conclusions and areas of poor performance The majority of indicators reported in this period are either in line with targets, improved on the previous period or expected to reach target by the end of the financial year. Indicators identified this quarter as underperforming or at risk of not achieving target/benchmark average this year are:
• Number of newly approved foster carers • Adults and older clients who have been reviewed as a percentage of those receiving a
service+) • Acceptable waiting times for assessment: For new clients (aged 18+) • Rent collected as a percentage of rent owed (Council Tenants) • Number of households in Nightly Rate • Average relet time in days (General Needs Stock) • Average relet time in days (Sheltered stock) • All Crime in Luton (soLUTiONs) • Volunteering - Hours • Timeliness of benefits - new claims and changes
Goals and Objectives Proposal Key Risks Consultations Appendices attached: Appendix Ai - Corporate Performance Data pack for Q4 2016-17 Appendix Aii - Corporate Performance Data pack for 2016-17 Background Papers: IMPLICATIONS For Executive reports For CLMT Reports
• grey boxes must be completed Clearance is not • all statements must be cleared by an appropriate officer required
Clearance – agreed by: Legal There are no direct Legal implications to this
report
Finance Page 82 of 293
Integrated Impact Assessment (IIA) – Key Points Equalities/ Cohesion/Inclusion (Social Justice)
There are no direct Equalities/Cohesion/Inclusion implications to this report
Social Justice Unit
Environment
There are no direct environmental implications to this report
Strategy & Sustainability
Health
There are no direct health implications to this report
Public Health
Community Safety Staffing Other FOR EXECUTIVE ONLY - Options:
Page 83 of 293
Subject: Capital funding for improvement of the Vauxhall Way / Kimpton Road junction and other junctions in the Vauxhall Way/Stopsley Way corridor, Luton
Consultations: (x) Councillors
(For Executive Only) Scrutiny Lead Executive Member(s): Cllr Malcolm/Castleman Stakeholders Wards Affected: Wigmore, Stopsley
Others
Recommendations 1. That the Executive is requested to approve the release and spend approval of a special
capital estimate of £3.2m for the improvement of the Vauxhall Way / Kimpton Road junction and other junctions in the Vauxhall Way/Stopsley Way corridor, to be fully funded by third party contributions.
Background 2. On 20th December 2013, Luton Council’s Development Control Committee approved in principle
a planning application submitted in Autumn 2012 (12/01400/FUL) for expansion of the airport to 18 million passengers per annum (mppa) by 2028. The Transport Assessment (TA) that accompanied that Application set out the need for the various highway and junction improvements in the Vauxhall Way/Stopsley Way corridor necessary to support the planned growth of the airport and taking account of other committed developments in the area. However the TA only included initial designs for the Vauxhall Way/ Kimpton Road junction.
The current position 3. The Council has appointed the Project Centre Limited, who provide consultancy support under
the Highways Term Contract, to review the initial design of the Vauxhall Way/ Kimpton Road junction. The Council is also currently procuring consultancy support to update the transport assessment in the south and east of Luton and develop initial designs of other junctions. Both of these studies are also taking account of changes to other committed developments, along with trends in recent growth in airport patronage which, if these continue, means the 18mppa is likely to be realised by 2020-21.
4. Notwithstanding the outcome of this further work, the Council’s highway engineers have provided indicative costs for the design and construction of these other junctions that were then used to inform the Section 106 contribution towards these other junction improvements, which totals £2 million. In 2013 the Council also bid for, and was successful in being awarded, £1.2 million of Local Growth Funding (LGF) from the South East Midlands Local Transport Board, which were subsequently transferred to the Local Enterprise Partnership (SEMLEP) when LEPs took over the role of LTBs.
Goals and Objectives 5. The overall objective of the highway improvements in the east Luton area is to improve access to
the airport and the wider business estate, and in particular to fund the improvement of various junctions on the south and east approaches to London Luton Airport to reduce delays and make journey times more reliable to cater for the anticipated increase in traffic movements to serve
For: (x) Agenda Item Number: 3.2 Executive X CLMT Meeting Date: 27.06.17 Report of: Service Director – Planning & Economic Growth
Report author: Keith Dove
Page 84 of 293
both the planned growth of the airport together with other key development sites in the south and east of Luton.
Proposal 6. The £1.2M LGF capital contribution has been allocated for spend in 2017-18 and, in accordance
with Financial procedures, requires approval by Executive. However Executive should note that it is currently anticipated that no Council funding is required as the total indicative cost of all the junction improvements is £3.2 million, with the balance of funding coming from the S106 monies from the approved airport planning permission. The indicative cost of £3.2m will need to be reassessed to ensure that it is still accurate; if the indicative costs have increased, either additional external funds will need to be identified or the works will need to be reduced to fit the available budget.
Key Risks 7. The main risk is that the total cost of junction improvements in the Vauxhall Way/Stopsley Way
corridor exceeds the total budget. If this does occur, and no additional external funding is identified to bridge the gap, LBC will have to fund any additional amounts. However, the risk of this happening can be mitigated by ensuring that a programme of works is prepared and that junction improvements are only undertaken if the total cost is within the budget provision of £3.2m.
Consultations 8. Public and stakeholder consultation on the individual junction designs will be undertaken as they
are developed.
Appendices attached: None Background Papers: None IMPLICATIONS For Executive reports For CLMT Reports
• grey boxes must be completed Clearance is not • all statements must be cleared by an appropriate officer required
Clearance – agreed by: Legal There are no direct Legal implications. Agreed by Steven Sparhott,
Legal Services, on 13th June 2017
Finance None of the funding has actually been received by the Council. The £1.2m from SEMLEP has been allocated for spend in 2017/18 and will need to be requested in line with the governance arrangements in place for release of LGF funding. The £2m s106 contribution will need to be requested from London Luton Airport Operations Limited. Works should not commence until funds have been secured.
Agreed by Darren Lambert, Finance Business Partner, on 14th June 2017.
Integrated Impact Assessment (IIA) – Key Points Equalities/ Cohesion/Inclusion (Social Justice)
There are no direct equality implications in the report.
Agreed by Sandra Legate, Equality and Inclusion Manager, 13th June 2017.
Page 85 of 293
Environment
The reduction in congestion will have a positive impact. Given it is anticipated these improvements can be undertaken within the existing highway boundary, no significant negative impacts are anticipated.
Agreed by Kat Wysocka, Strategy & Sustainability, on 13th June 2017.
Health
The reduction in congestion will improve air quality and driver stress, and have a positive impact.
Agreed by Stephen Gunther Public Health on 15th June 2017.
Community Safety Staffing Other FOR EXECUTIVE ONLY - Options: None, report for noting only.
Page 86 of 293
Subject: Next Steps for Health and Social Care in Luton Consultations: (x)
Councillors (For Executive Only) Scrutiny Lead Executive Member(s): Councillor Simmons Stakeholders Wards Affected: All Others Recommendations 1. The Executive is requested to review the rationale and proposed outcomes and to:
(i) Endorse a single integrated health and social care commissioning function for Luton (ii) Note the joint work programme and planned next steps (iii) Endorse the establishment of an Integrated Commissioning Committee.
Background 2. The purpose of this paper is to provide the Executive with an update on the progress and
development of effective Luton focused or place-based, system solution for the people of Luton. The inter-dependency between health and care systems to achieve better health and wellbeing outcomes is fully recognised and therefore Luton Clinical Commissioning Group (LCCG) and Luton Borough Council (LBC) seek support to establish an integrated commissioning function. The paper will explain how a single commissioning unit will help create both the strategic and operational direction to address the complex health and care needs for the Luton population.
The current position 3. The joint ambition of Luton Clinical Commissioning Group (CCG) and Luton Borough Council
(LBC) is to establish a single commissioning function in Luton by 1st April 2018 as a progression in the journey to establish a place based health and social care system. This paper proposes that a concordat is agreed between LCCG and LBC by July 2017 thus bringing together the accountability of health, social care and public health commissioning at a local level. The intention is to bring LCCG and LBC under one entity by 1st April 2018. This option enables LCCG and LBC to build on the current expertise contained within Luton. The proposal is to utilise co-production within the borough as a method of collective problem solving to address the health inequalities and influence an improvement of health outcomes.
4. This proposal builds on the Better Together Programme developed in 2014 (Better Together:
health and social care integration - Luton Borough Council), which sets out a clear vision of personalised, integrated health and social care for the residents of Luton. The Better Care programme has led to increased joint working between LCCG and LBC and there are a number of joint commissioning programmes and budgets for example a joint commissioning team for children which is based in LBC and the current joint commissioning of wellbeing services incorporating both mental and physical wellbeing. This proposal aims to take forward integrated commissioning at pace in order to achieve a joint health and social care focus on outcomes for the people of Luton and to begin to develop the Luton pound by bringing together all of the health and social care commissioning budgets across the two organisations.
For: (x) Agenda Item Number: 8
Executive CLMT Meeting Date: 27th June 2017 Report of: Director PHCP Report author: Gerry Taylor
Page 87 of 293
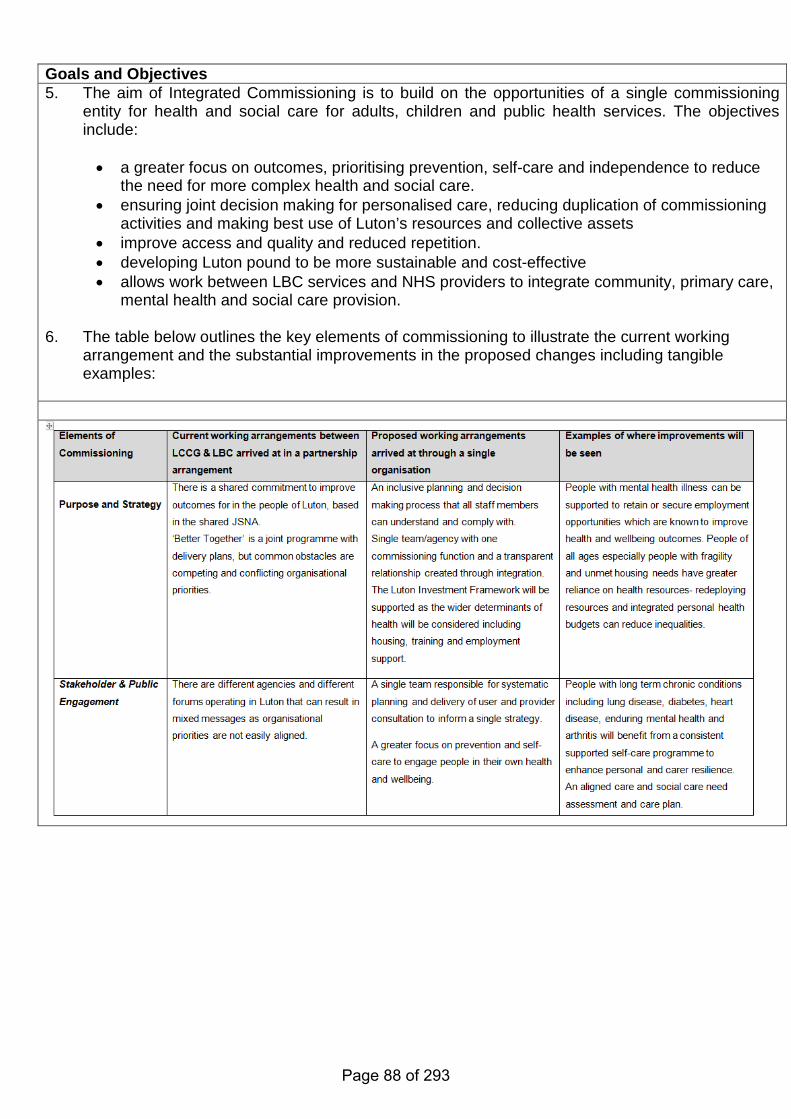
Goals and Objectives 5. The aim of Integrated Commissioning is to build on the opportunities of a single commissioning
entity for health and social care for adults, children and public health services. The objectives include:
• a greater focus on outcomes, prioritising prevention, self-care and independence to reduce
the need for more complex health and social care. • ensuring joint decision making for personalised care, reducing duplication of commissioning
activities and making best use of Luton’s resources and collective assets • improve access and quality and reduced repetition. • developing Luton pound to be more sustainable and cost-effective • allows work between LBC services and NHS providers to integrate community, primary care,
mental health and social care provision. 6. The table below outlines the key elements of commissioning to illustrate the current working
arrangement and the substantial improvements in the proposed changes including tangible examples:
Page 88 of 293
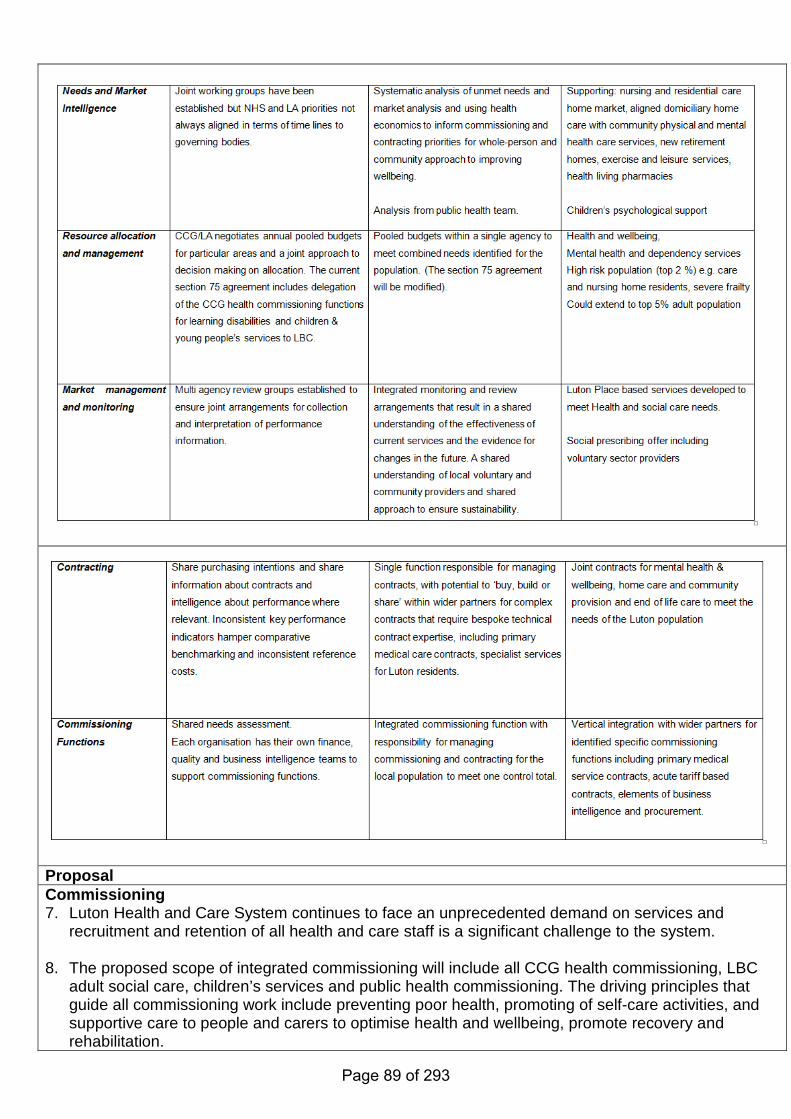
Proposal Commissioning 7. Luton Health and Care System continues to face an unprecedented demand on services and
recruitment and retention of all health and care staff is a significant challenge to the system. 8. The proposed scope of integrated commissioning will include all CCG health commissioning, LBC
adult social care, children’s services and public health commissioning. The driving principles that guide all commissioning work include preventing poor health, promoting of self-care activities, and supportive care to people and carers to optimise health and wellbeing, promote recovery and rehabilitation.
Page 89 of 293
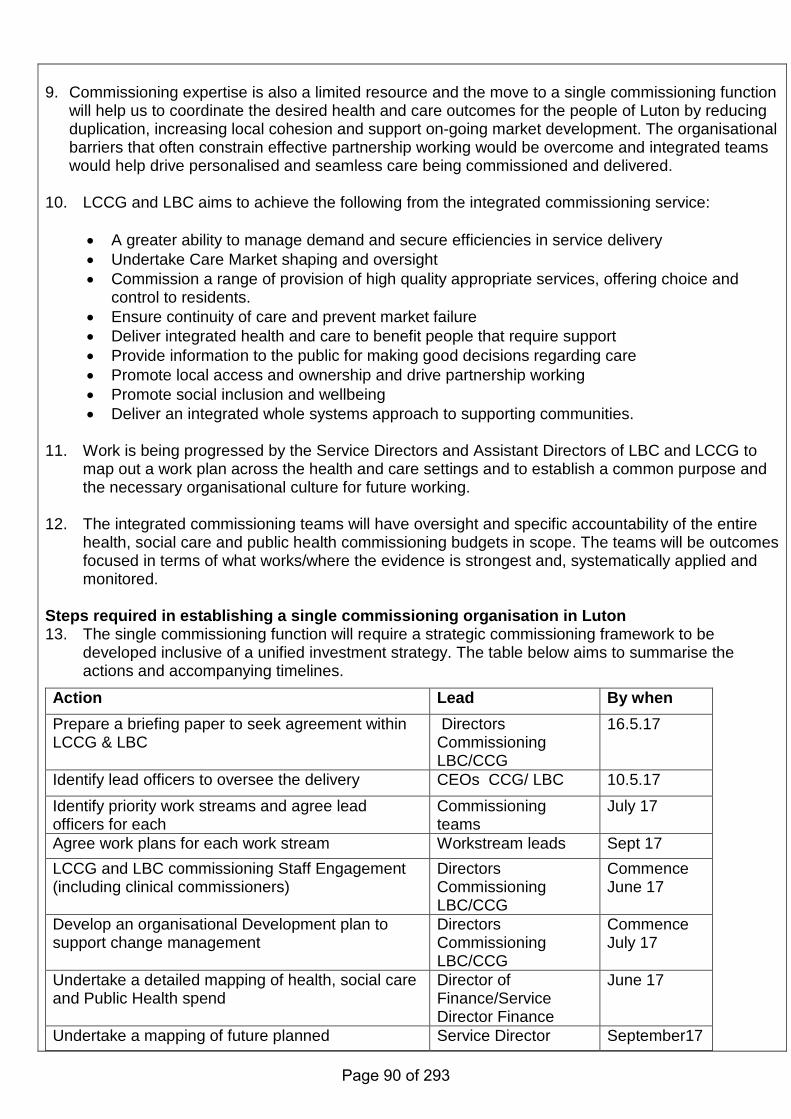
9. Commissioning expertise is also a limited resource and the move to a single commissioning function
will help us to coordinate the desired health and care outcomes for the people of Luton by reducing duplication, increasing local cohesion and support on-going market development. The organisational barriers that often constrain effective partnership working would be overcome and integrated teams would help drive personalised and seamless care being commissioned and delivered.
10. LCCG and LBC aims to achieve the following from the integrated commissioning service:
• A greater ability to manage demand and secure efficiencies in service delivery • Undertake Care Market shaping and oversight • Commission a range of provision of high quality appropriate services, offering choice and
control to residents. • Ensure continuity of care and prevent market failure • Deliver integrated health and care to benefit people that require support • Provide information to the public for making good decisions regarding care • Promote local access and ownership and drive partnership working • Promote social inclusion and wellbeing • Deliver an integrated whole systems approach to supporting communities.
11. Work is being progressed by the Service Directors and Assistant Directors of LBC and LCCG to map out a work plan across the health and care settings and to establish a common purpose and the necessary organisational culture for future working.
12. The integrated commissioning teams will have oversight and specific accountability of the entire
health, social care and public health commissioning budgets in scope. The teams will be outcomes focused in terms of what works/where the evidence is strongest and, systematically applied and monitored.
Steps required in establishing a single commissioning organisation in Luton 13. The single commissioning function will require a strategic commissioning framework to be
developed inclusive of a unified investment strategy. The table below aims to summarise the actions and accompanying timelines.
Action Lead By when Prepare a briefing paper to seek agreement within LCCG & LBC
Directors Commissioning LBC/CCG
16.5.17
Identify lead officers to oversee the delivery CEOs CCG/ LBC 10.5.17 Identify priority work streams and agree lead officers for each
Commissioning teams
July 17
Agree work plans for each work stream Workstream leads Sept 17 LCCG and LBC commissioning Staff Engagement (including clinical commissioners)
Directors Commissioning LBC/CCG
Commence June 17
Develop an organisational Development plan to support change management
Directors Commissioning LBC/CCG
Commence July 17
Undertake a detailed mapping of health, social care and Public Health spend
Director of Finance/Service Director Finance
June 17
Undertake a mapping of future planned Service Director September17
Page 90 of 293
Procurements Quality & Procurement
Undertake a review of all contracts and commissioning agreements in place across Health, Social Care & Public Health
Directors Commissioning LBC/CCG
September 17
Define the integrated commissioning governance required to support a single strategic commissioning function
Directors Commissioning LBC/CCG
First iteration July 17
Decide date to take responsibility for delegated Primary Care Commissioning (Primary Medical Contracts only)
CCG Board October 17
Identify costs and resource for implementation - initial costing
Directors of Finance September 17
Commissioning Intentions published to meet NHSE regulation
30.9.17
Develop a Luton Commissioning Strategy Service Directors/Assistant Directors
September 17
Define what commissioning tasks are most effectively outsourced to wider level
Integrated Commissioning Committee
November 17
Develop commissioning processes, contractual arrangements in line with agreed integrated provision approach
December 17
Review engagement with neighbourhoods (Review how CCG/LBC commissioning officers work with areas boards)
January 18
Identify estate to co-located commissioning staff Service Director Fixed Assets
April 18
Agree what Due Diligence exercise is needed TBC Develop & implement skills and capacity programme
September 17
Comprehensive community engagement plan Community Development Team
January 18
Governance and Decision making 14. Appropriate governance arrangements will need to be developed in order to take forward a
proposal around integrating commissioning. Initially interim arrangements are proposed which will help to move towards an integrated authority with longer term arrangements to be developed. This would involve establishing in the short term an Integrated Commissioning Committee (ICC) which would include the functions as illustrated in the table above: • commissioning strategies & plans • stakeholder engagement • needs and market intelligence • resource allocation and management, pooled (responsible) and aligned (advisory) budget • market management and monitoring • contracting • compliance with regulatory bodies • designing the future governance arrangements.
Page 91 of 293
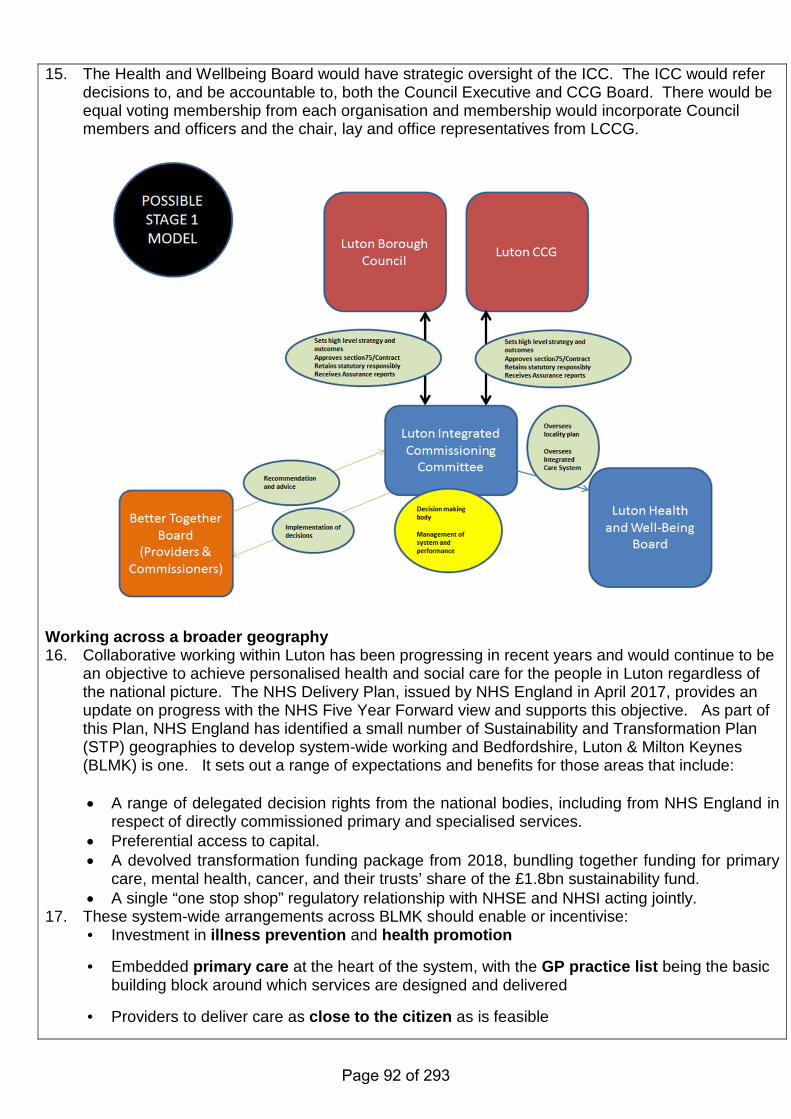
15. The Health and Wellbeing Board would have strategic oversight of the ICC. The ICC would refer decisions to, and be accountable to, both the Council Executive and CCG Board. There would be equal voting membership from each organisation and membership would incorporate Council members and officers and the chair, lay and office representatives from LCCG.
Working across a broader geography 16. Collaborative working within Luton has been progressing in recent years and would continue to be
an objective to achieve personalised health and social care for the people in Luton regardless of the national picture. The NHS Delivery Plan, issued by NHS England in April 2017, provides an update on progress with the NHS Five Year Forward view and supports this objective. As part of this Plan, NHS England has identified a small number of Sustainability and Transformation Plan (STP) geographies to develop system-wide working and Bedfordshire, Luton & Milton Keynes (BLMK) is one. It sets out a range of expectations and benefits for those areas that include:
• A range of delegated decision rights from the national bodies, including from NHS England in
respect of directly commissioned primary and specialised services. • Preferential access to capital. • A devolved transformation funding package from 2018, bundling together funding for primary
care, mental health, cancer, and their trusts’ share of the £1.8bn sustainability fund. • A single “one stop shop” regulatory relationship with NHSE and NHSI acting jointly.
17. These system-wide arrangements across BLMK should enable or incentivise: • Investment in illness prevention and health promotion
• Embedded primary care at the heart of the system, with the GP practice list being the basic building block around which services are designed and delivered
• Providers to deliver care as close to the citizen as is feasible
Page 92 of 293
• Greater self-managed care (including with support from carers)
• Care delivered to people with long term conditions, the chronically ill, and/or of those with multiple morbidities, to be wrapped around the citizen, their informal care network and their home
• Solutions that reduce inequalities in access to diagnosis and care of physical and mental health needs, and that remove unwarranted variations in care received
• Services delivered outside hospitals to be organised and co-ordinated at an aggregated level (30,000 to 50,000 population), but be tailored to local population profiles and associated needs.
18. Closer integration of commissioning between Luton CCG and Luton Borough Council is entirely consistent with guidance issued from NHS England and the direction of travel indicated by partners. In summary, we are looking to:
1. Further the aims and delivery of the STP model, through organisational integration at Place
and Footprint level. (Horizontal and Vertical Integration of commissioning functions) 2. Provide a single Joint Commissioning function. 3. Develop, at pace, a model for what are locally or centrally (STP - level) commissioned
services. 4. Drive economies in service delivery through wider understanding of the whole process within
one team, operating as a wider system rather than single organisation. Next Steps
1. Concordat to be agreed on 29th June 2017
2. Terms of Reference to be developed for the Integrated Health and Care Commissioning Joint
Committee
Key Risks 19. The key risks are around:
1. developing new financial arrangements and in particular risk sharing arrangements between Luton Council and CCG.
2. Ensuring appropriate legal arrangements for bringing two organisations together whilst maintaining statutory arrangements and duties and the political mandate.
3. Ensuring appropriate arrangement for staff and stakeholder consultation and involvement in the development of the programme, including an organisational development programme.
20. A detailed programme plan will be developed to take this forward and provide clear mitigation for identified risks.
Consultations 21. Initial discussions have taken place with staff who are likely to be impacted. A full engagement
process will need to be developed in order to take this forward. Appendices attached: Members Briefing Background Papers: IMPLICATIONS For Executive reports For CLMT Reports
• grey boxes must be completed Clearance is not • all statements must be cleared by an appropriate officer required
Page 93 of 293
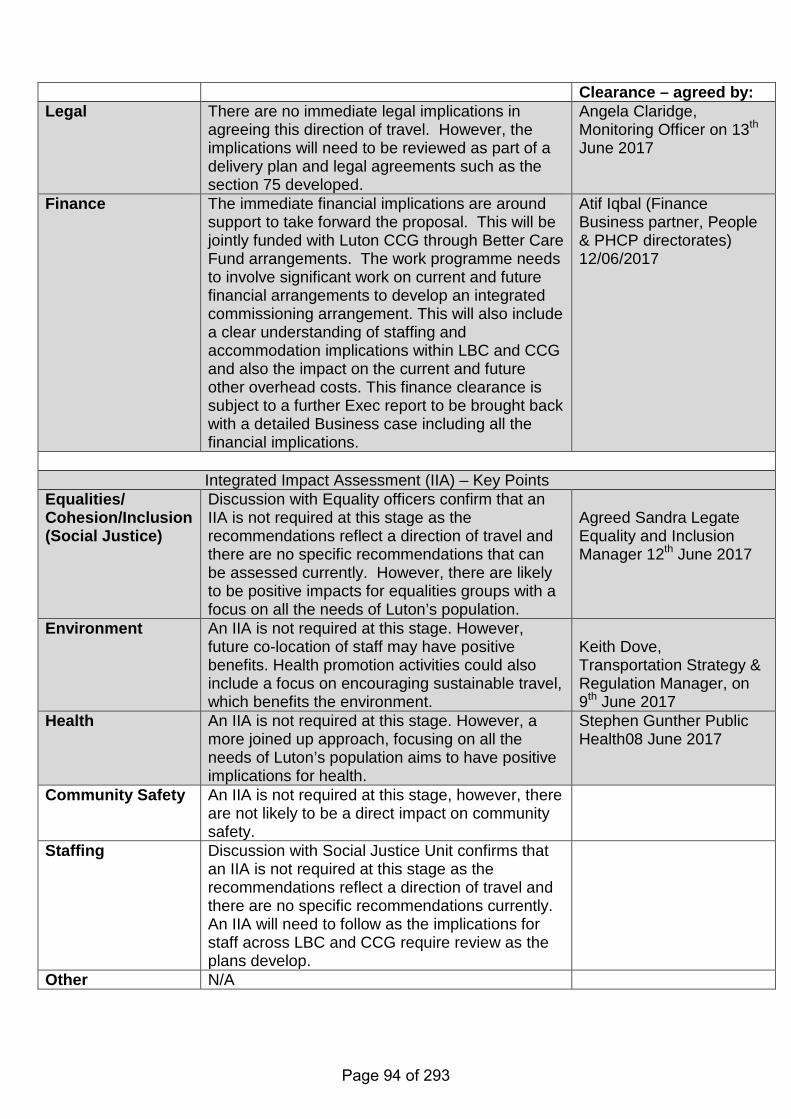
Clearance – agreed by: Legal There are no immediate legal implications in
agreeing this direction of travel. However, the implications will need to be reviewed as part of a delivery plan and legal agreements such as the section 75 developed.
Angela Claridge, Monitoring Officer on 13th June 2017
Finance The immediate financial implications are around support to take forward the proposal. This will be jointly funded with Luton CCG through Better Care Fund arrangements. The work programme needs to involve significant work on current and future financial arrangements to develop an integrated commissioning arrangement. This will also include a clear understanding of staffing and accommodation implications within LBC and CCG and also the impact on the current and future other overhead costs. This finance clearance is subject to a further Exec report to be brought back with a detailed Business case including all the financial implications.
Atif Iqbal (Finance Business partner, People & PHCP directorates) 12/06/2017
Integrated Impact Assessment (IIA) – Key Points Equalities/ Cohesion/Inclusion (Social Justice)
Discussion with Equality officers confirm that an IIA is not required at this stage as the recommendations reflect a direction of travel and there are no specific recommendations that can be assessed currently. However, there are likely to be positive impacts for equalities groups with a focus on all the needs of Luton’s population.
Agreed Sandra Legate Equality and Inclusion Manager 12th June 2017
Environment
An IIA is not required at this stage. However, future co-location of staff may have positive benefits. Health promotion activities could also include a focus on encouraging sustainable travel, which benefits the environment.
Keith Dove, Transportation Strategy & Regulation Manager, on 9th June 2017
Health
An IIA is not required at this stage. However, a more joined up approach, focusing on all the needs of Luton’s population aims to have positive implications for health.
Stephen Gunther Public Health08 June 2017
Community Safety An IIA is not required at this stage, however, there are not likely to be a direct impact on community safety.
Staffing Discussion with Social Justice Unit confirms that an IIA is not required at this stage as the recommendations reflect a direction of travel and there are no specific recommendations currently. An IIA will need to follow as the implications for staff across LBC and CCG require review as the plans develop.
Other N/A
Page 94 of 293

FOR EXECUTIVE ONLY - Options: a) To reject the recommendations b) To request further information
Page 95 of 293
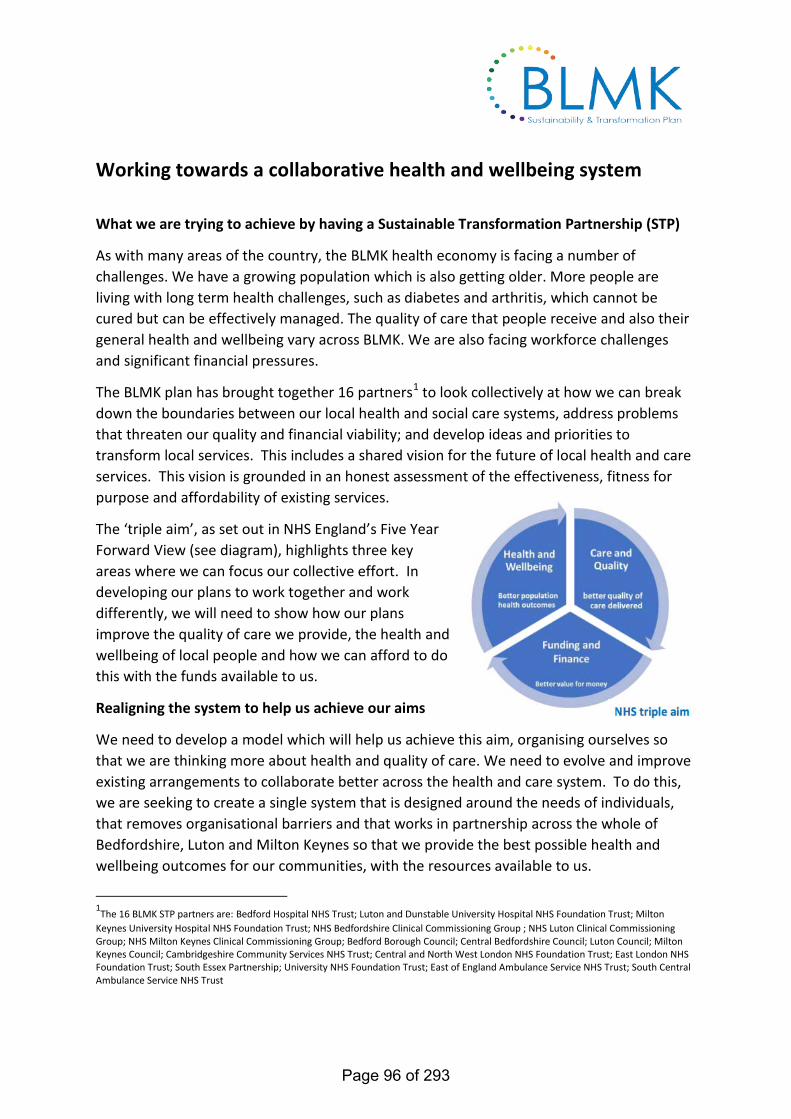
Working towards a collaborative health and wellbeing system
What we are trying to achieve by having a Sustainable Transformation Partnership (STP)
As with many areas of the country, the BLMK health economy is facing a number of challenges. We have a growing population which is also getting older. More people are living with long term health challenges, such as diabetes and arthritis, which cannot be cured but can be effectively managed. The quality of care that people receive and also their general health and wellbeing vary across BLMK. We are also facing workforce challenges and significant financial pressures.
The BLMK plan has brought together 16 partners1 to look collectively at how we can break down the boundaries between our local health and social care systems, address problems that threaten our quality and financial viability; and develop ideas and priorities to transform local services. This includes a shared vision for the future of local health and care services. This vision is grounded in an honest assessment of the effectiveness, fitness for purpose and affordability of existing services.
The ‘triple aim’, as set out in NHS England’s Five Year Forward View (see diagram), highlights three key areas where we can focus our collective effort. In developing our plans to work together and work differently, we will need to show how our plans improve the quality of care we provide, the health and wellbeing of local people and how we can afford to do this with the funds available to us.
Realigning the system to help us achieve our aims
We need to develop a model which will help us achieve this aim, organising ourselves so that we are thinking more about health and quality of care. We need to evolve and improve existing arrangements to collaborate better across the health and care system. To do this, we are seeking to create a single system that is designed around the needs of individuals, that removes organisational barriers and that works in partnership across the whole of Bedfordshire, Luton and Milton Keynes so that we provide the best possible health and wellbeing outcomes for our communities, with the resources available to us.
1The 16 BLMK STP partners are: Bedford Hospital NHS Trust; Luton and Dunstable University Hospital NHS Foundation Trust; Milton Keynes University Hospital NHS Foundation Trust; NHS Bedfordshire Clinical Commissioning Group ; NHS Luton Clinical Commissioning Group; NHS Milton Keynes Clinical Commissioning Group; Bedford Borough Council; Central Bedfordshire Council; Luton Council; Milton Keynes Council; Cambridgeshire Community Services NHS Trust; Central and North West London NHS Foundation Trust; East London NHS Foundation Trust; South Essex Partnership; University NHS Foundation Trust; East of England Ambulance Service NHS Trust; South Central Ambulance Service NHS Trust
Page 96 of 293
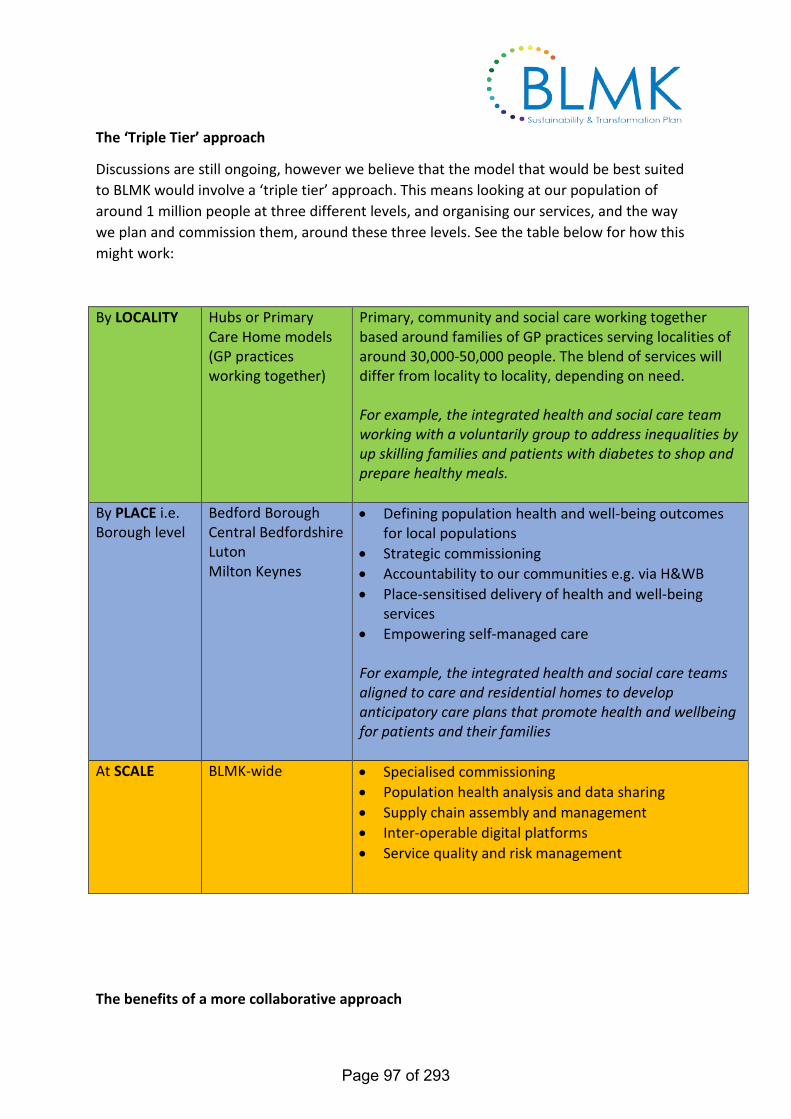
The ‘Triple Tier’ approach
Discussions are still ongoing, however we believe that the model that would be best suited to BLMK would involve a ‘triple tier’ approach. This means looking at our population of around 1 million people at three different levels, and organising our services, and the way we plan and commission them, around these three levels. See the table below for how this might work:
By LOCALITY Hubs or Primary Care Home models (GP practices working together)
Primary, community and social care working together based around families of GP practices serving localities of around 30,000-50,000 people. The blend of services will differ from locality to locality, depending on need.
For example, the integrated health and social care team working with a voluntarily group to address inequalities by up skilling families and patients with diabetes to shop and prepare healthy meals.
By PLACE i.e. Borough level
Bedford Borough Central Bedfordshire Luton Milton Keynes
• Defining population health and well-being outcomesfor local populations
• Strategic commissioning• Accountability to our communities e.g. via H&WB• Place-sensitised delivery of health and well-being
services• Empowering self-managed care
For example, the integrated health and social care teams aligned to care and residential homes to develop anticipatory care plans that promote health and wellbeing for patients and their families
At SCALE BLMK-wide • Specialised commissioning• Population health analysis and data sharing• Supply chain assembly and management• Inter-operable digital platforms• Service quality and risk management
The benefits of a more collaborative approach
Page 97 of 293
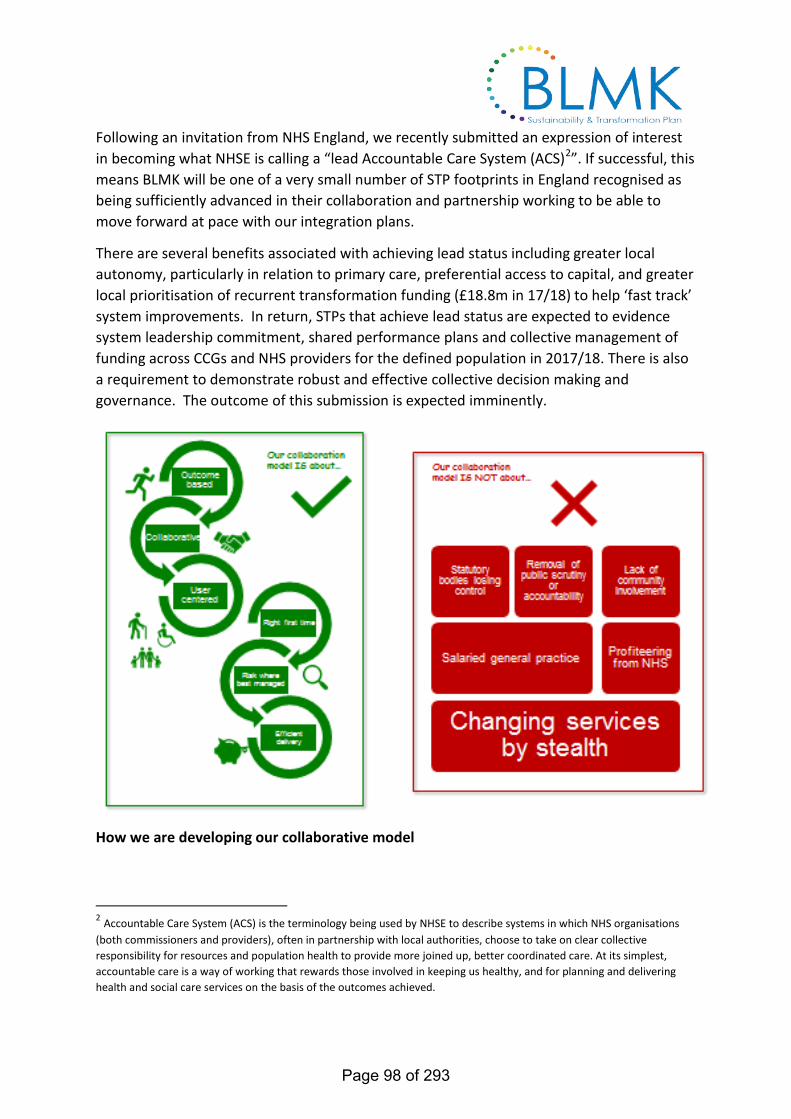
Following an invitation from NHS England, we recently submitted an expression of interest in becoming what NHSE is calling a “lead Accountable Care System (ACS)2”. If successful, this means BLMK will be one of a very small number of STP footprints in England recognised as being sufficiently advanced in their collaboration and partnership working to be able to move forward at pace with our integration plans.
There are several benefits associated with achieving lead status including greater local autonomy, particularly in relation to primary care, preferential access to capital, and greater local prioritisation of recurrent transformation funding (£18.8m in 17/18) to help ‘fast track’ system improvements. In return, STPs that achieve lead status are expected to evidence system leadership commitment, shared performance plans and collective management of funding across CCGs and NHS providers for the defined population in 2017/18. There is also a requirement to demonstrate robust and effective collective decision making and governance. The outcome of this submission is expected imminently.
How we are developing our collaborative model
2 Accountable Care System (ACS) is the terminology being used by NHSE to describe systems in which NHS organisations (both commissioners and providers), often in partnership with local authorities, choose to take on clear collective responsibility for resources and population health to provide more joined up, better coordinated care. At its simplest, accountable care is a way of working that rewards those involved in keeping us healthy, and for planning and delivering health and social care services on the basis of the outcomes achieved.
Page 98 of 293
Through 2017/18 partners in BLMK are exploring new ways of working with a view to formalising arrangements in 2018/19. In Luton, discussions are advancing between Luton CCG and Luton Council to formally agree an outline plan for an integrated approach to strategic commissioning. Proposals outlining this approach are being taken through governance forums in June 2017 and will be subject to formal approval by the Council and the CCG.
What would be different?
Within BLMK, as with other parts of the country, there are challenges to overcome if we are to achieve our vision of communities and organisations working together to improve the health and wellbeing of our people. However, we are not starting with a blank sheet of paper. Our local research already reveals several live examples where partners across BLMK are collaborating to achieve wider system goals, and indeed, partners have registered an aspiration to do much more of this in the coming months. This also builds on integration work that CCGs and Councils have been undertaking in recent years.
Through our STP work, we have recognised some of these challenges – a fragmented system with different rules that results in inequality of service provision; a system based on incentives that drives competition between organisations rather than co-operation; multiple IT systems that prevent efficient information sharing; too much focus on treatment and not enough on prevention. We also know that our staff is a precious and scarce resource and that we won’t have enough money to do everything we want.
Our goals will only be met through significant transformation of organisations, services and behaviours. Collaboration needs to become the “new normal”. The hallmarks of such behaviours include openness and transparency, knowledge sharing, joint learning, coordination and cooperation, collaboration, harmonisation and, as we move forward, integration.
We believe we can achieve our goals more quickly by working together as a partnership, learning from each other as we progress. Everything we do together will be tailored to meet the needs of our local communities in Bedford Borough, Central Bedfordshire, Luton and Milton Keynes. We will work closely with local Health and Wellbeing Boards to make sure this happens.
What impact will this have on the Council and on residents?
Partnership working across BLMK allows more joined up thinking and shared responsibility for health and wellbeing outcomes and associated health and care services, creating the best opportunity we must tackle growing challenges to provide high quality and sustainable health and social care services for the future. By taking a more holistic view, we can consider how we collectively spend the funding we have to ensure we get the best outcomes. This will include helping people to actively manage their own health and wellbeing within an environment that is focused on the individual. People will enjoy
Page 99 of 293
improved health and wellbeing because the BLMK community, care organisations and environment enables this to happen in a seamless way. The easiest way to describe the impact of adopting a more collaborative system-wide approach is to consider a person’s experience today with what that might look like in the future if we are to realise our ambitions.
Local case study: How working at ‘place’ level could improve patient access to services and help people to stay well at home for longer
George is 90 years old and is living independently in his own home. His daughter is worried he is becoming more frail, sleeps a lot, and is forgetting things more frequently. She telephones his GP practice which has a multidisciplinary team consisting of a range of health and social care professionals and they make arrangements for his GP to visit him.
During the visit, the GP identifies a number of actions that can be progressed as part of a centrally coordinated personal care package. This includes a medication review by the pharmacist who ensures both George and his daughter understand what they are for and how to take them; blood tests and a referral to the memory assessment service. Arrangements are also made for a social care worker to meet with George and his daughter to agree extra support, as well as ongoing assessment and support from the community matron to get his health as good as it can be.
This integrated approach across health and social care means that George has the support he needs at home and is less likely to end up in hospital because his conditions are being proactively managed:
Local case study: How can a more joined up approach managed at locality level improve care for patients?
Let’s consider Anna’s story. She is 88 years old and is being treated for multiple health conditions including diabetes, is overweight so suffers from joint pain and also has bouts of insomnia. She has been taking a range of medications for a considerable time, however these are prescribed by different healthcare providers, with no one responsible for her overall medicines management.
Within a more collaborative health and wellbeing system, Anna’s situation would be assessed using a medications risk tool. This would highlight concerns over whether multiple medications are having an adverse effect or worsening her conditions and Anna would be identified as ‘at risk’. As a result, arrangements are made for a clinical pharmacist to visit Anna at home and review her medication. The pharmacist finds that some of the medication is no longer required and others are not as effective as they could be. A new prescription is issued and a further review scheduled in 12 weeks. Anna is now receiving the best overall support and the right medication to help her manage her conditions. She understands how to take her medications safely and correctly and enjoys improved quality of life.
Page 100 of 293
What are the benefits?
By evolving the way we plan, buy and deliver health and social care services and work in partnership across the entire BLMK footprint, there are many opportunities for improvement and some real benefits that can be achieved. This includes:
• A more joined up service across health and social care and between community andhospital settings, with the individual’s health and wellbeing at the core
• Better value for money, increasing the proportion of funding spent on front-lineservices
• Establishing a common approach, shared ‘rules’ and drivers (including financial) andimproving information sharing to provide better patient experience and outcomes
• A real focus on prevention and wellness rather than just on treatment• Re-aligning the system and the way we work to ensure that people get the right care in
the right place, first time• More sustainable approach to delivering quality healthcare services within our means
What happens next?
As part of the development of the programme we would need to identify, review and mitigate any risks associated with implementing this approach. Immediate next steps will include notification from NHS England with regards to lead ACS status – this is expected to take place in June TBC. Alongside this, a Strategic Commissioning design and development work programme is currently being established.
May 2017 June 2017 2017-2018 2018-19 Lead ACS EoI submitted
Lead ACS status TBC
Design/ development of BLMK collaborative health and wellbeing system model
Formal system realignment agreed and will go ‘live’ (System control total and performance agreements in place)
Page 101 of 293
Subject: Draft Digital Strategy Consultations: (x) Councillors
(For Executive Only) Scrutiny Lead Executive Member(s): Councillor Andy Malcom Stakeholders Wards Affected: All Others Recommendations 1. The Executive is requested to:
(i) Agree and adopt the draft Luton Connected Digital Strategy for comment (ii) Agree the vision, aims and objectives of the strategy and note the investment
commitment Background 2. We need to save a further £11 - £17m over the next three years set against a backdrop of
increasing demand for our services and reductions from central government. We therefore need to continue to develop and become even more efficient in how we deliver services to residents and make use of our staff and digital resources.
3. The absence of a digital strategy has led to fragmented implementation of new processes and
investment – Luton connected Digital Strategy sets out the direction of travel and vision for digital by design services.
4. We have now entered into a re-negotiated 10 year IT partnership with Civica that will now enable
us to drive performance and promote innovation. Harnessing the capability that Civica can bring to the organisation will be key along with encouraging our services to bring ideas to the agenda.
The current position 5. As a Council, we continue to meet the changes and challenges of Central Government
expectations that public sector services will be delivered under significant financial constraints. Over the past ten years there has been increasing pressure on public services and we have seen rising demand for services and an increase in customer expectations.
6. Our changing organisational culture requires all of us to develop a more commercial approach, whilst subscribing to the values and ethics more commonly associated with the public sector.
7. Access to online information, digital technologies and rapid developments in social media
communications provide opportunities for the Council to develop digital services to engage and communicate with customers, partners and each other.
8. We have to:
• deliver an ambitious Strategic Investment Framework 2015-2035 that will result in improved
health and wellbeing and improved prosperity, Education and lifelong learning • manage increasing levels of demand from the local commu`nity, which has a larger than
national average proportion of young people, and an older population that is living longer, or
For: (x) Agenda Item Number: 9 Executive CLMT Meeting Date: 27th June 2017 Report of: Digital Strategy Report author: Jayne Robinson, Service Director Transformation & Technology
Page 102 of 293
facing long-term health conditions • respond to increasing levels of homelessness and over-crowding in Luton households • meet new responsibilities and changing working relationships with public health, NHS and
our business partners to develop closer working between services Goals and Objectives 9. To have well designed digital delivery of services across the organisation that will reduce
demand on services, improve service access and customer facing delivery, reduce cost and deliver efficiency savings to the council. Automation of processes and integration of forms with back office systems will reduce delivery costs and increase the productivity of staff and members
Proposal 10. Attached at Appendix A is the Luton Connected Digital Strategy which outlines the proposed
approach to achieving savings, improved delivery and accessibility of services for customers and greater productivity for staff and members.
11. The strategies on a page are intended to give staff, members and residents an ‘at a glance’
overview of our direction of travel for digital delivery and receipt of services, with the delivery plan at Appendix B provides the detail of action and timescales.
12. Luton Connected sets out the organisations approach to managing and developing the different
aspects and opportunities of digital - from the website, email, automated telephony, systems integration, portal, social media and digital marketing, to how digital re-design of services and automation will enable savings to deliver service more efficiently and contribute significantly to the delivery the Council’s vision over the next three years. The strategy looks at the business benefits from technology against current delivery and sets out the plan for delivery.
13. Luton Connected builds on work that is already underway in the organisation, and pushes the
boundaries in the art of the possible where service delivery should be digital by default. It also reflects on industry best practice from the private and other public sector organisations that have excelled in their digital delivery.
14. The aim of Luton Connected is to:
• Target investment in digital to improve outcomes and customer experience • Provide smarter, faster, better, efficient services • Develop a digital first culture & behaviour in the organisation • Deliver cost savings across the organisation • Innovate
15. There are no direct financial implications arising from this report, however corporate
transformation savings arising from a number of areas including Digital has been targeted at £4m over the next three years. Digital will enable greater integration, better use of technology, improved processes, improved productivity of staff and channel shift to cheaper channels of service delivery, and the potential benefits from digital will be developed on an end to end business case basis.
16. The investment has been built into the capital programme as part of the Civica 10 year
partnership. Any further funding requirements will be presented on a case by case basis. 17. Additional resources will be required to implement the strategy, and it is intended that this will be
done through an invest to save bid. The estimated cost is £300k over 2 years, which will help to ensure the delivery of the planned savings. This is based on a fixed term team of a Project Manager, Business Analyst and Project Support. Existing resources from Luton Excellence, the Technology Team, Civica and Business Intelligence will also form part of the team.
Page 103 of 293
Key Risks 18. Corporate adoption of the strategy is essential to move the organisation forward, reduce cost and
become more customer focussed with our digital offer. Engagement of services, resources to deliver and support services through the digital transition and onward investment are all risks to the programme to be managed and mitigated through the appropriate governance.
Consultations 19. The draft Strategy was presented to members of Joint Board in March 2017 20. Public consultation has taken place through April and May. Members of the public, staff and a
wide range of partners across all sectors have been consulted, with comments and feedback reflected in the draft presented to Executive. The summary consultation report is at Appendix C.
21. As a result of consultation, the strategy has been strengthened in how we will do the following:
a. Positive inclusion of all residents by using information to target intervention and support of
groups of the community that may not have the right skills, experience, equipment or access to digital services
b. How we will provide training for digital access to residents, staff and members c. Hold workshops with partners, staff and members to develop and share ideas and
opportunities as the plan for implementation of the Strategy develops d. Engagement of staff in on-line forums and workshops e. How we will engage with partners, share data and enable the sharing and sending of large
amounts of data f. Outlined clearer our intent around information security g. Produce a management summary document for residents and wider publications as part of
the communications plan for the strategy implementation. 22. A desk top review has also taken place to be aware of best practice and award winning
strategies in the public sector, along with a review of private sector thinking on digital innovation. Appendices attached: Appendix A - Draft Luton Digital Strategy Appendix B – On a page ‘at a glance’ Strategy Appendix C – Consultation Summary Report Appendix D - Integrated Impact Assessment Background Papers: None IMPLICATIONS For Executive reports For CLMT Reports
• grey boxes must be completed Clearance is not • all statements must be cleared by an appropriate officer required
Clearance – agreed by: Legal Save as indicated in the report there are no
immediate legal implications. J. Newman 08/06/17
Finance The financial implications are explained in the body of the report. Achievement of the savings is reliant on the Invest to Save bid being approved and demonstrating that the requested resources will deliver the required savings.
Darren Lambert, Finance Business Partner, on 14th June 2017
Integrated Impact Assessment (IIA) – Key Points
Page 104 of 293
Equalities/ Cohesion/Inclusion (Social Justice)
IIA undertaken. Sandra Legate Equality and Inclusion Manager 12th June 2017
Environment
Increased provision of digital services could reduce the need to travel in particular by car, which benefits the environment.
Keith Dove, Transportation Strategy & Regulation Manager, on 9th June 2017.
Health
We aim to use technology to join up health and wellbeing activities with partners, GPs and health provision. We also aim to use assistive health technologies such as Fitbit and i-watch apps.
Public Health – Stephen Gunther 12/6/17 16:30
Community Safety Staffing Other FOR EXECUTIVE ONLY - Options:
Page 105 of 293

Appendix A
DRAFT Digital: Luton
Strategy
March 2017 We aspire to be the most digitally connected Council by 2020, and enable our community, partners and
businesses to grow and prosper as a result of our innovation and vision
Page 106 of 293
Luton Borough Council – Digital Strategy 2017 – 2020
Draft Digital: Luton Delivery Plan
Introduction & Context
The need of Luton residents is at the heart of everything we do. Meeting customer’s needs and protecting the vulnerable will continue to be considered to ensure that we are providing the appropriate support where needed, whilst providing services on line, through automated telephony and self-service where we should be. As a Council, we continue to meet the changes and challenges of Central Government expectations that public sector services will be delivered under significant financial constraints. Over the past ten years there has been increasing pressure on public services and we have seen rising demand for services and an increase in customer expectations. Our changing organisational culture requires all of us to develop a more commercial approach, whilst subscribing to the values and ethics more commonly associated with the public sector. Access to online information, digital technologies and rapid developments in social media communications provide opportunities for the Council to develop digital services to engage and communicate with customers, partners and each other. We have to: • deliver an ambitious Strategic Investment Framework 2015-2035 that will result in improved health and wellbeing and improved
prosperity, Education and lifelong learning • manage increasing levels of demand from the local community, which has a larger than national average proportion of young people,
and an older population that is living longer, or facing long-term health conditions • respond to increasing levels of homelessness and over-crowding in Luton households • meet new responsibilities and changing working relationships with public health, NHS and our business partners to develop closer
working between services
Page 107 of 293
Luton Digital Strategy
The ‘Luton Digital’ Digital Strategy vision is to deliver improved efficiency and effectiveness in customer and business contact, as well as an enhanced employee and member experience and efficiency.
It sets the framework for how decisions on investment, selection and deployment of technology and digital by design services will be made and how we will manage the change associated with the application of digital technology to enable and openly embrace new types of innovation and creativity in how services are designed, delivered and accessed by residents and businesses.
Luton Digital sets out the organisations approach to managing and developing the different aspects and opportunities of digital - from the website, email, automated telephony, systems integration, portal, social media and digital marketing, to how digital re-design of services and automation will enable savings to deliver service more efficiently and contribute significantly to the delivery the Council’s vision over the next three years. The strategy looks at the business benefits from technology against current delivery and sets out the plan for delivery.
Luton Digital builds on work that is already underway in the organisation, and encourages and challenges the organisation to push further for where service delivery should be digital by default. It also reflects on industry best practice from the private and other public sector organisations that have excelled in their digital delivery.
The five aims of Luton Digital are to:
1. Target investment in digital to improve outcomes and customer experience 2. Provide smarter, faster, better, efficient services 3. Improve engagement and access to services for all Luton residents 4. Develop a digital first culture & behaviour in the organisation 5. Deliver cost savings across the organisation
These aims flow through the Strategy and underpin the digital priorities outlined in the following pages
Page 108 of 293
Making digital services so good that people prefer to use them!
Customers’ expectations are increasing, particularly as they use technology in their daily lives to pay bills, report issues, order goods and services online or through mobile or online apps, and make bookings. These expectations need to be met, while we need to balance how we manage demand and continue to support the vulnerable and those with complex needs.
We will use technology to evolve our digital delivery and deliver savings. This will entail:
• Automation and integration of systems • End to end review of business process, not being led by technology alone • Redirection of resources to where they add most value and reduce the cost of front line delivery • Improving the customers digital experience and making it easier to access services • Creating simple online applications, reporting and making payments • Being open and agile to new ways of delivering services and exploring new opportunities • Self-assessing our digital maturity
Where are we now?
Our journey has already started and great progress has been made. – Luton Digital describes the continuation of our digital journey.
• We have entered into a re-negotiated 10 year partnership contract with an outsourced IT supplier to ensure a resilient and secure IT infrastructure and a contract that will enable innovation, deliver continuous improvement and cost efficiency over the life of the contract.
• New social care case management system which brings a range of process improvements and the ability to share information across both Children’s & Adult services
• MyAccount was launched in 2015 with 31,000 users registered which has given residents’ access to council services including checking and paying council tax bills, move in move out, web chat, environmental reporting and the improvement of a number of on line forms and applications
• 92% benefits claims are now made on line and we have 9600 registered Council Tax users through MyAccount • 97.6% of addresses across Luton are connected to super-fast broadband
Page 109 of 293
• The use of SMS texting has increased across services including to 6000 residents for Council Tax payment reminders
• Use of Web Chat in customer services with further roll-out planned • For 2015-16 there were 1,708,583, user session across the luton.gov.uk digital estate with around half of these are now via a
mobile or tablet device • To promote digital inclusion a programme has started to provide free Wi-Fi in all key sites across the Borough, including the main
Library, Town Hall, Children’s Centres and Community Centres • We replaced an ageing telephony system with a new telephone platform that is resilient and enables up to date functionality such
as voice mail, teleconferencing, instant messaging and automated speech messaging • We have piloted the live streaming of a meeting of Full Council to promote greater inclusion and engagement in decision making
and democracy – with more to come • Engagement with the Council through the website has increased to 65%, resulting in a reduction in demand via face to face • Luton has actively participated with other local authorities in pioneering digital projects with central government. These include
working with the Department for Local Government and Communities on Waste Standards and the Government Digital Service on .GOV.UK Verify (the safe and simple way to prove who you are to government). We will continue to contribute to the appropriate GDS programmes.
• LBC Committed £180,000 and received an additional £180,000 match funding from BDUK to enable access to superfast broadband. We have received an additional £30,496 via SEMLEP, BDUK and acceleration
We are investing in our digital infrastructure over the next five years to ensure that is fit for purpose to support our digital ambition and opportunities from technology that will help us on our digital journey. Cultural change and service structure and design are an essential part of the getting the basics right, and the foundations in place to successfully deliver the aspirations and vision of Luton Digital.
Security of data and information is paramount for compliance and to gain the trust and confidence of our residents and partners. We will ensure that the information we hold is held securely, used appropriate to the means that it was collected, ensure we have consent for the use of data and that our systems that we hold the data is secure, maintained and fit for purpose. We will have in place the appropriate policies and procedures for holding data, deleting data and for sharing data with other services and partners.
We will be fully compliant with the General Data Protection Guidelines at all times.
Page 110 of 293

The National Landscape
The Government has recently published their Digital Economy Bill, UK Digital Strategy and Government Transformation Strategy. There are many points of interest in the proposals that are reflected in Luton Digital and offer further potential opportunities for Luton. The UK Digital Strategy published in February 2017 outlines the following plans
• Completing roll out of 4G and superfast broadband • Next generation digital infrastructure – full fibre and 5G • Free wifi on trains and more public spaces • New digital skills partnership • Education – coding in the national curriculum – from key stage one onwards • National Citizens Service to pilot new ways to include digital skills and careers in the NCS Programme • Growth and investment in digital businesses • Helping every business become a digital business • Ensuring a pipe line of cyber skills – running a national after school programme for the most talented students, apprenticeships
and adult retraining • Investing on a network of Teaching Excellence in Computer Science to help teacher and school leaders build their knowledge and
understanding of technology
The Government Transformation Strategy published in February 2017 outlines the following plans:
• Government business transformation – designing and delivering end to end services, whole government approach, meeting the GDS standard
• Growing the right people, skills and culture – embedding digital skills, make sure digital experts understand government, make sure staff understand digital, strengthen skills in agile project and programme management
• Establishing better ways to develop policy and deliver services in tandem • Building better tools, processes and governance and making better use of data • Creating shared platforms, components and reusable business capabilities
Page 111 of 293
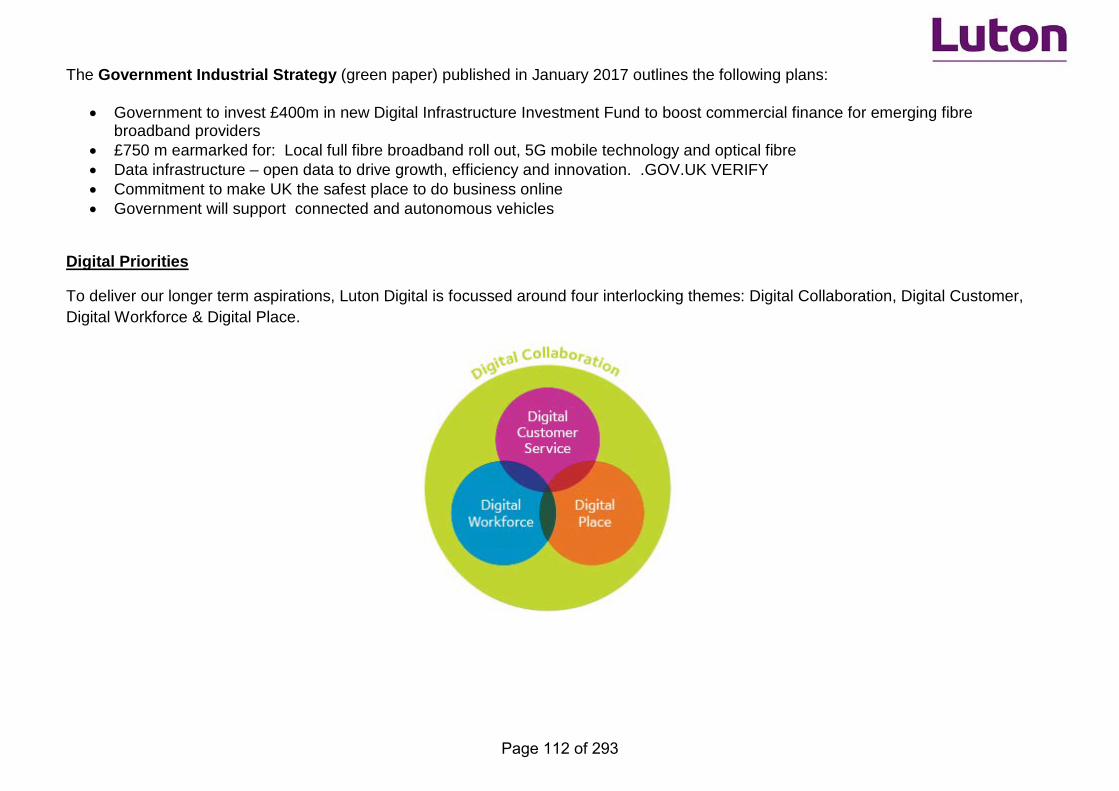
The Government Industrial Strategy (green paper) published in January 2017 outlines the following plans:
• Government to invest £400m in new Digital Infrastructure Investment Fund to boost commercial finance for emerging fibre broadband providers
• £750 m earmarked for: Local full fibre broadband roll out, 5G mobile technology and optical fibre • Data infrastructure – open data to drive growth, efficiency and innovation. .GOV.UK VERIFY • Commitment to make UK the safest place to do business online • Government will support connected and autonomous vehicles
Digital Priorities
To deliver our longer term aspirations, Luton Digital is focussed around four interlocking themes: Digital Collaboration, Digital Customer, Digital Workforce & Digital Place.
Page 112 of 293
Priority
What it means
Digital Collaboration “Digital technology will enable the Council and its partners to tackle complex issues and work together seamlessly.”
This means using digital technology to work with our partners to deliver the outcomes we both desire and incorporates aspects of Digital Customer Service, Digital Workforce and Digital Place.
Digital Service Delivery “Enabling Luton’s citizens to get the services and information they need online.”
This means providing services and information online to residents and businesses in a user-friendly way that encourages take up.
Digital Place “Equipping Luton’s residents and businesses with the digital skills and technology they need to enhance their lives and build and safe, strong and cohesive community.”
This means enabling residents and businesses in the borough to use digital technology to improve their lives, providing them with access to devices and the internet as well as developing their digital skills, from the children and young people in our schools to our elderly residents.
Digital Workforce “Staff will have the digital tools and skills required to deliver services effectively and efficiently.”
This means delivering positive outcomes for Luton’s residents by giving staff access to the data they need and appropriate technology, ensuring they have the skills to use it effectively.
Digital Collaboration
“Digital technology will enable the Council and its partners to tackle complex issues and work together seamlessly”
Technology is no longer the barrier to sharing data – people, engagement, process, culture and behaviours are now the hurdles that we will overcome to enable collaboration. As a council we need to liberate our information and data from individual departments to enable real time access to data to inform decision making. With reducing budgets, fewer resources and rising demand on our services particularly in social care, health and housing, collaboration with partners and sharing information and resources has increased importance and focus. We must enable residents to become more self-reliant, reduce costs, jointly commission and procure services and share our expertise. Health & social care integration, putting the customer at the heart of service design, and dealing with cultural and governance implications across partnerships is key and provides a big opportunity for radical redesign of appropriate services.
Page 113 of 293
The development of our Multi Agency Safeguarding Hub (MASH) is a key part of how we work across social care, health, the police and other agencies to safeguard children, sharing information, systems and resources. With the General Data Protection Regulations (GDPR) changing from April 2018, it is also the opportunity and time to ensure that records held across agencies are correct and consistent, giving residents and each partner added confidence to give consent to share data appropriately knowing it will be used in the right way. How we will achieve our vision:
• Prepare for the GDPR through a readiness and impact assessment and put in place the resulting governance and framework around areas such as consent, retention and destruction practice and procedure
• Use big data and business intelligence evidence to better understand our customer and inform decisions – join up intelligence and share data across services and partners
• Work towards having all publishable data sets available on our website to enable customers to get real time access to information • Engage with partners from across all sectors, staff and residents through a series of workshops to understand the opportunity and
generate ideas
A further big opportunity lay within the Sustainability & Transformation Plan (STP) digital work stream where the sharing of data and collaboration between systems will introduce the electronic shared care records across practitioners, give residents, patients and their carers access to their own medical records, do own health checks and receive notifications make appointments. Benefits include better support for patients on discharge, early intervention of conditions to avoid hospital admissions, reduction in the cost of social care, and demand on services such as housing and benefits. How we will achieve our vision:
• Create common standards and the appropriate agreements to allow sharing of data and integration of systems across our partners • Implementation of an integrated system for Business Intelligence and the use of data across service delivery • Produce an application portfolio that identifies all applications and systems used across the organisation, and a technical
architecture picture to determine how current systems can be integrated, where investment may be needed and where service delivery and process re-design is required
• Identify the datasets and information that is held by services and determine how we will appropriately share and use the data • Work with partners to develop consistent standards and design of systems and processes so that all systems look the same,
whether it is a partner or council service • Be an active and engaged member of the Sustainability & Transformation Plan, Digital work stream
Page 114 of 293
• Work with our technology partner to harness innovation and bring new concepts to the delivery of services at Luton
• Working with suppliers for open source technology and development of open standards Digital Place
“Equipping Luton’s residents and businesses with the digital skills and technology they need to enhance their lives, and build and safe, strong and cohesive community.”
Our aim is to maximise take-up of all digital channels, and to reduce cost and demand. In delivering this aim we will continue to support the vulnerable members of the community and encourage those that could use digital channels but currently choose not to. We need as many citizens as possible to prefer to use digital channels in accessing our services, but we will need to identify where the digital divide in skills and access to technology exists and provide support to those sections of the community. We will need to improve access to technology across the Borough and maximise the use of outreach work in council and partner premises to provide communities and groups access to information to support and enable communities, we will also continue to support volunteers and voluntary groups in the community through the development of on-line tools and guidance. We also aim to improve the online offer to enable greater democratic engagement and engage hard to reach groups to involve the whole community of Luton in shaping and informing the future direction of the Council and its services. How we will achieve our vision:
• Promote and identify digital champions in the community • Work with residents to understand the barriers to using technology, and put in place practical ways of ensuring they are included
and supported • Understand the information and data of the Luton residents to enable targeted support to prevent exclusion of residents and
proactively include all groups of the community • Development of the on-line housing offer to enable residents to apply for and receive housing advice and services • Develop the use of technology such as real time information on buses available on all mobile devices through an app, and energy
smart meters in homes to provide the information that will help us to understand what is happening in Luton regarding the use of energy
• Roll-out of superfast connections to community hubs, partner venues and building such as the Libraries where investment allows
Page 115 of 293
• Housing registrations, applications and online advice enabled and integrated to the back office • Develop and deliver support through assisted digital training to community groups to improve digital skills and improve the
confidence of communities in the use of technology and access to council and partner services • Exploring the development and deployment of Apps for mobiles and the web • Providing free to use WI-FI in the town centre • Involve local residents in the development of the on-line democratic offer • Increase and improve access to technology and services through our on-line offer for all resident groups • Development of on-line forms and systems that will enable residents to manage their housing needs to ensure the council can
assist with issues and support tenants. Economic development is essential for Luton in the development of our commercial and economic growth and bringing jobs and increased wealth into the Borough. To enable our businesses to grow, and to encourage new business and jobs into the Borough we will work with private investors to deploy high speed internet across the town, and continue to look for opportunity to reach all businesses in every area of the Borough. How we will achieve our vision:
• Deployment of the high speed internet across Luton reaching all businesses and homes by 2022 • Identification of future funding streams for continued investment in the connectivity infrastructure • Explore new investment opportunities in the public & private sector through the Luton Investment Framework to support the
delivery of Luton’s ambitions and inward investment into the Borough • Create simple online application forms, access to account information and payments • Engage with the business community and link our schools, colleges and universities to support the development of digital skills to
help people into digital roles and enable school leavers to be work ready in the digital environment • Create a hub in the town centre to support and connect residents to job opportunities, skills, training and local business. • Explore opportunities for collaboration with the private sector to invest in our technology infrastructure
Page 116 of 293

Digital Workforce
“Staff will have the digital tools and skills required to deliver services effectively and efficiently.”
Enabling our staff to deliver high quality, effective and efficient services is essential to the reduction of cost. We need to provide the right technology at the right time appropriate to the role, ensure staff have the right skills and accessibility to systems whether at home, mobile, in a partner building or at work, and to improve the productivity of our workforce. Our investment in technology through our partnership with Civica will put in place the fundamental elements of our core infrastructure that will enable the enhancement of service delivery and simplify access and improve the customer and workforce experience. The application of digital technology and design of digital services must become part of the organisations culture and a key consideration in our service planning if we are to exploit the opportunities that digital can provide to the delivery of services. We must be agile and progressive in our approach to development, based on evidence of need and business case benefits and encourage the piloting of new technologies at small cost and scale to test new ideas and concepts. How we will achieve our vision:
• Roll-out of corporate WI-FI to enable mobile and flexible working in all council offices and meeting rooms and all key sites across the council’s estate
• Refresh the mobile estate to equip our staff and Members with mobile technology and access to emails, social media etc. • Replacement of share point to integrate systems and processes • Device refresh to provide staff and members with the appropriate, fit for purpose tools, equipment and technology they need to do
their jobs, from any location which will increase flexibility and mobility. • Review use of social media apps for work purposes. Develop apps which will improve productivity, such as Staffapp for access to
all HR systems • Implementation and adoption of unified communications tools such as instant messaging, soft phones, video conferencing, skype
for business and presence awareness – all enabling our workforce and Members to work smart and connect with other, customers and businesses
• Develop roadmaps for each of our key line of business systems and align current and future budget requirements • Consult, engage and involve staff and members in the identification co-design of service delivery to a digital by design culture
through workshops and on-line forums
Page 117 of 293
• Upskilling staff and develop training for all staff to improve confidence and skills through access to training through e-learning and virtual classrooms. Ensure that the e-learning platform is fit for purpose
• Ensure our Information Asset Register is fit for purpose to facilitate an understanding of the Council’s digital assets, which are essential to the delivery, sharing and using of information correctly
• Create a Digital Leaders network to receive and support communications, identify issues at service level and be part of the solution
• Review how we share information internally to make the most effective and efficient use of our information
Digital Customer
“Enabling Luton’s customers to get the services and information they need online.”
We have started on a journey of encouraging channel shift from face to face to online and automated tools, however, there is more to do. We will continue to promote the digital agenda by increasing the number and range of transactional services available through our website, and enabling further delivery of website services on a tablet or smartphone device. Developing and promoting digital access channels will reduce transactional costs and improve service availability. We will continue to ensure that vulnerable customers and those who have difficulty accessing on-line services are supported to get the help and services they need. How we will achieve our vision:
• Consult with customers through workshops, user groups, resident groups, roadshows and other means in the delivery of the strategy to ensure that we understand their needs and views on accessing services digitally, and what the council needs to do to ensure inclusion of all residents irrelevant of ability and means
• Undertake a review of the use of the Digital portal that we have implemented, with a view to using alternative processes, appropriately rolling out further functionality and maximising our investment to date
• Implement the appropriate technology to enable on-line bookings, payments, applying for services and reporting • Promote customer self service • Commence the replacement and redesign of the internet to ensure our Council presence is clear and easy to use • Promote the use of a digital services through a digital portal on multiple devices • Review our customer services systems and processes to ensure they are fit for purpose • Re-design the website to make it engaging and easy to use for customers
Page 118 of 293
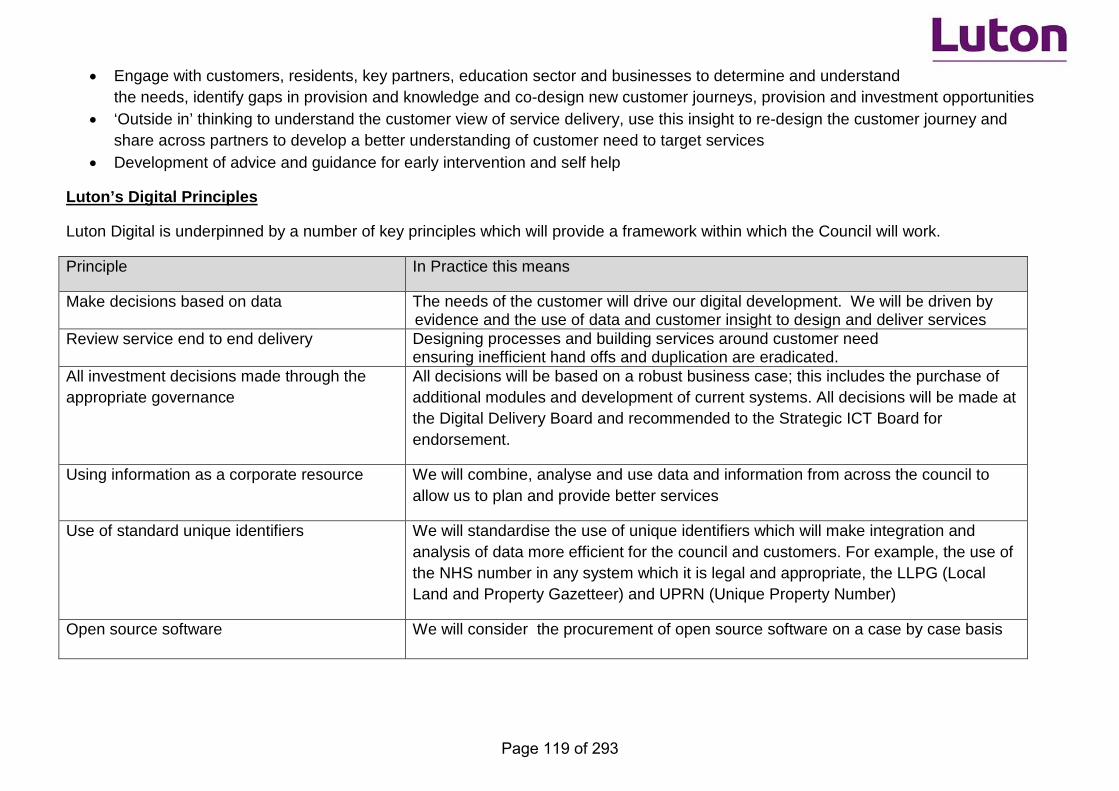
• Engage with customers, residents, key partners, education sector and businesses to determine and understand the needs, identify gaps in provision and knowledge and co-design new customer journeys, provision and investment opportunities
• ‘Outside in’ thinking to understand the customer view of service delivery, use this insight to re-design the customer journey and share across partners to develop a better understanding of customer need to target services
• Development of advice and guidance for early intervention and self help
Luton’s Digital Principles
Luton Digital is underpinned by a number of key principles which will provide a framework within which the Council will work.
Principle In Practice this means
Make decisions based on data The needs of the customer will drive our digital development. We will be driven by evidence and the use of data and customer insight to design and deliver services
Review service end to end delivery Designing processes and building services around customer need ensuring inefficient hand offs and duplication are eradicated.
All investment decisions made through the appropriate governance
All decisions will be based on a robust business case; this includes the purchase of additional modules and development of current systems. All decisions will be made at the Digital Delivery Board and recommended to the Strategic ICT Board for endorsement.
Using information as a corporate resource We will combine, analyse and use data and information from across the council to allow us to plan and provide better services
Use of standard unique identifiers We will standardise the use of unique identifiers which will make integration and analysis of data more efficient for the council and customers. For example, the use of the NHS number in any system which it is legal and appropriate, the LLPG (Local Land and Property Gazetteer) and UPRN (Unique Property Number)
Open source software We will consider the procurement of open source software on a case by case basis
Page 119 of 293
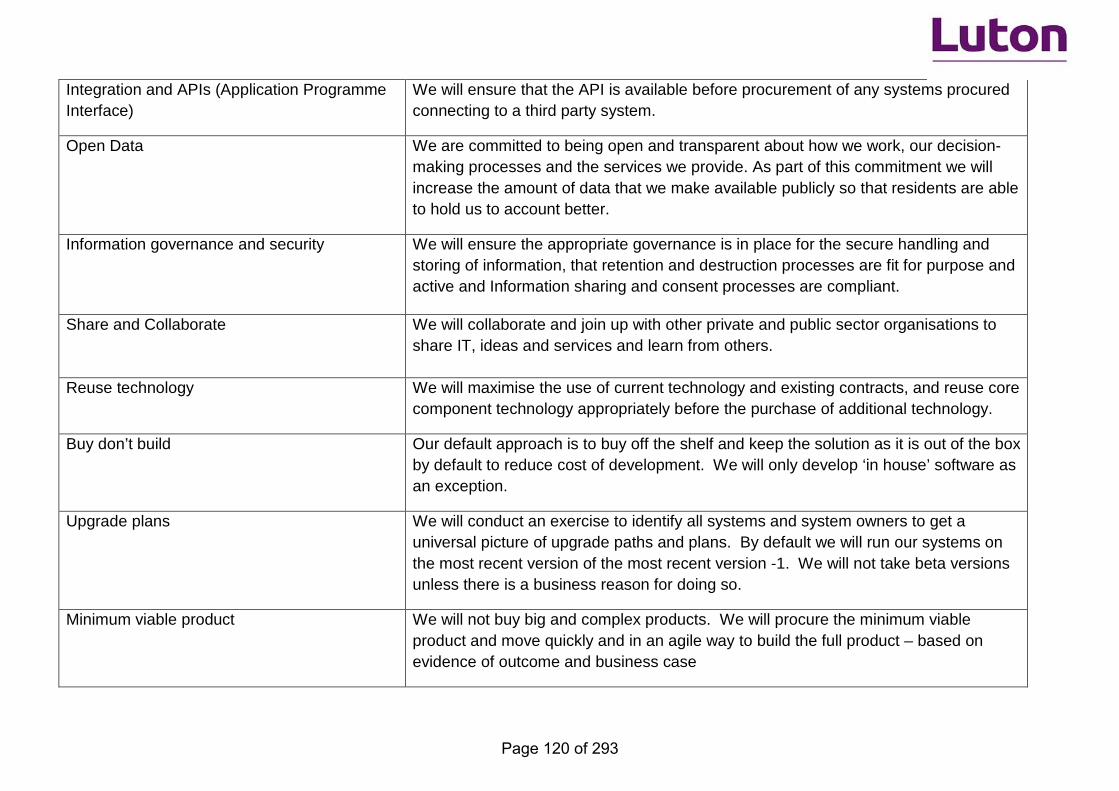
Integration and APIs (Application Programme Interface)
We will ensure that the API is available before procurement of any systems procured connecting to a third party system.
Open Data We are committed to being open and transparent about how we work, our decision-making processes and the services we provide. As part of this commitment we will increase the amount of data that we make available publicly so that residents are able to hold us to account better.
Information governance and security We will ensure the appropriate governance is in place for the secure handling and storing of information, that retention and destruction processes are fit for purpose and active and Information sharing and consent processes are compliant.
Share and Collaborate We will collaborate and join up with other private and public sector organisations to share IT, ideas and services and learn from others.
Reuse technology We will maximise the use of current technology and existing contracts, and reuse core component technology appropriately before the purchase of additional technology.
Buy don’t build Our default approach is to buy off the shelf and keep the solution as it is out of the box by default to reduce cost of development. We will only develop ‘in house’ software as an exception.
Upgrade plans We will conduct an exercise to identify all systems and system owners to get a universal picture of upgrade paths and plans. By default we will run our systems on the most recent version of the most recent version -1. We will not take beta versions unless there is a business reason for doing so.
Minimum viable product We will not buy big and complex products. We will procure the minimum viable product and move quickly and in an agile way to build the full product – based on evidence of outcome and business case
Page 120 of 293

Enabling Digital Foundations to deliver the Strategy The continued transition to digital through Luton Digital will require the consideration of implications for technology, policy and people changes. These enablers are essential for the success of digital transformation.
Key policies and strategies that integrate with the digital ambition that is supported and owned by the council’s leadership team and embrace the digital by default principle across all service delivery and transactional services, for example, policy on website development, use of microsites, apps, digital standards. Skills and confidence of our staff and citizens enabled by technology and training to proactively apply the use of technology to deliver improved service delivery and access and interaction with council services. Use of digital champions both internally and with partners to support staff and people who are not used to using technology and promote the use of online and social media tools and apps. Promote new ways of working across internal services to deliver services digital by default and adopt digital techniques and working practices when designing and delivering services. Supportive, resilient and innovative technology to ensure service provision is constant, reliable and regularly tested, to protect and enhance the reputation, confidence in and use of the technology platforms and online services. Robust data security and information management to protect residents, businesses, partners and council data from misuse and cyber threats. To ensure the security and safety of data we will have the appropriate information sharing arrangements in place internally and with external partners, owned by the cross functional Information Governance Group. Open source technology and systems alliance to enable the sharing and standardisation of data across local and central government systems and drive down cost of integration; Collaboration at a local, regional and national level to work in collaboration with local and national partners, e.g. Government Digital Service (GDS) and harness the benefits of co-production and development to deliver improved and cutting edge online services to the Luton community. We will sign up to delivering the GDS Digital Service Standards. Business and partner community engagement to be actively engaged with Luton Borough Council services to help shape the online offer to support continuous improvement in the digital ambitions in the town and enable maximum usage of digital tools;
Page 121 of 293
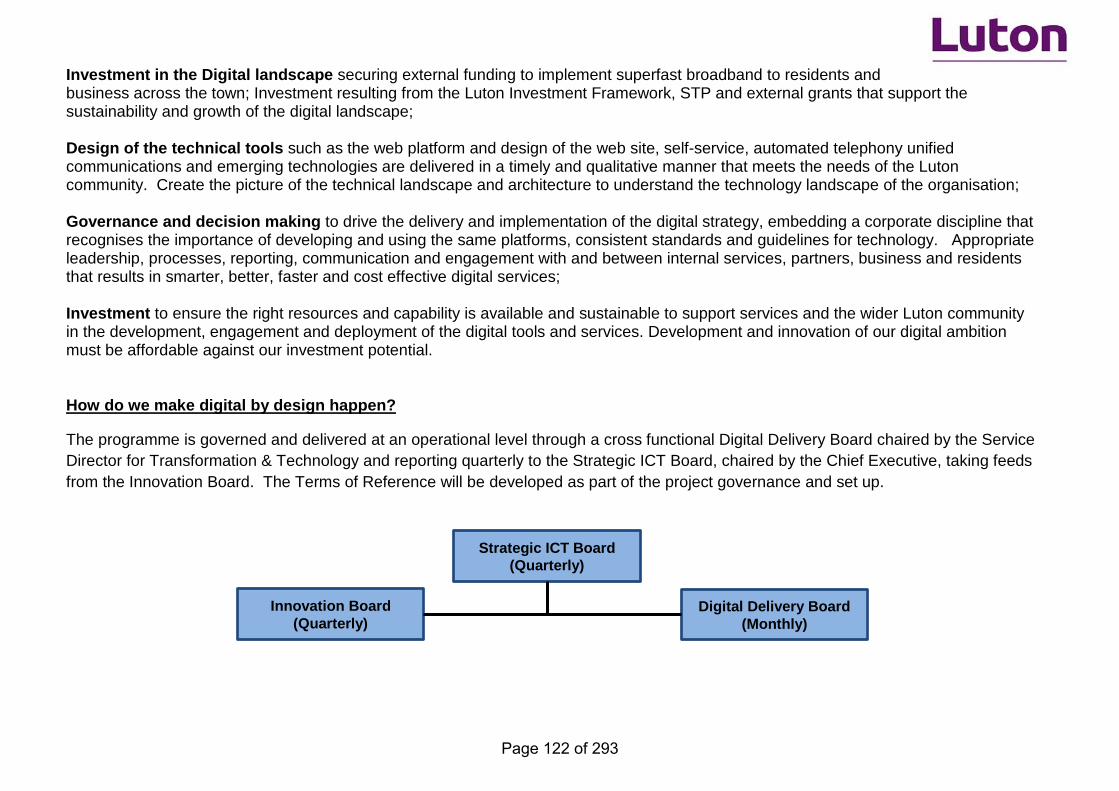
Investment in the Digital landscape securing external funding to implement superfast broadband to residents and business across the town; Investment resulting from the Luton Investment Framework, STP and external grants that support the sustainability and growth of the digital landscape; Design of the technical tools such as the web platform and design of the web site, self-service, automated telephony unified communications and emerging technologies are delivered in a timely and qualitative manner that meets the needs of the Luton community. Create the picture of the technical landscape and architecture to understand the technology landscape of the organisation; Governance and decision making to drive the delivery and implementation of the digital strategy, embedding a corporate discipline that recognises the importance of developing and using the same platforms, consistent standards and guidelines for technology. Appropriate leadership, processes, reporting, communication and engagement with and between internal services, partners, business and residents that results in smarter, better, faster and cost effective digital services; Investment to ensure the right resources and capability is available and sustainable to support services and the wider Luton community in the development, engagement and deployment of the digital tools and services. Development and innovation of our digital ambition must be affordable against our investment potential.
How do we make digital by design happen?
The programme is governed and delivered at an operational level through a cross functional Digital Delivery Board chaired by the Service Director for Transformation & Technology and reporting quarterly to the Strategic ICT Board, chaired by the Chief Executive, taking feeds from the Innovation Board. The Terms of Reference will be developed as part of the project governance and set up.
Strategic ICT Board (Quarterly)
Digital Delivery Board (Monthly)
Innovation Board (Quarterly)
Page 122 of 293
Investment in Resources
The digital programme will be ongoing as technologies and customer expectations evolve. We should adopt an agile model of investment that builds up our capability as we prioritise what needs to be delivered on a business case by business case basis. To support investment and capital and revenue planning, the programme of work will be costed, with a glide path of required investment that can be reviewed and amended accordingly. Current spend on IT in services will need to be manged through the programme governance to ensure value for money and alignment with the design principles of the strategy. The programme will not succeed if we are not flexible in how we invest. We have invested in and refocussed the digital team to deliver against our programme and we will need to ensure that capability and capacity remains fit for purpose.
Programme Delivery
Delivery plans for each priority will be developed and managed through the Digital Delivery Board. These plans will outline the timescales and the priority actions that will be delivered as part of the programme.
Immediate resources that are required to support the delivery of Luton Digital are not currently in place. There will be a requirement for a Programme Manager, Project Manager and Business Analyst – these resources will be advertised as a secondment for an initial 12 months in the first instance, and recruited externally thereafter. If the posts are externally resourced, an invest to accelerate business case will be developed for the sum in the region of £120k.
Page 123 of 293
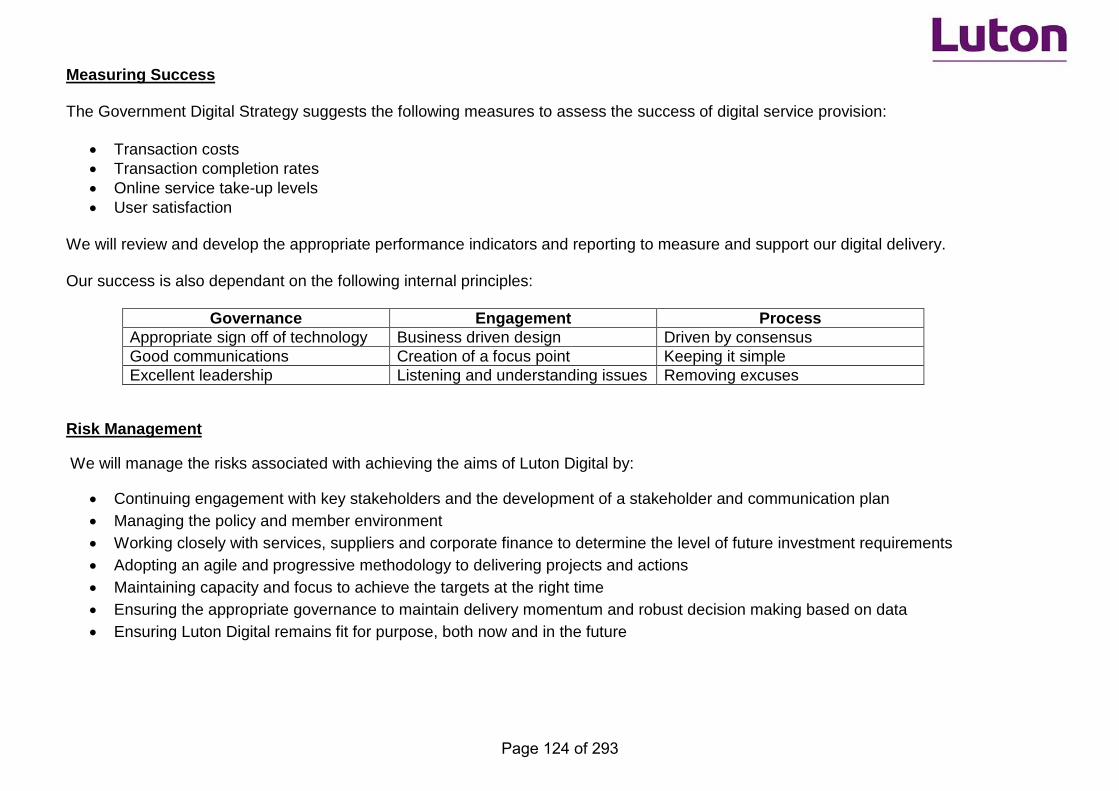
Measuring Success The Government Digital Strategy suggests the following measures to assess the success of digital service provision:
• Transaction costs • Transaction completion rates • Online service take-up levels • User satisfaction
We will review and develop the appropriate performance indicators and reporting to measure and support our digital delivery. Our success is also dependant on the following internal principles:
Governance Engagement Process Appropriate sign off of technology Business driven design Driven by consensus Good communications Creation of a focus point Keeping it simple Excellent leadership Listening and understanding issues Removing excuses
Risk Management
We will manage the risks associated with achieving the aims of Luton Digital by:
• Continuing engagement with key stakeholders and the development of a stakeholder and communication plan • Managing the policy and member environment • Working closely with services, suppliers and corporate finance to determine the level of future investment requirements • Adopting an agile and progressive methodology to delivering projects and actions • Maintaining capacity and focus to achieve the targets at the right time • Ensuring the appropriate governance to maintain delivery momentum and robust decision making based on data • Ensuring Luton Digital remains fit for purpose, both now and in the future
Page 124 of 293
Links with other plans
Luton Digital contributes to the delivery of the Corporate Plan, Luton Investment Framework, Luton Together Transformation Strategy and ICT Strategy. It also links to and enables elements of the People Plan and Asset Management Plan.
References and Related documents:
Luton Investment Framework 2015 – 2035;Council’s Corporate Plan 2014 – 2017; Customer Strategy 2014 – 2017; Luton Together Phase 3 Transformation Strategy 2015 – 2019; Technology Transition Plan 2017 – 2018; Technology Continuous Service Improvement Plan 2017 – 2018; Sustainable Transformation Plan – Digital Workstream; Service Plans 2017; People Plan 2016 – 2019
External Document References: Digital Economy Bill – Feb 2017 UK Digital Strategy – March 2017 Government Transformation Strategy – Feb 2017 GDS Digital Standards
Author: Jayne Robinson, Service Director Transformation & Technology Publication Date: July 2017 Review Date: July 2018 Strategy Owner: Trevor Holden, Chief Executive, Luton Borough Council
Page 125 of 293

Jayne Robinson Interim Service Director Transformation & Technology 01582 547952 [email protected]
Page 126 of 293
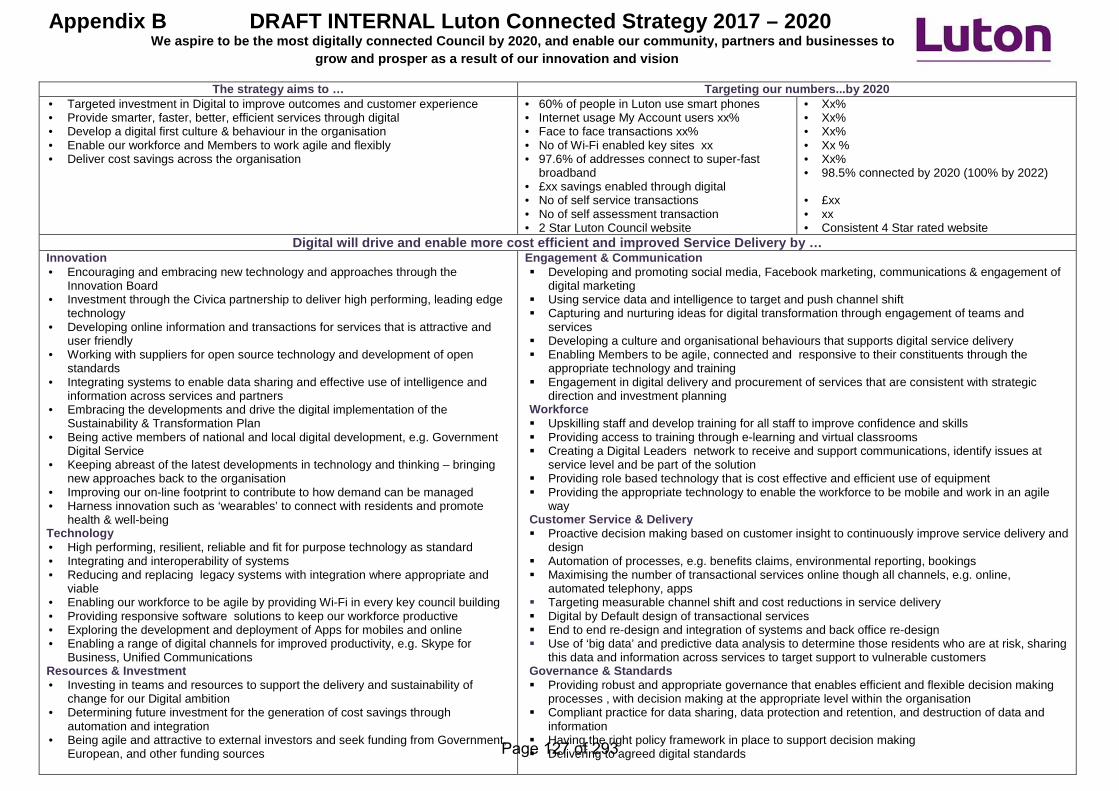
Appendix B DRAFT INTERNAL Luton Connected Strategy 2017 – 2020 We aspire to be the most digitally connected Council by 2020, and enable our community, partners and businesses to
grow and prosper as a result of our innovation and vision
The strategy aims to … Targeting our numbers...by 2020 • Targeted investment in Digital to improve outcomes and customer experience • Provide smarter, faster, better, efficient services through digital • Develop a digital first culture & behaviour in the organisation • Enable our workforce and Members to work agile and flexibly • Deliver cost savings across the organisation
• 60% of people in Luton use smart phones • Internet usage My Account users xx% • Face to face transactions xx% • No of Wi-Fi enabled key sites xx • 97.6% of addresses connect to super-fast
broadband • £xx savings enabled through digital • No of self service transactions • No of self assessment transaction • 2 Star Luton Council website
• Xx% • Xx% • Xx% • Xx % • Xx% • 98.5% connected by 2020 (100% by 2022)
• £xx • xx • Consistent 4 Star rated website
Digital will drive and enable more cost efficient and improved Service Delivery by … Innovation • Encouraging and embracing new technology and approaches through the
Innovation Board • Investment through the Civica partnership to deliver high performing, leading edge
technology • Developing online information and transactions for services that is attractive and
user friendly • Working with suppliers for open source technology and development of open
standards • Integrating systems to enable data sharing and effective use of intelligence and
information across services and partners • Embracing the developments and drive the digital implementation of the
Sustainability & Transformation Plan • Being active members of national and local digital development, e.g. Government
Digital Service • Keeping abreast of the latest developments in technology and thinking – bringing
new approaches back to the organisation • Improving our on-line footprint to contribute to how demand can be managed • Harness innovation such as ‘wearables’ to connect with residents and promote
health & well-being Technology • High performing, resilient, reliable and fit for purpose technology as standard • Integrating and interoperability of systems • Reducing and replacing legacy systems with integration where appropriate and
viable • Enabling our workforce to be agile by providing Wi-Fi in every key council building • Providing responsive software solutions to keep our workforce productive • Exploring the development and deployment of Apps for mobiles and online • Enabling a range of digital channels for improved productivity, e.g. Skype for
Business, Unified Communications Resources & Investment • Investing in teams and resources to support the delivery and sustainability of
change for our Digital ambition • Determining future investment for the generation of cost savings through
automation and integration • Being agile and attractive to external investors and seek funding from Government,
European, and other funding sources
Engagement & Communication Developing and promoting social media, Facebook marketing, communications & engagement of
digital marketing Using service data and intelligence to target and push channel shift Capturing and nurturing ideas for digital transformation through engagement of teams and
services Developing a culture and organisational behaviours that supports digital service delivery Enabling Members to be agile, connected and responsive to their constituents through the
appropriate technology and training Engagement in digital delivery and procurement of services that are consistent with strategic
direction and investment planning Workforce Upskilling staff and develop training for all staff to improve confidence and skills Providing access to training through e-learning and virtual classrooms Creating a Digital Leaders network to receive and support communications, identify issues at
service level and be part of the solution Providing role based technology that is cost effective and efficient use of equipment Providing the appropriate technology to enable the workforce to be mobile and work in an agile
way Customer Service & Delivery Proactive decision making based on customer insight to continuously improve service delivery and
design Automation of processes, e.g. benefits claims, environmental reporting, bookings Maximising the number of transactional services online though all channels, e.g. online,
automated telephony, apps Targeting measurable channel shift and cost reductions in service delivery Digital by Default design of transactional services End to end re-design and integration of systems and back office re-design Use of ‘big data’ and predictive data analysis to determine those residents who are at risk, sharing
this data and information across services to target support to vulnerable customers Governance & Standards Providing robust and appropriate governance that enables efficient and flexible decision making
processes , with decision making at the appropriate level within the organisation Compliant practice for data sharing, data protection and retention, and destruction of data and
information Having the right policy framework in place to support decision making Delivering to agreed digital standards Page 127 of 293
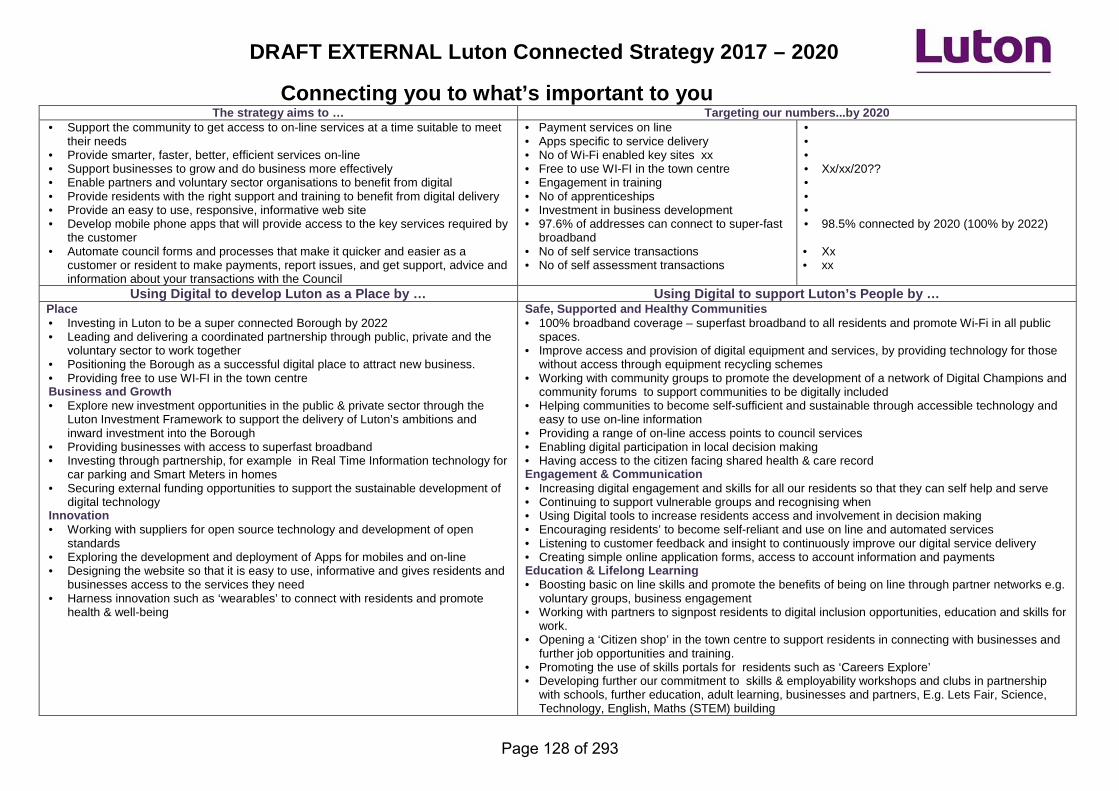
DRAFT EXTERNAL Luton Connected Strategy 2017 – 2020
Connecting you to what’s important to you The strategy aims to … Targeting our numbers...by 2020
• Support the community to get access to on-line services at a time suitable to meet their needs
• Provide smarter, faster, better, efficient services on-line • Support businesses to grow and do business more effectively • Enable partners and voluntary sector organisations to benefit from digital • Provide residents with the right support and training to benefit from digital delivery • Provide an easy to use, responsive, informative web site • Develop mobile phone apps that will provide access to the key services required by
the customer • Automate council forms and processes that make it quicker and easier as a
customer or resident to make payments, report issues, and get support, advice and information about your transactions with the Council
• Payment services on line • Apps specific to service delivery • No of Wi-Fi enabled key sites xx • Free to use WI-FI in the town centre • Engagement in training • No of apprenticeships • Investment in business development • 97.6% of addresses can connect to super-fast
broadband • No of self service transactions • No of self assessment transactions
• • • • Xx/xx/20?? • • • • 98.5% connected by 2020 (100% by 2022) • Xx • xx
Using Digital to develop Luton as a Place by … Using Digital to support Luton’s People by …
Place • Investing in Luton to be a super connected Borough by 2022 • Leading and delivering a coordinated partnership through public, private and the
voluntary sector to work together • Positioning the Borough as a successful digital place to attract new business. • Providing free to use WI-FI in the town centre Business and Growth • Explore new investment opportunities in the public & private sector through the
Luton Investment Framework to support the delivery of Luton’s ambitions and inward investment into the Borough
• Providing businesses with access to superfast broadband • Investing through partnership, for example in Real Time Information technology for
car parking and Smart Meters in homes • Securing external funding opportunities to support the sustainable development of
digital technology Innovation • Working with suppliers for open source technology and development of open
standards • Exploring the development and deployment of Apps for mobiles and on-line • Designing the website so that it is easy to use, informative and gives residents and
businesses access to the services they need • Harness innovation such as ‘wearables’ to connect with residents and promote
health & well-being
Safe, Supported and Healthy Communities • 100% broadband coverage – superfast broadband to all residents and promote Wi-Fi in all public
spaces. • Improve access and provision of digital equipment and services, by providing technology for those
without access through equipment recycling schemes • Working with community groups to promote the development of a network of Digital Champions and
community forums to support communities to be digitally included • Helping communities to become self-sufficient and sustainable through accessible technology and
easy to use on-line information • Providing a range of on-line access points to council services • Enabling digital participation in local decision making • Having access to the citizen facing shared health & care record Engagement & Communication • Increasing digital engagement and skills for all our residents so that they can self help and serve • Continuing to support vulnerable groups and recognising when • Using Digital tools to increase residents access and involvement in decision making • Encouraging residents’ to become self-reliant and use on line and automated services • Listening to customer feedback and insight to continuously improve our digital service delivery • Creating simple online application forms, access to account information and payments Education & Lifelong Learning • Boosting basic on line skills and promote the benefits of being on line through partner networks e.g.
voluntary groups, business engagement • Working with partners to signpost residents to digital inclusion opportunities, education and skills for
work. • Opening a ‘Citizen shop’ in the town centre to support residents in connecting with businesses and
further job opportunities and training. • Promoting the use of skills portals for residents such as ‘Careers Explore’ • Developing further our commitment to skills & employability workshops and clubs in partnership
with schools, further education, adult learning, businesses and partners, E.g. Lets Fair, Science, Technology, English, Maths (STEM) building
Page 128 of 293
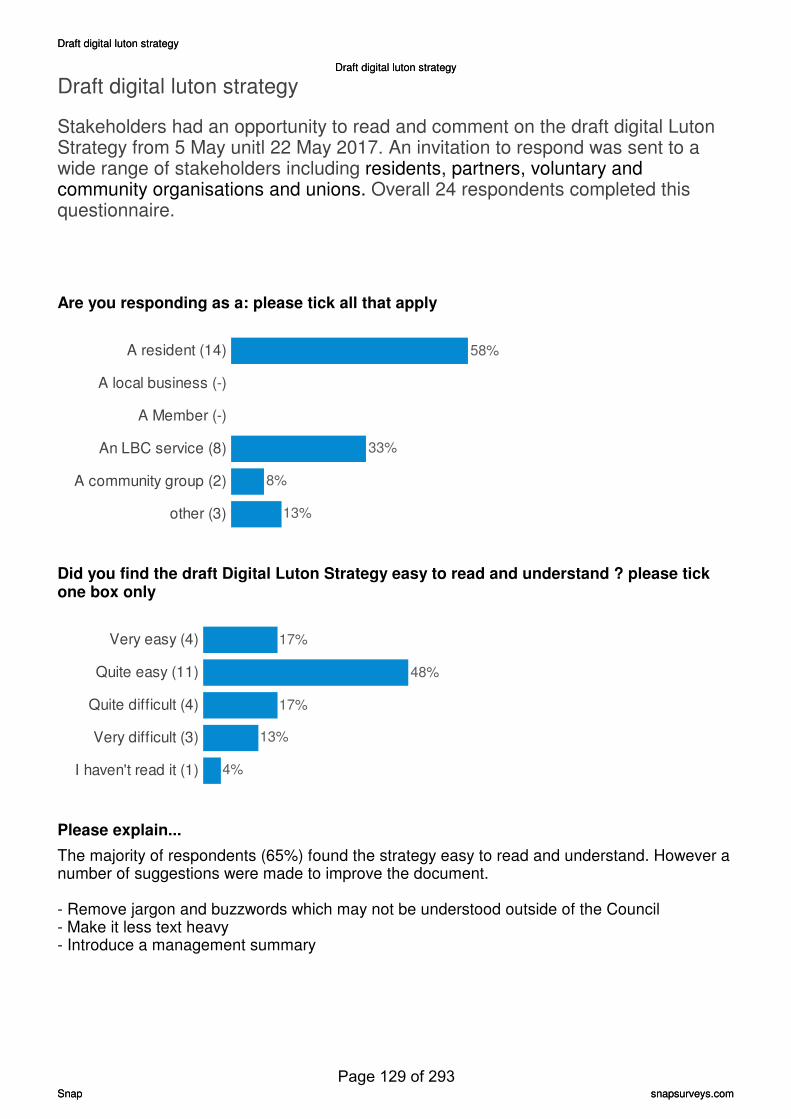
Draft digital luton strategyDraft digital luton strategy
Draft digital luton strategyDraft digital luton strategy
SnapSnap snapsurveys.comsnapsurveys.com
Draft digital luton strategy
Stakeholders had an opportunity to read and comment on the draft digital Luton Strategy from 5 May unitl 22 May 2017. An invitation to respond was sent to a wide range of stakeholders including residents, partners, voluntary and community organisations and unions. Overall 24 respondents completed this questionnaire.
Are you responding as a: please tick all that apply
A resident (14)
A local business (-)
A Member (-)
An LBC service (8)
A community group (2)
other (3)
33%
58%
8%
13%
Did you find the draft Digital Luton Strategy easy to read and understand ? please tickone box only
Very easy (4)
Quite easy (11)
Quite difficult (4)
Very difficult (3)
I haven't read it (1) 4%
17%
48%
17%
13%
Please explain...
The majority of respondents (65%) found the strategy easy to read and understand. However a number of suggestions were made to improve the document.
- Remove jargon and buzzwords which may not be understood outside of the Council- Make it less text heavy- Introduce a management summary
Page 129 of 293
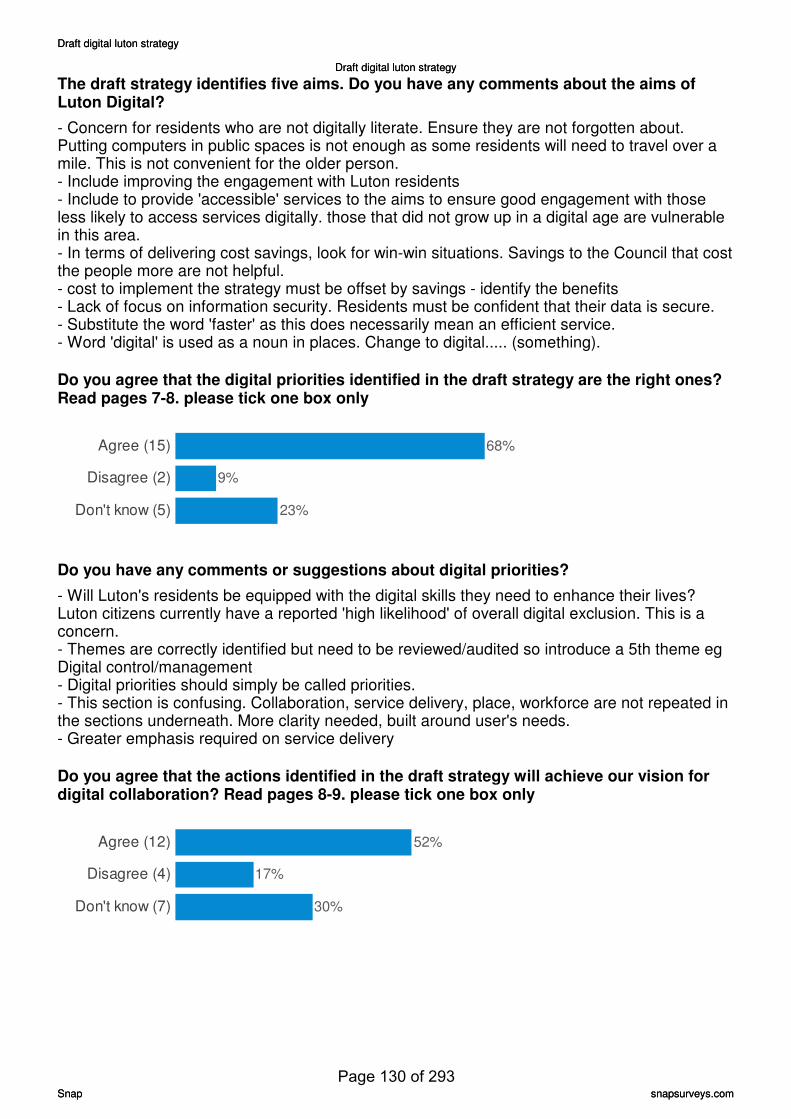
Draft digital luton strategyDraft digital luton strategy
Draft digital luton strategyDraft digital luton strategy
SnapSnap snapsurveys.comsnapsurveys.com
The draft strategy identifies five aims. Do you have any comments about the aims ofLuton Digital?
- Concern for residents who are not digitally literate. Ensure they are not forgotten about. Putting computers in public spaces is not enough as some residents will need to travel over a mile. This is not convenient for the older person.- Include improving the engagement with Luton residents- Include to provide 'accessible' services to the aims to ensure good engagement with those less likely to access services digitally. those that did not grow up in a digital age are vulnerable in this area.- In terms of delivering cost savings, look for win-win situations. Savings to the Council that cost the people more are not helpful.- cost to implement the strategy must be offset by savings - identify the benefits- Lack of focus on information security. Residents must be confident that their data is secure.- Substitute the word 'faster' as this does necessarily mean an efficient service.- Word 'digital' is used as a noun in places. Change to digital..... (something).
Do you agree that the digital priorities identified in the draft strategy are the right ones?Read pages 7-8. please tick one box only
Agree (15)
Disagree (2)
Don't know (5) 23%
68%
9%
Do you have any comments or suggestions about digital priorities?
- Will Luton's residents be equipped with the digital skills they need to enhance their lives? Luton citizens currently have a reported 'high likelihood' of overall digital exclusion. This is a concern.- Themes are correctly identified but need to be reviewed/audited so introduce a 5th theme eg Digital control/management- Digital priorities should simply be called priorities.- This section is confusing. Collaboration, service delivery, place, workforce are not repeated in the sections underneath. More clarity needed, built around user's needs.- Greater emphasis required on service delivery
Do you agree that the actions identified in the draft strategy will achieve our vision fordigital collaboration? Read pages 8-9. please tick one box only
Agree (12)
Disagree (4)
Don't know (7) 30%
17%
52%
Page 130 of 293
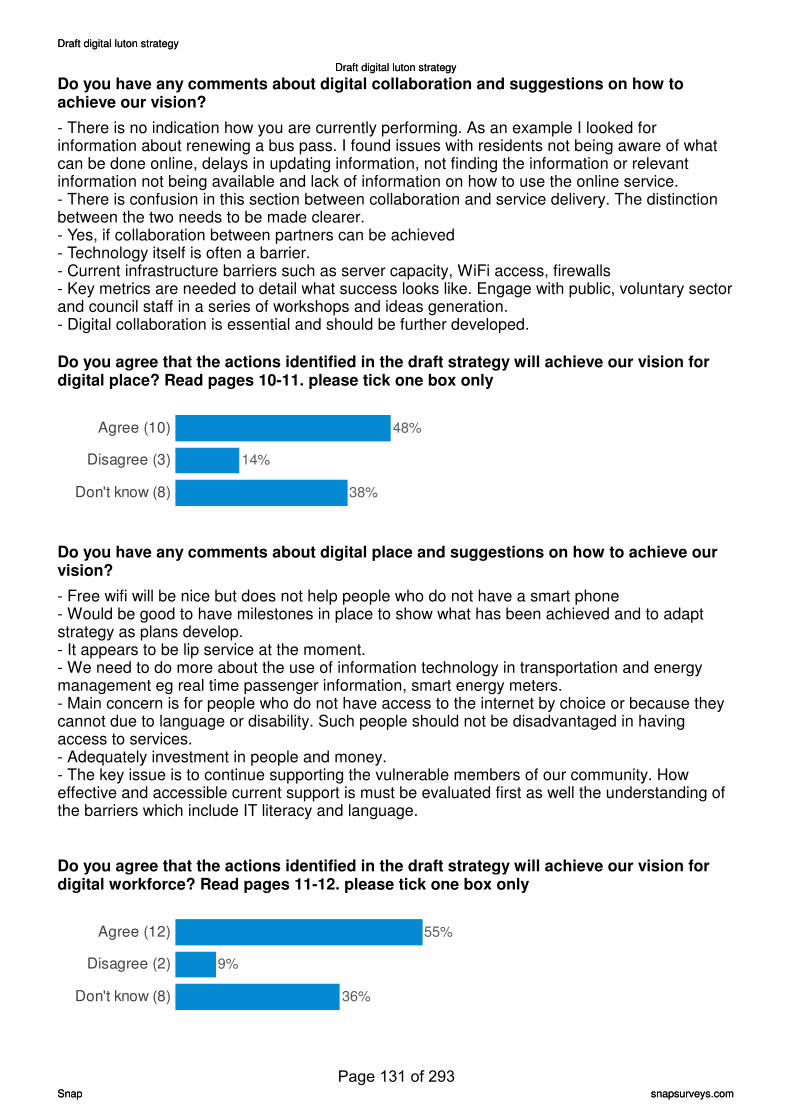
Draft digital luton strategyDraft digital luton strategy
Draft digital luton strategyDraft digital luton strategy
SnapSnap snapsurveys.comsnapsurveys.com
Do you have any comments about digital collaboration and suggestions on how toachieve our vision?
- There is no indication how you are currently performing. As an example I looked for information about renewing a bus pass. I found issues with residents not being aware of what can be done online, delays in updating information, not finding the information or relevant information not being available and lack of information on how to use the online service.- There is confusion in this section between collaboration and service delivery. The distinction between the two needs to be made clearer.- Yes, if collaboration between partners can be achieved- Technology itself is often a barrier.- Current infrastructure barriers such as server capacity, WiFi access, firewalls- Key metrics are needed to detail what success looks like. Engage with public, voluntary sector and council staff in a series of workshops and ideas generation.- Digital collaboration is essential and should be further developed.
Do you agree that the actions identified in the draft strategy will achieve our vision fordigital place? Read pages 10-11. please tick one box only
Agree (10)
Disagree (3)
Don't know (8) 38%
14%
48%
Do you have any comments about digital place and suggestions on how to achieve ourvision?
- Free wifi will be nice but does not help people who do not have a smart phone- Would be good to have milestones in place to show what has been achieved and to adapt strategy as plans develop.- It appears to be lip service at the moment.- We need to do more about the use of information technology in transportation and energy management eg real time passenger information, smart energy meters.- Main concern is for people who do not have access to the internet by choice or because they cannot due to language or disability. Such people should not be disadvantaged in having access to services.- Adequately investment in people and money.- The key issue is to continue supporting the vulnerable members of our community. How effective and accessible current support is must be evaluated first as well the understanding of the barriers which include IT literacy and language.
Do you agree that the actions identified in the draft strategy will achieve our vision fordigital workforce? Read pages 11-12. please tick one box only
Agree (12)
Disagree (2)
Don't know (8)
9%
55%
36%
Page 131 of 293
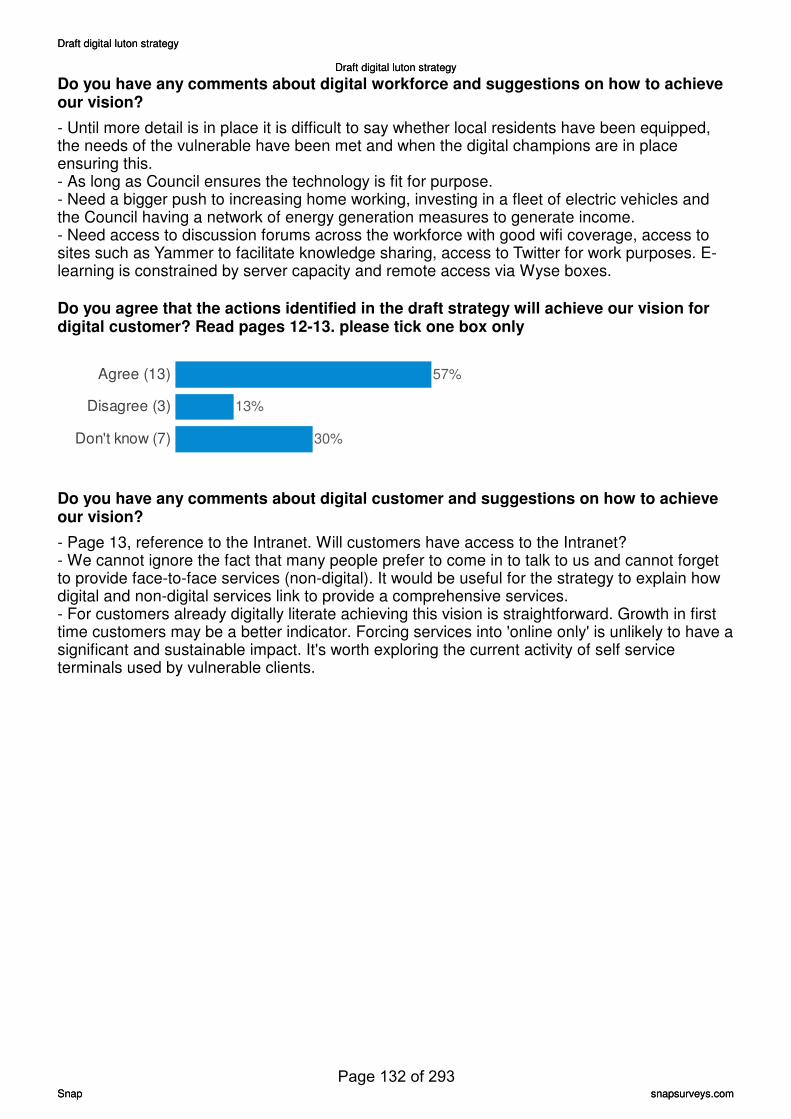
Draft digital luton strategyDraft digital luton strategy
Draft digital luton strategyDraft digital luton strategy
SnapSnap snapsurveys.comsnapsurveys.com
Do you have any comments about digital workforce and suggestions on how to achieveour vision?
- Until more detail is in place it is difficult to say whether local residents have been equipped, the needs of the vulnerable have been met and when the digital champions are in place ensuring this.- As long as Council ensures the technology is fit for purpose.- Need a bigger push to increasing home working, investing in a fleet of electric vehicles and the Council having a network of energy generation measures to generate income.- Need access to discussion forums across the workforce with good wifi coverage, access to sites such as Yammer to facilitate knowledge sharing, access to Twitter for work purposes. E-learning is constrained by server capacity and remote access via Wyse boxes.
Do you agree that the actions identified in the draft strategy will achieve our vision fordigital customer? Read pages 12-13. please tick one box only
Agree (13)
Disagree (3)
Don't know (7) 30%
13%
57%
Do you have any comments about digital customer and suggestions on how to achieveour vision?
- Page 13, reference to the Intranet. Will customers have access to the Intranet?- We cannot ignore the fact that many people prefer to come in to talk to us and cannot forget to provide face-to-face services (non-digital). It would be useful for the strategy to explain how digital and non-digital services link to provide a comprehensive services.- For customers already digitally literate achieving this vision is straightforward. Growth in first time customers may be a better indicator. Forcing services into 'online only' is unlikely to have a significant and sustainable impact. It's worth exploring the current activity of self service terminals used by vulnerable clients.
Page 132 of 293
Draft digital luton strategyDraft digital luton strategy
Draft digital luton strategyDraft digital luton strategy
SnapSnap snapsurveys.comsnapsurveys.com
Luton Digital is underpinned by a number of key principles which will provide aframework within which the Council will work. Do you have any comments about theprinciples set out in the draft strategy?
- 'Buy don't Build' is good but 'Rent don't Buy' may be better. Work with other authorities who are trying to do the same thing.- The strategy says that the needs of the customer will drive our digital development. However there is no indication of how you will consult customers. You need to identify what they see as their needs as well as what you see as their needs.- The principles in a way of commitments are quite good. Keeping things simple will encourage more users.- Principles are not specific to the digital strategy and some statements are misleading eg 'making digital decisions based on data' rather than 'make decisions based on data'. The former implies that we will ask computers to make decisions. Or 'all investment decisions made through the appropriate governance' implying that we are not doing this already.- Opinions from users are also important when making decisions eg frustrations. Always keep an eye on the customer.- When making decisions look at the wider cost to the public.- Using info as a corporate resource... Not sure - as a public resource?- Use of standard unique identifiers - keep the need for different password to a minimum as this can cause problems eg older people- Open Source Software: the principle should be 'information capable of being shared and used across customer(s) Integration and APIs (Application Programme Interface)- Share and collaborate: where it makes sense reuse technology.- Buy don't Build: needs to be managed carefully- Minimum viable product: agree not to purchase big and complex. A good principle is always to analyse and simplify the manual process first before computerising.- We feel the start point for most citizens in awareness of and actually accessing digital technology is much lower than the strategy recognises, where non-transferable skills of IT and language are double barriers to digital inclusion. We see this through our debt and general support services. The current LBC Population Report (May 2017) also identifies the current and high transient nature of the population which suggests continuing challenges even with education and support.
Page 133 of 293

Draft digital luton strategyDraft digital luton strategy
Draft digital luton strategyDraft digital luton strategy
SnapSnap snapsurveys.comsnapsurveys.com
Overall, is there anything else that you feel should be included in the final strategy?Please tell us if anything is missing.
- It is critical that the strategy recognises that some people will never be able to use digital services. There must be facilities to meet their needs!- Education about how to manage the internet would be very important. Some people are simply afraid of it.- Service by service consultation of consumers (and potential consumers). - Indicate what your targets are, how they will be set and what external assessment you will use to monitor.- Lack of focus on information security.- Resources to make this work within individual business divisions are not currently in place. Apart from IT resources, business processes, training in the business processes and ongoing support also need to happen. Fine tuning of these processes over time via analysis on the ground is missing in projects that have previously happened and therefore IT systems are not being fully utilised.- More detail required on governing the programme. Innovation Board responsibilities are not known. Risk management does not include an action plan in case something goes wrong and how to manage it.- How will you engage the hard to engage groups?- For LBC to become and remain a true Learning Organisation, real digital peer and online learning must be possible. Secure sites must be accessible and the e-learning platform fully supported. Digital learning must be encouraged at all levels.- Workshops engaging the public and businesses would be a really good idea. A greater emphasis on helping the more elderly use the technology and retain its use is becoming very important.- The roll out of Universal Credit will further test digital inclusion.More side by side support will be required. Trends around UC roll out elsewhere highlight delays in award decisions which in turn create debt issues.- Luton has high likelihood of overall digital exclusion (sources provided). The strategy does not address these issues or does not have plans in place to help our residents become more digitally included. The UK Digital Strategy is mentioned and new digital skills partnerships but not how we will utilise this to improve digital skills. Our residents need to be connected to us before we can make the bold claim 'most digitally connected council by 2020'. Do we or could we run courses/community events to show people digital skills and to show how easy and convenient it is eg set up email account, apply for jobs, shop online, use comparisons websites. We could also show them how to use LBC website. Work with Noah eg add more content to their courses and run campaign to sign people up. Also work with schools.
Do you have any suggestions on how you or key stakeholders could further support theLuton Digital Strategy?
- By being able to comment at certain points before entering the next stage.- Consult customers- If Luton has the right apps etc for the public, schools can support families to access easily- I think it's the way forward but at lower level there may be a reluctance so start with changing the working culture at LBC.- Take a look at LGInform regarding common local government datasets. The Association of Public Service Excellence will likely be able to offer advice and best practice on this subject.- All key Luton Access partners should seriously consider how our most vulnerable clients could be engaged and supported by this digital strategy. What will the engagement look like practically, measures of success and anticipated outcomes. It could actually support the Council's vision for further developing Luton Access significantly.
Page 134 of 293

Draft digital luton strategyDraft digital luton strategy
Draft digital luton strategyDraft digital luton strategy
SnapSnap snapsurveys.comsnapsurveys.com
Date
This report was generated on 08/06/17 by the Consultation Team.
Page 135 of 293
IIA from June 2013
This form replaces the previous Integrated Impact Assessment form used by LBC. The key aim of an impact assessment is to ensure that all Council policies, plans and strategies support the corporate mission statement that
‘The needs of Luton’s people will be first in everything we do’.
1. Why do I need to do an IIA? The aim of this impact assessment process is to:
Ensure adherence to the legal duties contained within the Equality Act 2010 and associated Public Sector Duty to analyse the impact of decisions to be undertaken by Council.
Ensure the Council has due regard to equality taking a proportionate and timely approach to analysing the impact on citizens
Minimise duplication of initial impact assessments with regards to Environment and Health and maximise consideration of other key Council priorities of Inclusion and Community Cohesion
Ensure that the Council has been able to consider the social, health, environmental and economic impacts in its decision making in a single document and, where necessary enable the production of a comprehensive action plan to mitigate any potential negative impacts identified
2. When do I need to do an IIA?
An IIA must be started at the beginning of any project, policy or strategy, and cannot be finalised until such time as all consultations, as required, are undertaken.
The Impact Table will help you to make early consideration of the potential impacts of your proposal and should be used from the point at which preliminary report is taken to Corporate Leadership and Management Team (CLMT) where appropriate. By using this table at your earliest point in the project, potential impacts can be highlighted and it will also be clear whether you need to carry out a full IIA.
If you complete this table and all impacts identified are neutral, i.e. there is no noticeable impact on characteristics and priorities listed and you are fully confident of this, please contact the SJU by email setting out how you have reached this judgement as it is unlikely you will need to carry out a full IIA.
An IIA must at all times identify those who will be affected by the decision, policy or strategy.
At a time of economic austerity IIA authors are minded to consider the whole range of decisions, both locally and nationally when analysing the impact on citizens
Your first early draft is to be sent to the Social Justice Unit for comments and guidance
Once consultation has ended, the IIA must be updated with results of the consultation and returned to Executive, where required, for further consideration and approval – at this stage it will be signed off as completed by the Social Justice Unit
Integrated Impact Assessment Form (IIA)
from June 2013
Page 136 of 293

IIA from June 2013
If at anytime you need further guidance please contact the Social Justice Unit. For your convenience, please see links at the end of this document to key Corporate and Partnership documents that may help you complete this IIA.
Page 137 of 293
IIA from June 2013
Tracker 2 No: Proposal Title: Digital Strategy Date of IIA: 8th May 2017 Updated after consultation - Date: 5th June 2017
Lead Officer Name: Jayne Robinson Service Director Transformation & Technology
Early draft Seen by:1 .................................... Finalised IIA Signed and seen by SJU : Name: Date:
Please include the names of all other contributors and stakeholders involved in the preparing of this proposal who have been consulted with and agreed this assessment. (Please note the IIA must not be carried out by one person):
If there is any potential impact on staffing please include the name/s of the trade union representative/s involved in the preparation of this assessment or any supporting evidence of request to participate:
Sue Nelson Clive Jones Michele Marvin Nicola Monk Hazel Lunn John Kenny
Please provide an outline of your proposal:
Luton Connected Digital Strategy sets out the organisations approach to managing and
developing the different aspects and opportunities of digital - from the website, email,
automated telephony, systems integration, portal, social media and digital marketing, to how
digital re-design of services and automation will enable savings to deliver service more
efficiently and contribute significantly to the delivery the Council’s vision over the next three
years. The strategy looks at the business benefits from technology against current delivery
and sets out the plan for delivery.
Luton Connected builds on work that is already underway in the organisation, and pushes the
boundaries in the art of the possible where service delivery should be digital by default. It also
reflects on industry best practice from the private and other public sector organisations that
have excelled in their digital delivery.
The aims of Luton Connected is to:
1 Please send an early draft of your IIA to the SJU to ensure all impacts are being considered at the appropriate time
Page 138 of 293
IIA from June 2013
Target investment in digital to improve outcomes and customer experience
Provide smarter, faster, better, efficient services
Develop a digital first culture & behaviour in the organisation
Deliver cost savings across the organisation
Innovate Information supporting the proposal (who, what, where, how2) Customer insight work has been carried out using the mosaic profile of the borough to better understand the behaviours, characteristics, service and access needs of our customers in the borough, and how we can target the right activity and service offer to customers. This has identified 15 customer types within the town. From this insight we know that 74% of our households could or already do access Council services through self serve channels as these are the households that have an average or above average propensity to use the web to access their services. This customer group of the 74% that ‘can’, will be targeted through communication and engagement and by ensuring that their self serve experience is effective, through an improved web service and expanded automated telephony. This will maximise their use of these self serve channels. The remaining 26% are the group of customers who have a below average propensity to self serve. A proportion of these, approximately 11% of the total number of households, are customers that can be assisted and with the right support could access web based services through 3mediated support. The remaining 15% are vulnerable customers that will either never be able, or are currently unable due to their complex circumstances, to receive their services by any other means than through face to face or telephony services. Over time with training, mediated support, improved technology access and abilities and an improved web service this proportion will reduce still further. However, we do know that services will always need to be flexible as new vulnerable groups emerge. Data from the LGA Get Digital Technology Partnership for Luton shows the following data:
60% of people in Luton use smart phones
97.6% of addresses connect to super-fast broadband
1% of households in Luton do not receive broadband speeds of at least 10mbs (megabits per second)
8.29% of households in Luton do not receive 4G mobile data from all providers
17.8% of adults in Luton have never been online
76% of adults in Luton have all five basic digital skills* (*Managing communication, Communicating, Transacting, Creating, Problem Solving)
28% of adults in Luton have used all five basic digital skills in the past three months The Strategy outlines the ways in which we will work to understand the residents that may not have the right skills, experience and ability that could exclude them from accessing services. We will 2 Breakdown of present users by ethnicity, age, gender, disability, religion/belief, sexuality (if recorded)
Also, show areas in the town with the biggest and lowest needs. Greater emphasis is required at the start of the IIA on the service, how it is delivered now and how the new service will be delivered 3 See p.26 for definitions of mediated serve and self serve.
Page 139 of 293
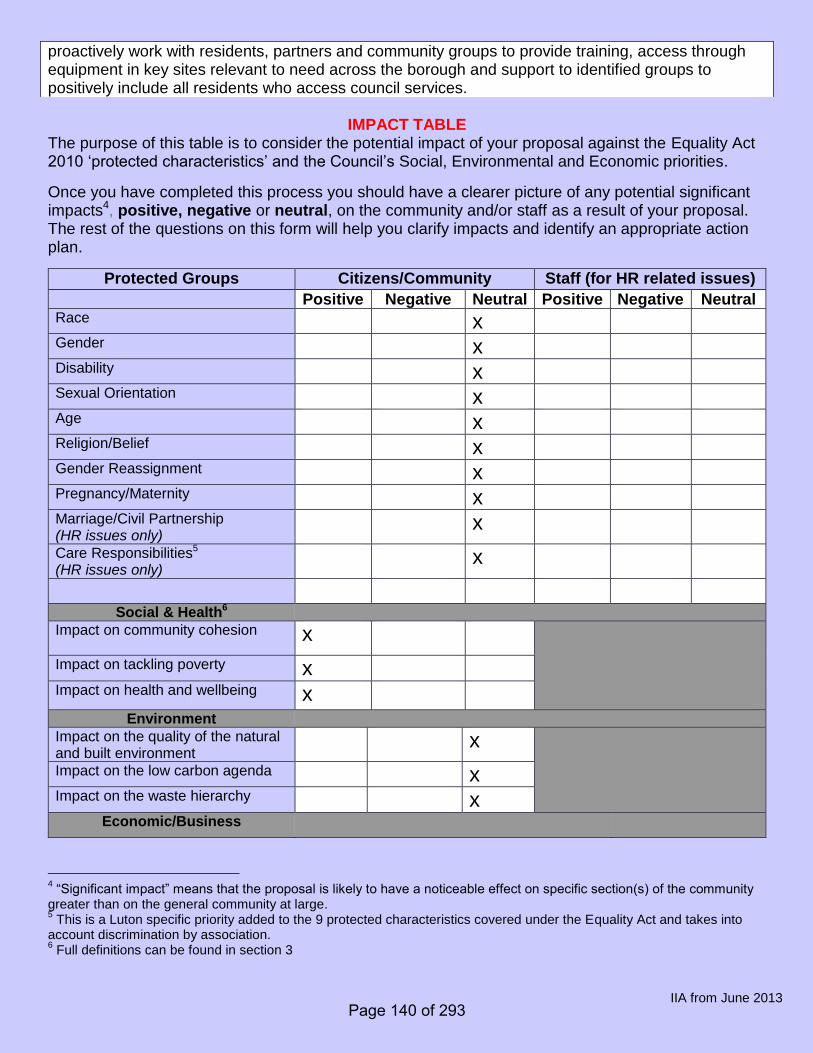
IIA from June 2013
proactively work with residents, partners and community groups to provide training, access through equipment in key sites relevant to need across the borough and support to identified groups to positively include all residents who access council services.
IMPACT TABLE
The purpose of this table is to consider the potential impact of your proposal against the Equality Act 2010 ‘protected characteristics’ and the Council’s Social, Environmental and Economic priorities.
Once you have completed this process you should have a clearer picture of any potential significant impacts4, positive, negative or neutral, on the community and/or staff as a result of your proposal. The rest of the questions on this form will help you clarify impacts and identify an appropriate action plan.
Protected Groups Citizens/Community Staff (for HR related issues)
Positive Negative Neutral Positive Negative Neutral Race x Gender x Disability x Sexual Orientation x Age x Religion/Belief x Gender Reassignment x Pregnancy/Maternity x Marriage/Civil Partnership (HR issues only)
x
Care Responsibilities5 (HR issues only)
x
Social & Health6
Impact on community cohesion
x
Impact on tackling poverty x Impact on health and wellbeing x
Environment
Impact on the quality of the natural and built environment
x
Impact on the low carbon agenda x Impact on the waste hierarchy x
Economic/Business
4 “Significant impact” means that the proposal is likely to have a noticeable effect on specific section(s) of the community
greater than on the general community at large. 5 This is a Luton specific priority added to the 9 protected characteristics covered under the Equality Act and takes into
account discrimination by association. 6 Full definitions can be found in section 3
Page 140 of 293
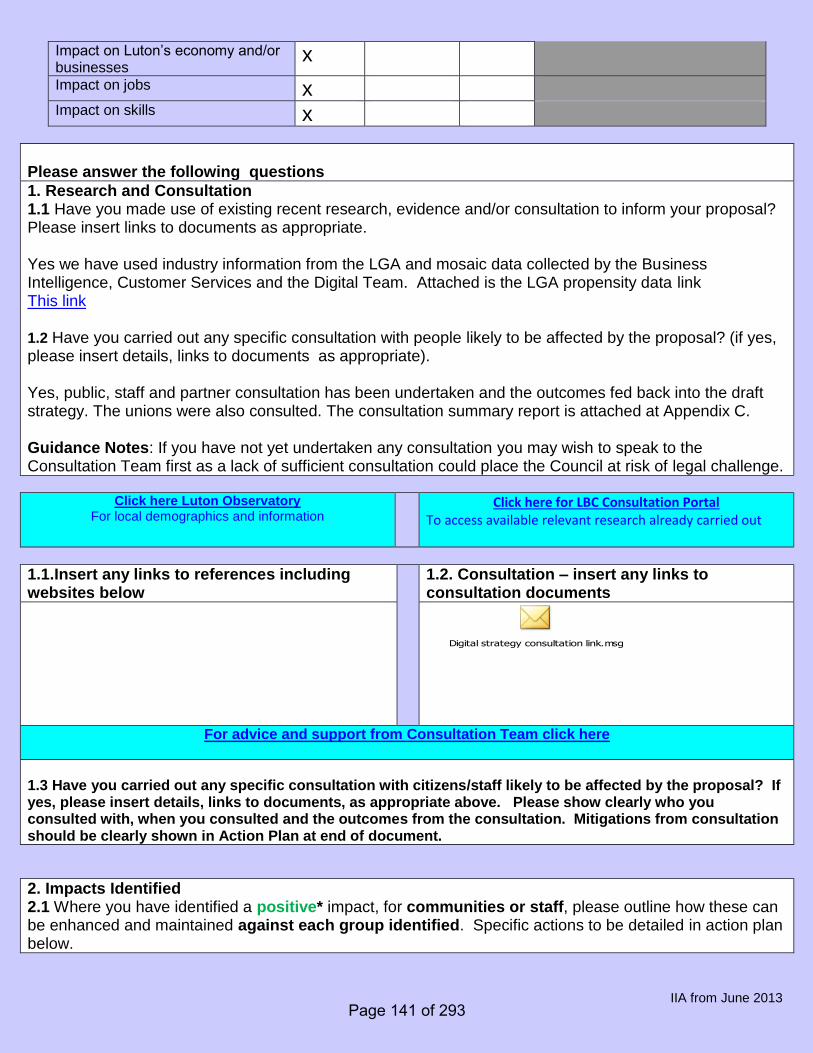
IIA from June 2013
Impact on Luton’s economy and/or businesses
x
Impact on jobs x
Impact on skills x
Please answer the following questions
1. Research and Consultation 1.1 Have you made use of existing recent research, evidence and/or consultation to inform your proposal? Please insert links to documents as appropriate. Yes we have used industry information from the LGA and mosaic data collected by the Business Intelligence, Customer Services and the Digital Team. Attached is the LGA propensity data link This link 1.2 Have you carried out any specific consultation with people likely to be affected by the proposal? (if yes, please insert details, links to documents as appropriate). Yes, public, staff and partner consultation has been undertaken and the outcomes fed back into the draft strategy. The unions were also consulted. The consultation summary report is attached at Appendix C. Guidance Notes: If you have not yet undertaken any consultation you may wish to speak to the Consultation Team first as a lack of sufficient consultation could place the Council at risk of legal challenge.
Click here Luton Observatory For local demographics and information
Click here for LBC Consultation Portal To access available relevant research already carried out
1.1.Insert any links to references including websites below
1.2. Consultation – insert any links to consultation documents
Digital strategy consultation link.msg
For advice and support from Consultation Team click here
1.3 Have you carried out any specific consultation with citizens/staff likely to be affected by the proposal? If yes, please insert details, links to documents, as appropriate above. Please show clearly who you consulted with, when you consulted and the outcomes from the consultation. Mitigations from consultation should be clearly shown in Action Plan at end of document.
2. Impacts Identified 2.1 Where you have identified a positive* impact, for communities or staff, please outline how these can be enhanced and maintained against each group identified. Specific actions to be detailed in action plan below.
Page 141 of 293
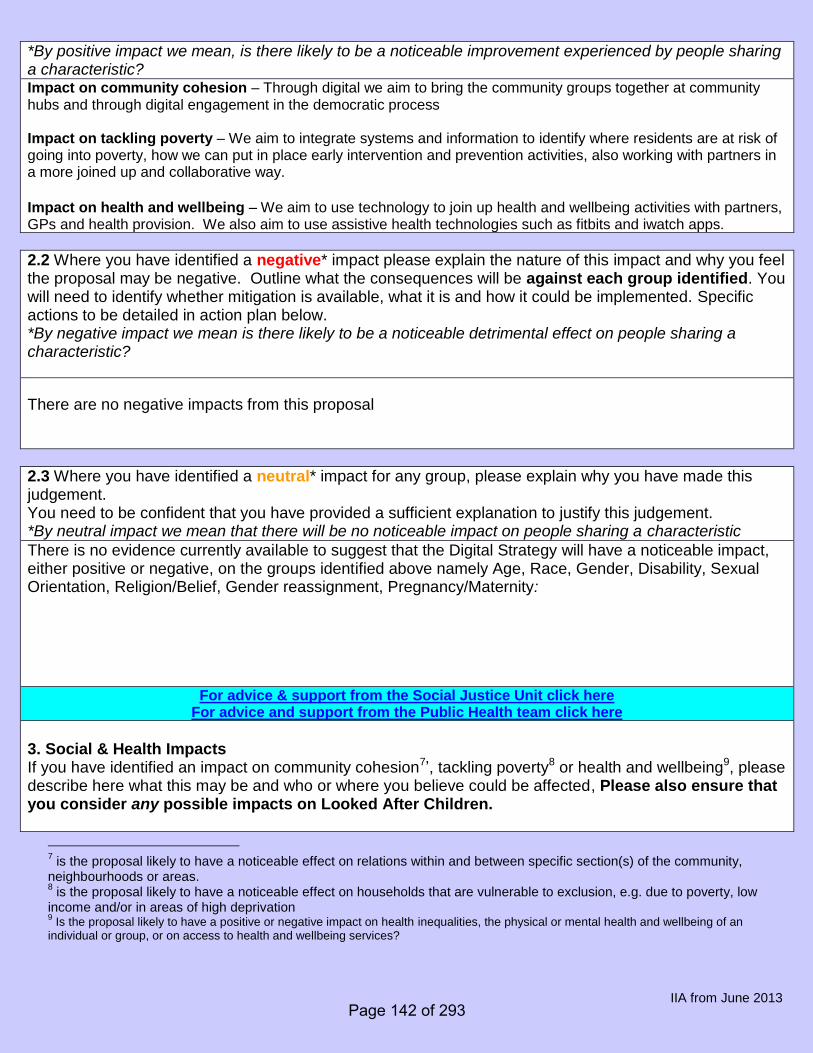
IIA from June 2013
*By positive impact we mean, is there likely to be a noticeable improvement experienced by people sharing a characteristic? Impact on community cohesion – Through digital we aim to bring the community groups together at community hubs and through digital engagement in the democratic process Impact on tackling poverty – We aim to integrate systems and information to identify where residents are at risk of going into poverty, how we can put in place early intervention and prevention activities, also working with partners in a more joined up and collaborative way.
Impact on health and wellbeing – We aim to use technology to join up health and wellbeing activities with partners, GPs and health provision. We also aim to use assistive health technologies such as fitbits and iwatch apps.
2.2 Where you have identified a negative* impact please explain the nature of this impact and why you feel the proposal may be negative. Outline what the consequences will be against each group identified. You will need to identify whether mitigation is available, what it is and how it could be implemented. Specific actions to be detailed in action plan below. *By negative impact we mean is there likely to be a noticeable detrimental effect on people sharing a characteristic?
There are no negative impacts from this proposal
2.3 Where you have identified a neutral* impact for any group, please explain why you have made this judgement. You need to be confident that you have provided a sufficient explanation to justify this judgement. *By neutral impact we mean that there will be no noticeable impact on people sharing a characteristic
There is no evidence currently available to suggest that the Digital Strategy will have a noticeable impact, either positive or negative, on the groups identified above namely Age, Race, Gender, Disability, Sexual Orientation, Religion/Belief, Gender reassignment, Pregnancy/Maternity:
For advice & support from the Social Justice Unit click here For advice and support from the Public Health team click here
3. Social & Health Impacts If you have identified an impact on community cohesion7’, tackling poverty8 or health and wellbeing9, please describe here what this may be and who or where you believe could be affected, Please also ensure that you consider any possible impacts on Looked After Children.
7 is the proposal likely to have a noticeable effect on relations within and between specific section(s) of the community,
neighbourhoods or areas. 8 is the proposal likely to have a noticeable effect on households that are vulnerable to exclusion, e.g. due to poverty, low
income and/or in areas of high deprivation 9 Is the proposal likely to have a positive or negative impact on health inequalities, the physical or mental health and wellbeing of an
individual or group, or on access to health and wellbeing services?
Page 142 of 293
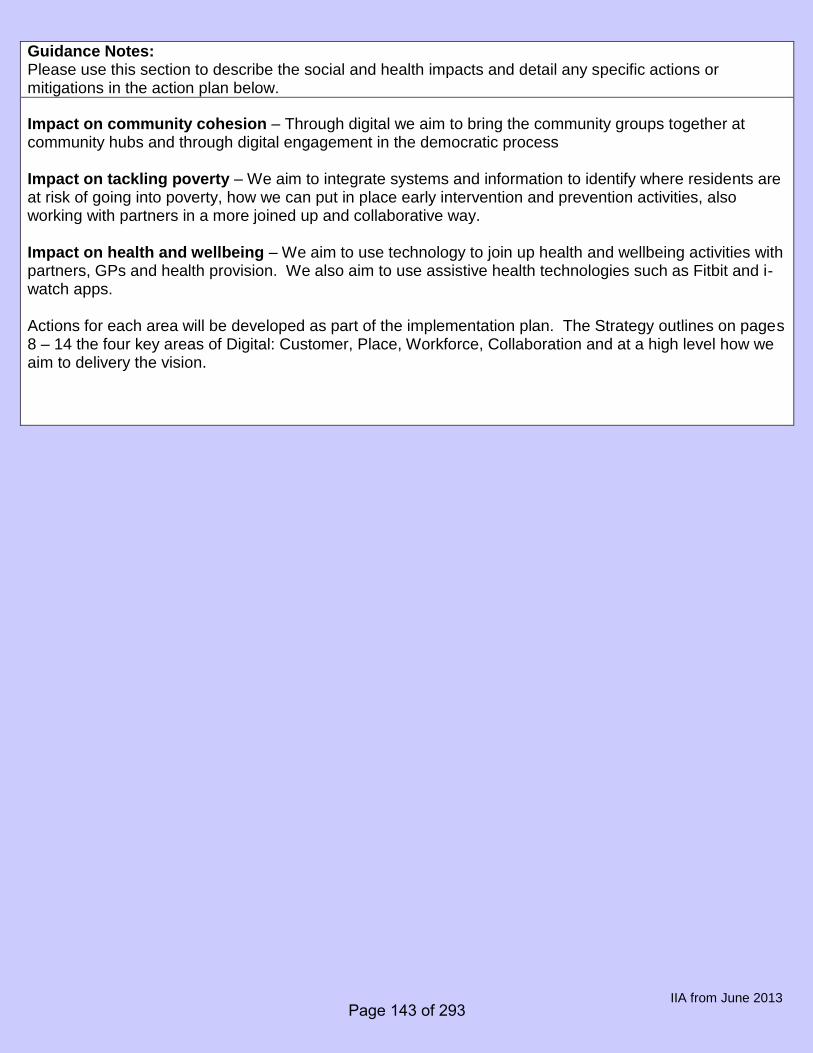
IIA from June 2013
Guidance Notes: Please use this section to describe the social and health impacts and detail any specific actions or mitigations in the action plan below.
Impact on community cohesion – Through digital we aim to bring the community groups together at community hubs and through digital engagement in the democratic process Impact on tackling poverty – We aim to integrate systems and information to identify where residents are at risk of going into poverty, how we can put in place early intervention and prevention activities, also working with partners in a more joined up and collaborative way. Impact on health and wellbeing – We aim to use technology to join up health and wellbeing activities with partners, GPs and health provision. We also aim to use assistive health technologies such as Fitbit and i-watch apps. Actions for each area will be developed as part of the implementation plan. The Strategy outlines on pages 8 – 14 the four key areas of Digital: Customer, Place, Workforce, Collaboration and at a high level how we aim to delivery the vision.
Page 143 of 293
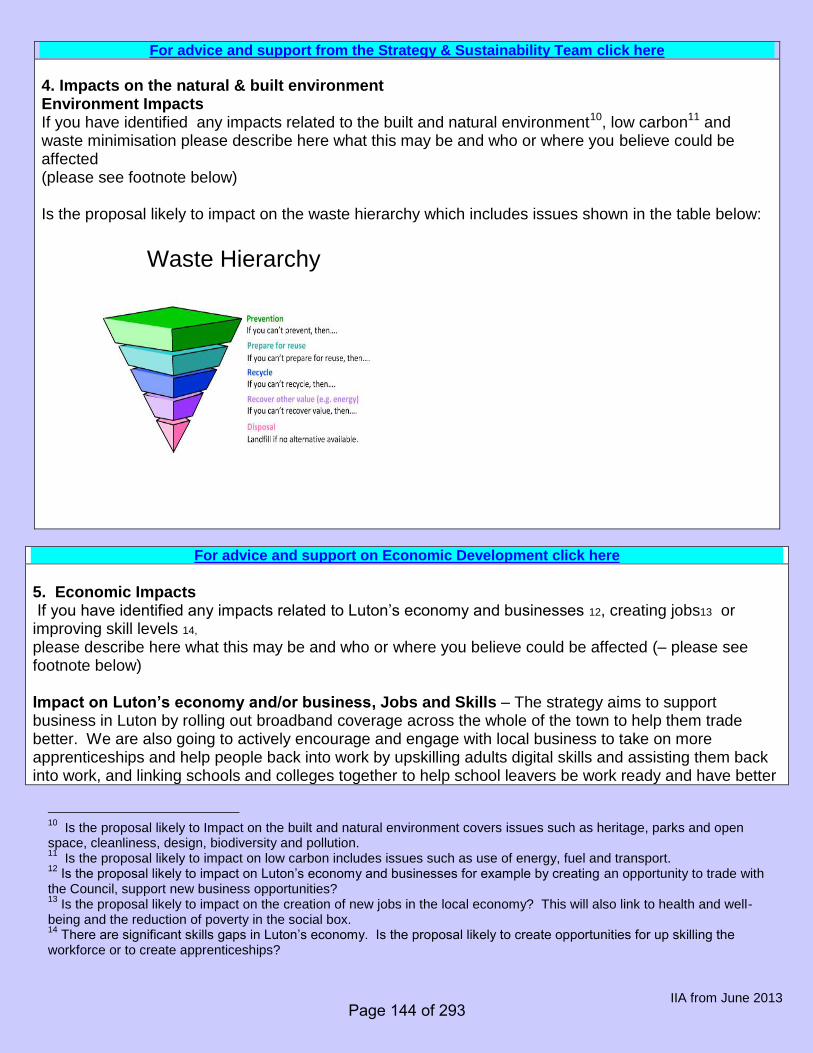
IIA from June 2013
For advice and support from the Strategy & Sustainability Team click here
4. Impacts on the natural & built environment Environment Impacts If you have identified any impacts related to the built and natural environment10, low carbon11 and waste minimisation please describe here what this may be and who or where you believe could be affected (please see footnote below) Is the proposal likely to impact on the waste hierarchy which includes issues shown in the table below:
For advice and support on Economic Development click here
5. Economic Impacts If you have identified any impacts related to Luton’s economy and businesses 12, creating jobs13 or improving skill levels 14, please describe here what this may be and who or where you believe could be affected (– please see footnote below) Impact on Luton’s economy and/or business, Jobs and Skills – The strategy aims to support business in Luton by rolling out broadband coverage across the whole of the town to help them trade better. We are also going to actively encourage and engage with local business to take on more apprenticeships and help people back into work by upskilling adults digital skills and assisting them back into work, and linking schools and colleges together to help school leavers be work ready and have better
10
Is the proposal likely to Impact on the built and natural environment covers issues such as heritage, parks and open space, cleanliness, design, biodiversity and pollution. 11
Is the proposal likely to impact on low carbon includes issues such as use of energy, fuel and transport. 12
Is the proposal likely to impact on Luton’s economy and businesses for example by creating an opportunity to trade with the Council, support new business opportunities? 13
Is the proposal likely to impact on the creation of new jobs in the local economy? This will also link to health and well-being and the reduction of poverty in the social box. 14
There are significant skills gaps in Luton’s economy. Is the proposal likely to create opportunities for up skilling the workforce or to create apprenticeships?
Waste Hierarchy
Page 144 of 293
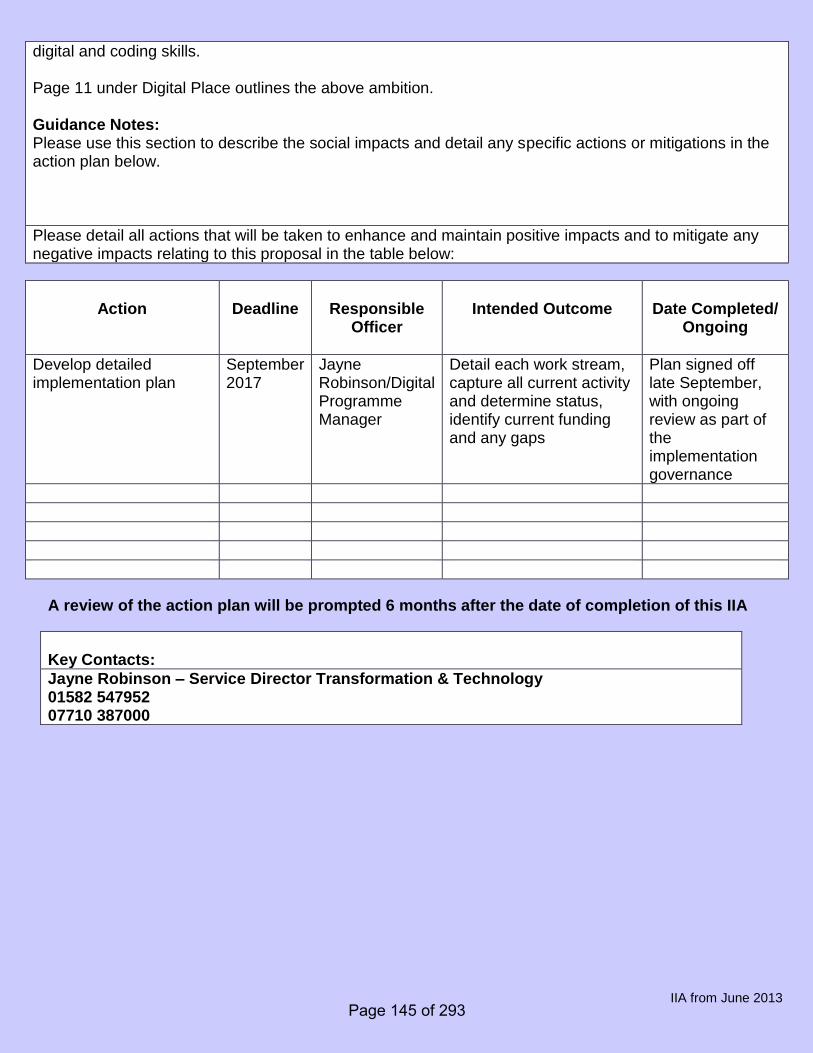
IIA from June 2013
digital and coding skills. Page 11 under Digital Place outlines the above ambition. Guidance Notes: Please use this section to describe the social impacts and detail any specific actions or mitigations in the action plan below.
Please detail all actions that will be taken to enhance and maintain positive impacts and to mitigate any negative impacts relating to this proposal in the table below:
Action
Deadline
Responsible
Officer
Intended Outcome
Date Completed/
Ongoing
Develop detailed implementation plan
September 2017
Jayne Robinson/Digital Programme Manager
Detail each work stream, capture all current activity and determine status, identify current funding and any gaps
Plan signed off late September, with ongoing review as part of the implementation governance
A review of the action plan will be prompted 6 months after the date of completion of this IIA
Key Contacts:
Jayne Robinson – Service Director Transformation & Technology 01582 547952 07710 387000
Page 145 of 293
IIA from June 2013
Next Steps
All Executive Reports, where relevant, must have an IIA attached
All report authors must complete the IIA section of Executive Reports (equalities, cohesion, inclusion, health, economic, business and environment)
All reports are to be forwarded to the Social Justice Unit, Public Health and Strategy & Sustainability Unit for sign off in time for Executive deadline
On the rare occasion that the Social Justice Unit are unable to sign off the report, e.g. recommendations are in breach of legislation, a statement will be submitted by Social Justice Unit Manager or Equality and Diversity Policy Manager
Completed and signed IIA’s will be published on the internet once the democratic process is complete
Corporate Plan http://intranet/SupportServices/Document%20library/Corporate%20plan%2011th%20July%202011.doc
Equality Charter http://intranet/SupportServices/socialjustice/Document%20library/Equality%20charter.pdf
Social Justice Framework http://www.luton.gov.uk/Community_and_living/Lists/LutonDocuments/PDF/Social%20Justice/Social%20Justice%20Framework%202012%20-2026.pdf
Family Poverty Strategy http://www.lutonforum.org/Forum/Documents/Family-Poverty-Strategy-Final-October2011_001.pdf
Joint Strategic Needs Assessment (JSNA) http://www.luton.gov.uk/Council_government_and_democracy/Lists/LutonDocuments/PDF/Consultation/Reports/Final%20JSNA%202011.pdf Community Involvement Strategy http://www.lutonforum.org/Forum/Documents/CISfinaljune2010.pdf
Page 146 of 293
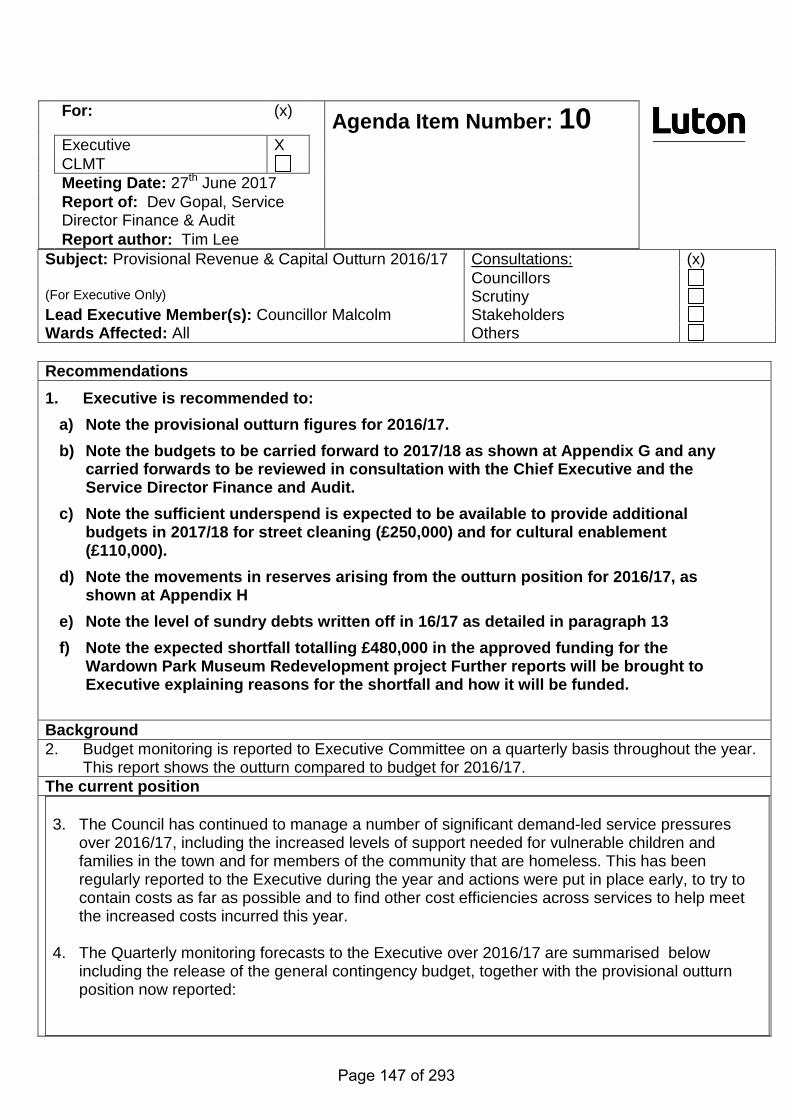
Subject: Provisional Revenue & Capital Outturn 2016/17 Consultations: (x) Councillors
(For Executive Only) Scrutiny Lead Executive Member(s): Councillor Malcolm Stakeholders Wards Affected: All Others Recommendations 1. Executive is recommended to:
a) Note the provisional outturn figures for 2016/17. b) Note the budgets to be carried forward to 2017/18 as shown at Appendix G and any
carried forwards to be reviewed in consultation with the Chief Executive and the Service Director Finance and Audit.
c) Note the sufficient underspend is expected to be available to provide additional budgets in 2017/18 for street cleaning (£250,000) and for cultural enablement (£110,000).
d) Note the movements in reserves arising from the outturn position for 2016/17, as shown at Appendix H
e) Note the level of sundry debts written off in 16/17 as detailed in paragraph 13 f) Note the expected shortfall totalling £480,000 in the approved funding for the
Wardown Park Museum Redevelopment project Further reports will be brought to Executive explaining reasons for the shortfall and how it will be funded.
Background 2. Budget monitoring is reported to Executive Committee on a quarterly basis throughout the year.
This report shows the outturn compared to budget for 2016/17. The current position 3. The Council has continued to manage a number of significant demand-led service pressures
over 2016/17, including the increased levels of support needed for vulnerable children and families in the town and for members of the community that are homeless. This has been regularly reported to the Executive during the year and actions were put in place early, to try to contain costs as far as possible and to find other cost efficiencies across services to help meet the increased costs incurred this year.
4. The Quarterly monitoring forecasts to the Executive over 2016/17 are summarised below including the release of the general contingency budget, together with the provisional outturn position now reported:
For: (x) Agenda Item Number: 10 Executive X CLMT Meeting Date: 27th June 2017 Report of: Dev Gopal, Service Director Finance & Audit
Report author: Tim Lee
Page 147 of 293
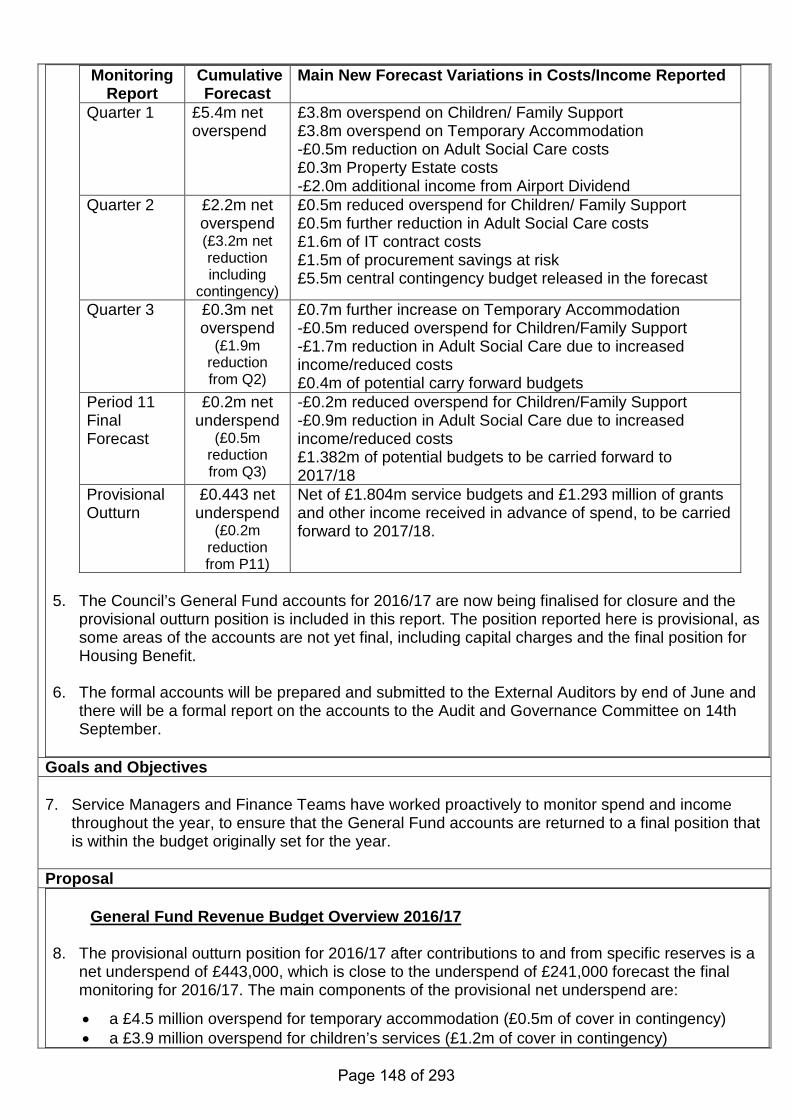
Monitoring
Report Cumulative
Forecast Main New Forecast Variations in Costs/Income Reported
Quarter 1 £5.4m net overspend
£3.8m overspend on Children/ Family Support £3.8m overspend on Temporary Accommodation -£0.5m reduction on Adult Social Care costs £0.3m Property Estate costs -£2.0m additional income from Airport Dividend
Quarter 2 £2.2m net overspend (£3.2m net reduction including
contingency)
£0.5m reduced overspend for Children/ Family Support £0.5m further reduction in Adult Social Care costs £1.6m of IT contract costs £1.5m of procurement savings at risk £5.5m central contingency budget released in the forecast
Quarter 3 £0.3m net overspend
(£1.9m reduction from Q2)
£0.7m further increase on Temporary Accommodation -£0.5m reduced overspend for Children/Family Support -£1.7m reduction in Adult Social Care due to increased income/reduced costs £0.4m of potential carry forward budgets
Period 11 Final Forecast
£0.2m net underspend
(£0.5m reduction from Q3)
-£0.2m reduced overspend for Children/Family Support -£0.9m reduction in Adult Social Care due to increased income/reduced costs £1.382m of potential budgets to be carried forward to 2017/18
Provisional Outturn
£0.443 net underspend
(£0.2m reduction from P11)
Net of £1.804m service budgets and £1.293 million of grants and other income received in advance of spend, to be carried forward to 2017/18.
5. The Council’s General Fund accounts for 2016/17 are now being finalised for closure and the
provisional outturn position is included in this report. The position reported here is provisional, as some areas of the accounts are not yet final, including capital charges and the final position for Housing Benefit.
6. The formal accounts will be prepared and submitted to the External Auditors by end of June and
there will be a formal report on the accounts to the Audit and Governance Committee on 14th September.
Goals and Objectives 7. Service Managers and Finance Teams have worked proactively to monitor spend and income
throughout the year, to ensure that the General Fund accounts are returned to a final position that is within the budget originally set for the year.
Proposal
General Fund Revenue Budget Overview 2016/17
8. The provisional outturn position for 2016/17 after contributions to and from specific reserves is a net underspend of £443,000, which is close to the underspend of £241,000 forecast the final monitoring for 2016/17. The main components of the provisional net underspend are:
• a £4.5 million overspend for temporary accommodation (£0.5m of cover in contingency) • a £3.9 million overspend for children’s services (£1.2m of cover in contingency)
Page 148 of 293
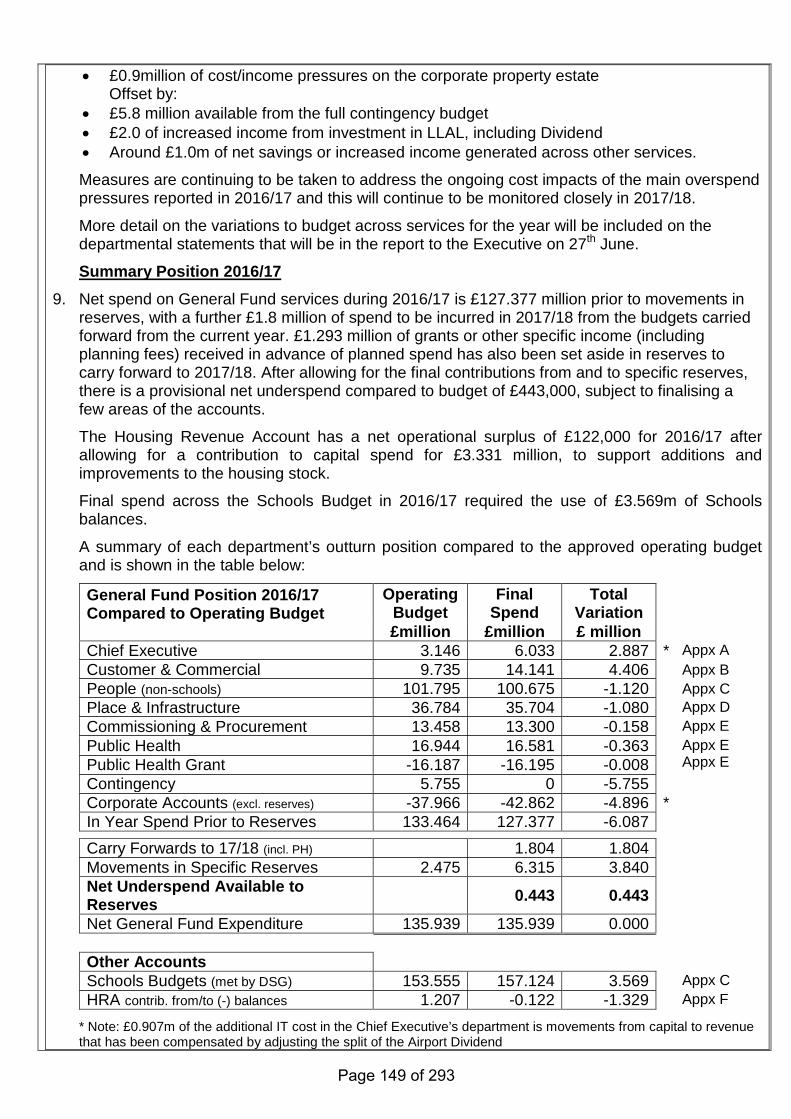
• £0.9million of cost/income pressures on the corporate property estate
Offset by: • £5.8 million available from the full contingency budget • £2.0 of increased income from investment in LLAL, including Dividend • Around £1.0m of net savings or increased income generated across other services.
Measures are continuing to be taken to address the ongoing cost impacts of the main overspend pressures reported in 2016/17 and this will continue to be monitored closely in 2017/18.
More detail on the variations to budget across services for the year will be included on the departmental statements that will be in the report to the Executive on 27th June.
Summary Position 2016/17
9. Net spend on General Fund services during 2016/17 is £127.377 million prior to movements in reserves, with a further £1.8 million of spend to be incurred in 2017/18 from the budgets carried forward from the current year. £1.293 million of grants or other specific income (including planning fees) received in advance of planned spend has also been set aside in reserves to carry forward to 2017/18. After allowing for the final contributions from and to specific reserves, there is a provisional net underspend compared to budget of £443,000, subject to finalising a few areas of the accounts.
The Housing Revenue Account has a net operational surplus of £122,000 for 2016/17 after allowing for a contribution to capital spend for £3.331 million, to support additions and improvements to the housing stock.
Final spend across the Schools Budget in 2016/17 required the use of £3.569m of Schools balances.
A summary of each department’s outturn position compared to the approved operating budget and is shown in the table below:
General Fund Position 2016/17 Compared to Operating Budget
Operating Budget
Final Spend
Total Variation
£million £million £ million Chief Executive 3.146 6.033 2.887 * Appx A Customer & Commercial 9.735 14.141 4.406 Appx B People (non-schools) 101.795 100.675 -1.120 Appx C Place & Infrastructure 36.784 35.704 -1.080 Appx D Commissioning & Procurement 13.458 13.300 -0.158 Appx E Public Health 16.944 16.581 -0.363 Appx E
Appx E Public Health Grant -16.187 -16.195 -0.008 Contingency 5.755 0 -5.755 Corporate Accounts (excl. reserves) -37.966 -42.862 -4.896 * In Year Spend Prior to Reserves 133.464 127.377 -6.087 Carry Forwards to 17/18 (incl. PH) 1.804 1.804 Movements in Specific Reserves 2.475 6.315 3.840 Net Underspend Available to Reserves 0.443 0.443
Net General Fund Expenditure 135.939 135.939 0.000 Other Accounts Schools Budgets (met by DSG) 153.555 157.124 3.569 Appx C HRA contrib. from/to (-) balances 1.207 -0.122 -1.329 Appx F
* Note: £0.907m of the additional IT cost in the Chief Executive’s department is movements from capital to revenue that has been compensated by adjusting the split of the Airport Dividend
Page 149 of 293
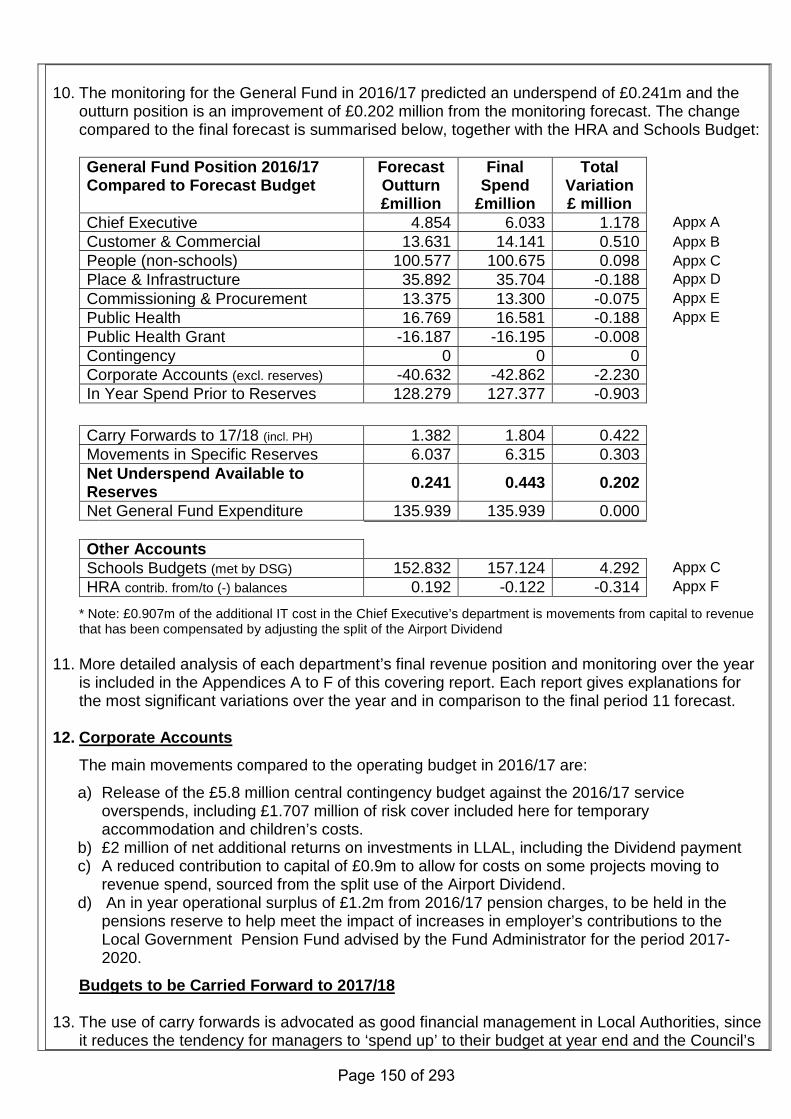
10. The monitoring for the General Fund in 2016/17 predicted an underspend of £0.241m and the outturn position is an improvement of £0.202 million from the monitoring forecast. The change compared to the final forecast is summarised below, together with the HRA and Schools Budget: General Fund Position 2016/17 Compared to Forecast Budget
Forecast Outturn
Final Spend
Total Variation
£million £million £ million Chief Executive 4.854 6.033 1.178 Appx A Customer & Commercial 13.631 14.141 0.510 Appx B People (non-schools) 100.577 100.675 0.098 Appx C Place & Infrastructure 35.892 35.704 -0.188 Appx D Commissioning & Procurement 13.375 13.300 -0.075 Appx E Public Health 16.769 16.581 -0.188 Appx E Public Health Grant -16.187 -16.195 -0.008 Contingency 0 0 0 Corporate Accounts (excl. reserves) -40.632 -42.862 -2.230 In Year Spend Prior to Reserves 128.279 127.377 -0.903
Carry Forwards to 17/18 (incl. PH) 1.382 1.804 0.422 Movements in Specific Reserves 6.037 6.315 0.303 Net Underspend Available to Reserves 0.241 0.443 0.202
Net General Fund Expenditure 135.939 135.939 0.000
Other Accounts Schools Budgets (met by DSG) 152.832 157.124 4.292 Appx C HRA contrib. from/to (-) balances 0.192 -0.122 -0.314 Appx F
* Note: £0.907m of the additional IT cost in the Chief Executive’s department is movements from capital to revenue that has been compensated by adjusting the split of the Airport Dividend
11. More detailed analysis of each department’s final revenue position and monitoring over the year is included in the Appendices A to F of this covering report. Each report gives explanations for the most significant variations over the year and in comparison to the final period 11 forecast.
12. Corporate Accounts
The main movements compared to the operating budget in 2016/17 are:
a) Release of the £5.8 million central contingency budget against the 2016/17 service overspends, including £1.707 million of risk cover included here for temporary accommodation and children’s costs.
b) £2 million of net additional returns on investments in LLAL, including the Dividend payment c) A reduced contribution to capital of £0.9m to allow for costs on some projects moving to
revenue spend, sourced from the split use of the Airport Dividend. d) An in year operational surplus of £1.2m from 2016/17 pension charges, to be held in the
pensions reserve to help meet the impact of increases in employer’s contributions to the Local Government Pension Fund advised by the Fund Administrator for the period 2017-2020.
Budgets to be Carried Forward to 2017/18
13. The use of carry forwards is advocated as good financial management in Local Authorities, since it reduces the tendency for managers to ‘spend up’ to their budget at year end and the Council’s
Page 150 of 293
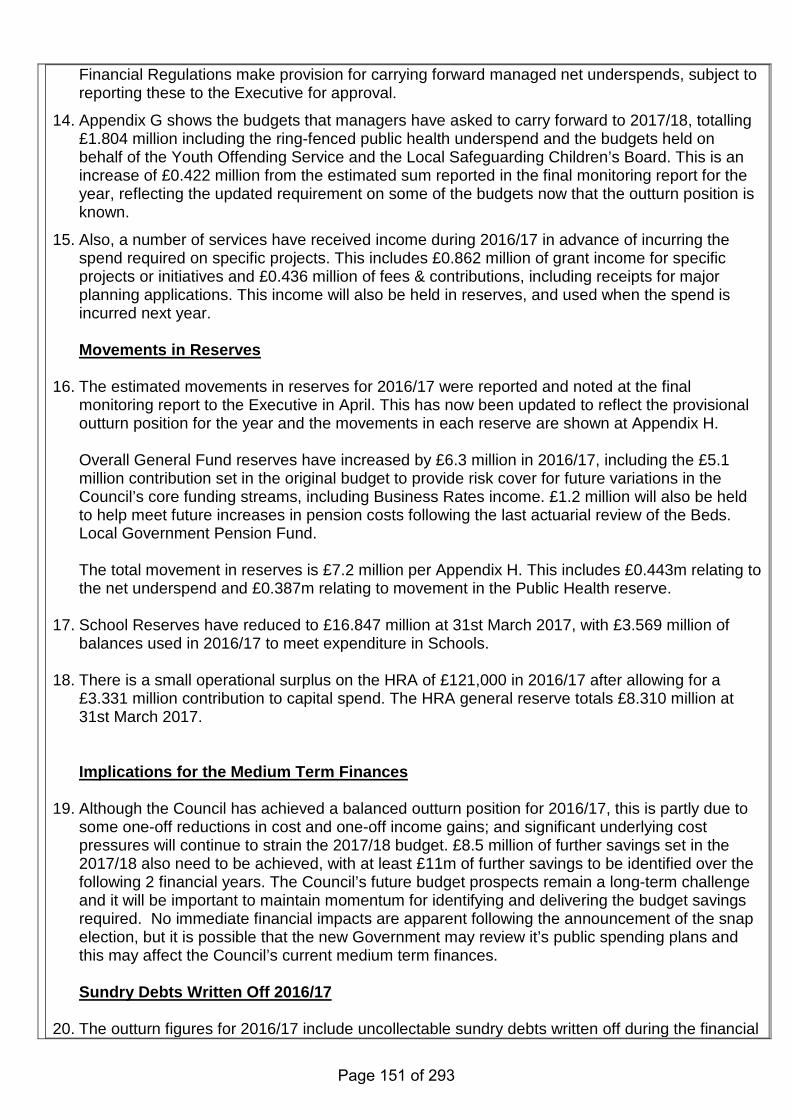
Financial Regulations make provision for carrying forward managed net underspends, subject to reporting these to the Executive for approval.
14. Appendix G shows the budgets that managers have asked to carry forward to 2017/18, totalling £1.804 million including the ring-fenced public health underspend and the budgets held on behalf of the Youth Offending Service and the Local Safeguarding Children’s Board. This is an increase of £0.422 million from the estimated sum reported in the final monitoring report for the year, reflecting the updated requirement on some of the budgets now that the outturn position is known.
15. Also, a number of services have received income during 2016/17 in advance of incurring the spend required on specific projects. This includes £0.862 million of grant income for specific projects or initiatives and £0.436 million of fees & contributions, including receipts for major planning applications. This income will also be held in reserves, and used when the spend is incurred next year.
Movements in Reserves
16. The estimated movements in reserves for 2016/17 were reported and noted at the final
monitoring report to the Executive in April. This has now been updated to reflect the provisional outturn position for the year and the movements in each reserve are shown at Appendix H.
Overall General Fund reserves have increased by £6.3 million in 2016/17, including the £5.1 million contribution set in the original budget to provide risk cover for future variations in the Council’s core funding streams, including Business Rates income. £1.2 million will also be held to help meet future increases in pension costs following the last actuarial review of the Beds. Local Government Pension Fund. The total movement in reserves is £7.2 million per Appendix H. This includes £0.443m relating to the net underspend and £0.387m relating to movement in the Public Health reserve.
17. School Reserves have reduced to £16.847 million at 31st March 2017, with £3.569 million of balances used in 2016/17 to meet expenditure in Schools.
18. There is a small operational surplus on the HRA of £121,000 in 2016/17 after allowing for a
£3.331 million contribution to capital spend. The HRA general reserve totals £8.310 million at 31st March 2017.
Implications for the Medium Term Finances
19. Although the Council has achieved a balanced outturn position for 2016/17, this is partly due to some one-off reductions in cost and one-off income gains; and significant underlying cost pressures will continue to strain the 2017/18 budget. £8.5 million of further savings set in the 2017/18 also need to be achieved, with at least £11m of further savings to be identified over the following 2 financial years. The Council’s future budget prospects remain a long-term challenge and it will be important to maintain momentum for identifying and delivering the budget savings required. No immediate financial impacts are apparent following the announcement of the snap election, but it is possible that the new Government may review it’s public spending plans and this may affect the Council’s current medium term finances.
Sundry Debts Written Off 2016/17
20. The outturn figures for 2016/17 include uncollectable sundry debts written off during the financial
Page 151 of 293
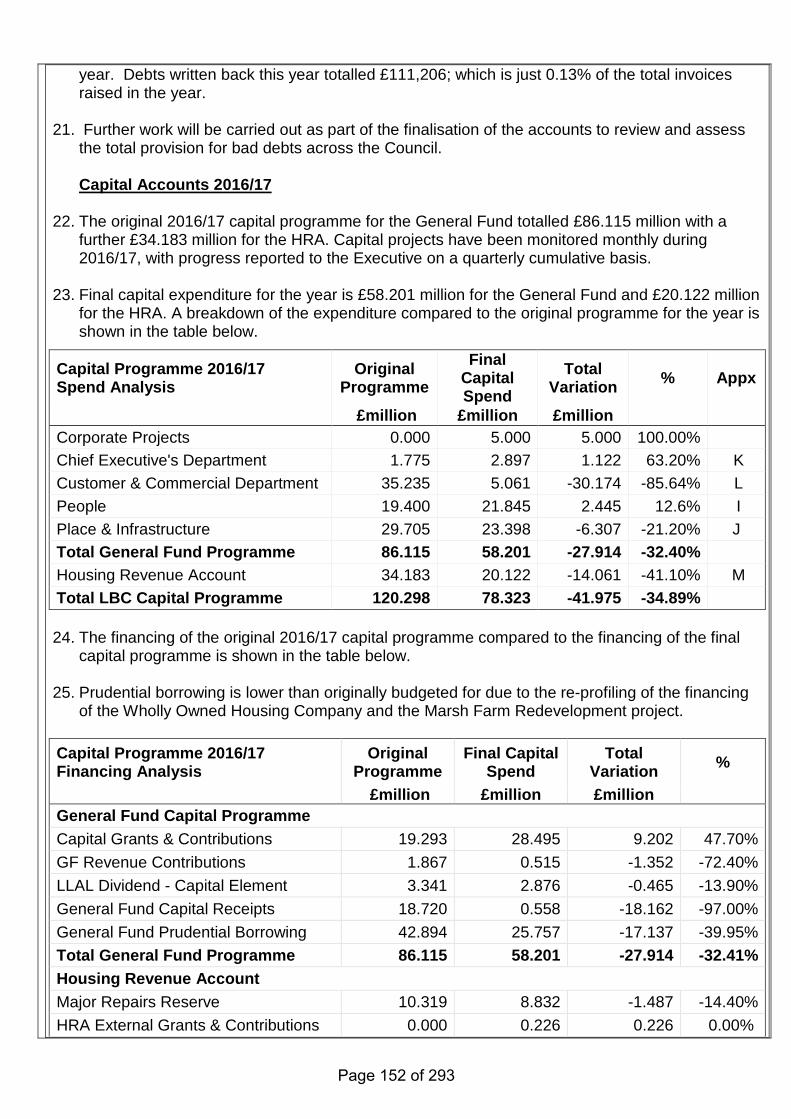
year. Debts written back this year totalled £111,206; which is just 0.13% of the total invoices raised in the year.
21. Further work will be carried out as part of the finalisation of the accounts to review and assess
the total provision for bad debts across the Council. Capital Accounts 2016/17
22. The original 2016/17 capital programme for the General Fund totalled £86.115 million with a further £34.183 million for the HRA. Capital projects have been monitored monthly during 2016/17, with progress reported to the Executive on a quarterly cumulative basis.
23. Final capital expenditure for the year is £58.201 million for the General Fund and £20.122 million for the HRA. A breakdown of the expenditure compared to the original programme for the year is shown in the table below.
Capital Programme 2016/17 Spend Analysis
Original Programme
Final Capital Spend
Total Variation % Appx
£million £million £million Corporate Projects 0.000 5.000 5.000 100.00% Chief Executive's Department 1.775 2.897 1.122 63.20% K Customer & Commercial Department 35.235 5.061 -30.174 -85.64% L People 19.400 21.845 2.445 12.6% I Place & Infrastructure 29.705 23.398 -6.307 -21.20% J Total General Fund Programme 86.115 58.201 -27.914 -32.40% Housing Revenue Account 34.183 20.122 -14.061 -41.10% M Total LBC Capital Programme 120.298 78.323 -41.975 -34.89%
24. The financing of the original 2016/17 capital programme compared to the financing of the final
capital programme is shown in the table below.
25. Prudential borrowing is lower than originally budgeted for due to the re-profiling of the financing of the Wholly Owned Housing Company and the Marsh Farm Redevelopment project.
Capital Programme 2016/17 Financing Analysis
Original Programme
Final Capital Spend
Total Variation %
£million £million £million General Fund Capital Programme Capital Grants & Contributions 19.293 28.495 9.202 47.70% GF Revenue Contributions 1.867 0.515 -1.352 -72.40% LLAL Dividend - Capital Element 3.341 2.876 -0.465 -13.90% General Fund Capital Receipts 18.720 0.558 -18.162 -97.00% General Fund Prudential Borrowing 42.894 25.757 -17.137 -39.95% Total General Fund Programme 86.115 58.201 -27.914 -32.41% Housing Revenue Account Major Repairs Reserve 10.319 8.832 -1.487 -14.40% HRA External Grants & Contributions 0.000 0.226 0.226 0.00%
Page 152 of 293
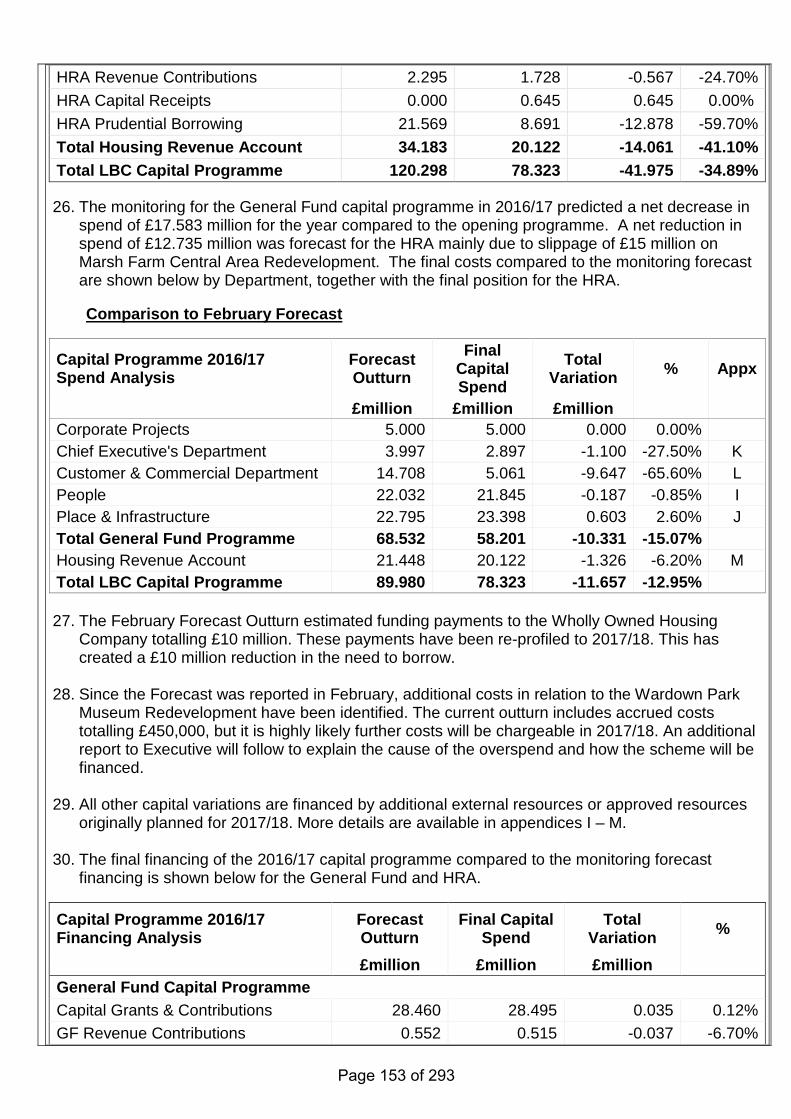
HRA Revenue Contributions 2.295 1.728 -0.567 -24.70% HRA Capital Receipts 0.000 0.645 0.645 0.00% HRA Prudential Borrowing 21.569 8.691 -12.878 -59.70% Total Housing Revenue Account 34.183 20.122 -14.061 -41.10% Total LBC Capital Programme 120.298 78.323 -41.975 -34.89%
26. The monitoring for the General Fund capital programme in 2016/17 predicted a net decrease in
spend of £17.583 million for the year compared to the opening programme. A net reduction in spend of £12.735 million was forecast for the HRA mainly due to slippage of £15 million on Marsh Farm Central Area Redevelopment. The final costs compared to the monitoring forecast are shown below by Department, together with the final position for the HRA.
Comparison to February Forecast
Capital Programme 2016/17 Spend Analysis
Forecast Outturn
Final Capital Spend
Total Variation % Appx
£million £million £million Corporate Projects 5.000 5.000 0.000 0.00% Chief Executive's Department 3.997 2.897 -1.100 -27.50% K Customer & Commercial Department 14.708 5.061 -9.647 -65.60% L People 22.032 21.845 -0.187 -0.85% I Place & Infrastructure 22.795 23.398 0.603 2.60% J Total General Fund Programme 68.532 58.201 -10.331 -15.07% Housing Revenue Account 21.448 20.122 -1.326 -6.20% M Total LBC Capital Programme 89.980 78.323 -11.657 -12.95% 27. The February Forecast Outturn estimated funding payments to the Wholly Owned Housing
Company totalling £10 million. These payments have been re-profiled to 2017/18. This has created a £10 million reduction in the need to borrow.
28. Since the Forecast was reported in February, additional costs in relation to the Wardown Park Museum Redevelopment have been identified. The current outturn includes accrued costs totalling £450,000, but it is highly likely further costs will be chargeable in 2017/18. An additional report to Executive will follow to explain the cause of the overspend and how the scheme will be financed.
29. All other capital variations are financed by additional external resources or approved resources originally planned for 2017/18. More details are available in appendices I – M.
30. The final financing of the 2016/17 capital programme compared to the monitoring forecast financing is shown below for the General Fund and HRA.
Capital Programme 2016/17 Financing Analysis
Forecast Outturn
Final Capital Spend
Total Variation %
£million £million £million General Fund Capital Programme Capital Grants & Contributions 28.460 28.495 0.035 0.12% GF Revenue Contributions 0.552 0.515 -0.037 -6.70%
Page 153 of 293
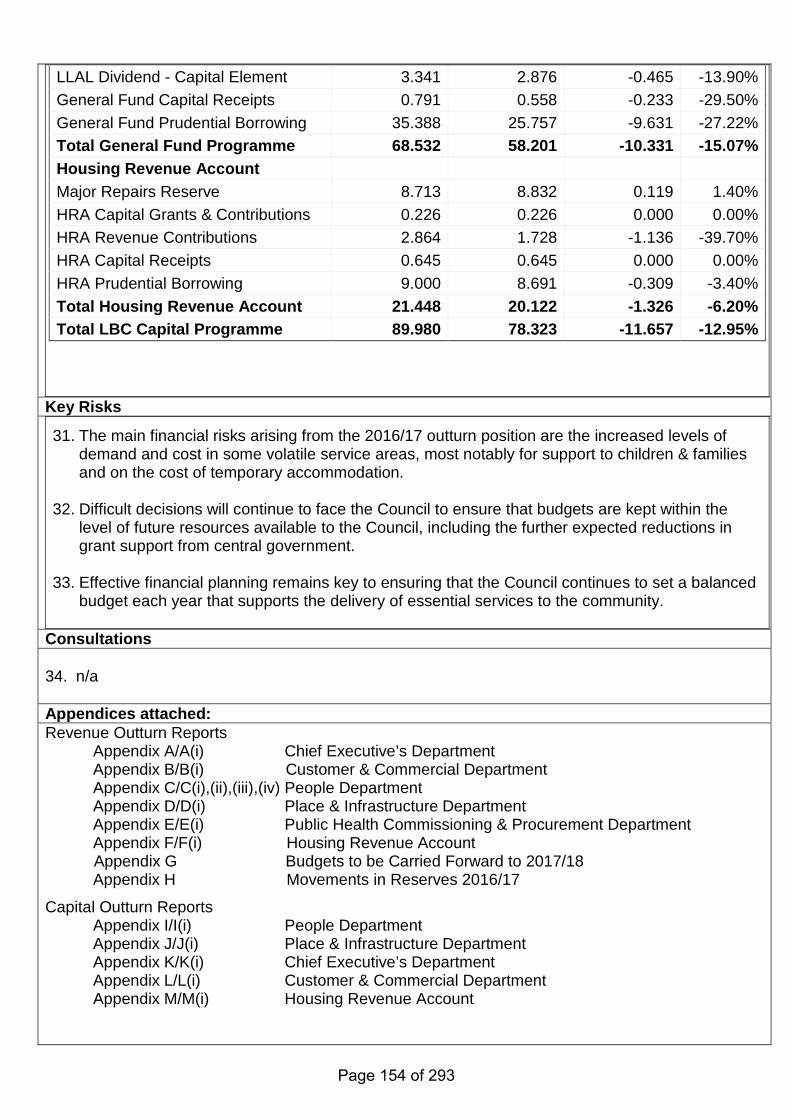
LLAL Dividend - Capital Element 3.341 2.876 -0.465 -13.90% General Fund Capital Receipts 0.791 0.558 -0.233 -29.50% General Fund Prudential Borrowing 35.388 25.757 -9.631 -27.22% Total General Fund Programme 68.532 58.201 -10.331 -15.07% Housing Revenue Account Major Repairs Reserve 8.713 8.832 0.119 1.40% HRA Capital Grants & Contributions 0.226 0.226 0.000 0.00% HRA Revenue Contributions 2.864 1.728 -1.136 -39.70% HRA Capital Receipts 0.645 0.645 0.000 0.00% HRA Prudential Borrowing 9.000 8.691 -0.309 -3.40% Total Housing Revenue Account 21.448 20.122 -1.326 -6.20% Total LBC Capital Programme 89.980 78.323 -11.657 -12.95%
Key Risks
31. The main financial risks arising from the 2016/17 outturn position are the increased levels of demand and cost in some volatile service areas, most notably for support to children & families and on the cost of temporary accommodation.
32. Difficult decisions will continue to face the Council to ensure that budgets are kept within the level of future resources available to the Council, including the further expected reductions in grant support from central government.
33. Effective financial planning remains key to ensuring that the Council continues to set a balanced budget each year that supports the delivery of essential services to the community.
Consultations 34. n/a Appendices attached: Revenue Outturn Reports
Appendix A/A(i) Chief Executive’s Department Appendix B/B(i) Customer & Commercial Department Appendix C/C(i),(ii),(iii),(iv) People Department Appendix D/D(i) Place & Infrastructure Department Appendix E/E(i) Public Health Commissioning & Procurement Department Appendix F/F(i) Housing Revenue Account
Appendix G Budgets to be Carried Forward to 2017/18 Appendix H Movements in Reserves 2016/17
Capital Outturn Reports Appendix I/I(i) People Department Appendix J/J(i) Place & Infrastructure Department Appendix K/K(i) Chief Executive’s Department Appendix L/L(i) Customer & Commercial Department Appendix M/M(i) Housing Revenue Account
Page 154 of 293
Background Papers: N/A IMPLICATIONS For Executive reports For CLMT Reports
• grey boxes must be completed Clearance is not • all statements must be cleared by an appropriate officer required
Clearance – agreed by: Legal There are no legal implications to the report Zac Sargusingh Solicitor
on 15th June 2017 Finance The financial implications are included in the main
body of the report Darren Lambert Finance Business Partner on 14th June 2017
Integrated Impact Assessment (IIA) – Key Points Equalities/ Cohesion/Inclusion (Social Justice)
This report has no direct equality outcomes. Agreed Sandra Legate Equality and Inclusion Manager 13th June 2017
Environment
There are no direct environmental implications from this report.
Strategy & Sustainability, Kat Wysocka, 13 Jun 2017
Health
No health implications at this stage Stephen Gunther 14/6/17
Community Safety
Staffing Other
FOR EXECUTIVE ONLY - Options: a) To reject the recommendations b) To request further information
Page 155 of 293
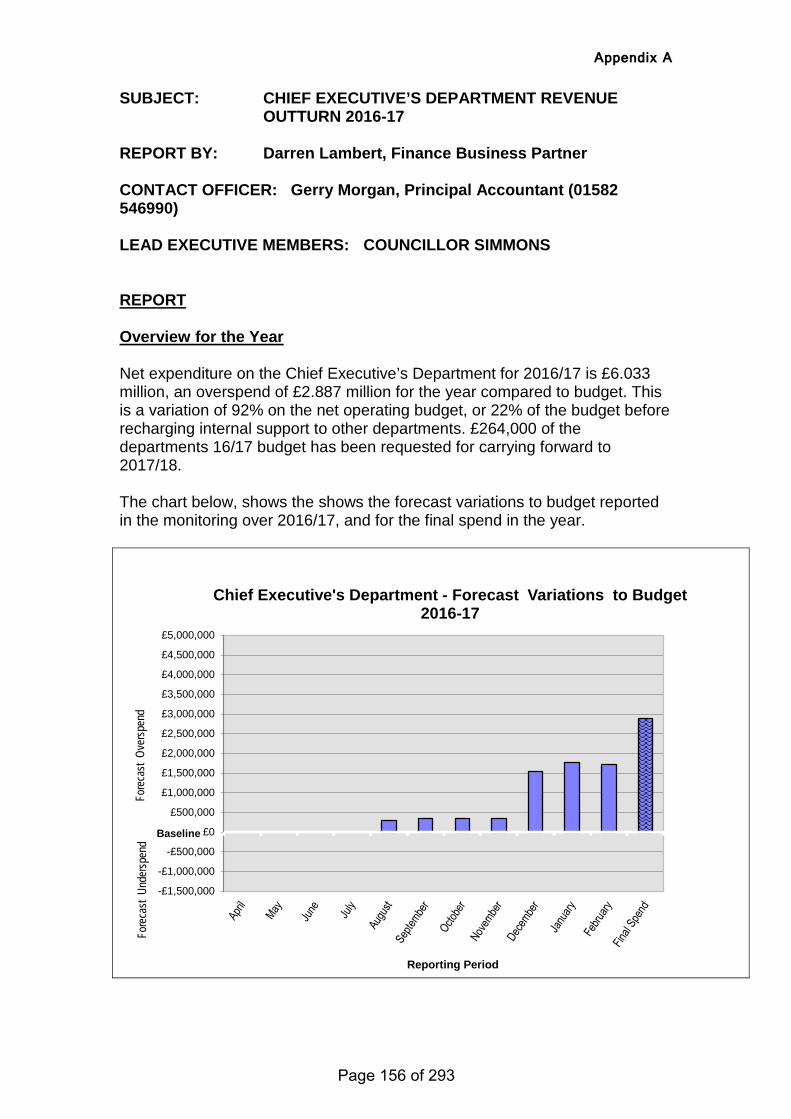
Appendix A
SUBJECT: CHIEF EXECUTIVE’S DEPARTMENT REVENUE OUTTURN 2016-17
REPORT BY: Darren Lambert, Finance Business Partner CONTACT OFFICER: Gerry Morgan, Principal Accountant (01582 546990) LEAD EXECUTIVE MEMBERS: COUNCILLOR SIMMONS REPORT Overview for the Year Net expenditure on the Chief Executive’s Department for 2016/17 is £6.033 million, an overspend of £2.887 million for the year compared to budget. This is a variation of 92% on the net operating budget, or 22% of the budget before recharging internal support to other departments. £264,000 of the departments 16/17 budget has been requested for carrying forward to 2017/18. The chart below, shows the shows the forecast variations to budget reported in the monitoring over 2016/17, and for the final spend in the year.
-£1,500,000
-£1,000,000
-£500,000
£0
£500,000
£1,000,000
£1,500,000
£2,000,000
£2,500,000
£3,000,000
£3,500,000
£4,000,000
£4,500,000
£5,000,000
Reporting Period
Chief Executive's Department - Forecast Variations to Budget 2016-17
Fore
cast
Ove
rspen
d Fo
reca
st U
nder
spen
d
Baseline
Page 156 of 293
Appendix A
Forecast Movements Reported in the Monitoring The cumulative position forecast for the department at the final Period 11 monitoring exercise was a predicted overspend of around £1.708 million for the year due to:
• Transformation costs for the renegotiated ICT contract - £1,489,000 • Running costs of 5 community centres transferred from the Cultural
Services Trust - £176,000 • One-off costs for Agilisys software - £183,000 • Zero Based Budgeting team costs - £86,000 • Underspend on Business Improvement Team employee costs –
(£112,000) • Underspend on the Registration of Electors grant – (£86,000)
Significant changes at Outturn compared to the period 11 forecast The department’s final spend compared to the period 11 forecast is attached at Appendix A(i), analysed at service level for each Service Director. Compared to the monitoring forecast, the overspend has increased by £1.178 million for the year. The main reason for this variation was:
• Additional ICT contract costs - £1,157,000 (£814,000 of these costs are due to items previously capitalised that are now revenue costs. The increase will be compensated by switching additional Dividend from capital to revenue).
Page 157 of 293
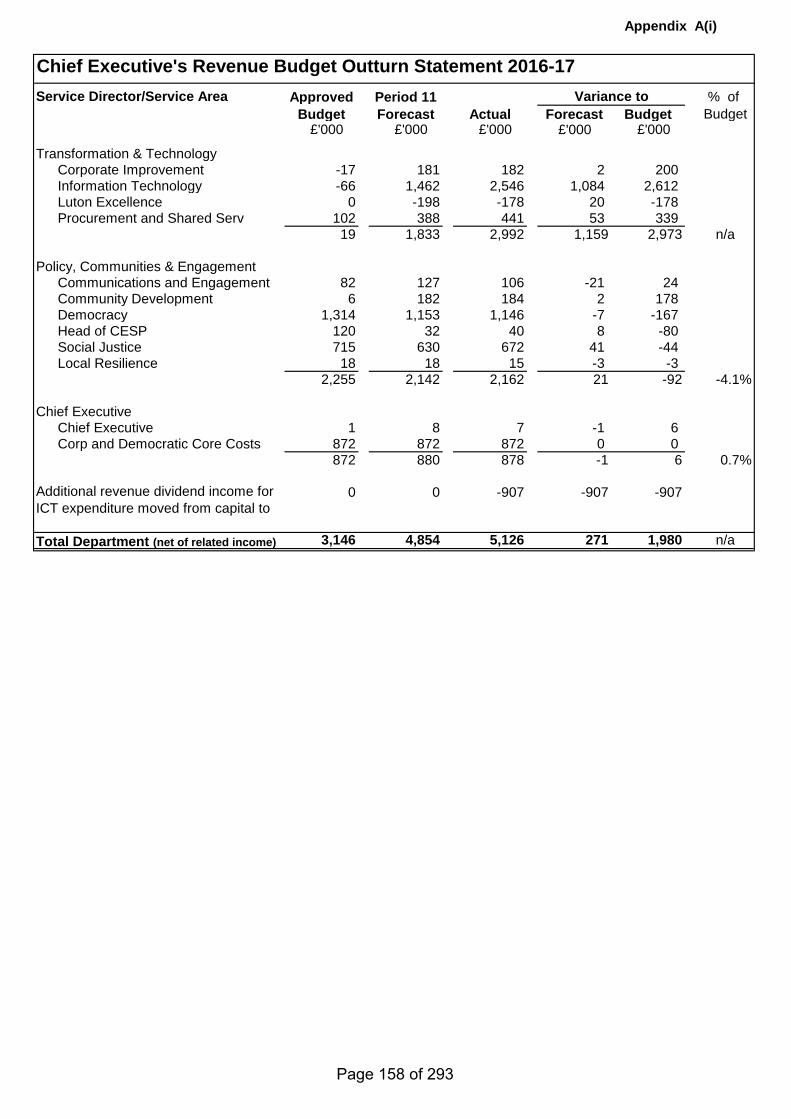
Appendix A(i)
Chief Executive's Revenue Budget Outturn Statement 2016-17Approved Period 11 % of
Budget Forecast Actual Forecast Budget Budget£'000
Transformation & TechnologyCorporate Improvement -17 181 182 2 200Information Technology -66 1,462 2,546 1,084 2,612Luton Excellence 0 -198 -178 20 -178 Procurement and Shared Serv 102 388 441 53 339
19 1,833 2,992 1,159 2,973 n/a
Policy, Communities & EngagementCommunications and Engagement 82 127 106 -21 24Community Development 6 182 184 2 178Democracy 1,314 1,153 1,146 -7 -167 Head of CESP 120 32 40 8 -80 Social Justice 715 630 672 41 -44 Local Resilience 18 18 15 -3 -3
2,255 2,142 2,162 21 -92 -4.1%
Chief ExecutiveChief Executive 1 8 7 -1 6Corp and Democratic Core Costs 872 872 872 0 0
872 880 878 -1 6 0.7%
0 0 -907 -907 -907
Total Department (net of related income) 3,146 4,854 5,126 271 1,980 n/a
Additional revenue dividend income for ICT expenditure moved from capital to
£'000 £'000
Service Director/Service Area Variance to
£'000 £'000
Page 158 of 293
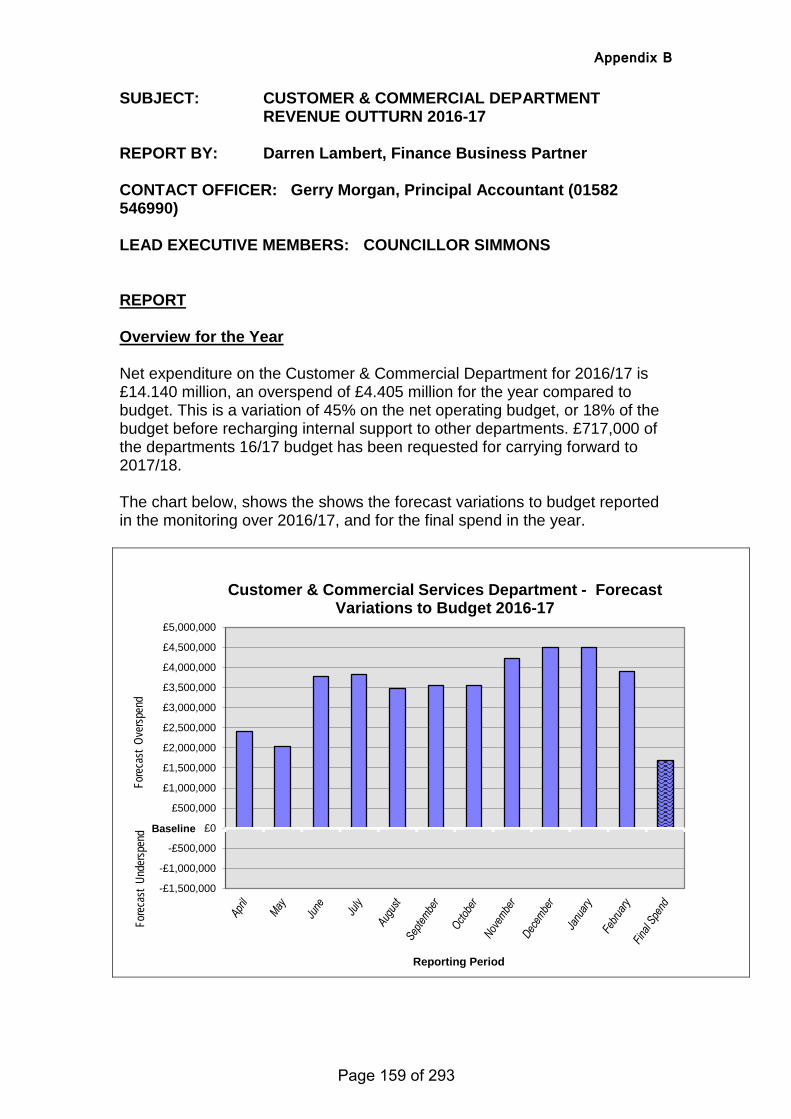
Appendix B
SUBJECT: CUSTOMER & COMMERCIAL DEPARTMENT REVENUE OUTTURN 2016-17
REPORT BY: Darren Lambert, Finance Business Partner CONTACT OFFICER: Gerry Morgan, Principal Accountant (01582 546990) LEAD EXECUTIVE MEMBERS: COUNCILLOR SIMMONS REPORT Overview for the Year Net expenditure on the Customer & Commercial Department for 2016/17 is £14.140 million, an overspend of £4.405 million for the year compared to budget. This is a variation of 45% on the net operating budget, or 18% of the budget before recharging internal support to other departments. £717,000 of the departments 16/17 budget has been requested for carrying forward to 2017/18. The chart below, shows the shows the forecast variations to budget reported in the monitoring over 2016/17, and for the final spend in the year.
-£1,500,000
-£1,000,000
-£500,000
£0
£500,000
£1,000,000
£1,500,000
£2,000,000
£2,500,000
£3,000,000
£3,500,000
£4,000,000
£4,500,000
£5,000,000
Reporting Period
Customer & Commercial Services Department - Forecast Variations to Budget 2016-17
Fore
cast
Ove
rspen
d Fo
reca
st U
nder
spen
d Baseline
Page 159 of 293
Appendix B
Forecast Movements Reported in the Monitoring The cumulative position forecast for the department at the final Period 11 monitoring exercise was a predicted overspend of around £3.896 million for the year due to: Overspend Pressures:
• Homelessness and Temporary Accommodation - £4,639,000 • Financial Assessments team costs to clear backlog of work - £323,000 • Billing & Recovery for increased collection rates and debt recovery -
£200,000 Underspends/Savings/Additional Income
• Building & Technical Services trading income – (£100,000) • HR Services employee underspends due to vacancies – (£165,000) • Increased commission from the Guidant contract – (£105,000) • Homelessness Trailblazer grant (transferred to reserves) – (£150,000) • Council Tax Hardship Scheme budget not fully utilised – (£357,000) • People in Crisis grant not fully utilised – (£191,000)
Significant changes at Outturn compared to the period 11 forecast The department’s final spend compared to the period 11 forecast is attached at Appendix A(i), analysed at service level for each Service Director. Compared to the monitoring forecast, the overspend has increased by £0.509 million. This increase was due to:
• Additional Homelessness Temporary Accommodation bad debt provision - £500,000
Page 160 of 293
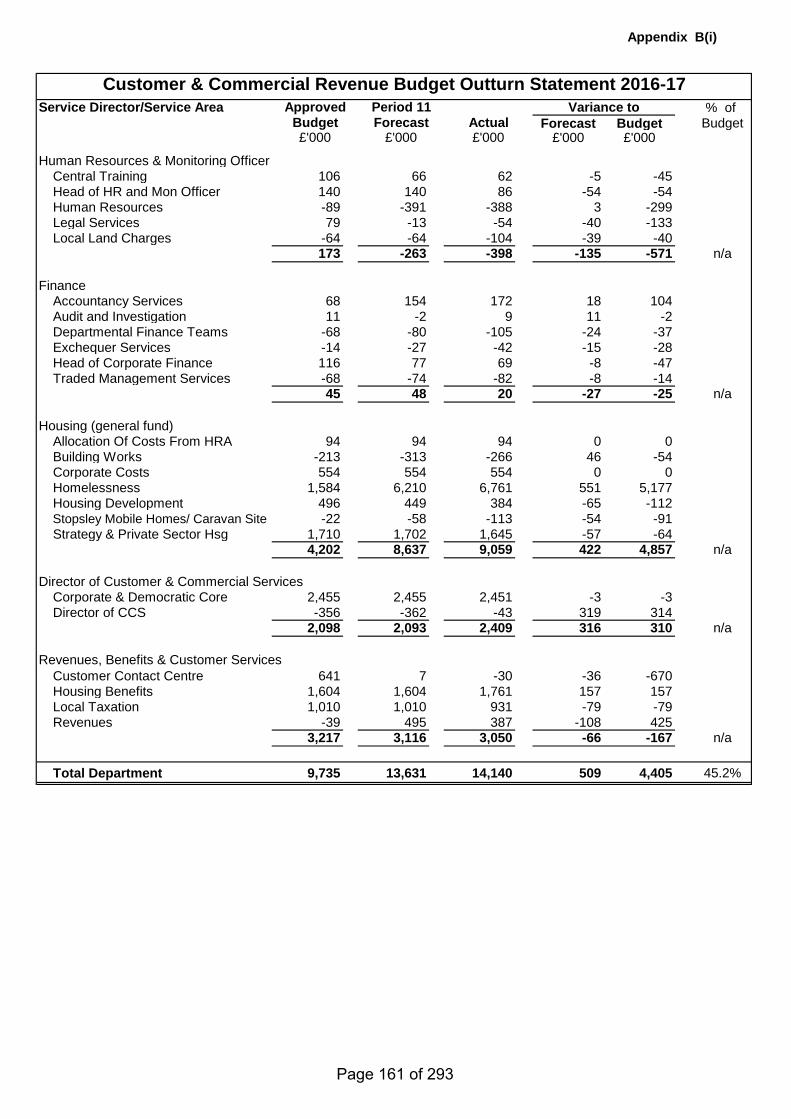
Appendix B(i)
% of Forecast Budget Budget
£'000 £'000
Human Resources & Monitoring OfficerCentral Training 106 66 62 -5 -45Head of HR and Mon Officer 140 140 86 -54 -54Human Resources -89 -391 -388 3 -299Legal Services 79 -13 -54 -40 -133Local Land Charges -64 -64 -104 -39 -40
173 -263 -398 -135 -571 n/a
FinanceAccountancy Services 68 154 172 18 104Audit and Investigation 11 -2 9 11 -2Departmental Finance Teams -68 -80 -105 -24 -37Exchequer Services -14 -27 -42 -15 -28Head of Corporate Finance 116 77 69 -8 -47Traded Management Services -68 -74 -82 -8 -14
45 48 20 -27 -25 n/a
Housing (general fund)Allocation Of Costs From HRA 94 94 94 0 0Building Works -213 -313 -266 46 -54Corporate Costs 554 554 554 0 0Homelessness 1,584 6,210 6,761 551 5,177Housing Development 496 449 384 -65 -112Stopsley Mobile Homes/ Caravan Site -22 -58 -113 -54 -91Strategy & Private Sector Hsg 1,710 1,702 1,645 -57 -64
4,202 8,637 9,059 422 4,857 n/a
Director of Customer & Commercial ServicesCorporate & Democratic Core 2,455 2,455 2,451 -3 -3Director of CCS -356 -362 -43 319 314
2,098 2,093 2,409 316 310 n/a
Revenues, Benefits & Customer ServicesCustomer Contact Centre 641 7 -30 -36 -670Housing Benefits 1,604 1,604 1,761 157 157Local Taxation 1,010 1,010 931 -79 -79Revenues -39 495 387 -108 425
3,217 3,116 3,050 -66 -167 n/a
Total Department 9,735 13,631 14,140 509 4,405 45.2%
Customer & Commercial Revenue Budget Outturn Statement 2016-17
£'000
Approved
£'000Budget Forecast Actual
Variance toService Director/Service Area Period 11
£'000
Page 161 of 293
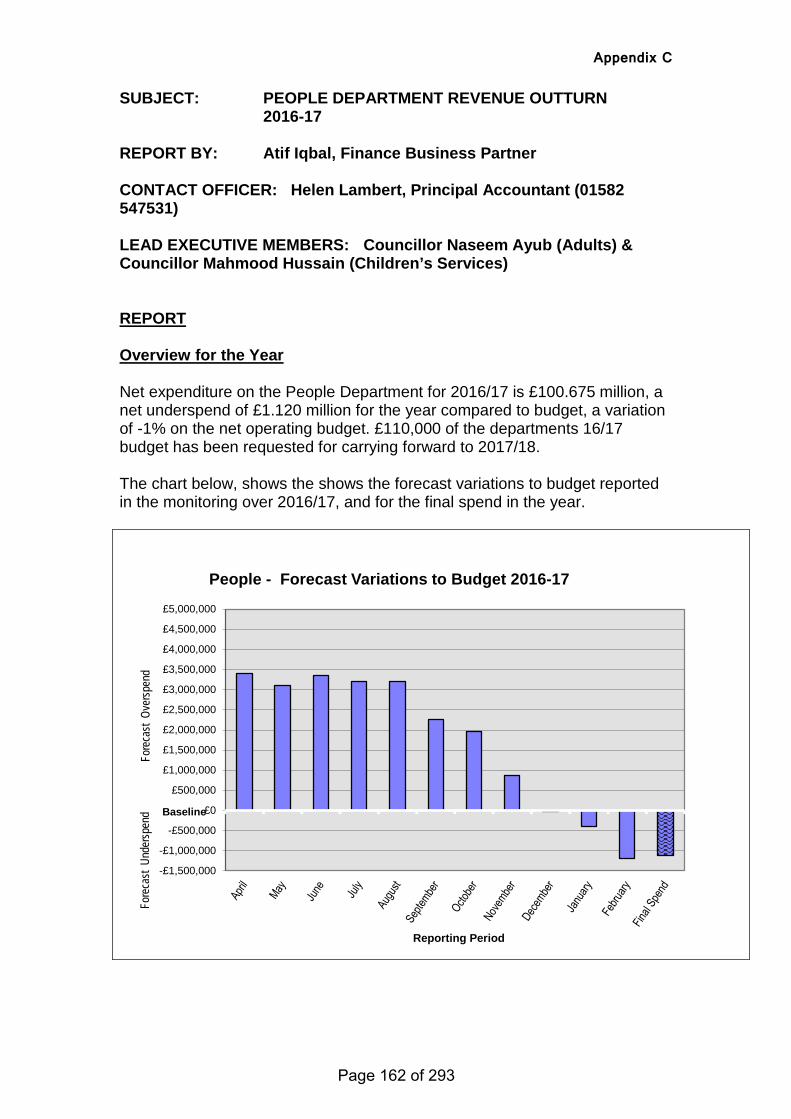
Appendix C
SUBJECT: PEOPLE DEPARTMENT REVENUE OUTTURN 2016-17
REPORT BY: Atif Iqbal, Finance Business Partner CONTACT OFFICER: Helen Lambert, Principal Accountant (01582 547531) LEAD EXECUTIVE MEMBERS: Councillor Naseem Ayub (Adults) & Councillor Mahmood Hussain (Children’s Services) REPORT Overview for the Year Net expenditure on the People Department for 2016/17 is £100.675 million, a net underspend of £1.120 million for the year compared to budget, a variation of -1% on the net operating budget. £110,000 of the departments 16/17 budget has been requested for carrying forward to 2017/18. The chart below, shows the shows the forecast variations to budget reported in the monitoring over 2016/17, and for the final spend in the year.
-£1,500,000
-£1,000,000
-£500,000
£0
£500,000
£1,000,000
£1,500,000
£2,000,000
£2,500,000
£3,000,000
£3,500,000
£4,000,000
£4,500,000
£5,000,000
Reporting Period
People - Forecast Variations to Budget 2016-17
Fore
cast
Ove
rspen
d Fo
reca
st U
nder
spen
d Baseline
Page 162 of 293
Appendix C
Forecast Movements Reported in the Monitoring The cumulative position forecast for the department at the final Period 11 monitoring exercise was a predicted under spend of around £1.181 million for the year. The main projected overspends were:
• £284,000 on Children’s Social Work Agency staff due to growing demand on the service
• £2,474,000 on Looked After Children Placements due to increased numbers and complexity of need of children placed in residential care
• £270,000 from the reduction in Education Services Grant due to schools converting to academies
• £195,000 on SEN Transport due to increased volumes of children requiring specialist transport
• £152,000 increased legal costs and court fees in respect of care proceedings
The main projected underspends were:
• £284,000 reduced expenditure on Section 17 payments due to fewer families needing emergency support.
• £153,000 Children’s Youth Offending pooled budget as the contingency was not fully required
• £400,000 on staffing within Extra Care and Re-ablement due to staff vacancies
• £360,000 staff vacancies pending OCA across Children’s Centres • £160,000 on Supported Living staffing costs • £972,000 within Adults purchased care primarily from recovery of
money within direct payment holding accounts • £529,000 in purchased care for people with learning Disabilities due to
delays in placing people following discharge from health facilities (Transforming Care)
• £200,000 reduced spend on agency staff within Care Management following successful recruitment of social workers to permanent positions
• £298,000 provision for ASC bad debt not required • £249,000 ASC government grants carried forward released • £791,000 across older persons day services due to a restructure
coupled with contingency funding for one-off revenue costs associated with the new learning disability day and respite service not required
• £348,000 various minor variations across the department as a whole Significant changes at Outturn compared to the period 11 forecast The department’s final spend compared to the period 11 forecast is attached at Appendix A(i), analysed at service level for each Service Director. Compared to the monitoring forecast, the under spend has reduced by £0.098 million for the year.
Page 163 of 293

Appendix C
Significant over spend variations since the period 11 forecast were:
• £666,000 of procurement savings not achieved • £73,000 further spend on SEN transport • £76,000 increased spend on Special Guardianship Orders and Section
17 payments • £73,000 increased spend on Looked After Children placements and
Staffing
Significant under spend variations since the period 11 forecast were: • £217,000 additional income from Health for Mental Health and Physical
Disability placements • £275,000 under spend in respect of grant carried forward not utilised • £70,000 reduced expenditure on older persons residential and nursing
placements SCHOOLS BUDGET REPORT DEDICATED SCHOOLS GRANT £153.399 million of Dedicated Schools Grant (DSG) was received for 2016/17, supplemented by £0.125 million Early Years adjustment relating to 2015/16 and £1.667 million of unspent grant brought forward from 2015/16. The final position for the year is an underspend of £1.123 million. This consists of:
Budget Outturn Variation £’000 £’000 £’000 Central School Budgets 16/17 22,105 20,882 -1,123 Individual Schools Budget 16/17 131,450 134,474 3,024 16/17 DSG 153,555 155,456 1,901 Use of 15/16 DSG Underspend 1,667 Net Movement in Balances 3,568
The gross underspend for Central expenditure in 2016/17 is £1.123m, representing 5% of the central budget. The main variations for the year were:
• £1,284,617 under spend for the Early Years Block - primarily relating to the in year adjustments clawback made for spring and autumn terms for early years pupils. This area has proved extremely difficult to budget accurately - there have been overspends in previous years.
• £533,428 over spend for the High Needs Block – primarily
relating to the Top Up funding where there has been a requirement for additional placements during the year.
Page 164 of 293
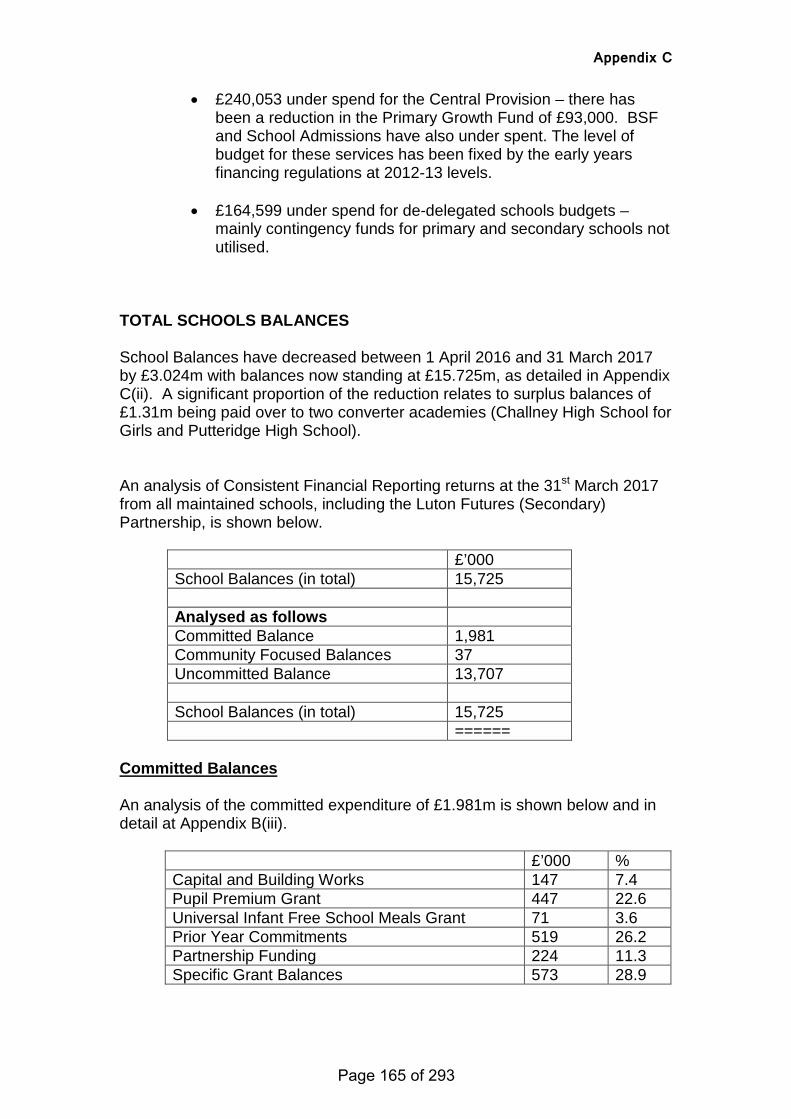
Appendix C
• £240,053 under spend for the Central Provision – there has been a reduction in the Primary Growth Fund of £93,000. BSF and School Admissions have also under spent. The level of budget for these services has been fixed by the early years financing regulations at 2012-13 levels.
• £164,599 under spend for de-delegated schools budgets –
mainly contingency funds for primary and secondary schools not utilised.
TOTAL SCHOOLS BALANCES School Balances have decreased between 1 April 2016 and 31 March 2017 by £3.024m with balances now standing at £15.725m, as detailed in Appendix C(ii). A significant proportion of the reduction relates to surplus balances of £1.31m being paid over to two converter academies (Challney High School for Girls and Putteridge High School). An analysis of Consistent Financial Reporting returns at the 31st March 2017 from all maintained schools, including the Luton Futures (Secondary) Partnership, is shown below.
£’000 School Balances (in total) 15,725 Analysed as follows Committed Balance 1,981 Community Focused Balances 37 Uncommitted Balance 13,707 School Balances (in total) 15,725 ======
Committed Balances An analysis of the committed expenditure of £1.981m is shown below and in detail at Appendix B(iii).
£’000 % Capital and Building Works 147 7.4 Pupil Premium Grant 447 22.6 Universal Infant Free School Meals Grant 71 3.6 Prior Year Commitments 519 26.2 Partnership Funding 224 11.3 Specific Grant Balances 573 28.9
Page 165 of 293

Appendix C
School financial advisers will be engaging with schools to ensure that the sums identified as being committed are correctly assigned and are being spent as intended. Uncommitted Balances The level of uncommitted balances stands at £13.707m. The Schools Forum has approved the removal of the balances clawback mechanism in the light of government guidance and the ever tighter financial climate for schools, pending the implementation of the national funding formula. This decision will be reviewed in two years’ time. Schools in Deficit Lealands High school has exceeded the target deficit of £391k agreed in its licensed deficit plan by £6k. Local Authority officers are working with the school to ensure that the budget is brought back into balance, as agreed in its recovery plan, by 31 March 2019.
Page 166 of 293
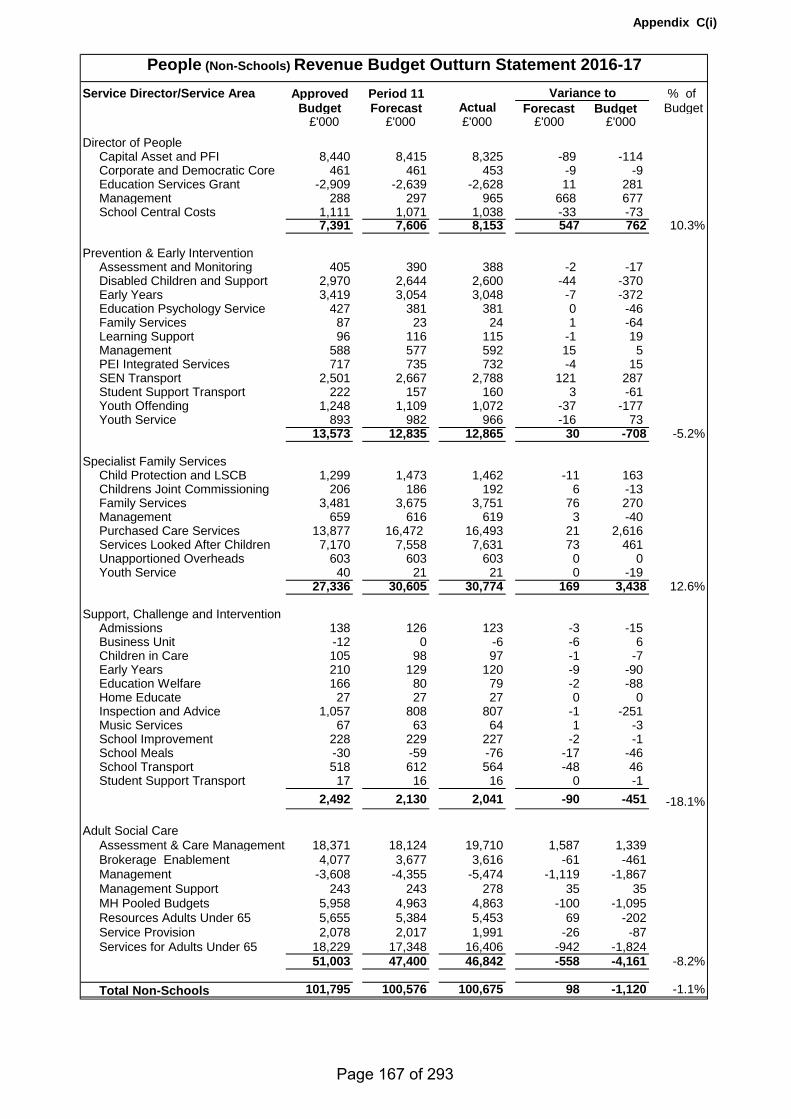
Appendix C(i)
Approved Period 11 % of Budget Forecast Forecast Budget Budget
£'000
Director of PeopleCapital Asset and PFI 8,440 8,415 8,325 -89 -114 Corporate and Democratic Core 461 461 453 -9 -9 Education Services Grant -2,909 -2,639 -2,628 11 281Management 288 297 965 668 677School Central Costs 1,111 1,071 1,038 -33 -73
7,391 7,606 8,153 547 762 10.3%
Prevention & Early InterventionAssessment and Monitoring 405 390 388 -2 -17 Disabled Children and Support 2,970 2,644 2,600 -44 -370 Early Years 3,419 3,054 3,048 -7 -372 Education Psychology Service 427 381 381 0 -46 Family Services 87 23 24 1 -64 Learning Support 96 116 115 -1 19Management 588 577 592 15 5PEI Integrated Services 717 735 732 -4 15SEN Transport 2,501 2,667 2,788 121 287Student Support Transport 222 157 160 3 -61 Youth Offending 1,248 1,109 1,072 -37 -177 Youth Service 893 982 966 -16 73
13,573 12,835 12,865 30 -708 -5.2%
Specialist Family ServicesChild Protection and LSCB 1,299 1,473 1,462 -11 163Childrens Joint Commissioning 206 186 192 6 -13 Family Services 3,481 3,675 3,751 76 270Management 659 616 619 3 -40 Purchased Care Services 13,877 16,472 16,493 21 2,616Services Looked After Children 7,170 7,558 7,631 73 461Unapportioned Overheads 603 603 603 0 0Youth Service 40 21 21 0 -19
27,336 30,605 30,774 169 3,438 12.6%
Support, Challenge and InterventionAdmissions 138 126 123 -3 -15 Business Unit -12 0 -6 -6 6Children in Care 105 98 97 -1 -7 Early Years 210 129 120 -9 -90 Education Welfare 166 80 79 -2 -88 Home Educate 27 27 27 0 0Inspection and Advice 1,057 808 807 -1 -251 Music Services 67 63 64 1 -3 School Improvement 228 229 227 -2 -1 School Meals -30 -59 -76 -17 -46 School Transport 518 612 564 -48 46Student Support Transport 17 16 16 0 -1
2,492 2,130 2,041 -90 -451 -18.1%
Adult Social CareAssessment & Care Management 18,371 18,124 19,710 1,587 1,339Brokerage Enablement 4,077 3,677 3,616 -61 -461Management -3,608 -4,355 -5,474 -1,119 -1,867Management Support 243 243 278 35 35MH Pooled Budgets 5,958 4,963 4,863 -100 -1,095Resources Adults Under 65 5,655 5,384 5,453 69 -202Service Provision 2,078 2,017 1,991 -26 -87Services for Adults Under 65 18,229 17,348 16,406 -942 -1,824
51,003 47,400 46,842 -558 -4,161 -8.2%
Total Non-Schools 101,795 100,576 100,675 98 -1,120 -1.1%
£'000
People (Non-Schools) Revenue Budget Outturn Statement 2016-17
Actual£'000£'000
Variance to
£'000
Service Director/Service Area
Page 167 of 293
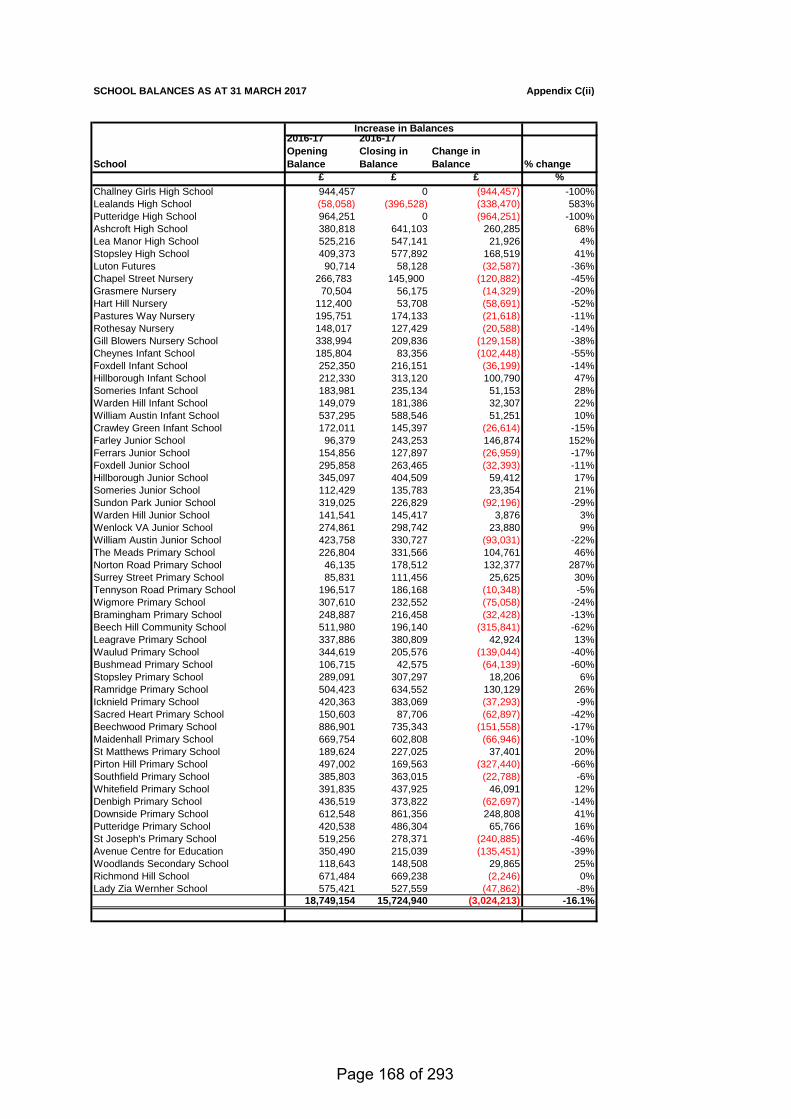
SCHOOL BALANCES AS AT 31 MARCH 2017 Appendix C(ii)
School
2016-17 Opening Balance
2016-17 Closing in Balance
Change in Balance % change
£ £ £ %Challney Girls High School 944,457 0 (944,457) -100%Lealands High School (58,058) (396,528) (338,470) 583%Putteridge High School 964,251 0 (964,251) -100%Ashcroft High School 380,818 641,103 260,285 68%Lea Manor High School 525,216 547,141 21,926 4%Stopsley High School 409,373 577,892 168,519 41%Luton Futures 90,714 58,128 (32,587) -36%Chapel Street Nursery 266,783 145,900 (120,882) -45%Grasmere Nursery 70,504 56,175 (14,329) -20%Hart Hill Nursery 112,400 53,708 (58,691) -52%Pastures Way Nursery 195,751 174,133 (21,618) -11%Rothesay Nursery 148,017 127,429 (20,588) -14%Gill Blowers Nursery School 338,994 209,836 (129,158) -38%Cheynes Infant School 185,804 83,356 (102,448) -55%Foxdell Infant School 252,350 216,151 (36,199) -14%Hillborough Infant School 212,330 313,120 100,790 47%Someries Infant School 183,981 235,134 51,153 28%Warden Hill Infant School 149,079 181,386 32,307 22%William Austin Infant School 537,295 588,546 51,251 10%Crawley Green Infant School 172,011 145,397 (26,614) -15%Farley Junior School 96,379 243,253 146,874 152%Ferrars Junior School 154,856 127,897 (26,959) -17%Foxdell Junior School 295,858 263,465 (32,393) -11%Hillborough Junior School 345,097 404,509 59,412 17%Someries Junior School 112,429 135,783 23,354 21%Sundon Park Junior School 319,025 226,829 (92,196) -29%Warden Hill Junior School 141,541 145,417 3,876 3%Wenlock VA Junior School 274,861 298,742 23,880 9%William Austin Junior School 423,758 330,727 (93,031) -22%The Meads Primary School 226,804 331,566 104,761 46%Norton Road Primary School 46,135 178,512 132,377 287%Surrey Street Primary School 85,831 111,456 25,625 30%Tennyson Road Primary School 196,517 186,168 (10,348) -5%Wigmore Primary School 307,610 232,552 (75,058) -24%Bramingham Primary School 248,887 216,458 (32,428) -13%Beech Hill Community School 511,980 196,140 (315,841) -62%Leagrave Primary School 337,886 380,809 42,924 13%Waulud Primary School 344,619 205,576 (139,044) -40%Bushmead Primary School 106,715 42,575 (64,139) -60%Stopsley Primary School 289,091 307,297 18,206 6%Ramridge Primary School 504,423 634,552 130,129 26%Icknield Primary School 420,363 383,069 (37,293) -9%Sacred Heart Primary School 150,603 87,706 (62,897) -42%Beechwood Primary School 886,901 735,343 (151,558) -17%Maidenhall Primary School 669,754 602,808 (66,946) -10%St Matthews Primary School 189,624 227,025 37,401 20%Pirton Hill Primary School 497,002 169,563 (327,440) -66%Southfield Primary School 385,803 363,015 (22,788) -6%Whitefield Primary School 391,835 437,925 46,091 12%Denbigh Primary School 436,519 373,822 (62,697) -14%Downside Primary School 612,548 861,356 248,808 41%Putteridge Primary School 420,538 486,304 65,766 16%St Joseph's Primary School 519,256 278,371 (240,885) -46%Avenue Centre for Education 350,490 215,039 (135,451) -39%Woodlands Secondary School 118,643 148,508 29,865 25%Richmond Hill School 671,484 669,238 (2,246) 0%Lady Zia Wernher School 575,421 527,559 (47,862) -8%
18,749,154 15,724,940 (3,024,213) -16.1%
Increase in Balances
Page 168 of 293
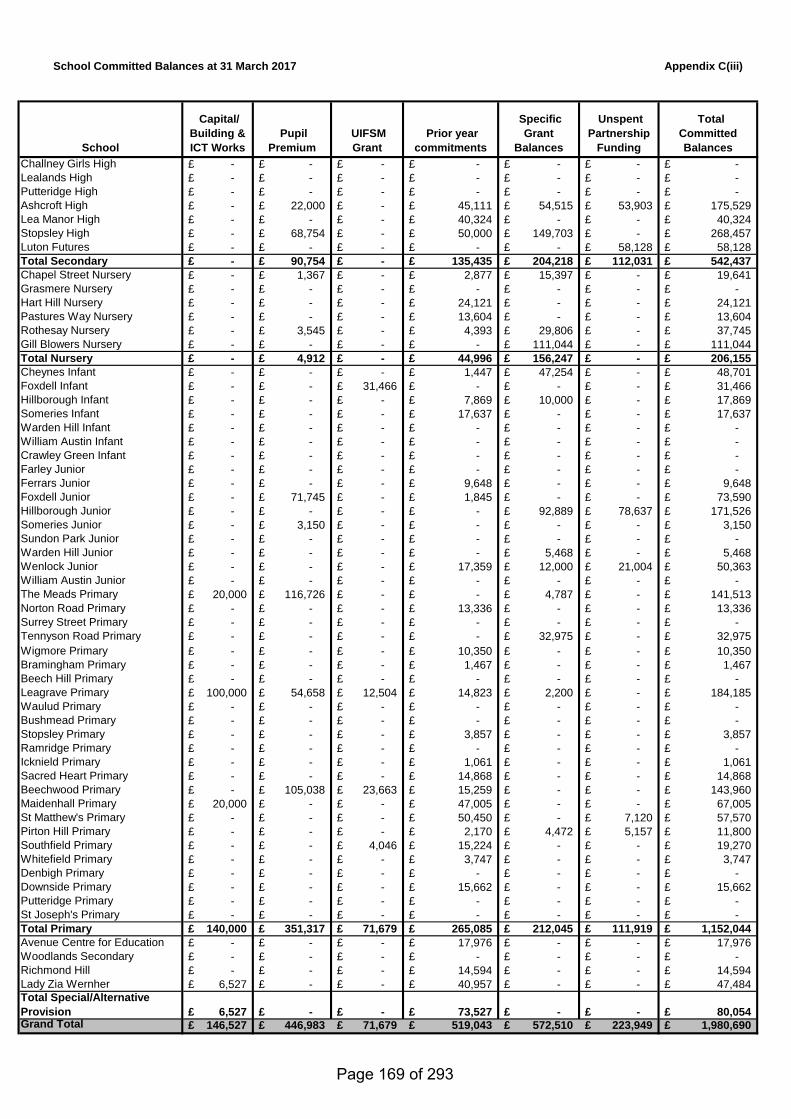
Appendix C(iii)
School
Capital/ Building & ICT Works
Pupil Premium
UIFSM Grant
Prior year commitments
Specific Grant
Balances
Unspent Partnership
Funding
Total Committed Balances
Challney Girls High -£ -£ -£ -£ -£ -£ -£ Lealands High -£ -£ -£ -£ -£ -£ -£ Putteridge High -£ -£ -£ -£ -£ -£ -£ Ashcroft High -£ 22,000£ -£ 45,111£ 54,515£ 53,903£ 175,529£ Lea Manor High -£ -£ -£ 40,324£ -£ -£ 40,324£ Stopsley High -£ 68,754£ -£ 50,000£ 149,703£ -£ 268,457£ Luton Futures -£ -£ -£ -£ -£ 58,128£ 58,128£ Total Secondary -£ 90,754£ -£ 135,435£ 204,218£ 112,031£ 542,437£ Chapel Street Nursery -£ 1,367£ -£ 2,877£ 15,397£ -£ 19,641£ Grasmere Nursery -£ -£ -£ -£ -£ -£ -£ Hart Hill Nursery -£ -£ -£ 24,121£ -£ -£ 24,121£ Pastures Way Nursery -£ -£ -£ 13,604£ -£ -£ 13,604£ Rothesay Nursery -£ 3,545£ -£ 4,393£ 29,806£ -£ 37,745£ Gill Blowers Nursery -£ -£ -£ -£ 111,044£ -£ 111,044£ Total Nursery -£ 4,912£ -£ 44,996£ 156,247£ -£ 206,155£ Cheynes Infant -£ -£ -£ 1,447£ 47,254£ -£ 48,701£ Foxdell Infant -£ -£ 31,466£ -£ -£ -£ 31,466£ Hillborough Infant -£ -£ -£ 7,869£ 10,000£ -£ 17,869£ Someries Infant -£ -£ -£ 17,637£ -£ -£ 17,637£ Warden Hill Infant -£ -£ -£ -£ -£ -£ -£ William Austin Infant -£ -£ -£ -£ -£ -£ -£ Crawley Green Infant -£ -£ -£ -£ -£ -£ -£ Farley Junior -£ -£ -£ -£ -£ -£ -£ Ferrars Junior -£ -£ -£ 9,648£ -£ -£ 9,648£ Foxdell Junior -£ 71,745£ -£ 1,845£ -£ -£ 73,590£ Hillborough Junior -£ -£ -£ -£ 92,889£ 78,637£ 171,526£ Someries Junior -£ 3,150£ -£ -£ -£ -£ 3,150£ Sundon Park Junior -£ -£ -£ -£ -£ -£ -£ Warden Hill Junior -£ -£ -£ -£ 5,468£ -£ 5,468£ Wenlock Junior -£ -£ -£ 17,359£ 12,000£ 21,004£ 50,363£ William Austin Junior -£ -£ -£ -£ -£ -£ -£ The Meads Primary 20,000£ 116,726£ -£ -£ 4,787£ -£ 141,513£ Norton Road Primary -£ -£ -£ 13,336£ -£ -£ 13,336£ Surrey Street Primary -£ -£ -£ -£ -£ -£ -£ Tennyson Road Primary -£ -£ -£ -£ 32,975£ -£ 32,975£ Wigmore Primary -£ -£ -£ 10,350£ -£ -£ 10,350£ Bramingham Primary -£ -£ -£ 1,467£ -£ -£ 1,467£ Beech Hill Primary -£ -£ -£ -£ -£ -£ -£ Leagrave Primary 100,000£ 54,658£ 12,504£ 14,823£ 2,200£ -£ 184,185£ Waulud Primary -£ -£ -£ -£ -£ -£ -£ Bushmead Primary -£ -£ -£ -£ -£ -£ -£ Stopsley Primary -£ -£ -£ 3,857£ -£ -£ 3,857£ Ramridge Primary -£ -£ -£ -£ -£ -£ -£ Icknield Primary -£ -£ -£ 1,061£ -£ -£ 1,061£ Sacred Heart Primary -£ -£ -£ 14,868£ -£ -£ 14,868£ Beechwood Primary -£ 105,038£ 23,663£ 15,259£ -£ -£ 143,960£ Maidenhall Primary 20,000£ -£ -£ 47,005£ -£ -£ 67,005£ St Matthew's Primary -£ -£ -£ 50,450£ -£ 7,120£ 57,570£ Pirton Hill Primary -£ -£ -£ 2,170£ 4,472£ 5,157£ 11,800£ Southfield Primary -£ -£ 4,046£ 15,224£ -£ -£ 19,270£ Whitefield Primary -£ -£ -£ 3,747£ -£ -£ 3,747£ Denbigh Primary -£ -£ -£ -£ -£ -£ -£ Downside Primary -£ -£ -£ 15,662£ -£ -£ 15,662£ Putteridge Primary -£ -£ -£ -£ -£ -£ -£ St Joseph's Primary -£ -£ -£ -£ -£ -£ -£ Total Primary 140,000£ 351,317£ 71,679£ 265,085£ 212,045£ 111,919£ 1,152,044£ Avenue Centre for Education -£ -£ -£ 17,976£ -£ -£ 17,976£ Woodlands Secondary -£ -£ -£ -£ -£ -£ -£ Richmond Hill -£ -£ -£ 14,594£ -£ -£ 14,594£ Lady Zia Wernher 6,527£ -£ -£ 40,957£ -£ -£ 47,484£ Total Special/Alternative Provision 6,527£ -£ -£ 73,527£ -£ -£ 80,054£ Grand Total 146,527£ 446,983£ 71,679£ 519,043£ 572,510£ 223,949£ 1,980,690£
School Committed Balances at 31 March 2017
Page 169 of 293
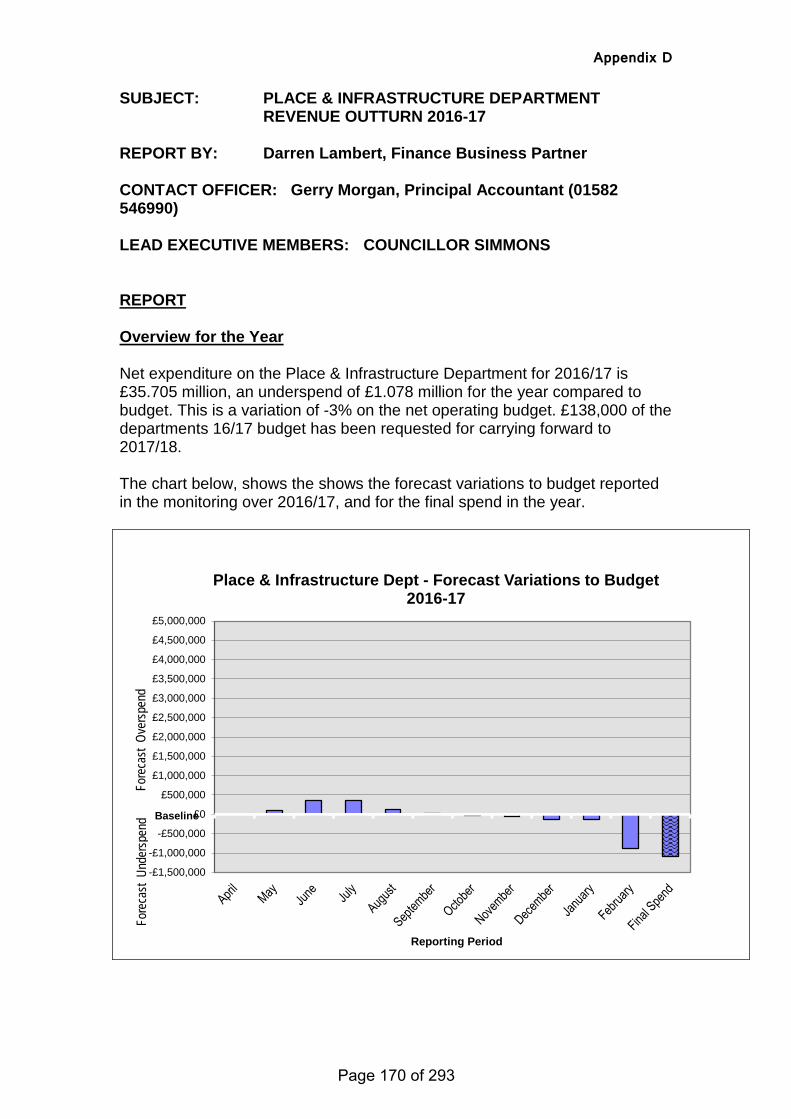
Appendix D
SUBJECT: PLACE & INFRASTRUCTURE DEPARTMENT REVENUE OUTTURN 2016-17
REPORT BY: Darren Lambert, Finance Business Partner CONTACT OFFICER: Gerry Morgan, Principal Accountant (01582 546990) LEAD EXECUTIVE MEMBERS: COUNCILLOR SIMMONS REPORT Overview for the Year Net expenditure on the Place & Infrastructure Department for 2016/17 is £35.705 million, an underspend of £1.078 million for the year compared to budget. This is a variation of -3% on the net operating budget. £138,000 of the departments 16/17 budget has been requested for carrying forward to 2017/18. The chart below, shows the shows the forecast variations to budget reported in the monitoring over 2016/17, and for the final spend in the year.
-£1,500,000
-£1,000,000
-£500,000
£0
£500,000
£1,000,000
£1,500,000
£2,000,000
£2,500,000
£3,000,000
£3,500,000
£4,000,000
£4,500,000
£5,000,000
Reporting Period
Place & Infrastructure Dept - Forecast Variations to Budget 2016-17
Fore
cast
Ove
rspen
d Fo
reca
st U
nder
spen
d Baseline
Page 170 of 293
Appendix D
Forecast Movements Reported in the Monitoring The cumulative position forecast for the department at the final Period 11 monitoring exercise was a predicted underspend of around £0.891 million for the year due to: Overspend Pressures:
• Property Estate costs - £790,000 • External vehicle hire for increased demand in home to school travel -
£164,000 • Cleansing & Refuse employees turnover provision not achieved due to
the need to maintain an effective frontline service - £125,000 • Increasing number of traveller encampments - £139,000 • New Neighbourhood Enforcement service - £164,000
Underspends/Savings/Additional Income
• Passenger Transport Unit additional income and reduced costs – (£206,000)
• Parking – increased income – (£100,000) • Development Control income for large planning applications –
(£239,000) • Fixed Assets additional trading income and reduced design &
maintenance service costs – (£315,000) • Waste Disposal contract delivering increased diversion from landfill
resulting in lower disposal costs – (£290,000) • Discount on energy costs – (£124,000) • Street lighting energy savings from the roll out of LED lighting –
(£109,000) • Major Projects team employee vacancies – (£111,000) • Commercial Waste increased income from trading – (£110,000) • Lead Local Flood Authority grant underspend – (£236,000)
Significant changes at Outturn compared to the period 11 forecast The department’s final spend compared to the period 11 forecast is attached at Appendix A(i), analysed at service level for each Service Director. Compared to the monitoring forecast, the underspend has increased by £0.187 million for the year. The main variations within this are:
• Waste disposal costs due to increased tonnages for green waste in March - £90,000
• Food & Safety additional income from Primary Authority fees and Public Health grant – (£97,000)
• Development Control additional fees – (£116,000) • Parking additional income – (£60,000)
Page 171 of 293
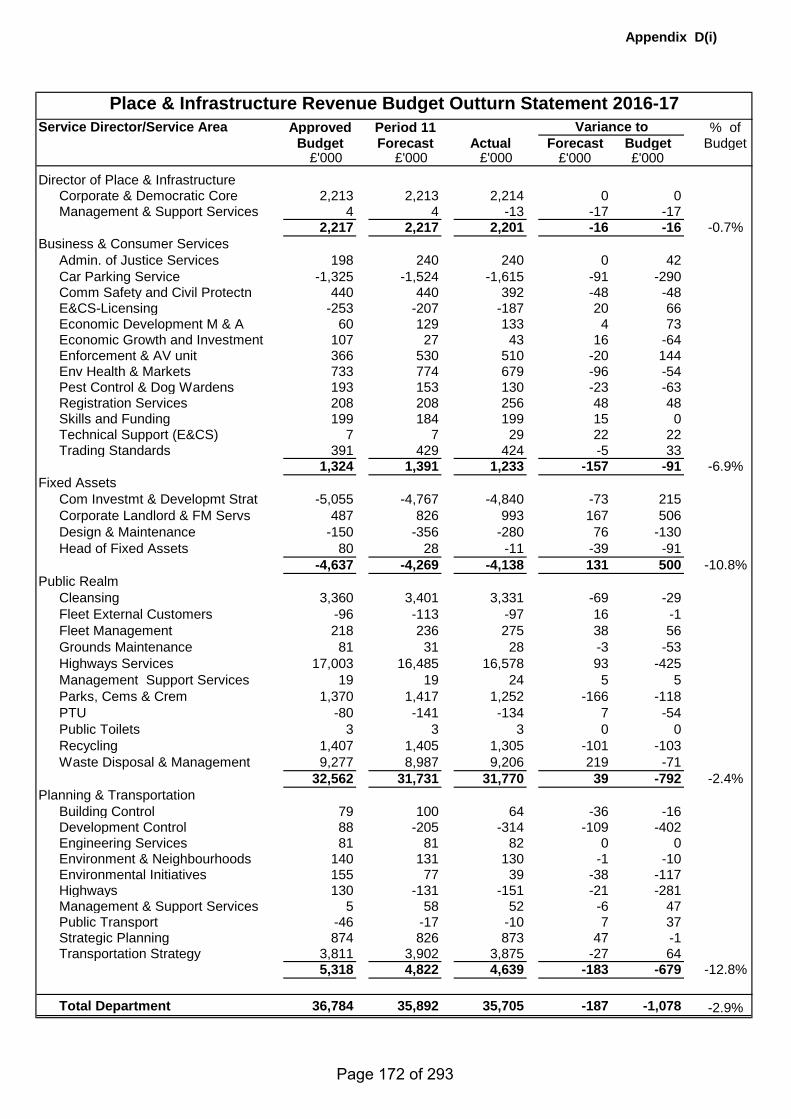
Appendix D(i)
Approved Period 11 % of Budget Forecast Actual Forecast Budget Budget
£'000 £'000Director of Place & Infrastructure
Corporate & Democratic Core 2,213 2,213 2,214 0 0Management & Support Services 4 4 -13 -17 -17
2,217 2,217 2,201 -16 -16 -0.7%Business & Consumer Services
Admin. of Justice Services 198 240 240 0 42Car Parking Service -1,325 -1,524 -1,615 -91 -290Comm Safety and Civil Protectn 440 440 392 -48 -48E&CS-Licensing -253 -207 -187 20 66Economic Development M & A 60 129 133 4 73Economic Growth and Investment 107 27 43 16 -64Enforcement & AV unit 366 530 510 -20 144Env Health & Markets 733 774 679 -96 -54Pest Control & Dog Wardens 193 153 130 -23 -63Registration Services 208 208 256 48 48Skills and Funding 199 184 199 15 0Technical Support (E&CS) 7 7 29 22 22Trading Standards 391 429 424 -5 33
1,324 1,391 1,233 -157 -91 -6.9%Fixed Assets
Com Investmt & Developmt Strat -5,055 -4,767 -4,840 -73 215Corporate Landlord & FM Servs 487 826 993 167 506Design & Maintenance -150 -356 -280 76 -130Head of Fixed Assets 80 28 -11 -39 -91
-4,637 -4,269 -4,138 131 500 -10.8%Public Realm
Cleansing 3,360 3,401 3,331 -69 -29Fleet External Customers -96 -113 -97 16 -1Fleet Management 218 236 275 38 56Grounds Maintenance 81 31 28 -3 -53Highways Services 17,003 16,485 16,578 93 -425Management Support Services 19 19 24 5 5Parks, Cems & Crem 1,370 1,417 1,252 -166 -118PTU -80 -141 -134 7 -54Public Toilets 3 3 3 0 0Recycling 1,407 1,405 1,305 -101 -103Waste Disposal & Management 9,277 8,987 9,206 219 -71
32,562 31,731 31,770 39 -792 -2.4%Planning & Transportation
Building Control 79 100 64 -36 -16Development Control 88 -205 -314 -109 -402Engineering Services 81 81 82 0 0Environment & Neighbourhoods 140 131 130 -1 -10Environmental Initiatives 155 77 39 -38 -117Highways 130 -131 -151 -21 -281Management & Support Services 5 58 52 -6 47Public Transport -46 -17 -10 7 37Strategic Planning 874 826 873 47 -1Transportation Strategy 3,811 3,902 3,875 -27 64
5,318 4,822 4,639 -183 -679 -12.8%
Total Department 36,784 35,892 35,705 -187 -1,078 -2.9%
£'000
Place & Infrastructure Revenue Budget Outturn Statement 2016-17
£'000
Service Director/Service Area
£'000
Variance to
Page 172 of 293
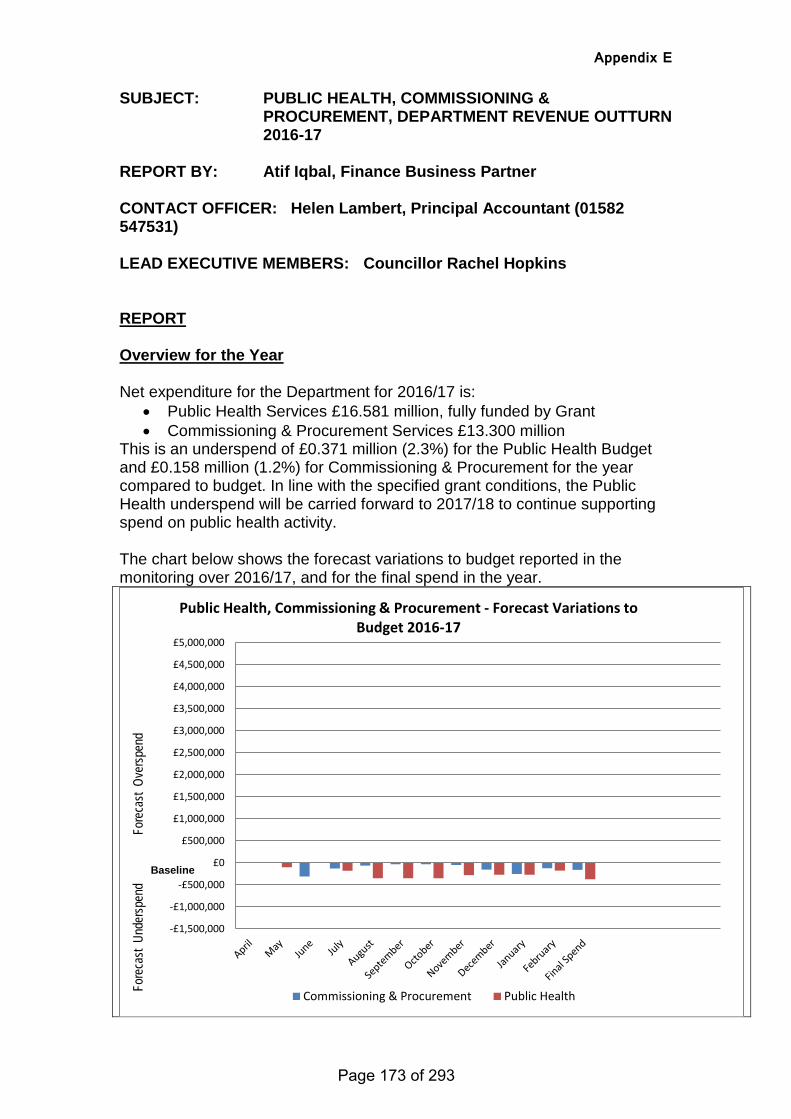
Appendix E
SUBJECT: PUBLIC HEALTH, COMMISSIONING & PROCUREMENT, DEPARTMENT REVENUE OUTTURN 2016-17
REPORT BY: Atif Iqbal, Finance Business Partner CONTACT OFFICER: Helen Lambert, Principal Accountant (01582 547531) LEAD EXECUTIVE MEMBERS: Councillor Rachel Hopkins REPORT Overview for the Year Net expenditure for the Department for 2016/17 is:
• Public Health Services £16.581 million, fully funded by Grant • Commissioning & Procurement Services £13.300 million
This is an underspend of £0.371 million (2.3%) for the Public Health Budget and £0.158 million (1.2%) for Commissioning & Procurement for the year compared to budget. In line with the specified grant conditions, the Public Health underspend will be carried forward to 2017/18 to continue supporting spend on public health activity. The chart below shows the forecast variations to budget reported in the monitoring over 2016/17, and for the final spend in the year.
-£1,500,000
-£1,000,000
-£500,000
£0
£500,000
£1,000,000
£1,500,000
£2,000,000
£2,500,000
£3,000,000
£3,500,000
£4,000,000
£4,500,000
£5,000,000
Public Health, Commissioning & Procurement - Forecast Variations to Budget 2016-17
Commissioning & Procurement Public Health
Fore
cast
Ove
rspen
d Fo
reca
st U
nder
spen
d
Baseline
Page 173 of 293
Appendix E
Forecast Movements Reported in the Monitoring The cumulative position forecast for the department at the final Period 11 monitoring exercise was:
• a predicted underspend of around £0.174 million for Public Health • a predicted underspend of around £0.120 million for Commissioning
and Procurement Significant variations predicted for Public Health, Commissioning and Procurement at period 11 were:
• £175,000 underspend in staffing and Public Health projects • £258,000 underspend due to renegotiated housing related support
contracts • £106,000 underspend on the Mental Health Pooled budget due to a
reduced contract payment Significant changes at Outturn compared to the period 11 forecast The department’s final spend compared to the period 11 forecast is attached at Appendix A (i), analysed at service level for each Service Director. Compared to the monitoring forecast, the under spend has increased by:
• £0.196 million for Public Health resulting from further reductions in Public Health activity based projects.
• £0.075 million in Commissioning and Procurement budgets due to of surplus 2015/16 redundancy provision written back in 2016/17.
Page 174 of 293
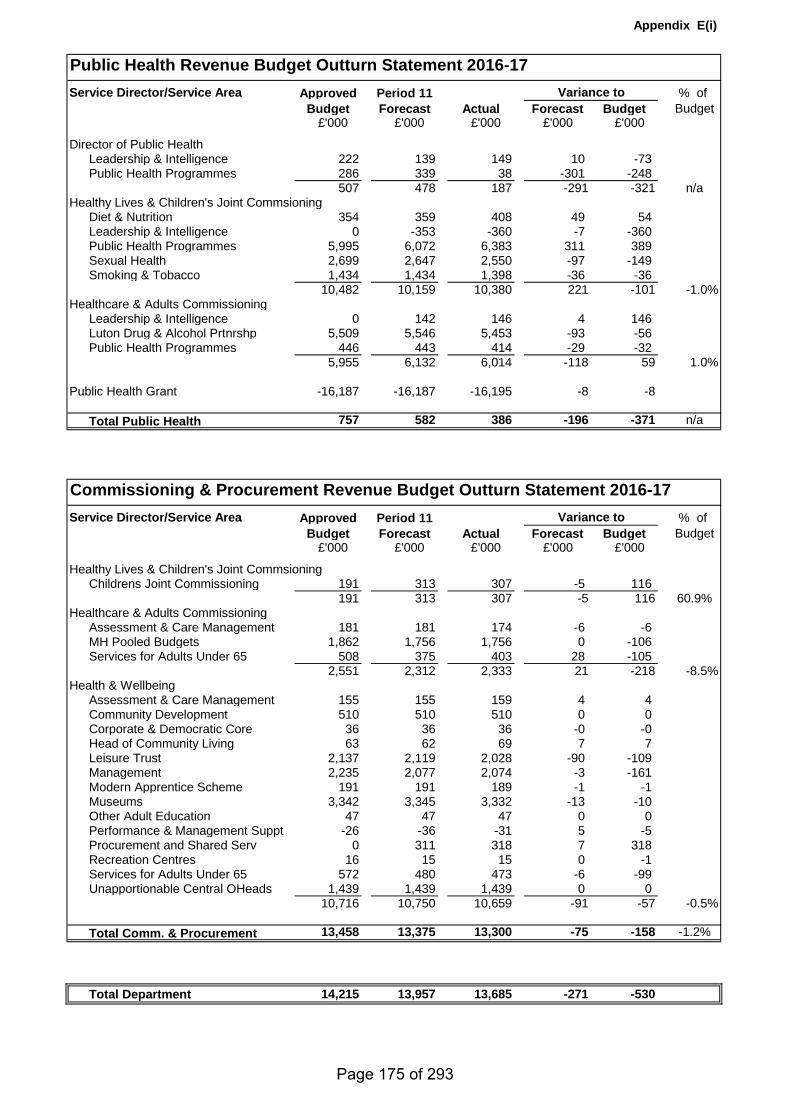
Appendix E(i)
Public Health Revenue Budget Outturn Statement 2016-17Approved Period 11 % of
Budget Forecast Actual Forecast Budget Budget£'000
Director of Public HealthLeadership & Intelligence 222 139 149 10 -73 Public Health Programmes 286 339 38 -301 -248
507 478 187 -291 -321 n/aHealthy Lives & Children's Joint Commsioning
Diet & Nutrition 354 359 408 49 54Leadership & Intelligence 0 -353 -360 -7 -360 Public Health Programmes 5,995 6,072 6,383 311 389Sexual Health 2,699 2,647 2,550 -97 -149 Smoking & Tobacco 1,434 1,434 1,398 -36 -36
10,482 10,159 10,380 221 -101 -1.0%Healthcare & Adults Commissioning
Leadership & Intelligence 0 142 146 4 146Luton Drug & Alcohol Prtnrshp 5,509 5,546 5,453 -93 -56 Public Health Programmes 446 443 414 -29 -32
5,955 6,132 6,014 -118 59 1.0%
Public Health Grant -16,187 -16,187 -16,195 -8 -8
Total Public Health 757 582 386 -196 -371 n/a
Commissioning & Procurement Revenue Budget Outturn Statement 2016-17Approved Period 11 % of
Budget Forecast Actual Forecast Budget Budget£'000
Healthy Lives & Children's Joint CommsioningChildrens Joint Commissioning 191 313 307 -5 116
191 313 307 -5 116 60.9%Healthcare & Adults Commissioning
Assessment & Care Management 181 181 174 -6 -6 MH Pooled Budgets 1,862 1,756 1,756 0 -106 Services for Adults Under 65 508 375 403 28 -105
2,551 2,312 2,333 21 -218 -8.5%Health & Wellbeing
Assessment & Care Management 155 155 159 4 4Community Development 510 510 510 0 0Corporate & Democratic Core 36 36 36 -0 -0 Head of Community Living 63 62 69 7 7Leisure Trust 2,137 2,119 2,028 -90 -109 Management 2,235 2,077 2,074 -3 -161 Modern Apprentice Scheme 191 191 189 -1 -1 Museums 3,342 3,345 3,332 -13 -10 Other Adult Education 47 47 47 0 0Performance & Management Suppt -26 -36 -31 5 -5 Procurement and Shared Serv 0 311 318 7 318Recreation Centres 16 15 15 0 -1 Services for Adults Under 65 572 480 473 -6 -99 Unapportionable Central OHeads 1,439 1,439 1,439 0 0
10,716 10,750 10,659 -91 -57 -0.5%
Total Comm. & Procurement 13,458 13,375 13,300 -75 -158 -1.2%
Total Department 14,215 13,957 13,685 -271 -530
£'000 £'000
Service Director/Service Area Variance to
£'000 £'000
Service Director/Service Area Variance to
£'000 £'000 £'000 £'000
Page 175 of 293
Appendix F
SUBJECT: HOUSING REVENUE ACCOUNT REVENUE OUTTURN 2016-17
REPORT BY: DIRECTOR OF HOUSING CONTACT OFFICER: ATIKA CHOWDHURY (01582 546112) LEAD EXECUTIVE MEMBERS: COUNCILLOR SHAW REPORT
Overview for the Year
The Housing Revenue Account budget for 2016/17 was set with an original contribution to balances of £1.207 million in line with HRA financing regulations that require contributions from revenue balances to support capital improvements and additions to the housing stock. The outturn position for the year is a net underspend of £122,000 compared to budget, period 11 projection was a revenue surplus of £3.139million out of which £3.331million was approved as contribution toward capital spend which left a deficit of £192.000. The final revenue balance transferred to reserve was £121,724 surplus.
Final Monitoring Forecast at Period 11 (February ‘17) The cumulative position forecast for the department at the final Period 11 monitoring exercise was a predicted operational underspend of around £0.314 million for the year. The main variations reported were:
• £305k underspend in salaries budgets due to number of vacancies and increased capital salaries recharges.
• £336k underspend was combination of increased rental income from Dwelling Rents, Non Dwellings Rents, Tenants Service Charges and Leaseholders Service Charges.
• Provision of Bad Debts was reduced by £341k due to the less impact from welfare reform changes to date.
• £33k related to Savings in Printing, postages and other Office supplies.
Significant Outturn Variations since period 11 The department’s final spend compared to the period 11 forecast is attached at Appendix F(i), analysed at service level. Compared to the monitoring forecast, the deficit reduced by around £653,000 for the year
Page 176 of 293
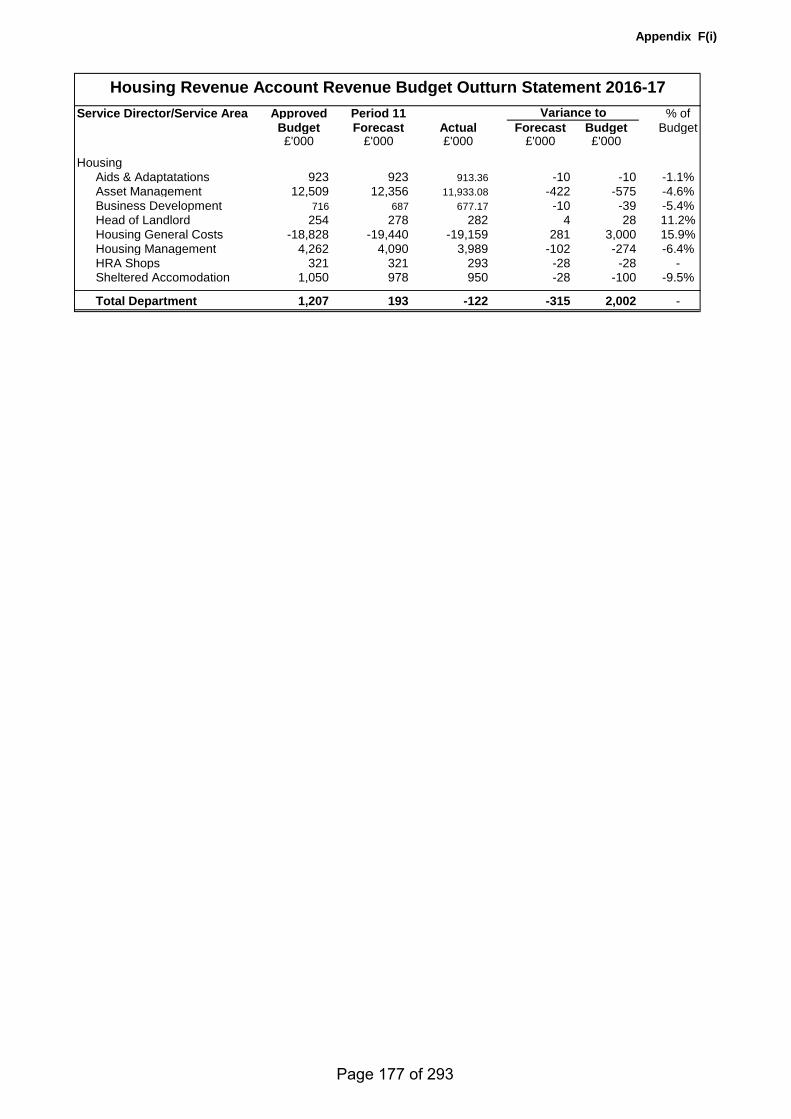
Appendix F(i)
Service Director/Service Area Approved Period 11 % ofBudget Forecast Actual Forecast Budget Budget£'000 £'000 £'000 £'000 £'000
Housing Aids & Adaptatations 923 923 913.36 -10 -10 -1.1%Asset Management 12,509 12,356 11,933.08 -422 -575 -4.6%Business Development 716 687 677.17 -10 -39 -5.4%Head of Landlord 254 278 282 4 28 11.2%Housing General Costs -18,828 -19,440 -19,159 281 3,000 15.9%Housing Management 4,262 4,090 3,989 -102 -274 -6.4%HRA Shops 321 321 293 -28 -28 -Sheltered Accomodation 1,050 978 950 -28 -100 -9.5%
Total Department 1,207 193 -122 -315 2,002 -
Housing Revenue Account Revenue Budget Outturn Statement 2016-17Variance to
Page 177 of 293
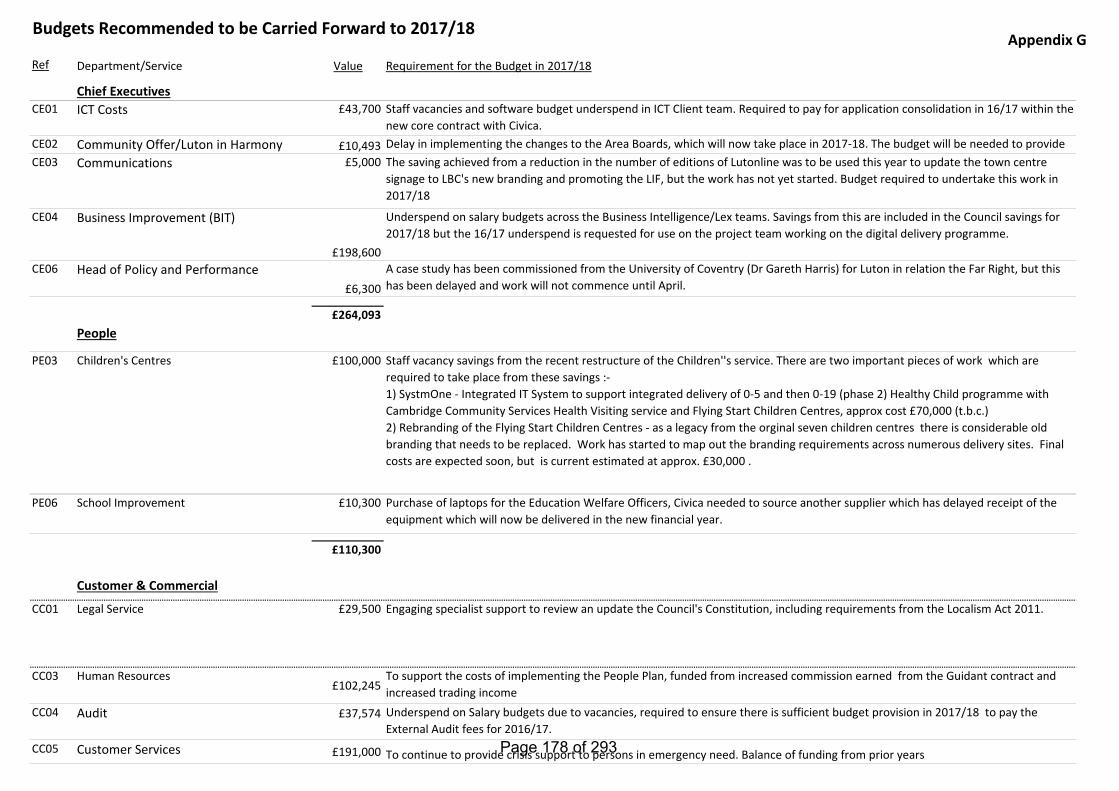
Appendix GBudgets Recommended to be Carried Forward to 2017/18
Ref Department/Service Value Requirement for the Budget in 2017/18
Chief ExecutivesCE01 ICT Costs £43,700 Staff vacancies and software budget underspend in ICT Client team. Required to pay for application consolidation in 16/17 within the
new core contract with Civica.CE02 Community Offer/Luton in Harmony £10,493 Delay in implementing the changes to the Area Boards, which will now take place in 2017-18. The budget will be needed to provide
CE03 Communications £5,000 The saving achieved from a reduction in the number of editions of Lutonline was to be used this year to update the town centre signage to LBC's new branding and promoting the LIF, but the work has not yet started. Budget required to undertake this work in 2017/18
CE04 Business Improvement (BIT)
£198,600
Underspend on salary budgets across the Business Intelligence/Lex teams. Savings from this are included in the Council savings for 2017/18 but the 16/17 underspend is requested for use on the project team working on the digital delivery programme.
CE06 Head of Policy and Performance£6,300
A case study has been commissioned from the University of Coventry (Dr Gareth Harris) for Luton in relation the Far Right, but this has been delayed and work will not commence until April.
£264,093People
PE03 Children's Centres £100,000 Staff vacancy savings from the recent restructure of the Children''s service. There are two important pieces of work which are required to take place from these savings :-1) SystmOne - Integrated IT System to support integrated delivery of 0-5 and then 0-19 (phase 2) Healthy Child programme with Cambridge Community Services Health Visiting service and Flying Start Children Centres, approx cost £70,000 (t.b.c.) 2) Rebranding of the Flying Start Children Centres - as a legacy from the orginal seven children centres there is considerable old branding that needs to be replaced. Work has started to map out the branding requirements across numerous delivery sites. Final costs are expected soon, but is current estimated at approx. £30,000 .
PE06 School Improvement £10,300 Purchase of laptops for the Education Welfare Officers, Civica needed to source another supplier which has delayed receipt of the equipment which will now be delivered in the new financial year.
£110,300
Customer & Commercial
CC01 Legal Service £29,500
CC03 Human Resources£102,245
To support the costs of implementing the People Plan, funded from increased commission earned from the Guidant contract and increased trading income
CC04 Audit £37,574
CC05 Customer Services £191,000 To continue to provide crisis support to persons in emergency need. Balance of funding from prior years
Engaging specialist support to review an update the Council's Constitution, including requirements from the Localism Act 2011.
Underspend on Salary budgets due to vacancies, required to ensure there is sufficient budget provision in 2017/18 to pay the External Audit fees for 2016/17.
Page 178 of 293
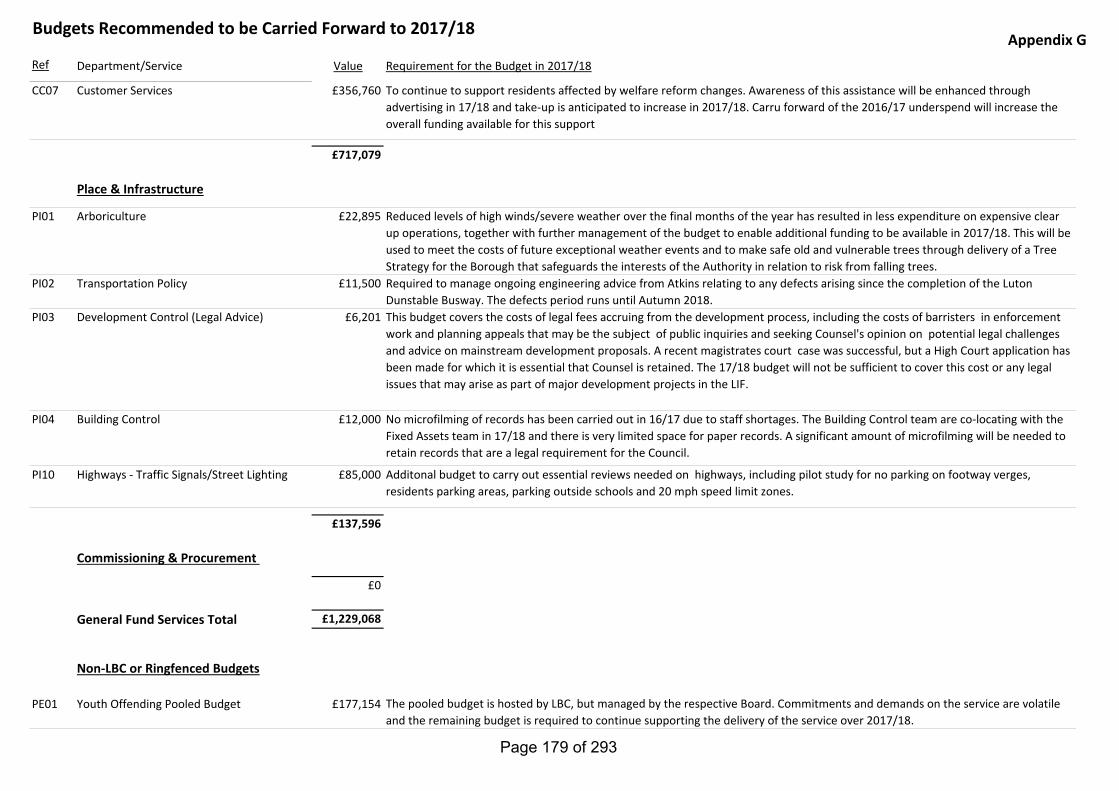
Appendix GBudgets Recommended to be Carried Forward to 2017/18
Ref Department/Service Value Requirement for the Budget in 2017/18
CC07 Customer Services £356,760 To continue to support residents affected by welfare reform changes. Awareness of this assistance will be enhanced through advertising in 17/18 and take-up is anticipated to increase in 2017/18. Carru forward of the 2016/17 underspend will increase the overall funding available for this support
£717,079
Place & Infrastructure
PI01 Arboriculture £22,895 Reduced levels of high winds/severe weather over the final months of the year has resulted in less expenditure on expensive clear up operations, together with further management of the budget to enable additional funding to be available in 2017/18. This will be used to meet the costs of future exceptional weather events and to make safe old and vulnerable trees through delivery of a Tree Strategy for the Borough that safeguards the interests of the Authority in relation to risk from falling trees.
PI02 Transportation Policy £11,500 Required to manage ongoing engineering advice from Atkins relating to any defects arising since the completion of the Luton Dunstable Busway. The defects period runs until Autumn 2018.
PI03 Development Control (Legal Advice) £6,201 This budget covers the costs of legal fees accruing from the development process, including the costs of barristers in enforcement work and planning appeals that may be the subject of public inquiries and seeking Counsel's opinion on potential legal challenges and advice on mainstream development proposals. A recent magistrates court case was successful, but a High Court application has been made for which it is essential that Counsel is retained. The 17/18 budget will not be sufficient to cover this cost or any legal issues that may arise as part of major development projects in the LIF.
PI04 Building Control £12,000
PI10 Highways - Traffic Signals/Street Lighting £85,000 Additonal budget to carry out essential reviews needed on highways, including pilot study for no parking on footway verges, residents parking areas, parking outside schools and 20 mph speed limit zones.
£137,596
Commissioning & Procurement
£0
General Fund Services Total £1,229,068
Non-LBC or Ringfenced Budgets
PE01 Youth Offending Pooled Budget £177,154
No microfilming of records has been carried out in 16/17 due to staff shortages. The Building Control team are co-locating with the Fixed Assets team in 17/18 and there is very limited space for paper records. A significant amount of microfilming will be needed to retain records that are a legal requirement for the Council.
The pooled budget is hosted by LBC, but managed by the respective Board. Commitments and demands on the service are volatile and the remaining budget is required to continue supporting the delivery of the service over 2017/18.
Page 179 of 293
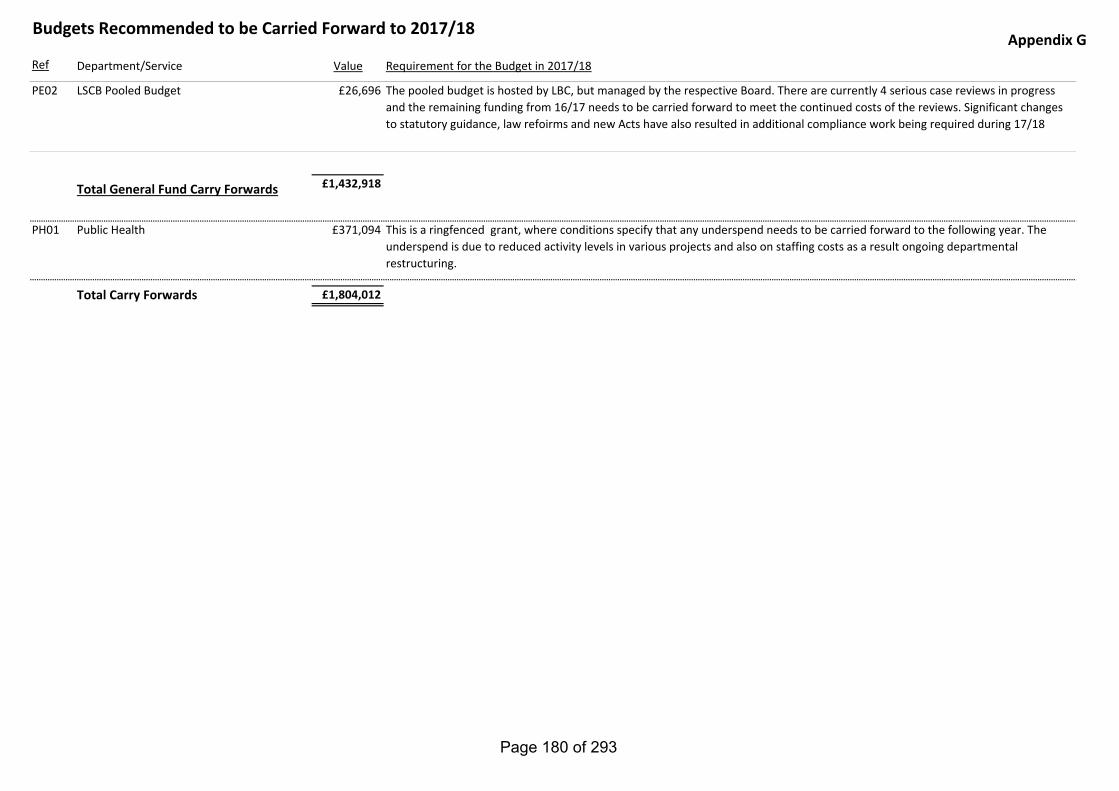
Appendix GBudgets Recommended to be Carried Forward to 2017/18
Ref Department/Service Value Requirement for the Budget in 2017/18
PE02 LSCB Pooled Budget £26,696 The pooled budget is hosted by LBC, but managed by the respective Board. There are currently 4 serious case reviews in progress and the remaining funding from 16/17 needs to be carried forward to meet the continued costs of the reviews. Significant changes to statutory guidance, law refoirms and new Acts have also resulted in additional compliance work being required during 17/18
Total General Fund Carry Forwards £1,432,918
PH01 Public Health £371,094 This is a ringfenced grant, where conditions specify that any underspend needs to be carried forward to the following year. The underspend is due to reduced activity levels in various projects and also on staffing costs as a result ongoing departmental restructuring.
Total Carry Forwards £1,804,012
Page 180 of 293
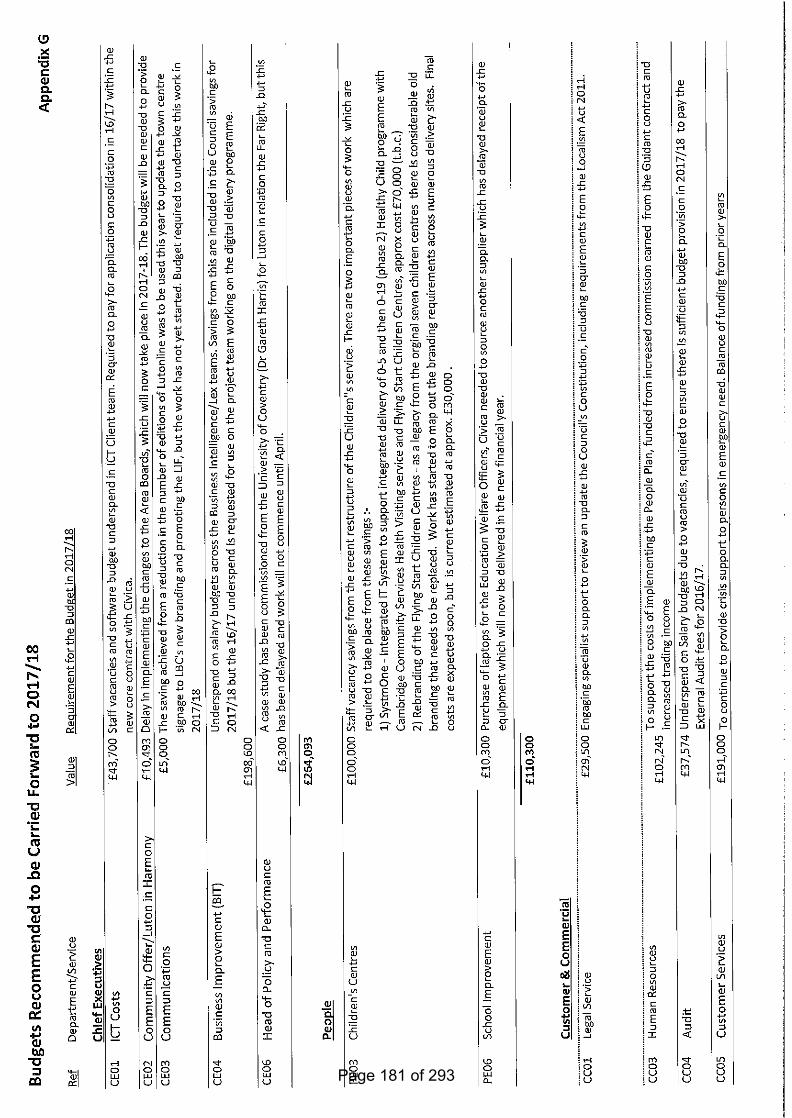
Page 181 of 293
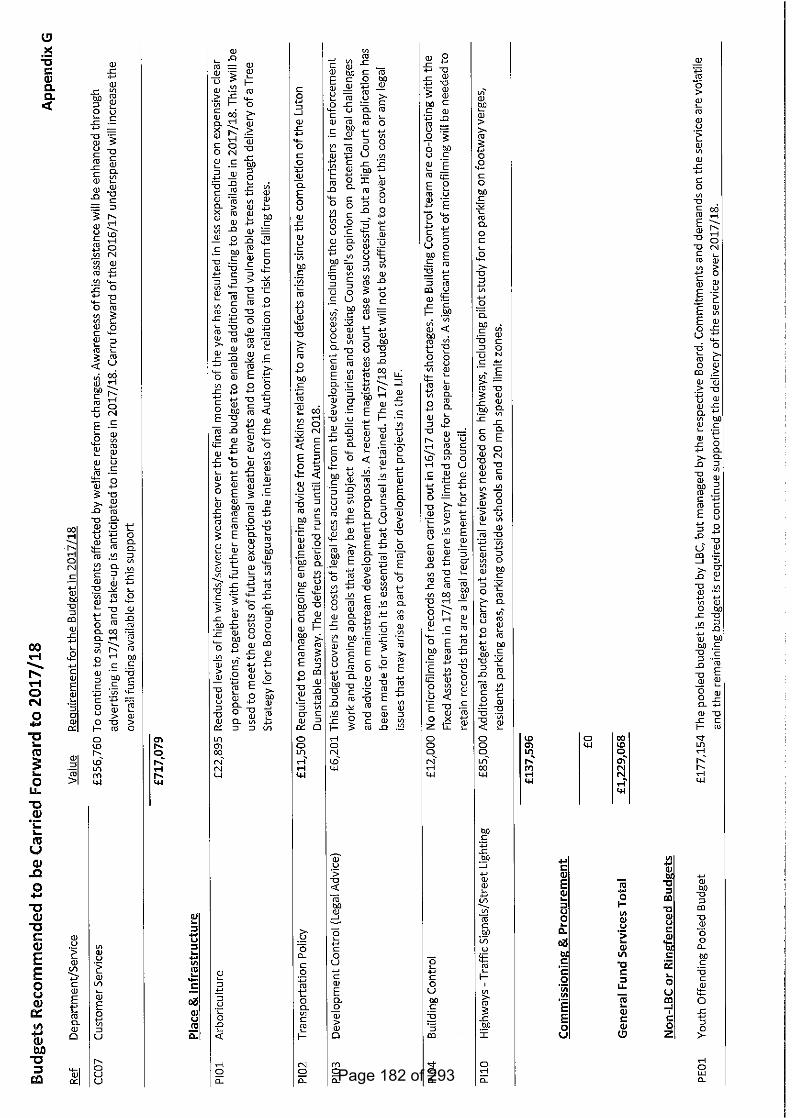
Page 182 of 293
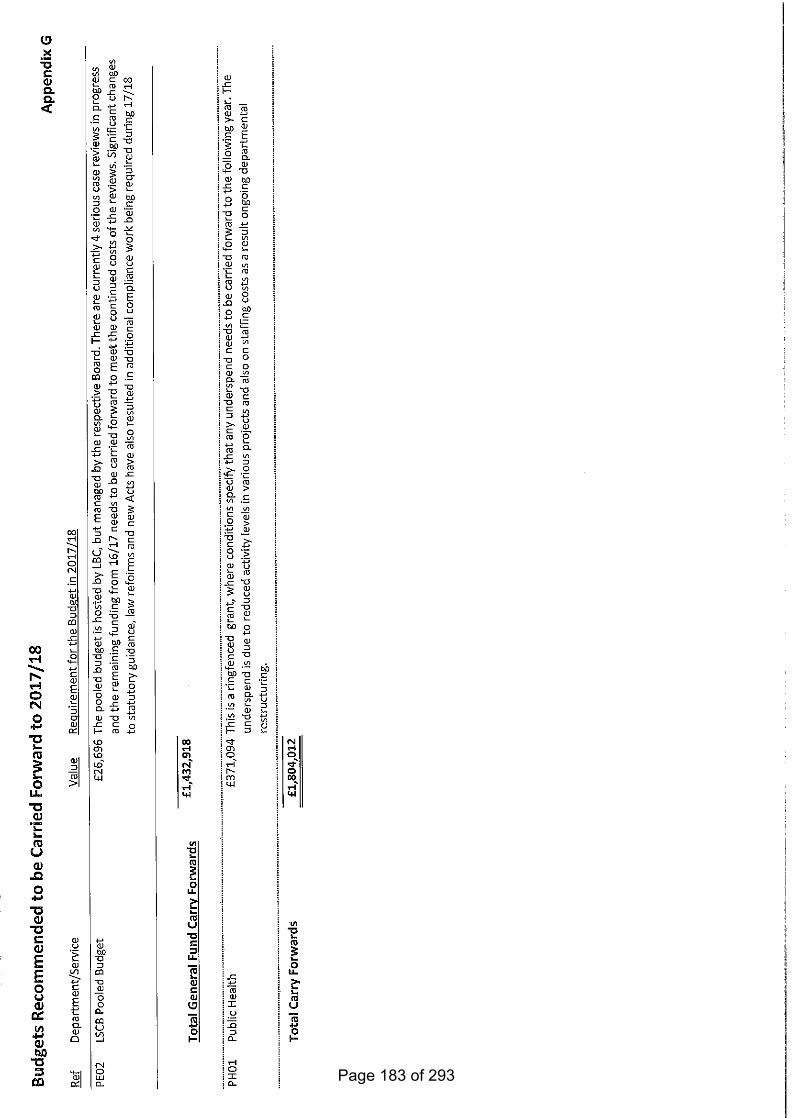
Page 183 of 293
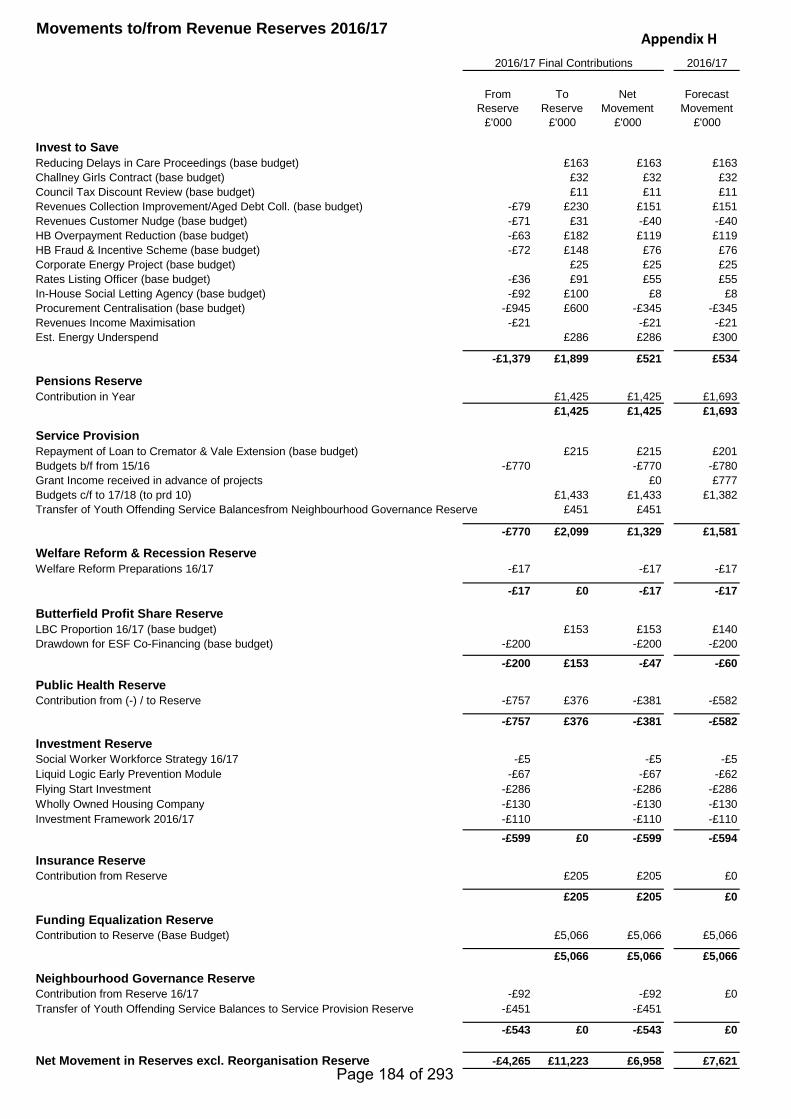
Appendix HMovements to/from Revenue Reserves 2016/17
2016/17
From Reserve
To Reserve
Net Movement
Forecast Movement
£'000 £'000 £'000 £'000
Invest to SaveReducing Delays in Care Proceedings (base budget) £163 £163 £163Challney Girls Contract (base budget) £32 £32 £32Council Tax Discount Review (base budget) £11 £11 £11Revenues Collection Improvement/Aged Debt Coll. (base budget) -£79 £230 £151 £151Revenues Customer Nudge (base budget) -£71 £31 -£40 -£40HB Overpayment Reduction (base budget) -£63 £182 £119 £119HB Fraud & Incentive Scheme (base budget) -£72 £148 £76 £76Corporate Energy Project (base budget) £25 £25 £25Rates Listing Officer (base budget) -£36 £91 £55 £55In-House Social Letting Agency (base budget) -£92 £100 £8 £8Procurement Centralisation (base budget) -£945 £600 -£345 -£345Revenues Income Maximisation -£21 -£21 -£21Est. Energy Underspend £286 £286 £300
-£1,379 £1,899 £521 £534
Pensions ReserveContribution in Year £1,425 £1,425 £1,693
£1,425 £1,425 £1,693
Service Provision Repayment of Loan to Cremator & Vale Extension (base budget) £215 £215 £201Budgets b/f from 15/16 -£770 -£770 -£780Grant Income received in advance of projects £0 £777Budgets c/f to 17/18 (to prd 10) £1,433 £1,433 £1,382Transfer of Youth Offending Service Balancesfrom Neighbourhood Governance Reserve £451 £451
-£770 £2,099 £1,329 £1,581
Welfare Reform & Recession ReserveWelfare Reform Preparations 16/17 -£17 -£17 -£17
-£17 £0 -£17 -£17
Butterfield Profit Share ReserveLBC Proportion 16/17 (base budget) £153 £153 £140Drawdown for ESF Co-Financing (base budget) -£200 -£200 -£200
-£200 £153 -£47 -£60
Public Health ReserveContribution from (-) / to Reserve -£757 £376 -£381 -£582
-£757 £376 -£381 -£582
Investment ReserveSocial Worker Workforce Strategy 16/17 -£5 -£5 -£5Liquid Logic Early Prevention Module -£67 -£67 -£62Flying Start Investment -£286 -£286 -£286Wholly Owned Housing Company -£130 -£130 -£130Investment Framework 2016/17 -£110 -£110 -£110
-£599 £0 -£599 -£594
Insurance ReserveContribution from Reserve £205 £205 £0
£205 £205 £0
Funding Equalization ReserveContribution to Reserve (Base Budget) £5,066 £5,066 £5,066
£5,066 £5,066 £5,066
Neighbourhood Governance ReserveContribution from Reserve 16/17 -£92 -£92 £0Transfer of Youth Offending Service Balances to Service Provision Reserve -£451 -£451
-£543 £0 -£543 £0
Net Movement in Reserves excl. Reorganisation Reserve -£4,265 £11,223 £6,958 £7,621
2016/17 Final Contributions
Page 184 of 293
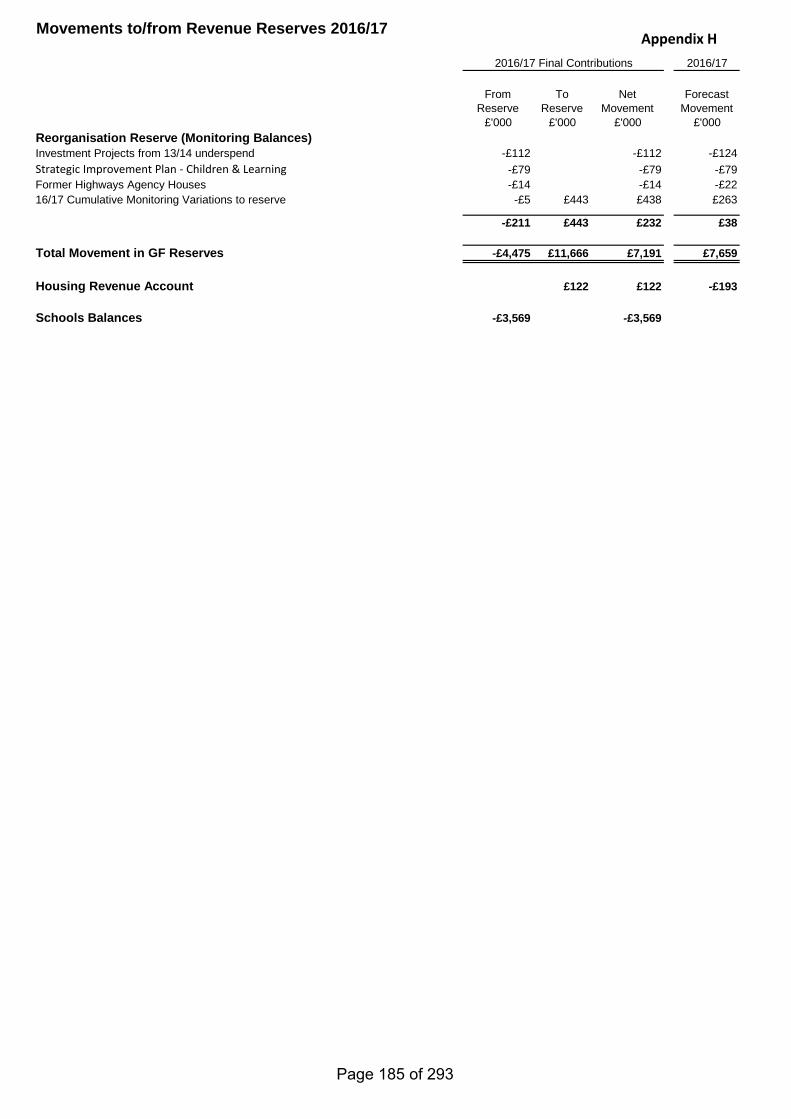
Appendix HMovements to/from Revenue Reserves 2016/17
2016/17
From Reserve
To Reserve
Net Movement
Forecast Movement
£'000 £'000 £'000 £'000
2016/17 Final Contributions
Reorganisation Reserve (Monitoring Balances)Investment Projects from 13/14 underspend -£112 -£112 -£124Strategic Improvement Plan - Children & Learning -£79 -£79 -£79Former Highways Agency Houses -£14 -£14 -£2216/17 Cumulative Monitoring Variations to reserve -£5 £443 £438 £263
-£211 £443 £232 £38
Total Movement in GF Reserves -£4,475 £11,666 £7,191 £7,659
Housing Revenue Account £122 £122 -£193
Schools Balances -£3,569 -£3,569
Page 185 of 293
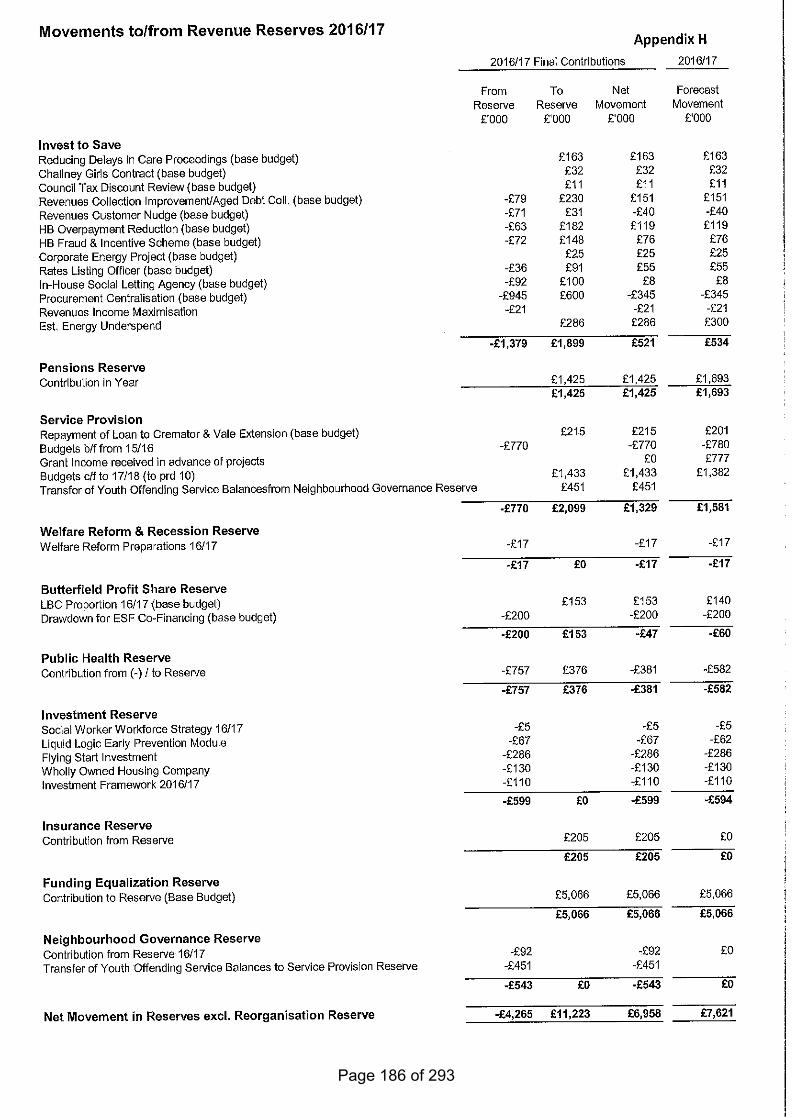
Page 186 of 293
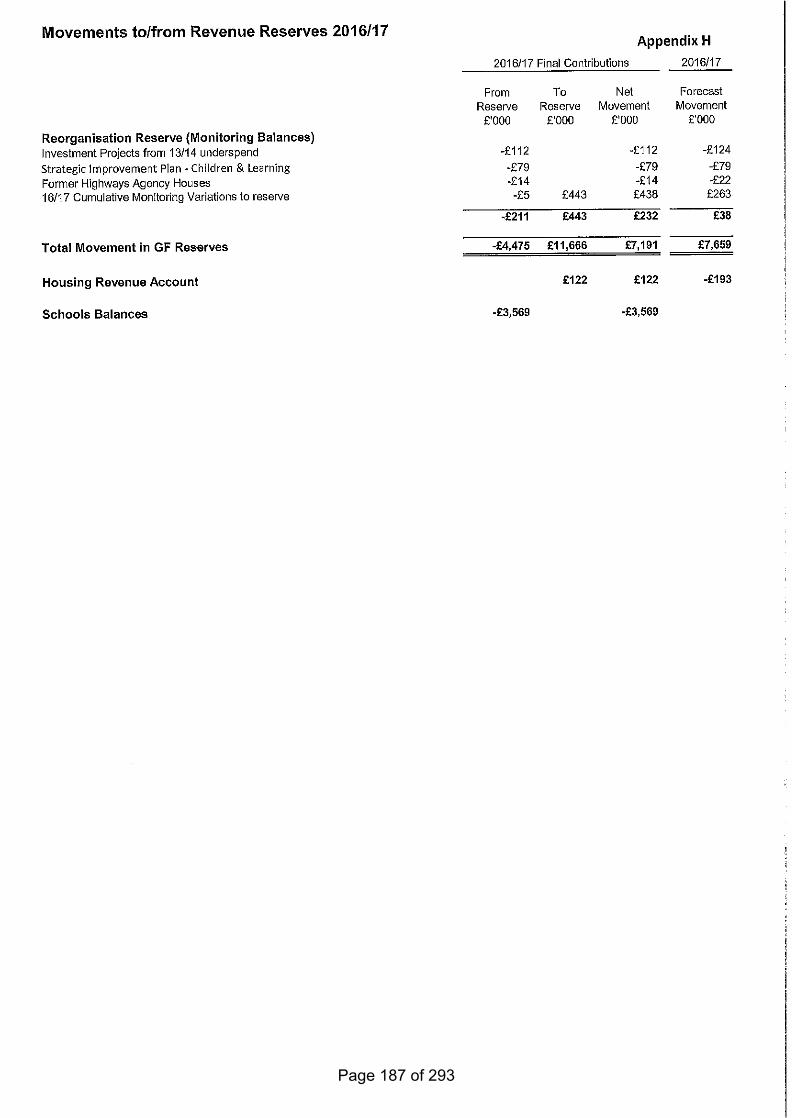
Page 187 of 293
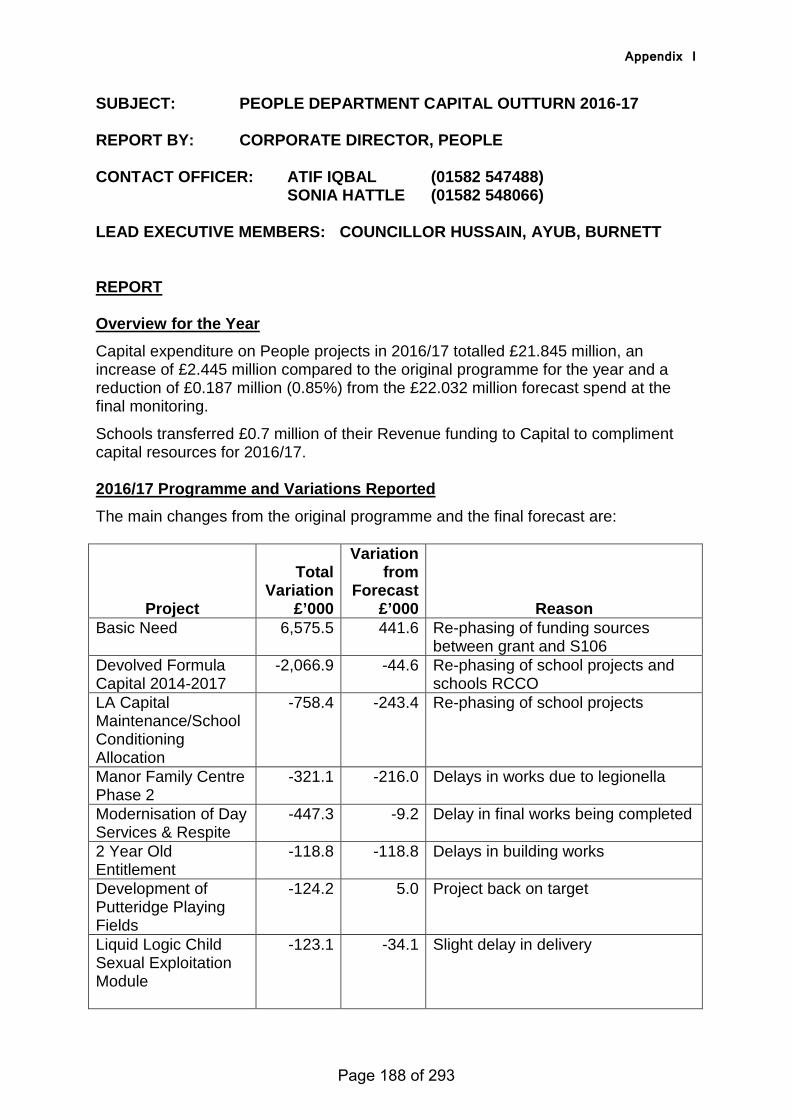
Appendix I
SUBJECT: PEOPLE DEPARTMENT CAPITAL OUTTURN 2016-17 REPORT BY: CORPORATE DIRECTOR, PEOPLE CONTACT OFFICER: ATIF IQBAL (01582 547488) SONIA HATTLE (01582 548066) LEAD EXECUTIVE MEMBERS: COUNCILLOR HUSSAIN, AYUB, BURNETT REPORT Overview for the Year
Capital expenditure on People projects in 2016/17 totalled £21.845 million, an increase of £2.445 million compared to the original programme for the year and a reduction of £0.187 million (0.85%) from the £22.032 million forecast spend at the final monitoring.
Schools transferred £0.7 million of their Revenue funding to Capital to compliment capital resources for 2016/17. 2016/17 Programme and Variations Reported
The main changes from the original programme and the final forecast are:
Project
Total Variation
£’000
Variation from
Forecast £’000 Reason
Basic Need 6,575.5 441.6 Re-phasing of funding sources between grant and S106
Devolved Formula Capital 2014-2017
-2,066.9 -44.6 Re-phasing of school projects and schools RCCO
LA Capital Maintenance/School Conditioning Allocation
-758.4 -243.4 Re-phasing of school projects
Manor Family Centre Phase 2
-321.1 -216.0 Delays in works due to legionella
Modernisation of Day Services & Respite
-447.3 -9.2 Delay in final works being completed
2 Year Old Entitlement
-118.8 -118.8 Delays in building works
Development of Putteridge Playing Fields
-124.2 5.0 Project back on target
Liquid Logic Child Sexual Exploitation Module
-123.1 -34.1 Slight delay in delivery
Page 188 of 293
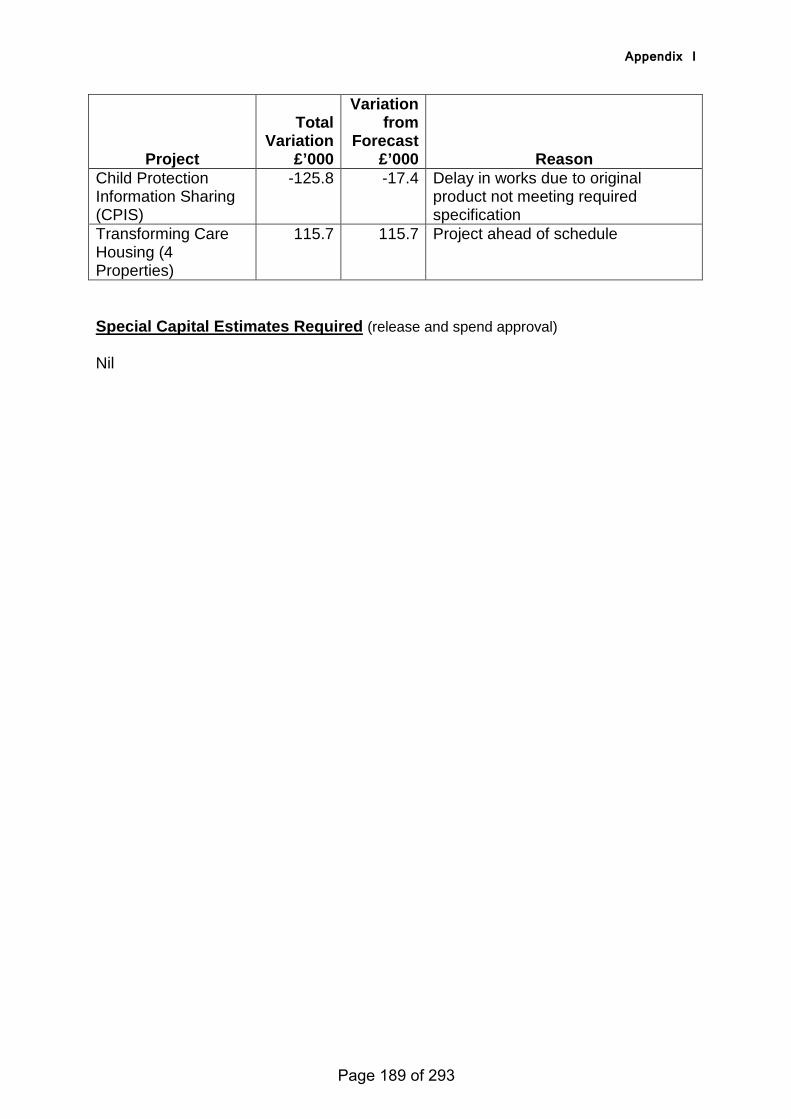
Appendix I
Project
Total Variation
£’000
Variation from
Forecast £’000 Reason
Child Protection Information Sharing (CPIS)
-125.8 -17.4 Delay in works due to original product not meeting required specification
Transforming Care Housing (4 Properties)
115.7 115.7 Project ahead of schedule
Special Capital Estimates Required (release and spend approval) Nil
Page 189 of 293
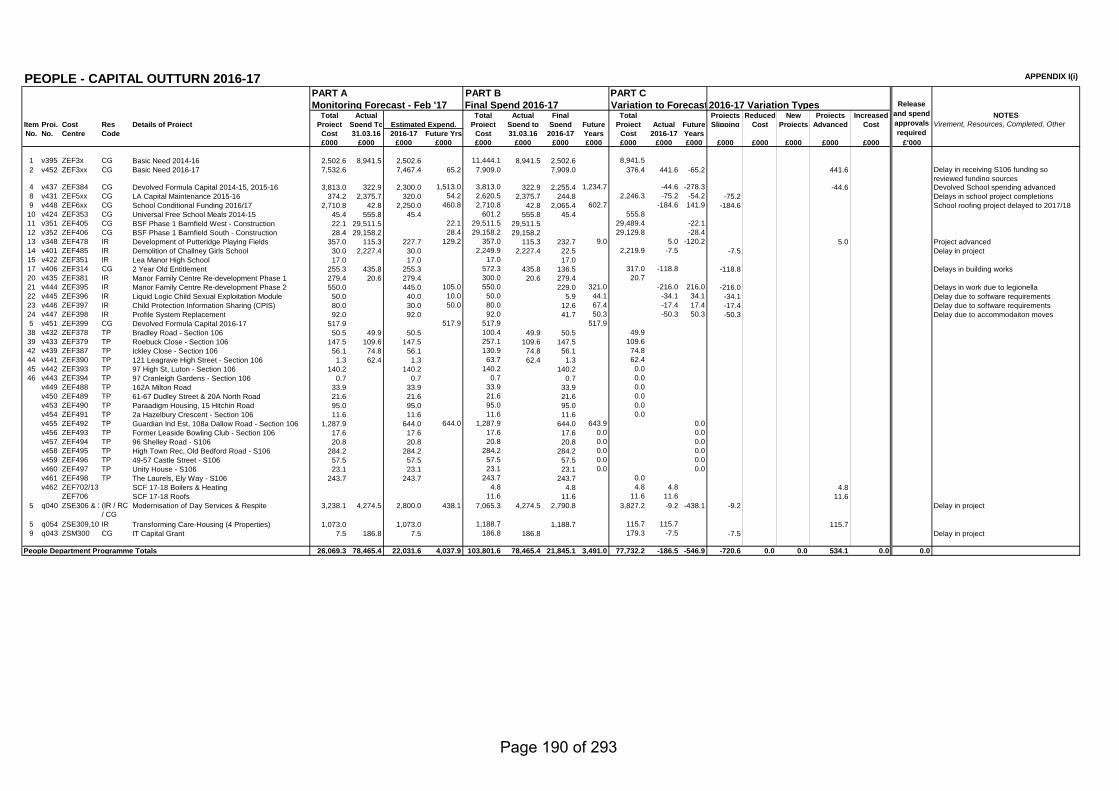
PEOPLE - CAPITAL OUTTURN 2016-17 APPENDIX I(i)
PART A PART B PART CMonitoring Forecast - Feb '17 Final Spend 2016-17 Variation to Forecast2016-17 Variation Types
Total Actual Total Actual Final Total Projects Reduced New Projects Increased NOTESItem Proj. Cost Res Details of Project Project Spend To Project Spend to Spend Future Project Actual Future Slipping Cost Projects Advanced CostNo. No. Centre Code Cost 31.03.16 2016-17 Future Yrs Cost 31.03.16 2016-17 Years Cost 2016-17 Years
£000 £000 £000 £000 £000 £000 £000 £000 £000 £000 £000 £000 £000 £000 £000 £000 £'000
1 v395 ZEF3x CG Basic Need 2014-16 2,502.6 8,941.5 2,502.6 0.0 11,444.1 8,941.5 2,502.6 0.0 8,941.5 0.0 0.02 v452 ZEF3xx CG Basic Need 2016-17 7,532.6 0.0 7,467.4 65.2 7,909.0 0.0 7,909.0 0.0 376.4 441.6 -65.2 441.6 Delay in receiving S106 funding so
reviewed funding sources4 v437 ZEF384 CG Devolved Formula Capital 2014-15, 2015-16 3,813.0 322.9 2,300.0 1,513.0 3,813.0 322.9 2,255.4 1,234.7 0.0 -44.6 -278.3 -44.6 Devolved School spending advanced8 v431 ZEF5xx CG LA Capital Maintenance 2015-16 374.2 2,375.7 320.0 54.2 2,620.5 2,375.7 244.8 0.0 2,246.3 -75.2 -54.2 -75.2 Delays in school project completions9 v448 ZEF6xx CG School Conditional Funding 2016/17 2,710.8 42.8 2,250.0 460.8 2,710.8 42.8 2,065.4 602.7 0.0 -184.6 141.9 -184.6 School roofing project delayed to 2017/18
10 v424 ZEF353 CG Universal Free School Meals 2014-15 45.4 555.8 45.4 0.0 601.2 555.8 45.4 0.0 555.8 0.0 0.011 v351 ZEF405 CG BSF Phase 1 Barnfield West - Construction 22.1 29,511.5 22.1 29,511.5 29,511.5 0.0 29,489.4 0.0 -22.112 v352 ZEF406 CG BSF Phase 1 Barnfield South - Construction 28.4 29,158.2 28.4 29,158.2 29,158.2 0.0 29,129.8 0.0 -28.413 v348 ZEF478 IR Development of Putteridge Playing Fields 357.0 115.3 227.7 129.2 357.0 115.3 232.7 9.0 0.0 5.0 -120.2 5.0 Project advanced14 v401 ZEF485 IR Demolition of Challney Girls School 30.0 2,227.4 30.0 0.0 2,249.9 2,227.4 22.5 0.0 2,219.9 -7.5 0.0 -7.5 Delay in project15 v422 ZEF351 IR Lea Manor High School 17.0 0.0 17.0 0.0 17.0 0.0 17.0 0.0 0.0 0.0 0.017 v406 ZEF314 CG 2 Year Old Entitlement 255.3 435.8 255.3 0.0 572.3 435.8 136.5 0.0 317.0 -118.8 0.0 -118.8 Delays in building works20 v435 ZEF381 IR Manor Family Centre Re-development Phase 1 279.4 20.6 279.4 0.0 300.0 20.6 279.4 0.0 20.7 0.0 0.021 v444 ZEF395 IR Manor Family Centre Re-development Phase 2 550.0 0.0 445.0 105.0 550.0 0.0 229.0 321.0 0.0 -216.0 216.0 -216.0 Delays in work due to legionella22 v445 ZEF396 IR Liquid Logic Child Sexual Exploitation Module 50.0 0.0 40.0 10.0 50.0 0.0 5.9 44.1 0.0 -34.1 34.1 -34.1 Delay due to software requirements23 v446 ZEF397 IR Child Protection Information Sharing (CPIS) 80.0 0.0 30.0 50.0 80.0 0.0 12.6 67.4 0.0 -17.4 17.4 -17.4 Delay due to software requirements24 v447 ZEF398 IR Profile System Replacement 92.0 0.0 92.0 0.0 92.0 0.0 41.7 50.3 0.0 -50.3 50.3 -50.3 Delay due to accommodaiton moves5 v451 ZEF399 CG Devolved Formula Capital 2016-17 517.9 0.0 517.9 517.9 0.0 0.0 517.9 0.0 0.0 0.0
38 v432 ZEF378 TP Bradley Road - Section 106 50.5 49.9 50.5 0.0 100.4 49.9 50.5 0.0 49.9 0.0 0.039 v433 ZEF379 TP Roebuck Close - Section 106 147.5 109.6 147.5 0.0 257.1 109.6 147.5 0.0 109.6 0.0 0.042 v439 ZEF387 TP Ickley Close - Section 106 56.1 74.8 56.1 0.0 130.9 74.8 56.1 0.0 74.8 0.0 0.044 v441 ZEF390 TP 121 Leagrave High Street - Section 106 1.3 62.4 1.3 0.0 63.7 62.4 1.3 0.0 62.4 0.0 0.045 v442 ZEF393 TP 97 High St, Luton - Section 106 140.2 0.0 140.2 0.0 140.2 0.0 140.2 0.0 0.0 0.0 0.046 v443 ZEF394 TP 97 Cranleigh Gardens - Section 106 0.7 0.0 0.7 0.0 0.7 0.0 0.7 0.0 0.0 0.0 0.0
v449 ZEF488 TP 162A Milton Road 33.9 0.0 33.9 0.0 33.9 0.0 33.9 0.0 0.0 0.0 0.0v450 ZEF489 TP 61-67 Dudley Street & 20A North Road 21.6 0.0 21.6 0.0 21.6 0.0 21.6 0.0 0.0 0.0 0.0v453 ZEF490 TP Paraadigm Housing, 15 Hitchin Road 95.0 0.0 95.0 0.0 95.0 0.0 95.0 0.0 0.0 0.0 0.0v454 ZEF491 TP 2a Hazelbury Crescent - Section 106 11.6 0.0 11.6 0.0 11.6 0.0 11.6 0.0 0.0 0.0 0.0v455 ZEF492 TP Guardian Ind Est, 108a Dallow Road - Section 106 1,287.9 0.0 644.0 644.0 1,287.9 0.0 644.0 643.9 0.0 0.0 0.0v456 ZEF493 TP Former Leaside Bowling Club - Section 106 17.6 0.0 17.6 0.0 17.6 0.0 17.6 0.0 0.0 0.0 0.0v457 ZEF494 TP 96 Shelley Road - S106 20.8 0.0 20.8 0.0 20.8 0.0 20.8 0.0 0.0 0.0 0.0v458 ZEF495 TP High Town Rec, Old Bedford Road - S106 284.2 0.0 284.2 0.0 284.2 0.0 284.2 0.0 0.0 0.0 0.0v459 ZEF496 TP 49-57 Castle Street - S106 57.5 0.0 57.5 0.0 57.5 0.0 57.5 0.0 0.0 0.0 0.0v460 ZEF497 TP Unity House - S106 23.1 0.0 23.1 0.0 23.1 0.0 23.1 0.0 0.0 0.0 0.0v461 ZEF498 TP The Laurels, Ely Way - S106 243.7 0.0 243.7 0.0 243.7 0.0 243.7 0.0 0.0 0.0 0.0v462 ZEF702/13 SCF 17-18 Boilers & Heating 0.0 4.8 0.0 4.8 0.0 4.8 4.8 0.0 4.8
ZEF706 SCF 17-18 Roofs 0.0 11.6 0.0 11.6 0.0 11.6 11.6 0.0 11.65 q040 ZSE306 & 3 (IR / RC
/ CGModernisation of Day Services & Respite 3,238.1 4,274.5 2,800.0 438.1 7,065.3 4,274.5 2,790.8 0.0 3,827.2 -9.2 -438.1 -9.2 Delay in project
5 q054 ZSE309,10 IR Transforming Care-Housing (4 Properties) 1,073.0 0.0 1,073.0 0.0 1,188.7 0.0 1,188.7 0.0 115.7 115.7 0.0 115.79 q043 ZSM300 CG IT Capital Grant 7.5 186.8 7.5 0.0 186.8 186.8 0.0 179.3 -7.5 0.0 -7.5 Delay in project
People Department Programme Totals 26,069.3 78,465.4 22,031.6 4,037.9 103,801.6 78,465.4 21,845.1 3,491.0 77,732.2 -186.5 -546.9 -720.6 0.0 0.0 534.1 0.0 0.0
Estimated Expend.
Release and spend approvals required
Virement, Resources, Completed, Other
Page 190 of 293
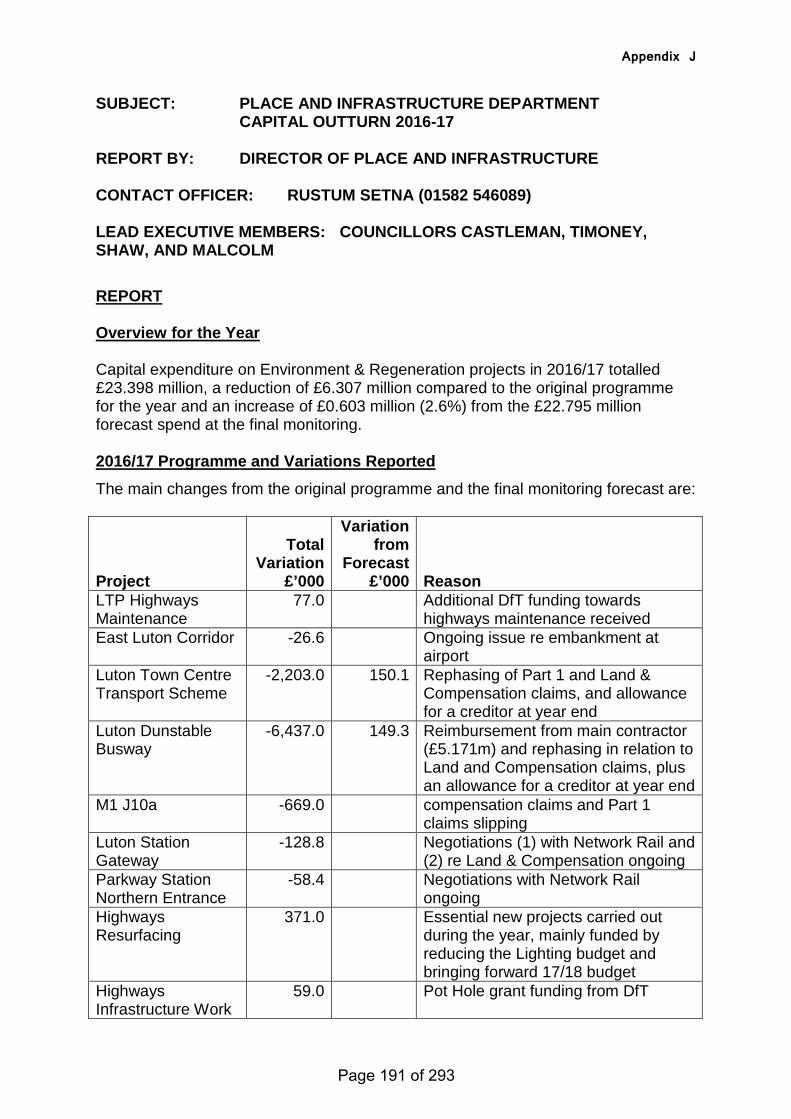
Appendix J
SUBJECT: PLACE AND INFRASTRUCTURE DEPARTMENT CAPITAL OUTTURN 2016-17
REPORT BY: DIRECTOR OF PLACE AND INFRASTRUCTURE CONTACT OFFICER: RUSTUM SETNA (01582 546089) LEAD EXECUTIVE MEMBERS: COUNCILLORS CASTLEMAN, TIMONEY, SHAW, AND MALCOLM
REPORT Overview for the Year Capital expenditure on Environment & Regeneration projects in 2016/17 totalled £23.398 million, a reduction of £6.307 million compared to the original programme for the year and an increase of £0.603 million (2.6%) from the £22.795 million forecast spend at the final monitoring. 2016/17 Programme and Variations Reported
The main changes from the original programme and the final monitoring forecast are:
Project
Total Variation
£’000
Variation from
Forecast £’000 Reason
LTP Highways Maintenance
77.0 Additional DfT funding towards highways maintenance received
East Luton Corridor -26.6 Ongoing issue re embankment at airport
Luton Town Centre Transport Scheme
-2,203.0 150.1 Rephasing of Part 1 and Land & Compensation claims, and allowance for a creditor at year end
Luton Dunstable Busway
-6,437.0 149.3 Reimbursement from main contractor (£5.171m) and rephasing in relation to Land and Compensation claims, plus an allowance for a creditor at year end
M1 J10a -669.0 compensation claims and Part 1 claims slipping
Luton Station Gateway
-128.8 Negotiations (1) with Network Rail and (2) re Land & Compensation ongoing
Parkway Station Northern Entrance
-58.4 Negotiations with Network Rail ongoing
Highways Resurfacing
371.0 Essential new projects carried out during the year, mainly funded by reducing the Lighting budget and bringing forward 17/18 budget
Highways Infrastructure Work
59.0 Pot Hole grant funding from DfT
Page 191 of 293
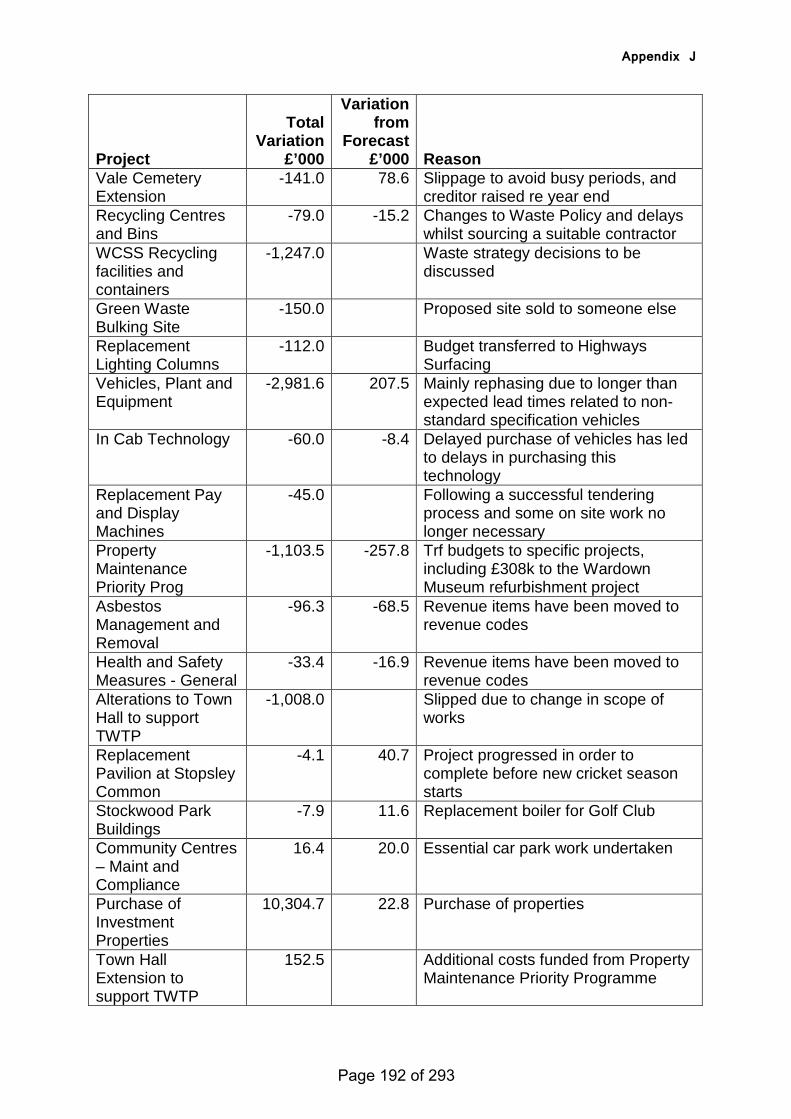
Appendix J
Project
Total Variation
£’000
Variation from
Forecast £’000 Reason
Vale Cemetery Extension
-141.0 78.6 Slippage to avoid busy periods, and creditor raised re year end
Recycling Centres and Bins
-79.0 -15.2 Changes to Waste Policy and delays whilst sourcing a suitable contractor
WCSS Recycling facilities and containers
-1,247.0 Waste strategy decisions to be discussed
Green Waste Bulking Site
-150.0 Proposed site sold to someone else
Replacement Lighting Columns
-112.0 Budget transferred to Highways Surfacing
Vehicles, Plant and Equipment
-2,981.6 207.5 Mainly rephasing due to longer than expected lead times related to non-standard specification vehicles
In Cab Technology -60.0 -8.4 Delayed purchase of vehicles has led to delays in purchasing this technology
Replacement Pay and Display Machines
-45.0 Following a successful tendering process and some on site work no longer necessary
Property Maintenance Priority Prog
-1,103.5 -257.8 Trf budgets to specific projects, including £308k to the Wardown Museum refurbishment project
Asbestos Management and Removal
-96.3 -68.5 Revenue items have been moved to revenue codes
Health and Safety Measures - General
-33.4 -16.9 Revenue items have been moved to revenue codes
Alterations to Town Hall to support TWTP
-1,008.0 Slipped due to change in scope of works
Replacement Pavilion at Stopsley Common
-4.1 40.7 Project progressed in order to complete before new cricket season starts
Stockwood Park Buildings
-7.9 11.6 Replacement boiler for Golf Club
Community Centres – Maint and Compliance
16.4 20.0 Essential car park work undertaken
Purchase of Investment Properties
10,304.7 22.8 Purchase of properties
Town Hall Extension to support TWTP
152.5 Additional costs funded from Property Maintenance Priority Programme
Page 192 of 293
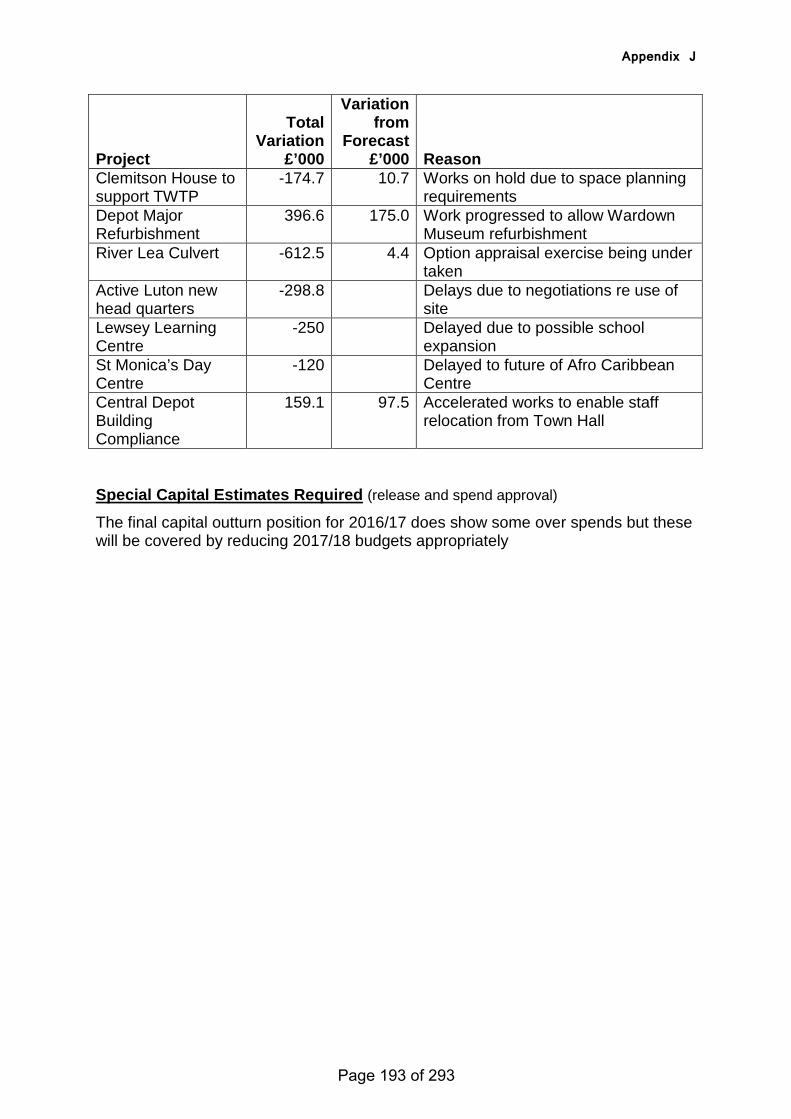
Appendix J
Project
Total Variation
£’000
Variation from
Forecast £’000 Reason
Clemitson House to support TWTP
-174.7 10.7 Works on hold due to space planning requirements
Depot Major Refurbishment
396.6 175.0 Work progressed to allow Wardown Museum refurbishment
River Lea Culvert -612.5 4.4 Option appraisal exercise being under taken
Active Luton new head quarters
-298.8 Delays due to negotiations re use of site
Lewsey Learning Centre
-250 Delayed due to possible school expansion
St Monica’s Day Centre
-120 Delayed to future of Afro Caribbean Centre
Central Depot Building Compliance
159.1 97.5 Accelerated works to enable staff relocation from Town Hall
Special Capital Estimates Required (release and spend approval)
The final capital outturn position for 2016/17 does show some over spends but these will be covered by reducing 2017/18 budgets appropriately
Page 193 of 293
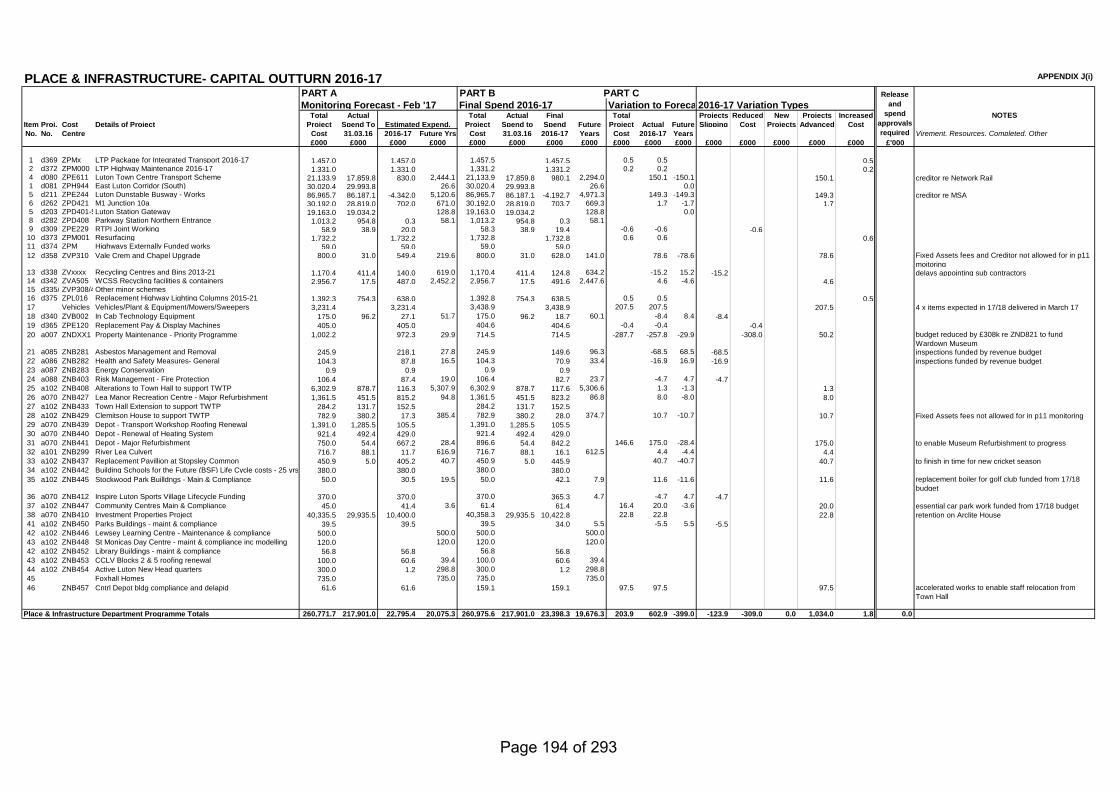
PLACE & INFRASTRUCTURE- CAPITAL OUTTURN 2016-17 APPENDIX J(i)
PART A PART B PART CMonitoring Forecast - Feb '17 Final Spend 2016-17 Variation to Foreca 2016-17 Variation Types
Total Actual Total Actual Final Total Projects Reduced New Projects Increased NOTESItem Proj. Cost Details of Project Project Spend To Project Spend to Spend Future Project Actual Future Slipping Cost Projects Advanced CostNo. No. Centre Cost 31.03.16 2016-17 Future Yrs Cost 31.03.16 2016-17 Years Cost 2016-17 Years Virement, Resources, Completed, Other
£000 £000 £000 £000 £000 £000 £000 £000 £000 £000 £000 £000 £000 £000 £000 £000 £'000
1 d369 ZPMx LTP Package for Integrated Transport 2016-17 1,457.0 1,457.0 0.0 1,457.5 0.0 1,457.5 0.0 0.5 0.5 0.0 0.52 d372 ZPM000 LTP Highway Maintenance 2016-17 1,331.0 1,331.0 0.0 1,331.2 0.0 1,331.2 0.0 0.2 0.2 0.0 0.24 d080 ZPE611 Luton Town Centre Transport Scheme 21,133.9 17,859.8 830.0 2,444.1 21,133.9 17,859.8 980.1 2,294.0 0.0 150.1 -150.1 150.1 creditor re Network Rail1 d081 ZPH944 East Luton Corridor (South) 30,020.4 29,993.8 26.6 30,020.4 29,993.8 26.6 0.0 0.0 0.05 d211 ZPE244 Luton Dunstable Busway - Works 86,965.7 86,187.1 -4,342.0 5,120.6 86,965.7 86,187.1 -4,192.7 4,971.3 0.0 149.3 -149.3 149.3 creditor re MSA6 d262 ZPD421 M1 Junction 10a 30,192.0 28,819.0 702.0 671.0 30,192.0 28,819.0 703.7 669.3 0.0 1.7 -1.7 1.75 d203 ZPD401-5Luton Station Gateway 19,163.0 19,034.2 128.8 19,163.0 19,034.2 128.8 0.0 0.0 0.08 d282 ZPD408 Parkway Station Northern Entrance 1,013.2 954.8 0.3 58.1 1,013.2 954.8 0.3 58.1 0.0 0.0 0.09 d309 ZPE229 RTPI Joint Working 58.9 38.9 20.0 0.0 58.3 38.9 19.4 -0.6 -0.6 0.0 -0.6
10 d373 ZPM001 Resurfacing 1,732.2 0.0 1,732.2 0.0 1,732.8 0.0 1,732.8 0.0 0.6 0.6 0.0 0.611 d374 ZPM Highways Externally Funded works 59.0 0.0 59.0 0.0 59.0 0.0 59.0 0.0 0.0 0.0 0.012 d358 ZVP310 Vale Crem and Chapel Upgrade 800.0 31.0 549.4 219.6 800.0 31.0 628.0 141.0 0.0 78.6 -78.6 78.6 Fixed Assets fees and Creditor not allowed for in p11
moitoring13 d338 ZVxxxx Recycling Centres and Bins 2013-21 1,170.4 411.4 140.0 619.0 1,170.4 411.4 124.8 634.2 0.0 -15.2 15.2 -15.2 delays appointing sub contractors14 d342 ZVA505 WCSS Recycling facilities & containers 2,956.7 17.5 487.0 2,452.2 2,956.7 17.5 491.6 2,447.6 0.0 4.6 -4.6 4.615 d335/ ZVP308/4Other minor schemes 0.0 0.0 0.0 0.0 0.0 0.0 0.016 d375 ZPL016 Replacement Highway Lighting Columns 2015-21 1,392.3 754.3 638.0 0.0 1,392.8 754.3 638.5 0.0 0.5 0.5 0.0 0.517 Vehicles Vehicles/Plant & Equipment/Mowers/Sweepers 3,231.4 3,231.4 0.0 3,438.9 0.0 3,438.9 0.0 207.5 207.5 0.0 207.5 4 x items expected in 17/18 delivered in March 1718 d340 ZVB002 In Cab Technology Equipment 175.0 96.2 27.1 51.7 175.0 96.2 18.7 60.1 0.0 -8.4 8.4 -8.419 d365 ZPE120 Replacement Pay & Display Machines 405.0 0.0 405.0 0.0 404.6 0.0 404.6 -0.4 -0.4 0.0 -0.420 a007 ZNDXX1 Property Maintenance - Priority Programme 1,002.2 0.0 972.3 29.9 714.5 0.0 714.5 -287.7 -257.8 -29.9 -308.0 50.2 budget reduced by £308k re ZND821 to fund
Wardown Museum21 a085 ZNB281 Asbestos Management and Removal 245.9 0.0 218.1 27.8 245.9 0.0 149.6 96.3 0.0 -68.5 68.5 -68.5 inspections funded by revenue budget22 a086 ZNB282 Health and Safety Measures- General 104.3 0.0 87.8 16.5 104.3 0.0 70.9 33.4 0.0 -16.9 16.9 -16.9 inspections funded by revenue budget23 a087 ZNB283 Energy Conservation 0.9 0.0 0.9 0.0 0.9 0.0 0.9 0.0 0.0 0.0 0.024 a088 ZNB403 Risk Management - Fire Protection 106.4 0.0 87.4 19.0 106.4 0.0 82.7 23.7 0.0 -4.7 4.7 -4.725 a102 ZNB408 Alterations to Town Hall to support TWTP 6,302.9 878.7 116.3 5,307.9 6,302.9 878.7 117.6 5,306.6 0.0 1.3 -1.3 1.326 a070 ZNB427 Lea Manor Recreation Centre - Major Refurbishment 1,361.5 451.5 815.2 94.8 1,361.5 451.5 823.2 86.8 0.0 8.0 -8.0 8.027 a102 ZNB433 Town Hall Extension to support TWTP 284.2 131.7 152.5 0.0 284.2 131.7 152.5 0.0 0.0 0.0 0.028 a102 ZNB429 Clemitson House to support TWTP 782.9 380.2 17.3 385.4 782.9 380.2 28.0 374.7 0.0 10.7 -10.7 10.7 Fixed Assets fees not allowed for in p11 monitoring29 a070 ZNB439 Depot - Transport Workshop Roofing Renewal 1,391.0 1,285.5 105.5 0.0 1,391.0 1,285.5 105.5 0.0 0.0 0.0 0.030 a070 ZNB440 Depot - Renewal of Heating System 921.4 492.4 429.0 0.0 921.4 492.4 429.0 0.0 0.0 0.0 0.031 a070 ZNB441 Depot - Major Refurbishment 750.0 54.4 667.2 28.4 896.6 54.4 842.2 0.0 146.6 175.0 -28.4 175.0 to enable Museum Refurbishment to progress32 a101 ZNB299 River Lea Culvert 716.7 88.1 11.7 616.9 716.7 88.1 16.1 612.5 0.0 4.4 -4.4 4.433 a102 ZNB437 Replacement Pavillion at Stopsley Common 450.9 5.0 405.2 40.7 450.9 5.0 445.9 0.0 0.0 40.7 -40.7 40.7 to finish in time for new cricket season34 a102 ZNB442 Building Schools for the Future (BSF) Life Cycle costs - 25 yrs 380.0 380.0 0.0 380.0 0.0 380.0 0.0 0.0 0.0 0.035 a102 ZNB445 Stockwood Park Builldngs - Main & Compliance 50.0 30.5 19.5 50.0 0.0 42.1 7.9 0.0 11.6 -11.6 11.6 replacement boiler for golf club funded from 17/18
budget36 a070 ZNB412 Inspire Luton Sports Village Lifecycle Funding 370.0 370.0 0.0 370.0 0.0 365.3 4.7 0.0 -4.7 4.7 -4.737 a102 ZNB447 Community Centres Main & Compliance 45.0 41.4 3.6 61.4 0.0 61.4 0.0 16.4 20.0 -3.6 20.0 essential car park work funded from 17/18 budget38 a070 ZNB410 Investment Properties Project 40,335.5 29,935.5 10,400.0 0.0 40,358.3 29,935.5 10,422.8 0.0 22.8 22.8 0.0 22.8 retention on Arclite House41 a102 ZNB450 Parks Buildings - maint & compliance 39.5 39.5 0.0 39.5 0.0 34.0 5.5 0.0 -5.5 5.5 -5.542 a102 ZNB446 Lewsey Learning Centre - Maintenance & compliance 500.0 500.0 500.0 500.0 0.0 0.0 0.043 a102 ZNB448 St Monicas Day Centre - maint & compliance inc modelling 120.0 120.0 120.0 120.0 0.0 0.0 0.042 a102 ZNB452 Library Buildings - maint & compliance 56.8 56.8 0.0 56.8 0.0 56.8 0.0 0.0 0.0 0.043 a102 ZNB453 CCLV Blocks 2 & 5 roofing renewal 100.0 60.6 39.4 100.0 0.0 60.6 39.4 0.0 0.0 0.044 a102 ZNB454 Active Luton New Head quarters 300.0 1.2 298.8 300.0 0.0 1.2 298.8 0.0 0.0 0.045 Foxhall Homes 735.0 735.0 735.0 735.0 0.0 0.0 0.046 ZNB457 Cntrl Depot bldg compliance and delapid 61.6 61.6 159.1 0.0 159.1 0.0 97.5 97.5 0.0 97.5 accelerated works to enable staff relocation from
Town Hall
Place & Infrastructure Department Programme Totals 260,771.7 217,901.0 22,795.4 20,075.3 260,975.6 217,901.0 23,398.3 19,676.3 203.9 602.9 -399.0 -123.9 -309.0 0.0 1,034.0 1.8 0.0
Estimated Expend.
Release and
spend approvals required
Page 194 of 293
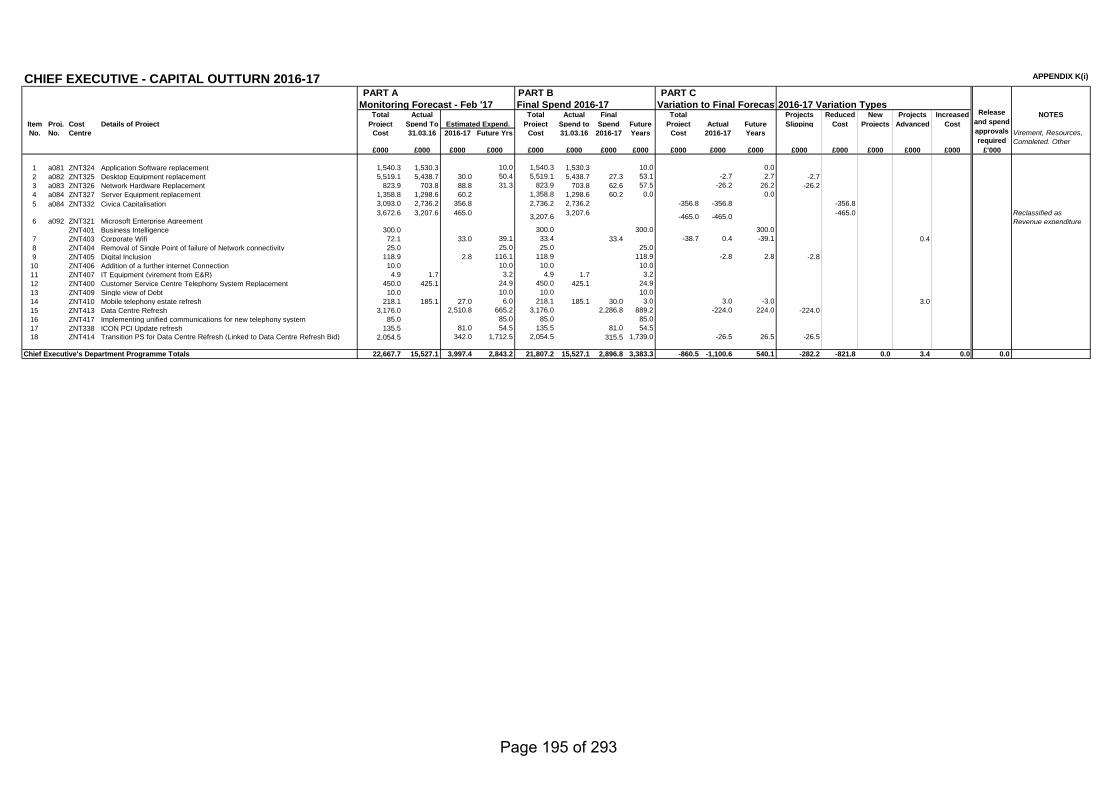
CHIEF EXECUTIVE - CAPITAL OUTTURN 2016-17 APPENDIX K(i)
PART A PART B PART CMonitoring Forecast - Feb '17 Final Spend 2016-17 Variation to Final Forecast2016-17 Variation Types
Total Actual Total Actual Final Total Projects Reduced New Projects Increased NOTESItem Proj. Cost Details of Project Project Spend To Project Spend to Spend Future Project Actual Future Slipping Cost Projects Advanced CostNo. No. Centre Cost 31.03.16 2016-17 Future Yrs Cost 31.03.16 2016-17 Years Cost 2016-17 Years Virement, Resources,
Completed, Other£000 £000 £000 £000 £000 £000 £000 £000 £000 £000 £000 £000 £000 £000 £000 £000 £'000
1 a081 ZNT324 Application Software replacement 1,540.3 1,530.3 10.0 1,540.3 1,530.3 10.0 0.0 0.0 0.02 a082 ZNT325 Desktop Equipment replacement 5,519.1 5,438.7 30.0 50.4 5,519.1 5,438.7 27.3 53.1 0.0 -2.7 2.7 -2.73 a083 ZNT326 Network Hardware Replacement 823.9 703.8 88.8 31.3 823.9 703.8 62.6 57.5 0.0 -26.2 26.2 -26.24 a084 ZNT327 Server Equipment replacement 1,358.8 1,298.6 60.2 0.0 1,358.8 1,298.6 60.2 0.0 0.0 0.0 0.05 a084 ZNT332 Civica Capitalisation 3,093.0 2,736.2 356.8 0.0 2,736.2 2,736.2 0.0 -356.8 -356.8 0.0 -356.8
6 a092 ZNT321 Microsoft Enterprise Agreement 3,672.6 3,207.6 465.0 0.0 3,207.6 3,207.6 0.0 -465.0 -465.0 0.0 -465.0 Reclassified as
Revenue expenditureZNT401 Business Intelligence 300.0 300.0 0.0 300.0 0.0 0.0 300.0
7 ZNT403 Corporate Wifi 72.1 33.0 39.1 33.4 0.0 33.4 -38.7 0.4 -39.1 0.48 ZNT404 Removal of Single Point of failure of Network connectivity 25.0 25.0 25.0 25.0 0.0 0.0 0.09 ZNT405 Digital Inclusion 118.9 0.0 2.8 116.1 118.9 0.0 0.0 118.9 0.0 -2.8 2.8 -2.8
10 ZNT406 Addition of a further internet Connection 10.0 10.0 10.0 0.0 10.0 0.0 0.0 0.011 ZNT407 IT Equipment (virement from E&R) 4.9 1.7 3.2 4.9 1.7 3.2 0.0 0.0 0.012 ZNT400 Customer Service Centre Telephony System Replacement 450.0 425.1 24.9 450.0 425.1 24.9 0.0 0.0 0.013 ZNT409 Single view of Debt 10.0 10.0 10.0 10.0 0.0 0.0 0.014 ZNT410 Mobile telephony estate refresh 218.1 185.1 27.0 6.0 218.1 185.1 30.0 3.0 0.0 3.0 -3.0 3.015 ZNT413 Data Centre Refresh 3,176.0 0.0 2,510.8 665.2 3,176.0 0.0 2,286.8 889.2 0.0 -224.0 224.0 -224.016 ZNT417 Implementing unified communications for new telephony system 85.0 85.0 85.0 85.0 0.0 0.0 0.017 ZNT338 ICON PCI Update refresh 135.5 81.0 54.5 135.5 0.0 81.0 54.5 0.0 0.0 0.018 ZNT414 Transition PS for Data Centre Refresh (Linked to Data Centre Refresh Bid) 2,054.5 342.0 1,712.5 2,054.5 0.0 315.5 1,739.0 0.0 -26.5 26.5 -26.5
Chief Executive's Department Programme Totals 22,667.7 15,527.1 3,997.4 2,843.2 21,807.2 15,527.1 2,896.8 3,383.3 -860.5 -1,100.6 540.1 -282.2 -821.8 0.0 3.4 0.0 0.0
Estimated Expend.Release
and spend approvals required
Page 195 of 293
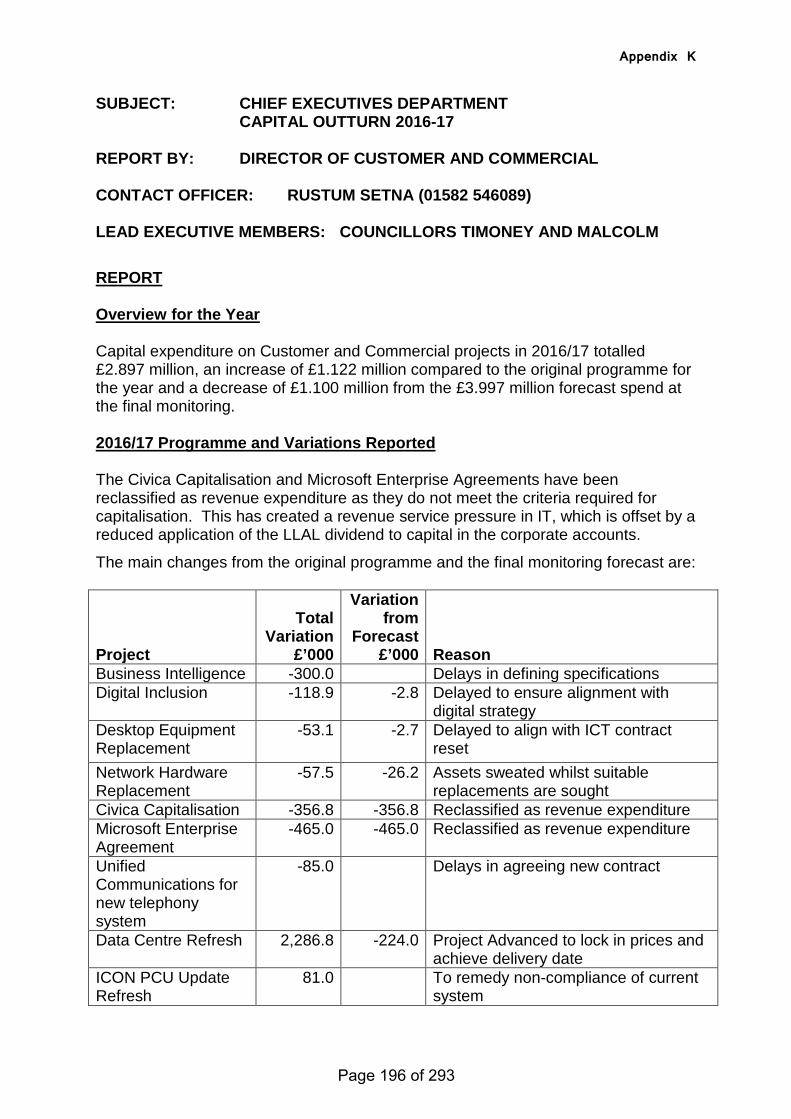
Appendix K
SUBJECT: CHIEF EXECUTIVES DEPARTMENT CAPITAL OUTTURN 2016-17
REPORT BY: DIRECTOR OF CUSTOMER AND COMMERCIAL CONTACT OFFICER: RUSTUM SETNA (01582 546089) LEAD EXECUTIVE MEMBERS: COUNCILLORS TIMONEY AND MALCOLM
REPORT Overview for the Year Capital expenditure on Customer and Commercial projects in 2016/17 totalled £2.897 million, an increase of £1.122 million compared to the original programme for the year and a decrease of £1.100 million from the £3.997 million forecast spend at the final monitoring. 2016/17 Programme and Variations Reported The Civica Capitalisation and Microsoft Enterprise Agreements have been reclassified as revenue expenditure as they do not meet the criteria required for capitalisation. This has created a revenue service pressure in IT, which is offset by a reduced application of the LLAL dividend to capital in the corporate accounts.
The main changes from the original programme and the final monitoring forecast are:
Project
Total Variation
£’000
Variation from
Forecast £’000 Reason
Business Intelligence -300.0 Delays in defining specifications Digital Inclusion -118.9 -2.8 Delayed to ensure alignment with
digital strategy Desktop Equipment Replacement
-53.1 -2.7 Delayed to align with ICT contract reset
Network Hardware Replacement
-57.5 -26.2 Assets sweated whilst suitable replacements are sought
Civica Capitalisation -356.8 -356.8 Reclassified as revenue expenditure Microsoft Enterprise Agreement
-465.0 -465.0 Reclassified as revenue expenditure
Unified Communications for new telephony system
-85.0 Delays in agreeing new contract
Data Centre Refresh 2,286.8 -224.0 Project Advanced to lock in prices and achieve delivery date
ICON PCU Update Refresh
81.0 To remedy non-compliance of current system
Page 196 of 293
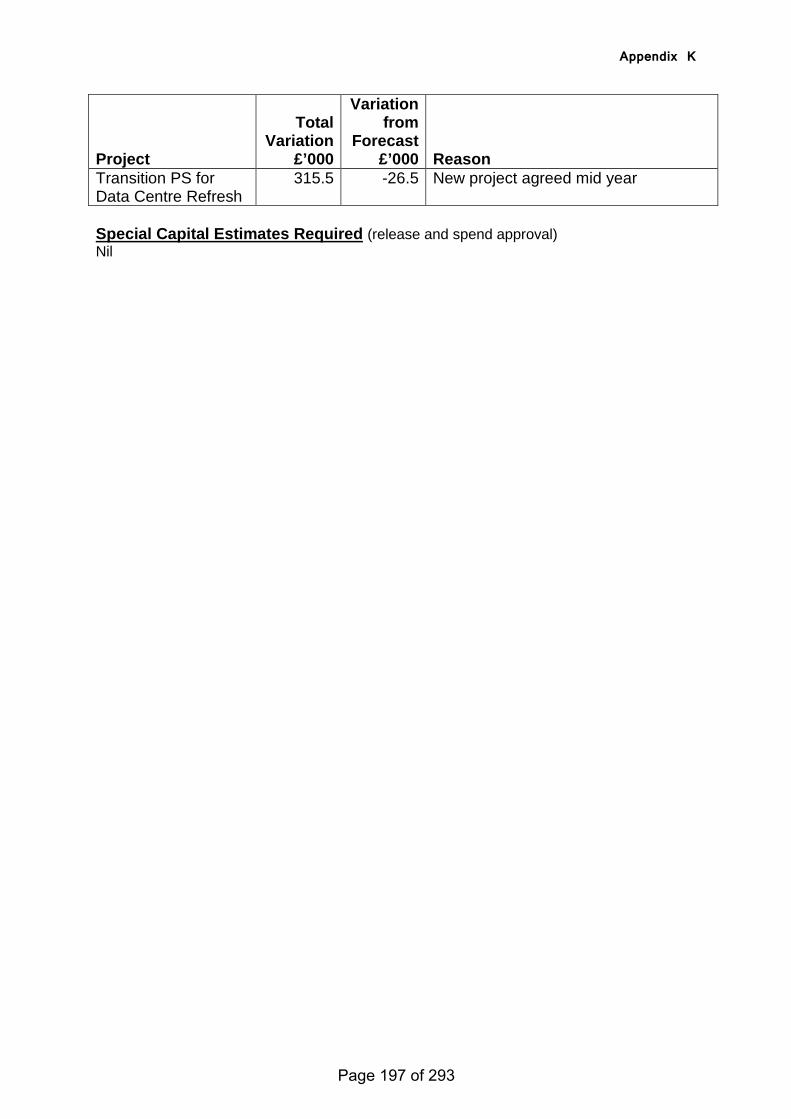
Appendix K
Project
Total Variation
£’000
Variation from
Forecast £’000 Reason
Transition PS for Data Centre Refresh
315.5 -26.5 New project agreed mid year
Special Capital Estimates Required (release and spend approval) Nil
Page 197 of 293
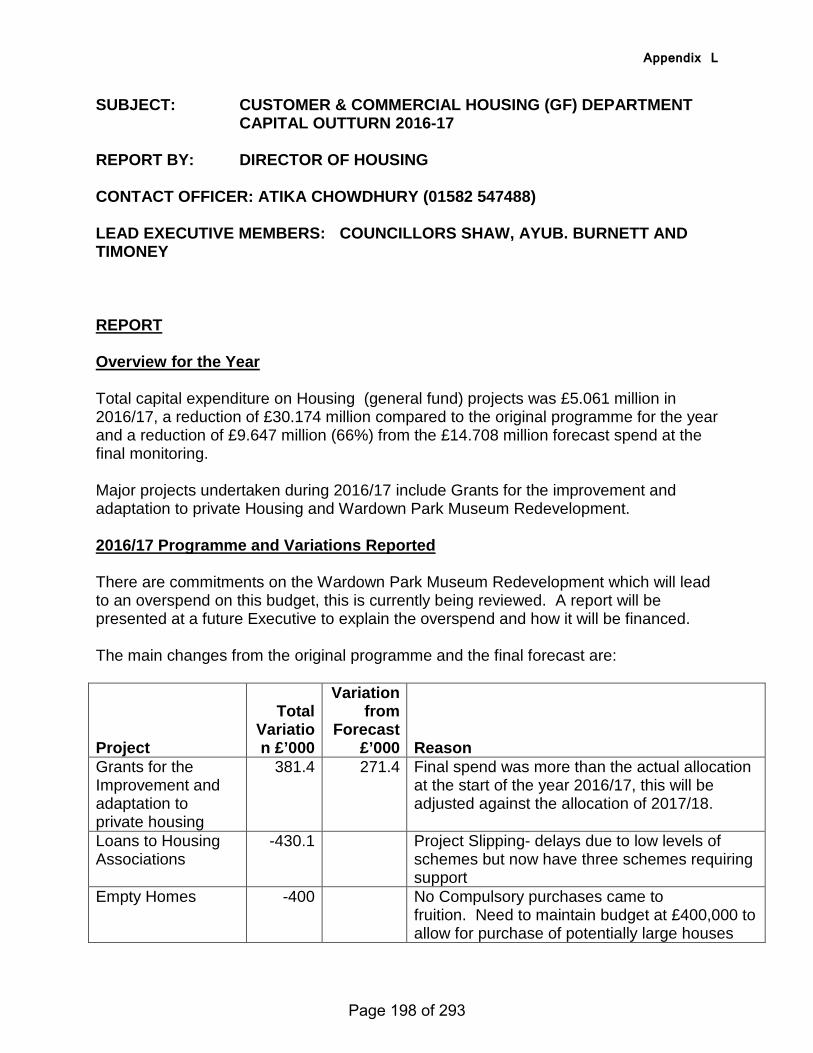
Appendix L
SUBJECT: CUSTOMER & COMMERCIAL HOUSING (GF) DEPARTMENT CAPITAL OUTTURN 2016-17
REPORT BY: DIRECTOR OF HOUSING CONTACT OFFICER: ATIKA CHOWDHURY (01582 547488) LEAD EXECUTIVE MEMBERS: COUNCILLORS SHAW, AYUB. BURNETT AND TIMONEY REPORT Overview for the Year Total capital expenditure on Housing (general fund) projects was £5.061 million in 2016/17, a reduction of £30.174 million compared to the original programme for the year and a reduction of £9.647 million (66%) from the £14.708 million forecast spend at the final monitoring. Major projects undertaken during 2016/17 include Grants for the improvement and adaptation to private Housing and Wardown Park Museum Redevelopment. 2016/17 Programme and Variations Reported There are commitments on the Wardown Park Museum Redevelopment which will lead to an overspend on this budget, this is currently being reviewed. A report will be presented at a future Executive to explain the overspend and how it will be financed. The main changes from the original programme and the final forecast are:
Project
Total Variation £’000
Variation from
Forecast £’000 Reason
Grants for the Improvement and adaptation to private housing
381.4 271.4 Final spend was more than the actual allocation at the start of the year 2016/17, this will be adjusted against the allocation of 2017/18.
Loans to Housing Associations
-430.1
Project Slipping- delays due to low levels of schemes but now have three schemes requiring support
Empty Homes -400 No Compulsory purchases came to fruition. Need to maintain budget at £400,000 to allow for purchase of potentially large houses
Page 198 of 293
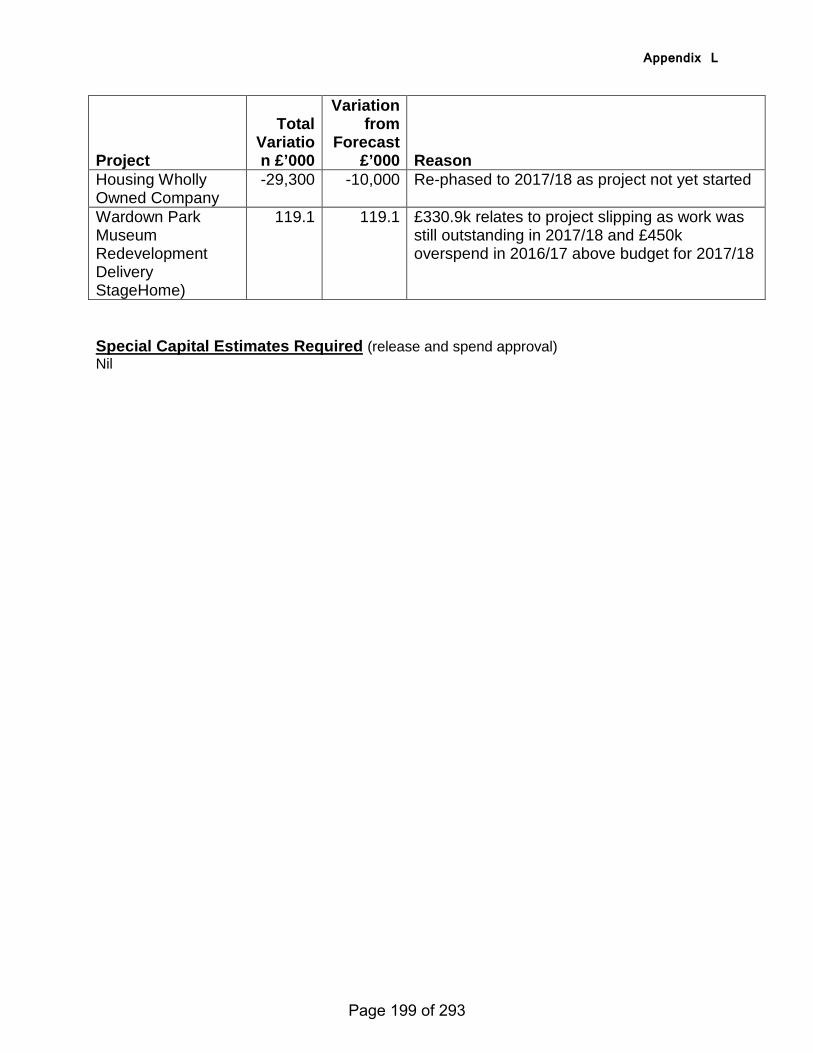
Appendix L
Project
Total Variation £’000
Variation from
Forecast £’000 Reason
Housing Wholly Owned Company
-29,300 -10,000 Re-phased to 2017/18 as project not yet started
Wardown Park Museum Redevelopment Delivery StageHome)
119.1 119.1 £330.9k relates to project slipping as work was still outstanding in 2017/18 and £450k overspend in 2016/17 above budget for 2017/18
Special Capital Estimates Required (release and spend approval) Nil
Page 199 of 293
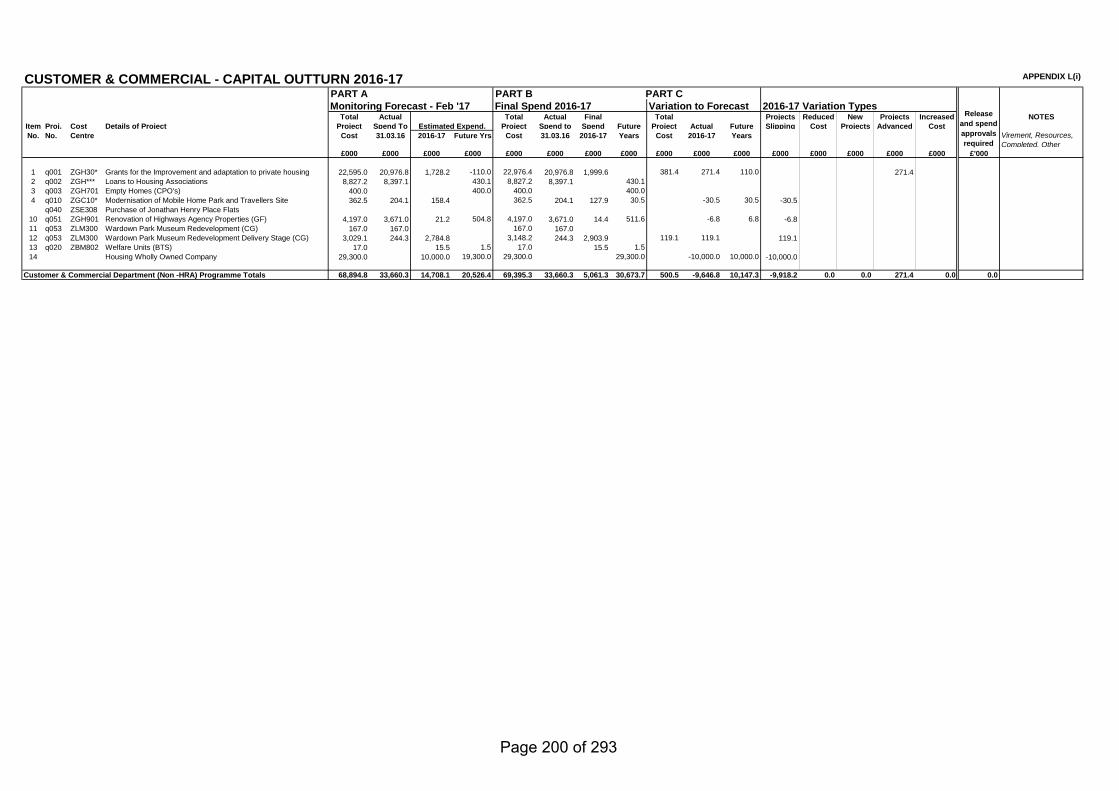
CUSTOMER & COMMERCIAL - CAPITAL OUTTURN 2016-17 APPENDIX L(i)
PART A PART B PART CMonitoring Forecast - Feb '17 Final Spend 2016-17 Variation to Forecast 2016-17 Variation Types
Total Actual Total Actual Final Total Projects Reduced New Projects Increased NOTESItem Proj. Cost Details of Project Project Spend To Project Spend to Spend Future Project Actual Future Slipping Cost Projects Advanced CostNo. No. Centre Cost 31.03.16 2016-17 Future Yrs Cost 31.03.16 2016-17 Years Cost 2016-17 Years Virement, Resources,
Completed, Other£000 £000 £000 £000 £000 £000 £000 £000 £000 £000 £000 £000 £000 £000 £000 £000 £'000
1 q001 ZGH30* Grants for the Improvement and adaptation to private housing 22,595.0 20,976.8 1,728.2 -110.0 22,976.4 20,976.8 1,999.6 0.0 381.4 271.4 110.0 271.42 q002 ZGH*** Loans to Housing Associations 8,827.2 8,397.1 430.1 8,827.2 8,397.1 430.1 0.0 0.0 0.03 q003 ZGH701 Empty Homes (CPO's) 400.0 400.0 400.0 400.0 0.0 0.0 0.04 q010 ZGC10* Modernisation of Mobile Home Park and Travellers Site 362.5 204.1 158.4 0.0 362.5 204.1 127.9 30.5 0.0 -30.5 30.5 -30.5
q040 ZSE308 Purchase of Jonathan Henry Place Flats 0.0 0.0 0.0 0.0 0.0 0.0 0.0 0.0 0.010 q051 ZGH901 Renovation of Highways Agency Properties (GF) 4,197.0 3,671.0 21.2 504.8 4,197.0 3,671.0 14.4 511.6 0.0 -6.8 6.8 -6.811 q053 ZLM300 Wardown Park Museum Redevelopment (CG) 167.0 167.0 0.0 167.0 167.0 0.0 0.0 0.0 0.012 q053 ZLM300 Wardown Park Museum Redevelopment Delivery Stage (CG) 3,029.1 244.3 2,784.8 0.0 3,148.2 244.3 2,903.9 0.0 119.1 119.1 0.0 119.113 q020 ZBM802 Welfare Units (BTS) 17.0 15.5 1.5 17.0 0.0 15.5 1.5 0.0 0.0 0.014 Housing Wholly Owned Company 29,300.0 10,000.0 19,300.0 29,300.0 0.0 0.0 29,300.0 0.0 -10,000.0 10,000.0 -10,000.0
Customer & Commercial Department (Non -HRA) Programme Totals 68,894.8 33,660.3 14,708.1 20,526.4 69,395.3 33,660.3 5,061.3 30,673.7 500.5 -9,646.8 10,147.3 -9,918.2 0.0 0.0 271.4 0.0 0.0
Estimated Expend.Release
and spend approvals required
Page 200 of 293
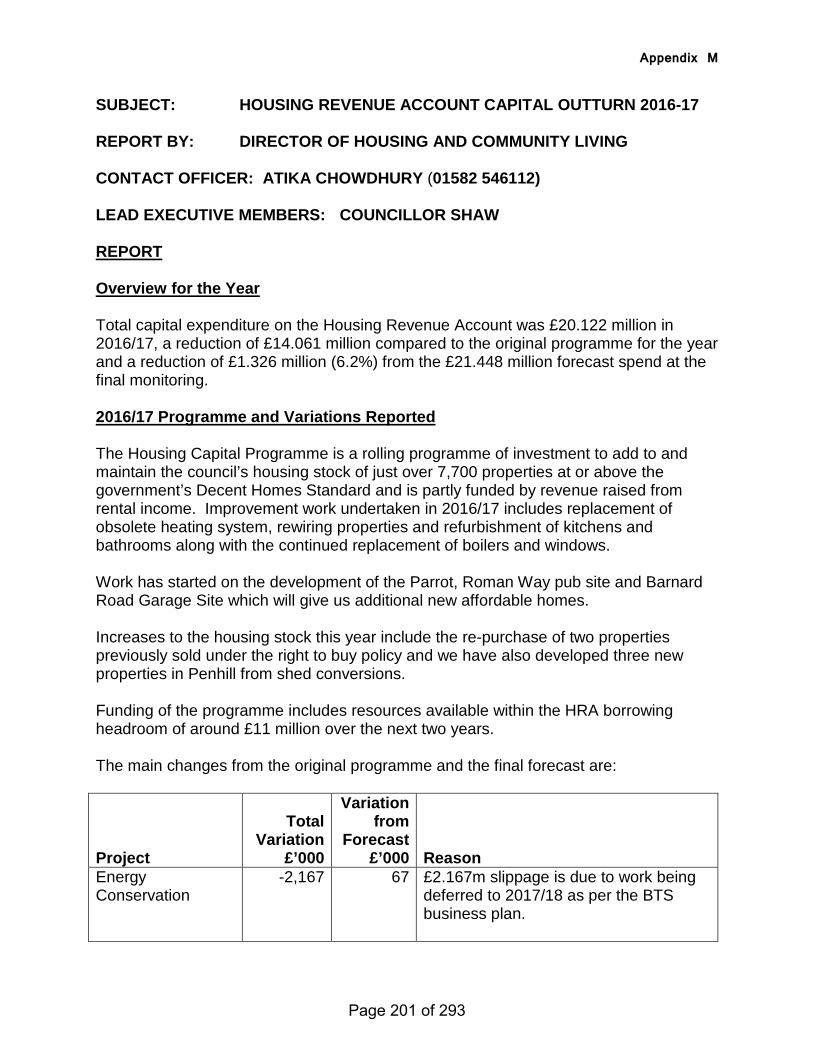
Appendix M
SUBJECT: HOUSING REVENUE ACCOUNT CAPITAL OUTTURN 2016-17 REPORT BY: DIRECTOR OF HOUSING AND COMMUNITY LIVING CONTACT OFFICER: ATIKA CHOWDHURY (01582 546112) LEAD EXECUTIVE MEMBERS: COUNCILLOR SHAW REPORT Overview for the Year Total capital expenditure on the Housing Revenue Account was £20.122 million in 2016/17, a reduction of £14.061 million compared to the original programme for the year and a reduction of £1.326 million (6.2%) from the £21.448 million forecast spend at the final monitoring. 2016/17 Programme and Variations Reported The Housing Capital Programme is a rolling programme of investment to add to and maintain the council’s housing stock of just over 7,700 properties at or above the government’s Decent Homes Standard and is partly funded by revenue raised from rental income. Improvement work undertaken in 2016/17 includes replacement of obsolete heating system, rewiring properties and refurbishment of kitchens and bathrooms along with the continued replacement of boilers and windows. Work has started on the development of the Parrot, Roman Way pub site and Barnard Road Garage Site which will give us additional new affordable homes. Increases to the housing stock this year include the re-purchase of two properties previously sold under the right to buy policy and we have also developed three new properties in Penhill from shed conversions. Funding of the programme includes resources available within the HRA borrowing headroom of around £11 million over the next two years. The main changes from the original programme and the final forecast are:
Project
Total Variation
£’000
Variation from
Forecast £’000 Reason
Energy Conservation
-2,167 67 £2.167m slippage is due to work being deferred to 2017/18 as per the BTS business plan.
Page 201 of 293
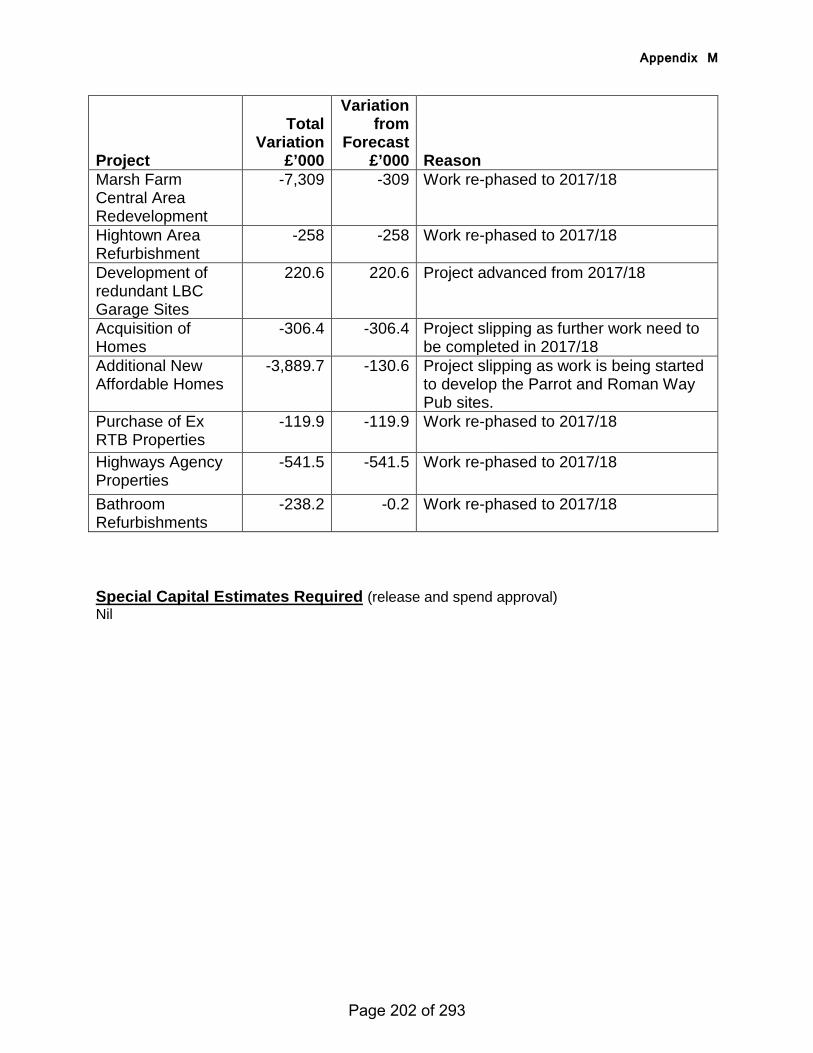
Appendix M
Project
Total Variation
£’000
Variation from
Forecast £’000 Reason
Marsh Farm Central Area Redevelopment
-7,309 -309 Work re-phased to 2017/18
Hightown Area Refurbishment
-258
-258 Work re-phased to 2017/18
Development of redundant LBC Garage Sites
220.6 220.6 Project advanced from 2017/18
Acquisition of Homes
-306.4 -306.4 Project slipping as further work need to be completed in 2017/18
Additional New Affordable Homes
-3,889.7 -130.6 Project slipping as work is being started to develop the Parrot and Roman Way Pub sites.
Purchase of Ex RTB Properties
-119.9 -119.9 Work re-phased to 2017/18
Highways Agency Properties
-541.5 -541.5 Work re-phased to 2017/18
Bathroom Refurbishments
-238.2 -0.2 Work re-phased to 2017/18
Special Capital Estimates Required (release and spend approval) Nil
Page 202 of 293
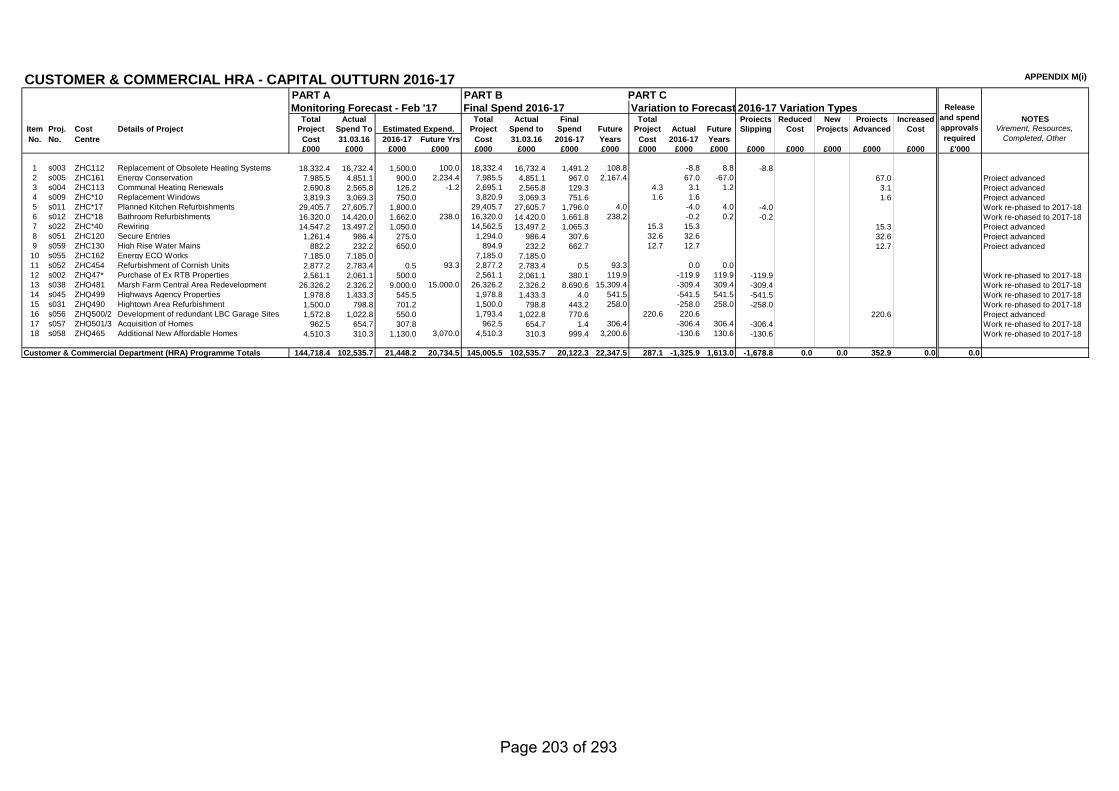
CUSTOMER & COMMERCIAL HRA - CAPITAL OUTTURN 2016-17 APPENDIX M(i)
PART A PART B PART CMonitoring Forecast - Feb '17 Final Spend 2016-17 Variation to Forecast 2016-17 Variation Types
Total Actual Total Actual Final Total Projects Reduced New Projects Increased NOTESItem Proj. Cost Details of Project Project Spend To Project Spend to Spend Future Project Actual Future Slipping Cost Projects Advanced CostNo. No. Centre Cost 31.03.16 2016-17 Future Yrs Cost 31.03.16 2016-17 Years Cost 2016-17 Years
£000 £000 £000 £000 £000 £000 £000 £000 £000 £000 £000 £000 £000 £000 £000 £000 £'000
1 s003 ZHC112 Replacement of Obsolete Heating Systems 18,332.4 16,732.4 1,500.0 100.0 18,332.4 16,732.4 1,491.2 108.8 0.0 -8.8 8.8 -8.82 s005 ZHC161 Energy Conservation 7,985.5 4,851.1 900.0 2,234.4 7,985.5 4,851.1 967.0 2,167.4 0.0 67.0 -67.0 67.0 Project advanced3 s004 ZHC113 Communal Heating Renewals 2,690.8 2,565.8 126.2 -1.2 2,695.1 2,565.8 129.3 0.0 4.3 3.1 1.2 3.1 Project advanced4 s009 ZHC*10 Replacement Windows 3,819.3 3,069.3 750.0 0.0 3,820.9 3,069.3 751.6 0.0 1.6 1.6 0.0 1.6 Project advanced5 s011 ZHC*17 Planned Kitchen Refurbishments 29,405.7 27,605.7 1,800.0 0.0 29,405.7 27,605.7 1,796.0 4.0 0.0 -4.0 4.0 -4.0 Work re-phased to 2017-186 s012 ZHC*18 Bathroom Refurbishments 16,320.0 14,420.0 1,662.0 238.0 16,320.0 14,420.0 1,661.8 238.2 0.0 -0.2 0.2 -0.2 Work re-phased to 2017-187 s022 ZHC*40 Rewiring 14,547.2 13,497.2 1,050.0 0.0 14,562.5 13,497.2 1,065.3 0.0 15.3 15.3 0.0 15.3 Project advanced8 s051 ZHC120 Secure Entries 1,261.4 986.4 275.0 0.0 1,294.0 986.4 307.6 0.0 32.6 32.6 0.0 32.6 Project advanced9 s059 ZHC130 High Rise Water Mains 882.2 232.2 650.0 0.0 894.9 232.2 662.7 0.0 12.7 12.7 0.0 12.7 Project advanced
10 s055 ZHC162 Energy ECO Works 7,185.0 7,185.0 7,185.0 7,185.0 0.0 0.0 0.0 0.011 s052 ZHC454 Refurbishment of Cornish Units 2,877.2 2,783.4 0.5 93.3 2,877.2 2,783.4 0.5 93.3 0.0 0.0 0.012 s002 ZHQ47* Purchase of Ex RTB Properties 2,561.1 2,061.1 500.0 0.0 2,561.1 2,061.1 380.1 119.9 0.0 -119.9 119.9 -119.9 Work re-phased to 2017-1813 s038 ZHQ481 Marsh Farm Central Area Redevelopment 26,326.2 2,326.2 9,000.0 15,000.0 26,326.2 2,326.2 8,690.6 15,309.4 0.0 -309.4 309.4 -309.4 Work re-phased to 2017-1814 s045 ZHQ499 Highways Agency Properties 1,978.8 1,433.3 545.5 0.0 1,978.8 1,433.3 4.0 541.5 0.0 -541.5 541.5 -541.5 Work re-phased to 2017-1815 s031 ZHQ490 Hightown Area Refurbishment 1,500.0 798.8 701.2 0.0 1,500.0 798.8 443.2 258.0 0.0 -258.0 258.0 -258.0 Work re-phased to 2017-1816 s056 ZHQ500/2 Development of redundant LBC Garage Sites 1,572.8 1,022.8 550.0 0.0 1,793.4 1,022.8 770.6 0.0 220.6 220.6 0.0 220.6 Project advanced17 s057 ZHQ501/3 Acquisition of Homes 962.5 654.7 307.8 0.0 962.5 654.7 1.4 306.4 0.0 -306.4 306.4 -306.4 Work re-phased to 2017-1818 s058 ZHQ465 Additional New Affordable Homes 4,510.3 310.3 1,130.0 3,070.0 4,510.3 310.3 999.4 3,200.6 0.0 -130.6 130.6 -130.6 Work re-phased to 2017-18
Customer & Commercial Department (HRA) Programme Totals 144,718.4 102,535.7 21,448.2 20,734.5 145,005.5 102,535.7 20,122.3 22,347.5 287.1 -1,325.9 1,613.0 -1,678.8 0.0 0.0 352.9 0.0 0.0
Estimated Expend. Virement, Resources, Completed, Other
Release and spend approvals required
Page 203 of 293
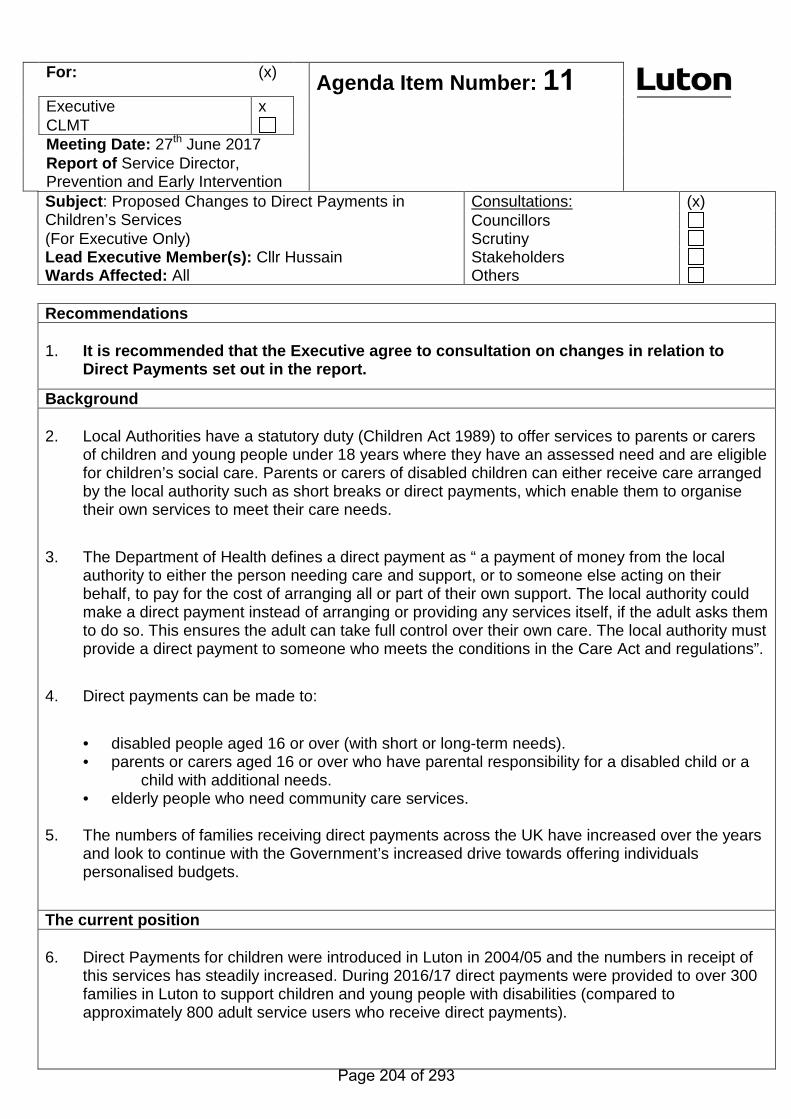
Subject: Proposed Changes to Direct Payments in Children’s Services
Consultations: (x) Councillors
(For Executive Only) Scrutiny Lead Executive Member(s): Cllr Hussain Stakeholders Wards Affected: All Others
Recommendations
1. It is recommended that the Executive agree to consultation on changes in relation toDirect Payments set out in the report.
Background
2. Local Authorities have a statutory duty (Children Act 1989) to offer services to parents or carersof children and young people under 18 years where they have an assessed need and are eligiblefor children’s social care. Parents or carers of disabled children can either receive care arrangedby the local authority such as short breaks or direct payments, which enable them to organisetheir own services to meet their care needs.
3. The Department of Health defines a direct payment as “ a payment of money from the localauthority to either the person needing care and support, or to someone else acting on theirbehalf, to pay for the cost of arranging all or part of their own support. The local authority couldmake a direct payment instead of arranging or providing any services itself, if the adult asks themto do so. This ensures the adult can take full control over their own care. The local authority mustprovide a direct payment to someone who meets the conditions in the Care Act and regulations”.
4. Direct payments can be made to:
• disabled people aged 16 or over (with short or long-term needs).• parents or carers aged 16 or over who have parental responsibility for a disabled child or a
child with additional needs. • elderly people who need community care services.
5. The numbers of families receiving direct payments across the UK have increased over the yearsand look to continue with the Government’s increased drive towards offering individualspersonalised budgets.
The current position
6. Direct Payments for children were introduced in Luton in 2004/05 and the numbers in receipt ofthis services has steadily increased. During 2016/17 direct payments were provided to over 300families in Luton to support children and young people with disabilities (compared toapproximately 800 adult service users who receive direct payments).
For: (x) Agenda Item Number: 11Executive x CLMT Meeting Date: 27th June 2017Report of Service Director, Prevention and Early Intervention
Page 204 of 293
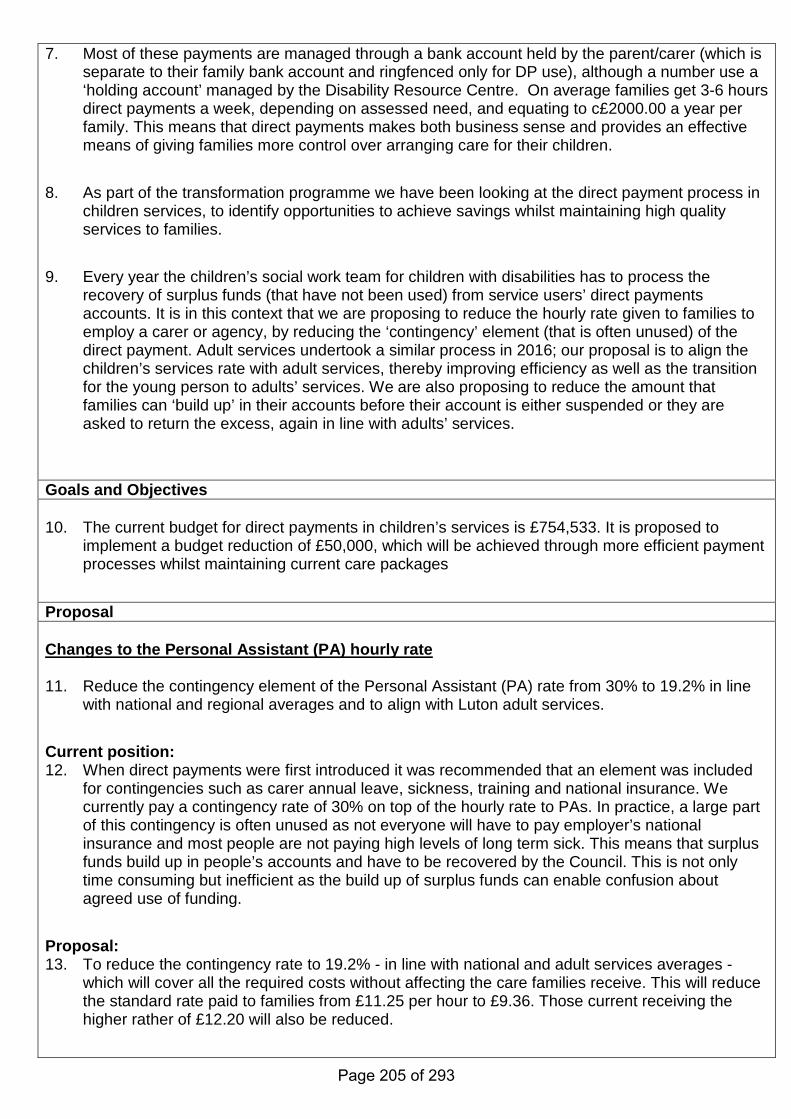
7. Most of these payments are managed through a bank account held by the parent/carer (which is separate to their family bank account and ringfenced only for DP use), although a number use a ‘holding account’ managed by the Disability Resource Centre. On average families get 3-6 hours direct payments a week, depending on assessed need, and equating to c£2000.00 a year per family. This means that direct payments makes both business sense and provides an effective means of giving families more control over arranging care for their children.
8. As part of the transformation programme we have been looking at the direct payment process in
children services, to identify opportunities to achieve savings whilst maintaining high quality services to families.
9. Every year the children’s social work team for children with disabilities has to process the
recovery of surplus funds (that have not been used) from service users’ direct payments accounts. It is in this context that we are proposing to reduce the hourly rate given to families to employ a carer or agency, by reducing the ‘contingency’ element (that is often unused) of the direct payment. Adult services undertook a similar process in 2016; our proposal is to align the children’s services rate with adult services, thereby improving efficiency as well as the transition for the young person to adults’ services. We are also proposing to reduce the amount that families can ‘build up’ in their accounts before their account is either suspended or they are asked to return the excess, again in line with adults’ services.
Goals and Objectives 10. The current budget for direct payments in children’s services is £754,533. It is proposed to
implement a budget reduction of £50,000, which will be achieved through more efficient payment processes whilst maintaining current care packages
Proposal Changes to the Personal Assistant (PA) hourly rate 11. Reduce the contingency element of the Personal Assistant (PA) rate from 30% to 19.2% in line
with national and regional averages and to align with Luton adult services.
Current position: 12. When direct payments were first introduced it was recommended that an element was included
for contingencies such as carer annual leave, sickness, training and national insurance. We currently pay a contingency rate of 30% on top of the hourly rate to PAs. In practice, a large part of this contingency is often unused as not everyone will have to pay employer’s national insurance and most people are not paying high levels of long term sick. This means that surplus funds build up in people’s accounts and have to be recovered by the Council. This is not only time consuming but inefficient as the build up of surplus funds can enable confusion about agreed use of funding.
Proposal: 13. To reduce the contingency rate to 19.2% - in line with national and adult services averages -
which will cover all the required costs without affecting the care families receive. This will reduce the standard rate paid to families from £11.25 per hour to £9.36. Those current receiving the higher rather of £12.20 will also be reduced.
Page 205 of 293
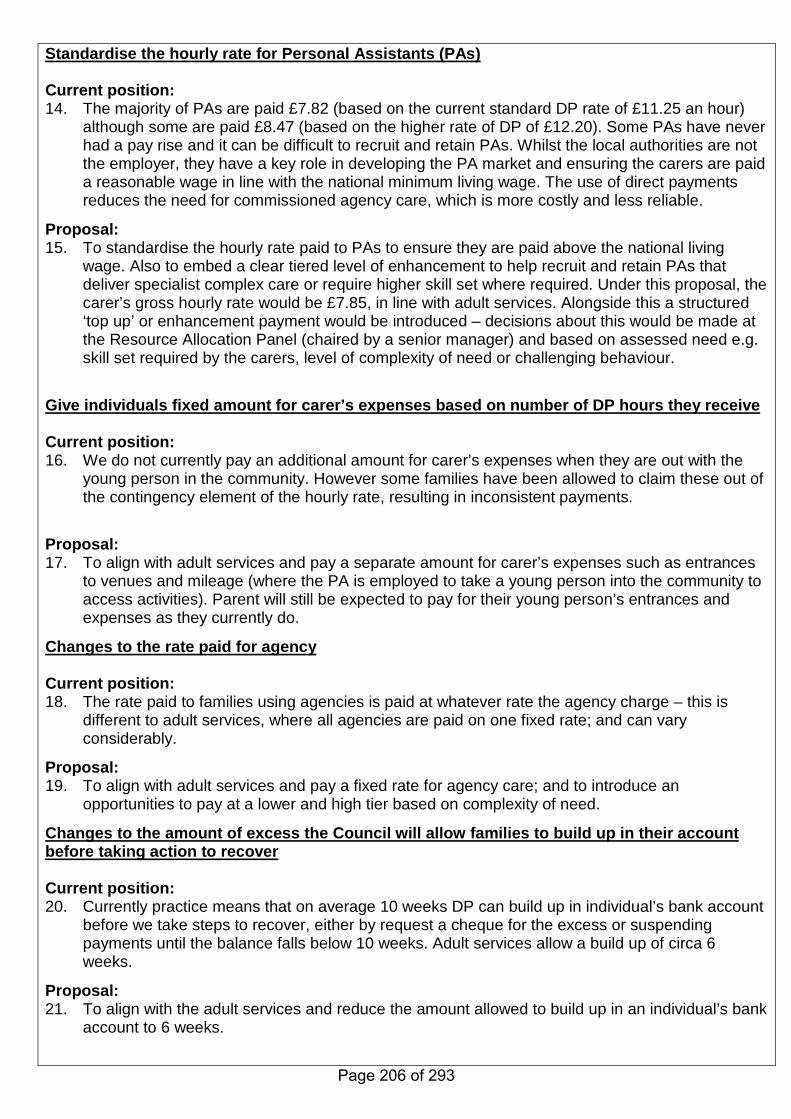
Standardise the hourly rate for Personal Assistants (PAs) Current position: 14. The majority of PAs are paid £7.82 (based on the current standard DP rate of £11.25 an hour)
although some are paid £8.47 (based on the higher rate of DP of £12.20). Some PAs have never had a pay rise and it can be difficult to recruit and retain PAs. Whilst the local authorities are not the employer, they have a key role in developing the PA market and ensuring the carers are paid a reasonable wage in line with the national minimum living wage. The use of direct payments reduces the need for commissioned agency care, which is more costly and less reliable.
Proposal: 15. To standardise the hourly rate paid to PAs to ensure they are paid above the national living
wage. Also to embed a clear tiered level of enhancement to help recruit and retain PAs that deliver specialist complex care or require higher skill set where required. Under this proposal, the carer’s gross hourly rate would be £7.85, in line with adult services. Alongside this a structured ‘top up’ or enhancement payment would be introduced – decisions about this would be made at the Resource Allocation Panel (chaired by a senior manager) and based on assessed need e.g. skill set required by the carers, level of complexity of need or challenging behaviour.
Give individuals fixed amount for carer’s expenses based on number of DP hours they receive Current position: 16. We do not currently pay an additional amount for carer’s expenses when they are out with the
young person in the community. However some families have been allowed to claim these out of the contingency element of the hourly rate, resulting in inconsistent payments.
Proposal: 17. To align with adult services and pay a separate amount for carer’s expenses such as entrances
to venues and mileage (where the PA is employed to take a young person into the community to access activities). Parent will still be expected to pay for their young person’s entrances and expenses as they currently do.
Changes to the rate paid for agency Current position: 18. The rate paid to families using agencies is paid at whatever rate the agency charge – this is
different to adult services, where all agencies are paid on one fixed rate; and can vary considerably.
Proposal: 19. To align with adult services and pay a fixed rate for agency care; and to introduce an
opportunities to pay at a lower and high tier based on complexity of need.
Changes to the amount of excess the Council will allow families to build up in their account before taking action to recover Current position: 20. Currently practice means that on average 10 weeks DP can build up in individual’s bank account
before we take steps to recover, either by request a cheque for the excess or suspending payments until the balance falls below 10 weeks. Adult services allow a build up of circa 6 weeks.
Proposal: 21. To align with the adult services and reduce the amount allowed to build up in an individual’s bank
account to 6 weeks.
Page 206 of 293
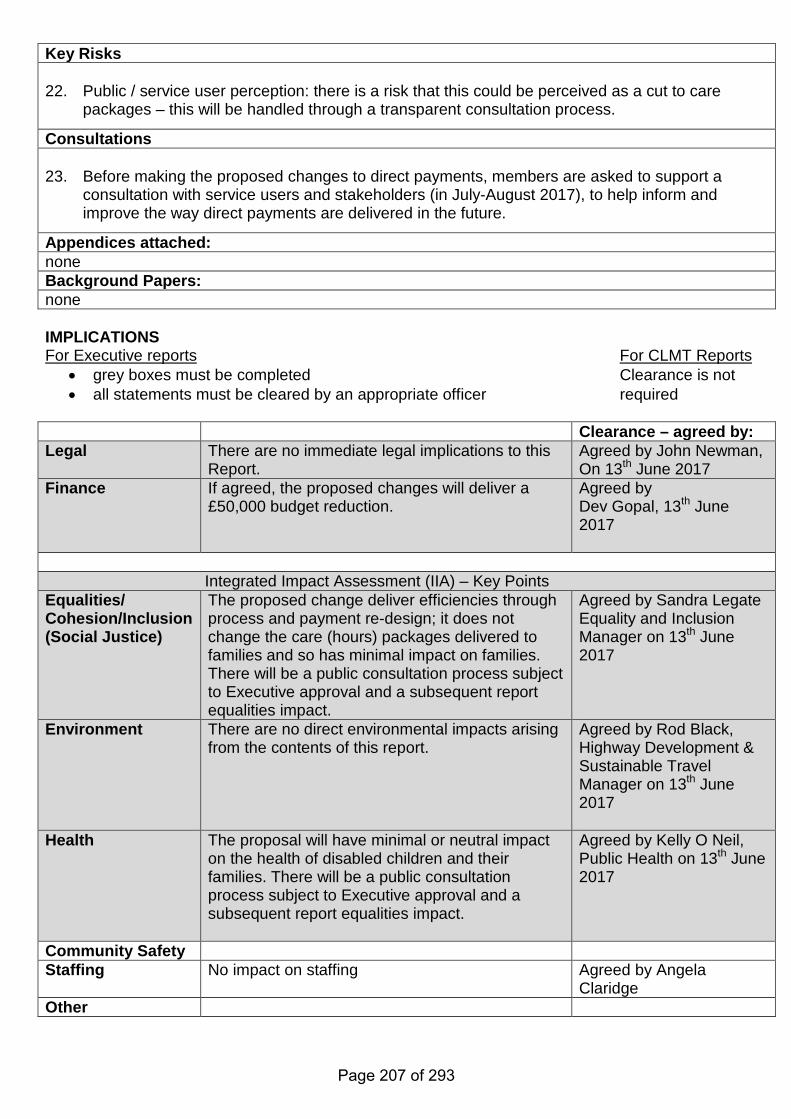
Key Risks 22. Public / service user perception: there is a risk that this could be perceived as a cut to care
packages – this will be handled through a transparent consultation process.
Consultations 23. Before making the proposed changes to direct payments, members are asked to support a
consultation with service users and stakeholders (in July-August 2017), to help inform and improve the way direct payments are delivered in the future.
Appendices attached: none Background Papers: none IMPLICATIONS For Executive reports For CLMT Reports
• grey boxes must be completed Clearance is not • all statements must be cleared by an appropriate officer required
Clearance – agreed by: Legal There are no immediate legal implications to this
Report. Agreed by John Newman, On 13th June 2017
Finance If agreed, the proposed changes will deliver a £50,000 budget reduction.
Agreed by Dev Gopal, 13th June 2017
Integrated Impact Assessment (IIA) – Key Points Equalities/ Cohesion/Inclusion (Social Justice)
The proposed change deliver efficiencies through process and payment re-design; it does not change the care (hours) packages delivered to families and so has minimal impact on families. There will be a public consultation process subject to Executive approval and a subsequent report equalities impact.
Agreed by Sandra Legate Equality and Inclusion Manager on 13th June 2017
Environment
There are no direct environmental impacts arising from the contents of this report.
Agreed by Rod Black, Highway Development & Sustainable Travel Manager on 13th June 2017
Health
The proposal will have minimal or neutral impact on the health of disabled children and their families. There will be a public consultation process subject to Executive approval and a subsequent report equalities impact.
Agreed by Kelly O Neil, Public Health on 13th June 2017
Community Safety Staffing No impact on staffing Agreed by Angela
Claridge Other
Page 207 of 293
FOR EXECUTIVE ONLY - Options: a) to reject the recommendation b) to request further information
Page 208 of 293
Subject: Youth Offending Service Joint management Board
Consultations: (x) Councillors X
(For Executive Only) Scrutiny Lead Executive Member(s): Cllr M Hussain & Cllr Rachel Hopkins
Stakeholders X
Wards Affected: All Wards Others X Recommendations 1. That the Executive recommend Full Council to approve the creation of a Bedfordshire
shared Youth Offending Strategic management Board. Background 2. The Youth Offending Service (YOS) is a statutory multi agency service which has a responsibility
to prevent offending and reoffending by those aged under 18 years resident in Luton. Luton YOS is well respected nationally as a high performing service achieving good outcomes for children and young people. Youth Justice Services in Bedford Borough and Central Beds are delivered by the Bedfordshire YOS.
3. Meeting 4 times a year, the YOS Strategic Management Board acts as the lead governance
body for the local youth justice system. In doing so, it has oversight of how youth justice services are performing locally and combined value for money.
4. The Board has responsibility for:
• Championing the vision for YOS and partners to play an active role in contributing to the vision and agendas in line with the Crime and Disorder Act 1998.
• Ensuring that relevant strategic priorities from involved organisations are implemented. • Reporting progress periodically to senior management and cabinet. • Ensure that YOS income, expenditure and commissioning activity are regularly reviewed. • Managing risks and harm to community. • The approach to offending and reoffending and prevention by children and young people
within its boundaries. • Oversee the formulation each year of a youth justice plan. • Oversee the appointment of respective service leads. • As part of the youth justice plan, agree measurable objectives linked to key performance
indicators, including the National Standards for Youth Justice.
For: (x) Agenda Item Number: 12 Executive X CLMT Meeting Date: 27th June 2017 Report of: YOS Service Manager Report author: Dave Collins
Page 209 of 293
The current position 5. Currently each Youth Offending Service has a single Board with different Chairs. In Luton the
Chair is Chief Superintendent David Boyle, in Bedfordshire the Board is Chaired by Kevin Crompton Director of Children & Adult Services. A number of the statutory partners that make up the Board have the same representative on each of the Boards.
6. At the Luton Strategic Management Board meeting in October 2016 the decision was taken to
scope the possibility of a shared Strategic Management Board for Bedfordshire with the aim of highlighting and identifying trends across the borough effectively and consistently.
7. The first phase of scoping involved a representative from Bedfordshire Borough Council (to
represent Central Bedfordshire and Bedfordshire Borough) with the Luton Borough Council project team to agree a draft terms of reference, a gap analysis and agreeing attendees.
8. This work included a benchmarking exercise where the TOR and attendees was reviewed for the
following joint youth justice boards:
1. Tri Borough 2. Bournemouth, Poole and Dorset 3. Cheshire West, Chester Borough, Halton Borough, Warrington and Cheshire East
9. Consideration was given to possible Chair and operating model options for the Board to consider
and agree. 10. With the agreement of Full Council, the next steps will include:
1. Review and agreement of paperwork including following key decisions. 2. Agreement of Chair. 3. Frequency of board. 4. Operating model. 5. Agreeing core attendees from each service. 6. Agreeing Performance Framework and data requirements. 7. Vision exercise for the joint board. 8. Agreeing date for the next board to take place
Goals and Objectives 11. In addition to the statutory responsibilities in terms of governance, the shared Strategic
Management Board aims would be to achieve:
• Effective sharing of information and intelligence to create better future opportunities for shared effective tasking.
• Opportunities to find shared priority setting to deliver better outcomes for residents and community including effective leadership.
• Better and more effective use of resources with a specific focus on. • Development of innovation that can be shared with partners and across Bedfordshire. • Become a sustainable model that can be delivered through any further changes.
Proposal 12. The Executive is asked to recommend Full Council to approve the creation of a Bedfordshire
shared Youth Offending Strategic management Board.
Page 210 of 293
Financial Implications 13. There are no Financial Implications from this proposed creation of a shared Youth Offending
Strategic Management Board as there is no proposal which could impact on the available service budgets and how they would be used in the future.
Key Risks 14. Each area in Bedfordshire has its own unique issues and delivery of youth justice services
across the whole of Bedfordshire cannot be a one size fits all. We have some specific issues in Luton and a YOS that is a consistently high performing Service. As such, one of the key aims would be to ensure that Luton YOS maintains its identify as a Service that provides innovative ways of working with young people as well as maintaining contributions, both financially and physically, from its statutory partners in Luton.
15. In terms of implications, there is no Integrated Impact Assessment for this project however, the
IIA from October 2016 relating to the Youth Justice Action Plan is provided along with the comments and clearance as the strategic delivery of statutory services from Luton YOS to Luton residents will not change as a result of a shared Board.
Consultations 16. Both Luton and Bedfordshire Board Chair have been consulted and agree with the idea of a
shared Board. Both Heads for Service for Luton and Bedfordshire YOS have been involved in the project and drafting of the terms of reference and other statutory partners have been consulted.
Appendices attached: Integrated Impact Assessment and Youth Justice Annual Plan for Luton 2016/17 Draft Terms of Reference Background Papers: Draft Tor for Joint Board IMPLICATIONS For Executive reports For CLMT Reports
• grey boxes must be completed Clearance is not • all statements must be cleared by an appropriate officer required
Clearance – agreed by: Legal There are no legal implications contained within
the report. Agreed by Samantha McKeeman, Senior Solicitor 31st October 2016
Finance The financial implications are contained within the body of the report.
Agreed by Atif Iqbal, Finance Business Partner (People & PHCP) 26/05/2017
Integrated Impact Assessment (IIA) – Key Points Equalities/ Cohesion/Inclusion (Social Justice)
The needs and vulnerabilities of the individuals the YOS offers service provision to include those where their needs would be covered under
Social Justice Unit An IIA has been
Page 211 of 293
equalities legislation. Many of the children, young people, their carers and the Victims the YOS works with would not necessarily self-define regarding a disability. The assessment and subsequent interventions of the YOS recognise issues of need such as disabilities (for example ADHD; Aspergers or any other physical/emotional health issue) through individual and family assessment including the input from Health workers in the Service (Speech and Language therapist; mental Health Nurse; Drug and Alcohol worker; YOS Physical Health Nurse).
completed which has a positive impact for the key groups. Sandra Legate, Equalities and Inclusion Manager, 26th May 2017
Environment
This report does not have any direct environmental implications.
Strategy & Sustainability Kat Wysocka on 13th June 2017
Health
The YOS is a partnership between Bedfordshire Police, Luton Borough Council, Luton Clinical Commissioning Group, Luton Health & Wellbeing Board & the National Probation Service and the Youth Justice Annual Plan is intended to secure improvements against the three youth justice outcomes in England and Wales:
• Preventing offending thereby reducing the number of first time entrants to the youth justice system
• Reducing the risk of further offending • Reducing the use of custody
Whilst the plan itself may appear not to focus on specific health outcomes and wider public health considerations there is significant association between drug and alcohol misuse and offending and antisocial behaviour. As such the work of the health workers based at the YOS is crucial to the strategic aims of preventing and reducing offending but also meeting the needs of the young people in the youth justice system who are at high risk of multiple health inequalities and poor life chances. Therefore any service reduction would have an impact on these service users in particular.
Public Health Kelly O’Neill, Service Director PHCP on 1st June 2017
Community Safety Although in recent times the direction and priorities for youth justice have and will again change, the legal requirements placed on the local authority and other named statutory partners which form a YOS, remain unaltered in relation to managing the risk to the community. Therefore, when we consider new delivery models and on-going reductions in service, we have to remain aware of the impact these reductions will have on community safety, our current statutory responsibilities, national standards and
Community Safety Partnership Comments agreed Vicky Hawkes – Acting Service Manager Public Protection
Page 212 of 293
monitoring/inspection arrangements for youth justice delivery
Staffing Other
FOR EXECUTIVE ONLY - Options: a) To reject the recommendation b) To request further information
Page 213 of 293
Appendix
Joint Justice Board
TERMS OF REFERENCE 1 TBC
Youth Offending Service Shared Board ToR governance 01/02/2017 Page 214 of 293
Appendix
1. INTRODUCTION Youth Offending Service (YOS) will focus on a number of key outcomes: • Ensure the Youth Offending Teams (YOT) and appropriate youth justice services are in
place • Those asked to serve on the steering group have the authority and skills to negotiate
with other services on matters concerning the YOT without having to refer back continually to their Chief Officer, though they will need to account properly to their own agency for their decisions.
Create a shared board highlighting and identifying trends across the borough effectively and consistently addressing issues using a holistic approach. The Board aims are to achieve:
• Effective sharing of information and intelligence to create better future opportunities for shared effective tasking;
• Opportunities to find shared priority setting to deliver better outcomes for residents and community including effective leadership;
• Better and more effective use of resources with a specific focus on: • Development of innovation that can be shared with partners and across
Bedfordshire • A sustainable model that can be delivered through any further changes
2. RELATIONSHIP TO OTHER PARTNERSHIP BOARDS: The Board will have due regard to:
• Any projects that have an impact of the priorities that are the responsibility of the board
• Report to YJB National & Regional; Locally to the relevant local authorities 3. RESPONSIBILITIES: The Board has responsibility for:
• Championing the vision for Joint YOS board and partners to play an active role in contributing to the vision and agendas linked to the YOS board in line with the crime and disorder act 1998.
• Ensuring that relevant strategic priorities from involved organisations are implemented.
• Reporting progress periodically to senior management and cabinet. • Managing risks and harm to community. • Pan Bedfordshire approach to offending and reoffending and prevention by children
and young people within its boundaries • Oversee the formulation each year of a youth justice plan • Oversee the appointment of respective service leads
Youth Offending Service Shared Board ToR governance 01/02/2017 Page 215 of 293
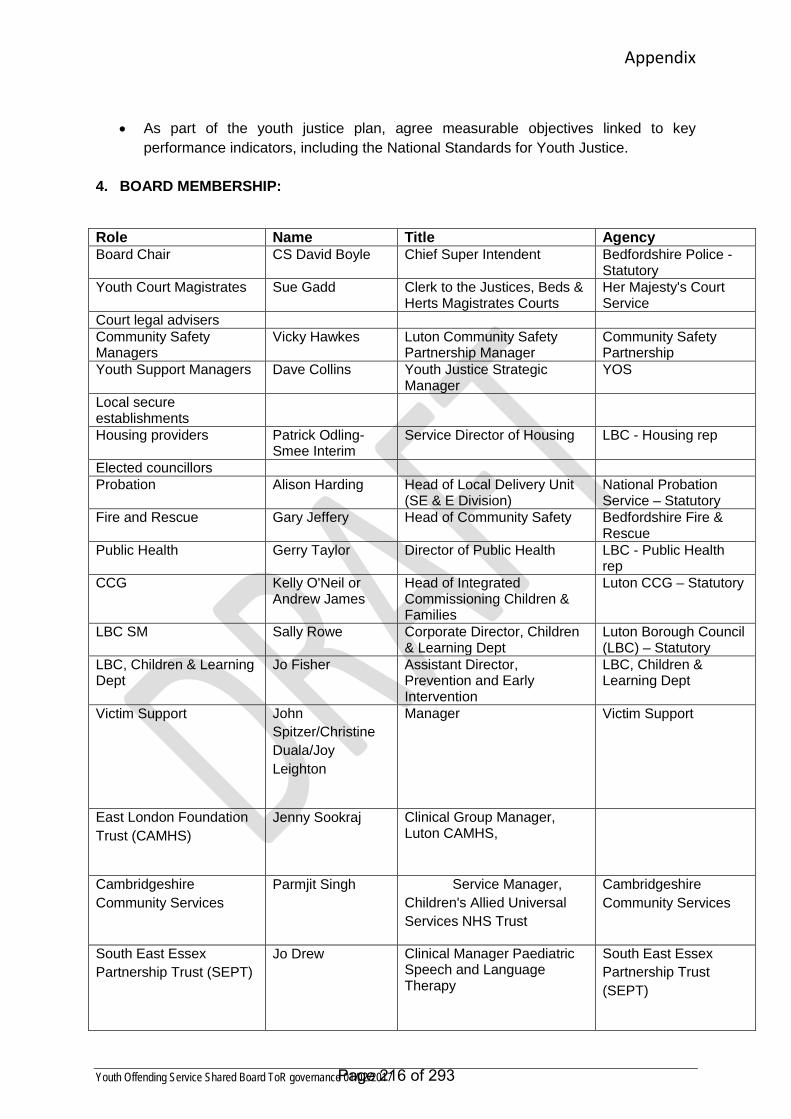
Appendix
• As part of the youth justice plan, agree measurable objectives linked to key performance indicators, including the National Standards for Youth Justice.
4. BOARD MEMBERSHIP: Role Name Title Agency Board Chair CS David Boyle Chief Super Intendent Bedfordshire Police -
Statutory Youth Court Magistrates Sue Gadd Clerk to the Justices, Beds &
Herts Magistrates Courts Her Majesty's Court Service
Court legal advisers Community Safety Managers
Vicky Hawkes Luton Community Safety Partnership Manager
Community Safety Partnership
Youth Support Managers Dave Collins Youth Justice Strategic Manager
YOS
Local secure establishments
Housing providers Patrick Odling-Smee Interim
Service Director of Housing LBC - Housing rep
Elected councillors Probation Alison Harding Head of Local Delivery Unit
(SE & E Division) National Probation Service – Statutory
Fire and Rescue Gary Jeffery Head of Community Safety Bedfordshire Fire & Rescue
Public Health Gerry Taylor Director of Public Health LBC - Public Health rep
CCG Kelly O'Neil or Andrew James
Head of Integrated Commissioning Children & Families
Luton CCG – Statutory
LBC SM Sally Rowe Corporate Director, Children & Learning Dept
Luton Borough Council (LBC) – Statutory
LBC, Children & Learning Dept
Jo Fisher Assistant Director, Prevention and Early Intervention
LBC, Children & Learning Dept
Victim Support
John Spitzer/Christine Duala/Joy Leighton
Manager
Victim Support
East London Foundation Trust (CAMHS)
Jenny Sookraj
Clinical Group Manager, Luton CAMHS,
Cambridgeshire Community Services
Parmjit Singh
Service Manager, Children's Allied Universal Services NHS Trust
Cambridgeshire Community Services
South East Essex Partnership Trust (SEPT)
Jo Drew
Clinical Manager Paediatric Speech and Language Therapy
South East Essex Partnership Trust (SEPT)
Youth Offending Service Shared Board ToR governance 01/02/2017 Page 216 of 293

Appendix
YOS Troy Hutchinson
Information & Systems Manager
YOS
• The Board may co-opt additional persons to attend the Board and may do
so either generally or for fixed terms or for particular meetings or in respect of particular issues. Persons co-opted to attend the Board shall not be entitled to vote.
• The details of persons co-opted to attend the Board shall be notified in writing
to the Head of Service.
• The Head of Service shall also attend the Board to provide information and reports but shall not be entitled to vote.
• Each Local Authority shall be represented by a senior officer (director or assistant director), of the authority as nominated from time to time by the Local Authority. A Local Authority may send a substitute who may attend in the absence of the senior officer and exercise the powers and duties of their Local Authority. The details of persons acting as a substitute shall be notified in writing to the Head of Service.
• Each Member Agency that is a Member of the Board shall be represented by a named individual or by reference to a particular post and the details shall be notified in writing to the Head of Service. The CCGs may be represented by one individual representing one or more or a group of CCGs.
• Member representatives may appoint a substitute the details of whom shall be notified in writing to the Head of Service.
• Substitutes for Member representatives may attend in the absence of their appointing Member representative and exercise the powers and duties of their appointing Member representative.
• Persons co-opted to attend the Board may not appoint substitutes.
5. CHAIR
• The Chair of the Board shall be appointed by the Board but shall be a representative from one of the statutory partners on a rotating annual basis as agreed by the Board Members.
• In the absence of the Chair for the purposes of a particular meeting the Chair of
the Board shall be appointed from amongst those statutory partners representatives present at that meeting.
6. ABSENCES
• If members are unable to attend meetings they should inform the Meeting Co-ordinator and Chair at the earliest opportunity. They should arrange for a deputy to represent them. The deputy should have sufficient authority and knowledge to speak on behalf of
Youth Offending Service Shared Board ToR governance 01/02/2017 Page 217 of 293
Appendix
the business area they represent and to input to decision making on behalf of the business area they represent. Any conflict of interests that may occur will be dealt with on a case by case basis.
• Topics or decisions that have been covered at early meetings will not be revisited as a
result of non-attendance. 7. FREQUENCY OF MEETINGS:
• 2-4 meetings a year 8. MINUTES:
• Minutes of all meetings will record actions which will be reviewed for progress at the following meeting. A copy of the agenda, minutes, reports and any supporting documents will be placed on file for information or audit purposes.
9. THE FUNCTIONS OF THE BOARD ARE TO:
• Coordinate the strategic and operational delivery of youth justice services across the three local authorities.
• Bring together all the key local agencies with a contribution to make to reducing
youth offending including the police, social care, education, probation, health and voluntary sector.
• Monitor performance against the outcomes specified in the Youth Justice Plan (YJP). • Keep the content of the YJP under review and proposing amendments in line with
the cycle of review for the YJP.
• Undertake a review every three years of the effectiveness of this joint working arrangement and this agreement and to report to the Local Authorities upon the outcome of each review and any changes to the arrangement or the agreement that the board recommends.
10. INTEGRITY
• The Members of the Board shall at all times in connection with the exercise of their powers and duties in relation to the Board uphold and comply with the Principles of Public Life recommended by the Nolan Committee and shall in particular declare any personal direct or indirect financial interests and withdraw from those parts of business meetings, formal or informal, where business is being discussed in respect of which they have such an interest.
11. DISPUTE RESOLUTION
• Any dispute arising in relation to any aspect of this Agreement shall be resolved
in accordance with this clause
Youth Offending Service Shared Board ToR governance 01/02/2017 Page 218 of 293
Appendix
• If a dispute arises in relation to any aspect of this Agreement, the parties to the agreement shall first consult in good faith in an attempt to come to an agreement in relation to the disputed matter
• If the dispute remains unresolved it shall be referred to and resolved by the Board. If the Board cannot reach agreement it will be referred to and resolved by the Chief Executives of the Local Authorities.
12. FREEDOM OF INFORMATION
• The Local Authorities and Member Agencies understand that they are each a Public Authority to which the Freedom of Information Act 2000 and the Environmental Information Regulations 2004 apply and shall co-operate with and provide assistance to each other and the Board at their own cost in enabling any party to this agreement to comply with a request under the Freedom of Information Act and Environmental Information Regulations.
• All requests to a Local Authority or Member Agency for information in relation to
youth offending must be notified without delay to the Head of Service to seek an opinion from the Head of Service upon the information requested and the appropriate and most efficient manner to comply with the request in accordance with the Act and Regulations.
• The Act and Regulations impose timescales for compliance in respect of requests for information. The Board and each Local Authority and Member Agency and the Head of Service will use their best endeavours to ensure that the information requested is supplied within sufficient time to comply with the timescales required by the Act and Regulations.
13. RESIGNATION AND TERMINATION OF THE JOINT BOARD
• Local Authorities will give not less than 12 months written notice (expiring on the 31
March in any year) to the Chair of their intention to cease their involvement with the Service.
• The Service and the Board will continue to operate until such time as one or more of the Local Authorities gives notice of their intention to cease their involvement with the Service and the Board pursuant to the above provision whereupon the joint working arrangement will cease as at the date of the expiry of the said notice.
• In the event of one or more Local Authorities giving notice under the above provision the Board shall take such steps as to minimise, so far as is consistent with the continuing delivery of the functions set out i n this agreement u n t i l termination, the liabilities of the Service as at the date of termination.
• Any outstanding joint assets or liabilities of the Service that are not otherwise identifiable as the asset or liability of a Local Authority as at the date of termination will be apportioned equally based on child population between the Local Authorities.
Youth Offending Service Shared Board ToR governance 01/02/2017 Page 219 of 293

IIA Form Updated January 2016
This form replaces the previous Integrated Impact Assessment form used by LBC. The key aim of an impact assessment is to ensure that all Council policies, plans and strategies support the corporate mission statement that
‘The needs of Luton’s people will be first in everything we do’.
1. Why do I need to do an IIA?The aim of this impact assessment process is to:
Ensure adherence to the legal duties contained within the Equality Act 2010 and associatedPublic Sector Duty to analyse the impact of decisions to be undertaken by Council.
Ensure the Council has due regard to equality taking a proportionate and timely approach toanalysing the impact on citizens
Minimise duplication of initial impact assessments with regards to Environment and Health andmaximise consideration of other key Council priorities of Inclusion and Community Cohesion
Ensure that the Council has been able to consider the social, health, environmental andeconomic impacts in its decision making in a single document and, where necessary enable the production of a comprehensive action plan to mitigate any potential negative impacts identified
2. When do I need to do an IIA?
An IIA must be started at the beginning of any project, policy or strategy, and cannot be finalised until such time as all consultations, as required, are undertaken.
The Impact Table will help you to make early consideration of the potential impacts of yourproposal and should be used from the point at which preliminary report is taken to CorporateLeadership and Management Team (CLMT) where appropriate. By using this table at yourearliest point in the project, potential impacts can be highlighted and it will also be clear whetheryou need to carry out a full IIA.
If you complete this table and all impacts identified are neutral, i.e. there is no noticeable impacton characteristics and priorities listed and you are fully confident of this, please contact the SJU byemail setting out how you have reached this judgement as it is unlikely you will need to carry out afull IIA.
An IIA must at all times identify those who will be affected by the decision, policy or strategy.
At a time of economic austerity IIA authors are minded to consider the whole range of decisions,both locally and nationally when analysing the impact on citizens
Your first early draft is to be sent to the Social Justice Unit for comments and guidance
Once consultation has ended, the IIA must be updated with results of the consultation andreturned to Executive, where required, for further consideration and approval – at this stage it willbe signed off as completed by the Social Justice Unit
If at anytime you need further guidance please contact the Social Justice Unit. For your convenience, please see links at the end of this document to key Corporate and Partnership documents that may help you complete this IIA.
Integrated Impact Assessment Form (IIA)
from June 2013
Page 220 of 293
IIA Form Updated January 2016
Proposal Title: Youth Justice Annual Strategic Plan for Luton
Date of IIA: 12th October 2016
Updated after consultation -
Lead Officer Name: David Collins
Early draft Seen by:1
Finalised IIA Signed and seen by SJU : Name: Date:
Please include the names of all other contributors and stakeholders involved in the preparing of this proposal who have been consulted with and agreed this assessment. (Please note the IIA must not be carried out by one person):
If there is any potential impact on staffing please include the name/s of the trade union representative/s involved in the preparation of this assessment or any supporting evidence of request to participate:
YOS Management Team YOS Staff team YOS Chief Officers Management Board People Directorate DMT
N/A
Please provide an outline of your proposal:
Information supporting the proposal (who, what, where, how2)
The Youth Offending Service (YOS) is a statutory multi agency service which has a responsibility to prevent offending and reoffending by those aged under 18 years resident in Luton. Luton YOS is well respected nationally as a high performing service achieving good outcomes for children and young people. There is a statutory requirement to produce and submit, to the Youth Justice Board, a Youth Justice Plan as set out in the Crime and Disorder Act 1998 section 40. The plan should set out how youth justice services are to be provided and funded, how the Youth Offending Service will be composed and funded, how it will operate and what functions it will carry out. The Plan must be submitted for approval to the Youth Justice Board and published in accordance with the directions of the Secretary of State. The submission of the plan is also a condition for receipt by the service of the second instalment of the Youth Justice Board Good Practice Grant.
1 Please send an early draft of your IIA to the SJU to ensure all impacts are being considered at the appropriate time
2 Breakdown of present users by ethnicity, age, gender, disability, religion/belief, sexuality (if recorded)
Also, show areas in the town with the biggest and lowest needs. Greater emphasis is required at the start of the IIA on the service, how it is delivered now and how the new service will be delivered
Page 221 of 293
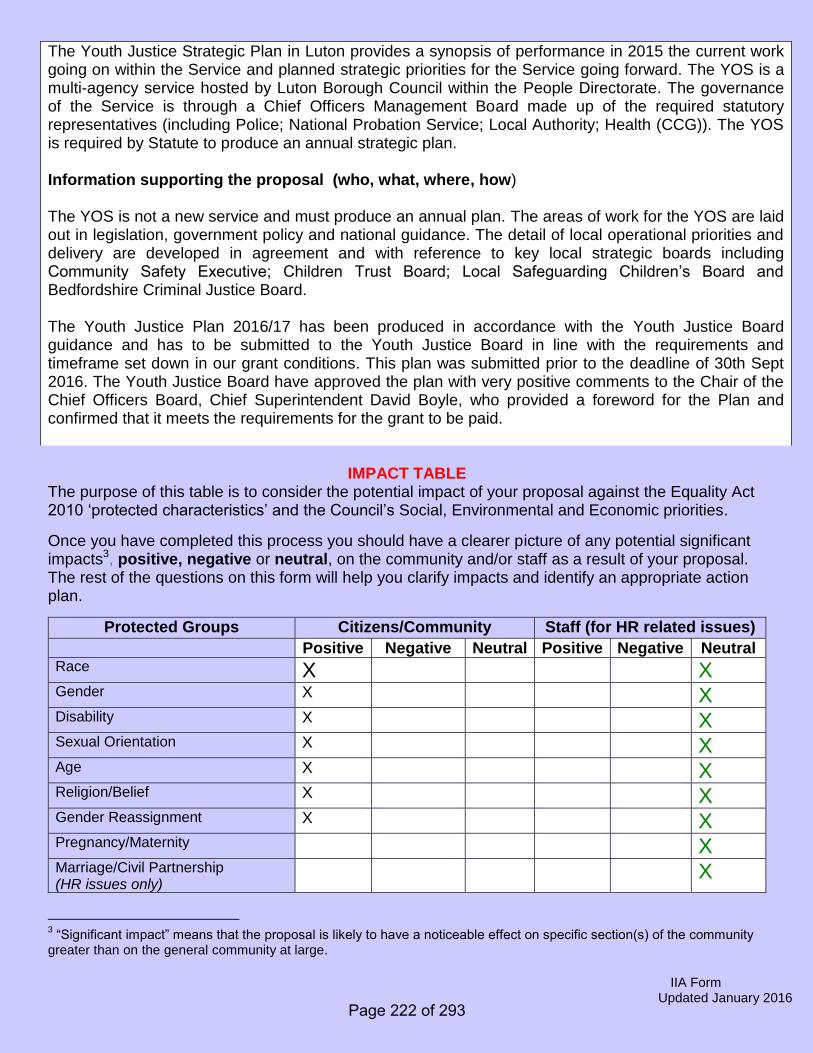
IIA Form Updated January 2016
The Youth Justice Strategic Plan in Luton provides a synopsis of performance in 2015 the current work going on within the Service and planned strategic priorities for the Service going forward. The YOS is a multi-agency service hosted by Luton Borough Council within the People Directorate. The governance of the Service is through a Chief Officers Management Board made up of the required statutory representatives (including Police; National Probation Service; Local Authority; Health (CCG)). The YOS is required by Statute to produce an annual strategic plan.
Information supporting the proposal (who, what, where, how)
The YOS is not a new service and must produce an annual plan. The areas of work for the YOS are laid out in legislation, government policy and national guidance. The detail of local operational priorities and delivery are developed in agreement and with reference to key local strategic boards including Community Safety Executive; Children Trust Board; Local Safeguarding Children’s Board and Bedfordshire Criminal Justice Board.
The Youth Justice Plan 2016/17 has been produced in accordance with the Youth Justice Board guidance and has to be submitted to the Youth Justice Board in line with the requirements and timeframe set down in our grant conditions. This plan was submitted prior to the deadline of 30th Sept 2016. The Youth Justice Board have approved the plan with very positive comments to the Chair of the Chief Officers Board, Chief Superintendent David Boyle, who provided a foreword for the Plan and confirmed that it meets the requirements for the grant to be paid.
IMPACT TABLE The purpose of this table is to consider the potential impact of your proposal against the Equality Act 2010 ‘protected characteristics’ and the Council’s Social, Environmental and Economic priorities.
Once you have completed this process you should have a clearer picture of any potential significant impacts3, positive, negative or neutral, on the community and/or staff as a result of your proposal. The rest of the questions on this form will help you clarify impacts and identify an appropriate action plan.
Protected Groups Citizens/Community Staff (for HR related issues)
Positive Negative Neutral Positive Negative Neutral Race X X Gender X X Disability X X Sexual Orientation X X Age X X Religion/Belief X X Gender Reassignment X X Pregnancy/Maternity X Marriage/Civil Partnership (HR issues only)
X
3 “Significant impact” means that the proposal is likely to have a noticeable effect on specific section(s) of the community
greater than on the general community at large.
Page 222 of 293
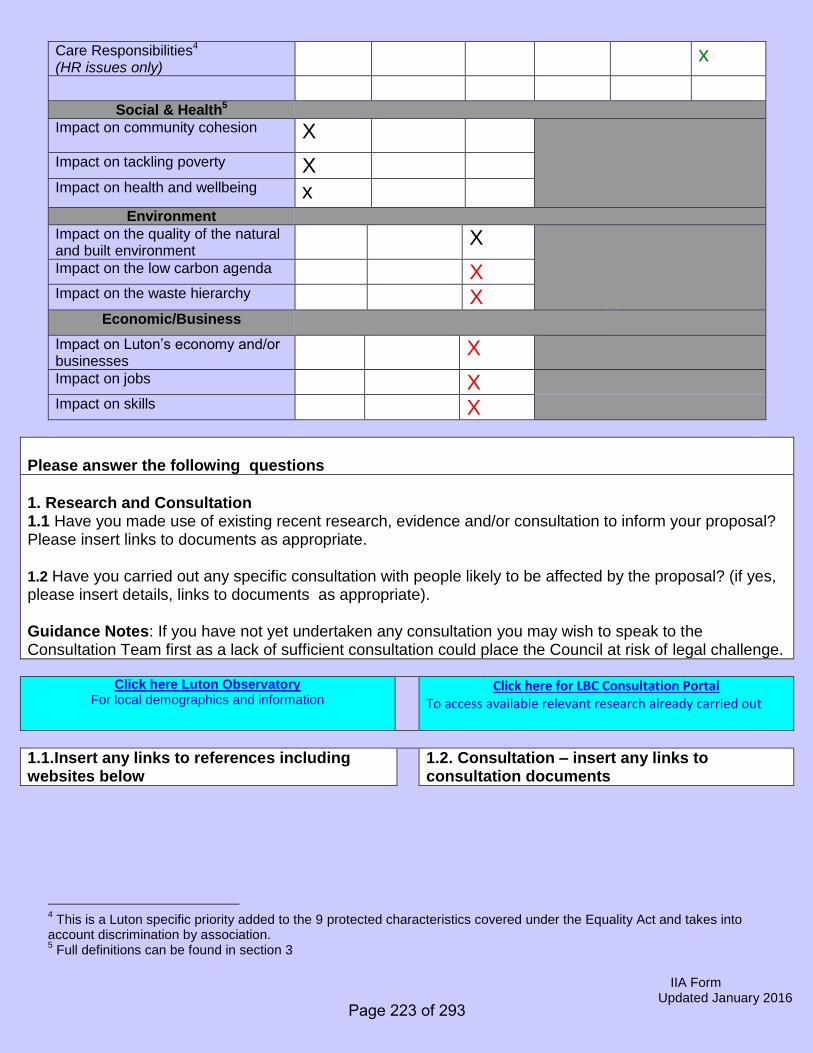
IIA Form Updated January 2016
Care Responsibilities4 (HR issues only)
x
Social & Health5
Impact on community cohesion X
Impact on tackling poverty X Impact on health and wellbeing x
Environment
Impact on the quality of the natural and built environment
X
Impact on the low carbon agenda X Impact on the waste hierarchy X
Economic/Business
Impact on Luton’s economy and/or businesses
X
Impact on jobs X Impact on skills X
Please answer the following questions
1. Research and Consultation1.1 Have you made use of existing recent research, evidence and/or consultation to inform your proposal? Please insert links to documents as appropriate.
1.2 Have you carried out any specific consultation with people likely to be affected by the proposal? (if yes, please insert details, links to documents as appropriate).
Guidance Notes: If you have not yet undertaken any consultation you may wish to speak to the Consultation Team first as a lack of sufficient consultation could place the Council at risk of legal challenge.
Click here Luton Observatory For local demographics and information
Click here for LBC Consultation Portal To access available relevant research already carried out
1.1.Insert any links to references including websites below
1.2. Consultation – insert any links to consultation documents
4 This is a Luton specific priority added to the 9 protected characteristics covered under the Equality Act and takes into
account discrimination by association. 5 Full definitions can be found in section 3
Page 223 of 293
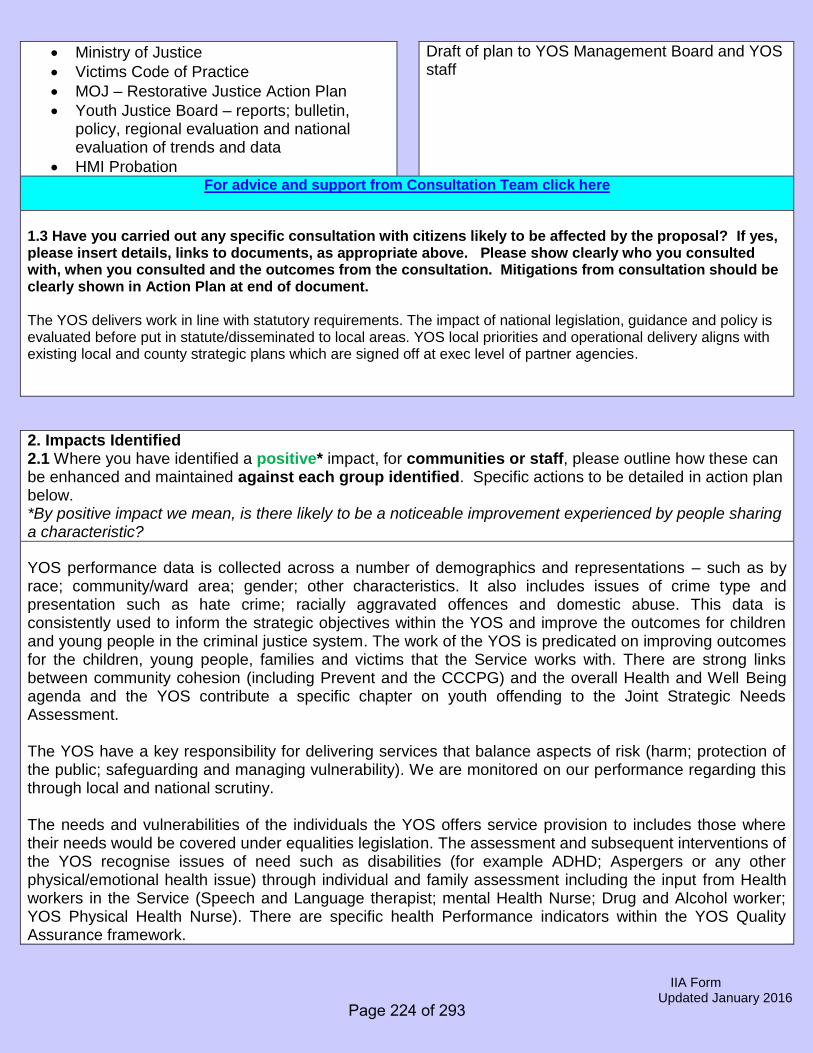
IIA Form Updated January 2016
Ministry of Justice
Victims Code of Practice
MOJ – Restorative Justice Action Plan
Youth Justice Board – reports; bulletin,policy, regional evaluation and nationalevaluation of trends and data
HMI Probation
Draft of plan to YOS Management Board and YOS staff
For advice and support from Consultation Team click here
1.3 Have you carried out any specific consultation with citizens likely to be affected by the proposal? If yes, please insert details, links to documents, as appropriate above. Please show clearly who you consulted with, when you consulted and the outcomes from the consultation. Mitigations from consultation should be clearly shown in Action Plan at end of document.
The YOS delivers work in line with statutory requirements. The impact of national legislation, guidance and policy is evaluated before put in statute/disseminated to local areas. YOS local priorities and operational delivery aligns with existing local and county strategic plans which are signed off at exec level of partner agencies.
2. Impacts Identified2.1 Where you have identified a positive* impact, for communities or staff, please outline how these can be enhanced and maintained against each group identified. Specific actions to be detailed in action plan below. *By positive impact we mean, is there likely to be a noticeable improvement experienced by people sharinga characteristic?
YOS performance data is collected across a number of demographics and representations – such as by race; community/ward area; gender; other characteristics. It also includes issues of crime type and presentation such as hate crime; racially aggravated offences and domestic abuse. This data is consistently used to inform the strategic objectives within the YOS and improve the outcomes for children and young people in the criminal justice system. The work of the YOS is predicated on improving outcomes for the children, young people, families and victims that the Service works with. There are strong links between community cohesion (including Prevent and the CCCPG) and the overall Health and Well Being agenda and the YOS contribute a specific chapter on youth offending to the Joint Strategic Needs Assessment.
The YOS have a key responsibility for delivering services that balance aspects of risk (harm; protection of the public; safeguarding and managing vulnerability). We are monitored on our performance regarding this through local and national scrutiny.
The needs and vulnerabilities of the individuals the YOS offers service provision to includes those where their needs would be covered under equalities legislation. The assessment and subsequent interventions of the YOS recognise issues of need such as disabilities (for example ADHD; Aspergers or any other physical/emotional health issue) through individual and family assessment including the input from Health workers in the Service (Speech and Language therapist; mental Health Nurse; Drug and Alcohol worker; YOS Physical Health Nurse). There are specific health Performance indicators within the YOS Quality Assurance framework.
Page 224 of 293
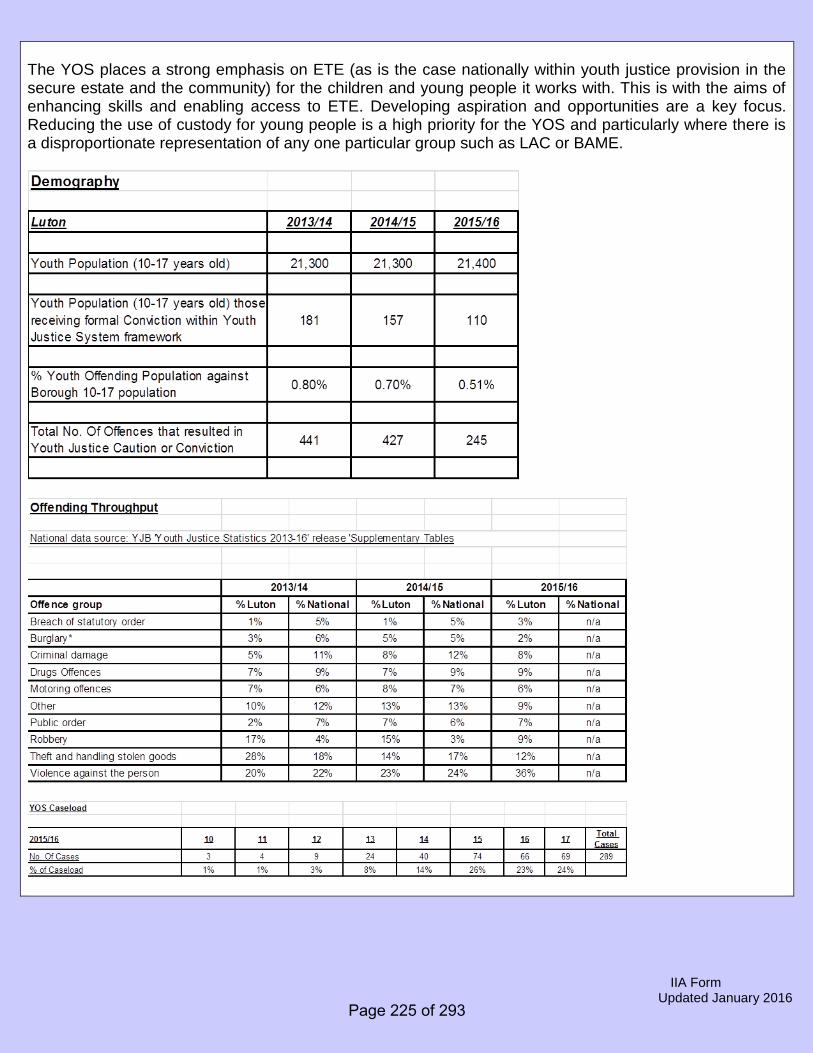
IIA Form Updated January 2016
The YOS places a strong emphasis on ETE (as is the case nationally within youth justice provision in the secure estate and the community) for the children and young people it works with. This is with the aims of enhancing skills and enabling access to ETE. Developing aspiration and opportunities are a key focus. Reducing the use of custody for young people is a high priority for the YOS and particularly where there is a disproportionate representation of any one particular group such as LAC or BAME.
Page 225 of 293
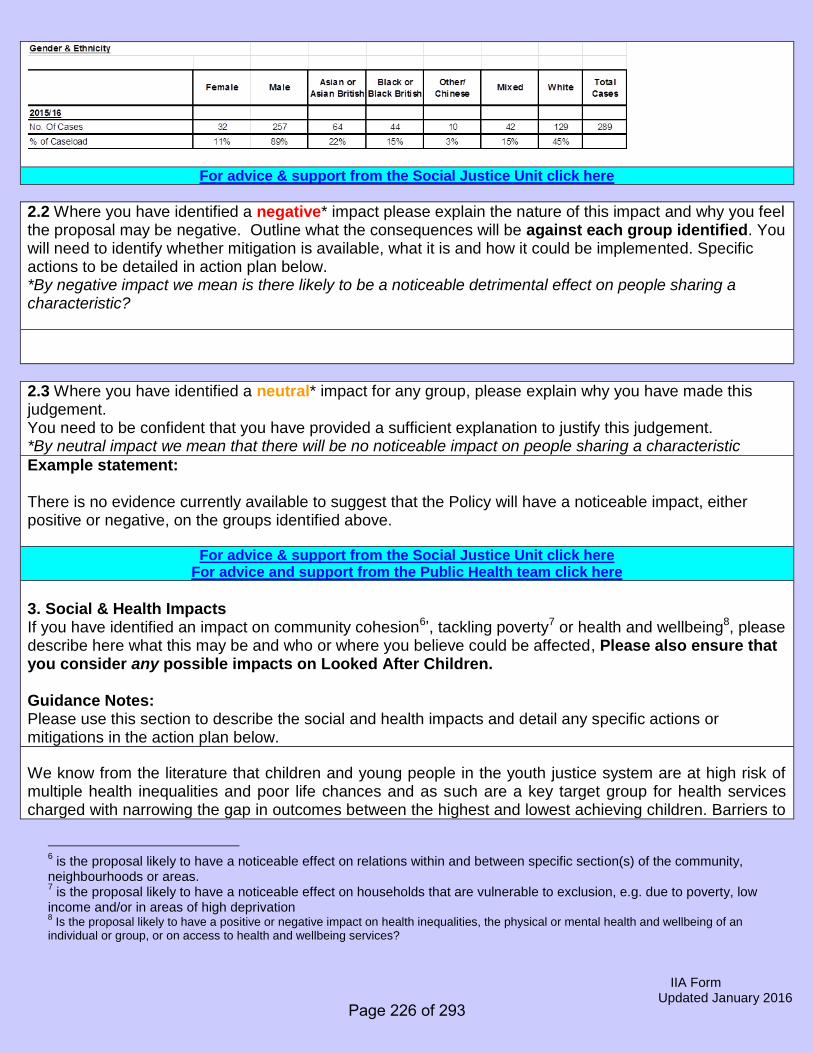
IIA Form Updated January 2016
For advice & support from the Social Justice Unit click here
2.2 Where you have identified a negative* impact please explain the nature of this impact and why you feel the proposal may be negative. Outline what the consequences will be against each group identified. You will need to identify whether mitigation is available, what it is and how it could be implemented. Specific actions to be detailed in action plan below. *By negative impact we mean is there likely to be a noticeable detrimental effect on people sharing acharacteristic?
2.3 Where you have identified a neutral* impact for any group, please explain why you have made this judgement. You need to be confident that you have provided a sufficient explanation to justify this judgement. *By neutral impact we mean that there will be no noticeable impact on people sharing a characteristic
Example statement:
There is no evidence currently available to suggest that the Policy will have a noticeable impact, either positive or negative, on the groups identified above.
For advice & support from the Social Justice Unit click here For advice and support from the Public Health team click here
3. Social & Health ImpactsIf you have identified an impact on community cohesion6’, tackling poverty7 or health and wellbeing8, please describe here what this may be and who or where you believe could be affected, Please also ensure that you consider any possible impacts on Looked After Children.
Guidance Notes: Please use this section to describe the social and health impacts and detail any specific actions or mitigations in the action plan below.
We know from the literature that children and young people in the youth justice system are at high risk of multiple health inequalities and poor life chances and as such are a key target group for health services charged with narrowing the gap in outcomes between the highest and lowest achieving children. Barriers to
6 is the proposal likely to have a noticeable effect on relations within and between specific section(s) of the community,
neighbourhoods or areas. 7 is the proposal likely to have a noticeable effect on households that are vulnerable to exclusion, e.g. due to poverty, low
income and/or in areas of high deprivation 8 Is the proposal likely to have a positive or negative impact on health inequalities, the physical or mental health and wellbeing of an
individual or group, or on access to health and wellbeing services?
Page 226 of 293
IIA Form Updated January 2016
progress include higher than average:
• Mental health vulnerabilities• Levels of learning disabilities• Levels of speech and communication needs• Health inequalities• Rates of problematic drug and alcohol use
The YOS is fortunate in that commissioning for health services in Luton have recognised this and Luton YOS has an integrated health team (including physical health, mental health, speech and language and substance misuse workers) With that said, it is still important for workers to forge systematic links with the broad range of voluntary and statutory services outside the organisation to ensure that we do not become isolated from mainstream services.
The YOS continues to work closely with key agendas for the Local Authority within relevant strategic groups and alongside key strategic plans (eg. Health and Well Being). The YOS sit on operational and strategic groups such as Prevent and Channel, Community Safety Executive, Bedfordshire Victims Partnership etc to ensure our work takes account of the aims and objectives of aligned plans and delivery. The YOS also sits on other groups where community leads are represented. The YOS works with key community agendas such as having the lead for one of the four key areas in the Ending Serious Youth Violence strategy and related action plan. The YOS Service Manager is the current theme lead for Serious Youth Violence in Luton as part of the CSP.
The YOS sits on the Corporate Parenting Board and has been a key member of the group revising the Children in Care Action Plan. There is a specific section within this plan on offending which ensures the strategic link up regarding work of the YOS in relation to children looked after by LBC. Additionally, the YOS is currently working on reducing the disproportionate use of custody for looked after children. The YOS Chief Officers Management Board also has a specific focus in monitoring issues relating to children in care, this is a key national and local YOS priority.
Whilst the plan itself may appear not to focus on specific health outcomes and wider public health considerations there is significant association between drug and alcohol misuse and offending and antisocial behaviour. As such the work of the health workers based at the YOS is crucial to the strategic aims of preventing and reducing offending but also meeting the needs of the young people in the youth justice system who are at high risk of multiple health inequalities and poor life chances. Therefore any service reduction would have an impact on these service users in particular.
Page 227 of 293
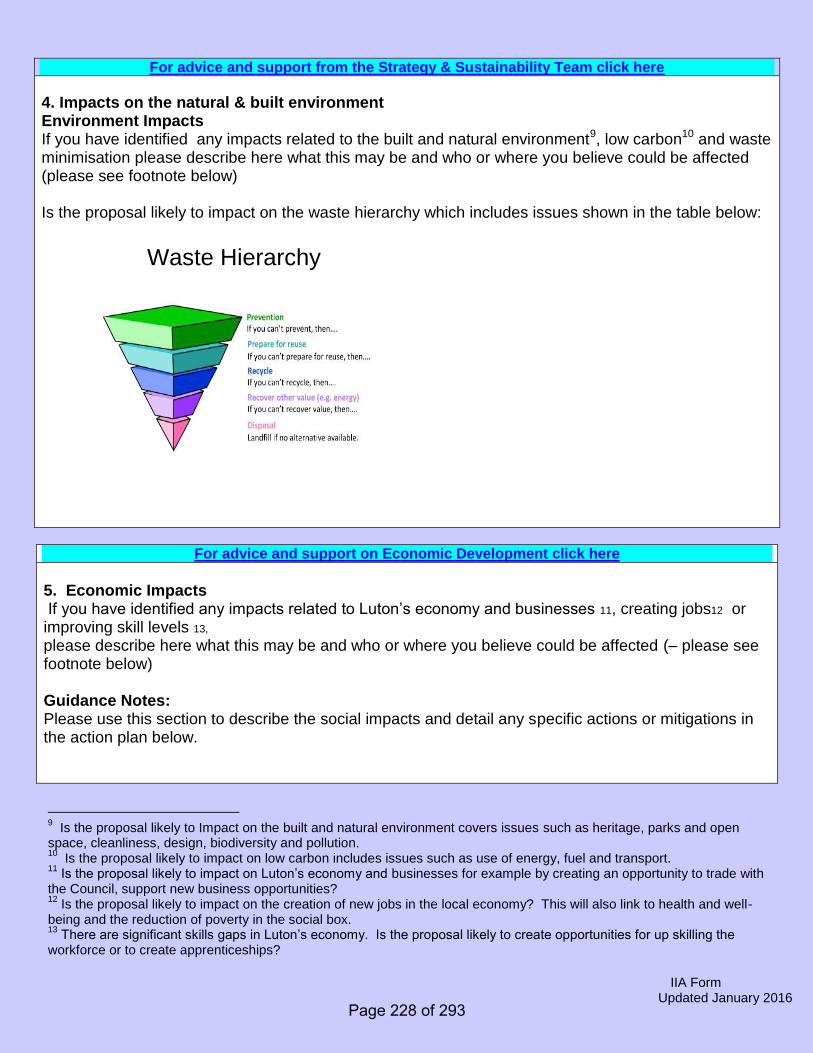
IIA Form Updated January 2016
For advice and support from the Strategy & Sustainability Team click here
4. Impacts on the natural & built environmentEnvironment Impacts If you have identified any impacts related to the built and natural environment9, low carbon10 and waste minimisation please describe here what this may be and who or where you believe could be affected (please see footnote below)
Is the proposal likely to impact on the waste hierarchy which includes issues shown in the table below:
Waste Hierarchy
For advice and support on Economic Development click here
5. Economic Impacts If you have identified any impacts related to Luton’s economy and businesses 11, creating jobs12 or improving skill levels 13, please describe here what this may be and who or where you believe could be affected (– please see footnote below)
Guidance Notes: Please use this section to describe the social impacts and detail any specific actions or mitigations in the action plan below.
9 Is the proposal likely to Impact on the built and natural environment covers issues such as heritage, parks and open
space, cleanliness, design, biodiversity and pollution. 10
Is the proposal likely to impact on low carbon includes issues such as use of energy, fuel and transport. 11
Is the proposal likely to impact on Luton’s economy and businesses for example by creating an opportunity to trade with the Council, support new business opportunities? 12
Is the proposal likely to impact on the creation of new jobs in the local economy? This will also link to health and well-being and the reduction of poverty in the social box. 13
There are significant skills gaps in Luton’s economy. Is the proposal likely to create opportunities for up skilling the workforce or to create apprenticeships?
Page 228 of 293
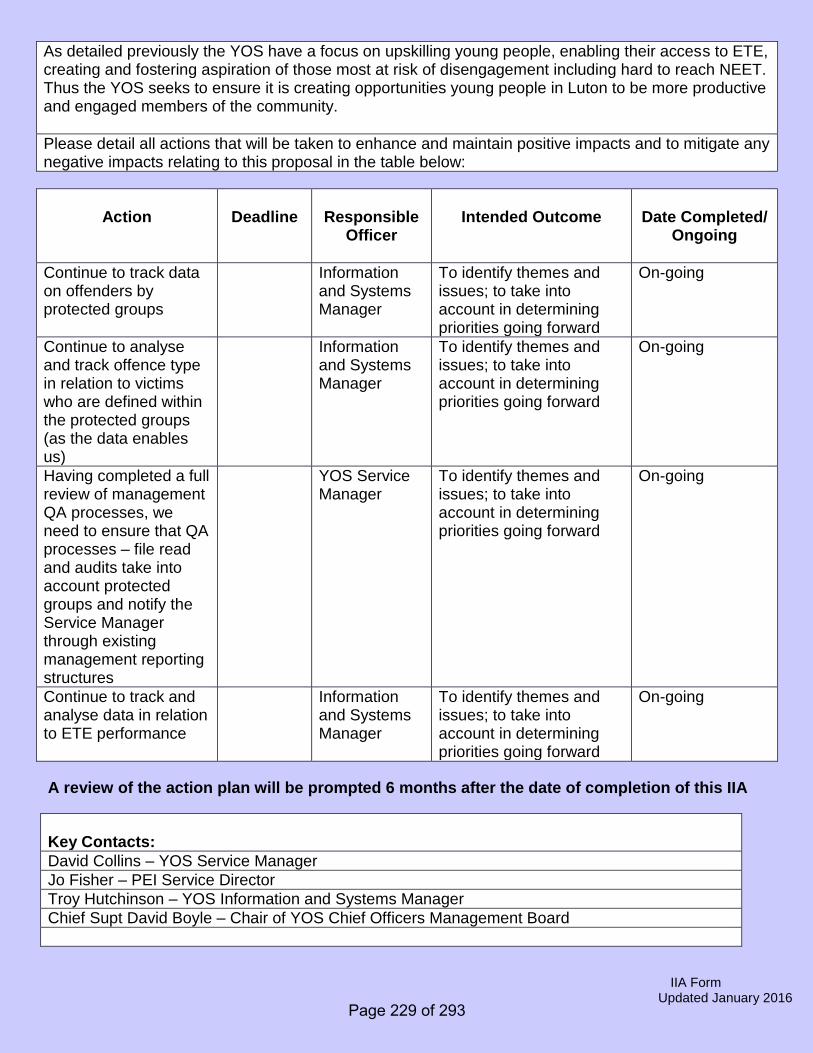
IIA Form Updated January 2016
As detailed previously the YOS have a focus on upskilling young people, enabling their access to ETE, creating and fostering aspiration of those most at risk of disengagement including hard to reach NEET. Thus the YOS seeks to ensure it is creating opportunities young people in Luton to be more productive and engaged members of the community.
Please detail all actions that will be taken to enhance and maintain positive impacts and to mitigate any negative impacts relating to this proposal in the table below:
Action Deadline Responsible Officer
Intended Outcome Date Completed/ Ongoing
Continue to track data on offenders by protected groups
Information and Systems Manager
To identify themes and issues; to take into account in determining priorities going forward
On-going
Continue to analyse and track offence type in relation to victims who are defined within the protected groups (as the data enables us)
Information and Systems Manager
To identify themes and issues; to take into account in determining priorities going forward
On-going
Having completed a full review of management QA processes, we need to ensure that QA processes – file read and audits take into account protected groups and notify the Service Manager through existing management reporting structures
YOS Service Manager
To identify themes and issues; to take into account in determining priorities going forward
On-going
Continue to track and analyse data in relation to ETE performance
Information and Systems Manager
To identify themes and issues; to take into account in determining priorities going forward
On-going
A review of the action plan will be prompted 6 months after the date of completion of this IIA
Key Contacts:
David Collins – YOS Service Manager
Jo Fisher – PEI Service Director
Troy Hutchinson – YOS Information and Systems Manager
Chief Supt David Boyle – Chair of YOS Chief Officers Management Board
Page 229 of 293
IIA Form Updated January 2016
Next Steps
All Executive Reports, where relevant, must have an IIA attached
All report authors must complete the IIA section of Executive Reports (equalities,cohesion, inclusion, health, economic, business and environment)
All reports are to be forwarded to the Social Justice Unit, Public Health and Strategy &Sustainability Unit for sign off in time for Executive deadline
On the rare occasion that the Social Justice Unit are unable to sign off the report, e.g.recommendations are in breach of legislation, a statement will be submitted by SocialJustice Unit Manager or Equality and Diversity Policy Manager
Completed and signed IIA’s will be published on the internet once the democratic process is complete
Corporate Plan http://intranet/SupportServices/Document%20library/Corporate%20plan%2011th%20July%202011.doc
Equality Charter http://intranet/SupportServices/socialjustice/Document%20library/Equality%20charter.pdf
Social Justice Framework http://www.luton.gov.uk/Community_and_living/Lists/LutonDocuments/PDF/Social%20Justice/Social%20Justice%20Framework%202012%20-2026.pdf
Family Poverty Strategy http://www.lutonforum.org/Forum/Documents/Family-Poverty-Strategy-Final-October2011_001.pdf
Joint Strategic Needs Assessment (JSNA)
http://www.luton.gov.uk/Community_and_living/Luton%20observatory%20census%20statistics%20and%20mapping/Pages/Joint%20Strategic%20Needs%20Assessment%20-%20JSNA.aspx Community Involvement Strategy
http://www.luton.gov.uk/Community_and_living/Lists/LutonDocuments/PDF/Community%20involvement%20strategy.pdf
Page 230 of 293
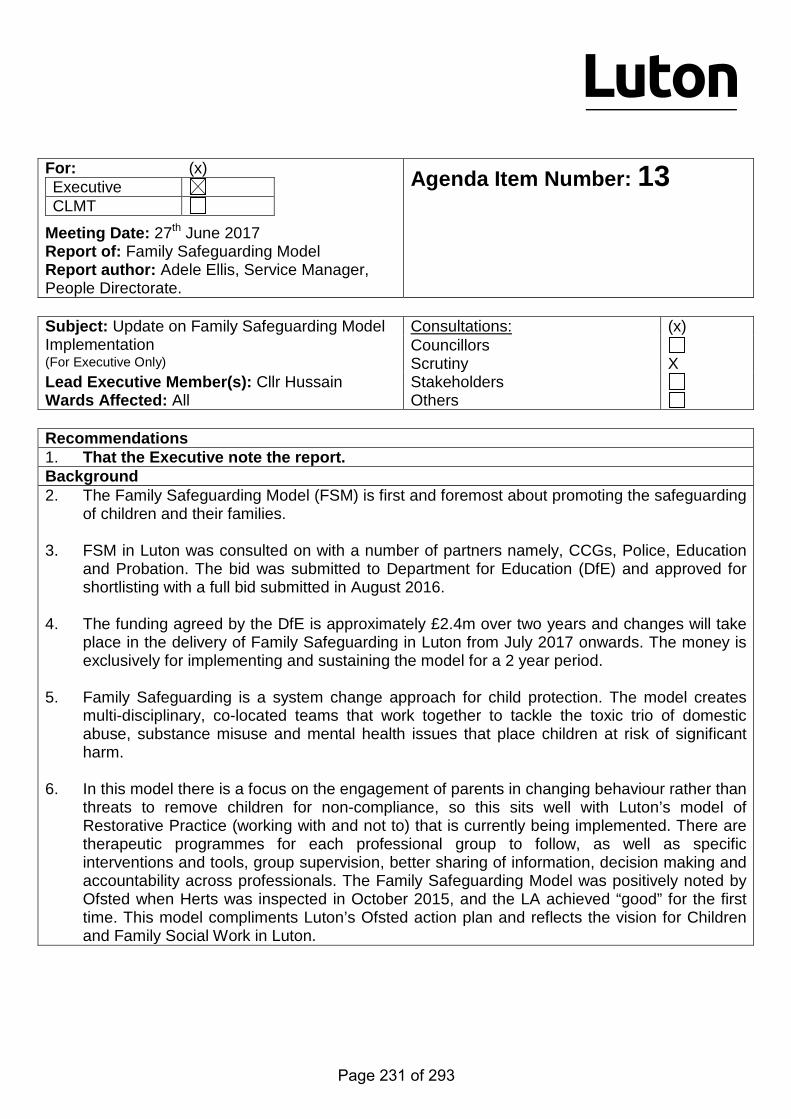
Subject: Update on Family Safeguarding Model Implementation
Consultations: (x) Councillors
(For Executive Only) Scrutiny X Lead Executive Member(s): Cllr Hussain Stakeholders Wards Affected: All Others Recommendations 1. That the Executive note the report. Background 2. The Family Safeguarding Model (FSM) is first and foremost about promoting the safeguarding
of children and their families. 3. FSM in Luton was consulted on with a number of partners namely, CCGs, Police, Education
and Probation. The bid was submitted to Department for Education (DfE) and approved for shortlisting with a full bid submitted in August 2016.
4. The funding agreed by the DfE is approximately £2.4m over two years and changes will take
place in the delivery of Family Safeguarding in Luton from July 2017 onwards. The money is exclusively for implementing and sustaining the model for a 2 year period.
5. Family Safeguarding is a system change approach for child protection. The model creates
multi-disciplinary, co-located teams that work together to tackle the toxic trio of domestic abuse, substance misuse and mental health issues that place children at risk of significant harm.
6. In this model there is a focus on the engagement of parents in changing behaviour rather than
threats to remove children for non-compliance, so this sits well with Luton’s model of Restorative Practice (working with and not to) that is currently being implemented. There are therapeutic programmes for each professional group to follow, as well as specific interventions and tools, group supervision, better sharing of information, decision making and accountability across professionals. The Family Safeguarding Model was positively noted by Ofsted when Herts was inspected in October 2015, and the LA achieved “good” for the first time. This model compliments Luton’s Ofsted action plan and reflects the vision for Children and Family Social Work in Luton.
For: (x) Executive CLMT
Meeting Date: 27th June 2017 Report of: Family Safeguarding Model Report author: Adele Ellis, Service Manager, People Directorate.
Agenda Item Number: 13
Page 231 of 293
The current position 7. The Project started on 5th May 2017 with a Project Lead supported by a Project Manager.
Workstreams have been identified and nominated leads from corporate and partner organisations supported to strat work on the necessary changes to make a “soft launch” possible by then end of July 2017. There has been considerable support from Hertfordshire colleagues in sharing learning and experiences with workstream leads and staff from the People Directorate attended a half day workshop with Herts colleagues to understand the model and its benefits for the children and families of Luton.
8. Consultations have already been undertaken with the Unions, the staff group and external
partners. A comprehensive communications strategy is in place to maintain transparency and keep all stakeholders updated.
9. Progress has been made in securing an upgrade to the Children’s recording system, Liquid
Logic; considering accommodation options, establishing partner organisation links in data performance, HR and Information Technology matters and a communication strategy. The staff group that will be directly affected by the changes have been briefed and appropriate training is being procured.
Goals and Objectives 10. To provide services in conjunction with our partners and commissioned providers to improve
outcomes for children in Luton, where there are issues relating to the “toxic trio” of substance misuse, domestic abuse and mental health.
11. To create multi disciplinary teams in the neighbourhood social work arena, including adult mental health, substance misuse and domestic abuse practitioners.
12. To ensure closer partnership working and communication. 13. To provide timely and early intervention for children and their families in order to improve their
outcomes. 14. To implement a ‘systemic approach’ in Children’s Social Care and Family Support 15. To establish a shared unified model of practice – Motivational Interviewing. 16. To reduce bureaucracy for practitioners by reforming recording practices and introducing
multi-agency recording. 17. To change the culture of our work with families, moving away from adversarial and towards
motivational. 18. To keep more children safely within their own families. 19. To achieve positive change for families rather than heavily monitoring compliance. 20. To reduce cost to the public purse by working together effectively. 21. To make Children’s Social Work a “doable” job. 22. Luton has 214 children subject to child protection plans. The aim is to safely reduce and
sustain this by 15%, to around 180 by 2020. 23. There are currently 370 Looked After Children (LAC) including unaccompanied asylum
seeking children and the aim is to safely reduce and sustain this by 15%, to approximately 315 by 2020.
Proposal 24. To launch the Safeguarding Families Model as the model for Luton with a first “soft launch” in
July 2017, followed by a further 18 – 24 month programme of improvements and embedding change.
Key Risks • Inability to secure appropriate accommodation for expanding teams and additional workforce • Sustainability of the model post 2 years funding • Stakeholder buy – in may not be achieved as quickly as need be. • Social Workers and associated staff in teams may not have appropriate skills
Page 232 of 293
Consultations
• Staff group – 2nd May, 9th May and 1st June 2017 • Unions – 25th May 2017 • Partners briefing in advance of bid submission – 28th July 2016
Appendices attached: Presentation – Family Safeguarding Model for Luton Background Papers: None IMPLICATIONS For Executive reports For CLMT Reports • grey boxes must be completed • all statements must be cleared by an appropriate officer
• Clearance is not required
Clearance – agreed by: Legal There are no direct implications to Legal noted in
this report. Any changes impacting the Council or its departments as a result of this project will be consulted with legal prior to implementation.
Parveen Begum Acting Principal Solicitor 9/6/17
Finance This report refers to bid monies which are ring-fenced solely for the delivery and implementation of the new Family Safeguarding Model. The bid money management will be supported by finance to ensure compliance and for audit records.
Atif Iqbal (Finance Business Partner People & PHCP Directorates) 12/06/2017
Integrated Impact Assessment (IIA) – Key Points Equalities/ Cohesion/ Inclusion (Social Justice)
There are no direct implications to Social Justice noted in this report. Throughout the project lifecycle, consideration is being given to equalities and the proposed changes will have a positive equalities impact for children and young people from all of Luton’s communities.
Agreed – Sandra Legate (Equality and Inclusion Manager) 12 June 2017
Environment
There are no direct implications to Environment noted in this report.
Strategy & Sustainability – Kat Wysocka, 12 June 2017
Health
Changes proposed as a result of this new model will have a positive health impact on children and their families. Through work done with partner agencies, specialist roles will be introduced to the neighbourhood teams that help tackle the toxic trio of domestic abuse, mental health and substance misuse. The new adult workers will be able to work with the adults, along side the children’s social workers who are working with the children, to ensure a stable and safe environment and keep children in their own homes where possible.
Public Health – Stephen Gunther
Community Safety Staffing Other
Page 233 of 293

FOR EXECUTIVE ONLY - Options: a) To reject the recommendation b) To request further information
Page 234 of 293
2017 Lee-Anne Farach Service Director Children & Families
Page 235 of 293
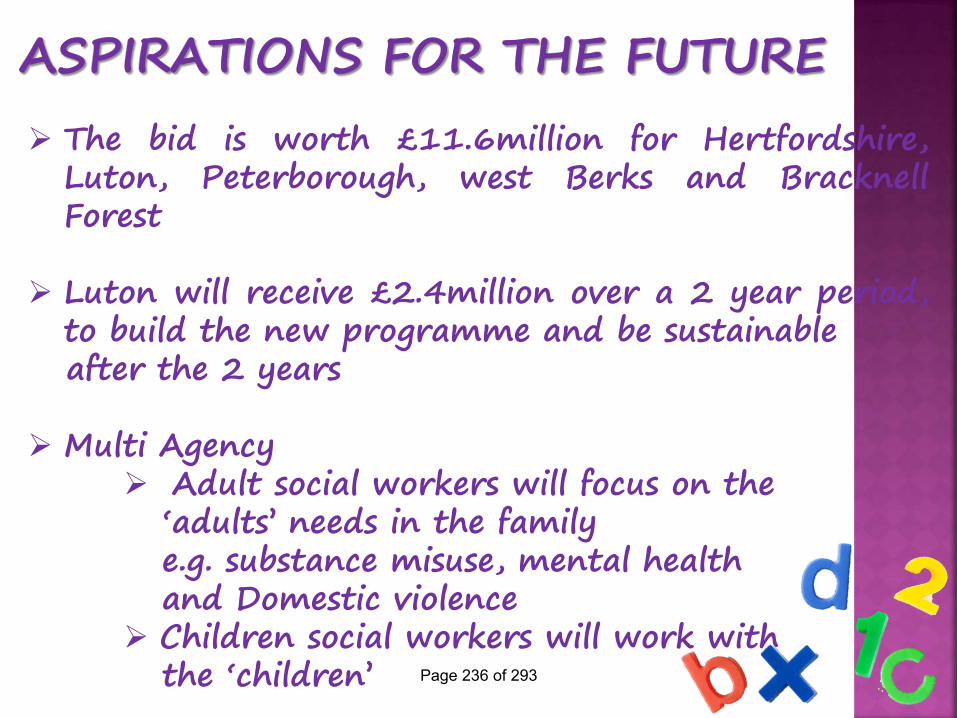
The bid is worth £11.6million for Hertfordshire, Luton, Peterborough, west Berks and Bracknell Forest
Luton will receive £2.4million over a 2 year period,
to build the new programme and be sustainable after the 2 years Multi Agency
Adult social workers will focus on the ‘adults’ needs in the family e.g. substance misuse, mental health and Domestic violence Children social workers will work with the ‘children’ Page 236 of 293
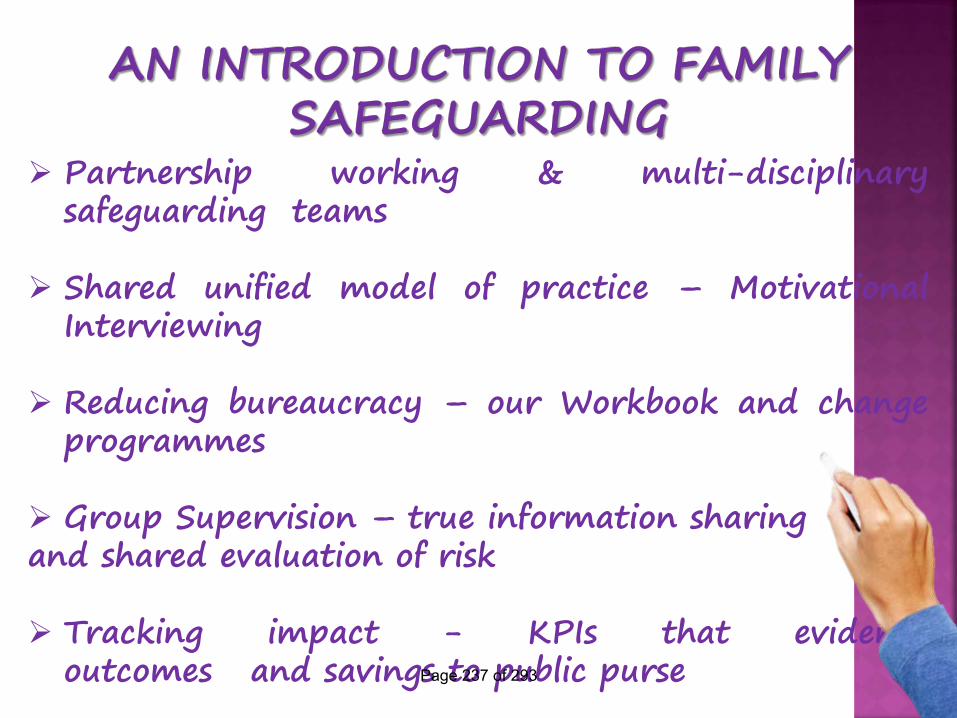
Partnership working & multi-disciplinary safeguarding teams
Shared unified model of practice – Motivational
Interviewing Reducing bureaucracy – our Workbook and change
programmes Group Supervision – true information sharing and shared evaluation of risk Tracking impact - KPIs that evidence
outcomes and savings to public purse
Page 237 of 293
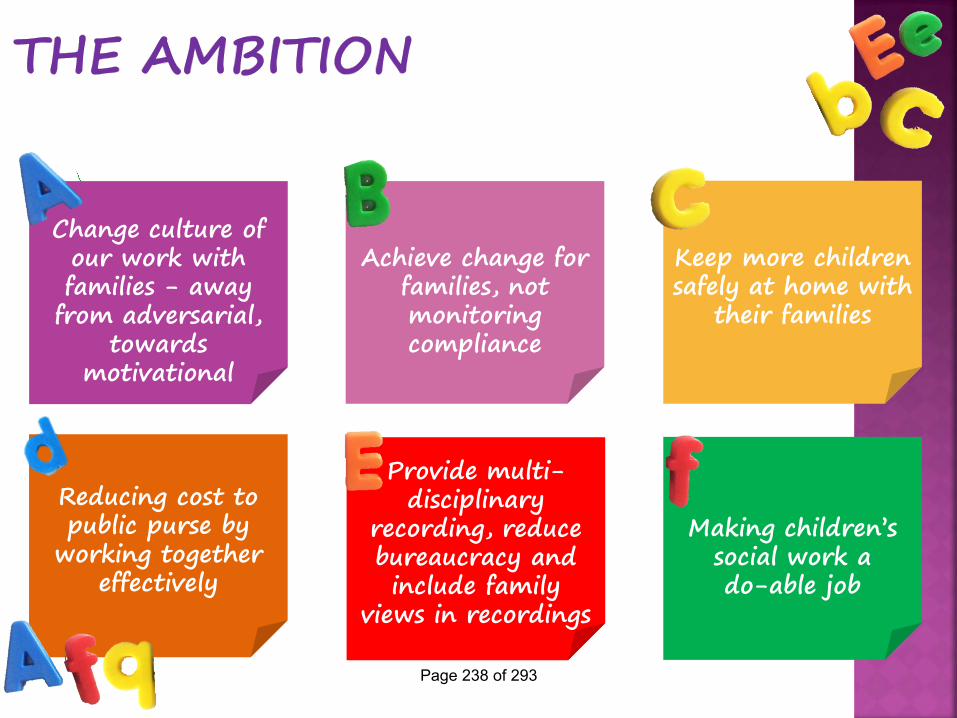
Keep more children safely at home with
their families
Reducing cost to public purse by
working together effectively
Provide multi-
disciplinary recording, reduce bureaucracy and include family
views in recordings
Making children’s social work a do-able job
Change culture of our work with families - away
from adversarial, towards
motivational
Achieve change for families, not monitoring compliance
Page 238 of 293
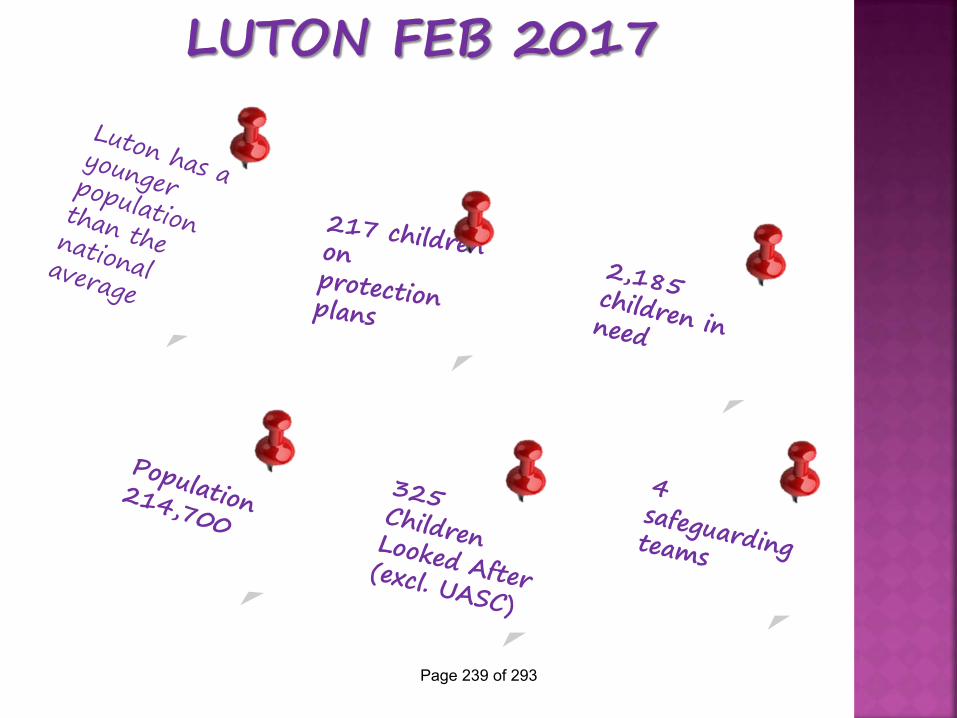
Page 239 of 293
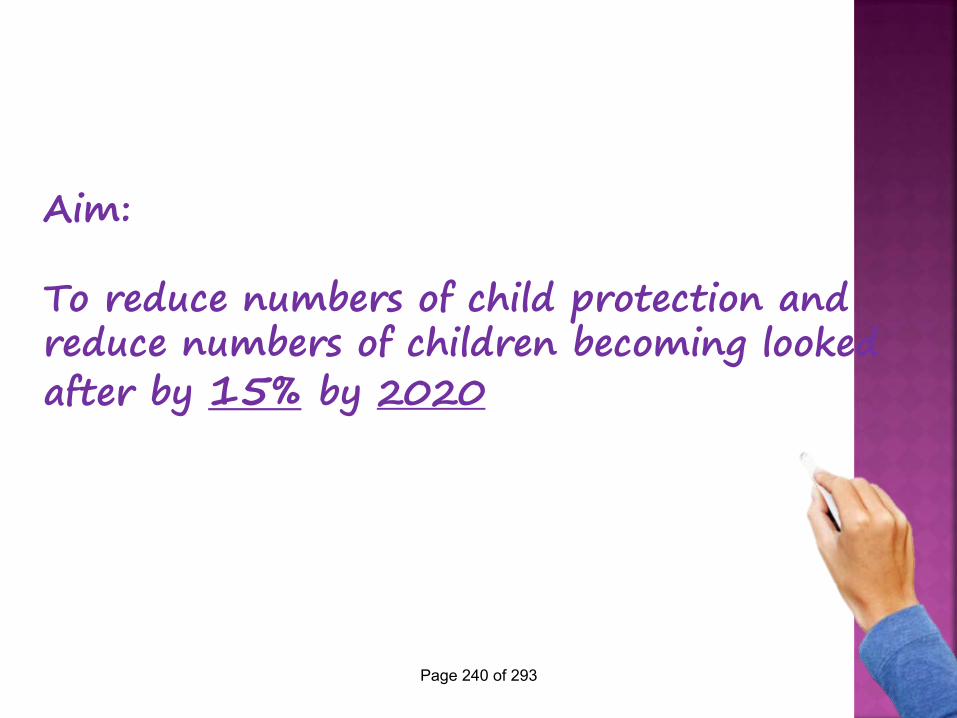
Aim: To reduce numbers of child protection and reduce numbers of children becoming looked after by 15% by 2020
Page 240 of 293
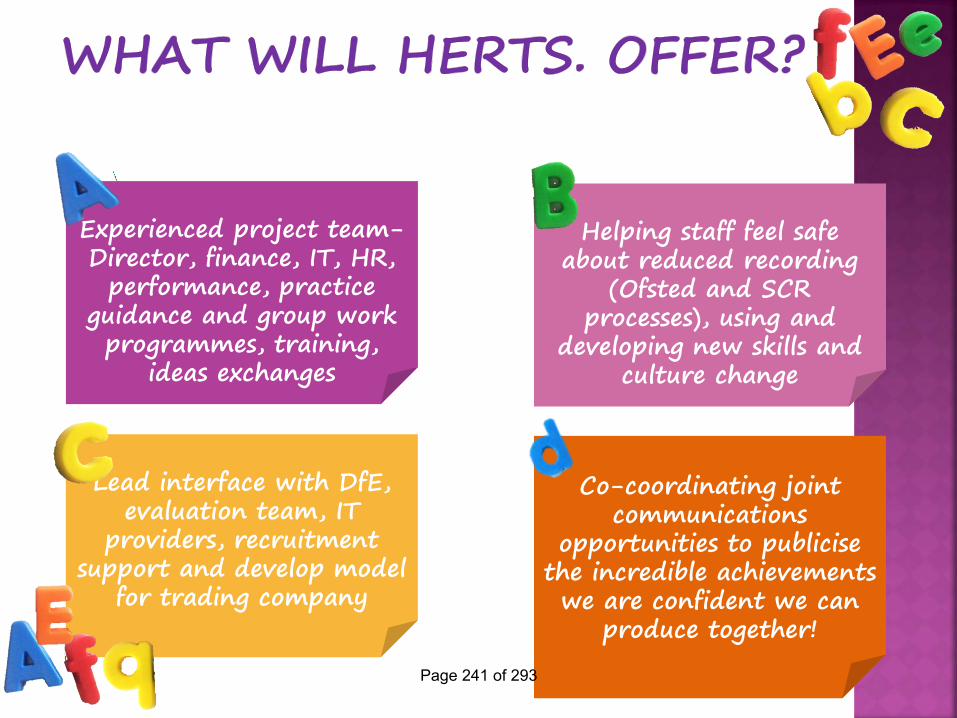
Lead interface with DfE,
evaluation team, IT providers, recruitment
support and develop model for trading company
Co-coordinating joint
communications opportunities to publicise
the incredible achievements we are confident we can
produce together!
Experienced project team-Director, finance, IT, HR,
performance, practice guidance and group work programmes, training,
ideas exchanges
Helping staff feel safe about reduced recording
(Ofsted and SCR processes), using and
developing new skills and culture change
Page 241 of 293
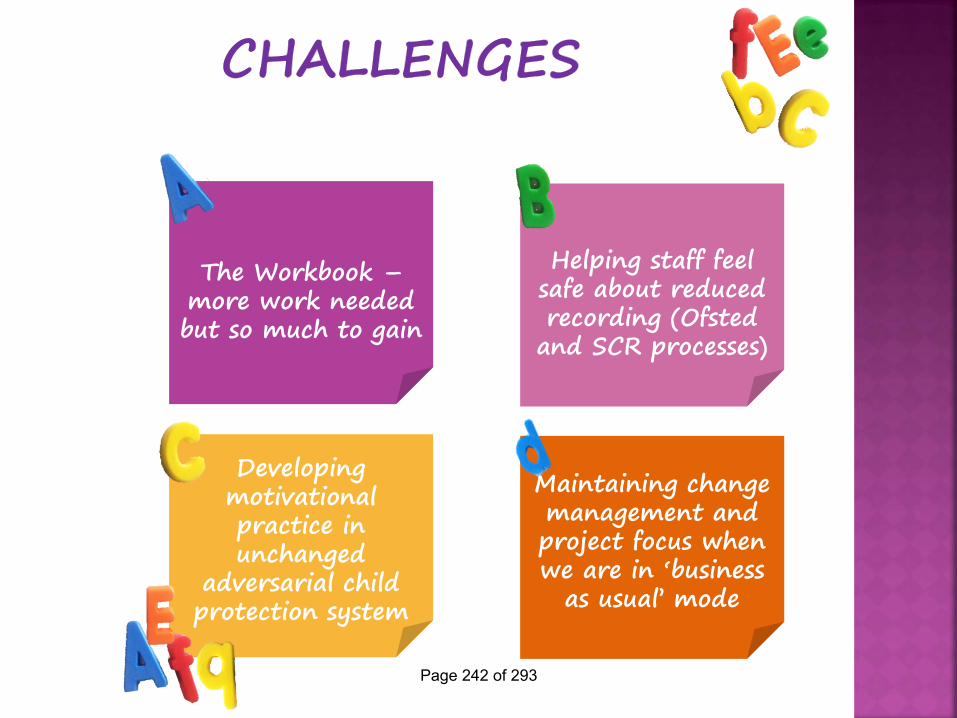
Developing
motivational practice in unchanged
adversarial child protection system
Maintaining change management and project focus when we are in ‘business
as usual’ mode
The Workbook – more work needed but so much to gain
Helping staff feel safe about reduced recording (Ofsted
and SCR processes)
Page 242 of 293
…….
Page 243 of 293
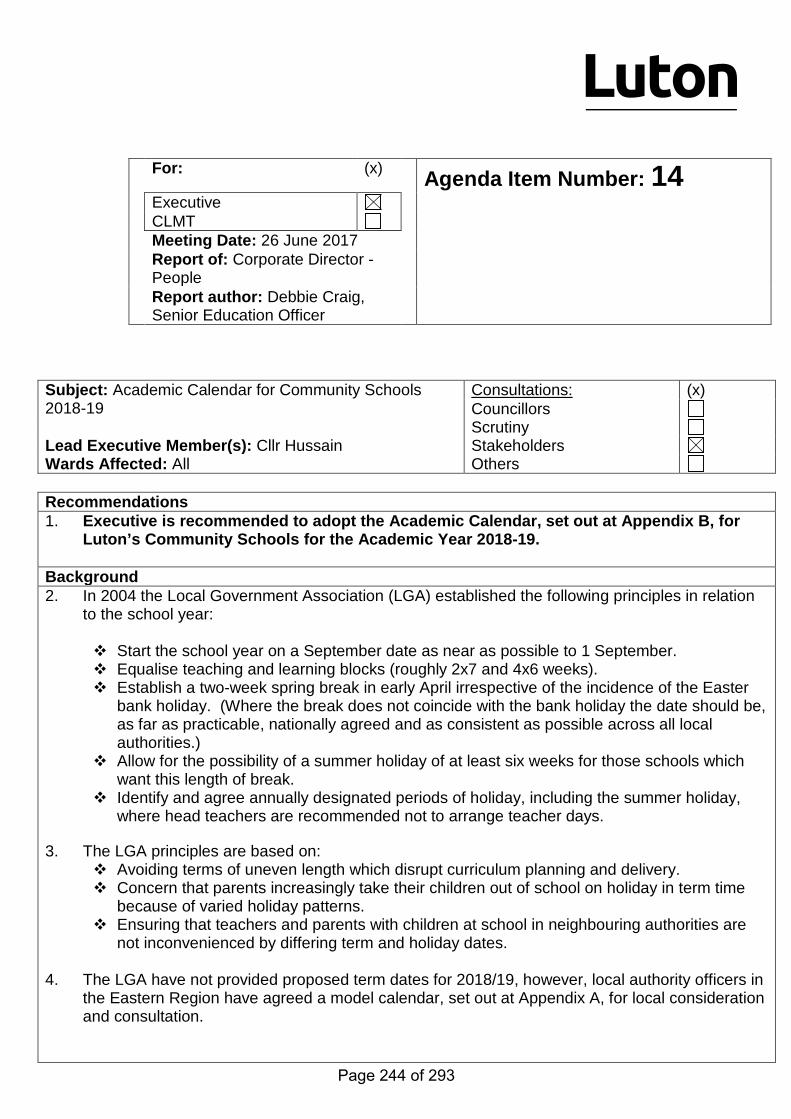
Subject: Academic Calendar for Community Schools 2018-19
Consultations: (x) Councillors
Scrutiny Lead Executive Member(s): Cllr Hussain Stakeholders Wards Affected: All Others Recommendations 1. Executive is recommended to adopt the Academic Calendar, set out at Appendix B, for
Luton’s Community Schools for the Academic Year 2018-19. Background 2. In 2004 the Local Government Association (LGA) established the following principles in relation
to the school year:
Start the school year on a September date as near as possible to 1 September. Equalise teaching and learning blocks (roughly 2x7 and 4x6 weeks). Establish a two-week spring break in early April irrespective of the incidence of the Easter
bank holiday. (Where the break does not coincide with the bank holiday the date should be, as far as practicable, nationally agreed and as consistent as possible across all local authorities.)
Allow for the possibility of a summer holiday of at least six weeks for those schools which want this length of break.
Identify and agree annually designated periods of holiday, including the summer holiday, where head teachers are recommended not to arrange teacher days.
3. The LGA principles are based on:
Avoiding terms of uneven length which disrupt curriculum planning and delivery. Concern that parents increasingly take their children out of school on holiday in term time
because of varied holiday patterns. Ensuring that teachers and parents with children at school in neighbouring authorities are
not inconvenienced by differing term and holiday dates.
4. The LGA have not provided proposed term dates for 2018/19, however, local authority officers in the Eastern Region have agreed a model calendar, set out at Appendix A, for local consideration and consultation.
For: (x) Agenda Item Number: 14 Executive CLMT Meeting Date: 26 June 2017 Report of: Corporate Director - People
Report author: Debbie Craig, Senior Education Officer
Page 244 of 293

Local Variations to the Eastern Region Model Calendar 5. Local Authorities, neighbouring Luton, have deviated from the Model calendar. The variation of
dates is summarised in the table below. LA October
2018 Half Term
Christmas 2018
February 2019 Half Term
Easter 2019
May Half Term
Eastern Region Model
w/c 22 Oct 20 Dec – 1 Jan
w/c 18 Feb 8-22 April w/c 27 May
Bedford Borough w/c 22 Oct 20 Dec – 2 Jan
w/c 11 Feb 8-22 April w/c 27 May
Central Bedfordshire
w/c 22 Oct 20 Dec – 2 Jan
w/c 11 Feb 8-22 April w/c 27 May
Buckinghamshire w/c 22 Oct 20 Dec – 2 Jan
w/c 18 Feb 8-22 April w/c 27 May
Hertfordshire w/c 29 Oct 24 Dec – 4 Jan
w/c 18 Feb 8-22 April w/c 27 May
6. Hertfordshire’s calendar is the least aligned to the Eastern Region Model calendar. Central
Bedfordshire and Bedford Borough have followed the Eastern Region model, with the exception of the February half term.
CLJNCC 7. The CLJNCC considered the Eastern Region Model Calendar and the local variations and
agreed with the proposal to consult head teachers on the adoption of the Eastern Region Model Calendar which aligns with all local authorities except Hertfordshire for the October half term and with all local authorities except Bedford Borough and Central Bedfordshire for the February half term.
8. The Academic Calendar must ensure that children receive their minimum educational
entitlement, which must be at least 190 school days per Academic Year (380 sessions). The current position Consultation with head teachers 9. Whilst the finalised calendar will apply to all community schools and maintained nursery schools,
head teachers of all Luton schools and academies were consulted on adopting the Eastern Region Model Calendar to try to ensure consistency of approach across the Borough.
10. Responses were received from the vast majority of schools; a summary of the responses is set
out at Appendix C. Most respondents were in favour of altering the Christmas holiday to provide a full week before and after the Christmas break to reduce the risk of pupil absence.
11. Whilst the majority of those that responded preferred the Hertfordshire Calendar, most cited the
Christmas holiday dates as the reason. Three schools and the East Area Partnership also stated that they would like the October half term to be one week later (week commencing 29 October). Two respondents requested that the Council opt for the academic calendar adopted by the Bedford Borough and Central Bedfordshire local authorities.
12. Following consultation the proposed academic calendar, set out at Appendix B, has been amended to take account of feedback in respect of the Christmas holiday dates. It is not proposed to alter the half term holidays as the proposed calendar aligns the October half term
Page 245 of 293

with Central Bedfordshire, Bedford Borough and Buckinghamshire and aligns the February half term with Hertfordshire and Buckinghamshire. Given that teaching staff will be drawn from across Hertfordshire (c.11%), Central Bedfordshire/Bedford Borough (c.24%) and further afield it is suggested that the Eastern Region Model Calendar provides a compromise position. The Proposed Calendar is summarised in the table below against term dates for neighbouring local authorities:
LA October
2018 Half Term
Christmas 2018
February 2019 Half Term
Easter 2019
May Half Term
Eastern Region Model
w/c 22 Oct 20 Dec – 1 Jan
w/c 18 Feb 8-22 April w/c 27 May
Bedford Borough w/c 22 Oct 20 Dec – 2 Jan
w/c 11 Feb 8-22 April w/c 27 May
Central Bedfordshire
w/c 22 Oct 20 Dec – 2 Jan
w/c 11 Feb 8-22 April w/c 27 May
Buckinghamshire w/c 22 Oct 20 Dec – 2 Jan
w/c 18 Feb 8-22 April w/c 27 May
Hertfordshire w/c 29 Oct 24 Dec – 4 Jan
w/c 18 Feb 8-22 April w/c 27 May
Proposed for Luton (as set out at Appendix B)
w/c 22 Oct 24 Dec – 4 Jan
w/c 18 Feb 8-22 April w/c 27 May
13. Given the local variation in term dates it is proposed that Governing Bodies be given the freedom
to set all five training dates. Governors will be strongly advised to work with their feeder schools and local high schools to try and align training days for the benefit of parents with children in more than one school within a locality.
Goals and Objectives 14. To devise an academic calendar that:
• ensures that children receive their minimum educational entitlement of at least 190 school days per academic year (380 sessions).
• supports curriculum planning and delivery. • ensures that, as far as possible, all foundation and voluntary aided schools and academies in
Luton align with the term dates set for community schools so there is a consistent approach to term dates with Luton.
• the academic calendar aligns as far as possible with neighbouring local authorities to ensure that teachers and parents with children at schools in neighbouring authorities are not inconvenienced by differing term and holiday dates.
Proposal 15. Executive is recommended to adopt the Academic Calendar, set out at Appendix B, for Luton’s
Community Schools. Key Risks 16. That foundation schools, voluntary aided schools or academies operate different term dates to
those determined for community schools. All head teachers were consulted to try to ensure consistency across the Borough.
17. Local variations in academic calendars may cause Luton school staff problems with childcare
arrangements, if they are resident in another local authority area. It will also be problematic for parents if they have children attending schools in Luton and neighbouring local authority areas.
Page 246 of 293
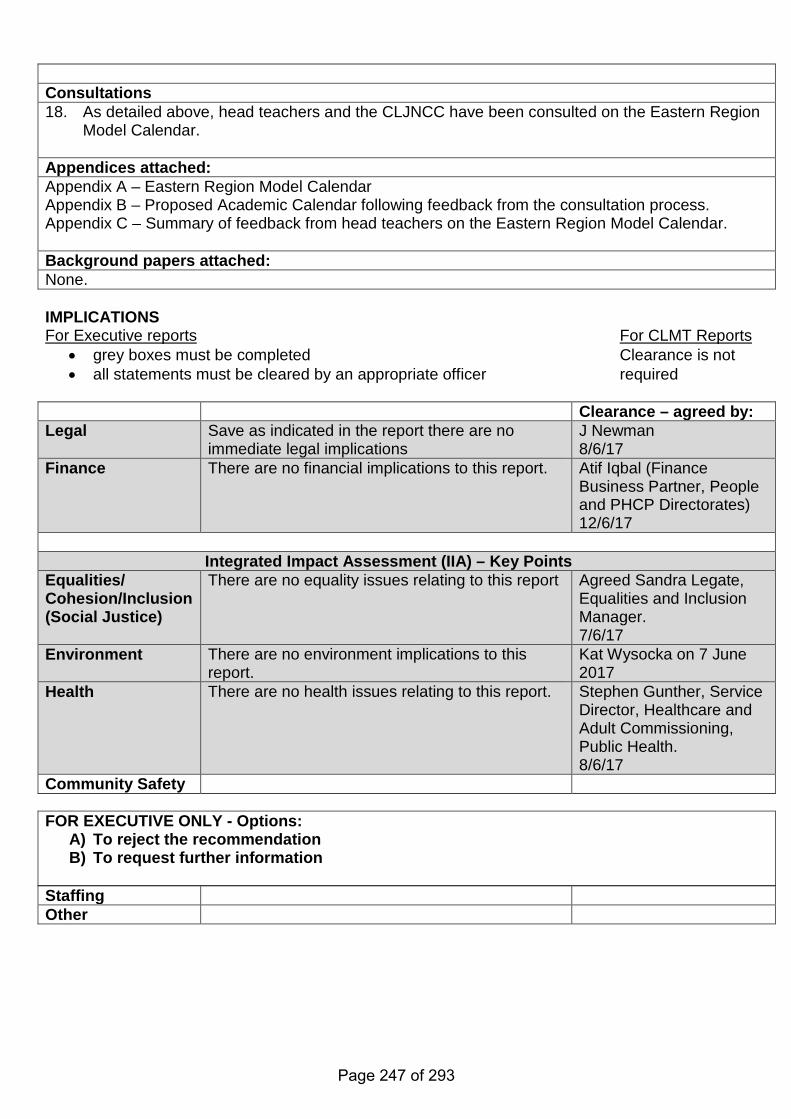
Consultations 18. As detailed above, head teachers and the CLJNCC have been consulted on the Eastern Region
Model Calendar. Appendices attached: Appendix A – Eastern Region Model Calendar Appendix B – Proposed Academic Calendar following feedback from the consultation process. Appendix C – Summary of feedback from head teachers on the Eastern Region Model Calendar. Background papers attached: None. IMPLICATIONS For Executive reports For CLMT Reports
• grey boxes must be completed Clearance is not • all statements must be cleared by an appropriate officer required
Clearance – agreed by: Legal Save as indicated in the report there are no
immediate legal implications J Newman 8/6/17
Finance There are no financial implications to this report. Atif Iqbal (Finance Business Partner, People and PHCP Directorates) 12/6/17
Integrated Impact Assessment (IIA) – Key Points Equalities/ Cohesion/Inclusion (Social Justice)
There are no equality issues relating to this report
Agreed Sandra Legate, Equalities and Inclusion Manager. 7/6/17
Environment
There are no environment implications to this report.
Kat Wysocka on 7 June 2017
Health
There are no health issues relating to this report. Stephen Gunther, Service Director, Healthcare and Adult Commissioning, Public Health. 8/6/17
Community Safety
Staffing Other
FOR EXECUTIVE ONLY - Options: A) To reject the recommendation B) To request further information
Page 247 of 293
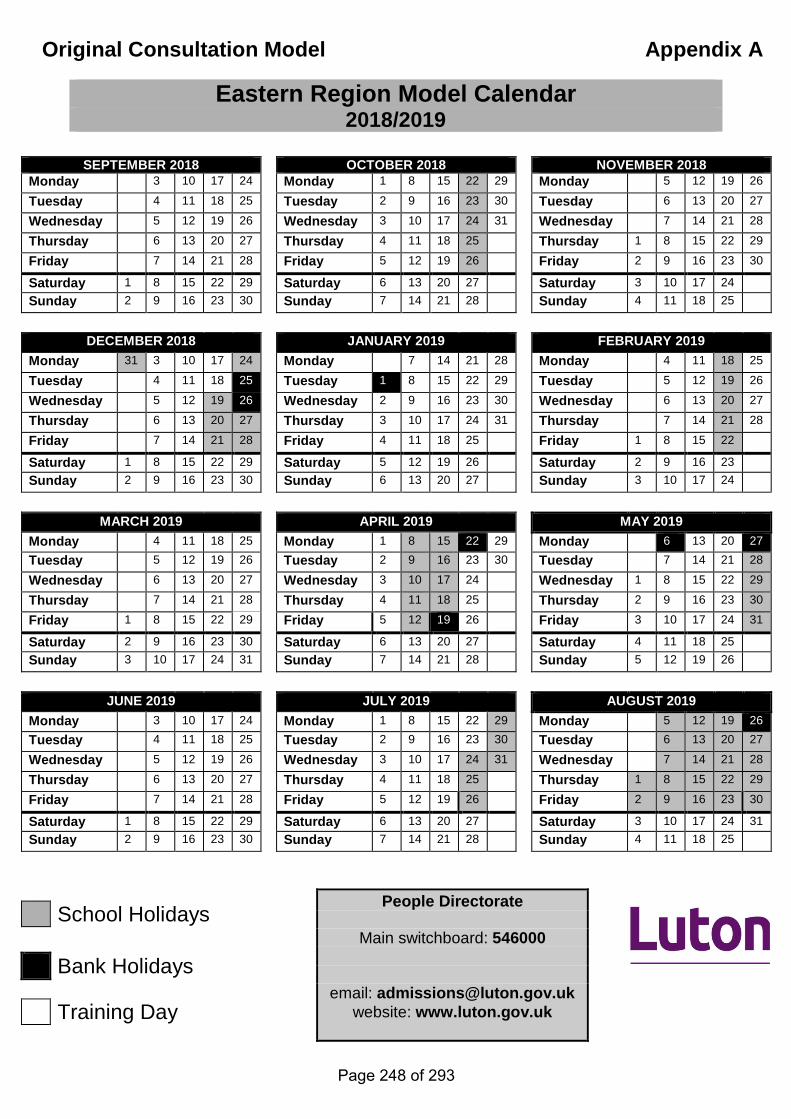
Original Consultation Model Appendix A
Eastern Region Model Calendar 2018/2019
SEPTEMBER 2018 OCTOBER 2018 NOVEMBER 2018
Monday 3 10 17 24 Monday 1 8 15 22 29 Monday 5 12 19 26
Tuesday 4 11 18 25 Tuesday 2 9 16 23 30 Tuesday 6 13 20 27
Wednesday 5 12 19 26 Wednesday 3 10 17 24 31 Wednesday 7 14 21 28
Thursday 6 13 20 27 Thursday 4 11 18 25 Thursday 1 8 15 22 29
Friday 7 14 21 28 Friday 5 12 19 26 Friday 2 9 16 23 30
Saturday 1 8 15 22 29 Saturday 6 13 20 27 Saturday 3 10 17 24 Sunday 2 9 16 23 30 Sunday 7 14 21 28 Sunday 4 11 18 25
DECEMBER 2018 JANUARY 2019 FEBRUARY 2019
Monday 31 3 10 17 24 Monday 7 14 21 28 Monday 4 11 18 25
Tuesday 4 11 18 25 Tuesday 1 8 15 22 29 Tuesday 5 12 19 26
Wednesday 5 12 19 26 Wednesday 2 9 16 23 30 Wednesday 6 13 20 27
Thursday 6 13 20 27 Thursday 3 10 17 24 31 Thursday 7 14 21 28
Friday 7 14 21 28 Friday 4 11 18 25 Friday 1 8 15 22
Saturday 1 8 15 22 29 Saturday 5 12 19 26 Saturday 2 9 16 23 Sunday 2 9 16 23 30 Sunday 6 13 20 27 Sunday 3 10 17 24
MARCH 2019 APRIL 2019 MAY 2019
Monday 4 11 18 25 Monday 1 8 15 22 29 Monday 6 13 20 27
Tuesday 5 12 19 26 Tuesday 2 9 16 23 30 Tuesday 7 14 21 28
Wednesday 6 13 20 27 Wednesday 3 10 17 24 Wednesday 1 8 15 22 29
Thursday 7 14 21 28 Thursday 4 11 18 25 Thursday 2 9 16 23 30
Friday 1 8 15 22 29 Friday 5 12 19 26 Friday 3 10 17 24 31
Saturday 2 9 16 23 30 Saturday 6 13 20 27 Saturday 4 11 18 25 Sunday 3 10 17 24 31 Sunday 7 14 21 28 Sunday 5 12 19 26
JUNE 2019 JULY 2019 AUGUST 2019
Monday 3 10 17 24 Monday 1 8 15 22 29 Monday 5 12 19 26
Tuesday 4 11 18 25 Tuesday 2 9 16 23 30 Tuesday 6 13 20 27
Wednesday 5 12 19 26 Wednesday 3 10 17 24 31 Wednesday 7 14 21 28
Thursday 6 13 20 27 Thursday 4 11 18 25 Thursday 1 8 15 22 29
Friday 7 14 21 28 Friday 5 12 19 26 Friday 2 9 16 23 30
Saturday 1 8 15 22 29 Saturday 6 13 20 27 Saturday 3 10 17 24 31 Sunday 2 9 16 23 30 Sunday 7 14 21 28 Sunday 4 11 18 25
School Holidays Bank Holidays Training Day
People Directorate
Main switchboard: 546000
email: [email protected] website: www.luton.gov.uk
Page 248 of 293

Post Consultation Model Appendix B
Proposed Academic Calendar for Community Schools 2018/2019
SEPTEMBER 2018 OCTOBER 2018 NOVEMBER 2018
Monday 3 10 17 24 Monday 1 8 15 22 29 Monday 5 12 19 26
Tuesday 4 11 18 25 Tuesday 2 9 16 23 30 Tuesday 6 13 20 27
Wednesday 5 12 19 26 Wednesday 3 10 17 24 31 Wednesday 7 14 21 28
Thursday 6 13 20 27 Thursday 4 11 18 25 Thursday 1 8 15 22 29
Friday 7 14 21 28 Friday 5 12 19 26 Friday 2 9 16 23 30
Saturday 1 8 15 22 29 Saturday 6 13 20 27 Saturday 3 10 17 24 Sunday 2 9 16 23 30 Sunday 7 14 21 28 Sunday 4 11 18 25
DECEMBER 2018 JANUARY 2019 FEBRUARY 2019
Monday 31 3 10 17 24 Monday 7 14 21 28 Monday 4 11 18 25
Tuesday 4 11 18 25 Tuesday 1 8 15 22 29 Tuesday 5 12 19 26
Wednesday 5 12 19 26 Wednesday 2 9 16 23 30 Wednesday 6 13 20 27
Thursday 6 13 20 27 Thursday 3 10 17 24 31 Thursday 7 14 21 28
Friday 7 14 21 28 Friday 4 11 18 25 Friday 1 8 15 22
Saturday 1 8 15 22 29 Saturday 5 12 19 26 Saturday 2 9 16 23 Sunday 2 9 16 23 30 Sunday 6 13 20 27 Sunday 3 10 17 24
MARCH 2019 APRIL 2019 MAY 2019
Monday 4 11 18 25 Monday 1 8 15 22 29 Monday 6 13 20 27
Tuesday 5 12 19 26 Tuesday 2 9 16 23 30 Tuesday 7 14 21 28
Wednesday 6 13 20 27 Wednesday 3 10 17 24 Wednesday 1 8 15 22 29
Thursday 7 14 21 28 Thursday 4 11 18 25 Thursday 2 9 16 23 30
Friday 1 8 15 22 29 Friday 5 12 19 26 Friday 3 10 17 24 31
Saturday 2 9 16 23 30 Saturday 6 13 20 27 Saturday 4 11 18 25 Sunday 3 10 17 24 31 Sunday 7 14 21 28 Sunday 5 12 19 26
JUNE 2019 JULY 2019 AUGUST 2019
Monday 3 10 17 24 Monday 1 8 15 22 29 Monday 5 12 19 26
Tuesday 4 11 18 25 Tuesday 2 9 16 23 30 Tuesday 6 13 20 27
Wednesday 5 12 19 26 Wednesday 3 10 17 24 31 Wednesday 7 14 21 28
Thursday 6 13 20 27 Thursday 4 11 18 25 Thursday 1 8 15 22 29
Friday 7 14 21 28 Friday 5 12 19 26 Friday 2 9 16 23 30
Saturday 1 8 15 22 29 Saturday 6 13 20 27 Saturday 3 10 17 24 31 Sunday 2 9 16 23 30 Sunday 7 14 21 28 Sunday 4 11 18 25
School Holidays Bank Holidays Training Day
People Directorate
Main switchboard: 546000
email: [email protected] website: www.luton.gov.uk
Page 249 of 293
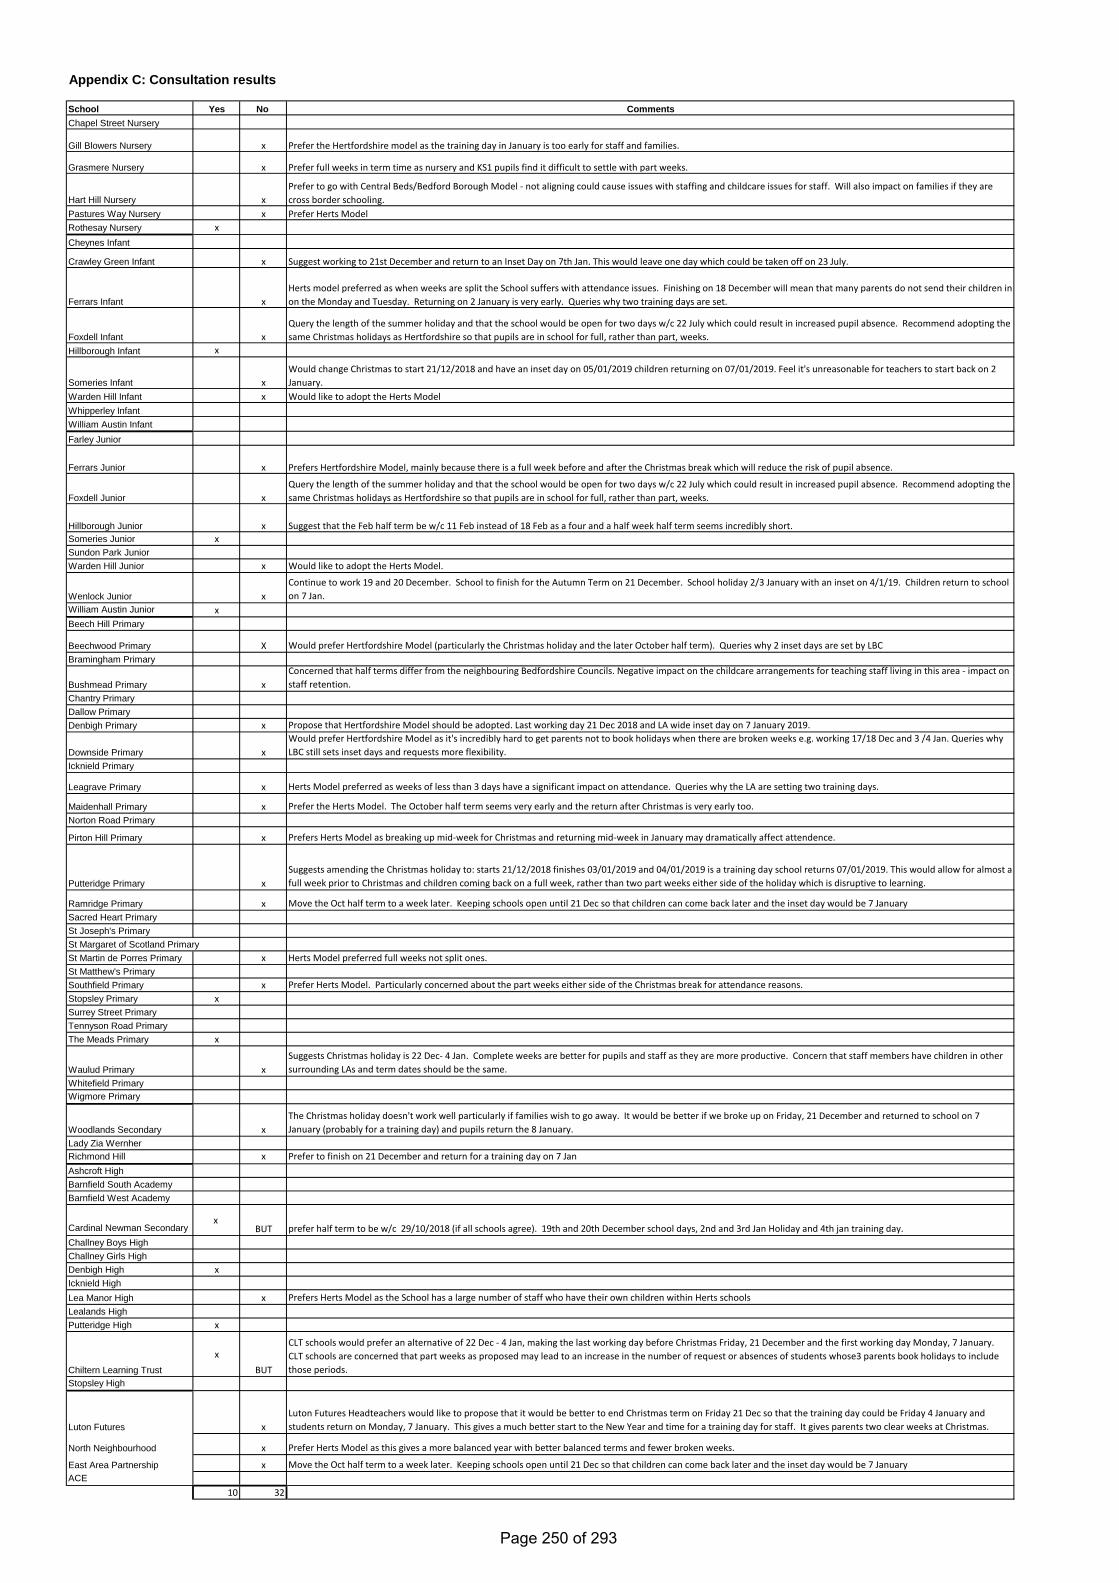
Appendix C: Consultation results
School Yes No CommentsChapel Street Nursery
Gill Blowers Nursery x Prefer the Hertfordshire model as the training day in January is too early for staff and families.
Grasmere Nursery x Prefer full weeks in term time as nursery and KS1 pupils find it difficult to settle with part weeks.
Hart Hill Nursery xPrefer to go with Central Beds/Bedford Borough Model - not aligning could cause issues with staffing and childcare issues for staff. Will also impact on families if they are cross border schooling.
Pastures Way Nursery x Prefer Herts ModelRothesay Nursery xCheynes Infant
Crawley Green Infant x Suggest working to 21st December and return to an Inset Day on 7th Jan. This would leave one day which could be taken off on 23 July.
Ferrars Infant xHerts model preferred as when weeks are split the School suffers with attendance issues. Finishing on 18 December will mean that many parents do not send their children in on the Monday and Tuesday. Returning on 2 January is very early. Queries why two training days are set.
Foxdell Infant xQuery the length of the summer holiday and that the school would be open for two days w/c 22 July which could result in increased pupil absence. Recommend adopting the same Christmas holidays as Hertfordshire so that pupils are in school for full, rather than part, weeks.
Hillborough Infant x
Someries Infant xWould change Christmas to start 21/12/2018 and have an inset day on 05/01/2019 children returning on 07/01/2019. Feel it's unreasonable for teachers to start back on 2 January.
Warden Hill Infant x Would like to adopt the Herts ModelWhipperley Infant William Austin Infant Farley Junior
Ferrars Junior x Prefers Hertfordshire Model, mainly because there is a full week before and after the Christmas break which will reduce the risk of pupil absence.
Foxdell Junior xQuery the length of the summer holiday and that the school would be open for two days w/c 22 July which could result in increased pupil absence. Recommend adopting the same Christmas holidays as Hertfordshire so that pupils are in school for full, rather than part, weeks.
Hillborough Junior x Suggest that the Feb half term be w/c 11 Feb instead of 18 Feb as a four and a half week half term seems incredibly short.Someries Junior xSundon Park Junior Warden Hill Junior x Would like to adopt the Herts Model.
Wenlock Junior xContinue to work 19 and 20 December. School to finish for the Autumn Term on 21 December. School holiday 2/3 January with an inset on 4/1/19. Children return to school on 7 Jan.
William Austin Junior xBeech Hill Primary
Beechwood Primary X Would prefer Hertfordshire Model (particularly the Christmas holiday and the later October half term). Queries why 2 inset days are set by LBCBramingham Primary
Bushmead Primary xConcerned that half terms differ from the neighbouring Bedfordshire Councils. Negative impact on the childcare arrangements for teaching staff living in this area - impact on staff retention.
Chantry Primary Dallow Primary Denbigh Primary x Propose that Hertfordshire Model should be adopted. Last working day 21 Dec 2018 and LA wide inset day on 7 January 2019.
Downside Primary xWould prefer Hertfordshire Model as it's incredibly hard to get parents not to book holidays when there are broken weeks e.g. working 17/18 Dec and 3 /4 Jan. Queries why LBC still sets inset days and requests more flexibility.
Icknield Primary
Leagrave Primary x Herts Model preferred as weeks of less than 3 days have a significant impact on attendance. Queries why the LA are setting two training days.
Maidenhall Primary x Prefer the Herts Model. The October half term seems very early and the return after Christmas is very early too.Norton Road Primary
Pirton Hill Primary x Prefers Herts Model as breaking up mid-week for Christmas and returning mid-week in January may dramatically affect attendence.
Putteridge Primary xSuggests amending the Christmas holiday to: starts 21/12/2018 finishes 03/01/2019 and 04/01/2019 is a training day school returns 07/01/2019. This would allow for almost a full week prior to Christmas and children coming back on a full week, rather than two part weeks either side of the holiday which is disruptive to learning.
Ramridge Primary x Move the Oct half term to a week later. Keeping schools open until 21 Dec so that children can come back later and the inset day would be 7 January Sacred Heart PrimarySt Joseph's PrimarySt Margaret of Scotland PrimarySt Martin de Porres Primary x Herts Model preferred full weeks not split ones.St Matthew's PrimarySouthfield Primary x Prefer Herts Model. Particularly concerned about the part weeks either side of the Christmas break for attendance reasons.Stopsley Primary xSurrey Street Primary Tennyson Road Primary The Meads Primary x
Waulud Primary xSuggests Christmas holiday is 22 Dec- 4 Jan. Complete weeks are better for pupils and staff as they are more productive. Concern that staff members have children in other surrounding LAs and term dates should be the same.
Whitefield PrimaryWigmore Primary
Woodlands Secondary xThe Christmas holiday doesn't work well particularly if families wish to go away. It would be better if we broke up on Friday, 21 December and returned to school on 7 January (probably for a training day) and pupils return the 8 January.
Lady Zia Wernher Richmond Hill x Prefer to finish on 21 December and return for a training day on 7 JanAshcroft High Barnfield South AcademyBarnfield West Academy
Cardinal Newman Secondaryx
BUT prefer half term to be w/c 29/10/2018 (if all schools agree). 19th and 20th December school days, 2nd and 3rd Jan Holiday and 4th jan training day.Challney Boys High Challney Girls High Denbigh High xIcknield High Lea Manor High x Prefers Herts Model as the School has a large number of staff who have their own children within Herts schoolsLealands High Putteridge High x
Chiltern Learning Trust
xBUT
CLT schools would prefer an alternative of 22 Dec - 4 Jan, making the last working day before Christmas Friday, 21 December and the first working day Monday, 7 January. CLT schools are concerned that part weeks as proposed may lead to an increase in the number of request or absences of students whose3 parents book holidays to include those periods.
Stopsley High
Luton Futures xLuton Futures Headteachers would like to propose that it would be better to end Christmas term on Friday 21 Dec so that the training day could be Friday 4 January and students return on Monday, 7 January. This gives a much better start to the New Year and time for a training day for staff. It gives parents two clear weeks at Christmas.
North Neighbourhood x Prefer Herts Model as this gives a more balanced year with better balanced terms and fewer broken weeks.
East Area Partnership x Move the Oct half term to a week later. Keeping schools open until 21 Dec so that children can come back later and the inset day would be 7 January ACE
10 32
Page 250 of 293
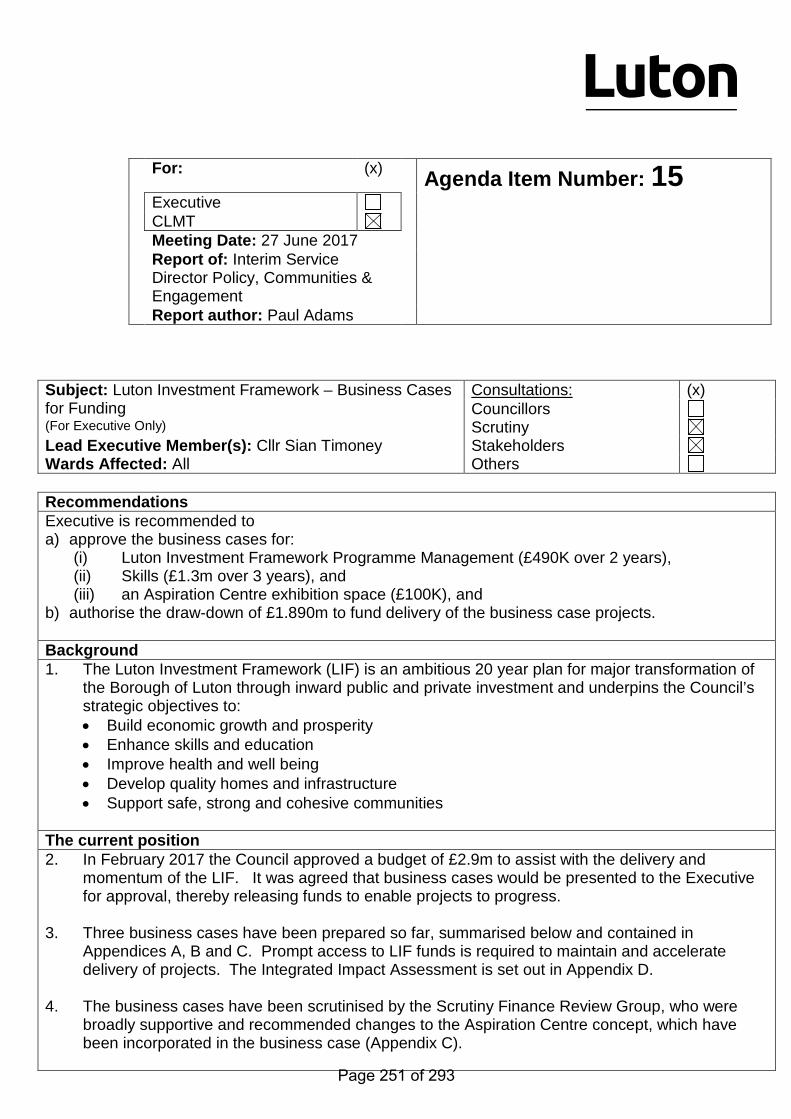
Subject: Luton Investment Framework – Business Cases for Funding
Consultations: (x) Councillors
(For Executive Only) Scrutiny Lead Executive Member(s): Cllr Sian Timoney Stakeholders Wards Affected: All Others Recommendations Executive is recommended to a) approve the business cases for:
(i) Luton Investment Framework Programme Management (£490K over 2 years), (ii) Skills (£1.3m over 3 years), and (iii) an Aspiration Centre exhibition space (£100K), and
b) authorise the draw-down of £1.890m to fund delivery of the business case projects. Background 1. The Luton Investment Framework (LIF) is an ambitious 20 year plan for major transformation of
the Borough of Luton through inward public and private investment and underpins the Council’s strategic objectives to: • Build economic growth and prosperity • Enhance skills and education • Improve health and well being • Develop quality homes and infrastructure • Support safe, strong and cohesive communities
The current position 2. In February 2017 the Council approved a budget of £2.9m to assist with the delivery and
momentum of the LIF. It was agreed that business cases would be presented to the Executive for approval, thereby releasing funds to enable projects to progress.
3. Three business cases have been prepared so far, summarised below and contained in
Appendices A, B and C. Prompt access to LIF funds is required to maintain and accelerate delivery of projects. The Integrated Impact Assessment is set out in Appendix D.
4. The business cases have been scrutinised by the Scrutiny Finance Review Group, who were
broadly supportive and recommended changes to the Aspiration Centre concept, which have been incorporated in the business case (Appendix C).
For: (x) Agenda Item Number: 15 Executive CLMT Meeting Date: 27 June 2017 Report of: Interim Service Director Policy, Communities & Engagement
Report author: Paul Adams
Page 251 of 293

5. The internal LIF Board will carry out ongoing monitoring to ensure delivery and effectiveness of
the projects and provide appropriate governance arrangements to facilitate scrutiny by the appropriate committee(s).
Staff Resources (Appendix A, £490,000 over 2 years) 6. This business case is for funding 5 specific LIF resources, in Programme Management,
Marketing and Communications:
a) LIF Programme Management : Funding 2 posts for a further 2 years b) Bid Writing resource : 1 post for 2 years, needed to lever in additional funding to support
LIF projects. c) Specialist public affairs support : Lead role in delivering a strong public affairs strategy,
promoting key messages and opening doors to government departments and major investors.
d) Marketing and community engagement: Funding to support effective communications and marketing strategies to support the LIF, and
e) Additional planning resources : 2 qualified planning officer posts to help deal with anticipated spike in major planning application that are central to the LIF ambitions.
Skills programme (Appendix B, £1.2m over 3 years) 7. Investment in skills is critical to helping Luton people access Luton jobs and the skills agenda is
a priority for employers, schools, colleges and residents. This business case focuses on two strategic priorities set out in the Council’s Skills and Employability Strategy 2016-2020:
8. Schools: Focusing on Years 9-11 in all High Schools, the aim is to introduce a Skills Passport
award scheme, closer links with businesses to provide more work experience, schemes to improve employability skills, and funding to assist schools to consistently track careers education.
9. Adult Skills: Focusing on construction jobs linked to house-building and employment land
development as part of the LIF. The plan is to fund: (a) provision of training to provide the necessary pre-requisite qualifications (CSCS card) which
is often a barrier to people accessing construction industry jobs, (b) promotion of job and career opportunities at the airport, and (c) provision of a service to assist potential job applicants to meet the 5 year job history airport
security requirements.
During the 3 year funding period, other training requirements may become a priority requiring project delivery changes. These will be governed through routine project management arrangements.
Aspiration Centre (Appendix C, up to £100K over 3 months) 10. A business case has been developed for a temporary facility, located in the town centre, to test
the concept which could;
a) give residents the opportunity to find out about the LIF transformation programme through exhibitions, information and engagement;
b) provide a base for supporting other projects, including member led engagement and the skills programme;
Page 252 of 293
c) provide themed activities, such as a focus on house building, or specific employers; and d) be supported by an additional mobile trailer solution which could be located in parts of the
town to maximise exposure to LIF information and opportunities. Goals and Objectives 11. The LIF ambitions directly support the Council’s strategic objectives, as set out in paragraph 1. 12. Funding will be used to provide programme management resources required to ensure
momentum is maintained and impact maximised. The proposals include 2 additional planning officer posts needed to deal with an anticipated increase in planning applications. A significant investment in skills focused on Key Stage 4 (Years 9-11) and adults is consistent with the Council’s Skills and Employability Strategy priorities.
13. An Aspiration Centre is needed to help Luton residents discover and understand the Council’s
ambitions for Luton, the positive impact these will have on people’s lives and how they can be involved in shaping the ideas and projects. The concept is consistent with the Council’s community engagement priorities.
Proposal 14. It is proposed that the Executive approve the business cases set out in Appendices A, B and C
and authorise the draw-down of associated funding totalling £1.890m to fund the resources needed to drive these projects forward.
Key Risks 15. Risks associated with each of the funding requests is set out in section S3 of each of the
business cases. The risk register for each project will be kept under review as part of routine project management and be accountable to the LIF Board in its governance and overview of these high profile projects.
16. It will be necessary to demonstrate the impact investing LIF money has on projects. For
programme management and the Aspiration Centre, this will be relatively straightforward to achieve through a range of performance indicators.
17. For the skills funding (Project Minerva), outcome measures, including the impact on
unemployment rates, reliance on benefits and businesses reporting the availability of a local, skilled workforce may not be possible to determine for a number of years. Additionally outcomes may not be reported comprehensively by partners, so a strand of the project will be to utilise internal resources to capture baseline data and analyse outcomes. Externally available paid for intelligence will also be obtained, alongside feedback from participants benefitting from funded support.
Consultations 18. Consultations have been held with the LIF Senior Steering Group (21 March 2017), the Scrutiny
Finance Review Group (22 May 2017) and two specific businesses, Arriva and Hayward Tyler. 19. The Senior Steering Group strongly advised to engage with school and college leaders. As a
consequence, engagement with the Progression and Transition Board, individual high schools and the Luton Sixth Form College has been established and this steering group will guide the development and delivery of the project.
20. The two businesses have agreed to work with the Minerva project team to pilot skills training and
work experience and this will guide the development of the project as it gets rolled out across the Borough.
Page 253 of 293
Appendices attached: A : LIF Programme Management resources business case B : Project Minerva – Investment in skills business case C : The Aspiration Centre business case D : Integrated Impact Assessment Background Papers: None IMPLICATIONS For Executive reports For CLMT Reports
• grey boxes must be completed Clearance is not • all statements must be cleared by an appropriate officer required
Clearance – agreed by: Legal Save as indicated in the report there are no
immediate legal implications.
J Newman 12/06/17
Finance Appendices A, B and C outline the proposed use of the £1.89m. It will be difficult to quantify any financial benefits directly attributable to spending the £1.89m, other than the level of additional funding levered in by the bid writing resource, and there are likely to be far more non-financial benefits. Future financial benefits, such as fewer people being on benefits due to more people being employed, are unlikely to materialise for a number of years. Costs incurred will need to be closely monitored and managed to ensure maximum benefit is derived.
Darren Lambert, Finance Business Partner, on 11th June 2017
Integrated Impact Assessment (IIA) – Key Points Equalities/ Cohesion/Inclusion (Social Justice)
An IIA is attached. Sandra Legate Equality and Inclusion Manger 12th June 2017
Environment
Additional Luton Investment Framework funding will be instrumental in driving forward projects with the potential to improve Luton’s environment and its attractiveness to investors. The Aspirational Centre is envisaged to be of high quality with carefully managed environmental impacts.
Strategy & Sustainability, Kat Wysocka, 12 Jun 2017
Page 254 of 293
Health
The Council’s Health Inequalities Strategy, Strategic Aim 3 is “Creating Fair Employment and Good Work for All”. It focuses on improving access to good jobs, reducing long-term unemployment, making it easier for people who are disadvantaged in the labour market to obtain and keep work, and supporting employers to provide healthy physical environments. Being in good employment is protective of health and is critical for reducing health inequalities. The investment in skills is therefore entirely consistent with the Council’s health and wellbeing plans and is designed to focus not just on young people but adults as well.
Public Health – Stephen Gunther
Community Safety
Staffing LIF Programme Management resource The business case sets out details for funding specific posts needed to accelerate delivery of LIF projects and funding opportunities, and to provide funding for much-needed additional planning officer resources. Project Minerva The business case includes budget for new fixed term posts needed to project manage and deliver key aspects of the project.
Other
FOR EXECUTIVE ONLY - Options: To approve all 3 business cases and draw down of funding for £1.890m. To approve some of the business cases and drawn down of associated funding. To reject the business cases and funding requests. To request reworking of one or more business cases and associated budget.
Page 255 of 293
LUTON INVESTMENT FRAMEWORK BUSINESS CASE TEMPLATE PROJECT TITLE
LIF Programme Management resources
LEAD OFFICER
Sinead McNamara
DATE
13 April 2017
STRATEGIC
S1 : Project outline : Existing state / Business need / Future state Existing state • LIF project team (2 posts) has been seconded for 1 year. • These posts are critical in performance management, coordination and promotion
of the LIF. • Current focus is on developing and marketing LIF2 to the public, investors and
stakeholders. Business need LIF Programme Management • Programme management needs to be kept on track. • Senior stakeholder buy in. • Marketing and promotion of the LIF. • Further inward investment and development. Bid writing resources • Additional sources of external funding need to be researched and accessed,
levering in new funding to support and invest in the LIF. • Sources include social finance schemes, charitable and grant making trust funds,
European, central government and regional funding streams. Specialist public affairs support • Luton has a number of challenges to unlock, requiring a strong public affairs
strategy. • The Council has a lead role and work with key partners to ensure key messages
are always promoted and to open doors to government departments and major investors, hosting key ministerial and investor visits, brokering key meetings between council officials, ministers and civil servants and representation at party conferences and other key networking events.
Marketing and community engagement • High priority to work with partners to support effective communications and
marketing strategies to promote opportunity, aspiration and prosperity. • Extensive engagement programme with residents of all ages is required, with this
centred around member led engagement. • Resources and tools are needed to help councillors and officers to promote the
LIF.
LIF Business case final: Programme management resources Page 256 of 293
Additional planning resources • Delivering private sector investment will accelerate the rate of change and
increase revenue in the longer term through business rates. • A package of business measures to support inward investment activities,
attracting new employers to the town, includes new planning officer resource, capable of handling the increased planning workload.
Future state LIF Programme Management • Programme Manager and Support post extended for a further 2 years to continue
their significant role in driving the LIF programme. Bid writing • Specialist bid writing support to be procured which will research, track, apply for
and secure external funding to resource LIF projects. Specialist public affairs • Dedicated lobbying/public affairs resource to influence high level, strategic
stakeholders and partners. Marketing and community engagement • Additional council funds are needed to pay for materials, events and engagement
activities. These costs will also be matched by developer funds secured which go towards funding the key programme of activity delivered under the Think Luton banner.
Additional planning resource • Two planning officers, hired for 2 years, to provide additional support to handle
an anticipated spike in major planning applications. S2 : Business objectives, intended outcomes and strategic fit (how it links with the Council’s strategic objectives) Business objectives • Resources in place to accelerate the pace of LIF programme delivery. • Access additional sources of funding to reduce the strain on council budgets. • Maintain and continue to improve the council’s profile, credibility and reputation
for delivery with partners, stakeholders, investors and residents. Intended outcomes • Informed residents and employers, confident in the LIF ambitions for the town. • High profile with government and investors for effective delivery of key LIF
projects. • Councillors and corporate leaders confident in programme delivery. • Minimal delays in determination of major planning applications. Strategic fit Investment in LIF resources directly supports the following corporate objectives: • Building economic growth and prosperity • Enhancing skills and education • Improving health and wellbeing • Developing quality homes and infrastructure
LIF Business case final: Programme management resources Page 257 of 293
S3 : Costs, Benefits and Risks Costs Costs approved in principal by the February 2017 Executive (and subject to a detailed business case) are: LIF Programme Management : £185K over 2 years Bid Writing resource : £75K over 2 years Specialist public affairs resource : £70K over 2 years Marketing and community engagement : £70K over 2 years Planning officer resource (2 posts) : £90K over 2 years Total: £490K Benefits • Maintain programme management. • Drive the LIF project delivery. • Lever in additional funding. • Deliver strategic engagement programme with influential policy and decision
makers. • High quality marketing programme to assist with engagement. • Minimising planning delays on major applications. Risks • The LIF comprises of 72 linked projects from across the organisation, requiring
resource to manage the programme and engage with a range of partners and stakeholders. A decision not to fund will end this resource and significantly raise the risk of projects not joining up or being delivered.
• Luton will miss out on levering in additional funding to support projects, resulting in increased strain on council funds or projects that would otherwise be viable not being delivered.
• Luton will not “tell its story” to key influencers and decision/policy makers, resulting in blockages to achieving LIF ambitions.
• The planning service will fail to deliver robustly assessed planning applications. S4 : Critical Success Factors (what does success look like? What are the KPIs) • Effective programme management, lobbying and public affairs. • Use of resources to deliver high quality, effective events and engagement
activities that result in positive press coverage and partner feedback. • Levering in of additional funding over 2 years to support LIF programmes, with
the aim of maximising funding with a minimum financial return on investment of 2:1.
• Improved planning performance KPIs. S5 : Impact of non-delivery • Significant impact of ceasing funding for programme management. • Bid Writing : No resource currently, but lack of resource and expertise in making
funding bids. • Public Affairs : No resource currently, but this prevents a coordinated, intensive
and ongoing high level programme of strategic engagement from taking place. • Planning resource : The Planning Service already has a very high workload and
LIF Business case final: Programme management resources Page 258 of 293
the accurate and timely assessment of applications will be delayed, resulting in pressure from developers and undermines the Council’s red carpet inward investment service.
S6 : Main stakeholders • Residents of Luton • LBC senior managers • LBC Councillors • LBC staff • Higher education and further education providers • Local businesses and outside businesses (looking to relocate) • Developers and investors • The Trusts • Other public services (Police and Fire)
ECONOMIC E1 : Outline of options appraisal This business plan comprises 5 separate funding elements, each of which has the potential to contribute significantly to the LIF programme and any one of which could be removed to reduce costs. However, each have implications if not delivered so, in order of priority the resources are: a) Programme Management (critical – without which the LIF programme won’t be
managed or delivered effectively. This also includes stakeholder management and marketing).
b) Additional planning resource (critical – the projected volume of work generated by expected major applications means delays unless additional planning support is brought in).
c) Marketing and community engagement (critical – funding will support the launch of LIF2 and other events and engagement activities).
d) Specialist public affairs (important – lack of a dedicated resource will make it much harder to engage with key influencers, government and investors).
e) Bid writing (important – the aim would be to lever in more money than the post costs). An option of not having bid writing will limit the funding available for projects.
E2 : Preferred option The preferred option is funding for all 5 options. Learning from existing LIF activity, additional specific resources are required to ensure activity under LIF2 is accelerated, and to assist the Council to work smarter to influence key partners at a strategic level.
COMMERCIAL
C1 : Procurement approach and methodology • HR procedures would be followed for posts. • LBC procurement procedures would be followed for any communications and
marketing activity.
FINANCIAL
LIF Business case final: Programme management resources Page 259 of 293
F1 : Cost and timescales Cost Costs approved by February 2017 Executive are: LIF Programme Management : £185K over 2 years Bid Writing resource : £75K over 2 years Specialist public affairs resource : £70K over 2 years Marketing and community engagement* : £70K over 2 years Planning officer resource (2 posts) : £90K over 2 years Total: £490K *Marketing and Comms spend breakdown: • £20k – LIF 2 launch event and marketing materials (Invites, new promotional
materials, social media) • £15k – Interactive map and imaging for the LIF promotion • £5k – Think Luton website • £15k – LIF related promotional materials for different audiences. • £15k – Allocated to running specific campaigns (still to be firmed up and agreed) Timescale Funding over 2 years, but with front loading of marketing spend to coincide with LIF2 launch. F2 : Proposed funding source(s) The cost would be met from the sums approved in principal by the February 2017 Executive.
MANAGEMENT
M1 : Outline of project management arrangements The LIF lead Service Director (Policy, Communities and Engagement) and Corporate Director, Place and Infrastructure, would provide a lead and be accountable to the LIF Board. The LIF Project Manager will lead on recruiting to posts and on directing comms and marketing spend, in partnership with the Communications and Marketing Manager. M2 : Key roles and responsibilities Corporate Director, Place and Infrastructure : Sponsor Service Director for LIF : Lead LIF Programme Manager : Programme management and responsible for the additional posts. LIF Programme Support Officer: Support and specialist projects Comms and Marketing team rep : Marketing and comms link. Finance Rep : Programme spend Planning representative: New planning resource M3 : Governance arrangements Governance will be managed through combination of established project reporting mechanisms, programme management and accountability to sponsor and LIF Board.
LIF Business case final: Programme management resources Page 260 of 293

LIF Business case final: Programme management resources Page 261 of 293
LUTON INVESTMENT FRAMEWORK BUSINESS CASE TEMPLATE PROJECT TITLE
Project Minerva : investment in skills
LEAD OFFICER
Paul Adams
DATE
7 6 2017
STRATEGIC
S1 : Project outline : Existing state / Business need / Future state Existing state The Skills and Employability Strategy includes strategic priorities on (a) transition of young people from education to employment, and (b) understanding and responding to needs of employers, including addressing adult skills and promoting job and career opportunities. This business case focuses on 2 linked projects:
• a pilot project engaging years 9-11 in high school • adult skills, careers and job opportunities, focusing on construction
skills and airport job opportunities.
a) Schools • A careers audit in schools has identified gaps which impact on
quality of careers guidance offer for Luton learners, often based on ad hoc activities which are not always reviewed, monitored, evaluated or quality checked for suitability and effectiveness.
• The Luton Careers Network Framework is addressing in schools, through self-assessment and peer coaching.
• A pilot group of schools has started developing the Business, Education and Skills Partnership (BESP) to increase engagement with schools and business
• The Careers and Enterprise Company (CEC) have 7 enterprise advisors allocated to schools to work with senior leaders to develop links with business. This is a national project, run in Luton by SEMLEP.
b) Adult skills, careers and job opportunities
• Investment in the airport facilities, new infrastructure projects and the provision an accelerated house-building programme and development of employment sites across the town will require the provision of new construction jobs and open up new opportunities for Luton residents.
• Airport growth and New Century Park enterprise zone development will lead to new businesses with a range of job opportunities, including well-paid, non-graduate technological and engineering jobs.
• A pre-requisite for working on employment sites is the Construction Skills Certification Scheme (CSCS) card. This provides nationally-
LIF Business case v2 : Skills Page 262 of 293
recognised proof that holders have the necessary training and qualifications to work on construction sites safely.
• Only one provider in Luton offers free CSCS training, to unemployed people claiming benefits. Due to funding restrictions it is limited.
• Evidence from Luton Employment Training and Skills Fairs is that there are high levels of interest in attending fully-funded CSCS training courses.
Business needs
a) Support Programme output measurement and reporting For both schools and adult skills elements of the project it has become clear that comprehensive baseline data and outcomes attributable to programmes of support are difficult to obtain.
• As LBC deliver few programmes directly, we are reliant on others to provide output data; frequently this is hard to obtain.
• Lead and lag means that often outputs are captured long after the event.
• It is difficult to attribute changes in data to specific inputs. • Some baseline data (school leaver’s destinations, individuals on
incomes below the living wage or working in low paid jobs etc.) is available but usually only after a significant time lag and reports on the whole universe of individuals in a category, not just those who have received support
• Changes in this data, though important, cannot be wholly (or even partly?) attributed to work we do.
It is proposed therefore that intelligence on individuals participating on elements of Project Minerva, and all support programmes should be obtained directly from them, and that our Customer Service team is ideally placed to manage this function (as well as signposting individuals to appropriate support). A proportion of the budget would be used to gain first hand objective and subjective feedback on the results of participation on programmes, intelligence on gaps in provision and identification of good practice and less good delivery, and evidence of groups/individuals not receiving the support they require, in order to gain better informed clients and a higher number accessing support. In addition, though our business engagement programme, we can capture feedback from employers about their needs and perceptions on skills availability, appropriateness and quality. This element of the project will identify and capture a range of baseline data and impact measures including;
a. Baseline data generally available (e.g. Office of National Statistics, JC+); school leavers and their destinations, numbers of apprenticeships, NEETs, registered JSA/ESA, working for less than the living wage, employed in elementary occupations and working in Luton but commuting in.
b. Objective data captured by LBC pre and post intervention (e.g.
LIF Business case v2 : Skills Page 263 of 293
current employment/benefit situation) through the customer service team
c. Subjective data (e.g. clients views on their current situation, measures that they would like to see change, their view on whether they are nearer work, in work or in an improved job, whether their circumstances have improved).
d. Data captured by providers/schools/other partners pre and post intervention.
e. Employer baseline data (number and type of vacancies, skills gaps, locally employed staff).
f. Household income data and/or Experian credit score ratings
b) Schools
• Enhancing skills and education is a strategic priority for the Council. Luton needs a skilled, adaptable workforce with the right mix of qualifications of skills to maximise opportunities for securing jobs. This will require significant additional investment in order to deliver a step change in the skills programme work for young learners in schools.
• Luton needs to become a location of choice for new and additional investment and the availability of a skilled, local workforce is critical to the success of attracting inward investment. o 4 out of 5 young people see the benefit and would like work
experience. o Only 1 in 10 young people see the apprenticeship route a
preferred option although there is greater uptake 2 or 3 years after leaving school.
o Employers in the engineering sector say young people lack skills in physics, maths and hand tools skills making it difficult to recruit them for roles available.
o Young people would like more help with interview skills and applications for universities and colleges.
o 2 in 5 (39%) Luton businesses report skills gaps in their work force
o 58% of employers in Luton had difficulties filling jobs with skilled trade posts experiencing most difficulty at 23%.
o Too many young people are leaving school and progressing to low level qualifications that do not aid their progression into the workplace.
o Luton has an ageing workforce with employers reporting a reluctance and inflexibility from staff to develop new skills particularly IT.
o Employers report that young people leave school, college or university lacking employability skills such as basic communication, the right attitude, initiative, self-reliance and self-discipline (43% in recent business consultation).
o 48% businesses thought Key Stage 4 (age 14-16) should be targeted.
o The current number of young people in learning (Spring 2017 Census) and will be Yrs 9-11 from September 2017 are:
LIF Business case v2 : Skills Page 264 of 293
Year 8 Year 9 Year 10 2656 2515 2509
c) Adult skills, careers and job opportunities
• LIF aims are to see development of 8 strategic sites, generate 18,500 new jobs, raise aspirations and improve lives of Luton residents.
• Skills and qualifications need to be developed to meet the employment demand.
• Estimates project over 2600 new construction jobs in the town will be required over the next 5 years.
• Projections for the South East are that at least 12,000 new construction jobs will be created by 2021, meaning Luton will be in stiff competition with other towns also requiring the same skills.
• Some construction companies are currently recruiting from overseas, including one company which as 52% of the workforce from Eastern Europe.
o Airport growth projections (Oxford Economics 2015) are that at least 3,700 new jobs (across the range from cabin cleaners to engineers and pilots) will be created through grown at LLA by 2030, and this a conservative estimate.
Future state Output measurement and reporting
• To have captured meaningful baseline data for comparison with post intervention intelligence
• To be able to evaluate the impact of LBC funded support • To report upon this impact and other projects and assess value for
money • To obtain views from participants (and non-participants) upon provision
and influence future programmes • To understand employer’s needs; feed back to them regarding changes
in provision, and measure improvements and perceptions for skills needs and recruitment
Schools
• To have a joined up and collaborative approach to employability, education and activities for all Luton’s’ young people.
• To have a Luton branded approach that is recognised and valued by students, schools and employers.
• That businesses are confident that young people are prepared for the world of work and have a good understanding of their responsibilities.
• That employers play a key role in developing young people’s knowledge, experience and aspirations.
• That schools, the sixth form college, further education colleges and the university are engaged and active partners in new skills projects.
LIF Business case v2 : Skills Page 265 of 293
• That the project can be embedded in education from primary through to post 16 and beyond.
Adult skills, careers and job opportunities
• That a jobs and skills pipeline will accurately predict the number of construction jobs needed in the town.
• That a fully funded programme for obtaining a CSCS card will have provided a pipeline of construction employment-ready candidates.
• That employers, the council, schools and further education colleges will be collaborating on contributing to that pipeline.
• That residents are able to view the range of jobs and career opportunities available at the airport, and that this links closely with employment, training and skills fairs running in the town.
• That the proposed Aspiration Centre can be used to support project delivery.
S2 : Business objectives, intended outcomes and strategic fit (how it links with the Council’s strategic objectives) Business objectives Schools
• A pilot project designed to change the way employers and education engage with each other, developing a programme that raises aspiration of young people, develops essential skills, knowledge and confidence whilst meeting the skills needs of employers.
• 3 year plan that will incorporate a broad range of activities and complement existing national and local work undertaken. Young people will:
o Be better informed about careers options and pathways to progression.
o Have had valuable work experience in industry. o Have developed skills through practical based training - industry
specific and employer led. o Have developed a range of employability skills. o Understand the local labour market.
• Using a “Skills Passport” the young person will develop evidence of achievements and meet set criteria that demonstrate to an employer or educational establishment that they have met minimum standards of behaviours, attitudes, knowledge and skills in relation to employment.
• The employer or educational establishment will recognise the awards and offer benefits to the young person dependent upon achievements, such as guaranteed work experience, interviews or potentially employment/sponsorship for further or higher education.
Adult skills, careers and job opportunities • Developing and delivering practical solutions to helping people into jobs
and career opportunities. • Focuses on 3 areas:
o Skills for construction : Develop understanding and knowledge ready to work in the construction industry (portfolio required).
o Health and Safety in a Construction Environment : Level 1 aware in health and safety (portfolio required).
LIF Business case v2 : Skills Page 266 of 293
o CSCS Card : Attendance at course followed by CITB on-line test.
• In addition, marketing of airport related jobs and pilot project to advise applicants on a 5 year work or education history, required as part of airport security requirements.
Intended outcomes Schools
• Participation from year 9/10/11 students (research needed for what is good level of participation, but aiming for 1200 students over 3 years).
• 500 young people achieve employer work placements or other benefits, resulting from completion of Bronze/Silver/Gold/Platinum awards for a skills passport (research needed to confirm target numbers)
• Participation from all 12 secondary schools. • Engagement from at least 6 major employers are involved in activities
in schools • 20% increase in the number of quality work experience placements
over baseline at start of project. • An increased number of industry days and taster sessions available in a
broad range of sectors. • A decrease in the number of employers who feel young people do not
have employability skills (survey/evaluation exercise). • Parents and young people understand the opportunities better and are
making informed choices that are meeting their aspirations. • Employers understand the needs of young people better and factor this
into their recruitment processes. • More availability of work based learning opportunities/ apprenticeships. • Increased uptake in apprenticeships as a 1st point destination. • A joined up approach to post 16 skills education locally that is informed
and meets local business needs. • An increase in 1st choice of post 16 destination being the right choice.
Adult skills, careers and job opportunities
• Employer feedback captured from LBC Business Engagement Programme and fed back to providers to influence provision
• Long term survey of employers to gauge improvements in applications from Luton residents
• Employers are able to fill construction vacancies with trained and work-ready Luton residents; vacancies surveyed and lengths of vacancies remaining open reduced by 15% .
• Reduced worklessness and increase the number of people in paid employment measured through ONS and JC+ data.
• Reduce the number of people with no recognised qualification; participation by 600 adults on construction related training courses.
• Increased employability skills, confidence and self-esteem. • Airport employers and participants report satisfaction with knowledge of
recruitment opportunities. • Pilot security clearance project learning informs development of further
work.
LIF Business case v2 : Skills Page 267 of 293
Strategic fit The Council’s Skills and Employability Strategy sets out actions for 3 strategic priorities:
a) Luton’s young people b) Adult residents and social mobility c) Skills for Luton’s Growth
Schools This project focuses on Luton’s young people.
• The University of Bedfordshire, schools, further education colleges, Progression and Transition Board (PTB) and key employers will work in partnership to develop their curriculum and learning opportunities to match where employers need highly skilled and trained members of their workforce.
• This is a key part of the Luton Skills Programme – a collection of projects focusing on Strategy and Leadership, Access to Jobs Information, Working with Employers and Getting a Job or Better Paid Job.
Adult skills, careers and job opportunities • This project will focus on adults and meets 3 Skills and
Employability Strategy priorities: o Opportunities for learning, self-development and employment
for low paid and low skilled. o Remove barriers and improve pathways into work for the
unemployed. o Equip people with skills need to better meet employer need.
S3 : Costs, Benefits and Risks Costs Detailed costings set out in Financial section. In summary:
Project management resource £180k Schools £490k
Adult skills, careers and job opportunities
£480k
Resources for projects impact assessment (including staff, data base licensing and out sourced analysis and
reporting)
£100k
Total £1,250k Unallocated (contingency) £50k
Benefits Schools • The links between education and employment are strengthened and the
work with business is embedded into the curriculum. • Key benefits for the young person, employers and schools:
LIF Business case v2 : Skills Page 268 of 293
o Young people have greater aspirations, a clearer understanding of the world of work and improved employability skills.
o Young people have a greater understanding of the options and pathways available
o Young people are more confident, self-aware and contribute to the community
o High quality and consistent careers guidance to young people in each of the 12 high schools.
o Schools gain a greater understanding of industry. o School staff are able to update their skills through CPD o Schools have industry contacts that enhance their curriculum o Increase in employers offering apprenticeships o Increase in higher and degree level apprenticeships available in Luton
and a greater take up in the growth sectors o Training providers offer a more flexible approach, entry point for
vocational routes at a higher level o Clear understanding of jobs pipeline for Luton schools and colleges o The percentage of young people with no qualifications is at or below
national average o Fewer young people needing ESOL in further education o Project is adaptable to deliver outcomes to other age groups – KS3,
post 16 university and beyond. Adult skills, careers and job opportunities • CSCS is the leading certification scheme within the UK construction
industry. • Most contractors and house-builders require construction workers on their
sites to hold a valid CSCS card. • Marketing and publicising airport jobs through fairs, Aspiration Centre,
website, Job Centre and social media will take advantage of a growing, high profile, employment area in the town and be ready to take advantage of enterprise zone new jobs.
• Piloting the security clearance requirements will assist in overcoming a barrier to working at airport sites.
Risks Each have mitigation measures in place. Schools • Schools don’t feel engaged or consulted in project development. • Businesses don’t feel engaged or consulted in project development. • Whilst businesses support the project, they offer minimal support and
involvement in delivery, e.g. through delivery of work experience. • Failure to research young people’s aspirations and current skills. • Lack of understanding of current and future skills needs. • Project targets are unachievable (work underway to provide stretching but
achievable targets). Adult skills, careers and job opportunities • Lack of interest from individuals to engage and upskill in the construction
sector.
LIF Business case v2 : Skills Page 269 of 293
• Construction companies’ requirements change. • Some airport related businesses don’t engage in publicising jobs. • Airport security requirements limit the ability to provide advisory/brokerage
service. S4 : Critical Success Factors (what does success look like? What are the KPIs) Schools • Number of students participating in employability skills training (target 1200
over 3 years) • Number of skills passports completed at Bronze, Silver, Gold and Platinum
resulting in work placement or other employer offer (target 500 over 3 years)
• %age feedback from schools that are satisfied with the project (target 90%) • Number of work placements offered by businesses (target 100). Other success factors: Employers are engaged in the projects Schools support through resources Project is valued by employers schools and students Awards are achievable but not easy Participation is high Quality is high Development into an accredited award Project is engaging and meets the needs of all stakeholders
Adult skills, careers and job opportunities • Number of people registering for and completing the 3 training courses
(target 600). • 90% of airport businesses advertise job vacancies through jobs
website/hub • 10% increase in residents gaining jobs (year on year) • 15% reduction in length of vacancies remaining open. • Number of people accessing the airport security advisory/brokerage
service (target 500). • At least 90% businesses whose employees use the brokerage service are
satisfied with the service. • %age of airport employees that receive quicker security clearance as a
result of using the advisory service (target 90%). • Satisfaction survey of participants on programmes to capture subjective
feedback on whether they feel their work prospects have improve, they have gained work, or training opportunities, or have better jobs
• Employer survey pre and post project implementation to establish number and type of vacancies, number filled by Luton residents, reported skills gaps
S5 : Impact of non-delivery Schools • Strategic objectives are not met • No change • Low aspirations • Skills gaps not met
LIF Business case v2 : Skills Page 270 of 293
• Fewer employer seek to locate to Luton • Slow economic growth
Adult skills, careers and job opportunities • Construction companies working in Luton would need to seek workforce
from outside Luton. • Local people would have more limited opportunities to access local jobs. • Skills gap would not be met. • Employment opportunities generated by airport growth would not be
exploited.
S6 : Main stakeholders Schools • Secondary schools, Barnfield College, Sixth Form College, employers
(large and SME), Luton Adult Learning, Young people, parents and LBC services (Education, Economic Development)
Adult skills, careers and job opportunities • LBC, Dept. for Work and Pensions Job Centre, commissioned delivery
partner for training, LLAOL, LLAL, construction companies, airport based employers.
ECONOMIC E1 : Outline of options appraisal Schools A project manager (to oversee all projects in this business case) is needed to oversee the implementation and design of the award/passport, manage the budget, report to managers and engage with stakeholders. An employability and skills award – Skills Passport This is an award that is recognised by employers as a minimum standard of employability education, developed in collaboration with schools and post 16 providers. Rewards include industry days and interviews, and are offered to young people that achieve at each level. There would be 4 grades- Bronze, Silver, Gold, and Platinum. Each would have set criteria for key standards such as:
1. Communication 2. Responsibility 3. Professional Conduct 4. Skills 5. Contribution to Community
This is an opportunity for all students to access employability, communication, and language and ‘hand’ skills education. Delivered via partners from schools, Luton Adult Learning, employers and colleges, this will enable young people to develop the basic skills in specific areas that employers require and can be specific to sectors such as Engineering, Hospitality, Construction Creative, Health, IT and Business. This could be skills education at college or a project
LIF Business case v2 : Skills Page 271 of 293
in conjunction with an employer. It could also include an employability qualification, longer term. The level of participation would attract points which go towards achievement of the award.
An employability coordinator would be recruited who would deliver Skills Passport related work in schools and colleges and would oversee the employer engagement activities. A key part of the award is the engagement with employers for skills, mentoring and work experience. The young person could receive some valuable and meaningful work experience (in addition to what is already offered in most schools). This would be either ½ day, 1 day, 2 day experiences where a young person is supported in a sector of real interest. The project would fund ways of encouraging employers to provide opportunities for hosting individuals or groups at their premises, including financial incentives. To support schools in tracking careers education a careers package that is funded by LBC will enable better data management and will inform the type of education required. Adult skills, careers and job opportunities Adult skills pilot project – construction skills will consist of three main qualifications to enable local people to seek employment within the construction industry. Note, depending on take-up and employer need, other courses around, for example, fork lift drivers’ qualification, may be substituted during the life of the project, subject to project sponsor/board approval. 1. Skills for construction This will focuses on developing understanding and knowledge ready to work in the construction industry, enabling individuals to progress in to employment. It is tailored to suit requirements of the construction industry. The course covers:
• Effective Communication in the Workplace • Working in a Team • Environmental Awareness in Construction • Measuring and Marking Out (Pipework activity/skills) • Health and Safety in Construction • Working in Construction
Achievement is measured by portfolio completion. 2. Health and Safety in a Construction Environment qualification
This part of the course is the new requirement required by CITB as of 1st July 2014. It is a Level 1 Award in Health and Safety in a Construction Environment Qualification. It covers:
LIF Business case v2 : Skills Page 272 of 293
• Risk Assessments • Manual handling • Working Safely at Height • Risks to Health • Plant and Equipment
Achievement is measured by portfolio completion. 3. Construction Skills Certification Scheme (CSCS) CITB (Green Labourer
card)
This is a nationally recognised qualification which enables candidates to work on construction sites. During the course relevant topics will be covered to prepare the learner to conduct the CITB online test. Achievement is measured by successful completion of a test following successful completion of the ‘Skills for Construction’ and ‘Health and Safety in a Construction Environment’ qualifications. Qualifications, CSCS test & card will delivered by commissioning an experienced and qualified provider. A project manager is needed to oversee the implementation and delivery, manage the budget, report to mangers and engage with stakeholder. In addition a recommendation is to have a website presence to provide a learning platform to support the award and also contains local information on airport opportunities, vacancies and apprenticeships. Finally, a staff resource (1 FTE – but could be a commissioned service) is required to lead on the brokerage/advisory service and wider jobs and training plan on airport related work, including use of the proposed Aspiration Centre facilities. E2 : Preferred option Section E1 sets out the proposals. Any part of it could be delayed or not taken forward, but each is interlinked, so would impact on the outcomes for the project overall. The preferred option is therefore as set out section E1.
COMMERCIAL
C1 : Procurement approach and methodology Procurement and tendering processes for external agencies to follow LBC procedures. Collaboration with internal and external stakeholders where necessary to reduce costs.
LIF Business case v2 : Skills Page 273 of 293
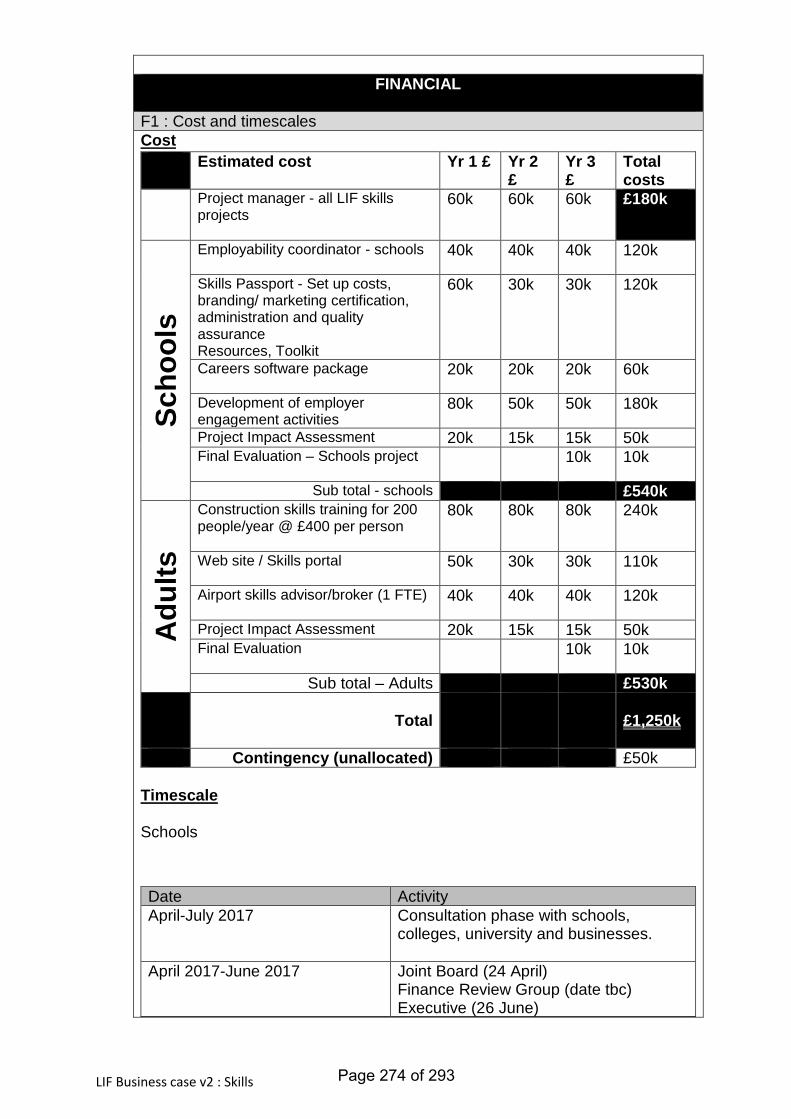
FINANCIAL
F1 : Cost and timescales Cost
Timescale Schools
Estimated cost Yr 1 £ Yr 2 £
Yr 3 £
Total costs
Project manager - all LIF skills projects
60k 60k 60k £180k
Scho
ols
Employability coordinator - schools
40k 40k 40k 120k
Skills Passport - Set up costs, branding/ marketing certification, administration and quality assurance Resources, Toolkit
60k 30k 30k 120k
Careers software package
20k 20k 20k 60k
Development of employer engagement activities
80k 50k 50k 180k
Project Impact Assessment 20k 15k 15k 50k Final Evaluation – Schools project
10k 10k
Sub total - schools £540k
Adu
lts
Construction skills training for 200 people/year @ £400 per person
80k 80k 80k 240k
Web site / Skills portal
50k 30k 30k 110k
Airport skills advisor/broker (1 FTE)
40k 40k 40k 120k
Project Impact Assessment 20k 15k 15k 50k Final Evaluation
10k 10k
Sub total – Adults £530k
Total
£1,250k
Contingency (unallocated) £50k
Date Activity April-July 2017 Consultation phase with schools,
colleges, university and businesses.
April 2017-June 2017 Joint Board (24 April) Finance Review Group (date tbc) Executive (26 June)
LIF Business case v2 : Skills Page 274 of 293
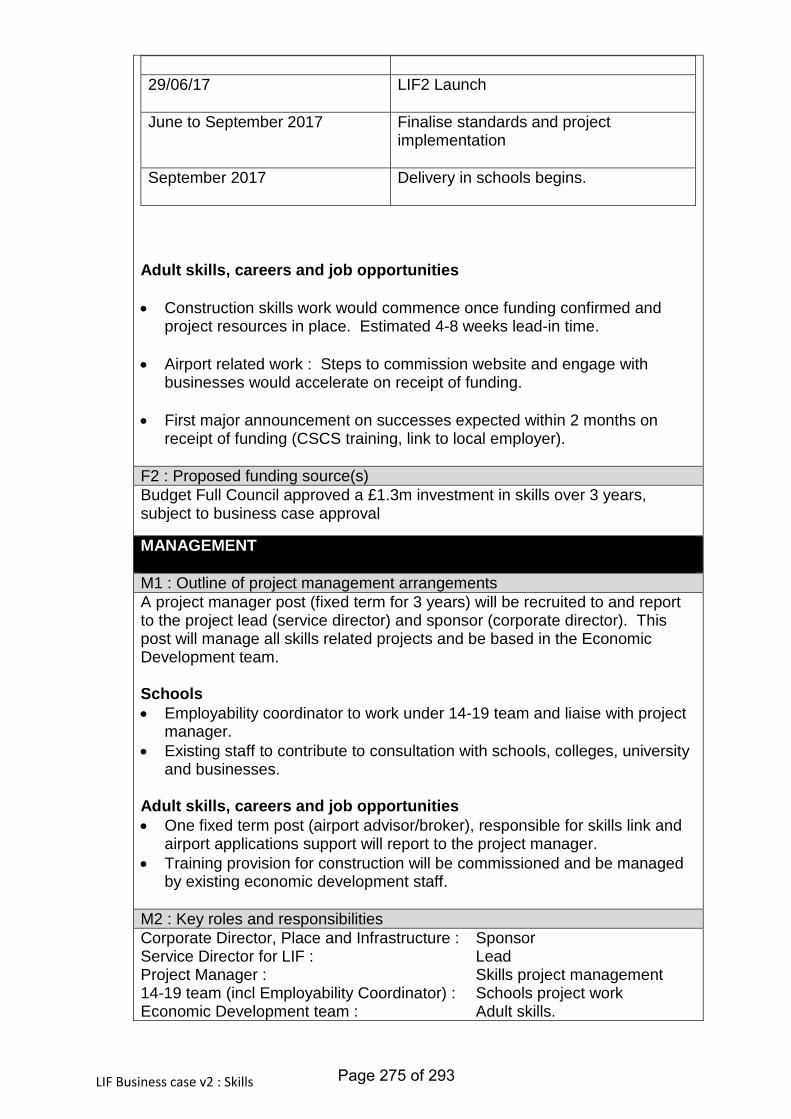
Adult skills, careers and job opportunities • Construction skills work would commence once funding confirmed and
project resources in place. Estimated 4-8 weeks lead-in time. • Airport related work : Steps to commission website and engage with
businesses would accelerate on receipt of funding. • First major announcement on successes expected within 2 months on
receipt of funding (CSCS training, link to local employer).
29/06/17
LIF2 Launch
June to September 2017 Finalise standards and project implementation
September 2017 Delivery in schools begins.
F2 : Proposed funding source(s) Budget Full Council approved a £1.3m investment in skills over 3 years, subject to business case approval
MANAGEMENT
M1 : Outline of project management arrangements A project manager post (fixed term for 3 years) will be recruited to and report to the project lead (service director) and sponsor (corporate director). This post will manage all skills related projects and be based in the Economic Development team. Schools • Employability coordinator to work under 14-19 team and liaise with project
manager. • Existing staff to contribute to consultation with schools, colleges, university
and businesses. Adult skills, careers and job opportunities • One fixed term post (airport advisor/broker), responsible for skills link and
airport applications support will report to the project manager. • Training provision for construction will be commissioned and be managed
by existing economic development staff. M2 : Key roles and responsibilities Corporate Director, Place and Infrastructure : Sponsor Service Director for LIF : Lead Project Manager : Skills project management 14-19 team (incl Employability Coordinator) : Schools project work Economic Development team : Adult skills.
LIF Business case v2 : Skills Page 275 of 293
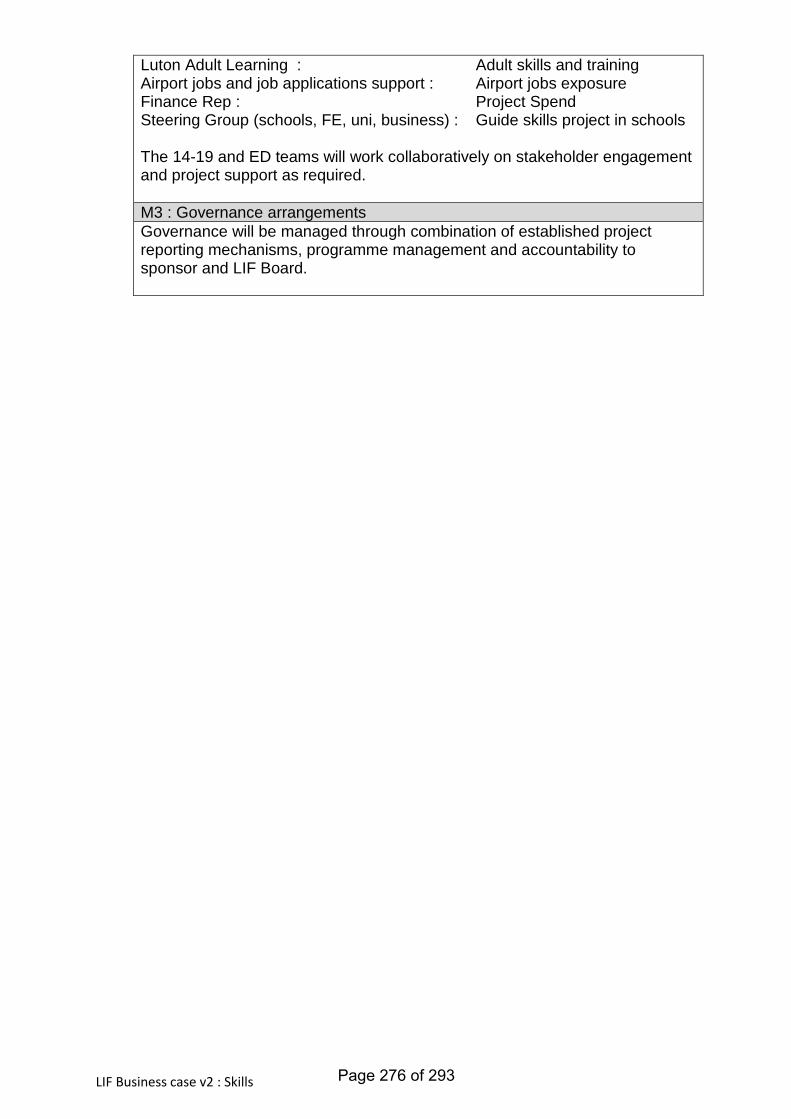
Luton Adult Learning : Adult skills and training Airport jobs and job applications support : Airport jobs exposure Finance Rep : Project Spend Steering Group (schools, FE, uni, business) : Guide skills project in schools The 14-19 and ED teams will work collaboratively on stakeholder engagement and project support as required. M3 : Governance arrangements Governance will be managed through combination of established project reporting mechanisms, programme management and accountability to sponsor and LIF Board.
LIF Business case v2 : Skills Page 276 of 293
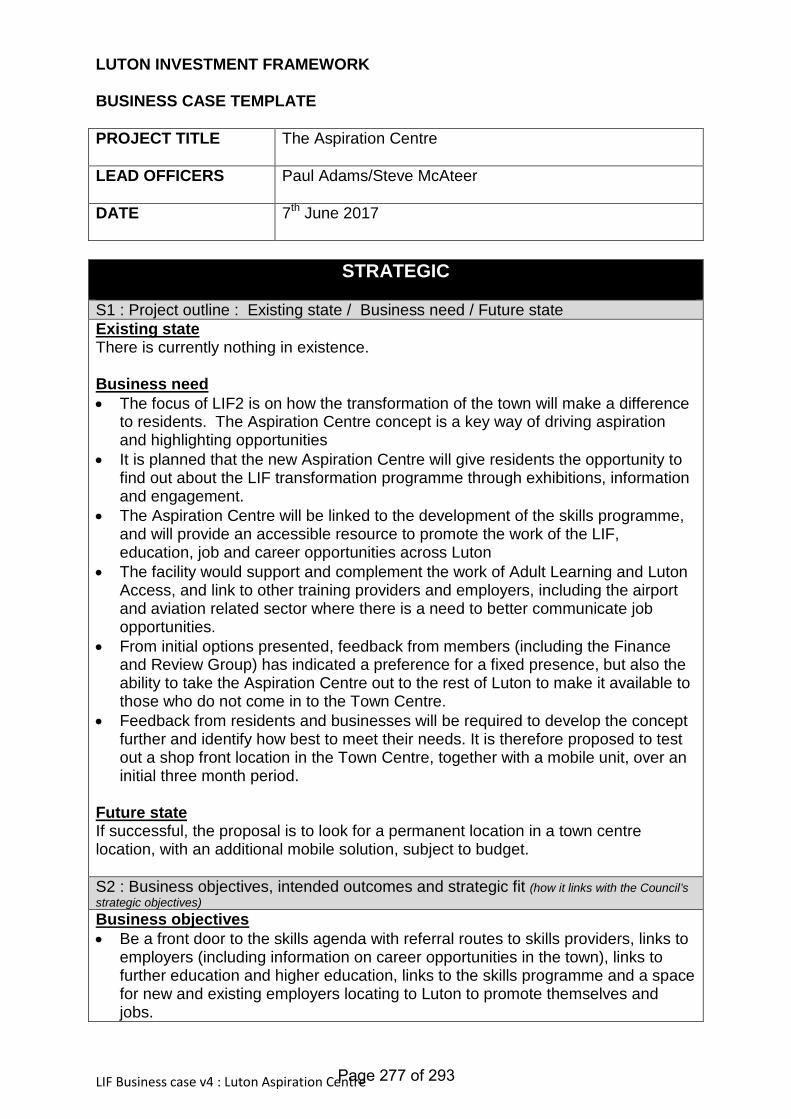
LUTON INVESTMENT FRAMEWORK BUSINESS CASE TEMPLATE PROJECT TITLE
The Aspiration Centre
LEAD OFFICERS
Paul Adams/Steve McAteer
DATE
7th June 2017
STRATEGIC
S1 : Project outline : Existing state / Business need / Future state Existing state There is currently nothing in existence. Business need • The focus of LIF2 is on how the transformation of the town will make a difference
to residents. The Aspiration Centre concept is a key way of driving aspiration and highlighting opportunities
• It is planned that the new Aspiration Centre will give residents the opportunity to find out about the LIF transformation programme through exhibitions, information and engagement.
• The Aspiration Centre will be linked to the development of the skills programme, and will provide an accessible resource to promote the work of the LIF, education, job and career opportunities across Luton
• The facility would support and complement the work of Adult Learning and Luton Access, and link to other training providers and employers, including the airport and aviation related sector where there is a need to better communicate job opportunities.
• From initial options presented, feedback from members (including the Finance and Review Group) has indicated a preference for a fixed presence, but also the ability to take the Aspiration Centre out to the rest of Luton to make it available to those who do not come in to the Town Centre.
• Feedback from residents and businesses will be required to develop the concept further and identify how best to meet their needs. It is therefore proposed to test out a shop front location in the Town Centre, together with a mobile unit, over an initial three month period.
Future state If successful, the proposal is to look for a permanent location in a town centre location, with an additional mobile solution, subject to budget. S2 : Business objectives, intended outcomes and strategic fit (how it links with the Council’s strategic objectives) Business objectives • Be a front door to the skills agenda with referral routes to skills providers, links to
employers (including information on career opportunities in the town), links to further education and higher education, links to the skills programme and a space for new and existing employers locating to Luton to promote themselves and jobs.
LIF Business case v4 : Luton Aspiration Centre Page 277 of 293
• Be a front door to LIF and include information on development sites and job opportunities and to showcase the transformation of the town. Provide a base for a “job ready” service – such as organising security clearances for jobs at the airport and construction cards.
• Host key events and themes, e.g. focus on housing, progress on developments, building/expansion of schools.
• Target audience should be in work people who are looking at better paid jobs. • Provide space for member led engagement with residents, focused around the
LIF opportunities. • There needs to be a link to an on-line presence. • Triage available to enable people to book themselves onto courses. • Needs to be high quality, vibrant and lively. Intended outcomes • Positive image of Luton • Supports the delivery of the new skills programme • Will show the direction of partners and strong working together • Residents are better informed about the LIF, its projects and opportunities for the
town • Residents securing better jobs, training and skills development and realising local
opportunities • Town Centre revitalisation Strategic fit • This forms part of the Council’s 20 year plan for the delivery of the Luton
Investment Framework. The Aspiration Centre will be one aspect to the marketing programme rolled out to residents. This will be the where they come and visit the centre, or have it visit them, understand what is going in their ward and town, the opportunities for their children, access new job opportunities, and improve their skills and life chances.
S3 : Costs, Benefits and Risks Costs As this is a 3 month trial it is proposed to;
• Secure a short term (3 month) lease on premises in the town centre • Rent/lease a mobile unit to take the Aspiration Centre out to local
communities and business areas. Estimated costs are likely to be circa £100k to run the trial. It should be noted that we must ensure the Centre facilities are of high quality to re-enforce the LIF message. One option is to utilise space at the Town Hall to keep costs down for the initial trial period, and this is being investigated further alongside costings for shop units. Below are estimated costs based on initial quotes we have secured and previous work we have delivered.
• £35k for the hire of the premises, rates and fitting out. • £11k for lease and initial fit out of the mobile unit • £21k for vehicle storage, management, maintenance and delivery to sites
LIF Business case v4 : Luton Aspiration Centre Page 278 of 293
• £10k for WIFI and computer access during this trial period • £20k for staffing • £3k contingency
Benefits The three month trial should provide us with initial data on what it is people are coming in to access, where we may need to focus our resources and marketing, if there is a need/demand for the Aspiration Centre and if a town centre/mobile solution works. Risks
• Negotiating and securing a short term lease for premises, and fitting out, may delay the launch of the Aspiration Centre. Use of our own premises could remove this risk
• Engagement with businesses may not yield sufficient short term interest to persuade them to participate (promoting job opportunities)
• Full corporate buy-in may take time to be established • No initial solution will meet all of the ‘wish-list’ requirements of the
originators of the Aspiration Centre concept • Staffing is key to the success of the Aspiration Centre – it will require
evening and weekend work and a requirement to staff the mobile unit, and therefore essential that all departments are brought into the delivery plan. A proposal could include involving the new Leadership and Management staff as one of their modules.
• It was planned to run the trial from September to November to align with the delivery of the new skills programme and young person’s ambassador’s programme. Fit out and launch may not be possible in this timeframe.
• Marketing and communications must be carefully planned, with a specific communications plan produced including press releases, social media, a fully functional website and other forms of advertising, focusing heavily on the benefits to residents and businesses of accessing the Aspiration Centre..
• The Aspiration Centre will almost definitely attract enquiries into project costs. A strong events and delivery programme would be needed for the Aspiration Centre to rebut any negative comments. Alongside this the promotion of strong success stories coming out of the Aspiration Centre will also support the need for this facility.
S4 : Critical Success Factors (what does success look like?) • High quality facility which people are accessing. • Partner buy in • Promotion of the opportunities coming on stream through the LIF Key Performance Indicators to be reported to the LIF Board will include: • Numbers of people accessing the Aspiration Centre • On-site survey analysis from visitors assessing whether the Aspiration Centre
has improved their understanding of LIF and the opportunities for them (and Luton)
• Feedback on future Aspiration Centre from and function • Numbers accessing added value services at the centre, e.g. skills, jobs and
careers.
LIF Business case v4 : Luton Aspiration Centre Page 279 of 293
• Number of business partners/employers using the centre (and analysis of their feedback).
• No of visitors gaining training and skills development opportunities, interviews and new jobs, as a result of visiting the Aspiration Centre, gaining information and accessing employers and business partners
• The six monthly resident’s survey showing an improved perception. S5 : Impact of non-delivery No physical place where people could visit to understand the opportunities coming from the LIF. The council would have to rely on existing channels, e.g. website, social media, press releases. No way to physically take out to communities and businesses (and make them aware of) the opportunities that LIF is bringing (and delivering). No way of measuring the appetite for a longer term Aspiration Centre to market LIF opportunities. S6 : Main stakeholders
• Residents of Luton • LBC senior managers • LBC Councillors • LBC staff • Higher education and further education providers • Local businesses • The Trusts • Other public services (Police and Fire) • Luton BID
ECONOMIC
E1 : Outline of options appraisal Do nothing
• this would be at zero cost to the Council • would leave only current mechanisms available to promote LIF
Do minimum (£25k min)
• Could run the trial period for a shorter duration (4 – 8 weeks). Could save some costs but would still need to meet the costs of a facility itself, including set-up costs, which is where most of the outlay is. Not practical to provide a mobile facility for any shorter period.
• Could consider a porta-cabin facility in St George’s Square – but additional costs regarding security would be incurred
Less ambitious (£50k)
• High quality (temporary) facility in St George’s Square but less spend on marketing and digital support for the facility itself.
• Reduced offer inside the facility and therefore limited resource and space. • This would still give the ability to engage with the public and trial the
facility. • Additional costs regarding out of hours access and security would be
incurred
LIF Business case v4 : Luton Aspiration Centre Page 280 of 293
More ambitious (up to £100k)
• High quality ‘shop-front’ facility or usage of space at the Town Hall (subject to security, access and usage constraints) which demonstrates the vision of the LIF through strong marketing and digital messaging.
• A facility which allows multiple use (e.g. link to skills project, Luton Adult Learning)
• At least three months of the facility operating allowing more people the opportunity to access the facility.
• Combined with a mobile unit to travel to other areas of the Borough and engage with communities and businesses
E2 : Preferred option More ambitious. Reason: Whatever option is delivered, it must be of high quality, sufficient to make a positive impact on people accessing the centre. Feedback indicates a preference for a town centre presence but also the ability to take information about LIF to other audiences
COMMERCIAL
C1 : Procurement approach and methodology Some initial quotes have been sought to allow the writing of the business case, but a tender would need to be produced for fit out of the physical space required, and lease terms negotiated for the town centre space and mobile unit. A separate tender for the mobile unit would also be let (for management, storage, maintenance and delivery to sites). Further scoping work needs to be completed to either rule in or out the option of considering space at the Town Hall.
FINANCIAL
F1 : Cost and timescales Cost The below quotes are outline due to the change in the options appraisal as a result of feedback gained, in order to rent town centre and mobile faculties. As this is a trial, there is the ability to adjust the costs/spend to meet specific requirements we wish to address. Costs can be adjusted based on size of shop front facility, lease/loan arrangements for the mobile unit, fit out (e.g. digital screens and provision of technology), amount of marketing and opening hours/regularity of use of the mobile unit (staff and running costs). Outline costs
• £35k for the hire of the premises, rates and fitting out. • £11k for lease and initial fit out of the mobile unit • £21k for vehicle storage, management, maintenance and delivery to sites • £10k for WIFI and computer access during this trial period
LIF Business case v4 : Luton Aspiration Centre Page 281 of 293
• £20k for staffing • £3k contingency
Total £100,000 Timescale
• The proposal is to have the trial Aspiration Centre from September to November, or January – March 2018 (if securing facilities and fit out do not allow a September start).
F2 : Proposed funding source(s) The money is to be met from the £600k approved in principal by the Budget Council in February 2017.
MANAGEMENT
M1 : Outline of project management arrangements It is proposed to form a working group to lead this project. It will be made up of representation from across the Council. A group of officers have met recently and this will form the working group going forward. M2 : Key roles and responsibilities • Corporate Director for LIF – Sponsor • Service Director for LIF – Lead • LIF Programme Manager – marketing and programme management • LIF Programme Support officer – logistics • Comms rep – marketing and comms of the Aspiration Centre • Public health representative – ensure health, wellbeing and culture
representation • Economic Development representative – local businesses and skills programme • People representative – links to schools, FE and HE • Finance representative – spend on the programme • Customer services representative – ensure no duplication and how Luton Access
etc. could feature • External representative – TBC M3 : Governance arrangements
• Terms of reference to be formed at the next meeting.
LIF Business case v4 : Luton Aspiration Centre Page 282 of 293
This form replaces the previous Integrated Impact Assessment form used by LBC. The key aim of an impact assessment is to ensure that all Council policies, plans and strategies support the corporate mission statement that ‘The needs of Luton’s people will be first in everything we do’. 1. Why do I need to do an IIA? The aim of this impact assessment process is to: • Ensure adherence to the legal duties contained within the Equality Act 2010 and associated Public
Sector Duty to analyse the impact of decisions to be undertaken by Council. • Ensure the Council has due regard to equality taking a proportionate and timely approach to
analysing the impact on citizens • Minimise duplication of initial impact assessments with regards to Environment and Health and
maximise consideration of other key Council priorities of Inclusion and Community Cohesion • Ensure that the Council has been able to consider the social, health, environmental and economic
impacts in its decision making in a single document and, where necessary enable the production of a comprehensive action plan to mitigate any potential negative impacts identified
2. When do I need to do an IIA?
An IIA must be started at the beginning of any project, policy or strategy, and cannot be finalised until such time as all consultations, as required, are undertaken.
• The Impact Table will help you to make early consideration of the potential impacts of your proposal and should be used from the point at which preliminary report is taken to Corporate Leadership and Management Team (CLMT) where appropriate. By using this table at your earliest point in the project, potential impacts can be highlighted and it will also be clear whether you need to carry out a full IIA.
• If you complete this table and all impacts identified are neutral, i.e. there is no noticeable impact on characteristics and priorities listed and you are fully confident of this, please contact the SJU by email setting out how you have reached this judgement as it is unlikely you will need to carry out a full IIA.
• An IIA must at all times identify those who will be affected by the decision, policy or strategy.
• At a time of economic austerity IIA authors are minded to consider the whole range of decisions, both locally and nationally when analysing the impact on citizens
• Your first early draft is to be sent to the Social Justice Unit for comments and guidance
• Once consultation has ended, the IIA must be updated with results of the consultation and returned to Executive, where required, for further consideration and approval – at this stage it will be signed off as completed by the Social Justice Unit
If at anytime you need further guidance please contact the Social Justice Unit. For your convenience, please see links at the end of this document to key Corporate and Partnership documents that may help you complete this IIA.
Integrated Impact Assessment Form (IIA)
from June 2013
IIA from June 2013 Page 283 of 293
Tracker 2 No: Proposal Title: Luton Investment Framework – business cases for funding Date of IIA: 6 June 2017 Updated after consultation - Date:
Lead Officer Name: Paul Adams
Early draft Seen by:1 .................................... Finalised IIA Signed and seen by SJU : Name: Date: Please include the names of all other contributors and stakeholders involved in the preparing of this proposal who have been consulted with and agreed this assessment. (Please note the IIA must not be carried out by one person):
If there is any potential impact on staffing please include the name/s of the trade union representative/s involved in the preparation of this assessment or any supporting evidence of request to participate:
Steve McAteer Julie Lockwood
Please provide an outline of your proposal: Draw down of £1.890m Luton Investment Framework funding to provide budget to take forward: • Programme management, marketing and communications resources (5 posts) • Investment in skills, focusing on schools (year 9-11) and adults • An Aspiration Centre, providing exhibition space to help residents understand the positive
benefits of LIF (pilot project). Information supporting the proposal (who, what, where, how2) To draw down LIF funding, business cases need to be approved by Executive. Three business cases have been drawn up. The skills project links in with the Skills and Employability Strategy, which was subject to a separate IIA when taken to Executive in September 2016.
1 Please send an early draft of your IIA to the SJU to ensure all impacts are being considered at the appropriate time 2 Breakdown of present users by ethnicity, age, gender, disability, religion/belief, sexuality (if recorded) Also, show areas in the town with the biggest and lowest needs. Greater emphasis is required at the start of the IIA on the service, how it is delivered now and how the new service will be delivered
IIA from June 2013
Page 284 of 293
The skills and Aspiration Centre projects in particular are designed to support all Luton residents seeking improved prospects in education, work and business, irrespective of ethnicity, gender, age, disability, religion/belief or sexuality. Those in reduced circumstances (unemployed, low income, low educational achievements) will be particularly targeted to benefit. Regarding working with schools; For young people the focus will be on those in year 9, following them through to year 11 and beyond, in order to measure the impact of the project. There are some key groups within this age range that will benefit from this project more than others and working with partners in schools support will be given to those groups to achieve;
• students that are not likely to achieve 5 A* -C Grade (9-4 new grades) • students that have a history of worklessness or low income in the family • boys of single parent families • those that have already been identified as Pre NEET • Looked After Children.
The aim is not only to increase the knowledge of the world of work but to raise the aspirations of Luton’s young people by engagement and reward from local employers, allowing young people to understand how the employability education helps them to improve basic skills that employers are looking for and how they relate the skills they develop at school to those needed in the workplace. The strands of support for adults will be available to all residents, however, positive impact is anticipated amongst some particular groups;
• A large proportion of low income earners and the economically inactive are female and/or non British. The programme of support will be of particular benefit to these groups as a focus is placed upon reaching and working with them via the mobile Aspiration Centre and elements of the skills programme.
• The mobile Aspiration Unit planned will visit communities where individuals who have
caring responsibilities (predominantly women), lack of transport and or disabilities preventing them from travelling into the town centre, will also have the chance to leant about and take advantage of the support programmes for training, up-skilling and taking individuals closer to work.
• Opportunities for training and re-skilling in construction related jobs will enable older
workers to re-train (whether currently employed or unemployed) and gain better jobs Programme management Funding proposed to extend 2 posts for 2 years. New posts for marketing and comms, plus funding for 2 planning posts, to provide additional resources. Skills project (Project Minerva) The proposal is to fund additional staff resources and activity focusing years 9-11 in schools, and investment in adult skills, including airport based employment opportunities.
IIA from June 2013
Page 285 of 293
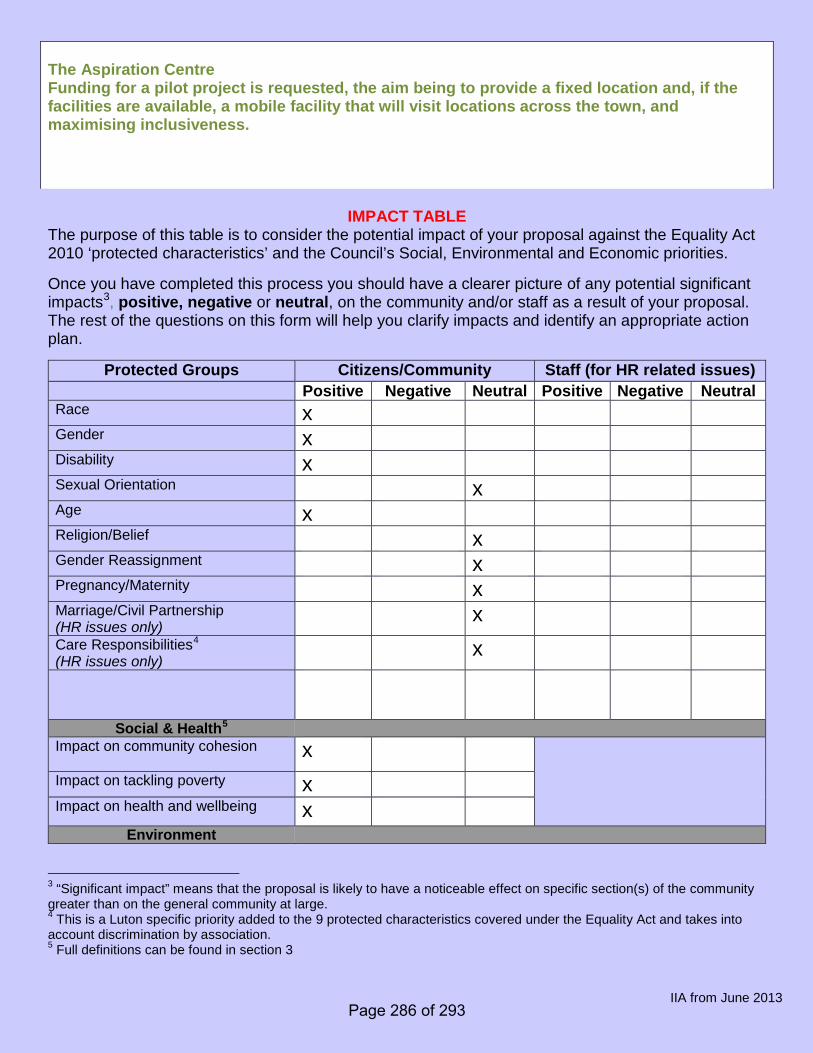
The Aspiration Centre Funding for a pilot project is requested, the aim being to provide a fixed location and, if the facilities are available, a mobile facility that will visit locations across the town, and maximising inclusiveness.
IMPACT TABLE
The purpose of this table is to consider the potential impact of your proposal against the Equality Act 2010 ‘protected characteristics’ and the Council’s Social, Environmental and Economic priorities. Once you have completed this process you should have a clearer picture of any potential significant impacts3, positive, negative or neutral, on the community and/or staff as a result of your proposal. The rest of the questions on this form will help you clarify impacts and identify an appropriate action plan.
Protected Groups Citizens/Community Staff (for HR related issues) Positive Negative Neutral Positive Negative Neutral
Race x Gender x Disability x Sexual Orientation x Age x Religion/Belief x Gender Reassignment x Pregnancy/Maternity x Marriage/Civil Partnership (HR issues only)
x Care Responsibilities4 (HR issues only)
x
Social & Health5 Impact on community cohesion
x Impact on tackling poverty x Impact on health and wellbeing x
Environment
3 “Significant impact” means that the proposal is likely to have a noticeable effect on specific section(s) of the community greater than on the general community at large. 4 This is a Luton specific priority added to the 9 protected characteristics covered under the Equality Act and takes into account discrimination by association. 5 Full definitions can be found in section 3
IIA from June 2013
Page 286 of 293
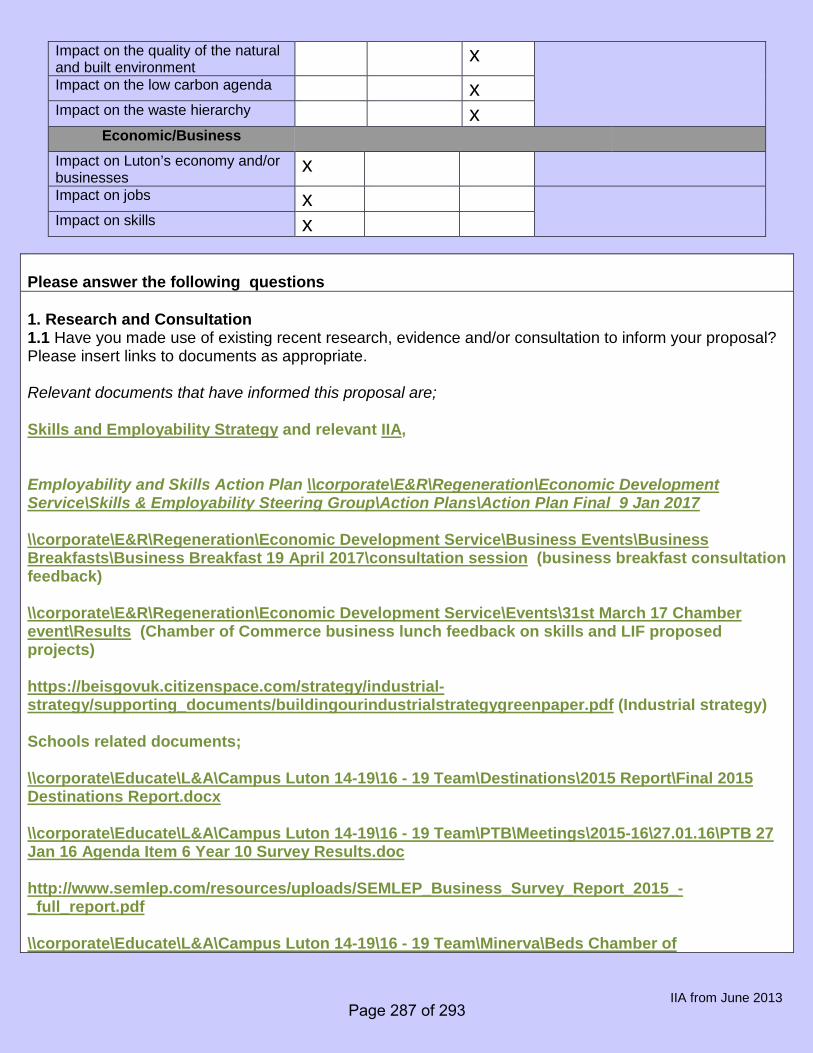
Impact on the quality of the natural and built environment
x
Impact on the low carbon agenda x Impact on the waste hierarchy x
Economic/Business
Impact on Luton’s economy and/or businesses
x
Impact on jobs x
Impact on skills x
Please answer the following questions 1. Research and Consultation 1.1 Have you made use of existing recent research, evidence and/or consultation to inform your proposal? Please insert links to documents as appropriate. Relevant documents that have informed this proposal are; Skills and Employability Strategy and relevant IIA, Employability and Skills Action Plan \\corporate\E&R\Regeneration\Economic Development Service\Skills & Employability Steering Group\Action Plans\Action Plan Final 9 Jan 2017 \\corporate\E&R\Regeneration\Economic Development Service\Business Events\Business Breakfasts\Business Breakfast 19 April 2017\consultation session (business breakfast consultation feedback) \\corporate\E&R\Regeneration\Economic Development Service\Events\31st March 17 Chamber event\Results (Chamber of Commerce business lunch feedback on skills and LIF proposed projects) https://beisgovuk.citizenspace.com/strategy/industrial-strategy/supporting_documents/buildingourindustrialstrategygreenpaper.pdf (Industrial strategy) Schools related documents; \\corporate\Educate\L&A\Campus Luton 14-19\16 - 19 Team\Destinations\2015 Report\Final 2015 Destinations Report.docx \\corporate\Educate\L&A\Campus Luton 14-19\16 - 19 Team\PTB\Meetings\2015-16\27.01.16\PTB 27 Jan 16 Agenda Item 6 Year 10 Survey Results.doc http://www.semlep.com/resources/uploads/SEMLEP_Business_Survey_Report_2015_-_full_report.pdf \\corporate\Educate\L&A\Campus Luton 14-19\16 - 19 Team\Minerva\Beds Chamber of
IIA from June 2013
Page 287 of 293
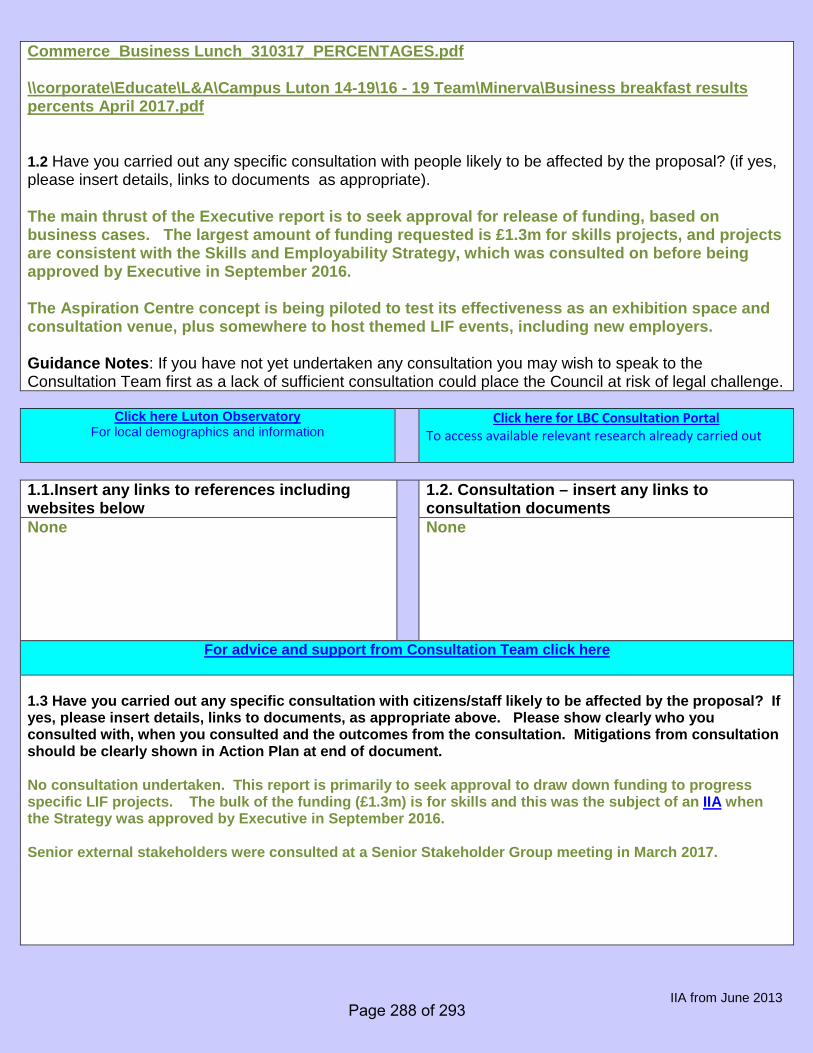
Commerce_Business Lunch_310317_PERCENTAGES.pdf \\corporate\Educate\L&A\Campus Luton 14-19\16 - 19 Team\Minerva\Business breakfast results percents April 2017.pdf 1.2 Have you carried out any specific consultation with people likely to be affected by the proposal? (if yes, please insert details, links to documents as appropriate). The main thrust of the Executive report is to seek approval for release of funding, based on business cases. The largest amount of funding requested is £1.3m for skills projects, and projects are consistent with the Skills and Employability Strategy, which was consulted on before being approved by Executive in September 2016. The Aspiration Centre concept is being piloted to test its effectiveness as an exhibition space and consultation venue, plus somewhere to host themed LIF events, including new employers. Guidance Notes: If you have not yet undertaken any consultation you may wish to speak to the Consultation Team first as a lack of sufficient consultation could place the Council at risk of legal challenge.
Click here Luton Observatory For local demographics and information
Click here for LBC Consultation Portal To access available relevant research already carried out
1.1.Insert any links to references including websites below
1.2. Consultation – insert any links to consultation documents
None None
For advice and support from Consultation Team click here
1.3 Have you carried out any specific consultation with citizens/staff likely to be affected by the proposal? If yes, please insert details, links to documents, as appropriate above. Please show clearly who you consulted with, when you consulted and the outcomes from the consultation. Mitigations from consultation should be clearly shown in Action Plan at end of document. No consultation undertaken. This report is primarily to seek approval to draw down funding to progress specific LIF projects. The bulk of the funding (£1.3m) is for skills and this was the subject of an IIA when the Strategy was approved by Executive in September 2016. Senior external stakeholders were consulted at a Senior Stakeholder Group meeting in March 2017.
IIA from June 2013
Page 288 of 293
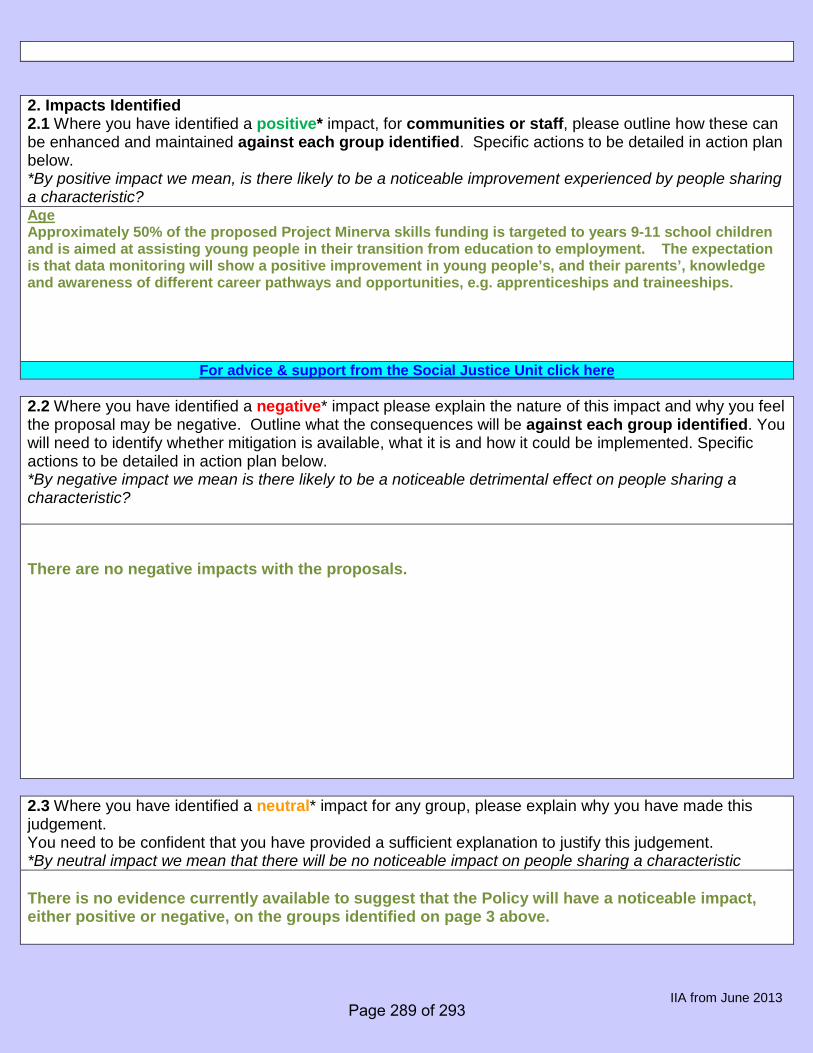
2. Impacts Identified 2.1 Where you have identified a positive* impact, for communities or staff, please outline how these can be enhanced and maintained against each group identified. Specific actions to be detailed in action plan below. *By positive impact we mean, is there likely to be a noticeable improvement experienced by people sharing a characteristic? Age Approximately 50% of the proposed Project Minerva skills funding is targeted to years 9-11 school children and is aimed at assisting young people in their transition from education to employment. The expectation is that data monitoring will show a positive improvement in young people’s, and their parents’, knowledge and awareness of different career pathways and opportunities, e.g. apprenticeships and traineeships.
For advice & support from the Social Justice Unit click here
2.2 Where you have identified a negative* impact please explain the nature of this impact and why you feel the proposal may be negative. Outline what the consequences will be against each group identified. You will need to identify whether mitigation is available, what it is and how it could be implemented. Specific actions to be detailed in action plan below. *By negative impact we mean is there likely to be a noticeable detrimental effect on people sharing a characteristic? There are no negative impacts with the proposals. 2.3 Where you have identified a neutral* impact for any group, please explain why you have made this judgement. You need to be confident that you have provided a sufficient explanation to justify this judgement. *By neutral impact we mean that there will be no noticeable impact on people sharing a characteristic There is no evidence currently available to suggest that the Policy will have a noticeable impact, either positive or negative, on the groups identified on page 3 above.
IIA from June 2013
Page 289 of 293
For advice & support from the Social Justice Unit click here For advice and support from the Public Health team click here
3. Social & Health Impacts If you have identified an impact on community cohesion6’, tackling poverty7 or health and wellbeing8, please describe here what this may be and who or where you believe could be affected, Please also ensure that you consider any possible impacts on Looked After Children. Guidance Notes: Please use this section to describe the social and health impacts and detail any specific actions or mitigations in the action plan below. Impact on Community Cohesion The pilot phase of the Aspiration Centre includes the possibility of touring the Borough with a trailer facility. The aim of this is to take this to residents rather than expecting residents to come to the town centre to access. We would expect this to assist in ensuring no particular group was disadvantaged in not being able to access the Aspiration Centre and its services. Impact on tackling poverty Investment in skills is designed to maximise young people’s and adults’ opportunities to get into employment and, if possible, get a career. The evidence set out in the Project Minerva skills business case shows the anticipated increase in construction jobs and, by providing a specific service, it is anticipated that more people will be able to get construction related jobs. Impact on health and wellbeing The Council’s Health Inequalities Strategy, Strategic Aim 3 is “Creating Fair Employment and Good Work for All”. It focuses on improving access to good jobs, reducing long-term unemployment, making it easier for people who are disadvantaged in the labour market to obtain and keep work, and supporting employers to provide healthy physical environments. Being in good employment is protective of health and is critical for reducing health inequalities. The investment in skills is therefore entirely consistent with the Council’s health and wellbeing plans and is designed to focus not just on young people but adults as well.
6 is the proposal likely to have a noticeable effect on relations within and between specific section(s) of the community, neighbourhoods or areas. 7 is the proposal likely to have a noticeable effect on households that are vulnerable to exclusion, e.g. due to poverty, low income and/or in areas of high deprivation 8 Is the proposal likely to have a positive or negative impact on health inequalities, the physical or mental health and wellbeing of an individual or group, or on access to health and wellbeing services?
IIA from June 2013
Page 290 of 293
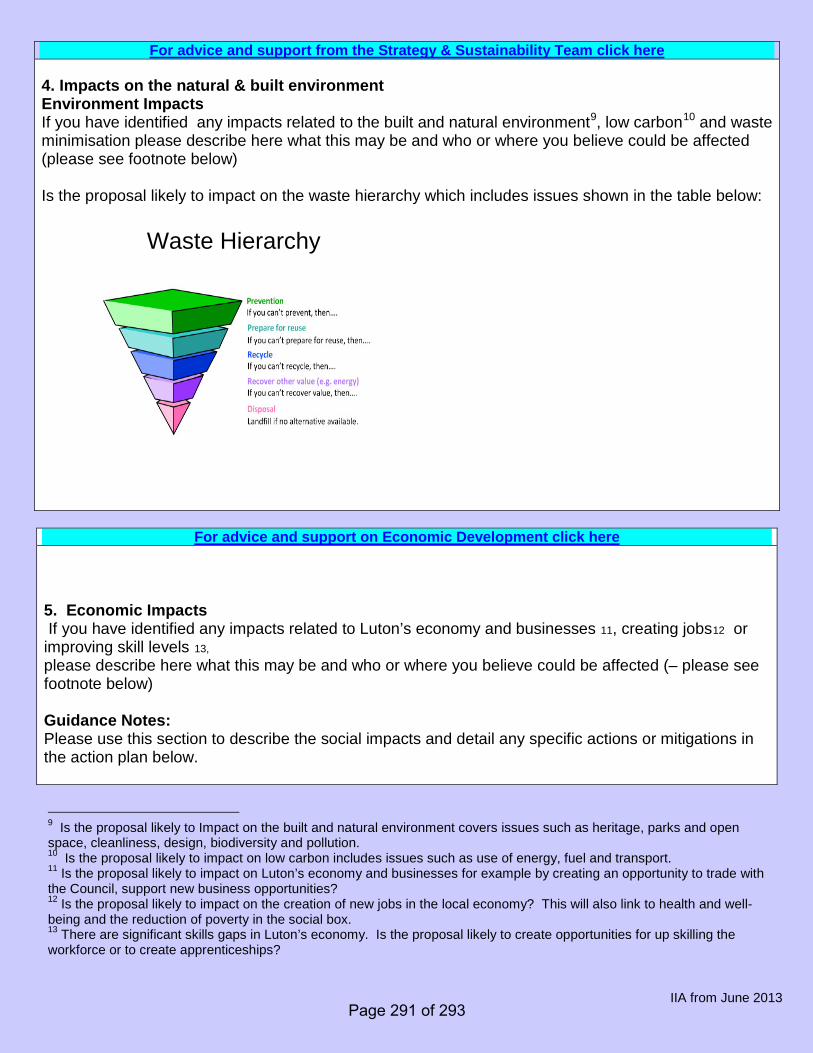
For advice and support from the Strategy & Sustainability Team click here 4. Impacts on the natural & built environment Environment Impacts If you have identified any impacts related to the built and natural environment9, low carbon10 and waste minimisation please describe here what this may be and who or where you believe could be affected (please see footnote below) Is the proposal likely to impact on the waste hierarchy which includes issues shown in the table below:
For advice and support on Economic Development click here 5. Economic Impacts If you have identified any impacts related to Luton’s economy and businesses 11, creating jobs12 or improving skill levels 13, please describe here what this may be and who or where you believe could be affected (– please see footnote below) Guidance Notes: Please use this section to describe the social impacts and detail any specific actions or mitigations in the action plan below.
9 Is the proposal likely to Impact on the built and natural environment covers issues such as heritage, parks and open space, cleanliness, design, biodiversity and pollution. 10 Is the proposal likely to impact on low carbon includes issues such as use of energy, fuel and transport. 11 Is the proposal likely to impact on Luton’s economy and businesses for example by creating an opportunity to trade with the Council, support new business opportunities? 12 Is the proposal likely to impact on the creation of new jobs in the local economy? This will also link to health and well-being and the reduction of poverty in the social box. 13 There are significant skills gaps in Luton’s economy. Is the proposal likely to create opportunities for up skilling the workforce or to create apprenticeships?
Waste Hierarchy
IIA from June 2013
Page 291 of 293
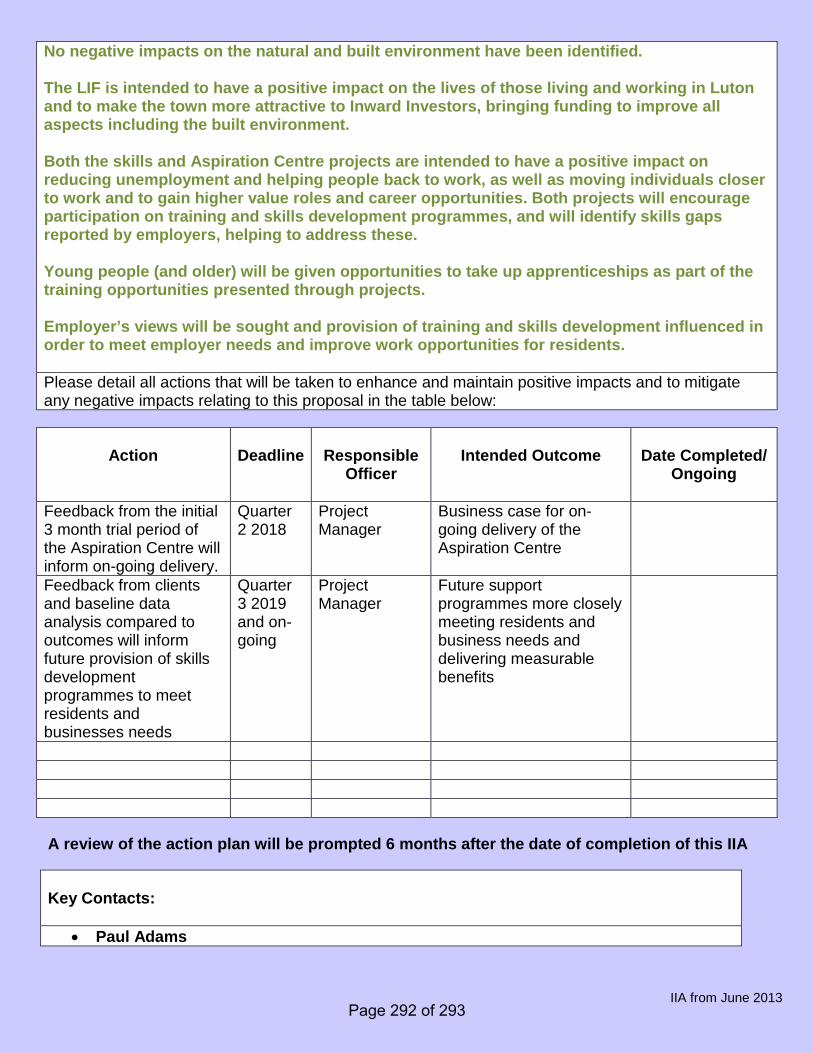
No negative impacts on the natural and built environment have been identified. The LIF is intended to have a positive impact on the lives of those living and working in Luton and to make the town more attractive to Inward Investors, bringing funding to improve all aspects including the built environment. Both the skills and Aspiration Centre projects are intended to have a positive impact on reducing unemployment and helping people back to work, as well as moving individuals closer to work and to gain higher value roles and career opportunities. Both projects will encourage participation on training and skills development programmes, and will identify skills gaps reported by employers, helping to address these. Young people (and older) will be given opportunities to take up apprenticeships as part of the training opportunities presented through projects. Employer’s views will be sought and provision of training and skills development influenced in order to meet employer needs and improve work opportunities for residents. Please detail all actions that will be taken to enhance and maintain positive impacts and to mitigate any negative impacts relating to this proposal in the table below:
Action
Deadline
Responsible
Officer
Intended Outcome
Date Completed/
Ongoing
Feedback from the initial 3 month trial period of the Aspiration Centre will inform on-going delivery.
Quarter 2 2018
Project Manager
Business case for on-going delivery of the Aspiration Centre
Feedback from clients and baseline data analysis compared to outcomes will inform future provision of skills development programmes to meet residents and businesses needs
Quarter 3 2019 and on-going
Project Manager
Future support programmes more closely meeting residents and business needs and delivering measurable benefits
A review of the action plan will be prompted 6 months after the date of completion of this IIA Key Contacts:
• Paul Adams
IIA from June 2013
Page 292 of 293
• Steve McAteer • Julie Lockwood • Project Manager (to be appointed)
Next Steps • All Executive Reports, where relevant, must have an IIA attached • All report authors must complete the IIA section of Executive Reports (equalities,
cohesion, inclusion, health, economic, business and environment) • All reports are to be forwarded to the Social Justice Unit, Public Health and Strategy &
Sustainability Unit for sign off in time for Executive deadline • On the rare occasion that the Social Justice Unit are unable to sign off the report, e.g.
recommendations are in breach of legislation, a statement will be submitted by Social Justice Unit Manager or Equality and Diversity Policy Manager
Completed and signed IIA’s will be published on the internet once the democratic process is complete
Corporate Plan http://intranet/SupportServices/Document%20library/Corporate%20plan%2011th%20July%202011.doc Equality Charter http://intranet/SupportServices/socialjustice/Document%20library/Equality%20charter.pdf Social Justice Framework http://www.luton.gov.uk/Community_and_living/Lists/LutonDocuments/PDF/Social%20Justice/Social%20Justice%20Framework%202012%20-2026.pdf Family Poverty Strategy http://www.lutonforum.org/Forum/Documents/Family-Poverty-Strategy-Final-October2011_001.pdf Joint Strategic Needs Assessment (JSNA) http://www.luton.gov.uk/Council_government_and_democracy/Lists/LutonDocuments/PDF/Consultation/Reports/Final%20JSNA%202011.pdf Community Involvement Strategy http://www.lutonforum.org/Forum/Documents/CISfinaljune2010.pdf
IIA from June 2013
Page 293 of 293