4. STATISTICS - TopperLearning
51
www.plancess.com 4. STATISTICS 1. Introduction In various fields, we need information in the form of numerical figures called data. ese data may relate to the marks obtained by the pupils of a class in a certain examination; the weights, heights, ages, etc., of pupils in a class; the monthly wages earned by workers in a factory; the population of a town or the profits of a company during last few years, etc. Evaluation of such data helps analysts study the various growth patterns and formulate future targets or policies or derive certain inferences. Statistics: It is the science which deals with the collection, presentation, analysis and interpretation of numerical data. In singular form, statistics is taken as a subject. And, in plural form, statistics means data. 2. Data e word data means a set of given facts in numerical figures. 2.1 Fundamental Characteristics of Data (i) Numerical facts alone form data. Qualitative characteristics, like honesty, poverty, etc., which cannot be measured numerically do not form data. (ii) Data are aggregate of facts. A single observation does not form data. (iii) Data collected for a definite purpose may not be suitable for another purpose. 2.2 Types of Data (i) Primary Data: e data collected by the investigator himself with a definite plan in mind are known as primary data. (ii) Secondary Data: e data collected by someone, other than the investigator, are known as secondary data.
-
Upload
khangminh22 -
Category
Documents
-
view
0 -
download
0
Transcript of 4. STATISTICS - TopperLearning

www.plancess.com
4. STATISTICS
1. IntroductionIn various �elds, we need information in the form of numerical �gures called data.
�ese data may relate to the marks obtained by the pupils of a class in a certain examination; the weights, heights, ages, etc., of pupils in a class; the monthly wages earned by workers in a factory; the population of a town or the pro�ts of a company during last few years, etc.
Evaluation of such data helps analysts study the various growth patterns and formulate future targets or policies or derive certain inferences.
Statistics: It is the science which deals with the collection, presentation, analysis and interpretation of numerical data.
In singular form, statistics is taken as a subject. And, in plural form, statistics means data.
2. Data�e word data means a set of given facts in numerical �gures.
2.1 Fundamental Characteristics of Data
(i) Numerical facts alone form data. Qualitative characteristics, like honesty, poverty, etc., which cannot be measured numerically do not form data.
(ii) Data are aggregate of facts. A single observation does not form data.
(iii) Data collected for a de�nite purpose may not be suitable for another purpose.
2.2 Types of Data (i) Primary Data: �e data collected by the investigator himself with a de�nite plan in mind are
known as primary data.
(ii) Secondary Data: �e data collected by someone, other than the investigator, are known as secondary data.

4.2 Statistics
www.plancess.com
3. VariableA quantity which can take di�erent values is called a variable.
Ex: Height, Age and Weight of pupils in a class are three variables.
If we denote them by x, y and z respectively, then values of x give the heights of the pupils; the values of y give the ages of the pupils and the values of z give the weights of the pupils.
3.1 Continuous and Discrete VariablesVariables are of 2 types
i. Continuous Variable: A variable which can take any numerical value within a certain range is called a continuous variable.
Ex. (i) Wages of workers in a factory (ii) Heights of children in a class (iii) Weights of persons in a group etc.
ii. Discontinuous (or discrete) Variable: A variable which cannot take all possible values between two given values, is called a discontinuous or discrete variable.
Ex. (i) Number of members in a family (ii) Number of workers in a factory
Such variables cannot take any value between 1 and 2, 2 and 3, etc.
3.2 Important Terms Range: �e di�erence between the maximum and minimum values of a variable is called its range.
Variate: A particular value of a variable is called variate.
Presentation of Data: Putting the data in condensed form in the form of a table, is known as presentation of data.
Frequency: The number of times an observation occurs is called its frequency.
Frequency Distribution: �e tabular arrangement of data showing the frequency of each observation is called its frequency distribution.
4. Raw or Ungrouped Data �e data obtained in original form are called raw data or ungrouped data.
Ex. �e marks obtained by 25 students in a class in a certain examination are given below:
25, 8, 37, 16, 45, 40, 29, 12, 42, 40, 25, 14, 16, 16, 20, 10, 36, 33, 24, 25, 35, 11, 30, 45,48.
�is is the raw data.
Array: An arrangement of raw data in ascending or descending order of magnitude is called an array.
Arranging the marks of 25 students in ascending order, we get the following array.
8, 10, 11, 12, 14, 16, 16, 16, 20, 24, 25, 25, 25, 29, 30, 33, 35, 36, 37, 40, 40, 42, 45, 45, 48.

4.3 Foundation for Mathematics
www.plancess.com
4.1. To Prepare Frequency Distribution Table for Raw Data Using Tally Marks
We take each observation from the data, one at a time, and indicate the frequency (the number of times the observation has occurred in the data) by small lines, called tally marks. For convenience, we write tally marks in bunches of �ve, the �fth one crossing the fourth diagonally. In the table so formed, the sum of all the frequencies is equal to the total number of observations in the given data.
Ex. �e sale of shoes of various sizes at a shop, on a particular day is given below:
7 8 5 4 9 8 5 7 6 8 9 6 7 9
8 7 9 9 6 5 8 9 4 5 5 8 9 6
�e above data is clearly raw data. From this data, we may construct a frequency table, as given below:
Frequency Table
Size Tally Marks Frequency
4 II 2
5 5
6 IIII 4
7 IIII 4
8 6
9 7
Total 28
4.2. Mean of Ungrouped Data�e average of numbers in arithmetic is known as the Arithmetic Mean or simply the mean of these numbers in statistics.
Sumof observationsMean
Numberof observations
�e mean of n observations x1, x2, ...., xn is given by
1 2 3 n i(x x x ...... x ) xMean, x
n n
where the symbol å, called sigma stands for the summation of the terms.

4.4 Statistics
www.plancess.com
4.3 Mean for an Ungrouped Frequency Distribution
Let n observations consist of values x1, x2, ...., xn of a variable x, occurring with frequencies f1, f2, ... , fn
respectively.
�en, the mean of these observations is given by:
1 1 2 2 n n i i
1 2 n i
(f x f x ... f x ) f xMean, x
(f f ..... f ) f
Illustration 1: �e ages of 40 students in a class are given below:
Age (in years) 12 13 14 15 16 17
Number of students 5 9 4 8 6 8
Find the mean age of the class.
Sol: We prepare the table as given below:
Age (in years) (xi) Number of students fi fi xi
12 5 60
13 9 117
14 4 56
15 8 120
16 6 96
17 8 136
fi = 40 fi xi = 585
∴Mean age = i i
i
f x 585f 40
= 14.625 years.
4.4 Median of Ungrouped DataMedian: After arranging the given data in an ascending or a descending order of magnitude, the value of the middle-most observation is called the median of the data.
Method for Finding the Median of an Ungrouped Data
Arrange the given data in an increasing or decreasing order of magnitude. Let the total number of observations be n.
(i) If n is odd, then median = n +12
th
value of observation.

4.5 Foundation for Mathematics
www.plancess.com
(ii) If n is even, then median = 21 n n
th observation 1 thobservation2 2
Illustration 2: �e weights (in kg) of 10 children are:
42, 50, 36, 45, 33, 31, 52, 39, 46, 32
Find the median weight.
Sol: Arranging the weights in ascending order, we have: 31, 32, 33, 36, 39, 42, 45, 46, 50, 52 Here, n = 10, which is even.
∴ Median weight =21 10 10
th term 1 thterm2 2
=21 {5th term + 6th term}
=21 {39 + 42} kg =
281 kg = 40.5 kg
Hence, median weight = 40.5 kg
PLANCESS CONCEPTS
Mean Median
De�nition �e mean is the arithmetic average of a set of numbers, or distribution.
�e median is described as the numeric value separating the higher half of a sample, a population, or a probability distribution, from the lower half.
Applicability �e mean is used for normal distributions.
�e median is generally used for skewed distributions.
Relevance to the data set
�e mean is not a robust tool since it is largely in�uenced by outliers.
�e median is better suited for skewed distributions to derive at central tendency since it is much more robust and sensible.
How to calculate A mean is computed by adding up all the values and dividing that score by the number of values.
�e Median is the number found at the exact middle of the set of values. A median can be computed by listing all numbers in ascending order and then locating the number in the centre of that distribution.
Vaibhav Gupta
Gold Medalist, INPhO
4.6 Statistics
www.plancess.com
5. Grouped Data To put the data in a more condensed form, we make groups of suitable size, and mention the frequency of each group. Such a table is called a grouped frequency distribution table.
Class-Interval: Each group into which the raw data is condensed, is called a class-interval.
Each class is bounded by two �gures, which are called class limits. �e �gure on the left side of a class is called its lower limit and that on its right is called its upper limit.
5.1 Types of Grouped Frequency Distribution i. Exclusive Form (or Continuous Interval Form): A frequency distribution in which the upper
limit of each class is excluded and lower limit is included, is called an exclusive form.
Ex. Suppose the marks obtained by some students in an examination are given.
We may consider the classes 0 – 10, 10 – 20 etc. In class 0 – 10, we include 0 and exclude 10. In class 10 - 20, we include 10 and exclude 20.
ii. Inclusive Form (or Discontinuous Interval Form): A frequency distribution in which each upper limit as well as lower limit is included, is called an inclusive form. �us, we have classes of the form 0 – 10, 11 – 20, 21 – 30 etc. In 0 – 10, both 0 and 10 are included.
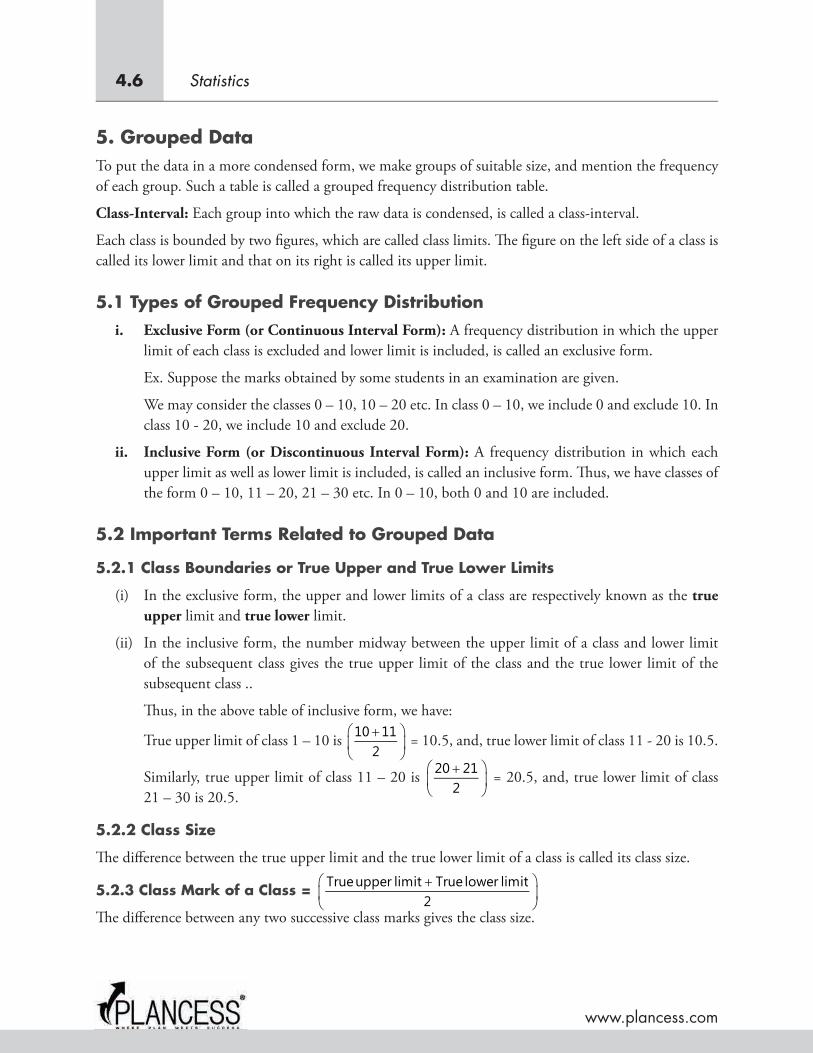
5.2 Important Terms Related to Grouped Data
5.2.1 Class Boundaries or True Upper and True Lower Limits
(i) In the exclusive form, the upper and lower limits of a class are respectively known as the true upper limit and true lower limit.
(ii) In the inclusive form, the number midway between the upper limit of a class and lower limit of the subsequent class gives the true upper limit of the class and the true lower limit of the subsequent class ..
�us, in the above table of inclusive form, we have:
True upper limit of class 1 – 10 is 10 112
= 10.5, and, true lower limit of class 11 - 20 is 10.5.
Similarly, true upper limit of class 11 – 20 is 20 212
= 20.5, and, true lower limit of class 21 – 30 is 20.5.
5.2.2 Class Size
�e di�erence between the true upper limit and the true lower limit of a class is called its class size.
5.2.3 Class Mark of a Class = Trueupper limit True lower limit2
�e di�erence between any two successive class marks gives the class size.

4.7 Foundation for Mathematics
www.plancess.com
5.3 Method of Forming Classes of a Data i. Determine the maximum and minimum values of the variate occurring in the data.
ii. Decide upon the number of classes to be formed.
iii. Find the range, i.e., the di�erence between the maximum value and the minimum value. Divide the range by the number of classes to be formed to get the class-size.
iv. Be sure that there must be classes having minimum and maximum values occurring in the data.
v. By counting, we obtain the frequency of each class.
5.4 Rule to Convert Discontinuous (or Inclusive) form to Continuous (or Exclusive) Form In a discontinuous interval or inclusive form, we have :
Adjustment factor = 12
[(Lower limit of one class – Upper limit of previous class)]
�us, if the classes are 1 – 10, 11 – 20, etc., then adjustment factor = 12
(11 – 10) = 0.5.
To convert data given in discontinuous form to the continuous form, we subtract the adjustment factor from each lower limit and add the adjustment factor to each upper limit to get the true limits.
Illustration 3: Convert the following frequency distribution from discontinuous to continuous form:
Marks (Class-intervals) Frequency
1-10 5
11-20 6
21-30 8
31-40 10
41-50 4
Sol: Adjustment factor = 12
(11 – 10) = 0.5. Subtract 0·5 from each lower limit and add 0·5 to each upper limit.
�en, the required table in continuous form may be prepared as under:
Marks (before adjustment) Marks (after adjustment) Frequency
1-10 0.5-10.5 5
11-20 10.5-20.5 6
21-30 20.5-30.5 8

4.8 Statistics
www.plancess.com
Marks (before adjustment) Marks (after adjustment) Frequency
31-40 30.5-40.5 10
41-50 40.5-50.5 4
Total 5
6. Cumulative Frequency of a Class-Interval �e sum of the frequencies of all the previous classes and that particular class, is called the cumulative frequency of the class.
6.1 Cumulative Frequency Table A table which shows the cumulative frequencies over various classes is called a cumulative frequency distribution table.
Illustration 4: Following are the ages (in years) of 360 patients, getting medical treatment in a hospital.
Age (in years) 10-20 20-30 30-40 40-50 50-60 60-70
Number of Patients 90 50 60 80 50 30
Construct the cumulative frequency table for the above data.
Sol: �e cumulative frequency table for the above data is given below.
Class interval 10-20 20-30 30-40 40-50 50-60 60-70
Frequency 90 50 60 80 50 30
Cumulative Frequency
90 140 200 280 330 360
�is table may be presented in ‘less than form’, as under.
Age (in years) Number of Patients Frequency
Less than 20 90 7
Less than 30 140 5
Less than 40 200 9
Less than 50 280 11
Less than 60 330 6
Less than 70 360 38

4.9 Foundation for Mathematics
www.plancess.com
7. Graphical Representation of Statistical Data�e tabular representation of data is an ideal way of presenting them in a systematic manner. When these numerical �gures are represented pictorially or graphically, they become more noticeable and easily intelligible, leaving a more lasting e�ect on the mind of the observer. With the help of these pictures or graphs, data can be compared easily.
�ere are various types of graphs. In this chapter, we shall be dealing with the following graphs:
1. Bar Graphs 2. Histogram 3. Frequency Polygon
7.1 Bar Graph (or Column Graph or Bar Chart) A bar graph is a pictorial representation of numerical data in the form of rectangles (or bars) of equal width and varying heights.
�ese rectangles are drawn either vertically or horizontally.
�e height of a bar represents the frequency of the corresponding observation.
�e gap between two bars is kept the same.
Illustration 5: �e following table shows the number of students participating in various games in a school.
Cricket Tennis Football Badminton
27 9 18 12
Draw a bar graph to represent the above data.
Sol: Take the games along x-axis and the number of students along Y-axis.
Along y-axis, take the scale 1 cm = 6 students.
�e bar-graph may, thus, be drawn as shown alongside.
7.2 HistogramA histogram is a graphical representation of a frequency distribution in an exclusive form in the form of rectangles with class intervals as bases and the corresponding frequencies as heights, there being no gap between any two successive rectangles.

4.10 Statistics
www.plancess.com
7.2.1 Method of Drawing a Histogram
Step 1: If the given frequency distribution is in inclusive form, convert it into an exclusive form.
Step 2: Taking suitable scales, mark the class-intervals along x-axis and frequencies along y-axis.
Note that the scales chosen for both the axes need not be the same.
Step 3: Construct rectangles with class-intervals as bases and the corresponding frequencies as heights.
Illustration 6: Draw a histogram to represent the following data:
Class interval 30-36 36-42 42-48 48-54 54-60
Frequency 15 25 20 30 10
Sol: Draw rectangles with bases 30 – 36, 36 – 42, 42 – 48, 48 – 54 and 54 – 60 and heights 15, 25, 20, 30 and 10 respectively.
Note: Since the scale on x-axis starts at 30, we make a kind in the beginning.
7.3 Frequency Polygon Let x1, x2, …..xn be the class marks (i.e., mid points) of the given frequency distribution and let f1, f2, .....fn be the corresponding frequencies. We plot the points (x1, f1), (x2, f2)... (xn, fn) on a graph paper and join these points by line segments. We complete the diagram in the form of a polygon by taking two more classes (called imagined classes), one at the beginning and the other at the end, each with frequency zero.
�is polygon is known as the frequency polygon of the given frequency distribution.
Illustration 7: Draw the frequency polygon representing the following frequency distribution.
Class interval 30-34 35-39 40-44 45-49 50-54 55-59
Frequency 12 16 20 8 10 4

4.11 Foundation for Mathematics
www.plancess.com
Sol: �ough the given frequency table is in inclusive form, yet we �nd that class marks in case of inclusive and exclusive forms are the same.
We take the imagined classes 25 – 29 at the beginning and 60 – 64 at the end, each with frequency zero.
�us, we have:
Class interval 25-29 30-34 35-39 40-44 45-49 50-54 55-59 60-64
Class Mark 27 32 37 42 47 52 57 62
Frequency 0 12 16 20 8 10 4 0
Now plot the points (27, 0), (32, 12), (37, 16), (42, 20), (47, 8), (52, 10), (57, 4) and (62, 0) and join them successively to obtain the required frequency polygon, as shown below:
7.4. Histogram and Frequency Polygon on the Same Graph When a histogram and a frequency polygon are to be drawn on the same graph, we �rst draw the histogram with the given data. We then join the mid-points of the tops of adjacent rectangles by line segments to obtain the frequency polygon.
Illustration 8: �e following table gives the number of doctors working in government hospitals in a city in various age groups. Draw a histogram and frequency polygon for the given data.
Age (in years) 20-25 25-30 30-35 35-40 40-45
Number of doctors 40 60 50 20 10
Sol: Step-1: Draw rectangles with bases 20–25, 25–30, 30–35, 35–40 and 40–45 and heights 40, 60, 50, 20 and 10 respectively. Since the scale on x-axis starts at 20, we make a kink in the beginning. �us, we obtain the required histogram.
Step-2: Mark the mid-point of the top of each rectangle of the histogram.
Step 3: Mark the mid-points of class-intervals 15 - 20 and 45 - 50 on x-axis.

4.12 Statistics
www.plancess.com
Step-4: Join the consecutive mid-points by line segments to obtain the required frequency polygon.
8. Mean of Grouped DataTo �nd mean of grouped Data we have three methods
(i) Direct Method (ii) Assumed Mean Method (iii) Step Deviation Method
8.1 Direct MethodSTEP-1: Find the class mark (xi) of each class using, xi = lower limit Upper limit
2STEP-2: Calculate fixi for each i
STEP-3: Use the formula: mean, x =
n
i ii 1
n
ii 1
f x,
f
8.2 Shortcut Method or Assumed Mean MethodIn this case, to calculate the mean, we follow the following steps:
STEP-1: Find the class mark xi of each class using, xi = lower limit Upper limit2
STEP-2: Choose a suitable value of xi in the middle as the assumed mean and denote it by ‘a’.
STEP-3: Find di = xi – a for each i
STEP-4: Find fi × di for each i
STEP-5: Find N = fi
STEP-6: Calculate the mean, ( x ) by using the formula x = a + i ifd
N.
4.13 Foundation for Mathematics
www.plancess.com
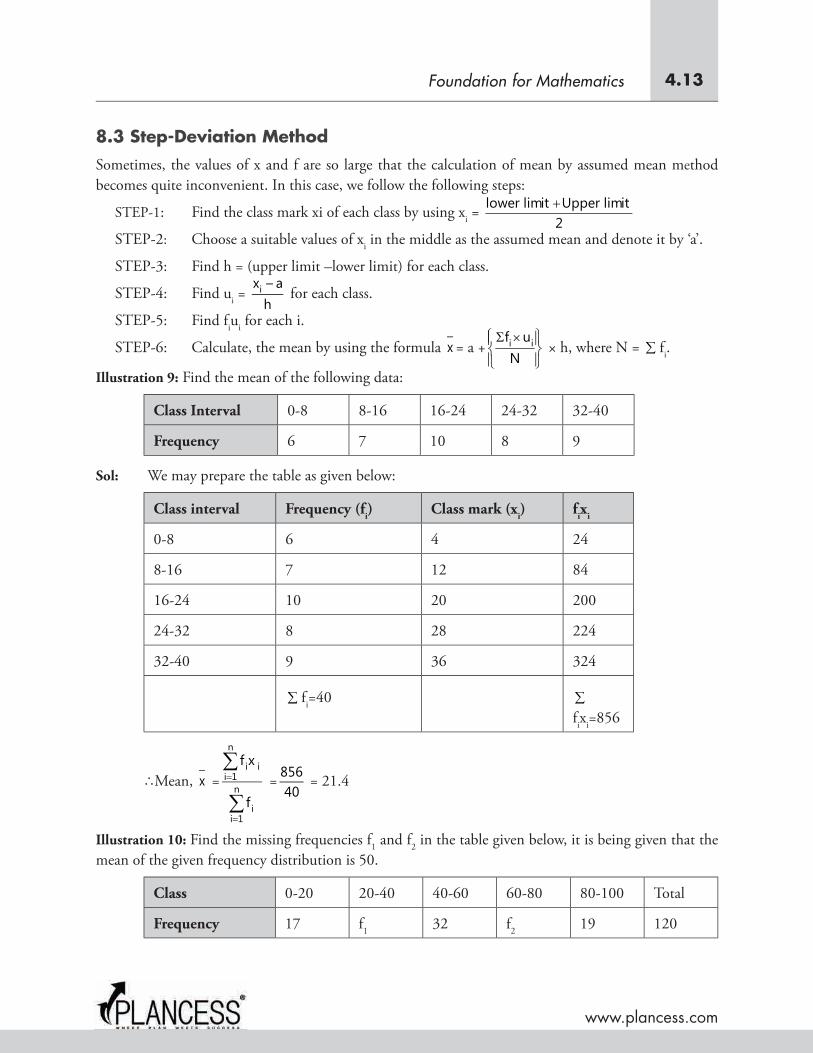
8.3 Step-Deviation MethodSometimes, the values of x and f are so large that the calculation of mean by assumed mean method becomes quite inconvenient. In this case, we follow the following steps:
STEP-1: Find the class mark xi of each class by using xi = lower limit Upper limit2
STEP-2: Choose a suitable values of xi in the middle as the assumed mean and denote it by ‘a’.
STEP-3: Find h = (upper limit –lower limit) for each class.
STEP-4: Find ui = ix – a
h for each class.
STEP-5: Find fiui for each i.
STEP-6: Calculate, the mean by using the formula x = a + i if u
N × h, where N = fi.
Illustration 9: Find the mean of the following data:
Class Interval 0-8 8-16 16-24 24-32 32-40
Frequency 6 7 10 8 9
Sol: We may prepare the table as given below:
Class interval Frequency (fi) Class mark (xi) fixi
0-8 6 4 24
8-16 7 12 84
16-24 10 20 200
24-32 8 28 224
32-40 9 36 324
fi=40fixi=856
∴Mean, x =
n
i ii 1
n
ii 1
f x
f
= 85640
= 21.4
Illustration 10: Find the missing frequencies f1 and f2 in the table given below, it is being given that the mean of the given frequency distribution is 50.
Class 0-20 20-40 40-60 60-80 80-100 Total
Frequency 17 f1 32 f2 19 120

4.14 Statistics
www.plancess.com
Sol: We may prepare the table as given below:
Class Frequency (fi) Class mark (xi) fixi
0-20 17 10 170
20-40 f1 30 30f1
40-60 32 50 1600
60-80 f2 70 70f2
80-100 19 90 1710
fi=68 +f1+f2 fixi=3480 30f1+70f2
∴ Mean , x = i i
i
f x
f = 1 2
1 2
3480 30f 70f
68 f f
Given, mean = 50
∴ 50 = 1 2
1 2
3480 30f 70f
68 f f ⇒ 3400 + 50f1 + 50f2 = 3480 + 30f1 + 70f2
⇒ 20f1 – 20f2 = 80 ⇒ f1 – f2 = 4 ...(i)
And fi = 68 + f1 + f2
∴ 120 = 68 + f1 + f2 [∵ f1 = 120]
⇒ f1 + f2 = 52 ...(ii)
Adding (1) and (2), we get 2f1 = 56 ⇒f1 = 28
∴ f2 = 24
Hence, the missing frequencies f1 and f2 are 28 and 24 respectively.
Illustration 11: Find the mean marks from the following data:
Marks Below
10
Below
20
Below
30
Below
40
Below
50
Below
60
Below
70
Below
80
Below
90
Below
100
No. of Students
5 9 17 29 45 60 70 78 83 85
Sol: We may prepare the table as given below:
Marks No. of students Class Interval fi Class mark (xi) fixi
Below 10 5 0-10 5 5 25
Below 20 9 10-20 4 15 60

4.15 Foundation for Mathematics
www.plancess.com
Marks No. of students Class Interval fi Class mark (xi) fixi
Below 30 17 20-30 9 25 225
Below 40 29 30-40 12 35 420
Below 50 45 40-50 16 45 720
Below 60 60 50-60 15 55 825
Below 70 70 60-70 10 65 650
Below 80 78 70-80 8 75 600
Below 90 83 80-90 5 85 425
Below 100
85 90-100 2 95 190
N=85 fixi=4140
∴ Mean = x = i if x
N = 4140
85= 48.41
9. Median of a Grouped Data Median: It is a measure of central tendency which gives the value of the middle most observation in the data. In a grouped data, it is not possible to �nd the middle observation by looking at the cumulative frequencies as the middle observation will be some value in a class interval. It is, therefore, necessary to �nd the value inside a class that divides the whole distribution into two halves.
Median Class: �e class whose cumulative frequency is greater than N2
is called the median class.
To calculate the median of a grouped data, we follow the following steps:
STEP-1: Prepare the cumulative frequency table corresponding to the given frequency distribution and obtain N = fi.
STEP-2: Find N2
STEP-3: Look at the cumulative frequency just greater than and �nd the corresponding class (Median class).
STEP-4: Use the formula Median, M = l + N
– C2 h
f
c
Where, l = Lower limit of median class.
f = Frequency of the median class.
c = Cumulative frequency of the class preceding the median class.

4.16 Statistics
www.plancess.com
h = Size of the median class.
n = fi.
Illustration 12: �e length of 40 leaves of a plant are measured correct to the nearest millimeter, and the data obtained is represented in the following table. Find the median length of the leaves.
Length (in mm)
118-126 127-135 136-144 145-153 154-162 163-171 172-180
No. of leaves 3 5 9 12 5 4 2
Sol: �e given series is in inclusive form. We may prepare the table in exclusive form and prepare the cumulative frequency table as given below:
Length (in mm) No. of leaves (fi) Cumulative frequency
117.5-126.5 3 3
126.5-135.5 5 8
135.5-144.5 9 17
144.5-153.5 12 29
153.5-162.5 5 34
162.5-171.5 4 38
171.5-180.5 2 40
N=40
Here, N = 40, ∴ N2
= 20
�e cumulative frequency just greater than 20 is 29 and the corresponding class is 144.5-153.5.
So, the median class is 144.5-153.5.
∴ l = 144.5, N = 40, c = 17, f = 12 and h = 9
�erefore, median = l + N
– C2 h
f
c = 144.5 + (20 17)
12 × 9 = 144.5 + 3 9
12 = 144.5 + 2.25
= 146.75
Hence, median length of leaves is 146.75 mm.
10. Mode of a Grouped DataMode: Mode is that value among the observations which occurs most often i.e. the value of the observation having the maximum frequency.

4.17 Foundation for Mathematics
www.plancess.com
In a grouped frequency distribution, it is not possible to determine the mode by looking at the frequencies.
Modal Class: �e class of a frequency distribution having maximum frequency is called modal class of a frequency distribution.
�e mode is a value inside the modal class and is calculated by using the formula.
Mode = l + 1 0
1 0 2
f – fh
2f f f
Where l = Lower limit of the modal class.
h = Size of class interval
f1 = Frequency of modal class
f0 = Frequency of the class preceding the modal class
f2 = Frequency of the class succeeding the modal class.
Illustration 13: Given below is the frequency distribution of the heights of players in a school.
Heights (in cm) 160-162 163-165 166-168 169-171 172-174
No. of students 15 118 142 127 18
Find the average height of maximum number of students.
Sol: �e given series is in inclusive form. We prepare the table in exclusive form, as given below:
Heights (in cm) 159.5- 162.5 162.5-165.5 165.5-168.5 168.5-171.5 171.5-174.5
No. of students 15 118 142 127 18
We have to �nd the mode of the data.
Here, the class 165.5-168.5 has maximum frequency, so it is the modal class.
Illustration 14: �e mode of the following series is 36. Find the missing frequency f in it.
Class 0-10 10-20 20-30 30-40 40-50 50-60 60-70
Frequency 8 10 f 16 12 6 7
Sol: Since the mode is 36, so the modal class will be 30-40
∴l = 30, h = 10, f1 = 16, f0 = f and f2 = 12
�erefore, mode = l + 1 0
1 0 2
f – fh
2f f f
⇒36 = 30 + 16 f2 16 f 12
× 10 ⇒ 6 = (16 f)(20 f)
× 10
⇒120 – 6f = 160 – 10f⇒ 4f = 40 ⇒ f = 10
Hence, the value of the missing frequency f is 10.

4.18 Statistics
www.plancess.com
11. Graphical Representation of Cumulative Frequency Distribution
11.1 Cumulative Frequency Polygon Curve (Ogive)Cumulative frequency is of two types and corresponding to these, the ogive is also of two types.
(A) Less �an Series (B) More �an Series
(a) Less �an Series To construct a cumulative frequency polygon and an ogive, we follow these steps:
STEP-1: Mark the upper class limit along x-axis and the corresponding cumulative frequencies along y-axis.
STEP-2: Plot these points successively by line segments. We get a polygon, called cumulative frequency polygon.
STEP-3: Plot these points successively by smooth curves, we get a curve called cumulative frequency curve or an ogive.
(b) MORE THAN SERIES To construct a cumulative frequency polygon and an ogive, we follow these steps:
STEP-1 : Mark the lower class limits along x-axis and the corresponding cumulative frequencies along y-axis.
STEP-2 : Plot these points successively by line segments, we get a polygon, called cumulative frequency polygon.
STEP-3 : Plot these points successively by smooth curves, we get a curve, called cumulative frequency curve or an ogive.
11.2 Application of an Ogive Ogive can be used to �nd the median of a frequency distribution. To �nd the median, we follow these steps.
Method –I
STEP-1: Draw anyone of the two types of frequency curves on the graph paper.
STEP-2: Compute iN
(N f )2
and mark the corresponding points on the y-axis.
STEP-3: Draw a line parallel to x-axis from the point marked in step 2, cutting the cumulative frequency curve at a point P.
STEP-4: Draw perpendicular PM from P on the x-axis. �e x - coordinate of point M gives the median.
Method -II
STEP-1: Draw less than type and more than type cumulative frequency curves on the graph paper.

4.19 Foundation for Mathematics
www.plancess.com
STEP-2: Mark the point of intersecting (P) of the two curves drawn in step 1.
STEP-3: Draw perpendicular PM from P on the x-axis. �e x- coordinate of point M gives the median.
Illustration 15: �e following table gives production yield per hectare of wheat of 100 farms of a village.
Production yield (in kg/ha) 50-55 55-60 60-65 65-70 70-75 75-80
No. of farms 2 8 12 24 38 16
Change the distribution to more than type distribution and draw its ogive.
Sol: From the given table, we may prepare more than type cumulative frequency distribution table, as given below:
Production more than (in kg/ha)
50 55 60 65 70 75
Cumulative frequency 100 98 90 78 54 16
Now, plot the points (50,100), (55,98), (60,90), (65,78), (70,54) and (75,16).
Join these points by a freehand to get an ogive of ‘more than’ type.
PLANCESS CONCEPTS
Empirical Relationship between Mean, Median and Mode
Following the relation :
Mode = 3 Median – 2 Mean
Median = Mode + 23
(Mean – Mode)
Mean = Mode + 32
(Median – Mode)
Symmetric Distribution: A distribution is said to be symmetric if Mean = Median = Mode
Uday Kiran G
KVPY Fellow

4.20 Statistics
www.plancess.com
Illustration 16: Find the mean of the following distribution.
Class 4—8 8—12 12—16 16—20 20—24 24—28 28—32 32—36
Number of Students
2 12 15 25 18 12 13 3
Sol:
Class (fi) Number of Students (xi) Mid-value Product = fixi
4 — 8 2 4 86
2
2 × 6 = 012
8 — 12 12 8 1210
2
12 ×10 = 120
12 — 16 15 12 1614
2
15 × 14 = 210
16 — 20 25 16 2018
2
25 × 18 = 450
20 — 24 18 20 2422
2
18 × 22 = 396
24 — 28 12 24 2826
2
12 × 26 = 312
28 — 32 13 28 3230
2
13 × 30 = 390
32 — 36 3 32 3634
2
3 × 34 = 102
Total N = 100 8
i ii 1
f x 1992
Mean = M = 1nN
8
i ii 1
f x where 8
i ii 1
f x = 1992 and n = 100
M = 1992100
= 19.92
Mean of the required distribution = M = 19.92

4.21 Foundation for Mathematics
www.plancess.com
SUMMARY
• We live in the age of information. �ere is data all around us but it is meaningful only if we try to make sense out of it.
• �is is exactly what makes Statistics so important. It is a tool we need to make sense of data. And for that, it is important to know what kind of data it is and what information can be extracted out of it.
• �is is exactly what we have learnt in this chapter. So try to apply what we have learnt in your day to day situations. You could try to statistically analyze the next cricket match you watch!

4.22 Statistics
www.plancess.com
SOLVED EXAMPLES
Example 1: �e arithmetic mean of the following frequency distribution is 52.5. Find the value of p.
Classes Frequency
0—20 15
20—40 22
40—60 37
60—80 p
80—100 21
Sol:
Classes Frequency (fi) Mid-value (xi) Product = Freq. × M.Value
fi × xi
0 — 20 15 10 15 × 10 = 150
20— 40 22 30 22 × 30 = 660
40— 60 37 50 37 × 50 = 1850
60— 80 p 70 p × 70 = 70 p
80—100 21 90 21 × 90 = 1890
Total N = 95 + p 5
i ii 1
f x 4550 70p
M = Mean of the distribution = 52.5
⇒ 1nN
5
i ii 1
f x = 52.5
⇒ 1(4550 70p)
95 p= 525
10 ⇒ 700 p – 525 p = 49875 – 45500 = 4375
⇒ 175 p = 4375 ⇒ p = 25
Hence, the value of p is 25.

4.23 Foundation for Mathematics
www.plancess.com
Example 2: Calculate the average height of each student in a class from the following frequency distribution.
Height (in cm) 140 - 150 150-160 160-170 170-180 180-190 190-200
No. of Students 5 10 20 9 6 2
Sol: Here, the class interval (i.e. height interval) is same (= 10) and mid-values of it will be of very large values ranging from 145 to 195. So, to avoid lengthy calculation. So deviation method is used to �nd the mean.
Height in cm (i) Mid-values (x)
Step Deviation
ds = x Ai
No. of students = f fds
140–150 145 –2 5 –10150–160 155 –1 10 –10160–170 165=A 0 20 0170–180 175 1 9 9180–190 185 2 6 12190–200 195 3 2 6
f = 52 = N fds = –20 + 27 = 7
Here, A = assumed mean = 165 (arbitrarily chosen near middle of the given class intervals)
Using the formula,
Mean = A + sfdi
N = 165 + 7
52 × 10 = 166.3 cm.
Hence the average height of each student of the class is 166.3 cm.
Example 3: �e daily wages (in rupees) of 100 workers in a factory are given below:
Daily wages (in Rs.) No. of workers
125 6
130 20
135 24
140 28
145 15
150 4
160 2
180 1

4.24 Statistics
www.plancess.com
Find the median wage of a worker for the above date.
Sol:
Daily wages (in Rs.) No. of workers Cumulative Frequency
125 6 6130 20 26135 24 50140 28 78145 15 93150 4 97160 2 99180 1 100
N = 100 (even)
∴Median = th th
N Nobservation 1 observation
2 22
= th th50 observation 51 observation
2 = 135 140
2 = 137.50
∴Median wage of a workers in the factory is Rs. 137.50
Example 4: Find the median of the following distribution
Marks Frequency
0—100 2
100—200 5
200—300 9300—400 12400—500 17500—600 20600—700 15700—800 9800—900 7900—1000 4
Sol: Let us construct the cumulative frequency table which is given below:

4.25 Foundation for Mathematics
www.plancess.com
Marks Frequency (�) Cumulative Frequency cf
0-100 2 2
100-200 5 7
200-300 9 16
300-400 12 28
400-500 17 cf = 45
500-600 f = 20 65 Median Class
600-700 15 80
700-800 9 89
800-900 7 96
900-1000 4 100
Here, N = total frequency = 100, calculate n2N = 100
2= 50
Cumulative frequency just greater than 50 is 65, the span of the group corresponding to 65 is 500—600. �erefore, 500—600 is the median class.
l = the lower limit of the median class = 500
cf = the cumulative frequency of the class proceeding the median class = 45
f = the frequency of the median class (500 – 600) = 20
h = the width of the median class = 100
Using the formula
Median = l n
cf h2f
N = 50 45
500 10020
= 5500 100
20 = 500 +25 = 525
Hence, the median of the given distribution is 525 marks.
Example 5: Find the missing frequency in the following distribution table (by using median formula) if N = 52 and median = 36
Class interval Frequency
0—10 7
10—20 8

4.26 Statistics
www.plancess.com
Class interval Frequency
20—30 x
30—40 10
40—50 12
50—60 6
60—70 4
Sol: We prepare the cumulative frequency table as under:
Class Interval Frequency (fi) Cumulative Frequency
0—10 7 7
10—20 8 15
20—30 x cf = 15 + x
30—40 f = 10 25 + x Median Class
40—50 12 37 + x
50—60 6 43 + x
60—70 4 47 + x
Total N = 52
It is given that the median 36 lies in the interval 30 — 40
l = lower limit of the median class = 30
cf = cumulative frequency of the median just before the median class = 15 + x
h = the width of the class interval = 10
f = frequency of the median class = 10
N = total frequency = 52
Median = l n
cf h2f
n 52
30
cf 15 x
f 10
h 10
N

4.27 Foundation for Mathematics
www.plancess.com
Median = 30 + 26 (15 x)10
× 10
= (30 + 26) – (15 + x) 36 = 56 – (15 + x) [Q Median = 36 ...... (Given)]
15 + x = 56 – 36 = 20 ⇒ 15 + x = 20
⇒ x = 20 – 15 = 5
Missing frequency = x = 5 (Answer)
Example 6: �e following table shows the marks obtained by 100 students of class X in a school during a particular academic session. Find the mode of this distribution.
Marks less than Number of students
10 7
20 21
30 34
40 46
50 66
60 77
70 92
80 100
Sol: Since the given distribution is cumulative frequency distribution, we �rst convert it into simple frequency distribution.
Marks less than Number of students
0—10 7 – 0 = 07
10—20 21 – 7 = 14
20—30 34 – 21 = 13
30—40 f0 = 46 – 34 = 12
40—50 f1 = 66 – 46 = 20 “modal class”
50—60 f2 = 77 – 66 = 11
60—70 92 – 77 = 15
70—80 100 – 92 = 08

4.28 Statistics
www.plancess.com
Here the maximum frequency is 20, and the class corresponding to this frequency is 40 – 50. So the modal class is 40 –50.
h = class size or width of the interval = 10
l = lower limit of the modal class = 40
f1 = frequency of the modal class = 20
f0 = frequency of the class proceeding the modal class = 12
f2 = frequency of the class succeeding the modal class = 11
Using the formula,
Mode = l + 1 0
1 0 2
f f
2f f f× h
Mode = 40 + 20 122 20 12 11
× 10 = 40 + 840 23
× 10
Modal class = 40 + 8017
= 40 + 4.71 = 44.71
Hence, the mode of the distribution is 44.71 marks.
Example 7: Find the median, from the following data: 5, 7, 9, 11, 13, 15, 17.
Sol: �e data is already is ascending order.
Since, n = 7 (odd)
Median =th
n 12
term = 4th term = 11.
Example 8: Calculate the median for the following distribution class:
Class 0-10 10-20 20-30 30-40 40-50 50-60
Frequency 5 10 20 7 8 5
Sol: (i) First we �nd th
N2
value i.e. th
552
th27.5 which lies in 20-30
Here l 20 , N
27.5,c.f. 15,f 20,h 102
275 15median 20 10 Median 26.25
20∴
Class Frequency c.f.
0-10 5 510-20 10 1520-30 20 3530-40 7 42

4.29 Foundation for Mathematics
www.plancess.com
Class Frequency c.f.
40-50 8 5050-60 5 55
Example 9: A family requires the commodities listed in the table below for regular use. �e importance (weights) attached to each commodity is also given. Find the di�erence in the mean and the weighted mean price per kg.
Commodity Weight (kg) Price /kg (Rs)
Rice 1 10.50
Wheat 3 2.75
Pulses 2 8.50
Vegetable 1 5.00
Oils 1 26.00
Sol: For calculating weighted mean and mean price per kg, we prepare the following table:
Commodity Weight (w) (kg) Price /kg (in Rs)(x) Product (wx)
Rice 1 10.50 10.50
Wheat 3 2.75 8.25
Pulses 2 8.50 17.00
Vegetable 1 1 5.00 5.00
Oils 1 26.00 26.00
Total 8 52.75 66.75
Mean 52.75 66.7510.55; wieMean ght mean 8.34 kg
5 5 weight mean 52.75 66.75
10.55; wieMean ght mean 8.34 kg5 5
Difference 10.55 8.34 2.21
Differencein price per kg Rs 2.21
∴
∴
Example 10: Find the mean of the following distribution:
Class interval 0-20 20-40 40-60 60-80 80-100 100-120
Frequency 11 18 24 17 11 9

4.30 Statistics
www.plancess.com
Sol:
Class interval Frequency (fi) Midpoint (xi) ii
x Au
h i ifu
0-20 11 10 -2 -22
20-40 18 30 -1 -18
40-60 24(A) 50 0 0
60-80 17 70 1 17
80-100 11 90 2 22
100-120 9 110 3 27
Total 90 26
Mean i i
i
fu 26 52A h 50 20 50 50 5.78 55.78.
f 90 9
Example 11: Construct a histogram from the distribution of total marks obtained by 65 students of X class in the �nal examination.
Marks (mid-points) 150 160 170 180 190 200
Number of females 8 9 25 12 7 9
Sol: Lower and upper class limits:
Since the di�erence between the second and �rst mid-point is 160-150=10
h
h 10 52
∴
So, lower and upper limits of the �rst class are 150-5 and 150+5 i.e. 145 and 155 respectively.
∴First class interval is 145-155
Using the same procedure, we get the classes of other mid-points us under:

4.31 Foundation for Mathematics
www.plancess.com
Class 145-155 155-165 165-175 175-185 185-195 195-205
frequency 8 9 256 12 7 9
Example 12: �e number of students admitted in di�erent faculties of a college are
Faculty Science Arts Commerce Law Education Total
No. of students 1000 1200 650 450 300 3600
Construct the pie chart for the following distribution.
Sol: �e following table gives the share of each faculty as a component of 3600.
Faculty No. of students
Share as a component of 3600
Science 1000 1000
Arts 1200 1200
Commerce 650 650
Law 450 450
Education 300 300
3600
Example 13: Find the mean for the following distribution:
Marks 10-20 20-30 30-40 40-50 50-60 60-70 70-80
Frequency 6 8 13 7 3 2 1
Sol:
Items Mid values xi No. of students fi fixi
10-20 15 6 90
20-30 25 8 200
30-40 35 13 455
40-50 45 7 315
50-60 55 3 165
60-70 65 2 130

4.32 Statistics
www.plancess.com
Items Mid values xi No. of students fi fixi
70-80 75 1 75
if 40 i if x 1430
i i
i
f x 1430 143x 35.75
f 40 4
Example 14: Find the mean following distribution with step-deviation method:
class 10-15 15-20 20-25 25-30 30-35 35-40
Frequency 5 6 8 12 6 3
Sol:
Calss xi fi ii
x 27.5u
5i ifu
10-15 12.5 5 3 15
15-20 17.5 6 2 12
20-25 22.5 8 1 8
25-30 27.5(A) 12 0 0
30-35 32.5 6 1 6
35-40 37.5 3 2 6
if 40 i ifu 23
i i
i
fu 23x A h x 27.5 5 24.7
f 40
Example 15: Find the mode of the following distribution:
Daily wages 31-36 37-42 43-48 49-54 55-60 61-66
No. of workers 6 12 20 15 9 4
Sol:
Daily wages No. of workers Daily wages No. of workers
31-36 6 30.5-35.5 6

4.33 Foundation for Mathematics
www.plancess.com
Daily wages No. of workers Daily wages No. of workers
37-42 12 35.5-42.5 12
43-48 20 42.5-48.5 20
49-54 15 48.5-54.5 15
55-60 9* 54.5-60.5 9
61-66 4 60.5-66.5 4
Modal class frequency is 42.5-48.5
1 0 242.5, f 20, f 12, f 15, h 6
20 12Mode 42.5 6,
2 20 12 15
Mode 46.2
∴
∴
l
Example 16: �e following frequency distribution gives the monthly consumption of electricity of 68 consumers of a locality. Find the mean, median and mode of the data.
Monthly consumption (in units) Number of consumers
65-85 4
85-105 5
105-125 13
125-145 20
145-165 14
165-185 8
185-205 4
Sol:
Class interval fi Cumulative frequency
xi ui
x 2755
i ifu
65-85 4 4 75 -12
85-105 5 9 95 -2 -10
105-125 13 22 115 -1 -13

4.34 Statistics
www.plancess.com
Class interval fi Cumulative frequency
xi ui
x 2755
i ifu
125-145 20 42 135 (A) 0 0
145-165 14 56 155 1 14
165-185 8 64 175 2 16
185-205 4 68 195 3 12
if 68 i ifu 7
Mean i i
i
fu 7x A h 135 20 137.05
f 68
n 68
34 125 1452 2N is the median class.
Median = L
nc.f 34 222 h 125 20 137
f 20
Maximum frequency is 20 125-145 is the modal class.
Mode = L i 0
1 0 2
f f 20 13Mode h 125 2
2f f f 2 20 13 14
140125 135.76
13

4.35 Foundation for Mathematics
www.plancess.com
EXERCISE 1 – For School Examinations
Fill in the BlanksDirections: Complete the following statements with an appropriate word/term to be �lled in the blank space(s).
Q.1. �e algebraic sum of the deviations from arithmetic mean is always .
Q.2. Percentile divides the number of items into equal parts.
Q.3. �e mean- deviation from the median is than that measured from any other value.
Q.4. �e di�erence between the maximum and the minimum observations in data is called the of the data.
Q.5. �e mid-point of a class interval is called its .
Q.6. Value of the middle-most observation (s) is called .
True / FalseDirections: Read the following statements and write your answer as true or false.
Q.7. �e median for grouped data is formed by using the formula, Median = L n
cf2 h
f
True False
Q.8. �e median of grouped data with unequal class sizes cannot be calculated.
True False
Q.9. �e modal value is the value of the variate which divides the total frequency into two equal parts.
True False
Q.10. 2(Median -Mean)=Mode-Mean.
True False
Q.11. Mean may or may not be the appropriate measure of measure of central tendency.
True False
Match the Following ColumnsDirections: Each question contains statements given in two columns which have to be matched. Statements (A, B, C, D) in column I have to be matched with statements (p, q, r, s) in Column II Column II gives data for description given in column I, match them correctly.

4.36 Statistics
www.plancess.com
Q.12.
Column I Column II
(A) the direct method(p) i i
i
fux a h
f
(B) step deviation method(q) l l 0
1 0 2
f fh
2f f f
(C) mode
(r) l n
cf2 h
f
(D) median(s) i i
i
f xx
f
Q.13. �e table shows a frequency distribution of the life time of 400 radio tubes tested at a company.
Life time (hours) Number of tubes
300-399 14
400-499 46
500-599 58
600-699 76
700-799 68
800-899 62
900-999 48
1000-1099 22
1100-1199 6
Total 400
Column I Column II
(A) upper limit of the �fth class (p) 100
(B) Lower limit of the eight class (q) 949.5

4.37 Foundation for Mathematics
www.plancess.com
Column I Column II
(C) class marks of the seventh class (r) 1000
(D) class interval size (s) 799
Very Short Answer QuestionsDirections: Give answer in one word or one sentence.
Q.14. In a school 85 boys and 35 girls appeared in a public examination. �e mean marks of boys was found to be 40%, whereas the mean marks of girls was 60% Determine the average marks percentage of the school.
Q.15. �e mean of 12 observations is 14. By an error one observation is registered as 24 is read of -24. Find. Find the actual mean.
Q.16. �e mean weight of 20 students is 25 kg and the mean weight of another 10 students is 40 kg. Find the mean weight of the 30 students.
Short Answer QuestionsDirections: Give answer in two to three sentences.
Q.17. �e mean of 50 numbers is 40. It was found that three numbers 23, 29 and 20 were taken as 28, 92 and 2. Find the correct mean.
Q.18. Given n
iI
(x 3n) 84 and n
iI
(x 2n) 144, �nd n and the mean.
Q.19. �e mean of n observation 1 2 3 nx ,x ,x ,.......x is x . If each observation is multiplied by p, prove that the mean of the new observations is px
Q.20. �e mean wages of 1000 workers in a factory was (INR) 600. �e mean wages of 200 workers of the night was (INR) 1000. Find the mean wages of the remaining 800 workers of the day shift.
Long Answer QuestionsDirections: Give answer in four to �ve sentences.
Q.21. �ere are six numbers. Combinations of 3 numbers are selected and their mean was calculated. �e resulting means were 2, 4, 6,…….36, 38, 40. What is the average of the original six numbers?
Q.22. If the mean of the following table is 30, �nd the missing frequencies.
Class interval 0- 15 15- 30 30- 45 45- 60 Total
Frequency 10 a b 8 60

4.38 Statistics
www.plancess.com
Q.23. �e mean of the following frequency table is 50. But the frequencies 1 2f and f in class 20-40 and 60-80 are missing. Find the missing frequencies.
Class 0-20 20-40 40-60 60-80 80-100 Total
Frequency 171f 32
2f 19 120
Q.24. A survey regarding the heights (in cm) of 51 girls of class X of a school was conducted and the following data was obtained:
Height (in cm) Number of girls
Less than 140 4
Less than 145 11
Less than 150 29
Less than 155 40
Less than 160 46
Less than 165 51
Find the median height and interpret the result.

4.39 Foundation for Mathematics
www.plancess.com
EXERCISE 2 – For Competitive Examinations
Multiple Choice QuestionsDirections: �is section contains multiple choice questions. Each question has 4 choices (a), (b), (c) and (d) out of which ONLY ONE is correct.
Q.1. �e mean of discrete observations 1 2 ny ,y ,......y is given by
(a)
n
ii l
y
n (b)
n
ii l
n
i l
y
i
(c)
n
i ii l
y f
n (d)
n
i ii l
n
ii l
y f
f
Q.2. If the mean of the numbers 27 +x, 31+x,89+x,107+x,156+x is 82, then the mean of 130+x, 126+x, 68+x, 50+x,1+x is
(a) 75 (b) 157
(c) 82 (d) 80
Q.3. �e number of observations in a group is 40. If the average of �rst 10 is 4.5 and that of the remaining 30 is 3.5, then the average of the whole group is
(a) 1/5 (b) 15/4
(c) 4 (d) 8
Q.4. In a class of 100 students there are 70 boys whose average marks in a subject are 75. If the average marks of the complete class are 72, then the average marks of the girls
(a) 73 (b) 65
(c) 68 (d) 74
Q.5. �e numbers 3, 5, 7, and 9 have respective frequencies x-2, x+2, x-3 and x+3. If the arithmetic mean is 6.5 then the value of x is
(a) 3 (b) 4
(c) 5 (d) 6
Q.6. If the sets of data had means of 15, 22.5 and 24 based on 6, 4, and 5 observations respectively, then the mean of these three sets combined is
(a) 20.0 (b) 20.5
(c) 22.5 (d) 24.0

4.40 Statistics
www.plancess.com
Q.7. Consider the following statements
(1) Mode can be computed from histogram
(2) Medium is not independent of change of scale
(3) Variance is independent of change of origin and scale.
Which of these is /are correct?
(a) (1), (2) and (3) (b) Only (2)
(c) Only (1) and (2) (d) Only (1)
More than One CorrectDirections: �is section contains multiple choice questions. Each question has 4 choices (a), (b), (c) and (d) out of which ONLY OR MORE may be correct.
Q.8. Which of the following is/are correct?
(a) Class mark= upper class limit lower class limts2
(b) Mode l 1 0
1 0 2
f fh
2f f f
(c) 2 median =mode +2 mean
(d) If n is odd, then median =th
n 12
term where, n is the number of terms.
Passage Based QuestionsDirections: Study the given passage (s) and answer the following questions.
Q.9. Passage – I
�e following table gives the weekly wages of workers in an factory:
Weekly wages Mid-value (xi) No. of (fi) workersi if x Cumulative frequency
50-55 52.5 5 262.5 555-60 57.5 20 1150.0 2560-65 62.5 10 625.0 3565-70 67.5 10 675.0 4570-75 72.5 9 652.0 5475-80 77.5 6 465.0 6080-85 82.5 12 990.0 7285-90 87.5 8 700.0 80
if 80 i if x 5520

4.41 Foundation for Mathematics
www.plancess.com
i. �e mean is
(a) 70 (b) 68
(c) 71 (d) 69
ii. �e modal class is
(a) 60-65 (b) 55-60
(c) 50-55 (d) none of these
iii. �e number of workers getting weekly wages, below (INR) 80 is
(a) 50 (b) 70
(c) 60 (d) 80
Q.10. Passage – II
�e marks of 20 students in a test were as follows:
5, 6, 8, 9, 10, 11, 11, 12, 13, 13, 14, 14, 15, 15, 15, 16, 16, 18, 19, 20
i. �e mean
(a) 14 (b) 13
(c) 12 (d) 15
ii. �e median is
(a) 13.5 (b) 12.5
(c) 14.5 (d) 15.5
iii. �e modal is
(a) 20 (b) 10
(c) 15 (d) 25
Assertion and ReasonDirections: Each of these questions contains an Assertion followed by Reason. Read them carefully and answer the questions on the basis of following options. You have to select the one that best describes the two statements.
a) If both assertion and reason are correct and reason is the correct explanation of assertion.
b) If both assertion and reason are correct, but reason is not the correct explanation of assertion.
c) If assertion is correct but reason is incorrect.
d) If assertion is incorrect but reason is correct.
Q.11. Assertion: If the value of mode and mean is 60 and 66 respectively, then the value of median is 64.
Reason: Mean =1/2 (mode + mean)

4.42 Statistics
www.plancess.com
Subjective Questions Directions: Answer the following questions.
Q.12. During the medical check-up of 35 students of a class, their weight were recorded as follows:
Weight (in kg) Number of students
Less than 38 0
Less than 40 3
Less than 42 5
Less than 44 9
Less than 46 14
Less than 48 28
Less than 50 32
Less than 52 35
Draw a less than type give for the given data. Hence obtain the median weight from the graph and verify the result by using the formula.
Q.13. �e following table shows the ages of the patients admitted in a hospital during a year:
Ages (in year) 5-15 15-25 25-35 35-45 45-55 55-65
Number of patients 6 11 21 23 14 5
Find the mean of the data given above. Compare and interpret the two measure of central tendency.
Q.14. Give below is a frequency distribution with median 46. In this distribution, some of the frequencies are missing: Determine the missing frequencies.
Marks No. of students
10-20 12
20-30 30
30-40 ?
40-50 65
50-60 ?
60-70 25
70-80 18
Total 229

4.43 Foundation for Mathematics
www.plancess.com
Q.15. �e adjoining pie chart the marks scored in an examination by a student in English, Hindi Science, social Science and Mathematics. If the total marks obtained by the student were 540, answer the following questions.
(a) In which subject scored 105 marks?
(b) How many more marks were obtained by the student in Mathematics than in Hindi?
(c) Examine whether the sum of marks obtained in social Science and mathematics is more than that in Science and Hindi.

4.44 Statistics
www.plancess.com
SOLUTIONS
EXERCISE 1 – For School Examinations
Fill in the Blanks1. Zero 2. Hundred 3. Less 4. Range 5. Class-mark 6. Median
True / False7. True 8. False 9. False 10. False 11. True
Match the Following Columns12. (A) s (B) p (C) q (D) r 13. (A) s (B) r (C) q (D) p
Very Short Answer Questions
14. 1 21 2c
1 2
n .x n .x 5500x 45.83
n n 120 15. 10 16. 30 kg
Short Answer Questions17. Correct mean = 39
18. n
2 1 2 n1
1 2 n
n
2 1 2 3 n1
x 3n x x ....x 3n 84
S 3n 84....(1) S x x .....x
x 2n x x x ....x 2n 144
S 2n 144
From (1) and (2), we get S=120, n=12
Mean S 12010
n 12
19. According to question, 1 2 3 nx x x .......xx.......(1)
n
New observation are 1 2 3 nx p,x p,x p,.....x p ; New mean 1 2 3 nx p x p x p..... x p
n

4.45 Foundation for Mathematics
www.plancess.com
1 2 3 np x x x ..... xp.x [From (1)]
n
20. Total wages of 1000 worker= 600 1000 600000
Total wages of 200 night shift workers 1000 200 200000
Total wages of 800 day shift workers. 600000 200000 400000 .
Mean wages of the day shift workers 400000(INR)500
800
Long Answer Questions21. Let the six numbers be 1 2 3 4 5 6x ,x ,x ,x ,x ,x . Number of combinations of 6
36 5 4
3 C 201 2 3
�e mean of these 20 combinations are 2, 4, 6, ……..36, 38, 40 Sum of all these means 2 40
20 4202
In the above sum, each number from the original six is repeated 10 times.
1 2 3 4 5 6
1 2 3 4 5 6
1 2 3 4 5 6
10 x x x x x x420
3x x x x x x
423
x x x x x x1 4221
2 3 2
22. 18, 24
23. Let the assumed mean be A=50 and h=20. Calculating of mean
Class Frequency fi Mid-values xii
i
x 50u
20 i ifu
0-20 17 10 -2 -34
20-40 f1 30 -1 -f1
40-60 32 50 0 0
60-80 f2 70 1 f2
80-100 19 90 2 38
i
1 2
N f 68
f f i i 1 2fu 4 f f
We have, iN f 120 (Given )

4.46 Statistics
www.plancess.com
1 2 1 268 f f f f 52.....(i)
Now, mean 50
1 2i i
1 2 1 2
1 2 1 2
4 f f1A h fu 50 50 20 50
N 20
4 f f 4 f f50 50 0
6 6
4 f f 0 f f 4.......(ii)
Solving equations (i) and (ii), we get f1=28 and f2 =24.
24. To calculate the median height, we need to �nd the class intervals and their corresponding table with the given cumulative frequencies is given below:
Class intervals Frequency Cumulative frequency
135-140 4 4
140-145 7 11
145-150 18 29
150-155 11 40
155-160 6 46
160-165 5 51
Here, N=51. So, n2Nn 51
25.52 2
. �is observation lies in the class 145-150. �en, l (the blower limit)=145, c.f (the cumulative frequency of the class preceding 145-150)=11, f(the frequency of the median class 145-150)=18, h (the class size)=5.
Using the formula, Median n
c.f2l h 149.03
f
N
�is means that the height of 50% girl is less than the height 149.03 cm and 50% are taller than the height 149.03 cm.
4.47 Foundation for Mathematics
www.plancess.com
EXERCISE 2 – For Competitive Examinations
Multiple Choice Questions1. (a)
2. (a) Given
27 x 31 x 89 x 107 x 156 x82
582 5 410 57 410 410 5x
x 0
∴Required mean is
130 x 126 x 68 x 50 x 1 xx
5
375 5x 375 0 375x 75
5 5 5
3. (b)
4. (b) Let the average marks of the girl students be x, then
70 75 30 x72
100
(Number of girls 100 70 30)
7200 5250i.e., x x 65
30∴
5. (c)
6. (a)
7. (d)
More than One Correct8. (a), (b), (c) and (d)
Passage Based Questions9. Passage I
i. (d) Mean i i
i
f x 5520Rs. 69
f 80
ii. (b) Modal class: We know that class of maximum frequency is called the modal class i.e., 55-60 is the modal class.
iii. (c) Number of workers getting weekly wages below (INR) 80 according to table =60 workers.

4.48 Statistics
www.plancess.com
10. Passage II
Arrange in ascending order
i. (b)
Mean=(5+6+8+9+10+11+11+12+13+13+14 +14+15 +15+15+16+16+18+19+20)/20
260
1320
ii. (a) Here, n =20 which is an even number
th th th th
n n 20 20term 1 term term 1 term
2 2 2 2Median
2 2∴
th th10 term 11 term 13 413.5
2 2iii. (c) In the data, 15 occurs the maximum times i.e. , 3 times ∴Mode =15
Assertion and Reason
11. (c) Median= 1(mode 3 mean)
31
(60 2 66) 643
Subjective Questions12. Use table cumulative frequency for each less than the upper limit. We mark the upper limits od
the class on X-axis and corresponding cumulative frequency at Y-axis.We can draw the ogive by plotting the points: (38, 0),(40, 3), (42, 5), (44, 9), (40, 35), (46, 14), (48, 28), (50, 32) and (52, 35).
Here n2Nn 17.5.2
Located the point on the give whose ordinate is 17.5. �e X-coordinate of this point will be the median. �is �nd the median by formula, we should convert less than type in continues class interval as given below:
Weight (in kg) Class frequency Cumulative frequency
Less than 38 0 0
38-40 3 3
40-42 2 5
42-44 4 9
44-46 5 14
46-48 14 28
48-50 4 32
50-52 3 35

4.49 Foundation for Mathematics
www.plancess.com
Here N =35. So n2Nn 17.5x2
Median class is 46-48. 46, c.f. 28, f 14, h 2 From formula,
median= l
ncf
2h
f
N
Median 17.5 14 3.5246 2 46 47.4
5 5
13.
Age (in year ) Number of patients (fi) Mid- values (xi) fixi
5-15 6 10 60
15-25 11 20 220
25-35 21 30 630
35-45 23 40 920
45-55 14 50 700
55-65 5 60 300
Total 80 2830
Mean = i i
i
f x 283035.37 years.
f 80
Here, maximum class frequency is 23, and the class corresponding to this frequency is 35-45. So, the modal class is 35-45.
Now, l 1 0 235, h 10, f 23, f 21, f 14

4.50 Statistics
www.plancess.com
∴Mode = l 1 0
1 0 2
f f 20Mode h 35 36.8 year.
2f f f 46 35∴
Mode =36.8 year, Mean =35.37 years. Maximum number of patients admitted in the hospital are of the age 36.8 years (approx.), while on an average the age of a patient admitted to the hospital is 35. 37 years.
14.
Marks No. of students c.f.
10-20 12 12
20-30 30 42
30-40 ? 42+x
40-50 65 107+x
50+60 ? 107+x+y
60-70 25 132+x+y
70-80 18 150+x+y
Total 229
Let the missing frequency corresponding to 30-40 and 50-60 class be x and y respectively.
Here, n=Total number of students= 229 ∴ n2Nn 229
114.5, and Median 462 2
∴
∴Median class =40-50 and l 40, c.f. 42 x,f 65,h 10
We know, Median = l n
c.f. 114.5 42 x2 h 46 40 10f 65
N
672x 145 78 67 or x 33.5
2x 34 ( Numberof students cannot be in fraction)∴
Now if
x y 150 229 ; x y 229 150 79.......(1)∴
Putting the value of x in (1), we get 34+y=79 ; y=79-34=45 ∴x=34, y=45
Hence, the missing frequency are 34 and 45 corresponding to class 30-40 and class 50-60 respectively.
15. (a) For the total marks 540, central angle =3600 ∴For 105 marks, central angle =0
0360105 70
540Since, central angle of the representing Hindi is 700, hence the students scored 105 marks in Hindi.

4.51 Foundation for Mathematics
www.plancess.com
(b) �e di�erent of central angles of the scores =900-700=200
∴ Corresponding di�erence of marks=0
0
20540 30
360Hence the students scored 30, marks more in mathematics than that in Hindi
(c) �e sum of central angles of the sectors representing Social Science and Mathematics= 650 +900
=1550 Since 1550 > 1500, so the sum of marks obtained in Social science and mathematics is more than that in Science and Hindi.