Statistics - USDA NASS
124
AGRICULTURAL Statistics 1973
-
Upload
khangminh22 -
Category
Documents
-
view
3 -
download
0
Transcript of Statistics - USDA NASS
AGRICULTURAL Statistics
1973

r 1
r r r r-
1 r· r -
f
f
(
r
I I I l t
t '
l_ '
l 1 L r
1 J
GALVIN L. RAMPTON GOVERNOR
STATE OF UTAH OFFICE OF THE GOVERNOR
SALT LAKE CITY
TO THE PEOPLE OF THE STATE OF UTAH
I appreciate the opportunity to present the 1973 Agricultural Statistics publication to the citizens of Utah and those interested in our agricultural economy. The purpose of this publication is to keep our citizens informed with factual information concerning our state's agri-business and agricultural industries.
This volume prepared annually by the State Department of Agriculture and the U.S.D.A. Statistical Reporting Service, is a vivid account of the dynamic industry that agriculture is to the State of Utah. Current data can help expand our markets as scientific advances permit better and improved ways of production.
I congratulate those responsible for the accumulation and publication of this basic information so essential to our state's economy.
fully,
Governor
JOSEPH H. FRANCIS COMMISSIONER
~tatc nf ~htq ~.epnrtm.eut nf J\Britultur.e
;§alt 1Jla:k~ Qlittl, ~freq 84114
TO ALL WHO MAY BE INVOLVED OR INTERESTED IN UTAH'S AGRICULTURAL ECONOMY
The State Department of Agriculture is happy to present to the citizens of our State this 1973 volume of our Utah Agricultural Statistics report. The current facts and figures presented provide a wide range of accurate information covering various segments of our State's agricultural economy.
Rapid changes which are taking place in our agricultural methods makes the data in this publication more essential to those interested or directly involved in some phase of agricultural pursuit. We have included in this volume, information on both a state and county basis, which will help to provide us with various production trends that are taking place within certain regions throughout the State.
Information from the census and the Utah Crop and 'Livestock Reporting Service is designed to serve the needs of all those interested in agricultural statistics. The Utah Agricultural Statistical publication for 1973 is made possible under a cooperative program with the State Department of Agriculture and the U.S.D.A. Statistical Reporting Service.
As Commissioner of Agriculture, I congratulate the personnel in those agencies who are responsible for the publication of this report.
R~spec,~,fully ,, ·/;; /) . I / j ./',· /
i / . ,_// i l )g{_~j, ~ ?F~&a,,LC'<4-/ ~o-sephlir~ Francis (./ State Commissioner of Agriculture
. j

UTAH AGRICULTURAL STATISTICS 1973
This report has been compiled and published as a cooperative effort and function of the following agencies of Federal and State Government.
FEDERAL PARTICIPATION
U. S. DEPARTMENT OF AGRICULTURE - STATISTICAL REPORTING SERVICE
Harry C. Trelogan, Administrator Bruce M. Graham, Deputy Administrator James L. Olson, Assistant Administrator
UTAH CROP AND LIVESTOCK REPORTING SERVICE 4418 Federal Building
Salt Lake City, Utah 84111
W. Grant Lee, Agricultural Statistician in Charge Glenn E. Casey, Assistant Statistician in Charge Stanley R. Koyle and J. Craig Thomas, Agricultural Statisticians Betty J. Owens, Supervisory Statistical Assistant
STATE PARTICIPATION
UTAH STATE DEPARTMENT OJ<' AGRICULTURE Room 412 State Capitol Building
Salt Lake City, Utah 84114
Joseph H. Francis, Commissioner David R. Waldron, Administrative Assistant John W. Gillman, Director of Division of Marketing and
Consumer Servic~s Ray J. Downs, Director of Division of Plant Industry Ben W. Lindsay, Direc~or of Agricultural Development Val S. Vickers, Director of Administration Division Kent Francis, Director of Laboratories
Note
It is desired by the sponsors to recognize the cooperation and input made by the Soil Conservation Service, U. S. Department of Agriculture; and the Department of Commerce, N.O.A.A. Climatologist for Utah, Department of Soils and Meteorology, Utah State University.

I N T R 0 D U C T I 0 N
This report summarizes the past year's agricultural activities in Utah and shows trends of the agricultural industry during previous years. When the 1969 Census of Agriculture became available, it was used as a benchmark to review annual USDA estimates based on sample surveys covering the years 1965 through 1971. Where necessary, revisions were made in previously published USDA crop and livestock estimates to bring them into reasonable alignment with census data. The tables in this bulletin include any revisions that were made as a result of the census review and, except for those credited to other agencies, are the latest official estimates of the U. S. Department of Agriculture.
Agriculture is a major industry in Utah with the gross farm income in 1972 amounting to 272 million dollars. This was more than 20 million above 1971 and 90 million above the 1960 level.
Some substantial shifts have been occurring in Utah's agriculture in the last decade or two. The cattle industry continues to gain in importance as numbers and income rise. Dairying also continues to gain in importance-not because cow numbers are going up but rather because production per cow is rising. Sheep numbers and their relative importance continue to decline as more stockmen shift from sheep to cattle because of labor and predator problems. Crops have also been affected by labor problems with vegetable crops, sugar beets, and potatoes losing out to feed crops such as corn silage, corn for grain, and hay to support the growing cattle numbers. This shift has also increased the acreage used for pasture and the acreage harvested for green chop and other ensilage feeds other than corn.
BEN W. LINDSAY Director of Agricultural Development Utah State Department of Agriculture
w._d,~~ W. GRANT LEE Agricultural Statistician in Charge Statistical Reporting Service, USDA

l 1 ' - ,
TABLE OF CONTENTS
GOVERNOR'S LETTER
COMMISSIONER'S LETTER
INTRODUCTION
POPULATION . . . . • . . . . . . . • . . . • . . • . . • . . . 7
NUMBER OF FARMS .......•.••••........ 8
LAND INVENTORY ........•............. 10 Cropland . . . . . . . . . . • . . . . . . . . . . . . . . • . 12 Land Ownership ..................... 13 Use of Land ........................ 14 Federal Lands ........••............ 15
FARM INCOME ..................•...... 16 Cash Receipts by Commodity ..•...... 18 Gross and Net Farm Income .......... 19 Farm Operating Expenses ............ 19
FIELD AND SEED CROPS ......•...•..... 20 Acreage, Production, Disposition,
and Value Corn ...•........................... 24 Wheat .•........................... 25 Barley ................. , .......... 26 Oats ....•......................... 26 Dry Beans ......................... 26 Potat:oes .......................... 27 Sugar Beets . . . . . . . . . . . . . . . . . . . . . . . 28 Sugar Beet Seed ...........•....... 28 Sugar Beets (County Estimates) .... 29 Hay Crops . . . . . . . . . . . . . . . . . . . . . . . . . 30 Alfalfa Seed ...................... 30
Grain Stocks Wheat ............................. 31 Oats .......................•...... 32 Barley ............................ 33 Corn ..•...••..............•....... 34 Sorghum Grain . . . . . . . . . . . . . . . . . . . . . 35
FRUITS .............................. 36 Production and Value ............... 37 Production by Varieties Apples ............................ 38
Production, Disposition, and Value Apples ..........•................. 38 Peaches ........................... 39 Pears .............•.....•......... 39 Sweet Cherries .................... 40 Sour Cherries ..................... 40 Apricots • . . . . . . . . . . . . • . . . . . . . . . . . . 41
Fruit Tree Survey of 1972 .......... 42 State Summary ..................... 43 Trees by Counties ................. 44
VEGETABLES . . . • . . . . • • • . • . . . . . . . . • . . . 45 Onions . . . . . . . . . . . • . . . . . . . . . . . . . . . • 46 Tomatoes, for Processing .......... 47 Vegetables for Processing ......... 47
CATTLE . . . . . . . . . . . • • . . . . . . . . . . . . . . . . 48 Inventory . . . . . . . . . . . . . . . . . . . . . . . . . 50 Calf Crop . . . . . . • . • • . . . . . . . . . . . . . . . 50 Inventory by Classes .............. 51 Disposition, Production, & Income .. 52 Commercial Slaughter . . . . . . . . . . . . . . 53
SHEEP AND WOOL . . . . . . . . . . . . . . . . . . . . . 54 Inventory . • . . . . . . • . . . . . . . . . . . . . . . . 56 Disposition, Production, & Income .. 57 Lamb Crop . . . . . . . . . . . . . • . . . . . . . . . . . 58 Wool Crop . . . . . . . . • . . . . . . . . . . . . . . . . 58 Commercial Slaughter .............. 59
HOGS . . . . . . . . . . . . . . • . . . . . . . . . . . . . . • . 60 Inventory . . . . . . . . • . . . . . . . . . . . . . . . . 61 Disposition, Production, & Income .. 62 Pig Crop . . . . . . . . . . . . . . . . . . . . . . . . . . 63 Commercial Slaughter .............. 64
DAIRY Milk Production, Monthly ......... . Milk Production and Disposition .. . Milk Marketings and Value ........ . Manufactured Dairy Products ...... .
CHICKENS AND EGGS ................. . Chicks Hatched ...•................ Chicken Inventory & Disposition ... Chickens and Broilers,
Production and Income ....... . Egg Production ................... . Eggs - Disposition and Income .... .
TURKEYS Poults Hatched Production and Income ............ .
65 66 67 68 69
71 72 73
74 75 75
76 77 77
MINK . . . . . . . . . . . . . . . . . . . . . . . . . . . . . . . 78
HONEY . . . . . . . . . . . . . • . . . . . . . . . . . . . . . . 79
FARM LABOR . . . . . . . . • . . . . . . . . . . . . . . . . 80
AGRICULTURAL PRICES . . . . . . . . . . . . . . . . 82 Grains . . . . . . . . . . . • . . . . . . . . • . . . . 82, 83 Dry Beans . . . . . . . . . . . . . . . . . . . . . . . . . 83 Potatoes . . . . . • . . . • . . . . . . . . . . . . . . . . 83 Hay . . . . . . . . . . . . . . . . . . . . . . . . . . . . . . . 84 Alfalfa Seed •..................... 84 Livestock .......•........... 85, 86, 87

TABLE OF CONTENTS CONTINUED
AGRICULTURAL PRICES CONTINUED Milk Cows ....................... . Turkeys ....•..................... Milk ........................... · · Eggs Wool
1969 CENSUS OF AGRICULTURE •....... County Census Data Farms and Farmland ............. . Land Use ....................... . Sales of Agricultural Products .. Value of Farms and Expenses .... . Wheat Acreage and Production ... . Feed Grains Acreage & Production. Hay & Alfalfa Seed
Acreage and Production ..... Potatoes, Sugar Beets, and Dry
Beans Acreage & Production .. Orchards, Number & Acres ....... .
87 87 88 89 89
90
91 92 93 94 95 96
97
98 99
Trees and Production Apples and Peaches ............... 100 Pears and Apricots . • . . . . . . . . . • . . . 101 Cherries, Tart and Sweet .•....... 102
Cattle & Calves Inventory ......... 103 Sheep & Lambs Inventory ..........• 104 Hogs & Pigs Inventory ............. 105 Poultry ........................... 106 Horses, Mink, and Honey
Bees Inventory . . . . . . . . . . . . . . • 107
WEATHER . . • . . . . . . . • . • . • . . . . . . . . . . . . . . 108 Frost Free Period ..•.•......•...... 109 Growing Degree Days ................ 110 Precipitation ...................... 112 Temperatures .........•...•......... 114
RANGE LAND .......................... 116
HORSES •............•................ 118
CONSERVATION .....••................. 119
PHOTOGRAPHS
We wish to thank those who have supplied photographs for this publication--particularly U.S.U. Extension Services, Bureau of Reclamation, and Soil Conservation Service who supplied the majority of them.

UTAH AGRICULTURAL STATISTICS 1973 7
Population
Population of Counties, Utah
u. s. c e n s u s - A p r i 1 1, 1 9 7 0 U of u July 1, 1972
County Urban Rural :?:_/ Total
I I Places of
I Total Percent Total 1,000 to Other Total
Urban Jj of Total Rural 2,500 Rural
Beaver ................ 3,800 -- -- 3,800 2,757 1,043 4,100 Box Elder ..•.......... 28,129 16' 801 59.7 11,328 2,232 9,096 30,100
Cache ...............•. 42,331 25,675 60.7 16,656 10,897 5,759 45,000 Carbon ................ 15,647 6,218 39. 7 9,429 3,578 5,851 16,500
Daggett. .....•........ 666 -- -- 666 -- 666 700 Davis ...•............. 99,028 85, 115 86.0 13,913 6,950 6,963 107 '000
Duchesne .............. 7,299 -- -- 7,299 3,099 4,200 9,700 Emery .............. ·.· 5,137 -- -- 5,137 969 4,168 5,200
Garfield .•............ 3,157 -- -- 3,157 1,318 1,839 3,100 Grand ................. 6,688 4,793 71. 7 1,895 64 1,831 6,200
Iron .................. 12, 177 8,946 73.5 3,231 1,423 1,808 13,200 Juab .................. 4,574 2,699 59.0 1,875 -- 1,875 4,500
Kane .......•......... · 2,421 -- -- 2,421 1,381 1,040 2,700 Millard ............... 6,988 -- -- 6,988 3,021 3,967 7,700
Morgan ................ 3,983 -- -- 3,983 1,586 2,397 4,400 Piute ................ · 1,164 -- -- 1,164 -- 1,164 1,100
Rich ........... •.· ... • 1,615 -- -- 1,615 -- 1,615 1,500 Salt Lake ....•......•. 458,607 436,201 95.1 22,406 -- 22,406 482,000
San Juan .............. 9, 606 -- -- 9,606 3,681 5,925 10,700 Sanpete ............... 10,976 -- -- 10,976 6,519 4,457 11, 900
Sevier ................ 10,103 4,471 44.3 5,632 1,494 4,138 10,900 Summit ............... · 5,879 -- -- 5,879 1,193 4,686 6,100
Tooele .......•........ 21,545 15,470 71.8 6,075 2,357 3, 718 22,000 ilintah ................ 12, 684 3,908 30.8 8, 776 1,248 7 ,528 14,400
j(Jtah .•.....•.......... 137, 776 120,554 87.5 17,222 5,344 11,878 150,000 1-/asatch .............•. 5,863 3,245 55.3 2,618 -- 2,618 6,500
1-/ashington ............ 13,669 7,097 51.9 6,572 1,408 5,164 16,000 !Yayne ............... • • 1,483 -- -- 1,483 -- 1,483 1,500
1-/eber ................. 126,278 110, 279 87.3 15,999 3,571 12,428 133,000
State Total. ....•..... 1,059, 273 851,472 80 .4 207,801 66,090 141, 711 1,128,000
1/ Urban population includes persons living in areas or places of 2,500 inhabitants or more. 2/ Population Work Committee, Utah Economic and Business Review, Bureau of Economic and Business Research, U of U, December 1972.

8 UTAH AGRICULTURAL STATISTICS 1973
Number of Farms
W. Grant Lee, Agricultural Statistician in Charge
The number of farms in Utah in 1973 is estimated at 12,600, down 400 from the revised estimate for 1972. Farm numbers have declined almost every year from the record high of 30,800 reached in 1936. Included in the farm count are all operations of 10 acres or more where sales of agricultural production are $50 or more and operations under 10 acres if annual farm product sales total at least $250. Full time farming operations have been getting larger and fewer as operators increase their acreages in order to get more efficiency from their machinery and labor investment. Also, many farms near the major population centers have been subdivided for residential or industrial sites and disappeared from the farm count. On the other hand, some farms near the cities and larger towns have been split up into smaller farms primarily for residential purposes but still qualify as farms.
Land in Utah farms reached a peak of about 13,600,000 acres in the late 50's and has declined slightly since 1963 to 13,000,000 acres in 1973. The average size farm in 1973 is a record high 1,032 acres--24 acres above 1972 and one-third larger than 10 years earlier. The acreage in farms is about 25 percent of the total 52.7 million acres in Utah. Most of the remaining land area is federally owned.
l
j

- ' ~
- \
f I
- I
l _I
UTAH AGRICULTURAL STATISTICS 1973 9
Number of Farms and Land in Farms, Selected Years 1850-1973 ];/.
UTAH UNITED STATES Year I Land in Farms I Land in Farms
Farms I Average I Total Farms I Average I Total 1,000 1,000,000
Number Acres Acres 1,000 Acres
1850 .......... 926 51 47 1,449 203 1860 .......... 3,635 25 90 2,044 199 1880 .......... 9,452 69 656 4,009 134 1900 .......... 19,387 212 4, 117 5,737 146 1920 .......... 25,662 197 5,050 6,448 148 1930 .......... 27,159 207 5,613 6,289 157
1936 '!:._/ ....... 30,800 -- -- -- --1940 .......... 28,500 354 10,100 6,097 174 1950 .......... 25,800 465 12,000 5,382 215 1960 .......... 19,000 716 13,600 3,963 297 1965 .......... 16,500 818 13, 500 3,356 340 1966 .......... 16,000 838 13,400 3,257 348
1967 .......... 15,500 858 13,300 3,162 355 1968 .......... 14,800 899 13,300 3,071 363 1969 .......... 14,300 930 13,300 2,999 369 1970 .......... 13,800 964 13,300 2,954 373 1971 .......... 13,400 985 13,200 2,909 377 1972 .......... 13,000 1,008 13,100 2,870 381 1973 .......... 12,600 1,032 13,000 2,831 385
1/ 1850-1931 from Census of Agriculture. 1940-1973 SRS estimates. Z/ Record high number of farms in Utah.
Number of Farms and Land in Farms, by States, 1971-73.
State I Farms I Land in Farms I 1971 l 1972 I 1973 I 1971 I 1972 I
1,000 1,000 Number Number Number Acres Acres
Mont . . . 26,000 25,500 25,100 63,700 63,200 Idaho ... 28,200 27,900 27,600 15,500 15,500 Wyo . . . . 8,400 8,300 8,200 35,500 35,500 Colo . . . 30,000 29,500 29,000 39,900 39,900 N. Mex. 12,200 12,000 11,800 47,600 47,400 Ariz . . . 6,200 6,100 6,000 40,200 39,600
Utah .... 13,400 13,000 12,600 13,200 13, 100 Nev . . . . 2,000 2,000 2,000 9,000 9,000 Wash . . . 41,000 40,500 40,000 16,600 16,600 Oreg . . . 34,000 33,500 33,000 19,900 19,800 Calif . . 64,000 63,000 63,000 36,600 36,400
Acres
294 407 536 839 956 987
--1,061 1,159 1,176 1,140 1,132
1,123 1,115 1,108 1, 103 1,097 1,093 1,089
1973 1,000 Acres
62,700 15,500 35,500 39,900 47,200 39,200
13, 000 9,000
16,600 19,700 36,200
U.S . . . . 2,908,950 2,869,710 2,831,290 1,097,300 1,093,017 1,088,730
10 UTAH AGRICULTURAL STATISTICS 1973
Land Inventory W. Grant Lee, Agricultural Statistician in Charge
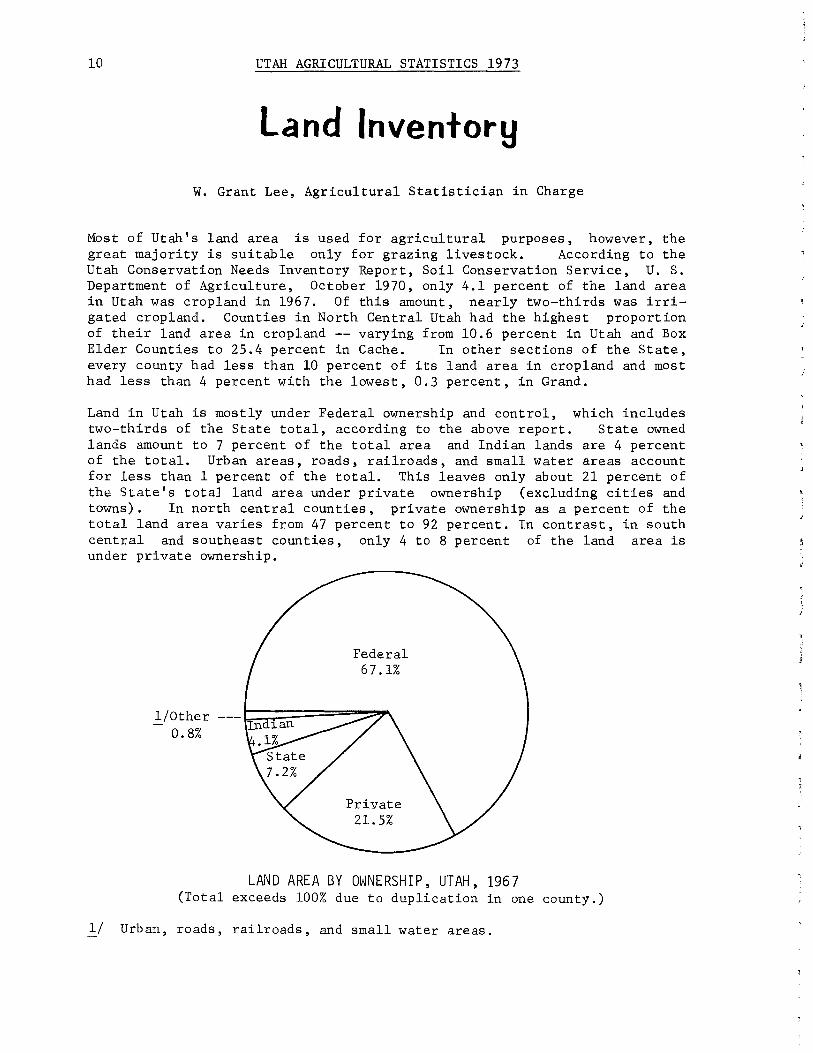
Most of Utah's land area is used for agricultural purposes, however, the great majority is suitable only for grazing livestock. According to the Utah Conservation Needs Inventory Report, Soil Conservation Service, U, S. Department of Agriculture, October 1970, only 4.1 percent of the land area in Utah was cropland in 1967. Of this amount, nearly two-thirds was irrigated cropland. Counties in North Central Utah had the highest proportion of their land area in cropland -- varying from 10.6 percent in Utah and Box Elder Counties to 25.4 percent in Cache. In other sections of the State, every county had less than 10 percent of its land area in cropland and most had less than 4 percent with the lowest, 0.3 percent, in Grand.
Land in Utah is mostly under Federal ownership and control, which includes two-thirds of the State total, according to the above report. State owned lands amount to 7 percent of the total area and Indian lands are 4 percent of the total. Urban areas, roads, railroads, and small water areas account for less than 1 percent of the total. This leaves only about 21 percent of the State's totaJ land area under private ownership (excluding cities and towns), In north central counties, private ownership as a percent of the total land area varies from 47 percent to 92 percent. In contrast, in south central and southeast counties, only 4 to 8 percent of the land area is under private ownership.
!/Other 0.8%
Federal 67.1%
LAND AREA BY OWNERSHIP, UTAH, 1967 (Total exceeds 100% due to duplication in one county.)
1/ Urban, roads, railroads, and small water areas.
' _J

UTAH AGRICULTURAL STATISTICS 1973
Bureau of Land Management 44.1%
Dept. of Defense
Range
16.5%
4.6%
USE OF NON-FEDERAL LANDS AND ADMINISTRATION OF FEDERAL LANDS, UTAH, 1967.
1_/ Other Federal includes Bureau of Reclamation and Bureau of Sport Fisheries and Wildlife.
11
12 UTAH AGRICULTURAL STATISTICS 1973
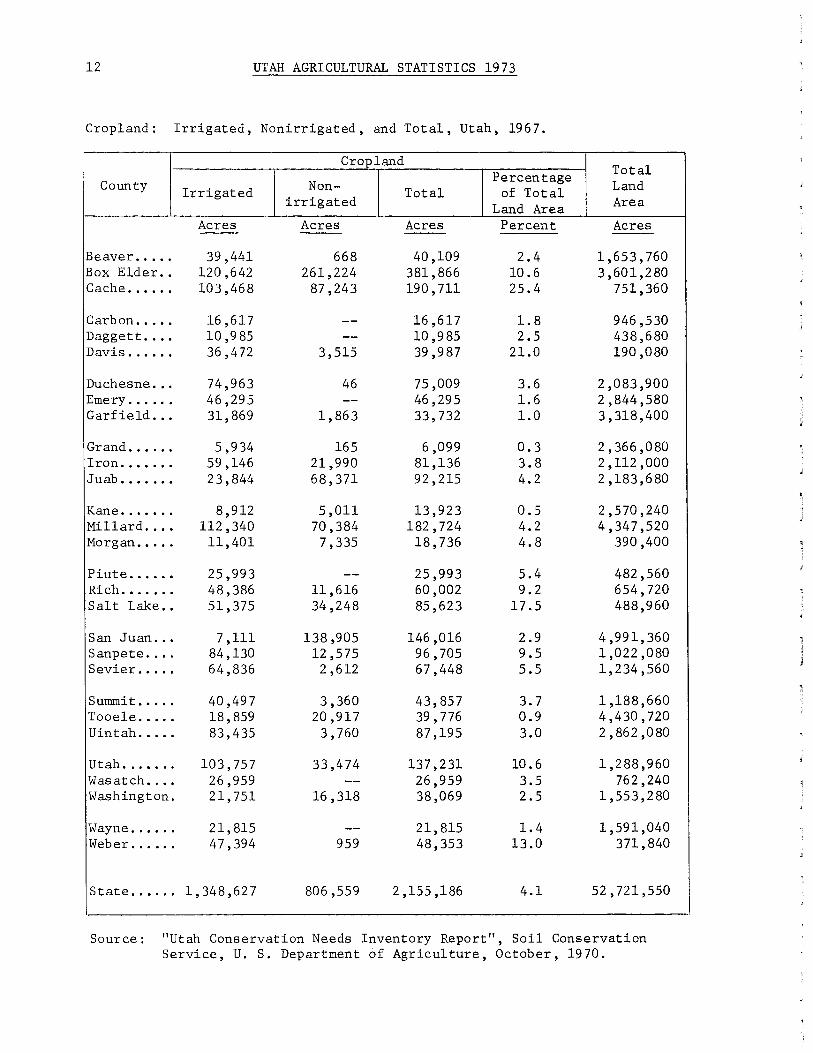
Cropland: Irrigated, Nonirrigated, and Total, Utah, 1967.
Cropland Total Percentage County Irrigated Non- Total of Total Land
irrigated Land Area Area
Acres Acres Acres Percent Acres
Beaver ..... 39,441 668 40,109 2.4 1,653,760 Box Elder .. 120 ,642 261,224 381,866 10.6 3 ,601,280 Cache ...... 103 ,468 87,243 190 '711 25.4 751,360
Carbon ..... 16 ,617 -- 16 '617 1. 8 946,530 Daggett •... 10 ,9 85 -- 10 ,985 2.5 438 ,680 Davis ...... 36 ,472 3,515 39 '9 87 21.0 190 ,080
Duchesne ... 74,963 46 75,009 3.6 2,083,900 Emery ..•... 46,295 -- 46,295 1.6 2,844,580 Garfield .•. 31,869 1,863 33,732 1.0 3,318,400
Grand •.•... 5,934 165 6,099 0.3 2 '366 ,080 Iron ....... 59,146 21, 990 81,136 3.8 2 ,112 ,000 Juab •..•... 23,844 68,371 92,215 4.2 2,183,680
Kane ...•... 8 ,912 5,011 13,923 0.5 2,570,240 Millard .... 112,340 70,384 182 '724 4.2 4,347,520 Morgan .•... 11, 401 7,335 18,736 4.8 390,400
Piute •..... 25,993 -- 25,993 5.4 482,560 Rich .•.•.•. 48,386 11,616 60,002 9.2 654 '720 Salt Lake .. 51,375 34,248 85,623 17.5 488,960
San Juan .•. 7 ,111 138,905 146,016 2.9 4,991,360 Sanpete •... 84,130 12,575 96,705 9.5 1,022 ,080 Sevier .•... 64,836 2 ,612 67,448 5.5 1,234,560
Sununi t ••... 40,497 3,360 43' 85 7 3.7 1,188,660 Tooele .•... 18,859 20,917 39 '776 0.9 4,430,720 Uintah .•... 83,435 3,760 87,195 3.0 2,862,080
Utah ...••.. 103,757 33,474 137,231 10.6 1,288,960 Wasatch •... 26,959 -- 26,959 3.5 762,240 Washington. 21,751 16 ,318 38,069 2.5 1,553,280
Wayne ..•... 21, 815 -- 21,815 1. 4 1,591,040 Weber ..•... 47,394 959 48,353 13.0 371,840
State ..•... 1,348,627 806,559 2,155,186 4.1 52 '721,550
Source: "Utah Conservation Needs Inventory Report", Soil Conservation Service, U. S. Department of Agriculture, October, 1970.

UTAH AGRICULTURAL STATISTICS 1973 13
Land Area in Utah by Ownership 1_/, 1967.
Urban Small County State Federal Indian Roads & Water Private Total
Railroads 2/ Acres Acres Acres Acres Acres Acres Acres --- --- --- --- --- --- ---
Beaver ............ 156 '330 1,266,443 -- 10,646 187 220,154 1,653,760 Box Elder ......... 199 ,880 1,633,700 -- 26,284 150 1,741,266 3 ,601,280 Cache .•...•....... 28 ,680 268,131 -- 18,235 919 435,395 751,360
Carbon ...........• 96 ,092 455,233 -- 9,290 1,130 384,785 946 ,530 Daggett ....•..•... 24,171 348,341 -- 2,066 550 63,552 438 ,680 Davis ....•........ 812 42 ,6 71 -- 23,646 118 122,833 190,080
Duchesne .........• 74,502 980 ,597 240 ,164 4,317 733 783,587 2,083,900 Emery .....•....•.. 304,624 2,325,218 -- 12,095 220 202 ,423 2,844,580 Garfield ..•......• 222 '712 2 ,953, 729 -- 8,662 960 132,337 3,318,400
Grand)./ •.•..•...• 362,105 2,053,635 200,274 10' 149 20 157,488 2 ,366 ,080 Iron .•...........• 134,803 1,215,203 -- 14,698 20 747,276 2 ,112 ,000 Juab .............. 178,526 1,569,966 39 ,038 13,569 50 382,531 2 ,183,680
Kane .............. 217,996 2,200,574 -- 6,346 36 145,288 2,570,240 Millard ........... 400,955 3,286 ,068 -- 24,602 1,240 634,655 4,347,520 Morgan ..•......... 9 ,982 17 ,290 -- 3,781 131 359,216 390 ,400
Piute ............. 57,220 357,186 -- 2 ,577 640 64,937 482,560 Rich ......••...... 6 7' 695 219,695 -- 4,376 118 362,836 654, 720 I Salt Lake ......... 4 ,286 110 ,335 -- 66 ,118 243 307 ,978 488,960 I
San Juan .......... 325,317 2 ,985 ,630 1,247,563 15,253 997 416,600 4,991,360 Sanpete ........... 42,679 531,989 -- 11,876 400 435,136 1,022 ,080 Sevier ............ 46,187 939,842 -- 12 ,285 247 235,999 1,234,560
Summit ............ 11,481 516,934 -- 6 ,610 1,380 652,255 1,188,660 Tooele .•......••.. 219 ,971 3,659,502 17,763 15,908 22 517,554 4 ,430' 720 Uintah ••.......•.. 232,625 1,856,529 411,023 10,576 1,396 349,931 2 ,862 ,080
Utah ........•.•.•. 64,136 572,302 -- 52,414 403 599,705 1,288,960 Wasatch ....•...•.. 56,252 450,035 -- 3,622 253 252,078 762,240 Washington ........ 94,556 1,171,516 -- 10,232 140 276,836 1,553,280
Wayne .....•....... 146,651 1,338,875 -- 5,416 133 99,965 1,591,040 Weber ............. 4,070 70,105 -- 24 '365 1,542 271,758 371,840
State Total ...... 3,785,296 35 ,397 ,274 2,155,825 430,014 14,378 11,356,354 52,721,550
1/ Water areas of more than 40 acres and rivers wider than one-eighth mile have been excluded. 2! Water areas of 2 to 40 acres and streams less than one-eighth mile in width. 3! An overlap between Federal and non-Federal land in Grand County by 417,591 acres.
Source: "Utah Conservation Needs Inventory Report", Soil Conservation Service, U. S. Department of Agriculture, October, 1970.

I
14 UTAH AGRICULTURAL STATISTICS 1973
Use of Land in Utah 1/ Excluding Federal, Urban, and Small Water]:_/, 1967.
Total County Cropland Pasture Range Forest Other Cross All
Total Land Acres Acres Acres Acres Acres Acres Acres --- --- --- --- --- --- ---
Beaver ............ 40,109 4,001 265 '721 58,031 8,622 376,484 1,653,760 Box Elder ......... 381,866 108,365 1,097 ,909 195 ,992 157 ,014 1,941,146 3,601,280 Cache .•........... 190 '711 1,138 162 ,889 101,042 8,295 464,075 751,360
Carbon ............ 16,617 -- 166,869 277,199 20,192 480 ,877 946,530 Daggett ........... 10 ,985 12 55,617 17 ,896 3 ,213 87 '723 438,680 Davis .......•..... 39 ,987 1,683 so' 793 23,603 7,579 123 ,645 190 ,080
Duchesne ........•. 75,009 1,622 393,956 558,557 69,109 1,098,253 2,083,900 Emery ....•..•..... 46,295 -- 325 '791 54,565 80 ,396 507 ,047 2,844,580 Garfield .......... 33,732 3,660 227,139 60,120 30 ,398 355,049 3,318,400
Grand ....•........ 6,099 1,664 137,270 150,016 7 ,22 7 302,276 2,366,080 Iron ......•....... 81,136 17,830 445'196 321,375 16,542 882,079 2,112,000 Juab .•............ 92,215 7,508 252,695 230,551 17,126 600,095 2,183,680
Kane .............. 13,923 11,795 84,813 250,708 2,045 363,284 2,570,240 Millard ........... 182,724 6,431 670 ,372 91,535 84,548 1,035,610 4,347,520 Morgan ............ 18,736 5 ,212 192 ,045 148,087 5 ,118 369,198 390,400
Piute ............. 25,993 438 6 7 '311 16,248 12 ,16 7 122,157 482,560 Rich .............. 60,002 42,173 2 71, 614 47,048 9,694 430,531 654 '720 Salt Lake ......... 85,623 10,556 132,385 69,594 14 ,106 312,264 488,960
San Juan ...•...... 146,016 60,531 1,263,007 462,318 57,608 1,989 ,480 4,991,360 Sanpete ........... 96 '705 19 ,937 138,981 209 '779 12 ,413 477 ,815 1,022 ,080 Sevier ....•....... 67 ,448 884 117,159 83,985 12 '710 282,186 1,234,560
Summit ............ 43,857 1,718 284,292 292,359 41,510 663,736 1,188,660 Tooele ............ 39 '776 2 ,326 418,469 214,332 80 '385 755,288 4,430,720 Uintah ............ 87,195 1,561 560,420 179 ,040 165 ,363 993,579 2 '862 ,080
Utah .••.....•..... 137,231 4,571 325,014 188,644 8,381 663,841 1,288,960 Wasatch ........... 26,959 292 126,829 141,333 12,917 308,330 762,240 Washington ........ 38,069 4 '729 181,112 124,459 23,023 371,392 1,553 ,280
Wayne ............. 21,815 -- 171,645 10 ,465 42 ,691 246 ,616 1,591,040 Weber ..•...•...... 48,353 1,770 117 ,803 86 ,346 21,556 275,828 371, 840
State Total. ...... 2,155,186 322,407 8,705,116 4,665,227 1,031,948 16,879,884 52' 721,550
1/ Water areas of more than 40 acres and rivers wider than one-eighth mile are excluded. 2! Water areas of 2 to 40 acres and streams less than one-eighth mile in width.
Source: "Utah Conservation Needs Inventory Report", Soil Conservation Service, U. S. Department of Agriculture, October, 1970.
- :ii

UTAH AGRICULTURAL STATISTICS 1973 15
Federal Land Acreage in Utah, 1967 1./.
Bureau Department Bureau of National Bureau of County Total National of Land of Sport fishery Park Rec lama-
Federal Forest Management Defense and Wildlife Service tion '!:._/ Acres Acres Acres Acres Acres Acres Acres --- --- --- --- --- --- ---
Beaver •••••••••••• 1,266,443 138,349 1,128,094 -- -- -- --Box Elder •••.•.••• 1,633,700 95,650 1,252,795 207 ,000 65 ,926 -- 12,329 Cache •.•••••.••••• 268,131 267,073 160 -- -- -- 898
Carbon •.••••.••.•. 455,233 29,632 422,758 400 -- -- 2,443 Daggett •••••••.••. 348,341 235,309 110,117 -- -- -- 2 ,915 Davis .••.•••.••.•• 42,671 35,123 23 7,321 -- -- 204
Duchesne •••••••••• 980 ,597 739,414 212,414 -- -- -- 28 '769 Emery ••••••..•.••• 2,325,218 210 ,108 2 ,110 ,325 -- -- -- 4,785 Garfield ••••••.••• 2,953,729 1,036,581 1,632,634 -- -- 284,331 183
Grand .••••••.••••• 2,053,635 57,527 1,454,301 507' 797 -- 34,010 --Iron ••••••.•••.••• 1,215,203 238,148 968,187 -- -- 8,868 --Juab ••.•••.••••••• 1,569,966 109,057 1,442,917 -- 17 ,992 -- --
Kane •••.••.••••••• 2,200,574 123 ,081 1,672 ,062 -- -- 375,060 30 ,371 !Millard •••.••••..• 3,286,068 306 ,344 2,976,769 2,955 -- -- --Morgan ••..•••••.•• 17,290 12 ,536 2,175 -- -- -- 2 ,579
Piute ••••.•••.•.•• 357,186 190 ,397 166,789 -- -- -- --Rich ••..•••••••.•• 219 ,695 53,874 165,821 -- -- -- --Salt Lake .••..•••• 110, 335 89 ,399 8,006 12 ,877 -- -- 53
San Juan .•••.••.•• 2 ,985 ,630 450,432 1,955,319 -- -- 579,060 819 Sanpete •...••••.•• 531,989 387,599 144,390 -- -- -- --Sevier •••..•.•• ; •• 939,842 711,162 228,680 -- -- -- --
Summit •••.••..•••. 516,934 507 ,479 5,573 -- -- -- 3,882 Tooele .••.•••••.•• 3,659,502 152,223 1,948,417 1,558,862 -- -- --Uintah ....•••••••• 1,856,529 268,053 1,438,405 93,376 7,448 47 ,989 1,258
Utah ••••••.••••••• 572 ,302 466,019 91,831 13,405 22 250 775 Wasatch ••.•••••••. 450,035 380,545 6,644 -- -- -- 62 ,846 Washington •••••..• 1,171,516 392 ,696 598,018 -- -- 122,874 57 ,928
Wayne •....••••..•• 1,338,875 161,589 1,124,026 -- -- 44,943 8,317 !Weber •••••••••..•• 70 ,105 60,634 600 3,516 -- -- 5,355
State Total 35,397,274 7,906,033 23,268,250 2 ,407 ,509 91,388 1,497,385 226,709
1/ Numerous changes have been made in acreage administered by various federal agencies. Current acreage figures should be obtained from the agency concerned. '!:_/ Acquired land administered by Bureau of Reclamation.
Source: "Utah Conservation Needs Inventory Report", Soil Conservation Service, U. S. Department of Agriculture, October, 1970.
16 UTAH AGRICULTURAL STATISTICS 1973
Farm Income W. Grant Lee, Agricultural Statistician in Charge
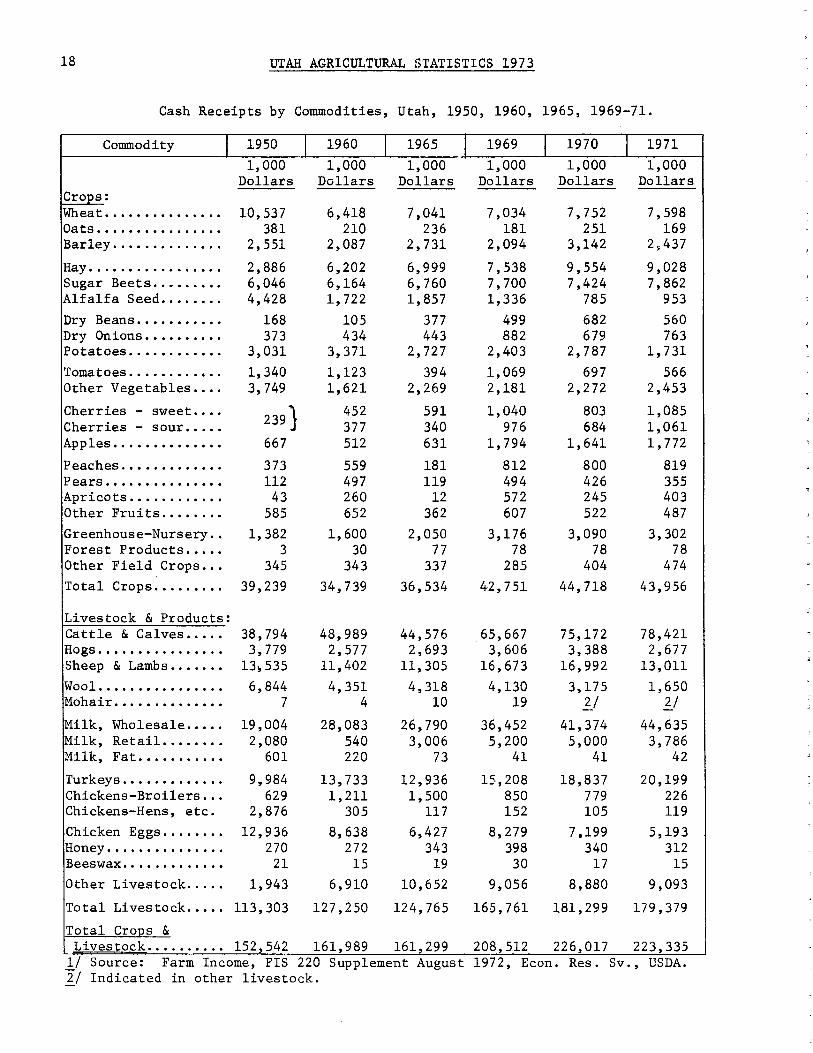
Cash receipts by Utah farmers for agricultural products sold in 1972 totaled 242.0 million dollars. This was a record high and 18.7 million or 8.3 percent above 1971. Livestock and livestock products accounted for 83.1 percent of the total, and crops 16.9 percent. The percent of total for livestock and livestock products was up appreciably from the 80.3 percent in 1971 and was the highest of record. Net farm income in 1972 at $73.9 million increased 22.8 percent from 1971 as cash receipts increased more rapidly than production expenses.
Receipts from individual items in 1972 are not yet available. For 1971, commodities or groups of connnodities in order of their relative importance and the percent of total cash receipts each accounted for were as follows: cattle and calves, 35.1 percent; milk, 21.7 percent; turkeys, 9.0 percent; sheep and wool, 6.6 percent; small grains (wheat, oats, and barley), 4.6 percent; hay, 4.1 percent; sugar beets, 3.5 percent; fruits, 2.7 percent; vegetables (onions and processing vegetables), 2.7 percent; chickens and eggs, 2.5 percent; and hogs, 1.2 percent. Other livestock and products accounted for 4.2 percent, and other crops, 2.1 percent.
The relative importance of livestock and livestock products has increased in the past 20 years. Cattle have shown a substantial increase during that period. In 1950, receipts from the sales of cattle and calves were 25.4 percent of the total cash receipts from all agricultural commodities. By 1960, this had risen to 30.2 percent. It was 33.2 percent in 1970 and rose to 35.1 percent in 1971, past one-third of the all connnodity total. Milk sales have also made substantial gains in importance -- rising from 14.2 percent of the total cash receipts in 1950 to 17.8 percent in 1960 and 21.7 in 1971. Third ranking turkeys have been fluctuating between 7.3 and 9.0 percent of the total cash receipts for the past 10 years. The sheep industry, which ranks fourth in cash receipts, declined from 13.4 percent of the total in 1950 to 9.7 in 1960 and 6.6 percent in 1971. These four classes accounted for 72 percent of the total cash receipts from agriculture in 1971.
Among the crops, small grain sales accounted for the greatest cash receipts in 1971--4.6 percent. Hay was second with 4.1 percent. The relative importance of hay in the state's total cash receipts more than doubled from 1950 to 1971 -- from 1.9 percent to 4.1 percent. Fruits and dry beans also accounted for a larger portion of agriculture's income in 1971 than 1950. However, most other crops declined in relative importance with small grains contributing only 4.6 percent in 1971 compared with 8.8 percent in 1950. The percentages for sugar beets, alfalfa seed, and total vegetables were all down substantially.
Realized gross income per farm in Utah averaged $20,159 in 1972, an increase of $2,181 from 1971. This was more than double the 1960 average. Realized net income per farm after deducting production expenses from

UTAH AGRICULTURAL STATISTICS 1973 17
gross income was $5,474 in 1972, an increase of $1,171 from a year earlier. This was 2.6 times the 1960 average. Utah's average net farm income is substantially lower than bordering states -- probably because of the larger portion of small farms in Utah operated by people who get the majority of their income from other sources. The only western state with a lower average is Oregon.
Production expenses during 1971 totaled 191.4 million dollars. Largest items were 46.2 million for feed, 35.7 million for depreciation and other consumption of capital, and 26.2 for repairs and operation of capital items.
I
L I V
Cattle 35.1%
Milk 21.7%
CASH RECEIPTS BY COMMODITIES, UTAH, 1971
--1
18 UTAH AGRICULTURAL STATISTICS 1973
Cash Receipts by Commodities, Utah, 1950, 1960, 1965, 1969-71.
Commodity I 1950 I 1960 I 1965 I 1969 I 1970 I 1971
1,000 1,000 1,000 1,000 1,000 1,000 Dollars Dollars Dollars Dollars Dollars Dollars
Crops: 'Wlleat • ..•••.•••.•••• 10,537 6,418 7,041 7,034 7,752 7' 598 Oats . •..•........... 381 210 236 181 251 169 Barley ...•.•...•.•.. 2,551 2,087 2,731 2,094 3,142 2,437
Hay . ..•.••...••..•.. 2,886 6,202 6,999 7,538 9,554 9,028 Sugar Beets •.•.•••.• 6,046 6,164 6,760 7,700 7,424 7,862 Alfalfa Seed •.•••... 4,428 1, 722 1,857 1,336 785 953 Dry Beans ..•.•.....• 168 105 377 499 682 560 Dry Onions ••.•••..•• 373 434 443 882 679 763 Potatoes •.....•••.•. 3,031 3, 371 2, 727 2,403 2,787 1,731 Tomatoes .••....•.•.. 1,340 1,123 394 1,069 697 566 Other Vegetables ..•• 3,749 1,621 2,269 2,181 2, 272 2,453
Cherries - sweet .... 239}
452 591 1,040 803 1,085 Cherries - sour .•... 377 340 976 684 1,061 Apples . ............. 667 512 631 1,794 1,641 1, 772
Peaches . .••..•...•.. 373 559 181 812 800 819 Pears . .............. 112 497 119 494 426 355 Apricots .......•.... 43 260 12 572 245 403 Other Fruits ..•••... 585 652 362 607 522 487 Greenhouse-Nursery .. 1,382 1,600 2,050 3,176 3,090 3,302 Forest Products .•.•. 3 30 77 78 78 78 Other Field Crops •.. 345 343 337 285 404 474 Total Crops ......... 39,239 34,739 36,534 42,751 44,718 43,956
Livestock & Products: Cattle & Calves ..... 38,794 48,989 44,576 65,667 75,172 78,421 Hogs . •..•.••.••••.•• 3, 779 2, 577 2,693 3,606 3,388 2, 677 Sheep & Lambs ....... 13~535 11,402 11,305 16,673 16,992 13,011 Wool ..... ........... 6,844 4,351 4,318 4,130 3,175 1,650 Mohair .............. 7 4 10 19 :?:./ ]:_/ Milk, Wholesale •.... 19,004 28,083 26,790 36,452 41,374 44,635 Milk, Retail .....•.. 2,080 540 3,006 5,200 5,000 3,786 Milk, Fat •.......... 601 220 73 41 41 42
Turkeys ... .......... 9,984 13,733 12,936 15,208 18,837 20,199 Chickens-Broilers ... 629 1,211 1,500 850 779 226 Chickens-Hens, etc. 2,876 305 117 152 105 119 Chicken Eggs ........ 12,936 8,638 6,427 8,279 7,199 5,193 Honey .....•......... 270 272 343 398 340 312 Beeswax ............. 21 15 19 30 17 15 Other Livestock ...•. 1,943 6,910 10,652 9,056 8,880 9,093
Total Livestock .•... 113,303 127,250 124,765 165,761 181,299 179,379
Total Crops & Livestock .......... 152,542 161,989 161,299 208,512 226,017 223,335
1/ Source: Farm Income, FIS 220 Supplement August 1972, Econ. Res. Sv., USDA. I_! Indicated in other livestock.

UTAH AGRICULTURAL STATISTICS 1973 19
Cash Receipts, Gross and Net Income from Farming, Utah, 1940, 1950, 1960, 1965, 1970-72.
I 1940 I 1950 I 1960 I 1965 I 1970 I 1971 !/ I 1972 y
Mil. Mil. Mil. Mil. Mil. Mil. Mil. _ $_ _ $_ _$ _ _ $ _ _ $ _ _$_ _$ _
Total for State
Cash Receipts: Crops ........................................... 12.6 36.5 44.7 44.0 40.8 Livestock and Livestock Products ................ 34.0 124.8 181.3 179.4 201.2 Crops and Livestock ............•......•......... 46.6 152.5 162.0 161. 3 226.0 223.3 242.0
Government Payments ............................. 2.8 2.4 6.6 8.8 11.1 10.3 Total. .......................................... 49.4 154.9 168.6 170.1 237.2 233.6
Value of Products Consumed on Farms ............... 3.7 6.8 4.4 3.8 4.7 4.3 Gross Rental Value of Farm Dwellings .............. 6.7 7.4 10. 5 12.4 13. 7 Realized Gross Farm Income ]:_/ ..................... 168.4 180.3 184.3 254.3 251. 7 272 .1
Farm Production Exp·enses ....•......•.••..•......•. 108.6 139.8 152.0 190.3 191.4 Realized Net Farm Income l_/ ...•....•..........••.• 59.8 40.6 32.3 64.0 60.2 73.9 Net Change in Farm Inventories .. , ................. +4.4 -5.6 +7.1 +1.5 +5.0
Total Net Farm Income !i_I •••• •••••••••••••••••••••• 64.2 35.0 39.4 65.5 65.2
Average Per Farm 21 Dal. Dal. Dal. Dal. Dal. Dal. Dal.
Realized Gross Income per Farm .................... 6,527 9,491 11, 170 17,538 17,978 20,159 Realized Net Income per Farm ...................... 2,320 2,136 1,955 4,414 4,303 5,474 Total Net Income per Farm ......................... 2,489 1,841 2,388
1/ Source: Farm Income Situation FIS221, Econ. Res. Service, USDA, February 1973. ]:_/ Cash receipts plus value of products consumed on farms plus gross rental value of farm dwellings. l_/ Realized gross farm income less farm production expenses. 4/ Realized net farm income plus net change in farm inventories. 21 Farm numbers used to compute averages: 196S - 16,500; 1970 - 13,800; 1971 - 13,400; 1972 - 13,000.
Farm Operating Expenses, Utah, 1950, 1960, 1965, 1969-71.
Item I
Feed ...•...........................•...........•...... Livestock ............. , .............................. .
Seed ................................................. . Fertilizer & Lime .................................... .
Repairs and Operation of Capital Items ............... . !Miscellaneous ...............................•.........
Hired Labor •.......................•.................• Total Current Farm Operating Expenses ................ .
Depreciation & Other Consumption of Farm Capital ..... . Taxes of Farm Property ...•..............•.•.•....•....
Interest on Farm Mortgage Debt ..•......•.............. Net Rent to Nonfarm Landlords ........................ .
Total Production Expenses .. .......................... .
1950
Mil. _ $_
25.9 12.2
2.7 1. 7
15.8 11.5
14.7 84.5
13.3 5.7
2.1 2.9
108.6
\ 1960 \
Mil. _$_
32.1 11.6
2.2 1.9
21.4 16.4
15.0 100.7
20.9 8.0
5.2 4.9
139.8
1965
Mil. _$_
32.4 7.9
2.4 3.1
23.0 20.0
14.2 102.9
26.8 10.0
6.7 5.6
152.0
\ 1969 !/ \ 1970 !/ \ 1971 11
Mil. _ $_
39.8 14.8
2.6 3.9
25.1 25.6
14 .8 126.6
33.2 10.4
8.0 5.7
184.0
Mil. _$ _
44.1 14.6
2.6 4.1
25.5 27.1
15.1 133.1
33.6 10.5
8.0 5.1
190.3
Mil. _$ _
46.2 9.0
2.8 4.3
26.2 27.4
15.4 131.3
35.7 10.8
8.3 5.3
191.4
],_/ Source: Farm Income Situation, FIS 220, and FIS 220 Supplement, Economic Research Service, USDA, August, 1972.

20 UTAH AGRICULTURAL STATISTICS 1973
field &SeedCrops Stanley R. Kayle, Agricultural Statistician
Summary: Total crop production in Utah during 1972 was 97.9 percent of the 1957 - 59 average and 9.0 points below 1971. The 1972 crop output was the lowest since 1966. Reductions in output from 1971 were experienced in all crop groups except fresh market vegetables. The greatest reduction was in fruit production where the index fell to nearly "O" or 108.5 points below the previous year.
Warm weather during February and the first three weeks of March resulted in tree fruits starting to bloom much earlier than usual. Severe freezes the last week of March and recurring freezes in April essentially wiped out Utah's fruit crop. Continued cool weather into the summer slowed alfalfa hay growth and resulted in a light cutting from the first crop. The season was generally favorable for other crops in the northern part of the state where irrigation water supplies were good. The central and southern part of the state had a drought from the first of the year well into the summer with nonirrigated crops and ranges damaged greatly. Also, some irrigated areas in southern Utah ran short of water. Grain harvest was completed under normal conditions. A late frost allowed for an extended period of harvest for late season vegetables and field crops. However, wet weather in the fall caused some loss of late season crops. Sugar beet harvest was slow and difficult and a small acreage was lost. About one-third of the dry bean acreage was caught by rain and snow and could not be harvested. Some late hay in Central Utah was lost in the windrow.
Corn: Silage equivalent of corn for grain production was included in corn silage estimates in the past but separate estimates were made in 1972. Production of corn silage in Utah was a record high 1,173,000 tons in 1972. This was 20 percent more than the quantity produced in 1971 and 33 percent more than that produced in 1970. Yield was 17.0 tons per acre on 69,000 acres compared with 17.5 tons per acre on 56,000 acres in 1971. Corn silage acreage has been increasing in recent years and has gone from 49,000 acres harvested in 1970 to 56,000 acres in 1971 to 69,000 acres in 1972. The value of corn silage production in Utah in 1972 amounted to 13.5 million dollars. The only crop produced in the state with a higher value in 1972 was hay. There has been a considerable expansion in production of corn for grain in the past few years in connection with a promotion program and installation of corn dryers at several locations. Some 1972 acreage planted for grain was harvested for silage because of the high hay prices which resulted in high silage prices. Corn for grain production totaled 736,000 bushels in 1972 -- 37 percent less than last year and 18 percent below 1970. Yield at 92.0 bushels per acre from 8,000 acres compared with 78.0 bushels per acre from 15,000 acres in 1971. The 1972 acreage of corn harvested for all purposes was an all time record high of 79,000 acres. Nearly all corn in Utah is grown on irrigated land and is
_grown wherever the season permits, but the heaviest concentrations are from Utah County north.
I , I
. l t
UTAH AGRICULTURAL STATISTICS 1973 21
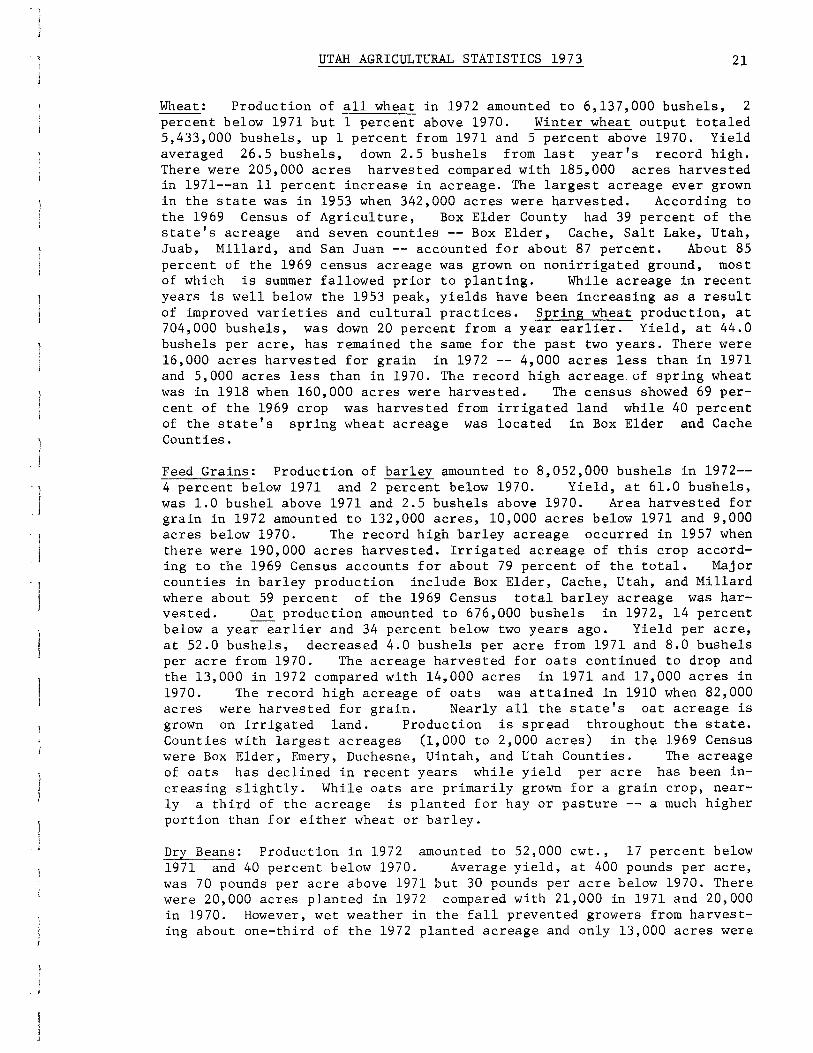
Wheat: Production of all wheat in 1972 amounted to 6,137,000 bushels, 2 percent below 1971 but 1 percent above 1970. Winter wheat output totaled 5,433,000 bushels, up 1 percent from 1971 and 5 percent above 1970. Yield averaged 26.5 bushels, down 2.5 bushels from last year's record high. There were 205,000 acres harvested compared with 185,000 acres harvested in 1971--an 11 percent increase in acreage. The largest acreage ever grown in the state was in 1953 when 342,000 acres were harvested. According to the 1969 Census of Agriculture, Box Elder County had 39 percent of the state's acreage and seven counties -- Box Elder, Cache, Salt Lake, Utah, Juab, Millard, and San Juan -- accounted for about 87 percent. About 85 percent of the 1969 census acreage was grown on nonirrigated ground, most of which is summer fallowed prior to planting. While acreage in recent years is well below the 1953 peak, yields have been increasing as a result of improved varieties and cultural practices. Spring wheat production, at 704,000 bushels, was down 20 percent from a year earlier. Yield, at 44.0 bushels per acre, has remained the same for the past two years. There were 16,000 acres harvested for grain in 1972 -- 4,000 acres less than in 1971 and 5,000 acres less than in 1970. The record high acreage of spring wheat was in 1918 when 160,000 acres were harvested. The census showed 69 percent of the 1969 crop was harvested from irrigated land while 40 percent of the state's spring wheat acreage was located in Box Elder and Cache Counties.
Feed Grains: Production of barley amounted to 8,052,000 bushels in 1972--4 percent below 1971 and 2 percent below 1970. Yield, at 61.0 bushels, was 1.0 bushel above 1971 and 2.5 bushels above 1970. Area harvested for grain in 1972 amounted to 132,000 acres, 10,000 acres below 1971 and 9,000 acres below 1970. The record high barley acreage occurred in 1957 when there were 190,000 acres harvested. Irrigated acreage of this crop according to the 1969 Census accounts for about 79 percent of the total. Major counties in barley production include Box Elder, Cache, Utah, and Millard where about 59 percent of the 1969 Census total barley acreage was harvested. Oat production amounted to 676,000 bushels in 1972, 14 percent below a year earlier and 34 percent below two years ago. Yield per acre, at 52.0 bushels, decreased 4.0 bushels per acre from 1971 and 8.0 bushels per acre from 1970. The acreage harvested for oats continued to drop and the 13,000 in 1972 compared with 14,000 acres in 1971 and 17,000 acres in 1970. The record high acreage of oats was attained in 1910 when 82,000 acres were harvested for grain. Nearly all the state's oat acreage is grown on irrigated land. Production is spread throughout the state. Counties with largest acreages (1,000 to 2,000 acres) in the 1969 Census were Box Elder, Emery, Duchesne, Uintah, and Utah Counties. The acreage of oats has declined in recent years while yield per acre has been increasing slightly. While oats are primarily grown for a grain crop, nearly a third of the acreage is planted for hay or pasture -- a much higher portion than for either wheat or barley.
Dry Beans: Production in 1972 amounted to 52,000 cwt., 17 percent below 1971 and 40 percent below 1970. Average yield, at 400 pounds per acre, was 70 pounds per acre above 1971 but 30 pounds per acre below 1970. There were 20,000 acres planted in 1972 compared with 21,000 in 1971 and 20,000 in 1970. However, wet weather in the fall prevented growers from harvesting about one-third of the 1972 planted acreage and only 13,000 acres were

22 UTAH AGRICULTURAL STATISTICS 1973
harvested compared with 19,000 in 1971 and 20,000 in 1970--the 1972 crop season was poor in the dry bean area of Utah (San Juan County) in the southeast part of the state. Beans were planted at normal dates and came up to generally good stands. However, parts of the bean area were short of moisture during the growing season and growth was only fair. An extremely wet fall slowed harvest and early snows caught 7,000 acres still in the field. This was a heavy loss to many growers. The largest bean acreage ever planted in the state was 21,000 acres in 1971 but the record high acreage harvested was in 1970 when 20,000 acres were·cut and threshed.
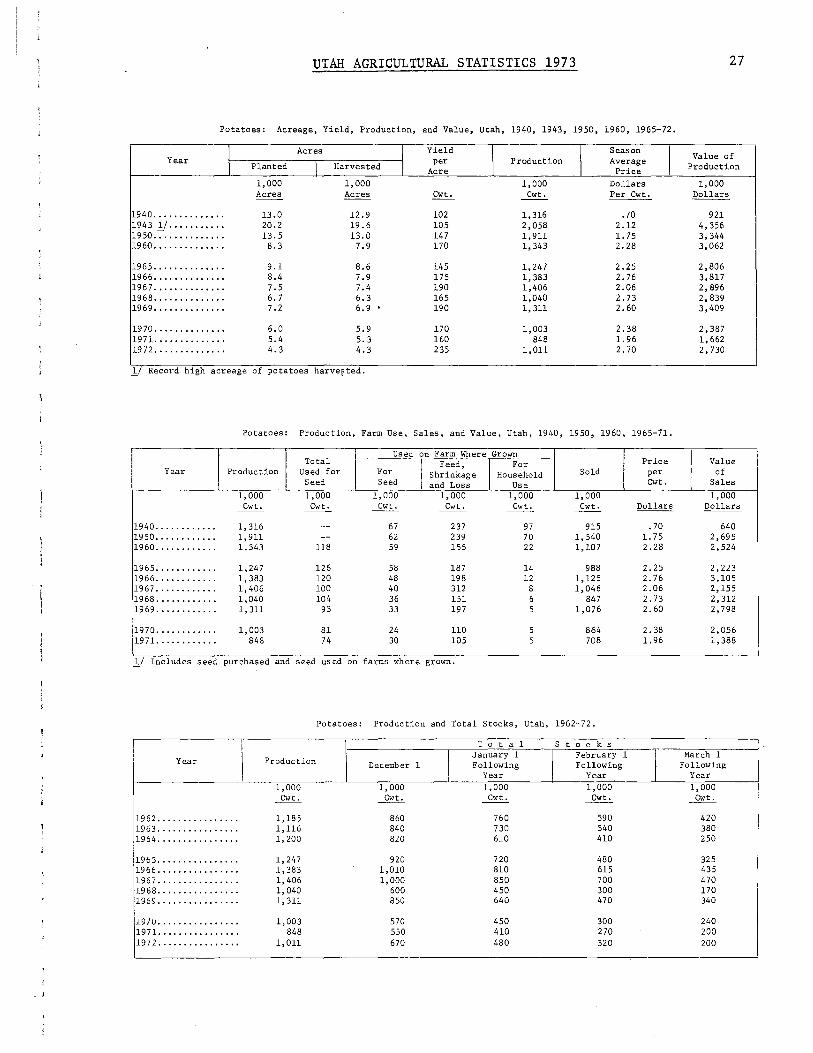
Potatoes: Growers harvested 4,300 acres of potatoes in 1972, down 1,000 from 1971 and the smallest acreage in over 100 years, since early pioneer days. However, yield per acre at 235 cwt. was up 75 cwt. and was the best ever. Production of 1,011,000 cwt. was the seventh smallest crop since 1901 but larger than last year's small crop with higher yield more than offsetting the drop in acreage. The largest potato acreage in Utah was recorded in 1943 when there were 19,600 acres harvested. Since that time, acreage has steadily declined in the state. All the state's potato production is on irrigated land. The Enterprise-Beryl area, located in Iron and Washington Counties of southwestern Utah, is the major producing area in the state. There has been some increase in north central Utah the past few years for late summer and early fall market but other producing areas have been steadily reducing their acreage.
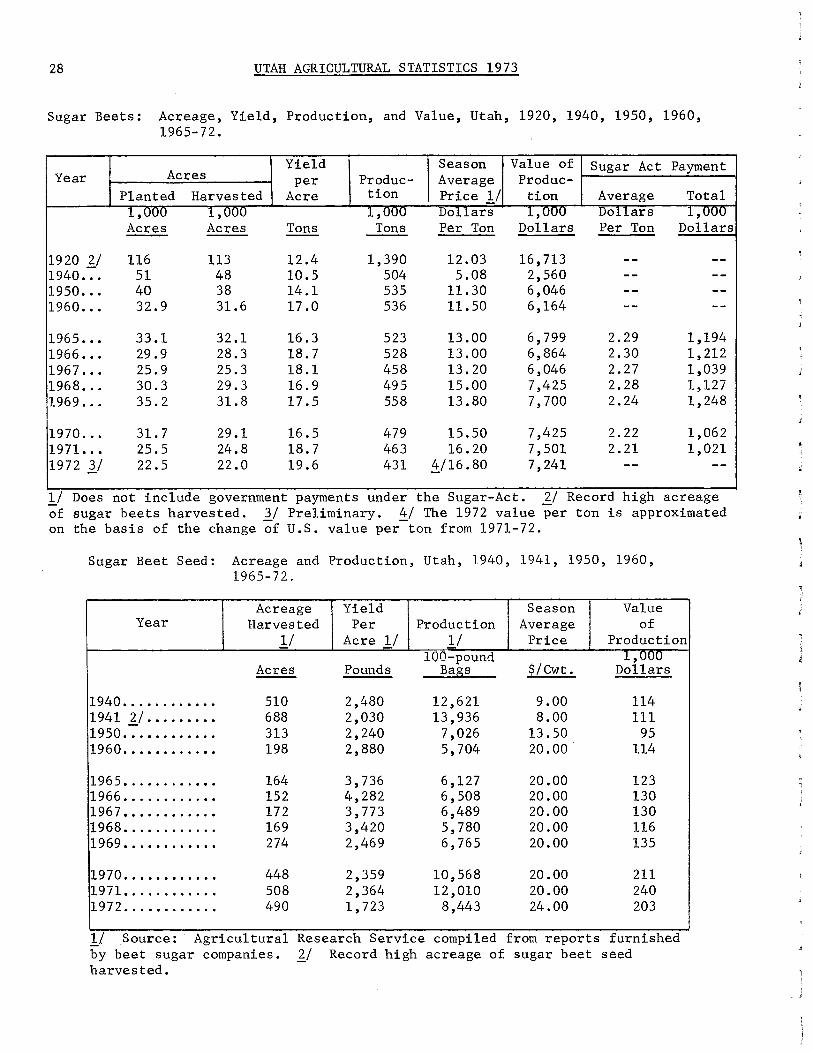
Sugar Beets: Production of sugar beets in 1972 amounted to 431,000 tons, 7 percent below a year earlier and 10 percent below 1970. Yield averaged 19.6 tons per acre from 22,000 acres compared with 18.7 tons per acre from 24,800 acres in 1971. The 19.6 tons is a record high for the state and was the result of a very favorable season plus the continued reduction of acreage in lower yielding areas. Early season growth was slowed by cool temperatures but beets made very good growth after mid-June. Wet weather during most of the sugar beet harvest season made harvest slow and difficult. A small acreage of beets was frozen in the ground. The record high acreage of beets harvested in Utah was attained in 1920 when there were 113,000 acres. As acreage has decreased, additional factories in the state have closed and as.additional factories have closed, freight rates have increased and a further reduction in acreage has resulted. The West Jordan plant closed at the end of the 1970 season and the Lewiston plant closed at the end of 1971. This left only the Garland plant operating in 1972. Box Elder is by far the leading sugar beet county with most of the remaining 1971 acreage along the Wasatch Front.
Hay Crops: Production of all hay in 1972 totaled 1,513,000 tons. This is 4 percent less than in 1971 and 8 percent less than 1970. Alfalfa hay production totaled 1,297,000 tons in 1972, 6 percent below a year earlier and 9 percent below 1970. Yield for alfalfa hay averaged 2.85 tons per acre in 1972 compared with 3.05 tons per acre a year ago and 3.25 tons per acre two years ago. Poor growing weather in the spring reduced yields from first crop sharply which more than offset some increase in acreage. Hay (all classes) is the major crop grown in Utah. The 586,000 acres harvested in 1972 accounted for more than half of the tota~acreage of all crops harvested. Hay is grown throughout the state although its relative importance is least in nonirrigated grain farming sections.

UTAH AGRICULTURAL STATISTICS 1973 23
Alfalfa Seed: Growers harvested 9,000 acres of alfalfa for seed in 1972, down 5,000 acres from 1971 and the smallest of record. Yield averaged 330 pounds of clean seed per acre--up 40 pounds and a record high. Production totaled 2,970,000 pounds, 27 percent below 1971 and 5 percent below 1970. Currently, production is pretty well limited to the area around Delta in Millard County and a small acreage is in northern Utah. Most other areas have dropped out of alfalfa seed production. The few growers still growing alfalfa seed are using improved cultural practices and some had very good yields in 1972. The record high acreage of alfalfa seed was harvested in 1925 when seed was taken from 71,700 acres of alfalfa.
Sugar Beet Seed: Production of sugar beet seed in Utah totaled 8,443 cwt. in 1972. This was 30 percent below 1971 and 20 percent below 1970. Yield per acre was 1,723 pounds in 1972 compared with 2,364 pounds per acre in 1971. Essentially, all the 1972 production was in Washington County in southwestern Utah.

24 UTAH AGRICULTURAL STATISTICS 1973
Corn: Acreage Planted and Acreage Harvested by Use, Utah, 1940, 1950, 1960, 1965-72.
I Planted I Harvested
Year Total I Total I For
I For
I For
Silage Grain Forage 1/
1,000 1,000 1,000 1,000 1,000 Acres Acres Acres Acres Acres
1940 ........•....... 29 27 10 10 7 1950 ...•............ 31 30 21 5 4 1960 ................ 49 47 41 3 3
1965 ................ 41 40 34 3 3 1966 ................ 43 42 38 2 2 1967 .•.............. 46 45 40 3 2 1968 ................ 46 45 41 3 1 1969 ................ 54 53 46 6 1
1970 .......•........ 63 62 49 10 3 1971. ......•.....•.. 75 73 56 15 2 1972 1/ ............. 80 79 69 8 2
1.1 Includes corn hogged, grazed, and that cut and fed without removing ears. 11 Record high acreage of corn.
Corn for Silage: Acreage, Yield, Production, and Value, Utah, 1940, 1950, 1960, 1965-72.
Year
1940 ............... . 1950 ............... . 1960 ............... .
1965 .•..........•... 1966 ............... . 1967 ............... . 1968 ............... . 1969 ............... .
1970 .......•........ 1971. ......•........ 1972 ±_/ ........... ..
I Acres
Harvested
1,000 Acres
10 21 41
34 38 40 41 46
49 56 69
I Yield
per Acre
Tons
9.4 11.0 14 .5
15.0 16.0 18.5 17.0 17.5
18.0 17.5 li.O
±_/ Record high acreage of corn harvested for silage.
I Production
1,000 Tons
94 231 594
510 608 740 697 805
882 980
1,173
I Season Average Price
Dollars Per Ton
7.50 8.00
8.40 9.80 8.60 8 .10 8.30
9.80 lG.00 11.50
I Value
of Production
1,000 Dollars
1,732 4,752
4,284 5,958 6,364 5,646 6,682
8,644 9,800
13,490
Corn Harvested for Grain: Acreage Harvested, Yield, Production, Sales, and Value, Utah, 1940, 1950, 1960, 1965-72.
Value of Production Acres Yield Exel. Price Support Incl. Price Support Sales
Year Harvested per Production Season
I Season
I I Value ±_/ Acre Total Total Average Value Average Value Quantity Price Price
1,000 1,000 Dollars 1,000 Dollars 1,000 1,000 1,000 Ar.:.res Bushel Bushel ~ Dollars per Bu. Dollars Bushels Dollars
1940 •...... 10 29.0 290 -- -- -- -- -- --1950 ....... 5 50.0 250 -- -- -- -- -- --1960 ....... 3 64.0 192 1. 50 288 -- -- 48 72
1965 ....... 3 75.0 225 1.47 331 1. 77 399 79 116 1966 ....... 2 80.0 160 1. 43 229 2.13 340 40 57 1967 ......• 3 76.0 228 1.38 315 1. 77 403 84 116 1968 •...... 3 70.0 210 1.30 27 3 1. 71 360 69 90 1969 ....... 6 85.0 510 1.35 689 1.61 819 275 371
1970 ...•... 10 90.0 900 1.40 1,260 1.56 1,407 495 693 1971 2/ .... 15 78.0 1,170 1.40 1,638 J_, 63 1,910 725 1,015 1972.-:-..... 8 92.0 736 1. 74 1,281 !.21 1, 624 420 731
±_/ Quantity sold times season average price. 11 Record high acreage of corn harvested for grain.
j
j

UTAH AGRICULTURAL STATISTICS 1973 25
Winter Wheat: Acreage, Yield, Production, and Value, Utah, 1940, 1950, 1953, 1960, 1965-72.
I Acres I Yield
I I Season
I Value
Year I I I
per Production Average of Pro-Planted Harvested Acre Price duct ion 1,000 1,000 1,000 Dollars 1,000 Acres Acres Bushel Bushel Per Bu. Dollars
1940 .............. 191 lSO 19.0 3,420 .63 2,155 1950 .•............ 344 326 16.0 5,216 1.86 9,702 1953 }). .......... 362 342 17.0 5,814 1.90 ll, 04 7 1960 .............. 193 181 18.5 3,348 1. 71 5, 725
1965 .............. 201 191 26.5 5,062 1.40 7,087 1966 .............. 205 195 24.0 4,680 1.65 7' 722 1967 .............. 246 238 28.5 6, 783 1. 42 9,632 1968 .............. 244 231 26.5 6,122 1.27 7' 775 1969 .............. 222 210 25.0 5,250 1.33 6,983
1970 .............. 200 191 27.0 5,157 1.41 7 ,271 1971. ............. 196 185 29.0 5,365 1.40 7 ,5ll 1972 .............. 218 205 26.5 5,433 ~/ 1. 60 8,693
)j Record high acreage of winter wheat harvested. ~/ Preliminary.
Spring Wheat: Acreage, Yield, Production, and Value, Utah, 1918, 1940, 1950, 1960, 1965-72.
I Acres I Yield
I I Season
I Value
Year I Planted I Harvested I Production Average of Pro-
Price duct ion 1,000 1,000 1,000 Dollars 1,000 Acres Acres Bushel Bushel Per Bu. Dollars
1918 1/ .... " .. ". 160 25.0 4,000 1.88 7,520 1940.-:-............ 68 66 31. 0 2,046 .65 1,330 IJ.950 .............. 84 82 32.0 2,624 1.86 4,881 IJ.960 .............. 52 48 40.5 1,944 1.61 3, 130
1965 .............. 40 38 44.0 1, 672 1.34 2,240 1966 .............. 30 28 45.0 1,260 1. 54 1,940 1967 .............. 33 32 45.5 1,456 1. 33 1,936 1968 .............. 31 28 41. 5 1,162 1.23 1,429 1969 .............. 25 24 42.0 1,008 1. 29 1,300
1970 .............. 23 21 44.0 924 1. 36 1,257 1971. ............. 21 20 44.0 880 1.40 1,232 1972 .............. 17 16 44.0 704 ~/1. 61 1,133
}) Record high acreage of spring wheat harvested. ~/ Preliminary.
All Wheat: Acreage, Yield, Production, and Value, Utah, 1940, 1950, 1953, 1960, 1965-72.
Season Value of Acres Average Pro due- Sales
Yield Produc- Season Value of Price + tion + Year Average
I Harvested
per ti on Production Price Price
I Planted Acre Price
Support Support Quantity Value }) Pavment Pavment
1,000 1,000 1,000 Dollars 1,000 Dollars 1,000 1,000 1,000 Acres Acres Bushel Bushel ~ Dollars Bushel Dollars Bushel Dollars --
1940 ...... 259 246 22.2 5,466 .64 3,498 -- --1950 ...... 428 408 19.2 7,840 1. 86 14,583 -- -- 5,108 9,501 1953 2/ ... 467 444 20.7 9,180 1. 89 17,350 -- --1900.-:-.... 245 229 23.1 5,292 1. 67 8,855 -- -- 4,172 6,967
1965 ...... 241 229 29.4 6,734 1.38 9,327 1. 70 ll, 421 6,098 8,415 1966 ...... 235 223 26.6 5,940 1. 62 9,665 2.15 12,744 5,333 8,639 1967 ...... 279 270 30.5 8,239 1.40 ll, 568 1. 87 15,413 7,553 10,574 1968 ...... 275 259 28.1 7,284 1. 26 9,204 1. 79 13,070 6,590 8,303 1969 ...... 247 234 26.7 6,258 1. 32 8,283 2.01 12,595 5,466 7 ,215
1970 ...... 223 212 28.7 6,081 1.40 8,528 2.15 13,080 5,333 7,466 1971 ...... 217 205 30.5 .6' 245 1.40 8,743 2.14 13,393 5,475 7,665 1972 ...... 235 221 27.8 6,137 1. 70 10,433 2.35 14,419 5,429 9,229
1/ Quantity sold times season average price excl. price support. ~/ Record high acreage of all wheat harvested.

26 UTAH AGRICULTURAL STATISTICS 1973
Barley: Acreage, Yield, Production, Sales, and Value, Utah, 1940, 1950, 1957, 1960, 1965-72.
Acres Value of Production
Sales Yield Exel. Price Support Incl. Price Support Year
I Produc-
Season l Season I Quantity I Har-
per ti on Total Total
Planted Acre Average Average Value 1:/ vested Price Value Price Value
1,000 1,000 1,000 . Dollars 1,000 Dollars 1,000 1,000 1,000 Acres Acres Bushel Bushel per Bu. Dollars per Bu. Dollars Bushel Dollars
1940 ...•... 109 107 41.0 4,387 .46 2,018 -- -- 1,009 464 1950 ....... 146 141 44.0 6,204 1.16 7,197 -- -- 2,109 2,446 1957 2/ .•.• 197 190 45.0 8,550 .93 7, 952 -- --1960.-:-....• 160 147 43.5 6,394 1.00 6,394 -- -- 1,982 1,982
1965 ....... 147 142 57.0 8,094 1.07 8,661 1.09 8,846 2,833 3,031 1966 ..•.... 154 146 50.0 7,300 1.14 8,322 1.17 8,556 2, 774 3,162 1967 ....... 142 137 61.0 8,357 1.03 8,608 -- -- 2,674 2,754 1968 ....•.. 149 141 55.0 7,755 1.01 7,833 -- -- 2,869 2,898 1969 ...•... 149 140 55.5 7, 770 1.06 8,236 1.09 8,473 2,642 2,801
1970 ...•... 148 141 58.5 8,249 1.07 8.826 1.10 9,049 3,217 3,442 1971 ...••.. 151 142 60.0 8,520 1.14 9,713 -- -- 2, 726 3,108 1972 ....... 143 132 61.0 8,052 1.35 10,870 1.46 ll, 729 3,221 4,348
_!/ Quantity sold times season average price--excluding price support. !:._/ Record high acreage of barley harvested.
Oats: Acreage, Yield, Pro due tion, Sales, and Value, Utah, 1910, 1940, 1950, 1960, 1965-72.
I Acres I Yield
I Production I Season
I Value I Sales
Year per Average of I Planted I Harvested I Acre Price Production I Quantity I Value }j
1,000 1,000 1,000 Dollars 1,000 1,000 1,000 Acres Acres Bushel Bushel per Bu. Dollars Bushel Dollars
1910 2/ ......... 82 39. 5 3,239 .49 1,587 1940.-:-.......... 46 39 39.0 1,521 .34 517 167 57 1950 ............ 56 51 45.0 2, 295 .89 2,043 367 327 1960 ..•...•..... 29 23 46.0 1,058 .83 878 201 167
1965 .........•.• 32 23 56.0 1,288 .81 1,043 296 240 1966 ............ 30 19 52.0 988 .81 800 237 192 1967 ............ 28 19 63.0 1,197 .80 958 215 172 1968 ............ 30 19 52.5 998 . 79 788 240 190 1969 ............ 26 18 56.0 1,008 .78 786 242 189
1970 ............ 24 17 60.0 1,020 .76 775 255 194 1971 ............ 23 14 56.0 784 .82 643 157 129 1972 ............ 24 13 52.0 676 1.05 710 142 149
_!/ Quantity sold times season average price. !:._/ Record high acreage of oats harvested.
Dry Beans: Acreage, Yield, Production, Sales, and Value, Utah, 1940, 1950, 1960, 1965-72.
I Acres I Yield
I Seas On
I I Sales Production I Value of Year
I per Average
I Planted I Harvested I Acre Clean Price Production Quantity I Value 1/ 1,000 1,000 1,000 Dollars 1,000 1,000 1,000 Acres Acres Pounds Cwt. per Cwt. Dollars Cwt. Dollars
1940 ..•..•..••.. 9 9 500 40 3.55 142 38 135 1950 .•........•. 12 ll 280 27 6.40 173 26 166 1960 ............ 8 6 300 10 7.10 128 17 121
1965 ......•..... 10 10 500 50 8.50 425 48 408 1966 ......••.... ll ll 560 62 6.20 384 60 372 1967 •.•.......•• 10 10 680 68 8.10 551 66 535 1968 ..•......... 13 13 510 66 6.40 422 64 410 1969 •.•......... 16 16 500 80 8.20 656 77 631
1970 2/ .•....... 20 20 430 86 7.90 679 83 656 1971.-:-•.•...•... 21 19 330 63 10.40 655 60 624 1972 .•.•......•. 20 13 400 52 8.10 452 49 426
_!/ Quantity sold times season average price. !:_I Record high acreage of dry beans harvested.
UTAH AGRICULTURAL STATISTICS 1973 27
Potatoes: Acreage, Yield, Production, and Value, Utah, 1940, 1943, 1950, 1960, 1965-72.
I Acres I Yield
I I Season
Value of Year I Planted I Harvested I
per Production Average Production Acre Price 1,000 1,000 1,000 Dollars 1,000 Acres Acres Cwt. Cwt. Per Cwt. Dollars
1940 ..•......•.... 13.0 12.9 102 1,316 .70 921 1943 1/ ........... 20.2 19 .6 105 2,058 2.12 4,356 1950.-:-..•......... 13. 5 13.0 147 1,911 1. 75 3,344 1960 .............• 8.3 7.9 170 1,343 2.28 3,062
1965 .............. 9.1 8.6 145 1,247 2.25 2,806 1966 .............. 8.4 7.9 175 1,383 2.76 3,817 1967 .............. 7.5 7.4 190 1,406 2.06 2,896 1968 .............. 6.7 6.3 165 1,040 2.73 2,839 1969 ....•......... 7.2 6.9 . 190 1, 3ll 2.60 3,409
1970 .............. 6.0 5.9 170 1,003 2.38 2, 387 1971. ............. 5.4 5.3 160 848 1. 96 1,662 1972 •.......•..... 4.3 4.3 235 1,011 2.70 2,730
1_/ Record high acreage of potatoes harve?ted.
Potatoes: Production, Farm Use, Sales, and Value, Utah, 1940, 1950, 1960, 1965-71.
Used on Farm Where Grown Total
I Feed,
I For Price Value
Year Production Used for For Shrinkage Household Sold per of Seed Seed and Loss Use Cwt. Sales
1,000 1,000 1,000 1,000 1,000 1,000 1,000 Cwt. Cwt. Cwt. Cwt. Cwt. Cwt. Dollars Dollars --
1940 ............ 1,316 -- 67 237 97 915 .70 640 1950 ............ 1,911 -- 62 239 70 1,540 1. 7 5 2,695 1960 ............ 1,343 118 59 155 22 1,107 2.28 2,524
1965 ............ 1,247 126 58 187 14 988 2.25 2,223 1966 ............ 1,383 120 48 198 12 1,125 2.76 3,105 1967 .....•...... 1,406 100 40 312 8 1,046 2.06 2,155 1968 ............ 1,040 104 36 151 6 847 2.73 2,312 1969 ............ l,3ll 93 33 197 5 1,076 2.60 2,798
1970 ............ 1,003 81 24 llO 5 864 2.38 2,056 1971. ........... 848 74 30 105 5 708 1.96 1,388
1_/ Includes seed purchased and seed used on farms where grown.
Potatoes: Production and Total Stocks, Utah, 1962-72.
T o t a 1 s t 0 c k s
I January 1
I February 1
I March 1
Year Production December 1 Following Following Following Year Year Year
1,000 1,000 1,000 1,000 1,000 Cwt. Cwt. Cwt. Cwt. Cwt. --
1962 ................ 1,185 860 760 590 420 1963 ................ l,ll6 840 730 540 380 (964 ................ 1,200 820 610 410 250
1965 ................ 1,247 920 720 480 325 11966 .•.............. 1,383 1,010 810 615 435 1967 ................ 1,406 1,000 850 700 470 1968 ................ 1,040 600 450 300 170 1969 ................ l,3ll 850 640 470 340
1970 ................ 1,003 570 450 300 240 1971. ............... 848 550 410 270 200 1972 ................ l,Oll 670 480 320 200
28 UTAH AGRICULTURAL STATISTICS 1973
Sugar Beets: Acreage, Yield, Production, and Value, Utah, 1920, 1940, 1950, 1960, 1965-72.
Yield Season Value of Sugar Act Payment Year Acres per Produc- Average Produc-
Planted Harvested Acre ti on Price 1/ ti on Average Total l,Uuu l,uuu l,uuu Dollars T,oou DoTiars l,uuu Acres Acres Tons Tons Per Ton Dollars Per Ton Dollars --
1920 ]j 116 113 12.4 1,390 12.03 16' 713 -- --1940 •.. 51 48 10.5 504 5.08 2,560 -- --1950 ... 40 38 14.1 535 11.30 6,046 -- --1960 ..• 32.9 31.6 17.0 536 11.50 6,164 -- --
1965 ... 33.1 32.l 16.3 523 13.00 6,799 2.29 1,194 1966 .•. 29.9 28.3 18.7 528 13.00 6,864 2.30 1,212 1967 ... 25.9 25.3 18.1 458 13. 20 6,046 2.27 1,039 1968 .•. 30.3 29.3 16.9 495 15.00 7,425 2.28 1,127 1969 •.. 35.2 31.8 17.5 558 13.80 7,700 2.24 1,248
1970 .•. 31. 7 29.1 16.5 479 15.50 7 ,425 2.22 1,062 1971 •.• 25.5 24.8 18.7 463 16.20 7,501 2.21 1,021 1972 1/ 22.5 22.0 19.6 431 ~/16.80 7,241 -- --l/ Does not include government payments under the Sugar-Act. 2/ Record high acreage of sugar beets harvested. ll Preliminary. ~/ The 1972 value per ton is approximated on the basis of the change of U.S. value per ton from 1971-72.
Sugar Beet Seed: Acreage and Production, Utah, 1940, 1941, 1950, 1960, 1965- 72.
Acreage Yield Season Value Year Harvested Per Production Average of
1/ Acre 1/ 1/ Price Production 100-pound 1,uuu
Acres Pounds Bags $/Cwt. Dollars --1940 . ........... 510 2,480 12,621 9.00 114 1941 ]j ......... 688 2,030 13,936 8.00 111 1950 ...•........ 313 2,240 7,026 13.50 95 1960 ..........•• 198 2,880 5,704 20.00 114
1965 •........••. 164 3,736 6,127 20.00 123 1966 ..........•• 152 4,282 6,508 20.00 130 196 7 •.....•..•.. 172 3, 773 6,489 20.00 130 1968 ............ 169 3,420 5,780 20.00 116 1969 . ........... 274 2,469 6,765 20.00 135
1970 ...•..•...•• 448 2,359 10,568 20.00 211 1971 •........... 508 2,364 12,010 20.00 240 1972 ....•......• 490 1, 723 8,443 24.00 203
. . . l/ Source: Agricultural Research Service compiled from reports furnished by beet sugar companies. 11 Record high acreage of sugar beet seed harvested.

I
' . J
UTAH AGRICULTURAL STATISTICS 1973 29
Sugar Beets: Acreage and Production by Counties!:__/, Utah, 1967-72.
Acreage Production Acreage Production County Farms
WlantedlHarvested Per
I !Farms
Wlanted !Harvested Per I Total Acre Total Acre
No. Acres Acres Tons Tons No. Acres Acres Tons Tons -- -- -- -- -- -- -- -- -- --1 9 6 7 1 9 6 8
Box Elder ... 241 8,910 8,750 17.7 154,700 261 10,930 10 ,670 18.8 200,300 Cache ....... 133 2,200 2,060 11. 9 24,500 171 2,820 2,650 14.2 37,700 Weber ....... 97 2,410 2,330 20.5 47,800 88 2,290 2 ,170 20.1 43 '700 Davis ....... 91 2,320 2,280 21. 8 49,800 87 2,220 2 ,160 18.1 39,100
!Salt Lake ... 85 2,680 2 ,640 19. 8 52,300 91 3 ,030 2 ,980 17.9 53,400
Utah ........ 126 3,750 3,690 18.6 68,700 126 4,410 4,200 15 .1 63,500 Juab ........ 1 90 90 15.6 1,400 1 160 160 12.5 2,000 Sanpete ..... 36 940 930 14.9 13,900 42 1,060 1,050 11.1 11,700 Sevier ...... 43 1,060 1,040 17.0 17,700 67 1,630 1,590 12.8 20,300 Iron ........ 1 240 210 13.8 2,900 3 380 320 9.4 3,000 Carbon ...... 16 1,300 1,280 19 .o 24,300 18 1,370 1,350 15.0 20,300
Total ....... 870 25,900 25 '300 18.1 458,000 955 30 ,300 29,300 16.9 495,000
1 9 6 9 1 9 7 0 Box Elder ... 273 13,470 12,290 17.2 211,000 269 13. 220 11, 900 17.3 206,400 Cache ....... 183 3,350 2,370 14.1 33,500 167 3,140 2, 720 16.0 43,600 Weber ....... 82 2 ,120 1,900 20.5 38,900 71 2,350 2,260 19.8 44,80@ Davis ....... 86 2,310 2 ,llO 20.9 44,200 65 1,870 1,780 19.0 33,900 Salt Lake ... 88 3,580 3,510 19.9 70,000 76 3,230 3,llO 16.5 51,400
Utah ........ 162 5,llO 4,950 18.2 90,300 120 3,880 3,730 15.4 57,600 Juab ........ 1 130 130 11.5 1,500 2 280 180 12.2 2,200 Millard ..... 9 510 280 7.5 2,100 4 240 170 4.1 700 Sanpete ...•. 32 870 790 13.4 10,600 23 590 570 11. 4 6,500 Sevier ...... 77 2 ,210 2,010 16.2 32,600 60 1,580 1,460 12.6 18,400
Iron ........ 1 220 140 10. 7 1,500 1 130 90 11.1 1,000 Carbon ...... 16 1,320 1,320 16.5 21,800 14 1,140 1,090 ll.2 12,200 Emery ....... -- -- -- -- -- 1 50 40 7.5 300
Total. ...... 1,010 35,200 31,800 17.5 558,000 873 31,700 29,100 16.5 479,000
1 9 7 1 1 9 7 2 Box Elder ... 246 12,060 ll,790 19.1 225,500 219 ll, 470 11, 260 19.0 214,000 Cache ....... 144 2,820 2,670 15.1 40,300 117 2,380 2,270 16.4 37,300 Weber ....... 66 2,190 2,160 21. 6 46,600 56 1,940 1,940 22.5 43,600 Davis ....... 51 1,650 1,620 22.8 37,000 48 1,680 1,630 23.9 38,900 Salt Lake ... 68 2,750 2,620 19.4 50,700 54 2,160 2,140 19.5 41,800
Utah ........ 74 2, 720 2,660 16.6 44,200 68 2,330 2,170 19.3 41,800 Sanpete ..... 5 200 200 14.0 2,800 2 50 40 17.5 700 Sevier ...... 6 120 120 15.8 1,900 1 60 60 23.3 1,400 Carbon ...... 10 990 960 14.6 14,000 8 530 490 19.4 9,500
Total ....... 670 25,500 24,800 18.7 463,000 573 22,600 22,000 19.5 429,000
!/ County estimates are based on Utah A.S.C.S. Annual Reports of Farm Programs adJusted to S.R.S. State estimates, rounded to 10 acres and 100 tons.

30 UTAH AGRICULTURAL STATISTICS 1973
All Hay: Acreage, Yield, Production, and Value, Utah, 1930, 1940, 1950, 1960, 1965-72.
I Acres
I Yield
I I Season
I I Sales Value of Year
Harvested per Production Average [ 1 Value !:._/ Acre Price Production Quantity
1,000 1,000 Dollars 1,000 1,000 1,000 Acres Tons Tons per Ton Dollars Tons Dollars
1930 1/ ..•..... 686 2.02 1,383 8.60 ll,894 1940.-:-....•.... 553 1.92 1,059 10.50 ll,120 191 2,006 1950 ........... 534 1.91 1,020 22.20 22,644 143 3,175 1960 .•..•...... 566 2.26 1,281 26.40 33,818 243 6,415
1965 ......•.... 573 2.86 1,638 23.00 37,674 311 7,153 1966 .....•...•. 547 2.66 1,454 26.50 38,531 276 7,314 1967 .•...•..... 561 2.99 1, 677 23.50 39,410 436 10,246 1968 .......•... 553 2.66 1,469 22.00 32,318 367 8,074 1969 ........... 549 2.85 1,564 24.00 37,536 313 7,512
1970 ........... 563 2. 91 1,638 25.00 40,950 426 10,650 1971. .•...•.... 578 2.74 1,584 29.50 46' 728 317 9,352 1972 .....•..... 586 2.58 1, 513 35.00 52,955 333 11, 655
}j Record high acreage of all hay harvested. !:._/ Quantity sold times season average price.
Hay Crops: Acreage, Yield, Production, Utah, 1940, 1950, 1960, 1965-72.
Yield Yield
I Acres
I I I Acres I I Year per Production Year per Production
Harvested Harvested Acre Acre
1,000 1,000 1,000 1,000 Acres Tons Tons Acres Tons Tons --
Alfalfa Hay All Other Hay y
1940 ......•.... 431 2.10 905 1940 .......... 122 1.26 154 1950 ........... 361 2.20 794 1950 .......... 173 1.31 226 1960 .....•..... 439 2.55 1,119 1960 .......... 127 1.28 162
1965 .....•..... 450 3.20 1,440 1965 .......... 123 1.61 198 1966 ........... 437 2.95 1,289 1966 .......... 110 1.50 165 1967 ........... 441 3.35 1,477 1967 .......... 120 1.67 200 1968 .....•....• 437 2.95 1,289 1968 .......... 116 1.55 180 1969 ........... 428 3.20 1,370 1969 .......... 121 1.60 194
1970 ........... 441 3.25 1,433 1970 .......... 122 1.68 205 1971. ........•. 450 3.05 1,373 1971. ......... 128 1.65 2ll 1972 ........... 455 2.85 1,297 1972 .......... 131 1.65 216
Jo/ Includes clover-timothy hay, grain hay, other tame hay and wild hay for which separate estimates were discontinued in 1971.
Alfalfa Seed: Acreage, Yield, Production, Sales, and Value, Utah, 1925, 1940, 1950, 1960, 1965-72.
I Acres
I
Yield
I I Season
I Value of I Sales
Year per Production Average Harvested Acre Price Production I Quantity I Value 2/
1,000 1,000 Dollars 1,000 1,000 1,000 Acres Pounds Pounds Eer Cwt. Dollars Pounds Dollars
1925 1/ ........ 71. 7 275 19, 718 14.80 2,918 Not available 1940.-:-.•...••.. 54 83 4,500 14.30 644 Not available 1950 ........... 57 165 9,405 49.50 4,655 8,888 4,400 1960 ........•.. 45 185 8,325 24.30 2,023 8,300 2,017
1965 ........... 40 125 5,000 35.20 1,760 4,950 1,742 1966 ........... 35 140 4,900 36. 50 1,789 4,851 1, 771 1967 ........•.. 30 180 5,400 40.20 2,171 5,346 2,149 1968 ........... 30 115 3,450 35.00 1,208 3, 381 1,183 1969 ........•.. 24 140 3,360 36.00 1,210 3,326 1,197
1970 ....•...... 16 195 3,120 33.00 1,030 3,089 1,019 1971. ..•....... 14 290 4,060 32.20 1,307 4,019 1,294 1972 ........... 9 330 2,970 47. 50 l,4ll 2,940 1,397
Jo/ Record high acreage of alfalfa seed harvested. !:._/ Quantity sold times season average price.

. 1
UTAH AGRICULTURAL STATISTICS 1973
Grain Stocks - Wheat: On Farms, Off Farms, and Total, by Quarters, Utah, 1961-72.
January 1, April 1, July 1,
31
Year Beginning
October 1, Stocks
Stocks, Follow- Stocks, Follow- Stocks, Follow-
1961 ........... . 1962 ........... . 1963 ........... . 1964 ........... . 1965 ........... .
1966 ........... . 1967 ........... . 1968 ........... . 1969 ........... . 1970 ........... . 1971 ........... . 1972 ........... .
1961 ........... . 1962 •........... 1963 ........... . 1964 .....•...... 1965 .........•..
1966 ........... . 1967 ........... . 1968 ........... . 1969 ........... . 1970 ........... . 1971 ........... . 1972 ........... .
1961 ........... . 1962 ...•......•. 1963 ........... . 1964 ........... . 1965 ........... .
1966 ........... . 1967 ..•......... 1968 ........... . 1969 ........... . 1970 ........... . 1971 ........... . 1972 ........... .
1,000 Bushels
1,624 2,118 2,270 2,662 2,694
2,138 3, 708 3,788 2,628 3,588 3,435 2,884
6,460 6,402 6,491 7,124 6,892
7,095 8,250 7,801 5,982 5,424 5,048 7,923
8,084 8,520 8,761 9,786 9,586
9,233 11, 958 11, 589
8,610 9,012 8,483
10,807
ing Year ing Year ing Year 1,000
Bushels
On Farms 1,325 1,575 1,584 2,088 1,684
1,723 2, 966 2, 185 1, 7 52 2,068 2,373 2,332
Off Farms_l/ 3,670 5,366 4,998 4,460 5,543
5,032 5,491 5,237 4,871 5,323 5,556 5,813
Total All Positions 4,995 6,941 6,582 6,548 7,227
6,755 8,457 7,422 6,623 7,391 7,929 8,145
1,000 Bushels
556 489 634 887 673
1,247 1,236
728 1,001 1,034 1,311 1,105
3,200 3,061 4,227 2,316 3,432
3,364 3,666 3,250 3,983 4,252 4,184 5,053
3,756 3,550 4,861 3,203 4,105
4,611 4,902 3,978 4,984 5,286 5,495 6,158
1,000 Bushels
299 380 422 470 471
891 494 364 501 304 406
2,481 1,169 1,552 1,240 1,513
2,180 2,595 2,006 2, 467. 2,264 2,707
2,780 1,549 1,974 1,710 1,984
3,071 3,089 2,370 2,968 2,568 3,113
1/ Includes stocks at mills, elevators, warehouses, terminals, processors, and CCC owned grain at bin sites .
32 UTAH AGRICULTURAL STATISTICS 1973
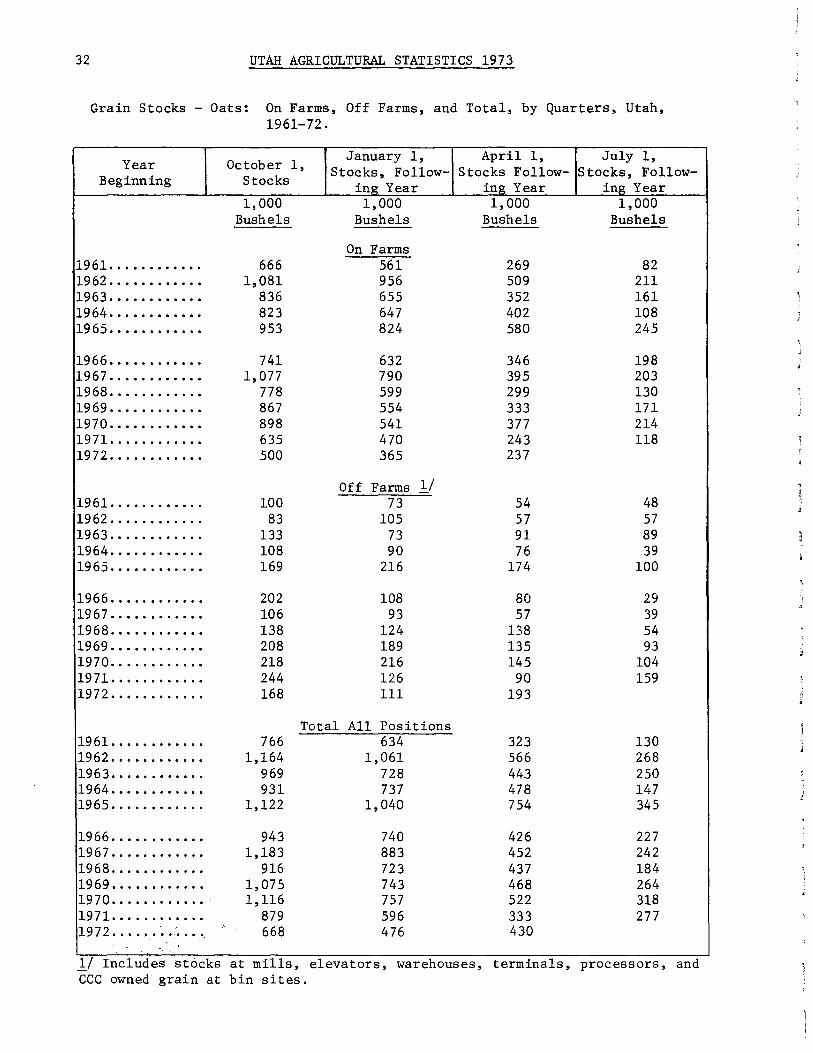
Grain Stocks - Oats: On Farms, Off Farms, and Total, by Quarters, Utah, 1961-72.
Year October 1, January 1, April 1, July 1,
Stocks, Follow- Stocks Follow- Stocks, Follow-Beginning Stocks ing Year ing Year ing Year
1,000 1,000 1,000 1,000 Bushels Bushels Bushels Bushels
On Farms 1961 ............ 666 561 269 82 1962 ...•.......• 1,081 956 509 211 1963 . ........... 836 655 352 161 1964 ............ 823 647 402 108 1965 ........•..• 953 824 580 245
1966 ............ 741 632 346 198 1967 ............ 1, 077 790 395 203 1968 .....•...... 778 599 299 130 1969 ............ 867 554 333 171 1970 . ........... 898 541 377 214 1971 ............ 635 470 243 118 1972 ............ 500 365 237
Off Farms 1/ 1961 •.•......... 100 73 54 48 1962 ..•......... 83 105 57 57 1963 ......•..... 133 73 91 89 1964 ............ 108 90 76 39 1965 ............ 169 216 174 100
1966 ..........•. 202 108 80 29 196 7 ...•....•... 106 93 57 39 1968 .•.......... 138 124 138 54 1969 .•.•..•..... 208 189 135 93 1970 ............ 218 216 145 104 1971. e e e I I I I I I I I 244 126 90 159 197 2 .••......... 168 111 193
Total All Positions 1961 ............ 766 634 323 130 1962 ... ......... 1,164 1,061 566 268 1963 ......•..... 969 728 443 250 1964 . ........... 931 737 478 147 1965 ..... ....... 1,122 1,040 754 345
1966. I I I I e I I I I I I 943 740 426 227 1967 .•.•........ 1,183 883 452 242 1968 ..•......... 916 723 437 184 1969 ...•...•.... 1,075 743 468 264 1970 ............ ' 1,116 757 522 318 1971 ............ 879 596 333 277 1972 ...... ~.~ ..• " 668 476 430
1/ Includes stocks at mills, elevators, warehouses, terminals, processors, and CCC owned grain at bin sites.

.. '
. l l j
i
'
UTAH AGRICULTURAL STATISTICS 1973 33
Grain Stocks - Barley: On Farms, Off Farms, and Total by Quarters, Utah, 1961-72.
Year Beginning
1961 ........... . 1962 ........... . 1963 ........... . 1964 ........... . 1965 ........... .
1966 ........... . 1967 ........... . 1968 ........•... 1969 ........... . 1970 ........... . 1971 ........... . 1972' ...•........
1961 ........... . 1962 ........... . 1963 ........... . 1964 ........... . 1965 ........... .
1966 ........... . 1967 ........... . 1968 ........... . 1969 ........... . 1970 ........... . 1971 ........... . 1972 ........... .
1961 ......•..... 1962 ........... . 1963 ........... . 1964 ........... . 1965 ........... .
1966 ........... . 1967 ........... . 1968 ........... . 1969 ... ~ ....... . 1970 ........... . 1971 ........... . 1972 ........... .
October 1, Stocks
1,000 Bushels
4,086 5,192 4,859 3,601 4,614
4,891 6,184 5,661 4,895 5,939 5,538 5,314
1,678 1,657 2,273 1,879 2,754
3,504 2,427 2,800 1,880 3,990 2,253 3,452
January 1, Stocks, Follow
ing Year 1,000
Bushels
On Farms 2,546 3,255 3,948 2,598 3,642
3,869 4,095 3,490 4,196 3,795 4,430 3,221
Off Farms 1./ 937
1,331 1,640 1,304 2,135
1,546 1, 712 1,512 1,910 3,110 1,.391 2,563
5,764 6,849 7,132 5,480 7,368
Total All Positions 3,483
8,395 8,611 8,461 6, 775 9,929 7,791 8,766
4,586 5,588 3,902 5, 777
5,415 5,807 5,002 6, 106 6,905 5,.821 5,784
April 1, Stocks, Follow
ing Year 1,000
Bushels
1,362 2,015 2,354 1,181 1,862
1,387 2,006 1.551 1,943 2,062 1,704 2,013
707 1,012
730 669
1,007
845 1,180
935 1,537 1,364 1,254 1,066
2,069 3,027 3,084 1,850 2,869
2,232 3, 186 2,486 3,480 3,426 2, 958 3,079
July 1, Stocks, Follow
ing Year 1,000
Bushels
533 1,008 1,063
472 1,052
1,022 919 931
1,166 577
1,022
191 404 378 265 375
351 321 398 578 755 653
724 1,412 1,441
737 1,427
1,373 1,240 1,329 1,744 1,332 1,675
1./ Includes stocks at mills, elevators, warehouses, terminals, processors,. and. CCC owned grain at bin sites.
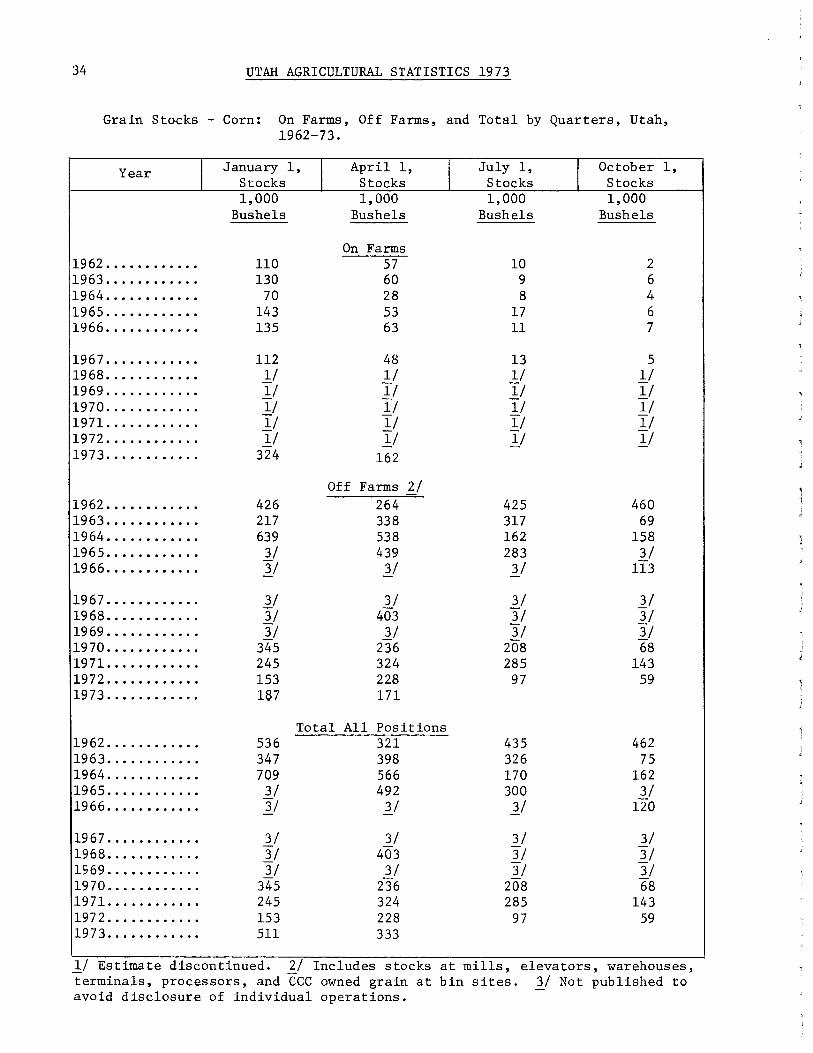
34 UTAH AGRICULTURAL STATISTICS 1973
Grain Stocks - Corn: On Farms, Off Farms, and Total by Quarters, Utah, 1962-73.
Year I January 1, I April 1,
I July 1, I October 1,
Stocks Stocks Stocks Stocks 1,000 1,000 1,000 1,000
Bushels Bushels Bushels Bushels
On Farms 19 62 .....•.•.... 110 57 10 2 1963 ............ 130 60 9 6 1964 .....•...... 70 28 8 4 1965 ...•......•. 143 53 17 6 1966 ............ 135 63 11 7
196 7 ............ 112 48 13 5 19 68 •..•.•.•..•. ll ll ll ll 1969 ..•..•...... II ll ll ll 1970 ............ ll ll ll ll 1971 ............ ll II II ll 1972 ............ Jj II II II 1973 ... ......... 324 162
Off Farms 21 1962 ...........• 426 264 425 460 1963 ... ......... 217 338 317 69 1964 ............ 639 538 162 158 1965 ............ 31 439 283 '}_I 1966 ..•..•...... }I '}_I 31 113
196 7 .....•..•... 31 31 31 31 1968 .....•...... 31 403 31 31 1969 ...•........ 31 l_I }I 11 1970 ........•... 345 236 208 68 1971 ............ 245 324 285 143 1972 .....••..... 153 228 97 59 1973 .....••..... 187 171
Total All Positions 1962 .....•...... 536 321 435 462 1963 ...•.•...... 347 398 326 75 1964 ...•.•...... 709 566 170 162 1965 ............ 31 492 300 31 1966 .....•...... }I 31 l_I lZO
1967 ............ 31 31 31 31 1968 .....•..•... 31 403 31 31 1969 ..•..•...... 31 l_I 11 11 1970 .....•...... 345 236 208 68 1971 .•...•...... 245 324 285 143 197 2 ............ 153 228 97 59 197 3 ...........• 511 333
1/ Estimate discontinued. ]:./ Includes stocks at mills, elevators, warehouses, terminals, processors, and CCC owned grain at bin sites. l_I Not published to avoid disclosure of individual operations.

- j
UTAH AGRICULTURAL STATISTICS 1973
Grain Stocks - Sorghum: Off Farm and Total by Quarters, Utah, 1962-73.
Y~ar
1962 ........... . 1963 ........... . 1964 ........... . 1965 ........... . 1966 ........... .
1967 ........... . 1968 ........... . 1969 ........... . 1970 ........... . 1971 ........... . 1972 ........... . 1973 ........... .
I January 1, Stocks 1,000
Bushels
619 840 2/
550 272
496 2/
135 142 253 244 165
I April 1, Stocks 1,000
Bushels
0.ff Farms 1./ 1,681
890 695 699 ]j
422 2/
113 146 243 407
84
I July 1, Stocks 1,000
Bushels
1,736 543 584 341
87
485 286 145 247 222 234
I October 1, Stocks 1,000
Bushels
593 2/
588 244 154
2/ 25 23
298 205 321
35
1/ Includes stocks at mills, elevators, warehouses, terminals, processors, and CCC owned grain at bin sites. 2/ Not published to avoid disclosure of individual operations.

36 UTAH AGRICULTURAL STATISTICS 1973
Fruits
J. Craig Thomas, Agricultural Statistician
General: Fruit in Utah has a history dating back to the early pioneers. The acreage in fruit orchards reached a peak of about 20,000 acres in the mid-1940's. Since then the acreage has dropped to about 12,000 as a result of subdivisions taking orchard lands and competition from other states. Recently there has been some increase in apple and tart cherry plantings while apricot and pear tree numbers show a steady decline.
Commercial fruit production in the state includes apples, peaches, pears, sweet cherries, tart cherries, and apricots. Commercial apple growers have concentrated on four major varieties -- Jonathan, Delicious, Golden Delicious, and Rome Beauty--with Delicious having over 50 percent of the total production in most recent years. Most of Utah's fruit trees are concentrated in a narrow band from Box Elder County on the north into Utah County on the south. The 1972 fruit tree count showed nearly two-thirds of the fruit trees in orchards of 25 or more trees located in Utah County and another 17 percent is in Box Elder. Utah County has the most trees for each fruit except apricots which are concentrated most heavily in Box Elder and Weber. Other important fruit producing counties are Cache, Davis, Salt Lake, and Washington.
Apples and peaches in Utah are grown primarily for fresh market and most apricots, sweet cherries, and pears are sold for fresh market although in some years some apricots are canned or frozen, some sweet cherries are brined, and some pears are shipped for canning in other states. The portion processed varies with the size and quality of the crop. Most tart cherries are processed--frozen, canned, or juice.
1972 Production: Utah's fruit orchards sustained heavy frost damage in late March and periodically through April and early May of 1972. Consequently production of apples, peaches, pears, sweet and tart cherries, and apricots was the lowest on record. Production of apples, at 4.0 million pounds, was less than one-sixth of the 1971 crop and was the smallest since 1890. Peach production, at 1.5 million pounds, was about one-tenth of the 1971 production. Pear production, at 200 tons, was only a small fraction of the 4,200 tons in 1971 and 4,300 tons in 1970. Although there was some production of sweet cherries in 1972, the crop was too small to warrant a quantitative estimate. There were 4,600 tons in 1971. Tart cherry production, at 650 tons, was less than one-tenth of the 6,700 tons produced in 1971 and about one-eighth of the 4,900 tons produced in 1970. Apricots were a complete failure with "O" production in 1972. This was the first time this has occurred for any fruit in any state. There were 3,200 tons harvested in 1971.
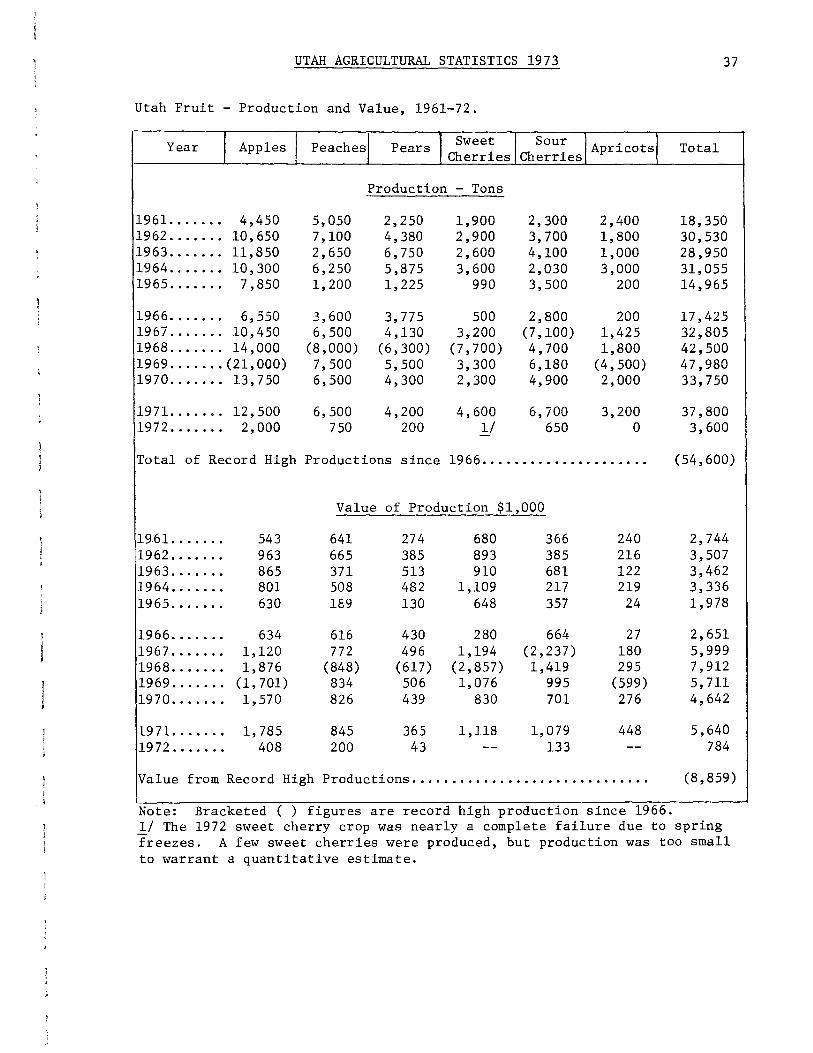
UTAH AGRICULTURAL STATISTICS 1973 37
Utah Fruit - Production and Value, 1961-72.
Year I Apples I Peaches! Pears J Swee~ I Sou: IA ricotsj Total Cherries Cherries p
1961. ..... . 1962 ......• 1963 ...... . 1964 ...... . 1965 ...... .
4,450 10,650 11, 850 10' 300
7,850
1966 ....... 6,550 1967 ....... 10,450 1968... . . . . 14' 000 1969 .....•. (21, 000) 1970 ....... 13,750
1971 ....... 12,500 1972 ....... 2,000
5,050 7,100 2,650 6,250 1,200
3,600 6,500
(8,000) 7,500 6,500
6,500 750
Production - Tons
2,250 4,380 6,750 5,875 1,225
3, 775 4,130
(6,300) 5,500 4,300
4,200 200
1,900 2,900 2,600 3,600
990
500 3,200
(7,700) 3,300 2,300
4,600 1/
2,300 3,700 4,100 2,030 3,500
2,800 (7,100) 4,700 6,180 4,900
6,700 650
2,400 1,800 1,000 3,000
200
200 1,425 1,800
(4,500) 2,000
3,200 0
Total of Record High Productions since 1966 ...............•.....
1961 ...... . 1962 ...... . 1963 ...... . 1964 ...... . 1965 ...... .
1966 ...... . 1967 ...... . 1968 ...... . 1969 ...... . 1970 ...... .
1971. ..... . 1972 ...... .
543 963 865 801 630
634 1,120 1,876
(1,701) 1,570
1,785 408
Value of Production $1,000
641 665 371 508 189
616 772
(848) 834 826
845 200
274 385 513 482 130
430 496
(617) 506 439
365 43
680 893 910
1,109 648
280 1,194
(2,857) 1,076
830
1,118
366 385 681 217 357
664 (2,237) 1,419
995 701
1,079 133
240 216 122 219
24
27 180 295
(599) 276
448
Value from Record High Productions ..........................•...
Note: Bracketed ( ) figures are record high production since 1966.
18,350 30,530 28,950 31,055 14,965
17,425 32,805 42,500 47,980 33,750
37,800 3,600
(54,600)
2,744 3,507 3,462 3,336 1,978
2,651 5,999 7,912 5, 711 4,642
5,640 784
(8,859)
1/ The 1972 sweet cherry crop was nearly a complete failure due to spring freezes. A few sweet cherries were produced, but production was too small to warrant a quantitative estimate.

38 UTAH AGRICULTURAL STATISTICS 1973
Commercial Apples ]:_/: Production, Use, and Value, Utah, 1925, 1940, 1950, 1960, 1965-72.
Production Farm Value of Disposition Average
Year Total I Not I Having Home I Sold Price Produc-1 Sales
Utilized Value Use ti on 1,000 1,000 1,000 1,000 1,000 Dollars 1,000 1,000
Bu. Bu. Bu. Bu. Bu. :eer Bu. $ $
1925 ]) .... 1,300 -- 1,300 205 1,095 1.13 1,469 1,237 1940 ....... 465 57 408 44 364 .83 339 302 1950 ....... 282 -- 282 38 244 2.60 733 634
Million Million Million Million Million Cents 1,000 1,000 Lbs. Lbs. Lbs. Lbs. --- Lbs. per Lb. $ $
1960 ....... 10.3 -- 10.3 .4 9.9 4.82 496 477 1965 ....... 15.7 -- 15.7 .4 15.3 4.01 630 581
1966 ....... 13.6 . 5 13.1 .3 12.8 4.84 634 621 1967 ..••... 21.8 .9 20.9 . 3 20.6 5.36 1,120 1,102 1968 .•.••.. 28.0 -- 28.0 .3 27.7 6.70 1,876 1,856 1969 .•..... 51.0 9.0 42.0 .3 41. 7 4.05 1,701 1,689 1970 ....... 28.0 .5 27.5 .3 27.2 5. 71 1,570 1,548
1971. ...... 26.0 1.0 25.0 3/ 3/ 7.14 1,785 3/ 1972 ....... 4.0 -- 4.0 3! l/ 10. 20 408 3!
1/ Estimates through 1933 were for all apples. Since 1934 estimates are for ~ommercial production including orchards with more than 100 trees. 2/ Record high apple production. '1_/ Separate estimates for home use discontinued.
Connnercial Apples: Production by Varieties, Utah, 1969-72.
1969 1970 1971 1972
Variety Million Percent
Million Percent
Million Percent
Million Percent
of of of of Pounds Total Pounds Total Pounds Total Pounds Total
S tl1llID. er . . . . . . . . . . . . . .5 1.0 .3 1.0 .3 1.2 -- --Jonathan .••..•.•..• 6.7 13.0 3.6 13.0 3.4 13.1 .1 2.5 Other Fall ••.••.... .5 1.0 .3 1.0 .3 1.2 -- --Delicious .•..•.•... 26.5 52.0 17.2 61.5 14.9 57.3 . 6 15.0 Golden Delicious •.• 5.1 10.0 2.0 7.0 2.3 8.8 • 6 15.0
Rome Beauty .•...•.. 10.2 20.0 3.6 13.0 4.0 15.4 2.7 67.5 Winesap .•.•.....•.• .5 1.0 . 7 2.5 . 5 1.9 -- --Other Winter ••••••. 1.0 2.0 .3 1.0 . 3 1.1 -- --
Total ••.•.••••••••• 51. 0 100.0 28.0 100.0 26.0 100.0 4.0 100.0

UTAH AGRICULTURAL STATISTICS 1973 39
Peaches: Production, Use, and Value, 1922, 1940, 1950, 1960, 1965-72.
Production Farm Value of YE:ar Disposition Average
Total I Not [ Having Home I Sold Price Produc-1 Sales Utilized Value Use tion
1,000 1,000 1,000 1,000 1,000 Dollars 1,000 1,000 Bu. Bu. Bu. Bu. Bu. per Bu. $ $ --- ---
1922 ll .... 921 -- 921 41 880 1. 25 1,151 1,000 1940 ....... 738 -- 738 22 716 .80 590 573
I 1950 ....... ll2 -- ll2 15 97 3.85 431 373
Million Million Million Million M:tllion Cents 1,000 1,000 Lbs. Lbs. Lbs. Lbs. Lbs. per Lb. $ $
1960 ....... 8.6 -- 8.6 .4 8.2 6.82 587 559 1965 ....... 2.4 -- 2.4 .1 2.3 7.87 189 181 1966 ....... 7.2 -- 7.2 .3 6.9 8.55 616 590 1967 ....... 13.0 -- 13.0 .4 12.6 5.94 772 748 1968 ....... 16.0 -- 16.0 . 4 15.6 5.30 848 827
1969 ....... 15.0 -- 15.0 .4 14.6 5.56 834 812 1970 .. 0 •••• 13.0 -- 13.0 .4 12.6 6.35 826 800 1971. ...... 13.0 -- 13.0 2/ 2/ 6.50 845 2/ 1972 ....... 1.5 -- 1. 5 21 21 13.30 200 I! -
~
1/ Record high peach production. ±_/ Separate estimates of home use discontinue.
Pears: Production, Use, and Value, Utah, 1940, 1950, 1954, 1960, 1965-72.
I ! Farm I Average! Value Production Disposition of Year I Not I Having I Home
I j Price I Pr~duc-1 Total Utilized Value I Use Sold t1on Sales
1,000 1,000 1,000 1,000 1,000 Dollars 1,000 1,000 Bu. Bu. Bu. Bu. --- Bu. per Bu. $ $
1940 ....... 181 -- 181 8 173 .95 172 164 1950 ....... 35 -- 35 4 31 3.60 126 ll2 1954 1/ .... 350 -- 350 15 335 2.15 752 720
I 1,000 Dollars 1,000
Tons Tons Tons Tons Tons per Ton $ _$ __ -- -- -- -- --
1960 ....... 4,380 200 4,180 200 3,980 108. 00 451 430 1965 ....... 1,250 25 1,225 100 1,125 106.00 130 ll9 1966 ....... 4,000 225 3, 77 5 175 3,600 114. 00 430 410 1967 ....... 4,500 370 4, 130 75 4,055 120.00 496 487
I 1968 ....... 6,300 -- 6,300 125 6,175 98.00 617 599
1969 ....... 5,500 -- 5,500 125 5,375 92.00 506 494 1970 ....... 4,300 -- 4,300 125 4,175 102.00 439 426 1971. ...... 4,620 420 4,200 2/ '!:../ 87.00 365 2/ 1972 ....... 200 -- 200 I_! 2/ 214.00 43 2! - -
1/ Record high pear production. ±_/ Separate estimates of home use discontinued.

40 UTAH AGRICULTURAL STATISTICS 1973
Sweet Cherries: Production, Use and Value, Utah, 1940, 1950, 1960, 1965-72.
Production Farm Price Value of Year Disposition per
Total I Not !Having Home : Pr~duc-1 I
Sold I
ton Sales Utilized Value Use tion
1,000 1,000 Tons Tons Tons Tons Tons Dollars $ $ -- -- -- -- --
1940 ....... 3,100 -- 3,100 320 2,780 80.00 248 222 1950 ....... 440 -- 440 50 390 282.00 124 110 1960 ....... 1,200 -- 1,200 90 1,110 407 .oo 488 452
1965 ....... 990 -- 990 90 900 655.00 648 591 1966 ....... 500 -- 500 36 464 559.00 280 261 1967 ....... 3,200 --· 3,200 85 3, 115 373.00 1, 194 1,156 1968 1./ .... 7,700 -- 7,700 190 7,510 371.00 2,857 2, 771 1969 ..•.... 3,300 -- 3,300 100 3,200 326.00 1,076 1,040 1970 ....... 2, 300 -- 2,300 70 2,230 361.00 830 803
1971 ....... 4,600 -- 4,600 2/ 2/ 243.00 1,118 2/ -
1972 ....•.. 3/ -- 3/ -- -- -- -- --
1/ Record high sweet cherry production. J:../ Separate estimates of home use discontinued. }_/ The 1972 crop was nearly a complete failure due to spring freezes. A few sweet cherries were produced but production was too small to warrant a quantitative estimate.
Tart Cherries: Production, Use and Value, Utah, 1940, 1950, 1960, 1965-72.
I Farm I ! Production Disuoi;itiou I
Price Value of Year
1
per Total I Not I Having Home I Sold Ton Produc- I S 1 Utilized Value Use tion a es
1,000 1,000 Tons Tons Tons Tons Tons Dollars $ $ -- -- -- -- --
1940 ....... 2,300 -- 2,300 120 2,180 44.00 101 96 1950 ..•.... 800 -- 800 70 730 177 .oo 142 129 1960 ....... 2,800 -- 2,800 90 2, 710 139.00 389 377
1965 ....... 3,700 200 3,500 90 3,410 102. 00 357 340 1966 ....•.. 2,800 -- 2,800 70 2,730 237.00 664 647 1967 1/ .... 7,100 -- 7,100 70 7,030 315.00 2,237 2,144 1968 .:-..... 4,700 -- 4,700 70 4,630 302. 00 1,419 1,398 1969 ....... 6,700 520 6,180 80 6,100 161.00 995 976 1970 .•..... 4,900 -- 4,900 80 4,820 143.00 701 684
1971 ....... 6,700 -- 6,700 2/ 2/ 161. 00 1,079 2/ 1972 ....... 650 -- 650 2! 2! 205.00 133 2!
-1./ Record high tart cherry production. 2/ Separate estimates of home use discontinued.
I I !
I I
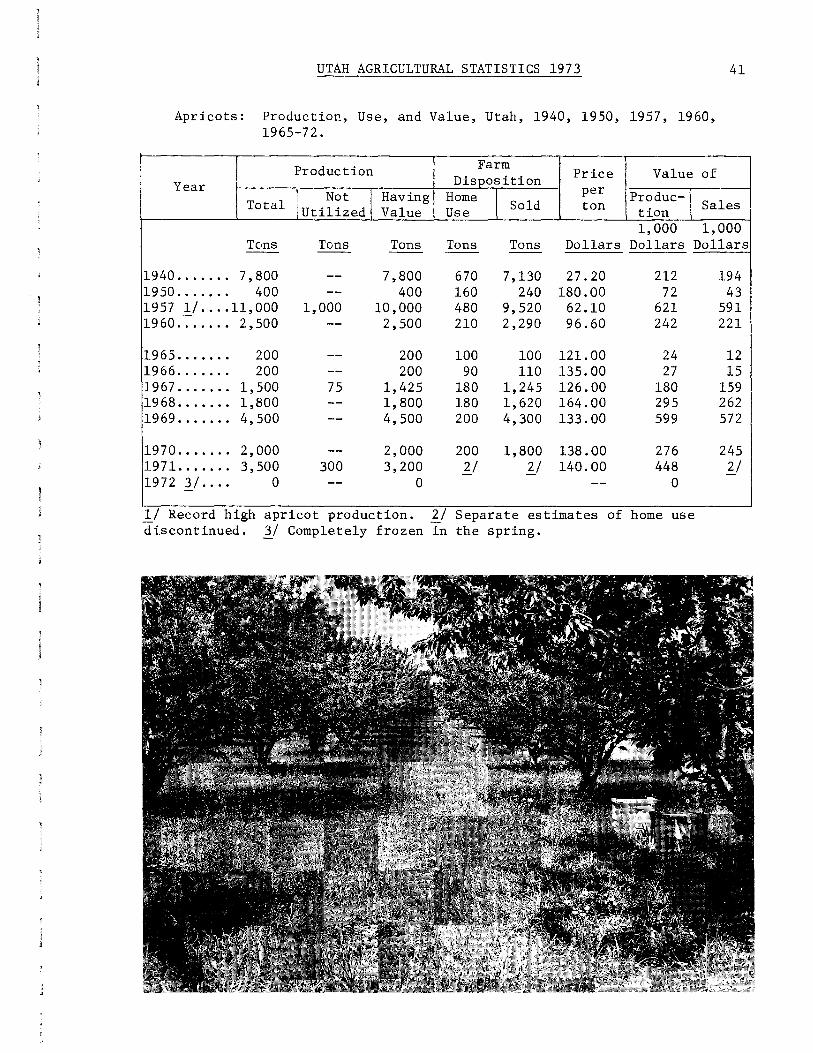
UTAH AGRICULTURAL STATISTICS 1973 41
Apricots: Production, Use, and Value, Utah, 1940, 1950, 1957, 1960, 1965-72.
Production Farm l Value of Price Year Disposition I
1 Not I Having Home I per
IPr~duc- ! Total I Utilized Value Use Sold ton Sales \ tion 1,000 1,000
Tons Tens Tons Tons Tons Dollars Dollars Dollars -- -- -- -- --
1940 ....... 7,800 -- 7,800 670 7,130 27.20 212 1950 ....... 400 -- 400 160 240 180.00 72 1957 _!/ .... 11,000 1,000 10,000 480 9,520 62.10 621 1960 ....... 2,500 -- 2,500 210 2,290 96.60 242
1965 ....... 200 -- 200 100 100 121.00 24 1966 ....... 200 -- 200 90 110 135. 00 27 1967 ....... 1,500 75 1,425 180 1,245 126.00 180 1968 •...... 1,800 -- 1,800 180 1,620 164.00 295 1969 ....... 4,500 -- 4,500 200 4,300 133.00 599
1970 ....... 2,000 -- 2,000 200 1,800 138.00 276 1971. ...... 3,500 300 3,200 Jj ]:_/ 140.00 448 1972 '}_/ .... 0 -- 0 -- 0
1/ Record high apricot production. 2/ Separate estimates of home use discontinued. '}_/ Completely frozen in the spring.
194 43
591 221
12 15
159 262 572
245 ]:_/
I
I
42 UTAH AGRICULTURAL STATISTICS 1973
UTAH FRUIT TREE SURVEY OF 1972
Ray J. Downs Director of Division of Plant Industry
Connnercial fruit production is largely limited to well-defined localized areas in Utah and its contribution to the economy in those areas is very significant. Since a highly specialized industry of this type requires large investments in land and equipment and relies heavily on a well-established and orderly marketing process, a periodic fruit tree survey is vital to provide growers, shippers, buyers, processors, and other interested parties with up-to-date information needed to facilitate and maintain successful marketing programs.
A detailed fruit tree survey was conducted by the Utah State Department of Agriculture during the spring and sunnner of 1972. District Agricultural Inspectors systematically surveyed every connnunity within every county in the state and obtained data on every known planting of fruit trees of commercial importance. In addition, the number of fruit trees was determined in nonconnnercial residential plantings, except in Salt Lake City and Ogden City. A conunercial planting was defined as a planting of 25 trees or more of a single kind of fruit or a combination of any of the fruits being surveyed. Actual number of trees, approximate age of trees, and spacing between trees were determined for each kind of fruit in each commercial planting. Whenever it was feasible, growers were contacted for such information; but, in most cases, data were obtained by actual field counts and field observations by the inspectors. In the case of nonconnnercial plantings, only the number of trees for each kind of fruit was determined.
The Statistical Reporting Service, United States Department of Agriculture, keypunched all data for commercial plantings and summarized data on the number of trees by age, connnunity, county, and state. The Plant Science Department, Utah State University, summarized spacing information from the punched cards to determine most common tree spacings for each type of fruit for different aged trees and to determine the number of acres in each commercial planting.
The 1972 Fruit Tree Survey showed a total of 1,268,594 fruit trees in commercial plantings in the State of Utah, which occupied approximately 11,929 acres of land. This represents an increase in the number of trees of about 12 percent over the number reported in a survey conducted in 1965, which is largely accounted for by new plantings of apples and sour cherries. During that seven-year period, there was a significant decline in apricots, pears, and prunes_, while there was little change in sweet cherries and peaches.
Apples are the leading kind of fruit grown in Utah comprising about 33 percent of all fruits, while peaches represent about 24 percent; sour cherries 19 percent; and sweet cherries 14 percent. Pears, apricots, and prunes represent lesser amounts of 6, 3, and 1 percent, respectively.

UTAH AGRICULTURAL STATISTICS 1973 43
The Utah State Department of Agriculture has prepared and published a detailed report of the 1972 fruit tree survey. All data have been tabulated and summarized for each individual fruit for each county and for the entire state. This report, entitled "Utah Fruit Tree Survey - 1972", is available at the Utah State Department of Agriculture, Room 412, State Capitol Building, Salt Lake City, Utah.
Following are summary tables from the 1972 survey, showing tree counts for all fruits in orchards of 25 trees or more for individual counties and for the state. Also shown on a state basis, are acreages of each fruit and relative importance of each by age category.
UTAH FRUIT TREE SURVEY, 1972 S S f N b T A d A tate ummary 0 um er rees, .ges, an creage
Total Percent Age Category Total Kind of Fruit Growers Trees of all Under ! 5-10 I Over Acres
1/ Fruits 5 yrs. years 10 yrs. 1/ Number Number Percent - -Percent- - Number
Apples ............ 1,173 414,773 33 38 15 47 4,153 Apricots .......... 724 42,923 3 2 1 97 426 Cherries, Sweet ... 1,012 173,743 14 15 10 75 1,958 Cherries, Sour .... 517 240,746 19 29 11 60 2,059
Peaches ........... 1,231 300,653 24 21 15 64 2,464 Pears ............. 7ll 82,339 6 2 6 92 703 Prunes ............ 483 13, 4ll 1 5 6 89 166
Total above fruits 1,268,588 100 -- -- -- 11,929 1/ Includes plantings of 25 trees or more of a single kind of fruit or a combination of the above fruits.
Utah Fruit Tree Survey, 1972--State Summary of Apple Trees by Variety and Age.
Total No. % All Percent by Age Category
Variety and Type Under 15-10 yrsi Over Trees Apples 5 yrs. 10 yrs.
Red Delicious - Standard .... 82,624 20 9 7 84
Red Delicious - Semi-Dwarf .. 174,038 42 48 22 30
Golden Delicious ............ 30,094 7 37 31 32
Rome Beauty ................. 79' 308 19 60 4 36
Jonathan .................... 28,756 7 8 13 79
Other Varieties ............. 19,953 5 35 6 59
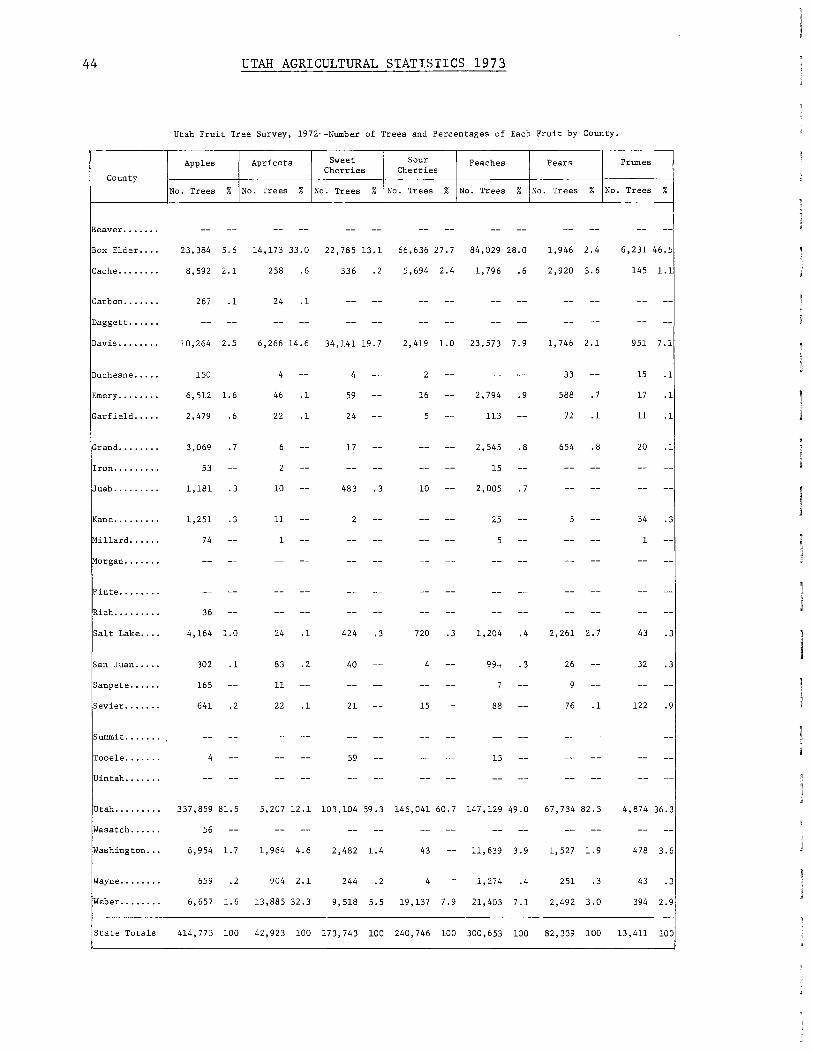
44
County
UTAH AGRICULTURAL STATISTICS 1973
Utah Fruit Tree Survey, 1972--Number of Trees and Percentages of Each Fruit by County.
Apples Apricots Sweet Cherries
Sour Cherries
Peaches Pears Prunes I No. Trees % No. Trees % No. Trees % No. Trees % No. Trees % No. Trees % No. Trees %
Beaver ...... .
Box Elder .... 23,384 5.6 14,173 33.0 22,785 13.1 66,636 27.7 84,029 28.0
Cache ....... . 8,592 2.1 258 .6 336 .2 5,694 2.4 1,796 • 6
Carbon ...... . 267 .1 24 .1
Daggett. .....
Davis ....... . 10,264 2.5 6,266 14.6 34,141 19.7 2,419 1.0 23,573 7.9
Duchesne ..... 150 4 4
Emery ....... . 6,512 1.6 46 .1 59 16 2,794 .9
Garfield ..... 2,479 .6 22 .1 24 5 113
Grand ....... . 3,069 .7 17 2,545 . 8
Iron ........ . 53 15
Juab ........ . 1,181 . 3 10 483 . 3 10 2,005 • 7
Kane •.••..••. 1,251 .3 11 25
Millard ..... . 74 1
Morgan ...... .
Piute ....... .
Rich......... 36
Salt Lake .... 4,164 1.0 24 .1 424 .3 720 .3 1,204 .4
San Juan ..... 302 .1 83 .2 40 4 99., . 3
Sanpete ..... . 165 11
Sevier ...... . 641 .2 22 .1 21 15 88
Summit .......
Tooele ..•.... 4 59 15
Uintah .......
1,946 2.4
2,920 3. 6
1,746 2.1
33
588 • 7
72 .1
654 .8
5
2,261 2.7
26
76 .1
Utah ........ . 337,859 81.5 5,207 12.1 103,104 59.3 146,041 60.7 147,129 49.0 67,734 82.3
Wasatch...... 56
Washington ... 6,954 1.7 1,964 4.6 2,482 1.4 43 11,639 3.9 1, 527 1. 9
Wayne ....... . 659 .2 904 2.1 244 . 2 4 1,274 .4 251 .3
Weber ....... . 6,657 1.6 13,885 32.3 9,518 5.5 19,137 7.9 21,403 7.1 2,492 3.0
__ I 6,231 46.5
145 1.1
951 7.1
15 .1
17 .1
11 .1
20 .1
34 .3
1
43 .3
32 • 3
122 .9
4,874 36.3
478 3.6
43 .3
394 2. 9
State Totals 414,773 100 42,923 100 173,743 100 240,746 100 300,653 100 82,339 100 13,411 100

UTAH AGRICULTURAL STATISTICS 1973 45
Vegetables
J. Craig Thomas, Agricultural Statistician
In the mid-1950's, Utah growers produced eight vegetables for connnercial fresh shipment in sufficient volume to be included in U. S .D .A. estimates, Since that time, production of seven dropped to such a low level that estimates were discontinued. Onions, the only fresh market crop remaining, are enjoying a recent increase in acreage, while the other seven--cabbage, cantaloupes, carrots, celery, lettuce, strawberries, and fresh tomatoes-are grown only on a limited basis for local consumption.
The value of Utah's onicn production in 1972 was 1,493,000 dollars. This was more than double the value of the 1971 crop. Although Utah's 1972 production was up 69 percent from a year earlier, onion production in other states suffered major setbacks reducing supplies nationally and contributing to a good price for Utah growers.
Onion acreage since 1961 has fluctuated from season to season and has been as low as 600 acres planted in 1966. Between 1966 and 1972, however, onion plantings increased to 1,100 acres--highest since 1951. There were 1,000 acres harvested from the 1,100 planted in 1972. Yields averaged 370 cwt. per acre and were up 61 percent from the 1971 crop. During the 1961-72 period, yields varied from 230 to 370 cwt. and averaged near 300 in most years. Davis is the leading onion county with some also grown in Weber, Box Elder, Salt Lake, and Utah Counties.
Production of vegetables for connnercial processing in Utah has declined sharply during the past 30 years. In 1972, there were 5,900 acres of vegetables harvested for processing, 2,000 less than a year earlier, the smallest in many years, and about one-fifth of the 1942 record high of 28,230. The value of 1972 production was $1,698,000. Tomatoes, sweet corn, green peas, and snap beans were the vegetables grown for processing during 1972. In earlier years, green lima beans, table beets, and cucumbers for pickles were also grown for processing in the state. Most of the acreage in 1972 was grown in Box Elder, Cache, Weber, and Davis Counties.

46 UTAH AGRICULTURAL STATISTICS 1973
Onions, Fresh Market: Acreage, Yield, Production, Value, and Stocks, Utah, 1940, 1944, 1950, 1960, 1965-72.
Acrea:?;e Yield Quantity Value of Sales Stocks Year Planted Har- per Produc- not Sales
Per Cwt J Total Following
vested Acre ti on Sold 1/ Jan. 1
1,000 1,000 1,000 1,000 1,000 Acres Acres Cwt. Cwt. Cwt. Cwt. Dollars Dollars Cwt •
1940 •••• -- 1,100 200 220 38 182 • 50 91 60 1944 ]j. -- 2,400 220 528 51 477 1.80 859 258 19 50 •••• 1,150 1,100 270 297 83 214 1.80 385 151 1960 •••• 750 700 325 228 63 165 2.80 462 ll2
1965 •••• 750 700 350 245 65 180 2.10 378 84 1966 •••• 600 550 280 154 25 129 4.80 619 48 1967 •••• 650 600 350 210 20 190 4.15 788 40 1968 •••• 800 750 290 218 38 180 2.30 414 69 1969 •••• 950 900 300 270 30 240 4.63 1, 111 58
1970 •••• 1,000 1,000 300 300 55 245 2.75 674 ll3 1971. ••• 1,000 950 230 219 44 175 4.24 742 89 1972 •••• 1,100 1,000 370 370 59 3ll 4.80 1,493 lll
11 Includes shrinkage, waste, and cullage. 11 Record high acreage of onions.
- '
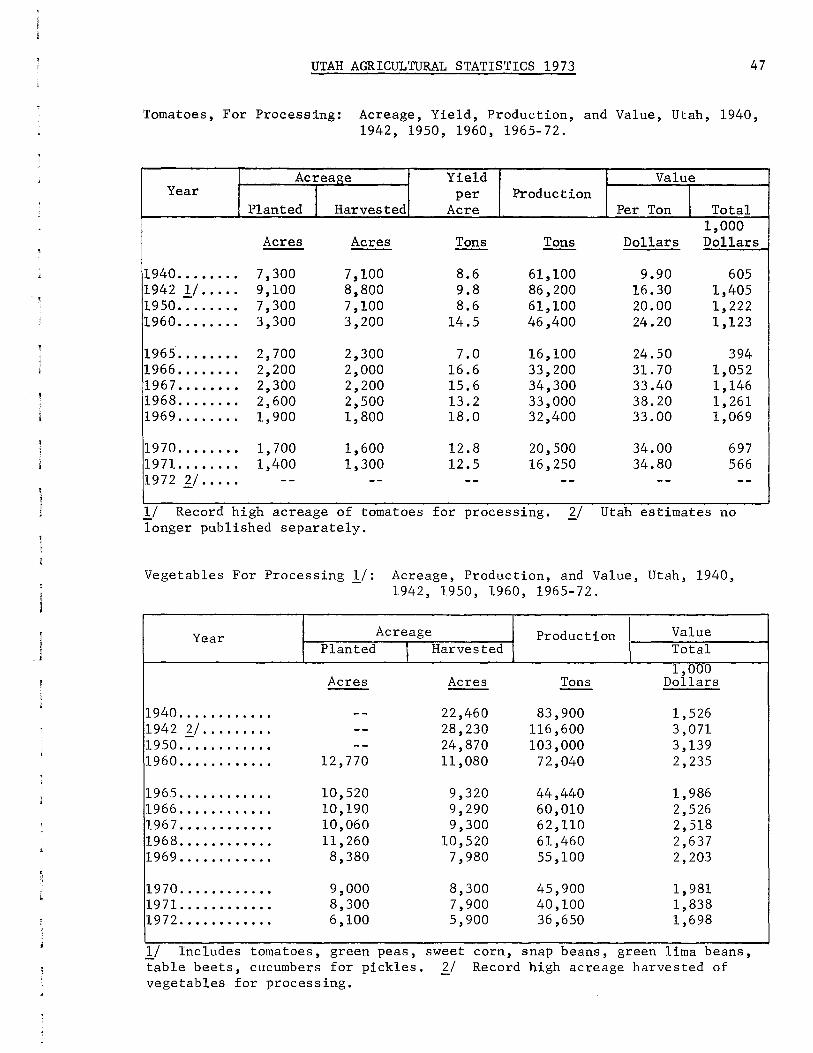
l
UTAH AGRICULTURAL STATISTICS 1973 47
Tomatoes, For Processing: Acreage, Yield, Production, and Value, Utah, 1940, 1942, 1950, 1960, 1965-72.
Acreage Yield Value Year I per Production I Planted Harvested Acre Per Ton Total
1,000 Acres Acres Tons Tons Dollars Dollars
1940 ..••.... 7,300 7,100 8.6 61,100 9.90 605 19421/ ••... 9,100 8,800 9.8 86,200 16.30 1,405 1950 •......• 7,300 7,100 8.6 61,100 20.00 1,222 1960 •.••.... 3,300 3,200 14.5 46,400 24.20 1,123
1965 •.••..•. 2,700 2,300 7.0 16,100 24.50 394 1966 •..••.•. 2,200 2,000 16.6 33,200 31. 70 1,052 196 7 •.•.••.• 2,300 2,200 15.6 34,300 33.40 1,146 1968 •..•..•. 2,600 2,500 13.2 33,000 38.20 1,261 1969 .....•.. 1,900 1,800 18.0 32,400 33.00 1,069
1970 ..•....• 1,700 1,600 12.8 20,500 34.00 697 1971 ...•.... 1,400 1,300 12.5 16,250 34.80 566 1972 ]j ..... -- -- -- -- -- --l/ Record high acreage of tomatoes for processing. 11 Utah estimates no longer published separately.
Vegetables For Processing l/: Acreage, Production, and Value, Utah, 1940, 1942, 1950, 1960, 1965-72.
Year Acreage Production Value Planted I Harvested Total
1,000 Acres Acres Tons Dollars -- --
1940 ............ -- 22,460 83,900 1,526 1942 11 ......... -- 28,230 116 ,600 3,071 1950 ............ -- 24,870 103,000 3,139 1960 ............ 12' 770 11,080 72,040 2,235
1965 ............ 10,520 9,320 44,440 1,986 1966 ............ 10,190 9,290 60,010 2, 526 196 7 ......•..... 10,060 9,300 62,110 2,518 1968 .........•.. 11, 260 10,520 61,460 2,637 1969 ............ 8,380 7,980 55,100 2,203
1970 .....•...... 9,000 8,300 45,900 1,981 1971 ............ 8,300 7,900 40,100 1,838 1972 ..•..•...... 6,100 5,900 36,650 1,698
l/ Includes tomatoes, green peas, sweet corn, snap beans, green lima beans, table beets, cucumbers for pickles. 11 Record high acreage harvested of vegetables for processing.

48 UTAH AGRICULTURAL STATISTICS 1973
Cattle Stanley R. Koyle, Agricultural Statistician
Cash receipts from the sale of cattle and calves by Utah farmers and ranchers during 1972 totaled $91,684,000. This was the greatest cash income from any of the agricultural commodities sold in the State. It accounted for 37.9 percent of the total cash receipts for all agricultural products sold during the year. The 1972 cash receipts from cattle and calves were nearly double the 1960 cash receipts of $49,373,000. The relative importance of cattle and calf sales increased substantially during the past 22 years--from 25.4 percent of the total receipts from all crops and livestock in 1950 to 37.9 percent in 1972.
The cattle industry in Utah has always been an important element in the livelihood of the State's inhabitants. Utah, with only 4.1 percent of its area in cropland, has vast canyonlands, desert areas, and mountain forests which lend themselves to livestock operations. Most farms and ranches producing cattle are cow-calf operations where breeding stock are maintained from year to year. Calves are weaned at 6-8 months and sold immediately or sold when yearlings, as stockers or feeders.
Cattle are important in all counties in the State, trations are in the north central, central, and Counties with largest numbers in the 1969 U, S. Census Box Elder, Utah, Millard, Cache, Uintah, and Duchesne.
but greatest concenUintah Basin areas. of Agriculture were
Cattle Inventory January 1, 1973: There were 840,000 head of cattle and calves in Utah on January 1, 1973. This was a new record high and was 1 percent or 8,000 more than on January 1, 1972. The increase was in beef stock while milk cow and milk heifer numbers declined. All cows and heifers that have calved totaled 414,000 head, 1 percent more than a year earlier. Beef cows accounted for 339,000 of the total, up 2 percent, and milk cows totaled 75,000, down 5 percent from a year earlier. Heifers, 500 pounds and over, amounted to 118,000 head, down 3 percent. Included were 51,000 for beef cow replacements, 41,000 for milk cow replacements, and 26,000 others. Steers, 500 pounds and over, at 76,000 were up 4 percent. Bulls, 500 pounds and over, totaled 17,000 this year, the same as a year earlier. Numbers of calves, under 500 pounds, increased 2 percent and totaled 215,000 head.
Since 1940, cattle numbers have nearly doubled -- from 432,000 to 840,000. During that 33 year period, milk cow numbers declined nearly one-fourth while beef cows about tripled. Beef heifers, steers, and calves also increased greatly during that period. The big increase in beef cattle production was the result of several changes in the State's agriculture-from sheep to beef, from dairy to beef, and from intensive row crops to feed crops and beef.
Cattle on Feed January 1, 1972: The number of cattle on feed for slaughter market in Utah on January 1, 1973, at 48,000 head, was down 7,000 from a
-1
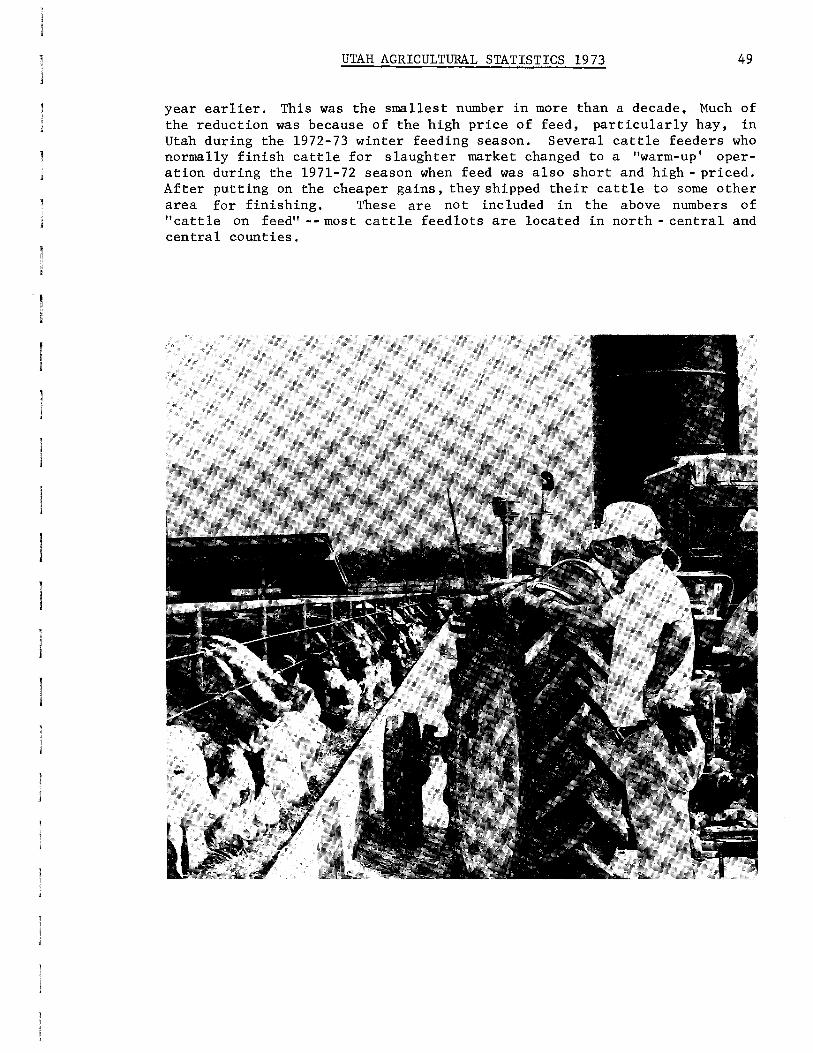
UTAH AGRICULTURAL STATISTICS 1973 49
year earlier. This was the smallest number in more than a decade. Much of the reduction was because of the high price of feed, particularly hay, in Utah during the 1972-73 winter feeding season, Several cattle feeders who normally finish cattle for slaughter market changed to a "warm-up' operation during the 1971-72 season when feed was also short and high - priced. After putting on the cheaper gains, they shipped their cattle to some other area for finishing. These are not included in the above numbers of "cattle on feed" -- most cattle feedlots are located in north - central and central counties.

50 UTAH AGRICULTURAL STATISTICS 1973
All Cattle: Number of Cattle Farms 1965- 72 and .Number and Value of Cattle on Farms, Utah, January 1, 1940, 1950, 1960~ 1965-73.
Farms Cattle on Farms Januarv 1 Year With I With I Value I On Feed
Cattle Milk Cows Number I Per Head Total I For Market 1,000 1,000 1,000 Head Dollars Dollars Head
1940 ......• -- -- 432 38.20 16,502 --1950 ....•.. -- -- 588 126 74,088 40 1960 ....... -- -- 719 136 97,784 61
1965 .....•• 11, 700 6,200 755 116 87,580 66 1966 ..•..•. 11, 200 5,700 755 141 106 ,455 81 196 7 ....•.• 10,700 5,300 747 151 112, 797 61 1968 ....•.. 10,200 4,700 762 150 114, 300 66 1969 ....... 9,900 4,200 777 160 124,320 61
1970 ....... 10,000 3,800 808 185 149,480 57 1971 ....... 9,600 3,500 832 195 162,240 68 1972 ....•.. 9,400 3,200 832 210 174, 720 55 1973 ll .... -- -- 840 255 214,200 48
ll Record high January 1 Inventory.
Calf Crop: Utah, 1940, 1950, 1960, 1965-72.
Calves Born Calves Born Cows and as Percent as Percent
Year Heifers Cows That Calves of Cows and of Cows 2 Yrs. & Have Calved Born Heifers 2+ Calved Older on Hand January 1 January 1
January 1 January 1 1/ f!/ l/Q/ 1,000 Head 1,000 Head 1,000 Head Percent Percent
1940 ....... 218 -- 174 80 --1950 ....... 302 -- 263 87 --1960 ....... 360 -- 317 88 --1965 ....... 390 -- 351 90 --1966 ....... 395 -- 348 88 --196 7 ....•.. 393 -- 354 90 --1968 ....... 400 -- 364 91 --1969 ....... 407 -- 358 88 --1970 ....... 424 392 372 88 95 1971 ....... -- 411 378 -- 92 1972 ....... -- 410 378 -- 92
l/ Not strictly a calving rate. Figure represents calves born expressed as percentage of the number of f!/cows and heifers 2 years old and over on farms and ranches January 1 ~/cows that have calved on hand January 1.

UTAH AGRICULTURAL STATISTICS 1973 51
Cattle: Inventory by Classes and Age, Utah, January 1, 1940, 1950, 1960, 1965-70.
All For Milk Beef Cattle
Year Cattle Cows and Heifers Heifer Cows Heifers Steers Bulls and Heifers 1 - 2 Yrs Calves 2 Yrs. + 1 - 2 Yrs Calves 1 Yr. + 1 Yr. -t
Calves 2 Yrs. + 1,000 1,000 1,000 1,000 1,000 1,000 1,000 1,000 1,000 Head Head Head Head Head Head Head Head Head -- -- -- -- -- --
1940 ..... 432 103 25 32 ll5 34 77 37 9
1950 •..•• 588 108 25 32 194 62 101 54 12
1960 •.••• 719 108 31 35 252 65 154 65 9
1965 •.••• 755 89 24 28 301 72 172 57 12
1966 ••••• 755 85 24 28 310 58 182 55 13
~967 ••..• 747 83 24 26 310 65 171 55 13
~968 ••••• 762 81 23 26 319 68 174 58 13
1969 •...• 777 82 24 26 325 66 183 57 14
1970 1/ .. 808 82 25 28 342 69 188 59 15
l/ Beginning with January 1, 1971, the classification estimates for cattle were changed from sex and age to sex and weight--See Table below.
Cattl~: Inventory by Classes and Weight, Utah, January 1, 1970-73.
All All Cows and Heifers Heifers 500 Pounds and Over Steers,
Cattle that have Calved Steers Bulls Heifers
Yea.r and Total Beef Milk Beef LOW Mille LOW Other Total 500 lbs 500 lbs & Bulls
Calves Cows Cows Replace- Replace- & Over & Over Under
men ts men ts 500 Lbs 1,000 1,000 1,000 1,000 1,000 1,000 1,000 1,000 1,000 1,000 1,000 Head Head Head Head Head Head Head Head Head Head Head --
1970 ••••.• 808 392 316 76 52 44 26 122 75 17 202
1971. ••.•• 832 4ll 331 80 55 45 25 125 72 17 207
1972 •••..• 832 410 331 79 53 43 26 122 73 17 210
1973 •••••• 840 414 339 75 51 41 26 ll8 76 17 215

52 UTAH AGRICULTURAL STATISTICS 1973
Cattle and Calves: Inventory, Supply, and Disposition, Utah, 1940, 1950, 1960, 1965-72.
I i Farm
Inventory Calf Inship-1 Marketings Slaughter Deaths Inventory Year Beginning Crop men ts 1/ 2/ End of
of Year I Cattle I Cattle & Year
I ! Calves Calves Cattle Calves
1,000 1,000 . 1,000 1,000 1,000 1,000 1,000 1,000 1,000 Head Head Head Head Head Head Head Head Head -- -- --
1940 .•.. 432 174 25 101 45 11 8 12 454 1950 .... 588 263 41 139 98 12 16 15 612 1960 .... 719 317 54 234 111 11 14 22 698
1965 .... 755 351 36 225 117 11 14 20 755 1966 .... 755 348 48 234 130 8 14 18 747
1967 .... 747 354 38 203 133 8 14 19 762 1968 .... 762 364 43 216 131 6 16 23 777
1969 .... 777 358 55 208 131 4 15 24 808 1970 ...• 808 372 50 213 140 4 17 24 832 1971. .•. 832 378 42 235 137 3 14 31 832 1972 .... 832 378 40 227 138 4 16 25 840
1/ Includes custom slaughter for use on farms where produced, but excludes interfarm sales within the State. 'l:J Excludes custom slaughtered at commercial establishments.
Cattle and Calves: Production and Income, Utah, 1940, 1950, 1960, 1965-72.
Produc- Market- Average Price Value Cash Value Gross Cost of Year ti on in gs per 100 lbs. of Receipts of Home Income Inship-
11 ]j Cattle -1 Calves Produc- '}_/ Cons ump- men ts ti on ti on
1,000 1,000 1,000 1,000 1,000 1,000 1,000 Pounds Pounds Dollars Dollars Dollars Dollars Dollars Dollars Dollars
1940 •.•• 105,545 103,170 6.80 8.90 -- 7,478 198 7,676 1,468 1950 ••.• 157,125 158,135 23.20 26.80 -- 38,794 850 39,644 7,827 1960 •••. 217,665 257' 715 18.40 23.40 41,993 49,373 1,172 50,545 8,249
1965 •.•. 234,025 251,735 16.90 21.50 41,563 44,576 1,293 45,869 5,249 1966 ••.. 237,600 264,652 20.00 25.60 49,949 55,532 1,551 57,083 7,970
1967 .... 232,200 237,890 20.30 24.90 49,484 50,541 1,658 52,199 6,002 1968 ..•. 239,260 249,348 21.40 27.90 54,749 56,658 1,740 58,398 7,099
1969 .... 242,310 245,820 24.40 31.20 62, 961 63,581 1,876 65,457 8,866 1970 .•.• 256,121 259,978 25.60 34.20 70,803 71, 552 2,189 73,741 --1971. ••• 260,435 281,845 27.40 35.70 76,477 82,154 2,124 84,278 --1972 •.•• 242,581 265,888 32.00 44.10 84,302 91,684 2,749 94,433 --1/ Adjustments made for inshipments and changes in inventories. 2/ Excludes custom slaughter for use on farms where produced and inter-farm sales within the State. ll Receipts from marketings of live cattle and sale of farm slaughter.

UTAH AGRICULTURAL STATISTICS 1973 53
Commercial Cattle Slaughter: Number and Liveweight, Utah, Annual, 1944, 1950, 1960, 1965-72 and Monthly 1971-72.
Cattle Calves Total Weight Total Weight Total Total
Year Number per Live Number per Live Number Live Head Weight Head Weight Weight
1,000 1,000 1,000 1,000 1,000 1,000 Head Pounds Pounds Head Pounds Pounds Head Pounds
1944 1/ ... 102. 9 -- -- 42.5 -- -- -- --1950 ...... 108.5 965 104,762 21. 7 275 5,966 130.2 110, 728 1960 ...... 212.2 994 210,924 12.7 316 4.008 224.9 214,932
1965 ...... 293.6 1,011 296' 797 6.8 349 2,376 300.4 299,173 1966 ...... 321.8 1,012 325,615 6.0 340 2,041 327 .8 327,656 1967 ...... 271.0 1,001 271, 364 5.8 351 2,033 276.8 273,397 1968 ...... 277 .1 1,001 277,299 5.4 364 1,963 282.5 279,262 1969 ...... 273.7 1,017 278,419 4.5 364 1,638 278.2 280,057 1970 ...... 258.5 1,040 268,914 3.2 397 1,270 261. 7 270,184 1971 ...... 269.8 1,037 279,852 3.1 397 1,232 272. 9 281,084 1972 ...... 265.5 1,106 293,530 2.0 419 838 267.5 294,368
1971 --Jan . . . . . 22.0 1,059 23,298 . 3 379 114 22.3 23,412 Feb . . . . . 20.5 1,049 21,504 . 3 386 116 20.8 21,620 Mar . . . . . 22.5 1,055 23,738 . 3 434 130 22.8 23,868 Apr . . . . . 21. 9 1,059 23,192 . 3 418 125 22.2 23,317 May ..... 21. 6 1,038 22,421 .2 428 86 21.8 22,507 June .... 23.6 1,046 24,686 . 2 429 86 23.8 24' 772
July .... 23.1 1,029 23' 770 .2 400 80 23.3 23,850 Aug . . . . . 23.6 1,002 23,647 .3 385 116 23.9 23,763 Sep . . . . . 23.6 1,011 23,860 . 3 395 118 23.9 23,978 Oct. .... 22.9 1,026 23,495 . 2 354 71 23.1 23,566 Nov . . . . . 23.4 1,023 23,938 .3 378 113 23.7 24,051 Dec . . . . . 21.l 1,057 22,303 . 2 383 77 21.3 22,380
1972 -Jan . . . . . 23.2 1,081 25,079 . 2 406 81 23.4 25,160 Feb. .... 22.l 1,100 24,310 . 2 426 85 22.3 24,395 Mar . . . ". 23.6 1, 115 26,314 .3 405 122 23.9 26,436 Apr . . . . . 20.5 1,123 23,022 . 2 387 77 20.7 23,099 May ...... 22.5 1, 111 24,998 .1 441 44 22.6 25,042 June ..... 22.9 1,081 24,755 .1 457 46 23.0 24,801
July ..... 21. 7 1,108 24,044 .1 417 42 21.8 24,086 Aug . . . . . 23.0 1,101 25,323 .2 421 84 23.2 25,407 Sep . . . . . 22.0 1,081 23,782 . 2 464 93 22.2 23,875 Oct. .... 23.2 1,114 25,845 .1 436 44 23.3 25,889 Nov . . . . . 21. 6 1, 135 24,516 . 2 393 79 21.8 24,595 Dec . . . . . 19.2 1,122 21,542 .1 407 41 19.3 21,583
1/ First year on record.
54 UTAH AGRICULTURAL STATISTICS 1973
Sheep & Wool Stanley R. Koyle, Agricultural Statistician
Sheep and wool dropped from third to fourth place in cash income among the agricultural products sold by Utah farmers during 1971--following cattle, milk, and turkeys--because of the lowest price for wool in 36 years. Cash receipts from sheep and wool during 1972 (excluding government wool payments) still ranked fourth and totaled 18.5 million dollars compared with 15.7 million in 1971. Both receipts from wool and from sheep and lambs increased in 1972 primarily because of higher prices.
There are quite a few farm flocks in Utah, but most sheep in the State are in range sheep operations. Sheep producers are predominantly headquartered in the central portion of the State. Most of the large sheep ranches rely heavily on public domain for grazing and move their sheep considerable distances during the year. As the spring season progresses and feed starts to grow, sheep are gradually moved to higher elevations and spend the summer months on the high mountain ranges. As winter approaches, sheep are moved from their summer ranges to lower elevations and many are grazed during the winter on desert ranges in western Utah and eastern Nevada. Some operations in eastern Utah, which move their sheep into Colorado for sununer ranges, winter them on lower ranges in eastern Utah.
Migratory sheep operations have always been one of the important agricultural industries in the State. Utah reached its peak number of stock sheep in 1901 with 2,882,000 head. Stock sheep numbers then gradually declined to 2,068,000 head in 1915 when the downward trend reversed and sheep numbers began to climb because of increased prices of wool and lambs. In 1931 stock sheep numbers approached the 1901 record high with 2,775,000 head. The droughts and the great depression of the 1930's started a downward trend in sheep numbers, and it has continued to the present time. The state's 820,000 stock sheep on January 1, 1973 were less than onethird of the 1901 and 1931 peak numbers. Utah is the sixth ranking state in stock sheep numbers, and is the nation's largest migratory sheep producer.
Inventory, January 1, 1973: The January 1, 1973 all-sheep inventory for Utah, at 905,000 head, was down 7 percent from a year earlier and the smallest in 90 years. The reduction was in stock sheep--from 891,000 to 820,000--while lambs on feed held steady at 85,000. The number of ewes one year old and over, at 713,000 was down 6 percent while ewe lambs, at 77,000, were down 25 percent. Wethers and rams of all ages totaled 30,000 head, 1,000 less than on January 1, 1972.
Wool Production, 1972: The 1972 wool crop for Utah was estimated at 9,218, 000 pounds, grease basis. This was slightly more than the 1971 clip, but second smallest since estimates started in 1909. The number of sheep

UTAH AGRICULTURAL STATISTICS 1973 55
shorn in 1972 totaled 896,000 compared with 960,000 in 1971. Weight per fleece averaged 10. 3 pounds against 9. 5 the year before with the heavier fleece weight more than offsetting the smaller number shorn. Prices received by sheepmen for wool sold in 1972 averaged 26 cents a pound, grease basis, 8 cents above the very low 1971 average, but was lower than all other years since 1939. The 1972 price was less than one-third of the record high 1951 average price of 91 cents.

56 UTAH AGRICULTURAL STATISTICS 1973
Sheep: Number of Sheep Farms, 1965-72 and Number and Value of Sheep on Farms, Utah, January 1, 1901, 1931, 1940, 1950, 1960, 1965-73.
Sheep on Farms January 1 Farms All Sheep Stock Sheep Sheep
Year With I Value I Farm Value on Sheep Number I Per Head I Total Numben Per Head I Total Feed
1,000 1,000 1,000 1,000 1,000 Head Dollars Dollars Head Dollars Dollars Head
1901 1/ ... -- -- -- -- 2,882 2.70 7,781 --1931 II ... -- 2,935 -- 18,784 2, 775 6.50 18,048 160 1940 ...•.. -- 2,248 -- 15,895 2,095 7.20 15,038 153 1950 .•..•. -- 1,329 -- 27,028 1,269 20.40 25,888 60 1960 ...••. -- 1,336 -- 24,461 1,249 18.40 22,982 87
1965 .••... 3,400 1,092 -- 20,440 1,028 18.70 19,224 64 1966 .•••.. 3,200 1,100 -- 26,857 1,038 24.50 25,431 62 1967 •••••• 3,100 1,100 -- 27'172 1,040 24.80 25,792 60 1968 •...•• 3,100 1,079 -- 26,387 1,019 24.60 25,067 60 1969 •••..• 3,100 1,053 -- 29,585 988 28.30 27 '960 65
1970 •.•... 3,000 1,053 -- _33' 998 978 32.50 31,785 75 1971 ••.••• 3,000 1,009 31.00 31,279 929 -- -- 80 1972 ••••.. 3,000 976 26.50 25,864 891 -- -- 85 1973 •.•..• -- 905 32.50 29,413 820 -- -- 85
1/ Record high January 1 Stock Sheep Inventory. 11 Record high January 1 All Sheep Inventory.
Stock.Sheep: Inventory by Classes, Utah, January 1, 1940, 1950, 1960, 1965-73.
All Lambs Sheep One Year and Over Year Stock Ewes
1 We the rs Ewes I Rams I Wethers I Rams &
Sheep & Rams Wethers
1,000 1,000 1,000 1,000 1,000 1,000 1,000 Head Head Head Head Head Head Head --
1940 ..•.•. 2,095 310 23 1,706 54 2 56 1950 .•••.. 1,269 165 5 1,066 32 1 33 1960 .•.•.. 1,249 144 6 1,065 33 1 34
1965 ...... 1,028 ll9 6 876 26 1 27 1966 ...... 1,038 ll7 6 890 24 1 25 196 7 ...... 1,040 123 12 878 26 1 27 1968 ...... 1,019 127 5 859 27 1 28 1969.; .... 988 125 7 830 .25 1 26
1970 ...... 978 125 7 821 24 1 25 1971. ..... 929 ll 7 8 780 23 1 24 1972 ...... 891 102 8 758 -- -- 23 1973 ...... 820 77 9 713 -- -- 21
~i - j

j - i
I . j
UTAH AGRICULTURAL STATISTICS 1973 57
Sheep and Lambs: Inventory Numbers, Lamb Crop and Disposition, Utah, 1931, 1940, 1950 1960 1965 72
' ' - . Inven- Marketing .!/ Farm Deaths Inven-tory Lambs Inship- Slaugh- tory
Year Begin- Saved men ts Sheep Lambs ter 2:.1 Sheep Lambs End ning of
of Year Year 1,000 1,000 1,000 1,000 1,000 1,000 1,000 1,000 1,000 Head Head Head Head Head Head Head Head Head
1931 3/ .. 2,935 1,560 69 156 1,049 40 300 174 2,845 1940.: .•. 2,248 1,365 40 127 894 38 236 110 2,248 1950 ..•.. 1,329 895 92 39 668 22 125 70 1,392 1960 ..•.• 1,336 927 54 59 759 21 125 76 1, 277
1965 ..•.. 1,092 745 5 5 548 18 102 69 1,100 1966 ..... 1,100 765 15 48 562 18 79 73 1,100 196 7 ..••• 1,100 792 15 38 590 16 110 74 1,079 1968 ...•• 1,079 790 10 75 578 14 83 76 1,053 1969 ..•.. 1,053 764 110 42 635 12 98 87 1,053
1970 ....• 1,053 780 100 74 646 25 94 85 1,009 1971. .... 1,009 710 70 51 578 12 92 80 976 1972 ..... 976 713 65 70 595 13 82 89 905
1/ Includes custom slaughter for use on farms where produced, but excludes interfarm sales within the State. 2:.1 Excludes custom slaughter for farmers at commercial establishments. ll Record high beginning of year inventory.
Sh d L b p d d I u h 1931 1940 1950 1960 1965 72 eep an am s: ro uction an ncome. ta , . . . . -
Produc- Market-Price Per 100 Pounds Value Cash
Value of Cost
Year ti on ing I of Re- Home Gross of I
]) 2:.1 Sheep I Lambs Produc- ceipts Cons ump-[Income Inship-I
I ti on ll ti on men ts
1,000 1,000 1,000 1,000 1,000 1,000 1,000 Pounds Pounds Dollars Dollars $ $ $ $ $
1931 !!._/ •• 82,830 90,122 3.55 5 .10 -- 4,372 126 4,498 255 1940 .•..• 75,523 76,550 3.35 7.50 -- 5,201 147 5,348 234 1950 ..... 56 '611 56 ,624 10.60 24.90 -- 13,535 278 13' 813 1,749 1960 ..... 62,307 71,459 5.30 17.00 10,352 11, 36 7 191 11, 558 574
1965 •••.• 52,519 49,957 5.90 22.80 11,476 11, 305 232 11, 537 79 1966 ..... 57,637 57,454 5.90 23.20 12,499 12,334 281 12,615 252 1967 ..... 57,685 59,986 5.60 22.20 12,383 12,560 260 12,820 231 1968 ••... 60,638 6 2' 7 24 6.00 23.50 13,301 13,165 261 13,426 165 1969 •.••• 58,656 65,205 7.30 27.10 15,099 16,673 320 16,993 2,118
1970 •.•.• 60,899 73,550 7.10 25.40 15,009 16,992 608 17,600 --1971. .... 57,795 63' 960 5.50 23.70 12,758 14,004 283 14,287 --1972 •.••• 52,916 65,060 6.20 27.70 14,140 16,143 369 16,512 --
1/ Adjustments made for changes in inventory and for inshipments. 2/ Excludes custom slaughter for use on farms where produced and inter-farm sales ;ithin the State. ll Receipt from marketings and sale of farm slaughter. !!._/ Record high January 1 Sheep Inventory.

58 UTAH AGRICULTURAL STATISTICS 1973
Lamb Crop: Utah, 1930, 1940, 1950, 1960, 1965-72.
Lambs Saved 1/ Breeding Ewes One Year and
Older January 1 r As Percent of
Year I
Number Ewes One Year and Older
1,000 Head 1,000 Head Percent
1930 11 .•.... 1940 ••••••••. 19 50 ••••••••• 1960 •••••••••
2,170 1,706 1,066 1,065
1,736 1, 365
895 927
80 80 84 87
1965......... 876 745 85 1966......... 890 765 86 1967... .••••• 878 792 90
1
11968......... 859 790 92 1969......... 830 764 92
11970......... 821 780 95 1~971......... 780 710 91 [_972......... 758 713 94
ll Lambs saved defined as lambs living July 1, or lambs docked or branded. 11 Record high lamb crop.
Wool Production and Value: Utah, 1931, 1940, 1950, 1960, 1965-72.
I All Sheep Weight Shorn Wool I Average Price
I Value I
Year I Shorn 11 Per Fleece Production I Per Pound ]) ]_/
1,000 1,000 1,000 Head Pounds Pounds Cents Dollars. --
1931 f:!/ •••• 2,692 9.0 24,228 13 3,150 1940 •.••••• 1,990 9.3 18,507 27 4,997 19 50 •.••••• 1,180 9.4 11,092 58 6,433 1960 .•.•••• 1,203 9.9 11, 950 39 4,660
196 5 .•••••• 1,018 9.4 9' 595 45 4,318 1966 ••••••• 991 10.0 9,895 52 5,145 196 7 ••••••• 1,009 9.8 9,840 41 4,034 1968 ••.•••• 1,013 9.9 10' 006 42 4,203 1969 ••••••• 984 9.6 9,406 43 4,045
1970 ••••••• 985 9.8 9,637 32 3,084 1971 ••••••• 960 9.5 9,167 18 1,650 1972 •.•.••• 896 10.3 9,218 26 2,397
ll Includes sheep shorn at connnercial feeding yards. 11 Monthly price weighted by monthly sales of wool. ]_/ Production multiplied by annual average price. !±_/ Record high January 1 Inventory.
- ,

l - J
UTAH AGRICULTURAL STATISTICS 1973 59
Sheep and Lamb Slaughter: Number and Liveweight, Utah, Annual, 1944, 1950, 1960, 1965-72, and monthly 1971-72.
Year I Number 1:/ I Average Liveweight I Total Per Head Liveweight
1,000 Head Pounds 1,000 Pounds
1944 ']j ..... 106.2 1950 ........ 155.0 101 15,682 1960 ........ 307.4 102 31,476
1965 ........ 860.5 105 90,586 1966 ........ 826.0 107 88' 721 1967 ........ 914.5 106 97,189 1968 ........ 890.0 108 95,876 1969 ........ 829.5 107 88,466
1970 .•...... 847.0 106 89,400 1971 ........ 632.5 106 67,098 1972 ........ 517.0 109 56,20 7
1971 -Jan. . ..... 69.5 105 7,298 Feb . . . . . . . 49.0 111 5,439 Mar . . . . . . . 61.0 110 6,710 Apr. . ..... 53.0 105 5,565 May ........ 28.0 103 2,884 June ....... 29.5 100 2,950 July ....... 58.0 106 6,148 Aug. . ..... 57.5 107 6,152 Sep . • • • • 0. 67.0 105 7,035 Oct. . ..... 59.0 100 5,900 Nov . . . . . . . 46.5 108 5,022 Dec . . . . . . . 54.5 110 5,995
1972 - Jan. ...... 50.0 111 5,550 Feb. ...... 48.5 105 5,092 Mar. ...... 45.0 116 5,'220 Apr. ...... 41.0 112 4,592 May ........ 27.5 115 3,162 June •...... 31.0 111 3,441 July ....... 34.5 104 3,588 Aug. ...... 52.5 106 5,565 Sep. ...... 61.5 101 6,212 Oct. ...... 50.0 108 5,400 Nov. ...... 40.0 112 4,480 Dec. ...... 35.5 110 3,905
1/ Includes slaughter under federal inspection and other commercial slaughter, excludes farm slaughter. !:_/ First year on record.

60 UTAH AGRICULTURAL STATISTICS 1973
Hogs Stanley R. Kayle, Agricultural Statistician
Hog production in Utah is relatively small, accounting for slightly more than 1 percent of the cash receipts of farmers in 1970. Farrowings in the state reached a peak in 1943 when the pig crop totaled 331,000 during the year. The current level of hog production is only one-fifth that large. However, there have been several relatively large hog operations started within the last few years. These large operations are tending to offset the continued reduction in the number of farms keeping only a few head. Only 1,554 farms reported hogs in the 1969 census compared with 2,633 in the 1964 census.
The 1969 U. s. Census showed hog production was distributed among all counties, but the heaviest concentration was in the Salt Lake-Utah County area. Box Elder, Cache, Sevier, and Uintah were the next highest ranking counties.
December l, 1972 Inventory: As of December 1, 1972 there were 43,000 head of hogs and pigs on Utah farms, down 16 percent from a year earlier. Of the total, 6,000 were being kept for breeding and 36,000 were classified as market hogs and pigs. January 1 hog numbers reached a peak in 1944 when 196,000 were on Utah farms--nearly 5 times the current level.
1972 Pig Crop: The 1972 pig crop for Utah was estimated at 64,000 pigs saved. This was down 14 percent from 1971 and 4 percent from 1970. The December 1971-May 1972 pig crop totaled 32,000 head, down 11 percent from a year earlier. Litter size for spring sows averaged 7.0 pigs compared with 7.2 a year earlier. The June-November 1972 pig crop was 32,000 head also, 16 percent below 1971 and 3 percent below 1970. Pigs per fall litter averaged 7.1 compared with 7.3 a year earlier •
.. ~-"".-.-'<;o<<0-~->0 • ... ~o>~O
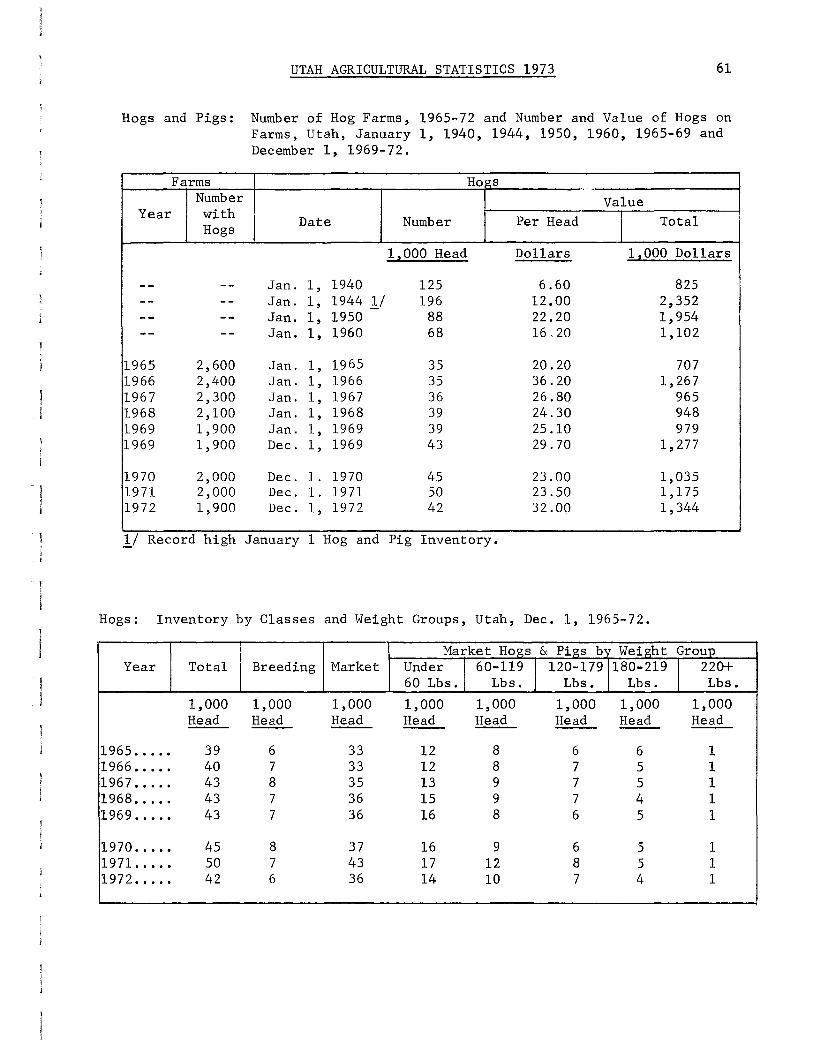
UTAH AGRICULTURAL STATISTICS 1973 61
Hogs and Pigs: Number of Hog Farms, 1965-72 and Number and Value of Hogs on Farms, Utah, January 1, 1940, 1944, 1950, 1960, 1965-69 and December 1, 1969-72.
Farms Hogs . -Number Value
Year with Date Number Per Head I Total Hogs
1,000 Head Dollars 1,000 Dollars
-- -- Jan. 1, 1940 125 6.60 825 -- -- Jan. 1, 1944 ]j 196 12.00 2,352 -- -- Jan. 1, 1950 88 22.20 1,954 -- -- Jan. 1, 1960 68 16.20 1,102
1965 2,600 Jan. 1, 1965 35 20.20 707 1966 2,400 Jan. 1, 1966 35 36.20 1,267 1967 2,300 Jan. 1, 1967 36 26.80 965 1968 2,100 Jan. 1, 1968 39 24.30 948 1969 1,900 Jan. 1, 1969 39 25.10 979 1969 1,900 Dec. 1, 1969 43 29.70 1, 277
1970 2,000 Dec. 1. 1970 45 23.00 1,035 1971 2,000 Dec. 1. 1971 50 23.50 1,175 1972 1,900 Dec. 1, 1972 42 32.00 1,344
l/ Record high January 1 Hog and Pig Inventory.
Hogs: Inventory by Classes and Weight Groups, Utah, Dec. 1, 1965-72.
Market Hogs & Pigs b' Weight Group Year Total Breeding Market Under I 60-119 I 120-179 180-219 I 220+
60 Lbs. Lbs. Lbs. Lbs. Lbs.
1,000 1,000 1,000 1,000 1,000 1,000 1,000 1,000 Head Head Head Head Head Head Head Head
1965 ...•• 39 6 33 12 8 6 6 1 1966 •...• 40 7 33 12 8 7 5 1 1967 •..•. 43 8 35 13 9 7 5 1 1968 ..... 43 7 36 15 9 7 4 1 1969 •.•.. 43 7 36 16 8 6 5 1
1970 ....• 45 8 37 16 9 6 5 1 1971. ...• 50 7 43 17 12 8 5 1 1972 ..... 42 6 36 14 10 7 4 1
'

62 UTAH AGRICULTURAL STATISTICS 1973
Hogs and Pigs: Inventory, Supply, and Disposition, Utah, 1940, 1944, 1950, 1960, 1965-72.
Inventory Annual Ins hip- Market- Farm Inventory Year Beginning Pig men ts ings .!/ S laught- Deaths End of
of Year Crop er Z:.I Year
1,000 1,000 1,000 1,000 1,000 1,000 1,000 Head Head Head Head Head Head Head -- -- --
1940 ••.•••• 125 164 3 139 32 16 105 1944 3/ .... 196 170 5 213 30 20 108 1950. -:-.•... 88 ll2 1 83 19 15 84 1960 ...•..• 68 84 1 64 ll 10 68
1965 ....... 41 69 1 60 6 6 39 1966 ....... 39 73 1 61 5 7 40 1967 ....... 40 75 1 64 4 5 43 1968 ..•.... 43 76 2 68 4 6 43 1969 •....•• 43 69 1 62 3 5 43
1970 ....... 43 67 2 59 3 5 45 1971. .....• 45 74 3 64 3 5 50 1972 ....... 50 64 2 67 3 4 42
1/ Includes custom slaughter for use on farm where produced but i;xclu.de.s interfarm sales within the State. 2/ Excludes custom slaughter for farmers at comcercial establishments. ll Re~ord high beginning of year inventory.
H d p· p d d I h 1940 1944 1950 1960 1965 72 ogs an igs: ro uction an ncome, Uta ' ' ' ' ' - .
Value Value of Produc- Market- Price of Cash Home Gross Cost of
Year tion ings Per Produc- Receipts Cons ump- Income Ins hip-1/ 2/ 100 Lbs, tion ll tion men ts
1,000 1,000 1,000 1,000 1,000 1,000 1,000 Pounds Pounds Dollars Dollars Dollars Dollars Dollars Dollars
1940 ...... 31,760 27,800 5.70 --- 1,734 268 2,002 22 1944 ...... 43,655 46,995 12.80 --- 6,345 592 6,937 72 1950 ...... 23,272 18,687 18.60 --- 3, 779 544 4,323 20 1960 ...... 16' 6ll 13,676 15.70 2,608 2,210 331 2,541 14
1965 .....• 14,333 12,942 20.20 2,895 2,614 264 2,878 16 1966 ...•.. 14,473 12,948 23.50 3,401 3,043 310 3,353 18 1967 ...... 15,214 13,837 18.90 2,875 2 ,615 195 2,810 14 1968 ...... 15,556 14,904 18.60 2,893 2, 772 222 2,994 28 1969 ...... 14,343 13,358 21.60 3,098 2,885 224 3,109 17
1970 •..... 14,061 12,697 22.40 3,150 2,844 269 3' ll3 --1971. ..•.. 15,290 13,876 16.40 2,508 2,276 208 2,484 --1972 .•..•• 15,598 15,398 22.90 3 ,571 3,526 275 3,801 --
1/ Adjustments made for inshipments and changes in inventories. 2/ Excludes interfarm sales and custom slaughter for use on farms where produced. -ll Includes receipts from marketings and from sales of farm slaughtered meat.

UTAH AGRICULTURAL STATISTICS 1973 63
Pig Crop: Sows Farrowing and Pigs Saved, Utah, 1940, 1943, 1950, 1960, 1965-72.
Spring Pig Crop ll Fall Pig Crop 2) Total Pig Crop
Year Sows Pigs Per Pigs Sows Pigs Per Pigs Spring and Fall Farrow- Litter Saved Farrow- Litter Saved Sows Far-1 Pigs
ing ing rowing Saved
1,000 1,000 1,000 1~000 1,000 1,000 Head Head Head Head Head Head Head Head -- -- -- --
1940 •..•.. 16.0 6.0 96 10.0 6.8 68 26.0 164 1943 '}__/ ... 28.0 6.4 179 23.0 6.6 152 51.0 331 1950 ...... 10.0 6.4 64 7.0 6.9 48 17.0 112 1960 ...... 5.8 6.7 39 6.2 7.3 45 12.0 84
1965 ...... 5.0 7.0 35 5.0 6.9 34 10.0 69 1966 ...... 5.0 7.2 36 5.2 7.2 37 10.2 73 1967 ...•.. 5.2 7. 4 38 5.3 7.0 37 10. 5 75 1968 ...... 5.0 7.5 38 5.0 7.5 38 10.0 76 1969 ...... 4.8 6.8 33 4.6 7.9 36 9.4 69
1970 ...... 4.8 7.1 34 4.6 7.2 33 9.4 67 "1971. ..... 5.0 7.2 36 5.2 7.3 38 10.2 74 1972 ...•.. 4.6 7.0 32 4.5 7.1 32 9.1 64
ll Spring, December through May. ~/ Fall, June through November. 11 Record high annual pig crop.

64 UTAH AGRICULTURAL STATISTICS 1973
Commercial Hog Slaughter: Number and Liveweight, Utah, Annual, 1944, 1950, 1960, 1965-72 and monthly 1971-72.
Year I Number };/ I Average LiveweightJ Total per Head Livewei2ht
1,000 Head Pounds 12000 Pounds
1944 '!:._/ .... 258.2 1950 ....... 246.7 228 56,259 1960 •...... 306.4 227 69,695
1965 ....... 173.4 223 38' 6 71 1966 ....... 152.7 224 34,217 1967 ....... 142.9 227 32,491 1968 ....... 140.9 231 32,530 1969 ....... 134.7 231 31,118
1970 ....... 117.4 229 26,837 1971. ...... 95.9 213 20,409 1972 ....... 90.1 214 19,280
1971 Jan. 8.2 214 1,755 Feb. 6.9 211 1,456 Mar. 7.7 221 1,702 Apr. 8.4 219 1,840 May ...•... 7.9 200 1,580 June .•.•.• 7.8 210 1,638 July .•.... 8.3 211 1,751 Aug. 7.6 218 1,657 Sep. 8.2 214 1,755 Oct. 7.9 217 1, 714 Nov. 9.0 209 1,881 Dec. 8.0 210 1,680
1972 Jan. 8.7 213 1,853 Feb. 7.2 207 1,490 Mar. 8.4 216 1,814 Apr. 7.1 218 1,548 May ....... 8.2 215 1,763 June ...... 7.8 213 1,661 July .....• 6.6 213 1,406 Aug. 7.1 210 1,491 Sep. 6.8 214 1,455 Oct. 8.0 214 1, 712 Nov. 7.4 214 1,584 Dec. 6.8 221 1,503
};_/ Includes slaughter in federally inspected plants and in other slaughter ·plants, but excludes animals slaughtered on farms. 2/ First year of record.
'i j
j
l I
UTAH AGRICULTURAL STATISTICS 1973 65
Dairy
Glenn E. Casey, Agricultural Statistician
Dairying is one of the major agricultural enterprises in Utah. Cash receipts from milk and cream sold by Utah farmers in 1972 totaled 51.4 million dollars, exceeded only by receipts from sales of cattle and calves which totaled 91. 7 million dollars. However, the dairy ind us try could challenge cattle and calves for first place among Utah's agricultural industries if the employment and economic activity generated by processing, distributing, and marketing of dairy products were included.
Dairying is distributed in the farming areas throughout the state. The main concentrations are in the north central area where the five top milk producing counties--Cache, Box Elder, Utah, Weber, and Salt Lake--are located. Plants making butter, cheese, and dry and condensed products are located at Richmond, Smithfield, Logan, Ogden, Salt Lake, Oakley, Mount Pleasant, Fillmore, Delta, Beaver, Altamont, Loa, Panguitch, and Roosevelt. Major grade A milk processing plants are located at Ogden, Salt Lake, Murray, and Cedar City.
Milk Production: In Utah milk production totaled 874 million pounds during 1972, a record high for the state and 4 percent above the previous high in 1971. Monthly totals varied from a low of 65 million pounds in February to a high of 80 million pounds in May. The record output in 1972 was the result of increased milk production per cow. The 1972 average production per cow, at 11,351 pounds, was the highest annual average ever attained in the state. It was more than double 40 years earlier, and fifth highest among the 50 states. The milk cow population for the state averaged 77,000 head during 1972, down 3,000 from 1971 and far below the 117,000 cows in the peak years 1944 and 1945.
Milk from Utah farms sold to plants in 1972 totaled 805 million pounds, of which 72 percent was A grade and 28 percent manufacturing or C grade. However 44 percent of the A grade milk was surplus over fluid usage requirements and was diverted to manufacturing plants. So, of the 805 million pounds of milk sold to plants, only 40 percent was used for fluid purposes (bottled milk and cream products mostly) and 60 percent was used for butter, cheese, dried products, ice cream, and other frozen products. In addition, 42 million pounds of whole milk were retailed directly to consumers. Farm uses (fed to calves and human consumption) totaled 26 million pounds.
For the milk sold to plants, Utah farmers received an average of $6.13 per cwt. for grade A milk, $5.06 for manufacturing grade milk, and $5.83 for all milk. These were the highest prices ever received. For the 42 million pounds retailed by Utah farmers in 1972, they received an average of $10.70 per cwt. 23 cents per quart). Gross farm income from dairy products in 1972 reached 52.5 million dollars, highest ever and up 8 percent from 1971.

66 UTAH AGRICULTURAL STATISTICS 1973
Manufactured Dairy Products Made in Utah: Utah butter, cheese, and other products are nationally known for their fine quality. They are marketed in all areas of the United States. Butter production, at 8.7 million pounds in 1972, was second largest in 30-~. Record high was 11.8 million pounds attained in 1937. Manufacture of cheese has been literally exploding in Utah in recent years. Production in 1972, in million pounds, was 32.6 for American; 15.2 for Swiss; 47.8 for all whole milk cheese--largest ever and up 23 percent from 1971. This was nearly 11 times the 1940 production of only 4.5 million pounds. Creamed cottage cheese pro-duction totaled 10.1 million pounds in 1971, largest ever, and up 8 percent from 1971.
Nonfat dry mil_k for human food was 4. 7 million pounds in 1972, less than half of the peak year 1969. However, dry whey production soared to a record high 20. 0 million pounds, up 37 percent from 1971. Dry whey is a byproduct of cheese making; hence, shares Utah's sharp increase in cheese. Unsweetened condensed skim milk (bulk goods) totaled 5.8 million pounds in 1972, down 7 percent from 1971.
Ice Cream production totaled 5.6 million gallons in 1972, largest ever and 11 percent above 1971. Ice milk production reached a high of 3.1 million gallons in 1972, up 5 percent from 1971, Of this total, 1.4 million gallons or 45 percent was in hard form and 1. 7 million gallons or 55 percent in soft form. All ice cream and sherbet is frozen in hard form in Utah. Sherbet production in 1972 was 476,000 gallons) largest ever and up 5 percent from 1971.
Hilk Cows and Milk Production by Months, Utah, 1971 and 1972.
Jan. Feb.· Mar, Apr.1 May Jun. Jul. j Aug. Sep. 1 Oct. Nov. Dec. Year
Hilk Cows (Thousand Head) jl971. ... 0. 80 80 80 80 80 80 80 80 80 80 80 79 80 11972 ••.... 79 79 79 79 78 78 77 76 75 75 75 75 77
Pounds Milk Per Cow !1971 ...•.. 840 790 999 900 950 940 940 910 860 850 800 830 10500 l
960 950 890 920 11351 11972 .•...• 850 820 920 940 1030 1010 1030 1030
!Hilk Produced (Mi.11ion Pounds) 1971. ..• ,. 67 63 72 72 76 75 75 7') 69 68 64 66 840 I J
11972 ....•.. 67 65 73 74 80 79 79 78 72 71 67 69 874 ....._
I _j

I I I I
l I
UTAH AGRICULTURAL STATISTICS 1973 67
Milk Cows and Production of Milk, Milkfat, and Butter on Farms, Utah, 1940, 1950, 1960, 1965-72.
Farms Production of Milk and Milkfat Number of Percentage
Year with milk cows Per milk cow of fat in Total milk on farms
I all milk I cows I Milk Milkfat produced Milk Milkfat
Million Million 1,000 1,000 Pounds Pounds Percent Pounds Pounds
11940 .... 96 5,730 215 3.75 550 21 1950 .... 100 6,550 246 3.75 655 25 1960 .... 94 8,130 297 3.65 764 28
1965 .... 6.2 80 9,200 330 3.59 736 26 1966 .... 5.7 77 9,560 343 3.59 736 26 1967 .... 5.3 76 9,800 356 3.63 745 27 1968 .... 4.7 75 10,120 364 3.60 759 27 1969 .... 4.2 76 10,303 373 3.62 783 28
1970 .... 3.8 78 10,500 382 3.64 819 30 1971. ... 3.5 80 10,500 384 3.66 840 31 1972 l_/. 3.2 77 ll,351 413 3.64 874 32
1/ Record high annual milk production.
Milk: Quantities Used and Marketed by Farmers, Utah, 1940, 1950, 1960, 1965-72.
Milk used on farms where produced Milk marketed by farmers
Fed ·Consumed Used·for Sold to plants Sold and dealers
Year to as fluid farm- Total As As farm- directly Total Calves milk and churned whole separated to
cream butter consumers milk cream
Million Million Million Million Million Million Million Million Pounds Pounds Pounds Pounds Pounds Pounds Pounds Pounds
I
11940 ...... 17 61 25 103 296 ll6 35 447 1950 ...... 22 51 13 86 515 26 28 569 1960 .....• 18 33 5 56 675 ll 22 708
1965 ...... 10 27 1 38 655 4 39 698 1966 ...... 10 24 -- 34 655 4 43 702 1967 ...... 9 22 -- 31 665 4 45 714 1968 ...... 9 21 -- 30 675 3 51 729 1969 ...... 9 19 -- 26 700 3 52 755
i I
11970 ...... 9 18 -- 27 740 2 50 792 11971 .....• 9 17 -- 26 775 2 37 814 11972 ..... ·. 9 17 -- 26 805 1 42 848
--1 I !

68 UTAH AGR1-CULTURAL STATISTICS 1973
Milk and Cream Marketed by Farmers: Quantity, Price and Cash Receipts, Utah, 1940, 1950, 1960, 1965-72.
Milk sold to plants Cream sold to plants Milk sold directly and dealers and dealers to consumers
Year Percent Price Price Price Quantity fluid per Cash Quantity per lb. Cash Quantity per Cash
grade 100 lb. receipts milkfat fat receiJ?.ts quart receipts
Million 1,000 1,000 1,000 Million 1,000 Pounds Percent Dol. Dollars Pounds Cents Dollars Quarts Cents Dollars --
1940 ... 296 1.45 4,292 4,330 30 1,299 16 7.7 1,232 1950 ... 515 3.69 19,004 970 62 601 13 16.0 2,080 1960 ... 675 4.07 27,472 400 55 220 10 18.0 1,800
1965 ... 655 74 4.09 26,790 140 52 73 18 16.7 3,006 1966 ... 655 72 4.67 30,588 140 53 74 20 19.2 3,840 1967 ... 665 71 4.88 32,452 140 59 83 21 20.0 4,200 1968 .•. 675 70 5.01 33,818 llO 58 64 24 21.2 5,088 1969 ... 700 70 5.20 36,400 110 59 65 24 21. 5 5,200
1970 ... 740 71 5.48 40,552 70 59 41 23 21.5 5,000 1971. .. 775 71 5.65 43,787 70 60 42 17 22.0 3,786 1972 ... 805 72 5.83 46,931 40 60 24 20 23.0 4,493
Farm Dairy Products: Marketings, Income, and Value, Utah, 1940, 1950, 1960, 1965-72.
Combined marketings of milk and cream Used for milk, Gross Average returns cream and butter farm Farm
Milk Cash on farms where income value Year Per 100 Per receipts produced from of utilized
pounds pound from Milk I dairy milk
milk milkfat marketings utilized Value products produced
Million 1,000 Million 1,000 1,000 1,000 Pounds Dollars Dollars Dollars Pounds Dollars Dollars Dollars
1940 .•.... 450 1.53 .41 6,868 83 1,270 8,138 8,423 1950 ...... 570 3.81 1.02 21, 717 63 2,400 24,117 24,956 1960 ...... 708 4.17 1.14 29,492 38 1,585 31,007 31,859
1965 .....• 698 4.28 1.19 28,869 28 1,198 31,067 31,501 1966 ...... 702 4.91 1. 36 34,502 24 1,178 35,680 36,138 1967 ...... 714 5.14 1.42 36,735 22 1,131 37,866 38,293 1968 ...... 729 5.35 1. 49 38,970 21 1,124 40,094 40,607 1969 ...... 755 5.52 1.52 41,665 19 1,049 42' 714 43,222
1970 ...... 792 5.76 1. 58 45,593 18 1,037 46,630 47,174 1971. ..... 814 5.85 1. 60 47,615 17 994 48,609 49,140 1972 ...... 848 6.07 1. 67 51, 448 17 1,032 52,480 53,052
1 1

UTAH AGRICULTURAL STATISTICS 1973 69
Butter and Cheese: Production, Utah, 1940, 1950, 1960, 1965-72.
Total Year Butter American Cheese Swiss Whole Milk
Cheese Cheddar l Other I All Cheese 1,000 1,000 1,000 1,000 1,000 1,000 Pounds Pounds Pounds Pounds Pounds Pounds ----
1940 ...... 10,426 4, 496 0 4,496 1950 ...... 5,834 6,901 5,163 12,064 1960 .....• 7,106 5,460 608 6,068 5,890 11,958
1965 ...... 6, 119 7,065 298 7,363 4,948 12' 311 1966 ..•... 5,978 7' 717 333 8,050 6,231 14,281 1967 ...... 6, 510 7,303 2,311 9,614 6,909 16,523 1968 ...... 7,065 9,482 2, 727 12,209 8,077 20,286 1969 .....• 8,300 11,870 3,556 15,426 8, 777 24,203
1970 ...... 8, 411 18,279 3,911 22,190 10, 776 32,966 1971. ..... 9,082 21,508 4, 714 26,222 12,760 38,982 1972 ...... 8, 715 27,587 4, 977 32,564 15,206 4 l' 770
Cottage Cheese and Dry and Condensed Products: Production, Utah, 1940; 1950, 1960, 1965-72.
Cottage Cheese Nonfat Dry Evap Whole Unsw. Condensed Year
Curd I Creamed Dry Milk Whey Milk Milk-Bulk
Spray Case Goods Skim I Whole 1,000 1,000 1,000 1,000 1,000 1,000 1,000 Pounds Pounds Pounds Pounds Pounds Pounds Pounds
1940 ... 670 966 5,794 52, 671 1950 ... 2,476 3,563 4,877 59,958 1960 ... 4,796 7,458 9,234 43,084 361 2,325
1965 ... 4,817 8,032 8,049 4,426 49,443 2,192 3,592 1966 ... 4,670 7,751 6,842 5,152 48,076 4,236 4,920 1967 ... 4,932 8,069 6,488 5,786 41,973 6,666 1,901 1968 ... 5,028 8,250 8,622 6,486 17,893 7,755 146 1969 ... 4, 992 8,180 11,184 7,987 531 7,803 0
1970 ... 5, 236 8,795 8,504 12,190 352 8,538 0 1971. .. 5,700 9,376 7' 721 14,602 246 6,188 0 1972 ..• 6,293 10,126 4,676 19' 971 206 5,769 0

70 UTAH AGRICULTURAL STATISTICS 1973
Frozen Products: Production, Utah, 1940, 1950, 1960, 1965-72.
Ice Ice Milk Year Cream Sherbet Water
All Hard Hard I Soft I Total All Hard Ices 1,000 1,000 1,000 1,000 1,000 1,000
Gallons Gallons Gallons Gallons Gallons Gallons
1940 ...... 1,235 -- -- 201 60 --1950 ...... 2,532 -- -- 578 76 --1960 ...... 3,849 563 771 1,334 350 181
1965 ..•... 4,303 993 1,045 2,038 385 289 1966 ...... 4,197 985 1,050 2,035 390 272 1967 ..•... 4,520 993 1,356 2,349 409 256 1968 ...... 4,569 931 1,450 2,381 385 297 1969: ..... 4,462 998 1,582 2,580 387 286
1970 ...... 4,456 1,189 1,547 2,736 449 292 1971 ...... 5,063 1,373 1,618 2,991 452 252 1972 ...... 5,610 1, 371 1,769 3,140 476 274

UTAH AGRICULTURAL STATISTICS 1973 71
Chickens & Eggs Glenn E. Casey, Agricultural Statistician
Egg production in Utah has shifted from a general enterprise on most farms to a highly specialized enterprise on relatively few farms. According to the U. S. Census of Agriculture, There were only 1,159 Utah farms ·with hens and pullets of laying age about January 1, 1970 (9 percent of all farms) compared with 18,231 farms with chickens four months and older January 1, 1945 (69 percent of all farms). This exodus has continued and in 1973 only 8 percent or about 1,000 of Utah's 12,600 farms have egg type chickens. Of these, 27 farms accounted for 90 percent of the state's laying flock on March 1, 1973. These large operations are mostly in Salt Lake and Utah Counties and most of the remaining laying flocks are in Wasatch Front counties.
In earlier years, Utah produced substantial numbers of broilers but commercial broiler production was discontinued in the state during 1971.
Note: In former years, chicken inventory population was estimated as of January 1 each year and egg production was estimated monthly. Now chicken inventory population is estimated as of Deceniber 1 each year. Egg production in minor states including Utah is now estimated quarterly (December-February; March-May; June-August; Septeniber-Noveniber).
December 1 Inventory: Egg type chickens on Utah farms December 1, 1972 were estimated at 1,292,000 hens and pullets of laying age, 408,000 pullets not yet layers, 2,000 male chickens, and 1,702,000 total chickens. Hens and pullets of laying age were down 2 percent while pullets not yet layers were down 9 percent from December 1, 1971. The all chicken population on December 1, 1972 was less than half the peak count of 3,494,000 on January 1, 1944.
Chickens Raised: The number of chickens raised (excluding commercial broilers) during 1972 totaled 830,000 birds. Nearly all of these were for laying flock replacements. Chickens sold (excluding inter-farm sales of replacement pullets) are virtually all cull hens from laying flocks. In 1972, 690,000 birds or 2.7 million pounds live weight were sold. Price averaged 5.5 cents a pound for a return of $148,000.
Egg Production: In 1972, Utah's laying flock averaged 1,326,000 birds. They produced 295 million eggs, an average of 222 per layer -- a 60.7 percent rate of lay. Layers and egg production were up 3 percent from 1971 while rate of lay held about the same. Historically, this was the largest laying flock and the largest egg production since 1960. In the 1940's and early 1950's, Utah was a surplus egg producing state and eggs were shipped by the carload to West Coast markets and to some eastern and mid-west cities. In recent years Utah has become an egg importer. Egg production
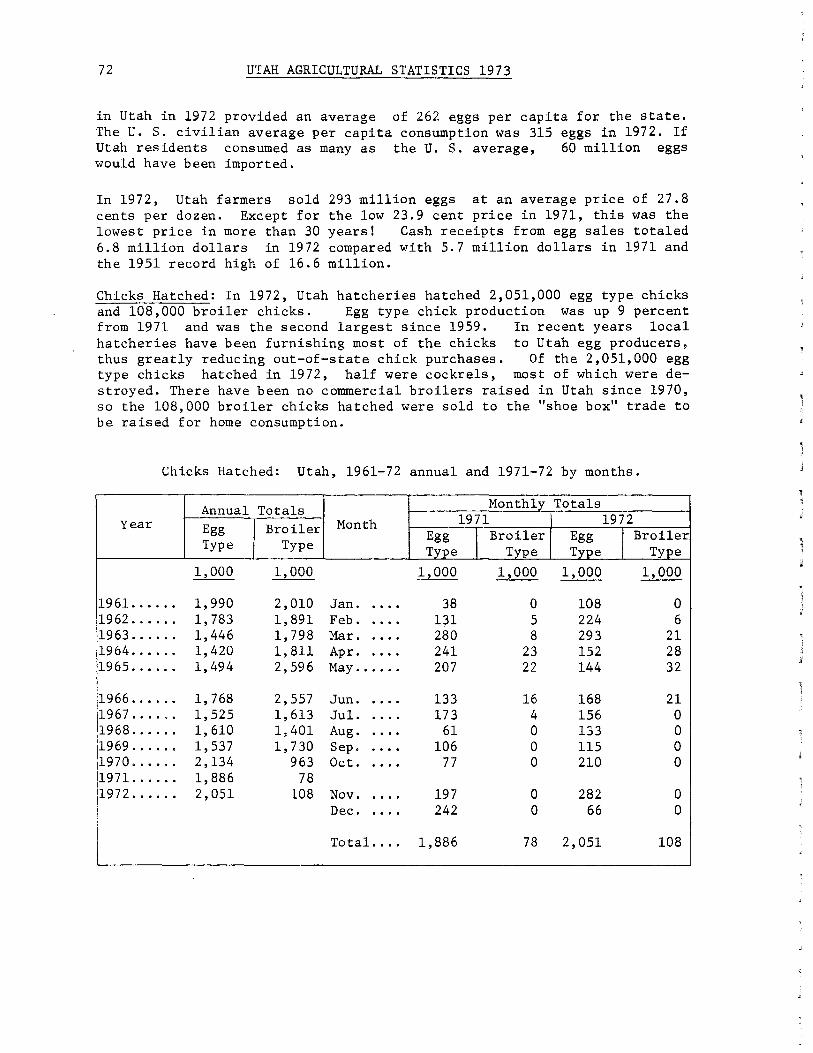
72 UTAH AGRICULTURAL STATISTICS 1973
in Utah in 1972 provided an average of 262 eggs per capita for the state. The U. S. civilian average per capita consumption was 315 eggs in 1972. If Utah residents consumed as many as the U. S. average, 60 million eggs would have been imported.
In 1972, Utah farmers sold 293 million eggs at an average price of 27.8 cents per dozen. Except for the low 23.9 cent price in 1971, this was the lowest price in more than 30 years! Cash receipts from egg sales totaled 6.8 million dollars in 1972 compared with 5.7 million dollars in 1971 and the 1951 record high of 16.6 million.
Chicks Hatched: In 1972, Utah hatcheries hatched 2,051,000 egg type chicks and 108,000 broiler chicks. Egg type chick production was up 9 percent from 1971 and was the second largest since 1959. In recent years local hatcheries have been furnishing most of the chicks to Utah egg producers, thus greatly reducing out-of-state chick purchases. Of the 2,051,000 egg type chicks hatched in 1972, half were cockrels, most of which were destroyed. There have been no commercial broilers raised in Utah since 1970, so the 108,000 broiler chicks hatched were sold to the "shoe box" trade to be raised for home consumption.
Chicks Hatched: Utah, 1961-72 annual and 1971-72 by months.
Annual Totals Monthly Totals 1971 1972 Year Month Egg Broiler Egg l Broiler Egg I Broiler
Type Type Type Type Type Type
1,000 1,000 1,000 1,000 1,000 1,000
1961. ..... 1,990 2,010 Jan . . . . . 38 0 108 0 ,1962 ...... 1,783 1,891 Feb . . . . . 131 5 224 6 I il963 ...... 1,446 1,798 Mar . . . . . 280 8 293 21 11964 ...... 1,420 1, 811 Apr . . . . . 241 23 152 28 1965 ...... 1,494 2, 596 May ...... 207 22 144 32 I I 1,768 133 16 168 21 11966 ...... 2,557 Jun. . ... 11967 ...... 1,525 1,613 Jul. .... 173 4 156 0 11968 ...... 1,610 1,401 Aug . . . . . 61 0 133 0 11969 ...... 1,537 1,730 Sep . . . . . 106 0 115 0 1970 ...... 2, 134 963 Oct . . . . . 77 0 210 0 11971 ...... 1,886 78 11972 ...... 2,051 108 Nov . . . . . 197 0 282 0
I Dec. .... 242 0 66 0
Total. ... 1,886 78 2,051 108

UTAH AGRICULTURAL STATISTICS 1973 73
Chicken Inventory 1/: Number and Value, Utah, January 1, 1940, 1944, 1950, 1960, 1965-69. December 1. 1969-72.
Hens & Pullets Pullets Total Chickens
Date Pullets 3 Mo. & Under Other Value of Lay- Over--Not 3 Chickens Number Average I Total ing Age Laying Months
1,000 1,000 1,000 1,000 1,000 1,000 Dollars Dollars
Jan. 1, 1940 .... 2,191 3/ 4/ 175 2,366 .63 1,491 Jan. 1, 1944 ]j. 3,181 J/ 4; 313 3,494 1.10 3,843 Jan. 1, 1950 .... 2,871 J/ 4; 150 3,021 1. 22 3,686 Jan. 1, 1960 .... 1,691 }j ;_; 69 1,760 .94 1,654
Jan. 1, 1965 .... 1,349 ]j !J:j 35 1,384 1.10 1,522 Jan. 1, 1965 •... 1,143 llO 96 35 1,384 1.10 1,522 Jan. 1, 1966 .... 1,177 154 121 32 1,484 1.05 1,558 Jan. 1, 1967"' •. 1,342 162 185 34 1,723 1.10 1,895 Jan. 1, 1968 .... 1,315 170 155 30 1,670 1.20 2,004 Jan. 1, 1969 .... 1,320 140 2ll 15 1,686 1.05 1, 770 Jan. 1, 1970 .... 1,320 190 219 10 1,739 1. 20 2,087
Dec. 1, 1969 .•.. 1,332 190 219 10 1,751 1. 20 2,101 Dec. 1, 1970 .... 1,182 218 327 10 1,737 1.10 1, 9ll Dec. 1, 1971. ... 1,312 194 255 ll 1, 772 1.10 1,949 Dec. 1, 1972 .... 1,292 136 272 2 1,702 1.30 2, 213
1/ Excludes commercial broilers. £/ Record high January 1 chicken inventory. ll Included with hens and pullets. ~/ Included in hens and pullets and in other chickens.
Chickens 1/: Inventory Numbers, Number Raised, and Disposition, Utah, 1940, 1950, 1960. 1965-72.
All All Produced Chickens Home Chickens
Year on Hand Lost Raised Cons ump- Sold on Hand Number Weight £/ Beginning ti on End
of Year of Year 1,000 1,000 1,000 1,000 1,000 1,000 1,000 1,000 Head Head Head Head Head Head Head Pounds --
11940 .••• 2,366 426 2,917 512 2,044 2,301 2,491 7 ,627 1950 •..• 3,021 634 4,236 395 3,562 2,666 3,602 13,851 1960 •••• 1,760 334 1,397 203 1,018 1,602 1,063 4,252
1965 .•.• 1,384 230 910 80 500 1,484 680 2,831 1966 .•.• 1,484 247 1,029 70 473 1, 723 782 3,129 1967 .... 1,723 242 936 60 687 1,670 694 3,017 1968 .•.. 1,670 224 936 50 646 1,686 712 2,734 1969 .••• 1,686 185 889 40 6ll 1,739 704 2,795 1970 ••.• 1,751 200 862 38 638 1,737 662 2,336 1971. ••• 1,737 190 1,045 20 800 1, 772 855 3,146 1972 •••• 1, 772 190 830 20 690 1,702 640 2,485
l/ Excludes commercial broilers. £/ Jan. 1-Jan. 1 through 1969--Dec. 1-Dec. 1 starting 1970.
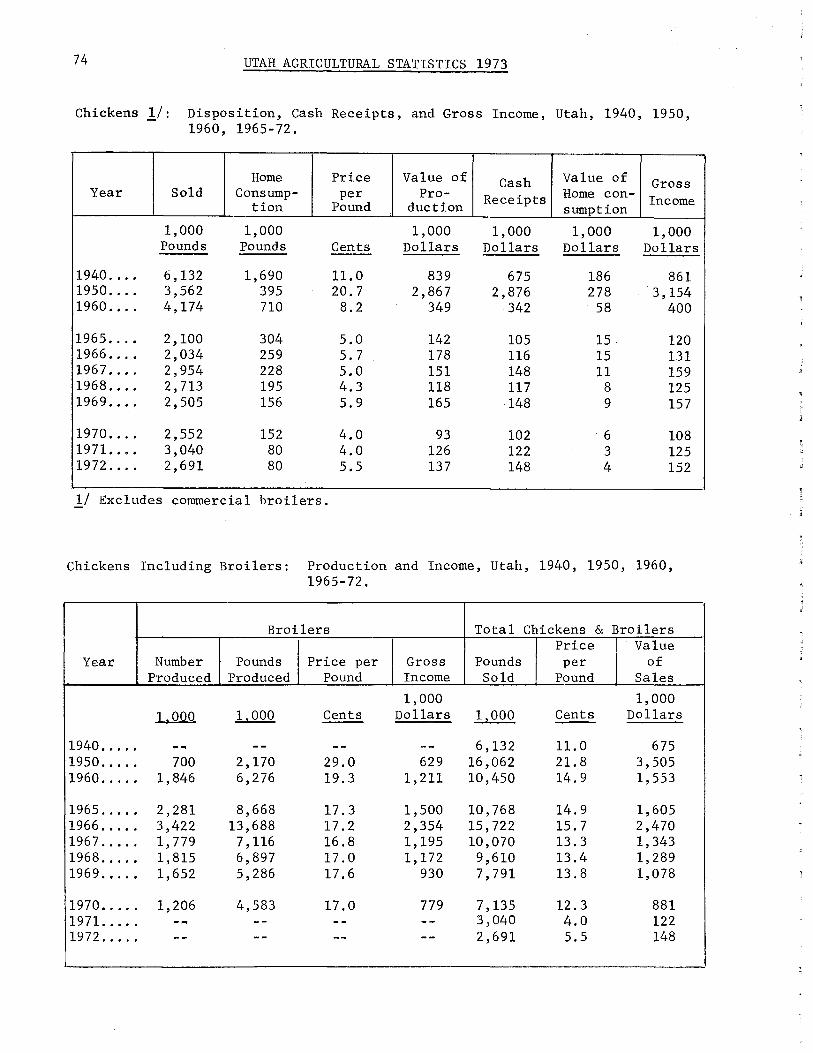
74 UTAH AGRICULTURAL STATISTICS 1973
Chickens l/: Disposition, Cash Receipts, and Gross Income, Utah, 1940, 1950, 1960' 1965- 72.
Home Price Value of Cash Value of Gross Year Sold Cons ump- per Pro- Receipts Home con- Income tion Pound duct ion sumption
1,000 1,000 1,000 1,000 1,000 1,000 Pounds Pounds Cents Dollars Dollars Dollars Dollars --
1940 .... 6,132 1,690 11.0 839 675 186 861 1950 .... 3,562 395 20.7 2,867 2,876 278 3, 154 1960 .... 4,174 710 8.2 349 342 58 400
1965 •..• 2, 100 304 5.0 142 105 15 120 1966 •... 2,034 259 5. 7 178 116 15 131 1967 •... 2,954 228 5.0 151 148 ll 159 1968 .... 2' 713 195 4.3 ll8 ll7 8 125 1969 .... 2,505 156 5.9 165 148 9 157
1970 .... 2,552 152 4.0 93 102 6 108 1971. ••• 3,040 80 4.0 126 122 3 125 1972 .... 2,691 80 5.5 137 148 4 152
ll Excludes commercial broilers.
Chickens Including Broilers: Production and Income, Utah, 1940, 1950, 1960, 1965-72.
Broilers Total Chickens & Broilers Price Value
Year Number Pounds Price per Gross Pounds per of Produced Produced Pound Income Sold Pound Sales
1,000 1,000 .l..J2QQ 1,000 Cents Dollars 1,000 Cents -- Dollars
1940 ... '. .,..., -- -- -- 6, 132 11. 0 675 1950 ..... 700 2,170 29.0 629 16,062 21.8 3,505 1960 ..... 1,846 6,276 19,3 l,2ll 10,450 14.9 1,553
1965 ..... 2,281 8,668 17.3 1,500 10,768 14.9 1,605 1966 ..... 3,422 13 '688 17.2 2,354 15' 722 15.7 2,470 1967 ..... 1, 779 7' ll6 16,8 1,195 10,070 13.3 1,343 1968 ..... 1,815 6,897 17.0 1, 172 9 ,610 13.4 1,289 1969 ....• 1,652 5,286 17.6 930 7' 791 13. 8 1,078
1970 ..... 1,206 4,583 17.0 779 7,135 12.3 881 1971. ..•. _,. -- -- -- 3,040 4.0 122 1972 ..... -- -- -- -- 2,691 5.5 148
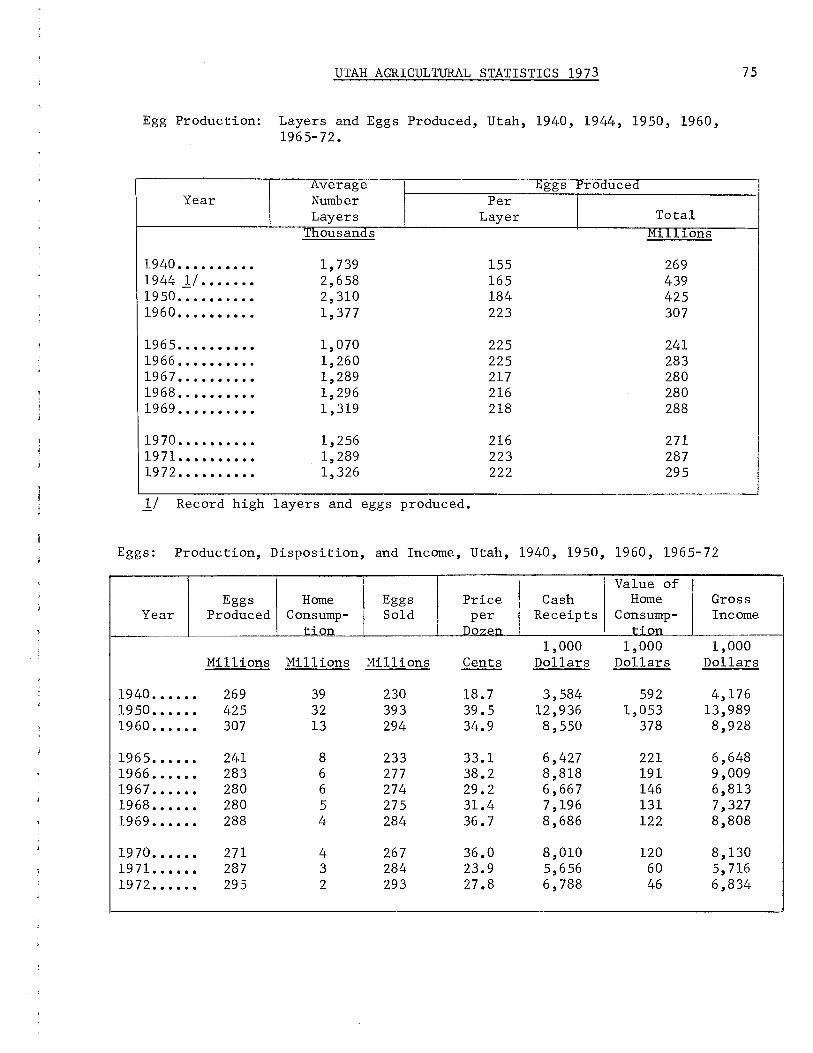
UTAH AGRICULTURAL STATISTICS 1973 75
Egg Production: Layers and Eggs Produced, Utah, 1940, 1944, 1950, 1960, 1965- 72.
Average I b;ggs Produced Year Number
I Per
I Layers Layer Total Thousands M1111ons
1940 .. ....•... 1,739 155 269 1944 1.1 • .•.... 2, 658 165 439 19 50 .. ..••...• 2,310 184 425 1960 . ...•..... 1,377 223 307
1965 ...•.••••• 1,070 225 241 1966 ....••••.. 1,260 225 283 1967 •..•••••.• 1,289 217 280 1968 ..•...•.•. 1,296 216 280 19690000000000 1, 319 218 288
19 70 ...• ••..•. 1,256 216 271 1971 .••••••••• 1,289 223 287 1972 .••••.••.. 1,326 222 295
11 Record high layers and eggs produced.
Eggs: Production, Disposition, and Income, Utah, 1940, 1950, 1960, 1965-72
~ I Value of
Eggs Home Eggs Price Cash Home Gross Produced Cons ump- Sold per Receipts Consump- Income
ti on Do7en ri nn
1,000 1,000 1,000 Millions Millions Millions Cents Dollars Dollars Dollars
1940 •••••• 269 39 230 18.7 3,584 592 4,176 19 50 •••••• 425 32 393 39.5 12,936 1,053 13,989 19 60 •••••• 307 13 294 34.9 8,550 378 8,928
1965 •••••• 241 8 233 33.l 6 ,427 221 6,648 1966 •••••• 283 6 277 38.2 8,818 191 9,009 196 7 •••••• 280 6 274 29.2 6 '667 146 6,813 1968 •••••• 280 5 275 31.4 7,196 131 7,327 1969 •••••• 288 4 284 36.7 8,686 122 8,808
19 70 •••••• 271 4 267 36.0 8,010 120 8,130 1971. ••••• 287 3 284 23.9 5,656 60 5, 716 19 72 •••••• 295 2 293 27.8 6,788 46 6,834

76 UTAH AGRICULTURAL STATISTICS 1973
Turkeys Glenn E. Casey, Agricultural Statistician
Turkey production is a major agricultural industry in Utah. In 1972, turkeys ranked third in cash receipts in the state--exceeded only by cattle and dairy. Utah ranked tenth among the states in turkey production in 1972. The leading county in the state is Sanpete where over 2 million turkeys were raised in 1972. In fact, this county is among the top ten in the United States in turkey production. Other counties growing turkeys in Utah are: Box Elder, Cache, Weber, Davis, Salt Lake, Utah, Sevier, and Washington. Utah processing plants are located in Ogden, Salt Lake City, Moroni, and Salina. Nearly all turkeys raised in Utah are killed for market by Christmas each year.
There were 3,905,000 turkeys raised in 1972, all heavy breeds, the second largest crop ever and only 1 percent below the record high 1970 crop. Intentions of growers expressed in December 1972 indicated 4,100,000 heavy breed turkeys will be raised in 1973. In 1972, Utah growers produced 89 million pounds liveweight. This was the second largest poundage ever produced. The preliminary liveweight price to the grower was estimated at 21.5 cents a pound for 1972 turkeys compared with 22.0 cents in 1971. Gross income from sales totaled 19.1 million dollars in 1972, second largest ever.
Breeder hens held on Utah farms December 1, 1972 were 43,000 head compared with 39,000 December 1, 1971 and 51,000 in January 1, 1971. Utah hatcheries hatched 4,181,000 turkey poults in 1972 -- nearly equal to the largest number ever hatched in the state of 4,193,000 poults in 1970. All poults hatched in Utah were placed on Utah farms. Poult placements are mostly complete0 by the end of June and the average raising time is six months.
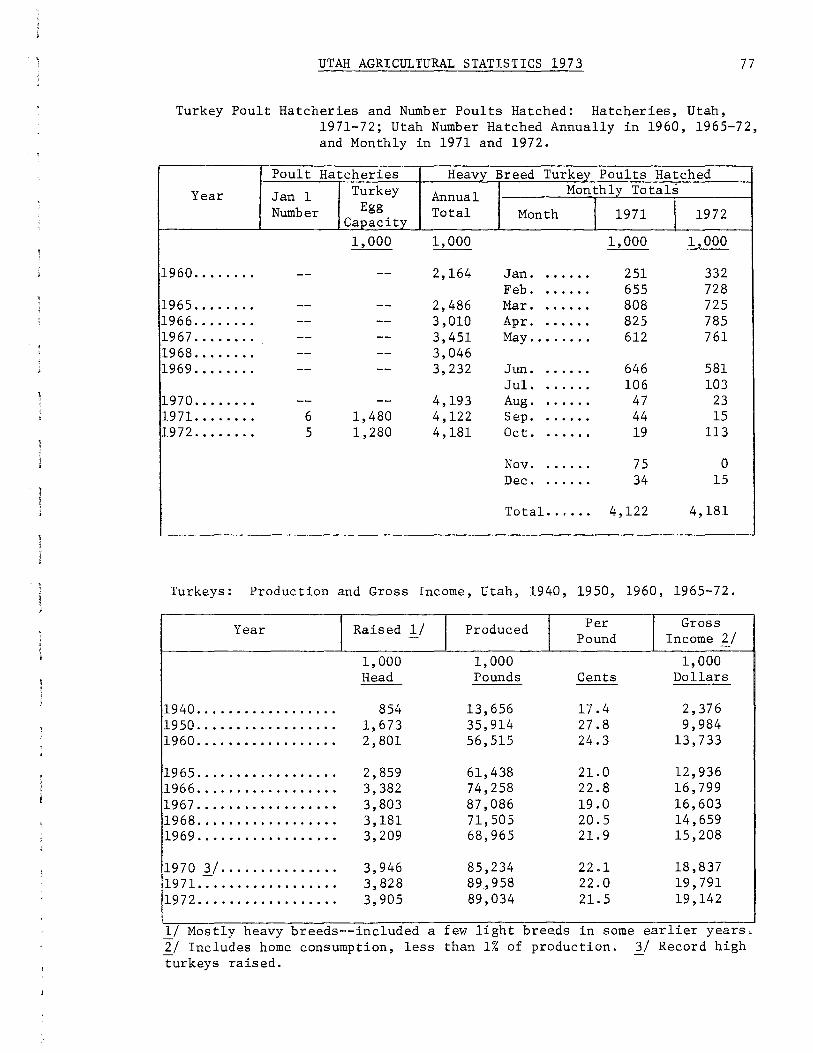
UTAH AGRICULTURAL STATISTICS 1973 77
Turkey Poult Hatcheries and Number Poults Hatched: Hatcheries, Utah, 1971-72; Utah Number Hatched Annually in 1960, 1965-72, and Monthly in 1971 and 1972.
Poult Hatcheries Heavy Breed Turkey Poults Hatched
Year Jan 1 Turkey Annual Monthly Totals
Number Egg Total Month I 1971 I 1972 Capacity 1,000 1,000 1,000 1,000
1960 ........ -- -- 2,164 Jan. ...... 251 332 Feb. . ..... 655 728
1965 ........ -- -- 2,486 Mar. ...... 808 725 1966 ........ -- -- 3,010 Apr. ...... 825 785 1967 ........ -- -- 3,451 May .••..•.. 612 761 1968 ........ -- -- 3,046 1969 ........ -- -- 3,232 Jun. ...... 646 581
Jul. ...... 106 103 1970 ........ -- -- 4,193 Aug. ...... 47 23 1971. ....... 6 1,480 4,122 Sep . . . . . . . 44 15 1972 ........ 5 1,280 4,181 Oct. ...... 19 113
Nov . . . . . . . 75 0 Dec. . ..... 34 15
Total ...... 4,122 4,181
Turkeys: Production and Gross Income, Utah, 1940, 1950, 1960, 1965-72.
Year I Raised 1/ I Produced I Per
I Gross
Pound Income 'l:._/
1,000 1,000 1,000 Head Pounds Cents Dollars
1940 .................. 854 13,656 17.4 2' 376 1950 .................. 1,673 35,914 27.8 9,984 1960 .................. 2,801 56,515 24.3 13, 733
1965 .................. 2,859 61,438 21.0 12,936 1966 .................. 3,382 74,258 22.8 16,799 1967 .................. 3,803 87,086 19.0 16,603 1968 .................. 3,181 71, 505 20.5 14,659 1969 .................. 3,209 68,965 21.9 15,208
1970 3/ ............... 3,946 85,234 22.1 18,837 1971 .................. 3,828 89,958 22.0 19,791 1972 .................. 3, 905 89,034 21. 5 19,142
1/ Mostly heavy breeds--included a few light bree.ds in some earlier years" "%./ Includes home consumption, less than 1% of production. 1/ Record high turkeys raised.

78 UTAH AGRICULTURAL STATISTICS 1973
Mink J. Craig Thomas, Agricultural Statistician
Mink production in Utah dropped 35 percent from 1969 to 1972 as a result of low prices although the reduction in Utah was less than the U. S. decline of 48 percent. The 285,000 pelts produced in Utah in 1972 were 16 percent less than in 1971. However, mink females bred to produce kits in 1973, at 100,000, were 6 percent more than 1972 which was a reversal of the downward trend.
Utah ranks third nationally in mink production--exceeded only by Wisconsin and Minnesota. Pelts produced in Utah are high quality and bring above average prices at the national auctions. Several color classes are produced in the state with "standard" the most important.
Mink production in Utah is primarily in the north central counties of the state-from Cache on the north to Utah County on the south. The heaviest concentration is in Morgan, Summit, and Salt Lake Counties. A few producers are scattered out of the main area--in the Uintah Basin and in Central Utah.
Mink: Pelts Produced 1969-72 and Females Bred 1970-73, Utah and U.S.
·--
L U T AH United States
I Ranches
I Pelts
I Females
Ranches
I Pelts
I Females Producing Producing
Pelts Produced Bred Pelts Produced
1,000 1,000 1,000
1969 ........ 343 439 -- 2,794 5,688 1970 ........ 308 396 134 2,227 4, 532 1971. ....... 261 340 108 1,615 3,380 1972 ........ 225 285 94.5 1,379 2,963 1973 ........ -- -- 100 -- --
Mink: Pelts Produced in 1971 and 1972, and Females Bred for 1972 and 197 3 in Utah
Bred
1,000
--1,416 1,011
858 901
I Mink Pelts Produced Mink Females Bred
Color Class to Produce Kits
I 1971 I 1972 I
1972 as 1972 I 1973 I 1973 as
% 1971 % 1972
Standard .......... 161,000 145,000 90 45,100 48,700 108 Pastel. ........... 105,000 87,000 83 29,000 30,900 107 Pale Brown ........ 1,700 1,600 94 620 180 29 Sapphire .......... 15,500 10,400 67 4,000 4,500 113 Gunmetal .......... 430 350 81 140 150 107
Platinum .......... 1,200 1,500 125 }j 240 --Pearl. ............ 28,200 20,400 72 7,700 8,400 109 Lavender Hope ..... 1,200 y -- 1/ -- --Violet Type ....... 25,200 18,500 73 7 ,7oo 6,900 90 White ............. 160 1/ -- !I }) --!Miscellaneous ..... 410 II -- -- -- --
Total. ............ 340,000 285,000 84 94,500 lG0,000 106
!/ Included in totals to avoid disclosing individual operations.

UTAH AGRICULTURAL STATISTICS 1973 79
Honey J. Craig Thomas, Agricultural Statistician
The number of colonies of bees maiPtained in Utah has trended down slightly in the last 10 years--from 52,000 in 1963 to 47,000 in 1972. However, production fluctuated sharply, depending on the season. The high was 4,368,000 pounds in 1963 and the low was 1,050,000 in 1968. There were 1,739,000 pounds produced in 1973. Honey popularity has increased sharply in recent years with prices rising each year since 1967. The average price for the 1972 crop was a record high 33.0 cents a pound compared with 21.4 for 1971 and the 1965-69 average of 15.2 cents. Total value of 1972 honey was $574,000 and beeswax added another $18,000. The importance of bees in the pollination of fruit and seed crops adds greatly to their value.
In recent years beekeepers have been faced with several serious and continuing problems. First, alfalfa growers are cutting their hay at early bloom or even pre-bloom and thus depriving bees of a major nectar plant. Second, increased use of pesticides by farmers, weed controi crews, and others are either killing bees directly or destroying their food source. Finally, adverse spring weather or unseasonal frosts have limited the honey flow. Bees are found in every county of the state, but the industry is most important in Millard County where about one-third of the colonies are located. Second is Utah County.
Honey & Beeswax: Number of Colonies, Production, Average Price and Value, Utah, 1936, 1940, 1950, 1960, 1965-72.
Colonies Honey Beeswax
Production Value Value Year of
Per I Per I Pro- Per I Tota~-Bees Colony Total Pound Total duct ion Pound
1,000 1,000 1,000 1,000 1,000 Colonies Pounds Pounds Cents Dollars Pounds Cents Dollars
1936 1/ ... 78 60 4,680 -- -- 49 36.0 18 1940 ...... 53 45 2,385 3.6 86 47 44.0 21 1950 ...... 49 51 2,499 11.0 275 35 42.0 15 1960 ...... 52 34 1,768 15.6 276 79 42.0 33
1965 ...... 50 44 2,200 15.0 330 44 44.0 19 1966 ...... 51 51 2,601 15.5 403 62 47.0 29 1967 ...... 51 44 2,244 13.1 294 40 53.0 21 1968 ...... 50 21 1,050 14.7 154 24 56.0 13 1969 ...... 49 50 2,450 17.5 429 51 58.0 30 1970 ...... 50 36 1,800 18.1 326 32 53.0 17
1971. ..... 48 30 1,440 21. 4 308 27 57.0 15 1972 47 37 1,739 33.0 574 31 59.0 18
1/ Record high number of colonies of bees.

80 UTAH AGRICULTURAL STATISTICS 1973
Farm Labor
J. Craig Thomas, Agricultural Statistician
Farm Workers: During 1972, the farm labor force in Utah ranged from a seasonal low of 14,000 in January and December to a seasonal high of 27,000 in August and averaged 20,000 for the year compared with 22,000 in 1971. The number of hired workers varied from a winter low of 1,000 to a summer high of 9,000 while family worker numbers varied from 11,000 to 20,000. Included in these totals are all hired workers and farm operators who do work during the survey period plus unpaid family workers who work 15 hours or more during the survey week. The survey period during each month includes the last full calendar week of that month.
The number of workers on Utah farms has followed a long time downward trend similar to the rest of the United States. From 1966 to 1972 there was a reduction of 20 percent in the number of Utah farm workers. Some of the reasons behind the reduction were a decrease in the number of farms, mechanization of farm tasks, and a trend towards consolidation of small farms into larger more efficient units. Between 1966 and 1973 the number of farms fell 21 percent, from 16,000 to 12,600. Over the same period, average size of farms in the state went from 838 acres to 1,032--a 23 percent increase.
Wage Rates: Wages paid to hired workers on Utah farms have also followed the national trend by showing a sustained increase over the 1966-72 period. Cash wages received by workers hired by the hour without board or room have moved from $1.39 in 1966 to $1.83 in 1972 -- a 32 percent rise. Worke~s under other hiring arrangements received increases ranging from 23 to 29 percent. Causes for the increased wages were changes in minimum wage legislation, competition from nonfarm industries, and the general inflation which has occurred.
- . ~
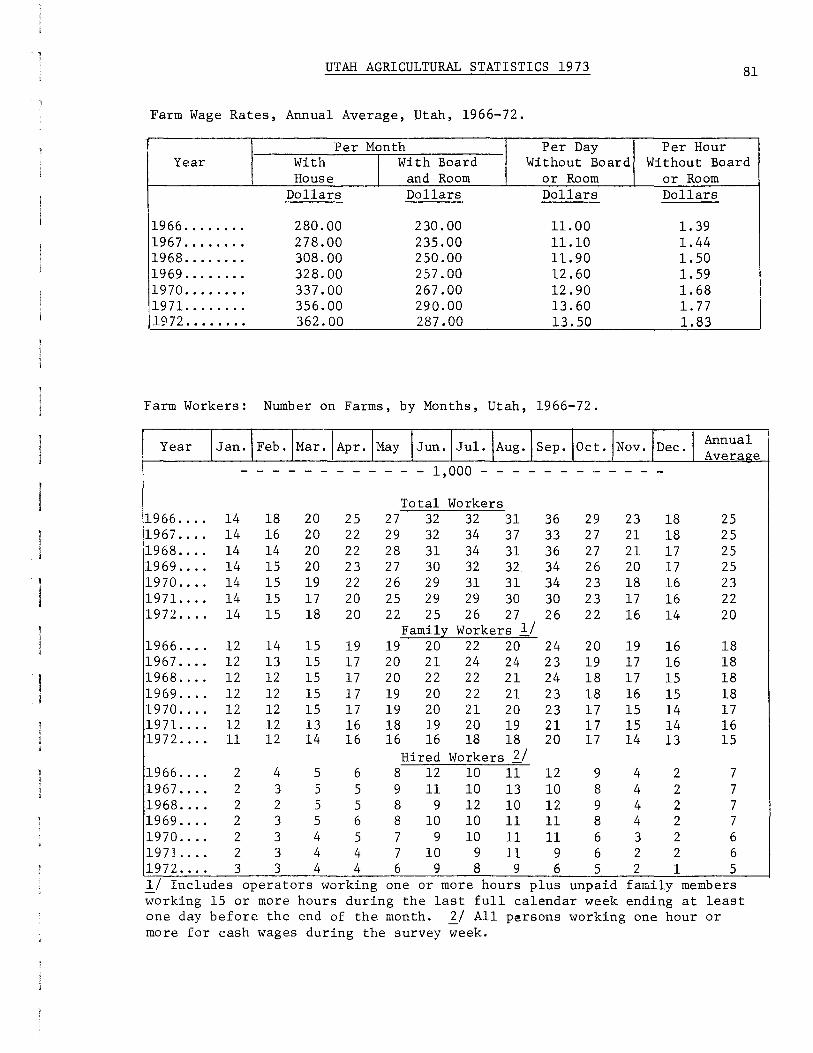
UTAH AGRICULTURAL STATISTICS 1973 81
Farm Wage Rates, Annual Average, Utah, 1966-72.
f Per Month Per Day Per Hour Year With I With Board Without Board Without Board
House and Room or Room or Room Dollars Dollars Dollars Dollars
1966 ........ 280.00 230.00 11.00 1. 39 1967 ........ 278.00 235.00 11.10 1.44 1968 ........ 308.00 250.00 11.90 1.50 1969 ........ 328.00 257.00 12.60 1.59 1970 ........ 337.00 267.00 12.90 1. 68 1971 ........ 356.00 290.00 13.60 1. 77 1972 ........ 362.00 287.00 13.50 1.83
Farm Workers: Number on Farms, by Months, Utah, 1966-72.
Year Jan. Feb. Mar. Apr. May Jun. Jul. Aug. Sep. Oct. Nov. Dec. Annual Avera e
------ - - - - - - 1,000 - - - - - - ------
Total Workers 1966 .... 14 18 20 25 27 32 32 31 36 29 23 18 25 1967 .... 14 16 20 22 29 32 34 37 33 27 21 18 25 1968 .... 14 14 20 22 28 31 34 31 36 27 21 17 25 1969 .... 14 15 20 23 27 30 32 32 34 26 20 17 25 1970 .... 14 15 19 22 26 29 31 31 34 23 18 16 23 1971. ... 14 15 17 20 25 29 29 30 30 23 17 16 22 1972 .... 14 15 18 20 22 25 26 27 26 22 16 14 20
Family Workers 1/ 1966 .... 12 14 15 19 19 20 22 20 24 20 19 16 18 1967 .... 12 13 15 17 20 21 24 24 23 19 17 16 18 1968 .... 12 12 15 17 20 22 22 21 24 18 17 15 18 1969 .... 12 12 15 17 19 20 22 21 23 18 16 15 18 1970 .... 12 12 15 17 19 20 21 20 23 17 15 14 17 1971. ... 12 12 13 16 18 19 20 19 21 17 15 14 16 1972 .... 11 12 14 16 16 16 18 18 20 17 14 13 15
Hired Workers '!:../ 1966 .... 2 4 5 6 8 12 10 11 12 9 4 2 7 1967 .... 2 3 5 5 9 11 10 13 10 8 4 2 7 1968 .... 2 2 5 5 8 9 12 10 12 9 4 2 7 1969 .... 2 3 5 6 8 10 10 11 11 8 4 2 7 1970 .... 2 3 4 5 7 9 10 11 11 6 3 2 6 1971. ... 2 3 4 4 7 10 9 11 9 6 2 2 6 1972 .... 3 3 4 4 6 9 8 9 6 5 2 1 5 .. !/ Includes operators working one or more hours plus unpaid family members working 15 or more hours during the last full calendar week ending at least one day before the end of the month. '!:._/ All persons working one hour or more for cash wages during the survey week.
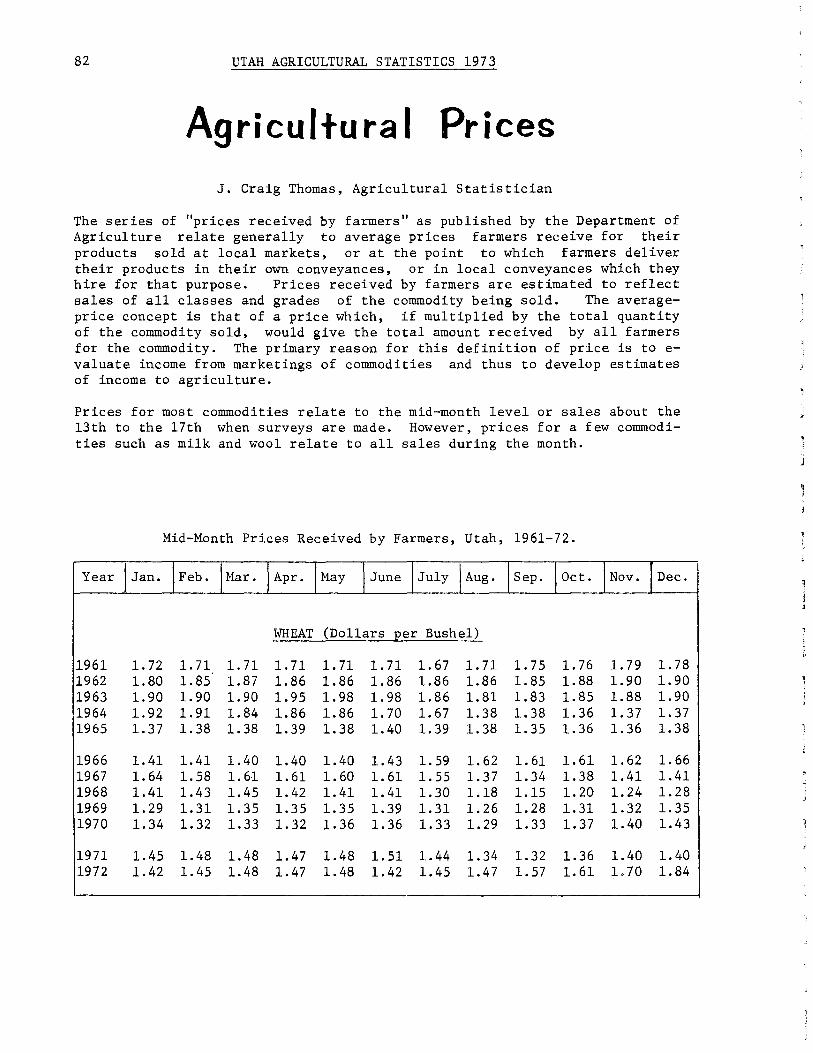
82 UTAH AGRICULTURAL STATISTICS 1973
Agricultural Prices J. Craig Thomas, Agricultural Statistician
The series of "prices received by farmers" as published by the Department of Agriculture relate generally to average prices farmers receive for their products sold at local markets, or at the point to which farmers deliver their products in their own conveyances, or in local conveyances which they hire for that purpose. Prices received by farmers are estimated to reflect sales of all classes and grades of the commodity being sold. The averageprice concept is that of a price which, if multiplied by the total quantity of the commodity sold, would give the total amount received by all farmers for the commodity. The primary reason for this definition of price is to evaluate income from marketings of commodities and thus to develop estimates of income to agriculture.
Prices for most commodities relate to the mid-month level or sales about the 13th to the 17th when surveys are made. However, prices for a few commodities such as milk and wool relate to all sales during the month.
Mid-Month Prices Received by Farmers, Utah, 1961-72.
Year Jan. Feb. Mar. Apr. May June July Aug. Sep. Oct. Nov. Dec.
WHEAT (Dollars per Bushel)
1961 1. 72 1. 71 1. 71 1. 71 1. 71 1. 71 1. 67 1. 71 1. 75 1. 76 1. 79 1. 78 1962 1.80 1.85 1.87 1.86 1.86 1.86 1.86 1.86 1. 85 1.88 1.90 1.90 1963 1.90 1. 90 1. 90 1.95 1.98 1.98 1.86 1.81 1.83 1.85 1.88 1.90 1964 1.92 1.91 1.84 1.86 1.86 1. 70 1. 67 1.38 1.38 1.36 1. 37 1.37 1965 1.37 1. 38 1. 38 1.39 1.38 1.40 1.39 1.38 1.35 1.36 1.36 1.38
1966 1.41 1.41 1.40 1.40 1.40 1.43 1. 59 1. 62 1. 61 1.61 1.62 1. 66 1967 1.64 1.58 1.61 1.61 1. 60 1. 61 1. 55 1.37 1.34 1.38 1.41 1.41 1968 1.41 1.43 1.45 1.42 1.41 1.41 1.30 1.18 1.15 1. 20 1.24 1.28 1969 1.29 1.31 1.35 1.35 1.35 1.39 1.31 1. 26 1.28 1.31 1.32 1.35 1970 1.34 1.32 1.33 1. 32 1.36 1.36 1.33 1. 29 1.33 1.37 1.40 1.43
1971 1.45 1.48 1.48 1.47 1.48 1.51 1.44 1.34 1.32 1.36 1.40 1.40 1972 1.42 1. 45 1.48 1.47 1. 48 1.42 1.45 1.47 1. 57 1.61 L70 1.84

UTAH AGRICULTURAL STATISTICS 1973 83
Mid-Month Prices Received by Farmers, Utah, 1961-72.
Year I Jan. j Feb. I Mar. I Apr. I May I June! July I Aug. I Sep. I Oct. I Nov. I Dec.
BARLEY (Dollars per Bushel)
1961 1.00 1. 02 1.02 1.02 1.05 1.04 1.02 .98 1.00 .99 .99 .99 1962 1.03 1.05 1.06 1.06 1.07 1.10 1.08 1.00 1. 00 1.03 1.03 1.06 1963 1.06 1.09 1.10 1.05 1.05 1.05 1.00 .95 .98 1.00 1.03 1.04 1964 1.09 1.09 1.09 1.09 1.09 1.09 1.09 1.07 1.00 1.04 1.08 1.12 1965 1.12 1.12 1.13 1.12 1.13 1.13 1.13 1.05 1.04 1.05 1.05 1.07
1966 1.09 1.13 1.12 1.13 1.12 1.10 1.11 1.11 1.11 1.13 1.16 1.18 1967 1.18 1.18 1.18 1.17 1.17 1.18 1.16 1.03 1.00 1.00 1.00 1.00 1968 1.05 1.06 1.07 1.10 1.10 1.07 1.04 .96 .97 .97 .99 1.02 1969 1.05 1.07 1.11 1.11 1.11 1.14 1.08 1.04 1.04 1.05 1.05 1.07 1970 1.10 1.10 1.09 1.04 1.03 1.05 1.01 . 98 . .99 1.04 1.07 1.12
1971 1.13 1.16 1.16 1.17 1. 20 1. 28 1.16 1.08 1.09 1.08 1.10 1.15 1972 1.15 1.21 1.21 1.22 1.22 1.14 1.14 1.15 1. 22 1.22 1.30 1.34
DRY BEANS (Dollars per Cwt.)
1961 7.10 6.80 6.80 6.80 7.20 7.50 6.70 6.50 7.20 7.00 6.80 6.30 1962 6.30 6.20 6.10 5.30 5.50 5.40 5.30 5.40 5.50 6.20 6.40 6.30 1963 6.30 6.50 6.50 6.30 6.20 6.30 6.30 6.30 6.30 6.00 5.80 5.70 1964 5.60 5.60 5.70 5.80 5.80 5.70 5.70 5.70 5.80 6.50 7.50 7.80 1965 9.00 9.10 9.30 9.30 9.20 9.20 15.00 14.00 7.00 9.00 9.00 8.60
1966 8.40 7.80 7.50 7.40 7.20 7.20 7.00 7.00 7.00 6.50 6.00 5.90 1967 5.90 5.90 6.30 6.30 6.10 6.00 7.50 7.50 7.50 7.70 7.90 8.00 1968 8.00 8.10 8.40 8.60 8.70 8.70 8.70 8.40 6.90 6.00 6.50 6.60 1969 6.50 6.40 6.50 6.40 6.40 6.30 6.50 6.50 6.30 7.00 7.50 7.20 1970 7.50 8.00 9.00 9.50 9.80 10.80 11.80 11.50 7.00 8.00 7.80 7.80
1971 7.30 8.00 8.00 7.80 8.20 8.20 9.00 9.00 9 ."oo 10.00 10.00 10.00 1972 10.00 10.50 10.90 12.00 -- 11:30 10. 50 9.30 9.30 9.00 9.00 8.80
POTATOES (Dollars per Cwt.)
1961 2.15 2.10 1.95 2.45 2.30 -- -- 1. 50 1. 50 1.55 1.55 1.40 1962 1.45 1.50 1. 55 1.60 1. 70 -- 1. 70 1. 70 1.90 2.00 1.85 1.90 1963 1.95 2.00 1. 90 1. 75 1. 70 -- -- 2.25 1.90 1.25 1.30 1.30 1964 1.40 1.40 1. 70 2.05 2.90 -- -- -- 1.90 2.20 2.70 3.30 1965 3.75 3.70 3.95 5.10 5.40 -- -- -- 1. 90 1.90 2.20 2.20
1966 2.25 2.40 2.45 2.45 2.40 -- -- -- 1. 90 2.60 2.90 2.75 1967 3.10 2.85 2.85 2.50 2.50 -- -- -- 2.25 2.15 2.00 2.00 1968 2.00 1.90 1. 80 2.35 4.00 -- -- -- 2.00 2.80 3.00 2.60 1969 2.60 2.90 3.10 3.10 3.30 -- -- 2.50 2.90 2.10 2.30 2.30 1970 2.60 2.80 2.90 3.00 3.20 -- -- 2.40 2.30 2.60 2.60 2.40
1971 2.40 2.10 2.20 2.10 2.60 -- -- -- 2.10 2.60 2.20 1.90 1972 2.00 2.00 1.90 1.80 1.80 -- -- 2.60 2.90 2.70 2.40 2.50

84 UTAH AGRICULTURAL STATISTICS 1973
Mid-Month Prices Received by Farmers, Utah, 1961-72.
Year Jan. Feb. Mar. Apr. May June July Aug. Sep. Oct. Nov. Dec.
1961 1962 1963 1964 1965
ALFALFA HAY, BALED (Dollars per Ton)
28.00 28.00 27.50 26.50 27.50 26.00 26.50 26.00 25.50 26.00 25.50 24.50 24.00 23.50 22.00 21.00 19.00 19.00 20.00 20.50 21. 50 21.00 21.00 21.00 20.50 20.00 20.00 22.00 22.00 22.50 22.50 23.50 23.00 20.50 20.00 20.00 24.00 24.50 23.50 24.00 24.00 23.00 22.00 22.00 22.00
25.00 26.00 25.5 19.50 20.00 19.5 20.00 20.50 20.5 20.00 21.00 23.0 22.50 23.00 24.0
1966 25.00 25.50 26.00 25.00 25.00 24.50 25.00 26.00 27.50 27.00 28.00 29.00 1967 29.50 28.50 29.00 28.00 29.00 27.00 25.00 23.00 22.00 22.50 22.50 22.50 1968 23.00 23.00 21.50 22.00 21.50 22.00 21.00 20.50 21.00 21.00 21.50 22.50 1969 23.00 24.00 24.00 24.00 25.50 23.50 23.00 23.00 23.50 24.00 25.00 25.00 1970 25.50 26.00 26.00 25.50 25.50 25.50 24.00 24.00 24.50 24.50 25.50 25.50
1971 27.00 28.50 28.50 29.50 29.00 28.50 28.00 28.00 28.00 28.00 30.50 33.50 1972 35.00 37.00 36.50 35.00 33.00 33.00 33.00 33.50 33.50 34.50 35.50 38.50
ALL HAY, BALED (Dollars per Ton)
1961 27.40 27.40 26.80 25.70 26.60 25.20 25.60 25.40 25.00 24.40 25.20 24.80 1962 25.50 24.90 23.90 23.40 22.70 21.50 20.70 18.50 18.60 19.10 19.60 19.00 1963 19.70 20.20 21.00 20.50 20.50 20.50 20.00 19.50 19.50 19.50 20.00 20.00 1964 21.50 21.50 21.80 21.80 22.90 22.40 20.00 19.60 19.60 19.50 20.40 22.50 1965 23.40 23.80 23.00 23.50 23.50 22.60 21.60 21.60 21.80 22.10 22.50 23.50
1966 24.40 24.80 25.50 24.50 24.50 24.10 24.50 25.50 26.90 26.40 27.60 28.40 1967 28.80 27.90 28.40 27.50 28.50 26.50 24.50 22.50 22.00 22.00 22.00 22.00 1968 22.50 22.50 21.50 21.50 21.30 21.80 20.90 20.30 20.70 20.80 21.20 22.10 1969 22.60 23.60 23.70 23.60 25.00 23.00 22.60 22.70 23.20 23.60 24.50 24.50 1970 25.00 25.~0 25.50 25.00 25.00 25.00 23.50 23.40 23.80 23.90 24.90 24.90
1971 26.30 27.90 27.90 28.70 28.20 27.70 27.30 27.30 27.50 27,40 29.70 32.40 1972 34.00 36.20 35.70 34.20 32.00 32.00 32.00 32.70 32.70 33.70 34.70 37.60
ALFALFA SEED (Dollars Eer Cwt.)
1961 24.40 25.20 25.00 25.30 26.50 28.00 29.50 35.00 37.50 37.50 1962 40.50 39.80 40.00 40.00 40.00 40.40 42.50 46.00
1963 46.00 46.00 46.00 45.00 23.50 23.50
1964 26.00 26.00 27.00 27.00 28.00 27.50
1965 28.00 29.00 30.00 30.00 30.00 38.00 32.50 33.50 35.00
1966 36.00 35.00 34.00 34.00 32.70 35.00
1967 37.00 37.00 37.00 37.00 40.00 41.00 40.00
1968 40.00 40.00 40.00 40.00 40.00 40.00 35.00 36.00 36.00 35.00
1969 34.50 35.00 34.50 34.50 34.50 36.00 32.50 34.00 34.00 1970 36.00 37.00 37.00 37.00 37.50 37.00 34.00 34.00 34.00
1971 33.00 33.00 33.00 33.00 35.00 32.00 33.00 32.00 32.00 1972 33.00 32.00 32.00 33.00 36.00 37.50 44.00 46.00 45.00
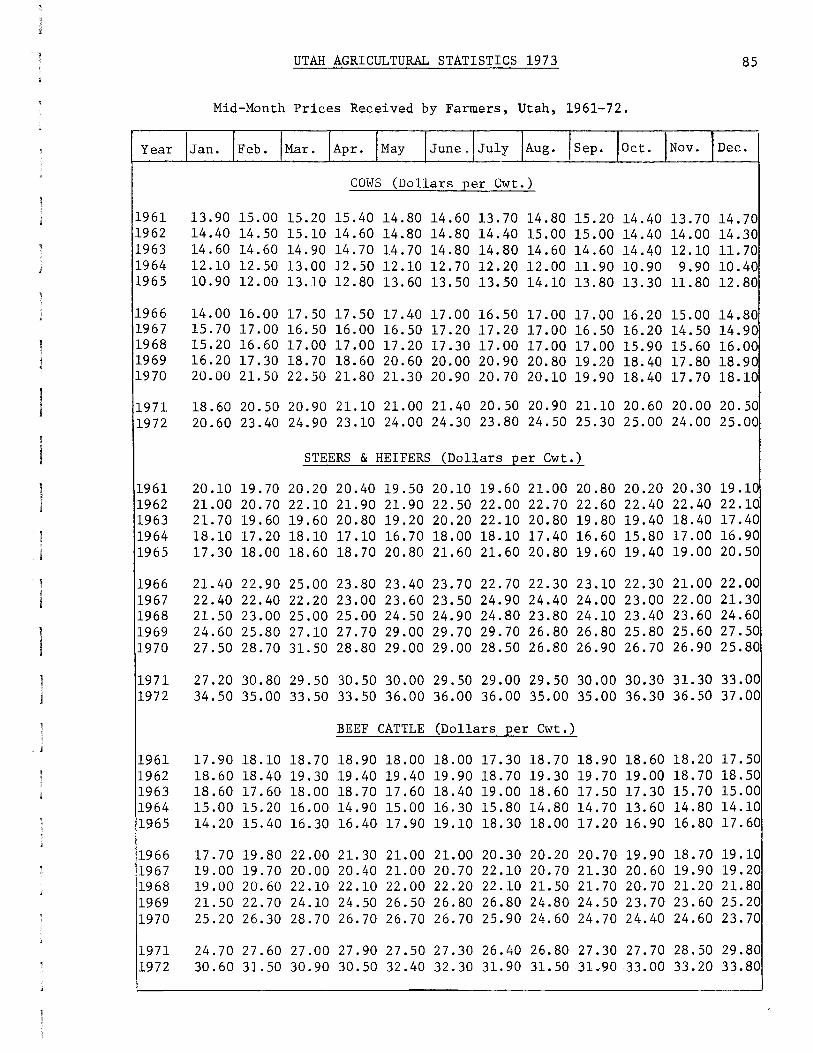
- 1 UTAH AGRICULTURAL STATISTICS 1973 85
Mid-Month Prices Received by Farmers, Utah, 1961-72.
Year Jan. Feb. Mar. Apr. May June. July Aug. Sep. Oct. Nov. Dec.
COWS (Dollars per Cwt.)
1961 13.90 15.00 15.20 15.40 14.80 14.60 13.70 14.80 15.20 14.40 13.70 14.70 1962 14.40 14.50 15.10 14.60 14.80 14.80 14.40 15.00 15~00 14.40 14.00 14.30 1963 14.60 14.60 14.90 14.70 14.70 14.80 14.80 14.60 14.60 14.40 12.10 11. 70 1964 12.10 12.50 13.00 12.50 12.10 12.70 12.20 12.00 11.90 10.90 9.90 10.40 1965 10.90 12.00 13.10 12.80 13.60 13.50 13.50 14.10 13.80 13.30 11.80 12. 80
1966 14.00 16.00 17.50 17.50 17.40 17.00 16.50 17.00 17.00 16.20 15.00 14.80 1967 15.70 17.00 16.50 16.00 16.50 17.20 17.20 17.00 16.50 16.20 14.50 14.90 1968 15.20 16.60 17.00 17.00 17.20 17.30 17.00 17.00 17.00 15.90 15.60 16.00 1969 16.20 17.30 18.70 18.60 20.60 20.00 20.90 20.80 19.20 18.40 17.80 18.90 1970 20.00 21.50 22.50 21.80 21.30 20.90 20.70 20.10 19.90 18.40 17.70 18.10
1971 18.60 20.50 20.90 21.10 21.00 21.40 20.50 20.90 21.10 20.60 20.00 20.50 1972 20.60 23.40 24.90 23.10 24.00 24.30 23.80 24.50 25.30 25.00 24.00 25.00
STEERS & HEIFERS (Dollars Eer Cwt.)
1961 20.10 19.70 20.20 20.40 19.50 20.10 19.60 21.00 20.80 20.20 20.30 19.10 1962 21.00 20.70 22.10 21.90 21.90 22.50 22.00 22.70 22.60 22.40 22.40 22.10 1963 21. 70 19.60 19.60 20.80 19.20 20.20 22.10 20.80 19.80 19.40 18.40 17.40 1964 18.10 17.20 18.10 17.10 16.70 18.00 18.10 17.40 16.60 15.80 17.00 16.90 1965 17.30 18.00 18.60 18.70 20.80 21.60 21. 60 20.80 19.60 19.40 19.00 20.50
-1 1966 21.40 22.90 25.00 23.80 23.40 23.70 22.70 22.30 23.10 22.30 21.00 22.00 1967 22.40 22.40 22.20 23.00 23.60 23.50 24.90 24.40 24.00 23.00 22. 00 21. 30 1968 21.50 23.00 25.00 25.00 24.50 24.90 24.80 23.80 24.10 23.40 23.60 24.60 1969 24.60 25.80 27.10 27. 70 29.00 29.70 29.70 26.80 26.80 25.80 25.60 27.50 1970 27.50 28.70 31.50 28.80 29.00 29.00 28.50 26.80 26.90 26.70 26.90 25.80
1971 27.20 30.80 29.50 30.50 30.00 29.50 29.00 29.50 30.00 30.30 31.30 33.00 1972 34.50 35.00 33.50 33.50 36.00 36.00 36.00 35.00 35.00 36.30 36.50 37.00
BEEF CATTLE (Dollars Eer Cwt.)
1961 17.90 18.10 18.70 18.90 18.00 18.00 17.30 18.70 18.90 18.60 18.20 17.50 1962 18.60 18.40 19.30 19.40 19.40 19.90 18.70 19.30 19.70 19.00 18.70 18.50 1963 18.60 17.60 18.00 18. 70 17.60 18.40 19.00 18.60 17.50 17.30 15.70 15.00 1964 15.00 15.20 16.00 14 .90 15.00 16.30 15.80 14.80 14.70 13.60 14.80 14.10 1965 14.20 15.40 16.30 16.40 17.90 19.10 18.30 18.00 17.20 16.90 16.80 17.60
1966 17.70 19.80 22.00 21. 30 21.00 21.00 20.30 20.20 20.70 19.90 18.70 19 .10 1967 19.00 19.70 20.00 20.40 21.00 20.70 22.10 20.70 21.30 20.60 19.90 19.20 1968 19.00 20.60 22.10 22.10 22.00 22.20 22.10 21.50 21.70 20.70 21.20 21.80 1969 21.50 22.70 24.10 24.50 26.50 26.80 26.80 24.80 24.50 23.70 23.60 25.20 1970 25.20 26.30 28.70 26.70 26.70 26.70 25.90 24.60 24.70 24.40 24.60 23.70
1971 24.70 27.60 27.00 27.90 27.50 27.30 26.40 26.80 27.30 27.70 28.50 29.80 1972 30.60 31.50 30.90 30.50 32.40 32.30 31. 90 31.50 31.90 33.00 33.20 33.80

86 UTAH AGRICULTURAL STATISTICS 1973
Mid-Month Prices Received by Farmers, Utah, 1961-72.
Year Jan. Feb. Mar. Apr. May June July Aug. Sep. Oct. Nov. Dec.
CALVES (Dollars Eer Cwt.)
1961 24.00 23.80 24.60 24.30 23.40 23.70 22.50 23.30 23.60 25.00 24.30 24.30 1962 25.60 24.50 25.90 25.70 26.10 26.20 24.50 25.30 24.80 27.00 27.50 27.70 1963 26.30 25.50 24.70 26.00 25.20 24.60 24.20 23.80 23.00 23.10 23.00 21.60 1964 23.60 21.60 21.80 20.30 19.30 20.90 18.10 18.00 17.00 18.00 17.90 17.40 1965 17.90 19.30 20.50 20.6Q 22.00 23.50 23.20 22.40 21.10 21.80 22.30 22.20
1966 23.60 26.30 26.60 25.80 26.00 25.50 26.00 24.00 24.50 25.00 26.00 26.00 1967 25.00 25.30 25.50 25.20 24.20 24.20 24.40 24.50 23.90 23.90 25.50 25.00 1968 25.50 26.00 28.00 28.60 28.50 28.20 28.00 28.50 28.10 27.90 28.00 28.50 1969 29.00 30.30 30.00 31.50 32.50 33.00 31.50 30.20 29.60 31.30 32.00 32.60 1970 35.00 37.20 38.00 34.50 34.40 34.90 33.00 31.00 31.70 33.00 32.60 33.30
1971 33.80 36.10 34.80 34.10 34.80 34.80 34.00 35.30 35.50 36.00 37.00 38.00 1972 40.00 41.00 42.00 40.50 41.50 42.00 42.50 42.50 44.60 48.40 46.50 46.50
SHEEP (Dollars Eer Cwt.)
1961 5.00 5.50 5.70 4.70 4.50 4.50 4.00 4.00 4.00 4.00 4.70 5.30 1962 5.20 5.30 5.00 4.80 5.10 4.60 5.50 5.00 5.20 5.20 6.00 6.30 1963 6.50 6.30 6.50 6.20 6.00 5.50 5.50 5.50 4.70 4.70 5.00 5.00 1964 5.90 6.00 5.40 5.10 4.40 4.60 4.70 5.00 4.80 4.70 4.80 5.70 1965 6.30 6.30 6.30 6.30 4·,30 4.40 5.60 6.00 5.60 6.20 5.50 6.50
1966 7.50 8.00 8.00 8.00 7.00 6.00 5.50 5.50 5.00 5.00 5.50 6.00 1967 5.80 6.00 6.00 6.00 6.50 5.50 5.00 5.50 5.30 5.60 5.50 5.50 1968 5.50 5.80 6.00 6.50 6.50 6.30 6.40 5.80 5.70 6.20 6.00 6.50 1969 6.20 7.50 7.60 7.40 7.40 6.90 6.90 7.50 7.50 7.00 7.20 7.80 1970 7.60 7.60 7.70 8.20 7.50 8.30 8.50 8.00 7.50 6.50 6.00 6.00
1971 5.00 4.90 6.00 6.00 5.50 5.50 5.50 5.50 5.50 5.50 6.00 6.00 1972 5.60 6.00 6.80 6.30 7.30 6.70 6.00 6.20 6.00 6.40 6.40 6.40
LAMBS (Dollars Eer Cwt.)
1961 17.00 16.70 16.50 15.00 15.50 15.50 16.00 15.70 15.00 15.20 14.10 15.50 1962 16.50 16.60 16.10 16.30 16.60 19.60 20.70 20.30 19.20 18.00 18.30 19.00 1963 19.10 18.50 18.00 19.00 20.00 20.50 20.00 19.00 18.50 17.50 17.70 17.60 1964 18.80 18.80 19.30 20.40 20.00 22.00 22 .00 21. 90 21.00 21.00 19.70 19.00 1965 21.20 21.90 21. 70 22.80 25.30 25.60 24.60 23.00 23.00 22.30 22.30 24.80
1966 27.00 27.40 25.70 25.00 24.00 24.00 23.00 23.30 22.00 22.50 21.50 22.00 1967 22.30 18.70 19.50 19.50 25.50 25.50 23.50 23.00 22.70 22.50 22.20 22.70 1968 21.60 22.00 24.00 25.00 25.50 23.80 23.60 23.60 23.70 23.70 23.90 23.70 1969 24.90 26.80 27.30 27.50 28.10 27.00 27.90 26.50 27.00 28.40 27.20 26.50 1970 28.00 27.50 27.00 26.00 25.50 26.00 26.00 26.20 25.80 25.00 23. 30 21. 50
1971 19.90 20.50 21. 70 24.00 26.00 27.20 25.00 25.50 25.00 24.50 25.00 25.00 1972 25.50 27.00 26.80 25.50 27.20 28.60 30.30 29.00 28.00 27.30 27.20 28.00

UTAH AGRICULTURAL STATISTICS 1973 87
Mid-Month Prices Received by Farmers, Utah, 1961-72.
Year Jan. Feb. Mar. Apr. May June July Aug. Sep. Oct. Nov. Dec.
HOGS (Dollars per Cwt.)
1961 17.50 18.40 17.80 16.70 17.20 17.00 18 .oo 17.60 17.80 16.80 16.00 17.00 1962 17.00 17.00 16.70 16.30 16.00 16.80 17.30 17.50 18.10 16.70 16.00 16.50 1963 15.90 15.60 14.50 13.50 14.50 15.60 16.80 17.00 16.30 15.70 14.60 14.20 1964 15.00 15.20 14.60 14.70 15.50 15.80 16.40 16.60 16.90 15.60 14.40 15.20 1965 16.00 16.70 17.30 17.20 20.60 23.30 24.00 24.20 22.50 22.40 23.10 26.00
1966 28.00 27.00 24.30 22.30 22.90 23.00 22.90 24.00 22.40 21.60 19.00 18.70 1967 19.00 18.70 17.90 16.90 19.60 20.80 20.80 20.70 19.30 18.00 17.20 17.20 1968 18.10 19.00 18.20 18.40 18.30 19.60 20.90 19.50 19.40 17.60 17.50 17.10 1969 18.00 19.30 19.70 18. 70 21.00 22.60 24.50 24.80 24.60 24.60 24.00 24.5 . 1970 25.90 26.40 25.90 23.60 23.30 22.30 23.80 21.90 20.00 17.20 15.70 15.6
1971 15.50 18.00 16.40 14.90 15.00 15.30 17.80 16.90 16.50 17.50 17.00 17.7 1972 19.90 22.60 21.20 20.60 22.30 23.20 25.60 26.30 26.70 26.50 26.00 28.0
MILK COWS (Dollars Eer Head)
1961 210 220 210 220 220 220 210 220 220 215 220 225 :1962 220 210 215 210 215 215 220 215 215 210 220 220
1963 220 225 220 220 220 225 215 215 215 210 215 210
1964 215 210 215 210 210 205 205 210 210 205 205 200
'1965 205 205 215 205 215 215 220 215 220 225 215 215
- 1 1966 220 220 230 240 240 240 245 240 245 245 240 240
1967 250 240 245 250 240 240 250 250 260 255 260 260
1968 260 255 260 270 260 270 270 280 265 270 270 260
1969 270 280 270 270 280 280 290 290 290 300 300 310
1970 320 320 330 330 330 330 325 315 310 320 340 320
1971 320 320 330 330 320 330 320 320 340 320 340 340
1972 350 360 350 340 335 330 330 340 340 340 350 370
TURKEYS (Cents Eer Pound)
23.0 22.0 21.0 19.0 18.0 19.0 18.0 17.0 18.0 17.0 1961 24.0 22.0 22.0 21.0
18.0 21. 0 22.0 23.0 22.0 20.0 21.0 20.0 1962 17.0 17.0
21.0 21.0 21.0 22.0 21.0 1963 21.0 21.0 21.0 22.0 22.0 22.0 21.0
19.0 20.0 20.0 20.0 23.0 20.0 20.0 20.0 21.0 1964 20.0 20.0
22.0 23.0 22.0 21.0 20.0 21.0 21.0 22.0 1965 20.0 20.0
25.0 25.0 25.0 22.0 24.0 21.0 22.0 23.0 23.0 24.0 1966 23.0 24.0 18.0 17.0
20.0 20.0 21.0 19.0 21.0 20.0 20.0 18.0 1967 23.0 21.0 21.0 21.0 20.0 1968 15.0 17.0 19.0 18.0 19.0 18.0 19 .o 21.0 21.0
22.0 22.0 22.0 21.0 21.0 21.0 23.0 24.0 1969 20.0
25.0 22.0 22.0 22.0 22.0 21.0 22.0 1970 24.0 27.0 24.0 26.0
21.0 21.0 21.0 22.0 23.0 22.0 22.0 22.0 22.0 23.0 1971 21.0 21.0 22.0
22.0 22.0 22.0 22.0 22.0 21.0 21.0 21.0 22.0 1972 23.0 22.0
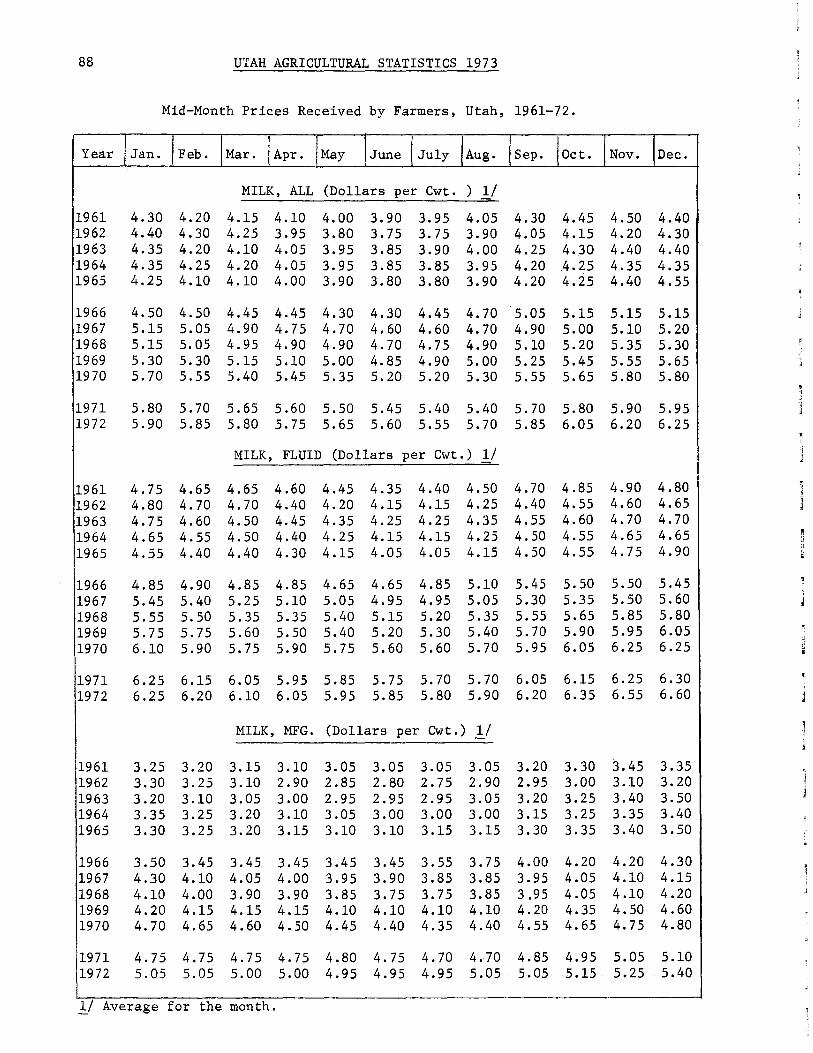
88 UTAH AGRICULTURAL STATISTICS 1973
Mid-Month Prices Received by Farmers, Utah, 1961-72.
Year I Jan. I Feb. [Mar. l Apr. I May ] June I July /Aug. I Sep. I Oct. I Nov. l Dec.
MILK, ALL (Dollars per Cwt. ) 1/
1961 4.30 4.20 4.15 4.10 4.00 3.90 3.95 4.05 4.30 4.45 4.50 4.40 1962 4.40 4.30 4.25 3.95 3.80 3.75 3.75 3.90 4.05 4.15 4.20 4.30 1963 4.35 4.20 4.10 4.05 3.95 3.85 3.90 4.00 4.25 4.,30 4.40 4.40 1964 4.35 4.25 4.20 4.05 3.95 3.85 3.85 3.95 4.20 .4. 25 4.35 4.35 1965 4.25 4.10 4.10 4.00 3.90 3.80 3.80 3.90 4.20 4.25 4.40 4.55
1966 4.50 4.50 4.45 4.45 4.30 4.30 4.45 4.70 5.05 5.15 5.15 5.15 1967 5.15 5.05 4.90 4.75 4. 70 4.60 4.60 4.70 4.90 5.00 5.10 5.20 1968 5.15 5.05 4.95 4.90 4.90 4.70 4.75 4.90 5.10 5.20 5.35 5.30 1969 5.30 5.30 5.15 5.10 5.00 4.85 4.90 5.00 5.25 5.45 5.55 5.65 1970 5.70 5.55 5.40 5.45 5.35 5.20 5.20 5.30 5.55 5.65 5.80 5.80
1971 5.80 5.70 5.65 5.60 5.50 5.45 5.40 5.40 5.70 5.80 5.90 5.95 1972 5.90 5.85 5.80 5.75 5.65 5.60 5.55 5.70 5.85 6.05 6.20 6.25
MILK, FLUID (Dollars per Cwt.) 1/
1961 4.75 4.65 4.65 4.60 4.45 4.35 4.40 4.50 4.70 4.85 4.90 4.80 1962 4.80 4.70 4.70 4.40 4.20 4.15 4.15 4.25 4.40 4.55 4.60 4.65 1963 4.75 4.60 4.50 4.45 4.35 4.25 4.25 4.35 4.55 4.60 4.70 4.70 1964 4.65 4.55 4.50 4.40 4.25 4.15 4.15 4.25 4.50 4.55 4.65 4.65 1965 4.55 4.40 4.40 4.30 4.15 4.05 4.05 4.15 4.50 4.55 4.75 4.90
1966 4.85 4.90 4.85 4.85 4.65 4.65 4.85 5.10 5.45 5.50 5.50 5.45 - ~
1967 5.45 5.40 5.25 5.10 5.05 4.95 4.95 5.05 5.30 5.35 5.50 5.60 1968 5.55 5.50 5.35 5.35 5.40 5.15 5.20 5.35 5.55 5.65 5.85 5.80 1969 5.75 5.75 5.60 5.50 5.40 5.20 5.30 5.40 5.70 5.90 5.95 6.05 1970 6.10 5.90 5.75 5.90 5.75 5.60 5.60 5.70 5.95 6.05 6.25 6.25
1971 6.25 6.15 6.05 5.95 5.85 5.75 5.70 5.70 6.05 6.15 6.25 6.30 1972 6.25 6.20 6.10 6.05 5.95 5.85 5.80 5.90 6.20 6.35 6.55 6.60
MILK, MFG. (Dollars per Cwt.) ±./
1961 3.25 3.20 3.15 3.10 3.05 3.05 3.05 3.05 3.20 3.30 3.45 3.35 1962 3.30 3.25 3.10 2.90 2.85 2.80 2.75 2.90 2.95 3.00 3.10 3.20 1963 3.20 3.10 3.05 3.00 2.95 2.95 2.95 3.05 3.20 3.25 3.40 3.50 1964 3.35 3.25 3.20 3.10 3.05 3.00 3.00 3.00 3.15 3.25 3.35 3.40 1965 3.30 3.25 3.20 3.15 3.10 3.10 3.15 3.15 3.30 3.35 3.40 3.50
1966 3.50 3.45 3.45 3.45 3.45 3.45 3.55 3.75 4.00 4.20 4.20 4.30 1967 4.30 4.10 4.05 4.00 3.95 3.90 3.85 3.85 3.95 4.05 4.10 4.15 1968 4.10 4.00 3.90 3.90 3.85 3.75 3.75 3.85 3.95 4.05 4.10 4.20 1969 4.20 4.15 4.15 4.15 4.10 4.10 4.10 4.10 4.20 4.35 4.50 4.60 1970 4.70 4.65 4.60 4.50 4.45 4.40 4.35 4.40 4.55 4.65 4.75 4.80
1971 4.75 4.75 4.75 4.75 4.80 4.75 4.70 4.70 4.85 4.95 5.05 5.10 1972 5.05 5.05 5.00 5.00 4.95 4.95 4.95 5.05 5.05 5.15 5.25 5.40
1_/ Average for the month.

-· 1
UTAH AGRICULTURAL STATISTICS 1973 89
Mid-Month Prices Received by Farmers, Utah, 1961-72.
Year Jan. Feb. Mar. Apr. I jMay June July Aug. Sep. Oct. Nov. Dec.
EGGS (Cents per Dozen)
1961 38.0 36.0 30.0 28.0 28.0 28.0 32.0 32.0 37.0 37.0 37.0 37.0 1962 37.0 36.0 33.0 28.0 24.0 2S.O 27.0 31.0 34.0 33.0 33.0 38.0 1963 39.0 41.0 36.0 32.0 30.0 27.0 31.0 32.0 34.0 36.0 36.0 37.0 1964 39 .0 38.0 3S.O 32.0 28.0 27.0 28.0 32.0 3S.O 34.0 32.0 34.0 196S 33.0 29.0 28.0 29.0 28.0 29.0 31.0 33.0 36.0 39.0 40.0 43.0
1966 40.0 42.0 44.0 39 .o 32.0 33.0 34.0 37.0 40.0 41.0 38 .o 39 .o 1967 39.0 34.0 31.0 28.0 26.0 2S.0 26.0 28.0 29.0 27.0 26.0 30.0 1968 31.0 30.0 26.0 27.0 22.0 2S.O 30.0 36.0 38.0 36.0 37.0 39.0 1969 41.0 38.0 38.0 34.0 27.0 2S.O 32.0 32.0 38.0 38.0 47.0 S2.0 1970 Sl.O 48.0 38.0 32.0 27.0 28.0 33.0 31.0 34.0 28.0 32.0 3S.O
1971 31.0 27.0 26.0 23.0 22.0 22.0 20.0 22.0 21.0 20.0 20.0 31.0 1972 26.0 2S.O 29.0 24.0 2S.O 2S.O 28.0 28.0 33.0 29.0 32.0 41.0
WOOL (Cents per Pound) 1:/
1961 38.0 37.0 37.0 40.0 40.0 40.0 42.0 42.0 42.0 39.0 39.0 42.0 1962 41.0 42.0 44.0 48.0 47.0 46.0 48.0 48.0 48.0 46.0 46.0 46.0 1963 4S.O 46.0 Sl.O 48.0 4S.O 4S.O 4S.O 44.0 46.0 46.0 46.0 46.0
~ l 1964 48.0 S4.0 S2.0 S2.0 Sl.O S3.0 49.0 49.0 S2.0 49.0 47.0 4S.O
I 196S 41.0 48.0 4S.O 46.0 4S.0 44.0 4S.O 4S.O 46.0 46.0 44.0 44.0
1966 so.a 42.0 so.a S4.0 S4.0 S3.0 47.0 S3.0 47.0 4S.O 46.0 46.0 1967 44.0 4S.O 44.0 40.0 40.0 43.0 42.0 39.0 42.0 39 .o 37.0 34.0 1968 44.0 38.0 40.0 42.0 42.0 42.0 43.0 40.0 44.0 41.0 39.0 36.0 1969 44.0 42.0 4S.O 43.0 43.0 43.0 46.0 41.0 42.0 39.0 42.0 39.0 1970 40.0 3S.O 36.0 36.0 34.0 37.0 36.0 33.0 3S.O 32.0 29.0 26.0
1971 22.0 29.0 21.0 23.0 21.0 21.0 18.0 17.0 18.0 18.0 16.0 16.0 1972 16.0 23.0 21.0 26.0 2S.O 27.0 3S.O 30.0 3S.O 38.0 23.0 38.0
1:/ Average for the month.

90 UTAH AGRICULTURAL STATISTICS 1973
1969 Census of Agriculture
U.S. DEPARTMENT OF COMMERCE I Bureau of the Census
How the 1969 Census of Agriculture Was Taken
The Mailing List-
During the last week of December 1969, the 1969 Census of Agriculture forms were mailed to a list representing, as nearly as possible, all persons and firms associated with the direction of agricultural operations in 1969. The list included land owners, tenants, renters, sharecroppers, and hired managers, but excluded hired farm laborers.
The mailing list was assembled from various administrative records including names and addresses from the 1964 Census of Agriculture, the Internal Revenue Service, the Social Security Administration, and the Agricultural Stabilization and Conservation Service.
The Census Forms and Their Distribution-
A standard 12-page form was sent to all operators expected to have 1969 sales of all agricultural products of $2,500 and over.
A four - page form went to a 50 percent sample of the operators whose 1969 sales were expected to total less than $2,500. Data in the "All Farms" tables are, consequently, subject to a small sampling variation. Tables of sampling variation will be included in Volume 1.
Followup Procedures-A series of followup letters brought response to well over the 90 percent level by July 1, 1970. At this point, field followup enumeration was conducted in 370 counties having low response rates to complete the collection of data for those counties.
To insure receiving reports from all large operations, telephone and field followup was started early in March. This work was continued until reports were obtained.
Comparability of Data-
"Farms", defined in the 1969 census exactly as in 1964, are places on which agricultural operations were conducted at any time during the census year under the control of an individual management. Places of less than 10 acres were counted as farms if the sales of agricultural products for the year amounted, or normally would amount, to at least $250. Places of 10 or more acres were counted as farms if the sales of agricultural products for the year amounted, or normally would amount, to at least $50.
TahZes foZZowing are compiled from cowity reports of the 1969 U.S. Census of Agriculture for UTAH.
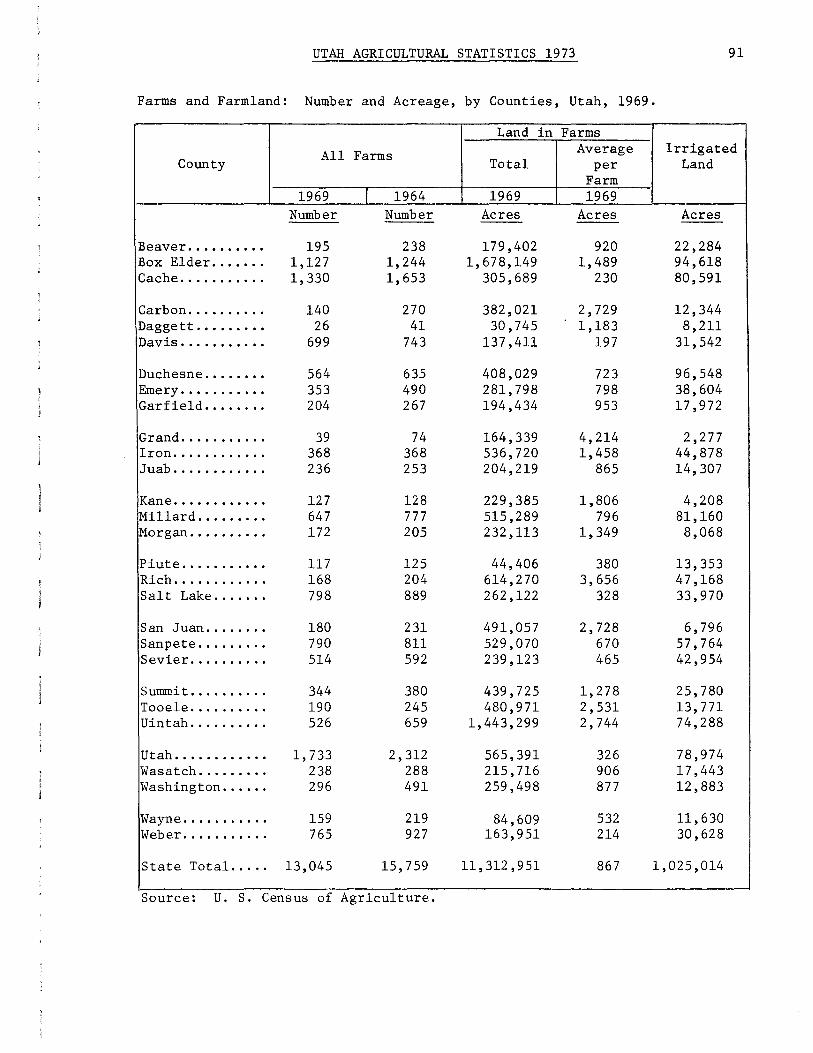
UTAH AGRICULTURAL STATISTICS 1973 91
Farms and Farmland: Number and Acreage, by Counties, Utah, 1969.
Land in Farms
All Farms Average Irrigated County Total per Land
Farm 1969 I 1964 1969 1969
Number Number Acres Acres Acres
Beaver ...•...... 195 238 179,402 920 22,284 Box Elder ....... 1,127 1,244 1,678,149 1,489 94,618 Cache ........... 1,330 1,653 305,689 230 80,591
Carbon .......... 140 270 382,021 2' 729 12,344 Daggett ......... 26 41 30,745 1,183 8,2ll Davis ........... 699 743 137,4ll 197 31,542
Duchesne ........ 564 635 408,029 723 96,548 Emery ........... 353 490 281,798 798 38,604 Garfield ........ 204 267 194,434 953 17,972
Grand ........... 39 74 164,339 4,214 2 ,277 Iron ............ 368 368 536,720 1,458 44,878 Juab ............ 236 253 204,219 865 14,307
Kane ............ 127 128 229,385 1,806 4,208 Millard ......... 647 777 515,289 796 81,160 Morgan .......... 172 205 232' 113 1,349 8,068
Piute ........... ll7 125 44,406 380 13, 353 Rich ............ 168 204 614,270 3,656 47,168 Salt Lake ....... 798 889 262,122 328 33,970
San Juan ........ 180 231 491,057 2, 728 6,796 Sanpete ......... 790 811 529,070 670 57,764 Sevier .......... 514 592 239,123 465 42,954
Summit .......... 344 380 439,725 1,278 25,780 Tooele .......... 190 245 480,971 2,531 13, 771 Uintah .......... 526 659 1,443,299 2,744 74,288
Utah ............ 1,733 2,312 565,391 326 78,974 Wasatch ......... 238 288 215' 716 906 17,443 Washing ton ...... 296 491 259,498 877 12,883
Wayne ........... 159 219 84,609 532 11, 630 Weber ........... 765 927 163,951 214 30,628
State Total. .... 13,045 15,759 11,312,951 867 1,025,014
Source: U. S. Census of Agriculture.
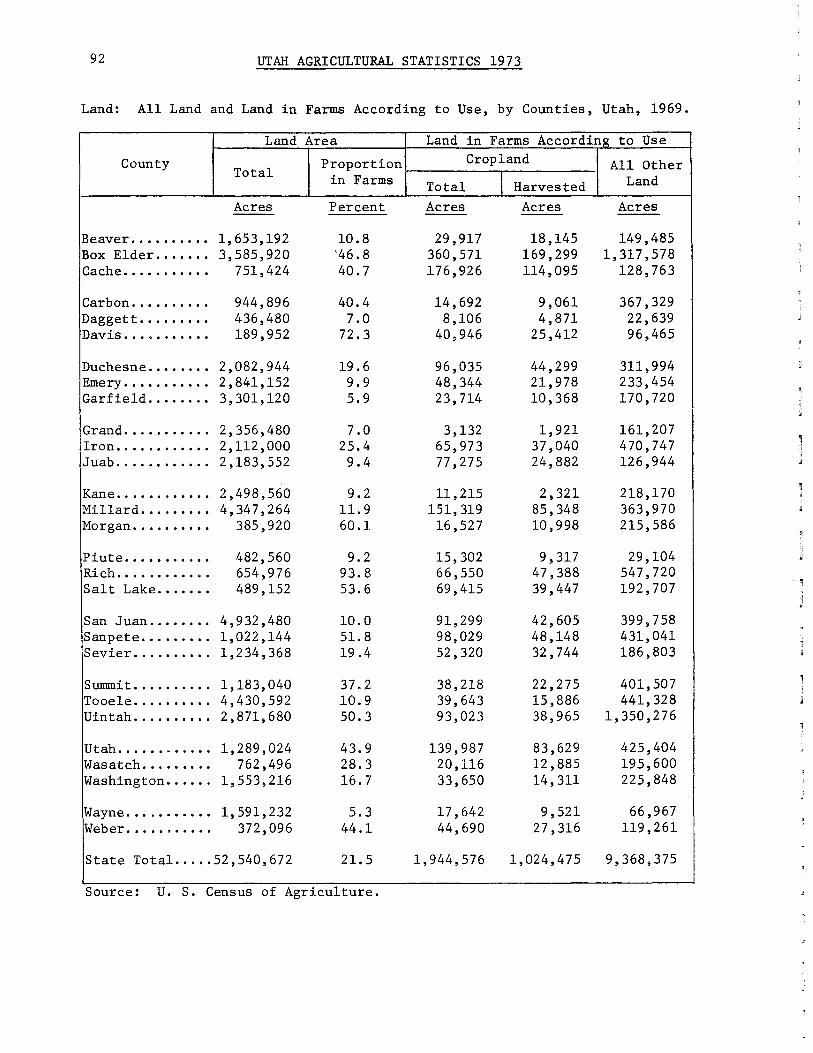
92 UTAH AGRICULTURAL STATISTICS 1973
Land: All Land and Land in Farms According to Use, by Counties, Utah, 1969.
Land Area Land in Farms According to Use
County Proportion Cropland All Other Total in Farms I Land Total Harvested Acres Percent Acres Acres Acres
Beaver .......... 1,653,192 10.8 29,917 18,145 149,485 Box Elder ..•.... 3,585,920 '46. 8 360' 571 169,299 1,317,578 Cache ........... 751,424 40.7 176,926 114,095 128,763
Carbon ........ ". 944,896 40.4 14,692 9,061 367,329 Daggett .•....... 436,480 7.0 8,106 4,871 22,639 Davis ........... 189,952 72.3 40,946 25,412 96,465
Duchesne ........ 2,082,944 19.6 96,035 44,299 311,994 Emery .•••..•.••• 2,841,152 9.9 48,344 21,978 233,454 Garfield •......• 3,301,120 5.9 23' 714 10,368 170,720
Grand .•......... 2,356,480 7.0 3,132 1,921 161,207 Iron .. .......... 2,112,000 25.4 65,973 37,040 470,747 Juab ............ 2,183,552 9.4 77,275 24,882 126,944
Kane ............ 2,498,560 9.2 11, 215 2,321 218,170 Millard ....•.... 4,347,264 11.9 151,319 85,348 363,970 Morgan .......... 385,920 60.1 16,527 10,998 215,586
Piute ........... 482,560 9.2 15,302 9,317 29,104 Rich ............ 654,976 93.8 66,550 47,388 54 7' 720 Salt Lake ....... 489,152 53.6 69,415 39,447 192,707
San Juan ......•. 4,932,480 10.0 91,299 42,605 399,758 Sanpete ......... 1,022,144 51.8 98,029 48,148 431,041 Sevier" ......... 1,234,368 19.4 52,320 32,744 186,803
Sunnnit .......... 1,183,040 37.2 38,218 22,275 401,507 Tooele .......... 4,430,592 10.9 39,643 15,886 441,328 Uintah .......... 2,871,680 50.3 93,023 38' 965 1,350,276
Utah ...... , ..... 1,289,024 43.9 139,987 83,629 425,404 Wasatch ....•.... 762,496 28.3 20,116 12,885 195,600 Washington ...... 1,553,216 16.7 33,650 14' 311 225,848
Wayne ............ 1,591,232 5.3 17,642 9,521 66,967 Weber ....•...... 372,096 44.1 44,690 27,316 119,261
State Total ..... 52,540,672 21. 5 1,944,576 1,024,475 9,368,375
Source: U. S. Census of Agriculture.

1 j i
- I
UTAH AGRICULTURAL STATISTICS 1973 93
Sales: Value of Agricultural Products Sold by Counties, Utah, 1969.
Market Value of All Agricultural Products Sold
County Crops Including Forest Livestock,
Total Poultry, and Nursery Products Products Their Products
Dollars Dollars Dollars Dollars
Beaver ......... 4,056,409 726, 308 -- 3,330,101 Box Elder ...... 22,583,169 7,965,383 5,760 14,612,026 Cache .......... 20,654,628 3,247,707 8,549 17 ,398,372
Carbon ......... 1,910,710 467,655 500 1,442,555 Daggett ........ 316,656 25,217 -- 291,439 Davis .......... 10,087,322 3,026,452 -- 7,060,870
Duchesne ....... 6,257,616 484,951 200 5, 772,465 Emery .......... 2,629,268 299,578 200 2,329,490 Garfield ....... 1, 720,043 94,432 -- 1,625,611
Grand .......... 534,556 39,650 500 494,406 Iron ........... 7,037,670 2,325,487 7,600 4,704,583 Juab ........... 2,172,858 450,291 -- 1,722,567
Kane ........... 1,041,035 36, 724 1,290 1,003,021 Millard ........ 12,062,725 2,650,060 200 9,412,465 Morgan ......... 3,048,493 131,521 -- 2,916,972
Piute .......... 1,381,588 151,644 1,000 1,228,944 Rich ........... 3,925,079 275,202 8,231 3,641,646 Salt Lake ...... 14,546,696 3,814,122 750 10,731,824
San Juan ....... 3,184,342 1,002,741 1,147 2,180,454 Sanpete ........ 17,986,970 926,069 695 17,060,206 Sevier ......... 11,368,140 1,050,624 112 10,317,404
Summit ......... 6,055,441 215'113 225 5,840,103 Tooele ......... 2,686,042 261,167 -- 2,424,875 Uintah ......... 6,365,757 1) 1/ 5,961,476
Utah ... , ....... 26,363,102 5,814,881 1,228 20,546,993 Wasatch ........ 3,536,865 174,338 -- 3,362,527 Washington ..... 5,147,003 644,842 823 4,501,338
Wayne .......... 1,463,384 120,542 -- 1,342,842 Weber .......... 12,853,314 1,745,896 -- 11,107 ,418
State Total .... 212,976,881 38,557,481 54,407 174,364,993
Source: U. S. Census of Agriculture.
1/ Data withheld to avoid disclosure of information for individual farms.

94 _UTAH AGRICULTURAL STATISTICS 1973
Value of Farms and Expenses: by Counties, Utah, 1969.
Value of Land and Buildings Machinery and Farm County Equipment
Production All Farms Average Market Total per Farm Value Expenses
Dollars Dollars Dollars Dollars
Beaver ....•..... 15,463,285 79,298 2,283,930 3,333,502 Box Elder ....... 114,691,201 101,766 15,855,617 18,627,792 Cache ...... f': •••• 75,452,818 56,731 12,331,102 17,098,092
Carbon .......... 11,965,188 85,465 1,345,720 1,710,815 Daggett ......... 2,756,892 106,034 240,700 258,213 Davis ........... 57,727,274 82,585 5,223,209 8,934,163
Duchesne ........ 35,223,979 62,453 4,883,387 5,349,788 Emery ........ , .• 17,215,983 48' 770 2,619,868 2,195,167 Garfield ........ 12,192,972 59,769 1,339,195 1,584,258
Grand ........... 7,962,237 204,159 274,701 495,621 Iron ............ 40,991,362 111,389 3,983,442 5,650,386 Juab ............ 14,216,386 60,238 2,075,720 2,060,854
Kane ............. 11,705,616 92,170 825,090 910,418 Millard ......... 45, 771,204 70,743 7,684,863 11,038,104 Morgan .......... 18,799,940 109,301 1,497,405 2,143,480
Piute .....•..... 6,628,919 56,657 1,211,808 1,164,935 Rich ............ 24,915,840 148,308 2,572,302 3,089,667 Salt Lake ....... 93,049,716 116' 603 7,204,866 12,084,258
San Juan ........ 21,193,577 117,742 2,403,406 2, 271, 533 Sanpete .•...•... 36,071,577 45,660 6,200,051 15,779,087 Sevier. o •••••••• 27,456,244 53,416 4,924,563 9,538,620
Summit ....... , .. 40,480,176 117,674 2j651,545 4,850,810 Tooele .......... 28,144,975 148, 131 1,868,650 2,656,421 Uintah .......... 64,147,065 121,952 4,362,318 5,764,522
Utah ............. 110,407,888 63,709 13,999,566 23,296,900 Wasatch .•.•..... 22,813,728 95,856 1,978,878 2,893,140 Washington ...... 22,602,396 76,359 2,063,199 4,035,532
Wayne .•••.•.•••• 7,741,377 48,687 1,334,318 1,237,430 Weber ... ...•.... 51,969,251 67,933 6,249,630 11,069,061
~tate Total ..... 1,039,759,066 79,705 121,489,049 181,122,569
Source: U. S. Census of Agriculture.
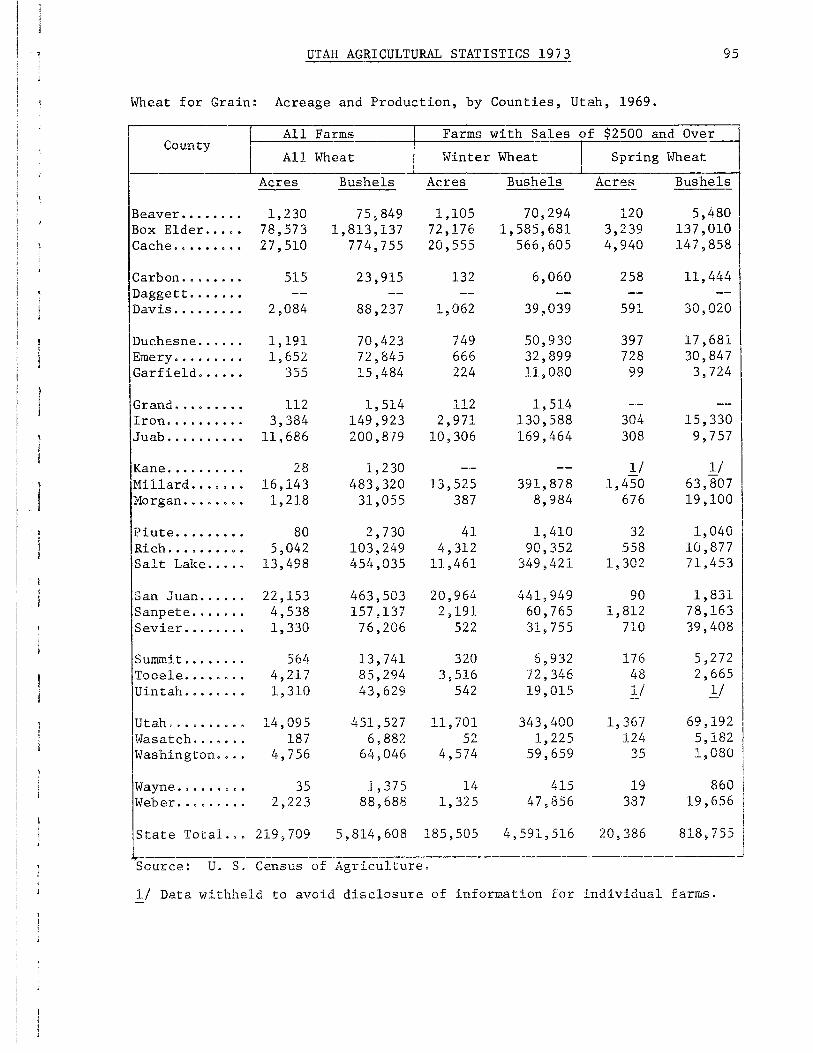
- ' UTAH AGRICULTURAL STATISTICS 1973 95
Wheat for Grain: Acreage and Production, by Counties, Utah, 1969.
I
All County
All
Acres
Beaver ........ 1,230 Box Elder ..•.• 78,573 Cache ........• 27,510
Carbon. , , .• , •. 515 Daggett. ..•••• --Davis •........ 2,084
Duchesne ....•. 1,191 Emery ......... 1,652 Garfield ...... 355
Grand ......... 112 Iron .•........ 3,384 Juab .•........ 11,686
Kane ••........ 28 Mill 1 ard ....... _6,143 Morgan........ 1,218
Piute ......••. Rich ... , ....•. Salt Lake ... ,.
San Juan ..... e
Sanpete ...... . Sevier ....... .
Summit ....... . Tooele ....... . Uintah ....... .
Utah, .•....... , 1
1
wasatch ••. , •.. Washington .... I Wayne ........ . Weber ...•.....
80 5,042
13,498
22,153 4,538 1,330
56L! 4,217 1,310
14,095 187
4,756
35 2,223
Farms
Wheat
Bushels
75,849 1,813,137
774,755
23,915 --
88,237
70,423 72, 845 15,484
1,514 149,923 200,879
1,230 483,320
31,055
2,730 103,249 45!+,035
463,503 157~137
76,206
13,741 85,294 43,629
451,527 6,882
64,046
1,375 88,688
I ! I
Farms with Sales
W:tnter
Acres
1,105 72,176 20,555
132 --
1~062
749 666 224
112 2,971
10,306
--" 2 l.:i,5 5
387
41 4' 312
11,461
20,96.'.i 2, 191
522
320 3$516
542
11, 701 52
4,574
14 1,325
Wheat
Bushels
70,294 1,585,681
566,605
6,060 --
39 '039
50,930 32,899 11, 080
1,514 130,588 169,464
--391,878
8,984
1,410 90,352
349,421
441,949 60,765 31,755
6,932 72' 346 19,015
343,400 1,225
59,659
415 47,856
of $2500 and Over
I Spring
Acres ---
120 3,239 4,940
258 --
591
397 728
99
--304 308
1/ 4 1, .50 676
32 558
1,302
90 1,812
710
176 48 l/
1,367 124
35
19 387
Wheat
Bushels
5,480 137 '010 14 7. 8581
11,444 --
30,020
17,681 30,847
3, 724
--15,330
9,757
1/ 63,807 19,100
1,040 10 '877 71,453
1,831 78,163 39,408
5 ,272 2,665
]:_/
69,192 5,182 1,080
860 19,656
i I I I State Total ... 219,709 5,814,608 185,505 4,591,516 20,386 818,755 J
Source: U. S. Census of Agriculture,
1/ Data withheld to avoid disclosure of information for individual farms.
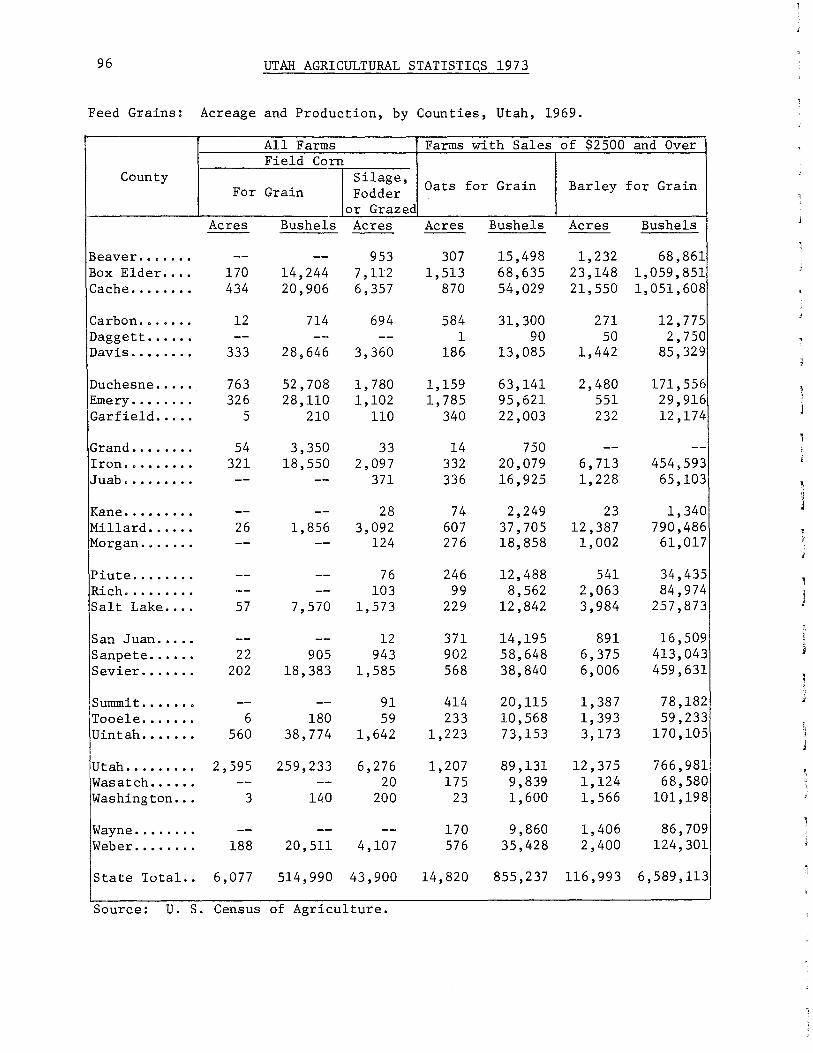
96 UTAH AGRICULTURAL STATISTIC.S 1973
Feed Grains: Acreage and Production, by Counties, Utah, 1969.
All Farms Farms with Sales of $2500 and Over Field Corn
County Silage, Oats for Grain Barley for Grain For Grain Fodder
or Grazed Acres Bushels Acres Acres Bushels Acres Bushels
Beaver ....... -- -- 953 307 15,498 1,232 68,861 Box Elder .... 170 14,244 7' 112 1,513 68,635 23,148 1,059,851 Cache •....... 434 20,906 6,357 870 54,029 21,550 1,051,608
Carbon ....... 12 714 694 584 31,300 271 12 '77 5 Daggett. ..... -- -- -- 1 90 so 2,750 Davis ..•..... 333 28,646 3,360 186 13,085 1,442 85,329
Duchesne ..... 763 52,708 1,780 1,159 63,141 2,480 171,556 Emery ..•..... 326 28,110 1,102 1,785 95,621 551 29,916 Garfield •.... 5 210 110 340 22,003 232 12,174
Grand ..•.... , 54 3,350 33 14 750 -- --Iron II o ••••••• 321 18,550 2,097 332 20,079 6,713 454,593 Juab ...••.... -- -- 371 336 16,925 1,228 65,103
Kane .•....... -- -- 28 74 2,249 23 1,340 Mi11ard ...... 26 1,856 3,092 607 37,705 12,387 790,486 Morgan .•..... -- -- 124 276 18,858 1,002 61,017
Piute ..•..... -- -- 76 246 12,488 541 34,435 Rich ...•....• -- -- 103 99 8,562 2,063 84,974 Salt Lake .... 57 7,570 1,573 229 12,842 3,984 257,873
San Juan ..... -- -- 12 371 14,195 891 16,509 Sanpete ...... 22 905 943 902 58,648 6,375 413,043 Sevier .•..... 202 18,383 1,585 568 38,840 6,006 459,631
Summit ...... o -- -- 91 414 20' 115 1,387 78,182 Tooele ....... 6 180 59 233 10,568 1,393 59,233 Uintah .••.... 560 38' 774 1,642 1,223 73,153 3,173 170,105
Utah ......... 2,595 259,233 6,276 1,207 89,131 12,375 766,981 Wasatch ...... -- -- 20 175 9 '839 1,124 68,580 Washington ... 3 140 200 23 1,600 1,566 101, 198
Wayne ..•....• -- -- -- 170 9,860 1,406 86,709 Weber ........ 188 20,511 4,107 576 35,428 2,400 124,301
State Total.. 6 ,077 514,990 43,900 14,820 855,237 116,993 6,589,113
Source: U. S. Census of Agriculture.
' i J
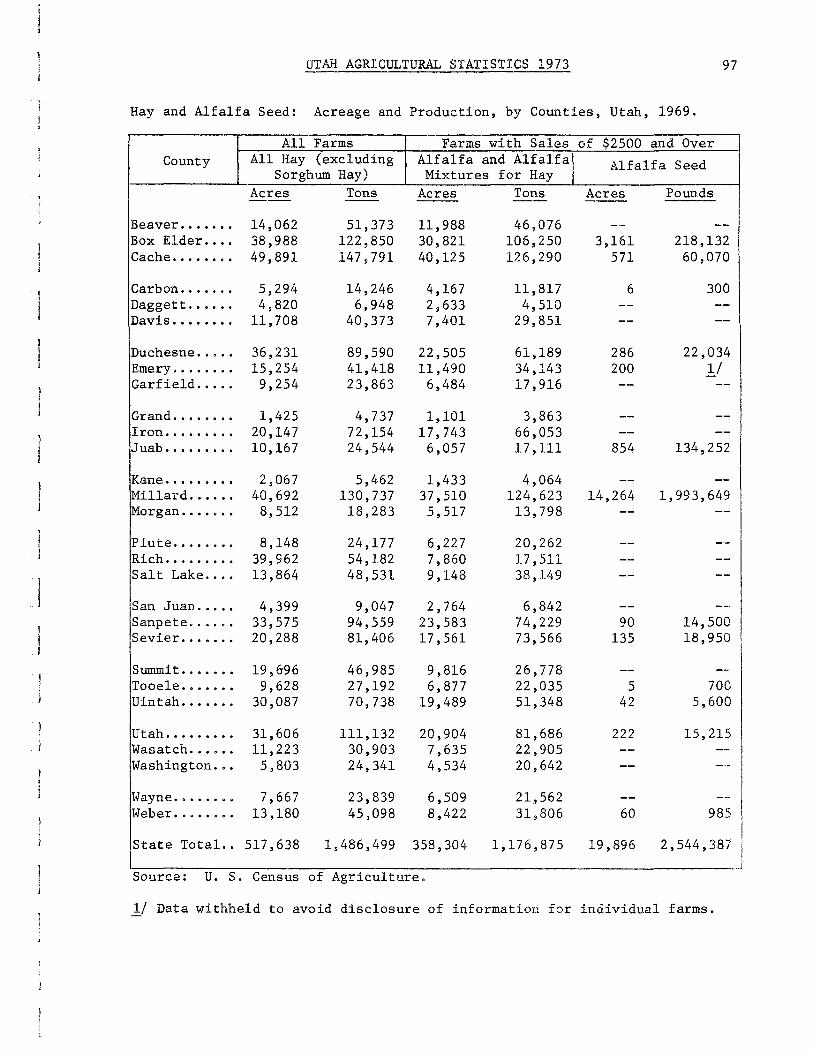
UTAH AGRICULTURAL STATISTICS 1973 97
Hay and Alfalfa Seed: Acreage and Production, by Counties, Utah, 1969.
All Farms Farms with Sales of $2500 and Over I County All Hay (excluding Alfalfa and Alfalfa! Alfalfa Seed
Sorghum Hay) Mixtures for Hay Acres Tons Acres Tons Acres Pounds -- --
Beaver ..•.... 14,062 51,373 11,988 46,076 -- --Box Elder .... 38,988 122,850 30,821 106,250 3,161 218,132 Cache ........ 49,891 147,791 40,125 126,290 571 60,070
Carbon ....... 5,294 14,246 4,167 11,817 6 300 Daggett. ..... 4,820 6,948 2,633 4,510 -- --Davis ........ 11, 708 40,373 7,401 29,851 -- --
Duchesne .•... 36,231 89,590 22,505 61,189 286 22,034 Emery ........ 15,254 41,418 11, 490 34,143 200 ]j Garfield •.... 9,254 23,863 6,484 17,916 -- --
Grand ........ 1,425 4,737 1,101 3,863 -- --Iron ..... o ••• 20,147 72,154 17,743 66,053 -- --Juab ....... <i. 10, 167 24,544 6,057 17' 111 854 134,252
Kane ......... 2,067 5,462 1,433 4,064 -- --Millard ...... 40,692 130,737 37,510 124,623 14,264 1,993,649 Morgan ..•.... 8,512 18,283 5,517 13,798 -- --
Piute ........ 8,148 24' 177 6,227 20,262 -- --=
Rich ......... 39' 962 54,182 7,860 17,511 -- --Salt Lake .... 13,864 48,531 9,148 38,149 -- --
San Juan ..... 4,399 9,047 2,764 6,842 -- --Sanpete ...... 33,575 94,559 23,583 74,229 90 14,500 Sevier ....... 20,288 81,406 17,561 73,566 135 18,950
Summit ....... 19 '&96 46,985 9,816 26 '778 -- --Tooele ....... 9,628 27,192 6, 877 22,035 5 700 Uintah ....... 30,087 70,738 19,489 51,348 42 5,600
Utah ......... 31,606 111,132 20,904 81,686 222 15,215 Wasatch ..•... 11,223 30,903 7,635 22,905 -- --Washington ... 5,803 24,341 4,534 20,642 -- ---
Wayne ........ 7,667 23,839 6,509 21,562 -- --Weber ........ 13,180 45,098 8,422 31,806 60 985
I State Total .. 517,638 1,486,499 358,304 1,176,875 19,896 2,544,387
-------------------------------~---~j Source: U. S. Census of Agriculture.
1./ Data withheld to avoid disclosure of information for individual farms.

98 UTAH AGRICULTURAL STATISTICS 1973
Potatoes, Sugar Beets, and Dry Beans: Acreage and Production, by Counties, Utah, 1969.
Farms with Sales of $2500 and Over County Potatoes I
Sugar Beets I Dry Beans
for Sugar Acres Cwt. Acres Tons Acres Cwt. -- -- --
Beaver ....... 313 55,415 -- -- -- --Box Elder ..•. 158 23,835 10, 808 192,834 -- --Cache ..•..... ll4 21,532 2,214 33,049 -- --
Carbon ....... 21 2,754 1,462 25,163 -- --Daggett. ..... 1 100 -- -- -- --Davis ........ 655 127,429 2,081 41,698 -- --
Duchesne ..... 10 1, 108 -- -- -- --Emery ........ 1 140 -- -- -- --Garfield ..... 99 16,530 -- -- -- --
Grand ........ 9 324 -- -- -- --Iron ......... 3,305 665,752 -- -- -- --Juab ...•..... 2 450 -- -- -- --
Kane ......... 5 500 -- -- -- --Millard •..... 14 2,050 267 2,833 -- --Morgan .•..... 8 1,310 -- -- -- --
Piute ........ 176 34,750 -- -- -- --Rich ......... 1 14 -- -- -- --Salt Lake .... 14 2, ll7 3,466 72 ,494 -- --
San Juan ..... 8 687 -- -- 14,221 71,619 Sanpete ...... 81 6,925 673 9,012 -- --Sevier ....... 63 9,950 1,854 30,733 -- --
Summit ....... -- -- -- -- -- --Tooele ....... 8 1,261 -- -- -- --Uintah ....... 4 530 -- -- -- --
Utah ...•..... 180 25,865 4,152 73,136 -- --Wasatch ...... -- -- -- -- -- --Washington ... 443 79,194 -- -- -- --
Wayne ........ 175 28,191 -- -- -- --Weber ..•..... 200 32,359 1,666 33,693 -- --All Other .... -- -- 543 8,247 197 694
State Total.. 1:/6,065 1,141,072 29,186 522,892 14,418 72, 313
Source: U. S. Census of Agriculture.
_!/ County acreages do not add to published State total.
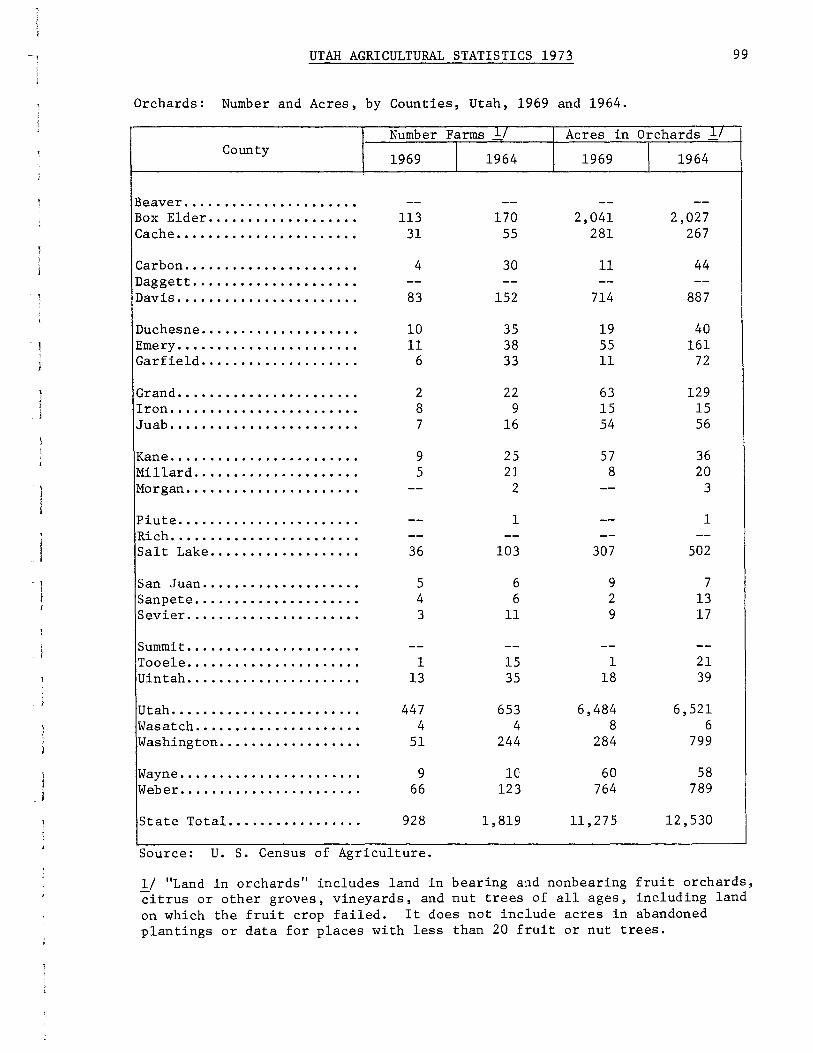
. 1 1
UTAH AGRICULTURAL STATISTICS 1973 99
Orchards: Number and Acres, by Counties, Utah, 1969 and 1964.
Number Farms 1/ Acres in Orchards 1/
County 1969 I 1964 1969 I 1964
Beaver ...................... -- -- -- --Box Elder ......... .......... 113 170 2,041 2,027 Cache ...... ................. 31 55 281 267
Carbon ...................... 4 30 11 44 Daggett ..••..••..•...••...•. -- -- -- --Davis .... ................... 83 152 714 887
Duchesne .................... 10 35 19 40 Emery .•..................... 11 38 55 161 Garfield ................••.. 6 33 11 72
Grand ....................... 2 22 63 129 Iron ........................ 8 9 15 15 Juab ........................ 7 16 54 56
Kane ........................ 9 25 57 36 Millard .••...••.....•.•.•..• 5 21 8 20 Morgan ...................... -- 2 -- 3
Piute ....................... -- 1 -- 1 Rich ........................ -- -- -- --Salt Lake ................... 36 103 307 502
San Juan .................... 5 6 9 7 Sanpete ....•.....••....••... 4 6 2 13 Sevier . ..................... 3 11 9 17
Summit ...................... -- -- -- --Tooele ...................... 1 15 1 21 Uintah •.•.....•...•.•.....•. 13 35 18 39
Utah ........................ 447 653 6,484 6,521 Wasatch ..••.•.•........•.... 4 4 8 6 Washington •....•••••..•.•... 51 244 284 799
Wayne •...••......•.•........ 9 lC 60 58 Weber ••...•..•....•.•.•.•.•. 66 123 764 789
State Total .•.......•.....•• 928 1,819 11,275 12,530
Source: U. S. Census of Agriculture.
1/ "Land in orchards" includes land in bearing a'.1d nonbearing fruit orchards, citrus or other groves, vineyards, and nut trees of all ages, including land on which the fruit crop failed. It does not include acres in abandoned plantings or data for places with less than 20 fruit or nut trees.

100 UTAH AGRICULTURAL STATISTICS 1973
Apples and Peaches: Number Trees and Production by Counties, Utah, 1969.
r County
I
Beaver •••..•.••. Box Elder .•.•••• Cache ••.....•.•. I jCarbon., ••..•...
!Daggett •...•.•.• Davis.., ..... "' . s .....
I JDuchesne .•.•.••. !Emery •........••
1 Garf~eld •.•.....
Grand .••.......• Iron ..... (I ...... q
!Juab .•......••••
Kane. Qo ••••••• I>".
Millard •.•...•.• Morgan ....•..•.•
Piute ..••......• Rich .......••••. Salt Lake •••..•.
San Juan ••..•••• Sanpete ••••....• Sevier .•.•...•.•
Sunnnit .. ...... o.
Tooele ....•....• Uintah ....•••...
Utah e II ~ • e • (I •••••
Wasatch •..•.••.• Washington •...•.
Wayne e •• o " • " ••••
Weber •.••.•..••.
Farms Apples
Number Trees 1All Ar4eS rBearing
-- --19,253 10,962
3,608 3,194
500 20
7~514 2,701
706 650 2,194 1~299
400 290
2,415 1,765 16 16
915 725
2,140 2,140 136 136
4,683 4,098
20 15 432 369
156,643 118,369
2,485 2,145
884 782 2,637 1,653
with Sales
!Harvested I Pounds
--1,838,950
4 71 ~000
2,000
139,230
48,350 73,400 12,220
43,000 9,000
202,884
173,500 4,000
596,513
400 26. 770
18,727,965
61,400
51,280 93,108
!State Total •••.• 207,581 151,329 22,574,970
Source: U. S. Census of Agriculture.
of $2500 and Over Peaches
Number Trees All Ages !Bearing
-- --80,973 66. 966
1,437 1,272
112 ~ lOz
10,324 8,990
196 108 441 434
25 10
640 540 455 355
1,470 1,120
132 132 50 50
4,125 3,228
18 14 162 95
60,976 48,915
3,959 2,948
992 596 11, 531 11,431
!Harvested I Pounds
--3,496,713
98' 134
12,0~~ I 726,621
14,233 17,400
600
5,000 4,250
12,500
14,400
292,458
400 540
2,946,271
194,744
34,746 927,698
178,018 147,306 8,798,708
; J

UTAH AGRICULTURAL STATISTICS 1973 101
Pears and Apricots: Number Trees and Production by Counties, Utah, 1969.
Farms with Sales of $2500 and Over
County Pears Apricots Number Trees !Harvested Number Trees !Harvested
All Ages !Bearing I Pounds All Ages !Bearing I Tons
Beaver .......... -- -- -- -- -- --Box Elder ....... 5,312 4,642 219,033 13,666 13,391 386 Cache, .......... 1,240 1,240 60,267 -- -- --
Carbon .......... 10 10 -- -- -- --Daggett ......... -- -- -~ -- -- --Davis ........... 482 264 14,600 2,406 2,008 98
Duchesne ........ 122 122 8,100 -- -- --Emery .. c •••••••• 405 400 112,800 -- -- --Garfield •....... 10 5 200 -- -- -- I
! Grand11•e••••11••" -- --· -- -- -- --Iron .......... (I. 60 60 15,000 -- -- --Juab ............ -- -- -- -- -- --
Kane .. o ••••••••• -- -- -- -- -- --Millard ......... 36 36 300 -- -- --Morgan .......... -- -- -- -- -- --
I ·Piute .......... . Rich ............ Salt Lake ....... 2,680 2,585 161,870 581 542 6
San Juan ........ Sanpete ......... Sevier ..........
Summit .........• Tooele .......... 28 28 400 Uintah .......... 64 64 2,000 93 93 6
Utah ............ 60,104 56,606 4,829,562 1,059 960 78 Wasatch ......... Washington ...... 737 737 57,357 736 706 29
Wayne .......•... 382 298 29,350 1,020 1,020 24 Weber ........... 2,667 2,640 60,313 6,978 6,862 526
All Other ....... 212 177 14
State Total. .... 74,339 69,737 5,571,152 26,751 25,759 1,167
Source: u. s. Census of Agriculture.

102 UTAH AGRICULTURAL STATISTICS 1973
Cherries: Number Trees and Production by Counties, Utah, 1969.
Farms with Sales of $2500 and Over County Tart Sweet
Number Trees I Harvested Number Trees I Harvested All Ages !Bearing I Pounds All Ages I Bearing I Pounds
Beavero•• ....... -- -- -- -- -- --Box Elder ....... 36,288 31,683 2,521,388 18,942 15,349 1,059,158 Cache a •••••••••• 3,983 3,611 95 '771 933 933 41,730
Carbon .......... -- -- -- -- -- --Daggett •........ -- -- -- -- -- --Davis ... o ••••• o. 1, 725 1,425 177,428 18,858 14,362 321,994
Duchesne ........ -- -- -- -- -- --Emery ..•........ 8 6 400 9 9 400 Garfield .......• -- -- -- -- -- --
Grand ........... -- -- -- -- -- --Iron ............ -- -- -- 20 20 --Juab ............ -- -- -- 855 402 79,700
Kane ...•........ -- -- -- 15 15 2,000 Millard ••....... -- -- -- -- -- --Morgan .•........ -- -- -- -- -- --Piute ........•.. -- -- -- -- -- --Rich ............ -- -- -- -- -- --Salt Lake ....... -- -- -- 566 509 12,858
San Juan ........ -- -- -- -- -- --Sanpete ......... -- -- -- -- -- --Sevier .... .,. e ••• -- -- -- -- -- --
Summit .......... -- -- -- -- -- --Tooele .......... -- -- -- 12 12 400 Uintah .•........ 13 13 286 6 5 90
Utah .. , ......... 80,503 58,398 4,550,995 69,050 57,185 1,854,518 Wasatch ......... -- -- -- -- -- --Washington ...... -- -- -- 1,312 568 42,000
Wayne ........... -- -- -- 198 142 9,781 Weber .........•. 20,813 13,921 967,872 8,425 7,965 261,332
State Total. .... 143,360 109,057 8,314,140 ll9,201 97,476 3,685,961
Source: U. S. Census of Agriculture.

UTAH AGRICULTURAL STATISTICS 1973 103
Cattle and Calves: Inventory, by Counties, Utah, December 31, 1969.
All Farms Farms with Sales of $2500 & Over
Cows and Heifers Bulls Farms Cattle that Have Calved Heifers and
County Report- Cattle and Steers ing and Milk and Heifer Includ-Calves All
Cattle Cows Calves Calves ing Calves
Number Number Number Number Number Number Number
Beaver ....... 154 24,001 12,194 3,706 23,171 4,509 6, 770 Box Elder .... 645 71, 907 33,636 7,568 70,285 18,817 18,597 Cache ........ 890 54,303 22,604 15,911 51,090 15,156 14,490
Carbon ....... 85 9,384 5,967 143 8,330 1,595 1,419 Daggett. ..... 21 3,079 2,070 15 3,029 514 465 Davis ........ 343 27,799 9,687 2,531 25,634 6 '776 9,854
Duchesne ..... 478 40,031 22,253 3,673 38,195 8,760 8,111 Emery ........ 295 22,960 12,308 842 21,418 4,501 5,269 Garfield •.... 159 16,619 9, 971 238 15,604 2,647 3,682
Grand ........ 34 6,456 3,766 21 6,218 1,573 1,002 Iron ......... 223 22,420 9,928 1,147 21,023 6,706 4,953 Juab ......... 157 14,261 7 ,103 176 13,383 3,329 3, 372
Kane ......... 108 10,042 6,0ll 49 9,469 2,064 1,673 Millard ...... 389 56,977 20,202 1,184 56,219 15,621 20,610 Morgan ....... ll5 5,748 3,130 1,322 5' 372 1,361 1,030
Piute ........ 100 9,001 4,390 1,122 8,708 2,329 2,121 Rich ........ ~ 143 33,060 19,798 176 32,751 7,913 5,208 Salt Lake .•.. 339 16,510 7,548 4,459 14' 102 4,740 2,680
San Juan ..... 104 16,064 10,399 51 15,506 3,395 1, 980 Sanpete ...... 491 31,933 15,396 3,216 30,232 8, 110 7,499 Sevier ....... 360 38. 773 12,356 1,881 37 '968 10,150 15,804
Summit ....... 232 19,137 9,196 2,864 18,467 4,586 4, 939 Tooele ....... 133 13' 701 7,589 202 12,733 2,730 2,894 Uintah ....... 403 41,973 24,153 1,429 32,926 6,932 8,525
Utah ......... 918 58,937 23,803 7,215 51,765 17,561 13,641 Wasatch ...... 185 10,760 4,861 2,066 9,921 3,082 2,320 Washington ... 227 18,670 8,461 928 17,006 4, 146 5,111
Wayne ........ 127 13,120 7' 710 377 12,805 2,467 2,809 Weber ........ 435 28,221 9,661 5,785 24, 717 9,767 6,429
State Total.. 8,293 735,847 346,151 70,297 688,047 181,837 183,257
Source: U. S. Census of Agriculture.

104 UTAH AGRICULTURAL STATISTICS 1973
Sheep and Lambs: Inventory, by Counties, Utah, December 31, 1969.
All Farms Farms with Sales of $2500 and Over Farms Sheep Sheep Lambs
!Ewes 1 Yr. Rams and
County Report- and and Under Wethers ing 1 Year I Old and 1 Yr. Old
I Lambs Lambs Older Sheep Old and Older Number Number Number Number Number Number
lBeaver ....... 23 7,802 7,680 1,554 5,548 578 Box Elder .... 149 60,748 60,029 13,148 45,686 1,195 Cache ..••.... 92 19,753 18,031 7,057 10,643 331
Carbon ..•.... 49 28,874 28,041 7,306 19,525 1,210 Daggett., .... 13 3,144 3,108 589 2,433 86 Davis .••....• 74 8,646 7,475 1,984 5,271 220
,~uchesne ..... 204 38,851 36,481 6,017 29,438 1,026 .i:!.mery .......• 118 18,851 17,412 4,908 10,781 1, 723 Garfield ..•.. 80 13, 778 12,658 3,147 9,099 412
Grand ....••.. 6 115 85 33 43 9 Iron ......... 131 62,270 60,119 16,010 42,523 1,586 Juab .•...•... 42 14,293 13,857 3,115 10' 368 374
Kane ......... 26 9, 611 9,258 1,593 7,453 212 Millard ..•.•. 80 17,900 17,517 4,991 12,080 446 Morgan ..•.... 33 44,620 44,416 11, 14 7 32 ,4 71 798
I
Piute ••...... 40 6,278 5,830 1,907 3,798 125 Rich ......... 58 43,038 42,883 6,022 35,889 972 Salt Lake ...• 135 19,874 18,762 6,657 11, 841 264
San Juan ..••. 10 20,727 20' 725 2' 110 18,230 385 Sanpete •..... 351 146,987 143,082 48' 712 91,885 2,485 Sevier ....... 175 82,147 80,719 47,000 32'19 7 1,822
Sunnnit ...•••• 115 69,532 68,769 13,666 53,322 1,781 Tooele ...•... 52 49,489 49,146 13,308 35,016 822 Uintah .....•. 219 63,576 59,235 19'177 38,695 1,363
Utah ....•.... 247 84,452 81,576 22,995 55,864 2,717 Wasatch ..•..• 67 42,168 41,621 12 '961 28,061 599 Washington .•• 19 2,151 2,037 634 1,366 37
Wayne .•....•. 66 14,440 14,018 4,889 8,828 301 Weber ..•.•... 78 20,135 19,347 6,631 12,432 284
State Total.. 2,752 1,014,250 983,917 289,268 670,786 24,163
Source: U. S. Census of Agriculture.

UTAH AGRICULTURAL STATISTICS 1973 105
Hogs and Pigs: Inventory, by Counties, Utah, December 31, 19 69.
I
All I Farms FaJ::"ms with Sales of $2500 and Over
County Farms Hogs and Hogs and Used or to \Other Hogs! Reporting Pigs I Pigs be Used 1 and I
Hogs for Breeding ! Pigs
Number Number Number Number Number
Beaver ••.••..••• 13 127 125 46 79 Box Elder •••..•. 82 3,738 2, 711 396 2,315
JCache .•.••••.••• 76 3,331 3,164 673 2,491
Carbon ...••....• 31 611 463 116 347 Daggett ••....••. L1 12 12 6 6 Davis ..••..•.... 31 315 297 50 247 I
Duchesne. , ••..•. 86 1,145 1,092 147 945 Emery .••..•.•.•. 95 1,506 1,169 179 990 Garfield •.••.•.. 33 373 340 64 276
Grand •. , ..•... ,. 4 60 58 21 37 Iron ...••.••.... 45 632 601 79 522
!Juab •.•..••..•.. 20 513 498 38 460
Kane •...•••..•.• 18 188 152 20 132 Millard .•••••••• 98 1, 728 1,574 258 1,316 'Morgan ....•.•••• 24 166 125 24 101
28 719 686 114 572 .Piute ....•.•••.. Rich ..•..•...••• 7 295 295 53 242 Salt Lake .•...•. 105 6,049 4,949 371 4,578
San Juan ••..••.. 12 87 47 17 30 Sanpete •.•...••. 124 2s250 2,079 229 1,850 Sevier .••..••••. 73 3,208 3,081 250 2,831
Summit ••••.•.••. 27 272 261 65 196 Tooele .•••...•.• 51 927 753 198 555 Uintah .......••. 109 2,807 2,556 264 2,292
Utah •..•••••..•• 174 4,003 3,053 582 2, 471 Wasatch ..••..•.. 19 155 l08 23 85 Washington .•.•.. 39 1,630 1,504 244 1,260
Wayne ..........• 70 1,041 950 147 803 Weber ..•....••.. 56 1,312 1,073 132 941
State TotaL ••.. 1,554 39,200 33,776 4,806 28,970
Source: u. s. Census of Agriculture.

106 UTAH AGRICULTURAL STATISTICS 1973
Poultry: Inventory 1/ and Sales :?:./ by Counties, Utah, 1969.
Farms With All Farms Sales of $2500 and Over
Chickens Broilers and Other County 3 months Meat Type Chickens
Turkeys old and older Under 3 Months
Inventory Inventory Sales Inventory Sales Number Number Number Number Number
Beaver ••......•• 716 -- -- 6 --Box Elder .....•. 16 '6 72 63,100 374,000 60 204,048 Cache .... ~(>····· 71,492 306 331,802 3/ ll Carbon ••.•..••.. 6, 712 20 500 8 --Daggett .•...•.•• 289 -- -- -- --Davis •.....••.•. 3,516 5 -- 3/ 193,805 -
Duchesne ......•. 5,822 54 -- 124 --Emery ••.. " •.•.•. 2,200 -- -- 58 2 Garfield ........ 4,091 -- -- 10 --
Grand ..•...•.... 2,801 -- 6 16 --Irono••··~···••• 1,490 13 -- 7 --Juab ..•........• 642 -- -- 3 --
Kane .•.......... 2,071 -- -- -- --Millard •..••.••. 28,991 364 -- 69 24 Morgan ...•....•. 89 -- -- 3/ 3/
Piut-e ........•.. 242 6 -- -- --!Rich •.........•. 1, 962 -- -- -- --Salt Lake •...•.. 586,589 30,550 89,450 3,633 ll San Juan .......• 1,643 -- -- 15 --Sanpete .....••.• 40,586 -- -- 15. 071 1,686,648 Sevier •..•...... 848 -- -- 1,200 205,040
Sutnm.it .. ........ 34,442 -- -- -- --Tooele ...•...... 5,451 ll ll 5 --Uintah •...•.•.•. 23. 77 5 123 -- 13 10
Utah ....•.....•• 502,026 41,000 346,792 3/ 316,300 Wasatch ••.•..... 50,089 -- 60 -- --Washington ...... 70,842 10 -- 35,005 ll Wayne .......•.•. 9,019 -- -- 11 --Weber •••.•.•••.• 39,979 98 50 3/ ll -State Total. •... 1,515,087 214,749 1,502,660 134,319 3,254,540
Source: U. S. Census of Agriculture.
l/ Inventory December 31, 1969. !:_/ Sales during 1969. )_/ Data withheld to avoid disclosure of information for individual farm~.

UTAH AGRICULTURAL STATISTICS 1973 107
Horses, Mink, and Honey Bees: Inventory by Counties, Utah, December 31, 1969.
All Farms Farms with Sales of $2500 and Over County Horses and Hives of I Mink !Mink & Pelts
Ponies Bees Inventory Sold in 1969 Number Number Number Number
Beaver .................. 375 -- -- --Box Elder ............... 1,718 -- 2,555 6,800 Cache ................... 1,072 2,500 15,221 36,457
Carbon ..............•... 500 -- -- --Daggett ................. 148 -- -- --Davis ................... 1,273 99 2,020 3,095
I Duchesne ................ 1,435 1,930 -- --Emery ................... 733 317 -- -- I Garfield ................ 484 -- -- --
I Grand ................... 185 -- -- --Iron ................. · .. 590 -- -- --Juab .................... 318 -- -- --
Kane .................... 268 -- -- --Millard ........•........ 916 7,300 -- --Morgan .................. 495 -- 16,945 40,545
Piute ................... 260 -- -- --Rich .................... 594 -- 1,675 4,142 Salt Lake ............... 1,474 718 61,740 150,388
San Juan ................ 442 -- -- --Sanpete ................. 1,133 -- 1,645 3,447 Sevier .................. 693 -- -- -- I
I I
Summit .................. 940 -- 21,758 41,299 Tooele .................. 554 -- 2,295 4,440 Uintah .................. 1,633 1,397 2,200 5,223
Utah .................... 2,433 4,090 33,828 96,571 Wasatch ................. 671 -- -- --Washington .............. 449 -- -- -- I
Wayne ................... 295 -- -- --Weber ................... 1,480 70 1,330 3,600 All Other ............... -- 1,098 504 1,150
lstate Total............. 23,561 19,519 163' 716 397,157
Source: U. S. Census of Agriculture.
108 UTAH AGRICULTURAL STATISTICS 1973
Weather WEATHER HIGHLIGHTS DURING 1972
E. Arlo Richardson, NOAA Climatologist for Utah
Most sections of Utah recorded unusual weather conditions at one time or another during 1972. To initiate the unusual nature of the year a very severe wind and snowstorm swept across the three corners area where Utah, Idaho and Wyoming meet, during the 2nd week in January. Winds reported in excess of 70 miles per hour blocked major highways in the area with drifts 10 to 15 feet deep. Entire cormrrunities were isolated for several days and ranchers and ca.ttlemen were unable to reach their cattle to feed them for nearly a week in some localities.
Following this chilly introduction to the new year, temperatures rose to well above normal and very severe drouth conditions developed. These drouth conditions developed very rapidly over all but the North Central section of the state and persisted for 8 consecutive months in Southern Utah. The first three months of the year were the driest in the history of weather records at such places and Zion Naticnal Park with records to 1904 and Saint George to 1890, both recording no precipitation at all.
The above normal temperatures associated with the drouth conditions produced very rapid development of fruit trees over all of the state and bloom dates in many localities were about the earliest of record. However, after seven consecutive weeks with much above normal temperatures, a severe freeze swept across most of the state during the latter part of March wiping out most of these fruit crops.
Some moisture was reported in the drouth areas during April and June but essentially little relief was felt until late September and October. Weather in October did an abr~pt about face and near record breaking precipitation occurred at some stations in Southern Utah. South Eastern Utah recorded nearly 500 percent of their usual n.orma.l precipitation during the month of October and over 200 percent of normal during November. South Central Utah did not record quite these extremes but was well above normal both months.
Another marked change in the weather regime took place during the second week in December when minimum temperatures dropped to near record values over many sections of the state. Between the 10th and 15th of the month, 19 reporting stations in the state tied or exceeded their previous all-time record minimum temperatures for any month of the year,
The year ended with another flurry of new records when heavy snowstorms resulted in record accumulations for any month at such widE:ly separated stations as Green River, Fillmore, Kanosh and Milford. In addition several stations in the Northern part of the state set new accumulation records for the month of December. Salt Lake City and Tooele both recorded the greatest 24 hour snowfall of record for any month of the year.
Indeed the year 1972 was an outstanding year in Utah in so far as weather records were concerned" Few years have seen so much variability.
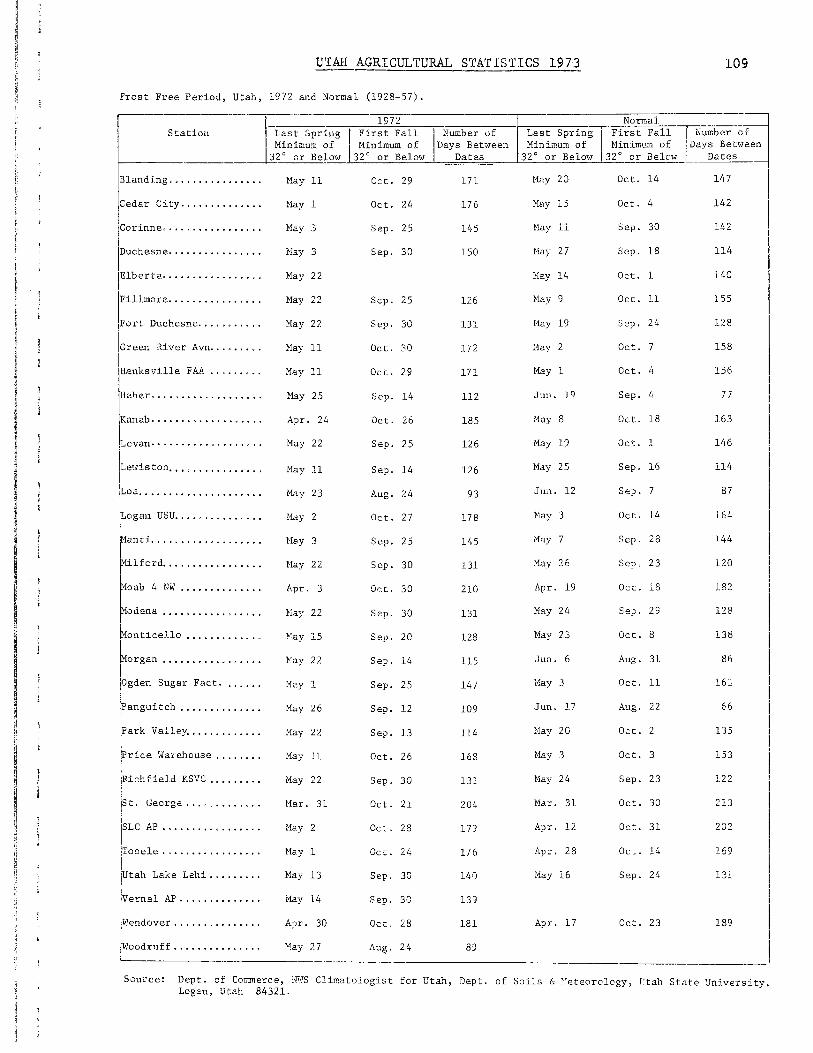
UTAH AGRICULTURAL STATISTICS 1973 109
Frost Free Period, Utah, 1972 and Normal (1928-57).
Station
Blanding., ..... , ....... .
ICed~r City ............. ,
Corinne ............•....
Duchesne ............... .
\Elberta ................ . I !Fillmore .••.............
iFort Duchesne .......... .
lcreen River Avn ........ .
Hanksville FAA ........ .
Heber .................. .
Kanab ....... , .......... .
,Levan· ............... , ..
ILe~·1is ton. , , , .......•.•..
!Loa ............. , .... , ..
~::::. ~~~: : : : : : : : : : : : : : : ~ilford ................ . ~loab 4 NW ••••••••••••••
~odena ... , ..... , . , .... .
~onticeJ.lo ............ .
rocgan ................ . IOgden Sugar Fact ...... .
~anguitch ............. .
lark Valley .......... , ..
rice Warehouse ....... .
Richfield KSVC ........ .
St. George .... " .......
SLC AP ••••••••••.••••.•
Tooele . ~ .............. .
Utah Lake Lehi ........ .
Vernal AP •.•.•.••.•.•..
~endover .............. .
)woodruff .............. .
l-~---·---·~~~-1_9_7_2~~~--~~~~~;~~~~~---,--,-Norma~J.,---~~--~--=:=J Last Spring First Fall 1 Number of Last Spring I First Fall I Number ofl Minimum of Minimum of Days Between Minimum of Minimum of Days Between I
J2° or Below 32° or Below Dates 32° or Below 32° or Below L Date_s_~
May 11 Oct. 29 171 May 20 Oct. 14 147 I
May l Oct. 24 176
May 3 Sep. 25 14'.i
Hay 3 Sep. 30 150
May 22
May 22 Sep. 25 126
Nay 22 Sep. 30 131
May ll Oct. 30 172
}fay 11. Oct. 29 171
May 25 Sep. 14 ll2
Apr. 24 Oct. 26 185
May 22 Sep. 25 126
May ll Sep. 14 126
May 23 Aug. :<t+ 93
May 2 Oct. 27 178
May 3 Sep. 25 145
Hay 22 Sep. 30 131
Apr. 3 0-::t. 30 210
Hay 22 Sep. 30 Ul
Kay 15 Sep. 20 128
l'ay 22 Sep. 14 115
11.e.y 1 Sep. 2 5 14/
Sep. 12 109
May 22 Sep. 13 114
May 11 Oct. 26 168
May 22 Sep. 30 131
Mar. 31 Oct. 21 204
May 2 Oct. 28 173
May 1 Oct. 24 176
May 13 Sep. 30 140
May 14 Sep. 3C 139
Apr. 30 Oct. 28 181
1'1ay 27 Aug. 24 80
May 15
May 11
May 27
Hay 14
May 9
Hay 19
May 2
May 1
Jun. J.9
May 8
May 19
May 25
Jun. 12
May 3
May 7
May 26
Apr. 19
May 24
May 23
Jun. 6
l1ay 3
Jun. l.7
May 20
May 3
May 24
Mar. :n
Apr. 12
Apr. 28
Mo.y 16
Apr. 17
Oct. 4
Sep. 30
Sep. 18
Oct. 1
Oct. 11
Sep. 24
Oct. 7
Oct. 4
Sep. 4
Oct. 18
Jct. l
Sep. 16
Siep. 7
Oct. 14
Sep. 28
Sep. 23
Oct. 18
Sep. 29
Oct. 8
Aug. 31
Oct. ll
Aug. 22
Oct. 2
Oct. 3
Sep. 23
Oct. 30
Oct. 31
Oct. 14
Sep. 24
Oct. 23
142
142
ll4
140
155
128
158
156
?7
163
146
114
87
164
144
120
182
128
138
86
161
66
135
153
122
213
202
169
1·"'1-_._..}_l
189
I I
I I I
Source: Dept. of Corrnnerce, N'·!S Climatologist for Utah, Dept. of Soils & "eteorology, Utah State University, Logan, Utah 84321.
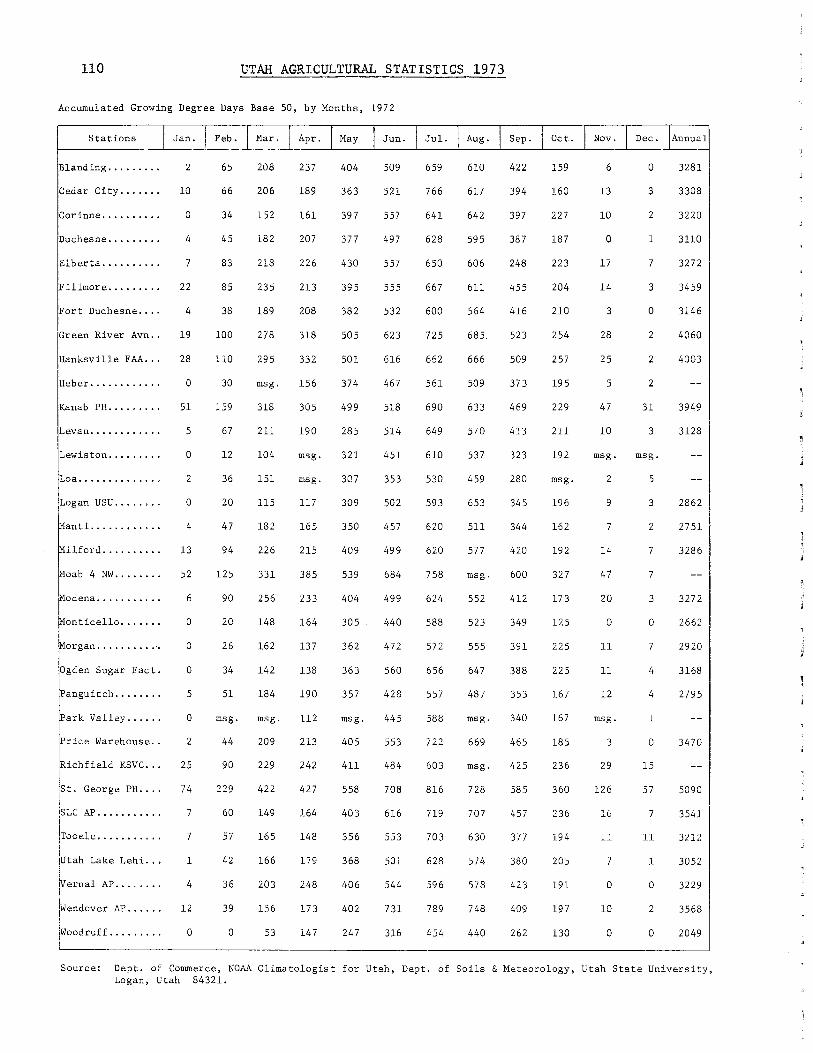
no UTAH AGRICULTURAL STATISTICS 1973
Accumulated Growing Degree Days Base 50, by Months, 1972
Stations
!
Blanding ........ .
Cedar City ...... .
!Corinne ......... .
Duchesne ........ .
Elberta ......... .
Fillmore ........ .
Fort Duchesne ....
Green River Avn ..
!Hanksville FAA .. .
Heber ........... .
Kanab PH ........ .
Levan ........... .
!Lewiston ........ .
ILoa ............. .
Logan USU ....... .
".!anti. .....•.....
ilford ......... .
oab 4 NW ........
10dena .......... .
organ .......... ·.
Ogden Sugar Fact.
Panguitch ....... .
Park Valley ..... .
Price Warehouse ..
iRichf ield KSVC ...
St. George PH ....
SLC AP .....•.....
!Tooele .......... .
lutah Lake Lehi. .• i
~ernal AP ..•.....
!
Wendover AP ..... .
Woodruff ........ . I
Jan.
2
10
0
4
7
22
4
19
28
0
51
5
0
2
0
4
13
52
6
0
0
0
5
0
2
25
74
7
7
1
4
12
0
Feb. Mar.
65 208
66 206
34 152
45 182
83 218
85 235
38 189
100 278
llO 295
30 msg.
159 318
67 211
12 104
36 151
20 115
47 182
94 226
125 331
90 256
20 148
26 162
34 142
51 184
msg. msg.
44 209
90 229
229 422
60 149
57 165
42 166
36 203
39 1%
0 53
Apr. May Jun. Jul. Aug.
237 404 509 659 610
189 363 521 766 617
161 397 557 641 642
207 377 497 628 595
226 430 557 650 606
213 395 555 667 611
208 382 532 600 564
318 505 623 725 685.
332 501 616 662 666
156 374 467 561 509
305 499 518 690 633
190 285 514 649 570
msg. 321 451 610 537
msg. 307 353 530 459
117 309 502 593 653
165 350 457 620 511
215 409 499 620 577
385 539 684 758 msg.
233 404 499 624 552
164 305 440 588 523
137 362 472 572 555
138 363 560 656 647
190 357 428 557 487
112 msg. 445 588 msg.
213 405 553 722 669
242 411 484 603 msg.
427 558 708 816 728
164 403 616 719 707
148 356 553 703 630
179 368 501 628
248 406 544 596 578
173 402 731 789 748
147 247 316 454 440
Sep. Oct. Nov. Dec. Annual
422 159 6 0 3281
394 160 13 3 3308
397 227 10 2 3220
387 187 0 1 3110
248 223 17 7 3272
455 204 14 3 3459
416 210 3 0 3146
523 254 28 2 4060
509 257 25 2 4003
373 195 5 2
469 229 47 31 3949
413 2ll 10 3 3128
323 192 msg. msg.
280 msg. 2 5
345 196 9 3 2862
344 162 7 2 2751
420 192 14 7 3286
600 327 47 7
412 17 3 20 3 327 2
349 125 0 0 2662
391 225 11 7 2920
388 225 11 4 3168
353 167 12 4 2795
340 167 msg. 1
465 185 3 0 3470
425 236 29 15
585 360 126 57 5090
457 236 16 7 3541
377 194 11 11 3212
380 205 7 1 3052
423 191 0 0 3229
409 197 10 2 3568
262 130 0 0 2049
Source: Dept. of Commerce, NOAA Climatologist for Utah, Dept. of Soils & Meteorology, Utah State University, Logan, Utah 84321.

- 1
UTAH AGRICULTURAL STATISTICS 1973 111
~c;rmal Growing Degree Days Base 50, by months.
Station I Jan. I Feb. [ Mar. Apr. \ May ! Jun. I Jul. j Aug. j Sep. l Oct. j Nov. j Dec. !Annual
Blanding 3 9 65 184 330 494 640 606 440 248 54 6 3079
Cedar City 8 17 74 184 335 502 670 635 472 263 79 19 3258
Corinne 0 8 62 202 342 480 637 606 461 286 50 2 3136
Duchesne 0 5 51 181 323 447 568 546 398 216 32 2 2769
Elberta 4 15 87 214 362 499 654 640 474 272 63 10 3294
Fillmore ll 22 97 222 372 538 714 689 508 306 83 18 3580
Fort Duchesne
Green River Avn 1 35 155 310 470 562 710 677 528 345 84 7 3884
Hanksville FAA 5 37 147 294 455 594 733 696 536 346 100 16 3959
Heber 0 3 41 156 292 414 489 589 412 259 60 3 2717
Kanab PH
Levan 3 13 79 203 328 462 627 609 451 268 71 ll 3125
Lewiston 0 0 34 153 299 419 572 557 407 219 32 2 2694
Loa
Logan USU 0 l 36 151 298 443 664 642 422 205 25 2 2889
Manti 0 4 61 176 307 448 585 558 409 238 55 5 2846
IMilford 5 20 96 216 353 493 643 626 464 278 83 16 3293
Moab 4 NW
Modena
Monticello
Morgan
Ogden Sugar Fact. 2 9 66 194 352 501 688 659 460 263 50 6 3250
Panguitch
Park Valley
Price Warehouse
Richfield KSVC 15 29 ll2 228 363 485 593 575 461 301 95 19 3276
St. George PH 69 136 269 399 541 650 798 779 615 460 213 82 50ll
SLC AP
Tooele
Utah Lake Lehi 0 6 55 178 330 465 621 605 425 234 42 2 2963
Vernal AP 0 4 49 179 345 462 569 547 424 245 39 1 2864
Wendover AP ]_ 8 72 200 403 574 800 766 506 235 29 3 3597
Woodruff
Source: Dept. of Commerce, NOAA Climatologist for Utah, Dept. of Soils & Meteorology, Utah State University, Logan, Utah 84321.

112 UTAH AGRICULTURAL STATISTICS 1973
Total Precipitation, Utah, 1972
.---~~~~--------,-~~-.--~~--..-~~~~~~~·--;-~~~--~~~~---.--~~--..-~~~~~~~~-;-~~---.
Station I Jan. Feb. Mar. Apr. May Jun. I
Blanding •..•..... T .oo T .10 T 1..46
Cedar City ...... . T T .02 .84 .14 1..03
Corinne ....... , .. 1. 32 .20 .74 2.85 .02 .91
Duchesne ........ . .20 .01 .14 .69 .so .93
!Elberta ......... . .7S .07 .20 • 72 .04 1..34
!Fillmore ........ . .27 .23 .41 2.01 .46 1..03
1Fort Duchesne ... . .00 .00 .09 .22 .26 .25
Green River Avn .. .00 .00 .oo .18 .S6
Hanksville FAA ... .oo .00 .oo .14 T .64
!
Heber ........... .
Kanab PH ........ ,
.63
.01
.41
.00 T .43
.86 2.18 .05 1.06
.08 1..42 I !Levan ........... . .38 .7S .10 .31 .83
Lewiston ........ . 1. 29 .37 l.B 3.SO .20 .96
Loa .. .. ~ ~ ....... . T T .11 .16 ,oo 1.13
Loga~ USU ... , .... .83 .3S .89 3.82 .17 1.87
~anti. .......... . .32 .18 .07 1..19 .56 .93
~ilford ......... .
oab 4 NW .•••••••
odena .......... .
.OS
.oo
.03
.96
.57
.57 T
.01
.00
.00
.66
.Sl
.so
.oo
.oo
.00
.02
.03
r•n,ioolln ...... . !!organ .......... . 2.46
.01 T .21
.88 2.47 .6S
.02
4.93
.41 1..19
.16
!Ogden 3ugar Fact . 80 .08 . 72 2.59 .11 .30 I Panguitch. . . . . . . . .1.2 .02 .05 .10 .OS 2.23
Park Valley...... .21 .l.8 .00 .81 .28 2.35
Price Warehouse.. .00 .oo .00 .19 . 21 .66
Richfield KSVC... .16 .09 .03 .49 -09 1.38
St. George PH.... .00 .00 .00 .24 .00 . 55
SLC AP........... 1.22 .48 1.18 3.62 .14 .15
Tooele .......... .
lutah Lake Lehi .. .
.89
.20 . 80
. !+9
.01
.64 5.20
.26
.32
.36
.17
.03
11Verna~ AP ....... .
Wendo·1er AP ..... .
T
.21
.61
.OS
.oo
.S6
.OS
.03 .31
.20 1..16
.06 I !Woodruff. ....... .
~~~~~~~~~~~~~~~~
.76 .22 .48 1. 46 .10 1.. SS
Jul. Aug. Sep. Oct.
1.32 .40 .86 6 .1)2
.28 1..88 2. 96 3.61
.10 .20 1. S7 2.70
.18 1..00 .82 2.40
.42 .96 .81 2.39
.42 1.. 20 1..13 3.06
.04 .47 .80 2.32
.18 .38 .53 4.39
.18 .56 .53 3.58
.17 .52 1..48 4.28
.03 .78 1..0i 3.98
.ls 1..14 1.. 26 3. 81
.1.5 .42 1..39 2.74
.68 1..49 1.. 67 1.81
.04 . 3L~ 1. 56 2.52
.38 1. 47 1.91 3.10
.04 2.52 .62 2.61
.l.7 .61 .89 3. 77
.60 1.. 73 .44 2.31
1.. 32 1.. 29 1.38 7.64
.07 1.. 65 1.. 20 3.31
.03 .33 1.. '12 2.23
.78 2.32 1.73 2.74
.41 .73 .62 3.59
.33 .91 1.33 4.34
.43 1.07 .94 1.74
.oo 1.26 2.00 2.33
.06 .21 1.36 2.74
.00 .29 1..13 3.27
.11 .53 ].. 36 2.59
.03 .67 .78 2.16
.24 .84 .24 2.41
.23 .31 .83 1. 79
Nov.
1..22
2.38
1.. 6S
1.03
.87
2.41
.2S
.94
.9S
1.. 01
1.. 28
1. 73
1.. 28
.49
1. 53
l.4G
.9S
1. 78
1.. 29
1. 7 3
1.. 70
Dec. Annual
2.31
1..31
1..41
.82
.84
3.32
.76
.88
.61
2.46
1.01
3.27
1. 05
.34
1. 62
1.12
2.21
1.51
.74
4.06
2.63
1. 86
14.29
14.4S
13.67
8. 72
9.41
lS .951
5.46 I 8.04
7 .19
15.21
10.091
16 .37 I
14.481
7 .8s I 15.541
12. 691 lo. 6s I
9.02
8.70
18.82
22.14
12.47
.75 1.17 12.06
1.27 .84 11.29
.83 .68 9.481
.so 1.14 8.06
l.S8 .60 8.62
1.36 3.22 15.74
1.. 87 3.62 17.89
1.44 .68 8.37
.6S .96 7.27
.07
.6S 1. 02
.30 5.321 9.40
Source: Dept. of Commerce, NWS Climatologist for Utah, Dept. of Soils & Meteorology, Utah State University, Logan, Utah 84321.
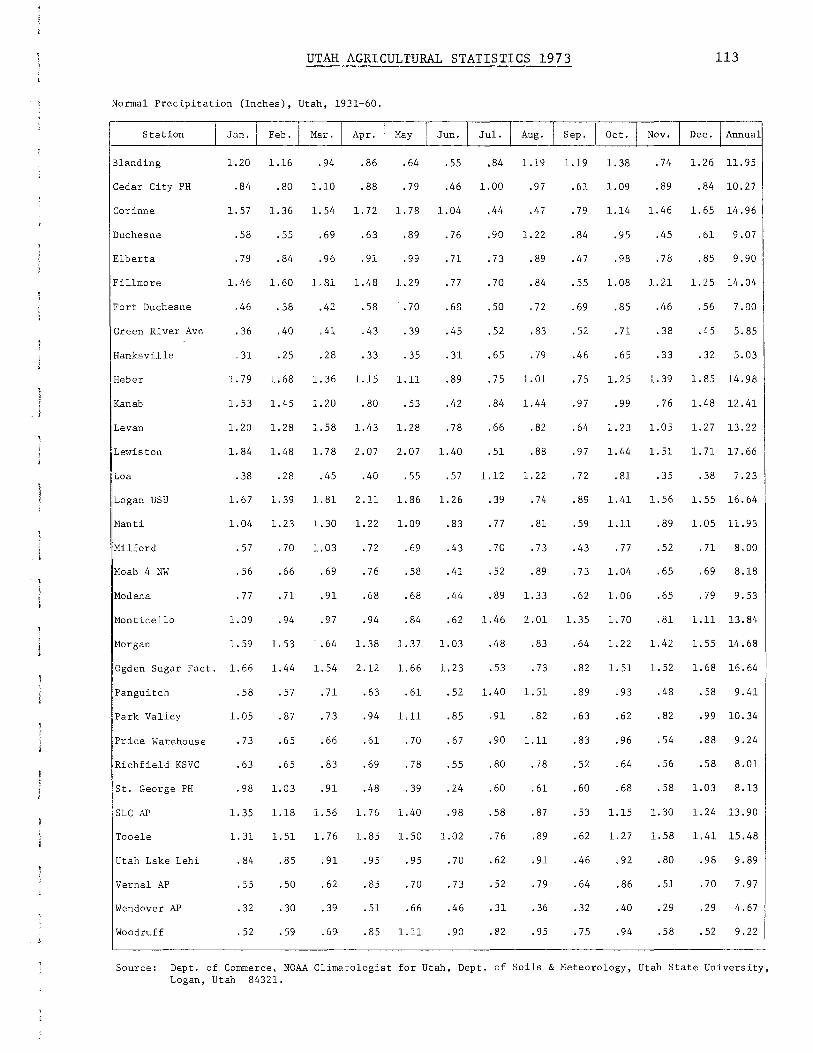
UTAH AGRICULTURAL STATISTICS 1973 113
Normal Precipitation (Inches), Utah, 1931-60.
Station
Blanding
Cedar City PH
Corinne
Duchesne
Elberta
Fillmore
Fort Duchesne
Green River Avn
Hanksville
Heber
Kanab
Levan
I Lewiston
Loa
Logan USU
Manti
Milford
Moab 4 NW
Jan. Feb. Mar. Apr. May Jun. Jul. Aug. Sep. Oct. Nov. Dec. Annual
1.20 1.16 .94 .86 .64 .SS .84 1.19 1.19 1.38 .74 1.26 11.9S
.84 .80 1.10 .88 .79 .46 1.00 .97 .61 1.09 .89 .84 10.27
l.S7 1.36 l.S4 1.72 1.78 1.04 .44 .47 .79 1.14 1.46 l.6S 14.96
.S8 .SS .69 .63 .89 .76 .90 1.22 .84 .95 .4S .61 9.07
.79 .84 .96 .91 .99 .71 .73 .89 .47 .98 .78 .8S 9.90
1.46 1.60 1.81 1.48 1.29 .77 .70 .84 .SS 1.08 1.21 1.25 14.04
.46 .38 .42 .58 .70 .68 .so .72 .69 .85 .46 .56 7.00
.36 .40 .41 .43 .39 .45 .52 .83 .S2 .71 .38 .4S 5.8S
.31 .25 .28 .33 .35 .31 .6S .79 .46 .65 .33 .32 5.03
1.79 1.68 1.36 1.15 1.11 .89 .7S 1.01 .75 1.25 1.39 l.8S 14.98
1.53 1.45 1.20 .80 .53 .42 .84 1.44 .97 .99 .76 1.48 12.41
1.20 1.28 l.S8 1.43 1.28 .78 .66 .82 .64 1.23 l.OS 1.27 13.22
1.84 1.48 1.78 2.07 2.07 1.40 .51 .88 .97 1.44 l.Sl 1.71 17.66
.38 .28 .45 .40 .SS .57 1.12 1.22 .72 .81 .3S .38 7.23
1.67 1.39 1.81 2.11 1.86 1.26 .39 .74 .89 1.41 l.S6 1.55 16.64
1.04 1.23 1.30 1.22 1.09 .83 .77 .81 .59 1.11 .89 1.05 11.93
.57 .70 1.03 .72 .69 .43 .70 .73 .43 .77 .52 .71 8.00
.S6 .66 .69 .76 .58 .41 .52 .89 .73 1.04 .65 .69 8.18
Modena .77 .71 .91 .68 .68 .44 .89 1.33 .62 l.OG .65 .79 9.S3
Monticello 1.09 .94 .97 .94 .84 .62 1.46 2.01 1.35 1.70 .81 1.11 13.81+
Morgan 1.59 1.53 1.64 1.38 1.37 1.03 .48 .83 .64 1.22 1.42 l.5S 14.68
Ogden Sugar Fact. 1.66 1.44 1.54 2.12 1.66 1.23 .S3 .73 .82 1.51 1.52 1.68 16.64
Panguitch .58 .57 .71 .63 .61 .S2 1.40 l.Sl .89 .93 .48 .S8 9.41
Park Valley 1.05 .87 .73 .94 1.11 .85 .91 .82 .63 .62 .82 .99 10.34
Price Warehouse .73 .6S .66 .61 .70 .67 .90 1.11 .83 .96 .54 .88 9.2l+
Richfield KSVC .63 .6S .83 .69 .78 .55 .80 .78 .S2 .64 .S6 .58 8.01
St. George PH .98 1.03 .91 .48 .39 .24 .60 .61 .60 .68 .S8 1.03 8.13
SLC AP 1.35 1.18 1.56 1.76 1.40 .98 .58 .87 .S3 1.15 1.30 1.24 13.90
Tooele 1.31 1.51 1.76 l.8S 1.50 1.02 .76 .89 .62 1.27 1.58 1.41 15.48
Utah Lake Lehi .84 .85 .91 .9S .95 .70 .62 .91 .46 .92 .80 .98 9.89
Vernal AP .55 .SO .62 .85 .70 .73 .52 .79 .64 .86 .SI .70 7.97
Wendover AP .32 .30 .39 .51 .66 .46 .31 .36 .32 .40 .29 .29 4.67
Woodruff .52 .59 .69 .85 1.11 .90 .82 .95 .75 .94 .58 .52 9.22
Source: Dept. of Commerce, NOAA Climatologist for Utah, Dept. of Soils & Meteorology, Utah State University, Logan, Utah 84321.
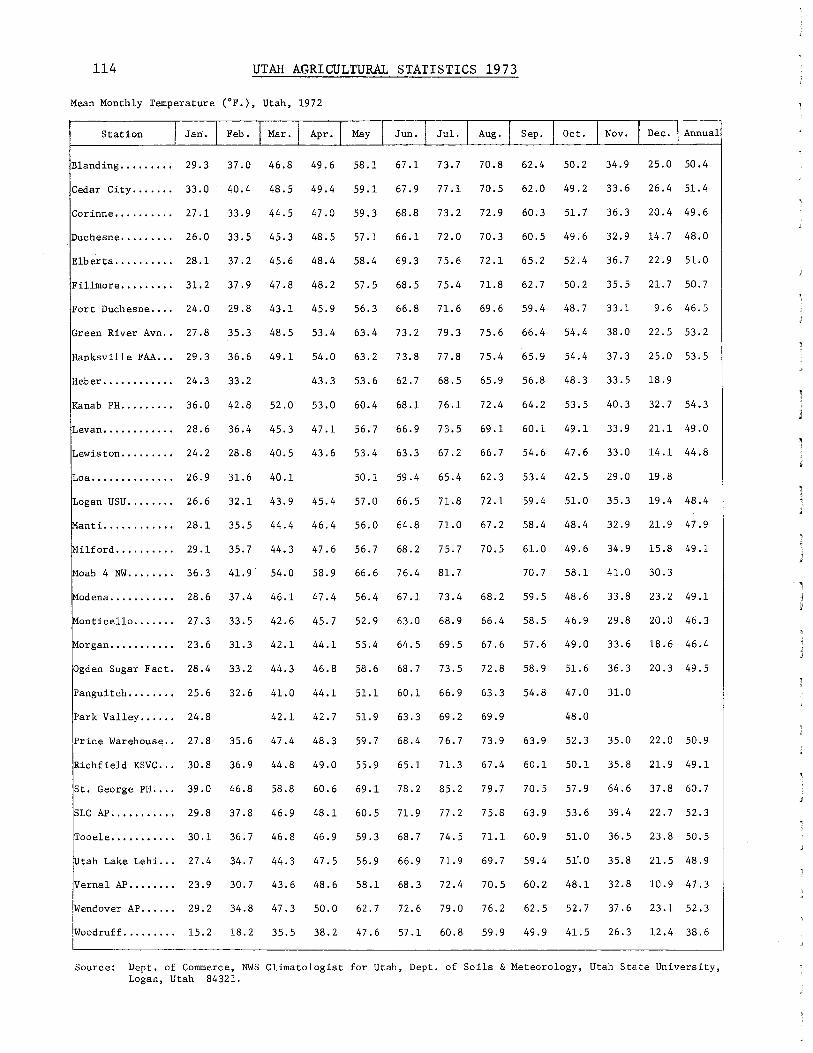
114 UTAH AGRICULTURAL STATISTICS 1973
Mean Monthly Temperature (°F.), Utah, 1972
Station Jan. Feb. Mar. Apr. May Jun. Jul. Aug. Sep. Oct. Nov. Dec. Annual
Blanding ......... 29.3 37.0 46.8 49.6 58.1 67.1 73.7 70.8 62.4 50.2 34.9 25.0 50.4
Cedar City ....... 33.0 40.4 48.5 49.4 59.1 67.9 77.1 70.5 62.0 49.2 33.6 26.4 51.4
Corinne .......... 27.1 33.9 44.5 47.0 59.3 68.8 73.2 72.9 60.3 51.7 36.3 20.4 49.6
Duchesne ......... 26.0 33.5 45.3 48.5 57.1 66.1 72.0 70.3 60.5 49.6 32.9 14.7 48.0
Elberta .......... 28.1 37.2 45.6 48.4 58.4 69.3 75.6 72.1 65.2 52.4 36.7 22.9 51.0
Fillmore ......... 31.2 37.9 47.8 48.2 57.5 68.5 75.4 71.8 62.7 50.2 35.5 21.7 50.7
Fort Duchesne .... 24.0 29.8 43.1 45.9 56.3 66.8 71.6 69.6 59.4 48.7 33.1 9.6 46.5
Green River Avn .. 27.8 35.3 48.5 53.4 63.4 73.2 79.3 75.6 66.4 54.4 38.0 22.5 53.2
Hanksville FAA ... 29.3 36.6 49.1 54.0 63.2 73.8 77.8 75.4 65.9 54.4 37.3 25.0 53.5
Heber............ 24.3 33.2 43.3 53.6 62.7 68.5 65.9 56.8 48.3 33.5 18.9
Kanab PH ......... 36.0 42.8 52.0 53.0 60.4 68.1 76.1 72.4 64.2 53.5 40.3 32.7 54.3
Levan ............ 28.6 36.4 45.3 47.1 56.7 66.9 73.5 69.1 60.1 49.1 33.9 21.l 49.0
Lewiston ......... 24.2 28.8 40.5 43.6 53.4 63.3 67.2 66.7 54.6 47.6 33.0 14.1 44.8
Loa .............. 26.9 31.6 40.1 50.1 59.4 65.4 62.3 53.4 42.5 29.0 19.8
Logan USU ........ 26.6 32.1 43.9 45.4 57.0 66.5 71.8 72.1 59.4 51.0 35.3 19.4 48.4
nti ............ 28.1 35.5 44.4 46.4 56.0 64.8 71.0 67.2 58.4 48.4 32.9 21.9 47.9
ilford .......... 29.1 35.7 44.3 47.6 56.7 68.2 75.7 70.5 61.0 49.6 34.9 15.8 49.1
oab 4 NW ........ 36.3 41.9 54.0 58.9 66.6 76.4 81.7 70.7 58.1 41.0 30.3
odena ........... 28.6 37.4 46.1 47.4 56.4 67.1 73.4 68.2 59.5 48.6 33.8 23.2 49.1
onticello ....... 27.3 33.5 42.6 45.7 52.9 63.0 68.9 66.4 58.5 46.9 29.8 20.0 46.3
organ ........... 23.6 31.3 42.1 44.1 55.4 64.5 69.5 67.6 57.6 49.0 33.6 18.6 46.4
Ogden Sugar Fact. 28.4 33.2 44.3 46.8 58.6 68.7 73.5 72.8 58.9 51.6 36.3 20.3 49.S
Panguitch ........ 25.6 32.6 41.0 44.1 51.1 60.1 66.9 63.3 54.8 47.0 31.0
Park Valley ...... 24.8 42.1 42.7 51.9 63.3 69.2 69.9 48.0
Price Warehouse .. 27.8 35.6 47.4 48.3 59.7 68.4 76.7 73.9 63.9 52.3 35.0 22.0 50.9
Richfield KSVC ... 30.8 36.9 44.8 49.0 55.9 65.1 71.3 67.4 60.1 50.1 35.8 21.9 49.1
St. George PH .... 39.0 46.8 58.8 60.6 69.1 78.2 85.2 79.7 70.5 57.9 64.6 37.8 60.7
SLC AP ........... 29.8 37.8 46.9 48.1 60.S 71.9 77.2 75.8 63.9 53.6 39.4 22.7 52.3
Tooele ........... 30.1 36.7 46.8 46.9 59.3 68.7 74.S 71.1 60.9 51.0 36.5 23.8 50.S
Utah Lake Lehi. .. 27.4 34.7 44.3 47.S 56.9 66.9 71.9 69.7 59.4 51'.0 35.8 21.5 48.9
Vernal AP ........ 23.9 30.7 43.6 48.6 58.1 68.3 72.4 70.5 60.2 48.1 32.8 10.9 47.3
Wendover AP ...... 29.2 34.8 47.3 50.0 62.7 72.6 79.0 76.2 62.5 52.7 37.6 23.1 52.3
Woodruff ......... 15.2 18.2 35.5 38.2 47.6 57.1 60.8 59.9 49.9 41.5 26.3 12.4 38.6
Source: Dept. of Commerce, NWS Climatologist for Utah, Dept. of Soils & Meteorology, Utah State University, Logan, Utah 84321.
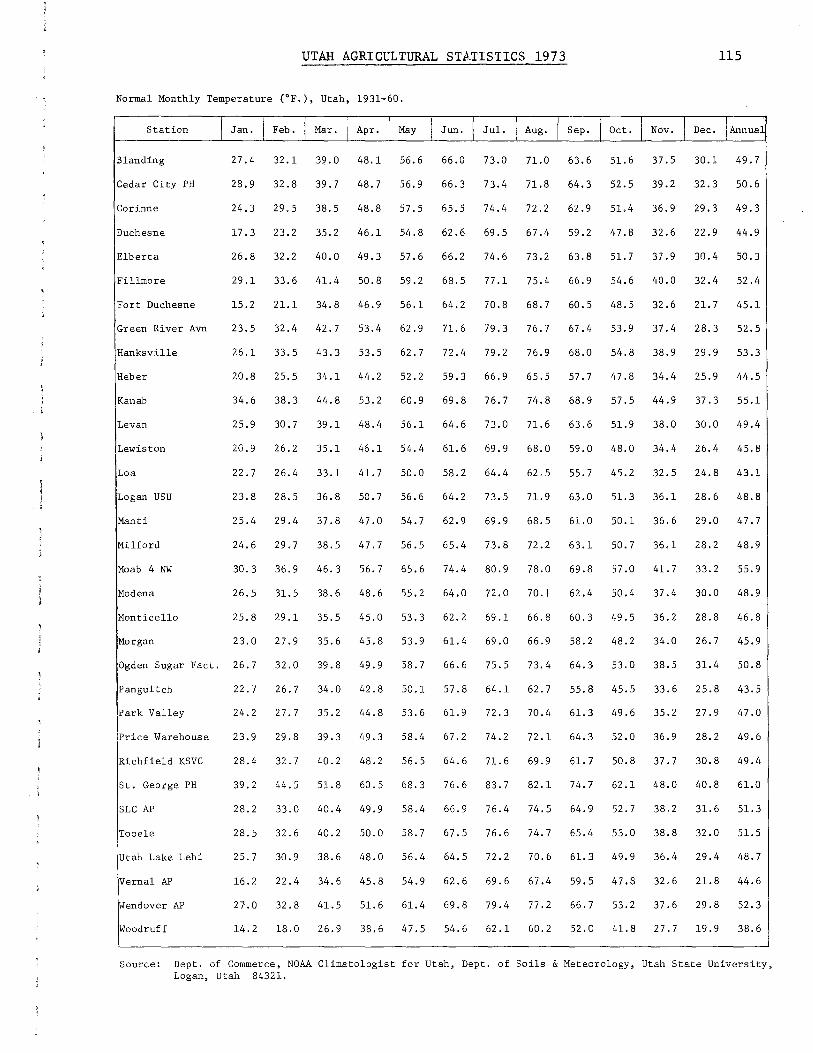
UTAH AGRICULTURAL STATISTICS 1973 115
Normal Monthly Temperature (°F.), Utah, 1931-60.
Station I Jan. I Feb. I Mar. Apr. I May I Jun. I Jul. I Aug. j Sep. j Oct. I Nov. I Dec. !Annual
Blanding 27.4 32.1 39.0 48.1 56.6 66.0 73.0 71.0 63.6 51.6 37.5 30.1 49.7
Cedar City PH 28.9 32.8 39.7 48.7 56.9 66.3 73.4 71.8 64.3 52.S 39.2 32.3 50.6
Corinne 24.3 29.S 38.S 48.8 57.S 65.S 74.4 72.2 62.9 51.4 36.9 29.3 49.3
Duchesne 17.3 23.2 35.2 46.1 54.8 62.6 69.S 67.4 59.2 47.8 32.6 22.9 44.9
Elberta 26.8 32.2 40.0 49.3 57.6 66.2 74.6 73.2 63.8 51.7 37.9 30.4 50.3
Fillmore 29.1 33.6 41.4 50.8 59.2 68.5 77.1 75.4 66.9 54.6 40.0 32.4 52.4
Fort Duchesne 15.2 21.1 34.8 46.9 56.1 64.2 70.8 68.7 60.5 48.5 32.6 21.7 45.1
Green River Avn 23.S 32.4 42.7 53.4 62.9 71.6 79.3 76.7 67.4 53.9 37.4 28.3 52.5
Hanksville 26.1 33.5 43.3 53.5 62.7 72.4 79.2 76.9 68.0 54.8 38.9 29.9 53.3
Heber 20.8 25.5 34.1 44.2 52.2 59.3 66.9 65.S 57.7 47.8 34.4 25.9 44.5
Kanab 34.6 38.3 44.8 53.2 60.9 69.8 76.7 74.8 68.9 57.5 44.9 37.3 55.1
Levan 25.9 30.7 39.1 48.4 56.1 64.6 73.0 71.6 63.6 51.9 38.0 30.0 49.4
Lewiston 20.9 26.2 35.1 46.1 54.4 61.6 69.9 68.0 59.0 48.0 34.4 26.4 45.8
Loa 22.7 26.4 33.1 41.7 50.0 58.2 64.4 62.5 55.7 45.2 32.S 24.8 43.1
Logan USU 23.8 28.5 36.8 50.7 56.6 64.2 73.5 71.9 63.0 51.3 36.1 28.6 48.8
Manti 25.4 29.4 37.8 47.0 54.7 62.9 69.9 68.5 61.0 50.1 36.6 29.0 47.7
Milford 24.6 29.7 38.5 47.7 56.5 65.4 73.8 72.2 63.1 50.7 36.1 28.2 48.9
Moab 4 NW 30.3 36.9 46.3 56.7 65.6 74.4 80.9 78.0 69.8 57.0 41.7 33.2 55.9
Modena 26.S 31.5 38.6 48.6 55.2 64.0 72.0 70.1 62.4 50.4 37.4 30.0 48.9
Monticello 25.8 29.1 35.5 45.0 53.3 62.2 69.1 66.8 60.3 49.S 36.2 28.8 46.8
Morgan 23.0 27.9 35.6 45.8 53.9 61.4 69.0 66.9 58.2 48.2 34.0 26.7 45.9
Ogden Sugar Fact. 26.7 32.0 39.8 49.9 58.7 66.6 75.5 73.4 64.3 53.0 38.5 31.4 50.8
Panguitch 22.7 26.7 34.0 42.8 50.1 57.8 64.1 62.7 55.8 45.5 33.6 25.8 43.S
Park Valley 24.2 27.7 35.2 44.8 53.6 61.9 72.3 70.4 61.3 49.6 35.2 27.9 47.0
Price Warehouse 23.9 29.8 39.3 49.3 58.4 67.2 74.2 72.1 64.3 52.0 36.9 28.2 49.6
Richfield KSVC 28.4 32.7 40.2 48.2 56.S 64.6 71.6 69.9 61.7 50.8 37.7 30.8 49.4
St. George PH 39.2 44.5 51.8 60.S 68.3 76.6 83.7 82.1 74.7 62.1 48.0 40.8 61.0
SLC AP 28.2 33.0 40.4 49.9 58.4 66.9 76.4 74.S 64.9 52.7 38.2 31.6 51.3
Tooele 28.S 32.6 40.2 50.0 58.7 67.5 76.6 74.7 65.4 53.0 38.8 32.0 51.S
Utah Lake Lehi 25.7 30.9 38.6 48.0 56.4 64.S 72.2 70.6 61.3 49.9 36.4 29.4 48.7
Vernal AP 16.2 22.4 34.6 45.8 54.9 62.6 69.6 67.4 59.5 47.8 32.6 21.8 44.6
Wendover AP 27.0 32.8 41.5 51.6 61.4 69.8 79.4 77.2 66.7 53.2 37.6 29.8 52.3
Woodruff 14.2 18.0 26.9 38.6 47.S 54.6 62.1 60.2 52.0 41.8 27.7 19.9 38.6
Source: Dept. of Commerce, NOAA Climatologist for Utah, Dept. of Soils & Meteorology, Utah State University, Logan, Utah 84321.
116 UTAH AGRICULTURAL STATISTICS 1973
Range Land Ben W. Lindsay, Director of Agricultural Development
Everyone enjoys the wide open spaces of our vast western ranges. This natural resource can be improved by management and a more desirable vegetative cover. Rangeland is one of our most important natural resources. There are 25,400 acres of land that can be improved by management and 6 million acres to be improved by re-vegetation. Range development improves the quality of water and makes better habitat for wild animals and increases forage production for livestock.
In years past, due to drouth conditions and overgrazing, the natural growth covering many of these range are~s was damaged to the point that invadingtype plants took over. Some of these invaders are the juniper-cedar, sagebrush, rabbit brush and many types of weeds. Research has found that these plants are undesirable plants for controlling erosion or fer providing the proper watershed protection on the mountains as well as in the valleys.
In order for these rangeland areas to provide the potential multi-purpose uses that they are capable of, water has got to be developed and made more available for wildlife and livestock. Reseeding has got to be performed in many areas because desirable plants are not there in a large enough qnantity to hold the soU if the undesirable vegetation were removed. The vast range areas provide habitat for thousands of all kinds of wild animals and also domestic livestock. The annual harvest of 100,000 mule deer provides an enjoyable sport for many people. This outdoor activity and other types of hunting, fishing and camping make the State of Utah an area to be enjoyed and appreciated by residents of the state as well as thousands of outsiders that come to Utah.
Watersheds and high mountain provide crystal clear water often taken for granted with soil protection.
areas hold the snow and generate springs that for people to enjoy. These watersheds are
no thought being given to their importance or
Loss of topsoil causes unsightly polluted streams, unsightly gullies, less feed is provided for anin~ls of each kind, and a long-felt financial loss to the economy of the area. When the fertile topsoil of an area is lost, that area.has lost one of its most life-sustaining resources.
Soil and water.specialists for range management recommend the undesirable plants be removed from some areas of the watershed and desirable, more productive grasses and shrubs be planted to more efficiently hold the soils and retard rapid water runoff. The specialists estiw~te that our rangelands are capable of carrying twice as many animals if the rangelands were developed to their possible potential.

UTAH AGRICULTURAL STATISTICS 1973 117
Brush management, which does not mean its eradication, means more abundant and vigorous grasses in areas suited to grass production. Brush control frequently increases useable forage production many times. The close growing grass, replacing the brush in areas of excellerated soil erosion, holds the soil in place and increases the percolation of the water into the soil to feed the streams and stabilize the stream flow, Woody plants such as sagebrush and pinion juniper are water greedy. Studies show they transpire about a thousand pounds of moisture for each pound they add to their dry weight. This is moisture that could be used by grass and oth2r beneficial plants< Sagebrush and juniper can be effectively and economically controlled by a number of methods.

118
Where least races Utah?
UTAH AGRICULTURAL STATISTICS 1973
Horses F. James Schoenfeld, D.V.M., State Veterinarian
are you going with your horse? If you are interested, there are at 73 horse shows and events, or you might be interested in 188 horse held annually in Utah. What does this mean to a new industry in
How much do we know about this growing industry?
There are more than 89 western riding clubs in the state. We have Jr. Posses, 4-H Clubs, The Utah Quarter Horse Association, Utah Arabian Horse Club, etc. There are Appaloosa, Morgan, Walking Horses, Thoroughbreds, Pintos, Ponies, Saddlers and then just horses. We have hunters and jumpers, cutter and chariot racing, flat racing and many other types of enjoyable activities that horse lovers and spectators enjoy.
There are thousands of horses used on livestock ranches throughout the state. Horses are an essential part of these industries. It's very possible that we might have 11 people per horse, but we're not certain of our horse numbers. We have estimated studies showing 40 to 95 thousand horses in Utah. These surveys can be off 50,000 horses because we simply don't know how many horses there are in our state.
According to our general survey, registered horses would number 15-16 thousand; ponies 3,000; unregistered saddle horses 20,000. This would give us a value of $11,000,000. The cost care for feed, veterinarians, farrier, training, tack, western wear, transportation, vehicles, taxes, etc., could run $20,000,000. Some people rate this industry as the fifth largest agricultural business in Utah.
With this great interest in equines, it will require a more accurate accounting and program surveillance of the horse industry. There are frequent requests to the State Department of Agriculture for information on the horse industry.
'

UTAH AGRICULTURAL STATISTICS 1973
Conservation
James D. Harvey, Executive Secretary Utah State Soil Conservation Corrnnission
119
Many of the state's 41 soil conservation districts have become involved in community projects. One such project is the Grand and San Juan County Agricultural Development Project. The agricultural potential of this twocounty area has not changed greatly over the years.
Moab, (settled during the 1870's) proved to be one of the most difficult of Utah's towns to settle; and to the south, the small community of Bluff was colonized in 1880. In both cases, irrigation proved to be the key the settlers needed in order to conquer the hardships imposed on all willing to bet their lives and fortune against the desert.
The local soil conservation districts (Grand and San Juan), in cooperation with the Grand and San Juan Counties, and the Southeastern Utah Economic Development District; are endeavoring to demonstrate that horticultural crops can be successfully grown in areas and on soils that have until now been virtually unproductive with the exception of maintaining a few range cows.
The recent development of "trickle irrigation" or "drip irrigation" in Israel and adopted for use in America will enable farmers to conserve irrigation water by maintaining optimum moisture and nutrient conditions in a limited volume of soil in which fruit tree roots are growing.
Fruit farmers in California and Arizona indicate a savings of 75 percent on irrigation water when compared with conventional irrigation practices. Plant nutrients and fertilizers can be added to the irrigation water in soluble form and delivered directly to the root zone.
Only through the efficient use of irrigation water can crops such as apples, cherries and grapes be produced in these counties. This demonstration project is in its second year and all plots show good progress.
The Soil Conservation Connnission is cooperating by making available the services of a soil conservation technician. This technician's responsibility is to supervise and administer the insect, cultivation and husbandry procedures associated with raising these crops. If and when this type of fruit production is considered to be economical, there are 7 to 9 thousand acres of comparable type soil in those areas.
The science of irrigation enabled the Utah Pioneers to successfully establish themselves in Utah. The refinement of this principle may make it possible to create a new agricultural industry in Southeastern Utah. The Soil Conservation Cornmission supports this concept.

120 UTAH AGRICULTURAL STATISTICS 1973
REPORTS ISSUED BY UTAH CROP AND LIVESTOCK REPORTING SERVICE
Report
General Reports: Farm Report (Crop Forecasts, Milk
Production, Farm Labor, Etc.) ...... . Weather, Crops, & Livestock ......... .
Reports on Crops: Acreage Reports: Winter Wheat Seedings .............. . Prospective Plantings .............. . Annual Crop Summary ................ .
Fruit Report ..................•...... Potato Stocks ........•............... Onions: Planting Intentions .........•....... Production ......................... . SLocks .•............................
Stocks of Grains ...................•.
Alfalfa Seed .......................•.
Frequency
Monthly Weekly
Annual Annual Annual Monthly, Jun-Jul Monthly, Dec-Apr
Annual Monthly, Sep-Oct Annual Quarterly
Annual
Reports on Livestock, Dairy, Poultry, and Livestock Products: Dairy ...•.. ; . • . . . . • . . . . . . . . . . . . . . . . . . Monthly Poultry (Egg Production, Chick and Poult Hatchings) ...............•.... Monthly
Livestock Slaughter .................. Monthly Jan. 1 Livestock Inventory and
Numb er Ra is ed. . . . . . . . . . . . . . . . . . . . . • . Annual Cattle on Feed, January 1 ........... . Sheep on Feed, January 1 •............ Lamb Crop .......•.................... Wool Crop ........................... . Pig Crop ............................ . Dairy ... o •••••••••••••••••••• ,, •••••••
Turkeys: Breeder Hen Intentions ............. . Raised and Intentions .............. . Raised . .. 0 •••• ;J •••••• 0 ••••• 0 •• e 0 ••••
Honey and Bees ...................... . Mink." .............................. .
Prices Reports: Agricultural Prices ................. . Farm Income ........................•.
Miscellaneous Reports: Farms and Farm Land ................. .
Annual Annual Annual Semi-Annually Annual Annual
Annual Annual Annual Annual Annual
Monthly Semi-Annually
Annual
Approximate Date of Publication
12th of month Mondays, April-October
December 24 March 16 January 17 12th of month 12th of month
March 9 9th of month January 20 24th of month--Jan., Apr., Jul., Oct. October 19
30th of following
19th of following 30th of following
February 1 January 19 January 17 July 24
month
month month
July 24 & April 16 December 24 April 24
September 19 January 10 August 25 January 17 June 6
30th of month March & August
January 12
The above reports may be obtained from the Utah Crop and Livestock Reporting Service, P. 0. Box 11486, Salt Lake City, Utah 84111 (Office - Room 4418, Federal Building-Phone 524-5003).
1 j
l j

---------------- ---
COOPERATION PAYS
We hope the contents of this report as outlined by the various
tables and charts will prove to be helpful and beneficial to the
agricultural segments of our State . This information certainly
could be used as a guide in formulating plans for production and
marketing of crops and livestock throughout the region.
We are indebted to and extend our thanks and appreciation to
the voluntary reporters who have provided basic information in fil
ling out questionnaires and answering numerous surveys. Voluntary
reports from producers, farmers and ranchers are the primary source
of data for this publication . We, therefore, urgently request and
appeal to people, who have failed to answer questionnaires in past
years, that they give us their support and cooperation in the fu
ture so as to make our Annual Report as accurate and meaningful as
possible .

I .
D A H 0 ! .·-r-------------.J i B O X E L D E R ;J l I j
OGDEN•~ C:> '<
UTAH e_COU.NTY SEAT
I WEBER
!,---------'"--- ,_:_-----·- --~ ~ MORG~ <(-<l: ...------k- D A V I S \ ... ~· COALVILLE
I \ FARMINGTOf.I • \ • IL
! \\ <~;T 1v S U ~ GG0ul!. y 0 M N G w
i TOOEL~~ HSA•L~~ ~K= E \ ,n,~Jf-./ !
I. • . • VERNAL !
O T 0 0 E L E ~- •HEB R ' D U C H E S N E \
I l DUCHESNE i i ..... WASATCH! • i I ~u T A H I u N T A H !
>
w
~ lo !
~ i
u/'/.t_;,s-___ . i io
NEPHI , C A R B 0 N !
l I '1 PR~E \
i '1--------+------------l ,_,.-I ":;"" I '" I S A N P E T E • CASTLE \ i DALE i l !
J A u B
I i I ! M L L A i
D R
I E M E R Y i
i \ i I i
FlLLMJ;,ORE i----,_____ ___ 1
_ R A N D \ 0::
SE V ER i I
r----:-::::-":~---------\-..i ----R-IC-!F. IELD l' I 0 MOAB \
• !
--r· ~A ---i E R
• BEAVER
P . I U T E i W A Y N E
JUNCTION ,-~
_j e _j • G A E L D R F
PAROWAN f PANGUITCH
1-~ c .. J ... t" ~it'( \
I ~[--"---~- · -
li WASH!NGTO : I KA N ·~
E <lo
I .s T. GEORGE
• KANAB
A
A R z 0 N
N J
A
MONTICELLO •
U A N