Appendix AC - USDA Forest Service
179
Appendix AC Patla, S.M. 1997. Nesting Ecology and Habitat of the Northern Goshawk in Undisturbed and Timber Harvest Areas on the Targhee National Forest, Greater Yellowstone Ecosystem., Masters Thesis, Idaho State University., 164 pp.
-
Upload
khangminh22 -
Category
Documents
-
view
0 -
download
0
Transcript of Appendix AC - USDA Forest Service

Appendix AC
Patla, S.M. 1997. Nesting Ecology and Habitat of the Northern Goshawk in Undisturbed and Timber Harvest Areas on the Targhee National Forest, Greater Yellowstone Ecosystem., Masters Thesis, Idaho State University., 164 pp.

NESTING ECOLOGY AND HABITAT OF THE NORTHERN GOSHAWK
IN UNDISTURBED AND TIMBER HARVEST AREAS
ON THE TARGHEE NATIONAIL FOREST,
GREATER YELLOWSTONE ECOSYSTEM
by
Susan M. Patla
A thesis
submitted in partial fulfiUment
of the requirements for the degree of
Masters of Science in the Department of Biology
Idaho State University
May 1997
Photocopy and Use Authorization
In presenting this thesis in partial Wfdlment of the requirements for an advanced degree at Idaho State University, I agree that the Library shall make it freely available for inspection. I further state that permission for extensive copying of my thesis for scholarly purposed may be granted by the Dean of Graduate Studies and Research, Dean of my academic division, or by the University Librarian. It is understood that any copying of publication of this thesis for financial gain shall not be allowed without my written permission.
1

Committee Approval
To the Graduate Faculty:
The members of the committee appointed to examine the thesis of Susan M. Patla ' Kid it satisfactory and recommend that it be accepted.
Major advisor
* ?LL Committee Member
Committee M M e r
Graduate Faculty Representative
... 111
ACKNOWLEDGMENTS
It would be impossible for me to acknowledge everyone who has contributed to this
project, given the number of years and number of miles it has encompassed. If1 attempted to list
the name of every person who helped look for nests, measure trees, or joined me in the field for a
few days to be rewarded with the sight of a goshawk or great gray owl, I would exhaust my
patience as well as the poor readers'. So, forgive me if you look for your name here and fail to find
it. Believe me, your help was greatly appreciated. I do want to thank the following individuals
who made this project possible. Mary Maj encouraged me to start research on goshawks; I remain
grateful for her efforts and inspiration. I thank everyone on the staff of the Targhee National Forest
who provided logistical support, advice, friendship, and raptor observations. In particular, I thank
the wildlife biologists (including many who have since moved on to other locations and
endeavors) for providing support in innumerable ways: T i m Kaminsky, Hal Gibbs, Stuart
Markow, Kim Johnson, Dave Strickland, Jill Kelly, Nancy Doyle, Dick Welch, Dan Trochta, Gail
Worden, Nancy HofGnan, Brain Aber, Bud Alford, Nadine Branson, Marynell Oechsner, and Lew
Becker. Fred Straus and Mark Orme in the Supervisor's Office provided valuable GIs support.
Other Forest Senrice goshawk biologists who shared their knowledge included Brain Woodbridge,
John Squires, Cole Crocker-Bedford, Clint McCarthy, Karen Austin and Tina Hargis. I shall
remain eternally grateful for my field assistants in 1992 and 1993 who literally wore themselves
out collecting data: Sophie Osborn, Garrett Lowe, Frank LaSorte and Cari Straight. Additional
data were collected in 1995 by Chris Rodes and Brad DiCarlo. Special appreciation goes out to
Forest Service volunteers and biological technicians whose enthusiasm and interest added much to
the project: Gorden Dicus, Sue Epstein, Nancy Carlson, Dan Hunt, S u i Langridge, Alexis
Blackmer, and Tim Bennett. Friends who were recruited to literally hug trees (obtain dbh
measurements) included Debra Patla, Laura Brattain, Tay Gerstell, Barb Agnew, Ari Agnew, and
Gloria Smith. Wildlife photographers Jeff Foote, Jeff Hogan, and Mike Quinton shared their
goshawk lore. I greatly appreciate the advice and support I obtained from professors and staff at
the Department of Biological Sciences, Idaho State University. Special kudos go to my advisor
and now fhend, Dr. Chuck Trost, who encouraged me to come to graduate school and who
constantly reminded me that research should be fun and include some serious bird-watching as
-.
'
iv

well as serious science. This project was greatly enhanced by the GIs, GPS, and computer support
offered by Dr. Chuck Peterson of Idaho State University who was also on my committee. Dr. Tom
Cade of the Peregrine Fund kindly offered to be on my committee and provided valuable
comments on my thesis. I thank Tay Gerstell for carefully reviewing the manuscript and offering
insightful suggestions on how to improve it. Don Lingle, deserves appreciation for putting up
with the often thankless task and hassle of being manied to a field biologist; he contributed in
every way imaginable. Merlin Hare deserve special thanks for providing countless hours of help
with graphics and presentations. Finally, I want to thank my parents, Stan and Mary Patla, and my
sister Debra for their constant love and support, both financially and emotionally.
The majority of funding for this project was provided by the Targhee National Forest
through Challenge Cost Share Grants With Idaho State University. Funding for field assistants was
obtained from the Mazamas Mountaineering Club in 1992 and the USDA Forest S d c e
Intermountain Research Station in Boise, ID in 1993. Additional grants were obtained from
the Idaho State University Graduate Research Council and the Department of Biological Sciences.
My talented hend, Barb North (biologist, birder, artist and dancer) kindly donated the
frontispiece.
V

TABLE OF CONTENTS
INTRODUCTION . . . . . . . . . . . . . . . . . . . . . . . . . . . . . . . . . . . . . . . . . . . . . . . . . . . . . . . . . 1
BACKGROUND . . . . . . . . . . . . . . . . . . . . . . . . . . . . . . . . . . . . . . . . . . . . . . . . . . . . . . . . . . 2
OBJECTIVES . . . . . . . . . . . . . . . . . . . . . . . . . . . . . . . . . . . . . . . . . . . . . . . . . . . . . . . . . . . . 5
STUDYAREA . . . . . . . . . . . . . . . . . . . . . . . . . . . . . . . . . . . . . . . . . . . . . . . . . . . . . . . . . . . 6 Topography . . . . . . . . . . . . . . . . . . . . . . . . . . . . . . . . . . . . . . . . . . . . . . . . . . . . . . . 7 Climate . . . . . . . . . . . . . . . . . . . . . . . . . . . . . . . . . . . . . . . . . . . . . . . . . . . . . . . . . . . 7 Vegetation . . . . . . . . . . . . . . . . . . . . . . . . . . . . . . . . . . . . . . . . . . . . . . . . . . . . . . . . . 8 Regional History of Fire and other Disturbance Factors . . . . . . . . . . . . . . . . . . . 10 Forest Composition and Timber Management on the TNF . . . . . . . . . . . . . . . . . 1 1
METHODS . . . . . . . . . . . . . . . . . . . . . . . . . . . . . . . . . . . . . . . . . . . . . . . . . . . . . . . . . . . . . 12 Nesting Ecology . . . . . . . . . . . . . . . . . . . . . . . . . . . . . . . . . . . . . . . . . . . . . . . . . . . 12 Monitoring methods . . . . . . . . . . . . . . . . . . . . . . . . . . . . . . . . . . . . . . . . . . . . . . . . 12 Calculating mean fledge date . . . . . . . . . . . . . . . . . . . . . . . . . . . . . . . . . . . . . . . . . 14 Calculating productivity . . . . . . . . . . . . . . . . . . . . . . . . . . . . . . . . . . . . . . . . . . . . . 14 Calculating occupancy . . . . . . . . . . . . . . . . . . . . . . . . . . . . . . . . . . . . . . . . . . . . . . 15 Analysis of the relation between weather and productivity and occupancy . . . . . 17 Analysis of goshawk prey . . . . . . . . . . . . . . . . . . . . . . . . . . . . . . . . . . . . . . . . . . . . 17 Habitat analyses methods . . . . . . . . . . . . . . . . . . . . . . . . . . . . . . . . . . . . . . . . . . . . 18
Level 1 : Nest tree and nest site analysis . . . . . . . . . . . . . . . . . . . . . . . . . . 18 Level 2: Nest plot analysis . . . . . . . . . . . . . . . . . . . . . . . . . . . . . . . . . . . . 19 Determination of nest site selection using paired random plots . . . . . . . . 21 Statistical analysis of nest tree and nest plot data . . . . . . . . . . . . . . . . . . . 22 GLS analysis of spatial . components within the home range (Levels 3-5) . 23 Analysis of the relation between cover types and re roductive success . 27 Analysis of effects of timber harvesting on nesting R abitat . . . . . . . . . . . 28
RESULTS . . . . . . . . . . . . . . . . . . . . . . . . . . . . . . . . . . . . . . . . . . . . . . . . . . . . . . . . . . . . . . 31 Nesting Ecology . . . . . . . . . . . . . . . . . . . . . . . . . . . . . . . . . . . . . . . . . . . . . . . . . . . 31
Description of study territories . . . . . . . . . . . . . . . . . . . . . . . . . . . . . . . . . . 31 Nestingchronology . . . . . . . . . . . . . . . . . . . . . . . . . . . . . . . . . . . . . . . . . . 33 Nest productivity . . . . . . . . . . . . . . . . . . . . . . . . . . . . . . . . . . . . . . . . . . . . 34 Productivity and weather . . . . . . . . . . . . . . . . . . . . . . . . . . . . . . . . . . . . . 34 Nest clusters and loss of nest trees . . . . . . . . . . . . . . . . . . . . . . . . . . . . . 35 Use of goshawk nests by Great Gay Owls . . . . . . . . . . . . . . . . . . . . . . . . 37 Reuse of individual nest trees 37
39 Reoccupancy of territories . . . . . . . . . . . . . . . . . . . . . . . . . . . . . . . . . . . . . Occupancy and weather . . . . . . . . . . . . . . . . . . . . . . . . . . . . . . . . . . . . . . . . 39 Goshawk prey . . . . . . . . . . . . . . . . . . . . . . . . . . . . . . . . . . . . . . . . . . . . . . . 40
43 Habitatha1 sis . . . . . . . . . . . . . . . . . . . . . . . . . . . . . . . . . . . . . . . . . . . . . . . . . . . Leve 1: Nest tree and site . . . . . . . . . . . . . . . . . . . . . . . . . . . . . . . . . . . . . 43
47 Level 2: Nest plot characteristics . . . . . . . . . . . . . . . . . . . . . . . . . . . . . . . Level 3: Nest Area (NA) . . . . . . . . . . . . . . . . . . . . . . . . . . . . . . . . . . . . . 47 Level 4: Post-fledging Family Area (PFA) . . . . . . . . . . . . . . . . . . . . . . . . 48
49 Comparison of NA, PFA, and FA . . . . . . . . . . . . . . . . . . . . . . . . . . . . . . . 49
. . . . . . . . . . . . . . . . . . . . . . . . . . . . . . . . . .
r Level 5 : Foraging Area (FA) . . . . . . . . . . . . . . . . . . . . . . . . . . . . . . . . . .
vi
I
Habitat selection of nest sites . . . . . . . . . . . . . . . . . . . . . . . . . . . . . . . . . . 50 Relation between productivity and nest site habitat variables . . . . . . . . . 51 Relation of productivity and occupancy to cover types . . . . . . . . . . . . . . 52 Comparison of productivity in Douglas fir and lodgepole pine territories 53 Effects of timber harvesting . . . . . . . . . . . . . . . . . . . . . . . . . . . . . . . . . . . . 54
DISCUSSION . . . . . . . . . . . . . . . . . . . . . . . . . . . . . . . . . . . . . . . . . . . . . . . . . . . . . . . . . . . 58 Evaluation of the database . . . . . . . . . . . . . . . . . . . . . . . . . . . . . . . . . . . . . . . . . . . 58 Evaluation of monitoring data . . . . . . . . . . . . . . . . . . . . . . . . . . . . . . . . . . . . . . . . 60 Nesting chronology . . . . . . . . . . . . . . . . . . . . . . . . . . . . . . . . . . . . . . . . . . . . . . . . . 61 Productivity . . . . . . . . . . . . . . . . . . . . . . . . . . . . . . . . . . . . . . . . . . . . . . . . . . . . . . . 62 Occupancy of nests and territories . . . . . . . . . . . . . . . . . . . . . . . . . . . . . . . . . . . . . 63 Goshawkprey . . . . . . . . . . . . . . . . . . . . . . . . . . . . . . . . . . . . . . . . . . . . . . . . . . . . . 66 Habitat analysis . . . . . . . . . . . . . . . . . . . . . . . . . . . . . . . . . . . . . . . . . . . . . . . . . . . . 67
Nestsites . . . . . . . . . . . . . . . . . . . . . . . . . . . . . . . . . . . . . . . . . . . . . . . . . . . 67 Nest site habitat selection . . . . . . . . . . . . . . . . . . . . . . . . . . . . . . . . . . . . . 68 Nest clusters . . . . . . . . . . . . . . . . . . . . . . . . . . . . . . . . . . . . . . . . . . . . . . . 69 Ephemeral territories . . . . . . . . . . . . . . . . . . . . . . . . . . . . . . . . . . . . . . . . . 71 Summary of habitat analyses within estimated home range areas . . . . . . 71 Relation between productivity and nest sitdplot habitat variables . . . . . 75 Relation between cover types and reproductive success . . . . . . . . . . . . 76
77 Effects of timber harvesting . . . . . . . . . . . . . . . . . . . . . . . . . . . . . . . . . . . . . . . . . . SUMMARY AND CONCLUSIONS . . . . . . . . . . . . . . . . . . . . . . . . . . . . . . . . . . . . . . . . . 82 MANAGEMENTIMPLICATIONS . . . . . . . . . . . . . . . . . . . . . . . . . . . . . . . . . . . . . . . . . . 83
REFERENCES . . . . . . . . . . . . . . . . . . . . . . . . . . . . . . . . . . . . . . . . . . . . . . . . . . . . . . . . . . 86 TABLES . . . . . . . . . . . . . . . . . . . . . . . . . . . . . . . . . . . . . . . . . . . . . . . . . . . . . . . . . . . . . . . 98
FIGURES . . . . . . . . . . . . . . . . . . . . . . . . . . . . . . . . . . . . . . . . . . . . . . . . . . . . . . . . . . . . . . . . 132
APPENDICES . . . . . . . . . . . . . . . . . . . . . . . . . . . . . . . . . . . . . . . . . . . . . . . . . . . . . . . . . . 149
vii

List of Tables
Table Number
Table Description Page Number
1
2
3
4
5
6
7
8
9
10
1 1
' .12
13
14
15
16
17'
List of TNF GIS vegetation classes used for analysis
List of goshawk study territories
Goshawk productivity data, 1989-1994
Weather data, March through May, 1989-1994
Summary of nest trees found at goshawk study territories, 1989- 1994
Summary of the greatest distance between alternate nests in a nest cluster, 1989-1994
Monitoring results for 76 goshawk nest trees, 1989-1994
Monitoring results for goshawk temtories, 1989-1994
List of goshawk prey species
Species of nest trees used by goshawks
Types of nest structures used by goshawks
Comparison of nest tree characteristics at Douglas fir and lodgepole pine nests
Distances from nest clusters to forest edge, permanent water, and roads
Comparison of nest plot characteristics at Douglas fir and lodgepole pine nests
Comparison of density of live trees in different size classes at Douglas fir and lodgepole pine nests
Comparison of density of snags in different size classes at Douglas fir and lodgepole pine nests
Proportions of different cover types within the nest area ("A) at Douglas fir and lodgepole pine territories
98
99
100
101
102
103
104
1 os 106
107
108
109
110
1 1 1
112
113
114
... vlll
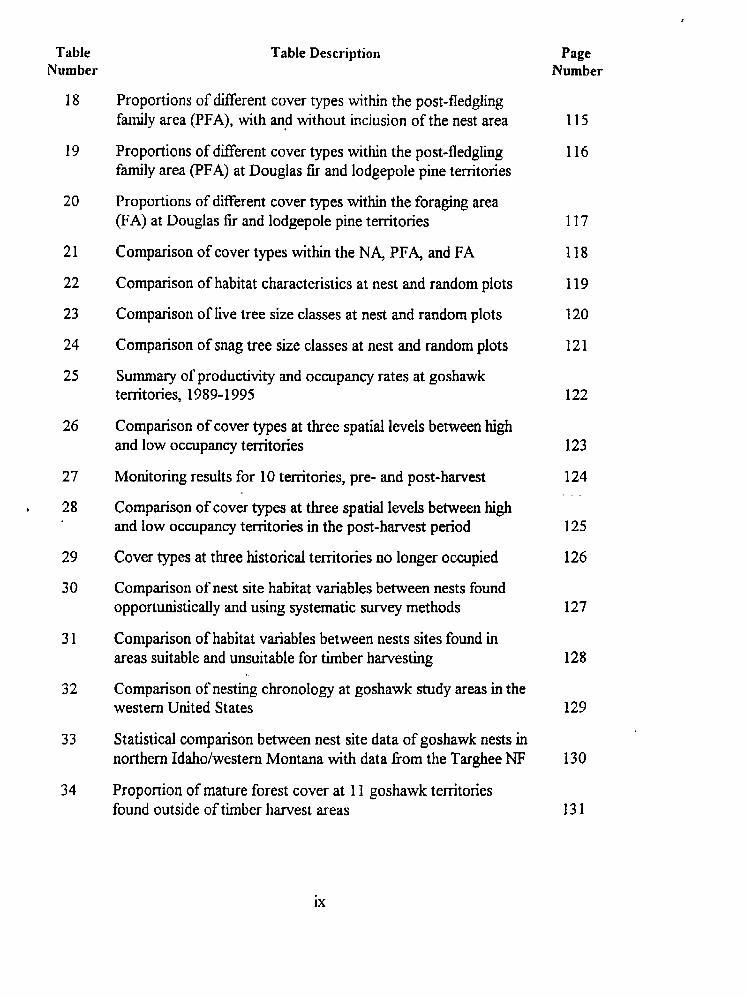
Table Number
Table Description Page Number
18 Proportions of different cover types within the post-fledgling family area (PFA), with and without inciusion of the nest area
Proportions of different cover types within the post-fledgling family area (PFA) at Douglas fir and lodgepole pine territories
Proportions of different cover types within the foraging area (FA) at Douglas fir and lodgepole pine territories
Comparison of cover types within the NA, PFA, and FA
Comparison of habitat characteristics at nest and random plots
Comparison of live tree size classes at nest and random plots
19
20
21
22
23
24 Comparison of snag tree size classes at nest and random plots
25 Summary of productivity and occupancy rates at goshawk territories, 1989-1 995
26 Comparison of cover types at three spatial levels between high and low occupancy territories
Monitoring results for 10 temtories, pre- and post-harvest
Comparison of cover types at three spatial levels between high and low occupancy territories in the post-harvest period
27
. 28
29
30
Cover types at three historical territories no longer occupied
Comparison of nest site habitat variables between nests found opportunistically and using systematic survey methods
Comparison of habitat variables between nests sites found in areas suitable and unsuitable for timber harvesting
Comparison of nesting chronology at goshawk study areas h the western United States
3 1
32
33 Statistical comparison between nest site data of goshawk nests in northern Idaho/western Montana with data from the Targhee NF Proponion of mature forest cover at 11 goshawk territories found outside of timber harvest areas
34
115
116
117
118
119
120
121
122
123
124
125
126
127
128
129
130
131
ix
List of Figures
Figure Number
Figure Description Page Number
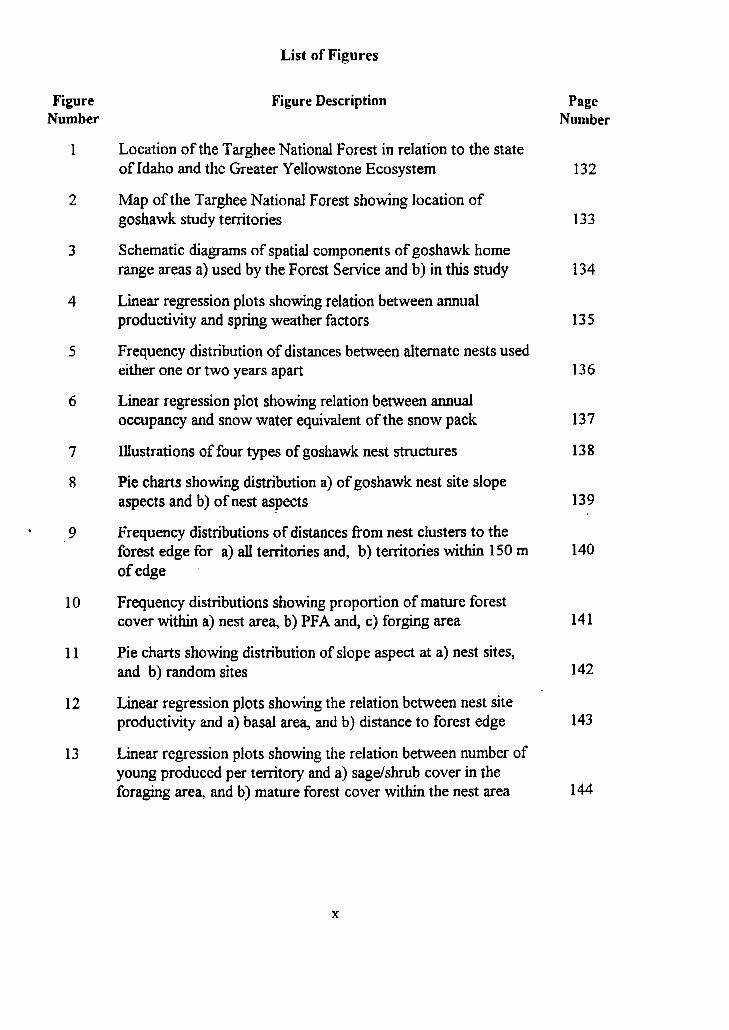
1 Location of the Targhee National Forest in relation to the state of Idaho and the Greater Yellowstone Ecosystem
Map of the Targhee National Forest showing location of goshawk study territories
Schematic diagrams of spatial components of goshawk home range areas a) used by the Forest Service and b) in this study
Linear regression plots showing relation between annual productivity and spring weather factors
Frequency distribution of distances between alternate nests used either one or two years apart
Linear regression plot showing relation between annual occupancy and snow water equivalent of the snow pack
Illustrations of four types of goshawk nest structures
Pie charts showing distribution a) of goshawk nest site slope aspects and b) of nest aspects
Frequency distributions of distances from nest clusters to the forest edge for a) all territories and, b) territories within 150 m of edge
Frequency distributions showing proportion of mature forest cover within a) nest area, b) PFA and, c) forging area
Pie charts showing distribution of slope aspect at a) nest sites, and b) random sites
2
3
4
5
6
7
8
9
10
11
12 Linear regression plots showing the relation between nest site productivity and a) basal area, and b) distance to forest edge
Linear regression plots showing the relation between number of young produced per territory and a) sagdshrub cover in the foraging area, and b) mature forest cover within the nest area
13
132
133
134
135
136
137
138
139
140
141
142
143
144
X
Figure Number
Figure Description Page Number
14 Linear regression plot showing the relation between territory occupancy and sage/shb cover within the foraging area
Comparison of mature forest cover at 10 territories showing pre- and post-harvest conditions 146
145
15
16 Linear regression plot showing the relation between occupancy in the post-harvest period and mature forest cover in the nest area
147
17 Comparison of mature forest cover at 3 historical territories no longer occupied showing pre-harvest and current conditions 148
xi

List of Appendices
Appendix Number
Appendix Description Page Number
A
B
List of habitat variables measured at goshawk nest sites
Categories and symbols for Targhee National Forest GIs vegetation attributes
Known and suspected goshawk nest areas on the Targhee National Forest not included in this study
Correlations of spring weather variables
Master list of goshawk nest trees found at study territories
Monitoring results for goshawk territories, 1989 to 1994
List of scientific names and weights of goshawk prey species
List of nest trees used in habitat analysis, Level 1 and Level 2
Summary of cover types within goshawk nest areas (NA)
Summary of cover types within goshawk post-fledgling family areas (PFA)
Summary of cover types within goshawk foraging areas (FA)
C
D
E
F
G
H
I
J
K
149-50
151
152
153
154-55
156
157
158
159
160
161 . ,
L Comparison of productivity data fiom Douglas fir and lodgepole pine territories I62
Comparison of mature forest cover at 10 individual territories in the pre- and post-harvest periods
Comparison of mature forest cover at high occupancy and low occupancy territories in the post-harvest period
M 163
N 164
xii

ABSTRACT
I investigated nesting ecology and habitat of a previously unstudied population of Northern Goshawks (Accipiter gentilis) on the Targhee National Forest in eastern Idaho and western Wyoming from 1989 to 1995. Twenty seven current and 4 historical territories in Douglas fir and lodgepole pine habitat were monitored. My main objectives were to describe nesting habitat at 5 hierarchical spatial scales, to determine the relationship between productivity/occupancy and habitat features, and to evaluate the effects of timber harvesting. Habitat analysis areas included: the nest tree, nest plot (0.13 ha), nest area (NA: 8 1 ha), post-fledgling family area (PFA: 162 ha), and the forging area (FA: 2428 ha). I determined habitat selection at the nest site level by comparing nest plots to random plots at 26 territories. Analysis of habitat within the home range area (NA, PFA, FA), was accomplished using A?X/INFO GIs vegetation coverages.
Goshawk territories produced an average of 1.96 young per nest; occupancy rate
averaged 61%. Annual productivity was negatively correlated with early spring
precipitation, and positiveh with temperature. Goshawk territones contained I to 7 alternate nest trees located in areas of extensive mature forest habitat: mature forest cover
. -
averaBd over 60% in the N&J!!FA and FA Few territories had less than 50% mature
forest cover at any analysis area. Goshawks selected nest sites on north and west aspects
that had taller trees, greater basal area, greater under canopy space, and higher density of
trees in the 3846 cm diameter size class compared to random sites. Productivity was
positively rdated hhadgea at the .-.. nest - site, and both productivity and occupancy were
positively related to the proportion of sagebrushlshrub cover within the FA, indicting its
value as foraging habitat. High occupancv territories (>SO% occupancy) had significantly
more mature forest cover within the NA and P F q and less seedling and young forest cover.
-. .-
At 10 territories monitored pre- and post-harvest, timber harvesting significantly
reduced the amount of mature forest within the home range area with greatest reduction
within the NA (33%). Average occupancy rate decreased in the post-harvest period from
79% to 47% at these territories but .this difference was not significant. Occupancy at 15
post-harvest temtories was positively related to the amount of mature forest cover retained
within the N A Large decreases in mature forest cover at three historical territories in
salvage logging areas indicate the need for modification of current silvicultural practices to
maintain goshawk nesting habitat over time in timber management areas.
... xlll
Unplanned, large-scale experiments are in progress in forested landscapes, as logging reduces the amount of remaining habitat. By taking advantage of these uncontrolled experiments, we may learn something about the effects of habitat loss on spotted owls. (p. 145) [or goshawks, author's note]
A Conservation Strategy for the Northern Spotted Owl (Thomas et al. 1990)
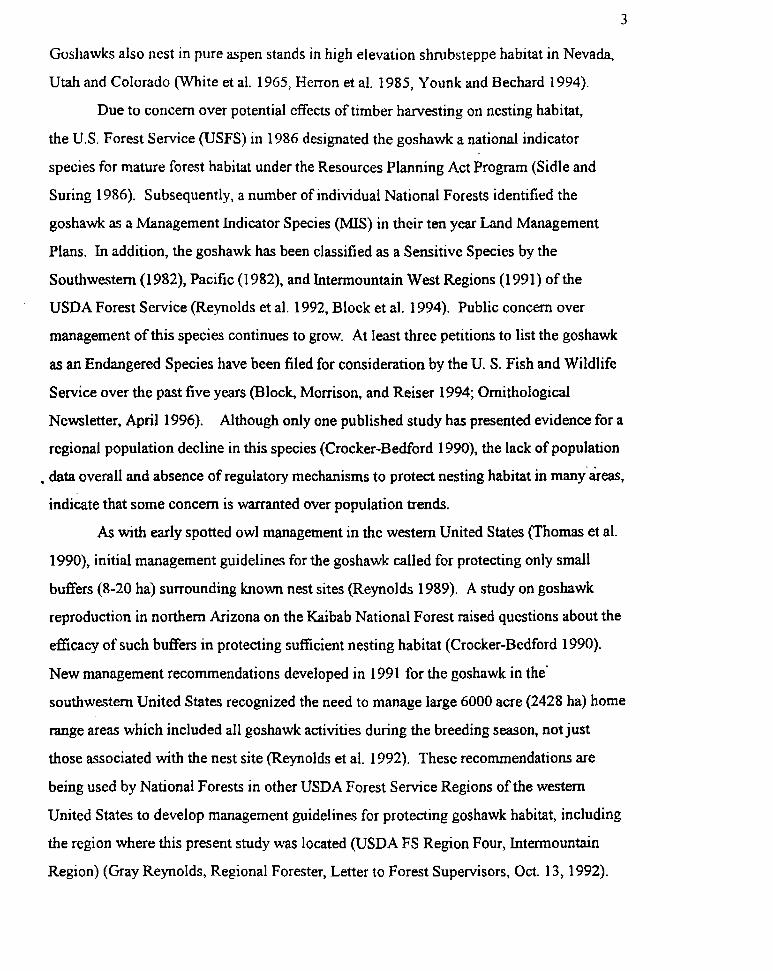
INTRODUCTION
Reductions in a number of raptor populations throughout the world have been
attributed to habitat destruction by man and associated loss of food supply and nest sites
(Newton 1991). In the western United States in the early 19703, public concern
developed over the effects of timber harvesting on wildlife species, including raptors, in
late-successional forests (Ruggiero et al. 1994). Although attention and research focused
mainly on the Northern Spotted Owl (Strix occzdentulis caurina) in the Pacific Northwest
(Thomas et al. 1990, Raphael et al. 1996), studies on the Northern Goshawk (Accipiter
gentilzs) were also initiated P during the 1970's (Bartelt 1974, Reynolds 1975, Hennessy
1978, Reynolds and Wight 1978, Reynolds 1979). Both raptor species, due to their
association with mature forest habitat and narrow ecological tolerances, were thought to be
vulnerable to timber harvesting which replaces older age classes of forest habitat with
younger seral stages (McCarthy et al. 1989). Over the past twenty-five years, the
Northern Spotted Owl, which was listed as a threatened species in 1990 under the federal
Endangered Species Act, has become one of the most intensively studied birds in the world
(Gutierrez 1996), but data on Northem Goshawk populations are lacking for many areas of
the western United States.
Successful conservation management of wildlife species depends upon our
understanding the resources needed by a species to persist over time (Morrison et al. 1992,
Manly et al. 1993, Ruggiero et al. 1994). Habitat requirements often vary over the
geographic range of a species, so conclusions from habitat studies from one location may
be misleading if applied to other locations, especially if ecological conditions are
dissimilar (Ruggiero et al. 1994). The purpose of this study was to document the nesting
ecology and habitat of the Northern Goshawk on the Targhee National Forest in eastern
Idaho/southwestern Wyoming, where it was previously unstudied. The study was designed
to gain an understanding of local habitat requirements during the breeding season, prey
use, and patterns of occupancy and productivity. I also wanted to determine how timber
harvesting was changing habitat within estimated home range areas, and whether habitat

2
changes resulting from harvesting were affecting productivity and occupancy. Since the
scale at which habitat data are collected can greatly influence our understanding of habitat
requirements, especially for a large-ranging species such as the goshawk (Wiens 198 1,
Orians and Wittenberger 1991, Block and Brennan 1993, Keane and Morrison 1994), I
analyzed habitat within estimated home range areas at five different scales using known
nest sites as the focal point.
BACKGROUND
Goshawks, in common with other species in the genus Accipiter, exhibit
adaptations thought to be advantageous for life in forest habitats. With relatively wide,
short wings and a long tail, goshawks can maneuver through woodlands in pursuit of prey,
relying on agility and strength to make kills while avoiding injury to themselves (Beebe
1974; Jones 1979; Snyder and Snyder 1991). Although the goshawk is considered to have
a circumpolar distribution and be conspecific with the goshawk in Europe and Asia,
morphological, behavioral, and plumage differences exist between the North American and
Eurasian forms (wattel 1973). '
Three subspecies of the goshawk have been described in North America: A. g.
urncupillus, the most widespread subspecies and the subject of this study; A. g. luingi,
found on the Queen Charlotte Islands and in southeast Alaska; and A g. apache in southern
Arizona and Mexico (Johnsgard 1990). The breeding range of the goshawk in North
America extends from west central Alaska throughout the boreal forests of Canada,
southward into forested and montane habitats in the western and eastern United States
(Johnsgard 1990). In the eastern United States, it nests in deciduous, mixed and coniferous
forests. It does not breed in most of the central and southern portions of the United States
(Johnsgard 1990). Its farthest breeding extension southward is in the Rocky Mountain
cordillera in northern Mexico (Johnsgard 1990). In the western, contiguous United States,
goshawks are generally associated with mature and old growth coniferous forest habitat
during the breeding season, although average tree size and stand structure of nesting
habitat vary among regions and forest cover types (Reynolds 1989, Marshall 1992). Most
nest sites occur in conifer, and mixed conifer and aspen (Populus tremulozdes) forests.
3
Goshawks also nest in pure aspen stands in high elevation shrubsteppe habitat in Nevada,
Utah and Colorado (White et al. 1965, Herron et al. 1985, You& and Bechard 1994).
Due to concern over potential effects of timber hawesting on nesting habitat,
the U.S. Forest Service (USFS) in 1986 designated the goshawk a national indicator
species for mature forest habitat under the Resources Planning Act Program (Sidle and
Suring 1986). Subsequently, a number of individual National Forests identified the
goshawk as a Management Indicator Species (MIS) in their ten year Land Management
Plans. In addition, the goshawk has been classified as a Sensitive Species by the
Southwestern (1 982), Pacific (1 982), and Intermountain West Regions (1 991) of the
USDA Forest Service (Reynolds et al. 1992, Block et al. 1994). Public concern over
management of this species continues to grow. At least three petitions to list the goshawk
as an Endangered Species have been filed for consideration by the U. S. Fish and Wildlife
Service over the past five years (Block, Morrison, and Reiser 1994; Ornithological
Newsletter, April 1996). Although only one published study has presented evidence for a
regional population decline in this species (Cracker-Bedford 1990), the lack of population
, data overall and absence of regulatory mechanisms to protect nesting habitat in many'keas,
indicate that some concern is warranted over population trends.
As with early spotted owl management in the western United States (Thomas et al.
1990), initial management guidelines for the goshawk called for protecting only small
buffers (8-20 ha) surrounding known nest sites (Reynolds 1989). A study on goshawk
reproduction in northern Arizona on the Kaibab National Forest raised questions about the
efficacy of such buffers in protecting sufficient nesting habitat (Crocker-Bedford 1990).
New management recommendations developed in 1991 for the goshawk in the'
southwestern United States recognized the need to manage large 6000 acre (2428 ha) home
range areas which included all goshawk activities during the breeding season, not just
those associated with the nest site (Reynolds et al. 1992). These recommendations are
being used by National Forests in other USDA Forest Service Regions of the western
United States to develop management guidelines for protecting goshawk habitat, including
the region where this present study was located (USDA FS Region Four, Intermountain
Region) (Gray Reynolds, Regional Forester, Letter to Forest Supervisors, Oct. 13,1992).

4
Although goshawk nesting habitat has been studied at a number of locations in the
contiguous western states including South Dakota (Bartelt 1974), Utah (Hennessy 1978,
Fischer 1986, Johansson et al. 1994), Oregon (Reynolds 1979, Moore and Henny 1983,
Bull and Hohmann 1994), Colorado (Shuster 1980, Joy et. al. 1994), California (Saunders
1982, Hall 1984, Austin 1993, Hargis et al. 1994, ), Arizona (Crocker-Bedford and Chaney
1988), New Mexico (Kennedy 1988, Siders and Kennedy 1996), Idaho (Hayward and
Escano 1989), Nevada (Younk and Bechard 1994), and Wyoming (Squires and Ruggiero
1996), few of these studies analyzed entire home range areas. Most habitat analyses
focused only on nest trees and a small activity area or stand surrounding them. Of the other
studies, Bartelt (1 974) and Hall (1 984) analyzed vegetation cover within a few estimated
home range areas, and Johannson (1 994) analyzed post-fledgling family areas (243 ha)
surrounding known nest sites. Radio tracking studies by Fischer (1 986), Kennedy (1 988),
Austin (1 993), and Hargis et al. (1 994) detailed actual use areas by breeding adults.
The Targhee National Forest (TNF), located within the Greater Yellowstone
Ecosystem in eastern Idaho and western Wyoming (Fig. I), is an administrative unit of the
USFS Intermountain Region (Region Four). Prior to the 1980's, no permanent records
were maintained on goshawk breeding sites on the TNF. Wildlife guidelines written in
1979 called for managing a four hectare buffer surrounding Accipiter nests and maintaining
"a forested environment adjacent to at least a portion of the buffer areas" within
management area (USDA FS 1979). District biologists in the early 1980's began to
document the location of active nest sites found within timber management areas. Since
1985, uncut buffers of varying sizes (0.2 ha-1 2 1 ha) were maintained around some nest
sites found within sales units (District Records, Targhee National Forest, 1981-1 988).
The TNF initiated a goshawk monitoring project in 1989 to determine the status of
historical goshawk territories and to describe nesting habitat eat la 1990; Patla 1991; Patla
and Trost 1995). The present study developed out of this initial monitoring program. I
have used habitat data for this analysis collected fiom 1989 through 1993, and nest
monitoring data collected fiom 1989 through 1995.
5
C.
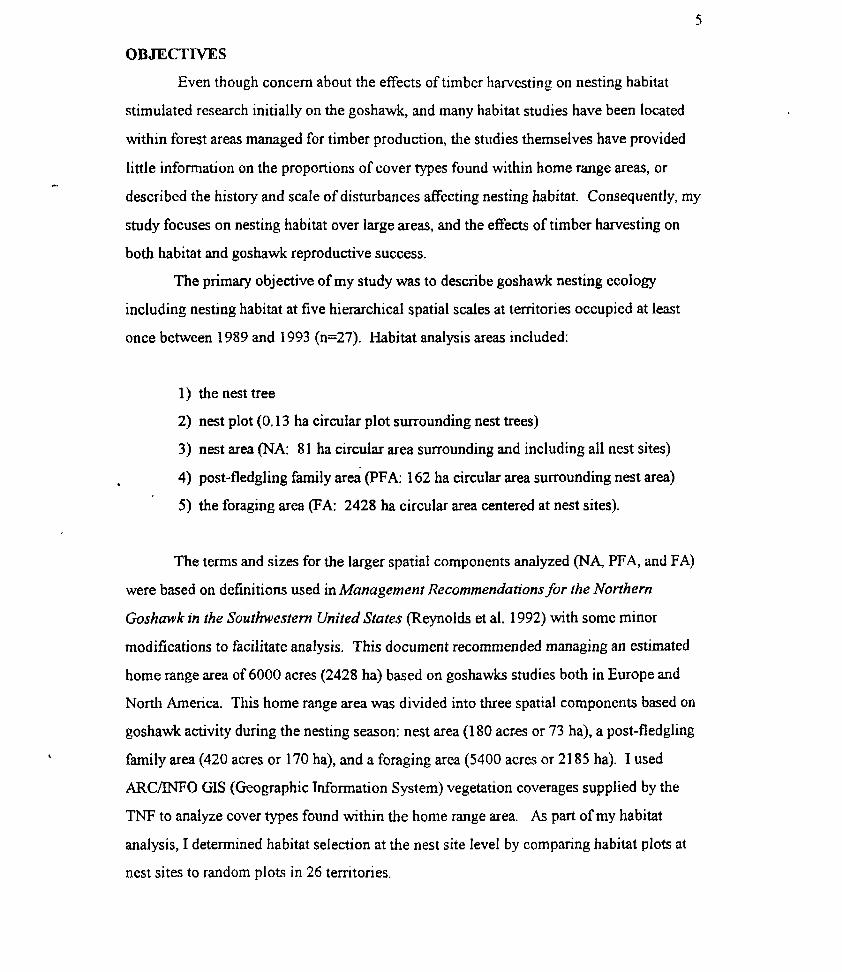
OBJECTWFS
Even though concern about the effects of timber harvesting on nesting habitat
stimulated research initially on the goshawk, and many habitat studies have been located
within forest areas managed for timber production, the studies themselves have provided
little information on the proportions of cover types found within home range areas, or
described the history and scale of disturbances affecting nesting habitat. Consequently, my
study focuses on nesting habitat over large areas, and the effects of timber harvesting on
both habitat and goshawk reproductive success.
The primary objective of my study was to describe goshawk nesting ecology
including nesting habitat at five hierarchical spatial scales at territories occupied at least
once between 1.989 and 1993 (n=27). Habitat analysis areas included:
1) thenesttree
2) nest plot (0.13 ha circular plot surrounding nest trees)
3) nest area (NA: 81 ha circular area surrounding and including all nest sites)
4) post-fledgling family area (FFA: 162 ha circular area surrounding nest area)
5) the foraging area (FA: 2428 ha circular area centered at nest sites).
The terms and sizes for the larger spatial components analyzed (N4 PFA, and FA)
were based on definitions used in Management Recommendations for the Northern
Goshawk in the Southwestern United States (Reynolds et al. 1992) with some minor
modifications to facilitate analysis. This document recommended managing an estimated
home range area of 6000 acres (2428 ha) based on goshawks studies both in Europe and
North America. This home range area was divided into three spatial components based on
goshawk activity during the nesting season: nest area (1 80 acres or 73 ha), a post-fledgling
family area (420 acres or 170 ha), and a foraging area (5400 acres or 21 85 ha). I used
ARC/INFO GIs (Geographic Information System) vegetation coverages supplied by the
TNF to analyze cover types found within the home range area. As part of my habitat
analysis, I determined habitat selection at the nest site level by comparing habitat plots at
nest sites to random plots in 26 territories.

6
My second objective was to determine the relation of habitat features at different
spatial scales to goshawk productivity and occupancy. I used stepwise linear regression to:
1) analyze the relationship between habitat features at individual nest sites and number of
young produced per nest, and 2) analyze the relationship of cover types within estimated
home range areas to occupancy and productivity of territories that had been surveyed a
minimum of three years (n=22). In addition, I compared proportions of mature forest
cover within home range areas of high and low occupancy territories.
My third and final objective was to evaluate of the effects of timber harvesting. I
used three approaches. First, I analyzed loss of mature forest habitat at current nesting
territories (n=1 0) where goshawks nested prior to harvesting, and compared productivity
and occupancy pre- and post-harvest. This was to determine the extent of habitat change
resulting fiom timber sales in the vicinity of goshawk nests, and to determine if habitat
changes were related to reproductive success. Second, I cornpared the proportion of
mature forest cover in post-hawest high and low occupancy territories to determine if the
amount of mature forest habitat remaining in disturbed territories was related to how oRen
these temtories were reoccupied by goshawks. Third, I measured the loss of mature.forest
habitat at three historical nesting territories in salvage harvest areas where goshawks had
nested previously but were not found during the current period. From this analysis I hoped
to gain some insight into the extent of habitat alteration that was occurring over time in
heavily logged areas of the TNF and possible threshold effects.
STUDYAREA
The TNF comprises the western portion of the Greater Yellowstone- Ecosystem.
Yellowstone and Grand Teton National Parks, and the Bridger Teton National Forest form
its eastern boundary (Fig. 1). The TNF contains approximately 728,000 ha located in
southeastern Idaho (84%) and western Wyoming (1 6%) (USDA FS 1985). The TNF is
bordered to the north by the Continental Divide which runs along the crest of the
Centennial Mountains on the Idahohiontana border (Fig. 2). The Big Hole and Snake
River Ranges, and the Snake River comprise the southern and southwestern boundaries. In
i ts farthest extension westward, the TNF includes portions of the Beaverhead Mountains
and the Lemhi Range (Fig. 2).
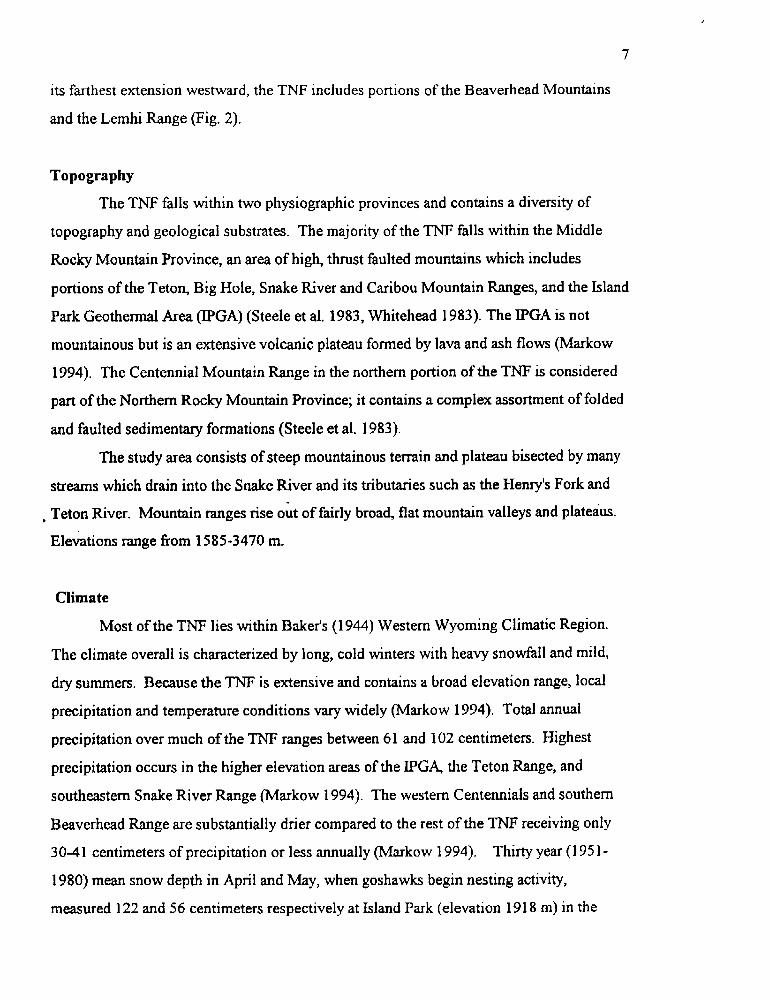
Topography
The TNF falls within two physiographic provinces and contains a diversity of
topography and geological substrates. The majority of the TNF falls within the Middle
Rocky Mountain Province, an area of high, thrust faulted mountains which includes
portions of the Teton, Big Hole, Snake River and Caribou Mountain Ranges, and the Island
Park Geothermal Area (IPGA) (Steele et al. 1983, Whitehead 1983). The E'GA is not
mountainous but is an extensive volcanic plateau formed by lava and ash flows (Markow
1994). The Centennial Mountain Range in the northern portion of the TNF is considered
part of the Northern Rocky Mountain Province; it contains a complex assortment of folded
and faulted sedimentary formations (Steele et al. 1983).
The study area consists of steep mountainous terrain and plateau bisected by many
streams which drain into the Snake River and its tributaries such as the Henry's Fork and
, Teton River. Mountain ranges rise out of fairly broad, flat mountain valleys and plateaus.
Elevations range from 1585-3470 m.
Climate
Most of the TNF lies within Baker's (1 944) Western Wyoming Climatic Region.
The climate overall is characterized by long, cold winters with heavy snowfall and mild,
dry summers. Because the TNF is extensive and contains a broad elevation range, local
precipitation and temperature conditions vary widely (Markow 1994). Total annual
precipitation over much of the TNF ranges between 61 and 102 centimeters. Highest
precipitation occurs in the higher elevation areas of the IPGA the Teton Range, and
southeastern Snake River Range (Markow 1994). The western Centennials and southern
Beaverhead Range are substantially drier compared to the rest of the TNF receiving only
30-41 centimeters of precipitation or less annually (Markow 1994). Thirty year (1 95 1 - 1980) mean snow depth in April and May, when goshawks begin nesting activity,
measured 122 and 56 Centimeters respectively at Island Park (elevation 191 8 m) in the
8
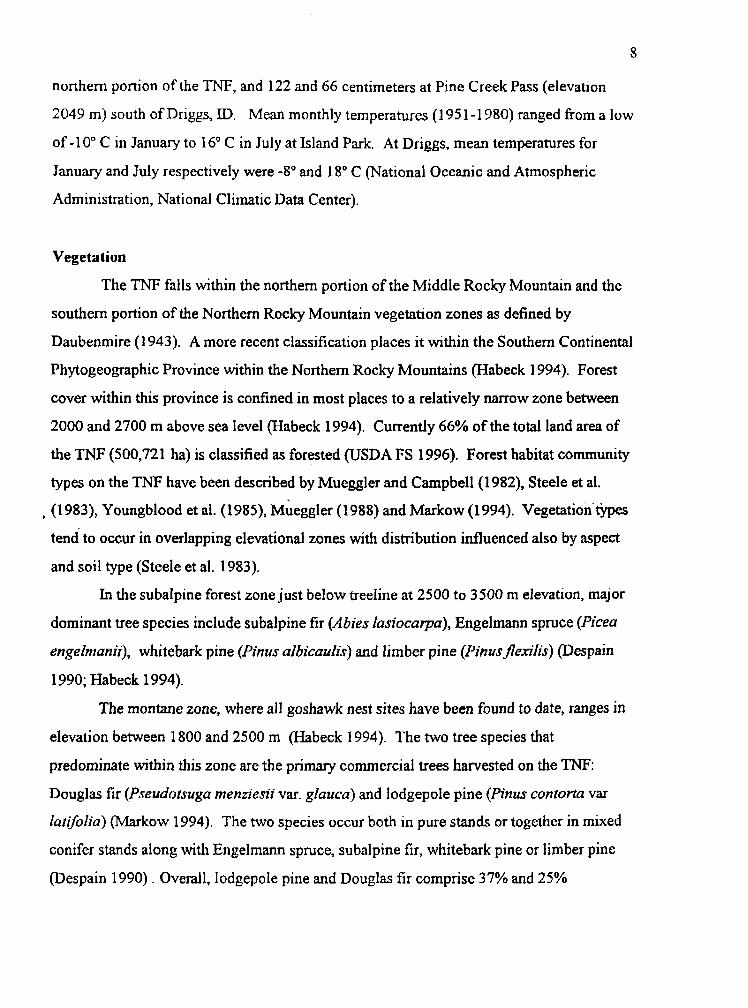
northern portion of the TNF, and 122 and 66 centimeters at Pine Creek Pass (elevation
2049 m) south of Driggs, ID. Mean monthly temperatures (1 95 1-1 980) ranged from a low
of -10" C in January to 16" C in July at Island Park. At Driggs, mean temperatures for
January and July respectively were -8" and 18" C (National Oceanic and Atmospheric
Administration, National Climatic Data Center).
Vegetation
The TNF falls within the northern portion of the Middle Rocky Mountain and the
southern portion of the Northern Rocky Mountain vegetation zones as defined by
Daubenmire (1 943). A more recent classification places it within the Southern Continental
Phytogeographic Province within the Northern Rocky Mountains (Habeck 1994). Forest
cover within this province is confined in most places to a relatively narrow zone between
2000 and 2700 rn above sea level (Habeck 1994). Currently 66% of the total land area of
the TNF (500,721 ha) is classified as forested (USDA FS 1996). Forest habitat community
types on the TNF have been described by Mueggler and Campbell (1982), Steele et al.
, (1 983), Youngblood et al. (1 9 8 9 , Mueggler (1 988) and Markow (1 994). Vegetation't)pes
tend to occur in overlapping elevational zones with distribution influenced also by aspect
and soil type (Steele et al. 1983).
In the subalpine forest zone just below treeline at 2500 to 3500 rn elevation, major
dominant tree species include subalpine fir (Abies lasiocalpa), Engelmann spruce (Picea
engelmanii), whitebark pine (Pinus albicaulis) and limber pine (Pz'nus_f7exils) (Despain
1990; Habeck 1994).
The montane zone, where all goshawk nest sites have been found to date, ranges in elevation between 1800 and 2500 m @beck 1994). The two tree species that
predominate within this zone are the primary commercial trees harvested on the TNF: Douglas fir (Pseudotsuga menziesii vu . glauca) and lodgepole pine (Pinus contorta var
ZutifoZia) (Markow 1994). The two species occur both in pure stands or together in mixed
conifer stands along with Engelmann spruce, subalpine fir, whitebark pine or limber pine
wespain 1990) . Overall, lodgepole pine and Douglas fir comprise 37% and 25%

9
respectively of all forested land found on the TNF (USDA FS 1996). Mixed stands of
lodgepole pine and Douglas fir account for another 24% (USDA FS 1996).
Douglas fir stands predominate in the Centennial Mountains and in portions of the
Snake River and Caribou Ranges. They are found primarily on calcareous and basic
extrusive volcanic substrates (Markow 1994). Lodgepole pine and quaking aspen (Populus
trernuloides) often occur as seral species within Douglas fir stands. Associated shrubs,
forbs and grasses include Acer glabrum, Paxistima myrsinites, Mahonia repens,
Symphoricarpos albus, Symphoricarpos oreophilius, Amelanchier alnifolia, Spirea
betulfolia, Vaccinium scoparium, Culamagrostis m bescens, Arnica cordifolia, Carex
geyeri, and Poa nervosa (Markow 1994).
Extensive stands of lodgepole pine cover the IPGA where it is thought to be a
climax species due to a combination of low precipitation, nutrient-poor rhyolitic soils, and
fire regimes (Despain 1990, Markow 1994). The understory of lodgepole pine forests is
usually sparse and consists of few species. The most common plants associated with
lodgepole pine include Vaccinium scopanum, Sorbus scopulina. Lonicera utahensis,
Symphoricarpos spp., Amelanchier utahensis, Calamugrostis mbescens, Poa nervosa;
Carex geyefi, Antennaria rosea, Arnica cordifolia, Spiraea betulifdia, and Lupinus
argenteus (Markow 1994).
Quaking aspen stands often occur along the lower edge of the montane zone.
These are most extensive along the South Fork of the Snake Rwer in the southern portions
of the TNF. Due to its wide environmental tolerance, however, ispen is found in scattered
stands throughout the TNF at all elevational gradients (Markow 1994, Mueggler and
Campbell 1982). It comprises 9% of the total forested area found on the TNF (USDA FS
1996). The understory of aspen stands resembles that of adjacent conifer communities but
is usually more species-rich and often more prolific. This is attributed to the more mesic
characteristic of such sites and the rapid decomposition of woody material and leaves
(Markow 1994, Peet 1988).
Public and private lands adjacent to the TNF consist mainly of sagebrush
(Artemisia rn'denrara)-grasslands, agricultural fields, cultivated pasture land, forest land
and an increasing number of developed homesites (Glick et al. 1991). Along the river

10
floodplain zones, cottonwood (Populus, sp.) can be found (Habeck 1994). Total area of
timberland (including all tree species, size classes and ages) located outside of the TNF in
adjacent Idaho counties (Teton, Clark, Fremont, Madison, and Bonneville) equals only
about 10% of the total area of timberland found on the TNF (Chojnacky 1995).
Considering this proportion, it is likely that the majority of the local goshawk breeding
population nests on Forest Service land.
Regional History of Fire and other Disturbance Factors
The forests of eastern Idaho and western Wyoming burned at fairly regular intervals
prior to the onset of fire suppression in the early 1900's (Habeck 1994; Steele et al. 1983).
Despain (1 990) has suggested that early fire suppression efforts were probably most
effective in sagebrush areas, rather than forests, until the use of aircraft and smoke jumpers
increased in the early 1950's. In presettlement times, low intensity fires are thought to have
, occurred every 20-50 years in Douglas fir forests, and every 40-60 years in lodgepole'pine
forests (USDA Forest Service 1996, Habeck 1994). Large stand replacement fires in
lodgepole pine occur approximately every 100 years and are thought to be tied to mountain
pine beetle (Dendroctonus ponderosae) infestations in mature stands (USDA Forest
Service 1996), although that idea has been challenged by Despain (1 990). Cyclical
outbreaks of epidemic population levels of mountain pine beetle and Western spruce
budworm-(Choristoneuru occidentulis) kill numerous whitebark pine, lodgepole pine and
Douglas fir (USDA Forest Service 1996, Habeck 1994). Outbreaks are closely correlated
with drought conditions (Habeck 1994). Extensive, unregulated grazing by both cattle and
sheep in the early 1900's substantially affected forest communities by depleting forage
plants and altering grass-conifer competition. Localized alteration by grazing still occurs
in some areas (Steele et al. 1983; Habeck 1994). Logging of forests in the early settlement
period was concentrated in accessible areas near towns and mines, where the majority of
high quality older trees were removed (Steele et al. 1983). Modern large-scale logging
operations expanded throughout the region to the point where examples of undisturbed

11
forest communities at lower elevations are becoming rare except for stands of low quality
timber on steep terrain (Steele et al. 1983). Outside of wilderness areas and national parks,
where higher elevational communities still exist, examples of old growth-forest are rapidly
disappearing (Steele et a1 1983, Habeck 1994).
Forest Composition and Timber Management on the TNF Fifky-seven percent (284,540 ha) of the forested land on the TNF (33% of the total
land area) falls within the category of "tentatively suitable forest land" considered capable
of producing marketable timber (USDA Forest Service 1996). This is land that is capable
of producing crops of industrial wood without irreversible damage to soils or watersheds,
can be adequately restocked within five years, and has not been withdrawn for other
purposes such as wilderness areas (USDA FS 1996). The floristic composition of the
suitable forest land is lodgepole pine (54%), Douglas fir (1 9%), a mix of these two species
(1 5%), other conifers mixed (6%), sprucdsubalpine fir (1%) and aspen (5%). Currently
these suitable forest lands consist of 69% mature and 4% pole-sited trees. Approximately
26% of this suitable forest land area has been harvested since 1960 and is classified
currently as sapling (6%), seedling (14%) or unstocked areas (6%) (USDA Forest Service
1996).
. .
Prior to 1960, only minor timber harvesting occurred on the TNF. During the early
1960's, a mountain pine beetle infestation began in lodgepole pine. leading to an intensive
salvage logging operation which peaked during the late 1970's (USDA FS 1985). The TNF
in 1960 sold the largest single timber sale at that time in the continental United States: a
sale for 3 18 million board fee (MMBF) in the Island Park area which was to b e harvested
over a period of 18 years (USDA FS 1985). Between 1981 and 1990, Douglas fir was
harvested in addition to lodgepole pine and mixed conifer stands (Analysis of Management
Situation, Targhee National Forest, Nov. 1992).
The most common harvest method used on the TNF was clear-cutting of lodgepole
pine and mixed conifer stands. For harvest of Douglas fir, either seed tree or sheltenvood
methods were used, retaming a variable number of mature trees for a specified period
within harvest units after the initial cut. All these methods are considered "even-aged"

12
management systems, that is entire stands were treated (Thompson et al. 1995) . In "uneven-aged" systems, only single trees or small groups of trees are harvested so a mature
component of trees remain (Thompson, Probst, and Raphael 1995). Given the age of
mature trees on the TNF, under even-aged management, it would take approximately 80-
100 years for treated stands to begin to develop mature forest characteristics in this climatic
region.
METHODS Nesting Ecology
Monitoring methods
The terminology used to define reproductive success of goshawk territories follows
recommendations by Postupalsky (1 973), Steenhof (1 987), Steenhof and Kochert (1 982),
and Woodbridge and Detrich (1 994), with minor modifications. A nesting territory was
considered an area that contained known nests where only one pair bred in a given year. A
nesting territory was considered occupied if a pair of adult goshawks was observed .
perching or behaving defensively in the vicinity of known nests in the early part of the
nesting season. A breeding site or territory was a location where I observed an adult in
incubation posture or young in the nest. Successful nests or territories were those sites
where I observed fledged young or fully feathered nestlings within 7-10 days of fledging.
Temtories contained either single nests or a nest cluster which I defined as all nest trees
that were found within 1.2 km of each other and occupied by only one pair of goshawks in
a given year. I used the distance of 1.2 km as this was one-half of the minimum inter-
territory distance (2.4 km) measured during this study between two concurrently active
goshawk nests. Except at one location, most nests within identified nest clusters occurred
closer to each other than 1.2 km.
An active nest was defined as a nest which was used by a breeding pair in a given
year during the study period. An alternate nest was a. nest found at a known nesting area
but not used by goshawks in a given year. Some of the nests I originally classified as
alternate were occupied in subsequent years by goshawks; others were never used during
13
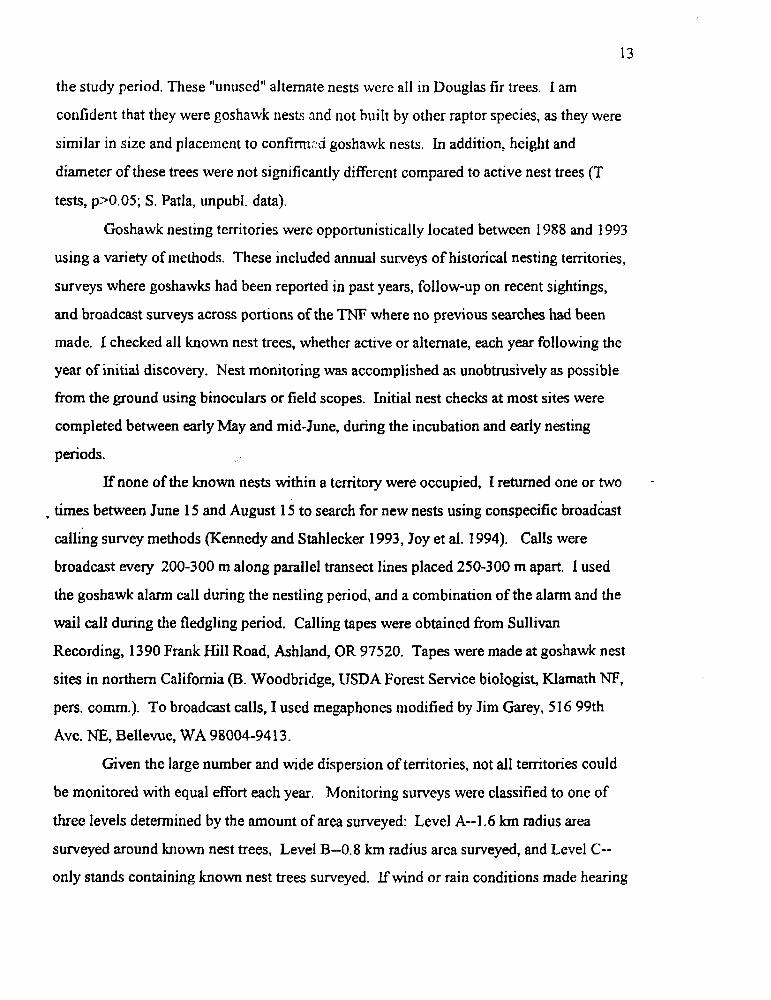
the study period. These "unused" alternate nests were all in Douglas fir trees. I am
confident that they were goshawk nests and not built by other raptor species, as they were
similar in size and placement to confirmxi goshawk nests. In addition, height and
diameter of these trees were not significantly different compared to active nest trees (T
tests, p>0.05; S. Patla, unpubl. data).
Goshawk nesting territories were opportunistically located between 1988 and 1993
using a variety of methods. These included annual surveys of historical nesting territories,
surveys where goshawks had been reported in past years, follow-up on recent sightings,
and broadcast surveys across portions of the TNF where no previous searches had been
made. I checked all known nest trees, whether active or alternate, each year following the
year of initial discovery, Nest monitoring was accomplished as unobtrusively as possible
from the ground using binoculars or field scopes. Initial nest checks at most sites were
completed between early May and mid-June, during the incubation and early nesting
periods.
If none of the known nests within a territory were occupied, I returned one or two
, times between June 15 and August 1 S to search for new nests using conspecific broadcast
-
calling survey methods (Kennedy and Stahlecker 1993, Joy et al. 1994). Calls were
broadcast every 200-300 rn along parallel transect lines placed 250-300 m apart. I used
the goshawk alarm call during the nestling period, and a combination of the alarm and the
wail call during the fledgling period. Calling tapes were obtained from Sullivan
Recording, 1390 Frank f i l l Road, Ashland, OR 97520. Tapes were made at goshawk nest
sites in northern California (6. Woodbridge, USDA Forest Service biologist, Klamath NF,
pen. comm.). To broadcast calls, I used megaphones modified by Jim Garey, 5 16 99th
Ave. NE, Bellevue, WA 98004-941 3.
Given the large number and wide dispersion of territories, not all territories could
be monitored with equal effort each year. Monitoring surveys were classified to one of
three levels determined by the amount of area surveyed: Level A--1.6 km radius area
surveyed around b o r n nest trees, Level B--0.8 km radius area surveyed, and Level C--
only stands containing known nest trees surveyed. Ifwind or rain conditions made hearing
14
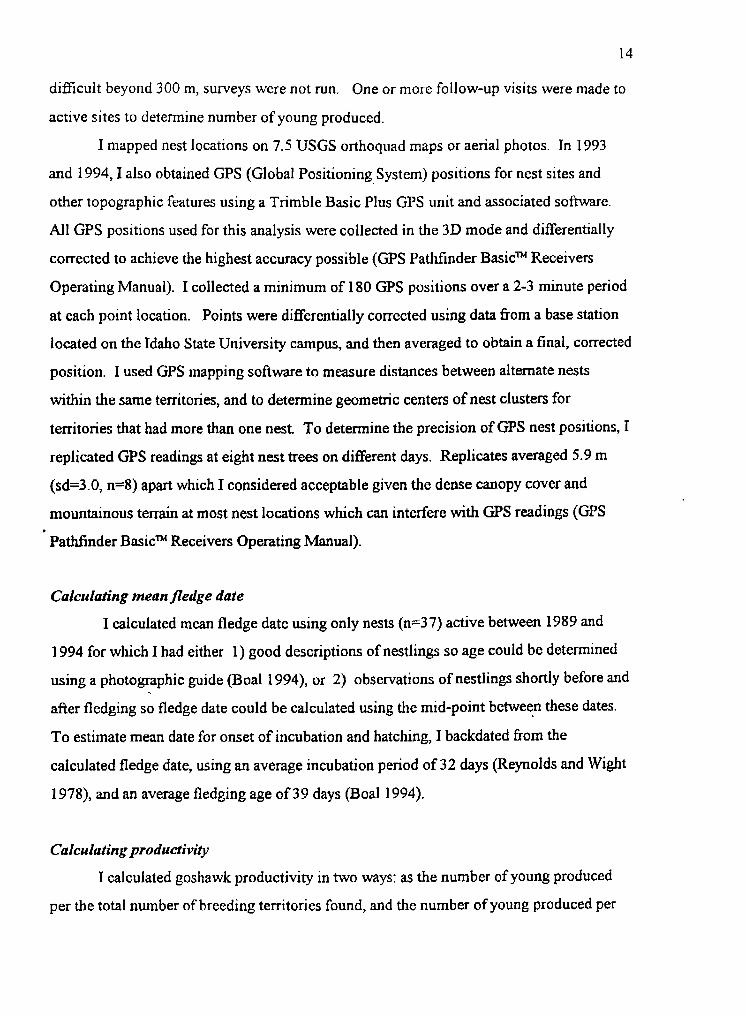
difficult beyond 300 rn, surveys were not run. One or more follow-up visits were made to
active sites to determine number of young produced.
I mapped nest locations on 7.5 USGS orthoquad maps or aerial photos. Ln 1993
and 1994, I also obtained GPS (Global Positioning System) positions for nest sites and
other topographic features using a Trimble Basic Plus GPS unit and associated software.
All GPS positions used for this analysis were collected in the 3D mode and differentially
corrected to achieve the highest accuracy possible (GPS Pathfinder Basicm Receivers
Operating Manual). I collected a minimum of 180 GPS positions over a 2-3 minute period
at each point location. Points were differentially corrected using data fiom a base station
located on the Idaho State University campus, and then averaged to obtain a final, corrected
position. I used GPS mapping software to measure distances between alternate nests
within the same territories, and to determine geometric centers of nest clusters for
territories that had more than one nest. To determine the precision of GPS nest positions, I
replicated GPS readings at eight nest trees on different days. Replicates averaged 5.9 m
(sd=3.0, n=8) apart which I considered acceptable given the dense canopy cover and
mountainous terrain at most nest locations which can interfere With GPS readings (GPS
Pathfinder Basicm Receivers Operating Manual).
Calculating mean fledge date
I calculated mean fledge date using only nests ( ~ 3 7 ) active between 1989 and
1994 for which I had either 1) good descriptions of nestlings so age could be determined
using a photographic guide (Boa1 1994), or 2) observations of nestlings shortly before and
after fledging so fledge date could be calculated using the mid-point between these dates.
To estimate mean date for onset of incubation and hatching, I backdated fiom the
calculated fledge date, using an average incubation period of 32 days (Reynolds and Wight
1978), and an average fledging age of 39 days (Boa1 1994).
Calculating productivity
I calculated goshawk productivity in two ways: as the number of young produced
per the total number of breeding territories found, and the number of young produced per
the total number of territories that were successful each year from 1989-1994. Thus,
first calculation includes all active nests in a year even those that failed to produce
fledglings. The second calculation includes only those nests that actually produced
15
the
fledglings. The total number of young produced each year included all nest sites found
even those discovered late in the season during the post-fledging period. Mean annual
productivity per breeding territory may be somewhat inflated because a higher proportion
of successful nests are found during late surveys as nests that failed early would not be
detected (Steenhof and Kochert 1982). Counts of young made after fledging occurs tend to
underestimate number of young (Steenhof 1987), so I tried to obtain at least two separate
counts of young at such territories on different days. Since some breeding territories were
discovered in the post-nesting period, and the total number of monitoring visits per
territory varied both within and between years, I did not attempt to use the Mayfield
method, which uses the total number of observations made at nests during the incubation
and nestling periods to determine percentage of nest success (Steenhof 1987).
To determine whether significant annual differences occurred in productivity, I
, compared productivity rates based on the number of young produced per successful nest
b e k e e n 1989-1 994, For this comparison, I used the distribution fiee, multi-response
permutation process (MRPP) procedure analogous to one-way analysis of variance (or t-
test) available on Blossom software (US Fish and Wildlife Service National Ecology
Research Center) (Slauson et al. 1991).
Calculating occupanq
Determining occupancy of goshawk territories is more difficult than for many
raptor species due to the fact that goshawks are secretive nesters and often move to
alternate nest locations each year, sometimes at a large distance from known nests
(Woodbridge and Detrich 1994). Maximum distance between alternate nests used within
the same territory has been reported to be occasionally as large as 2 kilometers; mean distances reported between alternate nests in study areas in northern California and Arizona
fell slightly under 300 m (Reynolds et al. 1994, Woodbridge and Detrich 1994). It has
been suggested that five years of monitoring a goshawk territory are needed to identify all
16
nest stands that contain alternate nests for a given territory (Woodbridge and Detrich
1994). Occupancy rate of known territories, thus, should increase as a function of the
number of years a territory is monitored (at least up to 5 years) and of the size of the area
monitored (Woodbridge and Detrich 1994).
I calculated occupancy rate for individual nest trees, as well as for territories, to
measure how often goshawks reused existing nests between 1989 and 1994. Each year a
nest tree (whether alternate or active) was checked following the year of its initial
discovery was counted as one nest check. To compute annual reuse rate of individual nest
trees by goshawks, I divided the number of nests checked that contained goshawks by the
total number of nest trees checked in each year. I also calculated the same rate for other
raptor species found in goshawk nests.
To determine how often goshawks reused the same nest tree in consecutive years, I
divided the number of times goshawks reoccupied the same nest in consecutive years by
the total number of times goshawks renested within the same territories in consecutive
years using the same or different nest tree. Percent occupancy of nest trees by other raptor , . .
, species was determined as well.
To calculate reoccupancy rate of nesting territories, 1990-1 994, I divided the
number of breeding pairs found at known territories by the total number of territories
surveyed regardless of the level of survey effort (Levels A, B, or C). Each year a territory
was checked, no matter how many visits were made to that territory, was considered one
year-check I calculated a second reoccupancy rate based only on those territories
surveyed at levels A and B, since alternate nest sites could have been missed at territories
where only Level C surveys were completed. This second reoccupancy rate, based on
Level A and B surveys only, should give a more accurate approximation of temtory
reoccupancy rate (Woodbridge and Detrich, 1994). I have included the first method for
comparative purposes, and because monitoring surveys of goshawk territories continue in
many places that I am aware of to rely only of checks made at known nest stands.
17
Analysis of the relation between weather and productivity and accupanly
Weather has been shown to influence reproductive success in a number of raptor
species (Kostrzewa and Kostrzewa 1991 b; Newton 1979; Newton 1986). Younk and
Bechard (1 994) attributed lower goshawk productivity in 1991 in Nevada to cold, wet
spring weather. I used linear regression analysis to examine the relationship between
productivity (1 989-1 994) and occupancy (1 990-1 994) with early season weather factors. I
analyzed mean temperature and total precipitation for March, April, and May individually
and, additive mean temperature and precipitation for pairs of months: March/April and
AprilNay. Also included in the analysis were March snow depth and snow water
equivalents (SWE). SWE is computed from snow density to determine percent water
content of the snow pack. Weather data were obtained from the National Climatic Data
Center, Asheville, NC 28801 -2733 and the USDA Natural Resource Conservation Service,
Driggs, ID 83422.
I did not include weather data from the months of January and February in the
regressions as temperature and precipitation varied little in these months over the study
years. For determining the relationship between occupancy and weather, I used results
from monitoring surveys Level A and B only. Data variables were transformed as needed.
I used the arcsine transformation for occupancy rate and SWE, and the square root
transformation for productivity, snow depth and precipitation (Zar 1984). I did not
transform temperature data due to negative values in some months. I also calculated
Pearson correlation coefficients for all independent variables to determine the degree that
variables were correlated with each other (SYSTAT, Wilkenson et al. 1990). I ran linear
step-wise regressions using all variables as well as linear regression for each independent
variable separately to determine their relationship with annual mean productivity and
occupancy.
Analysis of goshawk prey
I collected pellets and prey remains within the vicinity of active nests. These were
either frozen or dried, depending upon condition, and stored in labeled plastic bags. Prior
to analysis, pellet samples were catalogued, assigned a random sample number, measured,
18
and soaked overnight in a mild ammonia solution. I then broke the softened pellets apart
and dried them for one to three days on mesh screens. Aftenvards, I separated all bone
fragments and intact feathers from fur. A sample of fur was retained for future analysis but
was not analyzed for this study.
All prey remains and identifiable bone fragments and feathers from pellets were
compared to museum specimens at the Idaho Museum of Natural History at Idaho State
University for identification. To calculate biomass of prey species, weights were obtained
fiom Steenhof (1 983), Dunning (1 984), Johnsgard (1 988), Streubel(l989), and Johnsgard
(1 990). I used an average of adult male and female prey weights in calculations because
most prey items were not classified to age or sex.
Observations fiom blinds were made at three nest sites in 1992 (two in lodgepole
pine and one in Douglas fir habitat) during the last three weeks of the nesting period, and at
one nest (Douglas fir) in 1993 during the entire nesting period. Small, camouflaged tents
were placed on the ground within 3040 m of the nest trees. Observations were made
using a 20-60x power spotting scope, and observation periods, scheduled randomly
, throughout the day from sunrise to dark, averaged four to five hours. A single observer
would record time, species, and estimated size of all prey deliveries. Detailed notes were
also taken on behaviors and vocalizations of adults and young.
Habitat analyses methods
I completed habitat analysis at nesting territories occupied between the years 1989
and 1993. To ensure accuracy, measurements rather than estimates were obtained for most
vegetation and topographic variables (Block et al. 1987) (Appendix A-1 and A-2). Data
were collected either by myself, or by personnel I trained in 1992 and 1993
nest site data were collected over a period of five years, annual variation in the parameters
measured was minimal given the mature characteristics of the forest cover at nest sites.
Although
Level 1: Nest tree and nest site analysis
Level 1 analysis included a summary of nest tree characteristics and nest site
physiographic features for 49 nest trees occupied by goshawks between 1989 and 1993 in
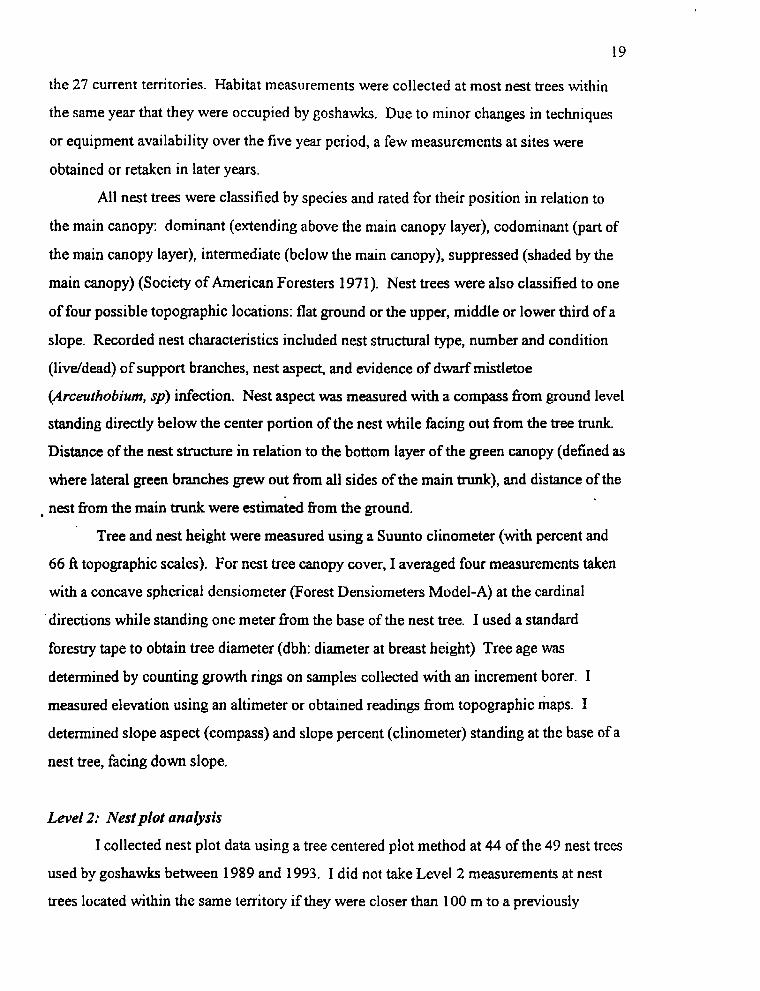
19
the 27 current territories. Habitat measurements were collected at most nest trees within
the same year that they were occupied by goshawks. Due to minor changes in techniques
or equipment availability over the five year period, a few measurements at sites were
obtained or retaken in later years.
All nest trees were classified by species and rated for their position in relation to
the main canopy: dominant (extending above the main canopy layer), codominant (part of
the main canopy layer), intermediate (below the main canopy), suppressed (shaded by the
main canopy) (Society of American Foresters 1971). Nest trees were also classified to one
of four possible topographic locations: flat ground or the upper, middle or lower third of a
slope. Recorded nest characteristics included nest structural type, number and condition
(livddead) of support branches, nest aspect, and evidence of dwarf mistletoe
(Arceuthobiurn, sp) infection. Nest aspect was measured with a compass from ground level
standing directly below the center portion of the nest while facing out from the tree trunk.
Distance of the nest structure in relation to the bottom layer of the green canopy (defined as
where lateral green branches grew out from all sides of the main trunk), and distance of the
, nest from the main trunk were estimated from the ground.
Tree and nest height were measured using a Suunto clinometer (with percent and
66 ft topographic scales). For nest tree canopy cover, I averaged four measurements taken
with a concave spherical densiometer (Forest Densiorneters Model-A) at the cardinal
' directions while standing one meter from the base of the nest tree. I used a standard
forestry tape to obtain tree diameter (dbh: diameter at breast height) Tree age was
determined by counting growth rings on samples collected with an increment borer. I
measured elevation using an altimeter or obtained readings from topographic maps. I
determined slope aspect (compass) and slope percent (clinometer) standing at the base of a
nest tree, facing down slope.
Level 2: Nest plot analysis
I collected nest plot data using a tree centered plot method at 44 of the 49 nest trees
used by goshawks between 1989 and 1993. I did not take Level 2 measurements at nest
trees located within the same territory if they were closer than 100 m to a previously

20
measured tree or had visually similar plot characteristics. The plot radius was equal to the
standard forestry length of one chain (66 fi) or 20.1 m. The resulting plot size equaled
0.127 ha centered at the nest tree. This plot size is substantially larger than the standard 12
m radius (0.04 ha plot) suggested for bird habitat studies (James and Shugart 1970) but I
selected it considering the large size of the trees used by the goshawk for nesting. Larger
plot sizes have been used in other forest raptor studies (Speiser and Bosakowski 1987,
Gutierrez et al. 1992). Total time to complete plot measurements ranged from 1.5 to 2.5
hours.
Within the plot, all live trees were counted and measured by species. I classified
trees into one of five size classes based on dbh (diameter at breast height): saplings (3.8-7.6
cm), poles (7.6-17.8 cm); small (17.8-30.5 cm), medium (30.5-40.6 cm) or large saw
timber (B40.6 cm). I selected these particular size categories based on categories used on
the TNF and recent goshawk literature (Hayward and Escano 1989). Number of seedlings
was counted or estimated from partial plot counts when more than 100 occurred in a plot.
All snags greater than 3.8 cm dbh were measured and counted, and classified into similar
dbh size categories used for live trees. To calculate overstory canopy cover, I averaged 16
spherical densiometer measurements: four each (one at each cardinal direction) taken at the
4 cardinal points located on the circumference of the plot circle. Average diameter of saw
timber and snags, number of living and dead trees per hectare, basal area of live saw
timber, and stand canopy cover were calculated for all plots.
I computed size categories of live and dead trees, ground cover height and number
of mature downed trees only for one plot per territory. Ground cover height was measured
in 1992 within four randomly selected 1 m radius plots within the main plot. I identified
the genus and measured the height of the five tallest plants (forb or grasses) within these
plots using a meter stick. The heights of all plants were averaged to calculate mean ground
cover height. In 1993, I changed this method and measured ground vegetation height
along four 20.1 rn transects radiating out from the plot center. As the number of shrubs
was extremely low in nest site plots, I did not collect data on shrub density or height
(except at plots compared with random plots; see next section). For downfall, I counted all
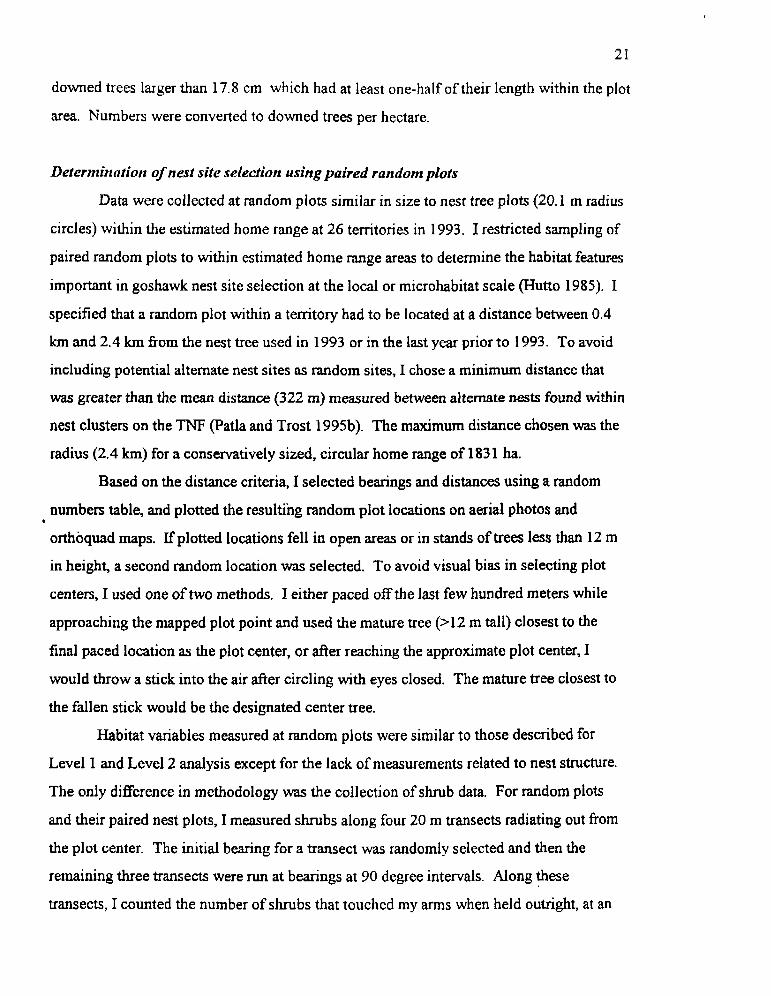
21
downed trees larger than 17.8 cm which had at least one-half of their length within the plot
area. Numbers were converted to downed trees per hectare.
Determination of nest site selection using paired random plots
Data were collected at random plots similar in size to nest tree plots (20.1 m radius
circles) within the estimated home range at 26 territories in 1993. I restricted sampling of
paired random plots to within estimated home range areas to determine the habitat features
important in goshawk nest site selection at the local or microhabitat scale (Hutto 1985). I
specified that a random plot within a temtory had to be located at a distance between 0.4
km and 2.4 km from the nest tree used in 1993 or in the last year prior to 1993. To avoid
including potential alternate nest sites as random sites, I chose a minimum distance that
was greater than the mean distance (322 m) measured between alternate nests found within
nest clusters on the TNF eat la and Trost 1995b). The maximum distance chosen was the
radius (2.4 km) for a conservatively sized, circular home range of 183 1 ha.
Based on the distance criteria, I selected bearings and distances using a random
numbers table, and plotted the resulting random plot locations on aerial photos and
orthoquad maps. If plotted locations fell in open areas or in stands of trees less than 12 m
in height, a second random location was selected. To avoid visual bias in selecting plot
centers, I used one of two methods. I either paced off the last few hundred meters while
approaching the mapped plot point and used the mature tree (>12 m tall) closest to the
final paced location as the plot center, or after reaching the approximate plot center, I
would throw a stick into the air after circling with eyes closed. The mature tree closest to
the fallen stick would be the designated center tree.
*
Habitat variables measured at random plots were similar to those described for
Level 1 and Level 2 analysis except for the lack of measurements related to nest structure.
The only difference in methodology was the collection of shrub data. For random plots
and their paired nest plots, I measured shrubs along four 20 rn transects radiating out from
the plot center. The initial bearing for a transect was randomly selected and then the
remaining three transects were run at bearings at 90 degree intervals. Along these
transects, I counted the number of shrubs that touched my arms when held outright, at an

22
approximate height of 143 cm. I used GPS measurements, aerial photos or orthoquad
maps, to measure distance from nest trees or random plot center trees to the nearest forest
edge (a definite ecotone where forest stands were no longer the dominant cover type that
was apparent on aerial photos), permanent water source, and open road (county road or
numbered Forest Service road that was ungated and appeared on district travel maps).
Statistical analysis of nest tree and nestplot data
For all nest tree and nest plot quantitative variables, descriptive statistics were
calculated including mean and standard deviation (SD) or standard error (SE). I
summarized data for all nest trees ( ~ 4 9 ) and nest plots (n=44), and also completed a
statistical comparison of Douglas fir and lodgepole pine nest trees and plots. To avoid
pseudoreplication, I selected one nest tree randomly from each territory for this comparison
(Hurlbert 1984). For statistical comparisons, I used multi-response permutation process
(MRPP) procedure analogous to one-way analysis of variance (or t-test) available on
Blossom software available through the USDI Fish and Wildlife Service National Ecology
, Research Center (Slauson et al. 1991). I chose to use MRPP statistical procedures because
they'are distribution free and work well for small sample sizes of ecological data that often
are not normally distributed even after data transformations (Slauson et al. 1991, Potvin
and Roff 1993, Squires and Ruggiero 1996). For comparison of paired nest sites and random sites, I used the W P permutation test for matched pairs (PTMP) to determine
which variables differed significantly. Slope and nest aspect were analyzed using statistics
for circular distributions: mean angle and Rayleigh's test for uniform distribution (Zar
1984), and Rao's spacing test (Batschelet 198 1).
To determine the relation between habitat variables at the nest site and productivity
(mean number of young fledged per nest), I used linear step-wise regression (SYSTAT,
Wilkenson et al. 1990). I selected 14 independent variables judged most biologically
meaningfd that were not highly correlated with each other @ < 0.75): nest tree height;
nest tree canopy cover; elevation; percent slope; basal area of living trees; mean sawtimber
dbh; number of sawtrees per hectare; mean snag dbh; number of snags per hectare;

23
number of saplings per hectare; number of downed mature trees per hectare; and distance
to edge, water and roads.
For this analysis I used productivity data from the same 27 conifer nests (one
selected per territory) used for comparing Douglas fir and lodgepole pine nest sites. Ea
nest was active in more than one year, I averaged the number of young produced per year. I
examined independent variables for normal distribution using histograms and normal
probability plots, and transformed data as needed using arcsine, log or square root
transformations (Zar 1984, Berk 1 994). Productivity data were transformed using the
square root transformation. Tests for multicollinearity, autocorrelation, and verification of
regression assumptions were completed following procedures suggested by Berk (1 994).
Significance levels were set at 0,OS for all statistical tests except for the inclusion of
variables in the stepwise regression model which was set at 0.15 (default value used in
SYSTAT).
GIs analysis of spatial components within the home range (Zevels 3-5)
Terminology and definitions for the larger spatial components that make up
goshawk home range areas were taken from Management Recommendations for the
Northern Goshawk in the Southwestern United States (MRNG) with slight modifications
(Reynolds et al. 1992). Although these recommendations were written specifically for
managing the goshawk in the Southwest, determination of the average home range size was
based on data from numerous locations both in North America and Europe (see Table 1,
MRNG). Since I did not have data on home range size for the study population, the
estimate given in the MRNG seemed the most appropriate to use for this analysis. Three
major spatial components of goshawk nesting territories (nest area, post-fledgling family
area, and foraging area) were defined within the MRNG as mutually exclusive circular
areas surrounding nest trees (Fig. 3a). For this study, I analyzed the nest area and post-
fledgling family area as exclusive areas but did not separate out these smaller home range
components from the larger scale foraging area as they constituted only 10 % of the total
home range area (Fig. 3b).
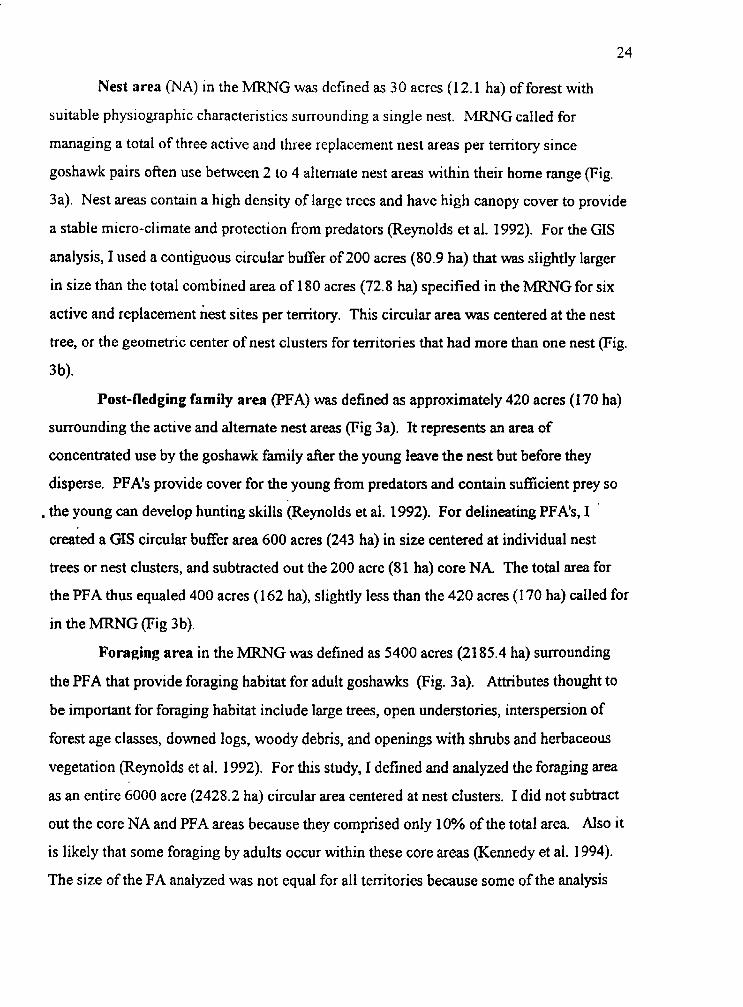
24
Nest area (NA) in the MIWG was defined as 30 acres (1 2.1 ha) of forest with
suitable physiographic characteristics surrounding a single nest. MRNG called for
managing a total of three active and three replacement nest areas per territory since
goshawk pairs often use between 2 to 4 alternate nest areas within their home range (Fig.
3a). Nest areas contain a high density of large trees and have high canopy cover to provide
a stable micro-climate and protection from predators (Reynolds et al. 1992). For the GIs
analysis, I used a contiguous circular buffer of 200 acres (80.9 ha) that was slightly larger
in size than the total combined area of 180 acres (72.8 ha) specified in the MRNG for six
active and replacement nest sites per territory. This circular area was centered at the nest
tree, or the geometric center of nest clusters for territories that had more than one nest (Fig.
3 b).
Post-fledging family area (PFA) was defined as approximately 420 acres (1 70 ha)
surrounding the active and alternate nest areas (Fig 3a). It represents an area of
concentrated use by the goshawk family after the young leave the nest but before they
disperse. PFA's provide cover for the young from predators and contain sufficient prey so
. the young can develop hunting skills (Reynolds et al. 1992). For delineating PFA's, I '
created a GIs circular buffer area 600 acres (243 ha) in size centered at individual nest
trees or nest clusters, and subtracted out the 200 acre (81 ha) core NA The total area for
the PFA thus equaled 400 acres (1 62 ha), slightly less than the 420 acres (1 70 ha) called for
in the MRNG (Fig 3b).
Foraging area in the MRNG was defined as 5400 acres (21 85.4 ha) surrounding
the PFA that provide foraging habitat for adult goshawks (Fig, 3a). Attributes thought to
be important for foraging habitat include large trees, open understories, interspersion of
forest age classes, downed logs, woody debris, and openings with shrubs and herbaceous
vegetation (Reynolds et al. 1992). For this study, I defined and analyzed the foraging area
as an entire 6000 acre (2428.2 ha) circular area centered at nest clusters. I did not subtract
out the core NA and PFA areas because they comprised only 10% of the total area. NSO it
is likely that some foraging by adults occur within these core areas (Kennedy et al. 1994).
The size of the FA analyzed was not equal for all territories because some of the analysis
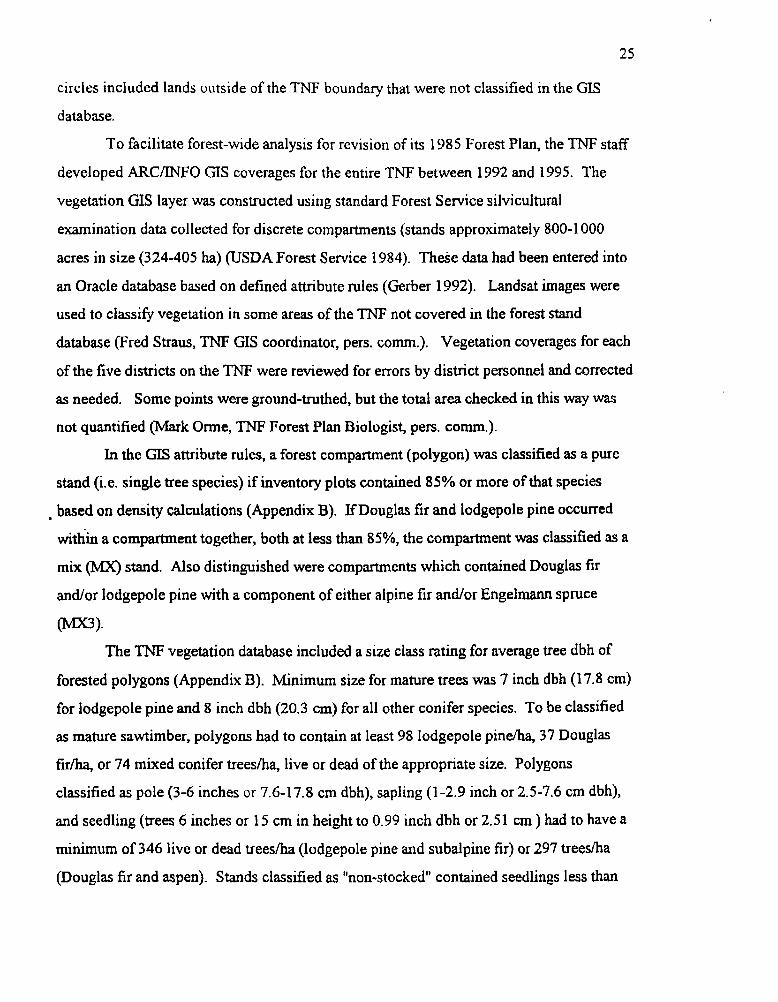
25
circles included lands outside of the TNF boundary that were not classified in the GIs
database.
To facilitate forest-wide analysis for revision of its 1985 Forest Plan, the TNF staff
developed ARC/INFO GIs coverages for the entire TNF between 1992 and 1995. The
vegetation GIs layer was constructed using standard Forest Service silvicultural
examination data collected for discrete compartments (stands approximately 800-1 000
acres in size (324-405 ha) (USDA Forest Service 1984). Theie data had been entered into
an Oracle database based on defined attribute rules (Gerber 1992). Landsat images were
used to classify vegetation in some areas of the TNF not covered in the forest stand
database (Fred Straus, TNF GIs coordinator, pers. comm.). Vegetation coverages for each
of the five districts on the TNF were reviewed for errors by district personnel and corrected
as needed. Some points were ground-truthed, but the total area checked in this way was
not quantified (Mark Orme, TNF Forest Plan Biologist, pen. comm.).
In the GIs attribute rules, a forest compartment (polygon) was classified as a pure
stand (i.e. single tree species) if inventory plots contained 85% or more of that species
. based on density calculations (Appendix B). IfDouglas fir and lodgepole pine occurred
w i t h a compartment together, both at less than 85%, the compartment was classified as a
mix 0 stand. Also distinguished were compartments which contained Douglas fir
andor lodgepole pine with a component of either alpine fir andor Engelmann spruce
(Mx3 1- The TNF vegetation database included a size class rating for average tree dbh of
forested polygons (Appendix B). Minimum size for mature trees was 7 inch dbh (17.8 cm)
for lodgepole pine and 8 inch dbh (20.3 cm) for all other conifer species. To be classified
as mature sawtimber, polygons had to contain at least 98 lodgepole pinidha, 37 Douglas
firha, or 74 mixed conifer treesha, live or dead of the appropriate size. Polygons
classified as pole (3-6 inches or 7.6-17.8 cm dbh), sapling (1-2.9 inch or 2.5-7.6 cm dbh),
and seedling (trees 6 inches or 15 CM in height to 0.99 inch dbh or 2.5 1 cm ) had to have a
minimum of 346 live or dead treesha (lodgepole pine and subalpine fir) or 297 treesha
(Douglas fir and aspen). Stands classified as "non-stocked" contained seedlings less than
26
15 cm in height, or had less than 346 seedlings/saplings per ha (lodgepole pine and
Douglas fir) or 297 seedlings/saplings/ha (Douglas fir and aspen).
Other attributes included in the TNF GIs database were stand age, density of live
and dead trees, and presence of whitebark pine and aspen. Since stands were not classified
consistently for these attributes (Fred Straus, TNF; GIS coordinator and John Councilman,
TNF silviculturist, pers. comm.), however, I did not include these attributes in my analysis.
Stand canopy cover was not included in the vegetation database so I could not analyze this
parameter although it is an important characteristic in evaluating goshawk nesting and
foraging habitat (Crocker-Bedford and Chaney 1988, Reynolds et al. 1992).
...
Non-forest land in the GIs database was classified into one of 12 categories:
mountain brush, willow, mahogany, grass, gradforb, gradsage, grasshrush, tall
sagelgrass, tall sagelmountain brush, bogdpondsflakes, wet meadows, or rocldtalusharren
(Appendix B) (Gerber 1992).
The ARC/INFO buffer command was used to create three circular buffers for each
temtory: Level 3 analysis--80.9 ha nest area (NA), Level 4 analysis--242.8 ha post-
, fledgling family area (PFA), and Level 5 analysis--2428.2 ha foraging area (FA) (Fred '
Straus, TNF GIs coordinator, pers. comm.). For each territory, I obtained a print-out
listing the total acreage by cover type within each buffer. I combined GIs vegetation
categories to obtain a total of five cover types for my analysis: mature sawtimber (size
class 9), young sawtimber (size class S), seedlinghaplinglhanrested (size classes 5,6,7 and
previously treated stands), sage/shrub (all sagebrush and shrub categories) and open area
(combination of grass, wetland, rock, or barren categories) (Table 1). The seedling
category contains forest stands that had no upper canopy layer. I included in this category
stands treated as sheltenvood and seed tree cuts because they did not occur in enough
territories to break out as a separate category: The seedling category thus includes all
stands that were harvested, including clear cuts or partial cuts, within goshawk home range
areas.
I created a separate spreadsheet for each spatial level (NA, PFA, and FA) which
included total acres of each cover type by territory and then converted acres to percent
cover. An overall mean for the five analysis categories at each spatial level was calculated

27
based on averaging data from all 27 territories. Based on my knowledge of these home
ranges, and an earlier analysis I had completed of PFA cover types at some territories using
aerial photographs (Patla and Trost 1995b), I noted a few errors in the proportions of cover
types calculated for territories on the Island Park District. The district supplied me with
corrected figures for these territories based on recent aerial photographs (John Councilman,
silviculturist; and Nancy Doyle, wildlife biologist, Island Park Ranger District).
At some territories located close to the TNF boundary, the PFA and FA buffers
included a substantial percentage of unclassified private lands. For the incompletely
classified PFA areas, I replotted territory positions used in the GIs analysis onto aerial
photos and delineated the PFA boundary on the photo along with the TNF boundary. I
classified private lands falling outside the TNF boundary but within the PFA into one of
the designated five cover types. To obtain areas for each patch, I used the dot grid method
(USDA Forest Service 1988). These classified areaiwere then added to the GIs PFA areas
to calculate final percent cover.
For the incomplete FA'S, I included only Forest Service lands classified by the
, ARC/INFO vegetation coverage rather than attempt to classify thousands of hectares of
private land using out-dated aerial photos. The size of the FA analyzed was smaller than
the specified 2428 ha for over half of the territories analyzed. Because for management
purposes the FS can consider only those portions of goshawk territories which fall within
their jurisdiction, it seemed appropriate for the FA analysis to include only FS managed
lands.
Analysis of the relation between habitai cover types and reproductive success
I used linear step-wise regression analysis (SYSTAT, Wilkenson et al. 1990) to
determine whether productivity and occupancy were related to percent cover types within
the different analysis areas surrounding nest trees (NA, PFA, FA). To calculate
productivity, I used the average number of young produced per nest attempt at 27 current
territories between 1989 and 1995, To calculate occupancy, I used only the subset of
territories (n=22) that had been monitored at survey Level A or B for at least 3 years
between 1989 and 1995. Habitat conditions at some territories substantially changed over
28
the monitoring period due to timber harvesting within home range areas. At territories that
underwent harvesting, I calculated occupancy and productivity using only the post-harvest
period to reflect current conditions.
Percent cover and occupancy data were transformed using the arcsine function
p e r k 1994). Productivity data were left untransformed as a square root transformation did
not improve the distribution. Because within the NA and PFA mature forest cover
predominated, many territories had little or no measurable amounts of the other four
possible cover types. To avoid inclusion of variables in the regression model that
consisted mainly of zeros, I decided to include only cover types that were present within at
least 18 territories (67%) for each spatial analysis level. I checked for correlations between
independent variables using Pearson’s correlation coefficient and included variables that
were not highly correlated ( ~ 0 . 7 5 ) (SYSTAT, Wilkenson et al. 1990). Tests for
multicollinearity, autocorrelation, and verification of regression assumptions were also
completed following procedures suggested by Berk (1 994). Significance levels were set at
0.05 for all statistical tests except for the inclusion of variables in the stepwise regression
model which was set at 0.15 (default value used in SYSTAT). ’ . In addition to regression analysis, I also compared percent cover types between
high (> 50%) and low (150%) occupancy territories at the NA, PFA , and FA analysis
levels using the MRPP statistical test analogous to the t-test (Slauson et al. 1991). I
decided post-hoc to conduct this analysis due to the fact that the relative lack of variation
in the most common cover type, mature forest, made it difficult to examine the
relationship between reproductive success and cover types using regression analysis. In
addition, I also compared productivity of territories that contained predominately Douglas
fidmixed conifer habitat within the home range area to territories in lodgepole pine habitat
to determine if productivity differed in relation to floristics.
Analysis of effects of timber harvesting on nesting habitat
For my analyses on the effects of harvesting, I focused on one factor that is of major
biological relevance for nesting goshawks and that could be measures at all territories: the
reduction of mature forest cover within different spatial components of the estimated home
29
range area. To evaluate the overall effects of timber harvesting on goshawk nesting habitat
a number of additional variables could be considered including timing and scale of
individual sales, and the total number of sales that have taken place in a particular area. At
goshawk nesting territories found in the Island Park area, a confusing array of overlapping
sales (lodgepole pine clearcut harvests and firewood harvesting) have occurred over the
past 30 years. At many goshawk territories in the Centennial Mountains, harvesting
(predominately Douglas fir shelterwood or seed tree cuts) has taken place fairly recently,
between 1987-1 992. How individual timber sales were planned and carried out has varied
considerably over the past 30 years as well (Hejl et al. 1995). Variations exist in unit size
and configuration, amount of downfall retained, number and size of live trees retained in
partial cuts, and post-harvest treatments between different timber sale areas. Consideration
of other biological factors in timber management besides timber production became more
important over the past decade such as protecting riparian zones and maintaining habitat
for threatened, endangered and sensitive species. Beside variations in si.lvicultura1
treatments, the level of grazing by cattle and sheep pre- and past-harvest also varied
, between individual sale areas. Documenting and quantifLing these factors would be
impossible in most cases as records are often scanty or lacking completely especially for
older sale areas. Ultimately, harvesting results in a complex of changes to a forest
community that vary in intensity and scale at different nesting territories (McCarthy,
Carrier, and Laudenslayer 1989).
To assess the impacts of timber harvesting on reproductive success, multi-year
baseline data on productivity and occupancy should be obtained, and then post-harvest
areas resurveyed over a number of years (McCarthy, Carrier, and Laudenslayer 1989).
Such surveys ideally would not be initiated until four to five years following the end of
harvesting activities. This would ensure that goshawks had adjusted to habitat changes and
had not just returned for a few years out of fidelity to traditional sites (Cracker-Bedford
1990). Although I have included results comparing productivity and occupancy in pre and
post-harvest territories, these results should be considered preliminary since the
monitoring period was short (3 year minimum) and post-harvest equilibrium had probably
not been reached at recently disturbed territories.

30
Analysis 1: Measuring habitat loss at known territories
To quantify how current silvicultural practices were changing goshawk nesting
habitat, I determined how much area had been hamested within the NA, PFA, and FA at 10
territories where active goshawk nests were found either before or during the year timber
harvesting was initiated. To determine the total area harvested using the GIs database, I
calculated the total land classified as nonstocked (GIs vegetation database symbol S),
seedling (GIs symbol 6), or having been partially harvested (GIs tree species with a "1"
prefix) (Appendix 13). I added the estimated harvested hectares to the total hectares
currently classified as mature to reconstruct conditions within home ranges prior to
harvesting. To determine whether reduction of mature cover was significant at different
spatial scales, I tested the null hypothesis that the proportion of mature forest cover was not
different in the pre and post-harvest periods within the NA, PFA or FA (MRPP, Blossom
Software, Slauson et al. 1991). To measure goshawk response, I tested the null hypotheses
that productivity (number of fledglings per nest attempt) and occupancy were not different
in the pre- and post-harvest periods (MRPP, Blossom Software, Slauson et al. 1991).
Analysis 2: Analysis of occupanqv at post-harvest tem'ton'es
For this analysis, I classified all territories found in timber harvest areas that had
been monitored for a minimum of three years into low ( ~ 5 0 % occupancy rate) or high
(50% or greater) occupancy groups, and tested the null hypothesis that these groups had
similar proportions of mature forest cover within each of the different habitat analysis afeas
(MRPP, Blossom Software, Slauson et al. 1991). I defined territories in timber harvest
areas as those which had at least 5% of the NA and PFA in seedling cover (Seedling cover
me included seedling, unstocked and previously harvested stands--see Table 1). I also
tested the null hypothesis that these groups had a similar average number of nest trees per
territory because the number of known nest trees in a territory may influence the
probability of finding a territory occupied (Crocker-Bedford 1990).
I also regressed occupancy in these post harvest territories against the proportion of
mature forest cover within the NA, PFA and FA (step-wise regression, SYSTAT,
Wilkenson et al. 1990). Percent cover types and occupancy rate were transformed using
31
the arcsine transformation. Other procedures for regression analysis were followed as
described previously in the section: Analysis ofthe relation between habitat cover types
and reproductive success.
Analysis 3: Analysis of historical tem’tones no longer used by goshawks
In 1992 and 1993, I completed intensive searches for nesting goshawks at three
historical territories where goshawk nests had been found originally between 1981-1 985.
These particular territories were selected because trained biologists had documented the
presence of nesting goshawks, and I could identify the stands where nest trees had been
located even though the exact tree could no longer be identified. To survey these
historical territories, broadcast calls during the nesting and fledgling periods were used to
elicit goshawk responses, and all remaining forest stands within a I .6 km (1 mile) radius of
known nest sites were searched for alternate nests or other sign of goshawk presence.
Observations of other raptor species and their nests were recorded as well. I summarized
the proportion of vegetation cover types at the NA, PFA and FA analysis levels and tested
, the null hypothesis that the proportion of mature forest cover at each analysis area was not
different fiom the high occupancy post-harvest current territories. Although the number of
territories was low, and I cannot verify why goshawks abandoned these areas, I analyzed
them as examples of territories where habitat loss may have exceeded thresholds necessary
to maintain breeding pairs of goshawks.
RESULTS
Nesting Ecology
Description of study territories
I collected monitoring and habitat data at 3 1 goshawk breeding territories (Table 2,
Fig. 2). These territories were found throughout the TNF in a variety of cover types and
management areas. To protect confidentiality of nest sites, only general locations have
been given. Territory identification numbers refer to the TNF district where nests were
found @1- D5), and a unique number for that district (Table 2). An additional 19

32
potential nest areas were not included in this habitat analysis (Appendix C). These
included 9 territories where either active nests were discovered in 1994 or 1995 after
collection of habitat data was completed (n=5), or nests located in remote portions of the
TNF that were not included in the monitoring program due to logistical constraints ( n d ) .
At 10 other potential territories, goshawks were seen during the breeding season but nest
trees never located (n=S), or historical nest stands once used by goshawks had fallen down
(n=2). Many of these 10 potential territories are located in timber sale areas that have
undergone substantial modification since goshawks were originally sighted.
Twenty-seven of the 3 1 study territories (87%) were occupied by goshawks at least
once during the current period between 1988 and 1993: 19 (70%) of these current
territories were first documented in 1988 or subsequent years (status ="C" in Table 2), and
8 (30%) were active at least once both prior to and since 1988 (status ="H/C" in Table 2).
I use the term "current" to refer to all 27 of these territories throughout the remainder of
this paper. Four territories out of the total 3 1 (13%) were active before 1988 but not in the
current period; these were classified as historical (status= " H I in Table 2).
Since territories were found opportunistically, suitable habitat in between
territories was not surveyed and estimates of home range size based on nearest-neighbor
distance could not be calculated with confidence. Distance between nest clusters ranged
from 2.4 to over 20 km. Through additional funding obtained for another study, I was able
to conduct one large-scale systematic survey in the Centennial Mountains in 1993 using
broadcast calling methods to survey a 85 km'study area (Patla and Trost 1995b). TWO
nests were found located 7.5 km apart. Calculated home range area for these nests based
on nearest-neighbor distance was 441 8 ha. Density of nesting pairs within the survey area
equaled 1 pair per 3030 ha of suitable habitat (Le. mature forest habitat) or 1 pair per 4167
ha for the entire study area.
The dominant conifer cover type at breeding territories, based on GIs vegetation
classification within estimated home range areas, was Douglas fir at 14 territories (45%),
mixed conifer at 9 (29%), and lodgepole pine at 8 (26%) (Table 2). Within the home range
area of 20 (64%) of these territories, some degree of timber harvesting occurred between
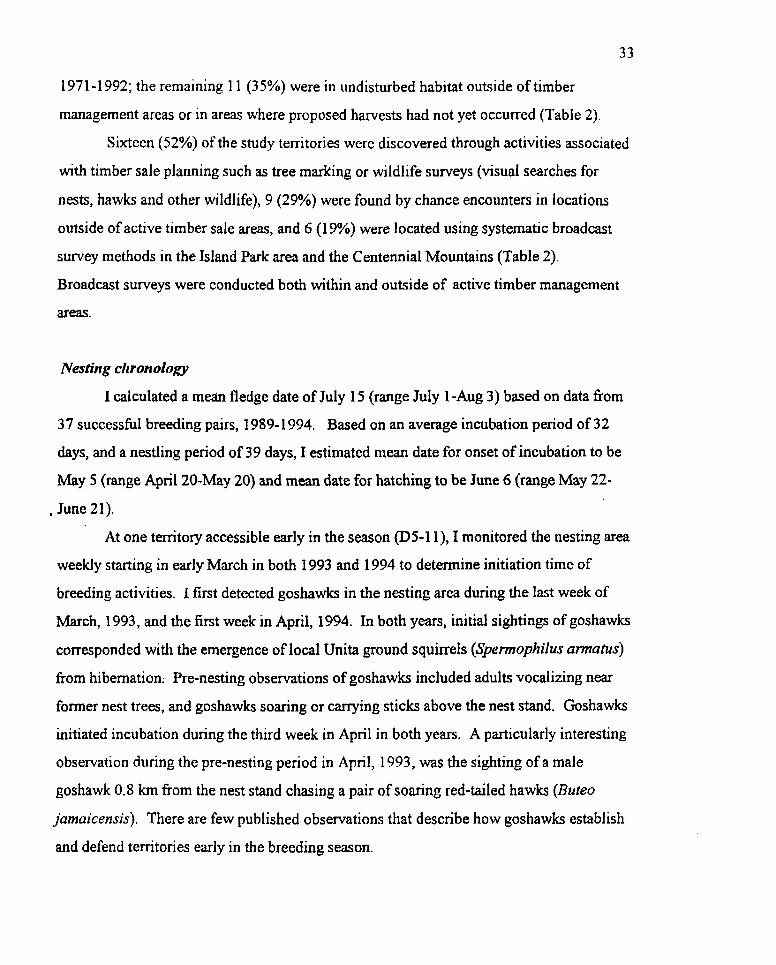
33
1971-1992; the remaining 11 (35%) were in undisturbed habitat outside of timber
management areas or in areas where proposed harvests had not yet occurred (Table 2).
Sixteen (52%) of the study territories were discovered through activities associated
with timber sale planning such as tree marking or wildlife surveys (visual searches for
nests, hawks and other wildlife), 9 (29%) were found by chance encounters in locations
outside of active timber sale areas, and 6 (1 9%) were located using systematic broadcast
survey methods in the Island Park area and the Centennial Mountains (Table 2).
Broadcast surveys were conducted both within and outside of active timber management
areas.
Nesting chronology
I calculated a mean fledge date of July 15 (range July 1-Aug 3) based on data from
37 successful breeding pairs, 1989-1 994. Based on an average incubation period of 32
days, and a nestling period of 39 days, I estimated mean date for onset of incubation to be
M a y 5 (range April 20-May 20) and mean date for hatching to be June 6 (range May 22-
, June 21).
At one territory accessible early in the season @5-1 l), I monitored the nesting area
weekly starting in early March in both 1993 and 1994 to determine initiation time of
breeding activities. I first detected goshawks in the nesting area during the last week of
March, 1993, and the first week in April, 1994. In both years, initial sightings of goshawks
corresponded with the emergence of local Unita ground squirrels (Spennophilus amatus)
from hibernation; Pre-nesting observations of goshawks included adults vocalizing near
former nest trees, and goshawks soaring or carrying sticks above the nest stand. Goshawks
initiated incubation during the third week in April in both years. A particularly interesting
observation during the pre-nesting period in April, 1993, was the sighting of a male
goshawk 0.8 km from the nest stand chasing a pair of soaring red-tailed hawks (Bureo
jarnaicensis). There are few published observations that describe how goshawks establish
and defend territories early in the breeding season.

34
Nest productivity
I documented 68 breeding attempts at 27 territories (2.5 atternpts/temitory) between
1989 and 1994 (Table 3). Sixty-two of these attempts (91%) were successful. A total of
132 young was produced, an average of 1.96 young per breeding pair or 2.1 1 young per
successful nest (Table 3). Over the study period, 21% of nests produced 1 young, 49%
produced 2, 27% produced 3, and 3% produced 4.
Six breeding attempts (9%) failed during the incubation or nestling period between
May 27 to June 28. Annual failure rate averaged one nest per year (range 0-1 7% per year)
(Table 3). At one site I attributed loss of nestlings to pine marten (Martes americma)
predation as downy feathers were caught in the bark along the trunk below the nest, and a
marten den was located within 30 m of the nest tree. Brood reduction occurred at three
successful nests. In all three instances, I found a partially feathered, dead nestling under a
nest tree in the latter part of the nestling period in July. These young either fell or were
pushed fiom the nest. In both cases, they appeared to have struck the ground head first and
died on impact.
Comparing mean annual productivity over the five year period 1990-1 994, I found
a significant difference between years (MRPP, p=0.027). Productivity was highest in 1994
(2.63 younghreeding pair) and lowest in 1993 (1.45 young) (Table 3). The proportion of
nests that produced either one young, or three to four young fluctuated widely over the
years studied. In 1994, the year in which productivity per nest was highest, 63% of the
active nests produced three young compared to only 8% and 6% respectively in 1991 and
1993. In 1993, the lowest productivity year, almost half the nests produced only one
young. During the study period overall there was an alternating pattern of high and IOW
productivity years.
Pradudivity and weather
Regression analysis examining the relationship between mean annual productivity
and spring weather variables (Table 4) indicated that productivity was most strongly
correlated to precipitation levels in early spring, and to a lesser extent, temperatures. Using
linear regression analysis, I found that the number of young produced per successful nest

3s
was significantly related to three individual factors: combined precipitation in MarcWApril
(negative relation, p=0.005, adj ?=O. 86), combined temperature in AprilNay (positive
relation, p=0.046, adj ?=0.590), and May precipitation (negative relation, p=0.041, adj
?=O. 6 1 2).
Using stepwise regression analysis, both MarcWApril precipitation (p=0.009) and
mean April temperature (p=O.OSS) entered the final model: ~ 1 . 9 6 7 -(O. 178)(March+April
precip) + (0.01 S)(April temp), (p=0.005, F=5 1.857, adjusted +0.953, SE=0.024, n=6).
Figure 4 shows regression plots for these two variables.
Study years tended to have either cold and wet, or warm and dry springs as
indicated by high correlations between the weather variables tested: mean temperatures for
the months of March, April and May tended to be positively correlated while temperatures
during this same time period tended to negatively correlated with total precipitation
(Pearson correlation) (Appendix D). Wet, cold weather could affect goshawk productivity
directly due to mortality of nestlings, or indirectly, due to decreased prey availability or
abundance (Newton 1976). . . .
Nest clusters and loss of nest trees
I documented the existence of 89 alternate and active goshawk nest trees beb+een
1980 and 1994 at the 3 1 study territories (mean22.9 treedterritory) (Table 5 , Appendix E).
Sixty-four of these nest trees (72%) were occupied by goshawks at least once between
1980 and 1994 (Table 5). For 25 alternate nests, I did not know year of construction or
occupancy (Table 5) .
I determined from historical records that five older nest trees were lost between
1986 and 1991 ; three were harvested and two apparently blew down. An additional nest
tree found in 1983 died in 1993, but remained standing. In addition, four current nest trees
were lost during the study period; two were blown down and two harvested (Appendix E).
Considering all losses, ten nest trees (1 1 %) were lost between 1986 and 1994,50% from
natural causes and 50% due to harvesting (Table 5) . This equals a loss rate of 0.9 nest trees
per year. This was undoubtably a conservative estimate since prior to 1989, when active

36
nests were discovered in timber sale areas, searches for alternate nests were usually not
undertaken.
The number of nest trees found per territory ranged from one to seven (Table 5) .
Alternate nests within the same territory usually were found within a contiguous forest
patch, often along the same slope, or in an adjacent first-order or intermittent/ephemeral
drainage. At one territory where I found the largest number of alternate nests (D1-06), nest
trees were located over 1 kilometer apart in two non-contiguous untreated patches of
mature forest habitat separated by a natural meadow and by harvest units that had been
thinned twenty years previously.
Average distance between alternate nest trees used by breeding pairs within the
same territories in consecutive years equaled 285 m (SE48 m, range 42-904 m, n=24).
Average distance between alternate nests used over a two year interval was 462 m (SE=124
m, range 170-1074, n=7). Combining these two categories, mean inter-nest distance
equaled 325 m (SE47 m, n=3 1). Only 4 active nests (1 3%) were located within 100 rn of
a previously used nest tree (Fig. 5). Nineteen nests (61%) were located between 100 and 400 m from a previously used nest tree, and 8 (26%) over 400 rn (Fig 5). The largest .
distance between nests found active within one or two years measured 1074 rn. If
monitoring of territories depended only upon visual checking the last known nest, a
majority of occupied nest sites would have been missed.
Considering all alternate nests found, whether used by goshawks or not during the
current period, average distance between the most widely separated alternate nest trees in a
cluster equaled 498 m (Table 6). The area of a circle with this radius equals 78 ha which
turned out to be nearly identical to the size of the nest area I selected to use for habitat
analysis. Mean inter-nest distance between active nests, and the largest distance measured
between alternate nests in a cluster were undoubtedly biased low due to variable survey
effort at territories and the fact that surveys never exceeded a 1.6 kilometer radius beyond
known nests. Goshawks have been reported to use alternate nests in consecutive years
spaced as far as 2.1 kilometers apart although distances this great appear to be the
exception (Woodbridge and Detrich 1994).

37
Use of gusliawk nests by Great Gray owls
I found Great Gray Owls nesting within active goshawk territories on 13 different
occasions in eight different territories. Four of these territories (50%) were in post-harvest
areas. At one location, the owls nested in a broken top snag but the other breeding pairs of
owls all used alternate goshawk nests. Mean distance between active hawk and owl nests
was 395 rn (SD=257, range=l 1 1 to 882 m). Goshawk nests failed twice /2/13=15%) but
all owl nests were successful. The two goshawk nests that failed, one at hatching and one
in the early nestling period, were located 142 m and 282 m from an owl nest. In one
territory, I found a Great Gray Owl nesting in a goshawk nest that had obviously been built
up by hawks earlier in the season. Goshawks used another nest within the territory that
same year. In Europe, Great Gray Owls often nest in goshawk stick nests, and owls can
take possession of nests that goshawks start to repair in the pre-nesting season (Hoglund
and Lansgren 1968; Pulliainen and Loisa 1977). The two species are considered highly
competitive in Europe Wkola 1983).
, Reuse of individual nest trees
Between 1989 and 1994, I obtained at least one year's monitoring data (range 1-6
years) for 76 of the 89 nest trees documented (Table 7). The 13 trees I did not obtain data
for included seven lost prior to the study period (see previous section on Nest clusters and
loss ofnwt rrees), and six found in 1994, the last year of the study period (Appendix E). I
completed a total of 229 nest checks between 1989 and 1994 at the 76 monitored nest trees
(mean=3.O checkshest, SD=l.5) (Table 7). Thirty-nine of the monitored nest trees (51%)
were checked a minimum of three years. I calculated a reuse rate based on both the total
number of nest checks completed, and the number of times an individual tree was used
over the six year period. The first rate gives the probability of finding a previously
identified nest tree reoccupied in a given year; the second rate gives the probability of
finding a particular nest tree reoccupied over the entire study period.
Out of 227 total nest checks completed during the six year period, I found raptors
occupying nests 47 times (21 % reuse rate). Goshawks were found 18 times (8% reuse rate)
(Table 7). The high rate in 1989 for goshawks (20%) was probably an artifact of the small
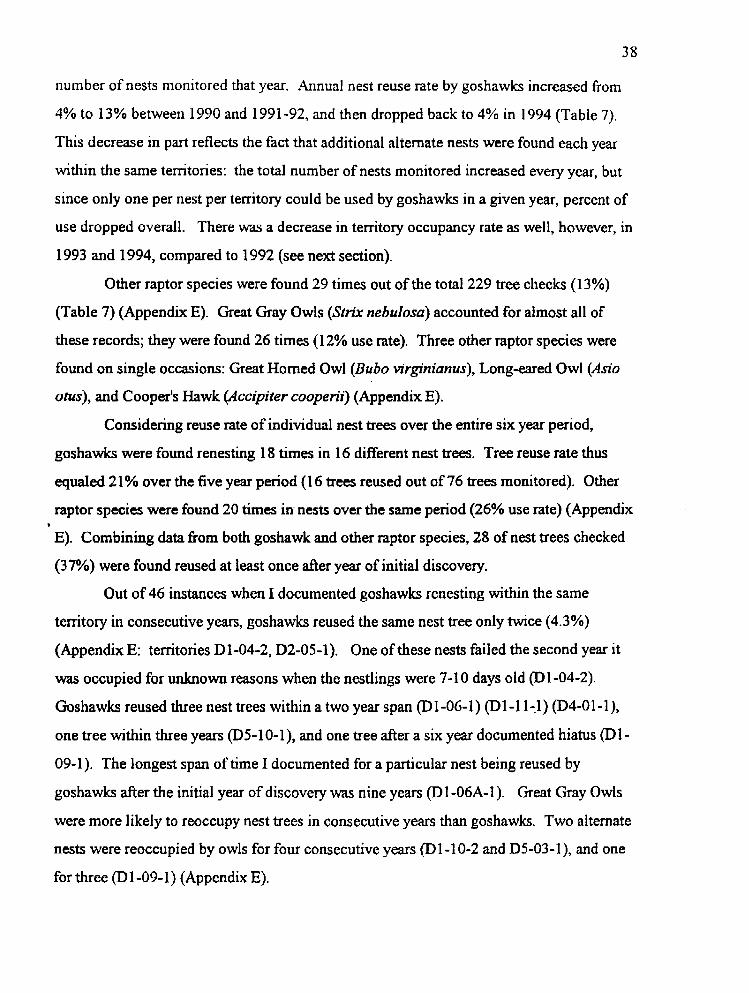
38
number of nests monitored that year. Annual nest reuse rate by goshawks increased from
4% to 13% between 1990 and 1991-92, and then dropped back to 4% in 1994 (Table 7).
This decrease in part reflects the fact that additional alternate nests were found each year
within the same temtories: the total number of nests monitored increased every year, but
since only one per nest per territory could be used by goshawks in a given year, percent of
use dropped overall. There was a decrease in territory occupancy rate as well, however, in
1993 and 1994, compared to 1992 (see next section).
Other raptor species were found 29 times out of the total 229 tree checks (13%)
(Table 7) (Appendix E). Great Gray Owls (Strix nebulosa) accounted for almost all of
these records; they were found 26 times (1 2% use rate). Three other raptor species were
found on single occasions: Great Homed Owl (Bubo virginianus), Long-eared Owl (&io
oms), and Cooper's Hawk (Accipiter coopen'?) (Appendix E).
Considering reuse rate of individual nest trees over the entire six year period,
goshawks were found renesting 1 8 times in 16 different nest trees. Tree reuse rate thus
equaled 21 % over the five year period (1 6 trees reused out of 76 trees monitored). Other raptor species were found 20 times in nests over the same period (26% use rate) (Appendix
E). Combining data from both goshawk and other raptor species, 28 of nest trees checked
(37%) were found reused at least once afier year of initial discovery.
Out of 46 instances when I documented goshawks renesting within the same
territory in consecutive years, goshawks reused the same nest tree only twice (4.3%)
(Appendix E: territories D1-04-2, D2-05-1). One of these nests failed the second year it
was occupied for unknown reasons when the nestlings were 7-1 0 days old (Dl -04-2).
Goshawks reused three nest trees within a two year span (Dl-06-1) @1-11--1) (04-01-l),
one tree within three years @5-10-l), and one tree after a six year documented hiatus @1-
09-1). The longest span of time I documented for a particular nest being reused by
goshawks after the initial year of discovery was nine years @1-06A-1). Great Gray Owls
were more likely to reoccupy nest trees in consecutive years than goshawks. Two alternate
nests were reoccupied by owls for four consecutive years @1-10-2 and D5-03-l), and one
for three (Dl-09-1) (Appendix E).
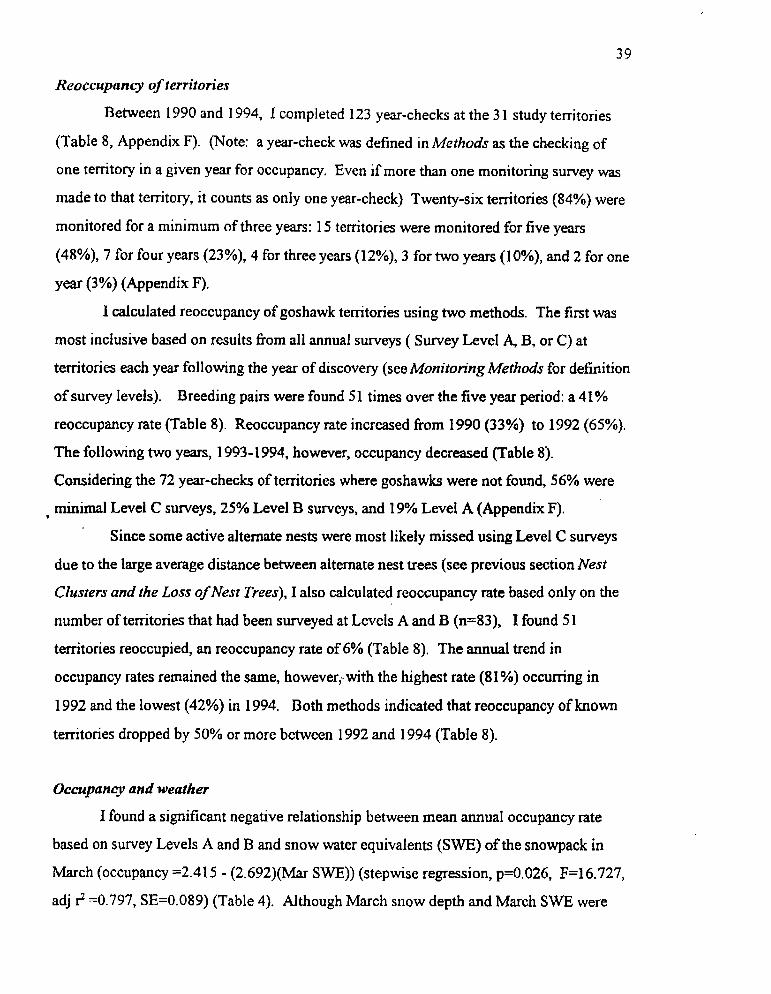
39
Reoccupancy of ferritories
Between 1990 and 1994, I completed 123 year-checks at the 3 1 study territories
(Table 8, Appendix F). (Note: a year-check was defined in Methods as the checking of
one territory in a given year for occupancy. Even if more than one monitoring survey was
made to that territory, it counts as only one year-check) Twenty-six territories (84%) were
monitored for a minimum of three years: 15 territories were monitored for five years
(48%), 7 for four years (23%), 4 for three years (1 2%), 3 for two years (1 O%), and 2 for one
year (3%) (Appendix F).
I calculated reoccupancy of goshawk territories using two methods. The first was
most inclusive based on results from all annual surveys ( Survey Level
territories each year following the year of discovery (see MonitoringMethods for definition
of survey levels). Breeding pairs were found 5 1 times over the five year period: a 4 I %
reoccupancy rate (Table 8). Reoccupancy rate increased from 1990 (33%) to 1992 (65%).
The following two years, 1993-1 994, however, occupancy decreased (Table 8).
Considering the 72 year-checks of territories where goshawks were not found, 56% were
minimal Level C sunteys, 25% Level B surveys, and 19% Level A (Appendix F).
B, or C) at
Since some active alternate nests were most likely missed using Level C surveys due to the large average distance between alternate nest trees (see previous section Nest
Clusters and the Loss of Nest Trees), I also calculated reoccupancy rate based only on the
number of territories that had been surveyed at Levels A and B (n=83), I found 5 1
territories reoccupied, an reoccupancy rate of 6% (Table 8). The annual trend in
occupancy rates remained the same, however; with the highest rate (81 %) occumng in
1992 and the lowest (42%) in 1994. Both methods indicated that reoccupancy of known
territories dropped by 50% or more between 1992 and 1994 (Table 8).
Occupuncy and weather
I found a significant negative relationship between mean annual occupancy rate
based on survey Levels A and B and snow water equivalents ( S W ) of the snowpack in
March (occupancy =2.415 - (2.692)(Mar SWE)) (stepwise regression, p=0.026, F=l6.727,
adj 3 =0.797, SE=0.089) (Table 4). Although March snow depth and March S W E were
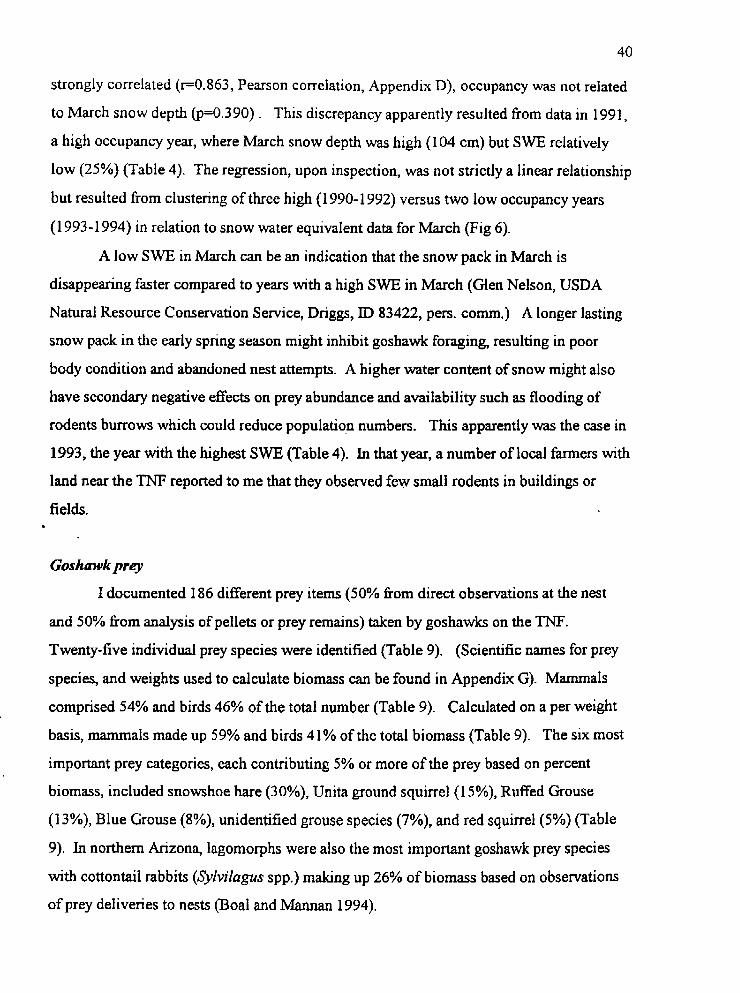
40
strongly correlated ( ~ 0 . 8 6 3 , Pearson correlation, Appendix D), occupancy was not related
to March snow depth (p0.390) . This discrepancy apparently resulted fiom data in 1991,
a high occupancy year, where March snow depth was high (1 04 cm) but SWE relatively
low (25%) (Table 4). The regression, upon inspection, was not strictly a linear relationship
but resulted fiom clustering of three high (1 990- 1 992) versus two low occupancy years
(1 993-1994) in relation to snow water equivalent data for March (Fig 6).
A low S W E in March can be an indication that the snow pack in March is
disappearing faster compared to years with a high SWE in March (Glen Nelson, USDA
Natural Resource Conservation Service, Driggs, I D 83422, pers. c o r n . ) A longer lasting
snow pack in the early spring season might inhibit goshawk foraging, resulting in poor
body condition and abandoned nest attempts. A higher water content of snow might also
have secondary negative effects on prey abundance and availability such as flooding of
rodents burrows which could reduce populatio,n numbers, This apparently was the case in
1993, the year with the highest SWE (Table 4). In that year, a number of local farmers with
land near the TNF reported to me that they observed few small rodents in buildings or
fields.
Goshawk p r q I documented 186 different prey items (50% from direct observations at the nest
and 50% fiom analysis of pellets or prey remains) taken by goshawks on the TNF.
Twenty-five individual prey species were identified (Table 9). (Scientific names for prey
species, and weights used to calculate biomass can be found in Appendix G). Mammals
comprised 54% and birds 46% of the total number (Table 9). Calculated on a per weight
basis, mammals made up 59% and birds 41% of the total biomass (Table 9). The six most
important prey categories, each contributing 5% or more of the prey based on percent
biomass, included snowshoe hare (30%), Unita ground squirrel (1 5%), Ruffed Grouse
(13%), Blue Grouse (8%), unidentified grouse species (7%), and red squirrel (5%) (Table
9). Xn northern Anzona, lagomorphs were also the most important goshawk prey species
with cottontail rabbits (Sylvilagus spp.) malung up 26% of biomass based on observations
of prey deliveries to nests @oal and Mannan 1994).

41
Birds comprised a higher proportion (53%) of items identified using pellets and
prey remains, while mammals were recorded more frequently based on prey deliveries to
the nest (61 %) (Table 9). Consistent with findings of Boa1 and Mannan (1 994), using only
pellets and prey remains to quantify goshawk prey most likely underestimates the
importance of mammalian prey in the diet. In contrast to avian prey, goshawks often did
not pluck mammalian prey, and consumed entire carcasses including bones and fur.
Exceptions to this included the hind feet of snowshoe hare, and the tails of red squirrels
which were frequently found in the vicinity of nests. To document mammalian prey from
prey samples, hair analysis would need to be completed, a time consuming process that
still would not provide good information on number of prey consumed.
Over 300 hours of observations fiom blinds were completed in 1992 and 1993.
Two lodgepole pine nests (1 59 hours) and two Douglas fir nests (1 61 hours) were
observed. The lodgepole pine nests were observed during the last three weeks of the
nestling period in 1992. One Douglas fir nest was observed during the last four days of the
nestling period in 1992; the other Douglas fir nest was observed during the entire nestling
period in 1993. Adults delivered prey to the lodgepole pine nests (1 -2 nestlings) at the rate
of 0.25 itemshour (n40). At the Douglas fir nests (3-4 young), delivery rate measured
was 0.40 itemhour ( ~ 6 4 ) . At the Douglas fir nest observed during the entire nestling
period, one prey species, Unita ground squirrel (Spennophilus amatus) accounted for 75%
of all prey deliveries (n48) . Individual goshawks have been reported to specialize on
certain prey species (Brown and Amadon 1968). This particular nest was located near the
edge of the forest adjacent to natural sagebrush and shrub habitat, and near an undeveloped
subdivision. Ground squirrels were abundant in the area. Aduit males were observed
bringing prey directly to nests on only two occasions when a female was absent. Usually
the male perched a distance from the nest and called, giving a low-pitched single note
contact call (Brown and Amadon 1968), The adult female responded with one or more
wail-type calls before leaving the nest to retrieve a prey item. She either returned
immediately to the nest and begin feeding the young, or disappeared for a period of five to
ten minutes, most likely feeding herself first. On some occasions, a female left a nest
without vocalizing and returned shortly afterwards with a partially consumed prey item

42
which appeared to have been cached near the nest. I observed females feeding young
throughout the entire nestling period, even when the young were almost fully developed.
Twice, small live prey items were left by adults at a nest one or two days before the young
fledged. In both cases, the young goshawks appeared to have trouble coordinating their
feet to firmly grasp and kill the prey.
At the Douglas fir nest observed in 1992, the smallest of the four nestlings
remained in the nest five days after his siblings fledged. The adults continued to deliver
food to the nest, and the three fledglings returned to the nest early each day to feed and
sleep, departing in late afternoon or evening to spend the night elsewhere. E1 had made
observations at this nest only during the mid-portion of the day, I would have assumed that
none of these young had fledged. Continued feeding at the nest ensured that the youngest
bird was fed adequately until it could also fledge.
In 1992, nest observers recorded no acts of physical aggression between siblings in
the nest except for very brief incidents of pecking or grabbing prey. At the nest observed
in 1993, the largest chick vigorously attacked its two smaller siblings four different times . .
, during a 4.5 hour period on June 7 when the chicks were approximately 12 days old.
H&y rain had Mlen during the previous two days and the weafher was cold and windy.
During this time period, the male made no prey deliveries to the nest. The young appeared
to be hungry and could be heard food-begging even when the hen settled down in a
brooding position over them. The attacks occurred only when the hen left the nest for
periods of time. The largest chick repeatedly struck the other two on the head with his bill,
and dragged them back into the nest bowl when they attempted to escape by crawling up
onto the rim of the nest, The chicks sustained no obvious injuries, and no other attacks
were observed during subsequent obsentations. All three young survived to fledge.
Siblicide related to food stress has been observed at goshawk nests (Boa1 and Bacorn
1994).
At this same nest in 1993, I observed the adult female chasing Red-tailed Hawks
out of the nest stand on two different occasions, June 8 (young two weeks old) and July 8
(first day young observed out of the nest). Nestlings appear to react to other potential avian
predators, Common Raven (Cowus corux) and Cooper's Hawk, near the nest by becoming

43
silent after hearing vocalizations. The first incident was on July 5 when the female was not
in attendance. Two ravens perched close to the nest and called loudly for a few minutes,
then departed. Later on the same day, a Cooper's Hawk called from approximately 1 SO m
from the nest. The young goshawk immediately lay down and ceased food-beg calling.
Visual observations of foraging goshawks, even of radio-tagged birds, are fairly rare
given the remote habitat and secretive behavior of the goshawk. During the course of this
study, I observed goshawks hunting ground squirrels in open areas of grass or sage
meadows at three different locations. Goshawks approached ground squirrel areas flying
just above the ground and landed near burrows, causing the rodents to draw back into their
holes briefly. While the squirrels remained underground, the goshawk would run and
position itself closer to a burrow or hide near the base of a sagebrush or small tree.
Goshawks remained standing still in the open (or hidden from sight in cover) for a few
minutes and then changed positions either by running across the ground or flying low for
short distances towards other burrow. If prey was secured or after an unsuccessful
foraging bout, a goshawk would fly directly to nearby stands of aspen or conifers. I
, observed one ground hunting episode that lasted a total of 45 minutes, but most were much
shorter, 5-1 5 minutes in length. While standing in the open, goshawks often rotated their
heads so they could scan the sky above. These foraging techniques differed greatly from
Red-tailed Hawks which hunt ground squirrels and other prey by soaring and stooping or
from perches (trees or poles) (Johnsgard 1990).
Habitat Analysis
Level 1: Nest tree and site
I documented a total of 60 nesting attempts at 27 current territories during the
years, 1989-1993, and collected habitat data at 49 nest trees used by goshawks (Appendix
H). Nest trees were not identified at seven sites where fledged young were found.
Goshawks also used four nest trees more than once during the study period.
Four different species of nest trees were used by goshawks with Douglas fir out-
numbering the other three species combined: 3 8 Douglas fir (78%), 9 lodgepole pine
(8%), 1 trembling aspen (2%) and 1 Engelmann spruce (2%) (Table IO). Douglas fir trees

44
tend to have stout, lateral branches that grow in a horizontal or upward position providing
good structural support for nests. Most nest trees (94%) were either codominant (n=39) or
dominant (n=7) within the nest stand (Table 10) . I found only one nest in a live tree of
intermediate canopy position. Two nests (4%) were found in snags (Table IO). The
majority of nest trees (53%) were located on the middle (n=22) and lower portions (n=14)
of forested slopes (Table 10). Only 8% were found on the upper third of slopes (n=4), and
18% on flat terrain (n=9) (Table 10).
I classified goshawk stick nests into one of four possible structural categories: 15
platform (37%), 1 1 basket (24%), 7 broom (22%) and 5 broken crown (16%) (Table 1 1,
Fig. 7). "Basket" nests were built on lateral branches that grew at an upward angle out
from the trunk (Fig. 7A). These nests were deeper than platform nests, and wider at the top
than bottom. ''Platformstt were nests with a flattened appearance placed on horizontal,
lateral branches (Fig. 7B). "Brooms" were nests placed on lateral branches either
deformed by dwarf mistletoe infection or on "simulation brooms" (Hawksworth and
Johnson 1989) (Fig. 7C). Simulation brooms in lodgepole pine trees appear similar to
mistletoe brooms but occur in non-infected trees. Brooms consist of thick clusters of short
green branches that make bushy nesting platforms. Some of the nests located on brooms
were difficult to find and monitor as added nest material was difficult to see from the
ground. "Broken crown" nests were in trees whose apical growing stem had been
damaged; lateral branches at the top of the damaged stem grew upward providing a basket-
type base on the top of the main trunk (Fig. 7D). Although this growth form occurs often
in mature aspen trees, such a deformity was less common in conifers on the TNF. I found
one broken crown nest in a suppressed, dead Douglas fir tree that was completely shaded
by adjacent live trees (Fig. 7D). Another type of broken crown nest was in a codominant
Douglas fir with a "U" shaped split trunk; the nest was built at the base of the "U". Over a quarter of the nests were built on branches infected with mistletoe (27%)
(Table 11). Overall, 38% of the nest trees would be considered defective from a
silvicultural perspective due to the presence of mistletoe, brooms or broken crowns (Table
11). Such structural defects can provide nesting platforms even in trees that lack well
developed lateral branches.
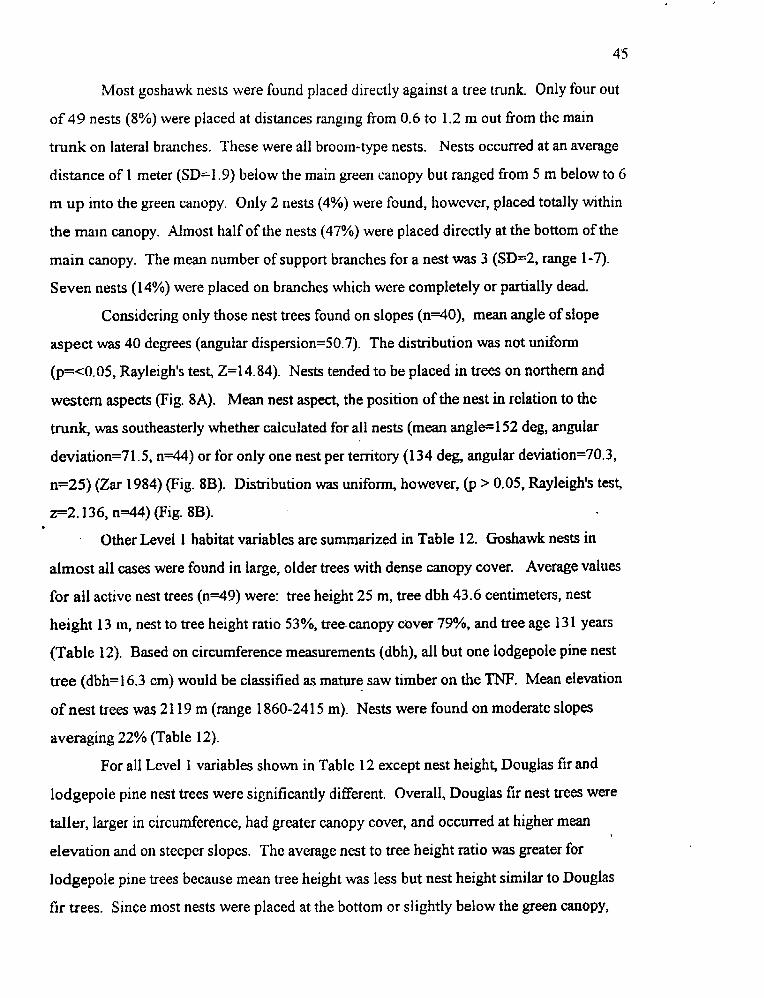
45
Most goshawk nests were found placed directly against a tree trunk. Only four out
of 49 nests (8%) were placed at distances ranging from 0.6 to 1.2 m out from the main
trunk on lateral branches. These were all broom-type nests. Nests occurred at an average
distance of 1 meter (SDzl.9) below the main green canopy but ranged from 5 m below to 6
m up into the green canopy. Only 2 nests (4%) were found, however, placed totally within
the main canopy. Almost half of the nests (47%) were placed directly at the bottom of the
main canopy. The mean number of support branches for a nest was 3 (SD=2, range 1-7).
Seven nests (1 4%) were placed on branches which were completely or partially dead.
Considering only those nest trees found on slopes (n40) , mean angle of slope
aspect was 40 degrees (angular dispersion=50.7). The distribution was not uniform
(p=<0.05, Rayleigh's test, S14.84). Nests tended to be placed in trees on northern and
western aspects (Fig. SA). Mean nest aspect, the position of the nest in relation to the
trunk, was southeasterly whether calculated for all nests (mean angle=l52 deg, angular
deviation=71.5, n 4 4 ) or for only one nest per territory (1 34 deg, angular deviation=70.3,
n=25) (Zar 1984) (Fig. SB). Distribution was uniform, however, (p > 0.05, Rayleigh's test,
2=2.136,n=44) (Fig. SB). . Other Level 1 habitat variables are summarized in Table 12. Goshawk nests in
almost all cases were found in large, older trees with dense canopy cover. Average values
for all active nest trees ( n 4 9 ) were: tree height 25 rn, tree dbh 43.6 centimeters, nest
height 13 m, nest to tree height ratio 53%, tree-canopy cover 79%, and tree age 131 years
(Table 12). Based on circumference measurements (dbh), all but one lodgepole pine nest
tree (dbh=l6.3 cm) would be classified as mature saw timber on the TNF. Mean elevation
of nest trees was 21 19 m (range 1860-2415 m). Nests were found on moderate slopes
averaging 22% (Table 12).
For all Level 1 variables shown in Table 12 except nest height, Douglas fir and
lodgepole pine nest trees were significantly different. Overall, Douglas fir nest trees were
taller, larger in circumference, had greater canopy cover, and occurred at higher mean
elevation and on steeper slopes. The average nest to tree height ratio was greater for
lodgepole pine trees because mean tree height was less but nest height similar to Douglas
fir trees. Since most nests were placed at the bottom or slightly below the green canopy,
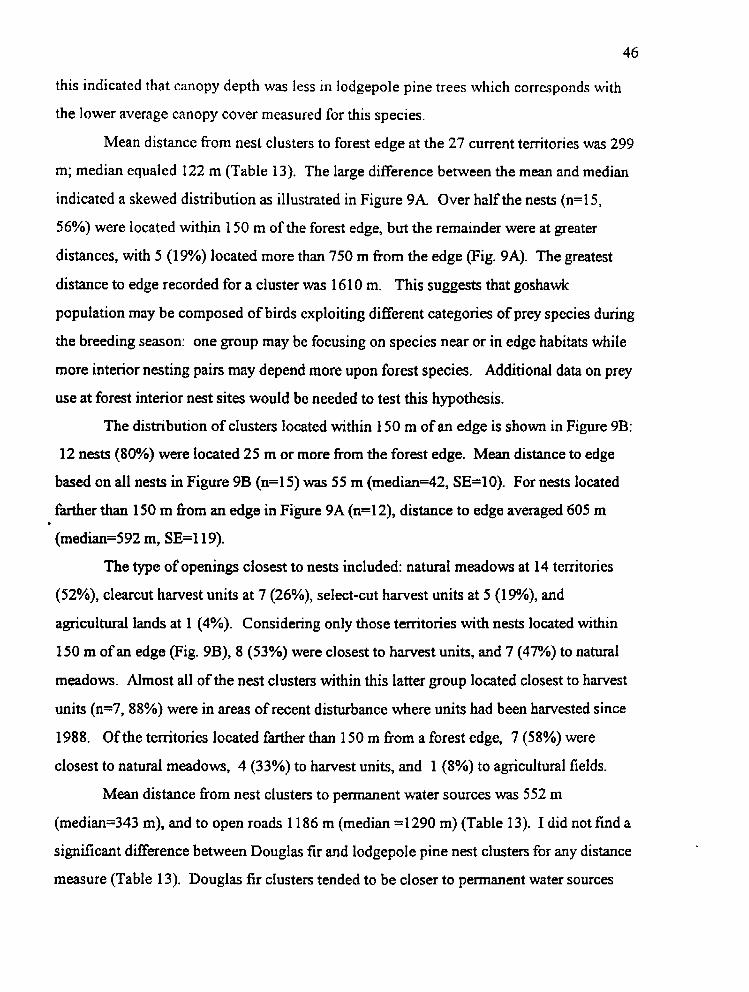
46
this indicated that canopy depth was less in lodgepole pine trees which corresponds with
the lower average canopy cover measured for this species.
Mean distance from nest clusters to forest edge at the 27 current territories was 299
m; median equaled 122 m (Table 13). The large difference between the mean and median
indicated a skewed distribution as illustrated in Figure 9A Over half the nests (n=l5,
56%) were located within 150 m of the forest edge, but the remainder were at greater
distances, with 5 (1 9%) located more than 750 m from the edge (Fig. 9A). The greatest
distance to edge recorded for a cluster was 161 0 m. This suggests that goshawk
population may be composed of birds exploiting different categories of prey species during
the breeding season: one group may be focusing on species near or in edge habitats while
more interior nesting pairs may depend more upon forest species. Additional data on prey
use at forest interior nest sites would be needed to test this hypothesis.
The distribution of clusters located within 150 m of an edge is shown in Figure 9B:
12 nests (80%) were located 25 m or more from the forest edge. Mean distance to edge
based on all nests in Figure 9B (n=15) was 55 m (median=42, SE=lO). For nests located
farther than 150 m from an edge in Figure 9A (n=12), distance to edge averaged 605 rn (median=592 m, SE=l19).
The type of openings closest to nests included: natural meadows at 14 territories
(52%), clearcut harvest units at 7 (26%), select-cut harvest units at 5 (1 9%), and
agricultural lands at 1 (4%). Considering only those territories with nests located within
150 m of an edge (Fig. 9B), 8 (53%) were closest to harvest units, and 7 (47%) to natural
meadows. Almost all of the nest clusters within this latter group located closest to harvest
units (n=7,88%) were in areas of recent disturbance where units had been harvested since
1988. Of the territories located farther than 150 rn from a forest edge, 7 (58%) were
closest to natural meadows, 4 (33%) to harvest units, and 1 (8%) to agricultural fields.
Mean distance from nest clusters to permanent water sources was 552 m
(median=343 m), and to open roads 1 186 m (median =1290 m) (Table 13). I did not find a
significant difference between Douglas fir and lodgepole pine nest clusters for any distance
measure (Table 13). Douglas fir clusters tended to be closer to permanent water sources

47
but farther from forest edge and open roads compared to lodgepole pine clusters (Table
13).
Level 2: Nest plot characteristics
I measured 44 Level 2 habitat plots at the 27 current territories (Appendix €€).
Plots were characterized by a large component of mature timber and relatively high canopy
cover. Mean dbh of sawtimber was 30.8 centimeters, number of mature trees per hectare
was 383, basal area of live mature trees averaged 27.7 m2 per hectare, mean snag diameter
was 15.1 centimeters, snag density was 286 per hectare, and stand canopy cover averaged
73% (Table 14). The dominant tree species at plots (accounting for 285% of all mature
trees) was Douglas fir at 27 plots (61%), lodgepole pine at 9 (20%), a mixture of the two
species at 5 (1 2%), and Douglas fir/Engelmann spruce at 3 (7%). Only three plots (7%)
contained mature aspen trees.
Comparing one plot per territory (n=27), I found no difference between Douglas fir (n=20) and lodgepole pine (n=7) plots in overall density of sawtimber or snags (Table 14).
Douglas fir nest plots, however, had significantly larger trees, and greater basal area and
canopy cover (Table 14). Comparing size classes of live trees, Douglas fir plots had a
significantly greater number of large and medium sized sawtimber; lodgepole pine plots
had significantly more small sawtimber, pole-sized trees, sapling and seedlings (Table 15).
Lodgepole pine plots also had a greater mean number of downed trees (1 34 vs 14 per
hectare) (Table 15). Ground cover height between Douglas fir and lodgepole pine plots
was similar averaging between 19-25 centimeters (Table 1 5) . There were no significant
differences between Douglas fir and lodgepole pine nest plots in the number of snags in
any size category (Table 16). In both Douglas fir and lodgepole pine plots, the greatest
density of snags was in the pole-size class (Table 16).
Level 3: Nest Area (IVA)
The average size of the nest area analyzed was 80.4 ha (SD=0.32, n=27). Mature
sawtimber was the most prevalent cover type whether calculated for all 27 current
territories (68%) or for Douglas fir (72%) and lodgepole pine territories separately (57%)
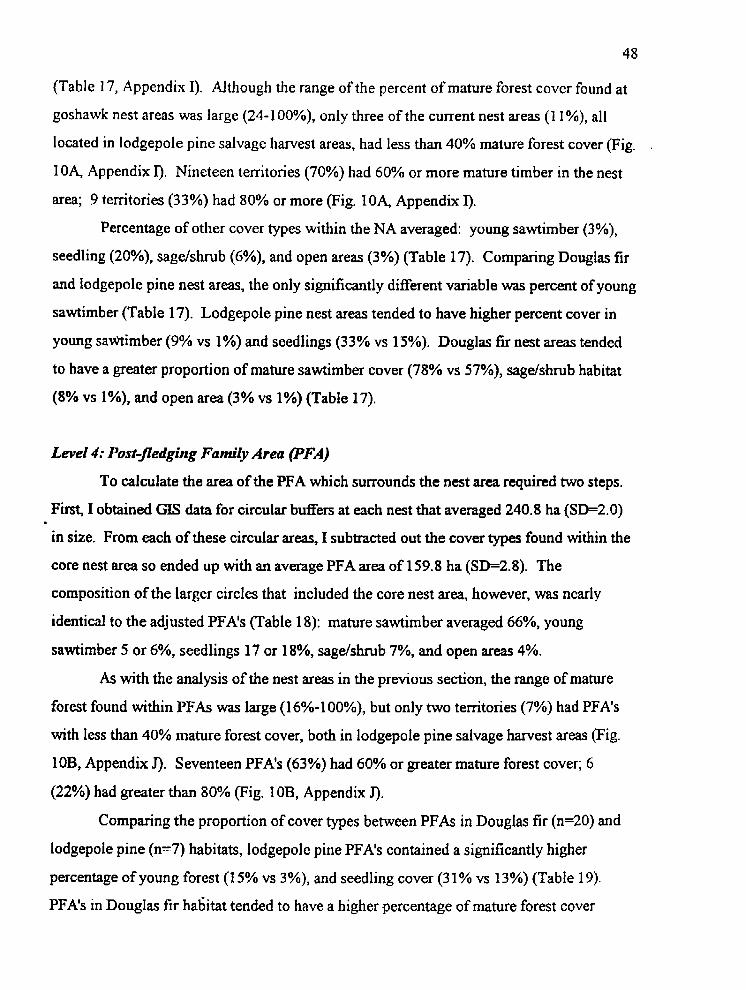
48
(Table 17, Appendix I). Although the range of the percent of mature forest cover found at
goshawk nest areas was large (24-1 OO%), only three of the current nest areas (1 l%), all
located in lodgepole pine salvage harvest areas, had less than 40% mature forest cover (Fig.
1 O q Appendix r). Nineteen territories (70%) had 60% or more mature timber in the nest
area; 9 territories (33%) had 80% or more (Fig. lOA, Appendix I).
Percentage of other cover types within the NA averaged: young sawtimber (3%),
seedling (20%), s a g d s h b (6%), and open areas (3%) (Table 17). Comparing Douglas fir
and lodgepole pine nest areas, the only significantly different variable was percent of young
sawtimber (Table 17). Lodgepole pine nest areas tended to have higher percent cover in
young s a ~ i m b e r (9% vs 1%) and seedlings (33% vs 13%). Douglas fir nest areas tended
to have a greater proportion of mature sawtimber cover (78% vs 57%), sagdshrub habitat
(8% vs l%), and open area (3% vs 1%) (Table 17).
Level 4: Post-fledging Family Area (PFA)
To calculate the area of the PFA which surrounds the nest area required two steps.
First I obtained GIs data for circular buffers at each nest that averaged 240.8 ha (SD=2.0)
in size. From each of these circular areas, I subtracted out the cover types found within the
core nest area so ended up with an average PFA area of 159.8 ha (SD=2.8). The
composition of the larger circles that included the core nest area, however, was nearly
identical to the adjusted PFA's (Table 18): mature sawtimber averaged 66%, young
sawtimber 5 or 6%, seedlings 17 or 18%, sagdshrub 7%, and open areas 4%.
I
As with the analysis of the nest areas in the previous section, the range of mature
forest found within PFAs was large (1 6%-1 OO%), but only two territories (7%) had PFA's
with less than 40% mature forest cover, both in lodgepole pine salvage harvest areas (Fig.
lOB, Appendix J). Seventeen PFA's (63%) had 60% or greater mature forest cover; 6
(22%) had greater than 80% (Fig. 1 OB, Appendix J).
Comparing the proportion of cover types between PFAs in Douglas fir (n=20) and
lodgepole pine (n=7) habitats, lodgepole pine PFA's contained a significantly higher
percentage of young forest (1 5% vs 3%), and seedling cover (3 1 % vs 13%) (Table 19).
PFA's in Douglas fir habitat ten&d to have a higher percentage of mature forest cover
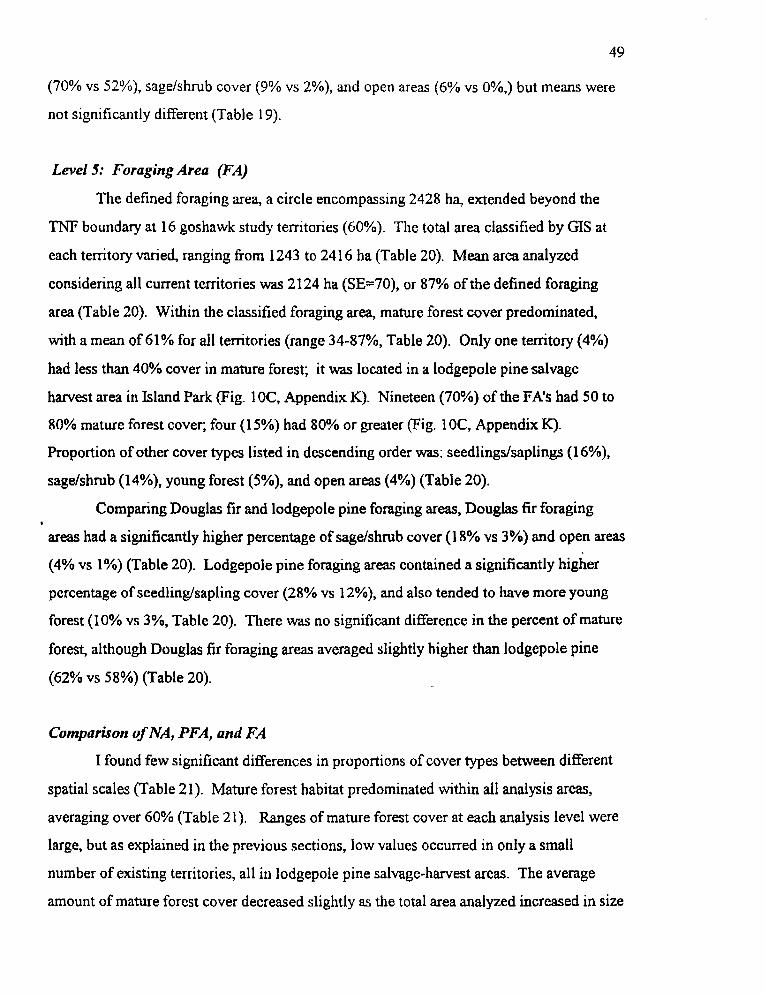
49
(70% vs 52%), sagehhrub cover (9% vs 2%), and open areas (6% vs O%,) but means were
not significantly different (Table 19).
Level 5: Foraging Area (FA)
The defined foraging area, a circle encompassing 2428 ha, extended beyond the
TNF boundary at 16 goshawk study territories (60%). The total area classified by GIs at
each territory varied, ranging from 1243 to 2416 ha (Table 20). Mean area analyzed
considering all current territories was 2124 ha (SE=70), or 87% of the defined foraging
area (Table 20). Within the classified foraging area, mature forest cover predominated,
With a mean of 61% for all territories (range 34-87%, Table 20). Only one territory (4%)
had less than 40% cover in mature forest; it was located in a lodgepole pine salvage
harvest area in Island Park (Fig 1 OC, Appendix K). Nineteen (70%) of the FA’S had 50 to
80% mature forest cover; four (1 5%) had 80% or greater (Fig. 1 OC, Appendix K).
Proportion of other cover types listed in descending order was: seedlings/saplings (1 6%),
sagelshrub (14%), young forest (5%), and open areas (4%) (Table 20).
Comparing Douglas fir and lodgepole pine foraging areas, Douglas fir foraging
areas had a significantly higher percentage of sagdshrub cover (1 8% vs 3%) and open areas
(4% vs 1%) (Table 20). Lodgepole pine foraging areas contained a significantly higher
percentage of seedlinghapling cover (28% vs 12%), and also tended to have more young
forest (1 0% vs 3%, Table 20). There was no significant difference in the percent of mature
forest, although Douglas fir foraging areas averaged slightly higher than lodgepole pine
(62% vs 58%) (Table 20).
Comparison of NA, PFA, and FA
I found few significant differences in proportions of cover types between different
spatial scales (Table 21). Mature forest habitat predominated within all analysis areas,
averaging over 60% (Table 21). Ranges of mature forest cover at each analysis level were
large, but as explained in the previous sections, low values occurred in only a small
number of existing territories, all in lodgepole pine salvage-harvest areas. The average
amount of mature forest cover decreased slightly as the total area analyzed increased in size
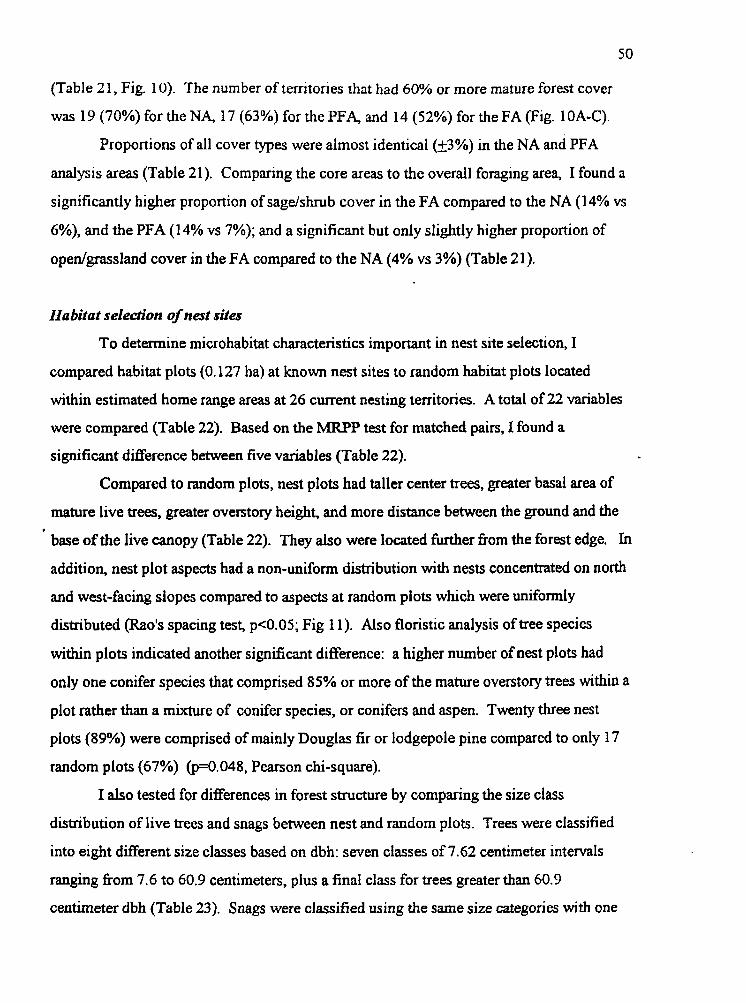
50
(Table 2 1, Fig. 10). The number of territories that had 60% or more mature forest cover
was 19 (70%) for the NA, 17 (63%) for the PFA and 14 (52%) for the FA (Fig. 1OA-C).
Proportions of all cover types were almost identical (&3%) in the NA and PFA
analysis areas (Table 21), Comparing the core areas to the overall foraging area, I found a
significantly higher proportion of sagdshrub cover in the FA compared to the NA (1 4% vs
6%), and the PFA (1 4% vs 7%); and a significant but only slightly higher proportion of
opedgrassland cover in the FA compared to the NA (4% vs 3%) (Table 21).
Habitat selection of nest sites
To determine microhabitat characteristics important in nest site selection, I
compared habitat plots (0.127 ha) at known nest sites to random habitat plots located
within estimated home range areas at 26 current nesting territories. A total of 22 variables
were compared (Table 22). Based on the MRPP test for matched pairs, I found a
significant difference between five variables (Table 22).
Compared to random plots, nest plots had taller center trees, greater basal area of
mature live trees, greater overstory height, and more distance between the ground and the
base of the live canopy (Table 22). They also were located further from the forest edge. In
addition, nest plot aspects had a non-uniform distribution with nests concentrated on north
and west-facing slopes compared to aspects at random plots which were uniformly
distributed (Rao's spacing test, pC0.05; Fig 1 1). Also floristic analysis of tree species
within plots indicated another significant difference: a higher number of nest plots had
only one conifer species that comprised 85% or more of the mature overstory trees within a
plot rather than a mixture of conifer species, or conifers and aspen. Twenty three nest
plots (89%) were comprised of mainly Douglas fir or lodgepole pine compared to only 17
random plots (67%) @=0.04&, Pearson chi-square).
I also tested for differences in forest structure by comparing the size class
distribution of live trees and snags between nest and random plots. Trees were classified
into eight different size classes based on dbh: seven classes of 7.62 centimeter intervals
ranging from 7.6 to 60.9 centimeters, plus a final class for trees greater than 60.9
centimeter dbh (Table 23). Snags were classified using the same size categories with one
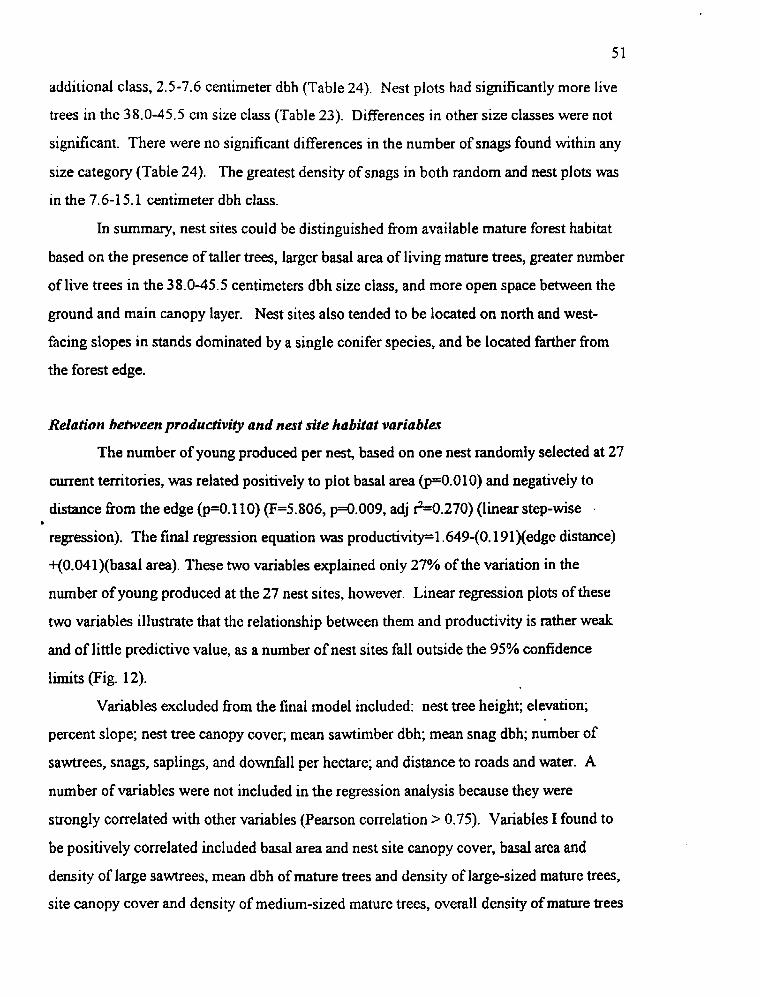
5 1
additional class, 2.5-7.6 centimeter dbh (Table 24). Nest plots had significantly more live
trees in the 38.0-45.5 cm size class (Table 23). Differences in other size classes were not
significant. There were no significant differences in the number of snags found within any
size category (Table 24). The greatest density of snags in both random and nest plots was
in the 7.6-1 5.1 centimeter dbh class.
In summary, nest sites could be distinguished from available mature forest habitat
based on the presence of taller trees, larger basal area of living mature trees, greater number
of live trees in the 38.0-45.5 centimeters dbh size class, and more open space between the
ground and main canopy layer. Nest sites also tended to be located on north and west-
facing slopes in stands dominated by a single conifer species, and be located farther from
the forest edge.
Relation between productivity and nest site habitat variables
The number of young produced per nest, based on one nest randomly selected at 27
current territories, was related positively to piot basal area (p=O.OlO) and negatively to
distance from the edge (p=O.110) (F=5.806, p=0.009, adj +0.270) (linear step-wise .
regression). The final regression equation was productivity=1.649-(0.191 )(edge distance)
+(0.04l)(basal area). These two variables explained only 27% of the variation in the
number of young produced at the 27 nest sites, however. Linear regression plots of these
two variables illustrate that the relationship between them and productivity is rather weak
and of little predictive value, as a number of nest sites fall outside the 95% confidence
limits (Fig. 12).
Variables excluded from the final model included: nest tree height; elevation;
percent slope; nest tree canopy cover; mean sawtimber dbh; mean snag dbh; number of
sawtrees, snags, saplings, and downfall per hectare; and distance to roads and water. A
number of variables were not included in the regression analysis because they were
strongly correlated with other variables (Pearson correlation > 0.75). Variables I found to
be positively correlated included basal area and nest site canopy cover, basal area and
density of large sawtrees, mean dbh of mature trees and density of large-sized mature trees,
site canopy cover and density of medium-sized mature trees, overall density of mature bees

52
and density of small-sized mature trees, and density of seedlings and saplings. Mean dbh
of mature trees and number of small-sized mature trees were negatively correlated.
Relation ofproductivity and occupancy to cover types in the NA, PFA ,FA
For these analyses, I included monitoring data from 1995, as well as data collected
between 1989 and 1994 summarized in Tables 3 and 8. Occupancy averaged 69% for 22
territories that had been monitored a minimum of three years between 1989 and 1995
(Table 25). Average number of young produced per nest attempt per temtory calculated
for territories over this same time span was 1.8s (SD=0.72, n=27) (Table 25). For step-
wise regression analysis, I included only those cover types at each spatial level that
occurred within at least 18 territories (67%) and that were not strongly correlated to
another variable as described in Methods. Six cover types were included in the regression
analyses: NA-mature cover, FA-mature, young forest, seedlinghut, sagdshrub, and open.
I found two variables significantly related to the average number of young
produced per territory: proportion of mature forest cover within the NA (negative), and
sagdshrub cover within the FA (positive) (stepwise regression, F4.739, adj ? = 0.223,
p=O:O18). The regression equation was productivityl.637 -t- 0.480 (mature forest FA)-
0.263 (mature forest NA), based on percent of forest cover that had been arcsine
transformed. Plots of these two variables against productivity shows a great deal of scatter,
however, with many temtories falling outside of the 95% confidence limits (Fig. 13), so
the relationship, though significant, offers little predictive value.
For occupancy, only one cover type was included in the final model: sagdshrub
cover within the FA (step-wise regression, F=6.879, adj 4 = 0.219, p=0.016. The
regression equation was occupancy (% arcsine transformed)= 0.702 + 0.974 (FA
sagdshrub cover, % arcsine transformed). The regression plot appears to have somewhat
less scatter compared to the previous regression plots between habitat variables and
reproductive success, but a number of territories still fall outside of the 95% confidence
bands (Fig. 14).
The fact that regression analysis failed to show a relation between occupancy and
mature forest cover within the NA or FA most likely reflected the relatively low variation
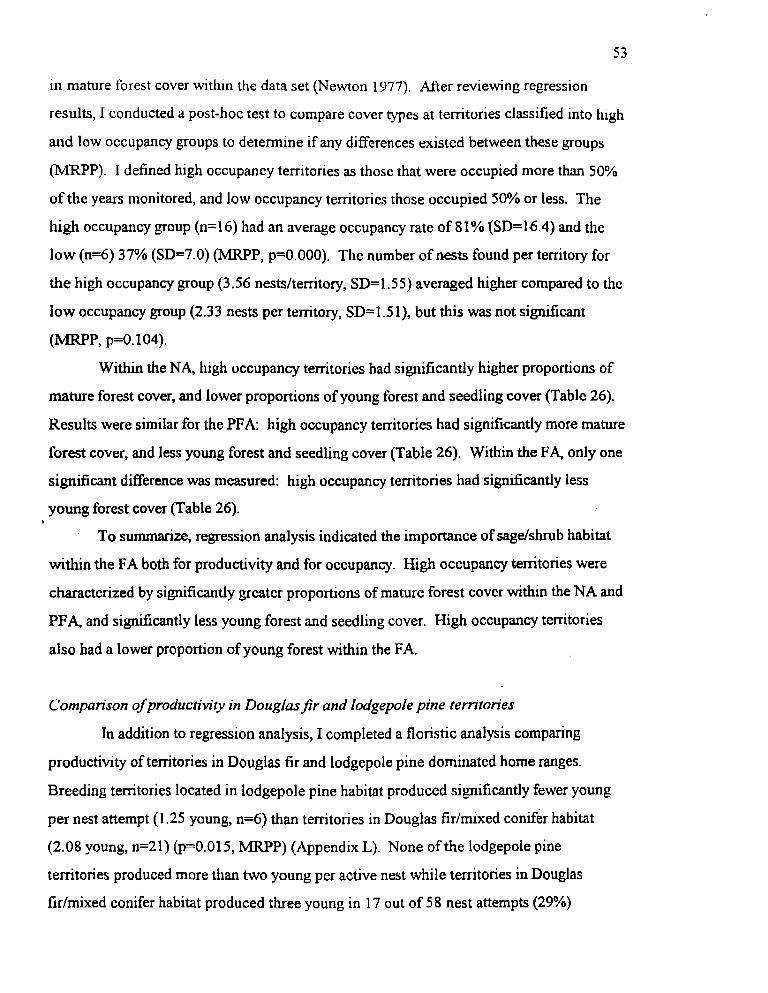
53
in mature forest cover within the data set (Newton 1977). After reviewing regression
results, I conducted a post-hoc test to compare cover types at territories classified into high
and low occupancy groups to determine if any differences existed between these groups
(MRPP). I defined high occupancy territories as those that were occupied more than 50%
of the years monitored, and low occupancy territories those occupied SO% or less. The
high occupancy group (n=l6) had an average occupancy rate of 81% (SD=16.4) and the
low (n=6) 37% (SD=7.0) W P , p=O.OOO). The number of nests found per territory for
the high occupancy group (3.56 nestdterritory, SD=l.S5) averaged higher compared to the
low occupancy group (2.33 nests per territory, SD=l S l ) , but this was not significant
(MRPP, p=O. 104).
Within the NA, high occupancy territories had significantly higher proportions of
mature forest cover, and lower proportions of young forest and seedling cover (Table 26).
Results were similar for the PFA: high occupancy territories had significantly more mature
forest cover, and less young forest and seedling cover (Table 26). Within the FA, only one
significant difference was measured: high occupancy territories had significantly less
young forest cover (Table 26). . To summarize, regression analysis indicated the importance of sagdshrub habitat
within the FA both for productivity and for occupancy. High occupancy territories were
characterized by significantly greater proportions of mature forest cover within the NA and
PFA, and significantly less young forest and seedling cover. High occupancy territories
also had a lower proportion of young forest within the FA.
Comparison of productivity in Douglas fir and lodgepole pine tenitones
In addition to regression analysis, I completed a floristic analysis comparing
productivity of territories in Douglas fir and lodgepole pine dominated home ranges.
Breeding territories located in lodgepole pine habitat produced significantly fewer young
per nest attempt (1.25 young, n=6) than territories in Douglas fidmixed conifer habitat
(2.08 young, n=21) (p-0.015, MRPP) (Appendix L). None of the lodgepole pine
territories produced more than two young per active nest while territories in Douglas
firhixed conifer habitat produced three young in 17 out of 5 8 nest attempts (29%)
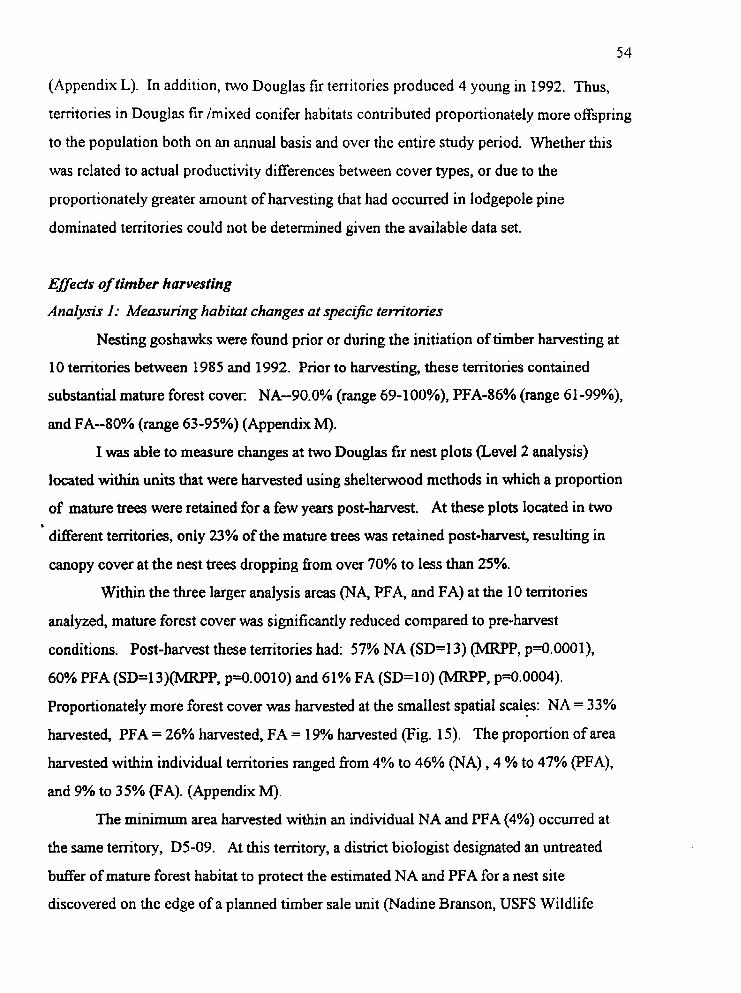
54
(Appendix L). In addition, two Douglas fir territories produced 4 young in 1992. Thus,
territories in Douglas fir /mixed conifer habitats contributed proportionately more offspring
to the population both on an annual basis and over the entire study period. Whether this
was related to actual productivity differences between cover types, or due to the
proportionately greater amount of harvesting that had occurred in lodgepole pine
dominated territories could not be determined given the available data set.
Effects of timber harvesting
Analysis I: Measuring habitat changes at specry5c tern-tories
Nesting goshawks were found prior or during the initiation of timber harvesting at
10 territories between 1985 and 1992. Prior to harvesting, these territories contained
substantial mature forest cover: NA-90.0% (range 69-1 OO%), PFA-86% (range 61-99%),
and FA-80% (range 63-95%) (Appendix M).
I was able to measure changes at two Douglas fir nest plots (Level 2 analysis)
located within units that were harvested using shelterwood methods in which a proportion
of mature trees were retained for a few years post-harvest. At these plots located in two
different territories, only 23% of the mature trees was retained post-harvest, resulting in
canopy cover at the nest trees dropping from over 70% to less than 25%.
Within the three larger analysis areas (NA, PFA, and FA) at the 10 territories
analyzed, mature forest cover was significantly reduced compared to pre-harvest
conditions. Post-harvest these territories had: 57% NA (SD=13) (MRPP, p=O.OOOl),
60% PFA (SD=13)(MRPP, p=O.OOlO) and 61% FA (SD=lO) CMRpP, p=0.0004).
Proportionately more forest cover was harvested at the smallest spatial scales: NA = 33%
harvested, PFA = 26% hawested, FA = 19% harvested (Fig. 15). The proportion of area
harvested within individual territories ranged from 4% to 46% (NA) , 4 % to 47% (PFA),
and 9% to 35% (FA). (Appendix Ivl).
The minimum area harvested within an individual NA and PFA (4%) occurred at
the same territory, D5-09. At this territory, a district biologist designated an untreated
buffer of mature forest habitat to protect the estimated NA and PFA for a nest site
discovered on the edge of a planned timber sale unit (Nadine Branson, USFS Wildlife
5 5
Biologist, Teton Basin District, Driggs, ID 83422, pers. corn. 1990). Smaller, untreated
buffers surrounding known nest sites were also retained at D1-09, D1-10, D2-02, D4-01,
and DS-07, but the proportion of area harvested within the NA still ranged between 34% to
46% at these territories (Table 27-marked by asterisks, Appendix M).
In the post-harvest period, I documented goshawk use at eight of these 10
territories. Occupancy rates post-hawest ranged from 0% to 100% per territory (mean =
47%, SD=33) for monitoring periods that ranged from 2 to 5 years per territory (Table 27).
Data on occupancy in the pre-harvest period was available for only four territories.
Average pre-harvest occupancy was higher at these four territories (mean=79%, SD=25)
compared to the post-harvest period, but was not statistically different, reflecting high
variance and small sample numbers (MRPP, p=O. 157, Table 27). Average number of
young produced per nest in the pre- and post-harvest periods was also not significantly
different (MRPP, p=0.63 1, Table 27).
To summarize, timber harvesting at known goshawk territories significantly
reduced mature forest cover within the NA, PFA, and FA analysis areas. Reductions were
greatest in the central part of the nesting territory within the NA and P F q compared to the
FA . Occupancy tended to be lower in the post-harvest period, but when nests were
occupied, goshawks produced a similar number of young compared to the pre-harvest
period.
Analysis 2: Occupancy patterns ut post-harvest tem'tories
Fifteen territories in post-harvest areas, i.e. those territories with 5% or greater.
seedling cover in the NA and PFA, that had been monitored a minimum of two years were
classified into either a high (more than 50% occupancy rate) or low occupancy group (50%
or lower occupancy rate) (Appendix N). The difference in occupancy rate between these
groups, 72% vs 27%, was statistically significant (MRF'P, p=0.002). High occupancy post-
harvest territories had a greater proportion of mature forest cover at all three levels. This
difference was significant at the NA level (MRPP, p=0.004), but not at the PFA or the FA
levels (Table 28).

56
I also ran a regression analysis of occupancy as a function of mature forest cover at
the three spatial levels. Occupancy was related to one variable: the percent of mature forest
within the NA (stepwise regression, F=8.685, ? adj=0.354, p=O.O1 1). The resulting
regression equation was: occupancy, percent arcsine transformed = -0.030 + 0.106 (mature
forest NA, % arcsine transformed). This regression for post-harvest territories (Fig. 16)
appears to have more predictive value than the regression shown earlier between
occupancy and cover types based on data from all current territories (Fig. 14). More
temtones fall within the 95% confidence limits (Fig. 16).
I also compared the number of nest trees found in the high and low occupancy
groups. There was a significant difference. High occupancy territories contained an
average of 4.0 nests (SD=l.S) and low occupancy 1.7 nests (SD=l.4) (MRPP, p=0.022,
Appendix N). This could indicate either that breeding adults failed to return and build
additional nests after the loss of some nest trees to harvesting, or that alternate nest trees
were located at greater distances than the area surveyed and were not found. It also
suggests that perhaps the lack of suitable nests trees might explain why the proportion of
mature cover within the nest area is related to occupancy rates. The amount of mature.
forest cover retainedwound nest trees in the nest area may be a critical Eactor, rather than
the absolute amount of mature forest cover retained in the nest area.
Overall trends of occupancy showed a different pattern for territories where no
buffers or only minimal buffers were retained around known nest trees, and territories
where known nests stands were protected by buffers of undisturbed mature forest habitat.
In territories where known nest sites were given minimal or no protection, a lag response
occurred: goshawks used a disturbed territory a few years post-harvest but then use
appeared to drop off (Table 27). Nesting goshawks were found up to three years post-
harvest but not in subsequent years @1-04, D1-09, D1-1 1, D2-02, D5-07) (Table 27). At
well buffered sites, goshawks were not present each year but were found nesting up to four
or five years post-harvest (Dl-10, D4-01, D5-09) (Table 27). Monitoring data from the
1980's for the historical territories D5-01 and D5-05 showed a similar type of lag response
(Patla and Trost 1995b). The result of a lag response would be to inflate occupancy rates
in the immediate post-harvest period. The determination of no significant difference in

occupancy rates pre-and post-harvest reported for territories in the previous section might
be a short term phenomenon.
Analysis 3: Historical tem'ton'es no longer used by goshawks
In addition to analyzing current territories, I classified vegetation at three historical
goshawk territories where goshawk nests had been found prior to my study @3-02, D3-04,
DS-01) (Table 29). Available monitoring data from the pre-study period for these three
territories varied (Patla and Trost, 1 995b, Table 10). At D3-02, a goshawk stick nest was
found in 1981 by Great Gray Owl researcher, Alan Franklin, occupied by a Great G a y
Owl. This stand, though scheduled for harvesting, was conserved. A district biologist
returned to check this site for activity during the nesting season for 7 years but no
goshawks were found (Gail Worden, former Ashton District Biologist). At D3-04, an
active goshawk nest was found in a firewood sale unit in 1985. This site was also checked
by Gail Worden over the next four years. Again, no goshawks were found. Both of these
sites are located in the Island Park caldera area in areas of extensive salvage logging. The
third temtory was found in the Jackpine Loop area in the foothills of the Teton Range
north of Driggs where lodgepole pine salvage harvests had also occurred in the mid to late
1980s. In this area, three active goshawk nests were found during timber sale related
activities in 1980, 1981, and 1986 F e w Becker, field notes, former Teton Basin District
Biologist).
Intensive broadcast surveys in 1992 andor 1993 within a 1.6 kilometer radius of
former nest stands failed to find any evidence (goshawk sightings, feathers, pluckings, prey
remains) that nesting goshawks currently reside in these historical territories.
Comparing, pre and post harvest conditions at these territories (Fig. 17), the
average propofiion of mature forest harvested at each analysis level was large: NA 62%
cut, PFA 45%, and FA 46%. Remaining mature forest cover at these sites averaged: NA
3 7%, PFA 49%, and FA 47% (Table 29). The highest proportion of mature forest cover
found at any territory and any analysis level was 58% in the PFA of D5-01. Surveying these
territories, I found few remaining mature stands that appeared to have adequate structure
for nesting habitat compared to known nest stands on the TNF. Patches of mature forest
S8
left in these areas had either low canopy cover, low density of mature trees, small patch
size, small diameter and height of remaining trees, or a combination of these attributes.
Other raptor species found nesting in these territories included Red-tailed Hawk
(Buteojumaicensis) (2 nests D3-04, fledglings D5-Ol ), Cooper's Hawk (nest used by
unidentified owl DS-01), and Great Gray Owl (nest D3-04). An active Common Raven
nest (Corvus corux) was also found in D3-04. Other raptors sighted in these areas included
Golden Eagle (Aquilu chrysaetos) (D5-01), Red-tailed Hawk (adults seen all territories),
Swainson's Hawk (Buteo swainsonz] (D3-02, DS-01 ), American Kestrel (Fulco spurverius)
@3-04), and Turkey Vulture (Cuthams aura) (DS-01). Except for evidence of a Cooper's
Hawk, all the other raptor species noted were those associated with open country rather
than forest habitats (Johnsgard 1990). Inter-specific competition between goshawks and
other raptors better adapted to utilize open areas may contribute to the absence of
goshawks in post-harvest areas (Crocker-Bedford 1990; Kenward 1996).
DISCUSSION Evaluation of the database
One of the difficulties in studying raptor nesting ecology and habitat is that study
samples are often too small to be effective for evaluating results (Newton 1976). Factors
that often make raptor nest sites hard to find (secretive behavior of nesting birds, low nest
density, and nests located in remote and inaccessible places) are especially true of the
goshawk. Broadcast surveys, the most widely used method for locating goshawk nests, are
extremely time consuming. Response rates reported from broadcast suweys of previously
unsurveyed areas equaled one response per 1 6.5 survey hours (1 99 1) and 1 8.8 hours
(1 992) in northern Anzona (Joy et al. 1994), and one response per 22.8 hours in eastern
Idaho (Patla and Trost 1995a). In both of these areas, approximately 30 kmz had to be
swveyed on average to find one active nest. To obtain an adequate sample for this study, I
used every method possible given available resources to lucate active nests. Part of my
s h t e g y was to include nests from as many different areas on the TNF to gain an
understanding of the range of habitats used by the goshawk on this large National Forest.

59
Basing a habitat study on nests found opportunistically, however, may result in a biased
estimate of habitat requirements (Siders and Kennedy 1996, Squires and Ruggiero 1996,
Mosher et al. 1987). It has also been suggested that goshawk nest sites found mainly in
the vicinity of active timber sales might bias data toward bigger and older trees (Hayward
and Escano 1989).
Of the 27 current territories used in this study, nearly half (44%) were located
outside of active timber sale areas. Only five of the 27 temtories, however, were located in
management areas classified as unsuitable for timber harvesting. Thus, 82% of the study
territories (22/27) were found in areas on the TNF considered suitable for harvesting.
Since 57% of the forested land on the TNF has been classified as suitable, the database
appears to be biased towards nest sites found on lands managed for timber. However,
given the definition of suitable forest land (see Study Area: Forest Composition and
TzmberManagement) it is reasonable to assume that these lands would be more productive
overall and contain more forest area structurally suitable for goshawk nesting habitat than
areas classified as unsuitable. Also, since density of nesting raptors is related to soil
productivity and overall prey abundance (Newton 1986), it is likely that a higher
proportion of nesting goshawks occurs in areas on the TNF classifiedas suitable for timber
production.
.
I used two approaches to evaluate bias from non-random selection methods or
over-representation of nest sites from timber management areas, First, I compared nest
sites at two Douglas fir territories found in 1993 during a large-scale systematic survey in
the Centennial Mountains to Douglas fir nest sites found opportunistically in other areas of
the TNF (n=37 nest trees at 15 territories). Comparing nest site and nest plot habitat
parameters, the only significant difference was that nest sites found opportunistically were
located closer to the forest edge (Table 30) (Patla and Trost 1995a). Distance to edge data
presented in Figure 9 supports the idea that a disproportionate number of nest sites in the
data set were found close to the forest edge. Interior nesting territories were probably
under-represented, but this did not appear to bias measurements of nest site and nest plot
structural and topographic features of goshawk nest sites. Considering the larger habitat
analysis levels (NA PFA and FA), territories fouxid using systematic survey methods had
60
very high proportions of mature forest cover within the estimated home range area
(NA=I OO%, PFA=95%, and FA=80%) (Patla and Trost 1995a). My data set of nesting
territories, if biased toward sites located near the forest edge, may also be biased toward
territories that contained less mature forest cover due either to natural or human causes.
For the second evaluation of bias, I compared five current nesting territories found
in management areas classified as unsuitable for timber management to 22 territories found
in suitable management areas. The five territories in unsuitable management areas were
located in the Beaverhead Mountains (2), Henry’s Lake Mountains (I), and the Big Hole
Mountains (2) (Table 2: D1-02, D1-03, D2-04, D5-IO, D5-11). Only two variables were
significantly different: nest sites in areas suitable for timber management tended to have
larger nest trees (dbh =51.S vs 35.2 cm; MRPP, p=0.014) and lower canopy cover within
nest plots (69% versus 87%; MRPP, p=O.O19) (Table 3 1). While this result appears to
support the idea that nest sites found primarily in timber sale areas might be biased toward
bigger trees (Hayward and Escano 1989), the average diameter and density of mature trees
within nest plots were not significantly different.
Evaluations of potential bias in this data set, although based on a small number. of
comparisons, indicates that my analysis of goshawk nesting habitat data was not seriously
biased. From a management perspective, the most serious bias appears to be the under-
representation of interior forest nest sites.
v
Evaluation of monitoring data
There is a potential bias in the monitoring data, since initial checks at most
territories occurred after the nest construction and early part of the incubation period. In some years, in fact, I did not check a few territories in outlying regions of the TNF until
late July or early August. Monitoring later in the breeding season would not detect early
nesting attempts by goshawh that failed. Ifthere was a substantial number of such
failures, the actual rates of temtory reoccupancy could be higher than my data suggest
(Steenhof and Kochert 1982).
To evaluate this potential bias, I evaluated when initial checks of territories were
completed between 1989 and 1994. Initial territory check dates were classified into one of
61
four periods relating to the chronology of events during the breeding season: pre-nesting
(April to May 5), incubation (May 5-June 6), nestling (June 7-July 14), fledgling (July 15-
August 15). Out of a total of 146 initial territory checks: 19 (1 3%) were compicted during
the pre-nesting period, 44 (30%) during the incubation period, and 54 (37%) during the
nestling period. Only 29 (20%) were completed during the fledgling period when the
probability of observing signs of failed nesting attempts such as freshly rebuilt nests, prey
remains, or presence of unsuccessful breeding adults would be greatly reduced. The
proportion of territories that were checked in the fledgling period was highest in the early
years of the study when I had no field assistants (43% in 1989 and 1990, and 33% in
1 Wl), and decreased substantially in later years: 7% (1 992), 3% (1 9931, and 10% (1 994).
In a two year study of 98 occupied nests in northern Arizona, 3% of nests failed
prior to or during early incubation. An additional 6% each were lost during the incubation
and the nestling period for a total failure rate of 15% from pre-incubation through the
nestling period (Reynolds et al. 1994). On the TNF, I measured a combined failure rate of
9% in the incubation and nesting period. Efailure rates are similar between the two areas,
data from Arizona suggest that while the calculated rate of territory reoccupancy on the
TNF would be higher if all territories could have been checked consistently between mid-
April and early May, the increase in territory occupancy overall probably would have been
less than 10%.
Nesting chronology
Nesting chronology on the TNF was very similar to dates reported elsewhere in the
western United States (Table 32). Goshawks on average start incubation between mid-
April to early May and fledge young in the early part of July (Table 32). There is a rather
remarkable consistency of dates reported from over a wide geographical and elevational
range
Incubation dates for other raptor species in the vicinity of the TNF that are potential
nest site competitors ranged from early April for Great Horned Owl, first three weeks in
April (peak April 10-1 1) for Red-tailed Hawk mid-April to early May for the Great Gray
Owl, and mid-May for Swainson's Hawk (Buteo swainsonz) (Franklin 1988; Whitfield and

62
Maj 1993; Smith 1994; S. Patla, unpubl. data). Great Gray Owl incubation overlaps most
closely with the goshawk, leading to the greatest possibility for direct conflicts over nest
sites. Although other studies have reported use of goshawk nests by Red-tailed Hawks and
Great Homed Owls (Moore and Henny 1983, Crocker-Bedford 1990, Woodbridge and
Detrich 1994), I recorded only one instance of a goshawk nest being used by a Great
Horned Owl. As noted earlier, Great Gray Owls were found at 30% of the current study
territories.
Productivity
The number of young fledged per active nest (1.96 younghest, Table 3) falls
within the range of values from older study sites in North America and Europe as
summarized by Reynolds and Wight (1 978). Most current study areas have reported fairly
similar averages for number of young per active nest including 1.93 in northern California
(Woodbridge and Detrich 1994); 1.9 in northern Arizona (Boal and Mannan 1994), 1.8-
2.0 in northern Arizona (Reynolds et al. 1994); 1.2-2.8 in northern Nevada (Younk and
Bechard 1994), and 0.7-2.2 in eastern Oregon 0.7-2.2 (DeStefmo et al. 1994). . Percentage of successful nests reported for goshawks ranged between 80 and 90%
at these same study areas, although results may have been biased high due to inability to
check all nests in the pre- and early incubation periods (Boa1 and Mannan 1994). Reasons
for goshawk nest failure and nestling mortality could not be ascertained in most instances
unless observations were made from blinds or by climbing nest trees. Boal and Mannan
(1 994) attributed 45% of nestling mortality to Great Homed Owl predation and 1 8% to
falling from the nest. Woodbridge and Detrich (1 994) reported 1 8% of nest failures
resulted fionl Great Homed Owl predation and 18% from severe spring storms.
Sirnilax to my findings, a correlation between cold, wet weather in the spring and
low productivity has been reported from Europe for the goshawk and for the European
Sparrowhawk (Accipiter nisus). h Germany, number of young goshawks fledged per pair
was correlated with April-May temperature, May temperature and rainfall days in May; and
the percentage of laying pairs was negatively correlated with March, and March and April
rainfall (Kostrzewa and Kostrzewa 1991 a). No significant relationship with weather were
63
found in June (Kostrzewa and Kostrzewa 1991 a) or with winter weather factors such as
temperature or snow cover (Kostrzewa and Kostrzewa 1991 b). Newton (1986) reported a
delay in sparrowhawk hatching date and reduction in total number of nesting pairs related
to poor weather in March and April.
Direct negative effects of cold and wet weather on raptor productivity and
occupancy during the pre-nesting and early incubation periods may include: increased
energy expenditure by breeding adults and associated reduction in body weight; death of
nestlings due to hypothermia, especially during the first week post-hatching; and reduction
in prey availability andor numbers resulting in reduced prey deliveries and starvation
(Kostrrewa and Kostrzewa 1991 a, Newton 1986). Rain has been shown to affect raptor
breeding success differentially in Australia, resulting from plumage differences among
species (Olsen and Olsen 1992). Weather appeared to be one of the most important
limiting factors for reproductive success of tree nesting raptors compared to those nesting
in more sheltered sites (Kostrzewa and Kostrzewa 1 99 1 a).
Few studies have been undertaken on the effects of weather on social behavior of
raptors (Temeles and Wellicome 1992). The observation of sibling aggression during a
period of wet weather and of reduced prey deliveries on the TNF indicates that the absence
of the adult female from the nest during a time of food shortage may be a proximate cause
of silblicide (see also Boa1 and Bacorn 1994).
The fact that good productivity (2-3 young produced) occurred at some nest sites
on the TNF even in years of poor spring weather (Table 3), suggests that differences in
vegetative structure and related microclimatic factors at some territories may create better
protection for nests and offer more opportunities for foraging in bad years. Selection by
the goshawk of dense canopy stands for nesting has been attributed to a sensitivity to
insolation at nest sites (Hall 1984; Reynolds 1984). However, protection from snow, rain
* and wind in the early part of the season may be an equally important fhctor.
Occupancy of nests and territories
Long term studies of occupancy patterns at goshawk territories are rare in North
America. In a few areas, historic territories discovered earlier have been resurveyed by
\

64
researchers for occupancy, but data were not available for the intervening years @ull and
Hohmann 1994; Crocker-Bedford 1990). In the longest term study to date, Woodbridge
and Detrich (1 994) monitored goshawk territories in Northern California over an eight year
period at three spatial levels: nest trees, nest stands, and nest stand clusters (all alternate
nesting stands in a territory based on surveys within 1.6 km radius area of known nests).
They reported a mean occupancy rate for individual nest trees of 49% (SD=ll) at 26
temtories over at least a 5 years period. Thirty seven out of 85 nest attempts (44 %) were
in nests used the previous year. At territories monitored for at least five successive years,
individual nest stands were occupied an average of 46% (SD=6) and entire nest stand
clusters, 74% (SD=6%) of the years monitored. Nest stand clusters were the collection of
all stands that were used for nesting in a territory.
Nest occupancy rates of individual trees on the TNF, calculated for all nests on a
per year basis, was only 18% for goshawk. Recalculating nest occupancy based on nests
monitored for five or more years resulted in an occupancy rate of 47% (711 5 total nests
reoccupied at least once), similar to northern California (Woodbridge and Detrich 1994).
Only 2 nest attempts (4%) on the TNF, however, occurred in nests used the previous year,
and one of those attempts failed.
Reoccupancy of territories on the TNF based on all survey levels (A,B,C) was close
to that reported for individual nest stands (equivalent to Level C surveys) in northern
California (Woodbridge and Detrich 1994): 4 1 % versus 46% respectively. Based only on
territories surveyed at levels A and B (03 to 1.6 km radius area surveyed), the reoccupancy
rate on the TNF increased to 61%, which was lower than the 73% reported by Woodbridge
and Detrich (1 994) for nest stand clusters. The lower rate on the TNF probably resulted
from differences in survey effort. In northern California, 1.6 km areas were surveyed
around each previously used nest, not just a subset of nests.
Three points are important in regard to the occupancy data. First, survey results
and occupancy rates from the TNF and northern California show that occupancy rate is
proportional to the amount of area surveyed around known nests. Monitoring based only
on checks of known nest stands missed almost 30% of nesting attempts (Woodbridge and
Detrich 1994). For my study, I assumed that I found a majority of active nest sites at
65
territories surveyed either at Level A and B (within 0.8 to 1.6 km of known nests). Ifthis
assumption was not correct, then levels of occupancy may have been higher than what I
reported here.
Second, large fluctuations were measured in annual occupancy rate on the TNF.
Percent occupancy of territories in the best year, 1992, was nearly double compared to
1994, the lowest year (Table 8). Although productivity alternated between above and
below average years, occupancy remained low for two consecutive years: 1993 and 1994.
The fact that productivity was high and occupancy low in 1994 suggests that breeding
birds failed to return to territories, indicating perhaps high mortality during the non-
breeding season and a lack of floaters or unmated birds without territories in the
population to replace breeding adults. The remarkable stability reported for many raptor
nesting populations has been attributed to a ready supply of replacement breeders in a
population (Newton 1979). Immigration of replacement breeders is thought to buffer
declines in Northern Spotted Owl populations that have low adult survivorship rates
(Burnham, et al. 1996).
Data on goshawk mortality during the non-breeding season are rare. Kenward .
(1 996) has suggested that goshawks in North America may experience both greater food
shortages and interspecific competition in winter compared to European populations
(Kenward 1996). Radio-tagged adult goshawks nesting in southcentral Wyoming were
found to migrate to Colorado in the winter; mortality of one male was attributed to eagle
predation (Squires and Ruggiero 1995). Data are needed on winter ecology of goshawks
to determine to what degree mortality during the non-breeding season influences
occupancy of breeding territories. Color-banding studies are also needed to measure
demographic parameters and replacement rate of breeding adults since little is known
concerning the goshawk (DeStefano et al. 1994).
Third, although occupancy of nest trees was similar on the TNF and in northern
California (47% vs 49% for nest trees monitored over at least a 5 year period), reoccupancy
of individual nest trees in consecutive years was much lower on the TNF, 4% versus 44%
(See Results: Reoccupancy ofNest Trees; Woodbridge and Detrich 1994). This could
result from two interacting phenomena: differential availability of nest sites, and different

66
predation pressures. Woodbridge and Detrich (1 994) described their study area as
intensively harvested and fragmented, with goshawks nesting in the remaining patches of
mature forest. This type of harvesting would reduce and concentrate the total number of
potential nest trees so goshawks might be forced to reoccupy the same nests more
frequently. Although habitat fragmentation and concentration of nest clusters would
appear to result in higher predation pressure compared to less fragmented areas, such
habitat changes might actually reduce or eliminate interior forest mammals in the family
Mustelidae that have been reported to prey on nesting goshawks such as pine marten (this
study), fisher (Martex pennanri) (Erdman 1993) and wolverine (Gulo gulo) (Doyle and
Smith 1994). Studies of nest box use by owls in Sweden showed that martens have spatial
memory of nest locations and will predate boxes left in the same location in consecutive
years (Sonerud 1985). Goshawks nesting in intact forests may switch nests not only
because they have more choices for alternate nest sites, but also to avoid mammalian
predators.
Goshawk prey . Goshawks are opportunistic foragers, preying upon a variety of different bird and
mammal species (Reynolds 1992, Doyle and Smith 1994). On the TNF, however, over
72% of prey biomass consisted of four species: snowshoe hare, Unita ground squirrel,
Ruffed Grouse and Blue Grouse (Table 9), and one male goshawk during the nestling
period fed almost exclusively on ground squirrels. Decreases in the populations of these
primary prey species due to natural cycles or man-caused disturbances may well explain
some of the fluctuations observed in productivity and occupancy at breeding territories
(Doyle and Smith 1994). In Finland, goshawk clutch size correlated with density of four
tetraonid species which peaked every 6-7 years (Sulkava et al. 1995). Population databases
on local prey species are not maintained by the Idaho Department of Fish and Game (Jeff
Copeland, Non-game biologist, Idaho Dept. of Fish and Game, pen. comm.), however, so I
could not correlate annual goshawk population fluctuations with prey cycles.
&7
Habits t analysis
Nest sites
Goshawk nest tree and nest plot structural characteristics on the TNF were similar
to those reported from other conifer habitats in the western United States outside of Alaska
(Hayward and Escano 1989; Jones 1979; Marshall 1992; Reynolds et al. 1992). Nests were
placed close to the trunk at or below the main green canopy with few exceptions. Almost
all nests were placed in dominant or codominant live trees in mature stands but were
usually not in the largest tree in a stand as reported by Reynolds (1 989) and Squires and
Ruggiero (1 996). Nest plots were characterized by high tree density and canopy cover;
plots were multi-storied in almost all cases with a fairly uni€om upper canopy layer. Nest trees tended to be located in single species conifer sites on the lower and middle portions
of moderate slopes with northwestern aspects.
The only published data on goshawk nest sites in Idaho were based on 17 nests in
northern Idaho and western Montana (Hayward and Escano 1989). These nest sites were
found over a broad geographic area encompassing two distinct climatic zones (on the east
and west sides of the Continental Divide), and a wide variety of forest types. The majority
of sites were found during timber sale operations. Since their plot size (0.04 ha) differed
from that used on the TNF, I converted trees per plot to trees per hectare. Mean nest tree
height, nest tree diameter, nest height and canopy cover were not significantly different
compared to sites in Douglas fir and lodgepole pine habitats on the TNF (Table 33). Basal
area on the TNF was significantly lower, however (Table 33). Comparing density of
different size-classes of trees, the greater basal area in the more northern forests resulted
fiom substantially more trees in the pole-sized (7.6-17.8 cm dbh) and small sawtimber
categories(l7.8-30.4 cm dbh) (Table 33). Density of medium (30.4-60.9 cm dbh) and large
sawtimber (>60.4 crn dbh) was not significantly different (Table 33). This comparison,
based on sites fiom a large area, indicates that goshawks in the northern Rocky Mountain
region are selecting nest sites with very specific structural characteristics. Nest sites are
characterized by large nest trees, high canopy cover and a component of larger-sized trees
in the nest stand.

68
Nest site habitat selection
According to current theory, factors important in h,abitat selection by birds are
scale-dependent. Recognition processes are thought to precede in a hierarchical (Hutto
1985) or branching fashion (Klopfer and Ganzhorn 1985). Responses to specific fine-scale
floristic and structural vegetation attributes should be important in choosing nest sites
within the larger home range area (Wiens and Rotenberry 1981).
Only a few goshawk habitat studies have included analysis of habitat selection
based on comparisons of nest sites to random sites ( Hall 1984, Speiser and Bosakowski
1987, Crocker-Bedford and Chaney 1988, Hargis et al. 1994). On the TNF, goshawks
selected nest sites in mature forest stands on north and west-facing aspects that had greater
basal area, taller trees, more,trees in the 38.0-45.5 centimeter dbh size class, and mare
space beneath the canopy compared to available habitat (Table 22). Squires and Ruggiero
(1 996) found many of the same structural variables to be significant in their study of
goshawk nest site selection in south central Wyoming. Forest cover types in their study
area included lodgepole pine with scattered aspen at lower elevations, and Engelmann
spruce and subalpine fir at higher elevations. All nests were found in the lower elevation
forest, Nest trees were significantly larger (height and dbh) than random plot center trees.
Nest plots (0.04 ha circles) had greater basal area, greater density of large trees (22.640.4
cm dbh), greater height to live canopy, and greater average tree height compared to random
plots (Squires and Ruggiero 1996). As an the TNF, they did not find a significant
difference in canopy cover which averaged 67% at nest sites and 60% at random sites.
Many of the significant structural differences measured in nest plots in south
central Wyoming also distinguished nest stands (groups of trees with homogeneous forest
structure 0.4-13.0 ha in size): higher density of large trees, taller trees, and greater height
to live canopy. Random stands had a significantly higher density of small trees (6.4-12.5
cm dbh) (Squires and Ruggiero 1996).
Results fiom these two habitat selection studies and the previous section show that
patterns of goshawk nest site selection in the Rocky Mountain region are consistent even in
different forest cover types. Taller and larger trees distinguish nest sites and stands from
available habitat. Habitat selection studies from other areas in the United States have also
69
found that goshawks place their nests in forests that contain a higher density of large
mature trees and greater basal area (Hall 1984, Speiser and Bosakowski 1987, Hargis et ai.
1994). These characteristics most likely reflect selection for nest stands that provide
nesting platforms of adequate size, protection from predators and weather, and room for
adult goshawks to maneuver beneath the canopy. Absolute values of habitat characteristics
differ, however, depending upon the specific forest cover type where nests are located. I
found significant differences in tree size, canopy cover, basal area and size class
distribution of live trees between nest sites located in the two predominant forest cover
types on the TNX;: Douglas fir and lodgepole pine (Tables 12-1 6).
Nest clusters
Early research on goshawk nesting habitat focused on describing a small activity
area (4-10 ha) surrounding nests occupied by goshawks in a given year (Reynolds et a1
1982, Bartelt 1 974). Delineation of the 'hest site" or "nesting territory" in these early
studies was based on observations of unmarked adults and fledged young as well as
locations of plucking and roost sites (Reynolds 1983), or on the distance around the nest
defended by the female adult goshawk (Bartelt 1974). Even though the existence of
alternate nests was acknowledged, the combined area containing all alternate nests in a
territory was not considered for analysis. Stands (defined as groups of trees With unique
vegetative characteristics) in which nest trees were found have also been described by
researchers (Reynolds et a1 1982, Hall 1984, Kennedy 1988, Squires and Ruggiero 19%)
but usually without reference to the matrix of vegetation surrounding such stands.
Although of some value and interest, the drawback of stand analysis is the implication that
goshawks prefer or select 8-1 2 hectare stands in which to place their nests (see Hejl et al.
1995 for an example of this). If habitat selection was occurring for larger patch sizes, it
could not be determined from such an approach.
Data collected over a multi-year period at different study areas show that goshawks
use a number of alternate nest sites within a territory and these sites can range from less
than 100 m to over two kilometers apart (Reynolds et al. 1994, Woodbridge and Detrich
1994). The mean distance measured between alternate nests occupied in consecutive years
70
in different parts of the western United States was quite consistent: 285 rn on the TNF (n=24), 272 m in northern California (n=45) (Woodbridge and Detrich 1994), and 266 m
in northern Arizona (n=17) (Reynolds et al, 1994). This suggests that the use of widely
spaced alternate nests is not a response to local conditions, and that goshawks most likely
select nesting areas that can provide a number of potential nest sites.
Woodbridge and Detrich (1 994) found a relationship between patch size and
occupancy rates of goshawk temtories. They reported that for nest stand clusters greater
than 61 ha, occupancy of territories was nearly 100% over a five year period compared to
less than 50% occupancy at clusters <20 ha (Woodbridge and Detrich 1994). These data
strongly support the idea that patch size plays a role in goshawk selection of nest areas.
I did not attempt to measure patch size of nest sites on the TNF due to the difficulty
of defining what constitutes a patch in complex forest environments. At traditional
territories on the TNF that contained more than one nest tree, the average distance between
the most widely spaced nest trees within a cluster equaled 498 rn & 298 m (Table 6). The
area of a circle with a radius this length equals 78 ha, which is nearly identical to the site
of the NA analyzed in this study (81 ha). Data collected on mature forest cover within'
predetermined analysis areas in the territory core (NA and PFA), though not a direct
measure of patch size, suggest that patch size is a component of goshawk nest site
selection. The proportion of mature forest cover was greatest within the NA and PFA
respectively, and averaged over 60% (Table 21, Fig. 10). In addition, comparison of high
and low occupancy territories (Table 26) showed that high occupancy territories had
significantly greater proportions of mature forest cover within 243 ha surrounding known
nests (NA and PFA). To determine selection for patch size, a comparison of habitat within
a series of concentric circular plots surrounding nest and random points would need to be
made. In a similar study of spotted owl nesting habitat in northwestern Californiq there
was a significantly greater amount of mature forest, and less fragmentation of forest cover
up to 1200 m surrounding nest sites compared to random sites (Hunter et al. 1995).
71
Ephemeral territories
The total number of alternate nest trees at current territories on the TNF averaged
3.0 (81 treed27 territories); however, at 26% (7127) of the territories, I found only one
nest tree. At four of these territories (Dl-09, D2-05, D2-06, D2-07), searches for alternate
nests were completed in a 1.6 kilometer radius of known nest sites but no additional nests
were found. These territories, all in post-harvest areas of the TNF, appear to be ephemeral
territories as defined by Woodbridge and Detrich (1 994). In contrast to traditional nesting
territories, where known nest clusters were occupied predictably by goshawks, ephemeral
territories were occupied less frequently and nest sites were highly dispersed (Woodbridge
and Detrich 1994). In northern California, these types of territories were associated with
fragmented areas of lodgepole pine as were those found on the TNF (Woodbridge and
Detrich 1994).
Newton has suggested that the continued use of particular nest sites over a number
of years indicates their superiority to other potential local nesting areas (Newton 1976).
Since all sites are not equal, competition for superior nest sites probably occurs. Poor or
marginal territories may be suitable for nesting only in particular years or by certain birds
(Newton 1991). It is likely that the single-nest ephemeral territories represent marginal
nesting habitat. While such sites might be considered by some to indicate a wide
ecological tolerance by the goshawk, data fiom the TNF and northern California show that
they represent exceptional situations compared to the majority of territories. Low
occupancy rates suggest that these territories may represent sinks for surplus birds
produced at other, source territories Cpulliam 1988).
I
Summary of habitat analyses within estimated home range areas
Overall, home range areas composed of less than SO% mature forest cover were the
exception, not the norm. Mature forest cover predominated within the nest area, post-
fledgling family area, and the foraging area at the majority of current nesting territories
analyzed. Moving out from the core area towards the periphery of the home range, the
proportion of mature forest decreased (Fig lo), and more area was covered by sagdshrub
and open habitat (Douglas fir/mixed conifer territories) or seedlinghapling and young
72
forest cover (lodgepole pine territories). Differences in the amount of mature forest cover,
however, were not statistically significant among the three analysis areas (Table 21).
Although I did not compare known home range areas to random locations on the forest,
home range data by themselves suggest the importance of extensive mature forest habitat
for nesting goshawks on the TNF.
At each analysis level, a few territories located in timber sale areas had a much
lower portion of mature forest cover compared to mean values. Minimum values for
mature forest cover measured at each analysis level were 24% in the NA (D3-06), 16% in
the PFA (D2-07) and 34% in the FA (D2-07). Three minimally forested territories that
contained less than 40% mature forest cover within either the NA, PFA, or FA (D2-06, D2- 07, D3-06) appear to be ephemeral territories as only one active nest was found in one year
of the study (Table 5). While high quality territories would be expected to be occupied in
most years, poor territories may be suitable only in certain years or by certain birds
(Newton 1991).
Differences in the proportion of mature forest cover between the FA and the two
smaller analysis areas were somewhat obscured because I did not classify portions of the
FA that fell outside of the Forest Setvice boundary, Most of these unclassified lands were
probably not forested or had only scattered trees, so inclusion of these privately owned
lands in the analysis would have lowered the average proportion of mature forest cover
within the FA to some degree. Inclusion of these lands in the analysis probably would
have resulted in a significant difference in proportion of mature forest cover between the
NA and the FA, and parhaps the PFA and FA as well.
*
It is likely that stand characteristics of mature forest habitat such as average tree
density, tree size, and canopy cover differed between the three analysis areas but I could
not distinguish such differences given the limitations of the GIs database (Hunter et al.
1995). However, studies of habitat use by radio-tagged adult goshawks in the nesting
season have shown a consistent preference by goshawks for closed canopy, maturdold
growth forest stands for foraging as well as nesting, although other available age
classes/canopy closure classes of forests are used for foraging as well (Fischer 1986, Austin
1993, Bright-Smith and Mannan 1994, Hargis et al. 1994). Hargis et al. (1 994) specifically
73
compared nest sites in eastern California to foraging and roosting locations of adults
(determined by telemetry), and to random locations. They found that forest stands at both
nest sites and foraging and roosting locations were distinguished from random locations by
higher basal area, more canopy cover, and higher tree density in the 15-27 centimeter dbh
and >46 cm dbh size classes. Further refinements in the GIs database on the TNF or
extensive field sampling would be needed to distinguish what, if any, characteristics of
mature forest stands differed between the FA, and the NA and PFA
The only significant difference in proportion of cover types that distinguished the
larger foraging area from both the NA and PFA, percent of sagehhrub habitat, suggests the
value of this particular cover type for goshawk foraging habitat (Shuster 1980). Not all
territories included this cover type, however. Six territories had less than 1.5% of
sage/shrub cover within the estimated foraging area (Appendix K). This could be
interpreted that sagdshrub cover is not always a distinguishing characteristic of foraging
areas or that goshawks in these particular territories travel greater distances to utilize such
habitat. The territories lacking this cover type were lodgepole pine territories located
within or just south of the Island Park area. Lodgepole pine territories on the TNF had
lower mean productivity compared to Douglas fdmixed conifer territories (Appendix L).
Observations of prey deliveries to nests, showed a significant difference bemeen the
proportion of mammal and bird prey items brought to Douglas fir and lodgepole pine nests
(contingency test for proportions, 2~3.3 14, ~ ~ 0 . 0 5 ) (Patla and Trost 1995b). Mammals
comprised 76% (range 43-85%) of prey items (n-54) at Douglas fir nests compared to an
average of 42% (range 28-57%, n 4 0 ) at lodgepole pine nests. Analysis of prey use at a
larger number of nests, and quantification of prey densities in different cover types are
needed to determine if prey abundance and use really are different in these cover types. If
differences exist, different management strategies may be needed to maintain adequate prey
populations in Douglas fir and lodgepole pine dominated habitats on the TNF.
8 '
Although many studies have analyzed habitat directly at or surrounding goshawk
nest sites, few studies have analyzed areas larger than nesting stands comparable to my
analysis of spatial components of the home range area. These studies from different
regions, although few in number, lend credence to my conclusion that forest cover types
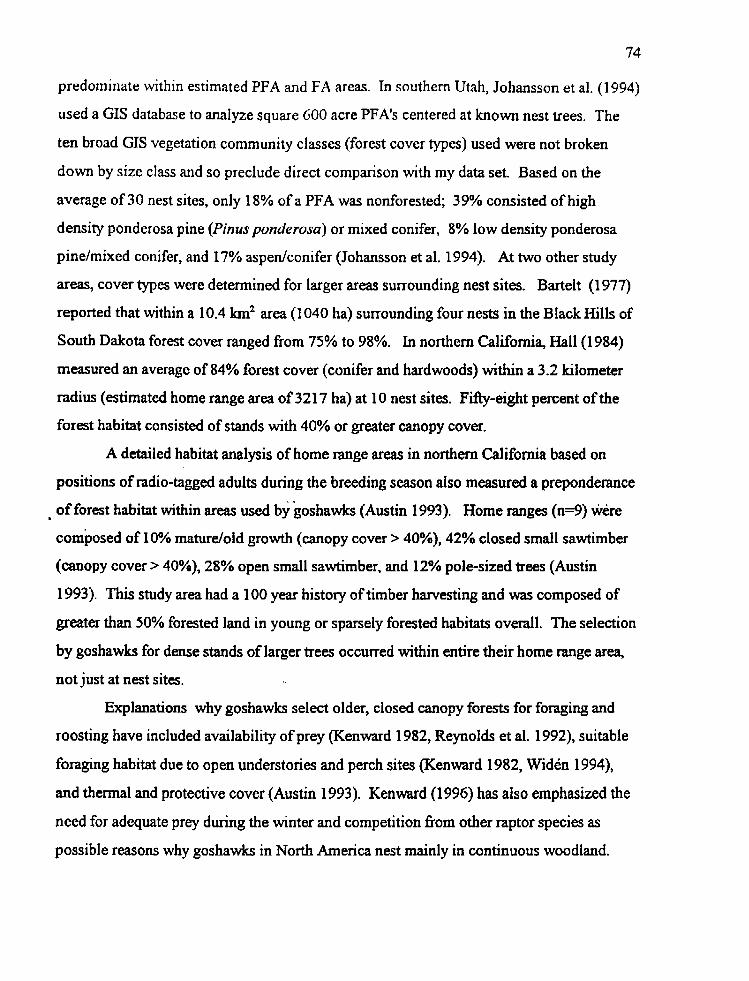
74
predominate within estimated PFA and FA ueas. In southern Utah, Johansson et al. (1994)
used a GIs database to analyze square 600 acre PFA's centered at known nest trees. The
ten broad GIs vegetation community classes (forest cover types) used were not broken
down by size class and so preclude direct comparison with my data set. Based on the
average of 30 nest sites, only 18% of a PFA was nonforested; 39% consisted of high
density ponderosa pine (Pinus ponderosa) or mixed conifer, 8% low density ponderosa
pinelmixed conifer, and 17% aspedconifer (Johansson et al. 1994). At two other study
areas, cover types were determined for larger areas surrounding nest sites. Bartelt (1 977)
reported that within a 10.4 km2 area (1 040 ha) surrounding four nests in the Black Hills of
South Dakota forest cover ranged from 75% to 98%. In northern California, Hall (1 984)
measured an average of 84% forest cover (conifer and hardwoods) within a 3.2 kilometer
radius (estimated home range area of 3217 ha) at 10 nest sites. Fifty-eight percent of the
forest habitat consisted of stands with 40% or greater canopy cover.
A detailed habitat analysis of home range areas in northern California based on positions of radio-tagged adults during the breeding season also measured a preponderance
, of forest habitat within areas used by goshawks (Austin 1993). Home ranges ( ~ 9 ) wkre
composed of 10% maturdold growth (canopy cover > 40%), 42% closed small sawtimber
(canopy cover > 40%), 28% open small sawtimber, and 12% pole-sized trees (Austin
1993). This study area had a 100 year history of timber harvesting and was composed of
greater than 50% forested land in young or sparsely forested habitats overall. The selection
by goshawks for dense stands of larger trees occurred within entire their home range area,
not just at nest sites.
Explanations why goshawks select older, closed canopy forests for foraging and
roosting have included availability of prey (Kenward 1982, Reynolds et al. 1992), suitable
foraging habitat due to open understories and perch sites (Kenward 1982, Width 1994),
and thermal and protective cover (Austin 1993). Kenward (1 996) has also emphasized the
need for adequate prey during the winter and competition from other raptor species as
possible reasons why goshawks in North America nest mainly in continuous woodland.

7s
Relation between productisity and nesf sitdplol habilat variables
Results of regression analysis suggest that the highest productivity nest sites
consist of patches of well developed mature forest habitat near high quality foraging
habitats that contain abundant and available prey species. Using regression analysis, X
found that productivity (based on one nest randomly selected at 27 current territories) was
related positively to nest plot basal area, and negatively with distance of nest site to forest
edge. This relationship, though significant, did not appear to be of much predictive value,
however (Fig. 12) The negative relation between productivity and distance to edge
appeared to be especially weak. A cluster of territories that had high productivity and was
located very near the forest edge (see Fig. 12, upper right corner) consisted of sites located
close to abundant ground squirrel populations. High basal area and distance from edge are
probably important factors for maintaining preferred microclimatic conditions at the nest
and for protection from predators (Reynolds et al, 1982; Hall 1984; Speiser and
Bosakowski 1987; Chen et al. 1993). In locations where prey specks are especially
abundant, distance to edge may be less important because predation pressures at the nest
site may be less, and well fed adults may be better able to thermoregulate and protect nest
sites’ from other predators.
Raptor habitat studies evaluating the relationship of reproductive success to nest
site habitat features have shown mixed results. Studies on Red-shouldered Hawks (Buteo
lineatus) (Morris et al. 1982, Moorman and Chaoman 1996) and Red-tailed Hawks (Smith
1994) found no relationship between nest site habitat variables and nest success. M O O I ~ ~ I I
and Chapman (1 996) found that successful Red-tailed Hawk nests were placed in shorter
trees compared to successful nests. Dijak et ai. (1 990) found a difkrence in nest tree
diameter between successful and unsuccessful nests for Red-shouldered Hawks. Hennessy
(1 978) reported that on the Cache NF in southern Idaho and northern Utah, goshawk nests
located on the bottom of slopes or in high canopy cover areas produced greater number of
young compared to nests on the top of slopes or those with little canopy cover.
Given the large number of factors that potentially influence raptor nesting success,
including weather, prey abundance and availability, behavior, age of breeding birds,
genetics, predation, and inter-specific competition (Newton 1979), the relationship
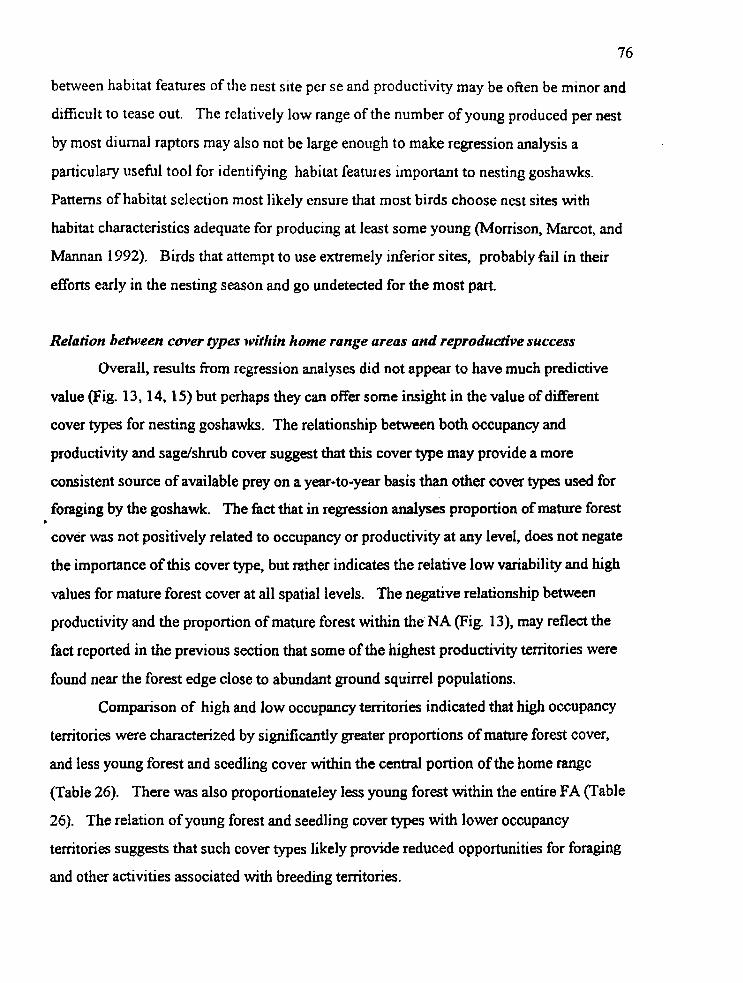
76
between habitat features of the nest site per se and productivity may be often be minor and
difficult to tease out. The relatively low range of the number of young produced per nest
by most diurnal raptors may also not be large enough to make regression analysis a
particulary useful tool for identifying habitat features important to nesting goshawks.
Patterns of habitat selection most likely ensure that most birds choose nest sites with
habitat characteristics adequate for producing at least some young (Morrison, Marcot, and
Mannan 1992). Birds that attempt to use extremely inferior sites, probably fail in their
efforts early in the nesting season and go undetected for the most part.
Relrrtion between cover gpes within home range areas and reproductive success
Overall, results from regression analyses did not appear to have much predictive
value (Fig. 13,14,15) but perhaps they can offer some insight in the value of different
cover types for nesting goshawks. The relationship between both occupancy and
productivity and sagdshrub cover suggest that this cover type may provide a more
consistent source of available prey on a year-to-year basis than other cover types used €or
foraging by the goshawk. The fact that in regression analyses proportion of mature forest
covdr was not positively related to occupancy or productivity at any level, does not negate
the importance of this cover type, but rather indicates the relative low variability and high
values for mature forest cover at all spatial levels, The negative relationship between
productivity and the proportion of mature forest within the NA (Fig. 13), may reflect the
fact reported in the previous section that some of the highest productivity territories were
found near the forest edge close to abundant ground squirrel populations.
*
Comparison of high and low occupancy territories indicated that high occupancy
territories were characterized by significantly greater proportions of mature forest cover,
and less young forest and seedling cover within the central portion of the home range
(Table 26). There was also proportionateley less young forest within the entire FA (Table
26). The relation of young forest and seedling cover types with lower occupancy
territories suggests that such cover types likely provide reduced opportunities for foraging
and other activities associated with breeding territories.

77
Shuster (1 980) in Colorado was the first to suggest the importance of sage habitat
and associated ground squirrel populations for nesting goshawks in the Rocky Mountain
Region. Prey analyses and observations of foraging goshawks on the TNF also indicated
that ground squirrels may be one of the most importance prey species found in sagdshrub
habitats. The negative relation on the TNF between occupancy and the amount of seedling
cover within the home range areas may reflect avoidance of clearcut areas by the goshawk,
increased competition by more open country raptors, or decreased prey abundance or prey
availability due to the reduction of cover within these areas (Austin 1993, Kenward 1996).
The negative relation between occupancy and young forest cover suggests that immature
stands containing small diameter trees also do not provide valuable prey or cover resources
for the goshawk.
Although this study includes data from a longer period of time than most graduate
research projects, results on the relation between occupancy and cover types should be
considered with some caution. The average number of years territories were monitored
under current habitat conditions was 3.7 (Table 25). My study may have been too short in
duration to measure goshawk response to recent habitat changes (Cracker-Bedford I990),
or to have located all possible alternate nest areas (Woodbridge and Detrich 1994). An
additional confounding factor was that if some territories contained highly dispersed nest
sites, active nests located outside of survey areas may have been missed resulting in
artificially low occupancy rates for some territories (Woodbridge and Detrich 1994).
Effects of timber harvesting
Ideally, to analyze the effects of habitat modification on goshawk nesting succcss,
controlled experiments at known nesting areas would be used to test the effects of different
levels and configurations of timber harvesting within home range areas on goshawk
occupancy and productivity. The complex coordination, large sample numbers, and long
time frames required for such experiments make it highly unlikely they could ever be
canied out on public land. Monitoring changes in habitat as well 8s patterns of goshawk
nest success over time within home range areas, while not as informative as cantrolled
experiments, can offer insights into how silvicultural practices modify nesting habitat over
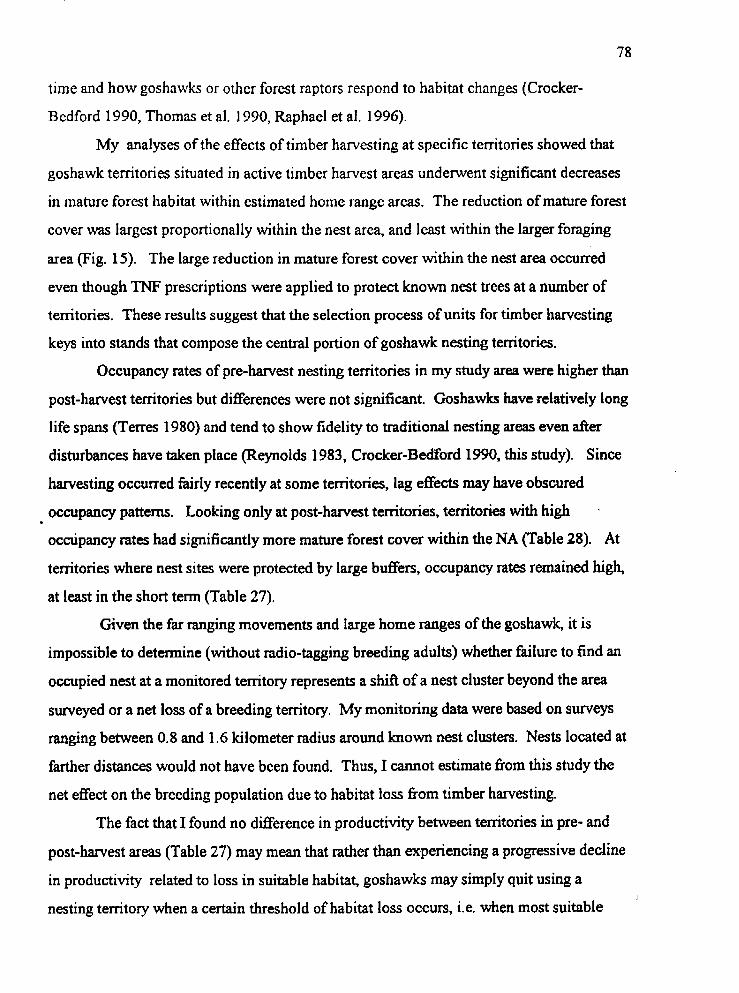
78
time and how goshawks or other forest raptors respond to habitat changes (Crocker-
Bedford 1990, Thomas et al. 1990, Raphael et al. 1996).
My analyses of the effects of timber harvesting at specific territories showed that
goshawk territories situated in active timber harvest areas underwent significant decreases
in mature forest habitat within estimated home range areas. The reduction of mature forest
cover was largest proportionally within the nest area, and least within the larger foraging
area (Fig. 15). The large reduction in mature forest cover within the nest area occurred
even though TNF prescriptions were applied to protect known nest trees at a number of
territories. These results suggest that the selection process of units for timber harvesting
keys into stands that compose the central portion of goshawk nesting territories.
Occupancy rates of pre-harvest nesting territories in my study area were higher than
post-hatvest territories but differences were not significant. Goshawks have relatively long
life spans (Terres 1980) and tend to show fidelity to traditional nesting areas even after
disturbances have taken place (Reynolds 1983, Crocker-Bedford 1990, this study). Since
harvesting occurred fairly recently at some territories, lag effects may have obscured
occupancy patterns. Looking only at post-harvest territories, territories with high
occupancy rates had significantly more mature forest cover within the NA (Table 28). At
territories where nest sites were protected by large buffers, occupancy rates remained high,
at least in the short term (Table 27).
.
Given the far ranging movements and large home ranges of the goshawk, it is
impossible to determine (without radio-tagging breeding adults) whether failure to find an
occupied nest at a monitored territory represents a shift of a nest cluster beyond the area
surveyed or a net loss of a breeding territory. My monitoring data were based on surveys
ranging between 0.8 and 1.6 kilometer radius around known nest clusters. Nests located at
farther distances would not have been found. Thus, I cannot estimate from this study the
net effect on the breeding population due to habitat loss from timber harvesting.
The fact that I found no difference in productivity between territories in pre- and
post-harvest areas (Table 27) may mean that rather than experiencing a progressive decline
in productivity related to loss in suitable habitat, goshawks may simply quit using a
nesting territory when a certain threshold of habitat loss occurs, i.e. when most suitable I
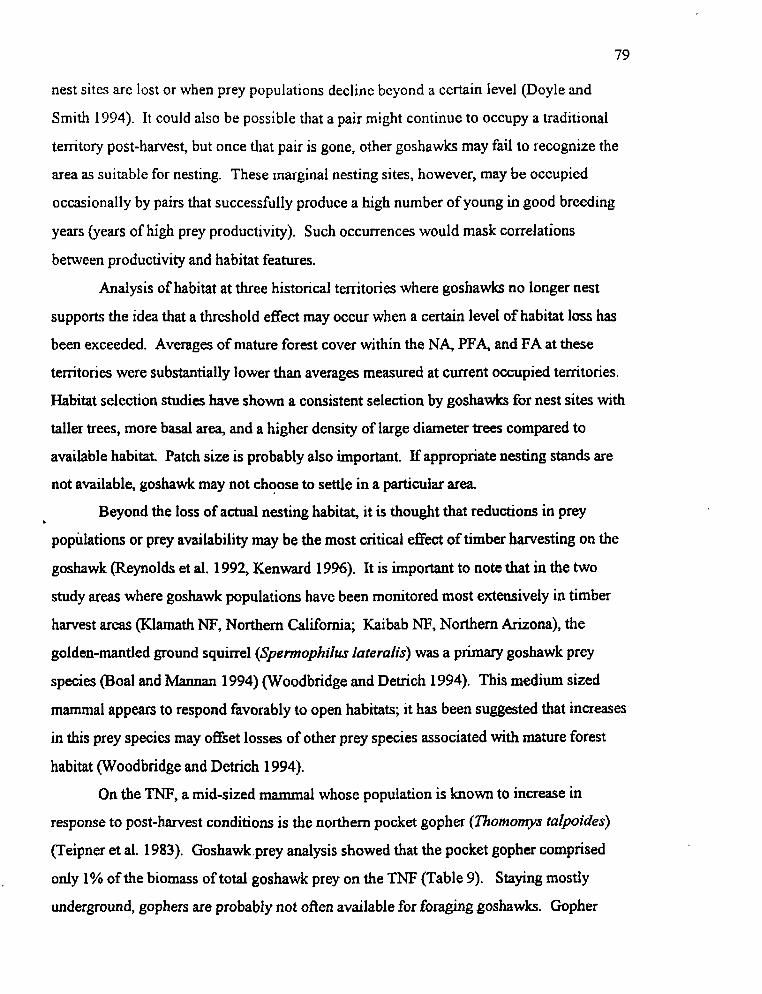
79
nest sites are lost or when prey populations decline beyond a certain level (Doyle and
Smith 1994). It could also be possible that a pair might continue to occupy a traditional
territory post-hamest, but once that pair is gone, other goshawks may fail to recognize the
area as suitable for nesting. These marginal nesting sites, however, may be occupied
occasionally by pairs that successfully produce a high number of young in good breeding
years (years of high prey productivity). Such occurrences would mask correlati'ons
between productivity and habitat features.
Analysis of habitat at three historical territories where goshawks no longer nest
supports the idea that a threshold effect may occur when a certain level of habitat loss has
been exceeded. Averages of mature forest cover within the NA, PFA, and FA at these
territories were substantially lower than averages measured at current occupied territories.
Habitat selection studies have shown a consistent selection by goshawks for nest sites with taller trees, more basal area, and a higher density of large diameter trees compared to
available habitat. Patch size is probably also important. E appropriate nesting stands are
not available, goshawk may not choose to settle in a particular area.
Beyond the loss of actual nesting habitat, it is thought that reductions in prey *
populations or prey availability may be the most critical effect of timber harvesting on the
goshawk (Reynolds et al. 1992, Kenward 1996). It is important to note that in the two
study areas where goshawk populations have been monitored most extensively in timber
harvest areas (Klamath NF, Northern California; Kaibab NF, Northern h z o n a ) , the
golden-mantled ground squirrel (Spemophilur lateralas) was a primary goshawk prey
species (Boa1 and Mannan 1994) (Woodbridge and Detrich 1994). This medium sized
mammal appears to respond favorably to open habitats; it has been suggested that increases
in this prey species may offset losses of other prey species associated with mature forest
habitat (Woodbridge and Detrich 1994).
On the TNF, a mid-sized mammal whose population is known to increase in
response to post-harvest conditions is the northern pocket gopher (XJzomomyS talpoides)
(Teipner et al. 1983). Goshawk.prey analysis showed that the pocket gopher comprised
only 1% of the biomass of total goshawk prey on the TNF (Table 9). Staying mostly
underground, gophers are probably not often available for foraging goshawks. Gopher
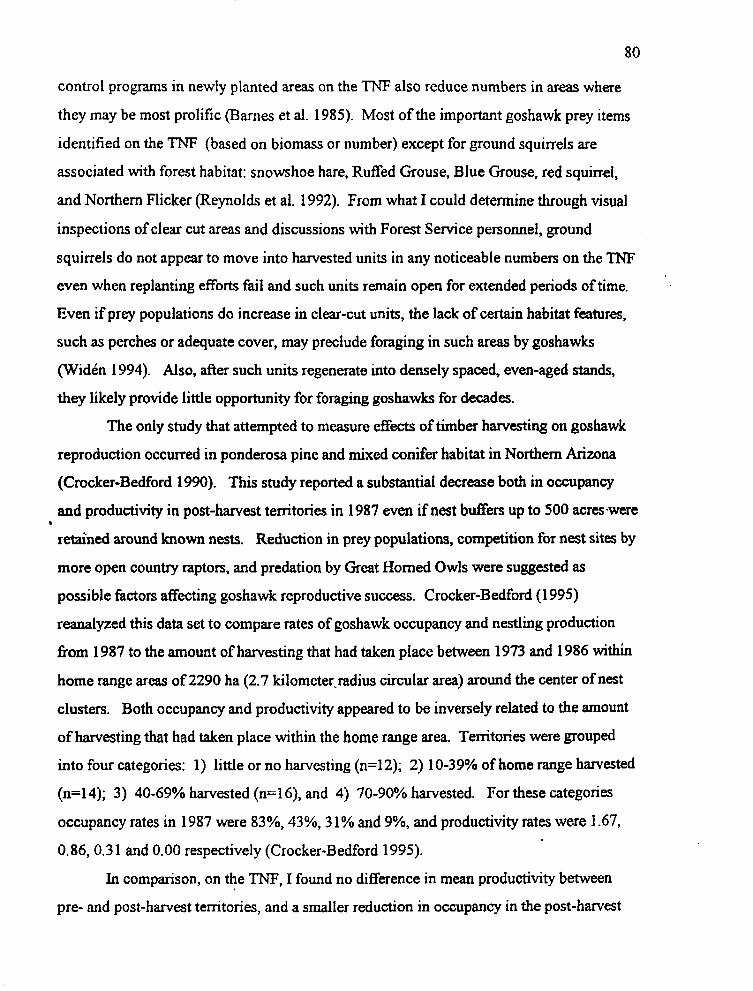
80
control programs in newly planted areas on the TNF also reduce numbers in areas where
they may be most prolific (Barnes et al. 1985). Most of the important goshawk prey items
identified on the TNF (based on biomass or number) except for ground squirrels are
associated with forest habitat: snowshoe hare, Ruffed Grouse, Blue Grousee, red squirrel,
and Northern Flicker (Reynolds et al. 1992). From what I could determine through visual
inspections of clear cut areas and discussions with Forest Service personnel, ground
squirrels do not appear to move into harvested units in any noticeable numbers on the TEJF
even when replanting efforts fail and such units remain open for extended periods of time.
Even if prey populations do increase in clear-cut units, the lack of certain habitat features,
such as perches or adequate cover, may preclude foraging in such areas by goshawks
(Widdn 1994). Also, after such units regenerate into densely spaced, even-aged stands,
they likely provide little opportunity for foraging goshawks for decades.
The only study that attempted to measure effects of timber harvesting on goshawk
reproduction occurred in ponderosa pine and mixed conifer habitat in Northern Arizona (Crocker-Bedford 1990). This study reported a substantial decrease both in occupancy
and productivity in post-harvest territories in 1987 wen if nest buffers up to 500 acres-were
retained around known nests. Reduction in prey populations, competition for nest sites by
more open countty raptors, and predation by Great Homed Owls were suggested as
possible factors affecting goshawk reproductive success. Crocker-Bedford (1 995)
reanalyzed this data set to compare rates of goshawk occupancy and nestling production
from 1987 to the amount of harvesting that had taken place between 1973 and 1986 within
home range areas of 2290 ha (2.7 kilometer.radius circular area) around the center of nest
clusters. Both occupancy and productivity appeared to be inversely related to the amount
of harvesting that had taken place within the home range area. Territories were grouped
into four categories: 1) little or no harvesting (n=12); 2) 10-39% of home range harvested
(n=14); 3) 40-69% harvested (n=16), and 4) 70-90% harvested. For these categories
occupancy rates in 1987 were 83%, 43%, 3 1 % and 9%, and productivity rates were 1.67,
0.86,0.3 1 and 0.00 respectively (Crocker-Bedford 1995).
In comparison, on the TNF, I found no difference in mean productivity between
pre- and post-harvest territories, and a smaller reduction in occupancy in the post-harvest

81
group. The range of habitat loss within my study territories was much less than the range
reported for the Kaibab territories, however, and harvesting methods differed as well. The
amount of the home range (FA) harvested (clear cut type of harvests) ranged from 9-3'5% at
current territories on the TNF (Appendix MJ and from 39-53% at historical territories
(Appendix N). Mean occupancy rates for current pre- and post-harvest territories on the
TM; were very close to values reported for the undisturbed and 10-39% harvested group
on the Kaibab: 79% and 47% on the TNF compared to 83% (undisturbed) and 43% (10-
39% harvested territories) on the Kaibab NF. Given the data presented.(Crocker-Bedford
1995), I could not determine whether differences reported in productivity and occupancy
between the non-disturbed and the 10-39% harvested group of territories w r e statistically
significant.
For the Northern Spotted Owl, Bart (1 995) reported that number of young ff edged
per pair showed a linear relationship with the proportion of suitable habitat found
surrounding the nest site. He did not find a threshold value above which there was little or
no increase in productivity. Since goshawks, compared to the spotted owl, appear to have
greater foraging flexibility, taking a greater variety of prey species, their response to loss of
mature forest habitat may not be as sensitive or as incremental in nature. It is also possible
that my data set may have had too few territories and too small a variation in proportion of
mature forest cover within home range areas to detect a linear relationship between
productivity and mature forest cover, even if one did exist. I also made the assumption that
the GIs category "mature forest" represented suitable habitat for goshawks. This category,
because it was defined only by tree size, may have actually contained an undetermined
amount of habitat that was not suitable either for nesting or foraging, thus obscuring any
relationship between productivity and cover type.
'
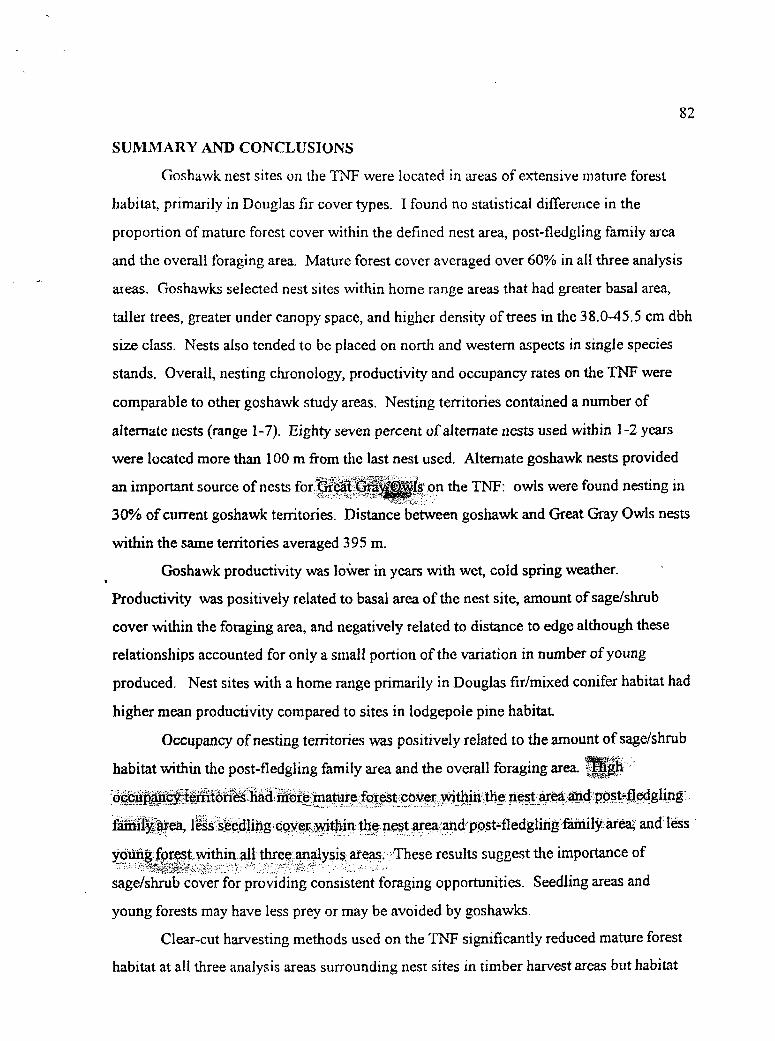
82
SUMMARY AND CONCLUSIONS
Goshawk nest sites on the TNF were located in areas of extensive mature forest
habitat, primarily in Douglas fir cover types. I found no statistical difference in the
proportion of mature forest cover within the defined nest area, post-fledgling family area
and the overall foraging area. Mature forest cover averaged over 60% in all three analysis
areas. Goshawks selected nest sites within home range areas that had greater basal area,
taller trees, greater under canopy space, and higher density of trees in the 38.0-45.5 crn dbh
size class. Nests also tended to be placed on north and western aspects in single species
stands. Overall, nesting chronology, productivity and occupancy rates on the TNF were
comparable to other goshawk study area. Nesting territories contained a number of
alternate nests (range 1-7). Eighty seven percent of alternate nests used within 1-2 years
were located more than 100 m fiom the last nest used. Alternate goshawk nests provided
an important source of nests for n the TNF: owls were found nesting xn
30% of current goshawk temtories. Distance between goshawk and Great Gray Owls nests
within the same territories averaged 395 m.
Goshawk productivity was lower in years with wet, cold spring weather.
Productivity was positively related to basal area of the nest site, amount of sagelshrub
cover within the foraging area, and negatively related to distance to edge although these
relationships accounted for only a small portion of the variation in number of young
produced. Nest sites with a home range primarily in Douglas firhixed conifer habitat had
higher mean productivity compared to sites in lodgepole pine habitat.
I
Occupancy of nesting territories was positively related to the amount of sageishmb
ts suggest the importance of
sagdshrub cover for providing consistent foraging opportunities. Seedling areas and
young forests may have less prey or may be avoided by goshawks.
Clear-cut harvesting methods used on the TNF significantly reduced mature forest
habitat at all three analysis areas surraunding nest sites in timber harvest areas but habitat
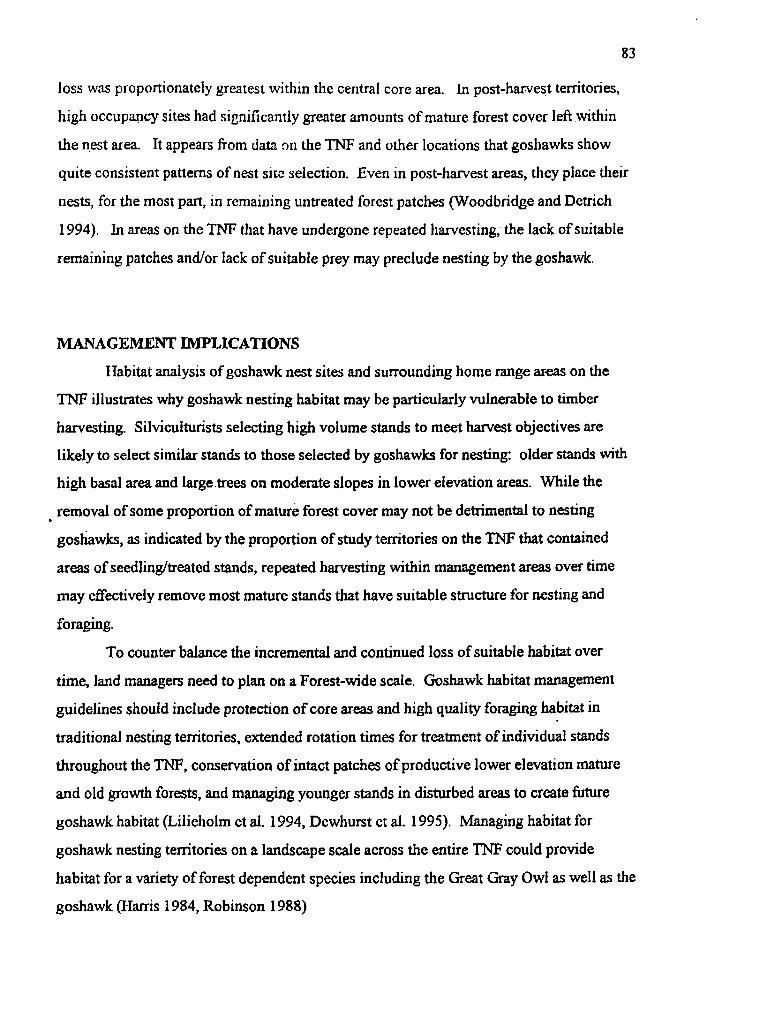
83
loss was proportionately greatest within the central core area. In post-harvest territories,
high occupancy sites had significantly greater amounts of mature forest cover left within
the n,est area. It appears from data nn the TNF and other locations that goshawks show
quite consistent patterns of nest sitc selection. Even in post-harvest areas, they place their
nests, for the most part, in remaining untreated forest patches (Woodbridge and Detrich
1994). In areas on the TNF that have undergone repeated harvesting, the lack of suitable
remaining patches andor lack of suitable prey may preclude nesting by the goshawk.
MANAGEMENT IMPLICATIONS
Habitat analysis of goshawk nest sites and surrounding home range areas on the
TNF illustrates why goshawk nesting habitat may be particularly vulnerable to timber
harvesting. Silviculturists selecting high volume stands to meet harvest objectives are
likely to select similar stands to those selected by goshawks for nesting: older stands with
high basal area and 1arge.trees an moderate slopes in lower elevation areas. While the
removal of some proportion of mature forest cover may not be detrimental to nesting
goshawks, as indicated by the proportion of study territories on the TNF that contained
areas of seedlingheated stands, repeated harvesting within management areas over time
may effectively remove most mature stands that have suitable structure for nesting and
foraging.
To counter balance the incremental and continued loss of suitable habitat over
time, land managers need to plan on a Forest-wide scale. Goshawk habitat management
guidelines should include protection of core areas and high quality foraging habitat in
traditional nesting territories, extended rotation times for treatment of individual stands
throughout the TNF, conservation of intact patches of productive lower elevation mature
and old growth forests, and managing younger stands in disturbed areas to create future
goshawk habitat (Lilieholm et al. 1994, Dewhurst et al. 1995). Managing habitat for
goshawk nesting territories on a landscape scale across the entire TNF could provide
habitat for a variety of forest dependent species including the Great Gray Owl as well as the
goshawk (Harris 1984, Robinson 1988)
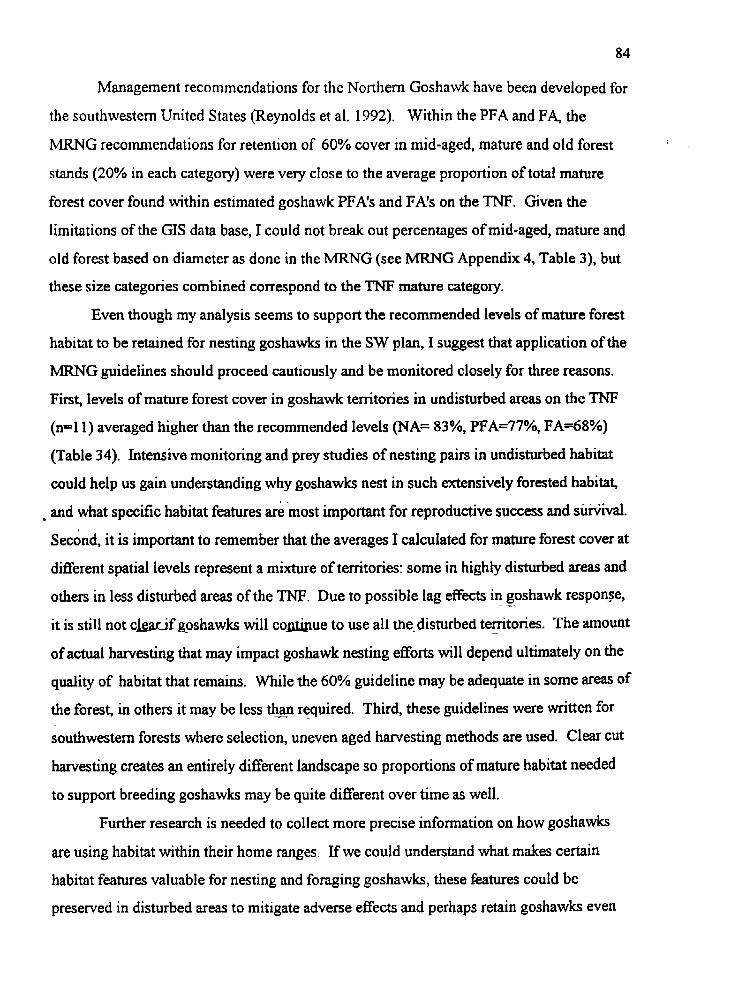
84
Management recommendations for the Northern Goshawk have been developed for
the southwestern United States (Reynolds et al. 1992). Within the PFA and FA, the
MRNG recommendations for retention of 60% cover in mid-aged, mature and old forest
stands (20% in each category) were very close to the average proportion of total mature
forest cover found within estimated goshawk PFA's and FA'S on the TNF. Given the
limitations of the GIs data base, I could not break out percentages of mid-aged, mature and
old forest based on diameter as done in the MRNG (see MRNG Appendix 4, Table 3), but
these size categories combined correspond to the TNF mature category.
Even though my analysis seems to support the recommended levels of mature forest
habitat to be retained for nesting goshawks in the SW plan, I suggest that application of the
MRNG guidelines should proceed cautiously and be monitored closely €or three reasons.
First, levels of mature forest cover in goshawk temtories in undisturbed areas on the TNF (n=1 1) averaged higher than the recommended levels (NA= 83%, PFA=77%, FA=68%)
(Table 34). Intensive monitoring and prey studies of nesting pairs in undisturbed habitat
could help us gain understanding why goshawks nest in such extensively forested habitat,
, and what specific habitat features are -most important for reproductive success and su%val.
Second, it is important to remember that the averages I calculated for mature forest cover at
different spatial levels represent a mixture of territories: some in highly disturbed areas and
others in less disturbed areas of the TNF. Due to possible lag effects in . goshawk .*. respon_se,
it is still not c W f goshawks will c o a n u e to use all the-disturbed territories. - Tne mount
of actual harvesting that may impact goshawk nesting efforts will depend ultimately on the
quality of habitat that remains. While the 60% guideline may be adequate in some are of
the forest, in others it may be less t h ~ required. Third, these guidelines were written for
southwestern forests where selection, uneven aged harvesting methods are used. Clear cut
harvesting creates an entirely different landscape so proportions of mature habitat needed
to support breeding goshawks may be quite different over time as well.
Further research is needed to collect more precise information on how goshawks
are using habitat within their home ranges. If we could understand what makes certain
habitat features valuable for nesting and foraging goshawks, these kames could be
preserved in disturbed areas to mitigate adverse effects and perhaps retain goshawks even
85
in more highly disturbed areas of the forest (Widen 1994). As aptly stated by Widen
(1 994): ". . .raptor habitat conservation is a matter of finding why certain habitats are
preferred, what factors make them valuable, as well as how depleted habitats can be
improved." Radio-tracking studies of breeding pairs throughout the entire year
incorporating ground and aerial observations are needed to collect precise data on habitat
use and habitat features most important for goshawks in undisturbed and timber harvest
areas. Combined with continued monitoring of known nest areas, such studies would help
ensure that a well distributed and viable population of breeding goshawks persists.
86
REIFE=RENCES
Austin, K. 1993. Habitat use and home range size of breeding Northern Goshawks in the southern Cascades. MS thesis. Oregon State Univ. Corvalis, OR
Baker, F. S. 1944. Mountain climates of the western United States. Ecological Monograph 14 : 223-254.
Barnes, Jr., V. G, and B. M. Anthony, K. A Fagerstone, and J. Evans. 1985. Hazards to grizzly bears of strychnine baiting for pocket gopher control. Wildl. Soc, Bull. 13: 552-5 58.
Bart, Jonathan. 1995. Amount of suitable habitat and viability of Northern Spotted Owls. Conserv. Biol. 9: 943-946.
Bartelf P. E. 1974. Management of the American goshawk in the Black Hills National Forest. M A Thesis, Iowa State University. Vermillion, SD.
Batschelet, Edward. 1981. Circular Statistics in Biology. Academic Press. New York.
Beebe, F. J. 1974. Field studies of the Falconifomes of British Columbia, Occ. Papers Brit Col. Prov. Museum 17: 54-62. . .
Be&, Kenneth N. 1994. Data Analysis with Student Systat. Course Technology, Inc. Cambridge, IvlA
Block, W. M., and L. A Brennan. 1993. The habitat concept in ornithology. Current Ornithology. 11 : 35-91.
Block, William M, Michael L. Morrison, and M. Hildegard Reiser. 1994. Introduction. Studies in Avian Biol. 16: 1-2.
Block, W. M, K. A With, and M. L. Morrison. 1987. On measuring bird habitat: influence of observer variability and sample size. The Conder. 89 (2): 241 -25 1.
Boal, Clint W. 1994. A photographic and behavioral guide to aging nestling Northern Goshawks. Studies in Avian Biol. 16: 32-40.
Boal, Clint W., and John E. Bacorn. 1994. Siblicide and cannibalism at Northem Goshawk nests. The Auk. 11 l(3): 748-750.
Boal, C. W., and R W. Mannan. 1994. Northern Goshawk diets in ponderosa pine forests on the Kaibab Plateau. Studies in Avian Biol. 16: 97-1 02.

87
Bright-Smith, D., and R W. Mannan. 1994. Habitat use by breeding male Northern Goshawks in northern hizona. Studies in Avian Biol. 16: 58-65.
Brown, L., and D. Amadon. 1968. Eagles, Hawks and Falcons of the World. McGraw Hill. New York.
Bull, E. L., and J. E. Hohmann. 1994. Breeding biology of Northern Goshawks in northeastern Oregon. Studies in Avian Biol. 16: 103-105.
Burnham, Kenneth P., David R Anderson, and Gary C. White. Meta-analysis of vital rates of the Northern Spotted Owl. Studies in Avian Biol. 17: 92-101.
Chen, Jiquan, J. F. Franklin, and T. A Spies. 1993. Contrasting microclimates among clearcut, edge, and interior of old growth Douglas-fir forest. Agricultural and Forest Meteorology. 63: 219-237.
Chojnacky, David C. 1995. Southeastern Idaho's forest land outside National Forests, 1991. USDA Forest Service Intermountain Research Station. Ogden, UT. Resource Bulletin. INT-RB-82.
Clark, T. and D. Zaunbracher. 1987. The Greater Yellowstone Ecosystem: The ecosystem concept in natural resource policy and management. Renewable Resources Journal. Summer.
Crocker-Bedford, D. C. 1995. Northern Goshawk reproduction relative to selection harvest in Arizona. Abstract of presentation made at the annual meeting of the Raptor Research Foundation, Nov. 2-6, 1994, FlagsW, AR Journal of Raptor Research 29( 1): 42.
Crocker-Bedford, D. C. 1990. Goshawk reproduction and forest management. Wildl. SOC. Bull. 18: 262-269.
Crocker-Bedford, D. C., $nd B. Chaney. 1988. Characteristics of goshawk nesting stands. In, R L. Glinski, et al. (eds.). Proceedings of the southwest raptor management symposium and workshop. Natl. Wildl. Fed. Sci. Tech. Ser. No. 11, pp. 2 1 0-2 1 7.
Daubenmire, R F. 1943. Vegetation zonation in the Rocky Mountains. Bot. Rev. 9: 325-393.
Despain, D. G. 1990, Yellowstone Vegetation. Roberts Rinehart. Boulder.
88
DeStefano, Stephen, Brain Woodbridge, and Philip J. Detrich. 1994. Survival of Northern Goshawks in the southern Cascades of California. Studies in Avian Biol. 16: 133-136.
Dewhurst, Stephen M., W. W. Covington, and D. B. Wood. 1995. Developing a model for adaptive ecosystem management. Journal of Forestry. Dec. 1995: 35-41.
Dijak, W. D., B. Tannenbaum, and M. A Parker. 1990. Nest-site characteristics affecting success and reuse of Red-shouldered Hawk nests. Wilson Bull. 102 (3): 480-486.
Doyle, Frank J., and James M. N. Smith. 1994. Population responses of Northern Goshawks to the 10-year cycle in numbers of snowshoe hares, Studies in Avian Biol. 16: 122-129.
Dunning, John B. , Jr. 1984. Body weights of 686 species of North American birds. Western Bird Banding Association. Monograph #1.
Erdman, T. C. 1993. Wisconsin goshawk populations. Presentation: Goshawk Symposium, Cooper Ornith. SOC. Meeting, Sacramento, CA April 14-15, 1993.
Fischer, D. L. 1986. Daily activity patterns and habitat use of Accipiter hawks in Utah. PhD. Dissertation, Brigham Young Univ. Provo, UT.
Franklin, Alan B. 1988. Breeding biology of the Great Gray Owl in southeastern Idaho and northwestern Wyoming. Condor. 90: 689-696.
Fuller, Mark R and James A Mosher. 1987. Raptor survey techniques. In, B. A Pendieton and et. al. (eds). Raptor management techniques manual, Scientific and Technical Series. Nat Wildl. Fed. Washington, D. C. pp. 37-65.
Gerber, Jim. 1992. Attribute Table Rules, Vegetation Map. Targhee National Forest Revision Plan. Appendix C. Feb. 6, 1992. Targhee National Foiest, St. Anthony, ID.
Glick, Dennis, Mary Can, and Bert Harting. 1991, An environmental profile of the Greater Yellowstone Ecosystem. The Greater Yellowstone Coalition. Bozeman, MT.
Gutierrez, R J. 1996. Biology and distribution of the Northern Spotted Owl. Studies in Avian Biol. 17: 2-5.
89
Cutikrrez, R J., E. D. Forsman, A B. Franklin, and E. C. Meslow. 1996. History of demographic studies in the management of the Northern Spotted Owl. Studies in Avian Biol. 17: 6-1 1.
Gutierrez, R J., J. Vemer, K. S. McKelvey, B. R Noon, G. N. S t e p , D. R Call, W. S. LaHaye, B. B. Bingham and J. S. Senser. 1992. Habitat relations of the California Spotted Owl. In, J. Verner, et al. (eds). The California Spotted Owl: a technical assessment of its current status. USDA FS Pacific Southwest Research Station. Albany. pp. 79-98.
Habeck James R 1994. Dynamics of forest communities used by great gray owls. In G. D. Hayward and J. Verner (eds). Flammulated, Boreal and Great Gray Owls in the United States: a technical conservation assessment. USDA Forest Service. Fort Collins, CO. pp: 176-201
Hall, P. A 1984. Characteristics of nesting habitat of goshawks in northwestern California. MS Thesis. Humboldt State Univ. Arcata, CA
Hargis, C. D., C. McCarthy, and R D. PerloE 1994. Home ranges and habitats of northern goshawks in eastern California. Studies in Avian Biol. 16: 66-74.
Hams, Larry D. 1984. The Fragmented Forest. Univ, of Chicago Press. Chicago.
' Hawkworth, F. G., and D. W. Johnson. 1989. Biology and management of dwarf mistletoe in lodgepole pine in the Rocky Mountains, USDA Forest Service Rocky Mountain Forest and Range Experimental. St. Gen. Tech. Rep. RM-169,
Hayward, G. D., and R E. Escano. 1989. Goshawk nest-site characteristics in western Montana and northern Idaho. Condor 91: 476-479.
Hejl, S. J., R L. Hutto, C. R Preston, and D. M. Finch. 1996, In, T. E. Martin and D. M. Finch (eds), Ecology and management of neotropical migratory birds. Oxford Univ. Press. New York. pp. 220-244.
Hennessy, S. P. 1978. Ecological relationships of accipiters in northern Utah--With special emphasis on the effects of human disturbance. MS Thesis, Utah State Univ. Logan UT.
Herron, G. B., C. A Mortimore, and M, S. Rawlings. 1985. Nevada raptors: their biology and management. Nevada Dept. Wildl. Biology Bull. No. 8.
Hoglund, N. H., and E. Lansgren. 1968. The Great Gray Owl and its prey in Sweden. Viltrevy. 5: 363-421.

90
Hunter, John B., R J. Gutiirrez, and Alan B. Franklin. 199s. Habitat configuration around Spotted Owl sites in northwestern California. Condor. 97: 684-693.
Hurlbert, Stuart H. 1984. Pseudoreplication and the design of ecological field experiments. Ecological Monograph. 54 (2): 187-21 1.
Hutto, R L. 1985. Habitat selection by nonbreeding, migratory land birds. Ln, M. L. Cody (ed). Habitat Selection in Birds. Academic Press. Orlando. pp. 455-476.
James, F, C, and Shugart, Jr., H, H. 1970. A quantitative methad of habitat description. Audubon Field Notes. 24: 727-736.
Johansson, C., P. J, Hardin, C. M. White, 1994. Large-area goshawk habitat modeling in Dixie National Forest using vegetation and elevation data. Studies in Avian Biol. 16: 50-57.
Johnsgard, Paul A 1990. Hawks, Eagles and Falcons of North America. Srnithsonian Press. Washington D.C.
U
Johnsgard, Paul A 1988. North American Owls. Srnithsonian Institution Press. Washington DC.
Jones, S. 1979. The Accipiter: Goshawk, Cooper's Ha* Sharp-shinned Hawk. Bureau of Land Management. Habitat management series for unique or endangered species No. 17. USDI BLM Tech Note 335.
Joy, S. M., R T. Reynolds, and D. G. Leslie. 1994. Northern goshawk broadcast surveys: hawk response variables and survey costs. Studies in Avian Biol. 16: 24-30.
K&e, John J., and Michael L. Morrison. 1994. Northern Goshawk ecology: effects of scale and levels of biological organization, Studies in Avian Biol. 16: 3-1 1.
Kennedy, P. L. 1988. Habitat characteristics of Cooper's Hawks and Northern'Goshawk in New Mexico. In, R L. Glinski, B. G. Pendleton, M. B. Moss, M. N. LeFranc, Jr., B.A Milsap, and S.W. Hoffman (eds.), Proceedings of the southwest raptor management symposium and workshop. Natl. Wildl. Fed. Sci. Tech. Ser. No. 11, pp. 218-227.
Kennedy, P. L., and D. W. Stahlecker. 1993. Responsiveness of nesting Northern Goshawks to taped broadcasts of 3 conspecific calls. J. Wildl. Manage. 57: 249-257.
Kennedy, P. L., J. M. Ward, G. A Rinker, and J. k Gessman. 1994. Post-fledging areas in northern goshawk home ranges. Studies in Avian Biol. 16: 75-82.

91
Kenward, R E. 1982. Goshawk hunting behavior, and range size as a function of food and habitat availability. J. Animal. Ecol. 5 1 : 69-80.
Kenward, R E. 1996. Goshawk adaptation to deforestation: does Europe differ fiom North America? In, David M. Bird, D. E. Varland, J. J. Negro (eds.). Raptors in human landscapes. Academic Press. London. pp. 21 3-243.
Klopfer, P. H. and J. U. Ganzhorn. 1985. Habitat selection: behavioral aspects. In M. L. Cody (ed). Habitat selection in birds. Academic Press. Orlando. pp. 436-454.
Kostrzewa, R, and A Kostrzewa. 1991a. The relationship of spring and summer weather with density and breeding performance of the buzzard Buteo buteo, goshawk Accipiter genrilis, and kestrel Fulco cinnuncufus, Ibis 132: (4): 550-559.
Kostnewa, R, and A Kostrzewa. 1991 b. Winter weather spring and summer density and subsequent breeding success of Eurasian Kestrels, Common Buzzards, and Northern Goshawks. Auk. 108 (2): 342-347.
Lilieholm, R J., J. N. Long, and S. M. Patla. 1994. Assessment of goshawk nest area habitat using stand density index. Studies in Avian Biol. 16: 18-23.
Manly, Bryan F. J., Lyman L. McDonald, and Dana L. Thomas. 1993. Resource Selection by Animals. Chapman & Hall. London.
*
Mhrkow, S. 1994. A floristic suryey of the Targhee National Forest and vicinity, east-central Idaho and west-central Wyoming. MS Thesis, Univ. of Wyoming. Larmie, WY.
Marshall, David B. 1992. Status of the Northern Goshawk in Oregon and Washington. Audubon Society of Portland. 51 51 N.W. Cornell Rd., Portland, OR 97210.
McCarthy, C., W. D. Carrier, and W. F. Laudenslayer. 1989. Coordinating timber management activities with raptor nesting habitat requirements. In B. G. Pendleton (ed). Proceedings of the Western Raptor Management Symposium and Workshop. Scientific and Technical Series No. 12. Nat. Wildl. Fed. Baltimore. pp: 229-235.
McGowan, J. D. 1975. Distribution, density and productivity of goshawks in interior Alaska. Alaska Dep. Fish and Game, Juneau, AK. Final report. Job 10.6R
Mikola, H 1983. Owls of Europe. Buteo Books. Vermillion, SD.
Moore, K. R and C. J. Henny. 1983. Nest site characteristics of three coexisting accipiter hawks in northeastern Oregon. J. Raptor Res. 17: 65-76.
92
Moorman, Christopher E. and Brian R Chapman. 1996. Nest-site selection of Red- shouldered and Red-tailed Hawks in a managed forest. Wilson Bull. lOS(2): 357- 368.
Morris, M. M. J., B. L. Penak, R E. Lemon, and D. M. Bird. 1982. Characteristics of red- shouldered hawk, Buteo lineatus, nest sites in southwestern Quebec. Canadian Field-Naturalist. 96: 139-142.
. C.
Momson, Michael L., Bruce G. Marcot, and R William Mannan. 1992. Wildlife-habitat Relationships. University of Wisconsin Press. Madison, WI.
Mosher, James A, Kimberly Titus, and Mark R Fuller. 1987. Habitat sampling, measurement and evaluation. Raptor management techniques manual. Scientific and Technical Series. Nat. Wildl. Fed. Washington, D. C. pp. 81-97.
Mueggler, W. F. 1988. Aspen community types of the Intermountain Region. USDA Forest Service Intermountain Research Station. INT-250.
Mueggler, W. F. and R E. Campbell. 1982, Aspen community types on the Caribou and Targhee National Forests in southwestern Idaho. USDA Forest Service Intermountain Station. INT-294.
Newton, Ian. 1976, Population limitation in diurnal raptors. Can. Field-Nat. 90: 274- . 300.
Newton, Ian. 1977. Spacing of sparrowhawk nesting territories. J. h i m . Ecol. 46: 425- 441.
Newton, Ian. 1979. Population Ecology of Raptors. Buteo Books. Vermillion, SD.
Newton, I. 1986, The Sparrowhawk. T & A D Poyser. Calton, England.
Newton, Ian. 1991. Population limitation in birds of prey: a comparative approach. C. M. Pemns, J.-D. Lebretou and C. J. M. Hirons (eds). Bird population studies: relevance to conservation and management. Oxford University Press. New York. pp: 3-21.
Olsen, Penny, and Jeny Olsen. 1992. Does rain hamper hunting by breeding raptors? Emu. 92: 84-187.
Orians, G. H, and J. F. Witteriberger. 1991. Spatial and temporal scales in habitat selection. The American Naturalist. 137: S29-S49.
93
Patla, S. 1990. Northern Goshawk monitoring project, 1989. Targhee National Forest. St Anthony, ID. Final Report. 37 pp.
Patla, S. 1991. Northern Goshawk monitoring project, 1990. Targhee National Forest. St. Anthony, ID. Final Report. 41 pp. plus tables.
Patla, S. M., and C. H. Trost. 1995a. The relationship of Northern Goshawk nest site locations to riparian areas in the Centennial Mountains, Idaho. USDA Forest Service Riparian Research Unit, Boise, ID. Final Report. INT-92738-WA 58 PP-
Patla, S. M. and C. H. Trost. 1995b. Northern Goshawk monitoring report, 1993-1 994 field seasons plus an overall summary: 1989-1 994. Targhee National Forest, St. Anthony, 130. Final Report. 39 pp.
Peet, R K. 1988. Forests of the Rocky Mountains. In, M. G. Barbour and W. D. Billings (eds). North American terrestrial vegetation. Cambridge University Press. New York. pp. 63-96.
Potvin, C., and D. A ROE 1993. Distribution-free and robust statistical methods: viable alternatives to parametric statistics. Ecology 74 (6): 161 7-1628.
Postupalsky, Serge]. 1973. Raptor reproductive success: some problems with methods, criteria, and terminology. In, IF. N. Hamerstrom, Jr., B, E. Hanell and R R Olendorff (eds.), Conference on Raptor Conservation Techniques, Fort Collins, Colorado. Raptor Research Foundation, Vermillion, South Dakota. pp 21-3 1.
.
Pulliainen, Erkki, and Kalevi Loisa. 1977. Breeding biology and food of the Great Gray Owl, Sfrix nebulosu, on northeastern Finnish Forest Lapland. Aquilo Ser. 2001. 17: 23-33.
Pulliam, H. R 1988. Sources, sinks and population regulation. Am. Naturalist. 132: 652- 661.
Raphael, M, G., R G. Anthony, S. DeStefano, E. D. Forsrnan, A 13. Franklin, R Holthausen, E. C. Meslow, and B. R Noon. 1996. Use, interpretation, and implications of demographic analyses of Northern Spotted Owl populations. Studies in Avian Biol. 1 7: 102-1 12.
Reynolds, R T. 1975. Distribution, density, and productivity of three species of Accipiter hawks in Oregon. MS thesis, Oregon State Univ., Corvallis.
Reynolds, R T. 1979. Food and habitat partitioning in two groups of coexisting Accipiter. Phd. Dissertation. Oregon State Univ. Corvallis, OR
94
Reynolds, R T. 1983. Management of western coniferous forest habitat for nesting accipiter hawks. USDA Forest Service. Gen. Tech. Rep. RM-102.
Reynolds, R 1989. Accipiter. In, Beth G. Pendleton et al. (eds.), Proceedings of the Western Raptor Management Symposium and Workshop: 26-28 Oct 1987. Western hp to r Management Symposium and Workshop, Boise, IJ). National Wildlife Federation. pp: 92-1 01.
Reynolds, R T., and H. M. Wight. 1978. Distribution, density, and productivity of accipiter hawks breeding in Oregon. Wilson Bull. 90 (2): 182-196.
Reynolds, R T., E. C. Meslow, and H. M. Wight. 1982. Nesting habitat of coexisting Accipiter in Oregon. J. Wildl. Manage. 46: 124-1 38.
Reynolds, R T., R T. Graham, M. H. Reiser, R L. Bassett, P. L. Kennedy, D. A Boyce, Jr., G. Goodwin, R Smith, and E. L. Fisher. 1992. Management recommendations for the Northern Goshawk in the southwestern United States. USDA Forest Senrice, Southwestern Region. Gen. Tech. Rep. RM-217.
Robinson, Gordon. 1988. The Forest and The Trees; Island Press. Washington, DC.
Ruggiero, L. F., W. J. Zielinski, K. A Aubry, S. W. Buskirk, and L. J. Lyon. 1994. A conservation assessment framework for forest carnivores. In L. F. Ruggiero, K:B. Aubry, S. W. Buskirk L. J. Lyon and W. J. Zielinski (eds). A scientific basis for conserving forest carnivores. American marten, fisher, lynx, and wolverine in the western United States. USDA Forest Senrice. Fort Collins, CO. pp: 1-6.
.
Saunders, L. B. 1982. Essential nesting habitat of the goshawk (Accipiter gentilis) on the Shasta-Trinity National Forest, McCloud District. MS Thesis, Calf. State Univ. Chico, CA
Shuster, W. C. 1980. Northern Goshawk nest site requirements in the Colorado Rockies. Western Birds. 1 1 : 89-96.
Siders, M. S., and P. L. Kennedy. 1996. Forest structural characteristics of accipiter nesting habitat: is there an allometric relationship? Condor. 98(1): 123-132.
Sidle, Winifred B., and L. H. Suring. 1986. Management indicator species for the National Forest lands in Alaska. USDA Forest Service, Alaska Region. Technical Publication. R10-TP-2.
Slauson, W.L. 1988. Graphical and statistical procedures for comparing habitat suitability data. USDI Fish and Wildlife. Sew. Biol. Rep. 89(6).
9s
Slauson, W. L., B. S. Cade, and J. D. Richards. 1991. User manual for BLOSSOM statistical software. Natl. Ecol. Res. Cent. USDI Fish and Wildlife. Sew. Fort Collins, CO.
Smith, R. N. 1994. Factors affecting Red-tailed Hawk reproductive success in Grand Teton National Park, Wyoming. MS Thesis, University of Wyoming. Lararnie, WY.
Snyder, Noel, and Helen Snyder. 1991. Birds of Prey. Voyageur Press. Stillwater, MN.
Society, of American Foresters. 1971. Terminology of forest science, technology, practice and products. Society of American Foresters. Washington, DC.
Sonerud, G. A 1985. Nest hole shift in Tengmalm's Owl Aegoliusfunereus as defense against nest predation involving long-term memory in the predator. J. h i m . Ecol. 54: 179-192.
Speiser, R, and T. Bosakowski. 1987. Nest site selection by Northern Goshawks in northern New Jersey and southeastern New York. Condor 89: 387-394.
Squires, J. R, and L. F. Ruggiero. 1996. Nest-site preference of Northern Goshawks in southcentral Wyoming. 5. Wildl. Manage. 60( 1): 170-1 77.
' Squires, John R, and Leonard F. Ruggiero. 1995. Winter movements of adult goshawks that nested in southcentral Wyoming. J. Raptor Res. 29 (1): 5-9.
Steele, R, S. V. Cooper, D, M. Ondov, D. W. Roberts, and R ID. Pfister. 1983, Forest habitat types of eastern Idaho-western Wyoming, USDA Forest Service. Gen. Tech. Rep. INT- 144.
Steenhof, Karen. 1983. Prey weights for computing percent biomass in raptor diets. J. Rap. Res. 17: 15-27.
Steenhof, K. 1987. Assessing raptor reproductive success and productivity. In, B. A Pendleton and et. al. (eds), Raptor management techniques manual. Scientific and Technical Series. Nat. Wildl. Fed. Washington, D. C. pp. 157-1 70.
Steenhof, Karen, and Michael N. Kochert. 1982. An evaluation of methods used to estimate raptor nesting success. J. Wildl. Manage. 46 (4): 885-893.
Streubel, Donald. 1989. Small Mammals of the Yellowstone Ecosystem. Roberts Rinehart, Inc. Boulder, CO.
96
. C.
Sulkava, Seppo, Kauko Huhtala, and Risto Tornberg. 1994. Regulation of goshawk Accipitsrgentilis breeding in western Finland over the last 30 years. In, B.-U. Meyburg and R. D. Chancellor (eds.) Raptor conservation today. Pica Press. London. pp. 67-76.
Teipner, C. L., E. 0 Garton, and L. Nelson, Jr. 1983 Pocket gophers in forest ecosystems. USDA Forest Service, Intermountain Forest and Range Exp. Station, Ogden, UT. e n . Tech Rep. DIT-1 54. 28 pp.
Temeles, Ethan J., and Troy I. Wellicome. 1992. Weather-dependent kleptoparasitism and aggression in a raptor guild. Auk. 109 (4): 920-923.
p Terres, J. K. 1980. The Audubon Society Encyclopedia of North American Birds. Alfred AKnopf. New York.
Thomas, J. W. , et al. 1990. A conservation strategy for the Northern Spotted Owl. U.S. Forest Service, US. Bureau of Land Management, U.S. Fish and Wildlife Service, National Park Service. Interagency Scientific Committee to Address the Conservation of the Northern Spotted Owl. Portland, OR
Thompson, F. R, IU, J. R Probst, and M. G. Raphael. 1995. Impacts of silviculture: overview and management recommendations. In, T. E. Martin and D. M. Finch (eds). Ecology and management of neotropical migratory birds. Oxford Udvcrsity
, Press. New York pp. 201-219. I
Titus, K., Flatten, C. J., and Lowell, R E. 1994. Northern Goshawk mol& and habitat relationships on the Tongass National Forest. Final Annual Project Report. Division of Wildlife Conservation, Alaska Department of Fish and Game. Juneau.
USDA Forest Service. 1979. Forest Service Manual. Title 2600. Targhee National Forest, Supplement, Sept. 1979. St. Anthony, ID.
I USDA Forest Service. 1984. Silvicultural Examination and Prescription Handbook. U.S. Dept. Agric., Forest Service Region 4. Ogden, UT.
USDA Forest Service. 1985. Final Environmental Impact Statement, Targhee NF Land Magement Plan. U.S, Dept. Agic., Forest Sew,, Targhee NF, St. Anthony, ID.
USDA Forest Service. 1988. How to use aerial photographs in natural resource applications. U.S. Dept. Agric., Forest Service. Nationwide Forestry Applications Program. November, 1988.
USDA Forest Service. 1996. Draft Environmental Impact Statement, Forest Plan Revision. U.S. Dept Agric., For. Sew., Targhee NF, St. Anthony, ID.
97
Wattel, J. 1973. Geographical differentiation in the genus Accipiter. Nu#. Omith. Club. #13.
White, C. M., G. D. Lloyd, and G. L. Rxhards. 1965. Goshawk nesting in the Upper Sonoran in Colorado and Utah. Condor. 67 (3): 269.
Whitehead, G. S, 1983. Flora of the Island Park geothermal study area. MS Thesis. Idaho State Univ., Pocatello, ID.
Whitfield, Michael B., and Monya E. Ma,,. 1993. Inventory and monitoring of raptorial birds of Teton Valley, IdahoNyoming. Teton Valley Land Trust. Teton Valley Wildlife Project, 1993 Report. Driggs, ID.
i?
Width, P. 1984. Activity patterns and time-budget in the goshawk (Accipiter gentilis) in a boreal forest area in Sweden. %is 13 1 : 205-23 1.
Widen, P. 1994. Habitat quality for raptors: a field experiment. Journal of Avian Biology 25: 219-223.
Wiens, John A 1981. Scale problems in avian censusing. Studies in Avian Biol. 6: 513- 521.
Wiens, J. A and J. T. Rotenbeny. 198 1. Habitat associations and community structure of , birds in shrubsteppe environments. Ecological Monograph. 51: 21-41.
Wilkinson, L. 1990. SYSTAT: the System for Statistics. SYSTAT, Inc., Evanston, Ill+ 677
Woodbridge, B., and P. J. Detrich. 1994. Territory occupancy and habitat patch size of Northern Goshawks in the southern Cascades of California. Studies in Avian Biol. 16: 83-87.
Youngblood, A P., W. G. Padgett, A H. Windward. 1985. Riparian community type classification of eastern Idaho-western Wyoming. USDA Forest Service, Intermountain Region. R4-Ecol-85-01.
You& J. V., and M. J. Bechard. 1994. Breeding ecology of the Northern Goshawk in high-elevational aspen forests of northern Nevada. Studies in Avian Biol. 16: 1 19- 121.
Zar, J. H. 1984. Biostatistical Analysis. Prentice Hall. Englewood Cliffs, N.J.

TABLE 1. List of five categories used for analysis of cover types within goshawk home range areas. Shown are ARCllNFO GIS vegetation classes included in each category. See Appendix B for definitions of Targhee National Forest GIs classes.
TNF GIS Vegetation Class Goshawk Habitat Analysis Category Attribute Symbol Tree Size Class
Mature Forest
Young Forest
Seedling/sapling/cut
Sagelshrub
Open Area
DF, LP, MX, MX3 AS, SF, WB, NDF NMX, NAS
DF, LP, MX, MX3 AS, SF, NDF, NMX
DF, LP, MX, MX3 AS, SF, NDF, NMX
9
a
lDF, ZLP, 1MX 9 (or no size class)
M, MB, TSG, W
GR, GR8, GRS, GRF, WA, R
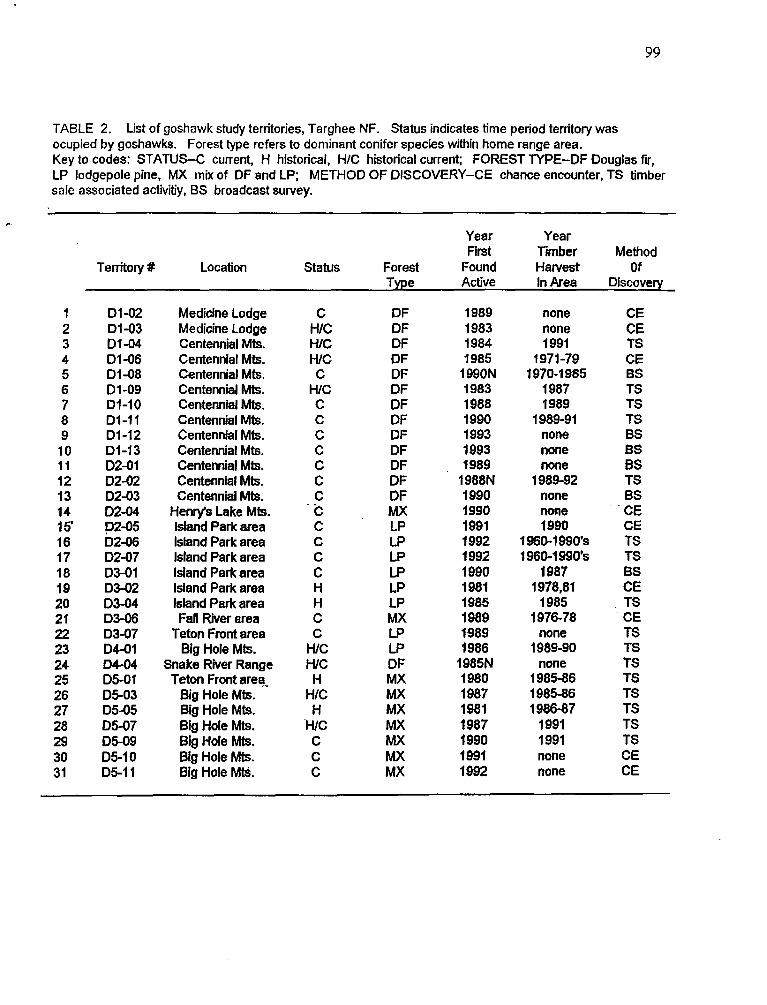
99
TABLE 2. List of goshawk study territories, Targhee NF. Status indicates time period territory was ocupied by goshawks. Forest type refers to dominant conifer species within home range area. Key to codes: STATUS-C current, H historical, H/C historical current; FOREST TYPE-DF Douglas fir, LP lodgepole pine, MX mix of DF and LP; METHOD OF DISCOVERY-CE chance encounter, TS timber sale associated activitiy, BS broadcast survey.
".
1 2 3 4 5 6 7 8 9 10 11 12 13 14 1 5' 16 17 18 19 20 21 22 23 24 25 26 27 28 29 30 31
Year Year First Timber Method
Territory # Location Status Forest Found Hatvest O f Type Active In Area Discovery
01 -02 D1Q3 01-04 D1-06 01-08 01 -09 Dl-10 Dl-11 D1-12 D1-13 D2-01 02-02 D2-03 D2-04 D2-05 D2-06 D2-07 03-01 D3-02 03-04 D3-06 D3-07 D4-01 D4-04 D5-01 05-03 D5-05 05-07 D509 D5-10 05-1 1
Medicine Lodge Medicine Lodge Centennial Mts. Centennial Mts. Centennial Mts. Centennial Mk. Centennial Mts. Centennial Mts. Centennial Mts. Centennial Mts. Centennial Mts. Centennial Mts. Centennial Mk.
Henty's Lake Mts. Island Park area Island Park area Island Park area Island Park area Island Park area Island Park area Fall m e r area
Teton Front area Big Hole Mk.
Snake River Range Teton Front area-
Big Hole Mts. Big Hole Mts. Big Hole Mts. Big Hole Mts. Big Hole Mts. Big Hole Mts.
C HIC H/C H/C C
H/C C C C C C C C 'C C C c C H H C C
H/C H/C H
H/C H
'H/C C C C
DF DF DF OF DF OF DF DF DF DF DF DF DF Mx LP LP LP LP LP LP MX LP LP DF MX MX MX MX MX Mx MX
1989 1983 1984 1985
1990N 1983
1990 1993 1993 1989
1988N 1990 1990 1991 1992 1992 1990 1981 1985 1989 1,989 1986
1985N 1980 1987 1981 1987 1990 1991 1992
1988
none none 1991
1971 -79 1970-1 985
1987 1989
1989-91 none none none
none none 1990
1960-1 990's 1960-1 990's
1987 1978,81
1985 1976-78
none
none 1985-86 1985-86 1986-87
1 G9l 1991 none none
1989-92
1989-90
CE CE TS CE BS TS TS TS BS BS BS TS BS CE CE TS TS 13s CE f S CE TS TS TS TS TS TS TS TS CE CE
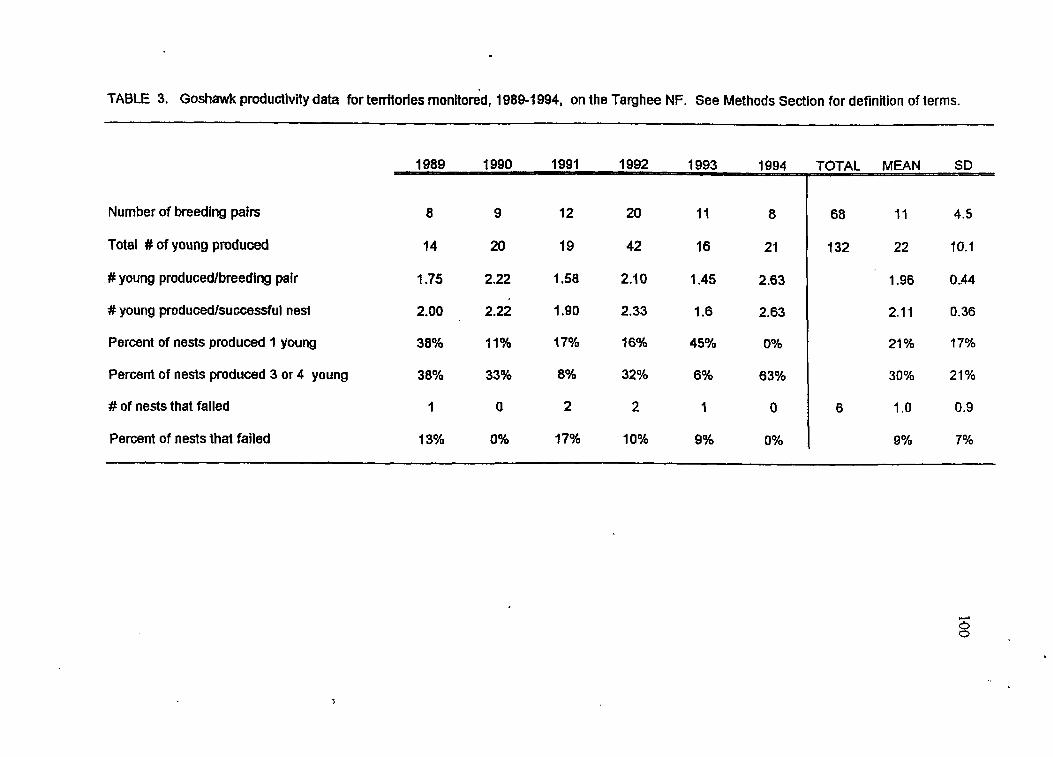
TABLE 3. Goshawk productivity data for tenitorles monltoid, 19881 994, on the Targhee NF. See Methods Section for definition of terms.
Number of breeding pairs
Total ## of young produced
# young producedbreeding pair
##young producedfsuccessful nest
Percent of nests produced 1 young
Percent of nests produced 3 or 4 young
# of nests that failed
Percent of nests that failed
1989 1990 1991 1992 1993 1994 TOTAL MEAN SO
8
14
I .75
2.00
38%
30%
1
13%
9
20
2.22
2.22
11%
33%
0
0%
12
19
1.58
1.90
17%
8%
2
17%
20
42
2.1 0
2.33
16%
32%
2
10%
11
16
1.45
1.6
45%
6 Yo
1
9%
8
21
2.63
2.63
0%
53%
0
0%
68 I 1 4.5
132 22 10.1
1.96 0.44
2.11 0.36
21 % 17%
30% 21 %
6 1 .o 0.9
9% 7%

TABLE 4. Weather data variables used to analyze the.relationship between weather and goshawk reproductive success, 19891 994. Mean temperature and precipitation data from Driggs, tD (St. #2676, Teton County, elevat. 1866 rn). Snow data from Pine Creek Pass (Station #6720, Teton County, elevat. 2049 m).
Mean Mean Mean Total Total Total Mean Total Mean Total
Year Goshawks Surveys Snowdepth SWE Temp Temp Temp Precip Precip Precip Temp Precip Temp Precip #Young Occup March March March April May March April MAY Mar+Ap Mar+Ap Ap+MayAp+May
1989 1990 1991 1992 1993 I994
2.00 145 41 0.6 5.6 9.4 6.5 1 .l 4.5 6 7.6 15.0 5.6 2.22 0.71 61 23 0.6 6.7 8.3 0.9 4.9 3.8 7 5.9 15.0 8.7 1.90 0.79 104 25 0.0 3.3 7.8 3.3 4.0 9.5 3 7.3 11.1 13.5 2.28 0.81 58 22 3.3 7.2 11.7 2.5 1.9 2.3 11 4.4 18.9 4.2 1.60 0.45 to2 36 -2.2 1.7 9.4 2.2 6.2 . 7.5 -1 8.4 11.1 13.7 2.63 0.42 92 32 0.6 5.5 11.1 0.2 2.4 2.6 6 2.6 16.6 5.0
30 year mean (1 96t-I 990): -2 4 9 2.8 3.3 5.1
L
0 Y
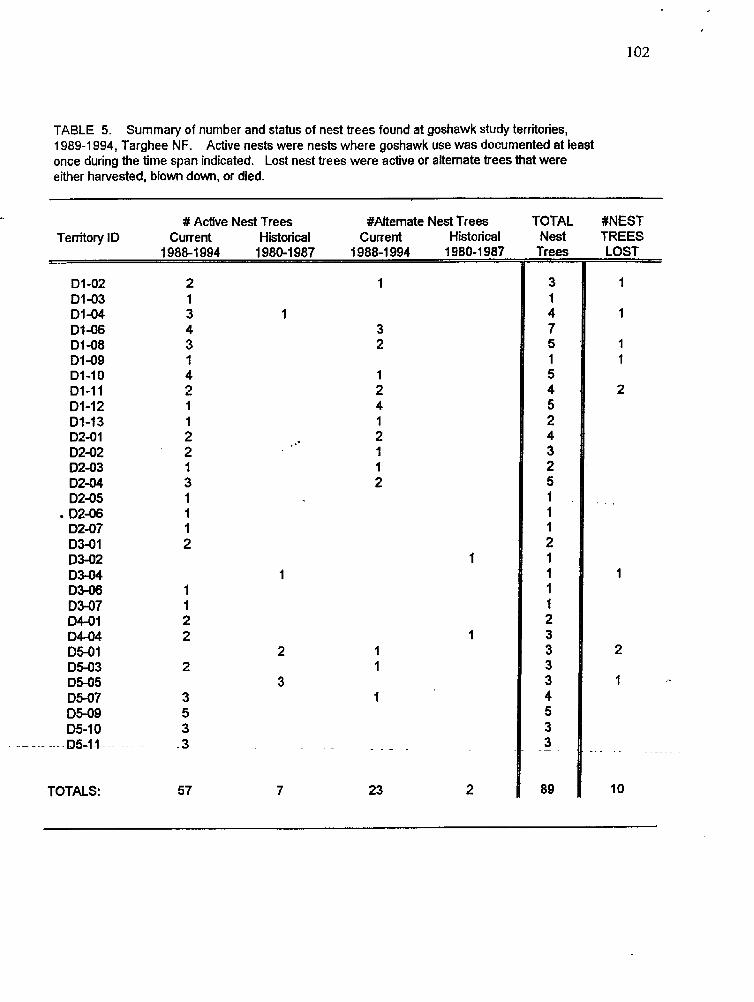
102
TABLE 5. Summary of number and status of nest trees found at goshawk study territories, 1989-1 994, Targhee NF. Active nests were nests where goshawk use was documented at least once during the time span indicated. Lost nest trees were active or alternate trees that were either harvested, blown down, or died.
# Active Nest Trees #Alternate Nest Trees Territory ID Current Historical Current Historical
1988-1 994 1980-1 987 1988-1 994 1980-1 987
D 1 -02 01-03 D1-04 01-06 D1-08 D1-09 01-10 D1-11 D1-12 01-13 D2-01 02-02 02-03 02-04 0205
D2-07 03-01 D3-M D3-04 03-06 D3-07 04-01 0.4134 D501 D5-03 D505 05-07 05-09
0246
D5-10 -.. ----Q5-l-j-.
TOTALS:
2 1 3 4 3 1 4 2 1 1 2 2 1 3 1 1 1 2
1 1 2 2
2
3 5 3 -3
57
1
1 3 2
..
I
2 1 1
3 1
. . - . . .
7 23
TOTAL Nest
Trees
3 1 4 7 5 1 5 4 5 2 4 3 2 5 1 1 1 2 1 1 1 1 2 3 3 3 3 4 5 3 3
-
._. .
89
#NEST TREES LOST
1
1
1 1
2
, . .
1
2
1
- - - - -
10
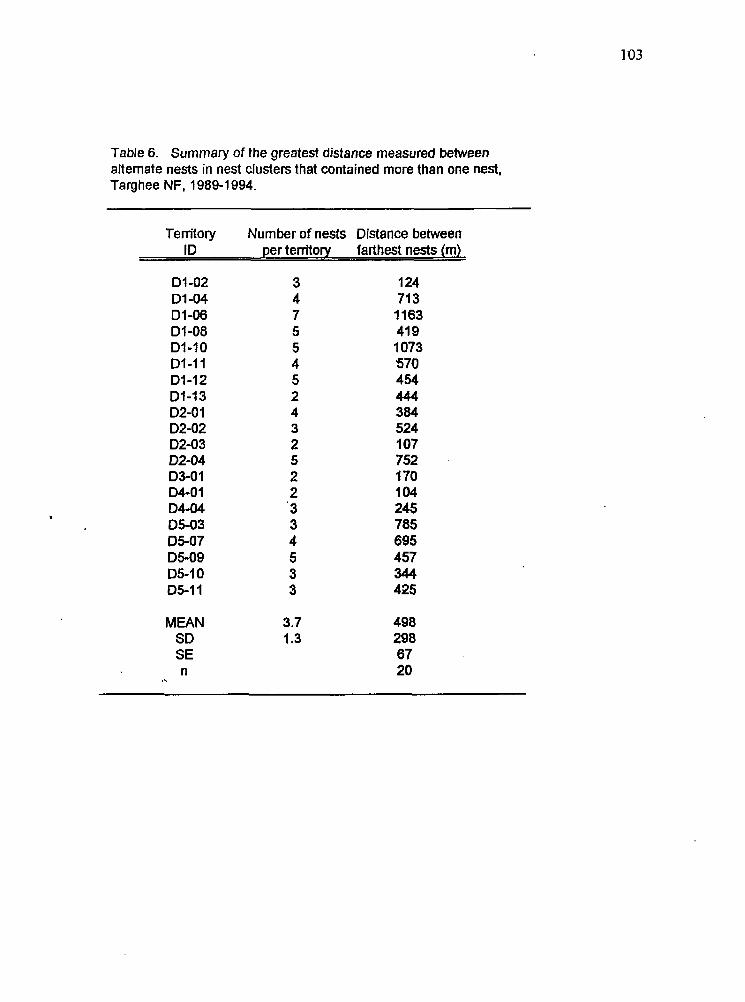
103
Table 6. Summary of the greatest distance measured between alternate nests in nest clusters that contained more than one nest, Targhee NF, 1989-1994.
Territory Number of nests Distance between ID per territory farthest nests (m)
D1-02 01-04 D l -06 01-08 D1-10 D1-11 D1-12 01-13 D2-01 D2-02 D2-03 D2-04 03-01 04-01
05-03 05-07 D5-09 05-1 0 D5-11
D4-04
3 4 7 5 5 4 5 2 4 3 2 5 2 2 ' 3 3 4 5 3 3
124 71 3 1183 41 9 1073 570 454 444 384 524 107 752 170 1 04 245 785 695 457 344 425
MEAN 3.7 498 SD 1.3 298 SE 67 n 20

TABLE 7. Monitoring results for 76 goshawk nest trees, 1989-1 994, Targhee NF. Shown are the total number of nests rechecked per year. Other raptor species found using goshawk nests induded great gray owl, fong-eared owl, great homed owl, and Coopets Hawk.
Number reused by goshawks All nests 1 1 4 5 4 3
Percent reused by goshawks
Number used by other raptors
Percent used by other raptors
All iiests 20% '4% f 3% 13% 7% 4%
All nests 0 4 3 8 7 7
All nests 0% 17% 10% 20% 1 2% I QQh
1989 1990 1991 1992 1993 1994 TOTAL
Number of nests checked All nests
18
8%
29
1 3%
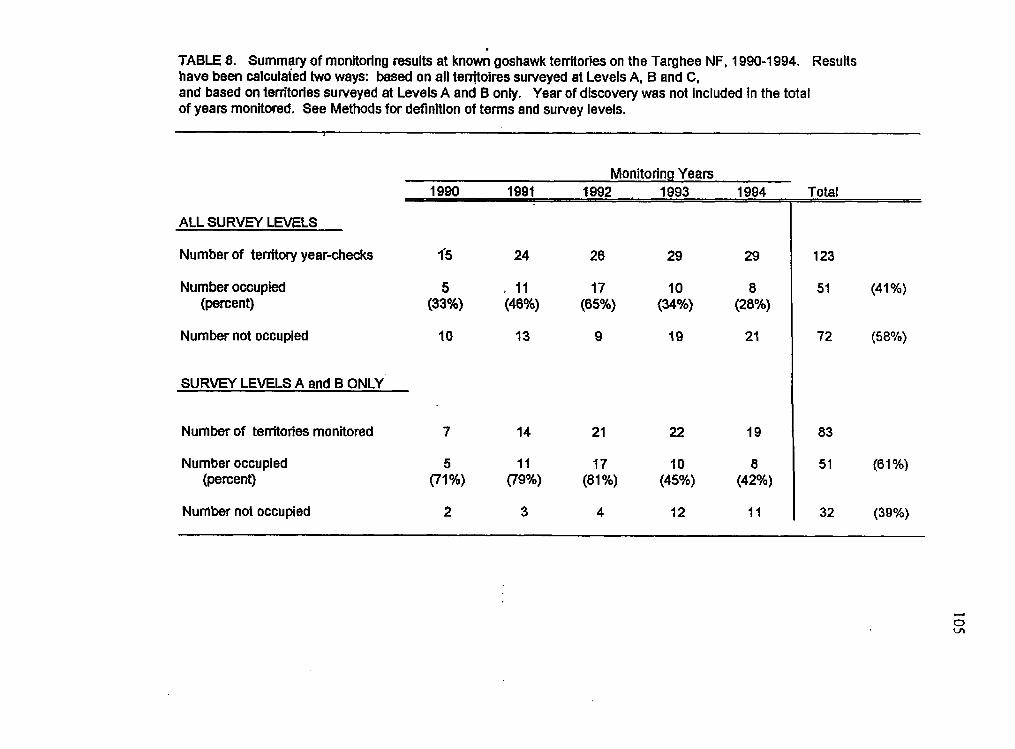
TABLE 8. Summary of monjtorlng results at known goshawk territories on the Targhee NF, 1990-1 994. Results have been catcurded two ways: based on all tenstoires surveyed at Levels A, 6 and C, and based on territories surveyed at Levels A and 8 only. Year of discovery was not included in the totat of years monitored. See Methods for definition of terms and sulvey levels.
ALL SURVEY LNELS
Number of tenitory year-checks
Number not occupied
SURVEY LEVELS A and B ONLY
Monitoring Years 1990 1991 I992 1993 1994 Total
1
Number of tenitories monitored
Number occupied (percent)
Number not occupied
1'5 24 26 29 29
5 : f l 17 10 8 (33%) (46%) (65%) (34%) (28%)
10 13 9 19 21
7 14 21 22 19
5 11 f 7 10 8 (71 %) WW (81%) (45%) (42%)
2 3 4 12 d1
123
51 (41 %)
72 (5 8%)
83
51 (61 Yo)
I 32 (39%)

TABLE 9. Goshawk prey species, Targhee NF, 1989-1993: See Appendix G for scientific names and weights used to calculate biomass.
Number of Pre PELLETS or BLIND
COMMON NAME PREY REMAINS OBSERVATIONS n n
_I-
BIRDS RuRed Grouse Blue Grouse Grouse, sp. Bird (medium). unidentifed common R w n Nothem Flicker Coopef's Hawk Long-aared owl BMegl owl Amarkan R d n ClarKs Nutcracker Duckling, sp. $teller's Jay Gray Jay woodm, w. R e d M p d 8apsucker Town#nd's 8diEaii Wl l lhm's Sapsucker
I
TOTAL BIRDS
MAMMALS
Smwvahoe Hare Unh Gmund squirrel Red Squirrel Medium marnml. unidenW Marmot NWsCottonbaIl Packet Gopher Long-tailed Weasel VOle.6P. Northern Flying Squirrel Yellow Pine Chipmunk Small rodent, unidentified
TOTAL MAMMALS
TOTAL NUMBER : aU prey Items
PERCENT BIRDS PERCENT MAMMMALS
16 5
2
1 1 1'
49
11 1
14
1 2 5 2 4 1 1 2
44
93
52.7% 47.3%
6 21
1
2 1 2
1 1
1
36
2 41 4 10
57
83
38.7% 61.3%
Items SUMoEal Percent of Total
Birds or Mammals B i a s n Y
18 5 6 26 2 8 3 2 '1 4 2 2 2 1 1 1 2 1
8s
13 42 18 10 1 2 5 2 4 1 1 2
101
186
45.7% 54.3%
18.8% 5.0% 7.1% 30.6% 2.4% 9.4% 35% 2.4% 1.2% 4.7% 2.4% 2.4% 2.4% 1.2% 1.2% 1.2% 2.4% 12%
100.0%
12.9% 41.8% 17.8% 9.9% 1 .O% 2.0% 5.0% 2.0% 48% 1 .O% 1 .0% 2.0%
100.0%
13.3% 7.5% 7.0% 3.8% 2.5% I .%% 1 .O% 0.6% 0.5% 0.5% 0.4% 0.3% 0.3% 0.1 % 0.1% 0.1% 0.1% 0.1%.
30.0% 14.9% 5.1 % 3.2% 2.696 '1.4% O.d% 0.5% 0.2% 0.2% 0.1% 0.1%
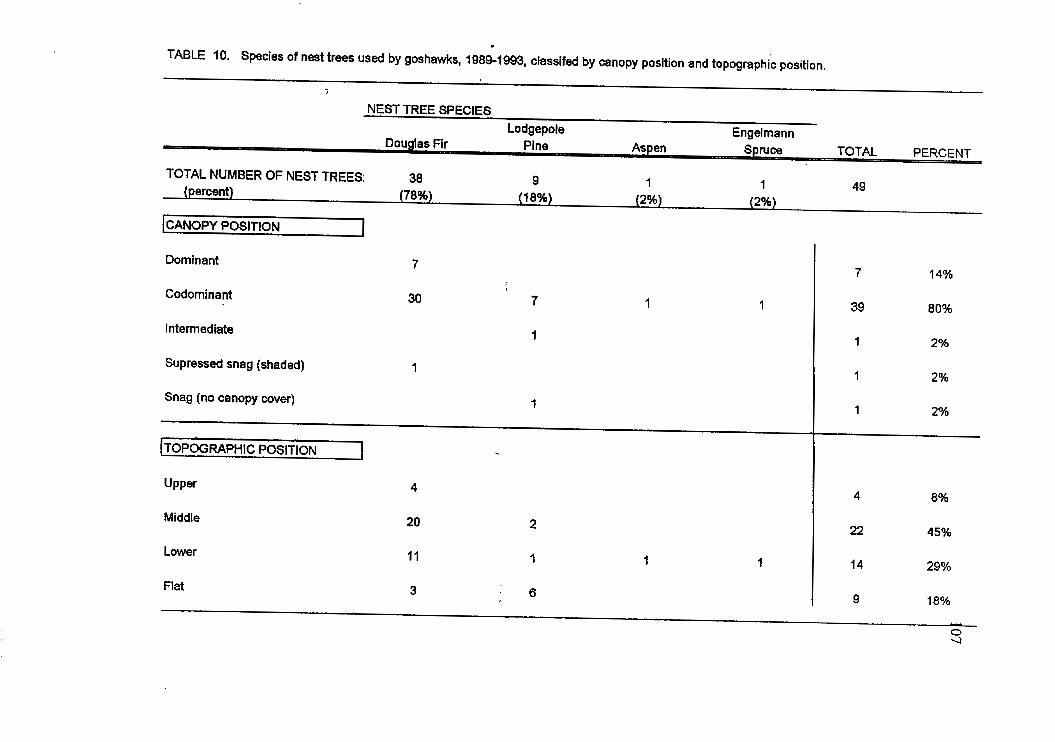
h
U
a, V
I
n
a
Y
i! Y
cn al C
O
Y-
r
bF
.. -
r
P
T-
07
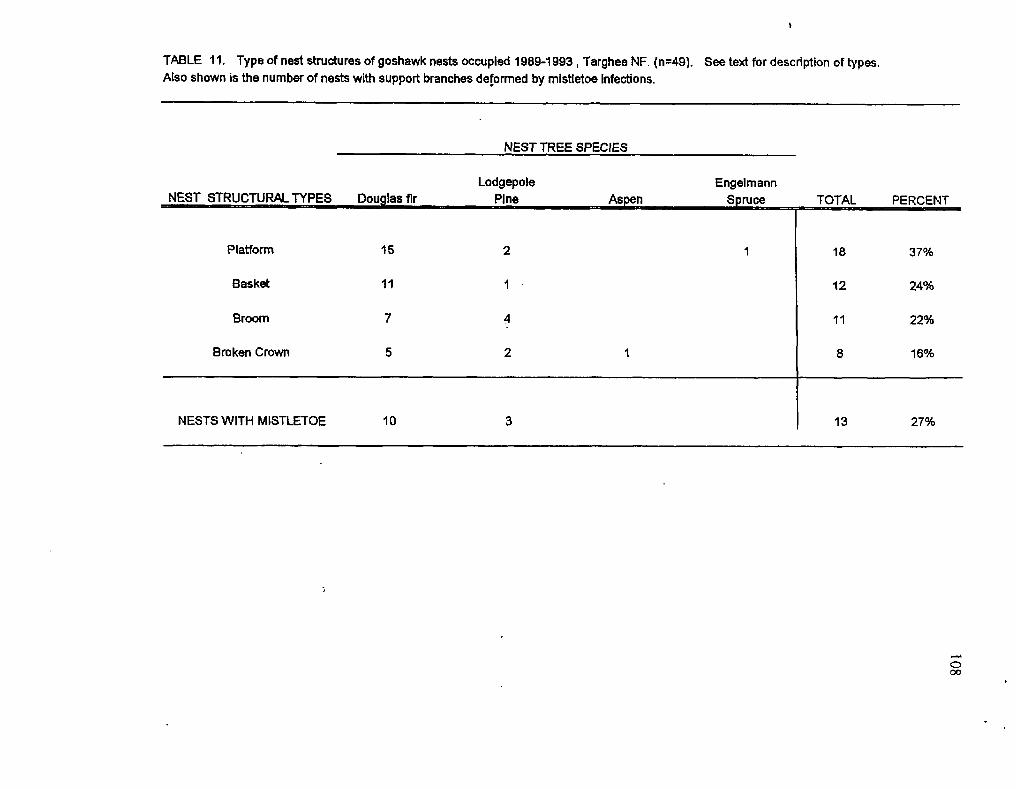
TABLE 1 1. Type of nest structures of goshawk nests occupied 1989-1 993 , Targhee NF. (n=49). See text for description of types. Also shown is the number of nests with support branches de@ned by mistletoe infections.
Broken Crown 5 2 1
NEST TREE SPECfES
8 16%
Lodgepole Engelmann
Plaffom
8asket
Broom
$5
11
7
2
1
4
1 18 3 7%
12 24%
71 22%
NESTS WITH MISTLETOE 10 3 I 13 27%

109 TABLE 12. Comparison of Level 1 habitat characteristics for all active goshawk nests found 1989-1 993, TNF. Shown are values calculated for all nests (n=49) ,and for only one nest per territory (n-27) at OF and LP ten"tories. Probability values indicate resub of a statistical comparison (MRPP) of Douglas fir and lodgepole pine nestsites.
l ( range)
All Nests Douglas Fir Lodgepole Pine p-value
(range) I 1 (range] I Variable (n=49) {n=21) (n=6)
st I I m e a n I mean mean S k T _c__
C.
. Nest tree height (m)
Nest tree dbh (crn)
Nest height (m)
25 1 27 1 20 2 0.004 (1 2-38) (1 2-38) (1 6-26)
43.6 2.5 48.3 3.5 24.5 1.8 0.001 (1 6.3-84.1) (20.884.1) (21.6-33.0)
13 0.4 14 0.7 13 1 0.544 (7-2 1 1 (8-21) (1 1-1 7)
Nest Ht /Tree Ht (%) 0.53 0.02 0.53 0.03 0.68 0.03 0.006 (0.29-1.00) (0.2s-1.00) (0.so-o.7Q)
Nest tree canopy cover (%) (a) 79 3 85 2 54 7 0.000 (29-70)
. . . (2@W (72-98)
-. -
9 143 13 9 6 8 0.052 (72-1 13)
Nest.tree age (years) @I 131 (62-280) (62-280)
Elevation (m) 2119 16 2147 25 1994 40 0.004 (1 860-241 5) (1 880-241 5) (1890-2lB5)
Percent slope (%) 22 2 26 3 13 4 0.027 (0-47) (547) (3-27)
.
(a) n= 41 (all nests) n - 18 @o (b) n=43(allnests) n - Z O O n*S(LP)

TABLE 13. Distances (mean, standard emr and median) from goshawk nest dusters to forest edge, permanent water and roads on the TNF, 1989-1 993. Probability values Indicate results of B statistical comparison (MRPP) of Douglas fir and lodgepole pine territories.
mean median St (range)
All Territories Douglas fir nests Lodgepole Pine nests
mean median St mean median St (range) (rang e}
0.973 272 137 126 Distance to forest edge (m) 299 122 75 307 122 90 ( I 1-1610) (11-1610) (36-793)
Distance to permanent water (m) 552 343 116 443 333 93 934 648 395 0.352 (30-2706) (30-1 753) (1 52-2706)
Distance to open road (m) 1186 1290 170 1290 1094 209 824 893 184 0.349 (1 14-4573) (t 14-4573) (84-1 372)
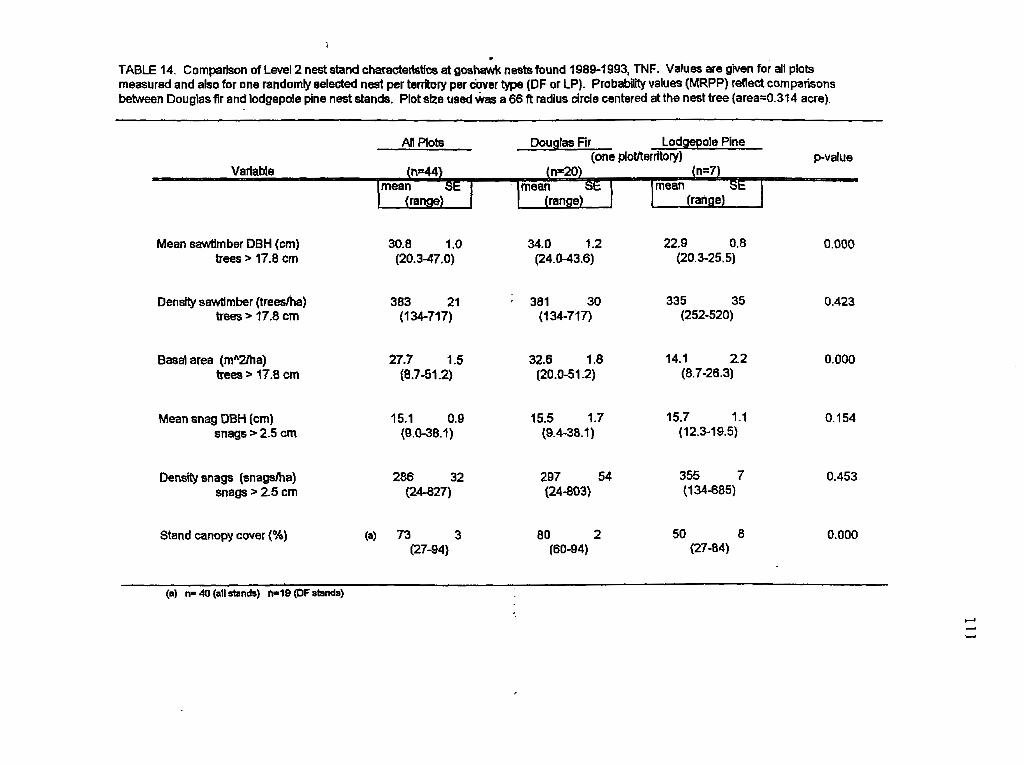
TABLE 14. Comparison of Level 2 nest stand characterietics at goshawk nests found 19891993, TNF. Values are given for an plots measured and also for one randomly selected nest per tenitory per dover type (DF or LP). Probability values (MRPP) reflect comparisons behrreen Douglas fir and lodgepole pine nest stands. Plot size used &as a 66 ft radius Circle centered at the nest tree (ares0.314 acre).
An Plots Doughs Fir Lodgepole Pine (one ptotrterritory) pvabe
Mean sawtimber DBH (cm) 30.8 1.0 34.0 1.2 22.9 0.8 0.000 bees > 17.8 crn (20.3-47.0) (24.0-43.6) (20.3-25.5)
Dens@ sawtimber (treeha) 383 21 I 381 30 335 35 0.423 trees > 17.8 cm (1 34-71 7) (7 34-7 i 7) (252-520)
Basal area (rnA21ha) trees > 17.8 cm
Mean snag DBH (cm) snags > 2.5 cm
Density snags (snagslha) snags > 2.5 cm
27.7 1.5 32.6 1.8 14.1 2.2 0.000 (8.7-51.2) (20.0-51 -2) (8.7-26.3)
15.1 0.9 15.5 1.7 15.7 1.1 0.154 {s.ws..r) (9.4-38.1) (12.3-99.5)
288 32 297 54 355 7 0.453 (24-827) (24-803) (1 34-685)
Stand canopy cover (%) (a) 73 3 80 2 50 8 0.000 (27-94) (60-94) (27-64)
(a) n= 40 (all stands) -19 @F stands)

TABLE 15. Comparison of density of he trees In diierent size citegories in nest stands at DF and LP goshawk territories, 1989-1 993, TNF. ProbabiMy values indicate results of MRPP tests for patred comparisons. Plot size used was a 66 ft radius cirde (area=0.314 ac) meaured at one nest site randomly selected per territory.
Dougak flr Lodgepole Plne
TREE DENSiTY (treeslha):
Large sawtimber (> 40.6 cm dbh)
Medium sawtimber (30.5-40.6 cm)
Small sawtimber (17.8-30.5 cm dbh)
Pole sized timber (7.6-17.8 cm)
Saplings (3.8-7.6 cm)
Seedlings (< 3.8 cm dbh)
GROUND COVER HEIGHT (crn);
MATURE DOWNFALL (numberha) downed logs > 17.8 cm dbh
82 I 1 (O-f 8 I)
108 13 (24-283)
192 32 (16-614)
1 27 22 (8-378)
67 20 (0-283)
(a) 363 123 (0-1693)
2 4 (0-8)
16 10 (0-63)
318 28 (21 3-449)
321 110 (47-874)
474 133 (0-1 126)
1672 823 (1266488)
25 2 (17-32)
134 44 (20-252)
0.000
0.000
0.010
0.054
0.000
0.01 5
0.200
0.000
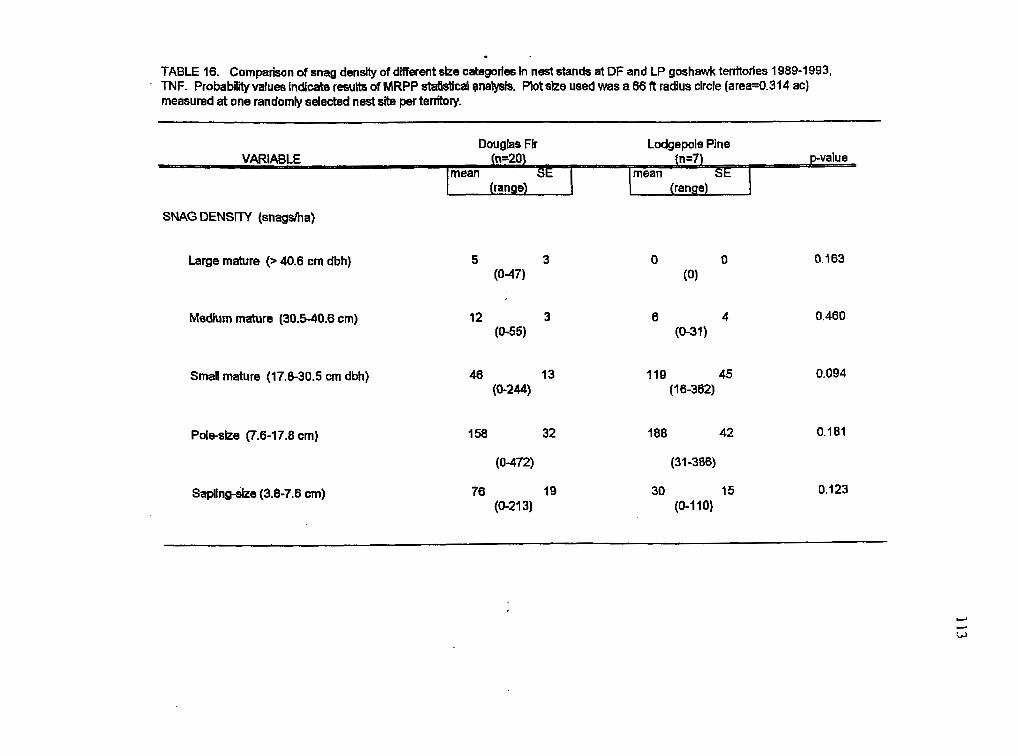
TAElLE 16. Comparison of snag density of different &e categories In nest stands at DF and LP goshawk territories 1989-1 993, TNF. Probability values indicate results of MRPP Statistid qnatysk. Plot size used was a 66 tt radius circfe (area=0.314 ac) measured at one randomly selected nest site per terrftory.
Lodgepole Pine Douglas Fir
SNAG DENSITY (snagsha)
Large mature (> 40.6 cm dbh)
Medium mature (30.5-40.8 cm) 12 3 (0-55)
Small mature (17.8-30.5 cm dbh)
Poledze (7.6-17.8 cm)
48 13 (6244)
158 32
(0-472)
Sapltng&e (3.8-7.6 cm) 78 19 (0-21 3)
0.163
0.460
I19 45 0.094 (1 6-362)
188 42 0.181
(31-386)
30 15 0.123 (0-1 10)
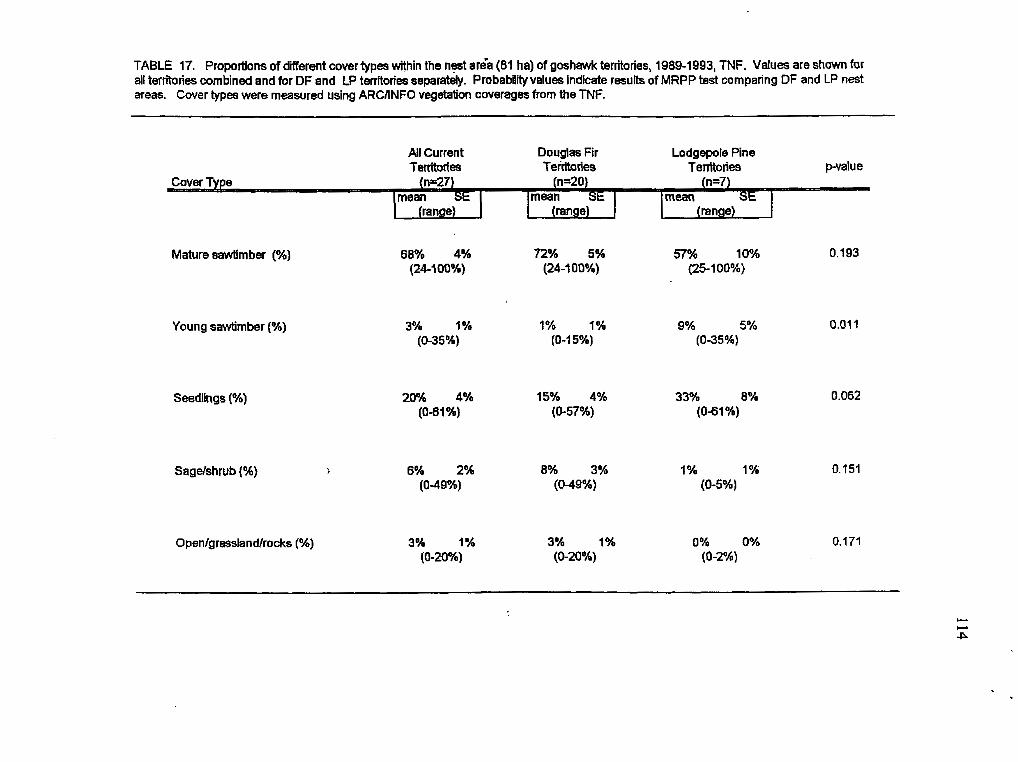
TABLE 17. Proportions of different cover types within the ne area (81 ha) of goshawk territories, 1989-1993, M F . Values are shown for all territories cornbind and for DF and LP tenitodes separably. Probability values indicate results of MRPP test comparing DF and LP nest areas. Cover types were measured using ARCANFO vegetation coverages from tbe TNF.
All Current Douglas Fir Lodgepole Pine Tenitodes Teititaies Territories Pvalue
Mature sawtimber (%)
Young sawtimber (%)
Seedlings (%)
Sagelshrub (%)
0 ps nlgrassla ndlrocks (%)
88% 4% 72% 5% 57% 10% (24-1 00%) (24100%) I251 00%)
3% 1% 1% 7% 9% 5% (0-35%) (0-1 5%) (0-35%)
20% 4% 15% 4% 33% 8% (041%) (0-57%) (041%)
6% 2% 8% 3% 1% 1 % (049%) (049%) (04%)
0.193
0.01 1
0.062
0.151
3% 1% 3% 1% 0% O# 0.771 (0-20%) (Q-20%) (0-2%)
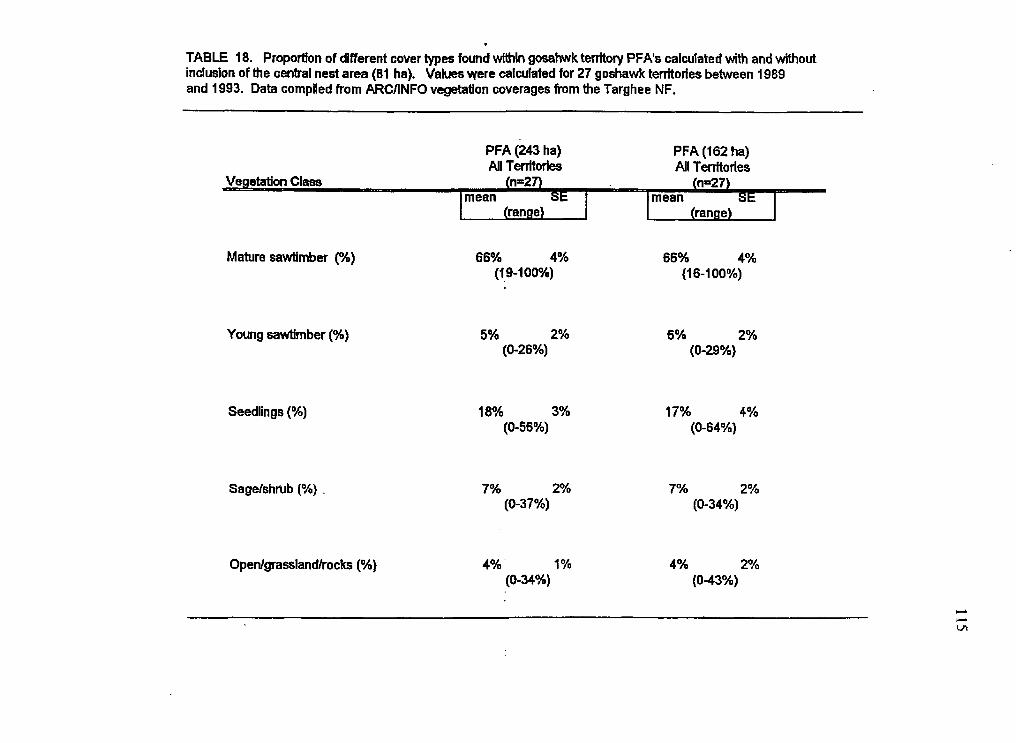
TABLE 18. Proportion of different cover types found within gosahwk territory PFA‘s calculated with and without inclusion of the central nest area (81 ha). Values were calcdated for 27 goshawk territories between 1989 and 1993. Data compiled from ARCANFO vegetation coverages fmm the Targhee NF.
PFA (243 ha) All Tenitodes
PFA (162 ha) All Territories
Mature sawtimber (“m)
Young sawtimber (“h)
Seedlings (%)
Sagelshrub (%) .
Openlgrasslandlrocks I“/.)
66% 4% (i 9-1 00%)
5% 2% (026%)
18% 3% (046%)
7% 2% (837%)
4% I% (&34%)
66% 4% (I64 OOYO)
6% 2% (0-29%)
17% 4% (O-64%)
7% 2% (O-34%)
4% 2% (043%)

TABLE 19, Proportion of different cover Iypes found within PFA's (1 62 ha) at goshawk territories 1989-1 993, TNF. P values indicate resub of MRPP analysis comparing DF. and 1F territories. Percent cover types were determined using ARCANFO vegetation coverages.
DOUGLAS FIR LODGEPOLE PINE MRPP
Mature sawtimber (%) 70% 3% 52% 1% 0.072 (48-100%) (1 6- 1 0 0%)
Young sawtimber (%)
Seedlings (%)
Sagelshrub (%)
3% 1% 15% 4% 0.005 (0-23%) (0-29016)
13% 3% 31 % 9% (047%) (044%)
0.039
9% 3% 2% 2% 0. t 52 (0-34%) (O-13%)
0 penlg rasda n dlrocks (%) 6W 2% 0% 0% 0.055 (04%) (0-IYO)
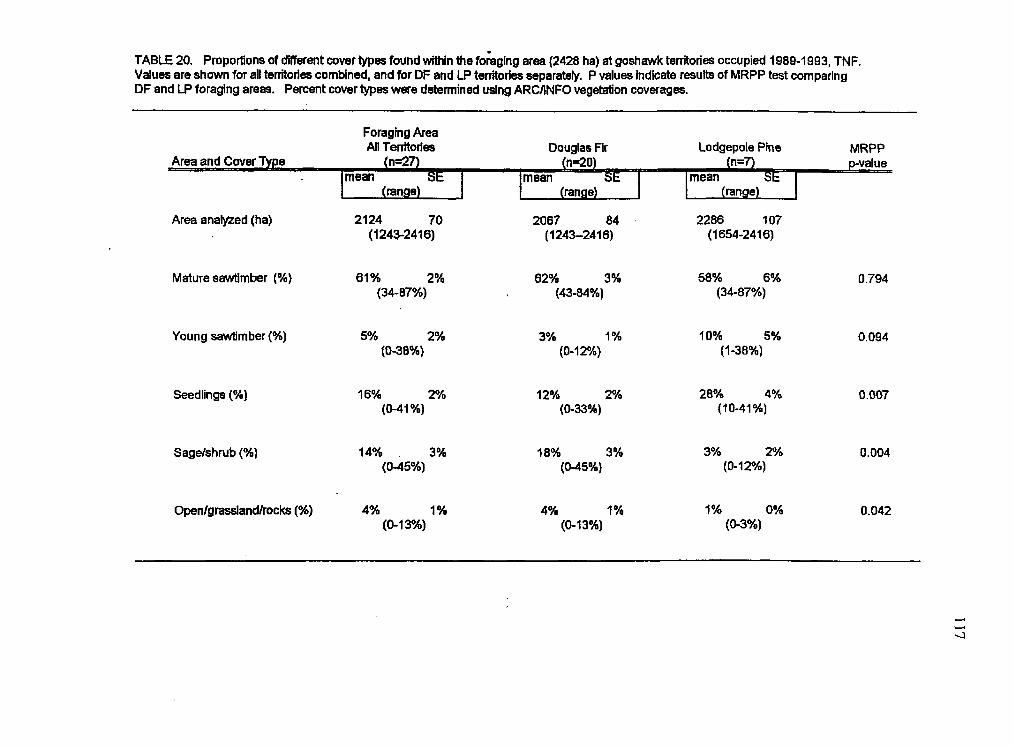
TABLE 20. Proportions of dmerent m e r types found within the fokglng area (2428 ha) at goshawk territodes occupied 1989-1 993, TNF. Values are shown for all territories combined, and for DF and LP territories separately. P values indicate results of MRPP test comparing DF and LP foraging areas. Percent cover types were determined udng ARCANFO vegetation coverages.
Foraging Area An Tenitodes Douglas Fir Lodgepole Pine MRPP
Area anabed (ha) 2124 70 (1 243-241 6)
2067 84 2286 1 07 (1243-2416) (1 654-241 6)
Mature sawtimber (%) 61% 2% 62% 3% 58% 6 O / 6 (3487%) (4344%) (34-87%)
0.794
Young sawtimber I%) 5% 2% 3% 1% 10% 5% 0.094 ( ~ 3 8 % ) (0-1 2%) (1 -38%)
Seedlings (%) 16% 2% (0-41%)
12% 2% 28OA 4% 0.007 (043%) (t0-41%)
Sagelshrub (%) 14% , 3% 18% 3% 3% 2% 0.004 ( 0 4 % ) (045%) (0-12016)
Openlgrasslandlrock (%) 4% 1% 4% ?% 1% 0% 0.042 (0-t3%) (0-13%) 603%)
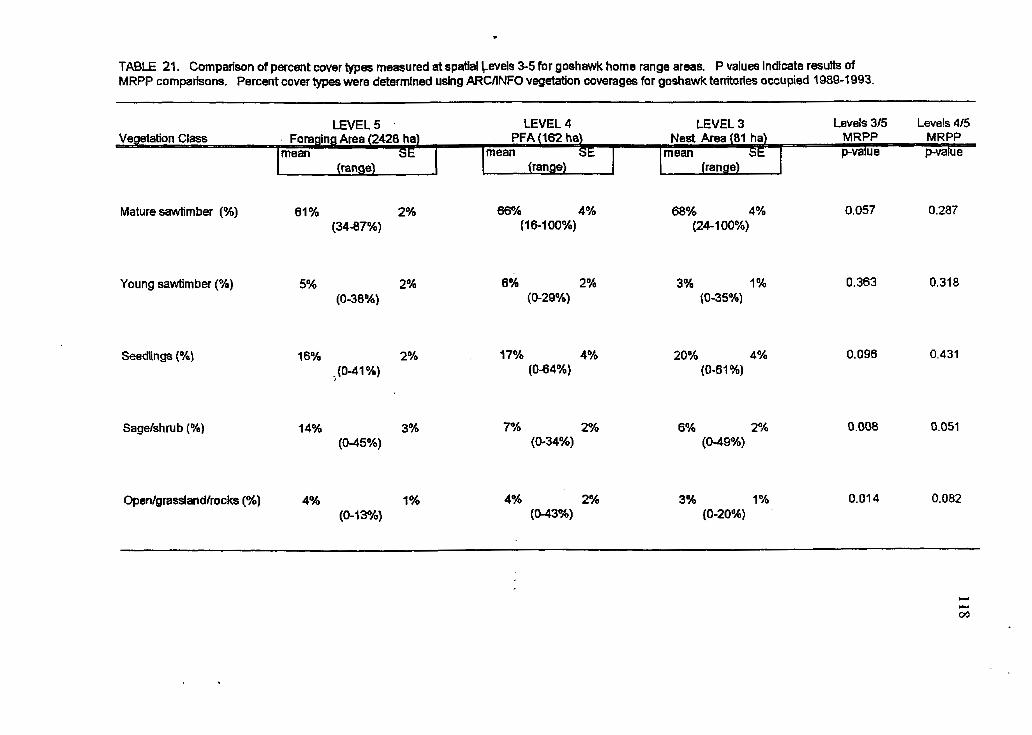
TABLE 21, Compan'son of percent m e r types measured at spatial Levels 3-5 for goshawk home range areas. P values indicate results of MRPP comparisons. Percent cover types were determtned using ARCANFO vegetation coverages for goshawk territories occupied 1989-t993.
LEVEL 4 LEVEL 3 Levels 315 Levels 415
Mature sawtimber (%) 61 % 2% 66% 4% 60% 4% (3447%) (1 6 1 00%) (24-100%)
Young sawtimber (%) 5% 2% 6% 2% 3% 1% (0-38%) @-29%) (0-35'h)
Seedlings (%)
Sagelshru b (%)
16% 2% . (0-41 %)
17% 4% 20% 4% (044%) (0-61 %)
14% 3% 7*h 2% 6% 2% (045%) (0-34%) (049%)
0.057 0.287
0.363 0.318
0.096 0.431
0.008 0.051
Openlgrasslandlrocks (K) 4% 1% 4% 2% 3% 1% 0.014 0.082 (0-13%) (043%) (0-20%) .

119
TABLE 22 . Comparison of habitat characteristics measured at goshawk nest sites and paired random plots. SD = standard deviation. Center tree refers to the nest tree at nest site plots. Probability levels at the results of multi-response permutation procedure for matched pairs. Significant differences kess than p=O.O1 are indicated by *.
-. Variable n Nest Sites Random Sites P-value
mean SD mean SO
Dist to bottom of canopy (m) Center tree height (rn) Main canopy height (m) Basal area (sq miha) Distance to edge (m) Mean DBH snags (cm) #Downed mature logs/plot Percent slope (%)
Mean DBH sawtimber (cm) Saplingdplot Site canopy cover (%) Center tree canopy cover (%)
Density kawtimber (treema) Mean ground cover,hefght (cm) Distance to road (m) Density of snags (snagdha) #Seedlings/plot
Shrubslplot Center tree DBH (cm) Distance to water (m) Canopy depth (m) Elevation (m)
26 26 26 26 26
26 22 26 26 25 25 23 26 26 26 26 23 25 26 26 26 26
14.7 5 3.2
24.9 2 5.7 25.2 4 5.6 28.5 2 10.7 327 5 346 15.2 2 6.2
20 2 13 31.0 5 6.6 23 2 34
49 2 67
75. 4 15 *:,81 5 12.6 387 2 142
21.8 2 12.1 1262 908 313 4 217 104 t 172 6 2 16
41.2 5 16.2 543 619 10.5 2 4.0 2124 5 122
10.8 2 4.1 20.5 2 4.9 21.3 2 5.0 21.2 4 10.6 172 2 314 13.6 2 5.2 28 2 34 25 5 17
28.9 2 7.4 19 2 17 71 2 15 76 5 17.9 347 2 195 18.7 5 5.9 1112 5 992 249 5 216 143 5 170
3 5 5 38.2 5 11.2 612 2 864 10.5 & 4.5 2140 4 151
0.000 * 0.002 * 0.004 0.005 * 0.009 * 0.079 0.1 34 0.144 0.151 0.231 0.249 0.285 0.292 0.380 0.394 0.404 0.452 0.457 0.460 0.529 0.554 0.588

120
TABLE 23 . Comparison of size classes of live trees measured at goshawk nest site plots and paired random sites. SE=standard error. Range is given in parentheses. Probability levels are the results of multi-response permutation procedure for matched pairs. Asterisks indicate significant results.
C. Size Class Nest Sites Random Sites mean SE mean SE P-value
(n=26) (n=26)
#Live treedplot 7.6-1 5.1 cm DBH (3.0-5.99
#Live treedplot 15.2-22.7 cm DBH (6.0-8.9’7
#Live treedplot 22.8-30.3 cm DBH (9.0-1 1.97
%?Live treedplot 30.4-37,9 cm DBH (12.0-1 4.9”)
#Live treedplot 38.0-45.5 cm DBH (15.0-17.9”)
#Live treedplot 45.6-53.2 cm DBH (1 8.0-20.9’1
#Live treeslplot 53.3-60.8 cm DBH (21.0-23.9”)
#Live treedplot > 60.9 cm DBH Q24“ DBH)
15.0 2 3.6 (0-85)
22.2 2 4.1 (2-1 04)
15.4 2 2.4 (0-57)
9.7 2 1.6 (0-3)
4.9 2 0.9 (0-1 8)
2.3 2- 0.5 (0-9)
1.2 2 0.3 (0-5)
1.0 2 0.3 (0-7)
19.2 2 3.6 (1 -80)
21.6 4 4.4 (0-1 03)
12.5 2 2.2 (1-45)
7.3 2 1.5 (0-29)
2.7 0.5 (0-9)
1.8 2 0.3 (0-4)
0.8 5 0.2 (0-4)
0.5 J- 0.3 (W
0.464
0.983
0.203
, . . 0.192
0.053 **
0.504
0.642
not tun

121
TABLE 24. Comparison of size classes of snags measured at goshawk nest site plots and paired random sites. SE= standard error. Range is given in parentheses. Probability levels are the results of multi-response permutation procedure for matched pairs.
Nest Sites Random Shes Snag Size Class mean SE mean SE
(n=26) ( 11x26 2 P-value
#Snags/plot 2.5-7.6 em dbh (1.0-3.0")
Wnagdplot 7,615.1 cm dbh (3.0-5.9")
#Snagdplot 15.2-22.7 cm dbh (6.&8,9")
#Snagslplot 22.8-30.3 cm dbh (9.0-1 1.9)
Wnagslplot 30.4-37.9 cm dbh (12.0-14.9")
#Snags/plot 38.0-45.5 cm dbh (1 5.G17.V)
#Snags/plot 45.6-53.2 cm dbh
Hnagdplot 53.3-60.8 cm dbh (21 .O-23.0")
#Snags/plot 60.0 em dbh (r24" DBH)
(18.0-20.0") ,.
9.6 + 1.8 (0-27)
3.1 2 1.0 (0-23)
6.5 2 1.4 0.107 (0-31)
14.8 2 2.6 0.278 (0-56)
6.7 2 1.6 (0-30)
2.6 2 1.2 (0-33)
0.8 2 0.2 1.0 4 0.6 (0-5) (0-14)
(only 5/28 nest plots had snags in this size dass)
(only 2128 nest plots had snags in this she dass)
(only 1/26 nest plot had snap in this she class)
(no nest plots had snags In this size dass)
0.846
0.579
- .- 0.548
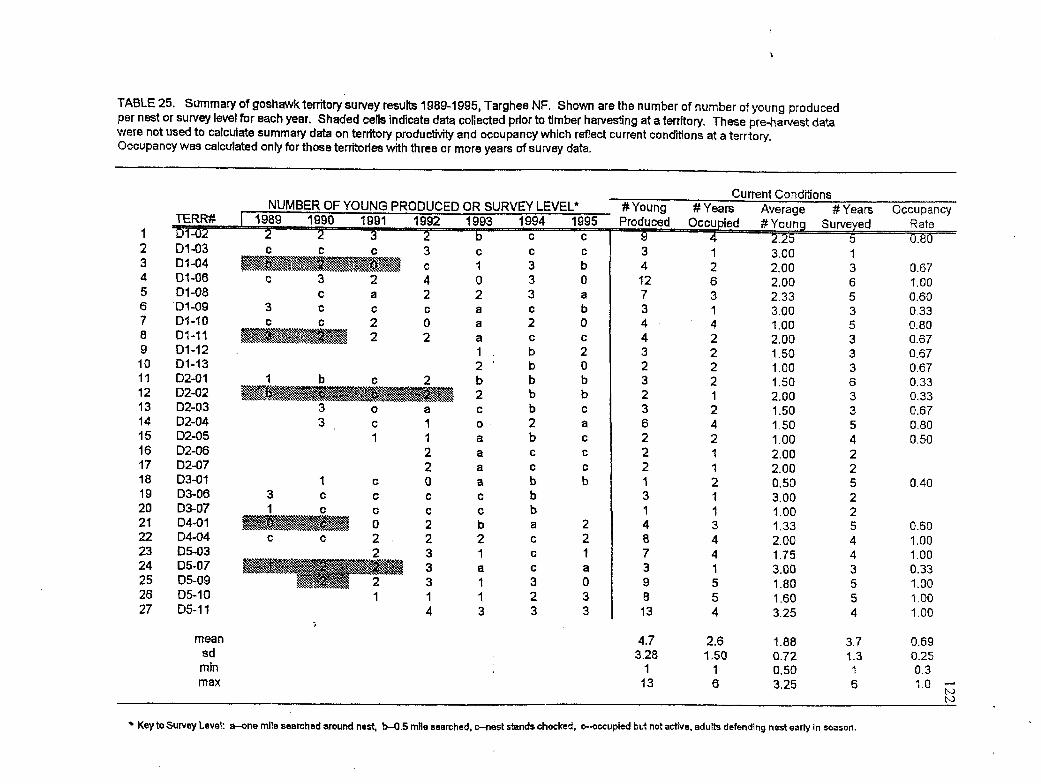
TABLE 25. Summary of goshawk territory survey results 1989-1 995, Targhee NF. Shown are the number of number of young produced per nest or survey level for each year. Shaded cetls indicate data collected prior to timber harvesting at a territory. These pre-harvest data were not used to caIcutate summary data on terrftory productivity and occupancy which reflect current conditions at a territory. Occupancy was calcuiated only for those territories with &ree or more years of survey data.
Current Condib'ons NUMBER OF YOUNG ##Young # Years Average # Years Occupancy
1 2 3 4 5 6 7 8 9
I O 11 12 13 14 15 16 17 18 19 20 21 22 23 24 25 26 27
D1-03 D i -04 Df46 D1-08 D1-09 DI-$0 03-31 D1-12 01-13 D2-01 D2-02 D2-03 D2-04 D2-05 D2-06 D2-07 D3-Of D3-06 D3-07 D4-01 D4-04 05-03 05-07 D5-09 D5-10 D5-11
mean sd min max
C C C 3 C
C 3 2 4 C a 2
3 C c C
c C 2 0 2 2
b E 7
3 0 a 3 C I
I I 2 2
1 c 0 3 C c C
1 C C G 0 2
C C 2 ' 2 CI .-a L J
3 3
1 1 4
C
1 0 2 a a a 1 . 2 . b 2 C
0
a
a a
a
C
c b 2 1 a 1 1 3
c C
3 b 3 0 3 a c b 2 0
b 2 b 0 b b b b b C 2 a b c
C C
C C
C C b b b b a 2 C 2 C I C a 3 0 2 3 3 3
Rate Produced Occupied #Young Surveyed 9 4 2.25 5 0.80 3 4 12 7 3 4 4 3 2 3 2 3 6 2 2 2 1 3 1 4 8 7 3 9 8 13
1 2 6 3 1 4 2 2 2 2 1 2 4 2 f 1 2 3 1 3 4 4 1 5 5 4
3.00 2.00 2.00 2.33 3.00 1.00 2.00 I .50 1 .oo 1.50 2.00 1 .so 1.50 1.00 2.00 2.00 0.50 3.00 1.00 f.33 2.00 1.75 3.00 1.80 1.60 3.25
7 3 6 5 3 5 3 3 3 6 3 3 5 4 2 2 5 2 2 5 4 4 3 5 5 4
0.67 7.00 0.60 0.33 0.80 0.67 0.67 0.67 0.33 0.33 0.67 0.80 0.50
0.40
0.60 1 .oo 1 .oo 0.33 1 .00 1 .DO 1.00
4.7 2.6 ?.88 3.7 0.69 3.28 1 s o 0.72 I .3 0.25
1 1 0.50 t 0.3 13 6 3.25 6 1.0 '3
N
K0y to Survey Levet: a-ono mile searched around nest, b-O.5 mfle searched. c-nest stands checked, *-occupied but not she. adults defendlng nest early In season.
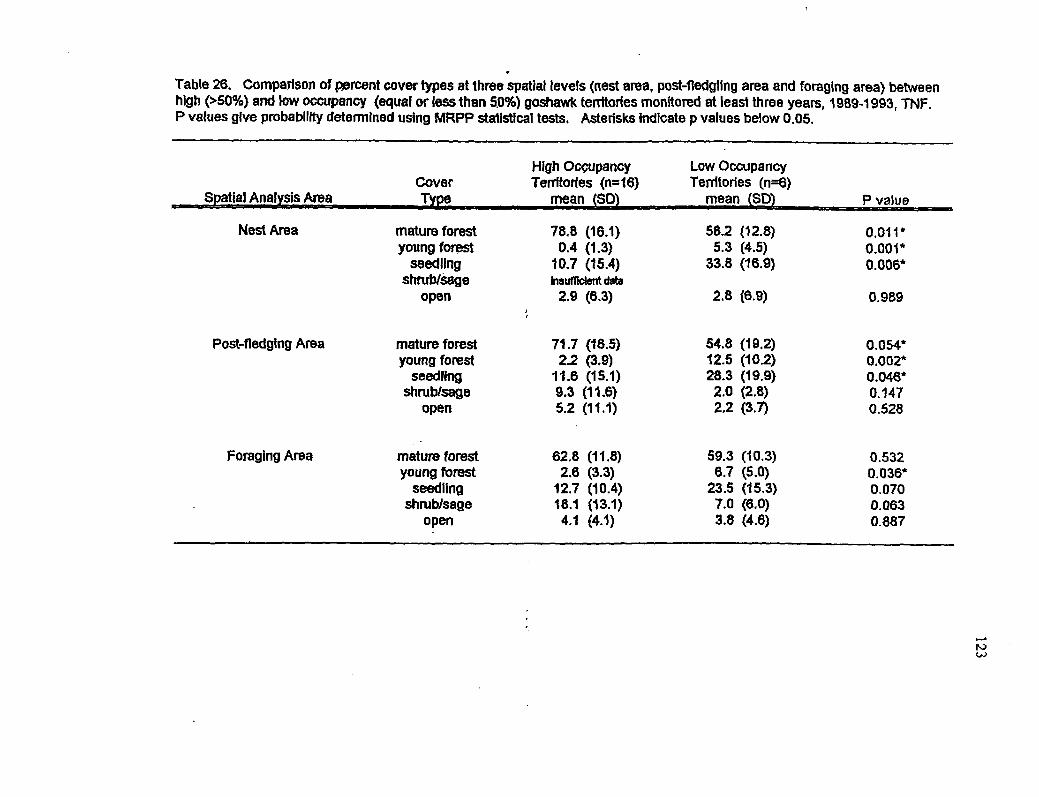
Table 26. Comparison of psrcent cover types at three spatial levels (nest area, post-fl8dgllng area and foraging area) between high (SO%) and low occupancy (equaf or less than 5.0%) goshawk territories monitored at least three years, 1989-1 993, TNF, P values give pmbability determined using MRPP statistical tests, Asterisks indicate p values below 0.05.
High Owpancy
P value Spatial Ty mp e mean SD
Low O w pan cy Cover Territories (n=16) Territories ( ~ 6 )
Nest Area mature forest 78.8 (16.1) 58.2 (12.8) 0.01 1 * young forest 0.4 (1.3) 5.3 (4.5) 0.001'
shrublsage lnsuflIclsntdata seedling 10.7 (15.4) 33.8 (16.9) 0.006'
open 2.9 (6.3) 2.8 (6.9) 0.989 2
Post-fledghg Area mature forest 71.7 (f6.5) 54.8 (19.2) 0.054* yOURg fore& 2.2 (3.9) 12.5 (10.2) 0.002"
seedling 11.6 (15.1) 28.3 (19.9) 0.045'
open 5.2 (11.1) 2.2 (3.7) 0.528 shm Wsags 9.3 (11.6) 2.0 (2.8) 0.147
Foraging Area mature forest 62.8 (11.8) 53.3 (10.3) 0.532 young forest 2.6 (3.3) 6.7 (5.0) 0.036"
seedling 12.7 (10.4) 23.5 (f5.3) 0.07O shrublsage 48.1 (13.1) 7.0 (6.0) 0.063
open 4.1 (4.1) 3.8 (4.6) 0.88t

Table 27. Monboring results at goshawk tenitodes pre and Po's-timber harvest Shown are the number of young produced per nest or the survey level per year. Occupancy rate was calculated only for tenftories monitored for two or more years at survey lev4 A or 8.
indicates small buffer left around known nests 10 ha. +* indicates large buffer left around known ne& > 40 ha. See Table 17 for key to survey level.
#Young YEAR Number of Young Produced or Survey Level #Years #Years Produced Occupancy
A U s e d PerNed Rate
PRE-HARVEST PERIOD
D1-04 1991 b 2 D1-11 1990 3 2 02-02 1992 b C D4-01 1990 0 C D5-07 199t I 2 D509 9991 2
Mean SD
POST-HARVEST PERIOD
Dl-04 D1-09' Df-IO" Dl-1 I D2-02' 04-01" D5-01 D5-05. D W T D509"
Mean SD
1991 1987 3 i C 1989 c C 1990 1992 1990 1986 1986 b I991 I991
C 2 2
0 b b
2
2
C
C 0 2
1 a a a 2 b b
a 1
C C c 3
a 0
3 2 2 1 3 1
2.0 0.9
2 1 .oo 0.67 2 2.50 1 .oo 1 2.00 0.50 1 0.00 3 1.67 f .oo 1 2.00
1.7 1.53 0.79 0.8 0.90 0.25
2 1 4 2 1 3 6 0 1 5
2.00 0.67 3.00 0.33 1 .oo 0.80 2.00 0.67 2.00 0.33 1.33 0.60
0.00 0.00
3.00 0.33 1 .a0 1.00
3.50 1.90 2.02 0.47 1 .OS 1.66 0.71 0.33
3 3 5 3 3 5 3 2 3 5
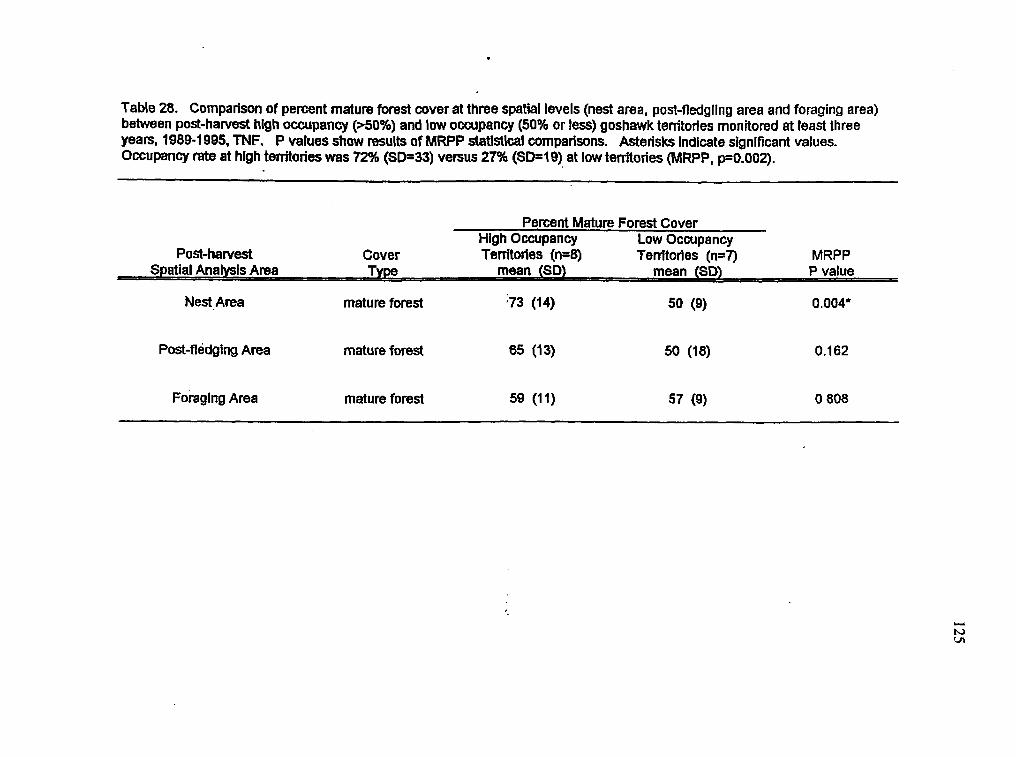
Table 28. Comparison of percent mature forest cover at three spatial levels (nest area, post-fledgling area and foraging area) between post-harvest high occupancy p50%) and low occupancy (50% or less) goshawk territories monitored at least three years, 1989-1 995, TNF. P values show results of MRPP stat!stlca! cornpatisons. Asterisks indicate significant values. Occupancy rate at high terdtories was 72% (S0=33) versus 27% (SD=19) at low territories (MRPP, p=O.OOZ).
Percent Mature Forest Cover High Occupancy Low Occupancy
Post-harvest Cover Territories (n=8) Tenttorles (n-7) MRPP mean (SD) mean (SD) P value
Nest.Area mature forest ;73 (14) 50 (9) O,OO4*
Post-fledging Area mature forest 65 (13) 50 (18) 0.162
Foraging Area mature forest 59 (11) 57 (9) 0 808
Y
N VI
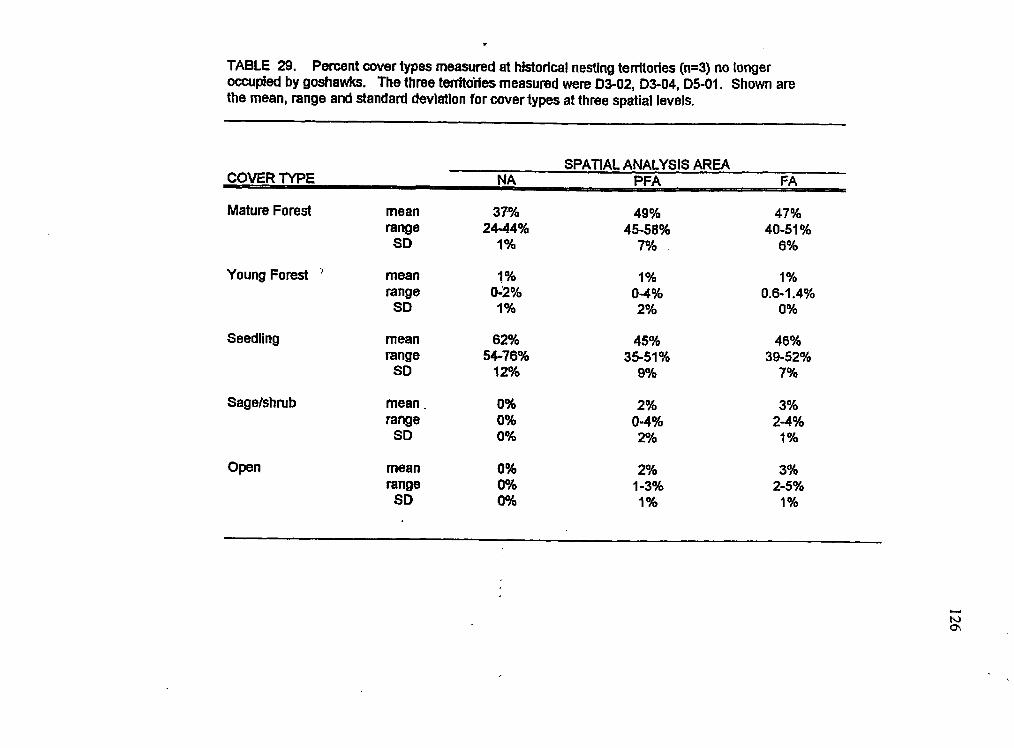
%C %S-2 %€
%I. %P-2 YO€
961 %E- c %Z
%Z %P-0 %Z
%Q as %O %6UW %U Uc3WJ uado
%O %O %O
%L %6 %Zi as %ZS-6€ 016 CS-9B %QL-PS a8uw %9P %SV 9QZ9 ueau
%Q %P' 1-9'0
Yo 1
%9 % is-OP
%LP
%Z %Po %l

TABE 30. Cornpadson of goshminest sRes found using a systematic broadcast survey method (n=Z) to nest sites found opportunistically on the Targhee NF in Douglas fir habitat (n=37 sites f i 15 different tenltoriesj. Only one distance measure per tenitory was analyzed- Probablllty values are shown for the multi-response permutation process (MRPP) test .
' Survey Nests Other DF Nest Sites MRPP
Habitat Variable (n=2) p value m n mean 0-4
Nest tree helght (m) Nest helght (m) Nest tree age (years) Nest tree dbh (cm) Nes tree canopy cover (%) Elevation (m) Sawtrees per hecatare Sawtrees mean dbh (cm) Snags per hectare Snag mean dbh (m). Ground cover height (cm) Slope (%I Distance to road (m) Distance to water (m) Distance to edge (m)
31 15 131 61
21 97 350 37 323 15
16.6 33
1677 158 934
83
29 16 169 58 81
21 46 464 36 281 20
18.0 21
1311 558 272
0.125 0.760 0.252 0.143 0.783 0.552 0.826 0.291 0.949 0.730 0.934 0.647 0.299 0.316 0.028'
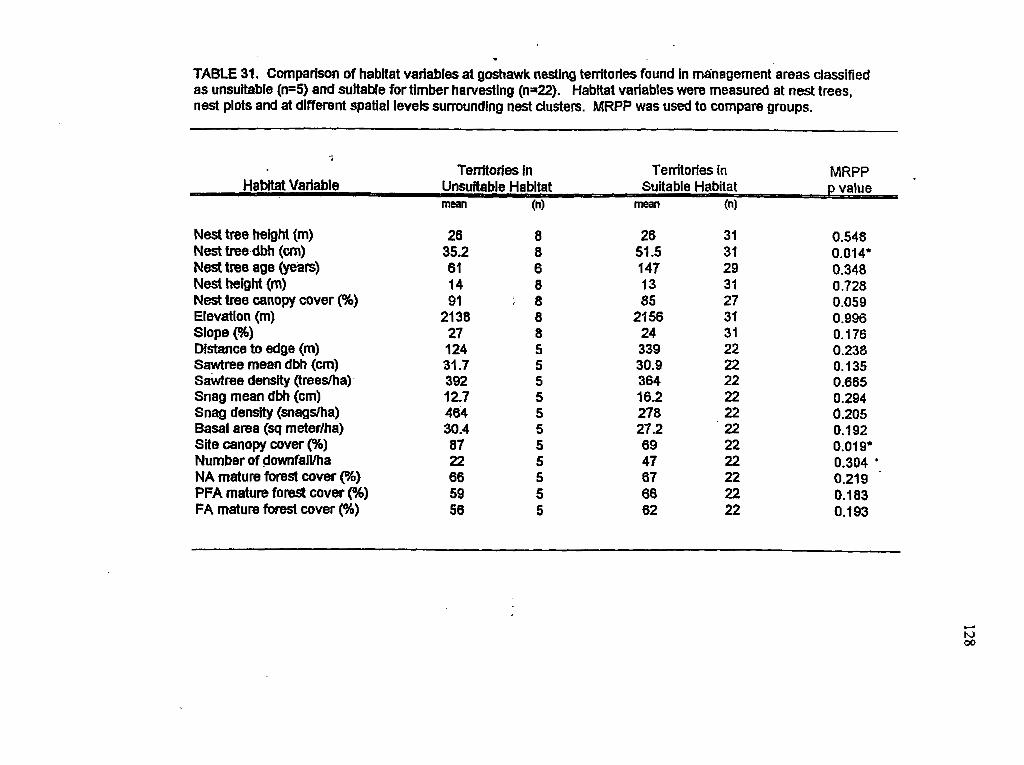
TABLE 31. Comparison of habitat variables at goshawk nesting tenitodes found in ma-nagement-areas classified as unsuitable (n=5) and sultable for timber hawsting (n=Z2). Habitat variables were measured at nest trees, nest plots and at different spatial levels sumundhg nest clusters. MRPP was used to compare groups.
Tenltories fn Temtorfes in MRPP Habitat Variable p value
mean mean
Nest tree helgM (m) Nest tree dbh (em) Nest tree age (years) Nest height (m) Nest tree canopy cover (?h) Elevation (m) Slope 0 Distance to edge (m) Sawtree mean dbh (cm) Sawtree density (treeslha) Snag mean dbh (cm) Snag density (snagslha) Basal area (sq meterha) Site canopy cover @) Number of dormfalVha NA mature forest cover (%) PFA mature forest cover (%) FA mature forest cover (?4)
26 35.2 61 14 91
21 38 27 1 24 31.7 392 12.7 464 30.4 87 22 66 59 56 '
8 8 6 8
: 8 8 8 5 5 5 5 5 5 5 5 5 5 5
26 51.5 147 13 85
2156 24 339 30.9 364 16.2 278 27.2 69 47 87 66 62
31 31 29 31 27 31 31 22 22 22 22 22 22 22 22 22 22 22
0.548 0.014* 0.348 0.728 0.059 0,996 0.176 0.238 0. I35 0.665 0.294 6.205 0.192 0.019* 0.304 ' 0.21 9 0.183 0.193
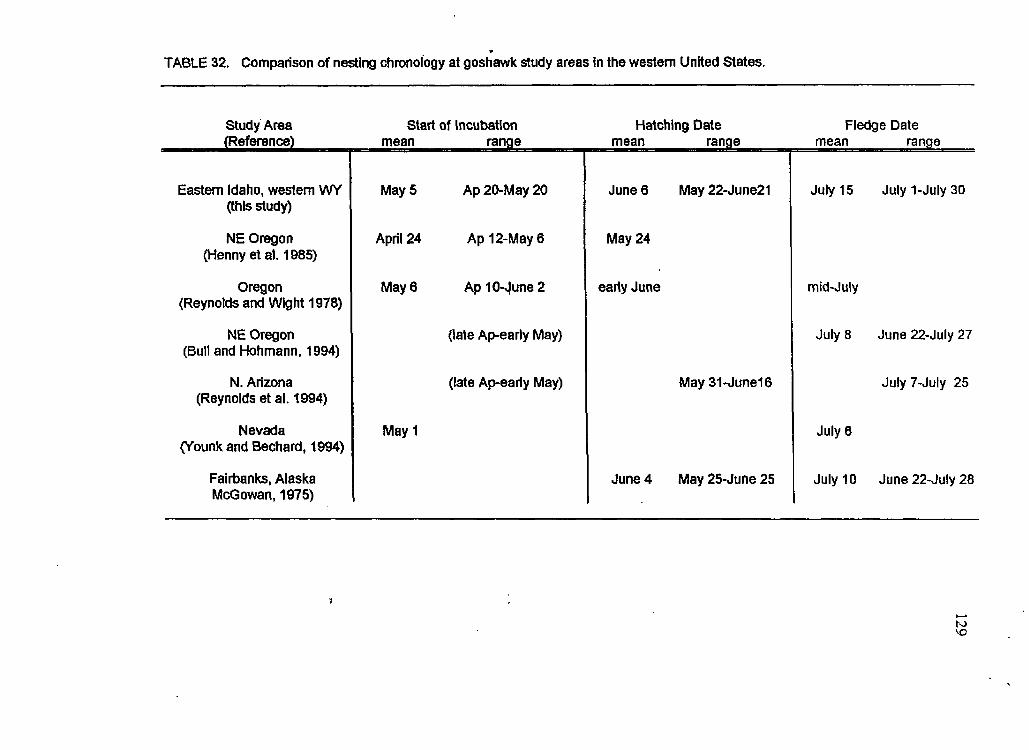
TABLE 32. Comparison of nesting chronology at goshawk study areas in the western United States.
Study Area Reference)
Eastern Idaho, western WY (this study)
NE Oregon (Henny et al. 1985)
Oregon (Reynolds and Wight 1978)
NE Oregon (Bull and Hohmann, 1994)
N. Arizona (Reynolds et al. 1994)
Nevada (Younk and Bechard, 1994)
Fairbanks, Alaska McGowan, 1975)
Start of Incubation mean range
May 5
Aptil24
May 6
May 1
Ap 20-May 20
Ap 12-May 8
Ap 105;lune 2
(rate Apearly May}
(late Apearly May)
Hatching Date mean range
June 6
May 24
early June
June 4
May 22June21
May 31Junei6
May 25-June 25
Fledge Date mean range
July i 5 July l-July 30
m id-Jul y
July 8 June 22-July 27
July 7-JUty 25
July 6
July 10 June 22July 28
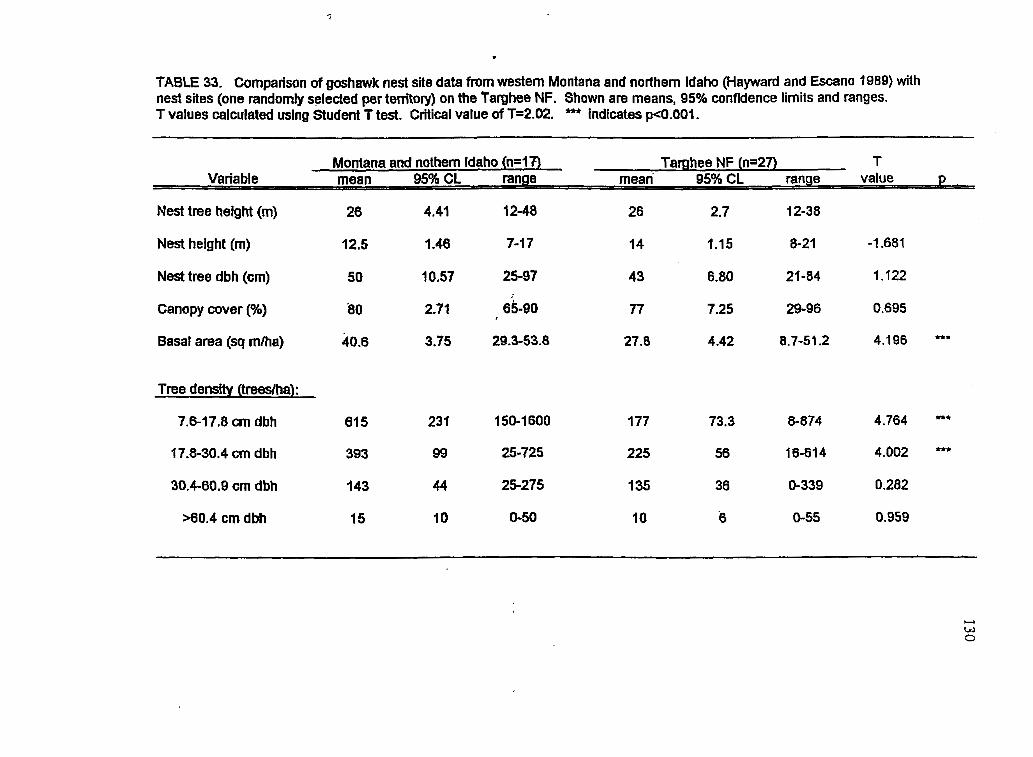
TABLE 33. Comparison of goshawk nest site data from western Montana and northern Idaho (Hayward and Escano 1989) with nest sites (one randomly selected per tenitory) on the farghee NF. Shown are means, 95% confidence limits and ranges. T values calculated using Student T test. Critical value of T=2.02. - indicates p<O.OOl.
Montana and nothem Idaho (n=l7) Targhee NF (n=27) T Variable mean 95% CL range mean 95% CL range value P
Nest tree height (m)
Nest height (m)
Nest tree dbh (cm)
Canopy cover (%I
Basal area (sq mma)
Tree density (treeslha):
7.6-17.8 cm dbh
17.8-30.4 CIII dbh
30.4-60.9 cm dbh
M0.4 crn dbh
26 4.41 12-48
12.5 1.46 7-1 7
50 10.57 25-97
'80 2.71 &-SO
40.6 3.75 29.3-53.8
61 5 23 i 150-1600
393 99 25-725
143 44 25275
15 10 0-50
26 2.7 12-38
14 1.15 8-21 -3.681
43 6.80 21-84 1.122
77 7.25 29-96 0.695
27.8 4.42 8.7-51.2 4.196 **
177 73.3 8-874 4.764 **
225 56 16-614 4.002 - 135 36 0-339 0.282
10 6 0-55 0,959
I w 0
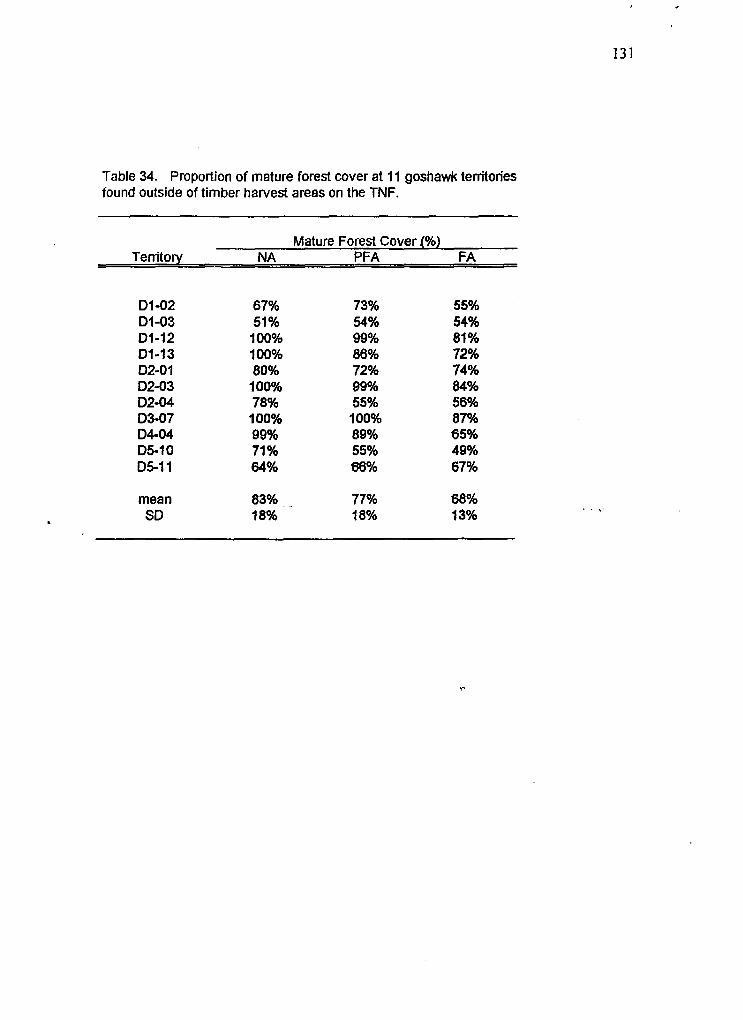
13 1
Table 34. Proportion of mature forest cover at 11 goshawk territories found outside of timber harvest areas on the TNF.
Mature Forest Cover 4%) Territory NA PFA FA
D l -02 D1-03 D1-12 D1-13 D2-0 1 D2-03 02-04 D3-07 04-04 D5-10 D5-11
67% 51 % 100% 100% 80% 100% 78% 100% 99% 71 96 64%
mean 83% . . SD 18%
73% 54% 99% 86% 72% 99% 55% 100% 89% 55% 66%
55% 54% 81 % 72% 74% 04% 56% 87% 85% 49% 67%
77% 68% 18% 13%

MONTANA
, . . . . . . . . . - ...-..-.-.._.... TARGHEE i
I I I
I I
I I
8 I I I 1
I I I I €
I I
1
I I
1 I r e I
I I I I 8 1
Greater Yellowstone Ecosystem
Fig I. Location of t he Targhee National Forest in relation to the state of Idaho and the Greater Yellowstone Ecosyste& Y

W
w I
c!J ac:
CJ)
ii
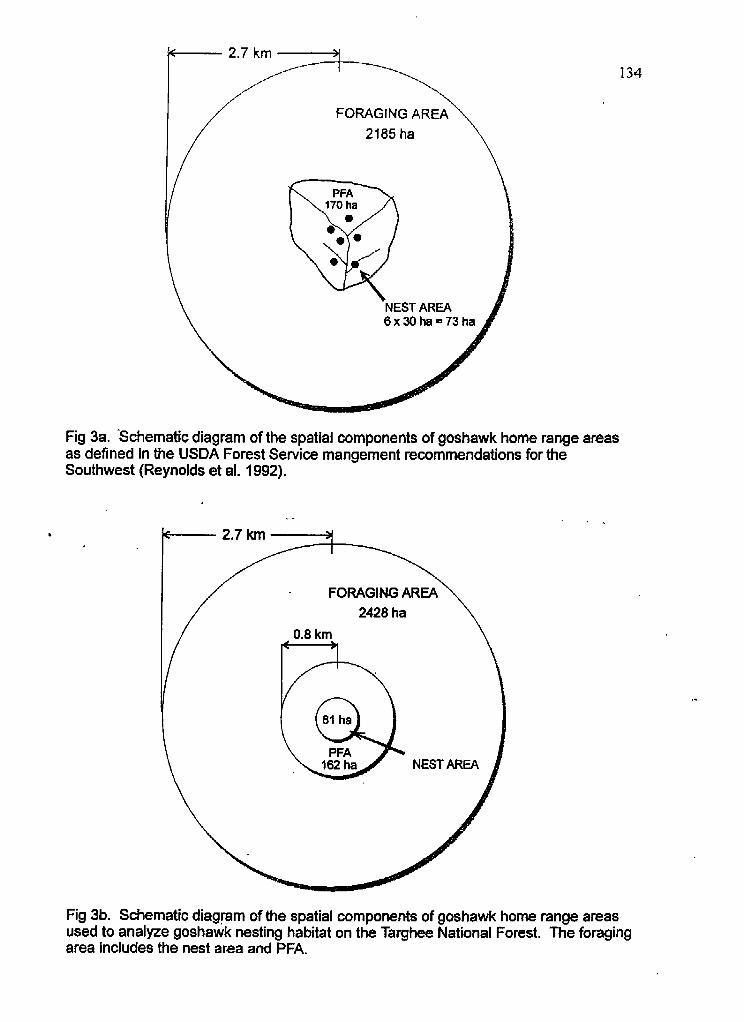
b 2.7 krn
FORAGING AREA 2185 ha
Fig 3a. Schematic diagram of the spatial components of goshawk home range areas as defined in the USDA Forest Service mangement recommendations for the Southwest (Reynolds et al. 1992).
, .
FORAGING AR
134
Fig 3b. Schematic diagpm of the spatial components of goshawk home range areas used to analyze goshawk nesting habitat on the Targhee National Forest. The foraging area includes the nest area and PFA.

a3
P-- 0,
d
W
w
I- +k-
=!
a
mi5
Z
I
E N
0
(4
Lo

<IO0 100-200 200.300 300-400 400-500 500.600 600-700 '700
Distance between alternate nests (m)
Fig 5. Distribution of inter-nest distances between alternate goshawks nests used within the same territory either one or two years apart.
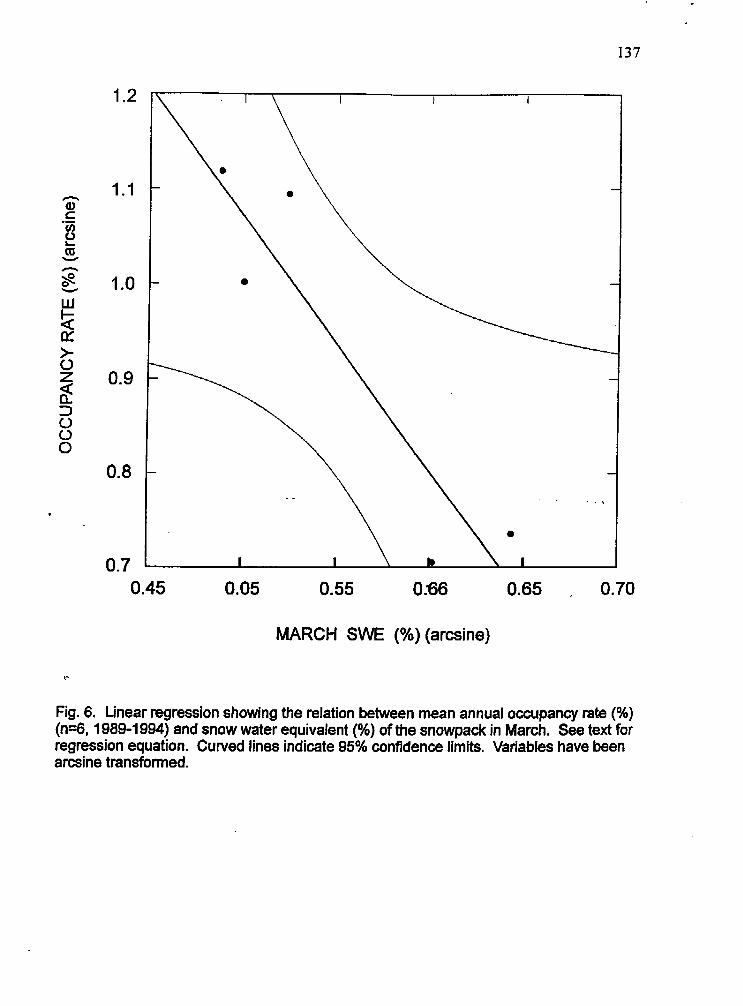
I37
I .2
I .I
I .o
0.9
0.8
0.7 0.45 0.05 0.55 0.66 0.65 , 0.70
MARCH SWE (%) (arcsine)
?-
Fig. 6. Linear regression showing the relation between mean annual occupancy rate (%) (n=6,1989-1994) and snow water equivalent (%) of the snowpack in March. See text for regression equation. Cutved lines indicate 95% confidence limits. Variables have been arcsine transformed.
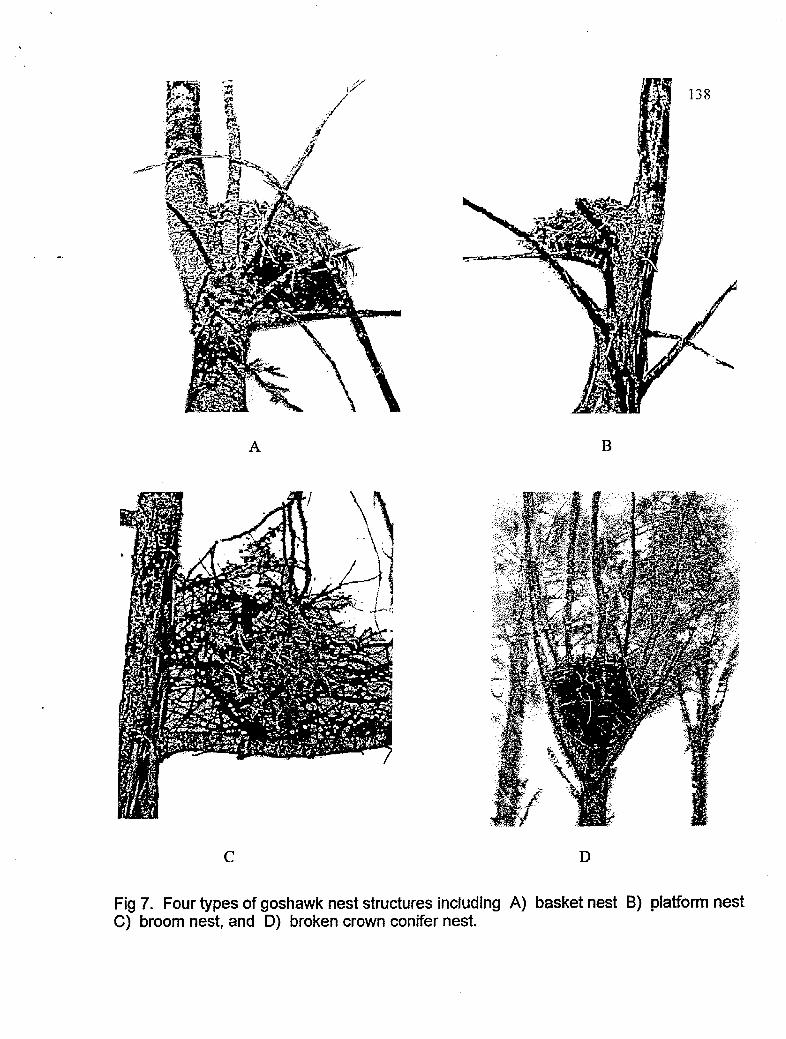
/-.-
A
C D
Fig 7. Four types of goshawk nest structures including A) basket nest B) platform nest C) broom nest, and D) broken crown conifer nest.

NEST SITE ASPECT
!
NEST ASPECT UNTREE
(n = 49) A. B.
Fig 8. The distribution of aspects of A) goshawk nest sites in relation to topography and, B) goshawk nests in relation to the tree trunk. Numbers in the center of each circle denote sites fomd on slopes < 5 degrees or nests located on broken cruwn trees.
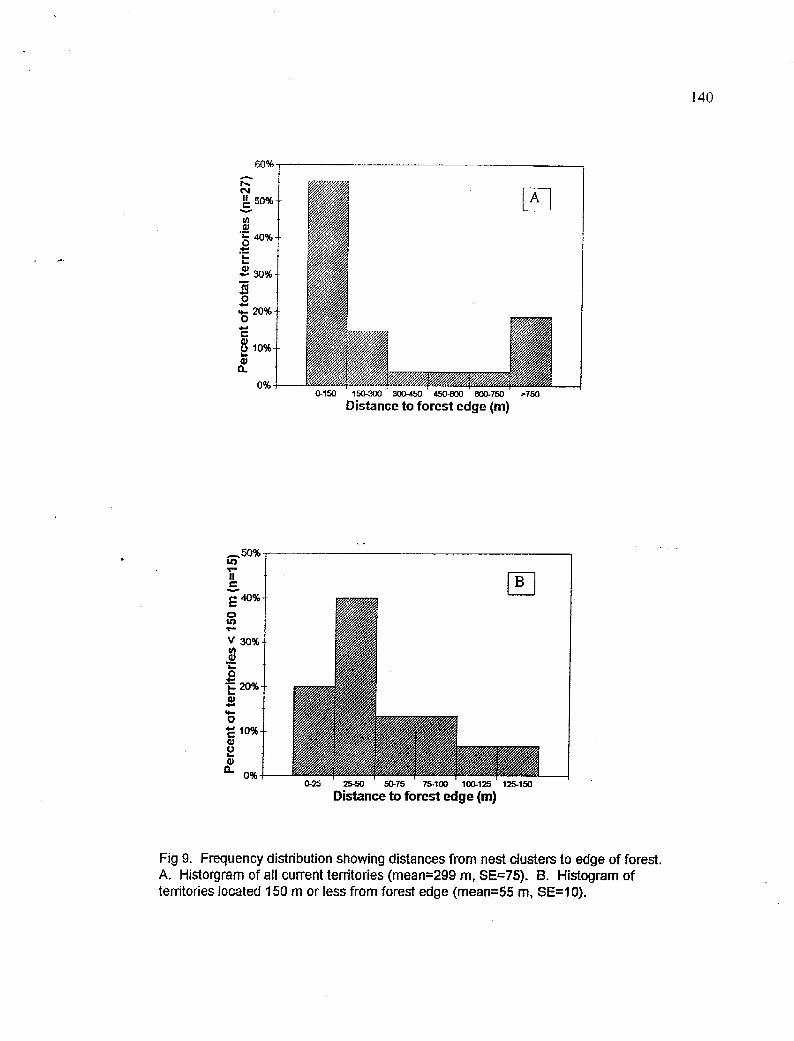
140
50% Y
Distance to forest edge (m)
025 ' 2550 ' 5075 75.100 ' IW-125 ' 125-150
Distance to forest edge (m)
Fig 9. Frequency distribution showing distances from nest clusters to edge of forest. A, Historgram of all current territories (mean=299 m, SE=75). B. Histogram of territories located 150 m or less from forest edge (mean=% m, SE=lO).
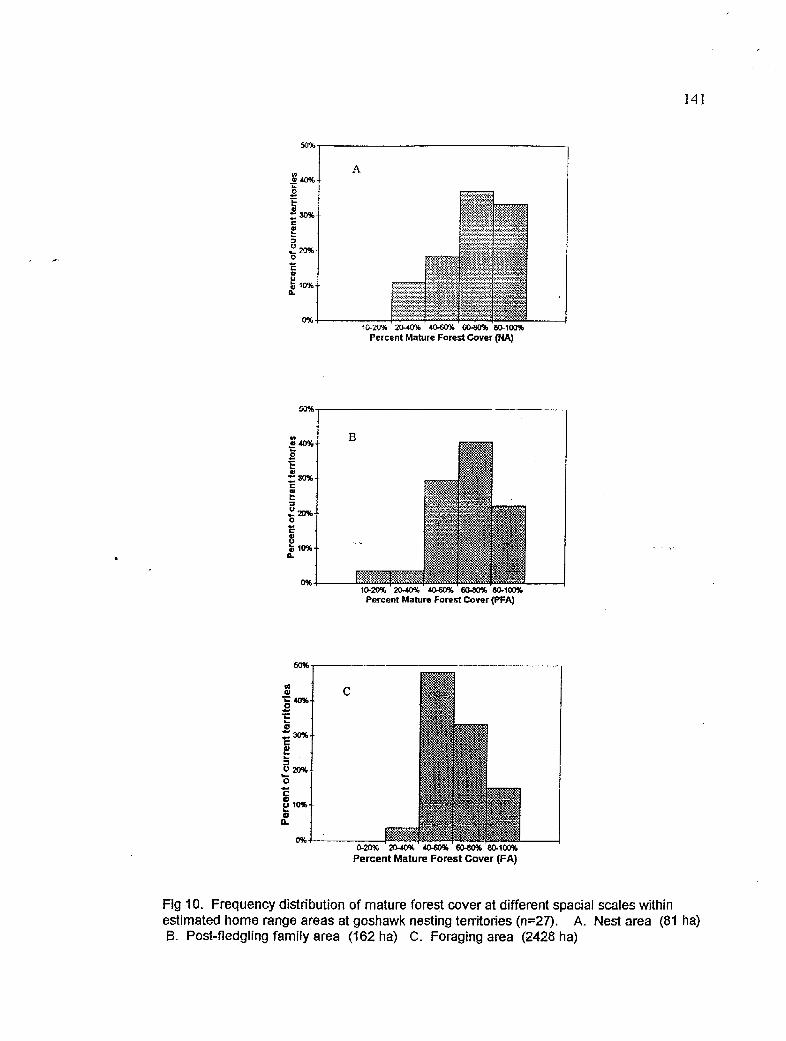
141
T------ 1
Percent Mature Forest Cover (NA)
Percent Mature Farest Cover (PFA)
Percent Mature Forest Cover (FA)
Fig 10. Frequency distribution of mature forest cover at different spacial scales within estimated home range areas at goshawk nesting territories (n=27). 6. Post-fledgling family area (162 ha) C. Foraging area (2428 ha)
A. Nest area (81 ha)

c 0
cd 0
F-i
ttl a
Y
Ld
142

143 ,
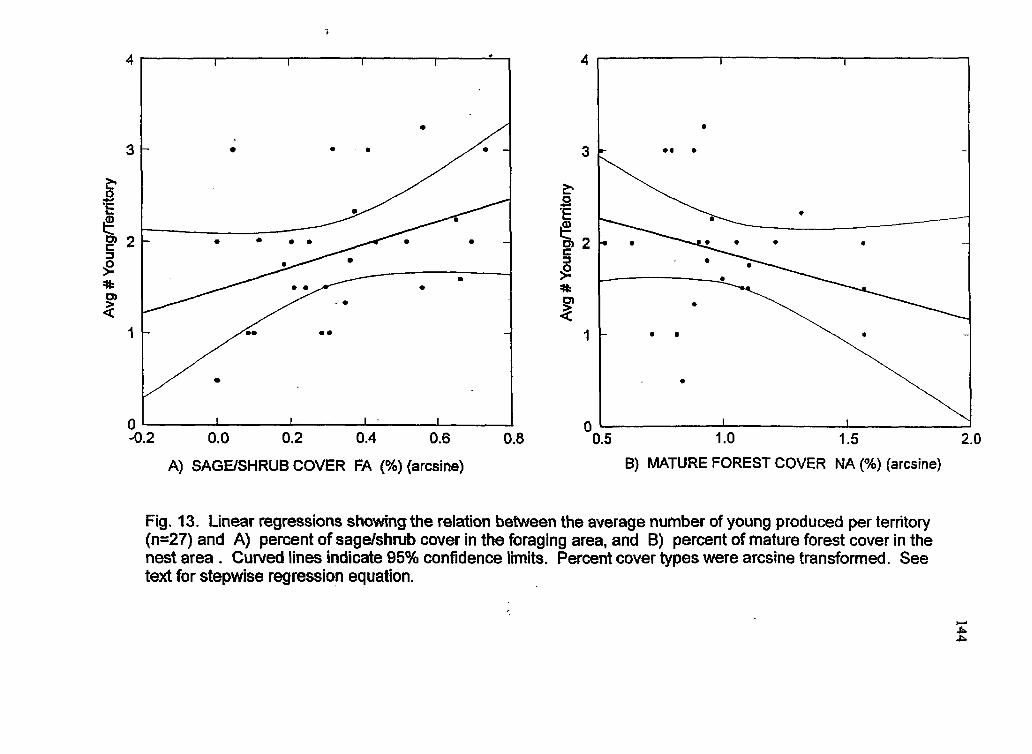
I / t Y
01 I 1 I . t I -0.2 0.0 0.2 0.4 0.6 0.8
A) SAGWSHRUB COVER FA (%) (arcsine)
0 .. 0
0 0.5 1 .o 1.5 2.0
B) MATURE FOREST COVER NA (%) (arcsine)
Fig. 13. Linear regressions showing the relation between the average number of young produced per territory (n=27) and A) percent of sagelshnrb cover in the foraging area, and B) percent of mature forest cover in the nest area . Curved lines indicate 95% confidence limits. Percent cover types were arcsine transformed. See text for stepwise regression equation.
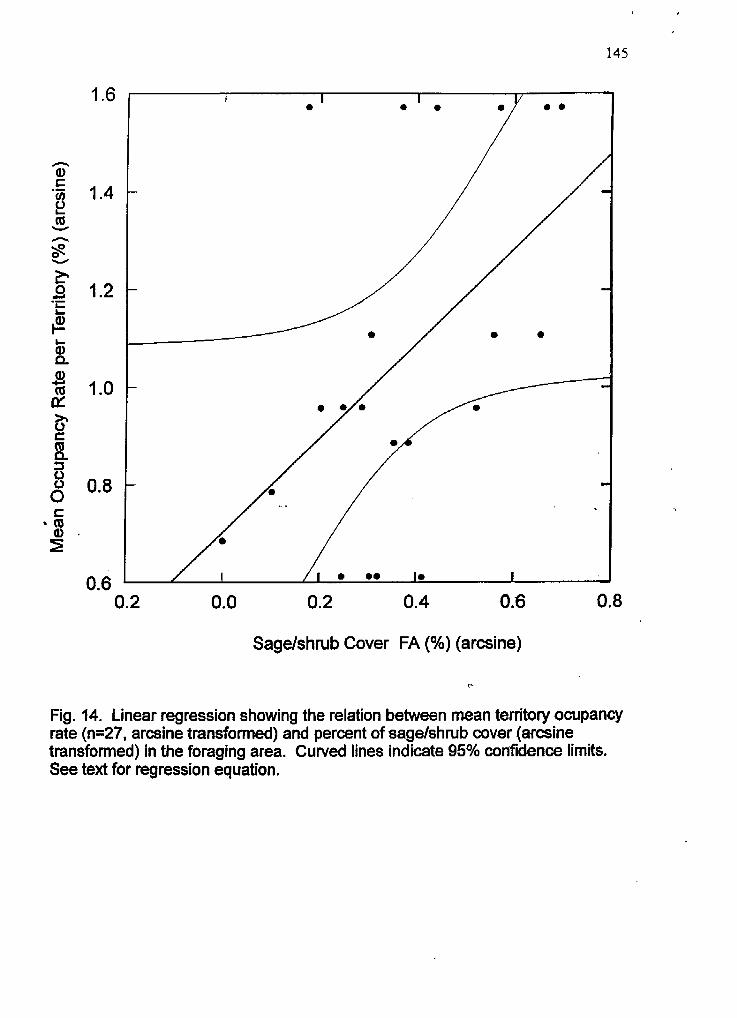
145
1.6
h
a, C
*- 1.4 12 m W h s 2 u 0 1.2 t F
2
W
.-
L a, e Q) - 1.0
c
8 0.8 0
c m e 3
c 'rn f *
0.6 0.2 0.0 0.2 0.4 0 5 0.8
Sagekhrub Cover FA (%) (arcsine)
Fig. 14. Linear regression showing the relation between mean territory ocupancy rate (n=27, arcsine transformed) and percent of sagekhrub cover (arcsine transformed) in the foraging area. Curved lines indicate 95% confidence limits. See text for regression equation.
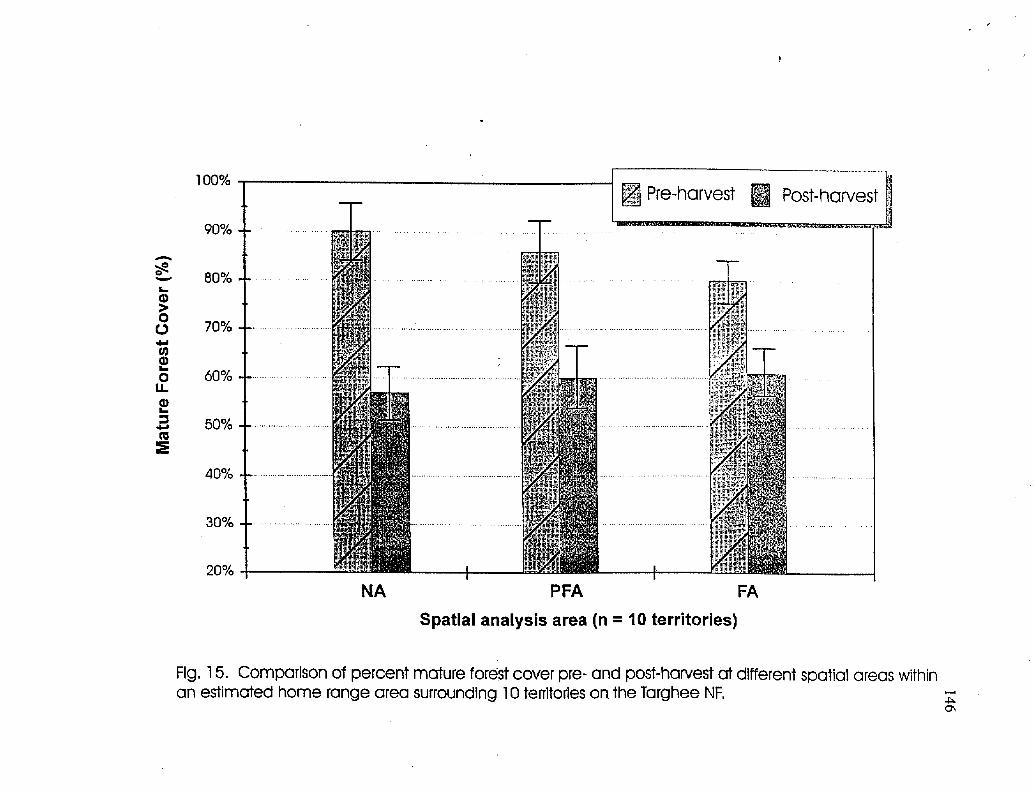
90%
80%
70%
60%
50%
40%
30%
20%
T 7-
. . . . . . . . . . . . . . . . . . . . . . r>;
NA PFA FA Spatial anatysis area (n = 10 territories)
Fig. 15. Cornparkon of percent mature forest cover pre- and pOst-hatVeSt at dtfferent spatial areas within an estimated home range urea surroundlng 10 terrltodes on the Targhee NF, Y
P cn
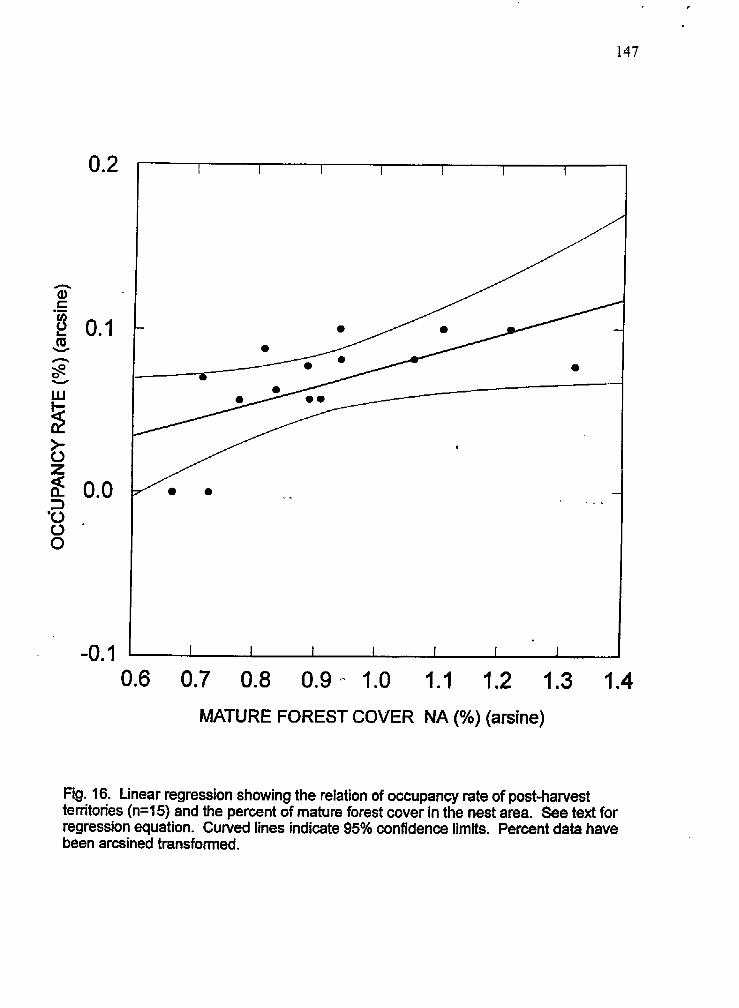
147
0.2
n (u E .- f2 0.1 m W
h s v
w
5 > 0 Z
3 '0 0 . 0
8 0.0
-0. I I I I I I I I
0.6 0.7 0.8 0.9 '1 1.0 1.1 1.2 1.3 1.4 MATURE FOREST COVER NA (%) (arsine)
Fig. 16. Linear regression showing the relation of occupancy rate of post-harvest territories (n=15) and the percent of mature forest cover in the nest area. See text for regression equation. Curved lines indicate 95% confidence limits. Percent data have been arcsined transformed.

100%
L 80% Q) > 0 0 cI v) 60% 22
!?2 40%
E 20%
0 L
a +.r
QI
b) e E
0%
. . . . . . . . .
. . . . . . . .
. . . . . .
. . . . . .
. . . . . . . . .
. . . . . . .
. . . . . . . . .
. . . . .
, . . , . .
. . . . . . . . . . .
NA
....
....
, . I
, . , .
. . . .
. . . .
. . . . .
. . . . .
. . . .
. . . . . . . . . . . . . .
. . . . . . . . . . .
. . . . . . . . . .
. . . . . . . .
. . . . . . . . . . . . .
. . . . . . . . . .
. . . . . . . . . . . . . .
. . . . . . . . . . .
. . . . . . . .
+
. . . . . . . . .
. . . . . . . . .
PFA
. . . . . .
. . . .
. . . . .
. . . .
. . . . . .
. . . . .
. . . . . .
. . . . .
. . .
. . . . . . . . . .
. . . . . . . . . .
. . . . . . . . .
. . . . . . . .
. . . . . . . . . .
. . . . . . . .
. . . . . . . . .
. . . .
. . . . . . . . .
t
FA fig. 1 7. Comparison of proportion of makrre forest cover between pre-harvest and current conditions at three Mstotlcal terrltodes found In salvage logglng timber sale areas where goshawk nests were not found in the current period. Percent forest cover is shown for different spatial components of the home range area NA = nest area, PFA = post-fledgllng fumtfy area, and FA = foruglng area#
Y
P 00
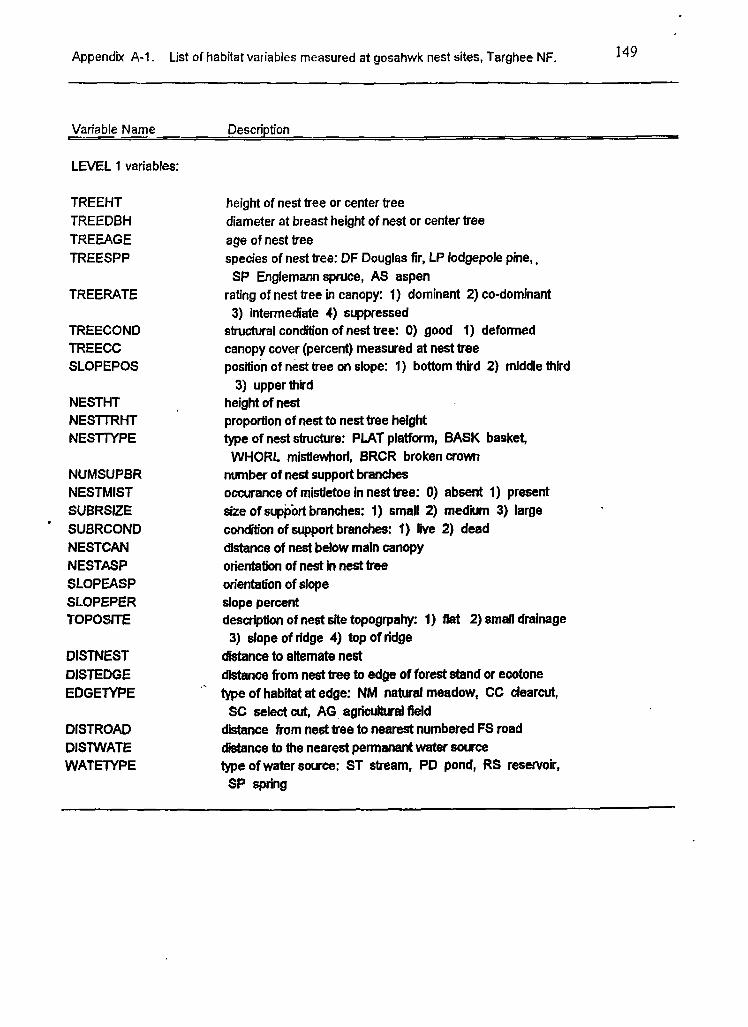
Appendix A-1. List of habitat variables measured at gosahwk nest sites, Targhee NF. 149
Variable Name Description
LEVEL 1 variables:
TREEHT TREEDBH TREEAGE TREESPP
TREERATE
TREECOND TREECC SLOPEPOS
NESTHT NESTTRHT NESTWPE
NUMSUPBR NESTMIST SUBRSIZE
' SUBRCOND NESTCAN NESTASP SLOPEASP SLOPEPER TOPOSITE
DISTNEST DISTEDGE EDGETYPE
DISTROAD DIS WATE WATETYPE
height of nest tree or center tree diameter at breast height of nest or center tree age of nest tree species of nest tree: DF Douglas fir, LP lodgepole pine,,
rating of nest tree in canopy: 1) dominant 2) codominant
structural condition of nest tree: 0) good 1) deformed canopy cover (percent) measured at nest tree position of nest tree on slope: 1) bottom third 2) middle third
height of nest proportion of nest to nest tree height type of nest structure: PLAT platform, BASK basket,
number of nest support branches occurance of mistletoe in nest tree: 0) absent 1) present size of support branches: 1) small 2) medium 3) large condition of support branches: I) live 2) dead distance of nest below main canopy orientation of nest in nest tree orientation of dope dope percent desaiption of nest site topogtpahy: 1) flat 2) small drainage
dEstance to atternate nest distance from nest tree to edge of forest stand or ecotone type of habitat at edge: NM natural meadow, CC clearcut,
distance from nest tree to nearest numbered FS road distance to the nearest penanant water source type of water source: ST stream, PD pond, RS reservoir,
SP Englemann spruce, AS aspen
3) intermediate 4) suppressed
3) upperthird
WHORL mistlewhorl, BRCR broken crown
3) slope of ridge 4) top of hdge
SC selectcut, AG agriculturalfield
SP spring
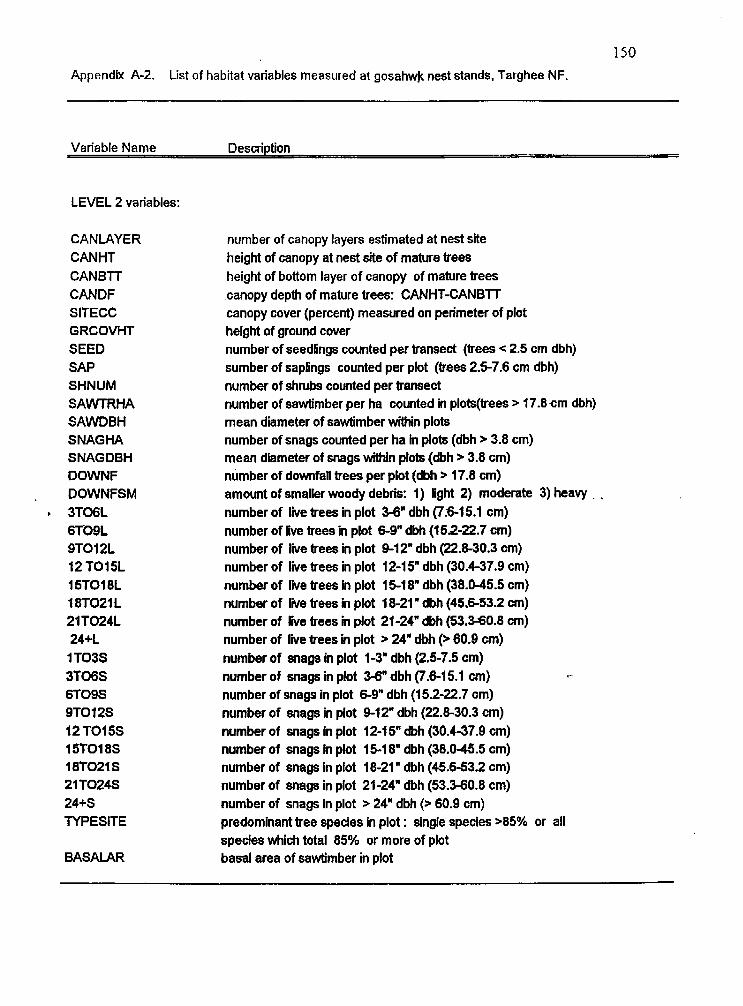
150 Appendix A-2. List of habitat variables measured at gosahwk nest stands, farghee NF.
Variable Name
LEVEL 2 variables:
CANLAYER CANHT CANBTT CANDF SITECC GRCOVHT SEED SAP SHNUM SAWTRHA SAWOBH SNAGHA SNAGDBH DOWNF DOWNFSM
* 3T06L 6T09L 9T012L 12 T015L 15T018L 18T021 L 21T024L 24*L 1 T03S 3T06S 6109s 9T012S 12 TOSS 15T018S 18T021 S 21 T024S 24+S TYPESITE
BASAIAR
number of canopy layers estimated at nest site height of canopy at nest site of mature trees height of bottom layer of canopy of mature trees canopy depth of mature trees: CANHT-CANBlT canopy cover (percent) measured on perimeter of plot height of ground cover number of seedlings counted per transect (bees < 2.5 cm dbh) sumber of saplings counted per plot (bees 2.5-7.6 cm dbh) number of shrubs counted per transect number of sawtimber per ha counted in plots(trees r 17.8cm dbh) mean diameter of sawtimber within plots number of snags counted per ha in plots (dbh > 3.8 cm) mean diameter of snags within plots {dbh > 3.8 cm) number of downfall trees per plot (dbh 17.8 cm) amount of smaller woody debris: 1) light 2) moderate 3) heavy . number of live trees in plot 3-6" dbh (7.8-15.1 cm) number of live trees in plot 6-9" dbh (152-22.7 cm) number of live trees in plot 9-1 2" dbh (22.8-30.3 cm) number of live trees in plot 12-1 5" dbh (30.4-37.9 cm) number of h e trees in plot 15-1 8" dbh (38.0-45.5 cm) number of live bees in plot 18-21 " dbh (45.6-53.2 cm) number of live trees in plot 21-24" dbh (53.340.8 cm) number of live trees in plot > 24" dbh (5 60.9 cm) number of snags in plot 1-3" dbh (2.5-7.5 cm) number of snags m plot 3-6" dbh (7.6-1 5.1 cm) number of snags in plot 6-9" dbh (15322.7 cm) number of snags in plot 9-12" dbh (22.8-30.3 cm) number of snags in plot 12-1 5" dbh (30.4-37.9 cm) number of snags in plot 15-1 8" dbh (38.045.5 cm) number of snags in plot 18-21 " dbh (45.6-53.2 cm) number of snags in plot 21-24" dbh (53.3-60.8 cm) number of snags in plot > 24" dbh (5 60.9 cm) predominant tree species in plot : single species ~ 8 5 % or all species which total 85% or more of plot basal area of sawtimber in plot

151 Appendix B. Categories and symbols used for the Targhee Nf G4S vegetation classification for the Forest Plan revision (USDA FS 1996).
SYMBOL
LP LP9 LP8 LP7 LP6 LP5
DF OF9 DF8 DF7 OF6 DF5
MX MX9 MX8 Mx7 MX6 Mx5
MX3 AS WB SF
N
MB w GR
GRFB GWSA GWBR TS/GR TSMB
M WA WM R
VEGETATION CLASS a
lodgepole pine mature trees, no previous treatment pole (3-7" dbh) sapling (1"-2.9" dbh) seedling (6" height, to 0.99" dbh) nonstocked (seedling~6" in height)
Douglas fir mature trees, no previous treatment pole (3-8" dbh) sapling (1"-2.9" dbh) seedling (6" height, to 0.99" dbh) nonstocked (~eedling<6~ in height)
Mixed Conifer @F AND LP, no species more 3 85% of total mature trees, no previous treatment pole (3-7" dbh) sapling (1"-2.9" dbh) seedling (6" height, to 0.99" dbh) nonstocked (seedling<B" in height)
Mixed Conifer @F or LP with fir or spruce component) '
Aspen Whitebark pine Spruce-fir (Englemann spruce and subalpine fir)
' '
prefut for non-commercial forest
Mountain Brush willow Grass GMss/forb Gradsage GraWnrsh Tall sagelbrush Tall sage/mountain brush Mahogany BogdpondsAakes Wet meadows Rock, talus, barren
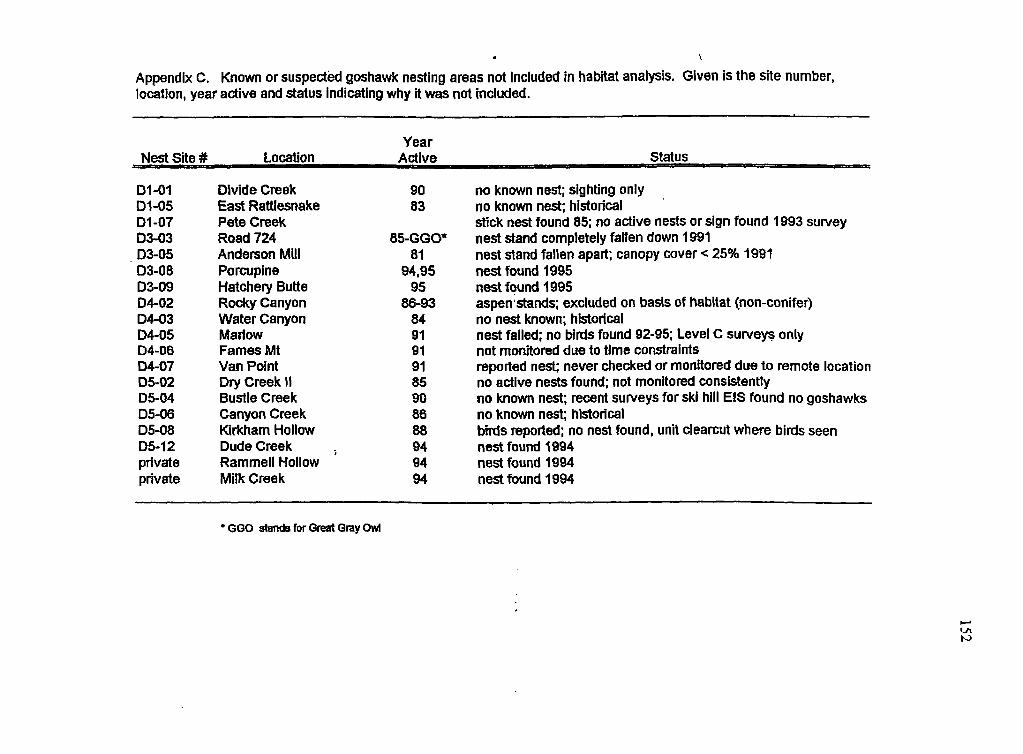
\
Appendix C. Known or suspedbd goshawk nesting areas not included in habitat analysis. Given is the site number, location, year active and status indicating why it was not included.
Year Nest Site # Location Status
D1-01 D1-05 D1-07 D3-03 D3-05
D3-09 04-02 04-03
03-08
D4-05 D4-06 D4-07 D5-02 D5-04 D5-06 05-08 D5-12 private private
Divide Creek East Rattlesnake Pete Creek Road 724 Anderson Mill Porcupine Hatchery Butte Rocky Canyon Water Canyon Mariow Fames Mt Van Point Dry Creek I I Bustle Creek Canyon Creek Kirkham Hollow Dude Creek Rammell Hollow Milk Creek
90 83
85-GGO* 81
94,95 95
86-93 84 91 91 91 85 BO
88 94 94 94
a8
no known nest; sighting only no known nest; historical stlck nest found 85; no active nests or sign found 1993 survey nest stand completely fallen down 1991 nest stand fallen apart; canopy cover c 25% 199t nest found 1995 nest fpund 1995 aspen’stands; excluded on basis of habitat (non-conifer) no nest known; historical nest falled; no birds found 92-95; Level C surveys only not monllored due to time constraints reported nest: never checked or monfiored due to remote location no active nests found; not monitored consistently no known nest; recent surveys for ski hill €IS found no goshawks no known nest; hlstoricat birds reported; no nest found, unit clearcut where birds seen nest found 1994 nest found 1994 nest found 1994
GGO stands for Greet Gray Owl
c Ln N

153
APPENDIX D. Correlations of spring weather variables on the TNF, 1989-1994. Key to terms: temp=temperature (C); precip=precipitation (cm), square root-transformed; snow depth= depth (crn), square-root transformed; SWE= snow water equivalents (%), arcsine transformed.
Correlated Correlation Variable Variable Coeeficient
March temp April temperature 0.877 March temp MarchIApn'l temp 0.973 March temp ApriVMay temp 0.871 March temp ApriVMay precip -0.788
April temp April temp April temp April temp
May temp May temp
March/April temp MaMApril temp MarcWApril temp
ApriVMay temp ApdVMay temp
MarcNApril temp 0.964
ApriVMay precip -0.835
ApriVMay temp 0.893 May precip -0.846
ApriVMay temp ApriVMay precip
ApriVMay temp May precip ApriVMay precip
May precip April/May precip
0.784 -0.767
0.91 8 -0.81 0 -0.844
-0.959 -0.952
April precip ApriVMay precip 0.830
May PEdP May precip
March SWE
March!April precip 0.773 ApriVMay precfp 0.924
March snow depth 0.863

APPENDIX E. Master list of goshawk nest trees found at study territorie, Targhee NF, 1980-1994. Page 1.
Year Nest Other Used by #Tree-Year
Nest ID Found Active Lost Species Species Species 1989-1 994 Year Year Tree Tree Raptor Other Checks
1 D1-02-1 2 01-02-2 3 D1-02-3 4 D1-03-1 5 D1-04-1 6 D1-04-2 7 D1-04-3 8 D1-044 9 Dl-06A-1 10 D1-06A-2 11 D1-06A-3 12 D1-06A-4 13 D1-066-1 14 D1-066-2 15 D1-068-3 16 DlQBA-1 17 D1-08A-2 18 D1-08A-3 19 D1-08A-4 20 D1-08A-5 21 01-09-1 22 01-10-1 23 D1-10-2 24 01-10-3 25 Dl-104 26 01-10-5 27 Dl-11-1 28 D1-11-2 29 Dl-11-3 30 01-114 31 01-12-1 32 D1-12-2a 33 D1-12-2b 34 01-12-3 35 01-124 36 D1-13-1 37 Di-13-2 38 02-01-1 39 D2-01-2 40 02-01-3 41 02-014 42 DZ-02-1 43 D2-02-2 44 02-02-3 45 02-03-1 46 D2-03-2
1991 1992 1989 1984 1983 1990 1993 1994 1985 1990 1990 1990 1990 1991 1991 1990 1,992 1990 1993 1994 1983 7988 1989 1 g91 1991 1994 1989 1990 1989 1992 1993 1993 1993 1993 1993 1993 1993 1989 1989 1992 1992 1988 1992 1992 1990 1992
1991 1992
1992 1985
1990,91 1993 1994
1992,94 1993
1990 1991
1992
1993 1 994 83,89 1988
1991 92,95 1994
1989,91 1990
1993
1993
1989
1992
1993 1992
1990
X
X
X
X
X X
SP-gone SP OF DF
DF-cut OF DF OF DF DF OF DF OF DF DF DF Df
DF-gone DF DF
DFdEd DF OF DF DF DF DF
D F d ' D F 4
DF DF DF OF DF DF DF DF DF DF DF DF DF DF DF DF DF
GGOW 93 2 5 6
4 1
6 LEOW, GGOW 91,94 4
GGOW
GEOW GGOW GGOW
OGOW
GGOW GGOW GGOW
GGOW GGOW GGOW
92,93 4 4 4 3 3 4 2 2 1
90,92,93,94 6 1990 . .. 6
91,92,93,94 4 3 3
95,93 5
93 90 92
90,91 94 92
' 1 2 1 1 1 1 1 1 1 5 5 2 1 6 2 2 4 2

APPENDIX E. Page 2. Master list of goshawk nest trees continued from previous page. 155
47 48 49 50 51 52 53 54 55 56 57 58 59 60 61 62 63 64 65 66 67 68 69 70 71 72 73 74 75 76 77 78 79 80
82 83 84 85 86 87 88 89
a i
~ - .__.
Year #Tree-Year
Year Year Tree Tree Raptor Other 1989-1 994 Nest Other Used by Checks
Nest ID Found Active Lost Species Species Species
D2-04-1 D2-04-2 D2-04-3 D2-044 D2-04-5 02-05-1 02-06-1 02-07-1 D3-01-1 D3-01-2 D3-02-1 D3-04-1 D3-06-1 03-07-1 04-01 -1 De01 -2 D4-04-1 D4-04-2 D4-04-3 D4-044 D5-01-I .D5-01-2 M 3 - 1 0503-2 D5-03-3 05-05-1 D5-05-2 D5-05-3 0547-1 05-07-2 05-07-3 05-07-4 D5-09-1 D5-09-2
D5-094 D5-09-5 D5-10-1
D5-10-3
D5-09-3
05-1 0-2
D511-I D5-11-2 D5-11-3
Total
1990 1992 1992 1992 1992 1991 1992 1992 1990 1991 1981 1985
' 1989 1989 1986 1992 1985 1990 1990 1992 1980 1981 1990 1992 1903 1981 1982 1986 1989 1991 1991 1993 1990 1991 1992 1993 1994 1991 1992 1993 1992 1993 1992
1990 1992 1994
91,92 1992 1992 1990 1991
1985 1989 1989
86,89,91 1992
1991
1993 1980 1981
I 992 1993 1981 1982 1986 1989 1991 1992
1990 1991 1992 1993 1,994
1991 $4 1992 1993 1992 1993 1994
AS DF DF DF DF LP LP LP LP LP LP
LP-gone DF DF LP LP DF DF DF DF
D F 4 DF-gone
DF LP
LP-snag DF
DF-cut OF DF DF DF DF DF DF DF DF DF DF OF DF
DF-snag DF DF
GHOW COHA
GGOW
GGOW
GGOW GGOW GGOW
GGOW
4 2 2 2 2 3
94 2 90 2
4 3
81
4 2 1 5
91,92,93,94
5 5
93 3 91 3
1 4 3 2 2
3 2 1 2 1
92 2
229
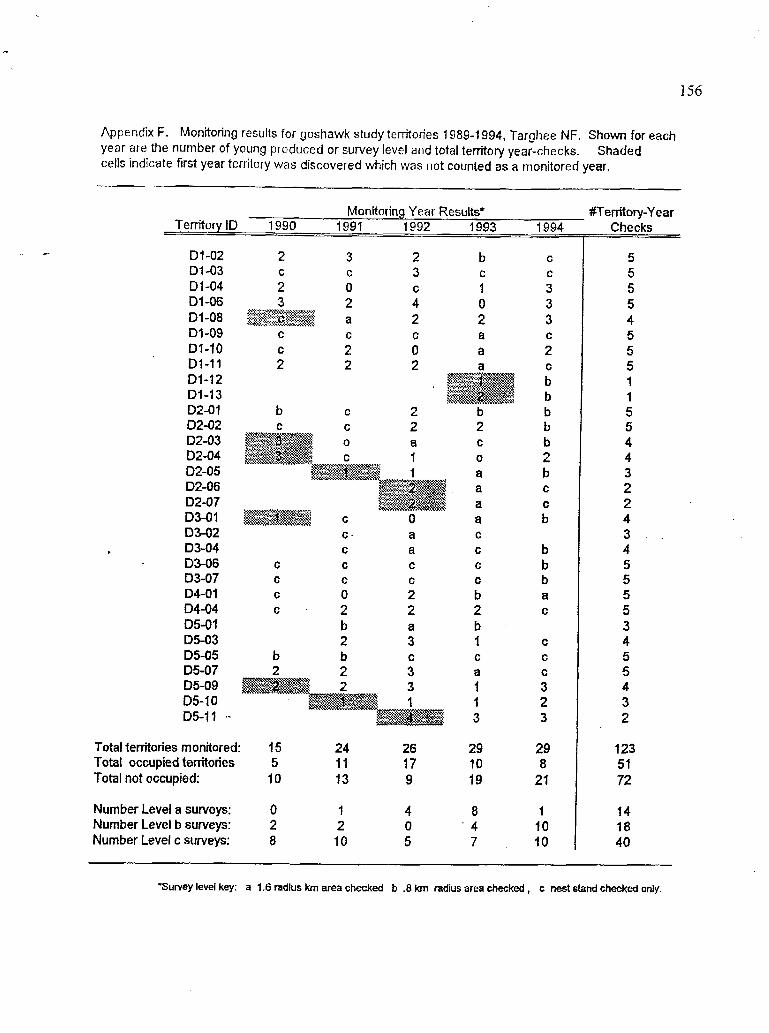
156
Appendix F. Monitoring results for goshawk study territories 1989-1 994, Targhce NF. Shown for each year are the number of young produced or survey level and total territory year-checks, cells indicate first year territory was discovered which was not counted as a monitored year.
Shaded
Monitoring Year Results* #Tenitory-Y ear TerritoryID 1990 1991 1992 1993 1994 Checks
D1-02 01-03 01-04 D1-06 D1-08 D1-09 D1-10 01-11 D1-12 D1-13 02-01
2 b 3 C
C 1 4 0 2 2
0 a C a
2 a
2 02-02 C C 2 D2-03 02-04 02-05 D2-06 D2-07
03-02 C - a D3-01
03-04 D3-06 D3-07 D4-0 1 D4-04 D5-01 D5-03 D5-05
C a C C C
c C C C 0 2 c . 2 2
b a 2 3
b b C
D5-07 2 2 3 D5-09 D5-10 D5-11 ~
Total territories monitored: 15 24 26 Total occupied territories 5 11 17 Total not occupied: 10 13 9
Number Level a surveys: 0 1 4 Number Level b sunrep: 2 2 0 Number Level c surveys: a 10 5
b 2 C
0
a a a a C C
C
C
b 2 b 1
a I 1 3
29 10 19
8 4 7
C
C C
3 3 3 C 2
b b b b b 2 b
C
C
C b
b b b a C
G
C
C
3 2 3
29 8
21
1 10 10
5 5 5 5 4 5 5 5 1 1 5 5 4 4 3 2 2 4 3 4 5 5 5 5 3 4 5 5 4 3 2
123 51 72
14 18 40
Survey level key: a 1.6 radius km area checked b .8 km radius area checked , c nest stand checked only.
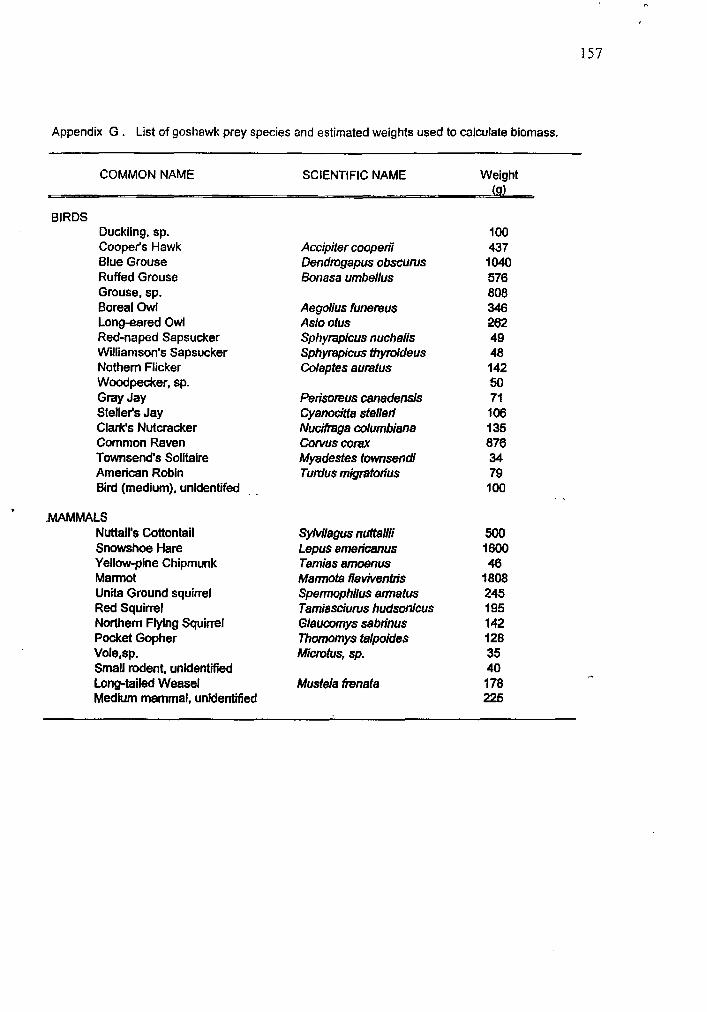
n
137
Appendix G . List of goshawk prey species and estimated weights used to calculate biomass.
COMMON NAME SCIENTIFIC NAME Weight I_.
BIRDS Duckling, sp. 1 00 Coopets Hawk Accipiter cooperii 437 Blue Grouse Dendmgapus obscunrs 1040
Boreal Owl Aegolius funemus 346
Red-naped Sapsucker Sphyrapicus nuchalis 49 Williamson's Sapsucker Sphyrapicus thyruideus 48
Woodpecker, sp. 50
Stellets Jay Cyanocitta stell& 106
Townsend's Solitaire Myadestes townsendi 34 American Robin Tu&& migratotfus 79 Bird (medium), unidentifed , .
Ruffed Grouse Bonasa urnbellus 576 Grouse, sp. 808
Longeared Owl Asio otus 262
Nothem Flicker Colaptes aumtus 142
Gray Jay Perisotws canadensis 71
Clark's Nutcracker Nucihga columbiana 135 Common Raven Corvus corn 876
100
' .MAMMALS Nuttall's Cottontail Snowshoe Hare Yellow-pine Chipmunk Marmot Unita Ground squirrel Red Squirrel Northern Flying Squirrel Pocket Gopher Vole,sp. Small rodent. unidentified Long-tailed Weasel Medium mammal, unidentified
Sylvilagus nutbllii Lepus emericanus Temias amoenus M a m i e flaviventris Spermophilus ematus Tamiasciunrs hudsonicus Glaucomys sabtinus Thonnnnys talpoides Micmtus, sp.
Mustela fmnata
500 1600 46
1808 245 105 1 42 128 35 40 178 225
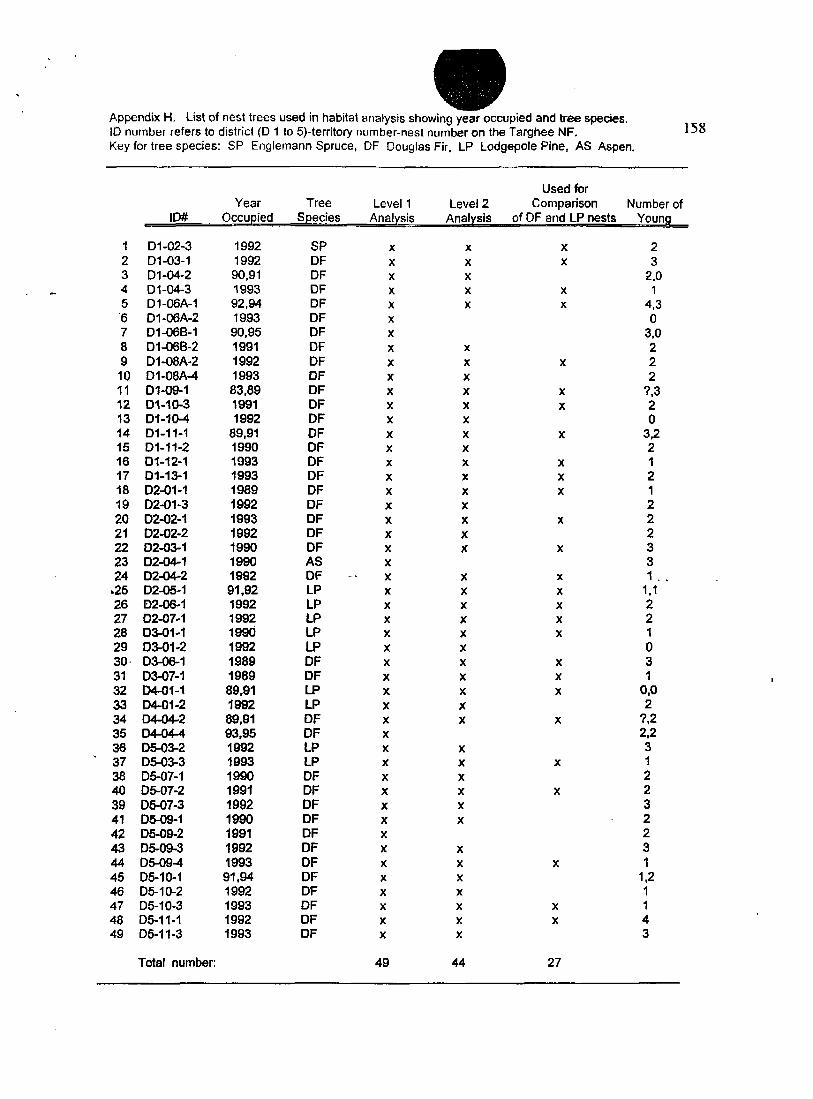
158 Appendix H. List of nest trees used in habitat analysis showing year occupied and tree species. ID number refers to district (D 1 10 5)-territory number-nest number on the Targhee NF. Key for tree species: SP Englemann Spruce, DF Douglas Fir, LP Lodgepole Pine, AS Aspen.
Used for Year Tree Level 1 Level 2 Comparison Number of
~ ID# Occupied Species Analy-P nests Young
1 Dl-02-3 2 Dl-03-1 3 01-04-2
. C. 4 01-04-3 5 Dl-MA-1 '6 D1-06A-2 7 Dl-OGB-1 8 D1-06B-2
10 D1-08A-4 11 01-09-1
9 D1-08A-2
12 D1-10-3 13 01-10-4 14 Dl-11-1 15 Dl-11-2 16 01-12-1 17 Dl-13-1 18 D2-01-I I 9 02-01-3 20 02-02-1 21 0242-2 22 D2-03-I 23 0244-1 24 0204-2 ,25 02-05-1 26 D2-061 27 02-07-1 28 03-01-1 29 03-01-2 30. 0-1 31 03-07-1 32 WI-I 33 0401-2 34 D4-04-2 35 D4-044 36 0503-2 37 05-03-3 38 05-07-1 40 0507-2 39 05-07-3 41 D5-09-1 42 D5-09-2
44 05-094 43 0509-3
45 D510-1 46 0510-2 47 D5-10-3 48 D5-11-1 49 D5-11-3
Total number:
1992 1992 90,91 1993 92,94 1993 90,95 1991 1992 1993 83,89 1991 1992
89,91 1990 1993 1993 1989 1992 1993 1 gg2 1990 1990 1992 91.92 1992 1992 1930 1 g92 1989 1909 89.91 1992 89.91 93,95 1 Q92 1 g93 1990 1991 1992 1990 1991 1992 1993 91,w 1992 1993 1 Q92 1993
SP DF DF DF DF DF DF DF DF DF DF DF DF OF OF DF DF DF DF DF DF OF AS OF - ' +
LP LP LP LP LP DF DF LP LP DF DF LP LP DF DF DF DF DF DF DF DF DF DF DF DF
X
X X
X X X X X X X X X X X X X X X X X X X X X X X X X X X X X X X X X X X X X X X X X X X X
X X
49
X
X X
X X
X
X X X X X X X X X X x X X X
X X X X X X X X X X X
X X X X X X
X X X X X X X
44
X X
X X
X
X X
X
X X X
X
X
X
X X X X
X X X
X
X
X
X
X X
27
2 3
2,O 1
4,3 0
3 8 2 2 2 7-3 2 0 32 2 1 2 1 2 2 2 3 3 1 . .
1,1 2 2 1 0 3 1
0-0 2
?,2 2.2 3 1 2 2 3 2 2 3 1
1 2 1 I 4 3
I

159
Appendix I . Summary of nest area (Level 3) GIS analysis for goshawk berritories.
Mature Young Sage/ Open SITE# acres Forest Forest Seedling Shrub Area
Current territories:
D1-02 D l -03 D1-04 01-06 D1-08 01-09 D1-io D1-11 Dl-I2 D1-13 02-01 02-02 D2-03 02-04 D2-05 D2-06 02-07' 03-01 03-06 03-07
. 04-01 04-04 05-03 05-07 D5-09 D5-IO D5-I 1
199 198
199 '
199 199 197 198
198 198 199 199 198 198 198 1 99 199 200 198 198 198 1 97 199 200 199 199
198
I 9a
Historical territories:
D3-02 199 D3-04 198 D5-01 196 05-05 198
67% 51 % 65% 88% 94% 60% 53% 76% 100% 100% 80% 62% 100% 78% 43% 35% 25% 55% 24% 100% 60% 99% 80% 49% 65% 71 % 64%
44% 24% 44% 38%
0% 0% 0% 0% 0% 0% 0% 0% 0% 0% 3% 3% 0% 0% 13% 4% 35% 6%
--15% 0% 5% 0% 1% 7% 1% 0% 0%
0% 0% 2% 10%
0% 0% 35% 9% 6% 40% 46% 24% 0% 0% 0% 35% 0% 0%
44% 61 % 40% 40% 57% 0% 34% 0% 13% 44% 4% 0% 0%
56% 76% 54% 35%
33% 49% 1% 3% 0% 0% 1% 0% 0% 0% 0% 0% 0% 6% 0% 0% 0% 0% 0% 0% 1% 0% 5% 0% 11% 21% 36%
0% 0% 0% 6%
0% 1% 0% 0% 0% 0% 0% 0% 0% 0% 17% 0% 0% 16% 0% 0% 0% 0% 4% , .
0% 0% 0% 2% 0% 20% 3% 0%
.. 0% 0% 0% 11%

1-60 Appendix J Summary of post-fledgling family area (Level 4) GtS analysis for goshawk territories.
Mature Young Sage/ Open
Current territories:
D 1 -02 D1-03
D1-06
D1-09
D 1-04
D1-08
01-10 D1-11 D1-12 D1-13 02-01 D2-02 02-03 D2-04 02-05 D2-06 D2-07 03-01 D346
. D3-07 D441 04-04 D5-03 D5-07 D5-09 D5-10 05-1 1
400 390 394 400 400 398 402 398 399 400 400 400
40 1 397 399 398 397 397 399 401 400 380 38 1 399 397 376
398
Historical territories:
D3-02 397 03-04 398 D5-01 401 D5-05 399
73% 54% 71% 60% 66% 62% 48% 92% 99% 86% 72% 59% 99% 55% 21 % 57% 16% 45% 69% 100% 56% 89% 71 % 70% 61% 55% 66%
46% 45% 58% 33%
0% 0% 0% 0% 0% 0% 0% 0% 0% 0%
d 2% 13% 0% 0% 17% 24% 21% 29%
% * 23% 0% 7% 2% 4% 4%
0% 1%
8%
0% 4% 0% 11%
2% 0% 14% 31% 34% 32% 47% 7% 0% 13% 0% 27% 0% 0% 62% 20% 63% 25% 9% 0%
23% 0%
21% 24% 4% 0% 0%
51 % 49% 35% 20%
25% 31% 4% 9% 0% 2% 4% 1% 1% 1% 7% 0% 1% 1% 0% 0% 0% 0% 0% 0% 13%
4% 3% 13% 34% 33%
8%
2% 0% 4% 11%
0% 15% 11% 0% 0% 4% 2% 0% 0% 0% 9% 0% 0%
43% 0% 0% 0% 0% 0% 0% 0% 1% 1% 0% 14% 11% 0%
1% 2% 3% 10%

Appendix K. Summary of foraging area (Level 5) GIS analysis for goshawk territories.
Mature Young Sage/ Open SITE# acres Forest Forest Seedling Shrub Area
Current territories:
D1-02 01-03 01-04 D1-06
01-09 D1-08
D1-10 D l - I 1 01-12
, 01-13 02-01 02-02 D2-03 D2-04 02-05 D2-06 02-07 D3-01
03-07 04-01 D4-04 05-03 D5-07 05-09
05-1 1
* , 03-06
D5-10
5394 4493 4848 5605 5505 5930 5754 5968 5034 5969
5971 4137 3071 5967 5612 5969 5968 5576 5970 5970 5966 4088 4673 3240 5310 3752
5938
Historical territories:
03-02 5969 D3-04 5967 D5-01 5266 05-05 3205
55% 54% 54% 43% 58% 50% 55% 80%
72% 74% 62% 84% 56% 46% 58% 34% 58% 67%
67% 65% 60% 66% 59% 49% 67%
81%
87%
41% 50% 51% 68%
0% 0% 1% 1% 0% 0% 0% 0% 1% 1%
11% 12% 2% 10% 10% 7% 38% 3% 1% 1% 5%
3% 4%
0% 1%
8%
8%
1% 1% 1% 4%
4% 0% 9% 15% 24%
33% 15% 13% 14% 4% IS% 8% 0%
41 % 32% 27% 40% 30% 10% 16% 1%
30% 12% 20% 0% 1%
28%
52% 46% 4% 15%
37% 45% 25% 41 % 14% 10% 9% 4% 4% 8% 9% 6% 6% 20% 1% 1% 0% 0% 0% 1% 12% 18% 3% 16% 13%
29% 38%
3% 2% 4% 12%
4% 2% 12% 1% 4% 13% 4% 4% 0% 5% 3% 3% 0% 6% . 2% 1% 0% 0% 2% 2% 0% 9% 3% 2% 1% 13% 3%
. . .
3% 2% 5% 1%
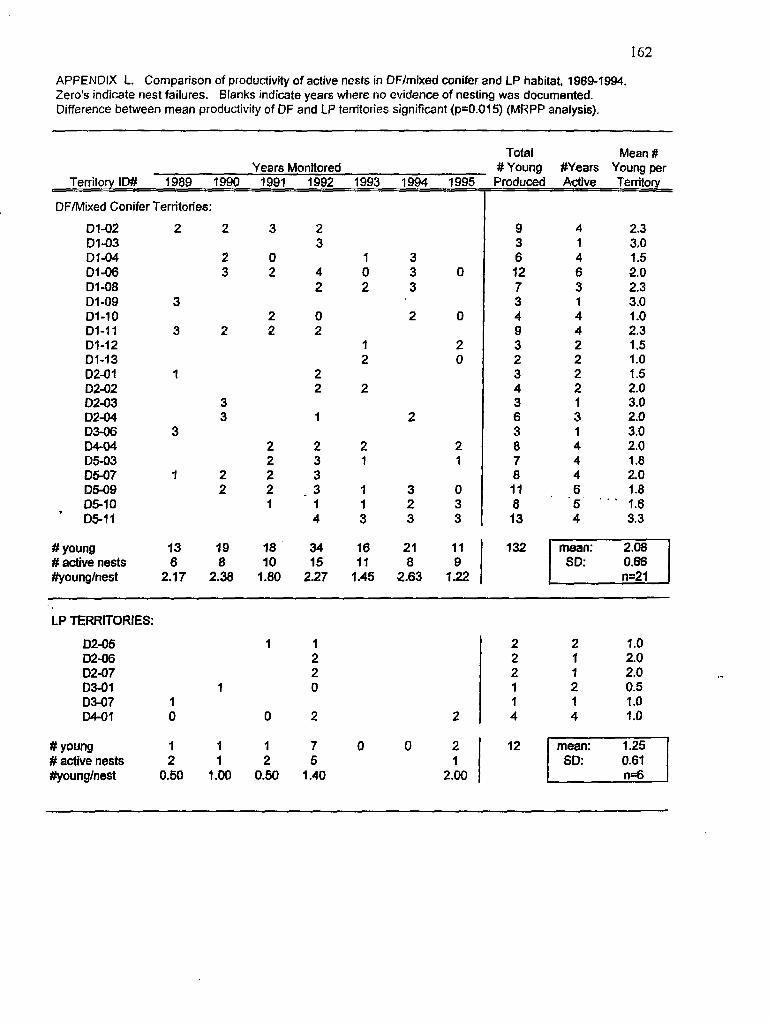
162
APPENDIX L. Comparison of productivity of active nests in OF/rnixed conifer and LP habitat, 19891994. Zero's indicate nest failures. Blanks indicate years where no evidence of nesting was documented. Difference between mean productivity of DF and LP territories significant (p=O.O15) (MRPP analysis).
Total Mean # Years Monitored # Young #Years Young per
TerritotyID?Y 1989 1990 1991 1992 1993 1994 1995
DFIMixed Conifer Territories:
01-02 D1-03 D1-04 D1-06 D1-08 D1-09 Dl-10 Dl-I 1 D1-12 Dl-13 02-01 D2-02 02-03 D2-04 03-06 04-04 D5-03 D507 D5-09 D5-10
' 05-11
2 2
2 3
3
3 2
1
3 3
3
1 2 2
# Young 13 19 # active nests 6 8 #younghest 2.17 2.38
3
0 2
2 2
2 2 2 2 1
18 10
1 .ao
2 3
4 2
0 2
2 2
1
2 3 3
- 3 1 4
34 15
2.27
1 0 2
I 2
2
2 1
I 1 3
16 11
1.45
3 3 0 3
2 0
2 0
2
2 1
3 0 2 3 3 3
21 11 0 9
2.63 1.22
9 4 3 1 6 4 12 6 7 3 3 1 4 4 9 4 3 2 2 2 3 2 4 2 3 1 6 3 3 1 8 4 7 4 8 4
6 5 8
13 4
11 , .
2.3 3.0 1.5 2.0 2.3 3.0 1 .o 2.3 1.5 1 .o 1.5 2.0 3.0 2.0 3.0 2.0 1.8 2.0 1.8
' 1.6 3.3
132 I mean: 2.08 1
LP TERRITORIES:
D2-05 02-06 D2-07 D3-01 03-07 1 D4-01 0
1
1 1 2 2 0
0 2
# young 1 1 1 7 0 # active nests 2 1 2 5 #younghest 0.50 1.00 0.50 1.40
2
2 2 1 .o 2 1 2.0 2 1 2.0 1 2 0.5 1 1 1 .o 4 4 1 .o
0 2 1 12 1
2.00 n=6
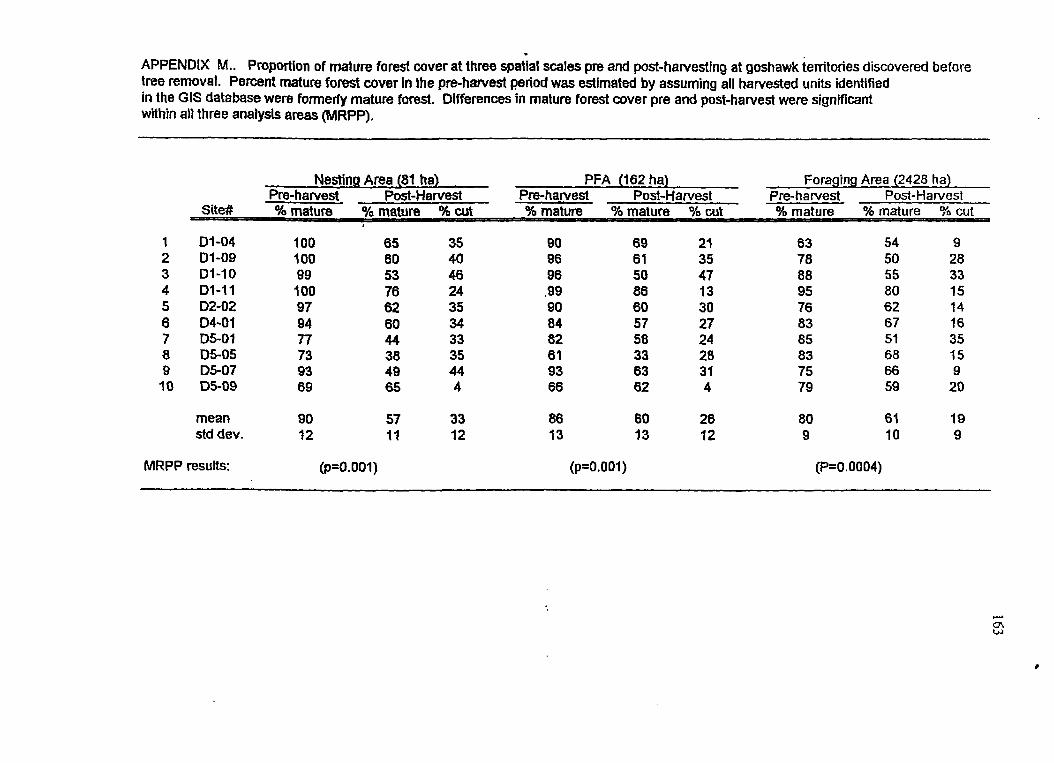
APPENDtX M.. Proportion of mature forest cover at three spatia! scales pre and post-harvesting at goshawk territories discovered before tree rernovaf. Percent mature forest cover in the pre-harvest period was estimated by assuming all harvested units identified in the GIS database were formerfy mature forest. Differences in mature forest cover pre and post-harvest were significant whin aft three analysis areas (MRPP).
1 2 3 4 5 6 7 3 9 10
Nesting Area (81 ha) . PFA (162ha) Foraging Area (2428 ha) Pre- hatvest Post-Ha west Pre-harvest Post-Harvest Pre-harvest Post-Harvest
Site# %mature % mature %cut %mature %mature %cut 9% mature % mature % cut
Dl -04 D1-09 D1-10 D1-11 D2-02 04-01 D5-01 D5-05 D5-07 DS-09
I 00 I00 99 100 97 94 77 73 93 69
65 60 53 76 62 60 44 38 49 65
35 40 46 24 35 34 33 35 44 4
BO 96 96 ,99 90
82 61 93 66
a4
69 61 50 86 60 57 58 33 63 62
21 35 47 13 30 27 24 28 31 4
63 78 88 95 76 83 85 83 75 79
54 50 55 80 62 67 51 68 66 59
9 2% 33 15 14 16 35 15 9
20
mean 90 57 33 86 60 26 80 61 19 std dev. 12 11 12 13 13 I2 9 10 9
MRPP results: (p=O.OOl) (p= 0.0 0 1 ) (P=O. 0004)
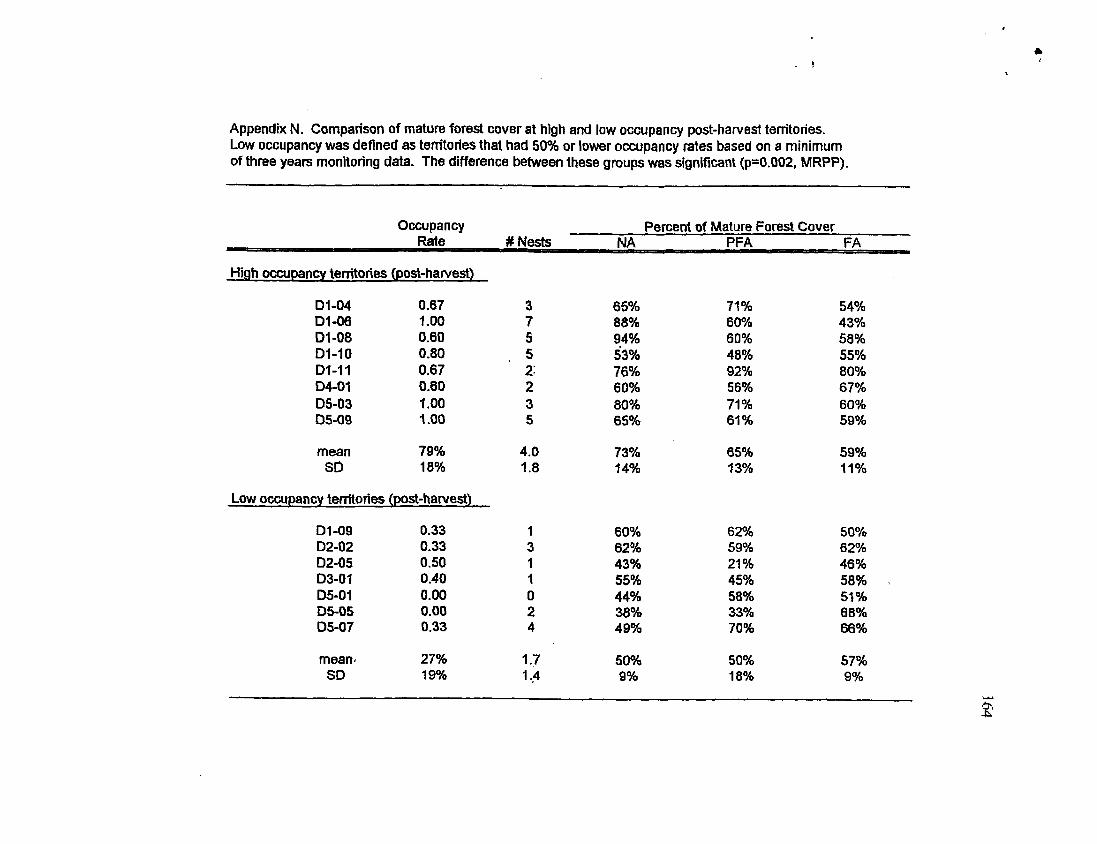
. !
Appendix N. comparison of mature forest cover at high and tow occupancy post-harvest territories. Low occupancy was defined as tenitones that had 50% or lower occupancy rates based OR a minimum of three years monitoring data. The difference between these groups was significant (p=0.002, MRPP).
Occupancy Percent of Mature Forest Cover Rate # Nests PFA FA
High occupancy territories (post-harvest)
D1-04 D1-06 D1-08 Dl-10 Dl-11 04-01 D5-03 05-09
0.67 I .oo 0.60 0.80 0.67 0.60 1 .oo 1 .oo
mean 79% SD 18%
Low occupancy territories (post-harvest)
01-09 0.33 D2-02 0.33 D2-05 0.50 D3-Of 0.40 D5-01 0.00 D5-05 0.00 05-07 0.33
meam 27% SD 19%
3 7 5 5 2; 2 3 5
4.0 1.8
1 3 1 1 0 2 4
1.7 1.4
65%
94%
76% 60% 80% 65%
73% 74%
88%
53%
60% 62% 43% 55% 44% 38% 49%
50% 9%
71 % 60% 60% 48% 92% 56% 71 % 61 %
65% 13%
62% 59% 21 % 45%
33% 70%
50% 18%
58%
54% 43% 58% 55%
67% 60% 5 9 2
59% 11%
80%
50% 62% 46%
51 % 68% 66%
57% 9%
58%