
Introduction - Southern Research Station - USDA
64
CHAPTER 2 C. lom mi on', D. chagnk2, D. pot3, S. ~ u m a r ~ , P. L. wilcox5, R. D. ~urdon~, D. prat6, D. G. peterson', J. ~aiva', P. chaumeill, G. G. vendramins, F. sebastiani9,C. D. ~elsonl~, C. S. ~cht'~, 0. avol la in en", T. L. ~ubisiak", M. T. Cervera12, N. de aria", and M. N. Islam-Faridi13 INRA, UMR BIOGECO, 69 route d'Arcachon, 33610 Cestas, France e-mail: [email protected] HortResearch, Private Bag 11030, Palmerston North, New Zealand Coffee Genomic Team, CIRAD, UMR PIA 1096,34398, Montpellier cedex 5, France Ensis-Genetics, Ensis, Private Bag 3020, Rotorua, New Zealand Cellwall Biotechnology Centre, Scion, Private Bag 3020, Rotorua, New Zealand Universite Claude Bernard - Lyon 1, EA 3731 Genome et Evolution des Plantes Supkrieures, Bat F.A. Forel, 6 rue Raphael Dubois, 69622, Villeurbanne Cedex, France ' Department of Plant and Soil Sciences, 117 Dorman Hall, Box 9555, Mississippi State University, Mississippi State, MS 39762, USA Plant Genetics Institute, National Research Council, Via Madonna del Piano 10, 50019 Sesto Fiorentino, Florence, Italy Department of Agricultural Biotechnology, University of Florence, Via della Lastruccia 14,50019 Sesto Fiorentino, Florence, Italy USDA - Forest Service, Southern Research Station, Southern Institute of Forest Genetics, 23332 Mississippi 67, Saucier, MS 39574, USA Department of Biology, PL 3000,90014, University of Oulu, Finland l2 CIFOR - INIA, Genktica y Ecofisiologia Forestal & Unidad Mixta de Gendmica y Ecofisiologia Forestal INIA-UPM, Departamento de Sistemas y Recursos Forestales, Carretera de La Corufia km 7,28040 Madrid, Spain l3 USDA-Forest Service, Southern Research Station, Southern Institute of Forest Genetics, Forest Tree Molecular Cytogenetics Laboratory, Texas A&M University, College Station, TX 77843, USA 2.1 Introduction 2.1.1 History of the Genus Origin and Distribution Pinus is the most important genus within the Family Pinaceae and also within the gymnosperms by the number of species (109 species recognized by Farjon 2001) and by its contribution to forest ecosystems. All pine species are evergreen trees or shrubs. They are widely distributed in the northern hemisphere, from tropical areas to northern areas in America and Eurasia. Their natural range reaches the equator only in Southeast Asia. In Africa, natural occurrences are confined to the Mediterranean basin. Pines grow at various elevations from sea level (not usual in tropical areas) to highlands. ' h o main regions of diversity are recorded, the most important one in Central America (43 species found in Mexico) and a secondary one in China. Some species have a very wide natural range (e.g., l? ponderosa, l? sylvestris). Pines are adapted to a wide range of ecological conditions: from tropical (e.g., I? merkusii, P. kesiya, l? tropicalis), temperate (e.g., l? pungens, l? thunbergii), and subalpine (e.g., I! albicaulis, l? cembra) to boreal (e.g., I? pumila) cli- mates (Richardson and Rundel 1998, Burdon 2002). They can grow in quite pure stands or in mixed forest with other conifers or broadleaved trees. Some species are especially adapted to forest fires, e.g., l? banksiana, in which fire is virtually essential for cone opening and seed dispersal. They can grow in arid conditions, on alluvial plain soils, on sandy soils, on rocky soils, or on marsh soils. Trees of some species can have a very long life as in l? longaeva (more than 3,000 years). Botanical Descriptions The genus is distinguished from other members of the Pinaceae family by its needlelike secondary leaves, borne commonly in fascicles of 1 to 8 on dwarf shoots, with a fascicle sheath of bud scales. The leaves of pines are of four types encompassing the complete plant development: cotyledons, juvenile leaves, scale leaves Genome Mapping and Molecular Breeding in Plants, Volume 7 Forest Trees C. Kole (Ed.) O Springer-Verlag Berlin Heidelberg 2007
-
Upload
khangminh22 -
Category
Documents
-
view
3 -
download
0
Transcript of Introduction - Southern Research Station - USDA

CHAPTER 2
C. lom mi on', D. chagnk2, D. pot3, S. ~ u m a r ~ , P. L. wilcox5, R. D. ~ u r d o n ~ , D. prat6, D. G. peterson', J. ~aiva' , P. chaumeill, G. G. vendramins, F. sebastiani9, C. D. ~ e l s o n l ~ , C. S. ~ c h t ' ~ , 0. avol la in en", T. L. ~ubisiak", M. T. Cervera12, N. de aria", and M. N. Islam-Faridi13
INRA, UMR BIOGECO, 69 route d'Arcachon, 33610 Cestas, France e-mail: [email protected] HortResearch, Private Bag 11030, Palmerston North, New Zealand Coffee Genomic Team, CIRAD, UMR PIA 1096,34398, Montpellier cedex 5, France Ensis-Genetics, Ensis, Private Bag 3020, Rotorua, New Zealand Cellwall Biotechnology Centre, Scion, Private Bag 3020, Rotorua, New Zealand Universite Claude Bernard - Lyon 1, EA 3731 Genome et Evolution des Plantes Supkrieures, Bat F.A. Forel, 6 rue Raphael Dubois, 69622, Villeurbanne Cedex, France
' Department of Plant and Soil Sciences, 117 Dorman Hall, Box 9555, Mississippi State University, Mississippi State, MS 39762, USA Plant Genetics Institute, National Research Council, Via Madonna del Piano 10, 50019 Sesto Fiorentino, Florence, Italy Department of Agricultural Biotechnology, University of Florence, Via della Lastruccia 14,50019 Sesto Fiorentino, Florence, Italy USDA - Forest Service, Southern Research Station, Southern Institute of Forest Genetics, 23332 Mississippi 67, Saucier, MS 39574, USA Department of Biology, PL 3000,90014, University of Oulu, Finland
l2 CIFOR - INIA, Genktica y Ecofisiologia Forestal & Unidad Mixta de Gendmica y Ecofisiologia Forestal INIA-UPM, Departamento de Sistemas y Recursos Forestales, Carretera de La Corufia km 7,28040 Madrid, Spain
l3 USDA-Forest Service, Southern Research Station, Southern Institute of Forest Genetics, Forest Tree Molecular Cytogenetics Laboratory, Texas A&M University, College Station, TX 77843, USA
2.1 Introduction
2.1.1 History of the Genus
Origin and Distribution Pinus is the most important genus within the Family Pinaceae and also within the gymnosperms by the number of species (109 species recognized by Farjon 2001) and by its contribution to forest ecosystems. All pine species are evergreen trees or shrubs. They are widely distributed in the northern hemisphere, from tropical areas to northern areas in America and Eurasia. Their natural range reaches the equator only in Southeast Asia. In Africa, natural occurrences are confined to the Mediterranean basin. Pines grow at various elevations from sea level (not usual in tropical areas) to highlands. ' h o main regions of diversity are recorded, the most important one in Central America (43 species found in Mexico) and a secondary one in China. Some species have a very wide natural range
(e.g., l? ponderosa, l? sylvestris). Pines are adapted to a wide range of ecological conditions: from tropical (e.g., I? merkusii, P. kesiya, l? tropicalis), temperate (e.g., l? pungens, l? thunbergii), and subalpine (e.g., I! albicaulis, l? cembra) to boreal (e.g., I? pumila) cli- mates (Richardson and Rundel 1998, Burdon 2002). They can grow in quite pure stands or in mixed forest with other conifers or broadleaved trees. Some species are especially adapted to forest fires, e.g., l? banksiana, in which fire is virtually essential for cone opening and seed dispersal. They can grow in arid conditions, on alluvial plain soils, on sandy soils, on rocky soils, or on marsh soils. Trees of some species can have a very long life as in l? longaeva (more than 3,000 years).
Botanical Descriptions The genus is distinguished from other members of the Pinaceae family by its needlelike secondary leaves, borne commonly in fascicles of 1 to 8 on dwarf shoots, with a fascicle sheath of bud scales. The leaves of pines are of four types encompassing the complete plant development: cotyledons, juvenile leaves, scale leaves
Genome Mapping and Molecular Breeding in Plants, Volume 7 Forest Trees C. Kole (Ed.) O Springer-Verlag Berlin Heidelberg 2007

30 C. Plomion et al.
(cataphylls), and secondary leaves. Cotyledons vary in number from 4 up to 24 in R maximartinezii. There are up to three resin ducts in the cotyledons and either one or two vascular bundles (Farjon 1984). Primary leaves are single, generally helically arranged, and acicular, and they are produced in most species only during the first growth season but for a longer period in a few species. Cataphylls, the nonchlorophyllous primary leaves produced on shoots, occur in an extension of the helical arrangement of the primary leaves and sub- tend all shoot structures, but they are typically small and subulate or lanceolate. Secondary leaves, the nee- dles, appear by the end of the first growing season, or later in some species. They are the most common pine leaves, permanently green, and metabolically active, ranging in length from 2 to 50 cm (generally smaller ones occur in subalpine or aridity-adapted species). They are borne on dwarf shoots axillary to cataphylls, in fascicles of one (R monophylla, with circular section needles) to eight needles, usual numbers per fascicle being two, three, or five. A fascicle is initially bound together by a basal sheath that may then fall off or persist, but actual leaf fall involves the entire fascicle structure. The number of leaves in the fascicles de- termines the transverse leaf shape (Farjon and Styles 1997). Stomata are arranged in several longitudinal lines along the entire leaf length. There are gener- ally two or more resin ducts in needles. The number of vascular bundles (one or two as in cotyledons) is the major trait for the identification of the main di- visions of genus Pinus. The trunk is usually single, erect, and columnar. The branches are grouped into pseudowhorls (often called clusters), at least when young. Bark patterns in pines result mainly from fis- suring due to expansion growth and to the formation of scales that eventually fall off.
Pine species are monoecious. Pollen cones are rel- atively small and soft; these ephemeral structures consist of an axis with many helically arranged mi- crosporophylls. Two microsporangia are attached to the underside of each microsporophyll. These cones open in spring, at least for temperate-climate species, and release large quantities of pollen into the air. Pollen is of the bisaccate type giving it great buoyancy in the air. Pine pollen can be blown over long distances. Its morphology is very similar for all pine species. Seed conelets are found in most species at the ends of new twigs, taking the position of a lateral bud. They are usually located on the higher branches. They consist of scales, the megasporophylls, arranged around an axis; on each megasporophyll lie two separate ovules,
each consisting of a cell mass protected by an in- tegument. The micropyle through which the pollen tube penetrates is turned toward the axis. After pol- lination the seed cone closes its scales by expansion. The seed cone then grows rapidly. Pollen germinates and produces the male gametophyte, with two sperm nuclei. Fertilization takes place later, about one year after pollination in temperate pine species. Seed cone maturation requires one growing season after fertil- ization for many species, and even a third for some species. In tropical climates the cycle can be short- ened because of the lack of winter dormancy. Individ- ual seed cones thus persist for 2, up to even 3, years on the same tree for most pine species. Seeds contain an embryo embedded in the remaining megagameto- phyte and the seed coat. The seed wings derive from tissue on the adaxial face of the seed scale. Even in species with vestigial or absent wings, remnants of basal wing tissue are present on the seed scale, on the seed, or on both. Seeds are mostly wind dispersed. In some species, birds are important seed-dispersal vectors (R albicaulis). Seed cones are serotinous in some species and open only following exposure to fire (R banksiana).
Systematics and Phylogeny The genus is divided into subgenera, sections, and subsections. Various classifications have been pro- posed in this genus since Linnaeus. Recent ones ob- tain support from DNA phylogenetics to identify re- lated species. Many phylogenetic studies have been carried out in pines. Some of the first studies in- volved restriction patterns of the chloroplast genome (Strauss and Doerksen 1990; Govindaraju et al. 1992; Krupkin et al. 1996). More recent classifications, in- cluding a large number of species, were established from nuclear sequences (ITS, Liston et al. 1999) and chloroplast sequences (rbcL: Gernandt et al. 2005), the chloroplast genome being paternally inherited in the genus Pinus (Neale and Sederoff 1989). Some stud- ies have also focused on subsets of the genus Pinus: subgenus Pinus (Geada L6pez et al. 2002), section Parrya (Gernandt et al. 2003), and Eurasian species (Wang et al. 1999). Comprehensive classifications of the genus Pinus were earlier established by Gaussen (1960) and Van der Burgh (1973) using morpholog- ical and anatomical traits. Later, Price et al. (1998) and Gernandt et al. (2005) also included molecu- lar data and identified monophyletic subgenera, sec- tions, and subsections. Some features are consistent, but variations are noticed between the classical and

Chapter 2 Pines 31
molecular approaches. The main division into two subgenera according to the number (one or two) of leaf vascular bundles has been recognized by these authors with various subgenera names (Haploxylon and Diploxylon, sometimes called, respectively, soft pines and hard pines, and, more recently, Strobus and Pinus named from type species as recommended by botanical nomenclature code; http:lltolweb.org/ tree?group=Pinus&contgroup=Pinaceae). The taxo- nomic position of a singular species with flat sec- ondary leaves l? krempfii is not fully agreed. It has been considered as a third monospecific subgenus by Gaussen (1960), while molecular data place it as a member of the subgenus Strobus (Wang et al. 2000; Gernandt et al. 2005). Most species belong to the sub- genus Pinus. Subgenus Pinus species are character- ized by thick seed-cone scales and persistent fasci- cle sheaths. The numerous sections proposed by Van der Burgh (1973) for this subgenus have subsequently been grouped into two sections Pinus and Trifoliae (Gernandt et al. 2005), the latter being called New World diploxylon pines by Price et al. (1998). The sec- tion Trifoliae consists of American species distributed into subsections Australes (septal, internal, or medial needle resin ducts), Ponderosae (internal or medial needle resin ducts), and Contortae (medial needle resin ducts): most of these species are characterized by three-needled fascicles (Table 1).
Each of these subsections groups two or more previously described subsections. l? leiophylla and l? lumholtzii are now clustered within subsection Aus- trales and are not further differentiated. The section Pinus is divided into subsections Pinus and Pinaster. Species within this section, with few exceptions, grow in Eurasia and northern Africa. Subsection Pinaster, characterized by the lack of a spine on the umbo of the cone scale, includes l? pinaster as the type. More recently, all of the other species included in the sec- tion Pinaster as defmed by Van den Burgh (1973) were found to cluster within the Australes subsection of the genus (Gernandt et al. 2005). Species of the subsec- tion Pinus including the type species of the genus, ?! sylvestris, were previously grouped into a section called Sylvestres by Van der Burgh (1973). The sub- genus Strobus has been divided into two sections: Quinquefoliae and Parrya. They differ from the sec- tions Strobus and Parrya of Van der Burgh (1973) and Price et al. (1998) by the transfer of the subsec- tions Krempfianae and Gerardianae from the section Parrya into the section Quinquefoliae, which also in- cludes the subsection Strobus. The subsection Strobus
consists of species with five-needled fascicles, thin cone scales, terminal position of spines on seed cone, and several other features absent in the subsections Krempfianae and Gerardianae of Southeast Asia al- ready differentiated by Van der Burgh (1973) and Price et al. (1998). The three subsections of the Quinque- foliae section share a deciduous fascicle sheath. The section Parrya conqists ofthe subsections Cembroides, Nelsoniae, and Balffourianae; they share an American distribution, the external position of resin ducts (as in subsections Krempfianae and Gerardianae), and thick cone scales (again as in subsections Krempfianae and Gerardianae). Subsection Nelsoniae shows persistent fascicle sheath not found in other species of subgenus Strobus. Most monophyletic groups cannot be identi- fied from unique morphoanatomical traits.
Two of the 11 subsections consist of American species and Eurasian species. Sections Pinus and Quinquefoliae have an Asiatic origin according to chloroplast data. The subsection Strobus lineage would have then evolved in America before coming back to Eurasia. Few dispersal events to eastern North America have probably occurred to explain the presence there of the limited number of species of the subsection Pinus. The development and utilization of low-copy-number nuclear genes (Syring et al. 2005) should provide new insights to solve remaining classification problems. Most ancient pine fossils have been dated to the early Cretaceous (Millar 1998). They have been found in China, North America, and Europe (which was very close to eastern North America at that time). They did not further refine the putative geographic origin of genus Pinus.
Hybridization Interspecific hybridization occurs in pines but is lim- ited mostly to related species within a subsection. Some species such as l? engelmannii, l? jeflreyi, and l? ponderosa are compatible in a number of different combinations (Liston et al. 1999). Natural hybridiza- tions are often indicated by the introgression ofthe pa- ternally inherited chloroplast genome. Barriers occur at different stages, from the failure of pollen germina- tion to failure at embryogenesis (Ledig 1998). A few species are postulated to have been derived from in- terspecific hybridization. They also exhibit the highly conserved chromosome number in pines (2n = 24). This is the situation for l? densata that has been shown to combine nuclear polymorphisms of l? tabuliformis and l? yunnanensis with the chloroplast genome of the latter (Wang et al. 2001) and probably several other
32 C. Plomion et al.
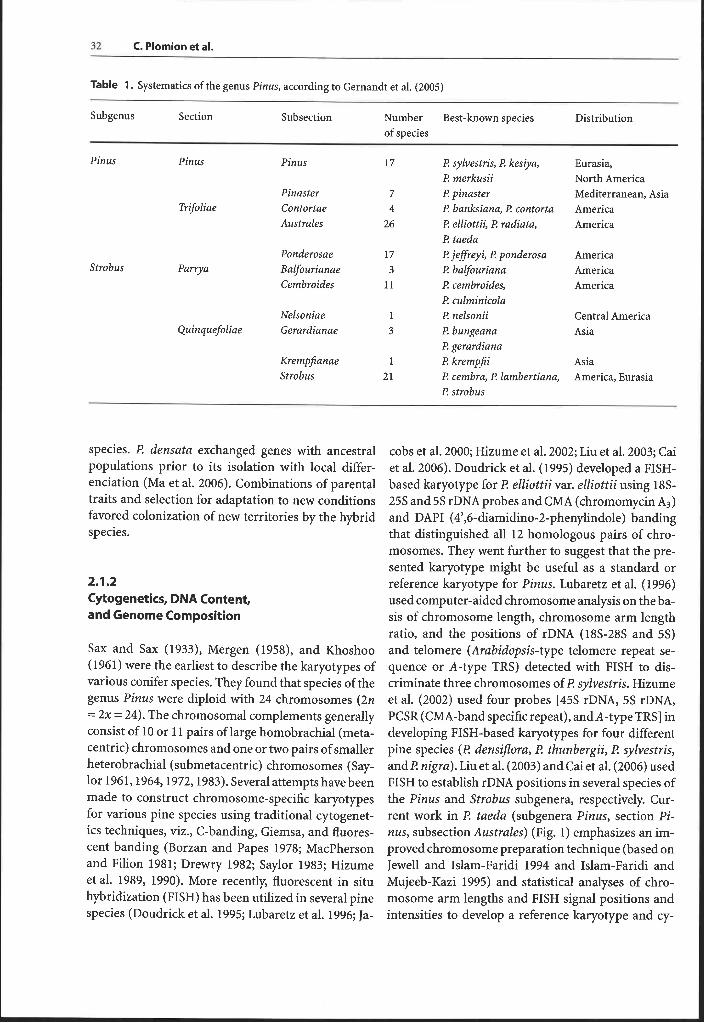
Table 1. Systematics of the genus Pinus, according to Gernandt et al. (2005)
Subgenus Section Subsection Number Best-known species Distribution of species
Pinus Pinus Pinus 17 l? sylvestris, l? kesiya, Eurasia, l? rnerkusii North America
Pinaster 7 l? pinaster Mediterranean, Asia Trifoliae Contortae 4 l? banksiana, l? contorta America
Australes 26 I! elliottii, l? radiata, America l? taeda
Ponderosae 17 l? jefieyi, I? ponderosa America Strobus Parrya Balfourianae 3 l? balfouriana America
Cembroides 11 l? cembroides, America l? culminicola
Nelsoniae 1 I! nebonii Central America Quinquefoliae Gerardianae 3 l? bungeana Asia
P. gerardiana Krempfianae 1 l? krernpjii Asia Strobus 2 1 l? cernbra, l? lambertiana, America, Eurasia
l? strobus
species. P. densata exchanged genes with ancestral cobs et al. 2000; Hizume et al. 2002; Liu et al. 2003; Cai populations prior to its isolation with local differ- et al. 2006). Doudrick et al. (1995) developed a FISH- enciation (Ma et al. 2006). Combinations of parental based karyotype for P. elliottii var. elliottii using 18S- traits and selection for adaptation to new conditions 25s and 5s rDNA probes and CMA (chromomycin A3) favored colonization of new territories by the hybrid and DAPI (4',6-diamidino-2-phenylindole) banding species. that distinguished all 12 homologous pairs of chro-
mosomes. They went further to suggest that the pre- sented karyotype might be useful as a standard or
2.1.2 reference karyotype for Pinus. Lubaretz et al. (1996) Cytogenetics, DNA Content, used computer-aided chromosome analysis on the ba- and Genome Composition sis of chromosome length, chromosome arm length
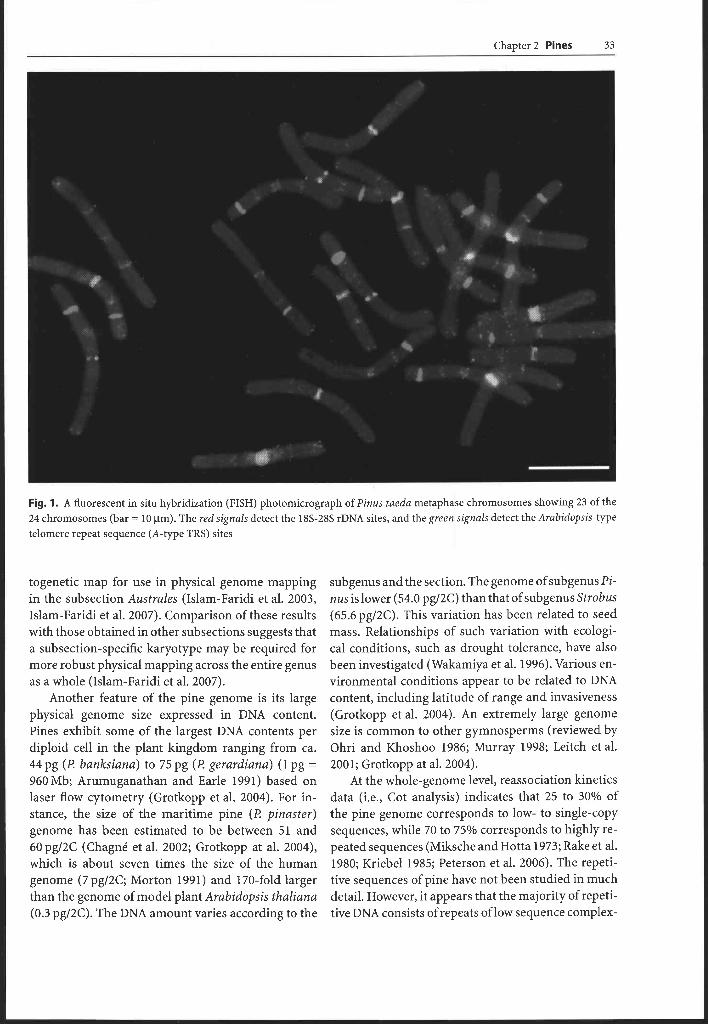
ratio, and the positions of rDNA (18s-28s and 5s) Sax and Sax (1933), Mergen (1958), and Khoshoo and telomere (Arabidopsis-type telomere repeat se- (1961) were the earliest to describe the karyotypes of quence or A-type TRS) detected with FISH to dis- various conifer species. They found that species of the criminate three chromosomes of P. sylvestris. Hizume genus Pinus were diploid with 24 chromosomes (2n et al. (2002) used four probes [45S rDNA, 5s rDNA, = 2x = 24). The chromosomal complements generally PCSR (CMA-band specific repeat), and A-type TRS] in consist of 10 or 11 pairs of large homobrachial (meta- developing FISH-based karyotypes for four different centric) chromosomes and one or two pairs of smaller pine species (l? densiflora, l? thunbergii, l? sylvestris, heterobrachial (submetacentric) chromosomes (Say- and l? nigra). Liu et al. (2003) and Cai et al. (2006) used lor 1961,1964,1972,1983). Several attempts have been FISH to establish rDNA positions in several species of made to construct chromosome-specific karyotypes the Pinus and Strobus subgenera, respectively. Cur- for various pine species using traditional cytogenet- rent work in l? taeda (subgenera Pinus, section Pi- ics techniques, viz., C-banding, Giemsa, and fluores- nus, subsection Australes) (Fig. 1) emphasizes an im- cent banding (Borzan and Papes 1978; MacPherson proved chromosome preparation technique (based on and Filion 1981; Drewry 1982; Saylor 1983; Hizume Jewel1 and Islam-Faridi 1994 and Islam-Faridi and et al. 1989, 1990). More recently, fluorescent in situ Mujeeb-Kazi 1995) and statistical analyses of chro- hybridization (FISH) has been utilized in several pine mosome arm lengths and FISH signal positions and species (Doudrick et al. 1995; Lubaretz et al. 1996; Ja- intensities to develop a reference karyotype and cy-
Chapter 2 Pines 33
Fig. 1. A fluorescent in situ hybridization (FISH) photomicrograph of Pinus taeda metaphase chromosomes showing 23 of the 24 chromosomes (bar = 10 ~ m ) The red signals detect the 18s-28s rDNA sites, and the green signals detect the Arabidopsis-type telomere repeat sequence (A-type TRS) sites
togenetic map for use in physical genome mapping in the subsection Australes (Islam-Faridi et al. 2003, Islam-Faridi et al. 2007). Comparison of these results with those obtained in other subsections suggests that a subsection-specific karyotype may be required for more robust physical mapping across the entire genus as a whole (Islam-Faridi et al. 2007).
Another feature of the pine genome is its large physical genome size expressed in DNA content. Pines exhibit some of the largest DNA contents per diploid cell in the plant kingdom ranging from ca. 44 pg ( P banksiana) to 75 pg (P gerardiana) (1 pg = 960 Mb; Arumuganathan and Earle 1991) based on laser flow cytometry (Grotkopp et al. 2004). For in- stance, the size of the maritime pine ( I ? pinaster) genome has been estimated to be between 51 and 60 pg12C (Chagnk et al. 2002; Grotkopp at al. 2004), which is about seven times the size of the human genome (7 pg/2C; Morton 1991) and 170-fold larger than the genome of model plant Arabidopsis thaliana (0.3 pgI2C). The DNA amount varies according to the
subgenus and the section. The genome of subgenus Pi- nus is lower (54.0 pgl2C) than that of subgenus Strobus (65.6 pg/2C). This variation has been related to seed mass. Relationships of such variation with ecologi- cal conditions, such as drought tolerance, have also been investigated (Wakamiya et al. 1996). Various en- vironmental conditions appear to be related to DNA content, including latitude of range and invasiveness (Grotkopp et al. 2004). An extremely large genome size is common to other gymnosperms (reviewed by Ohri and Khoshoo 1986; Murray 1998; Leitch et al. 2001; Grotkopp at al. 2004).
At the whole-genome level, reassociation kinetics data (i.e., Cot analysis) indicates that 25 to 30% of the pine genome corresponds to low- to single-copy sequences, while 70 to 75% corresponds to highly re- peated sequences (Miksche and Hotta 1973; Rake et al. 1980; Kriebel 1985; Peterson et al. 2006). The repeti- tive sequences of pine have not been studied in much detail. However, it appears that the majority of repeti- tive DNA consists of repeats of low sequence complex-
34 C. Plomion et al.
ity (Schmidt et al. 2000), retrotransposons (Kamm et al. 1996; Kossack and Kinlaw 1999; Friesen et al. 2001), and 18s-5.8s-25s rDNA genes. As shown by molecular, cytological, and linkage-mapping studies (Friesen et al. 2001; Scotti et al. 2005), most of these repeat sequences are present at multiple loci and are presumably interspersed among other sequences, al- though they tend to form loose clusters that surround gene-rich islands. The remainder of the genome is composed of low-copy sequences of which an un- known portion are genes. If the pine genome (1C -- 25 to 30pg; see above) is similar to Arabidopsis in having about 30,000 expressed genes and an aver- age gene size of 2,000 bp including introns and UTRs (The Arabidopsis Genome Initiative 2000), only 0.5% of its genome is likely to be transcribed. In compari- son, 54% of the Arabidopsis sequence and 5 to 6% of mammalian genomes are transcribed (Rat Genome Sequencing Project Consortium 2004).
Gene duplication and the formation of complex gene families have been widely cited as a potential cause of the abundance of low-copy DNA in the pine genome. Kinlaw and Neale (1997) suggested that levels of multiplication were greater in conifers than in other plant species, and transcriptional profiling studies have noted surprising levels of transcriptome com- plexity (Lorenz and Dean 2002). However, considering the relatively low proportion of a conifer genome rep- resented by expressed sequences, it is unlikely that the evolution of multigene families alone can ex- plain the enormous size of pine nuclear genomes. It is possible that a relatively large proportion of low-copy sequences in pine are pseudogenes and/or highly diverged repeat sequences, and indeed there is evidence supporting both possibilities (Elsik and Williams 2000; Rabinowicz et al. 2005).
2.1.3 Economic Importance
Pine species play an especially important role in modern plantation forestry worldwide and now form a large part of both the annual wood harvest and the immature plantation forests that will provide wood in the future (Burdon 2002). Pines enjoy such great popularity because the large number of species allows choice for widely varying site and environmental con- ditions; the volume of production of some species can be high to very high, even under unfavorable site con- ditions; they are well suited for reforestation and for
simple silviculture (monocultures and clear-felling); their wood is easily processed and utilized for a wide variety of end uses (lumber, pulp and paper, par- ticleboard, etc.); and even if species lack naturally durable heartwood, treatment with preservatives is easy.
Various minor forest products come from pines (Burdon 2002). Some pine plantations, especially F! pinaster in the Landes of southwest France, were established largely for resin production. Resin pro- duction from pines was also a major economic activ- ity in the southeast of the USA, Mediterranean basin, northern India, and east and Southeast Asia. Resin products are still recovered from chemical pulping of pines. Foliage, in the form of litterfall, has been used for a range of purposes. The bark is used for a vari- ety of purposes, and that of many species has a high tannin content. For a few species with large seeds, no- tably l? pinea, l? edulis, and l? sibirica, seeds have been a prized item of the human diet. Edible fungi, repre- senting the fruiting bodies of mycorrhizal symbionts, are often collected from pine stands.
Pine species are also used widely for shelter and the interlinked purposes of revegetation, soil stabiliza- tion, and soil conservation, as befits their tolerance of exposure and degraded soils in certain species. Most of the widely planted species of pines are used in some degree for one or more of these purposes, often with timber production as a major bonus. Ornamental and festive use is common, with F! sylvestris and f! virgini- ana being very widely grown for Christmas trees.
2.1.4 Classical Breeding Objectives
In most pine breeding programs, the setting of goals was originally done subjectively, based on perceptions of the main traits limiting profitability, of the vari- ability and heritability of the traits concerned, and of the genetic correlations (both favorable and adverse) among traits (Burdon 2004). The setting of breeding goals is crucial to any tree-improvement program, and yet most pine tree breeding programs do not have for- mally defined breeding objectives. Various reasons for this include complexity of the forest processing indus- try, difficulties in determining the relationships be- tween selection traits and end uses, and long rotation ages that create uncertainty about their use (Apiolaza and Greaves 2001). Earlier attempts of most improve- ment programs have been to improve growth, form,

Chapter2 Pines 35
climatic adaptation, and resistance to certain diseases (Cahalan 1981; Danjon 1995; Paul et al. 1997; Shel- bourne et al. 1997).
Most recent efforts have been diverted at improv- ing traits related to pulp and paper and solid-wood products (Shelbourne et al. 1997; Chambers and Bor- ralho 1999; Greaves 1999; Lowe et al. 1999; Pot et al. 2002; Kumar 2004). Wood density and fiber mor- phology (e.g., tracheid length and coarseness) have been reported to be crucial for pulp yield and quality. Wood properties such as wood density and stiffness are crucial selection traits for the improvement of wood stiffness, while compression wood, spiral grain, and microfibril angle are candidate traits for reducing in-service instability (Shelbourne et al. 1997; Ivkovic et al. 2006). Heartwood, resinous defects, and inter- nal checking are also being considered as selection traits to develop germplasm for appearance-grade products (Shelbourne et al. 1997). There are some sit- uations, especially involving exotic species and dis- ease resistance, etc., where hybrids between selective species are desirable to make genetic improvement in the breeding-objective traits (Hyun 1976; Byun et al. 1989; Blada 1994; Nikles 2000; Shelbourne 2000). Pine species vary widely in their amenability to vari- ous forms of vegetative propagation (Hartmann et al. 1990). Ease of propagation was generally a minor cri- terion for species selection in breeding programs of pines. Currently with improved technology, selection is based more on silvicultural performance and wood quality.
2.1.5 Classical Breeding Achievements
Various selection and deployment strategies are being used for different pine species. Species selection fol- lowed by provenance and family-within-provenance selection, and establishment of seed orchards are quite common first steps across various species including P. radiata (Falkenhagen 1991; Matziris 1995), l? oocarpa (Moura et al. 1998), l? caribaea (Zheng et al. 1994), l? strobus (Beaulieu et al. 1996), I? sylvestris (Quencez and Bastien 2001), l? pinaster (Alia et al. 1995, 1997; Danjon 1995), R taeda (Jiang et al. 1999; Lopez-Upton et al. 2000), F? tecunumanii (Hodge and Dvorak 1999), and l? contorta (Cahalan 1981). In advanced-generation breeding programs, forward selections and/or combined selection (among- and within-family) are the major sources of
genetic gain (Wei et al. 1997; Rosvall et al. 1998; Lam- beth 2000; Alazard 2001; Olsson et al. 2001; Plomion et al. 2001; Burdon and Kumar 2004). In the species that are easy to propagate, the concept of using clonal replication of individuals within families as a means of genetic testing is being implemented in order to increase the efficiency of genetic improvement. Significant genetic gains from such a strategy have been reported for l? radiata (Matheson and Lindgren 1985; Shelbourne 1992) and I! taeda (Isik et al. 2004).
Pinus patula, F? taeda, and l? elliottii, are planted in South Africa in summer rainfall zones, and their average productivity is 15 m3 ha-' yr-' (Du Toit et al. 1998). Brazil, with its humid summers, largely uses l? caribaea, l? taeda, and l? elliottii. Pines in Brazil pro- duce 8 to 30 m3 ha-' yr-l on rotations of 20 to 25 years. l? radiata is grown as large plantations in the temper- ate southern hemisphere countries of Australia, Chile, New Zealand, and South Africa. The mean annual in- crement over 25 years is often 25 to 30 m3 ha-' yr-' (Lamprecht 1990). However in New Zealand, growth rates of up to 50 m3 ha-' yr-' have been recorded on the best sites and as low as 11 m3 ha-' yr-' on very dry sites (Burdon and Miller 1992). The aver- age productivity of R pinaster in southern France is about 10 m3 ha-' yr-l but could reach 20 to 25 m3 ha-l yr-' on the best sites. Deployment of genetically improved loblolly pine in the USA has been reported to yield up to about 21 m3 ha-' yr-' (McKeand et al. 2003). Dhaka1 et al. (1996) reported a realized gain in volume of about 22% in a slash pine improvement program in the USA. Wood-quality traits that are cur- rently being included, in addition to growth, form, and health traits, in the breeding objectives of various pines species appear to be under moderate to strong genetic control (Burdon and Low 1992; Hannrup et al. 2000; Atwood et al. 2002; Gwaze et al. 2002; Pot et d. 2002; Kumar 2004), and predicted genetic gains from selection appeared to be in the order of about 10% for traits such as wood density and stiffness (Kumar 2004).
Clonal forestry (CLF) represents the large-scale propagation and deployment of selected clones that have been clonally tested. Deployment of tested clones by CLF is being increasingly employed with l? radiata in New Zealand (Sorensson and Shelbourne 2005), l? taeda in the USA (Stelzer and Goldfarb 1997), and pine hybrids in Australia (Walker et al. 1996). In prin- ciple, CLF offers additional genetic gains from cap- turing nonadditive effects, which are not captured via sexual propagation, plus the benefits of greater uni-

36 C. Plomion et al.
formity and predictability in performance resulting from a lack of genetic segregation. Genetic gains from CLF have been predicted to be considerably higher than those from family forestry in I! radiata (Aimers- Halliday et al. 1997), I! taeda (Stelzer and Goldfarb 1997), and I! strobus (Park 2002).
2.1.6 Molecular Diversity
The majority of studies aiming to monitor the level and distribution of genetic diversity in Pinus natural populations were based on the use of neutral markers. Indeed, molecular markers, such as microsatellites, provided useful information on historical demogra- phy and population evolution.
The use of isozyme electrophoresis significantly increased the amount of data on the genetic struc- ture of populations (Petit et al. 2005). These data re- vealed that pine species had high genetic diversity within populations and only low levels of differen- tiation among populations. For 28 north temperate pines, genetic differentiation (Gsr) averaged 0.076 (Ledig 1998). Exceptions are represented by F! pinea (G.G. Vendramin et al. personal communication), Pi- nus resinosa, a species that has a vast range across northeastern North America (Echt et al. 1998; Wal- ter and Epperson 2001), and I! torreyana (Ledig and Conkle 1983; Provan et al. 1999) where near absence of variation was observed, and by Mexican pine species where higher differentiation among populations was observed, probably because their natural distribu- tions are more highly fragmented by physiography than those of species at more northerly latitudes. Other pine species with disjunct populations and re- stricted gene flow also showed higher differentiation among populations: for example, 16 to 27% for I! ra- diata and 22% for I! muricata (Wu et al. 1999). On the other hand, experimental evidence indicates that seeds of some pines (e.g., I! palustris; Grace et al. 2004) have the potential to disperse greater distances than previously reported, which partly contributes to the low levels of genetic differentiation observed in these species.
In general, the typical distribution of the genetic diversity within and among populations of Pinus species is correlated with their mating system and life history (pines, for example, are wind-pollinated and tend to be predominately outcrossing) (Hamrick and Godt 1996; J. Duminil et d. personal communication)
and biogeographic history (the distributions of many species have been affected by Pleistocene glacial ad- vances), even if, in some cases, human activities also played a relevant role (e.g., I! pinaster in Portugal, Ribeiro et al. 2001).
Self-fertilization in pines generally occurs at a low level (Muona and Harju 1989), and a high outcross- ing at the mature seed stage is maintained. There is evidence of selection at the embryonic stage so that the number of inbreds is already low at the seedling stage (Karkkainen and Savolainen 1993). Selection af- ter the seedling stage is still severe. This has been shown by observing the survival of selfed seedlings in I! sylvestris (Muona et al. 1987) and in I! leucodermis (Morgante et al. 1993).
The mode of inheritance has a major effect on the partitioning of genetic diversity in pines, with studies based on maternally inherited markers (transmitted by seeds only) having significantly higher GST values than those based on paternally or biparentally inher- ited markers for pine (Burban and Petit 2003; Petit et al. 2005). In fact, the chloroplast and mitochondrial genomes are generally paternally and maternally in- herited in pines, respectively (Petit and Vendramin 2006). In pines, GST is nearly always larger at mi- tochondrial DNA markers than at chloroplast DNA markers. On the other hand, there is no significant dif- ference between GST at biparentally inherited mark- ers and at paternally inherited markers in pines (Petit et al. 2005). This is expected considering that both the cpDNA and half the nuclear genomic complement are dispersed by pollen and by seeds, i.e., they use the same vehicles to achieve gene flow.
Chloroplast and mitochondrial DNA markers al- low describing phylogeographic structure in pines. While chloroplast DNA generally exhibits the high- est diversity, phylogeographic inferences from these markers can be blurred by extensive pollen flow. Low population structure due to extensive pollen flow has been inferred in I? pinaster (Burban and Petit 2003), I! sylvestris (Robledo-Arnuncio et al. 2005), I! canariensis (Gomez et al. 2003), and F! albicaulis (Richardson et al. 2002). In contrast, the mitochon- drial markers, despite their generally lower level of diversity in pines (but this holds for all conifers; So- ranzo et d. 2000; Gugerli et al. 2001), generally pro- vide a clear picture of nonoverlapping areas colonized from different refugia (e.g., in I! pinaster; Burban and Petit 2003).
Neutral markers also have allowed investigating spatial genetic structure (SGS) in natural pine popu-

Chapter 2 Pines 37
lations. A generally weak within-population structure has been described. P. pinaster showed a fine-scale structure at the seedling stage with a patch size of ca. 10 m that seems to be produced by restricted seed flow (Gonzilez-Martinez et al. 2002). Pines with a heavy seed (differences in seed dispersion capability play an important role), such as P. pinaster, are expected to have a short dispersal distance, thus producing a fine-scale structure. However, fine-scale structure often does not persist as stands mature. For exam- ple, within-population genetic structure in Mediter- ranean pines may be affected by postdispersal events (e.g., mortality due to the severity of the Mediter- ranean climate and animal-mediated secondary dis- persal during the summer period) that may mod- ify the original spatial structure (GonzQez-Martinez et al. 2002). Logging can also play a role in decreasing spatial structuring, as observed in I! strobus (Mar- quardt and Epperson 2004), suggesting that man- agement practices can alter natural spatial patterns, too.
It should be stressed that the presence of fine-scale structure is uncommon in Pinus species. Epperson and Allard (1989), studying the spatial pattern of al- lozyme alleles within P. contorta ssp. Iatifolia stands, found a lack of structure in the distributions of most genotypes. Neutral markers by definition do not re- flect selective processes and therefore are not used as an indicator of the population adaptive potential to a changing environment (Morin et al. 2004). Recent and well-established markers to detect functional ge- netic variation are single nucleotide polymorphisms (SNPs), which are particularly useful for finding genes under selection and studying the dynamics of these genes in natural populations.
The availability of high-density markers, such as SNPs, opens the possibility of studying, by associa- tion genetics, the molecular basis of complex quanti- tative traits in natural populations, taking advantage of the fact that genetic markers in close proximity to causal polymorphisms may be in linkage disequilib- rium (LD) to them. The magnitude and distribution of LD determine the choice of association mapping methodology. Extension and distribution of LD de- pend on many factors including population history (e.g., the presence of population bottlenecks or ad- mixture) and the frequency of recombination.
In order to avoid false associations, the optimiza- tion of LD mapping requires a detailed knowledge of
basic population genetic parameters such as the pat- tern of nucleotide diversity and LD for each particular species and candidate gene set.
First estimates indicate that nucleotide diversity varies considerably between plant species. Interest- ingly, the pines (e.g., I! sylvestris, Dvornyk et al. 2002; Garcia-Gil et al. 2003; P. taeda, Brown et al. 2004; Gonzilez-Martinez et al. 2006a; I! pinaster, Pot et al. 2005a) are not among the most variable species, con- tradicting expectations from the results obtained us- ing neutral markers and their life history character- istics. First evidences seem to show that broadleaved species (e.g., Populus, Ingvarsson 2005; Quercus, Ta- ble 2.7 in Pot et al. 2005a) display higher levels of nucleotide diversity than pines.
Markers in specific functional regions of the genome need to be statistically analyzed in order to test for the possibility that these regions might have experienced different selective pressures. In unstruc- tured populations, standard neutrality tests might be applied. When variation is structured in populations, a relatively easy approach is the comparison of genetic differentiation estimates, such as Wright's F-statistics, among markers tagging a putative gene under selection and neutral markers or expected distributions computed using coalescence theory (see reviews in van Tienderen et al. 2002; Luikart et al. 2003). If population divergence (FST) is higher for the gene-targeted marker with respect to divergence estimates obtained from random markers, this might indicate divergent selection and local adaptation for the tagged gene (van Tienderen et al. 2002). Pot et al. (2005a) found a high differentiation among populations at Ppl (glycine-rich protein homolog) gene in P. pinaster, higher than at the neutral level. This result is consistent with diversifying selection acting at this locus in this species. On the other hand, the absence of differentiation observed for the gene CeA3 (cellulose synthase), compared with the significant level observed at neutral markers may indicate balancing selection acting on this gene.
Recent studies on pines reveal a rapid decay in LD with physical distance. LD declines very rapidly within 200 to 2,000 bp in Pinus taeda (Brown et al. 2004; GonzQez-Martinez et al. 2006a), Pinus sylvestris (Dvornyk et al. 2002 Garcia-Gil et al. 2003). A rapid decay of LD in pines is consistent with what is ex- pected from outcrossing species with large effective population size.

38 C. Plomion et al.
2.2 1992). Conkle (1981) located more loci, but still not
C ~ n ~ t r ~ ~ t i ~ n of Genetic Maps enough to cover the pine genome. Proteins revealed by two-dimensional polyacrylamide gel electrophoresis
In genetics, mapping is defined as the process of (2D-PAGE; O'Farrell 1975) presented the advantage deducing schematic representations of DNA. Three of being multiplexed compared to isozymes. Impor- types of DNA maps can be constructed depending on tantly, proteins can be easily characterized by mass the landmarks on which they are based: spectrometry (e.g., Gion et al. 2005) and may be rec- - Physical maps, whose highest resolution would be ognizable by sequence similarity to others proteins
the complete nucleotide sequence of the genome published in sequence databases, therefore provid- - Genetic maps, which describe the relative positions ing functional markers expressed in the tissues ana-
of specific DNA markers along the chromosomes, lyzed. Two-dimensional protein markers were devel- determined on the basis of how often these loci are oped only in I? pinaster (reviewed in CQnovas et al.
inherited together 2004 and Plomion et al. 2004). Although proteins pro-
- Cytogenetic maps, a visual appearance of a chro- vided physiologically relevant markers to map the
mosome when stained and examined under a mi- expressed genome, this time-consuming technique
croscope failed to provide enough markers for genetic appli- cation, which requires full genome coverage, such as
To provide a first glimpse of the pine genome, high- linkage mapping and quantitative trait loci (QTL) de- resolution genetic maps have been established for sev- tection. eral pine species using different types of molecular markers and following different strategies that are re- viewed in the following sections. RFLPs
Restriction fragment length polymorphism (RFLP) markers were developed in the early 1990s for P. taeda
2.2.1 (Neale and Williams 1991). They offered a sufficient Development of Molecular Markers in Pines number of markers for high-density genome map-
ping in pine. However, this labor-intensive and time- The construction of a linkage map relies on the avail- consuming technique was only applied to E! taeda ability of enough molecular markers to detect link- (Devey et al. 1994) and I! radiata (Devey et al. 1996). age between them. Each type of marker technology has advantages and limitations. Many factors (e.g., polymorphism information content, level of polymor- RAPDs and AFLPs phism exhibited for the mapping progeny, mode of In the mid-1990s PCR-based multiplex DNA finger-
inheritance, genome size) can influence the devel- printing techniques provided very powerful
opment of a particular technique and the choice of generate dense linkage maps in a period
a marker system for a given purpose (e.g., genetic time. Random amplified ~ o l ~ m o r ~ h i c DNA (RAPD; mapping, quantitative trait loci analysis, survey of ge- Williams et al. 1990) and then amplified fragment netic diversity, forensic applications). The purpose of length P ~ ~ Y ~ ~ ~ P ~ ~ ~ ~ (AFLP; Vos et 1995) became this section is to briefly review the different types of the most popular marker in
molecular marker techniques that have been devel- Despite their biallelic nature and dominant mode
oped in pines and used for genetic mapping appli- of inheritance (which was actually not an issue
cations. We will not present the details of each tech- for with megagametO~h~te, see nique. Both the review by Cervera et al. (2000a) and Sect. 2.2.2-), these markers tremendously boosted up
the references cited in Table will the reader genetic analysis in most forest tree species including
with the necessary information for understanding the pines (reviewed in Cervera et al. 2000b).
scientific basis of each technique.
Nuclear Microsatellites lsozymes and Proteins In contrast to other plant species, few polymorphic The first markers developed for pine were isozymes. single-copy nuclear microsatellite markers or sim- Linkage studies were carried out on more than 10 ple sequence repeats (SSRs) have been reported in species for about 15 loci (reviewed by Tulsieram et al. pines (reviewed in Chagn6 et al. 2004). The genome

Table 2. Characteristics and applications of molecular markers
Feature Protein markers DNA markers Hybridization-based PCR-based
Isozyme 2D-PAGE RFLP RAPD AFLP SSR SNP
Tissue quantity (g) 0.5-2 1 na na na na na DNA quantity (mg) na na 10 0.02 0.25-0.5 0.02 0.005-0.02 DNA quality na na high Medium Medium Medium Medium Allelism and mode Multiallelic biallelic, Biallelic Biallelic Biallelic Multiallelic Biallelic of inheritance codominant codominant, codominant dominant dominant codominant codominant
or dominant Number loci analysed 1-5 several tens 1-6 2-30 20-100 1-10 I-several hundred per assay (multiplexing) (multiplexing) Polymorphism Low Low Medium Medium Medium High Mediuma Development cost Low Low High Low Medium High High Cost per analysis Low Medium High Low Medium Low Low Amenable to automation Low Low Low Medium Medium High High
Technical demand Low High High Low Medium Low Medium Reproducibility ~ i ~ h ~ ~ e d i u m ~ High Low-highc High High High Review (Miiller-Starck (Plomion (Brettschneider (Rafalski 1998) (Cervera (Echt and (Syvanen 2001)
1998) et al. 2004) 1998) et al. 2000b) Burns 1999)
Applications Certification + +++ ++ Diversity + + ++ + + +++ +++ Phylogeny ++ + ++ ++ ++ ++ +++ Mapping ++ ++d ++d +++ +++ Comparative mapping + + ++ +++ +++ QTL analysis + + ++ + + +++ +++ Association studies + + + ++e +++
a Sequence dependent (exon vs UTR and intron) Under the same environmental conditions, type of tissue, and age Between laboratories vs single laborytory To construct dense maps Used as control loci
9 5 +i
N
w f' d
W w

40 C. Plomion et al.
structure of these species, characterized by a large physical size, with a large amount of repeated se- quence (Sect. 2.1.2), has been the main obstacle to the development of useful markers using classical SSR-enriched library approaches (e.g., Auckland et al. 2002; Guevara et al. 2005a; C.S. Echt and C.D. Nelson, unpublished results). In addition, the ancient diver- gence time between coniferous species (Price et al. 1998) and the complexity of their genomes means that transferability of single-copy SSRs among genera and even within Pinus is generally poor, resulting in a large proportion of amplification failure, nonspe- cific amplification, multibanding patterns, or lack of polymorphism (Echt and Nelson 1997; Mariette et al. 2001). In an attempt to circumvent these genome- related problems, Elsik and Williams (2001) removed most of the repetitive portion of the genome us- ing a DNA reassociation kinetics-based method, and Zhou et al. (2002) targeted the low-copy portion of the genome using an undermethylated region enrichment method. Both approaches yielded remarkable enrich- ment for useful SSR markers in I! taeda. SSRs made from low-copy, undermethylated, and total genomic DNA yielded mappable markers (Nelson et al. 2003; Zhou et al. 2003). l? taeda SSRs developed by Elsik and Williams (2001) and Zhou et al. (2002) transferred quite well between American hard pines (Shepherd et al. 2002a) but were shown to be less transferable in the phylogenetically divergent Mediterranean hard pines (ChagnC et al. 2004; GonzBlez-Martinez et al. 2004). Interestingly, perfect trinucleotide SSRs trans- ferred from American to Mediterranean pines better than other motifs (Kutil and Williams 2001). A num- ber of nuclear SSR markers have been developed for I? radiata, almost all of which are based on the more frequently polymorphic dinucleotide repeat motifs (Smith and Devey 1994; Fisher et al. 1996, 1998; De- vey et al. 2003), and used in a number of applications. Polymorphic chloroplast microsatellite loci have also been identified and applied (Cato and Richardson 1996; Kent and Richardson 1997). More recent SSR discovery efforts have been undertaken in both New Zealand and Australia and have been most commonly applied to fingerprinting (Kent and Richardson 1997; Bell et al. 2004) and QTL mapping applications (Devey et al. 2004a).
EST Polymorphisms With the availability of sequence data obtained by ran- dom sequencing of pine cDNAs (Sect. 2.5.2), there is now a clear trend toward the development of gene-
based markers (ESTP: EST polymorphisms). There are basically two groups of technologies used to de- tect nucleotide polymorphisms (SNPs and INDELs), either based on the knowledge of nucleotide vari- ants or not. Up to now, techniques based on the de- tection of differences in the DNA stability (denat- urating gradient gel electrophoresis, DGGE; Myers et al. 1987), conformation (single-strand conforma- tion polymorphisms, SSCPs; Orita el al. 1989) under specific polyacrylamide gel conditions, or heterodu- plex cleavage (TILLING, targeting induced local le- sions in genomes; Colbert et al. 2001) have been successfully applied in pines (Plomion et al. 1999; Temesgen et al. 2001; ChagnC et al. 2003; Ritland et al. 2006). With the decrease of sequencing costs and the availability of pine cDNA sequences, more targeted and precise approaches are now possible (Pot et al. 2005b). The bioinformatics assembly of ESTs into large contigs (i.e., unigenes) has also made it pos- sible to identify putative SNPs. Le Dantec et al. (2004) identified a set of 1,400 candidate SNPs in I? pinaster contigs containing between 4 and 20 sequence reads. This represents a great resource of molecular mark- ers for this species that can be used to map candi- date genes, study LD, and develop comparative or- thologous sequence markers for comparative genome mapping. In addition to SNPs and INDELs, a large set of microsatellite markers have been developed from E! taeda and l? pinaster expressed sequence tags (ESTs) (Echt and Burns 1999; ChagnC et al. 2004; Echt et al. 2006). These markers present the advantage of bei ng highly polymorphic and located in coding re- gions.
2.2.2 Haploid- and Diploid-Based Mapping Strategies
The construction of a genetic map requires two components: first, a segregating population (map- ping pedigree) derived from a cross between parental trees that are heterozygous for many loci and, sec- ond, a set of molecular markers segregating in the progeny according to Mendelian ratios. Linkage map construction is based on the statistical analysis of polymorphic markers in the mapping population, considering that the distance between two loci is related to the probability of observing a recombi- nation event between them. There is a number of mapping software to facilitate automated analysis (http:/llinkage.rockefeller.edu/softllist.html).

Chapter 2 Pines 41
Haploid- or Half-Sib-Based Mapping Strategy In conifers, the haploid megagametophyte constitutes an ideal plant material for genetic mapping. This nu- tritive tissue surrounding the embryo is derived from the same megaspore that gives rise to the maternal ga- mete. Therefore, it represents a single meiotic event in the parent tree that is genetically equivalent to a maternal gamete. The dominant nature and bial- lelic mode of inheritance of RAPD and AFLP is not an issue for genetic mapping with haploid megaga- metophytes. However, quantitative traits can only be measured on half-sib seedlings, limiting the detection of QTLs at the first stages of tree development. Thus, this approach is not applicable to the analysis of QTLs for economically important traits in well-established plantations, unless the megagametophytes were col- lected and saved, which has generally not been the case.
Diploid- or Full-Sib-Based Mapping Strategy Different strategies have been followed to construct genetic linkage maps of Pinus: the "pseudotestcross strategy:' the "Fz inbred model:' and the "three- generation outbred model.'' The pseudotestcross strategy is mainly based on selection of single-copy polymorphic markers heterozygous in one parent and homozygous null in the other parent and therefore segregating 1:l in their F1 progeny as in a testcross. Grattapaglia and Sederoff (1994) introduced the term two-way pseudotestcross to define this mapping strategy, where two independent genetic linkage maps are constructed by analyzing the cosegregation of markers in each progenitor. The efficiency of this strategy, as well as for the haploid mapping strategy, depends on finding individual trees that are heterozygous for many loci, which is quite easy using arbitrarily primed PCR assays (RAPD and AFLP) in highly heterozygous outcrossed tree species such as pines. The Fa inbred model is based on a three-generation pedigree for which the grandparents are treated as inbred lines. In the F2 generation, three genotypes occur at any locus - AA, AB, and BB - segregating 1:2:1. The three-generation outbred model (Sewell et al. 1999) is an extension of the pseudotestcross strategy. Within a single outbred pedigree, any given codominant marker will segregate in one of three different ways. When one parent is heterozygous and the other is homozygous, segregation will be 1:l (i.e., testcross mating type). When both parents are heterozygous, segregation will be either 1:2:1, ifboth parents have the same genotype
(i.e., intercross mating type), or 1:1:1:1, if they have different genotypes (i.e., fully informative mating type). These segregation data are then subdivided into two independent data sets that separately contain the meiotic segregation data from each parent, and independent maps are constructed for each parent. A sex-average map is then constructed using an out- bred mapping program, which uses fully informative and intercross markers to serve as common anchor points between each parental data set. Compared to "megagametophyte progeny," full-sibs can be grafted and/or propagated by cuttings, thereby constituting a perpetual population, analogous to recombinant inbred lines in crop plants. The use of such clonally propagated progeny obviously increases the preci- sion of quantitative measurements and therefore enhances the QTL detection power (Bradshaw and Foster 1992).
2.2.3 Genetic Mapping Initiatives in Pines
In this section and Table 3 we summarize what has been done in terms of linkage map construction in the genus Pinus with emphasis made on the most studied species. In addition, some maps have been published together with QTL studies and will be found in the references cited in Sect. 2.3.
Maritime Pine Linkage maps of the Maritime pine (Pinus pinaster Ait.) genome were first constructed by analyzing the cosegregation of proteins extracted from megagame- tophytes collected during the germination of the em- bryo. Bahrman and Damerval(1989) were the first to report a linkage analysis for 119 protein loci using 56 megagametophytes of a single tree. Extending this ap- proach, Gerber et al. (1993) reported a 65-locus link- age map covering one fourth of the pine genome, using 18 maritime pine trees with an average of 12 megaga- metophytes per tree. A more conventional pedigree (inbred F2) was used to map 61 proteins using hap- loid (Plomion et al. 1995a) and diploid (Plomion et al. 1997; Costa et al. 2000) tissues of the same seedlings. In the latter case, proteinloci were found on each chro- mosome (Thiellement et al. 2001). As stated above, the advance of PCR-based markers has allowed the construction of saturated linkage maps, in a short period of time, with no prior knowledge of DNA se- quence (Plomion et al. 1995a, b; Costa et al. 2000).

Table 3. Summary of genetic linkage maps of Pinus species
Species Number of LGs Total number RAPD, SSR EST-based Others Total genetic Genome References pedigree (+pairs, triplets) of linked AFLP distance (cM) saturation
marker loci
Pinus pinaster Haploid (1 tree) Not estimated 119 - - - 119 (2D proteins) Not estimated Not estimated Bahrman and
Damerval1989 Haploid (8 trees) Not estimated 65 - - - 65 (2D proteins) 530 25% Gerber et aL 1993 Haploid (H12 self) 13(+5) 263 25 1 - - - 1223 90% Plomion et aL 1995b Haploid 1236 90% (H12 open pollinated) Haploid (H12 self) 12 463 436 - - 27 (2D proteins) 1860 100% Plomion et al. 1995a Haploid (H12self) 11 94 94 - - - 1169 Not estimated Plomion and
O'Malley 1996 Diploid (H 12 self) 11 94 94 - - - 1354 Not estimated Haploid (HI2 self) 13 398 235+127 - - 36 (2D protein) 1873 93.4% Costa et al. 2000 F1- AFOCEL 12 759 738 14 7 - 1994 Not estimated Ritter et al. 2002 9.103.3 x 10.159.3 12 620 620 - - - 1441 Not estimated ChagnC et al. 2002 (consensus) 9.103.3 x 10.159.3 12 326 276 - 50 - 1638 Not estimated Chagne et al. 2003 (consensus)
Pinw taeda Various pedigrees Not estimated - - - - 20 isozymes Not estimated Not estimated Conkle et al. 1981 Base pedigree 20 75 - - 90 6 Not estimated Not estimated Devey et al. 1994 Haploid (Tree 10-5) 16 458 458 - - - 1727 97% Wilcox 1995 Base and QTL pedigrees 18 357 67 - 257 12 1300 76.4% Sewell et al. 1998 Tree 7-56 12 508 508 - - - 1741 100% Remington et al. 1999 Base and QTL pedigrees 20 265 253 12 - - 1281 75.4% Devey et al. 1999 Base pedigree 15 5 1 - 51 - - 795 46.7% Zhou et al. 2003
Pinus sylvestris 49-2 14 26 1 261 - - - 2638 Yazdani et al. 2003 Fl of P315 x Ell01 12(+4) 179 179 - - - 1000 50% Hurme et al. 2000 F1 of AC3065 x Y3038 9: 12 188 188 - - - 1645 98% Yin et al. 2003
a": 12 245 245 - - - 1681 F1 of E635 x 12(+3) 260 194 4 6 1 - 1314 66-85% Komulainen et al. 2003 EllOl
P N
CI 5 2 5 a 2 1

Table 3. (continued)
Species Number of LGs Total number RAPD, SSR EST-based Others Total genetic Genome References pedigree (+pairs, triplets) of linked AFLP distance (cM) saturation
marker loci
Pinus radiata 3-generation 22 208 41 2 165 - 1382 Not estimated Devey et al. 1996 Haploid (fun-sib seed) 14 267 267 - - 1665 93% Emebiri et al. 1998
S1 19 172 168 4 - - 1117 56% Kuang et al. 1999b Pseudotestcross 20 235 224 11 - - 1414 85% Wilcox et al. 2001a (Parent 850.055) Pseudotestcross 21 194 185 9 - - 1144 77% Wilcox et al. 2001a
(Parent 850.096) Two full-sib families 12 311 - 213 98 - 1352 Not estimated Wilcox et al. 2004
Pinus elliottii Tree 8-7 13(+9pairs) 73 73 - - - 782 64-75% Nelson et al. 1993 18-62 x 8-7 17(+12pairs) 129 129 - - - 1146 Not estimated Kubisiak et al. 2000 D4PC40 x D4PC13 15 154 63 - 41 (RFLPs) 1115 Not estimated Brown et al. 2001
45 5 isozyme
Pinuspalustris Tree 3-356 16(+6pairs) 133 133 - - - 1635 85% Nelson et al. 1994
F! elliotti and F! palustris hybrids Fl of - 3-356 x H-28 0: 18(+3 pairs) 122 122 1368 81% Kubisiak et al. 1995
a": 13(+6 pairs) 91 9 1 953 62%
BCl of 488 x 18-27 p: 17 133 133 1338 91% Weng et al. 2002
a":19 83 83 995 81%
E elliotti and P. caribea var. hondurensis hybrids F1 of 2PEE1-102 x q: 24 125 117 8 - - 1548 82Y0 Shepherd et al. 2003 1PCH1-63 8: 25 155 145 10 - - 1823 88%
9 5 r(
hl
5! 3 8
&

44 C. Plomion et at.
The two-way pseudotrestcross mapping strategy was SSR markers tested, only 9 were mapped in both used to construct genetic linkage maps of maritime species; however, these codominant markers along pine using AFLP markers (Chap6 et al. 2002; Ritter with several codominant RFLP markers were useful et al. 2002) as well as AFLP, SAMPL, SSR, and gene- in defining homeologous LGs between the species. based markers (N. de Maria and M.T. Cervera, un- Temesgen et al. (2001) added 56 ESTP markers to published results). Comparing the total map distance the consensus map developed earlier by Sewell. The of genetic maps constructed based on haploid and DGGE method proved quite useful for assaying ESTP diploid progeny from the same Maritime pine tree, markers and suggested a general method for plac- a higher rate (28%) of recombination in the pollen ing genes on the maps since the markers were de- parent was found (Plomion and O'Malley 1996). Such veloped from expressed sequences. Additional ESTP a significant difference between male and female re- markers were developed and used to identify an- combination was also reported in other pine species chored reference loci based on their sequence sim- (Moran et al. 1983; Groover et al. 1995; Sewell et al. ilarity between species and their nature to map to 1999). conserved locations in more than one species (Brown
et al. 2001). Zhou et al. (2003) mapped 51 SSR mark- Loblolly Pine ers, covering 795 cM on 15 LGs, in a three-generation Loblolly pine (Pinus taeda L.) has been used exten- pedigree with 118 progeny. The markers, developed sively for genetic mapping including the development from loblolly pine libraries of three types, were not of an early map based on 20 isozyme loci that in- found to be clustered within the genome, further high- cluded five linkage groups (LGs) (Conkle 1981). More lighting the value of SSR markers in genome map- recently, maps have been constructed in several pedi- ping. greed populations using several types of DNA-based markers. Devey et al. (1994) published the first map Radiata Pine utilizing 90 RFLP and six isozyme loci. The map was Over the past 15 years, a range of DNA-marker- based on a three-generation pedigree with 95 progeny based linkage maps have been constructed for this and revealed 20 LGs. Genomic mapping was success- species. Wilcox (1997) brieflyreviewedmapping stud- fully used by Wilcoxet al. (1996) to define a single gene ies undertaken up till that date. Although results were locus for resistance to an isolate ofthe fungus (Cronar- summarized from seven studies involving construc- tium quercuum f. sp. fusiforme) that causes fusiform tion of eight linkage maps, only one map had actu- rust disease. O'Malleyet al. (1996) describeda RAPD- ally been published by that date, consisting of 208 based map of clone 7-56, a top E! taeda parent. This (mostly) RFLP, SSR, and RAPD markers (Devey et al. map had been constructed several years prior to pub- 1996, 1999). This map consisted of 22 LGs and cov- lication. The first consensus map was produced by ered 1,382cM. All of the other maps reviewed by Sewell et al. (1999) combining data from two three- Wilcox (1997) were constructed using RAPD markers, generation pedigrees, including the pedigree used either using haploid megagametophytes, or diploid by Devey. RFLP, RAPD, and isozyme markers were tissues using a pseudotestcross approach. The num- placed on the integrated or consensus map contain- ber of markers used in these studies ranged from ing 357 loci and covering about 1,300 cM of genetic 124 to 290, with only one of the maps having LGs distance on 18LGs. The first complete genome map equal to the haploid number of chromosomes and was developed by Remington et al. (1999). They uti- the remainder ranging between 14 and 22 LGs. To- lized haploid megagametophyte samples from an in- tal map length estimates were undertaken in three dividual mother tree to develop a map based on 508 studies ranging between 1,978 and 3,000 cM. Subse- AFLP markers. This map revealed 12 LGs equaling the quent to these earlier studies a number of maps were basic number of chromosomes and about 1,700 cM of published, some of which were included in Wilcox's genetic distance. Their analysis suggested that this 1997 review. Using 222 RAPD markers to genotype distance saturated the genome, in slight contrast to 93 megametophytes, Emebiri et al. (1998) constructed an earlier estimate of 2,000 cM based on data from a linkage map that covered 14 LGs and spanned a total three species of pines (Echt and Nelson 1997). SSR distance of 1,665 cM. Kuang et al. (1999a) described markers developed in radiata pine (I? radiata) were a map constructed using megagametophytes of 198 used in a comparative mapping project between radi- S1 seeds that had been genotyped with 168 RAPD ata and loblolly pine (Devey et al. 1999). Of the 20 and four microsatellite markers. The resulting map
Chapter 2 Pines 45
consisted of 19 LGs, covering 1,116.7 cM, which was estimated to cover 56% of the genome. Because this was constructed using an S1 family, elevated levels of segregation distortion were observed. Wilcox et al. (2001a) published framework maps of both parents of 93 full-sib progenies based on a total of 429 AFLP, RAPD, and SSR markers. These parent-specific maps were constructed using apseudotestcross strategy and covered 1,414 and 1,144cM in 20 and 21 LGs, re- spectively. These maps have subsequently been added to, using over 300 SSR and EST markers, and have been reduced to 12 LGs (Wilcox et al. 2004). De- vey et al. (1999) published a comparative map of radiata and loblolly pine based on RFLP, SSR, and RAPD loci and showed that the highly syntenic na- ture of Pinus applies to these two economically im- portant species. Overall estimates of map length ap- pear to be similar to that of loblolly pine (Wilcox et al. 2001a).
Scots Pine
Early mapping work in I! sylvestris has been based on isozyme loci (Rudin and Ekberg 1978; Szmidt and Muona 1989). These maps contained no more than 20 loci. The number of RFLP markers developed for Scots pine had been very low (Karhu et al. 1996). Thus, the next mapping efforts were based on RAPD makers segregating in haploid megagametophytes. Yazdani et al. (1995) mapped 261 markers in 14 LGs in a tree that is part of the breeding program. Hurme et al. (2000) made a low-coverage RAPD map for an F1 tree that was a result of north x south cross, such that alleles for important quantitative traits were assumed to segregate in the same cross. The map with the best genome coverage, so far, was constructed by Yin et al. (2003). The AFLP mapping in a full-sib family resulted in two maps, for each of the breeding program par- ents. The map lengths for the two parents, based on about 200 framework markers, were about 1,645 and 1,681 cM for the male and female trees, respectively, with very high estimated genome coverage. Most re- cently, Komulainen et al. (2003) mapped about 60 gene based markers in the F1 progeny of a north x south cross. This map also contained markers that had been previously developed for I! pinaster (Plomion et al. 1999), and others that had been used for I? taeda. Most importantly, the homologous markers allowed defining the correspondence between 12 LGs in the two species. More markers were later added to this map (Pyhajarvi et al. unpublished).
Longleaf Pine, Slash Pine, Caribbean Pine, and their Hybrids
Longleaf pine (I! palustris Mill.), slash pine (I! elliottii Engelm. var. elliottii), and Caribbean pine (I! caribaea Morelet.) are hard pines of subsection Australes found along the coastal plains of the southeastern United States, eastern Central America, and the Caribbean islands. Although loblolly pine (Pinus taeda L.) has been planted on millions of acres that were once typ- ically occupied by these species, in many situations these pines are proving to be the preferred timber species due to their adaptation to the coastal-plain soils and the associated natural disturbances such as frequent fires and hurricanes (Wahlenberg 1946; Shoulders 1984). A number of genetic maps, con- sisting primarily of RAPD markers, have been con- structed for slash pine, longleaf pine, and their hy- brids (Nelson et al. 1993, 1994; Kubisiak et al. 1995), with the main goal being to use these marker maps as a tool for dissecting the inheritance of specific traits of interest and for use in marker-assisted-selection (MAS) strategies within tree-improvement programs (Kubisiak et al. 1997, 2000; Weng et al. 2002). Some markers significantly linked to traits of interest have been converted to more easily scorable markers, such as sequence characterized amplified region (SCAR), to aid selection efforts (Weng et al. 1998). Brown et al. (2001) assembled a genetic linkage map for slash pine using a variety of markers [RAPDs, ex- pressed sequence tag polymorphisms (ESTPs), re- striction fragment length polymorphisms (RFLPs), and isozymes]. An additional genetic map for slash pine and one for Caribbean pine, using amplified fragment length polymorphisms (AFLPs) and mi- crosatellite or SSR markers, were created using an F1 hybrid population (Shepherd et al. 2003). The num- ber of markers mapped and the genetic distances covered by some of the published maps for these species and their hybrids are summarized in Ta- ble 3. Unlike loblolly pine, significantly less effort has been focused on comparative mapping across these species. However, studies have shown synteny across slash and longleaf pines using RAPDs (Ku- bisiak et al. 1995,1996), slash and loblolly pines using ESTPs as anchored reference loci (Brown et al. 2001), and slash and Caribbean pine using AFLPs (Shepherd et al. 2003). In addition, SSR markers look promising for further comparative analyses across these species (Shepherd et al. 2002a; C.D. Nelson and C.S. Echt, pers. comm.).

46 C. Plomion et al.
Other Pines that their genome might be relatively well conserved Genetic linkage maps have also been constructed in among species. Approaches for evaluating genome other pine species including I? brutia (Kaya and Neale similarity have used cytogenetics and linkage map 1995), E! contorta (Li and Yeh 2001), E! edulis (Travis comparison. Although cytogenetics can provide et al. 1998), E! massoniana (Yin et al. 1997), I! strobus a direct idea about the conservation between (Echt and Nelson 1997), I? thunbergii (Kondo et al. different genomes (Hizume et al. 2002), most of 2000; Hayashi et al. 2001). These were based mainly the interspecies comparisons have been carried on RAPDs and AFLPs. out using genetic maps. The same tools have also
been developed for other applications such as gene mapping and QTL detection. Comparative genome
2.2.4 mapping aims to measure the conservation of gene Genetic vs. Physical Size and Practical Implication content (synteny) and order (colinearity) among
chromosomes and uses orthologous loci as anchor These mapping studies have led to the conclusion points between maps. Comparative genome mapping that the total genetic distance of the pine genome has been successfully used in grasses to explain the is around 2,000 cM (Gerber and Rodolphe 1994), i.e., genome evolution of cereals (Moore et al. 1995), for about 167 cM per chromosome. Given a physical size choosing a model species for whole-genome sequenc- of 25 pglC, one unit of genetic distance (1 cM) would ing (rice, Ware et al. 2002; http://www.cns.fr/externe/ therefore correspond to 13 x l~~nucleotides (13 Mb), English/Projets/Projet-CC/organisme_CC.html), while it represents 0.23 Mb in the model plant species and for transfering genetic information between Arabidopsis! Such high geneticlphysical size ratio ob- related species, such as the position of candidate viously hampers the characterization of QTLs by fine- genes (Schmidt 2002). The lack of genome sequence mapping and positional cloning approaches. Hence, for a Pinaceae species has made comparative map- as will be discussed in Sects. 2.3 and 2.4, the only ping even more important as the primary tool for way for understanding the molecular basis underly- integrating genetic information across species. ing quantitative trait variation is the candidate-gene To define the syntenic relationships among approach in which genes are identified a priori as phylogenetically related pine species, orthologous likely candidates for the trait of interest and their markers (i.e., homologous DNA sequences whose polymorphisms tested against quantitative trait vari- divergence follows a speciation event and whose ation. Interestingly, despite the 56-fold difference be- sequence and genome location is conserved between tween Pinus and Arabidopsis chromosomes, the num- different species) are used. A first example was ber of crossings over per chromosome was found to provided by Devey et al. (1999), who aligned the be highly conserved between both genera: 2 to 4 chi- genetic maps of E! taeda and I! radiata using RFLPs asmata per bivalent (1 chiasma = 50 cM; Ott 1991). and SSRs. This first effort was further consolidated A comparison of genome lengths among evolution- in the frame of the Conifer Comparative Genomics ary divergent pines found I! pinaster, I! palustrus, and Project (http:/ldendrome.ucdavis.edulccgp). LOW- I! strobus to have essentially identical rates of recombi- copy cDNA PCR-based markers were developed nation (Echt and Nelson 1997). Thus, genetic mapping in loblolly pine (Harry et al. 1998; Brown et al. studies carried out in pines have clearly demonstrated 2001; Temesgen et al. 2001; Krutovsky et al. 2004). that the mechanism of crossing over is conserved on These markers showed a relatively good PCR cross- a chromosomal basis, and independent of physical amplification rate between pine species because they map size and the fraction of coding DNA. target conserved coding regions, showing a relatively
high polymorphism rate and a low number of paralogous amplification when PCR primers were
2.2.5 chosen carefully. They were used to study the synteny Comparative Mapping: Toward the Construction between species belonging to the Family Pinaceae, of a Unified Pine Genetic Map which included pines, along with other important
conifers such as spruces and firs. These markers All pine species have the same number of chro- made it possible to assign LG homologies for 10 out mosomes (i.e., n = 12) as well as a similar genome of 12 chromosomes between E! elliottii and I! taeda size. Moreover, they are all diploid, which suggests (Brown et al. 2001; http://dendrome.ucdavis.edu/

Cha~ter 2 Pines 47
ccgp/compmaps.html), 10 out of 12 between F! pinaster and P. taeda (Chagn6 et al. 2003), and 9 out of 12 between F! sylvestris and E! taeda (Komu- lainen et al. 2003). About 30 or 40 ESTP markers were proved to be useful in demonstrating large areas of synteny between each species pair. While this comparison was only of low density, these pioneering studies suggested that pine genomes did not show any apparent chromosomal rear- rangement. They also provided an indication that gene content and gene order is conserved, as is illustrated for LG 6 in Fig. 2. Current efforts are being expended to add more markers common to F! radiata and I! taeda (P. Wilcox, personal communication). From an application point of view, these comparisons provide a set of markers that can be used for constructing framework genetic maps
Fig. 2. Synteny in the Pinus genus (linkage group 6 ) :
alignment of genetic maps of five pine species
of pine species for which maps have not yet been developed.
As more conifer ESTs become available in public databases (329,531 in Pinus teada, 132,531 in Picea glauca, 27,283 in Pinus pinaster, 28,170 in Picea engel- mannii x Picea sitchensis, 80,789 in Picea sitchensis, 6,808 in Pseudotsuga menziesii, 7,639 in Cryptome- ria japonica: EMBL 19 March 2006), a computational approach could be used for in silico development of putative orthologous EST-basedmarkers (Fulton et al. 2002), as was recently illustratedbetween loblollypine and Douglas fir by Krutovsky et al. (2004). Such re- sources should help to define the precise syntenic re- lationship across conifers and establish a framework for comparative genomics in Pinaceae.
The alignment of genetic maps of I! pinaster and F! taeda made it possible to discover putative con-
48 C. Plomion et al.
served QTLs between the two species (Chagnt! et al. periments of Sax (1923) and Thoday (1961), and it is 2003). Those are QTLs for wood density and wood now well known that a small number of segregating chemical composition traits located on LGs 3 and 8, loci are involved in the genetic control of quantitative respectively. The same observation has been made trait variation. These genes act together to provide in P. radiata (Telfer et al. 2006). Preliminary studies a quantitative difference and are referred to as quan- indicate wood-density QTLs are colocating more fre- titative trait loci or QTLs (Geldermann 1975). The quently than would be expected by chance between basic theory of using genetic markers to detect QTLs these two species (Telfer et al. 2006), and analyses was introduced by Sax (1923). Initially, the applica- are being extended to other wood property traits. tion of this theory was limited by the lack of avail- Moreover, candidate genes coding for functions that able segregating markers; however, rapid advances in are linked to wood formation have been mapped DNA marker-based technologies since the 1980s have in the same regions, which indicates that they may now made it possible to genoptype hundreds of ge- be involved in the molecular control of those traits. netic markers to construct dense genetic linkage maps These first examples of the application of compara- (Sect. 2.2.3) and further to carry out a comprehensive tive genome mapping in pines show that comparative search of QTLs along the genome. Sewell and Neale genome mapping can be used to verify QTLs across (2000) and Guevara et al. (2005b) recently reviewed species and that the same genes may be involved in the science of QTL mapping in pine trees. the genetic control of the same traits. In the first part of this section, devoted to the ge-
netic dissection of agronomically important traits, we will present an update of the studies that were car-
2.3 ried out in pines. The specificity of pines regarding the different types of populations and strategies used
Genetic Architecture to detect QTLs will be presented. Then, the main re- of Complex Traits sults of these studies will be discussed. In the second
part, a perspective on the identification of diagnostic Pine tree improvement is hampered by different in- markers for pine-tree breeding will be discussed. herent characteristics: (1) the time needed to reach sexual maturity, (2) the time lag required to evaluate field performance (e.g., growth; Kremer 1992), and 2.3.1 (3) in some cases, the cost ofphenotyping (e.g., wood- Strategy and Methods Used for QTL Detection quality-related traits). This makes breeding of these in Single Family Pedigrees species a slow process compared to that of most com- mon crop plants. In addition, selection of these traits Pines are characterized by late maturity (longevity), remains imprecise because environmental effects are an outbred mating system, and a high genetic variabil- rather high for most traits of interest. Heritabilities ity (Hamrick and Godt 1990). Their outbred mating for height, diameter, volume, branching traits, and system and high genetic load have hampered the de- bole taper, i.e., straightness, are in the range of 0.1 to velopment of inbred lines, the material of choice from 0.3, and only slightly higher (0.3 to 0.6) for wood and a QTL mapping perspective. In this context, specific end-use properties (reviewed by Cornelius 1994). In populations and statistical methods were developed this context, any tool directed toward selection pro- specially for forest trees, and pines in particular. Until cesses that would improve the evaluation of genetic recently, most of the QTL mapping efforts were fo- value and also reduce the generation time would be of cused on single family pedigrees. However, given the considerable value. high rate of polymorphism encountered in pines and
Most traits important to forestry, such as biomass the relative lack ofstability of QTLs in different genetic production, wood quality, and biotic and abiotic stress backgrounds, methods aimed at validating markers resistance are complex quantitative traits. In the the- linked to the traits of interest in more complex pedi- ory of quantitative genetics it is assumed that the grees or even in unrelated genotypes are emerging. heredity of a quantitative trait can be ascribed to the In this section, we will review the type of population, additive effects of a large number of genes with small statistical methods, and main results that have been and similar actions, modulated by environment. This obtained using simple mapping pedigrees. The limita- assumption has been questioned since the early ex- tions of this approach will be underlined, and the use

Chapter2 Pines 49
of complex pedigree designs or unrelated populations to unravel the genetic architecture of complex traits will be presented. Finally, the relevance of integra- tive approaches combining classical QTL studies and transcriptome and proteome analysis, together with studies of molecular evolution, will be highlighted.
Single Family Designs
Two-Generation Full-Sib Design The advantage of naturally high levels of heterozygosity in outbred for- est trees can be utilized in a two-generation popula- tion structure, where it may be expected that trees chosen as potential parents will likely be heterozy- gous for some number of QTLs, which will then seg- regate in the F1 . Typically, "plus trees" are identified and are used as parents of a QTL mapping popu- lation. Various studies have taken advantage of this two-generation design to analyze each parent under a pseudotestcross model (Kumar et al. 2000; Lerceteau et al. 2000; Ball 2001; Shepherd et al. 2002b; Weng et al. 2002; Markussen et al. 2003; Yazdani et al. 2003). This model is well suited for dominant markers. How- ever, the main limitation is that the phenotypic effects inherited from each parent are analyzed individually, even though the genetic contribution of each parent simultaneously contributes to the phenotypic vari- ation in the progeny population. Consequently, the genetic information in the four progeny classes of an outbred pedigree is collapsed into only two geno- typic classes, thereby reducing the robustness of the analysis. Of course, if codominant markers are used, a consensus map can be built precisely to detect allele effects from both progenitors simultaneously.
Three-Generation Full-Sib Design In the three- generation outbred population structure, two crosses are made among four unrelated grandparents, where each mating pair is selected among individuals dis- playing divergent phenotypic values for the trait (e.g., Groover et al. 1994). From each grandparental mat- ing, a single phenotypically intermediate individual is chosen as a parent. Presumably, these intermediate parents are heterozygous for both marker and QTL alleles and are potentially heterozygous for different allelic pairs that display a divergent phenotypic ef- fect. This three-generation full-sib structure is typ- ically designed for QTL analysis under an outbred model and has been used extensively (Table 4). Alter- natively, Plomion et al. (1996a, b) utilized the selfing ability of I! pinaster to design experiments that fit an
inbred F2 model. Although RAPD markers were used, genetic information from progeny and corresponding megagametophytes were utilized to overcome the lim- itations associated with dominant markers using an Fz model. It was also proposed to use trans-dominant- linked markers to overcome the problem of dominant markers on the sporophytic phase of F2 trees (Plomion et al. 1996~).
Two-Generation Half-Sib Design With this popula- tion structure, the effects of two maternal QTL alleles are averaged over a large pollen pool (Hurme et al. 2000). This type of structure allows one to test the stability of the effect of the maternal alleles in differ- ent genetic backgrounds. In addition to these classical mapping designs, particular populations (FIS) were especially developed to analyze inbreeding depression in I! taeda and I? radiata (Kuang et al. 1999a,b; Rem- ington and O'Malley 2000a,b; Williams et al. 2001).
Two-Generation Full-Sib and Half-Sib Design An extension of the pseudotestcross QTL mapping strat- egy, in which QTLs are defined in a narrow genetic background, Plomion and Durel (1996) show that a "general" value of a "specific' QTL detected in a full- sib family could be easily evaluated, provided that both parents of the full-sib were involved in maternal half-sib (open-polinated or polycross) families. Such two-generation pedigrees are widely available in most pine breeding programs that involve the simultaneous estimation of specific and general combining abilities of selected trees. However, this strategyhas never been tested experimentally.
Methods Used for QTL Mapping in Single Family Designs Regardless of the population structure and size (Beavis 1994), several factors must be considered for successful QTL detection. Statistical methodology significantly influences the accuracy of QTL position and effect estimation. Simple statistical methods such as analysis of variance (ANOVA) have opened the way to the development of more powerful QTL detection methods, integrating information available at multiple markers: interval mapping (IM), composite interval mapping (CIM), and multiple interval mapping (MIM).
The first method, called single marker analysis, proposed by Edwards et al. (1987), is the simplest one. ANOVA is performed with one marker at a time, on the genotypic classes defined by a single marker. This

Table 4. QTL and marker-trait association detected in pines: pedigree structure and methods
Species Objective Population ~ e ~ l i c a t i o n s ~ Clonal Genetic QTL analysis Software Reference (size)a replicates markers (analytical model)c
Pinus elliottii Detection FlOB (186) 1 No RAPD SG (54 : 27 genotypes SAS Kubisiak et al. 2000 from each tail), SM, MM
Pinus elliottii Detection FlOB (89) 2 sites (60,29) No AFLP, SSR SM, CIM QTLcartographer Shepherd et al. 2005 var elliottii x Pinus caribaea var kondurensis (Pinus palustris Mill x Detection, FlOB (258) 3 sites (82,83,93) No - SM, IM SAS, Weng et al. 2002 Pinus elliottii EngI) x stability (age) MAPMAKERlQTL Pinus elliottii Engl
Pinus sylvestris Detection FlOB 1 No AFLP IM Qgene Lerceteau et al. 2000 Detection, FZHS 2 No RAPD SG (1994 : 48 vs. 48, SAS, Multimapperl Hurme et al. 2000 Stability 1996 48 vs. 48), SM, OUTBRED (time replicate) Bayesian QTL analysis Detection FlOB 1 No R APD SM SAS Yazdani et al. 2003
Pinus pinaster Detection, F2S (120) 3 (age) No RAPD IM MAPMAKEWQTL Plomion et al. 1996a Stability (Age) Detection F2S 1 No RAPD, AFLP, CIM QTLcartographer Costa 1999
proteins Detection F20B (186) 1 No AFLP CIM MULTIQTL Brendel et al. 2002 Detection F20B (186) 1 No AFLP,EST CIM MULTIQTL Pot et a1.2005 Detection FlOB (80) 1 No AFLP, SSR, EST IM SAS Markussen et al. 2002 Detection, F20B (186) 1 No AFLP,EST CIM MULTIQTL Pot 2004 stability (age, season) Detection F2S (120) 1 No R APD IM MAPMAKEWQTL Plomion et al. 1996b
a FlOB: two-generation outbred design, F20B: three-generation outbred design, F2S: three-generation inbred design, F2HS: Two-generation half-sib design, CD: complex design (in this case more information is provided)
When the traits were measured on one site and at one given time, 1 is indicated, otherwise more details are provided SM: single-marker analysis, MM: multiple-marker analysis (without map information), IM: interval mapping, CIM: composite interval mapping, SG: selective genotyping, BSA: bulk
segregant analysis
ul 0
n $ g' z k

Table 4. (continued)
Species Objective Population ~ e ~ l i c a t i o n s ~ Clonal Genetic QTL analysis Software Reference (size)a replicates markers (analytical model)c
Pinus radiata Detection, FlOB (174) 1 No RAPD SM, BSA (9 vs 9) Emebiri et al. 1997
stability (age) Detection, FlOB (80-93) 3 times (age) No RAPD, AFLP, IM, MTM Kurnar et al. 2000 stability (age) SSR Detection, FlOB (93) 2 times (age) No RAPD, AFLP, Bayesian approach Splus Ball 2001 stability (age) SSR Detection CD 1 No SSR Kumar et al. 2004 Detection, validation, 3 unrelated FlOB 2 sites No RFLP and SSR SG (Juvenile wood GENSTAT Devey et a1.2004a stability (400 each) density : 50 vs 50;
(genetic background) Diameter at breast height : 100 vs loo), SM
Detection, Detection: 1 site for the No RFLP + SSR SM within family GENSTAT Devey et a1.2004b validation 6 related F20B (202) detection population + SM among families
Verification: 2 sites for the Yes 1 F20B (400) verification population
Pinus taeda Detection F20B (Detection 6 sites No RFLP SG, SM Home Groover et al. 1994 population : 172) (19 to 35 trees per sites) made
Detection F20B (Detection 6 sites No RFLP IM Home Knott et al. 1997 population : 172) (19 to 35 trees per sites) made
Detection, stability 2 F20B (Base : 95, 2 sites for BASE (48+47), No RFLP, RAPD, IM Home Kaya et al. 1999 (age, genetic Detection : 172) 6 sites for Detection Isozymes made background) (19 to 35 trees per sites) Detection, F20B (91) 5 times (age) No SSR IM Home Gwaze et al. 2003 stability (age), made development of statistical methods Detection, stability F20B (Detection 6 sites No RFLP IM Home Sewell et al. 2000 (age, season) population : 172) (19 to 35 trees per sites) made Detection, stability F20B (Detection 6 sites No RFLP IM Home Sewell et al. 2002 (age, season) population : 172) (19 to 35 trees per sites) made Detection, validation, 1 F20B D : 6 sites No RFLP + EST IM QTL Brown et al. 2003 stability detection (D) : 172, (19 to 35 trees per sites) express (genetic background) validation (V) : 457
0 r 2 W N
5! 3 2
VI -
:

52 C. Plomion et al.
method suffers from several limitations. First, it does not provide any information regarding the location of the QTLs in the genome, and furthermore the defini- tion of the QTL effect is largely inaccurate given the inability to separate small-effect QTLs with tight link- age from QTLs oflarge effect but more distant linkage.
In order to improve the efficiency of QTL mapping through the use of genetic map information, Lander and Botstein (1989) developed the IM method. This approach allows QTLs to be detected in the intervals defined by the markers. The IM has been widely used in pines (Groover 1994; Plomion et al. 1996a, b; Knott et al. 1997; Kaya et al. 1999; Costa and Plomion 1999; Costa et al. 2000; Sewell et al. 2000,2002; Brown et al. 2003). This method is, however, rather limited as QTL detection is made in a linear way, i.e., the same test is applied at each point of the interval without taking into account the results of successive tests.
More recently, statistical approaches have been de- veloped to increase the statistical power of QTL detec- tion and have received increasing attention in pines (Costa 1999; Brendel et al. 2002; Pot et al. 2005b). One ofthese approaches is CIM, developed by Zeng (1993a, b) and Jansen (1993), which combines IM with mul- tiple regression. Like IM, this method evaluates the presence of a QTL at multiple analysis points across each interlocus interval. However, at each point it also includes in the analysis the effect of one or more markers elsewhere in the genome. However, although IM and CIM brought significant improvements, both methods lack dimensionality: i.e., only a single QTL is being searched at a time.
The method proposed by Kao et al. (1999) and Zeng et al. (2000) called MIM differed from the pre- vious methods through the implementation of multi- QTL models. The selection of the model (i.e., QTL number, position, effect, and interactions) that best fits the data follows an iterative process. After iden- tification of QTL number and position by CIM, the MIM strategy consists of looking for additional QTLs through forward-backward selection cycles while in- tegrating interaction information between the differ- ent QTLs. Within each iterative cycle, QTL position and effect are reevaluated. MIM also allows the evalu- ation of QTL epistasis. However, it is important to note that, although this strategy provides significant im- provements over CIM, it does not allow the detection of nonsignificant QTLs at the individual level. There- fore, even if the concept aimed at detecting multiple QTL effects is simple, its implementation is relatively complex given the number of potential QTLs and the
resulting number of possible interactions. Thus, the problem is no longer genetic but resides in the ability to test all the possible genetic models and select the one that best fits the observed data (model selection). Until now, the MIM algorithm implemented in QTL Cartographer developed by Kao et al. (1999) and Zeng et al. (2000) has not been directly used in pines, but Bayesian approaches, also based on model selection, have been applied in these species (Hurme et al. 2000; Ball 2001).
The simultaneous analysis of multiple correlated traits has also been incorporated into algorithms in order to improve QTL detection efficiency (Jiang and Zeng 1995; Korol et al. 1995,1998). Although these al- gorithms have not been specifically used up till now, there is much interest in such algorithms, especially for such traits as annual growth or wood density. Ad- ditionally, application of specific genotyping strate- gies has further maximized the efficiency of QTL map- ping. One such strategy, called selective genotyping, has been extensivelyused in pines (Groover et al. 1994; Hurme et al. 2000; Kubisiak et al. 2000; Devey et al. 2004a). Another strategy, termed bulked segregant analysis (BSA), commonly used to study qualitative traits, has also been applied to analyze quantitative traits (Emebiri et al. 1997).
Besides statistical procedures, it has been clearly shown that the power of QTL detection largely de- pends upon the quality of the phenotypic assess- ment. Poor phenotypic assessments, i.e., imprecise measurements, generally result in QTLs with true ef- fects being left undected,,but in some circumstances (but to alesser extent) might even lead to the detection of false QTLs. Without the possibility of developing Fj populations or recombinant inbred lines to precisely estimate the value of the traits, clonally propagated material has become the material of choice for for- est tree geneticists (e.g., Scotti-Saintagne et al. 2004). However, this type of material has only been rarely used in pines (Devey et al. 2004b). This is most likely due to the large capital investments and technical ex- pertise needed to clonally propagate pines and the wide variability noted among specific genotypes in their ability to produce rooted cuttings.
2.3.2 QTL Discovery in Single Family Pedigree Designs
Ttiventy-six QTL studies aimed at detecting associa- tions between molecular markers and trait variation have been performed in seven pine species. However,

Chapter 2 Pines 53
most of the efforts have been concentrated in three species, I! pinaster, l? taeda, and I! radiata (Tables 4 and 5). In addition, studies on inbreeding depres- sion have been carried out in l? radiata and I! taeda (Kuang et al. 1999a, b; Remington and O'Malley2000a, b; Williams et al. 2001).
Qualitative Traits Associations between qualitative traits and molecu- lar markers have led to the identification of markers linked to resistance to different rust diseases: pine nee- dle gall midge in l? thunbergii (Hayashi et d. 2004), white pine blister rust in I! lambertiana Doug1 (De- vey et al. 1995; Harkins et al. 1998), and fusiform rust disease in I! taeda (Wilcox et al. 1996). A major gene controlling the biosynthesis of 6-3 carene has also been mapped in E! pinaster (Plomion et al. 1996b). Most of these studies have been based on intraspecific mapping populations. Additionally, two interspecific crosses were used to increase the level of polymor- phism and the range of variation for branch archi- tecture in the mapping population (Shepherd et al. 2002b).
Quantitative Traits Growth has been the most studied trait in QTL map- ping studies in pines. To date, a comparable num- ber of studies have been achieved for wood and end- use properties. These two classes of traits have been studied either globally (e.g., height growth, specific gravity) or after decomposition into simpler compo- nents (e.g., growth unit, ring density). Traits involving adaptation to the environment have also been stud- ied, including tree response to heavy metal, drought, and cold stress, as well as bud phenology (Costa 1999; Hurme et al. 2000; Kubisiak et al. 2000; Lerceteau et al. 2000; Brendel et al. 2002; Yazdani et al. 2003).
QTL Results The diversity of population types, population sizes, marker types, QTL detection methods, detec- tion thresholds, and variation of phenotypic trait measurements have made the comparison between QTL experiments a difficult task. However, general observations can be made regarding QTL number, position, phenotypic effect, and stability.
QTL Number and Effect Most QTLs have been de- tected at a single maturation stage and in a single en- vironment. Therefore, although all the analyzed traits
show continuous variation, suggesting polygenic con- trol of the traits, only a limited number of QTLs per trait (Table 4: between 0 and 8) have been detected. This number is in general smaller than in annual crops and has led to a smaller proportion of the phenotypic variation being explained (Table 5). As stated in the chapter on Eucalypts, "the limited power to detect QTL in forest trees compared to crop species may be due to the high environmental and developemental variation in tree plantations, as well as to the small size of the analyzed populations" (mainly between 91 and 200 genotypes, Table 4). However, QTL analyses carried out by Brown et al. (2003) and Devey et al. (2004a) using large mapping populations (>400 indi- viduals) do not support the latest hypothesis. Brown et al. (2003) reported QTL effects that were two- to threefold smaller than those reported by Sewell et al. (2000,2002) for the same traits. Such divergence likely represents more accurate estimates of the QTL ef- fects owing to the larger segregating population an- alyzed. These results suggest that most QTL studies performed in pines, with the exception of the analy- ses carried out by Devey et al. (2004a, b) and Brown et al. (2003), have yielded an overestimation of the QTL effects, which was also suggested by Beavis et al. (1994). Consequently, as underlined by Wilcox et d. (1997), the genetic determinism of most target traits for pine breeding is likely to be explained by small- effect genes, rather than any moderate- to large-effect genes. However, a larger number of QTL experiments with larger pedigree sizes will be required to validate this hypothesis.
Compared to the small number of QTLs detected at anyone maturation stage, the analysis of QTL stabil- ity along a cambial age or seasonal gradient (Table 4) revealed a significant increase in the number of QTLs detected. For instance, the simultaneous analysis of different maturation stages combined with seasonal variation allowed for the detection of 7 to 23 QTLs for wood-specific gravity, the percentage of latewood, and microfibrilar angle (Sewell et al. 2002). Similar results were reported by Pot (2004), who observed a total of 30 QTLs for wood density, 42 for wood heterogeneity, and 33 for radial growth when measured over several cambial ages.
QTL Stability In their review, Sewell and Neale (2000) pointed out that "before a commitment to marker- aided selection or breeding (MASIMAB) can be made in tree breeding, QTL that have been detected must be verified in different experiments, as well as in differ-

Table 5. QTLs and marker-trait associations detected in pines: number of QTLs and phenotypic variance explained
Species Type of trait Trait #QTlsa %Variance Note Reference (abbreviation used in the article) explained by
each Q T L ~
Pinus elliottii Adaptative traits Aluminium tolerance 3* 15.6lal1 Kubisiak et al. 2000
Pinus elliottii Wood-quality traits Average branch angle (AVBRA) 0 - Sheperd et al. 2002b var elliottii x and growth traits Average number of branch per whorl (AVBRN) 3*** 12-18
Pinus caribaea Average branch diameter (AVBRD) 2*** 16-17 var hondurensis Average whorl spacing (AVWS) 2*** 15-19
Regularity of whorl spacing (CVWS) I*** 17 Stem class (SC) 0 - Number of distinctively large, steep angled 0 - branches observed per tree (RAM) Number of "leaders" (DL) 0 - Bark thickness (AVBT) 2*** 11-12 Relative bark thickness (RBT) 0 - Trunk height (HT) 3*** 13-21 Overbark diameter at breast height (OBDBH) I*** 16 Underbark diameter at breast height (UBDBH) I*** 17 Basic density (ED) I*** 14
(Pinuspalushis Mill x Growth traits Total height (month 7,16,29,41) 5 1 ~ ~ 3.6-1 1 Weng et al. 2002 Pinus elliottii Engl) x Stem diameter 61~d2 4-10
Pinus elliottii Engl Height increments 5 1 ~ ~ 4.3-8.5 Diameter increments 510dZ 4.2-1 1
Pinus sylvestris Growth, wood-quality, Tree height (TH) 31~dz 11.5-12.2 Lerceteau et al. 2000 and adaptive traits Trunk diameter at breat height (DBH) 210d2 9.3-15
Trunk diameter 0.5m from ground (D0.5) 2 1 ~ ~ 12.6-13.3
a * significant at chromosomewide level (p < 0.05), *** significant at genomewide level (p < 0.05), 'Odx lod threshold value provided by authors (IM), pv=x significance level used for single-marker analysis, ': unique QTLs, defined as subset of QTLs (suggestive or significant) that map within ca. 15 cM of one to another and have the same general profile for their parental and interaction effects (magnitude and direction of effects)
when the % of phenotypic variance explained by each QTL was not provided, the phenotypic variance explained by all QTLs is indicated

Table 5. (continued)
Species Type of trait Trait #QTlsa %Variance Note Reference (abbreviation used in the article) explained by
each Q T L ~
Branch diameter of average branch at fourth 0 - branch level from terminal bud (BDA) Branch angle (BA) l l ~ d 2 15.9 Basic wood density measured with Pilodyn (PIL) 0 - Frost hardiness, critical temperature giving mean 2~~~ 12.1-21.1 injury (CTm) Frost hardiness, estimated temperature causing 21~d2 11.3-22.7 slight injury to 50% of needles (CT50) Tree volume calculated with DBH (VOL) 21~d2 10.7-16.7 Tree volume calculated with D0.5 (VOL0.5) 210d2 11-14.6
Adaptive traits Bud set 3 2.1-12.7 Hurme et al. 2000
Frost hardiness 7 3-11.1 Adaptive traits Cold acclimation 16p=~.~1 9-19.5~~' Yazdani et al. 2003 Growth traits Height growth 1 lp=O.O1 10.8-30.8~
Pinus pinaster Growth traits Total height week 15 2** 7-12 Plomion et al. 1996a Total height week 38 3** 6.2-11.5 Total height week 92 1 ** 10 Fertile zone length (LF)- cycle 5 1** 19.6 Fertile zone length (LF) adjusted to NSU- cycle 5 1** 11.8 Number of stem units in the fertile zone (NSU)- cycle 5 1** 20.4 Mean stem unit length (MSUL)- cycle 5 1** 6 Germination date (GERMD) 2** 15-17
Hypocotyl length (Lhypo) 2** 9.5-12.7
Megagametophyte weight (MW) 2** 6-8.6
Adaptive Delta 13C 4.7-12.4 pop : id to Brendel et al. 2002 3*** + 5**
I*** + 5** 5.9-18.1 Pot et al2006 and growth traits Ring width and Pot 2004
Total height 0 - Pot et al. 2006 Wood-quality pop : id to and growth traits Mean density of all the rings 2** 4.6-4.8 Brendel et al2002
2** + I*** and Pot 2004 Density estimated by Pilodyn penetration 3.7-8.8 Density heterogenity 3** 5.1-8 Lignin content 7** 5-9
n iT 2 N
E? 3 d
ul Ln

Table 5. (continued)
Species 'Qpe of trait Trait #QTlsa %Variance Note Reference (abbreviation used in the article) explained by
each Q T L ~
Water extractives content Acetone extractive content Alpha cellulose content Hemicellulose content Lignin composition Kraft pulping yield adjusted to Kappa number Kappa index Arithmetic fiber length Weighted fiber length Fibre width Coarseness Curl Zero span tensile value
Wood-quality Alpha cellulose content and growth traits Lignin content
Pulp yield Extractives content CIE brightness Mean wood density Minimum wood density Maximum wood density Diameter Height growth
Secondary metabolism 63Carene content Pinus radiata Growth traits Stem growth index
Wood-quality trait Wood density 1-5 years old Wood density 6-10 years old Wood density 14 years old
Wood-quality trait Wood density 1-5 year-old
Markussen et al. 2002
Plomion et al. 1996b Emebiri et al. 1997
Pop identical Kumar et al. 2000 to Ball 2001, LG3 only, multitrait model analysis Pop identical Ball 2001

Biotic stress tolerance Resistance to Dothistroma needle blight
Pinus taeda Wood-quality trait Wood specific gravity Wood-quality trait Wood specific gravity
Growth traits Height increment
Diameter increment
Table 5. (continued)
Species Type of trait Trait #QTlsa %Variance Note Reference (abbreviation used in the article) explained by
each Q T L ~
Wood density 14 year-old 0 - to Kumar et al. 2000, LGl and 3 only
Growth and Diameter at breast height 2*** - - 0 Kumar et al. 2004
wood-quality traits Stem straightness 2*** - 0 - Branching cluster frequency 2***-0 - Wood density I*** - - 0
Growth and Diameter at breast height Verification: Verification: 2.2au Devey et al. 2004a wood-quality traits p 0 . 0 5
Bridging pop : 0 Juvenile wood density Verification : Verification: 14.1a1'
@=0.05
Bridging pop : p 0 . 0 5
p 0 . 0 5 in the detection: not estimated, Devey et al. 2004b
detection population, validation: 1.76-4.8 4p'0.05 in the validation population gp=0.05 23d Groover et a1 1994 4**, I*** - re-analysis Knott et al. 1997
of Groover et al. 1994
Base: 6**, Base: 23.1-30.5~', Detection Kaya et al. 1999 detection: T** detection: 7.3-1 1 . 7 ~ ~ population: same as Detection : 8 Detection : 12.5-59.5" Groover et a1 1994,
Knott 1997, Sewell 2000,2002, Brown et a1 2003.
Growth traits Total height 2 years 2** 7.9-10.8 Gwaze et al. 2003 I*** Total height 3 years 10.3
Total height 4 years I*** 12.2 Total height 5 years I*** 12.2
n K 2 8 N
q ZT k
VI V

Wood-quality trait
Table 5. (continued)
Species Type of trait Trait #QTlsa %Variance Note Reference (abbreviation used in the article) explained by
each Q T L ~
Total height 10 years I*** 10.5 Growth rate I*** 11.3
Wood-quality trait Wood specific gravity (individual rings 23' 5.4-15.7 Same population Sewell et al. 2000
and composite rings, measured for early as Groover et al. and latewood) 1994 and
Knott et al. 1997 Percentage of latewood (individual rings 16' 5.5-12.3 and composite rings) Average microfibrilar angle (individual 7' 5.4-11.9 rings and composite rings, measured for early and latewood) Cell wall content 8& 5.3-12.7 Same population Sewell et al. 2002
as Groover et al. 1994 and Knott et al. 1997
Wood-quality traits Wood-specific gravity V : 18', V : 1.7-5.7, Detection population: Brown et al. 2003
U : 5' U : 1.8-4.4 same as Percentage of latewood (individual rings V : 12*, V : 1.7-5.7, Groover et a1 1994, and composite rings) U : 5' U : 1.8-4.4 Knott et al. 1997, Average microfibrilar angle (individual V : 4*, V : 1.7-5.7, Sewell et al. 2000,2002 rings and composite rings, measured for U : 2& U : 1.8-4.4 early and latewood) Cell wall content v : 10' V : 1.7-5.7
UI w
P
$ 5' B L

Chapter 2 Pines 59
ent genetic and environmental backgrounds." Indeed, estimation of QTL stability (position and phenotypic variation explained) is one of the most critical factors if QTL analysis is to be performed for application in MAS. This question has been addressed at different levels, including the stability of QTLs across differ- ent developmental stages (ontogenic or cambial age effect), time points during the growing season (sea- sonal effect), environments, and among diverse ge- netic backgrounds.
Ontogenic effect: Given the long-lived character- istic of forest trees, it has been questioned whether or not the same genomic regions would control quan- titative traits (e.g., annual growth, density) as trees mature. Several experiments have been conducted to answer this question (Plomion et d. 1996a; Eme- biri et al. 1997; Kaya et al. 1999; Sewell et al. 2000, 2002; Weng et al. 2002; Brown et al. 2003; Gwaze et al. 2003; Pot 2004). In general, a rather low QTL sta- bility has been noted across different maturation stages for growth (Brown et al. 2003; Pot 2004). In only one case did the authors report on the detec- tion of the same QTL regions at different matura- tion stages (Gwaze et al. 2003). Conversely, Kaya et al. (1999) did not find a single "common" QTL con- trolling growth rate through tree development. The same trend - low QTL stability across maturation stages - was observed for wood density, a trait that presents a higher juvenile-mature correlation than growth (e.g., Williams and Megraw 1993, Hannrup and Ekberg 1998). This unexpected result suggests that some of the wood-density QTLs probably re- flect the genotypic response to annual climatic vari- ation. Recently, Rozenberg et al. (2002) reported on the alteration of wood-density profiles in response to drought. More interestingly, they showed that the al- teration of annual wood-density profiles (the pres- ence of a false late wood ring in the early wood zone) in response to drought was genetically con- trolled.
Seasonal effect: Sewell et al. (2000,2002) and Pot (2004) analyzed the seasonal stability of growth and wood-quality QTLs for traits measured in spring (early wood) or summer (late wood). Overall, half of the detected QTLs were specific to one type of wood (early vs. late wood). These results agree with recent transcriptome studies that reveal that different sets of genes are regulated throughout the growing season (Le Provost et al. 2003; Egertsdotter et al. 2004).
Environmental effect: although several studies have been performed in multisite trials (Groover et al.
1994; Knott et al. 1997; Kaya et al. 1999; Sewell et al. 2000, 2002; Shepherd et al. 2002b; Weng et al. 2002; Brown et al. 2003; Devey et al. 2004a, b), in only one study did the authors analyze QTL stability at different sites (Groover et al. 1994).
Genetic effect: a complete understanding of the genetic variability of the traits of interest will rely on the analysis of multiple populations as all the ma- jor genes involved in the genetic control of a given trait are unlikely to be polymorphic in a single family. On a more practical side, QTL stability across differ- ent genetic backgrounds is a prerequesite to marker- assisted breeding (MAB) in multiparental tree breed- ing programs. As underlined by Brown et al. (2003), MAB will reveal its full potential under two scenar- ios: (1) if a genetic marker in full LD with molecular polymorphism causing trait variation at the popula- tion level is discovered or (2) if the gene (polymor- phism) underlying a QTL is identified. Given their allogamous reproductive system and their recent do- mestication, pines are characterized by high levels of genetic diversity and low levels of LD (reviewed in Gonzdez-Martinez et al. 2006b). The combination of these two factors (high diversity and low LD), to- gether with their perennial characteristics (matura- tion, environmental heterogeneity), is likely to con- tribute to QTL instability across genotypes. Yet few studies have addressed this important issue in pines. Kaya et al. (1999) did not find any QTL shared be- tween pedigrees, while Brown et al. (2003) and Devey et al. (2004a, b) found only a small fraction of the de- tected QTLs to be common across different genetic backgrounds.
Multiple-Trait QTL Analysis As stated ealier, multiple-trait QTL analysis will likely become very important for breeding purposes since pine breeding is a mdtitrait process. In several QTL experiments, more than one trait (e.g., growth, wood quality) was studied. In most cases, colocalizations between QTLs for different traits were observed, which might be expected for highly correlated traits. Possibly more important was the occurrence of multiple colocalizations in the genome, suggesting the effect of pleiotropic genes rather than the existence of physically linked genes controlling different traits. It should be noted that QTL clusters were also observed for traits that were not phenotypically correlated (Brown et al. 2003; Pot et al. 2005b), suggesting strong environmental/developmental effects masking genetic correlation.
60 C. Plornion et al.
2.3.3 Future Direction on QTL Mapping
As underlined in the previous section, the most reli- able QTLs - from a breeding perspective - are those that have been consistently detected at different de- velopmental stages, in different environments, and in diverse genetic backgrounds. However, it is impor- tant to remind the reader that most of the studies performed so far in pines have been based on single pedigree analysis, and that only a handful of exper- iments have attempted to validate QTLs across dif- ferent genetic backgrounds (Brown et al. 2003; Devey et al. 2004a, b). Considering that pine improvement involves the deployment of many familieslclones, the genetic stability of marker-trait association is a pre- requisite before any extended use of molecular mark- ers is considered in operational breeding programs. There have been two major attempts to identify diag- nostic markers for MAB either using neutral markers spanning the genome or selecting candidate genes based on their coincidence with QTLs.
Complex Designs for Detecting Marker-Trait Associations: LD Mapping As underlined in Guevara et al. (2005b), while QTL identification is based on physical LD generated in one or a few generations of crossing, association mapping or LD mapping takes advantage of events that created associations in the past to find a statistical associ- ation between molecular markers and a phenotype on a much finer scale. As presented in Sect. 2.1.6., five studies have provided valuable information re- garding the extent of LD in pines. In all cases, it was found that LD extended only over short distances. In P taeda, Brown et al. (2004) and Gonztilez-Martinez et al. (2006a) revealed a rapid decay of LD within 800 to 2,000 bp in candidate genes for wood quality and drought-stress response. In P sylvestris a rapid decay of LD was also detected by Dvornyk et al. (2003) and Garcia-Gil et al. (2003). The genotyping of a breeding population of P radiata with microsatellites (Kumar et al. 2004 also yielded the same result, i.e., no signif- icant LD was observed between pairs of genetically linked markers, suggesting that LD decreases rapidly with physical distance.
LD mapping is only in its infancy in pines. To our knowledge, only one study has reported the use of molecular markers (SSRs) in unrelated trees (Kumar et al. 2004). Marker-trait associations were analyzed in a I? radiata trial consisting of 45 parents (40 males
and 5 females). Parental trees were genotyped and the association between parental genotypes and the performance of 200 full-sib-generated families were analyzed according to the strategy used in larch and eucalyptus by Arcade et al. (1996) andverhaegen et al. (1998), respectively. This analysis allowed the iden- tification of several significant associations between - markers and traits. However, it is important to note that none of the marker-trait associations found using full-sib family performance were identified when the parental general combining ability was regressed on the allelic frequencies of the marker. This result sug- gests that the first associations detected were probably biased due to population structure (only five females), as in larch and eucalyptus. . -
Pan-genomic LD mapping in pines will require an extremely high marker density, given the low extent of LD as estimated so far within the few genes ana- lyzed. Alternatively, marker-trait association can be performed on selected candidate genes.
The Candidate-Gene Approach Candidate genes (CGs) can be proposed based on the coincidence between QTLs and known functional genes putatively involved in the genetic control of the trait. Such positional CGs have been described in P taeda (Brown et al. 2003) and P pinaster (Chagnk et al. 2003; Pot et al. 2005b) for wood-quality-related traits. In taeda, colocalizations between genes in- volved in monolignol biosynthesis (4CL, C4H, C3H, and CcOAOMT) and QTLs for wood density were observed (Brown et al. 2003). In l? pinaster, a sin- gle candidate gene-QTL colocalization was found between KORRIGAN, a gene involved in the hemi- cellusose/cellulose biosynthesis, and QTLs for hemi- cellulose and fiber characteristics.
Other types of analysis can be used to select CGs related to plant adaptation. As underlined by GonzAlez-Martinez et al. (2006b), "standard neutrality tests applied to DNA sequence variation data can be used to select candidate genes or amino acid sites that are putatively under selection for association mapping." Unusual patterns of nucleotide diversity andlor population differentiation have been detected in P taeda (Gonzdez-Martinez et al. 2006a), P pinaster, and P radiata (Pot et al. 2005a). Pot etal. (2005a) observed singular patterns of nucleotide diversity in three genes: a glycin-rich protein homolog that was found to be up-regulated in late wood-forming tissue (Le Provost et al. 2003); CesA3, a cellulose synthase gene; and KORRI-

Chapter 2 Pines 61
GAN, a membrane-bound endo-1,4-beta-glucanase involved in cellulose/cellulose biosynthesis. As men- tioned before, colocalization between KORRIGAN and wood-quality QTLs has been reported (Pot et al. 2005b). In P. taeda, although the action of neutral processes cannot be completely ruled out to explain the patterns of nucleotide diversity observed for CcoA-OMTl, several characteristics of its nucleotide diversity seem to indicate the action of natural selection on this gene. The colocalization of this gene with a QTL of water use efficiency (Brendel et al. 2002; Pot et al. 2005b) and the differential expression of this protein under different watering regimes (Costa et al. 1998) clearly emphasize the putative role of this gene in wood-trait variation. Association studies should now be used to validate this hypothesis.
2.4 Marker-Assisted Breeding
This section discusses the application of informa- tion from DNA polymorphisms in conifer-type tree-improvement programs. Note here that such information includes not only purposefully designed markers but also information obtained directly from (re)sequencing, for which specific markers may not have been designed. Applications of information from DNA polymorphisms fall into four generic areas: audit and quality control, elucidation of genetic phenomena, population management, and selection and breeding. We discuss each of these aspects below, covering both existing and potential applications. Furthermore, we provide examples where appropriate, as well as comments regarding the current status of each of these applications.
2.4.1 Quality Control and Audit
~evelodment of an array of DNA marker systems over the past two decades has provided tree breeding pro- grams with a range of tools to achieve basic aspects of quality control that hitherto could only be addressed with difficulty, if at all. Seedlot and/or clonal fidelity have been the key concerns for both commercial and research applications. Indeed, this area was the ear- liest commercial application of DNA markers in tree breeding programs and is still the most widespread, at least in coniferous species.
From a commercial perspective, the key objective is assurance of genetic gain by ensuring that seedlots and/or clones are true to intention. The applicability and efficacy of various DNA marker systems is de- pendent, therefore, on the way in which genetic gain is delivered. In conifers, such delivery can come in a number of different forms (and costs), even within the same breeding program.
Open-Pollinated Seed Open-pollinated seed from a mixture of selected seed orchard material generally consists of a few dozen ma- ternal parents, with little if any control of the pollen source. This is a common means of seed production, particularly in commercial Pinus species in the south- eastern United States. In such 'cases, there may be a need to ensure no contributions from unwanted maternal parents, which can be achieved by geno- typing megagametophytes with sufficient markers, assuming maternal parentage information is main- tained for all seed. Furthermore, markers could be used to quantify the relative contributions of each maternal parent to individual seedlots if seed counts are not available. A variation on this method of seed production is used in mass pollination techniques, such as supplemental mass pollination or liquid pol- lination. In these approaches, receptive conelets are pollinated using pollens from selected genotypes by various means, but the conelets themselves are not actually covered to prevent fertilization by unwanted pollens.
Control-Pollinated Seed Control-pollinated seed, where pollens from selected parents are used to fertilize selected seed parents, in the process excluding pollen from other sources using bags to cover receptive cones and/or under- taking pollinations in contained greenhouse facili- ties. This is usually undertaken to produce full-sib families or individual half-sib families with known selected pollen parents. Such methods are used in both breeding and commercial production for species such as l? radiata. Vegetative propagation, some- times involving in vitro technologies, can be used to amplify genotypes, particularly for commercial pro- duction, largely because of shortages of seed and/or cost of seed production. DNA markers - particu- larly codominant multiallelic marker systems such as microsatellites - have been developed for such purposes (e.g., Devey et al. 2003). In addition, pa- ternal parentage can sometimes be evaluated via pa- ternally inherited chloroplast markers. Such mark-

62 C. Plomion et al.
ers have been developed and applied in I? radiata 2.4.2 for checking paternal inheritance (Kent and Richard- Elucidation of Genetic Phenomena son 1997), although judiciously chosen nuclear DNA markers may mffice. In general, markers have All genetic gain ultimately depends on DNA polymor- shown that misidentification is common in breeding phisms. ~ ~ ~ ~ l ~ d ~ ~ of the nature and effects of the Programs; for example, Bell et al- (2004) estimated polymorphisms has the potential to generate far more that 2.6% of parents were misidentified in a sam- gain than the use of purely phenotypic data - on the pie an Australian breeding population radi- parents and/or their progeny. Information from DNA ata and that 8.4% of offspring of ten families were polymorphisms enables the elucidation of phenom-
not with Parentage. These results ena such as understanding of the genetic architecture also indicate that a proportion of misidentification of trait variation, revelation of population structure of o~en-~ollinated seedlots is possible. Furthermore, and history, and detection of selection fingerprints, our experience at Scion with putative full-sib fami- all of which can have direct or indirect applications in lies used for gene mapping experiments has revealed tree breeding.
few such families - produced either COn~mer- The genetic architecture of trait variation can be c i a l l ~ Or research groups - are completely con- defined as the frequencies, location, magnitude, and &tent with expected parentage (unpublished data). mode(s) of action of quantitative trait locilnucleotide DNA markers, particularly codominant n~arker sYs- (QTL/N) effects underpinning quantitative traits. tems, have therefore been useful in checking and as- while QTL mapping has been very informative in this suring parentage. regard, the results are relevant only to the pedigree(s)
used, not to whole populations. Association genetics Clonal Production may, therefore, be more relevant for understanding Clonal production is used either for experimental pur- the genetic landscape of trait variation in forest poses (such as clonal tests) or for mass-propagation trees. of tested clones for clonal forestry. In these cases, genotyping is undertaken to ensure that ramets do Estimation of Genetic Variance Structures represent the desired genotype(s). Similarly, ram- and Heritabilities ets deployed in seed orchards raise the same issue, DNA markers offer new ways of obtaining some although sometimes misidentification of parents is key knowledge that is fundamental to tree improve- detected via parentage testing of the seed obtained ment regarding genetic parameters, in particular ge- via methods described above. For applications where netic variances, heritabilities, and correlations among genotype fidelity is needed, "profiling" marker sys- traits. Such knowledge informs the breeder not only tems such as RAPDs and AFLPs is useful in that they about the feasibility of breeding for certain traits or are generally cheaper to both develop and use for combinations thereof, but also how it might be effi- this specific application, particularly as the high level ciently undertaken. of polymorphism revealed overcomes issues associ- For obtaining genetic gain, a trait must be both ated with dominance. However, in more recent years, variable and heritable. Genetic correlations between fingerprinting kits have tended to utilize codomi- economic traits can be a major constraint if they are nant markers (see references above), as these have adverse, but they can provide the breeder with great been developed for other purposes (above) and are opportunities if they are favorable. Even genetic cor- generally adequate for clonal fingerprinting, particu- relations between noneconomic indicator traits and larly if enough marker loci are used (e.g., Kirst et al. economic ones can be used to great advantage if 2005b). the correlations are strong and the indicator traits
DNA markers have, therefore, been developed highly heritable. For genetic variances and heritabil- and utilized extensively in tree breeding pro- ities, if they have to be estimated from seed collected grams, for both verifying commercially deployed in natural stands, then the coefficients of relation- materials and for ensuring that experimental ship within seed-parent families need to be known. materials meet the requirements. Even so, some Indeed, the relative contributions of inbreeding as programs still do not universally implement or rely such and finite effective numbers of (unrelated) pollen on such genotyping, largely due to the expenses parents per seed parent represent important infor- involved. mation. While in the past isozymes were a valuable

Chapter 2 Pines 63
tool for providing such information, DNA markers can be much more powerful for the purpose, and with a greater range of applications. This issue of nonrandom components in the mating system can be important with native stands of conifers (Burdon et al. 1992), despite their wind pollination, even if it is less acute than in insect-pollinated species like eucalypts (Hodge et al. 1996). The wind pollination of conifers tends to reduce the nonrandomness of mating, while the conifers' mechanism of archego- nial polyembryony probably reduces the inbreeding component still further. For estimating genetic cor- relations between traits, knowledge of coefficients of relationship within such families is likely to be much less crucial. As we will mention later, a priori family information as such may not be essential for this pur- pose, but it can be supplemented with information from markers.
Population Structuring and History The structuring and history of populations influ- ence both the availability of genetic variation for the breeder to exploit and the potential for asso- ciation genetics to contribute. While large, essen- tially panmictic populations cannot be expected to have appreciable across-family linkage disequilib- rium (LD), cryptic structuring may exist that gen- erates significant disequilibrium that could be use- ful for breeders. For example, localized population bottlenecks, followed by coalescences, could easily cause this. Such LD could provide valuable clues to "metapopulation" history. Despite wind pollina- tion, various factors can generate population struc- ture in conifers (Mitton 1992). Interesting possibil- ities of structure exist in populations derived from recent admixtures. In R radiata, the exotic, domesti- cated "landraces" still have large elements of the wild state. Interestingly, they evidently represent a genet- ically recent fusion of two of the native populations, Aiio Nuevo and Monterey (Burdon et al. 1998), which may provide a basis for some admixture disequilib- rium.
Polymorphisms revealed by DNA sequence data derived from both genic and nongenic regions can re- veal much about the genetic history of those regions. Departures from Hardy-Weinberg equilibrium could reveal the presence of previously undetected genetic phenomena such as the presencelabsence of inbreed- ing. Indeed, genetic variance (and gain) estimates are based on assumptions regarding the relatedness of parents used in genetic tests. Such data can be used to
check these assumptions and provide empirical data for more accurate estimates. Similarly, sequence data from genic regions can reveal evidence of selection: for example, balancing selection was detected by Cato et al. (2006b) in a gene associated with wood density and growth rate in I! radiata. Krutovsky and Neale (2005) found evidence for selection in three of 18 genes in Douglas-fir. Such evidence - which can be generated on a relatively small subset of genotypes - could be an effective prescreen for genes more likely to be associated with trait variations, although some caveats apply regarding the power to detect the effects of selection (Wright and Gaut 2005).
Assignment of Gene Function
Knowledge of gene function, if acquired, offers the greatest long-term opportunities to capture genetic gain, using either endogenous variation or genes in- troduced by conventional breeding or genetic engi- neering. LD mapping and association genetics can provide clues in the search for quantitative trait nu- cleotides (QTNs) regarding which genes have func- tional roles in trait variation. While relatively short stretches of disequilibrium (usually hundreds to low thousands of base pairs) represent constraints for breeding applications, a key advantage is the po- tential for assignment of function - even identifi- cation of individual QTNs. However, because of the size of conifer genomes and the lack of genomic sequence, identifying candidate genes will be cru- cial. Possible approaches are described in the fol- lowing section and in more detail by Wilcox et al. (2006).
In carefully selected cases, genetic transformation can be used to verify the role of a QTN in generating phenotypic variation. The costs of achieving a trans- formation, and often the regulatory issues, will de- mand a highly selective application of this approach. On the other hand, knowledge of gene function may be useful for identifying genes to target for genetic transformation, to create new variations of use for breeders, and to provide commercial cultivars. There are no reports yet of cloning QTLs from tree species, partly due to the large number of candidates within QTL confidence intervals, but also because of the time required for trait expression of transformants arising from complementation studies. Nonetheless, associa- tion genetics will be a key step in increasing resolution and, in some cases, identifying putative QTN for fur- ther analyses.
64 C. Plomion et al.
2.4.3 diversity will need to be cross-referenced with the Population Management functional diversity since the two classes of diversity
are not necessarily closely coupled, at least among
Pedigree Reconstruction and Detection species (Morgante and Salamini 2003; Paran and Za- of Genetic Contamination mir 2003). Components of DNA diversity obviously
Breeding populations represent the "engine room" for Percentage polymorphic genes (in either
capturing the additive gene effects that allow curnula- the coding or regi0ns), percentage base tive genetic gain over successive generations, through pairs that are P ~ ~ Y ~ ~ ~ P ~ ~ ~ , particularly for QTN that recurrent cyles of selection, intermating, evaluation, must exist in coding or regions), and allele selection, and so on. Maintaining full pedigree has frequencies for the P ~ ~ Y ~ ~ ~ P ~ ~ ~ ~ ~ . Such informa- been favored on the grounds that it helps preclude tion, in conjunction with knowledge of magnitudes inbreeding and maintains effective population size. of QTN effects, provides a ben~hmark for monitoring
However, the expense of maintaining full pedigree changes in for any forest trees-
can limit the size of the breeding population that can low-frequenc~ is an be handled, raising the question of whether larger manifestation of a decrease in genetic diversity. populations can be handled if pair crossing is not Paradoxically, abrupt increases in the frequencies of mandatory. Moreover, there may be situations where S U C ~ alleles, as can occur through genetic drift, can be
the breeder has reason to resort to material, e.g., corn- a manifestation the same phenomenon. While the
mercial stands, in pedigree has been sacrificed inherently outbreeding genetic systems of forest trees but which has the advantage of huge numbers (Burdon be able to cope with significant inbreeding in the 1997). wild, through selection for balanced heterozygotes,
~~d~~~ marker has major such mechanisms may be impeded under conditions
for pedigree reconstruction (Lamb& et 2001; Ku- of artificial breeding- In principle, almost any sort of
mar et al. 2006), at least in open-pollinated families genetic marker should be able to manifest the losses
of known seed parentage. Complete reconstruction of of alleles or sharp fluctuations in their frequencies- predigree will be more challenging, especially with Nevertheless, it seems preferable to know what genes the wind pollination that characterizes conifers. In are of particular current or contingent maintaining gene resources that underpin breeding and monitor their frequencies. This, however, will populations, controlled crossing is typically far too On knowing the the genes.
expensive, yet there may be a call for quantifying and even detecting individual cases of contamination Provision for Biotic Crises
(Burdon and Kumar 2003). Different types of markers While it appears QTNs typically exertminorindividu- maybe required for this purpose, and the task may be a1 effects in conifers, disease-resistance genes can rep- challenging, but it appears inherently feasible. Pedi- resent a notable exception (~urdon 2001). such genes
gree reconstruction is discussed later, in connection Can have large effects
with selection. ances of classical quantitative inheritance) (e.g., Kin- loch et al. 1970; Wilcox et al. 1996) and be present at
Tracking and Maintenance of Genetic Diversity low frequencies (R.D. Burdon andP.L. Wilcoxpersonal A key element of population management is mainte- communication). These genes can also have the fea- nance of genetic diversity, to give the breeder flexibil- ture of gene-for-gene specificities between host geno- ity in both the short and long terms and to safeguard types and fungal strains (pathotypes), which has im- continuing long-term genetic gain. While pedigree in- portant implications for ensuring durability of disease formation is an indicator of genetic diversity, it does resistance against pathogen mutations (Burdon 2001). not provide definitive information in itself. Achieving Establishing the nature of such genes can require care- that poses significant challenges. fully planned mating between parents and inocula-
The "gold standard" for functional genetic di- tion studies based on single-spore isolates, preferably versity will usually be performance in well-designed backed up with genomic studies. Here, as in other ar- and properly located common-garden genetic experi- eas, comparative genomics can have a major role, at ments. However, such experiments are expensive and least in studying resistance genes of lower specificity. often slow to deliver results. The use of DNA poly- The implications of such patterns of genetic varia- morphisms is clearly much quicker, but such marker tion within both hosts and pathogens, which are called

Chapter 2 Pines 65
pathosystems, can be major for both population man- agement and selection. Disease resistance can be very important in plantation forestry, especially with ex- otics that are being grown in the absence of natural or other pathogens. Conserving low-frequency genes of large effect, which are sometimes important in conifers, can pose a threefold challenge. A large popu- lation may be needed to find trees with such resis- tance. The requisite population size can be increased by the desirability of obtaining resistance genes in un- related pedigrees. It may be further increased by the desirability of combining ("pyramiding") genes in the genetic material that represent diverse mechanisms of resistance to the pathogen, toward ensuring durability of resistance against mutation or genetic shifts in the pathogen population. In implementing this approach, identification of resistance genes will be of enormous help.
The information on forest-tree pathosystems, in general, is still very sketchy, although there are re- sistance genes identified for some coevolved forest pathosystems (e.g., Wilcox et al. 1996). Nevertheless, what is known indicates that preparations for biotic crises in the form of new fungal diseases should in- clude having very large population resources avail- able. In at least some cases, it is very doubtful whether breeding programs effectively contain such a provi- sion (Burdon and Gea 2006).
2.4.4 Selection and Breeding
Pedigree Reconstruction as an Alternative to Maintaining Pedigree Records A proposed application (Lambeth et al. 2001) is to use markers in genetic tests to reconstruct pedigrees retrospectively, as opposed to maintaining pedigree information throughout the life of a genetic test. This involves applying pollen mixes of known composi- tion to a range of seed parents, planting the resul- tant offspring in designed experiments with limited or no maintenance offamily information (Kumar et al. 2006). Upon subsequent measurement, pedigree iden- tity is ascertained via DNA markers. Benefits of such an approach include logistical simplicity, cost reduc- tions for breeding and testing, potentially better es- timates of genetic parameters and increased gains, and assurance of parentage (see above). Furthermore, fewer financial costs are incurred if experiments are abandoned or lost prior to remeasurement - which does happen in tree-improvement programs. Disad-
vantages include underrepresentation of some spe- cific families due to either chance or factors affecting fertilization, prevalence of inbreeding in some fami- lies distorting breeding-value estimates of those fam- ilies, difficulties in detecting full-sib-specific combin- ing ability in full-sib families, and genotyping costs. Most of these disadvantages could be overcome, al- though further research is needed to fully evaluate various possible application scenarios. To date, this approach is currently being evaluated in the context of operational breeding in New Zealand with Eucalyt- pus and E! radiata.
Estimation of Heritability Based on Marker-Ascertained Relatedness Because molecular markers have the potential to es- timate relatedness between genotypes, methods to estimate the heritability of phenotypic characteris- tics have been proposed and evaluated (Andrew et al. 2005; Kumar and Richardson 2005) without the need to have any prior knowledge of genetic relationships (see above). Such methods have the potential bene- fit of allowing one to obtain information from exist- ing forests (e.g., natural forests or commercial plan- tations), thereby obviating the need for genetic test- ing involving progenies, thus speeding up the gener- ation of information, particularly for species where little a priori information is available. Some disad- vantages involve the reliability of marker-based es- timates, particularly as assumptions need to be ei- ther made or checked regarding genetic structure and prior levels of relatedness, as well as the reliabil- ity of phenotypic information, particularly if sourced from forests rather than purpose-designed common- garden tests with appropriate controls. These ap- proaches have not been extensively investigated but may have a role. In part, this maybe due to the fact that existing approaches are well established and success- ful, as well as to the existence of infrastructure such as extensive testing involving progenies. Kumar and Richardson (2005) compared phenotype-based with marker-based heritability estimates for wood density in I? radiata and found very little difference. Simi- larly, Andrew et al. (2005) reported nonzero estimates of heritability for a number of foliar defence-related chemicals in EucaIyPtus rnelliodora, some of which were consistent with independent estimates based on phenotype (see Andrew et al. 2005 and references therein). Such approaches may be of use also for as- sociation genetics, particularly in revealing cryptic population structuring in natural forests, as well as

66 C. Plomion et al.
for selecting maximally unrelated individuals for es- timating LD.
Within-Family Selection Based on Marker-Trait Associations Derived from Pedigreed QTL Mapping Populations Such selection is based upon selecting individuals within known full- or half-sib families where marker- trait associations have been previously determined. Genotypes with the desired multilocus genotypic composition are selected from within families. In theory, this can be applied within families in breed- ing populations and/or production populations. Generic benefits include earlier selection, increased selection intensity, and potentially cheaper selection (Stromberg et al. 1994). In conifer improvement, breeding populations are usually based on a few hundred parent genotypes; thus it is largely imprac- tical and very expensive to detect associations for each genotype independently (Strauss et al. 1992; Johnson et al. 2000). Rather, application of markers is more likely to be restricted to populations where specific families are advanced, as for example in elite populations or in small nucleus- or mainline breeding populations.
A number of situations have been evaluated either for species-specific scenarios or from a wider theo- retical perspective. One of the earliest such studies was that by Strauss et al. (1992), who concluded that within-family marker-assisted selection (MAS) was of limited or no value unless a high proportion of addi- tive genetic variation could be explained by markers for traits of low heritability but high value and where selection intensities within families were high com- pared to that among families. They also concluded that difficult- or expensive-to-measure traits such as wood quality or resistance to certain diseases showed the most potential for MAS. Williams and Neale (1 992) evaluated the relative efficiency (RE) of MAS and also concluded RE was greatest where (a) traits were not expressed sufficiently early to enable a reduction in generation length as well as (b) with lower-heritability traits where markers explain a high proportion of ad- ditive genetic variability for the traits. However, re- sults from many QTL mapping experiments have in- dicated that the genetic architecture of quantitatively inherited traits is dominated by genes of small effect (Wilcoxet al. 1997; Sewell andNeale 2000; Brown et al. 2003; Devey et al. 2004a, b), thus limiting the oppor- tunity to explain sufficient variation with markers.
Wu (2002) evaluated the tradeoff between proportion of variance explained by markers and shortening of selection interval. For traits of moderate heritability (0.2 to 0.4) marker-assisted early selection (MAES) was more efficient than phenotypic selection, if they explained more than 5 to 10% of additive genetic vari- ance and allowed the selection interval to be reduced by half. For later-expressed traits, even less variance explained by markers was necessary for markers to be more efficient than phenotypic selection. Wu (2002) also evaluated a number of other scenarios, including combining phenotypic selection with markers, and found that MAES is only marginally more efficient than phenotypic selection except in cases of relatively low juvenile-mature phenotypic correlations. Given genetic architectures of QTLs explaining a few per- cent each (Wilcox et al. 1997; Brown et al. 2003; De- vey et al. 2004a, b), and limitations for the selection of up to ten unlinked markers per family linked to such QTLs, the effectiveness of early selection is lim- ited for traits with low-moderate age-age phenotypic correlations, particularly once costs of QTL detection are taken into account. Time savings for traits of de- layed expression or low juvenile-mature correlation will, however, depend on the prior establishment of QTLIphenotype associations.
All the above studies investigating the applica- tion of markers for breeding population advancement have generically shown that while there are scenar- ios where markers could be used to generate genetic gains, the financial gains could be quite limited. This is in part due to the cost of genotyping as well as the length of time, meaning that additional costs will be incurred. A further limitation stems from the fact that most breeding objectives involve multiple quantita- tively inherited traits whose genetic architectures are likely to involve predominantly small-effect genes (see references above). This means limited genetic gains from individual markers. Furthermore, relatively few markers can be used to select within any particular . -
family: for a simple two-genotype-per-marker sce- nario, it would be necessary to generate and geno- type thousands of offspring per family to have suffi- cient power to generate the optimal ten-marker-locus genotype. If such selection were restricted to a limited range of traits, there would also be the need to aug- ment marker information with phenotypic records to effectively address the breeding objective; therefore the opportunity for earlier selection could be lost. On the other hand, few studies have investigated the ef- ficacy of marker-based or marker-assisted selection

Chapter 2 Pines 67
over multiple generations. Application over gener- ations is likely to reduce costs, although not in a man- ner linearly proportional to gains. This is owing to the fact that additional revenues in future generations are discounted relative to cost, as costs are effectively incurred early (e.g., Johnson et al. 2000).
An exception to the limitations outlined above is the selection for genes of large effect such as major- gene disease resistance (see references above). In breeding populations, frequencies of resistance genes could be increased much faster via marker-based se- lection than phenotypic selection; markers could ob- viate most of the need for field and/or greenhouse screening by allowing only those individuals to be de- ployed in field tests (for screening for other traits) that have the favorable marker phenotypes. Where gene pyramiding is crucial for durable resistance, this marker-based approach could be especially valuable. As with all marker-assisted (or based) selection sce- narios, such genes need to be detected, which in- curs costs early in the breeding cycle. However, such costs are likely to be lower in that such large-effect genes are less financially burdensome to detect, and in cases where resistance is valuable, financial gains can be considerable, particularly if undertaking de- velopment of disease-resistant (or tolerant) breeds.
Opportunities for MAS have also been evalu- ated for production populations in species such as Douglas-fir (Pseudotsuga menziesii) (Johnson et al. 2000) and Pinus radiata (Wilcox et al. 2001b), and for clonal deployment in I! radiata (Kumar and Gar- rick 2001). Results in general indicate that gain from MAS is possible in I! radiata for a range of options but marginal for Douglas fir, implying rotation length and product value are both important. For example, Wilcoxet al. (2001b) showed that even modest gains in physical traits of 3.0 to 3.4% resulted in product value gains in excess of 9% and internal rates of return rang- ing from 9.1 to 21%. However, a key condition here was the need to achieve adequate multiplication rates via vegetative propagation. Propagation technologies are key to MAS being cost-effective. Johnson et al. (2000) showed that modest genetic and financial gains were possible for MAS in Douglas fir for production population applications, although results were highly dependent upon assumed genetic architectures and relatively large areas of plantations were needed to justify the extra costs associated with MAS.
Given all of the above, it is not surprising that relatively few breeding programs are actively pur- suing MAS, particularly for quantitatively inherited
characteristics. Some private companies in the USA and New Zealand have undertaken or are still un- dertaking MAS on a limited scale, but there is as yet no widespread uptake either for breeding-population advancement or as a tool for more immediate genetic gains. Nonetheless, there is still some potential, as some of the above studies have indicated, as well as other possible areas of application yet to be explored. It may be, however, that other technologies, e.g., GAS (see below) or genetic modification, may supersede MAS.
Combined Among- and Within-family Selection Based upon Results from Association Genetics Experiments Advances in genomics technologies over the past 5 to 10 years have made possible almost unrestricted access to any region of tree genomes, particularly se- quences within and associated with expressed genes. Variation in genic regions and the associated regula- tory regions form the basis of phenotypic variation. LD mapping and association genetics are key tools in correlating such sequence variation with observed trait variation. Unlike marker-trait associations from pedigreed QTL detection populations (i.e., families), associations derived from association genetics have applicability for both within- and among-family se- lection. The term gene-assisted selection (GAS) has been used to describe this method ofselection (Wilcox et al. 2003, 2006; Wilcox and Burdon 2006); it dif- ferentiates the manner in which markers are found (i.e., via association genetics) and utilized from MAS (above).
Because association genetics is relatively new to forest trees (Neale and Savolainen 2004; Wilcox and Burdon 2006; Wilcox et al. 2006) - and many other plant species (Flint-Garcia et al. 2003) -very few quan- titative analyses have been undertaken to date that involve detailed specific strategies for incorporation into tree breeding programs. Wilcox et al. (2006) de- scribed a range of applications within tree breeding programs, which are summarized below.
Conifer breeding programs can be generically characterized as consisting of highly heterozygous genotypes in hierarchically arranged (and managed) populations, with multitrait breeding objectives. To be effective, marker-trait associations derived from as- sociation genetics must integrate within this scheme, as with MAS. A key generic benefit of GAS in this regard is application to both within- and among- family selection, in contrast to MAS, which is re-

68 C. Plornion et al.
stricted to those families in which the associations have been detected. Association genetics, therefore, has application to all levels of population hierarchies, from essentially unimproved germplasm, through to advanced-generation lines developed for clonal de- ployment.
A further benefit would be selection at the seedling stage, much sooner than full trait expression - as with MAS. For most commercially important pine species, phenotypic selection is applied at 6 to 12 years of age, with the onset of reproductive competency occurring slightly earlier. Opportunity exists for early selection to either increase selection intensities via a multistage approach as with MAS (Wu 2002) or undertake an additional round of selection prior to finalizing geno- types for deployment (Wilcox et al. 2001b). Where on- set of reproductive maturity precedes trait expression, there is also opportunity to reduce breeding-cycle length, although this would require known marker- trait associations for at least the majority of traits in the breeding objective(s). The opportunity for selec- tion among as well as within families provides even greater opportunity to shorten breeding cycles com- pared to MAS.
An additional benefit is cost reduction relative to phenotypic selection. Once marker-trait associations are detected, genotyping costs are generally some- what lower as compared to phenotypic evaluation. Such evaluations, however, are considerably more ex- pensive than obtaining sufficient markers for genome coverage for linkage and QTL mapping as well as for MAS purposes, as virtually all polymorphisms within and associated with expressed genes need to be de- tected - which, on a whole-transcriptome basis, en- tails major effort. Such information nonetheless has other potential applications (e.g., prescreening genes for genetic modification experiments), so the costs could be spread over several funding sources and ap- plications.
Because of the breadth of potential selection ap- plications within any one breeding program, as well as the fact that conifer breeding programs all differ in some regard from one another, the application of as- sociation genetics will need case-by-case evaluation - as has been the case with MAS - ultimately needing numerical simulation to evaluate different scenarios. However, although a number of breeding programs are involved in some of the basic research required for detecting marker-trait associations, as yet there are no published reports of evaluations of strategies that incorporate association genetics within conifer
breeding programs. We expect this will change as re- sults from association genetics and LD experiments become available.
Indeed, the outlook from results to date is cau- tiously favorable, as marker-trait associations have been reported for a number of tree species, includ- ing l? taeda (Brown et al. 2004), l? radiata (Cato et al. 2006b), and Eucalyptus nitens (Thumma et al. 2005), although all of these need to be independently veri- fied. Results from a range of other plant species are also emerging (see Gupta et al. 2005 for a review), also with encouraging messages.
Given the size of gymnosperm genomes and the lack of widespread genomic DNA sequence for most hardwood species, it appears that sequences within and associated with expressed genes are likely to be investigated. But how should such sequences be cho- sen? Possible approaches are as follows.
- Identifying gene sequences using EST libraries from both angiosperms and conifers, and complete genomic sequences from model angiosperm species to select numerous genes for high- throughput (re)sequencing. This approach is being used in l? taeda (see http://dendrome.ucdavis.edu/ adept2).
- Expression information at the mRNA level, via in silico expression profiling or application of a num- ber of gene expression profiling technologies. Protein-expression information is also available for some species.
- Selecting genes on the basis of biochemical role(s) andlor known sequence motifs.
- Information from colocalization of expressed genes and QTL from pedigreed QTL mapping popula- tions, within either the species of interest or related species.
- Combinations of the above, for example gene- or protein-expression information combined with QTL mapping (Kirst et al. 2004).
- Genes shown to be involved in trait variation via genetic modification experiments.
Technical advances in "omics" technologies may also offer a number of other approaches.
The undoubted importance of comparative ge- nomics, especially for establishing gene function, means that genomic information is needed on other species, in addition to the classical model species like Arabidopsis. This need is actually being met, to some degree at least. In conifers, parallel research is pro- ceeding in £? radiata in Australasia, E! taeda in the

Chapter 2 Pines 69
southeastern USA, and I! pinaster in Europe. The ev- idently close synteny among these species promises great opportunities to apply genomic information on any one species to the others. Using these as model species within conifers should allow one to capital- ize on the most favorable model features of all the species at once. Similarly, whole-genome sequences of Populus and EucaIyptus will allow for even more rapid advances in these species.
Should association genetics be utilized by tree breeders, then a number of other requirements need to be addressed. These include:
- Populations and analytical methods for adequate detection of marker-trait association (see Ball 2005),
- Suitable laboratory and bioinformatics capabilities functionally integrated into tree-improvement pro- grams, and
- Development of strategic alliances among appro- priate entities to effectively manage resource asso- ciation genetics programs in a manner that allows operational implementation.
The above issues are discussed in more detail by Wilcox et al. (2006).
2.4.5 Summary of Applications of DNA Polymorphisms in Conifer Breeding
Information from DNA polymorphisms has a wide range of applications for tree improvement, including quality control, pedigree reconstruction, elucidation of genetic phenomenon, monitoring and maintenance of genetic diversity, and selection and breeding based upon polymorphisms associated with trait variation. To date, only some of these applications have been im- plemented in operational breeding programs - largely those associated with quality control. Some potential applications, such as association genetics and pedi- gree reconstruction as part of operational testing, are largely in the research and development phase, while others such as within-family MAS have been suffi- ciently evaluated to identify at least some strategies for implementation. The lack of uptake across the spec- trum of potential applications is likely due to cost, which is particularly important in tree-improvement programs, which usually take years to recoup such costs. Nonetheless, technological advances will in- crease the scope of applications for tree improve- ment.
2.5 Genomics Resources for the Genus Pinus
2.5.1 Efforts Toward Complete Genome Sequencing
BAC Libraries Large-insert genomic DNA libraries in which each DNA clone is stored and archived individually (i.e., ordered libraries) are a fundamental tool in mod- ern genomics research. The most popular large-insert vector is the bacterial artificial chromosome (BAC), which, despite its name, is not a chromosome but rather a modified bacterial plasmid (F-factor) that can stably carry large inserts (ca. 50 to 400 kb) (Zhang and Wu 2001). BAC libraries have been made for a host of taxa and employed in a variety of applications (re- viewed by Zhang and Wu 2001).
Despite the importance of pine and other conifers and the value of BAC libraries to genomic research, BAC resources are extremely limited for gymnosperms. To our knowledge, there are three gymnosperm BAC libraries in existence - all of them for pine. The first pine BAC library, constructed by Islam-Faridi et al. (1998), affords 0 . 0 5 ~ coverage of the I! taeda genome. A second library, developed by Claros et al. (2004) for I! pinaster, provides considerably higher genome coverage (0.32 x ), although the probability of finding a gene of interest is still relatively low (27%). However, the I? pinaster library is reportedly being expanded to 3x (Claros et al. 2004), which would provide 95% probability of finding a given genome sequence (Fig. 3). In September 2004, the US National Science Foundation funded a 3-year project that included construction of a lox BAC library from the I! taeda genotype "7-56" (Peterson et al. 2005) as a primary objective (Fig. 4). When completed, this library will be, to our knowledge, the single largest BAC library ever made with roughly 1.7 to 2 million individual clones. As of this writing, the 7-56 BAC library affords 2x coverage of the pine genome. When the 7-56 library reaches 3x coverage (ca. June 2006), it will be gridded onto BAC macroarrays and screened with STS and molecular genetic markers including those associated with genes of economic importance. The resulting information will be utilized to isolate and sequence intact pine genes. Additionally, marker localization will represent the start of STS-based

70 C. Plomion et al.
Genome coverage (X)
Fig. 3. The relationship between genome coverage ( x ) provided by a BAC library and the probability (p) of finding a particular sequence of interest in that library. A 0 . 0 5 ~ BAC library, like the F! taeda BAC library generated by Islam-Faridi et al. (1998), affords only a 4.8% chance (p = 0.048) of finding a sequence of interest (triangle), while a 0.32 x library, like the current I! pinaster library (Claros et al. 2004), affords a considerably better chance (p = 0.27; circle). The I! taeda 7-56 library (Peterson et al. 2006) currently has a size of 2 x (p = 0.86; four-point star) and will be used to isolate genes of interest once it reaches 3x coverage (p = 0.95;five-point star). At l o x coverage (p = 0.9999; eight-point star), the I! taeda 7-56 BAC library will be of adequate size for essentially any use including genome-wide physical mapping and genome sequencing
physical mapping in pine. Comparison between the P. pinaster and P. taeda libraries should provide considerable insight into genome evolution within Pinus.
Need for Pine Genomic Sequence Although EST sequencing in pine is relatively ad- vanced (Sect. 2.5.2), there are few genomic sequence data available for pine or any other gymnosperm. As of 6 March 2006, the longest continuous gym- nospermlconifer genomic sequence in GenBank was only 6,884 bp. While ESTs provide the coding regions of many expressed genes, an understanding of gene function and regulation requires knowledge of those noncoding sequences that coordinate gene expression in response to biotic and abiotic cues (e.g. promoters, enhancers, silencers). Such information necessarily comes from sequencing genomic DNA.
As the pine genome is ten times larger than that of maize (the largest plant genome to be the target of a full-scale genome sequencing effort, NSF 2005), it may be a while before whole-genome sequencing of pine becomes a reality. Nonetheless, pine genomics can be greatly advanced by even relatively modest se- quencing of genomic DNA, especially sequencing of large continuous pieces of DNA such as BAC inserts. The following are just a few areas of pine genome re- search that will benefit from more extensive sequenc- ing of genomic DNA.
- Genome structure: Very little is known about the structure of any conifer genome, and relationships between genes, repeats, and pseudogenes have only been tangentially explored (e.g., Elsik and Williams 2000; Rabinowicz et al. 2005 ; Peterson et al. 2006). BAC and shotgun sequencing of pine DNA will pro- vide a more detailed understanding ofthe sequence structure of the pine genome. Such information will be essential in the development of an efficient strat- egy for sequencing the gene space of pine.
- Diflerential gene expression: The lack of genomic sequence for pine has severely limited the study of the noncoding regulatory regions of its genes. Information on these regions is essential if we are to understand differential gene expression in pine and manipulate conifer genes in a useful and controllable manner (No et al. 2000). To deter- mine the general tissue/development/environment specificity of the regulatory sequences for a given gene, the expression profiles of that gene can be examined; since there is already a considerable amount of expression profile data available (e.g., Egertsdotter et al. 2004; Lorenz et al. 2006), asso- ciating regulatory sequences with specific tissues and/or developmental events could be initiated im- mediately after sequencing. Comparison of regula- tory sequences from genes with similar expression patterns can be used to gain insight into the ac-

Chapter 2 Pines 71
Fig. 4. Constructing the Pinus taeda 7-56 BAC library. A GenetixQPixII robot picks 7-56 BAC colonies off of agar in a "Q-Tray." Picked clones are used to inoculate media in 384-well microtiter plates (left side of image)
tivationlrepression mechanisms underlying major developmental events.
- Comparative genomics of conifers: Pine BACIshotgun sequences and comparative ge- nomic approaches can be utilized to advance the study of other gymnosperm genomes, which will afford considerable insight into the evolution of this important group of organisms. Comparison of orthologous regions of conifer genomes (e.g., through sequencing of BACs and/or BAC contigs recognized by common markers) will provide high-resolution means of investigating conifer sequence evolution (see Stirling et al. 2003 and Yan et al. 2004 for angiosperm examples).
- Gymnosperm/angiosperm comparisons: Infor- mation garnered from pine genomic sequence should provide nearly limitless opportunities to explore comparative genome evolution between gymnosperms and angiosperms. BAC sequences from pines can be compared with existing plant genome sequences as a means of evaluating macro- and microsynteny as well as sequence conserva- tionldivergence between pines and angiosperms. As pine has been widely used as an outgroup in angiosperm comparative research, pine genomic sequences should enable investigations by many angiosperm research groups throughout the world.
- Polymorphism discovery and characterization: EST sequencing has afforded tremendous insight into polymorphisms within the coding sequences of
pine genes (e.g., Krutovsky et al. 2004; Le Dantec et al. 2004). However, sequence changes in the non- coding regulatory regions of pine genes may pro- vide as much, if not more, information on pheno- typic diversity than coding sequence.
- Association mapping: Relatively long DNA stretches produced by BAC sequencing will facil- itate genomewide studies of LD, which, in turn, will fuel association mapping projects (e.g., Brown et al. 2004; Krutovsky and Neale 2005).
- Sequencing adaptive and economic genes of pine: There is considerable interest in sequencing intact genes of economic importance andlor particular value to coniferlgymnosperm research. Potential target genes include those associated with outcross- ing (Williams et al. 2001), embryogenesis (Ciavatta et al. 2001), disease resistancelsusceptibility (e.g., Devey et al. 1995; Morse et al. 2004; Kayihan et al. 2005), abiotic stress resistance (e.g., Chang et al. 1996; Dubos and Plomion 2003; Dubos et al. 2003 ; Krutovsky and Neale 2005; Lorenz et al. 2006), and wood properties (Brown et al. 2003; Devey et al. 2004a; Krutovsky and Neale 2005; Pot et al. 2005b). Complete gene sequences can be utilized to explore pinelconifer evolution and facilitate pine improve- ment through traditional breeding, marker-aide se- lection, and genetic engineering. Of note is the fact that a BAC containing a target gene may well contain other genes of interest. The study of these "bonus" genes will likely be as important as studying target genes themselves.

72 C. Plomion et aL
- Exploring the evolution of repeat sequences: Re- cently a 454 Life Sciences Genome Sequencer 20 (Margulies et al. 2005) was used to generate 100 Mb of sequence from the J! taeda genotype 7-56 (Pe- terson et al. 2006). This sequence should provide considerable insight into pine genome structure, although the short length of 454 reads (ca. 100 bp each) limits the utility of the sequence. While pseu- domolecule contigs have been assembled, 100 Mb affords only 0.046 x coverage of the pine genome, and consequently it is likely that any 454 contig of significant length is a conglomeration of sequences in a repeat sequence family rather than an individu- al element found in native DNA. However, repeat sequences obtained from sequenced BACs and/or contigs assembled from Sanger/capillary shotgun reads can presumably be used as scaffolds on which 454 reads can be aligned. The depth and shape of the resulting alignments should permit detailed analy- sis of the evolution of major repeat-sequence fami- lies in pine.
- Genetic engineering: Regulatory sequences obtained from genomic sequences can be at- tached to reporter genes and used to study promoter/regulator specificities (e.g., No et al. 2000). Such testing will provide insight into pine gene regulation, which will eventually enable insertion of constructs containing pine promoters and genes/alleles of value into conifers. In addition, the genomic sequences can serve as sources of molecular markers that can be utilized in tree improvement through MAS.
Physical Mapping Given the enormous size of the pine genome and the time and financial resources required to conduct phys- ical mapping research, it is likely that complete phys- ical mapping of the pine genome will be too costly to pursue, at least with present technology. Because DNA sequencing technologies are advancing rapidly (e.g., Margulies et al. 2005), it is probable that complete shotgun sequencing of the pine genome will become affordable before complete physical mapping does. However, physical mapping of gene-rich genomic re- gions has been utilized to advance understanding of important chromosomal regions in many species (e.g., Folkertsma et al. 1999; Sanchez et al. 1999; Dilbirligi et al. 2004; Barker et al. 2005), and indeed, physical mapping of gene-rich regions is a goal of the re- search group constructing the J! taeda 7-56 BAC li- brary.
Sequencing the Pine Genome
C. Plomion: Will the pine genome be sequenced? D.G. Peterson: Yes. C. Plomion: When? D.G. Peterson: Not this week.
The complete sequencing and assembly ofthe Ara- bidopsis and rice genomes have afforded considerable insight into the evolution of higher plants including pines. For example, Kirst et al. (2003) compared the genome sequence of Arabidopsis with pine ESTs and showed that gymnosperms and angiosperms pos- sess highly similar gene complements. Other plant genomes, most notably poplar, sorghum (Sorghum bicolor L.), and maize (Zea mays L.), are current subjects of full-scale genome sequence efforts, and the genome sequences of these plants will further facilitate understanding of plant genome evolution and function (Paterson et al. 2005). The poplar se- quence, in particular, may provide information that will help advance understanding of wood formation in trees (Tuskan et al. 2004). However, angiosperms and gymnosperms diverged from a common ances- tor more than 300 million years ago (Bowe et al. 2000), and consequently the utility of angiosperm sequences in the study of pine and other gymnosperms will be limited. Ultimately, the best means of advancing pine and conifer genomics is complete sequencing of a conifer genome. While it is now theoretically fea- sible to sequence the genome of any organism, the large, repetitive nature of conifer genomes will likely prevent them from being targets of full-scale genome sequencing for at least a few years. However, the like- lihood that the pine genome will be sequenced is high based upon past and present investments made by the NSF (including construction of the I? taeda 7-56 BAC library) and other granting agencies and growing worldwide interest in pine as a biofuel/carbon seques- tration crop (Jackson and Schlesinger 2004; Perlack et al. 2005).
While whole-genome sequencing may have to wait, sequencing of gene-rich BACs is likely to begin in relatively short order. Additionally, reduced-representation sequencing (RRS) methods (see Peterson 2005 for review) are being used to investigate sequence subsets of the pine genome and are likely to play a role in eventual whole-genome sequencing as well. Two RRS techniques that have been successfully utilized in maize genome ex- ploration are methylation filtration (MF) and Cot

Chapter 2 Pines 73
filtration (CF)' (Whitelaw et al. 2003; Springer et al. Lamoureux et al. 2005) or used directly as a pyrose- 2004). quencing substrate. With regard to the latter op-
- MF is based on the preferential hypermethylation of retroelements and hypomethylation of genes ob- served in some plants (Rabinowicz et al. 1999). In MF, genomic DNA fragments are ligated into a plas- mid containing an antibiotic-resistance gene and the resulting recombinant molecules are used to transform a bacterial strain containing enzymes that preferentially cleave hypermethylated DNA. Linearization of a hypermethylated recombinant molecule results in its loss and makes its host
tion, Peterson et al. (2006) recently sequenced Cot- filtered I? taeda 7-56 DNA including isolated highly repetitive, moderately repetitive, and low-copy se- quences using the new 454 Life Sciences Genome Sequencer 20 (see Margulies et al. 2005 for details on this instrument). These data are currentlybeing evaluated, although initial results look promising. CF has proven highly effective in wheat, where it provides 19.5-fold enrichment for low-copy DNA (Lamoureux et al. 2005).
cell susceptible to an antibiotic in the growth medium. Consequently, only hypomethylated se- 2.5.2 quences are successfully cloned. While a useful Genomic Tools to Identify Genes
gene-enrichment tool in maize and sorghum (Ra- of Economic and Ecological Interest
binowicz et al. 1999; Bedell et al. 2005), MF has proven considerably less effective when applied to Characterization of the Pine Gene Space
the "mega genomes" of pine and wheat (Rabinow- A large-scale expressed sequence tag (EST) sequenc-
icz et al. 2005). ing project can generate a partial sequence for a large
- CF is rooted in the principles of Cot analysis, the proportion of genes from a given organism (Adams
study of DNA reassociation in solution (Peterson et al. 1991). As only genic sequences are analyzed re-
et al, 2002). men sheared DNA is heated to OC, gardless of genome size, this approach is considered
the two complementary strands of each double he- the most cost-efficient strategy of gene discovery for
lix come apart in a process known as denatura- organisms whose genome sequences are not yet avail-
tion. If the denatured DNA is slowly cooled, com- able (Rudd 2003), especially for species, such as pines,
plementary DNA strands find each other and form with exceedingly large genomes primarily composed
double helices (duplexes). The rate at which a par- of nongenic repetitive elements. For this reason, such
ticular DNA sequence finds a complementary se- projects have been initiated for many organisms in-
quence with which to pair is proportional to the cluding the numerous agronomically important plant
number of times that sequence (and hence its com- species (Rounsley et al. 1998). To rapidly scan for all
plementary sequence) is found within the genome. the protein coding genes and to provide a sequence
In other words, repetitive sequences renature more tag for each gene of the pine genome, large collections
quickly than low-copy sequences. In CF, sheared of ESTs has been developed in l? taeda and, to a lesser
genomic DNA is denatured and allowed to reas- extent, in l? pinaster.
sociate for a period of time in which only repet- itive DNA sequences are likely to form duplexes. The double-stranded repetitive DNA is then sepa- rated from single-stranded low-copy DNA using hy- droxyapatite chromatography. The low-copy DNA andlor the repetitive DNA can then be cloned and sequenced (Peterson et al. 2002; Yuan et al. 2003;
Cot filtration was originally called "Cot-Based Cloning and Sequencing" (CBCS; Peterson et al. 2002) and later "high Cot" (HC; Yuan et al. 2003) sequencing. However, the term "Cot filtration" and the acronym CF are becoming more widely used because (a) the acronym "CBCS" can also stand for "clone-by-clone sequencing:' (b) "high Cot" is frequently confused with "high copy:' and (c) Cot components may be sequenced without prior cloning (Peterson et al. 2006).
Loblolly pine ESTs Three major EST sequencing projects, mainly funded by the NSF, have been conducted so far in I? taeda. A first project, "Ge- nomics of wood formation in Loblolly pine:' was concerned with gene discovery in wood formation (http://pinetree.ccgb.umn.edu/). It resulted in ca. 60,000 ESTs placed in the public domain. A second project, entitled "Transcriptome responses to envi- ronmental conditions in Loblolly pine roots:' aimed at completing this information by targeting especially roots undergoing a variety of biotic and abiotic stresses (http://fungen.org/Projects/Pine/Pine.htm). It resulted in 140,000 additional ESTs. A third project, "Genomics of Loblolly pine embryo- genesis:' seeks to identify and characterize

74 C. Plomion et al.
Fig. 5. Pine sequence 400000 resources available at EMBL 350000 (www.ebi.ac.uWsrs), on 28 300000 February 2006 250000
200000 150000 100000 50000
0 CO m 0 r N m d V) cD Q) m 0 0 0 0 0 0 0
z! z! 0 0 0 0 0 0 0 (V N N N N N N
an additional 85,000 ESTs derived from so- unigene set of 45,500 genes (http://www.tigr.org/tigr- matic and zygotic embryos (http://www.tigr.org/ scripts/tgi/T-index.cgi?species=pinus), representing tdb/e2kl/pine/inde~.shtml). probably a major fraction of the coding genome of
pine. This resource has laid the foundation for fu- Maritime pine ESTs Early molecular biology ture identification, characterization, and cloning of studies paved the way for the construction of cDNA economically important genes in pines and should libraries from different woody tissues (Cant611 provide breeders with a wealth of information to sig- et al. 1993; Garcia-Gutibrrez et al. 1995), roots nificantly enhance and speed up the breeding pro- (Dubos and Plomion 2003) and buds (C. Collada, cess. M.A. Guevara, and M.T. Cervera, unpublished Besides this resource, a significant number of ESTs results) of maritime pine. Funded by the European have not been released yet in the public domain and Union (GEMINI project), INRA (lignome project), are mainly held by private companies. For instance, and CNS (ForEST project), 28,000 high-quality Strabala (2004) reported that in August 2001,344,279 sequences have been generated in about equal ESTs from l? radiata were sequenced by AgriGenesis number from wood-forming tissues, roots, and buds. Biosciences Ltd. based in New Zealand. These ESTs have been made available at the EMBL database and at the following URL: http://cbi.labri.fr/ Microarrays: New Noels to Study the Functioning outils/SAM/COMPLETE/. The l? pinaster CDNA of the Pine Genome clones are available for the scientific community, ESTs represent snapshots of the genes expressed in at the Platform for Integrated Clone Management a given tissue or at a given developmental stage and PICME Web site (http://www.picme.at/). A Web- provide a good representation of the expressed re- based environment for assembly and annotation of gions of the genome if a sufficient number of different collections of ESTs (Le Provost et al. in prep.) was libraries from a range of tissues and developmen- used to analyze the F? pinaster ESTs. tal stages and after various environmental challenges
are analyzed. To this end, several cDNA libraries A comprehensive unigene assembled for the user have been produced from pine roots, needles, dif- community The number of pine ESTs in public ferentiating xylem, and buds (see previous section). databases has increased dramatically during the past These genes have enabled the development of mi- decade (Fig. 5), especially for l? taeda, ranking at croarrays to identify genes whose expression varies the 19th position in dbEST with 329,469 ESTs, and in response to various environmental and develop- to a lesser extent for l? pinaster (about 28,000 ESTs). mental cues (mainly drought-stress response and The other pine species, l? elliottii, P. banksiana, l? pat- wood formation). These studies, which will likely ula, and l? sylvestris, represent less than 2,000 se- increase in the future, are listed in Table 6 with quences. In 2005, the Pinus genus was introduced others that have used other transcriptomic (SAGE, in the TIGR gene index (Quackenbush et al. 2001), SSH, cDNA-AFLP) and proteomic (2D PAGE MSIMS) where a comprehensive collection of all publicly avail- approaches to study the functioning of the pine able pine ESTs has been clustered into a tentative genome.

Table 6. Transcriptome and proteome analysis in pines
Species Methodology Study Tissue Authors
I! contorta Microarrays Adventitious root development Roots Brinker et al. 2004
I! halepensis, I! taeda cDNA library, Northern blot, Drought response in two Roots, needles Sathyan 2005 RT-PCR pine species
l? pinaster cDNA-AFLP, reverse Northern Drought response Roots Dubos and Plomion 2003
I! pinaster cDNA-AFLP, reverse Northern Drought response Needles Dubos et al. 2003
l? pinaster cDNA library Bud phenology Buds at different developmental Collada, Guevara, and Cerera, stages unpublished results
I! pinaster Six SSH cDNA libraries Wood formation Early vs. late, juvenile vs. mature Pacheco et al. 2005 wood-forming tissues.
I! pinaster cDNA-AFLP; reverse Northern; Wood formation Early vs. late, opposite vs. Le Provost et d. 2003 RT-PCR compression wood-forming tissues
I! pinaster cDNA library Wood formation Composite xylem tissues Cant6n et al. 2003
I! pinaster EST sequencing, microarrays, Wood formation Early vs. late, juvenile vs. mature Paiva 2006 qPCR wood-forming tissues and
8 different organs I! pinaster EST sequencing, macroarrays, Drought response in two ecotypes Roots Chaumeil2006
qPCR, 2DE MSlMS I? pinaster 2DE, tandem MS Wood formation Wood-forming tissues Gion et al. 2005
I? pinaster 2DE, micro-sequencing Drought response Needles Costa et al. 1998
I! pinaster 2DE, micro-sequencing Wood formation compression and opposite wood Plomion et al. 2000 forming tissues
E? pinea ~o SSH cDNA libraries Cytokinine induction of Cotyledons Alonso, Cantbn, Ordbs, adventitious buds unpublished results
I! sylvestris cDNA library Nitrogen and carbon assimilation Cotyledons Avila et al. 2000
I! radiata CAGE Wood formation Wood-forming tissues Cato et al. 2006a
E? radiata Three SSH cDNA libraries Adventitious rooting capacity Rooting competent tissues Sitnchez et al. 2005
I! taeda Differential screening, Drought response Needles, stems, roots Chang et al. 1996 northern blot
I! taeda Microarrays Wood formation Wood-forming tissues Yang and Loopstra 2005
E? taeda Microarrays Drought response and recovery Needles Watkinson et al. 2003
l? taeda Microarrays Drought response Needles, rooted cuttings, Heath et al. 2002 2 unrelated genotypes
C]
kr 2 R N
5 2
u U1

Table 7. (continued)
Species Methodology Study Tissue Authors
I! taeda Differential display Response to galled tissues Healthy and galled stem Warren and Covert 2004 I! taeda 0.35k microarrays; qRT-PCR Wood formation Unlignified early and latewood xylem: Egertsdotter et al. 2004
cambial region and developing secondary nonlignified xylem
I! taeda cDNA and subtractive Libraries; Wood formation Compression and opposite wood Allona et d. 1998 EST sequencing; Northern blot
l? taeda EST sequencing, microarray Wood formation Different tissues and organs, Whetten et al. 2001 including several types of differentiating xylem samples
I! taeda SAGE profiling Wood formation Juvenile and mature wood formatting Lorenz and Dean 2002 tissues
I! taeda cDNA library; EST sequencing, Wood formation Six types of wood forming tissues Kirst et al. 2003 comparative sequence analysis
I! taeda Microarray, qRT-PCR Identification of genes preferentially Differentiating xylem, needles, Yang et al. 2004 expressed in P. taeda megagametophytes, embryo
(growing radicule)
I! taeda Comparative sequence analysis, Computational analysis of transcript Differentt typoes of wood-forming Pavy et al. 2005 digital profiling accumulation in xylem. tissues
I! taeda EST sequencing, in silico detection Drought response Roots Lorenz et al. 2005
of differentially expressed genes I! taeda, I! sylvestris, Macroarrays Heterologous arrays Needles van Zyl et al. 2002
I! abies I! taeda Microarrays Disease resistance Stem (infection court) Myburg et al. 2006
I! elliottii Microarrays Disease resistance Stem (infection court) Morse et al. 2004 var. eliottii
.-
u Ch
n # 5. s % 3

Chapter 2 Pines 77
2.6 Future Perspective: Challenges for Molecular Breeding of Pines
Pines offer a great opportunity for molecular breed- ing given their large size and long generation interval. The large size causes inefficiencies in progeny testing and concomitant decreases in heritability of traits. Molecular-marker information can reduce these inef- ficiencies and effectively increase heritability, leading to more accurate selections and commensurate in- creases in genetic gain (Fernando and Grossman 1989; Lande and Thompson 1990; Hospital et al. 1997). The long generation intervals cause delays in obtaining genetic gain. Savings of many years in the breeding cycle can easily be envisioned if selections can be based on DNA marker information collected at a very early age as opposed to phenotypes measured much later (Williams and Neale 1992). However, these gains can only be achieved if breeding can commence very soon after the selections are made. This has tradi- tionally been known as accelerated breeding, and it is a critical, complementary technology (e.g., Bramlett and Burris 1995).
While the opportunity for increased genetic gain per year is great, major challenges to implement molecular breeding include pines' highly heterozy- gous, outbreeding nature and the presence of low levels of LD in natural populations (Strauss et al. 1992; Brown et al. 2004). Each of these factors limits the op- portunity for finding QTLs by association (Kruglyak 1999; Hirschhorn and Daly 2005) or candidate-gene (Pflieger et al. 2001; Neale and Savolainen 2004) map- ping approaches, and for extending QTL results from one pedigree to another within a breeding population. However, given very dense genetic maps or good leads about possible candidate genes, these low LD levels allow for the possibility of discovering tight linkages to important genes. These close linkages should be generally useful across the population for predicting genetic value and implementing molecular breeding.
The challenge in moving forward lies in the devel- opment of powerful genetic markers and maps and populations providing genetic information on traits of interest (e.g., Georges et al. 1995; Farnir et al. 2002; Laurie et al. 2004). These populations can include both pedigreed and nonpedigreed populations, and both are valid for the application of molecular breeding. Pedigreed populations place and maintain large re-
gions of the genome in LD, allowing for the tracking of most regions with mapped genetic markers (Lander andBotstein 1989). Once certain regions are identified as causing (or at least being predictive of) significant variation in the phenotype, marker alleles for these regions can be selected for two or more successive generations, thereby increasing the frequency of fa- vorable alleles in the population (Edwards and Page 1994; Hospital et al. 2000). One such view of this for pine breeding is termed marker-directed population improvement (MDPI) (Nelson and Echt 2003,2004).
Nonpedigreed populations provide an opportu- nity for tracking very small regions across the genome (Hirschhorn and Daly 2005). These are the regions that have remained in LD for a very long time, pos- sibly since the creation of the DNA polymorphism used as the genetic marker or the gene mutation it- self. Extremely dense genetic maps are required for mapping QTLs in nonpedigreed populations through a genome-scan analysis (Kruglyak 1999). Testing spe- cific genes known as candidate genes for association to phenotype does not require a genetic map (Pflieger et al. 2001; Neale and Savolainen 2004). Instead, a hy- pothesis about what gene(s) might affect a trait's phe- notype is needed as well as markers that allow detec- tion of alternative alleles of the candidate gene(s) in the population (Krutovsky and Neale 2005).
The greatest opportunities for implementing molecular breeding exist in breeding programs that utilize best testing practices, including good experimental design, careful field site selection and maintenance, and high-quality measurements on all important traits (e.g., Stuber et al. 1999; Tanksley and Nelson 1996). Most of these programs will contain populations with pedigree structure, allowing for moderately dense genetic maps (10 to 20 cM spacing) to be used in various linkage-mapping approaches (Darvasi et al. 1993) including MDPI. In addition, all trees are drawn from a source population where tight linkages will be maintained over short recombination intervals, allowing for mapping by association through a genome-scan or candidate-gene approach (Wu et al. 2002; Lund et al. 2003).
Where no breeding program exists, large ran- dom mating populations could be established specifi- cally for association mapping and subsequent marker- assisted selection and breeding. These would most likely use candidate-gene methods, as candidate genes could be selected from first principles or knowledge of related species and then tested for association with phenotype in the target species and population. It

78 C. Plomion et al.
would seem that genome-scan approaches will only be viable in very intensively studied species where dense genetic maps will be developed. In all cases, highly ef- ficient DNA isolation and genotyping methods (e.g., Darvasi and Soller 1994; Mosig et al. 2001) and effec- tive database management and bioinformatic tools will be required for cost-effective implementation (Nelson 1997). Expected results include increased ge- netic gain per generation due to increased effective heritability and with accelerated breeding, increas- ing the number of generations per unit of time. In addition, traits that are difficult to measure can be improved more readily assuming they are measured and mapped in an early generation.
Acknowledgement. This work was funded in part by (A) ANR awards GENOQB (GNP05013) and DIGENFOR (ANR-05- GPLA-006-01) to C Plomion, (B) NSF award DBI-0421717 to DG Peterson, CD Nelson, and MN Islam-Faridi, (C) award RTA03-213 from the Programa Nacional de Recursos y Tecnologias Agroalimentarias (Ministerio de Educaci6n y Ciencia, MEC) to MT Cervera, (D) National Research Council of Italy (Commessa: "Evoluzione e analisi della diversiti genetica in piante forestal?') to GG Vendramin, (E) New Zealand Foundation for Research Science and Technology (FRST) contract C04X0207 to Scion (P.L. Wilcox and R.D. Burdon), (F) the Finnish Funding Agency for Technology and Innovation and by the Biosciences and Environment Research Council of Finland, to 0 Savolainen.
References
Adams MD, Kelley JM, Gocayne JD, Dubnick M, Polymeropou- 10s MH, Xiao H, Merril CR, Wu A, Olde B, Moreno RF, Kerlavage AR, McCombie WR, Venter JC (1991) Comple- mentary DNA sequencing: expressed sequence tags and human genome project. Science 2521651-1656
Aimers-Halliday J, Shelbourne CJA, Hong SO (1997) Issues in developing clonal forestry with P. radiata. In: Burdon RD, Moore JM (eds) "IUFRO '97 Genetics of Radiata Pine", Proc IUFRO Conf 1-4 Dec and Workshop 5 Dec, Rotorua, New Zealand. FRI Bull 203:264-272
Alazard P (2001) Genetic gain in seeds from first generation seed orchards of maritime pine. Informations Forests, Afo- cel, France, No 628
Alia R, Gil L, Pardos JA (1995) Performance of 43 Pinuspinaster provenances on 5 locations in Central Spain. Silvae Genet 4475-81
Alfa R, Moro J, Denis JB (1997) Performance of Pinus pinaster Ait. provenances in Spain: interpretation of the genotype- environment interaction. Can J For Res 221548-1559
Allona I, Quinn M, Shoop I, Swope K, ST-Cyr S, Carlis J, Rield J, Retzel E, Campbell M, Sederoff R, Whetten RW (1998)
Analysis of xylem formation in pine by cDNA sequencing. Proc Natl Acad Sci USA 95:9693-9698
Andrew RL, Peakall R, Wallis IR, Wood JT, Knight EJ, Foley WJ (2005) Marker-based quantitative genetics in the wild!: The heritability and genetic correlation of chemical defenses in Eucalyptus. Genetics 171:1989-1998
Apiolaza LA, Greaves BL (2001) Why are most breeders not using economic breeding objectives. In: IUFRO Symp "De- veloping the Eucalypt for the Future", 10-14 Sept 2001, Valdivia, Chile
Arcade A, Faivre-Rampant P, Le Guerroue B, Paques LE, Prat D (1996) Quantitative traits and genetic markers: analysis of a factorial mating design in larch. In: Ahuja MR, Boerjan W, Neale D (eds) Somatic Cell Genetics and Molecular Genetics of Trees. Kluwer, Dordrecht, pp 211-216
Arumuganathan K, Earle ED (1991) Nuclear DNA content of some important plant species. Plant Mol Biol Rep 9:208-218
Atwood RA, White TL, Huber DA (2002) Genetic parameters and gains for growth and wood properties in Floridasource loblolly pine in the southeastern United States. Can J For Res 321025-1038
Auckland L, Bui T, Zhou Y, Shepherd M, Williams CG (2002) Conifer Microsatellite Handbook. Corporate Press, College Station, TX
Avila C, Muiioz-Chapuli R, Plomion C, Frigerio J-M, Czinovas FM (2000) ltvo genes encoding distinct cytosolic glutamine synthetases are closely located in the pine genome. FEBS Lett 472237-243
Bahrman N, Damerval C (1989) Linkage relationships of loci controlling protein amounts in maritime pine (Pinus pinaster Ait). Heredity 63:267-274
Ball RD (2001) Bayesian methods for quantitative trait loci mapping based on model selection: approximate anal- ysis using the Bayesian Information Criterion. Genetics 159:1351-1364
Ball RD (2005) Experimental designs for reliable detection of linkage disequilibrium in unstructured random population association studies. Genetics 170:859-873
Barker CL, Donald T, Pauquet J, Ratnaparkhe MB, Bouquet A, Adam-Blondon AF, Thomas MR, Dry I (2005) Genetic and physical mapping of the grapevine powdery mildew resis- tance gene, Runl, using a bacterial artificial chromosome library. Theor Appl Genet 11 1:370-377
Beaulieu J, Plourde A, Daoust G, Lamontagne L (1996) Ge- netic variation in juvenile growth of Pinus strobus in replicated Quebec provenance-progeny tests. For Genet 3:103-112
Beavis WD (1994) The power and deceit of QTL experiments: lessons from comparative QTL studies. In: Proc 49th Annu Corn and Sorghum Industry Res Conf, ASTA, Washington, DC, pp 250-266
Bedell JA, Budiman MA, Nunberg A, Citek RW, Robbins D, Jones J, Flick E, Rholfing T, Fries J, Bradford K, McMenamy J, Smith M, Holeman H, Roe BA, Wiley G, Korf IF, Rabinowicz PD, Lakey N, McCombie WR, Jeddeloh JA, Martienssen

Chapter 2 Pines 79
RA (2005) Sorghum genome sequencing by methylation filtration. PLoS Biol3:13
Bell JC, Powell M, Devey ME, Moran GF (2004) DNA profiling, pedigree lineage analysis and monitoring in the Australian breeding program of radiata pine. Silvae Genet 53:130-134
Blada I (1994) Inter-specific hybridization of Swiss Stone Pine Pinus cembra L. Silvae Genet 43:14-20
Borzan Z, Papes D (1978) Karyotype analysis in Pinus: contri- bution to the standardization ofthe karyotype analysis and review of some applied techniques. Silvae Genet 22144-150
Bowe LM, Coat G, depamphilis CW (2000) Phylogeny of seed plants based on all three genomic compartments: Extant gymnosperms are monophyletic and Gnetales' closest rel- atives are conifers. Proc Natl Acad Sci USA 924092-4097
Bradshaw HD, Foster GS (1992) Marker-aided selection and propagation systems in trees: advantages of cloning for studying quantitative inheritance. Can J For Res 221044-1049
Bramlett DL, Burris LC (1995) Topworking young scions into reproductively-mature loblolly pine. In: Weir RJ, Hatcher AV (eds) Proc 23rd South For Tree Improv Conf, Asheville, NC, pp 234-241
Brendel 0 , Pot D, Plomion C, Rozenberg P, Guehl JM (2002) Genetic parameters and QTL analysis of a13C and ring width in maritime pine. Plant Cell Environ 25:945-953
Brettschneider R (1998) RFLP analysis. In: Karp A, Isaac PG, In- gram DS (eds) Molecular Tools for Screening Biodiversity Plants and Animals. Chapman & Hall, London, pp 83-95
Brinker M, van Zyl L, Liu WB, Craig D, Sederoff RR, Clapham DH, von Arnold S (2004) Microarray analyses of gene ex- pression during adventitious root development in Pinus contorta. Plant Physiol 135(3):1526-1539
Brown GR, Kadel 111 EE, Bassoni DL, Kiehne KL, Temesgen B, van Buijtenen JP, Sewell MM, Marshall KA, Neale DB (2001) Anchored reference loci in loblolly pine (Pinus taeda L.) for integrating pine genomics. Genetics 159:799-809
Brown GR, Bassoni DL, Gill GP, Fontana JR, Wheeler NC, Megraw RA, Davis MF, Sewell MM, Tuskan GA, Neale DB (2003) Identification of quantitative trait loci influencing wood property traits in loblolly pine. 111. QTL verification and candidate gene mapping. Genetics 164:1537-1546
Brown GR, Gill GP, Kuntz RJ, Langley CH, Neale DB (2004) Nucleotide diversity and linkage disequilibrium in loblolly pine. Proc Natl Acad Sci USA 101:15255-15260
Burban C, Petit RJ (2003) Phylogeography of maritime pine inferred with organelle markers having contrasted inheri- tance. Mol Ecol 121487-1495
Burdon RD (1997) Genetic diversity for the future: conservation or creation and capture? In: Burdon RD, Moore JM (eds) "IUFRO '97 Genetics of Tadiata Pinen, Proc IUFRO Conf 1-4 Dec and workshop 5 Dec, Rotorua, New Zealand. FRI Bull 203:263-274
Burdon RD (2001) Genetic diversity and disease resistance: some considerations for research, breeding and deploy- ment. Can J For Res 32596-606
Burdon RD (2002) An introduction to pines. In: Pines of Silvi- cultural Importance. CABI, Wallingford, UK pp x-xxi
Burdon RD (2004) Breeding goals: Issues of goal-setting and applications. In: Walter C, Carson M (eds) Plantation For- est Biotechnology for the 21st Century, Research Signpost, Kerala, India, pp 101-1 18
Burdon RD, Bannister MH, Low CB (1992) Genetic Survey of Pinus radiata 4: variance structures and heritabilities in juvenile clones. NZ J For Sci 22187-210
Burdon RD, Firth A, Low CB, Miller MA (1998) Multi-site prove- nance trials of Pinus radiata in New Zealand. In: Forest Genetic Resources 26:3-8, FAO, Rome
Burdon RD, Gea LD (2006) Pursuit of genetic gain and biotic risk management for Pinus radiata in New Zealand. In: Proc 13th Australasian Plant Breed Conf, Christchurch, New Zealand pp 75-85, http:llwww.apbc.org.nz
Burdon RD, Kumar S (2003) Stochastic modelling of the impact of four generations of pollen contamination in unpedigreed gene resources. Silvae Genet 521-7
Burdon RD, Kumar S (2004) Forwards versus backwards se- lection: trade-offs between expected genetic gain and risk avoidance. NZ J For Sci 343-21
Burdon RD, Low CB (1992) Genetic survey of Pinus radiata. 6: Wood properties: variation, heritabilites, and interrela- tionship with other traits. NZ J For Sci 22228-245
Burdon RD, Miller IT (1992) Introduced forest trees of New Zealand: Recognition, role and seed source. 12. Radiata pine (Pinus radiata D. Don). NZ For Res Inst Bull 124112
PP 59 Byun KO, Kim MZS, Shim SY, Hong SH, Sohn SI (1989) Review
of pitch- loblolly hybrid pine (Pinus rigida and R taeda) breeding researches in Korea and future strategy. Res Rep, For Genet Res Inst, Korea 25204-211
Cahalan CM (1981) Provenance and clonal variation in growth, branching and phenology in Picea sitchensis and Pinus contorta. Silvae Genet 30:40-46
Cai Q, Zhang D, Liu ZL, Wang XR (2006) Chromosomal localiza- tion of 5s and 18s rDNA in five species of subgenus Strobus and their implications for genome evolution of Pinus. Ann Bot 97:715-722
Cinovas FM, Dumas-Gaudot E, Recorbet G, Jorrin J, Hans-Peter Mock HP, Rossignol M (2004) Plant proteome analysis. Proteomics 4285-298
Cant6n FR, Garcia-Gutibrrez A, Gallardo F, de Vicente A, CBno- vas FM (1993) Molecular characterization of a cDNA clone encoding glutamine synthetase from a gymnosperm: Pinus sylvestris. Plant Mol Biol22819-828
Cant6n FR, Le Provost G, Garcia V, Barre A, Frigerio J-M, Paiva J, Fevereiro P, Avila C, Mouret J-F, de Daruvar A, Cinovas FM, Plomion C (2003) Transcriptome analysis ofwood for- mation in maritime pine In: Espinel S, Barredo Y, Ritter E (eds) Sustainable Forestry, Wood Products and Biotechnol- ogy. DFA-AFA Press, Vitoria-Gasteiz, Spain, pp 333-347
Cato S, Mc Millan L, Donaldson L, Richardson T, Echt C, Gard- ner R (2006a) Wood formation from the base to the crownin


Chapter 2 Pines 81
Devey ME, Groom KA, Nolan MF, Bell JC, Dudzinski MJ, Old KM, Matheson AC, Moran GF (2004b) Detection and ver- ification of quantitative trait loci for resistance to Doth- istroma needle blight in Pinus radiata. Theor Appl Genet 108:1056-1063
Dhaka1 LP, White TL, Hodge GR (1996) Realized genetic gains from slash pine (Pinus elliottii) tree improvement. Silvae Genet 45:190-197
Dilbirligi M, Erayman M, Sandhu D, Sidhu D, Gill KS (2004) Identification of wheat chromosomal regions containing expressed resistance genes. Genetics 166461-481
Doudrick RL, Heslop-Harrison JS, Nelson CD, Schmidt T, Nance WL, Schwarzacher T (1995) Karyotype of slash pine (Pi- nus elliottii var elliottii) using patterns of fluorescence in situ hybridization and fluorochrome banding. J Hered 86:289-296
Drewry A (1982) G-banded chromosomes in Pinus resinosa. J Hered 73:305-306
Du Toit B, Smith C, Carlson C, Esprey L, Allen R, Little K (1998) Eucalypt and pine plantations in South Africa. In: Nambiar EKS, Cossalter C, Triarks A (eds) Workshop Proceedings. CIFOR, 16-20 Feb 1998, South Africa, pp 23-30
Dubos C, Plomion C (2003) Identification of water-deficit re- sponsive genes in maritime pine (Pinuspinaster Ait.) roots. Plant Mol Biol51(2):249-262
Dubos C, Provost G, Pot D, Salin F, Lalane C, Madur D, Frige- rio JM, Plomion C (2003) Identification and characteri- zation of water-stress-responsive genes in hydroponically grown maritime pine (Pinuspinaster) seedlings. Tree Phys- io123:169-179
Dvornyk V, Sirvio A, Mikkonen M, Savolainen 0 (2002) Low nu- cleotide diversity at thepall locus in the widely distributed Pinus sylvestris. Mol Biol Evol 19179-188
Echt CS, DeVerno LL, Anzidei M, Vendramin GG (1998) Chloro- plast microsatellites reveal population genetic diversity in red pine, Pinus resinosa Ait. Mol Ecol2307-317
Echt CS, Burns R (1999) PCR primer pair sequences and SSRs for various P. taeda ESTs. Available on the dendrome Web site at http:lldendrome.ucdavis.edulGen-res.htm, accessed 20 March 2006
Echt CS, Nelson CD (1997) Linkagemapping and genomelength in eastern white pine (Pinus strobus L.). Theor Appl Genet 94:1031-1037
Echt CS, Saha S, Deemer D, Nelson CD (2006) Evalua- tion of pine EST-SSR markers. In: Plant & Animal Genome XIV Conf, San Diego, W-117 (http:l/www.intl- pag.org/l4/abstracts/PAG14~Wll7.html, accessed 20 March 2006)
Edwards MD, Page NJ (1994) Evaluation of marker-assisted selection through computer simulation. Theor Appl Genet 88:376-382
Edwards MD, Stuber CW, Wendel JF (1987) Molecular-marker- facilitated investigations of quantitative-trait loci in maize. I. Numbers, genomic distribution and types of gene action. Genetics 116:113-125
Egertsdotter U, van Zyl LM, Mackay J, Peter G, Kirst M, Clark C, Whetten R, Sederoff R (2004) Gene expression during formation of earlywood and latewood in loblolly pine: ex- pression profiles of 350 genes. Plant Biol6654-663
Elsik CG, Williams CG (2000) Retroelements contribute to the excess low-copy-number DNA in pine. Mol Gen Genet 264:47-55
Elsik CG, Williams CG (2001) Low copy microsatellite recovery form a conifergenome. Theor Appl Genet 103:1189-1195
Emebiri LC, Devey ME, Matheson AC, Slee MU (1997) Linkage of RAPD markers to NESTUR, a stem growth index in radiata pine seedlings. Theor Appl Genet 95:119-124
Emebiri LC, Devey ME, Matheson AC, Slee MU (1998) Age- related changes in the expression of QTLs for growth in radiata pine seedlings. Theor Appl Genet 921053-1061
Epperson BK, Allard RW (1989) Spatial autocorrelation anal- ysis of the distribution of genotypes within population of lodgepole pine. Genetics 121:369-377
Falkenhagen E (1991) Provenanace variation in Pinus radiata at six sites in South Africa. Silvae Genet 40:41-50
Farjon A (1984) Pines. Drawings and description of the genus Pinus. Brill, Leiden
Farjon A (2001) World checklist and bibliography of conifers, 2nd edn. The Royal Botanic Gardens, Kew, UK
Farjon A, Styles BT (1997) Pinus (Pinaceae). Monograph 75, Flora Neotropica. New York Botanical Gardens, New York
Farnir F, Grisart B, Coppieters W, Riquet J, Berzi P, Cambisano N, Karim L, Mni M, Moisio S, Simon P, Wagenaar D, Vilkki J, Georges M (2002) Simultaneous mining of linkage and linkage disequilibrium to fine map quantitative trait loci in outbred half-sib pedigrees: revisiting the location of a quantitative trait locus with major effect on milk pro- duction on bovine chromosome 14. Genetics 161:275-287
Fernando RL, Grossman M (1989) Marker-assisted selection using best linear unbiased prediction. Genet Sel Evol 21:246-477
Fisher PJ, Gardner RC, Richardson TE (1996) Single locus mi- crosatellites isolated using 5' anchored PCR. Nucleic Acids Res 244369-4371
Fisher PJ, Gardner RC, Richardson TE (1998) Characteristics of single and multi-copy microsatellities from Pinus radiata. Theor Appl Genet 96:969-979
Flint-Garcia SA, Thornsberry JM, Buckler ES (2003) Structure of linkage disequilibrium in plants. Annu Rev Plant Biol 54357-374
Folkertsma RT, Spassova MI, Prins M, Stevens MR, Hille J, Goldbach RW (1999) Construction of a bacterial artificial chromosome (BAC) library of Lycopersicon esculentum cv. Stevens and its application to physically map the Sw-5locus. Mol Breed 5:197-207
Friesen N, Brandes A, Heslop-Harrison JS (2001) Diversity, ori- gin, and distribution ofretrotransposons (gypsy and copia) in conifers. Mol Biol Evol 18:1176-1188
Fulton TM, Van der Hoeven R, Eametta NT, Tanksley SD (2002) Identification, analysis, and utilization of conserved or-

82 C. Plomion et al.
tholog set markers for comparative genomics in higher plants. Plant Cell 14:1457-1467
Garcia-Gil MR, Mikkonen M, Savolainen 0 (2003) Nucleotide diversity at two phytochrome loci along a latitudinal cline in Pinus sylvestris. Mol Ecol 12:1195-1206
Garcia-Gutikrrez A, Cant6n FR, Gallardo F, SBnchez-Jimenez F, Chovas FM (1995) Expression of ferredoxin-dependent glutamate synthase in dark-grown pine seedlings. Plant Mol Biol27:115-128
Gaussen H (1960) Les Gymnospermes actuelles et fossils. Fas- cicule VI. Generalites, genre Pinus; Facultd des Sciences, Toulouse
Geada L6pez G, Kamiya K, Harada K (2002) Phylogenetic re- lationships of Diploxylon pines (subgenus Pinus) based on plastid sequence data.Int J Plant Sci 163:737-747
Geldermann H (1975) Investigations on inheritance of quanti- tative characters in animals by gene markers. I. Methods. Theor Appl Genet 46:319-330
Georges M, Nielsen D, Mackinnon M, Mishra A, Okimoto R, Pasquino AT, Sargeant LS, Sorensen A, Steele MR, Zhao X, Womack JE, Hoeschele I (1995) Mapping quantitative trait loci controlling milk production in dairy cattle by exploiting progeny testing. Genetics 139907-920
Gerber S, Rodolphe F (1994) An estimation of the genome length of maritime pine (Pinus pinaster Ait). Theor Appl Genet 88:289-292
Gerber S, Rodolphe F, Bahrman N, Baradat P (1993) Seed- protein variation in maritime pine (Pinus pinaster Ait.) revealed by two-dimensional electrophoresis: genetic de- terminism and construction of a linkage map. Theor Appl Genet 85:521-528
Gernandt DS, Geada Lopez G, Ortiz Garcia S, Liston A (2005) Phylogeny and classification of Pinus. Taxon 5429-42
Gernandt DS, Liston A, Pinero D (2003) Phylogenetics of Pi- nus subsections Cembroides and Nelsoniae inferred from cpDNA sequences. Syst Bot 28:657-673
Gion JM, Lalanne C, Le Provost G, Ferry-Dumazet H, Paiva J, Chaumeil P, Frigerio JM, Brach J, Barre A, de Daruvar A, Claverol S, Bonneu M, Sommerer N, Negroni L, Plomion C, Gion J-M, Lalanne C, et al. (2005) The proteome of mar- itime pine wood forming tissue. Proteomics 5:3731-3751
G6mez MA, Gonzdez-Martinez SC, Collada C, Climent J, Gi L (2003) Complex population genetic structure in the en- demic Canary Island pine revealed using chloroplast mi- crosatellite markers. Theor Appl Genet 107:1123-1131
Gonzdez-Martinez SC, Gerber S, Cervera MT, Martinez- Zapater J, Gil L, Alia R (2002) Seed gene flow and fine-scale structure in a Mediterranean pine (Pinus pinaster Ait.) using nuclear microsatellite markers. Theor Appl Genet 104:1290-1297
GonzAlez-Martinez SC, Robledo-Arnuncio JJ, Collada C, Diaz A, Wiiams CG, Alia R, Cervera MT (2004) Cross- amplification and sequence variation of microsatellite loci in Eurasian hard pines. Theor Appl Genet 109103-11
Gondlez-Martinez SC, Ersoz E, Brown GR, Wheeler NC, Neale DB (2006a) DNA sequence variation and selection of tag SNPs at candidate genes for drought-stress response in Pinus taeda. Genetics 172:1915-1926
GonzBlez-Martinez SC, Krutovsky KV, Neale DB (2006b) Forest- tree population genomics and adaptive evolution. New Phytol170:227-238
Govindaraju D, Lewis P, Cullis C (1992) Phylogenetic analysis of pines using ribosomal DNA restriction fragment length polymorphisms. Plant Syst Evol 179141-153
Grace SL, Hamrick JL, Platt WJ (2004) Estimation of seed dis- persal in an old-growth population of Longleaf Pine (Pi- nus palustris) using maternity exclusion analysis. Castanea 69:207-215
Grattapaglia D, Sederoff R (1994) Genetic linkage maps of Eu- calyptusgrandis and Eucalyptus urophylla using a pseudo- testcross mapping strategy and RAPD markers. Genetics 137:1121-1137
Greaves BL (1999) The value of tree improvement: A case study in radiata pine grown for structural sawn timber and liner- board. In: Nepveu G (ed) Connection between silviculture and wood quality through modelling approaches and sim- ulation software. Proc IUFRO Workshop, 5-12 Dec 1999, France, pp 448-459
Groover AT, Devey ME, Lee JM, Megraw R, Mitchell-Olds T, Sherman B, Vujcic S, Williams C, Neale DB (1994) Identi- fication of quantitative trait loci influencing wood specific gravity in an outbred pedigree of loblolly pine. Genetics 138:1293-1300
Groover AT, Williams CG, Devey ME, Lee JM, Neale DB (1995) Sex-related differences in meiotic recombination frequency in Pinus taeda. J Hered 86:157-158
Grotkopp E, Rejmanek M, Sanderson MJ, Rost TL (2004) Evo- lution of genome size in pines (Pinus) and its life-history correlates: supertree analyses. Evolution 58:1705-0729
Guevara MA, ChagnC D, Almeida MH, Byrne M, Collada C, Favre JM, Harvengt L, Jeandroz S, Orazio C, Plomion C, Ramboer A, Rocheta M, Sebastiani F, Soto A, Vendramin GG, Cervera MT (2005a) Isolation and characterization of nuclear microsatellite loci in F! pinaster. Mol Ecol Notes 5:57-59
Guevara MA, Soto A, Collada C, Plomion C, Savolainen 0 , Neale DB, GonzBlez-Martinez SC, CereveraMT (2005b) Ge- nomics applied to the study of adaptation in pine species. Invest Agrar Syst Recur For 14292-306
Gugerli F, Senn J, Anzidei M, Madaghiele A, Buchler U, Sperisen C, Vendramin GG (2001) Chloroplast microsatellites and mitochondria1 nadl intron 2 sequences indicate congruent phylogenetic relationships of Swiss stone pine (Pinus cern- bra), Siberian stone pine (F! sibirica) and Siberian dwarf pine (F! pumila). Mol Ecol10:1489-1497
Gupta PK, Rustgi S, Kulwal PL (2005) Linkage disequilibrium and association studies in higher plants: Present status and future prospects. Plant Mol Biol57:461-485

Chapter 2 Pines 83
Gwaze DP, Harding KJ, Purnell RC, Bridgwater FE (2002) Opti- mum selection age for wood density in loblolly Pine. Can J For Res 32:1393-1399
Gwaze DP, ZhouY, Reyes-Valdks MH, Al-RababahMA, Williams CG (2003) Haplotypic QTL mapping in an outbred pedi- gree. Genet Res 81:43-50
Hamrick JL, Godt JW (1990) Allozyme diversity in plant species. In: Brown A, Clegg MT, Kahler AL, Weir BS (eds) Plant Pop- ulation Genetics, Breeding and Genetic Resources. Sinauer, Sunderland, MA, pp 43-63
Hamrick JL, Godt MJW (1996) Effects of life history traits on genetic diversity in plant species. Phil Trans R Soc Lond B Biol Sci 351:1291-1298
Hannrup B, Ekberg I (1998) Age-age correlations for tracheid length and wood density in Pinus sylvestris. Can J For Res 28:1373-1379
Hannrup B, Ekberg I, Persson A (2000) Genetic correlations among wood, growth capacity and stem traits in Pinus sylvestris. Can J For Res 15:161-170
Harkins DM, Johnson GN, Skaggs PA, Mix AD, Dupper GE, De- vey ME, Kinloch Jr BB, Neale DB (1998) Saturationmapping of a major gene for resistance to white pine blister rust in sugar pine. Theor Appl Genet 97:1355-1360
Harry DE, Temesgen B, Neale DB (1998) Codominant PCR- based markers for Pinus taeda developed from mapped cDNA clones. Theor Appl Genet 92327-336
Hartmann HT, Kester DE, Davies FT Jr (1990) Plant Propagation Principles and Practices, 5th edn. Prentice Hall, Englewood Cliffs, NJ
Hayashi E, Kondo T, Terada K, Kuramoto N, Goto Y, Oka- mura M, Kawasaki H (2001) Linkage map of Japanese black pine based on AFLP and RAPD markers including mark- ers linked to resistance against the pine needle gall midge. Theor Appl Genet 102:871-875
Hayashi E, Kondo T, Terada K, Kuramoto N, Kawasaki S (2004) Identification of AFLP markers linked to a resistance gene against pine needle gall midge in Japanese balck pine. Theor Appl Genet 108:1177-1181
Heath LS, Ramakrishnan N, Sederoff RR, WhettenRW, Chevone BI, Struble CA, Jouenne VY, Chen D, van Zyl LM, Grene R (2002) Studying the functional genomics of stress re- sponses in loblolly pine with the "Expresso microarray experiment management system". Comp Funct Genom 3:226-243
Hirschhorn JN, Daly MJ (2005) Genome-wide association stud- ies for common diseases and complex traits. Nat Rev Genet 6:95-108
Hizume M, Arai M, Tanaka A (1990) Chromosome banding in the genus Pinus. 111. Fluorescent banding pattern of I? luchuensis and its relationships among the Japanese diploxylon pines. Bot Mag Tokyo 103:103- 11 1
Hizume M, Ohgiku A, Tanaka A (1989) Chromosome banding in the genus Pinus. 11. Interspecific variation of fluorescent banding patterns in I! densifora and I! thunbergii. Bot Mag Tokyo 102:25-36
Hizume M, Shibata F, Matsusaki Y, Garajova Z (2002) Chromo- some identification and comparative karyotypic analyses of four Pinus species. Theor Appl Genet 105:491-497
Hodge GR, Dvorak WS (1999) Genetic parameters and prove- nance variation of Pinus tecunurnanii in 78 international trials. For Genet 6:157-180
Hodge GR, Voker PW, Potts BM, Owen JV (1996) A comparison of genetic information from open-pollinated and control- pollinated progeny tests in two Eucalypt species. Theor Appl Genet 92:53-63
Hospital F, Goldringer I, Openshaw S (2000) Efficient marker- based recurrent selection for multiple quantitative trait loci. Genet Res 75:357-368
Hospital F, Moreau L, Lacoudre F, Charcosset A, Gallais A (1997) More on the efficiency of marker-assisted selection. Theor Appl Genet 95:1181-1189
Hurme P, Sillanpaa M, Repo T, Arjas E, Savolainen 0 (2000) Ge- netic basis of climatic adaptation in Scots pine by Bayesian QTL analysis. Genetics 156:1309-1322
Hyun SK (1976) Inter-specific hybridization in pines with the special reference to Pinus rigida and I! taeda. Silvae Genet 25:188-191
Ingvarsson PK (2005) Nudeotide polymorphism and linkage disequilibrium within and among natural populations of European Aspen (Populus trernula L., Salicaceae). Genetics 169:945-953
Isik F, Li B, Frampton J, Goldfarb B (2004) Efficiency of seedlings and rooted cuttings for testing andselection in Pinus taeda. For Sci 50:44-53
Islam-Faridi MN, Chang Y-L, Zhang HB, Kinlaw C, Doudrick RL, Neale DB, Echt CS, Price HJ, Stelly DM (1998) Construc- tion of a pine BAC library. In: Plant & Animal Genome VI Conf, San Diego
Islam-Faridi MN, Mujeeb-Kazi A (1995) Visualization of Secale cereale DNA in wheat germplasm by FISH. Theor Appl Genet 90:595-600
Islam-Faridi MN, Nelson CD, Kubisiak TL (2007) Reference karyotype and cytomolecular map for loblolly pine (Pinus taeda L.). Genome (in press)
Islam-Faridi MN, Nelson CD, Kubisiak TL, Gullirmo MV, Mc- Namara VH, Price HJ, Stelly DM (2003) Loblolly pine kary- otype using FISH and DAPI positive banding. In: Proc 27th Southern For Tree Improv Conf, 25-27 June 2003, Stillwater, OK, pp 184-188
Ivkovic M, Kumar S, Wu H (2006) Adding value to the end- products of radiatapine: A review ofbreeding for structural timber production. In: Proc 13th Australasian Plant Breed Conf, 18-22 April 2006, Christchurch, NZ, pp 273-278
Jackson RB, Schlesinger WH (2004) Curbing the U.S. carbon deficit. Proc Natl Acad Sci USA 101:15827-15829
Jacobs MD, Gardner RC, Murray BG (2000) Cytological charac- terization of heterochromatin and rDNA in Pinus radiata and I? taeda. Plant Syst Evol223:71-79
Jansen RC (1993) Interval mapping of multiple quantitative trait loci. Genetics 135:205-211

Chapter 2 Pines 85
sion in plus tree 850.055 of Pinus radiata D. Don. 1. Genetic map with distorted markers. Theor Appl Genet 98:697-703
Kubisiak TL, Nelson CD, Nance WL, Stine M (1995) RAPD linkage mapping in a longleaf pine x slash pine F1 family. Theor Appl Genet 90:1119-1127
Kubisiak TL, Nelson CD, Nance WL, Stine M (1996) Comparison of RAPD linkage maps constructed for a single longleaf pine from both haploid and diploid mapping populations. For Genet 3:230-211
Kubisiak TL, Nelson CD, Nowak J, Friend AL (2000) Genetic linkage mapping of genomic regions conferring tolerance to high aluminum in slash pine. J Sust For 10:69-78
Kubisiak TL, Nelson, CD, Stine M (1997) RAPD mapping of genomic regions influencing early height growth in lon- gleaf pine x slash pine F1 hybrids. In: Proc 24th South- ern For Tree Improv Conf, Orlando, FL, 9-12 June 1997, pp 198-206
Kumar S (2004) Genetic parameter estimates for wood stiffness, strength, internal checking and resin bleeding for radiata pine. Can J For Res 34:2601-2610
Kumar S, Garrick DJ (2001) Genetic response to within-family selection using molecular markers in some radiata pine breeding schemes. Can J For Res 31:779-785
Kumar S, Richardson TE (2005) Inferring heritability and relat- edness using molecular markers in radiata pine. Mol Breed 15:55-64
Kumar S, Spelman R, Garrick D, Richardson TE, Wilcox PL (2000) Multiple marker mapping of quantitative trait loci on chromosome three in an outbred pedigree of radiata pine. Theor Appl Genet 100:926-933
Kumar S, Echt C, Wilcox PL, Richardson TE (2004) Testing for linkage disequilibrium in the New Zealand radiata pine breeding population. Theor Appl Genet 108:292-298
Kumar S, Gerber S, Richardson TE (2006) Pedigree recon- struction using SSR markers in a radiata pine breed- ing programme. In: Proc 13th Australasian Plant Breed Conf, 17-21 April, Christchurch, New Zealand pp 578-583, http:llwww.apbc.org.nz
Kutil BL, Williams CG (2001) Triplet-repeat microsatellites shared among hard and soft pines. J Hered 92:327-32
Lambeth C (2000) Realized genetic gains for first generation improved loblolly pine in 45 tests in coastal North Carolina. J Appl For 24140- 144
Lambeth C, Lee BC, O'Malley D, Wheeler N (2001) Polymix breeding with parental analysis of progeny: an alterna- tive to full-sib breeding and testing. Theor Appl Genet 103:930-943
Lamoureux D, Peterson DG, Li W, Fellers JP, Gill BS (2005) The efficacy of Cot-based gene enrichment in wheat (Triticum aestivum L.). Genome 48:1120-1126
Lamprecht H (1990) Silviculture in the Tropics: tropical forest ecosystems and their tree species-possibilities and meth- ods for their long-term utilization. GTZ, Eschborn, Ger- many
Lande R, Thompson R (1990) Efficiency of marker-assisted se- lection in the improvement of quantitative traits. Genetics 124:743-756
Lander ES, Botstein D (1989) Mapping Mendelian factors un- derlying quantitative traits using RFLP linkage maps. Ge- netics 121:185-199
Laurie CC, Chasalow SD, LeDeaux JR, McCarroll R, Bush D, Hauge B, Lai C, Clark D, Rocheford TR, Dudley JW (2004) The genetic architecture of response to long-term artificial selection for oil concentration in the maize kernel. Genetics 168:2141-2155
Le Dantec L, Chagne D, Pot D, Cantin 0 , Garnier-G6r6 P, Bedon F, Frigerio JM, Chaumeil P, Leger P, Garcia V, Laigret F, de Daruvar A, Plomion C (2004) Automated SNP detection in expressed sequence tags: statistical considerations and application to maritime pine sequences. Plant Mol Biol 54461-470
Le Provost G, Paiva J, Pot D, Brach J, Plomion C (2003) Seasonal variation in transcript accumulation in wood forming tis- sues of maritime pine (Pinus pinaster Ait.) with emphasis on a cell wall Glycine Rich Protein. Planta 217:820-830
Ledig FT (1998) Genetic variation in Pinw. In: Richardson DM (ed) Ecology and Biogeography of Pinus. Cambridge Uni- versity Press, Cambridge, UK, pp 251-280
Ledig FT, Conkle MT (1983) Gene diversity and genetic struc- ture in a narrow endemic Torrey pine (Pinus torreyana Parry ex Carr). Evolution 37:79-85
Leitch IJ, Hanson L, Winfield M, Parker J, Bennett MD (2001) Nuclear DNA C-values complete familial representation in gymnosperms. Ann Bot 88:843-849
Lerceteau EC, Plomion C, Andersson B (2000) AFLP mapping and detection of quantitative trait loci (QTLs) for econom- ically important traits in Pinus sylvestris: a preliminary study. Mol Breed 6:451-458
Li C, Yeh FC (2001) Construction of a framework map in Pinus contorta subsp. latifolia using random amplified polymor- phic DNA markers. Genome 44147-153
Liston A, Robinson WA, Pinero D, Alvarez-Buylla ER (1999) Phylogenetics of Pinus (Pinaceae) based on nuclear ribo- somal DNA internal transcribed spacer region sequences. Mol Phylogenet Evol 11:95-109
Liu ZL, Zhang D, Hong DY, Wang XR (2003) Chromosomal localization of 5s and 18s-5.8s-25s ribosomal DNA sites in five Asian pines using fluorescence in situ hybridization. Theor Appl Genet 106:198-204
Lopez-Upton J, White TL, Huber DA (2000) Species differences in early growth and rust incidence of loblolly and slash pine. For Ecol Mng 132:211-222
Lorenz WW, Dean JFD (2002) SAGE profding and demonstra- tion of differential gene expression along the axial develop- mental gradient of lignifying xylem in loblolly pine (Pinus taeda). Tree Physiol22:301-310
Lorenz WW, Sun F, Liang C, Kolychev D, Wang H, Zhao X, Cordonnier-Pratt MM, Pratt LH, Dean JFD (2005) Water stress-responsive genes in loblolly pine (Pinus taeda) roots

86 C. Plornion et al.
identified by analyses of expressed sequence tag libraries. Tree Physiol26:l-16
Lorenz WW, Sun F, Liang C, Kolychev D, Wang H, Zhao X, Cordonnier-Pratt MM, Pratt LH, Dean JF (2006) Water stress-responsive genes in loblolly pine (Pinus taeda) roots identified by analyses of expressed sequence tag libraries. Tree Physiol26:l-16
Lowe WJ, Byram TD, Bridgwater FE (1999) Selecting loblolly pine parents for seed orchards to minimise the costs of producing pulp. For Sci 45:213-216
Lubaretz 0 , Fuchs J, Ahne R, Meister A, Schubert I (1996) Kary- otyping of three Pinaceae species via fluorescent in situ hybridization and computer-aided chromosome analysis. Theor Appl Genet 92:411-416
Luikart G, England P, Tallmon D, Jordan S, Taberlet P (2003) The power and promise of population genomics: from genotyp- ing to genome typing. Nat Rev Genet 4981-994
Lund MS, Sorensen P, Guldbrantsen B, Sorensen DA (2003) Multitrait fine mapping of quantitative trait loci using com- bined linkage disequilibrium and linkage analysis. Genet- ics 163:405-410
Ma XF, Szmidt A, Wang WR (2006) Genetic structure and evo- lutionary history of a diploid hybrid pine Pinus densata inferred from the nucleotide variation at seven gene loci. Mol Biol Evol23:807-816
MacPherson P, Filion WG (1981) Karyotype analysis and the distribution of constitutive heterochromatin in five species of Pinus. J Hered 72:193-198
Margulies M, Egholm M, Altman WE, Attiya S, Bader JS, Bem- ben LA, Berka J, Braverman MS, Chen YJ, Chen Z, Dewell SB, Du L, Fierro JM, Gomes XV, Godwin BC, He W, Helge- sen S, Ho CH, Irzyk GP, Jando SC, Alenquer ML, Jarvie TP, Jirage KB, Kim JB, Knight JR, Lanza JR, Leamon JH, Leikowitz SM, Lei M, Li J, Lohman KL, Lu H, Makhijani VB, McDade KE, McKenna MP, Myers EW, Nickerson E, Nobile JR, Plant R, Puc BP, Ronan MT, Roth GT, Sarkis GJ, Simons JF, Simpson JW, Srinivasan M, Tartaro KR, Tomasz A, Vogt KA, Volkmer GA, Wang SH, Wang Y, Weiner MP, Yu P, Begley RF, Rothberg JM (2005) Genome sequencing in microfabricated high-density picolitre reactors.Nature 437:376-380
Mariette S, Chagne D, Decroocq S, Vendramin GG, Lalanne C, Madur D, Plomion C (2001) Microsatellite markers for Pinus pinaster Ait. Ann For Sci 58:203-206
Markussen T, Fladung M, Achere V, Favre JM, Faivre-Rampant P, Aragones A, Da Silva Perez, Havengt L, Ritter E (2003) Identification of QTLs controlling growth, chemical and physicalwood property traitsin Pinuspinaster (Ait.). Silvae Genet 52:8-15
Marquardt PE, Epperson BK (2004) Spatial and population ge- netic structure of microsatellites in white pine. Mol Ecol 13:3305-3315
Matheson AC, Lindgren D (1985) Gain from the clonal and the clonal seed orchard options compared for tree breeding programs. Theor Appl Genet 71:242-249
Matziris DI (1995) Provenance variation of Pinus radiata grown in Greece. Silvae Genet 4488-96
McKeand S, Mullin T, Byram T, White TL (2003) Deployment of genetically improved loblolly and slash pines in the South USA. J For 101:32-37
Mergen F (1958) Natural polyploidy in slash pine. For Sci 4:283-295
Miksche JP, Hotta Y (19931973) DNA base composition and repetitious DNA in several conifers. Chromosoma 41:29-36
Millar CI (1998) Early evolution of pines. In: Richardson DM (ed) Ecology and Biogeography of Pinus. Cambridge Uni- versity Press, Cambridge, UK, pp 69-91
Mitton JB (1992) The dynamic mating system of conifers. New For 6:187-216
Moore G, Devos KM, Wang Z, Gale MD (1995) Grasses, line up and form a circle. Curr Biol5(7):737-739
Moran GF, Bell JC, Hilliker AJ (1983) Greater meiotic recombi- nation in male vs. female gametes in Pinus radiata. J Hered 7462
Morgante M, Salamini F (2003) From plant genomics to breed- ing practice. Curr Opin Biotechnol14:214-219
Morgante M, Vendramin GG, Rossi P, Olivieri AM (1993) Se- lection against inbreds in early life-cycle phases in Pinus leucoderrnis. Heredity 70:622-627
Morin PA, Luikart G, Wayne RK, and the SNP workshop group (2004) SNPs in ecology, evolution and conservation. Trends Ecol Evol19:208-2169
Morse AM, Nelson CD, Covert SF, Holliday AG, Smith KE, Davis JM (2004) Pine genes regulated by the necrotrophic pathogen Fusarium circinatum. Theor Appl Genet 109922-932
Morse AM, Nelson CD, Covert SF, Smith KE, Davis JM (2004) Pine genes regulated by the necrotrophic pathogen, Fusariurn circinaturn. Theoretical and Applied Genetics 109:922-932
Morton NE (1991) Parameters of the human genome. Proc Natl Acad Sci USA 88:7474-7476
Mosig MO, Lipkin E, Khutoreskaya G, Tchourzyna E, Soller M, Friedmann A (2001) A whole genome scan for quantita- tive trait loci affecting milk protein percentage in Israeli- Holstein cattle, by means of selective milk DNA pooling in a Daughter design, using an adjusted false discovery rate criterion. Genetics 157:1683-1698
Moura VPG, Dvorak WS, Hodge GR (1998) Provenance and family variation of Pinus oocarpa grown in the Brazilian cerrado. For Ecol Manage 109:315-322
Miiller-Starck G (1998) Isozymes. In: Karp A, Isaac PG, Ingram DS (eds) Molecular Tools for Screening Biodiversity: Plants and Animals. Chapman and Hall, London, UK, pp 75-81
Muona 0 , Harju A (1989) Effective population sizes, genetic variability and mating system in natural stands and seed orchards of Pinus sylvestris. Silvae Genet 38:221-228
Muona 0 , Yazdani R, Rudin R (1987) Genetic change between life stages in Pinus sylvestris: allozymes variation in seeds and planted seedlings. Silvae Genet 35:39-42

Chapter 2 Pines 87
Murray B (1998) Nuclear DNA amounts in gymnosperms. Ann Bot 82(Suppl A):3-15
Myburg H, Morse AM, Amerson HV, Kubisiak TL, Huber DA, Osborne JA, Garcia SA, Nelson CD, Davis JM, Covert SF, van Zyl LM (2006) Differential gene expression in loblolly pine (Pinus taeda L.) challenged with the fusiform rust fungus, Cronartium quercuum f. sp. fusiforrne. Physiological and Molecular Plant Pathology 69:79-101
Myers RM, Maniatis T, Lerman LS (1987) Detection and local- ization of single base changes by denaturing gradient gel electrophoresis. Methods Enzymol 155:501-527
Neale DB, Savolainen 0 (2004) Association genetics of complex traits in conifers. Trends Plant Sci 9:325-330
Neale DB, Sederoff RR (1989) Paternal inheritance of chloro- plast DNA and maternal inheritance of mitochondrialDNA in loblolly pine. Theor Appl Genet 72212-216
Neale DB, Williams CG (1991) Restriction fragmentlength poly- morphism mapping in conifers and applications to forest genetics and tree improvement. Can J For Res 21:545-554
Nelson CD, Echt CS (2003) New models for marker-assisted selection in tree breeding. In: McKinley C (ed) Proc 27th South For Tree Improv Conf, Stillwater, OK, p 114
Nelson CD, Echt CS (2004) Marker-directed population im- provement. In: Li B, McKeand S (eds) Proc IUFRO Joint Conf of Div 2, For Genet Tree Breed in the Age of Genomics: Progress and Future, Charleston, SC, p 255
Nelson CD, Kubisiak TL, Johnson G, Burdine C, Bridgwater FE (2003) Microsatellite analysis of loblolly pine. In: Plant & Animal Genome XI Conf, San Diego, p 560 (http://www.intl-pag.orgI1 llabstractslP5i~P56O~XI.htm1, accessed 20 March 2006)
Nelson CD, Kubisiak, TL, Stine M, Nance WL (1994) A genetic linkage map of longleafpine (Pinuspalustris Mill.) based on random amplified polymorphic DNAs. J Hered 85:433-439
Nelson CD, Nance WL, Doudrick RL (1993) A partial genetic linkage map of slash pine (Pinus elliottii Engelm. var. elliot- tii) based on random amplified polymorphic DNAs. Theor Appl Genet 8:145-151
Nelson JC (1997) QGENE: software for marker-based genomic analysis and breeding. Mol Breed 3:239-245
Nikles DG (2000) Experience with some Pinus hybrids in Queensland, Australia. In: Dungey HS, Dieters MJ, Nikles DG (Compl) Hybrid Breeding and Genetics of Forest Trees. Proc of QFRIICRC-SPF Symp, 9-14 April 2000, Noosa, Queensland, Australia. Dept of Pri Indus, Brisbane, pp 14-26
No E, Zhou Y, Loopstra CA (2000) Sequences upstream and downstream of two xylem-specific pine genes influence their expression. Plant Sci 160:77-86
NSF (2005) NSF, USDA and DOE Award $32 Million to Se- quence Corn Genome. Press Release 05-197. National Science Foundation. 11-15-2005. http:llwww.nsf.govl newslnews~summ.jsp?cntn~id=104608
O'Farrell PH (1975) High resolution two-dimensional elec- trophoresis of proteins J Biol Chem 250:4007-4021
O'Malley D, Grattaplagia D. Chaparro JX, Wilcox PL, Amerson HV, Liu B-H, Whetton R, McKeand S, Kuhlman EG, McCord S, Crane B, Sederoff RR (1996) Molecular markers, forest genetics and tree breeding. In: Gustafson JP, Flavell RB (eds) Genomes of Plants and Animals: 21st Stadler Genet Symp. Plenum, New York
Ohri D, Khoshoo TN (1986) Genome size in gymnosperms. Plant Syst Evol 153:119-131
OlssonT, Lindgren D, Li B (2001) Balancing genetic gain and relatedness in seed orchards. Silvae Genet 50:222-227
Orita M, Iwahana H, Kanazawa H, Hayashi K, Sekiya T (1989) Detection of polymorphisms of human DNA by gel electrophoresis as single-strand conformation polymor- phism~. Proc Natl Acad Sci USA 86:2766-2770
Ott J (1991) Analysis of Human Genetic Linkage. Johns Hopkins University Press, Baltimore, MD
Pacheco D, Diaz S, Osuna D, Bautista R, Claros MG, CAnovas FM, Canton FR (2005) Identification of candidate genes conferring specific properties to distinct types of Pinus pinaster Ait. wood. IUFRO Tree Biotechnol, Pretoria, South Africa
Paiva J (2006) Phenotypic and molecular plasticity of wood forming tissues in maritime pine (Pinuspinaster Ait.). PhD thesis of Universidad Nova de Lisboa and Bordeaux 1
Paran I, Zamir D (2003) Quantitative traits in plants: beyond the QTL. Trends Genet 19:303-306
Park YS (2002) Implementation of conifer somatic embryogen- esis in clonal forestry: technical requirements and deploy- ment considerations. Ann For Sci 59:651-656
Paterson AH, Freeling M, Sasaki T (2005) Grains of knowledge: genomics of model cereals. Genome Res 15:1643-1650
Paul AD, Foster GS, Caldwell T, McRae J (1997) Parameters for height, diameter, and volume in a multilocation clonal study with loblolly pine. For Sci 43:87-98
Pavy N, Laroche J, Bousquet J, MacKay J (2005) Large-scale analysis of secondary xylem ESTs in pine. Plant Mol Biol 52203224
Perlack RD, Wright LL, Turhollow AF, Graham RL, Stokes BJ, Erbach DC (2005) Biomass as a feed- stock for a bioenergy and bioproducts industry: the technical feasibility of a billion-ton annual supply. Report No DOEIGO-102005-2135. US Dept of En- ergy1US Dept of Agri. http:l/wwwl.eere.energy.gov/ biomasslpdfslfinal~billionton~vision~report2.pdf
Peterson DG (2005) Reduced representation strategies and their application to plant genomes. In: Meksem K, Kahl G (eds) The Handbook of Genome Map- ping: Genetic and Physical Mapping. Wiley, Weinheim, pp 307-335
Peterson DG, Chouvarine P, Thummasuwan S, Saha S, Mukher- jee D, Carlson JE (2006) Exploring the pine genome us- ing Cot filtration and 454 Life Sciences massively par- allel shotgun sequencing. In: Plant & Animal Genomes XIV Conf, San Diego. http:l/www.intl-pag.orgIpagll41 abstractsIPAG14~W376.html

88 C. Plomion et al.
Peterson DG, Nelson CD, Islam-Faridi MN, Main DS, Tomkins JP (2005) Accelerating pine genomics through development and utilization of molecular and cy- togenetic resources. In: Plant & Animal Genomes XI11 Conf, San Diego. http:l/www.intl-pag.org/pag/13/ abstractslPAG13-P515.html
Peterson DG, Schulze SR, Sciara EB, Lee SA, Bowers JE, Nagel A, Jiang N, Tibbitts DC, Wessler SR, Paterson AH (2002) Inte- gration of Cot analysis, DNA cloning, and high-throughput sequencing facilitates genome characterization and gene discovery. Genome Res 12:795-807
Petit RJ, Duminil J, Fineschi S, Hampe A, Salvini D, Vendramin GG (2005) Comparative organisation of chloroplast, mito- chondrial and nuclear diversity in plant populations. Mol Ecol14:689-701
Petit RJ, Vendramin GG (2007) Phylogeography of organelle DNA inplants: an introduction. In: Weiss S, Ferrand N (eds) Phylogeography of Southern European Refugia. Kluwer, Amsterdam, (in press)
Pflieger S, Lefebvre V, Causse M (2001) The candidate gene approach in plant genetics: a review. Mol Breed 7:275-291
Plomion C, Durel C-E (1996) Estimation of the average effects of specific alleles detected by the pseudo-testcross QTL mapping strategy. Gen Sel Evol28:223-235
Plomion C, O'Malley DM (1996) Recombination rate differ- ences for pollen parents and seed parents in pine. Heredity 77:341-350
Plomion C, Bahrman N, Durel CE, O'Malley DM (1995a) Ge- nomic analysis in Pinus pinaster (Maritime pine) using RAPD and protein markers. Heredity 74:661-668
Plomion C, O'Malley DM, Durel CE (1995b) Genomic analysis in Maritime pine (Pinus pinaster). Comparison of two RAPD maps using selfed and open-pollinated seeds of the same individual. Theor Appl Genet 90:1028-1034
Plomion C, Durel C-E, O'Malley D (1996a) Genetic dissection of height in maritime pine seedlings raised under accelerated growth condition. Theor Appl Genet 93:849-858
Plomion C, Yani A, Marpeau A (1996b) Genetic determinism of ?3-carene in maritime pine using random amplified poly- morphic DNA (RAPD) markers. Genome 39:1123-1127
Plomion C, Liu BH, O'Malley DM (1996~) Genetic analysis using trans dominant linked markers in an Fzfamily. Theor Appl Genet 93:1083-1089
Plomion C, Costa P, Bahrman N, Frigerio JM (1997) Genetic Analysis of needle proteins in maritime pine. 1. Mapping dominant and codominant protein markers assayed on diploid tissue, in a haploid-basedgenetic map. Silvae Genet 46:161-165
Plomion C, Hurme P, Frigerio J-M, Ridolphi M, Pot D, Pionneau C, Avila C, Gallardo F, David H, Neutlings G, Campbell M, Canovas FM, Savolainen 0, Bodenes C, Kremer A (1999) Developing SSCP markers in two Pinus species. Mol Breed 5:21-31
Plomion C, Pionneau C, Brach J, Costa P, BailUeres H (2000) Compression wood-responsive proteins in developing
xylem of maritime pine (Pinus pinaster Ait.). Plant Physiol 123:959-969
Plomion C, LeProvost G, Pot D, Vendramin G, Gerber S, De- croocq S, Brach J, Raffin A, Pastuszka P (2001) Pollen contamination in a maritime pine polycross seed orchard and certification of improved seeds using chloroplast mi- crosatellites. Can J For Res 31:1816-1825
Plomion C, Bahrman N, Costa P, Dubos C, FrigCrio J-M, Ger- ber S, Gion J-M, Lalanne C, Madur D, Pionneau C (2004) Proteomics for genetics and physiological studies in forest trees: application in maritime pine. In: Kumar S, Fladung M (eds) Molecular Genetics and Breeding of Forest Trees. Haworth, Binghamton, NY, pp 53-80
Pot D (2004) DCterminisme g6nCtique de la qualit6 du bois chez le pin maritime: du phenotype aux genes. PhD thesis, University of Rennes I, ENSAR, France
Pot D, Chantre G, Rozenberg P, Rodrigues JC, Jones GL, Pereira H, Hannrup B, Cahalan C, Plomion C (2002) Genetic con- trol of pulp and timber properties in maritime pine (Pinus pinaster Ait.). Ann For Sci 59:563-575
Pot D, McMillan L, Echt C, Le Provost G, Garnier-GCri P, Cato S, Plomion C (2005a) Nucleotide variation in genes in- volved in wood formation in two pine species. New Phytol 167:lOl-112
Pot D, Rodrigues J-C, Rozenberg P, Chantre G, Tibbits J, Cahalan C, Pichavant F, Plomion C (2005b) QTLs and candidate genes for wood properties in maritime pine (Pinuspinaster Ait.). Tree Genet Genom 2:lO-26
Price RA, Liston A, Strauss SH (1998) Phylogeny and systemat- ics of Pinus. In: Richardson DM (ed) Ecology and Biogeog- raphy of Pinus. Cambridge University Press, Cambridge, UK, pp 49-68
Provan J, Soranzo N, Wilson NJ, Goldstein DB, Powell W (1999) A low mutation rate for chloroplast microsatellites. Genet- ics 153:943-947
Quackenbush 7, Cho J, Lee D, Liang F, Holt I, Kararnycheva S, Parvizi B, Pertea G, Sultana R, White J (2001) The TIGR Gene Indices: analysis of gene transcript sequences in highly sampled eukaryotic species. Nucleic Acids Res 29159-164
Quencez C, Bastien C (2001) Genetic variation within and be- tween populations of Pinus sylvestris L. (Scots pine) for susceptibility to Melampsora pinitorqua Rostr. (pine twist rust). Heredity 86:36-44
Rabinowicz PD, Citek R, Budiman MA, Nunberg A, Bedell JA, Lakey N, O'Shaughnessy AL, Nascimento LU, McCombie WR, Martienssen RA (2005) Differential methylation of genes and repeats in land plants. Genome Res 15:1431-1440
Rabinowicz PD, Schutz K, Dedhia N, Yordan C, Parnell LD, Stein L, McCombie WR, Martienssen RA (1999) Differ- ential methylation of genes and retrotransposons facili- tates shotgun sequencing of the maize genome. Nat Genet 23:305-308
Rafalski A (1998) Randomly amplified polymorphic DNA (RAPD) analysis. In: Caetano-AnollCs G, Gresshoff

Chapter 2 Pines 89
PM (eds) DNA Markers Protocols, Applications, and Overviews. Wiley-Liss, New York, pp 75-83
Rake AV, Miksche JP, Hall RB, Hansen KM (1980) DNA reassoci- ation kinetics of four conifers. Can J Genet Cytol22:69-79
Rat Genome Sequencing Project Consortium (2004) Rat Genome Sequencing Project Consortium, Genome se- quence of the Brown Norway rat yields insights into mam- malian evolution. Nature 428:493-521
Remington DL, O'Malley DM (2000a) Evaluation of major ge- netic loci contributing to inbreeding depression for sur- vival and early growth in a selfed family of Pinus taeda. Evolution 541580- 1589
Rernington DL, O'Malley DM (2000b) Whole genome character- ization of embryonic state inbreeding depression ina selfed loblolly pine family. Genetics 155:337-348
Remington DL, Whetten RW, Liu BH, O'Malley DM (1999) Construction of an AFLP genetic map with nearly com- plete genome coverage in Pinus taeda. Theor Appl Genet 98~1279-1292
Ribeiro MM, Plomion C, Petit RJ, Vendramin GG, Szmidt AE (2001) Variation of chloroplast single-sequence repeats in Portuguese maritime pine (Pinuspinaster Ait.). Theor Appl Genet 10297-103
Richardson BA., Brunsfeld SJ, Klopfenstein NB (2002) DNA from bird-dispersed seed and wind-disseminated pollen provides insights into postglacialcolonization ofwhitebark pine (Pinus albicaulis). Mol Ecol11:215-227
Richardson DM, Rundel PW (1998) Ecology and biogeography of Pinus: an introduction. In: Richardson DM (ed) Ecology and Biogeography of Pinus. Cambridge University Press, Cambridge, UK, pp 3-46
Ritland K, Zhuang J, Ralph S, Ritland C, Bohlmann J (2006) Comparative conifer genomics and the new "Treenomix" program. In: Plant & Animal Genomes XIV Conf, San Diego, W 124
Ritter E, AragonCs A, Markussen T, AcherC V, Espinel S, Fladung M, Wrobel S, Faivre-Rampant P, Jeandroz S, Favre JM (2002) Toward construction of an ultra high density linkage map for Pinus pinaster. Ann For Sci 59637-643
Robledo-Arnuncio JJ, Collada C, Alia R, Gil L (2005) Genetic structure of montane isolates of Pinus sylvestris L. in a Mediterranean refugial area. J Biogeogr 32595-605
Rosvall 0, Liidgren D, Mullen TJ (1998) Sustainability, robust- ness and efficiency of a multi-generation breeding strat- egy based on within-family clonal selection. Silvae Genet 42307- 321
Rounsley S, Xiaoying L, Ketchum KA (1998) Large-scale se- quencing of plant genomes. Curr Opin Plant Biol1:136-141
Rozenberg P, Van Loo J, Hannrup B, Grabner M. 2002. Clonal variation of wood density record of cambium reaction to water deficit in Picea abies (L.) Karst. Ann For Sci 59533-540
Rudd S (2003) Expressed sequence tags: alternative or com- plement to whole genome sequences? Trends Plant Sci 8:321-329
Rudin D, Ekberg I (1978) Linkage studies in Pinus sylvestris L. using macrogametophyte allozymes. Silvae Genet 27:l-12
Sanchez AC, Ilag LL, Yang D, Brar DS, Ausubel F, Khush GS, Yano M, Sasaki T, Li Z, Huang N (1999) Genetic and physical mappingofxal3, a recessive bacterial blight resistancegene in rice. Theor Appl Genet 98:1022-1028
Sinchez C, Vielva MJ, Vieitez AM, de Mier B, Abarca D, Diaz- Sala C (2005) Identification of genes related to adventitious rooting capacity in pine and chestnut. IUFRO Tree Biotech- nol, Pretoria, South Africa
Sathyan P, Newton RJ, Loopstra CA (2005) Genes induced by WDS are differentially expressed in two populations of aleppo pine (Pinus halepensis). Tree Genet Genom 1:166-173
Sax K (1923) The association of size differences with seed-coat pattern and pigmentation in Phaseolus vulgaris. Genetics 8:552-560
Sax K, Sax HJ (1933) Chromosome numbers and morphology in the conifers. J Arnold Arbor 14356-375
Saylor LC (1961) A karyotype analysis of selected species of Pinus. Silvae Genet 10:77-85
Saylor LC (1964) Karyotype analysis ofpinus -group Lariciones. Silvae Genet 13:165-170
Saylor LC (1972) Karyotype analysis of Pinus -subgenus Pinus. Silvae Genet 21:155-163
Saylor LC (1983) Karyotype analysis of the genus Pinus - subgenus Strobus. Silvae Genet 32119-121
Schmidt A, Doudrick RL, Heslop-Harrison JS, Schmidt T (2000) The contribution of short repeats oflow sequence complex- ity to large conifer genomes. Theor Appl Genet 101:7-14
Schmidt R (2002) Plant genome evolution: lessons from com- parative genomics at the DNA level. Plant Mol Biol48:21-37
Scotti I, Burelli A, Cattonaro F, Chagnk D, Fuller J, Hedley PE, Jansson G, Lalanne C, Madur D, Neale D, Plomion C, Powell W, Troggio M, Morgante M (2005) Analysis of the distri- bution of marker classes in a genetic linkage map: a case study in Norway spruce (I? abies karst). Tree Genet Genom 1:93-102
Scotti-Saintagne C, Bodknks C, Barreneche T, Bertocchi E, Plomion C, Kremer A (2004) Detection of quantitative trait loci controlling bud burst and height growth in Quercus robur L. Theor Appl Genet 1091648-1659
Sewell MM, Bassoni DL, Megraw RA, Wheeler NC, Neale DB (2000) Identification of QTLs influencing wood property traits in loblolly pine (Pinus taeda L.). I. Physical wood properties. Theor Appl Genet 101:1273-1281
Sewell MM, Davis MF, Tuskan GA, Wheeler NC, Elam CC, Bas- soni DL, Neale DB (2002). Identification of QTLs influenc- ingwoodproperty traits in loblolly pine (Pinus taeda L.). 11. Chemical wood properties. Theor Appl Genet 104:214-222
Sewell MM, Neale DB (2000) Mapping quantitative traits in for- est trees. In: Jain SM, Minocha SC (eds) Molecular Biology of Woody Plants. Kluwer, Dordrecht, pp 407-433
Sewell MM, Sherman BK, Neale DB (1999) A consensus map for loblolly pine (Pinus taeda L.). I. Construction and in-

90 C. Plomion et al.
etegration if individual linkage maps from two outbred three-generation pedigrees. Genetics 151:321-330
Shelbourne CJA (1992) Genetic gains from different kinds of breeding population and seed or plant production popula- tions. S Afr For J 160:49-65
Shelbourne CJA (2000) Some insights on hybrids in forest tree improvement. In: Dungey HS, Dieters MJ, Nikles DG (Compl) Hybrid Breeding and Genetics of For- est Trees. Proc QFRIICRC-SPF Symp, 9-14 April 2000, Noosa, Queensland, Australia. Dept of Pri Indus, Brisbane, pp 53-62
Shelbourne CJA, Apiolaza LA, Jayawickrama KJS, Sorensson CT (1997) Developing breeding objectives for radiata pine in New Zealand. In: Burdon R, Moore JM (eds) "IUFRO '97 Genetics of Radiata Pine", Proc IUFRO Conf 1-4 Dec and workshop 5 Dec, Rotorua, New Zealand. FRI Bull 203~60-168
Shepherd M, Cross M, Dieters MJ, Henry R (2003) Genetic maps for Pinus elliottii var. elliottii and P. caribaea var. hondurensis using AFLP and microsatellite markers. Theor App Genet 106:1409-1419
Shepherd M, Cross M, Dieters MJ, Henry R (2002b) Branch architecture QTL for Pinus elliottii var. elliottii x Pinus caribea var. hondurensis hybrids. Ann For Sci 59:617-625
Shepherd M, Cross M, Maguire TL, Dieters MJ, Williams CG, Henry RJ (2002a) Transpecfic microsatellites for hard pines. Theor Appl Genet 104:819-827
Shoulders E (1984) The case for planting longleaf pine. Proc of the Southern Silvicultural Res Conf, 7-8 Nov 1984, Atlanta, GA, pp 255-260
Smith DN, Devey M (1994) Occurrence and inheritance of mi- crosatellites in Pinus radiata. Genome 37:977-983
Soranzo N, Alia R, Provan J, Powell W (2000) Patterns of vari- ation at a mitochondrial sequence-tagged-site locus pro- vides new insights into the postglacial history of European Pinus sylvestris populations. Mol Ecol9:1205-1211
Sorensson CT, Shelbourne CJA (2005) Clonal forestry. In: Col- ley M (ed) Forestry Handbook. NZ Inst of Foresters, pp 92-96
Springer NM, Xu X, Barbazuk WB (2004) Utility of dif- ferent gene enrichment approaches toward identifying and sequencing the maize gene space. Plant Physiol 136:3023-3033
Stelzer HE, Goldfarb B (1997) Implementing clonal forestry in the southeastern United States: SRIEG satellite workshop summary. Can J For Res 22442-446
Stirling B, Yang ZK, Gunter LE, Tuskan GA, Bradshaw HD (2003) Comparative sequence analysis between ortholo- gous regions of the Arabidopsis and Populus genomes re- veals substantial synteny and microcollinearity. Can J For Res 33:2245-2251
Strabala TJ (2004) Expressed sequence tag databases from forestry tree species. In: Kumar S, Fladung M (eds) Molec- ular Genetics and Breeding of Forest Trees. Haworth, Bing- hamton, NY, pp 19-52
Strauss SH, Doerksen AH (1990) Restriction fragment analysis of pine phylogeny. Evolution 441081-1096
Strauss SH, Lande R, Namkoong G (1992) Limitations of molec- ular marker-aided selection in forest tree breeding. Can J For Res 22:1050-1061
Stromberg LD, Dudley JD, Rufener GK (1994) Comparing con- ventional early generation selection with molecular marker assisted selection in maize. Crop Sci 341221-1225
Stuber CW, Polacco M, Senior ML (1999) Synergy of empiri- cal breeding, marker-assisted selection, and genomics to increase crop yield. Crop Sci 39:1571-1583
Syring J, Willyard A, Cronn R, Liston A (2005) Evolution- ary relationships among Pinus (Pinaceae) subsections in- ferred from multiple low-copy nuclear loci. Am J Bot 92:2086-2100
Syvanen AC (2001) Accessing genetic variation. Genotyping single nucleotide polymorphisms. Nat Rev Genet 2:930-942
Szmidt AE, Muona 0 (1989) Linkage relationships of allozyme loci in Pinus sylvestris. Heredity 11 1:91-97
Tanksley SD, Nelson JC (1996) Advanced backcross QTL analy- sis: a method for the simultaneous discovery and transfer of valuable QTLs from unadapted germplasm into elite breeding lines. Theor Appl Genet 92:191-203
Telfer EJ, Echt CS, Nelson CD, Wilcox PL (2006) Comparative mapping in Pinus radiata and l? taeda reveals co-location of wood density-related QTL. In: Plant & Animal Genome XIV Conf, San Diego
Temesgen B, Brown GR, Harry DE, Kinlaw CS, Sewell MM, Neale DB (2001) Genetic mapping of expressed sequence tag polymorphism (ESTP) markers in loblolly pine (Pinus taeda L.). Theor Appl Genet 102:664-675
The Arabidopsis Genome Initiative (2000) Analysis of the genome sequence of the flowering plant Arabidopsis thaliana. Nature 408:796-815
Thiellement H, Plomion C, Zivy M (2001) Proteomics as a tool for plant genetics and breeding. In: Dunn MJ, Pennington S (eds) Proteomics: from protein sequence to function. BIOS, Oxford, pp 289-309
Thoday JM (1961) Location of polygenes. Nature 191:368-370 Thumma BR, Nolan MF, Evans R, Moran GF (2005) Polymor-
phism~ in Cinnamoyl CoA Reductase (CCR) are associated with variation in microfibril angle in Eucalyptus spp. Ge- netics 171:1257-1265
Travis SE, Ritland K, Whitham TG, Keim P (1998) A genetic linkage map of pinyon pine (Pinus edulis) based on am- plified fragment length polymorphisms. Theor Appl Genet 92871-880
Tulsieram LK, Glaubitz JC, Kiss G, Carlson JE (1992) Single tree genetic linkage mapping in conifers using haploid DNA from megagarnetophytes. BiolTechnology 10:686-690
Tuskan GA, DiFazio SP, Teichmann T (2004) Poplar genomics is getting popular: the impact of the poplar genome project on tree research. Plant Biol (Stuttg) 6:2-4
Van der Burgh J (1973) Holzer der nierderrheinischen Braunkohlenformation. 2. Holzer der Braunkohlengruben
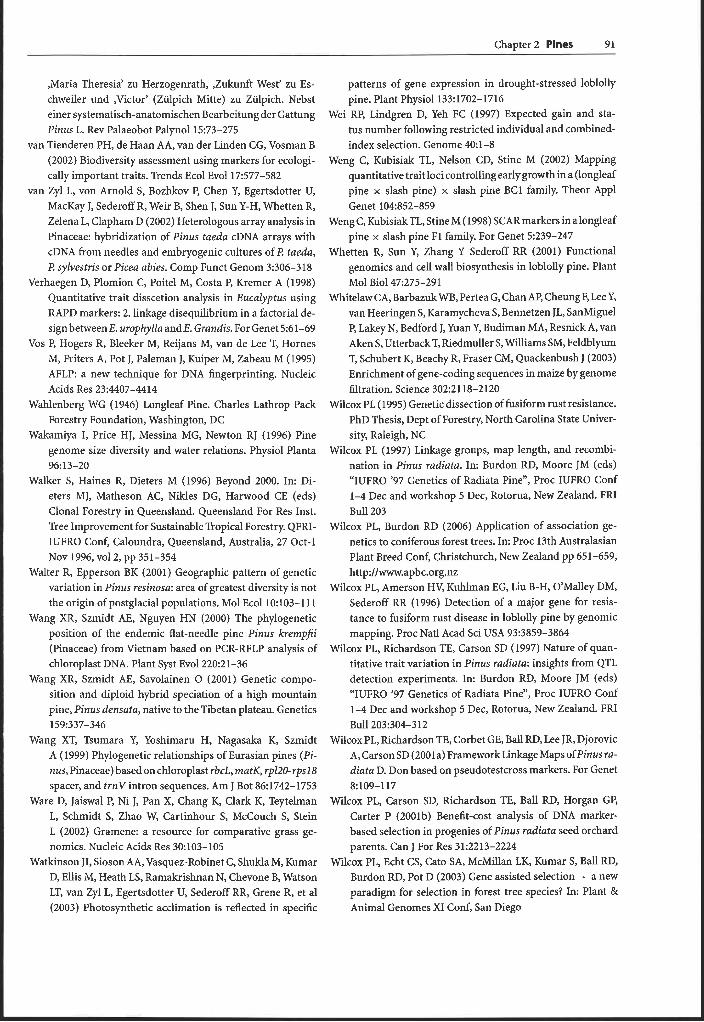
Chapter 2 Pines 91
,Maria Theresia' zu Herzogenrath, ,Zukunft West' zu Es- chweiler und ,Victor' (Ziilpich Mitte) zu Ziilpich. Nebst einer systematisch-anatomischen Bearbeitung der Gattung Pinus L. Rev Palaeobot Palynol15:73-275
van Tienderen PH, de Haan AA, van der Linden CG, Vosman B (2002) Biodiversity assessment using markers for ecologi- cally important traits. Trends Ecol Evol 17:577-582
van Zyl L, von Arnold S, Bozhkov P, Chen Y, Egertsdotter U, MacKay J, Sederoff R, Weir B, Shen J, Sun Y-H, Whetten R, Zelena L, Clapham D (2002) Heterologous array analysis in Pinaceae: hybridization of Pinus taeda cDNA arrays with cDNA from needles and embryogenic cultures of P. taeda, P. sylvestris or Picea abies. Comp Funct Genom 3:306-318
Verhaegen D, Plomion C, Poitel M, Costa P, Kremer A (1998) Quantitative trait disscetion analysis in Eucalyptus using RAPD markers: 2. linkage disequilibrium in a factorial de- sign betweenE. urophylla andE. Grandis. For Genet 5:61-69
Vos P, Hogers R, Bleeker M, Reijans M, van de Lee T, Hornes M, Friters A, Pot J, Paleman J, Kuiper M, Zabeau M (1995) AFLP: a new technique for DNA fingerprinting. Nucleic Acids Res 23:4407-4414
Wahlenberg WG (1946) Longleaf Pine. Charles Lathrop Pack Forestry Foundation, Washington, DC
Wakamiya I, Price HJ, Messina MG, Newton RJ (1996) Pine genome size diversity and water relations. Physiol Planta 96:13-20
Walker S, Haines R, Dieters M (1996) Beyond 2000. In: Di- eters MJ, Matheson AC, Nikles DG, Harwood CE (eds) Clonal Forestry in Queensland. Queensland For Res Inst. Tree Improvement for Sustainable Tropical Forestry. QFRI- IUFRO Conf, Caloundra, Queensland, Australia, 27 Oct-1 NOV 1996, V O ~ 2, pp 351-354
Walter R, Epperson BK (2001) Geographic pattern of genetic variation in Pinus resinosa: area of greatest diversity is not the origin of postglacial populations. Mol Ecol 10:103-111
Wang XR, Szmidt AE, Nguyen HN (2000) The phylogenetic position of the endemic flat-needle pine Pinus krempfii (Pinaceae) from Vietnam based on PCR-RFLP analysis of chloroplast DNA. Plant Syst Evol220:21-36
Wang XR, Szmidt AE, Savolainen 0 (2001) Genetic compo- sition and diploid hybrid speciation of a high mountain pine, Pinus densata, native to the Tibetan plateau. Genetics 159~337-346
Wang XT, Tsurnara Y, Yoshimaru H, Nagasaka K, Szmidt A (1999) Phylogenetic relationships of Eurasian pines (Pi- nus, Pinaceae) basedon chloroplast rbcL, matK, rp120-rps18 spacer, and trnV intron sequences. Am J Bot 86:1742-1753
Ware D, Jaiswal P, Ni J, Pan X, Chang K, Clark K, Teytelman L, Schmidt S, Zhao W, Cartinhour S, McCouch S, Stein L (2002) Gramene: a resource for comparative grass ge- nomics. Nucleic Acids Res 30:103-105
Watkinson JI, Sioson AA, Vasquez-Robinet C, Shukla M, Kumar D, Ellis M, Heath LS, Ramakrishnan N, Chevone B, Watson LT, van Zyl L, Egertsdotter U, Sederoff RR, Grene R, et al (2003) Photosynthetic acclimation is reflected in specific
patterns of gene expression in drought-stressed loblolly pine. Plant Physiol 133:1702-1716
Wei RP, Lindgren D, Yeh FC (1997) Expected gain and sta- tus number following restricted individual and combined- index selection. Genome 40:l-8
Weng C, Kubisiak TL, Nelson CD, Stine M (2002) Mapping quantitative trait loci controlling early growth in a (longleaf pine x slash pine) x slash pine BC1 family. Theor Appl Genet 104:852-859
Weng C, KubisiakTL, Stine M (1998) SCARmarkers inalongleaf pine x slash pine F1 family. For Genet 5:239-247
Whetten R, Sun Y, Zhang Y Sederoff RR (2001) Functional genomics and cell wall biosynthesis in loblolly pine. Plant Mol Biol47:275-291
Whitelaw CA, Barbazuk WB, Pertea G, Chan AP, Cheung F,LeeY, van Heeringen S, Karamycheva S, Bennetzen JL, SanMiguel P, Lakey N, Bedford J, Yuan Y, Budiman MA, Resnick A, van Aken S, Utterback T, Riedmuller S, Williams SM, Feldblyum T, Schubert K, Beachy R, Fraser CM, Quackenbush J (2003) Enrichment of gene-coding sequences in maize by genome filtration. Science 302:2118-2120
Wilcox PL (1995) Genetic dissection of fusiform rust resistance. PhD Thesis, Dept of Forestry, North Carolina State Univer- sity, Raleigh, NC
Wilcox PL (1997) Linkage groups, map length, and recombi- nation in Pinus radiata. In: Burdon RD, Moore JM (eds) "IUFRO '97 Genetics of Radiata Pinen, Proc IUFRO Conf 1-4 Dec and workshop 5 Dec, Rotorua, New Zealand. FRI Bull 203
Wilcox PL, Burdon RD (2006) Application of association ge- netics to coniferous forest trees. In: Proc 13th Australasian Plant Breed Conf, Christchurch, New Zealand pp 651-659, http://www.apbc.org.nz
Wilcox PL, Amerson HV, Kuhlman EG, Liu B-H, O'Malley DM, Sederoff RR (1996) Detection of a major gene for resis- tance to fusiform rust disease in loblolly pine by genomic mapping. Proc Natl Acad Sci USA 93:3859-3864
Wilcox PL, Richardson TE, Carson SD (1997) Nature of quan- titative trait variation in Pinus radiata: insights from QTL detection experiments. In: Burdon RD, Moore JM (eds) "IUFRO '97 Genetics of Radiata Pine", Proc IUFRO Conf 1-4 Dec and workshop 5 Dec, Rotorua, New Zealand. FRI Bull 203:304-312
Wilcox PL, Richardson TE, Corbet GE, Ball RD, Lee JR, Djorovic A, Carson SD (2001a) FrameworkLinkage Maps ofpinus ra- diata D. Don based on pseudotestcross markers. For Genet 8:109-117
Wilcox PL, Carson SD, Richardson TE, Ball RD, Horgan GP, Carter P (2001b) Benefit-cost analysis of DNA marker- based selection in progenies of Pinus radiata seed orchard parents. Can J For Res 31:2213-2224
Wilcox PL, Echt CS, Cato SA, McMillan LK, Kumar S, Ball RD, Burdon RD, Pot D (2003) Gene assisted selection - a new paradigm for selection in forest tree species? In: Plant & Animal Genomes XI Conf, San Diego