OBAL CHANGF: - USDA Forest Service
249
United States Department of Agriculture Proceedings Forest Service Northeastern Forest Experiment Station General Technical Report NE-214 1995 Meeting of the Northern Global Change Program NORTHERN OBAL CHANGF: GkisEARcH PROGRAM
-
Upload
khangminh22 -
Category
Documents
-
view
2 -
download
0
Transcript of OBAL CHANGF: - USDA Forest Service

United States Department of Agriculture
Proceedings Forest Service
Northeastern Forest Experiment Station
General Technical Report NE-214
1995 Meeting of the Northern Global Change Program
NORTHERN
OBAL CHANGF: G k i s E A R c H PROGRAM

Published by:
USDA FOREST SERVICE 5 RADNOR CORP CTR SUITE 200 RADNOR PA 19087-4585
March 1996
For additional copies:
USDA Forest Service Publications Distribution 359 Main Road Delaware, OH 43015

Proceedings 1995 Meeting of the Northern Global Change Program
March 14-1 6, 1995 Pittsburgh, PA
Edited by John Horn, Richard Birdsey, and Kelly O'Brian
The authors who submitted manuscripts published in these proceedings were responsible for having them critically reviewed by at least two (usually three) scientists with expertise in disciplines closely aligned to the subject of the manuscript. Reviews were returned to the senior author, who revised the manuscript appropriately and resubmitted it in a diskette format suitable for printing by the Northeastern Forest Experiment Station, USDA Forest Service, where they were edited to a uniform format and type style. Each contributor is responsible for the accuracy and content of his or her own paper. Statements of the contributors from outside the U.S. Department of Agriculture may not necessarily reflect the policy of the Department.
The use of trade, firm, or corporation names in this publication is for the information and convenience of the reader. Such use does not constitute an official endorsement or approval by the U.S. Department of Agriculture or the Forest Service of any product or service to the exclusion of others that may be suitable.

TABLE OF CONTENTS
INTRODUCTION
The Northern Global Change Research Program ............................................................................................. Richard A. Birdsey, John L. Hom, and Marla Emery 1 V
MONITORING AND PREDICTING REGIONAL ENVIRONMENTAL CHANGE
Delineation of Climate Regions in the Northeastern United States Arthur T. DeGaetano.. ............................................................................................................................................ -7
Enhancement of Regional Wet Deposition Estimates Based on Modeled Precipitation Inputs James A. Lynch, Jefiey W. Grirnrn, and Edward S. Corbett.. ............................................................................... .8 k*.
RESPONSES OF NORTHERN TREE SPECIES TO REGIONAL STRESS
Effects of Calcium Fertilization and Acid Mist on Calcium Concentration and Cold Tolerance of Red Spruce Needles
G. R. Strimbeck, David R. Vann, and Arthur H. Johnson. ................................................................................... 10
Ozone-Induced Accelerated Foliar Senescence: Implications for Toxicity and Compensation Eva J. Pell, Bryan W. Brendley, and Judith P. Sinn .............................................................................................. 13
Root Growth and Respiration of Aspen in Response to Ozone and Elevated Carbon Dioxide M. D. Coleman, R. E. Dickson, and J. G. Isebrands.. ...................................................................................... 2 0 '4'
Effects of Ozone and CO, on the Growth and Physiology of Aspen D. F. Karnosky, 2. Gagnon, R. E. Dickson, P. Pechter, M. Coleman, Oievi Kull, Anu Sober, and J. G. Isebrands.. -2 1 L" ..........................................................................................................................
Interacting Effects of Ozone and CO, on Growth and Physiological Processes in Northern Forest Trees
J. G. Isebrands and D. F. Karnosky .................................................................................................................. 2 ik
The Chronic Response of Yellow-Poplar and Eastern White Pine to Ozone and Elevated Carbon Dioxide: Three-Year Summary
Joanne Rebbeck.. ................................................................................................................................................. 23 w c
Effects of Carbon Dioxide Enrichment on Response of Pitch Pine Grown at Different Nutrient Levels to Aluminum
George A. Schier and Carolyn J. McQuattie.. ..................................................................................................... ..3 1 I/'*
Elevated CO, Compensates for Water Stress in Northern Red Oak Patricia T. Tornlinson and Paul D. Anderson. ...................................................................................................... 32
Modeling Impacts of CO,, Ozone, and Climate Change on Tree Growth George E. Host, Gary W. Theseira, and J. G. Isebrands.. ................................................................................... 3 3 cs . .
Ozone Exposure, Uptake, and Response of Different- Sized Black Cherry Trees Todd S. Fredericksen, John M. Skelly, IGm C. Steiner, and Thomas E. Kolb ..................................................... 38

Water Use in Forest Canopy Black Cherry Trees and Its Relationship to Leaf Gas Exchange and Environment
..................................................................................................... B. J. Joyce, K. C. Steiner, and J. M. Skelly.. .4 1
Effects of Elevated CO, and Ozone on Phenolic Glycosides of Trembling Aspen James K. Nitao, Muraleedharan G. Nair, William J. Mattson, Daniel A. H m s , Bruce A. B h ,
................................................................................... Mark D. Coleman, Teny M. Trier, and J.G. Isebrands.. -42
Variable Performance of Outbreak Defoliators on Aspen Clones Exposed to Elevated CO, and O, Daniel A. Henns, William J. Mattson, David N. Karowe, Mark D. Coleman, Teny M. Trier, Bruce A. Birr, and J. G. Isebrands ........................................................................................................ . . . . 4 3 J
Genetic Meaffects of Increased Temperature in Larix ......................................................................................... Michael S. Greenwood and Keith W, Hutchison.. -56
Physiological and Genotypic Responses of Central Hardwood Species to Allelochemicals, Other Stresses, and Their Interactions
.................................................. J. W. Van Sambeek, John E. Preece, Nadia E. Navarrete, and George Rink.. 6 J
RESPONSES OF ECOSYSTEM PROCESSES TO REGIONAL STRESS
The Howland Integrated Forest Study (HIFS) - Ecosystem Research on Atmospheric Influences Governing Forest Function
........................... Ivan J. Fernandez, Lindsey E. Rustad, JeBey A. Simmons, and James W. McLaughlin.. 6 i
Biogeochemical Cycling of Carbon, Nitrogen, and Sulfur at tbe Howland Integrated Forest Study Site, Howland, Maine
James W. McLaughlin, Ivan J. Fernandez, Stewart M. Goltz, Lindsey E, Rustad, andLany Zibilske ................................................................................................................................... ........,.....68
Elemental Cycling Response of an Adirondack Subalpine Spruce-Fir Forest to Atmospheric and Environmental Change
Andrew J. Friedland and Eric K. Miller.. ......................... .. ........................................................................... .77
Internal Uptake and Assimilation of Gaseous Nitric Acid by Western Forest Tree Species ................................. John L. Hom, Marek Krywult, Andrzej Bytnerowicz, and Kevin E. Pearcy. .............. .. 8 >J .
Climatic and Pollution Influences on Ecosystem Processes in Northern Hardwood Forests Kurt S. Pregitzer, David D. Reed, Glenn D. Mroz, Andrew J. Burton, John A. Witter, andDonald A. Zak .................... .. .................................................................................................... ...............83
Effectts of Elevated CO, and Shade on the Decomposition of Senesced Tree Foliage: Impacts on Microbial Activity
Michael G. KaulFman, R. Malcolm Strand, Mark E. Kubiske, William J. Mattson, .......................................... Daniel A. Herms, Edward D. Walker, Kurt S. Pregitzer, and Richard W. Menitt.. .89
Effects of Elevated CO, and Shade on the Decomposition of Senesced Tree Foliage: Impacts on the Growth and Survival of Treehole Mosquitoes
R. Malcolm Strand, Daniel A. Herms, Michael G. Kaufinan, Mark E. Kubiske, William J. Mattson, Edward D. Walker, Kurt S. Pregitzer, and Richard W. Memtt.. .......... .. ...................... 1 0 1
Cation Depletion in New England Forests .................................................................................................. Richard Hallett and James Hornbeck,. 1 1 1 L

Aluminum Mobilization and Calcium Depletion in the Forest ~ l & r of Red Spruce Forests in the Northeastern United States
............................................................................ Gregory B. Lawrence, Mark B. David and Walter C. Shortle 1 12
Calcium Status of the Forest Floor in Red Spruce Forests of the Northeastern U.S. - Past, Present and Future
Mark B. David, Gregory B. Lawrence, Walter C. Shortle, and Scott W. Bailey ............................................... 118
Putrescine: A Marker of Stress in Red Spruce Trees Rakesh Minocha, Walter C. Shortle, Gregory B. Lawrence, Mark B. David,
................................................................................................................................. and Subhash C. Minocha.. 1 19
Long-tern Changes in the Acidity of a DeKalb Forest Soil in the Mid-Region of the Susquehanna River Watershed
................................................................................................................. Joy R. Robert and William E. Sharpe 13 1
Experimental Soil Warming Effect on C, N, and Major Element Cycling in a Low Elevation Spruce-Fir Forest Soil
............................................................................ Lindsey E. Rustad, Ivan J. Fernandez, and Stephanie Arnold 132 :
Soil Respiration and Net N Mineralization Along a Climate Gradient in Maine Jefiey A. Simmons, Ivan J. Fernandez, and Russell D. Briggs.. ...................................................................... .I40
Increasing Soil Temperature in a Northern Hardwood Forest: Effects on Elemental Dynamics and Primary Productivity
Patrick J. McHale, Myron J. Mitchell, Dudley J. Raynal, and Francis P. Bowles .............................................. 146
Microhabitat Effects of Litter Temperature and Moisture on Forest-Floor Invertebrate Communities Tim A. Christiansen, Sue A. Perry, and William B. Peny ................................................................................. 153
Effects of Acidic Precipitation on Leaf Decomposition Rates, Microbial Biomass, and Leaf Pack Macroinvertebrates in Six Streams on the Allegheny Plateau of West Virginia
Er$ S. Engstrom, Sean K. Meegan, Sue A. Perry, and William B. Peny ......................................................... 154
Leaf Litter Processing in West Virginia Mountain Streams: Effects of Temperature and Stream Chemistry
Jacquelyn M. Rowe, William B. Perry, and Sue A. Perry .................................................................................. 157
Leaf Litter Decomposition and Elemental Change in Three Appalachian Mountain Streams of Different pH
Steven W. Solada, Sue A. Peny, and William B. Perry.. .............................................................................. 1 6 1
Methane Evolution from Minnesota Peatlands ................................................................................................................................................ Elon S. Veny... 1 5 I/
Nutrient Cycling in Aggrading Forests: 50 Years of Research at Pack Forest, New York Edwin H. White, Charles A. Z. Buxbaum, and Christopher A. Nowak ............................................................. 166 W .
Relative Nitrogen Mineralization and Nitrification Potentials in Relation to Soil Chemistry in Oak Forest Soils Along a Historical Deposition Gradient.
Ralph E. J. Boerner and Elaine Kennedy Sutherland.. ....................................................................................... 1 6 vr"

Mortality Patterns in Oak Forests Along a Climatic and Acid Deposition Gradient Elaine Kennedy Sutherland, Daniel A. Yaussy, and Ralph E. J. Boerner. ....................................................... 1 6 8 V *
FOREST AND LANDSCAPE RESPONSES TO REGIONAL STRESS AND MANAGEMENT ACTIVITIES
m - t h r e e Year Changes in Above- and Below-Ground Biomass in Northern Hardwood Stands in Vermont
A. H. Johnson and G. R. Strimbeck.. ................................................................................................................. -1 69
Evaluation of Methodology for Detectinflredicting Migration of Forest Species Dale S. Solomon and William B. Leak ............................................................................................................. 1 X, A
Growth Responses of White Oak and Black Oak to Drought Stress Across Gradients of Acid Deposition and Microclimate
David LeBlanc and Robert Haack ................................................................................................................. 1 8 3
Assessing the Ability of Plants to Respond to Climatic Change Through Distribution Shifts Mark W. Schwartz.. ........................................................................................................................................... -1 84
Overview of Current Research on Atmospheric Interactions With Wildland Fires ... Wmen E. Heilman.. .................................................................................................. .'. ....................................... -1 92
Synoptic Circulation and Temperature Pattern During Severe Wildland Fires . Warren E. Heilman.. ........................................................................................................................................... .I96
Atmospheric Mesoscale Simulations of Regional Wildland Fire Episodes: Looking for Weather-Related Factors and Scales of Interaction
Brian E. Potter.. ............................................................................................................................................... 197 v*
HUMAN-FOREST INTERACTIONS AND REGIONAL CHANGE
Spatial Patterns in Carbon Storage in a Lake States' Landscape J. C. Bell, D. F. Grigal, P. C. Bates, and C. A. Butler ........................................................................................ 198
Carbon Storage in Managed Forests of the Northern Great Lake States Jeanette L. Rollinger and Teny F. Strong.. ........................................................................................................ -203
Temperature and Earthworm Effects on C and N Dynamics in Oak Stands Along an Urban-Rural Land Use Gradient
R. V. Pouyat, P. M. Groffian, M. M. Carreiro, P. Bohlen, and R. W. Pannelee .............................................. 208 -kAf
AN INTEGRATED NATIONAL MODEL OF THE EFFECTS OF GLOBAL CHANGE ON U.S. FORESTS
Preparation of Forest Inventory and Analysis (FIA) and State Soil Geographic Data Base (STATSGO) Data for Global Change Research in the-~astem United States
Louis R. Iverson, Anantha M. G. Prasad, and Charles T. Scott.. ..................................................................... 2 0 9 "
Regeneration Attributes of Tree Species in the Central Hardwoods Type Elaine- Kennedy Sutherland, Betsy J. Hale, and David M. Hix.. ..................................................................... 2 1 5 ....
Herbivorous Insects and Climate Change: Potential Changes in the Spatial Distribution of Forest Defoliator Outbreaks
David W. Williams and Andrew M. Liebhold.. ................................................................................................ ..2 16

Predicting the Effects of Tropospheric Ozone on Forest Productivity in the Northeastern U. S. Scott V. Ollinger, John D. Aber, and Peter B. Reich.. ...................................................................................... .2 17
Catalog of Long-Term Research Conducted Within the USDA Forest Service, Northeastern Forest Experiment Station
Hope R. Barrett.. ............................................................................................................................................... 2 2 L-
BOREAL FORESTS AND GLOBAL CHANGE
Carbon Balance of the Alaskan Boreal Forest ........................................................................................................................ John Yarie and Tim Hamrnond.. .227
An Energy Balance Model for Forest Canopies: A Case Study S. M. Goltz and James A. Smith.. ...................................................................................................................... -228
Temporal and Spatial Trends of Fluxes and Concentrations of CO, Above and W i b the Canopy at Howland, Maine: Preliminary Results
S. M. Goltz .......................................................................................................................................................... 229
Dynamics of Calcium Concentration in Stemwood of Red Spruce and Siberian Fir Kevin T. Smith, Walter C. Shortle, Rakesh Minocha, and Vladislav A. Alexeyev.. ....................................... 2 3 &

FOREWORD
The Northern Global Change Program meeting was held March 14- 16, 1995, in Pittsburgh, Pennsylvania. Its
purpose was to chronicle the research activities of the Northern Global Change Program over the past five years, and
outline the implications of these research results for natural resource management. We thank the authors for their
participation and for promptly submitting their papers in both paper and electronic form.

THE NORTHERN GLOBAL CHANGE RESEARCH PROGRAM
Richard A. Birdsey, John L. Hom, and Marla Emery'
Abstract: The Forest Service goal for global change research is to establish a sound scientific basis for m h g regional, national, and international resource management and policy decisions in the context of global change issues. The objectives of the Northern Global Change Program (NGCP) are to understand: (1) what processes in forest ecosystems are sensitive to physical and chemical changes in the atmosphere, (2) how future physical and chemical climate changes will influence the structure, function, and productivity of forest and related ecosystems, and to what extent forest ecosystems will change in response to atmospheric changes, and (3) what are the implications for forest management and how must forest management activities be altered to sustain forest productivity, health, and diversity. The NGCP cwently emphasizes scientific inquiry into the effects of multiple air pollutants and climate changes on forest ecosystems. As the program matures, the impacts of prospective changes on interactions between forest ecosystems and social and economic processes will be evaluated, as will policy options for mitigating or adapting to predicted changes.
INTRODUCTION
Global change adds a new dimension to forest management policy and practice. Historically, management planners assumed that the physical and chemical environments on which a forest ecosystem depends would remain roughly stable. Our incomplete understanding of landscape-scale processes and our inability to predict how ecosystems will be affected by future environmental changes limit effective management planning and application. Furthermore, since we cannot predict the fate of many plants and animals under changing climatic conditions, we cannot adequately evaluate the mitigation and adaptation strategies under consideration by policy makers in response to increasing atmospheric CO, and possible climate changes.
Forest resources in the Northeastern, North Central, and Midwestern United States are intensively utilized for many different purposes. Population density is high and people are intimately associated with forest values in the Northeast, the most densely forested region of the United States. In the North Central and Midwestern states, forests scattered throughout agricultural landscapes play an important role in reducing sediment and nutrient runoff from farmlands to aquatic ecosystems. Both large and small municipalities rely on forested watersheds for water supplies. Local communities are tied to forest resources for outdoor recreation, hunting, maple syrup production, wood fiber production, and aesthetic values. The mix of urban, agriculture, and forest cover produces a fragmented landscape that in some areas may affect the ability of tree and wildlife species to adapt to major environmental stress or to migrate along with the changing environment.
Along with climate change, air pollution and acidic deposition exert strong influences on forest ecosystems in the northern region. Gradients of moisture and temperature are supplemented by strong pollutant deposition gradients, generally from very low levels in the Midwestern plains to the highest national levels in the East. Climate and pollution stresses, and their interactions with pests, humans, and other environmental changes are likely to cause unprecedented cumulative effects on northern forest ecosystems.
'USDA Forest Service, Northeastern Forest Experiment Station, Radnor, PA 19087.
1

GENERAL PROGRAM DESCRIPTION
Program Goals
The Forest Service goal for global change research is to establish a sound s c i en t~c basis for making regional, national, and international resource management and policy decisions in the context of global change issues. This is accomplished through a broad research initiative addressing the three national research questions concerning global change and forest ecosystems:
1. What processes in forest ecosystems are sensitive to physical and chemical changes in the atmosphere?
2. How will future physical and chemical climate changes influence the structure, function, and productivity of forest and related ecosystems; and to what extent will forest ecosystems change in response to atmospheric changes?
3. What are the implications for forest management and how must forest management activities be altered to sustain forest productivity, health, and diversity?
Answers to these research questions will provide guidance to policy makers and resource managers.
Research in the North (Figure 1) will lead to understanding of how changes in the physical and chemical environment will impact forests and people's associations with them. The challenge and opportunity facing the NGCP is to increase understanding of ecosystem processes and global change effects at various temporal and spatial scales, and to identifl key processes that link temporal and spatial scales. The NGCP currently emphasizes scientific inquiry into the effects of multiple pollutants, atmospheric change, and increased climatic variability on forest ecosystems. As the Program matures the impacts of prospective changes on interactions between forest ecosystems and social and economic processes will be evaluated, as will policy options for mitigating or adapting to predicted changes.
Figure 1. Regional emphasis of the Northern Global Change Program. Program Budget
The annual budget for the NGCP has been approximately $6.5 million per year. Of this amount, approximately half is appropriated directly to field locations and half to program management for funding research studies selected through a competitive, peer-reviewed process. The operating goal is to fund 50 percent internal and 50 percent extramural research by interdisciplinary teams of federal and nonfederal scientists.
Research Emphasis - 199 1 to 1993
Initial priorities focused research on the effects of global change on forest health and the productivity of forest lands. Approximately 50 percent of the research effort was a continuation of studies related to acid deposition and ozone effects, and 50 percent was allocated to study the effects of stresses identified with climate change (CO,,

temperature, precipitation, weather events). The approximate percentage of funds allocated to six broad research areas for the first three years was:
Studies of physiological processes 25% Studies of ecosystem processes 48% Landscape-scale studies 8% Model development and application 15% Social interactions and economics 2% Assessment and policy 2%
Research Emphasis - 1994 to 1995
More recent studies increased the program emphasis on the complicated issues of species migrations and composition changes, and effects of expected changes on human interactions with forests, including model development and application to support policy assessments (regional and national) and technology transfer. As a result, h d i n g allocations to the six research areas has shifted to the following approximate distribution:
Studies of physiological processes 20% Studies of ecosystem processes 40% Landscape-scale studies 10% Model development and application 15% Social interactions and economics 5% Assessment and policy 10%
Specific subject areas have been identified as lacking sufficient resources to complete regional and national assessments by 1997. These subject areas may receive emphasis in new research initiatives. The relative emphasis of these and possibly other subject areas is part of an ongoing review process.
PROGRAM COMPONENTS
Monitoring and Predicting Regional Environmental Change
Information about historical climate is used in the analysis of ecological data to develop models relating ecosystem processes and responses to climate, and to develop analogs for future climate scenarios at regional to local scales. NGCP researchers have developed techniques for modeling historical and current climate at specific locations of interest to land managers, and can produce estimates of precipitation and ionic deposition at any point in the NGCP region. We have the capability to project regional climate changes by nesting a mesoscale climate model within a specific area covered by much larger scale global climate models that are unable to resolve important local features such as topography and large water bodies.
Responses of Northern Tree Species to Regional Stress
Our understanding of how and why individual trees respond to change is inadequate because multiple interacting stresses may produce responses that are considerably different from reactions to any one factor. Since controlled experiments are limited in scope to evaluation of a few factors and their interactions, we have linked carefully selected experimental studies with models of physiological mechanisms to predict the complicated tree responses more realistically. Our ongoing objective has been to conduct comparative experiments on immature and mature trees, with the eventual goal of conducting experiments at the stand or ecosystem level.
We have featured research on the effects of chronic CO, and ozone exposure, interacting with nutrient and moisture limitations. Key responses include changes in carbon allocation, altered ecosystem productivity, and effects on

susceptibility to insect defoliation and disease. Extrapolation of these results to the ecosystem level and larger regional scales of interest to land managers and policy makers is based on mechanistic models at different scales.
A sizable body of research indicates that deposition of nitrogen and sulphur compounds via clouds, rain, snow, and wind is impacting the health of some tree species in the northeastern United States. Several NGCP studies are advancing our understanding of the affects of acid deposition on spruce physiology and cold tolerance. Additional studies examine the effects of acid deposition on ecosystems through changes in nutrient cycling.
Several long-term studies have been initiated or adopted by the NGCP to improve understanding of the physiological and genetic mechanisms of tree resistance to stresses such as physical and biological damage, disease, and water stress. An understanding of the mechanisms by which trees adapt to rapid change is critical to planning for climate change. Adaptation may be a si&icant alternate survival strategy to migration for some species, and will surely have an impact on fbture species composition, biodiversity, and the status of sensitive ecosystems.
Responses of Ecosystem Processes to Regional Stress
To successfully manage forests in a changing environment we must understand the complex dynamics of forest ecosystems as well as the responses of individual trees. Unless we have long-term records of environmental variables such as temperature, soil solution chemistry, and vegetation responses such as tree growth and mortality, we have no yardstick against which to measure our predictions about ecosystem responses to environmental change or to test the results of our models. The NGCP has continued observations at seven intensive research sites established during the National Acid Precipitation Assessment Program (NAPAP). Measurements of climate variables, atmospheric deposition, throughfall chemistry, and soil solution chemistry have been made for up to six years. Continuing such measurements over a long period of time can provide complete characterization of the variability in deposition and mineral cycling rates, and their relation to tree health.
Northern forest soils are susceptible to increases in the amount of soluble aluminum as a result of acidic deposition. Elevated concentrations of aluminum are toxic to roots and can inhibit the availability of calcium, an important nutrient. Establishing a cause-effect link between acid deposition, soil chemistry, and tree health was one of the major challenges of the NAPAP program; however, there are many factors affecting northern forest ecosystems and it became extremely challenging to establish a direct causal link. Under NGCP, research has continued on these important soil-mediated effects of acidic deposition. Several experiments have been established to study how a changing climate may affect tree growth through alterations in soil processes.
Forests in the North are dynamic and typically in a state of recovery or succession following the last disturbance, whether timber harvesting, land clearing and reversion to forest, or natural events such as hurricanes. Understanding ecoqstem responses to environmental change requires a solid understanding of how disturbance impacts the processes that govern successional change. NGCP scientists are studying the impacts of harvesting and natural disturbance on microclimate, species succession, nitrogen saturation, cation depletion, and carbon dynamics.
Forest and Landscape Responses to Regional Stress and Management Activities
A significant alteration in the mix of tree species, in the productivity of forest lands, or in the health of existing forests could have a substantial impact on aesthetic and commercial values of forests, as well as wildlife populations and associated forest values. Understanding how basic forest parameters are affected by environmental change is the objective of a series of observational and modeling studies. Where possible, long-term permanent plots have been relocated and remeasured to detect changes associated with disturbance, acid deposition, and climate. These data sets are used to both explain observed vegetation characteristics, and to parameterize models so that predictions about fiiture changes over large areas can be made.
Some tree species and ecosystems are more sensitive to climate and atmospheric chemistry than others, and are more rapidly affected by change. The susceptibility of vegetation to change, and the rate of change, will be influenced by the interaction of weather patterns and such factors as soil chemistry, elevation, and land use. Studies of vegetation

history have shown that the occurrence of an individual species or a whole biome is closely related to past climate changes. It is inevitable that species distributions will shift, either from climate change or other natural and human- induced environmental changes.
Changes in disturbance patterns are likely to be one of the more striking features of a changing climate. Studies of individual disturbances and relationships to global change will eventually lead to a more comprehensive understanding of the long-term role of disturbance in shaping forest communities. At the landscape scale, the NGCP has focused disturbance research on drought and fire regimes, and the possible role of global change in patterns and intensities of these disturbances. The climate changes predicted by GCMs would also lead to altered pattems of insect infestation. To anticipate these changes and their implications for forest health and productivity, the NGCP has undertaken research on the potential effects of climate change on insect populations.
Human-Forest Interactions and Regional Change
A growing number of NGCP studies address natural resource policy issues and management in a changing environment. Estimating carbon sequestration or release for managed forest ecosystems is crucial to understanding the role of terrestrial ecosystems under changing climates. This estimation requires a reliable assessment of the quantities of carbon stored in various ecosystem components such as the plant biomass, forest floor, and soil, along with a recognition of spatial patterns of ecosystem carbon variability. Regional-scale estimates must consider patterns of carbon variability and interactions with environmental factors and land use change to accurately estimate the effects of change on forests at landscape and regional scales.
The NGCP includes a series of studies designed to quantlfy how carbon in forested landscapes changes over time. Attempts to quantify the role of Northern forests in the global carbon cycle, and to understand the effects of alternate management activities on carbon storage, have been hampered by a lack of quantitative information. These studies are intended to fill this knowledge gap.
An Integrated Model of the Effects of Global Change on U.S. Forests
Environmental change could be rapid relative to the ability of a species to adapt or migrate. The capability to project successional change is particularly important because rapid environmental change could induce forest health problems during a transitional change fi-om one vegetation type to another. S i d ~ c a n t problems with forest health would in turn affect forest resource use and the people dependent on the multiple resource values of forests, fiom the timber industry to the subsistence user.
NGCP scientists are participating in the development of a national integrated model of global change effects on forests. The integrated model combines submodels of the physical, biological, and social systems. Climate models at global and regional scales, and hydrologic models represent major physical systems. Several different models of ecosystem change are being developed and evaluated at different temporal and spatial scales. The human dimensions are partially captured with econometric models of the forest sector, which can project land use change, harvesting activity, and impacts of change on the forest products industry.
Development and application of the integrated model are based on models used to conduct national assessments required by the Resources Planning Act @PA). The integrated model provides analyses of the effects of scenarios of global change on forests, and can be used as a tool for evaluating alternate policy responses to projected changes. Initial efforts are focused on improving projections of p~tential~forest vegetation distribution, forest ecosystem composition, forest growth, and the national carbon budget. As capability to project vegetation changes improves, the modeling system will be extended to project changes in other forest system attributes such as biodiversity and wildlife habitat.
An ongoing synthesis of basic forest statistics and development of carbon accounting models has highlighted the past and prospective role of U.S. forests in the global carbon cycle and provided input to policy decisions regarding the effects of alternate strategies for offsetting greenhouse gas emissions through forestry actions. The U.S. carbon

budget model (FORCARB) predicts carbon in major forest components: trees, understory vegetation, the litter layer and coarse woody debris, and soils. Although still under development, early versions of FORCARB have provided input to national decisions regarding the effects of alternate policies for offsetting greenhouse gas emissions through forestry actions. Using statistics from a nationwide inventory of trees and data from site-specific studies, the model makes continental-scale projections of the carbon that would be released and/or sequestered by various management activities that could result from national policy decisions.
Analyses at the national scale may obscure important regional changes that are likely to occur in specific ecoregions. There is a need to develop integrated models at the regional scale that are optimized for the specific domains under study -- large watersheds, river basins, multi state areas, economic regions, and the like. At the same time, there is an opportunity to establish feedbacks between national- and regional-scale models so that information developed at the national scale provides the context for regional assessments, and regional studies (that may contradict national studies) can be used to venfjr national-scale results or investigate possible regional effects in more detail. Model comparisons at different spatial and temporal scales are important to understanding the capabilities and limitations of models that are becoming widely used in assessments.
Boreal Forests and Global Change
Boreal forests play a major economic, social, and ecological role in the global environment. Circling the northern latitudes, boreal forests occur within the borders of Russia, Canada, the United States (Alaska), Finland, Norway, and Sweden. With an area of 920 million hectares they comprise 29 percent of the world's total forest cover. Boreal forests may be the single largest terrestrial carbon sink, with an estimated 40 billion tons of the world's stored carbon in Siberia's forests alone.
Boreal forest range and health are closely tied to prevailing climate conditions. Current projections indicate that global warming will be detected earlier and most strongly at high latitudes. NGCP scientists are part of a cooperative international effort to study boreal forests and the implications of global change for this critical ecosystem.

DELINEATION OF CLIMATE REGIONS IN THE NORTHEASTERN UNITED STATES
Arthur T. DeGaetanol
Climate is a primary criterion for the development, description and validation of subregional levels of the National Hierarchical Framework of Ecological Units. However, climate information is not currently available in the form or level of detail required for integration with other biophysical factors at the section or subsection levels. In this study, historical climate data from 640 observing sites in the northeastern United States and Canada are used to delineate climatic zones with sufEcient detail to be incorporated into subsection levels of the National Hierarchical Framework of Ecological Units.
For each site a total of 1 10 climatological variables representing such parameters as monthly average temperature, temperature extremes, fi-ost occurrence, precipitation, and potential evapotranspiration were quality controlled and adjusted to a standard observation hour. In addition, missing temperature observations were estimated to yield a serially complete temperature data set. All variables are representative of the 196 1 - I 990 climatological normals period. Using principal component analysis, the intercomelation of these variables is eliminated and thus the size of the original data set can be reduced. Eight components, explaining 94 percent of the variability in the original 1 10 variables, are retained for subsequent analysis..
Based on the retained components, Ward's method of cluster analysis is used to define 54 climate zones within the region. These zones are used as initial seeds for nonhierachical K-means clustering. This second clustering eliminates several of the shortfalls associated with hierarchical clustering and allows the grouping of stations based on a variable number of initial components.
Once this grouping of stations was established, discriminant functions were calculated to express the station grouping in terms of variables derived from latitude, longitude and elevation. Cross validation showed that more than 60 percent of the stations were correctly classified based on the discriminant functions. Since the spatial resolution of the 640 climatological stations is relatively low, a 5 minute gnded elevation data set was used in conjunction with the discriminant functions to produce the final climate delineations.
'~ortheast Regional Climate Center, Cornell University, Ithaca NY 14850.
7

ENHANCEMENT OF REGIONAL WET DEPOSITION ESTIMATES BASED ON MODELED PRECIPITATION
INPUTS
James A. Lynch1, Jeffrey W. Grimm2, and Edward S. Corbett3
Application of a variety of two-dimensional interpolation algorithms to precipitation chemistry data gathered at scattered monitoring sites for the purpose of estimating precipitation- born ionic inputs for specific points or regions have failed to produce accurate estimates. The accuracy of these estimates is particularly poor in areas of high topographic relief. Because wet deposition of pollutants is a fbnction of both the ionic concentration of precipitation and precipitation volume and because the local distribution of precipitation can be strongly influenced by terrain, incorporation of orographic effects into the wet deposition modeling process should markedly improve the accuracy of estimated depositions. This presentation describes progress made in the development and application of a model which utilizes topographic features fa the purpose of estimating wet deposition of major ions for any portion of the region encompassed by US. Forest Service Northern Global Change Program (NGCP).
The coordinates, elevations, and monthly precipitation records fiom the National Oceanic and Atmospheric Administration's (NOAA) precipitation monitoring sites in the states contained in and adjacent to the NGCP comprise the precipitation volume data set used for model development. Precipitation concentration data were derived from the weekly samples collected at National Atmospheric Deposition Project/National Trends Network monitoring sites which lie within or adjacent to the NGCP area.
Initial egorts to incorporate topographic effects into the precipitation volume component of the deposition model entailed an extension of the multi-quadric equation algorithm (MQE) to include scaled elevation as a third spatial dimension. This refinement greatly improved the ability to estimate precipitation volumes at validation points, particularly in small (one- to two-degree) regions with mountainous terrain. However, application of the 3-D MQE algorithm to an entire region as climatically and topographically diverse as the NGCP area was untenable due to the absence of a non-interactive procedure to determine the elevation scaling factor for each specific subregion. Further, the 3D-MQE was not appropriate for the incorporation of slope and aspect information. Similarly, co-kriging with topographic parameters was deemed too operator- intensive because of the changing influence of terrain on the distribution of precipitation across a large geographic region.
The present foxm of the precipitation volume model is a moving-neighborhood, distance- weighted, robust stepwise regression of monitoring site precipitation observations on latitudinal and longitudinal coordinates, elevation and a set of variates representing both slope and aspect. The derived regression equations from each neighborhood (0.1-degree block) are then applied to corresponding digital elevation data (DAM) to produce a grid of precipitation estimates at of the cumnt model is assessed by comparing the predicted and observed quarterly and annual precipitation volumes at approximately 1500 validation sites scattered over the NGCP region. At this point, the average annual estimation error is consistently near 3.0 inches for each year fiom 199 1 through 1993.
A major limitation on the accuracy of the precipitation volume model is the imprecision of the coordinates of the NOAA precipitation sites. NOAA coordinates for rain gage location are reported at a resolution no finer than 1
'School of Forest Resources, Pennsylvania State University 1 6802.
%vironmental Resources Research Institute, Pennsylvania State University 16802.
'USDA Fmst Service, NEFES, University Park, PA 16802.

minute of a degree of latitude or longitude. This level of uncertainty in the location of sampling sites impedes the modeling of localized, but important, orographic influences on precipitation. Unfortunately, NOAA data comprise the only precipitation data set that covers the NGCP area at a site density sufficient for deposition modeling. In order to scavenge some usehl slope and aspect information to be used with the NOAA observations, a long-range, neighborhood-oriented expression of slope and aspect was developed and incorporated into the precipitation-volume model. This subroutine within the model could be vastly improved with more precise coordinates of each NOAA precipitation monitoring station.
Future efforts in refining the deposition model will focus on enhancing the estimates of precipitation concentrations and on refinements that will improve model performance along the region of the NGCP that borders on Canada and over large bodies of water, such as the Great Lakes. We will also obtain precipitation chemistry data fiom other monitoring programs, such as the Electric Power Research Institute, to use in model evaluation and verification. Application of model output to cause-effect relationships, nutrient budgets and management, and hydrologic models will also be undertaken. Examples of such are requests for quantifying atmospheric deposition of nutrients to the Chesapeake Bay, determining mean precipitation values needed for use in the hydrologic module of the Northeast Decision Model, and the calculation of atmospheric deposition loadings over the Allegheny National Forest for use in ecosystem management studies and planning.

EFFECTS OF CALCIUM FERTILIZATION AND ACID MIST ON CALCIUM CONCENTRATION AND COLD
TOLERANCE OF RED SPRUCE NEEDLES
G. R. strimbeck', David R. vann2, and Arthur H. Johnson2
Several studies have shown that exposure to acid mist impairs cold tolerance of red spruce foliage, predisposing it to winter injury, which appears to be a major factor in the decline of montane populations of the species. Other studies have shown increases in calcium (Ca) concentration in canopy throughfall in montane spruce-fir forests, and decreases in foliar Ca concentration associated with exposure to acid mist. Studies of other plant species suggest that Ca may play a role in the development of cold tolerance or in stress response to cold. These considerations have led to the specific hypothesis that the reduction in cold tolerance associated with exposure to acid mist is caused by reduction in foliar Ca. To test this hypothesis, we applied Ca fertilizer to trees in a 33 year old red spruce provenance plantation in Colebrook, NH, and used branch chambers to expose individual branches to mist of known composition.
Ca fertilizer was applied during the 1992 and 1993 growing seasons. It was applied on the ground in a 1 m diameter circle around the base of designated trees, during bud break, in two stages, two weeks apart: CaCO, at a rate of 200 kg ha" Ca, and Ca Cl, at a rate of 800 kg ha-' Ca. To test the simple effect of fertilization, we determined Ca concentration (pg g-l) and cold tolerance of foliage collected in December 1992, after the first round of fertilization. Fertilization si&icantly increased Ca concentration of current year foliage from a mean of 902 to 1277 pg g- 1 in the unfertilized and fertilized groups, respectively (n = 12 trees in each group). There were no dfierences in cold tolerance attributable to fertilization (Table 1).
Table 1. Statistical analysis of cold tolerance data. Probabilities from analyses of variance of critical temperature (1 992) or Tm (1 993-94). Separate analyses were conducted for each date. Values significant at p < 0.05 are given in boldface. * 8 degrees of freedom for February 1994; 2 trees were omitted due to severe injury.
Source df Dec 92 d f Oct 93 Dec 93 Feb 94
Fertilization 1 0.1082 1 0.93 1 0.136 0.278 Tree[Fzrt] 22 0.0002 lo* 0.291 0.003 0.007 Mist 2 0.549 0.073 0.032
No chamber vs. chamber 1 0.302 0.318 0.825 pH 3.2 vs. pH 5.6 1 0.744 0.038 0.010
Mist * Calcium 2 0.491 0.553 0.204
The design of the fmal stage of the experiment was a split-plot, with trees as whole plots, fertilization as whole plot effect, and mist treatment as a subplot effect. During the 1993 growing season, branch chambers were used to expose two branches on each of 12 trees, 6 fertilized and 6 unfertilized, to either pH 3.2 or pH 5.6 mist. The following autumn and winter, we determined Ca concentration and cold tolerance of foliage from treated and untreated (no chamber) branches fiom each tree in October, December, and February.
'University of Vermont, School of Natural Resources, Burlington, VT 05405.
vniversity of Pennsylvania, Department of Geology, Philadelphia, PA 1 9 104.
10

There were no significant effects of any treatment, including fertilization, on Ca concentration. Mean Ca concentration of the unfertilized group increased after the second round of fertilization (Figure 1). Trees in the plantation were closely spaced, and roots of unfertilized trees may have extended into and absorbed Ca in fertilized areas. While branches misted at pH 5.6 on fertilized trees had substantially more calcium than any other group, this difference was not simcant at a = 0.05 in either the planned analysis of variance or a posteriori multiple comparison procedures.
600
May 1992 Dec 1992 Feb 1993 Figure 1. Changes in foliar Ca concentration over the course of the experiment. The May 1992 point is the mean * standard error of three branches in each of 54 trees. For the later dates error bars are standard error estimates fiom analysis of variance. The December 1992 points each represent 12 trees, and the December 1993 points represent 6 treated branches.
We found no significant dfierence in cold tolerance due to any treatment for foliage collected in October, and no significant difference attributable to Ca fertilization or its interaction with mist treatment on any date (Table 1). In the winter, branches exposed to pH 3.2 mist were significantly less cold tolerant than those exposed to pH 5.6 mist, with a mean difference of 4.4 " C in December and 5.2 " C in February (Figure 2). Simple correlation between Ca content and cold tolerance was weak (? = 0.22) but significant (p < 0.0 1, n = 36), with no strong influence of either mist or fertilization on the relationship.
Fertilized 0 Unfertilized - - pH 5.6 111.
/ pH 3.2 - No Chamber
/ /
/ / / /
/ /-
//"/ /'A
15, /.;
/9
<<\ -
7
The clear effect of acid mist on cold tolerance lends strong support to the conclusions of earlier studies that exposure to acid mist can significantly impair cold tolerance. Our results do not support the hypothesis that this effect is mediated by foliar leaching of Ca. The lack of strong effects of mist on Ca concentration and of fertilization on cold tolerance, and the weak and inconsistent correlation between Ca concentration and cold tolerance all argue that the two responses are not directly related. However, results are uncertain because of the poor separation of Ca concentration in fertilized and unfertilized groups in the second year of the study.

25 Oct 1993 13 Dec 1993 22 Feb 1
Figure 2. Mean Tm (an estimate of cold tolerance) by mist treatment on three dates. Error bars are standard error estimates fiom analyses of variance for each date.

OZONE-INDUCED ACCELERATED FOLIAR SENESCENCE: IMPLICATIONS FOR TOXICITY AND
COMPENSATION
Eva J. Pell', Bryan W. Brendlef, and Judith P. Sinn2
Abstract: Two-year-old seedlings of black cheny, Prunus serotina Ehrh., northern red oak, Quercus rubra L. and sugar maple, Acer saccharum Marsh., and ramets of hybrid poplar, Populus maximowizii x trichocarpa, clone 245 were grown in eight charcoal-filtered open-top chambers per species. Half the chambers, per species, received 0.08 /*L L'l O, from 1000 to 1800 h each day of the growing season. Accelerated foliar senescence and associated 0,- induced loss in Rubisco were observed in older foliage of hybrid poplar and black cherry. Younger leaves were less responsive to O,, and in the case of hybrid poplar actually exhibited signs of compensation to the stress. Sugar maple and northern red oak were less responsive and exhibited no signs of accelerated senescence. The relevance of the latter response is considered in the context of the indeterminate and determinate growth habits of these two groups of plant species.
INTRODUCTION
Ozone (0,) has been associated with the induction of accelerated foliar senescence in many plant species (Reich & Lassoie, 1985; Pell, Eckardt & Enyedi, 1992). During normal leaf development, expansion of the lamina is associated with an increase in the concentration of ribulose 1,s-bisphosphate carboxylase/oxygenase (Rubisco). Once the leaf has reached full expansion, synthesis of Rubisco becomes of less consequence and the protein levels decline until senescence palling, 1987). Because Rubisco is the protein responsible for fixing CO, during the Calvin Cycle, decline in this enzyme is linked with a reduction in net photosynthesis. We have shown that 0,- stressed plants exhibit a more rapid loss in Rubisco protein coupled with a more rapid decline in net photosynthesis (Pell, Eckardt & Glick, 1994); ultimately the leaf becomes chlorotic and abscises earlier than non stressed counterparts. Previously, we demonstrated that the accelerated loss in Rubisco can be attributed, in part, to enhanced degradation of the protein (Eckardt & Pell, 1994). In addition, Reddy et al. (1 993) have shown that O, induces a reduction in mRNA for the large and small subunits of Rubisco; how this reduction in transcript relates to possible reduction in synthesis of Rubisco remains to be determined.
The accelerated loss of photosynthetic tissue has inherently negative implications for the plant. However, plants possess compensatory mechanisms to minimize the adverse effects of stress. We have associated 0,-accelerated reduction in net photosynthesis and Rubisco content of older leaves of trembling aspen (Populus tremuloides) with increases in these parameters, above the level of control tissue, in younger leaves (Pell et al., 1994). The ability of plants to compensate for injury by accelerated foliar senescence as just described, is dependent on the capacity for plants to initiate new foliage. Thus, indeterminate species would have options unavailable to species that exhlbit determinate or fixed growth habit. In this study we explored the ability of 0, to induce accelerated senescence in plants with different rates of growth and with different growth habits viz. hybrid poplar, and black cherry, both indeterminate as young plants; and northern red oak, and sugar maple, relatively determinate as seedlings.
'Steimer Professor of Agricultural Sciences, Department of Plant Pathology and Environmental Resources Institute, The Pennsylvania State University, University Park, PA 16802.
'Graduate Student in Plant Physiology, and Research Assistant in Plant Pathology, respectively, The Pennsylvania State University, University Park, PA 16802.

METHODS
Cuttings of hybrid poplar clone 245, and two-year-old seedlings of black cheny, northern red oak and sugar maple were cultured as described elsewhere (Pell et al., 1995); plants received a nutrient supplement of 3.53 g 1-' Osmocote (N:P:K 14: 14: 14; Sierra Chemical Co., Milpitas, CA) at planting. All plants were grown in open-top chambers receiving charcoal-filtered air (Pell et al., 1993); in 1993 and 1994 0, concentrations in these chambers averaged 0.04 ~l I" during the exposure period. For each species, four replicate chambers served as controls whle an additional four chambers received supplemental O, from 1000 to 1800 h each day resulting in a summer average of 0.08 pl1-'. Experiments were conducted in 1993 and 1994. Most of the data reported herein was collected in 1993 with the results in 1994 supporting those of 1993. In addition, in 1992 a baseline study was conducted using only plants growing in charcoal-filtered air. Ozone exposures were conducted from June 24 - September 22,1993 and June 24 - September 27,1994.
When hybrid poplar and black cherry plants were approximately 18 cm in height, and when the second flush of sugar maple and northern red oak was initiated, a newly emergent leaf on each plant in every chamber was tagged. Once every two weeks throughout the growing season, leaves were sampled from two plants per chamber. In the case of hybrid poplar and black cherry, a second leaf 17 and 25 leaves above the fust leaf tagged, respectively, were also tagged at emergence. Subsequently these leaves were sampled along with the leaf positioned lower in the canopy.
Net photosynthesis and leaf conductance were measured by nondestructive gas exchange analysis with a Li-Cor 6200 closed-loop photosynthesis system (Li-Cor, Inc., Lincoln, NE) as described by Pell et al. (1 992). After the analysis samples were harvested in the field, frozen in liquid nitrogen and stored at -80°C. Rubisco quantity was determined as described by Eckardt and Pell (1 994).
Statistics
Data for each species were analyzed separately by analysis of variance (ANOVA) and significance was accepted at the P< 0.05 level (SAS Institute Inc., 1985).
RESULTS
In 1992 we followed the performance of foliage of the four species in the absence of 0,. Ozone concentration from 1000 to 1800 h averaged 0.03 pl I-' for the growing season. As we have previously reported (Pell et al., 1994), as the leaves of the indeterminate species (hybrid poplar and black cherry) aged, there was a rapid increase in concentration of Rubisco followed by a precipitous decline. In contrast, northern red oak and sugar maple foliage exhibited an increase in concentration of Rubisco followed by a prolonged plateau. Gas exchange data profiles were similar in all four cases (data not shown).
The fust (older) leaf of hybrid poplar to be sampled, exhibited a significant 0,-induced decline in net photosynthesis that paralleled the decline in Rubisco concentration and preceded a reduction in stomatal conductance (Fig. 1 A-C). The second bounger) leaf to be sampled, exhibited an initial increase in net photosynthesis, stomatal conductance and Rubisco content in response to 03, followed by a decline (Fig. 1 D-F).
The older leaf of black cherry sampled exhibited a signficant decline in net photosynthesis, stomatal conductance and Rubisco quantity in response to 0,. Accelerated senescence was observed in these leaves (Fig. 2 A-C). The younger leaf also sustained a reduction in net photosynthesis and stomatal conductance, but these responses were observed after a far longer 0, exposure than was necessary to elicit a similar response in older leaves (Fig. 2 D & E). Accelerated senescence was not observed in these younger leaves, and a significant reduction in Rubisco concentration was observed only at the last sampling point (Fig. 2F).
Northern red oak did exhibit a significant reduction in net photosynthesis coupled with a drop in stomatal conductance in response to O, stress (Fig. 3 A & B). Neither accelerated foliar senescence nor si&icant changes in Rubisco content were detected (Fig. 3C).

Days A f t e r Planting
Figure 1. Effect of O3 on net photosynthesis, leaf conductance and Rubisco content of hybrid poplar foliage, from emergence to senescence. (A-C) All samples derive from the two leaves that emerged when the plants were 18 cm tall. (D-F) All samples derive from the two leaves that emerged at a position 17 leaves above the first leaf sampled. (0) Plants grown in charcoal-filtered open-top chambers. (.)Plants grown in open-top chambers supplemented with 0.08 PL L-' 0, for 8h per day. Each value is the mean of eight and four observations + standard error of the mean, for gas exchange and Rubisco measurements, respectively.

Days Af te r Planting
Figure 2. Effect of O3 on net photosynthesis, leaf conductance and Rubisco content of black cherry foliage, from emergence to senescence. (AX) All samples derive from the two leaves that emerged when the plants were 18 cm tall. (D-F) All samples derive from the two leaves that emerged at a position 17 leaves above the first leaf sampled. (0)Plants grown in charcoal-filtered open-top chambers. (*)Plants grown inopen top chambers supplemented with 0.08 fiL L1 0, for 8h per day. Each value is the mean of eight and four observations + standard error of the mean, for gas exchange and Rubisco measurements, respectively.

Days After Plainting
Figure 3. Effect of 0, on net photosynthesis, leaf conductance and Rubisco content of foliage fi-om the second flush of growth of northern red oak (A-C) and sugar maple (D-F). The leaf was analyzed fi-om emergence to senescence. (0) Plants grown in charcoal-filtered open-top chambers. (*)Plants grown in open top chambers supplemented with 0.08 pL L-l 0, for 8h per day. Each value is the mean of observations 2 standard error of the mean, for gas exchange and Rubisco measurements, respectively.
When sugar maple seedlings were stressed by 0,, we detected no significant effects on net photosynthesis, stornatal conductance or Rubisco content (Fig. 3 D-F). Accelerated senescence of foliage was not detected.
DISCUSSION
The resource allocation strategies of the indeterminate species were clearly different from the more determinate species examined in this study. Hybrid poplar and black cherry leaves demonstrated rapid synthesis of protein as exhibited by the brief residence time of the Rubisco peak (Figs. 1 & 2). Both species exhibited less responsive younger foliage. In fact younger leaves of hybrid poplar actually performed better in plants under 0, stress. These

data are supported in a previous study with trembling aspen (Pell et al., 1994). Elsewhere Brendley et al. (1 994) have reported that in 0,-stressed plants, younger foliage actually synthesized higher rates of Rubisco than were observed in non stressed plants. Hybrid poplar may be more effective in compensating for 0, than is black cherry because of the higher rate of growth of the former species. Rapid rate of growth may lead to the greatest rate of senescence; it will also allow for nitrogen to be recycled most rapidly as Rubisco degrades. Thus, re utilization of nitrogen for a compensatory function in younger leaves will occur most readily in the plants with the most rapid growth rates.
Neither northern red oak nor sugar maple exhibited accelerated senescence or changes in Rubisco content following O, exposure (Fig. 3). Northern red oak did show a reduction in net photosynthesis; this response seemed to be closely associated with a reduction in stornatal conductance (Fig. 3).
We conclude that 0,-induced reduction in net photosynthesis may be regulated in part by a reduction in Rubisco content as shown for hybrid poplar, but it can occur without changes in this protein. Accelerated senescence seems to be tightly linked to the reduction in Rubisco content. The latter response seems to be associated with the growth habit of plants. In indeterminate species where nitrogen re utilization is a possible strategy for survival, accelerated senescence and loss of Rubisco provide a viable mechanism of compensation. For more determinate species this type of nitrogen recycling is not possible. Therefore, for plants with a determinate growth habit, accelerated senescence may be a less likely response to stress. Whether recycling of nitrogen within a leaf occurs as a result of the stress has not been detennined.
ACKNOWLEDGMENTS
Funding for this study was provided in part by the Pennsylvania Agricultural Experiment Station and the Environmental Resources Research Institute, and Forest Service Agreement No. 32-65 1 -A3.
LITERATURE CITED
Brendley, B. W., Sinn, J.P. and E. J. Pell. 1994. Ozone effects on quantity and synthesis of Rubisco in foliage of hybrid poplar and northern red oak seedlings. Plant Physiol. 105: 18.
Dalling, M.J. 1987. Proteolytic enzymes and leaf senescence. In: Plant Senescence: Its Biochemistry and Physiology (Ed. by W.W. Thomson, E.A. Nothnagel & R.C. Hdfaker), pp. 54-70. American Society of Plant Physiologists, Rockville, MD.
Eckardt, N.A. and E.J. Pell. 1994. 0,-induced degradation of Rubisco protein and loss of Rubisco mRNA in relation to leaf age in Solanum tuberosum L. New Phytol. 127:741-748.
Pell, E.J., Eckardt, N., and A.J.Enyedi. 1992. Timing of ozone stress and resulting status of ribulose bisphosphate carboxylase/oxygenase and associated net photosynthesis. New Phytol. 1 20: 3 97 -405.
Pell, E.J., Eckardt, N.A. and R.E. Glick. 1994. Biochemical and molecular basis for impairment of photosynthetic potential. Photosyn. Res. 39:453-462.
Pell, E.J. Sinn, J.P., Eckardt, N., Vinten Johansen, C., Winner, W.E. and H.A. Mooney. 1993. Response of radish to multiple stresses. 11. Influence of season and species on plant response to ozone and soil moisture deficit. New Phytol. 123: 153-163.
Pell, E.J., Sinn, J.P. and C. Vinten Johansen. 1995. Nitrogen supply as a limiting factor determining sensitivity of Populus tremuloides to ozone. New Phytol. In Press.

Pell E.J., Temple, P.J., Friend A.L., Mooney, H.A. and W.E. Winner. 1994. compensation as a plant response to ozone and associated stresses: an analysis of ROPIS experiments. J. Environ. Qual. 23 : 429-436.
G.N., Arteca, R.N., Dai, Y.-R., Flores, H.E., Negrn, F.B. and E.J. Pell. 1993. Changes in ethylene and polymines in relation to mRNA levelsof the large and small subunits of ribulose bisphosphate carboxylaseloxygenase in ozone-stressed potato foliage. Plant, Cell and Environ. 16:8 19-826.
Reich, P.B. and J.P. Lassoie. 1985. Influence of low concentrations of ozone on growth, biomass partitioning and leaf senescence in young hybrid poplar plants. Environ. Pollut. 39:39-5 1.
SAS Institute Inc. 1985. SAS user's guide: statistics, version 5. Cary, NC: SAS Institute Inc.

ROOT GROWTH AND RESPIRATION OF ASPEN IN RESPONSE TO OZONE AND ELEVATED CARBON
DIOXIDE
M. D. Coleman, R. E. Dickson, and J. G. Isebrands'
The response of tree root systems to interacting environmental stress is poorly understood in comparison to knowledge of above-ground organs. This research investigates the effect of ozone (0,), elevated carbon dioxide (CO,) and their combination on root system growth and respiration. Adventitiously rooted cuttings of three aspen clones (27 1,O, tolerant; 21 6, intermediate; 259,0, sensitive) were grown in 7 1 pots containing peat:sand:vermiculite (2: 1 : 1). Plants were placed in treatment chambers and exposed to either ambient air (control), ambient + 350 ppm CO,, 160 ppm 0, (8 h daily), elevated CO, and 0,. Root respiration was measured by sealing the entire pot into the measurement cuvette of an open-flow gas exchange system. Roots and soil were then separated; roots were dried and weighed, and soil was returned to pots and remeasured to estimate heterotrophic soil respiration. M e r 12 weeks, 0, treatment caused up to a 48 percent decrease in root dry weight with a corresponding 53 percent decrease in root system respiration rate (urn01 plant-' s-') compared with control treatments. Changes in root dry weight and respiration rate generally followed the 0, sensitivity rankings of the clones. In contrast, elevated CO, vs. control caused up to a 63 percent increase in root dry weight and a 47 percent increase in root system respiration; again there were big clonal differences in responses. Compared to the control treatment, there was no net change in root weight due to the combined 0, and elevated CO, treatment yet root system respiration declined slightly. When specific root respiration rate (urn01 g-' s-') was calculated, there were no consistent treatment effects; however specific root respiration declined as plants aged, and interesting clonal differences were also observed. For clones 2 16 and 259, specific root respiration generally increased with either O, or elevated CO, in 12-week-old plants, but for clone 27 1 speclfic root respiration decreased with treatment. These results show that above-ground environmental stress affects the growth and physiology of aspen roots in complex ways, and the particular response obtained has a strong genetic component.
'USDA Forest Service, Forestry Sciences Lab, Rhinelander WI 54501.
20

EFFECTS OF OZONE AND CO, ON THE GROWTH AND PHYSIOLOGY OF ASPEN
D. F. Karnoskyl, Z. Gagnon2, R. E. Dickson3, P. Pechterl, M. Coleman3, Olevi Ku114, Anu Sober4, and J. G. Isebrands3
During the past three years, we have examined the effects of ozone (0,) and carbon dioxide (CO,), alone and in combination, on the growth and physiology of trembling,aspen (Populus tremuloides Michx.). We have conducted several single growing season exposures of potted plants and a three growing season exposure with trees planted in the ground. All studies have been conducted in open-top chambers. Our research demonstrated that aspen is hlghly sensitive to ozone and that there are strong genotypic differences in response to ozone. Seasonal exposures of 70 to 100 ppm-h have a significant negative impact on height, diameter, leaf and branch retention, and above ground biomass. The O3 sensitivity appears stable as aspen trees reach flowering age. CO, administered at 150 ppm above background levels did not compensate for the adverse ozone effects. Photosynthesis measurements over all growing seasons and with multiple genotypes suggest that CO, may increase the 0, sensitivity of otherwise tolerant aspen clones. We are currently developing an unchambered 0, exposure system to more closely simulate forest conditions.
'Michigan Technological University, School of Forestry and Wood Products, Houghton, MI 4993 1.
'University of Minnesota, Duluth, MN.
'North Central Forest Experiment Station, Forestry Sciences Laboratory, Rhinelander, WI 54501.
'Estonia Academy of Science, Institute of Ecology/Marine Research, Tartu, Estonia.

INTERACTING EFFECTS OF OZONE AND CO, ON GROWTH AND PHYSIOLOGICAL PROCESSES IN
NORTHERN FOREST TREES
J. G. Isebrandsl and D. F. KarnoskyZ
Globally, surface-level concentrations of both CO, and ozone (0,) are increasing annually. Because many studies have shown beneficial effects of increasing CO,, predictions have been made that elevated levels of CO, would compensate for growth decreases caused by 0,. For the past two years, we have been examining the interaction of 0, and CO, on trembling aspen (Populus tremuloides) and eastern white pine (Pinus strobus) in open-top chamber studies involving both plants in pots and plants growing in the ground.
After two seasons of exposure to elevated ozone, alone or in combination with elevated CO, (ambient plus 150 ppm), soil-grown aspen and eastern white pine trees are exhibiting different response. While neither of the two pine seed sources has been negatively affected by ozone, significant negative effects of 0, have been found for two aspen clones differing in 0, tolerance: The negative impact of ozone was not compensated by CO, and for some physiological responses such as photosynthesis, stomata1 conductance, chlorophyll content and leaf abscission, a ~ i ~ c a n t negative interaction has been demonstrated for 0, plus CO, treatment. Second-year growth and biomass measurements appear to be following our physiological measurements. Crown architecture has also been altered by the 0, and CO, combination.
In addition, elevated CO, appears to alter the sensitivity of the tolerant aspen clone, making it more sensitive to 0,, as determined both by gas exchange and biomass measurements. The implications for these findings for modeling and response predictions will be discussed.
'USDA Forest Service, North Central Forest Experiment Station, Rhinelander, WI 5450 1.
'School of Forestry. Michigan Tech University, Houghton, MI 4993 1.

THE CHRONIC RESPONSE OF YELLOW-POPLAR AND EASTERN WHITE PINE TO OZONE AND
ELEVATED CARBON DIOXIDE: THREE-YEAR SUMMARY
Joanne Rebbeck'
Abstract: The objective of this study was to determine the long-term effects of ozone (0,) and carbon dioxide (CO,) on the growth and physiology of eastern white pine (Pinus strobus) and yellow-poplar (Liriodendron tulipgera) under plantation conditions. Two separate plantations of each species were established in Delaware, Ohlo, in 199 1 and 1992. Seedlings were fumigated from mid-May to mid-October in 1992, 1993, and 1 994 in standard 3m diameter open-top chambers. The treatments, each replicated three times in a randomized block design, included charcoal-filtered air (CF), 1X ambient O, (1 X), 2X ambient 0, (2X), 2X ambient ozone plus 350 ppm CO, above ambient (2X+C02), and open-air (OA) chamberless plot. Monthly growth and physiological measurements taken during each growing season included stem height and basal diameter, photosynthesis, stomata1 conductance, chlorophyll content, and foliar nitrogen and phosphorus concentration. Subsamples of yellow-poplar were destructively harvested in 1993. First-season exposure to 0, plus CO, appeared to have a stimulatory effect on the growth of both species. In 1993, decreases in white pine height growth, though not significant, were observed for both 2X- and 2X+C02-grown seedlings. Biomass and growth stimulations were observed on yellow-poplar in 1993, with mean increases of 14 percent in stem diameter and 16 percent in total plant height of yellow-poplar grown in 2X+C02 compared with all other treatments. Although not statistically significant at p = 0.05, 2X+C02-grown yellow-poplar had greater leaf, stem, branch and root biomass, and total leaf area compared with all other treatments. NO significant effects on the growth of white pine were observed. However in late August 1 994, both total height and basal stem diameter of 2X+C02-grown yellow-poplar were 2 1 percent greater than for all other treatments. The slower growing white pine appears to be responding differently to O, plus CO, than yellow-poplar.
INTRODUCTION
In the majority of studies of the response of tree species to air pollutants, potted seedlings have been exposed to gaseous pollutants under controlled environmental conditions for one to two growing seasons. Extrapolating data on seedlings to older trees is problematic as there is very little information on the response of older trees to gaseous pollutants. Experimental approaches that have been used in scaling seedling pollutant response to older trees include the use of whole-tree or branch chambers on mature trees (Albaugh et al. 1992; Grulke and Miller 1994; Hanson et al. 1994; Heagle et al. 1989; Houpis et al. 199 1 ; Samuelson 1994; Teskey et al. 1 99 1); descriptive physiological studies comparing mature and sapling trees along environmental gradients (McLaughlin et al. 1990); vegetative propagation of "mature" tissue (Rebbeck et al. 1992, 1993a); and free-air chamberless exposure systems (McLeod and Baker 1988). None of these approaches is without some limitations. To date, no research group has investigated the long-term effects of exposing the same population of trees to gaseous pollutants during their development from seedlings to saplings to older trees.
In this paper I summarize major findings of the first three years of long-term exposure of two important eastern tree species, yellow-poplar (Liriodendron tulipgera) and eastern white pine (Pinus strobus), to 0, and elevated CO,. The growth and physiological responses of these two field-planted species were studied within open-top chambers. Soil fertility was not manipulated and applications of irrigation water and pesticides were minimal. Three hypotheses were tested: (1) CO, enrichment ameliorates the negative effects of 0,; (2) the relative response to O3 and CO, is the same in short-term studies with seedlings as with older trees; and (3) faster growing hardwood species are more sensitive to 0, and more responsive to elevated CO, than slower growing conifer species.
'USDA Forest Service, Northeastern Forest Experiment Station, 3 5 9 Main Road, Delaware, OH 430 1 5.

METHODS
In 1991, two separate but adjoining field plantations of yellow-poplar and white pine were established at the Northeastern Forest Experiment Station Forestry Sciences Laboratory at the USDA Forest Service in Delaware, Ohio, by clearing a 26- by 73-m area in a 20-year-old abandoned American elm (Ulmus americana) plantation. Within each plot, 12 plants were arranged in a circular pattern approximately 1.8 m in diameter. The white pine plantation consisted of seedlings fi-om two sources: (1) northern genotype (2-0 stock) frorn the Upper Peninsula of Michigan (Baraga County), obtained fi-om Dr. David Karnosky, Michigan Technological University, Houghton; and (2) southern genotype(1-0 stock) fi-om northern Ohio (near Toledo), obtained frorn the State Nursery of Ohio, Marietta. Six seedlings of each source were planted within each plot. The yellow-poplar seedlings were planted on 7 May 1992, with 1-0 stock obtained fi-om a private nursery in western Pennsylvania. Seed collections were made in southeastern Tennessee. A standard 3m diameter open-top chamber (Heagle et al. 1973) was placed over each plot after planting. No fertilizer was applied to either species. Since ambient rain was not excluded from the chambers, rain shadows sometimes resulted in the uneven distribution of water. This was corrected by supplemental watering. The frequency and duration of these waterings were based on the amount and distribution of ambient rainfall in the open-top chambers.
The study design consisted of a randomized complete block with three replications of the following treatments: charcoal-filtered air (CF); ambient O3 concentration (1X); two times ambient O, concentration (2X); two times ambient 0, concentration plus 350 ppm CO, above ambient (2X+C02); and open-air, chamberless plot (OA). The 0, and CO, were dispensed automatically 24 h per day from mid-May through mid-October in 1992, 1993, and 1994. In 1994, the yellow-poplar open-top chambers were modified to increase their height to 4.6 m.
Monthly growth and physiological measurements taken during each growing season included stem height and basal diameter, photosynthesis, stomata1 conductance, chlorophyll content, and foliar nitrogen and phosphorus concentration. Gas exchange rates for individual yellow-poplar leaves (node 6 to 8 or node 10 to 12 from the apex) or two sets of white pine fascicles (current-year or one-year-old needles) were measured with a LI-COR 6200 portable photosynthesis system2. From these same leaves, chlorophyll was extracted from 15mm diameter discs with dimethyl sulfoxide (Rebbeck et al. 1993a). The remaining leaf tissue was digested with sulfUric acid, potassium sulfate, and copper sulfate and quantified with a Lachat QuikChem Series 4000 Automated Ion Analyzer (Lachat 1992 a, b). Subsamples were taken to assess treatment impacts on leaf ultrastructure and spectral reflectance and transmission (Carter et al. 1995; McQuattie and Rebbeck 1994). Reflected and transmitted radiances were measured with an integrating sphere (LI-COR LI- 1800UW spectroradiometer with LI1800- 12s integrating sphere) (Carter et al. 1995). In late September 1993, shoot systems of six yellow-poplar seedlings frorn each chamber were destructively harvested and leaf area and leaf and stem dry mass determined. Root systems were excavated from a fixed volume (1 5,625 cm3) of soil immediately surrounding the decapitated seedling and separated into tap and lateral roots. Senescent leaves harvested in October 1993 were packed in litter bags and placed in the forest floor in a hardwood stand at the Delaware Lab. Loss of leaf dry mass over time was compared among treatments (Boerner and Rebbeck 1995).
Pre-exposure stem height was used as a covariate in the statistical analysis of both the yellow-poplar and whte pine growth data sets. A General Linear Model (GLM) (SAS 1988) procedure was used to test for significant treatment effects. A Least Simcant Difference (LSD) means comparison test was performed on the covariate-adjusted means only when significant effects were found in the GLM analysis. The white pine data were analyzed as a split-plot design with treatment as a main plot and genotype-source as a subplot. Each monthly measurement data set was analyzed separately.
'The use of trade, firm or corporation names in this publication is for the information and convenience of the reader. Such use does not constitute an official endorsement or approval by the U.S. Department of Agriculture or the Forest Service of any product or service to the exclusion of others that may be suitable.
24

Details on plant culture and maintenance as well as treatment dispensing and monitoring are reported elsewhere (Rebbeck 1993).
RESULTS AND DISCUSSION
The cumulative ozone dose for each of the three exposure seasons (1 992- 1994) is shown in Figure 1. Actual ozone levels for the 2X ambient ozone treatment were 1.3X, 1.6X, and 1.4X in 1992, 1 993, and 1994, respectively. -
1993
Year
Figure 1. Cumulative ozone dose @pm.h) of yellow-poplar grown in open-top chambers in 1992-94. The dose for white pine was comparable.
Yellow-poplar. Stimulated growth of yellow-poplar exposed to 2X+C02-air was observed during the three seawns of exposures (Table 1). In September 1992, stem diameter of yellow-poplar grown in 2X+ CO, was 13,2 1, and 16 percent greater than that of CF-, 1 X-, and 2X-grown trees, respectively (p 5 0.05). In September 1993, yellow- poplar stem diameter (that portion of the terminal stem produced in 1 99 1, 1992, or 1993) si@icantly increased fiom 10 to 17 percent when grown in 2X+C02-air compared with all other treatments @ 5 0.05) (Rebbeck et al. 1993b). Total height growth also was 14- 18 percent greater in yellow-poplar grown in 2X+C02-air compared with other treatments (p 5 0.05). In late August 1994, both total height and basal stem diameter of 2X+C02-grown yellow-poplar were 21 percent greater than for all other treatments. Further, 2X+C02-grown yellow-poplar tended to have greater leaf, stem, branch and root biomass, and total leaf area compared with all other treatments when harvested in September 1 993; p-values ranged fiom 0.1 8 to 0.78 (Table 2) (Rebbeck and Scherzer 1 994).
Table 1. Yellow-poplar total stem height and basal diameter in 1 992, 1993, and 1 994. *
Total Stem Height Basal Diameter
Treatment 1992 1993 1994 1992 1993 1994
*Each value is a mean of 36 trees 2 one standard error. Means followed by different letters are significantly different at p < 0.05.
25

Table 2. Yellow-poplar biomass (g dry wt) harvested in September 1993.
Treatment Leaves Branches Primary stem Root
Each value is mean of 36 trees 5 one standard error. Means followed by different letters are significantly different at p < 0.05.
White pine. No sigmficant growth effects attributable to 0, or 0, plus CO, were observed for white pine in any of the three growing seasons (Table 3). In September 1992, height growth of white pine in 2X+C02-air was 50 and 18 percent greater than for the CF- and 2X-air treatments, respectively (p = 0.08) (Rebbeck 1993; Rebbeck et al. 1993a). In September 1993, height growth was lower for both 2X- and 2X+C02-grown seedlings than for seedlings of other treatments (Rebbeck and Scherzer 1994). The two seed sources grew differently, but no genotype X treatment interactions were observed at any time.
Table 3. Stem height growth and basal diameter of white pine in 1992, 1993, and 1994.*
Stem Height Growth
Treatment 1992 1993 1994
Basal Diameter
1992 1993 1994
*Each value is mean of 36 trees 2 one standard error. Means followed by different letters are significantly different at p < 0.05.
Physiological Effects
Yellow-poplar. Impacts of 0, and 0,plus CO, on seasonal photosynthetic rates of yellow-poplar at saturating light were observed in 1992 and 1993 (Table 4). Additions of enriched CO, to twice ambient O, ameliorated reductions in net photosynthesis caused by 0,. In 1992, net photosynthesis was reduced by 34 percent by 2X-air and increased by 13 percent by 2X+CO,-air compared with CF-grown trees. In 1993, 2X+C02 increased net photosynthesis by 3 1 to 45 percent compared with all other treatments. In both 1992 and 1993, respiration rates were approximately 36 percent higher in leaves of yellow-poplar trees grown in 2X 0,-air than in leaves of CF-grown trees; CO, enrichment to 2X 0, had no additional effect on respiration rates. In 1 992, stomatal conductance was reduced by 7 and 3 2 percent in 2X 0,- air and 2X+C02 -air, respectively, compared with CF-air. In July 1993, stomatal conductance rates of 2X+C02-grown yellow-poplar were 20 to 45 percent lower than for all other treatments.

Table 4. Seasonal photosynthetic rates (pmol C02m*2s-') of yellow-poplar and white pine in 1992 and 1993 at saturating light.
-- --
Yellow-~oplar
Treatment 1992 1993
White Pine
1992 1993
* Measurements at 700 ppm CO, for 2X0,+C02versus 350 ppm CO, for other treatments. Values are means across sampling dates, leaf or needle age, and genotype (white pine only). Means followed by different letters are significantly different at p < 0.05.
In 1992, total chlorophyll content was 21 and 30 percent lower in leaves of yellow-poplar grown in 2X- and 2X+C02-air, respectively, than in those grown in CF-air. In 1993, total chlorophyll content was reduced by 33 percent in 2X+C02-air compared with all other treatments (Rebbeck et al. 1995). Total chlorophyll content was reduced by exposure to 2X 0, only in older yellow-poplar leaves. In 1993, foliar nitrogen of yellow-poplar was reduced by 32 to 38 percent in 2X+C02-air compared with all other treatments; 0, alone did not affect foliar nitrogen content in 1 993 (Scherzer and Rebbeck 1 995).
Litter decomposition of yellow-poplar leaves was not affected by 03, but 2X+C02-grown leaves had 34 to 43 percent less decay than leaves of other treatments. These findings imply that the C:N ratio of the forest floor and soil would be raised and nitrogen limitations exacerbated by elevated CO,.
In both 1992 and 1993, the cuticular membrane ultrastructure of yellow-poplar leaves was altered both by 0, and elevated CO,. McQuattie and Rebbeck (1 994) reported that the cuticular membranes of 2X 0,-grown yellow-poplar leaves were 64 and 36 percent thinner than those of seedlings grown in CF-air and 2X+C02-grown, respectively, @ = 0.01). In July and August of 1994, cuticle membranes were thickest in 2X+C02-grown yellow-poplar leaves; CF-grown cuticles were intermediate and 2X 0,-grown were the thinnest. We hypothesize that the some of the extra carbon assimilated by the 0, plus C0,-grown trees was used to produce the cuticular membrane.
White pine. In 1992 and 1993, 0, alone did not have a negative effect on the photosynthetic rates of white pine needles (Table 4). Stimulations in net photosynthesis of white pine grown in 2X+C02-air were not observed until late August 1992. In 1993, photosynthetic rates of current- and 1 -year-old needles of trees grown in 2X+C02-air increased by 57 to 80 percent compared with all other treatments (p = 0.0 1).
In 1993, total chlorophyll content of 1 -year-old white pine needles grown in 2X+C02-air was reduced 41 -52 percent compared with other treated trees in 1993 (Rebbeck et al. 1995). Current-year white pine needle total chlorophyll content was not affected by 2X- or 2X+C02-air.
The leaf optical properties of white pine and yellow-poplar exposed to 0, and 0, plus CO, were monitored in 1992 (Carter et al. 1995). Ozone increased leaf reflectance and transmittance and decreased leaf absorptance in yellow-poplar. CO, added to 2X 0, did not affect reflectance but decreased transmittance and increased absorptance within the range of 400 to 42 1 nm and increased transmittance and decreased absorptance in the 694 to 697 nrn range. In white pine, 2X 0, increased reflectance in the 537 to 647,650, and 69 1 to 7 16 nm ranges. Transmittances and absorptances were not determined for white pine. The observed spectral responses were explained primarily by decreased concentrations of chlorophyll a as has been the case with a number of plant stressors.

SUMMARY AND CONCLUSIONS
In this three-year study, 0, alone had no significant effect on the growth of eastern white pine or yellow-poplar. A fast-growing indeterminate hardwood species, yellow-poplar appeared more responsive to additions of CO, to O, than the slower growing determinate conifer. Yellow-poplar exhibited the typically reported responses to enriched CO, including increased height and diameter growth, increased shoot and root biomass production, increased photosynthesis, decreased stomata1 conductance, decreased total chlorophyll and foliar nitrogen content, and decreased litter decomposition rate, even in the presence of up to 1.6X ambient 0, (target was 2x0,). Leaf gas exchange along with growth, biomass production, and foliar nutrient dynamics will continue to be monitored to determine if acclimation of yellow-poplar to elevated CO, occurs in the presence of 0,.
Although white pine exhibited increased rates of photosynthesis and decreased total chlorophyll content in response to 2X 0, plus enriched CO,, impacts on whole-tree growth were not observed. And although the initial growth of this white pine population was slow, it is possible that these now well-established trees will begin to exhibit more typical growth effects due to enriched CO,.
ACKNOWLEDGMENTS
This study is part of a cooperative effort of the USDA Forest Service's Northeastern and North Central Forest Experiment Stations, and Michigan Technological University, funded by the Northern Global Change Program. I would like to thank Amy Scherzer, Ken Loats, Carolyn McQuattie, Robert Long, Ralph Boerner, Kevin Percy, and Gregory Carter for their scientific contributions, and Mary Ann Tate, Jonathan Miller, Arthur Peterson, and Chad Richards for their highly valued technical assistance.
LITERATURE CITED
Albaugh, T.J., Mowry, F.L., and L.W. Kress. 1992. A field chamber for testing air pollution effects on mature trees. Journal of Environmental Quality 2 1 :476-485.
Boerner, R.E.J. and J. Rebbeck. 1995. Decomposition and nitrogen release from leaves of three hardwood species grown under elevated 0, and/or CO,. Plant and Soil 170: 149- 157.
Carter, G.A., J. Rebbeck, and K.E. Percy. 1995. Leaf' optical properties in Liriodendron tulipifera L. and Yinus strobus L. and influenced by exposure to increased ozone and carbon dioxide. Canadian Journal Forest Research. 25407-4 1 2.
M k e , N.E. and P.R. Miller. 1994. Changes in gas exchange characteristics during the life span of giant sequoia: implications for response to current and future concentrations of atmospheric ozone. Tree 'Physiology 14559- 668.
Hanson, P.J., L.S. Samuelson, S.D. Wullschleger, T.A. Tabberer, and G.S. Edwards. 1994. Seasonal patterns of light- saturated photosynthesis and leaf conductance for mature and seedling Quercus mbra L. foliage: differential sensitivity to ozone exposure. Tree Physiology 14: 1 35 1 - 1366.
Heagle, A.S., R.B. Philbeck, R.E. Ferrell, and W.W. Heck. 1989. Design and performance of a large, field exposure chamber to measure effects of air quality on plants. Journal of Environmental Quality 1 8: 36 1 -368.
Heagle, A.S., D.E. Body, and W.W. Heck. 1973. An open-top field chamber to assess the impact of air pollution on plants. Journal of Environmental Quality 2 :365-368.

Houpis, J.L., M.P. Costella, and S. Cowles. 199 1. A branch exposure chamber for furmgating ponderosa pine to atmospheric pollution. Journal of Environmental Quality 20:467-474.
Lachat Instruments. 1992a. QuikChen~ method 1 3- 107-06-2-D. Total Kjeldahl nitrogen in soillplant. Milwaukee WI: Lachat Instruments. 10 p.
Lachat Instruments. 1992b. QuikChem method 13- 1 1 5-0 1 - 1 -B. Total phosphorus in Kjeldahl digests. Milwaukee, WI: Lachat Instruments. 8 p.
McLaughlin, S., C.P. Andersen, N.T. Edwards, W.K. Roy; and P.A. Layton. 1990. Seasonal patterns of photosynthesis and respiration of red spruce saplings from two elevations in declining southern Appalachian stands. Canadian Journal Forest Research 20:485-495.
McLeod, A.R., and C.K. Baker. 1988. The use of open field systems to assess yield responses to gaseous pollutants. In: Heck, W.W., et al., eds. Assessment of crop loss from air pollutants. New York: Elsevier Applied Science: 1 8 1 -21 0.
McQuattie, C. J. and J. Rebbeck. 1994. Effect of ozone and elevated carbon dioxide on cuticular membrane ultrastructure of yellow-poplar (Liriodendron tulipijiera). In: Percy, K., J.N. Cape, R. Jagels, C.J. Simpson, eds. Air pollutants and the leaf cuticle. NATO AS1 Series G: Ecological Sciences, Vol. 36. Heidelberg, Germany: Springer-Verlag: 1 75- 1 82.
Rebbeck, J. 1993. Investigation of long-term effects of ozone and elevated carbon dioxide on eastern forest species: first-year response. In: Air & Waste Management Association: 86th annual meeting & exhibition; 1993 June 1 3- 18; Denver, CO. 93-TA-43.02. Pittsburgh, PA: Air & Waste Management Association: 1 - 10.
Rebbeck, J., K.F. Jensen, and M.S. Greenwood. 1992. Ozone effects on the growth of grafted mature and juvenile red spruce. Canadian Journal Forest Research 22: 756-760.
Rebbeck, J., K.F. Jensen, and M.S. Greenwood. 1993a. Ozone effects on grafted mature and juvenile red spruce: photosynthesis, stomata1 conductance, and chlorophyll concentration. Canadian Journal Forest Research 23: 450-456.
Rebbeck, J., K.V. Loats and A. J. Scherzer. 1 995. Second year effects on ozone and elevated carbon dioxide on the physiological response of white pine and yellow-poplar. Ohio Journal of Science 95:34-35. Abstract.
Rebbeck, J., and A. J. Scherzer. 1994. Growth and biomass response of Liriodendron tulipfera and Pinus strobus to two seasons of ozone and elevated carbon dioxide. In: Abstracts: Air pollution and multiple stresses: IUFRO 16th international meeting for specialists in air pollution effects on forest ecosystems; 1994 September 7-9; Fredicton, NB. Fredericton, NB: Canadian Forest Service: 60. Abstract.
Rebbeck, J., A.J. Scherzer, and K.V. Loats. 1993b. First season effects of elevated CO, and 0, on yellow poplar and white pine seedlings. Bulletin of the Ecological Society of America 74(2) (Suppl.): 403-404. Abstract.
SAS Institute, Inc. 1988. SAS Procedures Guide, Release 6.03 Edition. Cary, NC: 44 1 p.
Samuelson, L. J. 1994. The role of microclimate on the determining the sensitivity of Quercus rubral. to ozone. New Phytologist 128:235-24 1.
Scherzer, A. J., and J. Rebbeck. 1995. Effects of two years of exposure to ozone and elevated carbon dioxide on foliar N and P dynamics of yellow-poplar. Ohio Journal of Science 95: 3 5. Abstract.

Teskey, R.O., P. Dougherty, and A. Wiselogel. 1 99 1 . Design and performance of branch chambers suitable for long-term ozone fumigation of foliage in large trees. Journal of Environmental Quality 20: 5 9 1 -5 95.

EFFECTS OF CARBON DIOXIDE ENRICHMENT ON RESPONSE OF PITCH PINE GROWN AT DIFFERENT
NUTRIENT LEVELS TO ALUMINUM
George A. Schier and Carolyn J. ~ c ~ u a t t i e '
The effect of elevated CO, on the response of pitch pine (Pinus rigida) to aluminum was determined in three experiments with different nutrient levels. During each experiment seedlings inoculated with the ectomycorrhizal fungus Pisolithus tinctorius were grown for 13 to 15 weeks in sand irrigated with a nutrient solution (pH 3.5) containing 0,6.25, 12.5, or 25 mg/L Al(0,0.232,0.463, or 0.927 rnM Al, respectively) in growth chambers h g a t e d with 350 (ambient) or 700 (elevated) uL/L CO,. The concentration of mineral elements in the nutrient solution of the experiment with the lowest concentration of nutrients (X) simulated that in the soil solution of a nutrient poor, sandy New Jersey Pine Barrens soil. Levels of nutrients in the two other experiments were approximately two (2X) or four (4X) times higher. Total biomass of seedlings at the higher nutrient levels was 19 percent (2X) and 172 percent (4X) higher than that at the lowest nutrient level. Growth at elevated CO, was significantly greater than growth at ambient CO, at the 2X (+24 percent) and 4X (+22 percent) nutrient levels but not at the X level. At the 2X and 4X nutrient levels, aluminum significantly reduced shoot growth (biomass, needle length) and root growth (biomass, lateral root length) at both CO, levels and there were nd significant A1 x CO, interactions. At the lowest nutrient level only root growth was significantly reduced by Al. Symptoms of Al toxicity in needles differed depending on nutrient level: X, needle chlorosis at 12.5 and 25 mg/L Al at both CO, levels; 2X, tip chlorosis at 25 mg/L A1 at ambient CO, only; and 4X, no needle chlorosis in any treatment. At all nutrient levels without Al, seedlings growing at elevated CO, had greater numbers of mycorrhizal roots than seedlings growing at ambient CO,. In the presence of Al, mycorrhzal roots had greater Al-induced modifications (decreased numbers of bifhcate mycorrhizal roots, increased numbers of dark, stunted root tips) at the 2X and 4X nutrient levels than at the X nutrient level, especially at ambient CO,. The CO, concentration did not significantly affect Al concentration in roots or needles at either 2X or 4X nutrient levels (elemental analyses for X nutrient level not available at this time). Carbon dioxide fumigation had a minor influence on the nutrition of treated seedlings. The greatest effect of CO, on foliar concentration of mineral elements was at the 2X nutrient level; needles at elevated CO, had small but significantly higher concentrations of Ca, Mg, Fe, and B than needles at ambient CO,. Generally, Al decreased the concentration of mineral elements in roots and needles of treated seedlings. At all nutrient levels, disruption of root meristem cells and the mycorrhizal fungal mantle surrounding the short roots increased as Al concentration increased. In treatments containing 12.5 or 25 mg/L Al, aluminum was detected by energy-dispersive x-ray microanalysis in outer root cells and in dead root cells embedded in the fungal mantle.
'USDA Forest Service, NEFES, Delaware, OH 430 15.

ELEVATED CO, COMPENSATES FOR WATER STRESS IN NORTHERN RED OAK
Patricia T. Tomlinson and Paul D. ~nderson'
Global climate change models predict decreased rainfall in association with elevated CO, in the western Lakes States region. Currently, the western edge of northern red oak (Quercus rubra L.) distribution coincides with the most xeric conditions of its ecological range. Decreased rainfall and water availability could alter ecological fitness and distribution. To better understand how climate change may affect this species, we are examining the interaction of CO, (400,520,700 pprn CO,) with water stress (well-watered and water-stressed) on growth, and carbon and nitrogen metabolism of northern red oak seedlings through three flushes of development. In this report, we focus on growth, photosynthetic rate, and nitrogen responses to these stresses in three-flush seedlings.
Seedling biomass increased with increasing CO, and decreased with water stress. The water stress response was accompanied by a shift in relative biomass distribution fi-om stems to roots; CO, did not alter the relative distribution among leaves, stems, and roots. As a consequence, shoot:root dry weight ratio was decreased by water stress but remained uniform across CO, treatments.
Photosynthetic rate generally increased with elevated growth CO, and decreased with water stress. The response to CO, under water stress was approximately linear; under well-watered conditions, photosynthetic rate plateaued at 520 pprn CO,. Stomata1 conductance decreased in well-watered seedlings with elevated CO,. Although conductance was decreased by water stress, these seedlings did not respond to growth CO,. Thus, an increased diffusional gradient for CO, into the mesophyll of these water-stressed seedlings would be expected with increasing growth co,.
Photosynthetic water-use efficiency was largely unaffected by water stress but increased with growth CO, to a plateau at 520 ppm. In contrast, photosynthetic nitrogen-use efficiency was decreased by water stress and the response to growth CO, differed between water stress regimes. In water-stressed seedlings, nitrogen-use efficiency plateaued at 520 pprn growth CO,. However, in well-watered seedlings, efficiency increased to 520 pprn but decreased to 400 pprn levels at 700 pprn growth CO,. Tissue nitrogen concentration was apparently involved in this decrease because photosynthetic rate did not drop to this extent.
Leaves and roots of water-stressed seedlings displayed a greater nitrogen concentration than did those of well-watered seedlings and increasing growth CO, generally decreased nitrogen concentrations in these tissues. In well-watered 700 pprn CO, grown three-flush seedlings, nitrogen concentrations in the leaves and roots were relatively low at 1.4 percent and 0.9 percent, respectively. We hypothesize that nitrogen supply was unable to meet biomass demands associated with 700 pprn growth CO, under well-watered conditions. Consistent with this hypothesis, between 400 and 700 pprn growth CO, seedling biomass increased twofold for well-watered seedlings and nearly threefold for water-stressed seedlings.
These physiological responses to the interaction between elevated CO, and water stress resulted in similar 3-flush seedlings grown at 400 pprn CO, under well-watered conditions and at 700 pprn CO, under water-stressed conditions. The biomass, nitrogen concentration and photosynthetic rate of these seedlings were similar. Thus, in northern red oak, elevated CO, compensated for water stress. However, several physiological measures differed in these seedlings suggesting mechanistic differences. For example, differences in shoot:root dry weight ratio suggested changes in root-shoot interactions; differences in water-use efficiency suggested changes in photosynthetic mechanisms among these treatments. We are currently collecting data to delineate some of these physiological mechanisms.
'USDA Forest Service, Forestry Sciences Lab, North Central Forest Experiment Station, 5985 Highway K, Rhinelander, WI 5450 1.

MODELING IMPACTS OF CO,, OZONE, AND CLIMATE CHANGE ON TREE GROWTH
George E. Host1, Gary W. Theseira', and J. G. Isebrands2
INTRODUCTION
Understanding the mfluence of ozone, CO,, and changng climatic regimes on basic plant physiological processes is essential for predicting the response of forest ecosystems. To understand the relationships among these interacting factors, in the face of genetic and other environmental variability, requires a means of synthesis. Physiological process modeling provides one such tool: it allows the integration of diverse information from research, reflects the interactions among variables, and provides a direction for fbture research.
To model trace gas effects on aspen, we have adapted an existing growth process model for poplar known as ECOPHYS. ECOPHYS is a mechanistic whole-tree model that simulates growth of poplar in its establishment year (Host et al. 1990a, Isebrands et al. 1989, Rauscher et al. 1990). ECOPHYS uses the individual leaf as the primary biological unit of the model. Hourly solar radiation, temperature, and clonal (genetic) factors acting at the leaf level provide the major driving variables for plant growth. Canopy architecture is modeled by means of a three- dimensional geometric approach. By knowing leaf orientation patterns and tracking solar position over the course of the day, we calculate precise estimates of intercepted radiation, which in turn are supplied to a photosynthate production submodel. Photosynthates are distributed to various growth centers in the plant by means of a radiotracer-based model of carbon allocation pickson 1986). The amount of photosynthate arriving at a growth center, after respiratory losses are determined, is used to calculate biomass production and dimensional growth. The model has been subjected to extensive validations both in terms of photosynthesis (Host et al. 1990) and in regional predictions of biomass production (Host and Isebrands 1994).
Our current research has three major facets: the development of three-dimensional soil and root models to complement the existing above-ground portion of the model, the integration of existing trace gas response data into the model fiamework, and the scaling of the existing model in time and space; specifically to simulate the growth of an interacting population of trees for a number of years. These objectives will allow us to simulate impacts related to global change, and to provide input to models operating at larger temporal and spatial scales.
MODELING STRATEGIES AND APPLICATIONS
Soil Water and Nutrient Modeling
A three-dimensional soil water transport model was developed to provide a heterogeneous soil environment for root development. We currently simulate water movement in a 100 x 100 x 200 cm soil volume using variable-size cells (1 -5 cm on a side). The use of different cell sizes allows the user to run the model under different levels of resolution. The soil model runs on an hourly times step and accounts for surface evaporation, capillary rise from a water table, water distribution from irrigation lines, and water uptake into a plant root system (Figure 1). The use of a three-dimensional model, vs. the traditional two-dimensional approach, allows us to simulate variability in moisture and nutrients in horizontal as well as vertical directions. The ability to simulate soil heterogeneity in the horizontal dimension is important not only for simulating differential growth of the canopy as a result of
'Research Associate and Postdoctoral Research Associate, respectively, Natural Resources Research Institute, University of Minnesota, Duluth, MN 5581 1.
2Project Leader and Research Plant Physiologist, USDA Forest Service, North Central Forest Experiment Station, Rhinelander, WI 5450 1.

vascularization between branches and root segments, but also for simulating competition for resources among plants. This latter aspect is important as we scale from the individual tree to the patch, as described below.
Figure 1. Visualization of a sample soil slab containing a plant root and a sub-surface irrigation line, derived from volumetric soil water content (wetter soil cells are rendered darker and drier cells lighter, while soil cells with moisture contents between 23 percent and 32 percent have been rendered transparent) following six hours of simulated soil water redistribution. The root system consists of a tap root and six lateral roots, four of which are visible as drier soil cells (lighter shade) extending left and right of the tap root. The irrigation line has wetted a cylindrical volume of soil cells (darker) located behind the tap root. The soil surface (top) has been drled by evaporation while the base of the soil slab (bottom) is being wetted by capillary rise from a water table.
Root Growth Modeling
The ECOPHYS root growth model maintains roots of various orders in three-dimensional space. Root architecture is based on a highly relaxed fractal algorithm utilizing a monopodial branching pattern and is coded using a free tree structure (Figure 2). Overall root growth is governed by hourly translocation from the shoot. Branch roots may be formed at any radial position about the main axis of a parent root for which there is a corresponding vascular bundle. Initiation angles of branch roots with respect to parent roots vary randomly along a probability distribution as do changes in direction of growth of any root apex. The growth rate of root apices and the frequency of branch initiation are regulated by soil strength. Root geotropic response in poplar is strongly correlated to root order and is taken into account in the simulation. To simulate fine root turnover, a proportion of terminal higher order roots are 'killed' and replaced by new growth at each time step.

Figure 2. Two-dimensional rendering of a three-dimensional mathematical root model after 72 time steps, given a constant photosynthate input.
Trace Gas Modeling
Working with aspen and hybrid poplars, we have developed a mechanistic individual tree process model of the plant growth response to altered CO, and ozone concentrations. This modeling work has been done in close cooperation with field and growth chamber experiments. Specifically, we developed a mechanistic model for the AlCi response by incorporating our existing light response model with the CO, model proposed by Weber et al. (1 985), adding pkameters for carboxylation efficiency and CO, saturation rates. A mechanistic understanding of stomata1 conductance does not exist; we follow the assumption of Ball et al. (1 982) that plants maintain a relative constant ratio of internal to ambient CO, levels.
Submodels have been developed to simulate the effects of ozone on leaf longevity, and effective leaf area; direct effects of ozone on photosynthesis have proven more problematic, as the interactions between ozone and CO, are nonlinear (Coleman et al. In review).
Scaling
Scaling ECOPHYS into a second season of growth requires the ability to simulate branch growth and development. Our strategy for growing branches is based on the concept of branch autonomy, which states that branches essentially operate like first year shoots: they translocate carbon to their own internodes, and those of the lower stem and roots, but do not translocate upwards to other leaves or branches (Isebrands 1983). In addition, leaves on branches maintain the same genetically-determined photosynthetic characteristics. Patterns of internode expansion and growth are the same as in the first year shoot. As a result, our original ECOPHYS model, which simulates the growth of a first year shoot, coupled with a branch architecture algorithm, can be used to simulate the growth of a branched poplar tree.
To scale to branches requires that ECOPHYS be translated into an object-oriented format. There are several reasons for this translation. To accommodate the exponential increase in the number of leaves and branches that occur in the second and subsequent growing seasons requires that the model run in a language that can access extended computer memory. Second, object-oriented data structures can be organized hierarchically, and relate much more to the natural organization of biological systems, rather than the array-based structure of traditional programming languages. Finally, object-oriented languages are much easier to maintain and debug that procedure-based languages.

When the recoding is complete, the current aboveground ECOPHY S model will become an 'object' within the multi-year model. This 'ECOPHYS object' will have all the components of the original model (a population of leaves and internodes, coupled with photosynthate production and transport rules), plus new information on branch location, angle, and an expanded carbon allocation matrix that describes carbon transport within a branched structure. The object-oriented ECOPHYS will thus be able to grow an individual tree into the second and subsequent growing seasons. This approach will also allow us to simulate interactions within a small population of trees.
TO assess the above and below ground interactions among individual trees, we will simulate a block or patch of trees growing under uniform spacing. We envision simulating an interaction block of 16 trees in a 4 x 4 matrix, and planted under a range of typical planting densities (e.g. 2 to 4 m spacings). Trees within the block will shade each other as a function of size, leaf arrangement, branch architecture and solar angle. In addition, they will compete below ground in the three-dimensional soil matrix described previously. To scale to a field plantation level, this patch of trees can be considered a random sample within a particular soil type. To simulate growth within a plantation consisting of several soil types, the model can be run independently for each individual soil type, and area-weighted estimates of growth calculated to characterize the plantation as a whole (Figure 3).
Figure 3. The scaled ECOPHY S patch model as random samples within a field consisting of three soil types.
Model Applications
One of the foremost applications of physiological process models to climate change is the prediction of growth differences, and one of the foremost challenges is the development of realistic detailed climatic change scenarios. One resolution to this challenge is the use of existing, high resolution climatic data. In the Lake States, the growing seasons of 1988 and 1992 were the wannest and coldest years in 100 years of record. We collected hourly solar radiation and temperature data from a weather station in northern Wisconsin, USA, and used these as inputs to ECOPHYS. At this site, air temperatures averaged 2 "C higher and cumulative radiation was 30 percent greater in 1988 compared with 1992. These weather data were used to simulate one growing season's photosynthesis and growth in two Populus clones: P. Eugenei, a clone characterized by a strongly vertical leaf display and a long growing season, and P. Tristis, a planophile clone with an early bud set date. For P. Eugenei, photosynthesis was 85

percent greater in 1988 compared with 1992 (Host and Isebrands, In review). Leaf area and total biomass showed increases of 70 percent and 56 percent, respectively, between these years. The patterns were similar for P. Tristis, but the differences were less pronounced. These simulations indicate that differences in seasonal weather patterns observed over a few years can account for large but clonally-specific differences in photosynthesis and biomass production in the early growth of Populus.
CONCLUSIONS
Modeling at the scale of detailed physiological processes fills an important niche in the hierarchy of spatial scales required to understand global change. We have described the essential components of a modeling effort designed to understand interactions among soil, root, and shoot systems, plant response to trace gases, and the scaling of detailed physiological processes in time and space. In addition, we present an application of the model using 100 yr climatic extremes recorded over the past decade. The development and use of process models not only provides an integration of existing research, it also focuses research questions related to uncertain future conditions.
LITERATURE CITED
Ball, J. T. and J. A. Berry. 1982. The CiICs ratio: a basis for predicting stomata1 control of photosynthesis. Carnegie Institute of Washngton Yearbook 8 1 238-92.
Coleman, M. D., R. E. Dickson, J. G. Isebrands, and D. F. Karnosky. Response of trembling aspen root growth and physiology to tropospheric ozone. Tree Phys. In Review.
Dickson, R. E. 1986. Carbon fixation and distribution in young Populus trees. (T. Fujimori and D. Whitehead, eds). Proceedings Crown and Canopy Structure in Relation to Productivity. Forestry and Forest Products Research Institute, Ibaraki, Japan. pp. 409-426.
Host, G. E. and J. G. Isebrands. Predicting the effects of climatic extremes on early growth of poplar in the Lake States, USA: A modeling approach. Tree Physiology. In Review.
Host, G. E., H. M. Rauscher, J. G. Isebrands, D. I. Dickmann, R. E. Dickson, T. R. Crow, and D. A. Michael. 1990a. The Microcomputer Scientific Software Series #6: The ECOPHYS User's Manual. USDA Forest Service Gen. Tech. Rept. NC- 13 1.
Host, G. E., H. M. Rauscher, J. G. Isebrands, and D. A. Michael. 1990b. Validation of the photosynthate production in ECOPHYS, an ecophysiological growth process model of Populus. Tree Physiology. 7:268-296.
Isebrands, J. G., H. M. Rauscher, T. R. Crow, and D. I. Dickmann. 1989. Whole-tree growth process models based on structure-functional relationships. In: (R. Dixon, R. Meldahl, G. Ruark and W. Warren eds.) Forest Growth: Process Modeling of Responses to Environmental Stress. Timber Press, Portland pp 96- 1 1 2.
Isebrands, J. G., N. D. Nelson, D. I. Dickmann, and D. A. Michael. 1983. Yield physiology of short rotation intensively cultured poplars. North Central Forest Experiment Station General Technical Report NC-91:77- 93.
Rauscher, H. M., J. G. Isebrands, G. E. Host, R. E. Dickson, D. I. Dickmann, T. R. Crow, and D. A. Michael. 1990. ECOPHYS: an ecophysiological growth process model of poplar. Tree Physiology. 7: 255-28 1.
Weber, J. A., T. W. Jurik, J. D. Tenhunen, and D. M. Gates. 1 985. Analysis of gas exchange in seedlings of Acer saccharurn: integration of field and laboratory studies. Oecologia 65: 3 38-347.

OZONE EXPOSURE, UPTAKE, AND RESPONSE OF DIFFERENT-SIZED BLACK CHERRY TREES
Todd S. Fredericksen', John M. Skelly ', Kim C. Steinerl, and Thomas E. Kolb2
Abstract: Differences in exposure, uptake and relative sensitivity to ozone between seedling, sapling, and canopy black cherry (Prunus serotina Ehrh.) trees were characterized during two growing seasons in north central Pennsylvania. Open-grown trees of all sizes received a similar amount of ozone exposure. Seedlings had greater foliar ozone injury, expressed as adaxial stipple and early leaf senescence, than larger trees, which was correlated with their higher rates of stomatal conductance and greater rates of ozone uptake. The higher stomatal conductance and ozone uptake of seedlings was proportional to their higher (less negative) predawn xylem water potentials. Seedlings appeared to have some ability to compensate for injury because their free growth habit reduced exposure per unit leaf area compared to larger trees whose leaves were exposed to ozone throughout the entire growing season.
INTRODUCTION
Black cherry is a widespread deciduous tree species in eastern North America and is a highly-valuable commercial timber species in the Allegheny Mountains of Pennsylvania and West Virginia. However, black cherry also appears to be extremely sensitive to tropospheric ozone (Davis and Skelly 1992, Simini et a1 1992). Ozone concentrations often reach high levels in this region during the growing season and may impact the growth of black cherry (Comrie 1994). One problem with determining the impact of ozone on large, forest-grown black cheny trees, however, is that most air pollution studies have used seedlings grown in field chambers or greenhouses (Reich 1987, Pye 1988). The objective of this study was to determine if differences in physiology andor ozone exposure related to tree size may impact uptake of ozone and foliar injury response. More detailed results are presented by Fredericksen et al. (1 995a, 1995b).
METHODS
The study site is located within the Moshannon State Forest in Clearfield County, PA within the Allegheny Plateau physiographic province. Open-grown seedlings, saplings, and 80-year-old canopy black cherry trees were identified for study during the 1 993 and 1 994 growing seasons. Saplings were located in a canopy gap in 1 993 and in a larger forest opening in 1994. Seedlings were 1-2 year-old nursery transplants approximately 0.5- 1.5 m in height. Saplings were 5-7 m and canopy trees were approximately 20 m tall. Data collected during each growing season included seasonal within-canopy ozone concentrations for each tree size, daily and seasonal patterns of leaf gas exchange, predawn xylem water potential, seasonal leaf area development, and foliar ozone injury expressed as percent adaxial stipple and early leaf senescence. Ozone uptake was calculated for each tree size class as the product of ozone exposure and stomatal conductance adjusted for differences in diffisivity between water vapor and ozone. All measurements were made within the upper crown of each tree size class.
'Research Associate, Environmental Resources Research Institute; Professor, Department of Plant Pathology; and Professor, School of Forest Resources, respectively, The Pennsylvania State University, University Park, PA, 16802.
'Assistant Professor, School of Forestry, Northern Arizona University, Flagstaff, AZ, 860 1 1.
38

RESULTS AND DISCUSSION
7-hour average (0900- 1600 EST) ozone concentrations were slightly higher during the 1 994 growing season compared to 1993 (Table 1). Ozone concentrations were similar within the crowns of open-grown seedlings, saplings, and canopy trees, although sapling and canopy trees had lower ozone exposure than seedlings in 1 993.
Ozone uptake rates tended to decrease with increasing tree size (Table 1). High seedling uptake rates were correlated with higher rates of stomatal conductance. The higher stomatal conductance and ozone uptake of seedlings may be explained by the higher (less negative)' xylem water potentials of seedlings because seedlings have a shorter path length of water transport compared to larger trees, allowing for higher rates of stomatal conductance.
Table 1 . Ozone exposure (nl. 1.' , 7 -hour mean), stomatal conductance (mol/m2/s), ozone uptake (urnoVm2/hr), predawn xylem water potential (-MPa), percentage adaxial ozone stipple (Sept. l), and percentage early leaf abscission (Sept. 1) of seedling, sapling, and canopy black cherry trees during 1993 and 1994. Saplings sampled in 1993 were growing in a canopy gap. Saplings sampled in 1994 were open-grown. Standard errors of means are in parentheses.
Tree Size
Seedlings 1993
1994
Saplin~s 1993
1994
Canopy 1993
1994
Ozone Exposure
40.3 (0.5 1)
48.0 (0.51)
42.2 (0.48)
48.5 (0.5 1)
46.3 (0.55)
48.8 (0.53)
Stornatal Conductance
0.23 (0.01)
0.50 (0.02)
0.16 (0.0 1)
0.40 (0.02)
0.18 (0.0 1)
0.28 (.01)
Ozone Uptake
29.6 (1.22)
58.1 (0.79)
19.6 (0.35)
48.6 (0.74)
16.1 (0.37)
33.8 (0.57)
Predawn Water
Potential
0.12 (0.01)
0.12 (0.02)
0.22 (0.01)
0.18 (0.02)
0.46 (0.04)
0.36 (0.02)
% Ozone Stipple
0.6 (0.1)
43.8 (3.5)
0.2 (0.01)
12.5 (1 -2)
0.1 (0.01)
19.1 (1 SO)
% Early Leaf
Abscission
6.9 (2.3)
30.45 (10.6)
5.2 (1.7)
3.8 (2.0)
6.9 (2.6)
4.4 (2.0)
Seedlings had larger amounts of foliar injury per unit ozone exposure than saplings or canopy trees during both growing seasons (Table 1). Incidence of foliar injury and leaf senescence per unit leaf area was generally low in 1993, but much greater in 1994. Seedlings had greater rates of early leaf senescence than larger trees during 1994. The higher amounts of ozone uptake and foliar injury symptoms during 1994 may be explained by a higher soil moisture content during 1 994. Growing season rainfall totaled 74.5 cm during 1994 and 5 1.1 cm during 1993. Showman (1 99 1) similarly observed that foliar injury symptoms were much higher during a wet year with than a drier year despite relatively higher ozone during the dry year.
During 1993, and to a lesser extent in 1994, ozone injury to older seedling leaves may have been partially compensated by the production of new uninjured leaves throughout the growing season. Early leaf abscission of

older, injured leaves and replacement with new leaves may allow for the maintenance of high rates of whole plant net photosynthesis. Canopy trees, exhibiting fixed growth, did not have this compensatory ability. Open-grown saplings exhibited some free growth, but canopy-gap saplings did not.
I SUMMARY
Slight differences in ozone exposure were evident within the mature forest canopy and in forest openings. Seedlings had higher rates of ozone uptake and foliar ozone injwy than saplings and canopy trees. Ozone uptake rates were positively related to stomata1 conductance and xylem water potentials. Seedlings appeared to have some ability to compensate for foliar injury on older leaves by the production of new foliage throughout the growing season.
I ACKNOWLEDGMENTS
This study was funded by the United States Environmental Protection Agency with additional support fkom the Pennsylvania Department of Environmental Resources, the U.S. Forest Service, Penelec GPU Corporation, and the Pennsylvania Conservation Corps.
LITERATURE CITED
Davis, D.D. and J.M. Skelly. 1992. Foliar sensitivity of eight eastern hardwood species to ozone. J. Arr, Water, Soil Poll. 62:269-277.
Fredericksen, T.S., B.J. Joyce, J.M. Skelly, K.C. Steiner, T.E. Kolb, K.B. Kouterick, J.E. Savage and K.R. Snyder. 1995a. Physiology, morphology, and ozone uptake of seedlings, saplings, and canopy black cherry trees. Environ. Pollut. (in press).
Fredericksen, T.S., J.M. Skelly, K.C. Steiner, T.E. Kolb, and K.B. Kouterick. 1995b. Size-mediated foliar response to ozone in black cheny trees. Environ. Pollut. (in press).
Pye, J.M. 1988. Impact of ozone on the growth and yield of trees: A review. J. Env. Qual. 17:347-360.
Reich, P.B. 1987. Quantifying plant response to ozone: a uneing theory. Tree Physiol. 3:63-91.
Simini, M.J., J.M. Skelly, D.D. Davis, J.E. Savage, and A.C. Comrie. 1992. Sensitivity of four hardwood species to . ambient ozone in northcentral Pennsylvania. Can. J. For. Res. 22: 1789- 1 799.

WATER USE IN FOREST CANOPY BLACK CHERRY TREES AND ITS RELATIONSHIP TO LEAF GAS
EXCHANGE AND ENVIRONMENT
B. J. Joyce, K. C. Steiner, and J. M. Skelly'
Models of canopy gas exchange are needed to connect leaf-level measurement to higher scales. Because of the correspondence between leaf gas exchange and water use, it may be possible to predict variation in leaf gas exchange at the canopy level by monitoring rates of branch water use. Rates of water use were determined in branches of forest canopy black cherry trees (ca. 25 m) using the stem heat balance method, as were relationships between water use, leaf gas exchange, and microenvironment. Maximum rates of water flow occurred between 1200 and 1300 HRS (EST), and declined steadily throughout the afternoon hours. Total daily water use was greatest for branches within the upper crown, however, the magnitude of difference between upper and lower crown branches was less for south-facing branches than for north-facing branches. At the entire tree level, measured water flow rate (F) was correlated with stomata1 conductance (g,) (r = 0.66), transpiration rate (E) (r = 0.63), and photosynthetically active radiation (PAR) measured at the leaf surface (r = 0.79). The degree of association between these variables increased with stratification by crown level and increased further with stratification by branch level. Both relative humidity (RH) and PAR measured at 1 m above the canopy contributed significantly (P = 0.000 1 and 0.0 1 137 respectively) to a model expressing water flow rate as a function of microenvironmental variables. However, variation in RH explained a greater proportion of the total variation in measured flow rate in the lower crown than in the upper crown (? =0.94 and 0.60, respectively). These results suggest that (1) at the branch level, measured rates of water use can be used to estimate variation in g, and E, (2) much of the temporal and spatial variation in flow rate is driven by variation in incident PAR, and (3) vapor pressure deficit is probably more important to the regulation of leaf gas exchange in the lower crown while canopy boundary layer resistance is probably more important to the regulation of leaf gas exchange in the upper crown.
'The Pennsylvania State University, University Park, PA 16802.
4 1

EFFECTS OF ELEVATED CO, AND OZONE ON PHENOLIC GLYCOSIDES OF TREMBLING ASPEN
James K. Nitao', Muraleedharan G. Nair', William J. ~attson' , Daniel A. Hems3, Bruce A. B i d , Mark D. Coleman4, Terry M. Trier', and J. G. Isebrands4
We tested the effects of elevated CO, and ozone on concentrations of the phenolic glycosides salicortin and tremulacin in immature and mature foliage of the trembling aspen (Populus tremuloides) clones 2 16,259, and 27 1. Elevated CO, increased and elevated ozone decreased concentrations of both compounds in immature foliage, and trernulacin in mature leaves. Elevated CO, increased and ozone had no effect on salicortin in mature leaves. The ozone tolerant clone 21 6 had lower concentrations of tremulacin than the other clones. Effects of CO, and ozone on tremulacin and salicortin in immature leaves, and tremulacin in mature leaves corresponded with effects of CO, and ozone on the growth of insects on the same trees (see manuscript by Hems and others).
'Entomology Department, Michigan State University, E. Lansing, MI 48824.
'USDA Forest Service, North Central Experiment Station, E. Lansing, MI 48823.
3Dow Dotanical Gardens, Midland, MI 48640.
'USDA Forest Service, North Central Forest Experiment Station, Rhinelander, WI 5450 1

VARIABLE PERFORMANCE OF OUTBREAK DEFOLIATORS ON ASPEN CLONES EXPOSED TO
ELEVATED CO, AND O3
Daniel A. Hems', William J. Mattson2, David N. Karowe3, Mark D. Coleman4, Terry M. Triet-', Bruce A. B i d , and J. G. Isebrands4
Abstract: Increasing atmospheric concentrations of ozone and CO, affect many aspects of tree physiology. However, their effects on tree resistance to insects have received relatively little attention. The objectives of this study were to test the effects of elevated CO, and ozone on the resistance of three quaking aspen (Populus tremuloides) clones (2 16,259, and 27 1) to first and fourth instars of four Lepidoptera species: gypsy moth (Lymantria dispar) , forest tent caterpillar ~ a l a c o s o m a disstria), large aspen tortrix (Choristoneura confictana), and whitemarked tussock moth (Orayia leucostigma). Larval survival, growth rates, and nutritional indices were quantified. There were no treatment effects on larval survival. Elevated CO, decreased the growth rates of both instars of all species, except that of first instar forest tent caterpillar on aspen clone 2 16, which was increased. Elevated ozone increased the growth of first and fourth instars of all insect species tested. The treatment effects on growth rate were generally caused by their effects on the ability of larvae to convert digested food to biomass (ECD). Elevated ozone increased ECD. The effects of elevated CO, on ECD were clone dependent: elevated CO, decreased ECD on clones 27 1 and 259, but increased ECD on clone 2 16. Ozone had no effect on larval consumption rates. Elevated CO, decreased the consumption rate of large aspen tortrix but had no effect on the other species. This contrasts with other studies, in which elevated CO, generally increased insect consumption. There were no statistically significant interactions between the CO, and ozone treatments for any of the variables measured.
INTRODUCTION
Elevated concentrations of atmospheric CO, and ozone alter many aspects of tree physiology including gas exchange, growth, and carbon allocation (Pye 1988, Jarvis 1 989). Environmentally-induced variation in tree resistance to insects and other herbivores results primarily from effects on plant nutrient and secondary metabolite concentrations, which are intimately connected to whole-plant patterns of resource acquisition and allocation (Herms and Mattson 1992). Hence, elevated CO, and ozone may influence interactions between plants and herbivores, and therefore their distribution and abundance (Ayres 1993, Williams and Liebhold 1995). In turn, community composition and insect-mediated ecosystem processes such as nutrient cycling may be affected (Ayres 1993, Lambers 1993). Despite this potential, few studies have addressed the effects of increased atmospheric CO, or ozone on treeliisect interactions, and to our knowledge, no study has examined both factors simultaneously.
Elevated CO, generally decreases the nutritional quality of plants for leaf-feeding insects. In some cases, this translates into decreased insect growth and survival, but in other cases insects compensate for decreased foliage
'The Dow Gardens, 10 18 W. Main St., Midland, MI 48640.
'USDA North Central Forest Experiment Station, 1407 S. Harrison Rd., East Lansing, MI 48823.
'~epartment of Biology, Virginia Commonwealth University, Richmond, VA 23234.
4USDA North Central Forest Experiment Station, P.O. Box 898, Rhinelander, WI 5450 1.
ae~artrnent of Entomology, Michigan State University, East Lansing, MI 48824.

quality by increasing their consumption rate such that elevated CO, has no effect on growth (Lincoln 1993, Lincoln and others 1993). The only study with forest insects suggests that effects of elevated CO, are likely to be dependent on the species involved (Lindroth and others 1 993). The growth of gypsy moth larvae (Lymantria dispar) fed foliage from trees grown under elevated CO, was decreased on quaking aspen (Populus trernuloides), was unaffected on sugar maple (Acer saccharurn), and increased on red oak (Quercus rubra). In the same experiment, elevated CO, decreased the growth of forest tent caterpillar (Malacosoma disstria) on quaking aspen and sugar maple, but did not affect its growth on red oak.
The effects of ozone on plant~herbivore interactions have received less attention, but some studies have found elevated ozone to enhance insect performance on crop plants (Chappelka and others 1988, Reimer and Whittaker 1989, Lin and others 1990). Only a few studies have investigated ozone effects on tree resistance to insects. In a study with cottonwood (Populus deltoides), ozone exposure had no effect on the aphid Chaitophorus populicola (Coleman and Jones 1988a).
Although ozone decreased the growth and fecundity of the cottonwood leaf beetle (Plagiodera versicolora), this insect preferred to feed on, and consumed more, foliage exposed to elevated ozone than foliage exposed to ambient air (Coleman and Jones 1 988b, Jones and Coleman 1 988). Gypsy moth preferred to feed on white oak (Quercus alba) foliage exposed to the highest concentration of ozone (about 3X ambient), but preferred foliage exposed to ambient air over that exposed to intermediate levels of ozone (Jeffords and Endress 1984).
Objectives
Quaking aspen is the most widely distributed tree species in North America. Forest tent caterpillar, gypsy moth, large aspen tortrix (Choristoneura confictana), and whitemarked tussock moth (Orgyia leucostigma) can be important outbreak defoliators and dominant lepidopteran folivores of aspen. Quaking aspen displays genetic variation in ozone tolerance (Berrang and others 1989). Hence, ozone effects on insect performance may be dependent on host genotype. However, to our knowledge no studies have examined genetic variation in the effects of ozone or elevated CO, on tree resistance to insects. The objectives of this study were to test the effects of elevated CO, and ozone on the nutritional suitability for these four insect species of three aspen clones (Populus trernuloides) that differ in their sensitivity to ozone. The aspen genotypes tested were clone 2 16 (Bayfield Co. Wisconsin, ozone-tolerant), clone 259 (Porter Co. Indiana, ozone sensitive), and clone 27 1 (Porter Co. Indiana, intermediate tolerance of ozone).
METHODS
Production of Experimental Plant Material
Softwood cuttings taken from greenhouse-grown stock plants were dipped in 5000 mgA IBA and rooted in 65 cm3 Leach cells in vermiculite-peat (3: 1) mix with intermittent misting. Rooting occurred in four weeks, after which the plants were hardened on the greenhouse bench, then transplanted into 38 cm deep x 15 cm plastic pots in a media of peat-sand-vermiculite (2: 1 : I), supplemented with 8 g of Sierra Osmocote (1 7-6-1 0 formulation), plus micronutrients (8-9 month release time). Two days after transplanting, plants were moved to test chambers and exposed to experimental treatments for five weeks before use in insect bioassays.
Insect Culture
Insects of all four species were obtained as newly molted fourth instars and newly eclosed first instars from Forest Pest Management Institute, Canadian Forest Service, Sault Ste. Marie, Ontario. All four species were tested as fourth instars. All but large aspen tortrix were tested as first instars. Bioassays were initiated within 24 hours of obtaining the insects.

Implementation of Ozone and CO, Treatments
Gaseous treatments were applied in 1 .7m3 exposure chambers constructed from mylar covered aluminum angle frame. Ozone was produced using an electric discharge generator (GTC-0.25, M m Technics, Inc. Lodi, New Jersey) from bottled oxygen delivered through proportional control valves that were automatically adjusted to maintain 150 nrnoVmol by a CR- 10 datalogger (Campbell Scientific, Logan, UT). Ozone was maintained at the set point between 900 and 1700 hours each day, and returned to ambient for the remained of the day. The ozone application resulted in 10 ppm h accumulated each week, compared to 3 ppm h for the controls exposed to ambient levels. Elevated CO, was manually dispensed 24 hr per day through needle valves. The ambient concentrations (approximately 400 urnoV mol) were supplemented with 350 umol/mol. Ozone and CO, monitors were calibrated weekly. Hourly treatment concentrations were recorded for each chamber by the datalogger.
Experimental Design
Elevated and ambient ozone and CO, were applied to four chambers in factorial combination. Each COJozone treatment combination was replicated twice, for a total of eight chambers in the experiment. Five replicate individuals of all three aspen clones were grown in each chamber, for a total of 15 trees in each chamber. Thus, the experiment constituted a 2 x 2 x 3 x 4 nested factorial, with two levels of ozone (ambient and elevated), two levels of CO, (ambient and elevated), three aspen clones (2 16,259,27 l), and four insect species (three in the case of first instars with large aspen tortrix omitted from the test). We measured the growth of four individual larvae (fourth instars) or four groups of larvae (first instars) within each four-way treatment combination. Each of the four replicate larvae or larval groups received leaves from a separate tree so that individual trees were the experimental unit. First and fourth instar bioassays were treated as separate experiments.
Foliage Sampling and Leaf Assignments
To control for effects of tree ontogeny on leaf chemistry and insect performance, larvae were assigned leaves of a specific physiological age as determined by their leaf plastichron index (LPI) (Larson and Isebrands 197 1). Leaves were numbered sequentially with LPI one designated as the youngest leaf on the tree that was at least 3 cm in length. Assignments were based on judgements of leaf ages that larvae were likely to feed on under field conditions. First instar forest tent caterpillar, gypsy moth, and whitemarked tussock moth were fed LPI two, four, and seven, respectively. Gypsy moth and forest tent caterpillar both were fed LPI 10 and 1 1, whitemarked tussock moth were fed leaf plastichron 1 3. Each large aspen tortrix replicate was randomly assigned either LPI 1 0, 1 1 , 1 3, or 1 5.
First Instar Bioassay Procedures
Ten larvae were confined to petri dish an (8.5 cm diam. by 2 cm deep) with a base of plaster-of-Paris and charcoal. Water added to the plaster base provided a high humidity environment that maintained the turgor of detached leaves fed to larvae. Simultaneous measurements of leaves from trees exposed to the same treatments but not fed to insects showed no main or interacting effects of any of the treatments on fresh weight or respiratory losses of dry mass of leaves over the 48-hour bioassay period. Larvae were reared in a growth chamber at 25"C, under an 18:6 1ight:dax-k cycle.
All 10 larvae from each dish were weighed as a group prior to initiation of the bioassay. After 48 hours of feeding the bioassay was tenninated and the number of surviving larvae was recorded. Duration of the bioassay was quantified to the nearest 15-minute interval. Surviving larvae were then flash frozen, oven-dried to constant weight, and then weighed as a group. In order to estimate initial weights, twenty 1 0-larvae samples were weighed for each of the three species, then immediately frozen at -40°C, dried to constant weight and reweighed. The relationship of fresh mass to dry mass of these insects was determined from these data using linear regression. These regression equations were then used to estimate initial dry mass of the bioassay insects based on their initial fresh masses. We calculated percent survival and relative growth rate for each of the three species.

Fourth Instar Bioassay Procedures
Bioassays with fourth instars were conducted as above, with the following alterations. Only one larva was used per petri dish, and the petri dishes were larger: 1 1.5 cm d im. by 2.5 cm deep. The initial dry mass of each insect was estimated fiom initial fiesh mass as above, except that regression equations were developed from 20 individual larvae. Total leaf area consumed during the bioassay was determined by measuring the area of the leaf with a digital image analyzer before and after the bioassay period. Frass was collected, dried to constant weight, and weighed. The portions of the leaves not consumed were collected, and their cumulative area and dry mass determined. Initial dry mass was then calculated as:
initial d q mass = (initial leaf area * final dry mass) 1 final leaf area
The mount of foliage consumed was estimated by subtracting final leaf dry mass from initial leaf dry mass. Relative growth rate (RGR), relative consumption rate (RCR), approximate digestibility (AD), and efficiency of conversion of digested food (ECD) were calculated from gravimetric measurements following Ayres and McLean (1987) (note: AD=the percentage of food consumed that is digested; ECD=the percentage of digested food that is converted to biomass; RGR=RCR*AD*ECD).
Data Analysis
The data were analyzed by ANOVA (SAS, Proc GLM; Type I11 sum of squares). Aspen clone and insect species were nested within the CO, and ozone treatments. CO,, ozone, aspen clone, insect species, and chamber were all treated as fixed effects, and were tested over residual error (MSE). Chamber was considered a fixed effect because the chambers used in the study were not selected at random from a larger population of chambers. Treating chamber as a fixed effect increases the power of the experiment for detecting treatment effects, but limits the scope of inference fiom the analysis to this study (see Bennington and Thayne 1 994 for a discussion of fixed vs. random effects in ANOVA). Means were separated using the protected LSD test.
RESULTS
Larval Survival
First instar survival over the 48-hour bioassay period was high: 84 percent, 92 percent, and 99 percent for first instar gypsy moth, forest tent caterpillar, and whitemarked tussock moth, respectively, and over 90 percent for fourth instars of all species. Survival was not affected by any of the treatments.
CO, Effects on Insect Performance
Elevated CO, decreased the growth of first instars of all three species, but only on two of the three aspen clones tested (Table 1, significant CO,*clone interaction). Overall, elevated CO, decreased the relative growth rates of first instar forest tent caterpillar, gypsy moth, and whitemarked tussock moths by 65 percent, 32 percent, and 48 percent, respectively (Figure I). However, the growth rates of none of the insect species were decreased by elevated CO, when feeding on aspen clone 2 16, and elevated CO, actually increased the growth rate of forest tent caterpillar by 80 percent on this clone (Table 1, significant CO,*clone interaction). Elevated CO, decreased the relative growth rates of fourth instars of all species on all clones (Table 1, Figure 2). Percent decreases in growth rate ranged from 5 1 percent for gypsy moth to 26 percent for large aspen tortrix.

Table 1. F-values from ANOVA of performance of first and fourth instar gypsy moth, forest tent caterpillar, whitemarked tussock moth, and fourth instar large aspen tortrix on three aspen clones exposed to two levels of C02 and ozone. Statistical significance is shown as follows: **** indicates P s 0.000 1 ; *** indicates P s 0.00 1 ; ** indicates P s 0.0 1 ; * indicates P < 0.05.
Source df RGR df RGR RCR ECD AD
coz 03 CozQ *ber(CO2Q) aspen clone C02+clone 03+done C m Z l o n e done*chambn(C02+0f) insect species
c02"insea
w- m+i-
-hamber(co2Q) clone.insect
C02+done+insect Oj+done+insect m + d o n e + i r w c t done'insst'chamber(Cm) m r
The consumption rate (RCR) of large aspen tortrix was decreased 20 percent by elevated CO,. Consumption rates of the other species were not affected (Figure 3, Table 1, significant CO,*insect interaction). The unusually high consumption rates for large aspen tortrix are artefacts resulting because the image analyzer used to measure leaf area was unable to differentiate skeletonized foliage (characteristic of large aspen tortrix feeding) fiom completely consumed leaves. Hence, consumption was overestimated. This prevents direct comparisons with the other species, but will not affect relative comparisons of large aspen tortrix performance on the different CO, and ozone treatments. Elevated CO, had a minor but statistically significant effect on the ability of larvae to digest food, decreasing AD by only 5 percent (Table 1, Figure 4). The effect of elevated CO, on larval ability to convert digested food to biomass (ECD) was dependent on the aspen clone fed upon (Table 1, significant CO,*clone interaction). Elevated CO, decreased ECD by 5 1 percent and 32 percent on clones 259 and 27 1, respectively, but ECD was increased 55 percent on clone 21 6 (Figure 5).
Ozone Effects on Larval Performance
Elevated ozone increased the growth rates of first instars of all three species (Table 1). Forest tent caterpillar larvae were affected most dramatically, with their growth rate increasing 10-fold on ozone exposed foliage. Elevated ozone increased the growth rates of gypsy moth and whitemarked tussock moth by 70 percent and 60 percent, respectively (Figure 6). The growth rate of fourth instars of all species was also increased by elevated ozone, with percent increases ranging fiom 27 percent for forest tent caterpillar to 59 percent for gypsy moth (Figure 7). Ozone had no effect on relative consumption rate (Table 1, Figure 8). However, elevated ozone decreased the ability of larvae to digest food (Figure 9), with the magnitude of the effect dependent on clone (Table 1, significant ozone*clone interaction). Elevated ozone decreased AD 29 percent on clone 259, 14 percent on clone 2 16, and 6 percent on clone 27 1. Ozone increased the ability of larvae of all four species to convert digested food to biomass (ECD) (Table I), with the percent increases ranging from 35 percent for forest tent caterpillar to 230 percent for large aspen tortrix (Figure 10).

n h 0.4 a P m E - z 0°3 u
Q CI a [r 0.2 C z 2 0 0.1 a > .- w a - @ 0.0
Forest Tent GYPSY Whitemarked Caterpillar Moth Tussock Moth
Figure 1. Effkct of ambient and elevated C02 on the relative growth rate (RGR) of fust instar forest tent caterpillar, WSY moth, and whitemarked tussock moth feeding on quaking aspen. Data are expressd as least square means one standard error.
n S 0.6 a 2
0.6 - m E - 0.4 Q * a a: 0.3 r z g 0.2
(3
g 0.1 - C,
a - g 0.0
Forest Tent GYPSY Large Aspen Whitemarked Caterpillar Moth Tortrix Tussock Moth
Figure 2. Effscts of ambient and elevated C02 on the relative growth rate (RGR) of fourth instar forest tent caterpillar, gypsy moth, large aspen tortrix, and whitemarked tussock moth, feeding on quaking aspen Data are expressed as least square means * one standard error.

Q 2 F - 7
Ambient C 0 2
Eievated C 0 2
- -
Q) rr Forest Tent Gypsy Large Aspen Whitemarked LL
Caterpillar Moth Tortrix Tussock Moth
Figure 3. Effect of ambient and elevated C 0 2 on the relative consumption rate (RCR) of fourth instar forest tent caterpillar, gypsy moth, large aspen tortrix, and whitemarked tussock moth feeding on quaking aspen. Data are expressed as least square means * one standard error.
Ambient C 0 2 ** 1 Elevated C 0 2
Forest Tent Gypsy Large Aspen Whitemarked Caterpillar Moth Tortrix Tussock Moth
Figure 4. Effect of ambient and elevated C 0 2 on the percentage of consumed food digested (AD) by fourth instar forest tent caterpillar, gypsy moth, whitemarked tussock moth, and large aspen tortrix feeding on quaking aspen. Data expressed as least square means * one standard error.

40
35
30 Elevated C 0 2
25 s u
13 20 0
15
10
5
0
Clone 271 Clone 259 Clone 21 6
Figure 5. Effkct of ambient and elevated C02 on the persentage of digested food converted to biomass (ECD) by fourth instar forest tent caterpillar, gypsy moth, large aspen tortrix, and whitemarked tussock moth feeding on three clones of quaking aspen. Data are expressed as least square means of all insects combined * one standard error.
Caterpillar Moth Tussock Moth Figure 6. Effect of ambient and elevated ozone on the relative growth rate of first instar forest tent caterpillar, gypsy moth, and large aspen tortrix feeding on quaking aspen. Data are expressed as least square means k one standard - error.

Ambient 0 3
Elevated 0 3
LL Forest Tent GYPSY Large Aspen Whitemarked Caterpillar Moth Tortrix Tussock Moth
Figure 7. Effect of ambient and elevated ozone on the relative growth rate (RGR) of fourth instar forest tent caterpillar, gypsy moth, large aspen tortrix, and whitemarked tussock moth feeding on three clones of quaking aspen. Data are expressed as least square means * one standard error.
Ambient 03 - 7
- Q Forest Tent Gypsy Large Aspen Whitemarked a
Caterpillar Moth Tortrix Tussock Moth Figure 8. Effect of ambient and elevated ozone on the relative consumption rate (RCR) of fourth instar forest tent caterpillar, gypsy moth, whitemarked tussock moth, and large aspen tortrix feeding on quaking aspen. Data are expressed as least square means * one standard error.
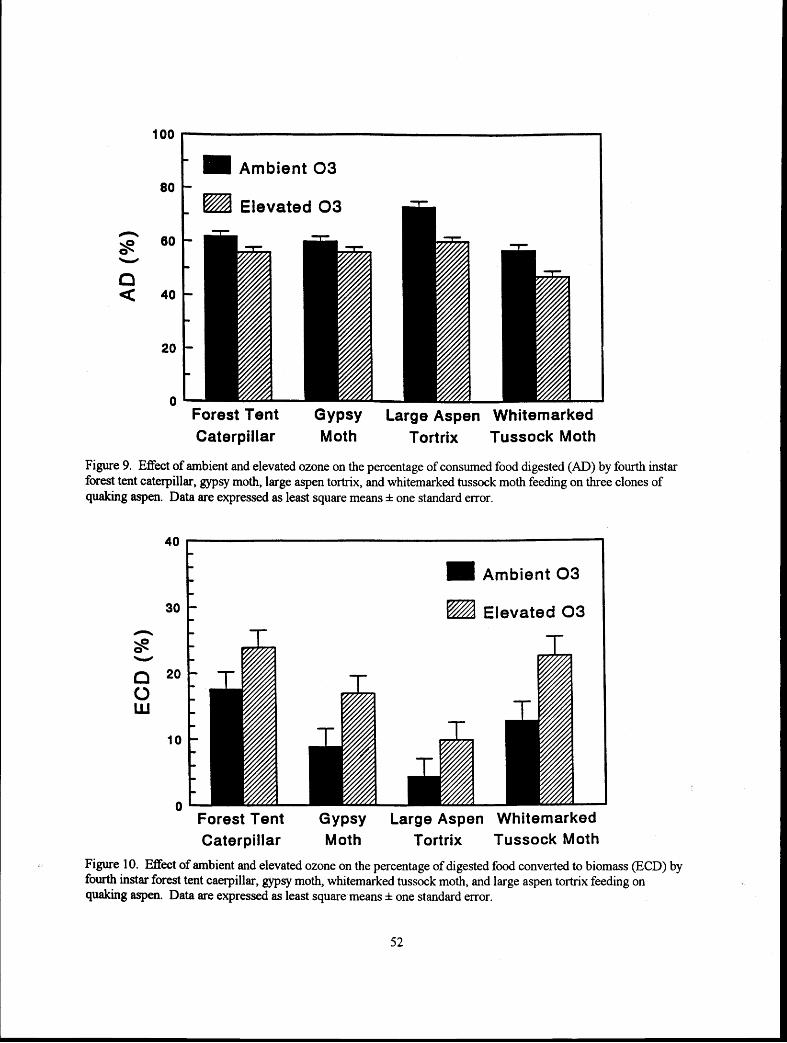
Ambient 0 3
Elevated 0 3
Forest Tent Gypsy Large Aspen Whitemarked Caterpillar Moth Tortrix Tussock Moth
Figure 9. Effect of ambient and elevated ozone on the percentage of consumed food digested (AD) by fourth instar forest tent caterpillar, gypsy moth, large aspen tortrix, and whitemarked tussock moth feeding on three clones of quaking aspen. Data are expressed as least square means one standard error.
Ambient 0 3
@ Elevated 0 3
Forest Tent Gypsy Large Aspen Whitemarked Caterpillar Moth Tortrix Tussock Moth
Figure 10. Effect of ambient and elevated ozone on the percentage of digested food converted to biomass (ECD) by fourth instar forest tent caerpillar, gypsy moth, whitemarked tussock moth, and large aspen tortrix feeding on quaking aspen. Data are expressed as least square means k one standard error.

DISCUSSION
CO, Effects on Insect Performance
Most studies have found elevated CO, to decrease the nutritional quality of plants for insects, in some cases resulting in decreased growth and survival (Lincoln 1993, Lincoln and others 1993). In other cases, however, insects increased their consumption rates, compensating for decreased nutritional quality (Lincoln 1993, Lincoln and others 1993). Lindroth and others (1 993) in the only published study of the effects of atmospheric CO, on forest insects found that consumption rates of gypsy moth and forest tent caterpillar increased substantially, but their growth rates declined.
In this experiment, elevated CO, decreased the growth rates of fourth instars of all species. However, the results of elevated CO, on the growth of first instars were dependent on the host genotype. Elevated CO, decreased the growth rate of first instars on two of the three clones tested. However, the growth rate of first instar forest tent caterpillar increased dramatically on clone 2 16, and the growth of the other two species were not affected on this clone.
Previous studies have found that insects frequently increase consumption rates to compensate for elevated C0,- induced reductions in foliage quality (Lindroth and others 1993, Lincoln and others 1993). In this experiment, however, elevated CO, decreased the consumption rate of large aspen tortrix and had no effect on the other species. The small reduction in the ability of larvae to digest food caused by elevated CO, was not enough to account for the dramatic decreases observed in growth rate. Rather, decreased growth was due to decreased ability of larvae to convert digested food to biomass (ECD), and in the case of large aspen tortrix, decreased consumption rate. However, the effect varied by clone. Elevated CO, decreased the ECD of larvae feeding on clones 259 and 27 1, but increased the ECD of larvae feeding on 2 16 (the same clone on which first instar forest tent caterpillar growth rate increased).
Lindroth and others (1 993) found that elevated CO, decreased the ECD of gypsy moth and forest tent caterpillar on aspen. Decreased ECD is consistent with increased concentrations of toxins in the diet. In a companion study using the same plants, we did see a corresponding increase in the phenolic glycosides tremulacin and salicortin in response to elevated CO, (see abstract by Nitao et al.). Tremulacin in particular has been shown previously to decrease growth and survival of gypsy moth and forest tent caterpillar (Lindroth 199 1). Tremulacin concentrations were lowest in clone 216, the clone on which ECD and first instar forest tent caterpillar growth rate were increased. However, affects of CO, on other secondary metabolites and nutrients also may have affected growth. Elevated CO, almost universally decreases foliar N concentrations (Lincoln and others 1 993), which frequently limits insect growth (Mattson 1980). Analyses of condensed tannins and N are currently underway.
Ozone Effects on Insect Performance
To our knowledge, this study represents the first report on the effects of ozone on the growth and nutritional physiology (as opposed to feeding preferences) of Lepidoptera larvae feeding on woody plants. The growth rates (RGR) of first and fourth instars of all species fed foliage exposed to elevated ozone were increased. Growth rates were increased because elevated ozone increased the ability of larvae to convert digested food to biomass (ECD), which overcompensated for the smaller negative effect of elevated ozone on their ability to digest foliage. Ozone had on effects on consumption rates. The enhanced quality of foliage exposed to elevated ozone-may be due to the observed decrease in foliar concentrations of tremulacin (see abstract by Nitao et al.).
No Interactions Between CO, and Ozone
To our knowledge, this is the first study that simultaneously tested the effects of atmospheric ozone and CO,, and there were no interactions between them. The ozone and CO, treatment levels used in this experiment had roughly equal and opposing effects on insect performance, with elevated ozone decreasing and elevated CO, enhancing aspen resistance to the four species.
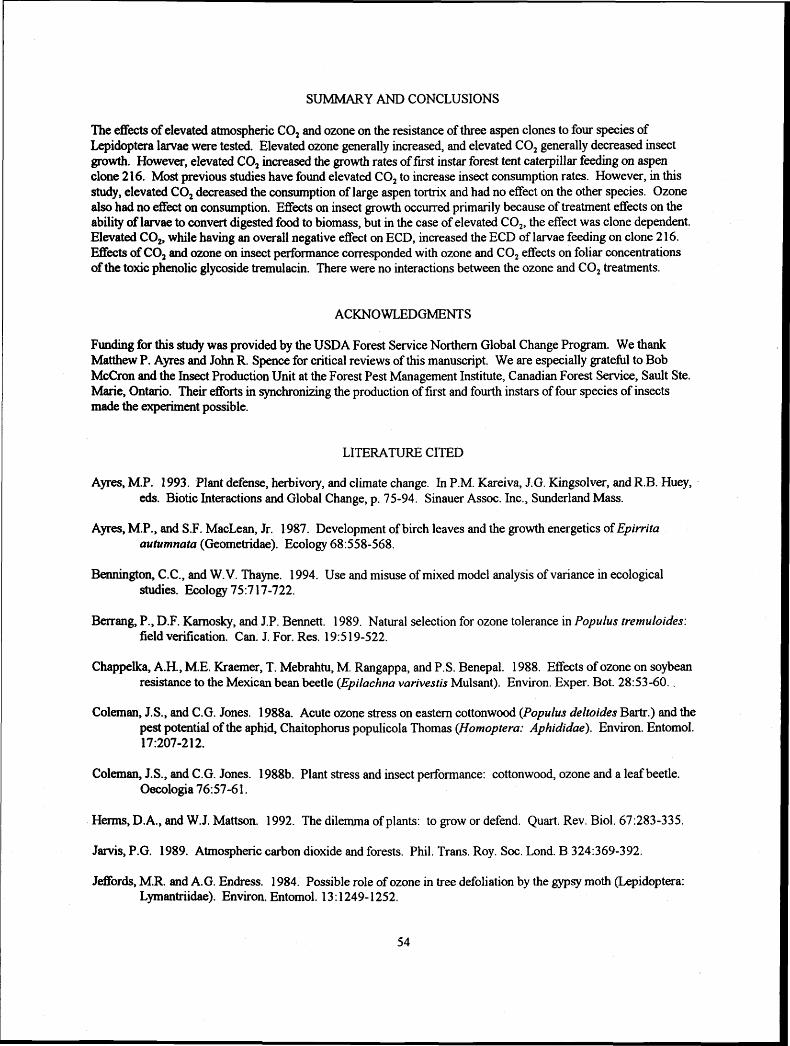
SUMMARY AND CONCLUSIONS
The effkcts of elevated atmospheric CO, and ozone on the resistance of three aspen clones to four species of Lepidoptera larvae were tested. Elevated ozone generally increased, and elevated CO, generally decreased insect growth. However, elevated CO, increased the growth rates of first instar forest tent caterpillar feeding on aspen clone 2 16. Most previous studies have found elevated CO, to increase insect consumption rates. However, in this study, elevated CO, decreased the consumption of large aspen tortrix and had no effect on the other species. Ozone also had no effect on consumption. Effects on insect growth occurred primarily because of treatment effects on the ability of larvae to convert digested food to biomass, but in the case of elevated CO,, the effect was clone dependent. Elevated CO,, while having an overall negative effect on ECD, increased the ECD of larvae feeding on clone 2 16. Eff'ts of CO, and ozone on insect performance corresponded with ozone and CO, effects on foliar concentrations of the toxic phenolic glycoside tremulacin. There were no interactions between the ozone and CO, treatments.
ACKNOWLEDGMENTS
Funding for this study was provided by the USDA Forest Service Northern Global Change Program. We thank Matthew P. Ayres and John R. Spence for critical reviews of this manuscript. We are especially grateful to Bob McCron and the Insect Production Unit at the Forest Pest Management Institute, Canadian Forest Service, Sault Ste. Marie, Ontario. Their efforts in synchronizing the production of first and fourth instars of four species of insects made the experiment possible.
LITERATURE CITED
Ayres, M.P. 1993. Plant defense, herbivory, and climate change. In P.M. Kareiva, J.G. Kingsolver, and R.B. Huey, eds. Biotic bteractions and Global Change, p. 75-94. Sinauer Assoc. Inc., Sunderland Mass.
Ayres, M.P., and S.F. MacLean, Jr. 1987. Development of birch leaves and the growth energetics of Epirrita autumnata (Geometridae). Ecology 68: 558-568.
Bennington, C.C., and W.V. Thayne. 1 994. Use and misuse of mixed model analysis of variance in ecological studies. Ecology 75:7 17-722.
Bmang, P., D.F. Karnosky, and J.P. Bennett. 1989. Natural selection for ozone tolerance in Populus trernuloides: field verification. Can. J. For. Res. 19:s 19-522.
Chappelka, A.H., M.E. Kraerner, T. Mebrahtu, M. Rangappa, and P.S. Benepal. 1988. Effects of ozone on soybean resistance to the Mexican bean beetle (Epilachna varivestis Mulsant). Environ. Exper. Bot. 2853-60. .
Coleman, J.S., and C.G. Jones. 1988a. Acute ozone stress on eastern cottonwood (Populus deltoides Bartr.) and the pest potential of the aphid, Chaitophorus populicola Thomas (Homoptera: Aphididae). Environ. Entomol. 17:207-2 12.
Coleman, J.S., and C.G. Jones. 1988b. Plant stress and insect performance: cottonwood, ozone and a leaf beetle. Oeeologia 7657-6 1.
Helms, D.A., and W.J. Mattson. 1992. The dilemma of plants: to grow or defend. Quart. Rev. Biol. 67:283-335.
Jarvis, P.G. 1989. Atmospheric carbon dioxide and forests. Phil. Trans. Roy. Soc. Lond. B 324:369-392.
Jeffords, M.R. and A.G. Endress. 1984. Possible role of ozone in tree defoliation by the gypsy moth (Lepidoptera: Lymantriidae). Environ. Entomol. 13 : 1249- 1 252.
54

Jones, C.G., and J.S. Coleman. 1988. Plant stress and insect behavior: cottonwood, ozone and the feeding and oviposition preference of a beetle. Oecologia 7 6 5 1-56.
Larnbers, H. 1 993. Rising CO,, secondq plant metabolism, plant-herbivore interactions and litter decomposition: theoretical considerations. Vegetatio 10411 05:263 -27 1 .
Larson, P.R., and J.G. Isebrands. 197 1. The plastichron index as applied to developmental studies of cottonwood. Can. J. For. Res. 1:l-11.
Lin, H., M. Kogan, and A. Endress. 1990. Influence of ozone on induced resistance in soybean to the Mexican bean beetle (Coleoptera: Coccinellidae). Environ. Entomol. 1 9: 854-858.
Lincoln, D.E. 1993. The influence of plant carbon dioxide and nutrient supply on susceptibility to insect herbivores. Vegetatio 10411 05:273 -280.
Lincoln, D.E., E.D. Fajer, and R.H. Johnson. 1993. Plant-insect herbivore interactions in elevated CO, environments. Trends Ecol. Evol. 8: 64-68.
Lindroth, R.L. 199 1. Biochemical ecology of aspen-Lepidoptera interactions. J. Kansas Entomol. Soc. 64:372-380.
Lindroth, R.L., K.K. Kinney, and C.L. Platz. 1993. Responses of deciduous trees to elevated atmospheric CO,: productivity, phytochemistry, and insect performance. Ecology 74:763-777.
Mattson, W. J. 1980. Herbivory in relation to plant nitrogen content. Annu. Rev. Ecol. Syst. 1 1 : 1 19- 16 1
Pye, J.M. 1988. Impact of ozone on the growth and yield of trees: a review. J. Environ. Qual. 17:347-360.
Riemer, J., and J.B. Whittaker. 1989. Air pollution and insect herbivores: observed interactions and possible mechanisms. In: Insect-Plant Interactions, Vol. I, E.A. Bernays, ed. CRC Press, Inc. Boca Raton, Fla. p. 73-99.
Williams, D.W., and A.M. Liebhold. 1995. Forest defoliators and climatic change: potential changes in spatial distribution of outbreaks of western spruce budworm (Lepidoptera: Tortricidae) and gypsy moth (Lepidoptera: Lyrnantriidae). Environ. Entomol. 24: 1 -9.

GENETIC AFTEREFFECTS OF INCREASED TEMPERATURE IN LARIX
Michael S. Greenwood and Keith W. Hutchison'
Abstract: We tested the hypothesis that temperature during gametogenesis and embryogenesis can &ect progeny genotype and phenotype. Identical crosses were made among cloned parents of Larix spp. inside and outside a greenhouse, where the temperature inside averaged 4OC above the outside temperature. Significant growth differences as a function of crossing environment were observed. When the crosses were grown in the same environment the phenotypes of crosses made inside tended to resemble more southern ecotypes. In addition, segregation distortion at the chlorophyll- ah-protein locus as a function of crossing environment was observed. These results support the hypothesis that progeny phenotype and genotype can exhibit aftereffects that are a function of crossing environment.
INTRODUCTION
Modification of progeny performance as a fbnction of parental environment has been reported for both Picea abies (L.) Karst. and Pinus svlvestris L. (Lindgren and Wang 1986, Johnsen 1989a and 1989b, Johnsen and others 1989, and Dormling and Johnsen 1992). For both species, the same crosses were made on cloned parents (of northern origin) in seed orchards about 5-8" latitude apart and the resulting progenies were planted on the same site. Full- and half-sibling progeny produced at the more southern locations consistently grew more than their siblings produced in the north. In addition, progeny produced in the south exhibited less cold hardiness and overall seemed to behave like southern ecotypes. These modifications due to parental environment have been called aftereffects. Similar changes in growth habits of inbred lines of Pisum and Linum were induced by temperature or fertilization regime (Highkin 1958, Durrant 197 l), which also appear to be heritable in these two species.
In general, clonal seed orchards located in more southerly regions of a species range flower better, which has resulted in the common practice of locating clonal seed orchards as far south within the range as possible (Schrnidtling 1987). In addition, consistently good flowering can be obtained using indoor, potted breeding orchards (e.g. Philipson 1983, Ross 1985, Adams and Greenwood 1992). These practices require fhther understanding of the effects of breeding environment on progeny performance by forest tree species. In addition, the possibility of rapid global warming raises questions about the ability of long-lived woody perennials to adapt to such changes. Are there short-term, as yet uncharacterized genetic strategies so that better adapted progeny can be selected before seed is even shed? The purpose of this paper is to compare the effect of adjacent indoor (greenhouse) and outdoor environments on height growth and allele frequencies of progeny from identical crosses Larix spp.
MATERIALS AND METHODS
Fourteen parents were selected fi-om a potted, indoor clonal breeding orchard of Larix spp. for creation of identical indoor and outdoor breeding populations. The orchard was established by grafting in 1987. Details of establishment and culture are described by Eysteinsson and Greenwood (1 993). The parents, representing three species (five from Larix laricina (DuRoi) K. Koch, five from L. decidua Mill., and four from L. le~tole~is Gord.), were each represented by at least four rarnets, all of which remained in the greenhouse until mid-November, 199 1. At that time two randomly chosen rarnets of each parent were moved outside to a pad immediately adjacent to the greenhouse. Crossing began in the spring of 1992 and continued in 1 993 (Table 1). The greenhouse remained unheated most of
'Ruth Hutchins Professor of Tree Physiology, Department of Forest Ecosystem Science; and Associate Professor of Biochemistry, Department of Biochemistry, Microbiology and Molecular Biology, respectively, University of Maine, Orono, ME 04469.

the winter, so that shoots went through winter dormancy. Temperatures were recorded simultaneously at hourly intervals at both locations using thermocouples (two inside and two out) attached to an ECD model 50 data logger (ECD Inc., Milwaukie, OR 97222-8825).
Twelve pairs of identical indoor-outdoor crosses (nine made in 1992 and three in 1993) yielded enough viable seed for a common garden progeny test. One cross was repeated in 1992 and 1993. Most crosses were intraspecific (four among eastern larch parents, three among European larch, three among Japanese larch) with two interspecific crosses between Japanese and European larch. Pollen always came from the same location as the female parent (see Eysteinsson and Greenwood 1993 for details on pollen collection and pollination). A total of five of the 14 parents were involved in two to three crosses each, but there were no reciprocal crosses between inside and out.
In early January, 1994, seed was germinated in 150x1 5mm petri dishes on moistened filter paper (Whatman #42) in a growth chamber under a 16h photoperiod (incandescent light only), 28°C day, 20°C night. Germinants (radicle emerged) were transplanted to 65 cm3 plastic tubes (Ray Leech cells, Stuewe and Sons, Inc. 2290 SE Kiger I. Drive, Corvallis, OR 97333) containing peat moss:builder's sand:vermiculite:perlite (8:4:3:3) with Osmocote 17:6: 12 (four mo. timed release) fertilizer at 4g.l.' (Grace-Sierra, 1001 Yosemite Dr., Milpitas, CA 95035). Percentage of seed germinating was recorded for each family. Seedlings continued to grow in a heated greenhouse (20-25" day, 15-20" night) under a 1 6h photoperiod (natural daylight supplemented with high pressure sodium lamps for 1 6h). Each family was grown as a single block, and trays containing the blocks were s h f l e d weekly to even out the effects of environmental variation.
In late May 1994, seedlings were transplanted into 11.4 1 plastic pots containing peat moss:vermiculite:builder's sand (2: 1 : 1) and Osmocote as described above, and moved into the same fiberglass-covered greenhouse used for the indoor breeding orchard with no supplemental photoperiod. The seedlings were arranged in four blocks containing four replicates, the latter consisting of full-sibling pairs (one sibling from outside, one from inside were placed side by side) of 12 families, for a total of 384 trees. The heights of all the seedlings were measured immediately after repotting. All the seedlings were watered via drip irrigation, assuring that the potting medium was close to field capacity most of the time. The trees were measured again in late September 1994.
In the spring of 1992 and again, in 1993, embryos were carehlly excised fiom seeds gathered in the respective year. DNA was extracted fiom the seeds as described by Doyle and Doyle (1 990). Inheritance of specific alleles at one of the loci encoding a chlorophyll-ahbinding protein (cab) protein was determined by PCR amplification of the genomic sequence, followed by analysis using single strand conformational polymorphisms (SSCP) (Orita and others 1989).
Statistical analysis was performed using SYSTAT software (Systat, Inc., 1800 Sherman Ave., Evanston, IL 60201 - 3793).
RESULTS
Temperatures averaged about 4°C warmer inside than out in 1992 but the difference was greatest between January and September (Figure 1). The lack of difference in the fall is probably due to greater cloud cover during the day, which is typical of fall and early winter in the northeastern US. Similar temperature profiles were observed in 1993.
A significant block effect developed during the growing season, probably due to uneven temperature in the greenhouse (Table 1). The effect of cross was highly significant at both measurement times. The effect of crossing environment was not significant at either time, but the cross by location interaction was highly significant at both dates, indicating that the crosses grew differently as a function of crossing environment. In general, crosses made outside among eastern larch grew more, while crosses made inside among the other species tended to grow more (Figure 2). The ANOVA of the height differences between crossing environments reveals that the effect of cross on height difference between crossing environments is highly significant (Table 2). Height difference due to crossing environment was significantly different fiom zero to five of the 12 crosses at each measurement date @ < 0.05).

v@ )fl eos'@@N//
MONTH
MONTH
Figure 1 . Mean monthly temperatures (1 992) at breeding orchards located inside and outside the greenhouse.
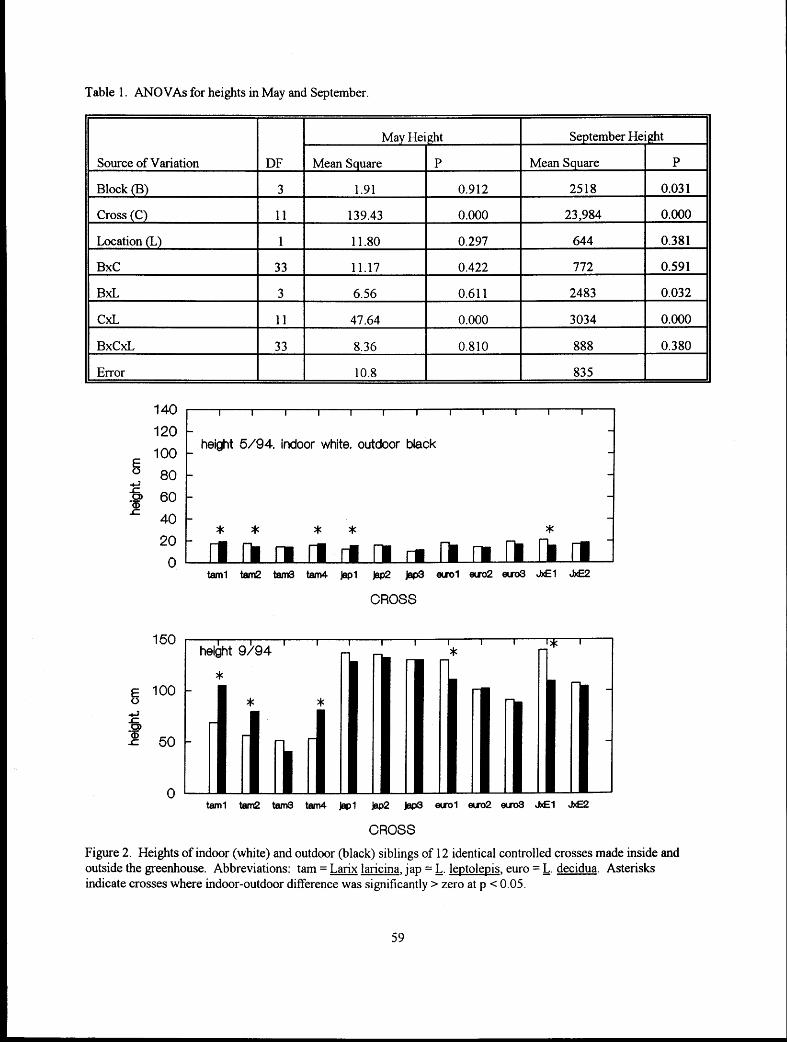
Table 1 . ANOVAs for heights in May and September.
Source of Variation
Block (B)
Cross (C)
Location (L)
BxC
BxL
Error
May Height September Height I I
DF I Mean Square I P I Mean Square I P I I I
0 tam1 ten9 tam3 tern4 Japl Jep2 j@ ml euo2 euo3 Jx€l JxE2
I I I I I I I I 1 I I I
- - height 5/94, indoor white. outdoor black - -
- - - -
- - * * * * * -
CROSS
CROSS
Figure 2. Heights of indoor (white) and outdoor (black) siblings of 12 identical controlled crosses made inside and outside the greenhouse. Abbreviations: tam = Larix laricina, jap = L. leptole~is, euro = L. decidua. Asterisks indicate crosses where indoor-outdoor difference was significantly > zero at p < 0.05.

Table 2. ANOVAs for height difference between indoor and outdoor full-sibling heights by cross.
Height differences due to crossing environment caused by differences in seed vigor must be considered because weight and percent germination of seed fiom crosses made inside tended to be slightly greater. However, there was no sigmiicant melat ion between percent germination and height at either measurement date (Pearson F-0. 150 in May, 14.193 in September). Also, height growth rank between crossing environments changed for four of the 12 crosses between the May and September measurements. May and September heights were not significantly correlated (Pearson F -0.081), providing fbrther evidence that residual effects of seed vigor on seedling height, if they exist at all, are not persistent.
The opposite response to crossing environment by L. laricina crosses may be a function of bud set following repotting. The relatively poor growth of these crosses was due to a tendency to set bud relatively easily after repotting: by midsummer, less than one third of these crosses had been growing continuously (see Table 3). The observation that a slightly higher percentage of the crosses made outside grew continuously explains in part why the crosses made outside grew more. In contrast, most of the trees from the crosses involving the other species grew continuously, with the percentage slightly higher for crosses made inside. The bud set probably occurred because ambient photoperiod at the time of repotting was about 14h, about 2h shorter than the trees had been receiving prior to repotting.
Table 3. The percentage of trees by species on 7- 19-94 that grew continuously following repotting the previous May.
Environmental aftereffects could be the result of either epigenetic or genetic changes. In the latter category, changes could arise either as a result of changes in the mutation rate or in selection for particular alleles or haplotypes within the genome. Selection should be detectable as segregation distortion, or non-Mendelian inheritance. Previous observations while constructing a genetic map for larch suggested that one of the cab loci protein would be a candidate marker for detecting segregation distortion (Hutchison et al. 1995, Unpublished). As shown in Table 4, allele 1 was found at significantly higher frequency in the progeny of an indoor grown L. decidua cross in 1992. Progeny f?om the outdoor grown clone was not available. This observation was repeated the following year. -
Though the simcance of the segregation distortion for the indoor grown trees was decreased, the trend remained
60
. Source of Variation
Block (B)
Cross (C)
BxC
Error
DF
3
11
33
Species
Eastern larch
Japanese larch
European larch
, Hybrid (JxE)
Mean Square
16.93
93.14
17.20
18.04
# Trees
Mean Square
5533
5778
1629
1437
P
0.424
0.000
0.547
In
9 1
53
70
42
Continuously Growing
P
0.01 1
0.000
0.305
Out
87
53
79
43
In
27%
98%
69%
68%
Out
32%
96%
63%
67%

the same. Of even greater interest is that segregation distortion reverses in the progeny of the clonal replications that were grown outdoors (Table 4).
Table 4. Frequency of occurrence of two alleles at the &-3 locus in L. decidua grown inside (1 992 and 1993) and outside (1 993), including x for deviation from expected 1 : 1 segregation of the two alleles.
1 992-Indoor 1992-Indoor 1 993-Outdoor
Allele Allele x 2 p Allele Allel'e x 2 p Allele Allele x 2 p 1 2 1 2 1 2
37 19 5.79 0.016 34 25 1.37 0.24 18 39 7.74 0.005
DISCUSSION
Significant environmental aftereffects on height growth of five of the 12 full-sib families created inside and outside the greenhouse have been demonstrated, which are not a function of seed vigor. The most likely cause of the aftereffects observed here is temperature, which was consistently higher inside the greenhouse throughout the periods of both gametogenesis and embryogenesis in larch. However, differences in light quality due to the fiberglass covering of the greenhouse were also present. These effects appear to be similar to those demonstrated for Pinus svlvestris and Picea abies, in that crosses made inside the greenhouse behaved like southern ecotypes. The crosses made between L. decidua and L. leptolepis inside tended to grow slightly more, and the majority of the trees among these crosses grew continuously after repotting. In the two crosses where this difference was significant at p<0.05, all the trees were growing actively in mid-July. In contrast, the majority of trees among the eastern larch crosses set bud after repotting, and had not resumed growth by mid-July, so the full growth potential of these crosses was not realized. Three of the four larch crosses exhibited significantly more height growth when made outside, and among these crosses, 40 percent of the trees from the outside crosses had been growing actively most of the summer, versus 29 percent for the crosses made inside. The greater frequency of resumption of active growth by the outdoor crosses is consistent with demonstrations that more northerly ecotypes at Picea abies require smaller heat sums before bud burst occurs (e.g. Beuker 1994). Observations on frost hardiness as a function of crossing environment have also been made, but await confirmation by further observations in the spring of 1995.
Environmental aftereffects could potentially be explained by selection for specific alleles or regions of the genome. This selection could take place either during gametogenesis or in the developing embryo. Segregation distortion of the & locus could be due to linkage to a generalized lethal allele at another locus. Alternatively, it could be due to environmental selection of a specific allele in the elevated temperatures of the greenhouse. Data from inheritance of allele 1 and allele 2 in the indoor vs. outdoor plants provides at least a partial answer to these two possibilities. In the indoor population allele 1 was the 'favored' allele (Table 4). However, the outdoor population of trees showed a strong segregation distortion in the opposite direction, that is, selection for the alternative allele (Table 4). These data strongly suggest that the segregation distortion is not due to a general lethal allele at a locus near the & locus. If that were the case, the selection should have been for the same allele in both populations. Rather, it appears that environment affect which allele is selected in these two populations.
ACKNOWLEDGEMENTS
Funding for this study provided by Northern Global Change Program (U.S.D.A. Forest Service), and the Co- Operative Forest Research Unit, University of Maine. We thank Christopher Campbell and William Livingston for their helpfil comments on the manuscript, and Bill Halteman and William Livingston for their help with the statistical analysis.

I LITERATURE CITED
Adams, G. W., and M.S. Greenwood. 1992. Optimization of environmental regimes for flowering in an indoor breeding hall for black spruce, white spruce and jack pine. In anon (ed): Mass production technology for genetically improved fast growing tree species. Proceedings of AFOCEL-IUFRO conference, Bordeaux, France: AFOCEL 77370 Nangis, France, pp. 2 1 9-227.
Beuker, E. 1994. Adaptation to climatic changes of the timing of bud burst in populations of Pinus svlvestris L. and Picea abies Karst. Tree Physiology 14: 96 1-970.
Dormling, I., and 0. Johnsen. 1992. Effects of the parental environment on full-sib families of Pinus svlvestris. Can. J. For. Res. 22: 88- 100.
I Doyle J. J., and J.L. Doyle. 1 990. Isolation of plant DNA from fi-esh tissue. BRL Focus 1 2: 1 3 - 1 5.
Eysteinsson, T., and M.S. Greenwood. 1993. Management of a prototype indoor orchard for accelerated breeding of larch. Orono, Maine 04469: Misc. report 377, Maine Agricultural Experiment Station, 18pp.
I Highkin, H.R. 1958. Temperature-induced variability in peas. Arner. J. Bot. 45: 626-63 1.
Johnsen, 0 . 1989a. Phenotypic changes in progenies of northern clones of Picea abies (L.) Karst. grown in a southern seed orchard. 11. Seasonal growth rhythm and height in field trials. Scandinavian Journal of Forest Research 4: 33 1-342.
1 Johnsen, 0 . 1989b. Phenotypic changes in progenies of northern clones of Picea abies @,.)Karst. grown in southern seed orchards. I. Frost hardiness in a phytotron experiment. Scandinavian Journal of Forest Research 4: 3 17-330.
I Johnsen, O., J. Dietrichson, and G. Skaret. 1989. Phenotypic changes in progenies of northern clones of Picea abies (L.) Karst. grown in a southern seed orchard. 111. Climatic damages and growth in a progeny trial.
I Scandinavian Journal of Forest Research 4: 343 -3 50.
Lindgren, D., and Q. Wang .1986. Are genetic results influenced by the environment during seed maturation? In (ed): In: Proc. IUFRO conf. on breeding theory, progeny testing and seed orchards, Oct. 13-17, 1986,
I Williarnsburg, VA, USA., pp. 1 92- 1 99.
Orita M H. Iwahana, H. Kanmwa, K. Hayashi, and T. Sekiya. 1989. Detection of polymorphisms of human DNA by gel electrophoresis as single-strand conformation polyrnorphisms. Proc. Natl. Acad. Sci. USA 86: 2766- 2770.
Philipson, J.J. 1983. The role of gibberellin A4f7, heat and drought in the induction of flowering in Sitka spruce. J. EXP. Bot. 34: 291 -302.
Ross, S.D. 1985. Promotion of flowering in potted Picea eneelmanii (Perry) grafts: Effects of heat, drought, gibberellin A4n, and their timing. Can. J. For. Res. 15: 6 18-624.
Schmidtling, R.C. 1987. Locating pine seed orchards in warmer climates: benefits and risks. Forest Ecology and Management. u:273-283.

PHYSIOLOGICAL AND GENOTYPIC RESPONSES OF CENTRAL HARDWOOD SPECIES TO
ALLELOCHEMICALS, OTHER STRESSES, AND THEIR INTERACTIONS
J. W. Van Sambeekl, John E. Preece', Nadia E. Navarrete2, and George Rink3
In response to increasing carbon dioxide levels, most general circulation models (GCMs) predict increasing temperatures and decreasing precipitation for the central hardwood region of the United States. Plants in this region will need to adapt to these changes as well as to other stress agents if they are to germinate, grow, and reproduce. For the last five years, our research program under the global change initiative has been designed to increase our understanding of the physiological and genetic mechanisms used by plants to respond and adapt to multiple stresses in forest ecosystems. To achieve this objective, we have conducted a series of field, greenhouse, and laboratory studies aimed at understanding how plants respond to allelochemicals, drought, and competition.
Rangewide provenance trials provide us with information about the amount of the genetic variation that exists w i t h a species as well as information on the effects of moving local populations to new environments. Recently, we remeasured several rangewide provenance tests for black walnut (Juglans nigra L.) and white ash (Fraxinus americana L.) that had been established in the 1960s to mid 1970s. These studies continue to provide new information about the genetic variation that exists within these species as they enter their mature growth phase. In addition, we can continually test previous recommendations about the effects of moving seed to new environments. The up-to-date information will help us predict how local populations might respond to altered climatic conditions.
Bresnan and others (1 994) recently confirmed our previous recommendations that collecting black walnut seed fiom 160 to 320 km (1 00 to 200 miles) south of a planting site results in increased growth of black walnut with acceptable survival for most of the central hardwood region. Similar movement of seed from sources along the edges of the natural range for black walnut, however, resulted in reduced survival or growth. Except in the test plantings along the western edge of the natural range, seed collected east of a planting site tended to show faster tree growth than seed collected west of the planting sites. Southward movement of seed to warmer climates and westward movement of seed to drier sites may simulate the effects of a warmer, drier climate such as that predicted by various GCMs. Few correlations, however, were found between latitude or longitude of the provenance source and subsequent height or diameter growth. These results suggest that sufficient genetic variation exists in black walnut populations throughout most of the central hardwood region to enable them to adapt to changes predicted by the various GCMs.
Recommendations similar to those for black walnut have also been made for white ash. With white ash, the movement of seed or seedlings up to 320 km (200 miles) northward also results in growth increases over local plant material for the central hardwood region. Recently, Roberds and others (1 991) found that white ash seed fiom the southern part of the natural range of white ash tended to be more broadly adapted and had acceptable growth considerably north of their origin. On the other hand, moving seed from the northern parts of the natural range led to
'~esearch Plant Physiologist and Research Geneticist, respectively, USDA Forest Service, North Central Forest Experiment Station, Southern Illinois University, Carbondale, IL 6290 1 -4630.
'Professor, Dept. of Plant and Soil Science, Southern Illinois University, Carbondale, IL 6290 1 -44 15,
3Researcher, Universidad de El Salvador, San Salvador, El Salvador.

reduced tree growth. Rink and Kung (1 991) confirmed earlier findings by using response surface regression modeling of new data to estimate genotypic responses of white ash to different environments. Latitudinal (north - south) movement of seed had a significant effect on tree growth at 10 of 12 test sites, while longitudinal (east - west) movement of white ash seed had a significant effect at only 4 of the 12 plantings. These results suggest that white ash adaptation to temperature gradients predicted by current GCMs will be more sensitive than its adaptation to decreased precipitation in the central hardwood region.
Greenhouse studies using a modified stair-step approach have also been done to evaluate the genetic and physiological response of black walnut, white ash, and white oak (Quercus alba L.) to drought and other stresses. In these studies, progenies of four to six local trees (half sib families) of each species were evaluated for their response to moisture stress, altered nutrient regimes, and leachates produced by a tall fescue sod (Festuca arundinaceae Schreb.). Interference by tall fescue on growth of hardwood trees is thought to involve reduced nitrogen cycling and the production of allelochemicals (Van Sambeek 1989, Van Sambeek and others 1989). In our greenhouse studies, 36 to 40 seedlings of each species were grown in 170 L, 60 cm deep wooden boxes filled with a mixture of 1 : 1 sand:silt-loam topsoil. A vacuum system was used to control available soil moisture at either 0.01 MPa (field capacity) or between 0.04 and 0.05 MPa (McBride and Rink 1986). Half the boxes were watered as needed with leachates collected fiom under a tall fescue sod. The remaining boxes were watered as needed with distilled water or water collected fiom under a sand bed. Depending on the species tested, nutrient regimes were altered by the addition of 6N-24P-24K fertilizer or growth of bluegrass (Poa pratensis L.) between the rows of seedlings.
Si@icant differences existed among the half-sib families of white ash, black walnut, and white oak in response to drought and/or allelochemicals produced by tall fescue sod. Leachates from tall fescue had a greater effect on height growth of black walnut seedlings when soils were near field capacity than when available soil moisture was limiting (Rink and Van Sambeek 1 985). These observations confirm results from a field planting in which irrigated walnut trees with a tall fescue ground cover had slower growth than the non-irrigated walnut trees (Van Sambeek and McBride 1993). Conversely, tall fescue leachates reduced white ash seedling growth more when the seedlings were under moisture stress than when they were under adequate soil moisture (Rink and Van Sambeek 1987). In two separate trials, height growth of white oak seedlings was unaffected by reduced available soil moisture, tall fescue leachates, or altered soil nutrient levels (Van Sambeek and Rink 1990). Several demonstration plots at ow Hardwood Research Demonstration Area confirm that black walnut and white ash trees are more responsive to cultural treatments for controlling tall fescue than are white oak trees (Van Sarnbeek and Walters 1989).
A subsequent study using dittany (Cunila origanoides (I.,.) Britton) confirmed how difficult it is even under controlled conditions in a greenhouse to separate the factors controlling interference by one plant on neighboring plants (Kobe and others 1992). Although the stair-step method was used, height growth of dittany may have differed in response to either rapid uptake of added nutrients in the recycled leachate or the production of allelochemicals by seedlings of either white oak, sugar maple (Acer saccharurn Marsh.), flowering dogwood (Comusjlorida L.), pawpaw (Asimina triloba (L.)Dunal), or black walnut. Although dittany is more commonly found in white oak stands than in sugar maple stands, leachates from white oak seedlings reduced dittany growth more than leachates fiom sugar maple. As with many other field and greenhouse studies on allelopathy, genotypic growth differences among the dittany plants apparently masked any response to allelochemicals.
Recent developments in hardwood micropropagation have made it possible to efficiently vegetatively propagate white ash (Navarrete and others 1989). In addition, the system used for in vitro culture provided a highly controlled environment for testing response of hardwood plantlets to allelochemicals and other stresses. The main advantage of the in vitro studies over greenhouse or field studies is the use of chemically defined growth medium eliminating possible growth inhibition from phytotoxic chemicals naturally occurring in soil that may mask effects of allelochemicals.
Preece and others (1 99 1) recently described and tested the suitability of using cloned white ash plantlets as part of an in vitro bioassay to test for allelochernicals. They found significant differences in root growth among three ash clones grown on Murashige and Skoog (MS) medium, a high salt medium containing all essential macronutients and rnicronutrients, organics, sucrose, and a gelling agent. No differences in root growth were found within clones when

roots were allowed to elongate on one-quarter to three-quarter strength MS medium. Thus, small aliquots of plant extracts or soil leachates could be added to one-quarter strength MS medium without creating osmotic potentials that would inhibit root growth of the ash microplants. Navarrete (1 993) used the bioassay to c o n h that leaf extracts fi-om tall fescue contain one or more phytotoxic compounds at low concentrations, which can inhibit root growth of cloned ash microplants. By altering the macroenvironment, this bioassay could also be used to test for effects of increased temperature or elevated carbon dioxide on microplant growth along with their potential interaction with other stress factors including moisture stress, allelochemicals, pesticides, and air pollutants.
In conclusion, the high-value tree species in the central hardwood region have the ability to respond and to adapt to multiple stresses and their interactions. Our research program will continue to evaluate the physiological and genetic mechanisms used by trees to adapt to changes in their environments as well as options for adaptation or mitigation management.
LITERATURE CITED
Bresnan, D. F., G. Rink, K. E. Diebel, and W. A. Geyer. 1 994. Black walnut provenance performance in seven 22-year-old plantations. Silvae Genet. 43:246-252.
Kobe, J. M., J. S. Fralish, and J. W. Van Sambeek. 1992. The effect of allelochemicals produced by sugar maple, white oak, flowering dogwood and pawpaw on growth of dittany, (Cunila origanoides) (L.) Britton. Assoc. of Southeast. Biol. Bull. 39:93.
McBride, F. D. and G. Rink. 1986. A soil moisture control system for greenhouse plant stress studies. Tree Planters' Notes 37:27-32.
Navarrete, N. E. 1993. Estudio del effect0 alelopatico del pasto (Festuca eliatior var. arundinaceae Schreb.) Wirnrn. en plantas micropropagadas de cenizo blanco (Fraxinus americana L.). In: M. A. Orellana Nufiez and J. A. Nuila de Mejia (eds.), Primer Congreso Nacional de Cultivo in vitro de Tejidos Vegetales, Universidad de El Salvador, pp. 25-3 1 .
Navarrete, N. E., J. W. Van Sarnbeek, J. E, Preece, and G. R. Gafkey. 1989. Improved micropropagation of white ash (Fraxinus americana L.). In: G. Rink and C. A. Budelsky (eds.), Proceedings of the Seventh Central Hardwood Conference, USDA Forest Service Gen. Tech. Rep. NC- 1 3 2, pp. 1 46- 1 49.
Preece, J. E., N. Navarrete, J. W. Van Sambeek, and G. R. GafTney. 199 1. An in vitro microplant bioassay using clonal white ash to test for tall fescue allelopathy. Plant Cell. Tissue and Organ Culture 27:203-210.
Rink, G. and F. H. Kung. 1991. Height and diameter variation in twelve white ash provenancelprogeny tests in eastern United States. In: L. H. McCormick and K. W. Gottschalk (eds.), Proceedings 8th Central Hardwood Forest Conference, USDA Forest Service Gen.Tech. Rep. NE- 148, pp. 179- 187.
Rink, G. and J. W. Van Sambeek. 1985. Variation among black walnut seedling families in resistance to competition and allelopathy. Plant and Soil 88:3- 10.
Rink, G. and J. W. Van Sambeek. 1987. Variation among four white ash families in.response to competition and allelopathy. For. Ecol. Manage. 1 8: 1 27- 1 34.
Roberds, J. H., J. 0. Hyun, G. Narnkoong, and G. Rink. 199 1. Analysis of height growth response function for white ash provenances. Silvae Genet. 39: 121-129.
Van Sambeek, J. W. 1989. Vegetation management in established stands. In: J. E. Phelps (ed.), The Continuing Quest for Quality, Walnut Council, pp. 1 14- 129.

Van Sambeek, J. W. and F. D. McBride. 1993. Grass control improves early growth of black walnut more than either deep ripping or irrigation. No. Nut Growers Assoc. Ann. Rep. 84 : 9- 1 9.
Van Sarnbeek, J. W. and G. Rink. 1990. Competitive and allelopathic components of grass sod interference on white oak seedling growth. In: J. W. Van Sambeek and M. M. Larson (eds.), Fourth workshop on seedling physiology and growth problems in oak plantings. USDA Forest Service Gen. Tech. Rep. NC- 1 3 9, p. 8.
Van Sarnbeek, J. W. and N. R. Walters. 1989. Hardwood research demonstration area walking trail guide. USDA Forest Service, North Central Forest Experiment Station Misc. Publ., 16 p.
Van Sambeek, J. W., R. C. Schlesinger, P. L. Roth, and I. Bocoum. 1989. Revitalizing slow-growth black walnut plantings. In: G. Rink and C.A. Budelsky (eds.), Proceedings of the Seventh Central Hardwood Conference, USDA Forest Service Gen. Tech. Rep. NC- 1 32, pp. 1 08- 1 1 4.

THE HOWLAND INTEGRATED FOREST STUDY (HIFS) - ECOSYSTEM RESEARCH ON ATMOSPHERIC
INFLUENCES GOVERNING FOREST FUNCTION
Ivan J. Femandez, Lindsey E. Rustad, Jeffrey A. Simmons, and James W. McLaughlinl
The Howland Integrated Forest Study (HIFS) was developed in a low elevation, commercial spruce-fir forest in east-central Maine, USA at approximately 60 m elevation on level topography. The site was established in the 1980's to evaluate the effects of atmospherically derived N and S on this important forest type through intensive studies of biogeochemical cycling. Since 1990 the program has developed a suite of studies designed to evaluate the influence of both the chemical and physical climate on Maine forests, including an ecosystem manipulation component. The current program includes (a) long-term intensive biogeochemical cycling measurements of major ecosystem pools and fluxes of elements, (b) a landscape-scale gradient study that examines the relationship between modern gradients in climate and ecosystem function, (c) an ecosystem manipulation that experimentally warms the forest floor to determine the effects of warming on critical soil processes, and (d) a modelling component to describe atmosphere-canopy interactions. Emphasis is on soil processes controlling carbon and nutrient cycling that include decomposition, nitrification, soil respiration, and fine root biomass production.
1 Department of Applied Ecology and Environmental Sciences, University of Maine, Orono, ME 04469-5722.

BIOGEOCHEMICAL CYCLING OF CARBON, NITROGEN, AND SULFUR AT THE HOWLAND
INTEGRATED FOREST STUDY SITE, HOWLAND, MAINE
James W. McLaughlin, Ivan J. Fernandez, Stewart M. Goltz, Lindsey E.Rustad, and Lany Zibilske'
Abstract: The biogeochemistry of C, N, and S was studied for six years at the Howland Integrated Forest Study (HIFS) site by measuring those constituents in major above- and below-ground pools and fluxes. Leaching losses of C fiom the solum were much less than CO, efflux, with a mean annual leaching rate of 3 1.2 kg ha-' yr-'. Carbon return to the forest floor via litterfall and outputs via CO, efflux were relatively equal. Mean annual total (wet+plus) atmospheric deposition inputs were 5.5 1 kg ha-' yr" for NO,--N, 2.64 kg ha-' yr-' for NH,'-N, and 8.09 kg ha-' yr-' for SO,"-S; wet deposition inputs for C were 6.67 kg ha-' yr". Sulfur-deposition, in the form of SO, dry deposition, and SO: in wet deposition showed significant decreasing temporal trends during the six year study period. There were no significant temporal trends for NO,' in neither dry nor wet deposition. Wet deposition of NH,', however, showed a significant decreasing pattern through the study period. Decreases in precipitation chemical flux was likely the result of decreases in precipitation volume through the study period because no significant decreases in concentration of SO,'- or NH,' occurred. There was a net ecosystem retention of NO,- and NH;, attributable to the N-deficiency of this forest. Mean annual input-output for Sod2-, however, was near zero for the study period, indicating the conservative behavior of that ion in this ecosystem. Ongoing research is attempting to further define the temporal trends in C, N, and S cycling, and to determine the mechanisms controlling these characteristics including the effects of temperature and moisture.
INTRODUCTION
We have witnessed at least two areas of concern regarding forest ecosystem structure and function during the past two decades; acidic deposition fiom the 1 970's through the 19801s, and global change from the mid 1980's through the present. While nitrogen (N) and sulfur (S) represent the clearest examples of an altered chemical climate to which forest ecosystems are now exposed, the past decade has also witnessed the emergence of widespread concern for the potential of global climate change to simultaneously alter the physical environment of forest ecosystems. Pastor and Post (1 988) discussed various models that predict 2" to 4°C increases in global temperatures, and how this change may shift forest distribution and character depending upon related ecosystem conditions, such as water balance and N availability. In Maine, this could result in a northward migration of the southern extent of the spruce- fir forest type. Numerous key soil processes may be influenced by climate change that include organic matter decomposition, N mineralization, and nitrification that have been discussed in the literature (Anderson 1 99 1 ; Van Cleve et al. 1990; McGuire et al. 1992; Rastetter et al. 199 1, 1992).
The Howland Integrated Forest Study (HIFS) has been developed to examine the influences of N and S deposition, and climatic variations, on biogeochemical cycling in a representative, low elevation, commercial coniferous forest ecosystem of northern New England. The program has focused on the role of soil processes in ecosystem function, but includes a wide range of ecological investigations within the practical limits of time and resources. The HIFS site originally served as the only low-elevation commercial spruce-fir forest site of the six sites in the Spruce-Fir Research Cooperative (SFRC) that was part of the national Forest Response Program (FRP) in the U.S. during the 1980's (Eager and Adarns 1992). The HIFS program was also a non-funded cooperating site in the Electric Power Research InstituteIOak Ridge National Laboratory (EPRIIORNL) Integrated Forest Study (IFS) during this period (Johnson and Lindberg 1 992), and part of the U. S. Environment a1 Protection Agency's Mountain
'Assistant Research Professor, Professor of Forest Soils, Research Associate Professor Emeritus of Climatology, Faculty Associate, and Associate Professor of Soil Microbiology, respectively, Department of Applied Ecology and Environmental Sciences, 5722 Deering Hall, University of Maine, Orono, ME 04469-5722.

Cloud Chemistry Program (MCCP) for the intensive measurement of the chemical and physical climate exposures to forests. Numerous investigators from various institutions have utilized HIFS as part of their research programs, including the National Oceanic and Atmospheric Administration (NOAA), the U.S. Geological Survey (USGS), the USDA Forest Service (USDA FS), and the US Environmental Protection Agency (US EPA), as well as other universities. The National Aeronautics and Space Administration's (NASA) FIFE, FED, and BOREAS field campaigns have also included the HIFS site. During the 1990's a number of new research initiatives were developed as part of the USDA Forest Service's Northern Global Change Research Program (NGCRP) that were built on the foundation of the HIFS program. The purpose of this paper is to present some of the highlights of the biogeochernistry of C, N, and S cycling at the HIFS site from January, 1988 through December, 1993.
MATERIALS AND METHODS
Study Site: The HIFS site is located in east-central Maine within International Paper's Northern Experimental Forest (Fig. 1). The site includes two, 0.2-ha biogeochemical study plots and a 27 m tower that extends above the canopy equipped with meteorological and air pollution monitoring instrumentation. Selected stand characteristics are given in Table 1.
1
Figure 1.
Sample Collection: Precipitation was sampled weekly from January, 1988 through December, 1993 with a single wet-only Aerochem ~ e t r i c @ collector located in a forest clearing approximately 2 km east of the study site, in accordance with National Atmospheric Deposition Program protocol (Bigelow and Dossett 1 988). Throughfall was sampled using two Aerochem ~ e t r i c " collectors weekly and cornposited monthly. Chemical fluxes for incident precipitation were estimated as the product of weekly volume-weighted concentrations and hydrologic flux. Chemical fluxes in throughfall were estimated as the product of monthly volume-weighted concentrations and hydrologic flux. Further description of the sampling protocols are given in Lawrence and Fernandez (1 99 1) and McLaughlin 4. (1 995).
Air concentrations for vapor-phase SO, and HNO,, and fine-particle SO:- and NO,', were measured continuously from January, 1 988 through December, 1993 on the meteorological tower 10 m above the forest canopy using filter packs consisting of three sequential filters (Teflon, nylon, and carbonate-treated cellulose) (Meyers et al. 199 1). Dry deposition fluxes were estimated as the product of air concentrations and deposition velocities (Vh. Deposition velocities for vapors were estimated using the big-leaf model of Hicks et al. (1 987) based on site-specific hourly meteorological measurements and canopy structure and physiological data. Deposition velocities for particles were

derived fiom site specific canopy structure data using the submicron radionuclide tracer methods of Bondietti et al. (1 984).
Table 1. Selected stand characteristics for the HIFS site.
Location Growing Season (days) Mean Annual Precipitation (rnm) Mean J a n u q Temperature ("C) Mean July Temperature ("C) Total Basal Area (m2) Overstory Vegetation (% basal area)
Red spruce White pine Hemlock
Soils
50 22 13 Aquic Haplorthods Aeric Haplaquods
Soil solution was collected beneath the Oa horizon and from the middle of the Bs horizon using zero-tension lysimetry fiom six lysimeter stations on each plot. At each sampling station, three lysimeters (23.3 x 12.5 cm-pans) drained into one collection bottle for each horizon. Samples were collected monthly from January, 1988 through December, 1993. Chemical fluxes in the Bs horizon solution were calculated by multiplying monthly solution concentrations by the mean monthly water flux. Monthly water flux was estimated using the Priestly-Taylor equation modified for interception losses (Shuttleworth and Calder 1 979; Spittlehouse 1 985). Further description of the sample design are given in Fernandez et al. (1 995).
Soil CO, efflux was measured every three weeks using the soda-lime technique (Edwards and Ross-Todd 1983) at three locations at each plot. Further description is given in Fernandez gt 4. (1 993b). Soil sampling was conducted during 1987 and 1988 using quantitative pits. Twelve 7 1 cm x 7 1 cm x 1 m pits were excavated in 1987 (six per plot) and 12 in 1988 (six per plot) for a total of 24 pits (Fernandez et al. 1993a).
Analytical Procedures: Solutions were analyzed for pH, SO:, NO;, NH,', and dissolved organic carbon (DOC). Prior to chemical analyses, solutions were passed through Whatman #42 filter paper. In addition, solutions for DOC analysis were passed through Whatman GFfF glass fiber filters. Sulfate and NO,- were measured using a Dionex Model 2000ilSP ion chromatograph. pH was measured potentiometrically using an Orion Model 70 1A pH meter. NH: was measured by automated colorimetric phenate (American Public Health association 1981) using a Bran- Lubbe Traacs Model 800 autoanalyzer, and DOC was measured by ultraviolet (UV)/persulfate oxidation with infrared detection of liberated CO, (EPA 1992) using an Oceanographic Instrument (01) Model 700 Total Organic Carbon Analyzer.
Soils were analyzed for total C and N using a Carlo-Erba CHN elemental analyzer, total S on a Leco Sulfur Determinator (SC 132), and phosphate-extractable ("adsorbed") SO? using ion chromatography.
Experimental Design and Statistical Analyses: The intent of this research is to provide an intensive case study of biogeochemical processes at the HIFS site, and to study the interactions of the soil-plant system with its chemical and physical climate. Temporal trends for the chemical constituents of precipitation, dry deposition, and throughfall were analyzed using the Mann-Kendall test for trend analysis (Gilbert 1987).

RESULTS AND DISCUSSION
Total C and N contents were greater in the mineral soil than the forest floor (Table 2), but the reverse was true for total S at the HIFS site. Total C, N, and S generally decreased with depth in the soil profile, with the exception of the albic horizon (E), whereas soil pH increased (Fig. 2). Adsorbed Sod2-, however, increased fiom the E to the Bs horizon, but then decreased in the BC and C horizons (Fig. 2). The vertical trends of total C, N, and S, are largely governed by organic matter (Fernandez gt A. 1993a). Comparing the quantitative pit method with that of standard morphological sampling suggests that the latter tends to underestimate total C (Fernandez g gJ. 1993a), which may have important implications in evaluating the sequestering of C in forest soils of the northeastern U.S. Every 1 percent change in the soil coarse fi-agment estimate at the HIFS site is equivalent to approximately 1 metric ton of C and 3 1 kg of N per ha. Litterfall C return to the forest floor was 1,300 kg ha-' yr-', and was about 40-fold higher than C returned via throughfall DOC.
Table 2. Soil carbon, nitrogen, and sulfiu contents at the HIFS site.
Constituent Forest Floor Mineral Soil
Total carbon Total nitrogen Total s u h Adsorbed sulfate
Fernandez et al. (1 993b) reported that CO, efflux from the forest floor at the HIFS was surprisingly similar to that for selected deciduous or harvested forest sites in Maine, being roughly 2000 kg CO, ha-' yr-'. Carbon efflux as CO, was much greater than that lost through leaching. Carbon output through CO, and DOC flux was slightly greater than the amount of C returned to the soil through litterfall and throughfall DOC. These differences, however, are likely not significant.
Dry deposition of SO,, NO,, and NH, was comparable to wet deposition, suggesting that a simple doubling of wet deposition is a reasonable estimate of total deposition to the forest canopy for these ionic species (Table 3). There was a significant @<0.05) decreasing trend for SO,-S flux, but no significant (p>0.05) pattern occurred for fme- particle SO:- (Fig. 3a). Decreasing SO, deposition suggests that local S-emissions are probably declining since it is likely that long-range transported SO, would be oxidized to SO, in transit. Mean annual dry deposition of NO,-N was 1.69 2 0.05 kg ha-' yf l with HNO, vapors accounting for over 99% of the flux. Neither HNO, or fine-particle NO,' dry deposition showed significant (p~0.05) temporal trends for the study period (Fig. 3a).
Table 3. Carbon, nitrogen, and sulfur fluxes for dry deposition, precipitation, throughfall, and soil solution in the Bs horizon at the HIFS site.
- - - -- --
Constituent Dry Deposition Wet Deposition Throughfall Net Canopy Bs Horizon Exchange Solution
.......................................... kg ha-' .................................... - ---- SO:--S 3.45 4.64 8.96 0.87 8.74 NO,'-N 2.70 2.81 0.52 -4.99 0.04 NHl-N 1.54 1.26 0.26 -2.52 0.4 1 DOC-C 6.67 103 99 31.16

HORIZON DEPTH (cm) 0
0 I
E 20
B 40
B/C 60
C 80
2.5 3.0 3.5 4.0 4.5 5.0 5.5
pH
HORIZON DEPTH (cm)
0 1 2 3 4 5 6
%
HORIZON DEPTH (cm) 0 - soluble
- - -+- adsorbed 20 I - - 1 . . I
I I , . I 40
I 1 I i
. - _ . - w- 60
C t-4 80
0 50 100 150 200 250 300
mg kg"
Figure 2. Vertical distribution of soil C, N, S, and pH at the HIFS site.

I -SO, -S 4- SO, -S * HNO, -N I
Flux (kg hi' )
-1 flux (kg ha )
1.4 I 1
Figure 3. Temporal trends in atmospheric deposition of N and S at HIFS: (a) Dry Deposition, @) Precipitation, (c) Throughfall. Data adapted from McLaughlin et al. ( 1 995).

Mean annual wet deposition of SO:--S, NO,-N, and N.I&+-N are shown in Table 3. Precipitation flux for SO," and NH,' showed significant ( ~ 4 . 0 5 ) decreasing trends, while NO; showed no significant (pN.05) temporal pattern (Fig. 3b). The decrease in flux for precipitation SO,", NH,+, and H+ was likely due to decreases in precipitation amount during the study period (Fig. 3b). McLaughlin et al. (1995) reported that there were no significant temporal patterns for precipitation SO: or Nf&' concentrations during the study period.
Sulfate and NH,' throughfall deposition decreased significantly (p<0.05) throughout the study period, while no significant trends occurred for NO,' (Fig. 3c). McLaughlin et al. (1995) also reported significant decreasing trends for throughfall concentrations of SO,", but not for NO,- nor NH,'. Therefore, the decreasing NH,' flux probably reflects decreasing throughfall amounts, whereas SO," decreases are likely the result of interactions between concentrations of those ions and throughfall amounts.
Mean annual net canopy exchange (NCE) for the study period indicated canopy uptake of N (Table 3) which is attributable to the Ndeficiency of the HlFS site as suggested by Fernandez g A. (1 990) based on foliar chemistry. Mean annual NCE of SO:, however, was near zero (Table 3) which is similar to other forest ecosystems in the United States.
Monomeric A1 was 0.38 and 0.32 mg L" in the Oa and Bs horizon solutions, respectively. Organic A1 was 0.30 and 0.16 mg L" in the Oa and Bs horizon solutions, respectively (Fernandez a A. 1995). Aluminum concentrations at the HTFS site are lower than that reported for other sites in the eastern U.S., and CatAl ratios do not suggest inhibition of Ca uptake by roots (Fernandez et al. 1995). -- There was a net ecosystem retention ofN at the HtFS site for the six-year study period (Fig. 4). Mean annual input-output for SO,", however, was near zero for the study period (Fig. 4), indicating the conservative behavior of SO,*' at HZFS (Lawrence and Fernandez 1991). The relatively high N-retention indicates efficient immobilization by vegetation and soil microflora. However, there were differences between the behavior of NO,- and NH,', although both ions showed net retention (Fig. 4). Total output ofNO,* was only 1 percent of the total atmospheric deposition, with approximately 90 percent retained within the forest canopy. Ninety percent of the NO,' that reached the forest floor as throughfall was also retained within the soil. In contrast to NO,, NH,,' had approximately a 1 S-fold higher flux from the Bs horizon as opposed to throughfall flux. However, the canopy retained about 90 percent of the total atmospheric NH; that was deposited to the canopy. The lack of a net retention of SO:- at HlFS is also a common occurrence in a number of forest ecosystems in the U.S. Outputs of SO: from the Bs horizon decreased temporally (Fernandez &. 1995), similarly as dry, wet, and throughfall fluxes reported in this study.
+ Throughfall -
Oa + Soll Solution -
Bs + Soll Solution -
ueq L -' Figure 4. Solution migration through the forest canopy and soil at the HIFS (Lawrence and Fernandez 1991).

SUMMARY
Carbon and N contents were greater in the mineral soil compared to the forest floor. Total C, N, and S decreased with depth, in relation to organic matter, where as adsorbed SO,'- increased with depth. Carbon return to the forest floor was greater for litterfall than that from throughfall DOC. Carbon dioxide represented the major C flux fiom the HIFS site.
There was a decline in S-loading, but not N-loading, to the HIFS site between 1988 and 1993. Declining S-loading was due to decreasing SO,, and may reflect trends in local SO, emissions for the state and region. Although little evidence of SO:- net ecosystem retention was found, biological immobilization in the canopy and soil removed most atmospherically deposited inorganic N. Only through long-term, intensive investigations of biogeochemical processes at the HIFS site is it possible to define mechanisms controlling temporal trends in atmospheric deposition and their effects on forest biogeochemistry.
ACKNOWLEDGMENTS
Funds for this study were provided by the U.S.D.A. Forest Service Northeastern Forest Experiment Station's Spruce- Fir Research Cooperative and Northern Global Change Research Program, and the University of Maine. The authors express their appreciation to the National Oceanic and Atmospheric Administration, Atmospheric Turbulence and Diffusion Laboratory for determination of the concentrations and fluxes from the filter packs. The authors also thank Karen Richards, John Lee, Cheryl Spencer, Amy Jones, Yowhan Son and Gregory Lawrence for their contributions to various aspects of the project.
LITERATURE CITED
Anderson, J.M. 199 1. The effects of climate change on decomposition processes in grassland and coniferous forests. Ecol. Applic. 1 :326-347.
Bigelow, D.S. and S.R. Dossett. 1988. Instruction manual. NADPMTN Site Operation. National Atmospheric Deposition Program. Natural Resources Ecology Laboratory, Colorado State University, Fort Collins, CO.
Bondietti, E.A., P.O. Hoffman, and I.L. Larson. 1984. Air-to-vegetation transfer rates of natural submicron aerosols. J. Environ. Radioact. 1 5-27
Edwards, N.T. and B.M. Ross-Todd. 1983. Soil carbon dynamics in a mixed deciduous forest following clear- cutting with and without residual removal. Soil Sci. Soc. Am. J. 47: 10 14- 102 1.
Eager, C. and M.B. Adams (eds.). 1992. Ecology and decline of red spruce in the eastern United States. Springer- Verlag, NY. Fernandez, I.J., G.B. Lawrence, and K.J. Richards. 1990. Characteristics of foliar chemistry in commercial spruce-fir stand of northern New England, USA. Plant Soil 125:288-292
Fernandez, I.J., G.B. Lawrence, and Y. Son. 1995. Soil-solution in a low-elevation spruce-fir ecosystem, Howland, Maine. Water, Air, Soil Pollut. In Press.
Fernandez, I.J., L.E. Rustad, and G.B. Lawrence. 1993a. Estimating total soil mass, nutrient content, and trace metals in soils under a low elevation spl-uce-fir forest. Can. J. Soil Sci. 73:3 17-328.
Fernandez, I.J., Y. Son, C.E. Kraske, L.E. Rustad, and M.B. David. 1993. Soil carbon dioxide characteristics under different forest types and after harvest. Soil Sci. Soc. Am. J. 57: 1 1 15-1 121.

Gilbert, R.O. 1987. Statistical methods for environmental pollution monitoring. van Nostrand Reinhold, New York, NY.
Goltz, S.M. 1989. Dry deposition, Chapter 5. In. Mountain Cloud Chemistry Proiect: Wet. Drv. and Cloud Water Deposition. Report to U.S. Environmental Protection Agency, AREAL, Research Triangle Park, NC. 77pp. Contract No. CR 813934-01-2.
Hicks, B.B., D.D. Baldocchi, T.P. Meyers, R.P. Hosker, and D.R. Matt. 1987. A preliminary multiple resistant routine for deriving deposition velocities from measured quantities. Water, Air, Soil Pollut. 36:3 1 1-330.
Lawrence, G.B. and I. J. Fernandez. 199 1. Biogeochemical interactions between acidic deposition and a low- elevation spruce-fir stand in Howland, Maine. Can. J. For. Res. 2 1 367-875.
McGuire, A.D., J.M. Mellilo, L.A. Joyce, D. W. Kicklighter, A.L. Grace, B. Moore 111, and C. J. Vorosmarty. 1992. Interactions between carbon and nitrogen dynamics in estimating net primary productivity for vegetation in North America. Global Biogeochem. Cycles 6: 10 1 - 1 34.
McLaughlin, J.W., I.J. Femandez, and K.J. Richards. 1995. Atmospheric deposition in a low-elevation spruce-fir forest Maine, USA. J. Environ. Qual. In Review.
Meyers, T.P., B.B. Hicks, R.P. Hosker, J.D. Womack, and L.C. Satterfield. 199 1. Dry deposition inferential measurement techniques-11. Seasonal and annual deposition rates of sulfur and nitrate. Atmos. Environ. 25A:236 1-2370
Pastor, J. and W.M. Post. 1 988. Response of northern forests to C0,-induced climate change. Nature 334: 55-58.
Rastetter, E.B., M.G. Ryan, G.R. Shaver, J.M. Mellilo, K.J. Nadelhoffer, J.E. Hobbie, and J.D. Aber. 1991. A general biogeochemical model describing the response of the C and N cycle in terrestrial ecosystems to changes in CO,, climate, and N deposition. Tree Physiol. 9: 10 1 - 126.
Shuttleworth, W.J. and I.R. Calder. 1979. Has the Priestly-Taylor equation any relevance to forest evaporation? J. Appl. Meteorol. 18:639-646.
Spittlehouse, D.L. 1985. Determination of the year-to-year variation in growing season water use of a Douglas fir stand. In. The Forest-Atmosphere Interaction. Ed., B.A. Hutchinson and B.B. Hicks. D. Reidel Publ. Co., Dordrecht, The Netherlands. 23 5-254 pp.
Van Cleve, K., W.C. Oecheland, and J.L. Hom. 1990. Response of black spruce (Picea mariana) ecosystems to soil temperature modification in interior Alaska. Can. J. For. Res. 20: 1530-1 535.

ELEMENTAL CYCLING RESPONSE OF AN ADIRONDACK SUBALPINE SPRUCE-FIR FOREST TO
ATMOSPHERIC AND ENVIRONMENTAL CHANGE
Andrew J. Friedland and Eric K. Miller1
Abstract: Patterns and trends in forest elemental cycling can become more apparent in the presence of atmospheric perturbations. High-elevation forests of the northeastem United States have received large amounts of atmospheric deposition of pollutants, which have altered natural elemental cycling and retention rates in a variety of ways. This study examined atmospheric deposition of nitrogen, sulfur and base cations, and their interactions in a high-elevation forest on Whiteface Mountain, New York. Eight years of elemental cycling data (1 986- 1993) have shown that at our main study site (1 050-m elevation), atmospheric deposition of N was approximately 16.7 kg N ha-' y f l , with 32 percent contributed by cloud water. Atmospheric deposition of S was 16.3 kg S ha-' yr-', with 37 percent contributed by cloud water. Total atmospheric inputs of nitrogen and sulfur to the forest canopy increased by a factor of four and five, respectively, over the elevational range of 600 to 1275 my largely due to the increased importance of cloud water deposition at high elevations. At 1050-m elevation, analyses of total ecosystem inventories and cycling revealed that nitrogen and potassium are conserved or retained in the ecosystem while sulfur, calcium and magnesium show losses in a relatively undisturbed spruce-fir-birch ecosystem.
INTRODUCTION
High elevation forests in the northeastern USA currently receive higher pollutant deposition inputs than most other locations in the country (Lovett 1994). Deposition rates were much lower earlier in this century, increased in the 1950s through 1980s, and have begun to decrease over the last ten years or so, depending on the element (NAS, 1986; Hedin et al. 1994; Miller and Friedland 1994). Atmospheric deposition has been shown and has been hypothesized to cause a variety of direct and indirect effects on forested ecosystems (Taylor et al. 1994). Given that elemental deposition rates will continue to change over the coming decades (EPA 1999, it is important to understand the role of atmospheric deposition in elemental cycling in forested ecosystems. A high-elevation site in the Adirondacks is an ideal location to study these projected changes and the potential effects of such changes because these types of sites: (1) receive relatively large pollutant inputs (Miller et al. 1993b); (2) already show some signs of assimilating atmospheric pollutants (Friedland et al. 1 99 1 ; McNulty et al. 1 99 1); and (3) have undergone significant red spruce decline, partly as a result of air pollution (Eagar and Adarns 1992) which has changed the composition of the forest (Scott et al. 1984; Friedland 1989; Battles et al. 1992).
In order to ascertain the effects of atmospheric deposition of pollutants on a high-elevation forested ecosystem, we have established atmospheric deposition and nutrient cycling monitoring plots on Whiteface Mountain, New York. These include two towers for atmospheric measurements, four 0.1 hectare permanent plots and two adjacent monitoring plots where litterfall, throughfall and soil water collectors have been installed. This project is the core effort of a series of projects funded by the USDA Forest Service Northern Global Change Research Program, NSF and the Andrew W. Mellon Foundation. As such, a primary objective of this project has been to provide a comprehensive evaluation of atmospheric deposition and nutrient cycling in high-elevation forests that can serve as a foundation for other process-level research, including branch and tree fertilizations.
'Associate Professor and Research Assistant Professor, respectively, Environmental Studies Program, Dartmouth College, 61 82 Steele Hall, Hanover, New Hampshire 03755.

RESULTS AND DISCUSSION
Ecosystem Mass Balance
An eight-year average of wet (a combination of rain, snow and cloud water) and dry input delivered to the forest illustrates that input is dominated by hydrogen ion, ammonium, nitrate and sulfate (Fig. 1). This is similar to deposition in many forests in the Northeast, but total deposition amounts are higher here because the site is at a higher elevation and is immersed in clouds as much as 10 percent of the year (Miller et al. 1993~). No element shows constant input and output during the eight years of measurements (Fig. 1). Calcium and magnesium inputs are fairly constant during the eight years of our study, although there is a long-term trend of decreasing calcium inputs in the Northeast (Hedin et al. 1 994). Hydrogen ion and ammonium outputs are nearly const ant during the study, and ammonium outputs are virtually zero. Nitrate output varies from year to year but is definitely greater than zero. High ammonium output is thought to be one indication of the later stages of excess nitrogen storage in an ecosystem, also called nitrogen saturation (Aber et al. 1989). Apparently, this site is not in the later stages of nitrogen saturation. But the continual loss of nitrate suggests that the site might be in early stages of nitrogen saturation (Aber et al. 1989). Hedin et al. (1 995) suggest that the loss of nitrate is an indicator of a polluted system.
Elements can be grouped into three categories based on their behavior: (1) sulfate and potassium outputs appear to be sensitive to inputs of sulfate and potassium, respectively; (2) hydrogen, ammonium and nitrate outputs appear to be insensitive to inputs of these same ions; and (3) the outputs of calcium and sulfate appear to be linked to one another (Fig. 1). These patterns suggest that the outputs of sulfate and potassium are in part regulated by inputs of those ions and of hydrogen ion. Both calcium and sulfate outputs are greatest in the 1989 water year, when water deposition is approximately 60 percent greater than any other year of the study and hydrogen ion input is greatest. Apparently, leaching of calcium and sulfate pools is at least partially dependent on water flow. This pattern of increased leaching with increased water flow is seen for nitrate but not sulfate in streams in the Catskills in 1989 (Murdoch and Stoddard 1992), and suggests there is a relatively labile pool of exchangeable sulfate and calcium (e.g. Johnson et al. 1991). Outputs of ammonium and nitrate are apparently insensitive to the size of the input presumably because they are in relatively high biological demand. However, nitrate output was high in at least one year, 1987 (Fig. lB), and is significantly higher during the non growing season (data not shown), suggesting that plants are using most of the nitrogen available during the growing season but that atmospheric deposition provides excess nitrate to the system at other times of the year.
In a previous study (Johnson et al. 1994), we presented hydrogen ion and calcium budgets for this forest and suggested that current calcium loss rates are higher than historical loss rates. However, the same article suggests that hydrogen ion accumulation will be offset by mineral soil weathering (which consumes hydrogen ion). The only pool that is questionable in terns of sustainability is the forest floor calcium pool.
In Miller et al. (1 993a), we show that as much as 60 percent of the forest floor calcium pool is derived from atmospheric calcium. Given that calcium outputs appear to be influenced by inputs of hydrogen and outputs of sulfate (Fig. lA,E,G), and since calcium deposition to the northeast has been decreasing (Hedin et al. 1994), it is reasonable to be concerned about calcium limitations in the future. This situation could be exacerbated by increased nitrogen deposition, which may occur; and it could be partially ameliorated by reductions in sulfur deposition. The effect of increased temperature is much more difficult to predict. Thus, the specific nature of the environmental change over the next few decades will be critical in determining the future health of high elevation spruce-fir-birch forests.
Atmospheric Deposition
Inputs of elements such as sulhr and nitrogen increase by a factor of four and five, respectively, over the elevational range of 600 to 1275 m (Fig. 2; for nitrogen, data not shown). Steep gradients in wind speed and cloud immersions contribute to a nearly exponential increase in ion deposition by cloud water interception. Deposition rates are for simulations based on wind speeds representative of topographically sheltered inter-montane areas below 1000-m elevation (Miller et al. 1993b). Atmospheric inputs can valy significantly from year to year (Fig. 1) in forests subject to significant cloud water deposition; therefore, atmospheric influences on the nutrient cycling can be dynamic as well as chronic.

lnput
& J Output
lnput
output A Fig. 1. Yearly mean inputs (precipitation + cloud water + dly deposition) and outputs (Bw horizon soil water) from 1025-m elevation on Whiteface Mountain, New York between 1986 and 1993. A given year (i.e., 1986) represents Water Year 1986 (June 1, 1986-May 3 1, 1 987). Source: A. J. Friedland and E.K. Miller, unpublished data.
- 1 a u s i t i o n
120 H Cloud Water
Elevation (meters)
Fig. 2. Model estimates of the total annual deposition of sulfur to the forest canopy on Whiteface Mt., NY. Deposition rates are for model simulations based on wind speeds representative of topogt-aphically sheltered inter- montane areas below 1000 m. Estimates of deposition rates to low elevation forests on more exposed mountain slopes and in the low elevation terrain surrounding the high peak region are indicated by the open bars. Source: Miller et al. 1993b.

LITERATURE CITED
Aber, J.D., K.J. Nadelhoffer, P. Steudler, and J.M. Melillo. 1989. Nitrogen saturation in northern forest ecosystems. Bioscience 39:378-386.
Battles, J.J., A.H. Johnson, T.G. Siccama, A.J. Friedland, and E.K. Miller. 1992. Red spruce death: Effects on forest composition and structure on Whiteface Mountain, NY. Bull. Torrey Bot. Club 1 19:4 18-430.
Eagar, C., and M.B. Adams. 1992. Ecology and decline of red spruce in the eastern United States. Springer-Verlag, New York, 417 pgs.
Environmental Protection Agency. 1995. Acid deposition standard feasibility study. Report to Congress. EPA 430-R-95-00 1 (February), Washington, DC.
Friedland, A.J. 1989. Recent changes in the montane spruce-fir forests of the northeastern United States. Environ. Mon. Assess. 12:237-244.
Friedland, A.J., E.K. Miller, J.J. Battles and J.T. Thorne. 199 1 . Nitrogen deposition, distribution and cycling in a subalpine spruce-fir forest, Adirondacks, New York, USA. Biogeochemistry 14:3 1-55.
Friedland, A.J., B. W. Craig, E.K. Miller, G.T. Herrick, T.G. Siccama and A.H. Johnson. 1992. Decreasing lead levels in the forest floor of the northeastern USA. Ambio 2 1 :400-403.
Friedland, A.J., E.K. Miller, and R.L. Boyce. 1993. A discussion of "Element distribution in red spruce (Picea rubens) fine roots; evidence for aluminum toxicity at Whiteface Mountain" by Schlegel, Amundson and Hiltternan. Can. J. For. Res. 23:1732-1733.
Hedin, L., L. Granat, G.E. Likens, T.A. Buishand, J.M. Galloway, T.J. Butler, and H. Rodhe. 1994. Steep declines in atmospheric base cations in regions of Europe and North America. Nature 367:35 1-354.
Hedin, L.O., J.J. Armesto, and A.H. Johnson. 1995. Patterns of nutrients lost from unpolluted, old-growth temperate forests: Evaluation of biogeochemical theory. Ecology 76:493-509.
Johnson, A.H., A.J. Friedland, E.K. Miller and T.G. Siccama. 1994. Acid rain and soils of the Adirondacks, 111: Rates of soil acidification in a montane spruce-fir forest at Whiteface Mountain, NY. Can. J. For. Res. 24:663-669.
Johnson D.W., H. Van Miegroet, S.E. Lindberg, D.E. Todd, and R.B. Harrison. 199 1 . Nutrient cycling in red spruce forests of the Great Smoky Mountains. Can. J. For. Res. 2 1 :769-787.
Lovett, G.M. 1994. Atmospheric deposition of nutrients and pollutants in North America: An ecological perspective. Ecol. Appl. 4:629-650.
McNulty, S.G., J.D. Aber, and R.D. Boone. 199 1. Forest floor and foliar chemistry changes in spruce-fir forests across New England. Biogeochemistry 14: 13-29.
Miller, E.K, J.D. Blurn and A. J. Friedland. 1993a. Dete~mination of soil exchangeable-cation loss and weathering rates using strontium isotopes. Nature 362:438-44 1.
Miller, E.K., A.J. Friedland, E.A. Arons, V.A. Mohnen, J. J. Battles, J.A. Panek, J. Kadlecek and A.H. Johnson. 1993b. Atmospheric deposition to forests along an elevational gradient at Whiteface Mountain, NY, USA. Atmos. Environ. 27A:2 12 1-2 136.

Miller, E.K, J.A. Panek, A.J. Friedland, J. A. Kadlecek and V.A. Mohnen. 1993c. Atmospheric deposition to a high-elevation forest at Whiteface Mountain, NY. Tellus 45B:209-227.
Miller, E.K. and A.J. Friedland. 1994. Lead migration in forest soils: Response to changing atmospheric inputs. Environ. Sci. Technol. 28:662-669.
Murdoch, P.S., and J.L. Stoddard. 1992. The role of nitrate in the acidification of streams in the Catskill Mountains of New York. Water Resources Res. 28:2707-2720.
National Academy of Sciences. 1986. Acid deposition. Long-term trends. National Academy Press, Washington. 506 pgs.
Scott, J.T., T.G. Siccama, A.H. Johnson, and A.R. Breisch. 1984. Decline of red spruce in the Adirondacks, New York. Bull. Torrey Bot. Club 1 1 1 :438-444.
Taylor, G.E., Jr., D. W. Johnson, and C.P. Andersen. 1 994. Air pollution and forest ecosystems: A regional to global perspective. Ecol. Appl. 4:662-689.

DJ'l33WAL UPTAKE AND ASSIMILATION OF GASEOUS NITRIC ACID BY WESTERN FOREST TREE
SPECIES
John L. Homl, Marek Krywult2, Andlzej ~ ~ t n e r o w i c z ~ , and Kevin E. Pearcy4
A nitric acid gas analysis system was designed, tested, and calibrated to measure nitric acid deposition to forest tree species. Two modified Monitor Labs 8440 NO, NO,, NO, analyzers were used in parallel to measure the nitric acid deposited onto leaf surfaces of ponderosa pine (Pinus ponderosa) and California black oak (Quercus kelloggii) seedlings. Measurements were made during 24 hr exposures in which plants were kept in dark, temperature controlled growth chambers. The broadleaf oaks had much higher rates of deposition than pines on a leaf area basis: 4.7 nrnoles HNO, mJ s-' for oaks, and 0.6 nrnoles HNO, m-2 s-' for pines. There was good agreement in HNO, deposition calculated fiom the nitric acid gas analysis system and that measured by nitrate analysis of leaf washings.
Alternate light with dark period experiments (48 hr fumigation) showed that nitric acid deposition was about 2X greater than fumigation under darkness calculated by gas analysis and 15N labeling methods. Nitrate reductase activity was used as an indicator of internal uptake and assimilation of HNO, into the leaf foliage. The enzyme activity increased in the alternate lightldark fumigated plants 1 OX greater than the unfumigated control. Preliminary experiments on the epicuticular waxes showed increases in the proportion of free fatty acids and alkyl esters, while estolide fractions decreased. These results indicate that nitric acid vapor may decrease the cuticular resistence to the nitric acid uptake into the leaf.
This HN03 analysis system is a significant advancement into nitric acid research and has the potential to measure the physiological response of plants to nitric acid exposures.
'USDA Forest Service, Northeastern Forest Experiment Station, Radnor, PA 19087-8775.
'Institute of Botany, Polish Academy of Sciences, Krakow, Poland.
WSDA Forest Service, Pacific Southwest Research Station, Riverside, CA.
'Canadian Forest Service, Maritimes Region, Fredericton, New Bi-unswick, Canada.
82

CLIMATIC AND POLLUTION INFLUENCES ON ECOSYSTEM PROCESSES IN NORTHERN HARDWOOD
FORESTS
Kurt S. Pregitzer', David D. Reed1, Glenn D. Mrozl, Andrew J. Burton1, John A. ~ i t t e ? , and Donald A. Zak2
The Michigan gradient study was established in 1987 to examine the effects of climate and atmospheric deposition on forest productivity and ecosystem processes in the Great Lakes region. Four intensively-monitored northern hardwood study sites are located along a climatic and pollutant gradient extending from southern lower Michigan to northwestern upper Michigan. The project continues today, with the following overall objectives: (1) to continue measuring key ecosystem variables at four sites; (2) to understand how carbon allocation, nutrient cycling, and forest productivity respond to differing levels of temperature, moisture availability, and atmospheric deposition; and (3) to quantify sources of temporal and spatial variability in ecosystem processes for use in regional modeling efforts. Additional research designed to investigate the effects of soil temperature and N availability on belowground processes was initiated at the sites in 1993. Objectives of this research are: (1) to quantifL relationships between soil temperature and fine root longevity, and root system construction and maintenance costs; (2) to determine how soil nitrogen supply affects fine root construction and maintenance costs, and lifespan; (3) to understand the effects of soil temperature and nitrogen availability on soil respiration; and (4) to quantlfL the contributions of root and microbial respiration to respiratory flux from the soil.
GENERAL APPROACH
The four study sites extend across a 600 krn climate/pollutant gradient in Michigan (Figure 1). All sites are 80 year old second-growth northern hardwood stands dominated by sugar maple (Acer sacchatunl Marsh.). Mean annual temperature increases from 4.2OC at Site 1 to 7.6OC at Site 4. Total annual wet plus d ~ y deposition of NO,-N increases from 4 kg ha-' to 8 kg ha" between Sites 1 and 4 (MacDonald et al. 1992), with similar gradients existing for SO, and H". At each site, three 30 m by 30 m study plots were established in 1987.
kilometers
Figure 1. Study site locations.
'School of Forestry & Wood Products, Michigan Technological University, Houghton, MI 4993 1.
'School of Natural Resources & Environment, University of Michigan, Ann Arbor, MI 48 109.
83

The influence of climate on ecosystem processes is being assessed by determining the effects of yearly variation in precipitation and temperature within sites. As length of record becomes sufficient, individual sites are compared to determine if they respond in the same way to climatic variation. The impact of pollutant deposition along the gradient is addressed by comparing rates of ecosystem processes at sites receiving historically different levels of pollutants. Our long-term records of key variables along the climatic/pollutant gradient give us a unique opportunity to study ecosystem processes under real-world environmental stress in an area that is predicted to be greatly affected should global change occur.
Our long-term data base includes the following parameters: forest productivity (basal area growth, height growth, biomass increment, individual tree vigor and mortality), wet deposition, soil solution chemistry, soil and air temperature, soil moisture availability, above and below-ground litter inputs, seed production, leaf and fine root nutrient contents, leaf area index, canopy transmittance, insect defoliation, and soil chemical and physical properties. Variables are measured on different time steps ranging from hourly measurements of soil temperature to annual measurements of tree diameter growth. Some measurements have been continuously recorded since 1987. In many instances, six to eight years of data exist. Measurements of soil and root respiration, soil gas fluxes, leaf and root nitrate reductase activity, microbial biomass, N mineralization, nitrification, and fine root turnover were initiated in the fall of 1993.
PROJECT STATUS
When we began our study, many believed that the substitution of space for time would be confounded by geographic differences in climate and soil, and temporal variation in variables such as leaf area and N flux in litterfall. Measurements along the gradient of insect defoliation, stand leaf area, foliar litter production, net primary productivity, production of flowers and seeds, and nutrient flux since 1987 have, in fact, demonstrated significant year-to-year variability within and among sites (Burton et al. 199 1 a; Pregitzer and Burton 199 1 ; Pregitzer et al. 1992; Burton et al. 1993; Reed et al. 1994~). Fluxes of reproductive litter and foliar litter were negatively correlated at the stand level, suggesting a direct tradeoff between production of leaf biomass and reproductive biomass (Pregitzer and Burton 1991). Bumper sugar maple seed crops and insect defoliation had large impacts on nutrient cycling, (Pregitzer and Burton 1 99 1, Burton et al. 1 993). But in spite of such spatial and temporal variation, there was clear evidence that pollutant deposition had altered vegetation and soil processes along the gradient. MacDonald et al. (1 992, 1994) documented a direct relationship between soil solution sod2- concentration and flux and SO:- deposition. Leaching losses of Ca2+ and Mg2+ exceeded inputs for all sites along the gradient. Elevated losses of Ca2' and preferential leaching of Mg2+ from high deposition sites with coarse textured soils suggest that depletion of cation reserves at poorly buffered sites remain a likely consequence of pollutant deposition. Liechty et al. (1 993) measured increased foliar leaching of Ca and Mg at sites receiving higher H+ deposition, and foliar concentrations of S and A1 were positively correlated with increasing Sod2- deposition along the gradient (Pregitzer and Burton 1992, Burton et al. 1993).
Several effects of climatic conditions on ecosystem processes have been demonstrated at the sites. Lane et al. (1 993) studied sugar maple diameter growth over the past fifty years at the sites and showed that productivity was affected by temperature to some degree at all sites, with precipitation increasing in importance at the southern sites. Climatic conditions in the prior growing season affected current season sugar maple growth. Reed et al. (1 994c) showed that growth efficiency measures may differ by an order of magnitude in successive years on a site due to natural factors affecting the accumulation of woody biomass. Production dynamics of the northern hardwood forests studied were driven by complex interactions among climatic factors affecting energy storage, insect defoliation, and seed crop production. Year-to-year changes in crown condition largely reflected the gradual decline and mortality of suppressed and intermediate trees, apparently the result of severe drought in 1988 in combination with other stress factors such as defoliation.
Contents of many nutrients in midsummer foliage and litterfall increased from north to south, largely as a consequence of higher foliar biomass production and litter fall at the more southern sites (Pregitzer et al. 1992, Burton et al. 1993). This increase in foliar biomass may be a consequence of increasing temperature and length of

growing season, but also is consistent with the hypothesized effects of chronic N deposition at the southern, higher deposition sites (Pregitzer et al. 1992).
Studies of fine root dynamics were performed at two sites and have shown that fine roots (< 2 mm) dominate total biomass and N litter inputs to soil, accounting for over 55 percent of total biomass and nearly 50 percent of total N returns (Hendrick and Pregitzer 1993a). Rates of fine root turnover were different for the two sites, and it appears that rates of fine root "turnover" (longevity) may be related to soil temperature (Hendrick and Pregitzer, 1993b), a possibility that has not been considered in current models of the effects of global warming on forest ecosystems.
Soils fiom the sites were incubated for 32 weeks over a range of temperatures to quantify the effects of temperature on kinetics of microbial respiration and mineralization of N and S (MacDonald et al. 1995). Microbial respiration and the net mineralization of N and S increased with temperature at all sites. Rate constants estimated for each site and temperature fiom these models were not consistently related to temperature. In contrast, estimates of labile C and N pools were strongly temperature dependent. These results suggest the commonly accepted assumptions of constant pool sizes and temperature-dependent rate constants may not be tenable (MacDonald et al. 1995), leading to possible errors in predictions of soil C storage and N availability in response to global warming.
We continue to examine the interacting effects of climate, defoliation, pollutant deposition and seed production on forest productivity and health, fine root dynamics, microbial dynamics, soil solution chemistry, foliar nutrient status, and leaf area. We are now entering a stage where sufficient years of record exist to allow us to assess the relative .
impacts of these multiple stressing factors on ecosystem processes in northern hardwoods, an important biome type, widely distributed in North America.
MICHIGAN GRADIENT PUBLICATIONS
Liechty, H.O., E. Kuuseoks, and G.D. Mroz. 1995. Dissolved organic carbon in northern hardwood stands with differing acidic inputs and temperature regimes. J. Environ. Qual. (In press).
MacDonald, N.W., D.R. Zak, and K.S. Pregitzer. 1995. Temperature and the kinetics of microbial respiration and the mineralization of N and S. Soil Sci. Soc. Am. J. 59:233-240.
McLaughlin, J. W., S.T. Bagley, D.D. Reed, M.F. Jurgensen, and G.D. Mroz. Relationships between sugar concentrations in roots and ecosystem stress for first-year sugar maple seedlings. Water, Air, and Soil Pollution (In press).
Jones, E.A., D.D. Reed, and P.V. Desanker. 1994. Ecological implications of projected climate change scenarios in forest ecosystems of central North America. Agric. For. Meteor. 72:3 1-46.
MacDonald, N.W., A.J. Burton, J.A. Witter, and D.D. Richter. 1994. Sulfate adsorption in forest soils of the Great Lakes region. Soil Sci. Soc. Am. J. 58: 1546- 1555.
McLaughlin, J.W., D.D. Reed, S.T. Bagley, M.F. Jurgensen, and G.D. Mroz. 1994. Foliar amino acid accumulation as an indicator of ecosystem stress for first-year sugar maple seedlings. J. Environ. Qual. 23: 154- 16 1.
Reed, D.D., E.A. Jones, and P.V. Desanker. 1994a. Potential impacts of projected climate change scenarios on individual tree species in central North America. p. 9 10-9 1 9 111 Proceedings of the 1 3th International Congress of Biometeorology, Part 2, Volume I (A.R. Maarouf, N.N. Barthakur, and W.U. Haufe, eds.). Calgary, Alberta.

Reed, D.D., G.D. Mroz, H.O. Liechty, K.S. Pregitzer, A.J. Burton, D.R. Zak, J.A. Witter, and N. W. MacDonald. 1994b. Studying the effects of air pollution on forests along exposure gradients: experiences in the United States and opportunities for cooperation. p. 1 09- 1 1 5 In Proceedings of the Conference on Climate and Atmospheric Deposition Studies in Forests (J. Solon, E. Roo-Zielinska, and A. Byternowicz, eds.). Nieborow, Poland, October 6-9, 1992. Polish Academy of Sciences.
Reed, D.D., K.S. Pregitzer, H.O. Liechty, A.J. Burton, and G.D. Mroz. 1994c. Productivity and growth efficiency in sugar maple forests. For. Ecol. and Manage. 70:3 1 9-327.
Burton, A.J., K.S. Pregitzer, and N.W. MacDonald. 1993. Foliar nutrient status and cycling in northern hardwoods along an acidic deposition gradient. Soil Sci. Soc. Am. J. 57: 16 1 9- 1628.
Hendrick, R.L. and K.S. Pregitzer. 1993a. The dynamics of fine root length, biomass and nitrogen content in two northern hardwood ecosystems. Can. J. For. Res. 23:2507-2520.
Hmdrick, R.L. and K.S. Pregitzer. 1993b. Patterns of fine root mortality in two sugar maple forests. Nature 361:59-61.
Jones, E.A., D.D. Reed, G.D. Mroz, H.O. Liechty, and P.J. Cattelino. 1993. Climate stress as a precursor to forest decline: paper birch in northern Michigan, 1 986- 1 990. Can. J. For. Res. 23 :229-23 3.
Lane, C.J., D.D. Reed, G.D. Mroz, and H.O. Liechty. 1993. Width of sugar maple (Acer saccharum, Marsh.) tree rings as affected by climate. Can. J. For. Res. 23 :2370-2375.
Liechty, H.O., G.D. Mroz, and D.D. Reed. 1993. Cation and anion fluxes in northern hardwood throughfall along an acidic deposition gradient. Can. J. For. Res. 23:457-467.
MacDonald, N.W., J.A. Witter, A.J. Burton, K.S. Pregitzer, and D.D. Richter. 1993. Relationships among atmospheric deposition throughfall, and soil properties in oak forest ecosystems. Can. J. For. Res. 23:2348- 2357.
Hendrick, R.L. and K.S. Pregitzer. 1992a The demography of fine roots in a noi-thein hardwood forest. Ecology 7311094-1 104.
Hendrick, R.L. and K.S. Pregitzer. 1992b. Spatial variation in tree root distribution and growth associated with minirhizotrons. Plant and Soil 143:283-288.
MacDonald, N. W., A. J. Burton, H.O. Liechty, J.A. Witter, K. S. Pregitzer, G.D. Mroz and D.D. Richter. 1992. Ion leaching in forest ecosystems along a Great Lakes air pollution gradient. J. Environ. Qual. 2 1 :614-623.
Pregitzer, K.S., A.J. Burton, G.D. Mroz, H.O. Liechty and N. W. MacDonald. 1992. Foliar sulhr and nitrogen along an 800-km pollution gradient. Can. J. For. Res. 22: 176 1 - 1769.
Randlett, D.L., D.R. Zak, and N. W. MacDonald. 1992. Sulfate adsorption and microbial immobilization in northern hardwood forests along an atmospheric deposition gradient. Can. J. For. Res. 22: 1843- 1850.

Burton, A.J., K.S. Pregitzer and D.D. Reed. 1991 a. Leaf area and foliar biomass relationships in northern hardwood forests located along an 800 krn acid deposition gradient. For. Sci. 37: 104 1 - 1059.
Burton, A.J., C. W. Ramm, K.S. Pregitzer, and D.D. Reed. 1991 b. Use of multivariate methods in forest research site selection. Can. J. For. Res. 2 1 : 1573- 1580.
Karnosky, D.F., Z.E. Gagnon, D.D. Reed, and J.A. Witter. 1991. Effects of genotype on the response of Populus tremuloides Michx. to ozone and nitrogen deposition. Water Air Soil Poll.
Liechty, H.O. and G.D. Mroz. 1991. Effects of collection interval on quality of throughfall samples in two northern hardwood stands. J. Environ. Qual. 20:588-590.
MacDonald, N.W., A.J. Burton, M.F. Jurgensen, J. W. McLaughlin and G.D. Mroz. 1991. Variation in forest soil properties along a Great Lakes air pollution gradient. Soil Sci. Soc. Am. J. 55: 1709- 17 15.
Medlarz, S., D. Reed, and R. Noble. 1991. Criteria for atmospheric deposition gradient studies in the USSR. Tallinn Botanical Garden. Tallinn, Estonia, USSR. Unnumbered publication.
Pregitzer, K.S. and A.J. Burton. 1991. Sugar maple seed production and nitrogen in litterfall. Can. J. For. Res. 21 :1148-1153.
Reed, D. 199 1. Effects of air pollution on forest ecosystems. p. 107- 1 10 In Soc. Am. Foresters Proc., Washington, D.C. (July 29 - Aug. 1, 1990).
Reed, D., S. Medlarz, and R. Noble. 1991. Investigations of the effects of forest stress factors along exposure gradients in the United States. Tallinn Botanical Garden. Tallinn, Estonia, USSR. Unnumbered publication.
Witter, J.A. 199 1. Effects of multiple interactions on forests: approaches and examples. p. 142- 147 In Soc. Am. Foresters Proc., Washington, D.C. (July 29 - Aug. I, 1990).
Goldfarb, D., R. Hendrick, and K. Pregitzer. 1990. Seasonal nitrogen and carbon concentrations in white, brown and woody fine roots of sugar maple (Acer saccharzrnl Marsh). Plant and Soil 126: 144- 148.
Hua, 0 . 1990. Effects of acid deposition on nitrogen mineralization in forest soils of the Great Lakes region. MS Thesis. Michigan Technological Univ., Houghton, MI.
KarnosLy, D.F. and F. Scholz. 1990. Genetic implications of air pollution for forestry at present and future. In: Proceedings of the 19th IUFRO World Congress, Division I , 5- 1 1 Aug. 1990, Montreal, Que., Canada. Canadian IUFRO World Congress Organizing Committee, Forestry Canada, Hull, Que.
Liechty, H.O., D. Reed, G. Mroz, and M. Jurgensen. 1990. Comparison of cation leaching in five northern hardwood stands along an air pollution gradient using a throughfall modeling approach. In: Proceedings of the 19th IUFRO World Congress, Division 1,s- 1 1 Aug. 1990, Montreal, Que., Canada. Canadian IUFRO World Congress Organizing Committee, Forestry Canada, Hull, Que. pp. 295-306.
Mattson, W.J. and J.A. Witter. 1990. Pollution induced changes in forest-insect relationships. In: Proceedings of the 1 9th IUFRO World Congress, Division 1,5- 1 1 Aug. 1990, Montreal, Que., Canada. Canadian IUFRO World Congress Organizing Committee, Forestiy Canada, Hull, Que.

Reed, D.D., H.O. Liechty, and A. J. Burton. 1989. A simple procedure for mapping tree locations in forest stands. For. Sci. 35:657-662.
Witter, J.A. (Ed.). 1989. Michigan gradient case history study for the NAPAP Assessment Plan. Report to EPA and USDA For. Serv. School of Natural Res., Univ. of Michigan, Ann Arbor. 1 3 3 p.

EFFECTS OF ELEVATED CO, AND SHADE ON THE DECOMPOSITION OF SENESCED TREE FOLIAGE:
IMPACTS ON MICROBIAL ACTIVITY
Michael G. K a ~ h a n ' , ~ , R. Malcolm Strand', Mark E. Kubiske3, William J. Matt~on'*~, Daniel A. Hems1* 5, Edward D. Walker', Kurt S. Pregitze?, and Richard W. Merritt'
Abstract: We examined microbial respiration and carbonlnitrogen content of decomposing leaf material in rnicrocosms used for growth studies of the treehole mosquito, Aedes triseriatus. Leaf material originated from birch and oak trees exposed to conditions of shadelsun and elevatedlambient levels of CO,. Microbial respiration as measured by CO, production was generally greatest on birch leaves grown under shaded conditions, however, ANOVA indicated possible light X CO, interactions. There were also strong interactions between species of leaf and CO, levels, but oak leaves grown under elevated CO, supported significantly higher microbial respiration rates than oak leaves grown in an ambient CO, atmosphere. Birch leaves grown under elevated CO, also generally supported higher rates of microbial respiration. However, light effects were much more pronounced and birch leaves grown under full sun and elevated CO, conditions supported relatively low microbial respiration. Microbial respiration varied inversely with leaf carbon:nitrogen ratio and directly with nitrogen content across treatments, however, initial carbon and nitrogen content of leaf material was not a consistent predictor of microbial respiration. In general, mosquito production paralleled microbial respiration, suggesting a tight link between the two trophic levels. These data indicate that interactions between available light and CO, on parent plant material could have variable, species-dependent effects on microorganisms and secondary consumers in aquatic, detritus-based systems.
INTRODUCTION
Most investigations of the potential effects of elevated atmospheric CO, levels on ecosystems have been directed toward plant growth in terrestrial environments. Repercussions from atmospheric perturbations, however, will also be seen in the indirect effects on other trophic levels (Field et al. 1992). The majority of vascular plant production ultimately enters the detrital pool in both te~restrial and aquatic systems, yet little is known about how atmospheric CO, changes might affect organisms involved in processing of detritus. Presumably, biochemical characteristics of litter produced under elevated CO, will be the key factors in detritus decomposition and a knowledge thereof should allow predictions of what may happen to detritus processing as atmospheric CO, concentrations increase (Mooney et al. 1991, Field et al. 1992, Meyer and Pulliam 199 1). This assumption has not been consistently met, however (e.g. Norby et al. 1986), and there is a conspicuous lack of investigation of this question in aquatic systems that depend upon terrestrial leaf litter as a major carbon source (Carpenter et al. 1 992).
Larvae of most mosquitoes are detritivores in aquatic environments and many species are thought to be dependent upon terrestrial plant litter and associated decomposer microorganisms for nutrition. One such species in North
'Department of Entomology, Michigan State University, E. Lansing, MI 48824.
'W. K. Kellogg Biological Station, Hickory Corners, MI 49060.
'School of Forestry and Lake Superior Ecosystems Research Center, Michigan Technological University, Houghton, MI 4993 1.
4USDA Forest Service, North Central Experimental Station, E. Lansing, MI 48824.
'Dew Gardens, Midland, MI 48640.

America is the treehole mosquito Aedes triseriatus. Previous studies have suggested that Ae. triseriatus growth and development are directly related to the quantity and quality of plant material available to larvae (Carpenter 1983, Fish and Carpenter 1982, Walker and Merritt 1988, Walker et al. 199 1). Although not well-documented at present, larvae are presumed to feed mainly on microorganisms that metabolize senescent leaf material in the treehole habitat (Fish and Carpenter 1982). Therefore, factors that affect the abundance, activity, and/or composition of microbial communities in the habitat would be expected to influence mosquito production.
In this study, we investigated the effects of parent-plant growth conditions on the microbial respiration associated with the decomposition of senescent leaf material in simulated larval Ae. triseriatus habitats. Overall microbial respiration was significantly affected by leafspecies, light conditions, and CO, levels. These results were related to leaf carbon and nitrogen content, and linked to mosquito growth and development.
METHODS
Experimental treatments and conditions
Senescent leaf material was obtained from one-year-old seedlings of paper birch (Betula papyrfera Marsh) and red oak (Quercus rubra L.) after growth under light and CO, conditions described by Kubiske and Pregitzer (1 995). The conditions were either full sun (sun) or 26 percent of full sun (shade), and ambient CO, levels (350 ppm) or approximately twice ambient levels (7 14 ppm). These treatments were administered via open top chambers.
Microcosms were set up in parallel to those described by Strand et al. (this volume). 600 mg of d ~ y leaf material was added to 300 rnl of a weak solution containing inorganic nutrients (Na,HPO,, NqSO,, KNO,) and a microbial inoculum fiom natural treeholes. Nitrate (1 52 pM), sulfate (68 PM), and phosphate (33 pM) ion concentrations in the solution were within ranges found in stemflow and treeholes (Walker et al. 1 99 1, Carpenter 1982a). Leaf material was incubated in the microcosm solution for one week at room temperature (23 - 25°C) prior to the first sampling. Mosquito larvae were added to half of the microcosms in the same proportion (one larva per 50 mg dry wt. leaf material) used by Strand et al. (this volume).
Microbial respiration and elemental analyses
On days 0 (coinciding with addition of larvae), 3, and 10, two subsamples of approximately 100 mg each of leaf material were removed, weighed, and placed into 38 ml serum vials. Serum vials were then capped and the headspace was sampled at approximately six hours (exact times recorded and used for rate calculations) after incubation at room temperature (24 - 25°C). Prelimina~y studies had shown CO, production from leaf material was linear for up to 18 hours under these conditions. Headspace gas was analyzed for CO, content with a Beckrnanm (#865, Beckman Instruments, Inc., Fullerton, CA) Infrared Analyzer. Remaining leaf material was dried, weighed, and analyzed for total carbon (C) and nitrogen (N) content with a Carlo Erba Nitrogen Analyzerm (# 1 500, Series 2, Carlo Erba, Milan, Italy).
Statistics
There was insufficient material for a complete leaf X light X CO, factorial ANOVA (no leaves from the oak shade treatment). Consequently, birch sun and birch shade treatments were analyzed as a two-way, repeated measures, fully factorial ANOVA ('S~stat, Inc.). The birch sun and oak sun data were analyzed in another two-way, repeated measures ANOVA. Data were transfo~med as necessaly with log or square root functions to reduce variance heteroscedasticty as determined with Bartlett's test (Sokal and Rolhf 1 969, 'Systat, Inc.). Initial analyses revealed no significant effects of larvae within any treatment or on any leaf parameter measured. Consequently, replicates from microcosms with and without larvae were combined within treatments for all analyses. Relationships between microbial respiration and leaf percent nitrogen, percent carbon, and carbon:nitrogen ratio (C/N) were analyzed with Pearson correlation and standard regression techniques. Relationships between grand means of total adult mosquito biomass (fiom Strand et al., this volume) and grand means of microbial respiration (averaged across all sampling dates), initial (prior to water addition) senescent leaf percent N, percent C, and C/N were similarly analyzed.

RESULTS AND DISCUSSION
Microbial respiration
Microbial respiration as indicated by CO, production rate varied greatly with time, leaf species, light, and CO, treatment (Fig. 1, Tables 1 and 2). Leaf X CO, comparisons (Table 1) showed significant interaction between all main factors, reflecting the more pronounced effect of growth-condition CO, levels on senescent oak leaf decomposition vs. birch leaf decomposition. Additionally, differences between treatments were less distinguishable as decay progressed. In contrast, the light X CO, comparison of birch leaves showed significant increases in microbial respiration rates on leaves from the shaded treatment and fewer interactions with other factors (Table 2). There was no evidence of a direct CO, effect in the birch-only comparison, however, significant interaction of light with time and CO, suggests elevated CO, history may have influenced microbial respiration during a portion of the decay process. As in the leaf X CO, comparison, differences between treatments became attenuated over time.
The convergence of respiration values on day 10 in both comparisons indicates that differences in leaf chemistry due to growth conditions were in the relatively labile fraction. This fraction would be utilized more readily in earlier stages of decomposition and remaining leaf material of all types would be similar in its refractory nature. Although mass loss was not determined in this study, decay curves for different deciduous leaves in aquatic and terrestrial habitats typically show the most pronounced divergence early in the process (Willoughby, 1974, Jensen 1974, Carpenter 1982b, Aber et al. 1990). Additionally, the overall decline of respiration rates with time may reflect depletion of initial inorganic nutrient sources that would normally be replenished by s t e d o w (Carpenter 1982a, Walker et al. 199 1 ).
Carbon and nitrogen content
Nitrogen (N) content and carbon:nitrogen (C/N) ratios of leaf material also varied considerably with time and treatment (Figs. 2 and 3, Tables 2 - 6). Nitrogen concentration in birch leaf material generally increased with time (Figure 2, Table 4), however, this trend was not obvious in the oak leaf material during the sampling period (Figure 2). An increase in N content during decay is characteristic of most litter and is presumably due to microbial immobilization and humification (Willoughby, 1 974, Suberkropp et al. 1 976, Melillo et al. 1982). Percent leaf N was significantly lower in decomposing oak than birch, but this was dependent upon growth-condition CO, level (Table 3). However, there was no overall main effect of plant growth-condition CO, on N content.
In general, C/N ratios in the leaf material reflected trends in nitrogen content; C/N declined with time as nitrogen increased and the trend was most obvious in the birch treatments. In contrast to percent N, however, analysis of CIN ratios showed significant light and CO, main effects (Tables 5 and 6). These main effects must be cautiously interpreted along with significant interaction telms, however, results from ANOVA of C/N ratios more closely parallel those found for microbial respiration (compare Tables 1 and 2 with 5 and 6). This suggests that carbon content and/or quality, not nitrogen content or quality, during decay was most affected by parent-plant treatment conditions and that carbon sources in the leaf material influenced microbial respiration more directly.
Relationships between microbial respiration, leaf carbon:nitrogen content, and adult mosquito biomass
That the relationship between microbial respiration, and carbon and nitrogen content is complex is illustrated in Figure 4. Microbial respiration varied directly with percent N, but inversely with percent C and C/N ratio. Although correlations are all significant, only 5 - 8 percent of the variance can be esplained by any factor. This would further suggest that other factors, including carbon quality of the leaf material, may have the strongest overall influence on microbial respiration. Carbon quality, for example, has been shown to be the major limiting factor for microbial decomposer activity in many terrestrial systems (e.g. Collins et al. 1 990, Melillo et al. 1 982).

MICROBIAL RESPIRATION +- birch, ambient
+ birch, elevated
700 4 oak, ambient
\ I 4- oak, elevated
LEAF X CO,
+ shade, ambient
+ shade, elevated
-E- sun, ambient
+ sun, elevated
600 L 500 < 400 < 300 - LIGHT X COZ
i (birch only) 2 0 0 ; . . . , . . . , . . . , . . . , . . I I
1 3 5 7 9 11
TIME (days)
Figure 1. Microbial respiration on decomposing, senescent leaf material in Ae. triseriatus microcosms. Values are mean 2 S.E. n = 6 in all cases. Initial values (day 0) correspond to addition of larvae in parallel microcosms.
Table 1. Repeated measures ANOVA results comparing microbial respiration on decomposing, senescent birch and oak leaf material grown under ambient and elevated CO, levels (see text).
SOURCE SS DF MS F P
BETWEEN SUBJECTS LEAF co2 LEAF*CO, ERROR
WITHIN SUBJECTS TIME TIME*LEAF TIME*CO, TIME*LEAF*C02 ERROR

Table 2. Repeated measures ANOVA results comparing microbial respiration on decomposing, senescent birch leaf material grown under ambient and elevated CO, levels, and two light levels (see text).
SOURCE SS DF MS F P
BETWEEN SUBJECTS co2 98.467 1 98.467 0.007 0.934 LIGHT 381763.220 1 381763.220 26.881 0.000 CO,*LIGHT 456 12.067 1 456 12.067 3.212 0.088 ERROR 284043.486 20 14202.174
WITHIN SUBJECTS TIME 1 134588.130 2 567294.065 73.464 0.000 TIME*C02 25508.008 2 12754.004 1.652 0.205 TIME'LIGHT 109450.810 2 54725.405 7.087 0.002 TIME*C02*LIGHT 78295.658 2 39 147.829 5.070 0.0 1 1 ERROR 308880.754 40 7722.0 19
NITROGEN CONTENT
Figure + S.E. -
2m8.j +- birch, ambient I I 1 + birch, elevated I I 2.24 + oak, ambient I I I 1 -+ oak, elevated I
5 2.5j t shade, elevated
43- sun. ambient PI
1.9
1.3
LIGHT X C02 (birch onlv)
0.7 1 . . . , . . , , , , , 1 3 5 7 9 11
TIME (days) 2. Nitrogen content of decomposing, senescent leaf material in Ae. triseriatus microcosms. Values n = 6 in all cases. Initial values (day 0) correspond to addition of larvae in parallel microcosms.
are mean
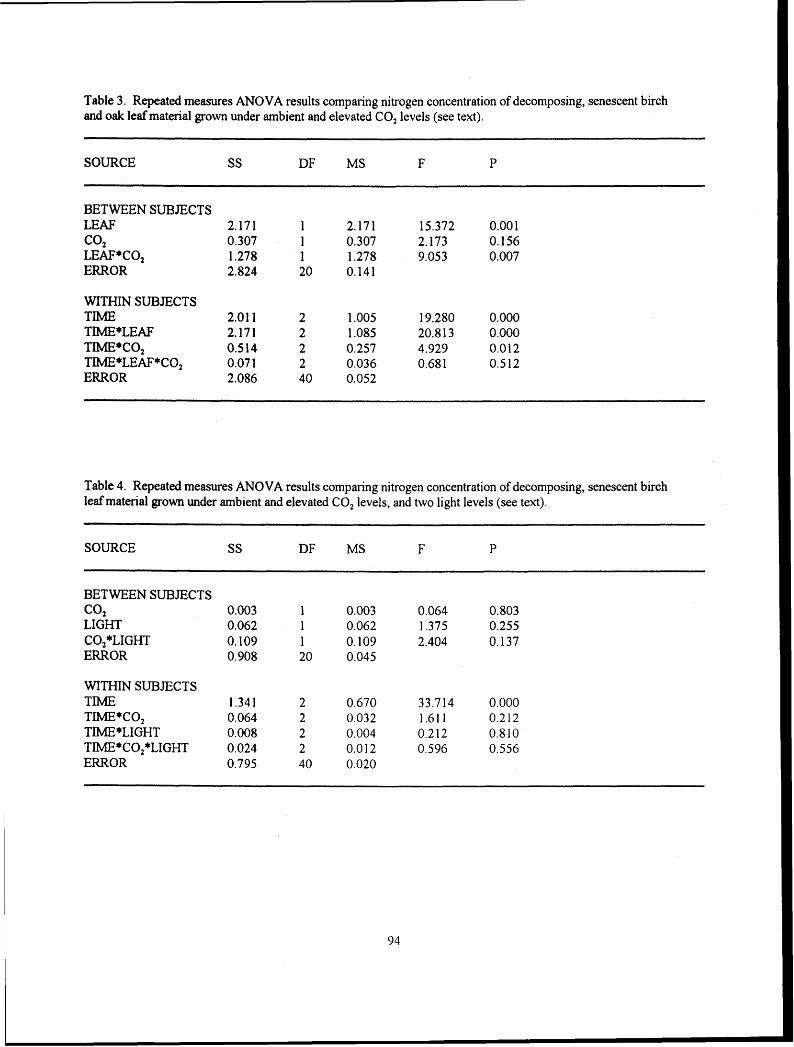
Table 3. Repeated measures ANOVA results comparing nitrogen concentration of decomposing, senescent birch and oak leaf material grown under ambient and elevated CO, levels (see text).
SOURCE SS DF MS F P
BETWEEN SUBJECTS LEAF co2 LEAFSC0, ERROR
WITHIN SUBJECTS TIME TIMESLEAF TIME*C02 TIMESLEAF*C02 ERROR
Table 4. Repeated measures ANOVA results comparing nitrogen concentration of decomposing, senescent birch leaf material grown under ambient and elevated CO, levels, and two light levels (see text).
SOURCE SS DF MS F P
BETWEEN SUBJECTS co2 LIGHT COZSLIGHT ERROR
WITHIN SUBJECTS TIME TIMESCO, TIME*LIGHT TIME*CO,*LIGHT ERROR
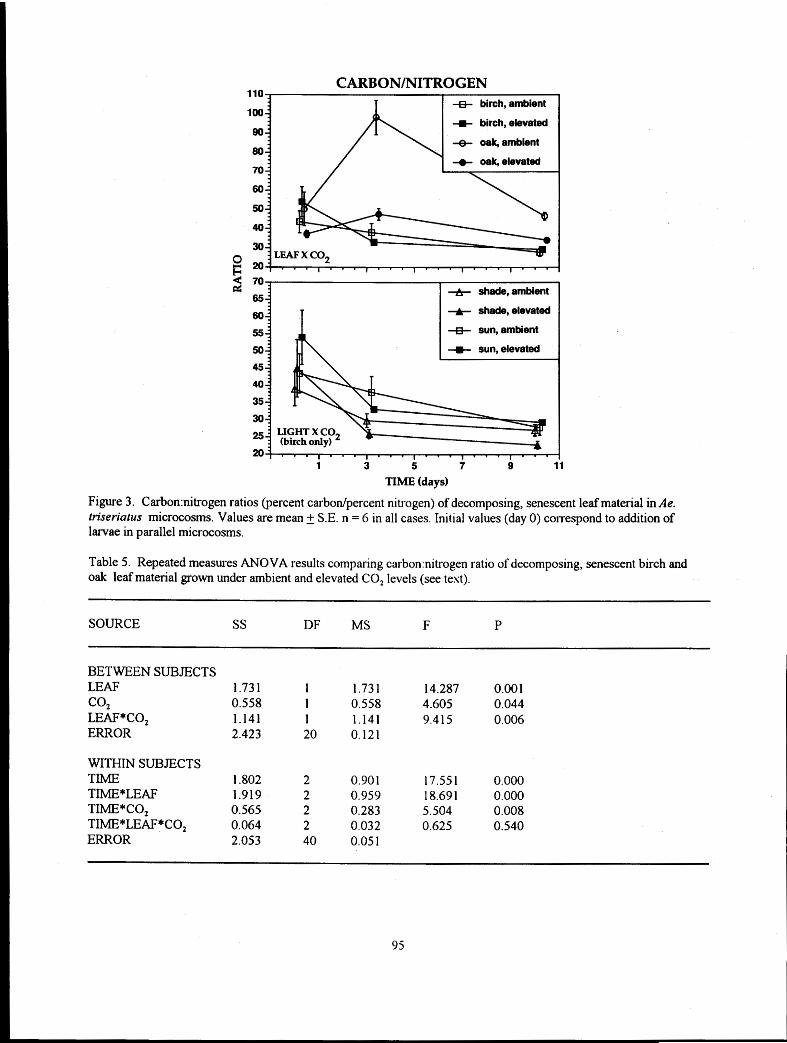
-8- birch, ambient
-m- birch, elevated
4 oak,ambiint
+ oak, elevated
h
3 70 &
65 + shade, ambient
I t shade, elevated
55
50
45
40
35
30
25
20 1 3 5 7 9 11
TIME (days)
Figure 3. Carbon:nitrogen ratios (percent carbonlpercent nitrogen) of decomposing, senescent leaf material in Ae. triseriatus microcosms. Values are mean 5 S.E. n = 6 in all cases. Initial values (day 0) con-espond to addition of larvae in parallel microcosms.
Table 5. Repeated measures ANOVA results comparing carbon:nitrogen ratio of decomposing, senescent birch and oak leaf material grown under ambient and elevated CO, levels (see test).
SOURCE SS DF MS F P
BETWEEN SUBJECTS LEAF co2 LEAF*C02 ERROR
WITHIN SUBJECTS TIME TIME*LEAF TIME*CO, TIME*LEAF*CO, ERROR

Table 6. Repeated measures ANOVA results comparing carbon:nitrogen ratio of decomposing, senescent birch leaf material grown under ambient and elevated CO, levels, and two light levels (see text).
SOURCE SS DF MS F P
BETWEEN SUBJECTS
co2 LIGHT C02*LIGHT ERROR
WITHIN SUBJECTS TIME TIME*CO, TIME*LIGHT TIME*CO,*LIGHT ERROR
40 42 44 46 48 50 52 54 56 CARBON (% drv wt.)
0 0.5 1 1.5 2 2.5 3 3.5 NITROGEN (% dry wt.)
CARB0N:NITROGEN RATIO
Figure 4. Correlation between microbial respiration and percent carbon, percent nitrogen, and carbon:nitrogen ratios of decomposing, senescent leaf material in Ae. tr.ise~.iatlrs microcosms. Data fi-om all leaf types and all three sampling dates are illustrated in each panel.

The initial carbon and nitrogen content of the senescent leaf material (Table 7) is likely to be a poor predictor of microbial respiration during decay or of adult mosquito biomass produced (Table 8). Only the relationship between initial percent N and mosquito adult biomass produced was significant, although the analysis also suggested a possible relationship between initial percent N and microbial respiration (Table 8). The negative relationships between percent N and mosquito biomass, and between percent N and microbial respiration are surprising in that nitrogen content of leaf detritus often is positively correlated with decomposition rates and detrivore growth in aquatic systems (Anderson and Sedell 1979 and references therein). These data must be viewed cautiously, however, since correlations based upon grand means simply reflect the relationships of general trends in the data set. Nevertheless, in contrast to earlier studies (see Park 1975, Jensen 1974) initial leaf N and C/N were not broad indicators of microbial respiration or detrital processing potential in these microcosms. Elevated CO, is generally thought to decrease overall percent N and increase C/N in terrestrial leaf litter; resulting in lower decomposition rates (Mooney et al. 1991, Field et al. 1992). However, excess carbon content of leaf litter from C0,-enhanced parent plants is mostly in the form of sugars and starches, not lignin (Mooney et al. 1 99 1 ). Therefore, decomposition rates of the litter could conceivably be increased provided other nutrients (e.g., N) are in adequate supply fiom external sources. It has been recognized more recently that percent N and CM in detritus may be inadequate predictors of decomposition since other factors such as lignin content have a more pronounced influence on decay processes in aquatic habitats (Gessner and Chautier 1994, Boulton and Boon 199 1, Stout 1989, Polunin 1984, Suberliropp et al. 1976). This M e r underscores the need to investigate specific carbon sources in treehole systems.
Table 7. Initial (before water addition and incubation) nitrogen (N), carbon (C), and carbonmitrogen ratios (CN) of senescent leaf material in Ae triseriatzis microcosms. Values are mean 2 S.E. of subsamples from pooled and homogenized material. n = 4 in all cases. BSHA = birch, shade, ambient CO,; BSHE = birch, shade, elevated CO,; BSA = birch, sun, ambient CO,; BSE =
birch, sun, elevated CO,; OSA = oak, sun, ambient CO,; OSE = oak, sun, elevated CO,.
Treatment N (% d ~ y wt.) C (% dry wt.) CIN
BSHA BSHE BSA BSE OSA OSE
Table 8. Pearson correlation analysis of initial (before water addition and incubation) carbon (C) and nitrogen (N) content of senescent leaf material vs. grand means of microbial respiration and total adult mosquito biomass. n = 6 in all cases.
- Leaf content vs. Pearson Correlation
Microbial Respiration Mosquito Biomass Coeff. p value Coeff. p value

Although leaf biochemical characters that may influence microbial respiration and decay processes are complex and incompletely-addressed in this study, microbial respiration appears to be a good predictor of larval Ae. triseriatus production in the microcosms. Figure 5 illustrates the relationship between grand means of adult mosquito biomass and microbial respiration. Such a relationship has been shown for other detritivorelmicrobe systems (e.g. Ward and Cummins 1979), but this study represents the first such evidence for larval mosquitoes. The positive relationship supports our contention that mosquito larvae in treehole habitats are limited by microbial biomass andlor respiration. The results also reinforce the idea of a tight link between trophic levels in the system and that microorganisms are the key intermediates. Kgher microbial respiration measurements have been associated with higher microbial biomass in detritus (Ward and Cummins, 1979). Since observations indicate that Ae triseriatus larvae feed directly upon leaf surface-associated microorganisms (Fish and Carpenter 1 982, Walker and Merri tt 1 99 1, Kaufman unpub. obs.), the higher biomass of emerging adults in some treatments is potentially attributable to a higher biomass of microbes. Alternatively, higher microbial respiration may be acting to release more leaf material for larval consumption. Since we presently have no data on microbial turnover rates or microbial biomasslvs. leaf material contributions to larval growth, additional experimentation will be required to address the details of the linkage. Further examination of this linkage will allow more detailed predictions of the effects of atmospheric changes on small, aquatic, detritus-based systems.
MICROBIAL RESPIRATION (pl C02 . g dry wt. hour
Figure 5. Correlation between mean total mosquito biomass and mean respiration values of decomposing, senescent leaf material in Ae. triseriatus microcosms. Mean respiration values are the average of mean respiration rates over the three sampling dates. Treatments are indicated as BSHA = birch, shade, ambient CO,; BSHE = birch, shade, elevated CO,, BSA = birch, sun, ambient CO,, BSE = birch, sun, elevated CO,; OSA = oak, sun, ambient CO,; OSE = oak, sun, elevated CO,.
SUMMARY AND CONCLUSIONS
Microbial respiration on decaying leaves in Ae. triseriatus microcosms was affected by leaf species and CO, conditions during growth of the parent plant. However, both of the effects changed significantly with time. Microbial respiration on oak was enhanced by growth-condition elevated CO, while birch leaves showed the opposite trend.
Microbial respiration on decomposing senescent birch leaves was affected most by par-ent-plant light conditions and this effect was more pronounced in earlier stages. Leaves from plants grown in shade supported higher levels of

respiration than those produced in full sun. Elevated CO, conditions during parent-plant growth enhanced microbial respiration on decomposing, senescent leaves only when the leaves originated fi-om plants grown under shaded conditions.
Nitrogen content and carbon-nitrogen ratios, both of which are known to be altered by microbial biomass and respiration, were sigdicantly correlated with microbial respiration. Senescent leaf material with higher nitrogen content had lower C M values and higher microbial respiration. Carbon content or quality, however, appeared to have a more direct influence on microbial respiration.
Initial values for percent nitrogen and carbon-nitrogen ratios in the senescent leaf material were not good indicators of either microbial respiration or mosquito production. This warrants further investigation, however, it also points out that over simplistic models of decomposition may not adequately predict the flow of carbon and nitrogen in plant material through decomposer and detritivore communities.
Adult mosquito production was directly and positively related to microbial respiration, suggesting a tight trophic link between mosquito larvae and decomposer microorganisms. Effects of elevated CO, and light on senescent leaf material will likely have complex repercussions for detritivores in aquatic systems and will depend upon the microbial mediation of the detritus-detritivore interactions.
ACKNOWLEDGMENTS
We gratefully acknowledge the technical assistance of Amanda Yager, Bruce Birr, and Amber Wujek. We also thank Sheridan Haack, Hal Collins, and Mike Klug for their helpful reviews of the manuscript. Facilities and equipment were available through the support of the W. K. Kellogg Biological Station and the Center for Microbial Ecology, Michigan State University. This work was supported in part by NIH (#NIAID-2 1884), USDA (90-37297- 5668), NIGEC, DOE (DE-FG02-93EK6 1 666), and the USDA Forest Service Northern Global Change Program.
LITERATURE CITED
Aber, J. D., J. M. Melillo, and C. A. McClaughtery. 1990. Predicting long-term patterns of mass loss, nitrogen dynamics, and soil organic matter formation fi-om initial fine litter chemistry in temperate forest ecosystems. Can. J. Bot. 68:2201-2208.
Anderson, N. H. and J. R. Ssedell. 1979. Detritus processing by macroinvertibrates in stream ecosystems. Ann Rev. Entomol. 24:35 1-377.
Boulton, A. J., and P. I. Boon. 199 1 . A review of methodology used to measure leaf litter decomposition in lotic environments: time to turn over an old leap Aust. J. Mar. and Freshw. Res. 42: 1-43.
Carpenter, S. R. 1982a. Stemflow chemistry: Effects on population dynamics of detritivorous mosquitoes in tree-hole ecosystems. Oecologia 53 : 1 -6.
Carpenter, S. R. 1982b. Comparisons of equations for decay of leaf litter in tree-hole ecosystems. Oikos 39: 17-22.
Carpenter, S. R. 1983. Resource limitation of larval treehole mosquitoes subsisting on beech detritus. Ecology 64:2 1 9-223.
Carpenter, S. R. , S. G. Fisher, N. B. G r i m , and J. F. Kitchell. 1992. Global change and freshwater ecosystems. Ann Rev. Ecol. Syst. 23 : 1 19- 1 39.
Collins, H. P., L. F. Elliott, R. W. Rickrnan, D. F. Bezdicek, and R. I. Papendick. 1990. Decomposition and interactions among wheat residue components. J. Soil Sci. Soc. Amer. 54:780-785.

Fieid, C. B,, F. S. Chapin m, P. A. Matson, and H. A. Mooney. 1992. Responses of terrestrial ecosystems to the changing atmosphere: A fesource-based approach. Ann Rev. Ecol. Syst. 23 :20 1 -23 5.
Fish, D., md S. R. Carpenter. 1982. Leaf litter and larval mosquito dynamics in treehole ecosystems. Ecology 63:283-288.
M. 0. and E. Chauvet. 1994. Importance of stream microfungi in controlling breakdown rates of leaf litter. Ecology 75:1807-1817.
J- V. 1974. Decomposition of angiosperm tree leaf litter. In. C. H. Dickinson and G. J. F. Pugh, eds. Biology of Plant Litter Decomposition. V 1 . Academic Press, London. pp. 69- 1 04.
Kubiske, M. E., and K. S. Pregiker. (1995, in press). Effect of elevated CO, and light availability on the photosynthetic light response of trees of contrasting shade tolerance. Tree Physiol.
MeWo. J. bf., J. D. Aber, and J. F. Muratore. 1982. Nitrogen and lignin control of hardwood leaf litter decom@tion dynamics. Ecology 63 :62 1 -626.
Wer, J., and W. M. Pulliam. 1991. Modifications of terrestrial-aquatic interactions by a changing climate. In P. Firth and S, G. Fisher, eds. Climate Change and ~reshwatck Ecosystems. ~ ~ A n ~ e r - ~ e i l a g , N.Y. pp.- 177-191.
m, H. A., B. G. Drake, R. J. Luxmoore, W. C. Oechel, and L. F. Pitelka. 199 1 . Predicting ecosystem responses to elevated CO, concentrations. Bioscience 4 1 : 96- 1 04.
Noaby, R. J., J. Pastor, and J. M. Melillo. 1986. Carbon-nitrogen in CO, enriched white oak: physiological and long-term perspectives. Tree Physiol. 2:223 -24 1.
Park, D. 1975. Carbon and nitrogen levels as factors influencing fungal decomposers. In J. M. Anderson and A. Mafadyen, eds. The role of terrestrial and aquatic organisms in decomposition processes. Blackell Scientific Pub. Oxford. pp. 4 1 -60.
Polunin, N. V. C. 1 984. The decomposition of emergent macrophytes in fi-esh water. Adv. Ecol. Res. 14: 1 1 5- 1 56.
Stouf R. J. 1989. Effects of condensed tannins on leaf processing in mid-latitude and tropical streams: a theoretical approach. Can J. Fish. Aquat. Sci. 46: 1097- 1 106
Suberkropp, K., G. L. Godshalk, and M. J. Klug. 1976. Changes in the chemical composition of leaves during processing in a woodland stream. Ecology 57 : 7 20-7 27.
Walka. E. D., D. L. Lawson, R. W. Menitt, W. T. Morgan, and M. J. Klug. 1991. Nutrient dynamics, bacterial populations, and mosquito productivity in tree hole ecosystems and microcosms. Ecology 72: 1 529- 1546.
Walker, E. D., and R. W. Merritt. 199 1. Behavior of larval Aedes triseriatus (Diptera: Culicidae). J . Med. Entomol. 28:581-589.
Walker, E. D., and R. W. Merritt. 1988. The significance of leaf detritus to mosquito @iptera:Culicidae) productivity fkom treeholes. Environ. Entomol. 17: 19-206.
Ward, G. M., and K. W. Cummins. 1979. Effects of food quality on growth of a stream detritivore, Paratendipes albimanus (Meigen) (Diptera: Chirmomidae). Ecology 60: 57-64.
Willoughby, L. G. 1974. Decomposition of litter in fi-eshwater. In. C. H. Dickinson and G. J .F. Pugh, eds. Biology of Plant Litter Decomposition. V2. Academic Press, London. pp. 659-68 1.
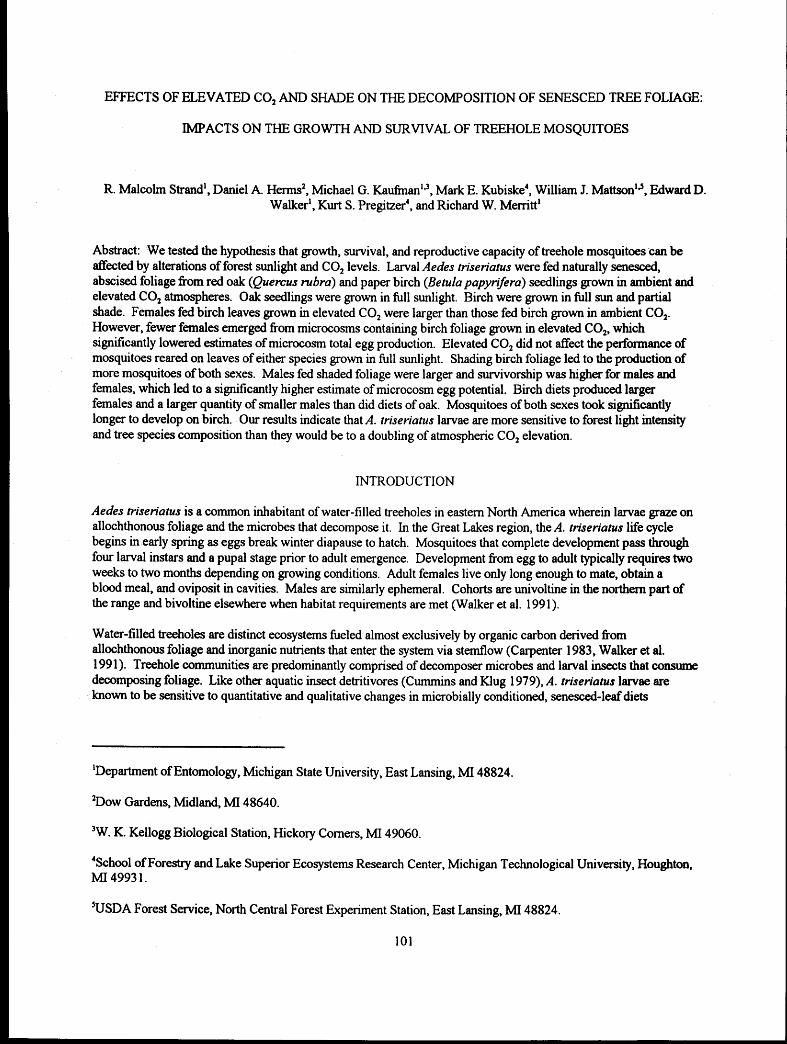
EFFECTS OF ELEVATED CO, AND SHADE ON THE DECOMPOSITION OF SENESCED TREE FOLIAGE:
IMPACTS ON THE GROWTH AND SURVIVAL OF TREEHOLE MOSQUITOES
R. Malcolm Strand', Daniel A. Herms2, Michael G. KaufinaniJ, Mark E. Kubiske4, William J. Mattsonl3, Edward D. Walker', Kurt S. Pregitzer', and Richard W. Memtt'
Abstract: We tested the hypothesis that growth, survival, and reproductive capacity of treehole mosquitoes can be affected by alterations of forest sunlight and CO, levels. Larval Aedes triseriatus were fed naturally s e n d , abscised foliage fi-om red oak (Quercus nr bra) and paper birch (Betula papyrijera) seedlings grown in ambient and elevated CO, atmospheres. Oak seedlings were grown in full sunlight. Birch were grown in full sun and partial shade. Females fed birch leaves grown in elevated CO, were larger than those fed birch grown in ambient CO,. However, fewer females emerged from microcosms containing birch foliage grown in elevated CO,, which significantly lowered estimates of microcosm total egg production. Elevated CO, did not affect the performance of mosquitoes reared on leaves of either species grown in full sunlight. Shading birch foliage led to the production of more mosquitoes of both sexes. Males fed shaded foliage were larger and survivorship was higher for males and females, which led to a significantly higher estimate of microcosm egg potential. Birch diets produced larger females and a larger quantity of smaller males than did diets of oak. Mosquitoes of both sexes took si&icantly longer to develop on birch. Our results indicate that A. triseriatus larvae are more sensitive to forest light intensity and tree species composition than they would be to a doubling of atmospheric CO, elevation.
INTRODUCTION
Aedes triseriatus is a common inhabitant of water-filled treeholes in eastern North America wherein larvae graze on allochthonous foliage and the microbes that decompose it. In the Great Lakes region, the A. triseriatus life cycle begins in early spring as eggs break winter diapause to hatch. Mosquitoes that complete development pass through four larval instars and a pupal stage prior to adult emergence. Development fi-om egg to adult typically requires two weeks to two months depending on growing conditions. Adult females live only long enough to mate, obtain a blood meal, and oviposit in cavities. Males are similarly ephemeral. Cohorts are univoltine in the northern part of the range and bivoltine elsewhere when habitat requirements are met (Walker et al. 1991).
Water-filled treeholes are distinct ecosystems fueled almost exclusively by organic carbon derived fi-om allochthonous foliage and inorganic nutrients that enter the system via stemflow (Carpenter 1983, Walker et al. 1991). Treehole communities are predominantly comprised of decomposer microbes and larval insects that consume decomposing foliage. Like other aquatic insect detritivores (Cummins and Klug 1979), A. triseriahrs larvae are known to be sensitive to quantitative and qualitative changes in microbially conditioned, senesced-leaf diets
'Department of Entomology, Michigan State University, East Lansing, MI 48824.
'Dew Gardens, Midland, MI 48640.
'W. K. Kellogg Biological Station, Hickory Comers, MI 49060.
'School of Forestry and Lake Superior Ecosystems Research Center, Michigan Technological University. Houghton, MI 4993 1.
'USDA Forest Service, North Central Forest Experiment Station, East Lansing, MI 48824.

(Carpenter 1983, Walker et al. 199 1). Therefore, alteration of any environmental variable that affects the quantity or quality of foliage inputs could affect all biological processes occu~ring in a treehole.
Qualitative changes in leaf chemical composition and quantitative changes in total leaf production can result from forest CO, and sunlight alteration (Kubiske and Pregitzer 1995). Such changes in leaf chemistry can affect the performance of decomposer microbes (Kaufman et al. this issue) and the insects that feed on leaves (Herms et al. this issue). In this study, we examine the effects of forest sunlight and CO, alteration on the development time, adult mass, survivorship, and reproductive capacity of a detritivorous insect common to the Great Lakes region.
MATERIALS AND METHODS
Leaves
Senesced leaves were collected following autumn abscission from one-year-old paper birch and red oak seedlings grown in 350 ppm and 750 ppm CO, atmospheres in full sunlight and from birch seedlings grown in both CO, levels under a simulated forest canopy (26 percent full sunlight) (see Kubiske and Pregitzer 1995).
Leaf material was sufficient to establish 42 microcosms: eight oak-sun-ambient CO,, five oak-sun-elevated CO,, nine birch-sun-ambient CO,, eight birch-sun-elevated CO,, seven birch-shade-ambient CO,, and five birch-shade- elevated CO, microcosms.
Mosquitoes
Eggs were collected from automobile tire oviposition traps that were placed in woodlots on the Michigan State University campus (47 ON, 84 " W, 244-274 m altitude). Eggs were hatched in deokygenated water and immediately added to microcosms. Each 500 ml plastic microcosm contained 20 larvae and 1 g of leaves conditioned for seven days in 300 ml of deionized water and a 5 ml inoculum of microbes in an inorganic ion solution derived from field- collected stemflow (see Kaufman et al. this issue). The experiment was conducted in a walk-in growth chamber. Temperature was held constant at 23 "C. Microcosms were shaded. Upon emergence, adults were aspirated from microcosms and immediately frozen at -20 OC. At the end of the experiment, they were dried for 12 hours at 65 OC and weighed on a Cahn model 27 microbalance.
Fecundity was estimated with Livdahl's (1 982) regression equation for A. triseriatus egg production potential (fecundity = 7.13 + 45.85 mg dry mass). Total microcosm egg production was calculated by summing fecundity estimates for each surviving female, thereby providing an estimate of the potential of treatment effects to influence A. triseriatus population dynamics.
Statistical Analysis
Effects of the six treatment combinations on development time, adult mass, and estimated fecundity were determined with the use of two ANOVA models. The first tested the effects of CO,, sunlight, and their interaction on the development time, adult mass, and estimated egg production potential of mosquitoes reared on birch leaves. The second model tested the effect of CO,, tree species, and their interaction on the development time, adult mass, and estimated potential egg production of mosquitoes reared on oak and birch grown in full sunlight. All data are reported as untransformed means except microcosm fecundity estimates which were square-root transformed to reduce variance heteroscedasticy.

RESULTS AND DISCUSSION
Effects of Elevated CO,
Females fed birch leaves grown in elevated CO, were larger, and therefore more fecund, than those fed birch grown in ambient CO, (Table 1, Figure 1). This positive response by a detritivore to elevated CO, is in direct contrast to previously observed and predicted effects of CO, elevation on foliage decomposition (Lambers 1993, Cotrufo et a1 1994).
Elevated CO, is predicted to decrease decomposition rate because it increases leaf C:N ratios and the concentration of lignin and other decomposition-inhibiting secondary metabolites (Lambers 1993). However, it is generally thought that the key component of the A. triseriatus larval diet is not leaves, but the microorganisms that decompose leaves (Walker and Merritt 1988, Walker 199 1, Kaufman et al. this issue). Kaufman et al. (this issue) observed that elevated CO, slows decomposition by microbes. Therefore, females, which take longel- to develop than males, may achieve greater mass due to increased substrate pelmanence as would result from delayed nutrient availability for microbes.
Table 1 . F values from ANOVA of mosquito perfolmance on senesced birch leaves exposed to two levels of CO, and sunlight (* denotes P < 0.10, ** I 0.05, *** 5 0.01).
SOURCE . co, Light CO, * Light
females per microcosm males per microcosm female development time male development time female mass male mass microcosm fecundity
SI-IAIIE SUN StlADII SUN
Figure 1. Effects of sunlight intensity and COz level on .-I. tr-i.set.icrtrls mass (k 1 S.E.).


Effects of Shade
Mosquito performance was greatly enhanced by the eflects of shade on birch (Table 1). Shading led to the production of a larger number of more-rapidly developing mosquitoes of both sexes (Figures 2,4, and 5). Also, microcosms containing shaded foliage had a higher potential egg production than did those containing foliage grown in full sunlight. This was attributable to enhanced female SUI-viva1 (Figure 3).
Like the effects of elevated CO, on mosquito performance, those of shading may be caused by alterations of leaf chemistry and structural integrity. Typical plant responses to shade include decreased C:N ratios and lowered concentrations of carbon-based allelochemicals such as lignin, tannins, and phenolics (Hems and Mattson 1992). These reductions would be expected to increase decomposition by microbes, as observed by Kaufman et al. (this issue). Decomposition of shaded foliage may, therefore, progress too rapidly to allow for the complete development of some female mosquitoes. Males were able to gain more mass on leaves grown in shade (Figure I), presumably due to their relatively rapid development time (Figure 5).
AMBIENT CO2 I:I,EVATEU C02
Figure 4. Effects of sunlight intensity and CO, level on A. trtse~-iatlrs male survival (* 1 S.E.)
45 1 AMBIENT CO2 I
I MAL.f:S FEMALES I I I I I
SHADE SUN SI-IAIIE SUN
Figure 5. Effects of sunlight intensity and C 0 2 level on .4. trise~-iatlrs development time (* 1 S.E.)

Birch responses to shade apparently caused the observed effects on mosquito pe~formance. Light intensity reduction can affect tree species differentially, which could alter forest vegetation composition. Therefore, changes in light intensity may be predicted to generate effects that cascade through an ecosystem from producers to detritivores.
Effects of Tree Species
Females fed birch leaves were larger than those fed oak, but they required much more time to complete development (Table 2, Figures 6 and 7). Males fed birch also took longer to develop and they were more numerous, but smaller than those fed oak (Table 2, Figures 8,6, and 7). Any positive population-level effects caused by increased female mass and male survivorship would likely be counteracted in natural systems by the increased rates of death by predation, disease, and habitat drying that would result from prolonged development time.
Females reared on birch were larger, and therefore more fecund, than those fed oak. However, this increase did not lead to differential estimated total egg production per microcosm, due, in part, to slightly lower female survivorship on birch relative to oak (Table 2, Figures 9 and 10).
Table 2. F values from ANOVA of mosquito pelfomance on senesced oak and birch leaves exposed to two levels of CO, (* denotes P s 0.10, ** 5 0.05, *** 5 0.0 1).
SOURCE
Co, Tree Species CO,*Species
females per microcosm males per microcosm female development time male development time female mass male mass microcosm fecundity
13 OAK - T s~ncrr T
- T ........... ;-:..- r . - . .=.==.*
;.=:~.=~.=:m: T
..: .=: .= m . ......... - ;'::::;.=',: ':;..:==':;.: ........... .......... ..... .-. .;=:;": ......... .;fl\-. : ........... . \::*:xa ...... =:; ::::xl ........... . .- . , :.:I.: ......... -..=. ... ,j:;:: ........... .......... = .. - ..:..-: ......
.*. .... - . . - .- . .- - .... ........... ' ..':.':.'.., M AI.13 I:I'MAI,L:S
Figure 6. Effects of tree species and two levels C 0 2 on A. iriseriotlts Inass (* 1 S.E.).

45
40
35 h
2 30 E.
2 5 . F:
20
1 5 - 8 d 1 0 -
5 -
0 -
AMBIENT COz GI,EVATEI> CO2 AMBIENT CO2 ELEVATED C02
Figure 7. Effects of tree species and two levels CO, on A. triseriatus development time (k 1 S.E.).
8
7
6
n 5
E g 4 5
- 3 k w
Y 2
3 0
Figure 8. Effects of tree species and two levels CO, on A. triseriatus male survival (A 1 S.E.).
107
- - - -
Q OAK BIRCH
T T T
r m b
MAI-ES FEMALES
- AMBIENT CO2
E1,EVATED CO2
- -
- - -
.c
OAK

I OAK
Figure 9. Effects of tree species and two levels CO, on A. tr,iseriatt/s fecundity (square root mean * 1 S.E.).
Figure 10. Effects of tree species and two levels COz on .-l. tr.iser.iatl/s female sulvival (* 1 S.E.).
1 OX

The relative dominance of any tree species is determined by a variety of abiotic conditions including ambient light and CO, levels (Herms and Mattson 1992). Trees respond differentially, both inter- and intraspecifically, to changes in these parameters (Kubiske and Pregitzer 1995). Therefore, ambient light intensity and CO, level could independently and in concert, shape forest vegetation composition. Ow results suggest that such an effect would ultimately affect detritivorous insect populations.
SUMMARY
Differences in light intensity and atmospheric CO, level can generate effects that cascade through an ecosystem fiom producer to detritivore. The effects of elevated CO, observed here (increased female mass and decreased female survival and potential egg production per microcosm) were generally small compared to those of sunlight (increased male and female survival and estimated potential egg production per microcosm and decreased male and female development time) and tree species (increased size and development time of females fed birch, prolonged development time and decreased mass of males fed birch, and decreased estimated egg production for microcosms containing birch). These results suggest that elevated CO, impacts on A. triseriatus may be dacult to detect against the backdrop of environmental variation already experienced by this insect in the forests of the Great Lakes region.
Further study is required to establish whether or not the patterns observed here for treehole mosquitoes also apply to other detritivores in heterotrophic aquatic systems or elsewhere. However, the reliance of detritivores on abscised foliage does lend support to the supposition that change of any environmental variable that alters leaves qualitatively, will likely impact ecosystem detritivory processes.
ACKNOWLEDGMENTS
Funding for this study was provided by the USDA Forest Service Northern Global Change Program and NIH award NIAD-21884. Leaves were obtained fiom a project supported by USDA competitive grant 90-37290-5668, NIGEC, and DOE grant DE-FG02-93ER6 1 666. We thank Matthew P. Ayres and Deborah G. McCullough for their critical reviews of this manuscript and William T. Morgan for his critical review and invaluable technical assistance in mosquito rearing.
LITERATURE CITED
Bradshaw, W. E. and C. M. Holzapfel. 1988. Predator-mediated, non-equilibrium coexistence of treehole mosquito communities. Oecologia 74: 507-5 14.
Carpenter, S. R. 1983. Resource limitation of larval treehole mosquitoes subsisting on beech detritus. Ecology 64: 2 19-223.
Cotrufo, M. F., P. Ineson, and A. P. Rowland. 1 994. Decomposition of tree leaf litters grown under elevated CO,: effect of litter quality. Plant and Soil 163 : 12 1 - 130.
Cumrnins, K. W. and M. J. Klug. 1979. Feeding ecology of stream invertebrates. Annual Review of Ecology and Systematics 10: 147- 172.
Edgerly, J. S., M. S. Willey, and T. P. Livdahl. 1993. The community ecology af Aedes egg hatching: implications for a mosquito invasion. Ecological Entomology 18: 23-1 28.
Fish, D., and S. R. Carpenter. 1982. Leaf litter and larval mosquito dynamics in treehole ecosystems. Ecology 63 :283-288.

Hems, D. A. and W. J. Mattson 1992. The dilemma of plants: to grow or defend. Qual-terly Review of Biology 67: 283-335.
Kubiske, M. E. and K. S. Pregitzer. 1995. Effect of elevated CO, and light availability on the photosynthetic light response of trees of contrasting shade tolerance. Tree Physiology (in press).
Lambers, H. 1993. Rising CO,, secondary plant metabolism, plant-herbivore interactions, and litter decomposition: theoretical considerations. Vegetation 10411 05: 263-27 1.
Steinwascher, K. 1982. Relationship between pupal mass and adult survivorship and fecundity for Aedes aegypti. Environmental Entomology 1 1 : 1 50- 1 53.
Livdahl, T. P. 1982. Competition within and between hatching cohorts of a treehole mosquito. Ecology 63: 175 1 - 1760.
Livdahl, W. E., R. Koenekoop, and R. S. Futtenveit. 1984. The complex hatching response of Aedes eggs to larval density. Ecological Entomology 9: 437 -442.
Walker, E. D., D. L. Lawson, R. W. Men-itt, W. T. Morgan, and M. J. Klug. 1991. Nutrient dynamics, bacterial populations, and mosquito productivity in tree hole ecosystems and microcosms. Ecology 72: 1529- 1546.

CATION DEPLETION IN NEW ENGLAND FORESTS
Richard Hallettl and James Hornbeck2
Preliminary results are presented from a case study designed to evaluate the potential for cation depletion in low- elevation forest soils of northern New England and New York. Samples of foliage, wood, and soils were collected in August, 1993 from plots with deep sandy soils that had previously been cleared or harvested and are now dominated by mature stands of either red oak or white pine. Plots were located in New York, Vermont, New Hampshire, Maine, and Massachusetts. Planned andlor completed analyses include estractable and total nutrients for soils, total nutrients in foliage, and extractable nutrients in wood. Nutrients include Ca, Mg, K, Fe, Mn, Al, N, and P. Results presented here include nutrient values in green foliage sampled from upper and middle layers of the canopy.
'Complex Systems Research Center, University of Ncw I-Iampsllirc, Durham, NII 03824.
'USDA Forest Service, Noitheastern Forest Erpa-iment Station, Durham, NH 03824.

ALUMINUM MOBILIZATION AND CALCIUM DEPLETION IN THE FOREST FLOOR OF RED SPRUCE
FORESTS IN THE NORTHEASTERN UNITED STATES
Gregory B. Lawrence', Mark B. David2 and Walter C. Shortle3
Abstract: Mechanisms of Ca depletion were investigated as part of a regional study of relations among acidic deposition, soil chemistry and red spruce decline. Comparison with results from studies in the Adirondack Mountains of New York and the White Mountains of New Hampshire indicates that current acid-extractable Ca concentrations in the Oa horizon are less than one-half the average measured in the 1930's. A statistically significant decrease of similar magnitude was also observed for both exchangeable and acid-extractable Ca, over the past two decades, in archived Oa horizon samples collected in red spruce stands at the Hubbard Brook Experimental Forest, N. ?I. The same samples indicated increases in exchangeable and acid-extractable A1 concentrations over this period. Our results indicated no relation between concentrations.of exchangeable Ca and exchangeable H in the forest floor, whereas a strong inverse relation was observed between concentrations of exchangeable Ca and exchangeable Al. We also found that exchangeable A1 concentrations were related to the concentrations of acid- extractable Al (mostly organically complexed Al), but unrelated to mineral A1 concentrations. Furthermore, the exchangeable Al content of the forest floor was positively correlated with the molar ratio of inorganic A1 to Ca in the soil solution of the B horizon. We propose that A1 mobilized within the mineral soil by acidic deposition is an important contributor to the pools of exchangeable and acid-extractable A1 in the forest floor. Once mobilized in the mineral soil, Al is transported by water movement and root uptake into the forest floor, where it can replace Ca on exchange sites through its strong &nity for organic functional groups.
INTRODUCTION
Concern about the effects of acidic deposition on forest soils has led to numerous investigations in both Europe and North America, as summarized by Johnson et al. 1 99 1 . The underlying hypothesis of these studies is that acidic deposition enhances leaching of base cations, increases soil acidity and reduces soil fertility. Decline and dieback of red spruce forests (Shortle and Smith 1988), acidification of surface-water (van Breemen et al. 1984), and decreases in forest productivity (Federer et al. 1989) have all been linked to increased soil acidity resulting from acidic deposit ion.
Investigations of soil acidification have shown that measurable increases in soil acidity can occur in as little as two decades and that both acidic deposition and natural growth processes can cause significant soil acidification (Johnson et al. 1991). Despite the progress that has been made, however, no consensus has been reached on whether acidic deposition has significantly increased soil acidity in declining red spruce forests of the northeastern United States. Varying interpretations of the effects of acidic deposition on soil chemistry in red spruce forests result from difficulties in quantifying processes such as plant uptake, weathering and leaching by organic acids, and also from a lack of data that characterizes the regional variability of these processes.
'Research Hydrologist, US Geological Survey, 425 Jordan Rd., Troy, NY 12 180.
'Associate Professor, Dept. of Natural Resources and Environmental Sciences, University of Illinois, W-503, Turner Hall, 1 102 S. Goodwin Ave., Urbana, IL 6 180 1.
'Supervisory Research Plant Pathologist, USDA Forest Service, Northeastern Forest Experiment Station, Durham, NH 03824.

With support fiom the Northern Global Change Research Program, a joint project was begun by the U.S. Geological Survey, the USDA Forest Service, the University of Illinois, and Yale University to investigate relations between acidic deposition and the health of northeastern red spruce forests. A primary goal of this project was to determine if acidic deposition has caused measurable changes in soil chemistry in these forests. This report summarizes data on Ca and A1 concentrations in soil and soil-solution samples from 12 red spruce forests in the northeastern U.S., and compares these data to results reported by Heimburger, 1 934 and Lunt, 1 93 2 for the same region.
METHODS
Sites were selected to include the four physiographic regions in the Northeast where spruce forests are common; the Adirondack Mountains of New York, Green Mountains of Vermont, White Mountains of New Hampshire and low- to-mid elevation areas in Maine. The sites were selected to encompass the range of conditions found in red spruce forests in the Northeast with respect to elevation, climate, bedrock, mineral weathering characteristics, acidic deposition, and forest-stand condition. Each site was sampled either two or four times during 1992 and 1993.
Soil samples were collected fiom the Oa horizon and top 10 cm of the B horizon from the faces of nine soil pits during each sampling. Exchangeable-Ca concentrations were measured by NWCl extraction, and mineral-matter concentrations were measured by loss-on-ignition, by the methods of Blurne et al. (1 990). Exchangeable-A1 concentrations were measured by the method of Thomas (1 982). Acid-extractable Ca concentrations were measured by the methods of Friedland et al. (1 984), and total Ca concentrations were analyzed by neutron activation (Parry, 199 1). Mineral Ca concentrations were calculated as the difference between total Ca concentrations and acid- extractable Ca concentrations.
Soil solutions were collected by a new method developed for this project, termed solution expulsion (Lawrence, et al. 1992). The solution-expulsion method was specifically designed to avoid the effort and expense required for lysimeter installations and to enable collection of soil solutions at a large number of sites regardless of soil moisture conditions before or at the time of sampling. In this method a soil sample is collected and then compressed in a PVC cylinder to increase bulk density by about 40 percent. A solution chemically similar to throughfall is then added to saturate the soil. Water not held by the soil is allowed to drain by gravity and is discarded. Positive air pressure is then applied to expel the remaining soil solution, which can then be chemically analyzed. Extensive experimentation has shown that the technique gives reproducible results that are insensitive to moderate changes in bulk density, duration of contact between soil and solution, and chemical concentrations of the added solution. Soil solutions were expelled fiom all Oa and B horizon samples and were chemically analyzed by the methods cited in Lawrence and Fernandez, (1 99 1 ).
A literature search on the past and present status of available Ca in soils of northeastern red spruce forests, was also conducted to locate all data collected since 1980 that could be directly related to our study, plus any comparable data that was collected before the onset of acidic deposition in the region (assumed to be 1950).
RESULTS AND DISCUSSION
Samples from all 12 sites indicated that exchangeable Ca concentrations varied between 2.1 and 2 1.6 cmol, kg'' in Oa horizons and 0.41 to 0.68 cmol, kg-' in the upper B horizon. All comparable data on exchangeable Ca concentrations fiom other studies in northeastern red spruce stands were within these concentration ranges, except for the concentration reported for the 0 2 horizon by Mollitor and Raynal(1982), of 1.07 cmol, kg-', which was about half the concentration we measured at Mt. Abraham, Vermont, our lowest value. At most sites, exchangeable Ca was the largest fraction of total Ca in the forest floor; exceptions were sites with the highest mineral matter concentrations, where mineral Ca was 55 to 70 percent of total Ca.
Concentrations of acid-extractable Ca measured in our study ranged from 1 3.9 rnrnol kg" at Mt. Abraham, Vexmont, to 102.6 mmol kg-' at Sleepers River, Vermont. Compa~ison of these values to those of Heimburger (1 934) and Lunt (1 932) for the White Mountains of New Hampshire and Adirondack Mountains of New York, indicates a highly

probable regional decrease in acid-extractable Ca concentrations since the 1930's (Fig. 1). Concentrations were less than the value we measwed at Sleepers River (the site with the highest concentration in our study), at only nine of 38 sites sampled in the previous studies.
I
E3) Y - 250 0 E E w (d 200 0 Q) E g 150 0 !! 8 roo
Adirondacks, Heimburger,
I . . 1934 - g White - A Mountains, 9
I Heimburger, - 1934 - - - . White - 0 Mountains, . • Lunt, 1932 I . 0 . - . .
0. A Sites sampled • in this study - .A. - . 0. - Maximum A m -
7 . A
50 • 9 - o" 0 b 0
0 0 - Minimum 0 ,
4 0 1
0 5 10 15 20 25 30 35 40 45
Mineral matter (%)
Figure 1. Acid-extractable Ca concentrations in Oa horizons of red spruce stands as a function of mineral matter concentrations (measured by loss-on-ignition), as determined by Heimburger (1 934), Lunt (1 932), and this study. Maximum and minimum lines represent the highest and lowest concentrations measured at the 12 sites we sampled.
Results of this study indicated, however, that concentrations of exchangeable Ca in the Oa horizon were correlated with neither exchangeable-H concentrations nor with soil pH (p > 0. l), but were inversely related to concentrations of exchangeable Al. Although an inverse relation between exchangeable Ca and A1 concentrations in the mineral soil has been frequently observed (Johnson and Fernandez, 1992), this study is the first to identify the same relation in the forest floor, over a wide range of sites. This finding led to the hypothesis that the documented decreases of root-available Ca concentrations were associated with increases in concentrations of reactive forms of Al. No data from previous studies were available from which to evaluate temporal trends of forest-floor A1 concentrations, but analysis of archived Oa-horizon soil samples collected from red spruce-balsam fir (Abies balsamea (L.) Mill) stands at the Hubbard Brook Experimental Forest (HBEF), New Hampshire suggested that, over the past two decades, concentrations of exchangeable and acid-extractable A1 have increased, while concentrations of exchangeable and acid-extractable Ca have decreased, although the increase for exchangeable A1 was not statistically significant.
The primary mechanism for incorporating A1 into the forest floor has been hypothesized to be mixing of mineral soil with the forest floor through tree uprooting (Rustad, 1988), and a strong relation found between total A1 and mineral content in this study @ < 0.01; R2 = 0.79) supports this hypothesis. Once in the forest floor, mineral forms of A1 can be mobilized by naturally derived organic acids, although dissolved A1 is typically undersaturated with respect to mineral solubility in this horizon (Walker et al. 1990). Acidic deposition provides an additional source of H? that could possibly enhance A1 mobilization and result in an increase in concentrations such as those observed at the HBEF. Results also showed, however, that in the forest floor, neither exchangeable- nor reactive-nonexchangeable Al (acid-extractable A1 minus exchangeable Al) concentrations were related to mineral A1 (total A1 minus acid- extractable Al) concentrations, although exchangeable and reactive-nonexchangeable A1 concentrations were positively correlated with each other (p < 0.01 ; R2=0.60).
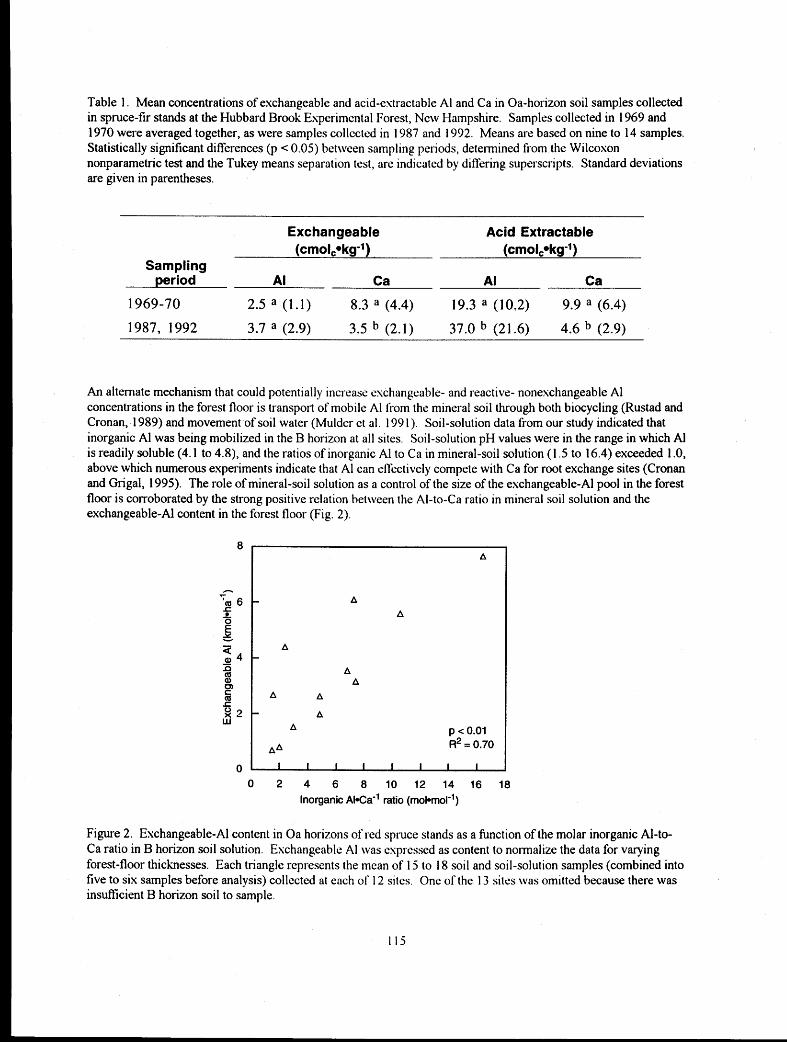
Table 1. Mean concentrations of eschangeable and acid-estractable Al and Ca in Oa-horizon soil samples collected in spruce-fir stands at the Hubbard Brook Esperimental Forest, New Hampshire. Samples collected in 1969 and 1970 were averaged together, as were samples collccted in 1987 and 1992. Means are based on nine to 14 samples. Statistically significant differences (p < 0.05) between sampling periods, determined from the Wilcoson nonparametric test and the Tukey means separation test, are indicated by differing superscripts. Standard deviations are given in parentheses.
Exchangeable Acid Extractable (cmol,*kg-l) (cmolc*kg-I)
Sampling period Al Ca Al Ca
An alternate mechanism that could potentially increase exchangeable- and reactive- nonexchangeable A1 concentrations in the forest floor is transport of mobile A1 from the mineral soil through both biocycling (Rustad and Cronan, 1989) and movement of soil water (Mulder et al. 199 1 ). Soil-solution data from our study indicated that inorganic A1 was being mobilized in the B horizon at all sites. Soil-solution pH values were in the range in which Al is readily soluble (4.1 to 4.8), and the ratios of inorganic A1 to Ca in mineral-soil solution (1.5 to 16.4) exceeded 1 .O, above which numerous experiments indicate that A1 can efictively compete with Ca for root exchange sites (Cronan and Grigal, 1995). The role of mineral-soil solution as a control of the size of the eschangeable-A1 pool in the forest floor is corroborated by the strong positive relation betiireen the Al-to-Ca ratio in mineral soil solution and the exchangeable-A1 content in the forest floor (Fig. 2).
0 0 2 4 6 8 10 12 14 16 18
Inorganic ~ l - ~ a - ' ratio (rno~*rnol-~)
Figure 2. Exchangeable-A1 content in Oa horizons of red spruce stands as a hnction of the molar inorganic Al-to- Ca ratio in B horizon soil solution. Exchangeable A1 was cspressed as content to normalize the data for varying forest-floor thicknesses. Each triangle represents the mean of 15 to 18 soil and soil-solution samples (combined into five to six samples before analysis) collected at each of 12 sites. One of the 13 sites \\'as omitted because there was insufficient B horizon soil to sample.

We propose that A1 mobilization in mineral-soil horizons, brought about by acid deposition, has significantly contributed to the documented decrease of root-available Ca in the forest floor of red spruce forests. Acidic deposition also might have enhanced A1 mobilization fsom mineral matter within the forest floor, but the mechanisms of this process are currently unknown. In either case, mobile A1 can exchange with Ca through its strong *nity for organic exchange sites (Deconink, 1980), increasing the susceptibility of Ca to leaching and also increasing the chemical similarity between the forest floor and the mineral soil.
LITERATURE CITED
Blume, L. J., B. A. Schumacher, P. W. Schaffer, K. A. Cappo, M. L. Papp, R. D. Van Remodel, D. S. Coffey, M. G. Johnson, and D. J. Chaloud. 1990. Handbook of methods for acid deposition studies: laboratory analyses for soil chemistry. U.S. Environmental Protection Agency, EPA/600/4-90/023. Environmental Monitoring Systems Laboratory, Las Vegas, Nevada.
Cronan, C. S. and D. F. Grigal. 1995. Use of calciurn/aluminum ratios as indicators of stress in forest ecosystems. Journal of Environmental Quality 24:209-226.
Deconink, F. 1980. Major mechanisms in fo~mation of spod~c horizons. Geodema 24: 10 1 - 128.
Federer, C. A., J. W. Hornbeck, L, M. Tritton, R. S. Pierce, and C. T. Smith. 1989. Long-te~m depletion of calcium and other nutrients in eastern US f~rests. Environment Management 13593-60 1.
Friedland, A. J., A. H. Johnson, T. G. Siccama, and D. L. Mader. 1984. Trace metal profiles in the forest floor of New England. Soil Science Society of America Journal 48:422-425.
Heimburger, C. C. 1934. Forest-type studies in the Adirondack Region. Cornell University Agriculture Experiment Station Memoir 165. Cornell University, Ithaca, New York.
Johnson, D. W. and I. J. Fetnandez. 1992. Soil mediated effects of atmospheric deposition on eastem U.S. spruce- fir forests. Pages 235-270 in C. Eager and M. B. Adams, editors. Ecology and decline of red spruce in the eastern United States. Springer-Verlag, New York.
Johnson, D. W., M. S. Cresses, S. I. Nilsson, J. Tumer, B. Ulsich, D. Binkley, and D.W. Cole. 1991. Soil changes in forest ecosystems: evidence for and probable causes. Pages 8 1 - 1 16 in F. T. Last and R. Watling, editors. Acidic deposition: its nature and impacts. Royal Society of Edinburgh, Edinburgh, Scotland.
Lawrence, G. B. and I. J. Feinandez. 1 99 1. Biogeochernical interactions between acidic deposition and a low- elevation spruce-fir stand in Howland Maine. Canadian Jou~nal of Forest Research 2 1 :867-875.
Lawrence, G. B., W. C. Shortle, M. B. David, P. M. Wargo, K. Vogt. 1992. FOI-est floor aluminum and calcium chemistry: Relationships with acid deposition, root vitality, stand dynam~cs, and red spruce -- Study Plan for the Northeastern Station Global Change Reseal-ch Progl-am U S. Forest Selvice Inte~nal Report, Radnor, Pa.
Lunt, H.A. 1932. Profile charactcristics of New England forest soils. Connecticut Agsicu1tu1-a1 Experiment Station Bulletin 342. New Haven, Connecticut.
Mollitor, A. V., and D. J. Raynal. 1982. Acid Precipitation and ionic movements in Adirondack Forest Soils. Soil Science Society of America Jou~nal 46: 137- 14 1 .

Mulder, J., M. Pijpers, and N. Christophersen. 199 1. Water flow paths and the spatial distribution of soils and exchangeable cations in an acid rain-impacted and a pristine catchment in Norway. Water Resources Research 27:29 1 9-2928.
P q , S. J. 1991. Activation Spectrometry in chemical analysis. in J. D. Winefordner and I. M. Kolthoff, editors. Chemical analysis volume 1 1 9. John Wiley and Sons, New Y ork.
Rustad, L. E. 1988. The biogeochemistry of aluminum in a red spruce (Picea rubens Sarg.) forest floor in Maine. Ph.D. Thesis, University of Maine.
Rustad, L. E. and C. S. Cronan. 1989. Cycling of aluminum and nutrients in litterfall of a red spruce (Picea rubens Sarg.) stand in Maine. Canadian Journal of Forest Research 1 9: 18-23.
Shortle, W. C. and K. T. Smith. 1988. Aluminum-induced calcium deficiency syndrome in declining red spruce. Science 240:1017-1018.
Thomas, G. W. 1982. Exchangeable cations. Pages 16 1 - 164, in A. L. Page, editor, Methods of soil analysis, part 2. 2nd edition. Agronomy Monographs, American Society of Agronomy, Madison, Wisconsin.
van Breemen, N., C. T. Driscoll, and J. Mulder. 1984. Acidic deposition and internal proton sources in acidification of soils and waters. Nature 307:599-604.
Walker, W.J., C. S. Cronan and P.R. Bloom. 1990. Aluminum Solubility in organic soil horizons from northern and southern forested watersheds. Soil Science Society of America Journal 54:369-374.

CALCIUM STATUS OF THE FOREST FLOOR IN RED SPRUCE FORESTS OF THE
NORTHEASTERN U.S. - PAST, PRESENT AND FUTURE
Mark B. David1, Gregory B. Lawrence2, Walter C. shortle3, and Scott W. Bailey4
Dieback and growth decline of red spruce (Picea rubens),in the eastern U.S. coincides with the period of acidic deposition, and has led to much speculation as to whether this decline is caused by decreased root-available Ca in the soil. Results of intensive research at several sites have led to conflicting conclusions as to whether acidic deposition has depleted Ca concentrations in the rooting zone to the degree that would cause growth decline in red spruce. Regional evaluations of the current status of soil Ca in red spruce forests have been limited by the small number of sites at which soil and soil solution Ca concentrations have been measured with comparable methods. Comparisons with historical data have also been limited by a lack of current data that is directly relatable. To obtain the additional data necessary for a regional analysis of soil Ca in red spruce forests, either 18 or 36 soil and soil solution samples were collected in 1992-93 from 12 sites in New York, Vermont, New Hampshire and Maine in a study supported by the USDA Forest Service Global Change Research Program. These sites represent the range of environmental conditions and stand health for red spruce in the northeastern U.S. Comparison with results from separate studies by Heimburger and Lunt in the 1930s indicate that current acid-extractable Ca concentrations in the Oa horizon are less than one-half the average measured in the 1930's. A statistically significant decrease of similar magnitude was also observed for both exchangeable and acid-extractable Ca, over the past two decades, in archived samples collected in red spruce stands at the Hubbard Brook Experimental Forest, N.H. The average ratio of inorganic A1 to Ca in mineral-soil solution for the 12 sites was 5.0, indicating that inhibition of Ca uptake by A1 in the mineral soil may have contributed to the decline of Ca concentrations in the forest floor. A Ca budget, developed through the use of Sr isotope ratios to estimate weathering rates, suggests that root-available Ca in the northeastern U.S. will likely continue to decline.
'Department of Forestry, University of Illinois, 1 102 S. Goodwin, Urbana, XL 6 180 1.
'Research Hydrologist, U. S. Geological Survey, 425 Jordan Rd., Troy, NY 1 2 1 80.
3USDA Forest Service, Northeastern Forest Experiment Station, Durham, NH 03 824. L
'USDA Forest Service, Northeastern Forest Experiment Station, Hubbard Brook Experimental Forest, Carnpton, W.
I18

PUTRESCINE: A MARKER OF STRESS IN RED SPRUCE TREES
Rakesh Minocha', Walter C. Shortlei, Gregoty B. Lawrence2, Mark B. David3, and Subhash C. Minocha4
Abstract: Aluminum (Al) has been suggested to be an important stress factor in forest decline due to its mobilization in soil following atmospheric deposition of acidic pollutants. A major goal of our research is to develop physiological and biochemical markers of stress in trees using cell cultures and whole plants. Needles of red spruce (Picea rubens) collected from several sites in the northeastern United States and red spruce cells grown in suspension cultures were examined for polyamine and inorganic-ion content. The cells in culture were exposed to various concentrations of Al for different lengths of time. Exposure to Al increased putrescine biosynthesis and lowered the concentrations of cellular Ca, Mg, Mn, and K. No treatments were applied to the trees but some of the sites were known to be under "general environmental stress" as indicated by a large number of dead and dying red spruce trees. All of the sites, while differing in geochemistry, had a soil pH value below 4.0. Data collected fkom field studies enabled us to categorize these sites on the basis of cellular levels of putrescine and soil chemistry. Needles from trees growing on Ca-rich soils (organic horizon) with low exchangeable Al:Ca ratios had lower levels of putrescine than those from trees growing on Ca-poor soils with high Al:Ca ratios.
INTRODUCTION
The negative effects of acidic deposition on soil fertility, possibly due to the mobilization of Aluminum (Al) and leaching of bases, are of major concern because such processes can impact forest growth over large areas. Although exposure to low levels of pollutants under natural conditions may not result in immediate visible injury, subtle physiological and biochemical changes may still be quantifiable. The ability to detect these changes at an early stage would enable us to predict future forest damage and may suggest means to reduce the severity of such damage. Therefore, it is necessary to develop a set of early physiological and biochemical indicators to assess possible adverse effects of soil Al and Calcium (Ca) concentrations on forest growth.
Changes in the A1:Ca ratio of the soil solutions are correlated with Al stress and nutrient imbalances in sensitive tree species (Cronan and Gngal 1995). Among the effects of A1 on plants are inhibition of cell division, DNA synthesis, needle biomass, root growth, and seedling height (McQuattie and Schier 1990, Schier et al. 1990). Al also aEects the uptake of Ca and other inorganic ions (Mlnocha et al. 1992, Zhou et al. 1995). Earlier work by our group suggests that changes in the A1:Ca ratio in fine roots of red spruce growing under stress may be linked to increased vulnerability and mortality of trees (Shortle and Smith 1988). However, the primary sites of Al toxicity and the chain of biochemical and molecular events through which Al exerts its toxic effects are not well understood (Delhaize and Ryan 1995).
Recently, considerable attention has been focused on the study of changes in the metabolism of aliphatic polyamines (pubescine, spennidine, and spennine) in plants subjected to various kinds of environmental stress. The cellular polyamine content is highly regulated and stimuli such as Ca and magnesium (Mg) deprivation, high salinity, sulfur dioxide (SOJ h g a t i o n , pathogenesis, osmotic stress, ozone, and acid stress lead to an accumulation of one or more of the polyamines (Galston 1989, Flores 1991). This increase in polyamines generally is accompanied by
'USDA Forest Service, Northeastern Forest Experiment Station, PO Box 640, Durham, NH 03824.
'Research Hydrologist, US Geological Survey, 425 Jordan Rd., Troy, NY 12 180.
%Jniversity of Illinois, W-503 Turner.Hal1, 1 102 S. Goodwin Ave., Urbana, IL 6 180 1.
4University of New Hampshire, Plant Biology Department, Durham, NH 03824.
119

increased activity of their biosynthetic enzymes. Studies with cell cultures of a woody plant, Catharanthus roseus, showed that treatments with A1 caused changes in cellular polyamines, particularly putrescine, while also causing inverse effects on cellular Ca levels (Minocha et al. 1992, Zhou et al. 1995). Therefore, we hypothesized that changes in levels of cellular putrescine or putrescinelspe~rnidine ratios could be used as an early indicator of the stress response not only in cell cultures but also in mature forest trees.
The objectives of this study were to: 1) analyze changes in putrescine and putrescinelspermidine molar ratios in response to A1 stress using cell cultures of red spruce; 2) determine cellular polyamine levels in needles of mature red spruce trees growing under stress; and 3) determine if there is a correlation between putrescine in needles of mature red spruce trees and Ca levels in soil solutions of the Oa and B horizons or exchangeable A1:Ca charge ratios in the Oa horizon.
MATERIALS AND METHODS
Cell Culture Studies
Culture conditions. Suspension cultures of Picea rubens were obtained from Dr. Krystyna Klimaszewska, Petawawa National Forestry Institute, Chalk River, ON, and maintained in half-strength Litvay's medium (Litvay et al. 1981) as modified by Klimaszewska (personal cornmun.). Modifications included the addition of 0.5 g/L glutaxnine, 1 .O g/L casein hydrolysate, 2 percent sucrose (rather than 3 percent), 9.05 pM 2,4-D, and 4.44 pM BA. In addition, iron-EDTA was replaced by 40 mg/L of a plant product called sequestrine containing 7 percent iron chelate (Plant Products Co., Brampton, Ontario L6T1). The medium was adjusted to pH 5.7 before it was autoclaved. Cells were subcultured at intervals of seven days by transferring 15 ml of cell suspension into 45 ml of fresh medium in 250-ml Erlenmeyer flasks. The flasks were kept in darkness at 25 "C 2 2 on a gyratory shaker at 120 rpm.
The A1 levels (0.2,0.5, and 1.0 mM of AlC1,) used in cell-culture experiments were based on earlier work on the effects of A1 on growth. The pH of the medium at the time of A1 addition was 4.2 or lower. To study A1 speciation in this medium A1 was added to the cell-fiee medium or to three-day-old cell cultures. In either case, about half of the added AlCl, was found to be precipitated. Before analysis for monomeric Al, the precipitate was removed by centrifuging the medium.
For experimental treatments, filter-sterilized AlCl, was added to a final concentration of 0.2,0.5, or 1.0 rnM to 20 rnl of three-day-old cells maintained in 50-ml flasks. The flasks were kept on a gyratory shaker at 120 rpm until analysis. The pH of the medium, which remained around 4.2 2 0.3 after 24 h of subculture, was not adjusted during the incubation period. Each treatment was run in triplicate and each experiment was run at least three times. At the end of the treatment period, cells were collected and analyzed for polyamines and inorganic ions by methods described in the section that follows.
Inorganic ion analysis. Cells were collected on Miracloth by vacuum filtration, washed thoroughly with deionized distilled water, and weighed. One hundred mg of cells were frozen and thawed (3X) in 10 ml of 0.01 N HC1 (Minocha et al. 1994). Extracts were centrifuged at 18,000 g for 20 min at 4 "C or filtered through a 45-pm nylon syringe filter. The supernatant solutions or the filtrates were analyzed for inorganic ion content with a Beckman Spectrospan V ARL DCP (Direct Current Plasma Emission Spectrometer, Beckrnan Instruments, Inc., Fullerton, CA) using the Environmental Protection Agency's method number 66-AE0029 (1 986).
'The use of trade, firm, or corporation names in this publication is for the information of the reader. Such use does not constitute an official endorsement or approval by the U.S. Department of Agriculture or the Forest Service of any product or service to the exclusion of others that may be suitable.

Polyarnhe analysis. Cells were collected and extracted in 5 percent perchloric acid (PCA) in the manner described for inorganic ions. Extracts were cenhifuged at 18,000 g for 20 min at 4 "C. The supernatant fractions were used for dansylation and quantification of polyamines by high performance liquid chromatography (HPLC) Wnocha et al. 1990).
Whole-Plant Studies
Sites
Six sites fiom the northeastern United States were selected for collection of soil, root, wood-core, and needle samples, as part of a collaborative effort funded under the USDA Forest Service Global Change Program. The sites were located at Howland, Lead Mountain, and Kossuth, ME; Crawford Notch, NH; Groton, VT; and Big Moose, NY. Seventy-two red spruce trees were selected randomly and tagged at each site at the beginning of the study. Each site was sampled twice a year for two years except for needle samples from Kossuth and Big Moose, which were sampled once a year. Soil and needle samples were collected within one year of each other. Visual observations at each site indicated that Howland, Kossuth, and Groton had no dieback or unusual mortality but that stands at the Big Moose and Crawford Notch were experiencing dieback. The stand at Lead Mountain, also known as Bear Brook, is relatively younger and did not exhibit dieback.
Needle Samples
Extraction of acid soluble polyarnines and inorganic cations. Ten of the 72 flagged trees were selected fiom each site for collection of needle samples. In some instances, because of difficulty in reaching branches of tall trees, untagged trees in the vicinity of tagged trees in the same stand were selected for needle samples. Needles from current- and previous-year growth were collected from freshly cut branches in the field and immediately placed in individual preweighed microfbge tubes containing 1 ml of 5 percent PCA. The tubes were kept on ice during transportation to the laboratory. The tubes were stored at -20 OC until they were processed. The samples were weighed, fiozen and thawed (3X), and centrihged at 14,000 rpm for 10 min. The supernatant was used directly for polyamine analysis or for inorganic-ion analysis after proper dilution with distilled, deionized water (final concentration of PCA 0.01 or 0.02 N) by the procedures described earlier.
Soil Samples
At each sampling time, three clusters of three trees each were selected from the 72 tagged trees. Soil samples were collected from the Oa horizon and upper 10 om of the B horizon near each of the nine selected trees and combined for each cluster. Thus, 12 pooled samples from the Oa and B horizons were collected at each site over the four sampling periods.
Analysis of exchangeable Ca and A1 in soil. Soil samples were extracted with 1 M ammonium chloride and the extracts were analyzed for Ca by the procedure of Blume et al. (1 990). Exchangeable A1 was determined in 1 M KC1 extracts (Thomas 1982).
Ca in soil solution. Each soil sample was placed in a sealed cylinder and an artificial throughfall (chemically similar to Howland site throughfall) was added to attain a moisture content that approximated field capacity. The soil solution was expelled by positive air pressure from the soil that was placed in the sealed cylinder. This procedure for extraction of soil solution was developed by Lawrence et al. The soil solution was analyzed for aqueous A1 species and other ions according to the procedures of Driscoll(1984) and Lawrence et al. (1 995).
6Lawrence, G. B. and M. B. David. A new method for collecting soil-solution in forest soils. In preparation.

RESULTS
Cell Culture Studies
Adding AlCl, to the cell-free medium or cell cultures resulted in precipitation of 50 to 60 percent of the added Al even when the medium pH was 4.2 or lower. This medium contains a nursery product called "sequestrine", which has 7 percent iron-EDTA. The remaining undefined component(s) of sequestrine in half-strength Litvay's medium was largely responsible for the precipitation of A1 (data not presented). All of the soluble Al was present in monomeric form at final concentrations of 0.085,0.22, and 0.5 1 0 mM, respectively for the 0.2,0.5, and 1.0 mM AC13 added to the cultures. More than 75 percent of this total monomeric Al was present as inorganic monomeric Al.
A significant negative growth effect was observed with the 1.0 mM A1 treatment, as early as one day after the addition of Al. The 0.2 mM A1 treatment had no significant effect on growth for the first three days. A dose- dependent inhibition of growth increased with increasing incubation time for treatments after four days (Fig. 1).
Control
Time after Al addition (days) Figure 1. Effects of aluminum chloride on total cell mass in three-day-old cell cultures of red spruce (data are mean + SE of three replications). -
Effects of A1 on cellular putrescine metabolism were observed as early as 4 h after treatment (Fig. 2). In general, A1 caused a dose-dependent elevation of cellular putrescine in these cells at all times ( a = 0.05 for 0.5 and 1.0 mM Al). Spermidine levels were not affected or showed a slight increase (Fig. 3). This effect was not always dose- dependent.
There was an increase in cellular concentrations of A1 and P in response to A1 additions at all times tested (Fig. 4). This increase always was dose-dependent for Al. There was no change in cellular levels of A1 between 4 and 48 h when cultures were incubated with 0.2 mM Al. However, the concentration of Al in 1.0 rnM Al-treated cells increased from 1 1.4 pmol (g FW)-' at 4 h to 23.94 pmol (g FW)-' at 24 h after incubation. The content of cellular potassium (K) showed a dose-dependent decrease with all concentrations of Al. Both manganese (Mn) and Mg decreased following treatment with 0.5 and 1.0 mM Al, while Ca was significantly reduced only by 1.0 mM Al.
A comparison of putrescine/spermidine ratios showed a significant increase in these ratios with A1 treatment pig. 5). This increase generally was dose-dependent.

-.t Control - u 0 . 2 mM Al
e 0 . 5 mM Al -
-1.0 mM Al -
-
- rn
-
-
Time after Al addition (days) Figure 2. Effects of aluminum on cellular levels of putrescine in three-day-old cell cultures of red spruce (data are mean 5 SE of three replications).
-rt Control I
Time after Al addition (days) Figure 3. E f f ~ t s of aluminum on cellular levels of spermidine in three-day-old cell cultures of red spruce (data are mean + SE of three replications).

Time after A l addition
Figure 4. Effects of aluminum on cellular levels of inorganic ions in three-day-old cell cultures of red spruce (data are mean + SE of three replications).

Control 0.2 mM Al
Time after Al addition
Figure 5. Effects of aluminum on putrescinelspermidine molar ratio in three-day-old cell cultures of red spruce (data are mean 5 SE of three replications).
Whole-Plant Studies
All field sites sampled had a soil pH (measured in 0.01 M CaCl,) of 2.56 to 3.1 1 and 3.58 to 4.46 for the Oa and B horizons, respectively. However, these sites differed in soil Ca and A1 levels as well as general tree stress. m l e Groton and Howland showed no obvious signs of dieback, Crawford Notch and Big Moose exhibited higher general stress as indicated by a high rate of dieback and mortality. Levels of cellular putrescine generally were higher in needles of red spruce trees growing at sites with higher exchangeable A1:Ca ratios (Fig. 6). Differences in putrescine levels between sites were statistically significant (P < 0.0 1). Putrescine levels in the needles were significantly correlated to the charge ratio of exchangeable A1:Ca in the Oa horizon of the forest floor (11 = 0.68, P = (0.02) (Fig. 6). Whereas putrescine levels in the needles showed a significant correlation with Ca in the soil solution of the Oa horizon of the forest floor (? = 0.58, P = < 0.05), there was no correlation with the Ca concentration in the soil solution of the upper 10 cm of the B horizon of the mineral soil (11 = .03) (Table 1).

3 160 . 2
140 Putrescine in Needles LL _ 120 1 Soil Al:Ca Charge
L(
Figure 6. Comparison of putrescine in needles of red spruce trees and charge ratio of exchangeable A1:Ca in Oa horizon of the forest floor for the six sites studied. Data for putrescine are mean of 80 replicate analyses (except for Kossuth, ME, and Big Moose, NY, for which n = 40). Each value for soil data represents 36 samples collected individually and combined into 12 samples for analysis. (Data for A1:Ca are a mean of 12 replicate analyses).
Table 1. Comparison of putrescine in needles of red spruce trees, Ca in soil solution of Oa horizon of forest floor, and Ca in soil solution of upper 10 cm of B horizon of mineral soil for six sites studied. Data for putrescine are mean SE of 80 replicate analyses (except for Kossuth, ME; and Big Moose, NY; for which n = 40). Each value for soil data represents 36 samples collected individually and combined into 12 samples for analysis (data for Ca are mean 5 SE of 12 replicate analyses).
Site Putrescine in needles
Ca in soil Ca in soil solution of Oa solution of B
Groton, VT 60.9 k 5.2 182 k 43 6 h 1 Howland, ME 42.6 k 3.3 143 * 28 5 h 1 Kossuth, ME 82.3 k 7.7 85 k 27 5*1 Big Moose, NY 90.4 k 7.1 22 k 2.9 5 * 1 Crawford Notch, NH 150.2 k 12.3 47 k 13 4 k 1 Lead Mountain, ME 140.9k 13.1 30 k 3.9 8 k 1

DISCUSSION
Joslin and Wolfe (1 988) reported a significant reduction in root and foliar biomass with an increase in the levels of inorganic monomeric A1 in the soils, and Ohno et al. (1 988) found a negative correlation between biomass of needles and concentration of A1 in the needles of red spruce. The data presented here using suspension cultures of red spruce are consistent with these reports. The inhibition of DNA synthesis and cell division had been previously associated with a reduction in the growth of Al-treated cells or plants (Maniwaki et al. 1 992, Ulrich and Clarkson 1992).
While the effects of A1 on K uptake vary with plant species (Curnmings et al. 1985, Godbold et al. 1988, Ohno et al. 1988, Schier et al. 1990); A1 often causes a reduction in Mg and Ca in needles, roots, or shoots of spruce and pine seedlings (Asp et al. 1988, Ohno et al. 1988, Schroder et al. 1988 Schier et al. 1990, Jentschke et al. 1991). In our study with red spruce cultures, a decrease in accumulation of Ca, Mg, Mn, and K was coincident with an increase in putrescine. The observed decrease in K uptake in response to A1 may be related to the efflux of malate and K, as seen in the root apices of wheat (Ryan et al. 1 995). This has been suggested as a mechanism for A1 detoxification (by chelation) around the critical growth region of the root (Delhaize and Ryan 1 995). The observed increase of P in Al-treated cells is consistent with previous studies (Asp et al. 1988, Bengtsson et al. 1988, Maniwaki et al. 1992).
I See Zhou et al. (1995) for a discussion of the interaction between A1 and P.
I Various biological and chemical agents induce the accumulation of cellular putrescine in several plant species (Dohrnen et al. 1990, Santerre et al. 1 990, Flores 199 1). The increase in putrescine generally was accompanied by an increase in arginine decarboxylase activity (Flores 1991). Treatment with A1 also resulted in an increase in cellular putrescine in our study. This effect generally was dose-dependent and could be observed as early as 4 h after treatment. In most plants, while levels of both putrescine and spermidine change in response to growth, it is only putrescine that changes in response to stress. Thus, a molar ratio of putrescine/spermidine might be a better indicator of stress than putrescine concentration alone. In this study, the level of cellular putrescine was signdicantly higher in the needles of red spruce growing in areas of higher general stress such as Big Moose and Crawford Notch. An exception was at Lead Mountain, despite the higher level of cellular putrescine in needles at that site, the trees did not show any visible signs of stress. However, these trees are much younger than those at Crawford Notch and Big Moose, so they may be better able to cope with stress.
The data from Lead Mountain also indicate that along with high reactive A1 concentrations, soil solutions at this site contain high concentrations of nitrate. In healthy coniferous stands nitrogen generally is expected to be growth limiting. This results in low to undetectable concentrations of nitrate in soil solutions. High concentrations of nitrate in soil solutions suggest that the trees at this site may be under early stages of stress that have not yet produced visible symptoms but this stress is detectable by changes in putrescine metabolism. These results are consistent with other studies with Norway spruce (Picea abies) that show that cellular putrescine levels and putrescine/spemidine ratios are higher in needles collected from trees growing in polluted areas (Tenter and Wild 199 1, Villanueva and Santerre 1 989).
An inverse correlation between cellular putrescine and Ca in Catharanthus roseus cell cultures treated with A1 was reported by Maniwaki et al. (1 992) and Zhou et al. (1 995). A similar response was seen with the cell cultures of red spruce. This observation supports the view that under stress, putrescine production (a divalent organic cation) may substitute for Ca and Mg deficiency (Cohen and Zalik 1978, Cho 1983). Further analysis showed that there was a significant inverse correlation between putrescine levels of needles and Ca concentration in soil solution and between putrescine levels and exchangeable A1:Ca charge ratio of the Oa horizon of the forest floor at all six sites. The reason for the lack of a correlation between putrescine levels and Ca in the soil solution of the B horizon may be that most roots of red spruce grow only in the Oa horizon. As a consequence the soil chemistry of only this horizon primarily affects the health of the species. Our data also suggest that all parts of a tree need not be exposed to high levels of A1 to respond to stress.
The AVCa ratio of the soil solution is one of several tools that can be used in assessing and predicting forest health (Cronan and Grigal 1995). Likewise, the molar ratio of AI/Ca rather than absolute amounts of these ions in root tips of spruce has been suggested as being important in dete~mining the level of A1 toxicity (Shortle and Smith 1988,

Schroder et al. 1988). Several studies have been reported where an AlICa molar ratio of greater than 1.0 in the soil solution, growth medium, or inside the cells had inhibitory effects on growth (Schier 1985, Stienen and Bauch 1988, Kruger and Sucoff 1989, Schulze 1989). On the basis of a critical review of the literature on A1 stress, Cronan and Grigal(1995) estimated that there may be a 50,75 and 100 percent risk of adverse impacts on tree growth or nutrition with molar A1:Ca ratios of 1,2 and 5, respectively. We demonstrate here that an increase in cellular putrescine level in response to direct or indirect stress imposed on trees by A1 exposure may be considered as another type of tool for assessing and predicting forest health. Further, the similarity of our results (on A1 effects on growth and inorganic-ion uptake) using cell cultures of red spruce with the results obtained by others using seedlings of red spruce indicates that the cell cultures grown in vitro are highly suitable for studies of the mechanisms of A1 effects on the metabolic processes of cells.
ACKNOWLEDGEMENTS
The authors thank Kenneth R. Dudzik, Daniel J. Coughlin Jr., and Stephanie Long for their superb technical assistance and Tracey Taylor-Lupien for assistance in preparing the manuscript for publication.
LITERATURE CITED
Asp, H.; Bengtsson, B.; Jensh, P. 1 988. Growth and cation uptake in spruce (Picea abies Karst.) grown in sand culture with various aluminum contents. Plant and Soil. 1 1 1 : 1 27- 1 3 3.
Bengtsson, B.; Asp, H.; Jensh, P.; Berggren, D. 1988. Influence of aluminum on phosphate and calcium uptake in beech (Fagus sylvatica) grown in nutrient solution and soil solution. Physiologia Plantariurn. 74: 299-305.
Blume, L. J.; Schumacher, B. A.; Schaffer, P. W.; Cappo, K. A.; Papp, M. L.; Van Remortel, R. D.; Coffey, D. S.; Johnson, M.G. ; Chaloud, D. J. 1 990. Handbook of methods for acid deposition studies laboratory analyses for soil chemistry. Publ. EPAl60014-901023. Las Vegas, NV: U.S. Environmental Protection Agency, Environmental Monitoring Systems Laboratory.
Cho, S. C. 1983. Effects of cytokinin and several inorganic cations on the polyamine content of lettuce cotyledons. Plant and Cell Physiology. 24: 27-32.
Cohen, A. S.; Zelik, S. 1978. Magnesium replacement by polyamines in higher plants cell free polyphenylalanine synthesis. Phytochemistry. 1 7 : 1 1 3 - 1 1 8.
Cronan, C. S.; Grigal, D. F. 1995. Use of calciurn/aluminum ratios as indicators of stress in forest ecosystems. Journal of Environmental Quality. 24: 209-226.
Curnmings, J. K.; Eckert, R. T.; Evans, L. S. 1985. Effects of aluminum on uptake by red spruce seedlings. Canadian Journal of Botany. 63: 1099- 1 103.
Delhaize, E.; Ryan, P. R. 1995. Aluminum toxicity and tolerance in plants. Plant Physiology. 107: 3 15-32 1
Dohrnen, G. P.; Koppers, A.; Langebartels, C. 1990. Biochemical response of Norway spruce (Picea abies (L.) Karst.) Toward 14-month exposure to ozone and acid mist: effects on amino acid, glutathione and polyarnine titers. Environmental Pollution. 64: 375-3 83.
Driscoll, C. T. 1984. A procedure for the fractionation of aqueous aluminum in dilute acidic waters. International Journal Environmental Analytical Chemistry. 1 6: 267-283.

Flores, H. E. 199 1. Changes in polyamine metabolism in response to abiotic stress. In: Slocum, R. D.; Flores, H. E., eds. Biochemistry and physiology of polyarnines in plants. Boca Raton, FL. CRC Press: 21 3-228.
Galston, A. W. 1989. Polyamines and plant response to stress. In: Bachrachand, U.; Heimer, Y. M. Heimer, eds. The physiology polyamines 11. Boca Raton, FL. CRC Press: 99- 106.
Godbold, D. L.; Fritz, E.; Huttermann, A. 1988. Aluminum toxicity and forest decline. Proceedings of the National Academy of Sciences of the United States of America. 85: 3888-3892.
Jentschke, G.; Schlegel, H.; Godbold, D. L. 199 1. The effect of aluminum on uptake and distribution of magnesium and calcium in roots of myconhizae Norway spruce seedlings. Physiologia Plantarium. 82 : 266-270.
Joslin, J. D.; Wolfe, M. H. 1988. Response of red spruce seedlings to changes in soil aluminum in six amended forest soil horizons. Canadian Journal of Forest Research. 1 8: 1 6 14- 1623.
Kruger, E.; Sucoff, E. 1989. Aluminum and hydraulic conductivity of Quercus rubra L. in response to A1 and Ca. Journal of Experimental Botany. 40: 659-665.
Lawrence, G. B.; Lincoln, T. H.; Ross, D. H. ; Olson, M. L. ; Waldron, L. A. 1 995. Methods of the U.S. Geological Survey, New York District Water Analysis Laboratory. U.S. Geological Survey. (In press).
Litvay, J. D.; Johnson, M. A.; Verma, D.; Einspahr, D.; Wayrauch, K. 1 98 1 . Conifer suspension culture medium development using analytical data from developing seeds. Inst. Pap. Chem. Tech Pap. Serv. 1 1 5: 1 - 17.
McQuattie, C. J.; Schier, G. A. 1990. Response of red spruce seedlings to aluminum toxicity in nutrient solution: Alterations in root anatomy. Canadian Journal of Forest Research. 20: 100 1 - 101 1.
Minocha, R.; Minocha, S. C.; Long, S. L.; Shortle, W. C. 1992. Effects of aluminum on DNA synthesis, cellular polyamines, polyamine biosynthetic enzymes and inorganic ions in cell suspension cultures of a woody plant, Catharanthus roseus. Plant. Physiology. 85: 4 17-424.
Minocha, R.; Shortle, W. C.; Long, S. L.; Minocha, S. C. 1994. A rapid and reliable procedure for extraction of cellular polyamines and inorganic ions from plant tissues. Journal of Plant Growth Regulation. 13 : 187- 193.
Minocha, S. C.; Minocha, R.; Robie, C. A. 1990. High-pelformance liquid chromatographic method for the determination of dansyl-polyarnines. Journal of Chromatography. 5 1 1 : 177- 183.
Ohno, T.; Sucoff, E. I.; Earich, M. S.; Bloom, P. R.; Buschena, C.A.; Dixon, R.K. 1 988. Growth and nutrient content of red spruce seedlings in soil amended with aluminum. Journal of Environmental Quality. 17: 666-672.
Ryan, P. R.; Delhaize, E.; Randall, P. J. 1995. Characterization of Al-stimulated malate efflux from the root apices of Al-tolerant-genotypes of wheat. Planta. (In press).
Santerre, A.; Markiewicz, M.; Villanueva, V. R. 1990. Effect of acid rain on polyamines in Picea. Phytochemistry. 29: 1767-1769.
Schier, G. A. 1985. Response of red spruce and balsam fir seedlings to aluminum toxicity in nutrient solutions. Canadian Journal ofForest Research. 15: 29-33.
Schier, G. A.; McQuattie, C. J.; Jensen, K. F. 1990. Effect of ozone and aluminum on pitch pine (Pinus rigida) seedlings: Growth and nutrition relations. Canadian Journal of Forest Research. 20: 17 14- 17 1 9.
Schroder, W. H.; Bauch, J.; Endeward, R. 1988. Mict-obeam analysis of Ca exchange and uptake in the fine roots of spruce: Influence of pH and aluminum. Trees. 2: 96- 103.
Schulze, E. D. 1989. Air pollution and forest decline in a spruce (Picea abies). Science. 244: 776-781.
Shortle, W. C.; Smith, K. T. 1988. Aluminum-induced calcium deficiency syndrome in declining red spruce. Science. 240: 10 17- 10 18.
Stienen, H.; Bauch, J. 1988. Element content in tissues of spruce seedlings from hydroponic cultures simulating acidification and deacidification. Plant and Soil. 106: 23 1 -238.
Thomas, G. W. 1982. Exchangeable cations. In: Page, A.L., ed. Methods of soil analysis, part 2; 2nd ed. Madison, WI: American Society of Agronomy: 16 1 - 164.
enter, M.; Wild, A. 199 1. Investigations on the polyamine content of spruce needles nutrition: aluminum. Progress in Botany. 53 : 63-67.
Ulrich, L.; Clarkson, D. T. 1992. Mineral ntrition: aluminum. Progress in Botany. 53: 63-67.
Vallanueva, V. R.; Santeme, A. 1 989. On the mechanism of adaptive metabolism of healthy-resistant trees from forest polluted areas. Water, Air, & Soil Pollution. 48: 59-75.
Zhou, X.; Minocha, R.; Minocha, S. C. 1995. Physiological responses of suspension cultures of Catharanthus roseus to aluminum: Changes in polyamines and inorganic ions. Jouinal of Plant Physiology. 145: 277- 284.

LONG-TERM CHANGES IN THE ACIDITY OF A DEKALB FOREST SOIL IN THE MID-REGION OF THE
SUSQUEHANNA RIVER WATERSHED
Joy R. Robert and William E. Sharpe'
Forest soil acidification has been reported to result in reduced forest productivity and forest decline. Soil acidification and forest decline may trigger changes in nutrient cycling in forest ecosystems with important consequences for drainage water chemistry and aquatic biota. In an attempt to determine whether or not Pennsylvania forest soils are becoming more acidic, soil samples were collected at six forested sites in Clinton County, Pennsylvania in 1993. Soil chemistry data obtained through two previous studies conducted in 1957 and 1961 were available for each of these sites. Soils were analyzed for pH and exchangeable calcium and magnesium, and results compared to the results obtained in the earlier studies. Soil analysis methods were evaluated to ensure that values obtained in the 1993 sampling were comparable to those of the original investigators. Results indicated sigmficant decreases in pH and exchangeable Mg content at all sites. Exchangeable Ca decreased on the undisturbed sites and increased on the disturbed sites. Significant acidification of these soils has taken place over the past 32-36 years. Comparisons of disturbed and undisturbed sites indicated that at least part of the observed increase in acidification was the result of acid deposition.
'School of Forest Resources and Environmental Resources Research Institute, The Pennsylvania State University, University Park, PA 16802.

EXPERIMENTAL SOIL WARMING EFFECTS ON C, N, AND MAJOR ELEMENT CYCLING IN A LOW
ELEVATION SPRUCE-FIR FOREST SOIL
Lindsey E. Rustad, Ivan J. Femandez, and Stephanie ~ rno ld '
Abstract: The effect of global warming on north temperate and boreal forest soils has been the subject of much recent debate. These soils serve as major reservoirs for C, N, and other nutrients necessary for forest growth and productivity. Given the uncertainties in estimates of organic matter turnover rates and storage, it is unclear whether these soils will serve as short or longer-term net sources or sinks for C and N if mean air and soil temperatures increase over time. In light of these information needs, a thermal manipulation study was initiated in 1991 at the Howland Integrated Forest Study (HIFS) site to investigate the effect of a 5 "C increase in soil temperature on C and N dynamics in a low elevation spruce-fir forest soil. Elevated soil temperatures have been successfblly maintained in replicated 15x1 5 m plots for two field seasons (1 993 and 1 994) using heat resistance cables buried 2-3 cm from the soil surface at 20 cm spacings. Replicated unheated plots with cables installed ("cabled control") and with no cable installation ("control") serve as the controls. Results to date indicate significantly increased rates of litter decay, fine root production, and CO, evolution in the heated plots relative to the controls as well as decreased concentrations of base cations and Mn in buried mineral soil bags. Soil moisture showed a slight but significant decrease in the 0 horizon in response to the thermal manipulations and no change in the upper B horizon. Although no statistically significant effect of the thermal manipulation has been observed on N mineralization rates during the first two years of this study, the cumulative amount of NH,-N mineralized over this period was greater in the heated plots relative to the control plots. No net nitrification has been observed at this site to date. Taken together, results from this thermal manipulation study indicate that modest changes in temperature can significantly alter C, N, and major nutrient dynamics at this site.
INTRODUCTION
Considerable scientific uncertainty is associated with both the current predictions of climate change as well as the expected effects of this climate change on forest ecosystems. However, it is well documented that tropospheric concentrations of CO, are increasing at a rate of - 0.5 percent per year (Houghton et al. 1 990, Denrnead 1 99 1, Keeling and Whorf 1992) and it is commonly agreed that this increase in CO, (as well as other "greenhouse" gases) could raise mean global temperature by 2-5 "C or more in the nest 50- 100 years, with a greater warming occurring in the higher latitudes than at the equator (Bolin et al. 1986, Hansen et al. 1988, IPCC 1990). Changes of this type would undoubtedly have an effect on the growth and character of northern temperate and boreal forests. The soils in these forests serve as major reservoirs for C, N, and nutrients necessary for forest growth and productivity, as well as sinks for "pollutants" ranging from metals to N to various organic compounds. Given the uncertainties in estimates of turnover rates and storage, it is unclear whether these soils will serve as a short or longer-term net source or sink for C and other materials if mean air and soil temperatures increase over time.
To address these information needs, a field study was initiated in 1 99 1 at the Howland Integrated Forest Study site to investigate the effects of a 5 "C increase in soil temperature on processes controlling C and N dynamics in a representative low elevation spruce-fir forest soil in Maine. Specifically, we evaluated the response of CO, evolution, soil air CO, concentrations, N minel-alization and nitrification, soil and soil solution chemistry, litter decay, fine root dynamics, and overstoiy foliar chemist~y to i r ~ silw experimental manipulations of soil temperature.
'Department of Applied Ecology and Environmental Sciences, University of Maine, Orono, ME 04469.
132

METHODS
Study Site. The study site is located in a low elevation (60 m) commercial spruce-fir forest in east-central Maine (45" 10' N, 68" 40' W), adjacent to the Howland Integrated Forest Study (HIFS) site. The vegetation is dominated by red spruce (Picea rubens Sarg.) (-50 percent of live basal area), with occasional co-dominant white pine (Pinus sfrobus L., -22 percent) and eastern hemlock (Tsuga canadensis Carr., 13 percent). Few balsam fir (Abies balsamea Mill.) over 4 cm dbh remain ii-om the last spruce budworm infestation. Soils at the site are classified as Aquic Haplorthods developed from an underlying layer of dense basal till. The climate is continental with mean temperature between 5 and 6 "C and mean precipitation slightly more than 1 00 cm yr-' (Lautzenheizer, 1 97 2).
Experimental Design. Three 15x1 5 m plots were established in each of two locations in the study area (separated by -300 m) in the spring and summer of 1992. One thermal treatment (5 "C above ambient) and two controls (the undisturbed "control" which has no disturbance from cable installation and the "cabled control" in which subsurface cables were installed but not heated) were assigned to one plot in each location in a blocked design. A buried cable method, in which heat resistance cables are installed 2-3 cm below the soil surface at 20 cm intervals, is used to experimentally increase soil temperatures in the heated plots.
Analytical Methods. Soil air CO, concentrations were measured by extracting gas samples fi-om soil air access tubes and determining CO, concentrations on a Gow-Mac 750P chromatograph (Erikson et al. 1990). Carbon dioxide flux was measured using a static chamber technique (modified fi-om Steudler et al. 1989). Nitrogen mineralization and nitrification rates were measured using an on-site buried bag approach (Pastor et al. 1984). Change in mineral soil chemistry was evaluated using a buried mineral bag approach (David et al. 1990) with subsequent analysis for pH (0.01 CaCId, exchangeable Ca, Mg, K, Na, extractable P, exchangeable acidity and Al, and total C, N, and S following the methods of Robarge and Fernandez (1 986). Soil solutions were sampled with ceramic cup tension lysimeters and analyzed for major chemical constituents following the methods of Hillman et al. (1 985). Litter decay rates were determined using the mesh bag technique @ocock, 1964). Litter element concentrations were determined using a HCI digest followed by ICP analysis for Ca, Mg, K, P, Fe, Mn and Zn (Munter and Grande, 198 1); C and N were determined on a Carlo Erbo NA 1500 CN Analyzer. Changes in fine root biomass were assessed using root ingrowth cores (modified from Persson, 1984). Fine root and overstory foliage samples were analyzed for total nutrient content using methods identical to those described for litter chemistry.
RESULTS AND DISCUSSION
Results from the initial two years of this experiment indicate that the buried cable method is highly effective at maintaining d a c e soil temperatures at 5 "C above ambient at this site (Fig. 1). It is noteworthy that this temperahue differential is maintained to a depth of 30-50 cm in the mineral soil (Fig. 2).
Both the surnmcrs of 1993 and 1994 were relatively dry when compared with previous years' data at the HIFS. Soil moisture tension was inversely related to throughfall volume, with peak moisture tensions occurring in early September. Soil moisture was slightly but significantly (P < 0.05) decreased in the 0 horizon in the heated plots relative to the control plots. A similar decrease in soil moisture in response to soil warming was observed by Peterjohn et al. (1 994) in a hardwood forest in Massachusetts.
Carbon dioxide evolution from the soil surface and soil air CO, concentrations both showed si&icant (P4.0001) positive exponential relationships with soil temperature. These results are consistent with data from other temperate forests and reflect an increase in microbial decomposition and/or root respiration with increasing temperature (Edwards 1975, Crill 1991, Peterjohn et al. 1994, MacDonald et al. 1995). Carbon dioxide evolution rates in the heated plots were significantly (P4l.05) greater than in the control plots (Fig. 3).
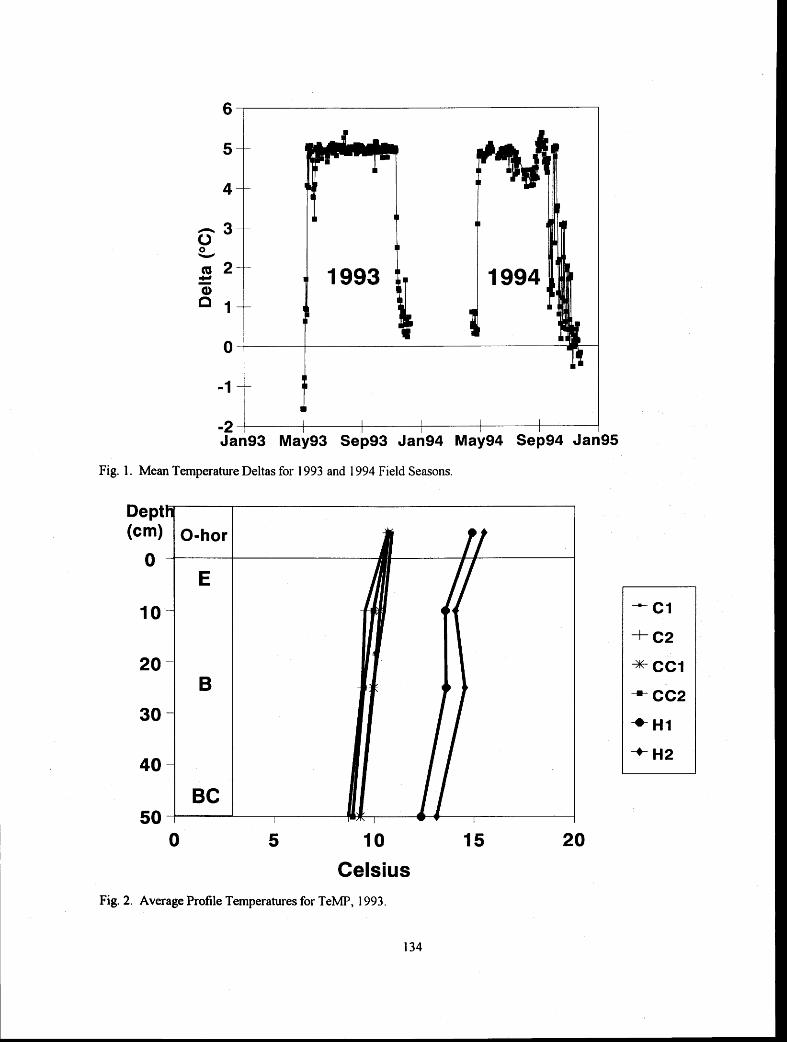
Fig. 1 . Mean Temperature Deltas for 1 993 and 1994 Field Seasons.
0 5 10
Celsius Fig. 2. Average Profile Temperatures for TeMP, 1 993.

Control Heated Fig. 3. The response of litter decay, CO, evolution, and fine root growth to a 5 "C increase in soil temperature. 'RM93' and 'RM94' are 1993 and 1994 red maple litter, respectively; 'RS93' and 'RS94' are 1993 and 1994 red spruce litter, respectively; 'CO,' is CO, evolution; and 'RTMASS' is soil core fine root mass. Units are percent original mass for litter decay, mg CO, m" k' for CO, evolution, and mglcore for root mass.
We presume that a large portion of the CO, released fi-om these soils is from the 0 horizon, where both roots and labile organic materials are most abundant. Neither 0 horizon nor mineral soil PCO, showed a response to heating. We attribute this to rapid gas diffusion in the 0 horizon toward equilibrium with the atmosphere and to minimal biological response to heating in the mineral soils.
Red maple and red spruce litter decay rates were both significantly increased (PiO.05) by thermal treatments (see RM93 and RS94, Fig.3). These results are consistent with other studies showing an increase in litter decomposition with increasing air and soil temperature (Witkamp 1 966, Meenterneyer 1978, Jansson and Berg 1984, Moore 1986, Ruark 1993). Corresponding to first year mass loss, total red maple litter C, N, and S content were significantly lower (P < 0.05) in the heated plots relative to the control plots. Red maple litter Ca, Mg, K, P, and Mn concentrations, however, were generally greater in heated plot litter relative to control plot litter, resulting in no significant differences in the total contenl of these elements between the treatments. Red spruce litter showed only minor differences in chemistry between the heated and control plots after the first year of decay, which reflects it's more recalcitrant mass loss patterns.
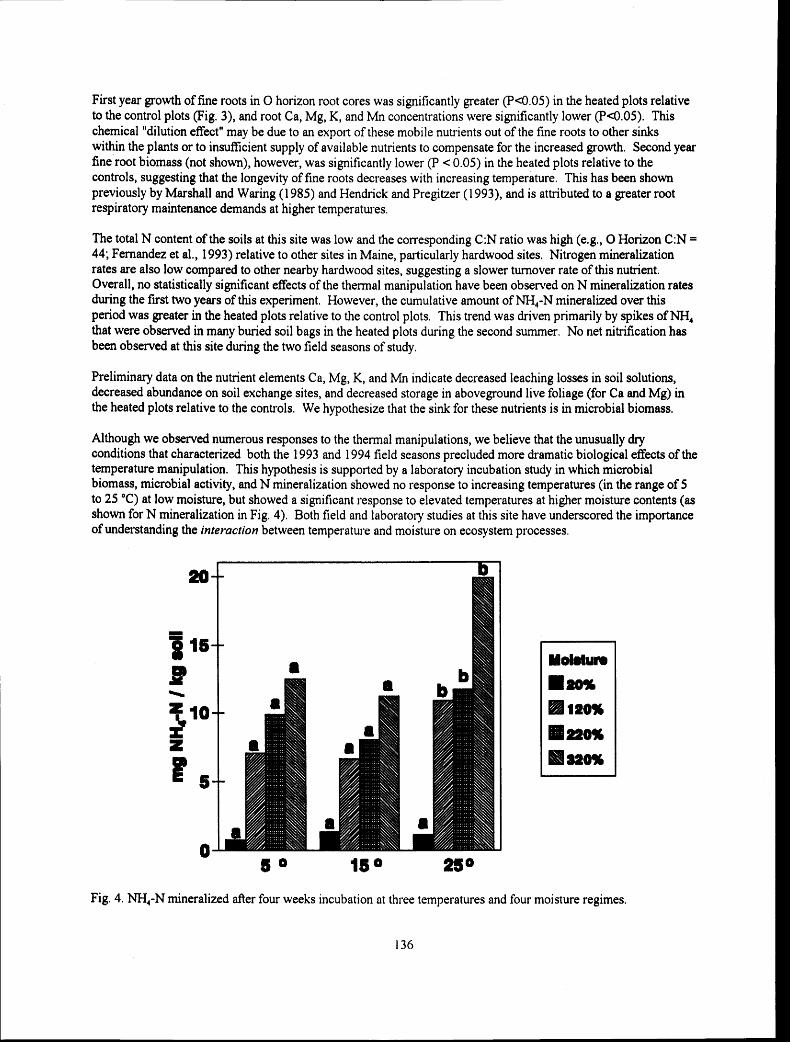
First year growth of fine roots in 0 horizon root cores was significantly greater (Pc0.05) in the heated plots relative to the control plots (Fig. 3), and root Ca, Mg, K, and Mn concentrations were significantly lower (Pc0.05). This chemical "dilution effect" may be due to an export of these mobile nutrients out of the fine roots to other sinks within the plants or to insufficient supply of available nutrients to compensate for the increased growth. Second year fine root biomass (not shown), however, was significantly lower (P < 0.05) in the heated plots relative to the controls, suggesting that the longevity of fine roots decreases with increasing temperature. This has been shown previously by Marshall and Waring (1 985) and Hend~ick and Pregitzer (1 993), and is attributed to a greater root respiratory maintenance demands at higher temperatures.
The total N content of the soils at this site was low and the corresponding C:N ratio was high (e.g., 0 Horizon C:N = 44; Fernandez et al., 1993) relative to other sites in Maine, particularly hardwood sites. Nitrogen mineralization rates are also low compared to other nearby hardwood sites, suggesting a slower turnover rate of this nutrient. Overall, no statistically significant effects of the thermal manipulation have been observed on N mineralization rates during the first two years of this experiment. However, the cumulative amount of NH,-N mineralized over this period was greater in the heated plots relative to the control plots. This trend was driven primarily by spikes of MI4 that were observed in many buried soil bags in the heated plots during the second summer. No net nitrification has been observed at this site during the two field seasons of study.
Preliminary data on the nutrient elements Ca, Mg, K, and Mn indicate decreased leaching losses in soil solutions, decreased abundance on soil exchange sites, and decreased storage in aboveground live foliage (for Ca and Mg) in the heated plots relative to the controls. We hypothesize that the sink for these nutrients is in microbial biomass.
Although we observed numerous responses to the thermal manipulations, we believe that the unusually dry conditions that characterized both the 1993 and 1994 field seasons precluded more dramatic biological effects of the temperature manipulation. This hypothesis is supported by a laboratory incubation study in which microbial biomass, microbial activity, and N mineralization showed no response to increasing temperatures (in the range of 5 to 25 "C) at low moisture, but showed a significant response to elevated temperatures at higher moisture contents (as shown for N mineralization in Fig. 4). Both field and laboratoty studies at this site have underscored the importance of understanding the interaction between temperature and moisture on ecosystem processes.
20
1 16 Molrrtun
B -h.
.ao%
f lo RH 100%
z .220%
% s H aww
0 s 1s 2s*
Fig. 4. NH4-N mineralized after four weeks incubation at three temperatures and four moisture regimes.
136

CONCLUSIONS
The use of heat resistance cable has proven to be an effective technique for in situ experimental warming of forest soils. Results fiom this study to date indicate that some parameters are responding to the thermal manipulations, e.g. CO, e m u , litter decay, and fineroot growth and turnover (as measured by root ingrowth cores) are all greater in the heated plots than the control plots. For other parameters, such as soil air PCO,, significant relationships were observed with temperature over a range of 0 " to 20 "C range, although differences were not significant over the narrower range of 5 "C. Although these results suggest that there is a more rapid release of C fiom the soil-plant system to the atmosphere with increasing temperatures, increases in temperature alone are not sufficient to alter certain parameters. Soil moisture must also be adequate to support biological activity. Ideal available moisture conditions will optimize the biological responses to temperature whereas decreasing available moisture will minimize temperature responses. Thus, a dryer fhture climate scenario, as has been predicted for some regions, might offset some of the potential effects of a warmer climate. Taken together, results from this thermal manipulation study indicate that modest changes in temperature can significantly alter C, N, and major nutrient dynamics at this site.
ACKNOWLEDGEMENTS
The authors would like to thank Dr. Frank Bowles for his help with the technical design of this project, and Holly Hike1 and Steve Scaturro for their invaluable assistance in the field. Funding for this study was provided by the U.S. Forest Service (Coop. Agree. #23-640) and the U.S.D.A. - C.S.R.S. (92-37 101 -7978).
LITERATURE CITED
BOCOC~, C. E. 1964. Changes in the amounts of dry matter, nitrogen, carbon and energy in decomposing woodland leaf litter in relation to the activities of the soil fauna. J. Ecol. 52: 272-28 1 .
Bolin, B., B. R. Doos, J. Jager, and R. Warrick (eds). 1986. The greenhouse effect, climatic change and ecosystems. SCOPE 29, John Wiley, Chichester, 54 1 pp.
Crill, P. M. 1991. Seasonal patterns of methane uptake and carbon dioxide release by a temperate woodland soil. Global Biogeochem. Cycles 5 : 3 1 9-3 34.
David, M. B., R. D. Fuller, I. J. Fernandez, M. J. Mitchell, L. E. Rustad, A. Stam, and S. C. Nodvin. 1990. Spodosol variability and assessment of response to acidic deposition. Soil Sci. Soc. Am. J. 54: 541 -548.
Denrnead, 0 . T. 1991. Sources and sinks of greenhouse gases in the soil-plant environment. Vegetatio 9 1 : 73-86.
Edwards, N. T. 1975. Effects of temperature and moisture on carbon dioxide evolution in a mixed deciduous forest floor. Soil Sci. Soc. Am Proc. 39: 36 1-365.
Erikson, H., L. E. Rustad, and S. C. Nodvin. 1 990. Watershed Manipulation Project: Field implementation plan for 1'986- 1 989. EPA Report Number PB9 1 - 1 48403, Environmental Research Laboratory, Office of Research and Development, U.S. EPA, Corvalis, OR.
Fernandez, I. J., L. E. Rustad and G. B. Lawrence. 1993. Chemistry and distribution of nutrients and trace metals in soils under a low elevation spruce-fir forest. Can. J. Soil. Sci. 73: 3 17-328.
Hansen, J., I. Fung, A. Rind, S. Lebedeff, R. Ruedy, G. Russell. 1988. Global climate change as forecast by Goddard Institute for Space Studies three dimensional model. J. Geophys. Res. 93: 934 1-9364.

Hendrick, R. L. and K. S. Pregitzer. 1993. Patterns of fine root mortality in two sugar maple forests. Nature 361 : 59-6 1.
Hillman, D. C., J. F. Potter, and S. J. Simon. 1985. Analvtical Methods for the National Surface Water Survey Eastern Lake Survev (Phase I - Svnoptic Chemistry). U.S. EPA Contract No. 68-03-3249, U.S. EPA, Las Vegas, Nevada.
Houghton, J. T., T. Jenkins. J. J. Ephraums (eds). 1990. Climate change. The IPCC Scientific Assessment. Cambridge University Press, 3 6 5 pp .
IPCC. 1990. Scientific Assessments of Climate Change. The policymaker's summary of Working Group 1 to the Intergovernmental Panel on Climate Change, WMONNEP, 26 pp.
Jansson, P. E. and B. Berg. 1985. Temporal variation of litter decomposition in relation to simulated soil climate. Long-term decomposition in a Scots pine forest. V. Can. J. Bot. 63 : 1008- 10 16.
Keeling, C. D. and T. P. Whorf. 1992. Atmospheric CO, - Modem Record, Mauna Loa. p 12- 15. In: Trends 91 : A Compendium of Data on Global Change, ORNLICDIAC-46. ed. by T. A. Boden, R. J. Sepanski and F. W. Stoss. Carbon Dioxide Infolmation Analysis Center, Oak Ridge National Laboratory, Oak Ridge, TN USA.
Lautzenheizer, R. E. 1972. The Climate of Maine. In: Climate of the States. Vol. 1, U.S. Dept. of Commerce, Washington, D.C.
MacDonald, N. W., D. R. Zak, and K. S. Pregitzer. 1995. Temperature effects on kinetics of microbial respiration and net nitrogen and sulfur mineralization. Soil Sci. Soc. Am. J. 59: 233-240.
Marshall, J. D. and R. H. Waring. 1985. Predicting fine root production and turnover by monitoring root starch and soil temperature. Can. J. For. Res. 1 5: 79 1 -800.
McInnes, K. J. and R. W. Weaver. 1994. Soil Water Potential. In: Weaver, R.W., S. Angle, P. Bottomly, D. Bezdicek, S. Smith, A. Tabatabai, and A. Wollum, Methods of Soil Analysis. Part 2 - Microbiological and Biochemical Properties. Soil Sci. Soc. Am. Book Series No. 5. Madison, WI.
Meentemyer, V. 1978. Macroclimate and lignin control of litter decomposition rates. Ecology 59: 465-472.
Moore, A. M. 1986. Temperature and moisture dependence of decomposition rates of hardwood and coniferous leaf litter. Soil Biol. Biochem. 18: 427-435.
Munter , R. C. and R. A. Grande. 1981. Plant tissue and soil extract analysis by ICP-atomic emission spectrometry. In: R. M. Barnes (ed.) Developments in Atomic Plasma Spectrochemical Analvsis. Heyden and Sons, London. pp 653-672.
Pastor, J., J. D. Aber, C. A. McClaugherty, and J. M. Melillo. 1984. Above-ground production and M and P cycling along a nitrogen mineralization gradient on Blackhawk Island, Wisconsin. Ecology 65: 256-268.
Persson, H. 1984. The dynamic fine roots of trees. In: Agren, G.I. (ed.): State and Change of Forest Ecosystems - Indicators in Current Research. Swed. Agric. Sci. Report no. 13, pp 193-204.
Peterjohn, W. T, J. M. Melillo, P. A. Steudler, K. M. Newkirk, S. T. Bowles, and J. D. Aber. 1994. Responses of trace gas fluxes and N availability to experimentally elevated soil temperatures. Ecological Applications 4: 6 17-625.

Robarge, W. and I. J. Fernandez. 1986. Quality Assurance Methods Manual for Laboratory Analytical Techniques. U.S. Environmental Protection Agency and U.S. Forest Service Forest Response Program. Environmental Research Laboratory, Corvalis, OR. 204 pp.
Ruark, G. A. 1993. Modelling soil temperature effects on in situ decomposition rates for fine roots of Loblolly Pine. For. Sci. 9: 1 18-1 29.
Rustad, L. E. and C. S. Cronan. 1988. Element loss and retention during litter decay in a red spruce stand in Maine. Can. J. For. Res. 1 8: 947-953.
Steudler, P. A., R. D. Bowden, J. M. Melillo, and J. D. Aber. 1989. Influence of nitrogen fertilization experiments on methane uptake in temperate forest ecosystems. Nature 34 1 : 3 1 4-3 1 6.
Witkamp, M. 1966. Decomposition of leaf litter in relation to environment, microflora, and microbial respiration. Ecology 47: 1 94-20 1.

SOIL RESPIRATION AND NET N MINERALIZATION ALONG A CLIMATE GRADIENT IN MAINE
Jeffrey A. Simmons, Ivan J. Femandez, and Russell D. Briggs'
Abstract: Our objective was to determine the influence of temperature and moisture on soil respiration and net N mineralization in northeastern forests. The study consisted of sixteen deciduous stands located along a regional climate gradient within Maine. A significant portion of the variance in net N mineralization (4 1 percent) and respiration (33 percent) was predicted by temperature. The fraction of explained variance (?) was much higher when data were partitioned by region or by individual sites (as high as 80 percent). This suggests that temperature is a strong predictor of respiration and net N mineralization within climate zones, but additional environmental factors become important at a larger landscape scale. The slope of the relationship between respiration and temperature was significantly greater in the Northern and Central regions than in the Southern and Coastal regions, suggesting that soil biota are more sensitive to temperature in the former. Soil moisture was a poor predictor, probably because moisture is infrequently and transiently limiting in these forests.
INTRODUCTION
The continuing accumulation of greenhouse gases has led scientists to predict a global warming of 2 to 4 "C (Hansen et al. 1988). Because New England is at a relatively high latitude, this climate effect should be amplified, resulting in a 4 to 8 "C increase in mean annual air temperature in that region (Hengeveld and Skinner 1993). Changes in precipitation patterns are less certain but significant increases or decreases could occur (Manabe and Wetherald 1986). New England forests will be subject to potentially significant effects of these projected climatic shifts, ranging from almost immediate changes in biogeochemical cycling and phenology, to longer term changes in forest composition and productivity across the Northeast landscape.
The ability of forest vegetation to respond to changes in climate, such as increased temperatures, will depend upon the resources available to them, such as water and nutrients (Luxrnoore et al. 1993, Pastor and Post 1988). Thus, it is essential that we understand how climate change will affect nutrient availability in forests. In order to predict the potential effects of climate change, we must first understand how climate currently influences soil nutrients. The Maine Gradient Study was initiated in 1993 to evaluate the effects of temperature and moisture on carbon (C) and nitrogen (N) mineralization, which are indicators of nutrient availability. We established a network of sixteen sites across the four climate regions of Maine (Briggs and Lemin 1992) and measured soil respiration, soil air CO, concentration, net N mineralization and nitrification, litterfall mass and chemistry, foliar chemistry and litter decomposition (Delaney et al. 1995). In this paper we focus on the soil respiration and net N mineralization results.
METHODS
Study Sites
In order to make comparisons among sites in the Gradient Study, we tried to minimize differences among sites in terms of soil and vegetation characteristics. Thus, all sites had to satisfy a set of criteria. Candidate sites were identified along a transect within each of the four climate regions (Figure 1). An extensive site selection procedure was used to reduce the over 300 candidate sites to the chosen 16 sites. Soils at all sites are moderately well-drained to well-drained Spodosols (Typic or Lithic Haploi~hods) with well-developed, mor-type forest floor. Stands are dominated by a combination of sugar maple (Ace,.saccha,unr Marsh.), red maple (Acer rwbrurn L.), American beech
'Department of Applied Ecology and Environmental Sciences, University of Maine, Orono, ME 04469-5722.
140

(Fagus gmndiJiolia Ehrh.) or red oak (Quercus rubra L.). Mean age of the overstoly is between 80 - 150 years old and basal area is between 25 and 35 m2 ha-'.
South
Figure 1. Location of Maine Gradient Study sites.
Sampling
At each of the 16 sites three 15 x 15 m study plots were established. Automated weather stations at central locations in half the sites continuously recorded air temperature, soil temperature at 5 and 35 cm soil depth, and throughfall volume. Linear interpolation was used to estimate these parameters at the remaining sites. Each of the sites was visited monthly fiom May through November in 1 993 and 1 994. During each visit air temperature, soil temperature, soil water content, and soil respiration (Zibilske 1995) were measured in each plot. At the same time, N mineralization was estimated using buried bags (Hart et al. 1995). Ammonium and nitrate were extracted for 30 hours in 1N KC1 before determination by phenol nitroprusside and cadmium reduction, respectively.
Statistical Analysis
Least-squares linear regression and Pearson's correlation were performed on log-transformed data. Temperature and moisture were the independent variables and soil respiration and net N mineralization were the dependent variables. Temperature response curves of soil from each site were compared using analysis of variance with a significance level of 0.05 (Meredith and Stehman 1 99 1 ).
RESULTS AND DISCUSSION
Data fiom the eight weather station sites confilmed that our experimental design successfully captured a broad range of climate conditions (Figure 2). Mean annual precipitation ranged from 90.1 cm at site 1 to 139.6 cm at site 16. Mean annual air temperature ranged fiom 2.0 "C at site 1 to 6.2 "C at sites 12 and 16. This 4 "C difference is within the projected range of temperature increase from global waiming (Hengeveld and Skinner 1 993).

Air Temperature (C) Forest Floor Temperature (C)
Figure 2. The location of the eight weather station sites on a climate surface. The sur-faces are (a) annual precipitation vs. mean annual air temperature, and (b) mean annual water-filled porosity (% of saturation) vs. mean growing-season (May - Oct.) soil temperature at 5 cm below the surface of the Oe.
Although precipitation and air temperature define the regional climate conditions of each of the sites, soil biota will be most responsive to soil environmental factors, such as soil temperature and water content. Water-filled porosity, the fraction of pore space that is water-filled, was greater than 0.3 in sites l ,4 , 5 and 16 and less than 0.3 in sites 8, 9, 12 and 13. Note that the two northern sites ehibited a high water-filled porosity even though precipitation inputs were relatively low. This may be a result of cooler temperatures in the northern region limiting evapotranspiration of soil moisture. Mean growing season forest floor temperature (May through October at 5 cm below the surface of the Oe) increased from 10.3 to 1 3 -4 "C from site 1 to site 1 6.
Soil respiration values ranged from 0.034 to 0.557 g CO, rn', hl;' with the highest rates in July and August and the lowest rates in November. Soil respiration from all sites and all dates was significantly con-elated with soil temperature (Figure 3a; ? = 0.33; p < 0.01), but not with water-filled porosity (? = 0.03; data not shown). Thus, temperature apparently influenced soil respiration at these sites, whereas soil moisture did not within the range of moistures we observed.
One of the unique aspects of this data set is that it represents the response of soil respiration over a wide geographic and climatic range. Most other soil respiration studies have used only a single site or adjacent sites (Reiners 1968; Bowden et al. 1993; Hanson et al. 1 993; Pete john et al. 1 994; Toland and Zak 1994). Perforrning correlations on data subdivided by region or by site revealed a noteworthy trend (Table 1). With a few exceptions, the strength of the correlations between temperature and either soil respiration or net N mineralization decreased as the spatial scale of the measurements increased. This suggests that temperature can be a strong predictor of soil respiration at individual sites, but is weaker at the landscape scale. Thus, at larger scales additional environmental parameters may be required,

ln (Resp.) = -2.70 + (0.0696) T; r2 = 0.33 ln(Nmin) = -0.697 + (0.135) T; r2 = 0.41
Temperature at 5 cm (C) Temperature at 5 cm (C)
Figure 3. Linear regressions of (a) ln(soi1 respiration, g CO, m-2 hr-') and (b) ln(net N mineralization, ,ug N g-' dayq1) versus forest floor temperature. Both regressions are significant (p < 0.0 1). Soil respiration data is for 1993-94 whereas net N mineralization data is for 1 993 only.
Table 1. Adjusted-? values from linear regressions of In (soil respiration) and in (net N mineralization) vs. forest floor temperature for the entire data set and for data grouped by region or site.
Net N Soil Respiration Mineralization
All points
By Region Northern Central Southern Coastal
By Site 1 through 16 nsd*
*nsd = not sufficient data
The slopes and y-intercepts of the In (respiration)-vs-temperature curves from each of the four climate regions were compared using analysis of variance to determine if the soil biota in each region responded to temperature changes in the same way. In other words, we wanted to know if the temperature response of soil biota from each region was governed by a unique equation or if there was one equation that can be applied to all regions. There were no significant differences in either y-intercept or slope among the four regions (p = 0.1 1 ; n = 4). However, when the North and Central regions were combined and compared to the combined South and Coastal regions, there was a simcant difference in slope @ < 0.05; n = 8). Apparently soil biota in the NorthICentral regions are more sensitive to temperature (have a steeper slope) than soil biota from the South/Coastal regions (Figure 4). Peterjohn et al. (1 994) combined data from a number of soil respiration studies in temperate deciduous forests (most of which were at lower latitudes) and reported a higher slope (0.1 13 compared to 0.0862 and 0.0627 in our study) and a lower y-intercept value (-3.89 compared to -2.84 and -2.52 in our study).

Temperature (C)
Figure 4. Soil respiration as a function of temperature (No~tWCentral = exp (-2.84 + 0.0862*T); South/Coastal = exp ( -2.52 + 0.0627*T)).
Net N mineralization ranged from -1.56 to 12.79 pg N g-I day-' in 1993 and was significantly correlated with temperature (Figure 3b; ? = 0.4 1; p < 0.01). This range of N mineralization rates is typical for northern hardwood forests (0.5 to 16 pg N g-' day"; Zak and Pregitzer 1990; Simmons et al. 1995). Correlation with water-filled porosity was not significant. However, when measurements fi-om November were omitted (a period when soil activity is not expected to be limited by water because of very low temperatures), then a weak correlation became apparent (? = 0.10; p < 0.05; data not shown). Thus, it appears that temperature had a significant effect on net N mineralization and soil water content had a weak effect during the relatively drier growing season.
Similar to soil respiration, the strength of the correlation of net N mineralization with temperature was greater within regions than in the combined data set (Table 1). This suggests that additional environmental parameters may be required to more accurately predict net N mineralization at the landscape scale. Correlations for each site were not attempted because there was not a large enough number of data points for each site in 1993.
SUMMARY AND CONCLUSIONS
Temperature was significantly correlated with soil respiration and net N mineralization at the regional level. Together with supporting evidence from laboratoly studies by other researchers, this suggests that both C and N mineralization of northern ha1-dwood forests in Maine have the potential to increase in response to global warming. The actual response of C and N mineralization will depend on a number of interacting factors including the response of foliar C:N ratios, litter C:N ratios, soil nutrient availability and soil C inputs. At the same time plants and soil biota will be exposed to elevated atmospheric CO, concentrations and continued inputs of N from atmospheric deposition. Regional differences in the relationship between soil respiration and temperature exist and should be investigated fbrther in other locations. Moisture was not an impo~tant limiting factor for C or N mineralization in these forests, probably because the forest floor remained moist most of the year.
ACKNOWLEDGEMENTS
We are gratefbl to M. T. Delaney, M. Leathers, P. M. Wagner, M. Ruppert, K. DeFrancesco, J. Christrup, and D. Violette for assistance with field wok and labol-atoly analyses. Funding for this study was provided by the U.S. Forest Service (Cooperative Agreement #23-62 1).

LITERATURE CITED
Bowden, R. D., M. S. Castro, J. M. Melillo, P. A. Steudler and J. D. Aber. 1993. Fluxes of greenhouse gases between soils and the atmosphere in a temperate forest following a simulated hurricane blowdown. Biogeochem. 2 1 :6 1 -7 1 .
Briggs, R. D. and R. C. Lernin, Jr. 1992. Delineation of climatic regions in Maine. Can. J. For. Res. 22:801-811.
Delaney, M., J. A. Simmons, I. J. Fernandez, and R. D. Briggs. (In review). Characteristics of forest litter decomposition along a climate gradient in northern New England.
Hansen, J., I. Fung, A. Rind, S. Lebedeff, R. Ruedy, and G. Russell. 1988. Global climate change as forecast by Goddard Institute of Space Studies three-dimensional model. J. Geophys. Res. 93 :934 1 -9364.
Hanson, P. J., S. D. Wullschleger, S. A. Bohlman, and D. E. Todd. 1993. Seasonal and topographic patterns of forest floor CO, efflux from an upland oak forest. Tree Physiol. 13 : 1 - 15.
Hart, S. C., J. M. Stark, E. A. Davidson, and M. K. Firestone. 1994. Nitrogen mineralization, immobilization and nitrification in Methods of Soil Analysis: Part two. ASA-SSSA, Madison, WI.
Hengeveld, H. and W. Skinner. (Houtrnan, N., eds.) A May, 1 9-2 1. Portland,
1993. The greenhouse effect and climate models: a scientific overview. In regional response to global climate change: New England and eastern Canada.
, ME.
Luxmoore, R. J., S. D. Wullschleger, and P. J. Hanson. 1993. Forest responses to CO, enrichment and climate warming. Water Air Soil Pollut. 70:309-323.
Manabe, S. and R. T. Wetherald. 1986. Reduction in summer soil wetness induced by an increase in atmospheric carbon dioxide. Science 23 2:626-628.
Meredith, M. P. and S. V. Stehman. 199 1 . Repeated measures experiments in forestry: focus on analysis of response curves. Can. J. For. Res. 2 1 :957-965.
Pastor, J. and W. M. Post. 1986. Influence of climate, soil moisture, and succession on forest carbon and nitrogen cycles. Biogeochem. 2:3-27.
Peterjohn, W. T., J. M. Melillo, P. A. Steudler, K. M. Newkirk, F. P. Bowles and J. D. Aber. 1994. Responses of trace gas fluxes and N availability to experimentally elevated soil temperatures. Ecolog. Applic. 4:6 17-625.
Reiners, W. A. 1968. Carbon dioxide evolution from the floor of three Minnesota forests. Ecology 49:47 1-483.
Simmons, J. A., J. B. Yavitt, and T. J. Fahey. 1995. Liming effects on the forest floor N cycle. Biogeochem. (In press).
Simmons, J. A., I. J. Fernandez, R. D. Briggs, and M. Delaney. (In preparation). Relationship between soil respiration and temperature aIong a regional climate gradient.
Toland, D. E. and D. R. Zak. 1994. Seasonal patterns of soil respiration in intact and clear-cut northern hardwood forests. Can. J. For. Res. 24: 17 1 1 - 17 16.
Zak, D. R. and K. S. Pregitzer. 1990. Spatial and temporal variability of nitrogen cycling in northern lower Michigan. Forest Science 36:367-380.
Zibilske, L. M. 1994. Carbon mineralization in Methods of Soil Analysis: Part two. ASA-SSSA, Madison, WI.

INCREASING SOIL TEMPERATURE IN A NORTHERN HARD WOOD FOREST: EFFECTS ON
ELEMENTAL DYNAMICS AND PRIMARY PRODUCTIVITY
Patrick J. McHalel, Myron J. Mitchell', Dudley J. Raynal' and Francis P. Bowles2
Abstract: To investigate the effects of elevated soil temperatures on a forest ecosystem, heating cables were buried at a depth of 5 cm within the forest floor of a northern hardwood forest at the Huntington Wildlife Forest (Adirondack Mountains, New York). Temperature was elevated 2.5, 5.0 and 7S°C above ambient, during May - September in both 1993 and 1994. Various aspects of forest ecosystem dynamics were studied, including soil solution chemistry (lysimeters at 15 and 50 cm depths), trace gas flux (closed box technique), decomposition of maple and American beech litter, and tree seed germination. A preliminary experiment showed that there was less effect on soil solution chemistry when cables were buried at 5 versus 15 cm depths. The soil warming plots experienced negligible disturbance effects associated with installation of heating cables. Nitrate concentrations were elevated in the highest temperature treatment. Carbon dioxide flus was positively correlated with soil temperature, as was the decomposition rate for American beech litter. In heated plots, germination of Pinus strobus (white pine) was positively correlated with soil temperature.
INTRODUCTION
The mean global temperature (MGT) has been increasing for the past 150 years (Houghton et al., 1990), giving possible evidence of the phenomenon of global warming. Current general circulation models (GCMs) suggest that the MGT will continue to rise and could increase 1 .5-5.0°C over the next 100 years (Houghton et al., 1990). Global warming is considered to be induced by increasing concentrations of atmospheric water vapor (H,O), carbon dioxide (CO,) and other trace gases, including methane (CH,), nitrous oxide (N,O) and chlorofluorocarbons (CFCs). Concentrations of CO,, CH, and N20 have been steadily increasing since the mid- 1800s (Houghton and Woodwell, 1989). Various predictions have been made as to how regional climates will change if the earth continues to warm (Graham et al. 1990; Houghton et al. 1990). Climate change is likely to occur on a regional scale. For instance, northern latitudes (temperate and boreal) are expected to become warmer and wetter in the future (Houghton et al., 1990). Thus, it is important to understand how different ecosystems may respond to climate change, both biotically and abiotically.
METHODS
Site Description
The study site is located in a 100 year-old birch-beech-maple stand at the Anna and Archer Huntington Wildlife Forest (HF). This northern hardwood forest is located in the central Adirondack mountains of New York State (43"59.N, 74'14.W) near Newcomb. The site is underlain by Spodosols, specifically coarse-loamy, mixed frigid, Typic Haplorthods in the Becket-Mundal association (Somers, 1986). The research area was chosen because of the availability of electrical power, which was required for heating the plots, and additionally, it lies within close proximity to a nearby access road. The biogeochemist~y and productivity of HF have also been well characterized by previous studies (Mollitor and Raynal, 1982; David et al., 1982; Shepard et al., 1989).
'State University of New York, College of Environmental Science and Forestry, Dept. of Environmental Forest Biology, One Forestry Drive, Syracuse, NY 1 32 10.
2Research Designs, Box 26, Woods Hole, MA 02543.

Experimental Design
Heating cables were buried in the forest floor to a depth of approximately 5 cm, at 20 cm spacing within four (1 0 m x 10 m) plots. At 5 cm, three heated plots had soil temperatures of 2.5,5.0 and 7S°C, respectively, above ambient (reference plot). Elevated soil temperatures were maintained throughout the field season from approximately mid- May to September 30 for both 1993 and 1 994.
Field and Laboratory Methods
Field sampling included measurements of nutrient cycling parameters identified as important to carbon and nitrogen dynamics within a forest ecosystem, and included solid phase (buried soil bags) and soil solution chemistry (lysimetry), trace gases fluxes (CO,, CH, and N,O), decomposition (litter bags), primary productivity (foliageAitter collection and germination) and soil moisture and soil temperature. Preliminary results from some of these analyses will be presented. Nitrate concentration was determined by ion chromatography, while calcium and magnesium concentrations were obtained by inductively coupled plasma emission (ICP) and potassium by atomic absorption spectrophotometry (AA), respectively (Standard Methods, 1992). Trace gas samples were collected and analyzed according to the methods of Richey (1 994). Litter bags containing either maple or American beech leaves were installed in plots during October 1992 and collected at one and two years following installation. After collection, the bags were dried and weighed. A comparison of the weights at collection to the original bag weight was used to determine percent mass remaining. An in situ germination experiment, where seeds of Pinus strobus (white pine) and Tsuga canadensis (eastern hemlock) were planted in the litter layer (Oa horizon), began in May 1994. A total of fifteen wire mesh boxes were randomly located along a transect one meter from one edge of each plot. Twenty seeds per species were planted in a box, and each species was planted in a total of five boxes per plot (100 seeds/species/plot) with five additional boxes per plot as controls. The box design and planting methods were similar to those described by Dustin (1 986).
Disturbance Study
Preceding the soil-warming study, a preliminary experiment was implemented in order to assess the influence of disturbance on soil solution chemistry associated with installing heating cables (McHale and Mitchell, 1995). The study was conducted near the soil-warming site (within 500 m). The main difference between the two studies was that the cables were installed during fall 199 1 for the disturbance experiment, whereas installation of heating cables occwed during spring 1992 for the soil warming study. Further details can be found in McHale and Mitchell (1 995).
RESULTS AND DISCUSSION
Disturbance
Results of the disturbance experiment showed that simulated cables buried at 15 cm initially produced elevated ion concentrations commonly associated with soil disturbance (Likens et al., 1970; Vitousek et al., 1979; Hornbeck et al., 1986), compared to simulated cables at 5 cm, which exhibited less disruption of elemental cycles due to cable burial (Fig. 1). Plots with no cable installation generally had the lowest ion concentration levels during the disturbance experiment. In comparison, the soil warning reference plot, which had heating cables installed at 5 cm, displayed no evidence of disturbance effects despite cable burial. McHale and Mitchell (1 995) suggested that the lack of disturbance effects in the soil warming reference plot could be attributed to the timing of cable installation.
Temperature Treatments
Mean temperatures at 5 cm depth were monitored and recorded continuously throughout the 1993 and 1994 field seasons (Fig. 2). Heated plots were maintained at the specified temperatures, except the 7.5"C plot. At the 7.5"C treatment there was notable deterioration of the heating cables by the end of the 1993 field season and heat treatment was terminated approximately one month before the field season ended in 1994.
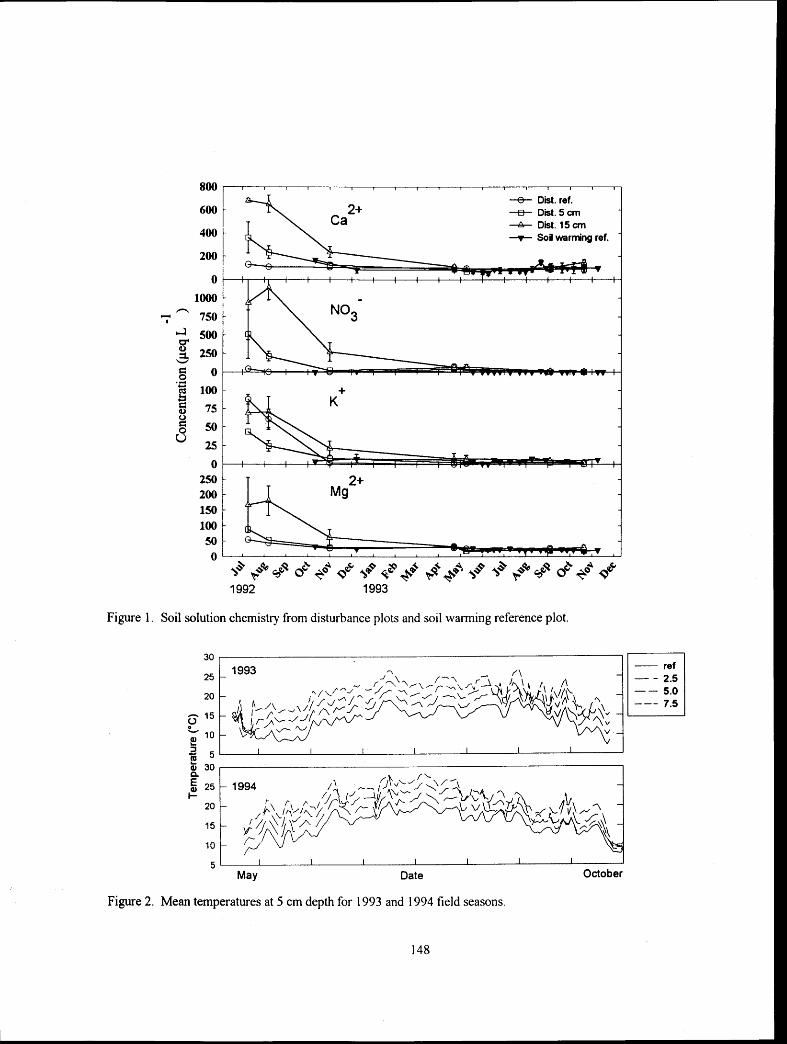
Figure 1. Soil solution chemistry from disturbance plots and soil warming reference plot.
Date October
Figure 2. Mean temperatures at 5 cm depth for 1993 and 1994 field seasons.

Soil Solution Chemistry
It was anticipated that raising the soil temperature could produce important alterations of elemental cycles, specifically, soil solution chemistry. Nitrate levels at 15 cm (Bh horizon) and 50 cm (Bs2 horizon) fiom the 7.S°C plot exceeded all other plot concentrations during early summer and again in late fall of both 1 993 and 1 994 (Fig. 3). These results suggest that increased soil temperatures increased N mineralization.
-* r e f 15 cm depth 1
ay Jun Jul Aug Sop O c t Nov Doc Jan Fob M a r Apr M a y Jun Jul Aug Sap O c t Nov
M a y Jun Jul Aug Sop O c t Nov Dao Jan Fab M a r Apt M a y Jun Ju l Aug Sop O c t Nov
1993 1994 Time
Figure 3. Mean monthly nitrate concentrations fiom soil warming plots at 1 5 and 50 cm depth.
Carbon Dioxide Flux
Carbon dioxide flux showed the strongest correlation to soil temperature of the three gases analyzed (Fig. 4). The relationship was stronger in 1993 (3 = 0.4 1, p i 0.05) than in 1 994 (? = 0.23, p 2 0.05). The relationship was linear and weaker than a similar soil warming study at Harvard Forest (Pete john et al., 1993) where the relationship was exponential and explained 72 percent of the variability. Methane and nitrous oxide fluxes failed to show any significant relationship to soil temperature.
5 10 15 20 25 30 35
Soil Temperature @ 5 an ("C)
Figure 4. Carbon Dioxide flux verses soil temperature at 5 cm depth.

Decomposition
One-way ANOVA showed that percent mass remaining in maple versus American beech litter bags was statistically significantly lower both one (p = 0.005, n = 48) and two (p = 0.0003, n = 93) years after heat treatments began (Fig. 5) , which would be expected since the latter has higher lignin content (Melillo et al. 1982) and thus is more resistant to decay. Maple did not exhibit any statistically significant differences between treatments in either year one or year two. In comparison, percent mass remaining after one year for American beech litter bags in the two highest heat treatments was statistically lower (p = 0.00 1, n = 24) than the reference and 2.5"C plots. After two years in situ, mass remaining was significantly lower in the 7.5"C plot than both the reference and 2.5"C plots (p = 0.0001, n = 48). These results suggest that elevated soil temperatures increased the decomposition rate for American beech litter.
Maple
Beech
1 Y e a r
Figure 5. Percent mass remaining in litter bags since time of installation (year = 0), (vertical lines are S.E.).
Seed Germination
Cumulative germination of planted eastern hemlock seeds failed to display a pattern of stimulation with increasing plot temperatures (Fig. 6 ) and was low in all plots. The reference plot had the highest germination rates for the entire study period. White pine seeds germinated faster with increasing temperatures in heated plots. The results of this experiment are consistent with the growth requirements of both species. Eastern hemlock is adapted to cool, moist conditions; white pine is more drought tolerant (Bums and Hondala 1990). Hemlock germination was more influenced by soil moisture than soil temperature. In comparison, white pine germination was strongly affected by soil temperature differences among the experimental plots.
Time (days)
Figure 6. Cumulative germination of tree seeds planted in soil warming plots.

CONCLUSIONS
Experimental manipulation of soil temperature is feasible and can be maintained throughout an entire field season. Experimentally heating a northern hardwood forest soil showed that elevated temperature can influence solute chemistry. Of the trace gases analyzed (CO,, CH, and N,O), carbon dioxide exhibited the strongest correlation to soil temperature. Elevated soil temperature showed differenti a1 effects on litter decomposition and seed germination. These results will be fiirther evaluated using various biogeochemical simulation models.
ACKNOWLEDGMENTS
This project was funded as part of the U.S. Forest Service, Global Change Program. We would like to thank Greg Burdick, David Lyons, Todd Anthony and Linda Galloway for their field and/or laboratory assistance and Dottie Richey for her help with trace gas methods.
LITERATURE CITED
Burns, R.M. and B.H. Honkala, tech. coords. 1990. Silvics of No~th America: 1 . Conifers. Agriculture Handbook 654. U.S. Department of Agriculture, Forest Service, Washington, D.C. vol. l ,67 5p.
David, M.B., M.J. Mitchell and J.P. Nakas. 1982. Organic and inorganic s u l k constituents of a forest soil and the irrelationship to microbial activity. Soil Sci. Soc. Am. J. 46:847-852.
Dustin, C.D. 1986. Effects of acidic deposition on sugar maple seedling development. M.S. Thesis. State Universityof New York, College of Environmental Science and Forestry, Syracuse, NY , USA.
Graham, R.L., M.G. Turner and V.H. Dale. 1990. How increasing CO, and climate change affect forests: At many spatial and temporal scales, there will be forest responses that will be affected by human activities. Bioscience 40: 575-587.
Hornbeck, J.W., C.W. Martin, R.S. Pierce, F.H. Bormann, G.E. Likens and J.S. Eaton. 1986. Clearcutting northern hardwoods: effects on hydrologic and nutrient ion budgets. Forest Sci. 3 2:667-686.
Houghton, J.T., G.T. Jenkins and J.J. Ephraums. (eds.). 1990. Climate Change: The IPCC Scientific Assessment. Cambridge University Press, Cambridge.
Houghton, J.T. and G.M. Woodwell. 1989. Global climate change. Scientific American 260:36-44.
Likens, G.E., F.H. Bormann, N.M. Johnson, W.D. Fisher and R.S. Pierce. 1970. Effects of forest cutting and herbicide treatment on nutrient budgets in the Hubbard Brook Watershed-Ecosystem. Ecol. Monogr. 40:23- 47.
McHale, P.J. and M.J. Mitchell. 1995. Disturbance effects on soil solution chemistry due to heating cable installation. Biol. Fert. Soils (In press).
Melillo, J.M., J.D. Aber and J.F. Muratore. 1982. Nitrogen and lignin control of hardwood leaf litter decomposition dynamics. Ecology 63:62 1 -626.
Mollitor, A.V. and D.J. Raynal. 1982. Acid precipitation and ionic input in Adirondack forest soils. Soil Sci. Soc. Am. J. 46: 137- 14 1.

Peterjohn, W.T., J.M. Melillo, F.P. Bowles and P.A. Steudler. 1993. Soil warming and trace gas fluxes: experimental design and preliminary flux results. Oecologia 93 : 18-24.
Richey, D.G. 1994. Nitrous oxide and methane flux between forest soils and the atmosphere and the effects of ammonium sulfate fertilization. M.S. Thesis. Syracuse University, Syracuse, NY USA.
Shepard, J.P. M. J.Mitchel1, T. J. Scott, Y.M. Zhang and D.J. Raynal. 1 989. Measurement of wet and dry deposition in a northern hardwood forest. Water, Air and Soil Pollution 48:225-238.
Somers, R.C. 1986. Soil classification, genesis, morphology, and variability of soils found within the central Adirondack region of New York. Ph.D. Dissertation. State University of New York, College of Environmental Science and Forestry, Syracuse, NY USA.
Standard Methods: For the Examination of Water and Wastewater, 18th ed. 1992. Greenberg A.E., L.S. Clesceri and A.D. Eaton, Eds. American Public Health Association, Washington, D.C.
Vitousek, P.M., J.R. Gosz, C.C. Grier, J.M. Melillo, W.A. Reiners and R.L. Todd. 1979. Nitrate losses fiom disturbed ecosystems. Science 204:469-474.
MICROHABITAT EFFECTS OF LITTER TEMPERATURE AND MOISTURE ON FOREST-FLOOR
INVERTEBRATE COMMUNITIES
Tim A. Christiansen', Sue A. Per$ , and William B. Perry'
Litter temperature and moisture may be altered due to changes in global climate. We investigated the effect of small changes in litter temperature and moisture on forest-floor communities in West Virginia. We altered litter temperature and moisture in 6 x 6 m plots covered with landscape cloth. The study sites were in six watersheds (three north-facing and three south-facing aspects) in the Fernow Experimental Forest and in the West Virginia University Forest from April 1 992 - April 1 993. We measured microbial biomass (ATP), invertebrate density, and invertebrate composition. In covered blocks, litter temperature increased by 0.01 "C, -2.1 "C and litter moisture increased by 0.01 - 4.2 percent.
We identified 134 litter invertebrate species in nine orders. Overall invertebrate density was not associated with changes in temperature and moisture; however, both richness and evenness were associated with changes in temperaturqand moisture. Density and richness of springtails (Collembola) were higher in covered blocks, which had higher temperawe and moisture values as compared with reference blocks. Densities of 20 invertebrate species were correlated with changes in mean daily temperature, mean moisture, or changes in the range of temperature and moisture. Maximum and minimum values for both temperature and moisture increased in covered blocks, and there were more sigmficant associations of invertebrate density and richness with changes in range (maximum and minimum values) than with changes in the average temperature or moisture values. Litter ATP decreased in covered study blocks.
Temporal (month and season) and spatial (forest, watershed, aspect, and location on slope) variables had an effect on invertebrate density, richness, and evenness, as well as on litter temperature and litter moisture. Results from this study indicate that small changes in litter temperature and moisture can effect forest-floor invertebrate communities.
'Division of Foreshy, West Virginia University, Morgantown, WV 26506.
'National Biological Service, West Virginia Cooperative Fish and Wildlife Research Unit, West Virginia University, Morgantown, WV 26506.

EFFECTS OF ACIDIC PRECIPITATION ON LEAF DECOMPOSITION RATES, MICROBIAL BIOMASS, AND
LEAF PACK MACROINVERTEBRATES IN SIX STREAMS ON THE ALLEGHENY PLATEAU OF WEST
VIRGINIA
Erik S. Engstroml, Sean K. Meeganl, Sue A. Perry2, and William B. Perry'
Abstract: We studied the effects of acidification on leaf litter decomposition in six headwater streams in the Monongahela National Forest. These streams differed in underlying geology and mean baseflow pH (3.99,4.24, 6.13,6.47,6.59, and 7.52). We placed 10-gram leaf packs of white oak, red maple, and yellow poplar in each stream, and retrieved them after two days, two weeks, and then at 4-week intervals fi-om November 1993 to February 1994. Leaf packs were analyzed to determine changes through time in leaf decay rate, invertebrate composition, density, and biomass, and microbial biomass (ATP concentration). The mass loss rate coefficient, k, ranged fiom -0.0 128 to -0.0052 for poplar, -0.0 120 to -0.0047 for maple, and -0.0059 to -0.00 18 for oak. The acidic streams had significantly lower decay rates. The acidic streams had higher invertebrate densities but lower biomass than the more alkaline streams. ATP concentrations were lower in the acidic streams than in the more alkaline streams. In streams that are vulnerable to acidification, pH depression may reduce energy and material availability to stream macroconsurners.
INTRODUCTION
Allochthonous leaf litter may constitute as much as 90 percent of a stream's energy budget (Anderson & Sedell 1979; Fisher & Likens 1973). Decreased leaf litter processing rates have been observed in acidified aquatic systems (Burton et al. 1985; Griffith & Pelry 1993; Mulholland et al. 1987). Decreases in processing rates have been attributed to direct toxicological effects of high H+ concentrations, increased solubility of metals, particularly aluminum, and decreased microbial activity.
We placed three species of leaf packs in six streams of different mean pH. Mass loss rates, invertebrate community structure, and ATP concentration (microbial biomass) from each stream were compared in order to determine the effects of acidification on detrital processing.
METHODS
Site Descriptions
We sampled six streams: Freeland Run (FR), Engine Run (ER), South Fork of Red Run (SFR), Wilson Hollow (WH), Hickman Slide Hollow (HSH), and Camp Hollow (CH). All are in or near the Monongahefa National Forest, Tucker County, West Virginia. Mean baseflow pH for the streams were 3.99 (ER), 4.24 (SFR), 6.13 (WH), 6.47 (FR), 6.59 (CH) and 7.52 (HSH).
'Graduate Students, and Professor, respectively, Division of Forestry, West Virginia University, Morgantown, WV ,
26506.
'West Virginia Cooperative Fish and Wildlife Research Unit, Division of Forestry, West Virginia University, Morgantown, WV 26506-6 1 25.

Field Procedures
Nylon mesh bags (3-rnrn) were filled with log of either white oak, red maple or yellow poplar leaves. During the first week in November 1993, we placed 42 bags of each species in the center of each stream channel. After 2,14, 28,56, and 84 days, five bags of each species were randomly selected and removed. On each sampling day, stream pH and conductivity were measured, and a grab sample for measuring water chemistry was collected. Water temperature was continuously monitored with a Ryan model J thermograph in a pool of each stream.
Laboratory Procedures
Three replicates of five leaf disks were cut from each leaf pack using a 1 0-rnrn diameter cork borer, two for ATP analysis, and one for ash-fiee dry weight determination.
Invertebrates in the leaf packs were separated from the organic matter, identified to the lowest possible taxa, and enumerated. They were then dried, and weighed to estimate biomass. ATP was extracted from two replicates fiom each leaf pack using %SO, and assayed using a luciferin-luciferase bioluminescence assay ( ~ u b e r k r o ~ ~ & Klug 1976).
RESULTS
Water chemistry and temperature
Streamwater pH was highest in HSH (7.52), lowest in ER (3.99) and SFR (4.24), and intermediate in WH (6.13), FR (6.47) and CH (6.59). Daily mean stream temperatures decreased as the study progressed from 7°C at the start of the study to 2 "C at the end.
Leaf pack processing rates
During the 12-week study, AFDW of the leaves decreased from a mean initial weight of 8.60 g/bag at all sites for all species to values ranging from 3.02 g/bag to 7.25 ghag. Decay rate coefficients ranged from -0.0018 for oak in ER to -0.01 28 for poplar in CH. The decay rates for the acidic streams were significantly lower than both the neutral and alkaline streams for all leaf species (pc0.0 1). The decay rate for the alkaline stream was not different from the circurnneutral streams for oak and poplar, but was significantly lower for maple @<0.0 1).
Microbial biomass
ATP concentrations were significantly lower in the acidic streams than in the neutral or alkaline streams for maple (p4.01) and for oak (p4.05). There were no significant differences in ATP concentrations on poplar leaves among streams.
Shredder densities and biomass
The acidic streams supported significantly higher densities of invertebrate shredders than the neutral streams, which in tum supported significantly higher numbers than the alkaline stream. Based on ANOVA results, there were no simcant differences in shredder biomass among the three pH groups. The shredder communities of the two acidic streams (ER and SFR) tended to be dominated by Leuctm and Amphinemura, and the communities of the other streams included significant numbers of Pycnopsyche, Peltoperla, Paracapnia, Lepidostoma, and Gammarus.
DISCUSSION
The AF'DW loss rates measured in this study, were lower in the low pH streams than in the more alkaline systems. This has been demonstrated by other investigators (Burton et al. 1 985; Kirnmel et al. 1 985; Mackay & Kersey 1 985;

Mulholland et al. 1987; Griffith & Peny 1993). The lower rates of decomposition in ER and SFR appear to be at least partially the result of lower microbial biomass. Our analysis of ATP concentrations showed that the acidic streams supported significantly less microbial biomass than the higher pH streams. This is consistent with the results of other studies which have examined the microbial communities of acidified systems. Rao and Dutka (1 983) found that bacteria populations and densities were nearly an order of magnitude less in acidified lakes than in neutral lakes. Palumbo et al. (1 987) found that epilithic microbial biomass was significantly correlated with pH in Tennessee b d North Carolina streams. We found a trend towards larger numbers of smaller species of macroinvertebrates in acidified waters and fewer numbers of larger species in neutral waters. Other researchers have found similar results at sites with low pH (Hildrew et al, 1984; Mackay & Kersey 1985; Mulholland et al. 1987).
In summary, our results suggest lower rates of leaf mass loss in streams with pH <4.0. The lower rate of leaf mass loss was accompanied by significantly lower ATP levels, significantly higher shredder densities, and lower shredder biomass. This suggests that decomposition rates in these acidic streams are depressed by a decrease in microbial biomass and the altered shredder community. Continued acidification of headwater streams in this area may result in firther reductions in decomposition rates, less microbial biomass, and altered macroinvertebrate communities.
LITERATURE CITED
Anderson, N. H., and J. R. Sedell. 1979. Detritus processing by macroinvertebrates in stream ecosystems. Annual Review of Entomology 24:35 1-377.
Burton, T. M.,R. M. Stanford, and J. W. Allan. 1985. Acidification effects on stream biota and organic matter processing. Canadian Journal of Fisheries and Aquatic Sciences 42:669-675.
Fisher, S. G., and G. E. Likens. 1973. Energy flow in Bear Brook, New Hampshire: an integrative approach to stream ecosystem metabolism. Ecological Monographs 43 :42 1 -439.
Grifith, M. B., and S. A. Perry. 1993. Colonization and processing of leaf litter by macroinvertebrate shredders in streams of contrasting pH. Freshwater Biology 30:93- 103.
Kimmel, W. G., D. J. Murphy, W. E. Sharpe, and D. R. DeWalle. 1 985. Macroinvertebrate community structure and detritus processing rates in two southwestern Pennsylvania streams acidified by atmospheric deposition. Hydrobiologia 124:97- 102.
Losche, C. K., and W. W. Beverage. 1967, Soil survey of Tucker and part of northern Randolph County, West Virginia. U. S. Dept. of Agriculture, Soil Conservation Service, Washington, D. C.
Mackay, R. J., and K. E. Kersey. 1985. A preliminary study of aquatic insect communities and leaf decomposition in acid streams near Dorset, Ontario. Hydrobiologia 1 22: 3 - 1 1 .
Mullholland, P. J., A. V. Palumbo,J. W. Elwood, and A. D. Rosemond. 1987. Effects of acidification on leaf decomposition in streams. Journal of the North American Benthological Society 6: 147- 158.
Palumbo, A. V., Mulholland, P. J., and Elwood, J. W. (1 987) Bacterial communities in acidic and circumnestreams. Applied and Environmental Microbiology 53 : 3 37-344.
Rao, S. S., and Dutka, B. J. (1 983) Influence of acid precipitation on bacterial populations in lakes. Hydrobiologia 98: 153- 157.
Suberkropp, K., and Klug, M. J. (1 976) Fungi and bacteria associated with leaves during processing in a woodland stream. Ecology 57:707-7 19.

LEAF LITTER PROCESSING IN WEST VIRGINIA MOUNTAIN STREAMS: EFFECTS OF TEMPERATURE
AND STREAM CHEMISTRY
Jacquelyn M. Rowe', William B. Perry', and Sue A. Perry2
Abstract: Climate change has the potential to alter det~ital processing in headwater streams, which receive the majority of their nutrient input as terrestrial leaf litter. Early placement of experimental leaf packs in streams, one month prior to most abscission, was used as an experimental manipulation to increase stream temperature during leaf pack breakdown. We studied leaf litter processing in three second-order, mid-Appalachian streams along a pH gradient (mean pH = 4.2,6.5,7.5). Leaf pack processing rate coefficients (k) were calculated for single species leaf packs of red maple, white oak, and yellow poplar retrieved from each stream at regular intervals over two 12-week study periods: October to January, average total degree days = 442.0; and November to February, average total degree days = 27 1.3. Processing rates for all leaf species in both study periods were highest in the most alkaline stream. Within each stream, processing rates were not significantly higher during either study period. Invertebrate density was higher during the earlier, warmer study period, but shredder biomass showed no significant trends. ATP concentrations on leaf material were generally higher during the earlier study period, indicating higher microbial biomass. Overall, leaf litter processing in t h s study was influenced by a combination of factors including temperature, water chemistry, invertebrate community, and microbial processing.
INTRODUCTION
Potential global climate change over the next century may alter regional climate and precipitation patterns (Levine 1991). The probable effects of climate-change on stream ecosystems include altered flow and temperature, which in turn can affect ecosystem energy flow, individual species distributions, and interspecific interactions (Carpenter et al. 1992). Forested headwater streams receive the majority of their nutrient input in the form of terrestrial leaf litter (Fisher and Likens 1973, Vannote et al. 1980). By altering the temperature and flow regimes of these forested headwater streams, climate change may affect rates of leaf litter breakdown in streams and also the life hstories of stream-dwelling invertebrates that consume leaf litter, known as shredders.
Typically, researchers have studied detrital processing in streams by placing small packs of leaves in streams to coincide with the timing of maximum natural leaf input (e.g., Petersen and Cumrnins 1974, Benfield and Webster 1985, Gnffith and Perry 1993). We used early placement of leaf packs in streams, one month prior to most abscission, in this study to increase the accumulation of degree-days over the processing period. This was done in order to investigate the role of increased temperature during leaf pack breakdown.
STUDY SITES
T~MS study was conducted fkom October 1993 to February 1994 in three second-order streams of different pH: South Fork of Red Run (SFR, mean pH = 4.2), Freeland Run (FR, pH = 6.5), and Hickrnan Slide Hollow (HSH, pH = 7.5).
'Division of Forestry, West Virginia University, Morgantown, WV 26506-6 1 25.
'National Biological Service, West Virginia Cooperative Fish and Wildlife Research Unit, West Virginia University, Morgantown, WV 26506.

The streams are located in (HSH) or near (SFR, FR) the Fernow Experimental Forest, Monongahela National Forest, Tucker County, WV.
METHODS
Water temperature was recorded by continuous recording thermographs in each stream. Water quality variables, including pH and total aluminum, were measured fi-om grab samples analyzed by the USFS Timber and Watershed Lab, Parsons WV, and PKC Environmental, Morgantown, WV. Single species leaf packs (red maple, white oak, yellow poplar) were constructed by placing 10 g of dried abscised leaves in mesh bags, which were then attached to bricks and placed in the streams. Five packs of each species were removed from each stream at predetermined intervals: approximately two days, two weeks, four weeks, eight weeks, and 12 weeks after the packs were originally placed in the stream. Early leaf packs were in place from October to January, and normal leaf packs were in place fi-om November to February.
In the laboratory, ash free dry weight remaining was determined. Invertebrates were separated from the leaf matter, preserved, and later identified, counted, and weighed to determine invertebrate biomass. Microbial biomass was estimated by detexmining ATP concentration on leaf discs cut from the leaf packs, using acid-extraction techniques (Suberkropp and Klug 1976). Rates of leaf pack decomposition were calculated as the rate coefficient (k) of a negative exponential model of leaf pack decay (Petersen and Cumrnins 1974). Separate calculations of k were made using either days or degree days as the independent variable, in an attempt to account for temperature differences between the two sampling periods (GriEth and Perry 1993, Irons et al. 1994). Degree days accumulated at each sample date were calculated as the cumulative sum of the mean daily temperatures from the beginning of the study to that sample date. The General Linear Models (GLM) procedure of SAS was used to contrast decay rate coefficients between the study periods and streams. Invertebrate shredder density and biomass and ATP concentrations were also compared between study periods and streams using the GLM procedure and Duncan's Multiple Range Test as a multiple comparison procedure, with = = 0.05.
RESULTS
Degree-day accumulation during the early study period was highest in HSH, the lowest elevation stream (533 degree days), intermediate in SFR (4 1 O), and lowest in FR (384). Over the normally timed experiments, the three streams accumulated 367 degree days (HSH), 234 degree days (SFR), and 2 13 degree days (FR).
Mass loss rate coefficients are reported in two ways: from the regression of time in days versus In AFDW remaining (k), and fi-om the regression of degree-days versus In AFDW remaining (k,) Values of k were highest in HSH, intermediate in FR, and lowest in SFR, and also varied by leaf species. In general, yellow poplar leaves broke down the fastest, red maple leaves broke down at an intermediate rate, and white oak leaves broke down the slowest. No significant differences were seen when k was contrasted between early and normally-timed experiments within the same stream.
Values of k, were calculated as a means of incorporating variation in temperature into the leaf litter breakdown rate. Values of k, were highest in FR or HSH, and lower in SFR. These rate coefficients (kd were significantly higher during the normally-timed experiments in HSH for all leaf species, and in FR for oak leaves.
Invertebrate density differed among the three study streams. Density was generally highest in either SFR or FR, and lower in HSH, for both study periods. Density was significantly higher in the early study period for all leaf species in HSR and FR. In SFR, densities were higher during the nolmal study period for red maple and white oak leaf packs. Invertebrate biomass also differed among the three streams. Biomass was highest in FR, intermediate in HSH, and lowest in SFR. This indicates that the shredder community in SFR was composed of many small individuals. Shredder biomass was higher during the normal study period, particularly on the last two sample dates. However, no statistically significant differences in biomass could be detected between study periods when considering all sample dates of both studies.
ATP concentrations, approximations of microbial biomass on leaf material, were significantly higher in the early study period for red maple and yellow poplar leaves. ATP concentrations were generally higher in FR and HSH, and low in SFR.
DISCUSSION
Stream temperature has a recognized role in leaf litter breakdown and related stream processes such as invertebrate and microbial metabolism. Processing rates have been shown by some researchers to increase directly with temperature; yet in this study, the warmer study period generally had similar or even slower breakdown rates. In other studies that compared processing in streams with different temperature regimes, faster processing rates in cooler streams have ofien been attributed to more abundant shredders in the cooler streams (Triska and Sedell1975, Short et al. 1980). However, still other studies comparing processing rates in the same stream during different study periods have found no si@cant differences in breakdown rate between study periods (Petersen and Cumrnins 1974), as was the case in the present study.
The differences in processing rates between early and normal study periods seen with the inclusion of degree-days in the breakdown rate calculation may indicate that temperature is a factor. Still, this method of rate calculation may not fully account for temperature differences between streams and study periods. The temperature differences in our two study periods may have been too slight to produce the expected effect of higher rates at higher temperatures, since temperature effects appear to have been confounded by other factors, particularly the biomass and life histories of shredding invertebrates.
Major effects of climate change on organic matter processing in streams may result over much longer time scales, as the range of tree species, timing of leaf abscission, and invertebrate life histories are affected. Future work may be directed toward exploring the impact of yearly variation in various climatic factors on leaf litter processing and the overall energy budget of streams in forested ecosystems.
LITERATURE CITED
Benfield, E. F. and J. R. Webster. 1985. Shredder abundance and leaf breakdown in an Appalachian mountain stream. Freshwater Biology 15: 1 1 3- 1 20.
Carpenter, S . R., S . G. Fisher, N. B. Grirnrn, and J. F. Kitchell. 1992. Global change and freshwater ecosystems. Annual Review of Ecology and Systematics 23 : 1 1 9- 1 3 9.
Fisher, S. G. and G. E. Likens. 1973. Energy flow in Bear Brook, New Hampshire: An integrative approach to stream ecosystem metabolism. Ecological Monographs 43: 42 1 -439.
mth, M. B. and S. A. Perry. 1993. Colonization and processing of leaf litter by macroinvertebrate shredders in streams of contrasting pH. Freshwater Biology 30: 93- 103.
Irons, J. G., M. W. Oswood, R. J. Stout, and C. M. Pringle. 1994. Latitudinal patterns in leaf litter breakdown: is temperature really important? Freshwater Biology 3 2: 40 1-4 1 1.
Levine, J. 199 1. Global climate change. In: Climate change and freshwater ecosystems. P. Firth and S. G. Fisher, eds. pp. 1-25. Springer-Verlag, New York, NY.
Petersen, R. C. and K. W. Curnrnins. 1974. Leaf processing in a woodland stream. Freshwater Biology 4: 343-368.
Short, R. A., S. P. Canton, and J. V. Ward. 1 980. Det~ital processing and associated macroinvertebrates in a Colorado mountain stream. Ecology 6 1 : 727-732.

Suberkropp, K. and M. J. Klug. 1976. Fungi and bacteria associated with leaves during processing in a woodland stream. Ecology 57: 707-719.
Triska, F. J. and J. R. Sedell. 1976. Decomposition of four species of leaf litter in response to nitrate manupulation. Ecology 57: 783-792.
Vannote, R. L., G. W. Minshall, K. W. Cummins, J. R. Sedell, and C. E. Cushing. 1980. The river continuum concept. Canadian Journal of Fisheries and Aquatic Sciences 37: 130- 137.

LEAF LITTER DECOMPOSITION AND ELEMENTAL CHANGE IN THREE APPALACHIAN MOUNTAIN
STREAMS OF DIFFERENT PH
Steven W. Solada', Sue A. Perry2, and William B. Peny'
Abstract: The decomposition of leaf litter provides the primary nutrient source for many of the headwater mountain streams in forested catchments. An investigation of factors affected by global change that influence organic matter decomposition, such as temperature and pH, is important in understanding the dynamics of these systems. We conducted a study of leaf litter elemental change during decomposition in three headwater mountain streams within or near the Fernow Experimental Forest, Monongahela National Forest, West Virginia. Three leaf species, placed in individual leafbags, were placed in three streams that had mean pH values of 4.2,6.2, ard 7.5. Nitrogen, expressed as percent of initial concentration, was conserved in leaf litter in all three streams. Nitrogen concentrations were not significantly ddferent in the acidic stream as compared with the more neutral streams. In contrast, phosphorus was lost more rapidly fkom the leaf detritus in the acidic stream (45.9 percent), than in the more neutral streams (52.0 percent and 63.1 percent). The rates of decomposition for white oak and red maple were significantly lower (k = 0.0062 for red maple) in the acidic stream as compared with the more neutral streams, WSH and HSH (k = 0.0128 and 0.0072, respectively). Although no differences in final nitrogen content were observed, detrital decomposition, microbial biomass, and the accumulation of phosphorus, calcium, and magnesium were inhibited in the low pH stream. These results suggest that acidification may significantly reduce the rate of leaf detrital breakdown, which may result in a reduction of the nutrient base for aquatic consumers.
INTRODUCTION
The trophic structure and secondary production in stream ecosystems is controlled by both the quality and quantity of leaf litter. Decomposition is often the major source of nutrients to both microconsumers and macroconsumers in headwater streams. Mobilization of nutrients from leaf detritus during decomposition is regulated by environmental factors such as stream water chemistry, temperature, and stream biota, as well as by the physical and chemical composition of the detrital substrate (Gosz et al., 1 973; Melillo et al., 1 984; Rustad, 1 994).
Changes in precipitation chemistry may affect detrital-based ecosystems that are otherwise unaffected by land use in a watershed. Acidification of streams as a result of atmospheric inputs may introduce changes in water chemistry, particularly depression of pH. These changes in water chemistry may, in turn affect detrital decomposition and the associated biogeochemical processes that influence every trophic level (Haines, 198 1).
The goal of our research was to compare detrital processing rates and temporal changes in detrital nutrients among streams with different pH. We measured changes in mass loss rates, microbial biomass, and elemental composition of leaf litter to provide insight into the effects of stream acidification on detrital processing and detrital quality.
'Division of Forestry, West Virginia University, Morgantown, WV 26506.
'West Virginia University, National Biological Service, West Virginia Cooperative Fish and Wildlife Research Unit, PO Box 61 25, Morgantown, WV 26506-6 125.
161

STUDY SITES
This study was conducted in three streams within or near the Fernow Experimental Forest, Monongahela National Fcrest, West Virginia. The study sites are within the physiographic region of the central Appalachian Mountains known as the Allegheny Plateau. Headwater streams of this region tend to form dendritic stream patterns common in landscapes originating from an elevated plateau that was previously level.
The South Fork of Red Run (SFR) is a second-order stream (mean pH = 4.2) draining approximately 230 hectares underlain by silicate sandstones and conglomerate of the-Pottsville formation. The riparian forest is dominated by red maple (Acer ru brum L.), yellow poplar (Liriodendron tuliprfera), eastern hemlock (Tsuga canadensis L.), and rhododendron (Rhododendron maximus L.).
Wilson Hollow (WH) is a third-order stream (mean pH = 6.2) which drains approximately 128 hectares underlain by shales and siltstones of the Hampshire formation. The riparian forest consists of red oak (Quercus rubra Michx.), eastern hemlock (Tsuga canadensis), and sugar maple (Acer saccharurn).
The North Fork of Hickrnan Slide Hollow (HSH), also in the Fernow Experimental Forest, is a second-order stream (mean pH = 7.5) draining a 72 hectare catchment underlain by the Mauch Chunk formation. The Mauch Chunk consists of shales and sandstones, as well as heavily jointed limestones of the Greenbriar member. The riparian vegetation is similar to that of Wilson Hollow.
METHODS
Three leaf species, white oak (Quercus alba), red maple (Acer rubrum), and yellow poplar (Liriodendron tulipfera) were selected. These species represent leaves that decompose at relatively slow, medium, and fast rates, respec- tively. Thirty-five leaf packs of each leaf species were placed in each of the three streams in November 1992. Five leaf packs of each species were retrieved from each stream after two days, two weeks, four weeks, and then at four- week intervals until March 1993. To measure the ash-free dry weight (AFDW), random subsamples of ten leaf disks were taken from the rinsed leaf pack material using a 1 cm diameter cork borer. Remaining leaf pack dry weight was then multiplied by the percent AFDW to estimate the remaining leaf pack AFDW. Microbial biomass estimations were made using ATP extraction and analysis with luciferin-luciferase enzyme system (Suberkropp et al. 1976).
A random experimental design was employed to examine the effects of stream, leaf species, and the interaction on rates of decomposition and elemental change. Both stream and leaf species were considered fixed effects. Differences in mean nutrient content after 1 12 days of incubation were evaluated using analysis of variance (ANOVA). Because sample sizes were unequal for some of the parameters that were measured, the general linear models and least-squares means procedures were used. Analysis of covariance was used to compare changes in mass loss among streams.
RESULTS
In terms of mass loss of the detritus, the rates of decomposition were significantly lower (k = 0.0062, for red maple) in the acidic stream, SFR, as compared with the more neutral streams, WH and HSH (k = 0.0 128 and 0.0072, respectively). This trend was also observed in white oak but not in yellow poplar.
Following a decline in nitrogen concentration during the first 20 days, nitrogen was conserved in all three leaf species. No significant difference in final nitrogen content of the detritus was observed among the three streams. Similarly, phosphorus and calcium were conserved in detritus from the two neutral streams, but were lost from detritus in the acidic stream. The final content of phosphorus was significantly lower in the acid stream SFR (45.9 percent for red maple), than in either of the two neutral streams WSH (52.0 percent) and HSH (63.1 percent), which

were not significantly different fi-om each other. Calcium in detritus was also conserved, but only during the fust 20 days in the alkaline stream, HSH. Calcium was lost by detritus by both SFR and WH.
Magnesium was lost by the detritus in all three species. Magnesium in SFR was significantly lower (4.09 percent for red maple) than WH and HSH, 25.3 percent and 25.7 percent respectively, which were not significantly different. Potassium was rapidly leached fi-om detritus in all three streams.
Microbial biomass on the detritus was significantly lower in the acidic stream, SFR (38.2 ng ATPIg for red maple), in comparison with the more neutral streams, WH (201.5 ng ATPIg) and HSH (145.2 ng ATPIg).
DISCUSSION
We concluded that litter decomposition and elemental accumulation or loss in aquatic detrital material was strongly influenced by water chemistry. Of the water quality variables measured, pH appeared to be the most important in determining decomposition rates. Decomposition rates and microbial colonization are significantly reduced in acidic conditions.
Nitrogen was conserved in the detrital material over time. However, no significant differences in net nitrogen concentration were observed among the three streams. This suggests that decomposition is not controlled by nitrogen alone in ow study streams. Nitrogen conservation was most likely the result of loss of more labile leaf litter components such as potassium.
Phosphorus was conserved in the two neutral streams but was lost in the acidic stream. Phosphorus may be accumulating on detritus in the two neutral streams as a result of contributions of phosphorus by the microbial community. Mulholland et al. (1 984) suggested that phosphorus accumulation in decomposing leaf detritus is a function of microbial biomass and activity within the detritus. Phosphorus loss in the acidic stream may be the result of the reduced microbial biomass.
Elemental changes in calcium and magnesium may be the result of the location of these components within the detritus or the presence of refractory materials. Potassium, the most mobile element measured, was rapidly leached fi-om the detritus.
Our results indicate that, with the exception of nitrogen, detrital elements are lost more rapidly in the acidic stream than in the more neutral streams. In addition, both decomposition rate and microbial biomass were also lower in the acidic stream. This suggests that elemental content of detritus was more rapidly depleted under acidic conditions, reducing quality for macroconsumers. In addition, lower microbial biomass in detritus in acidic systems may result in slower conditioning rates which may also contribute to lower detrital quality, an important factor in detrital- macroconsumer relationships.
LITERATURE CITED
Gosz, J. R., Likens, G. E., and Bormann, F. H. 1973. Nutrient release from decomposing leaf and branch litter in the Hubbard Brook Forest, New Hampshire. Ecological Monographs 43 : 173- 19 1.
Haines, T. A. 1981. Acidic precipitation and its consequences for aquatic ecosystems: a review. Transactions of the American Fisheries Society 1 1 0:669-707.
Melillo, J. M., R. J. Naiman, J. D. Aber, and A. E. Likens. 1 984. Factors controlling mass loss and nitrogen dynamics of plant litter decaying in northern streams. Bulletin of Marine Sciences 35.34 1-356.

Mulholland, P. J., Elwood, J. W., Newbold, J. D., Webster, J. R., Ferren, L. A., and Perkins, R. E. 1984. Phosphorus uptake by decomposing leaf detritus: effect of microbial biomass and activity. Verhandlungender Internationalen Vereinigung h e r Theoretische und Angewandte Limnologie 22: 18997 1905.
Rustad, L. E. 1994. Element dynamics along a decay continuum in red spruce ecosystem in Maine, USA. Ecology 75:867-879.
Suberkropp, K., Godshalk, G. L., and Klug, M. J. 1976. Changes in the chemical composition of leaves during processing in a woodland stream. Ecology 57 :720-727.

METHANE EVOLUTION FROM MINNESOTA PEATLANDS
Peatlands in the northern hemisphere (346 x 10' ha) store large amounts of carbon; estimated at 455 petagrams (Pg) (=loi5) (Gorharn 1991). This is about 30% of the world's pool of soil carbon (excluding peat), about 64% of the atmospheric pool (Bolin 1983), and about 55% of total plant biomass. This stored organic matter is passed to the atmosphere as both carbon dioxide (CO,) and methane (CH,) through aerobic or anaerobic decomposition, respectively. This review summarizes the annual evolution of methane from peatlands in north central Minnesota (1 990- 1993), its seasonal variance, its variance with air pressure, and its dependence on active transport through the stems of peatland emergents. Soil temperature, and water table position are major factors correlated with methane evolution. Modeling studies of possible climate changes (associated with 2X changes in CO, concentrations in the atmosphere) show that methane in the Lake Region will not change water levels. However, extended growing seasons and elevated peat temperatures will lead to additional methane evolution at rates 50 to 80 % higher than currently experienced. In this scenario, warming begets warming. However, field studies in 1994 testing the impact of elevated ammonium sulfate loading on peatlands, show that methane evolution is suppressed under atmospheric loading rates typical of Europe today.
'North Central Forest Experiment Station. Grand Rapids, MN 5 5744.
165

NUTRIENT CYCLING IN AGGRADING FORESTS: 50 YEARS OF RESEARCH AT PACK FOREST, NEW
YORK
Edwin H. White', Charles A. 2. Buxbaum', and Christopher A. NowakZ
The Charles Lathrop Pack Demonstration Forest, Warrensburg, New York, has been the site of long-term forest fertilization and biogeochemical ecosystem research for over 50 years. It is by far the longest ongoing examination of trends in nutrient cycling in North America. Plots of red pine that were fertilized 50 years ago with potassium were reexamined to determine the changes in forest soil properties after exposure to acid deposition. Subsoil uptake .of nutrients by plantation red pine was confirmed by experimental use of tracer techniques with SrC1, and RbIK ratios as a mechanism for improving the soil. K levels in the unfertilized sites did show improved levels of K relative to fertilized stands, improving at approximately twice the rate of the fertilized stand. The pH of unfertilized plots remained the same over time, while the pH of the fertilized plots significantly declined over the 50 years, attributed primarily to initial increase in pH due to the addition of KC1 as fertilizer and the increase in forest soil organic matter buildup over time. The results of historical biogeochemical trends, in conjunction with the analysis of lateral fertilizer transport and significant subsoil uptake each clarify distinct aspects of nutrient dynamics in the K-deficient soils of the Pack Forest Plain under fertilized and unfertilized red pine over time. Combined, the pieces ofthe story tell a greater tale of nutritional improvement of degraded surface soils mediated by the long-term effects of human management practices such as reforestation and forest fertilization, and by the nutrient uptake, conservation and distribution abilities of aggrading forests. The data provides new insights into understanding and modeling the interaction of developing forest ecosystems with subsoil nutrient pools and the dynamics of lateral transport and conservation of nutrients that need to be recognized in assessing impacts of global change on forest ecosystem sustainability.
'SUNY College of Environmental Science and Forestly, Syracuse, NY 1 32 10.
VSDA Forest Service, Northeastern Forest Experiment Station, Warren, PA.

RELATIVE NITROGEN MINERALIZATION AND NITRIFICATION POTENTIALS IN RELATION TO SOIL
CHEMISTRY IN OAK FOREST SOILS ALONG A HISTORICAL DEPOSITION GRADIENT
Ralph E. J. Boernerl and Elaine Kennedy Sutherland2
This study quantified soil nutrient status and N mineralizatiordnitrification potentials in soils of oak-dominated, unmanaged forest stands in seven USDA Forest Service experimental forests (EF) ranging along a historical and current acidic deposition gradient from southern Illinois to central West Virginia. Among these seven sites (that spanned 8.5 " of longitude) soil pH and Ca2' decreased and soil organic C and soluble A13' increased from west to east. In general, initial soil solution NO; and NH,' was uncorrelated with longitude. The Femow EF (WV), the easternmost site, was the exception to this trend. Soils from the Femow had the highest concentrations of both NO,' accumulation, and the greatest N mineralization potential. Stepwise regressions of N mineralization rate, net NO,' accumulation, and proportional nitrification on initial soil properties produced models with overall ? of 0.705,0.772, and 0.708, respectively. Rates of N turnover were positively con-elated with initial NO,, pH, and Ca:Al ratio and negatively correlated with soil solution ~ l " concentrations. Differences in oak growth and mortality may be related to the differences in soil chemical status and soil N dynamics along these seven experimental forests.
'Department of Plant Biology, 1735 Niel Ave., Ohio State University, Columbus, OH 43210-1293.
*USDA Forest Service, Northeastern Forest Experiment Station Delaware, OH 4301 5.
167

MORTALITY PATTERNS IN OAK FORESTS ALONG A CLIMATIC AND ACID DEPOSITION GRADIENT
Elaine Kennedy Sutherlandl, Daniel A. Yaussyl, and Ralph E. J. Boerne?
The cause or causes of recently observed mortality and changes in forest composition in eastern mixed-oak forests has been a controversial topic. Causes discussed in the literature include air pollution (ozone, acid deposition), drought-induced decline, insect infestation, or simply stand age. The objective of this study was to relate patterns of mortality and stand composition changes to edaphic characteristics, soil parameters, and records of drought. We compare individual tree records from seven experimental forests (EF) in the Ohio River Valley ranging along a historical and current acidic deposition gradient from southern Illinois to central West Virginia (Kaskasia EF, Illinois; McKee EF, KY; Bald Rock EF, KY; Robinson EF, KY; Mead EF, OH; Raccoon EF, OH; and Fernow EF, WV). To determine similarities among the sites, we performed multivariate analyses relating species composition to an integrated moisture index (IMI), soil elemental concentrations, Ca/A1 ratios, and nitrogen turnover rates. We characterized patterns of mortality as a function of species, tree size, and time. We used logistic regression approaches to model mortality as a function of the Palmer Drought Severity Index (PDSI), IMI, and the abovementioned soil parameters.
'USDA Forest Service, Northeastern Forest Experiment Station, Delaware, OH 430 15.
'Department of Plant Biology, The Ohio State University, Columbus, OH 432 10- 1293.
168

THIRTY-THREE YEAR CHANGES IN ABOVE- AND BELOW-GROUND BIOMASS IN NORTHERN
HARDWOOD STANDS IN VERMONT
A. H. ~ohnson' and G. R. strimbeck2
SUMMARY
In 1957-1 960, R. 0. Curtis and B. W. Post surveyed 81 even aged (45-90 y old) northern hardwood stands on acid till soils over the length of Vermont's Green Mountains. The purpose of the original study was to determine predictive relationships between site index and site characteristics, including latitude, elevation, soil drainage class, soil organic matter content and soil nutrients. The sites were not randomly selected in the 1950s. Rather, they were chosen to represent a range of stand ages and the range of environmental conditions associated with northern hardwood forests growing on acid till. In 1990-92 we were able to reliably relocate 40 of the original plots using sketch maps and witness trees. In 1990-9 1 we sampled 23 of the plots which were relocated exactly by blazed witness trees. These plots showed no signs of human disturbance other than possible minor removal of red maple for stand improvement. In 1992, we relocated 17 sites that had been selectively logged. The original witness trees had been removed in most cases, and these plots were located from roadside monuments, measured distances and compass bearings. Remeasurements of tree and soil characteristics allowed comparison of tree heights, basal areas, volumes, above-ground biomass, and soil organic matter pools.
These comparisons allowed us to explore some issues of environmental quality that surfaced in the 1980s. Areas of sugar maple decline were identified in Vermont and neighboring Canada, and several studies were conducted to determine what factors were related to maple decline, and if there was evidence of air pollution involvement. We reasoned that if there were adverse environmental changes in air or soil quality that had chronic effects on maple growth, patterns of individual and stand growth, and/or statistical relationships between growth and site characteristics establhhed in the early part of this century might have been different in the latter half of the century.
In addition to the maple decline issue, long-term trends in soil organic matter are of interest in refining carbon budgets on local, regional and global scales. Careful determination of bulk density and soil organic matter in the Post and Curtis project has allowed a comparison of soil organic matter content. As we sampled both disturbed and undisturbed stands, the effect of forest harvesting on soil organic matter pools could be evaluated.
We have been able to test four hypotheses as outlined below.
Hypothesis 1
In undisturbed plots, changes in DBH, volume and biomass show that shade tolerant species, especially sugar maple, increased to a greater degree than less tolerant species as predicted by normal trends in aggrading northern hardwood stands.
Basal area increased in 19 of the 23 undisturbed plots, and volume decreased in only 1 plot, apparently due to the removal of large red maples for stand improvement. Red maple showed large decreases in basal area and volume in two other plots, and we suspect that this too is related to stand improvement. White and yellow birch decreased in several other plots as might be expected on the basis of shade tolerance of these species and competition in
'University of Pennsylvania Department of Geology, Philadelphia, PA 1 9 104.
Vniversity of Vermont, Burlington, VT 05405.
I
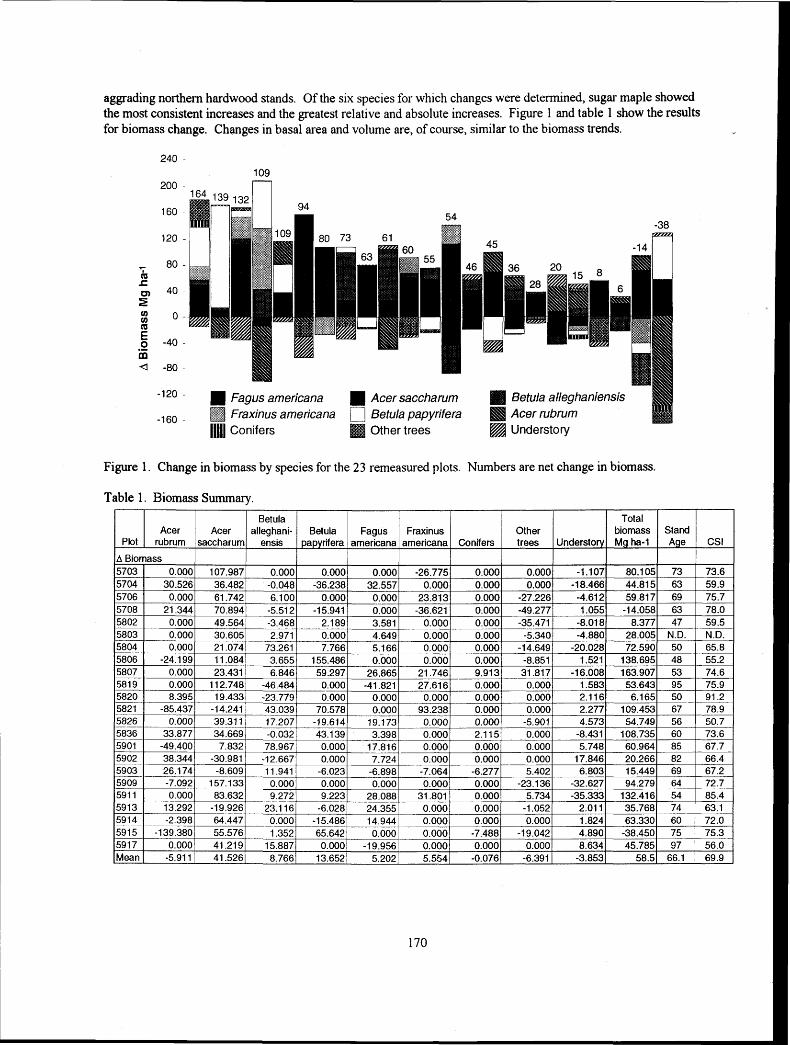
aggrading northern hardwood stands. Of the six species for which changes were determined, sugar maple showed the most consistent increases and the greatest relative and absolute increases. Figure 1 and table 1 show the results for biomass change. Changes in basal area and volume are, of course, similar to the biomass trends.
73 61 in -14 fi
-120 - Fagus americana Acer saccharum Betula aileghaniensis
-160 - Fraxinus americana Betula papyrifera Acer rubrum
II1II Conifers Other trees Understory
Figure 1. Change in biomass by species for the 23 remeasured plots. Numbers are net change in biomass.
Table 1. Biomass Summary.
Plot CSI
73.6 59.9 75.7 78.0 59.5 N.D. 65.8 55.2 74.6 75.9 91.2 78.9 50.7 73.6 67.7 66.4 67.2 72.7 85.4 63.1 72.0 75.3 56.0 69.9
Acer rubrum
Total biomass Mg ha-1
Stand Age
80.105 44.815 59.817
-14.058 8.377
28.005 72.590
138.695 163.907 53.643 6.165
109.453 54.749
108.735 60.964 20.266 15.449 94.279
132.416 35.768 63.330
-38.450 45.785
58.5
A Biomass 5703 5704 5706 5708 5802 5803 5804 5806 5807 581 9 5820 5821 5826 - --
.5836 ,5901 5902 5903 --
5909 591 1 5913
5914 5915 5917 Mean
73 63 69 63 47
N.D. 50 48 53 95 50 67 56 60 85 82 69 64 54 74 60 75 97
66.1
Understory Acer
saccharum
0.000 30.526 0.000
21.344 0.000 0.000 0.000
-24.199 0.000 0.000 8.395
-85.437 0.000
33.877 -49.400 38.344 26.1 74 -7.092 0.000
13.292 ___ -2.398
-139.380 0.000
-5.911
-1.107 -18.466 -4.612 1.055
-8.018 -4.880
-20.028 1.521
-16.008 1.583 2.1 16 2.277 4.573
-8.431 5.748
17.846 6.803
-32.627 -35.333
2.01 1 1.824 4.890 8.634
-3.853
107.987 36.482 61.742 70.894 49.564 30.605 21.074 11.084 23.431
112.748 19.433
-14.241 39.31 1 34.669 7.832
-30.981 -8.609
157.133 83.632
-19.926 64.447 55.576 41.219 41.526
Other trees
Betula alleghani-
ensis
0.000 0.000
-27.226 -49.277 -35.471 -5.340
-14.649 -8.851 31.817 0.000 0.000 0.000
-5.901 0.000 0.000 0.000 5.402
-23.136 5.734
-1.052 0.000
-19.042 0.000
-6.391
0.000 -0.048 6.100
-5.512 -3.468 2.971
73.261 3.655 6.846
-46.484 -23.779 43.039 17.207 -0.032 78.967
-12.667 11.941 0.000 9.272
23.1 16 0.000 1.352
15.887 8.766
Betula papyrifera
0.000 -36.238
0.000 -15.941
2.189 0.000 7.766
155.486 59.297 0.000 0.000
70.578 -19.614 43.139 0.000 0.000
-6.023 0.000 9.223
-6.028 -15.486 65.642 0.000
13.652
Fagus americana
0.000 32.557 0.000 0.000 3.581 4.649 5.166 0.000
26.865 -41.821
0.000 0.000
19.173 3.398
17.816 7.724
-6.898 0.000
28.088 24.355 14.944 0.000
-19.956 5.202
Fraxinus americana Conifers
-26.775 0.000
23.813 -36.621
0.000 0.000
- 0.000 0.000
21.746 27.616 0.000
93.238 0.000 0.000 0.000 0.000
-7.064 0.000
31.801 0.000 0.000 0.000 0.000 5.554
0.000 0.000 0.000 0,000 0.000 0.000 0.000 0.000 9.913 0.000 0.000 0.000 0.000 2.115 0.000 0.000
-6.277 0.000 0.000 0.000 0.000
-7.488 0.000
-0.076

Hypothesis 1 is supported by the comparisons, suggesting that normal stand dynamics have prevailed in the development of these stands.
Hypothesis 2
In undisturbed plots, the relationships between height (or BA/volume/biomass) and candidate predictors (site index, stand age and dbh) was unchanged between 1957-59 and 1990-9 1.
To test this hypothesis, we determined how height and biomass in the undisturbed plots were related to log dbh, stand age and site index. In both the 1957-59 and 1990-92 data sets, these variables explained ca. 70 percent of the variation in height. Figure 2 shows that the coefficients for these variables were not significantly different in the two studies. Both site index and stand age are significantly correlated with stand biomass as shown in figure 3 (shown for pooled data). The equations for the individual data sets are not different, with R2 = .65 for the 1 990-92 data set, and R2 = .59 for the 1957-59 data set. We interpret these results to mean that stand growth from the late 1950s through the early 1 990s has proceeded as expected based on the 1 957 -59 data, which integrates growth during the first half of the 20th century.
With respect to sugar maple, figure 4 shows that for a given DBH, sugar maple in 1990-92 were slightly (though not significantly) taller than in 1957-59. This is an expected result for aging stands, and adds more weight of evidence to the contention that sugar maple growth has not been adversely affected by changed growing conditions.
Hypothesis 3
In undisturbed stands, growing vegetation is an important sink for carbon, whereas there would be either a small change or no change in soil organic matterlsoil carbon.
While there exists much uncertainty in the role of forest soils in global carbon budgets, hypothesis 4 follows conventional thinking with respect to accumulation of carbon in most forested ecosystems. Carehl consideration of problems in delineating horizon boundaries, and of bulk density/depth/organic matter content relationships suggests some problems in cowparing the organic matter content of soils sampled decades apart by different investigators. We have computed organic matter content on the basis of a fixed weight of soil mineral particles as being the least biased way of making the comparisons. Figure 5 shows that there was no change in soil organic matter in the profile (Oa through Bw horizons) at the undisturbed sites.
Hypothesis 4
In logged stands disturbed only by commercial harvesting operations, soil organic matter would be unchanged.
In accordance with recent reviews of the effect of forest harvesting on soil organic matter, figure 5 shows that there was no signscant change in the soil organic matter content between 1958 and 1992 at the 17 logged sites.
CONCLUSION
With respect to questions about recent trends in forest productivity, we found no evidence from these stands that the growth of sugar maple (or other northern hardwoods) was adversely affected by changes in growing conditions. Height and biomass of stands in the early 1990s can be predicted within reasonable error, fiom relationships derived fiom measurements of 45-90 y old stands done in the 1 950s. With respect to the accumulation of carbon in these northern hardwood stands, the growing live biomass is a significant sink for atmospheric carbon, where as the soil appears to neither gain nor lose appreciable carbon regardless of whether the stands were logged or not.

: 1
- num be; of trees: 89 87 i384 267' 99 42305 101; 160 8 3 87 32
0 Beech Sugar White White Yellow Red
Maple ash birch birch maple
Species
data
data
Figure 2. Coefficients for the equation Tree Ht = a + b(1og dbh) + c(stand age) + d(site index).

Stand Age Composite Site Index
Figure 3. Biomass as a fbnction of stand age and composite site index (height in ft at age 75).
log(dbh, cm) 35 1
5 1 O
1 1.2 1.4 1.6 1.8
iog(dbh, cm)
Figure 4. Height-diameter relationship for sugar maple.

Unlogged 1958 1990
Logged
Unlogged Logged
Figure 5. Changes in average horizon depth (top) and SOM mass (bottom) across all plots.

EVALUATION OF METHODOLOGY FOR DETECTINGPREDICTING MIGRATION OF FOREST SPECIES
Dale S. Solomon and William B. Leak'
Abstract: Available methods for analyzing migration of forest species are evaluated, including simulation models, remeasured plots, resurveys, pollenlvegetation analysis, and ageldi st ance trends. Simulation models have provided some of the most drastic estimates of species changes due to predicted changes in global climate. However, these models require additional testing against field data to ensure their reliability. Remeasured plots would provide a basis for model testing, but the number of plots required to detect short term trends might be excessive. Remeasurement data &om forested areas where there have been no land-use changes provide a clearer picture of migrational trends. A 60-year record from the Bartlett Forest provided estimates of species changes in relation to management versus no management, land type, and elevation. Migration rates based on historical pollen analyses are of limited value because these analyses are derived from small, scattered samples formed under physicaVbiologica1 conditions much different from those of today. Ageldistance trends from carefully chosen and specified study locations will provide estimates of recent migrational trends and rates of elevational change. Independent swveys of vegetation in areas where previous plots cannot be relocated are subject to the same limitations as measured plots.
INTRODUCTION
During the past decade, there has been renewed interest in plant migration due to the potential impacts of global climate change. Predictions have suggested major shifts in species ranges - even extinction - over the next 50 to 200 years in response to temperature shifts of up to 4.5 "C (e. g., Davis 1 987; Peters 1 990; Overpeck et al. 1 99 1). Although some field studies have suggested actual changes in the elevational distribution of species due to climate change (Hamburg and Cogbill 1988; Grabherr et al. 1994), others show little or no detectable response (Solomon and Leak 1994; Leak and Smith1) that could be attributed to changes in climatic factors. We address this inconsistency by examining various approaches that are used to measure, detect, or predict species migration: simulation, remeasured plots, resurveys, interpretation of pollen records, and ageldistance trends.
We use the term migration to mean the invasion of a species into a geographic region where it has not recently been able to grow due to climatic or edaphic conditions. Succession means the invasion or increased proportions of a species in an area where the species is readily able to grow but has been excluded due to stand dynamics or serial stage.
SIMULATION
Some of the most drastic predictions of climatically induced vegetation change have been derived from computerized simulation models or graphical approaches. For example, Overpeck et al. (1 99 1) predicted shifts in plant ranges of 500 to 1000 krn within periods as shoi-t as 200 years. Others (e.g., Davis et al. 1994) suggest the possibility of near extinction of species such as sugar maple and beech due to an inability to migrate rapidly enough to keep pace with the changing climate. Most modeling attempts follow a similar format (Pastor and Post 1988; Solomon and West 1987). First, future changes in temperature and precipitation variables are predicted through one of several general circulation models (GCM). Relationships between species occurrence and climatic variables are developed or inferred using modem or historical geologic data. Future ranges are then predicted that can be compared to estimated migration rates by species as evidenced in the pollen record. The strength of this approach is that there is a strong relationship between species and climate as well as a wealth of empirical regional data (Denton
'Research Foresters, USDA Forest Service, Northeastern Forest Experiment Station, Durham, NH 03824.
175
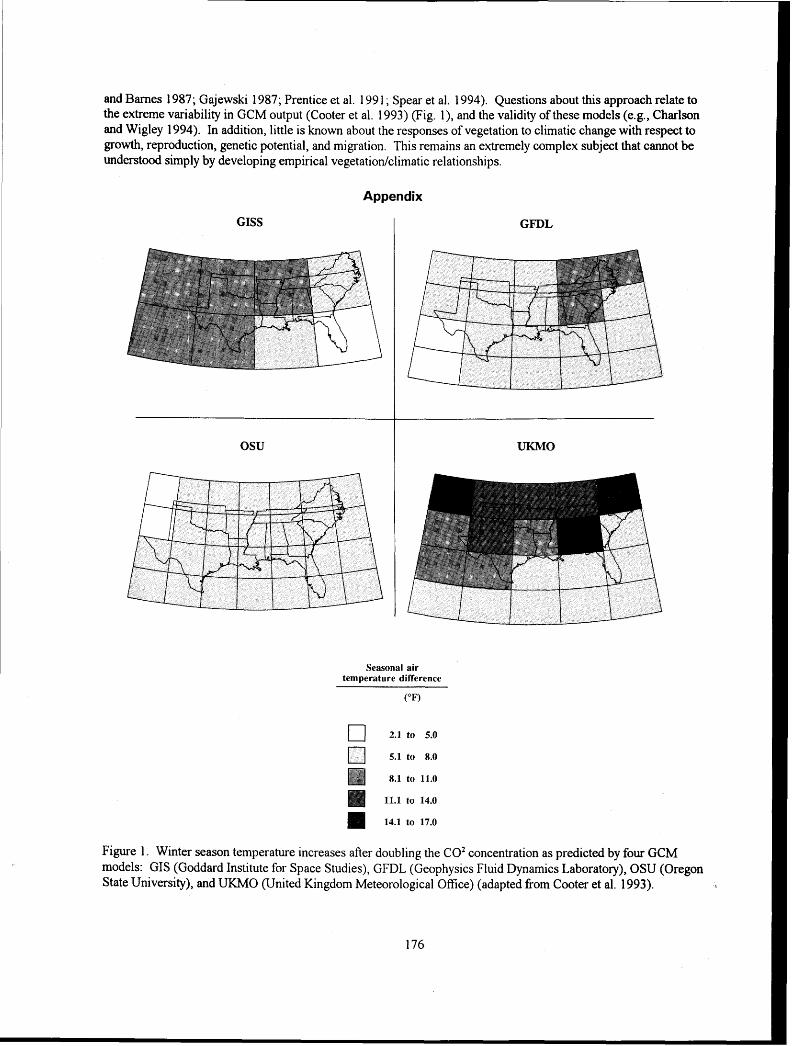
and Barnes 1 987; Gajewski 1987; Prentice et al. 1 99 1 ; Spear et al. 1 994). Questions about this approach relate to the extreme variability in GCM output (Cooter et al. 1993) (Fig. l), and the validity of these models (e.g., Charlson and Wigley 1994). In addition, little is known about the responses of vegetation to climatic change with respect to growth, reproduction, genetic potential, and migration. This remains an extremely complex subject that cannot be understood simply by developing empirical vegetation/climatic relationships.
Appendix
GISS I GFDL
Seasonal air temperature difference
OSU
Figure 1. Winter season temperature increases after doubling the C 0 2 concentration as predicted by four GCM models: GIs (Goddard Institute for Space Studies), GFDL (Geophysics Fluid Dynamics Laboratory), OSU (Oregon State University), and UKMO (United Kingdom Meteosological Ofice) (adapted from Cooter et al. 1993).
UKMO

REMEASURED PLOTS
USDA Forest Service Forest Inventory and Analysis (FIA) plots are ideal for monitoring species migration. Also, they provide the data needed to test migrational models. One complication is that, on a regional scale, existing vegetation is responding to factors other than climatechange. In New England, one dominant factor is natural successional change following prior disturbances from agricultural clearing and logging (Solomon and Leak 1994). This factor could easily mask any tendencies toward climatically driven changes in vegetation (Fig. 2, Table 1). A 24-year record on FIA plots in Maine indicated that white pine and balsam fir were declining in both average latitude and elevation. However, the area's land-use patterns suggested that these changes were not a reflection of climate change but the result of the invasion of abandoned agricultural land by these species.
f i
Figure 2. Initial locations in Maine with living white pine, new locations aAer an average 24-year period, and locations without white pine at either point in time (adapted from Solomon and Leak 1994).
Table 1. Average elevation (m) and latitude and longitude (degrees) of Maine plots occupied by major species at three measurement periods spanning 24-year average period from the 1950s and 60s to 1980s (adapted from Solomon and Leak 1994)
Measurement Red spruce Hemlock Balsatn fir White pine Sugar maple Beech Red oak period
Elevation 238(7) 1 5 O(9) 24 1 (7) 142(9) 23 1(7)** 134(8)* *
Latitude 45.69(.04) 44.82(.07) 45.7 1(.04) 44.73(.07) 45.65(.04)** 44.72(.06)*
Longitude 69.08(.04) 69.50(.08) 69.09(.04) 69.53(.08) 69.07(.04) 69.44(.07)
Standard error in parenthesis; **Significant at 0.0 1 level; *Significant at 0.05 level.
177

Table 2. Percent of basal area by species, elevation class (E), year (Y), and deciduous or coniferous landtype (T) for unmanaged stands on Bartlett Experimental Forest, with significance tests (* = 0.05 level) among factors and interactions with year'
---- id^^^^---- ------- - ------------ -- -Coniferous-------------- 200 to 350 m 200 to 350 m 650 to 820 m T E Y . ---- 500 to 650 m ---- TY EY
Species 1931 1940 1992 1931 1940 1992 1931 1940 1992 1931 1940 1992
RM 19.3 22.4 25.7 21.9 24.6 29.2 9.3 8.3 8.2 8.2 7.4 6.4 * *
PB 14.3 16.4 8.7 11.7 12.1 5.9 15.8 13. 5.5 21.6 21.8 6.6 *
WA 4.7 6.1 6.3 3.3 3.3 4.0 0.7 0.9 0.4 0.2 0.2 0.3 * *
ASP 10.8 5.6 2.9 8.2 5.0 1.3 0.2 0.0 0.0 0.0 0.0 0.0 *
EH 6.9 7.9 14.9 13.3 13.5 24.8 3 .O 3.4 7.8 1.1 1.2 3 .O * * *
RS 2.5 2.6 2.9 5.3 5.5 6.6 22.1 23. 25.9 34.5 34.9 43.4 * *
BF 0.3 0.6 0.3 2.7 2.6 1.8 0.8 0.8 0.5 5.8 5.4 6.2
Note: YB=yellow birch, SM=sugar maple, RM=red maple, PB=paper birch, WA=white ash, ASP=aspen, EH=eastern hemlock, RS=red spruce, BF=balsam fir.
'Leak, W.B; Smith, M.L. Sixty years of management and natural disturbance in New England forested landscape. (In preparation).

Local sets of long-term plot data in unrnanaged or lightly managed conditions allow some assessment of both successional and migrational tendencies' (Table 2). A 60-year record on the Bartlett Forest in New Hampshire provided infomation on species changes related to management, disturbance, land type, and elevation. On coniferous, unmanaged land types, eastern hemlock increased fiom 13 to 25 percent of the basal area in the 200- to 350-m elevational class, from three to eight percent in the 500- to 650-m class, and from one to three percent in the 650- to 820-m class. The results indicate that hemlock shows only a slight tendency to increase its elevational range, a result developed fiom an independent study of age/distance/elevational trends at Bartlett (Solomon an! Leak 1994).
Effects of global climate change on expansion or contraction of elevational range appear minimal or nonexistent at present. However, red spruce increased from 34 to 43 percent of the basal area in the 650-820 class (Table 2), and from 22 to 26 percent in the 500-650 class. Apparently, red spruce populations are maintaining themselves well at these elevations despite warnings about growth decline or winter injury due to acid deposition. In summary, the use of permanent plots is a long-term solution that requires careful selection and analysis to confirm migrational tendencies or serve as a data base for model testing.
RESURVEYS
Under this topic we refer to remeasurements where the initial plots cannot be relocated. This type of information might include resurveys of general areas where earlier survey data are available (e. g., Grabherr et al. 1 994) or surveys representing a sequence over time in comparable (but spatially different) locations (e.g., Hamburg and Cogbill 1988). Resurveys pose at least two special problems. First, specieslarea considerations make it necessary to use the same sampling protocol at each inventory so that the appearance or loss of species does not simply reflect a change in methodology. Second, in areas such as New England where there is high variability in environmental conditions over small spatial scales, it is difficult to resurvey without encountering different habitat conditions and different species.
POLLENNEGETATION ANALYSIS
Pollen records developed from bog and lake sediments provide long-term estimates of changes in vegetation on a regional level over a time scale established by carbon dating or historical markers (e.g., Spear et al. 1994). This approach provides general estimates of species migrational rates and indicates how communities might change with drastic fluctuations in climatic, edaphic, and competitive conditions during the analysis period.
Pollen diagrams can be constructed fi-om shallow-humus profiles that provide local point estimates of changes in vegetation over shorter periods (several hundred years) (Foster et al. 1992). A time scale seems difficult to establish, though qertain historical markers provide some basis for calibration. Apparently, this approach has not been used sufficiently to establish its value in determining recent migrational trends. A careful series of samples along an elevational gradient in an unmanaged landscape might prove useful.
AGEDISTANCE TRENDS
Migrating species exhibit a sequential relationship between age and distance or elevation, that is, young plants will be out in front of old plants (Solomon and Leak 1994). The migration rate can be represented as the change in distancelchange in time (Solomon et al. 1990).
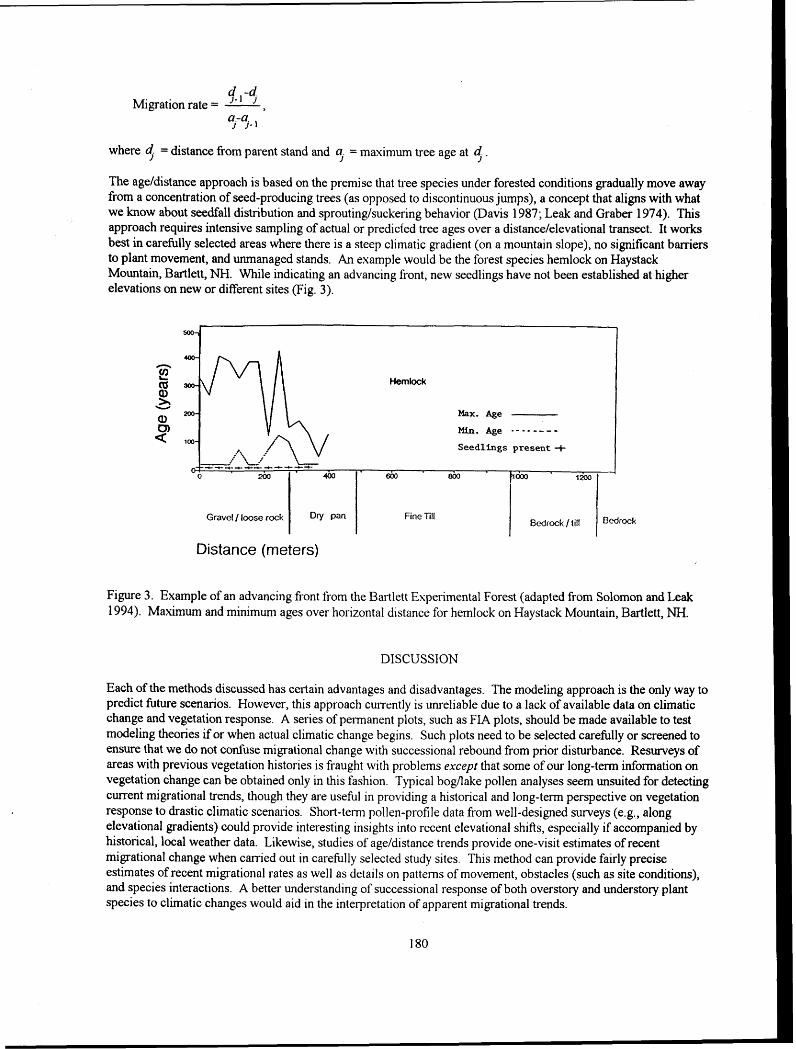
f. , -'$ Migration rate = - ,
a,-a. 1 1.1
where 9. = distance from parent stand and (: = maximum tree age at < The ageldistance approach is based on the premise that tree species under forested conditions gradually move away from a concentration of seed-producing trees (as opposed to discontinuous jumps), a concept that aligns with what we know about seedfall distribution and sproutinglsuckering behavior (Davis 1987; Leak and Graber 1974). This approach requires intensive sampling of actual or predicted tree ages over a distancelelevational transect. It works best in carefully selected areas where there is a steep climatic gradient (on a mountain slope), no significant barriers to plant movement, and unmanaged stands. An example would be the forest species hemlock on Haystack Mountain, Bartlett, NH. While indicating an advancing fi-ont, new seedlings have not been established at higher elevations on new or different sites (Fig. 3).
Hemlock
Distance (meters)
Figure 3. Example of an advancing fi-ont from the Bartlett Experimental Forest (adapted from Solomon and Leak 1 994). Maximum and minimum ages over horizontal distance for hemlock on Haystack Mountain, Bartlett, NH.
DISCUSSION
Each of the methods discussed has certain advantages and disadvantages. The modeling approach is the only way to predict future scenarios. However, this approach currently is unreliable due to a lack of available data on climatic change and vegetation response. A series of permanent plots, such as FIA plots, should be made available to test modeling theories if or when actual climatic change begins. Such plots need to be selected carefully or screened to ensure that we do not confuse migrational change with successional rebound from prior disturbance. Resurveys of areas with previous vegetation histories is fi-aught with problems except that some of our long-term information on vegetation change can be obtained only in this fashion. Typical bogllake pollen analyses seem unsuited for detecting current migrational trends, though they are useful in providing a historical and long-term perspective on vegetation response to drastic climatic scenarios. Short-term pollen-profile data from well-designed surveys (e.g., along elevational gradients) could provide interesting insights into recent elevational shifts, especially if accompanied by historical, local weather data. Likewise, studies of age/distance trends provide one-visit estimates of recent migrational change when carsied out in carefully selected study sites. This method can provide fairly precise estimates of recent migrational rates as well as details on patterns of movement, obstacles (such as site conditions), and species interactions. A better understanding of successional response of both overstory and understory plant species to climatic changes would aid in the interpretation of apparent migrational trends.

LITERATURE CITED
Charlson, R. J.; Wigley, T. M. L. 1994. Sulfate aerosol and climate change. Scientific American. 270: 48-57
Cooter, E. J. ; Eder, B. K. ; LeDuc, S. K. ; Truppi L. 1 993. General circulation model output for forest climate change research and applications. General Technical Report SE-85. Asheville, NC: U.S. Department of Agriculture, Forest Service, Southeastern Forest Experiment Station. 38 p.
Davis, M. B. 1987. Invasions of forest communities during the holocene: beech and hemlock in the Great Lakes region. In: Gran, A. J.; Crawley M. J.; Edward, P. J., eds. Reprint from the 26th Symposium of the British Ecological Society on Colonization, succession and stability. Blackwell Scientific Publications, Oxford. 18: 373-393.
Davis, M.; Zabinski, C. 1992. Changes in geographical range from greenhouse warming effects on biodiversity in forests. In: Peters, R.L. ; Lovejoy, T. E., eds. Proceedings, World Wildlife Fund conference on consequences of global warming for biological diversity. New Haven, CT: Yale University Press. 22: 297-308.
Denton, S. R.; Barnes, B. V. 1987. Tree species distributions related to climatic patterns in Michigan. Canadian Journal of Forest Research. 1 7 : 6 1 3 -629.
Foster, D. R.; Zebryk, T.; Schoonrnaker, P.; Lezberg, A. 1992. Post-settlement history of human land-use and vegetation dynamics of a Tsuga canadensis (hemlock) woodlot in central New England. Journal of E c o ~ o ~ . 80: 773-786.
Grabhem, G.; Gottfried, M.; Pauli, H. 1994. Climate effects on mountain plants. Nature. 369: 448.
Gajewski, K. 1987. Climatic impacts on the vegetation of eastern North America during the past 2000 years. Vegetatio. 68: 179- 1 90
Hamburg, S. P.; Cogbill, C. V. 1988. Historical decline of red spruce populations and climatic warming. Nature. 33 1 : 428-43 1.
Leak, W. B.; Graber, R. E. 1974. A method for detecting migration of forest vegetation. Ecology. 55: 1425-1427.
Overpeck, J. T.; Bartlein, P. J.; Webb, T., 111. 199 1 . Potential magnitude of future vegetation change in eastern North America: comparisons with the past. Science. 254: 692-695.
Pastor, J.; Post, W. M. 1988. Response of northern forests to C02-induced climate change. Nature. 334: 55-58.
Peters, R. L. 1990. Effects of global warming on forests. Forest Ecology and Management. 35: 13-33.
Prentice, I. C.; Bartlein, P. J; Webb, T., 111. 199 1 . Vegetation and climate change in eastern North America since the last glacial maximum. Ecology. 72: 2038-2056.
Solomon, A.; West, D. C. 1987. Simulating forest ecosystem responses to expected climate change in eastern North America: applications to decision making in the forest industry. In: Shands, W. E.; Hoffinan, J. S., eds. The greenhouse effect, climate change, and U.S. forests. Washington, D.C. : Conservation Foundation. 304 P.
Solomon, D. S.; Leak, W. B. 1994. Migration of tree species in New England based on elevational and regional analysis. Research Paper NE-688. Radnor, PA: U.S. Department of Agriculture, Forest Service, Northeastern Forest Experiment Station. 9 p.

Solomon, D. S.; Leak, W. B.; Hosmer, H. A. 1 990. Detecting and Modeling the Migration of Tree Species in Response to Environmental Change. In: Buskhart, H.E.; Bonner, G.M.; Lowe, J. J., eds. Research in Forest Inventoq Monitoring Growth and Yield Proceedings IUFRO S4.01 and S4.02. Virginia Polytechnical Institute and State University, Blacksburg, VA. Publication FWS-3-90.
Spear, R. W.; Davis, M. B.; Shane, L. C. K. 1994. Late quaternary history of low- and mid-elevation vegetation in the White Mountains of New Hampshire. Ecological Monographs. 64: 85- 109.

GROWTH RESPONSES OF WHITE OAK AND BLACK OAK TO DROUGHT STRESS ACROSS GRADIENTS
OF ACID DEPOSITION AND MICROCLIMATE
David LeBlanc' and Robert Haack2
Based on data from Illinois, Indiana, and Ohio following the 1988 drought, acid deposition does not increase the susceptibility of oak trees to drought stress. Measurements at six sites along a gradient from comparatively high to low levels of acid deposition refuted the hypothesis that high acid deposition rates would predispose oaks to growth decline and mortality after a severe drought. Neither patterns of growth rate nor outbreak of two-lined chestnut borer correlate with acid deposition patterns. Differences in growth and mortality between sites appear to relate to diierences in the timing and duration of drought conditions.
'Dept. of Biology, Ball State University, Muncie, IN 47306.
VSDA Forest Service, North Central Forest Experiment Station, E. Lansing, MI 48823
183

ASSESSING THE ABILITY OF PLANTS TO RESPOND TO CLIMATIC CHANGE THROUGH
DISTRIBUTION SHIFTS
Mark W. ~chwartz'
Abstract: Predictions of fbture global wanning suggest northward shifts of up to 800 km in the equilibrium distributions of plant species. Histoi-ical data estimating the maximum rate of tree distribution shifts (migration) suggest that most species will not keep pace with fbture rates of human-induced climatic change. Previous plant migrations have occurred at rates typically ranging from 15-50 krn per century. A simulation model, which incorporates the effects of forest fragmentation and habitat loss, predicts maximum potential migration responses of trees may be only 1 - 10 krn per century, or two orders of magnitude below that required to keep pace with predicted climatic warming. These predicted migration rates suggest that plants will fail to respond adequately to even modest climatic changes. Gauging the actual response of forest species to climatic change, and then appropriately managing forest resources poses several problems. First, we do not know the distribution limits of most forest species with the degi-ee of precision to detect migration events on a 1 - 10 km scale. Second, many species may become vulnerable to extinction by their inability to migrate, leaving them geographically isolated from regions within their climatic tolerance. Third, while the distributions of species can be artificially expanded if climate does warm, this is not currently part of acceptable conservation management practice. Deciding whether or not to artificially enhance species ranges forces a choice between species preservation and historical community composition models for conservation. A pressing concern for forest management is to discover how climate change, anthropogenic habitat change, and doubled CO, interact to alter forest species performance and regeneration within habitats they currently occupy. Range edges are the first place to look for key changes in these ecological responses.
INTRODUCTION
General circulation models, estimating climatic change during the next century in response to a doubling of the atmospheric CO, and other trace gases, suggest walming sufficient to trigger major changes in the earth's living systems. These environmental changes will affect vil-tually all plants and animals. Predicted terrestrial responses include altered: 1) plant-insect interactions (e.g., Lincoln et al. 1986); 2) plant-soil relationships (e.g., Luxmoore et al. 1 986); 3) biome boundaries (e. g., Solomon 1 986); 4) distributions of crop production areas (e.g., Rosenzweig 1993); and 5) distributions of individual species (e.g., Davis and Zabinski 1992), to name but a few. In order to manage natural resources, for extractable resoul-ces (e.g., timber trees) as well as for broadscale biological diversity, it is imperative that we understand the full suite of possible responses of species to the spectrum of climatic change scenarios. Toward this end, I review here what is known regarding the abilities of forest plants to respond under the combined forces of climatic change and anthropogenically altered habitats. Finally, I make research recommendations based on perceived gaps in this knowledge.
The Climate Scenarios
Various Global Circulation Models (GCM's) predict 2 to 6 "C temperature increases during the next century, as atmospheric CO, doubles (Mitchell et al. 1990). Predicted global increases in temperature vary strongly with season and latitude with higher latitudes experiencing greater temperature increases, particularly during the winter months. Thus, for North America, winter temperatures in the boreal forest under a doubled CO, environment may be increased by as much as 12 "C over cun-ent conditions. Further, growing season precipitation is, in general, predicted to decrease over much of North America, resulting in lower soil moisture. Model predictions, however, are recognized as a first approximation at a very complex problem in atmospheric chemistry and physics.
'Assistant Research Scientist, Center for Population Biology, University of California at Davis, Davis, CA 95616.
1 84

The variables predicted by the GCM's (mean seasonal temperature and precipitation), however, are not likely to be the variables that are most important to plant growth (e.g., Woodward 1995). Solomon (1 984), for example, modeled vegetation change based on climate projections using growing degree days, a variable one could estimate from, but not modeled by, GCM's. Frequently, it is the extremes of climate (e.g., drought frequency and severity, frost free days, lowest minimum temperatures) that may be the most important variables used to estimate responses of plants to their environment (Graumlich and Bl-ubaker 1995). Unfortunately, climatologists cannot easily model these parameters. Rind et al. (1 989) suggest that, whatever the exact magnitude of climate change, variability in weather is likely to increase. The biotic consequences of increased climatic variability are likely to be complex and unpredictable.
The Plant-Climate Relationship
Correlations between climate and plant distributions are widespread and well known (e.g., Good 193 1, Cain 1944, Pigott 1970, Woodward 1987, Denton and Barnes 1987, and Grime 1990). Further, vegetation has been responsive to large-scale changes in climate with most tree species altering their distribution limits hundreds to thousands of kilometers during the past 10,000 years (Davis 1 98 1, C O W 1 988). Likewise, recent climatic shifts have resulted in measurable changes in the distribution and performance of plant species. For example, about a dozen coniferous species in North America alone have shifted their growth forms or distribution limits northwards during the past 100 years (see references in Graumlich and Br-ubaker 1995). The manifestations of these changes vary from changes in growth forms and increased seedling recruitment at tree line to expansion of tree line and increased elevation of successfbl growth (e.g., Kullman 1983). The observed increases, however, are not uniformly observed even where climate has warmed. In addition, some range shifts are a result of changes in precipitation, different disturbance regimes, or simply a brief series of relatively warm temperatures (Graumlich and Brubaker 1995). In yet other cases, tree line has recessed owing to changes in disturbance rates (Payette and Gagnon 1979). Evidence of recent tree line shifts are abundant in both directions (Graumlich and Brubaker 1995). These observed changes in treeline are often dependent on proximate ecological factors as well as climatic factors. Nonetheless, the physical evidence of the response of trees to their environment suggests that climatic warming will result in differential recruitment, growth, and survivorship of plants in and around their distribution limits. Our primary limitation in predicting species level responses to future climatic change is that we lack a mechanistic understanding of the climatic limitations of virtually all plants (except see Pigott and Huntley 1 978, Cannell and Smith 1 986, Richardson and Bond 199 1). Even for important timber species much work remains on the physiological relationship between plants and climate to develop mechanistic models of climatic control on plant germination, growth, survivorship, and seed production.
Despite not fully understanding the mechanistic relationship between plants and climate, we can make assertions about the magnitude of vegetation change that ought to result of predicted future warming. Plant distributions correlate with mean annual temperature isobars (e.g., Denton and Barnes 1987). At present mean annual temperature isobars are distributed at approximately 100- 1 25 krn latitudinal intervals in eastern North America (Melillo et al. 1990). If plant-climate relationships remain intact, an increase in 5 "C may result in distribution shifts of 500 km for the equilibria ranges of most plants. Predictions of equilibrium plant distribution shifts become even more dramatic if one also considers both seasonal temperatures and precipitation. Davis and Zabinski (1 991) predict that northward shifts of the equilibria distribution for plants could exceed 800 km. A pressing question then becomes: can plants keep pace with the predicted mapitude of climatic forcing?
FUTURE PLANT MIGRATION RESPONSE
Historical data suggest that plants will not keep pace with climatic warning. Most trees migrated to their current distributions at rates of 10-50 krn per century (Davis 198 1 ). Presuming our climate models are correct, historical migration rates are an order of magnitude too slow to keep pace with hture warming. One must question, however, whether these past migrations were limited by rates of climatic change, or by the dispersal abilities of the plants. Detailed palynological studies have detected considerable lags in response to climatic change (e.g., Davis et al. 1986, Pennington 1986), suggesting that historical migration rates were at, or near, the limit set by the dispersal

abilities of trees. Further, the relative constancy of maximum migration rates through time, among regions, and among species, suggests that these migrations were limited by rates of seed dispersal and not climatic change, which varied through time and among regions, and to which species responses vary (Huntley 1 989). Thus, Holocene migration rates may be good predictors of maximum migration rates for most species.
A few species, however, migrated much faster than 50 km per century. Picea glauca expanded from southern Alberta, through Northwest Canada to Alaska (nearly 2000 km) from 10,000 to 9,500 ybp (Anderson and Brubaker 1993, Ritchie et a1 1983, Graumlich, and Brubaker 1995). This may be interpreted as a rapid expansion of the population with little to no dispersal limitation, Alternatively, treeline expansions may often be a result of krummholz vegetation beginning to grow upright as a result of amelioration and thus indicative of rapid population expansion without range expansion (Graumlich and Brubaker 1995). Thus, it is not clear what the actual migration rate of P. glauca was 10,000 ybp. Another issue complicating specific response predictions is that the climate of the past represents a unique combination of events that are unlike any potential climatic change of the near future. For example, summer insolation was higher, and winter insolation lower, 10,000 ybp owing to the perihelion (the point
- in orbit at which the earth is closest to the sun) occurring in summer rather than winter, as at present. Thus, there were probably higher seasonal eieemes, creating different temperature and moisture regimes (Graurnlich and Brubaker 1995). Indeed, there is evidence of past vegetations that have no modem analog (e.g., Jacobson and Grirnm 1986). Nonetheless, there is a broad consensus that the predicted magnitude of climate change would require migration rates to far exceed any historical rates of vegetation change (Overpeck et al. 1991) and that rates are likely to be limited more by the biology of species than the rates of change in the environment (Huntley 1991).
Regardless of how well past climate reflects fbture climate scenarios, an additional factor that must be considered is that past migration rates are based on a different landscape. Past migration rates are estimated from regions where trees moved from largely forested regions into largely forested regions. Future migrations for many forest species will be within the context of a largely fragmented forest landscape (Peters 1991). The effect of habitat loss on potential migration has been stochastically modeled using a simulated landscape in which dispersal and colonization is a function of the distance between occupied and unoccupied patches (Schwartz 1993). This model varied dispersal and colonization probabilities to fit either one of two functions (inverse power function or negative exponential function) based on empirically derived seed density data (e.g., Harper 1977, Portnoy and Wilson 1993). These models were calibrated to result in a migration rate of 50 km per century when 80 percent of the habitat cells were available for occupation. In sequential luns: 1 ) dispersal function (inverse power or negative exponential), 2) habitat availability (10-90 percent), and 3) within stand frequency (1 0-90 percent) were varied to characterize the effect of habitat loss on migration potential. Assuming 50 km per century to be an average maximum migration rate under a saturated environment (80 percent habitat availability), Schwartz (1 993) predicted migration rates under low (1 0-30 percent) habitat availability to be fi-om 1 - 10 km per centuly, yet another order of magnitude below that predicted to keep pace with climatic change (Figure 1).
n 1000 ,
i? G 9) i.1 " 100 -,
- g -g i - * s . 8 CI +
: ;g E 0 1 a z 3 2 "0 - & * > I 0 9)
.C.l + 3 GI 0 4 s 3 1
d CL . - 4 .r(
4 . C.
!? !? 6 C,
6 I: I! ,, -2 c1
3 x x s g z I E s2 'n g s
m 5! I I I I I I I
Figure 1. A schematic diagram of variation in tree migration rates comparing: 1) rates that would be required to keep pace with climate change; 2) obselvations of Holocene migration rates (based on palynological data); and 3) varying levels of habitat availability in a simulated landscape (redrawn fi-om Schwartz 1993).
1 86

The Potential for Species Loss
If plants can not migrate to keep pace with future climatic warming, then species may be vulnerable to extirpation as a result of climatic change because the current distribution of a species may become disjunct fiom a region of suitable climate (Peters 1991). Schwartz (1 991) estimated the magnitude of this extinction potential using a compendium of 3 16 rare forest taxa of the Southeastern United States (Kral 1983). Using the north-south distribution breadth of species as a measure of sensitivity to extinction, Schwartz (1 99 1) found that a substantial portion of the rare southeastern U. S. forest taxa are potentially vulnerable to extirpation under even modest warming, and that most rare taxa (> 85 percent) have north-south distributions of less than 500 km, the predicted baseline northward shift to keep pace with future warming (Figure 2). Naturally, not all, or even most, of these potentially vulnerable species are truly at risk. Many species are restricted by edaphic conditions, biogeographical boundaries or ecological factors, and not climate. Other species are in mountainous regions where relatively short geographical shifts upslope may be within the realm of migration potential. The point is that the risk of species loss is potentially large, and owing to ow lack of a mechanistic understanding of the plant-climate relationship for most species, we have little ability to predict which species are truly at risk. We do not know which species are, or are not, limited by climate, and this lack of knowledge poses a conservation problem.
North-South Range Breadth (km)
Figure 2. A histogram of the number of 3 16 rare forest species characterized by north-south distribution breadths of differing widths. The number of species in each range breadth category represent an upper estimate of the number, or percent, of species that are potentially vulnerable to extinction under different degrees of climatic change, assuming climatic control of distributions and an inability to migrate sufficiently to keep pace with future warming.
The lack of ability to migrate in response to climatic change for many species does not pose an insurmountable conservation problem. Certainly distributions can be altered through human intervention. This management activity, however, creates a conservation dilemma: we do not sanction range expansion as an acceptable conservation practice. Conserving historically accurate representatives of natural communities is, perhaps, the most common management directive and a common conservation goal. Intentional introduction of species perceived to be vulnerable to extinction into new habitats compromises traditional conservation efforts. Thus, if migration lag is severe, and causes species loss problems, then we must balance our efforts between two opposing conservation objectives: species conservation and maintaining community integrity (Schwartz 1994).

CONCLUSIONS
How do we address the critical issues of climatic change and forest management given our sparse ecological knowledge? I suggest three areas of research that may focus our attention on the critical knowledge gaps in this area. First, we need spatially explicit models of predicted species range expansions in order to test whether species are, in fact, responding to climatic change. Work in this area has begun with an expansion of the simulation model of Schwartz (1 993) to relax restrictions on the spatial scale and life histories of species modeled and to apply the model to real species in real landscapes (Schwal-tz and Iverson, personal communication). These spatially explicit models provide a testable hypothesis regarding the role of climate change in shifting species range boundaries. Knowledge of specific distribution limits, however, limits the extent to which we can test these hypotheses. Precisely indentiQing the distribution limits of a few critical species would allow the model to be empirically tested.
The second area of emphasis is to increase our mechanistic understanding of the plant-climate relationship. By targeting species of particular interest we can begin to assess which species are likely to become vulnerable to climatic change. A good place to start would be to contrast species that have historically shifted their range boundaries, versus those that merely expanded their distributions during the Holocene. Fagus grandfolia and Picea glauca provide a good contrast in this regard. During the last full glacial both species were found in region that is now the Southeastern U.S. During the Holocene, F. gl-andfoiia espanded its distribution northward, such that it is now distributed from Florida to Ontario, while P, giarrca shifted its distribution northward, such that it is found fiom the Great Lakes and New England to northem Canada (F i~ l r e 3). Species that shift their distributions in response to fiture climatic changes are at greater risk than those that expand their distributions.
Figure 3. An estimate of the distribution of A) Picea glazrca and B) Fagus grandfolia at 14,000 ybp (hashed) compared to the current (stippled) distributions showing a Holocene expansion of F. grandfolia compared to a wholesale shift in the distribution of P. glalrca.
The third area of emphasis is relating species interactions and other dynamic ecological processes to estimates of species' responses to warming. Within stand changes in abundance may be the most immediate and strong effect of a changing climate. Thus, studying the interaction of climate to other ecological factors may best help us to understand changing abundances within forested communities. For example, rates of disturbance have observed to be a strong correlative factor that can drive treeline response in conjunction with climate change (e.g., Payette and Gagnon 1979). On a global scale most grasslands are disturbance maintained. Changes in the disturbance regime may swamp climate change in the rates of movements of both species and community boundaries. Alternatively, differences in modem species abundances, such as high deer densities resulting high herbivory rates on Tsuga

canadensis seedlings (e.g., Alvorson et al. 1988), seem likely to overwhelm the species' ability to respond to climate change through migration. The lack of passenger pigeons, an important presettlement seed disperser (Webb 1986), may also strongly affect the ability of trees to respond to climatic change.
Finally, we expect northward range limit expansions to be slow and fear that southern range limit contractions may be swift. Thus, we must focus our attention on ecological processes at both southern and northern distribution limits of species. Curtis (1 959) defined a "tension zone" for the vegetation of Wisconsin as a region that is unusually rich in species distribution limits. Focusing research on "tension zones" allows us the ability to best capture the dynamic processes associated with climate change in a human-altered landscape. Further, sites that are characterized by anomalous microclimates, such as warm south-facing slopes, within these tension zones may be the most sensitive to early signs of climatic change. Lags are often observed in short term responses to climatic change owing to the fact that adult trees are less sensitive to the vagaries of climate than are juveniles; field studies targeting regeneration success and failure will most likely to detect critical changes in the response of species to their environment.
LITERATURE CITED
Alvorson, W. S., Waller, D. M. and Solheim, S. L. 1988. Forests too deer: edge effects in northern Wisconsin. Conservation Biology 2:348-358.
Anderson, P. M. and L. B. Brubaker. 1993. Holocene climate and vegetation histories of Alaska. Pages 386-400 in Global Climates Since the Last Glacial Maximum (J. Kutzbach, A. Pen-ot, W. F. Ruddiman, T. Webb, 111, and J. E. Wright, eds). University of Minnesota Press, Minneapolis.
Cain, S. A. 1944. Foundations of Plant Geomaphv. Harpers, New York.
Cannell, M. G. R. and R. I. Smith. 1986. Climatic warming, spring budburst and frost damage on trees. Journal of Applied Ecology 23 : 177- 1 9 1 .
COHMAP Members. 1988. Climatic changes of the last 18,000 years: observations and model simulations. Science 24 1 : 1043- 1052.
Curtis, J. T. 1959. Ve~etation of Wisconsin: &I Ordination of Plant Communities. University of Wisconsin Press, Madison.
Davis, M. B. 1 98 1. Quaternary history and the stability of forest communities. Pages 1 32- 1 53 in Forest Succession @.C. West, aqd H.H. Shugart, eds). Springer-Verlag, New York.
Davis, M. B., Woods, K. D., Webb, S. L. and R. P. Futyma. 1986. Dispersal versus climate: expansion of Fagus and Tsuga unto the Upper Great Lakes region. Vegetatio 67: 93-103.
Davis, M. B. and C. Zabinski. 1992. Changes in geographical range resulting fi-om greenhouse warming: effects on biodiversity in forests. Pages 297-308 in Global Warming and Biological Diversity (R. Peters and T. Lovejoy, eds). Yale University Press. New Haven, Connecticut.
Denton, S. R. and B. V. Barnes. 1987. Tree species distribution related to climatic patterns in Michigan. Canadian Journal of Forest Research 1 7 :6 1 3-629.
Good, R. 193 1. New Phytologist 30: 149- 1 7 1 .
Graumlich, L. J. and L. B. Brubaker. 1 995. Long-term records of growth and distribution of conifers: integration of paleoecology and physiological ecology. Pages 36-62 in E c o ~ h v s i o l o ~ of Coniferous Forests (W. K. Smith and T. M. Hinckley, eds). Academic Press, San Diego.

Grime, J. P. 1990. Ecological effects of climate change on plant populations and vegetation composition with particular reference to the British flora. Pages 40-60 in Climatic Change and Plant Genetic Resources (M.T. Jackson, B.V. Ford-Lloyd, and M.L. Pal-ry, eds). Bellhaven Press, London.
Harper, J. L. 1 977. Population Biolom of Plants. Academic Press, London.
Huntley, B. 1989. European post-glacial vegetation history: a new perspective. Pages 1060- 1077 in Proceedings of the XIX International Ornitholo~ical Conmess Volume 1, (H. Ouellet, ed). University of Ottawa Press, --- Ottawa.
Huntley, B. 199 1. How plants respond to climate change: migration rates, individualism and the consequences for plant communities. Annals of Botany 67 (supp.) 1 5-22.
Jacobson, G. L. and E. C. Grimrn. 1986. Numerical analysis of Holocene forest and prairie vegetation in central Minnesota. Ecology 67 :958-966.
Kral, R. 1983. A Report on Some Rare. Threatened, Endangered Forest-Related Vascular Plants of the South. USDA Technical Publication R8-TP-2. Atlanta. 1305p.
Kullman, L. 1979. Change and stability in the altitude of the birch tree limit in the southern Swedish Scandes 191 5- 1975. Acta Phytogeographica Suecica 65. 12 1 p.
Lincoln, D. E., D. Couvet and N. Sionit. 1986. Response of an insect herbivore to host plants grown in carbon dioxide enriched atmospheres. Oecologia 69:556-560.
Luxmoore, R. J., E. G. O'Neill, J. M. Ellis, and H. H. Rogers. 1986. Nutrient uptake and growth responses of Virginia pine to elevated atmospheric CO,. Journal of Environmental Quality 15:244-25 1.
Melillo, J. M., T. V. Callaghnn, F. I. Woodward, E. Salati, and S. K. Sinha. 1990. Effects of ecosystems. Pages 283-310 in Climatic Change: the IPCC Scientific Assessment (J. T. Houghton, G. J. Jenkins, and J. J. Ephraums, eds). Cambridge University Press, Cambridge.
Mitchell, J. F. B., S. Manabe, V. Meleshko and T. Tokioka. 1990. Equilibrium climate change and its implications for the future. Pages 1 3 1 - 1 72 in Climatic Change: the IPCC Scientific Assessment. (J. T. Houghton, G. J. Jenkins, and J. J. Ephraums, eds). Cambridge University Press, Cambridge.
Overpeck, J. T., P. J. Ba-tlein and T. Webb, 111. 199 1 . Potential magnitude of future vegetation change over, eastern North America: comparisons with the past. Science 254:692-695.
Payette, S. and R. Gagnon. 1979. Tree-line dynamics in Ungava Peninsula, northern Quebec. Holarctic Ecology 2:239-248.
Pennington, W. 1986. Lags in adjustment of vegetation to climate caused by the pace of soil development: evidence from Britain. Vegetatio 67: 105- 1 18.
Peters, R. L. 1991. Consequences of global warming for biodiversity. Pages 99-1 18 in Global Climate Channe and Life on Earth (R.L. Wyman, ed). Chapman and Hall, New York.
Pigott, C. D. 1970. Pages 32-44 in The Flora of g Changing Britain (F. H. Peny, ed). Botanical Society of the British Isles and Classey and Hampton.
Pigott, C. D. and J. P. Huntley. 1978. Factors controlling the distribution of Tilia cordata at the northern limits of its geographical range. New Phytologist 8 1 : 429-44 1.

Portnoy, S. and M. F. Willson. 1993. Seed dispersal culves: behavior of the tail of the distribution. Evolutionary Ecology 7:25-44.
Richardson, D. M. and W. J. Bond. 1991. Determinants of plant distribution: evidence from pine invasions. American Naturalist 137:63 9-668.
Rind, D., R. Goldberg and R. Ruedy. 1 989. Change in climate variability in the 2 1 st century. Climatic Change 145-37.
Ritchie, J. C., L. C. Cwynar and R. W. Spear. 1983. Evidence from northwestern Canada for an early Holocene Milankovich thermal maximum. Nature 305: 1 26- 1 28.
Rosenzweig, C. 1993. Modeling crop responses to environmental change. Pages 306-322 in Vepetation Dvnamics and Global Change (A. M. Solomon and H. H. Shugart, eds). Chapman & Hall, New York.
Schwartz, M. W. 1991. Potential effects of global climate change on the biodiversity of plants. The Forestry Chronicle 4: 462-47 1.
Schwartz, M. W. 199.3. Modelling effects of habitat fragmentation on the ability of trees to respond to climatic warming. Biodiversity and Conservation 2: 5 1 -6 1 .
Schwartz, M. W. 1994. Conflicting goals for conserving biodiversity: issues of scale and value. Natural Areas Journal 14:213-216.
Solomon, A. M. 1986. Transient response of forests to C0,-induced climate change: simulation modelling experiments in eastern North America. Oecologia 68: 567-579.
Webb, S. L. 1986. Potential role of passenger pigeons and other vertebrates in the rapid Holocene migrations of nut trees. Quaternary Research 26:367-375.
Woodward, F. I. 1987. Climate and Plant Distribution. Cambridge University Press. Cambridge.
Woodward, F. I. 1995. Ecophysiological controls of conifer distributions. Pages 79-94 in Eco~hvsioloey of Coniferous Forests (W.K. Smith and T. M. Hinckley, eds). Academic Press, San Diego.

OVERVIEW OF CURRENT RESEARCH ON ATMOSPHERIC INTERACTIONS WITH WILDLAND FIRES
Wa~ren E. Heilman'
Abstract: Changes in the large-scale mean thermal structure of the atmosphere have the potential for affecting the dynamics of the atmosphere across the entire spectrum of scales that govern atmospheric processes. Inherent in these changes are interactions among the scales that could change, resulting in an alteration in the frequency of regional weather systems conducive to fire occu11-ence In support of the Northern Stations Global Change Research Program, we have designed a research program to examine the interactions of large-scale atmospheric processes with regional fire-weather systems. This paper provides a summary of four studies that have been performed or are in progress that address some of the hndarnental characteristics of regional fire-weather systems and their behavior in response to larger-scale atmospheric conditions.
INTRODUCTION
Atmospheric processes span a wide range of temporal and spatial scales. Ambient micrometeorological conditions as well as micrometeorological conditions generated by wildland fires play a significant role in affecting small-scale physical processes like wildland fire behavior. On the other hand, the frequency of occurrence of severe wildland fires is influenced by larger-scale atmospheric processes like synoptic and mesoscale circulations, precipitation patterns, climatic variability, and extreme weather events. In I-ecent years, there has been considerable attention paid to the prospect of a globally wanner climate due to increases in atmospheric greenhouse gases. Altering the large- scale thermal structure of the atmosphere has the potential for affecting the dynamics of the atmosphere across a multitude of temporal and spatial scales, including those scales that characterize synoptic and regional circulations and regional climatelweather variability. In fact, climate variability and the effects of synoptic and mesoscale weather events with their associated circulation, temperature, and moisture patterns have a much greater influence on the frequency of severe fire occurrence than any global-scale temperature trends. In assessing the potential impact of a changed climate on wildland fire occurrence, it is critical that we examine the secondary effects of climate variability and the tertiary effect of individual weather events (Fosberg et al. 1 993).
We have designed a research program to specifically address the mechanisms by which synoptic-scale atmospheric processes, particularly middle-tropospheric circulations, control regional weather systems that are conducive to severe fire occurrence. By examining some of the fundamental characteristics of these atmospheric fire-weather systems, their development, and their interactions with larger-scale atmospheric processes, we will be in a better position to assess the importance of secondary and tei-tiaiy effects of climate change in affecting severe fire occurrence. Our research approach for examining regional fire-weather systems and their interactions with larger- scale atmospheric processes includes the following four studies: 1) synoptic circulation, temperature, and moisture patterns during severe wildland fires, 2) surface pressure pattern relationships with fire occurrence in the northeastern U.S., 3) atmospheric synoptic effects on the mesoscale dynamics of fire-weather systems, and 4) simulations of soil-moisture and vegetation effects on fire-weather development.
STUDY 1 : SYNOPTIC CIRCULATION, TEMPERATURE, AND MOISTURE PATTERNS DURING SEVERE WILDLAND FIRES
As a first step in examining the relationship of large-scale atmospheric processes to regional fire occurrence, Heilman (1 995) perfo~med a series of empirical-ol-thogonal-function (EOF) analyses on the observed 500 mb geopotential height anomaly fields and 850 mb temperature anomaly fields at the onset of severe wildland fires (i.e.
'Research Meteorologist, USDA Forest Service, Nonh Central Forest Experiment Station, East Lansing, MI 48823.
192

those fires that resulted in the burning of more than 1000 acres) between 197 1 - 199 1 in six different regions (NW, NC, NE, SW, SC, and SE) of the continental U.S. The EOF analyses were used as tools to identify the prevalent middle tropospheric synoptic circulation and temperature patterns that characterize severe fire occurrence on a regional basis.
For severe wildland fires occurring in the northeastern U.S. (typically in the spring and autumn months), defined as the region extending eastward fiom Wisconsin and Illinois to the Atlantic coast, two middle tropospheric circulation patterns were found to be predominant at the onset of the fires. The first circulation pattern is characterized by a 500 mb ridge centered over the western half of the U.S. accompanied by a prominent trough over the eastern U.S. and southeastern Canada, resulting in the transport of cool dry air into the northeastern U.S. This circulation pattern in the middle troposphere produces cooler than normal temperatures at the surface over much of the northeastern U.S., but relative humidity values can be anomalously low. This dryness contributes to the atmospheric conduciveness for severe wildland fires in this region. The second pattern is characterized by a strong 500 mb ridge over the eastern half of the U.S. or off the eastern U.S. coast, with the western and/or central states dominated by a 500 mb trough. Average temperatures and relative humidities in the lower atmosphere over the northeastern U.S. under this type of middle tropospheric circulation pattem are anomalously high and low, respectively. The presence of a middle tropospheric ridge over the eastern U.S. is conducive to the surface Bermuda high pressure system that can block the northward transport of Gulf moisture into the northeastern U.S. if it is displaced westward of its normal position.
Specific synoptic circulation, temperature, and moisture patterns prevalent in the middle and lower troposphere at the onset of severe wildland fires in the other regions of the U.S. were also identified. For all regions, the middle tropospheric circulations identified in this study as being associated with severe fire occurrence led to drier than normal lower atmospheric conditions over much if not all of the specific regon of interest. Circulation patterns obtained fiom the EOF analyses were compared with similar but subjective analyses performed by Schroeder et al. (1 964), and the results were found to be quite similar. Results from this study are being used to examine how specific synoptic circulation patterns influence the development and evolution of regional fire-weather episodes, and will be used in future studies that will assess the potential impact of large-scale circulation changes in the atmosphere associated with a globally changed climate on the frequency of future wildland fire occurrences.
STUDY 2: SURFACE PRESSURE PATTERN RELATIONSHIPS WITH FIRE OCCURRENCE IN THE NORTHEASTERN U.S.
In a companion study to the middle tropospheric circulation analyses performed in study # I , Takle et al. (1 994) examined surface pressure patterns and circulations coiresponding to reduced precipitation, high evaporation potential, and enhanced forest-fire danger for a portion of the northeastern U.S. Analyses of daily surface weather maps resulted in the identification of eight surface pressure or weather patterns (Yamal 1993) that describe distinctive flow situations over the northeastern U.S. throughout the year. Three particular surface pressure patterns were found to occur most frequently during severe fires in the four-state region of West Virginia, Ohio, Pennsylvania, and New York: 1) an extended region of high surface pressure over the eastern and central U.S., with light surface winds, 2) a high pressure system situated off the Atlantic coast (Bermuda high pressure system) resulting in southerly flow over the eastern U.S., and 3) a high pressure system centered over the western Great Lakes region with northerly surface flow over the northeastern U.S. Of these pressure patterns, the Bermuda high pressure pattern was found to be associated with a disproportionately large amount of fire-related damage in the West Virginia area. Evaporation and precipitation data indicate that these three patterns along with a fourth pressure pattern described by a high pressure system centered over the northern Gulf of Mexico all lead to drying conditions over the northeastern U. S. and enhance fire potential.
Simulation results from the Canadian Climate Centre's (CCC) general circulation model (GCM) for the present climate and a doubled atmospheric CO, climate were examined to determine whether there may be a tendency for more surface pressure patterns conducive for fire occurrence in the northeastern U.S. to develop under increased atmospheric C02. The results of the CCC GCM suggest a tendency for increased frequency of "drying" pressure

patterns in the northeastern U.S. under a globally changed climate, although the results were not statistically significant.
STUDY 3: ATMOSPHERIC SYNOPTIC EFFECTS ON THE MESOSCALE DYNAMICS OF FIRE-WEATHER SYSTEMS
Determining the role of synoptic-scale atmospheric processes in affecting severe fire occurrence in a particular region of the country requires a fundamental understanding of the atmospheric dynamics associated with mesoscale or regional fire-weather systems. Mesoscale weather events that produce atmospheric conditions favorable for severe wildland fires develop and evolve, to a large extent, in response to the larger-scale circulation, temperature, and moisture patterns identified in studies # 1 and #2. The development and evolution of mesoscale weather events conducive for fire occurrence can be examined through the use of atmospheric mesoscale modeling techniques that can also translate atmospheric conditions into estimates of fire risk.
As a precursor to actual mesoscale simulations of fire-weather episodes, a suitable but simple index of severe fire risk based on surface atmospheric conditions was developed by Potter (1 995). He performed statistical analyses of eight meteorological variables on fire days and non-fire days throughout the U.S. and found that surface dew-point depression is the best overall discriminator of fire and non-fire days. A fire-weather index suitable for implementation in atmospheric mesoscale models for fire-weather simulation was then developed by Potter (1 995) and is based on elevation-adjusted dew-point depression values at the earth's surface. Unlike other indices of fire- weather, this index does not require upper-air measurements and can be easily measured at any location. This index has been implemented in the Regional Atmospheric Modeling System (RAMS) (Pielke et al. 1992), a sophisticated computer model used for simulating atmospheric processes with spatial scales on the order of 2-2000 krn. Mesoscale simulations of specific fire-weather episodes are currently being performed with RAMS to examine how typical large-scale circulation, temperature, and moistuse patterns associated with regional fire occurrence influence the development and evolution of mesoscale weather systems that favor severe wildland fires. The new fire-weather index developed in this study serves as a useful tool for examining the spatial and temporal characteristics of fire- weather systems as they evolve over different regions of the country and for determining the potential for severe wildland fires.
STUDY 4: SIMULATIONS OF SOIL-MOISTURE AND VEGETATION EFFECTS ON FIRE-WEATHER DEVELOPMENT
The development of regional fire-weather systems in response to the large-scale atmospheric circulation, temperature, and moisture fields is also influenced by atmospheric processes taking place at the earth's surface. Surface fluxes of heat and moisture can moditjl air masses and alter the atmospheric dynamics of weather systems that tend to enhance or inhibit the occurrence of severe fires. In particular, the presence of inhomogeneous distributions of soil-moisture and vegetation can significantly influence circulations and the heat and moisture budgets in the lower atmosphere, which in turn can lead to modifications in the overall impact of the larger-scale circulation, temperature, and moisture fields. Fast ( 1 994) esamined some of the hndamental characteristics of the atmospheric secondrtly circulations that can result fi-om different soil-moisture and vegetation distributions. He also examined their impact on the lower atmospheric temperature and moisture fields which are very important variables in determining wildland fire potential.
Fast ( I 994) performed a series of numerical simulations with RAMS for the May 5- 17, 1 989 and October 25- November 16, 1987 periods when severe wildland fires occurred in Minnesota, Florida, and West Virginia, and abnormally dry and wet soil conditions existed in various regions of the eastern half of the country. For these particular periods, the simulations indicated that the use of realistic soil-moisture significantly affects the near- surface temperatures and moisture fields, and affects the cloud cover, precipitation, and wind speeds to a lesser extent. The largest effects due to soil-moisture usually occul- at locations where the soil is sufficiently moist, but there are occasions when moisture evaporated from wet soil can be transported downwind and affect locations that

are characterized by much drier soils. Soil-moisture variations were found to have a significant impact on local diurnal temperatures and relative humidities, with wet soils decreasing daytime temperatures and increasing daytime humidity values. The simulations also indicated that surface vegetation moderates the transfer of water from the soil to the atmosphere. Vegetation reduces the amount of water evaporated into the atmosphere where the soil is wet, and increases the amount evaporated where the soil is relatively dry. Changes in the lower atmospheric temperature and moisture fields resulting fiom soil-moisture and vegetation variations were also found to affect the Lower Atmospheric Severity Index (LASI), an indicator of suitable conditions for severe fire occurrence (Haines 1988). Numerical simulations suggest that the LASI is usually reduced over moist-soil regions, so that the potential for wildland fires is diminished. The LASI was found to be mostly affected by evapotranspiration which reduces the dew-point depression within the atmospheric boundary layer.
LITERATURE CITED
Fast, J. D. 1994. The effect of regional-scale soil-moisture deficits on mesoscale atmospheric dynamics that influence fire severity. Westinghouse Savannah River Company Technical Report, WSRC-TR-94-0468, Savannah River Technology Center, Aiken, SC. 1 30 p.
Fosberg, M. A., L. 0. Mearns, and C. Price. 1993. Climate change-fire interactions at the global scale: Predictions and limitations of methods. In: Fire in the environment: The ecological, atmospheric, and climatic importance of vegetation fires. P. J. Cl-utzen and J. G. Goldarnrner, Eds. John Wiley & Sons. p. 123-1 37.
Haines, D. A. 1988. A lower atmosphere severity index for wildland fires. Nat. Wea. Digest 13:23-27.
Heilman, W. E. 1995. Synoptic circulation and temperature patterns during severe wildland fires. Ninth Conference on Applied Climatology, American Meteorological Society. p. 346-35 1.
Pielke, R. A., W. R. Cotton, R. L. Walko, C. J. TI-emback, W. A. Lyons, L. D. Grasso, M. E. Nicholls, M. D. Moran, D. A. Wesley, T. J. Lee, and J. H. Copeland. 1992. A comprehensive meteorological modeling system - RAMS. Meteor. Atmos. Phys. 49:69-9 1 .
Potter, B. E. 1995. Atmospheric stability, moisture, and winds as indicators of wildfire risk. Ninth Conference on Applied Climatology, American Meteorological Society. p. 3 3 1 -3 34.
Schroeder, M. J., M. Glovinsky, V. F. Hendricks, F. C. Hood, M. K. Hull, H. L. Jacobson, R. Kirkpatrick, D. W. Krueger, L. P. Mallory, A. G. Oertel, R. H. Reese, L. A. Sergius, and C. E. Syverson. 1964. Synoptic weather types associated with critical fire weather. Pacific Southwest Forest and Range Experiment ,
Station, Berkeley, CA. 492 p.
Takle, E. S., D. J. Bramer, W. E. Heilman, and M. R. Thompson. 1994. A synoptic climatology for forest fires in the NE US and future implications from GCM simulations. Int. J. Wildland Fire 4:217-224.
Yarnal, B. 1993. Synoptic Climatology in Environmental Analysis: A Primer. Belhaven Press, London. 195 p. . .-

SYNOPTIC CIRCULATION AND TEMPERATURE PATTERN DURING SEVERE WILDLAND FIRES
Wan-en E. Heilman'
Large-scale changes in the atmosphere associated with a globally changed climate and changes in climatic variability may have important regional impacts on the frequency and severity of wildland fires in the future. Identlfjling the relationships of large-scale middle and lower atmospheric processes to regional-scale fire-weather systems is critical for understanding how a changing climate or climate variability can potentially influence wildland fire activity. Three very important middle and lower atmospheric variables that influence the development of regional fire- weather systems are wind, temperature and moisture.
In this study, empirical-orthogonal-function (EOF) analyses were performed on the middle and lower atmospheric circulation and temperature fields at the onset of past severe wildland fire episodes. These EOF analyses were used to identify the synoptic circulation and temperature patterns at the 500 mb and 850 mb levels in the atmosphere, respectively, that are prominent at the onset of severe fires in six different regions (NW, NC, NE, SW, SC, and SE) of the U.S. Lower atmospheric relative humidity patterns co~l-esponding to the EOF-derived circulation and temperature patterns during severe fires were also identified. The analyses suggest that there are two or three distinct synoptic circulation, temperature, and moisture patterns that tend to be associated with severe fires in each region. Additional studies are examining how these large-scale patterns influence the mesoscale dynamics of fire- weather systems.
'USDA Forest Service, North Cenral Forest Esperiment Station, 1407 S. Hairison Rd., room 220, East Lansing, MI 48823-5290.

ATMOSPHERIC MESOSCALE SIMULATIONS OF REGIONAL WILDLAND FIRE EPISODES: LOOKING
FOR WEATHER-RELATED FACTORS AND SCALES OF INTERACTION
Brian E. Potter'
The Regional Atmospheric Modeling System (RAMS) is a sophisticated computer model for the simulation of atmospheric processes on scales from a county to a country. It can accurately represent winds, air moisture, and air temperature. In the study of fire-weather episodes, this information must somehow be translated into an estimate of fire risk. We performed statistical analyses of eight meteorological variables on fire days and nofire days, and found that dewpoint depression differs between the two types of days throughout the United States (except Hawaii). By adjusting dewpoint depression for the surface elevation at a particular site, this measure of humidity becomes a fire-weather index that RAMS can easily compute. The model can subsequently produce maps showing the distribution of this fire-weather index at user-specified intervals for simulation of wildfire episodes. This new index serves as a us&l tool for examining how large-scale atmospheric processes iniluence the development of regional weather systems conducive to fire occurrence.
'USDA Forest Service, North Central Forest Experiment Station, East Lansing, MI 48823 -5290.

SPATIAL PATTERNS IN CARBON STORAGE IN A LAKE STATES' LANDSCAPE
J. C. Bell1, D. F. Grigall, P. C. Bates', and C. A. ~ u t l e ?
Abstract: We estimated total organic carbon storage (C -- kg m-') in biomass, forest floor, and soil for a gently undulating glacial outwash landscape in east-central Minnesota (45" 25'N, 93" 1 O'W). Abandoned agricultural tracts are common, and nearly 40 percent of the area is wet mineral or organic soil. Quantitative models based on 745 point-observations were used to define empirical relationships between C storage and landscape variables describing forest cover type and terrain charactet-istics. Exponential regressions for individual cover types explained from 3 1 to 70 percent @<0.05) of the variation in soil C and 39 percent (p<0.05) of the variation in peatland depth. Spatial patterns and quantities of C storage were estimated by applying these functions to a digital geographic database of cover type and terrain attributes. Landscape scale (-1 :20,000) estimates of soil C followed a bimodal distribution with means at 4 kg m" (mineral soils) and 130 kg m-' (peatlands). Biomass carbon for individual cover types ranged from 1 to 13 kg m-'. Total C storage in all components, based on a 1 m soil depth, was 32 kg m-2, with over 90 percent stored in peatlands.
INTRODIJCTION
Organic carbon (C) storage and its change are central issues in global change, but the magnitude of storage in forested systems is uncertain. Although the catena concept is filmly established in soil science, quantification of changes in soil C with landscape position is lacking. This is especially true in more recently glaciated regions such as the Lake States, where climate and a poorly-developed drainage network have led to abundant peatlands, occupying 10 to 30 percent of most basins. Modeled scenarios of global change suggest that both forest tree distribution and the balance between precipitation and evaporation may change, affecting C storage. Quantification of the C stored in these immature landscapes, the pools in which i t is stored, and the relationship of that storage to landscape features will all aid in predicting the magnitude of C response to various scenarios of global change.
The overall objective of our research is to better understand the mechanisms responsible for C sequestration at landscape scales. Although not our ultimate goal, the predictive mapping of C storage is a necessary first step in this understanding. Our specific objective for this study was to quantify the magnitude and spatial patterns of organic C storage in a typical landscape in the Lake States.
METHODS
We sought to quantify spatial patte~ns of organic C stol-age (kg m-') in three pools on the landscape: 1) biomass, 2) forest floor, and 3) soil.
Site
We worked at the Cedar Creek Natural Histoly Area (CCNHA), located 50 km north of Minneapolis-St. Paul, Minnesota, on the Anoka Sand Plain (45" 25'N, 93" 1 O'W). This National Science Foundation-Long Term Ecological Research (NSF-LTER) site is typical of sandy outwash areas of much of the Lake States. Natural vegetation includes prairie, oak savanna, closed forests, shrub cans, marshes, lakes, and bogs (Pierce 1954). Many of the present ecosystems developed following agricultural abandonment. Soils are derived from deep (20 m), well-
'Department of Soil, Water, and Climate, University of Minnesota,"'St. Paul, MN 55 108.
'Natural Resources Management Program, Western Carolina University, Cullowhee, NC 28723.

sorted glacial outwash of very uniform fine sand (> 90 percent sand). Slopes are gentle, usually less than 15 percent, and local relief ranges up to about 5 m. The regional climate is continental with a mean annual temperature of 6°C and annual precipitation of 660 mm (Grigal et al. 1974). The regional water table is at or near the soil surface in low-lying areas and only a few meters below the surface in the highest elevations. Nearly 40 percent of CCNHA is occupied by wet mineral or organic soils so that the 2200 ha site is an intricate upland-wetland mosaic. A few meters of horizontal distance often separate upland oak forests or old fields from adjacent wetlands.
Field Sampling
Samples and descriptions of soils, vegetative cover, and organic debris at the soil surface, referred to hereafter as forest floor, were collected along 19 transects crossing topographic changes of the major vegetation types. We sampled at two levels of intensity. Level #1 sites were at 25m increments along the transects (total = 745). We recorded landscape position and topography (slope gradient, curvature, and aspect); vegetation type; tree basal area, diameter, and condition; tall shrub cover and height; low shrub and forb cover; forest floor and A-horizon thickness; fiber type and depth of organic soil materials (if present); and location (based on global positioning system). Approximately one third of the level #1 sites were randomly selected for level #2 sampling (total = 250). Forest floor and soil samples were collected for laboratoly determinations of organic C content. Mineral soils were sampled at 0-25 and 26-100 cm depths with a bucket auger, and organic soils were sampled in 50-cm increments until impenetrable with a McCauley peat auger. A 5 percent subset of soils was sampled for bulk density using the core method.
Laboratory Methods
Loss-on-ignition (LOI) was detelmined for- all forest floor and soil samples by ashing overnight at 450°C. Approximately 30 percent of the samples were used to develop relationships between LOI, total organic C on a gravirnetric basis (g kg") (David 1988), and soil bulk density (kg m')) (Grigal et al. 1989). The relationships were used to calculate C and bulk density for the remaining samples. Organic C on a volumetric basis was calculated to 1 m for mineral soils and to the depth of sampling for organic soils.
Forest floor C concentrations were converted to mass per unit area based on the quantitative field sampling. Biomass of trees was based on published allometric relationships (Alemdag 1983, 1984). We developed our own biomass relationships for shrubs and forbs based on either cover and height (shrubs) or cover (forbs). These latter data had been previously collected at CCNHA (Suhartoyo 199 1). All biomass data included estimates of root mass. Biomass was expressed as mass per unit area, and its C content was considered to be 47.5 percent (Raich et al. 1991).
Spatial Data
We developed a digital geographic database that included vegetation cover type, peatland locations fiom an order I1 soil survey, and a digital terrain model. The info~mation was stored in a raster format using 10-meter gnd cells. Scales for input data ranged from 1 : 1 5,000 to 1 :20,000. Digital maps of slope gradient, slope curvature, aspect direction, plan and profile slope curvature, and both horizontal and vertical proximity to local topographic highs and lows (peatlands) were calculated for each gnd cell in the geographic database using methods described by Moore et al. (1 993) and Bell et al. (1 992). The transect sampling locations and the digital geographic database were registered to standard geographic coordinates to facilitate spatial comparisons.
Spatial Modeling
Estimates of total organic C were partitioned by vegetation type. Eight types (pine, oak, upland mixed hardwoods, savanna, old field, lowland conifers, lowland hardwoods, and lowland non forested) were recognized in both the geographic data base and at transect locations. The latter three types were primarily located in peatlands.

Using digital overlay techniques, each transect location was defined by combinations of landscape features (slope, vegetation type, etc.) as defined in the geographic database. Simple means were used to describe forest floor and biomass C by vegetation type. Linear and exponential statistical models were developed for soil C. Peatland depths cannot be ascertained from simple surface data (Swanson and Grigal 1989), and were estimated by functions related to distance to mineral soil and elevation. A 75 percent random subset of transect observations was used to calibrate statistical relationships between landscape att~ibutes and soil organic C concentrations. The remaining observations were used to obtain an unbiased estimate of model perfoimance (model validation).
After the quantitative relationships were calibrated and validated, digital overlay techniques were used to define the landscape attributes for each grid cell in the geographicdatabase, and the statistical models were applied to these attributes on a cell-by-cell basis to predict and map organic C storage for each pool (biomass, forest floor, soil).
RESULTS AND DISCUSSION
Organic C and LO1 were closely related, with ?= 0.97 for mineral soils with LO1 < 14 percent dry weight, ?= 0.83 for mineral soils with LO1 >= 14 percent, and rZ= 0.88 for organic soil materials.
Biomass and forest floor C varied among vegetation types (Fig. 1). For upland sites, soil organic C concentration varied significantly with terrain attributes including slope gsadient and horizontal distance and elevation above peatland. Correlations with the data used to calibrate the relationships (rCZ) ranged from 0.93 to 0.95, and correlations with the validation data (rv2) ranged fi-om 0.3 1 to 0.70 among vegetation types. Peatland depth was best estimated by distance to nearest mineral soil and elevation, with 1-2 = 0.29 and r: = 0.39. Carbon density varied significantly with depth in peatlands because of differences in both C concentration and bulk density. It ranged from 0.52 kg m-2 cm" for the 0 to 50 cm depth, 0.76 kg m-2 cm-' fol- the 50 to 100 cm depth, and 0.49 kg m" cm" for depths below 100 crn (p < 0.00 1 ). For all of the predictive relationships, the mean r: = 0.83 and the mean r: = 0.50.
15 - 1
- n
rn cv ST: Forest Floor E \ 10- i 1 0 L x w
Biomass c 0 5 z 0 =
;r;
w m 0 I I I I I I I
Pine Oak UpHd LwCn LwHd LwNF Savn OldFl
Vegetation Type Figure 1. Carbon storage in biomass and fosest flool- in eight vegetation types of the Cedar Creek Natural History Area. Mean and standard error indicated. Pine = pine, Oak = oak, UpHd = upland mixed hardwoods, LwCn = . lowland conifers, LwHd = lowland hardwoods, 1,wNF = lowland non forested, Savn = savanna, and OldFl = old field.

When applied to all of CCNHA, organic C storage is heavily weighted to the peatlands (Table 1). Reports of C storage in peatlands are rare. Gorham (1 99 1 ) estimated global carbon storage in peatland soils, and his estimate (1 33 kg mm2) is nearly equal to our estimate for peatland soils at CCNHA (1 3 1 kg me' -- Table 1).
In terms of C storage in uplands, G~igal and Ohmann ( 1992) reported mean C storage of five upland forest cover types in five geographic zones in a gradient across the Lake States. The C data for upland sites at CCNHA are at the low end of their range for forest floor (0.5 - 3.0 kg m-2) and biomass (7.0 - 10.0 kg m 4 , and are much lower than their range for soil C (7.0 - 15.0 kg m-') (Table 1). As a result, total system C at CCNHA is much lower that reported by Grigal and Ohmann (1 992) for upland forests (1 2.0 - 24.0 kg m"); total C storage in uplands of CCNHA is only 9 kg m". The lower estimates for CCNHA reflect the influence of the coarse texture of the mineral soil. Although the pine types in the gradient study were also coarse testured, their surfaces were somewhat finer-textured. In addition, CCNHA has experienced more agricultural disturbance than have the sites from the gradient study. Finally, because CCNHA is at the southwest estreme of Lake States forests, precipitation is lower and temperatures are higher than for most of those forests, further reducing C storage.
Table 1. Carbon storage in the landscape of Cedar Creek Natural Histo~y Area. All data in kg m-2. Sums are based on either the fill depth (Total System) or 1 m of organic soil in peatlands. Standard errors, based on cell-to-cell variation in estimates, were less than 1 % of the mean in all cases.
Total organic C storage over all 2070 ha of CCNHA (excluding lakes) is 1.22 x 10" g, of which the soil contributes nearly 90 percent, 1.08 x 10" g. If C storage in peatlands is only considered to 1 m, as is mineral soil, C storage in soil is 0.55 x 10" g. Our approach to estimating organic C storage in soil, which explained roughly half the spatial variation at CCNHA, treats the landscape as a continuum rather than as a set of discrete map units. The soil organic C storage was based on terrain attributes derived from a continuous representation of the topographic surface. In contrast, a discrete approach can also be used to estimate soil C, based on the area and the estimated C density of each soil map unit. Using that approach, estimated soil C storage to 1 m at CCNHA is 0.50 x 10¹² g. The continuous approach is much more amenable to modeling changes in C storage with changes in climate on these landscapes.
Biomass
Forest Floor
Soil
Total System
Total (1 m soil)
CONCLUSIONS
Peatlands store over 90 percent of the organic C in the landscape at CCNHA, and are important when considering the C storage of forested systems in the Lake States. More work is needed to reduce the uncertainty currently associated with estimates of C pools in northern forests. The techniques that we used are applicable to broader areas, and could rapidly move our understanding of C storage fo~~vard.
Uplands
6.0
0.5
4.0
9.0
9.0
Peatlands
6.0
0.5
131
138
69
Landscape
6.0
0.5
52
59
32

ACKNOWLEDGEMENTS
Funding was provided by the USDA Forest Service Northern Stations Global Change Program, and by the Minnesota Agricultural Experiment Station. Jim Engstrom played a major role in developing the initial coverages that we used.
LITERATURE CITED
Alemdag, I.S. 1983. Mass equations and merchantability factors for Ontario softwoods. Canadian Forestry Service, Petawawa National Forestry Institute. Info~mation Report PI-X-23.
Alemdag, I.S. 1984. Total tree and merchantable stem biomass equations for Ontario hardwoods. Canadian Forestry Service, Petawawa National Forestry Institute. Infolmation Report PI-X-46.
Bell, J. C., R.L. Cunningham, and M. W. Havens. 1992. Calibration and validation of a soil-landscape model for predicting soil drainage class. Soil Science Society of America Journal 56: 1 860- 1866.
David, M.B. 1988. Use of loss-on-ignition to assess soil organic carbon in forest soils. Cornrnun. Soil Sci. Plant Anal. 19: 1593- 1599.
Gorham, E. 199 1. Northern peatlands: role in the carbon cycle and probable responses to global warming. Ecological Applications 1 : 182- 195.
Grigal, D.F., L.M. Chamberlain, H.R. Finney, D.V. Wrohlewski and E.R. Gross. 1974. Soils of the Cedar Creek Natural History Area. Minn. Agr. esp. Sta. Miscell. Rep. 1 23. 47 p.
Grigal, D. F., S. L. Brovold, W. S. Nord, and I,. I;. Ohmann. 1 989. Bulk density of surface soils and peat in the North Central United States. Canadian Jou~nal Soil Science 69:895-900.
Grigal, D. F. and L. F. Ohrnann. 1992. Carbon storage in upland forests of the Lake States. Soil Science Society America Journal 56:935-943.
Moore, I. D., P.E. Gessler, G.A. Nielsen, and G.A. Peterson. 1993. Soil attribute prediction using terrain analysis. Soil Science Society of America Journal 57 :443-452.
Pierce, R.L. 1954. Vegetation cover types and land use history of the Cedar Creek Natural History Reservation, Anoka and Isanti Counties, Minnesota. M.S. thesis, University of Minnesota, Minneapolis. 137 p.
Raich, J.W., E.B. Rastetter, J.M. Melillo, D. W. Kicklighter, P.A. Steudler, B.J. Peterson, A.L. Grace, and C.J. Vorosmarty. 199 1 . Potential net primaly productivity in South America: application of a global model. Ecological Applications 1 :399-429.
Suhartoyo, H. 199 1. Analysis of vegetation of the Cedar Creek Natural History Area using methods of classification and ordination. M.S. thesis, University of Minnesota. St. Paul, MN. 125 p.
Swanson, D.K. and D.F. Grigal. 1989. Vegetation indicators of organic soil properties in Minnesota. Soil Science Society of America Jou~nal 53:49 1-495.

CARBON STORAGE IN MANAGED FORESTS OF THE NORTHERN GREAT LAKE STATES
Jeanette L. Rollingerl and Terry F. Strong2
Abstract: Carbon (C) storage in forest ecosystems is a significant part of the total terrestrial C pool, and may potentially be manipulated as an important C sink. The influence of management on C pools must be understood before guide!ines can be suggested for maximizing C sequestration in forests. Studies of hardwood, red pine (Pinus resinosa Ait.), aspen and hybrid poplar stands located primarily in Minnesota, Wisconsin and Michigan have been and are cwently being conducted to address the effects of common management practices on C storage. Factors studied include: (1) the effect of harvest intensities on soil and biomass C, (2) the effect of forest conversion from second growth hardwoods to red pine, and from old fields to hybrid poplar plantations or red pine, on ecosystem C, (3) the effects of soil compaction and biomass removal on stand productivity. Total aboveground C ranged from 303 to 335 Mglha, and did not differ by harvest intensity 40 years after partial cutting northern hardwoods on a ten- year cycle. However, distribution of C among aboveground components was significantly different (proportionately more C was in the understory with increased intensity of harvest). In both hardwood and some red pine stands, increasing harvest intensity appears to reduce C storage in soil. Soil compaction and forest floor removal reduced aspen shoot biomass and quantity of C in the forest floor. Total ecosystem C continued to decrease for five years after aspen harvest. However, the ecosystem began to gain C after seven years and accumulation continued until C reached a maximum at 70 years post-halvest. Total soil C was generally unchanged after aspen clear-cutting. Adjacent red pine plantations and hardwood stands on the same soils averaged the same mass of C in vegetation, in soil across the entire profile, and in total ecosystem C (2 1 1 and 206 Mgha, respectively), although the hardwood averaged 14 years older than red pine. Soil C accumulation in twelve to eighteen year old hybrid poplar plantations exceeded that on adjacent agricultural fields.
INTRODUCTION
In the United States, forest C pools constitute approximately 558 billion tons of C (Birdsey 1992). The land has been losing C to the atmosphere since about 1860, and until the end of the 1970s more C came from terrestrial ecosystems than fi-om fossil fie1 combustion (FIoughton el al. 1983). Because soil, litter, and peat contain more than twice as much C than does the atmosphere, and because forested ecosystems can store substantial C in vegetation and soil (Birdsey 1992), speculation has arisen on how afTorestation, land management and reforestation strategies can be employed to mitigate the rise in atmospheric CO? and expected global warming (Keeling 1984, Schneider 1989, Thompson and Matthews 1989). Among these strategies is the choice of which species to grow, and practices employed to manage those species.
The northern Great Lakes forests are located within the transition zone between the northern hardwood type and boreal forests. Prior to large scale logging that began in the middle 1800's until the early 1900s, forests were approximately 30 percent pine (Benzie 1977), with the remainder being upland mixed hardwood, hardwoodlconifer, and lowland conifer types. Following upland logging, second growth deciduous forests, primarily even-aged, have become established on most of the area. Pines occur primarily in plantations. Trees in most of these forests have reached merchantable size and are under some type of management.
'Research Ecologist, USDA Forest Service, North Central Forest Experiment Stat ion, 1 83 1 Highway 169 E., Grand Rapids, MN 55744.
*Research Forester, USDA Forest Service, North Central Forest Experiment Station, 5985 Highway K, Rhinelander, WI 5450 1.

The effect of both forest hai-vest practices and species conversion on the size of ecosystem C pools have been studied in this area. Manipulations associated with tree harvest were hypothesized to affect stored carbon including harvest intensity, soil compaction and forest floor removal (Alban el al. 1994, Perala and Alban 1993, Strong 1995). Land use conversion studied included the planting of red pine on second growth hardwood sites and planting hybrid poplars on old fields (Perala et al. 1995, Nansen 1993).
METHODS
Although the seven case studies featured in this review were conducted independently, the methods share some common features. Individual tree biomass was usually established from published regression equations (Perala and Alban 1993, Hansen 1992) or from a combination of plant diameter, height, and directly measured biomass relationships obtained by felling and diying. Understo~y biomass was estimated using techniques similar to those used for trees, and root biomass was also estimated. Biomass of coarse woody debris (minimum measured diameter varied among studies from 1 to 2.5 cm; too sound to be penetrated by a soil coring device) was estimated from oven- dried subsamples. Soil samples were collected fi-om small pits, and usually separated into forest floor (exception, Hansen 1993) and various depth layers of mineral soil to a maximum depth below the main rooting profile (varied among studies from 40- 100 cm). Bulk density was detelmined for each layer collected and percent C was measured either with a Carlo Erba C anal-per or by relationships \vith loss on ignition. Soil C was based on percent of C concentration in the soil and bulk density measurements.
CASE STUDIES
Cutting intensity anlong hardwoods
In this study, C was measured in various components of a noi-them hardwood ecosystem that has been managed under different intensities for forty years (Strong 1995). l'hcse data provide information on current effects of and potential forest management strategies on above- and below-ground forest C resources. Five cutting treatments were evaluated in 1992, including a control, a 20 cm stump diameter-limit cut, and three levels of individual tree selection cuts. The individual tree selection cuts were: heavy - 13.8 m'ha, medium - 17.2 m2/ha, light - 20.7 m2/ha residual basal area of trees 12 cm dbh and larger afier cutting. The individual selection treatments had been cut at ten-year intervals since 195 1 . The diameter-limit treatment was only cut in 195 1. Total aboveground biomass was separated into the following components: dead trees fi-om 1 95 1 - 1 992, cut trees from 195 1-1 992, overstory live trees in 1992 (trees 12 cm dbh and larger), saplings in 1932 (trees and shrubs 2 m tall to 12 cm dbh), and ground vegetation in 1992 (all plants less than 2 m tall). The ratio of C to biomass was assumed to be 50 percent. The study was a randomized block. Data were analyzed by analysis of ilariance.
Differences in total aboveground biomass of components were significant among treatments. Generally, increased harvesting resulted in a greater proportion of biomass in saplings, and less in dead trees and ground vegetation. However, these di fl'erences were not si gnllicant \vhcn components were combined. Average total aboveground biomass for the treatments (3 3 1 Mgha) is similar to that rstlrnated by Mroz el a/.( 1 985) for northern hardwoods in the same region.
Soil C at the 3- 10 cm depth differed in the diameter-limit treatment from other treatments. No differences were detected among treatments at the other depths, or when C was summed to 40 cm. However, linear regression revealed a trend of less soil C with increasing intensity of cutting (p= 0.028, R2 =O. 84). Soil C summed to 40 cm ranged from 90 Mgha in the diameter-limit treatment to 120 Mgha in the control treatment. Soils under red pine have a similar trend (Rollinger, unpublished data).
No differences in total ecosystem C were detected anlong treatments. However, a trend of less ecosystem C with greater cutting intensity appears to exist. Distribution of C in over- and understo~y vegetation and soil was similar

among all treatments; total ecosystem C ranged kom 29 1 M@a to 3 17 Mgtha for the diameter-limit treatment and medium individual selection treatment, respectively.
Aspen harvesting method
Aspen (Populus trewuloides Michx. and P o p s l ~ ~ s grai~didei~tata Michr.) in the Lake States is rapidly being harvested for pulpwood (Hackett 1992), oHcn using the whole-tree method with large equipment in clear-cuts. In the eastern USA, typical rotations range fi-om about 35-50 years (Alban et al. 1991). Aspens are short lived, early successional trees, and in general are fast growing and ubiquitous throughout temperate North America. Quaking aspen (P. trenruloides) also extends into high altitude and boreal forests. The distribution, harvesting issues and silvicultural qualities of these trees have stimulated interest in the effects of aspen management on long term site productivity, C sequestration, and resulting impacts on global climate change (Alban et al. 1991 and references therein). This discussion will focus on two studies of aspen management, one on the effect of clear-cutting disturbance on C storage (Alban and Perala 1992), the other on the effects of biomass removal and soil compaction on these ecosystems (Alban et al. 1 994).
A range of aspen ecosystems (including a chronosequence from 0 to 80 years) was surveyed for C in soil and vegetation (Alban and Perala 1992). Neither stand deirelopment nor timber harvesting affected soil C, but changes in total ecosystem C were coi~elated with changes in standing biomass. Total ecosystem C in these northern Great Lakes forests reached a maximum between 60 and 80 years (> 200 and < 250 Mgha). Soil compaction did not influence the results of in this study, because trees ivere hal-vested during the winter when the ground was frozen.
As part of a long term site productivity project, plots with val-ious intensities of soil compaction and biomass removal were established within aspen stands (Alban et 01. 1 994). Both forest floor removal and soil compaction reduced biomass and height of 2-year-old aspen sprouts. Forest floor C decreased by about 9 t/ha immediately after forest floor removal, but there was little or no immediate change in mineral soil C. One year after harvesting, C in the forest floor and in the 0- 10 cm mineral layer increased, PI-obahly because of root death. Within several years, this ongoing study should produce estimates of sates of soil reco\.ely and elkcts of treatments on vegetation growth. Relatively mild levels of soil compaction and severe forest tloor removal had similar effects on aspen growth.
Old field conversion
The interest and practice of growing trees on fonna-ly agsicultul-a1 land are increasing. Trees are often grown, because the land owner no longer cultivates crops, or are grown as a biological fuel source. During the first 20 years of cultivation, most grassland soil C decreases, particularly if the soil had high initial C (Burke et al. 1989, Mann 1986). Recovery of soil C aAer cultivation in certain systems is therefore a possible future C sink. The amount of C released by energy crops in combustion is equal to that captured in the material used for fuel; however C sequestered belowground as decomposed leaves, roots or root exudates could serve as a C sink. Trees, not grown for energy, on the other hand, could store C in the aggrading vegetation.
The C in soil under hybrid poplar plantations was con~pal-ed to that in adjacent row crops or mowed grass at locations in Minnesota, Wisconsin, eastern Noi-th Dakota, and in Iowa (Hansen 1993). The Establishment of these plantations resulted in early soil'C loss, but the trend later reversed and soil C became positively associated with plantation age. Significant amounts of soil C were sequestel-ed by hybrid poplar plantations older than about 6 to 12 years-old, grown on previously tilled apicultural land. The higher quantity of C under poplars was particularly noticeable among the deeper sampled layers (below 30 cm). Flus of C out of the soil C pool most frequently occurred in the shallowest layers (above 30 cm), indicating the loss was due to mineralization.
Forty-six years after establishment, a red pine plantation converted fi-om an old field showed a decrease in C per unit soil depth per volume of soil (Pregitzer and Palik unpublished manusci-ipt). However, this change in C mass could be almost entirely ascribed to decreased soil bulk density: C concentration did not change significantly. Carbon gain to this plantation occurred in forest floor, understory and tsee biomass.

Conversion of second growth hardwood to red pine
The distribution of C in soil and biomass was studied across Minnesota, Wisconsin, and Michigan, U.S.A., in 40 pole-sized red pine plantations paired with adjacent hardwood stands (Perala et a/. 1995). Pine and hardwood stands shared a common boundary and soil. Hardwood stands were mixed species, naturally regenerated second growth following logging.
Carbon in total standing crop averaged the same in both hardwood (AVG=96 Mgha, SD=24) and red pine (AVGz97 Mgha, SD=20) forest types, although the h;lrdwoods averaged 14 years older than the red pine. Coarse woody debris, shubs, and hei-bs contained little C. Only the forest floor carbon pool was different between forest types, with a greater mass beneath red pine (AVG=23 Mgha) than hardwoods (AVG=17 Mgha). There was no significant difference in total ecosystem C between red pine and hardwood stands (2 1 1 Mgha, SD 48; and 206 Mgtha, SD 4 1, respectively). Total mineral soil aggregated with depth contained the same total C in both pine and hardwood stands. However, the C occun-ed in din'crent vertical patterns. Amounts of C in the upper levels of soil (0-4 cm) were higher under hardwoods, and amounts \\rere higher under red pine at the 8- 16 cm and 16-32 cm soil depths. Grigal and Ohrnann (1992), in contrast, found that red pine sequestered less total soil C than did sugar maple or aspen, trees common to the hardwood stands studied by Perala et a/. (1 995). This discrepancy is likely due to the different study objectives and hence diil'crcnt site sclection criteria. The paired design adopted by Perala el al. (1 995) allowed careful same-soil pairing of stands.
Regression modeling showed that red pine stored carbon more eitlciently both in the forest floor and deep in the soil, in areas where July air temperatures were relatively cool. Red pine also sequestered more C in mineral soil with increasing April-September precipitation. In waimel-, drier climates, hardwood stands stored more soil C. July average air temperature was the only climate val-iable to be related to total ecosystem C, a decline of 21.5 MglhaPC. Thus, restoration of pine to historically pine forested areas rather than conversion to second growth hardwood stands may increase stored C in the soil and vegetation of these ecosystems, provided that the climate remains relatively cool and moist. Further C increases can be expected in red pine biomass accumulation. Similarly, conversion of historically hardwood forest back to ha]-dwoods fi.0111 red pine may slightly increase C stored in the soil in relatively warm and dry climates.
Comparisons among forest types
Grigal and Ohmann (1 992) sampled 169 forest stands, across Minnesota, Michigan and Wisconsin for total ecosystem C. Stands represented ma-lor I-egionnl upland fbl-est types: balsam fir (Abies balsan~ea [L.]), jack pine (Pinus banksiana Lamb.), red pine, quaking aspen, and northeln hardwoods. Regression analysis showed that about 63 percent of total ecosystem C variation was explained by forest type, stand age and soil clay content. Among the forest types measured, jack pine averaged thc least total ecosystem C (1 3.9 kg/mZ) and noithem hardwoods the most (23.4 kg/m2). Time since disturbance illfluenced C in vegetation and the forest floor. Both components stored more C with increased time.
CONCI .IJSION
Differences in halvesting techniques and forest convel.sion usually had little or transitory effects on the total stored C in the ecosystem. However, within components of the ecosystem, at least some effects were noticed in every case. In general, tree harvesting activities slightly reduced casbon storage. Cutting intensity of typical mixed hardwood stands apparently affected the size of the stored soil C pool, but the etiect was not significant when considering total ecosystem carbon. Carbon in aspen stands was reduced by compaction and forest floor removal, but the significance of the effect varies among years. The mineral soils in these stands were unaffected by clear-cutting. The effect of conversion of old fields to tree plantations varied \\lith the Ype of trees planted. Hybrid poplars increased stored ecosystem C compal-ed to agsicultural crops and rno\\rcd field species. In contrast, red pine did not increase carbon stored in soil after convel-sion from an old field. but did lncrcase biomass C. When maximization of C accumulation is a factor in choosing the trees to plant, managel-s should consider the potential of certain species to store more C

than others, and climatic factors. Over the entire region, conversion of second growth hardwoods to red pine neither increased nor decreased total ecosystem C. However, when the two stand types were corrected for age differences, the C pool in red pine vegetation could be espected to be larger than that in hardwoods. Whether red pine or hardwood stands were expected to accumulate more C depended on warm season precipitation. Dominant species also affected C pools, with jack pine stands having the least total ecosystem C. Although certain of these studies found effects of harvesting technique and forest conversion on mineral soil C, effects on forest floor and biomass C were more common and of larger magnitude. Vegetation and forest floor are also sensitive to disturbance related to stand replacement.
LITERATURE CITED
Alban, D. H., G. E. Host, J. D. Elioff, and D. A. Shadis. 1994. Soil and vegetation response to soil compaction and forest floor removal after aspen harvesting. USDA Forest Senlice Res. Pap. NC-3 15
Alban, D. H., and D. A. Perala. 1992. Carbon storage in Lake States aspen ecosystems. Can. J. For. Res. 22: 1 107- 1110.
Alban, D. H., D. A. Perala, M. J. Jurgenson, M. E. 0stl-y and J. R. Probst. 199 1 . Aspen ecosystem properties in the upper Great Lakes. USDA For. Sew. Res. Pap. NC-300.
Benzie, J. W. 1977. Manager's handbook for red pine in the north central states. USDA For. Serv. Technical Report NC-33.
Burke, I. C., C. M. Yonker, W. J. Ratton, C. V. Cole, K. Flach and D. S. Schimel. 1989. Texture, climate and cultivation effects on soil organic matter content in U.S. grassland soils. Soil Sci. Soc. Arner. J. 53:800- 805.
Grigal, D. F., and L. F. Ohmann. 1992. Carbon storage in upland forests of the Lake States. Soil Sci. Soc. Amer. L. 69:895-900.
Hackett, R. L. 1992. Pulpwood production in thc Late States, 199 1 . USDA For. Serv. Res. Note NC-36 1.
Hansen, E. A. 1993. Soil carbon sequestration beneath hybrid poplar plantations in the North Central United States. Biomass and Bioenergy 5:43 1 -436.
Mam, L. K. 1 986. Changes in soil carbon after cultivation. Soil Sci. 1 42:279-288.
Mroz, G. D., M. R. Gale, M. F. Jurgensen, D. J. Frederick, and A. Clark 111. 1985. Composition, structure, and aboveground biomass of two old-growth northem hardwood stands in Upper Michigan. Can. J. For. Res. 15 :78-82.
Perala, D. A., and D. H. Alban. 1993. Allometric biomass estimators for aspen-dominated ecosystems in the upper Great Lakes. USDA For. Sew. Res. Pap. NC-3 14.
Perala, D. A., J. L. Rollinger, and D. M. Wilson. 1 995. Comparison between soil and biomass carbon in adjacent hardwood and red pine forests. In: The proceedings of Global Warming 6 Conference. World Resources Review (in press).
Strong, T. F. 1995. Effects of harvesting intensity on the carbon distribution in a northern hardwood ecosystem. USDA For. Serv. Res. Pap. NC (in Review).
Thompson, D., and R. Matthews. 1989. Co, in trees and timber lovers greenhouse effect. Forestry and British Timber. 18: 19-24.

TEMPERATURE AND EARTHWOIW EFFECTS ON C AND N DYNAMICS IN OAK STANDS ALONG AN
URBAN-RURAL LAND USE GRADIENT
R.V. Pouyat', P.M. Groll'man', M M Ca~~ciro', P. E30hlen2, and R.W. paimelee2
In previous studies of an urban-rural land use gl-adirnt in the New Y 01-k City metropolitan area, urban forest soils had higher heavy metal concentrations, soil temperatures, and abundances of earthworms than rural soils, while rural soils had higher abundances of fungi. Leaf litter collected along the gradient had higher concentrations of lignin in urban than in rural stands. The effects of site (soil organisms, soil temperature) and substrate quality (lignin) on decomposition and N dynamics was tested by transplanting litter and soil between urban and rural stands. Rural derived litter decomposed more rapidly than urban derived litter regardless of site conditions and the urban sites exhibited higher decomposition rates regardless of litter type. In a laboratory experiment, initial lignin concentrations of leaf litter explained 50% of the variation measured in decomposition rate. Similar to the site effect on litter decomposition, net N mineralization rates were higher in urban than in i-ural stands regardless of soil type. Nitrification rates increased in urban stands; ho\\re\.er, rate increases \yere only measured in urban soil cores. In contrast to litter decomposition rates, urban soil had highcr N mineralization rates than rural soil, regardless of site conditions. An ealthwolm microcosm study was conducted to test whether eai-thwoim activity explains the increased N transfo~mation rate in the urban forest solls. N mineralization rates were significantly higher in urban soil with earthwolms (0.15 mg N kg-' d") than In urban soil ~vithout eal-thwoims. Rural soil with earthworms (0.57 mg kg" d-I) had significantly higher rates than L~I-ban so11 \vith eai-th~vo~ms and rural soil without earthworms (0.28 mg kg-' d-'). Net nitrification rates were 2 to 3 timcs highci- In urban soil with ea~thwoims than in the other treatments. These results suggest that eal-thwo~ms may explain the relatively high N tsansfo~mation rates in the urban stands despite the input of poorer quality litter
'USDA Forest Service, Noi-theastei-n Forest Espcrimcnt Station, SUNY-CESF, Syracuse, NY 1 32 10.
*Institute of Ecosystem Studies, Caiy AI-borctuin, Millhl-ook, NY 1 2545.
3Fordam University, Bronx, NY.

PREPARATION OF FOREST INVENTORY AND ANALYSIS (FIA) AND STATE SOIL GEOGRAPHIC DATA
BASE (STATSGO) DATA FOR GLOBAL CHANGE RESEARCH IN THE EASTERN UNITED STATES
Louis R. Iverson, Anantha M.G. Prasad, and Charles T. Scott'
Abstract: The USDA Forest Service's Forest Inventoty and Analysis (FIA) and the Natural Resource Conservation Service's State Soil Geographic (STATSGO) data bases provide valuable natural resource data that can be analyzed at the national scale. When coupled with other data (e.g., climate), these data bases can provide insights into factors associated with current and future ranges of tree species. However, a significant amount of data distillation is needed prior to such analyses. This paper describes the data base and geographic information system (GIs) processing involved with preparing the data for global change research in the eastern United States.
INTRODUCTION
To better understand the potential impacts of climate change on tree-species distributions (i.e., migration potentials), one must first understand the factors associated with c u ~ m t tree ranges. Then, projections of future ranges can be made assuming there are no barriers to migration. Finally, more realistic projections of migration can be modeled with proper attention to habitat and biological restrictions to migration. This paper reports on initial efforts in this overall project.
For purposes of coarse resolution analysis at the national scale, especially in the eastern United States, a county level of resolution seems appropriate. There are 3,048 counties across 37 states east of the 100th meridian. This level of detail allows several advantages over finer (e.g., individual plots 01- soil series) or coarser (e.g., ecoregions) levels of detail: (1) the data set is manageable in size and co~nputing power, yet of sufficient detail for adequate sample sizes, (2) data are more readily available, as many agencies report data at the county level, and (3) precise spatial co- location of forest inventory plots and ancillaly information is not necessary with a county level of resolution. However, any averaging of forest or soil information to the county will lose info~mation, especially in counties with highly heterogeneous habitats. Nonetheless, given the advantages of such a level of analysis, a procedure to recalculate data to the county reporting unit was needcd. 'This paper describes the PI-ocedures we used for two national-level data bases: the USDA Forest Service's Forest Invento~y and Analysis (FIA) and the Natural Resources Conservation Sel-vice's State Soil Geographic data bases.
For both data sets, we used ArcflnfoAML and UNIX shell programming (especially 'awk' and 'sed') running on a workstation. We developed a series of macro programs that did the desired operations on one state's data at a time. Nearly two gigabytes of data storage were needed to store and process the information for U.S. land east of the 100th meridian.
FOREST INVENTORY AN) ANALYSIS DATA BASE
The USDA Forest Service has a mandate to periodically deteimine the extent, condition, and volume of timber, growth, and removals of the nation's forest land. The six Forest Service FIA units conduct periodic regional surveys. Four FIA units produced a data base of standard fonnat called the Eastwide Data Base (EWDB) for the 37 states from North Dakota to Texas and east. These data are stored in three record types as described in their user's guide (Hansen et al. 1992): county data, plot data, and tree data. These 500 megabytes of 'raw' data were summarized into the desired county-level info~mation needed for o~ir global change research.
'USDA Forest Service, Northeastern Forest Esperiment Station, 359 Main Road, Delaware, OH 430 15.
209

Extraction of individual tree-species infon~~ation
The first step summarized the information for individual forested plots. Tree records represented observations of seedlings, saplings, and overstory trees. Tree species, tree status, and diameter at breast height were combined with information on plot size to compute a single summary record for each plot. The record contained the following information for each species that occu17-ed in the state: number of understory trees/acre, understory basal areafacre, number of overstory trees/acre, and oversto~y basal arealacre. This infolmation provided the next step in the FIA data summary.
Importance value calculation by species
Once the number of stems and basal area were available for each species (overstory vs. understory) for each plot, the relative importance of each species could be evaluated. Several importance values were calculated depending on the choice of variables considered (i.e., overstory vs. understory, basal area vs. number of stems). The overall importance value (IV) can be described as
where x is a particular species on a plot, BA is basal area, and NS is number of stems for both overstory and understory trees. On monotypic stands, the IV would reach the maximum of 200.
Mapping by plot
Importance values for any species could then be mapped by plot assuming that specific locations of the plots were available. Plot locations are truncated to 100 seconds (roughly 1000 m at this latitude) in the EWDB to protect the precise location of the long-term remeasurement plots. Under special all-angement with the FIA units, we obtained plot locations for Ohio, Kentucky, Illinois, and Indiana, our region of special interest for more detailed analysis. A method was devised by which importance values were divided into car-telist, with different symbols used for each cartel. Therefore, a quick visual inspection of the maps could determine where the species was found and how extensive it was relative to the other trees in the plots.
Aggregation and mapping at county level
To aggregate plot-level information to the county lc\~el. no (;IS 131-ocessing was necessary until final mapping since each plot has a county code associated with i t . A\lrrage rmpor-tance values were calculated for all forested plots, by species and by county. These values were associated with a county coverage of the United States (SRI 1992) for mapping into density slices of IV (Fig. I a). With these Inaps, biogeographical characteristics (such as absolute and optimum range) of the species can be visualized. Cun-cnt research involves statistical analysis of the range relative to other variables and a better characta-ization of eastc~n forest tsee species.


STATE SOIL GEOGIWI-IIC DATA BASE
The State Soil Geogsaphic Data Base (STATSGO) was developed by the USDA Soil Conservation Service (now Natural Resource Conservation Service) to help achieve their mandate to collect, store, maintain, and distribute soil- survey information for U.S. lands. STATSGO data recently became available for the entire nation on CD; it contains physical and chemical soil properties for about 18,000 soil series recognized in the nation (Soil Conservation Service 199 1). STATSGO maps were compiled by generalizing more detailed soil-survey maps into soil associations in a scale (1 : C) more appropriate for regional analysis. Detailed, digital soil-survey maps are available only for scattered poi-tions of the countly and requirenlents for data storage would be enonnous. Therefore, STATSGO data cuirently are one of the best sources of info~mation on the edifice landscape pattern and structure for the nation. However, the nature of the data dictates a sizable amount of preprocessing is necessary before maps of particular attributes can be produced on a national scale.
Attribute selection
STATSGO's user's guide (Soil Conselvation Selvice, 199 1) details the data structure and the myriad of files and variables contained within. For purposes of global change research, we selected 14 variables related to tree species habitat: pH, available water capacity, organic nlattcr, pelmeability, bulk density, salinity, cation exchange capacity, depth to bedrock, T factor, K factor, slope, and sevesal varial~les I-elated to texture (e.g., percent clay, percent fragments > 3 inches, percent volume of soil tlojving through screens with meshes of various sizes).
Weighted averaging by depth, soil-series composition, and county
Except for depth to bedrock, T factor, K factor, slope, and organic matter, each variable had estimates in STATSGO by individual layer in the horizon. A weighted average, based on the thickness of each layer to a depth of 60 inches (152 cm) or the depth to bedr-ock, was calculated Sol- each soil series. A second weighted average was calculated for the horizontal dimension based on the percent composition of each soil series within each soil association. Since mapping units were associations, maps of any of the estl-acted variables could then be made at the association level. Finally, a third weighted average was calculated to estimate attl-ihutes by county. The propostion of each soil association within each county (an intersection ol'countv coverage with STATSGO associations) was multiplied by the attribute weighted average for each association and sumnled for the county. Again, the county weighted averages can be mapped for any val-iable, as eselnplilied hy available water capacity for the eastern United States (Fig. Ib).
The two data bases described here providc \raluablc rusou~-ces for natural resoul-ce evaluation and environmental assessment, including modcling impacts of potcntlal cllmate change, at a regional level. Both data sets are only recently available in standard fo~nlat for such a la]-ge portlon of the countly. Because of limitations in spatial accuracy, computer po\irer, and data storagc, a county-le\.el analysis seems appropriate for revealing relationships between these data sets and others such as climate, t.lc\'ation, or land use. At this scale, one can look a level up to understand contest and a le\rel down to undcrstand 131-ocess Thus, the effoit described here was necessary to get the data in a foim useful for such analyses. 'Tablc 1 summarizes some infamation contained within the data bases, by state.

Table 1. Summary of selected FIA and STATSGO data by state. Column abbreviations include number of forested and total plots in the FIA data base, percent forest (from Powell et al. 1993), number of tree species recorded in FIA data, number of soil associations in STATSGO data, number of counties, and the date of the forest inventory in the FIA data base.

Future effoits entail building and enhancing data bascs on elevation, climate and land use for the eastern United States, and conducting statistical analysls (e.g., I-egression, dccislon-tree, and correspondence analysis) designed to better understand the cui-rent distribution of eastcln trees. Then, predictions of range changes can be made (under ideal conditions of seed source availability and hub1 t at availability) follo\ving a climate change. Finally, models under development will help dcteimine how well qxcies can migrate under the real situation of fragmented habitats.
ACKNOWLEDGMENTS
This study is hnded by the Noithein Global Change Program of the USDA Forest Service. We thank them and the Forest Inventory and Analysis research unit of the Northcastein Forest Experiment Station for providing the FIA data. Thanks also to Rachel Hershey, Roba-t Brooks, and Wayne Zippered for earlier reviews of the manuscript.
LITERATURE CITED
Environmental Systems Research Institute. 1 992. Arcus M, User's guide and data reference. Environmental Systems Research Institute, Redlands, CA.
Hansen M H, T. Fries~vyk, J. F. Glover, and J. F. Kcllv. 1992. The Eastwide forest inventory data base: user's manual. General Technical Report NC- 15 1 , IJSDA Forest Service, North Central Forest Experiment Station, St. Paul, MN.
Powell D S, J. L. Faulkner, D. R. Dan., 2. Zhu, and 13. W. MacCleeiy. 1993. Forest resources of the United States, 1992. Gcncl-a1 Technical Repost IiM-234, Rocky Moi~ntain Forest and Range Esperiment Station. Ft. Collins, CO.
Soil Conservation Sclvice. 199 1 . State soil gcogl-aphlc data base (STA'I'SGO) dala users guide. Miscellaneous Publication 1492, USDA Soil Conscrvatlon Sel-\we, Washington, D.C.

REGENERATION ATTRIBUTES OF TREE SPECIES IN THE CENTRAL HARDWOODS TYPE
Elaine Kennedy Sutherland', Rctsy .l. Hale2, and David M. His2
Processes relating to tree regeneration are many and complex. To develop generalized conceptual models of tree regeneration, we synthesized information fi-om the forest ecology literature. We produced a list of 2 1 regeneration attributes that describe flowering, seed production, seed dispersal, dormancy, germination environment, seedling characteristics, and vegetative reproduction. Attributes were classified for each of 62 tree species in the central portion of the eastern hardwoods region. The I-esul t ing data are categorical, both nominal and ordinal. We applied multivariate techniques to determine which species ivere similar and which attributes contributed most to species groupings, with special attention to constraints of categorical data. Based on Jaccard's similarity coefficient and Ward's clustering method, seven species clusters were evident. Given the con-elations fi-om Bray-Curtis ordination, thirteen attributes that contributed strongly to the groupings (univariate F-tests, p < .05) are being used to develop conceptual models of the regeneration pathways for each group. The pathways will be parameterized for each species, and then used to develop a rulc-based mechanistic model of ti-ee regeneration (Mechanistic Origination Model: MOM). We will continue to apply the same tcchniqiies to other regions (eg., northern hardwoods).
'USDA Forest Seivice, Noi-theastei-n Forest Espcrimcn t Stat 1011, Dcla\\~are, O H 4 30 1 5
'School of Natural Resources, The Ohio State IJn~\.crs~ly. Culun~hus. 01 1 432 10- 1293.
215

HERBIVOIiOUS INSECTS AND CLIMAI'IX CHANGE: POTENTIAL CHANGES IN THE SPATIAL
DISTRIBUTION OF FORl-;ST DE1:OLIATOR OUTBREAKS
David W. Williams' and Andrew M. ~iebhold'
The geographical ranges and spatial extent of outl>rcaks of ha-bivorous insect species are likely to shift with climatic change. We investigate potential changes in spatial distl-ibution of outbreaks of the westeln spruce budworm, Choristoneura occideiitalis Freeman, in Oregon and the gypsy moth, Lyi,ranti-ia dspar (L.), in Pennsylvania using maps of historical defoliation, climate, and forest composition in a geographic infolmation system. Maps of defoliation frequency were assembled using historical aerial reconnaissance data. Maps of monthly means of daily temperature maxima and minima and of monthly pl-ecipitation a~rel-aged over 30 years were developed using an interpolation technique. All maps were at a spatial resolution of 2 x 2 km. Relationships between defoliation status and the environmental variables were modclcd using a linear discriminant function. Five climatic change scenarios were investigated: an increase of 2 "C, a 2 "C incl-casc \vith an increase of 0.5 mm per day in precipitation, a 2 "C increase with an equivalent decrease in pl-ucipitation, and cquilihl-ium pl-ejections of temperature and precipitation by two general circulation models (GCMs) at douhlcd CC), Ic\,cls.
With an increase in tempel-atur-e alone, the projected dcfollatcd area decreased relative to ambient conditions for the budworm and increased slightly for the a p s y moth. Wlth an Increase In temperature and precipitation, the defoliated area increased for both specles. Convel-scly, the dcf'ollated area decreased for both when temperature increased and precipitation decreased. Iiesul ts for the GCM scunanos contrasted sharply. Using the scenario projected by the Geophysical Fluids Dynamlcs 1,aboratol~ (GFDL) GCM, defoliation by budworm was projected to cover Oregon completely, whereas no defollat~on \\!as pl-o~cctcd by gypsy moth in Pennsylvania. Under the scenario projected by the Goddasd Institute for Space Studies (GISS) GCM, dcfoliat~on disappeared completely for the budworm and slightly exceeded that under amblcnt condltlons for the upsy moth. The results are discussed in terms of potential changes in forest specles composition
'USDA Forest Sa-vice, Northeastern Forest Espcrlmcnt Station, Radnor, PA 19087-4200.
'USDA Forest Service, Noi-theastem Forest Esperimcnt Station. Morgantown, WV 26505.
2 16

PREDICTING THE EFFECTS OF TROPOSPHERIC OZONE ON FOREST PRODUCTIVITY IN THE
NORTHEASTERN U.S.
Scott V. Ollingerl, John D. Aber', and Peter B. Reich2
Abstract: It is widely believed that tropospheric ozone presents a significant anthropogenic stress on forest ecosystems. Although much information has been collected regarding ozone effects at the seedling and leaf level, we do not have a reliable means of estimating the effect on mature, native forests. For the present study, we incorporated leaf-level ozone response infolmation into an ecosystem model of forest production known as PnET-I1 in order to make whole-forest predictions that account for factors such as light attenuation, canopy ozone gradients and water stress. We ran the model using ambient ozone data from 64 locations across New York and New England. Predictions indicate reductions in annual NPP of from 2 to 17 percent under mean ozone from 1 987- 1992. Reductions were greatest in southern portions of the region on soils where drought stress was absent.
The formation of ozone in the lower atmosphere poses a serious threat to forest growth in industrialized regions. Controlled exposure studies have shown that concentrations observed in ambient air cause substantial reductions in plant productivity. Observed effects include decreased photosynthetic rates (Reich and Arnundson 1985, Pel1 et al. 1992), impaired stornatal function (Reich and Lassoie 1984), decreased biomass production (Shafer 1987, Wang et al. 1985), visible foliar injury (Hill et a/. 1970), and accelerated foliar senescence (Swank and Vose 1991).
Data fiom these studies have been used to establish response relationships whereby reductions in photosynthesis are related to ozone exposure levels (Reich 1987). I-Io\vever, these relationships by themselves are insufficient for predicting whole-forest growth effects. Factors such as light availability, photosynthetic capacity and ozone concentrations vary within a forest canopy, but the outcome of these interactions cannot be estimated from studies conducted on seedlings or individual branches alone (Pye 1988).
The purpose of this study was to combine leaf-level ozone response data with a physiologically-based forest ecosystem model known as PnET-I1 in order to allow ozone response relationships to interact with important canopy-level factors. Our approach was to summarize the effects of ozone on net photosynthesis at the leaf interior by relating reductions in net photosynthesis to ozone uptake, as opposed to external dose or concentration. This is important since factors affecting leaf conductance can greatly alter plant response to a given external dose. The resulting equations were built into the PnET-11 model and applied to individual canopy layers in order to calculate integrated, whole-canopy responses.
PnET-I1 is a monthly time step canopy- to stand-level model that is built on the following relationships: 1) maximum leaf photosynthetic rate is a linear function of foliar nitrogen content, each expressed on a mass basis
'Complex Systems Research Center, University of New I-Iempshire, Durham, NH 03824.
'Department of Forest Resources, University of Minnesota, S t Paul, MN 55 108.
217

(Aber and Federer 1992, Reich er at. 1995), and 2) water use ellkiency is inversely proportional to vapor pressure deficit (Aber and Federer 1 992). The simulatcd forest canopy is divided into multiple, even-mass layers to account for vertical variation in available light and specific leaf weight (Ellsworth and Reich 1993). The model has been successfUlly validated for forest production and COz eschanpc at diverse locat ions across North America (Aber and Federer 1992, Aber et at. 1995a, 1995b).
Ozone response relationships
Data from ozone fumigation experiments indicate a strong relationship between cumulative ozone dose and reductions in net photosynthesis ( Reich 1987). This impact varies greatly between species, although much of the variation can be explained by diflerences in stomatal conductance (Guderian et al. 1985, Reich 1987). Because conductance is the most important regulator of ozone uptake under a given external concentration (Taylor et al. 1994, Munger et at. 1994), this suggests that ozone ekc t s on net photosynthesis can be expressed largely as a hc t i on of how much ozone reaches the leaf interior.
uptake (mgIcm2)
Figure 1. Percent reduction in net photos~~nthesis in rclation to ozone uptake for hardwoods. From Reich 1987
It follows that across species, declines in net photosynthesis should be better correlated with ozone uptake than with external concentration or dose. Figure 1 sho\vs this rclat ivnship using data fi-om independent studies conducted over periods of several days to several months on a \vide \ral-icty of' hardwood seedlings (from Reich 1 987). Tjoelker et al. (1 995) obtained similar results fsom mature sugar mnplc Ica\,es in a pal-tial-canopy, open-air fumigation study conducted over a pel-iod of three months. Using poolcd data liom figure 1 and T-joclker ei at. (1 999 , we have derived the following response equation:
where do , is the ratio of ozone-exposed to contl-ol photosj.nthesis, g is mean stomatal conductance (in mm/sec) and D40 is the cumuli~tive ozone dose (in ppm-h) abo\lc a threshold concentration of 40 ppb, calculated as the sum of all hourly values > 40 ppb alter subtracting 40 li-om each. We use this threshold because 40 ppb is approximately the level at which negative impacts begin to appeal- in the poolcd data sct. Several other studies have also found 40 ppb to be the threshold beyond which negative g~-o\\-tI-r cil'ccts begin to occur (Fuhlw- 1994, McLaughlin and Downing 1995).

Canopy ozone gradients
We evaluated ozone gradients within a forest canopy using data fiom Munger et al. ( 1 994), which includes three years of measurements along a vertical profile though a mised hardwood forest at the Harvard Forest in central Massachusetts. For all months of the growing season \ire calculated the D40 value at each canopy level and plotted the resulting gradients. Figure 2 shows these gradients for May and July of 1992, during which times, ozone below the canopy decreased to 72 and 18 percent of the above-canopy D40, respectively. The shape of these patterns is such that, even during months of substantial canopy dupletion, ozone levels remain high in the upper canopy layers where light levels and photosynthetic rates are greatest. For all three years, canopy ozone depletion increased from spring through midsummer and declined at thc end of the growing season. These trends can be described by the equation:
2 ) dD40,e,l = 1 - (level * a))
where dD4OIe, is the proportion of the above-canopy D40 at a given canopy level, level is the normalized canopy level fiom 0 at the ground to 1 at the top of the canopy, and a is the ozone extinction coefficient that is determined for each month fi-om mean monthly D40 values. Table I shows mean values of a along with the corresponding absolute canopy gradient in D40 for each month of the growing season fiom 199 1 to 1993.
May 1 992
0.0 02 0.4 0.6 0.8 1 .O top D bottom
relative canopy level
July 1 992
0.0 0.0 0 2 0.4 0.8 0.8 1 .O top D bottom
relative cmmpy level
Figure 2. Ozone dose > 40ppb in relation to canops position at the Haward Forest in Central Massachusetts. Both axes have been normalized to a scale of 0 to I . Data arc h m Munger et al. 1994.

Table 1. Solutions to equation 2, showing mean canopy depletion of ozone D40 between 1991 and 1993.
Month a (from eq. 2 ) % decrease from above
R2 to below canopy
May June July August September October
Incorporation of ozone effects into PnET-I1
For the prediction of ozone effects on whole-forest growth, equation 1 has been built into the PnET-I1 model's photosynthesis routine at the level of individual canopy layers. For each layer, leaf conductance is calculated as a b c t i o n of potential net photosynthesis, and is thus affected by available light at that layer, foliar nitrogen content, and temperature. Monthly D40 values are estimated for each canopy layer by combining ambient concentrations with the mean 1 99 1 -93 ozone depletion profiles (fiom equation 2 and table 1 ). Ozone effects are determined from May through October and are calculated cumulat ivcly for each layer.
Conductance (g) is calculated as a linear function of net photosynthesis, based on a strong relationship (? = 0.93) between the two among data in the literature (Abrams et a/ . 1990, Amthor et al. 1990, Aubuchon et al. 1978, and Hinckley et al. 1 978). In equation 1, ozone uptake is approximated by the product of g and D40. Because g represents conductance to water vapor, calculating actual uptake rates would require inclusion of the difisivity ratio of water vapor to ozone. However, because this ratio is a constant, it's inclusion in the derivation and application of equation 1 would have no effect on the resulting predictions. For simplicity we have left it out of the equation.
Given the relationship between conductance and net photosynthesis, ozone exposure might be expected to cause conductance to decline along with photosynthesis, resulting in a reduction of subsequent ozone uptake. Reduced leaf conductance has been observed in many studies, altl~ough the effect is often minimal with respect to the photosynthetic response (e.g. Pel1 et al. 1992), 01- reversed under certain light regimes (e.g. Reich and Lassoie 1984, Volin et al. 1993). In one of the only open-air exposure studies performed on a mature tree canopy under field conditions, there was virtually no change in conductance (and hence ozone uptake) despite large reductions in photosynthesis (Tjoelker et a/. 1995). This lack of a response suggests impairment of stomatal function, as the net effect is an uncoupling of the normal relationship between photosynthesis and conductance (Volin et al. 1993, Tjolker et al. 1 995).
In the absence of consistent and predictable changes In conductance, we have not included any such feedback in the present modeling exercise. Inconsistencies in observed stomatal response indicate a lack of understanding of how ozone affects leaf conductance, but because photosynthet~c responses are generally much greater than, and typically precede changes in conductance (when such changcs have been observed), this should not be a crucial issue in predicting ozone effects on whole-forest productivity
Interactions between ozone and drought
For each canopy layer, the model tl-acks photosynthesis with and without ozone in order to determine the potential, whole-canopy ozone effect and to allo\v interaction with drought stress, which is calculated for the entire canopy as opposed to individual leaf layers. After the calculation of potential canopy photosynthesis (without ozone or water limitations), the PnET-II model's water balance routine determines potential transpiration and performs a comparison
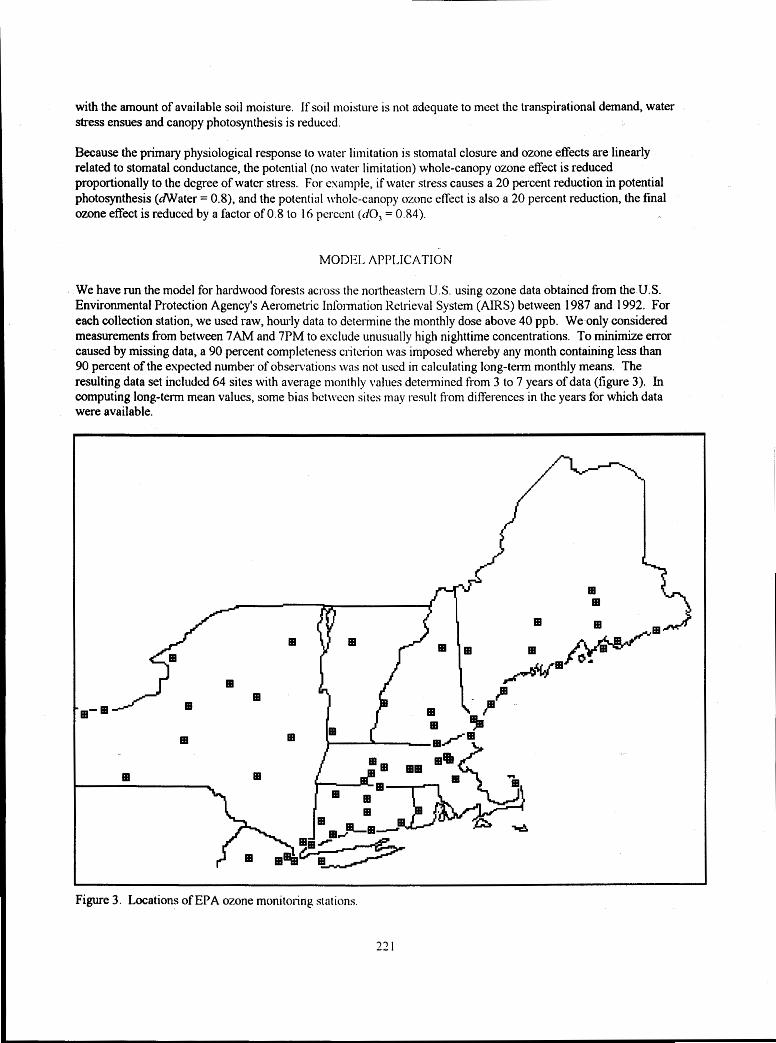
with the amount of available soil moisture. If soil moistui-e is not adequate to meet the transpirational demand, water stress ensues and canopy photosynthesis is reduced.
Because the primary physiological response to water limitation is stomatal closure and ozone effects are linearly related to stomatal conductance, the potential (no water limitation) whole-canopy ozone effect is reduced proportionally to the degree of water stress. For esample, if watcr stress causes a 20 percent reduction in potential photosynthesis (dWater = 0.8), and the potential n.hole-canopy ozone effect is also a 20 pa-cent reduction, the final ozone effect is reduced by a factor of 0.8 to 1 6 pmccnt (ljO, = 0 83).
We have run the model for hardwood forests acr-oss the northeastern U.S. using ozone data obtained from the U.S. Environmental Protection Agency's Aeromdric Inlormation Retl-ieval System (AIRS) between 1987 and 1992. For each collection station, we used raw, hourly data to determine the monthly dose above 40 ppb. We only considered measurements from between 7AM and 7PM to esclude untisually high nighttime concentrations. To minimize error caused by missing data, a 90 percent completeness criterion \\.as imposed whereby any month containing less than 90 percent of the espected number of ohse~vaticms was not used in calculating long-term monthly means. The resulting data set included 64 sites with average monthly \~aluas determined from 3 to 7 years of data (figure 3). In computing long-term mean values, some bias hctn.ccn sites may result fiom differences in the years for which data were available.
Figure 3. Locations of EPA ozone monitoring stations.
22 1

Climate data required by the PnET-I1 model \\.ere calculated for each of the 64 ozone data sites using a statistical climate model derived for the region from 30 year mean weather station data (Ollinger et al. 1995). We used a foliar nitrogen value of 2.2 percent, based on values measured at the Halvard Forest (Martin and Aber 1995). In the absence of soil water holding capacity (WIC) data fi-om each site, we have run the model under several conditions ranging fi-om high to low WI-IC.
RESULTS AND DISCUSSION
Results of initial model lvns indicate decreases in annual net pi-imaly production (NPP) of from 2 to 17 percent as a result of mean ozone levels from 1 987 - 1 992 (iipn-e 4) with greatest reductions in southein New York and New England where ozone levels and potential photosynthesis were gseatest. The predicted decrease was negatively correlated with latitude, following a trend of decreasing ozone fsom south to north across the region. Predictions varied significantly across the range of soil W I C values used (2-36 cm.), although ozone-induced growth reductions were substantial even on soils with low WT-IC (figuse 4).
cumulative dose > .04 ppm (ppm-h)
Figure 4. Predicted change in annual NI'P at 64 sites aci-oss the study region in response to mean ozone levels from 1987-1 992. Predictions are shown for three levels of soil water holding capacity to show how the response changes from well-watel-ed (WIC = 36) to drought-stressed (WI-IC = 2) conditions.
Table 2 shows means and ranges of predicted NI'P for the 64 sites under all soil WHC values used. At WHC = 36 cm, all predicted drought stress \vas eliminated, so these values can be used as a reference in estimating drought effects resulting from other moisture condi~lons. IJnder all hut the two wettest conditions, drought stress caused greater growth reductions than ozone. At WI-IC = 12 cm, \\fhicl~ I-epresents a typical well-drained till soil, ozone effects on NPP were roughly 25 percent less than \vhat was predicted in the absence of drought stress.

Table 2. Mean predicted NPP (g/m2yr) across the 64 study sites with and without ozone effects at 5 levels of soil water holding capacity (cm).
Soil WHC
NPP without ozone 7--
NPP with ozone mean mean range mean range % reduction
We consider these predictions to be conservative in that ozone effects are based solely on reductions in photosynthesis. Although this is generally accepted as the major physiological effect of ozone, other responses may also be important, particularly under circumstances such as unusually high concentration events. Nevertheless, current predictions do suggest substantial declines in NPP among forests across the northeast region. Although we have not addressed ozone effects on wood production, we expect wood to be affected to a greater extent than NPP because wood is a relatively low priority in tree carbon allocation.
In addition to ozone, other factors such as land use and atmospheric nitrogen deposition can have substantial impacts on ecosystems. Determining the net effect of human acti\lities on forest growth thus requires consideration of all these factors taken together, rather than any one on its own. Although the outcome of these interactions remains largely unknown, this study suggests that concern eves ozone as a cause of ecological and economic degradation is warranted.
ACKNOWLEDGMENTS
This research was conducted with support from the U.S.D.A. Forest Service Northern Global Change Program. We thank J.W. Munger for providing canopy ozone profile data and R. Poirot of the Northeast States for Cooperative Air Use Management (NESCAUM) for help in obtaining hourly ozone data. We also thank Dave Hollinger and Robert Eckert for providing helpfbl reviews of the manuscript.
LITERATURE CITED
Aber, J.D. and C.A. Federer. 1992. A generalized, lumped-parameter model of photosynthesis, evapotranspiration and net primary production in temperate and boreal forest ecosystems. Oecologia. 92: 463-474
Aber, J.D., P.B. Reich and M.L. Goulden. 199%. Extrapolating leaf CO, exchange to the canopy: A generalized model of photosynthesis validated by eddy colrelation. Oecologia (submitted).
Aber, J.D., S.V. Ollinger, C.A. Federer, P.B. Reich, M.L. Goulden, D.W. Kicklighter, J.M. Melillo and R.G. Lathrop. 1995b. Predicting the effects of climate changc on water yield and forest production in the northeastern U.S. Climate Change. (submitted)
Abrams, M.D., J.C. Schultz, and K. W. Kleiner. 1 990. Ecophysiological response in mesic versus xeric hardwood species to an early-season drought in central Pennsylvania. Forest Science. 36: 970-98 1.

Amthor, J.S., D.S. Gill and F.H. Bormann. 1990. Autumnal leaf conductance and apparent photosynthesis by saplings and sprouts in a recently disturbed northern hardwood forest. Oecologia. 84:93-98.
Aubuchon, R.R., D.R. Thompson and T.M. Hinckley. 1978. Environmental influences on photosynthesis within the crown of a white oak. Oecologia. 35:295-306.
Ellsworth, D.S. and P.B. Reich. 1993. Canopy structure and vertical patterns of photosynthesis and related leaf traits in a deciduous forest. Oecologia. 96: 1 69- 1 78.
Fuhrer, J. 1994. The critical level for ozone to protect agricultural crops - An assessment of data fiom European open-top chamber experiments. In: Cii tical levels for ozone: a UN-ECE workshop report (J. Fuhrer and B. Achermann eds.), p.42-57.
Guderian, R., D.T. Tingey and R. Rabe. 1985. Effects of photochemical oxidants on plants. In Guderian (ed.) Air Pollution by Photochemical Oxidants: Formation, Transport, Control, and Effects on Plants. Springer- Verlag. Berlin Heidelberg, Gelmany.
Hill, A.C., H.E. Heggestad and S.N. Linzon. 1 970. Ozone. In: Jacobson, J.S. and A.C. Hill (eds.). Recognition of air pollution injury to vegetation: a pictorial atlas. Air Pollution Control Association, Pittsburgh, PA.
Hinckley, T.M., R.G. Aslin, R.R. Aubuchon, C.L. Metcalf and J.E. Roberts. 1978. Leaf conductance and photosynthesis in four species of the oak-hicko~y type. Forest Science. 24:73-84.
McLaughlin, S.B. and D.J. Downing. 1995. Interactive effects of ambient ozone and climate measured on growth of mature forest trees. Nature. 374:252-254.
Martin, M.E. and J.D. Aber. 1995. Estimation of fol-est canopy lignin and nitrogen concentration and ecosystem processes by high spectral resolution remote sensing. Ecological Applications (submitted).
Munger, J., M. Goulden, S. Fan, A. Goldstein and S. Wofsy. 1 994. Deposition of ozone and nitrogen oxides to forest canopies. Haivard Forest Ecology Symposium Proceedings. 4: 3 1
Ollinger, S.V., J.D. Aber, C.A. Federer, G.M. Lovett and .l. Ellis. 1995. Modeling physical and chemical climatic variables across the northeastern U.S. for a Geographic Information System. USDA Forest Service General Technical Report NE- 1 9 1.
Pell, E. J., N. Eckerdt and A.J. Enyedi. 1 992. Timing of ozone stress and resulting status of ribulose bisphosphate carboxylase/oxygenase and associated net photosynthesis. New Phytol. 120:397-405.
Pye, J.M. 1988. Impact of ozone on the growth and yield of trees: a review. Journal of Environmental Quality. 171347-360.
Reich, P.B. and J.P. Lassoie. 1984. Effects of low level 0, exposure on leaf diffusive conductance and water-use efficiency in hybrid poplar. Plant, Cell and Environment. 7:66 1-668.
Reich, P.B and R.G. hundson . 1985. Ambient levels of ozone reduce net photosynthesis in tree and crop species. Science. 230566-570.
Reich, P.B. 1987. Quantifying plant response to ozone: a unifying theo~y. Tree Physioloey. 3: 63-91
Reich, P.B., B. Kloeppel, D.S. Ellswol~h and M.R. Walters. 1995. Different photosynthesis-nitrogen relations in deciduous and evergreen coniferous tree species. Oecologia. (in press)

Shafer, S.R., A.S. Heagle and D.M. Carnberato. 1987. Effects of chronic doses of ozone on field-grown loblolly pine: seedling response in the first year. JAPCA. 3 7 : 1 1 79- 1 1 84.
Swank, W.T. and J.M. Vose. 1991. Watershed-scale responses to ozone events in a Pinus strobus L. Plantation. Water, Air, and Soil pollution. 54: 1 1 9- 1 3 3.
Taylor, G.E. Jr., D.W. Johnson and C.P. Andersen. 1994. Air pollution and forest ecosystems: a regional to gIoba1 perspective. Ecological Applications 4:662:689.
Tjoelker, M.G., J.C. Volin, J. Oleksyn and P.B. Reich. 1 995. Interaction of ozone pollution and light on photosynthesis in a forest canopy experiment. submitted to Plant, Cell and Environment.
Volin, J.C., M.G. Tjoelker, J. Oleksyn and P. B. Reich. 1 993. Light environment a1 ters response to ozone stress in seedlings ofAcer saccharurn Marsh. and hybrid Populzis L. 11. Diagnostic gas exchange and leaf chemistry. New Phytol. 1 24:637-646.
Wang, D., D.F. Kamosky and F.H. Bormann. 1985. Effects of ambient ozone on the productivity of Populus fremuloides Michx. grown under field conditions. Can J. of For. Res. 16:47-55.

CATALOG OF LONG-TERM RESEARCH CONDUCTED WITHIN THE USDA FOREST SERVICE,
NORTHEASTERN FOREST EXPERIMENT STATION
Hope R. Barett'
Long-teim data sets are described in a catalog to reduce duplication of scientific efforts and to facilitate interaction among researchers. Individual entries for each of 90 long-term data sets include details such as site characteristics, variable names, year collected, sampling design, data storage method, intended purpose of the data set and potential application to global change research. Catalog entl-ies are organized according to common study topics into 29 themes such as forest monitoring: vegetation in unmanaged fosests, fertilization: effects on stream water, birds: habitat relationships, insects: population dynamics and soils: characteristics associated with plants. Themes contain as few as one and as many as 25 entries. Some multipurpose entl-ies are categorized under more than one theme.
Reviews af3rm the catalog is easy to use, infolmative and will cultivate productive communication among researchers. A secondary result is that scientists arc expressing a renewed and attentive awareness toward the management of long-term data. The resources employed to develop a database of metadata are substantiated as long as higher quality research is a result of better awareness. The catalog, forthcoming as a Forest Service publication with dBASE format, is already in high demand. Several options have been encouraged as ways to make the catalog accessible through the Internet. The Station and the Northern Global Change Research Program share a commitment to maintain and update their investment in high quality reseasch data.
'USDA Forest Service, Northeaste~n Forest Espa-iment Station, Delaware, OH 430 15.

CARBON BALANCE 01- -1.1-IE ALASKAN BOREAL FOREST
John Y aric and 'Tim I-Iammond'
Determination of the carbon balance in a broad f'orcst region like the Alaskan boreal forest requires the development of a number of important environmental (state i'actol-s) classes to allo\v for the development of carbon balance estimates. We have used the following factors to devclop n regional classification of the state: (1) average monthly temperature May through September (Approximate growing season); (2) total precipitation May through September; and (3) the domain, division and province levels of'thc ecorcgions classification of Alaska (see McNab and Avers 1994).
In addition the following classifications to fui-thcr subdi\fidc and descrihe the boreal forest regions of the state are being developed: (1) seasonal land cover classification is being developed by the USGS EROS field oflice in Anchorage; and (2) age structure of the vegetation in the forest ;Ireas.
A forest dynamics model (GGED) for the Alaskan borcal lbl-est \\fill bc I-un to dctelmine the effects of anticipated global change on the carbon dynamics within the rcgions of the biogeoclimatic classification. This approach should result in an accurate replt-sentation ofthe carbon d!rnnrnics ot'thc forest within an area of land the size of Alaska.
'Dept. of Forest Sciences, Universitv of Al:lska, I:n~l.hanks, AK 99775-7200.
237

AN ENERGY I3ALANCII MOIIIiI, ]:OK I;OKESrI' CANOPIES: A CASE STUDY
S. M. Goltz' and James A. smith2
The use of thelmal scanning devices to map undc~-l!.~ng ten-ain sill-face temperatures has been recognized as a potential tool for estimating cvapotranspirat~on and latcnt hcat flus densities in forest canopies. Ecologically, knowledge of thc temperature distribution ofph!,to-clcmcnts and the underlying soil surface is directly applicable to understanding photosynthetic, hcat and mass transrer and soil decomposition rates. Such knowledge of the current state and surface characterization of terrestrial ccosystcms 1s a critical starting point for understanding Global Change processes and modeling thc undcrly~ng enern cschangcs.
A steady-state thamal radiance model to compute thcml:~l csitancc and energy balance components within forest canopies is prescntcd. The model treats fully Icakd canoplcs as d~scretc ensembles of leaves partitioned into slope- angle and height classes. Short-wave energy ilus ahsol-bed \\ 1t111n the canopy is estimated by solving simplified radiosity equations. Sensible hcat cschangc IS cst~matcd using LI logar~thmic \\rind profile above the canopy and a modified exponential profile w~thin the canop! 'l'hc latcnt Ilcat ho11nda1-y 1ayt.1- rcslstance is estimated from site- specific measurcmcnts summarizing the c fcc ts 01' solar ~n-:td~ ancc. air temperature and vapor pressure deficit on stomata1 conductance. Compar~sons arc prescntcd ol'tl~c haslc model \uth field mcasurernents conducted at a dense spruce-fir forest study site at I-Io\\lland, Ma~nc I:~cld data ~ncludcd eddy co~l-elation values of latent and sensible heats as well as I13 measurcn~ents of fol~agc tcmpcrat~~rcs 1:or clear days the resulting root mean square error in modeled versus measured canopy tempcraturcs \\as 1 2 " C Con-csponding el~ors in latent and sensible heat flux energy budget temis \\iere 30 and 32 W m-', rcspcct~\.cl~~ For partly cloudy days the root mean square error in predicted temperatul-c was I 0 "C and con -c spond en-01.5 in latcnt and sensible heat were 40 and 1 1 0 W m'2.
'University of Maine, Orono, MI! 03473.
2Laboratory for Terrestrial Physics-NASNI;SI:C. (;I-ccnhclt. MI1 2077 1 .
22%

TEMPORN, AND SPATIAL. TIIENIIS OF FI,IJXL:S ANTI CONCENTRATIONS OF CO, ABOVE AND
WITI-IIN THE CANOPY AT I IOWI,AND, MAINE: PRELIMINARY RESULTS
In order to develop and evaluate models of net cai-bon cschange, we have collected profiles of CO, through and above the canopy for estendcd periods over three ycars as well as collected short-teim trial data of diurnal CO,, water vapor, and sensible heat fluses above the canopy as measurcd by eddy colrelation. For fluxes, carbon dioxide concentrations were measured with a LI-COR model I,I-625 1 Past response IRGA housed at the base of the tower. The air sampled fi-om 26 m (7 m above the canopv) was brought through tubing to the IRGA. Both vertical air movement and water vapor density were measured a* nccnt to the inlet of this tubing at the same elevation using a Campbell Scientific model CA-27 1 -D sonic ancmometc~- and a Campbell Scientific model KH-20 krypton hygrometer. For eddy flus analysis, sampling of the three scnsors occun-ed at a frequency of 10 Hz during sampling periods of 30 min. The CO, concentration prolilc thi-ough thc foi-est was dcteimincd from sequentially collected samples at three levels within the canopy and at 7 mctcrs a\>o\,c canopy using a system consisting of a dedicated LI- 6252 CO, analyzer, switching valves, pumps. 'l'ctlon inlet tubcs. calibration gases, and dedicated datalogger (model 21X, Campbell Scientific). These data ai-c used to dctc~m~nc a storage flus of CO, associated with the change in CO, concentration tvithiii the air colun~n. .l'hc cfIL.cts oi'atmosphcric stability, stomata1 conductance, and soil moisture on concenti-ations and fluses a]-e dcscribcd.
- -
'University of Maine, Orono, ME 04469.

DYNAMICS 01: CALCIUM CONCliN'I'IIA'I'ION IN S'I'I~MWOOD OF RED SPRUCE AND SIBERIAN FIR
Kevin 'I'. Smith', Wrllter C. Shol-tlc', R;lkcsIi Minoclia', and Vladislav A. Neseyev2
Abstract: The atmospheric deposition of stsong acid anions such as sulfa~e and nitrate shifts the ion exchange equilibrium in the rooting zone of sensiti\lc ti)rcsts. lied spl-ucc and othcr nol-theln coniferous forests are especially sensitive to deposition due to the shallo\v rooting of' t~-ces in a mol--type forest floor. Initially, the deposition of strong acid ions mobilizes essential cations such as calcium (Ca) l'som ion-exchange sites on soil organic matter. Hypothetically, this mobilization \\rould result in a bricl'period of increased availability for root uptake. Evidence for this temporaly pel-iod of increased uptake ol'csscntial Ca is the sul>ject of this report. Radial trends in stemwood calcium concentration [Ca] occurred in a common patte~n in two sample collections of red spruce from the northeastern United States and in one sample collection of Silxriun fir fi-om south-central Siberia, Russia. The [Ca] was measured in wood segments comprising sings that fonncd during 187 1-90, 189 1 - 19 10, 19 1 1-30, 193 1-50, 195 1 - 70 and 197 1-90. For each core, the relative increase or dccl-case in [Ca] for consecutive periods of wood formation was determined. Previous research indicated that under cquilib~.ium conditions, [Ca] in stemwood decreased in more recently formed wood due to declining nunihc~-s 01' C'a binding si tcs. Consistent \ \ r i th expectation, the relative frequency of positive change was low among most consccut i1.c pel-iods of grolvth. Contray to expectation, however, the frequency oSpositi\le incrcascs (48 pcl.ccn~) in I Ca 1 doubled in 195 1-70 compared to 193 1-50; this increased frequency \\,as significantl!. g1-catel- (1' 5 0.0 I ) 111an l>ct\vccn all other periods.
Declining health, pl-odt~ct~v~ty, and dl~ers~t!' 01's01iic no]-tlicln fi~-csts have been linked to the rapid increase in emissions of oxides of nitrogen and s~lllill- (1:1g 1 ) 1\.1tlcncc that supports this linkage of pollutant emission and deposition to detcr~orat~on In Ihrest cond~tlon and .\t;1\>111tj IS 1nt11rcct and subject to altelnate explanations (Friedland and others 1993, Johnson and others 1993, M111c1- and ot11c1-s 1992, and Sclilcgcl and others 1992)
Figure 1 . Bars represent 1x1-cent changc in bitlccndal Incall cn~issions ol'S and N oxides (deri\led from NAPAP 1992). For examl~lc, the bar for the 193 1-50 h~dccatlc scp~-cscnts an increase in emissions of 25 percent compared to the 191 1-30 bidccadc. Scattcl- plots rep~.csc~~t the I~IC ; I I I J ~ L ' I . C C I I ~ ~ ' I ~ C C I L I L ' I I C ~ ofpositi\'c change in [Ca] from the previous bidecadc. Mcans \\.c~-c calculated 1i.oln tllc I \ \ o data scts ol'rcd spl-uct: in the northeastern United States and one data set of Sibel-ian lil- li-om the Sa!.;tn Motillta~ns In Siberia. lii~ssia. Each cn-or bar represents the standard error associated with the Illcan.
'USDA Forest S ~ I - Y I ~ ~ , Nor~hcastc~-11 I;c)~-cst I : \ ~ > L ' I . I I I ~ C I ~ ~ ht '11 1011. II~i~.lia~n, Nc\v I Ia~iil>sh~rc 03824 USA.
2V. N. Sukachc\l Instlttitc Sol I-ol-es~n., I .a\>ol atol-\ 1 . c ~ cht I :co+ stcln I<csca~-cli, KI-asnoyarsk, 660036, Russia.
230

Deposition of strong acid anions such as nitrate and sulfate onto the forest floor tends to mobilize essential base cations e.g., Ca" and Mg", and cations that are antagonistic to the uptake of essential bases, e.g., A13' (Asp and Berggren 1990; Joslin and others 1988, Kuhn and others 1995). Northern coniferous forests are especially sensitive to the deposition of strong acid anions (Majdi and Persson 1993; Tomlinson 1990). Sensitivity to deposition is greatest where essential cation storage and uptake are from ion-exchange sites in thick, well-defined mor-type forest floor (Cronan 1 99 1 ). Such mobilization may have three consequences. First, root up take of essential bases may increase temporarily due to a period of increased availability (Bondietti and others 1990, Shortle and others, in press). A hypothetical marker of increased availability of essential Ca is presented in this report. Second, root uptake of essential bases may decrease due to the antagonistic binding of ~ 1 ' ' to the ion-exchange sites (Johnson and Femandez 1 992; Smith and others, in press). Third, root uptake of essential bases may continue to decrease as essential bases leach out of the forest floor, eventually impoverishing the rooting zone (Federer and others 1989). These consequences may or may not occur in a continuous series, and the sequence may be interrupted or reversed due to the replenishment of essential bases to the forest floor through stand disturbance.
We have proposed an etiological sequence, the aluminum-induced calcium deficiency syndrome, which may place at risk the health and productivity of sensitive spruce-fir forests in the northeastern United States (Shortle and Smith 1988). Our published reports and those of cooperators tend to support the linkage of pollutant deposition, mobilization and depletion of essential bases, and tree response. Preliminary research on several tree species indicated that stemwood sap increased in pH and/or divalent cation concentration in the mid- 1900's (Bondietti and others 1990; Momoshima and Bondietti 1 990). These changes would be expected during the hypothetical period of enhanced availability due to cation mobilization initiated or enhanced by atmospheric deposition. A comprehensive historical review indicated a marked, widespread decline in essential divalent cations in mor soil of northern forests in the mid- to late- 1900's (Shortle and Bondietti 1992). The ratio of A1:Ca in fine root tips, a hypothetical marker of antagonistic conditions in the rooting zone, was greater at higher elevations and in lower layers of the forest floor (Smith and others, in press). New methods for the estraction (Minocha and others 1994) and determination @!mocha and others 1990) of polyamines allowed the evaluation of the usefulness of these growth regulators as markers of stress caused by Al. Cultures of woody plant tissue dosed with A1 indicated that both the timing of the dose and the duration of exposure affected cellular processes in a dose-dependent manner (Minocha and others 1992, 2h0u and others 1995). Consequently, the effect of mobilization and antagonistic processes may depend on the phenological condition of the tree.
The time course for these consequences of mobilization is not well established. Rates of cation mobilization and depletion of essential bases differ among forest locations. We do know that the concentration and total amounts of essential bases in the forest floor is limited. Unfortunately, the natural availability of A1 is essentially inexhaustible. As the proportion of exchangeable A1 increases with ~.cspcct to exchangeable Ca in the rooting zone, forest stands may begin to decline due to suppressed gro\vth and increased vulnerability to pests and pathogens (Shortle and Smith 1988).
This report presents data on the dynamics of changes in radial trends of calcium concentration [Ca] in stemwood of red spruce h m the northeastern United States and Siberian fir (Abies sibirica Ledebour) from south-central Siberia, Russia The [Ca] in these trees have been published (Shortle and others, in press). Ca was emphasized because it is the base element most required for tree growth, and Ca availability in these forest soils may be potentially deficient. The two species were chosen as important components of potentially sensitive forest types. The two regions selected were as widely separated as possible while still being similar habitats.
METHODS
We analyzed the [Ca] in stemwood of three groups of noi-them conifers. The first data set, NEI , was derived fiom a previously published report (Bondiett i and others 1 990) on divalent cat ion concentrations in red spruce (n = 3 3 trees) from the northeastern United States (Fig. 2). Data in NE 1 were obtained through various methods of sample acquisition, preparation, and analysis. Trends in [Ca] of most individual trees in NE1 were not available, though published data summaries allowed comparison with the other data sets in this investigation. The second data set, RUl, was from Siberian fir (n = 20 trees) collected in August 199 1 fi-om the Sayan Mountains of the southern Krasnoyarsk region of Sibetia, Russia (ca. 53"N, 93"E) (Fig. 2). The third data set, NE2, was from red spruce (n =

20 trees) collected in June 1992 li-om 131g Moost: I .nht:, Nc\\ Ynl-k, Cone Pond and Crawford Notch, New Hampshire, and Kossuth, Maine, in the Ad~rondack-Nc\v ISngland highlands (ca. 44"N, 69-74"W) (Fig. 2).
Figure 2. Polar and Mercator projection maps sho\\ling the locat ions of data sets NE 1 and NE2 in the northeastern US and data set RU1 in south-central Siber-ia, Russia.
For RU1 and NE2 we used identical methods of sample collection and analysis. We removed stemwood cores with an increment borer (1 2 mm inside diam.) fiom ma till-c, canopy tl-ees (30 to 60 cm d. b.h.) at 1 30 cm above groundline. Cores \yere placed on racks to ail-dl? on thc da!' they wei-e collected. For chemical analysis we selected single cores from five trees fi-om each of four locat~ons thin the sampling al-eas of RU 1 and NE2. Selected cores were free of knots, pitch, and visible indicatoss oi'pru\ lous 1n.j u~y or infection. Ail--dried cores were glued into grooved wooden blocks and sanded with a serles of success~\,ely finer @its. Following sanding, ring widths were measured and crossdated. Decadal periods of ring fommat~on \vcre marked on the block surface adjacent to the mounted core. Minocha and Shol-tle (1 993) described thc preparation, estraction, and analysis of increment cores for cation concentrations. Shavings were removed Gon~ each mounted core with a 3.2 rnrn Ti-coated twist bit drilled perpendicular to the transverse sur-face at the middle of each decadal gocvth period. Because of the variable width of growth rings and the fixed diameter of the bit, samples contained varying numbers of growth rings within the
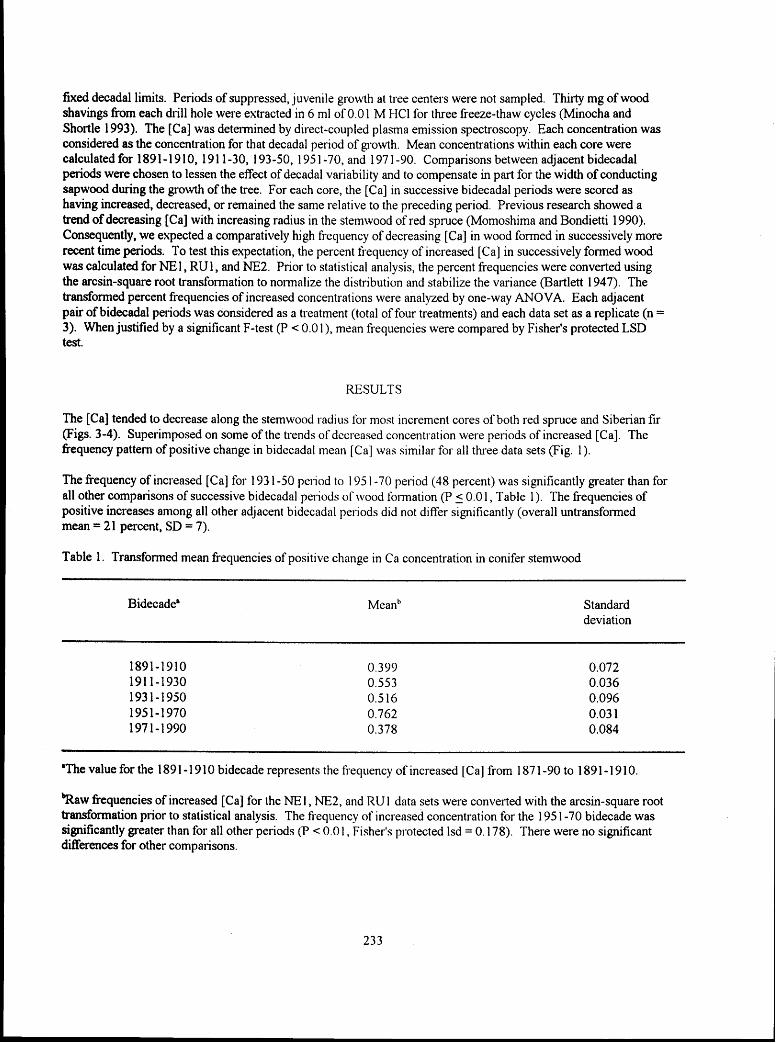
fixed decadal limits. Periods of suppressed, juvenile grocvlh at tree centers were not sampled. Thirty mg of wood shavings from each drill hole were extracted in 6 ml of 0.0 1 M HCI for three freeze-thaw cycles (Minocha and Shortle 1993). The [Ca] was detamined by direct-coupled plasma emission spectroscopy. Each concentration was considered as the concentration for that decadal period of growth. Mean concentrations within each core were calculated for 1891 - 1 9 10, 19 1 1-30, 1 93-50, 1 95 1 -70, and 1 97 1 -90. Comparisons between adjacent bidecadal periods were chosen to lessen the effect of decadal variability and to compensate in part for the width of conducting sapwood during the growth of the tree. For each core, the [Ca] in successive bidecadal periods were scored as having increased, decreased, or remained the same relative to the preceding period. Previous research showed a trend of decreasing [Ca] with increasing radius in the stemwood of red spruce (Momoshima and Bondietti 1990). Consequently, we expected a comparatively high fi-equency of decreasing [Ca] in wood formed in successively more recent time periods. To test this expectation, the percent frequency of increased [Ca] in successively formed wood was calculated for NE 1, RU 1, and NE2. Prior to statistical analysis, the percent frequencies were converted using the arcsin-square root transformation to normalize the distribution and stabilize the variance (Bartlett 1947). The transformed percent frequencies of increased concentrations were analyzed by one-way ANOVA. Each adjacent pair of bidecadal periods was considered as a treatment (total of four treatments) and each data set as a replicate (n = 3). When justified by a significant F-test (P < 0.0 1 ), mean fi-equencies were compared by Fisher's protected LSD test.
RESULTS
The [Ca] tended to decrease along the stemwood radius for most increment cores of both red spruce and Siberian fir (Figs. 3-4). Superimposed on some of the trends of decreased concentration were periods of increased [Ca]. The frequency pattern of positive change in bidecadal mean [Ca] was similar for all three data sets (Fig. 1).
The frequency of increased [Ca] for 193 1-50 period to 195 1-70 period (48 percent) was significantly greater than for all other comparisons of successive bidecadal periods of \vood formation (P 5 0.0 1 , Table 1). The frequencies of positive increases among all other adjacent bidecadal periods did not differ significantly (overall untransformed mean = 2 1 percent , SD = 7).
Table 1. Transfolmed mean frequencies of positive change in Ca concentration in conifer stemwood
Bidecade' Standard deviation
'The value for the 189 1 - 1 9 10 bidecade represents the frequency of increased [Ca] from 1 87 1 -90 to 1 89 1 - 19 10.
Qaw fi-equencies of increased [Ca] for the NE 1 , NE2, and RU I data sets were converted with the arcsin-square root transformation prior to statistical analysis. The frequency of increased concentration for the 195 1-70 bidecade was significantly greater than for all other periods (P < 0.0 I, Fisher's protected lsd = 0.178). There were no significant differences for other compa~-isons.
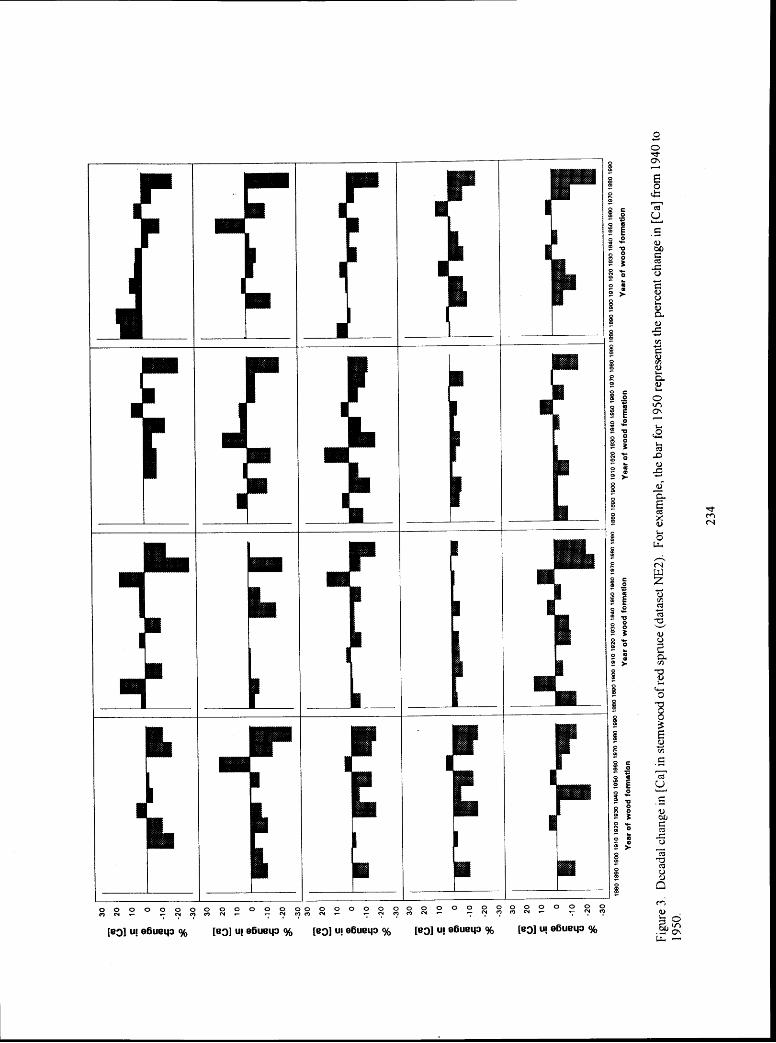


DISCUSSION
Stemwood samples of red spruce and Siberian fir contained similar anomalous increases in [Ca]. The overall trend in most increment cores was a decrease in concentl-at~on in more recently formed wood (Figs. 3-4). This general trend was consistent with ion-exchange characteristics previously described for red spruce (Bondietti and others 1990, Momoshima and Rondietti 1990). In wood, Ca occurs as a divalent cation bound to ion-exchange sites, primarily anionic carbo;\ylic acid groups of pectins and primary-wall materials (Demarty and others 1984). Ion binding experiments with red spruce wood indicated that the number of available ion-exchange sites per unit of wood tended to decrease with increasing stem diameter (Bondietti and others 1990). Consequently, when pH and [Ca] in sap were constant, [Ca] in stemtvood decreased in more recently formed wood. The underlying mechanism for the progressive decrease in ion-exchange sites has not been established.
The exception to the trend of decreasing [Ca] was the relatively high frequency of increased concentrations within the 195 1-70 rings relative to those formed fiom 1 93 1 to 1 950 (Fig. I ). Previous research with red spruce interpreted this increase as a signal of the tempora~y mobilization of bases in the tree rooting zone (Bondietti and others 1990; Momoshima and Bondietti 1990). Such a pa-iod of cation mobilization would have been expected to result fi-om anionic loading of sensitive forest soil with the atmosphel-ic deposition of nitrates and sulfates (Shortle and Bondietti 1 992). The mobilization of chemical bases in so11 that was recorded in stemwood chemistry was coincident in time with the greatest increase in SO, and NOx emissions (Fig. 1 ). The presence of a similar signal of increased [Ca] within Siberian fir emphasizes the need to esplain this anomaly more fully in future research.
Hypothetically, [Ca] in healthy stemwood could increase due to increasing numbers of ion-exchange sites, increasing the pH of sap or of [Ca] in the xylem stream, 01- some combination of these. We reject the explanation of increased numbers of ion-exchange sites as all ellidence sho\\ls decreasing numbers of exchange sites along the stemwood radius @ondietti and others 1990; Sn~ith and Shol-tle, in press). The concentration of exchangeable Ca in stemwood relative to the [Ca] and pH of the sap has the character-istics of a Donnan equilibrium in which 60 to 80 percent of binding sites are occupied with Ca (Momoshima and Hondietti 1990). An increase in saturation of stemwood binding sites with Ca from 60 to 80 pel-cent can be achieved by an increase in pH from 5.0 to 5.5 or an increase in [Ca] in the sap fi-om 0.5 to 2.5 mequiv pcr- L, 01- combinations of the two. This relationship is complicated somewhat in that other divalent, e.g., Mg, and monovalent (K) cations also participate in the chemistry of sap and stemurood. Nevertheless, the higher [Ca] \vithin wood formed during 195 1-70 relative to the previous 20 years suggest a concomitant change in sap chemistl~~.
What internal or este~nal factors could account for changes in sap chemistry in two widely separated parts of the northem coniferous forest (Smith and Shortle, in press)? Potential inte~nal factors include the constitutive transformation of sap\vood to heartwood. The sapwood:heal-tlvood boundaly was present in 195 1-70 period for essentially all trees in the three data sets. If this maturat~on process was responsible, we expect that a substantially greater frequency of increased [Ca] than the observed 48 per-cent would have occul-sed between the periods of 193 1 - 50 and 195 1-70 period. Also, there are no published repor-ts of the accumulation of Ca or increased pH at or near the sapwood:heal-twood boundary in any species of spl-uce or fir The internal, inducible factors that affect wood and sap chemistry inciiide stem infection and the response of tr-ees to inju~y and infection (Smith and Shortle, in press). The similarity in timing, pattern, and geographic sepal-ntion argues against a common pathological explanation. Base-cation mobilization might increase the concentr-at ions of Ca available to roots, resulting in increased concentrations within ivood. Such mobilization could occul- fi-om distulbances such as fire, though there are no records of fire on thcsc sites during this time perrod Climatic events that combine the effects of rain and prolonged hot summers might produce pulses of anions into the soil \\later, resulting in mobilization of base cations. However, no such climatic event has been documentcd for these \\.idely separated forests. Base-cation mobilization due to the deposition of strong acid anions is coincident in t~me and consistcnt with known mechanisms that would increase the frequency of increased [Ca] in wood formed in 195 1-70. The greatest increase in rates of emissions in the northeastern United States occun-ed during this pc1-1oL1 (1:1 g 1 ). l'ollution monitoi-~ng data for the Sayan Mountain region apparently are not available. Although th~s pa11 of Srber~a 1s remote, i t is not necessarily free of the influence of regional, industrial pollution.

Because of the legislative response to public concern, total emissions of SO, and NO, have begun to decrease (Fig. 1). However, the extent and severity of damage to forest stands due to previous emissions are not known. The biogeochemical links among emission, deposition, essential element uptake, and forest health are poorly understood. Seemingly, some shifts in the bigeochemical equilibrium have occu~red, though it is unclear whether a new, stable equilibrium has been reached.
ACKNOWLEDGMENTS
We were assisted in this work by Dr. Vecheslav Khan~k (Sukachev Institute of Forestry), Kenneth R. Dudzik (USDA Forest Service), and Paul J. Krusic and Stephanie Long (University of New Hampshire).
LITERATURE CITED
Asp, H.; Berggren, D. 1990. Phosphate and calcium uptake in beech (Fagus sylvatica) in the presence of aluminum and natural hlvic acids. Physiologia Plantarum. 80: 307-3 1 4.
Bartlett, M. S. 1 947. The use of transformations. Riometl-ics. 3 : 3 9-52.
Bondietti, E. A., Momoshima, N., Shortie, W. C. Smith, K. T. 1990. A historical perspective on divalent cation trends in red spruce stemwood and the hypothetical relationship to acidic deposition. Canadian Journal of Forest Research. 20: 1850- 1858.
Cronan, C. S. 1991. Differential adsorption of Al, Ca, and Mg by roots of red spruce (Picea mbens Sarg.). Tree Physiolag. 8: 227-237
Demarty, M., Mollran, C.; Thellier, M. 1984. Calcium and the cell wall. Plant Cell and Environment. 7: 44 1-448.
Federer, C. A.; Hornbeck, J. W.; Tritton, L. M.; Martin, C. W.; Pierce, R. S.; Smith, C. T. 1989. Long-term depletion of calcium and other nutrients in eastem US forests. Environmental Management. 13: 593-601
Friedland, A. J.; Miller, E. K.; Boyce, R. L. 1993. Element distribution in red spruce (Picea rubens) fine roots; evidence for aluminum toxicity at Whi teface Mountain: Discussion. Canadian Journal of Forest Research. 23: 1732-1733.
Johnson, A. H.; Andersen, S. B.; Siccama, T. G. 1994. Acid rain and soils of the Adirondacks. I. Changes in pH and available calcium, 1930-1 984. Canadian Jou~nal of Forest Research. 24: 39-45.
Johnson, D. W.; Fernandez, I. 1 992. Soil-mediated effects of atmospheric deposition on eastern U.S. spruce-fir forest. In: Eagar, C.; Adarns, M. B., eds. Ecology and decline of red spruce in the eastern United States. New York: Springer-Verlag. p. 205-22 1 .
Joslin, J. D.; Kelley, J. M.; Wolfe, M. H.; Rustad, L. E. 1988. Elemental patterns in roots and foliage of mature spruce across a gradient of soil aluminum. Water, Air and Soil Pollution. 40: 375-390.
Kuhn, A. J.; Bauch, J.; Schruder, W. H. 1 995. Monitoring uptake and contents of Mg, Ca and K in Norway spruce as influenced by pH and Al, using microprobe analysis and stable isotope labelling. Plant and Soil. 168- 169: 135-150.
Majdi, H.; Persson, 14. 1993. Spatial distribution of fine roots, rhizosphere and bulk-soil chemistry in an acidified Picea abies stand. Scandinavian Journal of Forest Research. 8: 1 47- 1 55.

Miller, E. K.; Huntingon, T. G.; Johnson, A. H.; Friedland, A. J. 1992. Aluminum in soil solutions fiom a subalpine spruce-fir forest at Whiteface Mountain, New York. Joumal of Environmental Quality. 21: 345- 352.
Minocha, R.; Minocha, S. C.; Long, S. L.; Shortle, W. C. 1992. Effects of aluminum on DNA synthesis, cellular polyarnines, polyamine biosynthetic enzymes and inorganic ions in cell suspension cultures of a woo* plant, Catharanthlrs roseus. Physiologia Plantalum. 85: 4 17-424.
Minocha, R.; Shortle, W. C. 1993. Fast, safe, and reliable methods for extraction of major inorganic cations fi-om small quantities of woody plant tissues. Canadian Jou~nal of Forest Research. 23: 1645- 1654.
Minocha, R.; Sho~tle, W. C.; Long, S. L.; Minocha, S. C. 1994. A rapid and reliable procedure for extraction of cellular polyamines and inorganic ions fiom plant tissues. Journal of Plant Growth Regulation. 13: 187- 193.
Minocha, S. C., Minocha, R., and Robie, C. A. 1990. Nigh peilbrmance liquid chromatographic method for the determination of dansyl-polyamines. Journal of Chromatography. 5 1 1 : 177- 183.
Momoshima, N.; Bondietti, E. A. 1990. Cation binding In wood: applications to understanding historical changes in divalent cation availability to red spruce. Canadian Jou~nal of Forest Research. 20: 1840-1 849.
National Acid Precipitation Assessment Program. 1992 Report to Congress. Washington, D.C.: National Acid Precipitation Assessment Program. 1 30 p.
Schlegel, H.; Amundson, R. G.; H~ttelmann, A. 1992. Element distribution in red spruce (Picea rubens) fine roots; evidence for aluminum toxicity at Whi teljce Mountain. Canadian Journal of Forest Research. 22: 1 132- 1138.
Shortle, W. C.; Bondietti, E. A. 1992. Timing, magnitude, and impact of acidic deposition on sensitive forest sites. Water, Air and Soil Pollution. 6 1 : 253-267.
Shortle, W. C.; Smith, K. T. 1988. Aluminum-induced calcium deficiency syndrome in decline red spruce. Science. 240: 10 17- 10 18.
Sholtle, W. C.; Smith, K. T.; Minocha, R.; Alescyev, V. Similal- patterns of change in stemwood calcium concentration in red spruce and Sibel-ian fir. .loumal of Biogeography. [in press].
Smith, K. T.; Shol-tle, W. C. Tree biology and dcndi-ochernist~y. In: Dean, J. S; Meko, D. M.; Swetnam, T. W., eds. Tree lings, environment, and humanity. Tucson: Radiocarbon. [in press].
Smith, K. T.; Shoitle, W. C,; Ostro~shy, W. I). Alurnin~~n~ and calcium in fine root tips of red sptuce collected from the forest floor. Canadian Jou~nal of Forest Research. [in press].
Tomlinson, G. I-I. 1990. Effects of acid deposition on the forests of Europe and North America. Boca Raton, FL: CRC Press. 28 1 p.
Zhou, X.; Minocha, R.; Minocha, S. 1 995. Physiological responses of suspension cultures of Catharanthus roseus to aluminum: changes in polyamines and inorganic ions. JOUI-nal of Plant Physiology. 145: 277-284.

Hom, John; Birdsey, Richard; O'Brian, Kelly, eds. 1996. Proceedings, 1995 meeting of the Northern Global Change Program; 1995 March 14-16; Pittsburgh, PA. Gen. Tech. Rep. NE-214. Radnor, PA: U.S. Department of Agriculture, Forest Service, Northeastern Forest Experiment Station. 238 p.
Contains articles presented at the 1995 Northern Global Change Program meeting on the following topics: monitoring and predicting regional environmental change, responses of northern tree species to regional stress, responses of ecosystem processes to regional stress, forest and landscape responses to regional stress and management activities, human-forest interactions and regional change, an integrated national model of the effects of global change on U.S. Forests, and boreal forest and global change.
a Printed on Recyded Paper C
~ $ u . s . GOVERNMENT PRINTING OFFICE: 1995/650-136/20024

Headquarters of the Northeastern Forest Experiment Station is in Radnor, Pennsylvania. Field laboratories are maintained at:
Amherst, Massachusetts, in cooperation with the University of Massachusetts
Burlington, Vermont, in cooperation with the University of Vermont
Delaware, Ohio
Durham, New Hampshire, in cooperation with the University of New Hampshire
Hamden, Connecticut, in cooperation with Yale University
Morgantown, West Virginia, in cooperation with West Virginia University
Orono, Maine, in cooperation with the University of Maine
Parsons, West Virginia
Princeton, West Virginia
Syracuse, New York, in cooperation with the State University of New York, College of Environmental Sciences and Forestry at Syracuse University
Warren, Pennsylvania
The United States Department of Agriculture (USDA) prohibits discrimination in its programs on the basis of race, color, national origin, sex, religion, age, disability, political beliefs, and marital or familial status. (Not all prohibited bases apply to all programs.) Persons with disabilities who require alternative means of communication of program information (braille, large print, audiotape, etc.) should contact the USDA Office of Communications at (202)720-2791.
To file a complaint, write the Secretary of Agriculture, U.S. Department of Agriculture, Washington, DC 20250, or call (202)720-7327 (voice) or (202)720-1127 (TDD). USDA is an equal opportunity employer.
Taring for the Imnd and Smring People Through Reseu~h"