(1) inmrprated int - USDA Forest Service
40
ms ChaDter SU.WARY OF 'RIE EIS I. PURF€)SE OF AND NEED EQR ACl'Ia :mikes whv the Plan is beirm ~roduced an the issues and concemsAthat form the b&is for this Enviro&&tal Impact Statement. The Inyu National Forest proposes the implementation of a cauprehensive Land and Reso- Management Plan (Plan). The Plan provides directim for the management of all lands and resoms ahinistered by the Inyo Nahonal Forest for the next ten to fifteen years. This Win3"tal Intpact Statement (EIS) donrments the envhnmental analysis conducted a s part of the p1- process. The planrung process is conducted under the auspices of the Multiple Use-Sustamed Yield Act of 1960, the Forest and Rangeland Renewable Resources P1annj.q Act of 1974 (RPA) and the National Forest Managemnt Act of 1976 (NFMA). The planning prooess itself is outlined in the implementmg regulations for those acts (36 CFR 219). Planning on each National Forest is ooordinated with "parable planning at the regional and M~LOM~ levels for all National Forest System lands. The Plan will supersede all past plans for individual resources or land mts on the Forest. See pppendix A in the Plan for listing of the documents. These past plans fit into one of three categories: (1) inmrprated into the Plan withut revision; (2) incorporated with direction to be revised or uflated; or (3) replaced by the Plan. All future environmental &aments for plans and projects on the Forest will be tiered to the Plan. The Plan can be irmended at any time, and all National Forest Plans will be revised every ten to fifteen years. i"t and revlsion will lnclude environmental analysis, documentation, and public involvement to the degree appropriate for the change proposed. The Regional Forester's decision to apprave the Plan and its EIS is subject to the public's rights of administrative appeal. Preliminary precess decisions are not subject to appeal [See 36 CFR 211.18(b)(ll)]. The area CQverd by the Plan includes National Forest System lands witlun the Inyo National Forest boundary (1,931,115 acres) and 25,201 acres of the Sierra NatiOMl Forest admirustered by the Inyo. Inyo Naticrnal Farest Lands Couniq Natid Forest acres % of total Mom (Califomia) 811,049 42.0 InyO 794,352 41.1 Tulare " 186,165 9.7 Madera I' 50,406 2.6 Fresno " 25,256 1.3 Emeralda (Nevada) 49,884 2.6 Mineral 14,003 0.7 Total 1,931,115 100.0 1
-
Upload
khangminh22 -
Category
Documents
-
view
2 -
download
0
Transcript of (1) inmrprated int - USDA Forest Service

m s C h a D t e r
SU.WARY OF 'RIE EIS
I. PURF€)SE OF AND NEED EQR ACl'Ia
:mikes whv the Plan is beirm ~roduced an the issues and concemsAthat form the b&is for this Enviro&&tal Impact Statement. The Inyu National Forest proposes the implementation of a cauprehensive Land and Reso- Management P lan (Plan) . The Plan provides directim for the management of a l l lands and resoms ahinistered by the Inyo Nahonal Forest for the next ten to fifteen years. This W i n 3 " t a l Intpact Statement (EIS) donrments the envhnmental analysis conducted as part of the p1- process.
The planrung process is conducted under the auspices of the Multiple Use-Sustamed Yield A c t of 1960, the Forest and Rangeland Renewable R e s o u r c e s P1annj.q A c t of 1974 (RPA) and the N a t i o n a l Forest Managemnt A c t of 1976 (NFMA). The planning prooess itself is outlined in the implementmg regulations for those acts (36 CFR 219). Planning on each National Forest is ooordinated with "parable planning a t the regional and M ~ L O M ~ levels for all National Forest System lands.
The Plan w i l l supersede a l l past plans for individual resources or land mts on the Forest. S e e pppendix A in the Plan for listing of the documents. These past plans fit into one of three categories: (1) inmrprated into the P lan withut revision; (2) incorporated with direction to be revised or uflated; or (3) replaced by the Plan. All future environmental &aments for plans and projects on the Forest w i l l be tiered to the Plan.
The Plan can be irmended a t any time, and all N a t i o n a l Forest P lans w i l l be revised every ten to fifteen years. i"t and revlsion w i l l lnclude environmental analysis, documentation, and public involvement to the degree appropriate for the change proposed. The R e g i o n a l Forester's decision to apprave the Plan and its EIS is subject to the public's rights of administrative appeal. Preliminary precess decisions are not subject to appeal [See 36 CFR 211.18(b)(ll)].
The area CQverd by the Plan includes N a t i o n a l Forest System lands w i t l u n the Inyo National Forest boundary (1,931,115 acres) and 25,201 acres of the Sierra NatiOMl Forest admirustered by the Inyo.
Inyo Naticrnal Farest Lands
Couniq N a t i d Forest acres % of total Mom (Califomia) 811,049 42.0 InyO 794,352 41.1 Tulare " 186,165 9.7 Madera I' 50,406 2.6 Fresno " 25,256 1.3 Emeralda (Nevada) 49,884 2.6 Mineral 14,003 0.7
Total 1,931,115 100.0
1

In September, 1984, cixgress designated the i" Basin N a t i o n a l Forest Scenic Area, which encapasses 116,000 acres of land witkin the Forest barndary. Detailed xesowxe and developnent planning for the Scenic Area is being conducted separately f m thls planning pmcess.
Public issues and management concerns are aspeds of natural resource management that receive special enrphasis in planning. The issues and concerns collectively indicate the scope and nature of the analysis needed for the hvirro7mental Inpact Statement; serve as blueprmts for the s t ruc tu rw of alternatives, direct the evaluation of e n v m m t a l consequences, and outline the resource use and developnent opportunities on the Forest. The follcwing are the issues and concerns identified for the Inyo National Forest.
1.
2.
3.
4.
5.
6.
7.
8.
9.
How can the Forest proauCe g o x k and services to maximize econcmuc efficiency?
How does the management of the Inp National Forest influence the local social environment and lifestyle?
What can the Forest do to influence a i r quality?
How should the Forest manage cultural resources and provide for the use of Forest lands by American Indians for t r a d i t i d practices?
What is a desirable level of vegetative d i v s i t y for the Inyo, and what should the Forest do to maintain or achieve that level?
H m does energy developnent f i t XI w i t h the overall resource management program on the Forest?
What level of facility consbctim and maintenance is needed to support Forest management objectives?
How should fish habitat on the Inp National Forest be managed?
How should Further Planning Areas on the Forest be managed?
10. What is the role of geokgic T~SOUK'RS and sdces in the overall Forest managexent program?
11. What land use and lanchnershp adjustment policies and procedures axe needed to respond both to local Carmunity needs and to the demands of regional and national publics?
12. How can the Forest best encourage mineral (including geothermal) exploration and developnent while protecting surface resource values and other land uses?
13. What is the apprupriate pest management strategy for the Inyo?
14. What is the appropriate f i r e management strategy for the Inyo?
2

15. How should the Inyo balance the needs of the range program (daestic livestock and mld horses and burros) with the need to protect and/or proCtuce other resources?
16. What is the best recreation opportunitY program for the Inyo (considerug supply, demand, other resource management and developent opprtumlxes, and ernrironmental protection needs)?
17. What contribution should the Inyo make to the national and regional systems of Research Natural Areas?
18. What is the s ipf icance of riparian areas on the Forest, and how should riparian area-de-t resources be maintained, enhanced, and/or restored?
19. How shauld the Forest manage habitat for sensitive plant species?
20. Should the Forest consider establishing any additional Special Interest Areas?
21. What is the best balance between timber (including fuelwood) prcduction, other resource management and developnent opprhnuties, and envirmmntal protechon needs?
22. What role does visual quality play III the werall resource managanent program, and how can that quality be prot&d and enhanced?
23. Hvd should the Forest respond to the needs for water quality, increased w a t e r yields, water rights for Forest resou~ce managemsnt, and healthy watershed condition?
24. What rmammdations should the Forest make for the managemsnt of candidate wild and scenic rivers?
25. Is there any need for change in the managemsnt of designated wilderness on the Forest?
26. Haw, whexe, and to what degree should w i l d l i f e habitat be "tamed and enhanced, and how should wildlife needs be ccordinated mth other reso- management and develope& opprtunities on the Forest?
This chapter describes the alt-ti- analyzed zn the planning prccess. Each alternative describes management direction that is designed to gude the management of Forest lands and resources fm their current state to a desired future condition. Many &mations of resource uses and management acixvilxes are possible in formulatug a reasonable range of alternatives.
The alternative formulation process began w i t h the analysis of Benchmarks. Benchmarks are analytical models that serve three functmns: to detemune reso- costs and outputs a t the level of managmt: to deternune
3

the maximum physical and biological capacity of the Forest to produce certain key resources; and to calculate the most econanically efficient mur of mamganent activities under different sets of objectives. B y establishmg rrrrm", maxinnnn, and cost-efficient output levels, the Bencharks describe a "decision space" within w h i c h reasonable alternatives can be developed and set standards mth w h i c h the alternatives can be canpared.
All alternatives w e r e designed to meet a set of managanent requirements and standards and guidelmes that would be acceptable to the public and could be implemented on the ground. Those requirements address such issues as long-term sustained yield and rmn-declining even flaw of wood pnxlucts, wildlife and fish population viability, vegetative diversity, soil productivity and water quality, riparian area protection, and scenic quality.
Eleven altematives were initially develop&. O f those eleven, five were eliminated fran further study and six were studied in detail. Alternatives w e r e eliminated fm further study for various reasons. "KI of the alt-eves had extremely high projected outputs, but f a l e d to meet the timber policy rquinmat of "-declining even f lm . "KI additional alternatives, w i t h large wilderness recarmendatians, did not respond to the management concern that wilderness on the Forest be suitable for and manageable as wilderness. The f if th alternative, which had a severe budget limitation, responded very poorly to the primary public issue on the Inyo National Forest, which is the quality and quantity of recreation opprtunities . The following six alternatives w e r e studied in detal.
. .
PRF: -F&TERNATIVE
This is the modified Preferred Alternative resulting fran public aments received on the Draft Preferred Alternative and intensive review by the Inyo National Forest managexst and mterdiscipljnary teams. It is designed to reflect the charges needed to incorporate identified concerns. A mixture of both "cdJ.ty and &ty outputs w i l l be produced, w i t h prwnsion for the historic uses of the Forest.
Developd slrmner recreation w i l l be managed with the objective of increasing oppr-hnuties in response to demand w i t h the a"t of developrent limited to the nmker of inventoried, undeveloped sites. Alpine skiing will increase consistent with approved developnent plans and at a rate that responds to demand consistent w i t h env in~mta l and infrastructure m i x a i n t s . The amunt of developrent w i l l be closely coordinated with cmnnxnty plannuq, so that ski area capacity and the c u " t y ' s ability to provide support services will be developd together. Addilxonal dispersed recreation o p r t u n i t i e s w i l l be pravided for both winter aral surrmer use.
Timber w i l l be managed to provlde a continuing supply of wood pnxlucts to met demand. Timber managanent objectives w i l l be cmpatible with recreation, wildlife, visual and other resource values.
Dcmestic livestock grazing will be managed to meet local demand and to be cQnpatible with timber and wildlife objectives.
4

The wilderness land base will be increased by the addition of mer Planning Areas w i t h high wilderness recreatim value, in cc&ination w i t h a low level of ccolflict with otber resources: ecological systems not yet represented in unl- m the Inyo; OT logical additions to exi- wilderness, in ccmbination with a law level of conflict w i t h other x-esnmxs.
Wildlife habitat will be managed with the objectives of maintainirag or enhancing deer habikat capacity: achieviq recovery for threatened and -ered species: maintaining or "cirg habitat for sensitive and special interest species: and maintahxin~ ppulation viability for a l l other native veebra te species. Fish habitat w i l l be managed w i t h the objectives of respnding tn projected increases in disparsed recreation and achievirg recarery for threatened trout species.
CUR:
This alternative displays the current program of management activities on the Irryo National Forest and projects it over the fifty-year p1anni.q horizon. The 1982 Forest budget is a a"&aint in the FOReLAN model. The buc?get "s essentially ccolstant over the planning horizon and continues to be &stxibut& amcolg the resources in roughly the same proportions as in 1982.
Developed sumner recreation w i l l be managed w i t h the objective of maintaming use a t cufient levels through the fifth decade. Alpine skiing w i l l increase a t a rate that responds to demand. actual a"t of developnent w i l l be closely coordinated w i t h c " i t y p1annh-g 60 that ski area capacity and the ability of the COmrmnity to pcovide Support services are developd together. T h e management of dispersed sumner and w i n t e r recreation will allow for an increase in use, but the quality of the experience will deteriorate because of re&& standards due to a limited haget.
T m b e r will be managed w i t h the objective of maintaining currently projected outputs over the p1anni.q horizon.
The grazing -am will be managed with the objective of maintaining the current level of managmt intensity through the f i f th decade.
The w i l d e r n e s s land base will be increased by the addition of Further Planning Areas with ecological Systems not yet represent& in w l l d e m e s s on the Inyo.
W i l d l i f e habitat w i l l be managed w i t h the objectives of minimizing Forest-wide redudion of deer habitat capacity: achieviq recovery for threatened and endangered species: m a i n t w or enhancing habitat for sensitive and special intexest species: and maintaining populatlon viability for all other native vertebrate species. Fish habitat will be managed with the ObJeCtiveS Of ' to projected increases in dispersed recreation and achieving recovery for threatened trout.
UlRRENC (1982) PIUXTWM - NO AC2ICN
5

RPA:
T h i s altemative is designed to meet tb targets and goals of the 1980 RPA hrogram, representirg m3derate to high outputs of cxmnxh 'ties and selected amenities. Scme of the assigned RPA targets and goals for the Forest are not mutually cmptible. h;lhere there is a conflict, market outputs (Emker , range, and developed nxxeation) are given priority over m-market outputs and amenities. In cases for w h i c h RPA goals cauld rat be mt in this alternative, they are mt in orie or mre of the other alternatives studied in detail.
Tlmber will be managed with the objective of achieving a progranmf?d annual harvest of 19.2 million board feet (IvMeF).
Danestic livestock grazing will be managed with the objective of m c i n g a t least 55,600 average m u a l Anjmal Unit I%" ( A m ) by the f i f th decade, representirag the president's target of a 46 percent increase over the specified base level.
mvelopd recreation will be managed with the objective of inmasing opprtunities in respcase to demand. The actual a"t of developnent wlll be lmited by potential supply. Alpine skiing will increase in response to demand to the extent cmpatible with timber objectives. The management of dispersed sumner and winter nxxeation will provide for an increase i n use rvughly pmprtional to develOpea s i te use.
Wildlife habitat w i l l be managed mth the objedives of nunimizirg Forest-wide reductions in deer habitat capaciw, given range and alpine skiing priorities: achieving recovery for threatened and endangered species; and mamtahirg ppulation viability for all other native vertebrate species. Fish habitat w i l l be manag& w i t h the objectives of achieving recovery for threatened trout species; ' to projected increases in dispersed recreation: and increasing s h e a m .trout habitat by 20 percent in response to the RPA goal.
MEET TAIEGETS AND CXAIS OF WE 1980 REsouRcEs PLANNING ACl' PROGRWl
There is 110 budget limitaticsl in the FDRPLAN m3del.
CEE: ~ z E c o s T - - E F F I c I E N c y
This alternative seeks the most cost-effective m i x of land allccaticms and management practices m l a b l e on the Inyo National Forest, given the application of Mini" Management R e q k r e m m b (IYMRS), Timber Policy Requl-tS, Mini" Implementation R e q u i r e m e n t s , and Forest-wide Standards and Guidelines.
If the Forest is managed w i t h the single objective of maximizing cost- efficiency, the follawing ccolditions will exist:
Developed recreation (including alpine skim) and dispersed recreation w i l l be provided in resp=o7se to projectea demand to the extent possible, limited by supply. A l l potential sites w i l l be developed and aperated a t standanl levels of service.
Those Further Plannirg Areas with moderate to high potential for w i l d e m e s s nxxeatim use w i l l be recamnended for wilderness.
6

Timber outputs will be managed at cost-effective levels outside developed recreation sites and ski areas, representing an Allowable Sale Quantity of 10.1 lvMBF by the fifth decade.
!rhe grazing program will be managed at cost-effective levels, representjng 46,500 AUMS, or a 12 percent increase over the base year of 1982 by the fifth decade.
Wildlife and fish habitat imp"ent for haraest species will be maxlrmzed in response to dmand for hunthg and fishing (the supply could not, hawever, meet that demand). Habitat for threatened and e n d a n g d species mll be managed for remvery. Habitat for all other species will be managed for population viability.
AMN: " I z E A M l m I l Y -
under this alternative, amenities are maxinuzed with little regard for the effects on corrm3dl 'ty outputs. Wilderness, wildlife, and prinutive and semi-primitive disprsed recreation are emphasized. There is m buc?get limitation in the FORPLAN -1.
The wilderness land base will be increased by the addition of a l l Further P l a m j n g Areas that are at least minimal ly suitable for wilderness, considering wilderness characteristics and manageability.
Wildlife habitat will be managed mth the objectives of lncreasmg mule deer habitat capacity by at least 20 percent in response to the FPA goal of " i z q habitat for threatened and endangered species; meeting the RPA goal of at least maintaining current habitat capacity for cavity-nesting birds; " i z i n g habitat capacity for sensitive and W i a l interest species; and maintaining or enhancing habitat for all other native vertebrate species. Fish habitat will be managed with the objectives of respm3u-g to projected levels of dispersed recreation and maxinuzing habitat for threatened trout species.
Dispetsed recreation will be managed mth an mqhasis on the quality of the experience, rather than the quantity of use. Prmitive and semi-prinutive -&unities and a high level of scenic quality will be mghasized. Develop3 s"xx recreation will be managed with the objective of maintaining current levels of use through the fifth decade. Alpine ski area developnent mll increase at a rate that respcolds to demand to the level projected ln the r4a"th-m Unit Plan.
Timber will be managed for carmercial proaudion to the extent canpatible with &-efficiency and d t y objectives.
Danestic livestock grazing will be managed to the extent ccmpatible w i t h wildlife objectives.
7

AMB - EMPHASIZE WILDLIFE AND RECRERTICN
This alternative places a primary mphasis on the quality and quanti* of wildlife habitat with a secondary eqhasis on moderate expansion of the developed recreation prclgram. Other ixnnrdz ' ty outputs are proauCea to the degree canpatible w i t h wildlife and recreation objectives. Amenity values other than. wildlife receive a &ate degree of emphasis. There is IW buaget limitation i n the FORPLAN -1.
Wildlife habitat w i l l be managed w i t h the objectives of increasing mule deer habitat capacity; maximizing habitat for threatened and endangered species; "izing habitat for sensitive and special interest species; and mzderately j"iq ecological diversity to enhance habitat for other nakve vertebrate species. Fish habitat w i l l be managed w i t h the objectives of respndirg to projected increases in dispersed recreation and " i z h g habitat for threatened trout species.
Developd recreatian w i l l be managed w i t h the objective of increasing use 30 to 35 percent by the year 2030. Alpine ski area developnent w i l l increase in respmse to demand where cmpatible w i t h wildlife objectives. The management of dispersed sumner and w i n t e r recreation will provide for an increase in use roughly proportional to develop3 site use.
The wilderness land base will be increased by the addition of Further Planning Areas with m t e to high wilderness -tion values and/or ecolqical types not yet represented in wilderness on the Inyo.
Danestic livestcck grazing w i l l be managed to the extent m t i b l e w i t h wildlife objectives.
Timber will be managed for maximum p"h 'cm to the extent cmpatible w i t h &-efficiency and wildlife, recreation, and rarge objedives.
The follcwirg discussion canpares the six alternatives studied in de ta i l in terms of the Forest's resources.
M"Es
It is asslrmed that the quantity of geothermal, s n a l l hydroelectric, wind, and solar energy T~SOUTCB developnent that could OCCUT is generated by private idustzy. There are no plans to lease additional land for geotlxmnal developnent under arry altenlative.
T k greatest acreage of land with high and medium mjneral potential withdrawn fran mineral entry is in the AMN alternative, followed by C 5 , AMB, PRF, aJR and RPA. lvLsst of the difference in acreage results fran the differences in withdrawals for wilderness.
8

RamE
The “pe t i t i on between &Wsb ‘c livestock and mule deer is addressed differently in each alternative. Cattle have priority over mule deer (in terms of jlEEas& forage resulting fmn raqe impnxrement) on key deer winter range in RPA. M e deer have priority in PRF, Oil, and CEE; catt le are remwed entirely fran key w i n t e r range in AMN and AMB. Cattle graz iq in key deer fawning areas is d e f e un t i l after July 15 in AMN and AMB; fawning areas are also eqhasized in PRF and CUR, but specific details are left to resolution in allotment management plans.
The “ p e t i t i o n between livestock grazing and timber management is also handled differently i n each alternative. Cattle grazing is allowed to decline fran current levels in suitable timber under all alternatives except AMB, in which current levels area maintained.
Range outputs are “eased i n most alternatives. RPA mpresents a 34 percent increase in grazing over current levels. CEE repsents a 12 percent increase; PRF maintains current levels. (XIR, AMN, and AMB involve 6, 15, and 5 percent reductiom i n range outputs respedively by the fif th decade.
Fm23mTJ.W
The quantity of use, quality of recreational expziences, and type of recreatimal mrhmities differ considerably by alternative; however, most of that difference occurs on a limited rmbr of acres.
Most differences in the quantity Of developea recreation, other than alpine skiing, a x m r primarily in concentrated recreation areas as a result of increased developed site capaci~. Differences in quality of developed recreation result fran maintenance and service standards.
The greatest differences in quantity of disparsed recreation use occur in ccolcentrated recreation areas in association with the quantity of developxl site use.
W e differences tend to be collcentrated on lands i n the area fran Wth to L e e Vinirag w i t h timber, geothermal, alpine skiing, and developed site potential; the major Sierra Nevada drainages fran C h v i c t Lake to Horseshoe MseacaOW wrth developed site potential; and the Wnache area of the K e r n Plateau w i t h timber potenkal.
!J%e assmption is that, other than a moderate trend tmard mre dispersed use, recreation on rmst Forest lands w r l l not change substantially from the current situation under any alternative.
The quantity of developd sumner recreation represents a wLde range of outputs under the alternatives. CUR and AMN represent the l awes t level of use with the maintenance at current levels. AMB represents a msderate increase in use. PRF, FGA, and CXE represent the high end of the scale w i + h
9

an increase of 57 percent over base year use by the fifth decade. will
The quality of developed -tion m € % C e s will also vary. A standard level of facility maintemanca and service contributes to recreational quality; low standard levels detract fmn such quality. The quality of developed recreation experiences will be impawa ' by low standard operation only in OUR.
Increases M ~ C U T primarily in the public sector.
Alpine ski area capacity estimates differ wnsiderably by altemahve. projected ski area capacity raqes fmn 31,000 SADT (1,678,600 RVDs) at the low end to 61,000 SAOT (3,372,600 FWDs) at the high end. AMN pruvides for the least grcrivth with the other alternatives increasing in order: OUR, AMB, RPA, to CEE. PRF calls for capacity at apFawed developnent plans. Additional developnent will require a CumULative impact study. The Sherwin Bay1 Koposed ski area is currently being analyzed Outside this pl- process in a separate Bwim" tal Impact statmt.
Dispersed Recreation
The quantity of dispersed recreation is assumed to increase in general to public developed site capacity and use. A large part of
dispersed sunner use on the Forest is generated by campground use. lb a lesser degree, dispersed winter use is generated by people wlm c~ne to the Forest primarily because of alpine skiing o p p r h u 'ties.
The quality of dispersed recreation in cmcentxated recreation areas is related to the overall munt of use and the availability of facilities such as trails, resbrocms, and interpretive signs that distribute use and proteot resource values. Increased use will be highest in PRF, P A , and CEE because of the f u l l developnent of facilities and standard levels of service. CUR m11 --bate the current low level of nxreaticmal quality, despite the rrrrmmdl increase in use, due to a lack of support facilities and low levels of s m c e . ?!MB will represent higher overall quality w i t h a moderate increase berth in use and in facilities. AMN projects ?..gh quality with slightly increased use and substantially increased facilities.
Dispersed recreation opprhmities vary fran primitive (m facilities, m vehicles, few people), through semi-primitive to intensively developed (many facilities, many vehicles, many people). These will be clustered at the prmitive and semi-primitive end of the scale m AMN and AMB. Wre owrhuties related to road ccastructian and facility developnent are available in PRF, OUR, RPA and CEE, in that order.
Recreation quality is affected by the potential for conflict with other resources. Timber management on the Inyo does not generally anflict directly with dispersed recreation use. Conflicts with sumner use are minimized because msst lcggjng occurs in the winter, and conflicts with winter dispersed use can be " i z e d by locating nordic ski and s"bile kails as needed to amid those areas being harvested.
. .
10

The t w o areas most susceptible to new or increased motorized use result- fran timber road access are the unroaded forested lands east of San Joaquin Fiiwe and the Mmache area of the K e m Plateau. Neither area is hanrested in AMN and PRF; only the San Joaquln area is harvested in AMB. Both areas are harvestedLTndertheotheralternatives.
Fis4rh-g opportunities outside of hatchery-stccked fisheries are r e l a t a to the m c t i n t y of resident trout fisheries, which is affected in tum by the a"t of stream habitat and watershed iqmc"t under an alternative. There is little difference between the alternatives for fish.mg opprtunities.
B i g game hunt- -*ties are related to the n m h r of deer on the Forest. Deer ppulations may decline under the impacts of facil i ty developnent, imlpaed access, and increased livestock on wmter range. They may increase with habitat improvemen t and reduced canptition with livestock on key deer range. The rarkirg of alternatives according to hunting oppzrhmities lists AMN, AMB and PRF at the high end, CUR m the middle, and RPA and CEE a t the low end.
-*ties to increase habitat capacity are limited.
T m
The alternatives differ in the amount of acreage detemnined suitable for timber management, as mopared with the acres considered tentatively suitable for plarming purposes. The final calculation of suitable acres (those that w i l l actually be managed for timber prcduct~on under an alternative) w a s derived from the tentatively suitable land base. Subtracted from ths were tmterlands m recQrmended w i l d e r n e s s , concentrated recreation areas, alpine ski areas, and areas managed mth an a " t y emphasis under an alternative. The largest suitable timber acreage is found m P A . Acreage figures decline from RPA to CEE, to CUR, to PRF, to AMB, to AMN a t the low end of the scale. The slutable timber in RPA represents 90 percent of tentatively suitable tunber; AMN represents 56 percent.
The alt-kves also differ III tlmber outputs, but the afference 1s not directly proprtional to suitable timber acreage under each alternative. The reason for t h i s lack of propria 'onality is the fact that suitable acreage may be managed under one of several sets of managmsmt strategies. Wgh level tlmber managemnt w i l l prcduce m e bard feet per acre than moderate level management. Timber Outputs i n the fif th decade range from 19.8 iWBF for RPA to 6.5 iW3F for AMN, mpresentirg a range from 2,000 to 1,OOO board-feet prcduced (on the average) per acre of suitable timber.
m e l d result- frun logging debris is roughly proportional to overall timber Outputs. Additional fuelwood may be made available as part of the pxgramed harvest i f needed to respmd to demand.
WILDERNESS
Alternatives &ffer m the total acreage recnrmended for wilderness. RPA represents the low end of the scale, with 110 wilderness recarmendations; AMN represents the tugh end of the scale, w i t h 510,800 acres m twelve areas
11

recarmended for wilderness. "he other alternatives in increasing order of acres reccmnended, are: PRF, CUR, AMB, and CEE.
Recreation use is not pmpr t imal to quantity of acres recannended. The PlaUning Areas on the Forest, as a group, have fewer wildemess
atixibutes than designated wildwmes. Although natural integrity and opportunities for solitude tend to be high, natural appearance and opprhmi t ies for primit ive. recreation tend to be low. The la t ter is t m e Primarily because many Further Planning Areas have primitive mads, accessible by four-wheel dr ive vehicles, and lack the available water sources that w i l l facil i tate m-mtorized recreation.
The m u n t of wilderness recreation use project& for an alternative reflects the availability of primitive recreation apportunities in the areas
for wildemess under that alternative. AMN, for example, which has the largest recmmnded wilderness acreage, includes considerable acreage in Further Plannbg Areas with milerate to low wildemess quality and law projected levels of wilderness recreation use. (XIR reMmEnds only that part of the white and Inyo Mountains with ou- ' ecological features such as desert sprbgs am3 alpine tundta. PRF, CEE, W and AMB mlude additional acreage withut such features.
WILDLIFEANDFISH
The majority of d x e c h 'on for wildlife and fish habitat is foutfi in the Forest-wide Standards and Guidelines cnm~n to all altematives; such direction is intended to m t Mininarm Managemnt R q u t r e m m t s (m) for native Verterbrate species. In only the following cases does direction exceed the "3 and, therefore, vary by alternative.
Mule deer. PRF, (XIR, and CEE give. priority to mule deer over catt le for any increases in forage proauction on key deer winter range; AMN and AMB remwe catt le fram key winter range; RPA gives priority to cattle on w i n t e r range. AMN and AMB call for delayed livestock grazing in key deer fawnkg areas; PFtF and alR also aphasize fawning areas, but leave the details to allotment managmt plans; RPA and CEE place I%I special aphasis on fawnkg areas. AMN, AMB, and PRF enphasize the integrity of mule deer migration mutes; the other do not address migratim routes.
m i n e falcxm. PRF, OUR, RPA, and CDI provide for the reintxcduction of tw0nestingpairs;AMNandAMElprovideforfour.
Goshad. PRF, CUR, AMN, and AMB maintain fifteen (a l l existing) goshawk territories i n suitable timber; RPA and CEE w i l l a l l o w a reduction in the runnber of such territories, maintaining only nine (the n m b r needed to meet minimum managmt requirements). PRF, AMN, and AM3 prwide one hundred
provide ordy the "I acres per goshawk territory; the ra"q managmt level, f i f tv acres per territory.
Sierra Nevada muntain steep . RPA and CEE provide for no additional reintnduced herds; PRF and (XIR prwide for at least one additional herd; AMN
. .
and AMBprovide fm seven additional herds.
12

Riparian aTea dql" tspeci es. All altematives call for negotiating w i t h u t i l i t y canpanies to rewater selected reaches of stream and reestablishmnt of streamside riparian vegetation. Wet meadows represent n u r e than two-thirds of the riparian vegetation on the Forest. Of the 26,000 acres of w e t meadow on the Forest, 23,500 a- have been identified for watershed restoration. CEE, AMN, and AMB call for fu l l watershed restoration i n wet meadows over f i f ty years: PRF calls for 17,100 acres of w a w work; RPA for 9,900 acres; and CUR for 2,000 acres.
Older seral stage dql" tspeci es. The alternatives vary in the a"t of suitable timber maintained in older seral stages. CUR, RPA, and CEE maintain only the amunt needed for gashawk n e s t i q territories (see above). PRF maintains 5.4 percent of suitable t i i n t e r in older seral stages, AMN 30 percent, and AMB 20 percent.
slag k. .. tspec ies. PRF, ClR, EA, and CEE will apply only the Mi" Management requirenents for slags (maintain a t least 40 percent of natural potential). AMN and AMB call for maintaining 100 percent of natural potential mag-dependent wildlife density.
Fish. There is limited potential to increase fish habitat capability on the Forest. W~re than 90 percent of resident trout are found in lakes, where habitat condition is generally gmd and there are m identified opprtunities to enhance or increase habitat. The majority of both lake and stream habitat is m wilderness, where habitat is also generally gccd and any potential for enhancement will be limited by wilderness managemnt.
Of the stream acreage identified as suitable and available for habitat hp"t, (JEE hplementS the full -am; PRF, RPA, AMN, and AMB represent high levels of imlpwement; CUR represents a mderately high level. Additional fish habitat w"mt is induced fm watershed hprovment, discussed above rolder riparian area-depmdent species.
Threatened trout habitat is managed only for species recovery under PRF, CUR, RPA, and (JEE: AMN and AMB call for increasing threatened trout habitat above recove~y levels.
EuJNcMccs AND TRADEOFF ANAGYSIS
The major e " i c txadeoffs between the alt-tives are projected ecormuc effects: costs and values of priced and "-priced rexmxes and benefits; and the level of ~ t i ~ ~ l and regional issue resolution. " U c indicators are of cnncem to the federal taxpayer, as they measuce alternatives in terms of their responsiveness to econanic efficiency in government . Total public benefits €ran the Inyu National Forest increase over the next f i f ty years prjmarily in response to the amnmt of dispersed and developed recreatian, and (to a much lesser degree) in response to wildlife, watershed, timbar, and range outputs. Increases in total benefits for the studied in detail range fnm 20 percent to 107 percent above the 1982 base level.
The lowest BcoIIcmic benefit levels are found in those alternatives i n w h i c h developed recreation or ski area expansion is limited by buclget or other
13

~ide ra t ions . ”-cash benefits, derived primarily frcm -tion use, cxnrprise 94 percent to 97 percent of total Forest benefits in the f i rs t decade. pmprtion to the size of the devalqed “ e a t i o n , timber, and range Ipograms.
mtal costs increase fran 7 percent to 35 pxent abare the 1982 base year level in the first decade. These Cost increases primarily reflect increases in capital irnresbnen ts, which range fran a 28 percent reduction to a greater than 600 percent increase over the 1982 base year level. Recreation facility, trail, and tmhx mad cxnstrudon vary w i t h the size of the recreation prcgram, the amount of wilderness ~ a p o s e d , and the quantity of -harvested.
mployment and incans opprhuu ‘ties are drawn primarily fran developed recreatim, alp- skiing, timber harvest, and livestock grazing. Related support businesses prwide C m S L ~ l y Emaller ‘cms of the available jobs. changes in local emplayment ‘ty range fran zero to an increase of mre than 36 mt.
A canparison of Present N e t V a l u e (PNV) between key b ” a r k s and alternatives illustrates the ecolloRic and resource opprhmity costs of the tQ.m” Managmat RequFremen t s , Timber policy Requirements, and i-4” Inplementatian R e q u i E ” ts. The basis of the Present N e t Value ccniparison is the rmst econanically efficient, unoonstrayled ‘ k e ” r k (FLW).
The Minimum Managaent R e c p h s m m t s and Timber Policy R e q ” m t s represent the f i r s t set of objectives added to FLW, resulting in the Mm Benchark. These requirements include goshawk nestirg territories, riparian area protection, maintenance of soil and water pnductivity, and “m diversity of vegetative seral stages. On the Inyo National Forest, only goshawk territories and riparian area protection were applied as ccdlstraints on the resxrce allccaticol model. Each of these requirements slightly restricted timber harvest.
TheMinimum Implaentation R q u b m e n t s represent the seccold set of objectives analyzed. They were added to the Mm benchmark, resulting in the CEE Alternative. On the Inyo Natimal Forest, maintenance of visual quality along state-designated scenic highways w a s the only Minimum Inplementation R e q U i n m n t applied to the analysis. The only effect w a s a slight addibonal restriction on timber harvest.
The Minimum m g a e n t R w t s , Timber Policy R q u k e m n t s and Mmi“ Implementation R q ~ i r e m e n t s collectively represent a reduction in present Net Value (PNV) of $0.3 million, less than 0.01 percent of the PNV for the F L W benchmark. This reduction in PNV results primarily fran increased costs for timber proaucticol and a loss of 0.275 M W F of timber harvest over the first five decades. The goshawk and riparian area -ts had the greatest effectont imberoosts . Theserequiremen ts axmre the maintenance of nine goshawk territories of f i f t y acres each in suitable timber and the protection of riparian area-dependat rem- i n suitable timkr. The two requirements shared -ally in reducing PNV.
cash re- increase over the Planrling horizon in dired
a l R p r m r i d e s t h e l e a s t ~ ‘ve gains in cash benefits.
. .
14

The Timber Policy R q u i r " ts of harvest dispersion and m-declining yield had negligible effects on PNV due to the law relative value of timber on the Inyo National Forest and the mt€ractian of Stand gcwth, diSc0unti.q of costs and benefits, and price .trends. These factors canbhed to redue the hamest i n earlier decades w i t h the trend steadily climbiq and stabilizing in later decades. All- for harvest to decline in the later decades had no appreciable effect on PNV, due mably to the discounting factor.
The Management Implementation R q r b m e n t for visual quality protection resulted in a very slight azOp of $0.1 million in PNV due to restrictions on timber harvest techniques and limitations on the size of openings.
The tctal cost of cmstraints added to benchmarks to develop the CEE Alternative are insignificant m terms of reduced PNV or reduced resource
Managenvat Requirements, prduction capability. The impact of the M" Timber Policy Requraents, and Management Implewntation ReQurenE!nts w a s felt exclusively on timber benefits, which a t most p-de less than 3 percent of the total discounted benefits on the Fo&. The distribution of benefits =thin the rsreat ion prcgram varied on the basis of facility maintenance levels, wilderness rea"%tions, and the extent of alpine ski area developnent. Timber, range, and other resource benefits and costs were f a r less significant than recreation in d e t e " q ' the relative PNV of the alternatives.
The OUR Alternative ranks lowest in PNV, primarily hecause bucQet constramts i n the FORPLAN -1 limited opp3rtunities to wnkibute to PNV.
An examination of net cash flow for the alternatives indcates that expCi~tures are greater than returns to the Treasury in all alternatives for both the f i r s t and f i f th decades.
Cash receipts w i l l be derived mainly f r a n develop3 recreation and .1-;Lmber prduction, w i t h livestock grazing and geothemal energy resources representing 3 to 8 parcent of the total. Grass receipts for all alternatives w i l l be higher than the 1982 base level of $2.2 nullion. R e c e i p t s w i l l be expected to nearly double between the f i r s t and f i f th decades in all a l te rm~ves except CUR, which increases the least because of buc?get limitatxns. Even w i t h substantial jncrsases in returns to the treasury, negative net cash flow haeases i n all alternatives except OUR, M, and AMB, w h i c h have the lowest total fe5ieral costs. This relationship is due primarily to the need for substantial irnrestrnent in order to realize major benefits i n the recreation and timber programs.
A large part of the total benefits derived fran Inyo National Forest lands represents the estimated amxlnt that cam." will be willing to pay for Forest outputs such as recreation. These values do not reflect the m m t that they a a a l l y pay for those outputs and are termed "willmgness-to-pay assigned values." Consequently, the actual cash received by the u.S. G"IEnt is not proprticmal to total benefits generated by Forest management Frrograrrrs.
The ranking of alternatives by net cash f l a w is inversely proprtianal to oosts in the f i r s t decade. Generally, those alternatives that mwe up in the ranking between the first and the f i f th decade are thase that recormend large
. .
15

acreages for wilderness and that have reduced i-,imber and develop3 recreation production. This relatiomhip results f r a n the high initial cwsts of wilderness designation (trail and .trailhead Ccastructran) mxsus the moderate costs and high-level benefits of wilderness management over the long term.
The most ecoMnically efficient alternative, CEE, fa l ls near the middle of the first-decade rankirg a m r d i r g to net cash flow. The OUR and RPA Altematives rank atove CEE, as they eqhasize resoulces producing incane to the treasury, primarily develope3 recreation and timber p1~3~ction. AMN and AMB mcur large f i r s t decade capital-investmen t costs to accanwdate large acreages of proposed wilderness. By the f i f th decade, thew costs are reduced substantially because neither al-hmative s u p p r t s a large timber or developed recreation nog gram. CEE ranks lowest XI the fifth decade, primarily because it provides only the & ecommically efficient timber harvest levels (lower than CUR or RPA) in canbination w i t h a substantial recreatim prcgram w h i c h provides l i t t l e in t- of actual incane to the .treasury-
In general, Alternatives CUR, AMN, and AMB ( w i t h burnet limitations, major initial investments for wilderness, and/or w i t h long-term law-pmfile timber and recreation prcgrams) provide fewer m-cash benefits than other alternatives. Alternatives RPA, CEE, and PRF (which strive t o m e e t projected public needs through increased developd mzreatim p r q r m ) incur high costs, provide the highest returns to the treasury, and offer the highest non-cash benefits.
That portion of the eco17oRic benefits that w i l l not be collected as cash receipts varies considerably a-s the alternatives. These benefits are based primarily on recxeatim, wildlife, and rarqe outputs, w h i c h prwide upnrds of 90 percent of the total PNV. For this reason, there is not a large range of net cash flow a"g the alternatives (except OUR, which is considerably lower because of budgetazy restrictions).
It is important to note that all pmjedicols beyond ten years are hghly speculative, as both ~ t u r a l resource and -io-econanic data 1s extremely variable.
The Inyr~ National Forest mists of four Ranger D i s t r i c t s mth offices in L e e V i n i q , Mammth L a k e s , Bishop, and Lcne Pine. The Forest Supxvisor's office is in Bisbp.
The Forest wntains 1,931,115 aces, -ing large parts of the Sierra Nevada, Glass, White, and Inyo Mwntains. Wst Forest lands drain into the Plnm B a s i n or C X e n s River. smaller porticms drain westward into the San Joa@n or K e m Rivers, or eastward into the Great Basin. The Forest is long and-, =t=dlKl ' 165 miles fran north to south, and varying in width fnm four to sixty miles. It ststststststststststes the i m r d a q between the southem
16

Sierra Nevada and southem Basin and R a n g e Physicgraphic and Geologic
The naturdl -t of ths Inyo is noteworthy for its ccoltrasts. Elevatiuns range fran 3,680 feet near O!" Dry Lake to the peak of M t . Whitney a t 14,495 feet. Plant and animal habitats include such ccoltrasting elements as desert and w e t meadow, forest and alpme tundra. Rugged, barren escarpnents stand abwe forested hills, sagebrush flats, and grassy plateaus.
The climate on the Forest is as drverse as its tapography. The higher elevatiuns in the Sierra Nevada receive high levels of precipitation. Mamnoth Pass, for example, receives an average of 45 inches a year, mst of which fa l ls as srm betmen "mbx and March. The eastern poaions and 1- elevatiuns of the Forest are quite arid. The ca"ity of Bishop, located a t 4,000 feet and about midway betmen the eastern and Western Forest boundaries, records an average of six inches of annual rainfall, nwst of which occurs durirg the winter mths.
' natural features are included w i t h i n the Forest boundary:
- Mt. Whitney is the highest peak in the 48 ccoltiguous states.
- The Ancient B r i s t l e " Pine Forest includes both the Methuselah tree (the world's oldest kr" living tree) and the Patriarch (the laryest lamwn bristlecone pine).
-i%m Lake is a large inland sea that SupKVrts a unique biological Comrmnity including brine shr iq, brine flies, nesting California gulls, and several million migratory birds.
- The Mcolo maters are "textbook examples" of volcanic geology visited annually by students and scientists fnm across the nation.
- The Mcolo maters and Mcolo Lake are tw of many unique features in the MXKI B a s i n National Forest Scenic Area designated by Ctngxess in 1984.
- The Devils Postpile National "ent, acfhiniistrered by the National Park The Devils Postpi le i t sel f is Service, lies within the Forest boundary.
an outstanding volcanic! feature.
- The (xyens Valley is cme of the deepest valleys i n the world. The floor The nrnmtains on either side are 14,000 of the valley is a t 4,000 feet.
feet high.
- The Palisades Glacier is the southerrrmost glacier m the northem hemisphere.
- The Inyo has the laryest continguous pure Jeffrey pine forest m the world.
- white Mountain Peak (14,246 feet) is the highest peak i n the Great ~asm.
- The native range of golden trout (the California State Fish) lies partly on the Inyo.
17

- The White Pkuntajn ReseKch Station is the highest site in the U.S. that is “ p i e d year-round.
scenic appeal and recreaticmal a+&ractims pravided by the natural envircolment and the Proximity of the Forest to utban southern California result in high levels of recreation use. The Inyo National Forest ranks f i f th in recreation visitation am2i-g Natimal Forests in the nation and second in California. Mamoth Pkuntah Ski Area receives mzre ski--days of use per year than a q other ski area in the united States. The John Muir W i l d e r n e s s is the mcSt heavily used i n the nation.
The Inyo ranks f i r s t in coldwat- fislsirg and second in m a l l angling recreation among the N a t i o n a l Forests in California. neVelaped-site campground use leads the nation. Sumner dispersed camping, m l e deer hunting, and four-wheel drive maeation are also popular.
SRIERE OF EUWMtC
The Inyo National Forest ccmtaim 2,046,346 acres. 1,931,115 are i n National Forest System ownershi p. These lands are located in seven -ties. Five counties are in California, two i n Nevada.
The primary zone of eccnzmic influence for the Inyo National Forest is in California‘s Inyo and McolD Cbunties. Nearly 85 percent of the Forest lies w i t h i n %?e Counties, and m x e than 95 percent of the Forest lies w i t h i n the State of California. N i n e t y percent of Inyo County, the s d largest wunty in the state, and nwre than 75 percent of Mcom County are adminxtered by the federal govemmnt. Currently, a l l timber harvesting conducted by the Inyo National Forest and nwre than 90 percent of recreational activity take place in these twD wunties. R e n e a t i o n a l activities on the Forest are closely linked to the tourist e c a ~ m y of these comties.
In wnbx&, the Forest has a relatively limited econanic jnpact on the California -ties of Ware, Madera, and Fresm and on the Nevada counties of Mineral and Esneralda. This ‘c situation is not expected to change in the foreseeable future.
R e s i d e n t s of Southexn California, pr-ily those fm San Diego, Los Angeles, orange, Vw-itura, Riverside, and San ’ counties, make heavy use of the Forest’s “erous recreational facilities and resources, such as alpine ski areas, a q q m u m k , and wildarness. The demand for recreabonal opprtunities by Southern Californians has an eccomnic impact on the Forest and on many of the “ run i t i e s near the Forest. The impact of the Inyo National Forest on Southem California is, however, negligible.
18

POPULATION
Population grawth in Inyo and Counties during the past two decades has been substantial. Mono County grew by mre than 113 percent between 1970 and 1980. This ranked the county second among the fastest grcwiq counties m the state. This rapid growth rate can be attributed to the recreational importance of the Wth Lakes area.
E u r i q the same decade, the Inyo County population grew 15 percent, laver than the state average of 18 percent. Mos t of this growth took place in and around the COmrmnity of Bishop, w h i c h serves as a service center for the two-county area. Major employers in the area are local, state, and federal govexnments .
EMpLx)yMENT
The eco~cmy of the area reflects the importance of recreation, tourism, and the public sector. The three employment categories of services, retail sales, and gOv.ernment together amunted for nearly three quarters of the total wages and salary for workers in 1980. The employment base has grown by nearly 75 percent in the past decade. The services and retail sales categories have enjoyed healthy employment gains, while gwernment employment levels have tapred off and recently recorded ECXW declmes.
The high unemployment rates ccrrmonly found in tourist-oriented ecOnanies are found in the Iny0-Ph-m area. Rapid population growth, a broadening of the work force, the lack of diversification in the rural ecortmy, and the seasonal nature of the tourist industry have resulted m unemployment rates generally higher than the state average.
ROLE OF THE INYO NATIONAL FORESP
The Forest makes a direct contribution to the area ec"y through expenditures in the private sector, the generation of jobs, recreational opprtunities, and payments into County revenues. Forest cqxnditures for payroll and procurementS in F i s c a l Y e a r 1982 were $8.55 million.
Payments inb county revenues are €ran two s o n s : Payment in Lieu of Taxes and R e c e i p t s A c t payments. Payment i n Lxeu of Taxes payments canpensate counties for the loss of property tax revenues represented by nontaxable federal land w i t h i n the county. In 1980, the total Payment i n Lieu of Taxes payment to munixes by the Inyo National Forest w a s $165,180.
Receipts Act payments are based on fees collected for use of Forest lands and resources. Twenty-five percent of dollars received by the federal treasury fran such activibes as t" sales, special use permits, and catqxg~und fees are distributed through the Forest Service to the counties to offset schm1 and mad costs. Total Inyo National Forest Receipts Act payments for Fiscal Y e a r 1980 munted to $385,003.
The Forest also pmvides indirect ecQllcmic benefits to the public by supplyirg c e r t a i n goods and saxices a t prices belav established or estimated
19

market values. Examples include outdoor recreation v r t u n i t i e s and Forest lands for the use of camwcial enterprises such as livestock pnxluction, apiaries, mineral and energy exploration and developnent, and water prcdu&ion.
F v R I R E " D s
Ecananic growth in the area is expected to continue much as it did in the 1970s, increasing overall. As econcm~c growth cnntinues, the resident population and the pressure for mre services will increase. An increased local population could stabilize the fluctuating tourism eco~3 l l l y of the 1970s. However, unless the different cumunities actively seek eccolcmic diversity by attxactiq manufacturing industries to the area, little change is foreseen.
The ec"ic foundation of the area will remain closely tied to increased recreation use and tourism. An increased demand for all Forest resources and services, especially those related to recreation, can be expected. The greatest lmpacts on Forest management are Likely to b% found in the areas of 1 m - p adjushmts and land uses, scenic quality, and the Forest's role in providng a variety of recreational opportunities. The demand for energy pxduction and water yield are also likely to increase with increases m population, both locally and elsewhere in California.
E 7 x " c s IN FOREST PLANNING
National Forest land is public land, and its value accmes to the public. The value of Forest land and resources is of two lunds; prducts with econanic value and those that do rat lend themselves to ecoIlcmic quantification, such as the cnnsmation and enjoyment of our natural heritage. The need to manage Forest lands and resources in a way that will provide the greatest net public benefit, taking both kinds of values into cansideration, is both a public issue and management concern.
Econcrnic efficiency analysis detennines the effects of diFferent managmt strategies on the econCmic values of Forest resources, us- t%e measure of
values of recreation (including wildlife and fish-related recreation), water, energy, timber, fuelwood, and grazing. The cost canponents of PM7 include such factors as Forest managwent expenditures, resource losses, and the opportunity costs of pxducing m-priced benefits. PNV plus all non-priced benefits represent net public benefit.
Present Net Value (PNV). The benefit ocmponents of PNV are the ccnmodl 'ty
SPHERE OF SOCIAZ, TliFW"
Inyo and Mnm Counties -rise the primary zone of social influence for the Forest. The lifestyles, quality of life, and social values of the individuals in this area are to varying degrees dependent upon Forest resources and facilities.
20

The median age for the +county area is about 34.5 years, well above the 30.8-year median age for the state. This fact is due, i n part, to the area's recreationdl opportunities which attract retiring senior citizens. Paxonal incane averages about $14,300. The area is wer 90 m t White (of which 5.6 percent is of Hispanic background), and 7.3 percent American Indian, w i t h Black, Asian, and other races together making up less than 2 p?"t of the total ppulat im of the area.
Parannmt to the quality of l i f e is the sense of open space, rugged terrain, scenic qualities, clean a i r and water, and the abundant recreaticolal opprhmities which the Forest provides. The natural resource attributes of the area are coupled with the social attributes of low ppulation density, slow growth, simple lifestyles, snall Carmrmnities, limited services, and a prevailing feeling of self-sufficiency and individualisn.
As the primary zone of Forest influence, the Inyo-Pbm area is expected to receive direct, identifiable, and measurable benefits and impacts €ran the Forest's management and plicies. The two counties have important ties to the Forest through 1- 'p patterns, land uses, energy prcduction, grazing, fuel@ supplies, fire protection, timber production, and recreational 0ppxtU-u 'ties.
Southexn California is a secondary mne of social influence for the Forest. Southern California's demand for recreation affects the Forest and many of the The social impact of the Forest on Southern California may be important but is lost i n that area's large size, huge metcoplitan Wpulation, and broadly diverse social S t r u d u r e .
camunities i n the primary zone of influence.
Management direction and resource outputs of the Inyu National Forest affect several local social groups, each of which places different demands and values on Forest resources. Slx major social p u p s have k e e n identified within the primary m e of influence. Those groups are: long-time residents, regional recreationists, seasonal employees, spcial use permittees, American Indians, andretirees.
Long-the Residents. Long-time residents are a diverse group of people identified primarily as having lived i n the area for ten years or longer. This large p u p is found mrkirg m every sector of the local econany including mirung, r e t a l sales, ranching, logging, recreation, and services.
R q i m a l Reneatidsts. Regicmal recreationists are attracted to the area to enjoy a recreation- oriented lifestyle. This group includes semnd-kme owners and those who enjoy the area for m e r vacations and w e e k e n d winter skiing. The latter group is particularly important to the ecorrmry of the area.
Seasonal Ehployees. Seasonal employees who reside i n the area are typically young individuals w i t h a primary goal of pursuing an outdoor lifestyle. Earning a living is often a secondary goal. If they are not able to obtain
21

full-time employment, they are depenaent upon the large seasaal employment market i n the area.
Special U s e Permittees. There are currently 972 Special use permits an the Inyo National Forest, gowrniq lands uses on 34,960 acres of Forest land. Special use permits are issued for a variety of purposes, including agricultural, industrial, recreatimal, research, transportation, and water uses. Special use permittees are especially important to CcmrmnitieS such as Mamnth and June Lake, both of w h i c h have alpine ski areas on Forest land under special use pennit. In 1980, the 546 recreation special use p a n i t s contributed mre than $1.29 million to the federal treasury, 25 percent of w h i c h w a s returned to lccal county governments. The Forest ranks f i r s t i n the ~ t i m in revenues received fran recreation special use permits.
Indians. Nearly 2,000 Paiute-Shoshone Indians live on reswxations in the Big Pine, Lone Pine, and Bishop areas of Inyo county. The Indian way
the mxlntains of the area. Many Indian religious sites, spiritual areas, and traditional food-gather- areas are located on National Forest land.
Retirees. Senior citizens, a segment of the ppulaticm wkse nmkers are increasmg, are attracted to the area because of its recreational opportunities, relaxed pace of l ife, and rural env.i"ent. Many retirees cone to the area f r a n Southem California.
of life, beliefs, and values are intennven w i t h nature, the ernrironmen t, and
AIR QUALITY
Air quality on Inyo National Forest lands meets or exceeds state air basin objectives mre than 99 percent of the t i m e .
"FAL REsouR(3Es
Current research indicates that eastem California and w e s t e m Nevada have been occupied for a t least the past 10,ooO years. The density of cultural sites on the Inyo National Forest averages 1 per 59 acres (contrasted w i t h 1 per 105 acres on the Angeles National Forest and 1 per 245 acres on the Take). It is estimated that the Forest contains 35,000 or mre sites.
DrVERSITY
Vegetative diversity on the Inyo National Forest has been changed frcrn ~ t u r a l levels primarily through water diversion, affecting the extent of riparian areas: past overgcaziq, affecting the condition of riparian areas and wet meadows; f i re suppression, reducing the seral stage diversity of brush and allowing woocty vegetation to encroach on meadows by preventing natural fire-caused rejuvenation; and m e r c i a l t i n h r manag-t, reducing the extent of older seral stages of coniferous forests.
22

ENERGY
IIydroelectric. The Inyo National Forest has a significant ptential mall hydroelectric resource, including the two major cxmpnents of perennial water f law and rapid chaqe in elevation. Six small hydroelectric projects are currently opera- and fifteen additional applications have been suhnitted for fifteen streams on the Forest. Major hydroelectric projects affect four streams on the Forest.
W i n d power. The suitability of Inyo National Forest land for w m d p e r is mt well knmn. Preliminary studies indicate, however, that wind patterns on the Inyo may rot be suitable for m e r generation.
FACILITIES
The Forest has eighty-six buildings at seven afmmistrative locations. Of these, all but one are federally cwned (the Forest Supervisor‘s office 111 B i & q is leased fran a private party). There are eighteen dams on Forest land: three are owned by the Forest Service: fifteen by uti l i ty canpanies. Altbugh one of the proposed mall hydroelectric projects could include a mall dam, mst w i l l divert water rather than impounding it. No new sites for major dams have been identified on the Forest.
There is one major mass t r a n s i t system on the Forest: several smaller ones; and thirteen roads that have been designated as Forest Wghways. The Forest has 32 miles of arterial roads, 201 mles of collector mads, 741 miles of local roads, and an estimated 300 miles of uninventoried roads. These roads are used primarily for public recreation access, a&inistration, f ire prwtection, and ccmnercial timber transprt.
FISH
Inyo National Forest fish habitat includes a b u t 1,100 mles of stream and several hundred lakes. Habitat canditicm in mst streams is rat& medium to high. Mre than 90 percent of resident fish on the Forest are found in lakes.
Waters on National Forest land wntain rainbow trout, brook trout, brown trout, Colorado cutthroat t rout , Lahontan cutthroat h u t , Paiute cutthroat trout, golden trout , w e s t e m sucker, and Owens sucker. The golden trout , westem and Owens suckers and ramlxw t r o u t in the K e r n River are the only native species k” to reside on the Forest. Repmducixg brown, b m , and rainbow trout are oz”n.
Lake fish habitat quality is generally high.
~ P L A N N I N G A R F A S
The Inyo National Forest has 1,008,282 acres of land that were invrsntorid as madless by the Roadless Area Review and Evaluation (RARE 11) study. Of those acres, 46,146 acres w e r e designated w i l d e r n e s s by the California W i l d e r n e s s Act ; 338,319 awes made available by that A c t for m n - w i l d e r n e s s
23

managemat; and 576,517 acres remained in the Further Planning category. addition we have 47,300 acres of inventoried ruadless areas in Nevada.
W s t Further P1arn-u-g Areas on the Forest are substantially lmer m user capacity and recreational attracticns than exist* wilderness. A f e w Further Planning Areas contain unique or outstanding geological or ecological features.
In
Gl"
Slope instability processes (including those triggered by e-akes) are the mast important geologic events on the Forest m term of risk, primarily Wause of their relative frequency. Volcanic events are the least important due to their low frequency, despite the size of their potential inqacts.
The extent and quality of groundwater on the Forest are rot k". Small-scale wells have been developed to serve campgrounds, admjnistrative sites, fire suppression units, and livestock and wildlife needs. Those uses currently total 43 acre-feet. Additional groundwater, amounting to 300 acre-feet, is used to supply m t h Mountain Slu Area. There is m Current Ccmrmnity use of groundwater frcm --Forest sauces.
LANDS
There are app"a te1y 1,181 miles of properkg lines on the Forest, of w h i c h thirty-one have been surveyed and posted to standard. The Forest currently resolves an average of five CCCLI- h s p a s s cases per year. Approximately 1,911 miles of utility, transportation, and water t"ission lines lines cross the Forest under special use permit. However, m u t i l i t y corridors have been designated to date.
Withdrawals on the Inyo National Forest total 757,516 acres, representing actions initiated by the Forest Sen%ice, by Congress, or by other federal agencies. The Forest Service is currently reviewing the withdrawals it has initiated. If the needed objectives can be m e t by a less restrictive managemnt option than withdrawal, sane withdrawals m y be modified or rmked.
The Inyo National Forest toundary includes 2,046,346 acres, of which 116,591 are in mn-federal ownershl 'p. In Inyo and i%m Counties, which contain mst of the Forest land, only seven percent of land w i t h i n the Forest boundary is in0therCMXXdU 'p (mre than half of that belorgs to the state of California or the City of Los Angeles and lies w i t h i n the recently legislated i%m B a s i n National Forest Scenic Area).
There are Currently 977 non-recreational special use permits mering 34,960 acres and 1,911 miles .
565,142 of these acres are in w i l d e r n e s s .

MINERALS
Leasable (Gsm- ). mthennal energy is a resou~c~ found on the Inyo National Forest. Appmxma ' tely 260,000 acres of the 460,000 acre mm-Lorg Valley Krvlwn Geothermal Resource Area are on National Forest land. Approximately 38,900 acres are currently under lease by six separate entitles.
Locatable. The Inyo National Forest has a long, active history of mining. The Bureau of Mines lists twenty Ccmmodl 'ties in 513 mineral prospects on the Forest. Wre than 3,000 mining, mill site, and tunnel site claims are recorded for Forest lands, but only eleven are currently in prcduction on the Forest. The mast significant of these are the umetoo Pine Cr& M i n e in Pine CY& and the U.S. Funice mine in the b t m Craters. The latter proaUces m e than 10,000 tons of block punice each year.
A mineral potential rating of "high" has been applied to 133,860 mn-wilderness acres on the Forest, and a rating of "medium" has been applied to 209,021 acres. The largest acreage in the high and medium categories is located in the Inyo Mxntains and the lower elevations of the white kbuntains.
Materials. Of the fifty material sources inventoried in the area, twenty-eight are on National Forest lands.
The r a n a h i q 1,021,732 acres have been rated "low".
H3NO BASIN "AL FOREST SCENIC ARER
The Wrm B a s i n National Forest Scenic Area enccmpasses 116,000 acres, of wbich 45,832 are National Forest land. The remaining acres include the lake surface itself and relicted lands (lakeshore created by the lmering of the lake level during forty years'of water &version) owned by the state, and additional City of Los Argeles and privately-owned lands.
PEST MAMlGEMENT
Pest proliferation on the Forest is not a serious concern. typically lccalized and fall within acceptable levels.
Pest problems are
-ION (FIRE MANA-)
From 1972 to 1982, the Inyo National Forest had 491 man-caused fires, (tnuning a total of 5,616 acres) and 715 lightning-caused fires (burning 2,496 acres). The Inyo is typical of many Forests in California, having many mall fires and an occasional large, damaging fire.
The risk of wildland fire igmtion on the Inyo is rising due to increasing d e v e l m t of intermingled and neighboring private lands. This grayth is especially significant around June Lake, P&"th Lakes, and Crwley Lake.
Prescribed fire has been used on the Inyo National Forest for the past several years, primarily for timber slte preparation. There are addLtiona1
25

opprhmities for prescribed inxning to benefit wildlife habitat and ckniesb ' C
livestock range. prescribed fire has m t been used to reduce fuels for fire managemnt purpsses because fuels accumlation is m t a serious prublm on the Inyo.
RANGE
The current grazing program supplies 41,400 Animal Unit Hmths per year of forage for danestic livestc& and wild horses and burros, and an unlau3wn amunt for wildlife.
The White Wuntain Wild Horse Territory (70 horses) and the Saline Valley and Lee Flat Burro Territory (112 burros) ppulatims are within established managecent levels. The Mmtgawry Pass Wild Horse Territory has mre animals than the range can support in the lorg tenn.
RECREZlTION
Developed. The Inyo N a t i o n a l Forest supplied 1,848,500 Recreation Visitor Days (RVDs) of developea recreation use in 1982. The current capacity of m-alpine developd sites is 25,479 Persans At One Time (PAOT). Abut 98 percent of recreational developmats lie in concentrated recreation areas. These areas m e r 47,529 acres (two percent of the Forest land base).
Alpine Skiing. The Inyu National Forest has tw alpine ski areas--Mamroth I%untain and June Mountain--with a combined capacity of 22,000 Skiers At One Time (SAOT). They provided 1.6 million skier visits durirg the 1981-82 season. The approved developnent plan for Manmth Wuntain and the June Mxntain developrent plan, if implemented, would increase their capacity to approximately 29,000 to 31,000 SAOT.
Dispersed . Dispetsed recreation in 1982 a"ted to a total of 1,909,200 Recreation Visitor Days (RVDs). Of this total, 540,000 RVDs represented wilderness use; 340,000 represented fishing, 25,200 represented deer hunting; and 25,800 represented other wildlife-related recreation. The reiminiq 1,004,000 RVDs represented such activities as drivirg for pleasure, hiking, riding, dispersedcamping, andboating.
Recreation Oppo rhrnity spec" . The Recreation Gpprtunity Spectrum classifies the Forest in terms of the types of recreational opportunities that would be appropriate in each class. The acreage classifications on the Forest are: Primitive (870,600 acres); S&-F"itive Non-I%tonzed (392,600); Semi-Primitive Motorized (189,200); Roaded Natural (383,600); Roaded Modified (35,100); Rural (11,600); and Urban (2,000).
REsEARMmmJRFlLAREAs
The Inyo National Forest has five established and tw candidate Research Natural Areas. Existing Research Natural Areas meet established targets for Jeffrey pine (Indiana Smmit), loa9epole pine (Sentinel Meah), foxtail pine (Last Chance Meah), bristlecone pine (White Mnmtain), and unique
26

eGosystems (Harvey Monroe Hall). Candidate Research Natural Areas meet the target for pinyon pine ( W h i p p " l 1 Flat) and alpine fellfields (PkAfee Meadow). The target for limber pine is met by stands in the Sentinel and Whippoorwill areas.
RIPARIAN ARFAS
There are approximately 37,000 acres of riparian vegetation (including wet meadows) on the Forest. That figure represents less than two perat of the total land base.
SENSITIVE PI"
There are twenty-two sensitive plant species on the Forest. Eight of these species are endemic to Inyo National Forest lands. Although none of the twenty-two species is federally listed as threatened or endangered, two species are proposed for federal listing and eight others are categorized by the U.S. Fish and Wildlife Service as needing further study. Altbough the condition of sensitive plant habitat varies by species and population, it is generally fair to excellent Forest-wide.
The Ancient B r i s t l e c o n e Pine Forest enwasses 28,887 acres in the White r4zn"aj.m. The primary attraction of the area is a stand of exceptionally old bristlecone pine txees, includmg the world's oldest l" living tree. The Botanical Area is internationally l" and has been the site of significant de"m1ogical (tree-ring dating) research.
The following candidate geological interest areas were selected fm a list of s ix ty interesting geologic features on or near the Forest: the P a v e Flat granitic intrusion; granitic dartes in the Buttermilk area and Egypt Creek; Hot eeek; Starkweather Lake glacial polish; Tioga Tarns; the Inyo traters area (including Inyo eat-, Dea- glass flow, Obsidian Dame, and Devils punchbowl); Earthquake Fault; and Convict Lake/lower cornrict Creek, including the mraines.
TIMBER
The current timber harvest on the Forest IS approximately 10.5 W F per year. The demand for sawtimber for the Forest cannot be predicted fran historical sales trends. Since all the timber offered for sale on the Forest durirg the past decade has been sold, it can be a s h that supply has not exceeded demand. In addition, there is relatively little uncut volume under contract (less than two years sell volume), and no sales have been tun-~ed back. Recently, bid prices for timber have been three to four times greater than advertised rates. Samills in both Nevada and California depnd u p logs from the Inyo National Forest. There are, however, m local samills or "unities that rely on Forest timber Outputs for ecoMmic stability.
27

Local conarmnities are almst entirely deprdent on the Forest as a so- of ccnnnexcial and --use fuelwood. The Inyo currently sells approximately 4,000 cords of fuelwood per year to cccrmercial operators and 6,000 cords per year to the public.
VISUAL F E s a K a s
The Inyo National Forest has an extraordinary visual resource. Forty-four percent of the Forest falls in the "distinctive" variety class and 76 percent falls in the highest sensitivity level (how many people see it, what is seen and how close it is).
Visual Quality Objectives (V-) describe the degree to which the natural landscape can acceptably be mdified, based on a canbination of variety class and sensitivity level. The VQO of Preservation (no modification) applies to all Wildernesses and Research Natural Areas, or 31 percent of the Forest. The Retention VQO (mdifications must not be visually evident) applies to 17 percent. Partial Retention (rrodifications must be visually subordinate to the natural landscape) applies to 34 percent.
Seventy-six percent of the natural landscape of the forest is rated as "untouched". Sixteen percent of the Forest has a high capacity to screen disturbances from view and 39 percent has a -ate capacity. This does rnt include wilderness. The current visual condition of the Forest is extremely high.
m- Soils. The mast c~my3n parent material is granitic: the second-tmst cxmmn is pumiceous. Most are in optimal or near-optimal condition. These soils typically suffer little or rn accelerated erosion, are stable, and each soil type is pmcirg vegetation at its optimal level. However, wet meadows grazed by livestsck and alpine ski areas are especially susceptible to soil erosion, due to both soil characteristics and to the management activities that =cur there.
e. Established water basin objectives are met by mre than 97 percent of the water caning off the Forest. As bacterial, nutrient, and chenucal problems are mall and localized, the m a i n threat to clean water is sedimentation. The major existing sou~ces of sediment are eroded wet meadows (damaged by poor range management in the past) and alpine ski areas.
The Forest holds adequate water rights to meet its current and foreseeable consumptive needs. Water flowkg off the Forest mmts to an average of 1,093,000 acre-feet per year.
Most soils on the Forest are coarse-texhrred.
Water quality on the Inyo is gccd overall.
28

kIILDAMISCENIClUVERS
The Inyo has one candidate wild and scenic river: the Middle Fork of the San Joaquin. The south Fork of the Kern and the North Fork of the Kern have recently been designated as Wild and Scenic Rivers by Congress.
WILDERNESS
The Inyo National Forest has 565,142 acres of designate3 wilderness; appraxlma ‘ tely 30 percent of the Forest land base. The Plan recarmends that 172,600 additional acres be added to the w i l d e r n e s s System. W i l d e r n e s s recreation on the Forest amDunted to 540,000 R M s in 1982. There are 584.6 miles of wilderness t ra i l currently maintained to C l a s s I standards and 29 tralheads w i t h a capacity of 2,212 PACTS.
WILDLIFE
Management Indicator Species on the Forest, by categoq, are:
Harvest hdangered Sensitive
Special interest
Dependent on riparian area Dependent on snags Depndent on early-middle
seral stages of brush Deprdent on older seral stage
of coniferous forest
Mule deer, Blue grouse, Sage grousf?. Bald eagle, Peregrine falcon. Goshawk, Sierra Nevada red fox, Goshawk, Pine men, Spotted awl, G r e a t gray awl, Sierra Nevada muntain sheep, Wolverine. Golden eagle, Tule elk, Prairie falcon, Nelson mnmtain sheep. Yellow warbler. Hairy wcdpcker, W i l l i a m s o n sapsucker. Sage grouse.
Goshawk.
Mule deer: The current population of mule deer that relies on the Forest for m e r range, winter range, and/or migratoq access is estimated a t 20,200 animals. ll-ase deer that sumner and/or w m t e r on Forest lands are estimated a t 12,000 w i t h a maxi” potential population estimated a t 16,000. Altbough the deer population has reinained fairly constant over the past ten years, declines are perceptible over the past twenty t o thirty years.
Deer rely mst heavily on Forest lands for winter range. Most spend the sumner a t higher elevations and many of the northem herds sumner west of the Forest ~OLJIY%ZY. The Inyo has 112,119 acres of key deer winter range, most of it between 4,500 and 6,000 feet elevation on the east slope of the Sierra Nevada.
Bald eagle: The Inyo has a s m a l l munt of bald eagle wintering habitat. Approximately 20 to 30 birds w i n t e r on or near National Forest land. Current information does not imkcate w h e t h e r the n m k r is increasing or decreasing.
Peregrine falcon: Although peregrine falcons existed on the Forest i n earlier times, the nearest active nesting pairs are now found in Yosmite Valley and
29

Hetch Hetchy Canyun. and 1984. There is potential nestkg habitat for four nesting pairs.
Cbsha&: Goshawk SUNeys have located apFaoxuna ' tely twenty-five active nest sites on the Forest, fifteen of these i n suitable t imber . W s t surveys have been conducted in areas managed for timber. It is estimated that an additimal twenty-five pairs have nest sites in wildemess or m-cormeTcial timber areas. There is insufficient data to determine whei3er the goshawk population on the Forest is charging-.
Blue grouse : Blue grouse is a harvest species found a t highex elevations on the Forest, in steep and inaccessible terrain. Them is m estimate of the blue grouse ppulation, trend, or potential on the Forest. There are m apparent conflicts between the needs of t h i s species and the managment of other resoutces.
sage grouse : The ppulation of sage grouse on the Forest is declining. The reason for this decline is not k". The current papulation of birds is estimated at 500 individuals, located primarily in the Lake Crowley basin and the mrthem White "&airs. The maxi" habitat capacity of the Forest for sage grouse is estimated at 1,500 birds.
Eight fledglings were reintnxiuced on the Forest i n 1983
P b s t blue gnxlse habitat is i n wildemess.
spottea owl and Great gray owl: Thm is l i t t l e data on the occurrence of these species on the Forest.
Although two spotted awl sightings have been documented on the Forest, there have been no donrmentations of nest territories.
Great gray owl sightings on the Forest have not been verified. There are few potential conflicts between the habitat needs of that species and other resource management because mt of the suitable habitat is in w i l d e r n e s s .
NelscEl (desea) "tain sheep : Nelson muntain sheep are found in both the White and Inyo Mmntains. It is estimated that there are a p p " t e 1 y one hundred sheep i n the White Mountains, and the papulation appears to be increasing. L i t t l e is knmn about the Inyo herd, but the population has been estimated a t thirty.
Sierra Nevada mountain sheep : Virtually a l l of the Sierra Nevada m t a i n sheep in California are found on the Inyo National Forest. There are five populations on t he Forest. 'I" populations represent natural distributions: the reminirg three have been reintrcdud into historic range. There is additional potential for reintrduction, as the B a x t e r herd is healthy and growing, and there is still suitable unoccupied habitat on the Forest. The total existing population includes approximately three hundred animals. If a l l identified suitable habitat on the Forest were occupied, it could supprt as many as one thousand animals.
Ffiparian area-dep" tspec ies: Riparian vegetation covers approximately two percent of the Inyo N a t i o n a l Forest; the remaining lands are, for the mt part, arid and sparsely vegetated. The population and trend of riparian-area dement wildlife species has not been studied. !I% a"t and COnditioIl of riparian habitat is vulnerable to the impacts of ground disturbance, vegetation manipulation, and/or streamflow reduction.
30

snag-- tspec ies: Snag densities on the Inyo are low, due both to the slow rate of natural slag recruitment and * amount of illegal public slag cutting for fuelwood. Snag-dq"t species are de-t on both standing dead trees (snags) and down and dead logs. Dead and dkrrwn wood is legally available to woodcutters and declines rapidly wherever it is accessible by vehicle.
Approximately 20 percent of tustoric s.tream habitat in the Wx-o and (xuens
B a s i n s has been eliminated by water remmal, irrigation, and recreational activities. Eighty-eight percent of all existing streams have been diverted to scme extent.
Species depen&n t on early-middle seral stages of brush: S e e sage grouse.
Species depmden t an older seral stages of rwniferous forest: see goshawk.
This chapter describes the envimmental consequences of implemnting the various altenatives. None of these consequences is severe because the only alternatives considered w e r e tbse that w i l l maintain the long-term
Marlagenat Fapchctivity of the land and be acceptable to the public. R e q ~ i r e n e n t s and Forest-wide Standards and Gtudelines cc" to a l l alternatives ensure that the minimum acceptable and implementable levels of management for the various Forest resources are inherent in a l l altematives.
Fnrviranmental consequences are described m tens of changes fran the Base Year 1982 situation unless otherwise indicated. Although this planning pericd covers only ten to fifteen years, the analysis of envirormmtal consequences is projected over f i f ty years to assess the long-term iqlications of the various alternatives. This information is for canparison purpses only, as natural resou~ce and social wnditians are extremely difficult to predict over time.
Key " e n t a l consequences are displayed cmparatively in the following tables. Only those resources for which consequences differed substantially between altematives are sunmrized here. The consequences for all resouTces are displayed in chapter IV.
. . Mrnu"
31

Alternatives
RESOURCE
PRP CUR RPA CEE A m AMB
The e c ~ n o m i c envi ronment v a n e s by alternative i n terms of t h e Forest budget, area emphyment, and ReceLpts A c t
Payments Average annual f i g u r e s f o r budget and Receipts A c t payments for t h e f i f t h decade are displayed below, employment f i g u r e s a r e projected for t h e f i r s t decade,
ECONOMIC ENVIRONMENT
Forest budget 17 1 million
Forest Budget Forest budget
13 i mliilon Forest budget 15 1 million 12 5 m1111on
Recexpts A c t
pmts $1 7 MM Receipts A c t
pmts $1 8 MM Rece ipt s A c t R e c e i p t s A c t
pmts $2 1 MM p t s $3 3 Mhl
Employment 1 c 100 person- years
Employment I 1 4 D O person- years
S O C I A L
ENVIRONMENT Benefits all recreationists
Bsnef1ts most sf
the affected g r o u p s in the
shor t t e r m , neg- atively a f f e c t s g r o u p s linked with
economic outputs in the long r u n
CULTURAL RESOURCES
A rating system has b e e n designed t o indicate t h e relative potential threat to cultural resources p o s e d by d i f f e r e n t combinations o f land-disturban; management a c t n u t l e s and land a l l o c a t m n decisions Cumulative relative threat
factors, representing t h e net effect of B ~ r e c t disturbance, indirect disturbance, and beneficial impacts are
drsplayed below
Relative threat f a c t o r high
Relalive threat factor maderate
Relative t h r e a t
f a c t o r l o w
Relative t h r e a t factor low
R e l a t m e t h r e a t factor low
Relative t h r e a t
factor ramie ra te

Table I (continued) Comparison of Key Environmental Consequences
- . h -
Alternatives RESOURCE
P R f CUR RPA CEE AMN AHB
Fish habitat capability changes by alternative i n response t v the r e l a t i v e amounts o f stream habitat improvemeat and watershed improvement The total acres of stream fish h a b i t a t improved (both by direct habitat improvement induced by wafershed improvement 1 and percent change i n Fore6t-adde stream h a b i t a t capability, relative t o 1982 the end o f the f i f t h decade are shown below L a k e habitat capability 1 s common to all alternatfves
bY
FISH
Stream a c r e s
Improved 205
Stream acres Improved 417
$tream acres Stream acres Stream a c r e s Improved 470
Stream a c r e s Improved 621 Impraved 583 Improved 561
Hab capability change fron
Hab capability Hab capability change from
Hab capability change from
Hab capability Hab capability change: from change from change f r o m
1982 +36% 1982 +39% 1982 +is 1982 +44x 1932. +32;: 1982 +31g
The canseguences of alternatives on f u r t h e r planning areas d i f f e r in t e r m s of t h e management prescr+ptlnns (Rx) applied t o those a reas Management p r e s e r i p t h n s have been grouped for this analysis I I ~ wilderness Rx, ameni ty-emphasis Rx, commodity-emphasis Rx, and concentrated recreation use Rx No fur ther p lanning acreage on the Forest was allocated t o concentrated mcreation use Rxs under any alternative
F U R T H E R
PLANNING AREAS
P e r c e n t of t o t a l
f u r t h e r planning a c r e s by Rx type
28% wilderness 52g amenity 203: commodity
Percent of t o t a l f u r t h e r planning a c r e s by Rx type
l71i: wilderness 37x amenity
463: commodity
Percent of total further planning acres by Rx type
0 wilderness
15% amenity
85% commodity
Percent of total
f u r t h e r planning
acres by Rx type
54% wilderness 5% amenity
41% commodity
Percent of tota l f u r t h e r planning a c r e s by Rx type
82% wilderness 8% amenity 0 commodity
Percent of total f u r t h e r planning acres by Rx type
36% wilderness 61% amenity
3% c w " d i t y
MINERALS The consequences of alternatives on opportunities for minera l exploration and development are determmed by acres of Forest land with high OF moderate m ~ ~ r a l potential available for mineral activities The m a j o r i t y Of
lands withdrawn f r o m mineral. e n t r y under the alternatives a r e in recommended wilderness

Table 1 (continued) Coaparison of Key Environmental Consequences
Alternatives RESOURCE
PRP CUR RPA GEE
Acres of hi/mod
mineral potentla1 available for "era a e t i v 1 t y 282 $00
A c r e s of hilmod mineral potential available for mineral activity 284,200
A c r e s o f hi/mod
mineral potential available f o r
mineral activity+ 314 400
A c r e s of hi/mod
mineral potential available for mineral activity
214 600
A c r e s of hilmod, mine F a 1 potential
available f o r mineral a c t i v i t y ,
A c r e s o f hilmod mineral potential
available f o r mineral activity# 237* 4QQ
Mineral opportu-
n i t y h i g h Mineral opportu- n i ty moderat e
Mineral opportu- nity moderate
Mineral opportu- n1ty l o w
I
PROTECTION
Total wildfire Total wildfire acres 52$870
Total w i l d f i r e Total w i l d f i r e a c r e s , 48 150
Total wildfire
RANGE
41 4 M AUMs
t o t a l outputs 39 4 M AUMs 55 6 M AUMs 46 5 M AUMs
total outputs 39 1 M AUMs 35 1 M AUMs
t o t a l outputs t o t a l outputs t o t a l outputs tota l outputs
6% reduction 12% reduction from 1982
15% reduction from 1982
5 % reduction from 1982 from 1982 from 1982
Range condition improved on 69 1 M a c r e s stable t o d e -
d i n i n g elsewhere
Range condition in gradual decline
Range condition improved on 95 6 M acres stable de-
clining elsewhers
Range condition Improved on 98 5 M acresp stable t o de-
clining elsewhere

Table I (continued)
Comparison o f Key Environmental Consequences
- - -
Alternatives RESOURCE - - - .
PRP CUR R P A CEE AMN AMI3
RECREATION The consequences of alte~natives o n recreation are measured in t e r m s of t h e amount of use, t h e quality of t h e recreational experience, and the r e l a h v e emphasis on different types o f r e c r e a t i o n The following is an overview
of recreational quality and relative emphasis
T I M B E R
Developed s i t e Developed site Developed site
quality high g u a h t y low quality h i g h
Dispersed r e w e - D i s p e r s e d recre - Dispersed
at1on quality ation quality low action q u a h t y
moderate moderate
Emphasis on d e v e l o p e d sites high, on alpine skiing moderate, on wilderness m o d e r a t e , on dispersed r e c r e - ation moderate
Emphasis on developed s i t e s low, On alpine
skiing moderate, on wilderness moderate, on dispersed r e c r e -
ation high
Emphasis on d e v e l o p a d s i t e s
high, on alpine skiing moderate, on wilderness lowm on dlsperaed recr+e- ation high
Developed site quality high
Dispersed recre- atxon quality
m o d e r a t e
Emphasis on developed s i t e s
highs OII a l p i n e skiing h i g h *
on wilderness high moderate, dispersed recre- ation moderate
Developed s i t e quality h i g h
Developed site quality hkgh
Dispersed r ee re - Dispersed r e ~ r e -
ation quality at1on quality
high h i g h moderate
Emphasis on
developed sites low, on a l p m e
skiing low, on wilderness high, on dispersed recT:e- atron low
Emphasis on developed s i t e s
mod t On a l p i n e skiing moderate, on wilderness high moderate, OII
dispersed r e m e - ation moderate
The consequences of alternatives on the t i m b e r management program vary in terms of t o t a l acres managed f o r timber prctduction and acres actually harvested within a given t i m e p e r i o d (including both regeneratIan harvest and
intermediate harvest) T h e following harvest figures are totals for, t h e fifth decade
Total timber production
751233 acres
Total timber p M d U C t L O n
89,100 acres
Regeneration
harvest 8,570 a c r e s
Total timber productran
99,200 acres
Regeneration
harvest 14,100 acres
Regene r a t don harvest 5 , 5 8 0 a c r e s
Total timber
production
61,800 a c r e s
Total timber production 6g,goo
Regeneration ha r v e s t
4,210 a c r e s

Alternatives RESOURCE
PRP CUR RPA CBE A m AMB
VISUAL RESOURCES
WATERStit t i
Intermediate harvest 20,052 acres
m g m t h a r v e s t
Intermediate harvest 29,100 acres
Intermediate harvest 18,600
In t e rmediat e
harvest 19c500 acres
Intermediate harvest 1716~0 acres
Intermediate harvest 21,600 acre6
Reduced visual condition Q 9%
Net change in
condition + 2 2%
Improved vi&u81
condition 2 4X
Reduced v i s u a l condition 1 2%
Net change in m n d i t m n +I 2X
Improved visual condition 0 3%
Reduced visual condition 2 1%
Improved visual condition 2 OX
Reduced visual condition I 8%
N e t change in condition +O 2j!
Improved v i s u a l condition 6 9%
Reduced v i s u a l
Improved visual
Reduced visual condition 0 8%
Net change in condition + 3 9%
1 0 W moderate high moderate low low

Table 1 (continued) Comparison of Key Environmental Consequences
Alternatives RESOURCE
PRP CUR HPR CEE
WILDERNESS The consequences of alternative8 an wilderness are measured primarily in t e r m s of acres o f new wilderness,
172,600 new wilderness
510,800 acres new wilderness
2 2 2 , 7 0 0
new wilderness new wilderness
38 percent of Forest In wJ+ldernesa
35 p e r c e n t of Porest in wilderness
30 p e r c e n t of Forest in wilderness
47 percent of Forest an wilderness
41 percent of Forest in wildepnesg
W I L D L I F E The consequences of alternatives on wildlife are assessed in terms of habitat capability Changes In the f o l l o w h g
habitat capability f a c t o r s a r e displayed below mule deer habitatm o l d e r seral s t a g e s of c o n i f e r o u s f o r e s t (species s u c h as go$hawk), early and midbsuccessional brush ( ~ p e c h s s u c h a8 sage grouse), snags and o t h e r h a b i t a t far cavity-nesting birds ( s p e c i e s such as hairy woodpeckers), &ad habitat f o r riparlan area-dependent species in w e t
meadows (such as yellow warbler$) Changes a m expressed h terms o f persent increase or decrease relative t o 1982
Mule d e e r habitat -2%
Mule deer habitat -14%
Mule deer habitat 920%
Mule deer habitat t.18.56
Existing o l d growth in
suitable timber base -27%
tentatively
Existing old Existing o l d growth in
tentatively suitable timber
Existing o l d
growth xn tentatively
base -86% suitable timber
Existing o l d
g r o w t h H I
tentatively su 1 t ab1 e timber base - 3 8 ~
Existing o l d
growth I n
tentatively
b a s e -59x s u i t a b l e timaber
growth in tentatively suitable timber
b a s e -91% base -92%
I

Table 1 (continued) Corpar~son o f Key Environmental Consequences
Alternatrves RESOURCE
Early-mid succ Early-mld succ Early-mrd succ
brush -69% brush -42% brush -31%
Snags 0
Wet meadows 0
Snags 0
Early-mid G U C C
brush -24%
Snags 0
Wet meadows 0
Early-mid e w e Early-mid succ
brush -36% brush - 3 6 ~
Snags +30%
Wet meadows 0 Wet meadow6 0

PURPOSE OF AND NEED FOR ACTION
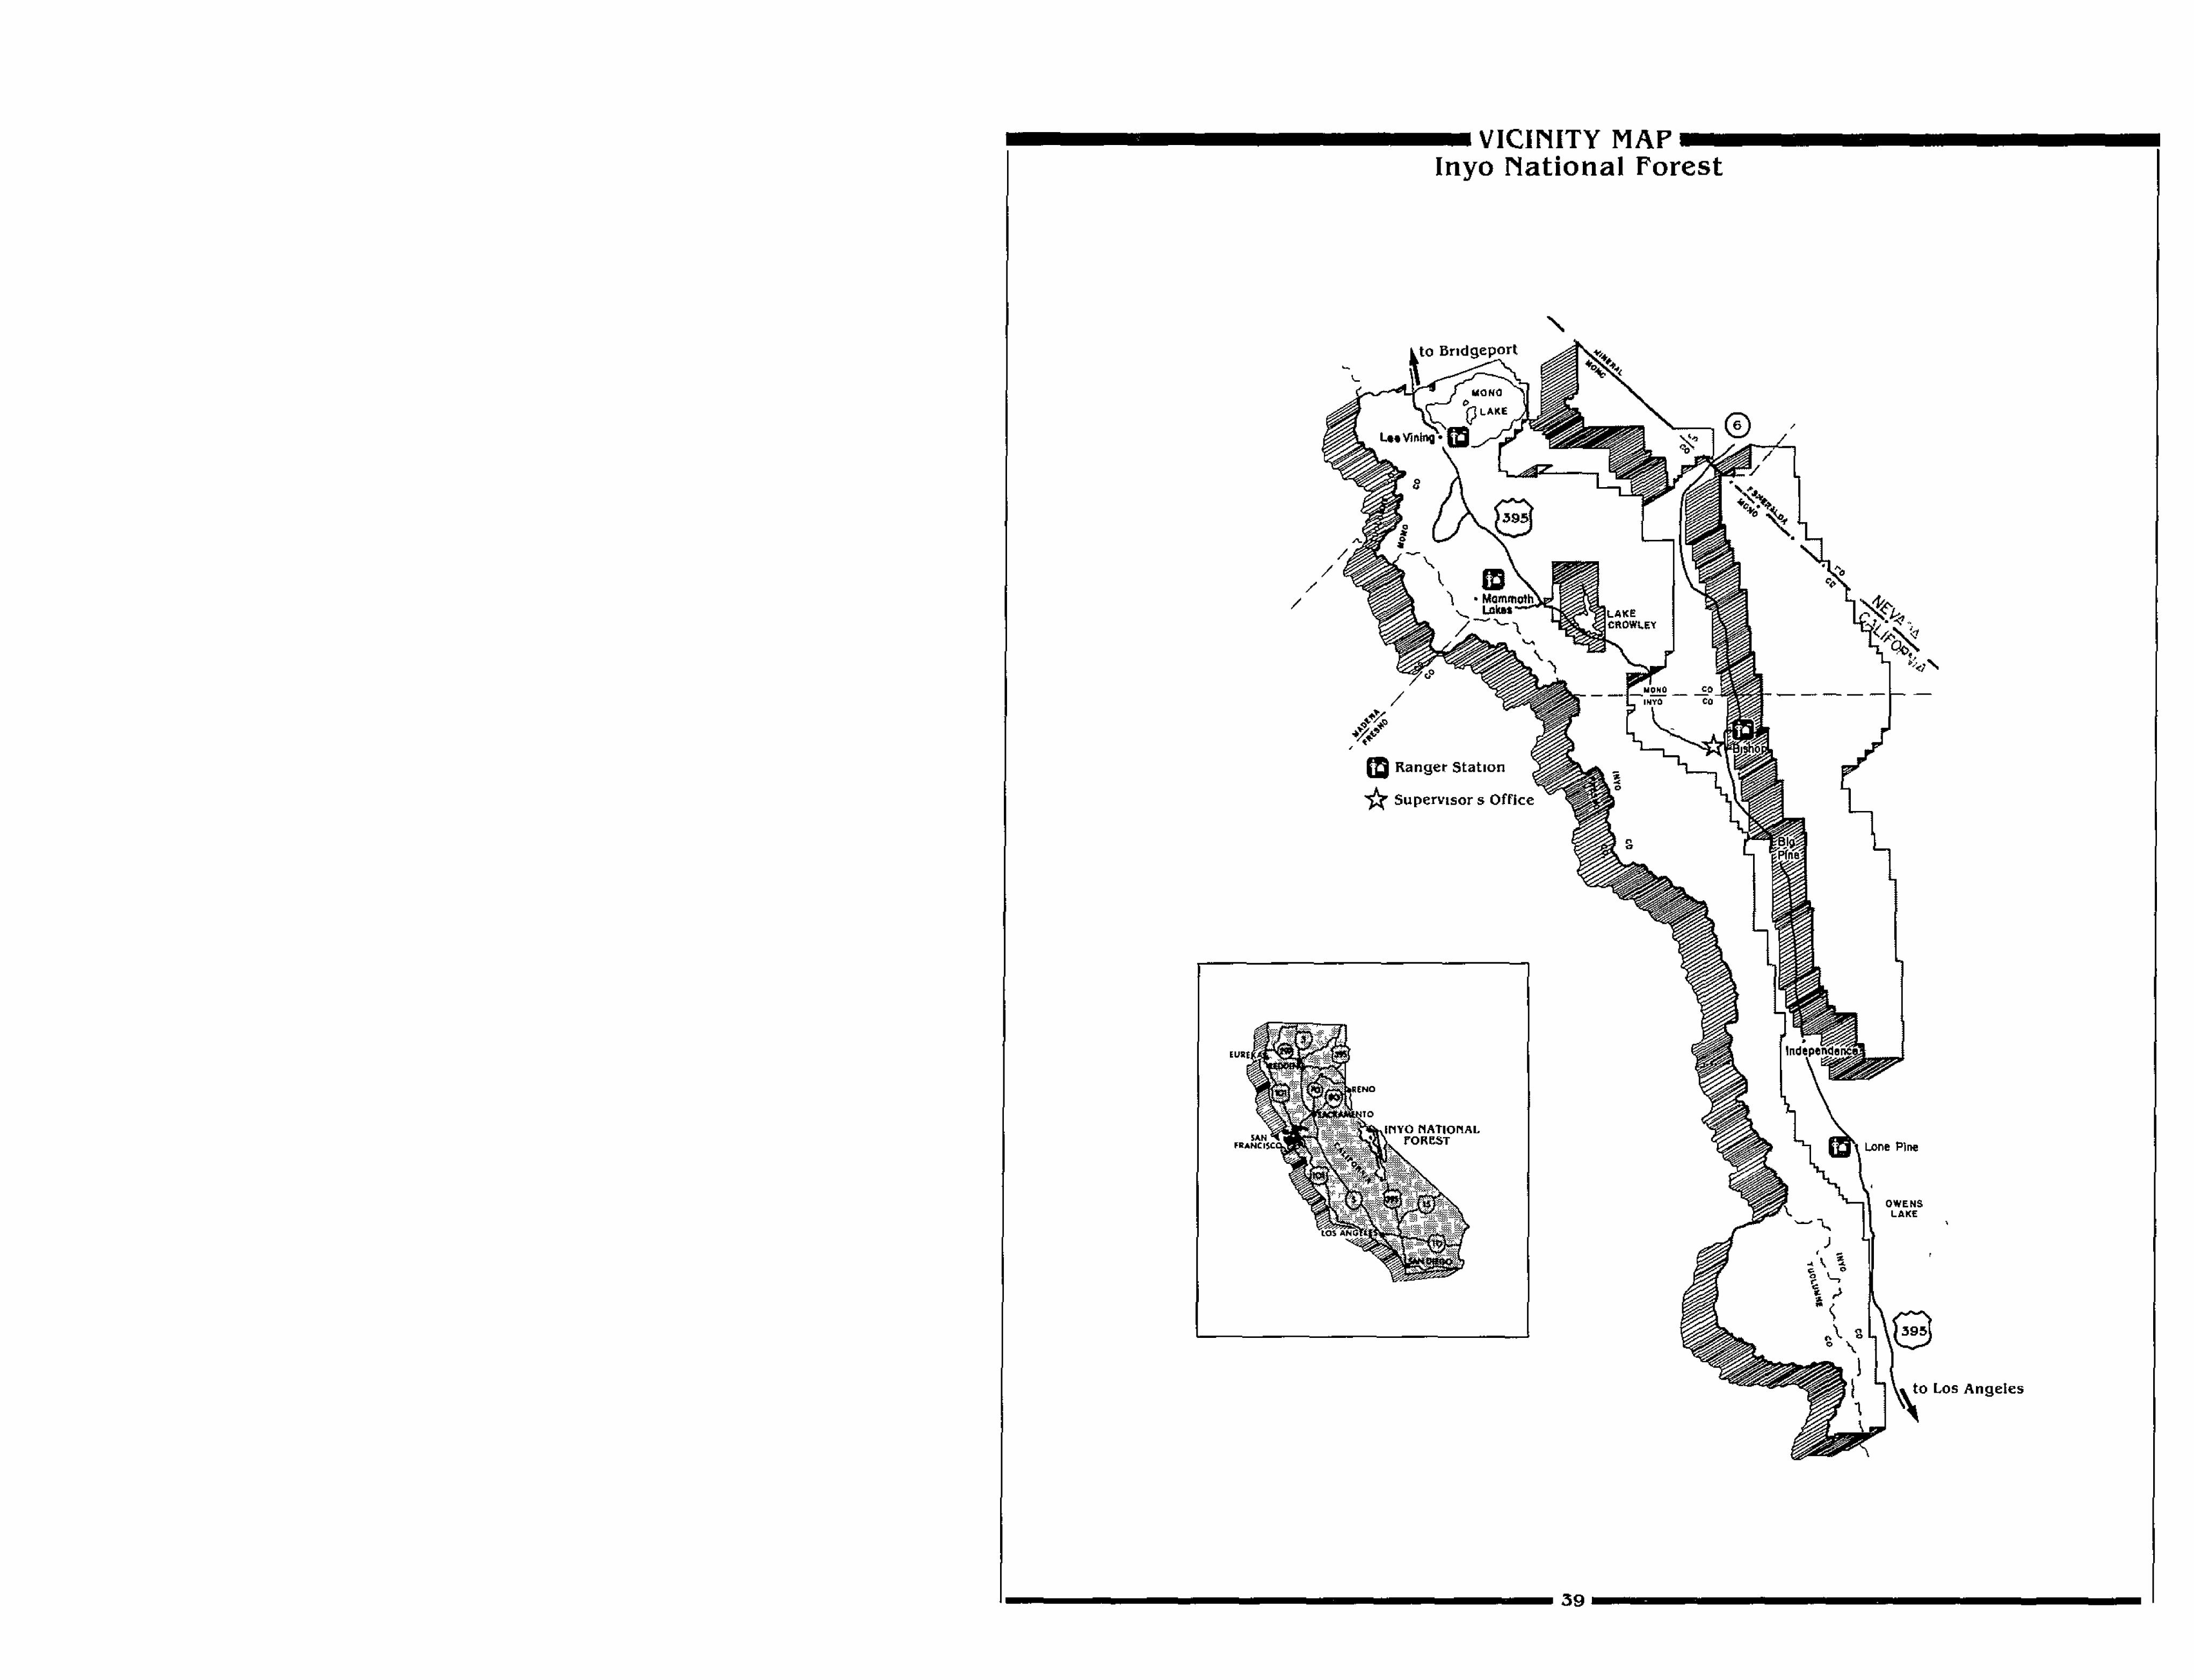
I 4
m
fl
uc
w
k 3