Test of a Digestion Optimization Model: Effects of Costs of Feeding on Digestive Parameters
11
168 Test of a Digestion Optimization Model: Effects of Costs of Feeding on Digestive Parameters Scott R. McWilliams* [1996]). For example, yellow-rumped warblers (Dendroica co- ronata) that are switched quickly from a low- to a high-protein William H. Karasov Department of Wildlife Ecology, University of Wisconsin — diet increase enzyme (aminopeptidase) activity, amino acid uptake, and extraction efficiency of an amino acid (Afik and Madison, Madison, Wisconsin 53706 Karasov 1995; Afik et al. 1995). These changes are not, however, associated with any changes in gut morphology (Afik and Kara- Accepted by G.K.S. 9/12/97 sov 1995), although diet quality has affected gut morphology in other situations (see, e.g., Piersma et al. 1993). Effects of diet quantity on avian digestive parameters have ABSTRACT not been studied often, but the available evidence indicates that increased food intake primarily causes changes in gut We tested predictions of a chemical reactor model of digestion by manipulating the short-term costs of feeding and then mea- morphology that allow digesta retention time and extraction efficiency to remain constant (Karasov 1996). However, such suring the effect on digestive parameters. We compared resi- dence time of digesta and extraction efficiency of glucose in modulation at the level of gut morphology requires time (per- haps as long as 2–3 mo; Redig 1989). Birds may often experi- cold-acclimated waxwings (Bombycilla cedrorum) feeding ad lib. and in birds whose costs of feeding were increased through ence short-term changes in food quantity that occur faster than the time scale required for changes in gut morphology. For the addition of intervals of time when they received no food. Such a feeding schedule simulated the ecological situation in example, frugivorous birds during migration may one day en- counter preferred fruits that are ubiquitous, allowing relatively which a frugivorous bird like a waxwing encounters food in patches and experiences nonfeeding periods as it searches for constant food intake, whereas the next day their preferred fruits may be patchily distributed and require much travel time be- new preferred food patches. None of the results were consistent with the predictions of the optimal digestion model: extraction tween patches. In such situations, a bird’s pattern of food intake may differ from day to day. efficiency was independent of costs of feeding, and residence times did not increase as costs of feeding increased. This empir- We know little about how short-term changes in food intake affect digestive performance in wild birds. Theoretical ical evidence on the passage of digesta in waxwings suggests that movement of digesta in the guts of birds is much more optimality models make explicit predictions about how an animal’s digestive parameters should respond to short-term complex than movement of material in an ideal chemical reac- tor. Tests of the optimal digestion model have involved manip- changes in food intake (Penry and Jumars 1986, 1987; Martı B - nez del Rio and Karasov 1990; Martı B nez del Rio et al. 1994), ulating food quality or the costs of feeding, and the conclusions are similar: compensatory modulation of retention time or although our study provides the first such empirical test of the models. The models predict that when costs of food digesta mixing and not rate of hydrolysis and absorption seem most important in maintaining the remarkably constant diges- acquisition are increased, for example, by adding intervals of time when the birds receive no food, the food should be tive efficiency. held longer in the intestine, and thus nutrients in the food will be more thoroughly digested (Fig. 1). It is important to note that if retention time and extraction efficiency are Introduction modulated as predicted by the model, determining the Digestive parameters at many organizational levels are influ- profitability (e.g., energetic gain divided by the energetic enced by diet quality and quantity (reviewed by Karasov costs) of a given food type is complicated, because digestive efficiency is not fixed but is instead conditional on the costs of acquiring the food. *To whom all correspondence should be addressed. Present address: Depart- We tested predictions of the model by manipulating the ment of Natural Resources Sciences, 237 Woodward Hall, 9 East Alumni Ave- short-term costs of feeding and then measuring the effect on nue, University of Rhode Island, Kingston, Rhode Island 02881; E-mail: [email protected]. retention time and digestive efficiency. For the test, we used cedar waxwings (Bombycilla cedrorum) fed a semisynthetic diet Physiological Zoology 71(2):168–178. 1998. q 1998 by The University of Chicago. All rights reserved. 0031-935X/98/7102-96116$03.00 rich in glucose. Cedar waxwings are ideal candidates for testing 9g12$$mr08 03-02-98 14:05:29 pza UC: PHYS ZOO
Transcript of Test of a Digestion Optimization Model: Effects of Costs of Feeding on Digestive Parameters

168
Test of a Digestion Optimization Model: Effects
of Costs of Feeding on Digestive Parameters
Scott R. McWilliams* [1996]). For example, yellow-rumped warblers (Dendroica co-ronata) that are switched quickly from a low- to a high-proteinWilliam H. Karasov
Department of Wildlife Ecology, University of Wisconsin— diet increase enzyme (aminopeptidase) activity, amino aciduptake, and extraction efficiency of an amino acid (Afik andMadison, Madison, Wisconsin 53706Karasov 1995; Afik et al. 1995). These changes are not, however,associated with any changes in gut morphology (Afik and Kara-Accepted by G.K.S. 9/12/97sov 1995), although diet quality has affected gut morphologyin other situations (see, e.g., Piersma et al. 1993).
Effects of diet quantity on avian digestive parameters haveABSTRACT
not been studied often, but the available evidence indicatesthat increased food intake primarily causes changes in gutWe tested predictions of a chemical reactor model of digestion
by manipulating the short-term costs of feeding and then mea- morphology that allow digesta retention time and extractionefficiency to remain constant (Karasov 1996). However, suchsuring the effect on digestive parameters. We compared resi-
dence time of digesta and extraction efficiency of glucose in modulation at the level of gut morphology requires time (per-haps as long as 2–3 mo; Redig 1989). Birds may often experi-cold-acclimated waxwings (Bombycilla cedrorum) feeding ad
lib. and in birds whose costs of feeding were increased through ence short-term changes in food quantity that occur faster thanthe time scale required for changes in gut morphology. Forthe addition of intervals of time when they received no food.
Such a feeding schedule simulated the ecological situation in example, frugivorous birds during migration may one day en-counter preferred fruits that are ubiquitous, allowing relativelywhich a frugivorous bird like a waxwing encounters food in
patches and experiences nonfeeding periods as it searches for constant food intake, whereas the next day their preferred fruitsmay be patchily distributed and require much travel time be-new preferred food patches. None of the results were consistent
with the predictions of the optimal digestion model: extraction tween patches. In such situations, a bird’s pattern of foodintake may differ from day to day.efficiency was independent of costs of feeding, and residence
times did not increase as costs of feeding increased. This empir- We know little about how short-term changes in foodintake affect digestive performance in wild birds. Theoreticalical evidence on the passage of digesta in waxwings suggests
that movement of digesta in the guts of birds is much more optimality models make explicit predictions about how ananimal’s digestive parameters should respond to short-termcomplex than movement of material in an ideal chemical reac-
tor. Tests of the optimal digestion model have involved manip- changes in food intake (Penry and Jumars 1986, 1987; MartıB -nez del Rio and Karasov 1990; MartıB nez del Rio et al. 1994),ulating food quality or the costs of feeding, and the conclusions
are similar: compensatory modulation of retention time or although our study provides the first such empirical test ofthe models. The models predict that when costs of fooddigesta mixing and not rate of hydrolysis and absorption seem
most important in maintaining the remarkably constant diges- acquisition are increased, for example, by adding intervalsof time when the birds receive no food, the food should betive efficiency.held longer in the intestine, and thus nutrients in the foodwill be more thoroughly digested (Fig. 1). It is importantto note that if retention time and extraction efficiency are
Introductionmodulated as predicted by the model, determining the
Digestive parameters at many organizational levels are influ- profitability (e.g., energetic gain divided by the energeticenced by diet quality and quantity (reviewed by Karasov costs) of a given food type is complicated, because digestive
efficiency is not fixed but is instead conditional on the costsof acquiring the food.
*To whom all correspondence should be addressed. Present address: Depart-We tested predictions of the model by manipulating thement of Natural Resources Sciences, 237 Woodward Hall, 9 East Alumni Ave-
short-term costs of feeding and then measuring the effect onnue, University of Rhode Island, Kingston, Rhode Island 02881; E-mail:
[email protected]. retention time and digestive efficiency. For the test, we usedcedar waxwings (Bombycilla cedrorum) fed a semisynthetic dietPhysiological Zoology 71(2):168 – 178. 1998. q 1998 by The University of
Chicago. All rights reserved. 0031-935X/98/7102-96116$03.00 rich in glucose. Cedar waxwings are ideal candidates for testing
9g12$$mr08 03-02-98 14:05:29 pza UC: PHYS ZOO

Foraging Costs and Digestive Physiology 169
the model’s predictions because their food is principally fruits Feeding Schedules and Experimental Designcomposed of readily absorbed simple sugars (MartıB nez del Rio
Before the experiment, birds were always presented with newet al. 1992; Witmer 1996), and many aspects of their digestivefood and water each day at 0930–1030 hours. Each day, birdsphysiology have been studied (Levey and Karasov 1989; MartıB -were provided with excess food ensuring ad lib. feeding condi-nez del Rio et al. 1989; Karasov and Levey 1990). We focusedtions. For birds at 0207C, a small hotplate was placed in eachon glucose absorption because the kinetics of glucose absorp-cage to keep the food soft and palatable. Each day, food wastion are well known (Fig. 1A) and the key assumptions of theplaced in a glass petri dish set in a clay saucer that evenlymodel with regards to nutrient gain are satisified for such adistributed the heat from the hotplate. A wooden perchnutrient (MartıB nez del Rio and Karasov 1990).attached to each hotplate enabled birds to eat while avoidingdirect contact with the hotplate or clay saucer. Once each day,we supplied birds in the cold with hot tap water in a plasticMaterial and Methodspetri dish. This water was used by the birds primarily for
Capture and Maintenance of Birds bathing. Water content of the food (Table 1) ensured adequateconsumption of water along with their regular diet.Six of the 18 cedar waxwings used in this study were captured
For the experiment, each control bird continued to receivein Gainesville, Florida (29741* N, 82716* W) and sent to us onad lib. food. Each treatment bird was tested on one of twoAugust 8, 1994. We captured the other 12 cedar waxwings onfeeding schedules on the test day, either ‘‘ad lib.’’ (ad lib. foodSeptember 30–October 1, 1994, in Madison, Wisconsin (4378*always available, i.e., 12 h d01 with food) or ‘‘interval’’ (ad lib.N, 89720* W) using mistnets. Birds were immediately weighedfood available for 2-h intervals separated by 1 h without foodand banded and then housed individually in stainless-steelfrom 0700–1800 hours, i.e., 9 h d01 with food). The 1-h inter-cages (60 1 45 1 33 cm) under initially constant light cyclevals were chosen to ensure that the birds had digested and(12L : 12D, lights on at 0700 hours) and temperature (217C).excreted most but not all of the food from the previous feedingAll birds were initially fed a banana-mash diet (Denslow et al.period before being allowed to feed again (mean retention time1987) that had been used successfully for maintaining cedarof digesta for waxwings at /217C on a similar diet was 32 { 4waxwings and other frugivorous passerines in the laboratorymin; Karasov and Levey 1990). In terms of the optimal diges-(Levey and Karasov 1989; MartıB nez del Rio et al. 1989; Karasovtion models, the interval feeding schedule increased the cost ofand Levey 1990).food acquisition, as compared with the ad lib. feeding schedule,because during the nonfeeding periods birds had to wait for
Temperature and Diet Acclimation before the Experiment food while maintenance and activity costs continued.On the pretest day, food was removed at 1730 hours to ensureBy manipulating ambient temperature, we tried to induce hy-
that birds would start the test day with a small energy deficit.perphagia in our experimental birds and consequently max-On the test day, treatment birds on the interval feeding scheduleimize their rate of food intake. On October 10, we randomlyhad food offered or removed as prescribed every 2–3 h betweenassigned 10 birds to a treatment group and eight birds to a0700–1900 hours. For birds on the ad lib. feeding schedule (bothcontrol group. All 18 birds continued on the same daily lightcontrol and treatment birds), food was weighed at the same timeschedule (12L : 12D). For control birds, the ambient tempera-intervals as the interval feeding schedule treatment, but the foodture was kept constant at 217C. For treatment birds, the ambi-was then immediately returned to the bird’s cage. This ensuredent temperature was gradually decreased over 30 d using thethat any disturbance caused by administration of the feedingfollowing schedule: from 217C to 17C over 10 d (027C d01),schedule was the same across all treatments.held constant at 17C for 10 d, then from 17C to 0207C over
Food intake, retention time, and extraction efficiency were10 d (027C d01). The control birds were used to test whethermeasured during a 4–5-h test period that began when the birdthe cold acclimation produced the expected increase in foodingested about 0.5 g of diet containing radiolabeled nutrientintake of treatment birds. We also used the control birds toand marker (see below). The radiolabeled food was offered totest for effects of cold acclimation on body mass changes duringeach bird at 1330 hours. This allowed birds on the intervalthe experiment.feeding schedule to feed for 30 min before being offered theOn November 18, we acclimated all birds to a new semisyn-radiolabeled food. Food intake on a dry-matter basis was esti-thetic diet (Table 1) that simulated a fruit diet in nutrient contentmated by drying subsamples of food collected at the start and(65% carbohydrate : 13% protein : 6% fat, by dry mass). Cedarend of the test period.waxwings select fruits that contain relatively low lipid and high
Tests on all treatment birds when on the ad lib. or intervalcarbohydrate content (Witmer 1996), like the diet we formu-feeding schedules were conducted between December 9 andlated. The use of such a semisynthetic diet made the composition20, 1994. Half of the treatment birds were randomly selectedof the diet less ambiguous than diets compounded from raw
foodstuffs (see also Murphy and King 1982). to be tested first on the ad lib. feeding schedule, and the other
9g12$$mr08 03-02-98 14:05:29 pza UC: PHYS ZOO

9g12$$mr08 03-02-98 14:05:29 pza UC: PHYS ZOO

Foraging Costs and Digestive Physiology 171
Table 1: Composition of semisynthetic Retention Time and Extraction Efficiencydiet fed to cedar waxwings
Special observation cages were used to reduce behavioral stressIngredients % Wet Mass % Dry Mass associated with our presence while the birds were observed
and their excreta collected (see Afik and Karasov [1995] forGlucose .................................... 16.5 65.8 full description). Most important, each cage had one-way glassCaseina ..................................... 2.5 10.0 for observations and a roll of plastic-coated paper (S/P Absor-Amino acid mixb .................... .7 2.8 bent Paper, Baxter Catalogue L5616-1) on a roller so that sheetsCellulose .................................. .7 2.7 of paper could be pulled across the cage’s floor to collect excretaVitamin and mineralsc ........... .3 1.0 with minimal disturbance to the bird. All birds were housedSalt mixd .................................. 1.7 6.7 in these cages for at least 1 d before the test day.Olive oil ................................... 1.5 6.0 Retention time of digesta was measured using the inertWater ....................................... 75.0 . . . marker [14C] ferrocyanide (FeCN). We compared estimates ofAgar .......................................... 1.3 5.0 extraction efficiency using two different radiolabeled markers
and nutrients because we were concerned that estimates ofa Casein (high N): Teklad, U.S. Biochemical Corp., Cleveland, Ohio. extraction efficiency based on tritiated nutrient might underes-b Amino acid mix: Murphy and King (1982).
timate actual extraction efficiency. Such an underestimatec AIN-76 Vitamin and Mineral Mix, ICN Biomedicals, Inc.could occur if tritiated glucose was metabolized and then par-d Salt mix: N Salt mixture, ICN Biomedicals, Inc.
tially excreted in urine as 3H2O, thereby confounding the calcu-lation of extraction efficiency from collections of combined
half of the treatment birds were tested first on the interval feces and urine, as is necessary in bird studies. Extraction effi-feeding schedule. All treatment birds were tested twice on each ciency of glucose was measured using the inert-marker methodfeeding schedule. One set of ad lib. and interval trials was used (Karasov et al. 1986). We used either [1-3H] D-glucose (Ameri-to test for effects of feeding schedule on extraction efficiency can Radiolabel Chemicals, Inc.) and the inert marker [14C]of glucose, and the other set of trials was used to test for effects FeCN (DuPont New England Nuclear Research Products) orof feeding schedule on retention time of digesta. Test days were [14C(U)(uniformily labeled)] D-glucose (American Radiolabelalways separated by at least 1 d and usually 2–3 d. Chemicals, Inc.) and the inert marker [1,2-3H] polyethylene
glycol (PEG; DuPont New England Nuclear Research Products)to estimate extraction efficiency. As expected, estimates of ex-
Figure 1. Hypothetical illustration of the effect of changing the traction efficiency using tritiated D-glucose and 14C FeCN sig-cost of food acquisition on optimal intestinal residence time and nificantly underestimated extraction efficiency, compared withextraction efficiency. A, Extraction efficiency (%) or uptake of
estimates determined with 14C D-glucose and tritiated PEGglucose (mmol mL01 of digesta volume) increases at a decreasing(55.9% { 2.9% vs. 92.4% { 0.45%, respectively; F1, 7 Å 175.1,rate with the time that food spends in the small intestine. This
decelerating gain curve is expected because passive absorption is P õ 0.0001, n Å 8). Thus, we conducted separate trials fora major pathway for glucose absorption in waxwings (Karasov and birds on both feeding schedules; retention time trials used 14CLevey 1990). Thus, intestinal absorption of glucose is fastest ini- FeCN as the inert marker, and extraction efficiency trials usedtially because luminal concentrations are high, but as glucose is
14C D-glucose as the nutrient and 3H PEG as the inert marker.absorbed and luminal concentrations decline, the rate of intestinalRadioisotopes were mixed into warm food mash (Table 1)absorption also declines. In this example, the gain curve was de-
rived exactly as described in MartıB nez del Rio and Karasov (1990) at a concentration of approximately 18.5 kBq of 14C D-glucosefor a frugivorous bird like a waxwing. B, Cost of food acquisition or 14C FeCN and 74 kBq of 3H PEG g01 of food mash. Afteris the sum of the energy expended during initial acquisition and
thorough mixing of the food mash and isotopes, the mashingestion of food (0.5 kJ) plus the energy expended during resi-
was cooled in a refrigerator. The resulting mixture had thedence of food in the gut (assumed here to be the minimal rate ofconsistency of thick gelatin. In each experiment, a bird hadenergy expenditure for a 30-g passerine bird, 29.6 J min01; Lasiew-
ski and Dawson 1967). In this example, higher foraging costs were food available to it for at least 30 min before being offered anestimated by assuming that a bird goes without food for 60 min approximately 0.5-g cube of the radiolabeled mash. Birds usu-while searching for a good-quality food patch. C, Net energy ob-
ally ingested the whole cube, but when they did not, the radio-tained from the food is defined as the difference between thelabeled food was removed 5 min after they initially consumedenergy assimilated and the cost of food acquisition (MartıB nez delsome of the cube. The average mass of radioactively labeledRio and Karasov 1990). The bird initially suffers a net loss of
energy as it searches, finds, ingests, and initiates digestion of the mash eaten per bird was 0.52 { 0.06 g wet weight. After con-food. The predicted optimal residence time is the point on the sumption of the labeled mash, all birds were resupplied withnet-energy curve at which a tangent line passing through the origin
unlabeled mash, which they readily consumed; thus, a smallcontacts the curve. These optimal residence times are used in panelvolume of marker and nutrient was inserted into the flow ofA to predict extraction efficiencies when foraging costs are lower
or higher. food in the bird’s digestive system.
9g12$$mr08 03-02-98 14:05:29 pza UC: PHYS ZOO

172 S. R. McWilliams and W. H. Karasov
Table 2: Body mass and food intake ({SE) of cedar waxwings ontwo feeding schedules (ad lib., interval) and two temperature conditions
Body Mass (g) on Body Mass (g) on Difference in Body Food Intake (g dryPretest Day Test Day Mass (g) between weight) during 5-h(1730 hours) (0700 hours) Pretest and Test Day Test Period
Treatment group (0207C):Ad lib. ................................... 39.13 { .67 34.82 { .56 04.32 { .18 6.87 { .37Interval .................................. 38.86 { .84 34.83 { .54 04.03 { .34 6.80 { .25
Control group (/217C):Ad lib. ................................... 36.21 { 1.31 32.97 { 1.54 03.24 { .67 1.63 { .25
Statistical comparisons:Ad lib. versus interval (both
at 0207C)a ........................ F1, 9 Å .21, P Å .661 F1, 9 Å .001, P Å .973 F1, 9 Å 1.57, P Å .242 F1, 9 Å .02, P Å .885Ad lib. treatment versus
control group ................... t16 Å 3.06, P Å .004 t16 Å 1.98, P Å .030 t16 Å 3.00, P Å .005 t16 Å 11.02, P õ .001
Note. See Material and Methods for definitions of each feeding schedule. Birds on the interval feeding schedule had food removed at 1730 hours on the
pretest day. Sample sizes were 10 birds for ad lib. and interval feeding schedules and eight birds for the control group.a Repeated-measures ANOVA (n Å 10).
When only extraction efficiency was measured in a trial, Repeated-measures ANOVA was used to analyze differencesin body mass, food intake, extraction efficiency, and retentionexcreta were collected 4–5 h after ingestion of the labeled diet.
When only retention time was measured in a trial, excreta were time of treatment birds across the two feeding schedules. Dif-ferences in body mass and food intake between treatment andcollected singly for the first 30 min and thereafter every 15
min for 4–5 h. Percent recovery of inert marker 4–5 h after control birds feeding ad lib. were analyzed using t-tests. Resultsare given as mean { SE unless otherwise noted.ingestion was 88% { 11% (n Å 25) for 3H PEG and 95%
{ 4% (n Å 27) for 14C FeCN.Mouth-to-anus total mean retention time was calculated as
the sum of the products of the proportion of inert marker Resultsexcreted during each time interval multiplied by the elapsed
Effects of Temperature on Body Mass and Food Intaketime since ingestion of marker (Warner 1981). Residence timein the intestine was estimated in two ways: first, by recording Birds in the cold (0207C) were on average 8.0% heavier than
birds at room temperature (217C; Table 2). Birds in the coldthe time since ingestion of inert marker that marker was firstfound in a defecation (see Penry and Jumars [1986] for ratio- on the ad lib. feeding schedule lost more absolute mass over-
night (Table 2) and a higher proportion of initial body massnale) and, second, by estimating mean residence time in theforegut and then subtracting this value from mouth-to-anus than birds at room temperature (cold group: 11.0% of body
mass; room temperature group: 9.0% of body mass; t16 Å 2.2,total mean retention time (see Discussion for important as-sumptions of this method of estimating residence time in the PÅ 0.04). Removing food at 1730 hours on the pretest day had
no significant effect on overnight mass loss of cold-acclimatedintestine). Mean residence time in the foregut was estimatedfrom semilogarithmic plots of fecal marker concentration waxwings (Table 2).
Birds in the cold consumed about 2.5 times more food each(ln dpm g01 excreta) versus time since ingestion of the marker(Warner 1981; Karasov and Cork 1996). The terminal portions day than birds at room temperature (14.0 { 0.5 g dry food
d01, n Å 10, compared with 5.2 { 0.5 g dry food d01, n Å 8,of the plots were visually inspected, and the start and end pointsfor regression analysis were chosen using the same criteria as respectively; t16Å 12.9, Põ 0.0001). During the 5-h test period,
birds in the cold ate about four times more than birds at roomKarasov and Cork (1996). Mean residence time in the foregutwas then calculated as the inverse of the absolute value of the temperature (Table 2), at least in part because birds in the cold
usually increased their food intake in the afternoon as theyslope of these regressions (Warner 1981).Extraction efficiency was calculated as: 100 0 100[(Mf /Nf) increased their fat depots.
1 (Ne/Me)], where Mf is the radioactivity of the inert marker(PEG or FeCN) in food, Nf is radioactivity of the nutrient (D-
Effects of Feeding Schedule on Body Mass and Food Intakeglucose) in food, Ne is radioactivity of nutrient (D-glucose) inexcreta, and Me is radioactivity of inert marker (PEG or FeCN) Birds in the cold consumed similar amounts of food during
the 5-h test period on both feeding schedules (Table 2), evenin excreta.
9g12$$mr08 03-02-98 14:05:29 pza UC: PHYS ZOO
Foraging Costs and Digestive Physiology 173
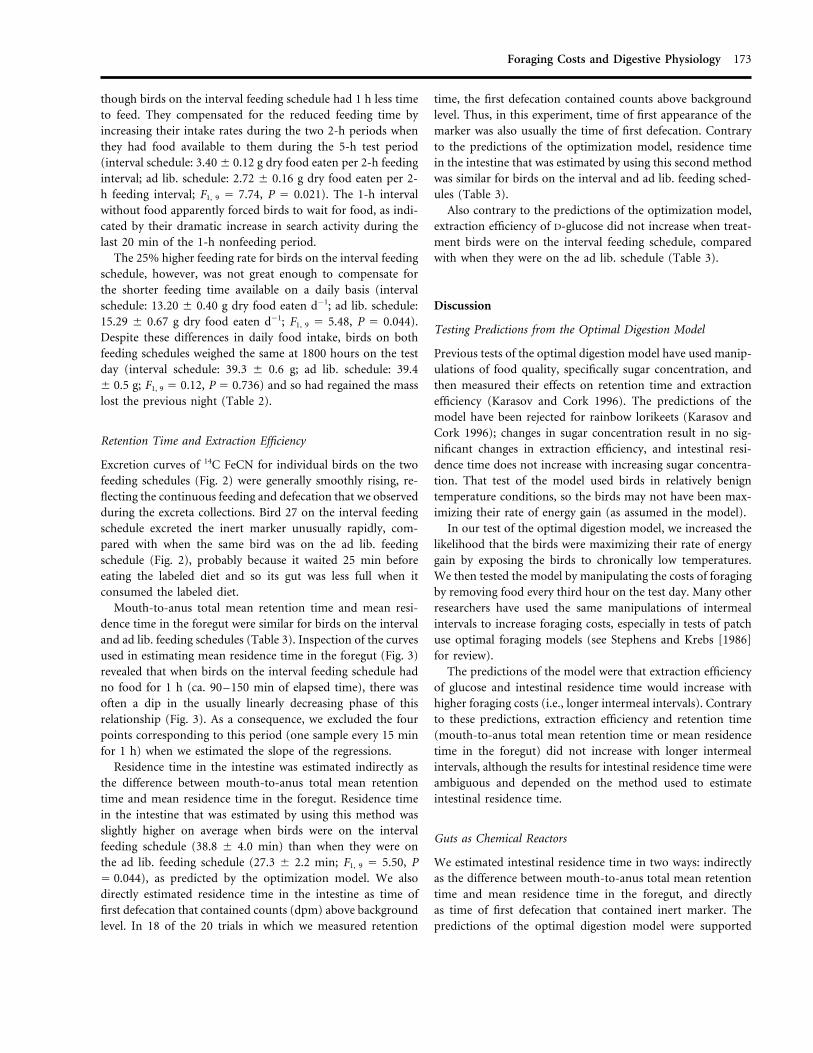
though birds on the interval feeding schedule had 1 h less time time, the first defecation contained counts above backgroundlevel. Thus, in this experiment, time of first appearance of theto feed. They compensated for the reduced feeding time by
increasing their intake rates during the two 2-h periods when marker was also usually the time of first defecation. Contraryto the predictions of the optimization model, residence timethey had food available to them during the 5-h test period
(interval schedule: 3.40 { 0.12 g dry food eaten per 2-h feeding in the intestine that was estimated by using this second methodwas similar for birds on the interval and ad lib. feeding sched-interval; ad lib. schedule: 2.72 { 0.16 g dry food eaten per 2-
h feeding interval; F1, 9 Å 7.74, P Å 0.021). The 1-h interval ules (Table 3).Also contrary to the predictions of the optimization model,without food apparently forced birds to wait for food, as indi-
cated by their dramatic increase in search activity during the extraction efficiency of D-glucose did not increase when treat-ment birds were on the interval feeding schedule, comparedlast 20 min of the 1-h nonfeeding period.
The 25% higher feeding rate for birds on the interval feeding with when they were on the ad lib. schedule (Table 3).schedule, however, was not great enough to compensate forthe shorter feeding time available on a daily basis (intervalschedule: 13.20 { 0.40 g dry food eaten d01; ad lib. schedule: Discussion15.29 { 0.67 g dry food eaten d01; F1, 9 Å 5.48, P Å 0.044).
Testing Predictions from the Optimal Digestion ModelDespite these differences in daily food intake, birds on bothfeeding schedules weighed the same at 1800 hours on the test Previous tests of the optimal digestion model have used manip-
ulations of food quality, specifically sugar concentration, andday (interval schedule: 39.3 { 0.6 g; ad lib. schedule: 39.4{ 0.5 g; F1, 9 Å 0.12, P Å 0.736) and so had regained the mass then measured their effects on retention time and extraction
efficiency (Karasov and Cork 1996). The predictions of thelost the previous night (Table 2).model have been rejected for rainbow lorikeets (Karasov andCork 1996); changes in sugar concentration result in no sig-
Retention Time and Extraction Efficiencynificant changes in extraction efficiency, and intestinal resi-dence time does not increase with increasing sugar concentra-Excretion curves of 14C FeCN for individual birds on the two
feeding schedules (Fig. 2) were generally smoothly rising, re- tion. That test of the model used birds in relatively benigntemperature conditions, so the birds may not have been max-flecting the continuous feeding and defecation that we observed
during the excreta collections. Bird 27 on the interval feeding imizing their rate of energy gain (as assumed in the model).In our test of the optimal digestion model, we increased theschedule excreted the inert marker unusually rapidly, com-
pared with when the same bird was on the ad lib. feeding likelihood that the birds were maximizing their rate of energygain by exposing the birds to chronically low temperatures.schedule (Fig. 2), probably because it waited 25 min before
eating the labeled diet and so its gut was less full when it We then tested the model by manipulating the costs of foragingby removing food every third hour on the test day. Many otherconsumed the labeled diet.
Mouth-to-anus total mean retention time and mean resi- researchers have used the same manipulations of intermealintervals to increase foraging costs, especially in tests of patchdence time in the foregut were similar for birds on the interval
and ad lib. feeding schedules (Table 3). Inspection of the curves use optimal foraging models (see Stephens and Krebs [1986]for review).used in estimating mean residence time in the foregut (Fig. 3)
revealed that when birds on the interval feeding schedule had The predictions of the model were that extraction efficiencyof glucose and intestinal residence time would increase withno food for 1 h (ca. 90–150 min of elapsed time), there was
often a dip in the usually linearly decreasing phase of this higher foraging costs (i.e., longer intermeal intervals). Contraryto these predictions, extraction efficiency and retention timerelationship (Fig. 3). As a consequence, we excluded the four
points corresponding to this period (one sample every 15 min (mouth-to-anus total mean retention time or mean residencetime in the foregut) did not increase with longer intermealfor 1 h) when we estimated the slope of the regressions.
Residence time in the intestine was estimated indirectly as intervals, although the results for intestinal residence time wereambiguous and depended on the method used to estimatethe difference between mouth-to-anus total mean retention
time and mean residence time in the foregut. Residence time intestinal residence time.in the intestine that was estimated by using this method wasslightly higher on average when birds were on the interval
Guts as Chemical Reactorsfeeding schedule (38.8 { 4.0 min) than when they were onthe ad lib. feeding schedule (27.3 { 2.2 min; F1, 9 Å 5.50, P We estimated intestinal residence time in two ways: indirectly
as the difference between mouth-to-anus total mean retentionÅ 0.044), as predicted by the optimization model. We alsodirectly estimated residence time in the intestine as time of time and mean residence time in the foregut, and directly
as time of first defecation that contained inert marker. Thefirst defecation that contained counts (dpm) above backgroundlevel. In 18 of the 20 trials in which we measured retention predictions of the optimal digestion model were supported
9g12$$mr08 03-02-98 14:05:29 pza UC: PHYS ZOO

9g12$$mr08 03-02-98 14:05:29 pza UC: PHYS ZOO

Foraging Costs and Digestive Physiology 175
Table 3: Mouth-to-anus total mean retention time, foregut mean retention time, intestinalresidence time, and extraction efficiency of glucose in cedar waxwings on two feeding schedules
Mouth-to-Anus Total Mean Residence Intestinal Residence Extraction EfficiencyMean Retention Time in the Foregut Time of D-glucose
Feeding Schedule Time (min)a (min)b (min)c (%)d
Treatment group:Ad lib. ....................................... 63.5 { 4.1 36.7 { 2.5 14.2 { 1.3 93.0 { .29Interval ...................................... 69.9 { 4.5 31.0 { 2.2 15.1 { 1.8 91.2 { .88
Statistical comparisonse ............... F1, 9 Å 1.79, P Å .214 F1, 9 Å 2.68, P Å .136 F1, 9 Å 0.14, P Å .722 F1, 9 Å 4.1, P Å .074
Note. See Material and Methods for definitions of each feeding schedule.a All retention times were measured using output distributions of the inert marker 14C FeCN (see Material and Methods).b Calculated as the inverse of the absolute values of the slopes in Figure 3.c Calculated as time of first defecation that contained counts (dpm) above background level.d Extraction efficiency (%) of radiolabeled D-glucose was measured by the inert-marker technique (Karasov et al. 1986).e Repeated-measures ANOVA (n Å 10).
when residence time in the intestine was estimated indirectly the estimates of residence time in the intestine were differentfor the direct and indirect methods.but were not supported when residence time in the intestine
was estimated directly. In evaluating the predictions of the Modeling an animal’s gut as a series of chemical reactorsmay be useful as a tool to describe patterns of digesta flowoptimal digestion model, we emphasize our estimates of resi-
dence time in the intestine using the direct method because in particular portions of the gut. However, our inability tosuccessfully apply chemical reactor theory to waxwings, whichthey depended on fewer assumptions than estimates using the
indirect method (MartıB nez del Rio et al. 1994). have quite simple guts (MartıB nez del Rio et al. 1994), indicatesthat movement of digesta in the guts of birds is much moreOur estimates of residence time in the intestine depended
on whether the stomach or intestine of waxwings functions as complex than movement of material in ideal chemical reactors.an ideal stirred-tank reactor or plug-flow reactor, respectively,in series. In stirred-tank reactors, material continuously flows
Are Animals Maximizing Their Rate of Energy Gain?into and out of the reactor, and the material in the reactor iswell mixed (MartıB nez del Rio et al. 1994). In contrast, material
Given the lack of agreement between the results from ourin a plug-flow reactor flows continuously through the chamber,
empirical test and the predictions of the optimal digestionand there is little axial mixing of material during transit.
model, perhaps the assumption that the net rate of energy gainIf the waxwing’s gut functions as a simple combination of
is maximized is inappropriate. In fact, our results suggest thatstirred-tank and plug-flow reactors, then mouth-to-anus total
the rate of energy intake was not maximized by waxwings.mean retention time minus mean residence time in the foregut
Extraction efficiency of glucose in cold-acclimated waxwingsshould equal our direct estimates of residence time in the
was similar for birds on both feeding schedules, although short-intestine (Levenspiel 1972; MartıB nez del Rio et al. 1994). Using
term feeding rates were 25% higher for birds on the intervalthe indirect approach, we estimated residence time in the intes-
feeding schedule. If the rate of energy intake were maximized,tine as about 27 min on the ad lib. feeding schedule and about
then birds on the ad lib. feeding schedule apparently could38 min on the interval feeding schedule. However, our direct
(but did not) increase their feeding rate to at least match thatestimates of residence time in the intestine were less than 15
of birds on the interval feeding schedule and thereby increasemin, on average, for birds on both feeding schedules. Using
their daily energy intake.the direct approach, Karasov and Levey (1990) and Levey and
Theoreticians working with optimal foraging models haveGrajal (1991) also estimated residence time in the intestine at
long recognized that such evidence does not necessarily meanabout 10 min, on average, for waxwings eating similar semisyn-
that maximization of net rate of energy gain is an inappropriatethetic diets. Mixing of digesta in the intestine has been observed
currency. Modelers of optimal diet or patch use typically as-in waxwings (Levey and Duke 1992), and this may explain why
sume that maximization of net rate of energy gain is the appro-priate optimization criterion (reviewed by Stephens and Krebs[1986]), but they point out that the predicted pattern of feeding
Figure 2. Cumulative output of inert marker for individual cold-depends on whether the time needed to obtain a fixed amountacclimated waxwings on ad lib. (solid line) or interval (dashed line)of energy is minimized (termed a ‘‘time minimizer’’) orfeeding schedules (see Material and Methods for definitions of
feeding schedules). whether the energy obtained in a fixed amount of time is
9g12$$mr08 03-02-98 14:05:29 pza UC: PHYS ZOO

9g12$$mr08 03-02-98 14:05:29 pza UC: PHYS ZOO

Foraging Costs and Digestive Physiology 177
maximized (termed a ‘‘energy maximizer’’; Schoener 1971, drase activity and rates of active glucose uptake do not increasewith increased glucose concentration (Levey and Karasov 1992;1987). Given the difference in feeding rate between waxwings
on the two feeding schedules, cold-acclimated waxwings were Afik et al. 1995; MartıB nez del Rio et al. 1995), although rela-tively few studies have focused on this type of response. Inclearly not always behaving like energy maximizers.
The optimal digestion model predicts that digestive effi- addition, such biochemical responses may be relatively unim-portant if passive absorption of nutrients such as glucose ac-ciency will be different for time minimizers and energy max-
imizers and so provides an additional criterion for discriminat- counts for a large fraction of total absorption (Karasov andCork 1994; Caviedes-Vidal and Karasov 1996; Levey and Cipol-ing between these two types of foragers. For an energy
maximizer, the net rate of energy gain is maximized when the lini 1996; Afik et al. 1997) and the time scale for modulationof enzymes and uptake capacity is relatively long.animal digests proportionately less of its food in favor of eating
more (Fig. 1). For a time minimizer, the net rate of energy There is some evidence for modulation of retention time inresponse to short-term changes in food quality or costs ofgain is maximized when the animal digests as much of the
food as possible, assuming the additional time required for feeding. Rainbow lorikeets hold digesta in their stomach longerwith increased sugar concentration, thereby maintaining rela-more thorough digestion still allows enough time for the for-
ager to obtain its fixed energy requirements. tively constant flow rate of sugar to the small intestine (Karasovand Cork 1994). In contrast, increased gut volume or digestaIn our study, cold-acclimated waxwings maintained con-
stant, high extraction efficiency. If waxwings were time mini- mixing apparently enabled waxwings (this study) and warblers(McWilliams and Karasov 1998) to maintain constant reten-mizers, then the extraction efficiencies we measured (91%–
93%) should be maximal. The two other studies that have tion time and hence extraction efficiency, despite short-termincreases in feeding rates of 25% and 50%, respectively.estimated extraction efficiency of glucose in waxwings provide
some support for this assumption (92%, MartıB nez del Rio et al. In summary, the picture that emerges is that of birds min-imizing feeding time by maximizing their extraction efficiency1989; 92%, Karasov and Levey 1990). Such less-than-complete
extraction of dietary glucose is apparently typical of frugivorous rather than maximizing their net rate of energy gain by reduc-ing extraction efficiency in favor of eating more. Modulationpasserines in general (Karasov and Levey 1990).of food intake, retention time, and digesta mixing may bethe primary ways that high, constant extraction efficiency is
Digestive Efficiency and Animal Ecology maintained during short-term changes in food quality or costsof feeding. From an ecological perspective, the lack of an effect
Digestive efficiency is of ecological importance because it re-of food quality or costs of feeding on extraction efficiency
flects the proportion of food eaten that is digested and absorbedsuggests that estimates of digestive efficiency are robust. How-
by the animal. Digestive physiologists view digestive efficiencyever, this conclusion is relevant to situations in which food
as a positive function of both retention time and the rate(s)type is constant (e.g., diets with constant high or low glucose
of hydrolysis and absorption and as a negative function of bothconcentrations). In situations in which birds switch between
concentration of nutrients in the food and digesta volumediets that differ in primary nutrients (e.g., between diets high
(Karasov 1996). Two important assumptions are implicit inin lipid and diets high in sugar), changes in extraction efficiency
this view: that any change in one of these parameters will causecan be significant (Afik and Karasov 1995).
a change in digestive efficiency unless a compensatory changeoccurs in another parameter, and hence that there is a tradeoffbetween rate of digesta processing and digestive efficiency, with Acknowledgmentsfaster processing resulting in reduced extraction efficiency.
Given this view, how did the parameters that determined We thank Doug Levey for kindly providing some of the wax-wings used in this study. Joceyln Bryant, Jean Fantle, and Jilldigestive efficiency in this study compensate during short-term
changes in food quality and costs of feeding so that digestive Keen provided excellent care for the captive birds. Denise Dear-ing, Doug Levey, and Carlos MartıB nez del Rio provided helpfulefficiency remained remarkably constant? Intestinal carbohy-criticisms of earlier drafts of the manuscript. We also especiallythank Bruce Darken for his valuable advice and assistance. The
Figure 3. Output distribution of inert marker for individual cold- work was supported by National Science Foundation grantacclimated waxwings on ad lib. (solid lines and solid squares) or IBN-9318675.interval (dashed lines and open squares) feeding schedules. For thead lib. feeding schedule, the regression line is based on all pointsafter the time with maximum marker output (ln dpm g01 excreta).
Literature CitedFor the interval feeding schedule, the regression line is also basedon all points after the time with maximum marker output
Afik D., E. Caviedes-Vidal, C. MartıB nez del Rio, and W.H.(ln dpm g01 excreta) but excludes points when the birds werewithout food (triangles). Karasov. 1995. Dietary modulation of intestinal hydrolytic
9g12$$mr08 03-02-98 14:05:29 pza UC: PHYS ZOO

178 S. R. McWilliams and W. H. Karasov
enzymes in yellow-rumped warblers. Am. J. Physiol. MartıB nez del Rio C., H.G. Baker, and I. Baker. 1992. Ecological269:R413–R420. and evolutionary implications of digestive processes: bird
Afik D. and W.H. Karasov. 1995. The trade-offs between diges- preferences and the sugar constituents of floral nectar andtion rate and efficiency in warblers and their ecological im- fruit pulp. Experientia 48:544–551.plications. Ecology 76:2247–2257. MartıB nez del Rio C., K.E. Brugger, J.L. Rios, M.E. Vergara, and
Afik D., S.R. McWilliams, and W.H. Karasov. 1997. A test for M. Witmer. 1995. An experimental and comparative studypassive absorption of glucose in yellow-rumped warblers of dietary modulation of intestinal enzymes in the Europeanand its ecological implications. Physiol. Zool. 70:370–377. starling (Sturnis vulgaris). Physiol. Zool. 68:490–511.
Caviedes-Vidal E. and W.H. Karasov. 1996. Glucose and amino MartıB nez del Rio C., S.J. Cork, and W.H. Karasov. 1994. Model-acid absorption in house sparrow intestine and its dietary ling gut function: an introduction. Pp. 25–53 in D.J. Chiversmodulation. Am. J. Physiol. 271:R561–R568. and P. Langer, eds. The Digestive System in Mammals: Food,
Denslow J.S., D.J. Levey, T.C. Moermond, and B.C. Went- Form and Function. Cambridge University Press, Cam-worth. 1987. A synthetic diet for fruit-eating birds. Wilson bridge.Bull. 99:131–134. MartıB nez del Rio C. and W.H. Karasov. 1990. Digestion strate-
Karasov W.H. 1996. Digestive plasticity in avian energetics and gies in nectar- and fruit-eating birds and the sugar composi-feeding ecology. Pp. 61–84 in C. Carey, ed. Avian Energetics tion of plant rewards. Am. Nat. 136:618–637.and Nutritional Ecology. Chapman & Hall, New York. MartıB nez del Rio C., W.H. Karasov, and D.J. Levey. 1989.
Karasov W.H. and S.J. Cork. 1994. Glucose absorption by a Physiological basis and ecological consequences of sugarnectarivorous bird: the passive pathway is paramount. Am. preferences in cedar waxwings. Auk 106:64–71.J. Physiol. 267:G18–G26. McWilliams S.R. and W.H. Karasov. 1998. Test of a digestion
. 1996. Test of a reactor-based digestion optimization optimization model: effect of variable-reward feeding sched-model for nectar-eating rainbow lorikeets. Physiol. Zool. ules on digestive performance of a migratory bird. Oecologia69:117–138. (in press).
Karasov W.H. and D.J. Levey. 1990. Digestive system trade- Murphy M.E. and J.R. King. 1982. Semi-synthetic diets as aoffs and adaptations of frugivorous passerine birds. Physiol.
tool for nutritional ecology. Auk 99:165–167.Zool. 63:1248–1270.
Penry D.L. and P.A. Jumars. 1986. Chemical reactor analysisKarasov W.H., D. Phan, J.M. Diamond, and F.L. Carpenter.
and optimal digestion. Bioscience 36:310–315.1986. Food passage and intestinal nutrient absorption in
. 1987. Modelling animal guts as chemical reactors. Am.hummingbirds. Auk 103:453–464.
Nat. 129:69–96.Lasiewski R.C. and W.R. Dawson. 1967. A re-examination of
Piersma T., A. Koolhaas, and A. Dekinga. 1993. Interactionsthe relation between standard metabolic rate and body
between stomach structure and diet choice in shorebirds.weight in birds. Condor 69:13–23.
Auk 110:552–564.Levenspiel O. 1972. Chemical Reactor Engineering. 2d ed. Wi-Redig P.T. 1989. The avian ceca: obligate combustion chambersley, New York.
or facultative afterburners? The conditioning influence ofLevey D.J. and M.L. Cipollini. 1996. Is most glucose absorbeddiet. J. Exp. Zool. Suppl. 3:66–69.passively in northern bobwhite? Comp. Biochem. Physiol.
Schoener T.W. 1971. Theory of feeding strategies. Annu. Rev.113A:225–231.Ecol. Syst. 2:369–404.Levey D.J. and G.E. Duke. 1992. How do frugivores process
. 1987. A brief history of optimal foraging ecology. Pp.fruit? Gastrointestinal transit and glucose absorption in ce-5–67 in A.C. Kamil, J.R. Krebs, and H.R. Pulliam, eds.dar waxwings (Bombycilla cedrorum). Auk 109:722–730.Foraging Behavior. Plenum, New York.Levey D.J. and A. Grajal. 1991. Evolutionary implications of
Stephens D.W. and J.R. Krebs. 1986. Foraging Theory.fruit processing and intake limitation in cedar waxwings.Princeton University Press, Princeton.Am. Nat. 138:171–189.
Warner A.C.I. 1981. Rate of passage of digesta through the gutLevey D.J. and W.H. Karasov. 1989. Digestive responses ofof mammals and birds. Nutr. Abstr. Rev. 51:789–820.temperate birds switched to fruit or insect diets. Auk
Witmer M.C. 1996. Annual diet of cedar waxwings based on106:675–686.U.S. Biological Survey records (1885–1950) compared to. 1992. Digestive modulation in a seasonal frugivore,diet of American robins: contrasts in dietary patterns andthe American robin (Turdus migratorius). Am. J. Physiol.
262:G711–G718. natural history. Auk 113:414–430.
9g12$$mr08 03-02-98 14:05:29 pza UC: PHYS ZOO