Dehydration of natural gas stored in underground gas storages

TPG4140: Natural Gas: Project
Department of Petroleum Engineering & Applied Geophysics
Norwegian University of Science & Technology, Trondheim, Norway
Natural Gas Sweetening & Effect of Declining Pressure
Supervisor Prof. Jon Steinar Gudmundsson Participants Ahsin Nazir Ayoub Ismailpour Fahad Saleem Muhammad Usman Idrees Syed Amjad Hussain Zaidy

2
Abstract
Demand of natural gas is increasing as it is cheaper than oil and a clean fuel. Natural gas
contains impurities like water, CO2, H2S, COS, mercury & N2. To meet pipeline
specifications/LNG specifications theses impurities have to be removed. Amines processes are
the developed technology available today for the removal of acid gases (CO2 & H2S). MEA,
DEA & MDEA are selected as commercial solvents keeping in view the feed gas composition.
When the gas reservoir pressure declines, new wells are usually drilled to maintain production
rate and front end compression may become necessary in the later stages of field life. But after a
while when front end compression is also unable to supply gas with enough pressure, the
pressure of the sweetening unit starts declining. In the present study the effect of declining
pressure on these sweetening processes is studied using HYSYS simulations. Two cases are
considered, firstly by reducing the pressure of absorber at given sour gas flow rate while keeping
the CO2 composition in sweet gas fixed using ‘adjust’ function. It was found that the lean amine
flow rate to absorber increases as pressure goes down which eventually leads to higher energy
requirement during the regeneration stage. Secondly, the sour gas flow rate was manipulated for
a given amine flow rate and specified CO2 content in sweet gas from which it was found that
amine sweetening unit capacity gets reduced as the pressure goes down.

3
Dedicated to Planet Earth

4
Acknowledgments
We extend our deepest gratitude to Prof. Jon Steinar Gudmundsson for his guidance and help
and his kind feedback which made it possible for us to come up with this report.

5
Table of Contents
Abstract
1.0 Introduction 6
2.0 Process Selection 7
2.1 Available Processes 7 2.2 Choice of solvent 10
3.0 Process description 12
4.0 HYSYS Simulations 14
5.0 Optimization 15
5.1 Optimization of absorber (MEA Case) 15 5.2 Optimization of absorber (DEA Case) 16 5.3 Optimization of absorber (MDEA Case) 17
6.0 Effect of declining pressure 17
6.1 Effect of declining pressure on lean Amine flow 18
6.2 Effect of declining pressure on capacity of amine unit 20
7.0 Conclusion 22
References 23
Appendices 24

6
Introduction
Natural gas from reservoir contains impurities like water, CO2, H2S, COS, mercury & N2. In
order to meet pipeline/LNG specifications these impurities have to be removed. Removal of acid
gases (CO2 & H2S) from natural gas stream is known as natural gas sweetening.
If the aim is to produce LNG or N2 removal by cryogenic processing then CO2 must be removed
up to 50 PPM in order to avoid solidification in exchangers, pipes or in turbo expanders [2].
Hydrogen sulfide in the presence of water forms a weak, corrosive acid that cause premature
failure of valves, pipelines and pressure vessels. Carbon dioxide is also corrosive in presence of
water and lowers the heating value. Natural gas is used as domestic fuel which makes it
necessary to remove H2S from gas because of the health hazards associated with it. The threshold
limit value (TLV) for prolonged exposure of H2S is 10 ppm. At 0.13 ppm, H2S can be sensed by
smell. At 4.6 ppm, the smell is quite noticeable. As the concentration increases beyond 200 ppm,
the sense of smell fatigues, and the gas can no longer be detected by odor. At 500 ppm, breathing
problems are observed and death can be expected in minutes. At 1000 ppm, death occurs
immediately [3].
Table-1.1: Specifications of a pipeline quality gas [1]

7
2.0 Process Selection
2.1 Available processes Process selection depends upon the pressure and composition of the raw natural gas, the trace
components and their composition, and the desired quality of marketable natural gas (pipeline
specification of LNG specification). The design of the absorber and the amount of solvent
required are determined by the absorption behavior of the least soluble compound to be removed
[4]. Some of the available processes are
1. Membrane
2. Adsorption
3. Physical absorption
4. Chemisorption
Important points to be considered before choosing a process for natural gas sweetening are:
• The concentration (partial pressure) of acid gases. In our case partial pressure of acid
gases in sour gas is 78.6 psig and partial pressure of acid gases in sweet gas is 2.74 psig.
• The specifications of the outlet gas (low outlet specifications favor the amines).
• The temperature and pressure at which the sour gas is available. High partial pressures of
the acid gases in the feed favor physical solvents, whereas low partial pressures favor the
amines.
• The volume of gas to be processed.
• The capital, operating, and royalty costs for the process.
• The environmental regulations.
• Relative economics [5]
1. Membrane process
Membranes can be used to remove bulk of CO2 but high feed pressure is required. Membranes
are thin polymer-based barriers that allow preferential passage of certain substances over others.
Gas separation through membranes relies on the principle that gases dissolve in and diffuse
through the membrane polymers. The difference in gas permeability rates through the membrane

8
provides the basis for the separation. The separation is actually driven by the component partial
pressure differences across the polymer membrane [5].
2. Adsorption process Acid gases, as well as water, can be effectively removed by physical adsorption on synthetic
zeolites. Applications are limited because water displaces acid gases on the adsorption bed [2].
3. Physical absorption Physical absorption processes are generally most efficient when the partial pressures of the acid
gases are relatively high, because partial pressure is the driving force for the absorption. These
processes are recommended for use when the partial pressure of the acid gas in the feed is greater
than 50 psi but these solvents are very sensitive to pressure [6].
4. Chemisorption Following reagents may be employed for chemisorption process:
A. Hot potassium carbonate solution
The hot potassium carbonate process is used to remove both CO2 and H2S in the gas stream. It
works best on a gas with CO2 partial pressures in the range of 30-90 psi [3].
B. Amines
Amines are well suited for applications where the acid gas partial pressures are low and low
levels of acid gas are desired in the residue gas since their acid gas removal capacity is relatively
high and insensitive to acid gas partial pressure as compared to physical solvents. The hydroxyl
group serves to reduce vapor pressure and increase water solubility, while the amine group
provides the necessary alkalinity in water solutions to promote the reaction with acid gases.
(Kohl, 1997). The following Amines are extensively used in industry for CO2 removal.
9
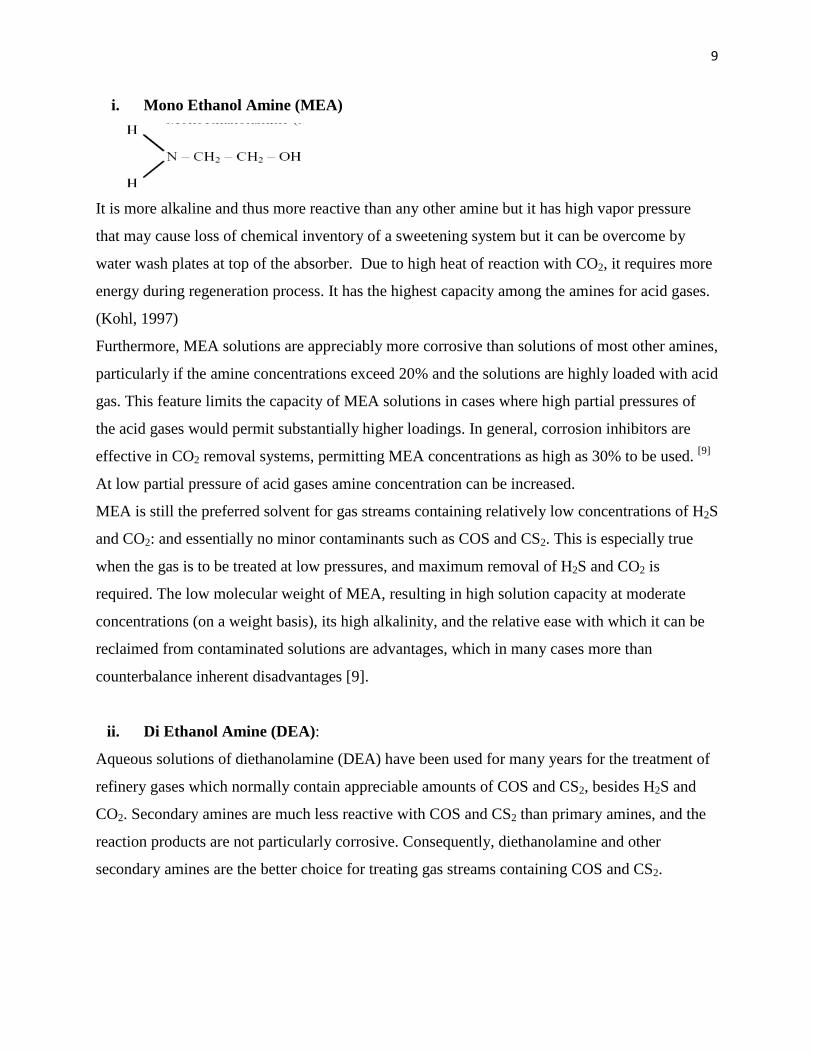
i. Mono Ethanol Amine (MEA)
It is more alkaline and thus more reactive than any other amine but it has high vapor pressure
that may cause loss of chemical inventory of a sweetening system but it can be overcome by
water wash plates at top of the absorber. Due to high heat of reaction with CO2, it requires more
energy during regeneration process. It has the highest capacity among the amines for acid gases.
(Kohl, 1997)
Furthermore, MEA solutions are appreciably more corrosive than solutions of most other amines,
particularly if the amine concentrations exceed 20% and the solutions are highly loaded with acid
gas. This feature limits the capacity of MEA solutions in cases where high partial pressures of
the acid gases would permit substantially higher loadings. In general, corrosion inhibitors are
effective in CO2 removal systems, permitting MEA concentrations as high as 30% to be used. [9]
At low partial pressure of acid gases amine concentration can be increased.
MEA is still the preferred solvent for gas streams containing relatively low concentrations of H2S
and CO2: and essentially no minor contaminants such as COS and CS2. This is especially true
when the gas is to be treated at low pressures, and maximum removal of H2S and CO2 is
required. The low molecular weight of MEA, resulting in high solution capacity at moderate
concentrations (on a weight basis), its high alkalinity, and the relative ease with which it can be
reclaimed from contaminated solutions are advantages, which in many cases more than
counterbalance inherent disadvantages [9].
ii. Di Ethanol Amine (DEA):
Aqueous solutions of diethanolamine (DEA) have been used for many years for the treatment of
refinery gases which normally contain appreciable amounts of COS and CS2, besides H2S and
CO2. Secondary amines are much less reactive with COS and CS2 than primary amines, and the
reaction products are not particularly corrosive. Consequently, diethanolamine and other
secondary amines are the better choice for treating gas streams containing COS and CS2.

10
The low vapor pressure of diethanolamine makes it suitable for low-pressure operations as
vaporization losses are quite negligible. One disadvantage of diethanolamine solutions is that the
reclaiming of contaminated solutions may require vacuum distillation. Another disadvantage of
DEA is that DEA undergoes numerous irreversible reactions with CO2, forming corrosive
degradation products, and for that reason, DEA may not be the optimum choice for treating gases
with a high CO2 content [7].
iii. Methyl Di Ethanol Amine (MDEA)
It has a low vapor pressure and thus, can be used at concentrations up to 60 wt% without
appreciable vaporization losses. Even with its relatively slow kinetics with CO2, MDEA is used
for bulk removal of CO2 from high-concentration gases because energy requirements for
regeneration are lower than those for the other amines.
MDEA process is particularly useful when CO2, is present at high partial pressures, as either
no steam or only a small amount of steam is required for regeneration. The rate of CO2,
absorption in MDEA can be significantly increased by the addition of relatively low
concentrations of primary or secondary amines [7].
2.2 Choice of solvent
The choice of amine concentration may be quite arbitrary and is usually made on the basis of
operating experience. In our case partial pressure of gases in flue gases is 78.65 psig and partial
pressure of acid gases in sweet gas is 2.74 psig. Membranes are often used to bulk removal of
CO2 while adsorption only applicable for small production units so we can use physical solvents
or alkanolamines (Figure-2.1) [2].
MEA is most reactive and has high capacity for CO2 loading than any other amine (more sites
are available for bond formation in one molecule of MEA than any other amine molecule).
Lower molecular weight of MEA than other amines but more acid gas loading hence less flow
rate of absorbent is required in case of MEA and less pumping cost. If there is CS2 or COS
present in small amounts in sour gas so degradations issues with MEA system and hence cannot
be used. Mixture of MDEA & activator peprazin is becoming more popular as it has low vapor

11
pressure and less degradation. Mixture of amines can also be used depending from case to case.
MDEA based mixed amine systems are flexible as selectivity for H2S and CO2 can be adjusted
by blending MDEA with primary or secondary amine in right proportions [7].
Figure-2.1: Process selection chart for simultaneous removal of CO2 & H2S present [2]
Physical solvents tend to dissolve heavier hydrocarbons, and the presence of these heavier
compounds in significant quantities tends to favor the selection of a chemical solvent. Solvent
must be high solubility in water, low volatility, less corrosive, low viscosity (low viscosity
facilitates both heat and mass transfer with less pressure drops and pump cost), non-toxic, non-
flammable, chemically stable and cheap (Kohl 1997).
Three amines i.e., MEA, DEA and MDEA have been selected from figure-2.1 keeping feed gas
composition given in Appendex-1 for simulation & optimization up to flash tank. Typical
process parameters are listed in the Table-2.1.

12
Table-2.1: Approximate guidelines for Amine processes [6]
3.0 Process Description
Flow scheme for all amine sweetening units is generally similar. MEA reacts with CO2 and H2S as following: [3]

13
The general process flow diagram for amine absorption is shown in Figure-2. The fundamental
underlying principle is the exothermic, reversible reaction between a weak acid (e.g., CO2) and a
weak base (e.g., amine) to form a soluble salt. The inlet gas is contacted counter-currently with
‘lean’ solvent in the Absorber. The acid gases are preferentially absorbed by the solution. Rich
amine pressure reduced to 100 psig so the entrapped gases (mostly methane) flashed off. The
solution, ‘enriched’ with H2S & CO2, is pre-heated before entering the Stripper where, through
the addition of heat, the reaction is reversed. From the bottom of the column, the ‘lean’ solvent
exchanges heat with the ‘rich’ solvent entering the column and are recycled back to the
Absorber. From the top, high-purity (dry-basis) acid gases are produced [2].
The choice of amine-concentration is often arbitrary and made on basis of experience (Kohl,
Nielsen, 1997). In general, corrosion inhibitors are effective in sweetening processes which
allows the use of high concentration of amine [9]. DEA concentration range is 30-40 wt. %
(GPSA, 2004) but HYSYS can be applicable up to 50 %. MDEA can be used up to 60 wt%.
Reboiler temperature is dependent on solution concentration, vent line back pressure and/or
residual acid gases content required. The stripping of acid gases from amine solution is aided by
raising the temperature of the operation. This may be done by increasing the pressure of the
reboiler [7].
The reason that CO2, stripping from MEA solution increases with increased reboiler pressure can
be explained on the basis of the effect of temperature on vapor pressures. The vapor pressure of
CO2 over an amine solution generally increases with temperature more rapidly than does the
vapor pressure of the water/amine mixture over the same solution. As a result, stripping to the
same mole fraction CO2 in the vapor phase means stripping to a lower mole fraction in the liquid
when the pressure (and thus the boiling point) is raised. ‘‘It should be noted that this
phenomenon is peculiar to CO2 in MEA and will neither occur with other amines nor with H2S in
MEA. The solution CO2 loading drops rapidly in the column immediately below the feed point,
then decreases more slowly until the bottom of the column is reached’’ [7].
14
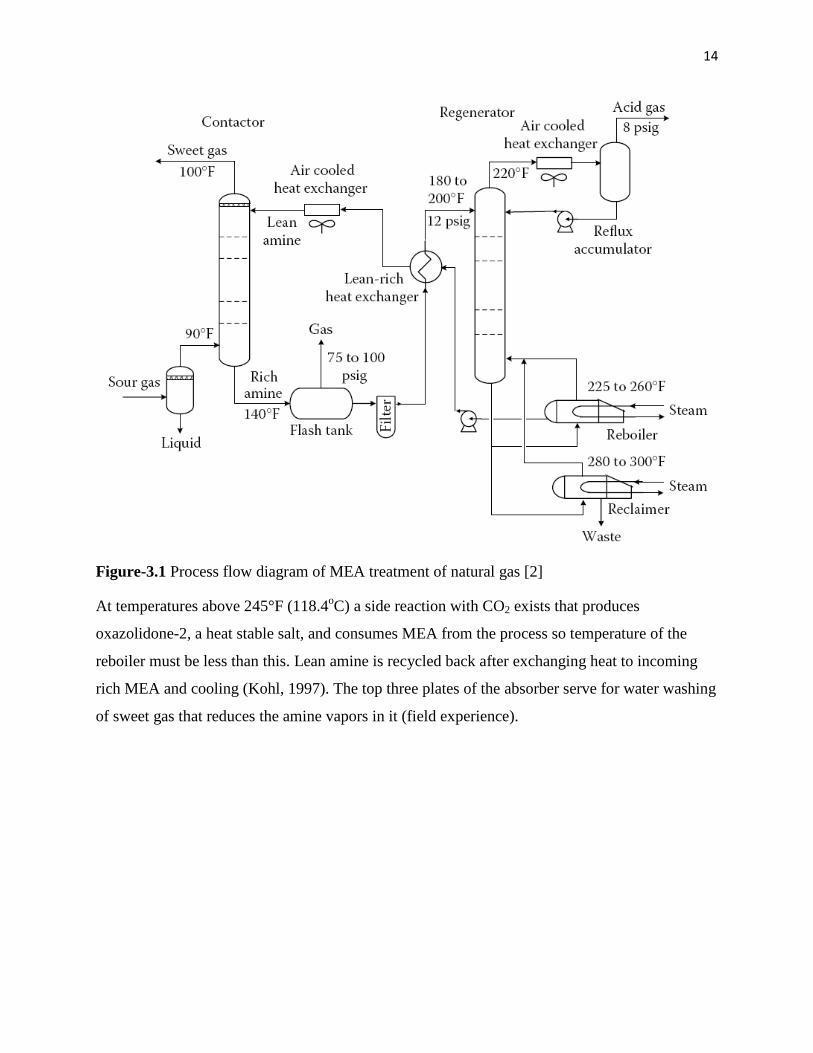
Figure-3.1 Process flow diagram of MEA treatment of natural gas [2]
At temperatures above 245°F (118.4oC) a side reaction with CO2 exists that produces
oxazolidone-2, a heat stable salt, and consumes MEA from the process so temperature of the
reboiler must be less than this. Lean amine is recycled back after exchanging heat to incoming
rich MEA and cooling (Kohl, 1997). The top three plates of the absorber serve for water washing
of sweet gas that reduces the amine vapors in it (field experience).

15
4.0 HYSYS 2006.5 Simulations
Simulation is done using Amine Package with Kent Eisenberg’s Thermodynamic Model for
Aqueous Amine Solutions and non ideal vapor phase model. PFD of simulations along with
material and energy balance is shown in figure-3 & 4. Specification of sweet gas is around 50
ppm CO2.
Figure-4.1 PFD of Natural Gas Sweetening using MEA, material and energy balance
Rest of the figures along with material and energy balance is in the appendex-4.
5.0 Optimization
5.1 Optimization of absorber (MEA case)
Absorber is optimized separately using adjust function and spread sheet. CO2 specification (50
ppm) in sweet gas is defined in the spread sheet (SPRDSHT-1) then user defined target value is
put in the adjust function (ADJ-1) window. Now values of Lean MEA flow rate and rich loading
which is also defined in the spread sheet noted by increasing number of trays. (Table-2.1 in
Appendix-2)

16
Figure-5.1: Optimization of MEA Absorber using spread sheet and adjust function
There is very less change in Lean MEA flow rate and rich loading after increasing the number of
plates from 18. Hence, the optimum numbers of plates for the absorber are 18 in terms of flow
rate of MEA but there is limitation for rich MEA loading which should not exceed more than
that of 0.5 mole CO2/mole of MEA due to downstream processing of rich MEA (Kohl, 1997).
Hence 11 numbers of plates selected. After optimization, optimum parameters impart in the
simulation and see the effect of decline in pressure.
5.2 Optimization of Absorber (DEA case)
Absorber optimization is similar to that of in MEA case in HYSYS. (Table-2.2 in Appendix-2)
Figure-5.2: Optimization of DEA Absorber using spread sheet and adjust function

17
Optimum number of plates are 20 which satisfy both flow rate and rich loading limit for DEA (0.35-0.65 moles CO2/mole DEA) [6].
5.3 Optimization of Absorber (MDEA case)
Absorber optimization is similar to that of in MEA case in HYSYS. (Table-2.3 in Appendix-2)
Figure-5.3: Optimization of MDEA Absorber using spread sheet and adjust function
Figure-5 shows the flow rate curve become flat after 38 plates while rich loading is not in the
range (0.4-0.55 moles CO2/moles of MDEA). HYSYS is not simulating good sweetening using
MDEA. So we decided to drop the case and not analyzing effect of declining pressure.
6.0 Effect of declining pressure
During initial phase of field operations gas flow out of the well because of natural pressure in the
reservoir. Pressure let down by well head choke. Once the pressure start declining, new wells can
be drilled depending upon reservoir to maintain pressure. Choke opening has to be increased
during production to maintain design flow to processing facility with passage of time. Finally
the the last option is to install front end compression. Compression station may be installed at
inlet of processing facility or near well head. Well head compression is more efficient and has
more productivity (Statoil decided to installed subea well head compression for Åsgard). When

18
even the compression cannot maintain pressure in sweetening unit one has to increase amine
flow rate. At plant design stage usually pumps are design with some margins in later stage of
field operations (field experience) but once lean amine pumps reached bottle neck then declining
pressure results in reduction of sweetening unit capacity[6].
6.1 Effect of declining pressure on lean Amine flow
‘‘The comparative capacities of MDEA and MEA for CO2 removal in an absorption/flash
process are shown in Figure-6.1. If it is assumed that equilibrium is attained in both the
absorption and striping steps and that isothermal conditions are maintained, the maximum net
capacity is simply the difference between equilibrium concentrations at the absorption and
stripping partial pressures’’ [7] .
If pressure of the absorber column decreases due to decline in reservoir pressure then partial
pressure of CO2 will also be reduced and hence the rich amine loading (moles of CO2/moles of
amine) will get reduced. In order to compensate for these effects the amine solution flow rate
will have to be increased which in turn will affect the energy efficiency of the process.
Figure-6.1: Comparative capacities of MEA & MDEA for CO2 recovery [7]

19
There are other effects like amine & water losses and increased energy consumption per unit
volume of gas processed due to increased amine flow rate. If more amine flow rate is employed
it will not only increase pumping cost but will also result in more energy consumption during
regeneration.
Figure-6.2(a): Effect of declining pressure on amine flow rate and rich MEA loading at
constant gas flow rate
Figure-6.2(b): Effect of declining pressure on amine flow rate and rich DEA loading at
constant gas flow rate

20
Figure-6.2(c): Effect of declining pressure on amine flow rate and rich DEA
loading at constant gas flow rate
6.2 Effect of declining pressure on capacity of amine unit
Declining of absorber pressure results in reduction of the capcity of absorber at a given amine
flow rate and sweet gas specification (figure-6.3).
Figure-6.3: Effect of declining pressure on capacity of natural gas amine sweetening unit [6]

21
‘Adjust’ function (in HYSYS) was used once again for given specification of sweet gas (50 ppm
CO2) but this time manipulating sour gas flow for the already optimized fixed amine flow rate. It
is observed that reducing absorber pressure affects the sweetening and CO2 will increase in sweet
gas but at same time ‘adjust’ function reduces the sour gas flow rate to meet the target
specification which results in capacity reduction of the tower as shown in figure-6.4(a).
Figure-6.4(a): Effect of declining pressure on natural gas MEA sweetening unit
Similar effect can be seen if DEA or MDEA is used as absorbent (Figure-6.4b & 6.4c).
Figure-6.4(b): Effect of declining pressure on natural gas DEA sweetening unit

22
Figure-6.4(c): Effect of declining pressure on natural gas MDEA sweetening unit
Conclusion The declining pressure of gas from the reservoir has direct effect on the amine solution flow rate.
As the gas pressure goes down, the amine flow rate needs to be increased in order to meet the
sweet gas specifications. This will result in increase of overall energy requirement for the
process due to the costs associated with pumping higher flow rates and cost of increased energy
needs for the regeneration of solution.
But in the extreme case when solution circulation limits have already been reached there can be
no option but to decrease the inlet sour gas flow rate to keep sweet gas specs under control. This
will thus limit the production rate. The options of changing the amine type and/or increasing the
amine concentration may also be considered keeping in view the margins available in the design
limits but these effects have not been studied in this short report.

23
References:
[A] Natural Gas Information 2010: IEA Statistics; International Energy Agency; 2010; Paris; pp-II.3
[1] Engineering Data Book; 12th ed.; Volume 1, Sec. 2; Product Specification; Gas Processors Suppliers Association; Tulsa OK; 2004; pp-3
[2] Kidney, A.J & Parrish, W. L.; Fundamentals of Natural Gas Processing; Taylor & Francis; 2006; pp (93-127).
[3] Arnold, K. & Stewart M.; Surface Production Operations, Vol. 2; Ed. 2; Gulf Publishing Company; Houston TX; 1999; pp 151-153, 164-167,190.
[4] Wiley Critical Content-Petroleum Technology; Vol.1; John Wiley & Sons; 2007; pp-378
[5] Engineering Data Book; 12th ed.; Volume 2, Sec. 21; Hydrocarbon Treating; Gas Processors Suppliers Association; Tulsa OK; 2004; pp 21-25
[6] Engineering Data Book; 12th ed.; Volume 2, Sec. 21; Hydrocarbon Treating; Gas Processors Suppliers Association; Tulsa OK; 2004; pp 6-14
[7] Kohl, A. & Nielsen, R; Gas Purification; Ed. 5; Gulf Publishing Company; Houston TX; 1997; 50-57.
[-] Polasek, J.C. & Bullin, J.A; ‘Selecting Amines for Sweetening Units’; Bryan Research and Engineering, Inc.-Technical Papers; 2006; pp 2.

24
Appendices
Appendix-1
Table-1.1: Sour and sweet gas composition
Sour gas pressure= 1100 psig Sweet gas pressure= 1095 psig Sour Gas Sweet Gas
Components Mol % Partial Pressure (psig)
Mol % Partial Pressure (psig)
Methane 87.48 962.28 93.7 1026.015 Ethane 0.9 9.9 0.98 10.731 Propane 0.26 2.86 0.3 3.285 Iso-butane 0.09 0.99 0.1 1.095 N-butane 0.05 0.55 0.05 0.5475 Iso-pentane 0.04 0.44 0.04 0.438 N-pentane 0.03 0.33 0.03 0.3285 Hexane 0.07 0.77 0.07 0.7665 Heptane 0.09 0.99 0.09 0.9855 N2 4 44 4.2 45.99 CO2 7 77 0.25 2.7375 H2S 0.15 1.65 0.0004 0.00438 H2O 0.08 0.88 0.14 1.533 100 1100 100.0 1095.0 Partial pressure of acid gas in sour gas= 78.65 psig Partial pressure of acid gas in sweet gas= 2.74 psig
Appendex-2
Table-2.1: Optimization of absorber using HYSYS (MEA Case)
Plates Solution flowrate Rich Loading
Kgmole/hr moles CO2/mole MEA 10 16980 0.472 11 14200 0.5646 12 12680 0.6322 13 12370 0.6481 14 12060 0.6648 15 11970 0.6697

25
16 11900 0.6739 17 11810 0.6791 18 11740 0.6828 19 11710 0.6847 20 11670 0.6871
21 11650 0.6883
Table-2.2: Optimization of absorber using HYSYS (DEA Case)
Plates Solution flow Rich loading
Kgmole/hr moles CO2/mole DEA 10 93270 0.03584 11 76290 0.04383 12 53180 0.06288 13 38040 0.0879 14 27670 0.1209 15 20270 0.165 16 14780 0.2263 17 10790 0.3099 18 8644 0.3869 19 7966 0.4198 20 7680 0.4354 21 7549 0.443 22 7477 0.4472 23 7449 0.4489 24 7422 0.4504
25 7422 0.4506
Table-2.3: Optimization of absorber using HYSYS (MDEA Case)
Plates Solution flow Rich loading
Kgmole/hr moles CO2/mole MDEA 14 2926000 0.001418 16 2220000 0.001869 18 1317000 0.003151 20 894000 0.004641 22 643300 0.00645 24 481200 0.008623 26 370500 0.0112

26
28 292400 0.01419 30 235500 0.01762 32 193100 0.02148 34 160600 0.02584 36 135100 0.0307 38 114600 0.03621 40 98330 0.04219 42 84830 0.04819 44 73820 0.0562 46 64570 0.06425
48 56720 0.07314
Appendex-3
Table 3.1(a): Effect of declining pressure on MEA sweetening unit (11 plates in absorber)
performance (HYSYS Simulation results)
Pressure of absorber flow rate of MEA Rich loading kPa Kgmole/hr moles CO2/moles MEA 7000 0.6167 13040 6500 0.6039 13270 6000 0.5818 13780 5500 0.5423 14780 5000 0.4803 16690 4500 0.4196 19100
4000 0.3714 21580
Table 3.1(b): Effect of declining pressure on DEA sweetening unit (20 plates in absorber)
performance (HYSYS Simulation results)
Pressure of absorber flow rate of DEA Rich loading kPa Kgmole/hr moles CO2/moles DEA 7584 0.4354 7680 7000 0.4353 7680 6500 0.4272 7827 6000 0.42 7960 5500 0.41 8153 5000 0.3886 8603
27
4500 0.3499 9556
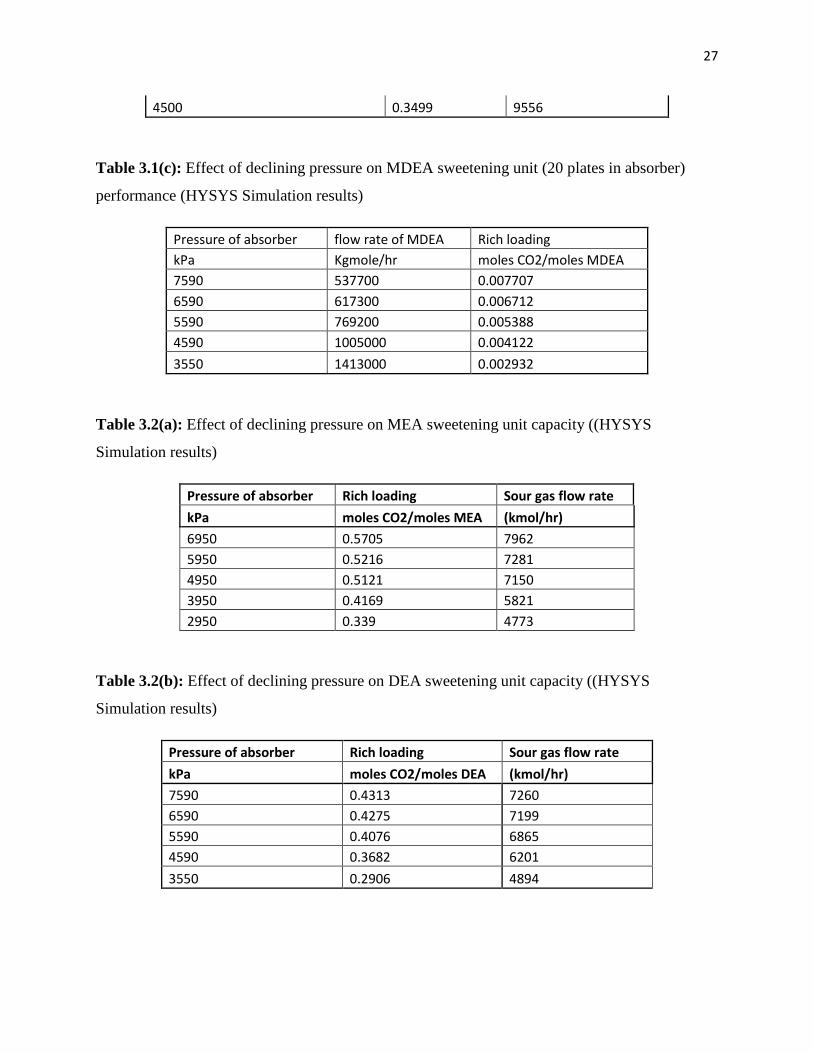
Table 3.1(c): Effect of declining pressure on MDEA sweetening unit (20 plates in absorber)
performance (HYSYS Simulation results)
Pressure of absorber flow rate of MDEA Rich loading kPa Kgmole/hr moles CO2/moles MDEA 7590 537700 0.007707 6590 617300 0.006712 5590 769200 0.005388 4590 1005000 0.004122
3550 1413000 0.002932
Table 3.2(a): Effect of declining pressure on MEA sweetening unit capacity ((HYSYS
Simulation results)
Pressure of absorber Rich loading Sour gas flow rate
kPa moles CO2/moles MEA (kmol/hr)
6950 0.5705 7962 5950 0.5216 7281 4950 0.5121 7150 3950 0.4169 5821 2950 0.339 4773
Table 3.2(b): Effect of declining pressure on DEA sweetening unit capacity ((HYSYS
Simulation results)
Pressure of absorber Rich loading Sour gas flow rate
kPa moles CO2/moles DEA (kmol/hr)
7590 0.4313 7260 6590 0.4275 7199 5590 0.4076 6865 4590 0.3682 6201
3550 0.2906 4894

28
Table 3.2(c): Effect of declining pressure on MDEA sweetening unit capacity ((HYSYS
Simulation results)
Pressure of absorber Rich loading Sour gas flow rate
kPa moles CO2/moles MDEA (kmol/hr)
7590 0.01233 7342 6590 0.01157 6889 5590 0.009921 5910 4590 0.0082 4885
3550 0.007 4170
Appendex 4
Figure-4.2 PFD of Natural Gas Sweetening using DEA, material and energy balance

29
Copyright © 2022 FDOKUMEN