Natural gas at thermodynamic equilibrium Implications for the origin of natural gas
12
BioMed Central Page 1 of 12 (page number not for citation purposes) Geochemical Transactions Open Access Research article Natural gas at thermodynamic equilibrium Implications for the origin of natural gas Frank D Mango* 1 , Daniel Jarvie 2 and Eleanor Herriman 1 Address: 1 Petroleum Habitats, 806 Soboda Ct., Houston, Texas 77079, USA and 2 Worldwide Geochemistry, 218 Higgins Street, Humble, Texas 77338, USA Email: Frank D Mango* - [email protected]; Daniel Jarvie - [email protected]; Eleanor Herriman - [email protected] * Corresponding author Abstract It is broadly accepted that so-called 'thermal' gas is the product of thermal cracking, 'primary' thermal gas from kerogen cracking, and 'secondary' thermal gas from oil cracking. Since thermal cracking of hydrocarbons does not generate products at equilibrium and thermal stress should not bring them to equilibrium over geologic time, we would not expect methane, ethane, and propane to be at equilibrium in subsurface deposits. Here we report compelling evidence of natural gas at thermodynamic equilibrium. Molecular compositions are constrained to equilibrium, and isotopic compositions are also under equilibrium constraints: The functions [(CH 4 )*(C 3 H 8 )] and [(C 2 H 6 ) 2 ] exhibit a strong nonlinear correlation (R 2 = 0.84) in which the quotient Q progresses to K as wet gas progresses to dry gas. There are striking similarities between natural gas and catalytic gas generated from marine shales. A Devonian/ Mississippian New Albany shale generates gas with Q converging on K over time as wet gas progresses to dry gas at 200°C. The position that thermal cracking is the primary source of natural gas is no longer tenable. It is challenged by its inability to explain the composition of natural gas, natural gases at thermodynamic equilibrium, and by the existence of a catalytic path to gas that better explains gas compositions. Published: 16 June 2009 Geochemical Transactions 2009, 10:6 doi:10.1186/1467-4866-10-6 Received: 24 February 2009 Accepted: 16 June 2009 This article is available from: http://www.geochemicaltransactions.com/content/10/1/6 © 2009 Mango et al; licensee BioMed Central Ltd. This is an Open Access article distributed under the terms of the Creative Commons Attribution License (http://creativecommons.org/licenses/by/2.0 ), which permits unrestricted use, distribution, and reproduction in any medium, provided the original work is properly cited. K CH CH CH = [( )*( )] /[( )] 4 3 8 2 6 2 K C C C C 12 13 2 12 1 13 1 12 2 , [( )*( )] /[( )*( )] = K C C C C 13 13 3 12 1 13 1 12 3 , [( )*( )] /[( )*( )] =
Transcript of Natural gas at thermodynamic equilibrium Implications for the origin of natural gas

BioMed CentralGeochemical Transactions
ss
Open AcceResearch articleNatural gas at thermodynamic equilibrium Implications for the origin of natural gasFrank D Mango*1, Daniel Jarvie2 and Eleanor Herriman1Address: 1Petroleum Habitats, 806 Soboda Ct., Houston, Texas 77079, USA and 2Worldwide Geochemistry, 218 Higgins Street, Humble, Texas 77338, USA
Email: Frank D Mango* - [email protected]; Daniel Jarvie - [email protected]; Eleanor Herriman - [email protected]
* Corresponding author
AbstractIt is broadly accepted that so-called 'thermal' gas is the product of thermal cracking, 'primary'thermal gas from kerogen cracking, and 'secondary' thermal gas from oil cracking. Since thermalcracking of hydrocarbons does not generate products at equilibrium and thermal stress should notbring them to equilibrium over geologic time, we would not expect methane, ethane, and propaneto be at equilibrium in subsurface deposits. Here we report compelling evidence of natural gas atthermodynamic equilibrium. Molecular compositions are constrained to equilibrium,
and isotopic compositions are also under equilibrium constraints:
The functions [(CH4)*(C3H8)] and [(C2H6)2] exhibit a strong nonlinear correlation (R2 = 0.84) inwhich the quotient Q progresses to K as wet gas progresses to dry gas. There are strikingsimilarities between natural gas and catalytic gas generated from marine shales. A Devonian/Mississippian New Albany shale generates gas with Q converging on K over time as wet gasprogresses to dry gas at 200°C.
The position that thermal cracking is the primary source of natural gas is no longer tenable. It ischallenged by its inability to explain the composition of natural gas, natural gases at thermodynamicequilibrium, and by the existence of a catalytic path to gas that better explains gas compositions.
Published: 16 June 2009
Geochemical Transactions 2009, 10:6 doi:10.1186/1467-4866-10-6
Received: 24 February 2009Accepted: 16 June 2009
This article is available from: http://www.geochemicaltransactions.com/content/10/1/6
© 2009 Mango et al; licensee BioMed Central Ltd. This is an Open Access article distributed under the terms of the Creative Commons Attribution License (http://creativecommons.org/licenses/by/2.0), which permits unrestricted use, distribution, and reproduction in any medium, provided the original work is properly cited.
K CH C H C H= [( )*( )] /[( ) ]4 3 8 2 62
K C C C C1 213
212
113
112
2, [( )*( )] /[( )*( )]=
K C C C C1 313
312
113
112
3, [( )*( )] /[( )*( )]=
Page 1 of 12(page number not for citation purposes)

Geochemical Transactions 2009, 10:6 http://www.geochemicaltransactions.com/content/10/1/6
BackgroundThe hydrocarbons in natural gas are believed to comefrom two sources, one biological ('biogenic gas'), and theother from thermal cracking, 'primary thermal gas' fromkerogen cracking and 'secondary thermal gas' from oilcracking [1,2]. Although there is general agreement on thesource of biogenic gas, disagreement persists over the ori-gin of thermal gas. One point of controversy is that ther-mal cracking does not produce a gas resembling naturalgas. Oil and kerogen pyrolysis typically give between 10and 60% wt methane (C1–C4) [3-9] while natural gas con-tains between 60 and 95+% methane [10]. None of theexplanations that have been offered to explain this [11-15] are satisfactory [16]. Catalysis by reduced transitionmetals can, in theory, explain high-methane in natural gas[17], and this hypothesis is supported by experimentalresults. Crude oils and n-alkanes decomposed overreduced nickel and cobalt oxides produce gas resemblingnatural gas in molecular and isotopic compositions [18].There is, however, no evidence of metal activity in sedi-mentary rocks and therefore no compelling reason toquestion thermal cracking theory. Moreover, recenthydrous pyrolysis experiments with metal-rich PermianKupferschiefer shale showed little evidence of catalyticactivity, seemingly dismissing the possibility of a catalyticpath to natural gas [19].
This changed with the recent disclosure of natural catalyticactivity in marine shales at temperatures 300° below ther-mal cracking temperatures [20]. Shales generated gasunder anoxic gas flow at 50°C, nearly five times more gasthan the same shale would generate at 350°C throughthermal cracking. Although there was only indirect evi-dence for transition metals as the active catalysts, it never-theless established natural catalytic activity in source rocksbelieved to be major sources of natural gas. There are,therefore, two possible paths to natural gas, a ther-mogenic path operating almost exclusively at high tem-peratures, and a catalytic path operating at much lowertemperatures. The latter redefines the time-temperaturedimensions of gas habitats opening the possibility of gasgeneration at subsurface temperatures previously thoughtimpossible.
Thermodynamic equilibrium could shed light on whichof these paths might dominate in nature. Thermal reac-tions are generally under kinetic control and their prod-ucts removed from thermodynamic equilibrium whilecatalytic reactions are often under equilibrium controland their products near equilibrium. Hydrocarbons canachieve equilibrium through metathesis where homo-logues interconvert (Reaction 1).
Olefin metathesis [21,22] is a well-known catalytic reac-tion shown in Reaction 2 for propylene. It is an extraordi-nary catalytic process because it breaks and makes carbon-carbon double bonds and reshuffles olefinic carbons dis-tributing them randomly to new partners. Catalyzed by avariety of transition metals, it proceeds to equilibrium atlow temperatures with conservation of π and σ bonds[23]. Metathesis of methane, ethane, and propane is illus-trated in Reaction 3, referred to here as 'gas metathesis'.Although hypothetical, it bears a strong resemblance toolefin metathesis in stoichiometry (1) and to low-temper-ature gas generation in marine shales [20]. Hydrocarbonsdecompose over reduced nickel and cobalt oxides toC1–C3 compositions near equilibrium, possibly throughcatalytic gas metathesis [18]. Equilibrium between hydro-carbons in natural environments is not limited to metath-esis, however. Metastable equilibria have been reportedfrom the interaction of hydrocarbons, water, and authi-genic mineral assemblages [24-26].
Gas metathesis without the aid of a catalytic agent ishighly unlikely. Hydrocarbon cracking generates meth-ane, ethane, and propane removed from thermodynamicequilibrium [3,27], and their extraordinary thermal stabil-ities [28,29] preclude equilibrium over geologic time.Thus natural gas at metathetic equilibrium (3) wouldimplicate catalytic assistance.
Here we address metathetic equilibrium in shale gas gen-eration and in natural gas deposits, and discuss the geneticimplications.
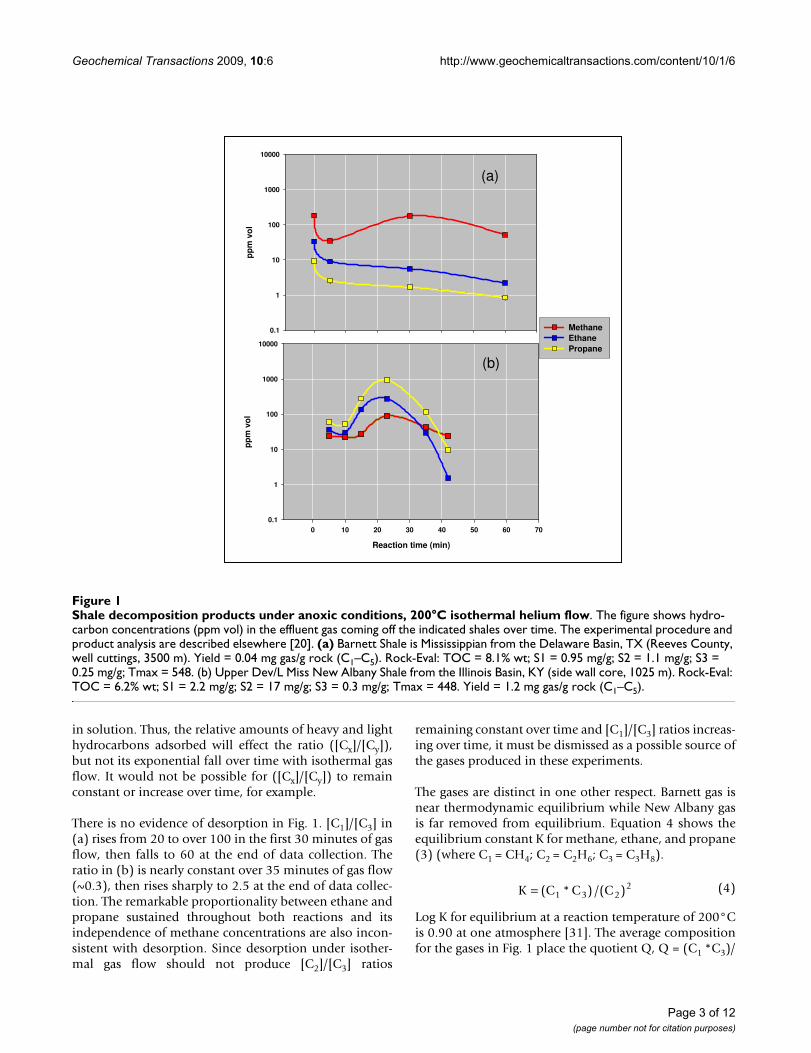
Results and discussionMethane or propane tends to dominate the hydrocarbonsemerging from marine shales under anoxic isothermal gasflow [20]. Fig. 1 illustrates two examples, a methane-richgas from a high-maturity Mississippian Barnett shale (a)and a propane-rich gas from a lower-maturity Devonian/Mississippian New Albany shale (b).
The possibility that these are preexisting hydrocarbonsdesorbed under isothermal gas flow is inconsistent withthe order in which hydrocarbons are released over time.Desorption under isothermal gas flow is a first order proc-ess where light hydrocarbons (Cx) will desorb beforeheavy hydrocarbons (Cy) with concentrations [Cx] and[Cy] in the effluent gas stream falling exponentially overtime [30]. In our analysis of exponential desorption,ratios ([Cx]/[Cy]) will also fall exponentially over timeirrespective of the concentrations adsorbed on surfaces or
2 1 2 1 2 C H C H C Hn m n m n m− − + ++ (1)
2 3 6 2 4 4 8 C H C H C H+ (2)
2 2 6 4 3 8 C H CH C H+ (3)
Page 2 of 12(page number not for citation purposes)
Geochemical Transactions 2009, 10:6 http://www.geochemicaltransactions.com/content/10/1/6
in solution. Thus, the relative amounts of heavy and lighthydrocarbons adsorbed will effect the ratio ([Cx]/[Cy]),but not its exponential fall over time with isothermal gasflow. It would not be possible for ([Cx]/[Cy]) to remainconstant or increase over time, for example.
There is no evidence of desorption in Fig. 1. [C1]/[C3] in(a) rises from 20 to over 100 in the first 30 minutes of gasflow, then falls to 60 at the end of data collection. Theratio in (b) is nearly constant over 35 minutes of gas flow(~0.3), then rises sharply to 2.5 at the end of data collec-tion. The remarkable proportionality between ethane andpropane sustained throughout both reactions and itsindependence of methane concentrations are also incon-sistent with desorption. Since desorption under isother-mal gas flow should not produce [C2]/[C3] ratios
remaining constant over time and [C1]/[C3] ratios increas-ing over time, it must be dismissed as a possible source ofthe gases produced in these experiments.
The gases are distinct in one other respect. Barnett gas isnear thermodynamic equilibrium while New Albany gasis far removed from equilibrium. Equation 4 shows theequilibrium constant K for methane, ethane, and propane(3) (where C1 = CH4; C2 = C2H6; C3 = C3H8).
Log K for equilibrium at a reaction temperature of 200°Cis 0.90 at one atmosphere [31]. The average compositionfor the gases in Fig. 1 place the quotient Q, Q = (C1 *C3)/
K C C C= ( * ) /( )1 3 22 (4)
Shale decomposition products under anoxic conditions, 200°C isothermal helium flowFigure 1Shale decomposition products under anoxic conditions, 200°C isothermal helium flow. The figure shows hydro-carbon concentrations (ppm vol) in the effluent gas coming off the indicated shales over time. The experimental procedure and product analysis are described elsewhere [20]. (a) Barnett Shale is Mississippian from the Delaware Basin, TX (Reeves County, well cuttings, 3500 m). Yield = 0.04 mg gas/g rock (C1–C5). Rock-Eval: TOC = 8.1% wt; S1 = 0.95 mg/g; S2 = 1.1 mg/g; S3 = 0.25 mg/g; Tmax = 548. (b) Upper Dev/L Miss New Albany Shale from the Illinois Basin, KY (side wall core, 1025 m). Rock-Eval: TOC = 6.2% wt; S1 = 2.2 mg/g; S2 = 17 mg/g; S3 = 0.3 mg/g; Tmax = 448. Yield = 1.2 mg gas/g rock (C1–C5).
pp
m v
ol
0.1
1
10
100
1000
10000
Methane EthanePropane
Reaction time (min)
0 10 20 30 40 50 60 70
pp
m v
ol
0.1
1
10
100
1000
10000
(a)
(b)
Page 3 of 12(page number not for citation purposes)

Geochemical Transactions 2009, 10:6 http://www.geochemicaltransactions.com/content/10/1/6
(C2)2, at log Q = 0.40 for Barnett gas and log Q = -1.30 forNew Albany gas, where C1, C2, & C3 are % vol.
A catalytic reaction can be metathetic, under equilibriumcontrol, and still yield these hydrocarbons removed fromequilibrium. All catalytic reactions tend to equilibriumover time in hydrocarbons that interconvert. Productcompositions will therefore change over time, removedfrom equilibrium initially (short residence times), butapproaching equilibrium with time. Thus, in flow reactorswhere residence times are short, gas metathesis could gen-erate these hydrocarbons removed from equilibrium.
The New Albany reaction was repeated under closed con-ditions for evidence of gas metathesis over longer resi-dence times. Gas flow was continued for 20 minutes toinsure active gas generation, then the reactor was closedand its contents allowed to stand for 200 hours at 200°C.
Fig. 2 shows the changes in gas composition over time andFig. 3 shows the approach to equilibrium that attendsthese changes.
The New Albany shale generates gas removed from equi-librium under flow conditions (Fig. 1b) and approachingequilibrium under closed conditions (Fig. 3). Equilibriumover time is a signature of catalysis. In this instance, itprogresses to equilibrium and gas dryness in concert (Fig.2). Natural gases might also progress to equilibrium anddryness in concert if the natural process is similarly cata-lytic.
Two methods were used to approximate the equilibriumconstant K (eq. 4) in the subsurface. One approximatesGibbs free energies as a function of temperature and pres-sure [32] and the other log K values at various tempera-tures for ideal gases at one atmosphere [31]. For
Gas compositions over time, closed reactor, anoxic procedure, New Albany shale (Fig. 1), 200°C, HeliumFigure 2Gas compositions over time, closed reactor, anoxic procedure, New Albany shale (Fig. 1), 200°C, Helium. After anoxic helium flow for 20 min., the reactor was closed, and the gas was analyzed (GC) at the indicated times by opening the reactor briefly to allow gas from the reactor to pass into a six-way valve for GC analysis [20].
Reaction time (hours)
0 50 100 150 200 250
% v
ol
0
10
20
30
40
50
60
MethaneEthanePropanei-Butanen-Butane
Page 4 of 12(page number not for citation purposes)

Geochemical Transactions 2009, 10:6 http://www.geochemicaltransactions.com/content/10/1/6
temperatures between 325 K and 575 K, and pressuresbetween 3 MPa and 150 MPa, log K falls between 0.9 and1.3 [32]. The second approximation [31] also places equi-librium limits within the same region: log K = 0.73 (575K) and 1.4 (325 K). If natural gas compositions are con-strained by equilibrium forces, they should have log Qvalues near these limits relative to the log Q limits forunaltered thermogenic gases.
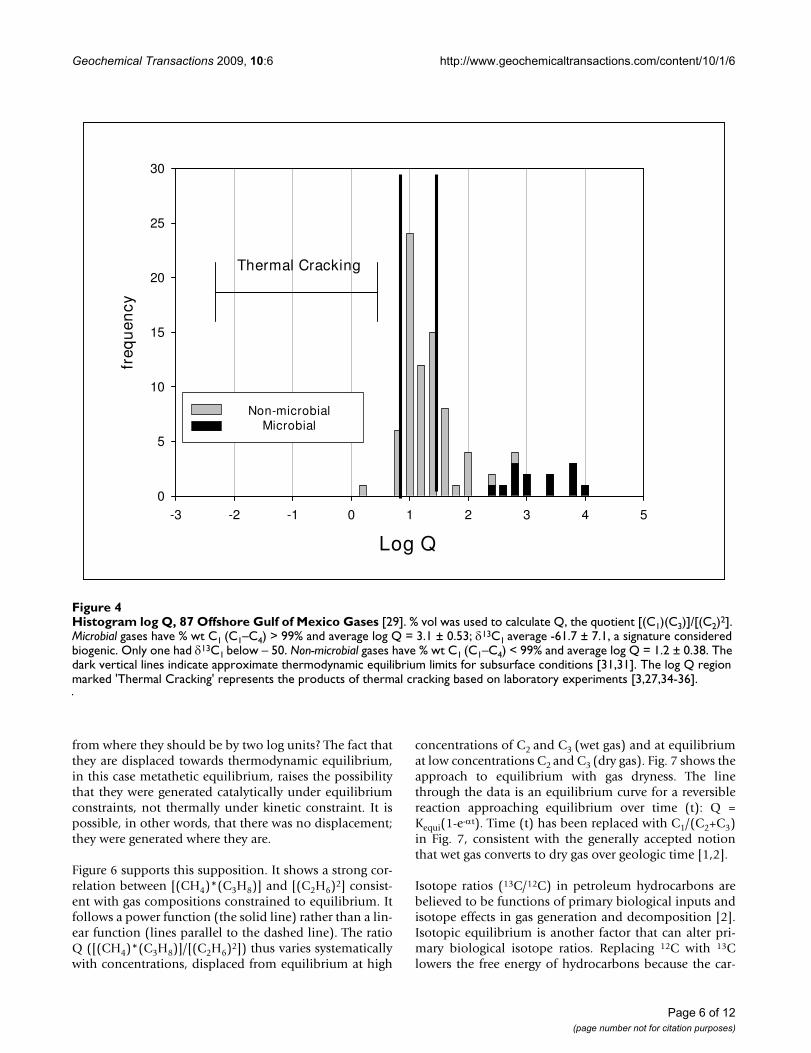
Figure 4 is a histogram of log Q for offshore Gulf of Mex-ico gases [33]. These gases were chosen because they aremostly free gases not associated with crude oils or othermaterials that might compromise their thermodynamicproperties. The gases are divided into non-microbial andmicrobial according to dryness (% wt C1 in C1–C4). Thenon-microbial gases are largely within the approximated
equilibrium limits, while the microbial gases are clearlyremoved from those limits.
Gas products from thermal cracking experiments fallwithin the region marked 'Thermal Cracking' in Fig.4[3,27,34-36]. We would expect 'primary thermal gas'from kerogen cracking and 'secondary thermal gas' fromoil cracking to fall within this region as well. The displace-ment of natural gases to the right of this region by two logunit is therefore significant.
Figure 5 shows a similar displacement in 1600 gases fromvarious basins in North America.
Figs. 4 &5 challenge the notion that thermal cracking isthe source of natural gas irrespective of thermodynamicequilibrium. How do we explain log Q values displaced
Gas composition over time and thermodynamic equilibriumFigure 3Gas composition over time and thermodynamic equilibrium. Gas compositions are shown in Fig. 2. Q is the quotient [(C1)(C3)]/[(C2)2], where concentrations are % vol. The horizontal line is the equilibrium constant K (K = 10) for the reaction conditions [31]. The solid line through the data is from the equation Q(t) = 10*(1-e-αt), where Q(t) is the quotient at time t (hours), 10 is Q at infinite time, and the constant α was set to 0.0094 to fit the data.
Reaction time (hours)
0 50 100 150 200 250 300
K (
t)
0.01
0.1
1
10
100
Equilibrium
Q
Page 5 of 12(page number not for citation purposes)
Geochemical Transactions 2009, 10:6 http://www.geochemicaltransactions.com/content/10/1/6
from where they should be by two log units? The fact thatthey are displaced towards thermodynamic equilibrium,in this case metathetic equilibrium, raises the possibilitythat they were generated catalytically under equilibriumconstraints, not thermally under kinetic constraint. It ispossible, in other words, that there was no displacement;they were generated where they are.
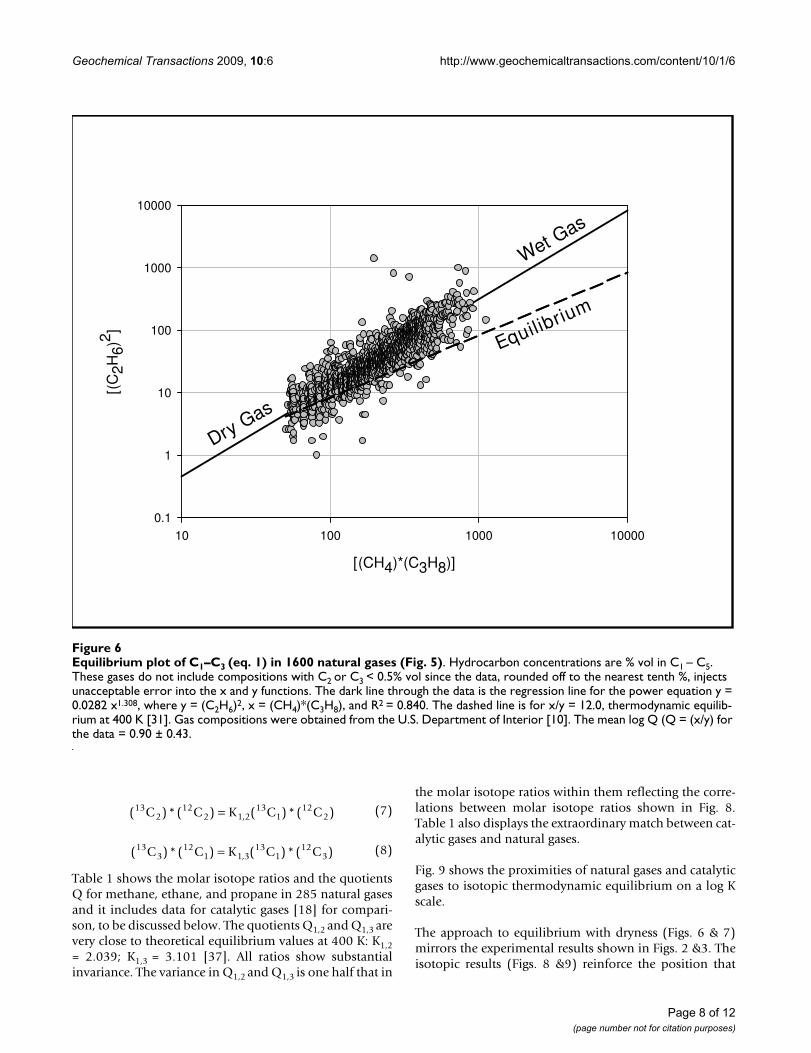
Figure 6 supports this supposition. It shows a strong cor-relation between [(CH4)*(C3H8)] and [(C2H6)2] consist-ent with gas compositions constrained to equilibrium. Itfollows a power function (the solid line) rather than a lin-ear function (lines parallel to the dashed line). The ratioQ ([(CH4)*(C3H8)]/[(C2H6)2]) thus varies systematicallywith concentrations, displaced from equilibrium at high
concentrations of C2 and C3 (wet gas) and at equilibriumat low concentrations C2 and C3 (dry gas). Fig. 7 shows theapproach to equilibrium with gas dryness. The linethrough the data is an equilibrium curve for a reversiblereaction approaching equilibrium over time (t): Q =Kequi(1-e-αt). Time (t) has been replaced with C1/(C2+C3)in Fig. 7, consistent with the generally accepted notionthat wet gas converts to dry gas over geologic time [1,2].
Isotope ratios (13C/12C) in petroleum hydrocarbons arebelieved to be functions of primary biological inputs andisotope effects in gas generation and decomposition [2].Isotopic equilibrium is another factor that can alter pri-mary biological isotope ratios. Replacing 12C with 13Clowers the free energy of hydrocarbons because the car-
Histogram log Q, 87 Offshore Gulf of Mexico Gases [29]Figure 4Histogram log Q, 87 Offshore Gulf of Mexico Gases [29]. % vol was used to calculate Q, the quotient [(C1)(C3)]/[(C2)2]. Microbial gases have % wt C1 (C1–C4) > 99% and average log Q = 3.1 ± 0.53; δ13C1 average -61.7 ± 7.1, a signature considered biogenic. Only one had δ13C1 below – 50. Non-microbial gases have % wt C1 (C1–C4) < 99% and average log Q = 1.2 ± 0.38. The dark vertical lines indicate approximate thermodynamic equilibrium limits for subsurface conditions [31,31]. The log Q region marked 'Thermal Cracking' represents the products of thermal cracking based on laboratory experiments [3,27,34-36].
log K
-3 -2 -1 0 1 2 3 4 5
freq
uen
cy
0
5
10
15
20
25
30
non-biogenic gases biogenic gases
Thermal Cracking
Log Q
Non-microbialMicrobial
Page 6 of 12(page number not for citation purposes)

Geochemical Transactions 2009, 10:6 http://www.geochemicaltransactions.com/content/10/1/6
bon and hydrogen bonds to 13C are stronger than thesame bonds to 12C. Bond energy enhancement increaseswith carbon number. Replacing 12C with 13C in ethaneyields more additional bond energy than it does in meth-ane, for example. Thus, at isotopic equilibrium, 13C willbe distributed preferentially in the higher hydrocarbonsaccording to their respective lower free energies [37]. Orig-inal 13C input will control the amount of 13C sharedbetween hydrocarbons at equilibrium, but their respectivefree energies will control how 13C is distributed betweenthem. The distribution of 13C at equilibrium will thereforebe independent of original input, rates of gas generationand rates of gas decomposition.
The isotopic equilibrium reaction for methane and ethaneis shown in Reaction 5 and for methane and propane inReaction 6 (the position of 13C in C3H8 is unspecified).
Eqs. 7 and 8 are the isotopic equilibrium equations withK1,2 (7) the carbon isotopic equilibrium constant formethane and ethane, and K1,3 (8) the carbon isotopicequilibrium constant for methane and propane: 12Cn and13Cn are fugacities; 13C2 = 13C12CH6, and 13C3 = 13C12C2H8.
13 CH C H CH CH412
2 612
413
6+ + (5)
13 122CH C H CH C C H4
123 8
124
138+ + (6)
Natural gas compositions and their relationship to thermodynamic equilibriumFigure 5Natural gas compositions and their relationship to thermodynamic equilibrium. Histogram of log Q (Q = [(C1)*(C3)/(C2)2]) for 1600 gas compositions obtained from the U.S. Department of Interior; mean log Q = 0.90 ± 0.43 [10]. Hydrocarbon concentrations used to calculate log Q were % vol C1–C5. These gases do not include compositions with C2 or C3 < 0.5% vol. Since concentrations were rounded off to the nearest tenth in the DOI database, values in that range introduced substantial errors in calculating Q. The vertical dark lines and the horizontal bar are defined in Fig. 4.
Log (K)
-3 -2 -1 0 1 2 3
freq
uen
cy
0
200
400
600
Thermal Cracking
Log Q
Page 7 of 12(page number not for citation purposes)
Geochemical Transactions 2009, 10:6 http://www.geochemicaltransactions.com/content/10/1/6
Table 1 shows the molar isotope ratios and the quotientsQ for methane, ethane, and propane in 285 natural gasesand it includes data for catalytic gases [18] for compari-son, to be discussed below. The quotients Q1,2 and Q1,3 arevery close to theoretical equilibrium values at 400 K: K1,2= 2.039; K1,3 = 3.101 [37]. All ratios show substantialinvariance. The variance in Q1,2 and Q1,3 is one half that in
the molar isotope ratios within them reflecting the corre-lations between molar isotope ratios shown in Fig. 8.Table 1 also displays the extraordinary match between cat-alytic gases and natural gases.
Fig. 9 shows the proximities of natural gases and catalyticgases to isotopic thermodynamic equilibrium on a log Kscale.
The approach to equilibrium with dryness (Figs. 6 & 7)mirrors the experimental results shown in Figs. 2 &3. Theisotopic results (Figs. 8 &9) reinforce the position that
( )*( ) ( )*( ),13
212
2 1 213
112
2C C K C C= (7)
( )*( ) ( )*( ),13
312
1 313
112
3C C K C C1 = (8)
Equilibrium plot of C1–C3 (eq. 1) in 1600 natural gases (Fig. 5)Figure 6Equilibrium plot of C1–C3 (eq. 1) in 1600 natural gases (Fig. 5). Hydrocarbon concentrations are % vol in C1 – C5. These gases do not include compositions with C2 or C3 < 0.5% vol since the data, rounded off to the nearest tenth %, injects unacceptable error into the x and y functions. The dark line through the data is the regression line for the power equation y = 0.0282 x1.308, where y = (C2H6)2, x = (CH4)*(C3H8), and R2 = 0.840. The dashed line is for x/y = 12.0, thermodynamic equilib-rium at 400 K [31]. Gas compositions were obtained from the U.S. Department of Interior [10]. The mean log Q (Q = (x/y) for the data = 0.90 ± 0.43.
[(CH4)*(C3H8)]
10 100 1000 10000
[(C
2H6)
2 ]
0.1
1
10
100
1000
10000
Dry Gas
Wet Gas
Equilibrium
Page 8 of 12(page number not for citation purposes)

Geochemical Transactions 2009, 10:6 http://www.geochemicaltransactions.com/content/10/1/6
hydrocarbons in natural gas are generated under equilib-rium constraints. It is a metathetic equilibrium and there-fore a catalytic equilibrium.
Other explanations are less satisfactory. It is difficult toexplain dry gas generation through thermal cracking[28,29] and harder to explain gas metathesis through ther-mal stress. Equilibrium requires the facile exchange of car-bon atoms between methane, ethane, and propane.Carbon-carbon and carbon-hydrogen σ bonds are brokenand reformed with overall bond conservation. This isunprecedented in thermal hydrocarbon reactions andinconceivable without catalytic assistance.
ConclusionThe following results support our position that naturalgases are at or near thermodynamic equilibrium:
1) Gas compositions are significantly displaced from ther-mogenic compositions to equilibrium compositions(Figs. 5 &6).
2) There is a strong nonlinear correlation between[(C1)*C3)] and [(C2)2] in which the quotient Q convergeson equilibrium as wet gas progresses to dry gas (Figs. 6)consistent with an approach to equilibrium over geologictime (Fig. 7).
Thermodynamic equilibrium and gas drynessFigure 7Thermodynamic equilibrium and gas dryness. Q = (C1)*(C3)/(C2)2. The data is taken from Fig. 6. The black line passing through the data is the equilibrium curve, where Q approaches the equilibrium constant K (10.4) with gas dryness: Q = 10.4(1-e-α(C1/C2+C3))), α was set to 0.1 to fit the data.
Page 9 of 12(page number not for citation purposes)

Geochemical Transactions 2009, 10:6 http://www.geochemicaltransactions.com/content/10/1/6
Page 10 of 12(page number not for citation purposes)
The correlations between molar isotope ratios in methane, ethane, and propane in 285 gases (USGS, Table 1)Figure 8The correlations between molar isotope ratios in methane, ethane, and propane in 285 gases (USGS, Table 1). Ratios are molar, calculated as described in Table 1. The lines are linear regression lines with a coefficients of correlation R2 = 0.638 for 13C2/12C2 with slope (zero intercept) = 2.028, and R2 = 0.47 for 13C3/12C3 with slope (zero intercept) = 3.055.
13C1/12C1
0.0097 0.0098 0.0099 0.0100 0.0101
13C
n/12
Cn
0.018
0.020
0.0220.028
0.030
0.032
0.034
13C2/12C2
13C3/12C3
Table 1: Statistical properties of molar isotope ratios and isotopic equilibrium constants in 285 natural gases and 5 catalytic gases.
Natural Gases Catalytic Gasesmean sd × 104 V × 106 Mean sd × 104 v × 107
13C1/12C1 0.00991 0.55 5.8 0.00991 0.40 0.3013C2/12C2 0.02031 1.07 5.2 0.02030 0.63 1.7813C3/12C3 0.03090 1.50 4.4 0.03090 0.97 1.9
Q1,2 2.0486 70.6 2.2 2.0481 35.7 5.7Q1,3 3.1175 130 3.3 3.1172 30.6 1.8
Natural gas data was taken from USGS Energy Resource Organic Geochemistry Data Base, http://energy.cr.usgs.gov/prov/og/. Catalytic gases are from octadecene decomposition over reduced nickel oxide (180 – 210°C) [18]. C1–C3 compositions were normalized to % wt carbon. δ13C values were converted to mass ratios which were used to calculate wt 13C at each carbon number: x1 at C1, x2 at C2, and x3 at C3. Wt 13C1 = x1; Wt 13C2 is wt C2 with composition 13C12C = x2+((12/13.00335)x2); wt 13C3 is wt C3 with composition 13C12C2 = x3+((24/13.00335)x3). Wt 12C at C2 was calculated as the total wt 12C at C2 minus the wt 12C in 13C2. Wt 12C at C3 was also the total wt 12C at C3 minus the wt 12C in 13C3. Weights (per 100 g) were converted to moles/(100 g C1–C3) which were used throughout our analysis. The quotient Q1,2 = (13C2)*(12C1)/(13C1)*(12C2) and Q1,3 = (13C3)*(12C1)/(13C1)*(12C3), where concentrations are moles/100 g. Variance (v) is (sd)2 for log (ratio).

Geochemical Transactions 2009, 10:6 http://www.geochemicaltransactions.com/content/10/1/6
3) The isotopic compositions of methane, ethane, andpropane are also constrained to equilibrium composi-tions (Figs 8 &9).
We propose catalytic gas metathesis as the source of equi-librium in natural gas. The natural catalytic activity inmarine shales [20], or some similar activity in other sedi-mentary rocks, is probably the source of equilibrium innatural gas deposits. This view is supported by the NewAlbany shale experiment in which Q progressed to meta-thetic equilibrium over time as wet gas progressed to drygas (Figs. 2 &3). A mechanistic connection between degra-dation to methane [20] and metathesis is suggested.
Catalysis by low valent transition metals [16-18] may bethe source of gas metathesis and degradation in the originof natural gas. The match in isotope ratios between cata-
lytic gases and natural gases (Table 1) supports this posi-tion and the sensitivity of marine shales to oxygenpoisoning [20] supports it as well.
The position that thermal cracking adequately explainsthe origin of natural gas [1,2] is no longer tenable. It can-not explain the high concentrations of methane in naturalgas [16], the distribution of light hydrocarbons [38,39],and the associations with thermodynamic equilibriumreported here. Of the two possible pathways to naturalgas, the catalytic path [20] appears the more attractive. Itis simple, economic, and does not suffer the now mount-ing deficiencies challenging thermal cracking theory.
Competing interestsThe authors declare that they have no competing interests.
Histogram of isotopic quotients (log Q1,2 and log Q1,3) for 285 natural gases (Table 1)Figure 9Histogram of isotopic quotients (log Q1,2 and log Q1,3) for 285 natural gases (Table 1). All values of Q1,2 and Q1,3 were calculated as described in Table 1. The arrows beneath the chart (catalytic gas) mark the positions of log Q1,2 and log Q1,3 for Catalytic Gases in Table 1. The vertical lines mark isotopic equilibrium constants at 300 K, log K1,2 = 0.31259; log K1,3 = 0.49602, and at 500 K, log K1,2 = 0.30786; log K1,3 = 0.49142 [37].
log K
0.28 0.30 0.32 0.50
freq
uen
cy
0
20
40
60
80
100
120
K1,2
K1,3
300K500K 300K 500K
Log Q(1,3) catalytic gasLog Q(1,2) catalytic gas Log Q
Q(1,2)
Q(1,3)
Page 11 of 12(page number not for citation purposes)
Geochemical Transactions 2009, 10:6 http://www.geochemicaltransactions.com/content/10/1/6
Publish with BioMed Central and every scientist can read your work free of charge
"BioMed Central will be the most significant development for disseminating the results of biomedical research in our lifetime."
Sir Paul Nurse, Cancer Research UK
Your research papers will be:
available free of charge to the entire biomedical community
peer reviewed and published immediately upon acceptance
cited in PubMed and archived on PubMed Central
yours — you keep the copyright
Submit your manuscript here:http://www.biomedcentral.com/info/publishing_adv.asp
BioMedcentral
Authors' contributionsFDM formulated theory, experimental design and super-vised the experimental work. DJ contributed to the exper-imental work and helped in shaping the paper. EH wasinstrumental in early strategy and in writing the ms.
AcknowledgementsWe thank Stephen Garcia for experimental assistance.
References1. Tissot BP, Welte DH: Petroleum Formation and Occurrence Springer,
New York; 1984. 2. Hunt JM: Petroleum Geochemistry and Geology Freeman, New York;
1995. 3. Voge HH, Good GM: Thermal cracking of higher paraffins. Jour-
nal American Chemical Society 1949, 71:593-597.4. McNab JG, Smith PV, Betts RI: The evolution of petroleum. Petro-
leum and Engineering Chemistry 1952, 44:2556-2563.5. Evans RJ, Felbeck GT: High temperature simulation of petro-
leum formation I. The pyrolysis of Green River Shale. OrganicGeochemistry 1983, 4:135-144.
6. Saxby JD, Riley KW: Petroleum generation by laboratory-scalepyrolysis over six years simulating conditions in a subsidingbasin. Nature 1984, 308:175-177.
7. Espitalie J, Ungerer P, Irwin I, Marquis F: Primary cracking of ker-ogens. Experimenting and modeling C1, C2-C5, C6-C15, andC15+ classes of hydrocarbons formed. Organic Geochemistry1987, 13:893-899.
8. Hikita T, Takahashi I, Yoshimichi T: Hydropyrolysis of heavy oils.Fuel 1989, 68:1140-1144.
9. Horsfield B, Schenk HJ, Mills N, Welte DH: An investigation of thein-reservoir conversion of oil to gas: compositional andkinetic findings from closed-system programmed-tempera-ture pyrolysis. Organic Geochemistry 1992, 19:191-204.
10. Mango FD: The light hydrocarbons in petroleum: a criticalreview. Organic Geochemistry 1997, 26:417-440.
11. Price LC, Schoell M: Constraints on the origins of hydrocarbongas from compositions of gases at their site of origin. Nature1995, 378:368-371.
12. McNeil RI, BeMent WO: Thermal stability of hydrocarbons:Laboratory criteria and field examples. Energy and Fuels 1996,10:60-67.
13. van Aarssen DGK, Bastow TP, Alexander R, Kagi RI: Distribution ofmethylated naphthalenes in crude oils: indicators of matu-rity, biodegradation and mixing. Organic Geochemistry 1999,30:1213-1227.
14. Inan S: Gaseous hydrocarbons generated during pyrolysis ofpetroleum source rocks using unconventional grain size.Organic Geochemistry 2000, 31:1409-1418.
15. Snowdon LR: Natural gas composition in the geological envi-ronment and the implications for the processes of genera-tion and preservation. Organic Geochemistry 2001, 32:913-931.
16. Mango FD: Methane concentrations in natural gas: the geneticimplications. Organic Geochemistry 2001, 32:1283-1287.
17. Mango FD: Transition metal catalysis in the generation ofpetroleum and natural gas. Geochimica et Cosmochimica Acta1992, 56:553-555.
18. Mango FD, Elrod LW: The carbon isotopic composition of cat-alytic gas: A comparative analysis with natural gas. Geochimicaet Cosmochimica Acta 1999, 63:1097-1106.
19. Lewan MD, Kotarba MJ, Wieclaw D, Piestrzynski A: Evaluatingtransition-metal catalysis in gas generation from the Per-mian Kupferschiefer by hydrous pyrolysis. Geochimica et Cosmo-chimica Acta 2008, 72:4069-4093.
20. Mango FD, Jarvie DM: Low temperature gas from marineshales. Geochemical Transactions 2009, 10:3.
21. Cotton FA, Wilkinson G, Murillo CA, Bochmann M: Advanced Inor-ganic Chemistry 6th edition. John Wiley & Sons, NY; 1999:1282-1285.
22. Rouhi AM: Olefin metathesis: Big-deal reaction. Chemical andEngineering News 2002, 80(51):29-83.
23. Mango FD: Olefin Metathesis. Coordination Chemistry Reviews 1975,15:152-163.
24. Fabuss BM, Smith JO, Lait RI, Borsanyi AS, Satterfield CN: Rapidthermal cracking of n-hexadecane at elevated temperatures.Industrial and Engineering Chemistry, Product Develoment 1962,1:293-299.
25. Helgeson HC, Knox AM, Owens CE, Shock EI: Petroleum oil fieldwaters, and authigenic mineral assemblages: Are they inmetastable equilibrium in hydrocarbon reservoirs. Geochim-ica Cosmochimica Acta 1993, 57:3295-3339.
26. Seewald JS: Evidence for metastable equilibrium betweenhydrocarbons under hydrothermal conditions. Nature 1994,370:285-287.
27. Seewald JS: Organic-Inorganic interactions in petroleum-pro-ducing sedimentary basins. Nature 2003, 426:323-333.
28. Laidler KJ, Wojciechowske BW: Kinetics and mechanisms of thethermal decomposition of ethane. I. The uninhibited reac-tion. Proceedings Royal Society 1961, A260:91-102.
29. Laidler KJ, Sagert NH, Wojciechowske BW: Kinetics and mecha-nisms of the thermal decomposition of propane. ProceedingsRoyal Society 1962, A270:242-253.
30. Tokoro Y, Misono M, Uchijima T, Yoneda Y: Analysis of thermaldesorption curves for heterogeneous surfaces. I. A linearvariation of the activation energy of desorption. Bulletin of theChemical Society of Japan 1978, 51:85-89.
31. Stull DR, Westrum EF Jr, Sinke GC: The chemical thermodynamics oforganic compounds Johy Wiley & Sons, New York; 1969.
32. Lemmon EW, Huber ML, McLinden MO: NIST Standard Refer-ence Database 23: Reference Fluid Thermodynamic andTransport Properties – REFPROP 8.0. National Institute ofStandards and Technology, Standard Reference Data Program, Gaith-ersburg, Maryland 20899, USA; 2007.
33. Rice DD, Threlkeld CN: Natural gas analyses from OffshoreGulf of Mexico. From Gulf Coast Oils and Gases, Their Char-acteristics, Origin, Distribution, and Exploration and Pro-duction Significance. Edited by: Schumacher D, Perkins BF.Proceeding of the Ninth Annual Research Conference, Gulf CoastSection Society of Economic Paleontologists and MineralologistsFoundations; 1990.
34. Behar F, Ungerer P, Kressmann S, Rudkiewiez JL: Thermal evolu-tion of crude oils in sedimentary basins: experimental simu-lation in a confined system and kinetic modeling. Revue del'Institut Francais du Pétrole 1991, 46:151-181.
35. Horsfield B, Schenk HJ, Mills N, Welte DH: An investigation of thein-reservoir conversion of oil to gas: compositional andkinetic findings from closed-system programmed-tempera-ture pyrolysis. Organic Geochemistry 1992, 19:191-204.
36. Burkle-Vitzum V, et al.: Kinetics of alkyl aromatics on the ther-mal stability of hydrocarbons under geologic conditions.Organic Geochemistry 2004, 35:3-33.
37. Galimov EM, Ivlev AA: Thermodynamic isotope effects inorganic compounds. I. Carbon isotope effects in straight-chain alkanes. Russian Journal of Physical Chemistry 1973,47:1564-66.
38. Mango FD: An invariance in the isoheptanes of petroleum. Sci-ence 1987, 237:514-517.
39. Mango FD: The stability of hydrocarbons under the time-tem-perature conditions of petroleum genesis. Nature 1991,352:146-148.
Page 12 of 12(page number not for citation purposes)